UNITED STATES
SECURITIES AND EXCHANGE COMMISSION
Washington, D.C. 20549
FORM N-CSR
CERTIFIED SHAREHOLDER REPORT
OF
REGISTERED MANAGEMENT INVESTMENT COMPANIES
Investment Company Act file number: 811-02687
| |
| Name of Registrant: | Vanguard Municipal Bond Funds |
| Address of Registrant: | P.O. Box 2600 |
| | Valley Forge, PA 19482 |
| |
| Name and address of agent for service: | Anne E. Robinson, Esquire |
| | P.O. Box 876 |
| | Valley Forge, PA 19482 |
Registrant’s telephone number, including area code: (610) 669-1000
Date of fiscal year end: October 31
Date of reporting period: November 1, 2017 – October 31, 2018
Item 1: Reports to Shareholders

Annual Report | October 31, 2018
Vanguard Municipal Bond Funds
Vanguard Short-Term Tax-Exempt Fund
Vanguard Limited-Term Tax-Exempt Fund
Vanguard Intermediate-Term Tax-Exempt Fund
Vanguard Long-Term Tax-Exempt Fund
Vanguard High-Yield Tax-Exempt Fund
Vanguard’s Principles for Investing Success
We want to give you the best chance of investment success. These principles, grounded in Vanguard’s research and experience, can put you on the right path.
Goals. Create clear, appropriate investment goals.
Balance. Develop a suitable asset allocation using broadly diversified funds. Cost. Minimize cost.
Discipline. Maintain perspective and long-term discipline.
A single theme unites these principles: Focus on the things you can control.
We believe there is no wiser course for any investor.
| |
| Contents | |
| |
| Your Fund’s Performance at a Glance | 1 |
| CEO’s Perspective | 3 |
| Advisor’s Report | 4 |
| Short-Term Tax-Exempt Fund | 6 |
| Limited-Term Tax-Exempt Fund | 55 |
| Intermediate-Term Tax-Exempt Fund | 149 |
| Long-Term Tax-Exempt Fund | 285 |
| High-Yield Tax-Exempt Fund | 326 |
| About Your Fund’s Expenses | 377 |
| Glossary | 379 |
Please note: The opinions expressed in this report are just that—informed opinions. They should not be considered promises or advice. Also, please keep in mind that the information and opinions cover the period through the date on the front of this report. Of course, the risks of investing in your fund are spelled out in the prospectus.
See the Glossary for definitions of investment terms used in this report.
Your Fund’s Performance at a Glance
• For the 12 months ended October 31, 2018, the returns for Investor Shares of the five tax-exempt bond funds discussed in this report ranged from –0.80% for Vanguard Intermediate-Term Tax-Exempt Fund to 0.68% for Vanguard Short-Term Tax-Exempt Fund. Results of the funds versus their benchmark indexes and peer groups were mixed.
• While fundamentals remained solid, municipal bonds went through a bumpy patch early on amid tax reforms that affected both supply and demand. With yields rising, prices of municipal bonds finished the period down across the maturity spectrum, but particularly toward the intermediate and long end.
• The funds generally benefited from a tilt toward lower-quality investment-grade bonds, which outperformed their higher-quality counterparts. Adding more premium callable bonds, which are less sensitive to rising interest rates, also added value. Duration positioning helped the shorter-term funds, but held back the longer-term investment-grade funds.
| | | | | | |
| Total Returns: Fiscal Year Ended October 31, 2018 | | | | |
| 30-Day | Taxable- | |
| SEC Equivalent | Income | Capital | Total |
| Yield | Yield1 | Returns | Returns | Returns |
| Vanguard Short-Term Tax-Exempt Fund | | | | |
| Investor Shares | 1.88% | 3.18% | 1.38% | -0.70% | 0.68% |
| Admiral™ Shares 2 | 1.93 | 3.26 | 1.46 | -0.70 | 0.76 |
| Bloomberg Barclays 1 Year Municipal Bond Index | | 0.65 |
| 1–2 Year Municipal Funds Average3 | | | 0.59 |
| |
| Vanguard Limited-Term Tax-Exempt Fund | | | | | |
| Investor Shares | 2.20% | 3.72% | 1.74% | -1.82% | -0.08% |
| Admiral Shares 2 | 2.25 | 3.80 | 1.82 | -1.82 | 0.00 |
| Bloomberg Barclays 1–5 Year Municipal Bond Index | | -0.16 |
| 1–5 Year Municipal Funds Average3 | | | 0.18 |
| |
| Vanguard Intermediate-Term Tax-Exempt Fund | | | | |
| Investor Shares | 2.70% | 4.56% | 2.73% | -3.53% | -0.80% |
| Admiral Shares 2 | 2.75 | 4.65 | 2.81 | -3.53 | -0.72 |
| Bloomberg Barclays 1–15 Year Municipal Bond Index | | -0.53 |
| Intermediate Municipal Funds Average3 | | | -0.79 |
| |
| Vanguard Long-Term Tax-Exempt Fund | | | | |
| Investor Shares | 3.16% | 5.34% | 3.36% | -3.95% | -0.59% |
| Admiral Shares 2 | 3.21 | 5.42 | 3.44 | -3.95 | -0.51 |
| Bloomberg Barclays Municipal Bond Index | | | -0.51 |
| General & Insured Municipal Debt Funds Average3 | | -0.37 |
| |
| Vanguard High-Yield Tax-Exempt Fund | | | | |
| Investor Shares | 3.54% | 5.98% | 3.69% | -3.34% | 0.35% |
| Admiral Shares 2 | 3.59 | 6.06 | 3.77 | -3.34 | 0.43 |
| Bloomberg Barclays Municipal Bond Index | | | -0.51 |
| General & Insured Municipal Debt Funds Average3 | | -0.37 |
1 This calculation, which assumes a typical itemized tax return, is based on the maximum federal income tax rate of 40.8%. State and local taxes were not considered. Please see the prospectus for a detailed explanation of the calculation.
2 Admiral Shares carry lower expenses and are available to investors who meet certain account-balance requirements.
3 Derived from data provided by Lipper, a Thomas Reuters Company.
1
| |
| Total Returns: Ten Years Ended October 31, 2018 | |
| Average Annual |
| Return |
| Short-Term Tax-Exempt Fund Investor Shares | 1.15% |
| Bloomberg Barclays 1 Year Municipal Bond Index | 1.27 |
| 1–2 Year Municipal Funds Average1 | 0.38 |
| |
| Limited-Term Tax-Exempt Fund Investor Shares | 2.01% |
| Bloomberg Barclays 1–5 Year Municipal Bond Index | 2.35 |
| 1–5 Year Municipal Funds Average1 | 1.63 |
| |
| Intermediate-Term Tax-Exempt Fund Investor Shares | 4.07% |
| Bloomberg Barclays 1–15 Year Municipal Bond Index | 3.98 |
| Intermediate Municipal Funds Average1 | 3.58 |
| |
| Long-Term Tax-Exempt Fund Investor Shares | 5.11% |
| Bloomberg Barclays Municipal Bond Index | 4.80 |
| General & Insured Municipal Debt Funds Average1 | 4.75 |
| |
| High-Yield Tax-Exempt Fund Investor Shares | 5.89% |
| Bloomberg Barclays Municipal Bond Index | 4.80 |
| General & Insured Municipal Debt Funds Average1 | 4.75 |
| 1 Derived from data provided by Lipper, a Thomson Reuters Company. | |
The figures shown represent past performance, which is not a guarantee of future results. (Current performance may be lower or higher than the performance data cited. For performance data current to the most recent month-end, visit our website at vanguard.com/performance.) Note, too, that both investment returns and principal value can fluctuate widely, so an investor’s shares, when sold, could be worth more or less than their original cost.
| | | |
| Expense Ratios1 | | | |
| Your Fund Compared With Its Peer Group | | | |
|
| Investor | Admiral | Peer Group |
| Shares | Shares | Average2 |
| Short-Term Tax-Exempt Fund | 0.19% | 0.09% | 0.55% |
| Limited-Term Tax-Exempt Fund | 0.19 | 0.09 | 0.66 |
| Intermediate-Term Tax-Exempt Fund | 0.19 | 0.09 | 0.77 |
| Long-Term Tax-Exempt Fund | 0.19 | 0.09 | 0.86 |
| High-Yield Tax-Exempt Fund | 0.19 | 0.09 | 0.86 |
1 The fund expense ratios shown are from the prospectus dated February 23, 2018, and represent estimated costs for the current fiscal year. For the fiscal year ended October 31, 2018, the funds’ expense ratios were: for the Short-Term Tax-Exempt Fund, 0.17% for Investor Shares and 0.09% for Admiral Shares; for the Limited-Term Tax-Exempt Fund, 0.17% for Investor Shares and 0.09% for Admiral Shares; for the Intermediate-Term Tax-Exempt Fund, 0.17% for Investor Shares and 0.09% for Admiral Shares; for the Long-Term Tax-Exempt Fund, 0.17% for Investor Shares and 0.09% for Admiral Shares; and for the High-Yield Tax-Exempt Fund, 0.17% for Investor Shares and 0.09% for Admiral Shares.
2 Peer groups are: for the Short-Term Tax-Exempt Fund, 1–2 Year Municipal Funds; for the Limited-Term Tax-Exempt Fund, 1–5 Year Municipal Funds; for the Intermediate-Term Tax-Exempt Fund, Intermediate Municipal Funds; and for the Long-Term Tax-Exempt Fund and High-Yield Tax-Exempt Fund, General & Insured Municipal Debt Funds. Peer-group values are derived from data provided by Lipper, a Thomson Reuters Company, and capture information through year-end 2017.
2
CEO’s Perspective

Tim Buckley
President and Chief Executive Officer
Dear Shareholder,
Over the years, I’ve found that prudent investors exhibit a common trait: discipline. No matter how the markets move or what new investing fad hits the headlines, those who stay focused on their goals and tune out the noise are set up for long-term success.
The prime gateway to investing is saving, and you don’t usually become a saver without a healthy dose of discipline. Savers make the decision to sock away part of their income, which means spending less and delaying gratification, no matter how difficult that may be.
Of course, disciplined investing extends beyond diligent saving. The financial markets, in the short term especially, are unpredictable; I have yet to meet the investor who can time them perfectly. It takes discipline to resist the urge to go all-in when markets are frothy or to retreat when things look bleak.
Staying put with your investments is one strategy for handling volatility. Another, rebalancing, requires even more discipline because it means steering your money away from strong performers and toward poorer performers.
Patience—a form of discipline—is also the friend of long-term investors. Higher returns are the potential reward for weathering the market’s turbulence and uncertainty.
We have been enjoying one of the longest bull markets in history, but it won’t continue forever. Prepare yourself now for how you will react when volatility comes back. Don’t panic. Don’t chase returns or look for answers outside the asset classes you trust. And be sure to rebalance periodically, even when there’s turmoil.
Whether you’re a master of self-control, get a boost from technology, or work with a professional advisor, know that discipline is necessary to get the most out of your investment portfolio. And know that Vanguard is with you for the entire ride.
Thank you for your continued loyalty.
Sincerely,

Mortimer J. Buckley
President and Chief Executive Officer
November 16, 2018
| | | |
| Market Barometer | | | |
| | Average Annual Total Returns |
| | Periods Ended October 31, 2018 |
| One | Three | Five |
| Year | Years | Years |
| Stocks | | | |
| Russell 1000 Index (Large-caps) | 6.98% | 11.31% | 11.05% |
| Russell 2000 Index (Small-caps) | 1.85 | 10.68 | 8.01 |
| Russell 3000 Index (Broad U.S. market) | 6.60 | 11.27 | 10.81 |
| FTSE All-World ex US Index (International) | -7.99 | 4.57 | 2.01 |
| |
| Bonds | |
| Bloomberg Barclays U.S. Aggregate Bond Index | | | |
| (Broad taxable market) | -2.05% | 1.04% | 1.83% |
| Bloomberg Barclays Municipal Bond Index | | | |
| (Broad tax-exempt market) | -0.51 | 1.90 | 3.25 |
| FTSE Three-Month U.S. Treasury Bill Index | 1.67 | 0.86 | 0.52 |
| |
| CPI | | |
| Consumer Price Index | 2.52% | 2.07% | 1.60% |
3
Advisor’s Report
For the 12 months ended October 31, 2018, Vanguard’s five national tax-exempt bond funds posted returns that ranged from –0.80% for Investor Shares of Vanguard Intermediate-Term Tax-Exempt Fund to 0.76% for Admiral Shares of Vanguard Short-Term Tax-Exempt Fund. Relative to their benchmark indexes and peer groups, results were mixed.
Municipal bond yields increased across the board. Vanguard High-Yield Tax-Exempt Fund’s 30-day SEC yield rose 75 basis points over the 12-month period to 3.54%. (Yields cited here are for Investor Shares. A basis point is one-hundredth of a percentage point.) The other funds saw even sharper increases, with Vanguard Intermediate-Term Tax-Exempt Fund’s 30-day SEC yield climbing 97 basis points to 2.70%.
Please note that the funds are permitted to invest in securities that would generate income distributions subject to the alternative minimum tax (AMT). During the fiscal year, only the High-Yield Fund owned such securities.
Investment environment
Macroeconomic fundamentals remained supportive throughout the period. The U.S. economy continued to expand at a robust pace, boosted by tax cuts and more government spending on top of solid business investment and consumer spending. The unemployment rate remained low, dropping to 3.7%, an almost 50-year low. Job creation averaged well over 200,000 per month for the period. While that has resulted in some modest upward
pressure on wages, inflation, as measured by the U.S. core personal consumption expenditures (PCE) price index, has moved up only modestly to hover near the Federal Reserve’s target of 2%.
Acknowledging the health of the economy, the Fed continued further down the path of monetary policy normalization. The pace of shrinking its holdings in Treasuries and mortgage-backed securities amassed in the wake of the global financial crisis accelerated from $20 billion per month when it began in October 2017 to $50 billion per month at the close of the funds’ fiscal year. The Fed also raised the federal funds target rate over the 12-month period by a quarter percentage point in December, March, June, and September, putting it at 2–2.25%.
Even with this robust macroeconomic backdrop, investors abruptly began to see the glass as half empty toward the end of January. Long-awaited signs of wage increases and higher inflation, coupled with the outlook for faster growth from tax cuts and increased government spending, raised fears that the Fed might start hiking rates more aggressively.
Market volatility spiked again in October, with stocks dropping sharply and bond yields rising amid an intensification of trade tensions with China and some large corporations signaling that earnings growth may have peaked. The possibility of more aggressive monetary tightening was also a concern, fueled in part by comments
| | |
| Yields of Municipal Securities | | |
| (AAA-Rated General Obligation Issues) | | |
| October 31, | October 31, |
| Maturity | 2017 | 2018 |
| 2 years | 1.09% | 2.08% |
| 5 years | 1.42 | 2.32 |
| 10 years | 2.01 | 2.76 |
| 30 years | 2.83 | 3.44 |
| Source: Vanguard. | | |
from Fed Chairman Jerome Powell on the strength of the economy and how much higher rates might go.
The muni market also had to contend with new federal tax laws passed in December 2017. One significant change is that municipalities can no longer issue bonds to advance-refund outstanding tax-exempt debt. There was also concern—which ended up being unfounded—that the law would no longer let municipalities issue tax-exempt private activity bonds to fund public benefit projects such as hospitals and airports. With municipalities rushing to issue both advance-refunding and private activity bonds ahead of the law’s passage, supply was more than three times higher in December 2017 than it had been a year earlier, and it’s been lower than usual since then.
The reduction in the statutory federal corporate tax rate to 21% also affected demand for munis, making their tax-equivalent yields a little less attractive to a fairly narrow segment of the market composed of nontraditional buyers such as banks and insurance companies. That resulted, however, in municipalities beginning to structure issuance more geared toward traditional buyers, which boosted usable supply for retail investors and mutual funds. In addition, a cap on deductions for state and local taxes and mortgage interest payments may make munis a little more attractive for investors residing in states with high taxes and expensive real estate markets. Overall, those factors contributed to an improvement in the balance between supply and demand.
Volatility early in the period aside, muni bond yields largely took their cues from the Treasury market, where yields across the maturity spectrum ended the period higher. The 2-year U.S. Treasury note climbed 127 basis points to 2.87%, its highest level in more than a decade. The yield of the bellwether 10-year Treasury note was up 76 basis points to 3.14%.
4
Management of the funds
The primary driver of the funds’ relative performance was a modest overweight to credit. Our overall tilt toward bonds rated A and BBB, which are on the lower rungs of the investment-grade credit ladder, was intended principally to capture the additional yield they produce, especially as credit spreads versus Treasuries were fairly tight. Over the 12 months, however, they performed better than their higher-quality counterparts as credit spreads compressed. Bonds rated BBB returned 0.82%, according to the Bloomberg Barclays Municipal Bond Index, compared with –1.01% for bonds rated AAA.
Our deep and experienced bench of credit analysts once again added value by helping us navigate this large, fragmented market made up of tens of thousands of issuers and uncover attractive investment opportunities. For the 12-month period, performance was helped in the Long-Term Fund and the High-Yield Fund by security selection in state and local general obligation bonds as well as in hospital and transportation revenue bonds.
Adding premium callable bonds in anticipation of rates heading higher worked in our favor, especially toward the end of 2017. Underweighting the front end of the yield curve with the expectation that yields on those securities would continue to rise generally added to performance as well, especially in September and October.
The shorter-term funds had durations that were structurally shorter than those of their benchmarks, a stance that helped performance for the period because of the rise in rates. (Duration is a measure, expressed in years, of a portfolio’s sensitivity to changes in interest rates.) The longer-term investment-grade funds’ structural durations were longer than those of their benchmarks and consequently detracted from their performance.
The outlook
In the absence of any external shocks, the U.S. economy is on pace to break above its long-term potential growth rate in 2018 and 2019—given the front-loaded effects of tax cuts and increased government spending coming on top of solid fundamentals—before dropping back toward 2%. That growth, along with some upward pressure on wages reflecting the tight labor market, may push up the U.S. core PCE price index through the first part of 2019. Against this backdrop, the Fed is likely to keep raising rates and trimming the amount of Treasuries and mortgage-backed securities on its balance sheet this year and into 2019.
We see this bounce as cyclical, however, and still expect long-term structural pressures from an aging population, global sourcing of goods and labor, and technological disruptions to result in moderate long-run growth and inflation.
We may continue to see bouts of volatility in the bond market related to shifting expectations for inflation and interest rates. Other potential volatility triggers we’ll be watching include an intensification of trade disputes, flare-ups in geopolitical tensions, uncertainty over Brexit, and government spending in Italy.
We are anticipating a convergence in global monetary policy, with central banks in developed countries adopting less accommodative stances—some raising rates, some planning to do so, some reducing quantitative easing. Withdrawing that accommodation unexpectedly or too quickly could rattle the markets.
As always, our experienced team of portfolio managers, credit analysts, and traders will continue to seek out opportunities to add to the funds’ performance, whatever the markets may bring.
Paul M. Malloy, CFA, Principal,
Head of Municipal Bond Group
James M. D’Arcy, CFA, Portfolio Manager
Adam M. Ferguson, CFA, Portfolio Manager
Mathew M. Kiselak, Principal,
Portfolio Manager, Head of
Municipal Bond Desk
Justin A. Schwartz, CFA, Portfolio Manager,
Head of Municipal Money Market Funds
Vanguard Fixed Income Group
November 21, 2018
5
Short-Term Tax-Exempt Fund
Fund Profile
As of October 31, 2018
| | |
| Share-Class Characteristics | | |
| Investor | Admiral |
| Shares | Shares |
| Ticker Symbol | VWSTX | VWSUX |
| Expense Ratio1 | 0.19% | 0.09% |
| 30-Day SEC Yield | 1.88% | 1.93% |
| | | |
| Financial Attributes | | |
| | Bloomberg | |
| Barclays | Bloomberg |
| 1 Year | Barclays |
| Municipal | Municipal |
| Bond | Bond |
| Fund | Index | Index |
| Number of Bonds | 2,277 | 3,886 | 53,575 |
| Yield to Maturity | | | |
| (before expenses) | 2.1% | 2.1% | 3.0% |
| Average Coupon | 3.4% | 4.8% | 4.7% |
| Average Duration | 1.3 years | 1.4 years | 6.5 years |
| Average Stated | | | |
| Maturity | 1.4 years | 1.5 years 13.0 years |
| Short-Term Reserves 27.7% | — | — |
| |
| Largest Area Concentrations2 | |
| |
| New York | 15.4% |
| Texas | 14.4 |
| Illinois | 9.0 |
| California | 5.4 |
| Maryland | 4.4 |
| Pennsylvania | 4.4 |
| New Jersey | 3.9 |
| Ohio | 3.6 |
| Georgia | 3.5 |
| Massachusetts | 3.1 |
| Top Ten | 67.1% |
| | |
| Volatility Measures | | |
| Bloomberg | |
| Barclays | Bloomberg |
| 1 Year | Barclays |
| Municipal | Municipal |
| Bond Index | Bond Index |
| R-Squared | 0.90 | 0.49 |
| Beta | 0.86 | 0.14 |
These measures show the degree and timing of the fund’s fluctuations compared with the indexes over 36 months.
| |
| Distribution by Stated Maturity (% of portfolio) |
| |
| Under 6 Months | 39.1% |
| 6 Months–1 Year | 9.6 |
| 1–2 Years | 18.2 |
| 2–3 Years | 17.6 |
| 3–4 Years | 9.6 |
| 4–5 Years | 4.0 |
| Over 5 Years | 1.9 |
| |
| Distribution by Credit Quality (% of portfolio) |
| |
| AAA | 24.8% |
| AA | 51.5 |
| A | 14.7 |
| BBB | 7.4 |
| BB | 0.1 |
| B or lower | 0.4 |
| Not Rated | 1.1 |
Credit-quality ratings are obtained from Moody’s and S&P, and the higher rating for each issue is shown. “Not Rated” is used to classify securities for which a rating is not available. Not rated securities include a fund’s investment in Vanguard Market Liquidity Fund or Vanguard Municipal Cash Management Fund, each of which invests in high-quality money market instruments and may serve as a cash management vehicle for the Vanguard funds, trusts, and accounts. For more information about these ratings, see the Glossary entry for Credit Quality.
Investment Focus
1 The expense ratios shown are from the prospectus dated February 23, 2018, and represent estimated costs for the current fiscal year. For the fiscal year ended October 31, 2018, the expense ratios were 0.17% for Investor Shares and 0.09% for Admiral Shares.
2 Percentage of net assets, excluding any futures contracts.
6
Short-Term Tax-Exempt Fund
Performance Summary
All of the returns in this report represent past performance, which is not a guarantee of future results that may be achieved by the fund. (Current performance may be lower or higher than the performance data cited. For performance data current to the most recent month-end, visit our website at vanguard.com/performance.) Note, too, that both investment returns and principal value can fluctuate widely, so an investor’s shares, when sold, could be worth more or less than their original cost. The returns shown do not reflect taxes that a shareholder would pay on fund distributions or on the sale of fund shares.
Cumulative Performance: October 31, 2008–October 31, 2018
Initial Investment of $10,000
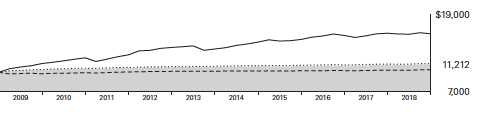
| | | | |
| | Average Annual Total Returns | Final Value |
| | Periods Ended October 31, 2018 | of a $10,000 |
| One Year | Five Years | Ten Years | Investment |
| Short-Term Tax-Exempt Fund Investor Shares | 0.68% | 0.69% | 1.15% | $11,212 |
| Bloomberg Barclays 1 Year Municipal | | | | |
| Bond Index | 0.65 | 0.72 | 1.27 | 11,340 |
| 1–2 Year Municipal Funds Average1 | 0.59 | 0.41 | 0.38 | 10,383 |
| Bloomberg Barclays Municipal Bond Index | -0.51 | 3.25 | 4.80 | 15,976 |
| | | | |
| Final Value |
| of a $50,000 |
| One Year | Five Years | Ten Years | Investment |
| Short-Term Tax-Exempt Fund Admiral Shares | 0.76% | 0.78% | 1.24% | $56,534 |
| Bloomberg Barclays 1 Year Municipal Bond Index | 0.65 | 0.72 | 1.27 | 56,702 |
| Bloomberg Barclays Municipal Bond Index | -0.51 | 3.25 | 4.80 | 79,878 |
1 Derived from data provided by Lipper, a Thomson Reuters Company.
See Financial Highlights for dividend and capital gains information.
7
Short-Term Tax-Exempt Fund
| | | | |
| Fiscal-Year Total Returns (%): October 31, 2008–October 31, 2018 | | | |
| Bloomberg |
| Barclays |
| 1 Year |
| Municipal |
| | Investor Shares | Bond Index |
| Income | Capital | Total | Total |
| Fiscal Year | Returns | Returns | Returns | Returns |
| 2009 | 2.31% | 1.28% | 3.59% | 4.40% |
| 2010 | 1.38 | 0.44 | 1.82 | 1.81 |
| 2011 | 1.23 | -0.31 | 0.92 | 1.18 |
| 2012 | 1.08 | 0.19 | 1.27 | 1.01 |
| 2013 | 0.89 | -0.38 | 0.51 | 0.74 |
| 2014 | 0.72 | -0.06 | 0.66 | 0.72 |
| 2015 | 0.70 | -0.19 | 0.51 | 0.76 |
| 2016 | 0.83 | -0.19 | 0.64 | 0.40 |
| 2017 | 1.01 | -0.06 | 0.95 | 1.07 |
| 2018 | 1.38 | -0.70 | 0.68 | 0.65 |
Average Annual Total Returns: Periods Ended September 30, 2018
This table presents returns through the latest calendar quarter—rather than through the end of the fiscal period.
Securities and Exchange Commission rules require that we provide this information.
| | | | | | |
| | | | | | Ten Years |
| Inception Date | One Year Five Years | Income | Capital | Total |
| Investor Shares | 9/1/1977 | 0.63% | 0.72% | 1.17% | 0.02% | 1.19% |
| Admiral Shares | 2/12/2001 | 0.71 | 0.81 | 1.25 | 0.02% | 1.27 |
8
Short-Term Tax-Exempt Fund
Financial Statements
Statement of Net Assets
As of October 31, 2018
The fund reports a complete list of its holdings in regulatory filings four times in each fiscal year, at the quarter-ends. For the second and fourth fiscal quarters, the lists appear in the fund’s semiannual and annual reports to shareholders. For the first and third fiscal quarters, the fund files the lists with the Securities and Exchange Commission on Form N-Q. Shareholders can look up the fund’s Forms N-Q on the SEC’s website at sec.gov.
| | | | |
| Face | Market |
| Maturity | Amount | Value• |
| Coupon | Date | ($000) | ($000) |
| Tax-Exempt Municipal Bonds (100.2%) | | | | |
| Alabama (1.5%) | | | | |
| 1 Alabama Federal Aid Highway Finance Authority Special Obligation Revenue TOB VRDO | 1.630% | 11/7/18 | 14,540 | 14,540 |
| Alabama Special Care Facilities Financing Authority Birmingham Revenue | | | | |
| (Ascension Health Credit Group) PUT | 1.850% | 11/1/22 | 1,530 | 1,481 |
| Black Belt Energy Gas District Alabama Gas Prepay Revenue (Project No. 3) PUT | 5.000% | 12/1/19 | 500 | 515 |
| Black Belt Energy Gas District Alabama Gas Prepay Revenue (Project No. 3) PUT | 5.000% | 12/1/21 | 1,000 | 1,069 |
| Black Belt Energy Gas District Alabama Gas Prepay Revenue (Project No. 3) PUT | 5.000% | 12/1/22 | 2,255 | 2,450 |
| 2 Black Belt Energy Gas District Alabama Gas Prepay Revenue (Project No. 3) PUT | 2.412% | 12/1/23 | 17,500 | 17,500 |
| Black Belt Energy Gas District Alabama Gas Prepay Revenue (Project No. 3) PUT | 4.000% | 12/1/23 | 21,000 | 21,862 |
| Black Belt Energy Gas District Alabama Gas Supply Revenue PUT | 4.000% | 6/1/21 | 8,900 | 9,189 |
| Black Belt Energy Gas District Alabama Gas Supply Revenue PUT | 4.000% | 7/1/22 | 20,000 | 20,759 |
| Jefferson County AL GO | 4.000% | 4/1/19 | 5,820 | 5,866 |
| Jefferson County AL GO | 5.000% | 4/1/20 | 2,500 | 2,596 |
| Jefferson County AL GO | 5.000% | 4/1/21 | 2,000 | 2,122 |
| Jefferson County AL GO | 5.000% | 4/1/22 | 3,500 | 3,784 |
| Jefferson County AL GO | 5.000% | 4/1/23 | 1,000 | 1,099 |
| Jefferson County AL Revenue | 5.000% | 9/15/19 | 940 | 963 |
| Jefferson County AL Revenue | 5.000% | 9/15/20 | 1,250 | 1,312 |
| Jefferson County AL Revenue | 5.000% | 9/15/21 | 1,625 | 1,737 |
| Jefferson County AL Revenue | 5.000% | 9/15/22 | 625 | 681 |
| Mobile County AL Board of School Commissioners GO | 5.000% | 3/1/19 | 850 | 858 |
| Mobile County AL Board of School Commissioners GO | 5.000% | 3/1/20 | 1,275 | 1,316 |
| Southeast Alabama Gas Supply District Revenue | 5.000% | 4/1/20 | 1,265 | 1,310 |
| Southeast Alabama Gas Supply District Revenue | 5.000% | 4/1/21 | 3,000 | 3,169 |
| Southeast Alabama Gas Supply District Revenue | 4.000% | 6/1/21 | 875 | 908 |
| Southeast Alabama Gas Supply District Revenue | 5.000% | 4/1/22 | 5,000 | 5,376 |
| Southeast Alabama Gas Supply District Revenue | 4.000% | 6/1/22 | 1,225 | 1,281 |
| Southeast Alabama Gas Supply District Revenue | 5.000% | 4/1/23 | 10,395 | 11,333 |
| Southeast Alabama Gas Supply District Revenue | 4.000% | 6/1/23 | 2,000 | 2,102 |
| Southeast Alabama Gas Supply District Revenue PUT | 4.000% | 6/1/24 | 10,825 | 11,287 |
| Tuscaloosa County AL Industrial Development Authority Gulf Opportunity Zone Revenue | | | | |
| (Hunt Refining Project) VRDO | 1.630% | 11/7/18 LOC | 49,900 | 49,900 |
| Tuscaloosa County AL Industrial Development Authority Gulf Opportunity Zone Revenue | | | | |
| (Hunt Refining Project) VRDO | 1.630% | 11/7/18 LOC | 21,200 | 21,200 |
| Tuscaloosa County AL Industrial Development Authority Gulf Opportunity Zone Revenue | | | | |
| (Hunt Refining Project) VRDO | 1.630% | 11/8/18 LOC | 26,000 | 26,000 |
| | | | 245,565 |
| Alaska (0.1%) | | | | |
| Alaska Railroad Corp. Capital Grant Receipt Revenue | 5.000% | 8/1/19 | 7,505 | 7,660 |
| Alaska Railroad Corp. Capital Grant Receipt Revenue | 5.000% | 8/1/20 | 6,900 | 7,206 |
| Anchorage AK GO | 5.000% | 9/1/22 | 1,000 | 1,099 |
| Anchorage AK GO | 5.000% | 9/1/22 | 1,500 | 1,648 |
| Matanuska-Susitna Borough AK Lease Revenue (Goose Creek Correctional Center) GO | 5.000% | 9/1/22 | 1,500 | 1,637 |
| North Slope Borough AK GO | 5.000% | 6/30/20 (Prere.) | 5,000 | 5,237 |
| | | | 24,487 |
| Arizona (1.2%) | | | | |
| Arizona COP | 5.250% | 10/1/20 (4) | 7,855 | 8,070 |
| Arizona Health Facilities Authority Hospital System Revenue (Phoenix Children’s Hospital) | 5.000% | 2/1/20 | 1,000 | 1,031 |
| 2 Arizona Health Facilities Authority Revenue (Phoenix Children’s Hospital) PUT | 3.450% | 2/5/20 | 12,500 | 12,625 |
| Arizona Health Facilities Authority Revenue (Scottsdale Lincoln Hospitals Project) | 5.000% | 12/1/18 | 500 | 501 |
| Arizona School Facilities Board COP | 5.000% | 9/1/19 | 7,500 | 7,686 |
| Arizona Transportation Board Excise Tax Revenue | 5.000% | 7/1/20 | 2,000 | 2,094 |
| Arizona Transportation Board Highway Revenue | 5.000% | 7/1/22 | 1,685 | 1,805 |
| Arizona Water Infrastructure Finance Authority Revenue | 5.000% | 10/1/19 (ETM) | 240 | 247 |
| Arizona Water Infrastructure Finance Authority Revenue | 5.000% | 10/1/19 | 1,230 | 1,264 |
| Glendale AZ GO | 4.000% | 7/1/19 (4) | 1,600 | 1,620 |
| Glendale AZ GO | 4.000% | 7/1/20 (4) | 2,920 | 3,003 |
9
Short-Term Tax-Exempt Fund
| | | | |
| Face | Market |
| Maturity | Amount | Value• |
| Coupon | Date | ($000) | ($000) |
| Maricopa County AZ Industrial Development Authority Health Facilities Revenue | | | | |
| (Banner Health Obligated Group) | 4.000% | 1/1/19 | 3,000 | 3,010 |
| Maricopa County AZ Industrial Development Authority Health Facilities Revenue | | | | |
| (Banner Health Obligated Group) PUT | 5.000% | 10/18/22 | 11,000 | 12,009 |
| 1 Maricopa County AZ Industrial Development Authority Health Facilities Revenue | | | | |
| (Banner Health Obligated Group) TOB VRDO | 1.620% | 11/7/18 | 5,730 | 5,730 |
| 1 Maricopa County AZ Industrial Development Authority Health Facilities Revenue | | | | |
| (Banner Health Obligated Group) TOB VRDO | 1.630% | 11/7/18 | 16,850 | 16,850 |
| Maricopa County AZ Industrial Development Authority Health Facilities Revenue | | | | |
| (Banner Health Obligated Group) VRDO | 1.620% | 11/7/18 | 21,200 | 21,200 |
| Maricopa County AZ Unified School District No. 4 (Mesa) GO | 4.000% | 7/1/19 | 3,750 | 3,801 |
| Phoenix AZ Civic Improvement Corp. Excise Tax Revenue | 5.000% | 7/1/21 | 11,870 | 12,728 |
| Phoenix AZ Civic Improvement Corp. Excise Tax Revenue | 5.000% | 7/1/21 | 11,565 | 12,401 |
| Phoenix AZ GO | 4.000% | 7/1/20 | 10,095 | 10,405 |
| Pima County AZ Regional Transportation Authority Excise Tax Revenue | 5.000% | 6/1/21 (Prere.) | 4,215 | 4,509 |
| Pima County AZ Sewer Revenue | 5.000% | 7/1/21 | 3,000 | 3,209 |
| Pima County AZ Tucson Unified School District No. 1 GO | 4.000% | 7/1/19 (15) | 1,355 | 1,373 |
| Salt River AZ Project Agricultural Improvement & Power District Revenue | 5.000% | 12/1/23 | 8,980 | 9,689 |
| Salt River AZ Project Agricultural Improvement & Power District Revenue | 5.000% | 1/1/19 (Prere.) | 13,125 | 13,192 |
| Tempe AZ Excise Tax Revenue | 5.000% | 7/1/19 | 2,025 | 2,065 |
| Tempe AZ Industrial Development Authority Revenue (Mirabella at ASU Project) | 4.000% | 10/1/23 | 7,250 | 7,252 |
| Tucson AZ Water System Revenue | 5.000% | 7/1/19 | 2,050 | 2,091 |
| Yavapai County AZ Industrial Development Authority Solid Waste Disposal Revenue | | | | |
| (Republic Services Inc.) PUT | 1.850% | 12/3/18 | 11,750 | 11,749 |
| Yuma AZ Industrial Development Authority Hospital Revenue (Yuma Regional Medical Center) | 5.000% | 8/1/19 | 1,000 | 1,021 |
| | | | 194,230 |
| Arkansas (0.0%) | | | | |
| Baxter County AR Hospital Revenue | 5.000% | 9/1/19 | 1,440 | 1,465 |
| | | | |
| California (5.4%) | | | | |
| Bay Area Toll Authority California Toll Bridge Revenue (San Francisco Bay Area) PUT | 1.875% | 4/1/19 | 23,995 | 23,995 |
| 2 Bay Area Toll Authority California Toll Bridge Revenue (San Francisco Bay Area) PUT | 2.300% | 10/1/19 | 5,500 | 5,512 |
| Bay Area Toll Authority California Toll Bridge Revenue (San Francisco Bay Area) PUT | 1.375% | 4/1/20 | 57,570 | 57,007 |
| Bay Area Toll Authority California Toll Bridge Revenue (San Francisco Bay Area) PUT | 1.875% | 4/1/20 | 7,500 | 7,479 |
| 2 Bay Area Toll Authority California Toll Bridge Revenue (San Francisco Bay Area) PUT | 2.200% | 4/1/20 | 2,500 | 2,510 |
| Bay Area Toll Authority California Toll Bridge Revenue (San Francisco Bay Area) PUT | 2.000% | 4/1/21 | 11,475 | 11,402 |
| Bay Area Toll Authority California Toll Bridge Revenue (San Francisco Bay Area) PUT | 2.100% | 4/1/22 | 7,200 | 7,146 |
| 2 California Department of Water Resources Water System Revenue (Central Valley Project) PUT | 1.820% | 12/1/20 | 15,900 | 15,880 |
| California GO | 5.000% | 8/1/19 | 43,645 | 44,686 |
| California GO | 5.000% | 9/1/19 | 10,000 | 10,265 |
| California GO | 5.000% | 10/1/19 | 5,000 | 5,145 |
| California GO | 5.000% | 8/1/20 | 20,000 | 21,046 |
| California GO | 5.000% | 8/1/20 | 10,325 | 10,865 |
| California GO | 5.000% | 9/1/20 | 10,075 | 10,627 |
| California GO | 5.250% | 10/1/20 | 2,000 | 2,063 |
| California GO | 5.000% | 8/1/21 | 14,000 | 15,117 |
| California GO | 5.000% | 11/1/21 | 43,230 | 46,945 |
| California GO | 5.000% | 11/1/21 | 14,180 | 15,399 |
| California GO PUT | 3.000% | 12/1/19 | 28,825 | 28,989 |
| 2 California GO PUT | 1.890% | 12/1/20 | 28,500 | 28,500 |
| 2 California GO PUT | 2.342% | 12/1/21 | 4,925 | 4,965 |
| California GO PUT | 4.000% | 12/1/21 | 6,830 | 7,112 |
| 2 California GO PUT | 1.980% | 12/1/22 | 27,000 | 27,065 |
| 1 California GO TOB VRDO | 1.700% | 11/7/18 | 27,760 | 27,760 |
| 1 California GO TOB VRDO | 1.700% | 11/7/18 | 62,165 | 62,165 |
| California Health Facilities Financing Authority Revenue (El Camino Hospital) | 5.000% | 2/1/20 | 600 | 621 |
| California Health Facilities Financing Authority Revenue (El Camino Hospital) | 5.000% | 2/1/21 | 1,000 | 1,067 |
| California Health Facilities Financing Authority Revenue | | | | |
| (Providence St. Joseph Health Obligated Group) PUT | 1.250% | 10/1/20 | 11,400 | 11,223 |
| California Health Facilities Financing Authority Revenue (St. Joseph Health System) PUT | 5.000% | 10/15/20 | 1,800 | 1,898 |
| California Health Facilities Financing Authority Revenue (Sutter Health) PUT | 1.000% | 8/15/19 | 8,150 | 8,069 |
| 2 California Infrastructure & Economic Development Bank Revenue (J. Paul Getty Trust) PUT | 2.047% | 4/1/20 | 5,625 | 5,639 |
| 2 California Infrastructure & Economic Development Bank Revenue (J. Paul Getty Trust) PUT | 2.047% | 4/1/20 | 4,500 | 4,511 |
| California Infrastructure & Economic Development Bank Revenue (Pacific Gas & Electric Co.) | 1.050% | 12/1/18 | 2,250 | 2,247 |
| 2 California Infrastructure & Economic Development Bank Revenue PUT | 2.256% | 2/1/21 | 25,000 | 25,039 |
| 2 California Infrastructure & Economic Development Bank Revenue | | | | |
| (California Academy of Sciences) PUT | 1.988% | 8/1/21 | 14,500 | 14,489 |
| California Municipal Finance Authority Revenue (Biola University) | 4.000% | 10/1/19 | 205 | 209 |
| California Municipal Finance Authority Revenue (Biola University) | 5.000% | 10/1/20 | 305 | 321 |
10
Short-Term Tax-Exempt Fund
| | | | |
| Face | Market |
| Maturity | Amount | Value• |
| Coupon | Date | ($000) | ($000) |
| California Municipal Finance Authority Revenue (California Lutheran University) | 5.000% | 10/1/20 | 325 | 342 |
| California Municipal Finance Authority Revenue (California Lutheran University) | 5.000% | 10/1/21 | 250 | 269 |
| California Municipal Finance Authority Revenue (California Lutheran University) | 5.000% | 10/1/22 | 250 | 273 |
| California Municipal Finance Authority Revenue | | | | |
| (Community Hospitals of Central California Obligated Group) | 5.000% | 2/1/19 | 500 | 504 |
| California Municipal Finance Authority Revenue | | | | |
| (Community Hospitals of Central California Obligated Group) | 5.000% | 2/1/20 | 625 | 645 |
| California Municipal Finance Authority Revenue | | | | |
| (Community Hospitals of Central California Obligated Group) | 5.000% | 2/1/21 | 1,000 | 1,055 |
| California Municipal Finance Authority Solid Waste Revenue (Republic Services Inc. Project) PUT | 1.970% | 1/2/19 | 18,250 | 18,249 |
| California Pollution Control Financing Authority Solid Waste Disposal Revenue | | | | |
| (Republic Services Inc. Project) PUT | 1.400% | 2/1/19 | 3,250 | 3,250 |
| California Public Works Board Lease Revenue (Various Capital Projects) | 5.000% | 4/1/19 | 8,760 | 8,877 |
| California State University Systemwide Revenue PUT | 3.000% | 11/1/19 | 21,000 | 21,092 |
| California Statewide Communities Development Authority Health Facility Revenue | | | | |
| (Catholic Healthcare West) | 1.810% | 11/2/18 (4) | 2,275 | 2,275 |
| California Statewide Communities Development Authority Health Facility Revenue | | | | |
| (Catholic Healthcare West) | 1.850% | 11/2/18 (4) | 7,600 | 7,600 |
| California Statewide Communities Development Authority Health Facility Revenue | | | | |
| (Catholic Healthcare West) | 1.990% | 11/2/18 (4) | 35,275 | 35,275 |
| California Statewide Communities Development Authority Revenue | | | | |
| (Adventist Health System/West) | 4.000% | 3/1/19 | 500 | 504 |
| 1 California Statewide Communities Development Authority Revenue | | | | |
| (Cottage Health System Obligated Group) TOB VRDO | 1.750% | 11/7/18 | 13,435 | 13,435 |
| California Statewide Communities Development Authority Student Housing Revenue | | | | |
| (CHF-Irvine LLC - UCI East Campus Apartments Phase II) | 5.000% | 5/15/19 | 500 | 508 |
| California Statewide Communities Development Authority Student Housing Revenue | | | | |
| (CHF-Irvine LLC - UCI East Campus Apartments Phase II) | 5.000% | 5/15/20 | 500 | 520 |
| Capistrano CA Unified School District Special Tax Revenue | 5.000% | 9/1/19 (15) | 2,080 | 2,130 |
| Foothill/Eastern Transportation Corridor Agency California Toll Road Revenue PUT | 5.000% | 1/15/20 | 1,475 | 1,502 |
| Fresno CA Joint Powers Financing Authority Lease Revenue | 5.000% | 4/1/19 | 1,130 | 1,143 |
| Fresno CA Joint Powers Financing Authority Lease Revenue | 5.000% | 4/1/20 | 3,000 | 3,113 |
| Fresno CA Joint Powers Financing Authority Lease Revenue | 5.000% | 4/1/21 | 1,250 | 1,329 |
| 1 Fresno CA Unified School District GO TOB VRDO | 1.750% | 11/7/18 | 8,760 | 8,760 |
| Golden State Tobacco Securitization Corp. California Revenue | 5.000% | 6/1/19 | 5,640 | 5,741 |
| Golden State Tobacco Securitization Corp. California Revenue | 5.000% | 6/1/20 | 3,335 | 3,480 |
| Golden State Tobacco Securitization Corp. California Revenue | 5.000% | 6/1/21 | 2,745 | 2,925 |
| Golden State Tobacco Securitization Corp. California Revenue | 5.000% | 6/1/22 | 7,165 | 7,780 |
| 1 Golden State Tobacco Securitization Corp. California Revenue TOB VRDO | 1.700% | 11/7/18 LOC | 3,160 | 3,160 |
| Jurupa CA Public Financing Authority Special Tax Revenue | 5.000% | 9/1/19 | 610 | 625 |
| Long Beach CA Finance Authority Natural Gas Purchase Revenue | 5.250% | 11/15/18 | 1,185 | 1,186 |
| Long Beach CA Finance Authority Natural Gas Purchase Revenue | 5.250% | 11/15/19 | 1,500 | 1,544 |
| Long Beach CA Harbor Revenue | 5.000% | 12/15/20 | 18,500 | 19,582 |
| Los Angeles CA Wastewater System Revenue | 5.000% | 6/1/21 | 1,200 | 1,296 |
| Menifee CA Union School District Public Financing Authority Revenue | 4.000% | 9/1/19 | 1,000 | 1,017 |
| Northern California Gas Authority No. 1 Revenue | 2.235% | 7/1/19 | 6,720 | 6,721 |
| 1 Nuveen California AMT-Free Quality Municipal Income Fund VRDP VRDO | 1.610% | 11/8/18 LOC | 10,000 | 10,000 |
| Oakland CA Redevelopment Agency Tax Allocation Revenue (Central District Project) | 5.000% | 9/1/19 | 1,500 | 1,538 |
| Palomar Pomerado Health California Revenue | 4.000% | 11/1/18 | 815 | 815 |
| Roseville CA Special Tax Revenue | 4.000% | 9/1/19 | 875 | 888 |
| Sacramento CA Municipal Utility District Revenue | 5.000% | 8/15/19 | 785 | 805 |
| Sacramento CA Municipal Utility District Revenue | 5.000% | 8/15/21 | 2,550 | 2,769 |
| 1 Sacramento CA Municipal Utility District Revenue TOB VRDO | 1.650% | 11/7/18 | 7,500 | 7,500 |
| 1 San Diego CA Community College District GO TOB VRDO | 1.650% | 11/7/18 (Prere.) | 4,200 | 4,200 |
| San Diego County CA Regional Transportation Commission Revenue | 4.000% | 4/1/21 | 40,000 | 41,953 |
| San Francisco CA City & County Unified School District GO | 5.000% | 6/15/21 | 7,045 | 7,597 |
| Santa Ana CA College Improvement District No. 1 Rancho Santiago Community College GO | 4.000% | 8/1/19 | 700 | 712 |
| Santa Clara County CA GO | 5.000% | 8/1/19 (Prere.) | 12,500 | 12,804 |
| Southern California Public Power Authority Revenue (Magnolia Power Project) PUT | 2.000% | 7/1/20 | 8,750 | 8,710 |
| Washington Township CA Health Care District Revenue | 5.000% | 7/1/19 | 370 | 376 |
| Washington Township CA Health Care District Revenue | 5.000% | 7/1/20 | 625 | 649 |
| Western CA Municipal Water District Revenue PUT | 1.500% | 10/1/20 | 7,325 | 7,220 |
| | | | 871,221 |
| Colorado (1.8%) | | | | |
| Adams & Arapahoe CO Joint School District No. 28J GO | 5.000% | 12/1/19 | 1,000 | 1,032 |
| Adams & Arapahoe CO Joint School District No. 28J GO | 5.000% | 12/1/20 | 1,455 | 1,540 |
| Adams County CO COP | 4.000% | 12/1/19 | 1,250 | 1,276 |
| Colorado Health Facilities Authority Hospital Revenue | | | | |
| (The Evangelical Lutheran Good Samaritan Society Project) | 5.000% | 6/1/19 | 675 | 684 |
11
Short-Term Tax-Exempt Fund
| | | | |
| Face | Market |
| Maturity | Amount | Value• |
| Coupon | Date | ($000) | ($000) |
| Colorado Health Facilities Authority Hospital Revenue | | | | |
| (The Evangelical Lutheran Good Samaritan Society Project) | 5.000% | 6/1/20 | 1,495 | 1,552 |
| Colorado Health Facilities Authority Hospital Revenue | | | | |
| (The Evangelical Lutheran Good Samaritan Society Project) | 5.000% | 6/1/21 | 1,000 | 1,058 |
| Colorado Health Facilities Authority Hospital Revenue | | | | |
| (The Evangelical Lutheran Good Samaritan Society Project) | 5.000% | 6/1/22 | 720 | 774 |
| Colorado Health Facilities Authority Hospital Revenue (Valley View Hospital Association) PUT | 2.800% | 5/15/23 | 3,000 | 2,985 |
| Colorado Health Facilities Authority Revenue | | | | |
| (Adventist Health System/Sunbelt Obligated Group) PUT | 5.000% | 11/15/23 | 2,500 | 2,777 |
| Colorado Health Facilities Authority Revenue (Catholic Health Initiatives) | 5.000% | 2/1/19 | 2,280 | 2,294 |
| Colorado Health Facilities Authority Revenue (Catholic Health Initiatives) | 5.000% | 7/1/20 | 6,955 | 7,069 |
| Colorado Health Facilities Authority Revenue (Catholic Health Initiatives) PUT | 1.875% | 11/6/19 | 7,250 | 7,204 |
| 2 Colorado Health Facilities Authority Revenue (Catholic Health Initiatives) PUT | 2.784% | 11/12/20 | 5,000 | 5,018 |
| 2 Colorado Health Facilities Authority Revenue (Catholic Health Initiatives) PUT | 2.784% | 11/12/20 | 7,500 | 7,527 |
| 1 Colorado Health Facilities Authority Revenue (Catholic Health Initiatives) TOB VRDO | 1.770% | 11/7/18 LOC | 11,805 | 11,805 |
| Colorado Health Facilities Authority Revenue (Christian Living Communities) | 4.000% | 1/1/20 | 500 | 505 |
| Colorado Health Facilities Authority Revenue (Covenant Retirement Community Inc.) | 3.150% | 12/1/18 | 3,640 | 3,643 |
| Colorado Health Facilities Authority Revenue (Covenant Retirement Community Inc.) | 4.000% | 12/1/18 | 600 | 601 |
| Colorado Health Facilities Authority Revenue | | | | |
| (Evangelical Lutheran Good Samaritan Society Project) | 4.000% | 6/1/19 | 1,000 | 1,010 |
| Colorado Health Facilities Authority Revenue (Sisters of Charity of Leavenworth Health System) | 5.000% | 1/1/21 | 2,500 | 2,582 |
| Colorado Health Facilities Authority Revenue | | | | |
| (Sisters of Charity of Leavenworth Health System) VRDO | 1.590% | 11/7/18 | 22,990 | 22,990 |
| Colorado Health Facilities Authority Revenue | | | | |
| (Sisters of Charity of Leavenworth Health System) VRDO | 1.590% | 11/7/18 | 25,490 | 25,490 |
| 2 Colorado Public Highway Authority Revenue PUT | 2.437% | 9/1/19 | 3,125 | 3,128 |
| 2 Colorado Public Highway Authority Revenue PUT | 2.579% | 9/1/21 | 3,000 | 3,022 |
| 1 Colorado Regional Transportation District CP TOB VRDO | 1.700% | 11/7/18 | 13,280 | 13,280 |
| Denver CO City & County Airport Revenue | 2.080% | 11/8/18 (12) | 12,075 | 12,075 |
| Denver CO City & County Airport Revenue | 1.990% | 11/2/18 (12) | 12,875 | 12,875 |
| Denver CO City & County Airport Revenue | 5.000% | 11/15/22 | 5,000 | 5,264 |
| 2 Denver CO City & County Airport Revenue PUT | 2.439% | 11/15/19 | 14,015 | 14,035 |
| 3 Interlocken Metropolitan District Colorado GO | 5.000% | 12/1/21 (4) | 400 | 430 |
| 3 Interlocken Metropolitan District Colorado GO | 5.000% | 12/1/22 (4) | 675 | 738 |
| Moffat County CO Pollution Control Revenue | | | | |
| (Tri-State Generation & Transmission Association Inc.) PUT | 2.000% | 10/3/22 | 13,500 | 13,234 |
| Park Creek CO Metropolitan District Limited Property Tax Revenue | 4.000% | 12/1/18 | 350 | 351 |
| Park Creek CO Metropolitan District Limited Property Tax Revenue | 4.000% | 12/1/20 | 1,055 | 1,087 |
| Regional Transportation District of Colorado Sales Tax Revenue | | | | |
| (Denver Transit Partners Eagle P3 Project) | 5.000% | 1/15/22 | 2,800 | 2,851 |
| Regional Transportation District of Colorado Sales Tax Revenue | | | | |
| (Denver Transit Partners Eagle P3 Project) | 5.125% | 7/15/23 | 3,250 | 3,316 |
| Southlands CO Metropolitan District GO | 3.000% | 12/1/22 | 275 | 271 |
| University of Colorado Enterprise System Revenue | 5.000% | 6/1/22 | 700 | 767 |
| University of Colorado Hospital Authority Revenue PUT | 4.000% | 3/1/20 | 40,645 | 41,203 |
| University of Colorado Hospital Authority Revenue PUT | 5.000% | 3/1/22 | 10,000 | 10,682 |
| University of Colorado Hospital Authority Revenue VRDO | 1.600% | 11/7/18 | 24,700 | 24,700 |
| University of Colorado Hospital Authority Revenue VRDO | 1.610% | 11/7/18 | 19,515 | 19,515 |
| | | | 294,240 |
| Connecticut (2.3%) | | | | |
| Bridgeport CT GO | 5.000% | 8/15/20 (4) | 3,680 | 3,838 |
| Bridgeport CT GO | 5.000% | 8/15/20 (4)(ETM) | 3,435 | 3,605 |
| 2 Connecticut GO | 2.700% | 5/15/19 | 5,000 | 5,012 |
| 2 Connecticut GO | 2.520% | 9/15/19 | 1,000 | 1,003 |
| Connecticut GO | 4.000% | 10/15/19 | 1,000 | 1,016 |
| Connecticut GO | 5.000% | 9/15/20 | 1,515 | 1,584 |
| Connecticut GO | 5.000% | 4/15/21 | 6,000 | 6,346 |
| Connecticut GO | 5.000% | 6/15/21 | 2,675 | 2,839 |
| Connecticut GO | 5.000% | 4/15/22 | 3,750 | 4,029 |
| Connecticut GO | 5.000% | 6/15/22 | 4,675 | 5,037 |
| Connecticut GO | 5.000% | 10/15/22 | 1,320 | 1,429 |
| Connecticut GO | 5.000% | 11/1/22 | 500 | 533 |
| Connecticut GO | 5.000% | 6/15/23 | 1,000 | 1,090 |
| Connecticut GO | 5.000% | 9/15/23 | 1,310 | 1,432 |
| Connecticut GO | 5.000% | 11/15/23 | 920 | 1,007 |
| 1 Connecticut GO TOB VRDO | 1.640% | 11/7/18 LOC | 23,000 | 23,000 |
| Connecticut Health & Educational Facilities Authority Revenue | | | | |
| (Ascension Health Credit Group) PUT | 1.650% | 3/1/19 | 2,190 | 2,187 |
| Connecticut Health & Educational Facilities Authority Revenue (Trinity Health Corp.) | 5.000% | 12/1/18 | 350 | 351 |
12
Short-Term Tax-Exempt Fund
| | | | |
| Face | Market |
| Maturity | Amount | Value• |
| Coupon | Date | ($000) | ($000) |
| Connecticut Health & Educational Facilities Authority Revenue (Trinity Health Corp.) | 3.000% | 12/1/19 | 750 | 757 |
| Connecticut Health & Educational Facilities Authority Revenue (University of New Haven) | 5.000% | 7/1/21 | 1,380 | 1,462 |
| Connecticut Health & Educational Facilities Authority Revenue (University of New Haven) | 5.000% | 7/1/22 | 765 | 822 |
| Connecticut Health & Educational Facilities Authority Revenue (Yale University) PUT | 1.200% | 2/1/19 | 5,000 | 4,991 |
| Connecticut Health & Educational Facilities Authority Revenue (Yale University) PUT | 1.000% | 2/6/19 | 5,350 | 5,337 |
| Connecticut Health & Educational Facilities Authority Revenue (Yale University) PUT | 1.000% | 2/6/19 | 4,845 | 4,833 |
| Connecticut Health & Educational Facilities Authority Revenue (Yale University) PUT | 1.000% | 7/1/19 | 17,550 | 17,430 |
| Connecticut Health & Educational Facilities Authority Revenue (Yale University) PUT | 1.000% | 7/1/19 | 8,450 | 8,392 |
| Connecticut Health & Educational Facilities Authority Revenue (Yale University) PUT | 1.300% | 2/3/20 | 58,500 | 57,845 |
| Connecticut Health & Educational Facilities Authority Revenue (Yale University) PUT | 1.650% | 2/3/20 | 17,400 | 17,280 |
| Connecticut Health & Educational Facilities Authority Revenue (Yale University) PUT | 1.800% | 2/9/21 | 23,500 | 23,231 |
| Connecticut Health & Educational Facilities Authority Revenue (Yale University) PUT | 1.800% | 2/9/21 | 16,125 | 15,940 |
| Connecticut Health & Educational Facilities Authority Revenue (Yale University) PUT | 2.050% | 7/12/21 | 61,650 | 61,169 |
| Connecticut Health & Educational Facilities Authority Revenue (Yale University) PUT | 5.000% | 7/1/22 | 3,210 | 3,513 |
| Connecticut Health & Educational Facilities Authority Revenue (Yale University) PUT | 5.000% | 7/1/22 | 13,500 | 14,773 |
| 2 Connecticut Health & Educational Facilities Authority Revenue | | | | |
| (Yale-New Haven Hospital Inc.) PUT | 2.062% | 7/1/19 | 9,750 | 9,750 |
| Connecticut Housing Finance Authority Revenue Housing Mortgage Finance Program PUT | 1.500% | 11/15/20 | 3,430 | 3,354 |
| Connecticut Housing Finance Authority Revenue Housing Mortgage Finance Program PUT | 2.600% | 11/15/21 | 16,755 | 16,760 |
| Connecticut Special Tax Revenue | 5.000% | 10/1/22 | 3,605 | 3,919 |
| Connecticut Special Tax Revenue (Transportation Infrastructure) | 5.000% | 10/1/20 | 2,500 | 2,624 |
| Connecticut Special Tax Revenue (Transportation Infrastructure) | 5.000% | 9/1/23 | 11,145 | 12,256 |
| 1 Connecticut Special Tax Revenue (Transportation Infrastructure) TOB VRDO | 1.660% | 11/7/18 | 4,550 | 4,550 |
| Hartford County CT Metropolitan District GO | 5.000% | 7/15/21 | 1,310 | 1,401 |
| Hartford County CT Metropolitan District GO | 5.000% | 7/15/22 | 1,000 | 1,087 |
| Hartford County CT Metropolitan District GO | 5.000% | 7/15/23 | 525 | 579 |
| Hartford CT GO | 5.000% | 4/1/19 (ETM) | 2,150 | 2,175 |
| Hartford CT GO | 5.000% | 7/1/19 (4) | 700 | 713 |
| Hartford CT GO | 5.000% | 10/1/19 (ETM) | 1,525 | 1,566 |
| New Britain CT GO | 5.000% | 3/1/19 (ETM) | 1,000 | 1,010 |
| New Britain CT GO | 5.000% | 3/1/20 (15)(ETM) | 1,050 | 1,090 |
| New Britain CT GO | 5.000% | 3/1/20 (15) | 125 | 130 |
| New Haven CT GO | 5.000% | 8/15/21 (4)(ETM) | 1,000 | 1,076 |
| New Haven CT TAN | 3.000% | 4/3/19 | 4,000 | 4,013 |
| | | | 371,166 |
| Delaware (0.3%) | | | | |
| Delaware GO | 5.000% | 2/1/19 | 1,000 | 1,008 |
| Delaware GO | 5.000% | 2/1/21 | 1,560 | 1,659 |
| Delaware GO | 5.000% | 3/1/21 | 1,585 | 1,688 |
| Delaware Transportation Authority Transportation System Revenue | 5.000% | 7/1/19 | 3,500 | 3,570 |
| Delaware Transportation Authority Transportation System Revenue | 5.000% | 7/1/20 | 825 | 863 |
| Delaware Transportation Authority Transportation System Revenue | 5.000% | 7/1/23 | 10,000 | 11,010 |
| New Castle County DE GO | 5.000% | 10/1/20 | 7,470 | 7,868 |
| New Castle County DE GO | 5.000% | 10/1/22 | 5,520 | 6,083 |
| 1 University of Delaware Revenue TOB VRDO | 1.690% | 11/7/18 | 9,170 | 9,170 |
| | | | 42,919 |
| District of Columbia (0.4%) | | | | |
| District of Columbia Housing Finance Agency Multifamily Housing Revenue | | | | |
| (Park 7 at Minnesota Benning Project) VRDO | 1.600% | 11/7/18 LOC | 41,400 | 41,400 |
| 1 District of Columbia Income Tax Revenue TOB VRDO | 1.630% | 11/7/18 | 12,910 | 12,910 |
| District of Columbia Water & Sewer Authority Public Utility Revenue | 5.000% | 10/1/19 | 500 | 514 |
| Washington D.C. Convention & Sports Authority Revenue | 5.000% | 10/1/20 | 2,500 | 2,633 |
| Washington D.C. Convention & Sports Authority Revenue | 5.000% | 10/1/21 | 2,500 | 2,685 |
| | | | 60,142 |
| Florida (2.9%) | | | | |
| Brevard County FL Health Facilities Authority Revenue (Health First Inc. Project) | 5.000% | 4/1/19 | 750 | 759 |
| 1 Broward County FL Airport System Revenue TOB VRDO | 1.630% | 11/7/18 LOC | 31,360 | 31,360 |
| Broward County FL School Board COP | 5.000% | 7/1/19 | 2,430 | 2,478 |
| Broward County FL School Board COP | 5.000% | 7/1/20 | 5,470 | 5,722 |
| Broward County FL School Board COP | 5.000% | 7/1/22 | 4,830 | 5,266 |
| Cape Coral FL Utility Improvement Special Assessment Revenue | 1.650% | 9/1/19 (4) | 1,100 | 1,093 |
| Cape Coral FL Utility Improvement Special Assessment Revenue | 1.900% | 9/1/20 (4) | 955 | 938 |
| Cape Coral FL Utility Improvement Special Assessment Revenue | 2.000% | 9/1/21 (4) | 1,200 | 1,166 |
| Citizens Property Insurance Corp. Florida Revenue (Coastal Account) | 5.000% | 6/1/20 | 4,350 | 4,481 |
| Citizens Property Insurance Corp. Florida Revenue | | | | |
| (Personal Lines Account/Commercial Lines Account) | 5.000% | 6/1/19 | 6,700 | 6,811 |
| Escambia County FL Pollution Control Revenue (Gulf Power Co. Project) PUT | 2.100% | 4/11/19 | 1,250 | 1,248 |
| Escambia County FL Solid Waste Disposal System Revenue (Gulf Power Co. Project) PUT | 1.800% | 11/19/20 | 20,000 | 19,589 |
13
Short-Term Tax-Exempt Fund
| | | | |
| Face | Market |
| Maturity | Amount | Value• |
| Coupon | Date | ($000) | ($000) |
| Florida Board of Education Lottery Revenue | 5.000% | 7/1/21 | 21,010 | 22,552 |
| Florida Board of Education Public Education Capital Outlay GO | 5.000% | 6/1/19 | 4,610 | 4,692 |
| Florida Board of Education Public Education Revenue | 5.000% | 6/1/21 | 5,190 | 5,561 |
| Florida Board of Education Public Education Revenue | 5.000% | 6/1/22 | 4,885 | 5,350 |
| Florida Department of Environmental Protection & Preservation Revenue | 5.000% | 7/1/20 | 13,160 | 13,767 |
| 3 Florida Department of Management Services COP | 5.000% | 11/1/21 | 6,995 | 7,523 |
| 1 Florida Housing Finance Corp. Homeowner Mortgage Revenue TOB VRDO | 1.630% | 11/7/18 | 12,540 | 12,540 |
| Florida Municipal Power Agency Revenue | 5.000% | 10/1/19 | 800 | 821 |
| Florida Municipal Power Agency Revenue | 5.000% | 10/1/20 | 6,090 | 6,398 |
| Gainesville FL Utilities System Revenue VRDO | 1.620% | 11/7/18 | 24,885 | 24,885 |
| Gainesville FL Utilities System Revenue VRDO | 1.620% | 11/7/18 | 10,400 | 10,400 |
| Halifax Hospital Medical Center Florida Hospital Revenue | 5.000% | 6/1/19 | 250 | 254 |
| Halifax Hospital Medical Center Florida Hospital Revenue | 5.000% | 6/1/19 | 825 | 838 |
| Halifax Hospital Medical Center Florida Hospital Revenue | 5.000% | 6/1/20 | 300 | 312 |
| Highlands County FL Health Facilities Authority Hospital Revenue | | | | |
| (Adventist Health System/Sunbelt Obligated Group) | 5.000% | 11/15/20 | 460 | 473 |
| Hillsborough County FL School Board COP | 5.000% | 7/1/21 | 1,500 | 1,607 |
| Hollywood FL Community Redevelopment Agency Tax Allocation Revenue | 5.000% | 3/1/19 | 2,000 | 2,019 |
| Jacksonville FL Electric Authority Electric System Revenue | 5.000% | 10/1/20 | 1,320 | 1,380 |
| Jacksonville FL Electric Authority Water & Sewer Revenue | 5.000% | 10/1/21 | 1,500 | 1,605 |
| Jacksonville FL Health Care Facilities Revenue (Brooks Rehabilitation) | 5.000% | 11/1/20 | 815 | 856 |
| Jacksonville FL Health Care Facilities Revenue (Brooks Rehabilitation) | 5.000% | 11/1/21 | 735 | 786 |
| Jacksonville FL Health Care Facilities Revenue (Brooks Rehabilitation) | 5.000% | 11/1/22 | 765 | 833 |
| Jacksonville FL Special Revenue | 5.000% | 10/1/20 | 2,500 | 2,621 |
| Jacksonville FL Special Revenue | 5.000% | 10/1/20 | 760 | 797 |
| Lakeland FL Energy System Revenue | 5.000% | 10/1/19 | 1,000 | 1,027 |
| Lakeland FL Hospital Revenue (Lakeland Regional Health Systems) | 5.000% | 11/15/20 | 7,215 | 7,600 |
| 1 Lee Memorial Health System Florida Hospital Revenue TOB VRDO | 1.720% | 11/7/18 LOC | 13,650 | 13,650 |
| Manatee County FL School District Revenue | 4.000% | 10/1/19 (4) | 1,115 | 1,135 |
| Manatee County FL School District Revenue | 5.000% | 10/1/20 (4) | 1,000 | 1,052 |
| Miami Beach FL Health Facilities Authority Revenue (Mount Sinai Medical Center) | 4.000% | 11/15/18 | 1,125 | 1,126 |
| Miami Beach FL Resort Tax Revenue | 5.000% | 9/1/19 | 1,615 | 1,655 |
| Miami Beach FL Resort Tax Revenue | 5.000% | 9/1/20 | 1,135 | 1,193 |
| 1 Miami Beach FL Resort Tax Revenue TOB VRDO | 1.640% | 11/7/18 | 9,240 | 9,240 |
| Miami-Dade County FL Aviation Revenue (Miami International Airport) | 5.000% | 10/1/21 (4) | 1,445 | 1,518 |
| 1 Miami-Dade County FL Educational Finance Authority Revenue TOB VRDO | 1.750% | 11/7/18 | 15,690 | 15,690 |
| 1 Miami-Dade County FL Public Facilities Revenue (Jackson Health System) TOB VRDO | 1.630% | 11/7/18 (12)(Prere.) | 10,395 | 10,395 |
| Miami-Dade County FL School Board COP | 5.000% | 2/1/20 | 2,250 | 2,329 |
| 1 Miami-Dade County FL School Board COP TOB VRDO | 1.680% | 11/7/18 (Prere.) | 19,500 | 19,500 |
| 1 Miami-Dade County FL Water & Sewer Revenue TOB VRDO | 1.630% | 11/7/18 (12) | 23,750 | 23,750 |
| 1 Miami-Dade County FL Water & Sewer Revenue TOB VRDO | 1.740% | 11/7/18 | 17,015 | 17,015 |
| North Brevard County FL Hospital District Revenue | 5.000% | 1/1/19 | 1,000 | 1,004 |
| North Brevard County FL Hospital District Revenue | 5.000% | 1/1/22 | 1,660 | 1,771 |
| Okeechobee County FL Solid Waste Disposal Revenue | | | | |
| (Waste Management Inc./Okeechobee Landfill Project) PUT | 1.550% | 7/1/21 | 1,100 | 1,059 |
| Orlando FL Tourist Development Tax Revenue | 4.000% | 11/1/18 (4) | 775 | 775 |
| Orlando FL Tourist Development Tax Revenue | 3.000% | 11/1/19 (4) | 1,380 | 1,392 |
| Orlando FL Tourist Development Tax Revenue | 4.000% | 11/1/20 (4) | 1,000 | 1,032 |
| Orlando FL Tourist Development Tax Revenue | 4.000% | 11/1/21 (4) | 1,000 | 1,046 |
| Orlando FL Tourist Development Tax Revenue | 5.000% | 11/1/22 (4) | 1,000 | 1,095 |
| Orlando FL Utility Commission Utility System Revenue PUT | 5.000% | 10/1/20 | 4,240 | 4,459 |
| Orlando FL Utility Commission Utility System Revenue VRDO | 1.620% | 11/7/18 | 28,400 | 28,400 |
| Palm Beach County FL Health Facilities Authority Hospital Revenue | | | | |
| (BRRH Corp. Obligated Group) | 4.000% | 12/1/18 | 750 | 751 |
| Pasco County FL School Board COP | 1.960% | 11/2/18 (2) | 9,500 | 9,500 |
| Sarasota County FL Health Facilities Authority Revenue (Village of Isle Project) | 4.000% | 1/1/19 | 500 | 501 |
| South Broward FL Hospital District Revenue | 5.000% | 5/1/20 | 4,190 | 4,368 |
| South Florida Water Management District COP | 5.000% | 10/1/19 | 1,760 | 1,807 |
| South Florida Water Management District COP | 5.000% | 10/1/20 | 2,015 | 2,119 |
| 1 South Miami FL Health Facilities Authority (Baptist Health South Florida Obligated Group) | | | | |
| TOB VRDO | 1.720% | 11/7/18 | 16,625 | 16,625 |
| South Miami FL Health Facilities Authority Revenue (Baptist Health South Florida Obligated Group) | 5.000% | 8/15/19 | 2,300 | 2,348 |
| South Miami FL Health Facilities Authority Revenue (Baptist Health South Florida Obligated Group) | 5.000% | 8/15/20 | 1,125 | 1,176 |
| South Miami FL Health Facilities Authority Revenue (Baptist Health South Florida Obligated Group) | 5.000% | 8/15/21 | 1,250 | 1,338 |
| South Miami FL Health Facilities Authority Revenue (Baptist Health South Florida Obligated Group) | 5.000% | 8/15/22 | 1,075 | 1,173 |
| 1 South Miami FL Health Facilities Authority Revenue | | | | |
| (Baptist Health South Florida Obligated Group) TOB VRDO | 1.700% | 11/7/18 | 3,750 | 3,750 |
| 1 South Miami FL Health Financing Authority (Baptist Health Obligated Group) TOB VRDO | 1.700% | 11/7/18 | 22,840 | 22,840 |
| Tallahassee FL Health Facilities Revenue (Tallahassee Memorial HealthCare Inc. Project) | 5.000% | 12/1/20 | 1,600 | 1,676 |
| 1 Tampa-Hillsborough FL County Expressway Authority Revenue TOB VRDO | 1.660% | 11/7/18 | 14,760 | 14,760 |
14
Short-Term Tax-Exempt Fund
| | | | |
| Face | Market |
| Maturity | Amount | Value• |
| Coupon | Date | ($000) | ($000) |
| Volusia County FL School Board COP | 4.000% | 8/1/19 (15) | 500 | 507 |
| Volusia County FL School Board COP | 5.000% | 8/1/20 (15) | 400 | 419 |
| | | | 465,347 |
| Georgia (3.5%) | | | | |
| Atlanta GA Airport Passenger Facility Charge Revenue | 5.000% | 1/1/21 | 8,345 | 8,623 |
| 1 Atlanta GA Airport Revenue TOB VRDO | 1.680% | 11/7/18 (4) | 10,000 | 10,000 |
| 2 Atlanta GA Water & Wastewater Revenue PUT | 3.037% | 11/1/18 | 56,750 | 56,750 |
| Augusta GA Water & Sewerage Revenue | 5.000% | 10/1/21 | 7,530 | 8,102 |
| Bartow County GA Development Authority Pollution Control Revenue | | | | |
| (Georgia Power Co. Plant Bowen Project) PUT | 2.050% | 11/19/21 | 2,050 | 1,987 |
| Burke County GA Development Authority Pollution Control Revenue | | | | |
| (Georgia Power Co. Plant Vogtle Project) PUT | 2.500% | 5/3/21 | 28,470 | 28,374 |
| Burke County GA Development Authority Pollution Control Revenue | | | | |
| (Georgia Power Co. Plant Vogtle Project) PUT | 1.850% | 8/22/19 | 15,785 | 15,672 |
| Burke County GA Development Authority Pollution Control Revenue | | | | |
| (Georgia Power Co. Plant Vogtle Project) PUT | 1.850% | 8/22/19 | 13,410 | 13,314 |
| Burke County GA Development Authority Pollution Control Revenue | | | | |
| (Georgia Power Co. Plant Vogtle Project) PUT | 2.350% | 12/11/20 | 3,200 | 3,173 |
| Burke County GA Development Authority Pollution Control Revenue | | | | |
| (Georgia Power Co. Plant Vogtle Project) PUT | 2.050% | 11/19/21 | 1,625 | 1,575 |
| Clarke County GA Hospital Authority Revenue (Piedmont Healthcare Inc.) | 5.000% | 7/1/19 | 700 | 713 |
| Cobb County GA Kennestone Hospital Authority Revenue | 5.000% | 4/1/19 | 200 | 203 |
| Cobb County GA Kennestone Hospital Authority Revenue | 5.000% | 4/1/21 | 505 | 536 |
| Douglas County GA GO | 5.000% | 4/1/20 | 3,200 | 3,330 |
| Douglas County GA GO | 5.000% | 4/1/21 | 1,500 | 1,600 |
| Forsyth County GA School District GO | 5.000% | 2/1/22 | 2,750 | 2,992 |
| Fulton County GA Development Authority Revenue (Piedmont Healthcare Inc. Project) | 5.000% | 7/1/19 | 700 | 713 |
| Fulton County GA Development Hospital Authority Revenue | | | | |
| (WellStar Health System Obligated Group) | 3.000% | 4/1/19 | 235 | 236 |
| Fulton County GA Development Hospital Authority Revenue | | | | |
| (WellStar Health System Obligated Group) | 5.000% | 4/1/20 | 590 | 613 |
| Fulton County GA Residential Care Facilities for the Elderly Authority Revenue (Lenbrook Square) | 3.000% | 7/1/19 | 500 | 501 |
| Fulton County GA Residential Care Facilities for the Elderly Authority Revenue (Lenbrook Square) | 3.000% | 7/1/20 | 1,465 | 1,469 |
| 2 Gainesville & Hall County GA Hospital Authority Revenue | | | | |
| (Northeast Georgia Health System Inc. Project) PUT | 2.550% | 2/18/20 | 18,825 | 18,888 |
| Georgia GO | 5.000% | 2/1/19 | 1,140 | 1,149 |
| Georgia GO | 5.000% | 7/1/19 | 5,000 | 5,102 |
| Georgia GO | 4.000% | 11/1/19 | 1,040 | 1,061 |
| Georgia GO | 5.000% | 1/1/20 | 975 | 1,008 |
| Georgia GO | 5.000% | 1/1/20 | 21,000 | 21,718 |
| Georgia GO | 5.000% | 2/1/20 | 17,710 | 18,356 |
| Georgia GO | 5.000% | 7/1/20 | 1,255 | 1,315 |
| Georgia GO | 5.000% | 12/1/20 | 1,740 | 1,842 |
| Georgia GO | 5.000% | 2/1/21 | 29,110 | 30,953 |
| Georgia GO | 5.000% | 2/1/21 | 25,000 | 26,582 |
| Georgia GO | 5.000% | 7/1/21 | 4,640 | 4,983 |
| Georgia GO | 5.000% | 7/1/21 | 2,945 | 3,163 |
| Georgia GO | 5.000% | 7/1/21 | 6,870 | 7,378 |
| Georgia GO | 5.000% | 7/1/21 | 660 | 709 |
| Georgia GO | 5.000% | 7/1/21 | 47,720 | 51,247 |
| Georgia GO | 5.000% | 9/1/21 | 6,395 | 6,893 |
| Georgia GO | 5.000% | 10/1/21 | 6,580 | 7,105 |
| Georgia GO | 5.000% | 1/1/22 | 16,110 | 17,496 |
| Georgia GO | 5.000% | 1/1/24 | 5,000 | 5,522 |
| Georgia Municipal Electric Power Authority Revenue | 5.000% | 1/1/20 | 1,000 | 1,031 |
| Georgia Municipal Electric Power Authority Revenue | 5.000% | 1/1/22 | 2,500 | 2,683 |
| Georgia Municipal Gas Authority Revenue | 5.000% | 10/1/19 | 5,000 | 5,130 |
| Georgia Road & Tollway Authority Revenue | 5.000% | 6/1/19 | 4,555 | 4,635 |
| Georgia Road & Tollway Authority Revenue | 5.000% | 6/1/20 | 15,445 | 16,137 |
| Georgia Road & Tollway Authority Revenue Federal Highway Reimbursement Revenue | 5.000% | 6/1/19 | 2,595 | 2,640 |
| Georgia Road & Tollway Authority Revenue Federal Highway Reimbursement Revenue | 5.000% | 6/1/20 | 6,665 | 6,964 |
| Glynn County GA School District GO | 5.000% | 8/1/19 | 7,030 | 7,189 |
| Griffin-Spalding County GA Hospital Authority Revenue (WellStar Health System Obligated Group) | 3.000% | 4/1/20 | 150 | 152 |
| LaGrange-Troup County GA Hospital Authority Revenue (WellStar Health System Obligated Group) | 5.000% | 4/1/21 | 350 | 371 |
| Main Street Natural Gas Inc. Georgia Gas Project Revenue | 5.000% | 3/15/19 | 1,000 | 1,010 |
| Main Street Natural Gas Inc. Georgia Gas Project Revenue | 4.000% | 6/1/23 | 4,290 | 4,506 |
| Main Street Natural Gas Inc. Georgia Gas Project Revenue PUT | 4.000% | 9/1/23 | 30,000 | 31,284 |
| 2 Main Street Natural Gas Inc. Georgia Gas Project Revenue PUT | 2.342% | 12/1/23 | 50,000 | 49,668 |
| Main Street Natural Gas Inc. Georgia Gas Project Revenue PUT | 4.000% | 12/1/23 | 9,000 | 9,412 |
15
Short-Term Tax-Exempt Fund
| | | | |
| Face | Market |
| Maturity | Amount | Value• |
| Coupon | Date | ($000) | ($000) |
| Monroe County GA Development Authority Pollution Control Revenue | | | | |
| (Georgia Power Company Plant Scherer Project) PUT | 2.050% 11/19/21 | 1,625 | 1,575 |
| Municipal Electric Authority Georgia Revenue | 5.000% | 1/1/20 | 8,940 | 9,214 |
| Municipal Electric Authority Georgia Revenue | 5.000% | 11/1/20 | 2,875 | 3,020 |
| Municipal Electric Authority Georgia Revenue | 5.000% | 1/1/21 | 7,495 | 7,874 |
| Municipal Electric Authority Georgia Revenue | 5.000% | 1/1/21 | 1,000 | 1,051 |
| Municipal Electric Authority Georgia Revenue | 5.000% | 1/1/22 | 2,310 | 2,470 |
| Municipal Electric Authority Georgia Revenue (Project One) | 5.000% | 1/1/21 | 3,855 | 4,050 |
| Richmond County GA Board of Education Sales Tax Revenue | 5.000% | 10/1/20 | 6,165 | 6,491 |
| | | | 571,503 |
| Guam (0.0%) | | | | |
| Guam Government Business Privilege Tax Revenue | 5.000% | 11/15/18 | 630 | 631 |
| Guam Government Business Privilege Tax Revenue | 5.000% | 11/15/19 | 1,000 | 1,025 |
| Guam Government Waterworks Authority Water & Waste Water System Revenue | 5.000% | 7/1/20 | 630 | 651 |
| Guam Government Waterworks Authority Water & Waste Water System Revenue | 5.000% | 7/1/21 | 500 | 525 |
| Guam Government Waterworks Authority Water & Waste Water System Revenue | 5.000% | 7/1/22 | 500 | 533 |
| | | | 3,365 |
| Hawaii (0.7%) | | | | |
| Hawaii Department of Budget & Finance Special Purpose Revenue (Queens Health System) PUT | 2.050% | 5/29/19 | 4,405 | 4,405 |
| Hawaii Department of Budget & Finance Special Purpose Revenue (Queens Health System) PUT | 2.050% | 5/29/19 | 2,275 | 2,275 |
| Hawaii GO | 5.000% | 10/1/19 | 4,000 | 4,110 |
| Hawaii GO | 5.000% | 10/1/20 | 2,750 | 2,899 |
| Hawaii GO | 4.000% | 5/1/21 | 8,090 | 8,452 |
| Hawaii GO | 5.000% | 4/1/22 | 5,500 | 5,994 |
| Hawaii GO | 5.000% | 12/1/22 | 4,000 | 4,321 |
| Honolulu HI City & County GO | 5.250% | 4/1/19 (Prere.) | 2,975 | 3,017 |
| Honolulu HI City & County GO | 5.000% | 9/1/19 | 2,535 | 2,599 |
| Honolulu HI City & County GO | 4.000% | 9/1/22 | 2,095 | 2,228 |
| Honolulu HI City & County GO | 5.000% | 9/1/22 | 2,000 | 2,200 |
| 2 Honolulu HI City & County GO PUT | 1.900% | 9/1/20 | 5,500 | 5,495 |
| 2 Honolulu HI City & County GO PUT | 1.900% | 9/1/20 | 7,500 | 7,493 |
| 2 Honolulu HI City & County GO PUT | 1.910% | 9/1/20 | 7,500 | 7,493 |
| 2 Honolulu HI City & County GO PUT | 1.920% | 9/1/20 | 6,500 | 6,494 |
| 2 Honolulu HI City & County GO PUT | 1.920% | 9/1/20 | 10,500 | 10,490 |
| 2 Honolulu HI City & County GO PUT | 1.920% | 9/1/20 | 9,250 | 9,241 |
| 2 Honolulu HI City & County GO PUT | 1.920% | 9/1/20 | 7,500 | 7,493 |
| 1 Honolulu HI City & County GO TOB VRDO | 1.750% | 11/15/18 | 15,290 | 15,290 |
| Honolulu HI City & County Wastewater System Revenue | 5.000% | 7/1/19 (Prere.) | 1,395 | 1,423 |
| | | | 113,412 |
| Idaho (0.1%) | | | | |
| Idaho Health Facilities Authority Revenue (St. Lukes Health System Project) | 5.000% | 3/1/20 | 600 | 621 |
| Idaho Health Facilities Authority Revenue (St. Lukes Health System Project) | 5.000% | 3/1/21 | 2,145 | 2,269 |
| Idaho Health Facilities Authority Revenue (St. Lukes Health System Project) | 5.000% | 3/1/22 | 1,350 | 1,455 |
| Idaho Health Facilities Authority Revenue (St. Lukes Health System Project) | 5.000% | 3/1/23 | 1,000 | 1,093 |
| Idaho Housing & Finance Association RAN | 5.000% | 7/15/19 | 6,580 | 6,711 |
| | | | 12,149 |
| Illinois (8.9%) | | | | |
| Chicago IL Board of Education GO | 0.000% | 12/1/21 (14) | 315 | 285 |
| Chicago IL Board of Education GO | 5.000% | 12/1/18 (Prere.) | 95 | 95 |
| Chicago IL Board of Education GO | 5.000% | 12/1/18 | 790 | 791 |
| Chicago IL Board of Education GO | 5.000% | 12/1/18 (14) | 100 | 100 |
| Chicago IL Board of Education GO | 5.500% | 12/1/18 (2) | 250 | 250 |
| Chicago IL Board of Education GO | 5.000% | 12/1/19 | 890 | 904 |
| Chicago IL Board of Education GO | 5.000% | 12/1/19 | 16,110 | 16,370 |
| Chicago IL Board of Education GO | 5.000% | 12/1/19 | 3,750 | 3,811 |
| Chicago IL Board of Education GO | 5.000% | 12/1/19 (14) | 155 | 155 |
| Chicago IL Board of Education GO | 5.250% | 12/1/19 (14)(3) | 830 | 847 |
| Chicago IL Board of Education GO | 5.500% | 12/1/19 (2) | 120 | 123 |
| Chicago IL Board of Education GO | 5.000% | 12/1/20 | 4,555 | 4,682 |
| Chicago IL Board of Education GO | 5.000% | 12/1/20 | 6,000 | 6,167 |
| Chicago IL Board of Education GO | 5.000% | 12/1/20 | 4,445 | 4,569 |
| Chicago IL Board of Education GO | 5.000% | 12/1/20 | 2,580 | 2,582 |
| Chicago IL Board of Education GO | 5.250% | 12/1/20 (14)(3) | 400 | 416 |
| Chicago IL Board of Education GO | 5.000% | 12/1/21 | 5,170 | 5,368 |
| Chicago IL Board of Education GO | 5.000% | 12/1/21 | 1,570 | 1,600 |
| Chicago IL Board of Education GO | 5.000% | 12/1/21 | 7,000 | 7,269 |
| Chicago IL Board of Education GO | 5.000% | 12/1/21 | 2,830 | 2,939 |
| Chicago IL Board of Education GO | 5.250% | 12/1/21 (14) | 1,900 | 2,005 |
16
Short-Term Tax-Exempt Fund
| | | | |
| Face | Market |
| Maturity | Amount | Value• |
| Coupon | Date | ($000) | ($000) |
| Chicago IL Board of Education GO | 5.000% | 12/1/22 (4) | 500 | 536 |
| Chicago IL Board of Education GO | 5.000% | 12/1/23 (4) | 2,000 | 2,166 |
| Chicago IL GO | 5.000% | 12/1/19 | 1,270 | 1,294 |
| Chicago IL GO | 4.000% | 1/1/20 | 100 | 101 |
| Chicago IL GO | 5.000% | 1/1/20 | 150 | 153 |
| Chicago IL GO | 4.000% | 1/1/21 | 1,250 | 1,259 |
| Chicago IL GO | 5.000% | 1/1/21 | 1,685 | 1,742 |
| Chicago IL GO | 5.000% | 1/1/22 | 715 | 747 |
| Chicago IL GO | 5.000% | 1/1/23 | 5,185 | 5,463 |
| Chicago IL GO | 5.000% | 1/1/24 | 1,150 | 1,220 |
| Chicago IL Housing Authority Revenue | 5.000% | 1/1/21 | 1,400 | 1,475 |
| Chicago IL Housing Authority Revenue | 5.000% | 1/1/22 | 1,330 | 1,428 |
| Chicago IL Metropolitan Water Reclamation District GO | 5.000% | 12/1/18 | 5,000 | 5,012 |
| Chicago IL O’Hare International Airport Revenue | 5.000% | 1/1/19 | 4,420 | 4,441 |
| Chicago IL O’Hare International Airport Revenue | 5.000% | 1/1/20 | 4,000 | 4,127 |
| Chicago IL O’Hare International Airport Revenue (Customer Facility Charge) | 5.000% | 1/1/21 | 3,980 | 4,180 |
| Chicago IL O’Hare International Airport Revenue VRDO | 1.610% | 11/7/18 LOC | 30,000 | 30,000 |
| Chicago IL Park District GO | 5.000% | 1/1/20 | 250 | 257 |
| Chicago IL Park District GO | 5.000% | 1/1/21 | 450 | 471 |
| Chicago IL Park District GO | 5.000% | 1/1/23 | 790 | 839 |
| Chicago IL Park District Harbor Facilities GO | 5.000% | 1/1/19 | 990 | 995 |
| Chicago IL Transit Authority Capital Grant Receipts Revenue | 4.000% | 6/1/19 | 1,250 | 1,262 |
| Chicago IL Transit Authority Capital Grant Receipts Revenue | 5.000% | 6/1/20 | 1,250 | 1,300 |
| Chicago IL Transit Authority Capital Grant Receipts Revenue | 5.000% | 6/1/21 | 1,000 | 1,058 |
| Chicago IL Transit Authority Capital Grant Receipts Revenue | 5.000% | 6/1/21 | 1,845 | 1,954 |
| Chicago IL Transit Authority Capital Grant Receipts Revenue | 5.000% | 6/1/22 | 3,095 | 3,325 |
| Chicago IL Transit Authority Capital Grant Receipts Revenue | 5.000% | 6/1/22 | 2,500 | 2,695 |
| 1 Chicago IL Transit Authority Sales Tax Receipts Revenue TOB VRDO | 1.700% | 11/7/18 | 45,790 | 45,790 |
| 1 Chicago IL Transit Authority Sales Tax Receipts Revenue TOB VRDO | 1.800% | 11/7/18 | 57,165 | 57,165 |
| Chicago IL Wastewater Transmission Revenue | 5.000% | 1/1/19 | 2,075 | 2,084 |
| Chicago IL Wastewater Transmission Revenue | 5.000% | 1/1/19 | 1,000 | 1,004 |
| Chicago IL Wastewater Transmission Revenue | 5.000% | 1/1/20 | 1,000 | 1,030 |
| Chicago IL Wastewater Transmission Revenue | 5.000% | 1/1/20 | 1,000 | 1,030 |
| Chicago IL Wastewater Transmission Revenue | 5.000% | 1/1/20 | 1,000 | 1,030 |
| Chicago IL Wastewater Transmission Revenue | 5.000% | 1/1/21 | 1,165 | 1,222 |
| Chicago IL Wastewater Transmission Revenue | 5.000% | 1/1/21 | 2,050 | 2,151 |
| Chicago IL Wastewater Transmission Revenue | 5.000% | 1/1/22 | 1,450 | 1,550 |
| Chicago IL Wastewater Transmission Revenue | 5.000% | 1/1/22 | 810 | 866 |
| Chicago IL Wastewater Transmission Revenue | 5.000% | 1/1/23 | 2,010 | 2,178 |
| Chicago IL Water Revenue | 5.000% | 11/1/18 | 675 | 675 |
| Chicago IL Water Revenue | 5.000% | 11/1/20 | 1,000 | 1,047 |
| 1 Chicago IL Water Revenue TOB VRDO | 1.780% | 11/7/18 | 5,250 | 5,250 |
| Chicago IL Waterworks Revenue | 5.000% | 11/1/18 | 1,155 | 1,155 |
| Chicago IL Waterworks Revenue | 4.000% | 11/1/19 | 1,430 | 1,453 |
| Chicago IL Waterworks Revenue | 5.000% | 11/1/19 | 1,620 | 1,662 |
| Chicago IL Waterworks Revenue | 5.000% | 11/1/20 | 2,500 | 2,619 |
| Chicago IL Waterworks Revenue | 5.000% | 11/1/20 | 1,700 | 1,781 |
| Chicago IL Waterworks Revenue | 5.000% | 11/1/21 | 680 | 725 |
| Chicago IL Waterworks Revenue | 5.000% | 11/1/21 | 1,325 | 1,412 |
| 1 Chicago IL Transit Authority Revenue TOB VRDO | 1.750% | 11/7/18 | 19,396 | 19,395 |
| 1 Chicago IL Transit Authority Revenue TOB VRDO | 1.850% | 11/7/18 | 3,695 | 3,695 |
| Cook County IL GO | 3.000% | 11/15/18 | 1,125 | 1,125 |
| Cook County IL GO | 5.000% | 11/15/19 | 1,000 | 1,028 |
| Cook County IL GO | 5.000% | 11/15/19 | 210 | 216 |
| Cook County IL GO | 5.000% | 11/15/20 | 500 | 527 |
| Cook County IL GO | 5.000% | 11/15/21 | 500 | 538 |
| Cook County IL GO | 5.000% | 11/15/22 | 285 | 312 |
| Cook County IL GO | 5.250% | 11/15/22 | 10,000 | 10,542 |
| 1 Cook County IL GO TOB VRDO | 1.700% | 11/7/18 LOC | 7,500 | 7,500 |
| 1 Cook IL Sales Tax Revenue TOB VRDO | 1.700% | 11/7/18 | 11,370 | 11,370 |
| Dewitt & Ford & Livingston & Logan Counties IL Community College District No. 540 GO | 4.000% | 12/1/18 | 1,620 | 1,623 |
| Dewitt & Ford & Livingston & Logan Counties IL Community College District No. 540 GO | 4.000% | 12/1/19 | 2,380 | 2,429 |
| Dewitt & Ford & Livingston & Logan Counties IL Community College District No. 540 GO | 4.000% | 12/1/20 | 2,475 | 2,557 |
| Dewitt & Ford & Livingston & Logan Counties IL Community College District No. 540 GO | 4.000% | 12/1/21 | 2,575 | 2,690 |
| Dewitt & Ford & Livingston & Logan Counties IL Community College District No. 540 GO | 4.000% | 12/1/22 | 2,680 | 2,823 |
| Illinois Educational Facilities Authority Revenue (University of Chicago) PUT | 1.650% | 2/1/19 | 20,000 | 19,976 |
| Illinois Educational Facilities Authority Revenue (University of Chicago) PUT | 1.550% | 2/13/20 | 6,250 | 6,196 |
| Illinois Educational Facilities Authority Revenue (University of Chicago) PUT | 1.800% | 2/13/20 | 500 | 497 |
| Illinois Finance Authority Revenue (Advocate Health Care Network) PUT | 5.000% | 5/1/19 | 5,500 | 5,577 |
| Illinois Finance Authority Revenue (Advocate Health Care Network) PUT | 1.900% | 5/29/19 | 5,750 | 5,750 |
17
Short-Term Tax-Exempt Fund
| | | | |
| Face | Market |
| Maturity | Amount | Value• |
| Coupon | Date | ($000) | ($000) |
| Illinois Finance Authority Revenue (Advocate Health Care Network) PUT | 5.000% | 2/12/20 | 2,450 | 2,534 |
| Illinois Finance Authority Revenue (Ascension Health Credit Group) PUT | 1.750% | 4/1/21 | 3,000 | 2,945 |
| Illinois Finance Authority Revenue (Ascension Health Credit Group) PUT | 2.250% | 4/29/22 | 7,500 | 7,403 |
| 1 Illinois Finance Authority Revenue (Ascension Health Credit Group) TOB VRDO | 1.630% | 11/7/18 | 10,360 | 10,360 |
| 1 Illinois Finance Authority Revenue (Carle Foundation) TOB VRDO | 1.720% | 11/7/18 (12) | 12,680 | 12,680 |
| 1 Illinois Finance Authority Revenue (Central DuPage Health) TOB VRDO | 1.630% | 11/7/18 | 13,125 | 13,125 |
| Illinois Finance Authority Revenue (Franciscan Communities Inc.) | 3.250% | 5/15/22 | 1,025 | 1,027 |
| Illinois Finance Authority Revenue (Illinois Wesleyan University) | 4.000% | 9/1/19 | 200 | 202 |
| Illinois Finance Authority Revenue (Illinois Wesleyan University) | 4.000% | 9/1/20 | 260 | 265 |
| Illinois Finance Authority Revenue (Northwestern Community Hospital) | 5.000% | 7/1/19 | 1,000 | 1,018 |
| Illinois Finance Authority Revenue (Northwestern Community Hospital) | 5.000% | 7/1/20 | 1,030 | 1,073 |
| Illinois Finance Authority Revenue (Northwestern Memorial Healthcare) | 5.000% | 7/15/21 | 2,600 | 2,779 |
| Illinois Finance Authority Revenue (Northwestern Memorial Healthcare) | 5.000% | 7/15/22 | 1,250 | 1,363 |
| Illinois Finance Authority Revenue (Northwestern Memorial Hospital) PUT | 5.000% | 12/15/22 | 19,500 | 21,372 |
| Illinois Finance Authority Revenue (OSF Healthcare System) | 5.000% | 5/15/20 | 700 | 729 |
| Illinois Finance Authority Revenue (OSF Healthcare System) | 5.000% | 5/15/21 | 375 | 399 |
| Illinois Finance Authority Revenue (OSF Healthcare System) | 5.000% | 5/15/22 | 875 | 947 |
| Illinois Finance Authority Revenue (OSF Healthcare System) | 5.000% | 5/15/23 | 500 | 550 |
| Illinois Finance Authority Revenue (Presbyterian Homes) | 4.000% | 11/1/18 | 550 | 550 |
| Illinois Finance Authority Revenue (Presbyterian Homes) | 4.000% | 11/1/19 | 1,000 | 1,015 |
| Illinois Finance Authority Revenue (Presbyterian Homes) | 5.000% | 11/1/20 | 1,875 | 1,960 |
| 2 Illinois Finance Authority Revenue (Presbyterian Homes) PUT | 2.929% | 5/1/21 | 2,500 | 2,509 |
| Illinois Finance Authority Revenue (Presence Health Network Obligated Group) | 5.000% | 2/15/20 | 7,575 | 7,810 |
| Illinois Finance Authority Revenue (Presence Health Network Obligated Group) | 5.000% | 2/15/21 | 3,055 | 3,239 |
| 1 Illinois Finance Authority Revenue (Presence Health Network Obligated Group) TOB VRDO | 1.630% | 11/7/18 | 3,995 | 3,995 |
| Illinois Finance Authority Revenue (Rush University Medical Center) | 5.000% | 11/15/18 | 750 | 751 |
| Illinois Finance Authority Revenue (Rush University Medical Center) | 5.000% | 11/15/19 | 500 | 514 |
| 1 Illinois Finance Authority Revenue (Rush University Medical Center) TOB VRDO | 1.700% | 11/7/18 (Prere.) | 8,570 | 8,570 |
| Illinois Finance Authority Revenue (Silver Cross & Medical Centers) | 7.000% | 8/15/19 (Prere.) | 3,000 | 3,115 |
| Illinois Finance Authority Revenue (Southern Illinois Healthcare) | 5.000% | 3/1/22 | 900 | 965 |
| Illinois Finance Authority Revenue (Swedish Covenant Hospital) | 5.000% | 8/15/19 | 500 | 509 |
| Illinois Finance Authority Revenue (Swedish Covenant Hospital) | 5.000% | 8/15/20 | 600 | 621 |
| Illinois Finance Authority Revenue (University of Chicago Medical Center) | 5.000% | 8/15/20 | 1,080 | 1,131 |
| 1 Illinois Finance Authority Revenue (University of Chicago Medical Center) TOB VRDO | 1.630% | 11/7/18 | 19,835 | 19,835 |
| Illinois Finance Authority Solid Waste Disposal Revenue (Prairie Power Inc. Project) PUT | 1.750% | 5/6/20 | 6,275 | 6,192 |
| Illinois GO | 5.000% | 11/1/18 | 243,825 | 243,825 |
| Illinois GO | 5.000% | 11/1/18 | 1,740 | 1,740 |
| Illinois GO | 5.000% | 12/1/18 | 13,100 | 13,125 |
| Illinois GO | 5.000% | 12/1/18 | 4,750 | 4,759 |
| Illinois GO | 5.000% | 1/1/19 | 700 | 703 |
| Illinois GO | 5.000% | 1/1/19 | 6,655 | 6,680 |
| Illinois GO | 4.000% | 2/1/19 | 8,050 | 8,076 |
| Illinois GO | 5.000% | 2/1/19 | 14,660 | 14,743 |
| Illinois GO | 5.000% | 2/1/19 | 1,620 | 1,629 |
| Illinois GO | 5.000% | 4/1/19 | 3,375 | 3,407 |
| Illinois GO | 5.000% | 4/1/19 | 2,500 | 2,524 |
| Illinois GO | 5.000% | 5/1/19 | 12,250 | 12,389 |
| Illinois GO | 5.000% | 6/1/19 | 3,750 | 3,799 |
| Illinois GO | 5.000% | 7/1/19 | 5,220 | 5,298 |
| Illinois GO | 5.000% | 8/1/19 | 15,000 | 15,250 |
| Illinois GO | 5.000% | 11/1/19 | 77,195 | 78,884 |
| Illinois GO | 5.250% | 1/1/20 | 1,305 | 1,337 |
| Illinois GO | 5.000% | 2/1/20 | 4,850 | 4,963 |
| Illinois GO | 5.000% | 2/1/20 | 730 | 747 |
| Illinois GO | 5.000% | 5/1/20 | 2,250 | 2,312 |
| Illinois GO | 5.000% | 8/1/20 | 1,260 | 1,299 |
| Illinois GO | 4.000% | 9/1/20 | 1,830 | 1,858 |
| Illinois GO | 5.000% | 10/1/20 | 13,785 | 14,255 |
| Illinois GO | 5.000% | 10/1/20 | 8,265 | 8,547 |
| Illinois GO | 5.000% | 11/1/20 | 61,420 | 63,591 |
| Illinois GO | 5.250% | 1/1/21 | 1,155 | 1,193 |
| Illinois GO | 5.000% | 3/1/21 | 1,000 | 1,030 |
| Illinois GO | 5.000% | 4/1/21 | 3,390 | 3,495 |
| Illinois GO | 5.000% | 7/1/21 | 8,260 | 8,536 |
| Illinois GO | 5.000% | 10/1/21 | 11,915 | 12,339 |
| Illinois GO | 5.000% | 10/1/21 | 2,060 | 2,133 |
| Illinois GO | 5.000% | 11/1/21 | 32,775 | 33,964 |
| Illinois GO | 5.000% | 1/1/22 | 100 | 102 |
| Illinois GO | 5.000% | 4/1/22 | 1,650 | 1,708 |
| Illinois GO | 5.000% | 7/1/22 | 4,385 | 4,546 |
18
Short-Term Tax-Exempt Fund
| | | | |
| Face | Market |
| Maturity | Amount | Value• |
| Coupon | Date | ($000) | ($000) |
| Illinois GO | 5.000% | 8/1/22 | 3,500 | 3,630 |
| Illinois GO | 5.000% | 10/1/22 | 13,785 | 14,310 |
| Illinois GO | 5.000% | 11/1/22 | 14,100 | 14,642 |
| Illinois GO | 5.000% | 11/1/23 | 11,000 | 11,468 |
| Illinois Regional Transportation Authority Revenue PUT | 1.880% | 11/3/18 | 29,245 | 29,245 |
| Illinois Sales Tax Revenue | 5.250% | 6/15/19 (Prere.) | 1,750 | 1,785 |
| 3 Illinois Sales Tax Revenue | 5.000% | 6/15/22 | 5,000 | 5,353 |
| 3 Illinois Sales Tax Revenue | 5.000% | 6/15/23 | 5,000 | 5,412 |
| 1 Illinois Sales Tax Revenue TOB VRDO | 1.870% | 11/7/18 (Prere.) | 4,155 | 4,155 |
| Illinois Sports Facility Authority Revenue | 0.000% | 6/15/19 (2) | 385 | 377 |
| Illinois Sports Facility Authority Revenue | 0.000% | 6/15/20 (2) | 1,475 | 1,387 |
| Illinois Toll Highway Authority Revenue | 5.000% | 12/1/19 | 1,275 | 1,314 |
| Illinois Toll Highway Authority Revenue VRDO | 1.600% | 11/7/18 | 29,850 | 29,850 |
| Illinois Toll Highway Authority Revenue VRDO | 1.620% | 11/7/18 | 98,735 | 98,735 |
| 1 Lake, Cook, Kane, & McHenry Counties IL Community Unified School District GO TOB VRDO | 1.660% | 11/7/18 | 10,360 | 10,360 |
| Metropolitan Pier & Exposition Authority Illinois Dedicated Sales Tax Revenue | | | | |
| (McCormick Place Expansion Project) | 5.000% | 12/15/20 | 3,495 | 3,644 |
| Northern Illinois Municipal Power Agency Project Revenue | 5.000% | 12/1/18 | 1,000 | 1,002 |
| Northern Illinois Municipal Power Agency Project Revenue | 5.000% | 12/1/19 | 1,340 | 1,377 |
| Northern Illinois Municipal Power Agency Project Revenue | 5.000% | 12/1/20 | 1,000 | 1,052 |
| Railsplitter Tobacco Settlement Authority Illinois Tobacco Settlement Revenue | 5.000% | 6/1/22 | 12,000 | 12,940 |
| 1 Regional Transportation Authority IL TOB VRDO | 1.640% | 11/7/18 | 11,550 | 11,550 |
| 1 Regional Transportation Authority IL TOB VRDO | 1.640% | 11/7/18 | 16,000 | 16,000 |
| 1 Regional Transportation Authority IL TOB VRDO | 1.640% | 11/7/18 | 9,000 | 9,000 |
| 1 Regional Transportation Authority IL TOB VRDO | 1.640% | 11/7/18 | 7,195 | 7,195 |
| 1 Sales Tax Securitization Corp. IL TOB VRDO | 1.770% | 11/7/18 | 8,340 | 8,340 |
| 1 Sales Tax Securitization Corp. IL TOB VRDO | 1.750% | 11/7/18 | 12,270 | 12,270 |
| Springfield IL Electric Revenue | 5.000% | 3/1/20 | 2,000 | 2,067 |
| 1 Springfield IL Water Revenue TOB VRDO | 1.810% | 11/7/18 | 4,113 | 4,113 |
| Village of Bolingbrook IL Special Tax Revenue (Will and DuPage Counties) | 4.000% | 3/1/20 | 350 | 357 |
| Village of Bolingbrook IL Special Tax Revenue (Will and DuPage Counties) | 4.000% | 3/1/22 (4) | 500 | 520 |
| Will & Kendall Counties IL Community Consolidated School District No. 202 Plainfield GO | 4.000% | 1/1/20 | 8,730 | 8,893 |
| Will & Kendall Counties IL Community Consolidated School District No. 202 Plainfield GO | 4.000% | 1/1/21 | 7,820 | 8,062 |
| | | | 1,451,316 |
| Indiana (0.8%) | | | | |
| Ball State University Housing & Dining System Indiana Revenue | 5.000% | 7/1/19 | 200 | 204 |
| Ball State University Housing & Dining System Indiana Revenue | 5.000% | 7/1/20 | 370 | 387 |
| Ball State University Student Fee Indiana Revenue | 4.000% | 7/1/19 | 1,000 | 1,013 |
| Ball State University Student Fee Indiana Revenue | 5.000% | 7/1/20 | 525 | 550 |
| Carmel IN Local Public Improvement Bond Bank Revenue | 5.000% | 1/15/19 | 750 | 755 |
| Carmel IN Local Public Improvement Bond Bank Revenue | 5.000% | 7/15/19 | 1,000 | 1,021 |
| Carmel IN Local Public Improvement Bond Bank Revenue | 5.000% | 1/15/20 | 1,000 | 1,034 |
| Carmel IN Local Public Improvement Bond Bank Revenue | 5.000% | 7/15/20 | 805 | 843 |
| Hammond IN Multi-School Building Corp. Revenue | 5.000% | 1/15/21 | 1,685 | 1,778 |
| Hammond IN Multi-School Building Corp. Revenue | 5.000% | 7/15/21 | 1,225 | 1,306 |
| Hammond IN Multi-School Building Corp. Revenue | 5.000% | 1/15/22 | 1,520 | 1,635 |
| Hammond IN Multi-School Building Corp. Revenue | 5.000% | 7/15/22 | 1,000 | 1,085 |
| Hammond IN Multi-School Building Corp. Revenue | 5.000% | 1/15/23 | 1,000 | 1,092 |
| Indiana Finance Authority Economic Development Revenue (Republic Services Inc. Project) PUT | 1.850% | 12/3/18 | 4,500 | 4,500 |
| Indiana Finance Authority Environmental Revenue (Duke Energy Indiana LLC) | 3.750% | 4/1/22 | 1,125 | 1,148 |
| Indiana Finance Authority Highway Revenue | 5.000% | 12/1/20 | 10,210 | 10,795 |
| Indiana Finance Authority Hospital Revenue (Indiana University Health Obligated Group) | 4.000% | 12/1/18 | 1,500 | 1,502 |
| Indiana Finance Authority Hospital Revenue (Parkview Health System) | 5.000% | 11/1/19 | 700 | 720 |
| Indiana Finance Authority Hospital Revenue (Parkview Health System) | 5.000% | 11/1/20 | 600 | 632 |
| Indiana Finance Authority Hospital Revenue (Parkview Health System) | 5.000% | 11/1/21 | 500 | 539 |
| Indiana Finance Authority Hospital Revenue (Parkview Health System) | 5.000% | 11/1/22 | 750 | 824 |
| 3 Indiana Finance Authority Hospital Revenue (Parkview Health Systems Obligated Group) | 5.000% | 5/1/22 | 1,300 | 1,391 |
| Indiana Finance Authority Revenue | 5.000% | 2/1/19 | 815 | 821 |
| Indiana Finance Authority Revenue | 5.000% | 2/1/19 | 3,730 | 3,759 |
| Indiana Finance Authority Revenue | 5.000% | 2/1/20 | 1,860 | 1,928 |
| Indiana Finance Authority Revenue (Community Foundation of Northwest Indiana Obligated Group) | 3.000% | 9/1/19 | 250 | 251 |
| Indiana Finance Authority Revenue (Community Foundation of Northwest Indiana Obligated Group) | 4.000% | 9/1/20 | 500 | 514 |
| Indiana Finance Authority Revenue (Franciscan Alliance Inc.) | 5.000% | 11/1/22 | 1,140 | 1,248 |
| Indiana Finance Authority Revenue (Franciscan Alliance Inc.) | 5.000% | 11/1/22 | 1,250 | 1,369 |
| Indiana Health & Educational Facility Financing Authority Revenue | | | | |
| (Ascension Health Credit Group) PUT | 1.750% | 11/2/21 | 6,845 | 6,678 |
| Indiana Health Facility Financing Authority Revenue (Ascension Health Credit Group) PUT | 2.000% | 8/1/19 | 1,110 | 1,108 |
| Indiana Health Facility Financing Authority Revenue (Ascension Health Credit Group) PUT | 1.250% | 5/1/20 | 1,850 | 1,819 |
| Indiana Health Facility Financing Authority Revenue (Ascension Health Credit Group) PUT | 1.375% | 5/1/20 (Prere.) | 55 | 54 |
19
Short-Term Tax-Exempt Fund
| | | | |
| Face | Market |
| Maturity | Amount | Value• |
| Coupon | Date | ($000) | ($000) |
| Indiana Health Facility Financing Authority Revenue (Ascension Health Credit Group) PUT | 1.375% | 5/1/20 | 2,460 | 2,423 |
| Indiana Health Facility Financing Authority Revenue (Ascension Health Credit Group) PUT | 1.500% | 5/1/20 | 3,040 | 3,000 |
| Indiana Health Facility Financing Authority Revenue (Ascension Health Credit Group) PUT | 1.500% | 5/1/20 | 3,800 | 3,750 |
| Indiana Health Facility Financing Authority Revenue (Ascension Health Credit Group) PUT | 1.350% | 8/4/20 | 6,245 | 6,127 |
| Indiana Health Facility Financing Authority Revenue (Ascension Health Credit Group) PUT | 1.350% | 8/4/20 | 4,210 | 4,130 |
| 1 Indianapolis IN Local Public Improvement Bond Bank Revenue TOB VRDO | 1.690% | 11/7/18 | 47,870 | 47,870 |
| Purdue University Indiana University COP | 5.000% | 7/1/19 | 1,000 | 1,020 |
| Richmond IN Hospital Authority Revenue (Reid Hospital & Health Care Services Inc.) | 5.000% | 1/1/19 | 1,000 | 1,005 |
| Rockport IN Pollution Control Revenue (Indiana Michigan Power Co. Project) PUT | 2.050% | 6/1/21 | 2,000 | 1,987 |
| | | | 125,615 |
| Iowa (0.4%) | | | | |
| Iowa Finance Authority Revenue | 5.000% | 8/1/19 | 6,700 | 6,851 |
| Iowa Finance Authority Revenue | 5.000% | 8/1/21 (Prere.) | 4,790 | 5,144 |
| Iowa Finance Authority Revenue | 5.000% | 8/1/22 | 1,135 | 1,190 |
| 2 Iowa Finance Authority Revenue PUT | 1.956% | 10/1/21 | 3,750 | 3,746 |
| 2 Iowa Finance Authority Single Family Mortgage Revenue PUT | 1.900% | 5/3/21 | 4,000 | 4,007 |
| 3 Iowa Financial Authority Revenue (Iowa Health System) | 5.000% | 2/15/20 | 400 | 414 |
| 3 Iowa Financial Authority Revenue (Iowa Health System) | 5.000% | 2/15/22 | 1,200 | 1,294 |
| 3 Iowa Financial Authority Revenue (Iowa Health System) | 5.000% | 2/15/24 | 1,315 | 1,462 |
| Iowa Special Obligation Revenue | 5.000% | 6/1/19 | 5,500 | 5,595 |
| Iowa Special Obligation Revenue | 5.000% | 6/1/20 | 8,000 | 8,355 |
| Iowa Special Obligation Revenue (Ijobs Program) | 5.000% | 6/1/22 | 3,465 | 3,627 |
| Polk County IA GO | 4.000% | 6/1/20 | 11,585 | 11,923 |
| Polk County IA GO | 4.000% | 6/1/21 | 12,135 | 12,661 |
| | | | 66,269 |
| Kansas (0.2%) | | | | |
| Hutchison KS Hospital Facilities Revenue (Hutchinson Regional Medical Center Inc.) | 4.000% | 12/1/18 | 250 | 250 |
| Hutchison KS Hospital Facilities Revenue (Hutchinson Regional Medical Center Inc.) | 4.000% | 12/1/19 | 250 | 252 |
| Hutchison KS Hospital Facilities Revenue (Hutchinson Regional Medical Center Inc.) | 4.000% | 12/1/20 | 350 | 355 |
| Hutchison KS Hospital Facilities Revenue (Hutchinson Regional Medical Center Inc.) | 4.000% | 12/1/21 | 500 | 510 |
| Johnson County KS Unified School District No. 233 GO | 5.000% | 9/1/20 | 1,330 | 1,398 |
| 2 Kansas Department of Transportation Highway Revenue | 1.912% | 9/1/19 | 4,250 | 4,256 |
| 2 Kansas Department of Transportation Highway Revenue | 1.879% | 9/1/21 | 7,580 | 7,567 |
| Kansas Development Finance Authority Revenue | 5.000% | 5/1/20 | 1,340 | 1,395 |
| Kansas Development Finance Authority Revenue (University of Kansas Projects) | 5.000% | 5/1/19 | 2,985 | 3,030 |
| Kansas Development Finance Authority Revenue (University of Kansas Projects) | 5.000% | 5/1/20 | 3,130 | 3,263 |
| Kansas Development Finance Authority Revenue (University of Kansas Projects) | 5.000% | 5/1/21 | 1,160 | 1,238 |
| Lawrence KS Hospital Revenue (Lawrence Memorial Hospital) | 5.000% | 7/1/22 | 535 | 583 |
| Lawrence KS Hospital Revenue (Lawrence Memorial Hospital) | 5.000% | 7/1/23 | 600 | 663 |
| Wyandotte County/Kansas City KS Unified Government Utility System Revenue | 5.000% | 9/1/19 | 500 | 512 |
| | | | 25,272 |
| Kentucky (0.9%) | | | | |
| Ashland KY Medical Center Revenue (King’s Daughters Medical Center Project) | 4.000% | 2/1/19 | 1,125 | 1,128 |
| Ashland KY Medical Center Revenue (King’s Daughters Medical Center Project) | 4.000% | 2/1/20 | 400 | 405 |
| Carroll County KY Pollution Control Revenue (Kentucky Utilities Co. Project) PUT | 1.050% | 9/1/19 | 10,375 | 10,270 |
| Kentucky Bond Development Corp. Hospital Facilities Revenue (St. Elizabeth Medical Center, Inc.) | 5.000% | 5/1/19 | 2,665 | 2,702 |
| Kentucky Bond Development Corp. Hospital Facilities Revenue (St. Elizabeth Medical Center, Inc.) | 5.000% | 5/1/20 | 1,025 | 1,068 |
| Kentucky Bond Development Corp. Revenue (Lexington Center Corporation Project) | 5.000% | 9/1/23 | 520 | 574 |
| Kentucky Bond Development Corp. Transient Room Tax Revenue | | | | |
| (Lexington Center Corporation Project) | 5.000% | 9/1/23 | 705 | 778 |
| Kentucky Economic Development Finance Authority Solid Waste Revenue | | | | |
| (Republic Services Inc. Project) PUT | 1.850% | 12/3/18 | 4,000 | 4,000 |
| Kentucky Property & Building Commission Revenue | 5.000% | 8/1/19 | 13,270 | 13,542 |
| Kentucky Property & Building Commission Revenue | 5.000% | 8/1/19 | 2,550 | 2,602 |
| Kentucky Property & Building Commission Revenue | 5.000% | 8/1/20 | 10,985 | 11,472 |
| Kentucky Property & Building Commission Revenue | 5.000% | 8/1/20 | 2,600 | 2,715 |
| Kentucky Public Energy Authority Gas Supply Revenue | 4.000% | 1/1/20 | 500 | 509 |
| Kentucky Public Energy Authority Gas Supply Revenue | 4.000% | 7/1/20 | 3,500 | 3,590 |
| Kentucky Public Energy Authority Gas Supply Revenue | 4.000% | 1/1/21 | 1,285 | 1,325 |
| Kentucky Public Energy Authority Gas Supply Revenue | 4.000% | 7/1/21 | 3,650 | 3,786 |
| Kentucky Public Energy Authority Gas Supply Revenue | 4.000% | 1/1/22 | 1,535 | 1,598 |
| Kentucky Public Energy Authority Gas Supply Revenue | 4.000% | 7/1/22 | 6,290 | 6,578 |
| Kentucky Public Energy Authority Gas Supply Revenue | 4.000% | 1/1/23 | 1,640 | 1,719 |
| Kentucky Public Energy Authority Gas Supply Revenue | 4.000% | 7/1/23 | 5,000 | 5,256 |
| Kentucky Public Energy Authority Gas Supply Revenue PUT | 4.000% | 4/1/24 | 19,175 | 19,941 |
| Kentucky Public Energy Authority Gas Supply Revenue PUT | 4.000% | 1/1/25 | 10,000 | 10,501 |
| 1 Kentucky Turnpike Authority Economic Development Road Revenue | | | | |
| (Revitalization Project) TOB VRDO | 1.620% | 11/7/18 | 6,380 | 6,380 |
20
Short-Term Tax-Exempt Fund
| | | | |
| Face | Market |
| Maturity | Amount | Value• |
| Coupon | Date | ($000) | ($000) |
| Louisville & Jefferson County KY Metropolitan Government Environmental Facilities Revenue | | | | |
| (Louisville Gas & Electric Co. Project) PUT | 1.500% | 4/1/19 | 6,600 | 6,579 |
| Louisville & Jefferson County KY Metropolitan Government Revenue (Catholic Health Initiatives) | 5.000% | 12/1/18 | 1,750 | 1,754 |
| 3 Louisville & Jefferson County KY Metropolitan Sewer & Drain System Revenue | 4.000% | 11/1/19 | 17,810 | 18,138 |
| | | | 138,910 |
| Louisiana (0.4%) | | | | |
| 1 Franciscan Missionaries of Our Lady Health System Louisiana Obligated Group TOB VRDO | 1.800% | 11/7/18 | 9,475 | 9,475 |
| Lafayette LA Communications System Revenue | 5.000% | 11/1/18 (4) | 1,620 | 1,620 |
| Lafayette LA Communications System Revenue | 5.000% | 11/1/19 (4) | 2,500 | 2,569 |
| Louisiana Citizens Property Insurance Corp. Assessment Revenue | 5.000% | 6/1/19 | 10,645 | 10,821 |
| Louisiana Local Government Environmental Facilities & Community Development | | | | |
| Authority Revenue | 5.000% | 10/1/20 (15) | 1,665 | 1,749 |
| Louisiana Local Government Environmental Facilities & Community Development | | | | |
| Authority Revenue | 5.000% | 10/1/21 (15) | 1,925 | 2,058 |
| Louisiana Local Government Environmental Facilities & Community Development | | | | |
| Authority Revenue | 5.000% | 10/1/21 (15) | 1,045 | 1,117 |
| Louisiana Local Government Environmental Facilities & Community Development | | | | |
| Authority Revenue | 5.000% | 10/1/22 (15) | 2,275 | 2,481 |
| Louisiana Local Government Environmental Facilities & Community Development | | | | |
| Authority Revenue | 5.000% | 10/1/22 (15) | 2,145 | 2,344 |
| Louisiana Offshore Terminal Authority Deep Water Port Revenue (LOOP LLC Project) PUT | 2.000% | 10/1/22 | 2,500 | 2,438 |
| 1 Louisiana Public Facilities Authority Hospital Revenue (Franciscan Missionaries of | | | | |
| Our Lady Health System Project) TOB VRDO | 1.720% | 11/7/18 (4) | 5,000 | 5,000 |
| Louisiana Public Facilities Authority Revenue (Christus Health) | 5.000% | 7/1/21 | 360 | 384 |
| Louisiana Public Facilities Authority Revenue (Christus Health) | 5.000% | 7/1/22 | 285 | 309 |
| Louisiana Public Facilities Authority Revenue (Christus Health) | 5.000% | 7/1/23 | 385 | 423 |
| Louisiana Public Facilities Authority Revenue (Christus Health) PUT | 5.000% | 6/1/23 | 2,835 | 3,108 |
| Louisiana Public Facilities Authority Revenue (Ochsner Clinic Foundation Project) | 4.000% | 5/15/19 | 300 | 303 |
| New Orleans LA GO | 4.000% | 12/1/18 | 700 | 701 |
| New Orleans LA GO | 4.000% | 12/1/19 | 775 | 790 |
| New Orleans LA Water Revenue | 5.000% | 12/1/18 | 500 | 501 |
| Shreveport LA GO | 3.000% | 8/1/22 (15) | 1,750 | 1,787 |
| Shreveport LA Water & Sewer Revenue | 5.000% | 12/1/22 (15) | 550 | 602 |
| St. James Parish LA Revenue (Nustar Logistics LP Project) VRDO | 1.640% | 11/7/18 LOC | 16,600 | 16,600 |
| Tobacco Settlement Financing Corp. Louisiana Revenue | 5.000% | 5/15/19 | 2,765 | 2,808 |
| | | | 69,988 |
| Maine (0.1%) | | | | |
| Maine GO | 4.250% | 6/1/19 | 1,015 | 1,028 |
| Maine GO | 5.000% | 6/1/21 | 1,250 | 1,338 |
| 1 Maine Health & Higher Educational Facilities Authority Revenue (Bowdoin College) TOB VRDO | 1.640% | 11/7/18 | 6,665 | 6,665 |
| | | | 9,031 |
| Maryland (4.4%) | | | | |
| Anne Arundel County MD GO | 3.000% | 10/1/20 | 4,185 | 4,256 |
| Anne Arundel County MD GO | 5.000% | 10/1/20 | 6,210 | 6,547 |
| Anne Arundel County MD GO | 4.000% | 10/1/21 | 4,140 | 4,346 |
| Anne Arundel County MD GO | 5.000% | 10/1/21 | 6,085 | 6,567 |
| Anne Arundel County MD GO | 5.000% | 10/1/22 | 4,880 | 5,378 |
| Anne Arundel County MD GO | 5.000% | 10/1/22 | 2,120 | 2,336 |
| Baltimore County MD BAN | 4.000% | 3/18/19 | 112,980 | 113,894 |
| Baltimore County MD GO | 5.000% | 2/1/19 | 2,800 | 2,821 |
| Baltimore County MD GO | 5.000% | 2/1/20 | 1,050 | 1,088 |
| Baltimore County MD GO | 5.000% | 11/1/20 | 1,685 | 1,780 |
| Baltimore County MD GO | 5.000% | 3/1/21 | 3,500 | 3,728 |
| Baltimore County MD GO | 5.000% | 3/1/21 | 5,300 | 5,645 |
| Baltimore County MD GO | 5.000% | 8/1/21 | 2,800 | 3,012 |
| Baltimore MD Consolidated Public Improvement GO | 5.000% | 2/1/20 | 1,100 | 1,140 |
| Baltimore MD Consolidated Public Improvement GO | 4.000% | 8/1/20 | 4,730 | 4,883 |
| Baltimore MD Consolidated Public Improvement GO | 5.000% | 8/1/20 | 3,795 | 3,983 |
| 1 Baltimore MD GO TOB VRDO | 1.640% | 11/7/18 | 3,975 | 3,975 |
| Frederick County MD GO | 5.000% | 8/1/20 | 2,145 | 2,252 |
| Frederick County MD GO | 5.000% | 2/1/21 | 2,000 | 2,126 |
| Gaithersburg MD Economic Development Revenue (Asbury Maryland Obligated Group) | 4.000% | 1/1/23 | 875 | 911 |
| Gaithersburg MD Economic Development Revenue (Asbury Maryland Obligated Group) | 4.000% | 1/1/24 | 1,500 | 1,565 |
| Harford County MD Public Improvement GO | 5.000% | 2/1/19 | 6,980 | 7,034 |
| Maryland Department of Transportation Revenue | 5.000% | 12/15/18 | 16,020 | 16,079 |
| Maryland Department of Transportation Revenue | 4.000% | 5/15/20 | 2,355 | 2,423 |
| Maryland Department of Transportation Revenue | 4.000% | 9/1/21 | 20,665 | 21,674 |
| Maryland Department of Transportation Revenue | 5.000% | 9/1/21 | 13,990 | 15,055 |
| Maryland Department of Transportation Revenue | 5.000% | 6/1/24 | 9,320 | 10,352 |
21
Short-Term Tax-Exempt Fund
| | | | |
| Face | Market |
| Maturity | Amount | Value• |
| Coupon | Date | ($000) | ($000) |
| Maryland Economic Development Corp. Revenue (Constellation Energy Group, Inc. Project) PUT | 2.550% | 6/1/20 | 8,900 | 8,859 |
| Maryland Economic Development Corp. Revenue (Transportation Facilities Project) | 4.000% | 6/1/19 | 1,205 | 1,217 |
| Maryland Economic Development Corp. Revenue (Transportation Facilities Project) | 4.000% | 6/1/20 | 1,490 | 1,525 |
| Maryland Economic Development Corp. Revenue (Transportation Facilities Project) | 5.000% | 6/1/22 | 1,750 | 1,878 |
| Maryland Economic Development Corp. Student Housing Revenue | | | | |
| (University of Maryland College Park) | 4.000% | 6/1/19 (4) | 675 | 682 |
| Maryland GO | 5.000% | 3/1/19 | 10,000 | 10,104 |
| Maryland GO | 5.000% | 3/15/19 | 1,090 | 1,103 |
| Maryland GO | 4.500% | 8/1/19 | 1,400 | 1,427 |
| Maryland GO | 5.000% | 8/1/19 | 5,060 | 5,175 |
| Maryland GO | 5.000% | 3/1/20 | 14,640 | 15,206 |
| Maryland GO | 5.000% | 3/1/20 | 12,450 | 12,931 |
| Maryland GO | 5.000% | 6/1/20 | 22,910 | 23,948 |
| Maryland GO | 5.000% | 8/1/20 | 2,135 | 2,241 |
| Maryland GO | 5.250% | 8/1/20 | 29,620 | 31,217 |
| Maryland GO | 5.000% | 6/1/21 | 12,000 | 12,854 |
| Maryland GO | 5.000% | 8/1/21 | 15,000 | 16,126 |
| Maryland GO | 5.000% | 8/1/21 | 46,385 | 49,866 |
| Maryland GO | 5.000% | 8/1/21 | 20,000 | 21,501 |
| Maryland Health & Higher Educational Facilities Authority Revenue | | | | |
| (Adventist Healthcare Obligated Group) | 5.000% | 1/1/20 | 750 | 770 |
| Maryland Health & Higher Educational Facilities Authority Revenue | | | | |
| (Adventist Healthcare Obligated Group) | 5.000% | 1/1/21 | 1,000 | 1,048 |
| Maryland Health & Higher Educational Facilities Authority Revenue (Broadmead Inc.) | 2.875% | 7/1/23 | 875 | 872 |
| Maryland Health & Higher Educational Facilities Authority Revenue (MedStar Health, Inc.) | 5.000% | 8/15/19 | 2,615 | 2,672 |
| 1 Maryland Health & Higher Educational Facilities Authority Revenue (MedStar Health, Inc.) | | | | |
| TOB VRDO | 1.650% | 11/7/18 LOC | 24,300 | 24,300 |
| Maryland Health & Higher Educational Facilities Authority Revenue (Meritus Medical Center, Inc.) | 5.000% | 7/1/19 | 900 | 915 |
| Maryland Health & Higher Educational Facilities Authority Revenue | | | | |
| (University of Maryland Medical System) | 5.000% | 7/1/20 | 785 | 821 |
| Maryland Health & Higher Educational Facilities Authority Revenue | | | | |
| (University of Maryland Medical System) | 4.000% | 7/1/21 | 1,380 | 1,444 |
| Maryland Water Quality Financing Administration Bay Restoration Revolving Loan Fund Revenue | 5.000% | 3/1/19 | 10,570 | 10,677 |
| Montgomery County MD GO | 5.000% | 7/1/19 (Prere.) | 9,000 | 9,185 |
| Montgomery County MD GO | 5.000% | 7/1/19 | 5,010 | 5,111 |
| Montgomery County MD GO | 5.000% | 8/1/19 | 1,570 | 1,605 |
| Montgomery County MD GO | 5.000% | 10/1/19 | 4,215 | 4,330 |
| Montgomery County MD GO | 5.000% | 12/1/19 | 15,800 | 16,307 |
| Montgomery County MD GO | 5.000% | 11/1/20 | 5,900 | 6,234 |
| Montgomery County MD GO | 5.000% | 12/1/20 | 16,380 | 17,338 |
| Montgomery County MD GO | 5.000% | 6/1/21 | 5,000 | 5,358 |
| Montgomery County MD GO | 5.000% | 7/1/21 | 1,000 | 1,074 |
| Montgomery County MD GO | 5.000% | 11/1/21 | 9,625 | 10,423 |
| Montgomery County MD GO | 5.000% | 12/1/21 | 12,970 | 14,074 |
| Prince George’s County MD GO | 4.000% | 7/15/21 | 4,210 | 4,412 |
| Prince George’s County MD GO | 5.000% | 8/1/19 | 5,075 | 5,190 |
| Prince George’s County MD GO | 5.000% | 9/15/19 | 4,780 | 4,906 |
| Prince George’s County MD GO | 5.000% | 3/1/20 | 2,200 | 2,285 |
| Prince George’s County MD GO | 5.000% | 9/15/20 | 1,720 | 1,812 |
| Prince George’s County MD GO | 5.000% | 9/15/20 | 12,385 | 13,044 |
| Prince George’s County MD GO | 5.000% | 7/15/21 | 9,500 | 10,207 |
| Rockville MD Mayor & Council Economic Development Revenue (Ingleside at King Farm Project) | 5.000% | 11/1/18 | 140 | 140 |
| Rockville MD Mayor & Council Economic Development Revenue (Ingleside at King Farm Project) | 5.000% | 11/1/19 | 400 | 409 |
| Rockville MD Mayor & Council Economic Development Revenue (Ingleside at King Farm Project) | 5.000% | 11/1/20 | 200 | 208 |
| Rockville MD Mayor & Council Economic Development Revenue (Ingleside at King Farm Project) | 5.000% | 11/1/21 | 500 | 526 |
| Rockville MD Mayor & Council Economic Development Revenue (Ingleside at King Farm Project) | 5.000% | 11/1/22 | 300 | 319 |
| University of Maryland Auxiliary Facility & Tuition Revenue | 5.000% | 4/1/19 | 4,995 | 5,058 |
| University of Maryland Auxiliary Facility & Tuition Revenue | 5.000% | 4/1/20 | 4,040 | 4,205 |
| University of Maryland Auxiliary Facility & Tuition Revenue | 5.000% | 4/1/21 | 3,815 | 4,068 |
| Washington MD Suburban Sanitary Commission GO | 5.000% | 6/1/19 | 4,285 | 4,362 |
| Washington MD Suburban Sanitary Commission GO | 4.000% | 6/1/20 | 12,870 | 13,250 |
| Washington MD Suburban Sanitary Commission GO | 5.000% | 6/15/21 | 7,250 | 7,777 |
| Washington MD Suburban Sanitary Commission GO | 4.000% | 6/1/22 | 2,975 | 3,155 |
| Washington Suburban Sanitation District Maryland GO | 5.000% | 6/1/19 | 7,260 | 7,390 |
| Washington Suburban Sanitation District Maryland GO | 5.000% | 6/1/19 | 7,585 | 7,720 |
| Washington Suburban Sanitation District Maryland GO | 5.000% | 6/1/20 | 4,820 | 5,037 |
| Washington Suburban Sanitation District Maryland GO | 5.000% | 6/1/20 | 2,550 | 2,665 |
| Westminster MD Educational Facilities Revenue (McDaniel College Inc.) | 5.000% | 11/1/19 | 1,640 | 1,680 |
| Westminster MD Educational Facilities Revenue (McDaniel College Inc.) | 5.000% | 11/1/20 | 1,735 | 1,812 |
| | | | 718,905 |
22
Short-Term Tax-Exempt Fund
| | | | | |
| Face | Market |
| Maturity | Amount | Value• |
| | Coupon | Date | ($000) | ($000) |
| Massachusetts (3.1%) | | | | |
| Boston MA GO | 5.000% | 4/1/20 | 1,940 | 2,020 |
| Massachusetts Bay Transportation Authority General Transportation Revenue VRDO | 1.560% | 11/7/18 | 31,950 | 31,950 |
| Massachusetts Bay Transportation Authority Sales Tax Revenue | 5.000% | 7/1/19 | 4,500 | 4,590 |
| Massachusetts Bay Transportation Authority Sales Tax Revenue PUT | 1.900% | 5/29/19 | 29,195 | 29,195 |
| Massachusetts Clean Water Trust Revenue | 5.000% | 2/1/19 | 3,305 | 3,330 |
| Massachusetts Development Finance Agency Revenue (Boston Medical Center) | 5.000% | 7/1/21 | 1,430 | 1,512 |
| 1 | Massachusetts Development Finance Agency Revenue (Boston University) TOB VRDO | 1.800% | 11/7/18 | 6,665 | 6,665 |
| Massachusetts Development Finance Agency Revenue (CareGroup Inc.) | 5.000% | 7/1/19 | 2,050 | 2,086 |
| Massachusetts Development Finance Agency Revenue (CareGroup Inc.) | 5.000% | 7/1/20 | 1,255 | 1,307 |
| Massachusetts Development Finance Agency Revenue (CareGroup Inc.) | 5.000% | 7/1/21 | 500 | 530 |
| Massachusetts Development Finance Agency Revenue (CareGroup Inc.) | 5.000% | 7/1/22 | 765 | 825 |
| Massachusetts Development Finance Agency Revenue (CareGroup Inc.) | 5.000% | 7/1/22 | 2,740 | 2,954 |
| Massachusetts Development Finance Agency Revenue (CareGroup Inc.) | 5.000% | 7/1/23 | 500 | 546 |
| Massachusetts Development Finance Agency Revenue (Commonwealth Contract Assistance) | 5.500% | 2/1/20 (Prere.) | 5,000 | 5,211 |
| Massachusetts Development Finance Agency Revenue (Harvard University) | 4.000% | 7/15/20 | 2,500 | 2,582 |
| Massachusetts Development Finance Agency Revenue (Harvard University) | 5.000% | 7/15/20 | 5,000 | 5,247 |
| Massachusetts Development Finance Agency Revenue (Harvard University) | 5.000% | 10/15/20 | 1,610 | 1,701 |
| Massachusetts Development Finance Agency Revenue (Harvard University) | 5.000% | 7/15/21 | 4,200 | 4,521 |
| Massachusetts Development Finance Agency Revenue | | | | |
| | (Lawrence General Hospital Obligated Group) | 5.000% | 7/1/19 | 450 | 457 |
| Massachusetts Development Finance Agency Revenue | | | | |
| | (Lawrence General Hospital Obligated Group) | 5.000% | 7/1/22 | 1,290 | 1,373 |
| 3 | Massachusetts Development Finance Agency Revenue (Linden Ponds Inc.) | 4.000% | 11/15/23 | 1,335 | 1,335 |
| Massachusetts Development Finance Agency Revenue (NewBridge Charles Inc.) | 3.000% | 10/1/19 | 620 | 621 |
| Massachusetts Development Finance Agency Revenue (NewBridge Charles Inc.) | 3.000% | 10/1/20 | 425 | 424 |
| Massachusetts Development Finance Agency Revenue (NewBridge Charles Inc.) | 3.000% | 10/1/21 | 665 | 659 |
| Massachusetts Development Finance Agency Revenue (Partners Healthcare) | 5.000% | 7/1/19 | 750 | 765 |
| Massachusetts Development Finance Agency Revenue (Partners Healthcare) | 5.000% | 7/1/20 | 400 | 418 |
| Massachusetts Development Finance Agency Revenue (Partners Healthcare) | 5.000% | 7/1/21 | 2,000 | 2,142 |
| Massachusetts Development Finance Agency Revenue (Partners Healthcare) | 5.000% | 7/1/22 | 1,565 | 1,710 |
| 2 | Massachusetts Development Finance Agency Revenue (Partners Healthcare) PUT | 2.080% | 1/29/20 | 5,750 | 5,755 |
| Massachusetts Development Finance Agency Revenue (South Shore Hospital Inc.) | 4.000% | 7/1/19 | 800 | 808 |
| Massachusetts Development Finance Agency Revenue (South Shore Hospital Inc.) | 4.000% | 7/1/20 | 750 | 768 |
| Massachusetts Development Finance Agency Revenue (Suffolk University) | 5.000% | 7/1/20 | 500 | 519 |
| Massachusetts Development Finance Agency Revenue (Suffolk University) | 5.000% | 7/1/21 | 750 | 793 |
| Massachusetts Development Finance Agency Revenue (Suffolk University) | 5.000% | 7/1/22 | 440 | 473 |
| Massachusetts Development Finance Agency Revenue (UMass Memorial Medical Center) | 5.000% | 7/1/20 | 1,435 | 1,493 |
| Massachusetts Development Finance Agency Revenue (Williams College) PUT | 1.450% | 7/1/21 | 5,900 | 5,768 |
| Massachusetts Development Finance Agency Solid Waste Disposal Revenue | | | | |
| | (Dominion Energy Brayton Point Issue) PUT | 5.750% | 5/1/19 (Prere.) | 3,460 | 3,527 |
| 2 | Massachusetts GO | 2.070% | 2/1/19 | 865 | 865 |
| 1,2 Massachusetts GO | 2.150% | 2/1/19 | 62,500 | 62,504 |
| Massachusetts GO | 4.000% | 5/23/19 | 20,000 | 20,231 |
| Massachusetts GO | 4.000% | 6/20/19 | 20,000 | 20,261 |
| Massachusetts GO | 5.500% | 12/1/19 (14) | 1,940 | 2,013 |
| 2 | Massachusetts GO | 2.200% | 2/1/20 | 1,500 | 1,503 |
| Massachusetts GO | 5.000% | 3/1/20 | 7,540 | 7,831 |
| Massachusetts GO | 5.000% | 7/1/21 | 15,505 | 16,647 |
| Massachusetts GO | 5.000% | 7/1/21 | 2,845 | 3,055 |
| Massachusetts GO | 5.000% | 8/1/21 | 5,000 | 5,378 |
| Massachusetts GO | 5.250% | 8/1/21 | 3,565 | 3,858 |
| Massachusetts GO | 5.250% | 8/1/21 | 6,395 | 6,921 |
| Massachusetts GO | 5.000% | 11/1/21 | 39,980 | 43,234 |
| Massachusetts GO | 5.000% | 1/1/22 | 7,490 | 8,130 |
| Massachusetts GO | 5.000% | 7/1/22 | 4,800 | 5,265 |
| Massachusetts GO PUT | 1.050% | 7/1/20 | 31,500 | 30,851 |
| Massachusetts GO PUT | 1.700% | 8/1/22 | 23,250 | 22,596 |
| Massachusetts Health & Educational Facilities Authority Revenue (Museum of Fine Arts) VRDO | 1.680% | 11/1/18 | 20,300 | 20,300 |
| Massachusetts Health & Educational Facilities Authority Revenue (Partners Healthcare System) | 2.030% | 11/7/18 (4) | 13,110 | 13,110 |
| Massachusetts Health & Educational Facilities Authority Revenue (Partners Healthcare System) | 1.790% | 11/2/18 (4) | 3,550 | 3,550 |
| Massachusetts Health & Educational Facilities Authority Revenue | | | | |
| | (UMass Memorial Medical Center) | 5.000% | 7/1/20 | 1,500 | 1,561 |
| Massachusetts Housing Finance Agency Revenue | 1.850% | 6/1/20 | 2,750 | 2,730 |
| Massachusetts Housing Finance Agency Revenue | 2.050% | 12/1/21 | 12,500 | 12,374 |
| Massachusetts Housing Finance Agency Single Family Housing Revenue PUT | 1.500% | 7/1/20 | 5,805 | 5,717 |
| 2 | Massachusetts Housing Finance Agency Single Family Housing Revenue PUT | 1.959% | 9/1/21 | 3,750 | 3,746 |
| Massachusetts School Building Authority Dedicated Sales Tax Revenue | 5.000% | 5/15/19 (ETM) | 775 | 788 |
| Massachusetts School Building Authority Dedicated Sales Tax Revenue | 5.000% | 5/15/19 | 225 | 229 |
| Massachusetts School Building Authority Dedicated Sales Tax Revenue | 5.000% | 8/15/21 | 9,795 | 10,546 |
23
Short-Term Tax-Exempt Fund
| | | | |
| Face | Market |
| Maturity | Amount | Value• |
| Coupon | Date | ($000) | ($000) |
| Massachusetts School Building Authority Dedicated Sales Tax Revenue | 5.000% | 10/15/22 | 5,000 | 5,389 |
| Massachusetts Water Pollution Abatement Trust Revenue | 5.250% | 8/1/19 | 1,000 | 1,025 |
| Massachusetts Water Resources Authority Revenue | 5.000% | 8/1/24 | 9,300 | 9,975 |
| University of Massachusetts Building Authority Revenue PUT | 1.900% | 5/30/19 | 9,185 | 9,185 |
| | | | 497,948 |
| Michigan (1.7%) | | | | |
| Detroit MI City School District GO | 5.000% | 5/1/23 | 2,115 | 2,280 |
| 1 Detroit MI City School District GO TOB VRDO | 1.780% | 11/7/18 (18) | 10,245 | 10,245 |
| 1 Detroit MI City School District GO TOB VRDO | 2.300% | 11/7/18 (18) | 17,845 | 17,845 |
| Downriver Utility Wastewater Authority Michigan Revenue | 5.000% | 4/1/21 (4) | 315 | 334 |
| Downriver Utility Wastewater Authority Michigan Revenue | 5.000% | 4/1/22 (4) | 400 | 431 |
| Downriver Utility Wastewater Authority Michigan Revenue | 5.000% | 4/1/23 (4) | 1,060 | 1,159 |
| East Lansing MI School District GO | 5.000% | 5/1/19 | 450 | 457 |
| Eastern Michigan University Revenue | 5.000% | 3/1/20 (15) | 1,200 | 1,243 |
| 1 Great Lakes MI Water Authority Sewer Disposal System Revenue TOB VRDO | 1.800% | 11/7/18 (4) | 6,235 | 6,235 |
| Great Lakes MI Water Authority Water Supply System Revenue | 5.000% | 7/1/22 | 7,785 | 8,482 |
| Karegnondi Water Authority Michigan Water Supply System Revenue (Karegnondi Water Pipeline) | 5.000% | 11/1/20 | 250 | 262 |
| Karegnondi Water Authority Michigan Water Supply System Revenue (Karegnondi Water Pipeline) | 5.000% | 11/1/21 | 250 | 268 |
| Kent Hospital Finance Authority Michigan Revenue (Spectrum Health System) | 5.000% | 11/15/18 | 1,515 | 1,517 |
| Lansing MI School District GO | 5.000% | 5/1/19 | 765 | 777 |
| Lincoln MI Consolidated School District GO | 5.000% | 5/1/19 (4) | 1,100 | 1,116 |
| Lincoln MI Consolidated School District GO | 5.000% | 5/1/20 (4) | 1,025 | 1,068 |
| Marysville MI Public Schools District GO | 4.000% | 5/1/19 | 1,425 | 1,439 |
| Michigan Building Authority Revenue | 5.000% | 4/15/19 | 8,300 | 8,413 |
| Michigan Building Authority Revenue | 5.000% | 10/15/21 | 1,350 | 1,455 |
| Michigan Finance Authority Revenue | 5.000% | 4/1/19 | 23,435 | 23,690 |
| Michigan Finance Authority Revenue | 5.000% | 4/1/20 | 5,300 | 5,480 |
| Michigan Finance Authority Revenue | 5.000% | 4/1/21 | 8,100 | 8,538 |
| Michigan Finance Authority Revenue (Beaumont Health Obligated Group) | 4.000% | 8/1/19 | 3,035 | 3,076 |
| Michigan Finance Authority Revenue (Beaumont Health Obligated Group) | 4.000% | 8/1/20 | 1,310 | 1,348 |
| 1 Michigan Finance Authority Revenue (Beaumont Health Obligated Group) TOB VRDO | 1.800% | 11/7/18 | 6,060 | 6,060 |
| Michigan Finance Authority Revenue (Detroit Water & Sewer) | 5.000% | 7/1/19 (14) | 3,500 | 3,566 |
| Michigan Finance Authority Revenue (Detroit Water & Sewer) | 5.000% | 7/1/19 (14) | 2,855 | 2,909 |
| Michigan Finance Authority Revenue (Detroit Water & Sewer) | 5.000% | 7/1/19 | 800 | 815 |
| Michigan Finance Authority Revenue (Detroit Water & Sewer) | 5.000% | 7/1/20 (4) | 7,000 | 7,300 |
| Michigan Finance Authority Revenue (Detroit Water & Sewer) | 5.000% | 7/1/20 | 300 | 313 |
| Michigan Finance Authority Revenue (Great Lakes Water Authority Water Supply System) | 5.000% | 7/1/21 (14) | 1,000 | 1,065 |
| 2 Michigan Finance Authority Revenue (McLaren Health Care Corp.) PUT | 1.951% | 10/15/21 | 15,625 | 15,586 |
| Michigan Finance Authority Revenue (Sparrow Obligated Group) | 4.000% | 11/15/18 | 750 | 751 |
| Michigan Finance Authority Revenue (Trinity Health Credit Group) | 5.000% | 12/1/18 | 250 | 251 |
| Michigan Finance Authority Revenue (Trinity Health Credit Group) | 5.000% | 12/1/19 | 545 | 562 |
| Michigan Finance Authority Revenue (Trinity Health Credit Group) | 5.000% | 12/1/22 | 1,750 | 1,922 |
| Michigan Finance Authority Revenue (Unemployment Obligation Assessment) | 5.000% | 1/1/19 | 22,000 | 22,110 |
| Michigan Finance Authority Revenue (Unemployment Obligation Assessment) | 5.000% | 1/1/20 | 6,335 | 6,460 |
| Michigan Finance Authority Revenue (Unemployment Obligation Assessment) | 5.000% | 7/1/20 | 4,185 | 4,268 |
| Michigan Hospital Finance Authority Revenue (Ascension Health Credit Group) PUT | 1.625% | 11/1/19 | 11,385 | 11,309 |
| Michigan Hospital Finance Authority Revenue (Ascension Health Credit Group) PUT | 1.950% | 4/1/20 | 6,250 | 6,213 |
| Michigan Hospital Finance Authority Revenue (Ascension Health Credit Group) PUT | 1.375% | 5/1/20 | 1,385 | 1,364 |
| Michigan Hospital Finance Authority Revenue (Ascension Health Credit Group) PUT | 1.500% | 5/1/20 | 2,645 | 2,610 |
| Michigan Hospital Finance Authority Revenue (Ascension Health Credit Group) PUT | 1.900% | 4/1/21 | 14,750 | 14,530 |
| Michigan Hospital Finance Authority Revenue (Ascension Health Credit Group) PUT | 2.400% | 3/15/23 | 3,535 | 3,486 |
| Michigan Hospital Finance Authority Revenue (Ascension Health Credit Group) PUT | 4.000% | 6/1/23 | 10,500 | 11,112 |
| Michigan Hospital Finance Authority Revenue (Ascension Health Credit Group) PUT | 4.000% | 7/1/24 | 7,500 | 7,997 |
| Michigan Hospital Finance Authority Revenue (Trinity Health Credit Group) | 5.000% | 12/1/18 | 600 | 601 |
| Michigan Hospital Finance Authority Revenue (Trinity Health Credit Group) | 5.000% | 12/1/19 | 1,100 | 1,134 |
| Michigan Hospital Finance Authority Revenue (Trinity Health Credit Group) | 5.000% | 12/1/20 | 1,165 | 1,230 |
| Michigan Housing Development Authority Revenue | 1.450% | 4/1/20 | 3,750 | 3,711 |
| 3 Milan MI Area Schools GO | 5.000% | 5/1/20 | 765 | 789 |
| 3 Milan MI Area Schools GO | 5.000% | 5/1/22 | 500 | 536 |
| Portage MI Public Schools GO | 5.000% | 11/1/18 | 1,180 | 1,180 |
| Portage MI Public Schools GO | 5.000% | 5/1/19 | 550 | 558 |
| Portage MI Public Schools GO | 5.000% | 11/1/19 | 1,465 | 1,509 |
| Portage MI Public Schools GO | 5.000% | 11/1/20 | 750 | 792 |
| Rockford MI Public Schools GO | 4.000% | 5/1/19 | 1,360 | 1,374 |
| Saline MI Area Schools GO | 5.000% | 5/1/22 | 1,000 | 1,090 |
| St. Johns MI Public Schools School District GO | 5.000% | 5/1/19 (18) | 7,250 | 7,359 |
| University of Michigan Revenue | 5.000% | 4/1/19 | 2,215 | 2,243 |
| University of Michigan Revenue | 5.000% | 4/1/20 | 1,500 | 1,561 |
| University of Michigan Revenue | 5.000% | 4/1/20 | 1,750 | 1,822 |
24
Short-Term Tax-Exempt Fund
| | | | |
| Face | Market |
| Maturity | Amount | Value• |
| Coupon | Date | ($000) | ($000) |
| University of Michigan Revenue | 5.000% | 4/1/21 | 1,500 | 1,601 |
| Wayne County MI Airport Authority Revenue | 5.000% | 12/1/20 | 365 | 386 |
| Wayne County MI Airport Authority Revenue | 5.000% | 12/1/21 | 700 | 756 |
| Wayne County MI Airport Authority Revenue | 5.000% | 12/1/21 | 1,500 | 1,620 |
| Wayne County MI Airport Authority Revenue | 5.000% | 12/1/22 | 500 | 550 |
| 3 Wayne County MI Airport Authority Revenue (Detroit Metropolitan Wayne County Airport) | 4.000% | 12/1/19 | 2,290 | 2,336 |
| 3 Wayne County MI Airport Authority Revenue (Detroit Metropolitan Wayne County Airport) | 4.000% | 12/1/20 | 1,785 | 1,848 |
| 3 Wayne County MI Airport Authority Revenue (Detroit Metropolitan Wayne County Airport) | 5.000% | 12/1/21 | 1,225 | 1,321 |
| 3 Wayne County MI Airport Authority Revenue (Detroit Metropolitan Wayne County Airport) | 5.000% | 12/1/22 | 1,000 | 1,098 |
| 3 Wayne County MI Airport Authority Revenue (Detroit Metropolitan Wayne County Airport) | 5.000% | 12/1/23 | 1,000 | 1,115 |
| 1 Wayne State University Michigan Revenue TOB VRDO | 1.750% | 11/7/18 | 2,500 | 2,500 |
| | | | 282,337 |
| Minnesota (0.8%) | | | | |
| Hennepin County MN GO | 5.000% | 12/1/18 | 4,605 | 4,617 |
| Maple Grove MN Health Care Facilities Revenue (Maple Grove Hospital Corp.) | 4.000% | 5/1/20 | 500 | 511 |
| Maple Grove MN Health Care Facilities Revenue (Maple Grove Hospital Corp.) | 4.000% | 5/1/21 | 550 | 569 |
| Minneapolis & St. Paul MN Metropolitan Airports Commission Revenue | 4.000% | 1/1/19 | 300 | 301 |
| Minneapolis & St. Paul MN Metropolitan Airports Commission Revenue | 4.000% | 1/1/20 | 350 | 358 |
| Minneapolis & St. Paul MN Metropolitan Airports Commission Revenue | 4.000% | 1/1/21 | 125 | 130 |
| Minneapolis & St. Paul MN Metropolitan Council Transit GO | 5.000% | 3/1/19 | 3,230 | 3,264 |
| Minneapolis & St. Paul MN Metropolitan Council Wastewater GO | 5.000% | 3/1/21 | 2,650 | 2,818 |
| Minneapolis & St. Paul MN Metropolitan Council Wastewater GO | 5.000% | 3/1/22 | 2,935 | 3,194 |
| Minneapolis MN GO | 2.000% | 12/1/18 | 12,800 | 12,801 |
| Minneapolis MN Health Care System Revenue (Fairview Health Services) | 4.000% | 11/15/18 | 750 | 751 |
| Minneapolis MN Health Care System Revenue (Fairview Health Services) | 5.000% | 11/15/19 | 750 | 772 |
| Minneapolis MN Health Care System Revenue (Fairview Health Services) VRDO | 1.720% | 11/7/18 LOC | 26,510 | 26,510 |
| Minnesota General Fund Revenue | 5.000% | 6/1/21 | 3,670 | 3,927 |
| Minnesota GO | 5.000% | 8/1/19 (ETM) | 30 | 31 |
| Minnesota GO | 5.000% | 8/1/19 | 2,270 | 2,321 |
| Minnesota GO | 5.000% | 8/1/19 | 5,990 | 6,124 |
| Minnesota GO | 5.000% | 8/1/20 (Prere.) | 115 | 121 |
| Minnesota GO | 5.000% | 8/1/21 | 1,750 | 1,881 |
| Minnesota GO | 5.000% | 8/1/21 | 1,250 | 1,344 |
| Minnesota GO | 5.000% | 10/1/22 | 19,625 | 21,605 |
| Minnesota GO | 5.000% | 8/1/23 | 7,860 | 8,224 |
| Minnesota Public Facilities Authority Revenue (State Revolving Fund) | 5.000% | 3/1/20 | 8,665 | 9,002 |
| Northern Minnesota Municipal Power Agency Electric System Revenue | 4.000% | 1/1/19 | 900 | 903 |
| Northern Minnesota Municipal Power Agency Electric System Revenue | 5.000% | 1/1/20 | 825 | 852 |
| Northern Minnesota Municipal Power Agency Electric System Revenue | 5.000% | 1/1/21 | 2,500 | 2,638 |
| Northern Minnesota Municipal Power Agency Electric System Revenue | 5.000% | 1/1/22 | 588 | 633 |
| Shakopee MN Healthcare Facilities Revenue (St. Francis Regional Medical Center) | 5.000% | 9/1/19 | 555 | 566 |
| St. Paul MN Housing & Redevelopment Authority Health Care Revenue | | | | |
| (Fairview Health Services Obligated Group) | 4.000% | 11/15/20 | 400 | 413 |
| St. Paul MN Housing & Redevelopment Authority Health Care Revenue | | | | |
| (Fairview Health Services Obligated Group) | 5.000% | 11/15/21 | 500 | 537 |
| St. Paul MN Housing & Redevelopment Authority Health Care Revenue | | | | |
| (Fairview Health Services Obligated Group) | 5.000% | 11/15/22 | 370 | 405 |
| University of Minnesota Revenue | 5.000% | 12/1/18 (ETM) | 1,750 | 1,754 |
| University of Minnesota Revenue | 5.000% | 12/1/20 (Prere.) | 3,920 | 4,149 |
| | | | 124,026 |
| Mississippi (0.2%) | | | | |
| Gulfport MS Hospital Facilities Revenue (Memorial Hospital at Gulfport Project) | 5.000% | 7/1/19 | 1,250 | 1,269 |
| Gulfport MS Hospital Facilities Revenue (Memorial Hospital at Gulfport Project) | 5.000% | 7/1/20 | 1,000 | 1,036 |
| Jackson MS Public School District GO | 5.000% | 4/1/19 | 1,660 | 1,680 |
| Jackson MS Public School District GO | 5.000% | 4/1/20 | 1,500 | 1,556 |
| 2 Mississippi GO PUT | 1.842% | 9/1/20 | 5,035 | 5,039 |
| 2 Mississippi Hospital Equipment & Facilities Authority Revenue (Baptist Health System) PUT | 2.900% | 8/15/20 | 7,850 | 7,911 |
| Mississippi Hospital Equipment & Facilities Authority Revenue | | | | |
| (Baptist Memorial Health Care Obligated Group) | 5.000% | 9/1/21 | 3,110 | 3,282 |
| Mississippi Hospital Equipment & Facilities Authority Revenue | | | | |
| (Baptist Memorial Health Care Obligated Group) PUT | 2.125% | 1/9/19 | 1,875 | 1,873 |
| Warren County MS Gulf Opportunity Zone Revenue (International Paper Co. Projects) PUT | 2.900% | 9/1/23 | 6,250 | 6,194 |
| | | | 29,840 |
| Missouri (0.5%) | | | | |
| Branson MO Industrial Development Authority Tax Increase Revenue | | | | |
| (Branson Shoppes Redevelopment) | 3.000% | 11/1/18 | 250 | 250 |
| Branson MO Industrial Development Authority Tax Increase Revenue | | | | |
| (Branson Shoppes Redevelopment) | 3.000% | 11/1/19 | 400 | 402 |
25
Short-Term Tax-Exempt Fund
| | | | |
| Face | Market |
| Maturity | Amount | Value• |
| Coupon | Date | ($000) | ($000) |
| Branson MO Industrial Development Authority Tax Increase Revenue | | | | |
| (Branson Shoppes Redevelopment) | 3.000% | 11/1/20 | 400 | 401 |
| Branson MO Industrial Development Authority Tax Increase Revenue | | | | |
| (Branson Shoppes Redevelopment) | 3.000% | 11/1/21 | 350 | 349 |
| Cape Girardeau County MO Industrial Development Authority of the Health Facilities Revenue | | | | |
| (Southeast Health) | 5.000% | 3/1/20 | 735 | 756 |
| Cape Girardeau County MO Industrial Development Authority of the Health Facilities Revenue | | | | |
| (Southeast Health) | 5.000% | 3/1/21 | 365 | 381 |
| Curators of the University of Missouri System Facilities Revenue | 5.000% | 11/1/24 | 1,500 | 1,616 |
| Joplin MO Industrial Development Authority Health Facilities Revenue (Freeman Health System) | 5.000% | 2/15/19 | 645 | 650 |
| Kansas City MO Special Obligation Revenue | 5.000% | 10/1/19 | 2,750 | 2,822 |
| Kansas City MO Special Obligation Revenue | 5.000% | 10/1/19 | 2,510 | 2,576 |
| Kansas City MO Special Obligation Revenue | 5.000% | 10/1/20 | 2,000 | 2,103 |
| Kansas City MO Special Obligation Revenue | 5.000% | 10/1/20 | 1,260 | 1,325 |
| Kansas City MO Special Obligation Revenue (Downtown Arena Project) | 5.000% | 4/1/19 | 2,000 | 2,024 |
| Kansas City MO Special Obligation Revenue (Downtown Arena Project) | 5.000% | 4/1/20 | 2,660 | 2,763 |
| Lee’s Summit MO Senior Living Facilities Revenue (John Knox Village) | 5.000% | 8/15/19 | 1,000 | 1,014 |
| Lee’s Summit MO Senior Living Facilities Revenue (John Knox Village) | 5.000% | 8/15/21 | 1,640 | 1,703 |
| Lee’s Summit MO Senior Living Facilities Revenue (John Knox Village) | 5.000% | 8/15/23 | 1,285 | 1,351 |
| Metropolitan St. Louis MO Sewer District Wastewater System Revenue | 5.000% | 5/1/21 | 1,250 | 1,337 |
| Missouri Environmental Improvement & Energy Resources Authority Revenue | 5.000% | 1/1/19 | 985 | 990 |
| Missouri Environmental Improvement & Energy Resources Authority Revenue | 5.000% | 1/1/20 | 1,395 | 1,443 |
| Missouri Environmental Improvement & Energy Resources Authority Revenue | 5.000% | 7/1/21 | 2,880 | 3,089 |
| Missouri Health & Educational Facilities Authority Health Facilities Revenue | | | | |
| (SSM Health System) PUT | 5.000% | 6/1/23 | 7,900 | 8,534 |
| Missouri Health & Educational Facilities Authority Revenue (St. Luke’s Health System Inc.) | 5.000% | 11/15/20 | 1,440 | 1,519 |
| Missouri Highways & Transportation Commission Road Revenue | 5.000% | 5/1/21 | 10,000 | 10,697 |
| Missouri Highways & Transportation Commission Road Revenue | 5.000% | 5/1/24 | 10,000 | 11,326 |
| St. Joseph MO Industrial Development Authority Health Facilities Revenue | | | | |
| (Heartland Regional Medical Center) VRDO | 1.650% | 11/1/18 LOC | 19,600 | 19,600 |
| St. Louis MO Parking Revenue | 5.000% | 12/15/19 (4) | 1,000 | 1,033 |
| St. Louis MO Parking Revenue | 5.000% | 12/15/20 (4) | 1,000 | 1,053 |
| | | | 83,107 |
| Montana (0.0%) | | | | |
| Montana Facility Finance Authority Hospital Revenue (Benefis Health System) | 5.000% | 2/15/19 | 890 | 897 |
| Montana Facility Finance Authority Hospital Revenue (Benefis Health System) | 5.000% | 2/15/20 | 1,750 | 1,811 |
| Montana Facility Finance Authority Hospital Revenue (Billings Clinic Obligated Group) | 4.000% | 8/15/21 | 665 | 694 |
| Montana Facility Finance Authority Hospital Revenue (Billings Clinic Obligated Group) | 4.000% | 8/15/22 | 570 | 601 |
| | | | 4,003 |
| Multiple States (2.6%) | | | | |
| 4 Federal Home Loan Mortgage Corp. Multifamily Housing Revenue TOB VRDO | 1.620% | 11/7/18 LOC | 26,905 | 26,905 |
| 4 Federal Home Loan Mortgage Corp. Multifamily Housing Revenue VRDO | 1.850% | 11/8/18 LOC | 25,000 | 25,000 |
| 4 Federal Home Loan Mortgage Corp. Multifamily Housing VRDO | 1.900% | 11/1/18 LOC | 23,660 | 23,660 |
| 1 Nuveen AMT-Free Municipal Income Fund VRDP VRDO | 1.730% | 11/7/18 LOC | 109,000 | 109,000 |
| 1 Nuveen AMT-Free Quality Municipal Income Fund VRDP VRDO | 1.690% | 11/7/18 LOC | 167,800 | 167,800 |
| 1 Nuveen Enhanced AMT-Free Municipal Credit Opportunities Fund VRDP VRDO | 1.690% | 11/8/18 LOC | 65,700 | 65,700 |
| | | | 418,065 |
| Nebraska (0.5%) | | | | |
| Central Plains Energy Project Nebraska Gas Project Revenue (Project No. 1) | 5.250% | 12/1/18 | 2,080 | 2,085 |
| Central Plains Energy Project Nebraska Gas Supply Revenue PUT | 5.000% | 12/1/19 | 57,510 | 59,076 |
| Douglas County NE GO | 4.000% | 12/15/18 | 2,500 | 2,506 |
| Douglas County NE GO | 5.000% | 12/15/19 | 2,605 | 2,692 |
| Douglas County NE Hospital Authority No. 3 Health Facilities Revenue | | | | |
| (Nebraska Methodist Health System) | 4.000% | 11/1/18 | 925 | 925 |
| Douglas County NE Housing Authority Revenue (Blair High Residences Project) | 1.400% | 4/1/19 | 5,180 | 5,156 |
| 3 Omaha NE GO | 1.850% | 1/15/19 | 1,000 | 1,000 |
| 3 Omaha NE GO | 5.000% | 1/15/21 | 1,200 | 1,272 |
| 3 Omaha NE GO | 5.000% | 1/15/22 | 1,000 | 1,084 |
| University of Nebraska Facilities Corp. Revenue | 3.000% | 7/15/19 | 5,530 | 5,571 |
| University of Nebraska Student Fee Revenue | 4.000% | 7/1/19 | 2,395 | 2,426 |
| University of Nebraska Student Fee Revenue | 5.000% | 7/1/21 | 1,100 | 1,179 |
| University of Nebraska Student Health & Recreation Project Revenue | 4.000% | 5/15/19 | 1,110 | 1,122 |
| | | | 86,094 |
| Nevada (0.7%) | | | | |
| Carson City NV Hospital Revenue (Carson Tahoe Regional Medical Center) | 5.000% | 9/1/20 | 250 | 261 |
| Clark County NV School District GO | 5.000% | 6/15/20 | 48,275 | 50,358 |
| Clark County NV School District GO | 5.000% | 6/15/20 | 3,125 | 3,260 |
| Clark County NV School District GO | 5.000% | 6/15/20 | 520 | 543 |
26
Short-Term Tax-Exempt Fund
| | | | |
| Face | Market |
| Maturity | Amount | Value• |
| Coupon | Date | ($000) | ($000) |
| Clark County NV School District GO | 5.000% | 6/15/21 | 4,520 | 4,807 |
| 3 Clark County NV School District GO | 5.000% | 6/15/22 | 7,465 | 8,077 |
| Clark County NV School District GO | 5.000% | 6/15/22 | 5,500 | 5,951 |
| Clark County NV School District GO | 5.000% | 6/15/22 | 1,260 | 1,363 |
| 1 Clark County NV Water Reclamation District GO TOB VRDO | 1.630% | 11/7/18 (Prere.) | 7,005 | 7,005 |
| Humboldt County NV Pollution Control Revenue (Sierra Pacific Power Co.) PUT | 1.250% | 6/3/19 | 4,000 | 3,973 |
| 1 Las Vegas NV Convention & Visitors Authority TOB VRDO | 1.680% | 11/7/18 | 10,000 | 10,000 |
| Nevada GO | 5.000% | 4/1/19 | 16,405 | 16,613 |
| North Las Vegas NV GO | 5.000% | 6/1/21 (4) | 2,100 | 2,230 |
| North Las Vegas NV GO | 5.000% | 6/1/22 (4) | 2,400 | 2,595 |
| | | | 117,036 |
| New Hampshire (0.2%) | | | | |
| New Hampshire Business Finance Authority Revenue PUT (The United Illuminating Co.) | 2.800% | 10/2/23 | 5,480 | 5,420 |
| New Hampshire Health & Education Facilities Authority Revenue (Elliott Hospital Obligated Group) | 5.000% | 10/1/19 | 600 | 613 |
| New Hampshire Health & Education Facilities Authority Revenue (Elliott Hospital Obligated Group) | 5.000% | 10/1/20 | 1,265 | 1,318 |
| 1 New Hampshire Health & Education Facilities Authority Revenue (LRGHealthcare) TOB VRDO | 1.630% | 11/7/18 | 15,645 | 15,645 |
| New Hampshire Health & Education Facilities Authority Revenue | | | | |
| (Partners Healthcare System Inc.) | 5.000% | 7/1/20 | 350 | 366 |
| New Hampshire Health & Education Facilities Authority Revenue | | | | |
| (Partners Healthcare System Inc.) | 5.000% | 7/1/21 | 1,085 | 1,162 |
| New Hampshire Health & Education Facilities Authority Revenue | | | | |
| (Southern New Hampshire Medical Center) | 3.000% | 10/1/19 | 1,280 | 1,288 |
| New Hampshire Municipal Bond Bank Revenue | 5.000% | 8/15/20 (Prere.) | 2,005 | 2,107 |
| | | | 27,919 |
| New Jersey (3.9%) | | | | |
| Aberdeen NJ GO | 2.750% | 3/8/19 | 10,500 | 10,522 |
| Atlantic City NJ GO | 4.000% | 3/1/19 (4) | 250 | 251 |
| Atlantic City NJ GO | 5.000% | 3/1/20 (4) | 200 | 206 |
| Atlantic City NJ GO | 5.000% | 3/1/21 (4) | 650 | 683 |
| Atlantic City NJ GO | 5.000% | 3/1/22 (4) | 500 | 535 |
| Bergen County NJ GO | 2.500% | 12/13/18 | 40,615 | 40,652 |
| Camden County NJ Improvement Authority Health Care Redevelopment Project Revenue | | | | |
| (Cooper Health System Obligated Group) | 5.000% | 2/15/19 | 3,200 | 3,223 |
| Freehold Borough NJ BAN | 2.250% | 11/30/18 | 13,097 | 13,100 |
| Garden State Preservation Trust New Jersey Revenue (Open Space & Farmland Preservation) | 5.000% | 11/1/20 | 1,295 | 1,352 |
| Garden State Preservation Trust New Jersey Revenue (Open Space & Farmland Preservation) | 5.000% | 11/1/22 (15) | 1,095 | 1,192 |
| Gloucester County NJ Improvement Authority Revenue (Rowan University) | 5.000% | 11/1/21 (4) | 2,000 | 2,144 |
| Gloucester County NJ Improvement Authority Revenue (Rowan University) | 5.000% | 11/1/22 (4) | 1,700 | 1,855 |
| 1 Inspira Health Obligated Group New Jersey TOB VRDO | 1.720% | 11/7/18 | 2,100 | 2,100 |
| Jersey City NJ Redevelopment Authority Revenue (Pathside Redevelopment Project) | 3.000% | 5/30/19 | 10,000 | 10,046 |
| Lakewood Township NJ BAN | 2.750% | 6/27/19 | 14,000 | 14,041 |
| Monmouth County NJ GO | 3.000% | 3/1/20 | 2,540 | 2,573 |
| Monmouth County NJ GO | 5.000% | 7/15/21 | 4,855 | 5,218 |
| Monmouth County NJ Improvement Authority Revenue (Pooled Government Loan) | 5.000% | 12/1/20 | 2,575 | 2,725 |
| New Brunswick NJ BAN | 3.000% | 5/30/19 | 10,275 | 10,327 |
| New Jersey Building Authority Revenue | 5.000% | 6/15/19 | 5,000 | 5,077 |
| New Jersey Economic Development Authority Revenue | 5.000% | 6/15/19 | 50,000 | 50,775 |
| New Jersey Economic Development Authority Revenue | 5.000% | 6/15/19 | 1,000 | 1,015 |
| New Jersey Economic Development Authority Revenue | 5.000% | 6/15/21 | 5,965 | 6,279 |
| New Jersey Economic Development Authority Revenue | 5.000% | 6/15/22 | 3,050 | 3,248 |
| New Jersey Economic Development Authority Revenue | 5.000% | 6/15/22 | 2,000 | 2,130 |
| New Jersey Economic Development Authority Revenue | 5.000% | 11/1/22 | 750 | 806 |
| New Jersey Economic Development Authority Revenue (Motor Vehicle Surcharge) | 4.000% | 7/1/22 | 4,395 | 4,531 |
| 1 New Jersey Economic Development Authority Revenue (Motor Vehicle Surcharge) TOB VRDO | 1.750% | 11/7/18 | 4,200 | 4,200 |
| New Jersey Economic Development Authority Revenue (School Facilities Construction) | 4.000% | 12/15/18 | 275 | 276 |
| New Jersey Economic Development Authority Revenue (School Facilities Construction) | 5.000% | 12/15/18 | 365 | 366 |
| New Jersey Economic Development Authority Revenue (School Facilities Construction) | 5.500% | 12/15/19 (2) | 5,000 | 5,164 |
| New Jersey Economic Development Authority Revenue (School Facilities Construction) | 5.000% | 9/1/21 | 150 | 157 |
| New Jersey Economic Development Authority Revenue (School Facilities Construction) | 5.000% | 3/1/22 | 10 | 11 |
| New Jersey Economic Development Authority Revenue (School Facilities Construction) | 5.000% | 9/1/22 | 7,150 | 7,484 |
| 1 New Jersey Economic Development Authority Revenue | | | | |
| (School Facilities Construction) TOB VRDO | 1.620% | 11/7/18 LOC | 18,310 | 18,310 |
| 1 New Jersey Economic Development Authority Revenue | | | | |
| (School Facilities Construction) TOB VRDO | 1.650% | 11/7/18 LOC | 9,805 | 9,805 |
| New Jersey Educational Facilities Authority Revenue (Princeton University) | 5.000% | 7/1/20 | 2,000 | 2,097 |
| New Jersey Educational Facilities Authority Revenue (Princeton University) | 5.000% | 7/1/20 | 1,345 | 1,410 |
| New Jersey Educational Facilities Authority Revenue (Princeton University) | 5.000% | 7/1/21 | 1,000 | 1,077 |
| New Jersey Educational Facilities Authority Revenue (Princeton University) | 5.000% | 7/1/22 | 3,065 | 3,287 |
| New Jersey Educational Facilities Authority Revenue (Seton Hall University) | 5.000% | 7/1/21 | 265 | 282 |
27
Short-Term Tax-Exempt Fund
| | | | |
| Face | Market |
| Maturity | Amount | Value• |
| Coupon | Date | ($000) | ($000) |
| New Jersey Health Care Facilities Financing Authority Revenue | | | | |
| (Hospital Asset Transformation Program) | 5.000% | 10/1/20 | 700 | 730 |
| New Jersey Health Care Facilities Financing Authority Revenue | | | | |
| (Hospital Asset Transformation Program) | 5.000% | 10/1/21 | 1,250 | 1,321 |
| New Jersey Health Care Facilities Financing Authority Revenue | | | | |
| (Hospital Asset Transformation Program) | 5.000% | 10/1/22 | 1,500 | 1,601 |
| New Jersey Health Care Facilities Financing Authority Revenue | | | | |
| (Hospital Capital Asset Pooled Program) VRDO | 1.600% | 11/7/18 LOC | 6,850 | 6,850 |
| New Jersey Health Care Facilities Financing Authority Revenue (Princeton Healthcare System) | 5.000% | 7/1/20 | 2,100 | 2,195 |
| New Jersey Health Care Facilities Financing Authority Revenue (St. Joseph’s Healthcare System) | 4.000% | 7/1/19 | 1,200 | 1,210 |
| New Jersey Health Care Facilities Financing Authority Revenue (St. Joseph’s Healthcare System) | 4.000% | 7/1/20 | 1,000 | 1,018 |
| New Jersey Health Care Facilities Financing Authority Revenue (Virtua Health) | 4.000% | 7/1/19 | 2,000 | 2,024 |
| New Jersey Health Care Facilities Financing Authority Revenue (Virtua Health) | 5.000% | 7/1/19 | 1,000 | 1,019 |
| 1 New Jersey Health Care Facilities Financing Authority Revenue (Virtua Health) TOB VRDO | 1.700% | 11/7/18 (12) | 8,684 | 8,684 |
| 1 New Jersey Higher Education Assistance Authority Student Loan Revenue TOB VRDO | 1.640% | 11/7/18 | 6,000 | 6,000 |
| New Jersey Housing & Mortgage Finance Agency Multi-Family Housing Revenue | | | | |
| (Garden Spires Urban Renewal LP) PUT | 2.020% | 8/1/20 | 4,000 | 3,962 |
| New Jersey Housing & Mortgage Finance Agency Multi-Family Housing Revenue | | | | |
| (GK Preservation LLC) PUT | 2.450% | 10/1/20 | 3,750 | 3,747 |
| 1 New Jersey Housing & Mortgage Finance Agency Multi-Family Housing Revenue TOB VRDO | 1.630% | 11/7/18 | 5,050 | 5,050 |
| New Jersey Transportation Trust Fund Authority Federal Highway Reimbursement Revenue | 4.000% | 6/15/19 | 400 | 404 |
| New Jersey Transportation Trust Fund Authority Federal Highway Reimbursement Revenue | 5.000% | 6/15/19 | 39,050 | 39,711 |
| New Jersey Transportation Trust Fund Authority Federal Highway Reimbursement Revenue | 4.000% | 6/15/20 | 300 | 307 |
| New Jersey Transportation Trust Fund Authority Federal Highway Reimbursement Revenue | 5.000% | 6/15/20 | 43,175 | 44,870 |
| New Jersey Transportation Trust Fund Authority Federal Highway Reimbursement Revenue | 5.000% | 6/15/21 | 5,000 | 5,276 |
| New Jersey Transportation Trust Fund Authority Federal Highway Reimbursement Revenue | 5.000% | 6/15/22 | 8,340 | 8,934 |
| New Jersey Transportation Trust Fund Authority Federal Highway Reimbursement Revenue | 5.000% | 6/15/23 | 8,250 | 8,949 |
| New Jersey Transportation Trust Fund Authority Federal Highway Reimbursement Revenue | 5.000% | 6/15/24 | 1,375 | 1,507 |
| New Jersey Transportation Trust Fund Authority Revenue | 5.000% | 6/15/19 | 1,250 | 1,269 |
| New Jersey Transportation Trust Fund Authority Revenue | 5.250% | 12/15/22 (4) | 1,120 | 1,227 |
| New Jersey Transportation Trust Fund Authority Revenue | 5.000% | 12/15/23 | 2,000 | 2,177 |
| New Jersey Transportation Trust Fund Authority Revenue | 5.000% | 12/15/24 | 5,000 | 5,464 |
| 2 New Jersey Transportation Trust Fund Authority Transportation Program Revenue PUT | 2.600% | 12/15/19 | 35,000 | 35,051 |
| 2 New Jersey Transportation Trust Fund Authority Transportation Program Revenue PUT | 2.800% | 12/15/21 | 5,000 | 5,052 |
| New Jersey Transportation Trust Fund Authority Transportation System Revenue | 4.000% | 12/15/19 | 850 | 864 |
| New Jersey Transportation Trust Fund Authority Transportation System Revenue | 5.250% | 12/15/22 (2) | 5,445 | 5,927 |
| New Jersey Transportation Trust Fund Authority Transportation System Revenue | 5.250% | 12/15/22 | 3,750 | 4,065 |
| New Jersey Transportation Trust Fund Authority Transportation System Revenue | 5.500% | 12/15/22 | 2,105 | 2,302 |
| New Jersey Transportation Trust Fund Authority Transportation System Revenue | 5.500% | 12/15/22 (4) | 4,000 | 4,421 |
| New Jersey Transportation Trust Fund Authority Transportation System Revenue | 5.875% | 12/15/38 | 20,825 | 20,920 |
| New Jersey Transportation Trust Fund Authority Transportation System Revenue | 6.000% | 12/15/38 | 9,555 | 9,600 |
| 1 New Jersey Transportation Trust Fund Authority Transportation System Revenue TOB VRDO | 1.650% | 11/7/18 LOC | 18,750 | 18,750 |
| 1 New Jersey Transportation Trust Fund Authority Transportation System Revenue TOB VRDO | 1.730% | 11/7/18 | 10,850 | 10,850 |
| 2 New Jersey Turnpike Authority Revenue | 1.919% | 1/1/21 | 2,500 | 2,499 |
| 2 New Jersey Turnpike Authority Revenue | 2.059% | 1/1/22 | 3,495 | 3,498 |
| 2 New Jersey Turnpike Authority Revenue | 2.059% | 1/1/22 | 4,535 | 4,539 |
| 2 New Jersey Turnpike Authority Revenue PUT | 2.039% | 1/1/21 | 22,065 | 22,111 |
| 2 New Jersey Turnpike Authority Revenue PUT | 2.329% | 1/1/23 | 10,000 | 10,070 |
| 1 New Jersey Turnpike Authority Revenue TOB VRDO | 1.700% | 11/7/18 | 8,335 | 8,335 |
| 1 New Jersey Turnpike Authority Revenue TOB VRDO | 1.700% | 11/7/18 (4) | 6,500 | 6,500 |
| 1 New Jersey Turnpike Authority Revenue TOB VRDO | 1.750% | 11/7/18 | 5,745 | 5,745 |
| 1 New Jersey Turnpike Authority Revenue TOB VRDO | 1.750% | 11/7/18 LOC | 22,235 | 22,235 |
| Tobacco Settlement Financing Corp. New Jersey Revenue | 5.000% | 6/1/19 | 2,500 | 2,538 |
| Tobacco Settlement Financing Corp. New Jersey Revenue | 5.000% | 6/1/20 | 2,000 | 2,077 |
| Tobacco Settlement Financing Corp. New Jersey Revenue | 5.000% | 6/1/21 | 2,285 | 2,419 |
| Tobacco Settlement Financing Corp. New Jersey Revenue | 5.000% | 6/1/22 | 1,500 | 1,615 |
| Tobacco Settlement Financing Corp. New Jersey Revenue | 5.000% | 6/1/23 | 1,500 | 1,637 |
| | | | 629,658 |
| New Mexico (0.8%) | | | | |
| Albuquerque NM Municipal School District No. 12 GO | 5.000% | 8/1/20 | 1,850 | 1,940 |
| Albuquerque NM Municipal School District No. 12 GO | 5.000% | 8/1/21 | 1,200 | 1,287 |
| Farmington NM Pollution Control Revenue | | | | |
| (Southern California Edison Co. Four Corners Project) PUT | 1.875% | 4/1/20 | 1,000 | 989 |
| New Mexico Finance Authority Transportation Revenue | 5.000% | 6/15/21 | 1,685 | 1,805 |
| New Mexico Finance Authority Transportation Revenue | 5.000% | 6/15/22 | 9,800 | 10,721 |
| New Mexico Finance Authority Transportation Revenue | 5.000% | 12/15/22 | 3,395 | 3,590 |
| New Mexico Finance Authority Transportation Revenue | 5.000% | 6/15/24 | 7,390 | 8,361 |
| New Mexico GO | 5.000% | 3/1/19 | 1,200 | 1,212 |
| New Mexico GO | 5.000% | 3/1/20 | 7,000 | 7,263 |
28
Short-Term Tax-Exempt Fund
| | | | |
| Face | Market |
| Maturity | Amount | Value• |
| Coupon | Date | ($000) | ($000) |
| New Mexico GO | 5.000% | 3/1/21 | 7,500 | 7,983 |
| New Mexico GO | 5.000% | 3/1/21 | 5,000 | 5,322 |
| 2 New Mexico Municipal Energy Acquisition Authority Gas Supply Revenue | 2.162% | 2/1/19 | 200 | 200 |
| 2 New Mexico Municipal Energy Acquisition Authority Gas Supply Revenue | 2.182% | 8/1/19 | 1,000 | 999 |
| 2 New Mexico Municipal Energy Acquisition Authority Gas Supply Revenue PUT | 2.262% | 8/1/19 | 66,500 | 66,490 |
| New Mexico Municipal Energy Acquisition Authority Gas Supply Revenue PUT | 5.000% | 8/1/19 | 9,055 | 9,229 |
| New Mexico Severance Tax Revenue | 5.000% | 7/1/21 | 7,925 | 8,494 |
| | | | 135,885 |
| New York (15.4%) | | | | |
| 1 Battery Park City Authority New York Revenue TOB VRDO | 1.690% | 11/1/18 LOC | 41,845 | 41,845 |
| Brookhaven NY Local Development Corp. Revenue (Jefferson’s Ferry Project) | 4.000% | 11/1/18 | 580 | 580 |
| Brookhaven NY Local Development Corp. Revenue (Jefferson’s Ferry Project) | 5.000% | 11/1/19 | 325 | 334 |
| Brookhaven NY Local Development Corp. Revenue (Jefferson’s Ferry Project) | 5.000% | 11/1/20 | 650 | 683 |
| Brookhaven NY Local Development Corp. Revenue (Jefferson’s Ferry Project) | 5.000% | 11/1/21 | 500 | 535 |
| Brooklyn NY Local Development Corp. PILOT Revenue (Brooklyn Events Center) | 5.000% | 7/15/20 | 640 | 667 |
| Buffalo & Erie County NY Industrial Land Development Corp. Revenue | 5.000% | 11/15/18 | 1,000 | 1,001 |
| Buffalo & Erie County NY Industrial Land Development Corp. Revenue | 5.000% | 11/15/19 | 680 | 696 |
| Copiague Union Free School District GO | 2.500% | 2/20/19 | 21,884 | 21,912 |
| Elmira City NY School District BANS | 3.000% | 6/27/19 | 11,000 | 11,050 |
| 1 Hudson Yards Infrastructure Corp. New York Revenue TOB VRDO | 1.650% | 11/7/18 LOC | 6,065 | 6,065 |
| Lockport NY BAN | 2.500% | 12/12/18 | 5,779 | 5,783 |
| Long Island NY Power Authority Electric System Revenue | 5.500% | 4/1/19 (Prere.) | 1,890 | 1,919 |
| Long Island NY Power Authority Electric System Revenue | 5.000% | 9/1/21 | 1,000 | 1,075 |
| 2 Metropolitan NY Transportation Authority PUT | 2.189% | 7/1/21 | 25,000 | 25,000 |
| Metropolitan Transportation Authority NY BAN | 5.000% | 9/1/20 | 4,825 | 5,053 |
| Metropolitan Transportation Authority NY BAN | 5.000% | 5/15/21 | 30,000 | 31,910 |
| Metropolitan Transportation Authority NY BAN | 5.000% | 5/15/21 | 49,000 | 52,119 |
| Metropolitan Transportation Authority NY BAN | 5.000% | 5/15/21 | 12,500 | 13,296 |
| Metropolitan Transportation Authority NY BAN | 5.000% | 9/1/21 | 51,800 | 55,378 |
| 2 Metropolitan Transportation Authority NY Revenue PUT | 1.857% | 4/1/21 (4) | 33,375 | 33,241 |
| 1 Metropolitan Transportation Authority NY Revenue TOB VRDO | 1.750% | 11/7/18 | 8,000 | 8,000 |
| Nassau County NY Local Economic Assistance & Financing Corp. Revenue | | | | |
| (Catholic Health Services) | 5.000% | 7/1/19 | 1,305 | 1,328 |
| Nassau County NY Local Economic Assistance & Financing Corp. Revenue | | | | |
| (Catholic Health Services) | 5.000% | 7/1/20 | 9,390 | 9,768 |
| Nassau County NY Local Economic Assistance Corp. Revenue | | | | |
| (Catholic Health Services of Long Island Obligated Group Project) | 4.000% | 7/1/19 | 375 | 379 |
| New York City NY GO VRDO | 1.990% | 11/5/18 (12) | 35,900 | 35,900 |
| New York City NY GO VRDO | 1.750% | 11/6/18 (4) | 3,850 | 3,850 |
| New York City NY GO VRDO | 1.990% | 11/7/18 (4) | 14,750 | 14,750 |
| New York City NY GO VRDO | 2.010% | 11/7/18 (4) | 1,425 | 1,425 |
| New York City NY GO VRDO | 1.990% | 11/8/18 (4) | 33,150 | 33,150 |
| New York City NY GO VRDO | 1.990% | 11/2/18 (4) | 1,625 | 1,625 |
| New York City NY GO | 5.000% | 8/1/19 | 15,440 | 15,786 |
| New York City NY GO | 3.000% | 10/1/19 | 3,000 | 3,028 |
| New York City NY GO | 5.000% | 8/1/20 | 8,410 | 8,825 |
| New York City NY GO | 5.000% | 8/1/21 | 5,500 | 5,907 |
| New York City NY GO | 5.000% | 8/1/21 | 13,865 | 14,890 |
| New York City NY GO | 5.000% | 8/1/21 | 1,000 | 1,074 |
| New York City NY GO | 5.000% | 8/1/21 | 12,180 | 13,081 |
| New York City NY GO | 5.000% | 8/1/21 | 1,095 | 1,176 |
| New York City NY GO | 5.000% | 8/1/22 | 37,000 | 40,566 |
| New York City NY GO | 5.000% | 8/1/22 | 3,000 | 3,289 |
| New York City NY GO | 5.000% | 8/1/22 | 4,965 | 5,322 |
| New York City NY GO VRDO | 1.700% | 11/1/18 LOC | 15,875 | 15,875 |
| New York City NY GO VRDO | 1.600% | 11/7/18 | 35,665 | 35,665 |
| New York City NY GO VRDO | 1.600% | 11/7/18 LOC | 20,215 | 20,215 |
| New York City NY GO VRDO | 1.600% | 11/7/18 LOC | 23,050 | 23,050 |
| New York City NY GO VRDO | 1.600% | 11/7/18 LOC | 32,860 | 32,860 |
| New York City NY Housing Development Corp. Multi-Family Housing Revenue | 1.250% | 11/1/18 | 10,415 | 10,415 |
| New York City NY Housing Development Corp. Multi-Family Housing Revenue | 1.500% | 11/1/18 | 8,885 | 8,885 |
| New York City NY Housing Development Corp. Multi-Family Housing Revenue | 1.500% | 11/1/18 | 7,880 | 7,880 |
| New York City NY Housing Development Corp. Multi-Family Housing Revenue | 1.650% | 5/1/19 | 21,990 | 21,976 |
| New York City NY Housing Development Corp. Multi-Family Housing Revenue | 1.650% | 5/1/19 | 1,300 | 1,297 |
| New York City NY Housing Development Corp. Multi-Family Housing Revenue | 1.900% | 5/1/21 | 5,000 | 4,927 |
| New York City NY Housing Development Corp. Multi-Family Housing Revenue | 1.700% | 7/1/21 | 5,850 | 5,746 |
| New York City NY Housing Development Corp. Multi-Family Housing Revenue | 2.200% | 11/1/21 | 3,660 | 3,642 |
| New York City NY Housing Development Corp. Multi-Family Housing Revenue | 2.350% | 7/1/22 | 17,250 | 17,112 |
29
Short-Term Tax-Exempt Fund
| | | | |
| Face | Market |
| Maturity | Amount | Value• |
| Coupon | Date | ($000) | ($000) |
| New York City NY Housing Development Corp. Multi-Family Rental Housing Revenue | | | | |
| (90 West Street) VRDO | 1.620% | 11/7/18 LOC | 15,000 | 15,000 |
| New York City NY Housing Development Corp. Sustainable Neighborhood Revenue | 1.300% | 11/1/19 | 13,500 | 13,348 |
| New York City NY Housing Development Corp. Sustainable Neighborhood Revenue | 1.375% | 5/1/20 | 5,750 | 5,675 |
| New York City NY Housing Development Corp. Sustainable Neighborhood Revenue PUT | 1.450% | 4/29/20 | 4,000 | 3,942 |
| New York City NY Housing Development Corp. Sustainable Neighborhood Revenue PUT | 2.000% | 12/31/21 | 7,000 | 6,902 |
| New York City NY Housing Development Corp. Sustainable Neighborhood Revenue VRDO | 1.570% | 11/8/18 | 18,850 | 18,850 |
| New York City NY Municipal Water Finance Authority Water & Sewer System Revenue | 5.000% | 6/15/23 | 8,500 | 9,488 |
| 1 New York City NY Municipal Water Finance Authority Water & Sewer System Revenue | | | | |
| TOB VRDO | 1.630% | 11/7/18 | 7,300 | 7,300 |
| 1 New York City NY Municipal Water Finance Authority Water & Sewer System Revenue | | | | |
| TOB VRDO | 1.630% | 11/7/18 | 14,120 | 14,120 |
| 1 New York City NY Municipal Water Finance Authority Water & Sewer System Revenue | | | | |
| TOB VRDO | 1.630% | 11/7/18 | 5,000 | 5,000 |
| 1 New York City NY Municipal Water Finance Authority Water & Sewer System Revenue | | | | |
| TOB VRDO | 1.650% | 11/7/18 | 36,940 | 36,940 |
| New York City NY Municipal Water Finance Authority Water & Sewer System Revenue VRDO | 1.700% | 11/1/18 | 8,250 | 8,250 |
| New York City NY Municipal Water Finance Authority Water & Sewer System Revenue VRDO | 1.600% | 11/7/18 | 72,580 | 72,580 |
| 1 New York City NY Municipal Water Finance Authority Water & Sewer System Revenue | | | | |
| TOB VRDO | 1.620% | 11/7/18 | 8,040 | 8,040 |
| 1 New York City NY Transitional Finance Authority Building Aid Revenue TOB VRDO | 1.630% | 11/7/18 | 17,110 | 17,110 |
| New York City NY Transitional Finance Authority Future Tax Revenue VRDO | 1.590% | 11/1/18 (4) | 1,975 | 1,975 |
| New York City NY Transitional Finance Authority Future Tax Revenue VRDO | 1.990% | 11/2/18 (4) | 60,100 | 60,100 |
| New York City NY Transitional Finance Authority Future Tax Revenue | 5.000% | 8/1/19 (ETM) | 1,300 | 1,330 |
| New York City NY Transitional Finance Authority Future Tax Revenue | 5.000% | 11/1/20 | 6,825 | 7,201 |
| 1 New York City NY Transitional Finance Authority Future Tax Revenue TOB VRDO | 1.630% | 11/7/18 LOC | 15,000 | 15,000 |
| New York City NY Transitional Finance Authority Future Tax Revenue VRDO | 1.680% | 11/1/18 | 13,355 | 13,355 |
| New York City NY Transitional Finance Authority Revenue | 5.000% | 8/1/22 | 28,620 | 31,400 |
| New York City NY Transitional Finance Authority Revenue VRDO | 1.680% | 11/1/18 | 27,355 | 27,355 |
| New York City Transitional Finance Authority Future Tax Secured Revenue | 5.000% | 8/1/22 | 15,600 | 17,115 |
| 1 New York City Transitional Finance Authority Future Tax Secured Revenue TOB VRDO | 1.630% | 11/7/18 | 1,000 | 1,000 |
| 1 New York City Transitional Finance Authority Future Tax Secured Revenue TOB VRDO | 1.630% | 11/7/18 | 8,000 | 8,000 |
| 1 New York Convention Center Development Corp. Revenue TOB VRDO | 1.620% | 11/7/18 | 10,400 | 10,400 |
| 1 New York Convention Center Development Corp. Revenue TOB VRDO | 1.750% | 11/7/18 | 7,020 | 7,020 |
| 1 New York Liberty Development Corp. Revenue (Goldman Sachs Headquarters) TOB VRDO | 1.900% | 11/7/18 | 7,500 | 7,500 |
| 1 New York Liberty Development Corp. Revenue (Port Authority Consolidated Bonds) TOB VRDO | 1.650% | 11/7/18 | 37,805 | 37,805 |
| 1 New York Liberty Development Corp. Revenue (Port Authority Consolidated Bonds) TOB VRDO | 1.650% | 11/7/18 | 27,435 | 27,435 |
| 1 New York Liberty Development Corp. Revenue TOB VRDO | 1.680% | 11/7/18 | 2,035 | 2,035 |
| New York Metropolitan Transportation Authority Revenue | 4.000% | 11/15/21 | 3,365 | 3,523 |
| New York Metropolitan Transportation Authority Revenue | 5.000% | 11/15/21 | 6,000 | 6,463 |
| 2 New York Metropolitan Transportation Authority Revenue (Dedicated Tax Fund) PUT | 2.050% | 11/1/19 | 3,875 | 3,879 |
| 2 New York Metropolitan Transportation Authority Revenue (Dedicated Tax Fund) PUT | 2.180% | 11/1/19 | 23,500 | 23,538 |
| 1 New York Metropolitan Transportation Authority Revenue (Transit Revenue) TOB VRDO | 1.650% | 11/7/18 | 11,250 | 11,250 |
| 2 New York Metropolitan Transportation Authority Revenue PUT | 1.812% | 11/1/19 | 19,695 | 19,627 |
| New York Metropolitan Transportation Authority Revenue PUT | 4.000% | 11/15/19 | 4,175 | 4,234 |
| 2 New York Metropolitan Transportation Authority Revenue PUT | 2.212% | 2/1/20 | 9,500 | 9,499 |
| New York Metropolitan Transportation Authority Revenue PUT | 5.000% | 2/15/20 | 64,175 | 66,373 |
| 2 New York Metropolitan Transportation Authority Revenue PUT | 2.127% | 4/6/20 (4) | 7,000 | 7,012 |
| 2 New York Metropolitan Transportation Authority Revenue PUT | 2.180% | 6/1/20 | 88,350 | 88,464 |
| New York Metropolitan Transportation Authority Revenue PUT | 4.000% | 11/15/20 | 3,205 | 3,296 |
| New York Metropolitan Transportation Authority Revenue PUT | 5.000% | 11/15/20 | 50,050 | 52,570 |
| 2 New York Metropolitan Transportation Authority Revenue PUT | 2.050% | 11/15/22 | 10,000 | 9,981 |
| 1 New York Metropolitan Transportation Authority Revenue TOB VRDO | 1.680% | 11/7/18 | 12,500 | 12,500 |
| 1 New York Metropolitan Transportation Authority Revenue TOB VRDO | 1.680% | 11/7/18 | 10,605 | 10,605 |
| New York Metropolitan Transportation Authority Revenue VRDO | 1.600% | 11/7/18 LOC | 26,545 | 26,545 |
| New York Metropolitan Transportation Authority Revenue VRDO | 1.600% | 11/7/18 LOC | 19,580 | 19,580 |
| New York NY GO | 5.000% | 8/1/19 | 3,500 | 3,578 |
| New York NY GO | 5.000% | 8/1/20 | 12,500 | 13,116 |
| New York NY GO | 5.000% | 8/1/21 | 31,040 | 33,335 |
| New York State Dormitory Authority Revenue | 5.000% | 3/15/21 | 50,000 | 53,273 |
| New York State Dormitory Authority Revenue | 5.000% | 3/15/22 | 50,000 | 54,521 |
| New York State Dormitory Authority Revenue (Columbia University) | 5.000% | 10/1/20 | 1,125 | 1,188 |
| New York State Dormitory Authority Revenue (Orange Regional Medical Center Obligated Group) | 4.000% | 12/1/18 | 1,300 | 1,301 |
| New York State Dormitory Authority Revenue (Orange Regional Medical Center Obligated Group) | 4.000% | 12/1/19 | 1,500 | 1,520 |
| New York State Dormitory Authority Revenue (Pace University) | 5.000% | 5/1/19 | 1,350 | 1,369 |
| New York State Dormitory Authority Revenue (Personal Income Tax) | 5.000% | 2/15/19 | 1,000 | 1,009 |
| New York State Dormitory Authority Revenue (Personal Income Tax) | 5.000% | 2/15/19 | 16,215 | 16,360 |
| New York State Dormitory Authority Revenue (Personal Income Tax) | 5.000% | 2/15/21 | 12,805 | 13,611 |
| New York State Dormitory Authority Revenue (Personal Income Tax) | 5.000% | 2/15/21 | 8,140 | 8,653 |
| New York State Dormitory Authority Revenue (Personal Income Tax) | 5.000% | 2/15/21 | 10,130 | 10,768 |
30
Short-Term Tax-Exempt Fund
| | | | |
| Face | Market |
| Maturity | Amount | Value• |
| Coupon | Date | ($000) | ($000) |
| New York State Dormitory Authority Revenue (Personal Income Tax) | 5.000% | 2/15/21 | 63,405 | 67,398 |
| New York State Dormitory Authority Revenue (Personal Income Tax) | 5.000% | 2/15/22 | 50,000 | 54,347 |
| 1 New York State Dormitory Authority Revenue (Personal Income Tax) TOB VRDO | 1.630% | 11/7/18 (Prere.) | 565 | 565 |
| New York State Dormitory Authority Revenue (Yeshiva University) | 5.000% | 11/1/18 (ETM) | 370 | 370 |
| New York State Dormitory Authority Revenue (Yeshiva University) | 5.000% | 11/1/18 | 630 | 630 |
| New York State Dormitory Authority Revenue (Yeshiva University) | 5.000% | 11/1/19 (ETM) | 600 | 617 |
| New York State Dormitory Authority Revenue (Yeshiva University) | 5.000% | 11/1/19 | 1,025 | 1,042 |
| 1 New York State Dormitory Authority Sales Tax Revenue TOB VRDO | 1.620% | 11/8/18 | 7,500 | 7,500 |
| 1 New York State Environmental Facilities Corp. Revenue | | | | |
| (State Clean Water & Drinking Water Revolving Funds) TOB VRDO | 1.610% | 11/7/18 | 7,500 | 7,500 |
| New York State Housing Finance Agency Affordable Housing Revenue | 1.800% | 5/1/20 | 1,620 | 1,610 |
| New York State Housing Finance Agency Affordable Housing Revenue | 1.500% | 5/1/21 | 2,950 | 2,900 |
| New York State Housing Finance Agency Affordable Housing Revenue | 1.500% | 5/1/21 | 3,570 | 3,510 |
| New York State Housing Finance Agency Affordable Housing Revenue | 1.900% | 5/1/21 | 14,210 | 14,063 |
| New York State Housing Finance Agency Affordable Housing Revenue | 2.000% | 5/1/21 | 2,510 | 2,489 |
| New York State Housing Finance Agency Affordable Housing Revenue | 2.000% | 5/1/21 | 1,755 | 1,741 |
| New York State Housing Finance Agency Affordable Housing Revenue | 2.000% | 5/1/21 | 5,000 | 4,959 |
| New York State Housing Finance Agency Affordable Housing Revenue | 2.000% | 5/1/21 | 1,300 | 1,289 |
| New York State Housing Finance Agency Housing Revenue | 1.375% | 11/1/19 | 2,000 | 1,986 |
| New York State Housing Finance Agency Housing Revenue | 1.600% | 5/1/21 | 3,900 | 3,829 |
| New York State Housing Finance Agency Housing Revenue | 1.650% | 11/1/21 | 8,500 | 8,314 |
| New York State Housing Finance Agency Housing Revenue | 1.650% | 11/1/21 | 9,005 | 8,808 |
| New York State Housing Finance Agency Housing Revenue | 2.300% | 5/1/22 | 4,500 | 4,418 |
| New York State Housing Finance Agency Housing Revenue | 2.650% | 5/1/22 | 6,865 | 6,863 |
| New York State Housing Finance Agency Housing Revenue | 2.750% | 11/1/22 | 7,890 | 7,887 |
| New York State Housing Finance Agency Housing Revenue (10 Liberty Street) VRDO | 1.600% | 11/7/18 LOC | 26,900 | 26,900 |
| New York State Housing Finance Agency Housing Revenue (West 17th Street) VRDO | 1.610% | 11/7/18 LOC | 15,900 | 15,900 |
| New York State Housing Finance Agency Revenue | 1.050% | 5/1/19 | 850 | 846 |
| New York State Housing Finance Agency Revenue | 1.100% | 11/1/19 | 1,000 | 991 |
| New York State Housing Finance Agency Revenue | 1.250% | 5/1/20 | 7,500 | 7,395 |
| New York State Housing Finance Agency Revenue (Clinton Park) VRDO | 1.590% | 11/7/18 LOC | 50,890 | 50,890 |
| 1 New York State Thruway Authority Personal Income Tax Revenue TOB VRDO | 1.620% | 11/7/18 | 9,000 | 9,000 |
| New York State Thruway Authority Revenue | 5.000% | 5/1/19 | 53,895 | 54,696 |
| New York State Thruway Authority Revenue (Personal Income Tax) | 5.000% | 3/15/22 | 4,335 | 4,619 |
| 1 New York State Thruway Authority Revenue TOB VRDO | 1.630% | 11/7/18 | 13,000 | 13,000 |
| New York State Urban Development Corp. Revenue (Personal Income Tax) | 5.000% | 3/15/20 | 32,280 | 33,576 |
| New York State Urban Development Corp. Revenue (Personal Income Tax) | 5.000% | 3/15/21 | 19,195 | 20,442 |
| New York State Urban Development Corp. Revenue (Personal Income Tax) | 5.000% | 3/15/21 | 12,860 | 13,696 |
| New York State Urban Development Corp. Revenue (Service Contract) | 5.250% | 1/1/20 | 1,500 | 1,508 |
| New York State Urban Development Corp. Revenue (Service Contract) VRDO | 1.600% | 11/7/18 | 15,130 | 15,130 |
| New York State Urban Development Corp. Revenue (Service Contract) VRDO | 1.620% | 11/7/18 LOC | 10,600 | 10,600 |
| 1 Nuveen New York AMT-Free Quality Municipal Income Fund VRDP VRDO | 1.660% | 11/7/18 LOC | 43,800 | 43,800 |
| 1 Nuveen New York AMT-Free Quality Municipal Income Fund VRDP VRDO | 1.700% | 11/7/18 LOC | 23,500 | 23,500 |
| Onondaga County NY Civic Development Corp. Revenue (St. Joseph’s Hospital & Health Center) | 5.000% | 7/1/19 (ETM) | 260 | 265 |
| Orange & Ulster Counties NY Board Cooperative Educational Services Revenue | 3.000% | 7/24/19 | 9,000 | 9,037 |
| 1 Port Authority of New York & New Jersey Revenue TOB VRDO | 1.620% | 11/7/18 | 3,750 | 3,750 |
| Tobacco Settlement Financing Corp. New York Revenue | 4.000% | 6/1/19 | 6,000 | 6,056 |
| Tobacco Settlement Financing Corp. New York Revenue | 5.000% | 6/1/20 | 5,000 | 5,189 |
| Tobacco Settlement Financing Corp. New York Revenue | 5.000% | 6/1/20 | 1,775 | 1,839 |
| Tobacco Settlement Financing Corp. New York Revenue | 5.000% | 6/1/21 | 4,435 | 4,690 |
| Tobacco Settlement Financing Corp. New York Revenue | 5.000% | 6/1/21 | 1,000 | 1,046 |
| Tobacco Settlement Financing Corp. New York Revenue | 5.000% | 6/1/22 | 1,075 | 1,155 |
| 2 Triborough Bridge & Tunnel Authority New York Revenue | 2.040% | 1/1/19 (4) | 1,800 | 1,801 |
| 2 Triborough Bridge & Tunnel Authority New York Revenue PUT | 1.912% | 2/1/19 | 10,350 | 10,351 |
| Triborough Bridge & Tunnel Authority New York Revenue PUT | 1.891% | 9/26/19 | 12,500 | 12,499 |
| 2 Triborough Bridge & Tunnel Authority New York Revenue PUT | 2.010% | 11/15/21 | 5,185 | 5,188 |
| Westchester County NY GO | 5.000% | 1/1/19 | 500 | 503 |
| Westchester County NY GO | 5.000% | 1/1/21 | 1,570 | 1,669 |
| Westchester County NY Health Care Corp. Revenue | 5.000% | 11/1/18 | 1,000 | 1,000 |
| Westchester County NY Health Care Corp. Revenue | 5.125% | 11/1/20 | 850 | 892 |
| Westhill NY Central School District BAN | 3.000% | 7/5/19 | 7,200 | 7,235 |
| | | | 2,489,207 |
| North Carolina (1.4%) | | | | |
| Cape Fear NC Public Utility Authority Water & Sewer System Revenue | 5.000% | 8/1/20 | 3,345 | 3,512 |
| Charlotte NC GO | 5.000% | 12/1/18 | 4,000 | 4,010 |
| Charlotte NC GO | 5.000% | 7/1/22 | 3,725 | 4,085 |
| Charlotte NC Water & Sewer System Revenue | 5.000% | 12/1/19 | 1,360 | 1,405 |
| Charlotte NC Water & Sewer System Revenue | 5.000% | 7/1/21 | 2,310 | 2,420 |
| Charlotte-Mecklenburg NC Hospital Authority Health Care System Revenue | | | | |
| (Carolinas HealthCare System) | 5.000% | 1/15/19 | 3,575 | 3,597 |
31
Short-Term Tax-Exempt Fund
| | | | |
| Face | Market |
| Maturity | Amount | Value• |
| Coupon | Date | ($000) | ($000) |
| 1 Charlotte-Mecklenburg NC Hospital Authority Health Care System Revenue | | | | |
| (Carolinas HealthCare System) TOB VRDO | 1.630% | 11/7/18 | 10,805 | 10,805 |
| East Carolina University North Carolina Revenue | 5.000% | 10/1/19 | 3,525 | 3,623 |
| East Carolina University North Carolina Revenue | 5.000% | 10/1/20 | 3,660 | 3,859 |
| Fayetteville NC Public Works Commission Revenue | 5.000% | 3/1/19 | 3,500 | 3,536 |
| Fayetteville NC Public Works Commission Revenue | 5.000% | 3/1/21 | 1,000 | 1,064 |
| Greensboro NC Combined Enterprise System Revenue | 5.250% | 6/1/21 | 4,370 | 4,709 |
| Guilford County NC GO | 5.000% | 5/1/19 | 1,820 | 1,848 |
| Guilford County NC GO | 5.000% | 2/1/21 | 1,200 | 1,276 |
| Mecklenburg County NC GO | 5.000% | 12/1/18 | 4,780 | 4,792 |
| New Hanover County NC Hospital Revenue (New Hanover Regional Medical Center Project) | 5.000% | 10/1/20 | 1,000 | 1,050 |
| New Hanover County NC Hospital Revenue (New Hanover Regional Medical Center Project) | 5.000% | 10/1/21 | 1,000 | 1,074 |
| North Carolina Capital Facilities Finance Agency Solid Waste Disposal Revenue | | | | |
| (Republic Services, Inc. Project) PUT | 1.850% | 12/3/18 | 23,750 | 23,747 |
| North Carolina Eastern Municipal Power Agency Power Systems Revenue | 5.000% | 1/1/19 (ETM) | 2,245 | 2,257 |
| North Carolina GO | 5.000% | 5/1/19 | 1,525 | 1,549 |
| North Carolina GO | 5.000% | 5/1/20 | 2,300 | 2,400 |
| North Carolina GO | 5.000% | 5/1/20 | 1,035 | 1,080 |
| North Carolina GO | 5.000% | 6/1/20 | 2,840 | 2,970 |
| North Carolina GO | 5.000% | 6/1/21 | 1,000 | 1,072 |
| North Carolina GO | 5.000% | 6/1/21 | 17,915 | 19,208 |
| North Carolina GO | 4.000% | 5/1/22 | 10,000 | 10,610 |
| North Carolina GO | 4.000% | 6/1/22 | 3,140 | 3,335 |
| North Carolina Medical Care Commission Health Care Facilities Revenue | | | | |
| (Novant Health Obligated Group) VRDO | 1.670% | 11/7/18 | 32,860 | 32,860 |
| North Carolina Medical Care Commission Hospital Revenue (Moses Cone Health System) PUT | 1.950% | 5/30/19 | 11,600 | 11,600 |
| 3 North Carolina Medical Care Commission Retirement Facilities Revenue (Moravian Home Inc.) | 3.550% | 10/1/24 | 500 | 499 |
| North Carolina Medical Care Commission Retirement Facilities Revenue (Southminster Inc.) | 5.000% | 10/1/20 | 670 | 694 |
| North Carolina Medical Care Commission Retirement Facilities Revenue | | | | |
| (United Methodist Retirement Homes Inc.) | 5.000% | 10/1/19 | 250 | 256 |
| North Carolina Medical Care Commission Retirement Facilities Revenue | | | | |
| (United Methodist Retirement Homes Inc.) | 5.000% | 10/1/20 | 310 | 323 |
| North Carolina Medical Care Commission Retirement Facilities Revenue | | | | |
| (United Methodist Retirement Homes Inc.) | 5.000% | 10/1/21 | 275 | 292 |
| North Carolina Medical Care Commission Retirement Facilities Revenue | | | | |
| (United Methodist Retirement Homes Inc.) | 5.000% | 10/1/22 | 350 | 377 |
| North Carolina Turnpike Authority Revenue | 5.000% | 1/1/20 | 650 | 669 |
| North Carolina Turnpike Authority Revenue | 5.000% | 1/1/21 | 700 | 737 |
| North Carolina Turnpike Authority Revenue | 5.000% | 1/1/22 | 500 | 536 |
| Raleigh NC Combined Enterprise System Revenue VRDO | 1.560% | 11/7/18 | 21,325 | 21,325 |
| Raleigh NC GO | 5.000% | 9/1/22 | 2,000 | 2,201 |
| Union County NC GO | 5.000% | 9/1/20 | 1,430 | 1,505 |
| Union County NC GO | 5.000% | 9/1/21 | 1,200 | 1,293 |
| Wake County NC GO | 5.000% | 3/1/21 | 1,645 | 1,752 |
| Wake County NC GO | 5.000% | 3/1/21 | 2,395 | 2,551 |
| Wake County NC GO | 5.000% | 3/1/21 | 2,385 | 2,540 |
| Wake County NC GO | 5.000% | 4/1/21 | 2,400 | 2,562 |
| Wake County NC GO | 5.000% | 3/1/22 | 8,200 | 8,936 |
| Wake County NC Public Improvement GO | 5.000% | 9/1/21 | 1,505 | 1,622 |
| | | | 220,023 |
| North Dakota (0.0%) | | | | |
| Grand Forks ND Health Care System Revenue (Altru Health System Obligated Group) | 5.000% | 12/1/18 | 350 | 351 |
| Grand Forks ND Health Care System Revenue (Altru Health System Obligated Group) | 5.000% | 12/1/19 | 150 | 154 |
| Grand Forks ND Health Care System Revenue (Altru Health System Obligated Group) | 5.000% | 12/1/20 | 750 | 784 |
| Grand Forks ND Health Care System Revenue (Altru Health System Obligated Group) | 5.000% | 12/1/21 | 1,000 | 1,065 |
| 1 North Dakota Public Finance Authority Revenue TOB VRDO | 1.690% | 11/8/18 | 5,095 | 5,095 |
| | | | 7,449 |
| Ohio (3.6%) | | | | |
| Akron OH Bath & Copley Joint Township Hospital District Revenue | | | | |
| (Summa Health System Obligated Group) | 5.000% | 11/15/20 | 1,460 | 1,527 |
| Akron OH Income Tax Revenue (Packaging Facilities) | 5.000% | 12/1/18 | 1,145 | 1,148 |
| Akron OH Income Tax Revenue (Packaging Facilities) | 5.000% | 12/1/19 | 1,590 | 1,642 |
| Allen County OH Hospital Facilities Revenue (Mercy Health) | 5.000% | 8/1/19 | 1,000 | 1,021 |
| Allen County OH Hospital Facilities Revenue (Mercy Health) | 5.000% | 8/1/21 | 2,605 | 2,766 |
| Allen County OH Hospital Facilities Revenue (Mercy Health) | 5.000% | 8/1/22 | 3,750 | 4,051 |
| Allen County OH Hospital Facilities Revenue (Mercy Health) PUT | 5.000% | 5/5/22 | 12,175 | 13,225 |
| American Municipal Power Ohio Inc. Revenue | 5.000% | 2/15/23 | 1,250 | 1,293 |
| American Municipal Power Ohio Inc. Revenue (Hydroelectric Projects) PUT | 2.250% | 8/15/21 | 8,000 | 7,929 |
32
Short-Term Tax-Exempt Fund
| | | | |
| Face | Market |
| Maturity | Amount | Value• |
| Coupon | Date | ($000) | ($000) |
| American Municipal Power Ohio Inc. Revenue (Prairie State Energy Campus Project) PUT | 5.000% | 8/15/19 | 24,250 | 24,451 |
| Bluffton OH Hospital Facilities Revenue (Blanchard Valley Health System Obligated Group) | 5.000% | 12/1/21 | 750 | 806 |
| Bluffton OH Hospital Facilities Revenue (Blanchard Valley Health System Obligated Group) | 5.000% | 12/1/22 | 750 | 819 |
| Centerville OH Health Care Revenue (Graceworks Lutheran Services) | 5.000% | 11/1/20 | 275 | 285 |
| Centerville OH Health Care Revenue (Graceworks Lutheran Services) | 5.000% | 11/1/21 | 285 | 298 |
| Chillicothe OH Hospital Facilities Revenue (Adena Health System Obligated Group) | 5.000% | 12/1/21 | 925 | 992 |
| Cleveland OH Airport System Revenue | 5.000% | 1/1/19 (4) | 410 | 412 |
| Cleveland OH Airport System Revenue | 5.000% | 1/1/20 (4) | 430 | 444 |
| Cleveland OH GO | 4.000% | 12/1/21 | 375 | 394 |
| Cleveland OH GO | 5.000% | 12/1/22 | 500 | 550 |
| Cleveland-Cuyahoga County OH Port Authority Revenue | | | | |
| (Carnegie/89th Garage & Service Center LLC Project) VRDO | 1.600% | 11/7/18 LOC | 40,580 | 40,580 |
| Cuyahoga County OH Excise Tax Revenue (Sports Facilities Improvement Project) | 5.000% | 12/1/18 | 1,000 | 1,002 |
| 1 Cuyahoga OH CP TOB VRDO | 1.740% | 11/7/18 | 4,155 | 4,155 |
| 2 Franklin County OH Hospital Facilities Revenue (OhioHealth Corp.) PUT | 2.030% | 11/15/21 | 7,500 | 7,500 |
| 1 Franklin County OH Hospital Facilities Revenue (OhioHealth Corp.) TOB VRDO | 1.640% | 11/7/18 | 8,250 | 8,250 |
| Franklin County OH Hospital Facilities Revenue (OhioHealth Corp.) VRDO | 1.600% | 11/7/18 | 31,750 | 31,750 |
| Franklin County OH Hospital Facilities Revenue (OhioHealth Corp.) VRDO | 1.600% | 11/7/18 | 45,000 | 45,000 |
| Franklin County OH Hospital Facilities Revenue (OhioHealth Corp.) VRDO | 1.600% | 11/7/18 | 17,110 | 17,110 |
| Hamilton County OH Healthcare Revenue (Life Enriching Communities) | 4.000% | 1/1/19 | 560 | 561 |
| Hamilton County OH Healthcare Revenue (Life Enriching Communities) | 4.000% | 1/1/20 | 575 | 583 |
| 1 Hamilton County OH Hospital Facilities Revenue (UC Health) TOB VRDO | 1.660% | 11/7/18 LOC | 11,395 | 11,395 |
| Hamilton County OH Sales Tax Revenue | 4.000% | 12/1/18 | 1,500 | 1,503 |
| Hamilton County OH Sales Tax Revenue | 5.000% | 12/1/18 | 2,900 | 2,907 |
| Hamilton County OH Sales Tax Revenue | 5.000% | 12/1/19 | 3,000 | 3,094 |
| JobsOhio Beverage System Statewide Liquor Profits Revenue TOB VRDO | 1.650% | 11/7/18 | 42,200 | 42,200 |
| 1 Kettering Health Network Obligated Group Ohio TOB VRDO | 1.750% | 11/7/18 | 5,580 | 5,580 |
| Lake County OH Hospital Facilities Revenue (Lake Hospital System Inc.) | 5.000% | 8/15/19 | 810 | 827 |
| 2 Lancaster OH Port Authority Gas Supply Revenue PUT | 2.232% | 8/1/19 | 18,575 | 18,580 |
| Lucas County OH Hospital Revenue (ProMedica Healthcare Obligated Group) | 5.000% | 11/15/19 | 1,165 | 1,194 |
| 1 Montgomery County OH Revenue (Miami Valley Hospital) TOB VRDO | 1.750% | 11/7/18 | 4,000 | 4,000 |
| Ohio Common Schools GO | 5.000% | 9/15/20 | 5,000 | 5,266 |
| Ohio Common Schools GO VRDO | 1.580% | 11/7/18 | 2,775 | 2,775 |
| Ohio Cultural & Sports Capital Facilities Lease Revenue | 5.000% | 10/1/19 | 1,045 | 1,073 |
| Ohio Cultural & Sports Capital Facilities Lease Revenue | 5.000% | 10/1/21 | 2,755 | 2,959 |
| Ohio GO | 2.000% | 3/1/20 | 3,040 | 3,038 |
| Ohio GO | 5.000% | 2/1/21 | 2,250 | 2,390 |
| Ohio GO | 5.000% | 9/15/21 | 1,300 | 1,401 |
| Ohio Higher Education GO | 5.000% | 5/1/20 | 10,520 | 10,975 |
| Ohio Higher Education GO | 5.000% | 5/1/21 | 11,050 | 11,806 |
| Ohio Higher Educational Facility Commission Revenue (Denison University Project) | 5.000% | 11/1/19 | 1,500 | 1,544 |
| Ohio Higher Educational Facility Commission Revenue (Denison University Project) | 5.000% | 11/1/20 | 1,500 | 1,581 |
| Ohio Higher Educational Facility Commission Revenue (Denison University Project) | 5.000% | 11/1/21 | 1,045 | 1,126 |
| Ohio Highway Capital Improvements GO | 5.000% | 5/1/19 | 1,200 | 1,219 |
| Ohio Hospital Revenue (University Hospitals Health System Inc.) VRDO | 1.850% | 11/7/18 | 13,000 | 13,000 |
| Ohio Hospital Revenue (University Hospitals Health System Inc.) VRDO | 1.850% | 11/7/18 | 10,875 | 10,875 |
| Ohio Hospital Revenue (University Hospitals Health System Inc.) VRDO | 1.950% | 11/1/18 | 13,250 | 13,250 |
| Ohio Major New State Infrastructure Project Revenue | 5.000% | 12/15/21 | 20,000 | 21,616 |
| Ohio Parks & Recreation Capital Facilities Revenue | 5.000% | 12/1/20 | 1,125 | 1,188 |
| Ohio Solid Waste Revenue (Republic Services Inc. Project) PUT | 1.850% | 12/3/18 | 5,000 | 4,999 |
| Ohio State University General Receipts Revenue | 5.000% | 12/1/19 | 1,515 | 1,564 |
| Ohio State University General Receipts Revenue | 5.000% | 12/1/20 | 1,250 | 1,322 |
| Ohio State University General Receipts Revenue | 5.000% | 12/1/21 | 1,400 | 1,514 |
| Ohio State University General Receipts Revenue | 5.000% | 12/1/22 | 1,110 | 1,225 |
| Ohio State University General Receipts Revenue VRDO | 1.560% | 11/7/18 | 1,050 | 1,050 |
| Ohio State University General Receipts Revenue VRDO | 1.570% | 11/7/18 | 64,515 | 64,515 |
| Ohio State University General Receipts Revenue VRDO | 1.570% | 11/7/18 | 1,100 | 1,100 |
| 1 Ohio Turnpike Commission Turnpike Revenue TOB VRDO | 1.700% | 11/7/18 | 7,500 | 7,500 |
| Ohio Water Development Authority Fresh Water Revenue | 5.000% | 12/1/21 | 2,890 | 3,129 |
| Ohio Water Development Authority Fresh Water Revenue | 5.250% | 12/1/21 | 1,250 | 1,347 |
| Ohio Water Development Authority Pollution Control Revenue (Water Quality) | 5.000% | 12/1/18 | 3,880 | 3,890 |
| 2 Ohio Water Development Authority Water Pollution Control Loan Fund Revenue | 1.820% | 12/1/20 | 69,870 | 69,770 |
| Ross County OH Hospital Facilities Revenue (Adena Health System) | 5.250% | 12/1/18 (ETM) | 1,510 | 1,514 |
| Toledo OH GO | 4.000% | 12/1/18 (4) | 1,880 | 1,883 |
| University of Akron Ohio General Receipts Revenue | 4.000% | 1/1/19 | 1,000 | 1,003 |
| | | | 586,231 |
| Oklahoma (0.3%) | | | | |
| Cleveland County OK Educational Facilities Authority Lease Revenue | | | | |
| (Norman Public Schools Project) | 5.000% | 7/1/19 | 2,250 | 2,293 |
33
Short-Term Tax-Exempt Fund
| | | | | | |
| Face | Market |
| Maturity | Amount | Value• |
| | | Coupon | Date | ($000) | ($000) |
| Norman OK Regional Hospital Authority Revenue | 4.000% | 9/1/19 | 2,000 | 2,027 |
| Norman OK Regional Hospital Authority Revenue | 5.000% | 9/1/20 | 1,170 | 1,221 |
| Oklahoma City OK GO | 5.000% | 3/1/19 | 4,080 | 4,122 |
| Oklahoma City OK GO | 4.000% | 3/1/21 | 2,940 | 3,065 |
| Oklahoma Development Finance Authority Health System Revenue (OU Medicine) | 5.000% | 8/15/22 | 1,000 | 1,076 |
| Oklahoma Water Resources Board Revolving Fund Revenue | 5.000% | 4/1/19 | 3,000 | 3,038 |
| Oklahoma Water Resources Board Revolving Fund Revenue | 5.000% | 4/1/21 | 1,405 | 1,499 |
| Tulsa County OK | Independent School District No. 11 (Owasso) GO | 3.000% | 1/1/20 | 4,000 | 4,038 |
| Tulsa County OK | Independent School District No. 11 (Owasso) GO | 4.000% | 1/1/21 | 7,450 | 7,719 |
| Tulsa County OK | Independent School District No. 11 (Owasso) GO | 4.000% | 1/1/22 | 7,450 | 7,820 |
| Tulsa County OK | Independent School District No. 11 (Owasso) Revenue | 5.000% | 9/1/20 | 1,500 | 1,573 |
| Tulsa County OK | Independent School District No. 11 (Owasso) Revenue | 5.000% | 9/1/21 | 825 | 884 |
| Tulsa County OK | Independent School District No. 11 (Owasso) Revenue | 5.000% | 9/1/22 | 825 | 900 |
| Tulsa County OK | Independent School District No. 11 (Owasso) Revenue | 5.000% | 9/1/23 | 500 | 553 |
| Tulsa County OK Industrial Authority Housing Revenue | | | | |
| | (St. Thomas Square & Worthington Townhouse Apartment Project) PUT | 1.700% | 2/1/19 | 5,750 | 5,744 |
| | | | | | 47,572 |
| Oregon (0.8%) | | | | | |
| Clackamas County OR Hospital Facility Authority Revenue (Mary’s Woods at Marylhurst) | 2.600% | 11/15/23 | 3,100 | 3,050 |
| Clackamas County OR Hospital Facility Authority Revenue (Mary’s Woods at Marylhurst) | 2.800% | 5/15/24 | 575 | 566 |
| Multnomah County OR GO | 5.000% | 6/1/19 | 7,960 | 8,101 |
| Multnomah County OR GO | 5.000% | 6/1/20 | 8,345 | 8,725 |
| Multnomah County OR GO | 5.000% | 6/1/21 | 8,770 | 9,399 |
| Multnomah County OR GO | 5.000% | 6/1/22 | 9,205 | 10,084 |
| Oregon Department of Transportation Highway User Tax Revenue | 5.000% | 11/15/21 | 6,020 | 6,512 |
| 1 | Oregon Department of Transportation Highway User Tax Revenue TOB VRDO | 1.660% | 11/7/18 | 5,000 | 5,000 |
| 1 | Oregon Facilities Authority Revenue (Reed College Project) TOB VRDO | 1.630% | 11/7/18 | 7,500 | 7,500 |
| Oregon GO | | 5.000% | 11/1/18 | 3,750 | 3,750 |
| Oregon GO | | 3.000% | 5/1/19 | 2,500 | 2,514 |
| Oregon GO | | 3.000% | 6/1/19 | 1,000 | 1,006 |
| Oregon GO | | 3.000% | 11/1/19 | 1,000 | 1,010 |
| Oregon GO | | 5.000% | 5/1/20 | 2,725 | 2,843 |
| Oregon GO | | 5.000% | 8/1/20 | 3,300 | 3,464 |
| Oregon GO | | 5.000% | 11/1/20 | 3,100 | 3,274 |
| Oregon GO | | 5.000% | 5/1/21 | 2,065 | 2,208 |
| Oregon GO | | 5.000% | 6/1/21 | 2,075 | 2,224 |
| Oregon GO | | 5.000% | 8/1/21 | 1,750 | 1,882 |
| Oregon GO | | 4.000% | 11/1/21 | 3,610 | 3,800 |
| Oregon GO | | 5.000% | 5/1/22 | 4,105 | 4,389 |
| Oregon Housing & Community Service Department Single Family Mortgage Revenue VRDO | 1.600% | 11/7/18 | 13,140 | 13,140 |
| Tri-County Metropolitan Transportation District of Oregon Capital Grant Receipt Revenue | 3.000% | 11/1/18 | 4,490 | 4,490 |
| Tri-County Metropolitan Transportation District of Oregon Capital Grant Receipt Revenue | 5.000% | 11/1/18 | 8,110 | 8,110 |
| Tri-County Metropolitan Transportation District of Oregon Capital Grant Receipt Revenue | 3.000% | 11/1/19 | 2,200 | 2,201 |
| Washington County OR GO | 5.000% | 3/1/19 | 2,365 | 2,389 |
| Washington Yamhill and Multnomah Counties OR Hillsboro School District No. 1J GO | 4.000% | 6/15/20 | 1,600 | 1,648 |
| | | | | | 123,279 |
| Pennsylvania (4.4%) | | | | |
| Allegheny County PA Higher Education Building Authority University Revenue | | | | |
| | (Robert Morris University) | 3.000% | 10/15/22 | 600 | 598 |
| Allegheny County PA Hospital Development Authority Revenue | 5.000% | 4/1/22 | 1,750 | 1,881 |
| Allegheny County PA Hospital Development Authority Revenue | 5.000% | 5/15/22 | 1,335 | 1,390 |
| Allegheny County PA Hospital Development Authority Revenue | 5.000% | 4/1/23 | 1,625 | 1,771 |
| Allegheny County PA Hospital Development Authority Revenue | | | | |
| | (Children’s Hospital of Pittsburgh Project) VRDO | 1.610% | 11/7/18 LOC | 1,250 | 1,250 |
| Allegheny County PA Hospital Development Authority Revenue | | | | |
| | (University of Pittsburgh Medical Center) | 2.290% | 2/1/21 | 4,465 | 4,483 |
| 1,2 Allegheny County PA Hospital Development Authority Revenue | | | | |
| | (University of Pittsburgh Medical Center) TOB PUT | 1.770% | 12/3/18 LOC | 10,000 | 10,000 |
| 1 | Allegheny County PA Hospital Development Authority Revenue | | | | |
| | (University of Pittsburgh Medical Center) TOB VRDO | 1.630% | 11/8/18 LOC | 9,895 | 9,895 |
| Allegheny County PA Port Authority Revenue | 5.250% | 3/1/22 | 5,000 | 5,326 |
| Allentown PA City School District TRAN | 2.200% | 1/2/19 | 2,625 | 2,624 |
| Allentown PA Neighborhood Improvement Zone Development Authority Tax Revenue | 5.000% | 5/1/22 | 1,875 | 1,964 |
| Beaver County PA GO | 4.000% | 4/15/19 (15) | 950 | 957 |
| Beaver County PA GO | 4.000% | 4/15/20 (15) | 660 | 675 |
| Beaver County PA GO | 4.000% | 4/15/21 (15) | 695 | 718 |
| Beaver County PA GO | 4.000% | 4/15/22 (15) | 720 | 751 |
| Berks County PA Industrial Development Authority Health System Revenue | | | | |
| | (Tower Health Project) | 5.000% | 11/1/22 | 500 | 543 |
34
Short-Term Tax-Exempt Fund
| | | | |
| Face | Market |
| Maturity | Amount | Value• |
| Coupon | Date | ($000) | ($000) |
| 1 Berks County PA Municipal Authority Revenue (Reading Hospital & Medical Center Project) | | | | |
| TOB VRDO | 1.700% | 11/7/18 | 9,750 | 9,750 |
| 2 Bethlehem PA Area School District Authority Revenue PUT | 2.077% | 11/1/21 | 10,990 | 10,959 |
| 2 Bethlehem PA Area School District Authority Revenue PUT | 2.087% | 11/1/21 | 5,390 | 5,376 |
| Bethlehem PA GO | 5.000% | 12/1/21 (4) | 305 | 329 |
| Bethlehem PA GO | 5.000% | 12/1/22 (4) | 300 | 330 |
| Bethlehem PA Water Authority Revenue | 5.000% 11/15/18 (15) | 500 | 501 |
| Bucks County PA GO | 5.000% | 5/1/19 | 1,500 | 1,523 |
| Bucks County PA Water & Sewer Authority Water System Revenue | 4.000% | 6/1/19 (15) | 500 | 506 |
| Capital Region Water Pennsylvania Sewer System Revenue | 5.000% | 7/15/22 (15) | 1,725 | 1,878 |
| Centre County PA Hospital Authority Revenue (Mount Nittany Medical Center Project) | 5.000% 11/15/22 | 800 | 870 |
| Clarion County PA Industrial Development Authority Revenue | | | | |
| (Clarion University Foundation Inc. Student Housing Project) | 5.000% | 7/1/19 | 970 | 983 |
| Coatesville PA School District GO | 4.000% | 8/1/20 (4) | 325 | 333 |
| Coatesville PA School District GO | 5.000% | 8/1/21 (4) | 1,270 | 1,352 |
| Commonwealth Financing Authority Pennsylvania Revenue | 5.000% | 6/1/20 | 1,125 | 1,168 |
| Commonwealth Financing Authority Pennsylvania Revenue | 5.000% | 6/1/21 | 1,000 | 1,058 |
| Commonwealth Financing Authority Pennsylvania Revenue | 5.000% | 6/1/22 | 1,760 | 1,893 |
| Commonwealth Financing Authority Pennsylvania Revenue | 5.000% | 6/1/23 | 2,625 | 2,866 |
| Dauphin County PA General Authority Health System Revenue (Pinnacle Health System Project) | 4.000% | 6/1/19 | 1,265 | 1,279 |
| Delaware County PA GO | 5.000% | 10/1/19 | 3,025 | 3,108 |
| Delaware County PA GO | 5.000% | 10/1/20 | 2,700 | 2,845 |
| 1 Delaware River PA Joint Toll Bridge Commission Revenue TOB VRDO | 1.750% | 11/7/18 | 6,380 | 6,380 |
| 2 Downingtown PA Area School District GO PUT | 2.300% | 5/1/19 | 5,075 | 5,077 |
| Dubois PA Hospital Authority Revenue (Penn Highlands Healthcare Obligated Group) | 5.000% | 7/15/20 | 575 | 601 |
| Dubois PA Hospital Authority Revenue (Penn Highlands Healthcare Obligated Group) | 5.000% | 7/15/22 | 815 | 885 |
| Dubois PA Hospital Authority Revenue (Penn Highlands Healthcare Obligated Group) | 5.000% | 7/15/23 | 500 | 551 |
| Franklin County PA Industrial Development Authority Revenue (Menno-Haven Inc. Project) | 5.000% | 12/1/21 | 750 | 787 |
| Hempfield PA School District GO | 4.000% | 3/15/20 (15) | 2,745 | 2,812 |
| 2 Hempfield PA School District GO PUT | 2.062% | 8/1/19 | 8,865 | 8,873 |
| Hempfield PA School District GO | 2.032% | 8/1/19 | 1,905 | 1,907 |
| Indiana County PA Industrial Development Authority Student Housing Revenue BAN | 1.450% | 9/1/20 | 6,375 | 6,239 |
| 3 Kennett PA Consolidated School District GO | 4.000% | 2/15/20 | 350 | 358 |
| 3 Kennett PA Consolidated School District GO | 4.000% | 2/15/21 | 720 | 747 |
| 3 Kennett PA Consolidated School District GO | 4.000% | 2/15/22 | 800 | 841 |
| Lackawanna County PA Industrial Development Authority Revenue (University of Scranton) | 5.000% | 11/1/22 | 1,000 | 1,082 |
| Lehigh County PA General Purpose Hospital Authority Revenue (Lehigh Valley Health Network) | 5.000% | 7/1/19 | 500 | 510 |
| Lehigh County PA General Purpose Hospital Authority Revenue (Lehigh Valley Health Network) | 5.000% | 7/1/20 | 820 | 854 |
| 1 Lehigh County PA General Purpose Hospital Authority Revenue (Lehigh Valley Health Network) | | | | |
| TOB VRDO | 1.750% | 11/7/18 | 7,425 | 7,425 |
| Luzerne County PA GO | 5.000% | 12/15/20 (4) | 1,000 | 1,050 |
| Luzerne County PA GO | 5.000% | 12/15/21 (4) | 1,500 | 1,606 |
| Luzerne County PA GO | 5.000% | 12/15/22 (4) | 1,000 | 1,089 |
| Luzerne County PA Industrial Development Authority Lease Revenue | 5.000% | 12/15/21 (4) | 1,190 | 1,261 |
| Luzerne County PA Industrial Development Authority Lease Revenue | 5.000% | 12/15/22 (4) | 1,305 | 1,401 |
| 2 Manheim Township PA School District GO | 1.754% | 5/1/19 | 700 | 700 |
| 2 Manheim Township PA School District GO | 1.804% | 5/1/20 | 750 | 751 |
| 2 Manheim Township PA School District GO | 1.854% | 5/3/21 | 1,000 | 1,002 |
| 2 Manheim Township PA School District GO | 1.954% | 11/1/21 | 1,125 | 1,130 |
| 2 Manheim Township PA School District GO PUT | 2.004% | 11/1/21 | 2,000 | 2,009 |
| Montgomery County PA GO | 5.000% | 4/1/19 | 1,840 | 1,863 |
| Montgomery County PA Higher Education & Health Authority Hospital Revenue | | | | |
| (Abington Memorial Hospital) | 5.000% | 6/1/19 (ETM) | 490 | 498 |
| Montgomery County PA Higher Education & Health Authority Hospital Revenue | | | | |
| (Abington Memorial Hospital) | 5.000% | 6/1/19 | 510 | 518 |
| Montgomery County PA Higher Education & Health Authority Revenue | | | | |
| (Holy Redeemer Health System) | 4.000% | 10/1/19 | 500 | 506 |
| Montgomery County PA Higher Education & Health Authority Revenue | | | | |
| (Holy Redeemer Health System) | 5.000% | 10/1/20 | 1,260 | 1,310 |
| Montgomery County PA Higher Education & Health Authority Revenue | | | | |
| (Holy Redeemer Health System) | 5.000% | 10/1/21 | 1,320 | 1,393 |
| Montgomery County PA Higher Education & Health Authority Revenue | | | | |
| (Thomas Jefferson University) | 5.000% | 9/1/22 | 825 | 898 |
| Montgomery County PA Higher Education & Health Authority Revenue | | | | |
| (Thomas Jefferson University) | 5.000% | 9/1/23 | 1,275 | 1,410 |
| 2 Montgomery County PA Higher Education & Health Authority Revenue | | | | |
| (Thomas Jefferson University) PUT | 2.320% | 9/1/23 | 9,250 | 9,246 |
| Montgomery County PA Industrial Development Authority Health Services Revenue | | | | |
| (Albert Einstein Healthcare Network) | 5.000% | 1/15/19 | 2,805 | 2,817 |
35
Short-Term Tax-Exempt Fund
| | | | | |
| Face | Market |
| Maturity | Amount | Value• |
| | Coupon | Date | ($000) | ($000) |
| Montgomery County PA Industrial Development Authority Pollution Control Revenue | | | | |
| | (Exelon Generation Co., LLC) PUT | 2.500% | 4/1/20 | 5,000 | 4,979 |
| Montgomery County PA Industrial Development Authority Pollution Control Revenue | | | | |
| | (Exelon Generation Co., LLC) PUT | 2.500% | 4/1/20 | 8,000 | 7,967 |
| Montgomery County PA Industrial Development Authority Pollution Control Revenue | | | | |
| | (Exelon Generation Co., LLC) PUT | 2.550% | 6/1/20 | 11,250 | 11,198 |
| Montgomery County PA Industrial Development Authority Revenue | | | | |
| | (Philadelphia Presbyterian Homes Inc. Project) | 2.000% | 12/1/18 | 570 | 570 |
| Montgomery County PA Industrial Development Authority Revenue | | | | |
| | (Philadelphia Presbyterian Homes Inc. Project) | 2.000% | 12/1/20 | 650 | 641 |
| Montgomery County PA Industrial Development Authority Revenue | | | | |
| | (Philadelphia Presbyterian Homes Inc. Project) | 3.000% | 12/1/22 | 785 | 785 |
| Mount Lebanon PA Hospital Authority Revenue (St. Clair Memorial Hospital Project) | 5.000% | 7/1/21 | 725 | 773 |
| 1 | Mount Lebanon PA School District GO TOB VRDO | 1.650% | 11/7/18 | 15,500 | 15,500 |
| 2 | North Penn PA Water Authority Revenue | 1.862% | 11/1/18 | 700 | 700 |
| 2 | North Penn PA Water Authority Revenue PUT | 2.010% | 11/1/19 | 2,500 | 2,500 |
| Northampton County PA General Purpose Authority Hospital Revenue | | | | |
| | (St. Luke’s Hospital Project) | 4.000% | 8/15/19 | 1,340 | 1,359 |
| Northampton County PA General Purpose Authority Hospital Revenue | | | | |
| | (St. Luke’s Hospital Project) | 5.000% | 8/15/20 | 1,000 | 1,046 |
| 2 | Northampton County PA General Purpose Authority Hospital Revenue | | | | |
| | (St. Luke’s Hospital Project) PUT | 3.000% | 8/15/20 | 8,125 | 8,204 |
| Northampton County PA Industrial Development Authority Revenue | | | | |
| | (Morningstar Senior Living, Inc. Project) | 3.250% | 7/1/19 | 940 | 941 |
| Pennsylvania COP | 5.000% | 7/1/20 | 470 | 489 |
| Pennsylvania COP | 5.000% | 7/1/22 | 300 | 323 |
| Pennsylvania Economic Development Financing Authority Revenue (UPMC Obligated Group) | 4.000% | 11/15/22 | 5,000 | 5,290 |
| 1 | Pennsylvania Economic Development Financing Authority Revenue (UPMC Obligated Group) | | | | |
| | TOB VRDO | 1.700% | 11/7/18 | 3,335 | 3,335 |
| Pennsylvania Economic Development Financing Authority Solid Waste Disposal Revenue | | | | |
| | (Republic Services Inc. Project) PUT | 1.970% | 1/2/19 | 5,005 | 5,005 |
| Pennsylvania Economic Development Financing Authority Unemployment Compensation Revenue | 5.000% | 1/1/20 | 7,290 | 7,439 |
| Pennsylvania Economic Development Financing Authority Unemployment Compensation Revenue | 5.000% | 7/1/20 | 5,265 | 5,373 |
| Pennsylvania GO | 5.000% | 3/1/20 | 11,310 | 11,721 |
| Pennsylvania GO | 5.000% | 1/1/21 | 19,835 | 20,946 |
| Pennsylvania GO | 5.000% | 3/1/21 | 11,900 | 12,613 |
| Pennsylvania GO | 5.000% | 11/15/21 (Prere.) | 10,000 | 10,824 |
| Pennsylvania GO | 5.000% | 11/15/21 (Prere.) | 8,250 | 8,930 |
| Pennsylvania GO | 5.000% | 3/1/22 | 5,100 | 5,512 |
| Pennsylvania GO | 5.000% | 8/15/23 | 10,000 | 11,059 |
| Pennsylvania Higher Educational Facilities Authority Revenue (Higher Education System) | 5.000% | 6/15/20 | 3,575 | 3,733 |
| Pennsylvania Higher Educational Facilities Authority Revenue (Higher Education System) | 5.000% | 6/15/20 | 1,205 | 1,258 |
| Pennsylvania Higher Educational Facilities Authority Revenue (Higher Education System) | 5.000% | 6/15/21 | 4,830 | 5,157 |
| Pennsylvania Higher Educational Facilities Authority Revenue (Higher Education System) | 5.000% | 6/15/21 | 1,285 | 1,372 |
| Pennsylvania Higher Educational Facilities Authority Revenue (Higher Education System) | 5.000% | 6/15/22 | 5,920 | 6,442 |
| Pennsylvania Higher Educational Facilities Authority Revenue (Higher Education System) | 5.000% | 6/15/22 | 1,360 | 1,480 |
| 1 | Pennsylvania Higher Educational Facilities Authority Revenue (Higher Education System) | | | | |
| | TOB VRDO | 1.660% | 11/7/18 | 7,560 | 7,560 |
| Pennsylvania Higher Educational Facilities Authority Revenue (York College) PUT | 2.250% | 4/30/20 | 2,305 | 2,303 |
| Pennsylvania Higher Educational Facilities Authority Revenue (York College) PUT | 2.850% | 5/1/21 | 1,605 | 1,597 |
| 1 | Pennsylvania Intergovernmental Cooperation Authority Special Tax Revenue | | | | |
| | (Philadelphia Funding Program) TOB VRDO | 1.630% | 11/7/18 | 6,315 | 6,315 |
| Pennsylvania State University Revenue | 5.000% | 9/1/19 | 500 | 512 |
| Pennsylvania State University Revenue | 5.000% | 9/1/19 | 4,220 | 4,326 |
| Pennsylvania Turnpike Commission Oil Franchise Tax Revenue | 5.000% | 12/1/18 | 1,250 | 1,253 |
| Pennsylvania Turnpike Commission Oil Franchise Tax Revenue | 5.000% | 12/1/19 | 1,260 | 1,300 |
| 2,3 Pennsylvania Turnpike Commission Revenue | 0.000% | 11/8/18 | 25,000 | 25,000 |
| Pennsylvania Turnpike Commission Revenue | 5.000% | 6/1/19 | 1,320 | 1,343 |
| Pennsylvania Turnpike Commission Revenue | 5.250% | 6/1/19 (Prere.) | 10,080 | 10,273 |
| Pennsylvania Turnpike Commission Revenue | 5.750% | 6/1/19 (Prere.) | 22,000 | 22,484 |
| Pennsylvania Turnpike Commission Revenue | 5.000% | 6/1/20 | 18,520 | 19,330 |
| 2 | Pennsylvania Turnpike Commission Revenue | 1.950% | 12/1/20 | 3,750 | 3,742 |
| 2 | Pennsylvania Turnpike Commission Revenue | 2.870% | 12/1/20 | 1,930 | 1,954 |
| Pennsylvania Turnpike Commission Revenue | 5.000% | 12/1/20 | 325 | 343 |
| 2 | Pennsylvania Turnpike Commission Revenue | 2.030% | 12/1/21 | 10,000 | 9,979 |
| Pennsylvania Turnpike Commission Revenue | 5.000% | 12/1/21 | 375 | 405 |
| Pennsylvania Turnpike Commission Revenue | 5.000% | 12/1/22 | 250 | 275 |
| 3 | Pennsylvania Turnpike Commission Revenue | 5.000% | 12/1/22 | 5,250 | 5,576 |
| Pennsylvania Turnpike Commission Revenue | 5.000% | 6/1/23 | 1,000 | 1,097 |
| 3 | Pennsylvania Turnpike Commission Revenue | 5.000% | 12/1/23 | 4,300 | 4,632 |
36
Short-Term Tax-Exempt Fund
| | | | |
| Face | Market |
| Maturity | Amount | Value• |
| Coupon | Date | ($000) | ($000) |
| 2 Pennsylvania Turnpike Commission Revenue PUT | 2.400% | 12/1/18 | 8,500 | 8,504 |
| 1 Pennsylvania Turnpike Commission Revenue TOB VRDO | 1.800% | 11/7/18 | 1,880 | 1,880 |
| 1 Pennsylvania Turnpike Commission Revenue TOB VRDO | 1.800% | 11/7/18 | 5,595 | 5,595 |
| Philadelphia Gas Works Co. Revenue | 5.000% | 8/1/19 | 5,890 | 6,012 |
| Philadelphia PA Authority for Industrial Development Revenue (Temple University) | 5.000% | 4/1/19 | 1,650 | 1,671 |
| Philadelphia PA Gas Works Revenue | 5.000% | 10/1/19 | 6,510 | 6,674 |
| Philadelphia PA Gas Works Revenue | 5.000% | 10/1/20 | 3,500 | 3,672 |
| Philadelphia PA Gas Works Revenue | 5.000% | 10/1/22 | 3,100 | 3,374 |
| Philadelphia PA Hospitals & Higher Education Facilities Authority Hospital Revenue | | | | |
| (Temple University Health System Obligated Group) | 5.000% | 7/1/20 | 1,005 | 1,038 |
| Philadelphia PA Hospitals & Higher Education Facilities Authority Hospital Revenue | | | | |
| (Temple University Health System Obligated Group) | 5.000% | 7/1/21 | 715 | 750 |
| Philadelphia PA Hospitals & Higher Education Facilities Authority Hospital Revenue | | | | |
| (Temple University Health System Obligated Group) | 5.000% | 7/1/22 | 1,000 | 1,063 |
| Philadelphia PA Hospitals & Higher Education Facilities Authority Hospital Revenue | | | | |
| (Temple University Health System Obligated Group) | 5.000% | 7/1/23 | 1,000 | 1,074 |
| Philadelphia PA School District GO | 5.000% | 9/1/19 | 1,750 | 1,788 |
| Philadelphia PA School District GO | 5.000% | 9/1/19 | 1,750 | 1,788 |
| Philadelphia PA School District GO | 5.000% | 9/1/20 | 2,975 | 3,112 |
| Philadelphia PA School District GO | 5.000% | 9/1/20 | 4,000 | 4,184 |
| Philadelphia PA School District GO | 5.000% | 9/1/21 | 1,100 | 1,173 |
| Philadelphia PA School District GO | 5.000% | 9/1/23 | 845 | 924 |
| Pittsburgh & Allegheny County PA Sports & Exhibition Authority Lease Revenue VRDO | 1.650% | 11/7/18 (4) | 42,770 | 42,770 |
| Pittsburgh & Allegheny County PA Sports & Exhibition Authority Parking System Revenue | 3.000% | 12/15/18 | 620 | 621 |
| Pittsburgh & Allegheny County PA Sports & Exhibition Authority Parking System Revenue | 4.000% | 12/15/20 | 500 | 516 |
| Pittsburgh PA GO | 5.000% | 9/1/21 | 500 | 534 |
| Pittsburgh PA Urban Redevelopment Authority Revenue (Crawford 123 LP) PUT | 2.250% | 6/1/20 | 3,150 | 3,138 |
| Pittsburgh PA Water & Sewer Authority Revenue | 5.000% | 9/1/20 (4) | 12,995 | 13,637 |
| Pittsburgh PA Water & Sewer Authority Revenue | 5.000% | 9/1/21 (4) | 13,650 | 14,650 |
| 2 Pittsburgh PA Water & Sewer Authority Revenue PUT | 2.265% | 12/1/20 (4) | 50,000 | 50,022 |
| Reading PA School District GO | 5.000% | 3/1/22 (4) | 540 | 580 |
| Saint Mary PA Hospital Authority Health System Revenue (Trinity Health Corp Obligated Group) | 5.000% | 11/15/18 | 500 | 500 |
| Saint Mary PA Hospital Authority Health System Revenue (Trinity Health Corp Obligated Group) | 5.000% | 11/15/21 | 1,000 | 1,075 |
| Saint Mary PA Hospital Authority Health System Revenue (Trinity Health Corp Obligated Group) | 5.000% | 11/15/22 | 765 | 837 |
| Scranton PA School District GO | 5.000% | 6/1/19 | 500 | 507 |
| Scranton PA School District GO | 5.000% | 6/1/20 | 645 | 667 |
| 2 Scranton PA School District GO PUT | 2.384% | 4/1/21 | 2,875 | 2,880 |
| Southeastern Pennsylvania Transportation Authority Revenue | 5.000% | 3/1/21 | 675 | 717 |
| Southeastern Pennsylvania Transportation Authority Revenue | 5.000% | 3/1/22 | 300 | 325 |
| Swarthmore Borough PA Authority College Revenue (Swarthmore College) | 5.000% | 9/15/20 | 3,515 | 3,702 |
| 1 Tower Health Obligated Group Pennsylvania TOB VRDO | 1.720% | 11/7/18 | 4,500 | 4,500 |
| University Area Joint Authority Pennsylvania Sewer Revenue | 4.000% | 11/1/20 (15) | 1,535 | 1,585 |
| University Area Joint Authority Pennsylvania Sewer Revenue | 5.000% | 11/1/21 (15) | 1,245 | 1,337 |
| University Area Joint Authority Pennsylvania Sewer Revenue | 5.000% | 11/1/22 (15) | 545 | 596 |
| 1 University of Pittsburgh PA Revenue TOB VRDO | 1.630% | 11/7/18 (Prere.) | 7,500 | 7,500 |
| 1 University of Pittsburgh-of the Commonwealth System of Higher Education TOB VRDO | 1.630% | 11/7/18 (Prere.) | 4,430 | 4,430 |
| West Shore PA Area Authority Revenue (Messiah Lifeways Obligated Group) | 4.000% | 7/1/19 | 860 | 869 |
| 1 Westmoreland County PA Municipal Authority Revenue TOB VRDO | 1.750% | 11/7/18 (15) | 5,665 | 5,665 |
| 1 Westmoreland County PA Municipal Authority Revenue TOB VRDO | 1.750% | 11/7/18 (15) | 3,685 | 3,685 |
| York County PA School of Technology Authority Lease Revenue | 3.000% | 2/15/19 (15) | 300 | 301 |
| York County PA School of Technology Authority Lease Revenue | 4.000% | 2/15/20 (15) | 500 | 511 |
| York County PA School of Technology Authority Lease Revenue | 5.000% | 2/15/21 (15) | 740 | 782 |
| | | | 712,898 |
| Puerto Rico (0.1%) | | | | |
| Puerto Rico Electric Power Authority Power Revenue | 5.000% | 7/1/20 (14) | 1,025 | 1,049 |
| Puerto Rico Electric Power Authority Power Revenue | 5.000% | 7/1/22 (14) | 3,250 | 3,272 |
| Puerto Rico Electric Power Authority Revenue | 5.000% | 7/1/21 (14) | 2,595 | 2,617 |
| Puerto Rico GO | 5.500% | 7/1/20 (14) | 1,700 | 1,753 |
| Puerto Rico GO | 5.500% | 7/1/20 (14) | 515 | 531 |
| | | | 9,222 |
| Rhode Island (0.1%) | | | | |
| Rhode Island Economic Development Corp. Airport Revenue | 5.000% | 7/1/22 | 500 | 539 |
| 1 Rhode Island Health & Educational Building Corp. Higher Education Facilities Revenue | | | | |
| (University of Rhode Island) TOB VRDO | 1.700% | 11/7/18 | 6,670 | 6,670 |
| Rhode Island Health & Educational Building Corp. Hospital Financing Revenue | | | | |
| (Lifespan Obligated Group) | 5.000% | 5/15/19 | 1,760 | 1,784 |
| Rhode Island Health & Educational Building Corp. Hospital Financing Revenue | | | | |
| (Lifespan Obligated Group) | 5.000% | 5/15/20 | 1,650 | 1,710 |
| | | | 10,703 |
37
Short-Term Tax-Exempt Fund
| | | | |
| Face | Market |
| Maturity | Amount | Value• |
| Coupon | Date | ($000) | ($000) |
| South Carolina (0.7%) | | | | |
| Columbia SC Waterworks & Sewer System Revenue VRDO | 1.600% | 11/7/18 LOC | 3,115 | 3,115 |
| Kershaw County SC Public Schools Foundation Installment Purchase Revenue | 5.000% | 12/1/18 | 700 | 701 |
| Kershaw County SC Public Schools Foundation Installment Purchase Revenue | 5.000% | 12/1/19 | 1,050 | 1,085 |
| Lexington County SC Health Services District Inc. Hospital Revenue | 5.000% | 11/1/18 | 750 | 750 |
| Lexington County SC Health Services District Inc. Hospital Revenue | 5.000% | 11/1/19 | 560 | 575 |
| Lexington County SC Health Services District Inc. Hospital Revenue | 5.000% | 11/1/21 | 1,000 | 1,068 |
| Lexington County SC Health Services District Inc. Hospital Revenue | 5.000% | 11/1/21 | 500 | 534 |
| Myrtle Beach SC Tax Increase Revenue (Myrtle Beach Air Force Base Redevelopment Project) | 5.000% | 10/1/20 | 1,000 | 1,050 |
| Patriots Energy Group Finance Authority SC Gas Supply Revenue PUT | 4.000% | 2/1/24 | 10,000 | 10,462 |
| South Carolina Association of Governmental Organizations Educational Facilities Corp. Revenue | | | | |
| (Pickens School District) | 5.000% | 12/1/18 | 1,000 | 1,002 |
| South Carolina Educational Facilities Authority Revenue (Furman University) VRDO | 1.700% | 11/1/18 | 14,450 | 14,450 |
| South Carolina GO | 5.000% | 4/1/19 (ETM) | 1,500 | 1,519 |
| South Carolina Jobs Economic Development Authority Hospital Revenue (AnMed Health Project) | 5.000% | 2/1/20 | 1,310 | 1,354 |
| South Carolina Jobs Economic Development Authority Hospital Revenue (AnMed Health Project) | 5.000% | 2/1/21 | 1,900 | 2,009 |
| South Carolina Public Service Authority Revenue | 5.500% | 1/1/19 (Prere.) | 7,205 | 7,248 |
| South Carolina Public Service Authority Revenue | 4.000% | 12/1/19 (ETM) | 2,715 | 2,772 |
| South Carolina Public Service Authority Revenue | 5.000% | 12/1/19 | 2,150 | 2,209 |
| South Carolina Public Service Authority Revenue | 5.000% | 12/1/19 | 8,850 | 9,095 |
| South Carolina Public Service Authority Revenue | 5.000% | 12/1/19 | 1,475 | 1,516 |
| South Carolina Public Service Authority Revenue | 5.000% | 12/1/19 | 1,250 | 1,285 |
| South Carolina Public Service Authority Revenue | 4.000% | 12/1/20 (ETM) | 450 | 467 |
| South Carolina Public Service Authority Revenue | 5.000% | 12/1/20 | 4,125 | 4,328 |
| South Carolina Public Service Authority Revenue | 5.000% | 12/1/20 | 21,000 | 22,031 |
| South Carolina Public Service Authority Revenue | 5.000% | 12/1/21 | 2,850 | 3,041 |
| South Carolina Public Service Authority Revenue | 5.000% | 12/1/21 | 1,100 | 1,174 |
| South Carolina Public Service Authority Revenue | 5.000% | 12/1/21 | 2,135 | 2,278 |
| South Carolina Public Service Authority Revenue | 5.000% | 12/1/22 | 1,110 | 1,191 |
| 1 South Carolina Public Service Authority Revenue TOB VRDO | 1.850% | 11/7/18 | 3,295 | 3,295 |
| 1 South Carolina Public Service Authority TOB VRDO | 1.850% | 11/7/18 | 2,300 | 2,300 |
| South Carolina Transportation Infrastructure Revenue | 5.000% | 10/1/21 | 4,000 | 4,297 |
| Sumter Two School Facilities Inc. South Carolina Installment Purchase Revenue | 4.000% | 12/1/18 (15) | 1,715 | 1,717 |
| | | | 109,918 |
| South Dakota (0.0%) | | | | |
| South Dakota Health & Educational Facilities Authority Revenue | | | | |
| (Regional Health System Obligated Group) | 5.000% | 9/1/19 | 1,840 | 1,884 |
| South Dakota Health & Educational Facilities Authority Revenue | | | | |
| (Regional Health System Obligated Group) | 5.000% | 9/1/20 | 1,130 | 1,187 |
| South Dakota Health & Educational Facilities Authority Revenue | | | | |
| (Regional Health System Obligated Group) | 5.000% | 9/1/21 | 1,500 | 1,609 |
| South Dakota Health & Educational Facilities Authority Revenue (Sanford Health) | 3.000% | 11/1/18 | 500 | 500 |
| South Dakota Health & Educational Facilities Authority Revenue (Sanford Health) | 4.000% | 11/1/18 | 800 | 800 |
| South Dakota Health & Educational Facilities Authority Revenue (Sanford Health) | 4.000% | 11/1/19 | 395 | 402 |
| South Dakota Health & Educational Facilities Authority Revenue (Sanford Health) | 5.000% | 11/1/19 | 600 | 617 |
| | | | 6,999 |
| Tennessee (2.1%) | | | | |
| Clarksville TN Public Building Authority Revenue (Morristown) VRDO | 1.710% | 11/1/18 LOC | 13,985 | 13,985 |
| Clarksville TN Public Building Authority Revenue (Pooled Financing) VRDO | 1.710% | 11/1/18 LOC | 1,600 | 1,600 |
| Clarksville TN Public Building Authority Revenue (Pooled Financing) VRDO | 1.710% | 11/1/18 LOC | 11,470 | 11,470 |
| Clarksville TN Public Building Authority Revenue (Pooled Financing) VRDO | 1.710% | 11/1/18 LOC | 8,060 | 8,060 |
| Clarksville TN Public Building Authority Revenue (Pooled Financing) VRDO | 1.710% | 11/1/18 LOC | 13,165 | 13,165 |
| Greeneville TN Health & Educational Facilities Board Hospital Revenue (Ballad Health) | 5.000% | 7/1/19 | 1,575 | 1,604 |
| Greeneville TN Health & Educational Facilities Board Hospital Revenue (Ballad Health) | 5.000% | 7/1/20 | 1,500 | 1,563 |
| Greeneville TN Health & Educational Facilities Board Hospital Revenue (Ballad Health) | 5.000% | 7/1/21 | 1,075 | 1,144 |
| Greeneville TN Health & Educational Facilities Board Hospital Revenue (Ballad Health) | 5.000% | 7/1/22 | 1,250 | 1,354 |
| Greeneville TN Health & Educational Facilities Board Hospital Revenue (Ballad Health) | 5.000% | 7/1/23 | 900 | 989 |
| Hamilton County TN GO | 5.000% | 1/1/21 | 1,200 | 1,241 |
| Hamilton County TN GO | 5.000% | 4/1/21 | 10,810 | 11,533 |
| Knox County TN GO | 5.000% | 6/1/21 | 1,435 | 1,538 |
| Knox County TN Health Educational & Housing Facilities Board Hospital Facilities Revenue | | | | |
| (Covenant Healthcare) | 5.000% | 1/1/19 | 2,925 | 2,938 |
| Knox County TN Health Educational & Housing Facilities Board Hospital Facilities Revenue | | | | |
| (University Health System Inc.) | 4.000% | 4/1/19 | 400 | 402 |
| Knox County TN Health Educational & Housing Facilities Board Hospital Facilities Revenue | | | | |
| (University Health System Inc.) | 5.000% | 9/1/19 | 385 | 393 |
| Knox County TN Health Educational & Housing Facilities Board Hospital Facilities Revenue | | | | |
| (University Health System Inc.) | 5.000% | 4/1/20 | 395 | 407 |
38
Short-Term Tax-Exempt Fund
| | | | |
| Face | Market |
| Maturity | Amount | Value• |
| Coupon | Date | ($000) | ($000) |
| Knox County TN Health Educational & Housing Facilities Board Hospital Facilities Revenue | | | | |
| (University Health System Inc.) | 5.000% | 9/1/20 | 1,000 | 1,039 |
| Knox County TN Health Educational & Housing Facilities Board Hospital Facilities Revenue | | | | |
| (University Health System Inc.) | 4.000% | 4/1/21 | 635 | 652 |
| Metropolitan Government of Nashville & Davidson County TN GO | 5.000% | 7/1/19 | 3,200 | 3,265 |
| Metropolitan Government of Nashville & Davidson County TN Health & | | | | |
| Educational Facilities Board Revenue (Ascension Health Credit Group) PUT | 1.550% | 11/3/20 | 17,550 | 17,243 |
| Montgomery County TN Public Building Authority Pooled Financial Revenue | | | | |
| (Tennessee County Loan Pool) VRDO | 1.710% | 11/1/18 LOC | 1,200 | 1,200 |
| Montgomery County TN Public Building Authority Pooled Financial Revenue | | | | |
| (Tennessee County Loan Pool) VRDO | 1.710% | 11/1/18 LOC | 30,980 | 30,980 |
| Montgomery County TN Public Building Authority Pooled Financial Revenue | | | | |
| (Tennessee County Loan Pool) VRDO | 1.710% | 11/1/18 LOC | 12,825 | 12,825 |
| Murfreesboro TN GO | 5.000% | 6/1/19 | 2,160 | 2,198 |
| Shelby County TN GO | 5.000% | 4/1/19 | 750 | 760 |
| Shelby County TN GO | 5.000% | 3/1/21 | 1,210 | 1,289 |
| Shelby County TN Health Educational & Housing Facility Board Revenue | | | | |
| (Methodist Le Bonheur Healthcare) | 5.000% | 5/1/20 | 1,000 | 1,041 |
| Shelby County TN Health Educational & Housing Facility Board Revenue | | | | |
| (Methodist Le Bonheur Healthcare) VRDO | 1.650% | 11/1/18 (4) | 54,085 | 54,085 |
| Shelby County TN Health Educational & Housing Facility Board Revenue | | | | |
| (Methodist Le Bonheur Healthcare) VRDO | 1.670% | 11/1/18 (4) | 36,160 | 36,160 |
| Tennessee Energy Acquisition Corp. Gas Revenue | 5.000% | 2/1/19 | 8,815 | 8,873 |
| Tennessee Energy Acquisition Corp. Gas Revenue | 5.250% | 9/1/19 | 22,540 | 23,098 |
| Tennessee Energy Acquisition Corp. Gas Revenue | 5.000% | 2/1/20 | 3,500 | 3,605 |
| Tennessee Energy Acquisition Corp. Gas Revenue | 5.250% | 9/1/20 | 2,500 | 2,622 |
| Tennessee Energy Acquisition Corp. Gas Revenue | 5.000% | 2/1/23 | 2,500 | 2,703 |
| Tennessee Energy Acquisition Corp. Gas Revenue PUT | 4.000% | 5/1/23 | 37,750 | 39,150 |
| Tennessee GO | 5.000% | 8/1/21 | 1,000 | 1,076 |
| Tennessee GO | 5.000% | 2/1/22 | 7,270 | 7,909 |
| Tennessee GO | 4.000% | 8/1/22 | 6,865 | 7,299 |
| Tennessee School Bond Authority Higher Educational Facilities Revenue (2nd Program) | 5.000% | 11/1/21 | 2,500 | 2,701 |
| Williamson County TN GO | 5.000% | 4/1/19 | 4,070 | 4,122 |
| Williamson County TN GO | 5.000% | 4/1/21 | 500 | 534 |
| Williamson County TN GO | 5.000% | 4/1/21 | 2,800 | 2,988 |
| | | | 342,803 |
| Texas (14.4%) | | | | |
| Aldine TX Independent School District GO | 5.000% | 2/15/19 | 2,320 | 2,340 |
| Aldine TX Independent School District GO | 5.000% | 2/15/20 | 8,875 | 9,203 |
| Alvin TX Independent School District GO PUT | 1.400% | 8/15/20 | 12,500 | 12,302 |
| Alvin TX Independent School District GO PUT | 2.150% | 8/15/21 | 7,500 | 7,432 |
| Arlington TX Independent School District GO | 4.000% | 2/15/19 | 1,225 | 1,232 |
| Arlington TX Independent School District GO | 5.000% | 2/15/20 | 1,200 | 1,244 |
| Austin Convention Enterprises Inc. Texas Convention Center Revenue | 5.000% | 1/1/19 | 650 | 653 |
| Austin Convention Enterprises Inc. Texas Convention Center Revenue | 5.000% | 1/1/19 | 600 | 602 |
| Austin Convention Enterprises Inc. Texas Convention Center Revenue | 5.000% | 1/1/20 | 650 | 670 |
| Austin Convention Enterprises Inc. Texas Convention Center Revenue | 5.000% | 1/1/20 | 500 | 516 |
| Austin Convention Enterprises Inc. Texas Convention Center Revenue | 5.000% | 1/1/21 | 560 | 591 |
| Austin Convention Enterprises Inc. Texas Convention Center Revenue | 5.000% | 1/1/21 | 530 | 560 |
| Austin TX Affordable Multifamily Housing Revenue (Commons at Goodnight Apartments) PUT | 1.850% | 7/1/20 | 10,000 | 9,867 |
| Austin TX Community College District Public Facilities Corp. Lease Revenue | 5.000% | 8/1/20 | 200 | 210 |
| Austin TX Community College District Public Facilities Corp. Lease Revenue | 5.000% | 8/1/21 | 150 | 160 |
| Austin TX Community College District Public Facilities Corp. Lease Revenue | 5.000% | 8/1/22 | 150 | 163 |
| 5 Austin TX GO | 5.000% | 9/1/19 | 2,865 | 2,935 |
| Bexar County TX GO | 5.000% | 6/15/20 | 7,840 | 8,195 |
| Bexar County TX GO | 5.000% | 6/15/20 | 2,595 | 2,712 |
| Brazosport TX Independent School District GO | 5.000% | 2/15/19 | 5,690 | 5,739 |
| Central Texas Regional Mobility Authority Revenue | 5.750% | 1/1/19 | 630 | 634 |
| Central Texas Regional Mobility Authority Revenue | 5.750% | 1/1/20 | 700 | 727 |
| Central Texas Regional Mobility Authority Revenue | 5.000% | 1/1/21 | 1,000 | 1,053 |
| 3 Central Texas Regional Mobility Authority Revenue | 4.000% | 1/1/22 | 3,500 | 3,630 |
| Central Texas Regional Mobility Authority Revenue PUT | 5.000% | 1/7/21 | 5,500 | 5,636 |
| Clear Creek TX Independent School District GO | 5.000% | 2/15/19 | 2,525 | 2,547 |
| Clear Creek TX Independent School District GO PUT | 1.450% | 8/14/20 | 9,950 | 9,801 |
| Clear Creek TX Independent School District GO PUT | 2.150% | 8/16/21 | 7,500 | 7,424 |
| Coastal Bend TX Health Facilities Development Corp. Hospital Revenue (CHRISTUS Health) | 1.990% | 11/8/18 (4) | 4,900 | 4,900 |
| Colorado River TX Municipal Water District Revenue | 5.000% | 1/1/21 | 770 | 814 |
| Conroe TX Independent School District GO | 5.000% | 2/15/19 | 3,345 | 3,374 |
| Conroe TX Independent School District GO | 5.000% | 2/15/20 | 2,230 | 2,312 |
39
Short-Term Tax-Exempt Fund
| | | | | |
| Face | Market |
| Maturity | Amount | Value• |
| | Coupon | Date | ($000) | ($000) |
| Corpus Christi TX Independent School District GO PUT | 2.000% | 8/15/19 | 2,750 | 2,746 |
| Cypress-Fairbanks TX Independent School District GO | 5.000% | 2/15/22 | 4,020 | 4,268 |
| Cypress-Fairbanks TX Independent School District GO | 4.000% | 2/15/24 | 10,140 | 10,767 |
| Cypress-Fairbanks TX Independent School District GO PUT | 2.500% | 8/15/19 | 17,000 | 17,043 |
| Cypress-Fairbanks TX Independent School District GO PUT | 4.000% | 8/15/19 | 19,290 | 19,563 |
| Cypress-Fairbanks TX Independent School District GO PUT | 1.400% | 8/17/20 | 5,000 | 4,921 |
| Cypress-Fairbanks TX Independent School District GO PUT | 1.400% | 8/17/20 | 5,375 | 5,290 |
| Cypress-Fairbanks TX Independent School District GO PUT | 3.000% | 8/17/20 | 5,700 | 5,768 |
| Dallas TX Area Rapid Transit Sales Tax Revenue | 5.250% | 12/1/18 (Prere.) | 12,000 | 12,033 |
| Dallas TX GO | 5.000% | 2/15/19 | 6,215 | 6,269 |
| Dallas TX GO | 5.000% | 2/15/19 | 8,565 | 8,639 |
| Dallas TX GO | 5.000% | 2/15/20 | 1,255 | 1,301 |
| Dallas TX GO | 5.000% | 2/15/20 | 7,165 | 7,426 |
| Dallas TX Independent School District GO | 5.000% | 2/15/19 | 5,500 | 5,548 |
| Dallas TX Independent School District GO PUT | 5.000% | 2/15/19 | 14,000 | 14,114 |
| Dallas TX Independent School District GO PUT | 5.000% | 2/15/20 | 15,000 | 15,518 |
| Dallas TX Waterworks & Sewer System Revenue | 5.000% | 10/1/20 | 3,000 | 3,158 |
| Deer Park TX Independent School District GO PUT | 3.000% | 10/1/19 | 8,580 | 8,642 |
| Denton County TX GO | 4.000% | 7/15/19 | 2,500 | 2,535 |
| Denton County TX GO | 5.000% | 7/15/20 | 1,100 | 1,152 |
| Dickinson TX Independent School District GO PUT | 1.350% | 8/1/19 | 2,750 | 2,733 |
| Eagle Mountain & Saginaw TX Independent School District GO | 5.000% | 8/15/19 | 1,435 | 1,469 |
| Eagle Mountain & Saginaw TX Independent School District GO PUT | 2.000% | 8/1/19 | 10,000 | 9,987 |
| El Paso TX GO | 5.000% | 8/15/19 | 3,500 | 3,580 |
| El Paso TX Water & Sewer Revenue | 4.000% | 3/1/19 | 1,475 | 1,485 |
| El Paso TX Water & Sewer Revenue | 4.000% | 3/1/19 | 1,000 | 1,007 |
| Fort Bend County TX GO | 5.000% | 3/1/19 | 2,000 | 2,020 |
| Fort Bend TX Independent School District GO | 5.000% | 8/15/22 | 2,455 | 2,577 |
| Fort Bend TX Independent School District GO PUT | 1.350% | 8/1/19 | 3,885 | 3,861 |
| Fort Bend TX Independent School District GO PUT | 1.350% | 8/1/20 | 5,580 | 5,489 |
| Fort Bend TX Independent School District GO PUT | 1.500% | 8/1/21 | 5,385 | 5,244 |
| Fort Worth TX GO | 5.000% | 3/1/19 | 5,000 | 5,050 |
| 1 | Fort Worth TX Special Tax Revenue TOB VRDO | 1.770% | 11/7/18 | 11,675 | 11,675 |
| Fort Worth TX Water & Sewer Revenue | 5.000% | 2/15/20 | 4,005 | 4,155 |
| Fort Worth TX Water & Sewer Revenue | 5.000% | 2/15/20 | 1,680 | 1,743 |
| Fort Worth TX Water & Sewer Revenue | 5.250% | 2/15/21 | 1,880 | 1,955 |
| Friendswood TX Independent School District GO | 5.000% | 2/15/19 | 1,810 | 1,826 |
| Frisco TX GO | 4.000% | 2/15/19 | 7,650 | 7,695 |
| Frisco TX GO | 5.000% | 2/15/20 | 8,435 | 8,745 |
| Frisco TX Independent School District GO | 5.000% | 8/15/21 | 1,500 | 1,612 |
| Galveston County TX GO | 4.000% | 2/1/19 | 500 | 503 |
| Galveston County TX GO | 4.000% | 2/1/20 | 1,200 | 1,229 |
| Garland TX GO | 5.000% | 2/15/19 | 3,000 | 3,026 |
| Georgetown TX Independent School District GO PUT | 2.500% | 8/1/19 | 1,500 | 1,504 |
| Georgetown TX Independent School District GO PUT | 2.000% | 8/1/20 | 12,000 | 12,231 |
| Georgia GO PUT | 1.950% | 8/14/20 | 6,750 | 6,708 |
| Goose Creek TX Consolidated Independent School District GO | 5.000% | 2/15/21 | 6,135 | 6,514 |
| Goose Creek TX Consolidated Independent School District GO | 5.000% | 2/15/23 | 1,650 | 1,747 |
| Goose Creek TX Consolidated Independent School District GO PUT | 1.180% | 8/15/19 | 5,000 | 4,962 |
| Grand Parkway Transportation Corp. Texas System Toll Revenue PUT | 5.000% | 10/1/23 | 15,000 | 16,599 |
| Grand Parkway Transportation Corp. Texas BAN | 5.000% | 2/1/23 | 87,200 | 95,267 |
| Grand Prairie TX Independent School District GO | 5.000% | 2/15/19 | 2,420 | 2,441 |
| 1,2 Grapevine-Colleyville TX Independent School District GO PUT TOB | 1.750% | 1/3/19 | 22,035 | 22,035 |
| Grapevine-Colleyville TX Independent School District GO PUT | 2.000% | 8/1/20 | 3,750 | 3,742 |
| Harlandale TX Independent School District GO PUT | 3.000% | 8/15/21 | 13,775 | 13,899 |
| 2 | Harris County TX Cultural Education Facilities Finance Corp. Hospital Revenue | | | | |
| | (Memorial Hermann Healthcare System) | 2.430% | 6/1/21 | 1,000 | 1,012 |
| 1 | Harris County TX Cultural Education Facilities Finance Corp. Hospital Revenue | | | | |
| | (Memorial Hermann Healthcare System) TOB VRDO | 1.690% | 11/1/18 LOC | 5,740 | 5,740 |
| 2 | Harris County TX Cultural Education Facilities Finance Corp. Revenue | | | | |
| | (Texas Children’s Hospital) PUT | 2.410% | 6/1/20 | 32,500 | 32,714 |
| Harris County TX Cultural Education Facilities Finance Corp. Thermal Utility Revenue | | | | |
| | (TECO Project) | 5.000% | 11/15/19 | 500 | 515 |
| Harris County TX Cultural Education Facilities Finance Corp. Thermal Utility Revenue | | | | |
| | (TECO Project) | 5.000% | 11/15/20 | 860 | 907 |
| Harris County TX GO | 5.000% | 10/1/19 | 1,550 | 1,592 |
| Harris County TX GO | 5.000% | 8/15/20 | 4,250 | 4,459 |
| Harris County TX GO | 5.000% | 10/1/20 | 4,635 | 4,879 |
| Harris County TX GO | 5.000% | 10/1/20 | 3,005 | 3,163 |
| Harris County TX Health Facilities Development Corp. Hospital Revenue (CHRISTUS Health) | 1.990% | 11/8/18 (4) | 900 | 900 |
40
Short-Term Tax-Exempt Fund
| | | | |
| Face | Market |
| Maturity | Amount | Value• |
| Coupon | Date | ($000) | ($000) |
| Harris County TX Health Facilities Development Corp. Hospital Revenue (CHRISTUS Health) | 1.990% | 11/8/18 (4) | 4,450 | 4,450 |
| Harris County TX Health Facilities Development Corp. Revenue | | | | |
| (Methodist Hospital System) VRDO | 1.700% | 11/1/18 | 12,600 | 12,600 |
| 1 Harris County TX Metropolitan Transit Authority Sales & Use Tax Revenue TOB VRDO | 1.630% | 11/7/18 | 6,660 | 6,660 |
| 1 Harris TX TOB VRDO | 1.630% | 11/7/18 | 24,835 | 24,835 |
| Hays County TX GO | 5.000% | 2/15/22 | 600 | 650 |
| Houston TX GO | 5.000% | 3/1/19 (Prere.) | 10,500 | 10,607 |
| Houston TX GO | 5.000% | 3/1/19 (Prere.) | 1,145 | 1,157 |
| Houston TX GO | 5.000% | 3/1/20 | 15,000 | 15,561 |
| Houston TX GO | 5.000% | 3/1/20 | 3,030 | 3,143 |
| Houston TX GO | 5.000% | 3/1/20 | 1,275 | 1,287 |
| Houston TX GO | 5.000% | 3/1/20 | 2,500 | 2,594 |
| Houston TX GO | 5.000% | 3/1/21 | 17,850 | 18,975 |
| Houston TX GO | 5.000% | 3/1/21 | 2,500 | 2,650 |
| Houston TX GO | 5.000% | 3/1/22 | 3,000 | 3,259 |
| Houston TX GO | 5.000% | 3/1/23 | 1,750 | 1,936 |
| Houston TX Independent School District GO | 5.000% | 2/15/20 | 18,970 | 19,671 |
| Houston TX Independent School District GO | 5.000% | 2/15/21 | 17,510 | 18,593 |
| Houston TX Independent School District GO PUT | 1.375% | 6/1/19 | 1,000 | 996 |
| Houston TX Independent School District GO PUT | 3.000% | 6/1/19 | 27,520 | 27,662 |
| Houston TX Independent School District GO PUT | 2.200% | 6/1/20 | 6,000 | 5,993 |
| Houston TX Independent School District GO PUT | 2.400% | 6/1/21 | 3,000 | 2,995 |
| Houston TX Independent School District GO PUT | 2.400% | 6/1/21 | 3,400 | 3,390 |
| Houston TX Utility System Revenue | 5.000% | 11/15/18 | 1,750 | 1,752 |
| Houston TX Utility System Revenue | 4.000% | 11/15/20 | 1,780 | 1,843 |
| Houston TX Utility System Revenue | 4.000% | 11/15/21 | 1,795 | 1,884 |
| 2 Houston TX Utility System Revenue PUT | 2.500% | 5/1/20 | 36,500 | 36,701 |
| 2 Houston TX Utility System Revenue PUT | 1.957% | 8/1/21 | 42,600 | 42,482 |
| Humble TX Independent School District GO | 5.000% | 2/15/19 | 1,135 | 1,145 |
| Humble TX Independent School District GO | 5.000% | 2/15/20 | 2,060 | 2,137 |
| Hurst-Euless-Bedford TX Independent School District GO | 5.000% | 8/15/21 | 1,250 | 1,342 |
| Hurst-Euless-Bedford TX Independent School District GO | 5.000% | 8/15/22 | 1,000 | 1,095 |
| Irving TX Independent School District GO | 5.000% | 2/15/20 | 2,000 | 2,074 |
| Katy TX Independent School District GO | 5.000% | 2/15/19 | 2,500 | 2,522 |
| Katy TX Independent School District GO | 5.000% | 2/15/20 | 2,600 | 2,696 |
| 2 Katy TX Independent School District GO PUT | 2.077% | 8/15/19 | 17,165 | 17,176 |
| Kerrville TX Health Facilities Development Corp. Hospital Revenue | | | | |
| (Peterson Regional Medical Center Project) | 4.000% | 8/15/19 | 1,100 | 1,112 |
| Klein TX Independent School District GO | 5.000% | 8/1/19 | 2,025 | 2,071 |
| Lake Travis TX Independent School District Revenue GO PUT | 2.625% | 2/15/22 | 5,000 | 5,023 |
| Lamar TX Consolidated Independent School District GO PUT | 1.950% | 8/17/20 | 15,500 | 15,402 |
| Leander TX Independent School District GO | 5.000% | 8/15/21 | 1,000 | 1,075 |
| Lewisville TX Independent School District GO | 5.000% | 8/15/19 | 3,775 | 3,864 |
| Lewisville TX Independent School District GO | 5.000% | 8/15/22 | 1,185 | 1,300 |
| Lone Star College System Texas GO | 5.000% | 2/15/21 | 1,000 | 1,062 |
| 1 Lone Star College System Texas GO TOB VRDO | 1.630% | 11/7/18 (Prere.) | 17,400 | 17,400 |
| Longview TX Independent School District GO | 5.000% | 2/15/20 | 1,000 | 1,037 |
| Lower Colorado River Authority Texas Revenue | 5.000% | 5/15/21 | 675 | 703 |
| 1 Lower Colorado River Authority Texas Transmission Contract Revenue | | | | |
| (LCRA Transmission Services Corp.) TOB VRDO | 1.720% | 11/7/18 | 5,370 | 5,370 |
| Lubbock TX GO | 5.000% | 2/15/19 | 1,000 | 1,009 |
| Lubbock TX GO | 5.000% | 2/15/20 | 1,150 | 1,192 |
| Lubbock TX GO | 5.000% | 2/15/20 | 1,010 | 1,047 |
| Mansfield TX Independent School District GO PUT | 2.500% | 8/1/21 | 6,435 | 6,454 |
| Midlothian Independent School District GO PUT | 2.500% | 8/1/20 | 5,500 | 5,518 |
| Mission TX Economic Development Corp. Solid Waste Disposal Revenue | | | | |
| (Allied Waste Inc. Project) PUT | 1.970% | 1/2/19 | 17,075 | 17,074 |
| Missouri City TX GO | 4.000% | 6/15/19 | 1,000 | 1,012 |
| New Caney TX Independent School District GO PUT | 3.000% | 8/15/21 | 7,500 | 7,612 |
| New Hope TX Cultural Education Facilities FinanceCorp. Hospital Revenue | | | | |
| (Children’s Health System of Texas Obligated Group) | 5.000% | 8/15/21 | 1,855 | 1,989 |
| New Hope TX Cultural Education Facilities FinanceCorp. Retirement Facilities Revenue | | | | |
| (Westminster Manor Project) | 4.000% | 11/1/21 | 730 | 754 |
| North East TX Independent School District GO | 5.000% | 8/1/21 | 1,160 | 1,245 |
| North East TX Independent School District GO PUT | 1.420% | 8/1/21 | 565 | 548 |
| North East TX Independent School District GO PUT | 2.375% | 8/1/22 | 7,000 | 6,954 |
| North East TX Regional Mobility Authority Revenue | 5.000% | 1/1/20 | 650 | 669 |
| North Texas Municipal Water District Regional Wastewater System Revenue | 5.000% | 6/1/20 | 1,410 | 1,471 |
| North Texas Municipal Water District Regional Wastewater System Revenue | 5.000% | 6/1/21 | 1,450 | 1,551 |
41
Short-Term Tax-Exempt Fund
| | | | |
| Face | Market |
| Maturity | Amount | Value• |
| Coupon | Date | ($000) | ($000) |
| North Texas Municipal Water District Upper East Fork Wastewater Interceptor System Revenue | 5.000% | 6/1/21 | 1,540 | 1,647 |
| North Texas Municipal Water District Wastewater System Revenue (Upper East Interceptor) | 5.000% | 6/1/20 | 1,405 | 1,466 |
| North Texas Municipal Water District Water System Revenue | 5.000% | 9/1/19 | 6,105 | 6,252 |
| North Texas Municipal Water District Water System Revenue | 5.250% | 9/1/22 | 4,405 | 4,822 |
| North Texas Tollway Authority System Revenue | 5.000% | 1/1/19 | 700 | 703 |
| North Texas Tollway Authority System Revenue | 5.000% | 1/1/19 | 2,265 | 2,276 |
| North Texas Tollway Authority System Revenue | 5.000% | 1/1/20 | 2,075 | 2,143 |
| North Texas Tollway Authority System Revenue | 5.000% | 1/1/21 | 4,000 | 4,232 |
| North Texas Tollway Authority System Revenue | 5.000% | 1/1/22 | 2,500 | 2,702 |
| North Texas Tollway Authority System Revenue | 5.000% | 1/1/23 | 2,625 | 2,886 |
| North Texas Tollway Authority System Revenue | 5.000% | 1/1/23 | 2,625 | 2,875 |
| 2 North Texas Tollway Authority System Revenue PUT | 2.400% | 1/1/19 | 13,580 | 13,583 |
| 2 North Texas Tollway Authority System Revenue PUT | 2.270% | 1/1/20 | 33,940 | 34,031 |
| 1 North Texas Tollway Authority System Revenue TOB VRDO | 1.800% | 11/7/18 | 5,400 | 5,400 |
| North Texas Tollway Authority System Revenue VRDO | 1.620% | 11/7/18 LOC | 59,205 | 59,205 |
| Northside Independent School District Texas GO PUT | 2.750% | 8/1/23 | 15,840 | 15,903 |
| Northside Independent School District Texas GO | 5.000% | 2/15/19 | 2,505 | 2,527 |
| Northside Independent School District Texas GO | 5.000% | 8/1/20 | 2,315 | 2,427 |
| Northside Independent School District Texas GO PUT | 1.450% | 6/1/20 | 15,935 | 15,733 |
| Northside Independent School District Texas GO PUT | 2.125% | 8/1/20 | 7,320 | 7,306 |
| Northside Independent School District Texas GO PUT | 1.750% | 6/1/22 | 1,760 | 1,709 |
| Northside Independent School District Texas GO | 5.000% | 2/15/21 | 1,000 | 1,062 |
| Pasadena TX Independent School District GO VRDO | 1.600% | 11/7/18 (4) | 31,840 | 31,840 |
| Pflugerville TX Independent School District GO | 5.000% | 2/15/20 | 1,700 | 1,763 |
| Plano TX Independent School District GO | 5.000% | 2/15/19 | 2,335 | 2,356 |
| Red River TX Education Finance Revenue (Texas Christian University) VRDO | 1.640% | 11/7/18 | 39,600 | 39,600 |
| Richardson TX Independent School District GO | 5.000% | 2/15/19 | 1,920 | 1,937 |
| Rockwall TX GO | 5.000% | 8/1/19 | 2,300 | 2,350 |
| Round Rock TX Independent School District GO | 5.000% | 8/1/19 | 1,795 | 1,835 |
| Round Rock TX Independent School District GO | 5.000% | 8/1/20 | 1,000 | 1,049 |
| San Antonio TX Electric & Gas Systems Revenue | 5.000% | 2/1/19 | 16,360 | 16,485 |
| San Antonio TX Electric & Gas Systems Revenue | 5.000% | 2/1/19 | 3,000 | 3,023 |
| 3 San Antonio TX Electric & Gas Systems Revenue | 5.000% | 2/1/20 | 5,450 | 5,645 |
| 3 San Antonio TX Electric & Gas Systems Revenue | 5.000% | 2/1/21 | 6,000 | 6,369 |
| San Antonio TX Electric & Gas Systems Revenue PUT | 1.750% | 12/1/18 | 11,000 | 11,000 |
| San Antonio TX Electric & Gas Systems Revenue PUT | 2.000% | 12/1/18 | 10,150 | 10,152 |
| San Antonio TX Electric & Gas Systems Revenue PUT | 2.000% | 12/1/18 | 15,000 | 15,002 |
| San Antonio TX Electric & Gas Systems Revenue PUT | 3.000% | 12/1/19 | 45,000 | 45,382 |
| San Antonio TX Electric & Gas Systems Revenue PUT | 2.000% | 12/1/21 | 31,010 | 30,426 |
| San Antonio TX GO | 5.000% | 2/1/20 | 2,000 | 2,072 |
| San Antonio TX Independent School District GO | 5.000% | 2/15/19 | 5,000 | 5,044 |
| San Antonio TX Water Revenue | 5.000% | 5/15/19 | 250 | 254 |
| San Antonio TX Water Revenue PUT | 2.000% | 11/1/21 | 2,695 | 2,649 |
| San Antonio TX Water Revenue PUT | 2.000% | 11/1/22 | 13,000 | 12,701 |
| Southwest Texas Higher Education Authority Inc. Revenue | | | | |
| (Southern Methodist University Project) | 5.000% | 10/1/21 | 500 | 537 |
| Southwest Texas Higher Education Authority Inc. Revenue | | | | |
| (Southern Methodist University Project) | 5.000% | 10/1/22 | 500 | 547 |
| Spring Branch TX Independent School District GO | 5.000% | 2/1/19 | 2,615 | 2,635 |
| Spring Branch TX Independent School District GO | 5.000% | 2/1/20 | 1,915 | 1,984 |
| Spring TX Independent School District GO | 5.000% | 8/15/19 | 1,000 | 1,024 |
| 1 Tarrant County TX Cultural Education Facilities Finance Corp. Hospital Revenue | | | | |
| (Baylor Scott & White Healthcare Project) TOB VRDO | 1.630% | 11/7/18 | 4,620 | 4,620 |
| Tarrant County TX Cultural Education Facilities Finance Corp. Revenue (CHRISTUS Health) | 5.000% | 7/1/21 | 1,105 | 1,179 |
| Tarrant County TX Cultural Education Facilities Finance Corp. Revenue (CHRISTUS Health) | 5.000% | 7/1/22 | 875 | 950 |
| Tarrant County TX Cultural Education Facilities Finance Corp. Revenue (CHRISTUS Health) | 5.000% | 7/1/23 | 750 | 826 |
| Texas A&M University System Revenue Board of Regents Revenue | 5.000% | 5/15/20 | 7,000 | 7,307 |
| Texas A&M University System Revenue Board of Regents Revenue | 5.000% | 5/15/21 | 1,000 | 1,069 |
| Texas A&M University System Revenue Board of Regents Revenue | 5.000% | 5/15/21 | 2,460 | 2,631 |
| Texas A&M University System Revenue Board of Regents Revenue | 5.000% | 5/15/21 | 1,755 | 1,877 |
| Texas GO | 4.000% | 8/1/19 | 1,320 | 1,340 |
| Texas GO | 5.000% | 10/1/19 | 14,195 | 14,585 |
| Texas GO | 5.000% | 10/1/19 | 1,000 | 1,027 |
| Texas GO | 5.000% | 8/1/20 | 1,000 | 1,050 |
| Texas GO | 5.000% | 8/1/20 | 1,000 | 1,050 |
| Texas GO | 5.000% | 10/1/20 | 1,250 | 1,317 |
| Texas GO | 5.000% | 8/1/21 | 1,000 | 1,074 |
| Texas GO | 5.000% | 8/1/22 | 2,500 | 2,690 |
| Texas GO | 5.000% | 8/1/23 | 1,500 | 1,618 |
42
Short-Term Tax-Exempt Fund
| | | | |
| Face | Market |
| Maturity | Amount | Value• |
| Coupon | Date | ($000) | ($000) |
| Texas GO VRDO | 1.640% | 11/7/18 | 23,840 | 23,840 |
| Texas Municipal Gas Acquisition & Supply Corp. Revenue | 5.000% | 12/15/18 | 6,500 | 6,522 |
| Texas Municipal Gas Acquisition & Supply Corp. Revenue | 5.250% | 12/15/18 | 1,825 | 1,832 |
| Texas Municipal Gas Acquisition & Supply Corp. Revenue | 5.000% | 12/15/19 | 1,350 | 1,389 |
| Texas Municipal Gas Acquisition & Supply Corp. Revenue | 5.250% | 12/15/20 | 7,700 | 8,133 |
| Texas Revenue | 4.000% | 8/29/19 | 380,270 | 386,286 |
| Texas State University System Financing System Revenue | 5.000% | 3/15/19 | 5,000 | 5,057 |
| Texas State University System Financing System Revenue | 5.000% | 3/15/20 | 4,500 | 4,679 |
| Texas State University System Financing System Revenue | 5.000% | 3/15/21 | 2,250 | 2,394 |
| Texas Transportation Commission GO | 5.000% | 4/1/19 | 2,800 | 2,836 |
| Texas Transportation Commission GO | 5.000% | 4/1/19 | 5,335 | 5,403 |
| Texas Transportation Commission GO | 5.000% | 4/1/20 | 2,800 | 2,914 |
| Texas Transportation Commission GO | 5.000% | 10/1/20 | 3,350 | 3,529 |
| Texas Transportation Commission GO | 5.000% | 4/1/21 | 1,245 | 1,327 |
| Texas Transportation Commission GO | 5.000% | 10/1/21 | 1,980 | 2,134 |
| 2 Texas Transportation Commission GO PUT | 1.900% | 10/1/21 | 109,275 | 108,965 |
| Texas Transportation Commission Revenue | 5.000% | 4/1/19 | 4,040 | 4,091 |
| Texas Transportation Commission Revenue | 5.000% | 10/1/19 | 19,935 | 20,485 |
| Texas Transportation Commission Revenue | 5.000% | 4/1/20 | 4,375 | 4,554 |
| Texas Transportation Commission Revenue | 5.000% | 10/1/20 | 37,270 | 39,294 |
| Texas Transportation Commission Revenue | 5.000% | 10/1/20 | 5,725 | 6,036 |
| Texas Transportation Commission Revenue PUT | 4.000% | 10/1/21 | 6,820 | 7,127 |
| Texas Transportation Commission Turnpike System Revenue PUT | 5.000% | 4/1/20 | 35,440 | 36,733 |
| Texas Water Development Board Revenue | 4.000% | 10/15/19 | 2,200 | 2,242 |
| Texas Water Development Board Revenue | 5.000% | 4/15/21 | 4,755 | 5,068 |
| Texas Water Development Board Revenue | 5.000% | 4/15/21 | 3,675 | 3,917 |
| Texas Water Development Board Revenue | 5.000% | 8/1/21 | 4,300 | 4,612 |
| Texas Water Development Board Revenue | 5.000% | 10/15/21 | 15,830 | 17,053 |
| Texas Water Development Board Revenue | 5.000% | 4/15/22 | 4,750 | 5,172 |
| Texas Water Development Board Revenue | 5.000% | 4/15/22 | 5,020 | 5,466 |
| Texas Water Development Board Revenue | 5.000% | 8/1/22 | 4,100 | 4,489 |
| Texas Water Development Board Revenue | 5.000% | 10/15/22 | 11,305 | 12,425 |
| Texas Water Financial Assistance GO | 5.000% | 8/1/20 | 1,825 | 1,916 |
| Texas Water Financial Assistance GO | 5.000% | 8/1/22 | 1,670 | 1,797 |
| Texas Water Financial Assistance GO | 5.000% | 8/1/22 | 1,520 | 1,635 |
| Texas Water Financial Assistance GO | 5.000% | 8/1/22 | 5,600 | 6,025 |
| Tomball TX Independent School District GO PUT | 1.100% | 8/15/19 | 6,060 | 6,010 |
| Trinity River Authority of Texas Regional Wastewater System Revenue | 5.000% | 8/1/20 | 1,000 | 1,049 |
| Trinity River Authority of Texas Regional Wastewater System Revenue | 5.000% | 8/1/21 | 1,000 | 1,074 |
| Trinity River Authority of Texas Regional Wastewater System Revenue | 3.000% | 8/1/22 | 2,045 | 2,096 |
| Trinity River Authority of Texas Regional Wastewater System Revenue | 5.000% | 8/1/22 | 2,000 | 2,193 |
| University of North Texas Revenue | 5.000% | 4/15/19 | 1,810 | 1,835 |
| University of North Texas Revenue | 5.000% | 4/15/20 | 1,650 | 1,717 |
| University of Texas Permanent University Fund Revenue | 5.000% | 7/1/19 | 3,210 | 3,273 |
| University of Texas Permanent University Fund Revenue | 5.000% | 7/1/19 | 16,330 | 16,651 |
| University of Texas Permanent University Fund Revenue | 5.000% | 7/1/20 | 1,000 | 1,046 |
| University of Texas Permanent University Fund Revenue | 5.000% | 7/1/21 | 2,415 | 2,592 |
| University of Texas Permanent University Fund Revenue | 5.250% | 7/1/21 | 1,650 | 1,781 |
| University of Texas System Revenue Financing System Revenue | 5.000% | 8/15/19 | 8,000 | 8,187 |
| University of Texas System Revenue Financing System Revenue | 5.000% | 2/15/20 (Prere.) | 3,500 | 3,630 |
| University of Texas System Revenue Financing System Revenue | 5.000% | 8/15/20 | 3,115 | 3,271 |
| University of Texas System Revenue Financing System Revenue | 5.000% | 8/15/20 | 3,660 | 3,843 |
| University of Texas System Revenue Financing System Revenue | 5.000% | 8/15/20 | 5,100 | 5,355 |
| University of Texas System Revenue Financing System Revenue | 5.000% | 8/15/20 | 1,000 | 1,050 |
| University of Texas System Revenue Financing System Revenue | 5.000% | 8/15/21 | 1,880 | 2,021 |
| University of Texas System Revenue Financing System Revenue | 5.000% | 8/15/22 | 2,000 | 2,195 |
| Williamson County TX GO | 5.000% | 2/15/20 | 1,055 | 1,095 |
| | | | 2,337,208 |
| Utah (0.6%) | | | | |
| Murray City UT Hospital Revenue (IHC Health Services Inc. Obligated Group) VRDO | 1.600% | 11/7/18 | 49,435 | 49,435 |
| University of Utah Revenue | 5.000% | 8/1/19 | 1,000 | 1,022 |
| University of Utah Revenue | 5.000% | 8/1/22 | 1,500 | 1,649 |
| Utah County UT Hospital Revenue (IHC Health Services) PUT | 5.000% | 8/1/22 | 32,000 | 34,697 |
| Utah GO | 5.000% | 7/1/20 | 10,000 | 10,476 |
| Utah Transit Authority Sales Tax Revenue | 5.250% | 6/15/20 (4) | 1,035 | 1,087 |
| Utah Transit Authority Sales Tax Revenue | 5.000% | 6/15/21 | 5,000 | 5,362 |
| | | | 103,728 |
43
Short-Term Tax-Exempt Fund
| | | | |
| Face | Market |
| Maturity | Amount | Value• |
| Coupon | Date | ($000) | ($000) |
| Vermont (0.0%) | | | | |
| Vermont Educational & Health Buildings Financing Agency Revenue | | | | |
| (University of Vermont Health Network) | 3.000% | 12/1/18 | 500 | 500 |
| Vermont Educational & Health Buildings Financing Agency Revenue | | | | |
| (University of Vermont Health Network) | 4.000% | 12/1/19 | 475 | 484 |
| Vermont Educational & Health Buildings Financing Agency Revenue | | | | |
| (University of Vermont Health Network) | 4.000% | 12/1/20 | 600 | 620 |
| Vermont GO | 4.000% | 8/15/19 | 2,615 | 2,657 |
| Vermont Municipal Bond Bank Revenue | 5.000% | 10/1/21 | 1,040 | 1,121 |
| Vermont Municipal Bond Bank Revenue | 5.000% | 10/1/22 | 500 | 550 |
| | | | 5,932 |
| Virgin Islands (0.0%) | | | | |
| Virgin Islands Public Finance Authority Revenue | 5.000% | 9/1/19 | 2,500 | 2,539 |
| | | | |
| Virginia (1.6%) | | | | |
| Alexandria VA GO | 5.000% | 7/1/21 | 1,850 | 1,985 |
| Arlington County VA GO | 5.000% | 8/15/20 | 10,000 | 10,513 |
| Chesterfield County VA Water & Sewer Revenue | 5.000% | 11/1/18 | 4,610 | 4,610 |
| Fairfax County VA Economic Development Authority Facilities Revenue (County Facilities Project) | 5.000% | 10/1/19 | 2,000 | 2,055 |
| Fairfax County VA GO | 4.000% | 4/1/20 | 2,355 | 2,419 |
| Fairfax County VA GO | 5.000% | 10/1/20 | 11,320 | 11,935 |
| Fairfax County VA GO | 4.000% | 10/1/21 | 3,810 | 4,006 |
| Fairfax County VA Industrial Development Authority Health Care Revenue | | | | |
| (Inova Health System Obligated Group) PUT | 5.000% | 5/15/23 | 14,500 | 16,026 |
| Fairfax County VA Industrial Development Authority Health Care Revenue | | | | |
| (Inova Health System Obligated Group) VRDO | 1.600% | 11/7/18 | 5,500 | 5,500 |
| Fairfax County VA Public Improvement GO | 5.000% | 4/1/20 | 4,785 | 4,981 |
| Fairfax County VA Public Improvement GO | 5.000% | 10/1/22 | 10,315 | 11,126 |
| Henrico County VA GO | 5.000% | 8/1/20 | 4,185 | 4,394 |
| Henrico County VA GO | 5.000% | 8/1/21 | 5,115 | 5,500 |
| Lexington VA Industrial Development Authority Residential Care Facility Revenue | | | | |
| (Kendall at Lexington Corp.) | 3.000% | 1/1/19 | 300 | 300 |
| Lexington VA Industrial Development Authority Residential Care Facility Revenue | | | | |
| (Kendall at Lexington Corp.) | 3.000% | 1/1/20 | 450 | 452 |
| Loudoun County VA GO | 5.000% | 12/1/18 | 5,120 | 5,133 |
| Loudoun County VA GO | 5.000% | 12/1/23 | 4,670 | 5,166 |
| Louisa VA Industrial Development Authority Poll Control Revenue | | | | |
| (Virginia Electric & Power Co.) PUT | 1.750% | 5/16/19 | 10,000 | 9,974 |
| Louisa VA Industrial Development Authority Poll Control Revenue | | | | |
| (Virginia Electric & Power Co.) PUT | 1.850% | 5/16/19 | 750 | 748 |
| Lynchburg VA Economic Development Authority Hospital Revenue | | | | |
| (Centra Health Obligated Group) | 5.000% | 1/1/19 | 345 | 347 |
| Lynchburg VA Economic Development Authority Hospital Revenue | | | | |
| (Centra Health Obligated Group) | 5.000% | 1/1/20 | 500 | 516 |
| Lynchburg VA Economic Development Authority Hospital Revenue | | | | |
| (Centra Health Obligated Group) | 5.000% | 1/1/21 | 510 | 538 |
| Lynchburg VA Economic Development Authority Hospital Revenue | | | | |
| (Centra Health Obligated Group) | 5.000% | 1/1/22 | 900 | 969 |
| Newport News VA Economical Development Authority Residential Care Facilities Revenue | 2.000% | 12/1/18 | 450 | 450 |
| Newport News VA Economical Development Authority Residential Care Facilities Revenue | 4.000% | 12/1/19 | 1,215 | 1,231 |
| Newport News VA Economical Development Authority Residential Care Facilities Revenue | 4.000% | 12/1/20 | 2,705 | 2,759 |
| 1 Norfolk VA Economic Development Authority Hospital Facilities Revenue | | | | |
| (Sentara Healthcare) TOB VRDO | 1.620% | 11/7/18 | 12,860 | 12,860 |
| Norfolk VA Water Revenue | 5.000% | 11/1/18 | 725 | 725 |
| Peninsula VA Town Center Community Development Authority Revenue | 4.000% | 9/1/23 | 220 | 223 |
| Peninsula VA Ports Authority Coal Terminal Revenue PUT | 1.550% | 10/1/19 | 1,875 | 1,867 |
| Richmond VA GO | 5.000% | 3/1/19 | 3,710 | 3,748 |
| Virginia Beach VA Development Authority Public Facility Revenue | 5.000% | 3/1/19 | 1,000 | 1,010 |
| Virginia Beach VA GO | 5.000% | 2/1/21 | 1,775 | 1,887 |
| Virginia Beach VA GO | 4.000% | 7/15/21 | 1,100 | 1,115 |
| Virginia Beach VA GO | 5.000% | 4/1/22 | 1,685 | 1,839 |
| Virginia College Building Authority Educational Facilities Revenue | | | | |
| (21st Century College & Equipment Programs) | 5.000% | 2/1/19 | 4,095 | 4,126 |
| Virginia College Building Authority Educational Facilities Revenue | | | | |
| (21st Century College & Equipment Programs) | 5.000% | 2/1/19 | 1,000 | 1,008 |
| Virginia College Building Authority Educational Facilities Revenue | | | | |
| (21st Century College & Equipment Programs) | 5.000% | 2/1/19 | 14,875 | 14,989 |
| Virginia College Building Authority Educational Facilities Revenue | | | | |
| (21st Century College & Equipment Programs) | 5.000% | 2/1/19 | 1,150 | 1,159 |
44
Short-Term Tax-Exempt Fund
| | | | |
| Face | Market |
| Maturity | Amount | Value• |
| Coupon | Date | ($000) | ($000) |
| Virginia College Building Authority Educational Facilities Revenue | | | | |
| (21st Century College & Equipment Programs) | 5.000% | 2/1/20 | 3,190 | 3,305 |
| Virginia College Building Authority Educational Facilities Revenue | | | | |
| (21st Century College & Equipment Programs) | 5.000% | 2/1/20 | 2,215 | 2,295 |
| Virginia College Building Authority Educational Facilities Revenue | | | | |
| (21st Century College & Equipment Programs) | 5.000% | 2/1/20 | 2,275 | 2,357 |
| Virginia College Building Authority Educational Facilities Revenue | | | | |
| (21st Century College & Equipment Programs) | 5.000% | 2/1/21 | 5,930 | 6,299 |
| Virginia College Building Authority Educational Facilities Revenue | | | | |
| (21st Century College & Equipment Programs) | 5.000% | 2/1/21 | 500 | 531 |
| Virginia College Building Authority Educational Facilities Revenue | | | | |
| (21st Century College & Equipment Programs) | 5.000% | 2/1/21 | 4,720 | 5,013 |
| Virginia College Building Authority Educational Facilities Revenue | | | | |
| (21st Century College & Equipment Programs) | 5.000% | 2/1/21 (ETM) | 95 | 101 |
| Virginia College Building Authority Educational Facilities Revenue | | | | |
| (21st Century College & Equipment Programs) | 5.000% | 2/1/21 | 2,140 | 2,273 |
| Virginia College Building Authority Educational Facilities Revenue | | | | |
| (21st Century College & Equipment Programs) | 5.000% | 2/1/22 | 7,780 | 8,451 |
| Virginia College Building Authority Educational Facilities Revenue | | | | |
| (Public Higher Education Financing Program) | 5.000% | 9/1/19 | 3,010 | 3,086 |
| Virginia Commonwealth Transportation Board Revenue | 5.000% | 5/15/20 | 7,095 | 7,405 |
| Virginia Commonwealth Transportation Board Revenue | 5.000% | 5/15/21 | 5,450 | 5,831 |
| Virginia Commonwealth Transportation Board Revenue | 5.000% | 5/15/21 | 3,575 | 3,825 |
| Virginia Commonwealth Transportation Board Revenue | 5.000% | 5/15/22 | 1,000 | 1,092 |
| Virginia Commonwealth Transportation Board Revenue | 5.000% | 5/15/22 | 1,855 | 2,025 |
| Virginia GO | 5.000% | 6/1/21 | 1,000 | 1,072 |
| 1 Virginia GO TOB | 1.750% | 1/31/19 | 9,175 | 9,175 |
| Virginia Public Building Authority Public Facilities Revenue | 5.000% | 8/1/21 | 1,000 | 1,075 |
| Virginia Public Building Authority Revenue | 5.000% | 8/1/21 | 5,405 | 5,811 |
| Virginia Public Building Authority Revenue | 5.000% | 8/1/22 | 5,685 | 6,244 |
| Virginia Public School Authority Revenue | 5.000% | 3/1/21 | 5,795 | 6,175 |
| Virginia Public School Authority Revenue | 5.000% | 7/15/21 | 1,250 | 1,344 |
| Virginia Public School Authority Revenue | 5.000% | 8/1/21 | 1,115 | 1,200 |
| Virginia Public School Authority Revenue | 5.000% | 3/1/22 | 5,795 | 6,319 |
| Virginia Public School Authority School Technology & Security Notes Revenue | 5.000% | 4/15/20 | 13,570 | 14,142 |
| | | | 266,635 |
| Washington (2.1%) | | | | |
| Chelan County WA Public Utility District No. 1 Consolidated System Revenue VRDO | 1.610% | 11/7/18 | 5,000 | 5,000 |
| Energy Northwest Washington Electric Revenue (Project No. 3) | 5.000% | 7/1/23 | 1,500 | 1,671 |
| Energy Northwest Washington Electric Revenue (Project No. 3) | 5.000% | 7/1/23 | 11,000 | 12,254 |
| 2 Everett WA GO PUT | 2.000% | 12/1/19 | 3,360 | 3,363 |
| Grant County WA Public Utility District No. 2 Electric System Revenue | 5.000% | 1/1/22 | 600 | 649 |
| King County WA GO | 5.000% | 12/1/18 | 2,745 | 2,752 |
| King County WA GO | 4.000% | 6/1/19 | 3,610 | 3,653 |
| King County WA GO | 5.000% | 12/1/19 | 2,885 | 2,978 |
| King County WA School District No. 414 GO | 4.000% | 12/1/19 | 1,020 | 1,042 |
| King County WA School District No. 414 GO | 5.000% | 12/1/21 | 1,000 | 1,082 |
| Pierce County WA School District No. 10 (Tacoma) GO | 5.000% | 12/1/18 | 5,000 | 5,012 |
| Pierce County WA School District No. 10 (Tacoma) GO | 4.000% | 6/1/19 | 5,000 | 5,060 |
| Pierce County WA School District No. 10 (Tacoma) GO | 5.000% | 12/1/19 | 3,500 | 3,613 |
| Port of Seattle WA Revenue | 5.000% | 3/1/19 | 4,500 | 4,545 |
| Port of Seattle WA Revenue | 5.000% | 1/1/20 | 2,350 | 2,430 |
| Port of Seattle WA Revenue | 5.000% | 1/1/21 | 1,345 | 1,426 |
| Seattle WA Drain and Wastewater Revenue | 5.000% | 7/1/21 | 4,895 | 5,250 |
| Seattle WA GO | 5.000% | 6/1/19 | 4,500 | 4,579 |
| Seattle WA GO | 5.000% | 6/1/20 | 4,360 | 4,555 |
| Seattle WA Municipal Light & Power Revenue | 5.000% | 2/1/21 (Prere.) | 1,355 | 1,439 |
| Seattle WA Municipal Light & Power Revenue | 5.000% | 4/1/21 | 1,000 | 1,066 |
| Seattle WA Municipal Light & Power Revenue | 5.000% | 2/1/23 | 7,630 | 7,900 |
| 2 Seattle WA Municipal Light & Power Revenue PUT | 1.890% | 11/1/21 | 21,100 | 21,101 |
| Seattle WA Water System Revenue | 5.000% | 5/1/20 | 4,000 | 4,172 |
| University of Washington Revenue | 5.000% | 12/1/18 | 1,135 | 1,138 |
| Washington (Motor Vehicle Fuel Tax) GO | 5.000% | 7/1/20 | 4,890 | 5,121 |
| Washington (Motor Vehicle Fuel Tax) GO | 5.000% | 6/1/22 | 5,755 | 6,154 |
| Washington (Motor Vehicle Fuel Tax) GO | 5.000% | 7/1/22 | 1,680 | 1,800 |
| Washington Federal Highway Grant Anticipation Revenue (520 Corridor Program) | 5.000% | 9/1/19 | 19,645 | 20,119 |
| Washington GO | 5.000% | 1/1/19 (Prere.) | 2,000 | 2,010 |
| Washington GO | 5.000% | 2/1/19 | 10,190 | 10,269 |
| Washington GO | 0.000% | 7/1/19 (14)(ETM) | 4,000 | 3,948 |
45
Short-Term Tax-Exempt Fund
| | | | |
| Face | Market |
| Maturity | Amount | Value• |
| Coupon | Date | ($000) | ($000) |
| Washington GO | 5.000% | 7/1/19 | 22,835 | 23,299 |
| Washington GO | 4.000% | 8/1/19 | 15,435 | 15,673 |
| Washington GO | 5.000% | 8/1/19 | 4,500 | 4,603 |
| Washington GO | 5.000% | 2/1/20 | 5,350 | 5,544 |
| Washington GO | 5.000% | 2/1/20 | 4,820 | 4,995 |
| Washington GO | 5.000% | 8/1/20 | 3,155 | 3,311 |
| Washington GO | 5.000% | 1/1/21 | 2,000 | 2,119 |
| Washington GO | 5.000% | 7/1/21 | 4,195 | 4,391 |
| Washington GO | 5.000% | 8/1/21 | 12,720 | 13,664 |
| Washington GO | 5.000% | 8/1/21 | 22,540 | 24,213 |
| Washington GO | 5.000% | 8/1/21 | 1,240 | 1,332 |
| Washington GO | 5.000% | 7/1/22 | 9,620 | 10,305 |
| Washington GO | 5.000% | 2/1/23 | 1,115 | 1,182 |
| 1 Washington GO TOB VRDO | 1.630% | 11/7/18 | 29,420 | 29,420 |
| 1 Washington GO TOB VRDO | 1.630% | 11/7/18 (Prere.) | 11,790 | 11,790 |
| 1 Washington GO TOB VRDO | 1.630% | 11/7/18 | 5,005 | 5,005 |
| 1 Washington Health Care Facilities Authority Revenue (MultiCare Health System) TOB VRDO | 1.650% | 11/7/18 | 7,875 | 7,875 |
| Washington Health Care Facilities Authority Revenue (Providence Health & Services) PUT | 5.000% | 10/1/21 | 5,140 | 5,520 |
| Washington Higher Education Facilities Authority Revenue (Whitman College Project) VRDO | 1.640% | 11/7/18 | 3,950 | 3,950 |
| Washington Housing Finance Commission Multi-Family Housing Revenue | | | | |
| (The Hearthstone Project) | 3.500% | 7/1/23 | 1,735 | 1,717 |
| | | | 337,059 |
| West Virginia (0.3%) | | | | |
| 1 West Virginia Economic Development Authority Lottery Revenue TOB VRDO | 1.700% | 11/7/18 | 7,210 | 7,210 |
| West Virginia Economic Development Authority Solid Waste Facilities Disposal Revenue | | | | |
| (Appalachian Power Co. - Amos Project) PUT | 1.900% | 4/1/19 | 8,000 | 7,981 |
| West Virginia Economic Development Authority Solid Waste Facilities Disposal Revenue | | | | |
| (Appalachian Power Co. - Amos Project) PUT | 2.625% | 6/1/22 | 5,000 | 4,950 |
| West Virginia Economic Development Authority Solid Waste Facilities Disposal Revenue | | | | |
| (Appalachian Power Co. - Amos Project) PUT | 2.625% | 6/1/22 | 5,125 | 5,074 |
| West Virginia GO | 5.000% | 6/1/20 | 1,400 | 1,463 |
| West Virginia GO | 5.000% | 6/1/22 | 3,610 | 3,948 |
| West Virginia Hospital Finance Authority Hospital Revenue (Cabell Huntington Hospital Inc.) | 5.000% | 1/1/20 | 400 | 412 |
| West Virginia Hospital Finance Authority Hospital Revenue (Cabell Huntington Hospital Inc.) | 5.000% | 1/1/21 | 570 | 600 |
| West Virginia Hospital Finance Authority Hospital Revenue (Cabell Huntington Hospital Inc.) | 5.000% | 1/1/23 | 1,075 | 1,168 |
| West Virginia State School Building Authority Lottery Revenue | 5.000% | 7/1/21 | 2,030 | 2,173 |
| West Virginia State School Building Authority Lottery Revenue | 5.000% | 7/1/22 | 2,130 | 2,326 |
| West Virginia University Revenue | 5.000% | 10/1/22 | 1,475 | 1,583 |
| 2 West Virginia University Revenue PUT | 2.130% | 10/1/19 | 8,575 | 8,580 |
| | | | 47,468 |
| Wisconsin (1.0%) | | | | |
| Madison WI GO | 4.000% | 10/1/19 | 2,395 | 2,438 |
| Milwaukee WI GO | 3.000% | 3/1/19 | 13,575 | 13,626 |
| Milwaukee WI GO | 4.000% | 3/1/20 | 13,130 | 13,468 |
| 3 Wisconsin General Fund Annual Appropriation Revenue | 5.000% | 5/1/21 | 3,250 | 3,437 |
| 3 Wisconsin General Fund Annual Appropriation Revenue | 5.000% | 5/1/22 | 8,100 | 8,750 |
| Wisconsin GO | 5.000% | 5/1/19 | 23,380 | 23,738 |
| Wisconsin GO | 5.000% | 5/1/19 (2) | 4,000 | 4,061 |
| Wisconsin GO | 5.000% | 5/1/20 | 23,790 | 24,812 |
| Wisconsin GO | 5.000% | 5/1/21 | 1,250 | 1,336 |
| Wisconsin GO | 5.000% | 11/1/21 | 5,000 | 5,404 |
| Wisconsin Health & Educational Facilities Authority Revenue (Agnesian HealthCare Inc.) | 5.000% | 7/1/20 | 300 | 312 |
| Wisconsin Health & Educational Facilities Authority Revenue (Agnesian HealthCare Inc.) | 5.000% | 7/1/22 | 1,000 | 1,081 |
| Wisconsin Health & Educational Facilities Authority Revenue | | | | |
| (Ascension Health Alliance Credit Group) PUT | 4.000% | 5/30/19 | 13,325 | 13,466 |
| Wisconsin Health & Educational Facilities Authority Revenue | | | | |
| (Ascension Health Alliance Credit Group) PUT | 1.375% | 12/3/19 | 18,845 | 18,657 |
| Wisconsin Health & Educational Facilities Authority Revenue (Froedtert Health Inc.) | 5.000% | 4/1/20 | 1,000 | 1,039 |
| Wisconsin Health & Educational Facilities Authority Revenue (Froedtert Health Inc.) | 5.000% | 4/1/21 | 1,000 | 1,062 |
| Wisconsin Health & Educational Facilities Authority Revenue | | | | |
| (Hospital Sisters Services Inc. Obligated Group) | 5.000% 11/15/18 | 750 | 751 |
| Wisconsin Health & Educational Facilities Authority Revenue (ProHealth Care Obligated Group) | 6.625% | 2/15/19 (Prere.) | 6,150 | 6,232 |
| Wisconsin Health & Educational Facilities Authority Revenue | | | | |
| (University of Wisconsin Medical Foundation) VRDO | 1.640% | 11/7/18 LOC | 35 | 35 |
| Wisconsin Housing & Economic Development Authority Revenue PUT | 1.950% | 5/1/20 | 3,750 | 3,720 |
| 1 Wisconsin Public Finance Authority Lease Development Revenue | | | | |
| (KU Campus Development Corp. - Central District Development Project) TOB VRDO | 1.710% | 11/7/18 | 5,185 | 5,185 |
| Wisconsin Public Finance Authority Revenue (Church Home of Hartford Inc.) | 4.000% | 9/1/20 | 225 | 229 |
46
Short-Term Tax-Exempt Fund
| | | | |
| Face | Market |
| Maturity | Amount | Value• |
| Coupon | Date | ($000) | ($000) |
| Wisconsin Public Finance Authority Revenue | | | | |
| (Retirement Housing Foundation National Obligated Group) | 5.000% 11/15/18 | 690 | 691 |
| Wisconsin Public Finance Authority Revenue | | | | |
| (Retirement Housing Foundation National Obligated Group) | 5.000% 11/15/19 | 440 | 452 |
| Wisconsin Public Finance Authority Revenue | | | | |
| (Retirement Housing Foundation National Obligated Group) | 5.000% 11/15/20 | 425 | 444 |
| Wisconsin Public Finance Authority Revenue | | | | |
| (Retirement Housing Foundation National Obligated Group) | 5.000% 11/15/21 | 750 | 796 |
| Wisconsin Public Finance Authority Revenue | | | | |
| (Retirement Housing Foundation National Obligated Group) | 5.000% 11/15/22 | 750 | 805 |
| Wisconsin Transportation Revenue | 5.000% | 7/1/19 | 2,220 | 2,265 |
| | | | 158,292 |
| Wyoming (0.0%) | | | | |
| 2 Wyoming Community Development Authority PUT | 1.920% | 9/1/21 | 4,000 | 4,000 |
| Total Tax-Exempt Municipal Bonds (Cost $16,327,404) | | | | 16,241,600 |
| |
| Shares | |
| Temporary Cash Investment (1.8%) | | | | |
| Money Market Fund (1.8%) | | | | |
| 6 Vanguard Municipal Cash Management Fund (Cost $295,480) | 1.620% | 2,954,825 | 295,482 |
| Total Investments (102.0%) (Cost $16,622,884) | | | | 16,537,082 |
| |
| Amount |
| ($000) |
| Other Assets and Liabilities (-2.0%) | |
| Other Assets | |
| Investment in Vanguard | 822 |
| Receivables for Investment Securities Sold | 24,310 |
| Receivables for Accrued Income | 137,648 |
| Receivables for Capital Shares Issued | 34,948 |
| Variation Margin Receivable—Futures Contracts | 363 |
| Other Assets | 1,351 |
| Total Other Assets | 199,442 |
| Liabilities | |
| Payables for Investment Securities Purchased | (491,632) |
| Payables for Capital Shares Redeemed | (19,231) |
| Payables for Distributions | (5,911) |
| Payables to Vanguard | (7,108) |
| Variation Margin Payable—Futures Contracts | (696) |
| Total Liabilities | (524,578) |
| Net Assets (100%) | 16,211,946 |
47
Short-Term Tax-Exempt Fund
| |
| At October 31, 2018, net assets consisted of: | |
| Amount |
| ($000) |
| Paid-in Capital | 16,323,715 |
| Total Distributable Earnings (Loss) | (111,769) |
| Net Assets | 16,211,946 |
| |
| Investor Shares—Net Assets | |
| Applicable to 65,681,031 outstanding $.001 par value shares of beneficial interest (unlimited authorization) | 1,029,589 |
| Net Asset Value Per Share—Investor Shares | $15.68 |
| |
| Admiral Shares—Net Assets | |
| Applicable to 968,534,641 outstanding $.001 par value shares of beneficial interest (unlimited authorization) | 15,182,357 |
| Net Asset Value Per Share—Admiral Shares | $15.68 |
• See Note A in Notes to Financial Statements.
1 Security exempt from registration under Rule 144A of the Securities Act of 1933. Such securities may be sold in transactions exempt from registration, normally to qualified institutional buyers. At October 31, 2018, the aggregate value of these securities was $2,291,166,000, representing 14.1% of net assets.
2 Adjustable-rate security based upon SIFMA Municipal Swap Index Yield plus spread.
3 Security purchased on a when-issued or delayed-delivery basis for which the fund has not taken delivery as of October 31, 2018.
4 The issuer was placed under federal conservatorship in September 2008; since that time, its daily operations have been managed by the Federal Housing Finance Agency and it receives capital from the U.S. Treasury, as needed to maintain a positive net worth, in exchange for senior preferred stock.
5 Securities with a value of $2,116,000 have been segregated as initial margin for open futures contracts.
6 Affiliated money market fund available only to Vanguard funds and certain trusts and accounts managed by Vanguard. Rate shown is the 7-day yield.
A key to abbreviations and other references follows the Statement of Net Assets.
See accompanying Notes, which are an integral part of the Financial Statements.
48
Short-Term Tax-Exempt Fund
Key to Abbreviations
ARS—Auction Rate Security.
BAN—Bond Anticipation Note.
COP—Certificate of Participation.
CP—Commercial Paper.
FR—Floating Rate.
GAN—Grant Anticipation Note.
GO—General Obligation Bond.
PILOT—Payments in Lieu of Taxes.
PUT—Put Option Obligation.
RAN—Revenue Anticipation Note.
TAN—Tax Anticipation Note.
TOB—Tender Option Bond.
TRAN—Tax Revenue Anticipation Note.
VRDO—Variable Rate Demand Obligation.
VRDP—Variable Rate Demand Preferred.
(ETM)—Escrowed to Maturity.
(Prere.)—Prerefunded.
Scheduled principal and interest payments are guaranteed by:
(1) MBIA (Municipal Bond Investors Assurance).
(2) AMBAC (Ambac Assurance Corporation).
(3) FGIC (Financial Guaranty Insurance Company).
(4) AGM (Assured Guaranty Municipal Corporation).
(5) BIGI (Bond Investors Guaranty Insurance).
(6) Connie Lee Inc.
(7) FHA (Federal Housing Authority).
(8) CapMAC (Capital Markets Assurance Corporation).
(9) American Capital Access Financial Guaranty Corporation.
(10) XL Capital Assurance Inc.
(11) CIFG (CDC IXIS Financial Guaranty).
(12) AGC (Assured Guaranty Corporation).
(13) BHAC (Berkshire Hathaway Assurance Corporation).
(14) NPFG (National Public Finance Guarantee Corporation).
(15) BAM (Build America Mutual Assurance Company).
(16) MAC (Municipal Assurance Corporation).
(17) RAA (Radian Asset Assurance Inc.).
(18) SBLF (Michigan School Bond Loan Fund).
(19) TPSF (Texas Permanent School Fund).
The insurance does not guarantee the market value of the municipal bonds.
LOC—Scheduled principal and interest payments are guaranteed by bank letter of credit.
| | | | |
| Derivative Financial Instruments Outstanding as of Period End | | | | |
| |
| Futures Contracts | | | | |
| ($000) |
| Value and |
| Number of | Unrealized |
| Long (Short) | Notional | Appreciation |
| Expiration | Contracts | Amount | (Depreciation) |
| Long Futures Contracts | |
| 2-Year U.S. Treasury Note | December 2018 | 863 | 181,796 | 11 |
| 10-Year U.S. Treasury Note | December 2018 | 925 | 109,555 | (280) |
| Ultra 10-Year U.S. Treasury Note | December 2018 | 779 | 97,460 | 361 |
| | | | 92 |
| |
| Short Futures Contracts |
| 5-Year U.S. Treasury Note | December 2018 | (1,341) | (150,705) | (110) |
| | | | (18) |
See accompanying Notes, which are an integral part of the Financial Statements.
49
Short-Term Tax-Exempt Fund
Statement of Operations
Statement of Changes in Net Assets
| | | |
| Year Ended |
| October 31, 2018 |
| | ($000) |
| Investment Income | | |
| Income | | |
| Interest1 242,437 |
| Total Income 242,437 |
| Expenses | | |
| The Vanguard Group—Note B | | |
| Investment Advisory Services | 1,918 |
| Management and Administrative— | |
| Investor Shares | 1,460 |
| Management and Administrative— | |
| Admiral Shares | 9,963 |
| Marketing and Distribution— | | |
| Investor Shares | 239 |
| Marketing and Distribution— | | |
| Admiral Shares | 1,136 |
| Custodian Fees | 70 |
| Auditing Fees | 33 |
| Shareholders’ Reports and Proxy— | |
| Investor Shares | 43 |
| Shareholders’ Reports and Proxy— | |
| Admiral Shares | 116 |
| Trustees’ Fees and Expenses | 9 |
| Total Expenses | 14,987 |
| Net Investment Income | 227,450 |
| Realized Net Gain (Loss) | | |
| Investment Securities Sold1 | (21,302) |
| Futures Contracts | (829) |
| Realized Net Gain (Loss) | (22,131) |
| Change in Unrealized Appreciation | |
| (Depreciation) | | |
| Investment Securities1 | (89,501) |
| Futures Contracts | (87) |
| Change in Unrealized Appreciation | |
| (Depreciation) | (89,588) |
| Net Increase (Decrease) in Net Assets | |
| Resulting from Operations | 115,731 |
1 Interest income, realized net gain (loss), and change in unrealized appreciation (depreciation) from an affiliated company of the fund were $4,509,000, ($3,000), and $7,000, respectively. Purchases and sales are for temporary cash investment purposes.
| | | |
| Year Ended October 31, |
| 2018 | 2017 |
| ($000) | ($000) |
| Increase (Decrease) in Net Assets | | |
| Operations | | |
| Net Investment Income | 227,450 | 161,292 |
| Realized Net Gain (Loss) | (22,131) | 5,397 |
| Change in Unrealized Appreciation (Depreciation) | (89,588) | (14,411) |
| Net Increase (Decrease) in Net Assets Resulting from Operations | 115,731 | 152,278 |
| Distributions | | |
| Net Investment Income | | |
| Investor Shares | (15,088) | (12,471) |
| Admiral Shares | (212,068) | (148,774) |
| Realized Capital Gain | | |
| Investor Shares | — | — |
| Admiral Shares | — | — |
| Total Distributions | (227,156) | (161,245) |
| Capital Share Transactions | | |
| Investor Shares | (190,515) | (5,090) |
| Admiral Shares | 1,385,963 | 1,303,306 |
| Net Increase (Decrease) from Capital Share Transactions | 1,195,448 | 1,298,216 |
| Total Increase (Decrease) | 1,084,023 | 1,289,249 |
| Net Assets |
| Beginning of Period | 15,127,923 | 13,838,674 |
| End of Period | 16,211,946 | 15,127,923 |
See accompanying Notes, which are an integral part of the Financial Statements.
50
Short-Term Tax-Exempt Fund
Financial Highlights
Investor Shares
| | | | | | |
| For a Share Outstanding | | | | Year Ended October 31, |
| Throughout Each Period | 2018 | 2017 | 2016 | 2015 | 2014 |
| Net Asset Value, Beginning of Period | | $15.79 | $15.80 | $15.83 | $15.86 | $15.87 |
| Investment Operations | |
| Net Investment Income | | . 2151 | .1601 | .131 | .110 | .115 |
| Net Realized and Unrealized Gain (Loss) | | | | | | |
| on Investments | | (.109) | (.010) | (.030) | (.030) | (.010) |
| Total from Investment Operations | | .106 | .150 | .101 | .080 | .105 |
| Distributions | | |
| Dividends from Net Investment Income | | (.216) | (.160) | (.131) | (.110) | (.115) |
| Distributions from Realized Capital Gains | — | — | — | — | — |
| Total Distributions | | (.216) | (.160) | (.131) | (.110) | (.115) |
| Net Asset Value, End of Period | | $15.68 | $15.79 | $15.80 | $15.83 | $15.86 |
| |
| Total Return 2 | | 0.68% | 0.95% | 0.64% | 0.51% | 0.66% |
| |
| Ratios/Supplemental Data | | |
| Net Assets, End of Period (Millions) | | $1,030 | $1,228 | $1,234 | $1,366 | $1,713 |
| Ratio of Total Expenses to Average Net Assets | 0.17% | 0.19% | 0.19% | 0.20% | 0.20% |
| Ratio of Net Investment Income to | | | | | | |
| Average Net Assets | | 1.38% | 1.01% | 0.83% | 0.70% | 0.72% |
| Portfolio Turnover Rate | | 42% | 36% | 29% | 32% | 27% |
1 Calculated based on average shares outstanding.
2 Total returns do not include account service fees that may have applied in the periods shown. Fund prospectuses provide information about any applicable account service fees.
| | | | | | |
| Admiral Shares | | | | | | |
| | | | | | |
| For a Share Outstanding | | | | Year Ended October 31, |
| Throughout Each Period | 2018 | 2017 | 2016 | 2015 | 2014 |
| Net Asset Value, Beginning of Period | | $15.79 | $15.80 | $15.83 | $15.86 | $15.87 |
| Investment Operations | |
| Net Investment Income | | . 2291 | .1761 | .147 | .123 | .128 |
| Net Realized and Unrealized Gain (Loss) | | | | | | |
| on Investments | | (.111) | (.010) | (.030) | (.030) | (.010) |
| Total from Investment Operations | | .118 | .166 | .117 | .093 | .118 |
| Distributions | | |
| Dividends from Net Investment Income | | (.228) | (.176) | (.147) | (.123) | (.128) |
| Distributions from Realized Capital Gains | — | — | — | — | — |
| Total Distributions | | (.228) | (.176) | (.147) | (.123) | (.128) |
| Net Asset Value, End of Period | | $15.68 | $15.79 | $15.80 | $15.83 | $15.86 |
| |
| Total Return 2 | | 0.76% | 1.05% | 0.74% | 0.59% | 0.74% |
| |
| Ratios/Supplemental Data | | |
| Net Assets, End of Period (Millions) | | $15,182 | $13,900 | $12,604 | $11,029 | $11,100 |
| Ratio of Total Expenses to Average Net Assets | 0.09% | 0.09% | 0.09% | 0.12% | 0.12% |
| Ratio of Net Investment Income to | | | | | | |
| Average Net Assets | | 1.46% | 1.11% | 0.93% | 0.78% | 0.80% |
| Portfolio Turnover Rate | | 42% | 36% | 29% | 32% | 27% |
1 Calculated based on average shares outstanding.
2 Total returns do not include account service fees that may have applied in the periods shown. Fund prospectuses provide information about any applicable account service fees.
See accompanying Notes, which are an integral part of the Financial Statements.
51
Short-Term Tax-Exempt Fund
Notes to Financial Statements
Vanguard Short-Term Tax-Exempt Fund is registered under the Investment Company Act of 1940 as an open-end investment company, or mutual fund. The fund invests in debt instruments of many municipal issuers; the issuers’ abilities to meet their obligations may be affected by economic and political developments in a specific state or region. The fund offers two classes of shares: Investor Shares and Admiral Shares. Investor Shares are available to any investor who meets the fund’s minimum purchase requirements. Admiral Shares are designed for investors who meet certain administrative, service, and account-size criteria.
A. The following significant accounting policies conform to generally accepted accounting principles for U.S. investment companies. The fund consistently follows such policies in preparing its financial statements.
1. Security Valuation: Securities are valued as of the close of trading on the New York Stock Exchange (generally 4 p.m., Eastern time) on the valuation date. Bonds and temporary cash investments are valued using the latest bid prices or using valuations based on a matrix system (which considers such factors as security prices, yields, maturities, and ratings), both as furnished by independent pricing services. Investments in Vanguard Municipal Cash Management Fund are valued at that fund’s net asset value. Securities for which market quotations are not readily available, or whose values have been affected by events occurring before the fund’s pricing time but after the close of the securities’ primary markets, are valued by methods deemed by the board of trustees to represent fair value.
2. Futures Contracts: The fund uses futures contracts to invest in fixed income asset classes with greater efficiency and lower cost than is possible through direct investment, to add value when these instruments are attractively priced, or to adjust sensitivity to changes in interest rates. The primary risks associated with the use of futures contracts are imperfect correlation between changes in market values of bonds held by the fund and the prices of futures contracts, and the possibility of an illiquid market. Counterparty risk involving futures is mitigated because a regulated clearinghouse is the counterparty instead of the clearing broker. To further mitigate counterparty risk, the fund trades futures contracts on an exchange, monitors the financial strength of its clearing brokers and clearinghouse, and has entered into clearing agreements with its clearing brokers. The clearinghouse imposes initial margin requirements to secure the fund’s performance and requires daily settlement of variation margin representing changes in the market value of each contract. Any assets pledged as initial margin for open contracts are noted in the Statement of Net Assets.
Futures contracts are valued at their quoted daily settlement prices. The notional amounts of the contracts are not recorded in the Statement of Net Assets. Fluctuations in the value of the contracts are recorded in the Statement of Net Assets as an asset (liability) and in the Statement of Operations as unrealized appreciation (depreciation) until the contracts are closed, when they are recorded as realized futures gains (losses).
During the year ended October 31, 2018, the fund’s average investments in long and short futures contracts each represented 2% of net assets, based on the average of the notional amounts at each quarter-end during the period.
3. Federal Income Taxes: The fund intends to continue to qualify as a regulated investment company and distribute all of its income. Management has analyzed the fund’s tax positions taken for all open federal income tax years (October 31, 2015–2018), and has concluded that no provision for federal income tax is required in the fund’s financial statements.
4. Distributions: Distributions from net investment income are declared daily and paid on the first business day of the following month. Annual distributions from realized capital gains, if any, are recorded on the ex-dividend date. Distributions are determined on a tax basis and may differ from net investment income and realized capital gains for financial reporting purposes.
5. Credit Facility: The fund and certain other funds managed by The Vanguard Group (“Vanguard”) participate in a $3.1 billion committed credit facility provided by a syndicate of lenders pursuant to a credit agreement that may be renewed annually; each fund is individually liable for its borrowings, if any, under the credit facility. Borrowings may be utilized for temporary and emergency purposes, and are subject to the fund’s regulatory and contractual borrowing restrictions. The participating funds are charged administrative fees and an annual commitment fee of 0.10% of the undrawn amount of the facility; these fees are allocated to the funds based on a method approved by the fund’s board of trustees and included in Management and Administrative expenses on the fund’s Statement of Operations. Any borrowings under this facility bear interest at a rate based upon the higher of the one-month London Interbank Offered Rate, federal funds effective rate, or overnight bank funding rate plus an agreed-upon spread.
52
Short-Term Tax-Exempt Fund
The fund had no borrowings outstanding at October 31, 2018, or at any time during the period then ended.
6. Other: Interest income includes income distributions received from Vanguard Municipal Cash Management Fund and is accrued daily. Premiums and discounts on debt securities purchased are amortized and accreted, respectively, to interest income over the lives of the respective securities. Security transactions are accounted for on the date securities are bought or sold. Costs used to determine realized gains (losses) on the sale of investment securities are those of the specific securities sold.
Each class of shares has equal rights as to assets and earnings, except that each class separately bears certain class-specific expenses related to maintenance of shareholder accounts (included in Management and Administrative expenses), shareholder reporting, and the proxy. Marketing and distribution expenses are allocated to each class of shares based on a method approved by the board of trustees. Income, other non-class-specific expenses, and gains and losses on investments are allocated to each class of shares based on its relative net assets.
B. In accordance with the terms of a Funds’ Service Agreement (the “FSA”) between Vanguard and the fund, Vanguard furnishes to the fund investment advisory, corporate management, administrative, marketing, and distribution services at Vanguard’s cost of operations (as defined by the FSA). These costs of operations are allocated to the fund based on methods and guidelines approved by the board of trustees. Vanguard does not require reimbursement in the current period for certain costs of operations (such as deferred compensation/benefits and risk/insurance costs); the fund’s liability for these costs of operations is included in Payables to Vanguard on the Statement of Net Assets. All other costs of operations payable to Vanguard are generally settled twice a month.
Upon the request of Vanguard, the fund may invest up to 0.40% of its net assets as capital in Vanguard. At October 31, 2018, the fund had contributed to Vanguard capital in the amount of $822,000, representing 0.01% of the fund’s net assets and 0.33% of Vanguard’s capitalization. The fund’s trustees and officers are also directors and employees, respectively, of Vanguard.
C. Various inputs may be used to determine the value of the fund’s investments. These inputs are summarized in three broad levels for financial statement purposes. The inputs or methodologies used to value securities are not necessarily an indication of the risk associated with investing in those securities.
Level 1—Quoted prices in active markets for identical securities.
Level 2—Other significant observable inputs (including quoted prices for similar securities, interest rates, prepayment speeds, credit risk, etc.).
Level 3—Significant unobservable inputs (including the fund’s own assumptions used to determine the fair value of investments). Any investments valued with significant unobservable inputs are noted on the Statement of Net Assets.
The following table summarizes the market value of the fund’s investments as of October 31, 2018, based on the inputs used to value them:
| | | |
| Level 1 | Level 2 | Level 3 |
| Investments | ($000) | ($000) | ($000) |
| Tax-Exempt Municipal Bonds | — | 16,241,600 | — |
| Temporary Cash Investments | 295,482 | — | — |
| Futures Contracts—Assets1 | 363 | — | — |
| Futures Contracts—Liabilities1 | (696) | — | — |
| Total | 295,149 | 16,241,600 | — |
| 1 Represents variation margin on the last day of the reporting period. | | | |
D. Permanent differences between book-basis and tax-basis components of net assets, if any, are reclassified among capital accounts in the financial statements to reflect their tax character. These reclassifications have no effect on net assets or net asset value per share.
53
Short-Term Tax-Exempt Fund
Temporary differences between book-basis and tax-basis components of total distributable earnings (loss) arise when certain items of income, gain, or loss are recognized in different periods for financial statement and tax purposes; these differences will reverse at some time in the future. The differences are primarily related to the tax deferral of losses on wash sales and straddles, the realization of unrealized gains or losses on certain futures contracts, and payables for distributions. As of period end, the tax-basis components of total distributable earnings (loss) are detailed in the table as follows:
| |
| Amount |
| ($000) |
| Undistributed Ordinary Income | — |
| Undistributed Tax-Exempt Income | 12,253 |
| Undistributed Long-Term Gains | — |
| Capital Loss Carryforwards* | (25,945) |
| Net Unrealized Gains (Losses) | (85,912) |
* Includes $3,580,000, which may be used to offset future net capital gains through October 31, 2019, as well as capital losses of $22,365,000, which may be carried forward indefinitely but must be used before any expiring loss carryforwards.
As of October 31, 2018, gross unrealized appreciation and depreciation for investments and derivatives based on cost for U.S. federal income tax purposes were as follows:
| |
| Amount |
| ($000) |
| Tax Cost | 16,622,994 |
| Gross Unrealized Appreciation | 3,282 |
| Gross Unrealized Depreciation | (89,194) |
| Net Unrealized Appreciation (Depreciation) | (85,912) |
E. During the year ended October 31, 2018, the fund purchased $5,394,816,000 of investment securities and sold $4,721,343,000 of investment securities, other than temporary cash investments.
The fund purchased securities from and sold securities to other Vanguard funds or accounts managed by Vanguard or its affiliates, in accordance with procedures adopted by the board of trustees in compliance with Rule 17a-7 of the Investment Company Act of 1940. For the year ended October 31, 2018, such purchases and sales were $2,359,033,000 and $1,815,117,000, respectively; these amounts are included in the purchases and sales of investment securities noted above.
| | | | |
| F. Capital share transactions for each class of shares were: | | | |
| | | Year Ended October 31, |
| | 2018 | | 2017 |
| Amount | Shares | Amount | Shares |
| ($000) | (000) | ($000) | (000) |
| Investor Shares | | | | |
| Issued | 375,594 | 23,903 | 525,767 | 33,337 |
| Issued in Lieu of Cash Distributions | 12,600 | 802 | 10,247 | 649 |
| Redeemed | (578,709) | (36,827) | (541,104) | (34,306) |
| Net Increase (Decrease)—Investor Shares | (190,515) | (12,122) | (5,090) | (320) |
| Admiral Shares | | | | |
| Issued | 7,364,062 | 468,618 | 7,183,378 | 455,477 |
| Issued in Lieu of Cash Distributions | 154,571 | 9,841 | 106,416 | 6,743 |
| Redeemed | (6,132,670) | (390,347) | (5,986,488) | (379,572) |
| Net Increase (Decrease)—Admiral Shares | 1,385,963 | 88,112 | 1,303,306 | 82,648 |
G. Management has determined that no events or transactions occurred subsequent to October 31, 2018, that would require recognition or disclosure in these financial statements.
54
Limited-Term Tax-Exempt Fund
Fund Profile
As of October 31, 2018
| | |
| Share-Class Characteristics | | |
| Investor | Admiral |
| Shares | Shares |
| Ticker Symbol | VMLTX | VMLUX |
| Expense Ratio1 | 0.19% | 0.09% |
| 30-Day SEC Yield | 2.20% | 2.25% |
| | | |
| Financial Attributes | | |
| Bloomberg | |
| Barclays | Bloomberg |
| 1–5 Year | Barclays |
| Municipal | Municipal |
| Bond | Bond |
| Fund | Index | Index |
| Number of Bonds | 5,127 | 16,981 | 53,575 |
| Yield to Maturity | | | |
| (before expenses) | 2.4% | 2.3% | 3.0% |
| Average Coupon | 4.2% | 4.8% | 4.7% |
| Average Duration | 2.6 years | 2.8 years | 6.5 years |
| Average Stated | | | |
| Maturity | 3.5 years | 3.3 years 13.0 years |
| Short-Term Reserves | 7.9% | — | — |
| |
| Largest Area Concentrations2 | |
| |
| New York | 13.4% |
| Texas | 13.3 |
| Illinois | 7.9 |
| California | 6.8 |
| Pennsylvania | 5.8 |
| New Jersey | 4.5 |
| Ohio | 3.7 |
| Florida | 3.2 |
| Massachusetts | 2.9 |
| Georgia | 2.9 |
| Top Ten | 64.4% |
| | |
| Volatility Measures | | |
| Bloomberg | |
| Barclays | Bloomberg |
| 1–5 Year | Barclays |
| Municipal | Municipal |
| Bond Index | Bond Index |
| R-Squared | 0.97 | 0.80 |
| Beta | 0.96 | 0.42 |
These measures show the degree and timing of the fund’s fluctuations compared with the indexes over 36 months.
| |
| Distribution by Stated Maturity (% of portfolio) |
| |
| Under 6 Months | 14.2% |
| 6 Months–1 Year | 7.3 |
| 1–2 Years | 13.0 |
| 2–3 Years | 16.6 |
| 3–4 Years | 13.1 |
| 4–5 Years | 12.5 |
| Over 5 Years | 23.3 |
| |
| Distribution by Credit Quality (% of portfolio) |
| |
| AAA | 18.6% |
| AA | 44.3 |
| A | 25.3 |
| BBB | 9.9 |
| BB | 0.5 |
| B or Lower | 0.7 |
| Not Rated | 0.7 |
Credit-quality ratings are obtained from Moody’s and S&P, and the higher rating for each issue is shown. “Not Rated” is used to classify securities for which a rating is not available. Not rated securities include a fund’s investment in Vanguard Market Liquidity Fund or Vanguard Municipal Cash Management Fund, each of which invests in high-quality money market instruments and may serve as a cash management vehicle for the Vanguard funds, trusts, and accounts. For more information about these ratings, see the Glossary entry for Credit Quality.
Investment Focus
1 The expense ratios shown are from the prospectus dated February 23, 2018, and represent estimated costs for the current fiscal year. For the fiscal year ended October 31, 2018, the expense ratios were 0.17% for Investor Shares and 0.09% for Admiral Shares. 2 Percentage of net assets, excluding any futures contracts.
55
Limited-Term Tax-Exempt Fund
Performance Summary
All of the returns in this report represent past performance, which is not a guarantee of future results that may be achieved by the fund. (Current performance may be lower or higher than the performance data cited. For performance data current to the most recent month-end, visit our website at vanguard.com/performance.) Note, too, that both investment returns and principal value can fluctuate widely, so an investor’s shares, when sold, could be worth more or less than their original cost. The returns shown do not reflect taxes that a shareholder would pay on fund distributions or on the sale of fund shares.

| | | | |
| | Average Annual Total Returns | Final Value |
| | Periods Ended October 31, 2018 | of a $10,000 |
| One Year | Five Years | Ten Years | Investment |
| Limited-Term Tax-Exempt Fund | | | | |
| Investor Shares | -0.08% | 1.05% | 2.01% | $12,206 |
| Bloomberg Barclays 1–5 Year Municipal | | | | |
| Bond Index | -0.16 | 1.12 | 2.35 | 12,614 |
| 1–5 Year Municipal Funds Average1 | 0.18 | 0.77 | 1.63 | 11,757 |
| Bloomberg Barclays Municipal Bond Index | -0.51 | 3.25 | 4.80 | 15,976 |
| | | | |
| Final Value |
| of a $50,000 |
| One Year | Five Years | Ten Years | Investment |
| Limited-Term Tax-Exempt Fund Admiral Shares | 0.00% | 1.14% | 2.10% | $61,543 |
| Bloomberg Barclays 1–5 Year Municipal Bond Index | -0.16 | 1.12 | 2.35 | 63,068 |
| Bloomberg Barclays Municipal Bond Index | -0.51 | 3.25 | 4.80 | 79,878 |
1 Derived from data provided by Lipper, a Thomson Reuters Company.
See Financial Highlights for dividend and capital gains information.
56
Limited-Term Tax-Exempt Fund
| | | | |
| Fiscal-Year Total Returns (%): October 31, 2008–October 31, 2018 | | | |
| Bloomberg |
| Barclays |
| 1–5 Year |
| Municipal |
| | Investor Shares | Bond Index |
| Income | Capital | Total | Total |
| Fiscal Year | Returns | Returns | Returns | Returns |
| 2009 | 2.92% | 3.00% | 5.92% | 7.51% |
| 2010 | 2.40 | 1.64 | 4.04 | 4.32 |
| 2011 | 2.25 | -0.72 | 1.53 | 2.15 |
| 2012 | 1.94 | 0.99 | 2.93 | 3.17 |
| 2013 | 1.67 | -1.07 | 0.60 | 0.93 |
| 2014 | 1.63 | 0.18 | 1.81 | 1.98 |
| 2015 | 1.51 | -0.36 | 1.15 | 1.39 |
| 2016 | 1.49 | -0.18 | 1.31 | 1.09 |
| 2017 | 1.52 | -0.45 | 1.07 | 1.32 |
| 2018 | 1.74 | -1.82 | -0.08 | -0.16 |
Average Annual Total Returns: Periods Ended September 30, 2018
This table presents returns through the latest calendar quarter—rather than through the end of the fiscal period.
Securities and Exchange Commission rules require that we provide this information.
| | | | | | |
| | | | | Ten Years |
| Inception Date | One Year Five Years | Income | Capital | Total |
| Investor Shares | 8/31/1987 | -0.02% | 1.19% | 1.92% | 0.12% | 2.04% |
| Admiral Shares | 2/12/2001 | 0.07 | 1.28 | 2.00 | 0.12 | 2.12 |
57
Limited-Term Tax-Exempt Fund
Financial Statements
Statement of Net Assets
As of October 31, 2018
The fund reports a complete list of its holdings in regulatory filings four times in each fiscal year, at the quarter-ends. For the second and fourth fiscal quarters, the lists appear in the fund’s semiannual and annual reports to shareholders. For the first and third fiscal quarters, the fund files the lists with the Securities and Exchange Commission on Form N-Q. Shareholders can look up the fund’s Forms N-Q on the SEC’s website at sec.gov.
| | | | |
| Face | Market |
| Maturity | Amount | Value• |
| Coupon | Date | ($000) | ($000) |
| Tax-Exempt Municipal Bonds (100.1%) | | | | |
| Alabama (2.2%) | | | | |
| Alabama Federal Aid Highway Finance Authority Special Obligation Revenue | 5.000% | 9/1/23 | 6,105 | 6,837 |
| Alabama Federal Aid Highway Finance Authority Special Obligation Revenue | 5.000% | 9/1/25 | 6,130 | 7,074 |
| Alabama Special Care Facilities Financing Authority Birmingham Revenue | | | | |
| (Ascension Health Credit Group) PUT | 1.850% | 11/1/22 | 9,000 | 8,712 |
| Auburn University Alabama General Fee Revenue | 5.000% | 6/1/19 | 2,000 | 2,035 |
| Baldwin County AL Board of Education Revenue | 5.000% | 6/1/21 | 1,000 | 1,068 |
| Baldwin County AL Board of Education Revenue | 5.000% | 6/1/22 | 1,500 | 1,633 |
| Birmingham AL Special Care Facilities Financing Authority Revenue | | | | |
| (Ascension Health Credit Group) PUT | 1.500% | 5/1/20 | 3,730 | 3,681 |
| Birmingham AL Water Works Board Water Revenue | 5.000% | 1/1/23 | 1,000 | 1,104 |
| Birmingham AL Water Works Board Water Revenue | 5.000% | 1/1/23 | 430 | 472 |
| 1 Birmingham AL Water Works Board Water Revenue | 5.000% | 1/1/24 | 250 | 280 |
| 1 Birmingham AL Water Works Board Water Revenue | 5.000% | 1/1/25 | 375 | 425 |
| 1 Birmingham AL Water Works Board Water Revenue | 5.000% | 1/1/26 | 850 | 975 |
| Black Belt Energy Gas District Alabama Gas Prepay Revenue (Project No. 3) PUT | 5.000% | 12/1/20 | 765 | 804 |
| Black Belt Energy Gas District Alabama Gas Prepay Revenue (Project No. 3) PUT | 5.000% | 12/1/21 | 1,000 | 1,069 |
| Black Belt Energy Gas District Alabama Gas Prepay Revenue (Project No. 3) PUT | 5.000% | 12/1/22 | 2,255 | 2,450 |
| 2 Black Belt Energy Gas District Alabama Gas Prepay Revenue (Project No. 3) PUT | 2.412% | 12/1/23 | 60,000 | 60,000 |
| Black Belt Energy Gas District Alabama Gas Prepay Revenue (Project No. 3) PUT | 4.000% | 12/1/23 | 90,000 | 93,693 |
| Black Belt Energy Gas District Alabama Gas Prepay Revenue (Project No. 3) PUT | 5.000% | 12/1/23 | 7,280 | 8,004 |
| Black Belt Energy Gas District Alabama Gas Supply Revenue PUT | 4.000% | 6/1/21 | 78,865 | 81,423 |
| Black Belt Energy Gas District Alabama Gas Supply Revenue PUT | 4.000% | 7/1/22 | 56,130 | 58,260 |
| City of Huntsville AL Electric System Revenue | 5.000% | 12/1/24 | 350 | 399 |
| Houston County AL Health Care Authority Revenue | 5.000% | 10/1/24 | 3,050 | 3,349 |
| Houston County AL Health Care Authority Revenue | 5.000% | 10/1/25 | 1,000 | 1,092 |
| Huntsville AL Electric System Revenue | 5.000% | 12/1/23 | 250 | 281 |
| Huntsville AL Electric System Revenue | 5.000% | 12/1/23 | 200 | 224 |
| Huntsville AL Electric System Revenue | 5.000% | 12/1/24 | 365 | 416 |
| Huntsville AL Electric System Revenue | 4.000% | 12/1/25 | 200 | 218 |
| Huntsville AL Electric System Revenue | 5.000% | 12/1/25 | 300 | 346 |
| Huntsville AL GO | 5.000% | 11/1/24 | 1,400 | 1,565 |
| Huntsville AL GO | 5.000% | 11/1/24 | 1,195 | 1,336 |
| Huntsville AL Water System Revenue | 5.000% | 11/1/20 | 1,000 | 1,056 |
| Infirmary Health System Special Care Facilities Financing Authority Mobile Alabama Revenue | | | | |
| (Infirmary Health System Inc.) | 5.000% | 2/1/21 | 3,065 | 3,233 |
| Infirmary Health System Special Care Facilities Financing Authority Mobile Alabama Revenue | | | | |
| (Infirmary Health System Inc.) | 5.000% | 2/1/22 | 4,365 | 4,685 |
| Infirmary Health System Special Care Facilities Financing Authority Mobile Alabama Revenue | | | | |
| (Infirmary Health System Inc.) | 5.000% | 2/1/23 | 4,565 | 4,980 |
| Jefferson County AL GO | 5.000% | 4/1/23 | 1,000 | 1,099 |
| Jefferson County AL GO | 5.000% | 4/1/24 | 5,500 | 6,124 |
| Jefferson County AL GO | 5.000% | 4/1/25 | 3,760 | 4,233 |
| Jefferson County AL Revenue | 5.000% | 9/15/19 | 935 | 958 |
| Jefferson County AL Revenue | 5.000% | 9/15/20 | 1,250 | 1,312 |
| Jefferson County AL Revenue | 5.000% | 9/15/21 | 1,625 | 1,737 |
| Jefferson County AL Revenue | 5.000% | 9/15/22 | 625 | 681 |
| Jefferson County AL Revenue | 5.000% | 9/15/23 | 2,500 | 2,767 |
| Jefferson County AL Revenue | 5.000% | 9/15/24 | 6,725 | 7,517 |
| Jefferson County AL Sewer Revenue | 5.000% | 10/1/21 | 1,300 | 1,373 |
| Mobile County AL Board of School Commissioners GO | 5.000% | 3/1/22 | 600 | 643 |
| Mobile County AL Board of School Commissioners GO | 5.000% | 3/1/22 | 1,010 | 1,082 |
| Mobile County AL Board of School Commissioners GO | 5.000% | 3/1/23 | 950 | 1,033 |
| Mobile County AL Board of School Commissioners GO | 5.000% | 3/1/24 | 1,345 | 1,479 |
| Mobile County AL Board of School Commissioners GO | 5.000% | 3/1/25 | 2,580 | 2,863 |
| Mobile County AL Board of School Commissioners GO | 5.000% | 3/1/26 | 2,735 | 3,056 |
| Southeast Alabama Gas Supply District Revenue | 4.000% | 6/1/21 | 870 | 902 |
| Southeast Alabama Gas Supply District Revenue | 4.000% | 6/1/22 | 1,225 | 1,281 |
58
Limited-Term Tax-Exempt Fund
| | | | |
| Face | Market |
| Maturity | Amount | Value• |
| Coupon | Date | ($000) | ($000) |
| Southeast Alabama Gas Supply District Revenue | 4.000% | 6/1/23 | 2,000 | 2,102 |
| Southeast Alabama Gas Supply District Revenue PUT | 4.000% | 4/1/24 | 49,000 | 51,057 |
| Southeast Alabama Gas Supply District Revenue PUT | 4.000% | 6/1/24 | 23,460 | 24,461 |
| Tuscaloosa AL Public Educational Building Authority Student Housing Revenue | | | | |
| (Ridgecrest Student Housing LLC) | 5.000% | 7/1/22 (15) | 3,485 | 3,760 |
| Tuscaloosa AL Public Educational Building Authority Student Housing Revenue | | | | |
| (Ridgecrest Student Housing LLC) | 5.000% | 7/1/23 (15) | 3,660 | 4,030 |
| Tuscaloosa AL Public Educational Building Authority Student Housing Revenue | | | | |
| (Ridgecrest Student Housing LLC) | 5.000% | 7/1/24 (15) | 3,845 | 4,289 |
| Tuscaloosa County AL Board of Education Special Tax Revenue | 5.000% | 2/1/23 | 200 | 220 |
| Tuscaloosa County AL Board of Education Special Tax Revenue | 5.000% | 2/1/24 | 150 | 168 |
| Tuscaloosa County AL Board of Education Special Tax Revenue | 5.000% | 2/1/27 | 275 | 316 |
| Tuscaloosa County AL Industrial Development Authority Gulf Opportunity Zone Revenue | | | | |
| (Hunt Refining Project) VRDO | 1.630% | 11/7/18 LOC | 20,000 | 20,000 |
| Tuscaloosa County AL Industrial Development Authority Gulf Opportunity Zone Revenue | | | | |
| (Hunt Refining Project) VRDO | 1.630% | 11/7/18 LOC | 25,000 | 25,000 |
| Tuscaloosa County AL Industrial Development Authority Gulf Opportunity Zone Revenue | | | | |
| (Hunt Refining Project) VRDO | 1.630% | 11/7/18 LOC | 20,350 | 20,350 |
| University of Alabama General Revenue | 5.000% | 7/1/19 | 5,345 | 5,451 |
| University of South Alabama University Facilities Revenue | 5.000% | 11/1/20 | 1,395 | 1,465 |
| University of South Alabama University Facilities Revenue | 5.000% | 11/1/21 | 825 | 884 |
| University of South Alabama University Facilities Revenue | 5.000% | 10/1/22 (15) | 325 | 355 |
| University of South Alabama University Facilities Revenue | 5.000% | 11/1/22 | 1,080 | 1,177 |
| University of South Alabama University Facilities Revenue | 5.000% | 10/1/23 (15) | 500 | 556 |
| University of South Alabama University Facilities Revenue | 5.000% | 10/1/24 (15) | 525 | 591 |
| University of South Alabama University Facilities Revenue | 5.000% | 10/1/26 (15) | 800 | 919 |
| | | | 570,470 |
| Alaska (0.4%) | | | | |
| Alaska GO | 5.000% | 8/1/22 | 5,590 | 6,122 |
| Alaska GO | 5.000% | 8/1/25 | 1,435 | 1,576 |
| Alaska Municipal Bond Bank Authority Revenue | 5.000% | 12/1/21 | 2,265 | 2,440 |
| Alaska Municipal Bond Bank Authority Revenue | 5.000% | 12/1/22 | 2,410 | 2,641 |
| Alaska Municipal Bond Bank Authority Revenue | 5.000% | 12/1/22 | 1,755 | 1,924 |
| Alaska Municipal Bond Bank Authority Revenue | 5.000% | 12/1/23 | 2,530 | 2,811 |
| Alaska Municipal Bond Bank Authority Revenue | 5.000% | 12/1/23 | 4,785 | 5,316 |
| Alaska Railroad Corp. Capital Grant Receipt Revenue | 5.000% | 8/1/19 | 2,000 | 2,041 |
| Alaska Railroad Corp. Capital Grant Receipt Revenue | 5.000% | 8/1/21 | 10,140 | 10,734 |
| Alaska Railroad Corp. Capital Grant Receipt Revenue | 5.000% | 8/1/22 | 10,265 | 11,032 |
| Alaska Railroad Corp. Capital Grant Receipt Revenue | 5.000% | 8/1/23 | 13,645 | 15,021 |
| Alaska State International Airport Revenue | 5.000% | 10/1/23 | 525 | 583 |
| Alaska State International Airport Revenue | 5.000% | 10/1/24 | 1,635 | 1,840 |
| Anchorage AK GO | 5.000% | 9/1/21 | 2,000 | 2,152 |
| Anchorage AK GO | 5.000% | 9/1/21 | 2,605 | 2,803 |
| Anchorage AK GO | 5.000% | 9/1/21 | 1,000 | 1,076 |
| Anchorage AK GO | 5.000% | 9/1/22 | 2,000 | 2,198 |
| Anchorage AK GO | 5.000% | 9/1/22 | 1,665 | 1,830 |
| Anchorage AK GO | 5.000% | 9/1/25 | 5,000 | 5,663 |
| Anchorage AK Wastewater Revenue | 5.000% | 5/1/23 | 750 | 833 |
| Anchorage AK Wastewater Revenue | 5.000% | 5/1/24 | 600 | 678 |
| Anchorage AK Wastewater Revenue | 5.000% | 5/1/25 | 575 | 658 |
| Matanuska-Susitna Borough AK Lease Revenue (Goose Creek Correctional Center) GO | 5.000% | 9/1/20 | 1,725 | 1,812 |
| Matanuska-Susitna Borough AK Lease Revenue (Goose Creek Correctional Center) GO | 5.000% | 9/1/21 | 1,950 | 2,090 |
| Matanuska-Susitna Borough AK Lease Revenue (Goose Creek Correctional Center) GO | 5.000% | 9/1/22 | 1,525 | 1,664 |
| Matanuska-Susitna Borough AK Lease Revenue (Goose Creek Correctional Center) GO | 5.000% | 9/1/23 | 4,160 | 4,604 |
| | | | 92,142 |
| Arizona (1.7%) | | | | |
| Arizona Board of Regents Arizona State University System Revenue | 5.000% | 7/1/19 | 325 | 331 |
| Arizona Board of Regents Arizona State University System Revenue | 5.000% | 8/1/19 | 2,140 | 2,188 |
| Arizona Board of Regents Arizona State University System Revenue | 5.000% | 7/1/20 | 1,045 | 1,094 |
| Arizona Board of Regents Arizona State University System Revenue | 5.000% | 8/1/20 | 1,700 | 1,783 |
| Arizona Board of Regents Arizona State University System Revenue | 5.000% | 7/1/21 | 5,000 | 5,359 |
| Arizona Board of Regents Arizona State University System Revenue | 5.000% | 7/1/21 | 10,000 | 10,718 |
| Arizona Board of Regents Arizona State University System Revenue | 5.000% | 7/1/21 | 625 | 670 |
| Arizona Board of Regents Arizona State University System Revenue | 5.000% | 7/1/21 | 500 | 536 |
| Arizona Board of Regents Arizona State University System Revenue | 5.000% | 7/1/21 | 1,170 | 1,254 |
| Arizona Board of Regents Arizona State University System Revenue | 5.000% | 7/1/21 | 975 | 1,045 |
| Arizona Board of Regents Arizona State University System Revenue | 5.000% | 7/1/21 | 300 | 321 |
| Arizona Board of Regents Arizona State University System Revenue | 5.000% | 7/1/22 | 3,190 | 3,492 |
| Arizona Board of Regents Arizona State University System Revenue | 5.000% | 7/1/22 | 3,185 | 3,487 |
59
Limited-Term Tax-Exempt Fund
| | | | |
| Face | Market |
| Maturity | Amount | Value• |
| Coupon | Date | ($000) | ($000) |
| Arizona Board of Regents Arizona State University System Revenue | 5.000% | 7/1/22 | 425 | 465 |
| Arizona Board of Regents Arizona State University System Revenue | 5.000% | 7/1/22 | 600 | 657 |
| Arizona Board of Regents Arizona State University System Revenue | 5.000% | 7/1/22 | 300 | 328 |
| Arizona Board of Regents Arizona State University System Revenue | 5.000% | 7/1/22 | 455 | 498 |
| Arizona Board of Regents Arizona State University System Revenue | 5.000% | 7/1/23 | 750 | 837 |
| Arizona Board of Regents Arizona State University System Revenue | 5.000% | 7/1/23 | 1,500 | 1,673 |
| Arizona Board of Regents Arizona State University System Revenue | 5.000% | 7/1/23 | 500 | 558 |
| Arizona Board of Regents Arizona State University System Revenue | 5.000% | 7/1/23 | 500 | 558 |
| Arizona Board of Regents Arizona State University System Revenue | 5.000% | 7/1/23 | 690 | 770 |
| Arizona Board of Regents Arizona State University System Revenue | 5.000% | 7/1/24 | 400 | 453 |
| Arizona Board of Regents Arizona State University System Revenue | 5.000% | 7/1/24 | 400 | 453 |
| Arizona Board of Regents Arizona State University System Revenue | 5.000% | 7/1/25 | 800 | 904 |
| Arizona Board of Regents Arizona State University System Revenue | 5.000% | 7/1/25 | 620 | 712 |
| Arizona Board of Regents COP (University of Arizona) | 5.000% | 6/1/19 | 1,605 | 1,632 |
| Arizona Board of Regents COP (University of Arizona) | 5.000% | 6/1/19 | 710 | 722 |
| Arizona Board of Regents COP (University of Arizona) | 5.000% | 6/1/20 | 1,310 | 1,366 |
| Arizona Board of Regents COP (University of Arizona) | 5.000% | 6/1/20 | 585 | 610 |
| Arizona Board of Regents COP (University of Arizona) | 5.000% | 6/1/21 | 1,250 | 1,336 |
| Arizona Board of Regents COP (University of Arizona) | 5.000% | 6/1/21 | 1,000 | 1,068 |
| Arizona Board of Regents COP (University of Arizona) | 5.000% | 6/1/22 | 1,000 | 1,091 |
| Arizona Board of Regents COP (University of Arizona) | 5.000% | 6/1/22 | 500 | 546 |
| Arizona Board of Regents COP (University of Arizona) | 5.000% | 6/1/23 | 480 | 533 |
| Arizona Board of Regents COP (University of Arizona) | 5.000% | 6/1/24 | 500 | 564 |
| Arizona COP | 4.000% | 9/1/19 | 1,500 | 1,525 |
| Arizona COP | 5.000% | 9/1/20 | 4,300 | 4,520 |
| Arizona COP | 5.000% | 9/1/21 | 6,380 | 6,862 |
| Arizona COP | 5.000% | 10/1/22 | 4,910 | 5,394 |
| Arizona COP | 5.000% | 10/1/23 | 6,530 | 7,290 |
| Arizona Health Facilities Authority Hospital System Revenue (Phoenix Children’s Hospital) | 5.000% | 2/1/19 | 2,600 | 2,617 |
| Arizona Health Facilities Authority Hospital System Revenue (Phoenix Children’s Hospital) | 5.000% | 2/1/20 | 4,550 | 4,690 |
| Arizona Health Facilities Authority Hospital System Revenue (Phoenix Children’s Hospital) | 5.000% | 2/1/21 | 1,000 | 1,052 |
| Arizona Health Facilities Authority Hospital System Revenue (Phoenix Children’s Hospital) | 5.000% | 2/1/30 | 3,250 | 3,444 |
| Arizona Health Facilities Authority Revenue (Banner Health) VRDO | 1.590% | 11/7/18 LOC | 39,000 | 39,000 |
| 2 Arizona Health Facilities Authority Revenue (Phoenix Children’s Hospital) PUT | 3.450% | 2/5/20 | 20,000 | 20,200 |
| 2 Arizona Health Facilities Authority Revenue (Phoenix Children’s Hospital) PUT | 3.450% | 2/5/20 | 5,000 | 5,050 |
| Arizona Health Facilities Authority Revenue (Scottsdale Lincoln Hospitals Project) | 5.000% | 12/1/19 | 600 | 618 |
| Arizona Health Facilities Authority Revenue (Scottsdale Lincoln Hospitals Project) | 5.000% | 12/1/20 | 1,305 | 1,374 |
| Arizona Health Facilities Authority Revenue (Scottsdale Lincoln Hospitals Project) | 5.000% | 12/1/21 | 1,000 | 1,075 |
| Arizona Health Facilities Authority Revenue (Scottsdale Lincoln Hospitals Project) | 5.000% | 12/1/22 | 835 | 913 |
| Arizona School Facilities Board COP | 5.000% | 9/1/21 | 7,000 | 7,527 |
| Arizona State University Revenue (McAllister Academic Village LLC) | 5.000% | 7/1/20 | 1,505 | 1,575 |
| Arizona State University Revenue (McAllister Academic Village LLC) | 5.000% | 7/1/22 | 1,770 | 1,933 |
| Arizona Transportation Board Excise Tax Revenue | 5.000% | 7/1/21 | 9,000 | 9,651 |
| Arizona Transportation Board Excise Tax Revenue | 5.000% | 7/1/22 | 3,350 | 3,670 |
| Arizona Transportation Board Excise Tax Revenue | 5.000% | 7/1/23 | 3,500 | 3,897 |
| Arizona Transportation Board Excise Tax Revenue (Maricopa County Regional Area) | 5.000% | 7/1/24 | 7,500 | 8,501 |
| Arizona Transportation Board Excise Tax Revenue (Maricopa County Regional Area) | 5.000% | 7/1/25 | 11,425 | 13,138 |
| Arizona Transportation Board GAN | 5.000% | 7/1/23 | 1,000 | 1,114 |
| Arizona Transportation Board GAN | 5.000% | 7/1/24 | 1,000 | 1,131 |
| Arizona Transportation Board Highway Revenue | 5.000% | 7/1/20 | 3,380 | 3,539 |
| Arizona Transportation Board Highway Revenue | 5.000% | 7/1/25 | 5,000 | 5,656 |
| Arizona Transportation Board Highway Revenue | 5.000% | 7/1/26 | 20,000 | 21,754 |
| Arizona Transportation Board Highway Revenue | 5.000% | 7/1/26 | 10,000 | 11,290 |
| Arizona Transportation Board Highway Revenue | 5.000% | 7/1/29 | 7,150 | 7,751 |
| Arizona Water Infrastructure Finance Authority Revenue | 5.000% | 10/1/19 (ETM) | 530 | 544 |
| Arizona Water Infrastructure Finance Authority Revenue | 5.000% | 10/1/19 | 1,470 | 1,511 |
| Arizona Water Infrastructure Finance Authority Revenue | 5.000% | 10/1/25 | 9,200 | 10,085 |
| Glendale AZ GO | 4.000% | 7/1/21 (4) | 3,400 | 3,549 |
| Glendale AZ GO | 5.000% | 7/1/22 (4) | 1,670 | 1,823 |
| Glendale AZ Industrial Development Authority Senior Living Facilities Revenue | | | | |
| (Royal Oaks Life Care Community) | 4.000% | 5/15/20 | 450 | 460 |
| Glendale AZ Industrial Development Authority Senior Living Facilities Revenue | | | | |
| (Royal Oaks Life Care Community) | 4.000% | 5/15/21 | 750 | 775 |
| Glendale AZ Industrial Development Authority Senior Living Facilities Revenue | | | | |
| (Royal Oaks Life Care Community) | 4.000% | 5/15/22 | 750 | 781 |
| Glendale AZ Industrial Development Authority Senior Living Facilities Revenue | | | | |
| (Royal Oaks Life Care Community) | 4.000% | 5/15/23 | 750 | 785 |
| Glendale AZ Senior Excise Tax Revenue | 5.000% | 7/1/20 | 2,770 | 2,894 |
| Glendale AZ Senior Excise Tax Revenue | 5.000% | 7/1/21 | 2,900 | 3,102 |
| Glendale AZ Senior Excise Tax Revenue | 5.000% | 7/1/22 | 3,100 | 3,384 |
60
Limited-Term Tax-Exempt Fund
| | | | |
| Face | Market |
| Maturity | Amount | Value• |
| Coupon | Date | ($000) | ($000) |
| Goodyear Public Improvement Corp. AZ Municipal Facilities Revenue | 5.000% | 7/1/21 | 800 | 857 |
| Goodyear Public Improvement Corp. AZ Municipal Facilities Revenue | 5.000% | 7/1/22 | 1,500 | 1,640 |
| Goodyear Public Improvement Corp. AZ Municipal Facilities Revenue | 5.000% | 7/1/24 | 900 | 1,014 |
| Maricopa County AZ Industrial Development Authority Health Facilities Revenue | | | | |
| (Banner Health Obligated Group) | 5.000% | 1/1/21 | 3,500 | 3,704 |
| Maricopa County AZ Industrial Development Authority Health Facilities Revenue | | | | |
| (Banner Health Obligated Group) | 5.000% | 1/1/22 | 3,650 | 3,944 |
| Maricopa County AZ Industrial Development Authority Health Facilities Revenue | | | | |
| (Banner Health Obligated Group) | 5.000% | 1/1/23 | 5,500 | 6,054 |
| Maricopa County AZ Industrial Development Authority Health Facilities Revenue | | | | |
| (Banner Health Obligated Group) | 5.000% | 1/1/24 | 2,275 | 2,544 |
| Maricopa County AZ Industrial Development Authority Health Facilities Revenue | | | | |
| (Banner Health Obligated Group) PUT | 5.000% | 10/18/24 | 9,000 | 10,101 |
| Maricopa County AZ Unified School District No. 4 (Mesa) GO | 4.000% | 7/1/19 | 3,750 | 3,801 |
| Phoenix AZ Civic Improvement Corp. Airport Revenue | 5.000% | 7/1/20 | 450 | 471 |
| Phoenix AZ Civic Improvement Corp. Airport Revenue | 5.000% | 7/1/21 | 335 | 358 |
| Phoenix AZ Civic Improvement Corp. Airport Revenue | 5.000% | 7/1/22 | 200 | 218 |
| Phoenix AZ Civic Improvement Corp. Excise Tax Revenue | 5.000% | 7/1/21 | 2,000 | 2,145 |
| Phoenix AZ Civic Improvement Corp. Excise Tax Revenue | 5.000% | 7/1/22 | 1,775 | 1,944 |
| Phoenix AZ Civic Improvement Corp. Excise Tax Revenue | 5.000% | 7/1/23 | 11,755 | 13,107 |
| Phoenix AZ Civic Improvement Corp. Water System Revenue | 5.000% | 7/1/21 | 12,360 | 13,254 |
| Phoenix AZ Civic Improvement Corp. Water System Revenue | 5.000% | 7/1/25 | 4,125 | 4,657 |
| Phoenix AZ Industrial Development Authority Lease Revenue | | | | |
| (Downtown Phoenix Student Housing LLC) | 5.000% | 7/1/23 | 100 | 108 |
| Phoenix AZ Industrial Development Authority Lease Revenue | | | | |
| (Downtown Phoenix Student Housing LLC) | 5.000% | 7/1/24 | 400 | 438 |
| Phoenix AZ Industrial Development Authority Lease Revenue | | | | |
| (Downtown Phoenix Student Housing LLC) | 5.000% | 7/1/25 | 400 | 441 |
| Pima County AZ Regional Transportation Authority Excise Tax Revenue | 5.000% | 6/1/19 | 3,155 | 3,210 |
| Pima County AZ Regional Transportation Authority Excise Tax Revenue | 5.000% | 6/1/20 | 2,840 | 2,967 |
| Pima County AZ Regional Transportation Authority Excise Tax Revenue | 5.000% | 6/1/21 | 3,000 | 3,209 |
| Pima County AZ Sewer Revenue | 5.000% | 7/1/19 | 1,000 | 1,020 |
| Pima County AZ Sewer Revenue | 5.000% | 7/1/22 | 7,250 | 7,928 |
| Pima County AZ Tucson Unified School District No. 1 GO | 5.000% | 7/1/21 (15) | 400 | 429 |
| Pima County AZ Tucson Unified School District No. 1 GO | 5.000% | 7/1/22 (15) | 1,000 | 1,095 |
| Regional Public Transportation Authority Arizona Excise Tax Revenue | | | | |
| (Maricopa County Public Transportation) | 5.250% | 7/1/20 | 4,850 | 5,097 |
| Salt River Project Arizona Agricultural Improvement & Power District Revenue | 5.000% | 12/1/18 | 4,520 | 4,531 |
| Salt River Project Arizona Agricultural Improvement & Power District Revenue | 5.000% | 1/1/19 (Prere.) | 13,125 | 13,192 |
| Salt Verde AZ Financial Corp. Gas Revenue | 5.000% | 12/1/18 | 165 | 165 |
| Salt Verde AZ Financial Corp. Gas Revenue | 5.250% | 12/1/19 | 1,565 | 1,613 |
| Scottsdale AZ GO | 5.000% | 7/1/19 | 1,860 | 1,897 |
| Tempe AZ Industrial Development Authority Revenue (Mirabella at ASU Project) | 4.000% | 10/1/23 | 10,000 | 10,003 |
| University Medical Center Corp. Arizona Hospital Revenue | 5.000% | 7/1/21 (ETM) | 2,740 | 2,930 |
| Yavapai County AZ Industrial Development Authority Solid Waste Disposal Revenue | | | | |
| (Republic Services Inc.) PUT | 1.850% | 12/3/18 | 11,750 | 11,749 |
| Yuma AZ Industrial Development Authority Hospital Revenue (Yuma Regional Medical Center) | 5.000% | 8/1/20 | 1,000 | 1,045 |
| Yuma AZ Industrial Development Authority Hospital Revenue (Yuma Regional Medical Center) | 5.000% | 8/1/21 | 750 | 797 |
| Yuma AZ Industrial Development Authority Hospital Revenue (Yuma Regional Medical Center) | 5.000% | 8/1/22 | 1,100 | 1,190 |
| Yuma AZ Industrial Development Authority Hospital Revenue (Yuma Regional Medical Center) | 5.000% | 8/1/23 | 1,000 | 1,098 |
| | | | 434,021 |
| Arkansas (0.3%) | | | | |
| Arkansas Development Finance Authority Healthcare Revenue (Baptist Health) | 5.000% | 12/1/20 | 4,300 | 4,538 |
| Arkansas Development Finance Authority Healthcare Revenue (Baptist Health) | 5.000% | 12/1/21 | 4,560 | 4,916 |
| Arkansas Development Finance Authority Healthcare Revenue (Baptist Health) | 5.000% | 12/1/22 | 700 | 768 |
| Arkansas Development Finance Authority Healthcare Revenue (Baptist Health) PUT | 3.750% | 9/1/25 | 24,000 | 24,185 |
| Arkansas Development Finance Authority Hospital Revenue (Washington Regional Medical Center) | 5.000% | 2/1/21 | 920 | 970 |
| Arkansas Development Finance Authority Hospital Revenue (Washington Regional Medical Center) | 5.000% | 2/1/22 | 815 | 875 |
| Arkansas Development Finance Authority Hospital Revenue (Washington Regional Medical Center) | 5.000% | 2/1/27 | 2,970 | 3,265 |
| Arkansas Development Finance Authority Hospital Revenue (Washington Regional Medical Center) | 5.000% | 2/1/28 | 3,845 | 4,206 |
| Arkansas Federal Highway Grant Anticipation & Tax Revenue GO | 5.000% | 10/1/21 | 5,000 | 5,389 |
| Arkansas Federal Highway Grant Anticipation & Tax Revenue GO | 5.000% | 10/1/24 | 9,500 | 10,592 |
| Baxter County AR Hospital Revenue | 5.000% | 9/1/20 | 1,385 | 1,432 |
| Baxter County AR Hospital Revenue | 5.000% | 9/1/21 | 1,140 | 1,196 |
| Baxter County AR Hospital Revenue | 5.000% | 9/1/22 | 1,000 | 1,062 |
| Baxter County AR Hospital Revenue | 5.000% | 9/1/23 | 1,910 | 2,046 |
| Independence County AR Pollution Control Revenue (Entergy Arkansas, Inc. Project) | 2.375% | 1/1/21 | 15,000 | 14,954 |
| Springdale AR Sales and Use Revenue | 5.000% | 11/1/24 | 3,090 | 3,382 |
| Springdale AR Sales and Use Revenue | 5.000% | 4/1/25 (15) | 3,610 | 4,047 |
61
Limited-Term Tax-Exempt Fund
| | | | |
| Face | Market |
| Maturity | Amount | Value• |
| Coupon | Date | ($000) | ($000) |
| University of Arkansas Revenue (Fayetteville Campus) | 5.000% | 11/1/23 | 355 | 396 |
| University of Arkansas Revenue (Fayetteville Campus) | 5.000% | 11/1/24 | 405 | 459 |
| University of Arkansas Revenue (Fayetteville Campus) | 5.000% | 11/1/25 | 275 | 315 |
| | | | 88,993 |
| California (6.8%) | | | | |
| ABAG Finance Authority for Nonprofit Corps. California Revenue (Jackson Laboratory) | 5.000% | 7/1/19 | 1,050 | 1,072 |
| ABAG Finance Authority for Nonprofit Corps. California Revenue (Sharp Healthcare) | 5.000% | 8/1/19 | 1,000 | 1,022 |
| ABAG Finance Authority for Nonprofit Corps. California Revenue (Sharp Healthcare) | 4.000% | 8/1/20 | 500 | 516 |
| Alameda CA Corridor Transportation Authority Revenue | 5.000% | 10/1/19 | 1,010 | 1,038 |
| Alameda CA Corridor Transportation Authority Revenue | 0.000% | 10/1/20 (2)(ETM) | 5,485 | 5,271 |
| Alameda CA Corridor Transportation Authority Revenue | 0.000% | 10/1/20 (2) | 115 | 108 |
| Alameda CA Corridor Transportation Authority Revenue | 5.000% | 10/1/20 | 1,730 | 1,828 |
| Alameda County CA Joint Powers Authority Lease Revenue | 5.000% | 12/1/21 | 1,200 | 1,309 |
| Alameda County CA Joint Powers Authority Lease Revenue | 5.000% | 12/1/22 | 1,540 | 1,717 |
| Alameda County CA Joint Powers Authority Lease Revenue | 5.000% | 12/1/23 | 1,830 | 2,081 |
| Antelope Valley-East Kern CA Water Agency Revenue | 4.000% | 6/1/21 | 1,000 | 1,051 |
| Bay Area Toll Authority California Toll Bridge Revenue (San Francisco Bay Area) | 4.000% | 4/1/21 | 3,350 | 3,520 |
| Bay Area Toll Authority California Toll Bridge Revenue (San Francisco Bay Area) PUT | 1.875% | 4/1/19 | 15,400 | 15,400 |
| 2 Bay Area Toll Authority California Toll Bridge Revenue (San Francisco Bay Area) PUT | 2.300% | 10/1/19 | 9,825 | 9,846 |
| Bay Area Toll Authority California Toll Bridge Revenue (San Francisco Bay Area) PUT | 1.375% | 4/1/20 | 34,965 | 34,623 |
| Bay Area Toll Authority California Toll Bridge Revenue (San Francisco Bay Area) PUT | 1.875% | 4/1/20 | 27,500 | 27,422 |
| 2 Bay Area Toll Authority California Toll Bridge Revenue (San Francisco Bay Area) PUT | 2.200% | 4/1/20 | 2,500 | 2,510 |
| Bay Area Toll Authority California Toll Bridge Revenue (San Francisco Bay Area) PUT | 2.100% | 4/1/22 | 23,100 | 22,927 |
| 2 Bay Area Toll Authority California Toll Bridge Revenue (San Francisco Bay Area) PUT | 2.500% | 5/1/23 | 4,000 | 4,087 |
| 2 Bay Area Toll Authority California Toll Bridge Revenue (San Francisco Bay Area) PUT | 2.500% | 5/1/23 | 28,500 | 29,117 |
| Bay Area Toll Authority California Toll Bridge Revenue (San Francisco Bay Area) PUT | 2.000% | 4/1/24 | 30,400 | 29,454 |
| Bay Area Toll Authority California Toll Bridge Revenue (San Francisco Bay Area) PUT | 2.125% | 4/1/25 | 4,800 | 4,616 |
| Brea CA Redevelopment Agency Successor Agency Tax Allocation Revenue | | | | |
| (Redevelopment Project AB) | 5.000% | 8/1/19 | 2,000 | 2,048 |
| Brea CA Redevelopment Agency Successor Agency Tax Allocation Revenue | | | | |
| (Redevelopment Project AB) | 5.000% | 8/1/20 | 2,200 | 2,318 |
| California County CA Tobacco Securitization Agency Revenue | 5.000% | 6/1/19 | 1,210 | 1,229 |
| California County CA Tobacco Securitization Agency Revenue | 5.000% | 6/1/20 | 1,200 | 1,248 |
| California Department of Water Resources Power Supply Revenue | 5.000% | 5/1/19 | 10,000 | 10,164 |
| California Department of Water Resources Power Supply Revenue | 5.000% | 5/1/21 | 23,000 | 24,708 |
| California Department of Water Resources Power Supply Revenue | 5.000% | 5/1/22 | 54,000 | 59,426 |
| California Department of Water Resources Water System Revenue (Central Valley Project) | 5.000% | 12/1/18 (ETM) | 5 | 5 |
| California Department of Water Resources Water System Revenue (Central Valley Project) | 5.000% | 12/1/18 | 1,360 | 1,364 |
| California Department of Water Resources Water System Revenue (Central Valley Project) | 5.000% | 12/1/19 (ETM) | 10 | 10 |
| California Department of Water Resources Water System Revenue (Central Valley Project) | 5.000% | 12/1/19 | 3,990 | 4,129 |
| 2 California Department of Water Resources Water System Revenue (Central Valley Project) PUT | 1.820% | 12/1/20 | 15,875 | 15,855 |
| California GO | 5.000% | 9/1/19 | 17,825 | 18,297 |
| California GO | 5.000% | 9/1/19 | 19,000 | 19,503 |
| California GO | 5.000% | 2/1/20 | 44,500 | 46,202 |
| California GO | 5.000% | 11/1/20 | 21,520 | 22,795 |
| California GO | 5.000% | 12/1/20 | 25,475 | 27,051 |
| California GO | 5.000% | 2/1/21 | 10,000 | 10,665 |
| California GO | 5.000% | 8/1/21 | 4,425 | 4,778 |
| California GO | 5.000% | 8/1/21 | 14,000 | 15,117 |
| California GO | 5.000% | 9/1/21 | 10,000 | 10,818 |
| California GO | 5.000% | 10/1/21 | 28,000 | 30,349 |
| California GO | 5.000% | 10/1/21 | 41,940 | 45,459 |
| California GO | 5.000% | 11/1/21 | 49,440 | 53,689 |
| California GO | 5.000% | 9/1/22 | 10,000 | 11,023 |
| California GO | 5.000% | 8/1/23 | 5,000 | 5,599 |
| California GO | 4.000% | 11/1/23 | 1,970 | 2,122 |
| California GO | 5.000% | 8/1/25 | 10,000 | 11,523 |
| California GO | 5.000% | 8/1/26 | 26,485 | 30,817 |
| California GO | 3.500% | 8/1/27 | 10,000 | 10,547 |
| 2 California GO PUT | 1.890% | 12/1/20 | 22,500 | 22,500 |
| California GO PUT | 4.000% | 12/1/21 | 21,700 | 22,597 |
| 2 California GO PUT | 1.980% | 12/1/22 | 27,000 | 27,065 |
| California Health Facilities Financing Authority Revenue (Adventist Health System/West) | 3.000% | 3/1/19 | 6,045 | 6,068 |
| California Health Facilities Financing Authority Revenue (Adventist Health System/West) | 4.000% | 3/1/21 | 850 | 882 |
| California Health Facilities Financing Authority Revenue (Catholic Healthcare West) | 5.000% | 3/1/19 | 5,125 | 5,175 |
| California Health Facilities Financing Authority Revenue (Catholic Healthcare West) | 5.250% | 3/1/22 | 1,465 | 1,558 |
| California Health Facilities Financing Authority Revenue (City of Hope Medical Center) | 4.000% | 11/15/18 | 1,000 | 1,001 |
| California Health Facilities Financing Authority Revenue (El Camino Hospital) | 4.000% | 2/1/21 | 1,500 | 1,568 |
| California Health Facilities Financing Authority Revenue (El Camino Hospital) | 5.000% | 2/1/22 | 1,035 | 1,127 |
62
Limited-Term Tax-Exempt Fund
| | | | |
| Face | Market |
| Maturity | Amount | Value• |
| Coupon | Date | ($000) | ($000) |
| California Health Facilities Financing Authority Revenue (El Camino Hospital) | 5.000% | 2/1/22 | 750 | 817 |
| California Health Facilities Financing Authority Revenue (El Camino Hospital) | 5.000% | 2/1/23 | 680 | 755 |
| California Health Facilities Financing Authority Revenue (El Camino Hospital) | 5.000% | 2/1/24 | 1,020 | 1,153 |
| California Health Facilities Financing Authority Revenue (Kaiser Permanente) PUT | 5.000% | 11/1/22 | 47,560 | 52,629 |
| California Health Facilities Financing Authority Revenue (Kaiser Permanente) PUT | 5.000% | 11/1/22 | 8,000 | 8,853 |
| California Health Facilities Financing Authority Revenue (Providence Health & Services) | 5.000% | 10/1/21 | 750 | 812 |
| California Health Facilities Financing Authority Revenue (Providence Health & Services) | 5.000% | 10/1/22 | 2,230 | 2,471 |
| California Health Facilities Financing Authority Revenue | | | | |
| (Providence St. Joseph Health Obligated Group) PUT | 1.250% | 10/1/20 | 6,400 | 6,301 |
| California Health Facilities Financing Authority Revenue (St. Joseph Health System) PUT | 5.000% | 10/15/19 | 23,500 | 24,119 |
| California Health Facilities Financing Authority Revenue (St. Joseph Health System) PUT | 5.000% | 10/15/20 | 10,000 | 10,542 |
| California Health Facilities Financing Authority Revenue (St. Joseph Health System) PUT | 1.700% | 10/18/22 | 10,000 | 9,815 |
| California Health Facilities Financing Authority Revenue (St. Joseph Health System) PUT | 5.000% | 10/18/22 | 6,000 | 6,636 |
| California Health Facilities Financing Authority Revenue (Sutter Health) PUT | 1.000% | 8/15/19 | 6,000 | 5,940 |
| California Infrastructure & Economic Development Bank Revenue | | | | |
| (Academy of Motion Picture Arts & Sciences Obligated Group) | 5.000% | 11/1/22 | 1,000 | 1,111 |
| 2 California Infrastructure & Economic Development Bank Revenue | | | | |
| (Academy of Motion Picture Arts & Sciences Obligated Group) PUT | 2.556% | 11/1/20 | 20,000 | 20,000 |
| California Infrastructure & Economic Development Bank Revenue | | | | |
| (Academy of Motion Picture Arts & Sciences Obligated Group) TOB VRDO | 1.800% | 11/7/18 | 6,670 | 6,670 |
| 2 California Infrastructure & Economic Development Bank Revenue (J. Paul Getty Trust) PUT | 2.047% | 4/1/20 | 9,375 | 9,398 |
| 2 California Infrastructure & Economic Development Bank Revenue (J. Paul Getty Trust) PUT | 2.047% | 4/1/20 | 7,500 | 7,518 |
| California Infrastructure & Economic Development Bank Revenue (Pacific Gas & Electric Co.) | 1.050% | 12/1/18 | 2,250 | 2,247 |
| 2 California Infrastructure & Economic Development Bank Revenue PUT | 2.256% | 2/1/21 | 25,000 | 25,039 |
| 2 California Infrastructure & Economic Development Bank Revenue | | | | |
| (California Academy of Sciences) PUT | 1.988% | 8/1/21 | 14,500 | 14,489 |
| California Municipal Finance Authority Revenue (Anaheim Electric Utility Distribution System) | 5.000% | 10/1/21 | 1,300 | 1,411 |
| California Municipal Finance Authority Revenue (Biola University) | 5.000% | 10/1/22 | 135 | 148 |
| California Municipal Finance Authority Revenue (Biola University) | 5.000% | 10/1/23 | 415 | 462 |
| California Municipal Finance Authority Revenue | | | | |
| (Community Hospitals of Central California Obligated Group) | 5.000% | 2/1/21 | 1,000 | 1,055 |
| California Municipal Finance Authority Revenue | | | | |
| (Community Hospitals of Central California Obligated Group) | 5.000% | 2/1/22 | 500 | 538 |
| California Municipal Finance Authority Revenue | | | | |
| (Community Hospitals of Central California Obligated Group) | 5.000% | 2/1/23 | 835 | 914 |
| California Municipal Finance Authority Revenue (Eisenhower Medical Center) | 5.000% | 7/1/24 | 725 | 802 |
| California Municipal Finance Authority Revenue (Eisenhower Medical Center) | 5.000% | 7/1/25 | 800 | 891 |
| California Municipal Finance Authority Revenue (Eisenhower Medical Center) | 5.000% | 7/1/26 | 615 | 688 |
| California Municipal Finance Authority Revenue (NorthBay Healthcare Group) | 2.000% | 11/1/19 | 1,705 | 1,693 |
| California Municipal Finance Authority Revenue (NorthBay Healthcare Group) | 3.000% | 11/1/20 | 800 | 802 |
| California Municipal Finance Authority Revenue (NorthBay Healthcare Group) | 5.000% | 11/1/24 | 985 | 1,076 |
| California Municipal Finance Authority Revenue (NorthBay Healthcare Group) | 5.000% | 11/1/27 | 2,455 | 2,715 |
| California Municipal Finance Authority Revenue (University of La Verne) | 5.000% | 6/1/21 | 350 | 374 |
| California Municipal Finance Authority Revenue (University of La Verne) | 5.000% | 6/1/22 | 250 | 273 |
| California Municipal Finance Authority Revenue (University of La Verne) | 5.000% | 6/1/23 | 600 | 666 |
| California Municipal Finance Authority Revenue (University of La Verne) | 5.000% | 6/1/24 | 350 | 394 |
| California Municipal Finance Authority Solid Waste Revenue (Republic Services Inc. Project) PUT | 1.970% | 1/2/19 | 18,250 | 18,249 |
| California Pollution Control Financing Authority Solid Waste Disposal Revenue | | | | |
| (Republic Services Inc. Project) PUT | 1.400% | 2/1/19 | 3,250 | 3,250 |
| California Public Finance Authority Revenue (Henry Mayo Newhall Memorial Hospital) | 5.000% | 10/15/22 | 375 | 403 |
| California Public Finance Authority Revenue (Henry Mayo Newhall Memorial Hospital) | 5.000% | 10/15/23 | 350 | 380 |
| California Public Works Board Lease Revenue | 5.000% | 3/1/21 | 1,965 | 2,095 |
| California Public Works Board Lease Revenue | 5.000% | 10/1/21 | 7,455 | 8,056 |
| California Public Works Board Lease Revenue | 5.000% | 3/1/22 | 1,600 | 1,745 |
| California Public Works Board Lease Revenue | 5.000% | 10/1/22 | 5,750 | 6,344 |
| California Public Works Board Lease Revenue | 5.000% | 3/1/23 | 4,000 | 4,448 |
| California Public Works Board Lease Revenue | 5.000% | 10/1/23 | 12,880 | 14,468 |
| California Public Works Board Lease Revenue | 5.000% | 3/1/24 | 3,145 | 3,555 |
| California Public Works Board Lease Revenue (Department of Corrections) | 5.250% | 11/1/18 (14) | 1,180 | 1,180 |
| California Public Works Board Lease Revenue (Department of Corrections) | 5.000% | 6/1/19 | 16,620 | 16,929 |
| California Public Works Board Lease Revenue (Department of Corrections) | 5.000% | 10/1/20 | 1,690 | 1,785 |
| California Public Works Board Lease Revenue (Department of Corrections) | 5.000% | 5/1/21 | 4,800 | 5,138 |
| California Public Works Board Lease Revenue (Department of Corrections) | 5.000% | 5/1/25 | 5,835 | 6,705 |
| California Public Works Board Lease Revenue (Department of State Hospitals) | 5.000% | 6/1/19 | 5,600 | 5,704 |
| California Public Works Board Lease Revenue (Department of State Hospitals) | 5.000% | 6/1/20 | 5,200 | 5,444 |
| California Public Works Board Lease Revenue (Judicial Council Projects) | 5.000% | 12/1/18 | 4,000 | 4,011 |
| California Public Works Board Lease Revenue (Judicial Council Projects) | 5.000% | 3/1/20 | 1,175 | 1,222 |
| California Public Works Board Lease Revenue (Judicial Council Projects) | 5.000% | 10/1/20 | 1,240 | 1,309 |
| California Public Works Board Lease Revenue (Regents of The University of California) | 5.000% | 10/1/19 (ETM) | 2,960 | 3,047 |
| California Public Works Board Lease Revenue (Various Capital Projects) | 5.000% | 11/1/18 | 2,500 | 2,500 |
63
Limited-Term Tax-Exempt Fund
| | | | |
| Face | Market |
| Maturity | Amount | Value• |
| Coupon | Date | ($000) | ($000) |
| California Public Works Board Lease Revenue (Various Capital Projects) | 5.000% | 11/1/18 | 1,200 | 1,200 |
| California Public Works Board Lease Revenue (Various Capital Projects) | 5.000% | 1/1/19 | 7,755 | 7,797 |
| California Public Works Board Lease Revenue (Various Capital Projects) | 5.000% | 11/1/19 | 2,000 | 2,064 |
| California Public Works Board Lease Revenue (Various Capital Projects) | 5.000% | 11/1/19 | 2,750 | 2,837 |
| California Public Works Board Lease Revenue (Various Capital Projects) | 5.000% | 4/1/20 | 3,050 | 3,179 |
| California Public Works Board Lease Revenue (Various Capital Projects) | 5.000% | 11/1/20 | 2,000 | 2,115 |
| California Public Works Board Lease Revenue (Various Capital Projects) | 5.000% | 5/1/21 | 2,495 | 2,671 |
| California Public Works Board Lease Revenue (Various Capital Projects) | 5.000% | 11/1/21 | 3,500 | 3,789 |
| California Public Works Board Lease Revenue (Various Capital Projects) | 5.000% | 4/1/22 | 5,885 | 6,428 |
| California Public Works Board Lease Revenue (Various Capital Projects) | 5.000% | 11/1/22 | 5,000 | 5,525 |
| California Public Works Board Lease Revenue (Various Capital Projects) | 5.000% | 4/1/23 | 6,620 | 7,375 |
| California Public Works Board Lease Revenue (Various Capital Projects) | 5.000% | 11/1/23 | 5,000 | 5,624 |
| California Public Works Board Lease Revenue (Various Capital Projects) | 5.000% | 5/1/25 | 3,055 | 3,510 |
| California State University Systemwide Revenue | 5.000% | 11/1/18 | 4,000 | 4,000 |
| California State University Systemwide Revenue | 5.000% | 11/1/22 | 2,700 | 3,006 |
| California State University Systemwide Revenue | 5.000% | 11/1/23 | 2,270 | 2,577 |
| California State University Systemwide Revenue PUT | 4.000% | 11/1/21 | 28,075 | 29,158 |
| California State University Systemwide Revenue PUT | 4.000% | 11/1/23 | 4,000 | 4,275 |
| California Statewide Communities Development Authority Revenue | | | | |
| (Citrus Valley Health Partners) | 5.850% | 11/2/18 (14) | 12,500 | 12,500 |
| California Statewide Communities Development Authority Revenue | | | | |
| (Huntington Memorial Hospital) | 5.000% | 7/1/19 | 500 | 510 |
| California Statewide Communities Development Authority Revenue | | | | |
| (Huntington Memorial Hospital) | 5.000% | 7/1/20 | 325 | 340 |
| California Statewide Communities Development Authority Revenue | | | | |
| (Huntington Memorial Hospital) | 5.000% | 7/1/21 | 275 | 294 |
| California Statewide Communities Development Authority Revenue | | | | |
| (Huntington Memorial Hospital) | 5.000% | 7/1/22 | 250 | 273 |
| California Statewide Communities Development Authority Revenue | | | | |
| (Redlands Community Hospital) | 5.000% | 10/1/19 | 1,110 | 1,133 |
| California Statewide Communities Development Authority Revenue | | | | |
| (Redlands Community Hospital) | 5.000% | 10/1/22 | 395 | 426 |
| California Statewide Communities Development Authority Revenue | | | | |
| (Redlands Community Hospital) | 5.000% | 10/1/23 | 1,365 | 1,489 |
| Capistrano CA Unified School District Special Tax Revenue | 5.000% | 9/1/20 (15) | 4,810 | 4,932 |
| Chula Vista CA Municipal Financing Authority Special Tax Revenue | 5.000% | 9/1/19 | 2,610 | 2,680 |
| Contra Costa CA Municipal Water District Revenue | 5.000% | 10/1/19 | 2,100 | 2,164 |
| Contra Costa CA Municipal Water District Revenue | 5.000% | 10/1/20 | 1,525 | 1,616 |
| Contra Costa CA Municipal Water District Revenue | 5.000% | 10/1/21 | 2,025 | 2,201 |
| El Camino CA Healthcare District GO | 5.000% | 8/1/21 | 1,100 | 1,188 |
| El Camino CA Healthcare District GO | 5.000% | 8/1/22 | 1,085 | 1,198 |
| El Camino CA Healthcare District GO | 0.000% | 8/1/24 (14) | 4,085 | 3,497 |
| Foothill/Eastern Transportation Corridor Agency California Toll Road Revenue | 0.000% | 1/15/21 (4) | 4,115 | 3,901 |
| Foothill/Eastern Transportation Corridor Agency California Toll Road Revenue PUT | 5.000% | 1/15/20 | 52,515 | 53,492 |
| Fresno CA Joint Powers Financing Authority Lease Revenue | 5.000% | 4/1/22 (4) | 450 | 489 |
| Fresno CA Joint Powers Financing Authority Lease Revenue | 5.000% | 4/1/23 (4) | 800 | 887 |
| Fresno CA Joint Powers Financing Authority Lease Revenue | 5.000% | 4/1/24 (4) | 675 | 759 |
| Glendale CA Redevelopment Agency Successor Agency Tax Allocation Revenue | | | | |
| (Central Glendale Redevelopment Project) | 4.000% | 12/1/18 (4) | 1,185 | 1,187 |
| Glendale CA Redevelopment Agency Successor Agency Tax Allocation Revenue | | | | |
| (Central Glendale Redevelopment Project) | 4.000% | 12/1/19 (4) | 2,910 | 2,976 |
| Glendale CA Redevelopment Agency Successor Agency Tax Allocation Revenue | | | | |
| (Central Glendale Redevelopment Project) | 5.000% | 12/1/21 (4) | 1,725 | 1,872 |
| Golden State Tobacco Securitization Corp. California Revenue | 5.000% | 6/1/19 | 5,640 | 5,741 |
| Golden State Tobacco Securitization Corp. California Revenue | 5.000% | 6/1/20 | 3,830 | 3,997 |
| Golden State Tobacco Securitization Corp. California Revenue | 5.000% | 6/1/21 | 2,750 | 2,930 |
| Golden State Tobacco Securitization Corp. California Revenue | 5.000% | 6/1/22 | 4,665 | 5,065 |
| Golden State Tobacco Securitization Corp. California Revenue | 5.000% | 6/1/23 | 6,015 | 6,629 |
| La Quinta CA Redevelopment Agency Tax Allocation Revenue | 5.000% | 9/1/19 | 1,150 | 1,180 |
| La Quinta CA Redevelopment Agency Tax Allocation Revenue | 5.000% | 9/1/20 | 1,045 | 1,102 |
| La Quinta CA Redevelopment Agency Tax Allocation Revenue | 5.000% | 9/1/21 | 1,250 | 1,352 |
| La Verne CA (Brethren Hillcrest Homes) COP | 5.000% | 5/15/20 | 640 | 667 |
| La Verne CA (Brethren Hillcrest Homes) COP | 5.000% | 5/15/21 | 310 | 330 |
| La Verne CA (Brethren Hillcrest Homes) COP | 5.000% | 5/15/22 | 725 | 786 |
| Long Beach CA Finance Authority Natural Gas Purchase Revenue | 5.250% | 11/15/20 | 1,505 | 1,585 |
| Long Beach CA Harbor Revenue | 5.000% | 12/15/20 | 23,550 | 24,928 |
| Los Angeles CA Community College District GO | 5.000% | 8/1/21 | 5,000 | 5,420 |
| Los Angeles CA GO | 5.000% | 9/1/19 | 5,000 | 5,132 |
| Los Angeles CA Unified School District GO | 5.000% | 7/1/20 | 17,195 | 18,069 |
| Los Angeles CA Unified School District GO | 5.000% | 7/1/20 | 22,525 | 23,670 |
64
Limited-Term Tax-Exempt Fund
| | | | |
| Face | Market |
| Maturity | Amount | Value• |
| Coupon | Date | ($000) | ($000) |
| Los Angeles CA Unified School District GO | 5.000% | 7/1/20 | 20,940 | 22,005 |
| Los Angeles CA Unified School District GO | 5.000% | 7/1/20 | 14,755 | 15,505 |
| Los Angeles CA Unified School District GO | 5.000% | 7/1/22 | 10,695 | 11,815 |
| Los Angeles CA Unified School District GO | 5.000% | 7/1/23 | 25,000 | 28,169 |
| Los Angeles CA Unified School District GO | 5.000% | 7/1/24 | 13,500 | 15,471 |
| Los Angeles CA Unified School District GO | 5.000% | 7/1/25 | 3,220 | 3,668 |
| Los Angeles County CA Metropolitan Transportation Authority Sales Tax Revenue | 5.000% | 7/1/19 | 20,000 | 20,433 |
| Los Angeles County CA Public Works Financing Authority Lease Revenue | 5.000% | 8/1/19 | 1,000 | 1,025 |
| Los Angeles County CA Public Works Financing Authority Lease Revenue | 5.000% | 8/1/20 | 500 | 527 |
| Los Angeles County CA Redevelopment Authority Tax Allocation Revenue (Various Project Areas) | 5.000% | 9/1/19 | 2,000 | 2,050 |
| Los Angeles County CA Redevelopment Authority Tax Allocation Revenue (Various Project Areas) | 5.000% | 9/1/20 | 5,495 | 5,782 |
| Los Angeles County CA Redevelopment Authority Tax Allocation Revenue (Various Project Areas) | 5.000% | 9/1/21 (4) | 5,000 | 5,382 |
| Modesto CA Irrigation District Electric Revenue | 5.000% | 7/1/19 | 3,000 | 3,064 |
| Modesto CA Irrigation District Electric Revenue | 5.000% | 7/1/19 | 500 | 511 |
| Modesto CA Irrigation District Electric Revenue | 5.000% | 7/1/20 | 750 | 787 |
| Northern California Gas Authority No. 1 Revenue | 2.235% | 7/1/19 | 6,725 | 6,726 |
| 3 Nuveen California AMT-Free Quality Municipal Income Fund VRDP VRDO | 1.700% | 11/7/18 LOC | 35,500 | 35,500 |
| Oakland CA Redevelopment Agency Tax Allocation Revenue (Central District Project) | 5.000% | 9/1/19 | 1,500 | 1,538 |
| Oakland CA Redevelopment Agency Tax Allocation Revenue (Central District Project) | 5.000% | 9/1/20 | 6,000 | 6,313 |
| Orange County CA Transportation Authority Toll Road Revenue | 5.000% | 8/15/19 | 1,000 | 1,025 |
| Palomar Pomerado Health California Revenue | 5.000% | 11/1/22 | 2,680 | 2,872 |
| Riverside County CA Transportation Commission Sales Tax Revenue | 5.000% | 6/1/19 | 850 | 866 |
| Riverside County CA Transportation Commission Sales Tax Revenue | 5.000% | 6/1/20 | 1,770 | 1,857 |
| San Bernardino CA City Unified School District GO | 5.000% | 8/1/19 (4) | 700 | 716 |
| San Diego County CA Regional Airport Authority Revenue | 5.000% | 7/1/24 | 400 | 458 |
| San Diego County CA Regional Transportation Commission Revenue | 4.000% | 4/1/21 | 40,000 | 41,953 |
| San Diego County CA Water Authority Revenue | 5.000% | 5/1/21 | 1,465 | 1,576 |
| San Diego County CA Water Authority Revenue | 5.000% | 5/1/22 | 1,200 | 1,324 |
| San Francisco CA City & County Redevelopment Financing Authority Tax Allocation Revenue | | | | |
| (Redevelopment Projects) | 5.000% | 8/1/19 | 2,000 | 2,048 |
| San Francisco CA City & County Redevelopment Financing Authority Tax Allocation Revenue | | | | |
| (Redevelopment Projects) | 5.000% | 8/1/20 | 1,500 | 1,580 |
| San Francisco CA City & County Redevelopment Financing Authority Tax Allocation Revenue | | | | |
| (Redevelopment Projects) | 5.000% | 8/1/21 | 2,000 | 2,161 |
| San Juan CA Unified School District GO | 5.000% | 8/1/21 | 1,000 | 1,081 |
| San Mateo County CA Joint Powers Financing Authority Lease Revenue | | | | |
| (Maple Street Correctional Center) | 5.000% | 6/15/20 | 1,015 | 1,066 |
| San Mateo County CA Joint Powers Financing Authority Lease Revenue | | | | |
| (Maple Street Correctional Center) | 5.000% | 6/15/21 | 500 | 539 |
| San Pablo CA Redevelopment Agency Successor Agency Tax Allocation Revenue | 5.000% | 6/15/20 (4) | 1,045 | 1,093 |
| San Pablo CA Redevelopment Agency Successor Agency Tax Allocation Revenue | 5.000% | 6/15/21 (4) | 575 | 616 |
| Santa Clara County CA GO | 5.000% | 8/1/19 (Prere.) | 12,500 | 12,804 |
| 4 Solano County CA Community College District GO | 0.000% | 8/1/25 | 4,250 | 3,875 |
| South Orange County CA Public Financing Authority Special Tax Revenue | 5.000% | 8/15/19 | 1,000 | 1,023 |
| South Orange County CA Public Financing Authority Special Tax Revenue | 5.000% | 8/15/20 | 600 | 631 |
| Southern California Public Power Authority Revenue (Magnolia Power Project) PUT | 2.000% | 7/1/20 | 8,750 | 8,710 |
| University of California Regents Medical Center Pooled Revenue | 5.000% | 5/15/21 | 5,010 | 5,397 |
| University of California Revenue | 5.000% | 5/15/19 | 4,435 | 4,513 |
| University of California Revenue | 5.000% | 5/15/21 | 2,725 | 2,937 |
| University of California Revenue | 5.000% | 5/15/21 | 8,260 | 8,897 |
| University of California Revenue PUT | 1.400% | 5/15/21 | 12,700 | 12,362 |
| Washington Township CA Health Care District Revenue | 5.000% | 7/1/21 | 665 | 705 |
| Washington Township CA Health Care District Revenue | 5.000% | 7/1/22 | 1,325 | 1,427 |
| Washington Township CA Health Care District Revenue | 5.000% | 7/1/23 | 970 | 1,055 |
| Washington Township CA Health Care District Revenue | 5.000% | 7/1/24 | 1,295 | 1,423 |
| Washington Township CA Health Care District Revenue | 5.000% | 7/1/25 | 965 | 1,068 |
| Western CA Municipal Water District Revenue PUT | 1.500% | 10/1/20 | 2,325 | 2,292 |
| | | | 1,765,056 |
| Colorado (1.1%) | | | | |
| Adams & Arapahoe CO Joint School District No. 28J GO | 5.000% | 12/1/21 | 1,345 | 1,455 |
| Adams & Arapahoe CO Joint School District No. 28J GO | 5.000% | 12/1/22 | 1,165 | 1,286 |
| Adams & Arapahoe CO Joint School District No. 28J GO | 5.000% | 12/1/23 | 1,265 | 1,418 |
| Adams County CO COP | 5.000% | 12/1/21 | 1,000 | 1,079 |
| Adams County CO COP | 5.000% | 12/1/22 | 1,250 | 1,375 |
| Castle Rock CO Water & Sewer Revenue | 4.000% | 12/1/20 | 350 | 363 |
| Castle Rock CO Water & Sewer Revenue | 4.000% | 12/1/22 | 225 | 239 |
| Castle Rock CO Water & Sewer Revenue | 5.000% | 12/1/23 | 250 | 280 |
| Colorado (UCDHSC Fitzsimons Academic Projects) COP | 5.000% | 11/1/18 | 3,080 | 3,080 |
| Colorado Building Excellent Schools COP | 5.000% | 3/15/24 | 600 | 676 |
65
Limited-Term Tax-Exempt Fund
| | | | |
| Face | Market |
| Maturity | Amount | Value• |
| Coupon | Date | ($000) | ($000) |
| Colorado Building Excellent Schools COP | 5.000% | 3/15/25 | 1,450 | 1,655 |
| Colorado Building Excellent Schools COP | 5.000% | 3/15/25 | 875 | 999 |
| Colorado COP | 5.000% | 12/15/24 | 3,500 | 3,966 |
| Colorado COP | 5.000% | 12/15/25 | 8,385 | 9,609 |
| Colorado Educational & Cultural Facilities Authority Revenue (Johnson & Wales University) | 5.000% | 4/1/20 (ETM) | 780 | 810 |
| Colorado Educational & Cultural Facilities Authority Revenue (Johnson & Wales University) | 5.000% | 4/1/20 | 1,850 | 1,919 |
| Colorado Health Facilities Authority Hospital Revenue (Frasier Meadows Manor Inc.) | 3.125% | 5/15/27 | 1,250 | 1,224 |
| Colorado Health Facilities Authority Hospital Revenue | | | | |
| (The Evangelical Lutheran Good Samaritan Society Project) | 5.000% | 6/1/23 | 1,225 | 1,334 |
| Colorado Health Facilities Authority Hospital Revenue | | | | |
| (The Evangelical Lutheran Good Samaritan Society Project) | 5.000% | 6/1/24 | 1,000 | 1,099 |
| Colorado Health Facilities Authority Hospital Revenue | | | | |
| (The Evangelical Lutheran Good Samaritan Society Project) | 5.000% | 6/1/25 | 1,245 | 1,381 |
| Colorado Health Facilities Authority Hospital Revenue (Valley View Hospital Association) | 5.000% | 5/15/22 | 770 | 827 |
| Colorado Health Facilities Authority Hospital Revenue (Valley View Hospital Association) | 5.000% | 5/15/23 | 850 | 926 |
| Colorado Health Facilities Authority Hospital Revenue (Valley View Hospital Association) | 5.000% | 5/15/24 | 1,110 | 1,221 |
| Colorado Health Facilities Authority Hospital Revenue (Valley View Hospital Association) | 5.000% | 5/15/25 | 800 | 887 |
| Colorado Health Facilities Authority Hospital Revenue (Valley View Hospital Association) PUT | 2.800% | 5/15/23 | 3,000 | 2,985 |
| Colorado Health Facilities Authority Retirement Facilities Revenue (Liberty Heights Project) | 0.000% | 7/15/24 (ETM) | 20,000 | 17,077 |
| Colorado Health Facilities Authority Revenue | | | | |
| (Adventist Health System/Sunbelt Obligated Group) PUT | 5.000% | 11/15/23 | 27,000 | 29,986 |
| Colorado Health Facilities Authority Revenue (Catholic Health Initiatives) | 5.000% | 2/1/19 | 2,280 | 2,294 |
| Colorado Health Facilities Authority Revenue (Catholic Health Initiatives) | 5.000% | 7/1/20 | 6,950 | 7,064 |
| 2 Colorado Health Facilities Authority Revenue (Catholic Health Initiatives) PUT | 2.784% | 11/12/20 | 5,000 | 5,018 |
| 2 Colorado Health Facilities Authority Revenue (Catholic Health Initiatives) PUT | 2.784% | 11/12/20 | 7,500 | 7,527 |
| Colorado Health Facilities Authority Revenue (Children’s Hospital) | 5.000% | 12/1/20 | 1,375 | 1,450 |
| Colorado Health Facilities Authority Revenue (Children’s Hospital) | 5.000% | 12/1/21 | 1,735 | 1,870 |
| Colorado Health Facilities Authority Revenue (Children’s Hospital) | 5.000% | 12/1/22 | 680 | 746 |
| Colorado Health Facilities Authority Revenue (Children’s Hospital) | 5.000% | 12/1/22 | 1,350 | 1,482 |
| Colorado Health Facilities Authority Revenue (Christian Living Communities) | 4.000% | 1/1/21 | 350 | 355 |
| Colorado Health Facilities Authority Revenue (Christian Living Communities) | 4.000% | 1/1/22 | 400 | 407 |
| Colorado Health Facilities Authority Revenue (Christian Living Communities) | 5.000% | 1/1/23 | 750 | 792 |
| Colorado Health Facilities Authority Revenue (Christian Living Communities) | 5.000% | 1/1/24 | 750 | 796 |
| Colorado Health Facilities Authority Revenue (Covenant Retirement Community Inc.) | 3.150% | 12/1/18 | 3,640 | 3,643 |
| Colorado Health Facilities Authority Revenue (Covenant Retirement Community Inc.) | 4.000% | 12/1/19 | 625 | 635 |
| Colorado Health Facilities Authority Revenue (Covenant Retirement Community Inc.) | 5.000% | 12/1/20 | 2,055 | 2,150 |
| Colorado Health Facilities Authority Revenue | | | | |
| (Evangelical Lutheran Good Samaritan Society Project) | 4.000% | 6/1/20 | 1,025 | 1,048 |
| Colorado Health Facilities Authority Revenue | | | | |
| (Evangelical Lutheran Good Samaritan Society Project) | 5.000% | 6/1/21 | 2,000 | 2,116 |
| Colorado Health Facilities Authority Revenue | | | | |
| (Evangelical Lutheran Good Samaritan Society Project) | 5.000% | 6/1/22 | 2,300 | 2,473 |
| Colorado Health Facilities Authority Revenue | | | | |
| (Evangelical Lutheran Good Samaritan Society Project) | 5.000% | 6/1/23 | 2,000 | 2,178 |
| 2 Colorado Public Highway Authority Revenue PUT | 2.437% | 9/1/19 | 3,125 | 3,128 |
| 2 Colorado Public Highway Authority Revenue PUT | 2.579% | 9/1/21 | 3,000 | 3,022 |
| Colorado Springs CO Utility System Revenue | 5.000% | 11/15/18 | 2,000 | 2,002 |
| Colorado Springs CO Utility System Revenue | 5.000% | 11/15/19 | 3,000 | 3,093 |
| Colorado Springs CO Utility System Revenue | 5.000% | 11/15/23 | 530 | 595 |
| Colorado Springs CO Utility System Revenue | 5.000% | 11/15/23 | 545 | 612 |
| Colorado Springs CO Utility System Revenue | 5.000% | 11/15/23 | 1,000 | 1,123 |
| Colorado Springs CO Utility System Revenue | 5.000% | 11/15/24 | 420 | 479 |
| Colorado Springs CO Utility System Revenue | 5.000% | 11/15/24 | 400 | 456 |
| Denver CO City & County Airport Revenue | 5.000% | 11/15/19 | 1,310 | 1,350 |
| Denver CO City & County Airport Revenue | 5.000% | 11/15/23 | 19,205 | 21,492 |
| 2 Denver CO City & County Airport Revenue PUT | 2.439% | 11/15/19 | 14,020 | 14,040 |
| E-470 Public Highway Authority Colorado Revenue | 5.000% | 9/1/19 | 1,595 | 1,633 |
| E-470 Public Highway Authority Colorado Revenue | 0.000% | 9/1/20 (14) | 2,000 | 1,916 |
| E-470 Public Highway Authority Colorado Revenue | 5.000% | 9/1/20 | 1,125 | 1,179 |
| El Paso County CO COP | 5.000% | 12/1/24 (4) | 450 | 511 |
| El Paso County CO COP | 5.000% | 12/1/25 (4) | 650 | 741 |
| Garfield, Pitkin, & Eagle County CO School District GO | 5.000% | 12/15/25 | 3,000 | 3,236 |
| 1 Interlocken CO Metropolitan District GO | 5.000% | 12/1/23 (4) | 750 | 830 |
| 1 Interlocken CO Metropolitan District GO | 5.000% | 12/1/24 (4) | 875 | 980 |
| 1 Interlocken CO Metropolitan District GO | 5.000% | 12/1/25 (4) | 1,000 | 1,131 |
| Moffat County CO Pollution Control Revenue | | | | |
| (Tri-State Generation & Transmission Association Inc.) PUT | 2.000% | 10/3/22 | 13,500 | 13,234 |
| Park Creek CO Metropolitan District Limited Property Tax Revenue | 4.000% | 12/1/20 | 1,055 | 1,087 |
| Park Creek CO Metropolitan District Limited Property Tax Revenue | 5.000% | 12/1/22 | 1,250 | 1,362 |
| Regional Transportation District of Colorado COP | 5.000% | 6/1/20 (Prere.) | 2,785 | 2,908 |
66
Limited-Term Tax-Exempt Fund
| | | | |
| Face | Market |
| Maturity | Amount | Value• |
| Coupon | Date | ($000) | ($000) |
| Regional Transportation District of Colorado COP | 5.000% | 6/1/20 (Prere.) | 2,000 | 2,089 |
| Regional Transportation District of Colorado COP | 5.000% | 6/1/22 | 7,460 | 8,119 |
| 3 Regional Transportation District of Colorado COP TOB VRDO | 1.650% | 11/7/18 LOC | 8,000 | 8,000 |
| Regional Transportation District of Colorado Sales Tax Revenue | | | | |
| (Denver Transit Partners Eagle P3 Project) | 5.000% | 7/15/21 | 3,460 | 3,524 |
| Regional Transportation District of Colorado Sales Tax Revenue | | | | |
| (Denver Transit Partners Eagle P3 Project) | 5.125% | 1/15/23 | 2,835 | 2,893 |
| Regional Transportation District of Colorado Sales Tax Revenue | | | | |
| (Denver Transit Partners Eagle P3 Project) | 5.125% | 7/15/23 | 2,420 | 2,469 |
| University of Colorado Enterprise System Revenue | 5.000% | 6/1/19 | 2,500 | 2,545 |
| University of Colorado Enterprise System Revenue | 5.000% | 6/1/19 | 1,000 | 1,018 |
| University of Colorado Enterprise System Revenue | 5.000% | 6/1/21 | 1,000 | 1,072 |
| University of Colorado Hospital Authority Revenue PUT | 5.000% | 3/1/22 | 20,000 | 21,363 |
| University of Colorado Hospital Authority Revenue VRDO | 1.600% | 11/7/18 | 15,300 | 15,300 |
| | | | 283,732 |
| Connecticut (2.3%) | | | | |
| Bridgeport CT GO | 5.000% | 8/15/22 (4) | 7,015 | 7,586 |
| Bridgeport CT GO | 5.000% | 8/15/22 (4) | 5,635 | 6,094 |
| Bridgeport CT GO | 5.000% | 8/15/23 (4)(ETM) | 360 | 402 |
| Bridgeport CT GO | 5.000% | 8/15/23 (4) | 750 | 822 |
| Bridgeport CT GO | 5.000% | 8/15/23 (4) | 7,460 | 8,176 |
| Connecticut GO | 5.000% | 11/1/18 | 1,000 | 1,000 |
| 2 Connecticut GO | 2.090% | 3/1/19 | 2,300 | 2,299 |
| 2 Connecticut GO | 2.150% | 3/1/19 | 2,000 | 1,999 |
| 2 Connecticut GO | 2.700% | 4/15/19 | 6,000 | 6,013 |
| 2 Connecticut GO | 2.700% | 5/15/19 | 5,000 | 5,012 |
| Connecticut GO | 5.000% | 6/1/19 | 34,275 | 34,803 |
| 2 Connecticut GO | 2.520% | 9/15/19 | 4,000 | 4,012 |
| Connecticut GO | 4.000% | 10/15/19 | 1,000 | 1,016 |
| 2 Connecticut GO | 2.250% | 3/1/20 | 7,500 | 7,509 |
| Connecticut GO | 5.000% | 6/15/20 | 18,135 | 18,861 |
| Connecticut GO | 5.000% | 12/15/20 | 5,865 | 6,163 |
| Connecticut GO | 5.000% | 3/15/21 | 7,110 | 7,506 |
| Connecticut GO | 5.000% | 4/15/21 | 6,015 | 6,362 |
| Connecticut GO | 5.000% | 11/1/21 | 365 | 390 |
| Connecticut GO | 5.000% | 11/15/21 | 7,325 | 7,831 |
| Connecticut GO | 5.000% | 3/15/22 | 9,620 | 10,321 |
| Connecticut GO | 5.000% | 4/15/22 | 4,275 | 4,593 |
| Connecticut GO | 5.000% | 11/15/22 | 12,560 | 13,613 |
| Connecticut GO | 5.000% | 6/15/23 | 1,000 | 1,090 |
| Connecticut GO | 5.000% | 9/15/23 | 1,305 | 1,426 |
| Connecticut GO | 5.000% | 9/15/24 | 1,390 | 1,534 |
| Connecticut GO | 5.000% | 9/15/24 | 3,355 | 3,702 |
| Connecticut GO | 5.000% | 10/15/24 | 13,895 | 15,118 |
| Connecticut GO | 5.000% | 9/15/25 | 5,310 | 5,888 |
| Connecticut Health & Educational Facilities Authority Revenue | | | | |
| (Connecticut State University System) | 5.000% | 11/1/21 | 2,080 | 2,231 |
| Connecticut Health & Educational Facilities Authority Revenue | | | | |
| (Connecticut State University System) | 5.000% | 11/1/22 | 2,135 | 2,323 |
| Connecticut Health & Educational Facilities Authority Revenue | | | | |
| (Connecticut State University System) | 5.000% | 11/1/23 | 2,295 | 2,524 |
| Connecticut Health & Educational Facilities Authority Revenue (Hartford Healthcare) | 5.000% | 7/1/19 | 4,270 | 4,352 |
| Connecticut Health & Educational Facilities Authority Revenue (Quinnipiac University) | 5.000% | 7/1/21 | 875 | 932 |
| Connecticut Health & Educational Facilities Authority Revenue (Quinnipiac University) | 5.000% | 7/1/22 | 1,280 | 1,386 |
| Connecticut Health & Educational Facilities Authority Revenue (Quinnipiac University) | 5.000% | 7/1/23 | 1,950 | 2,136 |
| Connecticut Health & Educational Facilities Authority Revenue (Sacred Heart University Inc.) | 5.000% | 7/1/19 | 500 | 510 |
| Connecticut Health & Educational Facilities Authority Revenue (Sacred Heart University Inc.) | 5.000% | 7/1/20 | 950 | 992 |
| Connecticut Health & Educational Facilities Authority Revenue (Sacred Heart University Inc.) | 5.000% | 7/1/21 | 750 | 801 |
| Connecticut Health & Educational Facilities Authority Revenue (Sacred Heart University Inc.) | 5.000% | 7/1/22 | 750 | 817 |
| Connecticut Health & Educational Facilities Authority Revenue (Sacred Heart University Inc.) | 5.000% | 7/1/23 | 1,500 | 1,656 |
| Connecticut Health & Educational Facilities Authority Revenue (Sacred Heart University Inc.) | 5.000% | 7/1/24 | 250 | 279 |
| Connecticut Health & Educational Facilities Authority Revenue (Sacred Heart University Inc.) | 5.000% | 7/1/25 | 500 | 564 |
| Connecticut Health & Educational Facilities Authority Revenue (Stamford Hospital) | 5.000% | 7/1/20 | 1,525 | 1,590 |
| Connecticut Health & Educational Facilities Authority Revenue (University of New Haven) | 5.000% | 7/1/22 | 765 | 822 |
| Connecticut Health & Educational Facilities Authority Revenue (University of New Haven) | 5.000% | 7/1/23 | 1,000 | 1,086 |
| Connecticut Health & Educational Facilities Authority Revenue (University of New Haven) | 5.000% | 7/1/25 | 1,000 | 1,104 |
| Connecticut Health & Educational Facilities Authority Revenue (Yale University) PUT | 1.000% | 2/6/19 | 6,500 | 6,484 |
| Connecticut Health & Educational Facilities Authority Revenue (Yale University) PUT | 1.000% | 2/6/19 | 5,350 | 5,337 |
| Connecticut Health & Educational Facilities Authority Revenue (Yale University) PUT | 1.000% | 7/1/19 | 21,950 | 21,800 |
67
Limited-Term Tax-Exempt Fund
| | | | |
| Face | Market |
| Maturity | Amount | Value• |
| Coupon | Date | ($000) | ($000) |
| Connecticut Health & Educational Facilities Authority Revenue (Yale University) PUT | 1.000% | 7/1/19 | 10,550 | 10,478 |
| Connecticut Health & Educational Facilities Authority Revenue (Yale University) PUT | 1.300% | 2/3/20 | 55,000 | 54,385 |
| Connecticut Health & Educational Facilities Authority Revenue (Yale University) PUT | 1.650% | 2/3/20 | 10,000 | 9,931 |
| Connecticut Health & Educational Facilities Authority Revenue (Yale University) PUT | 1.800% | 2/9/21 | 23,500 | 23,231 |
| Connecticut Health & Educational Facilities Authority Revenue (Yale University) PUT | 1.800% | 2/9/21 | 16,125 | 15,941 |
| Connecticut Health & Educational Facilities Authority Revenue (Yale University) PUT | 2.050% | 7/12/21 | 13,500 | 13,395 |
| Connecticut Health & Educational Facilities Authority Revenue (Yale University) PUT | 5.000% | 7/1/22 | 28,000 | 30,641 |
| Connecticut Health & Educational Facilities Authority Revenue (Yale University) PUT | 5.000% | 2/1/23 | 15,000 | 16,578 |
| Connecticut Health & Educational Facilities Authority Revenue (Yale University) VRDO | 1.630% | 11/7/18 LOC | 17,135 | 17,135 |
| 2 Connecticut Health & Educational Facilities Authority Revenue (Yale-New Haven Hospital Inc.) PUT | 2.062% | 7/1/19 | 24,750 | 24,751 |
| Connecticut Housing Finance Authority Revenue Housing Mortgage Finance Program | 4.000% | 11/15/44 | 1,545 | 1,585 |
| Connecticut Housing Finance Authority Revenue Housing Mortgage Finance Program | 4.000% | 11/15/44 | 5,370 | 5,521 |
| Connecticut Housing Finance Authority Revenue Housing Mortgage Finance Program | 4.000% | 11/15/44 | 2,965 | 3,033 |
| Connecticut Housing Finance Authority Revenue Housing Mortgage Finance Program | 3.500% | 11/15/45 | 9,065 | 9,223 |
| Connecticut Housing Finance Authority Revenue Housing Mortgage Finance Program | 4.000% | 11/15/45 | 9,520 | 9,816 |
| Connecticut Housing Finance Authority Revenue Housing Mortgage Finance Program | 4.000% | 11/15/47 | 9,530 | 9,890 |
| Connecticut Housing Finance Authority Revenue Housing Mortgage Finance Program PUT | 1.500% | 11/15/20 | 3,435 | 3,359 |
| Connecticut Housing Finance Authority Revenue Housing Mortgage Finance Program PUT | 2.600% | 11/15/21 | 16,755 | 16,760 |
| Connecticut Special Tax Revenue | 5.000% | 10/1/20 | 1,310 | 1,375 |
| Connecticut Special Tax Revenue | 5.000% | 10/1/23 | 3,375 | 3,718 |
| Connecticut Special Tax Revenue | 5.000% | 10/1/25 | 7,500 | 8,400 |
| Connecticut Special Tax Revenue (Transportation Infrastructure) | 5.000% | 11/1/18 | 1,475 | 1,475 |
| Connecticut Special Tax Revenue (Transportation Infrastructure) | 5.000% | 12/1/19 | 4,915 | 5,062 |
| Connecticut Special Tax Revenue (Transportation Infrastructure) | 5.000% | 10/1/20 | 6,585 | 6,911 |
| Connecticut Special Tax Revenue (Transportation Infrastructure) | 5.000% | 9/1/21 | 11,340 | 12,090 |
| Connecticut Special Tax Revenue (Transportation Infrastructure) | 5.000% | 9/1/24 | 2,615 | 2,906 |
| Connecticut Special Tax Revenue (Transportation Infrastructure) | 5.000% | 12/1/24 | 10,320 | 10,989 |
| Greater New Haven CT Water Pollution Control Authority Regional Wastewater System Revenue | 5.000% | 8/15/20 | 200 | 210 |
| Greater New Haven CT Water Pollution Control Authority Regional Wastewater System Revenue | 5.000% | 8/15/22 | 400 | 437 |
| Hartford County CT Metropolitan District GO | 5.000% | 7/15/23 | 525 | 579 |
| Hartford County CT Metropolitan District GO | 5.000% | 7/15/25 | 900 | 1,014 |
| New Haven CT GO | 5.000% | 8/15/19 (4)(ETM) | 2,215 | 2,267 |
| New Haven CT GO | 5.000% | 8/15/19 (ETM) | 285 | 292 |
| New Haven CT GO | 5.000% | 8/1/20 (4) | 2,015 | 2,104 |
| New Haven CT GO | 5.000% | 8/15/20 (4)(ETM) | 1,500 | 1,576 |
| New Haven CT GO | 5.000% | 8/15/21 (4)(ETM) | 1,575 | 1,695 |
| New Haven CT TANS | 3.000% | 4/3/19 | 4,000 | 4,013 |
| University of Connecticut GO | 5.000% | 2/15/22 | 10,250 | 10,993 |
| University of Connecticut GO | 5.000% | 2/15/22 | 2,940 | 3,153 |
| | | | 607,779 |
| Delaware (0.2%) | | | | |
| Delaware GO | 5.000% | 7/1/21 (ETM) | 1,045 | 1,120 |
| Delaware GO | 5.000% | 7/1/21 | 14,465 | 15,530 |
| Delaware GO | 3.000% | 8/1/26 | 2,265 | 2,304 |
| Delaware River & Bay Authority Delaware Revenue | 5.000% | 1/1/19 | 3,760 | 3,779 |
| Delaware River & Bay Authority Delaware Revenue | 5.000% | 1/1/20 | 225 | 232 |
| Delaware River & Bay Authority Delaware Revenue | 5.000% | 1/1/20 | 2,575 | 2,659 |
| Delaware River & Bay Authority Delaware Revenue | 5.000% | 1/1/21 | 250 | 265 |
| Delaware River & Bay Authority Delaware Revenue | 5.000% | 1/1/21 | 2,295 | 2,429 |
| Delaware River & Bay Authority Delaware Revenue | 5.000% | 1/1/22 | 325 | 351 |
| Delaware River & Bay Authority Delaware Revenue | 5.000% | 1/1/22 | 3,000 | 3,245 |
| Delaware Transportation Authority Transportation System Revenue | 5.000% | 7/1/21 | 375 | 402 |
| Delaware Transportation Authority Transportation System Revenue | 5.000% | 7/1/22 | 2,510 | 2,747 |
| Delaware Transportation Authority Transportation System Revenue | 5.000% | 7/1/23 | 3,315 | 3,693 |
| New Castle County DE GO | 5.000% | 10/1/21 | 7,575 | 8,177 |
| New Castle County DE Student Housing Revenue (University Courtyard Apartments) VRDO | 1.610% | 11/7/18 LOC | 15,730 | 15,730 |
| | | | 62,663 |
| District of Columbia (0.2%) | | | | |
| District of Columbia GO | 5.000% | 6/1/22 | 1,775 | 1,941 |
| District of Columbia Hospital Revenue (Children’s Hospital Obligated Group) | 5.000% | 7/15/20 | 1,010 | 1,056 |
| District of Columbia Hospital Revenue (Children’s Hospital Obligated Group) | 5.000% | 7/15/22 | 1,725 | 1,881 |
| District of Columbia Hospital Revenue (Children’s Hospital Obligated Group) | 5.000% | 7/15/23 | 1,390 | 1,540 |
| District of Columbia Income Tax Revenue | 5.000% | 12/1/18 | 5,500 | 5,514 |
| District of Columbia Income Tax Revenue | 5.000% | 12/1/18 | 5,250 | 5,263 |
| District of Columbia Income Tax Revenue | 5.000% | 12/1/19 | 1,500 | 1,548 |
| District of Columbia Revenue (Federal Highway Grant Anticipation) | 5.250% | 12/1/22 | 5,345 | 5,666 |
| District of Columbia Revenue (Georgetown University) | 5.000% | 4/1/21 | 930 | 987 |
| District of Columbia Revenue (Georgetown University) | 5.000% | 4/1/22 | 1,410 | 1,526 |
| District of Columbia Revenue (Georgetown University) | 5.000% | 4/1/23 | 2,260 | 2,490 |
68
Limited-Term Tax-Exempt Fund
| | | | |
| Face | Market |
| Maturity | Amount | Value• |
| Coupon | Date | ($000) | ($000) |
| District of Columbia Revenue (National Public Radio, Inc.) | 5.000% | 4/1/21 | 1,100 | 1,166 |
| District of Columbia Revenue (National Public Radio, Inc.) | 5.000% | 4/1/22 | 1,885 | 2,037 |
| District of Columbia Revenue (National Public Radio, Inc.) | 5.000% | 4/1/23 | 2,015 | 2,213 |
| District of Columbia Student Dormitory Revenue (Provident Group - Howard Properties LLC) | 4.000% | 10/1/19 | 255 | 256 |
| District of Columbia University Revenue (Georgetown University) | 5.000% | 4/1/24 | 1,070 | 1,196 |
| Washington Convention & Sports Authority Revenue | 5.000% | 10/1/19 | 2,500 | 2,568 |
| Washington Convention & Sports Authority Revenue | 5.000% | 10/1/20 | 2,500 | 2,633 |
| Washington Convention & Sports Authority Revenue | 5.000% | 10/1/21 | 2,500 | 2,685 |
| Washington Convention & Sports Authority Revenue | 5.000% | 10/1/22 | 3,500 | 3,830 |
| | | | 47,996 |
| Florida (3.2%) | | | | |
| Boynton Beach FL Utility System Revenue | 5.500% | 11/1/18 (14) | 3,125 | 3,125 |
| Brevard County FL Health Facilities Authority Revenue (Health First Inc. Project) | 5.000% | 4/1/20 | 500 | 519 |
| Brevard County FL Health Facilities Authority Revenue (Health First Inc. Project) | 5.000% | 4/1/21 | 1,000 | 1,058 |
| Brevard County FL Health Facilities Authority Revenue (Health First Inc. Project) | 5.000% | 4/1/22 | 1,050 | 1,132 |
| Broward County FL Airport System Revenue | 5.000% | 10/1/19 | 750 | 770 |
| Broward County FL Airport System Revenue | 5.000% | 10/1/19 | 500 | 513 |
| Broward County FL Airport System Revenue | 5.000% | 10/1/20 | 1,060 | 1,114 |
| Broward County FL Airport System Revenue | 5.000% | 10/1/21 | 480 | 516 |
| Broward County FL School Board COP | 5.000% | 7/1/19 | 8,140 | 8,302 |
| Broward County FL School Board COP | 5.000% | 7/1/23 | 5,500 | 6,094 |
| Broward County FL School Board COP | 5.000% | 7/1/24 | 6,740 | 7,583 |
| Broward County FL School Board COP | 5.000% | 7/1/25 | 12,710 | 14,482 |
| Cape Coral FL Utility Improvement Special Assessment Revenue | 2.125% | 9/1/22 (4) | 1,205 | 1,158 |
| Cape Coral FL Utility Improvement Special Assessment Revenue | 2.250% | 9/1/23 (4) | 1,065 | 1,019 |
| Cape Coral FL Utility Improvement Special Assessment Revenue | 2.500% | 9/1/24 (4) | 1,450 | 1,390 |
| Cape Coral FL Water & Sewer System Revenue | 5.000% | 10/1/23 | 770 | 855 |
| Cape Coral FL Water & Sewer System Revenue | 5.000% | 10/1/24 | 1,120 | 1,259 |
| Citizens Property Insurance Corp. Florida Revenue (Coastal Account) | 5.000% | 6/1/22 | 30,260 | 32,601 |
| Citizens Property Insurance Corp. Florida Revenue (Coastal Account) | 5.000% | 6/1/25 | 5,000 | 5,623 |
| Citizens Property Insurance Corp. Florida Revenue | | | | |
| (Personal Lines Account/Commercial Lines Account) | 5.000% | 6/1/19 | 19,465 | 19,788 |
| Citizens Property Insurance Corp. Florida Revenue | | | | |
| (Personal Lines Account/Commercial Lines Account) | 5.000% | 6/1/22 | 5,340 | 5,814 |
| Duval County FL School Board COP | 5.000% | 7/1/20 | 750 | 785 |
| Duval County FL School Board COP | 5.000% | 7/1/21 | 1,020 | 1,089 |
| Duval County FL School Board COP | 5.000% | 7/1/22 | 1,030 | 1,118 |
| Escambia County FL Pollution Control Revenue (Gulf Power Co. Project) PUT | 2.100% | 4/11/19 | 2,500 | 2,496 |
| Escambia County FL School Board Sales Tax Revenue | 5.000% | 9/1/21 | 225 | 241 |
| Escambia County FL School Board Sales Tax Revenue | 5.000% | 9/1/22 | 300 | 327 |
| Escambia County FL School Board Sales Tax Revenue | 5.000% | 9/1/23 | 275 | 305 |
| Florida Board of Education Lottery Revenue | 4.000% | 7/1/25 | 5,045 | 5,319 |
| Florida Board of Education Public Education Capital Outlay GO | 5.000% | 6/1/21 | 17,140 | 18,364 |
| Florida Board of Education Public Education Capital Outlay GO | 5.000% | 6/1/22 | 6,000 | 6,571 |
| Florida Board of Education Public Education Capital Outlay GO | 5.000% | 6/1/24 | 5,750 | 6,523 |
| Florida Board of Education Public Education Capital Outlay GO | 5.000% | 6/1/24 | 9,210 | 9,827 |
| Florida Board of Education Public Education Capital Outlay GO | 5.000% | 6/1/25 | 10,000 | 10,662 |
| Florida Board of Education Public Education Capital Outlay GO | 4.000% | 6/1/26 | 4,080 | 4,284 |
| Florida Board of Governors University System Improvement Revenue | 5.000% | 7/1/21 | 1,040 | 1,113 |
| Florida Board of Governors University System Improvement Revenue | 5.000% | 7/1/22 | 2,080 | 2,272 |
| Florida Department of Environmental Protection & Preservation Revenue | 5.000% | 7/1/19 | 9,015 | 9,192 |
| Florida Department of Environmental Protection & Preservation Revenue | 5.000% | 7/1/22 | 4,510 | 4,934 |
| 1 Florida Department of Management Services COP | 5.000% | 11/1/25 | 24,910 | 28,520 |
| Florida Municipal Power Agency Revenue | 5.000% | 10/1/20 | 500 | 525 |
| Florida Municipal Power Agency Revenue | 5.000% | 10/1/21 | 945 | 1,016 |
| Florida Municipal Power Agency Revenue | 5.000% | 10/1/21 | 7,170 | 7,708 |
| Florida Municipal Power Agency Revenue | 5.000% | 10/1/22 | 1,600 | 1,752 |
| Florida Municipal Power Agency Revenue | 5.000% | 10/1/22 | 8,050 | 8,815 |
| Florida Municipal Power Agency Revenue | 5.000% | 10/1/23 | 9,000 | 10,034 |
| Florida Municipal Power Agency Revenue | 5.000% | 10/1/25 | 3,600 | 4,121 |
| Florida Municipal Power Agency Revenue | 5.000% | 10/1/26 | 5,575 | 6,453 |
| Florida Municipal Power Agency Revenue (Stanton II Project) | 5.000% | 10/1/19 | 2,800 | 2,876 |
| Florida Turnpike Authority Revenue | 5.000% | 7/1/19 | 10,000 | 10,200 |
| Florida Turnpike Authority Revenue | 5.000% | 7/1/21 | 4,095 | 4,392 |
| Florida Turnpike Authority Revenue | 5.000% | 7/1/21 | 6,965 | 7,470 |
| Florida Turnpike Authority Revenue | 5.000% | 7/1/22 | 8,595 | 9,418 |
| Florida Turnpike Authority Revenue | 5.000% | 7/1/22 | 3,210 | 3,518 |
| Gainesville FL Utilities System Revenue | 5.000% | 10/1/23 | 2,595 | 2,902 |
| Gainesville FL Utilities System Revenue | 5.000% | 10/1/24 | 3,035 | 3,448 |
69
Limited-Term Tax-Exempt Fund
| | | | |
| Face | Market |
| Maturity | Amount | Value• |
| Coupon | Date | ($000) | ($000) |
| Gainesville FL Utilities System Revenue VRDO | 1.620% | 11/7/18 | 9,900 | 9,900 |
| Greater Orlando Aviation Authority Florida Airport Facilities Revenue | 5.000% | 10/1/21 | 330 | 355 |
| Greater Orlando Aviation Authority Florida Airport Facilities Revenue | 5.000% | 10/1/22 | 575 | 630 |
| Greater Orlando Aviation Authority Florida Airport Facilities Revenue | 5.000% | 10/1/24 | 910 | 1,026 |
| Halifax FL Hospital Medical Center Revenue | 5.000% | 6/1/26 | 2,685 | 2,955 |
| Halifax Hospital Medical Center Florida Hospital Revenue | 5.000% | 6/1/19 | 825 | 838 |
| Halifax Hospital Medical Center Florida Hospital Revenue | 5.000% | 6/1/20 | 765 | 795 |
| Halifax Hospital Medical Center Florida Hospital Revenue | 5.000% | 6/1/21 | 2,390 | 2,530 |
| Halifax Hospital Medical Center Florida Hospital Revenue | 5.000% | 6/1/21 | 350 | 371 |
| Halifax Hospital Medical Center Florida Hospital Revenue | 5.000% | 6/1/22 | 1,110 | 1,195 |
| Halifax Hospital Medical Center Florida Hospital Revenue | 5.000% | 6/1/23 | 775 | 846 |
| Halifax Hospital Medical Center Florida Hospital Revenue | 5.000% | 6/1/25 | 1,335 | 1,486 |
| Highlands County FL Health Facilities Authority Hospital Revenue | | | | |
| (Adventist Health System/Sunbelt Obligated Group) | 5.000% | 11/15/19 (ETM) | 5 | 5 |
| Highlands County FL Health Facilities Authority Hospital Revenue | | | | |
| (Adventist Health System/Sunbelt Obligated Group) | 5.000% | 11/15/19 | 2,995 | 3,084 |
| Hillsborough County FL Community Investment Tax Revenue | 5.000% | 11/1/21 | 8,705 | 9,385 |
| Hillsborough County FL Community Investment Tax Revenue | 5.000% | 11/1/25 | 2,000 | 2,289 |
| Hillsborough County FL School Board COP | 5.000% | 7/1/22 | 6,500 | 7,104 |
| Hillsborough County FL School Board COP | 5.000% | 7/1/22 | 700 | 765 |
| Hillsborough County FL School Board COP | 5.000% | 7/1/23 | 8,510 | 9,461 |
| Hillsborough County FL School Board COP | 5.000% | 7/1/23 | 850 | 945 |
| Hillsborough County FL School Board COP | 5.000% | 7/1/24 | 975 | 1,100 |
| Hillsborough County FL School Board Sales Tax Revenue | 5.000% | 10/1/20 (4) | 2,220 | 2,335 |
| Hillsborough County FL School Board Sales Tax Revenue | 5.000% | 10/1/21 (4) | 1,750 | 1,877 |
| Hillsborough County FL School Board Sales Tax Revenue | 5.000% | 10/1/22 (4) | 1,620 | 1,771 |
| Hollywood FL Community Redevelopment Agency Tax Allocation Revenue | 5.000% | 3/1/20 | 1,570 | 1,627 |
| Hollywood FL Community Redevelopment Agency Tax Allocation Revenue | 5.000% | 3/1/21 | 2,250 | 2,363 |
| Hollywood FL Community Redevelopment Agency Tax Allocation Revenue | 5.000% | 3/1/22 | 2,865 | 3,053 |
| Jacksonville FL Electric Authority Electric System Revenue | 5.000% | 10/1/20 | 1,655 | 1,730 |
| Jacksonville FL Electric Authority Electric System Revenue | 5.000% | 4/1/23 (Prere.) | 1,710 | 1,895 |
| Jacksonville FL Electric Authority Electric System Revenue | 5.000% | 10/1/24 | 2,280 | 2,500 |
| Jacksonville FL Electric Authority Electric System Revenue | 5.000% | 10/1/24 | 4,000 | 4,509 |
| Jacksonville FL Electric Authority Electric System Revenue | 5.000% | 10/1/25 | 27,220 | 31,015 |
| Jacksonville FL Electric Authority Water & Sewer Revenue | 5.000% | 10/1/22 | 1,485 | 1,614 |
| Jacksonville FL Electric Authority Water & Sewer Revenue | 5.000% | 10/1/23 | 1,500 | 1,655 |
| Jacksonville FL Electric Authority Water & Sewer Revenue | 5.000% | 10/1/24 | 2,750 | 3,074 |
| Jacksonville FL Electric Authority Water & Sewer Revenue | 5.000% | 10/1/25 | 4,020 | 4,540 |
| Jacksonville FL Health Care Facilities Revenue (Baptist Health System Obligated Group) | 5.000% | 8/15/23 | 1,690 | 1,875 |
| Jacksonville FL Health Care Facilities Revenue (Brooks Rehabilitation) | 5.000% | 11/1/20 | 810 | 850 |
| Jacksonville FL Health Care Facilities Revenue (Brooks Rehabilitation) | 5.000% | 11/1/21 | 735 | 786 |
| Jacksonville FL Health Care Facilities Revenue (Brooks Rehabilitation) | 5.000% | 11/1/22 | 770 | 838 |
| Jacksonville FL Health Care Facilities Revenue (Brooks Rehabilitation) | 5.000% | 11/1/23 | 1,645 | 1,815 |
| Jacksonville FL Health Care Facilities Revenue (Brooks Rehabilitation) | 5.000% | 11/1/24 | 1,750 | 1,949 |
| Jacksonville FL Health Care Facilities Revenue (Brooks Rehabilitation) | 5.000% | 11/1/25 | 1,665 | 1,863 |
| Jacksonville FL Special Revenue | 5.000% | 10/1/21 | 1,750 | 1,882 |
| Jacksonville FL Special Revenue | 5.000% | 10/1/21 | 760 | 817 |
| Jacksonville FL Special Revenue | 5.000% | 10/1/22 | 1,660 | 1,818 |
| Jacksonville FL Special Revenue | 5.000% | 10/1/22 | 1,055 | 1,155 |
| Jacksonville FL Special Revenue | 5.000% | 10/1/23 | 1,500 | 1,670 |
| Jacksonville FL Special Revenue | 5.000% | 10/1/23 | 2,460 | 2,739 |
| Jacksonville FL Transportation Revenue | 5.000% | 10/1/28 | 8,425 | 9,137 |
| Lakeland FL Energy System Revenue | 5.000% | 10/1/22 | 5,000 | 5,497 |
| Lakeland FL Hospital Revenue (Lakeland Regional Health Systems) | 5.000% | 11/15/21 | 365 | 391 |
| Lakeland FL Hospital Revenue (Lakeland Regional Health Systems) | 5.000% | 11/15/22 | 500 | 545 |
| Lakeland FL Hospital Revenue (Lakeland Regional Health Systems) | 5.000% | 11/15/23 | 1,200 | 1,326 |
| Lee County FL School Board COP | 5.000% | 8/1/20 | 2,530 | 2,652 |
| Lee County FL School Board COP | 5.000% | 8/1/21 | 2,005 | 2,144 |
| Manatee County FL School District Revenue | 5.000% | 10/1/21 (4) | 1,050 | 1,133 |
| Manatee County FL School District Revenue | 5.000% | 10/1/22 (4) | 1,500 | 1,652 |
| Martin County FL Health Facilities Authority Revenue (Martin Memorial Medical Center) | 5.000% | 11/15/20 | 875 | 918 |
| Martin County FL Health Facilities Authority Revenue (Martin Memorial Medical Center) | 5.000% | 11/15/21 | 2,720 | 2,905 |
| Martin County FL Health Facilities Authority Revenue (Martin Memorial Medical Center) | 5.000% | 11/15/22 | 1,575 | 1,708 |
| Martin County FL Health Facilities Authority Revenue (Martin Memorial Medical Center) | 5.000% | 11/15/23 | 500 | 548 |
| Miami Beach FL Health Facilities Authority Revenue (Mount Sinai Medical Center) | 4.000% | 11/15/18 | 1,125 | 1,126 |
| Miami Beach FL Health Facilities Authority Revenue (Mount Sinai Medical Center) | 4.000% | 11/15/18 | 385 | 385 |
| Miami Beach FL Health Facilities Authority Revenue (Mount Sinai Medical Center) | 5.000% | 11/15/19 | 1,650 | 1,691 |
| Miami Beach FL Health Facilities Authority Revenue (Mount Sinai Medical Center) | 5.000% | 11/15/20 | 400 | 418 |
| Miami Beach FL Redevelopment Agency Tax Allocation Revenue | 5.000% | 2/1/24 | 1,250 | 1,398 |
| Miami Beach FL Resort Tax Revenue | 5.000% | 9/1/21 | 1,125 | 1,205 |
70
Limited-Term Tax-Exempt Fund
| | | | |
| Face | Market |
| Maturity | Amount | Value• |
| Coupon | Date | ($000) | ($000) |
| Miami Beach FL Resort Tax Revenue | 4.000% | 9/1/22 | 1,025 | 1,079 |
| Miami Beach FL Resort Tax Revenue | 5.000% | 9/1/24 | 1,695 | 1,904 |
| Miami Beach FL Stormwater Revenue | 5.000% | 9/1/22 | 1,000 | 1,092 |
| Miami Beach FL Stormwater Revenue | 5.000% | 9/1/23 | 1,000 | 1,111 |
| Miami Beach FL Stormwater Revenue | 5.000% | 9/1/24 | 1,420 | 1,595 |
| Miami Beach FL Stormwater Revenue | 5.000% | 9/1/25 | 1,660 | 1,888 |
| Miami Beach FL Water & Sewer Revenue | 4.000% | 9/1/19 | 250 | 254 |
| Miami Beach FL Water & Sewer Revenue | 4.000% | 9/1/20 | 400 | 413 |
| Miami Beach FL Water & Sewer Revenue | 5.000% | 9/1/21 | 350 | 375 |
| Miami Beach FL Water & Sewer Revenue | 5.000% | 9/1/22 | 305 | 333 |
| Miami Beach FL Water & Sewer Revenue | 5.000% | 9/1/23 | 375 | 417 |
| Miami Beach FL Water & Sewer Revenue | 5.000% | 9/1/24 | 350 | 394 |
| Miami Beach FL Water & Sewer Revenue | 5.000% | 9/1/25 | 700 | 798 |
| Miami-Dade County FL Aviation Revenue (Miami International Airport) | 5.000% | 10/1/21 (4) | 1,445 | 1,518 |
| 3 Miami-Dade County FL Educational Finance Authority Revenue TOB VRDO | 1.750% | 11/7/18 | 15,690 | 15,690 |
| Miami-Dade County FL Expressway Authority Toll System Revenue | 5.000% | 7/1/19 | 1,900 | 1,937 |
| Miami-Dade County FL Expressway Authority Toll System Revenue | 5.000% | 7/1/20 | 1,500 | 1,569 |
| Miami-Dade County FL Expressway Authority Toll System Revenue | 5.000% | 7/1/20 | 2,525 | 2,641 |
| Miami-Dade County FL Expressway Authority Toll System Revenue | 5.000% | 7/1/21 | 1,000 | 1,070 |
| Miami-Dade County FL Expressway Authority Toll System Revenue | 5.000% | 7/1/21 | 2,355 | 2,520 |
| Miami-Dade County FL Expressway Authority Toll System Revenue | 5.000% | 7/1/22 | 760 | 830 |
| Miami-Dade County FL GO | 5.000% | 7/1/22 | 10,260 | 11,224 |
| Miami-Dade County FL Health Facilities Authority Hospital Revenue (Miami Children’s Hospital) | 5.000% | 8/1/19 | 1,000 | 1,022 |
| Miami-Dade County FL Health Facilities Authority Hospital Revenue (Miami Children’s Hospital) | 4.000% | 8/1/20 | 2,180 | 2,242 |
| Miami-Dade County FL Health Facilities Authority Hospital Revenue (Miami Children’s Hospital) | 5.000% | 8/1/21 | 1,300 | 1,391 |
| Miami-Dade County FL Health Facilities Authority Hospital Revenue (Miami Children’s Hospital) | 5.000% | 8/1/22 | 1,400 | 1,527 |
| Miami-Dade County FL Health Facilities Authority Hospital Revenue (Miami Children’s Hospital) | 5.000% | 8/1/23 | 1,000 | 1,108 |
| Miami-Dade County FL Health Facilities Authority Hospital Revenue (Miami Children’s Hospital) | 5.000% | 8/1/24 | 1,920 | 2,116 |
| Miami-Dade County FL Industrial Development Authority Revenue (Biscayne Properties LLC) | 4.500% | 6/1/21 | 840 | 853 |
| Miami-Dade County FL Industrial Development Authority Revenue (Biscayne Properties LLC) | 5.000% | 6/1/22 | 985 | 1,020 |
| Miami-Dade County FL Public Facilities Revenue (Public Health Trust) | 4.000% | 6/1/22 | 1,155 | 1,214 |
| Miami-Dade County FL Public Facilities Revenue (Public Health Trust) | 5.000% | 6/1/23 | 2,270 | 2,505 |
| Miami-Dade County FL Public Facilities Revenue (Public Health Trust) | 5.000% | 6/1/24 | 2,180 | 2,438 |
| Miami-Dade County FL School Board COP | 5.000% | 2/1/23 | 11,605 | 12,747 |
| Miami-Dade County FL School District GO | 5.000% | 3/15/22 | 3,795 | 4,127 |
| Miami-Dade County FL Seaport Revenue | 5.000% | 10/1/20 | 1,250 | 1,309 |
| Miami-Dade County FL Seaport Revenue | 5.000% | 10/1/23 | 425 | 465 |
| Miami-Dade County FL Special Obligation Revenue | 5.000% | 4/1/23 | 9,340 | 10,355 |
| Miami-Dade County FL Transit Sales Surtax Revenue | 5.000% | 7/1/19 | 1,250 | 1,275 |
| Miami-Dade County FL Transit Sales Surtax Revenue | 5.000% | 7/1/19 (12) | 2,020 | 2,060 |
| Miami-Dade County FL Transit Sales Surtax Revenue | 5.000% | 7/1/25 | 1,000 | 1,087 |
| Miami-Dade County FL Water & Sewer Revenue | 5.000% | 10/1/25 | 3,360 | 3,856 |
| Monroe County FL School District Sales Tax Revenue | 5.000% | 10/1/21 (4) | 400 | 430 |
| Monroe County FL School District Sales Tax Revenue | 5.000% | 10/1/22 (4) | 400 | 437 |
| Monroe County FL School District Sales Tax Revenue | 5.000% | 10/1/23 (4) | 625 | 695 |
| North Brevard County FL Hospital District Revenue | 5.000% | 1/1/20 | 1,100 | 1,130 |
| North Brevard County FL Hospital District Revenue | 5.000% | 1/1/21 | 1,535 | 1,609 |
| North Brevard County FL Hospital District Revenue | 5.000% | 1/1/23 | 2,115 | 2,285 |
| North Brevard County FL Hospital District Revenue | 5.000% | 1/1/24 | 2,015 | 2,197 |
| Okeechobee County FL Solid Waste Disposal Revenue | | | | |
| (Waste Management Inc./Okeechobee Landfill Project) PUT | 1.550% | 7/1/21 | 1,100 | 1,059 |
| Orange County FL Health Facilities Authority Revenue (Nemours Foundation Project) | 5.000% | 1/1/23 | 2,000 | 2,010 |
| Orange County FL School Board COP | 5.000% | 8/1/19 | 1,765 | 1,805 |
| Orange County FL Tourist Development Revenue | 5.000% | 10/1/20 | 2,525 | 2,660 |
| Orange County FL Tourist Development Revenue | 5.000% | 10/1/25 | 4,575 | 5,250 |
| Orlando & Orange County FL Expressway Authority Revenue | 5.000% | 7/1/19 | 3,920 | 3,998 |
| Orlando & Orange County FL Expressway Authority Revenue | 5.000% | 7/1/19 | 10,745 | 10,960 |
| Orlando & Orange County FL Expressway Authority Revenue | 5.000% | 7/1/25 (4) | 1,210 | 1,341 |
| Orlando FL Capital Improvement Revenue | 5.000% | 10/1/22 | 4,200 | 4,610 |
| Orlando FL Capital Improvement Revenue | 5.000% | 10/1/22 | 1,040 | 1,142 |
| Orlando FL Capital Improvement Revenue | 5.000% | 10/1/23 | 1,500 | 1,673 |
| Orlando FL Capital Improvement Revenue | 5.000% | 10/1/23 | 1,090 | 1,216 |
| Orlando FL Tourist Development Tax Revenue | 5.000% | 11/1/22 (4) | 1,500 | 1,642 |
| Orlando FL Tourist Development Tax Revenue | 5.000% | 11/1/23 (4) | 1,260 | 1,402 |
| Orlando FL Tourist Development Tax Revenue | 5.000% | 11/1/24 (4) | 1,010 | 1,140 |
| Orlando FL Tourist Development Tax Revenue | 5.000% | 11/1/25 (4) | 1,630 | 1,863 |
| Orlando FL Utility Commission Utility System Revenue | 5.000% | 10/1/19 | 5,500 | 5,651 |
| Orlando FL Utility Commission Utility System Revenue PUT | 5.000% | 10/1/20 | 11,975 | 12,593 |
| Palm Beach County FL Health Facilities Authority Hospital Revenue (BRRH Corp. Obligated Group) | 4.000% | 12/1/18 | 775 | 776 |
| Palm Beach County FL Health Facilities Authority Hospital Revenue (BRRH Corp. Obligated Group) | 4.000% | 12/1/19 | 1,000 | 1,015 |
71
Limited-Term Tax-Exempt Fund
| | | | |
| Face | Market |
| Maturity | Amount | Value• |
| Coupon | Date | ($000) | ($000) |
| Palm Beach County FL Health Facilities Authority Hospital Revenue (BRRH Corp. Obligated Group) | 5.000% | 12/1/20 | 900 | 942 |
| Palm Beach County FL Health Facilities Authority Hospital Revenue (BRRH Corp. Obligated Group) | 5.000% | 12/1/21 | 1,165 | 1,242 |
| Palm Beach County FL Health Facilities Authority Revenue (Jupiter Medical Center Inc. Project) | 4.000% | 11/1/18 | 710 | 710 |
| Palm Beach County FL Health Facilities Authority Revenue (Jupiter Medical Center Inc. Project) | 5.000% | 11/1/19 | 2,740 | 2,805 |
| Palm Beach County FL Health Facilities Authority Revenue (Jupiter Medical Center Inc. Project) | 5.000% | 11/1/20 | 1,500 | 1,565 |
| Palm Beach County FL Health Facilities Authority Revenue (Jupiter Medical Center Inc. Project) | 5.000% | 11/1/21 | 1,330 | 1,412 |
| Palm Beach County FL School Board COP | 5.000% | 8/1/21 | 1,705 | 1,826 |
| Palm Beach County FL School Board COP | 5.000% | 8/1/21 | 1,845 | 1,976 |
| Palm Beach County FL School Board COP | 5.000% | 8/1/22 | 2,000 | 2,184 |
| Palm Beach County FL School Board COP | 5.000% | 8/1/22 | 750 | 819 |
| Palm Beach County FL School Board COP | 5.000% | 8/1/23 | 1,760 | 1,957 |
| Palm Beach County FL School Board COP | 5.000% | 8/1/23 | 1,500 | 1,668 |
| Palm Beach County FL School Board COP | 5.000% | 8/1/23 | 2,000 | 2,224 |
| Palm Beach County FL School Board COP | 5.000% | 8/1/24 | 1,600 | 1,801 |
| Palm Beach County FL School Board COP | 5.000% | 8/1/24 | 13,680 | 15,398 |
| Palm Beach County FL School Board COP | 5.000% | 8/1/25 | 2,000 | 2,277 |
| Palm Beach County FL Solid Waste Authority Revenue | 5.000% | 10/1/25 | 1,620 | 1,851 |
| 1 Pasco County FL School Board COP | 5.000% | 8/1/23 | 145 | 161 |
| 1 Pasco County FL School Board COP | 5.000% | 8/1/24 | 200 | 225 |
| 1 Pasco County FL School Board COP | 5.000% | 8/1/25 | 250 | 284 |
| Port St. Lucie FL Special Assessment Revenue | 1.250% | 7/1/19 | 1,000 | 989 |
| Port St. Lucie FL Special Assessment Revenue | 1.375% | 7/1/20 | 1,000 | 970 |
| Port St. Lucie FL Special Assessment Revenue | 1.500% | 7/1/21 | 1,000 | 967 |
| Port St. Lucie FL Special Assessment Revenue | 1.750% | 7/1/22 | 1,265 | 1,200 |
| Port St. Lucie FL Special Assessment Revenue | 2.000% | 7/1/23 | 2,245 | 2,126 |
| Port St. Lucie FL Special Assessment Revenue | 2.000% | 7/1/24 | 1,580 | 1,472 |
| Port St. Lucie FL Utility Revenue | 4.000% | 9/1/21 | 240 | 250 |
| Port St. Lucie FL Utility Revenue | 5.000% | 9/1/22 | 910 | 993 |
| Port St. Lucie FL Utility Revenue | 5.000% | 9/1/23 | 510 | 566 |
| Reedy Creek FL Improvement District GO | 5.000% | 6/1/20 | 1,000 | 1,045 |
| Reedy Creek FL Improvement District GO | 5.000% | 6/1/20 | 1,000 | 1,045 |
| Reedy Creek FL Improvement District GO | 5.000% | 6/1/21 | 730 | 781 |
| Reedy Creek FL Improvement District GO | 5.000% | 6/1/22 | 400 | 437 |
| Reedy Creek FL Improvement District GO | 5.000% | 6/1/23 | 3,490 | 3,881 |
| Reedy Creek FL Improvement District GO | 5.000% | 6/1/23 | 1,175 | 1,307 |
| Reedy Creek FL Improvement District GO | 5.000% | 6/1/24 | 2,500 | 2,818 |
| Sarasota County FL Health Facilities Authority Revenue (Village of Isle Project) | 5.000% | 1/1/21 | 1,715 | 1,777 |
| Sarasota County FL Health Facilities Authority Revenue (Village of Isle Project) | 5.000% | 1/1/22 | 1,125 | 1,179 |
| Sarasota County FL Health Facilities Authority Revenue (Village of Isle Project) | 5.000% | 1/1/23 | 1,865 | 1,975 |
| Sarasota County FL Health Facilities Authority Revenue (Village of Isle Project) | 5.000% | 1/1/24 | 1,250 | 1,331 |
| Sarasota County FL Infrastructure Sales Surtax Revenue | 5.000% | 10/1/21 | 1,515 | 1,631 |
| Sarasota County FL Public Hospital District Revenue VRDO | 1.630% | 11/7/18 LOC | 5,645 | 5,645 |
| Seacoast FL Utility Authority Water & Sewer Revenue | 5.500% | 3/1/19 (14) | 3,595 | 3,638 |
| South Florida Water Management District COP | 5.000% | 10/1/21 | 1,765 | 1,896 |
| South Florida Water Management District COP | 5.000% | 10/1/22 | 2,050 | 2,246 |
| South Florida Water Management District COP | 5.000% | 10/1/23 | 3,000 | 3,342 |
| 3 South Miami FL Health Facilities Authority (Baptist Health South Florida Obligated Group) | | | | |
| TOB VRDO | 1.720% | 11/7/18 | 16,625 | 16,625 |
| South Miami FL Health Facilities Authority Revenue (Baptist Health South Florida Obligated Group) | 5.000% | 8/15/19 | 2,315 | 2,364 |
| South Miami FL Health Facilities Authority Revenue (Baptist Health South Florida Obligated Group) | 5.000% | 8/15/20 | 1,125 | 1,176 |
| South Miami FL Health Facilities Authority Revenue (Baptist Health South Florida Obligated Group) | 5.000% | 8/15/21 | 1,250 | 1,338 |
| South Miami FL Health Facilities Authority Revenue (Baptist Health South Florida Obligated Group) | 5.000% | 8/15/22 | 1,075 | 1,173 |
| South Miami FL Health Facilities Authority Revenue (Baptist Health South Florida Obligated Group) | 5.000% | 8/15/23 | 2,200 | 2,438 |
| South Miami FL Health Facilities Authority Revenue (Baptist Health South Florida Obligated Group) | 5.000% | 8/15/24 | 2,500 | 2,809 |
| 3 South Miami FL Health Facilities Authority Revenue (Baptist Health South Florida Obligated Group) | | | | |
| TOB VRDO | 1.700% | 11/7/18 | 3,750 | 3,750 |
| Sunrise FL Utility System Revenue | 5.200% | 10/1/20 (Prere.) | 7,255 | 7,533 |
| Sunshine State Governmental Financing Commission Florida Revenue | | | | |
| (Miami Dade County Program) | 5.000% | 9/1/19 | 2,390 | 2,450 |
| Sunshine State Governmental Financing Commission Florida Revenue | | | | |
| (Miami Dade County Program) | 5.000% | 9/1/19 | 2,360 | 2,419 |
| Sunshine State Governmental Financing Commission Florida Revenue | | | | |
| (Miami Dade County Program) | 5.000% | 9/1/20 | 2,830 | 2,977 |
| Sunshine State Governmental Financing Commission Florida Revenue | | | | |
| (Miami Dade County Program) | 5.000% | 9/1/20 | 1,185 | 1,246 |
| Sunshine State Governmental Financing Commission Florida Revenue | | | | |
| (Miami Dade County Program) | 5.000% | 9/1/21 | 2,090 | 2,238 |
| Sunshine State Governmental Financing Commission Florida Revenue | | | | |
| (Miami Dade County Program) | 5.000% | 9/1/21 | 1,500 | 1,606 |
| Tallahassee FL Energy System Revenue | 5.000% | 10/1/23 | 460 | 514 |
72
Limited-Term Tax-Exempt Fund
| | | | |
| Face | Market |
| Maturity | Amount | Value• |
| Coupon | Date | ($000) | ($000) |
| Tallahassee FL Energy System Revenue | 5.000% | 10/1/24 | 450 | 511 |
| Tallahassee FL Energy System Revenue | 5.000% | 10/1/25 | 1,000 | 1,148 |
| Tallahassee FL Health Facilities Revenue (Tallahassee Memorial HealthCare Inc. Project) | 5.000% | 12/1/22 | 1,535 | 1,661 |
| Tallahassee FL Health Facilities Revenue (Tallahassee Memorial HealthCare Inc. Project) | 5.000% | 12/1/23 | 525 | 574 |
| Tampa FL Cigarette Tax Allocation Revenue (H. Lee Moffitt Cancer Center Project) | 5.000% | 9/1/20 | 1,650 | 1,728 |
| Tampa FL Cigarette Tax Allocation Revenue (H. Lee Moffitt Cancer Center Project) | 5.000% | 9/1/21 | 655 | 700 |
| Tampa FL Cigarette Tax Allocation Revenue (H. Lee Moffitt Cancer Center Project) | 5.000% | 9/1/22 | 1,190 | 1,294 |
| Tampa FL Cigarette Tax Allocation Revenue (H. Lee Moffitt Cancer Center Project) | 5.000% | 9/1/24 | 1,040 | 1,162 |
| Tampa FL Cigarette Tax Allocation Revenue (H. Lee Moffitt Cancer Center Project) | 5.000% | 9/1/25 | 2,000 | 2,261 |
| Tampa FL Hospital Revenue | 5.000% | 7/1/19 | 1,755 | 1,787 |
| Tampa FL Hospital Revenue | 4.000% | 7/1/20 | 1,100 | 1,129 |
| Tampa FL Hospital Revenue (H. Lee Moffitt Cancer Center Project) | 5.000% | 7/1/23 | 1,675 | 1,843 |
| Tohopekaliga FL Water Authority Utility System Revenue | 5.000% | 10/1/19 | 1,165 | 1,197 |
| Tohopekaliga FL Water Authority Utility System Revenue | 5.000% | 10/1/20 | 1,825 | 1,924 |
| Tohopekaliga FL Water Authority Utility System Revenue | 4.000% | 10/1/22 | 3,425 | 3,639 |
| Volusia County FL Educational Facilities Authority Revenue | | | | |
| (Embry-Riddle Aeronautical University Inc.) | 5.000% | 10/15/23 | 755 | 836 |
| Volusia County FL Educational Facilities Authority Revenue (Stetson University) | 5.000% | 6/1/19 | 1,300 | 1,321 |
| Volusia County FL Educational Facilities Authority Revenue (Stetson University) | 5.000% | 6/1/21 | 1,485 | 1,580 |
| Volusia County FL School Board COP | 5.000% | 8/1/21 (15) | 450 | 482 |
| Volusia County FL School Board COP | 5.000% | 8/1/22 (15) | 810 | 884 |
| | | | 839,873 |
| Georgia (2.9%) | | | | |
| Atlanta GA Airport Passenger Facility Charge Revenue | 5.000% | 1/1/25 | 2,440 | 2,724 |
| Atlanta GA Airport Revenue | 5.000% | 1/1/19 | 1,675 | 1,683 |
| Atlanta GA Airport Revenue | 5.000% | 1/1/20 | 1,205 | 1,245 |
| Atlanta GA Airport Revenue | 5.000% | 1/1/21 | 750 | 795 |
| Atlanta GA Tax Allocation Revenue (Atlantic Station Project) | 5.000% | 12/1/18 | 1,400 | 1,403 |
| Atlanta GA Tax Allocation Revenue (Atlantic Station Project) | 5.000% | 12/1/19 | 1,100 | 1,132 |
| Atlanta GA Tax Allocation Revenue (Atlantic Station Project) | 5.000% | 12/1/20 | 1,000 | 1,049 |
| Atlanta GA Tax Allocation Revenue (Atlantic Station Project) | 5.000% | 12/1/21 | 1,150 | 1,230 |
| Atlanta GA Tax Allocation Revenue (Atlantic Station Project) | 5.000% | 12/1/22 | 1,000 | 1,085 |
| Atlanta GA Tax Allocation Revenue (Atlantic Station Project) | 5.000% | 12/1/23 | 1,000 | 1,101 |
| Atlanta GA Tax Allocation Revenue (Atlantic Station Project) | 5.000% | 12/1/24 | 900 | 1,004 |
| Atlanta GA Water & Wastewater Revenue | 5.000% | 11/1/21 | 2,015 | 2,178 |
| Atlanta GA Water & Wastewater Revenue | 5.000% | 11/1/22 | 2,500 | 2,756 |
| Atlanta GA Water & Wastewater Revenue | 5.000% | 11/1/23 | 2,500 | 2,806 |
| 2 Atlanta GA Water & Wastewater Revenue PUT | 3.037% | 11/1/18 | 47,300 | 47,300 |
| Augusta GA Water & Sewerage Revenue | 5.000% | 10/1/22 | 12,295 | 13,487 |
| Augusta GA Water & Sewerage Revenue | 5.000% | 10/1/23 | 7,800 | 8,700 |
| Augusta GA Water & Sewerage Revenue | 5.000% | 10/1/24 | 8,190 | 9,261 |
| Augusta GA Water & Sewerage Revenue | 5.000% | 10/1/25 | 8,600 | 9,834 |
| Bartow County GA Development Authority Pollution Control Revenue | | | | |
| (Georgia Power Co. Plant Bowen Project) PUT | 2.050% | 11/19/21 | 2,650 | 2,569 |
| Bleckley County & Dodge County GA Joint Development Authority Revenue | | | | |
| (USG Real Estate Foundation VII LLC Project) | 5.000% | 7/1/22 | 500 | 544 |
| Bleckley County & Dodge County GA Joint Development Authority Revenue | | | | |
| (USG Real Estate Foundation VII LLC Project) | 5.000% | 7/1/23 | 625 | 691 |
| Bleckley County & Dodge County GA Joint Development Authority Revenue | | | | |
| (USG Real Estate Foundation VII LLC Project) | 5.000% | 7/1/24 | 660 | 739 |
| Bleckley County & Dodge County GA Joint Development Authority Revenue | | | | |
| (USG Real Estate Foundation VII LLC Project) | 5.000% | 7/1/25 | 750 | 848 |
| Bulloch County GA Development Authority Revenue | | | | |
| (Georgia Southern University Housing Foundation) | 5.000% | 7/1/23 | 500 | 554 |
| Bulloch County GA Development Authority Revenue | | | | |
| (Georgia Southern University Housing Foundation) | 5.000% | 7/1/24 | 345 | 387 |
| Bulloch County GA Development Authority Revenue | | | | |
| (Georgia Southern University Housing Foundation) | 5.000% | 7/1/26 | 590 | 674 |
| Burke County GA Development Authority Pollution Control Revenue | | | | |
| (Georgia Power Co. Plant Vogtle Project) PUT | 2.500% | 5/3/21 | 28,470 | 28,374 |
| Burke County GA Development Authority Pollution Control Revenue | | | | |
| (Georgia Power Co. Plant Vogtle Project) PUT | 2.200% | 4/2/19 | 3,500 | 3,496 |
| Burke County GA Development Authority Pollution Control Revenue | | | | |
| (Georgia Power Co. Plant Vogtle Project) PUT | 2.200% | 4/2/19 | 10,000 | 9,987 |
| Burke County GA Development Authority Pollution Control Revenue | | | | |
| (Georgia Power Co. Plant Vogtle Project) PUT | 2.200% | 4/2/19 | 7,500 | 7,491 |
| Burke County GA Development Authority Pollution Control Revenue | | | | |
| (Georgia Power Co. Plant Vogtle Project) PUT | 2.200% | 4/2/19 | 10,000 | 9,987 |
73
Limited-Term Tax-Exempt Fund
| | | | |
| Face | Market |
| Maturity | Amount | Value• |
| Coupon | Date | ($000) | ($000) |
| Burke County GA Development Authority Pollution Control Revenue | | | | |
| (Georgia Power Co. Plant Vogtle Project) PUT | 1.850% | 8/22/19 | 5,500 | 5,461 |
| Burke County GA Development Authority Pollution Control Revenue | | | | |
| (Georgia Power Co. Plant Vogtle Project) PUT | 1.850% | 8/22/19 | 4,970 | 4,935 |
| Burke County GA Development Authority Pollution Control Revenue | | | | |
| (Georgia Power Co. Plant Vogtle Project) PUT | 1.650% | 6/18/21 | 15,000 | 14,371 |
| Burke County GA Development Authority Pollution Control Revenue | | | | |
| (Georgia Power Co. Plant Vogtle Project) PUT | 2.050% | 11/19/21 | 1,600 | 1,551 |
| Cherokee County GA Board of Education GO | 5.000% | 2/1/21 | 400 | 425 |
| Cherokee County GA Board of Education GO | 5.000% | 8/1/22 | 3,000 | 3,297 |
| Cobb County GA Kennestone Hospital Authority Revenue | 5.000% | 4/1/19 | 250 | 253 |
| Cobb County GA Kennestone Hospital Authority Revenue | 5.000% | 4/1/20 | 350 | 364 |
| Cobb County GA Kennestone Hospital Authority Revenue | 5.000% | 4/1/22 | 500 | 541 |
| Cobb County GA Kennestone Hospital Authority Revenue | 5.000% | 4/1/23 | 400 | 439 |
| Cobb County GA Kennestone Hospital Authority Revenue | 5.000% | 4/1/24 | 500 | 556 |
| Dahlonega GA Downtown Development Authority Revenue (North Georgia MAC LLC Project) | 5.000% | 7/1/19 | 200 | 204 |
| Dahlonega GA Downtown Development Authority Revenue (North Georgia MAC LLC Project) | 5.000% | 7/1/20 | 335 | 350 |
| Dahlonega GA Downtown Development Authority Revenue (North Georgia MAC LLC Project) | 5.000% | 7/1/21 | 400 | 427 |
| Dahlonega GA Downtown Development Authority Revenue (North Georgia MAC LLC Project) | 5.000% | 7/1/23 | 675 | 747 |
| Dahlonega GA Downtown Development Authority Revenue (North Georgia MAC LLC Project) | 5.000% | 7/1/24 | 860 | 966 |
| Dalton GA Combined Utilities Revenue | 5.000% | 3/1/23 | 1,000 | 1,090 |
| Dalton GA Combined Utilities Revenue | 5.000% | 3/1/24 | 1,000 | 1,105 |
| Dalton GA Combined Utilities Revenue | 5.000% | 3/1/25 | 550 | 613 |
| Dalton GA Development Authority Revenue (Hamilton Health Care System) | 5.000% | 8/15/19 | 1,000 | 1,024 |
| Dalton GA Development Authority Revenue (Hamilton Health Care System) | 5.000% | 8/15/20 | 1,500 | 1,575 |
| Dalton GA Development Authority Revenue (Hamilton Health Care System) | 5.000% | 8/15/21 | 1,890 | 2,017 |
| Dalton GA Development Authority Revenue (Hamilton Health Care System) | 5.000% | 8/15/28 | 6,685 | 7,175 |
| DeKalb County GA Water & Sewer Revenue | 5.000% | 10/1/19 | 1,300 | 1,335 |
| DeKalb County GA Water & Sewer Revenue | 5.000% | 10/1/19 | 1,000 | 1,027 |
| DeKalb County GA Water & Sewer Revenue | 5.000% | 10/1/20 | 1,270 | 1,338 |
| Douglas County GA GO | 5.000% | 4/1/21 | 1,500 | 1,600 |
| Douglas County GA GO | 5.000% | 4/1/22 | 775 | 844 |
| Fulton County GA Development Hospital Authority Revenue | | | | |
| (WellStar Health System Obligated Group) | 5.000% | 4/1/22 | 405 | 438 |
| Fulton County GA Development Hospital Authority Revenue | | | | |
| (WellStar Health System Obligated Group) | 5.000% | 4/1/23 | 345 | 379 |
| Fulton County GA Development Hospital Authority Revenue | | | | |
| (WellStar Health System Obligated Group) | 5.000% | 4/1/24 | 500 | 556 |
| Fulton County GA Residential Care Facilities for the Elderly Authority Revenue (Lenbrook Square) | 3.000% | 7/1/21 | 1,925 | 1,921 |
| Fulton County GA Residential Care Facilities for the Elderly Authority Revenue (Lenbrook Square) | 4.000% | 7/1/22 | 1,335 | 1,368 |
| Fulton County GA Residential Care Facilities for the Elderly Authority Revenue (Lenbrook Square) | 4.000% | 7/1/23 | 1,990 | 2,044 |
| Fulton County GA Residential Care Facilities for the Elderly Authority Revenue (Lenbrook Square) | 4.000% | 7/1/24 | 2,185 | 2,244 |
| Gainesville & Hall County GA Hospital Authority Revenue | | | | |
| (Northeast Georgia Health System Inc. Project) | 5.000% | 2/15/21 | 1,000 | 1,058 |
| Gainesville & Hall County GA Hospital Authority Revenue | | | | |
| (Northeast Georgia Health System Inc. Project) | 5.000% | 2/15/21 | 700 | 742 |
| Gainesville & Hall County GA Hospital Authority Revenue | | | | |
| (Northeast Georgia Health System Inc. Project) | 5.000% | 2/15/22 | 550 | 595 |
| Gainesville & Hall County GA Hospital Authority Revenue | | | | |
| (Northeast Georgia Health System Inc. Project) | 5.000% | 2/15/23 | 500 | 550 |
| 2 Gainesville & Hall County GA Hospital Authority Revenue | | | | |
| (Northeast Georgia Health System Inc. Project) PUT | 2.550% | 2/18/20 | 18,725 | 18,788 |
| 3 Gainesville & Hall County GA Hospital Authority Revenue | | | | |
| (Northeast Georgia Health System Inc. Project) TOB VRDO | 1.750% | 11/7/18 | 5,900 | 5,900 |
| Georgia GO | 4.000% | 11/1/18 | 11,000 | 11,000 |
| Georgia GO | 5.000% | 12/1/18 | 7,800 | 7,820 |
| Georgia GO | 5.000% | 2/1/26 | 5,755 | 6,351 |
| Georgia Housing & Finance Authority Single Family Mortgage Revenue | 4.000% | 6/1/44 | 2,085 | 2,139 |
| Georgia Municipal Electric Power Authority Revenue | 5.000% | 1/1/19 | 1,000 | 1,005 |
| Georgia Municipal Electric Power Authority Revenue | 5.000% | 1/1/20 | 5,015 | 5,169 |
| Georgia Municipal Electric Power Authority Revenue | 5.000% | 1/1/20 | 750 | 773 |
| Georgia Municipal Electric Power Authority Revenue | 5.000% | 1/1/21 (15) | 2,665 | 2,808 |
| Georgia Municipal Electric Power Authority Revenue | 5.000% | 1/1/22 | 10,050 | 10,784 |
| Georgia Municipal Electric Power Authority Revenue | 5.000% | 1/1/23 | 350 | 382 |
| Georgia Municipal Electric Power Authority Revenue | 5.000% | 1/1/24 | 1,440 | 1,577 |
| Georgia Municipal Gas Authority Revenue | 5.000% | 10/1/19 | 5,000 | 5,130 |
| Georgia Municipal Gas Authority Revenue | 5.000% | 10/1/20 | 3,600 | 3,780 |
| Georgia Municipal Gas Authority Revenue | 5.000% | 10/1/22 | 4,420 | 4,829 |
| Georgia Road & Tollway Authority GAN | 5.000% | 6/1/19 (Prere.) | 25,760 | 26,223 |
| Georgia Road & Tollway Authority Revenue | 5.000% | 6/1/19 | 4,555 | 4,635 |
74
Limited-Term Tax-Exempt Fund
| | | | |
| Face | Market |
| Maturity | Amount | Value• |
| Coupon | Date | ($000) | ($000) |
| Georgia Road & Tollway Authority Revenue | 5.000% | 6/1/21 | 16,190 | 17,325 |
| Georgia Road & Tollway Authority Revenue | 5.000% | 6/1/22 | 650 | 710 |
| Georgia Road & Tollway Authority Revenue | 5.000% | 6/1/23 | 525 | 584 |
| Georgia Road & Tollway Authority Revenue | 5.000% | 6/1/24 | 515 | 580 |
| Georgia Road & Tollway Authority Revenue | 5.000% | 6/1/25 | 490 | 559 |
| Georgia Road & Tollway Authority Revenue Federal Highway Reimbursement Revenue | 5.000% | 6/1/19 | 2,590 | 2,635 |
| Georgia Road & Tollway Authority Revenue Federal Highway Reimbursement Revenue | 5.000% | 6/1/21 | 5,000 | 5,351 |
| Glynn-Brunswick GA Memorial Hospital Authority Revenue | | | | |
| (Southeast Georgia Health System Obligated Group) | 5.000% | 8/1/21 | 2,500 | 2,667 |
| Glynn-Brunswick GA Memorial Hospital Authority Revenue | | | | |
| (Southeast Georgia Health System Obligated Group) | 5.000% | 8/1/22 | 2,500 | 2,717 |
| Griffin-Spalding County GA Hospital Authority Revenue (WellStar Health System Obligated Group) | 4.000% | 4/1/22 | 375 | 393 |
| Griffin-Spalding County GA Hospital Authority Revenue (WellStar Health System Obligated Group) | 5.000% | 4/1/23 | 370 | 406 |
| Griffin-Spalding County GA Hospital Authority Revenue (WellStar Health System Obligated Group) | 5.000% | 4/1/24 | 530 | 589 |
| Gwinnett County GA School District GO | 5.000% | 2/1/19 | 1,500 | 1,512 |
| Gwinnett County GA School District GO | 5.000% | 2/1/20 | 1,000 | 1,037 |
| LaGrange-Troup County GA Hospital Authority Revenue | | | | |
| (WellStar Health System Obligated Group) | 5.000% | 4/1/22 | 300 | 324 |
| LaGrange-Troup County GA Hospital Authority Revenue | | | | |
| (WellStar Health System Obligated Group) | 5.000% | 4/1/23 | 325 | 357 |
| LaGrange-Troup County GA Hospital Authority Revenue | | | | |
| (WellStar Health System Obligated Group) | 5.000% | 4/1/24 | 450 | 500 |
| Main Street Natural Gas Inc. Georgia Gas Project Revenue | 5.000% | 3/15/19 | 1,325 | 1,338 |
| Main Street Natural Gas Inc. Georgia Gas Project Revenue | 5.000% | 3/15/21 | 3,460 | 3,649 |
| Main Street Natural Gas Inc. Georgia Gas Project Revenue | 5.500% | 9/15/23 | 4,545 | 5,076 |
| Main Street Natural Gas Inc. Georgia Gas Project Revenue | 5.500% | 9/15/24 | 5,000 | 5,665 |
| Main Street Natural Gas Inc. Georgia Gas Project Revenue PUT | 4.000% | 9/1/23 | 117,715 | 122,752 |
| 2 Main Street Natural Gas Inc. Georgia Gas Project Revenue PUT | 2.342% | 12/1/23 | 100,000 | 99,336 |
| Monroe County GA Development Authority Pollution Control Revenue | | | | |
| (Georgia Power Company Plant Scherer Project) PUT | 2.050% | 11/19/21 | 1,625 | 1,575 |
| Municipal Electric Authority Georgia Revenue | 5.750% | 1/1/19 | 1,045 | 1,047 |
| Municipal Electric Authority Georgia Revenue | 5.000% | 1/1/20 | 2,430 | 2,505 |
| Municipal Electric Authority Georgia Revenue | 5.000% | 1/1/20 | 40,920 | 42,176 |
| Municipal Electric Authority Georgia Revenue | 5.000% | 1/1/21 | 5,185 | 5,447 |
| Municipal Electric Authority Georgia Revenue | 5.000% | 1/1/21 | 2,690 | 2,826 |
| Municipal Electric Authority Georgia Revenue | 5.000% | 1/1/21 | 2,150 | 2,259 |
| Municipal Electric Authority Georgia Revenue | 5.000% | 1/1/22 | 9,250 | 9,891 |
| Municipal Electric Authority Georgia Revenue | 5.000% | 1/1/22 | 3,710 | 3,967 |
| Municipal Electric Authority Georgia Revenue | 5.000% | 1/1/23 | 2,635 | 2,856 |
| Municipal Electric Authority Georgia Revenue | 5.000% | 1/1/23 | 2,630 | 2,850 |
| Municipal Electric Authority Georgia Revenue | 5.000% | 1/1/23 | 3,840 | 4,162 |
| Municipal Electric Authority Georgia Revenue (Combined Cycle Project) | 5.000% | 11/1/18 | 1,550 | 1,550 |
| Municipal Electric Authority Georgia Revenue (Project One) | 5.000% | 1/1/21 | 6,885 | 7,233 |
| Municipal Gas Authority Georgia Revenue (Gas Portfolio III Project) | 5.000% | 10/1/19 | 1,500 | 1,539 |
| Municipal Gas Authority Georgia Revenue (Gas Portfolio III Project) | 5.000% | 10/1/20 | 1,015 | 1,066 |
| Municipal Gas Authority Georgia Revenue (Gas Portfolio III Project) | 5.000% | 10/1/21 | 1,525 | 1,635 |
| Municipal Gas Authority Georgia Revenue (Gas Portfolio III Project) | 5.000% | 10/1/22 | 1,000 | 1,093 |
| Richmond County GA Hospital Authority Revenue (University Health Services Inc. Project) | 5.000% | 1/1/21 | 1,000 | 1,054 |
| Richmond County GA Hospital Authority Revenue (University Health Services Inc. Project) | 5.000% | 1/1/22 | 1,200 | 1,291 |
| Richmond County GA Hospital Authority Revenue (University Health Services Inc. Project) | 5.000% | 1/1/23 | 1,185 | 1,297 |
| Richmond County GA Hospital Authority Revenue (University Health Services Inc. Project) | 5.000% | 1/1/24 | 1,020 | 1,132 |
| South Regional GA Joint Development Authority Revenue | | | | |
| (VSU Auxiliary Services Parking & Student Center Project) | 5.000% | 8/1/21 | 1,550 | 1,653 |
| South Regional GA Joint Development Authority Revenue | | | | |
| (VSU Auxiliary Services Parking & Student Center Project) | 5.000% | 8/1/22 | 1,000 | 1,087 |
| South Regional GA Joint Development Authority Revenue | | | | |
| (VSU Auxiliary Services Parking & Student Center Project) | 5.000% | 8/1/23 | 1,080 | 1,193 |
| South Regional GA Joint Development Authority Revenue | | | | |
| (VSU Auxiliary Services Parking & Student Center Project) | 5.000% | 8/1/24 | 1,490 | 1,669 |
| | | | 745,847 |
| Guam (0.1%) | | | | |
| Guam Business Privilege Tax Revenue | 5.000% | 1/1/19 | 380 | 381 |
| Guam Business Privilege Tax Revenue | 5.000% | 1/1/22 | 345 | 367 |
| Guam Government Business Privilege Tax Revenue | 5.000% | 11/15/18 | 1,105 | 1,106 |
| Guam Government Business Privilege Tax Revenue | 5.000% | 1/1/20 | 240 | 247 |
| Guam Government Business Privilege Tax Revenue | 5.000% | 11/15/20 | 2,095 | 2,192 |
| Guam Government Business Privilege Tax Revenue | 5.000% | 11/15/21 | 1,700 | 1,809 |
| Guam Government Business Privilege Tax Revenue | 5.000% | 11/15/22 | 2,150 | 2,321 |
| Guam Government Business Privilege Tax Revenue | 5.000% | 1/1/23 | 2,650 | 2,809 |
| Guam Government Business Privilege Tax Revenue | 5.000% | 11/15/23 | 1,095 | 1,196 |
75
Limited-Term Tax-Exempt Fund
| | | | |
| Face | Market |
| Maturity | Amount | Value• |
| Coupon | Date | ($000) | ($000) |
| Guam Government Business Privilege Tax Revenue | 5.000% | 1/1/25 | 990 | 1,040 |
| Guam Government Waterworks Authority Water & Waste Water System Revenue | 5.000% | 7/1/20 | 1,000 | 1,033 |
| Guam Government Waterworks Authority Water & Waste Water System Revenue | 5.000% | 7/1/20 | 630 | 651 |
| Guam Government Waterworks Authority Water & Waste Water System Revenue | 5.250% | 7/1/20 | 600 | 622 |
| Guam Government Waterworks Authority Water & Waste Water System Revenue | 5.250% | 7/1/21 | 1,390 | 1,469 |
| Guam Government Waterworks Authority Water & Waste Water System Revenue | 5.000% | 7/1/23 | 575 | 619 |
| Guam Government Waterworks Authority Water & Waste Water System Revenue | 5.000% | 7/1/23 | 1,500 | 1,615 |
| Guam Government Waterworks Authority Water & Waste Water System Revenue | 5.000% | 7/1/24 | 500 | 543 |
| Guam Government Waterworks Authority Water & Waste Water System Revenue | 5.000% | 7/1/25 | 500 | 545 |
| Guam Power Authority Revenue | 5.000% | 10/1/20 | 520 | 539 |
| Guam Power Authority Revenue | 5.000% | 10/1/23 | 1,000 | 1,073 |
| Guam Power Authority Revenue | 5.000% | 10/1/24 | 2,145 | 2,320 |
| Guam Power Authority Revenue | 5.000% | 10/1/25 | 1,480 | 1,610 |
| | | | 26,107 |
| Hawaii (0.9%) | | | | |
| Hawaii County HI GO | 5.000% | 9/1/22 | 1,330 | 1,460 |
| Hawaii County HI GO | 5.000% | 9/1/22 | 1,275 | 1,400 |
| Hawaii County HI GO | 5.000% | 9/1/23 | 1,200 | 1,340 |
| Hawaii County HI GO | 5.000% | 9/1/23 | 1,785 | 1,993 |
| Hawaii County HI GO | 5.000% | 9/1/23 | 1,395 | 1,557 |
| Hawaii Department of Budget & Finance Special Purpose Revenue (Queens Health System) PUT | 2.050% | 5/29/19 | 4,410 | 4,410 |
| Hawaii Department of Budget & Finance Special Purpose Revenue (Queens Health System) PUT | 2.050% | 5/29/19 | 2,280 | 2,280 |
| Hawaii GO | 5.000% | 12/1/18 | 17,250 | 17,294 |
| Hawaii GO | 5.000% | 6/1/19 | 2,370 | 2,412 |
| Hawaii GO | 5.000% | 8/1/19 | 3,735 | 3,819 |
| Hawaii GO | 5.000% | 8/1/19 | 3,500 | 3,579 |
| Hawaii GO | 5.000% | 12/1/19 | 5,000 | 5,161 |
| Hawaii GO | 5.000% | 8/1/21 | 7,630 | 8,203 |
| Hawaii GO | 5.000% | 8/1/21 | 7,020 | 7,547 |
| Hawaii GO | 5.000% | 8/1/22 | 6,000 | 6,583 |
| Hawaii GO | 5.000% | 8/1/22 | 2,500 | 2,743 |
| Hawaii GO | 5.000% | 10/1/22 | 5,500 | 6,053 |
| Hawaii GO | 5.000% | 10/1/22 | 2,570 | 2,828 |
| Hawaii GO | 5.000% | 10/1/22 | 9,025 | 9,932 |
| Hawaii GO | 5.000% | 10/1/22 | 7,030 | 7,736 |
| Hawaii GO | 4.000% | 5/1/23 | 2,000 | 2,141 |
| Hawaii GO | 5.000% | 5/1/23 | 5,055 | 5,626 |
| Hawaii GO | 5.000% | 10/1/23 | 3,625 | 4,061 |
| Hawaii GO | 5.000% | 4/1/24 | 13,610 | 15,345 |
| Hawaii GO | 4.000% | 5/1/24 | 3,950 | 4,253 |
| Hawaii GO | 5.000% | 5/1/24 | 13,040 | 14,726 |
| Hawaii GO | 5.000% | 10/1/24 | 6,580 | 7,471 |
| Hawaii GO | 5.000% | 8/1/25 | 2,235 | 2,482 |
| Hawaii Highway Revenue | 5.000% | 1/1/20 | 1,000 | 1,034 |
| Honolulu HI City & County GO | 5.000% | 11/1/18 | 4,000 | 4,000 |
| Honolulu HI City & County GO | 5.000% | 9/1/19 | 2,500 | 2,563 |
| Honolulu HI City & County GO | 5.000% | 10/1/21 | 1,510 | 1,629 |
| Honolulu HI City & County GO | 5.000% | 10/1/21 | 2,255 | 2,432 |
| Honolulu HI City & County GO | 5.000% | 10/1/21 | 3,660 | 3,948 |
| Honolulu HI City & County GO | 5.000% | 9/1/23 | 1,800 | 2,014 |
| Honolulu HI City & County GO | 5.000% | 9/1/24 | 2,925 | 3,326 |
| Honolulu HI City & County GO | 5.000% | 9/1/25 | 1,815 | 2,092 |
| 2 Honolulu HI City & County GO PUT | 1.900% | 9/1/20 | 5,500 | 5,495 |
| 2 Honolulu HI City & County GO PUT | 1.900% | 9/1/20 | 7,500 | 7,493 |
| 2 Honolulu HI City & County GO PUT | 1.910% | 9/1/20 | 7,500 | 7,493 |
| 2 Honolulu HI City & County GO PUT | 1.920% | 9/1/20 | 6,500 | 6,494 |
| 2 Honolulu HI City & County GO PUT | 1.920% | 9/1/20 | 10,500 | 10,490 |
| 2 Honolulu HI City & County GO PUT | 1.920% | 9/1/20 | 9,250 | 9,241 |
| 2 Honolulu HI City & County GO PUT | 1.920% | 9/1/20 | 7,500 | 7,493 |
| | | | 231,672 |
| Idaho (0.1%) | | | | |
| 1 Idaho Building Authority Building Revenue (Idaho Department of Correction) | 5.000% | 9/1/23 | 900 | 1,000 |
| 1 Idaho Building Authority Building Revenue (Idaho Department of Correction) | 5.000% | 9/1/24 | 850 | 958 |
| Idaho Health Facilities Authority Revenue (St. Lukes Health System Project) | 5.000% | 3/1/23 | 1,000 | 1,093 |
| Idaho Health Facilities Authority Revenue (St. Lukes Health System Project) | 5.000% | 3/1/24 | 1,350 | 1,495 |
| Idaho Health Facilities Authority Revenue (St. Lukes Health System Project) | 5.000% | 3/1/25 | 4,355 | 4,869 |
| Idaho Health Facilities Authority Revenue (Trinity Health Group) | 5.000% | 12/1/20 | 5,000 | 5,279 |
| Idaho Health Facilities Authority Revenue (Trinity Health Group) | 5.000% | 12/1/21 | 2,000 | 2,156 |
| Idaho Health Facilities Authority Revenue (Trinity Health Group) | 5.000% | 12/1/22 | 2,000 | 2,196 |
76
Limited-Term Tax-Exempt Fund
| | | | |
| Face | Market |
| Maturity | Amount | Value• |
| Coupon | Date | ($000) | ($000) |
| Idaho Health Facilities Authority Revenue (Trinity Health Group) | 5.000% | 12/1/23 | 4,420 | 4,931 |
| Idaho Housing & Finance Association RAN | 5.000% | 7/15/23 | 2,530 | 2,802 |
| Idaho Housing & Finance Association RAN | 5.000% | 7/15/24 | 2,035 | 2,282 |
| | | | 29,061 |
| Illinois (7.9%) | | | | |
| Chicago IL Board of Education GO | 0.000% | 12/1/18 (14) | 1,000 | 998 |
| Chicago IL Board of Education GO | 5.000% | 12/1/18 (2) | 655 | 656 |
| Chicago IL Board of Education GO | 5.000% | 12/1/18 | 795 | 796 |
| Chicago IL Board of Education GO | 5.000% | 12/1/18 (12) | 7,305 | 7,316 |
| Chicago IL Board of Education GO | 5.000% | 12/1/18 (Prere.) | 95 | 95 |
| Chicago IL Board of Education GO | 5.250% | 12/1/18 (14) | 4,970 | 4,978 |
| Chicago IL Board of Education GO | 5.500% | 12/1/18 (2) | 250 | 250 |
| Chicago IL Board of Education GO | 5.000% | 12/1/19 | 1,540 | 1,565 |
| Chicago IL Board of Education GO | 5.000% | 12/1/19 | 7,000 | 7,113 |
| Chicago IL Board of Education GO | 5.000% | 12/1/19 (14) | 155 | 155 |
| Chicago IL Board of Education GO | 5.250% | 12/1/19 (14)(3) | 1,835 | 1,872 |
| Chicago IL Board of Education GO | 5.000% | 12/1/20 | 7,825 | 8,042 |
| Chicago IL Board of Education GO | 5.000% | 12/1/20 | 2,585 | 2,587 |
| Chicago IL Board of Education GO | 5.250% | 12/1/20 (14)(3) | 1,750 | 1,819 |
| Chicago IL Board of Education GO | 0.000% | 12/1/21 (14) | 485 | 438 |
| Chicago IL Board of Education GO | 5.000% | 12/1/21 | 2,460 | 2,462 |
| Chicago IL Board of Education GO | 5.000% | 12/1/21 | 1,570 | 1,600 |
| Chicago IL Board of Education GO | 5.000% | 12/1/21 | 13,860 | 14,392 |
| Chicago IL Board of Education GO | 5.000% | 12/1/21 | 3,395 | 3,525 |
| Chicago IL Board of Education GO | 0.000% | 12/1/22 (13)(3) | 3,855 | 3,391 |
| Chicago IL Board of Education GO | 5.000% | 12/1/22 | 7,000 | 7,261 |
| Chicago IL Board of Education GO | 5.000% | 12/1/22 | 3,000 | 3,112 |
| Chicago IL Board of Education GO | 0.000% | 12/1/23 (14) | 1,500 | 1,236 |
| Chicago IL Board of Education GO | 5.000% | 12/1/23 | 2,950 | 3,065 |
| Chicago IL Board of Education GO | 5.000% | 12/1/23 | 9,000 | 9,351 |
| Chicago IL Board of Education GO | 5.250% | 12/1/23 (4) | 250 | 251 |
| Chicago IL Board of Education GO | 5.250% | 12/1/23 | 3,105 | 3,107 |
| Chicago IL Board of Education GO | 0.000% | 12/1/24 (14) | 570 | 447 |
| Chicago IL Board of Education GO | 5.000% | 12/1/24 | 1,000 | 1,038 |
| Chicago IL Board of Education GO | 5.000% | 12/1/24 | 3,055 | 3,172 |
| Chicago IL Board of Education GO | 5.000% | 12/1/24 | 10,000 | 10,381 |
| Chicago IL Board of Education GO | 5.000% | 12/1/24 (4) | 5,600 | 6,120 |
| Chicago IL Board of Education GO | 5.250% | 12/1/24 | 270 | 270 |
| Chicago IL Board of Education GO | 5.000% | 12/1/25 (4) | 4,500 | 4,953 |
| Chicago IL Board of Education GO | 5.250% | 12/1/26 | 6,225 | 6,228 |
| Chicago IL Board of Education GO | 7.000% | 12/1/26 | 10,000 | 11,672 |
| Chicago IL GO | 5.000% | 12/1/19 | 1,505 | 1,534 |
| Chicago IL GO | 5.000% | 1/1/20 | 100 | 102 |
| Chicago IL GO | 4.000% | 1/1/21 | 1,250 | 1,259 |
| Chicago IL GO | 5.000% | 1/1/21 | 145 | 150 |
| Chicago IL GO | 5.000% | 1/1/21 | 195 | 202 |
| Chicago IL GO | 5.000% | 1/1/21 | 1,685 | 1,742 |
| Chicago IL GO | 5.000% | 12/1/21 | 500 | 519 |
| Chicago IL GO | 5.000% | 1/1/22 | 15,725 | 16,435 |
| Chicago IL GO | 5.000% | 1/1/23 | 770 | 814 |
| Chicago IL GO | 5.000% | 1/1/23 | 18,500 | 19,492 |
| Chicago IL GO | 0.000% | 1/1/24 (14) | 1,000 | 823 |
| Chicago IL GO | 5.000% | 1/1/24 | 5,675 | 6,019 |
| Chicago IL GO | 5.000% | 1/1/25 | 11,865 | 12,654 |
| Chicago IL GO | 5.000% | 1/1/25 | 450 | 468 |
| Chicago IL GO | 5.000% | 1/1/26 | 2,750 | 2,894 |
| Chicago IL GO | 5.000% | 1/1/26 | 160 | 168 |
| Chicago IL GO | 5.000% | 1/1/27 (4) | 1,945 | 1,995 |
| Chicago IL GO | 5.000% | 1/1/27 | 200 | 200 |
| Chicago IL Housing Authority Revenue | 5.000% | 1/1/23 | 1,710 | 1,865 |
| Chicago IL Housing Authority Revenue | 5.000% | 1/1/24 | 1,450 | 1,599 |
| Chicago IL Housing Authority Revenue | 5.000% | 1/1/25 | 4,320 | 4,816 |
| Chicago IL Metropolitan Water Reclamation District GO | 5.000% | 12/1/18 | 5,000 | 5,012 |
| Chicago IL Metropolitan Water Reclamation District GO | 5.000% | 12/1/21 | 4,470 | 4,805 |
| Chicago IL Metropolitan Water Reclamation District GO | 5.000% | 12/1/21 | 5,105 | 5,487 |
| Chicago IL Midway Airport Revenue | 5.000% | 1/1/20 | 2,075 | 2,141 |
| Chicago IL Midway Airport Revenue | 5.000% | 1/1/25 | 8,000 | 8,800 |
| Chicago IL Motor Fuel Tax Revenue | 5.000% | 1/1/21 | 500 | 517 |
| Chicago IL O’Hare International Airport Revenue | 5.000% | 1/1/19 | 1,000 | 1,005 |
77
Limited-Term Tax-Exempt Fund
| | | | |
| Face | Market |
| Maturity | Amount | Value• |
| Coupon | Date | ($000) | ($000) |
| Chicago IL O’Hare International Airport Revenue | 5.000% | 1/1/19 | 1,470 | 1,477 |
| Chicago IL O’Hare International Airport Revenue | 5.000% | 1/1/20 | 16,500 | 17,026 |
| Chicago IL O’Hare International Airport Revenue | 5.000% | 1/1/20 | 4,000 | 4,127 |
| Chicago IL O’Hare International Airport Revenue | 5.000% | 1/1/21 | 3,650 | 3,857 |
| Chicago IL O’Hare International Airport Revenue | 5.000% | 1/1/21 | 600 | 634 |
| Chicago IL O’Hare International Airport Revenue | 5.000% | 1/1/21 | 4,175 | 4,412 |
| Chicago IL O’Hare International Airport Revenue | 5.000% | 1/1/21 | 500 | 528 |
| Chicago IL O’Hare International Airport Revenue | 5.000% | 1/1/22 | 1,600 | 1,724 |
| Chicago IL O’Hare International Airport Revenue | 5.000% | 1/1/22 | 700 | 754 |
| Chicago IL O’Hare International Airport Revenue | 5.000% | 1/1/22 | 1,440 | 1,552 |
| Chicago IL O’Hare International Airport Revenue | 5.000% | 1/1/22 | 9,700 | 10,454 |
| Chicago IL O’Hare International Airport Revenue | 5.000% | 1/1/22 | 1,125 | 1,213 |
| Chicago IL O’Hare International Airport Revenue | 5.000% | 1/1/23 | 750 | 822 |
| Chicago IL O’Hare International Airport Revenue | 5.000% | 1/1/23 | 1,010 | 1,107 |
| Chicago IL O’Hare International Airport Revenue | 5.000% | 1/1/23 | 1,930 | 2,115 |
| Chicago IL O’Hare International Airport Revenue | 5.000% | 1/1/23 | 2,270 | 2,487 |
| Chicago IL O’Hare International Airport Revenue | 5.000% | 1/1/23 | 7,000 | 7,670 |
| Chicago IL O’Hare International Airport Revenue | 5.000% | 1/1/23 | 1,100 | 1,205 |
| Chicago IL O’Hare International Airport Revenue | 5.000% | 1/1/24 | 1,400 | 1,556 |
| Chicago IL O’Hare International Airport Revenue | 5.000% | 1/1/24 | 4,410 | 4,900 |
| Chicago IL O’Hare International Airport Revenue | 5.000% | 1/1/24 | 1,575 | 1,750 |
| Chicago IL O’Hare International Airport Revenue | 5.000% | 1/1/24 | 2,385 | 2,650 |
| Chicago IL O’Hare International Airport Revenue | 5.000% | 1/1/24 | 2,445 | 2,717 |
| Chicago IL O’Hare International Airport Revenue | 5.000% | 1/1/25 | 750 | 843 |
| Chicago IL O’Hare International Airport Revenue VRDO | 1.610% | 11/7/18 LOC | 30,000 | 30,000 |
| Chicago IL Park District GO | 4.000% | 1/1/19 | 100 | 100 |
| Chicago IL Park District GO | 5.000% | 1/1/22 | 125 | 133 |
| Chicago IL Park District GO | 5.000% | 1/1/22 | 400 | 426 |
| Chicago IL Park District GO | 5.000% | 1/1/22 | 1,000 | 1,066 |
| Chicago IL Park District GO | 5.500% | 1/1/22 | 1,115 | 1,122 |
| Chicago IL Park District GO | 5.000% | 1/1/23 | 1,265 | 1,366 |
| Chicago IL Park District GO | 5.000% | 1/1/23 | 400 | 432 |
| Chicago IL Park District GO | 5.000% | 1/1/23 | 790 | 839 |
| Chicago IL Park District GO | 5.000% | 1/1/23 | 500 | 540 |
| Chicago IL Park District GO | 5.000% | 1/1/24 | 550 | 601 |
| Chicago IL Park District Harbor Facilities GO | 5.000% | 1/1/20 | 1,195 | 1,229 |
| Chicago IL Park District Harbor Facilities GO | 5.000% | 1/1/21 | 2,920 | 3,058 |
| Chicago IL Public Building Commission Revenue | 5.250% | 12/1/18 (14) | 4,265 | 4,275 |
| Chicago IL Transit Authority Capital Grant Receipts Revenue | 4.000% | 6/1/19 | 1,250 | 1,262 |
| Chicago IL Transit Authority Capital Grant Receipts Revenue | 5.000% | 6/1/20 | 1,250 | 1,300 |
| Chicago IL Transit Authority Capital Grant Receipts Revenue | 5.000% | 6/1/21 | 1,840 | 1,949 |
| Chicago IL Transit Authority Capital Grant Receipts Revenue | 5.000% | 6/1/21 | 1,000 | 1,058 |
| Chicago IL Transit Authority Capital Grant Receipts Revenue | 5.000% | 6/1/22 | 3,090 | 3,320 |
| Chicago IL Transit Authority Capital Grant Receipts Revenue | 5.000% | 6/1/22 | 2,500 | 2,695 |
| Chicago IL Transit Authority Capital Grant Receipts Revenue | 5.000% | 6/1/23 | 9,205 | 10,028 |
| Chicago IL Transit Authority Capital Grant Receipts Revenue | 5.000% | 6/1/23 | 5,000 | 5,472 |
| Chicago IL Transit Authority Capital Grant Receipts Revenue | 5.000% | 6/1/24 | 5,065 | 5,568 |
| Chicago IL Transit Authority Capital Grant Receipts Revenue | 5.000% | 6/1/24 | 1,250 | 1,378 |
| Chicago IL Transit Authority Capital Grant Receipts Revenue | 5.000% | 6/1/25 | 4,000 | 4,419 |
| Chicago IL Transit Authority Capital Grant Receipts Revenue | 5.000% | 6/1/25 | 1,500 | 1,658 |
| Chicago IL Transit Authority Sales Tax Receipts Revenue | 5.000% | 12/1/22 | 9,820 | 10,483 |
| Chicago IL Wastewater Transmission Revenue | 5.000% | 1/1/21 | 1,000 | 1,049 |
| Chicago IL Wastewater Transmission Revenue | 5.000% | 1/1/22 | 2,815 | 3,009 |
| Chicago IL Wastewater Transmission Revenue | 5.000% | 1/1/23 | 1,310 | 1,420 |
| Chicago IL Wastewater Transmission Revenue | 5.000% | 1/1/23 | 2,300 | 2,493 |
| Chicago IL Wastewater Transmission Revenue | 5.000% | 1/1/23 | 2,350 | 2,547 |
| Chicago IL Wastewater Transmission Revenue | 5.000% | 1/1/24 | 1,125 | 1,234 |
| Chicago IL Wastewater Transmission Revenue | 5.000% | 1/1/24 | 2,700 | 2,960 |
| Chicago IL Wastewater Transmission Revenue | 5.000% | 1/1/25 | 1,000 | 1,103 |
| Chicago IL Wastewater Transmission Revenue | 5.000% | 1/1/25 | 3,550 | 3,917 |
| Chicago IL Wastewater Transmission Revenue | 5.000% | 1/1/25 | 2,000 | 2,207 |
| Chicago IL Wastewater Transmission Revenue | 5.000% | 1/1/26 | 1,020 | 1,134 |
| Chicago IL Water Revenue | 5.000% | 11/1/18 | 675 | 675 |
| Chicago IL Water Revenue | 5.000% | 11/1/21 | 2,090 | 2,186 |
| Chicago IL Waterworks Revenue | 5.000% | 11/1/19 | 750 | 770 |
| Chicago IL Waterworks Revenue | 5.000% | 11/1/20 | 2,500 | 2,619 |
| Chicago IL Waterworks Revenue | 5.000% | 11/1/22 | 1,540 | 1,668 |
| Chicago IL Waterworks Revenue | 5.000% | 11/1/23 | 2,900 | 3,176 |
| Chicago IL Waterworks Revenue | 5.000% | 11/1/24 | 3,100 | 3,429 |
| Chicago IL Waterworks Revenue | 5.000% | 11/1/24 | 1,125 | 1,244 |
78
Limited-Term Tax-Exempt Fund
| | | | |
| Face | Market |
| Maturity | Amount | Value• |
| Coupon | Date | ($000) | ($000) |
| Chicago IL Waterworks Revenue | 5.000% | 11/1/25 | 12,505 | 13,890 |
| Chicago IL Waterworks Revenue | 5.000% | 11/1/26 | 11,825 | 13,228 |
| 3 Chicago Transit Authority Revenue TOB VRDO | 1.750% | 11/7/18 | 13,400 | 13,399 |
| 3 Chicago Transit Authority Revenue TOB VRDO | 1.850% | 11/7/18 | 3,600 | 3,600 |
| Cook County IL Forest Preservation District GO | 5.000% | 12/15/18 | 1,000 | 1,003 |
| Cook County IL Forest Preservation District GO | 5.000% | 12/15/19 | 1,580 | 1,628 |
| Cook County IL GO | 3.000% | 11/15/18 | 1,125 | 1,125 |
| Cook County IL GO | 5.000% | 11/15/18 | 2,000 | 2,002 |
| Cook County IL GO | 5.000% | 11/15/19 | 215 | 221 |
| Cook County IL GO | 5.000% | 11/15/19 | 1,500 | 1,542 |
| Cook County IL GO | 5.000% | 11/15/19 | 1,000 | 1,028 |
| Cook County IL GO | 5.000% | 11/15/20 | 500 | 527 |
| Cook County IL GO | 5.000% | 11/15/20 | 2,125 | 2,242 |
| Cook County IL GO | 5.000% | 11/15/21 | 500 | 538 |
| Cook County IL GO | 5.000% | 11/15/22 | 280 | 307 |
| Cook County IL GO | 5.250% | 11/15/24 | 5,000 | 5,357 |
| Cook County IL GO | 5.250% | 11/15/25 | 4,500 | 4,811 |
| Dewitt & Ford & Livingston & Logan Counties IL Community College District No. 540 GO | 4.000% | 12/1/18 | 1,615 | 1,618 |
| Dewitt & Ford & Livingston & Logan Counties IL Community College District No. 540 GO | 4.000% | 12/1/19 | 2,380 | 2,429 |
| Dewitt & Ford & Livingston & Logan Counties IL Community College District No. 540 GO | 4.000% | 12/1/20 | 2,475 | 2,557 |
| Dewitt & Ford & Livingston & Logan Counties IL Community College District No. 540 GO | 4.000% | 12/1/21 | 2,575 | 2,690 |
| Dewitt & Ford & Livingston & Logan Counties IL Community College District No. 540 GO | 4.000% | 12/1/22 | 2,680 | 2,823 |
| Elk Grove Village IL GO | 3.000% | 1/1/23 | 500 | 509 |
| Elk Grove Village IL GO | 3.000% | 1/1/24 | 550 | 559 |
| Elk Grove Village IL GO | 3.000% | 1/1/25 | 560 | 568 |
| Illinois Educational Facilities Authority Revenue (University of Chicago) PUT | 1.650% | 2/1/19 | 10,000 | 9,988 |
| Illinois Educational Facilities Authority Revenue (University of Chicago) PUT | 1.550% | 2/13/20 | 6,000 | 5,948 |
| Illinois Educational Facilities Authority Revenue (University of Chicago) PUT | 1.800% | 2/13/20 | 500 | 497 |
| Illinois Finance Authority Gas Supply Revenue (Peoples Gas Light & Coke) PUT | 1.875% | 8/1/20 | 8,000 | 7,908 |
| Illinois Finance Authority Revenue (Advocate Health Care Network) | 5.000% | 8/1/19 | 1,000 | 1,021 |
| Illinois Finance Authority Revenue (Advocate Health Care Network) | 5.000% | 8/1/21 | 2,000 | 2,140 |
| Illinois Finance Authority Revenue (Advocate Health Care Network) | 5.000% | 8/1/22 | 1,000 | 1,090 |
| Illinois Finance Authority Revenue (Advocate Health Care Network) | 1.375% | 11/15/22 | 2,060 | 1,972 |
| Illinois Finance Authority Revenue (Advocate Health Care Network) PUT | 5.000% | 5/1/19 | 27,295 | 27,678 |
| Illinois Finance Authority Revenue (Advocate Health Care Network) PUT | 1.900% | 5/29/19 | 5,750 | 5,750 |
| Illinois Finance Authority Revenue (Advocate Health Care Network) PUT | 5.000% | 1/15/20 | 5,850 | 6,040 |
| Illinois Finance Authority Revenue (Advocate Health Care Network) VRDO | 1.590% | 11/7/18 | 31,500 | 31,500 |
| Illinois Finance Authority Revenue (Ann & Robert H. Lurie Children’s Hospital of Chicago) | 5.000% | 8/15/22 | 700 | 761 |
| Illinois Finance Authority Revenue (Ann & Robert H. Lurie Children’s Hospital of Chicago) | 5.000% | 8/15/23 | 750 | 828 |
| Illinois Finance Authority Revenue (Ann & Robert H. Lurie Children’s Hospital of Chicago) | 5.000% | 8/15/24 | 1,330 | 1,487 |
| Illinois Finance Authority Revenue (Ascension Health Credit Group) PUT | 1.750% | 4/1/21 | 3,000 | 2,945 |
| Illinois Finance Authority Revenue (Carle Foundation) | 5.000% | 2/15/21 | 750 | 793 |
| Illinois Finance Authority Revenue (Carle Foundation) | 5.000% | 2/15/23 | 1,000 | 1,095 |
| Illinois Finance Authority Revenue (Carle Foundation) | 5.375% | 8/15/26 | 1,000 | 1,068 |
| Illinois Finance Authority Revenue (Centegra Health System) | 5.000% | 9/1/19 | 1,115 | 1,142 |
| Illinois Finance Authority Revenue (Centegra Health System) | 5.000% | 9/1/20 | 2,940 | 3,084 |
| Illinois Finance Authority Revenue (Centegra Health System) | 5.000% | 9/1/20 | 500 | 524 |
| Illinois Finance Authority Revenue (Centegra Health System) | 5.000% | 9/1/21 | 975 | 1,045 |
| Illinois Finance Authority Revenue (DePaul University) | 5.000% | 10/1/21 | 380 | 407 |
| Illinois Finance Authority Revenue (DePaul University) | 5.000% | 10/1/24 | 250 | 280 |
| Illinois Finance Authority Revenue (Edward Elmhurst Obligated Group) | 5.000% | 1/1/21 | 375 | 392 |
| Illinois Finance Authority Revenue (Edward Elmhurst Obligated Group) | 5.000% | 1/1/22 | 350 | 372 |
| Illinois Finance Authority Revenue (Edward Elmhurst Obligated Group) | 5.000% | 1/1/23 | 500 | 538 |
| Illinois Finance Authority Revenue (Edward Elmhurst Obligated Group) | 5.000% | 1/1/24 | 565 | 614 |
| Illinois Finance Authority Revenue (Franciscan Communities Inc.) | 3.250% | 5/15/22 | 1,030 | 1,032 |
| Illinois Finance Authority Revenue (Hospital Sister Services Inc.) | 5.000% | 8/15/19 | 4,205 | 4,301 |
| Illinois Finance Authority Revenue (Hospital Sister Services Inc.) | 5.000% | 8/15/20 | 4,210 | 4,413 |
| Illinois Finance Authority Revenue (Hospital Sister Services Inc.) | 5.000% | 8/15/21 | 5,510 | 5,887 |
| Illinois Finance Authority Revenue (Illinois Wesleyan University) | 5.000% | 9/1/26 | 680 | 755 |
| Illinois Finance Authority Revenue (Mercy Health System) | 5.000% | 12/1/22 | 5,380 | 5,801 |
| Illinois Finance Authority Revenue (Northwestern Community Hospital) | 5.000% | 7/1/20 | 1,035 | 1,078 |
| Illinois Finance Authority Revenue (Northwestern Community Hospital) | 5.000% | 7/1/22 | 2,380 | 2,582 |
| Illinois Finance Authority Revenue (Northwestern Memorial Healthcare) | 5.000% | 7/15/19 | 2,600 | 2,654 |
| Illinois Finance Authority Revenue (Northwestern Memorial Healthcare) | 5.000% | 7/15/20 | 1,000 | 1,046 |
| Illinois Finance Authority Revenue (Northwestern Memorial Healthcare) | 5.000% | 7/15/22 | 1,250 | 1,363 |
| Illinois Finance Authority Revenue (Northwestern Memorial Healthcare) | 5.000% | 7/15/23 | 1,000 | 1,108 |
| Illinois Finance Authority Revenue (Northwestern Memorial Healthcare) | 5.000% | 7/15/24 | 3,250 | 3,648 |
| Illinois Finance Authority Revenue (Northwestern Memorial Healthcare) | 5.000% | 7/15/25 | 4,500 | 5,119 |
| Illinois Finance Authority Revenue (Northwestern Memorial Hospital) PUT | 5.000% | 12/15/22 | 19,500 | 21,372 |
| Illinois Finance Authority Revenue (Northwestern University) VRDO | 1.590% | 11/7/18 | 44,775 | 44,775 |
79
Limited-Term Tax-Exempt Fund
| | | | |
| Face | Market |
| Maturity | Amount | Value• |
| Coupon | Date | ($000) | ($000) |
| Illinois Finance Authority Revenue (OSF Healthcare System) | 5.000% | 5/15/20 | 875 | 911 |
| Illinois Finance Authority Revenue (OSF Healthcare System) | 5.000% | 11/15/20 | 3,560 | 3,746 |
| Illinois Finance Authority Revenue (OSF Healthcare System) | 5.000% | 5/15/21 | 375 | 399 |
| Illinois Finance Authority Revenue (OSF Healthcare System) | 5.000% | 11/15/21 | 1,100 | 1,181 |
| Illinois Finance Authority Revenue (OSF Healthcare System) | 5.000% | 5/15/22 | 875 | 947 |
| Illinois Finance Authority Revenue (OSF Healthcare System) | 5.000% | 5/15/22 | 2,605 | 2,820 |
| Illinois Finance Authority Revenue (OSF Healthcare System) | 5.000% | 11/15/22 | 1,585 | 1,730 |
| Illinois Finance Authority Revenue (OSF Healthcare System) | 5.000% | 5/15/23 | 500 | 550 |
| Illinois Finance Authority Revenue (OSF Healthcare System) | 5.000% | 5/15/24 | 1,650 | 1,837 |
| Illinois Finance Authority Revenue (OSF Healthcare System) | 5.000% | 5/15/25 | 7,570 | 8,496 |
| Illinois Finance Authority Revenue (OSF Healthcare System) | 5.000% | 5/15/26 | 4,315 | 4,865 |
| Illinois Finance Authority Revenue (OSF Healthcare System) | 5.000% | 5/15/26 | 1,120 | 1,198 |
| Illinois Finance Authority Revenue (Presbyterian Homes) | 5.000% | 5/1/21 | 1,200 | 1,264 |
| Illinois Finance Authority Revenue (Presbyterian Homes) | 5.000% | 5/1/22 | 1,600 | 1,711 |
| Illinois Finance Authority Revenue (Presbyterian Homes) | 5.000% | 5/1/23 | 1,400 | 1,515 |
| 2 Illinois Finance Authority Revenue (Presbyterian Homes) PUT | 2.929% | 5/1/21 | 2,500 | 2,509 |
| Illinois Finance Authority Revenue (Presence Health Network Obligated Group) | 5.000% | 2/15/21 | 3,055 | 3,239 |
| Illinois Finance Authority Revenue (Presence Health Network Obligated Group) | 5.000% | 2/15/22 | 4,000 | 4,329 |
| Illinois Finance Authority Revenue (Presence Health Network Obligated Group) | 5.000% | 2/15/23 | 5,000 | 5,509 |
| Illinois Finance Authority Revenue (Rehabilitation Institute of Chicago) | 5.000% | 7/1/20 | 1,000 | 1,039 |
| Illinois Finance Authority Revenue (Rush University Medical Center) | 5.000% | 11/15/19 | 500 | 514 |
| Illinois Finance Authority Revenue (Rush University Medical Center) | 5.000% | 11/15/20 | 1,000 | 1,052 |
| Illinois Finance Authority Revenue (Rush University Medical Center) | 5.000% | 11/15/21 | 1,000 | 1,074 |
| Illinois Finance Authority Revenue (Rush University Medical Center) | 5.000% | 11/15/22 | 1,000 | 1,094 |
| 3 Illinois Finance Authority Revenue (Rush University Medical Center) TOB VRDO | 1.700% | 11/7/18 (Prere.) | 8,595 | 8,595 |
| Illinois Finance Authority Revenue (Silver Cross & Medical Centers) | 5.000% | 8/15/22 | 1,000 | 1,070 |
| Illinois Finance Authority Revenue (Southern Illinois Healthcare) | 5.250% | 3/1/20 (Prere.) | 1,160 | 1,207 |
| Illinois Finance Authority Revenue (Southern Illinois Healthcare) | 5.000% | 3/1/22 | 900 | 965 |
| Illinois Finance Authority Revenue (Southern Illinois Healthcare) | 5.000% | 3/1/24 | 2,410 | 2,649 |
| Illinois Finance Authority Revenue (Southern Illinois Healthcare) | 5.000% | 3/1/25 | 595 | 660 |
| Illinois Finance Authority Revenue (Swedish Covenant Hospital) | 5.000% | 8/15/21 | 700 | 737 |
| Illinois Finance Authority Revenue (Swedish Covenant Hospital) | 5.000% | 8/15/22 | 1,000 | 1,067 |
| Illinois Finance Authority Revenue (Swedish Covenant Hospital) | 5.000% | 8/15/23 | 1,500 | 1,618 |
| Illinois Finance Authority Revenue (University of Chicago Medical Center) | 5.000% | 8/15/22 | 1,200 | 1,306 |
| Illinois Finance Authority Revenue (University of Chicago Medical Center) | 5.000% | 8/15/23 | 1,100 | 1,216 |
| Illinois Finance Authority Revenue (University of Chicago) | 5.000% | 10/1/19 | 1,745 | 1,791 |
| Illinois Finance Authority Revenue (University of Chicago) | 5.000% | 10/1/20 | 7,000 | 7,363 |
| Illinois Finance Authority Solid Waste Disposal Revenue (Prairie Power Inc. Project) PUT | 1.750% | 5/6/20 | 6,325 | 6,241 |
| Illinois Finance Authority Student Housing & Academic Facilities Revenue | | | | |
| (University of Illinois at Chicago Project) | 4.000% | 2/15/22 | 845 | 870 |
| Illinois Finance Authority Student Housing & Academic Facilities Revenue | | | | |
| (University of Illinois at Chicago Project) | 4.000% | 2/15/24 | 1,675 | 1,731 |
| Illinois Finance Authority Student Housing & Academic Facilities Revenue | | | | |
| (University of Illinois at Chicago Project) | 5.000% | 2/15/25 | 875 | 954 |
| Illinois GO | 5.000% | 11/1/18 | 10,340 | 10,340 |
| Illinois GO | 5.000% | 11/1/18 | 213,500 | 213,500 |
| Illinois GO | 5.000% | 12/1/18 | 13,100 | 13,125 |
| Illinois GO | 5.000% | 12/1/18 | 4,750 | 4,759 |
| Illinois GO | 5.000% | 1/1/19 | 700 | 703 |
| Illinois GO | 5.000% | 1/1/19 | 3,305 | 3,317 |
| Illinois GO | 5.250% | 1/1/19 | 8,635 | 8,671 |
| Illinois GO | 5.000% | 2/1/19 | 1,575 | 1,584 |
| Illinois GO | 5.000% | 2/1/19 | 9,680 | 9,735 |
| Illinois GO | 5.000% | 4/1/19 | 3,375 | 3,407 |
| Illinois GO | 5.000% | 4/1/19 | 2,500 | 2,524 |
| Illinois GO | 5.000% | 6/1/19 | 3,750 | 3,799 |
| Illinois GO | 5.000% | 7/1/19 | 4,920 | 4,993 |
| Illinois GO | 5.000% | 8/1/19 | 26,925 | 27,373 |
| Illinois GO | 4.000% | 9/1/19 | 2,000 | 2,021 |
| Illinois GO | 5.000% | 11/1/19 | 10,000 | 10,219 |
| Illinois GO | 5.000% | 11/1/19 | 77,195 | 78,884 |
| Illinois GO | 5.000% | 2/1/20 | 3,055 | 3,126 |
| Illinois GO | 5.000% | 2/1/20 | 4,850 | 4,963 |
| Illinois GO | 5.000% | 3/1/20 | 10,690 | 10,954 |
| Illinois GO | 5.000% | 4/1/20 | 2,025 | 2,078 |
| Illinois GO | 5.000% | 5/1/20 | 24,500 | 25,172 |
| Illinois GO | 5.000% | 5/1/20 | 2,245 | 2,307 |
| Illinois GO | 5.000% | 7/1/20 | 12,500 | 12,876 |
| Illinois GO | 5.000% | 8/1/20 | 1,260 | 1,299 |
| Illinois GO | 5.000% | 8/1/20 (4) | 6,500 | 6,744 |
80
Limited-Term Tax-Exempt Fund
| | | | |
| Face | Market |
| Maturity | Amount | Value• |
| Coupon | Date | ($000) | ($000) |
| Illinois GO | 4.000% | 9/1/20 | 1,520 | 1,543 |
| Illinois GO | 5.000% | 11/1/20 | 52,730 | 54,593 |
| Illinois GO | 5.000% | 1/1/21 (4) | 8,425 | 8,649 |
| Illinois GO | 5.000% | 2/1/21 | 4,100 | 4,219 |
| Illinois GO | 5.000% | 2/1/21 | 10,000 | 10,290 |
| Illinois GO | 5.000% | 4/1/21 | 8,600 | 8,866 |
| Illinois GO | 5.000% | 4/1/21 | 3,390 | 3,495 |
| Illinois GO | 5.000% | 5/1/21 | 17,000 | 17,539 |
| Illinois GO | 5.000% | 10/1/21 | 6,210 | 6,431 |
| Illinois GO | 5.000% | 10/1/21 | 6,940 | 7,187 |
| Illinois GO | 5.000% | 11/1/21 | 32,780 | 33,969 |
| Illinois GO | 5.000% | 1/1/22 | 100 | 102 |
| Illinois GO | 5.000% | 2/1/22 | 2,000 | 2,068 |
| Illinois GO | 5.000% | 7/1/22 | 4,325 | 4,484 |
| Illinois GO | 5.000% | 8/1/22 | 7,000 | 7,261 |
| Illinois GO | 5.000% | 10/1/22 | 19,930 | 20,689 |
| Illinois GO | 5.000% | 11/1/22 | 8,200 | 8,515 |
| Illinois GO | 5.000% | 11/1/22 | 18,800 | 19,523 |
| Illinois GO | 5.000% | 1/1/23 | 19,200 | 19,959 |
| Illinois GO | 5.000% | 2/1/23 | 7,000 | 7,279 |
| Illinois GO | 5.000% | 10/1/23 | 10,000 | 10,424 |
| Illinois GO | 5.000% | 11/1/23 | 25,000 | 26,065 |
| Illinois GO | 5.000% | 8/1/24 | 1,755 | 1,815 |
| Illinois GO | 5.000% | 10/1/24 | 5,000 | 5,202 |
| Illinois GO | 5.000% | 11/1/24 | 15,000 | 15,606 |
| Illinois GO | 5.000% | 4/1/25 | 4,170 | 4,324 |
| Illinois GO | 5.000% | 11/1/25 | 17,200 | 17,889 |
| Illinois GO | 5.000% | 3/1/26 (4) | 1,125 | 1,185 |
| Illinois GO | 5.000% | 4/1/26 (4) | 1,500 | 1,601 |
| Illinois GO | 5.000% | 5/1/26 | 6,275 | 6,482 |
| Illinois Housing Development Authority Revenue (Larkin Village) | 4.000% | 10/1/48 | 15,715 | 16,369 |
| Illinois Sales Tax Revenue | 5.000% | 6/15/19 | 14,220 | 14,442 |
| Illinois Sales Tax Revenue | 5.000% | 6/15/20 | 15,050 | 15,602 |
| Illinois Sales Tax Revenue | 4.000% | 6/15/21 | 255 | 257 |
| 1 Illinois Sales Tax Revenue | 5.000% | 6/15/24 | 5,000 | 5,457 |
| 1 Illinois Sales Tax Revenue | 5.000% | 6/15/24 (15) | 4,600 | 5,047 |
| 1 Illinois Sales Tax Revenue | 5.000% | 6/15/25 | 5,000 | 5,489 |
| 3 Illinois Sales Tax Revenue TOB VRDO | 1.870% | 11/7/18 (Prere.) | 4,155 | 4,155 |
| Illinois Sports Facility Authority Revenue | 0.000% | 6/15/22 (2) | 1,395 | 1,207 |
| Illinois Sports Facility Authority Revenue | 0.000% | 6/15/23 (2) | 8,945 | 7,406 |
| Illinois Sports Facility Authority Revenue | 0.000% | 6/15/24 (2) | 13,500 | 10,682 |
| Illinois Toll Highway Authority Revenue | 5.000% | 12/1/18 | 7,000 | 7,017 |
| Illinois Toll Highway Authority Revenue | 5.000% | 1/1/19 | 1,000 | 1,005 |
| Illinois Toll Highway Authority Revenue | 5.000% | 12/1/19 | 20,100 | 20,713 |
| Illinois Toll Highway Authority Revenue | 5.000% | 1/1/20 | 5,000 | 5,161 |
| Illinois Toll Highway Authority Revenue | 5.000% | 12/1/20 | 20,775 | 21,921 |
| Illinois Toll Highway Authority Revenue | 5.000% | 1/1/21 | 5,000 | 5,285 |
| Illinois Toll Highway Authority Revenue | 5.000% | 12/1/21 | 15,000 | 16,174 |
| Illinois Toll Highway Authority Revenue | 5.000% | 1/1/29 | 3,000 | 3,089 |
| Kendall County IL Forest Preserve District GO | 5.000% | 1/1/24 (4) | 1,425 | 1,573 |
| Kendall, Kane, & Will Counties IL Community Unified School District No. 308 GO | 5.000% | 10/1/22 | 1,375 | 1,488 |
| Kendall, Kane, & Will Counties IL Community Unified School District No. 308 GO | 5.000% | 10/1/23 | 550 | 604 |
| McHenry County IL Conservation District GO | 5.000% | 2/1/19 | 2,500 | 2,518 |
| McHenry County IL Conservation District GO | 5.000% | 2/1/21 | 3,000 | 3,176 |
| Metropolitan Pier & Exposition Authority Illinois Dedicated Sales Tax Revenue | 0.000% | 6/15/21 (14) | 16,775 | 15,298 |
| Metropolitan Pier & Exposition Authority Illinois Dedicated Sales Tax Revenue | 0.000% | 12/15/21 (14) | 2,510 | 2,241 |
| Metropolitan Pier & Exposition Authority Illinois Dedicated Sales Tax Revenue | 0.000% | 12/15/23 (14) | 100 | 82 |
| Metropolitan Pier & Exposition Authority Illinois Dedicated Sales Tax Revenue | 0.000% | 12/15/24 (14) | 6,825 | 5,334 |
| Metropolitan Pier & Exposition Authority Illinois Dedicated Sales Tax Revenue | | | | |
| (McCormick Place Expansion Project) | 0.000% | 12/15/19 (14) | 1,235 | 1,193 |
| Metropolitan Pier & Exposition Authority Illinois Dedicated Sales Tax Revenue | | | | |
| (McCormick Place Expansion Project) | 5.000% | 12/15/20 | 3,500 | 3,649 |
| Metropolitan Pier & Exposition Authority Illinois Dedicated Sales Tax Revenue | | | | |
| (McCormick Place Expansion Project) | 5.000% | 12/15/22 | 3,130 | 3,139 |
| Metropolitan Pier & Exposition Authority Illinois Dedicated Sales Tax Revenue | | | | |
| (McCormick Place Expansion Project) | 5.000% | 12/15/22 | 875 | 927 |
| Metropolitan Pier & Exposition Authority Illinois Dedicated Sales Tax Revenue | | | | |
| (McCormick Place Expansion Project) | 5.000% | 6/15/23 | 4,595 | 4,829 |
| Metropolitan Pier & Exposition Authority Illinois Dedicated Sales Tax Revenue | | | | |
| (McCormick Place Expansion Project) | 5.000% | 12/15/25 | 1,000 | 1,070 |
81
Limited-Term Tax-Exempt Fund
| | | | |
| Face | Market |
| Maturity | Amount | Value• |
| Coupon | Date | ($000) | ($000) |
| Metropolitan Pier & Exposition Authority Illinois Dedicated Sales Tax Revenue | | | | |
| (McCormick Place Expansion Project) | 5.000% | 12/15/26 | 26,320 | 27,386 |
| Northern Illinois Municipal Power Agency Project Revenue | 5.000% | 12/1/22 | 2,500 | 2,730 |
| Northern Illinois Municipal Power Agency Project Revenue | 5.000% | 12/1/23 | 2,210 | 2,444 |
| Northern Illinois Municipal Power Agency Project Revenue | 5.000% | 12/1/24 | 1,290 | 1,442 |
| Railsplitter Tobacco Settlement Authority Illinois Tobacco Settlement Revenue | 5.250% | 6/1/20 | 9,100 | 9,482 |
| Railsplitter Tobacco Settlement Authority Illinois Tobacco Settlement Revenue | 5.000% | 6/1/23 | 15,000 | 16,423 |
| Railsplitter Tobacco Settlement Authority Illinois Tobacco Settlement Revenue | 5.000% | 6/1/24 | 20,030 | 22,193 |
| Railsplitter Tobacco Settlement Authority Illinois Tobacco Settlement Revenue | 5.000% | 6/1/25 | 33,000 | 36,914 |
| Romeoville IL Revenue (Lewis University Project) | 5.000% | 10/1/21 | 615 | 649 |
| Romeoville IL Revenue (Lewis University Project) | 5.000% | 10/1/23 | 1,155 | 1,245 |
| 3 Sales Tax Securitization Corp. IL TOB VRDO | 1.750% | 11/7/18 | 10,475 | 10,475 |
| Springfield IL Electric Revenue | 5.000% | 3/1/19 | 2,000 | 2,018 |
| Springfield IL Electric Revenue | 5.000% | 3/1/21 | 2,000 | 2,114 |
| Springfield IL Electric Revenue | 5.000% | 3/1/22 | 2,335 | 2,515 |
| Springfield IL Electric Revenue | 5.000% | 3/1/23 | 5,000 | 5,473 |
| Springfield IL Electric Revenue | 5.000% | 3/1/24 | 4,515 | 5,013 |
| 3 Springfield IL Water Revenue TOB VRDO | 1.810% | 11/7/18 | 4,112 | 4,112 |
| University of Illinois Auxiliary Facilities System Revenue | 5.000% | 4/1/24 | 2,655 | 2,746 |
| University of Illinois COP | 5.000% | 8/15/20 | 5,000 | 5,232 |
| University of Illinois COP | 5.000% | 10/1/20 | 3,850 | 4,040 |
| University of Illinois COP | 5.000% | 8/15/21 | 5,000 | 5,329 |
| Village of Bolingbrook IL Special Tax Revenue (Will and DuPage Counties) | 4.000% | 3/1/22 (4) | 500 | 520 |
| Village of Bolingbrook IL Special Tax Revenue (Will and DuPage Counties) | 4.000% | 3/1/24 (4) | 500 | 525 |
| Village of Bolingbrook IL Special Tax Revenue (Will and DuPage Counties) | 4.000% | 3/1/25 (4) | 555 | 583 |
| Will County IL Community High School District No. 210 (Lincoln-Way) GO | 4.000% | 1/1/22 | 1,300 | 1,299 |
| Will County IL Community High School District No. 210 (Lincoln-Way) GO | 0.000% | 1/1/24 (4) | 2,820 | 2,340 |
| Will County IL Community High School District No. 210 (Lincoln-Way) GO | 0.000% | 1/1/24 (4)(ETM) | 12,375 | 10,692 |
| | | | 2,056,299 |
| Indiana (1.2%) | | | | |
| Avon IN Community School Building Corp. | 5.000% | 7/15/21 | 1,505 | 1,610 |
| Avon IN Community School Building Corp. | 5.000% | 1/15/21 | 2,325 | 2,459 |
| Ball State University Housing & Dining System Indiana Revenue | 5.000% | 7/1/21 | 200 | 214 |
| Ball State University Housing & Dining System Indiana Revenue | 5.000% | 7/1/22 | 250 | 274 |
| Ball State University Housing & Dining System Indiana Revenue | 5.000% | 7/1/23 | 295 | 329 |
| Ball State University Student Fee Indiana Revenue | 5.000% | 7/1/21 | 500 | 536 |
| Ball State University Student Fee Indiana Revenue | 5.000% | 7/1/22 | 225 | 246 |
| Ball State University Student Fee Indiana Revenue | 5.000% | 7/1/23 | 565 | 630 |
| 1 Brownsburg IN Community 1999 School Building Corporation Revenue | 5.000% | 7/15/24 | 200 | 225 |
| 1 Brownsburg IN Community 1999 School Building Corporation Revenue | 5.000% | 1/15/25 | 350 | 396 |
| 1 Brownsburg IN Community 1999 School Building Corporation Revenue | 5.000% | 7/15/25 | 350 | 398 |
| 1 Brownsburg IN Community 1999 School Building Corporation Revenue | 5.000% | 1/15/26 | 350 | 400 |
| Evansville IN Redevelopment Authority Revenue (Arena Project) | 5.000% | 2/1/21 (15) | 3,155 | 3,337 |
| Evansville IN Redevelopment Authority Revenue (Arena Project) | 5.000% | 2/1/22 (15) | 3,370 | 3,639 |
| Evansville IN Redevelopment Authority Revenue (Arena Project) | 5.000% | 2/1/23 (15) | 3,535 | 3,884 |
| Hammond IN Multi-School Building Corp. Revenue | 5.000% | 7/15/23 | 1,655 | 1,821 |
| Hammond IN Multi-School Building Corp. Revenue | 5.000% | 1/15/24 | 1,250 | 1,382 |
| Hammond IN Multi-School Building Corp. Revenue | 5.000% | 7/15/24 | 1,500 | 1,669 |
| Hammond IN Multi-School Building Corp. Revenue | 5.000% | 1/15/25 | 1,055 | 1,178 |
| Indiana Bond Bank Special Program Gas Revenue | 5.250% | 10/15/19 | 50 | 51 |
| Indiana Finance Authority Economic Development Revenue (Republic Services Inc. Project) PUT | 1.850% | 12/3/18 | 4,500 | 4,499 |
| Indiana Finance Authority Environmental Revenue (Duke Energy Indiana LLC) | 3.750% | 4/1/22 | 1,125 | 1,148 |
| Indiana Finance Authority Health System Revenue | | | | |
| (Sisters of St. Francis Health Services Inc. Obligated Group) | 5.000% | 11/1/21 | 2,380 | 2,386 |
| Indiana Finance Authority Health System Revenue | | | | |
| (Sisters of St. Francis Health Services Inc. Obligated Group) | 5.000% | 11/1/22 | 1,550 | 1,696 |
| Indiana Finance Authority Hospital Revenue (Community Health Network) | 5.000% | 5/1/20 | 860 | 895 |
| Indiana Finance Authority Hospital Revenue (Indiana University Health Obligated Group) | 5.000% | 3/1/19 | 5,000 | 5,049 |
| Indiana Finance Authority Hospital Revenue (Indiana University Health Obligated Group) | 5.000% | 12/1/20 | 1,000 | 1,056 |
| Indiana Finance Authority Hospital Revenue (Indiana University Health Obligated Group) | 5.000% | 12/1/20 | 2,100 | 2,218 |
| Indiana Finance Authority Hospital Revenue (Indiana University Health Obligated Group) | 5.000% | 12/1/21 | 2,500 | 2,700 |
| Indiana Finance Authority Hospital Revenue (Indiana University Health Obligated Group) | 5.000% | 12/1/22 | 7,050 | 7,761 |
| Indiana Finance Authority Hospital Revenue (Indiana University Health Obligated Group) | 5.000% | 12/1/23 | 5,250 | 5,875 |
| Indiana Finance Authority Hospital Revenue (Parkview Health System Obligated Group) | 5.000% | 11/1/19 | 700 | 720 |
| Indiana Finance Authority Hospital Revenue (Parkview Health System Obligated Group) | 5.000% | 11/1/20 | 600 | 632 |
| Indiana Finance Authority Hospital Revenue (Parkview Health System Obligated Group) | 5.000% | 11/1/21 | 500 | 539 |
| Indiana Finance Authority Hospital Revenue (Parkview Health System Obligated Group) | 5.000% | 11/1/22 | 905 | 994 |
| Indiana Finance Authority Hospital Revenue (Parkview Health System Obligated Group) | 5.000% | 11/1/23 | 1,265 | 1,411 |
| Indiana Finance Authority Hospital Revenue (Parkview Health System Obligated Group) | 5.000% | 11/1/24 | 1,020 | 1,154 |
82
Limited-Term Tax-Exempt Fund
| | | | |
| Face | Market |
| Maturity | Amount | Value• |
| Coupon | Date | ($000) | ($000) |
| Indiana Finance Authority Hospital Revenue (Parkview Health Systems Obligated Group) | 5.000% | 11/1/25 | 1,530 | 1,750 |
| Indiana Finance Authority Hospital Revenue (Parkview Health Systems Obligated Group) | 5.000% | 5/1/19 (ETM) | 55 | 56 |
| Indiana Finance Authority Hospital Revenue (Parkview Health Systems Obligated Group) | 5.000% | 5/1/19 | 1,595 | 1,619 |
| 1 Indiana Finance Authority Hospital Revenue (Parkview Health Systems Obligated Group) | 5.000% | 5/1/20 | 1,830 | 1,885 |
| 1 Indiana Finance Authority Hospital Revenue (Parkview Health Systems Obligated Group) | 5.000% | 5/1/24 | 1,015 | 1,119 |
| 1 Indiana Finance Authority Hospital Revenue (Parkview Health Systems Obligated Group) | 5.000% | 5/1/25 | 1,205 | 1,343 |
| Indiana Finance Authority Lease Revenue | 5.000% | 2/1/19 | 3,700 | 3,728 |
| Indiana Finance Authority Lease Revenue | 5.000% | 2/1/20 | 3,500 | 3,628 |
| Indiana Finance Authority Revenue | 5.000% | 2/1/23 | 2,675 | 2,909 |
| Indiana Finance Authority Revenue (Ascension Health Credit Group) VRDO | 1.610% | 11/7/18 | 30,000 | 30,000 |
| Indiana Finance Authority Revenue (Community Foundation of Northwest Indiana Obligated Group) | 5.000% | 3/1/19 | 1,000 | 1,010 |
| Indiana Finance Authority Revenue (Community Foundation of Northwest Indiana Obligated Group) | 5.000% | 3/1/20 | 1,300 | 1,348 |
| Indiana Finance Authority Revenue (Community Foundation of Northwest Indiana Obligated Group) | 4.000% | 9/1/21 | 250 | 261 |
| Indiana Finance Authority Revenue (Community Foundation of Northwest Indiana Obligated Group) | 5.000% | 9/1/22 | 250 | 272 |
| Indiana Finance Authority Revenue (Community Foundation of Northwest Indiana Obligated Group) | 5.000% | 3/1/23 | 750 | 809 |
| Indiana Finance Authority Revenue (Community Foundation of Northwest Indiana Obligated Group) | 5.000% | 9/1/23 | 700 | 774 |
| Indiana Finance Authority Revenue (Franciscan Alliance Inc.) | 5.000% | 11/1/20 | 900 | 948 |
| Indiana Finance Authority Revenue (Franciscan Alliance Inc.) | 5.000% | 11/1/21 | 550 | 591 |
| Indiana Finance Authority Revenue (Franciscan Alliance Inc.) | 5.000% | 11/1/23 | 2,000 | 2,224 |
| Indiana Finance Authority Revenue (Franciscan Alliance Inc.) | 5.000% | 11/1/23 | 1,115 | 1,240 |
| Indiana Finance Authority Revenue (Franciscan Alliance Inc.) | 5.000% | 11/1/24 | 3,275 | 3,687 |
| Indiana Finance Authority Revenue (Franciscan Alliance Inc.) | 5.000% | 11/1/24 | 1,905 | 2,145 |
| Indiana Finance Authority Revenue (Franciscan Alliance Inc.) | 5.000% | 11/1/25 | 6,240 | 7,098 |
| Indiana Finance Authority Revenue (Franciscan Alliance Inc.) | 5.000% | 11/1/25 | 5,315 | 6,046 |
| Indiana Finance Authority Wastewater Utility Revenue (CWA Authority Project) | 5.000% | 10/1/19 | 335 | 344 |
| Indiana Finance Authority Wastewater Utility Revenue (CWA Authority Project) | 5.000% | 10/1/20 | 840 | 883 |
| Indiana Finance Authority Wastewater Utility Revenue (CWA Authority Project) | 5.000% | 10/1/20 | 375 | 394 |
| Indiana Finance Authority Wastewater Utility Revenue (CWA Authority Project) | 5.000% | 10/1/21 | 1,680 | 1,805 |
| Indiana Finance Authority Wastewater Utility Revenue (CWA Authority Project) | 5.000% | 10/1/21 | 380 | 408 |
| Indiana Finance Authority Wastewater Utility Revenue (CWA Authority Project) | 5.000% | 10/1/22 | 1,000 | 1,094 |
| Indiana Health & Educational Facility Financing Authority Revenue | | | | |
| (Ascension Health Credit Group) PUT | 1.750% | 11/2/21 | 34,110 | 33,278 |
| Indiana Health Facility Financing Authority Revenue (Ascension Health Credit Group) | 4.000% | 10/1/19 | 1,780 | 1,811 |
| Indiana Health Facility Financing Authority Revenue (Ascension Health Credit Group) | 4.000% | 10/1/20 | 1,865 | 1,925 |
| Indiana Health Facility Financing Authority Revenue (Ascension Health Credit Group) | 4.000% | 10/1/21 | 1,925 | 2,013 |
| Indiana Health Facility Financing Authority Revenue (Ascension Health Credit Group) | 4.000% | 10/1/22 | 1,985 | 2,099 |
| Indiana Health Facility Financing Authority Revenue (Ascension Health Credit Group) | 4.000% | 10/1/23 | 1,845 | 1,967 |
| Indiana Health Facility Financing Authority Revenue (Ascension Health Credit Group) PUT | 1.250% | 5/1/20 | 1,850 | 1,819 |
| Indiana Health Facility Financing Authority Revenue (Ascension Health Credit Group) PUT | 1.375% | 5/1/20 (Prere.) | 60 | 59 |
| Indiana Health Facility Financing Authority Revenue (Ascension Health Credit Group) PUT | 1.375% | 5/1/20 | 2,460 | 2,423 |
| Indiana Health Facility Financing Authority Revenue (Ascension Health Credit Group) PUT | 1.500% | 5/1/20 | 3,805 | 3,755 |
| Indiana Health Facility Financing Authority Revenue (Ascension Health Credit Group) PUT | 1.350% | 8/4/20 | 6,235 | 6,117 |
| Indiana Health Facility Financing Authority Revenue (Ascension Health Credit Group) PUT | 1.350% | 8/4/20 | 4,215 | 4,135 |
| Indiana Transportation Finance Authority Revenue | 5.500% | 12/1/22 (14) | 16,640 | 18,668 |
| Indiana University Student Fee Revenue | 5.000% | 6/1/19 | 1,500 | 1,527 |
| Indiana University Student Fee Revenue | 5.000% | 6/1/21 | 3,500 | 3,750 |
| Indiana University Student Fee Revenue | 5.000% | 6/1/22 | 3,040 | 3,329 |
| Indianapolis Department of Public Utilities Water System Revenue | 5.000% | 10/1/25 | 1,400 | 1,608 |
| Indianapolis IN Local Public Improvement Bond Bank Revenue (Waterworks Project) | 5.250% | 1/1/24 (14) | 9,000 | 10,159 |
| Indianapolis IN Local Public Improvement Bond Bank Revenue (Waterworks Project) | 5.250% | 1/1/25 (14) | 12,215 | 13,987 |
| Ivy IN Tech Community College Revenue | 5.000% | 7/1/19 | 850 | 867 |
| Ivy IN Tech Community College Revenue | 5.000% | 7/1/20 | 500 | 524 |
| Purdue University Indiana University COP | 5.000% | 7/1/21 | 2,290 | 2,459 |
| Purdue University Indiana University COP | 5.000% | 7/1/22 | 2,290 | 2,513 |
| Richmond IN Hospital Authority Revenue (Reid Hospital & Health Care Services Inc.) | 5.000% | 1/1/20 | 1,010 | 1,042 |
| Richmond IN Hospital Authority Revenue (Reid Hospital & Health Care Services Inc.) | 5.000% | 1/1/22 | 1,275 | 1,358 |
| Richmond IN Hospital Authority Revenue (Reid Hospital & Health Care Services Inc.) | 5.000% | 1/1/23 | 850 | 918 |
| Rockport IN Pollution Control Revenue (Indiana Michigan Power Co. Project) PUT | 2.050% | 6/1/21 | 2,000 | 1,987 |
| Terre Haute IN Sanitation District Special Tax Revenue | 4.000% | 1/1/19 | 3,740 | 3,746 |
| Wayne Township School Building Corp. Marion County Indiana Revenue | 4.000% | 7/15/22 | 2,660 | 2,815 |
| Wayne Township School Building Corp. Marion County Indiana Revenue | 4.000% | 1/15/23 | 3,450 | 3,671 |
| Wayne Township School Building Corp. Marion County Indiana Revenue | 4.000% | 7/15/23 | 3,125 | 3,340 |
| Wayne Township School Building Corp. Marion County Indiana Revenue | 4.000% | 1/15/24 | 2,910 | 3,114 |
| Wayne Township School Building Corp. Marion County Indiana Revenue | 4.000% | 7/15/24 | 2,150 | 2,310 |
| Wayne Township School Building Corp. Marion County Indiana Revenue | 4.000% | 1/15/25 | 4,070 | 4,358 |
| Whiting IN Environmental Facilities Revenue (BP Products North America Inc. Project) PUT | 1.850% | 10/1/19 | 30,000 | 29,846 |
| | | | 326,126 |
83
Limited-Term Tax-Exempt Fund
| | | | |
| Face | Market |
| Maturity | Amount | Value• |
| Coupon | Date | ($000) | ($000) |
| Iowa (0.3%) | | | | |
| Iowa Board of Regents Hospital Revenue (University of Iowa Hospitals & Clinics) | 4.000% | 9/1/19 | 5,675 | 5,764 |
| Iowa Finance Authority Healthcare Revenue (Genesis Health System) | 5.000% | 7/1/19 | 4,075 | 4,149 |
| Iowa Finance Authority Healthcare Revenue (Genesis Health System) | 5.000% | 7/1/24 | 1,000 | 1,096 |
| Iowa Finance Authority Midwestern Disaster Area Revenue (Iowa Fertilizer Co. Project) | 5.500% | 12/1/22 | 25 | 25 |
| 3 Iowa Finance Authority Midwestern Disaster Area Revenue (Iowa Fertilizer Co. Project) | 5.875% | 12/1/27 | 12,155 | 12,866 |
| Iowa Finance Authority Midwestern Disaster Area Revenue (Iowa Fertilizer Co. Project) PUT | 5.250% | 12/1/37 | 18,000 | 19,115 |
| Iowa Finance Authority Revenue | 5.000% | 8/1/21 | 9,410 | 10,121 |
| 2 Iowa Finance Authority Revenue PUT | 1.956% | 10/1/21 | 3,750 | 3,746 |
| 1 Iowa Financial Authority Revenue (Iowa Health System) | 5.000% | 2/15/21 | 1,395 | 1,476 |
| 1 Iowa Financial Authority Revenue (Iowa Health System) | 5.000% | 2/15/23 | 1,000 | 1,097 |
| 1 Iowa Financial Authority Revenue (Iowa Health System) | 5.000% | 2/15/25 | 1,700 | 1,907 |
| 1 Iowa Financial Authority Revenue (Iowa Health System) | 5.000% | 2/15/26 | 1,000 | 1,131 |
| Iowa Higher Education Loan Authority Revenue Private College Facility (Grinnell College Project) | 4.000% | 12/1/21 | 400 | 420 |
| Iowa Higher Education Loan Authority Revenue Private College Facility (Grinnell College Project) | 4.000% | 12/1/22 | 425 | 452 |
| Iowa Higher Education Loan Authority Revenue Private College Facility (Grinnell College Project) | 4.000% | 12/1/23 | 500 | 535 |
| Iowa Special Obligation Revenue | 5.000% | 6/15/21 | 1,820 | 1,948 |
| Iowa Special Obligation Revenue | 5.000% | 6/15/22 | 3,740 | 4,087 |
| Iowa Special Obligation Revenue | 5.000% | 6/15/23 | 4,830 | 5,374 |
| Xenia IA Rural Water District Revenue | 3.000% | 12/1/19 | 430 | 432 |
| Xenia IA Rural Water District Revenue | 5.000% | 12/1/21 | 320 | 341 |
| Xenia IA Rural Water District Revenue | 5.000% | 12/1/22 | 1,675 | 1,812 |
| Xenia IA Rural Water District Revenue | 5.000% | 12/1/23 | 450 | 493 |
| | | | 78,387 |
| Kansas (0.5%) | | | | |
| Butler County KS Unified School District No. 385 Andover GO | 4.000% | 9/1/23 | 1,515 | 1,618 |
| Butler County KS Unified School District No. 385 Andover GO | 4.000% | 9/1/24 | 1,535 | 1,650 |
| Hutchison KS Hospital Facilities Revenue (Hutchinson Regional Medical Center Inc.) | 5.000% | 12/1/22 | 500 | 529 |
| Hutchison KS Hospital Facilities Revenue (Hutchinson Regional Medical Center Inc.) | 5.000% | 12/1/23 | 500 | 533 |
| Hutchison KS Hospital Facilities Revenue (Hutchinson Regional Medical Center Inc.) | 5.000% | 12/1/24 | 1,080 | 1,159 |
| Hutchison KS Hospital Facilities Revenue (Hutchinson Regional Medical Center Inc.) | 5.000% | 12/1/25 | 600 | 648 |
| Johnson County KS Unified School District No. 233 GO | 4.000% | 9/1/21 | 1,325 | 1,389 |
| Johnson County KS Unified School District No. 233 GO | 5.000% | 9/1/21 | 750 | 807 |
| Johnson County KS Unified School District No. 233 GO | 5.000% | 9/1/21 | 1,795 | 1,931 |
| Johnson County KS Unified School District No. 233 GO | 4.000% | 9/1/22 | 1,000 | 1,059 |
| Johnson County KS Unified School District No. 233 GO | 5.000% | 9/1/22 | 1,015 | 1,115 |
| Johnson County KS Unified School District No. 233 GO | 5.000% | 9/1/23 | 450 | 503 |
| Johnson County KS Unified School District No. 233 GO | 5.000% | 9/1/23 | 750 | 838 |
| Johnson County KS Unified School District No. 233 GO | 5.000% | 9/1/24 | 250 | 284 |
| Johnson KS GO | 4.000% | 9/1/25 | 1,055 | 1,119 |
| 2 Kansas Department of Transportation Highway Revenue | 1.912% | 9/1/19 | 4,250 | 4,256 |
| 2 Kansas Department of Transportation Highway Revenue | 1.879% | 9/1/21 | 7,580 | 7,567 |
| Kansas Department of Transportation Highway Revenue | 5.000% | 9/1/22 | 3,650 | 4,016 |
| Kansas Development Finance Authority Health Facilities Revenue | | | | |
| (Kansas University Health System) | 5.000% | 3/1/19 | 1,150 | 1,161 |
| Kansas Development Finance Authority Health Facilities Revenue | | | | |
| (Kansas University Health System) | 5.375% | 3/1/29 | 3,000 | 3,114 |
| Kansas Development Finance Authority Revenue | 5.000% | 5/1/21 | 17,635 | 18,797 |
| Kansas Development Finance Authority Revenue | 5.000% | 4/1/22 | 3,795 | 4,122 |
| Kansas Development Finance Authority Revenue | 5.000% | 5/1/22 | 17,565 | 19,113 |
| Kansas Development Finance Authority Revenue | 5.000% | 5/1/24 | 16,420 | 18,053 |
| Lawrence KS Hospital Revenue (Lawrence Memorial Hospital) | 5.000% | 7/1/25 | 1,000 | 1,124 |
| Sedgwick County KS Unified School District No. 259 (Wichita) GO | 4.000% | 10/1/23 | 4,035 | 4,334 |
| Sedgwick County KS Unified School District No. 259 (Wichita) GO | 4.000% | 10/1/24 | 8,045 | 8,714 |
| Sedgwick County KS Unified School District No. 266 (Maize) GO | 3.000% | 9/1/19 | 200 | 202 |
| Sedgwick County KS Unified School District No. 266 (Maize) GO | 4.000% | 9/1/20 | 400 | 413 |
| Sedgwick County KS Unified School District No. 266 (Maize) GO | 5.000% | 9/1/21 | 525 | 563 |
| Sedgwick County KS Unified School District No. 266 (Maize) GO | 5.000% | 9/1/22 | 1,250 | 1,367 |
| Seward County KS Unified School District No. 480 GO | 3.000% | 9/1/19 | 470 | 474 |
| Seward County KS Unified School District No. 480 GO | 3.000% | 9/1/20 | 450 | 457 |
| Seward County KS Unified School District No. 480 GO | 5.000% | 9/1/21 | 400 | 429 |
| Seward County KS Unified School District No. 480 GO | 5.000% | 9/1/22 | 315 | 344 |
| Seward County KS Unified School District No. 480 GO | 5.000% | 9/1/23 | 1,200 | 1,333 |
| Seward County KS Unified School District No. 480 GO | 5.000% | 9/1/24 | 1,500 | 1,692 |
| Seward County KS Unified School District No. 480 GO | 5.000% | 9/1/25 | 1,750 | 1,999 |
| University of Kansas Hospital Authority Health Facilities Revenue | 5.000% | 3/1/22 | 180 | 196 |
| University of Kansas Hospital Authority Health Facilities Revenue | 5.000% | 3/1/23 | 300 | 331 |
| University of Kansas Hospital Authority Health Facilities Revenue | 5.000% | 3/1/24 | 300 | 337 |
| Wichita KS Hospital Facilities Revenue (Via Christi Health System Inc.) | 5.000% | 11/15/18 (ETM) | 2,250 | 2,252 |
84
Limited-Term Tax-Exempt Fund
| | | | |
| Face | Market |
| Maturity | Amount | Value• |
| Coupon | Date | ($000) | ($000) |
| Wichita KS Water & Sewer Utility Revenue | 5.000% | 10/1/22 | 1,040 | 1,142 |
| Wyandotte County KS Unified School District No. 500 GO | 5.000% | 9/1/22 | 1,000 | 1,088 |
| Wyandotte County KS Unified School District No. 500 GO | 5.000% | 9/1/23 | 1,200 | 1,328 |
| Wyandotte County/Kansas City KS Unified Government Utility System Revenue | 5.000% | 9/1/19 | 500 | 512 |
| Wyandotte County/Kansas City KS Unified Government Utility System Revenue | 5.000% | 9/1/20 | 1,580 | 1,658 |
| Wyandotte County/Kansas City KS Unified Government Utility System Revenue | 5.000% | 9/1/22 | 750 | 819 |
| | | | 128,489 |
| Kentucky (1.4%) | | | | |
| Ashland KY Medical Center Revenue (King’s Daughters Medical Center Project) | 4.000% | 2/1/21 | 540 | 550 |
| Ashland KY Medical Center Revenue (King’s Daughters Medical Center Project) | 5.000% | 2/1/22 | 2,245 | 2,372 |
| Ashland KY Medical Center Revenue (King’s Daughters Medical Center Project) | 5.000% | 2/1/23 | 765 | 818 |
| Ashland KY Medical Center Revenue (King’s Daughters Medical Center Project) | 5.000% | 2/1/24 | 680 | 733 |
| Carroll County KY Pollution Control Revenue (Kentucky Utilities Co. Project) PUT | 1.050% | 9/1/19 | 10,375 | 10,270 |
| Kenton County KY Airport Revenue | 5.000% | 1/1/20 | 700 | 721 |
| Kenton County KY Airport Revenue | 5.000% | 1/1/21 | 700 | 738 |
| Kenton County KY Airport Revenue | 5.000% | 1/1/22 | 750 | 806 |
| Kenton County KY Airport Revenue | 5.000% | 1/1/23 | 500 | 545 |
| Kentucky Asset/Liability Commission Agency Fund Revenue (Federal Highway Trust) | 5.000% | 9/1/22 | 3,995 | 4,180 |
| Kentucky Asset/Liability Commission Agency Fund Revenue (Federal Highway Trust) | 5.250% | 9/1/22 | 8,560 | 9,405 |
| Kentucky Bond Development Corp. Hospital Facilities Revenue (St. Elizabeth Medical Center, Inc.) | 5.000% | 5/1/21 | 1,050 | 1,121 |
| Kentucky Bond Development Corp. Hospital Facilities Revenue (St. Elizabeth Medical Center, Inc.) | 5.000% | 5/1/22 | 870 | 949 |
| Kentucky Bond Development Corp. Transient Room Tax Revenue | | | | |
| (Lexington Center Corporation Project) | 5.000% | 9/1/25 | 1,660 | 1,873 |
| Kentucky Economic Development Finance Authority Medical Center Revenue | | | | |
| (King’s Daughters Medical Center Project) | 5.000% | 2/1/21 | 1,185 | 1,215 |
| Kentucky Economic Development Finance Authority Revenue (Catholic Health Initiatives) | 5.000% | 5/1/24 | 1,295 | 1,309 |
| 2 Kentucky Economic Development Finance Authority Revenue (Catholic Health Initiatives) PUT | 2.434% | 2/1/20 | 25,000 | 25,007 |
| Kentucky Economic Development Finance Authority Revenue (Owensboro Health, Inc.) | 5.000% | 6/1/19 | 1,825 | 1,848 |
| Kentucky Economic Development Finance Authority Revenue (Owensboro Health, Inc.) | 5.000% | 6/1/21 | 1,500 | 1,567 |
| Kentucky Economic Development Finance Authority Revenue (Owensboro Health, Inc.) | 5.000% | 6/1/22 | 1,675 | 1,766 |
| Kentucky Economic Development Finance Authority Solid Waste Revenue | | | | |
| (Republic Services Inc. Project) PUT | 1.850% | 12/3/18 | 4,000 | 4,000 |
| Kentucky Municipal Power Agency Power System Revenue | 5.000% | 9/1/20 (14) | 6,000 | 6,259 |
| Kentucky Municipal Power Agency Power System Revenue | 5.000% | 9/1/21 (14) | 6,085 | 6,483 |
| Kentucky Municipal Power Agency Power System Revenue | 5.000% | 9/1/22 (14) | 2,500 | 2,708 |
| Kentucky Property & Building Commission Revenue | 5.000% | 8/1/21 | 15,885 | 16,915 |
| Kentucky Property & Building Commission Revenue | 5.000% | 8/1/22 | 4,510 | 4,884 |
| Kentucky Property & Building Commission Revenue | 5.000% | 8/1/22 | 15,110 | 16,362 |
| Kentucky Public Energy Authority Gas Supply Revenue PUT | 4.000% | 4/1/24 | 106,540 | 110,797 |
| Kentucky Public Energy Authority Gas Supply Revenue PUT | 4.000% | 1/1/25 | 66,750 | 70,095 |
| Louisville & Jefferson County KY Metropolitan Government Environmental Facilities Revenue | | | | |
| (Louisville Gas & Electric Co. Project) PUT | 1.500% | 4/1/19 | 19,850 | 19,787 |
| Louisville & Jefferson County KY Metropolitan Government Health System Revenue | | | | |
| (Norton Healthcare Obligated Group) | 5.000% | 10/1/20 | 1,715 | 1,796 |
| Louisville & Jefferson County KY Metropolitan Government Health System Revenue | | | | |
| (Norton Healthcare Obligated Group) | 3.000% | 10/1/21 | 1,405 | 1,422 |
| Louisville & Jefferson County KY Metropolitan Government Health System Revenue | | | | |
| (Norton Healthcare Obligated Group) | 5.000% | 10/1/22 | 1,855 | 2,015 |
| Louisville & Jefferson County KY Metropolitan Government Revenue (Catholic Health Initiatives) | 5.000% | 12/1/19 | 300 | 308 |
| Louisville & Jefferson County KY Metropolitan Government Revenue (Catholic Health Initiatives) | 5.000% | 12/1/20 | 1,000 | 1,048 |
| 1 Louisville & Jefferson County KY Metropolitan Sewer & Drain System Revenue | 4.000% | 11/1/19 | 17,810 | 18,138 |
| Owensboro KY Electric Light & Power System Revenue | 4.000% | 1/1/21 | 2,000 | 2,068 |
| Owensboro KY Electric Light & Power System Revenue | 4.000% | 1/1/22 | 1,955 | 2,046 |
| Owensboro KY Electric Light & Power System Revenue | 4.000% | 1/1/23 | 2,500 | 2,637 |
| Owensboro KY Electric Light & Power System Revenue | 5.000% | 1/1/23 (4) | 1,590 | 1,638 |
| Owensboro KY Electric Light & Power System Revenue | 4.000% | 1/1/24 | 3,765 | 3,994 |
| Owensboro KY Electric Light & Power System Revenue | 4.000% | 1/1/25 | 2,800 | 2,976 |
| Owensboro KY Electric Light & Power System Revenue | 4.000% | 1/1/26 | 2,100 | 2,232 |
| Owensboro KY Electric Light & Power System Revenue | 4.000% | 1/1/27 | 1,975 | 2,099 |
| | | | 370,500 |
| Louisiana (1.2%) | | | | |
| DeSoto Parish LA Pollution Control Revenue (Southwestern Electric Power Co. Project) | 1.600% | 1/1/19 | 13,500 | 13,502 |
| Ernest N. Morial New Orleans LA Exhibition Hall Authority Special Tax Revenue | 5.000% | 7/15/19 | 1,190 | 1,214 |
| 3 Franciscan Missionaries of Our Lady Health System Obligated Group LA TOB VRDO | 1.800% | 11/7/18 | 9,475 | 9,475 |
| Greater New Orleans LA Expressway Commission Revenue | 5.000% | 11/1/24 (4) | 500 | 564 |
| Greater New Orleans LA Expressway Commission Revenue | 5.000% | 11/1/25 (4) | 570 | 652 |
| Lafayette LA Communications System Revenue | 5.000% | 11/1/20 (4) | 1,000 | 1,051 |
| Lafayette LA Communications System Revenue | 5.000% | 11/1/21 (4) | 1,010 | 1,086 |
| Lafayette LA Communications System Revenue | 5.000% | 11/1/22 (4) | 4,010 | 4,397 |
85
Limited-Term Tax-Exempt Fund
| | | | |
| Face | Market |
| Maturity | Amount | Value• |
| Coupon | Date | ($000) | ($000) |
| Lafayette LA Utilities Revenue | 5.000% | 11/1/23 (4) | 300 | 335 |
| Lafayette LA Utilities Revenue | 5.000% | 11/1/24 (4) | 540 | 609 |
| Lafayette LA Utilities Revenue | 5.000% | 11/1/25 (4) | 500 | 572 |
| Lafayette LA Utilities Revenue | 5.000% | 11/1/26 | 7,210 | 7,915 |
| Louisiana Citizens Property Insurance Corp. Assessment Revenue | 5.000% | 6/1/20 | 8,000 | 8,334 |
| Louisiana Citizens Property Insurance Corp. Assessment Revenue | 5.000% | 6/1/21 (4) | 5,000 | 5,338 |
| Louisiana Citizens Property Insurance Corp. Assessment Revenue | 5.000% | 6/1/22 (4) | 4,150 | 4,527 |
| Louisiana Gasoline & Fuel Tax Revenue | 5.000% | 5/1/23 | 1,445 | 1,604 |
| Louisiana Gasoline & Fuel Tax Revenue | 5.000% | 5/1/24 | 2,370 | 2,674 |
| Louisiana Gasoline & Fuel Tax Revenue | 5.000% | 5/1/25 | 1,665 | 1,902 |
| Louisiana Gasoline & Fuel Tax Revenue | 5.000% | 5/1/25 | 18,420 | 19,972 |
| Louisiana Gasoline & Fuel Tax Revenue | 5.000% | 5/1/26 | 12,000 | 12,990 |
| Louisiana GO | 5.000% | 10/1/21 | 3,335 | 3,589 |
| Louisiana GO | 5.000% | 5/1/22 | 10,320 | 11,248 |
| Louisiana GO | 5.000% | 5/1/22 | 2,800 | 3,043 |
| Louisiana GO | 5.000% | 9/1/22 | 4,000 | 4,386 |
| Louisiana GO | 5.000% | 7/15/23 | 23,000 | 25,183 |
| Louisiana GO | 5.000% | 10/1/23 | 11,640 | 13,006 |
| Louisiana GO | 5.000% | 7/15/24 | 3,050 | 3,336 |
| Louisiana GO | 5.000% | 10/1/24 | 12,240 | 13,862 |
| Louisiana GO | 5.000% | 10/1/25 | 12,865 | 14,711 |
| Louisiana GO | 5.000% | 10/1/26 | 6,750 | 7,761 |
| Louisiana Highway Improvement Revenue | 5.000% | 6/15/19 | 1,000 | 1,018 |
| Louisiana Highway Improvement Revenue | 5.000% | 6/15/20 | 1,325 | 1,382 |
| Louisiana Highway Improvement Revenue | 5.000% | 6/15/21 | 1,135 | 1,211 |
| Louisiana Local Government Environmental Facilities & Community Development | | | | |
| Authority Revenue | 5.000% | 10/1/21 (15) | 1,930 | 2,064 |
| Louisiana Local Government Environmental Facilities & Community Development | | | | |
| Authority Revenue | 5.000% | 10/1/22 (15) | 2,435 | 2,656 |
| Louisiana Local Government Environmental Facilities & Community Development | | | | |
| Authority Revenue | 5.000% | 10/1/23 (15) | 5,000 | 5,528 |
| Louisiana Local Government Environmental Facilities & Community Development | | | | |
| Authority Revenue | 5.000% | 10/1/23 (15) | 2,265 | 2,504 |
| Louisiana Local Government Environmental Facilities & Community Development | | | | |
| Authority Revenue | 5.000% | 10/1/24 (15) | 4,365 | 4,880 |
| Louisiana Local Government Environmental Facilities & Community Development | | | | |
| Authority Revenue | 5.000% | 10/1/24 (15) | 2,370 | 2,650 |
| Louisiana Local Government Environmental Facilities & Community Development | | | | |
| Authority Revenue | 5.000% | 10/1/25 (15) | 4,300 | 4,862 |
| Louisiana Local Government Environmental Facilities & Community Development | | | | |
| Authority Revenue (Women’s Hospital Foundation Project) | 3.000% | 10/1/22 | 1,000 | 1,013 |
| Louisiana Local Government Environmental Facilities & Community Development | | | | |
| Authority Revenue (Women’s Hospital Foundation Project) | 5.000% | 10/1/23 | 1,000 | 1,100 |
| Louisiana Local Government Environmental Facilities & Community Development | | | | |
| Authority Revenue (Women’s Hospital Foundation Project) | 5.000% | 10/1/24 | 1,410 | 1,567 |
| Louisiana Local Government Environmental Facilities & Community Development | | | | |
| Authority Revenue (Women’s Hospital Foundation Project) | 4.000% | 10/1/25 | 2,075 | 2,193 |
| Louisiana Offshore Terminal Authority Deep Water Port Revenue (LOOP LLC Project) PUT | 2.000% | 10/1/22 | 2,500 | 2,438 |
| Louisiana Public Facilities Authority Hospital Revenue (Louisiana Children’s Medical Center) PUT | 5.000% | 6/1/25 | 25,000 | 28,013 |
| Louisiana Public Facilities Authority Revenue (Christus Health) | 5.000% | 7/1/21 | 360 | 384 |
| Louisiana Public Facilities Authority Revenue (Christus Health) | 5.000% | 7/1/22 | 290 | 314 |
| Louisiana Public Facilities Authority Revenue (Christus Health) | 5.000% | 7/1/23 | 380 | 418 |
| Louisiana Public Facilities Authority Revenue (Christus Health) | 5.000% | 7/1/24 | 1,135 | 1,262 |
| Louisiana Public Facilities Authority Revenue (Christus Health) | 5.000% | 7/1/25 | 2,540 | 2,848 |
| Louisiana Public Facilities Authority Revenue (Christus Health) | 5.000% | 7/1/26 | 2,670 | 3,010 |
| Louisiana Public Facilities Authority Revenue (Ochsner Clinic Foundation Project) | 4.000% | 5/15/20 | 330 | 338 |
| Louisiana Public Facilities Authority Revenue (Ochsner Clinic Foundation Project) | 5.000% | 5/15/21 | 450 | 478 |
| Louisiana Public Facilities Authority Revenue (Ochsner Clinic Foundation Project) | 5.000% | 5/15/22 | 350 | 378 |
| Louisiana Public Facilities Authority Revenue (Ochsner Clinic Foundation Project) | 5.000% | 5/15/23 | 645 | 708 |
| Louisiana Public Facilities Authority Revenue (Ochsner Clinic Foundation Project) | 5.000% | 5/15/24 | 620 | 689 |
| Louisiana Public Facilities Authority Revenue (Ochsner Clinic Foundation Project) | 5.000% | 5/15/25 | 720 | 809 |
| Louisiana Stadium & Exposition District Revenue | 5.000% | 7/1/19 | 1,250 | 1,274 |
| Louisiana Stadium & Exposition District Revenue | 5.000% | 7/1/20 | 1,100 | 1,149 |
| New Orleans LA Aviation Board Revenue | 5.000% | 1/1/22 | 135 | 145 |
| New Orleans LA Aviation Board Revenue | 5.000% | 1/1/23 | 150 | 164 |
| New Orleans LA Aviation Board Revenue | 5.000% | 1/1/24 | 200 | 222 |
| New Orleans LA Aviation Board Revenue | 5.000% | 10/1/24 (4) | 100 | 112 |
| New Orleans LA Aviation Board Revenue | 5.000% | 1/1/25 | 100 | 112 |
| New Orleans LA Aviation Board Revenue | 5.000% | 10/1/25 (4) | 350 | 394 |
| New Orleans LA GO | 5.000% | 12/1/18 | 4,065 | 4,074 |
86
Limited-Term Tax-Exempt Fund
| | | | |
| Face | Market |
| Maturity | Amount | Value• |
| Coupon | Date | ($000) | ($000) |
| New Orleans LA GO | 5.000% | 12/1/20 | 1,400 | 1,475 |
| New Orleans LA GO | 5.000% | 12/1/21 | 1,260 | 1,354 |
| New Orleans LA GO | 5.000% | 12/1/22 | 700 | 765 |
| New Orleans LA Sewage Service Revenue | 5.000% | 6/1/19 | 570 | 579 |
| New Orleans LA Water Revenue | 5.000% | 12/1/20 | 400 | 420 |
| Shreveport LA Water & Sewer Revenue | 5.000% | 12/1/23 (15) | 1,500 | 1,664 |
| Shreveport LA Water & Sewer Revenue | 5.000% | 12/1/24 (15) | 1,390 | 1,559 |
| Shreveport LA Water & Sewer Revenue | 5.000% | 12/1/25 (15) | 2,000 | 2,259 |
| St. Charles Parish LA Gulf Opportunity Zone Revenue (Valero Energy Corp.) PUT | 4.000% | 6/1/22 | 14,650 | 15,255 |
| Tobacco Settlement Financing Corp. Louisiana Revenue | 5.000% | 5/15/19 | 2,500 | 2,538 |
| Tobacco Settlement Financing Corp. Louisiana Revenue | 5.000% | 5/15/20 | 8,990 | 9,346 |
| Tobacco Settlement Financing Corp. Louisiana Revenue | 5.000% | 5/15/22 | 1,000 | 1,077 |
| | | | 321,490 |
| Maine (0.1%) | | | | |
| Maine GO | 5.000% | 6/1/22 | 10,205 | 11,161 |
| Maine Governmental Facilities Authority Revenue | 4.000% | 10/1/24 | 690 | 738 |
| Maine Health & Higher Educational Facilities Authority Revenue | 5.000% | 7/1/21 | 3,930 | 4,193 |
| Maine Health & Higher Educational Facilities Authority Revenue | 5.000% | 7/1/22 | 1,425 | 1,550 |
| Maine Health & Higher Educational Facilities Authority Revenue | 5.000% | 7/1/23 | 3,275 | 3,618 |
| Maine Health & Higher Educational Facilities Authority Revenue | 5.000% | 7/1/24 | 2,740 | 3,069 |
| Maine Health & Higher Educational Facilities Authority Revenue | 5.000% | 7/1/24 | 1,000 | 1,121 |
| Maine Health & Higher Educational Facilities Authority Revenue (University of New England) | 5.000% | 7/1/24 | 500 | 557 |
| Maine Health & Higher Educational Facilities Authority Revenue (University of New England) | 4.000% | 7/1/25 | 595 | 632 |
| Maine Housing Authority Mortgage Revenue | 3.500% | 11/15/47 | 3,425 | 3,494 |
| Maine Housing Authority Mortgage Revenue | 4.000% | 11/15/47 | 4,840 | 5,022 |
| 1 Maine Municipal Bond Bank Revenue GANS | 5.000% | 9/1/23 | 825 | 921 |
| 1 Maine Municipal Bond Bank Revenue GANS | 5.000% | 9/1/24 | 850 | 962 |
| 1 Maine Municipal Bond Bank Revenue GANS | 5.000% | 9/1/25 | 1,580 | 1,809 |
| | | | 38,847 |
| Maryland (2.7%) | | | | |
| Anne Arundel County MD GO | 5.000% | 4/1/19 | 6,960 | 7,049 |
| Anne Arundel County MD GO | 5.000% | 4/1/19 | 2,640 | 2,674 |
| Anne Arundel County MD GO | 5.000% | 10/1/22 | 3,110 | 3,427 |
| Anne Arundel County MD GO | 5.000% | 10/1/22 | 1,455 | 1,603 |
| Anne Arundel County MD GO | 5.000% | 10/1/22 | 2,520 | 2,777 |
| Anne Arundel County MD GO | 5.000% | 10/1/22 | 4,690 | 5,169 |
| Anne Arundel County MD GO | 5.000% | 10/1/23 | 3,110 | 3,489 |
| Anne Arundel County MD GO | 5.000% | 10/1/23 | 2,485 | 2,788 |
| Anne Arundel County MD GO | 5.000% | 10/1/23 | 3,880 | 4,353 |
| Anne Arundel County MD GO | 5.000% | 4/1/28 | 1,395 | 1,588 |
| Baltimore County MD GO | 5.000% | 2/1/20 | 2,100 | 2,176 |
| Baltimore County MD GO | 5.000% | 10/15/21 | 10,400 | 11,222 |
| Baltimore County MD GO | 5.000% | 2/1/23 | 6,950 | 7,543 |
| Baltimore County MD GO | 5.000% | 8/1/25 | 3,000 | 3,276 |
| Baltimore MD Project Revenue | 5.000% | 7/1/21 | 750 | 802 |
| Baltimore MD Project Revenue | 5.000% | 7/1/21 | 520 | 558 |
| Baltimore MD Project Revenue | 5.000% | 7/1/22 | 550 | 600 |
| Baltimore MD Project Revenue | 5.000% | 7/1/22 | 500 | 547 |
| Baltimore MD Project Revenue | 5.000% | 7/1/23 | 550 | 610 |
| Baltimore MD Project Revenue | 5.000% | 7/1/23 | 525 | 585 |
| 3 Baltimore MD Project Revenue TOB VRDO | 1.630% | 11/7/18 | 8,185 | 8,185 |
| 1 Charles County MD GO | 5.000% | 10/1/23 | 3,400 | 3,805 |
| 1 Charles County MD GO | 5.000% | 10/1/24 | 3,575 | 4,066 |
| Gaithersburg MD Economic Development Revenue (Asbury Maryland Obligated Group) | 4.500% | 1/1/25 | 1,500 | 1,606 |
| Gaithersburg MD Economic Development Revenue (Asbury Maryland Obligated Group) | 4.500% | 1/1/26 | 2,000 | 2,147 |
| Howard County MD GO | 5.000% | 2/15/19 | 3,830 | 3,864 |
| Howard County MD GO | 5.000% | 8/15/19 | 5,000 | 5,119 |
| Howard County MD GO | 5.000% | 2/15/20 | 4,475 | 4,643 |
| Maryland Department of Transportation Revenue | 5.000% | 5/1/19 | 4,000 | 4,061 |
| Maryland Department of Transportation Revenue | 5.000% | 12/1/20 | 15,495 | 16,395 |
| Maryland Department of Transportation Revenue | 5.000% | 11/1/21 | 12,375 | 13,364 |
| Maryland Department of Transportation Revenue | 5.000% | 12/15/21 | 7,930 | 8,588 |
| Maryland Department of Transportation Revenue | 5.000% | 2/15/22 | 38,965 | 42,353 |
| Maryland Department of Transportation Revenue | 5.000% | 11/1/22 | 10,000 | 11,021 |
| Maryland Department of Transportation Revenue | 5.000% | 12/15/22 | 11,270 | 12,464 |
| Maryland Department of Transportation Revenue | 5.000% | 2/1/24 | 10,165 | 11,221 |
| Maryland Department of Transportation Revenue | 4.000% | 12/15/24 | 17,620 | 18,917 |
| Maryland Department of Transportation Revenue | 4.000% | 2/1/28 | 21,560 | 22,686 |
| Maryland Department of Transportation Revenue | 4.000% | 5/1/28 | 10,410 | 11,122 |
87
Limited-Term Tax-Exempt Fund
| | | | |
| Face | Market |
| Maturity | Amount | Value• |
| Coupon | Date | ($000) | ($000) |
| Maryland Economic Development Corp. Revenue (Constellation Energy Group, Inc. Project) PUT | 2.550% | 6/1/20 | 8,900 | 8,859 |
| Maryland Economic Development Corp. Revenue (Transportation Facilities Project) | 4.000% | 6/1/19 | 1,200 | 1,212 |
| Maryland Economic Development Corp. Revenue (Transportation Facilities Project) | 4.000% | 6/1/20 | 1,485 | 1,520 |
| Maryland Economic Development Corp. Revenue (Transportation Facilities Project) | 5.000% | 6/1/21 | 1,640 | 1,736 |
| Maryland Economic Development Corp. Revenue (Transportation Facilities Project) | 5.000% | 6/1/23 | 1,480 | 1,608 |
| Maryland Economic Development Corp. Revenue (Transportation Facilities Project) | 5.000% | 6/1/24 | 1,500 | 1,650 |
| Maryland Economic Development Corp. Revenue (Transportation Facilities Project) | 5.000% | 6/1/25 | 1,500 | 1,660 |
| Maryland Economic Development Corp. Student Housing Revenue | | | | |
| (University of Maryland College Park) | 4.000% | 6/1/20 (4) | 620 | 637 |
| Maryland Economic Development Corp. Student Housing Revenue | | | | |
| (University of Maryland College Park) | 4.000% | 6/1/21 (4) | 700 | 729 |
| Maryland Economic Development Corp. Student Housing Revenue | | | | |
| (University of Maryland College Park) | 4.000% | 6/1/22 (4) | 1,200 | 1,265 |
| Maryland Economic Development Corp. Student Housing Revenue | | | | |
| (University of Maryland College Park) | 4.000% | 6/1/23 (4) | 1,350 | 1,438 |
| Maryland GO | 5.000% | 11/1/18 | 2,525 | 2,525 |
| Maryland GO | 5.000% | 8/1/19 (Prere.) | 28,995 | 29,660 |
| Maryland GO | 5.000% | 11/1/19 | 4,265 | 4,393 |
| Maryland GO | 5.000% | 3/1/21 (Prere.) | 3,745 | 3,984 |
| Maryland GO | 4.000% | 8/1/21 | 20,000 | 20,970 |
| Maryland GO | 5.000% | 8/1/21 | 34,110 | 36,670 |
| Maryland GO | 5.000% | 8/1/21 | 30,020 | 32,273 |
| Maryland GO | 5.000% | 8/1/22 | 4,430 | 4,860 |
| Maryland GO | 5.000% | 8/1/23 | 6,510 | 7,274 |
| Maryland GO | 5.000% | 8/1/23 | 35,000 | 39,109 |
| Maryland GO | 5.000% | 3/15/24 | 18,250 | 20,617 |
| Maryland GO | 5.000% | 8/1/24 | 10,000 | 11,359 |
| Maryland GO | 4.000% | 3/1/25 | 34,080 | 35,371 |
| Maryland Health & Higher Educational Facilities Authority Revenue | | | | |
| (Adventist Healthcare Obligated Group) | 5.250% | 1/1/24 | 1,455 | 1,605 |
| Maryland Health & Higher Educational Facilities Authority Revenue (Anne Arundel Health System) | 4.000% | 7/1/19 | 850 | 860 |
| Maryland Health & Higher Educational Facilities Authority Revenue (Anne Arundel Health System) | 5.000% | 7/1/20 | 1,000 | 1,044 |
| Maryland Health & Higher Educational Facilities Authority Revenue (Broadmead Inc.) | 5.000% | 7/1/22 | 680 | 730 |
| Maryland Health & Higher Educational Facilities Authority Revenue (Broadmead Inc.) | 2.875% | 7/1/23 | 875 | 872 |
| Maryland Health & Higher Educational Facilities Authority Revenue (Broadmead Inc.) | 5.000% | 7/1/25 | 735 | 813 |
| Maryland Health & Higher Educational Facilities Authority Revenue (MedStar Health) | 5.000% | 8/15/19 | 1,400 | 1,431 |
| Maryland Health & Higher Educational Facilities Authority Revenue (MedStar Health) | 5.000% | 8/15/20 | 2,170 | 2,272 |
| Maryland Health & Higher Educational Facilities Authority Revenue (MedStar Health) | 5.000% | 8/15/21 | 1,785 | 1,909 |
| Maryland Health & Higher Educational Facilities Authority Revenue (MedStar Health) | 5.000% | 8/15/22 | 4,600 | 5,013 |
| Maryland Health & Higher Educational Facilities Authority Revenue (Meritus Medical Center, Inc.) | 4.000% | 7/1/20 | 1,055 | 1,080 |
| Maryland Health & Higher Educational Facilities Authority Revenue (Meritus Medical Center, Inc.) | 5.000% | 7/1/21 | 650 | 690 |
| Maryland Health & Higher Educational Facilities Authority Revenue (Meritus Medical Center, Inc.) | 5.000% | 7/1/22 | 500 | 540 |
| Maryland Health & Higher Educational Facilities Authority Revenue (Meritus Medical Center, Inc.) | 5.000% | 7/1/23 | 1,220 | 1,335 |
| Maryland Health & Higher Educational Facilities Authority Revenue | | | | |
| (Peninsula Regional Medical Center) | 5.000% | 7/1/21 | 2,220 | 2,365 |
| Maryland Health & Higher Educational Facilities Authority Revenue | | | | |
| (University of Maryland Medical System) | 4.000% | 7/1/21 | 1,015 | 1,062 |
| Maryland Health & Higher Educational Facilities Authority Revenue | | | | |
| (University of Maryland Medical System) | 5.000% | 7/1/22 | 2,580 | 2,825 |
| Maryland Health & Higher Educational Facilities Authority Revenue | | | | |
| (Western Maryland Health System) | 5.000% | 7/1/19 | 2,750 | 2,799 |
| Maryland Health & Higher Educational Facilities Authority Revenue | | | | |
| (Western Maryland Health System) | 5.000% | 7/1/20 | 3,150 | 3,280 |
| Maryland Health & Higher Educational Facilities Authority Revenue | | | | |
| (Western Maryland Health System) | 5.000% | 7/1/21 | 7,045 | 7,485 |
| Maryland Health & Higher Educational Facilities Authority Revenue | | | | |
| (Western Maryland Health System) | 5.000% | 7/1/22 | 5,000 | 5,400 |
| Maryland Water Quality Financing Administration Bay Restoration Revolving Loan Fund Revenue | 5.000% | 3/1/22 | 12,350 | 13,429 |
| Maryland Water Quality Financing Administration Bay Restoration Revolving Loan Fund Revenue | 3.000% | 3/1/27 | 3,000 | 3,013 |
| Montgomery County MD GO | 5.000% | 10/1/19 | 4,215 | 4,330 |
| Montgomery County MD GO | 5.000% | 11/1/19 | 2,840 | 2,925 |
| Montgomery County MD GO | 5.000% | 11/1/21 | 22,680 | 24,560 |
| Montgomery County MD GO | 5.000% | 12/1/21 | 10,000 | 10,851 |
| Montgomery County MD GO | 5.000% | 12/1/22 | 8,650 | 9,565 |
| Montgomery County MD GO | 5.000% | 11/1/24 | 5,260 | 6,001 |
| Montgomery County MD GO | 4.000% | 11/1/25 | 6,195 | 6,763 |
| Prince Georges County MD (Regional Medical Center) COPS | 5.000% | 10/1/24 | 1,140 | 1,291 |
| Rockville MD Mayor & Council Economic Development Revenue (Ingleside at King Farm Project) | 5.000% | 11/1/23 | 650 | 696 |
| Rockville MD Mayor & Council Economic Development Revenue (Ingleside at King Farm Project) | 2.500% | 11/1/24 | 4,000 | 3,844 |
| Rockville MD Mayor & Council Economic Development Revenue (Ingleside at King Farm Project) | 5.000% | 11/1/24 | 1,145 | 1,233 |
88
Limited-Term Tax-Exempt Fund
| | | | |
| Face | Market |
| Maturity | Amount | Value• |
| Coupon | Date | ($000) | ($000) |
| Rockville MD Mayor & Council Economic Development Revenue (Ingleside at King Farm Project) | 3.000% | 11/1/25 | 1,375 | 1,336 |
| Rockville MD Mayor & Council Economic Development Revenue (Ingleside at King Farm Project) | 5.000% | 11/1/25 | 1,250 | 1,353 |
| Washington MD Suburban Sanitary Commission GO | 4.000% | 6/1/21 | 14,705 | 15,392 |
| Washington Suburban Sanitation District Maryland GO | 5.000% | 6/1/21 | 4,695 | 5,031 |
| Westminster MD Educational Facilities Revenue (McDaniel College Inc.) | 5.000% | 11/1/21 | 1,840 | 1,956 |
| Westminster MD Educational Facilities Revenue (McDaniel College Inc.) | 5.000% | 11/1/22 | 1,950 | 2,100 |
| Westminster MD Educational Facilities Revenue (McDaniel College Inc.) | 5.000% | 11/1/23 | 2,060 | 2,242 |
| | | | 703,163 |
| Massachusetts (2.9%) | | | | |
| Massachusetts Bay Transportation Authority Sales Tax Revenue PUT | 1.900% | 5/29/19 | 29,190 | 29,190 |
| Massachusetts Bay Transportation Authority Sales Tax Revenue VRDO | 1.570% | 11/7/18 | 22,000 | 22,000 |
| Massachusetts College Building Authority Revenue | 5.000% | 5/1/21 | 5,495 | 5,865 |
| Massachusetts Department of Transportation Metropolitan Highway System Revenue | 5.000% | 1/1/23 | 7,000 | 7,235 |
| Massachusetts Department of Transportation Metropolitan Highway System Revenue | 5.000% | 1/1/24 | 1,500 | 1,691 |
| Massachusetts Department of Transportation Metropolitan Highway System Revenue | 5.000% | 1/1/25 | 7,055 | 8,083 |
| Massachusetts Development Finance Agency Revenue (Berkshire Health System) | 5.000% | 10/1/19 | 1,215 | 1,246 |
| Massachusetts Development Finance Agency Revenue (Boston Medical Center) | 5.000% | 7/1/21 | 750 | 793 |
| Massachusetts Development Finance Agency Revenue (Boston Medical Center) | 5.000% | 7/1/21 | 1,425 | 1,507 |
| Massachusetts Development Finance Agency Revenue (Boston Medical Center) | 5.000% | 7/1/22 | 850 | 913 |
| Massachusetts Development Finance Agency Revenue (Boston Medical Center) | 5.250% | 7/1/23 | 2,395 | 2,604 |
| Massachusetts Development Finance Agency Revenue (Boston Medical Center) | 5.250% | 7/1/24 | 1,610 | 1,746 |
| 3 Massachusetts Development Finance Agency Revenue (Boston University) TOB VRDO | 1.660% | 11/7/18 LOC | 6,430 | 6,430 |
| Massachusetts Development Finance Agency Revenue (CareGroup Inc.) | 5.000% | 7/1/20 | 1,260 | 1,312 |
| Massachusetts Development Finance Agency Revenue (CareGroup Inc.) | 5.000% | 7/1/20 | 5,000 | 5,207 |
| Massachusetts Development Finance Agency Revenue (CareGroup Inc.) | 5.000% | 7/1/21 | 5,035 | 5,333 |
| Massachusetts Development Finance Agency Revenue (CareGroup Inc.) | 5.000% | 7/1/21 | 500 | 530 |
| Massachusetts Development Finance Agency Revenue (CareGroup Inc.) | 5.000% | 7/1/21 | 5,705 | 6,043 |
| Massachusetts Development Finance Agency Revenue (CareGroup Inc.) | 5.000% | 7/1/22 | 1,655 | 1,784 |
| Massachusetts Development Finance Agency Revenue (CareGroup Inc.) | 5.000% | 7/1/22 | 3,485 | 3,758 |
| Massachusetts Development Finance Agency Revenue (CareGroup Inc.) | 5.000% | 7/1/23 | 2,605 | 2,847 |
| Massachusetts Development Finance Agency Revenue (CareGroup Inc.) | 5.000% | 7/1/23 | 500 | 546 |
| Massachusetts Development Finance Agency Revenue (CareGroup Inc.) | 5.000% | 7/1/23 | 6,000 | 6,557 |
| Massachusetts Development Finance Agency Revenue (CareGroup Inc.) | 5.000% | 7/1/24 | 1,350 | 1,492 |
| Massachusetts Development Finance Agency Revenue (CareGroup Inc.) | 5.000% | 7/1/25 | 1,570 | 1,750 |
| Massachusetts Development Finance Agency Revenue (CareGroup Inc.) | 5.000% | 7/1/25 | 780 | 870 |
| Massachusetts Development Finance Agency Revenue (Emerson College) | 5.000% | 1/1/19 | 1,540 | 1,547 |
| Massachusetts Development Finance Agency Revenue (Emerson College) | 5.000% | 1/1/20 | 1,070 | 1,100 |
| Massachusetts Development Finance Agency Revenue (Emerson College) | 5.000% | 1/1/21 | 3,180 | 3,334 |
| Massachusetts Development Finance Agency Revenue (Emerson College) | 5.000% | 1/1/22 | 3,285 | 3,502 |
| Massachusetts Development Finance Agency Revenue (Emerson College) | 5.000% | 1/1/22 | 1,710 | 1,823 |
| Massachusetts Development Finance Agency Revenue (Emerson College) | 5.000% | 1/1/23 | 3,335 | 3,604 |
| Massachusetts Development Finance Agency Revenue (Emerson College) | 5.000% | 1/1/23 | 1,200 | 1,297 |
| Massachusetts Development Finance Agency Revenue (Emerson College) | 5.000% | 1/1/24 | 1,625 | 1,774 |
| Massachusetts Development Finance Agency Revenue (Emerson College) | 5.000% | 1/1/24 | 3,655 | 3,989 |
| Massachusetts Development Finance Agency Revenue (Emerson College) | 5.000% | 1/1/25 | 1,010 | 1,113 |
| Massachusetts Development Finance Agency Revenue | | | | |
| (Lawrence General Hospital Obligated Group) | 5.000% | 7/1/20 | 700 | 724 |
| Massachusetts Development Finance Agency Revenue | | | | |
| (Lawrence General Hospital Obligated Group) | 5.000% | 7/1/21 | 750 | 788 |
| Massachusetts Development Finance Agency Revenue | | | | |
| (Lawrence General Hospital Obligated Group) | 5.000% | 7/1/23 | 800 | 858 |
| Massachusetts Development Finance Agency Revenue | | | | |
| (Lawrence General Hospital Obligated Group) | 5.000% | 7/1/24 | 1,420 | 1,532 |
| Massachusetts Development Finance Agency Revenue | | | | |
| (Lawrence General Hospital Obligated Group) | 5.000% | 7/1/25 | 1,195 | 1,291 |
| 1 Massachusetts Development Finance Agency Revenue (Linden Ponds Inc.) | 4.000% | 11/15/23 | 1,340 | 1,340 |
| Massachusetts Development Finance Agency Revenue (NewBridge Charles Inc.) | 3.000% | 10/1/20 | 425 | 424 |
| Massachusetts Development Finance Agency Revenue (NewBridge Charles Inc.) | 3.000% | 10/1/21 | 665 | 659 |
| Massachusetts Development Finance Agency Revenue (NewBridge Charles Inc.) | 3.500% | 10/1/22 | 505 | 506 |
| Massachusetts Development Finance Agency Revenue (NewBridge Charles Inc.) | 3.500% | 10/1/23 | 2,800 | 2,784 |
| Massachusetts Development Finance Agency Revenue (NewBridge Charles Inc.) | 4.000% | 10/1/24 | 1,150 | 1,164 |
| Massachusetts Development Finance Agency Revenue (NewBridge Charles Inc.) | 4.000% | 10/1/25 | 500 | 504 |
| Massachusetts Development Finance Agency Revenue (Partners Healthcare) | 5.000% | 7/1/20 | 800 | 837 |
| Massachusetts Development Finance Agency Revenue (Partners Healthcare) | 5.000% | 7/1/21 | 2,000 | 2,142 |
| Massachusetts Development Finance Agency Revenue (Partners Healthcare) | 5.000% | 7/1/22 | 1,565 | 1,710 |
| Massachusetts Development Finance Agency Revenue (Partners Healthcare) | 5.000% | 7/1/23 | 2,800 | 3,113 |
| Massachusetts Development Finance Agency Revenue (Partners Healthcare) | 5.000% | 7/1/24 | 3,000 | 3,385 |
| 2 Massachusetts Development Finance Agency Revenue (Partners Healthcare) PUT | 2.080% | 1/29/20 | 5,750 | 5,755 |
| Massachusetts Development Finance Agency Revenue (Partners Healthcare) PUT | 5.000% | 1/25/24 | 5,000 | 5,568 |
89
Limited-Term Tax-Exempt Fund
| | | | | |
| Face | Market |
| Maturity | Amount | Value• |
| | Coupon | Date | ($000) | ($000) |
| Massachusetts Development Finance Agency Revenue (Partners Healthcare) PUT | 5.000% | 1/30/25 | 4,000 | 4,511 |
| Massachusetts Development Finance Agency Revenue (Seven Hills Foundation Obligated Group) | 5.000% | 9/1/19 | 1,080 | 1,101 |
| Massachusetts Development Finance Agency Revenue (Seven Hills Foundation Obligated Group) | 5.000% | 9/1/20 | 1,105 | 1,147 |
| Massachusetts Development Finance Agency Revenue (Seven Hills Foundation Obligated Group) | 5.000% | 9/1/21 | 1,095 | 1,152 |
| Massachusetts Development Finance Agency Revenue (Seven Hills Foundation Obligated Group) | 5.000% | 9/1/22 | 1,165 | 1,240 |
| Massachusetts Development Finance Agency Revenue (Simmons College) | 5.250% | 10/1/21 (10) | 200 | 215 |
| Massachusetts Development Finance Agency Revenue (South Shore Hospital Inc.) | 5.000% | 7/1/21 | 625 | 664 |
| Massachusetts Development Finance Agency Revenue (South Shore Hospital Inc.) | 5.000% | 7/1/22 | 695 | 751 |
| Massachusetts Development Finance Agency Revenue (Suffolk University) | 5.000% | 7/1/22 | 435 | 467 |
| Massachusetts Development Finance Agency Revenue (Suffolk University) | 5.000% | 7/1/23 | 1,500 | 1,631 |
| Massachusetts Development Finance Agency Revenue (Suffolk University) | 5.000% | 7/1/24 | 1,000 | 1,099 |
| Massachusetts Development Finance Agency Revenue | | | | |
| | (UMass Memorial Health Care Obligated Group) | 5.000% | 7/1/26 | 845 | 954 |
| Massachusetts Development Finance Agency Revenue (UMass Memorial Medical Center) | 5.000% | 7/1/19 | 2,000 | 2,035 |
| Massachusetts Development Finance Agency Revenue (UMass Memorial Medical Center) | 5.000% | 7/1/21 | 3,200 | 3,398 |
| Massachusetts Development Finance Agency Revenue (UMass Memorial Medical Center) | 5.000% | 7/1/21 | 1,440 | 1,529 |
| Massachusetts Development Finance Agency Revenue (UMass Memorial Medical Center) | 5.000% | 7/1/22 | 750 | 810 |
| Massachusetts Development Finance Agency Revenue (Western New England University) | 5.000% | 9/1/20 | 300 | 312 |
| Massachusetts Development Finance Agency Revenue (Western New England University) | 5.000% | 9/1/21 | 250 | 265 |
| Massachusetts Development Finance Agency Revenue (Western New England University) | 5.000% | 9/1/22 | 400 | 430 |
| Massachusetts Development Finance Agency Revenue (Western New England University) | 5.000% | 9/1/23 | 1,035 | 1,124 |
| Massachusetts Development Finance Agency Revenue (Western New England University) | 5.000% | 9/1/25 | 1,145 | 1,264 |
| Massachusetts Development Finance Agency Revenue (Williams College) PUT | 1.450% | 7/1/21 | 4,750 | 4,644 |
| Massachusetts Educational Financing Authority Education Loan Revenue | 5.500% | 1/1/22 | 1,000 | 1,037 |
| Massachusetts Federal Highway GAN (Accelerated Bridge Program) | 5.000% | 6/15/20 | 5,000 | 5,233 |
| Massachusetts GO | 5.000% | 12/1/18 | 30,000 | 30,076 |
| 2,3 Massachusetts GO | 2.150% | 2/1/19 | 62,500 | 62,504 |
| Massachusetts GO | 4.000% | 5/23/19 | 20,000 | 20,231 |
| Massachusetts GO | 4.000% | 6/20/19 | 20,000 | 20,261 |
| Massachusetts GO | 5.250% | 8/1/19 | 9,000 | 9,221 |
| Massachusetts GO | 5.500% | 12/1/19 (14) | 9,160 | 9,506 |
| 2 | Massachusetts GO | 2.200% | 2/1/20 | 1,500 | 1,503 |
| Massachusetts GO | 5.000% | 6/1/20 (Prere.) | 10,000 | 10,451 |
| Massachusetts GO | 5.000% | 8/1/21 (Prere.) | 7,500 | 8,055 |
| Massachusetts GO | 5.000% | 8/1/21 | 40,500 | 43,562 |
| Massachusetts GO | 5.000% | 10/1/21 (Prere.) | 7,860 | 8,482 |
| Massachusetts GO | 5.000% | 7/1/22 | 3,235 | 3,548 |
| Massachusetts GO | 5.000% | 7/1/22 (Prere.) | 7,020 | 7,700 |
| Massachusetts GO | 5.000% | 7/1/22 (Prere.) | 14,955 | 16,404 |
| Massachusetts GO | 5.000% | 11/1/22 (Prere.) | 3,500 | 3,863 |
| Massachusetts GO | 5.000% | 11/1/22 (Prere.) | 10,000 | 11,038 |
| Massachusetts GO | 5.000% | 10/1/23 | 4,330 | 4,855 |
| Massachusetts GO PUT | 1.050% | 7/1/20 | 24,435 | 23,931 |
| Massachusetts GO PUT | 1.700% | 8/1/22 | 32,000 | 31,100 |
| Massachusetts Health & Educational Facilities Authority Revenue | | | | |
| | (Milford Regional Medical Center) | 5.000% | 7/15/22 | 410 | 414 |
| Massachusetts Health & Educational Facilities Authority Revenue (Partners Healthcare System) | 5.000% | 7/1/19 (Prere.) | 5,000 | 5,100 |
| Massachusetts Health & Educational Facilities Authority Revenue | | | | |
| | (UMass Memorial Medical Center) | 5.000% | 7/1/20 | 960 | 999 |
| Massachusetts Health & Educational Facilities Authority Revenue | | | | |
| | (UMass Memorial Medical Center) | 5.000% | 7/1/21 | 1,415 | 1,472 |
| Massachusetts Housing Finance Agency Revenue | 1.850% | 6/1/20 | 2,750 | 2,730 |
| Massachusetts Housing Finance Agency Revenue | 2.050% | 12/1/21 | 12,500 | 12,374 |
| Massachusetts Housing Finance Agency Single Family Housing Revenue | 3.500% | 6/1/42 | 6,170 | 6,284 |
| Massachusetts Housing Finance Agency Single Family Housing Revenue | 4.000% | 12/1/44 | 3,565 | 3,674 |
| Massachusetts Housing Finance Agency Single Family Housing Revenue | 4.000% | 6/1/45 | 3,230 | 3,322 |
| Massachusetts Housing Finance Agency Single Family Housing Revenue PUT | 1.500% | 7/1/20 | 2,000 | 1,969 |
| 2 | Massachusetts Housing Finance Agency Single Family Housing Revenue PUT | 1.959% | 9/1/21 | 3,750 | 3,746 |
| Massachusetts School Building Authority Dedicated Sales Tax Revenue | 5.000% | 5/15/19 | 2,250 | 2,289 |
| Massachusetts Special Obligation Dedicated Tax Revenue | 5.500% | 1/1/23 (14) | 12,440 | 13,954 |
| Massachusetts Special Obligation Dedicated Tax Revenue | 5.500% | 1/1/24 (14) | 28,990 | 33,178 |
| Massachusetts Transportation Fund Revenue (Accelerated Bridge Program) | 5.000% | 6/1/19 | 11,460 | 11,675 |
| Massachusetts Transportation Fund Revenue (Accelerated Bridge Program) | 5.000% | 6/1/21 | 5,000 | 5,361 |
| Massachusetts Transportation Fund Revenue (Accelerated Bridge Program) | 5.000% | 6/1/22 | 3,850 | 4,115 |
| Massachusetts Turnpike Authority Revenue (Metropolitan Highway System) | 0.000% | 1/1/20 (14) | 17,000 | 16,553 |
| Massachusetts Water Pollution Abatement Trust Revenue | 5.000% | 8/1/19 (Prere.) | 7,520 | 7,691 |
| Massachusetts Water Pollution Abatement Trust Revenue | 5.000% | 8/1/19 (Prere.) | 4,290 | 4,388 |
| Massachusetts Water Pollution Abatement Trust Revenue | 5.000% | 8/1/19 (Prere.) | 5,000 | 5,114 |
| Massachusetts Water Pollution Abatement Trust Revenue | 5.000% | 8/1/19 | 4,500 | 4,602 |
| Massachusetts Water Pollution Abatement Trust Revenue | 5.000% | 8/1/20 (Prere.) | 6,000 | 6,297 |
| Massachusetts Water Pollution Abatement Trust Revenue | 5.000% | 8/1/21 | 4,580 | 4,928 |
90
Limited-Term Tax-Exempt Fund
| | | | |
| Face | Market |
| Maturity | Amount | Value• |
| Coupon | Date | ($000) | ($000) |
| Massachusetts Water Resources Authority Revenue | 5.000% | 8/1/19 (Prere.) | 3,210 | 3,283 |
| Massachusetts Water Resources Authority Revenue | 5.000% | 8/1/19 (Prere.) | 1,370 | 1,401 |
| Massachusetts Water Resources Authority Revenue | 5.000% | 8/1/19 (Prere.) | 930 | 951 |
| Massachusetts Water Resources Authority Revenue | 5.000% | 8/1/21 | 3,900 | 4,195 |
| Massachusetts Water Resources Authority Revenue | 5.000% | 8/1/23 | 6,000 | 6,439 |
| University of Massachusetts Building Authority Revenue | 5.000% | 11/1/20 | 1,250 | 1,320 |
| University of Massachusetts Building Authority Revenue PUT | 1.900% | 5/30/19 | 9,185 | 9,185 |
| University of Massachusetts Building Authority Revenue VRDO | 1.620% | 11/7/18 | 9,190 | 9,190 |
| | | | 746,996 |
| Michigan (2.4%) | | | | |
| Byron Center MI Public School District GO | 5.000% | 5/1/23 | 100 | 110 |
| Byron Center MI Public School District GO | 5.000% | 5/1/24 | 120 | 134 |
| Byron Center MI Public School District GO | 5.000% | 5/1/25 | 100 | 113 |
| Byron Center MI Public School District GO | 5.000% | 5/1/26 | 110 | 125 |
| Byron Center MI Public School District GO | 5.000% | 5/1/27 | 200 | 229 |
| Chippewa Valley MI Schools GO | 5.000% | 5/1/19 | 1,025 | 1,041 |
| Chippewa Valley MI Schools GO | 5.000% | 5/1/22 | 450 | 489 |
| Chippewa Valley MI Schools GO | 5.000% | 5/1/23 | 3,095 | 3,429 |
| Chippewa Valley MI Schools GO | 5.000% | 5/1/23 | 575 | 637 |
| Coopersville MI Area Public Schools GO | 5.000% | 5/1/20 | 1,235 | 1,288 |
| Coopersville MI Area Public Schools GO | 5.000% | 5/1/21 | 2,325 | 2,476 |
| Coopersville MI Area Public Schools GO | 5.000% | 5/1/22 | 1,900 | 2,065 |
| Detroit MI City School District GO | 5.000% | 5/1/23 | 2,115 | 2,280 |
| Detroit MI Water Supply System Revenue | 5.000% | 7/1/20 | 1,755 | 1,827 |
| Downriver Utility Wastewater MI Authority Revenue | 5.000% | 4/1/24 (4) | 675 | 746 |
| Downriver Utility Wastewater MI Authority Revenue | 5.000% | 4/1/25 (4) | 700 | 781 |
| East Lansing MI School District GO | 5.000% | 5/1/20 | 600 | 626 |
| East Lansing MI School District GO | 5.000% | 5/1/22 | 2,110 | 2,294 |
| East Lansing MI School District GO | 4.000% | 5/1/23 | 390 | 415 |
| East Lansing MI School District GO | 4.000% | 5/1/24 | 900 | 966 |
| East Lansing MI School District GO | 4.000% | 5/1/26 | 440 | 476 |
| Eastern Michigan University Revenue | 5.000% | 3/1/24 (15) | 1,835 | 2,040 |
| Eastern Michigan University Revenue | 5.000% | 3/1/25 (15) | 1,610 | 1,807 |
| Forest Hills MI Public Schools GO | 5.000% | 5/1/22 | 4,645 | 5,056 |
| Forest Hills MI Public Schools GO | 5.000% | 5/1/23 | 4,405 | 4,877 |
| Great Lakes MI Water Authority Sewer Disposal System Revenue | 5.000% | 7/1/24 | 1,000 | 1,124 |
| Great Lakes MI Water Authority Sewer Disposal System Revenue | 5.000% | 7/1/25 | 1,665 | 1,892 |
| Great Lakes MI Water Authority Sewer Disposal System Revenue | 5.000% | 7/1/25 | 2,465 | 2,801 |
| 3 Great Lakes MI Water Authority Sewer Disposal System Revenue TOB VRDO | 1.800% | 11/7/18 (4) | 6,235 | 6,235 |
| Great Lakes MI Water Authority Water Supply System Revenue | 5.000% | 7/1/22 | 1,840 | 2,007 |
| Great Lakes MI Water Authority Water Supply System Revenue | 5.000% | 7/1/23 | 4,820 | 5,349 |
| Great Lakes MI Water Authority Water Supply System Revenue | 5.000% | 7/1/23 | 4,365 | 4,832 |
| Great Lakes MI Water Authority Water Supply System Revenue | 5.000% | 7/1/24 | 3,000 | 3,368 |
| Great Lakes MI Water Authority Water Supply System Revenue | 5.000% | 7/1/25 | 3,500 | 3,972 |
| Hudsonville MI Public Schools GO | 5.000% | 5/1/22 | 260 | 283 |
| Hudsonville MI Public Schools GO | 5.000% | 5/1/23 | 300 | 332 |
| Hudsonville MI Public Schools GO | 5.000% | 5/1/25 | 340 | 384 |
| Kalamazoo MI Hospital Financing Authority Hospital Revenue (Bronson Healthcare Group) | 5.000% | 5/15/21 | 500 | 531 |
| Kalamazoo MI Hospital Financing Authority Hospital Revenue (Bronson Healthcare Group) | 5.000% | 5/15/22 | 500 | 539 |
| Kalamazoo MI Hospital Financing Authority Hospital Revenue (Bronson Healthcare Group) | 5.000% | 5/15/23 | 500 | 546 |
| Kalamazoo MI Hospital Financing Authority Hospital Revenue (Bronson Healthcare Group) | 5.000% | 5/15/24 | 550 | 608 |
| Karegnondi Water Authority Michigan Water Supply System Revenue (Karegnondi Water Pipeline) | 5.000% | 11/1/22 | 700 | 762 |
| Karegnondi Water Authority Michigan Water Supply System Revenue (Karegnondi Water Pipeline) | 5.000% | 11/1/23 | 250 | 277 |
| Karegnondi Water Authority Michigan Water Supply System Revenue (Karegnondi Water Pipeline) | 5.000% | 11/1/24 | 500 | 557 |
| Kentwood MI Economic Development Corp. Revenue (Holland Home Obligated Group) | 4.000% | 11/15/24 | 3,120 | 3,197 |
| L’Anse Creuse MI Public Schools GO | 5.000% | 5/1/19 | 1,030 | 1,045 |
| L’Anse Creuse MI Public Schools GO | 5.000% | 5/1/20 | 1,670 | 1,741 |
| L’Anse Creuse MI Public Schools GO | 5.000% | 5/1/21 | 250 | 266 |
| Lincoln MI Consolidated School District GO | 5.000% | 5/1/21 (4) | 1,000 | 1,067 |
| Lincoln MI Consolidated School District GO | 5.000% | 5/1/23 (4) | 1,310 | 1,450 |
| Livonia MI Public Schools School District GO | 5.000% | 5/1/19 (15) | 1,000 | 1,015 |
| Livonia MI Public Schools School District GO | 5.000% | 5/1/20 (15) | 3,365 | 3,508 |
| Livonia MI Public Schools School District GO | 5.000% | 5/1/21 (15) | 2,000 | 2,119 |
| Macomb MI Interceptor Drain Drainage District Special Assessment Revenue | 5.000% | 5/1/24 | 1,500 | 1,693 |
| Macomb MI Interceptor Drain Drainage District Special Assessment Revenue | 5.000% | 5/1/25 | 1,000 | 1,145 |
| Macomb MI Interceptor Drain Drainage District Special Assessment Revenue | 5.000% | 5/1/26 | 1,040 | 1,201 |
| Marquette MI Board of Light & Power Electric Utility System Revenue | 5.000% | 7/1/21 | 710 | 755 |
| Marquette MI Board of Light & Power Electric Utility System Revenue | 5.000% | 7/1/22 | 2,335 | 2,530 |
| Marquette MI Board of Light & Power Electric Utility System Revenue | 5.000% | 7/1/23 | 1,300 | 1,428 |
91
Limited-Term Tax-Exempt Fund
| | | | |
| Face | Market |
| Maturity | Amount | Value• |
| Coupon | Date | ($000) | ($000) |
| Marquette MI Board of Light & Power Electric Utility System Revenue | 5.000% | 7/1/24 | 505 | 562 |
| Michigan Building Authority Revenue | 5.000% | 4/15/20 | 7,000 | 7,286 |
| Michigan Building Authority Revenue | 5.000% | 10/15/20 | 2,250 | 2,371 |
| Michigan Building Authority Revenue | 5.000% | 10/15/21 | 1,750 | 1,887 |
| Michigan Building Authority Revenue | 5.000% | 4/15/22 | 4,410 | 4,806 |
| Michigan Building Authority Revenue | 5.000% | 4/15/22 | 1,010 | 1,101 |
| Michigan Building Authority Revenue | 5.000% | 4/15/23 | 1,465 | 1,628 |
| Michigan Finance Authority Revenue | 5.000% | 10/1/19 | 850 | 872 |
| Michigan Finance Authority Revenue | 5.000% | 4/1/20 | 5,400 | 5,583 |
| Michigan Finance Authority Revenue | 5.000% | 10/1/20 | 1,200 | 1,227 |
| Michigan Finance Authority Revenue | 5.000% | 4/1/21 | 7,275 | 7,669 |
| Michigan Finance Authority Revenue | 5.000% | 4/15/21 | 6,280 | 6,698 |
| Michigan Finance Authority Revenue | 5.000% | 10/1/21 | 1,275 | 1,332 |
| Michigan Finance Authority Revenue | 5.000% | 4/1/22 | 11,185 | 11,977 |
| Michigan Finance Authority Revenue | 5.000% | 10/1/22 | 525 | 559 |
| Michigan Finance Authority Revenue | 5.000% | 11/1/22 | 650 | 713 |
| Michigan Finance Authority Revenue | 5.000% | 4/1/23 | 9,000 | 9,781 |
| Michigan Finance Authority Revenue | 5.000% | 11/1/23 | 685 | 763 |
| Michigan Finance Authority Revenue | 5.000% | 11/1/24 | 780 | 880 |
| Michigan Finance Authority Revenue | 5.000% | 11/1/25 | 1,000 | 1,139 |
| Michigan Finance Authority Revenue (Beaumont Health Obligated Group) | 4.000% | 8/1/20 | 1,250 | 1,287 |
| Michigan Finance Authority Revenue (Beaumont Health Obligated Group) | 5.000% | 8/1/21 | 3,580 | 3,827 |
| Michigan Finance Authority Revenue (Beaumont Health Obligated Group) | 5.000% | 8/1/22 | 2,500 | 2,725 |
| Michigan Finance Authority Revenue (Beaumont Health Obligated Group) | 5.000% | 8/1/28 | 3,265 | 3,607 |
| 3 Michigan Finance Authority Revenue (Beaumont Health Obligated Group) TOB VRDO | 1.800% | 11/7/18 | 6,060 | 6,060 |
| Michigan Finance Authority Revenue (Detroit School District) | 5.000% | 5/1/25 | 1,250 | 1,412 |
| Michigan Finance Authority Revenue (Detroit Water & Sewer) | 5.000% | 7/1/19 (14) | 2,000 | 2,038 |
| Michigan Finance Authority Revenue (Detroit Water & Sewer) | 5.000% | 7/1/19 (14) | 2,855 | 2,909 |
| Michigan Finance Authority Revenue (Detroit Water & Sewer) | 5.000% | 7/1/19 (14) | 3,500 | 3,566 |
| Michigan Finance Authority Revenue (Detroit Water & Sewer) | 5.000% | 7/1/19 (14) | 1,310 | 1,335 |
| Michigan Finance Authority Revenue (Detroit Water & Sewer) | 5.000% | 7/1/20 (14) | 8,000 | 8,342 |
| Michigan Finance Authority Revenue (Detroit Water & Sewer) | 5.000% | 7/1/20 (4) | 8,500 | 8,864 |
| Michigan Finance Authority Revenue (Detroit Water & Sewer) | 5.000% | 7/1/20 (14) | 2,310 | 2,409 |
| Michigan Finance Authority Revenue (Detroit Water & Sewer) | 5.000% | 7/1/20 (14) | 3,000 | 3,128 |
| Michigan Finance Authority Revenue (Detroit Water & Sewer) | 5.000% | 7/1/21 | 1,000 | 1,064 |
| Michigan Finance Authority Revenue (Detroit Water & Sewer) | 5.000% | 7/1/21 (4) | 16,260 | 17,357 |
| Michigan Finance Authority Revenue (Detroit Water & Sewer) | 5.000% | 7/1/21 (4) | 10,000 | 10,675 |
| Michigan Finance Authority Revenue (Detroit Water & Sewer) | 5.000% | 7/1/21 (14) | 3,000 | 3,191 |
| Michigan Finance Authority Revenue (Detroit Water & Sewer) | 5.000% | 7/1/22 | 1,500 | 1,627 |
| Michigan Finance Authority Revenue (Detroit Water & Sewer) | 5.000% | 7/1/22 (14) | 2,000 | 2,163 |
| Michigan Finance Authority Revenue (Henry Ford Health System Obligated Group) | 5.000% | 11/15/21 | 1,875 | 2,008 |
| Michigan Finance Authority Revenue (Henry Ford Health System Obligated Group) | 5.000% | 11/15/22 | 2,170 | 2,363 |
| Michigan Finance Authority Revenue (Henry Ford Health System Obligated Group) | 5.000% | 11/15/23 | 3,060 | 3,380 |
| Michigan Finance Authority Revenue (McLaren Health Care Corp.) | 5.000% | 5/15/19 | 1,000 | 1,015 |
| Michigan Finance Authority Revenue (McLaren Health Care Corp.) | 5.000% | 5/15/20 | 600 | 624 |
| Michigan Finance Authority Revenue (McLaren Health Care Corp.) | 5.000% | 5/15/21 | 600 | 639 |
| Michigan Finance Authority Revenue (McLaren Health Care Corp.) | 5.000% | 5/15/22 | 800 | 868 |
| 2 Michigan Finance Authority Revenue (McLaren Health Care Corp.) PUT | 1.951% | 10/15/21 | 15,470 | 15,432 |
| Michigan Finance Authority Revenue (MidMichigan Obligated Group) | 4.000% | 6/1/20 | 600 | 617 |
| Michigan Finance Authority Revenue (MidMichigan Obligated Group) | 5.000% | 6/1/21 | 1,095 | 1,164 |
| Michigan Finance Authority Revenue (MidMichigan Obligated Group) | 5.000% | 6/1/22 | 1,000 | 1,083 |
| Michigan Finance Authority Revenue (Sparrow Obligated Group) | 4.000% | 11/15/18 | 500 | 500 |
| Michigan Finance Authority Revenue (Sparrow Obligated Group) | 4.000% | 11/15/19 | 600 | 612 |
| Michigan Finance Authority Revenue (Sparrow Obligated Group) | 4.000% | 11/15/19 | 1,000 | 1,019 |
| Michigan Finance Authority Revenue (Sparrow Obligated Group) | 4.000% | 11/15/20 | 2,000 | 2,069 |
| Michigan Finance Authority Revenue (Sparrow Obligated Group) | 5.000% | 11/15/21 | 1,600 | 1,720 |
| Michigan Finance Authority Revenue (Sparrow Obligated Group) | 5.000% | 11/15/22 | 1,525 | 1,669 |
| Michigan Finance Authority Revenue (State Clean Water Revolving Fund) | 5.000% | 10/1/19 | 1,500 | 1,541 |
| Michigan Finance Authority Revenue (State Clean Water Revolving Fund) | 5.000% | 10/1/21 | 4,575 | 4,940 |
| Michigan Finance Authority Revenue (Trinity Health Credit Group) | 5.000% | 12/1/20 | 9,305 | 9,824 |
| Michigan Finance Authority Revenue (Trinity Health Credit Group) | 5.000% | 12/1/21 | 1,850 | 1,995 |
| Michigan Finance Authority Revenue (Trinity Health Credit Group) | 5.000% | 12/1/21 | 5,000 | 5,391 |
| Michigan Finance Authority Revenue (Trinity Health Credit Group) | 5.000% | 12/1/22 | 5,780 | 6,347 |
| Michigan Finance Authority Revenue (Trinity Health Credit Group) | 5.000% | 12/1/23 | 2,115 | 2,359 |
| Michigan Finance Authority Revenue (Trinity Health Credit Group) | 5.000% | 12/1/23 | 6,120 | 6,827 |
| Michigan Finance Authority Revenue (Trinity Health Credit Group) | 5.000% | 12/1/24 | 2,110 | 2,387 |
| Michigan Finance Authority Revenue (Trinity Health Credit Group) | 5.000% | 12/1/25 | 4,250 | 4,864 |
| Michigan Finance Authority Revenue (Unemployment Obligation Assessment) | 5.000% | 7/1/19 | 20,000 | 20,397 |
| Michigan GAN | 5.000% | 3/15/20 | 6,000 | 6,227 |
| Michigan GAN | 5.000% | 3/15/21 | 4,045 | 4,297 |
92
Limited-Term Tax-Exempt Fund
| | | | |
| Face | Market |
| Maturity | Amount | Value• |
| Coupon | Date | ($000) | ($000) |
| Michigan GAN | 5.000% | 3/15/22 | 2,585 | 2,806 |
| Michigan GAN | 5.000% | 3/15/23 | 2,125 | 2,349 |
| Michigan Hospital Finance Authority Revenue (Ascension Health Credit Group) | 5.000% | 11/15/19 | 1,510 | 1,555 |
| Michigan Hospital Finance Authority Revenue (Ascension Health Credit Group) | 5.000% | 11/15/23 | 7,330 | 7,532 |
| Michigan Hospital Finance Authority Revenue (Ascension Health Credit Group) PUT | 1.950% | 4/1/20 | 6,250 | 6,213 |
| Michigan Hospital Finance Authority Revenue (Ascension Health Credit Group) PUT | 1.375% | 5/1/20 | 1,390 | 1,369 |
| Michigan Hospital Finance Authority Revenue (Ascension Health Credit Group) PUT | 1.500% | 5/1/20 | 2,325 | 2,294 |
| Michigan Hospital Finance Authority Revenue (Ascension Health Credit Group) PUT | 1.900% | 4/1/21 | 11,435 | 11,265 |
| Michigan Hospital Finance Authority Revenue (Ascension Health Credit Group) PUT | 2.400% | 3/15/23 | 16,535 | 16,305 |
| Michigan Hospital Finance Authority Revenue (Ascension Health Credit Group) PUT | 4.000% | 6/1/23 | 10,500 | 11,112 |
| Michigan Hospital Finance Authority Revenue (Ascension Health Credit Group) PUT | 4.000% | 7/1/24 | 7,500 | 7,996 |
| Michigan Hospital Finance Authority Revenue (McLaren Health Care) | 5.000% | 6/1/19 | 3,350 | 3,405 |
| Michigan Hospital Finance Authority Revenue (Trinity Health Credit Group) | 5.000% | 12/1/21 | 1,000 | 1,078 |
| Michigan Hospital Finance Authority Revenue (Trinity Health Credit Group) | 5.000% | 12/1/22 | 1,000 | 1,098 |
| Michigan Hospital Finance Authority Revenue (Trinity Health Credit Group) | 5.000% | 12/1/23 | 2,270 | 2,532 |
| Michigan Hospital Finance Authority Revenue (Trinity Health Credit Group) | 5.000% | 12/1/24 | 1,775 | 2,008 |
| Michigan Hospital Finance Authority Revenue (Trinity Health Credit Group) | 5.000% | 12/1/25 | 1,540 | 1,763 |
| Michigan Housing Development Authority Single Family Mortgage Revenue | 4.000% | 6/1/46 | 9,690 | 10,002 |
| Michigan Housing Development Authority Single Family Mortgage Revenue | 3.500% | 6/1/48 | 11,330 | 11,558 |
| Michigan Strategic Fund Limited Obligation Revenue (Cadillac Place Project) | 5.250% | 10/15/22 | 1,460 | 1,581 |
| Michigan Strategic Fund Limited Obligation Revenue (Detroit Edison Co. Project) PUT | 1.450% | 9/1/21 | 9,000 | 8,615 |
| Michigan Strategic Fund Limited Obligation Revenue (Detroit Edison Co. Project) PUT | 1.450% | 9/1/21 | 2,000 | 1,914 |
| Michigan Strategic Fund Limited Obligation Revenue (Event Center Project) PUT | 4.125% | 1/1/19 | 5,000 | 5,008 |
| Michigan Strategic Fund Limited Obligation Revenue | | | | |
| (Facility for Rare Isotope Beams Project at Michigan State University) | 5.000% | 3/1/19 | 1,085 | 1,096 |
| Michigan Strategic Fund Limited Obligation Revenue | | | | |
| (Facility for Rare Isotope Beams Project at Michigan State University) | 5.000% | 3/1/20 | 800 | 830 |
| Michigan Strategic Fund Limited Obligation Revenue | | | | |
| (Facility for Rare Isotope Beams Project at Michigan State University) | 5.000% | 3/1/21 | 600 | 637 |
| 1 Milan MI Area Schools GO | 5.000% | 5/1/22 | 500 | 536 |
| 1 Milan MI Area Schools GO | 5.000% | 5/1/23 | 585 | 637 |
| 1 Milan MI Area Schools GO | 5.000% | 5/1/26 | 2,010 | 2,252 |
| Northern Michigan University Revenue | 5.000% | 12/1/23 | 645 | 718 |
| Northern Michigan University Revenue | 5.000% | 12/1/24 | 755 | 850 |
| Northern Michigan University Revenue | 5.000% | 12/1/25 | 1,200 | 1,364 |
| Oakland University MI Revenue | 5.000% | 3/1/20 | 1,780 | 1,845 |
| Oakland University MI Revenue | 5.000% | 3/1/21 | 1,000 | 1,058 |
| Oakland University MI Revenue | 5.000% | 3/1/22 | 1,285 | 1,383 |
| Oakland University MI Revenue | 5.000% | 3/1/23 | 445 | 487 |
| Portage MI Public Schools GO | 5.000% | 11/1/20 | 750 | 792 |
| Portage MI Public Schools GO | 5.000% | 5/1/22 | 1,790 | 1,948 |
| Portage MI Public Schools GO | 5.000% | 11/1/22 | 1,470 | 1,614 |
| Rochester MI Community School District GO | 5.000% | 5/1/21 | 4,100 | 4,373 |
| Rochester MI Community School District GO | 5.000% | 5/1/22 | 1,650 | 1,794 |
| Rochester MI Community School District GO | 5.000% | 5/1/23 | 1,225 | 1,353 |
| Romeo MI Community School District GO | 5.000% | 5/1/23 | 1,000 | 1,106 |
| Royal Oak MI City School District GO | 5.000% | 5/1/20 | 1,250 | 1,305 |
| Royal Oak MI City School District GO | 5.000% | 5/1/21 | 600 | 640 |
| Royal Oak MI Hospital Finance Authority Hospital Revenue (William Beaumont Hospital) | 5.000% | 9/1/19 | 1,500 | 1,536 |
| Royal Oak MI Hospital Finance Authority Hospital Revenue (William Beaumont Hospital) | 5.000% | 9/1/20 | 1,580 | 1,658 |
| Saline MI Area Schools GO | 5.000% | 5/1/23 | 700 | 779 |
| Saline MI Area Schools GO | 5.000% | 5/1/24 | 1,000 | 1,131 |
| Saline MI Area Schools GO | 5.000% | 5/1/25 | 850 | 973 |
| University of Michigan Revenue | 5.000% | 4/1/21 | 1,000 | 1,067 |
| University of Michigan Revenue VRDO | 1.570% | 11/7/18 | 46,625 | 46,625 |
| Walled Lake MI Consolidate School District GO | 5.000% | 5/1/22 | 3,135 | 3,408 |
| Warren MI Consolidated School District GO | 5.000% | 5/1/23 (15) | 2,755 | 3,040 |
| Wayne County MI Airport Authority Revenue | 5.000% | 12/1/20 | 360 | 380 |
| Wayne County MI Airport Authority Revenue | 5.000% | 12/1/20 | 3,490 | 3,686 |
| Wayne County MI Airport Authority Revenue | 5.000% | 12/1/21 | 700 | 756 |
| Wayne County MI Airport Authority Revenue | 5.000% | 12/1/21 | 4,900 | 5,291 |
| Wayne County MI Airport Authority Revenue | 5.000% | 12/1/22 | 500 | 550 |
| Wayne County MI Airport Authority Revenue | 5.000% | 12/1/22 | 2,235 | 2,458 |
| Wayne County MI Airport Authority Revenue | 5.000% | 12/1/23 | 825 | 919 |
| Wayne County MI Airport Authority Revenue | 5.000% | 12/1/23 | 2,665 | 2,974 |
| Wayne County MI Airport Authority Revenue | 5.000% | 12/1/23 | 2,345 | 2,567 |
| Wayne County MI Airport Authority Revenue | 5.000% | 12/1/24 | 500 | 565 |
| Wayne County MI Airport Authority Revenue | 5.000% | 12/1/24 | 2,520 | 2,846 |
| Wayne County MI Airport Authority Revenue | 5.000% | 12/1/25 | 3,000 | 3,271 |
| 1 Wayne County MI Airport Authority Revenue (Detroit Metropolitan Wayne County Airport) | 5.000% | 12/1/24 | 1,000 | 1,128 |
93
Limited-Term Tax-Exempt Fund
| | | | |
| Face | Market |
| Maturity | Amount | Value• |
| Coupon | Date | ($000) | ($000) |
| 1 Wayne County MI Airport Authority Revenue (Detroit Metropolitan Wayne County Airport) | 5.000% | 12/1/25 | 750 | 855 |
| 3 Wayne State University Michigan Revenue TOB VRDO | 1.750% | 11/7/18 | 2,500 | 2,500 |
| Western Michigan University Revenue | 5.000% | 11/15/21 | 1,055 | 1,137 |
| Woodhaven-Brownstone MI School District GO | 5.000% | 5/1/21 | 1,710 | 1,824 |
| Woodhaven-Brownstone MI School District GO | 5.000% | 5/1/22 | 1,730 | 1,881 |
| Woodhaven-Brownstone MI School District GO | 5.000% | 5/1/23 | 1,615 | 1,787 |
| | | | 615,052 |
| Minnesota (1.0%) | | | | |
| Maple Grove MN Health Care Facilities Revenue (Maple Grove Hospital Corp.) | 4.000% | 5/1/21 | 550 | 569 |
| Maple Grove MN Health Care Facilities Revenue (Maple Grove Hospital Corp.) | 5.000% | 5/1/23 | 1,110 | 1,214 |
| Maple Grove MN Health Care Facilities Revenue (Maple Grove Hospital Corp.) | 5.000% | 5/1/24 | 1,245 | 1,382 |
| Minneapolis & St. Paul MN Housing & Redevelopment Authority Health Care System Revenue | | | | |
| (Allina Health System) | 5.000% | 11/15/20 | 675 | 713 |
| Minneapolis & St. Paul MN Housing & Redevelopment Authority Health Care System Revenue | | | | |
| (Allina Health System) | 5.000% | 11/15/21 | 600 | 648 |
| Minneapolis & St. Paul MN Housing & Redevelopment Authority Health Care System Revenue | | | | |
| (Allina Health System) | 5.000% | 11/15/22 | 660 | 726 |
| Minneapolis & St. Paul MN Housing & Redevelopment Authority Health Care System Revenue | | | | |
| (Allina Health System) | 5.000% | 11/15/23 | 1,530 | 1,707 |
| Minneapolis & St. Paul MN Metropolitan Airports Commission Revenue | 4.000% | 1/1/21 | 125 | 130 |
| Minneapolis & St. Paul MN Metropolitan Airports Commission Revenue | 5.000% | 1/1/21 | 2,775 | 2,939 |
| Minneapolis & St. Paul MN Metropolitan Airports Commission Revenue | 5.000% | 1/1/21 | 350 | 371 |
| Minneapolis & St. Paul MN Metropolitan Airports Commission Revenue | 5.000% | 1/1/22 | 1,000 | 1,082 |
| Minneapolis & St. Paul MN Metropolitan Airports Commission Revenue | 5.000% | 1/1/22 | 250 | 271 |
| Minneapolis & St. Paul MN Metropolitan Airports Commission Revenue | 5.000% | 1/1/23 | 5,105 | 5,632 |
| Minneapolis & St. Paul MN Metropolitan Airports Commission Revenue | 5.000% | 1/1/23 | 305 | 337 |
| Minneapolis & St. Paul MN Metropolitan Airports Commission Revenue | 5.000% | 1/1/24 | 7,265 | 8,143 |
| Minneapolis & St. Paul MN Metropolitan Airports Commission Revenue | 5.000% | 1/1/24 | 200 | 225 |
| Minneapolis & St. Paul MN Metropolitan Council Wastewater GO | 5.000% | 9/1/25 | 6,370 | 6,977 |
| Minneapolis MN GO | 5.000% | 12/1/19 | 1,000 | 1,033 |
| Minneapolis MN GO | 5.000% | 12/1/20 | 4,065 | 4,299 |
| Minneapolis MN GO | 5.000% | 12/1/21 | 2,485 | 2,693 |
| Minneapolis MN Health Care System Revenue (Fairview Health Services) | 5.000% | 11/15/21 | 550 | 590 |
| Minneapolis MN Health Care System Revenue (Fairview Health Services) | 5.000% | 11/15/22 | 200 | 219 |
| Minneapolis MN Health Care System Revenue (Fairview Health Services) VRDO | 1.720% | 11/7/18 LOC | 26,505 | 26,505 |
| Minneapolis MN Special School District No. 1 COP | 5.000% | 2/1/19 | 6,830 | 6,881 |
| Minneapolis MN Special School District No. 1 COP | 5.000% | 2/1/21 | 7,225 | 7,650 |
| Minnesota 911 Revenue | 5.000% | 6/1/21 | 9,390 | 10,048 |
| Minnesota GO | 5.000% | 11/1/19 | 2,000 | 2,059 |
| Minnesota GO | 5.000% | 8/1/20 (Prere.) | 100 | 105 |
| Minnesota GO | 5.000% | 8/1/21 | 6,000 | 6,450 |
| Minnesota GO | 5.000% | 8/1/21 | 15,500 | 16,663 |
| Minnesota GO | 5.000% | 8/1/22 | 12,900 | 14,158 |
| Minnesota GO | 5.000% | 8/1/23 | 6,565 | 6,869 |
| Minnesota GO | 5.000% | 8/1/23 | 5,295 | 5,919 |
| Minnesota GO | 5.000% | 10/1/23 | 8,250 | 8,867 |
| Minnesota GO | 5.000% | 8/1/24 | 3,250 | 3,692 |
| Minnesota GO | 5.000% | 8/1/24 | 19,660 | 22,332 |
| Minnesota GO | 5.000% | 8/1/24 | 10,300 | 11,700 |
| Minnesota GO | 4.000% | 10/1/24 | 14,225 | 15,247 |
| Minnesota GO | 5.000% | 8/1/25 | 10,200 | 11,760 |
| Minnesota Higher Education Facilities Authority Revenue (University of St. Thomas) | 4.000% | 4/1/20 | 500 | 512 |
| Minnesota Higher Education Facilities Authority Revenue (University of St. Thomas) | 4.000% | 4/1/21 | 425 | 442 |
| Minnesota Higher Education Facilities Authority Revenue (University of St. Thomas) | 4.000% | 4/1/22 | 495 | 521 |
| Minnesota Housing Finance Agency Residential Housing Revenue | 4.000% | 7/1/47 | 6,275 | 6,491 |
| Minnesota Housing Finance Agency Residential Housing Revenue | 4.000% | 1/1/48 | 6,520 | 6,771 |
| Minnesota Municipal Power Agency Revenue | 5.000% | 1/1/21 | 1,250 | 1,324 |
| Northern Minnesota Municipal Power Agency Electric System Revenue | 5.000% | 1/1/21 | 2,500 | 2,638 |
| Northern Minnesota Municipal Power Agency Electric System Revenue | 5.000% | 1/1/22 | 587 | 632 |
| Northern Minnesota Municipal Power Agency Electric System Revenue | 5.000% | 1/1/23 | 1,140 | 1,249 |
| Northern Minnesota Municipal Power Agency Electric System Revenue | 5.000% | 1/1/24 | 1,590 | 1,766 |
| Shakopee MN Healthcare Facilities Revenue (St. Francis Regional Medical Center) | 5.000% | 9/1/20 | 1,340 | 1,398 |
| Shakopee MN Healthcare Facilities Revenue (St. Francis Regional Medical Center) | 5.000% | 9/1/21 | 1,195 | 1,271 |
| Shakopee MN Healthcare Facilities Revenue (St. Francis Regional Medical Center) | 5.000% | 9/1/22 | 1,580 | 1,708 |
| St. Cloud MN Health Care Revenue (CentraCare Health System) | 5.000% | 5/1/22 | 2,975 | 3,233 |
| St. Paul MN Housing & Redevelopment Authority Health Care Revenue | | | | |
| (Fairview Health Services Obligated Group) | 3.000% | 11/15/19 | 760 | 767 |
| St. Paul MN Housing & Redevelopment Authority Health Care Revenue | | | | |
| (Fairview Health Services Obligated Group) | 4.000% | 11/15/20 | 470 | 485 |
94
Limited-Term Tax-Exempt Fund
| | | | |
| Face | Market |
| Maturity | Amount | Value• |
| Coupon | Date | ($000) | ($000) |
| St. Paul MN Housing & Redevelopment Authority Health Care Revenue | | | | |
| (Fairview Health Services Obligated Group) | 5.000% | 11/15/21 | 520 | 558 |
| St. Paul MN Housing & Redevelopment Authority Health Care Revenue | | | | |
| (Fairview Health Services Obligated Group) | 5.000% | 11/15/22 | 365 | 399 |
| St. Paul MN Housing & Redevelopment Authority Health Care Revenue | | | | |
| (Fairview Health Services Obligated Group) | 5.000% | 11/15/23 | 740 | 821 |
| St. Paul MN Housing & Redevelopment Authority Health Care Revenue | | | | |
| (Fairview Health Services Obligated Group) | 5.000% | 11/15/24 | 800 | 900 |
| St. Paul MN Housing & Redevelopment Authority Health Care Revenue | | | | |
| (Fairview Health Services Obligated Group) | 5.000% | 11/15/25 | 675 | 769 |
| St. Paul MN Housing & Redevelopment Authority Health Care Revenue | | | | |
| (Fairview Health Services Obligated Group) | 5.000% | 11/15/26 | 1,785 | 2,049 |
| University of Minnesota Revenue | 5.000% | 8/1/22 | 1,575 | 1,728 |
| University of Minnesota Revenue | 5.000% | 9/1/24 | 1,740 | 1,982 |
| | | | 259,219 |
| Mississippi (0.4%) | | | | |
| DeSoto County MS School District GO | 5.000% | 5/1/19 | 8,000 | 8,118 |
| Gulfport MS Hospital Facilities Revenue (Memorial Hospital at Gulfport Project) | 5.000% | 7/1/21 | 1,165 | 1,228 |
| Gulfport MS Hospital Facilities Revenue (Memorial Hospital at Gulfport Project) | 5.000% | 7/1/22 | 2,015 | 2,155 |
| Gulfport MS Hospital Facilities Revenue (Memorial Hospital at Gulfport Project) | 5.000% | 7/1/23 | 1,560 | 1,684 |
| Jackson MS Public School District GO | 5.000% | 4/1/22 | 1,545 | 1,670 |
| Mississippi Business Finance Corp. Gulf Opportunity Zone Industrial Development Revenue | | | | |
| (Chevron USA Inc. Project) VRDO | 1.670% | 11/1/18 | 5,600 | 5,600 |
| Mississippi Development Bank Special Obligation Revenue | | | | |
| (Marshall County Industrial Development Highway Refunding Project) | 5.000% | 1/1/23 | 2,000 | 2,187 |
| Mississippi Development Bank Special Obligation Revenue | | | | |
| (Marshall County Industrial Development Highway Refunding Project) | 5.000% | 1/1/24 | 4,175 | 4,635 |
| Mississippi Development Bank Special Obligation Revenue | | | | |
| (Marshall County Industrial Development Highway Refunding Project) | 5.000% | 1/1/25 | 5,205 | 5,877 |
| Mississippi Gaming Tax Revenue | 5.000% | 10/15/21 | 1,125 | 1,206 |
| Mississippi Gaming Tax Revenue | 5.000% | 10/15/22 | 1,610 | 1,755 |
| Mississippi Gaming Tax Revenue | 5.000% | 10/15/25 | 1,040 | 1,173 |
| Mississippi GO | 5.000% | 11/1/23 | 18,500 | 20,308 |
| Mississippi GO | 5.000% | 11/1/25 | 5,000 | 5,485 |
| 2 Mississippi GO PUT | 1.842% | 9/1/20 | 5,035 | 5,039 |
| Mississippi Hospital Equipment & Facilities Authority Revenue (Baptist Health System) | 5.000% | 9/1/24 | 2,480 | 2,706 |
| 2 Mississippi Hospital Equipment & Facilities Authority Revenue (Baptist Health System) PUT | 2.900% | 8/15/20 | 7,875 | 7,936 |
| Mississippi Hospital Equipment & Facilities Authority Revenue | | | | |
| (Baptist Memorial Health Care Obligated Group) | 5.000% | 9/1/21 | 3,390 | 3,577 |
| Mississippi Hospital Equipment & Facilities Authority Revenue | | | | |
| (Baptist Memorial Health Care Obligated Group) | 5.000% | 9/1/23 | 500 | 541 |
| Mississippi Hospital Equipment & Facilities Authority Revenue | | | | |
| (Baptist Memorial Health Care Obligated Group) PUT | 2.125% | 1/9/19 | 1,875 | 1,873 |
| Mississippi State University Educational Building Corp. Revenue | 5.000% | 8/1/22 | 220 | 240 |
| Mississippi State University Educational Building Corp. Revenue | 5.000% | 8/1/23 | 600 | 663 |
| Mississippi State University Educational Building Corp. Revenue | 5.000% | 8/1/23 | 750 | 832 |
| Mississippi State University Educational Building Corp. Revenue | 5.000% | 8/1/24 | 500 | 563 |
| Warren County MS Gulf Opportunity Zone Revenue (International Paper Co. Projects) PUT | 2.900% | 9/1/23 | 6,250 | 6,194 |
| West Rankin MS Utility Authority Revenue | 5.000% | 1/1/23 (4) | 275 | 303 |
| West Rankin MS Utility Authority Revenue | 5.000% | 1/1/24 (4) | 400 | 447 |
| West Rankin MS Utility Authority Revenue | 5.000% | 1/1/25 (4) | 525 | 594 |
| | | | 94,589 |
| Missouri (0.7%) | | | | |
| Boone County MO Hospital Revenue | 5.000% | 8/1/22 | 1,370 | 1,447 |
| Boone County MO Hospital Revenue | 5.000% | 8/1/23 | 2,465 | 2,615 |
| Branson MO Industrial Development Authority Tax Increase Revenue | | | | |
| (Branson Shoppes Redevelopment) | 4.000% | 11/1/22 | 350 | 358 |
| Branson MO Industrial Development Authority Tax Increase Revenue | | | | |
| (Branson Shoppes Redevelopment) | 4.000% | 11/1/23 | 750 | 764 |
| Branson MO Industrial Development Authority Tax Increase Revenue | | | | |
| (Branson Shoppes Redevelopment) | 4.000% | 11/1/24 | 2,345 | 2,362 |
| Cape Girardeau County MO Industrial Development Authority of the Health Facilities Revenue | | | | |
| (Southeast Health) | 5.000% | 3/1/22 | 600 | 635 |
| Cape Girardeau County MO Industrial Development Authority of the Health Facilities Revenue | | | | |
| (Southeast Health) | 5.000% | 3/1/23 | 1,675 | 1,793 |
| Cape Girardeau County MO Industrial Development Authority of the Health Facilities Revenue | | | | |
| (Southeast Health) | 5.000% | 3/1/24 | 1,740 | 1,879 |
| Cape Girardeau County MO Industrial Development Authority of the Health Facilities Revenue | | | | |
| (Southeast Health) | 5.000% | 3/1/25 | 1,450 | 1,579 |
95
Limited-Term Tax-Exempt Fund
| | | | |
| Face | Market |
| Maturity | Amount | Value• |
| Coupon | Date | ($000) | ($000) |
| Cape Girardeau County MO Industrial Development Authority of the Health Facilities Revenue | | | | |
| (St. Francis Medical Center) | 5.000% | 6/1/19 | 2,000 | 2,034 |
| Cape Girardeau County MO Industrial Development Authority of the Health Facilities Revenue | | | | |
| (St. Francis Medical Center) | 5.000% | 6/1/20 | 1,000 | 1,043 |
| Curators of the University of Missouri System Facilities Revenue | 5.000% | 11/1/18 | 1,445 | 1,445 |
| Curators of the University of Missouri System Facilities Revenue | 5.000% | 11/1/18 | 2,225 | 2,225 |
| Curators of the University of Missouri System Facilities Revenue | 5.000% | 11/1/19 | 805 | 829 |
| Curators of the University of Missouri System Facilities Revenue | 5.000% | 11/1/20 | 2,000 | 2,113 |
| Jackson County MO Special Obligation Revenue (Truman Sports Complex Project) | 5.000% | 12/1/22 | 2,065 | 2,263 |
| Joplin MO Industrial Development Authority Health Facilities Revenue (Freeman Health System) | 5.000% | 2/15/22 | 1,500 | 1,615 |
| Joplin MO Industrial Development Authority Health Facilities Revenue (Freeman Health System) | 5.000% | 2/15/23 | 1,420 | 1,553 |
| Kansas City MO Airport Revenue | 5.000% | 9/1/19 | 2,740 | 2,806 |
| Kansas City MO Sanitary Sewer System Revenue | 4.000% | 1/1/21 | 1,025 | 1,064 |
| Kansas City MO Sanitary Sewer System Revenue | 4.000% | 1/1/22 | 1,250 | 1,316 |
| Kansas City MO Special Obligation Revenue | 5.000% | 10/1/21 | 1,285 | 1,377 |
| Kansas City MO Special Obligation Revenue | 5.000% | 10/1/21 | 1,305 | 1,398 |
| Kansas City MO Special Obligation Revenue | 5.000% | 10/1/22 | 1,310 | 1,429 |
| Kansas City MO Special Obligation Revenue | 5.000% | 10/1/22 | 1,410 | 1,538 |
| Kansas City MO Special Obligation Revenue (Downtown Arena Project) | 5.000% | 4/1/21 | 3,000 | 3,183 |
| Kansas City MO Special Obligation Revenue (Downtown Arena Project) | 5.000% | 4/1/22 | 4,955 | 5,360 |
| Lee’s Summit MO Senior Living Facilities Revenue (John Knox Village) | 5.000% | 8/15/20 | 1,075 | 1,104 |
| Lee’s Summit MO Senior Living Facilities Revenue (John Knox Village) | 5.000% | 8/15/22 | 1,725 | 1,805 |
| Lees Summit MO TAN | 3.500% | 11/1/23 | 1,410 | 1,380 |
| Metropolitan St. Louis MO Sewer District Wastewater System Revenue | 5.000% | 5/1/25 | 1,210 | 1,395 |
| Missouri Development Finance Board Infrastructure Facilities Revenue (Branson Landing Project) | 4.000% | 12/1/20 | 1,300 | 1,334 |
| Missouri Health & Educational Facilities Authority Educational Facilities Revenue | | | | |
| (St. Louis College of Pharmacy Project) | 5.000% | 5/1/19 | 750 | 762 |
| Missouri Health & Educational Facilities Authority Educational Facilities Revenue | | | | |
| (St. Louis College of Pharmacy Project) | 5.000% | 5/1/20 | 870 | 909 |
| Missouri Health & Educational Facilities Authority Educational Facilities Revenue | | | | |
| (St. Louis College of Pharmacy Project) | 5.000% | 5/1/21 | 1,420 | 1,519 |
| Missouri Health & Educational Facilities Authority Health Facilities Revenue (Cox Health) | 5.000% | 11/15/22 | 3,410 | 3,712 |
| Missouri Health & Educational Facilities Authority Health Facilities Revenue | | | | |
| (Freeman Health System) | 5.000% | 2/15/19 | 3,040 | 3,065 |
| Missouri Health & Educational Facilities Authority Health Facilities Revenue | | | | |
| (Freeman Health System) | 5.000% | 2/15/20 | 3,085 | 3,193 |
| Missouri Health & Educational Facilities Authority Health Facilities Revenue | | | | |
| (Lester E. Cox Obligated Group) | 5.000% | 11/15/24 | 1,075 | 1,201 |
| Missouri Health & Educational Facilities Authority Health Facilities Revenue | | | | |
| (SSM Health System) PUT | 5.000% | 6/1/23 | 17,600 | 19,012 |
| Missouri Health & Educational Facilities Authority Health Facilities Revenue | | | | |
| (SSM Health System) VRDO | 1.610% | 11/7/18 | 33,925 | 33,925 |
| Missouri Health & Educational Facilities Authority Revenue | | | | |
| (Lutheran Senior Services Obligated Group) | 4.000% | 2/1/19 | 650 | 653 |
| Missouri Health & Educational Facilities Authority Revenue | | | | |
| (Lutheran Senior Services Obligated Group) | 4.000% | 2/1/20 | 900 | 916 |
| Missouri Health & Educational Facilities Authority Revenue | | | | |
| (Lutheran Senior Services Obligated Group) | 5.000% | 2/1/21 | 400 | 419 |
| Missouri Health & Educational Facilities Authority Revenue | | | | |
| (Lutheran Senior Services Obligated Group) | 5.000% | 2/1/22 | 1,440 | 1,531 |
| Missouri Health & Educational Facilities Authority Revenue | | | | |
| (Lutheran Senior Services Obligated Group) | 5.000% | 2/1/23 | 1,200 | 1,291 |
| Missouri Health & Educational Facilities Authority Revenue | | | | |
| (Lutheran Senior Services Obligated Group) | 5.000% | 2/1/24 | 750 | 813 |
| Missouri Highways & Transportation Commission Road Revenue | 5.000% | 5/1/21 | 4,380 | 4,685 |
| Missouri Joint Municipal Electric Utility Commission Power Project Revenue | 5.000% | 1/1/19 | 2,345 | 2,356 |
| Missouri Joint Municipal Electric Utility Commission Power Project Revenue | 5.000% | 1/1/21 | 6,275 | 6,629 |
| Missouri Joint Municipal Electric Utility Commission Power Project Revenue | 5.000% | 1/1/22 | 4,375 | 4,718 |
| Missouri Joint Municipal Electric Utility Commission Power Project Revenue (Prairie Project) | 5.000% | 12/1/18 | 1,250 | 1,253 |
| Missouri Joint Municipal Electric Utility Commission Power Project Revenue (Prairie Project) | 5.000% | 6/1/19 | 2,750 | 2,796 |
| Missouri Joint Municipal Electric Utility Commission Power Project Revenue (Prairie Project) | 5.000% | 12/1/19 | 2,500 | 2,575 |
| Missouri Joint Municipal Electric Utility Commission Power Project Revenue (Prairie Project) | 5.000% | 6/1/20 | 1,325 | 1,381 |
| Missouri Joint Municipal Electric Utility Commission Power Project Revenue (Prairie Project) | 5.000% | 12/1/20 | 1,050 | 1,108 |
| Missouri Joint Municipal Electric Utility Commission Power Project Revenue (Prairie Project) | 5.000% | 6/1/21 | 1,250 | 1,333 |
| Missouri Joint Municipal Electric Utility Commission Power Project Revenue (Prairie Project) | 5.000% | 12/1/21 | 1,860 | 2,004 |
| Missouri Joint Municipal Electric Utility Commission Power Project Revenue (Prairie Project) | 5.000% | 6/1/22 | 3,205 | 3,485 |
| Missouri Joint Municipal Electric Utility Commission Power Project Revenue (Prairie Project) | 5.000% | 12/1/22 | 1,585 | 1,738 |
| Springfield MO Public Utility Revenue | 5.000% | 8/1/23 | 3,425 | 3,819 |
| St. Louis County MO Industrial Development Authority Senior Living Facilities Revenue | | | | |
| (Friendship Village Obligated Group) | 3.000% | 9/1/22 | 390 | 381 |
96
Limited-Term Tax-Exempt Fund
| | | | |
| Face | Market |
| Maturity | Amount | Value• |
| Coupon | Date | ($000) | ($000) |
| St. Louis MO Parking Revenue | 5.000% 12/15/21 (4) | 1,535 | 1,650 |
| St. Louis MO Parking Revenue | 5.000% 12/15/22 (4) | 1,000 | 1,093 |
| | | | 170,966 |
| Montana (0.2%) | | | | |
| Forsyth MT Pollution Control Revenue (Northwestern Corporation Colstrip Project) | 2.000% | 8/1/23 | 25,330 | 24,331 |
| Gallatin County MT High School District No. 7 GO | 5.000% | 6/1/23 | 490 | 546 |
| Gallatin County MT High School District No. 7 GO | 5.000% | 12/1/23 | 515 | 578 |
| Gallatin County MT High School District No. 7 GO | 5.000% | 6/1/24 | 530 | 600 |
| Gallatin County MT High School District No. 7 GO | 5.000% | 12/1/24 | 680 | 775 |
| Gallatin County MT High School District No. 7 GO | 5.000% | 6/1/25 | 565 | 648 |
| Gallatin County MT High School District No. 7 GO | 5.000% | 12/1/25 | 900 | 1,038 |
| Lewis & Clark County MT School District No. 1 GO | 5.000% | 7/1/23 | 550 | 610 |
| Lewis & Clark County MT School District No. 1 GO | 5.000% | 7/1/24 | 770 | 867 |
| Lewis & Clark County MT School District No. 1 GO | 5.000% | 7/1/25 | 375 | 428 |
| Montana Facility Finance Authority Health Facilities Revenue | | | | |
| (Bozeman Deaconess Health Services Obligated Group) | 4.000% | 6/1/19 | 200 | 202 |
| Montana Facility Finance Authority Health Facilities Revenue | | | | |
| (Bozeman Deaconess Health Services Obligated Group) | 5.000% | 6/1/22 | 200 | 216 |
| Montana Facility Finance Authority Health Facilities Revenue | | | | |
| (Bozeman Deaconess Health Services Obligated Group) | 3.000% | 6/1/23 | 350 | 355 |
| Montana Facility Finance Authority Health Facilities Revenue | | | | |
| (Bozeman Deaconess Health Services Obligated Group) | 5.000% | 6/1/25 | 380 | 427 |
| Montana Facility Finance Authority Hospital Revenue (Benefis Health System) | 5.000% | 2/15/21 | 1,290 | 1,366 |
| Montana Facility Finance Authority Hospital Revenue (Benefis Health System) | 5.000% | 2/15/22 | 1,435 | 1,548 |
| Montana Facility Finance Authority Hospital Revenue (Benefis Health System) | 5.000% | 2/15/23 | 2,075 | 2,274 |
| Montana Facility Finance Authority Hospital Revenue (Benefis Health System) | 5.000% | 2/15/24 | 2,145 | 2,380 |
| | | | 39,189 |
| Multiple States (1.0%) | | | | |
| 5 Federal Home Loan Mortgage Corp. Multifamily Housing Revenue VRDO | 1.850% | 11/8/18 LOC | 25,000 | 25,000 |
| 5 Federal Home Loan Mortgage Corp. Multifamily Housing VRDO | 1.900% | 11/1/18 LOC | 23,660 | 23,660 |
| 3 Nuveen AMT-Free Municipal Income Fund VRDP VRDO | 1.730% | 11/7/18 LOC | 95,000 | 95,000 |
| 3 Nuveen AMT-Free Quality Municipal Income Fund VRDP VRDO | 1.690% | 11/7/18 LOC | 78,300 | 78,300 |
| 3 Nuveen Enhanced AMT-Free Municipal Credit Opportunities Fund VRDP VRDO | 1.680% | 11/7/18 LOC | 34,100 | 34,100 |
| | | | 256,060 |
| Nebraska (0.7%) | | | | |
| Central Plains Energy Project Nebraska Gas Project Revenue (Project No. 1) | 5.250% | 12/1/20 | 5,000 | 5,279 |
| Central Plains Energy Project Nebraska Gas Project Revenue (Project No. 1) | 5.250% | 12/1/21 | 3,100 | 3,343 |
| Central Plains Energy Project Nebraska Gas Project Revenue (Project No. 3) | 5.000% | 9/1/25 | 6,350 | 7,038 |
| Central Plains Energy Project Nebraska Gas Supply Revenue PUT | 5.000% | 6/1/19 | 11,175 | 11,355 |
| Central Plains Energy Project Nebraska Gas Supply Revenue PUT | 5.000% | 12/1/19 | 77,360 | 79,467 |
| Douglas County NE Hospital Authority No. 3 Health Facilities Revenue | | | | |
| (Nebraska Methodist Health Syst | 4.000% | 11/1/19 | 750 | 762 |
| Douglas County NE Hospital Authority No. 3 Health Facilities Revenue | | | | |
| (Nebraska Methodist Health System) | 5.000% | 11/1/20 | 1,400 | 1,469 |
| Douglas County NE Hospital Authority No. 3 Health Facilities Revenue | | | | |
| (Nebraska Methodist Health System) | 5.000% | 11/1/22 | 1,000 | 1,090 |
| Douglas County NE Housing Authority Revenue (Blair High Residences Project) | 1.400% | 4/1/19 | 5,175 | 5,151 |
| Lincoln County NE Hospital Authority No. 1 Hospital Revenue | | | | |
| (Great Plains Regional Medical Center Project) | 5.000% | 11/1/18 | 500 | 500 |
| Lincoln County NE Hospital Authority No. 1 Hospital Revenue | | | | |
| (Great Plains Regional Medical Center Project) | 4.000% | 11/1/19 | 750 | 763 |
| Lincoln County NE Hospital Authority No. 1 Hospital Revenue | | | | |
| (Great Plains Regional Medical Center Project) | 4.000% | 11/1/20 | 600 | 618 |
| Municipal Energy Agency of Nebraska Power Supply System Revenue | 5.000% | 4/1/19 | 1,500 | 1,519 |
| Municipal Energy Agency of Nebraska Power Supply System Revenue | 5.000% | 4/1/20 | 1,350 | 1,402 |
| Municipal Energy Agency of Nebraska Power Supply System Revenue | 5.000% | 4/1/23 | 1,030 | 1,135 |
| Nebraska Investment Finance Authority Single Family Housing Revenue | 3.000% | 3/1/43 | 330 | 331 |
| Nebraska Investment Finance Authority Single Family Housing Revenue | 3.000% | 9/1/43 | 1,375 | 1,381 |
| Nebraska Investment Finance Authority Single Family Housing Revenue | 3.000% | 3/1/44 | 1,235 | 1,239 |
| Nebraska Investment Finance Authority Single Family Housing Revenue | 4.000% | 9/1/44 | 3,185 | 3,281 |
| Nebraska Investment Finance Authority Single Family Housing Revenue | 3.500% | 9/1/45 | 7,380 | 7,519 |
| Nebraska Public Power Agency Revenue | 5.000% | 1/1/22 | 4,830 | 5,196 |
| Nebraska Public Power District Revenue | 5.000% | 1/1/19 | 1,000 | 1,005 |
| Nebraska Public Power District Revenue | 5.000% | 1/1/19 | 1,000 | 1,005 |
| Nebraska Public Power District Revenue | 5.000% | 7/1/20 | 6,600 | 6,909 |
| Nebraska Public Power District Revenue | 5.000% | 1/1/21 | 4,635 | 4,907 |
| Nebraska Public Power District Revenue | 5.000% | 1/1/21 | 2,250 | 2,382 |
| Nebraska Public Power District Revenue | 5.000% | 7/1/21 | 3,185 | 3,411 |
| Nebraska Public Power District Revenue | 5.000% | 1/1/22 | 1,250 | 1,353 |
97
Limited-Term Tax-Exempt Fund
| | | | |
| Face | Market |
| Maturity | Amount | Value• |
| Coupon | Date | ($000) | ($000) |
| Nebraska Public Power District Revenue | 5.000% | 1/1/23 | 1,320 | 1,457 |
| Nebraska Public Power District Revenue | 5.000% | 1/1/24 | 1,740 | 1,949 |
| Nebraska Public Power Generation Agency Revenue (Whelan Energy Center Unit 2) | 5.000% | 1/1/19 | 2,000 | 2,010 |
| Omaha NE Public Power District Electric Revenue | 5.000% | 2/1/21 | 6,400 | 6,799 |
| 1 Omaha NE GO | 5.000% | 1/15/24 | 750 | 843 |
| 1 Omaha NE GO | 5.000% | 1/15/25 | 375 | 428 |
| 1 Omaha NE GO | 5.000% | 1/15/26 | 500 | 578 |
| Scotts Bluff County NE Hospital Authority Revenue (Regional West Medical Center) | 5.000% | 2/1/21 | 1,535 | 1,587 |
| Scotts Bluff County NE Hospital Authority Revenue (Regional West Medical Center) | 5.000% | 2/1/22 | 1,000 | 1,044 |
| Scotts Bluff County NE Hospital Authority Revenue (Regional West Medical Center) | 5.000% | 2/1/23 | 1,700 | 1,784 |
| University of Nebraska Student Fee Revenue | 5.000% | 7/1/21 | 1,335 | 1,431 |
| University of Nebraska Student Fee Revenue | 5.000% | 7/1/21 | 1,000 | 1,072 |
| University of Nebraska Student Fee Revenue | 5.000% | 7/1/22 | 1,400 | 1,533 |
| University of Nebraska Student Health & Recreation Project Revenue | 5.000% | 5/15/22 | 1,135 | 1,240 |
| | | | 184,565 |
| Nevada (0.5%) | | | | |
| Carson City NV Hospital Revenue (Carson Tahoe Regional Medical Center) | 5.000% | 9/1/19 | 1,030 | 1,052 |
| Carson City NV Hospital Revenue (Carson Tahoe Regional Medical Center) | 5.000% | 9/1/19 | 220 | 225 |
| Carson City NV Hospital Revenue (Carson Tahoe Regional Medical Center) | 5.000% | 9/1/20 | 1,165 | 1,216 |
| Carson City NV Hospital Revenue (Carson Tahoe Regional Medical Center) | 5.000% | 9/1/22 | 790 | 855 |
| Carson City NV Hospital Revenue (Carson Tahoe Regional Medical Center) | 5.000% | 9/1/24 | 750 | 830 |
| Clark County NV Highway Improvement Motor Vehicle Fuel Tax Revenue | 5.000% | 7/1/22 | 1,715 | 1,874 |
| Clark County NV Highway Improvement Motor Vehicle Fuel Tax Revenue | 5.000% | 7/1/24 | 1,015 | 1,146 |
| Clark County NV Highway Improvement Motor Vehicle Fuel Tax Revenue | 5.000% | 7/1/25 | 1,020 | 1,164 |
| Clark County NV Highway Improvement Motor Vehicle Fuel Tax Revenue | 5.000% | 7/1/26 | 1,055 | 1,214 |
| Clark County NV Passenger Facility Charge Revenue (Las Vegas McCarran International Airport) | 5.000% | 7/1/19 | 2,375 | 2,420 |
| Clark County NV Passenger Facility Charge Revenue (Las Vegas McCarran International Airport) | 5.000% | 7/1/20 | 3,000 | 3,134 |
| Clark County NV Passenger Facility Charge Revenue (Las Vegas McCarran International Airport) | 5.000% | 7/1/21 | 3,000 | 3,210 |
| Clark County NV Passenger Facility Charge Revenue (Las Vegas McCarran International Airport) | 5.000% | 7/1/22 | 3,060 | 3,341 |
| Clark County NV School District GO | 5.000% | 6/15/20 | 3,125 | 3,260 |
| Clark County NV School District GO | 5.000% | 6/15/20 | 520 | 542 |
| 1 Clark County NV School District GO | 5.000% | 6/15/21 | 7,110 | 7,561 |
| Clark County NV School District GO | 5.000% | 6/15/21 | 4,515 | 4,802 |
| Clark County NV School District GO | 5.000% | 6/15/22 | 5,500 | 5,951 |
| Clark County NV School District GO | 5.000% | 6/15/22 | 1,255 | 1,358 |
| 1 Clark County NV School District GO | 5.000% | 6/15/23 | 7,835 | 8,595 |
| Clark County NV School District GO | 5.000% | 6/15/23 | 5,820 | 6,384 |
| Clark County NV School District GO | 5.000% | 6/15/23 | 1,760 | 1,917 |
| 1 Clark County NV School District GO | 5.000% | 6/15/24 | 8,230 | 9,129 |
| Clark County NV School District GO | 5.000% | 6/15/24 | 3,180 | 3,527 |
| 1 Clark County NV School District GO | 5.000% | 6/15/25 | 8,640 | 9,681 |
| 1 Clark County NV School District GO | 5.000% | 6/15/26 | 9,075 | 10,217 |
| 3 Las Vegas Convention & Visitors Authority TOB VRDO | 1.680% | 11/7/18 | 4,665 | 4,665 |
| Las Vegas NV Convention & Visitors Authority Revenue | 5.000% | 7/1/21 | 1,000 | 1,070 |
| Las Vegas NV Convention & Visitors Authority Revenue | 5.000% | 7/1/22 | 1,570 | 1,712 |
| Las Vegas NV Convention & Visitors Authority Revenue | 5.000% | 7/1/23 | 1,180 | 1,308 |
| 1 Las Vegas NV New Convention & Visitors Authority Revenue | 5.000% | 7/1/23 | 600 | 665 |
| 1 Las Vegas NV New Convention & Visitors Authority Revenue | 5.000% | 7/1/24 | 500 | 562 |
| 1 Las Vegas NV New Convention & Visitors Authority Revenue | 5.000% | 7/1/25 | 600 | 681 |
| Nevada Highway Improvement Revenue (Motor Vehicle Fuel Tax) | 5.000% | 12/1/24 | 2,680 | 3,021 |
| North Las Vegas NV GO | 5.000% | 6/1/24 (4) | 2,810 | 3,123 |
| North Las Vegas NV GO | 5.000% | 6/1/25 (4) | 2,950 | 3,317 |
| North Las Vegas NV GO | 5.000% | 6/1/26 (4) | 3,095 | 3,498 |
| Reno NV Sales Tax Revenue (Reno Transportation Rail Access) | 5.000% | 6/1/19 | 250 | 254 |
| Reno NV Sales Tax Revenue (Reno Transportation Rail Access) | 5.000% | 6/1/21 | 500 | 531 |
| Reno NV Sales Tax Revenue (Reno Transportation Rail Access) | 5.000% | 6/1/21 (4) | 320 | 338 |
| Reno NV Sales Tax Revenue (Reno Transportation Rail Access) | 5.000% | 6/1/22 (4) | 335 | 359 |
| Reno NV Sales Tax Revenue (Reno Transportation Rail Access) | 5.000% | 6/1/23 | 455 | 498 |
| Reno NV Sales Tax Revenue (Reno Transportation Rail Access) | 5.000% | 6/1/23 (4) | 355 | 386 |
| Reno NV Sales Tax Revenue (Reno Transportation Rail Access) | 5.000% | 6/1/24 | 250 | 277 |
| Reno NV Sales Tax Revenue (Reno Transportation Rail Access) | 5.000% | 6/1/25 | 485 | 544 |
| Washoe County NV Gas & Water Facilities Revenue PUT | 3.000% | 6/1/22 | 9,500 | 9,584 |
| | | | 130,998 |
| New Hampshire (0.1%) | | | | |
| Manchester NH General Airport Revenue | 5.000% | 1/1/22 | 6,820 | 7,320 |
| New Hampshire Business Finance Authority Revenue PUT (The United Illuminating Co.) | 2.800% | 10/2/23 | 5,480 | 5,420 |
| New Hampshire Health & Education Facilities Authority Revenue (Elliott Hospital Obligated Group) | 5.000% | 10/1/21 | 1,250 | 1,326 |
| New Hampshire Health & Education Facilities Authority Revenue (Elliott Hospital Obligated Group) | 5.000% | 10/1/22 | 925 | 996 |
| New Hampshire Health & Education Facilities Authority Revenue (Elliott Hospital Obligated Group) | 5.000% | 10/1/23 | 1,675 | 1,820 |
98
Limited-Term Tax-Exempt Fund
| | | | |
| Face | Market |
| Maturity | Amount | Value• |
| Coupon | Date | ($000) | ($000) |
| New Hampshire Health & Education Facilities Authority Revenue | | | | |
| (Partners Healthcare System Inc.) | 5.000% | 7/1/19 | 700 | 714 |
| New Hampshire Health & Education Facilities Authority Revenue | | | | |
| (Partners Healthcare System Inc.) | 5.000% | 7/1/22 | 565 | 617 |
| New Hampshire Health & Education Facilities Authority Revenue | | | | |
| (Partners Healthcare System Inc.) | 5.000% | 7/1/23 | 400 | 445 |
| New Hampshire Health & Education Facilities Authority Revenue | | | | |
| (Partners Healthcare System Inc.) | 5.000% | 7/1/24 | 1,000 | 1,128 |
| New Hampshire Health & Education Facilities Authority Revenue | | | | |
| (Southern New Hampshire Medical Center) | 4.000% | 10/1/22 | 2,070 | 2,160 |
| New Hampshire Health & Education Facilities Authority Revenue | | | | |
| (Southern New Hampshire Medical Center) | 4.000% | 10/1/23 | 2,355 | 2,467 |
| New Hampshire Health & Education Facilities Authority Revenue | | | | |
| (Southern New Hampshire Medical Center) | 5.000% | 10/1/24 | 1,910 | 2,106 |
| New Hampshire Health & Education Facilities Authority Revenue | | | | |
| (Southern New Hampshire Medical Center) | 4.000% | 10/1/25 | 1,695 | 1,779 |
| New Hampshire Health & Education Facilities Authority Revenue | | | | |
| (Southern New Hampshire University) | 5.000% | 1/1/24 | 1,015 | 1,122 |
| New Hampshire Municipal Bond Bank Revenue | 4.000% | 8/15/21 | 505 | 529 |
| New Hampshire Municipal Bond Bank Revenue | 4.000% | 8/15/22 | 1,000 | 1,061 |
| | | | 31,010 |
| New Jersey (4.5%) | | | | |
| Aberdeen NJ GO | 2.750% | 3/8/19 | 10,548 | 10,571 |
| Atlantic City NJ GO | 5.000% | 11/1/19 | 3,315 | 3,289 |
| Atlantic City NJ GO | 5.000% | 12/1/19 | 6,995 | 6,946 |
| Atlantic City NJ GO | 5.000% | 11/1/20 | 4,025 | 3,945 |
| Atlantic City NJ GO | 5.000% | 12/1/20 | 7,185 | 7,062 |
| Atlantic City NJ GO | 5.000% | 3/1/21 (15) | 300 | 315 |
| Atlantic City NJ GO | 5.000% | 11/1/21 | 3,020 | 2,951 |
| Atlantic City NJ GO | 5.000% | 12/1/21 | 1,970 | 1,914 |
| Atlantic City NJ GO | 5.000% | 3/1/23 (4) | 1,250 | 1,357 |
| Atlantic City NJ GO | 5.000% | 3/1/23 (15) | 500 | 542 |
| Atlantic City NJ GO | 5.000% | 3/1/24 (4) | 1,300 | 1,428 |
| Atlantic City NJ GO | 5.000% | 3/1/24 (15) | 300 | 329 |
| Atlantic City NJ GO | 5.000% | 3/1/25 (4) | 750 | 833 |
| Atlantic City NJ GO | 5.000% | 3/1/25 (15) | 800 | 888 |
| Atlantic City NJ GO | 5.000% | 3/1/26 (4) | 615 | 688 |
| Bergen County NJ GO | 2.500% | 12/13/18 | 40,615 | 40,652 |
| Camden County NJ Improvement Authority Health Care Redevelopment Project Revenue | | | | |
| (Cooper Health System Obligated Group) | 5.000% | 2/15/20 | 2,290 | 2,361 |
| Camden County NJ Improvement Authority Health Care Redevelopment Project Revenue | | | | |
| (Cooper Health System Obligated Group) | 5.000% | 2/15/21 | 2,460 | 2,591 |
| Camden County NJ Improvement Authority Health Care Redevelopment Project Revenue | | | | |
| (Cooper Health System Obligated Group) | 5.000% | 2/15/22 | 2,295 | 2,462 |
| Camden County NJ Improvement Authority Health Care Redevelopment Project Revenue | | | | |
| (Cooper Health System Obligated Group) | 5.000% | 2/15/26 | 2,715 | 2,943 |
| Camden County NJ Improvement Authority Health Care Redevelopment Project Revenue | | | | |
| (Cooper Health System Obligated Group) | 5.000% | 2/15/27 | 2,000 | 2,155 |
| Camden County NJ Improvement Authority Lease Revenue | | | | |
| (Rowan University School of Osteopathic Medicine Project) | 5.000% | 12/1/22 | 1,120 | 1,219 |
| Garden State Preservation Trust New Jersey Revenue (Open Space & Farmland Preservation) | 5.000% | 11/1/20 | 1,390 | 1,451 |
| Garden State Preservation Trust New Jersey Revenue (Open Space & Farmland Preservation) | 5.000% | 11/1/22 (15) | 1,095 | 1,192 |
| Gloucester County NJ Improvement Authority Revenue (Rowan University) | 5.000% | 7/1/19 | 1,700 | 1,734 |
| Gloucester County NJ Improvement Authority Revenue (Rowan University) | 5.000% | 7/1/20 | 1,800 | 1,884 |
| Gloucester County NJ Improvement Authority Revenue (Rowan University) | 5.000% | 7/1/21 | 2,800 | 2,987 |
| Gloucester County NJ Improvement Authority Revenue (Rowan University) | 5.000% | 7/1/22 | 1,200 | 1,302 |
| Gloucester County NJ Improvement Authority Revenue (Rowan University) | 5.000% | 11/1/24 (4) | 1,250 | 1,402 |
| Gloucester County NJ Improvement Authority Revenue (Rowan University) | 5.000% | 11/1/25 (4) | 1,335 | 1,511 |
| Gloucester County NJ Improvement Authority Revenue (Rowan University) | 5.000% | 11/1/26 (4) | 1,285 | 1,468 |
| 3 Inspira Health Obligated Group NJ TOB VRDO | 1.720% | 11/7/18 | 2,175 | 2,175 |
| Morris County NJ Improvement Authority Revenue | 4.000% | 5/1/21 | 2,000 | 2,091 |
| New Jersey Building Authority Revenue | 5.000% | 6/15/19 | 5,455 | 5,540 |
| New Jersey Building Authority Revenue | 5.000% | 6/15/23 | 160 | 172 |
| New Jersey Casino Reinvestment Development Authority Revenue (Luxury Tax) | 5.000% | 11/1/22 | 2,885 | 3,092 |
| New Jersey Casino Reinvestment Development Authority Revenue (Luxury Tax) | 5.000% | 11/1/23 | 535 | 580 |
| New Jersey Economic Development Authority Revenue | 5.000% | 3/1/19 (ETM) | 29,800 | 30,100 |
| New Jersey Economic Development Authority Revenue | 5.000% | 6/15/20 | 1,000 | 1,038 |
| New Jersey Economic Development Authority Revenue | 5.000% | 6/15/21 | 2,000 | 2,105 |
| New Jersey Economic Development Authority Revenue | 5.000% | 6/15/21 | 5,405 | 5,689 |
99
Limited-Term Tax-Exempt Fund
| | | | |
| Face | Market |
| Maturity | Amount | Value• |
| Coupon | Date | ($000) | ($000) |
| New Jersey Economic Development Authority Revenue | 5.000% | 6/15/22 | 3,055 | 3,253 |
| New Jersey Economic Development Authority Revenue | 5.000% | 6/15/22 | 62,735 | 66,807 |
| New Jersey Economic Development Authority Revenue | 5.000% | 6/15/22 | 10,000 | 10,649 |
| New Jersey Economic Development Authority Revenue | 5.000% | 11/1/22 | 750 | 806 |
| New Jersey Economic Development Authority Revenue | 5.000% | 6/15/23 | 7,750 | 8,369 |
| New Jersey Economic Development Authority Revenue | 5.000% | 6/15/23 | 4,000 | 4,319 |
| New Jersey Economic Development Authority Revenue | 5.000% | 6/15/23 | 16,000 | 17,277 |
| New Jersey Economic Development Authority Revenue | 5.000% | 6/15/23 | 6,395 | 6,905 |
| New Jersey Economic Development Authority Revenue | 5.000% | 6/15/24 | 4,000 | 4,344 |
| New Jersey Economic Development Authority Revenue | 5.000% | 6/15/24 | 1,630 | 1,770 |
| New Jersey Economic Development Authority Revenue | 5.000% | 6/15/25 | 2,500 | 2,724 |
| New Jersey Economic Development Authority Revenue (Cigarette Tax) | 5.000% | 6/15/19 | 9,500 | 9,650 |
| New Jersey Economic Development Authority Revenue (Cigarette Tax) | 5.000% | 6/15/20 | 7,000 | 7,259 |
| New Jersey Economic Development Authority Revenue (Motor Vehicle Surcharge) | 4.000% | 7/1/22 | 4,400 | 4,536 |
| New Jersey Economic Development Authority Revenue (Motor Vehicle Surcharge) | 5.000% | 7/1/23 (15) | 7,000 | 7,618 |
| New Jersey Economic Development Authority Revenue (Motor Vehicle Surcharge) | 3.000% | 7/1/24 (15) | 2,705 | 2,673 |
| New Jersey Economic Development Authority Revenue (Provident Group-Rowan Properties LLC) | 5.000% | 1/1/23 | 500 | 536 |
| New Jersey Economic Development Authority Revenue (School Facilities Construction) | 4.000% | 12/15/18 | 275 | 275 |
| New Jersey Economic Development Authority Revenue (School Facilities Construction) | 5.000% | 3/1/19 (ETM) | 15,000 | 15,151 |
| New Jersey Economic Development Authority Revenue (School Facilities Construction) | 5.000% | 12/15/19 | 16,805 | 17,264 |
| New Jersey Economic Development Authority Revenue (School Facilities Construction) | 5.500% | 12/15/19 (2) | 5,000 | 5,164 |
| New Jersey Economic Development Authority Revenue (School Facilities Construction) | 5.000% | 3/1/20 (ETM) | 910 | 944 |
| New Jersey Economic Development Authority Revenue (School Facilities Construction) | 5.000% | 3/1/20 | 8,325 | 8,587 |
| New Jersey Economic Development Authority Revenue (School Facilities Construction) | 5.000% | 6/15/20 | 2,500 | 2,594 |
| New Jersey Economic Development Authority Revenue (School Facilities Construction) | 5.000% | 9/1/20 (ETM) | 5,650 | 5,921 |
| New Jersey Economic Development Authority Revenue (School Facilities Construction) | 5.000% | 9/1/20 | 2,095 | 2,183 |
| New Jersey Economic Development Authority Revenue (School Facilities Construction) | 5.250% | 12/15/20 (2) | 9,670 | 10,178 |
| New Jersey Economic Development Authority Revenue (School Facilities Construction) | 5.250% | 3/1/21 (Prere.) | 13,480 | 14,390 |
| New Jersey Economic Development Authority Revenue (School Facilities Construction) | 5.000% | 9/1/21 | 150 | 157 |
| New Jersey Economic Development Authority Revenue (School Facilities Construction) | 5.000% | 3/1/22 | 830 | 880 |
| New Jersey Economic Development Authority Revenue (School Facilities Construction) | 5.000% | 9/1/22 | 1,365 | 1,429 |
| New Jersey Economic Development Authority Revenue (School Facilities Construction) | 5.250% | 9/1/22 | 4,990 | 5,251 |
| New Jersey Economic Development Authority Revenue (School Facilities Construction) | 5.250% | 9/1/23 | 6,545 | 6,871 |
| New Jersey Economic Development Authority Revenue (School Facilities Construction) | 5.000% | 3/1/25 | 425 | 454 |
| New Jersey Economic Development Authority Revenue (School Facilities Construction) | 5.000% | 6/15/25 | 340 | 371 |
| New Jersey Economic Development Authority Revenue (School Facilities Construction) | 4.250% | 6/15/26 | 1,630 | 1,676 |
| New Jersey Economic Development Authority Revenue | | | | |
| (State Capitol Joint Management Commission) | 5.000% | 6/15/24 | 2,945 | 3,198 |
| New Jersey Economic Development Authority Revenue | | | | |
| (State Capitol Joint Management Commission) | 5.000% | 6/15/25 | 8,200 | 8,936 |
| New Jersey Economic Development Authority Revenue (State Police Barracks Project) | 5.000% | 6/15/23 | 200 | 216 |
| New Jersey Economic Development Authority Revenue | | | | |
| (United Methodist Homes Obligated Group) | 4.000% | 7/1/22 | 1,315 | 1,357 |
| New Jersey Economic Development Authority Revenue (Provident Group- | | | | |
| Montclair Properties LLC - Montclair State University Student Housing Project) | 4.000% | 6/1/21 (4) | 1,850 | 1,916 |
| New Jersey Economic Development Authority Revenue (Provident Group- | | | | |
| Montclair Properties LLC - Montclair State University Student Housing Project) | 4.000% | 6/1/22 (4) | 2,000 | 2,086 |
| New Jersey Economic Development Authority Revenue (Provident Group- | | | | |
| Montclair Properties LLC - Montclair State University Student Housing Project) | 5.000% | 6/1/23 (4) | 2,800 | 3,054 |
| New Jersey Economic Development Authority Revenue (Provident Group- | | | | |
| Montclair Properties LLC - Montclair State University Student Housing Project) | 5.000% | 6/1/24 (4) | 1,155 | 1,274 |
| New Jersey Economic Development Authority Revenue (Provident Group- | | | | |
| Montclair Properties LLC - Montclair State University Student Housing Project) | 5.000% | 6/1/25 (4) | 1,105 | 1,230 |
| New Jersey Economic Development Authority Revenue | | | | |
| (United Methodist Homes of New Jersey Obligated Group) | 4.000% | 7/1/20 | 780 | 797 |
| New Jersey Economic Development Authority Sublease Revenue | | | | |
| (New Jersey Transit Corp. Light Rail Transit System Project) | 5.000% | 5/1/19 | 1,025 | 1,038 |
| New Jersey Economic Development Authority Sublease Revenue | | | | |
| (New Jersey Transit Corp. Projects) | 5.000% | 11/1/19 | 4,925 | 5,046 |
| New Jersey Educational Facilities Authority Revenue (College of New Jersey) | 4.000% | 7/1/20 | 405 | 417 |
| New Jersey Educational Facilities Authority Revenue (College of New Jersey) | 5.000% | 7/1/21 | 500 | 532 |
| New Jersey Educational Facilities Authority Revenue (College of New Jersey) | 5.000% | 7/1/22 | 730 | 790 |
| New Jersey Educational Facilities Authority Revenue (College of New Jersey) | 5.000% | 7/1/23 (15) | 3,955 | 4,371 |
| New Jersey Educational Facilities Authority Revenue (College of New Jersey) | 5.000% | 7/1/23 | 1,000 | 1,098 |
| New Jersey Educational Facilities Authority Revenue (Higher Education Trust Fund) | 5.000% | 6/15/19 | 275 | 279 |
| New Jersey Educational Facilities Authority Revenue (Higher Education Trust Fund) | 5.000% | 6/15/23 | 465 | 502 |
| New Jersey Educational Facilities Authority Revenue (Higher Education Trust Fund) | 5.000% | 6/15/24 | 4,640 | 5,039 |
| New Jersey Educational Facilities Authority Revenue (Higher Education Trust Fund) | 5.000% | 6/15/25 | 4,000 | 4,327 |
| New Jersey Educational Facilities Authority Revenue (Montclair State University) | 5.000% | 7/1/25 | 1,610 | 1,829 |
| New Jersey Educational Facilities Authority Revenue (Princeton University) | 5.000% | 7/1/21 | 15,510 | 16,707 |
100
Limited-Term Tax-Exempt Fund
| | | | |
| Face | Market |
| Maturity | Amount | Value• |
| Coupon | Date | ($000) | ($000) |
| New Jersey Educational Facilities Authority Revenue (Princeton University) | 5.000% | 7/1/23 | 3,125 | 3,503 |
| New Jersey Educational Facilities Authority Revenue (Seton Hall University) | 5.000% | 7/1/21 | 365 | 388 |
| New Jersey GO | 5.000% | 8/15/19 | 8,395 | 8,580 |
| New Jersey Health Care Facilities Financing Authority Lease Revenue | | | | |
| (Greystone Park Psychiatric Hospital Project) | 5.000% | 9/15/24 | 8,000 | 8,607 |
| New Jersey Health Care Facilities Financing Authority Revenue (Barnabas Health) | 4.500% | 7/1/21 (Prere.) | 3,550 | 3,756 |
| New Jersey Health Care Facilities Financing Authority Revenue (Barnabas Health) | 5.000% | 7/1/23 | 2,710 | 2,949 |
| New Jersey Health Care Facilities Financing Authority Revenue (Hackensack Meridian Health) | 5.000% | 7/1/19 | 2,000 | 2,038 |
| New Jersey Health Care Facilities Financing Authority Revenue (Hackensack Meridian Health) | 5.000% | 7/1/21 | 2,120 | 2,266 |
| New Jersey Health Care Facilities Financing Authority Revenue | | | | |
| (Hospital Asset Transformation Program) | 5.250% | 10/1/19 (Prere.) | 9,610 | 9,881 |
| New Jersey Health Care Facilities Financing Authority Revenue | | | | |
| (Hospital Asset Transformation Program) | 5.000% | 10/1/20 | 700 | 730 |
| New Jersey Health Care Facilities Financing Authority Revenue | | | | |
| (Hospital Asset Transformation Program) | 5.000% | 10/1/21 | 1,250 | 1,321 |
| New Jersey Health Care Facilities Financing Authority Revenue | | | | |
| (Hospital Asset Transformation Program) | 5.000% | 10/1/22 | 1,500 | 1,601 |
| New Jersey Health Care Facilities Financing Authority Revenue | | | | |
| (Hospital Asset Transformation Program) | 5.000% | 10/1/24 | 3,380 | 3,677 |
| New Jersey Health Care Facilities Financing Authority Revenue (Inspira Health Obligated Group) | 3.000% | 7/1/19 | 150 | 151 |
| New Jersey Health Care Facilities Financing Authority Revenue (Inspira Health Obligated Group) | 4.000% | 7/1/20 | 140 | 144 |
| New Jersey Health Care Facilities Financing Authority Revenue (Inspira Health Obligated Group) | 5.000% | 7/1/21 | 220 | 235 |
| New Jersey Health Care Facilities Financing Authority Revenue (Inspira Health Obligated Group) | 5.000% | 7/1/22 | 300 | 326 |
| New Jersey Health Care Facilities Financing Authority Revenue (Inspira Health Obligated Group) | 5.000% | 7/1/23 | 240 | 265 |
| New Jersey Health Care Facilities Financing Authority Revenue (Inspira Health Obligated Group) | 5.000% | 7/1/24 | 3,000 | 3,360 |
| New Jersey Health Care Facilities Financing Authority Revenue (Inspira Health Obligated Group) | 5.000% | 7/1/24 | 300 | 336 |
| New Jersey Health Care Facilities Financing Authority Revenue (Inspira Health Obligated Group) | 5.000% | 7/1/25 | 250 | 283 |
| New Jersey Health Care Facilities Financing Authority Revenue | | | | |
| (Inspira Health Obligated Group) | 5.000% | 7/1/26 | 2,400 | 2,742 |
| New Jersey Health Care Facilities Financing Authority Revenue (Princeton Healthcare System) | 5.000% | 7/1/21 | 1,000 | 1,070 |
| New Jersey Health Care Facilities Financing Authority Revenue (Princeton Healthcare System) | 5.000% | 7/1/22 | 1,500 | 1,638 |
| New Jersey Health Care Facilities Financing Authority Revenue (Princeton Healthcare System) | 5.000% | 7/1/23 | 2,000 | 2,221 |
| New Jersey Health Care Facilities Financing Authority Revenue (St. Joseph’s Healthcare System) | 4.000% | 7/1/20 | 1,000 | 1,018 |
| New Jersey Health Care Facilities Financing Authority Revenue (St. Joseph’s Healthcare System) | 5.000% | 7/1/21 | 1,000 | 1,052 |
| New Jersey Health Care Facilities Financing Authority Revenue (St. Joseph’s Healthcare System) | 5.000% | 7/1/22 | 1,500 | 1,600 |
| New Jersey Health Care Facilities Financing Authority Revenue (St. Joseph’s Healthcare System) | 5.000% | 7/1/23 | 3,000 | 3,236 |
| New Jersey Health Care Facilities Financing Authority Revenue | | | | |
| (St. Peter’s University Hospital Obligated Group) | 5.000% | 7/1/20 | 1,000 | 1,022 |
| New Jersey Health Care Facilities Financing Authority Revenue | | | | |
| (Trinitas Hospital Obligated Group) | 5.000% | 7/1/23 | 955 | 1,042 |
| New Jersey Health Care Facilities Financing Authority Revenue (University Hospital) | 5.000% | 7/1/21 (4) | 1,000 | 1,058 |
| New Jersey Health Care Facilities Financing Authority Revenue (University Hospital) | 5.000% | 7/1/25 (4) | 2,380 | 2,662 |
| New Jersey Health Care Facilities Financing Authority Revenue (University Hospital) | 5.000% | 7/1/26 (4) | 1,800 | 2,021 |
| New Jersey Health Care Facilities Financing Authority Revenue (Virtua Health) | 5.500% | 7/1/20 (12) | 5,455 | 5,573 |
| New Jersey Health Facilities Financing Authority Revenue | | | | |
| (St Joseph’s Healthcare System Obligated Group) | 5.000% | 7/1/26 | 1,000 | 1,099 |
| New Jersey Higher Education Assistance Authority Student Loan Revenue | 5.000% | 6/1/19 | 1,500 | 1,523 |
| 3 New Jersey Higher Education Assistance Authority Student Loan Revenue TOB VRDO | 1.640% | 11/7/18 | 6,000 | 6,000 |
| New Jersey Housing & Mortgage Finance Agency Multi-Family Housing Revenue | | | | |
| (Garden Spires Urban Renewal LP) PUT | 2.020% | 8/1/20 | 4,000 | 3,962 |
| New Jersey Housing & Mortgage Finance Agency Multi-Family Housing Revenue | | | | |
| (GK Preservation LLC) PUT | 2.450% | 10/1/20 | 3,750 | 3,747 |
| New Jersey Housing & Mortgage Finance Agency Single Family Housing Revenue | 4.500% | 10/1/48 | 21,760 | 23,120 |
| New Jersey Transportation Corp. GAN | 5.000% | 9/15/20 | 22,550 | 23,594 |
| New Jersey Transportation Trust Fund Authority Federal Highway Reimbursement Revenue | 4.000% | 6/15/19 | 400 | 404 |
| New Jersey Transportation Trust Fund Authority Federal Highway Reimbursement Revenue | 5.000% | 6/15/19 | 16,300 | 16,576 |
| New Jersey Transportation Trust Fund Authority Federal Highway Reimbursement Revenue | 4.000% | 6/15/20 | 300 | 307 |
| New Jersey Transportation Trust Fund Authority Federal Highway Reimbursement Revenue | 5.000% | 6/15/20 | 18,660 | 19,392 |
| New Jersey Transportation Trust Fund Authority Federal Highway Reimbursement Revenue | 5.000% | 6/15/21 | 5,000 | 5,276 |
| New Jersey Transportation Trust Fund Authority Federal Highway Reimbursement Revenue | 5.000% | 6/15/21 | 9,075 | 9,576 |
| New Jersey Transportation Trust Fund Authority Federal Highway Reimbursement Revenue | 5.000% | 6/15/22 | 8,335 | 8,929 |
| New Jersey Transportation Trust Fund Authority Federal Highway Reimbursement Revenue | 5.000% | 6/15/22 | 10,050 | 10,766 |
| New Jersey Transportation Trust Fund Authority Federal Highway Reimbursement Revenue | 5.000% | 6/15/23 | 8,250 | 8,949 |
| New Jersey Transportation Trust Fund Authority Federal Highway Reimbursement Revenue | 5.000% | 6/15/23 | 10,125 | 10,983 |
| New Jersey Transportation Trust Fund Authority Federal Highway Reimbursement Revenue | 5.000% | 6/15/24 | 5,000 | 5,481 |
| New Jersey Transportation Trust Fund Authority Revenue | 5.250% | 12/15/22 (4) | 1,125 | 1,232 |
| New Jersey Transportation Trust Fund Authority Revenue | 5.000% | 12/15/24 | 5,000 | 5,464 |
| New Jersey Transportation Trust Fund Authority Revenue | 5.000% | 6/15/25 | 1,110 | 1,188 |
| New Jersey Transportation Trust Fund Authority Revenue | 5.000% | 12/15/25 | 14,000 | 15,350 |
| New Jersey Transportation Trust Fund Authority Transportation Program Revenue | 5.000% | 6/15/20 | 11,000 | 11,414 |
101
Limited-Term Tax-Exempt Fund
| | | | |
| Face | Market |
| Maturity | Amount | Value• |
| Coupon | Date | ($000) | ($000) |
| New Jersey Transportation Trust Fund Authority Transportation Program Revenue | 5.000% | 6/15/21 | 1,295 | 1,366 |
| New Jersey Transportation Trust Fund Authority Transportation Program Revenue | 5.000% | 6/15/21 | 12,550 | 13,236 |
| New Jersey Transportation Trust Fund Authority Transportation Program Revenue | 5.000% | 6/15/22 | 2,890 | 3,091 |
| New Jersey Transportation Trust Fund Authority Transportation Program Revenue | 5.000% | 6/15/23 | 2,500 | 2,706 |
| 2 New Jersey Transportation Trust Fund Authority Transportation Program Revenue PUT | 2.600% 12/15/19 | | 41,000 | 41,060 |
| 2 New Jersey Transportation Trust Fund Authority Transportation Program Revenue PUT | 2.800% 12/15/21 | | 24,000 | 24,250 |
| New Jersey Transportation Trust Fund Authority Transportation System Revenue | 5.000% 12/15/18 | | 15,810 | 15,861 |
| New Jersey Transportation Trust Fund Authority Transportation System Revenue | 5.000% | 6/15/19 | 2,815 | 2,859 |
| New Jersey Transportation Trust Fund Authority Transportation System Revenue | 4.000% 12/15/19 | | 850 | 864 |
| New Jersey Transportation Trust Fund Authority Transportation System Revenue | 5.000% 12/15/19 | | 31,245 | 32,098 |
| New Jersey Transportation Trust Fund Authority Transportation System Revenue | 5.250% 12/15/19 | | 200 | 206 |
| New Jersey Transportation Trust Fund Authority Transportation System Revenue | 5.000% | 6/15/20 | 14,635 | 15,186 |
| New Jersey Transportation Trust Fund Authority Transportation System Revenue | 5.250% | 12/15/20 (4) | 5,000 | 5,279 |
| New Jersey Transportation Trust Fund Authority Transportation System Revenue | 5.250% | 12/15/20 (4) | 5,800 | 6,123 |
| New Jersey Transportation Trust Fund Authority Transportation System Revenue | 5.250% | 12/15/21 | 850 | 910 |
| New Jersey Transportation Trust Fund Authority Transportation System Revenue | 5.250% | 12/15/22 | 3,750 | 4,065 |
| New Jersey Transportation Trust Fund Authority Transportation System Revenue | 5.250% | 12/15/22 (2) | 1,000 | 1,089 |
| New Jersey Transportation Trust Fund Authority Transportation System Revenue | 5.250% | 12/15/22 (2) | 5,445 | 5,927 |
| New Jersey Transportation Trust Fund Authority Transportation System Revenue | 5.500% | 12/15/22 (14) | 22,000 | 24,232 |
| New Jersey Transportation Trust Fund Authority Transportation System Revenue | 5.500% | 12/15/22 (4) | 4,175 | 4,614 |
| New Jersey Transportation Trust Fund Authority Transportation System Revenue | 5.000% | 12/15/23 | 475 | 517 |
| New Jersey Transportation Trust Fund Authority Transportation System Revenue | 5.250% | 12/15/23 (2) | 230 | 253 |
| New Jersey Transportation Trust Fund Authority Transportation System Revenue | 0.000% | 12/15/26 | 10,000 | 7,124 |
| New Jersey Transportation Trust Fund Authority Transportation System Revenue | 5.875% | 12/15/38 | 20,800 | 20,895 |
| New Jersey Transportation Trust Fund Authority Transportation System Revenue | 6.000% | 12/15/38 | 9,555 | 9,600 |
| New Jersey Turnpike Authority Revenue | 5.000% | 1/1/20 (ETM) | 145 | 150 |
| New Jersey Turnpike Authority Revenue | 5.000% | 1/1/20 | 605 | 625 |
| 2 New Jersey Turnpike Authority Revenue | 1.919% | 1/1/21 | 2,500 | 2,499 |
| New Jersey Turnpike Authority Revenue | 5.000% | 1/1/21 | 1,000 | 1,058 |
| 2 New Jersey Turnpike Authority Revenue | 2.059% | 1/1/22 | 3,495 | 3,498 |
| 2 New Jersey Turnpike Authority Revenue | 2.059% | 1/1/22 | 4,530 | 4,534 |
| New Jersey Turnpike Authority Revenue | 5.000% | 1/1/25 | 3,500 | 3,969 |
| 2 New Jersey Turnpike Authority Revenue PUT | 2.039% | 1/1/21 | 22,065 | 22,111 |
| 2 New Jersey Turnpike Authority Revenue PUT | 2.329% | 1/1/23 | 10,000 | 10,070 |
| North Hudson NJ Sewerage Authority Revenue | 0.000% | 8/1/25 (14)(ETM) | 9,000 | 7,421 |
| Rutgers State University New Jersey Revenue | 5.000% | 5/1/19 | 1,000 | 1,015 |
| Rutgers State University New Jersey Revenue | 5.000% | 5/1/19 | 1,000 | 1,015 |
| Rutgers State University New Jersey Revenue | 5.000% | 5/1/20 | 2,000 | 2,086 |
| Rutgers State University New Jersey Revenue VRDO | 1.680% | 11/1/18 | 21,865 | 21,865 |
| South Jersey Transportation Authority New Jersey Transportation System Revenue | 5.000% | 11/1/20 | 2,145 | 2,248 |
| Sparta Township NJ Board of Education GO | 5.000% | 2/15/21 | 1,030 | 1,093 |
| Tobacco Settlement Financing Corp. New Jersey Revenue | 5.000% | 6/1/19 | 2,500 | 2,538 |
| Tobacco Settlement Financing Corp. New Jersey Revenue | 5.000% | 6/1/20 | 2,030 | 2,108 |
| Tobacco Settlement Financing Corp. New Jersey Revenue | 5.000% | 6/1/21 | 3,550 | 3,758 |
| Tobacco Settlement Financing Corp. New Jersey Revenue | 5.000% | 6/1/22 | 1,750 | 1,884 |
| Tobacco Settlement Financing Corp. New Jersey Revenue | 5.000% | 6/1/23 | 1,500 | 1,637 |
| Tobacco Settlement Financing Corp. New Jersey Revenue | 5.000% | 6/1/24 | 8,010 | 8,840 |
| Tobacco Settlement Financing Corp. New Jersey Revenue | 5.000% | 6/1/25 | 9,610 | 10,689 |
| Tobacco Settlement Financing Corp. New Jersey Revenue | 3.200% | 6/1/27 | 15,500 | 15,219 |
| Trenton NJ GO | 4.000% | 7/15/22 (4) | 2,000 | 2,104 |
| Trenton NJ GO | 4.000% | 7/15/23 (4) | 1,500 | 1,592 |
| Union County NJ GO | 4.000% | 2/15/19 | 4,255 | 4,281 |
| Union County NJ GO | 5.000% | 2/15/21 | 5,615 | 5,975 |
| Union County NJ GO | 5.000% | 2/15/22 | 6,275 | 6,831 |
| | | | 1,163,036 |
| New Mexico (1.2%) | | | | |
| Albuquerque Bernalillo County NM Water Utility Authority Revenue | 5.000% | 7/1/20 | 2,000 | 2,094 |
| Albuquerque Bernalillo County NM Water Utility Authority Revenue | 5.000% | 7/1/20 | 3,225 | 3,377 |
| Albuquerque NM Municipal School District No. 12 GO | 5.000% | 8/1/20 | 1,800 | 1,888 |
| Albuquerque NM Municipal School District No. 12 GO | 5.000% | 8/1/20 | 6,580 | 6,900 |
| Albuquerque NM Municipal School District No. 12 GO | 5.000% | 8/1/21 | 1,130 | 1,212 |
| Albuquerque NM Municipal School District No. 12 GO | 5.000% | 8/1/21 | 5,450 | 5,847 |
| Albuquerque NM Municipal School District No. 12 GO | 5.000% | 8/1/21 | 1,200 | 1,287 |
| Albuquerque NM Municipal School District No. 12 GO | 5.000% | 8/1/22 | 2,250 | 2,464 |
| Farmington NM Pollution Control Revenue | | | | |
| (Southern California Edison Co. Four Corners Project) PUT | 1.875% | 4/1/20 | 19,000 | 18,794 |
| New Mexico Finance Authority Transportation Revenue | 5.000% | 6/15/23 | 26,290 | 29,261 |
| New Mexico Finance Authority Transportation Revenue | 5.000% | 6/15/24 | 107,540 | 121,671 |
| New Mexico Finance Authority Transportation Revenue | 4.000% | 6/15/25 | 13,765 | 14,446 |
102
Limited-Term Tax-Exempt Fund
| | | | |
| Face | Market |
| Maturity | Amount | Value• |
| Coupon | Date | ($000) | ($000) |
| New Mexico Finance Authority Transportation Revenue | 5.000% | 6/15/25 | 9,175 | 10,530 |
| New Mexico Hospital Equipment Loan Council Hospital System Revenue | | | | |
| (Presbyterian Healthcare Services) | 5.000% | 8/1/21 | 1,600 | 1,713 |
| 2 New Mexico Municipal Energy Acquisition Authority Gas Supply Revenue PUT | 2.262% | 8/1/19 | 66,445 | 66,435 |
| New Mexico Municipal Energy Acquisition Authority Gas Supply Revenue PUT | 5.000% | 8/1/19 | 26,475 | 26,983 |
| | | | 314,902 |
| New York (13.4%) | | | | |
| Amherst NY Development Corp. Student Housing Facility Revenue | 5.000% | 10/1/21 | 500 | 538 |
| Amherst NY Development Corp. Student Housing Facility Revenue | 5.000% | 10/1/22 | 1,000 | 1,095 |
| Amherst NY Development Corp. Student Housing Facility Revenue | 5.000% | 10/1/24 (4) | 1,000 | 1,127 |
| 3 Battery Park City Authority New York Revenue TOB VRDO | 1.690% | 11/1/18 LOC | 10,225 | 10,225 |
| Brookhaven NY Local Development Corp. Revenue (Jefferson’s Ferry Project) | 5.000% | 11/1/22 | 500 | 543 |
| Brookhaven NY Local Development Corp. Revenue (Jefferson’s Ferry Project) | 5.000% | 11/1/23 | 600 | 661 |
| Brooklyn NY Local Development Corp. PILOT Revenue (Brooklyn Events Center) | 5.000% | 7/15/21 | 1,100 | 1,171 |
| Brooklyn NY Local Development Corp. PILOT Revenue (Brooklyn Events Center) | 5.000% | 7/15/22 | 2,100 | 2,274 |
| Brooklyn NY Local Development Corp. PILOT Revenue (Brooklyn Events Center) | 5.000% | 7/15/23 | 2,720 | 2,983 |
| Brooklyn NY Local Development Corp. PILOT Revenue (Brooklyn Events Center) | 5.000% | 7/15/24 | 1,500 | 1,654 |
| Brooklyn NY Local Development Corp. PILOT Revenue (Brooklyn Events Center) | 5.000% | 7/15/25 | 2,000 | 2,221 |
| Buffalo & Erie County NY Industrial Land Development Corp. Revenue | 5.000% | 11/15/20 | 1,265 | 1,320 |
| Buffalo & Erie County NY Industrial Land Development Corp. Revenue | 5.000% | 11/15/21 | 1,355 | 1,435 |
| Buffalo & Erie County NY Industrial Land Development Corp. Revenue | 5.000% | 7/1/26 | 450 | 497 |
| Buffalo & Erie County NY Industrial Land Development Corp. Revenue | | | | |
| (Catholic Health System Obligated Group) | 5.000% | 7/1/24 | 1,055 | 1,174 |
| Copiague Union NY Free School District GO | 2.500% | 2/20/19 | 21,000 | 21,027 |
| Dutchess County NY Local Development Corp. Revenue (Culinary Institute of America Project) | 5.000% | 7/1/20 | 1,000 | 1,041 |
| Dutchess County NY Local Development Corp. Revenue (Culinary Institute of America Project) | 5.000% | 7/1/21 | 300 | 319 |
| Dutchess County NY Local Development Corp. Revenue (Culinary Institute of America Project) | 5.000% | 7/1/22 | 300 | 324 |
| Dutchess County NY Local Development Corp. Revenue (Culinary Institute of America Project) | 5.000% | 7/1/23 | 350 | 383 |
| Dutchess County NY Local Development Corp. Revenue (Culinary Institute of America Project) | 5.000% | 7/1/24 | 350 | 388 |
| Hempstead NY Local Development Corp. Revenue (Molloy College) | 4.000% | 7/1/19 | 1,000 | 1,011 |
| Hempstead NY Local Development Corp. Revenue (Molloy College) | 5.000% | 7/1/21 | 250 | 266 |
| Hempstead NY Local Development Corp. Revenue (Molloy College) | 5.000% | 7/1/21 | 430 | 457 |
| Hempstead NY Local Development Corp. Revenue (Molloy College) | 5.000% | 7/1/22 | 265 | 286 |
| Hempstead NY Local Development Corp. Revenue (Molloy College) | 5.000% | 7/1/23 | 275 | 301 |
| Hempstead NY Local Development Corp. Revenue (Molloy College) | 5.000% | 7/1/23 | 1,435 | 1,570 |
| Hempstead NY Local Development Corp. Revenue (Molloy College) | 5.000% | 7/1/24 | 290 | 320 |
| Hempstead NY Local Development Corp. Revenue (Molloy College) | 5.000% | 7/1/25 | 305 | 339 |
| Hempstead NY Local Development Corp. Revenue (Molloy College) | 5.000% | 7/1/25 | 800 | 890 |
| Hempstead NY Local Development Corp. Revenue (Molloy College) | 5.000% | 7/1/26 | 320 | 357 |
| Hempstead NY Local Development Corp. Revenue (Molloy College) | 5.000% | 7/1/27 | 335 | 375 |
| Lockport NY BAN | 2.500% | 12/12/18 | 5,775 | 5,780 |
| Long Island NY Power Authority Electric System Revenue | 5.500% | 4/1/19 (Prere.) | 1,895 | 1,924 |
| Long Island NY Power Authority Electric System Revenue | 5.000% | 5/1/19 (ETM) | 1,500 | 1,524 |
| Long Island NY Power Authority Electric System Revenue | 5.000% | 9/1/20 | 1,295 | 1,362 |
| Long Island NY Power Authority Electric System Revenue | 5.000% | 9/1/21 | 1,295 | 1,392 |
| Long Island NY Power Authority Electric System Revenue | 5.000% | 9/1/21 | 1,000 | 1,075 |
| Long Island NY Power Authority Electric System Revenue | 5.000% | 9/1/22 | 2,055 | 2,254 |
| Long Island NY Power Authority Electric System Revenue | 5.000% | 9/1/22 | 750 | 823 |
| Long Island NY Power Authority Electric System Revenue | 5.000% | 9/1/23 | 1,010 | 1,128 |
| Long Island NY Power Authority Electric System Revenue | 5.000% | 9/1/24 | 750 | 848 |
| 2 Metropolitan NY Transportation Authority PUT | 2.189% | 7/1/21 | 40,000 | 40,000 |
| Metropolitan Transportation Authority NY BANS | 5.000% | 9/1/20 | 4,825 | 5,053 |
| Metropolitan Transportation Authority NY BANS | 5.000% | 5/15/21 | 20,000 | 21,273 |
| Metropolitan Transportation Authority NY BANS | 5.000% | 5/15/21 | 49,175 | 52,305 |
| Metropolitan Transportation Authority NY BANS | 5.000% | 5/15/21 | 12,500 | 13,296 |
| Metropolitan Transportation Authority NY BANS | 5.000% | 9/1/21 | 62,800 | 67,138 |
| 2 Metropolitan Transportation Authority NY Revenue PUT | 1.857% | 4/1/21 (4) | 33,375 | 33,241 |
| Metropolitan Transportation Authority Revenue PUT | 5.000% | 11/15/22 | 42,760 | 46,702 |
| Monroe County NY Industrial Development Agency School Facility Revenue | | | | |
| (Rochester Schools Modernization Project) | 5.000% | 5/1/19 | 2,000 | 2,030 |
| Monroe County NY Industrial Development Agency School Facility Revenue | | | | |
| (Rochester Schools Modernization Project) | 5.000% | 5/1/19 | 3,520 | 3,573 |
| Monroe County NY Industrial Development Agency School Facility Revenue | | | | |
| (Rochester Schools Modernization Project) | 5.000% | 5/1/24 | 1,400 | 1,589 |
| Monroe County NY Industrial Development Agency School Facility Revenue | | | | |
| (Rochester Schools Modernization Project) | 5.000% | 5/1/25 | 1,700 | 1,953 |
| Monroe County NY Industrial Development Corp. Revenue (University of Rochester Project) | 5.000% | 7/1/21 | 1,350 | 1,449 |
| Monroe County NY Industrial Development Corp. Revenue (University of Rochester Project) | 5.000% | 7/1/21 | 745 | 800 |
| Monroe County NY Industrial Development Corp. Revenue (University of Rochester Project) | 5.000% | 7/1/22 | 1,930 | 2,118 |
103
Limited-Term Tax-Exempt Fund
| | | | |
| Face | Market |
| Maturity | Amount | Value• |
| Coupon | Date | ($000) | ($000) |
| Monroe County NY Industrial Development Corp. Revenue (University of Rochester Project) | 5.000% | 7/1/22 | 480 | 527 |
| Monroe County NY Industrial Development Corp. Revenue (University of Rochester Project) | 5.000% | 7/1/23 | 1,115 | 1,245 |
| Monroe County NY Industrial Development Corp. Revenue (University of Rochester Project) | 5.000% | 7/1/23 | 1,000 | 1,117 |
| Monroe County NY Industrial Development Corp. Revenue (University of Rochester Project) | 5.000% | 7/1/25 | 720 | 829 |
| Monroe County NY Industrial Development Corp. Revenue (University of Rochester Project) | 5.000% | 7/1/25 | 400 | 461 |
| Nassau County NY GO | 5.000% | 4/1/20 | 14,340 | 14,918 |
| Nassau County NY GO | 5.000% | 4/1/21 | 11,075 | 11,765 |
| Nassau County NY GO | 5.000% | 1/1/22 | 9,685 | 10,441 |
| Nassau County NY Local Economic Assistance & Financing Corp. Revenue | | | | |
| (Catholic Health Services) | 5.000% | 7/1/19 | 7,965 | 8,104 |
| Nassau County NY Local Economic Assistance & Financing Corp. Revenue | | | | |
| (Catholic Health Services) | 5.000% | 7/1/20 | 4,650 | 4,837 |
| Nassau County NY Local Economic Assistance & Financing Corp. Revenue | | | | |
| (South Nassau Communities Hospital) | 5.000% | 7/1/20 | 1,660 | 1,730 |
| Nassau County NY Local Economic Assistance & Financing Corp. Revenue | | | | |
| (Winthrop University Hospital Association Project) | 5.000% | 7/1/19 | 1,565 | 1,591 |
| Nassau County NY Local Economic Assistance & Financing Corp. Revenue | | | | |
| (Winthrop University Hospital Association Project) | 5.000% | 7/1/20 | 170 | 177 |
| Nassau County NY Local Economic Assistance Corp. Revenue | | | | |
| (Catholic Health Services of Long Island Obligated Group Project) | 4.000% | 7/1/19 | 375 | 379 |
| Nassau County NY Local Economic Assistance Corp. Revenue | | | | |
| (Catholic Health Services of Long Island Obligated Group Project) | 5.000% | 7/1/21 | 1,340 | 1,423 |
| New York City Health & Hospital Corp. Revenue | 5.000% | 2/15/22 | 1,900 | 1,969 |
| New York City NY Build NYC Resource Corp. Revenue (Ethical Culture Fieldston Project) | 4.000% | 6/1/19 | 850 | 859 |
| New York City NY Build NYC Resource Corp. Revenue (Ethical Culture Fieldston Project) | 5.000% | 6/1/20 | 600 | 626 |
| New York City NY Build NYC Resource Corp. Revenue (Ethical Culture Fieldston Project) | 5.000% | 6/1/21 | 1,000 | 1,067 |
| New York City NY Build NYC Resource Corp. Revenue (Ethical Culture Fieldston Project) | 5.000% | 6/1/22 | 745 | 810 |
| New York City NY GO | 4.000% | 8/1/19 | 12,165 | 12,348 |
| New York City NY GO | 5.000% | 8/1/19 | 15,000 | 15,336 |
| New York City NY GO | 5.000% | 8/1/19 | 8,000 | 8,179 |
| New York City NY GO | 5.000% | 8/1/19 | 15,000 | 15,336 |
| New York City NY GO | 5.000% | 8/1/19 | 5,830 | 5,961 |
| New York City NY GO | 5.000% | 8/1/19 | 20,155 | 20,607 |
| New York City NY GO | 5.000% | 8/1/19 | 7,225 | 7,387 |
| New York City NY GO | 5.000% | 8/1/19 | 5,000 | 5,112 |
| New York City NY GO | 5.000% | 8/1/19 | 5,000 | 5,112 |
| New York City NY GO | 5.000% | 8/1/20 | 4,500 | 4,722 |
| New York City NY GO | 5.000% | 8/1/20 | 20,000 | 20,986 |
| New York City NY GO | 5.000% | 8/1/20 | 15,000 | 15,739 |
| New York City NY GO | 5.000% | 10/1/20 | 4,375 | 4,610 |
| New York City NY GO | 5.000% | 8/1/21 | 11,985 | 12,871 |
| New York City NY GO | 5.000% | 8/1/21 | 2,000 | 2,148 |
| New York City NY GO | 5.000% | 8/1/21 | 4,000 | 4,296 |
| New York City NY GO | 5.000% | 8/1/21 | 6,100 | 6,551 |
| New York City NY GO | 5.000% | 8/1/21 | 9,000 | 9,665 |
| New York City NY GO | 5.000% | 8/1/21 | 10,000 | 10,739 |
| New York City NY GO | 5.000% | 8/1/21 | 23,000 | 24,701 |
| New York City NY GO | 5.000% | 8/1/21 | 12,000 | 12,887 |
| New York City NY GO | 5.000% | 8/1/21 | 5,890 | 6,326 |
| New York City NY GO | 5.000% | 8/1/21 | 17,280 | 18,558 |
| New York City NY GO | 5.000% | 8/1/22 | 14,640 | 16,051 |
| New York City NY GO | 5.000% | 8/1/22 | 40,940 | 44,885 |
| New York City NY GO | 5.000% | 8/1/22 | 4,275 | 4,687 |
| New York City NY GO | 5.000% | 8/1/22 | 5,000 | 5,482 |
| New York City NY GO | 5.000% | 8/1/22 | 12,880 | 14,121 |
| New York City NY GO | 5.000% | 8/1/22 | 6,165 | 6,759 |
| New York City NY GO | 5.000% | 8/1/22 | 1,495 | 1,639 |
| New York City NY GO | 5.000% | 8/1/22 | 4,000 | 4,385 |
| New York City NY GO | 5.000% | 8/1/23 | 10,000 | 11,155 |
| New York City NY GO | 5.000% | 8/1/23 | 14,800 | 16,509 |
| New York City NY GO | 5.000% | 8/1/23 | 2,415 | 2,694 |
| New York City NY GO | 5.000% | 8/1/23 | 20,000 | 22,310 |
| New York City NY GO | 5.000% | 8/1/24 | 3,400 | 3,854 |
| New York City NY GO | 5.000% | 8/1/24 | 3,300 | 3,741 |
| New York City NY GO | 5.000% | 8/1/24 | 5,500 | 6,235 |
| New York City NY GO | 5.000% | 8/1/25 | 3,205 | 3,672 |
| New York City NY GO | 5.000% | 8/1/25 | 4,010 | 4,446 |
| New York City NY GO | 5.000% | 8/1/27 | 5,770 | 6,211 |
| 3 New York City NY GO TOB VRDO | 1.700% | 11/1/18 LOC | 13,000 | 13,000 |
| New York City NY GO VRDO | 1.680% | 11/1/18 | 26,275 | 26,275 |
104
Limited-Term Tax-Exempt Fund
| | | | |
| Face | Market |
| Maturity | Amount | Value• |
| Coupon | Date | ($000) | ($000) |
| New York City NY GO VRDO | 1.600% | 11/7/18 LOC | 30,000 | 30,000 |
| New York City NY GO VRDO | 1.600% | 11/7/18 | 55,000 | 55,000 |
| New York City NY Health & Hospital Corp. Revenue (Health System) | 5.000% | 2/15/21 | 3,075 | 3,269 |
| New York City NY Health & Hospital Corp. Revenue (Health System) | 5.000% | 2/15/25 | 12,625 | 13,065 |
| New York City NY Housing Development Corp. Multi-Family Housing Revenue | 1.500% | 11/1/18 | 7,880 | 7,880 |
| New York City NY Housing Development Corp. Multi-Family Housing Revenue | 1.500% | 11/1/18 | 8,890 | 8,890 |
| New York City NY Housing Development Corp. Multi-Family Housing Revenue | 1.650% | 5/1/19 | 17,820 | 17,809 |
| New York City NY Housing Development Corp. Multi-Family Housing Revenue | 5.000% | 7/1/19 | 4,300 | 4,384 |
| New York City NY Housing Development Corp. Multi-Family Housing Revenue | 5.000% | 7/1/20 | 4,760 | 4,978 |
| New York City NY Housing Development Corp. Multi-Family Housing Revenue | 1.700% | 7/1/21 | 8,350 | 8,202 |
| New York City NY Housing Development Corp. Multi-Family Housing Revenue | 2.350% | 7/1/22 | 17,250 | 17,112 |
| New York City NY Housing Development Corp. Sustainable Neighborhood Revenue | 1.300% | 11/1/19 | 13,500 | 13,348 |
| New York City NY Housing Development Corp. Sustainable Neighborhood Revenue | 1.375% | 5/1/20 | 5,750 | 5,675 |
| New York City NY Housing Development Corp. Sustainable Neighborhood Revenue PUT | 1.450% | 4/29/20 | 4,000 | 3,942 |
| New York City NY Housing Development Corp. Sustainable Neighborhood Revenue PUT | 2.000% | 12/31/21 | 7,000 | 6,902 |
| New York City NY Industrial Development Agency PILOT Revenue (Yankee Stadium Project) | 0.000% | 3/1/26 (12) | 5,000 | 3,959 |
| New York City NY Municipal Water Finance Authority Water & Sewer System Revenue | 5.000% | 6/15/19 | 5,000 | 5,096 |
| New York City NY Municipal Water Finance Authority Water & Sewer System Revenue | 5.000% | 6/15/24 | 11,000 | 12,545 |
| New York City NY Municipal Water Finance Authority Water & Sewer System Revenue VRDO | 1.690% | 11/1/18 | 7,975 | 7,975 |
| New York City NY Municipal Water Finance Authority Water & Sewer System Revenue VRDO | 1.600% | 11/7/18 | 30,000 | 30,000 |
| New York City NY Municipal Water Finance Authority Water & Sewer System Revenue VRDO | 1.600% | 11/8/18 | 27,230 | 27,230 |
| New York City NY Municipal Water Finance Authority Water & Sewer System Revenue VRDO | 1.600% | 11/8/18 | 26,450 | 26,450 |
| New York City NY Municipal Water Finance Authority Water & Sewer System Revenue VRDO | 1.610% | 11/8/18 | 31,855 | 31,855 |
| New York City NY Sales Tax Asset Receivable Corp. Revenue | 5.000% | 10/15/21 | 19,510 | 21,104 |
| New York City NY Transitional Finance Authority Building Aid Revenue | 5.000% | 7/15/19 (ETM) | 1,000 | 1,021 |
| New York City NY Transitional Finance Authority Building Aid Revenue | 5.000% | 7/15/20 (ETM) | 1,500 | 1,573 |
| New York City NY Transitional Finance Authority Building Aid Revenue | 5.000% | 7/15/21 (ETM) | 1,520 | 1,635 |
| New York City NY Transitional Finance Authority Building Aid Revenue | 5.000% | 7/15/22 (ETM) | 4,585 | 5,044 |
| New York City NY Transitional Finance Authority Building Aid Revenue | 5.000% | 7/15/24 | 1,035 | 1,171 |
| New York City NY Transitional Finance Authority Future Tax Revenue | 5.000% | 11/1/18 | 7,455 | 7,455 |
| New York City NY Transitional Finance Authority Future Tax Revenue | 5.000% | 11/15/18 | 11,950 | 11,964 |
| New York City NY Transitional Finance Authority Future Tax Revenue | 5.000% | 11/1/19 | 8,560 | 8,816 |
| New York City NY Transitional Finance Authority Future Tax Revenue | 5.000% | 2/1/20 | 6,395 | 6,628 |
| New York City NY Transitional Finance Authority Future Tax Revenue | 5.000% | 2/1/20 | 8,925 | 9,250 |
| New York City NY Transitional Finance Authority Future Tax Revenue | 5.000% | 11/1/20 | 3,090 | 3,260 |
| New York City NY Transitional Finance Authority Future Tax Revenue | 5.000% | 11/1/21 | 7,925 | 8,572 |
| New York City NY Transitional Finance Authority Future Tax Revenue | 5.000% | 11/1/21 | 9,000 | 9,735 |
| New York City NY Transitional Finance Authority Future Tax Revenue | 5.000% | 11/1/22 | 6,000 | 6,613 |
| New York City NY Transitional Finance Authority Future Tax Revenue | 5.000% | 2/1/25 | 1,535 | 1,657 |
| New York City Transitional Finance Authority Future Tax Secured Revenue | 5.000% | 8/1/24 | 5,500 | 6,232 |
| 3 New York City Transitional Finance Authority Future Tax Secured Revenue TOB VRDO | 1.700% | 11/1/18 LOC | 28,780 | 28,780 |
| New York Convention Center Development Corp. Revenue | 5.000% | 11/15/21 | 2,010 | 2,171 |
| New York Convention Center Development Corp. Revenue | 5.000% | 11/15/22 | 1,040 | 1,146 |
| 3 New York Liberty Development Corp. Revenue (Goldman Sachs Headquarters) TOB VRDO | 1.900% | 11/7/18 | 4,464 | 4,464 |
| New York Metropolitan Transportation Authority Revenue | 5.000% | 11/15/18 | 1,500 | 1,502 |
| New York Metropolitan Transportation Authority Revenue | 5.000% | 11/15/18 | 2,520 | 2,523 |
| New York Metropolitan Transportation Authority Revenue | 4.000% | 5/15/19 | 5,110 | 5,165 |
| New York Metropolitan Transportation Authority Revenue | 5.000% | 11/15/19 | 1,100 | 1,133 |
| New York Metropolitan Transportation Authority Revenue | 5.000% | 11/15/19 | 2,530 | 2,605 |
| New York Metropolitan Transportation Authority Revenue | 5.000% | 11/15/19 | 4,725 | 4,866 |
| New York Metropolitan Transportation Authority Revenue | 5.500% | 11/15/19 (14) | 5,000 | 5,174 |
| New York Metropolitan Transportation Authority Revenue | 5.000% | 11/15/20 | 1,560 | 1,646 |
| New York Metropolitan Transportation Authority Revenue | 5.000% | 11/15/20 | 5,000 | 5,274 |
| New York Metropolitan Transportation Authority Revenue | 5.000% | 11/15/21 | 1,230 | 1,325 |
| New York Metropolitan Transportation Authority Revenue | 5.000% | 11/15/21 | 1,500 | 1,616 |
| New York Metropolitan Transportation Authority Revenue | 5.000% | 11/15/21 | 5,000 | 5,386 |
| New York Metropolitan Transportation Authority Revenue | 5.000% | 11/15/21 | 1,780 | 1,917 |
| New York Metropolitan Transportation Authority Revenue | 5.000% | 11/15/22 | 1,000 | 1,097 |
| New York Metropolitan Transportation Authority Revenue | 5.000% | 11/15/22 | 16,145 | 17,705 |
| New York Metropolitan Transportation Authority Revenue | 5.000% | 11/15/22 | 2,275 | 2,495 |
| New York Metropolitan Transportation Authority Revenue | 5.000% | 11/15/23 | 1,000 | 1,112 |
| New York Metropolitan Transportation Authority Revenue | 5.000% | 11/15/23 | 35,310 | 39,268 |
| New York Metropolitan Transportation Authority Revenue | 5.000% | 11/15/24 | 27,915 | 31,353 |
| New York Metropolitan Transportation Authority Revenue | 5.000% | 11/15/24 | 2,785 | 3,031 |
| New York Metropolitan Transportation Authority Revenue | 5.000% | 11/15/25 | 25,035 | 28,359 |
| New York Metropolitan Transportation Authority Revenue | 5.000% | 11/15/25 | 2,360 | 2,563 |
| 2 New York Metropolitan Transportation Authority Revenue (Dedicated Tax Fund) | 2.550% | 11/1/19 | 9,300 | 9,364 |
| New York Metropolitan Transportation Authority Revenue (Dedicated Tax Fund) | 5.000% | 11/15/19 (ETM) | 835 | 862 |
| New York Metropolitan Transportation Authority Revenue (Dedicated Tax Fund) | 5.000% | 11/15/19 | 165 | 170 |
| New York Metropolitan Transportation Authority Revenue (Dedicated Tax Fund) | 5.000% | 11/15/20 (ETM) | 1,025 | 1,085 |
105
Limited-Term Tax-Exempt Fund
| | | | |
| Face | Market |
| Maturity | Amount | Value• |
| Coupon | Date | ($000) | ($000) |
| New York Metropolitan Transportation Authority Revenue (Dedicated Tax Fund) | 5.000% 11/15/20 | | 1,375 | 1,450 |
| New York Metropolitan Transportation Authority Revenue (Dedicated Tax Fund) | 5.000% 11/15/20 | | 4,600 | 4,864 |
| New York Metropolitan Transportation Authority Revenue (Dedicated Tax Fund) | 5.000% 11/15/23 | | 2,500 | 2,808 |
| New York Metropolitan Transportation Authority Revenue (Dedicated Tax Fund) | 5.000% 11/15/27 | | 2,110 | 2,305 |
| 2 New York Metropolitan Transportation Authority Revenue (Dedicated Tax Fund) PUT | 2.050% | 11/1/19 | 2,750 | 2,753 |
| 2 New York Metropolitan Transportation Authority Revenue (Dedicated Tax Fund) PUT | 2.180% | 11/1/19 | 23,500 | 23,538 |
| New York Metropolitan Transportation Authority Revenue (Hudson Yards Development) | 5.000% 11/15/46 | | 32,750 | 33,534 |
| New York Metropolitan Transportation Authority Revenue (Transit Revenue) | 5.000% 11/15/18 | | 4,000 | 4,005 |
| New York Metropolitan Transportation Authority Revenue (Transit Revenue) | 5.000% 11/15/19 | | 3,500 | 3,604 |
| 2 New York Metropolitan Transportation Authority Revenue PUT | 1.812% | 11/1/19 | 10,995 | 10,957 |
| 2 New York Metropolitan Transportation Authority Revenue PUT | 2.212% | 2/1/20 | 9,500 | 9,499 |
| New York Metropolitan Transportation Authority Revenue PUT | 5.000% | 2/15/20 | 54,175 | 56,030 |
| 2 New York Metropolitan Transportation Authority Revenue PUT | 2.127% | 4/6/20 (4) | 7,000 | 7,012 |
| 2 New York Metropolitan Transportation Authority Revenue PUT | 2.180% | 6/1/20 | 88,350 | 88,464 |
| New York Metropolitan Transportation Authority Revenue PUT | 4.000% | 11/15/20 | 11,000 | 11,313 |
| New York Metropolitan Transportation Authority Revenue PUT | 5.000% | 11/15/20 | 50,050 | 52,570 |
| 2 New York Metropolitan Transportation Authority Revenue PUT | 2.050% | 11/15/22 | 10,000 | 9,981 |
| New York NY GO | 5.000% | 8/1/23 | 31,255 | 34,865 |
| New York NY GO | 5.000% | 8/1/24 | 43,695 | 49,533 |
| New York NY GO | 5.000% | 8/1/25 | 49,245 | 56,416 |
| New York NY GO VRDO | 1.670% | 11/1/18 | 21,900 | 21,900 |
| New York State Dormitory Authority Revenue | 5.000% | 3/15/24 | 42,500 | 47,966 |
| New York State Dormitory Authority Revenue | 5.000% | 7/1/24 | 2,000 | 2,276 |
| New York State Dormitory Authority Revenue | 5.000% | 10/1/24 | 5,000 | 5,663 |
| New York State Dormitory Authority Revenue | 5.000% | 3/15/25 | 3,935 | 4,350 |
| New York State Dormitory Authority Revenue | 5.000% | 3/15/25 | 37,455 | 42,912 |
| New York State Dormitory Authority Revenue | 5.000% | 7/1/25 | 2,000 | 2,312 |
| New York State Dormitory Authority Revenue | 5.000% | 10/1/25 | 5,000 | 5,728 |
| New York State Dormitory Authority Revenue | 5.000% | 10/1/25 (4) | 3,500 | 4,009 |
| New York State Dormitory Authority Revenue (Brooklyn Law School) | 5.000% | 7/1/19 (ETM) | 2,180 | 2,224 |
| New York State Dormitory Authority Revenue (Columbia University) | 5.000% | 10/1/21 | 1,540 | 1,666 |
| New York State Dormitory Authority Revenue (Department of Health) | 5.000% | 7/1/22 | 8,500 | 9,295 |
| New York State Dormitory Authority Revenue (Department of Health) | 5.000% | 7/1/23 | 6,590 | 7,335 |
| New York State Dormitory Authority Revenue (Icahn School of Medicine at Mount Sinai) | 4.000% | 7/1/20 | 5,000 | 5,139 |
| New York State Dormitory Authority Revenue (Icahn School of Medicine at Mount Sinai) | 5.000% | 7/1/21 | 2,265 | 2,418 |
| New York State Dormitory Authority Revenue (Icahn School of Medicine at Mount Sinai) | 5.000% | 7/1/22 | 4,000 | 4,352 |
| New York State Dormitory Authority Revenue (Montefiore Obligated Group) | 5.000% | 8/1/24 | 2,000 | 2,217 |
| New York State Dormitory Authority Revenue (Montefiore Obligated Group) | 5.000% | 8/1/25 | 3,535 | 3,948 |
| New York State Dormitory Authority Revenue (Mount Sinai Hospital Obligated Group) | 5.000% | 7/1/22 | 5,995 | 6,265 |
| New York State Dormitory Authority Revenue | | | | |
| (Mount Sinai School of Medicine of New York University) | 5.000% | 7/1/21 | 1,260 | 1,317 |
| New York State Dormitory Authority Revenue (New York University Hospitals Center) | 5.000% | 7/1/21 | 2,400 | 2,568 |
| New York State Dormitory Authority Revenue (New York University Hospitals Center) | 5.000% | 7/1/27 | 2,650 | 2,952 |
| New York State Dormitory Authority Revenue (New York University) | 5.000% | 7/1/23 | 2,065 | 2,309 |
| New York State Dormitory Authority Revenue (North Shore - Long Island Jewish Obligated Group) | 5.000% | 5/1/21 | 2,555 | 2,722 |
| New York State Dormitory Authority Revenue (North Shore - Long Island Jewish Obligated Group) | 5.000% | 5/1/22 | 2,440 | 2,655 |
| New York State Dormitory Authority Revenue (Orange Regional Medical Center Obligated Group) | 4.000% | 12/1/20 | 1,000 | 1,022 |
| New York State Dormitory Authority Revenue (Orange Regional Medical Center Obligated Group) | 4.000% | 12/1/21 | 1,200 | 1,236 |
| New York State Dormitory Authority Revenue (Orange Regional Medical Center Obligated Group) | 5.000% | 12/1/22 | 1,000 | 1,078 |
| New York State Dormitory Authority Revenue (Pace University) | 4.000% | 5/1/20 (ETM) | 45 | 46 |
| New York State Dormitory Authority Revenue (Pace University) | 4.000% | 5/1/20 | 1,695 | 1,734 |
| New York State Dormitory Authority Revenue (Pace University) | 5.000% | 5/1/24 | 380 | 413 |
| New York State Dormitory Authority Revenue (Personal Income Tax) | 5.000% | 12/15/18 | 22,675 | 22,762 |
| New York State Dormitory Authority Revenue (Personal Income Tax) | 5.000% | 2/15/19 | 10,000 | 10,089 |
| New York State Dormitory Authority Revenue (Personal Income Tax) | 5.000% | 2/15/19 (ETM) | 10 | 10 |
| New York State Dormitory Authority Revenue (Personal Income Tax) | 5.000% | 2/15/19 (ETM) | 5 | 5 |
| New York State Dormitory Authority Revenue (Personal Income Tax) | 5.000% | 2/15/19 | 4,135 | 4,172 |
| New York State Dormitory Authority Revenue (Personal Income Tax) | 5.250% | 2/15/19 (Prere.) | 5 | 5 |
| New York State Dormitory Authority Revenue (Personal Income Tax) | 5.250% | 2/15/19 (Prere.) | 15 | 15 |
| New York State Dormitory Authority Revenue (Personal Income Tax) | 5.250% | 2/15/19 (Prere.) | 4,755 | 4,802 |
| New York State Dormitory Authority Revenue (Personal Income Tax) | 5.000% | 8/15/19 | 11,665 | 11,945 |
| New York State Dormitory Authority Revenue (Personal Income Tax) | 5.000% | 2/15/20 | 4,000 | 4,151 |
| New York State Dormitory Authority Revenue (Personal Income Tax) | 5.000% | 8/15/20 | 9,550 | 10,040 |
| New York State Dormitory Authority Revenue (Personal Income Tax) | 5.000% | 3/15/21 | 33,395 | 35,565 |
| New York State Dormitory Authority Revenue (Personal Income Tax) | 5.000% | 3/15/21 | 12,620 | 13,440 |
| New York State Dormitory Authority Revenue (Personal Income Tax) | 5.000% | 6/15/21 | 7,710 | 8,260 |
| New York State Dormitory Authority Revenue (Personal Income Tax) | 5.250% | 2/15/22 | 225 | 227 |
| New York State Dormitory Authority Revenue (Personal Income Tax) | 5.000% | 2/15/23 | 6,020 | 6,667 |
| New York State Dormitory Authority Revenue (Personal Income Tax) | 5.000% | 2/15/24 | 50,655 | 56,994 |
| New York State Dormitory Authority Revenue (Personal Income Tax) | 5.000% | 2/15/24 | 58,640 | 65,979 |
106
Limited-Term Tax-Exempt Fund
| | | | |
| Face | Market |
| Maturity | Amount | Value• |
| Coupon | Date | ($000) | ($000) |
| New York State Dormitory Authority Revenue (Personal Income Tax) | 5.000% | 2/15/25 | 56,870 | 64,949 |
| New York State Dormitory Authority Revenue (Personal Income Tax) | 5.000% | 12/15/26 | 5,705 | 6,267 |
| New York State Dormitory Authority Revenue (School Districts Financing Program) | 5.000% | 10/1/19 (15) | 1,000 | 1,027 |
| New York State Dormitory Authority Revenue (School Districts Financing Program) | 5.000% | 10/1/19 | 5,905 | 6,063 |
| New York State Dormitory Authority Revenue (School Districts Financing Program) | 5.000% | 10/1/19 (4) | 6,010 | 6,177 |
| New York State Dormitory Authority Revenue (School Districts Financing Program) | 5.000% | 10/1/19 (4) | 3,200 | 3,286 |
| New York State Dormitory Authority Revenue (School Districts Financing Program) | 5.000% | 10/1/20 (15) | 1,690 | 1,782 |
| New York State Dormitory Authority Revenue (School Districts Financing Program) | 5.000% | 10/1/20 (4) | 1,125 | 1,185 |
| New York State Dormitory Authority Revenue (School Districts Financing Program) | 5.000% | 10/1/21 (15) | 1,425 | 1,537 |
| New York State Dormitory Authority Revenue (School Districts Financing Program) | 4.000% | 10/1/22 | 11,500 | 12,197 |
| New York State Dormitory Authority Revenue (School Districts Financing Program) | 4.000% | 10/1/22 | 19,425 | 20,564 |
| New York State Dormitory Authority Revenue (School Districts Financing Program) | 5.000% | 10/1/22 | 3,335 | 3,661 |
| New York State Dormitory Authority Revenue (School Districts Financing Program) | 5.000% | 10/1/22 | 4,070 | 4,461 |
| New York State Dormitory Authority Revenue (School Districts Financing Program) | 4.000% | 10/1/23 | 4,575 | 4,884 |
| New York State Dormitory Authority Revenue (School Districts Financing Program) | 4.000% | 10/1/23 | 4,460 | 4,761 |
| New York State Dormitory Authority Revenue (School Districts Financing Program) | 5.000% | 10/1/23 | 7,500 | 8,365 |
| New York State Dormitory Authority Revenue (School Districts Financing Program) | 5.000% | 10/1/23 | 10,595 | 11,828 |
| New York State Dormitory Authority Revenue (School Districts Financing Program) | 4.000% | 10/1/24 | 2,250 | 2,422 |
| New York State Dormitory Authority Revenue (School Districts Financing Program) | 5.000% | 10/1/24 | 6,060 | 6,863 |
| New York State Dormitory Authority Revenue (School Districts Financing Program) | 5.000% | 10/1/24 | 3,000 | 3,398 |
| New York State Dormitory Authority Revenue (School Districts Financing Program) | 5.000% | 10/1/24 | 2,800 | 3,171 |
| New York State Dormitory Authority Revenue (School Districts Financing Program) | 5.000% | 10/1/25 | 2,030 | 2,320 |
| New York State Dormitory Authority Revenue (School Districts Financing Program) | 5.000% | 10/1/25 | 1,915 | 2,194 |
| New York State Dormitory Authority Revenue (State University Educational Facilities) | 5.000% | 5/15/19 | 3,500 | 3,558 |
| New York State Dormitory Authority Revenue (Teachers College) | 4.000% | 7/1/20 | 220 | 227 |
| New York State Dormitory Authority Revenue (Teachers College) | 5.000% | 7/1/21 | 245 | 263 |
| New York State Dormitory Authority Revenue (Teachers College) | 4.000% | 7/1/22 | 325 | 344 |
| New York State Dormitory Authority Revenue (Teachers College) | 5.000% | 7/1/23 | 200 | 222 |
| New York State Dormitory Authority Revenue (The New School) | 5.000% | 7/1/21 | 1,000 | 1,068 |
| New York State Dormitory Authority Revenue (The New School) | 5.000% | 7/1/22 | 500 | 544 |
| New York State Dormitory Authority Revenue (The New School) | 5.000% | 7/1/23 | 1,135 | 1,255 |
| New York State Dormitory Authority Revenue (Yeshiva University) | 5.000% | 9/1/19 (Prere.) | 35 | 36 |
| New York State Dormitory Authority Revenue (Yeshiva University) | 5.000% | 9/1/19 (Prere.) | 230 | 236 |
| New York State Dormitory Authority Revenue (Yeshiva University) | 5.000% | 9/1/21 | 1,025 | 1,043 |
| 6 New York State Dormitory Authority Sales Tax Revenue | 5.000% | 3/15/21 | 60,000 | 63,928 |
| New York State Dormitory Authority Sales Tax Revenue | 5.000% | 3/15/22 | 2,500 | 2,726 |
| New York State Energy Research & Development Authority Pollution Control Revenue | | | | |
| (New York State Electric & Gas Corp.) PUT | 2.625% | 7/3/23 | 40,000 | 39,470 |
| New York State Energy Research & Development Authority Pollution Control Revenue | | | | |
| (Rochester Gas & Electric Corp.) PUT | 3.000% | 7/1/25 | 10,000 | 9,881 |
| New York State Energy Research & Development Authority Pollution Control Revenue | | | | |
| (Rochester Gas & Electric Corp.) PUT | 3.000% | 7/1/25 | 14,000 | 13,833 |
| New York State Energy Research & Development Authority Pollution Control Revenue | | | | |
| (Rochester Gas & Electric Corp.) PUT | 3.000% | 7/1/25 | 23,900 | 23,615 |
| New York State Environmental Facilities Corp. Revenue | 5.000% | 8/15/26 | 3,185 | 3,443 |
| New York State Environmental Facilities Corp. Revenue | | | | |
| (State Clean Water & Drinking Water Revolving Funds) | 5.000% | 6/15/20 | 3,000 | 3,143 |
| New York State GO | 5.000% | 3/1/19 | 12,715 | 12,849 |
| New York State Housing Finance Agency Affordable Housing Revenue | 1.400% | 5/1/20 | 9,420 | 9,288 |
| New York State Housing Finance Agency Affordable Housing Revenue | 1.400% | 5/1/20 | 1,620 | 1,597 |
| New York State Housing Finance Agency Affordable Housing Revenue | 1.350% | 5/1/21 | 7,115 | 6,906 |
| New York State Housing Finance Agency Affordable Housing Revenue | 1.500% | 5/1/21 | 2,935 | 2,885 |
| New York State Housing Finance Agency Affordable Housing Revenue | 1.500% | 5/1/21 | 3,500 | 3,441 |
| New York State Housing Finance Agency Affordable Housing Revenue | 2.000% | 5/1/21 | 2,510 | 2,489 |
| New York State Housing Finance Agency Affordable Housing Revenue | 2.000% | 5/1/21 | 1,755 | 1,741 |
| New York State Housing Finance Agency Affordable Housing Revenue | 2.000% | 5/1/21 | 5,000 | 4,959 |
| New York State Housing Finance Agency Affordable Housing Revenue | 2.000% | 5/1/21 | 1,300 | 1,289 |
| New York State Housing Finance Agency Housing Revenue | 2.650% | 5/1/22 | 6,870 | 6,868 |
| New York State Housing Finance Agency Housing Revenue | 2.750% | 11/1/22 | 7,895 | 7,892 |
| New York State Housing Finance Agency Revenue | 1.050% | 5/1/19 | 850 | 846 |
| New York State Housing Finance Agency Revenue | 1.100% | 11/1/19 | 1,000 | 991 |
| New York State Housing Finance Agency Revenue | 1.250% | 5/1/20 | 7,500 | 7,395 |
| New York State Mortgage Agency Homeowner Mortgage Revenue | 4.000% | 4/1/40 | 3,575 | 3,712 |
| New York State Mortgage Agency Homeowner Mortgage Revenue | 2.625% | 4/1/41 | 405 | 403 |
| New York State Mortgage Agency Homeowner Mortgage Revenue | 3.500% | 10/1/47 | 13,450 | 13,727 |
| New York State Thruway Authority Revenue | 5.000% | 1/1/19 | 3,700 | 3,718 |
| New York State Thruway Authority Revenue | 5.000% | 5/1/19 | 83,125 | 84,361 |
| New York State Thruway Authority Revenue | 5.000% | 1/1/20 | 1,500 | 1,550 |
| New York State Thruway Authority Revenue | 5.000% | 1/1/21 | 2,465 | 2,613 |
| New York State Thruway Authority Revenue | 5.000% | 1/1/22 | 1,520 | 1,646 |
107
Limited-Term Tax-Exempt Fund
| | | | |
| Face | Market |
| Maturity | Amount | Value• |
| Coupon | Date | ($000) | ($000) |
| New York State Thruway Authority Revenue | 5.000% | 1/1/22 | 6,200 | 6,716 |
| New York State Thruway Authority Revenue | 5.000% | 1/1/23 | 6,010 | 6,631 |
| New York State Thruway Authority Revenue | 5.000% | 1/1/24 | 3,730 | 4,183 |
| New York State Thruway Authority Revenue | 5.000% | 1/1/25 | 3,280 | 3,728 |
| New York State Thruway Authority Revenue (Personal Income Tax) | 5.000% | 3/15/19 | 500 | 506 |
| New York State Urban Development Corp. Revenue (Personal Income Tax) | 5.000% | 3/15/19 | 8,030 | 8,122 |
| New York State Urban Development Corp. Revenue (Personal Income Tax) | 5.000% | 3/15/20 | 23,430 | 24,371 |
| New York State Urban Development Corp. Revenue (Personal Income Tax) | 5.000% | 3/15/20 | 10,145 | 10,552 |
| New York State Urban Development Corp. Revenue (Personal Income Tax) | 5.000% | 3/15/20 | 8,525 | 8,867 |
| New York State Urban Development Corp. Revenue (Personal Income Tax) | 5.000% | 3/15/21 | 50,035 | 53,287 |
| New York State Urban Development Corp. Revenue (Personal Income Tax) | 5.000% | 3/15/21 | 24,900 | 26,518 |
| New York State Urban Development Corp. Revenue (Personal Income Tax) | 5.000% | 3/15/21 | 10,625 | 11,316 |
| New York State Urban Development Corp. Revenue (Personal Income Tax) | 5.000% | 3/15/22 | 45,795 | 49,874 |
| New York State Urban Development Corp. Revenue (Personal Income Tax) | 5.000% | 3/15/22 | 25,000 | 27,227 |
| Niagara NY Frontier Transportation Authority Airport Revenue | | | | |
| (Buffalo Niagara International Airport) | 5.000% | 4/1/19 | 600 | 607 |
| 3 Nuveen New York AMT-Free Quality Municipal Income Fund VRDP VRDO | 1.700% | 11/7/18 LOC | 24,000 | 24,000 |
| 3 Nuveen New York AMT-Free Quality Municipal Income Fund VRDP VRDO | 1.640% | 11/8/18 LOC | 6,300 | 6,300 |
| Onondaga County NY Civic Development Corp. Revenue (St. Joseph’s Hospital & Health Center) | 5.000% | 7/1/19 (ETM) | 265 | 270 |
| Onondaga NY Civic Development Corp. Revenue (Le Moyne College Project) | 5.000% | 1/1/19 | 245 | 246 |
| Onondaga NY Civic Development Corp. Revenue (Le Moyne College Project) | 5.000% | 1/1/20 | 285 | 293 |
| Onondaga NY Civic Development Corp. Revenue (Le Moyne College Project) | 5.000% | 1/1/21 | 300 | 316 |
| Onondaga NY Civic Development Corp. Revenue (Le Moyne College Project) | 5.000% | 1/1/22 | 315 | 337 |
| Onondaga NY Civic Development Corp. Revenue (Le Moyne College Project) | 5.000% | 1/1/23 | 330 | 358 |
| Onondaga NY Civic Development Corp. Revenue (Le Moyne College Project) | 5.000% | 1/1/24 | 345 | 379 |
| Orange & Ulster Counties NY Board Cooperative Educational Services Revenue | 3.000% | 7/24/19 | 9,000 | 9,037 |
| Oyster Bay NY GO | 5.000% | 1/15/19 (15) | 5,140 | 5,169 |
| Oyster Bay NY GO | 5.000% | 8/15/19 (15) | 3,125 | 3,189 |
| Oyster Bay NY GO | 5.000% | 1/15/20 (15) | 3,105 | 3,196 |
| Oyster Bay NY GO | 5.000% | 8/15/20 (15) | 4,350 | 4,532 |
| Suffolk County NY Economic Development Corp. Revenue (Catholic Health Services) | 5.000% | 7/1/19 | 9,190 | 9,350 |
| Suffolk County NY Economic Development Corp. Revenue (Catholic Health Services) | 5.000% | 7/1/20 | 835 | 869 |
| Suffolk County NY Economic Development Corp. Revenue (Catholic Health Services) | 5.000% | 7/1/28 | 5,000 | 5,291 |
| Suffolk County NY GO | 5.000% | 2/1/19 (4) | 3,915 | 3,945 |
| Suffolk County NY GO | 5.000% | 2/1/21 (4) | 4,580 | 4,847 |
| Suffolk County NY GO | 5.000% | 5/15/22 (4) | 10,310 | 11,195 |
| Suffolk County NY GO | 5.000% | 5/15/23 (4) | 10,845 | 11,966 |
| Tobacco Settlement Financing Corp. New York Revenue | 5.000% | 6/1/21 | 3,000 | 3,137 |
| Tobacco Settlement Financing Corp. New York Revenue | 5.000% | 6/1/21 | 4,435 | 4,690 |
| Tobacco Settlement Financing Corp. New York Revenue | 5.000% | 6/1/22 | 3,500 | 3,759 |
| Tobacco Settlement Financing Corp. New York Revenue | 5.000% | 6/1/23 | 5,000 | 5,345 |
| Tobacco Settlement Financing Corp. New York Revenue | 5.000% | 6/1/23 | 10,000 | 10,885 |
| Tobacco Settlement Financing Corp. New York Revenue | 5.000% | 6/1/24 | 4,000 | 4,302 |
| Tobacco Settlement Financing Corp. New York Revenue | 5.000% | 6/1/24 | 9,570 | 10,536 |
| Tobacco Settlement Financing Corp. New York Revenue | 5.000% | 6/1/26 | 2,500 | 2,792 |
| Tobacco Settlement Financing Corp. New York Revenue | 5.000% | 6/1/27 | 2,030 | 2,275 |
| Triborough Bridge & Tunnel Authority New York Revenue | 5.000% | 11/15/18 | 7,000 | 7,008 |
| 2 Triborough Bridge & Tunnel Authority New York Revenue | 2.040% | 1/1/19 (4) | 1,700 | 1,701 |
| Triborough Bridge & Tunnel Authority New York Revenue | 5.000% | 11/15/20 | 500 | 529 |
| Triborough Bridge & Tunnel Authority New York Revenue | 5.000% | 11/15/21 | 1,000 | 1,085 |
| Triborough Bridge & Tunnel Authority New York Revenue | 5.000% | 11/15/22 | 850 | 940 |
| Triborough Bridge & Tunnel Authority New York Revenue | 5.000% | 11/15/26 | 7,795 | 8,619 |
| 2 Triborough Bridge & Tunnel Authority New York Revenue PUT | 1.912% | 2/1/19 | 11,350 | 11,351 |
| Triborough Bridge & Tunnel Authority New York Revenue PUT | 1.891% | 9/26/19 | 12,500 | 12,499 |
| 2 Triborough Bridge & Tunnel Authority New York Revenue PUT | 2.010% | 11/15/21 | 5,180 | 5,183 |
| Troy NY Capital Resource Corp. Revenue (Rensselaer Polytechnic Institute Project) | 5.000% | 9/1/20 | 535 | 561 |
| Troy NY Capital Resource Corp. Revenue (Rensselaer Polytechnic Institute Project) | 5.000% | 8/1/21 | 645 | 690 |
| Troy NY Capital Resource Corp. Revenue (Rensselaer Polytechnic Institute Project) | 5.000% | 8/1/22 | 1,055 | 1,149 |
| Westchester County NY Health Care Corp. Revenue | 5.000% | 11/1/21 | 4,800 | 5,110 |
| Westchester County NY Health Care Corp. Revenue | 5.000% | 11/1/25 | 2,000 | 2,116 |
| Westchester County NY Local Development Corp. Revenue | | | | |
| (Westchester County Health Care Corp.) | 5.000% | 11/1/24 | 1,230 | 1,360 |
| Westchester NY Tobacco Asset Securitization Revenue | 5.000% | 6/1/23 | 1,610 | 1,753 |
| Westhill NY Central School District BANS | 3.000% | 7/5/19 | 7,200 | 7,235 |
| Yonkers NY GO | 4.000% | 3/15/19 (ETM) | 1,700 | 1,714 |
| Yonkers NY GO | 3.000% | 8/15/19 | 885 | 891 |
| Yonkers NY GO | 3.000% | 8/15/20 | 1,115 | 1,130 |
| | | | 3,500,772 |
108
Limited-Term Tax-Exempt Fund
| | | | |
| Face | Market |
| Maturity | Amount | Value• |
| Coupon | Date | ($000) | ($000) |
| North Carolina (1.0%) | | | | |
| Board of Governors of the University of North Carolina Revenue | | | | |
| (University of North Carolina at Charlotte) | 5.000% | 10/1/23 | 300 | 335 |
| Board of Governors of the University of North Carolina Revenue | | | | |
| (University of North Carolina at Charlotte) | 5.000% | 10/1/24 | 400 | 453 |
| Buncombe County NC Limited Obligation Revenue | 5.000% | 6/1/21 | 6,070 | 6,502 |
| Buncombe County NC Limited Obligation Revenue | 5.000% | 6/1/22 | 4,070 | 4,453 |
| Cabarrus County NC Installment Financing Contract Revenue | 5.000% | 6/1/23 | 1,000 | 1,112 |
| Charlotte NC Airport Revenue | 4.000% | 7/1/23 | 1,175 | 1,256 |
| Charlotte NC Airport Revenue | 5.000% | 7/1/23 | 430 | 480 |
| Charlotte NC Airport Revenue | 5.000% | 7/1/24 | 520 | 590 |
| Charlotte NC Airport Revenue | 5.000% | 7/1/24 | 1,520 | 1,724 |
| Charlotte NC GO | 5.000% | 7/1/26 | 11,140 | 12,137 |
| Charlotte NC Water & Sewer System Revenue | 5.000% | 12/1/18 | 2,625 | 2,632 |
| Charlotte-Mecklenburg NC Hospital Authority Health Care System Revenue | | | | |
| (Carolinas HealthCare System) | 5.000% | 1/15/22 | 4,275 | 4,622 |
| Charlotte-Mecklenburg NC Hospital Authority Health Care System Revenue | | | | |
| (Carolinas HealthCare System) | 5.000% | 1/15/24 | 14,330 | 16,022 |
| Guilford County NC GO | 5.000% | 3/1/25 | 18,855 | 21,670 |
| Mecklenburg County NC COP | 5.000% | 10/1/21 | 4,000 | 4,314 |
| New Hanover County NC Hospital Revenue (New Hanover Regional Medical Center Project) | 5.000% | 10/1/19 | 1,000 | 1,027 |
| New Hanover County NC Hospital Revenue (New Hanover Regional Medical Center Project) | 5.000% | 10/1/21 | 3,200 | 3,436 |
| New Hanover County NC Hospital Revenue (New Hanover Regional Medical Center Project) | 5.000% | 10/1/22 | 1,020 | 1,116 |
| New Hanover County NC Hospital Revenue (New Hanover Regional Medical Center Project) | 5.000% | 10/1/23 | 1,140 | 1,267 |
| New Hanover County NC Hospital Revenue (New Hanover Regional Medical Center Project) | 5.000% | 10/1/24 | 2,115 | 2,383 |
| New Hanover County NC Hospital Revenue (New Hanover Regional Medical Center Project) | 5.000% | 10/1/25 | 1,115 | 1,270 |
| New Hanover County NC Hospital Revenue (New Hanover Regional Medical Center Project) | 5.000% | 10/1/26 | 1,510 | 1,736 |
| North Carolina Capital Facilities Finance Agency Solid Waste Disposal Revenue | | | | |
| (Republic Services, Inc. Project) PUT | 1.850% | 12/3/18 | 23,750 | 23,747 |
| North Carolina Eastern Municipal Power Agency Power Systems Revenue | 5.000% | 1/1/19 (ETM) | 3,515 | 3,533 |
| North Carolina Eastern Municipal Power Agency Power Systems Revenue | 5.000% | 1/1/19 (ETM) | 1,025 | 1,030 |
| North Carolina Eastern Municipal Power Agency Power Systems Revenue | 5.000% | 1/1/20 (ETM) | 13,050 | 13,493 |
| North Carolina Eastern Municipal Power Agency Power Systems Revenue | 5.000% | 1/1/20 (ETM) | 2,500 | 2,585 |
| North Carolina GAN | 5.000% | 3/1/22 | 2,250 | 2,442 |
| North Carolina GO | 5.000% | 6/1/19 | 2,000 | 2,036 |
| North Carolina GO | 5.000% | 6/1/23 | 9,415 | 10,523 |
| North Carolina Housing Finance Agency Revenue | 4.000% | 7/1/47 | 9,580 | 9,947 |
| North Carolina Medical Care Commission Health Care Facilities Revenue | | | | |
| (Cape Fear Valley Health System) | 5.000% | 10/1/19 | 3,350 | 3,426 |
| North Carolina Medical Care Commission Health Care Facilities Revenue | | | | |
| (Cape Fear Valley Health System) | 5.000% | 10/1/20 | 7,885 | 8,272 |
| North Carolina Medical Care Commission Health Care Facilities Revenue | | | | |
| (Novant Health Obligated Group) VRDO | 1.670% | 11/7/18 | 39,670 | 39,670 |
| 3 North Carolina Medical Care Commission Hospital Revenue (Baptist Hospital) TOB VRDO | 1.920% | 11/7/18 | 6,300 | 6,300 |
| North Carolina Medical Care Commission Hospital Revenue (Moses Cone Health System) PUT | 1.950% | 5/30/19 | 11,710 | 11,710 |
| North Carolina Medical Care Commission Hospital Revenue (North Carolina Baptist Hospital) | 5.000% | 6/1/19 | 3,910 | 3,976 |
| North Carolina Medical Care Commission Hospital Revenue | | | | |
| (Southeastern Regional Medical Center) | 4.000% | 6/1/19 | 1,450 | 1,465 |
| North Carolina Medical Care Commission Hospital Revenue | | | | |
| (Southeastern Regional Medical Center) | 4.000% | 6/1/20 | 500 | 514 |
| 1 North Carolina Medical Care Commission Retirement Facilities Revenue (Moravian Home Inc.) | 3.550% | 10/1/24 | 500 | 499 |
| North Carolina Medical Care Commission Retirement Facilities Revenue (Southminster Inc.) | 5.000% | 10/1/21 | 375 | 394 |
| North Carolina Medical Care Commission Retirement Facilities Revenue (Southminster Inc.) | 5.000% | 10/1/22 | 1,105 | 1,172 |
| North Carolina Medical Care Commission Retirement Facilities Revenue (Southminster Inc.) | 5.000% | 10/1/23 | 800 | 855 |
| North Carolina Medical Care Commission Retirement Facilities Revenue (Southminster Inc.) | 5.000% | 10/1/24 | 920 | 987 |
| North Carolina Medical Care Commission Retirement Facilities Revenue | | | | |
| (United Church Homes & Services Obligated Group) | 5.000% | 9/1/24 | 1,000 | 1,058 |
| North Carolina Medical Care Commission Retirement Facilities Revenue | | | | |
| (United Methodist Retirement Homes Inc.) | 5.000% | 10/1/23 | 510 | 556 |
| North Carolina Medical Care Commission Retirement Facilities Revenue | | | | |
| (United Methodist Retirement Homes Inc.) | 5.000% | 10/1/24 | 1,250 | 1,373 |
| North Carolina Medical Care Commission Retirement Facilities Revenue | | | | |
| (United Methodist Retirement Homes Inc.) | 5.000% | 10/1/25 | 890 | 981 |
| North Carolina Municipal Power Agency No. 1 Revenue (Catawba Electric) | 5.000% | 1/1/19 (ETM) | 4,475 | 4,498 |
| North Carolina Municipal Power Agency No. 1 Revenue (Catawba Electric) | 5.000% | 1/1/19 | 12,025 | 12,086 |
| North Carolina Turnpike Authority Revenue | 5.000% | 1/1/22 | 850 | 912 |
| North Carolina Turnpike Authority Revenue | 5.000% | 1/1/23 | 1,650 | 1,798 |
| North Carolina Turnpike Authority Revenue | 5.000% | 1/1/24 (4) | 1,250 | 1,387 |
| | | | 263,762 |
109
Limited-Term Tax-Exempt Fund
| | | | |
| Face | Market |
| Maturity | Amount | Value• |
| Coupon | Date | ($000) | ($000) |
| North Dakota (0.0%) | | | | |
| Burleigh County ND Health Care Revenue (St. Alexis Medical Center Project) | 5.000% | 7/1/21 (ETM) | 650 | 695 |
| Burleigh County ND Health Care Revenue (St. Alexis Medical Center Project) | 5.000% | 7/1/21 (Prere.) | 1,200 | 1,283 |
| North Dakota Housing Finance Agency Revenue | 4.000% | 1/1/38 | 3,530 | 3,625 |
| | | | 5,603 |
| Ohio (3.7%) | | | | |
| Akron OH Bath & Copley Joint Township Hospital District Revenue | | | | |
| (Children’s Hospital Medical Center of Akron) | 5.000% 11/15/18 | 1,000 | 1,001 |
| Akron OH Bath & Copley Joint Township Hospital District Revenue | | | | |
| (Children’s Hospital Medical Center of Akron) | 5.000% 11/15/25 | 3,475 | 3,738 |
| Akron OH Bath & Copley Joint Township Hospital District Revenue | | | | |
| (Summa Health System Obligated Group) | 5.000% 11/15/23 | 1,605 | 1,746 |
| Akron OH Bath & Copley Joint Township Hospital District Revenue | | | | |
| (Summa Health System Obligated Group) | 5.000% 11/15/26 | 500 | 554 |
| Akron OH Income Tax Revenue (Community Learning Centers) | 5.000% | 12/1/20 | 1,220 | 1,288 |
| Allen County OH Hospital Facilities Revenue (Catholic Healthcare Partners) | 5.000% | 5/1/23 | 3,485 | 3,757 |
| 3 Allen County OH Hospital Facilities Revenue (Catholic Healthcare Partners) TOB VRDO | 1.730% | 11/7/18 | 7,500 | 7,500 |
| Allen County OH Hospital Facilities Revenue (Mercy Health) | 5.000% | 8/1/20 | 895 | 934 |
| Allen County OH Hospital Facilities Revenue (Mercy Health) | 5.000% | 8/1/21 | 4,260 | 4,523 |
| Allen County OH Hospital Facilities Revenue (Mercy Health) | 5.000% | 8/1/22 | 3,750 | 4,051 |
| Allen County OH Hospital Facilities Revenue (Mercy Health) | 5.000% | 8/1/23 | 9,010 | 9,877 |
| Allen County OH Hospital Facilities Revenue (Mercy Health) | 5.000% | 8/1/24 | 14,890 | 16,534 |
| Allen County OH Hospital Facilities Revenue (Mercy Health) | 5.000% | 8/1/25 | 25,015 | 28,082 |
| Allen County OH Hospital Facilities Revenue (Mercy Health) PUT | 5.000% | 5/5/22 | 12,200 | 13,253 |
| American Municipal Power Ohio Inc. Revenue | 5.000% | 2/15/20 | 7,000 | 7,243 |
| American Municipal Power Ohio Inc. Revenue | 5.000% | 2/15/21 | 16,295 | 17,258 |
| American Municipal Power Ohio Inc. Revenue | 5.000% | 2/15/22 | 12,025 | 12,995 |
| American Municipal Power Ohio Inc. Revenue | 5.000% | 2/15/23 | 22,470 | 23,248 |
| American Municipal Power Ohio Inc. Revenue | 5.000% | 2/15/24 | 12,385 | 12,809 |
| American Municipal Power Ohio Inc. Revenue (Fremont Energy Center Project) | 5.000% | 2/15/19 | 1,725 | 1,740 |
| American Municipal Power Ohio Inc. Revenue (Fremont Energy Center Project) | 5.000% | 2/15/20 | 2,145 | 2,219 |
| American Municipal Power Ohio Inc. Revenue (Hydroelectric Projects) | 5.000% | 2/15/21 | 300 | 318 |
| American Municipal Power Ohio Inc. Revenue (Hydroelectric Projects) | 5.000% | 2/15/22 | 400 | 432 |
| American Municipal Power Ohio Inc. Revenue (Hydroelectric Projects) | 5.000% | 2/15/23 | 3,000 | 3,299 |
| American Municipal Power Ohio Inc. Revenue (Hydroelectric Projects) | 5.000% | 2/15/23 | 500 | 550 |
| American Municipal Power Ohio Inc. Revenue (Hydroelectric Projects) | 5.000% | 2/15/24 | 3,800 | 4,240 |
| American Municipal Power Ohio Inc. Revenue (Hydroelectric Projects) | 5.000% | 2/15/25 | 7,000 | 7,908 |
| American Municipal Power Ohio Inc. Revenue (Hydroelectric Projects) PUT | 2.250% | 8/15/21 | 8,000 | 7,929 |
| American Municipal Power Ohio Inc. Revenue (Meldahl Hydroelectric Project) | 5.000% | 2/15/22 | 530 | 572 |
| American Municipal Power Ohio Inc. Revenue (Meldahl Hydroelectric Project) | 5.000% | 2/15/23 | 405 | 445 |
| American Municipal Power Ohio Inc. Revenue (Meldahl Hydroelectric Project) | 5.000% | 2/15/24 | 370 | 412 |
| American Municipal Power Ohio Inc. Revenue (Prairie State Energy Campus Project) | 5.000% | 2/15/26 | 3,000 | 3,310 |
| American Municipal Power Ohio Inc. Revenue (Prairie State Energy Campus Project) PUT | 5.000% | 8/15/19 | 17,625 | 17,771 |
| American Municipal Power Ohio Inc. Revenue (Prairie State Energy Campus Project) PUT | 5.000% | 8/15/20 | 16,310 | 16,869 |
| Bluffton OH Hospital Facilities Revenue (Blanchard Valley Health System Obligated Group) | 5.000% | 12/1/21 | 1,000 | 1,074 |
| Bluffton OH Hospital Facilities Revenue (Blanchard Valley Health System Obligated Group) | 5.000% | 12/1/22 | 750 | 819 |
| Bluffton OH Hospital Facilities Revenue (Blanchard Valley Health System Obligated Group) | 5.000% | 12/1/23 | 2,010 | 2,221 |
| Bluffton OH Hospital Facilities Revenue (Blanchard Valley Health System Obligated Group) | 5.000% | 12/1/24 | 2,000 | 2,229 |
| Bowling Green State University Ohio Revenue | 5.000% | 6/1/23 | 175 | 193 |
| Bowling Green State University Ohio Revenue | 5.000% | 6/1/24 | 325 | 363 |
| Butler County OH Hospital Facilities Revenue (UC Health) | 5.500% | 11/1/20 (Prere.) | 3,415 | 3,630 |
| Butler County OH Transportation Improvement District Tax Allocation Revenue | 4.000% | 12/1/20 | 700 | 725 |
| Centerville OH Health Care Revenue (Graceworks Lutheran Services) | 5.000% | 11/1/22 | 400 | 422 |
| Centerville OH Health Care Revenue (Graceworks Lutheran Services) | 5.000% | 11/1/23 | 420 | 445 |
| Centerville OH Health Care Revenue (Graceworks Lutheran Services) | 5.000% | 11/1/24 | 650 | 690 |
| Chillicothe OH Hospital Facilities Revenue (Adena Health System Obligated Group) | 5.000% | 12/1/22 | 1,005 | 1,097 |
| Chillicothe OH Hospital Facilities Revenue (Adena Health System Obligated Group) | 5.000% | 12/1/23 | 1,580 | 1,748 |
| Chillicothe OH Hospital Facilities Revenue (Adena Health System Obligated Group) | 5.000% | 12/1/24 | 500 | 560 |
| Chillicothe OH Hospital Facilities Revenue (Adena Health System Obligated Group) | 5.000% | 12/1/25 | 950 | 1,072 |
| Cincinnati OH GO | 4.000% | 12/1/19 | 300 | 306 |
| Cincinnati OH GO | 5.000% | 12/1/22 | 300 | 330 |
| Cincinnati OH GO | 5.000% | 12/1/23 | 2,110 | 2,357 |
| Cincinnati OH GO | 5.000% | 12/1/24 | 1,700 | 1,927 |
| Cleveland OH Airport System Revenue | 5.000% | 1/1/20 | 1,500 | 1,546 |
| Cleveland OH Airport System Revenue | 5.000% | 1/1/21 (4) | 455 | 480 |
| Cleveland OH Airport System Revenue | 5.000% | 1/1/22 (4) | 450 | 485 |
| Cleveland OH Airport System Revenue | 5.000% | 1/1/22 (4) | 1,635 | 1,761 |
| Cleveland OH Airport System Revenue | 5.000% | 1/1/23 (4) | 1,030 | 1,128 |
| Cleveland OH Airport System Revenue | 5.000% | 1/1/24 (4) | 3,150 | 3,500 |
110
Limited-Term Tax-Exempt Fund
| | | | |
| Face | Market |
| Maturity | Amount | Value• |
| Coupon | Date | ($000) | ($000) |
| Cleveland OH Airport System Revenue | 5.000% | 1/1/26 | 1,000 | 1,066 |
| Cleveland OH GO | 5.000% | 12/1/20 | 1,800 | 1,901 |
| Cleveland OH GO | 5.000% | 12/1/21 | 2,880 | 3,108 |
| Cleveland OH GO | 5.000% | 12/1/22 | 3,595 | 3,955 |
| Cleveland OH GO | 5.000% | 12/1/24 | 1,000 | 1,128 |
| Cleveland OH GO | 5.000% | 12/1/25 | 410 | 467 |
| Cleveland OH Income Tax Revenue | 5.000% | 5/15/22 | 1,560 | 1,702 |
| Cleveland OH Income Tax Revenue | 5.000% | 10/1/22 | 265 | 291 |
| Cleveland OH Income Tax Revenue | 4.000% | 10/1/23 | 250 | 267 |
| Cleveland OH Income Tax Revenue | 4.000% | 10/1/23 | 200 | 214 |
| Cleveland OH Income Tax Revenue | 5.000% | 10/1/23 | 230 | 257 |
| Cleveland OH Income Tax Revenue | 4.000% | 10/1/24 | 300 | 321 |
| Cleveland OH Income Tax Revenue | 4.000% | 10/1/24 | 280 | 300 |
| Cleveland OH Income Tax Revenue | 5.000% | 10/1/24 | 200 | 226 |
| Cleveland OH Income Tax Revenue | 4.000% | 10/1/25 | 200 | 215 |
| Cleveland OH Income Tax Revenue | 4.000% | 10/1/25 | 235 | 252 |
| Cleveland OH Income Tax Revenue | 5.000% | 10/1/25 | 175 | 200 |
| Cleveland OH Income Tax Revenue | 4.000% | 10/1/26 | 225 | 241 |
| Cleveland OH Income Tax Revenue | 4.000% | 10/1/26 | 300 | 321 |
| Cleveland OH Public Power System Revenue | 5.000% | 11/15/19 | 200 | 206 |
| Cleveland OH Public Power System Revenue | 5.000% | 11/15/20 | 220 | 231 |
| Cleveland OH Public Power System Revenue | 5.000% | 11/15/21 (4) | 335 | 360 |
| Cleveland OH Public Power System Revenue | 5.000% | 11/15/22 (4) | 400 | 438 |
| Cleveland OH Public Power System Revenue | 5.000% | 11/15/23 (4) | 360 | 399 |
| Cleveland OH Public Power System Revenue | 5.000% | 11/15/24 (4) | 475 | 533 |
| Cleveland OH Public Power System Revenue | 5.000% | 11/15/25 (4) | 200 | 226 |
| Cleveland OH Water Revenue | 5.000% | 1/1/19 | 3,100 | 3,116 |
| Cleveland OH Water Revenue | 5.000% | 1/1/21 | 1,000 | 1,060 |
| Cleveland OH Water Revenue | 5.000% | 1/1/23 | 2,080 | 2,299 |
| Cleveland OH Water Revenue | 5.000% | 1/1/24 | 1,365 | 1,534 |
| Cleveland State University Ohio General Receipts Revenue | 5.000% | 6/1/19 | 2,000 | 2,034 |
| Cleveland-Cuyahoga County OH Port Authority Revenue (Cleveland Museum of Art Project) | 5.000% | 10/1/19 | 6,000 | 6,155 |
| Cleveland-Cuyahoga County OH Port Authority Revenue | | | | |
| (Euclid Avenue Development Corp. Project) | 5.000% | 8/1/19 | 1,390 | 1,420 |
| Cleveland-Cuyahoga County OH Port Authority Revenue | | | | |
| (Euclid Avenue Development Corp. Project) | 5.000% | 8/1/22 | 1,475 | 1,593 |
| Columbus OH GO | 5.000% | 2/15/19 | 1,910 | 1,927 |
| Columbus OH GO | 5.000% | 6/1/19 | 3,000 | 3,054 |
| Columbus OH GO | 5.000% | 7/1/19 | 6,690 | 6,826 |
| Columbus OH GO | 5.000% | 7/1/23 | 1,830 | 2,043 |
| Cuyahoga County OH (Convention Hotel Project) COP | 5.000% | 12/1/19 | 5,340 | 5,502 |
| Cuyahoga County OH (Convention Hotel Project) COP | 5.000% | 12/1/20 | 5,575 | 5,866 |
| Cuyahoga County OH (Convention Hotel Project) COP | 5.000% | 12/1/21 | 4,110 | 4,409 |
| Cuyahoga County OH Economic Development Revenue (Med Mart/Convention Center Project) | 5.000% | 12/1/19 | 7,000 | 7,224 |
| Cuyahoga County OH Excise Tax Revenue (Sports Facilities Improvement Project) | 5.000% | 12/1/21 | 1,070 | 1,151 |
| Cuyahoga County OH Excise Tax Revenue (Sports Facilities Improvement Project) | 5.000% | 12/1/22 | 1,040 | 1,139 |
| Cuyahoga County OH Excise Tax Revenue (Sports Facilities Improvement Project) | 5.000% | 12/1/24 | 535 | 595 |
| Cuyahoga County OH Excise Tax Revenue (Sports Facilities Improvement Project) | 5.000% | 12/1/26 | 1,000 | 1,107 |
| Cuyahoga County OH Hospital Revenue (MetroHealth System) | 5.000% | 2/15/23 | 4,660 | 4,963 |
| Cuyahoga County OH Hospital Revenue (MetroHealth System) | 5.000% | 2/15/24 | 5,030 | 5,396 |
| Cuyahoga County OH Hospital Revenue (MetroHealth System) | 5.000% | 2/15/25 | 4,000 | 4,317 |
| Cuyahoga County OH Sales Tax Revenue | 5.000% | 12/1/20 | 2,045 | 2,160 |
| Cuyahoga County OH Sales Tax Revenue | 5.000% | 12/1/21 | 1,000 | 1,080 |
| 3 Cuyahoga OH COP TOB VRDO | 1.740% | 11/7/18 | 4,100 | 4,100 |
| Dayton OH City School District GO | 5.000% | 11/1/19 | 3,500 | 3,599 |
| Dayton OH City School District GO | 5.000% | 11/1/20 | 5,000 | 5,254 |
| Fairfield County OH Hospital Facilities Revenue (Fairfield Medical Center) | 5.000% | 6/15/21 | 1,045 | 1,101 |
| Franklin County OH GO | 5.000% | 12/1/19 | 5,045 | 5,058 |
| 2 Franklin County OH Hospital Facilities Revenue (OhioHealth Corp.) PUT | 2.030% | 11/15/21 | 7,500 | 7,500 |
| Franklin County OH Hospital Revenue (Nationwide Children’s Hospital Project) VRDO | 1.610% | 11/7/18 | 1,300 | 1,300 |
| Greater Cleveland OH Regional Transit Authority Sales Tax Revenue | 5.000% | 12/1/19 | 1,185 | 1,223 |
| Greater Cleveland OH Regional Transit Authority Sales Tax Revenue | 5.000% | 12/1/21 | 1,355 | 1,465 |
| Greater Cleveland OH Regional Transit Authority Sales Tax Revenue | 5.000% | 12/1/22 | 1,590 | 1,754 |
| Hamilton County OH Healthcare Facilities Revenue (Christ Hospital Project) | 5.000% | 6/1/20 | 1,475 | 1,535 |
| Hamilton County OH Healthcare Facilities Revenue (Christ Hospital Project) | 5.000% | 6/1/22 | 4,665 | 5,055 |
| Hamilton County OH Healthcare Revenue (Life Enriching Communities) | 4.000% | 1/1/21 | 450 | 459 |
| Hamilton County OH Healthcare Revenue (Life Enriching Communities) | 5.000% | 1/1/22 | 470 | 495 |
| Hamilton County OH Healthcare Revenue (Life Enriching Communities) | 5.000% | 1/1/23 | 1,450 | 1,543 |
| Hamilton County OH Healthcare Revenue (Life Enriching Communities) | 5.000% | 1/1/24 | 1,355 | 1,451 |
| Hamilton County OH Hospital Facilities Revenue (Cincinnati Children’s Hospital Medical Center) | 5.000% | 5/15/19 | 1,000 | 1,016 |
111
Limited-Term Tax-Exempt Fund
| | | | |
| Face | Market |
| Maturity | Amount | Value• |
| Coupon | Date | ($000) | ($000) |
| Hamilton County OH Hospital Facilities Revenue (Cincinnati Children’s Hospital Medical Center) | 5.000% | 5/15/20 | 1,000 | 1,044 |
| Hamilton County OH Hospital Facilities Revenue (Cincinnati Children’s Hospital Medical Center) | 5.000% | 5/15/21 | 1,000 | 1,067 |
| Hamilton County OH Hospital Facilities Revenue (Cincinnati Children’s Hospital Medical Center) | 5.000% | 5/15/22 | 500 | 545 |
| Hamilton County OH Hospital Facilities Revenue (UC Health) | 5.000% | 2/1/19 | 820 | 826 |
| Hamilton County OH Hospital Facilities Revenue (UC Health) | 5.000% | 2/1/20 | 800 | 827 |
| Hamilton County OH Hospital Facilities Revenue (UC Health) | 5.000% | 2/1/22 | 500 | 538 |
| Hamilton County OH Sales Tax Revenue | 5.000% | 12/1/21 | 1,000 | 1,079 |
| Hamilton County OH Sales Tax Revenue | 5.000% | 12/1/22 | 2,250 | 2,476 |
| Hamilton County OH Sewer System Revenue | 5.000% | 12/1/21 | 2,085 | 2,255 |
| Hamilton OH City School District GO | 5.000% | 12/1/21 | 3,475 | 3,755 |
| JobsOhio Beverage System Statewide Liquor Profits Revenue | 5.000% | 1/1/20 | 14,245 | 14,719 |
| JobsOhio Beverage System Statewide Liquor Profits Revenue | 5.000% | 1/1/21 | 2,260 | 2,388 |
| JobsOhio Beverage System Statewide Liquor Profits Revenue | 5.000% | 1/1/23 | 1,725 | 1,894 |
| JobsOhio Beverage System Statewide Liquor Profits Revenue TOB VRDO | 1.650% | 11/7/18 | 18,800 | 18,800 |
| Kent State University Ohio Revenue | 5.000% | 5/1/20 | 1,650 | 1,720 |
| Kent State University Ohio Revenue | 5.000% | 5/1/21 | 1,685 | 1,797 |
| Kent State University Ohio Revenue | 4.000% | 5/1/22 | 3,000 | 3,158 |
| Kent State University Ohio Revenue | 4.000% | 5/1/23 | 3,000 | 3,182 |
| Lake County OH Hospital Facilities Revenue (Lake Hospital System Inc.) | 5.000% | 8/15/20 | 1,230 | 1,284 |
| Lake County OH Hospital Facilities Revenue (Lake Hospital System Inc.) | 5.000% | 8/15/21 | 1,095 | 1,165 |
| Lake County OH Hospital Facilities Revenue (Lake Hospital System Inc.) | 5.000% | 8/15/22 | 1,595 | 1,727 |
| Lake County OH Hospital Facilities Revenue (Lake Hospital System Inc.) | 5.000% | 8/15/23 | 815 | 894 |
| Lake County OH Hospital Facilities Revenue (Lake Hospital System Inc.) | 5.000% | 8/15/24 | 980 | 1,088 |
| 2 Lancaster OH Port Authority Gas Supply Revenue PUT | 2.232% | 8/1/19 | 11,400 | 11,403 |
| Lucas County OH Hospital Revenue (ProMedica Healthcare Obligated Group) | 5.000% | 11/15/21 (Prere.) | 3,095 | 3,341 |
| Lucas County OH Hospital Revenue (ProMedica Healthcare Obligated Group) | 5.000% | 11/15/21 | 1,560 | 1,655 |
| Lucas County OH Hospital Revenue (ProMedica Healthcare Obligated Group) | 5.000% | 11/15/22 | 4,925 | 5,222 |
| Lucas County OH Hospital Revenue (ProMedica Healthcare Obligated Group) | 5.000% | 11/15/23 | 5,605 | 5,925 |
| Lucas-Plaza Housing Development Corp. OH Revenue | 0.000% | 6/1/24 (ETM) | 19,430 | 16,656 |
| Montgomery County OH Revenue (Miami Valley Hospital) | 5.750% | 11/15/21 | 4,800 | 5,085 |
| 3 Montgomery County OH Revenue (Miami Valley Hospital) TOB VRDO | 1.750% | 11/7/18 | 3,500 | 3,500 |
| Ohio Building Authority Revenue (Highway Safety Building) | 5.000% | 10/1/20 | 1,265 | 1,333 |
| Ohio Capital Facilities Lease-Appropriation Revenue (Administrative Building Fund Projects) | 5.000% | 4/1/19 | 1,395 | 1,412 |
| Ohio Capital Facilities Lease-Appropriation Revenue (Adult Correctional Building Fund Projects) | 4.000% | 10/1/20 | 500 | 517 |
| Ohio Capital Facilities Lease-Appropriation Revenue (Adult Correctional Building Fund Projects) | 5.000% | 10/1/21 | 1,000 | 1,077 |
| Ohio Capital Facilities Lease-Appropriation Revenue (Adult Correctional Building Fund Projects) | 5.000% | 10/1/21 | 465 | 501 |
| Ohio Capital Facilities Lease-Appropriation Revenue (Adult Correctional Building Fund Projects) | 5.000% | 10/1/21 | 1,000 | 1,077 |
| Ohio Capital Facilities Lease-Appropriation Revenue (Adult Correctional Building Fund Projects) | 5.000% | 10/1/22 | 550 | 604 |
| Ohio Capital Facilities Lease-Appropriation Revenue (Adult Correctional Building Fund Projects) | 5.000% | 10/1/22 (Prere.) | 750 | 825 |
| Ohio Capital Facilities Lease-Appropriation Revenue (Adult Correctional Building Fund Projects) | 5.000% | 10/1/22 | 890 | 977 |
| Ohio Capital Facilities Lease-Appropriation Revenue (Adult Correctional Building Fund Projects) | 5.000% | 10/1/22 | 1,000 | 1,098 |
| Ohio Capital Facilities Lease-Appropriation Revenue | | | | |
| (Cultural & Sports Facilities Building Fund Projects) | 5.000% | 10/1/21 | 1,360 | 1,464 |
| Ohio Capital Facilities Lease-Appropriation Revenue | | | | |
| (Cultural & Sports Facilities Building Fund Projects) | 5.000% | 10/1/22 | 1,020 | 1,120 |
| Ohio Capital Facilities Lease-Appropriation Revenue | | | | |
| (Cultural & Sports Facilities Building Fund Projects) | 5.000% | 10/1/23 | 1,200 | 1,339 |
| Ohio Capital Facilities Lease-Appropriation Revenue | | | | |
| (Mental Health Facilities Improvement Fund Projects) | 5.000% | 6/1/21 | 1,000 | 1,069 |
| Ohio Capital Facilities Lease-Appropriation Revenue | | | | |
| (Mental Health Facilities Improvement Fund Projects) | 5.000% | 6/1/22 | 1,000 | 1,091 |
| Ohio Capital Facilities Lease-Appropriation Revenue | | | | |
| (Mental Health Facilities Improvement Fund Projects) | 5.000% | 6/1/23 | 1,000 | 1,110 |
| Ohio Capital Facilities Lease-Appropriation Revenue | | | | |
| (Parks & Recreation Improvement Fund Projects) | 5.000% | 8/1/23 | 1,000 | 1,113 |
| Ohio Common Schools GO | 5.000% | 9/15/19 | 3,910 | 4,013 |
| Ohio Common Schools GO | 5.000% | 9/15/21 | 5,920 | 6,378 |
| Ohio Common Schools GO | 5.000% | 9/15/21 (Prere.) | 4,410 | 4,755 |
| Ohio Common Schools GO | 5.000% | 9/15/23 | 11,315 | 12,665 |
| Ohio Cultural & Sports Capital Facilities Lease revenue | 5.000% | 10/1/23 | 1,525 | 1,698 |
| Ohio Cultural & Sports Capital Facilities Lease revenue | 5.000% | 10/1/24 | 1,550 | 1,752 |
| Ohio Cultural & Sports Capital Facilities Lease revenue | 5.000% | 10/1/25 | 1,090 | 1,247 |
| Ohio GO | 5.000% | 5/1/19 | 6,680 | 6,782 |
| Ohio GO | 5.000% | 5/1/19 | 5,000 | 5,080 |
| Ohio GO | 5.000% | 9/15/19 | 5,000 | 5,132 |
| Ohio GO | 5.000% | 9/15/20 | 26,315 | 27,716 |
| Ohio GO | 5.000% | 5/1/21 | 2,645 | 2,827 |
| Ohio GO | 5.000% | 6/15/25 | 12,150 | 13,474 |
| Ohio GO | 4.000% | 2/1/26 | 7,905 | 8,312 |
| Ohio Higher Education GO | 5.000% | 5/1/22 | 5,800 | 6,334 |
112
Limited-Term Tax-Exempt Fund
| | | | |
| Face | Market |
| Maturity | Amount | Value• |
| Coupon | Date | ($000) | ($000) |
| Ohio Higher Educational Facility Commission Revenue (Case Western Reserve University Project) | 5.000% | 12/1/22 | 4,540 | 4,994 |
| Ohio Higher Educational Facility Commission Revenue (Case Western Reserve University Project) | 5.000% | 12/1/23 | 2,525 | 2,823 |
| Ohio Higher Educational Facility Commission Revenue (Case Western Reserve University Project) | 5.000% | 12/1/24 | 1,915 | 2,172 |
| Ohio Higher Educational Facility Commission Revenue (Case Western Reserve University Project) | 5.000% | 12/1/25 | 2,000 | 2,292 |
| Ohio Higher Educational Facility Commission Revenue (Denison University Project) | 5.000% | 11/1/22 | 1,220 | 1,339 |
| Ohio Higher Educational Facility Commission Revenue (Denison University Project) | 5.000% | 11/1/23 | 1,385 | 1,545 |
| Ohio Higher Educational Facility Commission Revenue (Denison University Project) | 5.000% | 11/1/24 | 1,255 | 1,418 |
| Ohio Higher Educational Facility Commission Revenue (Oberlin College Project) | 4.000% | 7/1/19 | 310 | 314 |
| Ohio Higher Educational Facility Commission Revenue (Oberlin College Project) | 4.000% | 7/1/20 | 325 | 334 |
| Ohio Higher Educational Facility Commission Revenue (Oberlin College Project) | 4.000% | 7/1/21 | 500 | 522 |
| Ohio Higher Educational Facility Commission Revenue (Oberlin College Project) | 5.000% | 7/1/22 | 305 | 332 |
| Ohio Higher Educational Facility Commission Revenue (Oberlin College Project) | 5.000% | 7/1/23 | 400 | 443 |
| Ohio Higher Educational Facility Commission Revenue (Oberlin College Project) | 5.000% | 7/1/24 | 500 | 562 |
| Ohio Higher Educational Facility Commission Revenue (Oberlin College Project) | 5.000% | 7/1/25 | 260 | 295 |
| Ohio Higher Educational Facility Commission Revenue (Xavier University Project) | 5.000% | 5/1/19 | 625 | 633 |
| Ohio Higher Educational Facility Commission Revenue (Xavier University Project) | 5.000% | 5/1/20 | 1,350 | 1,397 |
| Ohio Higher Educational Facility Commission Revenue (Xavier University Project) | 5.000% | 5/1/22 | 500 | 535 |
| Ohio Highway Capital Improvements GO | 5.000% | 5/1/21 | 2,500 | 2,672 |
| Ohio Highway Capital Improvements GO | 5.000% | 5/1/22 | 1,000 | 1,093 |
| Ohio Hospital Revenue (University Hospitals Health System Inc.) | 5.000% | 1/15/19 | 1,595 | 1,604 |
| Ohio Hospital Revenue (University Hospitals Health System Inc.) VRDO | 1.850% | 11/7/18 | 8,500 | 8,500 |
| Ohio Hospital Revenue (University Hospitals Health System Inc.) VRDO | 1.850% | 11/7/18 | 10,875 | 10,875 |
| Ohio Hospital Revenue (University Hospitals Health System Inc.) VRDO | 1.950% | 11/1/18 | 13,250 | 13,250 |
| Ohio Juvenile Correctional Capital Facilities Revenue | 5.000% | 4/1/24 | 1,000 | 1,125 |
| Ohio Juvenile Correctional Capital Facilities Revenue | 5.000% | 4/1/25 | 750 | 853 |
| Ohio Major New State Infrastructure Project Revenue | 4.000% | 12/15/18 | 2,750 | 2,757 |
| Ohio Major New State Infrastructure Project Revenue | 4.000% | 12/15/19 | 2,450 | 2,503 |
| Ohio Major New State Infrastructure Project Revenue | 5.000% | 12/15/19 | 2,500 | 2,581 |
| Ohio Major New State Infrastructure Project Revenue | 5.000% | 12/15/19 | 6,160 | 6,360 |
| Ohio Major New State Infrastructure Project Revenue | 5.000% | 12/15/20 | 2,750 | 2,908 |
| Ohio Major New State Infrastructure Project Revenue | 5.000% | 12/15/20 | 3,500 | 3,701 |
| Ohio Major New State Infrastructure Project Revenue | 5.000% | 12/15/21 | 4,000 | 4,323 |
| Ohio Major New State Infrastructure Project Revenue | 5.000% | 12/15/21 | 2,565 | 2,772 |
| Ohio Major New State Infrastructure Project Revenue | 5.000% | 12/15/22 | 5,000 | 5,511 |
| Ohio Major New State Infrastructure Project Revenue | 5.000% | 12/15/24 | 10,010 | 11,379 |
| Ohio Mental Health Facilities Improvement Fund Revenue | 5.000% | 6/1/24 | 1,645 | 1,857 |
| Ohio Mental Health Facilities Improvement Fund Revenue | 5.000% | 6/1/25 | 2,790 | 3,191 |
| Ohio Parks & Recreation Capital Facilities Revenue | 5.000% | 12/1/25 | 2,090 | 2,396 |
| Ohio Public Facilities Commission GO | 5.000% | 2/1/21 | 1,390 | 1,476 |
| Ohio Public Facilities Commission GO | 5.000% | 4/1/21 | 2,280 | 2,431 |
| Ohio Solid Waste Revenue (Republic Services Inc. Project) PUT | 1.850% | 12/3/18 | 5,000 | 4,999 |
| Ohio State University General Receipts Revenue | 5.000% | 12/1/18 (Prere.) | 1,440 | 1,444 |
| Ohio State University General Receipts Revenue | 5.000% | 12/1/23 | 1,100 | 1,235 |
| Ohio State University General Receipts Revenue | 5.000% | 12/1/24 | 1,015 | 1,156 |
| Ohio State University General Receipts Revenue | 5.000% | 12/1/25 | 815 | 940 |
| Ohio State University General Receipts Revenue VRDO | 1.560% | 11/7/18 | 3,030 | 3,030 |
| Ohio Turnpike Commission Turnpike Revenue | 5.000% | 2/15/24 | 1,500 | 1,687 |
| Ohio Turnpike Commission Turnpike Revenue | 5.000% | 2/15/25 | 1,500 | 1,709 |
| 3 Ohio Turnpike Commission Turnpike Revenue TOB VRDO | 1.700% | 11/7/18 | 12,000 | 12,000 |
| Ohio Water Development Authority Drinking Water Assistance Fund Revenue | 5.000% | 12/1/22 | 1,520 | 1,678 |
| Ohio Water Development Authority Pollution Control Revenue (Water Quality) | 5.000% | 12/1/18 | 1,105 | 1,108 |
| Ohio Water Development Authority Pollution Control Revenue (Water Quality) | 5.000% | 12/1/19 | 1,925 | 1,987 |
| Ohio Water Development Authority Pollution Control Revenue (Water Quality) | 5.000% | 12/1/20 | 7,500 | 7,934 |
| Ohio Water Development Authority Pollution Control Revenue (Water Quality) | 5.000% | 6/1/21 | 12,260 | 13,129 |
| Ohio Water Development Authority Pollution Control Revenue (Water Quality) | 5.000% | 12/1/21 | 4,050 | 4,385 |
| Ohio Water Development Authority Water Pollution Control Loan Fund Revenue | 5.000% | 6/1/19 | 1,695 | 1,725 |
| Ohio Water Development Authority Water Pollution Control Loan Fund Revenue | 5.000% | 12/1/19 | 5,490 | 5,666 |
| 2 Ohio Water Development Authority Water Pollution Control Loan Fund Revenue | 1.820% | 12/1/20 | 69,655 | 69,555 |
| Ohio Water Development Authority Water Pollution Control Loan Fund Revenue | 5.000% | 6/1/21 | 1,350 | 1,446 |
| Ohio Water Development Authority Water Pollution Control Loan Fund Revenue | 5.000% | 12/1/21 | 1,300 | 1,407 |
| Ohio Water Development Authority Water Pollution Control Loan Fund Revenue | 5.000% | 6/1/22 | 3,000 | 3,281 |
| Ohio Water Development Authority Water Pollution Control Loan Fund Revenue | 5.000% | 12/1/22 | 2,850 | 3,147 |
| Penta Career Center Ohio COP | 5.000% | 4/1/19 | 2,470 | 2,501 |
| Penta Career Center Ohio COP | 5.000% | 4/1/20 | 1,095 | 1,138 |
| Penta Career Center Ohio COP | 5.250% | 4/1/24 | 2,915 | 3,165 |
| Princeton OH City School District GO | 4.000% | 12/1/21 | 1,200 | 1,260 |
| Princeton OH City School District GO | 5.000% | 12/1/22 | 700 | 771 |
| Princeton OH City School District GO | 5.000% | 12/1/23 | 1,350 | 1,511 |
| Princeton OH City School District GO | 5.000% | 12/1/25 | 815 | 920 |
| Ross County OH Hospital Facilities Revenue (Adena Health System) | 5.375% | 12/1/18 (Prere.) | 1,560 | 1,564 |
113
Limited-Term Tax-Exempt Fund
| | | | |
| Face | Market |
| Maturity | Amount | Value• |
| Coupon | Date | ($000) | ($000) |
| Ross County OH Hospital Facilities Revenue (Adena Health System) | 5.750% | 12/1/18 (Prere.) | 5,750 | 5,767 |
| Scioto County OH Hospital Facilities Revenue (Southern Ohio Medical Center) | 5.000% | 2/15/19 | 630 | 635 |
| Scioto County OH Hospital Facilities Revenue (Southern Ohio Medical Center) | 5.000% | 2/15/20 | 1,135 | 1,174 |
| Scioto County OH Hospital Facilities Revenue (Southern Ohio Medical Center) | 5.000% | 2/15/21 | 650 | 686 |
| Scioto County OH Hospital Facilities Revenue (Southern Ohio Medical Center) | 5.000% | 2/15/22 | 1,125 | 1,210 |
| South-Western City OH School District GO | 5.000% | 12/1/21 | 1,020 | 1,102 |
| South-Western City OH School District GO | 5.000% | 12/1/23 | 1,000 | 1,120 |
| Southeastern Ohio Port Authority Hospital Facilities Revenue | | | | |
| (Marietta Area Health Care Inc. Obligated Group) | 5.000% | 12/1/22 | 735 | 769 |
| Toledo OH City School District GO | 5.000% | 12/1/18 | 3,055 | 3,062 |
| Toledo OH City School District GO | 5.000% | 12/1/19 | 2,220 | 2,288 |
| University of Akron Ohio General Receipts Revenue | 5.000% | 1/1/24 | 955 | 1,063 |
| University of Toledo Ohio General Receipts Revenue | 5.000% | 6/1/19 (ETM) | 2,805 | 2,855 |
| University of Toledo Ohio General Receipts Revenue | 5.000% | 6/1/22 | 2,480 | 2,693 |
| University of Toledo Ohio General Receipts Revenue | 5.000% | 6/1/23 | 3,000 | 3,312 |
| Warren County OH Health Care Facilities Improvement Revenue (Otterbein Homes Project) | 5.000% | 7/1/19 | 1,810 | 1,842 |
| Warren County OH Health Care Facilities Improvement Revenue (Otterbein Homes Project) | 5.000% | 7/1/20 | 2,550 | 2,651 |
| Warren County OH Health Care Facilities Improvement Revenue (Otterbein Homes Project) | 5.000% | 7/1/21 | 2,495 | 2,642 |
| | | | 967,540 |
| Oklahoma (0.3%) | | | | |
| Cleveland County OK Educational Facilities Authority Lease Revenue | | | | |
| (Norman Public Schools Project) | 5.000% | 7/1/19 | 2,335 | 2,379 |
| Comanche County OK Hospital Authority Revenue | 5.000% | 7/1/19 | 3,145 | 3,177 |
| Edmond OK Public Works Authority Sales Tax & Utility System Revenue | 4.000% | 7/1/23 | 1,000 | 1,066 |
| Edmond OK Public Works Authority Sales Tax & Utility System Revenue | 4.000% | 7/1/24 | 1,000 | 1,074 |
| Grand River Dam Authority Oklahoma Revenue | 5.000% | 6/1/21 | 5,000 | 5,347 |
| Grand River Dam Authority Oklahoma Revenue | 5.000% | 6/1/22 | 1,525 | 1,666 |
| Grand River Dam Authority Oklahoma Revenue | 5.000% | 6/1/23 | 3,415 | 3,799 |
| Norman OK Regional Hospital Authority Revenue | 5.000% | 9/1/21 | 2,150 | 2,287 |
| Norman OK Regional Hospital Authority Revenue | 5.000% | 9/1/22 | 2,375 | 2,569 |
| Norman OK Regional Hospital Authority Revenue | 5.000% | 9/1/23 | 5,040 | 5,511 |
| Oklahoma Capitol Improvement Authority Facilities Revenue | 5.000% | 7/1/21 | 1,000 | 1,071 |
| Oklahoma Development Finance Authority Health System Revenue | | | | |
| (Integris Health Obligated Group) | 5.000% | 8/15/19 | 2,000 | 2,044 |
| Oklahoma Development Finance Authority Health System Revenue | | | | |
| (Integris Health Obligated Group) | 5.000% | 8/15/20 | 1,310 | 1,373 |
| Oklahoma Development Finance Authority Health System Revenue | | | | |
| (Integris Health Obligated Group) | 5.000% | 8/15/21 | 2,000 | 2,141 |
| Oklahoma Development Finance Authority Health System Revenue | | | | |
| (Integris Health Obligated Group) | 5.000% | 8/15/22 | 1,325 | 1,446 |
| Oklahoma Development Finance Authority Health System Revenue (OU Medicine) | 5.000% | 8/15/23 | 1,040 | 1,132 |
| Oklahoma Development Finance Authority Health System Revenue (OU Medicine) | 5.000% | 8/15/24 | 715 | 785 |
| Oklahoma Development Finance Authority Health System Revenue (OU Medicine) | 5.000% | 8/15/25 | 700 | 775 |
| Tulsa County OK Industrial Authority Capital Improvements Revenue | 4.000% | 12/1/23 | 3,565 | 3,810 |
| Tulsa County OK Industrial Authority Capital Improvements Revenue | 4.000% | 12/1/24 | 3,710 | 3,992 |
| Tulsa County OK Industrial Authority Capital Improvements Revenue | 4.000% | 12/1/25 | 3,860 | 4,163 |
| Tulsa County OK Independent School District No. 11 (Owasso) Revenue | 5.000% | 9/1/21 | 825 | 884 |
| Tulsa County OK Independent School District No. 11 (Owasso) Revenue | 5.000% | 9/1/22 | 750 | 818 |
| Tulsa County OK Independent School District No. 11 (Owasso) Revenue | 5.000% | 9/1/23 | 530 | 587 |
| Tulsa County OK Industrial Authority Educational Facilities Lease Revenue | 5.000% | 9/1/21 | 1,470 | 1,580 |
| Tulsa County OK Industrial Authority Educational Facilities Lease Revenue | 5.000% | 9/1/22 | 2,120 | 2,323 |
| Tulsa County OK Industrial Authority Housing Revenue | | | | |
| (St. Thomas Square & Worthington Townhouse Apartment Project) PUT | 1.700% | 2/1/19 | 5,750 | 5,744 |
| Tulsa County OK Industrial Authority Senior Living Community Revenue (Montereau Inc.) | 5.000% | 11/15/24 | 1,000 | 1,086 |
| Tulsa County OK Public Facilities Authority Revenue | 4.000% | 10/1/24 | 11,510 | 12,329 |
| Tulsa County OK Public Facilities Authority Revenue | 4.000% | 10/1/25 | 11,610 | 12,465 |
| | | | 89,423 |
| Oregon (0.3%) | | | | |
| Clackamas County OR Hospital Facilities Authority Revenue (Willamette View Inc.) | 3.000% | 11/15/22 | 2,500 | 2,502 |
| Clackamas County OR Hospital Facility Authority Revenue (Mary’s Woods at Marylhurst) | 2.600% | 11/15/23 | 3,100 | 3,050 |
| Clackamas County OR Hospital Facility Authority Revenue (Mary’s Woods at Marylhurst) | 2.800% | 5/15/24 | 575 | 566 |
| Clackamas County OR School District No. 7J Lake Oswego GO | 5.000% | 6/1/23 | 1,000 | 1,114 |
| Clackamas County OR School District No. 7J Lake Oswego GO | 5.000% | 6/1/24 | 1,000 | 1,131 |
| Forest Grove OR Campus Improvement Revenue (Pacific University Project) | 4.000% | 5/1/19 | 410 | 413 |
| Forest Grove OR Campus Improvement Revenue (Pacific University Project) | 4.000% | 5/1/20 | 500 | 511 |
| Forest Grove OR Campus Improvement Revenue (Pacific University Project) | 4.000% | 5/1/21 | 350 | 361 |
| Forest Grove OR Campus Improvement Revenue (Pacific University Project) | 5.000% | 5/1/22 | 350 | 375 |
| Marion & Polk Counties OR School District GO (No. 24J Salem) | 5.000% | 6/15/23 | 550 | 613 |
| Marion & Polk Counties OR School District GO (No. 24J Salem) | 5.000% | 6/15/24 | 800 | 907 |
114
Limited-Term Tax-Exempt Fund
| | | | | |
| Face | Market |
| Maturity | Amount | Value• |
| | Coupon | Date | ($000) | ($000) |
| Marion & Polk Counties OR School District GO (No. 24J Salem) | 5.000% | 6/15/25 | 1,000 | 1,151 |
| Metro OR GO | 5.000% | 6/1/23 | 2,805 | 3,129 |
| Metro OR GO | 5.000% | 6/1/25 | 3,330 | 3,834 |
| Multnomah and Clackamas Counties OR School District GO | 5.000% | 6/15/25 | 3,125 | 3,587 |
| Oregon Department of Administrative Services Lottery Revenue | 5.000% | 4/1/21 | 7,000 | 7,467 |
| Oregon Department of Administrative Services Lottery Revenue | 5.000% | 4/1/29 | 1,500 | 1,695 |
| Oregon Department of Transportation Highway User Tax Revenue | 5.000% | 11/15/24 | 3,410 | 3,752 |
| Oregon Facilities Authority Revenue (Legacy Health Project) | 5.000% | 6/1/22 | 750 | 815 |
| Oregon Facilities Authority Revenue (Legacy Health Project) | 5.000% | 6/1/23 | 675 | 746 |
| Oregon Facilities Authority Revenue (PeaceHealth) | 5.000% | 11/15/19 | 1,015 | 1,045 |
| Oregon Facilities Authority Revenue (PeaceHealth) | 5.000% | 11/15/20 | 1,275 | 1,345 |
| Oregon Facilities Authority Revenue (Samaritan Health Services Project) | 4.875% | 10/1/25 | 1,695 | 1,778 |
| Oregon GO | 5.000% | 8/1/21 | 1,750 | 1,882 |
| Oregon GO | 5.000% | 8/1/24 | 3,600 | 4,100 |
| Oregon GO | 5.000% | 5/1/26 | 5,560 | 6,160 |
| Oregon Housing & Community Service Department Single Family Mortgage Revenue | 4.000% | 7/1/44 | 2,660 | 2,735 |
| Portland OR Community College District GO | 5.000% | 6/15/24 | 1,125 | 1,277 |
| Salem OR Hospital Facilities Authority Revenue (Capital Manor Inc.) | 5.000% | 5/15/23 | 100 | 109 |
| Salem OR Hospital Facilities Authority Revenue (Capital Manor Inc.) | 5.000% | 5/15/24 | 110 | 121 |
| Salem OR Hospital Facilities Authority Revenue (Capital Manor Inc.) | 5.000% | 5/15/25 | 115 | 127 |
| Tri-County Metropolitan Transportation District of Oregon Capital Grant Receipt Revenue | 3.000% | 11/1/18 | 4,250 | 4,250 |
| Tri-County Metropolitan Transportation District of Oregon Capital Grant Receipt Revenue | 5.000% | 11/1/18 | 3,000 | 3,000 |
| Tri-County Metropolitan Transportation District of Oregon Capital Grant Receipt Revenue | 5.000% | 10/1/22 | 1,470 | 1,609 |
| Tri-County Metropolitan Transportation District of Oregon Capital Grant Receipt Revenue | 5.000% | 10/1/23 | 2,525 | 2,810 |
| Tri-County Metropolitan Transportation District of Oregon Capital Grant Receipt Revenue | 5.000% | 10/1/24 | 2,575 | 2,901 |
| Tri-County Metropolitan Transportation District of Oregon Capital Grant Receipt Revenue | 5.000% | 10/1/25 | 2,020 | 2,298 |
| Washington Yamhill and Multnomah Counties OR Hillsboro School District No. 1J GO | 5.000% | 6/15/23 | 425 | 474 |
| Washington Yamhill and Multnomah Counties OR Hillsboro School District No. 1J GO | 5.000% | 6/15/24 | 645 | 732 |
| Washington Yamhill and Multnomah Counties OR Hillsboro School District No. 1J GO | 4.000% | 6/15/25 | 500 | 542 |
| | | | | 77,014 |
| Pennsylvania (5.8%) | | | | |
| Allegheny County PA GO | 5.000% | 12/1/18 | 7,000 | 7,017 |
| Allegheny County PA GO | 5.000% | 12/1/19 | 5,310 | 5,478 |
| Allegheny County PA Higher Education Building Authority University Revenue | | | | |
| | (Chatham University) | 5.000% | 9/1/22 | 1,000 | 1,064 |
| Allegheny County PA Higher Education Building Authority University Revenue | | | | |
| | (Robert Morris University) | 3.000% | 10/15/22 | 600 | 598 |
| Allegheny County PA Higher Education Building Authority University Revenue | | | | |
| | (Robert Morris University) | 5.000% | 10/15/26 | 500 | 548 |
| Allegheny County PA Hospital Development Authority Revenue | 5.000% | 4/1/22 | 1,750 | 1,881 |
| Allegheny County PA Hospital Development Authority Revenue | 5.000% | 4/1/23 | 1,625 | 1,771 |
| Allegheny County PA Hospital Development Authority Revenue | 5.000% | 4/1/24 | 5,000 | 5,507 |
| Allegheny County PA Hospital Development Authority Revenue | 5.000% | 4/1/25 | 8,000 | 8,883 |
| Allegheny County PA Hospital Development Authority Revenue | | | | |
| | (University of Pittsburgh Medical Center) | 2.290% | 2/1/21 | 4,470 | 4,489 |
| 2,3 Allegheny County PA Hospital Development Authority Revenue | | | | |
| | (University of Pittsburgh Medical Center) TOB PUT | 1.770% | 12/3/18 LOC | 10,000 | 10,000 |
| 3 | Allegheny County PA Hospital Development Authority Revenue | | | | |
| | (University of Pittsburgh Medical Center) TOB VRDO | 1.690% | 11/1/18 LOC | 32,975 | 32,975 |
| 3 | Allegheny County PA Hospital Development Authority Revenue | | | | |
| | (University of Pittsburgh Medical Center) TOB VRDO | 1.700% | 11/1/18 LOC | 2,500 | 2,500 |
| Allegheny County PA Sanitary Authority Sewer Revenue | 5.000% | 12/1/18 (4) | 3,685 | 3,694 |
| Allegheny County PA Sanitary Authority Sewer Revenue | 5.000% | 12/1/20 | 2,535 | 2,673 |
| Allentown PA City School District GO | 5.000% | 2/1/24 (15) | 1,160 | 1,267 |
| Allentown PA City School District GO | 5.000% | 2/1/25 (15) | 955 | 1,058 |
| Allentown PA City School District TRANS | 2.200% | 1/2/19 | 2,625 | 2,624 |
| Allentown PA Neighborhood Improvement Zone Development Authority Tax Revenue | 5.000% | 5/1/22 | 1,875 | 1,964 |
| Allentown PA Neighborhood Improvement Zone Development Authority Tax Revenue | 5.000% | 5/1/23 | 1,000 | 1,054 |
| Allentown PA Neighborhood Improvement Zone Development Authority Tax Revenue | 5.000% | 5/1/25 | 2,500 | 2,644 |
| Beaver County PA GO | 4.000% | 4/15/20 (15) | 660 | 675 |
| Beaver County PA GO | 4.000% | 4/15/21 (15) | 690 | 712 |
| Beaver County PA GO | 4.000% | 4/15/22 (15) | 725 | 756 |
| Beaver County PA GO | 5.000% | 4/15/24 (15) | 1,090 | 1,205 |
| Beaver County PA GO | 5.000% | 4/15/25 (15) | 1,415 | 1,581 |
| Beaver County PA Hospital Authority Revenue (Heritage Valley Health System Inc.) | 5.000% | 5/15/25 | 1,370 | 1,450 |
| Berks County PA Industrial Development Authority Health System Revenue (Tower Health Project) | 5.000% | 11/1/21 | 500 | 534 |
| Berks County PA Industrial Development Authority Health System Revenue (Tower Health Project) | 5.000% | 11/1/23 | 1,445 | 1,592 |
| Berks County PA Industrial Development Authority Health System Revenue (Tower Health Project) | 5.000% | 11/1/24 | 1,020 | 1,135 |
115
Limited-Term Tax-Exempt Fund
| | | | |
| Face | Market |
| Maturity | Amount | Value• |
| Coupon | Date | ($000) | ($000) |
| 3 Berks County PA Municipal Authority Revenue (Reading Hospital & Medical Center Project) | | | | |
| TOB VRDO | 1.700% | 11/7/18 | 8,420 | 8,420 |
| Bethel Park PA School District GO | 5.000% | 8/1/22 | 500 | 546 |
| Bethel Park PA School District GO | 5.000% | 8/1/23 | 780 | 866 |
| 2 Bethlehem PA Area School District Authority Revenue PUT | 2.077% | 11/1/21 | 10,140 | 10,111 |
| 2 Bethlehem PA Area School District Authority Revenue PUT | 2.087% | 11/1/21 | 5,395 | 5,381 |
| Bethlehem PA GO | 5.000% | 12/1/23 (4) | 260 | 291 |
| Bethlehem PA GO | 5.000% | 12/1/24 (4) | 290 | 328 |
| Bethlehem PA GO | 5.000% | 12/1/25 (4) | 475 | 543 |
| Bethlehem PA Water Authority Revenue | 5.000% | 11/15/18 (15) | 500 | 501 |
| Bethlehem PA Water Authority Revenue | 5.000% | 11/15/19 (15) | 1,165 | 1,200 |
| Bethlehem PA Water Authority Revenue | 5.000% | 11/15/20 (15) | 1,000 | 1,053 |
| Bucks County PA GO | 5.000% | 5/1/21 | 3,060 | 3,271 |
| Bucks County PA Water & Sewer Authority Water System Revenue | 5.000% | 6/1/21 (15) | 4,510 | 4,816 |
| Bucks County PA Water & Sewer Authority Water System Revenue | 4.000% | 6/1/22 (15) | 605 | 637 |
| Bucks County PA Water & Sewer Authority Water System Revenue | 4.000% | 6/1/23 (15) | 500 | 531 |
| Butler County PA General Authority Revenue (North Allegheny School District Project) VRDO | 1.600% | 11/7/18 | 9,265 | 9,265 |
| Butler County PA Hospital Authority Revenue (Butler Health System Project) | 3.000% | 7/1/19 | 1,460 | 1,464 |
| Butler County PA Hospital Authority Revenue (Butler Health System Project) | 4.000% | 7/1/20 | 525 | 537 |
| Butler County PA Hospital Authority Revenue (Butler Health System Project) | 4.000% | 7/1/21 | 575 | 594 |
| Butler County PA Hospital Authority Revenue (Butler Health System Project) | 5.000% | 7/1/22 | 1,150 | 1,237 |
| Butler County PA Hospital Authority Revenue (Butler Health System Project) | 5.000% | 7/1/23 | 1,410 | 1,534 |
| Capital Region Water Pennsylvania Sewer System Revenue | 5.000% | 7/15/23 (15) | 1,705 | 1,888 |
| Capital Region Water Pennsylvania Sewer System Revenue | 5.000% | 7/15/25 | 1,000 | 1,131 |
| Centre County PA Hospital Authority Revenue (Mount Nittany Medical Center Project) | 5.000% | 11/15/24 | 1,000 | 1,111 |
| Centre County PA Hospital Authority Revenue (Mount Nittany Medical Center Project) | 5.000% | 11/15/25 | 1,040 | 1,165 |
| Clarion County PA Industrial Development Authority Revenue | | | | |
| (Clarion University Foundation Inc. Student Housing Project) | 5.000% | 7/1/20 | 1,015 | 1,044 |
| Clarion County PA Industrial Development Authority Revenue | | | | |
| (Clarion University Foundation Inc. Student Housing Project) | 5.000% | 7/1/21 | 1,070 | 1,115 |
| Clarion County PA Industrial Development Authority Revenue | | | | |
| (Clarion University Foundation Inc. Student Housing Project) | 5.000% | 7/1/22 | 1,120 | 1,178 |
| Clarion County PA Industrial Development Authority Revenue | | | | |
| (Clarion University Foundation Inc. Student Housing Project) | 5.000% | 7/1/23 | 1,180 | 1,251 |
| Coatesville PA School District Building Authority Lease Revenue | 5.000% | 12/1/20 (15) | 345 | 362 |
| Coatesville PA School District Building Authority Lease Revenue | 5.000% | 12/1/21 (15) | 315 | 337 |
| Coatesville PA School District Building Authority Lease Revenue | 5.000% | 12/1/22 (15) | 400 | 433 |
| Coatesville PA School District Building Authority Lease Revenue | 5.000% | 12/1/23 (15) | 400 | 433 |
| Coatesville PA School District Building Authority Lease Revenue | 5.000% | 12/1/24 (15) | 430 | 462 |
| Coatesville PA School District Building Authority Lease Revenue | 5.000% | 12/1/25 (15) | 390 | 417 |
| Coatesville PA School District GO | 5.000% | 8/1/22 (4) | 2,280 | 2,469 |
| Coatesville PA School District GO | 5.000% | 8/1/23 (4) | 3,735 | 4,087 |
| Commonwealth Financing Authority Pennsylvania Revenue | 5.000% | 6/1/19 | 750 | 762 |
| Commonwealth Financing Authority Pennsylvania Revenue | 5.000% | 6/1/20 | 1,125 | 1,168 |
| Commonwealth Financing Authority Pennsylvania Revenue | 5.000% | 6/1/21 | 1,000 | 1,058 |
| Commonwealth Financing Authority Pennsylvania Revenue | 5.000% | 6/1/22 | 1,760 | 1,893 |
| Commonwealth Financing Authority Pennsylvania Revenue | 5.000% | 6/1/23 | 2,625 | 2,866 |
| Commonwealth Financing Authority Pennsylvania Revenue | 5.000% | 6/1/24 | 3,000 | 3,317 |
| Delaware County PA Authority University Revenue (Villanova University) | 5.000% | 8/1/19 | 240 | 245 |
| Delaware County PA Authority University Revenue (Villanova University) | 5.000% | 8/1/19 | 600 | 613 |
| Delaware County PA Authority University Revenue (Villanova University) | 5.000% | 8/1/20 | 530 | 555 |
| Delaware County PA Authority University Revenue (Villanova University) | 5.000% | 8/1/21 | 700 | 750 |
| Delaware County PA Authority University Revenue (Villanova University) | 5.000% | 12/1/21 | 435 | 469 |
| Delaware County PA Authority University Revenue (Villanova University) | 5.000% | 8/1/22 | 400 | 437 |
| Delaware County PA Authority University Revenue (Villanova University) | 5.000% | 12/1/22 | 400 | 439 |
| Delaware County PA Authority University Revenue (Villanova University) | 5.000% | 12/1/23 | 750 | 836 |
| Delaware River Joint Toll Bridge Commission Pennsylvania & New Jersey Revenue | 5.500% | 7/1/19 (14) | 1,300 | 1,330 |
| Delaware River Joint Toll Bridge Commission Pennsylvania & New Jersey Revenue | 5.000% | 7/1/20 | 385 | 403 |
| Delaware River Joint Toll Bridge Commission Pennsylvania & New Jersey Revenue | 5.000% | 7/1/21 | 380 | 407 |
| Delaware River Joint Toll Bridge Commission Pennsylvania & New Jersey Revenue | 5.000% | 7/1/22 | 290 | 317 |
| Delaware River Port Authority Pennsylvania & New Jersey Revenue | 5.000% | 1/1/19 | 1,745 | 1,753 |
| Delaware River Port Authority Pennsylvania & New Jersey Revenue | 5.000% | 1/1/20 | 7,320 | 7,541 |
| Delaware River Port Authority Pennsylvania & New Jersey Revenue | 5.000% | 1/1/22 | 2,410 | 2,586 |
| Delaware River Port Authority Pennsylvania & New Jersey Revenue | 5.000% | 1/1/23 | 2,425 | 2,642 |
| Delaware River Port Authority Pennsylvania & New Jersey Revenue VRDO | 1.580% | 11/7/18 LOC | 2,700 | 2,700 |
| Dubois PA Hospital Authority Revenue (Penn Highlands Healthcare Obligated Group) | 5.000% | 7/15/19 | 620 | 632 |
| Dubois PA Hospital Authority Revenue (Penn Highlands Healthcare Obligated Group) | 5.000% | 7/15/21 | 570 | 608 |
| Dubois PA Hospital Authority Revenue (Penn Highlands Healthcare Obligated Group) | 5.000% | 7/15/23 | 500 | 551 |
| Dubois PA Hospital Authority Revenue (Penn Highlands Healthcare Obligated Group) | 5.000% | 7/15/24 | 1,330 | 1,482 |
| Dubois PA Hospital Authority Revenue (Penn Highlands Healthcare Obligated Group) | 5.000% | 7/15/25 | 1,635 | 1,836 |
116
Limited-Term Tax-Exempt Fund
| | | | |
| Face | Market |
| Maturity | Amount | Value• |
| Coupon | Date | ($000) | ($000) |
| Dubois PA Hospital Authority Revenue (Penn Highlands Healthcare Obligated Group) | 5.000% | 7/15/26 | 1,460 | 1,648 |
| East Hempfield PA Industrial Development Authority Revenue | | | | |
| (Millersville University Student Housing Project) | 5.000% | 7/1/20 | 790 | 818 |
| Erie PA Sewer Authority Revenue | 0.000% | 12/1/25 (15) | 2,155 | 1,696 |
| Franklin County PA Industrial Development Authority Revenue (Menno-Haven Inc. Project) | 5.000% | 12/1/24 | 500 | 530 |
| Franklin County PA Industrial Development Authority Revenue (Menno-Haven Inc. Project) | 5.000% | 12/1/26 | 570 | 602 |
| Harrisburg PA School District GO | 5.000% | 11/15/24 (4) | 2,000 | 2,222 |
| Harrisburg PA School District GO | 5.000% | 11/15/25 (4) | 5,000 | 5,603 |
| Hempfield PA School District GO | 4.000% | 3/15/20 (15) | 2,740 | 2,807 |
| 2 Hempfield PA School District GO PUT | 2.062% | 8/1/19 | 5,690 | 5,695 |
| Indiana County PA Industrial Development Authority Student Housing Revenue BAN | 1.450% | 9/1/20 | 6,375 | 6,239 |
| 1 Kennett PA Consolidated School District GO | 4.000% | 2/15/24 | 500 | 534 |
| Lackawanna County PA Industrial Development Authority Revenue (University of Scranton) | 5.000% | 11/1/23 | 510 | 558 |
| Lackawanna County PA Industrial Development Authority Revenue (University of Scranton) | 5.000% | 11/1/24 | 500 | 552 |
| Lancaster County PA Hospital Authority Health System Revenue | | | | |
| (University of Pennsylvania Health System) | 5.000% | 8/15/22 | 2,750 | 3,009 |
| Lancaster County PA Hospital Authority Revenue (Brethren Village Project) | 5.000% | 7/1/22 | 915 | 965 |
| Lancaster County PA Hospital Authority Revenue (Brethren Village Project) | 5.000% | 7/1/23 | 700 | 743 |
| Lancaster County PA Hospital Authority Revenue (Brethren Village Project) | 5.000% | 7/1/24 | 1,300 | 1,381 |
| Lancaster County PA Solid Waste Management Authority Solid Waste Disposal System Revenue | 5.000% | 12/15/18 | 1,625 | 1,631 |
| Lancaster County PA Solid Waste Management Authority Solid Waste Disposal System Revenue | 5.000% | 12/15/20 | 2,850 | 3,002 |
| 3 Lehigh County PA General Purpose Hospital Authority Revenue (Lehigh Valley Health Network) | | | | |
| TOB VRDO | 1.750% | 11/7/18 | 7,430 | 7,430 |
| Luzerne County PA GO | 5.000% | 12/15/19 (4) | 600 | 617 |
| Luzerne County PA GO | 5.000% | 12/15/20 (4) | 1,000 | 1,050 |
| Luzerne County PA GO | 5.000% | 12/15/21 (4) | 1,000 | 1,071 |
| Luzerne County PA GO | 5.000% | 12/15/22 (4) | 750 | 816 |
| Luzerne County PA GO | 5.000% | 12/15/23 (4) | 750 | 824 |
| Luzerne County PA GO | 5.000% | 12/15/23 (4) | 750 | 824 |
| Luzerne County PA GO | 5.000% | 12/15/24 (4) | 1,500 | 1,659 |
| Luzerne County PA GO | 5.000% | 12/15/24 (4) | 1,000 | 1,106 |
| Luzerne County PA Industrial Development Authority Lease Revenue | 5.000% | 12/15/19 (4) | 500 | 513 |
| Luzerne County PA Industrial Development Authority Lease Revenue | 5.000% | 12/15/20 (4) | 1,760 | 1,836 |
| Luzerne County PA Industrial Development Authority Lease Revenue | 5.000% | 12/15/23 (4) | 1,000 | 1,085 |
| Luzerne County PA Industrial Development Authority Lease Revenue | 5.000% | 12/15/24 (4) | 1,330 | 1,457 |
| 2 Manheim Township PA School District GO | 1.754% | 5/1/19 | 700 | 700 |
| 2 Manheim Township PA School District GO | 1.804% | 5/1/20 | 750 | 751 |
| 2 Manheim Township PA School District GO | 1.854% | 5/3/21 | 1,000 | 1,002 |
| 2 Manheim Township PA School District GO | 1.954% | 11/1/21 | 1,100 | 1,105 |
| 2 Manheim Township PA School District GO PUT | 2.004% | 11/1/21 | 2,000 | 2,010 |
| Monroe County PA Hospital Authority Revenue (Pocono Medical Center) | 5.000% | 7/1/21 | 700 | 742 |
| Monroeville PA Finance Authority Revenue (UPMC Health System) | 5.000% | 2/15/19 | 1,000 | 1,008 |
| Montgomery County PA GO | 5.000% | 4/1/21 | 1,975 | 2,108 |
| Montgomery County PA GO | 5.000% | 4/1/23 | 2,395 | 2,664 |
| Montgomery County PA Higher Education & Health Authority Hospital Revenue | | | | |
| (Abington Memorial Hospital) | 5.000% | 6/1/19 (ETM) | 1,625 | 1,653 |
| Montgomery County PA Higher Education & Health Authority Hospital Revenue | | | | |
| (Abington Memorial Hospital) | 5.000% | 6/1/19 | 1,675 | 1,702 |
| Montgomery County PA Higher Education & Health Authority Hospital Revenue | | | | |
| (Abington Memorial Hospital) | 5.000% | 6/1/20 (ETM) | 2,000 | 2,087 |
| Montgomery County PA Higher Education & Health Authority Hospital Revenue | | | | |
| (Abington Memorial Hospital) | 5.000% | 6/1/20 | 4,410 | 4,588 |
| Montgomery County PA Higher Education & Health Authority Revenue (Arcadia University) | 5.000% | 4/1/19 | 1,535 | 1,550 |
| Montgomery County PA Higher Education & Health Authority Revenue (Arcadia University) | 5.000% | 4/1/20 | 1,515 | 1,563 |
| Montgomery County PA Higher Education & Health Authority Revenue (Arcadia University) | 5.000% | 4/1/21 | 1,550 | 1,630 |
| Montgomery County PA Higher Education & Health Authority Revenue | | | | |
| (Holy Redeemer Health System) | 4.000% | 10/1/19 | 500 | 506 |
| Montgomery County PA Higher Education & Health Authority Revenue | | | | |
| (Holy Redeemer Health System) | 5.000% | 10/1/20 | 1,265 | 1,315 |
| Montgomery County PA Higher Education & Health Authority Revenue | | | | |
| (Holy Redeemer Health System) | 5.000% | 10/1/21 | 1,320 | 1,393 |
| Montgomery County PA Higher Education & Health Authority Revenue | | | | |
| (Holy Redeemer Health System) | 5.000% | 10/1/22 | 1,380 | 1,475 |
| Montgomery County PA Higher Education & Health Authority Revenue | | | | |
| (Thomas Jefferson University) | 5.000% | 9/1/22 | 825 | 898 |
| Montgomery County PA Higher Education & Health Authority Revenue | | | | |
| (Thomas Jefferson University) | 5.000% | 9/1/23 | 1,275 | 1,410 |
| Montgomery County PA Higher Education & Health Authority Revenue | | | | |
| (Thomas Jefferson University) | 5.000% | 9/1/24 | 1,610 | 1,802 |
117
Limited-Term Tax-Exempt Fund
| | | | |
| Face | Market |
| Maturity | Amount | Value• |
| Coupon | Date | ($000) | ($000) |
| 2 Montgomery County PA Higher Education & Health Authority Revenue | | | | |
| (Thomas Jefferson University) PUT | 2.320% | 9/1/23 | 9,250 | 9,246 |
| Montgomery County PA Industrial Development Authority Health Services Revenue | | | | |
| (Albert Einstein Healthcare Network) | 5.000% | 1/15/20 | 1,200 | 1,228 |
| Montgomery County PA Industrial Development Authority Health Services Revenue | | | | |
| (Albert Einstein Healthcare Network) | 5.000% | 1/15/21 | 2,175 | 2,264 |
| Montgomery County PA Industrial Development Authority Health Services Revenue | | | | |
| (Albert Einstein Healthcare Network) | 5.000% | 1/15/22 | 4,500 | 4,753 |
| Montgomery County PA Industrial Development Authority Pollution Control Revenue | | | | |
| (Exelon Generation Co., LLC) PUT | 2.500% | 4/1/20 | 8,000 | 7,967 |
| Montgomery County PA Industrial Development Authority Pollution Control Revenue | | | | |
| (Exelon Generation Co., LLC) PUT | 2.500% | 4/1/20 | 5,000 | 4,979 |
| Montgomery County PA Industrial Development Authority Pollution Control Revenue | | | | |
| (Exelon Generation Co., LLC) PUT | 2.550% | 6/1/20 | 18,810 | 18,723 |
| Montgomery County PA Industrial Development Authority Revenue | | | | |
| (Philadelphia Presbyterian Homes Inc. Project) | 2.000% | 12/1/19 | 735 | 731 |
| Montgomery County PA Industrial Development Authority Revenue | | | | |
| (Philadelphia Presbyterian Homes Inc. Project) | 3.000% | 12/1/21 | 715 | 716 |
| Montgomery County PA Industrial Development Authority Revenue | | | | |
| (Philadelphia Presbyterian Homes Inc. Project) | 3.000% | 12/1/22 | 790 | 790 |
| Montgomery County PA Industrial Development Authority Revenue | | | | |
| (Whitemarsh Continuing Care Retirement Community Inc.) | 3.000% | 1/1/19 | 295 | 295 |
| Montgomery County PA Industrial Development Authority Revenue | | | | |
| (Whitemarsh Continuing Care Retirement Community Inc.) | 3.250% | 1/1/20 | 1,680 | 1,670 |
| Moon Industrial Development Authority Pennsylvania Revenue | | | | |
| (Baptist Home Society Obligated Group) | 5.000% | 7/1/20 | 720 | 733 |
| 2 North Penn PA Water Authority Revenue | 1.922% | 11/1/19 | 1,000 | 999 |
| 2 North Penn PA Water Authority Revenue PUT | 2.010% | 11/1/19 | 2,500 | 2,500 |
| Northampton County PA General Purpose Authority Hospital Revenue (St. Luke’s Hospital Project) | 5.000% | 8/15/21 | 1,510 | 1,607 |
| Northampton County PA General Purpose Authority Hospital Revenue (St. Luke’s Hospital Project) | 5.000% | 8/15/22 | 3,885 | 4,210 |
| Northampton County PA General Purpose Authority Hospital Revenue (St. Luke’s Hospital Project) | 5.000% | 8/15/23 | 2,185 | 2,403 |
| 2 Northampton County PA General Purpose Authority Hospital Revenue | | | | |
| (St. Luke’s Hospital Project) PUT | 3.000% | 8/15/20 | 8,125 | 8,204 |
| Northampton County PA Industrial Development Authority Revenue | | | | |
| (Morningstar Senior Living, Inc. Project) | 3.750% | 7/1/21 | 1,005 | 1,013 |
| Northeastern Pennsylvania Hospital & Educational Authority Revenue (Wilkes University Project) | 5.000% | 3/1/22 | 925 | 980 |
| Northeastern Pennsylvania Hospital & Educational Authority Revenue (Wilkes University Project) | 5.000% | 3/1/23 | 1,380 | 1,477 |
| Northeastern Pennsylvania Hospital & Educational Authority Revenue (Wilkes University Project) | 5.000% | 3/1/23 | 985 | 1,054 |
| Pennsbury PA School District GO | 5.000% | 1/15/21 | 1,250 | 1,323 |
| Pennsbury PA School District GO | 5.000% | 1/15/22 | 1,045 | 1,130 |
| Pennsylvania COP | 5.000% | 7/1/21 | 350 | 371 |
| Pennsylvania COP | 5.000% | 7/1/23 | 250 | 273 |
| Pennsylvania COP | 5.000% | 7/1/24 | 300 | 331 |
| Pennsylvania COP | 5.000% | 7/1/25 | 500 | 554 |
| Pennsylvania Economic Development Financing Authority Health System Revenue | | | | |
| (Albert Einstein Healthcare Network) | 6.250% | 10/15/19 (Prere.) | 6,750 | 7,006 |
| Pennsylvania Economic Development Financing Authority Pollution Control Revenue | | | | |
| (PPL Electric Utilities Corp. Project) | 4.000% | 10/1/23 | 10,100 | 10,410 |
| Pennsylvania Economic Development Financing Authority Revenue (UPMC Obligated Group) | 4.000% | 2/1/20 | 1,650 | 1,687 |
| Pennsylvania Economic Development Financing Authority Revenue (UPMC Obligated Group) | 5.000% | 2/1/21 | 2,250 | 2,382 |
| Pennsylvania Economic Development Financing Authority Revenue (UPMC Obligated Group) | 5.000% | 2/1/22 | 2,775 | 2,998 |
| Pennsylvania Economic Development Financing Authority Revenue (UPMC Obligated Group) | 5.000% | 11/15/23 | 5,120 | 5,699 |
| Pennsylvania Economic Development Financing Authority Revenue (UPMC Obligated Group) | 5.000% | 11/15/24 | 7,535 | 8,499 |
| Pennsylvania Economic Development Financing Authority Solid Waste Disposal Revenue | | | | |
| (Republic Services Inc. Project) PUT | 1.970% | 1/2/19 | 5,030 | 5,030 |
| Pennsylvania GO | 5.000% | 4/1/19 | 30,390 | 30,764 |
| Pennsylvania GO | 5.000% | 5/1/19 | 5,000 | 5,073 |
| Pennsylvania GO | 5.000% | 6/1/19 | 15,000 | 15,256 |
| Pennsylvania GO | 5.000% | 7/1/19 | 10,000 | 10,194 |
| Pennsylvania GO | 5.000% | 7/1/19 | 9,900 | 10,092 |
| Pennsylvania GO | 5.000% | 3/1/20 | 26,400 | 27,360 |
| Pennsylvania GO | 5.000% | 3/15/20 | 5,380 | 5,581 |
| Pennsylvania GO | 5.000% | 4/1/20 | 7,450 | 7,737 |
| Pennsylvania GO | 5.000% | 6/15/20 | 21,120 | 22,041 |
| Pennsylvania GO | 5.000% | 7/1/20 | 20,925 | 21,859 |
| Pennsylvania GO | 5.000% | 10/15/20 | 22,345 | 23,504 |
| Pennsylvania GO | 5.000% | 3/1/21 | 27,700 | 29,361 |
| Pennsylvania GO | 5.000% | 3/1/22 | 12,530 | 13,541 |
| Pennsylvania GO | 5.000% | 6/1/22 (Prere.) | 3,000 | 3,285 |
| Pennsylvania GO | 5.000% | 8/1/22 | 7,500 | 8,144 |
118
Limited-Term Tax-Exempt Fund
| | | | | |
| Face | Market |
| Maturity | Amount | Value• |
| | Coupon | Date | ($000) | ($000) |
| Pennsylvania GO | 4.000% | 7/1/23 | 13,065 | 13,839 |
| Pennsylvania GO | 5.000% | 8/15/23 | 20,000 | 22,118 |
| Pennsylvania GO | 5.000% | 9/15/23 | 4,840 | 5,359 |
| Pennsylvania GO | 5.000% | 1/1/24 | 30,000 | 33,289 |
| Pennsylvania GO | 5.000% | 8/1/25 | 8,150 | 9,123 |
| Pennsylvania GO | 5.000% | 9/15/25 (4) | 11,000 | 12,480 |
| Pennsylvania Higher Education Assistance Agency Revenue | 5.000% | 12/15/18 | 3,490 | 3,503 |
| Pennsylvania Higher Education Assistance Agency Revenue | 5.000% | 12/15/19 | 2,490 | 2,573 |
| Pennsylvania Higher Educational Facilities Authority Revenue | | | | |
| | (AICUP Financing Program - Delaware Valley College Project) | 5.000% | 11/1/18 | 1,075 | 1,075 |
| Pennsylvania Higher Educational Facilities Authority Revenue (Higher Education System) | 5.000% | 6/15/19 | 5,480 | 5,581 |
| Pennsylvania Higher Educational Facilities Authority Revenue (Higher Education System) | 5.000% | 6/15/23 | 6,225 | 6,885 |
| Pennsylvania Higher Educational Facilities Authority Revenue (Higher Education System) | 5.000% | 6/15/23 | 1,450 | 1,604 |
| Pennsylvania Higher Educational Facilities Authority Revenue (Higher Education System) | 5.000% | 6/15/24 | 4,220 | 4,732 |
| Pennsylvania Higher Educational Facilities Authority Revenue (Higher Education System) | 5.000% | 6/15/24 | 1,535 | 1,721 |
| Pennsylvania Higher Educational Facilities Authority Revenue (Higher Education System) | 5.000% | 6/15/25 | 4,510 | 5,114 |
| Pennsylvania Higher Educational Facilities Authority Revenue (Higher Education System) | 5.000% | 6/15/25 | 1,625 | 1,843 |
| Pennsylvania Higher Educational Facilities Authority Revenue (La Salle University) | 5.000% | 5/1/19 (ETM) | 1,190 | 1,207 |
| Pennsylvania Higher Educational Facilities Authority Revenue (La Salle University) | 5.000% | 5/1/19 | 660 | 668 |
| Pennsylvania Higher Educational Facilities Authority Revenue (St. Joseph’s University) | 5.000% | 11/1/18 | 700 | 700 |
| Pennsylvania Higher Educational Facilities Authority Revenue | | | | |
| | (Trustees of the University of Pennsylvania) | 5.000% | 10/1/21 | 2,120 | 2,290 |
| Pennsylvania Higher Educational Facilities Authority Revenue | | | | |
| | (Trustees of the University of Pennsylvania) | 5.000% | 10/1/21 | 3,000 | 3,240 |
| Pennsylvania Higher Educational Facilities Authority Revenue | | | | |
| | (Trustees of the University of Pennsylvania) | 5.000% | 10/1/22 | 5,010 | 5,527 |
| Pennsylvania Higher Educational Facilities Authority Revenue | | | | |
| | (University of Pennsylvania Health System) | 5.000% | 8/15/19 | 5,655 | 5,786 |
| Pennsylvania Higher Educational Facilities Authority Revenue | | | | |
| | (University of Pennsylvania Health System) | 5.000% | 5/15/20 | 8,030 | 8,366 |
| Pennsylvania Higher Educational Facilities Authority Revenue | | | | |
| | (University of Pennsylvania Health System) | 5.000% | 8/15/20 | 1,925 | 2,018 |
| Pennsylvania Higher Educational Facilities Authority Revenue | | | | |
| | (University of Pennsylvania Health System) | 5.000% | 8/15/21 | 3,035 | 3,257 |
| Pennsylvania Higher Educational Facilities Authority Revenue | | | | |
| | (University of Pennsylvania Health System) | 5.000% | 8/15/22 | 750 | 821 |
| Pennsylvania Higher Educational Facilities Authority Revenue | | | | |
| | (University of Pennsylvania Health System) | 5.000% | 8/15/23 | 3,000 | 3,338 |
| Pennsylvania Higher Educational Facilities Authority Revenue (York College) PUT | 2.250% | 4/30/20 | 2,310 | 2,308 |
| Pennsylvania Housing Finance Agency Single Family Mortgage Revenue | 4.000% | 10/1/48 | 13,260 | 13,822 |
| Pennsylvania Public School Building Authority Lease Revenue (School District of Philadelphia) | 5.000% | 4/1/19 | 1,330 | 1,345 |
| Pennsylvania State University Revenue | 5.000% | 3/1/19 (Prere.) | 1,500 | 1,515 |
| Pennsylvania Turnpike Commission Motor License Fund Revenue | 5.000% | 12/1/19 | 1,020 | 1,052 |
| Pennsylvania Turnpike Commission Oil Franchise Tax Revenue | 5.000% | 12/1/22 | 3,485 | 3,798 |
| 1,2 Pennsylvania Turnpike Commission Revenue | 0.000% | 11/8/18 | 25,000 | 25,000 |
| Pennsylvania Turnpike Commission Revenue | 3.000% | 12/1/18 | 2,890 | 2,893 |
| Pennsylvania Turnpike Commission Revenue | 5.000% | 12/1/18 | 3,240 | 3,248 |
| Pennsylvania Turnpike Commission Revenue | 5.000% | 12/1/18 | 1,150 | 1,153 |
| Pennsylvania Turnpike Commission Revenue | 5.000% | 6/1/19 (Prere.) | 5,000 | 5,088 |
| 2 | Pennsylvania Turnpike Commission Revenue | 2.300% | 12/1/19 | 15,000 | 15,028 |
| 2 | Pennsylvania Turnpike Commission Revenue | 2.750% | 12/1/19 | 20,500 | 20,591 |
| Pennsylvania Turnpike Commission Revenue | 5.000% | 12/1/19 | 1,015 | 1,047 |
| Pennsylvania Turnpike Commission Revenue | 5.000% | 12/1/19 | 1,175 | 1,212 |
| Pennsylvania Turnpike Commission Revenue | 5.000% | 12/1/19 | 900 | 929 |
| 2 | Pennsylvania Turnpike Commission Revenue | 1.950% | 12/1/20 | 3,750 | 3,742 |
| 2 | Pennsylvania Turnpike Commission Revenue | 2.480% | 12/1/20 | 25,100 | 25,265 |
| 2 | Pennsylvania Turnpike Commission Revenue | 2.870% | 12/1/20 | 1,430 | 1,448 |
| Pennsylvania Turnpike Commission Revenue | 5.000% | 12/1/20 | 1,805 | 1,902 |
| Pennsylvania Turnpike Commission Revenue | 5.000% | 12/1/20 | 350 | 370 |
| Pennsylvania Turnpike Commission Revenue | 5.000% | 6/1/21 | 29,715 | 31,590 |
| 2 | Pennsylvania Turnpike Commission Revenue | 2.030% | 12/1/21 | 10,000 | 9,979 |
| Pennsylvania Turnpike Commission Revenue | 5.000% | 12/1/21 | 1,250 | 1,342 |
| Pennsylvania Turnpike Commission Revenue | 5.000% | 12/1/21 | 415 | 448 |
| Pennsylvania Turnpike Commission Revenue | 5.000% | 6/1/22 | 34,945 | 37,806 |
| Pennsylvania Turnpike Commission Revenue | 5.000% | 12/1/22 | 250 | 275 |
| Pennsylvania Turnpike Commission Revenue | 5.000% | 6/1/23 | 440 | 483 |
| Pennsylvania Turnpike Commission Revenue | 5.000% | 6/1/23 | 8,980 | 9,848 |
| Pennsylvania Turnpike Commission Revenue | 5.000% | 6/1/23 | 28,505 | 31,260 |
| Pennsylvania Turnpike Commission Revenue | 5.000% | 12/1/23 | 650 | 724 |
| Pennsylvania Turnpike Commission Revenue | 5.000% | 6/1/24 | 350 | 388 |
119
Limited-Term Tax-Exempt Fund
| | | | |
| Face | Market |
| Maturity | Amount | Value• |
| Coupon | Date | ($000) | ($000) |
| Pennsylvania Turnpike Commission Revenue | 5.000% | 6/1/24 | 3,000 | 3,327 |
| Pennsylvania Turnpike Commission Revenue | 5.000% | 12/1/24 | 3,470 | 3,911 |
| 1 Pennsylvania Turnpike Commission Revenue | 5.000% | 12/1/24 | 4,000 | 4,357 |
| Pennsylvania Turnpike Commission Revenue | 5.000% | 6/1/25 | 3,860 | 4,311 |
| Pennsylvania Turnpike Commission Revenue | 5.000% | 6/1/25 | 685 | 765 |
| 1 Pennsylvania Turnpike Commission Revenue | 5.000% | 12/1/25 | 3,935 | 4,311 |
| Pennsylvania Turnpike Commission Revenue | 5.000% | 6/1/26 | 3,775 | 4,248 |
| Pennsylvania Turnpike Commission Revenue | 5.000% | 6/1/26 | 1,165 | 1,311 |
| 2 Pennsylvania Turnpike Commission Revenue PUT | 2.400% | 12/1/18 | 6,575 | 6,578 |
| Philadelphia PA Airport Parking Authority Revenue | 5.250% | 9/1/24 | 4,025 | 4,217 |
| Philadelphia PA Airport Revenue | 5.000% | 7/1/19 | 290 | 296 |
| Philadelphia PA Airport Revenue | 5.000% | 7/1/20 | 750 | 784 |
| Philadelphia PA Airport Revenue | 5.000% | 7/1/21 | 750 | 801 |
| Philadelphia PA Airport Revenue | 5.000% | 7/1/22 | 1,020 | 1,110 |
| Philadelphia PA Airport Revenue | 5.000% | 7/1/23 | 850 | 940 |
| Philadelphia PA Airport Revenue | 5.000% | 7/1/24 | 630 | 708 |
| Philadelphia PA Airport Revenue | 5.000% | 6/15/25 | 8,505 | 8,851 |
| Philadelphia PA Authority for Industrial Development Revenue (Benjamin Franklin Parkway Project) | 5.000% | 2/15/23 | 2,565 | 2,802 |
| Philadelphia PA Authority for Industrial Development Revenue (Benjamin Franklin Parkway Project) | 5.000% | 2/15/24 | 2,960 | 3,273 |
| Philadelphia PA Authority for Industrial Development Revenue (Benjamin Franklin Parkway Project) | 5.000% | 2/15/25 | 3,165 | 3,535 |
| Philadelphia PA Authority for Industrial Development Revenue (Cultural & Commercial Corridors) | 5.000% | 12/1/22 | 4,470 | 4,875 |
| Philadelphia PA Authority for Industrial Development Revenue (Cultural & Commercial Corridors) | 5.000% | 12/1/23 | 5,415 | 5,981 |
| Philadelphia PA Authority for Industrial Development Revenue (Temple University) | 5.000% | 4/1/19 | 1,000 | 1,013 |
| Philadelphia PA Authority for Industrial Development Revenue (Temple University) | 5.000% | 4/1/19 | 1,700 | 1,721 |
| Philadelphia PA Authority for Industrial Development Revenue (Temple University) | 5.000% | 4/1/20 | 750 | 780 |
| Philadelphia PA Authority for Industrial Development Revenue (Temple University) | 5.000% | 4/1/20 | 3,500 | 3,641 |
| Philadelphia PA Authority for Industrial Development Revenue (Temple University) | 5.000% | 4/1/21 | 1,060 | 1,126 |
| Philadelphia PA Authority for Industrial Development Revenue (Temple University) | 5.000% | 4/1/21 | 3,605 | 3,830 |
| Philadelphia PA Authority for Industrial Development Revenue (Temple University) | 5.000% | 4/1/22 | 750 | 814 |
| Philadelphia PA Authority for Industrial Development Revenue (Temple University) | 5.000% | 4/1/22 | 5,680 | 6,161 |
| Philadelphia PA Authority for Industrial Development Revenue (Temple University) | 5.000% | 4/1/23 | 650 | 717 |
| Philadelphia PA Authority for Industrial Development Revenue (Temple University) | 5.000% | 4/1/23 | 5,705 | 6,290 |
| Philadelphia PA Gas Works Revenue | 5.000% | 10/1/22 | 3,050 | 3,319 |
| Philadelphia PA Gas Works Revenue | 5.000% | 8/1/23 | 1,015 | 1,117 |
| Philadelphia PA Gas Works Revenue | 5.000% | 8/1/24 | 875 | 975 |
| Philadelphia PA Gas Works Revenue | 5.000% | 8/1/25 | 875 | 983 |
| Philadelphia PA Gas Works Revenue | 5.000% | 8/1/26 | 1,300 | 1,470 |
| Philadelphia PA GO | 5.000% | 7/15/19 | 1,435 | 1,464 |
| Philadelphia PA GO | 5.000% | 8/1/19 (Prere.) | 220 | 225 |
| Philadelphia PA GO | 5.000% | 8/1/19 | 5,150 | 5,260 |
| Philadelphia PA GO | 5.000% | 8/1/20 | 3,625 | 3,786 |
| Philadelphia PA GO | 5.000% | 8/1/21 | 3,500 | 3,731 |
| Philadelphia PA GO | 5.000% | 8/1/22 | 4,810 | 5,223 |
| Philadelphia PA GO | 5.000% | 8/1/24 (12) | 1,780 | 1,818 |
| Philadelphia PA Hospitals & Higher Education Facilities Authority Hospital Revenue | | | | |
| (Temple University Health System Obligated Group) | 5.000% | 7/1/19 | 1,000 | 1,014 |
| Philadelphia PA Hospitals & Higher Education Facilities Authority Hospital Revenue | | | | |
| (Temple University Health System Obligated Group) | 5.000% | 7/1/21 | 715 | 750 |
| Philadelphia PA Hospitals & Higher Education Facilities Authority Hospital Revenue | | | | |
| (Temple University Health System Obligated Group) | 5.000% | 7/1/22 | 1,000 | 1,063 |
| Philadelphia PA Hospitals & Higher Education Facilities Authority Hospital Revenue | | | | |
| (Temple University Health System Obligated Group) | 5.000% | 7/1/23 | 2,750 | 2,954 |
| Philadelphia PA Hospitals & Higher Education Facilities Authority Hospital Revenue | | | | |
| (Temple University Health System Obligated Group) | 5.000% | 7/1/24 | 7,195 | 7,791 |
| Philadelphia PA Municipal Authority Revenue | 5.000% | 11/15/18 | 2,500 | 2,503 |
| Philadelphia PA School District GO | 5.000% | 9/1/19 | 700 | 715 |
| Philadelphia PA School District GO | 5.000% | 9/1/19 | 6,215 | 6,349 |
| Philadelphia PA School District GO | 5.000% | 9/1/20 | 500 | 523 |
| Philadelphia PA School District GO | 5.000% | 9/1/20 | 6,000 | 6,276 |
| Philadelphia PA School District GO | 5.000% | 9/1/21 | 2,745 | 2,928 |
| Philadelphia PA School District GO | 5.000% | 9/1/21 | 4,500 | 4,800 |
| Philadelphia PA School District GO | 5.000% | 9/1/21 | 8,000 | 8,534 |
| Philadelphia PA School District GO | 5.000% | 9/1/22 | 4,000 | 4,329 |
| Philadelphia PA School District GO | 5.000% | 9/1/22 | 6,345 | 6,868 |
| Philadelphia PA School District GO | 5.000% | 9/1/22 | 1,000 | 1,082 |
| Philadelphia PA School District GO | 5.000% | 9/1/23 | 6,450 | 7,050 |
| Philadelphia PA School District GO | 5.000% | 9/1/23 | 6,250 | 6,832 |
| Philadelphia PA School District GO | 5.000% | 9/1/24 | 1,285 | 1,418 |
| Philadelphia PA School District GO | 5.000% | 9/1/25 | 1,000 | 1,114 |
| Philadelphia PA Water & Wastewater Revenue | 5.000% | 6/15/19 (4) | 2,500 | 2,546 |
120
Limited-Term Tax-Exempt Fund
| | | | |
| Face | Market |
| Maturity | Amount | Value• |
| Coupon | Date | ($000) | ($000) |
| Philadelphia PA Water & Wastewater Revenue | 5.000% | 1/1/20 | 7,165 | 7,402 |
| Philadelphia PA Water & Wastewater Revenue | 5.000% | 11/1/20 | 500 | 527 |
| Philadelphia PA Water & Wastewater Revenue | 5.000% | 7/1/21 | 1,000 | 1,069 |
| Philadelphia PA Water & Wastewater Revenue | 5.000% | 7/1/21 | 1,285 | 1,374 |
| Philadelphia PA Water & Wastewater Revenue | 5.000% | 11/1/21 | 320 | 345 |
| Philadelphia PA Water & Wastewater Revenue | 5.000% | 11/1/23 | 350 | 390 |
| Philadelphia PA Water & Wastewater Revenue | 5.000% | 11/1/25 | 1,345 | 1,538 |
| Philadelphia PA Water & Wastewater Revenue | 5.000% | 7/1/19 | 1,000 | 1,020 |
| Philadelphia PA Water & Wastewater Revenue | 5.000% | 7/1/20 | 2,000 | 2,090 |
| Philadelphia PA Water & Wastewater Revenue | 5.000% | 11/1/22 | 520 | 570 |
| Philadelphia PA Water & Wastewater Revenue | 5.000% | 10/1/23 | 5,000 | 5,565 |
| Pittsburgh & Allegheny County PA Sports & Exhibition Authority Hotel Room Excise Tax Revenue | 5.000% | 2/1/26 (4) | 3,030 | 3,270 |
| Pittsburgh & Allegheny County PA Sports & Exhibition Authority Parking System Revenue | 4.000% | 12/15/21 | 700 | 730 |
| Pittsburgh & Allegheny County PA Sports & Exhibition Authority Parking System Revenue | 5.000% | 12/15/23 | 500 | 552 |
| Pittsburgh & Allegheny County PA Sports & Exhibition Authority Parking System Revenue | 5.000% | 12/15/24 | 500 | 558 |
| Pittsburgh PA GO | 5.000% | 9/1/23 | 350 | 385 |
| Pittsburgh PA GO | 5.000% | 9/1/24 | 520 | 579 |
| Pittsburgh PA Urban Redevelopment Authority Revenue (Crawford 123 LP) PUT | 2.250% | 6/1/20 | 3,150 | 3,138 |
| Pittsburgh PA Water & Sewer Authority Revenue | 5.000% | 9/1/19 (4) | 2,500 | 2,561 |
| Pittsburgh PA Water & Sewer Authority Revenue | 5.000% | 9/1/20 (4) | 3,385 | 3,552 |
| Pittsburgh PA Water & Sewer Authority Revenue | 5.000% | 9/1/22 (4) | 14,360 | 15,713 |
| Pittsburgh PA Water & Sewer Authority Revenue | 5.000% | 9/1/23 (4) | 15,225 | 16,932 |
| Pittsburgh PA Water & Sewer Authority Revenue | 5.000% | 9/1/24 (4) | 17,180 | 19,357 |
| 2 Pittsburgh PA Water & Sewer Authority Revenue PUT | 2.265% | 12/1/20 (4) | 50,000 | 50,023 |
| Pocono Mountain PA School District GO | 4.000% | 9/1/23 (4) | 2,650 | 2,810 |
| Reading PA School District GO | 5.000% | 4/1/19 | 6,230 | 6,301 |
| Reading PA School District GO | 5.000% | 3/1/24 (4) | 665 | 736 |
| Saint Mary PA Hospital Authority Health System Revenue (Trinity Health Corp Obligated Group) | 5.000% | 11/15/19 | 700 | 720 |
| Saint Mary PA Hospital Authority Health System Revenue (Trinity Health Corp Obligated Group) | 5.000% | 11/15/20 | 900 | 948 |
| Saint Mary PA Hospital Authority Health System Revenue (Trinity Health Corp Obligated Group) | 5.000% | 11/15/23 | 500 | 556 |
| Saint Mary PA Hospital Authority Health System Revenue (Trinity Health Corp Obligated Group) | 5.000% | 11/15/24 | 1,950 | 2,194 |
| Scranton PA School District GO | 5.000% | 6/1/22 | 2,150 | 2,275 |
| 2 Scranton School District PA GO PUT | 2.384% | 4/1/21 | 2,875 | 2,880 |
| Southcentral Pennsylvania General Authority Revenue (WellSpan Health Obligated Group) | 5.000% | 6/1/28 | 2,775 | 3,051 |
| Southeastern Pennsylvania Transportation Authority Revenue | 5.000% | 3/1/21 | 675 | 717 |
| Southeastern Pennsylvania Transportation Authority Revenue | 5.000% | 3/1/22 | 325 | 352 |
| Southeastern Pennsylvania Transportation Authority Revenue | 5.000% | 3/1/23 | 875 | 966 |
| Southeastern Pennsylvania Transportation Authority Revenue | 5.000% | 3/1/24 | 700 | 785 |
| Southeastern Pennsylvania Transportation Authority Revenue | 5.000% | 3/1/25 | 750 | 853 |
| St. Mary Hospital Authority Pennsylvania Health System Revenue (Catholic Health Initiatives) | 5.000% | 5/15/20 (Prere.) | 5,000 | 5,216 |
| St. Mary Hospital Authority Pennsylvania Health System Revenue (Catholic Health Initiatives) | 5.000% | 11/15/20 | 1,500 | 1,584 |
| State Public School Building Authority Pennsylvania College Revenue | | | | |
| (Community College of Philadelphia Project) | 4.000% | 6/15/20 (15) | 1,940 | 1,992 |
| State Public School Building Authority Pennsylvania College Revenue | | | | |
| (Community College of Philadelphia Project) | 5.000% | 6/15/21 (15) | 1,345 | 1,433 |
| State Public School Building Authority Pennsylvania College Revenue | | | | |
| (Community College of Philadelphia Project) | 5.000% | 6/15/22 (15) | 1,160 | 1,258 |
| State Public School Building Authority Pennsylvania College Revenue | | | | |
| (Community College of Philadelphia Project) | 5.000% | 6/15/23 (15) | 2,580 | 2,838 |
| State Public School Building Authority Pennsylvania College Revenue | | | | |
| (Delaware County Community College Project) | 5.000% | 10/1/19 (15) | 1,725 | 1,769 |
| State Public School Building Authority Pennsylvania College Revenue | | | | |
| (Delaware County Community College Project) | 5.000% | 10/1/20 (15) | 1,035 | 1,087 |
| State Public School Building Authority Pennsylvania College Revenue | | | | |
| (Delaware County Community College Project) | 5.000% | 10/1/21 (15) | 2,670 | 2,864 |
| State Public School Building Authority Pennsylvania College Revenue | | | | |
| (Montgomery County Community College) | 5.000% | 5/1/20 | 2,995 | 3,118 |
| State Public School Building Authority Pennsylvania College Revenue | | | | |
| (Montgomery County Community College) | 5.000% | 5/1/21 | 1,115 | 1,184 |
| State Public School Building Authority Pennsylvania College Revenue | | | | |
| (Montgomery County Community College) | 5.000% | 5/1/22 | 1,010 | 1,092 |
| State Public School Building Authority Pennsylvania Lease Revenue | | | | |
| (School District of Philadelphia) | 5.000% | 4/1/22 | 1,250 | 1,340 |
| 3 Tower Health Obligated Group PA TOB VRDO | 1.720% | 11/7/18 | 4,435 | 4,435 |
| University Area Joint Authority Pennsylvania Sewer Revenue | 5.000% | 11/1/22 (15) | 545 | 596 |
| University Area Joint Authority Pennsylvania Sewer Revenue | 5.000% | 11/1/23 (15) | 1,110 | 1,234 |
| University Area Joint Authority Pennsylvania Sewer Revenue | 5.000% | 11/1/24 (15) | 720 | 812 |
| University Area Joint Authority Pennsylvania Sewer Revenue | 5.000% | 11/1/25 (15) | 1,000 | 1,140 |
| University Area Joint Authority Pennsylvania Sewer Revenue | 5.000% | 11/1/26 (15) | 1,000 | 1,133 |
121
Limited-Term Tax-Exempt Fund
| | | | |
| Face | Market |
| Maturity | Amount | Value• |
| Coupon | Date | ($000) | ($000) |
| University of Pittsburgh of the Commonwealth System of Higher Education | | | | |
| Pennsylvania Revenue (University Capital Project) | 5.500% | 3/15/19 (Prere.) | 1,030 | 1,044 |
| Westmoreland County PA Industrial Development Authority Revenue (Excela Health Project) | 5.000% | 7/1/25 | 1,000 | 1,036 |
| 3 Westmoreland County PA Municipal Authority Revenue TOB VRDO | 1.710% | 11/7/18 LOC | 5,770 | 5,770 |
| Westmoreland County PA Municipal Authority Service Water Revenue | 0.000% | 8/15/23 (14) | 5,000 | 4,344 |
| Wilkes-Barre PA Finance Authority Revenue (University of Scranton Project) | 5.000% | 11/1/20 | 2,465 | 2,581 |
| York County PA School of Technology Authority Lease Revenue | 5.000% | 2/15/23 (15) | 1,265 | 1,388 |
| York County PA School of Technology Authority Lease Revenue | 5.000% | 2/15/24 (15) | 1,000 | 1,113 |
| York County PA School of Technology Authority Lease Revenue | 5.000% | 2/15/25 (15) | 500 | 563 |
| | | | 1,526,245 |
| Puerto Rico (0.2%) | | | | |
| Puerto Rico Aqueduct & Sewer Authority Revenue | 5.000% | 7/1/25 (12) | 50 | 53 |
| Puerto Rico Electric Power Authority Power Revenue | 5.000% | 7/1/19 (14) | 125 | 126 |
| Puerto Rico Electric Power Authority Power Revenue | 5.250% | 7/1/19 (14) | 2,185 | 2,213 |
| Puerto Rico Electric Power Authority Power Revenue | 5.000% | 7/1/20 (14) | 4,415 | 4,517 |
| Puerto Rico Electric Power Authority Power Revenue | 5.000% | 7/1/22 (14) | 270 | 272 |
| Puerto Rico Electric Power Authority Power Revenue | 5.000% | 7/1/22 (14) | 1,505 | 1,515 |
| Puerto Rico Electric Power Authority Power Revenue | 5.000% | 7/1/22 (14) | 4,180 | 4,209 |
| Puerto Rico Electric Power Authority Power Revenue | 5.000% | 7/1/23 (4) | 110 | 115 |
| Puerto Rico Electric Power Authority Power Revenue | 5.000% | 7/1/23 (4) | 145 | 150 |
| Puerto Rico Electric Power Authority Power Revenue | 5.000% | 7/1/23 (14) | 700 | 703 |
| Puerto Rico Electric Power Authority Power Revenue | 5.000% | 7/1/23 (14) | 1,410 | 1,417 |
| Puerto Rico Electric Power Authority Power Revenue | 5.000% | 7/1/24 (4) | 300 | 315 |
| Puerto Rico Electric Power Authority Revenue | 5.000% | 7/1/21 (14) | 290 | 292 |
| Puerto Rico Electric Power Authority Revenue | 5.000% | 7/1/21 (14) | 3,420 | 3,449 |
| Puerto Rico Electric Power Authority Revenue | 5.250% | 7/1/21 (14) | 5,270 | 5,468 |
| Puerto Rico Electric Power Authority Revenue | 5.250% | 7/1/22 (14) | 1,805 | 1,890 |
| Puerto Rico GO | 0.000% | 7/1/19 (14) | 1,815 | 1,769 |
| Puerto Rico GO | 3.875% | 7/1/19 (4) | 100 | 100 |
| Puerto Rico GO | 5.500% | 7/1/19 (14) | 260 | 264 |
| Puerto Rico GO | 5.500% | 7/1/19 (14) | 4,035 | 4,093 |
| Puerto Rico GO | 5.500% | 7/1/20 (14) | 22,695 | 23,403 |
| Puerto Rico GO | 5.500% | 7/1/20 (14) | 4,165 | 4,295 |
| Puerto Rico GO | 5.500% | 7/1/20 (12)(3) | 120 | 125 |
| Puerto Rico GO | 5.250% | 7/1/21 (14) | 125 | 127 |
| Puerto Rico GO | 5.500% | 7/1/21 (14) | 1,080 | 1,127 |
| Puerto Rico GO | 4.000% | 7/1/22 (4) | 65 | 67 |
| Puerto Rico GO | 5.500% | 7/1/22 (12) | 20 | 21 |
| Puerto Rico GO | 5.250% | 7/1/24 (4) | 600 | 639 |
| Puerto Rico GO | 5.375% | 7/1/25 (4) | 125 | 133 |
| Puerto Rico Highway & Transportation Authority Revenue | 5.500% | 7/1/19 (4) | 200 | 204 |
| Puerto Rico Highway & Transportation Authority Revenue | 5.500% | 7/1/19 (14) | 200 | 203 |
| Puerto Rico Highway & Transportation Authority Revenue | 5.500% | 7/1/20 (14) | 200 | 206 |
| Puerto Rico Highway & Transportation Authority Revenue | 5.500% | 7/1/20 (4) | 525 | 547 |
| Puerto Rico Highway & Transportation Authority Revenue | 5.500% | 7/1/23 (4) | 375 | 408 |
| Puerto Rico Highway & Transportation Authority Transportation Revenue | 5.000% | 7/1/23 (12) | 15 | 16 |
| Puerto Rico Municipal Finance Agency GO | 5.250% | 8/1/22 (12) | 20 | 21 |
| Puerto Rico Public Buildings Authority Government Facilities Revenue | 5.250% | 7/1/19 (14) | 40 | 40 |
| Puerto Rico Public Buildings Authority Government Facilities Revenue | 5.250% | 7/1/21 (12) | 40 | 42 |
| Puerto Rico Public Buildings Authority Government Facilities Revenue | 5.500% | 7/1/21 (14) | 155 | 159 |
| Puerto Rico Public Buildings Authority Government Facilities Revenue | 5.250% | 7/1/23 (12) | 25 | 27 |
| Puerto Rico Public Buildings Authority Government Facilities Revenue | 5.250% | 7/1/27 (12) | 100 | 101 |
| | | | 64,841 |
| Rhode Island (0.4%) | | | | |
| Rhode Island Commerce Corp. Grant Anticipation Revenue | 5.000% | 6/15/23 | 5,485 | 6,085 |
| Rhode Island Economic Development Corp. Airport Revenue | 5.000% | 7/1/19 | 700 | 708 |
| Rhode Island Economic Development Corp. Airport Revenue | 5.000% | 7/1/20 | 1,165 | 1,209 |
| Rhode Island Economic Development Corp. Airport Revenue | 5.000% | 7/1/21 | 1,355 | 1,437 |
| Rhode Island Economic Development Corp. Airport Revenue | 5.000% | 7/1/22 | 500 | 540 |
| Rhode Island Economic Development Corp. Revenue (Department of Transportation) | 5.000% | 6/15/24 | 2,895 | 3,254 |
| Rhode Island Health & Educational Building Corp. Higher Education Facilities Revenue | | | | |
| (University of Rhode Island) | 4.000% | 9/15/21 | 200 | 209 |
| Rhode Island Health & Educational Building Corp. Higher Education Facilities Revenue | | | | |
| (University of Rhode Island) | 5.000% | 9/15/21 | 400 | 429 |
| Rhode Island Health & Educational Building Corp. Higher Education Facilities Revenue | | | | |
| (University of Rhode Island) | 5.000% | 9/15/21 | 405 | 434 |
| Rhode Island Health & Educational Building Corp. Higher Education Facilities Revenue | | | | |
| (University of Rhode Island) | 5.000% | 9/15/22 | 510 | 558 |
122
Limited-Term Tax-Exempt Fund
| | | | |
| Face | Market |
| Maturity | Amount | Value• |
| Coupon | Date | ($000) | ($000) |
| Rhode Island Health & Educational Building Corp. Higher Education Facilities Revenue | | | | |
| (University of Rhode Island) | 5.000% | 9/15/22 | 450 | 491 |
| Rhode Island Health & Educational Building Corp. Higher Education Facilities Revenue | | | | |
| (University of Rhode Island) | 5.000% | 9/15/22 | 200 | 218 |
| Rhode Island Health & Educational Building Corp. Higher Education Facilities Revenue | | | | |
| (University of Rhode Island) | 5.000% | 9/15/23 | 450 | 500 |
| Rhode Island Health & Educational Building Corp. Higher Education Facilities Revenue | | | | |
| (University of Rhode Island) | 5.000% | 9/15/23 | 640 | 710 |
| Rhode Island Health & Educational Building Corp. Higher Education Facilities Revenue | | | | |
| (University of Rhode Island) | 5.000% | 9/15/23 | 300 | 333 |
| Rhode Island Health & Educational Building Corp. Higher Education Facilities Revenue | | | | |
| (University of Rhode Island) | 5.000% | 9/15/24 | 365 | 411 |
| Rhode Island Health & Educational Building Corp. Higher Education Facilities Revenue | | | | |
| (University of Rhode Island) | 5.000% | 9/15/24 | 670 | 752 |
| Rhode Island Health & Educational Building Corp. Higher Education Facilities Revenue | | | | |
| (University of Rhode Island) | 5.000% | 9/15/24 | 1,030 | 1,160 |
| Rhode Island Health & Educational Building Corp. Higher Education Facilities Revenue | | | | |
| (University of Rhode Island) | 5.000% | 9/15/25 | 225 | 254 |
| Rhode Island Health & Educational Building Corp. Higher Education Facilities Revenue | | | | |
| (University of Rhode Island) | 5.000% | 9/15/25 | 400 | 452 |
| Rhode Island Health & Educational Building Corp. Hospital Financing Revenue | | | | |
| (Care New England Health System Obligated Group) | 5.000% | 9/1/19 (ETM) | 1,650 | 1,691 |
| Rhode Island Health & Educational Building Corp. Hospital Financing Revenue | | | | |
| (Care New England Health System Obligated Group) | 5.000% | 9/1/20 (ETM) | 1,455 | 1,529 |
| Rhode Island Health & Educational Building Corp. Hospital Financing Revenue | | | | |
| (Care New England Health System Obligated Group) | 5.000% | 9/1/21 (ETM) | 1,650 | 1,775 |
| Rhode Island Health & Educational Building Corp. Hospital Financing Revenue | | | | |
| (Care New England Health System Obligated Group) | 5.000% | 9/1/21 | 5,625 | 5,846 |
| Rhode Island Health & Educational Building Corp. Hospital Financing Revenue | | | | |
| (Care New England Health System Obligated Group) | 5.000% | 9/1/22 | 2,500 | 2,623 |
| Rhode Island Health & Educational Building Corp. Hospital Financing Revenue | | | | |
| (Care New England Health System Obligated Group) | 5.000% | 9/1/23 | 2,700 | 2,851 |
| Rhode Island Health & Educational Building Corp. Hospital Financing Revenue | | | | |
| (Lifespan Obligated Group) | 5.000% | 5/15/19 | 1,500 | 1,521 |
| Rhode Island Health & Educational Building Corp. Hospital Financing Revenue | | | | |
| (Lifespan Obligated Group) | 5.000% | 5/15/21 | 2,330 | 2,462 |
| Rhode Island Health & Educational Building Corp. Hospital Financing Revenue | | | | |
| (Lifespan Obligated Group) | 5.000% | 5/15/22 | 2,510 | 2,698 |
| Rhode Island Health & Educational Building Corp. Hospital Financing Revenue | | | | |
| (Lifespan Obligated Group) | 5.000% | 5/15/23 | 2,295 | 2,502 |
| Rhode Island Health & Educational Building Corp. Providence Public Schools Revenue | | | | |
| (Providence Public Buildings Authority) | 5.000% | 5/15/19 | 1,255 | 1,275 |
| Rhode Island Health & Educational Building Corp. Providence Public Schools Revenue | | | | |
| (Providence Public Buildings Authority) | 5.000% | 5/15/20 | 2,760 | 2,878 |
| Rhode Island Health & Educational Building Corp. Providence Public Schools Revenue | | | | |
| (Providence Public Buildings Authority) | 4.000% | 5/15/21 (4) | 10,470 | 10,859 |
| Rhode Island Health & Educational Building Corp. Providence Public Schools Revenue | | | | |
| (Providence Public Buildings Authority) | 5.000% | 5/15/21 | 2,000 | 2,123 |
| Rhode Island Health & Educational Building Corp. Providence Public Schools Revenue | | | | |
| (Providence Public Buildings Authority) | 4.000% | 5/15/22 (4) | 11,705 | 12,271 |
| Tobacco Settlement Financing Corp. Rhode Island Revenue | 5.000% | 6/1/19 | 10,580 | 10,750 |
| Tobacco Settlement Financing Corp. Rhode Island Revenue | 5.000% | 6/1/20 | 3,500 | 3,638 |
| Tobacco Settlement Financing Corp. Rhode Island Revenue | 5.000% | 6/1/21 | 2,755 | 2,915 |
| Tobacco Settlement Financing Corp. Rhode Island Revenue | 5.000% | 6/1/22 | 2,615 | 2,803 |
| | | | 95,154 |
| South Carolina (1.3%) | | | | |
| Berkeley County SC School District Revenue | 5.000% | 12/1/18 | 1,000 | 1,003 |
| Berkeley County SC School District Revenue | 5.000% | 12/1/20 | 1,000 | 1,056 |
| Charleston County SC GO | 5.000% | 11/1/18 | 7,085 | 7,085 |
| Charleston SC Educational Excellence Financing Corp. Revenue | | | | |
| (Charleston County School District, South Carolina Project) | 5.000% | 12/1/19 | 2,000 | 2,066 |
| Charleston SC Educational Excellence Financing Corp. Revenue | | | | |
| (Charleston County School District, South Carolina Project) | 5.000% | 12/1/26 | 10,000 | 11,115 |
| Darlington County SC School District GO | 5.000% | 3/1/24 | 3,605 | 4,052 |
| Darlington County SC School District GO | 5.000% | 3/1/25 | 3,825 | 4,362 |
| Kershaw County SC Public Schools Foundation Installment Purchase Revenue | 5.000% | 12/1/20 | 600 | 631 |
| Kershaw County SC Public Schools Foundation Installment Purchase Revenue | 5.000% | 12/1/21 | 1,000 | 1,071 |
| Kershaw County SC Public Schools Foundation Installment Purchase Revenue | 5.000% | 12/1/22 | 1,000 | 1,090 |
| Lexington County SC Health Services District Inc. Hospital Revenue | 5.000% | 11/1/18 | 1,345 | 1,345 |
123
Limited-Term Tax-Exempt Fund
| | | | |
| Face | Market |
| Maturity | Amount | Value• |
| Coupon | Date | ($000) | ($000) |
| Lexington County SC Health Services District Inc. Hospital Revenue | 5.000% | 11/1/19 | 500 | 514 |
| Lexington County SC Health Services District Inc. Hospital Revenue | 5.000% | 11/1/20 | 550 | 577 |
| Lexington County SC Health Services District Inc. Hospital Revenue | 5.000% | 11/1/22 | 550 | 597 |
| Lexington County SC Health Services District Inc. Hospital Revenue | 5.000% | 11/1/23 | 1,925 | 2,117 |
| Lexington County SC Health Services District Inc. Hospital Revenue | 5.000% | 11/1/24 | 675 | 750 |
| Lexington County SC Health Services District Inc. Hospital Revenue | 5.000% | 11/1/26 | 2,000 | 2,096 |
| Myrtle Beach SC Hospitality Fee Revenue | 5.000% | 6/1/20 | 500 | 521 |
| Myrtle Beach SC Hospitality Fee Revenue | 5.000% | 6/1/21 | 1,000 | 1,064 |
| Myrtle Beach SC Tax Increase Revenue (Myrtle Beach Air Force Base Redevelopment Project) | 5.000% | 10/1/21 | 1,245 | 1,327 |
| Myrtle Beach SC Tax Increase Revenue (Myrtle Beach Air Force Base Redevelopment Project) | 5.000% | 10/1/22 | 1,240 | 1,345 |
| Newberry County SC School District Installment Purchase Revenue | 5.000% | 12/1/22 | 1,290 | 1,415 |
| Patriots Energy Group Finance Authority SC Gas Supply Revenue PUT | 4.000% | 2/1/24 | 40,485 | 42,355 |
| Piedmont SC Municipal Power Agency Revenue | 5.000% | 1/1/22 | 7,310 | 7,675 |
| Piedmont SC Municipal Power Agency Revenue | 5.000% | 1/1/24 | 7,960 | 8,845 |
| Piedmont SC Municipal Power Agency Revenue | 5.000% | 1/1/25 | 1,490 | 1,672 |
| Richland County SC School District No. 2 GO | 5.000% | 2/1/22 | 19,280 | 20,943 |
| Rock Hill SC Utility System Revenue | 5.000% | 1/1/22 | 780 | 838 |
| Rock Hill SC Utility System Revenue | 5.000% | 1/1/23 | 1,110 | 1,218 |
| Rock Hill SC Utility System Revenue | 5.000% | 1/1/24 | 1,000 | 1,115 |
| South Carolina Association of Governmental Organizations Educational Facilities Corp. Revenue | | | | |
| (Pickens School District) | 5.000% | 12/1/19 | 1,270 | 1,309 |
| South Carolina Association of Governmental Organizations Educational Facilities Corp. Revenue | | | | |
| (Pickens School District) | 5.000% | 12/1/20 | 3,260 | 3,437 |
| South Carolina Association of Governmental Organizations Educational Facilities Corp. Revenue | | | | |
| (Pickens School District) | 5.000% | 12/1/21 | 2,850 | 3,069 |
| South Carolina Association of Governmental Organizations Educational Facilities Corp. Revenue | | | | |
| (Pickens School District) | 5.000% | 12/1/22 | 3,795 | 4,161 |
| South Carolina Association of Governmental Organizations Educational Facilities Corp. Revenue | | | | |
| (Pickens School District) | 5.000% | 12/1/26 | 2,970 | 3,332 |
| South Carolina Housing Finance & Development Authority Mortgage Revenue | 4.000% | 7/1/47 | 5,330 | 5,528 |
| South Carolina Housing Finance & Development Authority Mortgage Revenue | 4.500% | 7/1/48 | 9,000 | 9,576 |
| South Carolina Jobs Economic Development Authority Hospital Revenue (AnMed Health Project) | 5.000% | 2/1/23 | 1,860 | 2,040 |
| South Carolina Jobs Economic Development Authority Hospital Revenue (AnMed Health Project) | 5.000% | 2/1/24 | 1,825 | 2,029 |
| South Carolina Jobs Economic Development Authority Hospital Revenue (Palmetto Health) | 5.000% | 8/1/19 (ETM) | 1,000 | 1,022 |
| South Carolina Jobs Economic Development Authority Hospital Revenue (Palmetto Health) | 5.000% | 8/1/20 (ETM) | 2,710 | 2,842 |
| South Carolina Jobs Economic Development Authority Hospital Revenue (Palmetto Health) | 5.000% | 8/1/21 (ETM) | 1,000 | 1,071 |
| South Carolina Jobs Economic Development Authority Hospital Revenue (Palmetto Health) | 4.000% | 8/1/22 (ETM) | 1,500 | 1,589 |
| South Carolina Jobs Economic Development Authority Hospital Revenue (Palmetto Health) | 5.000% | 8/1/23 (ETM) | 1,500 | 1,671 |
| South Carolina Jobs Economic Development Authority Revenue (Bon Secours Health System Inc.) | 5.000% | 11/1/18 | 1,500 | 1,500 |
| South Carolina Jobs Economic Development Authority Revenue (Bon Secours Health System Inc.) | 5.000% | 11/1/19 | 1,000 | 1,028 |
| South Carolina Jobs Economic Development Authority Revenue (Bon Secours Health System Inc.) | 5.000% | 11/1/20 | 1,765 | 1,857 |
| South Carolina Public Service Authority Revenue | 5.000% | 12/1/19 | 1,250 | 1,285 |
| South Carolina Public Service Authority Revenue | 5.000% | 12/1/19 | 5,280 | 5,426 |
| South Carolina Public Service Authority Revenue | 5.000% | 7/1/20 (Prere.) | 1,255 | 1,313 |
| South Carolina Public Service Authority Revenue | 5.000% | 12/1/20 | 39,545 | 41,487 |
| South Carolina Public Service Authority Revenue | 5.000% | 12/1/20 | 4,025 | 4,223 |
| South Carolina Public Service Authority Revenue | 5.000% | 12/1/21 | 2,590 | 2,763 |
| South Carolina Public Service Authority Revenue | 5.000% | 12/1/21 | 2,040 | 2,176 |
| South Carolina Public Service Authority Revenue | 5.000% | 12/1/21 | 650 | 693 |
| South Carolina Public Service Authority Revenue | 5.000% | 12/1/22 | 10,000 | 10,826 |
| South Carolina Public Service Authority Revenue | 5.000% | 12/1/22 | 1,715 | 1,857 |
| South Carolina Public Service Authority Revenue | 5.000% | 12/1/22 | 580 | 628 |
| South Carolina Public Service Authority Revenue | 5.000% | 12/1/22 | 1,200 | 1,288 |
| South Carolina Public Service Authority Revenue | 5.000% | 12/1/22 | 1,120 | 1,213 |
| South Carolina Public Service Authority Revenue | 5.000% | 12/1/23 | 520 | 569 |
| South Carolina Public Service Authority Revenue | 5.000% | 12/1/23 | 3,375 | 3,694 |
| South Carolina Public Service Authority Revenue | 5.000% | 12/1/24 | 245 | 271 |
| South Carolina Public Service Authority Revenue | 5.000% | 12/1/24 | 4,875 | 5,390 |
| South Carolina Public Service Authority Revenue | 5.000% | 12/1/25 | 1,085 | 1,143 |
| South Carolina Public Service Authority Revenue | 5.000% | 12/1/25 | 8,305 | 9,185 |
| South Carolina Public Service Authority Revenue | 5.000% | 12/1/25 | 1,750 | 1,924 |
| South Carolina Public Service Authority Revenue (Santee Cooper) | 5.000% | 12/1/25 | 2,000 | 2,126 |
| 3 South Carolina Public Service Authority Revenue TOB VRDO | 1.850% | 11/7/18 | 2,650 | 2,650 |
| 3 South Carolina Public Service Authority TOB VRDO | 1.850% | 11/7/18 | 2,325 | 2,325 |
| South Carolina Transportation Infrastructure Revenue | 5.000% | 10/1/19 | 25,805 | 26,493 |
| South Carolina Transportation Infrastructure Revenue | 5.000% | 10/1/23 | 4,885 | 5,437 |
| South Carolina Transportation Infrastructure Revenue | 5.000% | 10/1/23 | 7,025 | 7,818 |
| South Carolina Transportation Infrastructure Revenue | 3.000% | 10/1/27 | 3,600 | 3,564 |
| University of South Carolina Athletic Facilities Revenue | 5.000% | 5/1/23 | 1,000 | 1,108 |
| University of South Carolina Athletic Facilities Revenue | 5.000% | 5/1/24 | 750 | 844 |
124
Limited-Term Tax-Exempt Fund
| | | | |
| Face | Market |
| Maturity | Amount | Value• |
| Coupon | Date | ($000) | ($000) |
| University of South Carolina Athletic Facilities Revenue | 5.000% | 5/1/25 | 750 | 856 |
| York County SC GO | 5.000% | 4/1/25 | 3,825 | 4,298 |
| | | | 333,794 |
| South Dakota (0.1%) | | | | |
| South Dakota Board of Regents Housing & Auxiliary Facilities System Revenue | 4.000% | 4/1/20 | 350 | 359 |
| South Dakota Board of Regents Housing & Auxiliary Facilities System Revenue | 5.000% | 4/1/21 | 800 | 848 |
| South Dakota Board of Regents Housing & Auxiliary Facilities System Revenue | 5.000% | 4/1/22 | 375 | 406 |
| South Dakota Board of Regents Housing & Auxiliary Facilities System Revenue | 5.000% | 4/1/23 | 750 | 824 |
| South Dakota Board of Regents Housing & Auxiliary Facilities System Revenue | 5.000% | 4/1/24 | 1,100 | 1,224 |
| South Dakota Board of Regents Housing & Auxiliary Facilities System Revenue | 5.000% | 4/1/25 | 1,000 | 1,125 |
| South Dakota Building Authority Revenue | 5.000% | 6/1/20 | 500 | 522 |
| South Dakota Health & Educational Facilities Authority Revenue | | | | |
| (Regional Health System Obligated Group) | 5.000% | 9/1/22 | 1,285 | 1,404 |
| South Dakota Health & Educational Facilities Authority Revenue | | | | �� |
| (Regional Health System Obligated Group) | 5.000% | 9/1/23 | 750 | 831 |
| South Dakota Health & Educational Facilities Authority Revenue | | | | |
| (Regional Health System Obligated Group) | 5.000% | 9/1/24 | 1,000 | 1,120 |
| South Dakota Health & Educational Facilities Authority Revenue | | | | |
| (Regional Health System Obligated Group) | 5.000% | 9/1/25 | 500 | 565 |
| South Dakota Health & Educational Facilities Authority Revenue (Sanford Health) | 4.000% | 11/1/20 | 665 | 687 |
| South Dakota Health & Educational Facilities Authority Revenue (Sanford Health) | 5.000% | 11/1/20 | 645 | 679 |
| South Dakota Health & Educational Facilities Authority Revenue (Sanford Health) | 4.000% | 11/1/21 | 500 | 523 |
| South Dakota Health & Educational Facilities Authority Revenue (Sanford Health) | 5.000% | 11/1/21 | 550 | 591 |
| South Dakota Health & Educational Facilities Authority Revenue (Sanford Health) | 5.000% | 11/1/22 | 400 | 438 |
| South Dakota Health & Educational Facilities Authority Revenue (Sanford Health) | 5.000% | 11/1/22 | 535 | 586 |
| South Dakota Housing Development Authority Homeownership Mortgage Revenue | 4.000% | 11/1/47 | 9,840 | 10,229 |
| | | | 22,961 |
| Tennessee (1.8%) | | | | |
| Chattanooga TN Electric System Revenue | 5.000% | 9/1/21 | 2,500 | 2,695 |
| Chattanooga TN Electric System Revenue | 5.000% | 9/1/22 | 2,000 | 2,201 |
| Clarksville TN Natural Gas Acquisition Corp. Revenue | 5.000% | 12/15/19 | 1,520 | 1,564 |
| Clarksville TN Natural Gas Acquisition Corp. Revenue | 5.000% | 12/15/20 | 700 | 734 |
| Clarksville TN Public Building Authority Revenue (Pooled Financing) VRDO | 1.710% | 11/1/18 LOC | 3,050 | 3,050 |
| Greeneville TN Health & Educational Facilities Board Hospital Revenue (Ballad Health) | 5.000% | 7/1/19 | 1,575 | 1,604 |
| Greeneville TN Health & Educational Facilities Board Hospital Revenue (Ballad Health) | 5.000% | 7/1/20 | 1,500 | 1,563 |
| Greeneville TN Health & Educational Facilities Board Hospital Revenue (Ballad Health) | 5.000% | 7/1/21 | 1,075 | 1,144 |
| Greeneville TN Health & Educational Facilities Board Hospital Revenue (Ballad Health) | 5.000% | 7/1/22 | 1,250 | 1,354 |
| Greeneville TN Health & Educational Facilities Board Hospital Revenue (Ballad Health) | 5.000% | 7/1/23 | 900 | 989 |
| Greeneville TN Health & Educational Facilities Board Hospital Revenue (Ballad Health) | 5.000% | 7/1/24 | 3,500 | 3,849 |
| Greeneville TN Health & Educational Facilities Board Hospital Revenue (Ballad Health) | 5.000% | 7/1/25 | 2,810 | 3,080 |
| Jackson TN Hospital Improvement Revenue (Jackson-Madison County General Hospital Project) | 5.000% | 4/1/22 | 3,545 | 3,820 |
| Knox County TN Health Educational & Housing Facilities Board Hospital Facilities Revenue | | | | |
| (Covenant Healthcare) | 5.000% | 1/1/20 | 2,500 | 2,575 |
| Knox County TN Health Educational & Housing Facilities Board Hospital Facilities Revenue | | | | |
| (University Health System Inc.) | 5.000% | 9/1/21 | 1,145 | 1,211 |
| Knox County TN Health Educational & Housing Facilities Board Hospital Facilities Revenue | | | | |
| (University Health System Inc.) | 5.000% | 4/1/22 | 960 | 1,025 |
| Knox County TN Health Educational & Housing Facilities Board Hospital Facilities Revenue | | | | |
| (University Health System Inc.) | 5.000% | 4/1/23 | 1,000 | 1,082 |
| Knox County TN Health Educational & Housing Facilities Board Hospital Facilities Revenue | | | | |
| (University Health System Inc.) | 5.000% | 9/1/23 | 1,370 | 1,490 |
| Knox County TN Health Educational & Housing Facilities Board Hospital Facilities Revenue | | | | |
| (University Health System Inc.) | 5.000% | 4/1/24 | 1,010 | 1,106 |
| Memphis TN Electric System Revenue | 5.000% | 12/1/24 | 760 | 865 |
| Memphis TN Gas System Revenue | 5.000% | 12/1/24 | 665 | 757 |
| Memphis TN GO | 5.000% | 6/1/23 | 6,585 | 7,332 |
| Memphis TN Water System Revenue | 4.000% | 12/1/24 | 860 | 936 |
| Memphis-Shelby County TN Airport Authority Revenue | 5.000% | 7/1/22 | 5,280 | 5,619 |
| Metropolitan Government of Nashville & Davidson County TN GO | 5.000% | 7/1/19 | 25,130 | 25,636 |
| Metropolitan Government of Nashville & Davidson County TN GO | 5.000% | 7/1/24 | 3,945 | 4,307 |
| Metropolitan Government of Nashville & Davidson County TN GO | 5.000% | 7/1/24 | 18,905 | 21,079 |
| Metropolitan Government of Nashville & Davidson County TN GO | 5.000% | 7/1/24 | 14,660 | 16,609 |
| Metropolitan Government of Nashville & Davidson County TN GO | 5.000% | 7/1/25 | 46,420 | 51,584 |
| Metropolitan Government of Nashville & Davidson County TN GO | 5.000% | 7/1/25 | 23,375 | 26,848 |
| Metropolitan Government of Nashville & Davidson County TN GO | 5.000% | 7/1/26 | 14,485 | 16,056 |
| Metropolitan Government of Nashville & Davidson County TN Health & | | | | |
| Educational Facilities Board Revenue (Ascension Health Credit Group) PUT | 1.550% | 11/3/20 | 2,500 | 2,456 |
| Metropolitan Government of Nashville & Davidson County TN Water & Sewer Revenue | 5.000% | 7/1/19 | 6,070 | 6,190 |
| Metropolitan Government of Nashville & Davidson County TN Water & Sewer Revenue | 5.000% | 7/1/20 | 1,000 | 1,046 |
125
Limited-Term Tax-Exempt Fund
| | | | |
| Face | Market |
| Maturity | Amount | Value• |
| Coupon | Date | ($000) | ($000) |
| Shelby County TN GO | 5.000% | 3/1/19 | 10,275 | 10,380 |
| Shelby County TN GO | 5.000% | 4/1/23 | 1,000 | 1,112 |
| Shelby County TN Health Educational & Housing Facility Board Revenue | | | | |
| (Methodist Le Bonheur Healthcare) | 5.000% | 5/1/21 | 1,350 | 1,436 |
| Shelby County TN Health Educational & Housing Facility Board Revenue | | | | |
| (Methodist Le Bonheur Healthcare) | 5.000% | 5/1/23 | 1,210 | 1,335 |
| Sullivan County TN GO | 5.000% | 5/1/21 | 2,705 | 2,887 |
| Sullivan County TN GO | 5.000% | 5/1/22 | 2,745 | 2,994 |
| Sullivan County TN GO | 5.000% | 5/1/23 | 2,985 | 3,314 |
| Tennessee Energy Acquisition Corp. Gas Revenue | 5.000% | 2/1/19 | 13,075 | 13,162 |
| Tennessee Energy Acquisition Corp. Gas Revenue | 5.250% | 9/1/19 | 7,520 | 7,706 |
| Tennessee Energy Acquisition Corp. Gas Revenue | 5.000% | 2/1/20 | 6,335 | 6,525 |
| Tennessee Energy Acquisition Corp. Gas Revenue | 5.250% | 9/1/20 | 19,005 | 19,934 |
| Tennessee Energy Acquisition Corp. Gas Revenue | 5.000% | 2/1/21 | 8,535 | 8,956 |
| Tennessee Energy Acquisition Corp. Gas Revenue | 5.250% | 9/1/21 | 13,315 | 14,245 |
| Tennessee Energy Acquisition Corp. Gas Revenue | 5.000% | 2/1/22 | 2,195 | 2,340 |
| Tennessee Energy Acquisition Corp. Gas Revenue | 5.250% | 9/1/22 | 1,570 | 1,712 |
| Tennessee Energy Acquisition Corp. Gas Revenue | 5.000% | 2/1/23 | 5,725 | 6,190 |
| Tennessee Energy Acquisition Corp. Gas Revenue | 5.250% | 9/1/23 | 2,840 | 3,137 |
| Tennessee Energy Acquisition Corp. Gas Revenue PUT | 4.000% | 5/1/23 | 92,750 | 96,189 |
| Tennessee Energy Acquisition Corp. Gas Revenue PUT | 4.000% | 11/1/25 | 31,500 | 32,608 |
| Tennessee Housing Development Agency Residential Finance Program Revenue | 4.000% | 7/1/39 | 1,685 | 1,729 |
| Tennessee Housing Development Agency Residential Finance Program Revenue | 4.000% | 1/1/42 | 4,615 | 4,786 |
| Tennessee Housing Development Agency Residential Finance Program Revenue | 4.000% | 1/1/45 | 2,730 | 2,811 |
| Washington County TN GO | 4.000% | 6/1/21 | 2,030 | 2,123 |
| Washington County TN GO | 4.000% | 6/1/23 | 2,000 | 2,140 |
| | | | 473,207 |
| Texas (13.3%) | | | | |
| Alamo TX Community College District GO | 5.000% | 8/15/23 | 5,420 | 6,051 |
| Alamo TX Community College District GO | 5.000% | 8/15/24 | 12,260 | 13,894 |
| Alamo TX Community College District GO | 5.000% | 8/15/25 | 7,950 | 9,130 |
| Aldine TX Independent School District GO | 5.000% | 2/15/24 | 200 | 225 |
| Aldine TX Independent School District GO | 5.000% | 2/15/25 | 250 | 285 |
| Alvin TX Independent School District GO | 5.000% | 2/15/22 | 1,780 | 1,929 |
| Alvin TX Independent School District GO PUT | 1.400% | 8/15/20 | 12,500 | 12,302 |
| Alvin TX Independent School District GO PUT | 2.150% | 8/15/21 | 7,500 | 7,432 |
| Arlington TX GO | 4.000% | 8/15/23 | 2,925 | 3,135 |
| Arlington TX GO | 5.000% | 8/15/24 | 2,925 | 3,313 |
| Arlington TX GO | 5.000% | 8/15/25 | 2,925 | 3,351 |
| Arlington TX GO | 5.000% | 8/15/26 | 2,920 | 3,380 |
| Arlington TX Independent School District GO | 5.000% | 2/15/24 | 2,615 | 2,935 |
| Arlington TX Independent School District GO | 5.000% | 2/15/25 | 2,275 | 2,587 |
| Arlington TX Special Tax Revenue | 3.000% | 2/15/20 | 600 | 606 |
| Arlington TX Special Tax Revenue | 3.000% | 2/15/21 | 750 | 761 |
| Arlington TX Special Tax Revenue | 4.000% | 2/15/22 | 750 | 786 |
| Arlington TX Special Tax Revenue | 4.000% | 2/15/23 | 735 | 777 |
| Arlington TX Special Tax Revenue | 5.000% | 2/15/24 | 1,410 | 1,569 |
| Arlington TX Special Tax Revenue | 5.000% | 2/15/25 (4) | 1,070 | 1,210 |
| Arlington TX Special Tax Revenue | 5.000% | 2/15/26 (4) | 1,075 | 1,210 |
| Austin Convention Enterprises Inc. Texas Convention Center Revenue | 5.000% | 1/1/22 | 400 | 430 |
| Austin Convention Enterprises Inc. Texas Convention Center Revenue | 5.000% | 1/1/22 | 500 | 538 |
| Austin Convention Enterprises Inc. Texas Convention Center Revenue | 5.000% | 1/1/23 | 750 | 817 |
| Austin Convention Enterprises Inc. Texas Convention Center Revenue | 5.000% | 1/1/23 | 755 | 823 |
| Austin Convention Enterprises Inc. Texas Convention Center Revenue | 5.000% | 1/1/24 | 750 | 827 |
| Austin Convention Enterprises Inc. Texas Convention Center Revenue | 5.000% | 1/1/24 | 690 | 761 |
| Austin TX Community College District Public Facilities Corp. Lease Revenue | 5.000% | 8/1/20 | 1,000 | 1,049 |
| Austin TX Community College District Public Facilities Corp. Lease Revenue | 5.000% | 8/1/21 | 1,000 | 1,067 |
| Austin TX Community College District Public Facilities Corp. Lease Revenue | 5.000% | 8/1/22 | 1,000 | 1,087 |
| Austin TX Community College District Public Facilities Corp. Lease Revenue | 5.000% | 8/1/23 | 200 | 221 |
| Austin TX Community College District Public Facilities Corp. Lease Revenue | 5.000% | 8/1/24 | 200 | 224 |
| Austin TX Community College District Public Facilities Corp. Lease Revenue | 5.000% | 8/1/25 | 255 | 288 |
| Austin TX Electric Utility System Revenue | 5.000% | 11/15/18 | 500 | 501 |
| Austin TX Electric Utility System Revenue | 5.000% | 11/15/19 | 500 | 515 |
| Austin TX Electric Utility System Revenue | 5.000% | 11/15/20 | 1,010 | 1,067 |
| Austin TX GO | 5.000% | 9/1/22 | 11,720 | 12,869 |
| Austin TX Independent School District GO | 5.000% | 8/1/23 | 1,250 | 1,392 |
| Austin TX Independent School District GO | 5.000% | 8/1/24 | 1,260 | 1,425 |
| Austin TX Independent School District GO | 5.000% | 8/1/25 | 1,750 | 2,004 |
| Austin TX Independent School District GO | 5.000% | 8/1/26 | 3,055 | 3,532 |
126
Limited-Term Tax-Exempt Fund
| | | | |
| Face | Market |
| Maturity | Amount | Value• |
| Coupon | Date | ($000) | ($000) |
| Austin TX Water & Wastewater System Revenue | 5.000% | 11/15/19 (ETM) | 60 | 62 |
| Austin TX Water & Wastewater System Revenue | 5.000% | 11/15/19 | 940 | 969 |
| Austin TX Water & Wastewater System Revenue | 5.000% | 11/15/20 | 2,420 | 2,558 |
| Beaumont TX Independent School District GO | 5.000% | 2/15/23 | 3,945 | 4,362 |
| Beaumont TX Independent School District GO | 5.000% | 2/15/24 | 4,150 | 4,665 |
| Beaumont TX Independent School District GO | 5.000% | 2/15/25 | 4,360 | 4,974 |
| Bedford TX GO | 5.000% | 2/1/22 | 2,515 | 2,725 |
| Bedford TX GO | 5.000% | 2/1/23 | 2,635 | 2,905 |
| Bedford TX GO | 5.000% | 2/1/24 | 2,775 | 3,105 |
| Bedford TX GO | 5.000% | 2/1/25 | 2,920 | 3,311 |
| Bexar County TX GO | 5.000% | 6/15/21 | 5,155 | 5,514 |
| Bexar County TX GO | 5.000% | 6/15/21 | 2,930 | 3,134 |
| Bexar County TX GO | 5.000% | 6/15/22 | 6,000 | 6,548 |
| Bexar County TX GO | 5.000% | 6/15/22 | 2,775 | 3,029 |
| Bexar County TX GO | 5.000% | 6/15/23 | 9,220 | 10,241 |
| Bexar County TX GO | 5.000% | 6/15/23 | 4,055 | 4,504 |
| Bexar County TX Hospital District GO | 5.000% | 2/15/21 | 1,875 | 1,989 |
| Bexar County TX Hospital District GO | 5.000% | 2/15/22 | 1,525 | 1,651 |
| Bexar County TX Hospital District GO | 5.000% | 2/15/23 | 1,465 | 1,615 |
| Bexar County TX Hospital District GO | 5.000% | 2/15/24 | 2,000 | 2,238 |
| Brazosport TX Independent School District GO | 5.000% | 2/15/25 | 1,955 | 2,216 |
| Brownsville TX Independent School District GO | 5.000% | 2/15/22 | 2,805 | 3,042 |
| Brownsville TX Utility System Revenue | 5.000% | 9/1/20 | 1,250 | 1,311 |
| Brownsville TX Utility System Revenue | 5.000% | 9/1/21 | 1,000 | 1,072 |
| Central Texas Regional Mobility Authority Revenue | 5.000% | 1/1/19 | 530 | 532 |
| Central Texas Regional Mobility Authority Revenue | 5.000% | 1/1/20 | 625 | 644 |
| Central Texas Regional Mobility Authority Revenue | 5.000% | 1/1/20 | 610 | 628 |
| Central Texas Regional Mobility Authority Revenue | 5.750% | 1/1/20 | 1,000 | 1,038 |
| Central Texas Regional Mobility Authority Revenue | 5.000% | 1/1/21 | 2,295 | 2,416 |
| 1 Central Texas Regional Mobility Authority Revenue | 4.000% | 1/1/22 | 3,500 | 3,630 |
| Central Texas Regional Mobility Authority Revenue | 5.000% | 1/1/22 | 225 | 241 |
| Central Texas Regional Mobility Authority Revenue | 5.000% | 1/1/22 | 2,570 | 2,759 |
| Central Texas Regional Mobility Authority Revenue | 5.000% | 1/1/23 | 1,170 | 1,273 |
| Central Texas Regional Mobility Authority Revenue | 5.000% | 1/1/23 | 4,500 | 4,914 |
| Central Texas Regional Mobility Authority Revenue PUT | 5.000% | 1/7/21 | 5,500 | 5,636 |
| Clear Creek TX Independent School District GO PUT | 1.450% | 8/14/20 | 8,500 | 8,373 |
| Clear Creek TX Independent School District GO PUT | 2.150% | 8/16/21 | 7,500 | 7,424 |
| Colorado River TX Municipal Water District Revenue | 5.000% | 1/1/22 | 1,000 | 1,080 |
| Colorado River TX Municipal Water District Revenue | 5.000% | 1/1/23 | 1,395 | 1,534 |
| Colorado River TX Municipal Water District Revenue | 5.000% | 1/1/24 | 1,550 | 1,732 |
| Colorado River TX Municipal Water District Revenue | 5.000% | 1/1/25 | 1,000 | 1,142 |
| 1 Conroe TX GO | 5.000% | 11/15/24 | 1,380 | 1,566 |
| Conroe TX Independent School District GO | 5.000% | 2/15/21 | 3,380 | 3,590 |
| Conroe TX Independent School District GO | 5.000% | 2/15/22 | 3,125 | 3,389 |
| Conroe TX Independent School District GO | 5.000% | 2/15/23 | 4,240 | 4,684 |
| Coppell TX Independent School District GO | 5.000% | 8/15/22 | 1,000 | 1,095 |
| Corpus Christi TX GO | 5.000% | 3/1/22 | 4,000 | 4,338 |
| Corpus Christi TX Independent School District GO PUT | 2.000% | 8/15/19 | 2,750 | 2,746 |
| Cypress-Fairbanks TX Independent School District GO | 5.000% | 2/15/22 | 9,890 | 10,737 |
| Cypress-Fairbanks TX Independent School District GO PUT | 2.500% | 8/15/19 | 17,000 | 17,043 |
| Cypress-Fairbanks TX Independent School District GO PUT | 1.400% | 8/17/20 | 5,000 | 4,921 |
| Cypress-Fairbanks TX Independent School District GO PUT | 1.400% | 8/17/20 | 5,375 | 5,290 |
| Cypress-Fairbanks TX Independent School District GO PUT | 3.000% | 8/17/20 | 4,850 | 4,908 |
| Dallas County TX Community College District GO | 5.000% | 2/15/25 | 3,270 | 3,728 |
| Dallas County TX Utility & Reclamation District GO | 5.000% | 2/15/21 | 7,230 | 7,646 |
| Dallas County TX Utility & Reclamation District GO | 5.000% | 2/15/22 | 5,365 | 5,784 |
| Dallas County TX Utility & Reclamation District GO | 5.000% | 2/15/23 | 1,000 | 1,096 |
| Dallas TX Area Rapid Transit Sales Tax Revenue | 5.000% | 12/1/21 | 3,250 | 3,515 |
| Dallas TX GO | 5.000% | 2/15/22 | 6,135 | 6,634 |
| Dallas TX GO | 5.000% | 2/15/23 (15) | 3,400 | 3,743 |
| Dallas TX GO | 5.000% | 2/15/23 (15) | 10,875 | 11,973 |
| Dallas TX Independent School District GO | 5.000% | 8/15/23 | 7,275 | 8,125 |
| Dallas TX Independent School District GO | 5.000% | 2/15/26 | 1,075 | 1,218 |
| Dallas TX Independent School District GO | 5.000% | 2/15/26 | 4,000 | 4,243 |
| Dallas TX Independent School District GO PUT | 5.000% | 2/15/20 | 2,500 | 2,586 |
| Dallas TX Independent School District GO PUT | 5.000% | 2/15/22 (Prere.) | 310 | 337 |
| Dallas TX Independent School District GO PUT | 5.000% | 2/15/22 | 19,690 | 21,259 |
| Dallas TX Waterworks & Sewer System Revenue | 5.000% | 10/1/24 | 3,315 | 3,758 |
| Dallas TX Waterworks & Sewer System Revenue | 5.000% | 10/1/25 | 1,740 | 1,996 |
| Dallas-Fort Worth TX International Airport Revenue | 5.000% | 11/1/18 | 500 | 500 |
127
Limited-Term Tax-Exempt Fund
| | | | |
| Face | Market |
| Maturity | Amount | Value• |
| Coupon | Date | ($000) | ($000) |
| Dallas-Fort Worth TX International Airport Revenue | 5.000% | 11/1/19 | 2,500 | 2,571 |
| Dallas-Fort Worth TX International Airport Revenue | 5.000% | 11/1/19 | 2,500 | 2,571 |
| Dallas-Fort Worth TX International Airport Revenue | 5.000% | 11/1/19 | 1,000 | 1,028 |
| Dallas-Fort Worth TX International Airport Revenue | 5.000% | 11/1/20 | 2,500 | 2,633 |
| Dallas-Fort Worth TX International Airport Revenue | 5.000% | 11/1/20 | 1,000 | 1,053 |
| Dallas-Fort Worth TX International Airport Revenue | 5.000% | 11/1/21 | 4,045 | 4,352 |
| Deer Park Independent School District TX GO PUT | 3.000% | 10/1/19 | 8,580 | 8,642 |
| Denton County TX GO | 5.000% | 7/15/22 | 2,000 | 2,190 |
| Denton County TX GO | 5.000% | 7/15/23 | 2,090 | 2,329 |
| Denton TX GO | 5.000% | 2/15/22 | 2,000 | 2,071 |
| Denton TX Independent School District GO | 0.000% | 8/15/20 | 1,195 | 1,144 |
| Denton TX Independent School District GO | 0.000% | 8/15/22 | 5,000 | 4,534 |
| Denton TX Independent School District GO | 5.000% | 8/15/24 | 2,775 | 3,140 |
| Dickinson TX Independent School District GO PUT | 1.350% | 8/1/19 | 2,750 | 2,733 |
| Eagle Mountain & Saginaw TX Independent School District GO PUT | 2.000% | 8/1/19 | 9,000 | 8,989 |
| El Paso TX GO | 5.000% | 8/15/21 | 5,615 | 6,023 |
| El Paso TX GO | 5.000% | 8/15/21 | 1,935 | 2,076 |
| El Paso TX GO | 5.000% | 8/15/22 | 2,815 | 3,079 |
| El Paso TX Independent School District GO | 5.000% | 8/15/25 | 1,000 | 1,144 |
| El Paso TX Municipal Drainage Utility System Revenue | 5.000% | 3/1/23 | 1,505 | 1,662 |
| El Paso TX Municipal Drainage Utility System Revenue | 5.000% | 3/1/24 | 1,690 | 1,897 |
| El Paso TX Municipal Drainage Utility System Revenue | 5.000% | 3/1/25 | 1,985 | 2,259 |
| El Paso TX Water & Sewer Revenue | 4.000% | 3/1/21 | 1,750 | 1,820 |
| El Paso TX Water & Sewer Revenue | 5.000% | 3/1/21 | 1,010 | 1,073 |
| El Paso TX Water & Sewer Revenue | 5.000% | 3/1/22 | 1,000 | 1,085 |
| El Paso TX Water & Sewer Revenue | 5.000% | 3/1/24 | 2,500 | 2,710 |
| El Paso TX Water & Sewer Revenue | 5.000% | 3/1/25 | 3,075 | 3,499 |
| Fort Bend County TX GO | 5.000% | 3/1/21 | 2,000 | 2,126 |
| Fort Bend County TX GO | 5.000% | 3/1/22 | 2,500 | 2,715 |
| Fort Bend County TX GO | 5.000% | 3/1/23 | 1,265 | 1,399 |
| Fort Bend County TX GO | 5.000% | 3/1/24 | 2,270 | 2,550 |
| Fort Bend County TX GO | 5.000% | 3/1/25 | 2,775 | 3,158 |
| Fort Bend County TX Toll Road Revenue | 5.000% | 3/1/22 | 200 | 216 |
| Fort Bend County TX Toll Road Revenue | 5.000% | 3/1/23 | 200 | 219 |
| Fort Bend TX Independent School District GO | 5.000% | 2/15/21 | 4,855 | 5,160 |
| Fort Bend TX Independent School District GO | 5.000% | 2/15/22 | 4,270 | 4,638 |
| Fort Bend TX Independent School District GO | 5.000% | 8/15/22 | 1,695 | 1,860 |
| Fort Bend TX Independent School District GO | 5.000% | 2/15/23 | 3,010 | 3,332 |
| Fort Bend TX Independent School District GO | 5.000% | 2/15/24 | 2,735 | 3,076 |
| Fort Bend TX Independent School District GO | 5.000% | 2/15/25 | 2,500 | 2,854 |
| Fort Bend TX Independent School District GO PUT | 1.350% | 8/1/19 | 3,885 | 3,861 |
| Fort Bend TX Independent School District GO PUT | 1.350% | 8/1/20 | 2,695 | 2,651 |
| Fort Bend TX Independent School District GO PUT | 1.500% | 8/1/21 | 5,390 | 5,249 |
| Fort Worth TX GO | 5.000% | 3/1/19 | 3,500 | 3,535 |
| Fort Worth TX GO | 5.000% | 3/1/21 | 10,060 | 10,687 |
| Fort Worth TX Independent School District GO | 5.000% | 2/15/22 | 1,135 | 1,231 |
| Fort Worth TX Independent School District GO | 5.000% | 2/15/23 | 850 | 939 |
| Fort Worth TX Independent School District GO | 5.000% | 2/15/24 | 1,370 | 1,537 |
| Fort Worth TX Independent School District GO | 5.000% | 2/15/24 | 1,270 | 1,425 |
| Fort Worth TX Independent School District GO | 5.000% | 2/15/25 | 1,820 | 2,071 |
| Fort Worth TX Independent School District GO | 5.000% | 2/15/26 | 1,500 | 1,725 |
| Frisco TX GO | 5.000% | 2/15/21 | 4,295 | 4,564 |
| Frisco TX GO | 5.000% | 2/15/21 | 8,890 | 9,446 |
| Frisco TX GO | 5.000% | 2/15/22 | 7,730 | 8,392 |
| Frisco TX GO | 5.000% | 2/15/23 | 4,115 | 4,550 |
| Frisco TX GO | 5.000% | 2/15/24 | 10,000 | 11,031 |
| Frisco TX Independent School District GO | 5.000% | 8/15/23 | 2,000 | 2,234 |
| Frisco TX Independent School District GO | 5.000% | 8/15/24 | 2,885 | 3,266 |
| Frisco TX Independent School District GO | 5.000% | 8/15/24 | 1,535 | 1,680 |
| Frisco TX Independent School District GO | 5.000% | 8/15/25 | 1,900 | 2,174 |
| Galena Park TX Independent School District GO | 5.000% | 8/15/24 | 1,000 | 1,133 |
| Galena Park TX Independent School District GO | 5.000% | 8/15/25 | 1,525 | 1,751 |
| Galveston County TX GO | 4.000% | 2/1/21 | 1,000 | 1,039 |
| Galveston County TX GO | 4.000% | 2/1/22 | 1,110 | 1,168 |
| Galveston County TX GO | 4.000% | 2/1/23 | 785 | 835 |
| Galveston County TX GO | 4.000% | 2/1/24 | 1,000 | 1,071 |
| Galveston County TX GO | 4.000% | 2/1/25 | 1,000 | 1,079 |
| Georgetown TX Independent School District GO PUT | 2.500% | 8/1/19 | 1,500 | 1,504 |
| Georgetown TX Independent School District GO PUT | 2.000% | 8/1/20 | 12,000 | 12,231 |
| Georgia TX GO PUT | 1.950% | 8/14/20 | 6,750 | 6,708 |
128
Limited-Term Tax-Exempt Fund
| | | | |
| Face | Market |
| Maturity | Amount | Value• |
| Coupon | Date | ($000) | ($000) |
| Goose Creek TX Consolidated Independent School District GO | 5.000% | 2/15/24 | 1,630 | 1,829 |
| Goose Creek TX Consolidated Independent School District GO | 5.000% | 2/15/25 | 1,325 | 1,507 |
| Goose Creek TX Consolidated Independent School District GO PUT | 1.180% | 8/15/19 | 5,000 | 4,962 |
| Grand Parkway Transportation Corp. TX BAN | 5.000% | 2/1/23 | 170,000 | 185,727 |
| Grand Prairie TX Independent School District GO | 5.000% | 2/15/21 | 1,500 | 1,593 |
| Grand Prairie TX Independent School District GO | 5.000% | 2/15/22 | 1,000 | 1,085 |
| Grand Prairie TX Independent School District GO | 5.000% | 2/15/23 | 675 | 746 |
| Grapevine-Colleyville TX Independent School District GO PUT | 2.000% | 8/1/20 | 3,750 | 3,742 |
| Harlandale TX Independent School District GO PUT | 3.000% | 8/15/21 | 4,500 | 4,541 |
| 2 Harris County TX Cultural Education Facilities Finance Corp. Hospital Revenue | | | | |
| (Memorial Hermann Healthcare System) | 2.300% | 6/1/19 | 2,250 | 2,255 |
| 2 Harris County TX Cultural Education Facilities Finance Corp. Hospital Revenue | | | | |
| (Memorial Hermann Healthcare System) | 2.350% | 6/1/20 | 2,000 | 2,015 |
| 2 Harris County TX Cultural Education Facilities Finance Corp. Hospital Revenue | | | | |
| (Memorial Hermann Healthcare System) PUT | 2.180% | 12/1/19 | 9,000 | 9,014 |
| Harris County TX Cultural Education Facilities Finance Corp. Revenue (Baylor College of Medicine) | 5.000% | 11/15/19 | 1,265 | 1,302 |
| Harris County TX Cultural Education Facilities Finance Corp. Revenue (Baylor College of Medicine) | 5.000% | 11/15/20 | 2,500 | 2,630 |
| Harris County TX Cultural Education Facilities Finance Corp. Revenue (Baylor College of Medicine) | 5.000% | 11/15/21 | 2,950 | 3,167 |
| Harris County TX Cultural Education Facilities Finance Corp. Revenue (Baylor College of Medicine) | 5.000% | 11/15/22 | 1,820 | 1,989 |
| Harris County TX Cultural Education Facilities Finance Corp. Revenue (Texas Children’s Hospital) | 5.000% | 10/1/19 | 2,350 | 2,412 |
| Harris County TX Cultural Education Facilities Finance Corp. Revenue (Texas Children’s Hospital) | 5.000% | 10/1/21 | 4,000 | 4,299 |
| Harris County TX Cultural Education Facilities Finance Corp. Revenue (Texas Children’s Hospital) | 5.000% | 10/1/22 | 2,560 | 2,806 |
| 2 Harris County TX Cultural Education Facilities Finance Corp. Revenue | | | | |
| (Texas Children’s Hospital) PUT | 2.410% | 6/1/20 | 32,500 | 32,714 |
| Harris County TX Cultural Education Facilities Finance Corp. Revenue | | | | |
| (YMCA of the Greater Houston Area) | 5.000% | 6/1/19 | 1,410 | 1,431 |
| Harris County TX Cultural Education Facilities Finance Corp. Thermal Utility Revenue | | | | |
| (TECO Project) | 5.000% | 11/15/21 | 760 | 819 |
| Harris County TX Cultural Education Facilities Finance Corp. Thermal Utility Revenue | | | | |
| (TECO Project) | 5.000% | 11/15/22 | 600 | 658 |
| Harris County TX Cultural Education Facilities Finance Corp. Thermal Utility Revenue | | | | |
| (TECO Project) | 5.000% | 11/15/23 | 760 | 847 |
| Harris County TX Cultural Education Facilities Finance Corp. Thermal Utility Revenue | | | | |
| (TECO Project) | 5.000% | 11/15/24 | 1,025 | 1,157 |
| Harris County TX Flood Control District Revenue | 5.000% | 10/1/24 | 3,295 | 3,741 |
| Harris County TX Flood Control District Revenue | 5.000% | 10/1/25 | 2,555 | 2,937 |
| Harris County TX Flood Control District Revenue | 5.000% | 10/1/25 | 1,150 | 1,297 |
| Harris County TX GO | 5.000% | 10/1/22 | 10,025 | 11,021 |
| Harris County TX GO | 5.000% | 10/1/22 | 1,100 | 1,209 |
| Harris County TX GO | 5.000% | 10/1/23 | 4,455 | 4,982 |
| Harris County TX GO | 5.000% | 10/1/23 | 8,575 | 9,420 |
| Harris County TX GO | 5.000% | 10/1/23 | 3,950 | 4,339 |
| Harris County TX GO | 5.000% | 10/1/24 | 4,080 | 4,633 |
| Harris County TX GO | 5.000% | 10/1/24 | 3,315 | 3,764 |
| Harris County TX GO | 5.000% | 10/1/24 | 9,000 | 9,876 |
| Harris County TX GO | 5.000% | 10/1/25 | 1,750 | 2,012 |
| Harris County TX GO | 5.000% | 10/1/25 | 1,140 | 1,311 |
| Harris County TX GO | 5.000% | 10/1/26 | 1,040 | 1,188 |
| Harris County TX Health Facilities Development Corp. Hospital Revenue | | | | |
| (Memorial Hermann Healthcare System) | 5.000% | 12/1/18 | 1,000 | 1,002 |
| Harris County TX Health Facilities Development Corp. Hospital Revenue | | | | |
| (Memorial Hermann Healthcare System) | 5.000% | 12/1/19 | 400 | 412 |
| Harris County TX Hospital District Revenue | 5.000% | 2/15/22 | 1,235 | 1,333 |
| Harris County TX Hospital District Revenue | 5.000% | 2/15/23 | 2,000 | 2,195 |
| Harris County TX Hospital District Revenue | 5.000% | 2/15/24 | 2,250 | 2,502 |
| Harris County TX Metropolitan Transit Authority Sales & Use Tax Revenue | 5.000% | 11/1/19 | 1,455 | 1,498 |
| Harris County TX Metropolitan Transit Authority Sales & Use Tax Revenue | 5.000% | 11/1/19 (ETM) | 545 | 561 |
| Harris County TX Metropolitan Transit Authority Sales & Use Tax Revenue | 5.000% | 11/1/24 | 1,785 | 2,020 |
| Harris County TX Sports Authority Revenue | 5.000% | 11/15/20 | 3,300 | 3,476 |
| Harris County TX Sports Authority Revenue | 5.000% | 11/15/20 | 575 | 602 |
| Harris County TX Sports Authority Revenue | 5.000% | 11/15/21 | 8,115 | 8,722 |
| Harris County TX Sports Authority Revenue | 5.000% | 11/15/26 (4) | 11,155 | 12,463 |
| 3 Harris County TX TOB VRDO | 1.630% | 11/7/18 | 24,800 | 24,800 |
| Hays County TX GO | 5.000% | 2/15/20 | 200 | 207 |
| Hays County TX GO | 5.000% | 2/15/21 | 850 | 903 |
| Hays County TX GO | 5.000% | 2/15/21 | 285 | 303 |
| Hays County TX GO | 5.000% | 2/15/23 | 1,120 | 1,234 |
| Hays County TX GO | 5.000% | 2/15/23 | 840 | 926 |
| Hays County TX GO | 5.000% | 2/15/24 | 1,025 | 1,146 |
| Hays County TX GO | 5.000% | 2/15/25 | 1,225 | 1,388 |
129
Limited-Term Tax-Exempt Fund
| | | | |
| Face | Market |
| Maturity | Amount | Value• |
| Coupon | Date | ($000) | ($000) |
| Houston TX Airport System Revenue | 5.000% | 7/1/24 | 2,225 | 2,508 |
| Houston TX Airport System Revenue | 5.000% | 7/1/25 | 3,500 | 3,990 |
| Houston TX Airport System Revenue | 5.000% | 7/1/25 | 1,650 | 1,881 |
| Houston TX Community College System GO | 5.000% | 2/15/19 | 2,860 | 2,885 |
| Houston TX Community College System GO | 5.000% | 2/15/19 | 870 | 878 |
| Houston TX Community College System Revenue | 5.000% | 4/15/20 | 1,000 | 1,042 |
| Houston TX Community College System Revenue | 5.000% | 4/15/22 | 1,900 | 2,059 |
| Houston TX Community College System Revenue | 5.000% | 4/15/23 | 2,000 | 2,203 |
| Houston TX Community College System Revenue | 5.000% | 4/15/24 | 2,880 | 3,220 |
| Houston TX GO | 5.000% | 3/1/19 | 5,000 | 5,052 |
| Houston TX GO | 5.000% | 3/1/19 (Prere.) | 4,460 | 4,505 |
| Houston TX GO | 5.000% | 3/1/19 | 12,195 | 12,321 |
| Houston TX GO | 5.000% | 3/1/19 | 1,135 | 1,147 |
| Houston TX GO | 5.000% | 3/1/20 | 2,500 | 2,594 |
| Houston TX GO | 5.000% | 3/1/21 | 2,500 | 2,650 |
| Houston TX GO | 5.000% | 3/1/22 | 3,000 | 3,259 |
| Houston TX GO | 5.000% | 3/1/22 | 20,000 | 21,728 |
| Houston TX GO | 5.000% | 3/1/23 | 1,750 | 1,936 |
| Houston TX GO | 5.000% | 3/1/23 | 12,605 | 13,945 |
| Houston TX GO | 5.000% | 3/1/24 | 2,315 | 2,603 |
| Houston TX GO | 5.000% | 3/1/24 | 10,000 | 11,245 |
| Houston TX GO | 5.000% | 3/1/24 | 540 | 545 |
| Houston TX GO | 5.000% | 3/1/25 | 5,000 | 5,705 |
| Houston TX GO | 5.000% | 3/1/25 | 1,000 | 1,081 |
| Houston TX Hotel Occupancy Tax & Special Revenue (Convention & Entertainment Facilities) | 5.000% | 9/1/19 | 700 | 715 |
| Houston TX Hotel Occupancy Tax & Special Revenue (Convention & Entertainment Facilities) | 5.000% | 9/1/21 | 1,500 | 1,603 |
| Houston TX Independent School District GO | 5.000% | 2/15/19 | 2,890 | 2,916 |
| Houston TX Independent School District GO | 5.000% | 2/15/23 | 25,070 | 27,687 |
| Houston TX Independent School District GO | 5.000% | 2/15/24 | 20,015 | 22,467 |
| Houston TX Independent School District GO PUT | 3.000% | 6/1/19 | 23,750 | 23,873 |
| Houston TX Independent School District GO PUT | 2.200% | 6/1/20 | 6,000 | 5,993 |
| Houston TX Independent School District GO PUT | 2.400% | 6/1/21 | 3,400 | 3,390 |
| Houston TX Independent School District GO PUT | 2.400% | 6/1/21 | 3,000 | 2,995 |
| Houston TX Utility System Revenue | 5.000% | 11/15/18 | 2,500 | 2,503 |
| Houston TX Utility System Revenue | 5.000% | 11/15/19 | 3,000 | 3,092 |
| Houston TX Utility System Revenue | 5.000% | 5/15/20 | 6,000 | 6,257 |
| Houston TX Utility System Revenue | 5.000% | 11/15/20 | 3,500 | 3,694 |
| Houston TX Utility System Revenue | 5.000% | 5/15/21 | 5,050 | 5,394 |
| Houston TX Utility System Revenue | 5.000% | 11/15/21 | 5,000 | 5,398 |
| Houston TX Utility System Revenue | 5.000% | 11/15/21 | 5,460 | 5,890 |
| Houston TX Utility System Revenue | 5.000% | 11/15/22 | 3,205 | 3,526 |
| Houston TX Utility System Revenue | 5.000% | 11/15/22 | 7,125 | 7,834 |
| Houston TX Utility System Revenue | 5.000% | 11/15/23 | 200 | 223 |
| Houston TX Utility System Revenue | 5.000% | 11/15/23 | 7,400 | 8,263 |
| Houston TX Utility System Revenue | 5.000% | 11/15/24 | 300 | 340 |
| Houston TX Utility System Revenue | 5.000% | 11/15/24 | 1,895 | 2,145 |
| Houston TX Utility System Revenue | 5.000% | 11/15/25 | 1,255 | 1,439 |
| 2 Houston TX Utility System Revenue PUT | 2.500% | 5/1/20 | 35,500 | 35,696 |
| 2 Houston TX Utility System Revenue PUT | 1.957% | 8/1/21 | 28,400 | 28,321 |
| Humble TX Independent School District GO | 5.000% | 2/15/23 | 2,200 | 2,437 |
| Humble TX Independent School District GO | 5.500% | 2/15/25 | 1,580 | 1,847 |
| Hurst-Euless-Bedford TX Independent School District GO | 5.000% | 8/15/23 | 1,430 | 1,592 |
| Hurst-Euless-Bedford TX Independent School District GO | 5.000% | 8/15/24 | 1,100 | 1,244 |
| Hurst-Euless-Bedford TX Independent School District GO | 5.000% | 8/15/24 | 1,565 | 1,768 |
| Hurst-Euless-Bedford TX Independent School District GO | 5.000% | 8/15/24 | 1,500 | 1,696 |
| Hurst-Euless-Bedford TX Independent School District GO | 5.000% | 8/15/25 | 1,250 | 1,431 |
| Hurst-Euless-Bedford TX Independent School District GO | 5.000% | 8/15/25 | 4,165 | 4,766 |
| Irving TX Hospital Authority Revenue (Baylor Medical Center at Irving) | 5.000% | 10/15/20 | 250 | 261 |
| Irving TX Hospital Authority Revenue (Baylor Medical Center at Irving) | 5.000% | 10/15/21 | 250 | 266 |
| Irving TX Hospital Authority Revenue (Baylor Medical Center at Irving) | 5.000% | 10/15/22 | 250 | 271 |
| Irving TX Hospital Authority Revenue (Baylor Medical Center at Irving) | 5.000% | 10/15/23 | 350 | 384 |
| Irving TX Hospital Authority Revenue (Baylor Medical Center at Irving) | 5.000% | 10/15/24 | 515 | 571 |
| Irving TX Hospital Authority Revenue (Baylor Medical Center at Irving) | 5.000% | 10/15/25 | 500 | 559 |
| Irving TX Independent School District GO | 5.000% | 2/15/22 | 3,750 | 4,071 |
| Irving TX Independent School District GO | 5.000% | 2/15/23 | 2,035 | 2,252 |
| Katy TX Independent School District GO | 5.000% | 2/15/21 | 2,185 | 2,322 |
| Katy TX Independent School District GO | 5.000% | 2/15/22 | 2,295 | 2,492 |
| Katy TX Independent School District GO | 5.000% | 2/15/23 | 1,510 | 1,672 |
| Katy TX Independent School District GO | 4.000% | 2/15/24 | 410 | 436 |
| Katy TX Independent School District GO | 4.000% | 2/15/25 | 1,000 | 1,060 |
130
Limited-Term Tax-Exempt Fund
| | | | |
| Face | Market |
| Maturity | Amount | Value• |
| Coupon | Date | ($000) | ($000) |
| 2 Katy TX Independent School District GO PUT | 2.077% | 8/15/19 | 16,095 | 16,105 |
| Keller TX Independent School District GO | 5.000% | 8/15/22 | 3,010 | 3,297 |
| Kerrville TX Health Facilities Development Corp. Hospital Revenue | | | | |
| (Peterson Regional Medical Center Project) | 5.000% | 8/15/21 | 800 | 845 |
| Kerrville TX Health Facilities Development Corp. Hospital Revenue | | | | |
| (Peterson Regional Medical Center Project) | 5.000% | 8/15/22 | 1,000 | 1,073 |
| Kerrville TX Health Facilities Development Corp. Hospital Revenue | | | | |
| (Peterson Regional Medical Center Project) | 5.000% | 8/15/23 | 255 | 276 |
| Kerrville TX Health Facilities Development Corp. Hospital Revenue | | | | |
| (Peterson Regional Medical Center Project) | 5.000% | 8/15/24 | 340 | 372 |
| Klein TX Independent School District GO | 5.000% | 8/1/21 | 8,550 | 9,173 |
| Klein TX Independent School District GO | 5.000% | 8/1/22 | 5,000 | 5,474 |
| Lake Travis TX Independent School District GO | 5.000% | 2/15/24 | 400 | 449 |
| Lake Travis TX Independent School District GO | 5.000% | 2/15/25 | 1,535 | 1,747 |
| Lake Travis TX Independent School District Revenue GO PUT | 2.625% | 2/15/22 | 5,000 | 5,023 |
| Lamar TX Consolidated Independent School District GO | 5.000% | 2/15/19 | 2,705 | 2,729 |
| Lamar TX Consolidated Independent School District GO | 5.000% | 2/15/21 | 2,340 | 2,486 |
| Lamar TX Consolidated Independent School District GO | 5.000% | 2/15/22 | 2,500 | 2,715 |
| Lamar TX Consolidated Independent School District GO | 5.000% | 2/15/25 | 3,175 | 3,436 |
| Lamar TX Consolidated Independent School District GO | 5.000% | 2/15/25 | 2,000 | 2,284 |
| Lamar TX Consolidated Independent School District GO PUT | 1.950% | 8/17/20 | 15,500 | 15,402 |
| Leander TX Independent School District GO | 0.000% | 8/16/20 | 2,675 | 2,557 |
| Leander TX Independent School District GO | 0.000% | 8/16/21 | 5,395 | 5,029 |
| Leander TX Independent School District GO | 0.000% | 8/16/22 | 9,615 | 8,697 |
| Leander TX Independent School District GO | 5.000% | 8/15/23 | 500 | 558 |
| Leander TX Independent School District GO | 0.000% | 8/16/23 | 8,500 | 7,414 |
| Leander TX Independent School District GO | 5.000% | 8/15/24 | 850 | 964 |
| Leander TX Independent School District GO | 5.000% | 8/15/27 | 5,280 | 6,079 |
| Lewisville TX Independent School District GO | 4.000% | 8/15/21 | 2,240 | 2,344 |
| Lewisville TX Independent School District GO | 5.000% | 8/15/21 | 12,700 | 13,652 |
| Lewisville TX Independent School District GO | 5.000% | 8/15/22 | 7,500 | 8,230 |
| Lewisville TX Independent School District GO | 5.000% | 8/15/22 | 2,605 | 2,853 |
| Lone Star College System Texas GO | 5.000% | 2/15/22 | 6,000 | 6,508 |
| Lower Colorado River Authority Texas Revenue | 5.000% | 5/15/22 | 1,380 | 1,437 |
| Lower Colorado River Authority Texas Revenue | 5.000% | 5/15/22 | 875 | 952 |
| Lower Colorado River Authority Texas Revenue | 5.000% | 5/15/23 | 6,025 | 6,551 |
| Lower Colorado River Authority Texas Revenue | 5.000% | 5/15/23 | 1,440 | 1,595 |
| Lower Colorado River Authority Texas Revenue | 5.000% | 5/15/26 | 3,045 | 3,341 |
| Lower Colorado River Authority Texas Transmission Contract Revenue | | | | |
| (LCRA Transmission Services Corp.) | 5.000% | 5/15/20 | 1,000 | 1,042 |
| Lower Colorado River Authority Texas Transmission Contract Revenue | | | | |
| (LCRA Transmission Services Corp.) | 5.000% | 5/15/21 | 1,255 | 1,338 |
| Lower Colorado River Authority Texas Transmission Contract Revenue | | | | |
| (LCRA Transmission Services Corp.) | 5.000% | 5/15/22 | 7,645 | 8,133 |
| Lower Colorado River Authority Texas Transmission Contract Revenue | | | | |
| (LCRA Transmission Services Corp.) | 5.000% | 5/15/22 | 6,080 | 6,617 |
| Lower Colorado River Authority Texas Transmission Contract Revenue | | | | |
| (LCRA Transmission Services Corp.) | 5.000% | 5/15/22 | 2,075 | 2,258 |
| Lower Colorado River Authority Texas Transmission Contract Revenue | | | | |
| (LCRA Transmission Services Corp.) | 5.000% | 5/15/23 | 2,310 | 2,558 |
| Lower Colorado River Authority Texas Transmission Contract Revenue | | | | |
| (LCRA Transmission Services Corp.) | 5.000% | 5/15/24 | 1,020 | 1,147 |
| Lower Colorado River Authority Texas Transmission Contract Revenue | | | | |
| (LCRA Transmission Services Corp.) | 5.000% | 5/15/24 | 3,000 | 3,374 |
| Lower Colorado River Authority Texas Transmission Contract Revenue | | | | |
| (LCRA Transmission Services Corp.) | 5.000% | 5/15/25 | 1,100 | 1,251 |
| Lower Colorado River Authority Texas Transmission Contract Revenue | | | | |
| (LCRA Transmission Services Corp.) | 5.000% | 5/15/25 | 4,200 | 4,700 |
| Lower Colorado River Authority Texas Transmission Contract Revenue | | | | |
| (LCRA Transmission Services Corp.) | 5.000% | 5/15/26 | 5,000 | 5,577 |
| 3 Lower Colorado River Authority Texas Transmission Contract Revenue | | | | |
| (LCRA Transmission Services Corp.) TOB VRDO | 1.720% | 11/7/18 | 7,970 | 7,970 |
| Lubbock TX GO | 5.000% | 2/15/21 | 1,755 | 1,863 |
| Lubbock TX GO | 5.000% | 2/15/21 | 850 | 902 |
| Lubbock TX GO | 5.000% | 2/15/22 | 645 | 700 |
| Lubbock TX GO | 5.000% | 2/15/22 | 1,610 | 1,746 |
| Lubbock TX GO | 5.000% | 2/15/23 | 720 | 796 |
| Lubbock TX GO | 5.000% | 2/15/23 | 1,780 | 1,967 |
| Magnolia TX Independent School District GO | 5.000% | 8/15/21 | 1,505 | 1,616 |
| Magnolia TX Independent School District GO | 5.000% | 8/15/22 | 1,580 | 1,731 |
131
Limited-Term Tax-Exempt Fund
| | | | |
| Face | Market |
| Maturity | Amount | Value• |
| Coupon | Date | ($000) | ($000) |
| Magnolia TX Independent School District GO | 5.000% | 8/15/23 | 510 | 568 |
| Mansfield TX Independent School District GO | 4.000% | 2/15/24 | 2,540 | 2,727 |
| Mansfield TX Independent School District GO | 4.000% | 2/15/25 | 4,910 | 5,300 |
| Mansfield TX Independent School District GO PUT | 2.500% | 8/1/21 | 4,125 | 4,137 |
| Marshall TX Independent School District GO | 5.000% | 2/15/23 | 2,185 | 2,419 |
| McAllen TX Independent School District GO | 4.000% | 2/15/25 | 3,330 | 3,529 |
| McAllen TX Independent School District GO | 4.000% | 2/15/26 | 3,010 | 3,177 |
| McAllen TX Independent School District GO | 4.000% | 2/15/27 | 4,440 | 4,668 |
| McAllen TX Independent School District GO | 4.000% | 2/15/28 | 2,885 | 3,024 |
| Midlothian TX Independent School District GO PUT | 2.500% | 8/1/20 | 5,500 | 5,518 |
| Mission TX Economic Development Corp. Solid Waste Disposal Revenue | | | | |
| (Allied Waste Inc. Project) PUT | 1.970% | 1/2/19 | 17,050 | 17,049 |
| Montgomery County TX Toll Road Authority Revenue | 5.000% | 9/15/23 | 250 | 273 |
| Montgomery County TX Toll Road Authority Revenue | 5.000% | 9/15/24 | 500 | 550 |
| Montgomery County TX Toll Road Authority Revenue | 5.000% | 9/15/25 | 750 | 829 |
| New Caney TX Independent School District GO PUT | 3.000% | 8/15/21 | 7,500 | 7,612 |
| New Hope TX Cultural Education Facilities Finance Corp. Hospital Revenue | | | | |
| (Children’s Health System of Texas Obligated Group) | 5.000% | 8/15/24 | 2,750 | 3,104 |
| New Hope TX Cultural Education Facilities Finance Corp. Hospital Revenue | | | | |
| (Children’s Health System of Texas Obligated Group) | 5.000% | 8/15/25 | 2,535 | 2,899 |
| New Hope TX Cultural Education Facilities Finance Corp. Retirement Facilities Revenue | | | | |
| (Westminster Manor Project) | 4.000% | 11/1/20 | 350 | 359 |
| New Hope TX Cultural Education Facilities Finance Corp. Retirement Facilities Revenue | | | | |
| (Westminster Manor Project) | 5.000% | 11/1/22 | 500 | 538 |
| New Hope TX Cultural Education Facilities Finance Corp. Retirement Facilities Revenue | | | | |
| (Westminster Manor Project) | 5.000% | 11/1/23 | 775 | 843 |
| New Hope TX Cultural Education Facilities Finance Corp. Retirement Facilities Revenue | | | | |
| (Westminster Manor Project) | 5.000% | 11/1/24 | 625 | 682 |
| New Hope TX Cultural Education Facilities Finance Corp. Student Housing Revenue | | | | |
| (Tarleton State University Project) | 4.000% | 4/1/20 | 180 | 183 |
| New Hope TX Cultural Education Facilities Finance Corp. Student Housing Revenue | | | | |
| (Tarleton State University Project) | 4.000% | 4/1/21 | 310 | 317 |
| New Hope TX Cultural Education Facilities Finance Corp. Student Housing Revenue | | | | |
| (Tarleton State University Project) | 4.000% | 4/1/22 | 215 | 221 |
| New Hope TX Cultural Education Facilities Finance Corp. Student Housing Revenue | | | | |
| (Texas A&M University Project) | 5.000% | 7/1/23 | 2,665 | 2,366 |
| New Hope TX Cultural Education Facilities Finance Corp. Student Housing Revenue | | | | |
| (Texas A&M University Project) | 5.000% | 7/1/24 | 2,000 | 1,768 |
| Newark TX Cultural Education Facilities Finance Corp. Revenue | 5.000% | 11/15/22 | 1,000 | 1,093 |
| Newark TX Cultural Education Facilities Finance Corp. Revenue | 5.000% | 11/15/23 | 1,000 | 1,110 |
| North Central TX Health Facilities Development Corp. Hospital Revenue | | | | |
| (Children’s Medical Center of Dallas Project) | 5.000% | 8/15/19 | 1,900 | 1,942 |
| North East TX Independent School District GO | 5.000% | 2/1/22 | 6,985 | 7,572 |
| North East TX Independent School District GO PUT | 1.420% | 8/1/21 | 7,090 | 6,879 |
| North East TX Independent School District GO PUT | 2.375% | 8/1/22 | 5,000 | 4,967 |
| North East TX Regional Mobility Authority Revenue | 5.000% | 1/1/23 | 900 | 973 |
| North East TX Regional Mobility Authority Revenue | 5.000% | 1/1/23 | 755 | 819 |
| North East TX Regional Mobility Authority Revenue | 5.000% | 1/1/24 | 1,285 | 1,403 |
| North East TX Regional Mobility Authority Revenue | 5.000% | 1/1/24 | 1,090 | 1,196 |
| North East TX Regional Mobility Authority Revenue | 5.000% | 1/1/25 | 1,200 | 1,328 |
| North Texas Municipal Water District Upper East Fork Wastewater Interceptor System Revenue | 5.000% | 6/1/23 | 785 | 874 |
| North Texas Municipal Water District Upper East Fork Wastewater Interceptor System Revenue | 5.000% | 6/1/25 | 1,450 | 1,654 |
| North Texas Tollway Authority System Revenue | 5.000% | 1/1/19 | 4,000 | 4,020 |
| North Texas Tollway Authority System Revenue | 5.000% | 1/1/20 | 5,000 | 5,165 |
| North Texas Tollway Authority System Revenue | 5.000% | 1/1/20 | 4,000 | 4,132 |
| North Texas Tollway Authority System Revenue | 5.000% | 1/1/20 | 700 | 723 |
| North Texas Tollway Authority System Revenue | 5.000% | 1/1/21 | 11,395 | 12,055 |
| North Texas Tollway Authority System Revenue | 5.000% | 1/1/21 | 3,640 | 3,851 |
| North Texas Tollway Authority System Revenue | 5.000% | 1/1/21 | 4,000 | 4,232 |
| North Texas Tollway Authority System Revenue | 5.000% | 1/1/21 | 1,000 | 1,055 |
| North Texas Tollway Authority System Revenue | 5.000% | 1/1/22 | 11,015 | 11,903 |
| North Texas Tollway Authority System Revenue | 5.000% | 1/1/22 | 6,165 | 6,662 |
| North Texas Tollway Authority System Revenue | 5.000% | 1/1/22 | 2,510 | 2,712 |
| North Texas Tollway Authority System Revenue | 5.000% | 1/1/22 | 1,500 | 1,615 |
| North Texas Tollway Authority System Revenue | 5.000% | 1/1/23 | 6,630 | 7,290 |
| North Texas Tollway Authority System Revenue | 5.000% | 1/1/23 | 1,000 | 1,095 |
| North Texas Tollway Authority System Revenue | 5.000% | 1/1/23 | 2,730 | 3,002 |
| North Texas Tollway Authority System Revenue | 5.000% | 1/1/23 | 2,650 | 2,903 |
| North Texas Tollway Authority System Revenue | 5.000% | 1/1/24 | 1,100 | 1,223 |
| North Texas Tollway Authority System Revenue | 5.000% | 1/1/24 | 4,540 | 4,975 |
132
Limited-Term Tax-Exempt Fund
| | | | |
| Face | Market |
| Maturity | Amount | Value• |
| Coupon | Date | ($000) | ($000) |
| North Texas Tollway Authority System Revenue | 5.000% | 1/1/24 | 3,520 | 3,851 |
| North Texas Tollway Authority System Revenue | 5.000% | 1/1/25 | 4,045 | 4,452 |
| North Texas Tollway Authority System Revenue | 5.000% | 1/1/25 | 4,220 | 4,603 |
| North Texas Tollway Authority System Revenue | 5.000% | 1/1/26 | 935 | 1,051 |
| North Texas Tollway Authority System Revenue | 5.000% | 1/1/26 | 3,000 | 3,327 |
| North Texas Tollway Authority System Revenue | 5.000% | 1/1/26 | 2,950 | 3,239 |
| 2 North Texas Tollway Authority System Revenue PUT | 2.400% | 1/1/19 | 25,375 | 25,380 |
| 2 North Texas Tollway Authority System Revenue PUT | 2.270% | 1/1/20 | 33,940 | 34,031 |
| 3 North Texas Tollway Authority System Revenue TOB VRDO | 1.800% | 11/7/18 | 2,600 | 2,600 |
| North Texas Tollway Authority System Revenue VRDO | 1.620% | 11/7/18 LOC | 38,350 | 38,350 |
| Northside Independent School District Texas GO | 5.000% | 8/15/24 | 760 | 861 |
| Northside Independent School District Texas GO | 5.000% | 8/15/25 | 1,155 | 1,323 |
| Northside Independent School District Texas GO PUT | 2.750% | 8/1/23 | 15,840 | 15,903 |
| Northside Independent School District Texas GO | 5.000% | 8/15/23 | 1,000 | 1,117 |
| Northside Independent School District Texas GO | 5.000% | 8/15/24 | 1,955 | 2,214 |
| Northside Independent School District Texas GO | 5.000% | 8/15/25 | 1,035 | 1,186 |
| Northside Independent School District Texas GO | 4.000% | 8/15/26 | 3,000 | 3,261 |
| Northside Independent School District Texas GO PUT | 1.450% | 6/1/20 | 15,200 | 15,007 |
| Northside Independent School District Texas GO PUT | 2.125% | 8/1/20 | 7,325 | 7,311 |
| Northside Independent School District Texas GO PUT | 1.750% | 6/1/22 | 13,100 | 12,722 |
| Northside Independent School District TX GO | 5.000% | 2/15/25 | 3,520 | 3,953 |
| 1 Northside TX Independent School District GO | 5.000% | 8/15/24 | 750 | 850 |
| 1 Northside TX Independent School District GO | 5.000% | 8/15/25 | 1,000 | 1,146 |
| Odessa TX Junior College District GO | 5.000% | 8/15/23 | 500 | 554 |
| Olmos Park TX Higher Education Facilities Corp. Revenue | | | | |
| (University of the Incarnate Word Project) | 5.000% | 12/1/19 | 1,735 | 1,786 |
| Olmos Park TX Higher Education Facilities Corp. Revenue | | | | |
| (University of the Incarnate Word Project) | 5.000% | 12/1/21 | 1,000 | 1,070 |
| Pearland TX GO | 5.000% | 3/1/19 | 155 | 157 |
| Pearland TX GO | 4.000% | 3/1/20 | 330 | 338 |
| Pearland TX GO | 5.000% | 3/1/21 | 600 | 637 |
| Pearland TX GO | 5.000% | 3/1/22 | 720 | 781 |
| Pearland TX GO | 5.000% | 3/1/23 | 440 | 486 |
| Pearland TX GO | 5.000% | 3/1/24 | 820 | 918 |
| Pearland TX GO | 5.000% | 3/1/25 | 685 | 776 |
| Pearland TX GO | 5.000% | 3/1/26 | 590 | 674 |
| Pearland TX Independent School District GO | 5.000% | 2/15/24 | 835 | 939 |
| Pearland TX Waterworks & Sewer System Revenue | 5.000% | 9/1/19 | 220 | 225 |
| Pearland TX Waterworks & Sewer System Revenue | 5.000% | 9/1/20 | 315 | 331 |
| Pearland TX Waterworks & Sewer System Revenue | 5.000% | 9/1/21 | 240 | 257 |
| Pearland TX Waterworks & Sewer System Revenue | 5.000% | 9/1/22 | 160 | 175 |
| Pearland TX Waterworks & Sewer System Revenue | 5.000% | 9/1/23 | 370 | 411 |
| Pearland TX Waterworks & Sewer System Revenue | 5.000% | 9/1/24 | 690 | 776 |
| Pearland TX Waterworks & Sewer System Revenue | 5.000% | 9/1/25 | 960 | 1,090 |
| Pearland TX Waterworks & Sewer System Revenue | 5.000% | 9/1/26 | 950 | 1,088 |
| Plano TX Independent School District GO | 4.000% | 2/15/26 | 1,860 | 1,948 |
| Port Authority of Houston TX GO | 5.000% | 10/1/20 | 3,110 | 3,273 |
| Port Authority of Houston TX GO | 5.000% | 10/1/21 | 8,900 | 9,579 |
| Port Authority of Houston TX GO | 5.000% | 10/1/22 | 2,700 | 2,965 |
| Prosper TX Independent School District GO | 5.000% | 2/15/21 | 1,190 | 1,264 |
| Prosper TX Independent School District GO | 5.000% | 2/15/22 | 1,315 | 1,427 |
| Prosper TX Independent School District GO | 5.000% | 2/15/23 | 400 | 442 |
| Richardson TX Independent School District GO | 5.000% | 2/15/22 | 2,500 | 2,709 |
| Richardson TX Independent School District GO | 5.000% | 2/15/23 | 3,000 | 3,313 |
| Rockwall TX GO | 5.000% | 8/1/21 | 800 | 858 |
| Rockwall TX GO | 5.000% | 8/1/22 | 2,780 | 3,040 |
| Rockwall TX GO | 5.000% | 8/1/23 | 1,635 | 1,818 |
| Rockwall TX Independent School District GO | 5.000% | 2/15/25 | 1,500 | 1,709 |
| Round Rock TX Independent School District GO | 5.000% | 8/1/21 | 3,095 | 3,324 |
| Round Rock TX Independent School District GO | 5.000% | 8/1/22 | 1,000 | 1,096 |
| Round Rock TX Independent School District GO | 5.000% | 8/1/23 | 3,700 | 4,127 |
| Round Rock TX Independent School District GO | 5.000% | 8/1/23 | 2,000 | 2,231 |
| Round Rock TX Independent School District GO | 5.000% | 8/1/24 | 4,000 | 4,528 |
| Round Rock TX Independent School District GO | 5.000% | 8/1/25 | 1,675 | 1,920 |
| SA Energy Acquisition Public Facility Corp. Texas Gas Supply Revenue | 5.500% | 8/1/21 | 5,120 | 5,517 |
| SA Energy Acquisition Public Facility Corp. Texas Gas Supply Revenue | 5.500% | 8/1/22 | 335 | 368 |
| Sam Rayburn TX Municipal Power Agency Revenue | 5.000% | 10/1/19 | 1,000 | 1,024 |
| San Antonio TX Electric & Gas Systems Revenue | 5.000% | 2/1/21 | 5,450 | 5,785 |
| San Antonio TX Electric & Gas Systems Revenue | 5.000% | 2/1/21 | 12,000 | 12,738 |
| San Antonio TX Electric & Gas Systems Revenue | 5.000% | 2/1/22 | 4,000 | 4,340 |
133
Limited-Term Tax-Exempt Fund
| | | | |
| Face | Market |
| Maturity | Amount | Value• |
| Coupon | Date | ($000) | ($000) |
| San Antonio TX Electric & Gas Systems Revenue PUT | 2.000% | 12/1/18 | 10,165 | 10,167 |
| San Antonio TX Electric & Gas Systems Revenue PUT | 3.000% | 12/1/20 | 20,000 | 20,238 |
| San Antonio TX Electric & Gas Systems Revenue PUT | 2.000% | 12/1/21 | 12,625 | 12,387 |
| San Antonio TX GO | 5.000% | 2/1/21 | 3,550 | 3,767 |
| San Antonio TX GO | 5.000% | 2/1/22 | 3,000 | 3,254 |
| San Antonio TX GO | 4.000% | 2/1/27 | 1,250 | 1,311 |
| San Antonio TX GO | 4.000% | 2/1/28 | 9,000 | 9,414 |
| San Antonio TX Independent School District GO | 5.000% | 2/15/26 | 9,480 | 10,762 |
| San Antonio TX Independent School District GO | 5.000% | 8/15/22 | 1,330 | 1,458 |
| San Antonio TX Water Revenue | 5.000% | 5/15/19 | 2,250 | 2,286 |
| San Antonio TX Water Revenue | 5.000% | 5/15/20 | 1,500 | 1,565 |
| San Antonio TX Water Revenue | 5.000% | 5/15/21 | 1,000 | 1,069 |
| San Antonio TX Water Revenue | 5.000% | 5/15/22 | 1,800 | 1,965 |
| San Antonio TX Water Revenue | 5.000% | 5/15/24 | 575 | 650 |
| San Antonio TX Water Revenue | 5.000% | 5/15/25 | 650 | 744 |
| San Antonio TX Water Revenue PUT | 2.000% | 11/1/21 | 40,000 | 39,324 |
| San Antonio TX Water Revenue PUT | 2.000% | 11/1/22 | 12,250 | 11,968 |
| Schertz-Cibolo-Universal City TX Independent School District GO | 5.000% | 2/1/23 | 3,830 | 4,231 |
| Sheldon TX Independent School District | 5.000% | 2/15/25 | 3,015 | 3,434 |
| Socorro TX Independent School District GO | 5.000% | 8/15/23 | 1,255 | 1,397 |
| Socorro TX Independent School District GO | 5.000% | 8/15/24 | 1,495 | 1,689 |
| Socorro TX Independent School District GO | 5.000% | 8/15/25 | 600 | 687 |
| Southside Independent School District Texas GO | 5.000% | 8/15/23 | 300 | 334 |
| Southside Independent School District Texas GO | 5.000% | 8/15/24 | 250 | 282 |
| Southwest Texas Higher Education Authority Inc. Revenue | | | | |
| (Southern Methodist University Project) | 5.000% | 10/1/20 | 3,000 | 3,160 |
| Southwest Texas Higher Education Authority Inc. Revenue | | | | |
| (Southern Methodist University Project) | 5.000% | 10/1/21 | 2,500 | 2,685 |
| Southwest Texas Higher Education Authority Inc. Revenue | | | | |
| (Southern Methodist University Project) | 5.000% | 10/1/22 | 3,900 | 4,270 |
| Southwest Texas Higher Education Authority Inc. Revenue | | | | |
| (Southern Methodist University Project) | 5.000% | 10/1/23 | 700 | 779 |
| Southwest Texas Higher Education Authority Inc. Revenue | | | | |
| (Southern Methodist University Project) | 5.000% | 10/1/24 | 500 | 565 |
| Southwest TX Higher Education Authority Inc. Revenue | | | | |
| (Southern Methodist University Project) | 5.000% | 10/1/25 | 5,000 | 5,724 |
| Spring Branch TX Independent School District GO | 5.000% | 2/1/22 | 5,000 | 5,415 |
| Stephen F Austin TX State University Revenue | 5.000% | 10/15/23 | 1,250 | 1,390 |
| Sugar Land TX GO | 3.000% | 2/15/21 | 400 | 407 |
| Sugar Land TX GO | 5.000% | 2/15/22 | 250 | 271 |
| Sugar Land TX GO | 5.000% | 2/15/23 | 370 | 409 |
| Sugar Land TX GO | 5.000% | 2/15/24 | 500 | 561 |
| Sugar Land TX GO | 5.000% | 2/15/25 | 500 | 568 |
| Tarrant County TX Cultural Education Facilities Finance Corp. Hospital Revenue | | | | |
| (Hendrick Medical Center) | 5.000% | 9/1/21 | 1,200 | 1,280 |
| Tarrant County TX Cultural Education Facilities Finance Corp. Hospital Revenue | | | | |
| (Methodist Hospitals of Dallas) | 5.000% | 10/1/19 | 2,225 | 2,285 |
| Tarrant County TX Cultural Education Facilities Finance Corp. Hospital Revenue | | | | |
| (Methodist Hospitals of Dallas) | 5.000% | 10/1/20 | 1,865 | 1,964 |
| Tarrant County TX Cultural Education Facilities Finance Corp. Hospital Revenue | | | | |
| (Methodist Hospitals of Dallas) | 5.000% | 10/1/21 | 2,400 | 2,579 |
| Tarrant County TX Cultural Education Facilities Finance Corp. Hospital Revenue | | | | |
| (Scott & White Healthcare Project) | 5.000% | 8/15/20 | 1,520 | 1,593 |
| Tarrant County TX Cultural Education Facilities Finance Corp. Retirement Facilities Revenue | | | | |
| (Buckner Senior Living Inc.) | 3.875% | 11/15/22 | 2,750 | 2,719 |
| Tarrant County TX Cultural Education Facilities Finance Corp. Revenue (CHRISTUS Health) | 5.000% | 7/1/21 | 1,105 | 1,179 |
| Tarrant County TX Cultural Education Facilities Finance Corp. Revenue (CHRISTUS Health) | 5.000% | 7/1/22 | 875 | 950 |
| Tarrant County TX Cultural Education Facilities Finance Corp. Revenue (CHRISTUS Health) | 5.000% | 7/1/23 | 750 | 826 |
| Tarrant County TX Cultural Education Facilities Finance Corp. Revenue (CHRISTUS Health) | 5.000% | 7/1/24 | 1,950 | 2,171 |
| Tarrant County TX Cultural Education Facilities Finance Corp. Revenue (CHRISTUS Health) | 5.000% | 7/1/25 | 1,370 | 1,539 |
| Tarrant County TX Cultural Education Facilities Finance Corp. Revenue (CHRISTUS Health) | 5.000% | 7/1/26 | 3,500 | 3,953 |
| Tarrant Regional Water District Texas Water Revenue | 5.000% | 3/1/21 | 1,000 | 1,063 |
| Tarrant Regional Water District Texas Water Revenue | 5.000% | 3/1/22 | 1,375 | 1,493 |
| Texas (Veterans Housing Assistance Program) GO VRDO | 1.640% | 11/7/18 | 43,545 | 43,545 |
| Texas A&M University Revenue | 5.000% | 5/15/24 | 4,730 | 5,351 |
| Texas A&M University System Revenue Board of Regents Revenue | 5.000% | 5/15/21 | 4,425 | 4,732 |
| Texas GO | 5.000% | 10/1/19 | 8,000 | 8,220 |
| Texas GO | 5.000% | 10/1/20 | 10,000 | 10,535 |
| Texas GO | 5.000% | 4/1/21 | 3,490 | 3,720 |
| Texas GO | 5.000% | 10/1/21 | 19,000 | 20,476 |
134
Limited-Term Tax-Exempt Fund
| | | | |
| Face | Market |
| Maturity | Amount | Value• |
| Coupon | Date | ($000) | ($000) |
| Texas GO | 5.000% | 10/1/21 | 5,950 | 6,412 |
| Texas GO | 5.000% | 4/1/23 | 11,995 | 13,085 |
| Texas GO | 5.000% | 8/1/24 | 1,000 | 1,080 |
| Texas GO | 5.000% | 4/1/25 | 4,040 | 4,617 |
| Texas GO | 5.000% | 8/1/25 | 950 | 1,019 |
| Texas GO | 5.000% | 8/1/25 | 2,825 | 3,206 |
| Texas GO | 5.000% | 10/1/26 | 3,535 | 4,003 |
| Texas GO VRDO | 1.640% | 11/7/18 | 70,000 | 70,000 |
| Texas GO VRDO | 1.650% | 11/7/18 | 121,150 | 121,150 |
| Texas Municipal Gas Acquisition & Supply Corp. Revenue | 5.000% | 12/15/18 | 2,000 | 2,007 |
| Texas Municipal Gas Acquisition & Supply Corp. Revenue | 5.250% | 12/15/18 | 3,565 | 3,579 |
| Texas Municipal Gas Acquisition & Supply Corp. Revenue | 5.000% | 12/15/19 | 5,000 | 5,145 |
| Texas Municipal Gas Acquisition & Supply Corp. Revenue | 5.250% | 12/15/19 | 6,495 | 6,700 |
| Texas Municipal Gas Acquisition & Supply Corp. Revenue | 5.000% | 12/15/20 | 6,000 | 6,301 |
| Texas Municipal Gas Acquisition & Supply Corp. Revenue | 5.250% | 12/15/20 | 11,450 | 12,093 |
| Texas Municipal Gas Acquisition & Supply Corp. Revenue | 5.000% | 12/15/21 | 2,125 | 2,275 |
| Texas Municipal Gas Acquisition & Supply Corp. Revenue | 5.000% | 12/15/22 | 1,000 | 1,089 |
| Texas Municipal Gas Acquisition & Supply Corp. Revenue | 5.250% | 12/15/23 | 3,415 | 3,794 |
| Texas Municipal Gas Acquisition & Supply Corp. Revenue | 5.250% | 12/15/24 | 805 | 904 |
| Texas Municipal Gas Acquisition & Supply Corp. Revenue | 5.250% | 12/15/25 | 1,520 | 1,721 |
| Texas Municipal Power Agency Revenue | 5.000% | 9/1/22 | 500 | 526 |
| Texas Municipal Power Agency Revenue | 5.000% | 9/1/23 | 810 | 851 |
| Texas Municipal Power Agency Revenue | 5.000% | 9/1/24 | 420 | 441 |
| Texas Municipal Power Agency Revenue | 5.000% | 9/1/25 | 450 | 472 |
| Texas Public Finance Authority Revenue (Midwestern State University) | 5.000% | 12/1/20 | 1,000 | 1,053 |
| Texas Public Finance Authority Revenue (Midwestern State University) | 5.000% | 12/1/21 | 1,250 | 1,344 |
| Texas Public Finance Authority Revenue (Midwestern State University) | 5.000% | 12/1/22 | 675 | 738 |
| Texas Public Finance Authority Revenue (Midwestern State University) | 5.000% | 12/1/23 | 1,720 | 1,909 |
| Texas Revenue | 4.000% | 8/29/19 | 420,265 | 426,914 |
| Texas State University System Financing System Revenue | 5.000% | 3/15/21 | 2,250 | 2,394 |
| Texas State University System Financing System Revenue | 5.000% | 3/15/22 | 1,845 | 2,004 |
| Texas State University System Financing System Revenue | 5.000% | 3/15/23 | 2,290 | 2,533 |
| Texas State University System Financing System Revenue | 5.000% | 3/15/24 | 1,915 | 2,153 |
| Texas Tech University System Financing System Revenue | 5.000% | 8/15/19 | 3,040 | 3,111 |
| Texas Tech University System Financing System Revenue | 5.000% | 8/15/20 | 5,000 | 5,250 |
| Texas Transportation Commission GO | 5.000% | 10/1/21 | 15,000 | 16,166 |
| Texas Transportation Commission GO | 5.000% | 10/1/22 | 16,900 | 18,578 |
| Texas Transportation Commission GO | 5.000% | 10/1/24 | 9,295 | 10,565 |
| 2 Texas Transportation Commission GO PUT | 1.900% | 10/1/21 | 84,275 | 84,036 |
| Texas Transportation Commission Mobility Fund GO VRDO | 1.600% | 11/7/18 | 29,705 | 29,705 |
| Texas Transportation Commission Revenue | 5.000% | 10/1/21 | 10,000 | 10,771 |
| Texas Transportation Commission Revenue | 5.000% | 10/1/21 | 37,020 | 39,875 |
| Texas Transportation Commission Revenue | 5.000% | 10/1/22 | 5,000 | 5,495 |
| Texas Transportation Commission Revenue | 5.000% | 10/1/23 | 4,420 | 4,941 |
| Texas Transportation Commission Revenue | 5.000% | 10/1/24 | 4,795 | 5,442 |
| Texas Transportation Commission Turnpike System Revenue PUT | 5.000% | 4/1/20 | 19,525 | 20,237 |
| Texas Turnpike Authority Central Texas Turnpike System Revenue | 0.000% | 8/15/22 (ETM) | 1,920 | 1,746 |
| Texas Turnpike Authority Central Texas Turnpike System Revenue | 0.000% | 8/15/22 (2) | 8,365 | 7,552 |
| Texas Water Development Board Revenue | 5.000% | 4/15/22 | 4,810 | 5,237 |
| Texas Water Development Board Revenue | 5.000% | 8/1/22 | 4,100 | 4,489 |
| Texas Water Development Board Revenue | 5.000% | 10/15/22 | 3,480 | 3,825 |
| Texas Water Development Board Revenue | 5.000% | 8/1/23 | 3,900 | 4,347 |
| Texas Water Development Board Revenue | 5.000% | 4/15/24 | 3,230 | 3,643 |
| Texas Water Development Board Revenue | 5.000% | 4/15/24 | 2,500 | 2,819 |
| Texas Water Development Board Revenue | 5.000% | 8/1/24 | 4,000 | 4,530 |
| Texas Water Development Board Revenue | 5.000% | 10/15/24 | 2,050 | 2,328 |
| Texas Water Development Board Revenue | 5.000% | 10/15/24 | 2,750 | 3,123 |
| Texas Water Development Board Revenue | 5.000% | 4/15/25 | 4,485 | 5,132 |
| Texas Water Development Board Revenue | 5.000% | 4/15/25 | 3,000 | 3,433 |
| Texas Water Development Board Revenue | 5.000% | 8/1/25 | 5,900 | 6,775 |
| Texas Water Development Board Revenue | 5.000% | 10/15/25 | 2,540 | 2,924 |
| Tomball TX Independent School District GO | 5.000% | 2/15/25 | 5,000 | 5,695 |
| Tomball TX Independent School District GO PUT | 1.100% | 8/15/19 | 4,500 | 4,463 |
| Trinity River Authority of Texas Regional Wastewater System Revenue | 5.000% | 8/1/23 | 1,030 | 1,148 |
| Trinity River Authority of Texas Regional Wastewater System Revenue | 5.000% | 8/1/24 | 1,300 | 1,472 |
| Trinity River Authority of Texas Revenue (Tarrant County Water Project) | 5.000% | 2/1/23 | 2,375 | 2,622 |
| University of Houston Texas Revenue | 5.000% | 2/15/21 | 4,405 | 4,674 |
| University of Houston Texas Revenue | 5.000% | 2/15/23 | 6,880 | 7,604 |
| University of North Texas Revenue | 5.000% | 4/15/20 (ETM) | 325 | 338 |
| University of North Texas Revenue | 5.000% | 4/15/20 | 2,180 | 2,269 |
135
Limited-Term Tax-Exempt Fund
| | | | |
| Face | Market |
| Maturity | Amount | Value• |
| Coupon | Date | ($000) | ($000) |
| University of North Texas Revenue | 5.000% | 4/15/21 | 1,750 | 1,867 |
| University of North Texas Revenue | 5.000% | 4/15/22 | 1,000 | 1,089 |
| University of North Texas Revenue | 5.000% | 4/15/23 | 1,250 | 1,385 |
| University of North Texas Revenue | 5.000% | 4/15/24 | 2,250 | 2,531 |
| University of North Texas Revenue | 5.000% | 4/15/25 | 1,135 | 1,294 |
| University of Texas Permanent University Fund Revenue | 5.000% | 7/1/21 | 4,175 | 4,480 |
| University of Texas Permanent University Fund Revenue | 5.000% | 7/1/21 | 1,250 | 1,341 |
| University of Texas Permanent University Fund Revenue | 5.000% | 7/1/22 | 2,820 | 3,089 |
| University of Texas Permanent University Fund Revenue | 5.000% | 7/1/22 | 1,500 | 1,643 |
| University of Texas Permanent University Fund Revenue | 5.000% | 7/1/23 | 2,820 | 3,144 |
| University of Texas System Revenue Financing System Revenue | 5.000% | 8/15/19 | 5,000 | 5,117 |
| University of Texas System Revenue Financing System Revenue | 5.000% | 8/15/21 | 11,860 | 12,752 |
| University of Texas System Revenue Financing System Revenue | 5.000% | 8/15/21 | 5,000 | 5,376 |
| University of Texas System Revenue Financing System Revenue | 5.000% | 8/15/21 | 2,000 | 2,150 |
| University of Texas System Revenue Financing System Revenue | 5.000% | 8/15/22 | 2,500 | 2,743 |
| University of Texas System Revenue Financing System Revenue | 5.000% | 8/15/23 | 17,495 | 19,531 |
| Waller TX Independent School District GO | 5.000% | 2/15/22 | 1,095 | 1,187 |
| West Travis County TX Public Utility Agency Revenue | 3.000% | 8/15/21 (15) | 200 | 203 |
| West Travis County TX Public Utility Agency Revenue | 5.000% | 8/15/22 (15) | 275 | 299 |
| West Travis County TX Public Utility Agency Revenue | 5.000% | 8/15/23 (15) | 950 | 1,050 |
| | | | 3,468,039 |
| Utah (0.2%) | | | | |
| Central UT Water Conservancy District Revenue | 5.000% | 10/1/23 | 1,250 | 1,399 |
| Central UT Water Conservancy District Revenue | 5.000% | 10/1/24 | 1,000 | 1,135 |
| Central UT Water Conservancy District Revenue | 5.000% | 10/1/25 | 1,000 | 1,151 |
| Intermountain Power Agency Utah Power Supply Revenue | 5.000% | 7/1/19 | 2,360 | 2,407 |
| Murray UT Hospital Revenue (IHC Health Services) VRDO | 1.600% | 11/7/18 | 25,400 | 25,400 |
| University of Utah Revenue | 5.000% | 8/1/21 | 600 | 645 |
| University of Utah Revenue | 5.000% | 8/1/22 | 1,150 | 1,264 |
| University of Utah Revenue | 5.000% | 8/1/23 | 625 | 700 |
| Utah Associated Municipal Power Systems Revenue (Payson Power Project) | 5.000% | 4/1/21 | 5,300 | 5,625 |
| Utah County UT Hospital Revenue (IHC Health Services) PUT | 5.000% | 8/1/24 | 21,000 | 23,326 |
| Utah Transit Authority Sales Tax Revenue | 5.000% | 6/15/21 | 585 | 626 |
| Utah Transit Authority Sales Tax Revenue | 5.000% | 6/15/22 | 710 | 775 |
| | | | 64,453 |
| Vermont (0.0%) | | | | |
| Vermont Educational & Health Buildings Financing Agency Revenue | | | | |
| (University of Vermont Health Network) | 5.000% | 12/1/21 | 360 | 388 |
| Vermont Educational & Health Buildings Financing Agency Revenue | | | | |
| (University of Vermont Health Network) | 5.000% | 12/1/22 | 650 | 712 |
| Vermont Municipal Bond Bank Revenue | 5.000% | 10/1/23 | 1,000 | 1,120 |
| Vermont Municipal Bond Bank Revenue | 5.000% | 10/1/24 | 2,445 | 2,776 |
| | | | 4,996 |
| Virgin Islands (0.0%) | | | | |
| Virgin Islands Public Finance Authority Revenue | 5.000% | 9/1/20 | 1,000 | 1,030 |
| Virgin Islands Public Finance Authority Revenue | 5.000% | 9/1/21 | 2,000 | 2,086 |
| Virgin Islands Public Finance Authority Revenue | 5.000% | 9/1/22 | 2,000 | 2,103 |
| | | | 5,219 |
| Virginia (1.6%) | | | | |
| Albemarle County VA Economic Development Hospital Revenue | | | | |
| (Sentara Martha Jefferson Hospital) VRDO | 1.590% | 11/7/18 | 16,000 | 16,000 |
| Arlington County VA GO | 4.000% | 8/1/25 | 7,780 | 8,339 |
| Arlington County VA GO | 4.000% | 8/1/26 | 13,670 | 14,620 |
| Fairfax County VA Economic Development Authority Facilities Revenue (County Facilities Project) | 5.000% | 10/1/20 | 2,500 | 2,634 |
| Fairfax County VA Economic Development Authority Facilities Revenue (County Facilities Project) | 5.000% | 10/1/21 | 6,185 | 6,676 |
| Fairfax County VA GO | 4.000% | 10/1/21 | 6,525 | 6,860 |
| Fairfax County VA GO | 3.000% | 10/1/22 | 9,555 | 9,822 |
| Fairfax County VA GO | 5.000% | 10/1/25 | 10,215 | 11,429 |
| Fairfax County VA Industrial Development Authority Health Care Revenue | | | | |
| (Inova Health System Obligated Group) | 5.000% | 5/15/19 (Prere.) | 1,000 | 1,016 |
| Fairfax County VA Industrial Development Authority Health Care Revenue | | | | |
| (Inova Health System Obligated Group) PUT | 5.000% | 5/15/23 | 14,500 | 16,026 |
| Fairfax County VA Industrial Development Authority Health Care Revenue | | | | |
| (Inova Health System Obligated Group) VRDO | 1.600% | 11/7/18 | 54,445 | 54,445 |
| Halifax County VA Industrial Development Authority Revenue (Virginia Electric & Power Co.) PUT | 2.150% | 9/1/20 | 10,000 | 9,941 |
| Lexington VA Industrial Development Authority Residential Care Facility Revenue | | | | |
| (Kendall at Lexington Corp.) | 4.000% | 1/1/21 | 440 | 452 |
136
Limited-Term Tax-Exempt Fund
| | | | |
| Face | Market |
| Maturity | Amount | Value• |
| Coupon | Date | ($000) | ($000) |
| Lexington VA Industrial Development Authority Residential Care Facility Revenue | | | | |
| (Kendall at Lexington Corp.) | 4.000% | 1/1/22 | 530 | 548 |
| Lexington VA Industrial Development Authority Residential Care Facility Revenue | | | | |
| (Kendall at Lexington Corp.) | 4.000% | 1/1/23 | 825 | 856 |
| Lexington VA Industrial Development Authority Residential Care Facility Revenue | | | | |
| (Kendall at Lexington Corp.) | 4.000% | 1/1/24 | 1,015 | 1,055 |
| Loudoun County VA GO | 5.000% | 12/1/18 | 3,435 | 3,444 |
| Louisa VA Industrial Development Authority Poll Control Revenue | | | | |
| (Virginia Electric & Power Co.) PUT | 1.750% | 5/16/19 | 10,000 | 9,974 |
| Lynchburg VA Economic Development Authority Hospital Revenue | | | | |
| (Centra Health Obligated Group) | 5.000% | 1/1/23 | 1,250 | 1,367 |
| Lynchburg VA Economic Development Authority Hospital Revenue | | | | |
| (Centra Health Obligated Group) | 5.000% | 1/1/24 | 1,040 | 1,152 |
| Lynchburg VA Economic Development Authority Hospital Revenue | | | | |
| (Centra Health Obligated Group) | 5.000% | 1/1/25 | 1,455 | 1,629 |
| Lynchburg VA Economic Development Authority Hospital Revenue | | | | |
| (Centra Health Obligated Group) | 5.000% | 1/1/26 | 1,420 | 1,602 |
| Newport News VA Economical Development Authority Residential Care Facilities Revenue | 4.000% | 12/1/21 | 2,800 | 2,867 |
| Newport News VA Economical Development Authority Residential Care Facilities Revenue | 4.000% | 12/1/22 | 2,900 | 2,977 |
| Newport News VA Economical Development Authority Residential Care Facilities Revenue | 4.000% | 12/1/23 | 3,070 | 3,151 |
| Norfolk VA GO | 5.000% | 10/1/22 | 2,535 | 2,791 |
| Norfolk VA GO | 5.000% | 10/1/23 | 360 | 403 |
| Peninsula VA Town Center Community Development Authority Revenue | 4.000% | 9/1/23 | 225 | 228 |
| Peninsula VA Ports Authority Coal Terminal Revenue PUT | 1.550% | 10/1/19 | 1,875 | 1,867 |
| Roanoke VA Economic Development Authority Hospital Revenue (Carilion Clinic Obligated Group) | 5.000% | 7/1/19 | 5,015 | 5,111 |
| Roanoke VA Economic Development Authority Hospital Revenue (Carilion Clinic Obligated Group) | 5.000% | 7/1/20 | 1,460 | 1,526 |
| University of Virginia Revenue | 5.000% | 6/1/20 | 500 | 523 |
| University of Virginia Revenue | 5.000% | 6/1/21 | 2,660 | 2,851 |
| University of Virginia Revenue | 5.000% | 8/1/21 | 33,000 | 35,495 |
| Virginia Beach VA Development Authority Residential Care Facility Revenue | | | | |
| (Westminster-Canterbury on Chesapeake Bay) | 5.000% | 9/1/20 | 140 | 146 |
| Virginia Beach VA Development Authority Residential Care Facility Revenue | | | | |
| (Westminster-Canterbury on Chesapeake Bay) | 5.000% | 9/1/21 | 250 | 265 |
| Virginia Beach VA Development Authority Residential Care Facility Revenue | | | | |
| (Westminster-Canterbury on Chesapeake Bay) | 5.000% | 9/1/23 | 400 | 436 |
| Virginia Beach VA Development Authority Residential Care Facility Revenue | | | | |
| (Westminster-Canterbury on Chesapeake Bay) | 5.000% | 9/1/25 | 750 | 832 |
| Virginia College Building Authority Educational Facilities Revenue | | | | |
| (21st Century College & Equipment Programs) | 5.000% | 2/1/24 | 11,670 | 13,151 |
| Virginia College Building Authority Educational Facilities Revenue (Marymount University Project) | 5.000% | 7/1/19 | 425 | 431 |
| Virginia College Building Authority Educational Facilities Revenue (Marymount University Project) | 5.000% | 7/1/20 | 275 | 283 |
| Virginia College Building Authority Educational Facilities Revenue (Marymount University Project) | 5.000% | 7/1/21 | 1,000 | 1,043 |
| Virginia College Building Authority Educational Facilities Revenue (Marymount University Project) | 5.000% | 7/1/21 | 1,140 | 1,189 |
| Virginia College Building Authority Educational Facilities Revenue (Marymount University Project) | 5.000% | 7/1/22 | 970 | 1,023 |
| Virginia College Building Authority Educational Facilities Revenue (Marymount University Project) | 5.000% | 7/1/22 | 1,000 | 1,054 |
| Virginia College Building Authority Educational Facilities Revenue | | | | |
| (Public Higher Education Financing Program) | 5.000% | 9/1/21 | 18,585 | 20,005 |
| Virginia College Building Authority Educational Facilities Revenue | | | | |
| (Public Higher Education Financing Program) | 5.000% | 9/1/21 | 10,990 | 11,830 |
| Virginia Commonwealth Transportation Board GAN | 5.000% | 9/15/20 | 3,130 | 3,294 |
| Virginia Commonwealth Transportation Board Revenue | 5.000% | 3/15/19 | 1,750 | 1,770 |
| Virginia Commonwealth Transportation Board Revenue | 5.000% | 5/15/19 | 8,525 | 8,665 |
| Virginia Commonwealth Transportation Board Revenue | 5.000% | 9/15/19 | 1,605 | 1,647 |
| Virginia Commonwealth Transportation Board Revenue | 5.000% | 3/15/22 | 4,000 | 4,355 |
| Virginia Commonwealth Transportation Board Revenue | 5.000% | 5/15/22 | 1,000 | 1,092 |
| Virginia Commonwealth Transportation Board Revenue | 5.000% | 9/15/22 | 3,865 | 4,246 |
| Virginia Commonwealth Transportation Board Revenue | 5.000% | 3/15/23 | 2,685 | 2,978 |
| Virginia Commonwealth Transportation Board Revenue | 5.000% | 5/15/23 | 2,500 | 2,781 |
| Virginia Commonwealth Transportation Board Revenue | 5.000% | 9/15/23 | 1,800 | 2,013 |
| Virginia Commonwealth Transportation Board Revenue | 5.000% | 5/15/24 | 5,000 | 5,656 |
| Virginia GO | 5.000% | 6/1/28 | 7,455 | 8,550 |
| Virginia Public Building Authority Public Facilities Revenue | 5.000% | 8/1/19 | 4,965 | 5,076 |
| Virginia Public Building Authority Public Facilities Revenue | 5.000% | 8/1/19 (Prere.) | 11,350 | 11,609 |
| Virginia Public Building Authority Revenue | 5.000% | 8/1/24 | 6,280 | 7,119 |
| Virginia Public School Authority Revenue | 5.000% | 8/1/19 | 16,220 | 16,590 |
| Virginia Public School Authority Revenue | 5.000% | 8/1/20 | 20,425 | 21,435 |
| Virginia Public School Authority Revenue | 5.000% | 8/1/23 | 3,000 | 3,288 |
| Virginia Public School Authority Revenue | 4.000% | 8/1/25 | 5,000 | 5,380 |
| Virginia Resources Authority Clean Water Revenue (State Revolving Fund) | 5.000% | 10/1/19 | 3,500 | 3,598 |
137
Limited-Term Tax-Exempt Fund
| | | | |
| Face | Market |
| Maturity | Amount | Value• |
| Coupon | Date | ($000) | ($000) |
| Wise County VA Industrial Development Authority Solid Waste & Sewage Disposal Revenue | | | | |
| (Virginia Electric & Power Co.) PUT | 1.875% | 6/1/20 | 8,000 | 7,927 |
| York County VA Economic Development Authority Pollution Control Revenue | | | | |
| (VA Electric & Power Co. Project) PUT | 1.875% | 5/16/19 | 5,000 | 4,990 |
| | | | 425,424 |
| Washington (2.1%) | | | | |
| Central Washington University System Revenue | 5.000% | 5/1/19 | 2,050 | 2,080 |
| Central Washington University System Revenue | 5.000% | 5/1/20 | 2,150 | 2,238 |
| Energy Northwest Washington Electric Revenue (Columbia Generating Station) | 5.000% | 7/1/20 | 1,170 | 1,225 |
| Energy Northwest Washington Electric Revenue (Project No. 1) | 4.000% | 7/1/24 | 4,500 | 4,859 |
| Energy Northwest Washington Electric Revenue (Project No. 3) | 5.000% | 7/1/24 | 3,175 | 3,595 |
| Energy Northwest Washington Electric Revenue (Project No. 3) | 5.000% | 7/1/24 | 11,035 | 12,496 |
| Energy Northwest Washington Electric Revenue (Project No. 3) | 5.000% | 7/1/25 | 11,060 | 12,703 |
| 2 Everett WA GO PUT | 2.000% | 12/1/19 | 3,365 | 3,368 |
| Grant County WA Public Utility District No. 2 Electric System Revenue | 5.000% | 1/1/23 | 525 | 577 |
| Grant County WA Public Utility District No. 2 Electric System Revenue | 5.000% | 1/1/24 | 255 | 284 |
| Grant County WA Public Utility District No. 2 Electric System Revenue | 5.000% | 1/1/25 | 235 | 266 |
| King County WA (Public Hospital District) GO | 5.000% | 12/1/19 | 2,500 | 2,579 |
| King County WA (Public Hospital District) GO | 5.000% | 12/1/20 | 2,500 | 2,641 |
| King County WA GO | 5.000% | 1/1/25 | 1,800 | 1,963 |
| King County WA GO | 5.000% | 12/1/25 | 1,575 | 1,763 |
| King County WA School District No. 216 GO | 4.000% | 12/1/18 | 1,250 | 1,252 |
| King County WA School District No. 216 GO | 4.000% | 12/1/19 | 1,360 | 1,389 |
| King County WA School District No. 216 GO | 5.000% | 12/1/20 | 2,085 | 2,205 |
| King County WA School District No. 216 GO | 5.000% | 12/1/21 | 2,265 | 2,451 |
| King County WA School District No. 411 Issaquah GO | 5.000% | 12/1/26 | 1,575 | 1,730 |
| King County WA School District No. 414 GO | 5.000% | 12/1/22 | 4,040 | 4,461 |
| King County WA School District No. 414 GO | 5.000% | 12/1/22 | 160 | 177 |
| King County WA School District No. 414 GO | 5.000% | 12/1/23 | 400 | 449 |
| King County WA School District No. 414 GO | 5.000% | 12/1/24 | 385 | 439 |
| King County WA School District No. 414 GO | 5.000% | 12/1/25 | 520 | 600 |
| King County WA Sewer Revenue | 5.000% | 1/1/19 | 12,835 | 12,900 |
| King County WA Sewer Revenue | 5.250% | 1/1/21 (Prere.) | 6,240 | 6,644 |
| King County WA Sewer Revenue | 5.000% | 7/1/22 | 5,330 | 5,839 |
| King County WA Sewer Revenue | 5.000% | 1/1/26 | 3,990 | 4,340 |
| Lewis & Thurston Counties WA Centralia School District No. 401 GO | 4.000% | 12/1/20 | 510 | 529 |
| Lewis & Thurston Counties WA Centralia School District No. 401 GO | 4.000% | 12/1/21 | 575 | 604 |
| Lewis & Thurston Counties WA Centralia School District No. 401 GO | 5.000% | 12/1/22 | 355 | 391 |
| Lewis & Thurston Counties WA Centralia School District No. 401 GO | 5.000% | 12/1/23 | 270 | 302 |
| Lewis & Thurston Counties WA Centralia School District No. 401 GO | 5.000% | 12/1/24 | 335 | 380 |
| Lewis County WA Public Utility District No. 1 Revenue (Cowlitz Falls Hydroelectric Project) | 5.000% | 10/1/20 | 1,000 | 1,054 |
| Lewis County WA Public Utility District No. 1 Revenue (Cowlitz Falls Hydroelectric Project) | 5.000% | 10/1/21 | 1,000 | 1,077 |
| Northwest Energy Washington Electric Revenue (Columbia Generating Station) | 5.000% | 7/1/22 | 16,685 | 17,851 |
| Pierce County WA School District No. 402 GO | 4.000% | 12/1/22 | 1,000 | 1,063 |
| Pierce County WA School District No. 402 GO | 5.000% | 12/1/23 | 780 | 875 |
| Pierce County WA School District No. 402 GO | 5.000% | 12/1/24 | 500 | 568 |
| Pierce County WA School District No. 402 GO | 5.000% | 12/1/25 | 1,000 | 1,150 |
| Port of Seattle WA Revenue | 5.000% | 3/1/22 | 1,290 | 1,399 |
| Port of Seattle WA Revenue | 5.000% | 8/1/23 | 2,315 | 2,523 |
| Seattle WA GO | 5.000% | 5/1/19 | 8,385 | 8,511 |
| Seattle WA GO | 5.000% | 6/1/22 | 15,755 | 17,254 |
| Seattle WA Municipal Light & Power Revenue | 5.000% | 5/1/25 | 5,000 | 5,729 |
| Seattle WA Municipal Light & Power Revenue | 5.000% | 9/1/25 | 2,810 | 3,231 |
| 2 Seattle WA Municipal Light & Power Revenue PUT | 1.890% | 11/1/21 | 21,035 | 21,036 |
| Seattle WA Water System Revenue | 5.000% | 5/1/23 | 4,800 | 5,342 |
| Skagit County WA Public Hospital District Revenue | 4.000% | 12/1/18 | 400 | 401 |
| Skagit County WA Public Hospital District Revenue | 4.000% | 12/1/20 | 1,705 | 1,746 |
| Skagit County WA Public Hospital District Revenue | 4.000% | 12/1/22 | 1,340 | 1,393 |
| Skagit County WA Public Hospital District Revenue | 4.000% | 12/1/23 | 1,915 | 1,994 |
| Snohomish County WA GO | 4.000% | 12/1/25 | 3,220 | 3,419 |
| Snohomish County WA School District No. 15 (Edmonds) GO | 5.000% | 12/1/20 | 1,000 | 1,058 |
| Snohomish County WA School District No. 4 (Lake Stevens) GO | 5.000% | 12/1/21 | 735 | 793 |
| Snohomish County WA School District No. 4 (Lake Stevens) GO | 5.000% | 12/1/22 | 700 | 770 |
| Tobacco Settlement Authority Washington Revenue | 5.250% | 6/1/30 | 9,060 | 9,192 |
| Washington (Motor Vehicle Fuel Tax) GO | 5.000% | 7/1/19 | 10,000 | 10,203 |
| Washington (Motor Vehicle Fuel Tax) GO | 5.000% | 7/1/20 | 41,360 | 43,317 |
| Washington (Motor Vehicle Fuel Tax) GO | 5.000% | 7/1/21 | 41,175 | 44,152 |
| Washington (Motor Vehicle Fuel Tax) GO | 5.000% | 2/1/25 | 1,100 | 1,232 |
138
Limited-Term Tax-Exempt Fund
| | | | |
| Face | Market |
| Maturity | Amount | Value• |
| Coupon | Date | ($000) | ($000) |
| Washington Economic Development Finance Authority Lease Revenue | | | | |
| (Washington Biomedical Research Properties 2) | 5.000% | 6/1/19 | 850 | 865 |
| Washington Federal Highway Grant Anticipation Revenue (520 Corridor Program) | 5.000% | 9/1/20 | 9,210 | 9,670 |
| Washington Federal Highway Grant Anticipation Revenue (520 Corridor Program) | 5.000% | 9/1/22 | 3,540 | 3,876 |
| Washington Federal Highway Grant Anticipation Revenue (520 Corridor Program) | 5.000% | 9/1/22 | 4,775 | 5,228 |
| Washington GO | 0.000% | 7/1/19 (14)(ETM) | 4,155 | 4,101 |
| Washington GO | 5.000% | 7/1/19 | 14,580 | 14,876 |
| Washington GO | 5.000% | 7/1/19 | 19,770 | 20,172 |
| Washington GO | 5.000% | 7/1/20 | 9,070 | 9,499 |
| Washington GO | 5.000% | 8/1/20 | 10,000 | 10,495 |
| Washington GO | 5.000% | 7/1/21 | 11,000 | 11,515 |
| Washington GO | 5.000% | 8/1/23 | 5,000 | 5,582 |
| Washington GO | 5.000% | 2/1/24 | 1,575 | 1,772 |
| Washington GO | 5.000% | 7/1/24 | 10,000 | 10,910 |
| Washington GO | 5.000% | 8/1/24 | 13,675 | 15,510 |
| Washington GO | 5.000% | 7/1/25 | 12,500 | 13,619 |
| Washington GO | 5.000% | 8/1/25 | 5,000 | 5,745 |
| Washington GO | 4.000% | 7/1/26 | 28,260 | 29,613 |
| Washington GO | 4.000% | 7/1/27 | 15,000 | 15,697 |
| Washington GO | 4.000% | 7/1/29 | 10,000 | 10,445 |
| Washington Health Care Facilities Authority Revenue | | | | |
| (Central Washington Health Services Association) | 5.000% | 7/1/20 | 875 | 906 |
| Washington Health Care Facilities Authority Revenue | | | | |
| (Central Washington Health Services Association) | 5.000% | 7/1/21 | 1,000 | 1,056 |
| Washington Health Care Facilities Authority Revenue | | | | |
| (Central Washington Health Services Association) | 5.000% | 7/1/22 | 1,965 | 2,108 |
| Washington Health Care Facilities Authority Revenue (MultiCare Health System) | 4.000% | 8/15/19 | 850 | 863 |
| Washington Health Care Facilities Authority Revenue (MultiCare Health System) | 5.000% | 8/15/19 | 1,000 | 1,023 |
| Washington Health Care Facilities Authority Revenue (MultiCare Health System) | 4.000% | 8/15/20 | 1,000 | 1,031 |
| Washington Health Care Facilities Authority Revenue (MultiCare Health System) | 5.000% | 8/15/20 | 1,380 | 1,447 |
| Washington Health Care Facilities Authority Revenue (MultiCare Health System) | 4.000% | 8/15/21 | 1,000 | 1,046 |
| Washington Health Care Facilities Authority Revenue (MultiCare Health System) | 5.000% | 8/15/23 | 705 | 784 |
| Washington Health Care Facilities Authority Revenue (MultiCare Health System) | 5.000% | 8/15/24 | 1,365 | 1,541 |
| Washington Health Care Facilities Authority Revenue (MultiCare Health System) | 5.000% | 8/15/25 | 670 | 765 |
| Washington Health Care Facilities Authority Revenue (PeaceHealth) | 5.000% 11/15/20 | 1,010 | 1,066 |
| Washington Health Care Facilities Authority Revenue (PeaceHealth) | 5.000% 11/15/21 | 1,020 | 1,097 |
| Washington Health Care Facilities Authority Revenue (Providence Health & Services) | 5.000% | 10/1/19 | 1,000 | 1,026 |
| Washington Health Care Facilities Authority Revenue (Providence Health & Services) | 5.000% | 10/1/22 | 1,830 | 2,000 |
| Washington Health Care Facilities Authority Revenue (Providence Health & Services) PUT | 5.000% | 10/1/21 | 3,085 | 3,313 |
| Washington Health Care Facilities Authority Revenue (Seattle Cancer Care Alliance) | 5.000% | 3/1/19 | 600 | 606 |
| Washington Health Care Facilities Authority Revenue (Seattle Cancer Care Alliance) | 5.000% | 3/1/20 | 1,105 | 1,145 |
| Washington Health Care Facilities Authority Revenue (Seattle Cancer Care Alliance) | 4.000% | 3/1/21 | 800 | 828 |
| Washington Health Care Facilities Authority Revenue (Seattle Cancer Care Alliance) | 5.000% | 3/1/22 | 735 | 793 |
| Washington Health Care Facilities Authority Revenue | | | | |
| (Virginia Mason Medical Center Obligated Group) | 5.000% | 8/15/25 | 2,210 | 2,438 |
| Washington Housing Finance Commission Revenue (Horizon House Project) | 5.000% | 1/1/20 | 480 | 491 |
| Washington Housing Finance Commission Revenue (Horizon House Project) | 5.000% | 1/1/21 | 1,000 | 1,040 |
| Washington Housing Finance Commission Revenue (Horizon House Project) | 5.000% | 1/1/22 | 540 | 569 |
| Washington Housing Finance Commission Revenue (Horizon House Project) | 5.000% | 1/1/24 | 605 | 649 |
| Washington State University General Revenue | 5.000% | 4/1/21 | 1,300 | 1,384 |
| Washington State University General Revenue | 5.000% | 4/1/22 | 1,450 | 1,577 |
| | | | 539,834 |
| West Virginia (0.3%) | | | | |
| West Virginia Commissioner of Highways Revenue (Surface Transportation Improvements) | 5.000% | 9/1/23 | 5,000 | 5,561 |
| West Virginia Commissioner of Highways Revenue (Surface Transportation Improvements) | 5.000% | 9/1/24 | 6,575 | 7,423 |
| West Virginia Economic Development Authority Lottery Revenue | 5.000% | 6/15/25 | 3,465 | 3,965 |
| West Virginia Economic Development Authority Pollution Control Revenue | | | | |
| (American Electric Power Co. Inc.) | 3.250% | 5/1/19 | 10,000 | 10,010 |
| West Virginia Economic Development Authority Solid Waste Facilities Disposal Revenue | | | | |
| (Appalachian Power Co. - Amos Project) PUT | 1.900% | 4/1/19 | 8,000 | 7,981 |
| West Virginia Economic Development Authority Solid Waste Facilities Disposal Revenue | | | | |
| (Appalachian Power Co. - Amos Project) PUT | 2.625% | 6/1/22 | 5,000 | 4,950 |
| West Virginia Economic Development Authority Solid Waste Facilities Disposal Revenue | | | | |
| (Appalachian Power Co. - Amos Project) PUT | 2.625% | 6/1/22 | 5,125 | 5,074 |
| West Virginia GO | 5.000% | 6/1/22 | 11,010 | 12,042 |
| West Virginia Higher Education Policy Commission Revenue | 5.000% | 7/1/23 | 700 | 774 |
| West Virginia Higher Education Policy Commission Revenue | 5.000% | 7/1/24 | 1,000 | 1,122 |
| West Virginia Higher Education Policy Commission Revenue | 5.000% | 7/1/25 | 1,150 | 1,306 |
| West Virginia Hospital Finance Authority Hospital Revenue (Cabell Huntington Hospital Inc.) | 5.000% | 1/1/24 | 1,900 | 2,086 |
139
Limited-Term Tax-Exempt Fund
| | | | |
| Face | Market |
| Maturity | Amount | Value• |
| Coupon | Date | ($000) | ($000) |
| West Virginia Hospital Finance Authority Hospital Revenue (Cabell Huntington Hospital Inc.) | 5.000% | 1/1/26 | 1,370 | 1,524 |
| West Virginia State School Building Authority Lottery Revenue | 5.000% | 7/1/23 | 2,235 | 2,482 |
| West Virginia State School Building Authority Lottery Revenue | 5.000% | 7/1/24 | 2,350 | 2,650 |
| West Virginia State School Building Authority Lottery Revenue | 5.000% | 7/1/25 | 2,465 | 2,815 |
| 2 West Virginia University Revenue PUT | 2.130% | 10/1/19 | 4,500 | 4,503 |
| West Virginia Water Development Authority Infrastructure Excess Lottery Revenue | | | | |
| (Chesapeake Bay/Greenbrier River Projects) | 5.000% | 7/1/21 | 750 | 805 |
| | | | 77,073 |
| Wisconsin (1.0%) | | | | |
| Milwaukee WI GO | 5.000% | 4/1/22 | 3,715 | 4,045 |
| Milwaukee WI GO | 4.000% | 3/15/25 | 3,000 | 3,243 |
| Milwaukee WI Sewerage System Revenue | 5.000% | 6/1/21 | 3,440 | 3,682 |
| Milwaukee WI Sewerage System Revenue | 5.000% | 6/1/23 | 3,800 | 4,235 |
| University of Wisconsin Hospitals & Clinics Authority Revenue | 5.000% | 4/1/20 | 660 | 686 |
| University of Wisconsin Hospitals & Clinics Authority Revenue | 5.000% | 4/1/26 | 2,410 | 2,644 |
| 1 Verona WI Area School District GO | 5.000% | 4/1/25 | 3,315 | 3,779 |
| Wisconsin Clean Water Revenue | 5.000% | 6/1/22 (ETM) | 5,500 | 6,003 |
| Wisconsin GO | 5.000% | 11/1/18 | 11,000 | 11,000 |
| Wisconsin GO | 5.000% | 5/1/19 | 5,000 | 5,077 |
| Wisconsin GO | 5.000% | 5/1/19 (ETM) | 2,285 | 2,320 |
| Wisconsin GO | 5.000% | 5/1/19 | 2,715 | 2,757 |
| Wisconsin GO | 5.000% | 11/1/19 | 3,100 | 3,193 |
| Wisconsin GO | 5.000% | 11/1/20 | 7,400 | 7,815 |
| Wisconsin GO | 5.000% | 5/1/22 (Prere.) | 135 | 147 |
| Wisconsin GO | 5.000% | 5/1/24 | 8,910 | 9,695 |
| Wisconsin GO | 5.000% | 5/1/24 | 7,920 | 8,768 |
| Wisconsin GO | 5.000% | 5/1/24 | 2,000 | 2,214 |
| Wisconsin GO | 5.000% | 5/1/25 | 18,615 | 20,583 |
| Wisconsin GO | 5.000% | 5/1/25 | 4,920 | 5,440 |
| Wisconsin Health & Educational Facilities Authority Health Facilities Revenue | | | | |
| (Iowa Health System Obligated Group) | 5.000% | 12/1/18 | 850 | 852 |
| Wisconsin Health & Educational Facilities Authority Health Facilities Revenue | | | | |
| (Iowa Health System Obligated Group) | 5.000% | 12/1/20 | 820 | 865 |
| Wisconsin Health & Educational Facilities Authority Health Facilities Revenue (SSM Health Care) | 5.000% | 6/1/20 (Prere.) | 1,330 | 1,388 |
| Wisconsin Health & Educational Facilities Authority Revenue (Agnesian HealthCare Inc.) | 5.000% | 7/1/24 | 1,000 | 1,109 |
| Wisconsin Health & Educational Facilities Authority Revenue (Agnesian HealthCare Inc.) | 5.000% | 7/1/26 | 1,000 | 1,129 |
| Wisconsin Health & Educational Facilities Authority Revenue | | | | |
| (Ascension Health Alliance Credit Group) PUT | 5.000% | 6/1/20 | 34,460 | 35,830 |
| Wisconsin Health & Educational Facilities Authority Revenue (Aurora Health Care Inc.) | 5.000% | 7/15/19 (ETM) | 1,160 | 1,185 |
| Wisconsin Health & Educational Facilities Authority Revenue (Aurora Health Care Inc.) | 5.000% | 7/15/21 (Prere.) | 13,000 | 13,950 |
| Wisconsin Health & Educational Facilities Authority Revenue | | | | |
| (Children’s Hospital of Wisconsin Inc.) | 5.000% | 8/15/23 | 525 | 582 |
| Wisconsin Health & Educational Facilities Authority Revenue | | | | |
| (Children’s Hospital of Wisconsin Inc.) | 5.000% | 8/15/24 | 950 | 1,066 |
| Wisconsin Health & Educational Facilities Authority Revenue | | | | |
| (Children’s Hospital of Wisconsin Inc.) | 5.000% | 8/15/25 | 725 | 822 |
| Wisconsin Health & Educational Facilities Authority Revenue (Froedtert Health Inc.) | 5.000% | 4/1/22 | 1,000 | 1,084 |
| Wisconsin Health & Educational Facilities Authority Revenue (Froedtert Health Inc.) | 5.000% | 4/1/23 | 1,000 | 1,102 |
| Wisconsin Health & Educational Facilities Authority Revenue (Froedtert Health Inc.) | 5.000% | 4/1/24 | 1,050 | 1,174 |
| Wisconsin Health & Educational Facilities Authority Revenue | | | | |
| (Hospital Sisters Services Inc. Obligated Group) | 5.000% | 11/15/18 | 750 | 751 |
| Wisconsin Health & Educational Facilities Authority Revenue | | | | |
| (Hospital Sisters Services Inc. Obligated Group) | 4.000% | 8/15/19 | 1,500 | 1,523 |
| Wisconsin Health & Educational Facilities Authority Revenue | | | | |
| (Hospital Sisters Services Inc. Obligated Group) | 5.000% | 11/15/19 | 1,500 | 1,545 |
| Wisconsin Health & Educational Facilities Authority Revenue | | | | |
| (Hospital Sisters Services Inc. Obligated Group) | 5.000% | 8/15/20 | 5,335 | 5,592 |
| Wisconsin Health & Educational Facilities Authority Revenue | | | | |
| (Hospital Sisters Services Inc. Obligated Group) | 5.000% | 11/15/20 | 2,275 | 2,394 |
| Wisconsin Health & Educational Facilities Authority Revenue | | | | |
| (Hospital Sisters Services Inc. Obligated Group) | 5.000% | 11/15/21 | 2,485 | 2,668 |
| Wisconsin Health & Educational Facilities Authority Revenue (Marquette University) | 5.000% | 10/1/21 | 630 | 677 |
| Wisconsin Health & Educational Facilities Authority Revenue (Marquette University) | 5.000% | 10/1/22 | 350 | 382 |
| Wisconsin Health & Educational Facilities Authority Revenue (Marquette University) | 5.000% | 10/1/23 | 325 | 359 |
| Wisconsin Health & Educational Facilities Authority Revenue | | | | |
| (Marshfield Clinic Health System Obligated Group) | 5.000% | 2/15/20 | 1,840 | 1,902 |
| Wisconsin Health & Educational Facilities Authority Revenue | | | | |
| (Marshfield Clinic Health System Obligated Group) | 5.000% | 2/15/21 | 1,990 | 2,102 |
140
Limited-Term Tax-Exempt Fund
| | | | |
| Face | Market |
| Maturity | Amount | Value• |
| Coupon | Date | ($000) | ($000) |
| Wisconsin Health & Educational Facilities Authority Revenue | | | | |
| (Marshfield Clinic Health System Obligated Group) | 5.000% | 2/15/22 | 2,100 | 2,258 |
| Wisconsin Health & Educational Facilities Authority Revenue | | | | |
| (Marshfield Clinic Health System Obligated Group) | 5.000% | 2/15/23 | 2,130 | 2,325 |
| Wisconsin Health & Educational Facilities Authority Revenue (ThedaCare Inc. Obligated Group) | 5.000% | 12/15/18 | 500 | 502 |
| Wisconsin Health & Educational Facilities Authority Revenue (ThedaCare Inc. Obligated Group) | 5.000% | 12/15/21 | 1,470 | 1,576 |
| Wisconsin Health & Educational Facilities Authority Revenue (ThedaCare Inc. Obligated Group) | 5.000% | 12/15/24 | 970 | 1,085 |
| Wisconsin Housing & Economic Development Authority Revenue PUT | 1.950% | 5/1/20 | 3,750 | 3,720 |
| Wisconsin Housing & Economic Development Authority Revenue PUT | 5.000% | 6/1/23 | 20,000 | 21,605 |
| Wisconsin Public Finance Authority Hospital Revenue (Renown Regional Medical Center) | 5.000% | 6/1/19 | 2,130 | 2,165 |
| Wisconsin Public Finance Authority Hospital Revenue (Renown Regional Medical Center) | 5.000% | 6/1/20 | 4,685 | 4,880 |
| Wisconsin Public Finance Authority Hospital Revenue (Renown Regional Medical Center) | 5.000% | 6/1/21 | 4,830 | 5,142 |
| Wisconsin Public Finance Authority Hospital Revenue (Renown Regional Medical Center) | 5.000% | 6/1/21 | 2,070 | 2,204 |
| Wisconsin Public Finance Authority Hospital Revenue (Renown Regional Medical Center) | 5.000% | 6/1/22 | 3,085 | 3,347 |
| Wisconsin Public Finance Authority Hospital Revenue (Renown Regional Medical Center) | 5.000% | 6/1/22 | 2,125 | 2,306 |
| Wisconsin Public Finance Authority Hospital Revenue (Renown Regional Medical Center) | 5.000% | 6/1/23 | 1,300 | 1,433 |
| Wisconsin Public Finance Authority Hospital Revenue (Renown Regional Medical Center) | 5.000% | 6/1/24 | 3,225 | 3,605 |
| Wisconsin Public Finance Authority Hospital Revenue (Renown Regional Medical Center) | 5.000% | 6/1/25 | 910 | 1,029 |
| Wisconsin Public Finance Authority Lease Development Revenue | | | | |
| (Central District Development Project) | 5.000% | 3/1/20 | 900 | 932 |
| Wisconsin Public Finance Authority Lease Development Revenue | | | | |
| (Central District Development Project) | 5.000% | 3/1/21 | 900 | 952 |
| Wisconsin Public Finance Authority Lease Development Revenue | | | | |
| (Central District Development Project) | 5.000% | 3/1/22 | 1,375 | 1,485 |
| Wisconsin Public Finance Authority Lease Development Revenue | | | | |
| (Central District Development Project) | 5.000% | 3/1/23 | 1,400 | 1,540 |
| Wisconsin Public Finance Authority Revenue (Church Home of Hartford Inc.) | 4.000% | 9/1/20 | 225 | 229 |
| Wisconsin Public Finance Authority Revenue | | | | |
| (Retirement Housing Foundation National Obligated Group) | 5.000% | 11/15/23 | 815 | 882 |
| Wisconsin Public Finance Authority Revenue | | | | |
| (Retirement Housing Foundation National Obligated Group) | 5.000% | 11/15/24 | 2,555 | 2,784 |
| Wisconsin Public Finance Authority Revenue | | | | |
| (Retirement Housing Foundation National Obligated Group) | 5.000% | 11/15/25 | 4,485 | 4,904 |
| Wisconsin Public Finance Authority Revenue | | | | |
| (Retirement Housing Foundation National Obligated Group) | 5.000% | 11/15/26 | 3,210 | 3,521 |
| | | | 265,770 |
| Wyoming (0.0%) | | | | |
| 2 Wyoming Community Development Authority PUT | 1.920% | 9/1/21 | 4,000 | 4,000 |
| Wyoming Municipal Power Agency Power Supply Revenue | 5.000% | 1/1/22 (15) | 350 | 375 |
| Wyoming Municipal Power Agency Power Supply Revenue | 5.000% | 1/1/23 (15) | 200 | 219 |
| | | | 4,594 |
| Total Tax-Exempt Municipal Bonds (Cost $26,414,976) | | | | 26,131,013 |
| |
| Shares | |
| Temporary Cash Investment (0.6%) | | | | |
| Money Market Fund (0.6%) | | | | |
| 7 Vanguard Municipal Cash Management Fund (Cost $164,705) | 1.620% | 1,647,103 | 164,710 |
| Total Investments (100.7%) (Cost $26,579,681) | | | | 26,295,723 |
141
Limited-Term Tax-Exempt Fund
| |
| Amount |
| ($000) |
| Other Assets and Liabilities (-0.7%) | |
| Other Assets | |
| Investment in Vanguard | 1,323 |
| Receivables for Investment Securities Sold | 18,505 |
| Receivables for Accrued Income | 291,365 |
| Receivables for Capital Shares Issued | 55,776 |
| Variation Margin Receivable—Futures Contracts | 810 |
| Other Assets | 740 |
| Total Other Assets | 368,519 |
| Liabilities | |
| Payables for Investment Securities Purchased | (489,243) |
| Payables for Capital Shares Redeemed | (50,904) |
| Payables for Distributions | (10,306) |
| Payables to Vanguard | (10,267) |
| Variation Margin Payable—Futures Contracts | (1,386) |
| Other Liabilities | (13) |
| Total Liabilities | (562,119) |
| Net Assets (100%) | 26,102,123 |
| |
| At October 31, 2018, net assets consisted of: | |
| Amount |
| ($000) |
| Paid-in Capital | 26,496,928 |
| Total Distributable Earnings (Loss) | (394,805) |
| Net Assets | 26,102,123 |
| |
| Investor Shares—Net Assets | |
| Applicable to 134,861,207 outstanding $.001 par value shares of beneficial interest (unlimited authorization) | 1,452,884 |
| Net Asset Value Per Share—Investor Shares | $10.77 |
| |
| Admiral Shares—Net Assets | |
| Applicable to 2,288,019,861 outstanding $.001 par value shares of beneficial interest (unlimited authorization) | 24,649,239 |
| Net Asset Value Per Share—Admiral Shares | $10.77 |
• See Note A in Notes to Financial Statements.
1 Security purchased on a when-issued or delayed-delivery basis for which the fund has not taken delivery as of October 31, 2018. 2 Adjustable-rate security based upon SIFMA Municipal Swap Index Yield plus spread.
3 Security exempt from registration under Rule 144A of the Securities Act of 1933. Such securities may be sold in transactions exempt from registration, normally to qualified institutional buyers. At October 31, 2018, the aggregate value of these securities was $696,340,000, representing 2.7% of net assets.
4 5.000% coupon rate will be effective August 2023.
5 The issuer was placed under federal conservatorship in September 2008; since that time, its daily operations have been managed by the Federal Housing Finance Agency and it receives capital from the U.S. Treasury, as needed to maintain a positive net worth, in exchange for senior preferred stock.
6 Securities with a value of $3,889,000 have been segregated as initial margin for open futures contracts.
7 Affiliated money market fund available only to Vanguard funds and certain trusts and accounts managed by Vanguard. Rate shown is the 7-day yield.
A key to abbreviations and other references follows the Statement of Net Assets.
See accompanying Notes, which are an integral part of the Financial Statements.
142
Limited-Term Tax-Exempt Fund
Key to Abbreviations
ARS—Auction Rate Security.
BAN—Bond Anticipation Note.
COP—Certificate of Participation.
CP—Commercial Paper.
FR—Floating Rate.
GAN—Grant Anticipation Note.
GO—General Obligation Bond.
PILOT—Payments in Lieu of Taxes.
PUT—Put Option Obligation.
RAN—Revenue Anticipation Note.
TAN—Tax Anticipation Note.
TOB—Tender Option Bond.
TRAN—Tax Revenue Anticipation Note.
VRDO—Variable Rate Demand Obligation.
VRDP—Variable Rate Demand Preferred.
(ETM)—Escrowed to Maturity.
(Prere.)—Prerefunded.
Scheduled principal and interest payments are guaranteed by:
(1) MBIA (Municipal Bond Investors Assurance).
(2) AMBAC (Ambac Assurance Corporation).
(3) FGIC (Financial Guaranty Insurance Company).
(4) AGM (Assured Guaranty Municipal Corporation).
(5) BIGI (Bond Investors Guaranty Insurance).
(6) Connie Lee Inc.
(7) FHA (Federal Housing Authority).
(8) CapMAC (Capital Markets Assurance Corporation).
(9) American Capital Access Financial Guaranty Corporation.
(10) XL Capital Assurance Inc.
(11) CIFG (CDC IXIS Financial Guaranty).
(12) AGC (Assured Guaranty Corporation).
(13) BHAC (Berkshire Hathaway Assurance Corporation).
(14) NPFG (National Public Finance Guarantee Corporation).
(15) BAM (Build America Mutual Assurance Company).
(16) MAC (Municipal Assurance Corporation).
(17) RAA (Radian Asset Assurance Inc.).
(18) SBLF (Michigan School Bond Loan Fund).
(19) TPSF (Texas Permanent School Fund).
The insurance does not guarantee the market value of the municipal bonds.
LOC—Scheduled principal and interest payments are guaranteed by bank letter of credit.
| | | | |
| Derivative Financial Instruments Outstanding as of Period End | | | | |
| |
| Futures Contracts | | | | |
| ($000) |
| Value and |
| Number of | Unrealized |
| Long (Short) | Notional | Appreciation |
| Expiration | Contracts | Amount | (Depreciation) |
| Long Futures Contracts | | | | |
| 10-Year U.S. Treasury Note | December 2018 | 2,853 | 337,902 | (1,461) |
| Ultra 10-Year U.S. Treasury Note | December 2018 | 1,067 | 133,492 | 498 |
| 2-Year U.S. Treasury Note | December 2018 | 432 | 91,004 | (4) |
| | | | (967) |
| |
| Short Futures Contracts | | | | |
| 5-Year U.S. Treasury Note | December 2018 | (2,854) | (320,741) | (321) |
| | | | (1,288) |
See accompanying Notes, which are an integral part of the Financial Statements.
143
Limited-Term Tax-Exempt Fund
Statement of Operations
| | | |
| Year Ended |
| October 31, 2018 |
| | ($000) |
| Investment Income | | |
| Income | | |
| Interest1 492,826 |
| Total Income 492,826 |
| Expenses | | |
| The Vanguard Group—Note B | | |
| Investment Advisory Services | 3,124 |
| Management and Administrative— | |
| Investor Shares | 2,125 |
| Management and Administrative— | |
| Admiral Shares | 16,241 |
| Marketing and Distribution— | | |
| Investor Shares | 349 |
| Marketing and Distribution— | | |
| Admiral Shares | 1,860 |
| Custodian Fees | 116 |
| Auditing Fees | 33 |
| Shareholders’ Reports and Proxy— | |
| Investor Shares | 71 |
| Shareholders’ Reports and Proxy— | |
| Admiral Shares | 315 |
| Trustees’ Fees and Expenses | 15 |
| Total Expenses | 24,249 |
| Net Investment Income | 468,577 |
| Realized Net Gain (Loss) | | |
| Investment Securities Sold1 | (59,813) |
| Futures Contracts | 2,737 |
| Realized Net Gain (Loss) | (57,076) |
| Change in Unrealized Appreciation | |
| (Depreciation) | | |
| Investment Securities1 (398,692) |
| Futures Contracts | (2,354) |
| Change in Unrealized Appreciation | |
| (Depreciation) (401,046) |
| Net Increase (Decrease) in Net Assets | |
| Resulting from Operations | 10,455 |
1 Interest income, realized net gain (loss), and change in unrealized appreciation (depreciation) from an affiliated company of the fund were $3,559,000, ($11,000), and $10,000, respectively. Purchases and sales are for temporary cash investment purposes.
Statement of Changes in Net Assets
| | | |
| Year Ended October 31, |
| 2018 | 2017 |
| ($000) | ($000) |
| Increase (Decrease) in Net Assets | | |
| Operations | | |
| Net Investment Income | 468,577 | 382,821 |
| Realized Net Gain (Loss) | (57,076) | (4,031) |
| Change in Unrealized Appreciation (Depreciation) | (401,046) | (116,162) |
| Net Increase (Decrease) in Net Assets Resulting from Operations | 10,455 | 262,628 |
| Distributions | | |
| Net Investment Income | | |
| Investor Shares | (28,287) | (27,459) |
| Admiral Shares | (439,887) | (355,321) |
| Realized Capital Gain | | |
| Investor Shares | — | — |
| Admiral Shares | — | — |
| Total Distributions | (468,174) | (382,780) |
| Capital Share Transactions | | |
| Investor Shares | (278,191) | (226,629) |
| Admiral Shares | 1,804,732 | 1,423,525 |
| Net Increase (Decrease) from Capital Share Transactions | 1,526,541 | 1,196,896 |
| Total Increase (Decrease) | 1,068,822 | 1,076,744 |
| Net Assets |
| Beginning of Period | 25,033,301 | 23,956,557 |
| End of Period | 26,102,123 | 25,033,301 |
See accompanying Notes, which are an integral part of the Financial Statements.
144
Limited-Term Tax-Exempt Fund
Financial Highlights
Investor Shares
| | | | | | |
| For a Share Outstanding | | | | Year Ended October 31, |
| Throughout Each Period | 2018 | 2017 | 2016 | 2015 | 2014 |
| Net Asset Value, Beginning of Period | | $10.97 | $11.02 | $11.04 | $11.08 | $11.06 |
| Investment Operations | |
| Net Investment Income | | .1911 | .1661 | .164 | .166 | .178 |
| Net Realized and Unrealized Gain (Loss) | | | | | | |
| on Investments | | (.200) | (.050) | (.020) | (.040) | .020 |
| Total from Investment Operations | | (.009) | .116 | .144 | .126 | .198 |
| Distributions | | |
| Dividends from Net Investment Income | | (.191) | (.166) | (.164) | (.166) | (.178) |
| Distributions from Realized Capital Gains | — | — | — | — | — |
| Total Distributions | | (.191) | (.166) | (.164) | (.166) | (.178) |
| Net Asset Value, End of Period | | $10.77 | $10.97 | $11.02 | $11.04 | $11.08 |
| |
| Total Return2 | | -0.08% | 1.07% | 1.31% | 1.15% | 1.81% |
| |
| Ratios/Supplemental Data | | |
| Net Assets, End of Period (Millions) | | $1,453 | $1,761 | $1,998 | $2,040 | $2,241 |
| Ratio of Total Expenses to Average Net Assets | 0.17% | 0.19% | 0.19% | 0.20% | 0.20% |
| Ratio of Net Investment Income to | | | | | | |
| Average Net Assets | | 1.76% | 1.52% | 1.48% | 1.51% | 1.61% |
| Portfolio Turnover Rate | | 28% | 19% | 13% | 16% | 15% |
1 Calculated based on average shares outstanding.
2 Total returns do not include account service fees that may have applied in the periods shown. Fund prospectuses provide information about any applicable account service fees.
| | | | | | |
| Admiral Shares | | | | | | |
| | | | | | |
| For a Share Outstanding | | | | Year Ended October 31, |
| Throughout Each Period | 2018 | 2017 | 2016 | 2015 | 2014 |
| Net Asset Value, Beginning of Period | | $10.97 | $11.02 | $11.04 | $11.08 | $11.06 |
| Investment Operations | |
| Net Investment Income | | . 2001 | .1771 | .175 | .175 | .187 |
| Net Realized and Unrealized Gain (Loss) | | | | | | |
| on Investments | | (.200) | (.050) | (.020) | (.040) | .020 |
| Total from Investment Operations | | — | .127 | .155 | .135 | .207 |
| Distributions | | |
| Dividends from Net Investment Income | | (.200) | (.177) | (.175) | (.175) | (.187) |
| Distributions from Realized Capital Gains | — | — | — | — | — |
| Total Distributions | | (.200) | (.177) | (.175) | (.175) | (.187) |
| Net Asset Value, End of Period | | $10.77 | $10.97 | $11.02 | $11.04 | $11.08 |
| |
| Total Return 2 | | 0.00% | 1.17% | 1.41% | 1.23% | 1.89% |
| |
| Ratios/Supplemental Data | | |
| Net Assets, End of Period (Millions) | | $24,649 | $23,273 | $21,959 | $19,035 | $17,621 |
| Ratio of Total Expenses to Average Net Assets | 0.09% | 0.09% | 0.09% | 0.12% | 0.12% |
| Ratio of Net Investment Income to | | | | | | |
| Average Net Assets | | 1.84% | 1.62% | 1.58% | 1.59% | 1.69% |
| Portfolio Turnover Rate | | 28% | 19% | 13% | 16% | 15% |
1 Calculated based on average shares outstanding.
2 Total returns do not include account service fees that may have applied in the periods shown. Fund prospectuses provide information about any applicable account service fees.
See accompanying Notes, which are an integral part of the Financial Statements.
145
Limited-Term Tax-Exempt Fund
Notes to Financial Statements
Vanguard Limited-Term Tax-Exempt Fund is registered under the Investment Company Act of 1940 as an open-end investment company, or mutual fund. The fund invests in debt instruments of many municipal issuers; the issuers’ abilities to meet their obligations may be affected by economic and political developments in a specific state or region. The fund offers two classes of shares: Investor Shares and Admiral Shares. Investor Shares are available to any investor who meets the fund’s minimum purchase requirements. Admiral Shares are designed for investors who meet certain administrative, service, and account-size criteria.
A. The following significant accounting policies conform to generally accepted accounting principles for U.S. investment companies. The fund consistently follows such policies in preparing its financial statements.
1. Security Valuation: Securities are valued as of the close of trading on the New York Stock Exchange (generally 4 p.m., Eastern time) on the valuation date. Bonds and temporary cash investments are valued using the latest bid prices or using valuations based on a matrix system (which considers such factors as security prices, yields, maturities, and ratings), both as furnished by independent pricing services. Investments in Vanguard Municipal Cash Management Fund are valued at that fund’s net asset value. Securities for which market quotations are not readily available, or whose values have been affected by events occurring before the fund’s pricing time but after the close of the securities’ primary markets, are valued by methods deemed by the board of trustees to represent fair value.
2. Futures Contracts: The fund uses futures contracts to invest in fixed income asset classes with greater efficiency and lower cost than is possible through direct investment, to add value when these instruments are attractively priced, or to adjust sensitivity to changes in interest rates. The primary risks associated with the use of futures contracts are imperfect correlation between changes in market values of bonds held by the fund and the prices of futures contracts, and the possibility of an illiquid market. Counterparty risk involving futures is mitigated because a regulated clearinghouse is the counterparty instead of the clearing broker. To further mitigate counterparty risk, the fund trades futures contracts on an exchange, monitors the financial strength of its clearing brokers and clearinghouse, and has entered into clearing agreements with its clearing brokers. The clearinghouse imposes initial margin requirements to secure the fund’s performance and requires daily settlement of variation margin representing changes in the market value of each contract. Any assets pledged as initial margin for open contracts are noted in the Statement of Net Assets.
Futures contracts are valued at their quoted daily settlement prices. The notional amounts of the contracts are not recorded in the Statement of Net Assets. Fluctuations in the value of the contracts are recorded in the Statement of Net Assets as an asset (liability) and in the Statement of Operations as unrealized appreciation (depreciation) until the contracts are closed, when they are recorded as realized futures gains (losses).
During the year ended October 31, 2018, the fund’s average investments in long and short futures contracts represented 2% and 1% of net assets, respectively, based on the average of the notional amounts at each quarter-end during the period.
3. Federal Income Taxes: The fund intends to continue to qualify as a regulated investment company and distribute all of its income. Management has analyzed the fund’s tax positions taken for all open federal income tax years (October 31, 2015–2018), and has concluded that no provision for federal income tax is required in the fund’s financial statements.
4. Distributions: Distributions from net investment income are declared daily and paid on the first business day of the following month. Annual distributions from realized capital gains, if any, are recorded on the ex-dividend date. Distributions are determined on a tax basis and may differ from realized capital gains for financial reporting purposes.
5. Credit Facility: The fund and certain other funds managed by The Vanguard Group (“Vanguard”) participate in a $3.1 billion committed credit facility provided by a syndicate of lenders pursuant to a credit agreement that may be renewed annually; each fund is individually liable for its borrowings, if any, under the credit facility. Borrowings may be utilized for temporary and emergency purposes, and are subject to the fund’s regulatory and contractual borrowing restrictions. The participating funds are charged administrative fees and an annual commitment fee of 0.10% of the undrawn amount of the facility; these fees are allocated to the funds based on a method approved by the fund’s board of trustees and included in Management and Administrative expenses on the fund’s Statement of Operations. Any borrowings under this facility bear interest at a rate based upon the higher of the one-month London Interbank Offered Rate, federal funds effective rate, or overnight bank funding rate plus an agreed-upon spread.
The fund had no borrowings outstanding at October 31, 2018, or at any time during the period then ended.
146
Limited-Term Tax-Exempt Fund
6. Other: Interest income includes income distributions received from Vanguard Municipal Cash Management Fund and is accrued daily. Premiums and discounts on debt securities purchased are amortized and accreted, respectively, to interest income over the lives of the respective securities. Security transactions are accounted for on the date securities are bought or sold. Costs used to determine realized gains (losses) on the sale of investment securities are those of the specific securities sold.
Each class of shares has equal rights as to assets and earnings, except that each class separately bears certain class-specific expenses related to maintenance of shareholder accounts (included in Management and Administrative expenses), shareholder reporting, and the proxy. Marketing and distribution expenses are allocated to each class of shares based on a method approved by the board of trustees. Income, other non-class-specific expenses, and gains and losses on investments are allocated to each class of shares based on its relative net assets.
B. In accordance with the terms of a Funds’ Service Agreement (the “FSA”) between Vanguard and the fund, Vanguard furnishes to the fund investment advisory, corporate management, administrative, marketing, and distribution services at Vanguard’s cost of operations (as defined by the FSA). These costs of operations are allocated to the fund based on methods and guidelines approved by the board of trustees. Vanguard does not require reimbursement in the current period for certain costs of operations (such as deferred compensation/benefits and risk/insurance costs); the fund’s liability for these costs of operations is included in Payables to Vanguard on the Statement of Net Assets. All other costs of operations payable to Vanguard are generally settled twice a month.
Upon the request of Vanguard, the fund may invest up to 0.40% of its net assets as capital in Vanguard. At October 31, 2018, the fund had contributed to Vanguard capital in the amount of $1,323,000, representing 0.01% of the fund’s net assets and 0.53% of Vanguard’s capitalization. The fund’s trustees and officers are also directors and employees, respectively, of Vanguard.
C. Various inputs may be used to determine the value of the fund’s investments. These inputs are summarized in three broad levels for financial statement purposes. The inputs or methodologies used to value securities are not necessarily an indication of the risk associated with investing in those securities.
Level 1—Quoted prices in active markets for identical securities.
Level 2—Other significant observable inputs (including quoted prices for similar securities, interest rates, prepayment speeds, credit risk, etc.).
Level 3—Significant unobservable inputs (including the fund’s own assumptions used to determine the fair value of investments). Any investments valued with significant unobservable inputs are noted on the Statement of Net Assets.
The following table summarizes the market value of the fund’s investments as of October 31, 2018, based on the inputs used to value them:
| | | |
| Level 1 | Level 2 | Level 3 |
| Investments | ($000) | ($000) | ($000) |
| Tax-Exempt Municipal Bonds | — | 26,131,013 | — |
| Temporary Cash Investments | 164,710 | — | — |
| Futures Contracts—Assets1 | 810 | — | — |
| Futures Contracts—Liabilities1 | (1,386) | — | — |
| Total | 164,134 | 26,131,013 | — |
| 1 Represents variation margin on the last day of the reporting period. | | | |
D. Permanent differences between book-basis and tax-basis components of net assets are reclassified among capital accounts in the financial statements to reflect their tax character. These reclassifications have no effect on net assets or net asset value per share. As of period end, the following permanent differences primarily attributable to the accounting for the expiration of capital loss carryforwards were reclassified to the following accounts:
| |
| Amount |
| ($000) |
| Paid-in Capital | (4,067) |
| Total Distributable Earnings (Loss) | 4,067 |
147
Limited-Term Tax-Exempt Fund
Temporary differences between book-basis and tax-basis components of total distributable earnings (loss) arise when certain items of income, gain, or loss are recognized in different periods for financial statement and tax purposes; these differences will reverse at some time in the future. The differences are primarily related to the tax deferral of losses on wash sales and straddles, the realization of unrealized gains or losses on certain futures contracts, and payables for distributions. As of period end, the tax-basis components of total distributable earnings (loss) are detailed in the table as follows:
| |
| Amount |
| ($000) |
| Undistributed Ordinary Income | — |
| Undistributed Tax-Exempt Income | 19,331 |
| Undistributed Long-Term Gains | — |
| Capital Loss Carryforwards (Non-expiring)* | (110,845) |
| Net Unrealized Gains (Losses) | (284,071) |
* Includes $27,082,000, which may be used to offset future net capital gains through October 31, 2019, as well as capital losses of $83,763,000, which may be carried forward indefinitely but must be used before any expiring loss carryforwards.
As of October 31, 2018, gross unrealized appreciation and depreciation for investments and derivatives based on cost for U.S. federal income tax purposes were as follows:
| |
| Amount |
| ($000) |
| Tax Cost | 26,579,794 |
| Gross Unrealized Appreciation | 25,608 |
| Gross Unrealized Depreciation | (309,679) |
| Net Unrealized Appreciation (Depreciation) | (284,071) |
E. During the year ended October 31, 2018, the fund purchased $7,909,918,000 of investment securities and sold $6,473,200,000 of investment securities, other than temporary cash investments.
The fund purchased securities from and sold securities to other Vanguard funds or accounts managed by Vanguard or its affiliates, in accordance with procedures adopted by the board of trustees in compliance with Rule 17a-7 of the Investment Company Act of 1940. For the year ended October 31, 2018, such purchases and sales were $2,014,360,000 and $2,107,986,000, respectively; these amounts are included in the purchases and sales of investment securities noted above.
| | | | |
| F. Capital share transactions for each class of shares were: | | | |
| | | Year Ended October 31, |
| | 2018 | | 2017 |
| Amount | Shares | Amount | Shares |
| ($000) | (000) | ($000) | (000) |
| Investor Shares | | | | |
| Issued | 454,635 | 41,884 | 624,744 | 57,173 |
| Issued in Lieu of Cash Distributions | 22,623 | 2,088 | 22,049 | 2,016 |
| Redeemed | (755,449) | (69,619) | (873,422) | (79,999) |
| Net Increase (Decrease)—Investor Shares | (278,191) | (25,647) | (226,629) | (20,810) |
| Admiral Shares | | | | |
| Issued | 9,573,303 | 882,384 | 9,048,226 | 827,683 |
| Issued in Lieu of Cash Distributions | 326,894 | 30,172 | 266,052 | 24,310 |
| Redeemed | (8,095,465) | (746,339) | (7,890,753) | (723,185) |
| Net Increase (Decrease)—Admiral Shares | 1,804,732 | 166,217 | 1,423,525 | 128,808 |
G. Management has determined that no events or transactions occurred subsequent to October 31, 2018, that would require recognition or disclosure in these financial statements.
148
Intermediate-Term Tax-Exempt Fund
| | |
| Share-Class Characteristics | | |
| Investor | Admiral |
| Shares | Shares |
| Ticker Symbol | VWITX | VWIUX |
| Expense Ratio1 | 0.19% | 0.09% |
| 30-Day SEC Yield | 2.70% | 2.75% |
| | | |
| Financial Attributes | | |
| | Bloomberg | |
| Barclays | Bloomberg |
| | 1–15 Year | Barclays |
| Municipal | Municipal |
| Bond | Bond |
| Fund | Index | Index |
| Number of Bonds | 7,982 | 42,898 | 53,575 |
| Yield to Maturity | | | |
| (before expenses) | 2.9% | 2.7% | 3.0% |
| Average Coupon | 4.7% | 4.7% | 4.7% |
| Average Duration | 5.4 years | 4.9 years | 6.5 years |
| Average Stated | | | |
| Maturity | 8.9 years | 8.0 years 13.0 years |
| Short-Term Reserves 1.8% | — | — |
| |
| Largest Area Concentrations2 | |
| |
| New York | 15.6% |
| California | 10.6 |
| Texas | 9.1 |
| Illinois | 6.1 |
| Florida | 5.0 |
| Pennsylvania | 5.0 |
| Washington | 3.5 |
| New Jersey | 3.3 |
| Maryland | 3.3 |
| Ohio | 2.7 |
| Top Ten | 64.2% |
| | |
| Volatility Measures | | |
| Bloomberg | |
| Barclays | Bloomberg |
| 1–15 Year | Barclays |
| Municipal | Municipal |
| Bond Index | Bond Index |
| R-Squared | 0.99 | 0.99 |
| Beta | 1.05 | 0.90 |
These measures show the degree and timing of the fund’s fluctuations compared with the indexes over 36 months.
| |
| Distribution by Stated Maturity (% of portfolio) |
| |
| Under 1 Year | 4.3% |
| 1–3 Years | 11.5 |
| 3–5 Years | 11.5 |
| 5–10 Years | 28.5 |
| 10–20 Years | 43.6 |
| 20–30 Years | 0.5 |
| Over 30 Years | 0.1 |
| |
| Distribution by Credit Quality (% of portfolio) |
| |
| AAA | 22.2% |
| AA | 46.0 |
| A | 22.6 |
| BBB | 7.3 |
| BB | 0.3 |
| B or Lower | 0.5 |
| Not Rated | 1.1 |
Credit-quality ratings are obtained from Moody’s and S&P, and the higher rating for each issue is shown. “Not Rated” is used to classify securities for which a rating is not available. Not rated securities include a fund’s investment in Vanguard Market Liquidity Fund or Vanguard Municipal Cash Management Fund, each of which invests in high-quality money market instruments and may serve as a cash management vehicle for the Vanguard funds, trusts, and accounts. For more information about these ratings, see the Glossary entry for Credit Quality.
Investment Focus

1 The expense ratios shown are from the prospectus dated February 23, 2018, and represent estimated costs for the current fiscal year. For the fiscal year ended October 31, 2018, the expense ratios were 0.17% for Investor Shares and 0.09% for Admiral Shares. 2 Percentage of net assets, excluding any futures contracts.
149
Intermediate-Term Tax-Exempt Fund
Performance Summary
All of the returns in this report represent past performance, which is not a guarantee of future results that may be achieved by the fund. (Current performance may be lower or higher than the performance data cited. For performance data current to the most recent month-end, visit our website at vanguard.com/performance.) Note, too, that both investment returns and principal value can fluctuate widely, so an investor’s shares, when sold, could be worth more or less than their original cost. The returns shown do not reflect taxes that a shareholder would pay on fund distributions or on the sale of fund shares.
Cumulative Performance: October 31, 2008–October 31, 2018
Initial Investment of $10,000
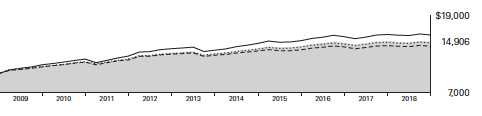
| | | | |
| | Average Annual Total Returns | Final Value |
| | Periods Ended October 31, 2018 | of a $10,000 |
| One Year | Five Years | Ten Years | Investment |
| Intermediate-Term Tax-Exempt Fund | | | | |
| Investor Shares | -0.80% | 2.64% | 4.07% | $14,906 |
| Bloomberg Barclays 1–15 Year Municipal | | | | |
| Bond Index | -0.53 | 2.49 | 3.98 | 14,767 |
| Intermediate Municipal Funds Average1 | -0.79 | 2.06 | 3.58 | 14,214 |
| Bloomberg Barclays Municipal Bond Index | -0.51 | 3.25 | 4.80 | 15,976 |
| | | | |
| Final Value |
| of a $50,000 |
| One Year | Five Years | Ten Years | Investment |
| Intermediate-Term Tax-Exempt Fund Admiral Shares | -0.72% | 2.73% | 4.16% | $75,156 |
| Bloomberg Barclays 1–15 Year Municipal Bond Index | -0.53 | 2.49 | 3.98 | 73,837 |
| Bloomberg Barclays Municipal Bond Index | -0.51 | 3.25 | 4.80 | 79,878 |
1 Derived from data provided by Lipper, a Thomson Reuters Company.
See Financial Highlights for dividend and capital gains information.
150
Intermediate-Term Tax-Exempt Fund
| | | | |
| Fiscal-Year Total Returns (%): October 31, 2008–October 31, 2018 | | | |
| Bloomberg |
| Barclays |
| 1–15 Year |
| Municipal |
| | Investor Shares | Bond Index |
| Income | Capital | Total | Total |
| Fiscal Year | Returns | Returns | Returns | Returns |
| 2009 | 4.24% | 6.27% | 10.51% | 10.72% |
| 2010 | 3.81 | 3.14 | 6.95 | 6.81 |
| 2011 | 3.71 | -0.36 | 3.35 | 3.62 |
| 2012 | 3.35 | 4.80 | 8.15 | 7.02 |
| 2013 | 3.00 | -3.96 | -0.96 | -0.41 |
| 2014 | 3.28 | 3.03 | 6.31 | 5.56 |
| 2015 | 2.93 | -0.49 | 2.44 | 2.46 |
| 2016 | 2.78 | 0.85 | 3.63 | 3.10 |
| 2017 | 2.74 | -0.98 | 1.76 | 1.94 |
| 2018 | 2.73 | -3.53 | -0.80 | -0.53 |
Average Annual Total Returns: Periods Ended September 30, 2018
This table presents returns through the latest calendar quarter—rather than through the end of the fiscal period.
Securities and Exchange Commission rules require that we provide this information.
| | | | | | |
| | | | | Ten Years |
| Inception Date | One Year | Five Years | Income | Capital | Total |
| Investor Shares | 9/1/1977 | -0.15% | 2.92% | 3.26% | 0.88% | 4.14% |
| Admiral Shares | 2/12/2001 | -0.07 | 3.01 | 3.35 | 0.88 | 4.23 |
151
Intermediate-Term Tax-Exempt Fund
Financial Statements
Statement of Net Assets
As of October 31, 2018
The fund reports a complete list of its holdings in regulatory filings four times in each fiscal year, at the quarter-ends. For the second and fourth fiscal quarters, the lists appear in the fund’s semiannual and annual reports to shareholders. For the first and third fiscal quarters, the fund files the lists with the Securities and Exchange Commission on Form N-Q. Shareholders can look up the fund’s Forms N-Q on the SEC’s website at sec.gov.
| | | | |
| Face | Market |
| Maturity | Amount | Value• |
| Coupon | Date | ($000) | ($000) |
| Tax-Exempt Municipal Bonds (99.1%) | | | | |
| Alabama (1.3%) | | | | |
| Alabama 21st Century Authority Tobacco Settlement Revenue | 5.000% | 6/1/20 | 1,000 | 1,040 |
| Alabama 21st Century Authority Tobacco Settlement Revenue | 5.000% | 6/1/21 | 1,500 | 1,591 |
| Alabama Economic Settlement Authority BP Settlement Revenue | 4.000% | 9/15/33 | 7,500 | 7,535 |
| Alabama Federal Aid Highway Finance Authority Special Obligation Revenue | 5.000% | 9/1/29 | 3,080 | 3,562 |
| Alabama Federal Aid Highway Finance Authority Special Obligation Revenue | 5.000% | 9/1/30 | 7,950 | 8,866 |
| Alabama Federal Aid Highway Finance Authority Special Obligation Revenue | 4.000% | 6/1/37 | 10,030 | 10,262 |
| Alabama Incentives Financing Authority Special Obligation Revenue | 5.000% | 9/1/24 | 2,520 | 2,576 |
| Alabama Incentives Financing Authority Special Obligation Revenue | 5.000% | 9/1/24 | 3,695 | 3,777 |
| Alabama Incentives Financing Authority Special Obligation Revenue | 5.000% | 9/1/30 | 6,905 | 7,388 |
| Alabama Incentives Financing Authority Special Obligation Revenue | 5.000% | 9/1/31 | 7,245 | 7,749 |
| Alabama Incentives Financing Authority Special Obligation Revenue | 5.000% | 9/1/32 | 7,000 | 7,479 |
| Alabama Public School & College Authority Capital Improvement Revenue | 5.000% | 5/1/19 | 1,820 | 1,848 |
| Alabama Public School & College Authority Capital Improvement Revenue | 5.000% | 5/1/21 | 4,895 | 5,228 |
| Auburn University Alabama General Fee Revenue | 5.000% | 6/1/31 | 3,000 | 3,234 |
| Baldwin County AL Board of Education Revenue | 5.000% | 6/1/26 | 1,520 | 1,709 |
| Baldwin County AL Board of Education Revenue | 5.000% | 6/1/27 | 1,750 | 1,961 |
| Baldwin County AL Board of Education Revenue | 5.000% | 6/1/28 | 2,750 | 3,073 |
| Baldwin County AL Board of Education Revenue | 5.000% | 6/1/29 | 3,000 | 3,345 |
| Baldwin County AL Board of Education Revenue | 5.000% | 6/1/30 | 6,335 | 7,053 |
| Baldwin County AL Board of Education Revenue | 5.000% | 6/1/32 | 2,005 | 2,221 |
| Birmingham AL GO | 5.000% | 3/1/32 | 5,000 | 5,420 |
| Birmingham AL Special Care Facilities Financing Authority Revenue | | | | |
| (Children’s Hospital of Alabama) | 5.000% | 6/1/29 | 2,195 | 2,428 |
| Birmingham AL Water Works Board Water Revenue | 5.000% | 1/1/26 | 1,755 | 2,014 |
| Birmingham AL Water Works Board Water Revenue | 5.000% | 1/1/27 | 3,945 | 4,559 |
| 1 Birmingham AL Water Works Board Water Revenue | 5.000% | 1/1/27 | 1,100 | 1,271 |
| 1 Birmingham AL Water Works Board Water Revenue | 5.000% | 1/1/28 | 1,200 | 1,394 |
| Birmingham AL Water Works Board Water Revenue | 5.000% | 1/1/33 | 4,000 | 4,468 |
| Birmingham AL Water Works Board Water Revenue | 5.000% | 1/1/35 | 5,000 | 5,570 |
| Birmingham-Jefferson AL Civic Center Authority Special Tax Revenue | 5.000% | 7/1/32 | 1,150 | 1,293 |
| Birmingham-Jefferson AL Civic Center Authority Special Tax Revenue | 5.000% | 7/1/33 | 1,500 | 1,680 |
| Birmingham-Jefferson AL Civic Center Authority Special Tax Revenue | 5.000% | 7/1/34 | 1,575 | 1,759 |
| Birmingham-Jefferson AL Civic Center Authority Special Tax Revenue | 5.000% | 7/1/35 | 2,155 | 2,397 |
| 2 Black Belt Energy Gas District Alabama Gas Prepay Revenue (Project No. 3) PUT | 2.412% | 12/1/23 | 16,500 | 16,500 |
| Black Belt Energy Gas District Alabama Gas Prepay Revenue (Project No. 3) PUT | 4.000% | 12/1/23 | 35,715 | 37,180 |
| Black Belt Energy Gas District Alabama Gas Supply Revenue PUT | 4.000% | 6/1/21 | 86,640 | 89,450 |
| Hoover AL GO | 4.000% | 7/1/30 | 2,440 | 2,570 |
| Huntsville AL Electric System Revenue | 5.000% | 12/1/26 | 300 | 350 |
| Huntsville AL Electric System Revenue | 5.000% | 12/1/26 | 500 | 583 |
| Huntsville AL Electric System Revenue | 5.000% | 12/1/27 | 275 | 321 |
| Huntsville AL Electric System Revenue | 5.000% | 12/1/27 | 400 | 467 |
| Huntsville AL Electric System Revenue | 5.000% | 12/1/28 | 395 | 458 |
| Huntsville AL Electric System Revenue | 5.000% | 12/1/28 | 500 | 580 |
| Huntsville AL Electric System Revenue | 5.000% | 12/1/29 | 1,000 | 1,153 |
| Huntsville AL Electric System Revenue | 5.000% | 12/1/29 | 500 | 576 |
| Huntsville AL Electric System Revenue | 5.000% | 12/1/31 | 350 | 400 |
| Huntsville AL Electric System Revenue | 5.000% | 12/1/32 | 1,000 | 1,140 |
| Huntsville AL Electric System Revenue | 5.000% | 12/1/33 | 1,000 | 1,136 |
| Huntsville AL Electric System Revenue | 5.000% | 12/1/34 | 1,880 | 2,129 |
| Huntsville AL Electric System Revenue | 5.000% | 12/1/35 | 2,000 | 2,257 |
| Huntsville AL Electric System Revenue | 5.000% | 12/1/36 | 2,025 | 2,277 |
| Huntsville AL Electric System Revenue | 5.000% | 12/1/37 | 1,500 | 1,683 |
| Huntsville AL Electric System Revenue | 5.000% | 12/1/38 | 1,200 | 1,343 |
| Huntsville AL GO | 5.000% | 5/1/21 (Prere.) | 2,050 | 2,189 |
| Huntsville AL GO | 5.000% | 5/1/21 (Prere.) | 2,375 | 2,536 |
| Huntsville AL GO | 5.000% | 9/1/21 (Prere.) | 2,245 | 2,415 |
| Huntsville AL GO | 5.000% | 5/1/24 | 2,410 | 2,727 |
152
Intermediate-Term Tax-Exempt Fund
| | | | |
| Face | Market |
| Maturity | Amount | Value• |
| Coupon | Date | ($000) | ($000) |
| Huntsville AL GO | 5.000% | 5/1/25 | 2,535 | 2,908 |
| Huntsville AL GO | 5.000% | 3/1/26 | 295 | 316 |
| Huntsville AL GO | 5.000% | 5/1/26 | 2,660 | 3,086 |
| Huntsville AL GO | 5.000% | 5/1/33 | 575 | 611 |
| Huntsville AL GO | 5.000% | 5/1/34 | 3,515 | 4,000 |
| Huntsville AL GO | 5.000% | 5/1/35 | 3,690 | 4,184 |
| Huntsville AL GO | 5.000% | 5/1/35 | 3,000 | 3,402 |
| Huntsville AL GO | 5.000% | 5/1/36 | 3,875 | 4,378 |
| Huntsville AL GO | 5.000% | 5/1/36 | 4,330 | 4,892 |
| Huntsville AL GO | 5.000% | 5/1/37 | 4,070 | 4,588 |
| Huntsville AL GO | 5.000% | 5/1/37 | 3,050 | 3,438 |
| Huntsville AL GO | 5.000% | 5/1/38 | 2,210 | 2,484 |
| Huntsville AL Water System Revenue | 5.000% | 11/1/25 | 1,500 | 1,716 |
| Huntsville AL Water System Revenue | 5.000% | 11/1/27 | 1,580 | 1,789 |
| Huntsville AL Water System Revenue | 5.000% | 11/1/28 | 1,525 | 1,719 |
| Infirmary Health System Special Care Facilities Financing Authority Mobile Alabama Revenue | | | | |
| (Infirmary Health System Inc.) | 5.250% | 2/1/19 | 2,415 | 2,433 |
| Infirmary Health System Special Care Facilities Financing Authority Mobile Alabama Revenue | | | | |
| (Infirmary Health System Inc.) | 5.250% | 2/1/20 | 2,845 | 2,943 |
| Infirmary Health System Special Care Facilities Financing Authority Mobile Alabama Revenue | | | | |
| (Infirmary Health System Inc.) | 5.250% | 2/3/20 (Prere.) | 3,630 | 3,768 |
| Infirmary Health System Special Care Facilities Financing Authority Mobile Alabama Revenue | | | | |
| (Infirmary Health System Inc.) | 5.250% | 2/3/20 (Prere.) | 5,450 | 5,658 |
| Jefferson County AL GO | 5.000% | 4/1/26 | 3,430 | 3,890 |
| Jefferson County AL Revenue | 5.000% | 9/15/25 | 3,680 | 4,148 |
| Jefferson County AL Revenue | 5.000% | 9/15/27 | 5,265 | 5,981 |
| Jefferson County AL Revenue | 5.000% | 9/15/28 | 2,500 | 2,822 |
| Jefferson County AL Revenue | 5.000% | 9/15/29 | 5,285 | 5,929 |
| Jefferson County AL Revenue | 5.000% | 9/15/30 | 7,405 | 8,267 |
| Jefferson County AL Revenue | 5.000% | 9/15/32 | 5,000 | 5,536 |
| Jefferson County AL Revenue | 5.000% | 9/15/33 | 6,700 | 7,393 |
| Jefferson County AL Revenue | 5.000% | 9/15/34 | 3,305 | 3,637 |
| Jefferson County AL Revenue | 4.000% | 9/15/36 | 5,105 | 5,105 |
| Jefferson County AL Revenue | 4.000% | 9/15/37 | 5,000 | 4,987 |
| Jefferson County AL Sewer Revenue | 5.000% | 10/1/22 | 1,730 | 1,848 |
| Jefferson County AL Sewer Revenue | 5.000% | 10/1/23 | 7,000 | 7,555 |
| Jefferson County AL Sewer Revenue | 0.000% | 10/1/26 (4) | 1,000 | 741 |
| Jefferson County AL Sewer Revenue | 0.000% | 10/1/27 (4) | 1,410 | 979 |
| Jefferson County AL Sewer Revenue | 0.000% | 10/1/28 (4) | 1,500 | 973 |
| Mobile County AL Board of School Commissioners GO | 3.000% | 3/1/19 | 550 | 551 |
| Mobile County AL Board of School Commissioners GO | 5.000% | 3/1/29 | 3,575 | 3,929 |
| Mobile County AL Board of School Commissioners GO | 5.000% | 3/1/30 | 2,500 | 2,735 |
| Mobile County AL Board of School Commissioners GO | 5.000% | 3/1/31 | 3,000 | 3,260 |
| Southeast Alabama Gas Supply District Revenue PUT | 4.000% | 4/1/24 | 250,000 | 260,495 |
| Southeast Alabama Gas Supply District Revenue PUT | 4.000% | 6/1/24 | 41,510 | 43,280 |
| Tuscaloosa AL City Board of Education School Tax Warrants Revenue | 5.000% | 8/1/30 | 1,500 | 1,689 |
| Tuscaloosa AL City Board of Education School Tax Warrants Revenue | 5.000% | 8/1/34 | 1,000 | 1,112 |
| Tuscaloosa AL City Board of Education School Tax Warrants Revenue | 5.000% | 8/1/35 | 1,500 | 1,663 |
| Tuscaloosa AL City Board of Education School Tax Warrants Revenue | 5.000% | 8/1/36 | 2,000 | 2,211 |
| University of Alabama General Revenue | 5.000% | 7/1/21 | 10,530 | 11,289 |
| University of South Alabama University Facilities Revenue | 5.000% | 11/1/24 (4) | 1,635 | 1,843 |
| University of South Alabama University Facilities Revenue | 5.000% | 11/1/25 (4) | 1,700 | 1,935 |
| University of South Alabama University Facilities Revenue | 5.000% | 11/1/27 (4) | 2,035 | 2,324 |
| University of South Alabama University Facilities Revenue | 5.000% | 11/1/28 (4) | 2,170 | 2,465 |
| University of South Alabama University Facilities Revenue | 5.000% | 11/1/29 (4) | 1,110 | 1,253 |
| University of South Alabama University Facilities Revenue | 5.000% | 11/1/33 (4) | 5,110 | 5,682 |
| | | | 773,990 |
| Alaska (0.1%) | | | | |
| Alaska GO | 5.000% | 8/1/24 | 5,000 | 5,503 |
| Alaska Housing Finance Corp. Revenue | 5.000% | 6/1/22 (Prere.) | 4,505 | 4,926 |
| Alaska Housing Finance Corp. Revenue | 5.000% | 6/1/22 (Prere.) | 1,690 | 1,848 |
| Alaska Housing Finance Corp. Revenue | 5.000% | 6/1/22 (Prere.) | 2,600 | 2,843 |
| Alaska Housing Finance Corp. Revenue | 5.000% | 12/1/25 | 475 | 512 |
| Alaska Housing Finance Corp. Revenue | 5.000% | 12/1/26 | 825 | 889 |
| Alaska Housing Finance Corp. Revenue | 5.000% | 12/1/29 | 310 | 333 |
| Alaska Municipal Bond Bank Authority Revenue | 5.000% | 2/1/32 | 4,855 | 5,223 |
| Anchorage AK Electric Utility Revenue | 5.000% | 12/1/26 | 2,350 | 2,629 |
| Anchorage AK Electric Utility Revenue | 5.000% | 12/1/34 | 4,500 | 4,960 |
| Anchorage AK Wastewater Revenue | 5.000% | 5/1/30 | 1,555 | 1,772 |
153
Intermediate-Term Tax-Exempt Fund
| | | | |
| Face | Market |
| Maturity | Amount | Value• |
| Coupon | Date | ($000) | ($000) |
| Anchorage AK Wastewater Revenue | 5.000% | 5/1/31 | 2,000 | 2,269 |
| Anchorage AK Water Revenue | 5.000% | 5/1/30 | 2,020 | 2,301 |
| Anchorage AK Water Revenue | 5.000% | 5/1/31 | 1,500 | 1,702 |
| Anchorage AK Water Revenue | 5.000% | 5/1/34 | 4,000 | 4,494 |
| Anchorage AK Water Revenue | 5.000% | 5/1/35 | 4,000 | 4,472 |
| Anchorage AK Water Revenue | 5.000% | 5/1/36 | 3,470 | 3,866 |
| Matanuska-Susitna Borough AK Lease Revenue (Goose Creek Correctional Center) GO | 5.000% | 9/1/31 | 15,000 | 16,654 |
| Matanuska-Susitna Borough AK Lease Revenue (Goose Creek Correctional Center) GO | 5.000% | 9/1/32 | 5,000 | 5,538 |
| Northern Alaska Tobacco Securitization Corp. Revenue | 4.625% | 6/1/23 | 1,995 | 1,995 |
| | | | 74,729 |
| Arizona (2.0%) | | | | |
| Arizona Board of Regents Arizona State University System Revenue | 5.000% | 6/1/19 (Prere.) | 2,545 | 2,590 |
| Arizona Board of Regents Arizona State University System Revenue | 5.000% | 7/1/22 (Prere.) | 715 | 783 |
| Arizona Board of Regents Arizona State University System Revenue | 5.000% | 7/1/22 (Prere.) | 800 | 876 |
| Arizona Board of Regents Arizona State University System Revenue | 5.000% | 7/1/26 | 755 | 877 |
| Arizona Board of Regents Arizona State University System Revenue | 5.000% | 7/1/27 | 315 | 343 |
| Arizona Board of Regents Arizona State University System Revenue | 5.000% | 7/1/27 | 900 | 1,055 |
| Arizona Board of Regents Arizona State University System Revenue | 5.000% | 7/1/28 | 285 | 310 |
| Arizona Board of Regents Arizona State University System Revenue | 5.000% | 7/1/28 | 785 | 914 |
| Arizona Board of Regents Arizona State University System Revenue | 5.000% | 7/1/28 | 1,860 | 2,113 |
| Arizona Board of Regents Arizona State University System Revenue | 5.000% | 7/1/28 | 3,510 | 3,988 |
| Arizona Board of Regents Arizona State University System Revenue | 5.000% | 6/1/30 | 2,065 | 2,334 |
| Arizona Board of Regents Arizona State University System Revenue | 5.000% | 7/1/30 | 710 | 795 |
| Arizona Board of Regents Arizona State University System Revenue | 5.000% | 6/1/31 | 1,000 | 1,078 |
| Arizona Board of Regents Arizona State University System Revenue | 5.000% | 7/1/31 | 725 | 819 |
| Arizona Board of Regents Arizona State University System Revenue | 5.000% | 6/1/32 | 1,100 | 1,237 |
| Arizona Board of Regents Arizona State University System Revenue | 5.000% | 6/1/32 | 1,290 | 1,389 |
| Arizona Board of Regents Arizona State University System Revenue | 5.000% | 7/1/32 | 875 | 985 |
| Arizona Board of Regents Arizona State University System Revenue | 5.000% | 7/1/32 | 750 | 837 |
| Arizona Board of Regents Arizona State University System Revenue | 5.000% | 7/1/33 | 700 | 785 |
| Arizona Board of Regents Arizona State University System Revenue | 5.000% | 7/1/33 | 750 | 835 |
| Arizona Board of Regents Arizona State University System Revenue | 5.000% | 7/1/34 | 1,000 | 1,118 |
| Arizona Board of Regents Arizona State University System Revenue | 5.000% | 7/1/34 | 750 | 833 |
| Arizona Board of Regents Arizona State University System Revenue | 5.000% | 7/1/34 | 1,250 | 1,412 |
| Arizona Board of Regents Arizona State University System Revenue | 5.000% | 7/1/35 | 600 | 669 |
| Arizona Board of Regents Arizona State University System Revenue | 5.000% | 7/1/35 | 750 | 831 |
| Arizona Board of Regents Arizona State University System Revenue | 5.000% | 7/1/35 | 1,280 | 1,440 |
| Arizona Board of Regents Arizona State University System Revenue | 5.000% | 7/1/36 | 1,250 | 1,400 |
| Arizona Board of Regents Arizona State University System Revenue | 5.000% | 7/1/36 | 1,000 | 1,105 |
| Arizona Board of Regents Arizona State University System Revenue | 5.000% | 7/1/37 | 1,500 | 1,676 |
| Arizona COP | 5.000% | 10/1/19 | 3,335 | 3,425 |
| Arizona COP | 5.000% | 9/1/20 | 1,700 | 1,787 |
| Arizona Health Facilities Authority Hospital System Revenue (Phoenix Children’s Hospital) | 5.000% | 2/1/21 | 3,480 | 3,663 |
| Arizona Health Facilities Authority Hospital System Revenue (Phoenix Children’s Hospital) | 5.000% | 2/1/22 | 3,100 | 3,321 |
| Arizona Health Facilities Authority Hospital System Revenue (Phoenix Children’s Hospital) | 5.000% | 2/1/23 | 5,000 | 5,353 |
| Arizona Health Facilities Authority Hospital System Revenue (Phoenix Children’s Hospital) | 5.000% | 2/1/27 | 6,500 | 6,936 |
| 2 Arizona Health Facilities Authority Revenue (Phoenix Children’s Hospital) PUT | 3.450% | 2/5/20 | 12,500 | 12,625 |
| Arizona Health Facilities Authority Revenue (Scottsdale Lincoln Hospitals Project) | 5.000% | 12/1/23 | 1,000 | 1,110 |
| Arizona Health Facilities Authority Revenue (Scottsdale Lincoln Hospitals Project) | 5.000% | 12/1/25 | 3,810 | 4,260 |
| Arizona Industrial Development Authority Revenue (Eastern Michigan University Parking Project) | 5.000% | 5/1/31 | 685 | 759 |
| Arizona Industrial Development Authority Revenue (Eastern Michigan University Parking Project) | 5.000% | 5/1/35 | 1,820 | 1,982 |
| Arizona Lottery Revenue | 5.000% | 7/1/22 (4) | 18,000 | 18,571 |
| Arizona Lottery Revenue | 5.000% | 7/1/24 (4) | 15,000 | 15,464 |
| Arizona Lottery Revenue | 5.000% | 7/1/25 (4) | 15,000 | 15,459 |
| Arizona Lottery Revenue | 5.000% | 7/1/26 (4) | 13,975 | 14,394 |
| Arizona School Facilities Board COP | 5.000% | 9/1/21 | 5,130 | 5,516 |
| Arizona State University Revenue (McAllister Academic Village LLC) | 5.000% | 7/1/24 | 1,605 | 1,813 |
| Arizona State University Revenue (McAllister Academic Village LLC) | 5.000% | 7/1/34 | 2,900 | 3,233 |
| Arizona State University Revenue (McAllister Academic Village LLC) | 5.000% | 7/1/35 | 2,000 | 2,224 |
| Arizona State University Revenue (McAllister Academic Village LLC) | 5.000% | 7/1/36 | 2,520 | 2,794 |
| Arizona Transportation Board Excise Tax Revenue | 5.000% | 7/1/21 | 6,730 | 7,217 |
| Arizona Transportation Board Excise Tax Revenue | 5.000% | 7/1/22 | 10,060 | 11,020 |
| Arizona Transportation Board Excise Tax Revenue | 5.000% | 7/1/23 | 12,015 | 13,408 |
| Arizona Transportation Board Excise Tax Revenue | 5.000% | 7/1/24 | 27,590 | 31,273 |
| Arizona Transportation Board Excise Tax Revenue (Maricopa County Regional Area) | 5.000% | 7/1/20 (Prere.) | 9,940 | 10,410 |
| Arizona Transportation Board Highway Revenue | 5.000% | 7/1/22 | 8,500 | 9,311 |
| Arizona Transportation Board Highway Revenue | 5.000% | 7/1/22 (Prere.) | 7,580 | 8,301 |
| Arizona Transportation Board Highway Revenue | 5.000% | 7/1/23 | 4,225 | 4,619 |
| Arizona Transportation Board Highway Revenue | 5.000% | 7/1/24 | 6,390 | 7,261 |
154
Intermediate-Term Tax-Exempt Fund
| | | | |
| Face | Market |
| Maturity | Amount | Value• |
| Coupon | Date | ($000) | ($000) |
| Arizona Transportation Board Highway Revenue | 5.000% | 7/1/25 | 6,000 | 6,787 |
| Arizona Transportation Board Highway Revenue | 5.000% | 7/1/30 | 4,300 | 4,894 |
| Arizona Transportation Board Highway Revenue | 5.000% | 7/1/32 | 14,000 | 15,802 |
| Arizona Transportation Board Highway Revenue | 5.000% | 7/1/33 | 5,000 | 5,625 |
| Arizona Water Infrastructure Finance Authority Revenue | 5.000% | 10/1/20 (ETM) | 2,155 | 2,271 |
| Arizona Water Infrastructure Finance Authority Revenue | 5.000% | 10/1/20 | 1,345 | 1,418 |
| Arizona Water Infrastructure Finance Authority Revenue | 5.000% | 10/1/21 (ETM) | 1,450 | 1,565 |
| Arizona Water Infrastructure Finance Authority Revenue | 5.000% | 10/1/21 | 2,085 | 2,249 |
| Arizona Water Infrastructure Finance Authority Revenue | 5.000% | 10/1/22 (ETM) | 1,490 | 1,642 |
| Arizona Water Infrastructure Finance Authority Revenue | 5.000% | 10/1/22 | 2,355 | 2,594 |
| Arizona Water Infrastructure Finance Authority Revenue | 5.000% | 10/1/22 | 6,000 | 6,610 |
| Chandler AZ GO | 4.000% | 7/1/22 | 3,390 | 3,601 |
| Chandler AZ GO | 5.000% | 7/1/23 | 3,400 | 3,794 |
| Chandler AZ GO | 5.000% | 7/1/24 | 4,250 | 4,822 |
| Gilbert AZ GO | 5.000% | 7/1/20 | 14,000 | 14,660 |
| Gilbert AZ GO | 5.000% | 7/1/21 | 6,655 | 7,145 |
| Gilbert AZ Waterworks & Sewer System Revenue | 5.000% | 7/1/27 | 2,555 | 2,967 |
| Glendale AZ Excise Tax Revenue | 5.000% | 7/1/27 | 3,495 | 4,051 |
| Glendale AZ Excise Tax Revenue | 5.000% | 7/1/29 | 2,500 | 2,854 |
| Glendale AZ Industrial Development Authority Revenue (Midwestern University) | 5.000% | 5/15/19 | 2,000 | 2,031 |
| Glendale AZ Industrial Development Authority Revenue (Midwestern University) | 5.000% | 5/15/20 | 1,500 | 1,563 |
| Glendale AZ Industrial Development Authority Revenue (Midwestern University) | 5.000% | 5/15/21 | 1,500 | 1,561 |
| Glendale AZ Industrial Development Authority Revenue (Midwestern University) | 5.000% | 5/15/22 | 3,500 | 3,640 |
| Glendale AZ Industrial Development Authority Revenue (Midwestern University) | 5.000% | 5/15/23 | 3,805 | 3,957 |
| Glendale AZ Industrial Development Authority Revenue (Midwestern University) | 5.000% | 5/15/25 | 3,750 | 3,900 |
| Glendale AZ Industrial Development Authority Revenue (Midwestern University) | 5.000% | 5/15/26 | 2,890 | 3,004 |
| Glendale AZ Industrial Development Authority Revenue (Midwestern University) | 5.000% | 5/15/27 | 5,000 | 5,196 |
| Glendale AZ Industrial Development Authority Revenue (Midwestern University) | 5.000% | 5/15/30 | 14,000 | 14,528 |
| Glendale AZ Senior Excise Tax Revenue | 5.000% | 7/1/20 | 2,770 | 2,894 |
| Glendale AZ Senior Excise Tax Revenue | 5.000% | 7/1/21 | 2,990 | 3,198 |
| Glendale AZ Senior Excise Tax Revenue | 5.000% | 7/1/22 | 3,140 | 3,428 |
| Glendale AZ Senior Excise Tax Revenue | 5.000% | 7/1/30 | 8,745 | 9,800 |
| Glendale AZ Senior Excise Tax Revenue | 5.000% | 7/1/31 | 6,415 | 7,164 |
| Goodyear AZ Public Improvement Corp. Municipal Facilities Revenue | 5.000% | 7/1/19 | 1,455 | 1,484 |
| Goodyear AZ Public Improvement Corp. Municipal Facilities Revenue | 5.000% | 7/1/20 | 1,695 | 1,774 |
| Goodyear AZ Public Improvement Corp. Municipal Facilities Revenue | 4.000% | 7/1/30 | 1,775 | 1,835 |
| Goodyear AZ Public Improvement Corp. Municipal Facilities Revenue | 4.000% | 7/1/31 | 1,500 | 1,545 |
| Goodyear AZ Public Improvement Corp. Municipal Facilities Revenue | 4.000% | 7/1/31 | 1,400 | 1,442 |
| La Paz County AZ Industrial Development Authority (Harmony Public Schools Project) Revenue | 5.000% | 2/15/28 | 350 | 381 |
| La Paz County AZ Industrial Development Authority (Harmony Public Schools Project) Revenue | 5.000% | 2/15/38 | 600 | 626 |
| Maricopa County AZ Industrial Development Authority Health Facilities Revenue | | | | |
| (Banner Health Obligated Group) | 5.000% | 1/1/27 | 8,050 | 9,283 |
| Maricopa County AZ Industrial Development Authority Health Facilities Revenue | | | | |
| (Banner Health Obligated Group) | 5.000% | 1/1/28 | 15,205 | 17,638 |
| Maricopa County AZ Industrial Development Authority Health Facilities Revenue | | | | |
| (Banner Health Obligated Group) | 4.000% | 1/1/32 | 12,020 | 12,349 |
| Maricopa County AZ Industrial Development Authority Health Facilities Revenue | | | | |
| (Banner Health Obligated Group) | 5.000% | 1/1/32 | 9,045 | 10,103 |
| Maricopa County AZ Industrial Development Authority Health Facilities Revenue | | | | |
| (Banner Health Obligated Group) | 5.000% | 1/1/34 | 7,455 | 8,254 |
| Maricopa County AZ Regional Public Transportation Authority Excise Tax Revenue | 5.000% | 7/1/19 (Prere.) | 6,220 | 6,347 |
| Maricopa County AZ School District No. 28 (Kyrene Elementary) GO | 4.000% | 7/1/20 | 1,355 | 1,397 |
| Maricopa County AZ School District No. 28 (Kyrene Elementary) GO | 5.250% | 7/1/23 (Prere.) | 690 | 779 |
| Maricopa County AZ School District No. 28 (Kyrene Elementary) GO | 5.500% | 7/1/23 (Prere.) | 480 | 547 |
| Maricopa County AZ School District No. 28 (Kyrene Elementary) GO | 5.500% | 7/1/23 (Prere.) | 375 | 427 |
| Maricopa County AZ Unified School District GO | 5.000% | 7/1/22 | 8,450 | 9,250 |
| Maricopa County AZ Unified School District No. 48 (Scottsdale) GO | 4.000% | 7/1/29 | 1,600 | 1,712 |
| Maricopa County AZ Unified School District No. 48 (Scottsdale) GO | 4.000% | 7/1/30 | 1,425 | 1,506 |
| Maricopa County AZ Unified School District No. 48 (Scottsdale) GO | 4.000% | 7/1/31 | 2,000 | 2,105 |
| Mesa AZ Utility System Revenue | 5.000% | 7/1/19 (14) | 10,000 | 10,199 |
| Mesa AZ Utility System Revenue | 5.000% | 7/1/21 (14) | 11,900 | 12,744 |
| Mesa AZ Utility System Revenue | 4.000% | 7/1/32 | 6,700 | 6,969 |
| Phoenix AZ Civic Improvement Corp. Airport Revenue | 5.000% | 7/1/20 (Prere.) | 9,555 | 9,999 |
| Phoenix AZ Civic Improvement Corp. Airport Revenue | 5.000% | 7/1/20 (Prere.) | 13,330 | 13,950 |
| Phoenix AZ Civic Improvement Corp. Airport Revenue | 5.000% | 7/1/27 | 2,480 | 2,868 |
| Phoenix AZ Civic Improvement Corp. Airport Revenue | 5.000% | 7/1/30 | 3,895 | 4,444 |
| Phoenix AZ Civic Improvement Corp. Airport Revenue | 5.000% | 7/1/31 | 12,475 | 14,132 |
| Phoenix AZ Civic Improvement Corp. Airport Revenue | 5.000% | 7/1/32 | 1,525 | 1,728 |
| Phoenix AZ Civic Improvement Corp. Airport Revenue | 5.000% | 7/1/33 | 4,500 | 5,079 |
| Phoenix AZ Civic Improvement Corp. Airport Revenue | 5.000% | 7/1/34 | 2,000 | 2,250 |
155
Intermediate-Term Tax-Exempt Fund
| | | | |
| Face | Market |
| Maturity | Amount | Value• |
| Coupon | Date | ($000) | ($000) |
| Phoenix AZ Civic Improvement Corp. Airport Revenue | 5.000% | 7/1/35 | 2,000 | 2,242 |
| Phoenix AZ Civic Improvement Corp. Airport Revenue | 5.000% | 7/1/35 | 24,500 | 27,361 |
| Phoenix AZ Civic Improvement Corp. Airport Revenue | 5.000% | 7/1/36 | 4,190 | 4,679 |
| Phoenix AZ Civic Improvement Corp. Airport Revenue | 5.000% | 7/1/36 | 19,000 | 21,143 |
| Phoenix AZ Civic Improvement Corp. Airport Revenue | 5.000% | 7/1/37 | 20,065 | 22,233 |
| Phoenix AZ Civic Improvement Corp. Airport Revenue | 5.000% | 7/1/37 | 3,085 | 3,431 |
| Phoenix AZ Civic Improvement Corp. Airport Revenue | 5.000% | 7/1/38 | 4,000 | 4,442 |
| Phoenix AZ Civic Improvement Corp. Excise Tax Revenue | 5.000% | 7/1/22 | 6,250 | 6,846 |
| Phoenix AZ Civic Improvement Corp. Excise Tax Revenue | 5.000% | 7/1/22 | 11,000 | 12,050 |
| Phoenix AZ Civic Improvement Corp. Excise Tax Revenue | 4.000% | 7/1/28 | 6,440 | 6,959 |
| Phoenix AZ Civic Improvement Corp. Excise Tax Revenue | 4.000% | 7/1/28 | 2,730 | 2,950 |
| Phoenix AZ Civic Improvement Corp. Wastewater System Revenue | 5.000% | 7/1/26 | 1,750 | 2,031 |
| Phoenix AZ Civic Improvement Corp. Wastewater System Revenue | 5.000% | 7/1/27 | 2,035 | 2,384 |
| Phoenix AZ Civic Improvement Corp. Wastewater System Revenue | 5.000% | 7/1/34 | 5,000 | 5,593 |
| Phoenix AZ Civic Improvement Corp. Water System Revenue | 5.000% | 7/1/20 | 3,010 | 3,152 |
| Phoenix AZ Civic Improvement Corp. Water System Revenue | 5.000% | 7/1/22 | 11,010 | 12,061 |
| Phoenix AZ Civic Improvement Corp. Water System Revenue | 5.000% | 7/1/23 | 7,000 | 7,811 |
| Phoenix AZ Civic Improvement Corp. Water System Revenue | 5.000% | 7/1/24 | 7,835 | 8,890 |
| Phoenix AZ Civic Improvement Corp. Water System Revenue | 5.000% | 7/1/25 | 9,040 | 10,206 |
| Phoenix AZ Civic Improvement Corp. Water System Revenue | 5.000% | 7/1/26 | 7,000 | 7,895 |
| Phoenix AZ Civic Improvement Corp. Water System Revenue | 5.000% | 7/1/27 | 2,565 | 2,884 |
| Phoenix AZ Civic Improvement Corp. Water System Revenue | 5.000% | 7/1/31 | 9,440 | 10,703 |
| Phoenix AZ Civic Improvement Corp. Water System Revenue | 5.000% | 7/1/32 | 12,820 | 14,488 |
| Phoenix AZ Civic Improvement Corp. Water System Revenue | 5.000% | 7/1/33 | 11,340 | 12,775 |
| Phoenix AZ Civic Improvement Corp. Water System Revenue | 5.000% | 7/1/34 | 12,815 | 14,399 |
| Phoenix AZ Civic Improvement Corp. Water System Revenue | 5.000% | 7/1/35 | 10,000 | 11,200 |
| Phoenix AZ Civic Improvement Corp. Water System Revenue | 5.000% | 7/1/36 | 8,750 | 9,769 |
| Phoenix AZ Civic Improvement Corp. Water System Revenue | 5.000% | 7/1/37 | 8,700 | 9,694 |
| Phoenix AZ Industrial Development Authority Lease Revenue | | | | |
| (Downtown Phoenix Student Housing LLC) | 5.000% | 7/1/26 | 250 | 277 |
| Phoenix AZ Industrial Development Authority Lease Revenue | | | | |
| (Downtown Phoenix Student Housing LLC) | 5.000% | 7/1/29 | 700 | 775 |
| Phoenix AZ Industrial Development Authority Lease Revenue | | | | |
| (Downtown Phoenix Student Housing LLC) | 5.000% | 7/1/31 | 700 | 767 |
| Phoenix AZ Industrial Development Authority Lease Revenue | | | | |
| (Downtown Phoenix Student Housing LLC) | 5.000% | 7/1/33 | 300 | 326 |
| Pima County AZ GO | 4.000% | 7/1/21 | 6,000 | 6,271 |
| Pima County AZ Industrial Development Authority Revenue (Tucson Electric Power Co. Project) | 4.000% | 9/1/29 | 12,000 | 12,375 |
| Pima County AZ Regional Transportation Authority Excise Tax Revenue | 5.000% | 6/1/22 | 3,000 | 3,279 |
| Pima County AZ Regional Transportation Authority Excise Tax Revenue | 5.000% | 6/1/23 | 3,530 | 3,929 |
| Pima County AZ Regional Transportation Authority Excise Tax Revenue | 5.000% | 6/1/26 | 3,590 | 3,965 |
| Pima County AZ Sewer Revenue | 5.000% | 7/1/20 | 4,000 | 4,187 |
| Pima County AZ Sewer Revenue | 5.000% | 7/1/21 | 4,400 | 4,706 |
| Pima County AZ Sewer Revenue | 5.000% | 7/1/24 | 5,800 | 6,564 |
| Pima County AZ Sewer Revenue | 5.000% | 7/1/25 | 5,010 | 5,744 |
| Regional Public Transportation Authority Arizona Excise Tax Revenue | | | | |
| (Maricopa County Public Transportation) | 5.250% | 7/1/22 | 2,010 | 2,219 |
| Regional Public Transportation Authority Arizona Excise Tax Revenue | | | | |
| (Maricopa County Public Transportation) | 5.250% | 7/1/23 | 1,000 | 1,127 |
| Regional Public Transportation Authority Arizona Excise Tax Revenue | | | | |
| (Maricopa County Public Transportation) | 5.250% | 7/1/25 | 1,000 | 1,139 |
| Salt River Project Arizona Agricultural Improvement & Power District Revenue | 5.000% | 1/1/26 | 10,600 | 12,268 |
| Salt River Project Arizona Agricultural Improvement & Power District Revenue | 5.000% | 1/1/28 | 5,000 | 5,810 |
| Salt River Project Arizona Agricultural Improvement & Power District Revenue | 5.000% | 1/1/28 | 11,585 | 13,632 |
| Salt River Project Arizona Agricultural Improvement & Power District Revenue | 5.000% | 1/1/29 | 3,060 | 3,536 |
| Salt River Project Arizona Agricultural Improvement & Power District Revenue | 5.000% | 1/1/30 | 18,410 | 21,469 |
| Salt River Project Arizona Agricultural Improvement & Power District Revenue | 5.000% | 1/1/31 | 8,565 | 9,943 |
| Salt River Project Arizona Agricultural Improvement & Power District Revenue | 5.000% | 1/1/32 | 6,600 | 7,622 |
| Salt River Project Arizona Agricultural Improvement & Power District Revenue | 5.000% | 1/1/34 | 5,030 | 5,699 |
| Salt River Project Arizona Agricultural Improvement & Power District Revenue | 5.000% | 12/1/34 | 23,970 | 26,828 |
| Salt River Project Arizona Agricultural Improvement & Power District Revenue | 5.000% | 12/1/35 | 10,000 | 11,161 |
| Salt River Project Arizona Agricultural Improvement & Power District Revenue | 5.000% | 1/1/36 | 14,000 | 15,754 |
| Salt Verde AZ Financial Corp. Gas Revenue | 5.250% | 12/1/19 | 25 | 26 |
| Salt Verde AZ Financial Corp. Gas Revenue | 5.250% | 12/1/21 | 4,045 | 4,357 |
| Salt Verde AZ Financial Corp. Gas Revenue | 5.250% | 12/1/22 | 4,335 | 4,740 |
| Salt Verde AZ Financial Corp. Gas Revenue | 5.250% | 12/1/23 | 8,440 | 9,350 |
| Salt Verde AZ Financial Corp. Gas Revenue | 5.250% | 12/1/24 | 4,510 | 5,062 |
| Salt Verde AZ Financial Corp. Gas Revenue | 5.250% | 12/1/25 | 19,125 | 21,565 |
| Salt Verde AZ Financial Corp. Gas Revenue | 5.250% | 12/1/26 | 2,790 | 3,173 |
| Salt Verde AZ Financial Corp. Gas Revenue | 5.250% | 12/1/28 | 270 | 310 |
156
Intermediate-Term Tax-Exempt Fund
| | | | |
| Face | Market |
| Maturity | Amount | Value• |
| Coupon | Date | ($000) | ($000) |
| Scottsdale AZ GO | 5.000% | 7/1/22 | 3,000 | 3,292 |
| Scottsdale AZ GO | 4.000% | 7/1/24 | 3,040 | 3,289 |
| Scottsdale AZ Municipal Property Corp. Excise Tax Revenue | 5.000% | 7/1/22 | 12,415 | 13,600 |
| Tempe AZ GO | 4.000% | 7/1/25 | 5,745 | 6,263 |
| Tucson AZ GO | 5.000% | 7/1/19 (Prere.) | 1,000 | 1,020 |
| Tucson AZ GO | 5.000% | 7/1/19 (Prere.) | 1,000 | 1,020 |
| Tucson AZ Water System Revenue | 5.000% | 7/1/23 | 3,500 | 3,904 |
| Tucson AZ Water System Revenue | 5.000% | 7/1/28 | 1,740 | 2,027 |
| Tucson AZ Water System Revenue | 5.000% | 7/1/29 | 1,750 | 2,020 |
| University Medical Center Corp. Arizona Hospital Revenue | 6.250% | 7/1/19 (Prere.) | 1,500 | 1,541 |
| Yuma AZ Industrial Development Authority Hospital Revenue (Yuma Regional Medical Center) | 5.000% | 8/1/24 | 1,200 | 1,333 |
| Yuma AZ Industrial Development Authority Hospital Revenue (Yuma Regional Medical Center) | 5.000% | 8/1/25 | 1,250 | 1,385 |
| Yuma AZ Industrial Development Authority Hospital Revenue (Yuma Regional Medical Center) | 5.000% | 8/1/32 | 1,010 | 1,107 |
| Yuma AZ Industrial Development Authority Hospital Revenue (Yuma Regional Medical Center) | 5.250% | 8/1/32 | 1,500 | 1,665 |
| | | | 1,142,989 |
| Arkansas (0.3%) | | | | |
| Arkansas Development Finance Authority Healthcare Revenue (Baptist Health) PUT | 3.750% | 9/1/25 | 49,000 | 49,378 |
| Arkansas Development Finance Authority Hospital Revenue | | | | |
| (Washington Regional Medical Center) | 5.000% | 2/1/22 | 380 | 408 |
| Arkansas Federal Highway Grant Anticipation & Tax Revenue GO | 5.000% | 10/1/24 | 10,105 | 11,498 |
| Pulaski County AR Hospital Revenue (Arkansas Children’s Hospital) | 5.000% | 3/1/31 | 2,390 | 2,660 |
| Pulaski County AR Hospital Revenue (Arkansas Children’s Hospital) | 5.000% | 3/1/32 | 3,000 | 3,325 |
| Pulaski County AR Hospital Revenue (Arkansas Children’s Hospital) | 5.000% | 3/1/33 | 3,305 | 3,651 |
| Pulaski County AR Hospital Revenue (Arkansas Children’s Hospital) | 5.000% | 3/1/34 | 2,815 | 3,102 |
| Rogers AR Sales & Use Tax Revenue | 2.125% | 11/1/29 | 1,045 | 1,044 |
| Springdale AR Sales and Use Revenue | 5.000% | 4/1/26 (15) | 2,620 | 2,923 |
| Springdale AR Sales and Use Revenue | 5.000% | 4/1/27 (15) | 1,500 | 1,665 |
| Springdale AR Sales and Use Revenue | 5.000% | 4/1/28 (15) | 1,025 | 1,134 |
| Springdale AR Sales and Use Revenue | 4.000% | 4/1/30 (15) | 2,670 | 2,747 |
| Springdale AR Sales and Use Revenue | 4.000% | 4/1/31 (15) | 2,860 | 2,933 |
| Springdale AR Sales and Use Revenue | 5.000% | 4/1/37 (15) | 18,550 | 20,025 |
| Springdale AR School District No. 50 GO | 4.000% | 6/1/26 | 4,505 | 4,741 |
| Springdale AR School District No. 50 GO | 4.000% | 6/1/27 | 3,500 | 3,671 |
| Springdale AR School District No. 50 GO | 4.000% | 6/1/32 | 4,500 | 4,652 |
| Springdale AR School District No. 50 GO | 4.000% | 6/1/33 | 5,500 | 5,676 |
| University of Arkansas Revenue | 4.000% | 11/1/18 | 600 | 600 |
| University of Arkansas Revenue | 5.000% | 11/1/19 | 600 | 618 |
| University of Arkansas Revenue | 5.000% | 11/1/20 | 855 | 902 |
| University of Arkansas Revenue | 5.000% | 11/1/25 | 525 | 602 |
| University of Arkansas Revenue | 5.000% | 11/1/26 | 600 | 695 |
| University of Arkansas Revenue | 5.000% | 11/1/29 | 710 | 811 |
| University of Arkansas Revenue | 5.000% | 11/1/31 | 800 | 907 |
| University of Arkansas Revenue | 5.000% | 11/1/33 | 1,000 | 1,127 |
| University of Arkansas Revenue | 5.000% | 11/1/34 | 1,000 | 1,124 |
| University of Arkansas Revenue | 5.000% | 11/1/36 | 1,200 | 1,338 |
| University of Arkansas Revenue (Fayetteville Campus) | 5.000% | 11/1/22 | 2,000 | 2,198 |
| University of Arkansas Revenue (Fayetteville Campus) | 5.000% | 11/1/23 | 1,280 | 1,429 |
| University of Arkansas Revenue (Fayetteville Campus) | 5.000% | 11/1/25 | 2,020 | 2,273 |
| University of Arkansas Revenue (Fayetteville Campus) | 5.000% | 11/1/25 | 1,815 | 1,952 |
| University of Arkansas Revenue (Fayetteville Campus) | 5.000% | 11/1/26 | 2,205 | 2,477 |
| University of Arkansas Revenue (Fayetteville Campus) | 5.000% | 11/1/26 | 1,075 | 1,156 |
| University of Arkansas Revenue (Fayetteville Campus) | 5.000% | 11/1/27 | 1,695 | 1,822 |
| University of Arkansas Revenue (Fayetteville Campus) | 5.000% | 11/1/28 | 3,210 | 3,594 |
| University of Arkansas Revenue (Fayetteville Campus) | 5.000% | 11/1/29 | 3,355 | 3,747 |
| University of Arkansas Revenue (Fayetteville Campus) | 5.000% | 11/1/30 | 2,555 | 2,845 |
| University of Arkansas Revenue (UAMS Campus) | 5.000% | 11/1/27 | 1,000 | 1,113 |
| University of Arkansas Revenue (UAMS Campus) | 5.000% | 11/1/28 | 3,000 | 3,335 |
| University of Arkansas Revenue (UAMS Campus) | 5.000% | 11/1/29 | 1,970 | 2,187 |
| University of Arkansas Revenue (UAMS Campus) | 5.000% | 11/1/30 | 2,000 | 2,218 |
| | | | 166,303 |
| California (10.6%) | | | | |
| ABAG Finance Authority for Nonprofit Corps. California Revenue (Jackson Laboratory) | 5.000% | 7/1/27 | 1,375 | 1,484 |
| ABAG Finance Authority for Nonprofit Corps. California Revenue (Jackson Laboratory) | 5.000% | 7/1/29 | 2,795 | 3,013 |
| ABAG Finance Authority for Nonprofit Corps. California Revenue | | | | |
| (Windemere Ranch Infrastructure Financing Program) | 5.000% | 9/2/21 | 160 | 172 |
| ABAG Finance Authority for Nonprofit Corps. California Revenue | | | | |
| (Windemere Ranch Infrastructure Financing Program) | 5.000% | 9/2/22 | 1,450 | 1,586 |
| ABAG Finance Authority for Nonprofit Corps. California Revenue | | | | |
| (Windemere Ranch Infrastructure Financing Program) | 5.000% | 9/2/26 (4) | 1,875 | 2,180 |
157
Intermediate-Term Tax-Exempt Fund
| | | | |
| Face | Market |
| Maturity | Amount | Value• |
| Coupon | Date | ($000) | ($000) |
| ABAG Finance Authority for Nonprofit Corps. California Revenue | | | | |
| (Windemere Ranch Infrastructure Financing Program) | 5.000% | 9/2/27 (4) | 2,325 | 2,719 |
| ABAG Finance Authority for Nonprofit Corps. California Revenue | | | | |
| (Windemere Ranch Infrastructure Financing Program) | 5.000% | 9/2/29 (4) | 955 | 1,097 |
| ABAG Finance Authority for Nonprofit Corps. California Revenue | | | | |
| (Windemere Ranch Infrastructure Financing Program) | 5.000% | 9/2/33 (4) | 750 | 845 |
| ABAG Finance Authority for Nonprofit Corps. California Revenue | | | | |
| (Windemere Ranch Infrastructure Financing Program) | 5.000% | 9/2/34 (4) | 450 | 505 |
| Alameda CA Corridor Transportation Authority Revenue | 5.000% | 10/1/34 | 6,500 | 7,066 |
| Alameda County CA Joint Powers Authority Lease Revenue | 5.250% | 12/1/27 | 3,000 | 3,404 |
| Alameda County CA Joint Powers Authority Lease Revenue | 5.000% | 12/1/30 | 12,395 | 13,852 |
| Anaheim CA Housing & Public Improvements Authority Revenue | | | | |
| (Electric Utility Distribution System) | 5.000% | 10/1/21 (Prere.) | 2,195 | 2,382 |
| Anaheim CA Housing & Public Improvements Authority Revenue | | | | |
| (Electric Utility Distribution System) | 5.000% | 10/1/27 | 4,015 | 4,444 |
| Anaheim CA Housing & Public Improvements Authority Revenue | | | | |
| (Electric Utility Distribution System) | 5.000% | 10/1/29 | 5,000 | 5,513 |
| Anaheim CA Housing & Public Improvements Authority Revenue | | | | |
| (Electric Utility Distribution System) | 5.000% | 10/1/30 | 9,000 | 9,903 |
| Anaheim CA Housing & Public Improvements Authority Revenue | | | | |
| (Electric Utility Distribution System) | 5.000% | 10/1/33 | 5,000 | 5,473 |
| Anaheim CA Housing & Public Improvements Authority Revenue | | | | |
| (Electric Utility Distribution System) | 5.000% | 10/1/35 | 5,000 | 5,451 |
| Anaheim CA Public Financing Authority Revenue (Electric System) | 5.250% | 4/1/21 (Prere.) | 5,030 | 5,428 |
| Anaheim CA Public Financing Authority Revenue (Electric System) | 5.250% | 4/1/21 (Prere.) | 5,300 | 5,720 |
| Bay Area Toll Authority California Toll Bridge Revenue (San Francisco Bay Area) | 4.000% | 4/1/30 | 7,900 | 8,381 |
| Bay Area Toll Authority California Toll Bridge Revenue (San Francisco Bay Area) | 4.000% | 4/1/31 | 4,680 | 4,926 |
| Bay Area Toll Authority California Toll Bridge Revenue (San Francisco Bay Area) | 4.000% | 4/1/32 | 12,670 | 13,231 |
| Bay Area Toll Authority California Toll Bridge Revenue (San Francisco Bay Area) | 4.000% | 4/1/33 | 11,840 | 12,321 |
| Bay Area Toll Authority California Toll Bridge Revenue (San Francisco Bay Area) | 4.000% | 4/1/34 | 25,295 | 26,191 |
| Bay Area Toll Authority California Toll Bridge Revenue (San Francisco Bay Area) | 4.000% | 4/1/35 | 39,965 | 41,233 |
| Bay Area Toll Authority California Toll Bridge Revenue (San Francisco Bay Area) | 4.000% | 4/1/37 | 26,415 | 27,041 |
| Bay Area Toll Authority California Toll Bridge Revenue (San Francisco Bay Area) | 4.000% | 4/1/38 | 20,000 | 20,343 |
| Bay Area Toll Authority California Toll Bridge Revenue (San Francisco Bay Area) PUT | 1.875% | 4/1/20 | 38,860 | 38,749 |
| 2 Bay Area Toll Authority California Toll Bridge Revenue (San Francisco Bay Area) PUT | 2.200% | 4/1/20 | 18,625 | 18,703 |
| Bay Area Toll Authority California Toll Bridge Revenue (San Francisco Bay Area) PUT | 2.000% | 4/1/21 | 15,375 | 15,278 |
| 2 Bay Area Toll Authority California Toll Bridge Revenue (San Francisco Bay Area) PUT | 2.300% | 4/1/21 | 14,500 | 14,649 |
| Bay Area Toll Authority California Toll Bridge Revenue (San Francisco Bay Area) PUT | 2.100% | 4/1/22 | 7,200 | 7,146 |
| 2 Bay Area Toll Authority California Toll Bridge Revenue (San Francisco Bay Area) PUT | 2.500% | 5/1/23 | 13,500 | 13,792 |
| Bay Area Toll Authority California Toll Bridge Revenue (San Francisco Bay Area) PUT | 2.125% | 4/1/25 | 55,000 | 52,896 |
| Bay Area Toll Authority California Toll Bridge Revenue (San Francisco Bay Area) PUT | 2.850% | 4/1/25 | 18,750 | 18,995 |
| Bay Area Toll Authority California Toll Bridge Revenue (San Francisco Bay Area) PUT | 2.950% | 4/1/26 | 24,000 | 24,330 |
| Beverly Hills CA Unified School District GO | 0.000% | 8/1/28 | 5,000 | 3,680 |
| Beverly Hills CA Unified School District GO | 0.000% | 8/1/29 | 7,950 | 5,598 |
| California Department of Water Resources Power Supply Revenue | 5.000% | 5/1/20 | 45,065 | 47,159 |
| California Department of Water Resources Power Supply Revenue | 5.000% | 5/1/20 (Prere.) | 12,410 | 12,987 |
| California Department of Water Resources Power Supply Revenue | 5.000% | 5/1/20 (Prere.) | 6,200 | 6,488 |
| California Department of Water Resources Power Supply Revenue | 5.000% | 5/1/20 | 20,000 | 20,929 |
| California Department of Water Resources Water System Revenue (Central Valley Project) | 5.000% | 12/1/23 (ETM) | 80 | 91 |
| California Department of Water Resources Water System Revenue (Central Valley Project) | 5.000% | 12/1/24 (ETM) | 35 | 40 |
| California Department of Water Resources Water System Revenue (Central Valley Project) | 5.000% | 12/1/24 (Prere.) | 55 | 63 |
| California Department of Water Resources Water System Revenue (Central Valley Project) | 5.000% | 12/1/24 (Prere.) | 10 | 12 |
| California Department of Water Resources Water System Revenue (Central Valley Project) | 5.000% | 12/1/29 | 2,490 | 2,862 |
| California Economic Recovery GO | 5.000% | 7/1/19 (Prere.) | 20,000 | 20,441 |
| California Economic Recovery GO | 5.250% | 7/1/19 (Prere.) | 18,220 | 18,652 |
| California Economic Recovery GO | 5.250% | 7/1/19 (Prere.) | 31,780 | 32,534 |
| California Educational Facilities Authority Revenue (Loyola Marymount University) | 0.000% | 10/1/37 (14) | 6,340 | 2,851 |
| California Educational Facilities Authority Revenue (University of the Pacific) | 5.000% | 11/1/29 | 3,000 | 3,415 |
| California Educational Facilities Authority Revenue (University of the Pacific) | 5.000% | 11/1/32 | 1,595 | 1,792 |
| California Educational Facilities Authority Revenue (University of the Pacific) | 5.000% | 11/1/33 | 1,500 | 1,678 |
| California GO | 5.000% | 12/1/18 | 85 | 85 |
| California GO | 6.500% | 4/1/19 (Prere.) | 29,515 | 30,109 |
| California GO | 5.000% | 4/1/20 | 18,000 | 18,234 |
| California GO | 5.000% | 10/1/20 | 3,000 | 3,171 |
| California GO | 5.000% | 11/1/20 | 68,080 | 72,114 |
| California GO | 5.000% | 3/1/22 | 26,540 | 28,958 |
| California GO | 5.000% | 8/1/22 | 19,000 | 20,910 |
| California GO | 5.000% | 8/1/22 | 4,880 | 5,371 |
| California GO | 5.000% | 9/1/22 | 4,900 | 5,401 |
| California GO | 5.000% | 9/1/22 | 5,620 | 6,195 |
158
Intermediate-Term Tax-Exempt Fund
| | | | |
| Face | Market |
| Maturity | Amount | Value• |
| Coupon | Date | ($000) | ($000) |
| California GO | 5.000% | 9/1/22 | 17,000 | 18,739 |
| California GO | 5.250% | 10/1/22 | 15,000 | 15,465 |
| California GO | 5.000% | 12/1/22 | 11,000 | 12,186 |
| California GO | 5.000% | 9/1/23 | 9,770 | 10,955 |
| California GO | 5.000% | 11/1/23 | 9,700 | 10,905 |
| California GO | 5.000% | 12/1/23 | 34,000 | 38,290 |
| California GO | 5.000% | 3/1/24 | 30,065 | 33,985 |
| California GO | 5.000% | 5/1/24 | 35,000 | 39,680 |
| California GO | 5.000% | 10/1/24 | 10,500 | 11,972 |
| California GO | 5.000% | 10/1/24 | 38,000 | 43,326 |
| California GO | 5.000% | 3/1/25 | 15,065 | 17,266 |
| California GO | 5.000% | 10/1/25 | 34,000 | 39,249 |
| California GO | 5.000% | 10/1/25 | 20,000 | 22,227 |
| California GO | 5.000% | 11/1/25 | 33,000 | 37,905 |
| California GO | 5.000% | 10/1/26 | 31,195 | 34,613 |
| California GO | 3.500% | 8/1/27 | 21,000 | 22,150 |
| California GO | 5.000% | 10/1/27 | 11,250 | 12,448 |
| California GO | 5.250% | 10/1/27 | 26,440 | 28,727 |
| California GO | 5.000% | 11/1/27 | 17,380 | 19,453 |
| California GO | 5.000% | 2/1/28 | 12,500 | 13,783 |
| California GO | 5.000% | 11/1/28 | 9,175 | 10,242 |
| California GO | 5.000% | 11/1/28 | 7,770 | 9,081 |
| California GO | 5.000% | 12/1/28 | 3,575 | 3,997 |
| California GO | 5.750% | 4/1/29 | 2,395 | 2,432 |
| California GO | 5.000% | 9/1/29 | 5,600 | 6,439 |
| California GO | 5.250% | 9/1/29 | 10,460 | 11,730 |
| California GO | 5.000% | 10/1/29 | 10,000 | 11,308 |
| California GO | 5.000% | 10/1/29 | 27,000 | 27,747 |
| California GO | 5.250% | 3/1/30 | 29,500 | 30,724 |
| California GO | 5.000% | 5/1/30 | 30,000 | 33,568 |
| California GO | 4.000% | 8/1/30 | 12,400 | 13,032 |
| California GO | 5.000% | 8/1/30 | 15,000 | 17,138 |
| California GO | 5.000% | 9/1/30 | 4,500 | 4,840 |
| California GO | 5.250% | 9/1/30 | 25,480 | 28,464 |
| California GO | 5.750% | 4/1/31 | 79,190 | 80,419 |
| California GO | 4.000% | 8/1/31 | 27,000 | 28,263 |
| California GO | 4.000% | 9/1/31 | 7,660 | 8,022 |
| California GO | 5.000% | 10/1/31 | 24,000 | 26,970 |
| California GO | 5.000% | 11/1/31 | 17,395 | 20,032 |
| California GO | 5.000% | 2/1/32 | 50,640 | 55,282 |
| California GO | 4.000% | 8/1/32 | 8,000 | 8,341 |
| California GO | 4.000% | 9/1/32 | 5,000 | 5,215 |
| California GO | 5.000% | 9/1/32 | 6,500 | 7,386 |
| California GO | 5.000% | 10/1/32 | 11,000 | 12,329 |
| California GO | 5.000% | 2/1/33 | 60,000 | 65,399 |
| California GO | 6.500% | 4/1/33 | 24,985 | 25,445 |
| California GO | 4.000% | 8/1/33 | 26,000 | 27,000 |
| California GO | 5.000% | 8/1/33 | 14,000 | 15,839 |
| California GO | 4.000% | 9/1/33 | 26,050 | 27,061 |
| California GO | 5.000% | 10/1/33 | 6,000 | 6,708 |
| California GO | 4.000% | 8/1/34 | 4,980 | 5,154 |
| California GO | 5.000% | 9/1/34 | 1,655 | 1,870 |
| California GO | 5.000% | 10/1/34 | 10,000 | 11,151 |
| California GO | 4.000% | 9/1/35 | 10,000 | 10,312 |
| California GO | 4.000% | 9/1/35 | 7,900 | 8,146 |
| California GO PUT | 3.000% | 12/1/19 | 6,000 | 6,034 |
| California GO PUT | 4.000% | 12/1/21 | 13,300 | 13,850 |
| California Health Facilities Financing Authority Revenue (Catholic Healthcare West) | 5.250% | 3/1/27 | 19,000 | 20,237 |
| California Health Facilities Financing Authority Revenue (Catholic Healthcare West) | 5.250% | 3/1/28 | 9,180 | 9,782 |
| California Health Facilities Financing Authority Revenue (Children’s Hospital of Los Angeles) | 5.000% | 11/15/25 | 5,000 | 5,431 |
| California Health Facilities Financing Authority Revenue (Children’s Hospital of Los Angeles) | 5.000% | 11/15/26 | 5,000 | 5,415 |
| California Health Facilities Financing Authority Revenue (Children’s Hospital of Los Angeles) | 5.000% | 11/15/27 | 3,845 | 4,150 |
| California Health Facilities Financing Authority Revenue (City of Hope Medical Center) | 5.000% | 11/15/26 | 2,475 | 2,725 |
| California Health Facilities Financing Authority Revenue (Kaiser Permanente) | 5.000% | 11/1/27 | 34,320 | 40,981 |
| California Health Facilities Financing Authority Revenue (Kaiser Permanente) | 4.000% | 11/1/38 | 42,940 | 43,361 |
| California Health Facilities Financing Authority Revenue (Kaiser Permanente) PUT | 5.000% | 11/1/22 | 5,095 | 5,638 |
| California Health Facilities Financing Authority Revenue | | | | |
| (Providence St. Joseph Health Obligated Group) PUT | 4.000% | 10/1/24 | 41,525 | 44,905 |
| California Health Facilities Financing Authority Revenue (St. Joseph Health System) | 5.250% | 7/1/21 | 25,980 | 26,559 |
| California Health Facilities Financing Authority Revenue (St. Joseph Health System) | 5.500% | 7/1/29 | 15,000 | 15,374 |
159
Intermediate-Term Tax-Exempt Fund
| | | | |
| Face | Market |
| Maturity | Amount | Value• |
| Coupon | Date | ($000) | ($000) |
| California Health Facilities Financing Authority Revenue (St. Joseph Health System) PUT | 5.000% | 10/15/20 | 12,500 | 13,178 |
| California Health Facilities Financing Authority Revenue (St. Joseph Health System) PUT | 5.000% | 10/18/22 | 1,510 | 1,670 |
| California Health Facilities Financing Authority Revenue (Stanford Health Care Obligated Group) | 5.000% | 11/15/33 | 5,000 | 5,782 |
| California Health Facilities Financing Authority Revenue (Sutter Health) | 5.500% | 8/15/20 (Prere.) | 4,500 | 4,786 |
| California Health Facilities Financing Authority Revenue (Sutter Health) | 5.875% | 8/15/20 (Prere.) | 10,000 | 10,702 |
| California Health Facilities Financing Authority Revenue (Sutter Health) | 5.000% | 11/15/29 | 1,750 | 2,043 |
| California Health Facilities Financing Authority Revenue (Sutter Health) | 5.000% | 11/15/30 | 2,750 | 3,190 |
| California Health Facilities Financing Authority Revenue (Sutter Health) | 5.000% | 11/15/31 | 2,025 | 2,337 |
| California Health Facilities Financing Authority Revenue (Sutter Health) | 5.000% | 11/15/32 | 2,280 | 2,621 |
| California Health Facilities Financing Authority Revenue (Sutter Health) | 5.000% | 11/15/33 | 2,250 | 2,573 |
| California Health Facilities Financing Authority Revenue (Sutter Health) | 5.000% | 11/15/33 | 4,000 | 4,575 |
| California Health Facilities Financing Authority Revenue (Sutter Health) | 5.000% | 11/15/34 | 3,400 | 3,871 |
| California Health Facilities Financing Authority Revenue (Sutter Health) | 5.000% | 11/15/37 | 2,000 | 2,244 |
| California Health Facilities Financing Authority Revenue (Sutter Health) | 5.000% | 11/15/38 | 5,645 | 6,301 |
| 2 California Infrastructure & Economic Development Bank Revenue (The Colburn School) PUT | 2.600% | 6/1/20 | 10,350 | 10,425 |
| California Municipal Finance Authority | | | | |
| (Community Hospitals of Central California Obligated Group) COP | 5.000% | 2/1/19 (Prere.) | 1,575 | 1,588 |
| California Municipal Finance Authority | | | | |
| (Community Hospitals of Central California Obligated Group) COP | 5.000% | 2/1/19 (Prere.) | 1,740 | 1,754 |
| California Municipal Finance Authority | | | | |
| (Community Hospitals of Central California Obligated Group) COP | 5.250% | 2/1/19 (Prere.) | 5,050 | 5,095 |
| California Municipal Finance Authority Revenue (Anaheim Electric Utility Distribution System) | 5.000% | 10/1/29 | 1,000 | 1,141 |
| California Municipal Finance Authority Revenue (Anaheim Electric Utility Distribution System) | 5.000% | 10/1/32 | 2,190 | 2,478 |
| California Municipal Finance Authority Revenue (Anaheim Electric Utility Distribution System) | 5.000% | 10/1/35 | 1,755 | 1,969 |
| California Municipal Finance Authority Revenue (University of La Verne) | 5.750% | 6/1/20 (Prere.) | 8,525 | 9,028 |
| California Municipal Finance Authority Revenue (University of La Verne) | 6.125% | 6/1/20 (Prere.) | 3,000 | 3,194 |
| California Pollution Control Financing Authority Revenue (Pacific Gas & Electric Co.) VRDO | 1.650% | 11/1/18 LOC | 29,300 | 29,300 |
| California Public Works Board Lease Revenue (Department of Corrections) | 5.000% | 6/1/27 | 7,420 | 8,059 |
| California Public Works Board Lease Revenue (Department of Corrections) | 5.250% | 10/1/27 | 1,325 | 1,512 |
| California Public Works Board Lease Revenue (Department of General Services) | 6.125% | 4/1/19 (Prere.) | 2,000 | 2,037 |
| California Public Works Board Lease Revenue (Department of General Services) | 6.125% | 4/1/19 (Prere.) | 5,000 | 5,093 |
| California Public Works Board Lease Revenue (Department of State Hospitals) | 5.000% | 6/1/27 | 5,000 | 5,522 |
| California Public Works Board Lease Revenue (Judicial Council Projects) | 5.000% | 10/1/23 | 750 | 842 |
| California Public Works Board Lease Revenue (Judicial Council Projects) | 5.000% | 10/1/24 | 900 | 1,026 |
| California Public Works Board Lease Revenue (Judicial Council Projects) | 5.000% | 12/1/24 | 10,000 | 10,870 |
| California Public Works Board Lease Revenue (Judicial Council Projects) | 5.250% | 12/1/25 | 7,000 | 7,654 |
| California Public Works Board Lease Revenue (Judicial Council Projects) | 5.250% | 12/1/26 | 5,000 | 5,463 |
| California Public Works Board Lease Revenue (Judicial Council Projects) | 5.000% | 3/1/27 | 3,145 | 3,459 |
| California Public Works Board Lease Revenue (Judicial Council Projects) | 5.000% | 12/1/27 | 13,000 | 14,094 |
| California Public Works Board Lease Revenue (Judicial Council Projects) | 5.000% | 12/1/28 | 8,000 | 8,666 |
| California Public Works Board Lease Revenue (Judicial Council Projects) | 5.000% | 3/1/29 | 4,250 | 4,650 |
| California Public Works Board Lease Revenue (Judicial Council Projects) | 5.000% | 12/1/29 | 10,705 | 11,580 |
| California Public Works Board Lease Revenue (Judicial Council Projects) | 5.000% | 3/1/30 | 3,930 | 4,295 |
| California Public Works Board Lease Revenue (Judicial Council Projects) | 5.000% | 3/1/31 | 5,000 | 5,456 |
| California Public Works Board Lease Revenue (Judicial Council Projects) | 5.000% | 3/1/33 | 3,350 | 3,644 |
| California Public Works Board Lease Revenue (Regents of The University of California) | 5.000% | 12/1/21 (Prere.) | 8,145 | 8,889 |
| California Public Works Board Lease Revenue (Various Capital Projects) | 6.250% | 11/1/19 (Prere.) | 13,665 | 14,276 |
| California Public Works Board Lease Revenue (Various Capital Projects) | 5.000% | 4/1/20 | 2,700 | 2,814 |
| California Public Works Board Lease Revenue (Various Capital Projects) | 5.000% | 5/1/20 | 8,975 | 9,376 |
| California Public Works Board Lease Revenue (Various Capital Projects) | 4.000% | 4/1/21 | 5,000 | 5,225 |
| California Public Works Board Lease Revenue (Various Capital Projects) | 5.000% | 5/1/21 | 5,000 | 5,352 |
| California Public Works Board Lease Revenue (Various Capital Projects) | 5.000% | 5/1/21 | 3,075 | 3,292 |
| California Public Works Board Lease Revenue (Various Capital Projects) | 5.000% | 12/1/21 (Prere.) | 10,000 | 10,914 |
| California Public Works Board Lease Revenue (Various Capital Projects) | 5.000% | 5/1/22 | 6,075 | 6,649 |
| California Public Works Board Lease Revenue (Various Capital Projects) | 5.000% | 5/1/23 | 3,065 | 3,419 |
| California Public Works Board Lease Revenue (Various Capital Projects) | 5.000% | 5/1/23 | 4,510 | 5,032 |
| California Public Works Board Lease Revenue (Various Capital Projects) | 5.000% | 4/1/27 | 3,085 | 3,340 |
| California Public Works Board Lease Revenue (Various Capital Projects) | 4.000% | 11/1/30 | 8,245 | 8,660 |
| California Public Works Board Lease Revenue (Various Capital Projects) | 5.500% | 11/1/30 | 2,495 | 2,815 |
| California Public Works Board Lease Revenue (Various Capital Projects) | 5.125% | 10/1/31 | 4,260 | 4,592 |
| California Public Works Board Lease Revenue (Various Capital Projects) | 4.000% | 11/1/31 | 20,000 | 20,891 |
| California Public Works Board Lease Revenue (Various Capital Projects) | 5.000% | 4/1/32 | 9,650 | 10,395 |
| California State University Systemwide Revenue | 5.000% | 5/1/19 (Prere.) | 14,775 | 15,023 |
| California State University Systemwide Revenue | 5.750% | 5/1/19 (Prere.) | 5,000 | 5,102 |
| California State University Systemwide Revenue | 5.000% | 11/1/28 | 3,550 | 4,127 |
| California State University Systemwide Revenue | 5.250% | 11/1/28 | 7,395 | 8,030 |
| California State University Systemwide Revenue | 5.250% | 11/1/29 | 7,790 | 8,447 |
| California State University Systemwide Revenue | 5.000% | 11/1/30 | 24,865 | 28,027 |
| California State University Systemwide Revenue | 5.000% | 11/1/30 | 3,350 | 3,838 |
| California State University Systemwide Revenue | 5.000% | 11/1/30 | 8,345 | 9,663 |
160
Intermediate-Term Tax-Exempt Fund
| | | | |
| Face | Market |
| Maturity | Amount | Value• |
| Coupon | Date | ($000) | ($000) |
| California State University Systemwide Revenue | 5.250% | 11/1/30 | 7,960 | 8,627 |
| California State University Systemwide Revenue | 5.000% | 11/1/31 | 21,630 | 24,316 |
| California State University Systemwide Revenue | 5.000% | 11/1/31 | 4,600 | 5,247 |
| California State University Systemwide Revenue | 5.000% | 11/1/31 | 5,720 | 6,591 |
| California State University Systemwide Revenue | 5.250% | 11/1/31 | 4,000 | 4,329 |
| California State University Systemwide Revenue | 5.000% | 11/1/32 | 10,000 | 11,219 |
| California State University Systemwide Revenue | 5.000% | 11/1/32 | 10,000 | 11,363 |
| California State University Systemwide Revenue | 5.000% | 11/1/32 | 2,500 | 2,871 |
| California State University Systemwide Revenue | 5.000% | 11/1/33 | 20,000 | 22,378 |
| California State University Systemwide Revenue | 5.000% | 11/1/33 | 8,000 | 9,147 |
| California State University Systemwide Revenue | 5.000% | 11/1/33 | 1,000 | 1,143 |
| California State University Systemwide Revenue | 5.000% | 11/1/34 | 24,190 | 26,996 |
| California State University Systemwide Revenue | 5.000% | 11/1/34 | 1,000 | 1,139 |
| California State University Systemwide Revenue | 5.000% | 11/1/34 | 10,270 | 11,701 |
| California State University Systemwide Revenue | 5.000% | 11/1/35 | 4,355 | 4,848 |
| California State University Systemwide Revenue | 5.000% | 11/1/35 | 12,825 | 14,551 |
| California State University Systemwide Revenue | 5.000% | 11/1/36 | 11,585 | 13,071 |
| California State University Systemwide Revenue PUT | 3.000% | 11/1/19 | 6,700 | 6,729 |
| * California Statewide Communities Development Authority Revenue | | | | |
| (Daughters of Charity Health System) | 5.750% | 7/1/24 | 3,160 | 2,687 |
| California Statewide Communities Development Authority Revenue | | | | |
| (Loma Linda University Medical Center) | 5.000% | 12/1/28 | 5,925 | 6,345 |
| California Statewide Communities Development Authority Revenue | | | | |
| (Loma Linda University Medical Center) | 5.000% | 12/1/29 | 2,000 | 2,128 |
| California Statewide Communities Development Authority Revenue | | | | |
| (Loma Linda University Medical Center) | 5.250% | 12/1/29 | 5,000 | 5,348 |
| California Statewide Communities Development Authority Revenue | | | | |
| (Loma Linda University Medical Center) | 5.000% | 12/1/30 | 3,500 | 3,703 |
| California Statewide Communities Development Authority Revenue | | | | |
| (Viamonte Senior Living Project) | 3.000% | 7/1/27 | 5,000 | 5,018 |
| California Statewide Communities Development Authority Student Housing Revenue | | | | |
| (CHF-Irvine LLC - UCI East Campus Apartments Phase II) | 5.000% | 5/15/25 | 1,000 | 1,124 |
| California Statewide Communities Development Authority Student Housing Revenue | | | | |
| (CHF-Irvine LLC - UCI East Campus Apartments Phase II) | 5.000% | 5/15/26 | 1,000 | 1,133 |
| California Statewide Communities Development Authority Student Housing Revenue | | | | |
| (CHF-Irvine LLC - UCI East Campus Apartments Phase II) | 5.000% | 5/15/27 | 1,000 | 1,126 |
| California Statewide Communities Development Authority Student Housing Revenue | | | | |
| (CHF-Irvine LLC - UCI East Campus Apartments Phase II) | 5.000% | 5/15/30 | 2,000 | 2,217 |
| Capistrano CA Unified School District Special Tax Revenue | 4.000% | 9/1/23 (15) | 6,435 | 6,535 |
| Cerritos CA Community College District GO | 0.000% | 8/1/28 | 1,000 | 728 |
| Cerritos CA Community College District GO | 0.000% | 8/1/30 | 1,850 | 1,221 |
| Cerritos CA Community College District GO | 0.000% | 8/1/31 | 1,000 | 630 |
| Chabot-Las Positas CA Community College District GO | 5.000% | 8/1/27 | 7,000 | 7,808 |
| Chabot-Las Positas CA Community College District GO | 5.000% | 8/1/30 | 15,000 | 16,619 |
| Chabot-Las Positas CA Community College District GO | 5.000% | 8/1/31 | 5,000 | 5,532 |
| Chabot-Las Positas CA Community College District GO | 5.000% | 8/1/32 | 17,000 | 18,786 |
| Chaffey CA Community College District GO | 5.000% | 6/1/29 | 1,250 | 1,415 |
| Chaffey CA Community College District GO | 5.000% | 6/1/30 | 2,000 | 2,261 |
| Chino CA Public Financing Authority Special Tax Revenue | 5.000% | 9/1/26 (4) | 800 | 904 |
| Chino CA Public Financing Authority Special Tax Revenue | 5.000% | 9/1/27 (4) | 2,340 | 2,630 |
| Chino CA Public Financing Authority Special Tax Revenue | 5.000% | 9/1/29 (4) | 1,300 | 1,446 |
| Chula Vista CA Municipal Financing Authority Special Tax Revenue | 5.000% | 9/1/23 | 1,080 | 1,193 |
| Chula Vista CA Municipal Financing Authority Special Tax Revenue | 5.000% | 9/1/24 | 1,130 | 1,265 |
| Chula Vista CA Municipal Financing Authority Special Tax Revenue | 5.000% | 9/1/25 | 1,145 | 1,291 |
| Chula Vista CA Municipal Financing Authority Special Tax Revenue | 5.000% | 9/1/26 | 1,255 | 1,397 |
| Chula Vista CA Municipal Financing Authority Special Tax Revenue | 5.000% | 9/1/27 | 1,320 | 1,454 |
| Chula Vista CA Municipal Financing Authority Special Tax Revenue | 5.000% | 9/1/28 | 1,380 | 1,512 |
| Chula Vista CA Municipal Financing Authority Special Tax Revenue | 5.000% | 9/1/29 | 1,445 | 1,575 |
| Chula Vista CA Municipal Financing Authority Special Tax Revenue | 5.000% | 9/1/30 | 1,400 | 1,519 |
| Chula Vista CA Municipal Financing Authority Special Tax Revenue | 5.000% | 9/1/31 | 1,600 | 1,729 |
| Clovis CA Unified School District GO | 0.000% | 8/1/25 (14) | 2,485 | 2,053 |
| Contra Costa CA Community College District GO | 5.000% | 8/1/29 | 2,000 | 2,226 |
| Contra Costa CA Community College District GO | 5.000% | 8/1/30 | 3,000 | 3,332 |
| Contra Costa CA Community College District GO | 5.000% | 8/1/34 | 4,000 | 4,424 |
| Corona-Norco CA Unified School District GO | 4.000% | 8/1/35 | 5,240 | 5,409 |
| Corona-Norco CA Unified School District GO | 4.000% | 8/1/36 | 5,550 | 5,702 |
| Cupertino CA Union School District GO | 5.000% | 8/1/35 | 1,000 | 1,088 |
| East Bay CA Municipal Utility District Water System Revenue | 5.000% | 6/1/30 | 6,890 | 8,079 |
| East Bay CA Municipal Utility District Water System Revenue | 5.000% | 6/1/31 | 10,900 | 12,709 |
| East Bay CA Municipal Utility District Water System Revenue | 5.000% | 6/1/33 | 7,320 | 8,456 |
161
Intermediate-Term Tax-Exempt Fund
| | | | | |
| Face | Market |
| Maturity | Amount | Value• |
| | Coupon | Date | ($000) | ($000) |
| East Side CA Union High School District Santa Clara County GO | 5.000% | 8/1/26 | 2,575 | 2,876 |
| East Side CA Union High School District Santa Clara County GO | 5.000% | 8/1/27 | 2,000 | 2,228 |
| East Side CA Union High School District Santa Clara County GO | 5.000% | 8/1/28 | 3,000 | 3,338 |
| East Side CA Union High School District Santa Clara County GO | 5.000% | 8/1/28 | 2,655 | 2,903 |
| Eastern California Municipal Water District Water & Sewer Revenue | 4.000% | 7/1/34 | 5,730 | 5,886 |
| Eastern California Municipal Water District Water & Wastewater Revenue | 4.000% | 7/1/35 | 8,125 | 8,319 |
| El Dorado CA Irrigation District Revenue | 5.000% | 3/1/22 (4) | 1,035 | 1,133 |
| El Dorado CA Irrigation District Revenue | 5.000% | 3/1/23 (4) | 1,750 | 1,912 |
| El Dorado CA Irrigation District Revenue | 5.000% | 3/1/25 (4) | 1,000 | 1,089 |
| El Dorado CA Irrigation District Revenue | 5.000% | 3/1/26 (4) | 2,485 | 2,697 |
| El Dorado CA Irrigation District Revenue | 5.000% | 3/1/27 (4) | 2,110 | 2,285 |
| El Dorado CA Irrigation District Revenue | 5.000% | 3/1/28 (4) | 2,000 | 2,160 |
| El Dorado CA Irrigation District Revenue | 5.000% | 3/1/34 (4) | 3,060 | 3,391 |
| El Monte CA High School District GO | 5.500% | 6/1/19 (Prere.) | 2,630 | 2,688 |
| El Monte CA High School District GO | 5.500% | 6/1/19 (Prere.) | 2,355 | 2,407 |
| El Segundo CA Unified School District GO | 0.000% | 8/1/28 | 2,705 | 1,962 |
| El Segundo CA Unified School District GO | 0.000% | 8/1/29 | 8,655 | 5,986 |
| El Segundo CA Unified School District GO | 0.000% | 8/1/30 | 9,160 | 6,031 |
| Elk Grove CA Finance Authority Special Tax Revenue | 5.000% | 9/1/23 | 775 | 863 |
| Elk Grove CA Finance Authority Special Tax Revenue | 5.000% | 9/1/24 | 1,000 | 1,131 |
| Elk Grove CA Finance Authority Special Tax Revenue | 5.000% | 9/1/25 | 750 | 859 |
| Elk Grove CA Finance Authority Special Tax Revenue | 5.000% | 9/1/26 | 1,155 | 1,313 |
| Elk Grove CA Finance Authority Special Tax Revenue | 5.000% | 9/1/30 (15) | 1,130 | 1,269 |
| Elk Grove CA Finance Authority Special Tax Revenue | 5.000% | 9/1/31 (15) | 1,750 | 1,958 |
| Elk Grove CA Finance Authority Special Tax Revenue | 5.000% | 9/1/32 (15) | 1,365 | 1,522 |
| Folsom Cordova CA Unified School District School Facilities Improvement District No. 3 GO | 0.000% | 10/1/23 (14) | 2,875 | 2,513 |
| Folsom Cordova CA Unified School District School Facilities Improvement District No. 3 GO | 0.000% | 10/1/24 (14) | 1,700 | 1,432 |
| Folsom Cordova CA Unified School District School Facilities Improvement District No. 3 GO | 0.000% | 10/1/25 (14) | 2,055 | 1,666 |
| Folsom Cordova CA Unified School District School Facilities Improvement District No. 3 GO | 0.000% | 10/1/26 (14) | 2,985 | 2,325 |
| Folsom Cordova CA Unified School District School Facilities Improvement District No. 3 GO | 0.000% | 10/1/28 (14) | 2,875 | 2,044 |
| 5 | Foothill/Eastern Transportation Corridor Agency California Toll Road Revenue | 0.000% | 1/15/28 | 20,090 | 17,576 |
| 18 | Foothill/Eastern Transportation Corridor Agency California Toll Road Revenue | 0.000% | 1/15/29 | 2,000 | 1,763 |
| Foothill/Eastern Transportation Corridor Agency California Toll Road Revenue | 6.250% | 1/15/33 | 2,000 | 2,291 |
| Foothill/Eastern Transportation Corridor Agency California Toll Road Revenue PUT | 5.500% | 1/15/23 | 40,500 | 44,740 |
| Gavilan CA Joint Community College District GO | 5.000% | 8/1/30 | 5,000 | 5,652 |
| Gavilan CA Joint Community College District GO | 5.000% | 8/1/31 | 6,000 | 6,755 |
| Gilroy CA Unified School District GO | 0.000% | 8/1/30 (ETM) | 255 | 178 |
| Gilroy CA Unified School District GO | 0.000% | 8/1/30 (12) | 5,245 | 3,425 |
| Gilroy CA Unified School District GO | 0.000% | 8/1/32 (12) | 3,400 | 2,016 |
| Golden State Tobacco Securitization Corp. California Revenue | 5.000% | 6/1/25 | 7,500 | 8,272 |
| Golden State Tobacco Securitization Corp. California Revenue | 0.000% | 6/1/26 (4) | 5,000 | 4,011 |
| Golden State Tobacco Securitization Corp. California Revenue | 0.000% | 6/1/27 (2) | 5,000 | 3,805 |
| Golden State Tobacco Securitization Corp. California Revenue | 0.000% | 6/1/28 (2) | 52,135 | 37,994 |
| Golden State Tobacco Securitization Corp. California Revenue | 5.000% | 6/1/33 | 17,000 | 18,739 |
| Golden State Tobacco Securitization Corp. California Revenue | 5.000% | 6/1/34 | 6,000 | 6,591 |
| Golden State Tobacco Securitization Corp. California Revenue | 3.500% | 6/1/36 | 15,000 | 14,699 |
| Hacienda La Puente CA Unified School District GO | 5.000% | 8/1/25 (4) | 7,075 | 8,277 |
| Hayward CA Unified School District GO | 5.000% | 8/1/28 (4) | 2,720 | 3,052 |
| Hayward CA Unified School District GO | 5.000% | 8/1/28 (4) | 3,795 | 4,259 |
| Hayward CA Unified School District GO | 5.000% | 8/1/29 (4) | 2,575 | 2,878 |
| Hayward CA Unified School District GO | 5.000% | 8/1/29 (4) | 4,315 | 4,823 |
| Huntington Beach CA City School District GO | 4.000% | 8/1/34 | 1,000 | 1,038 |
| Huntington Beach CA City School District GO | 4.000% | 8/1/36 | 1,000 | 1,029 |
| Huntington Beach CA City School District GO | 4.000% | 8/1/37 | 1,000 | 1,025 |
| Imperial CA Irrigation District Electric Revenue | 5.000% | 11/1/20 (Prere.) | 5,200 | 5,518 |
| Imperial CA Irrigation District Electric Revenue | 4.000% | 11/1/34 | 3,735 | 3,863 |
| Jurupa CA Public Financing Authority Special Tax Revenue | 5.000% | 9/1/28 | 1,025 | 1,134 |
| Jurupa CA Public Financing Authority Special Tax Revenue | 5.000% | 9/1/29 | 1,000 | 1,095 |
| Jurupa CA Public Financing Authority Special Tax Revenue | 5.000% | 9/1/31 | 1,190 | 1,292 |
| Kern CA Community College District GO | 0.000% | 11/1/26 (4) | 10,210 | 8,085 |
| La Mesa-Spring Valley CA School District GO | 0.000% | 8/1/23 (14) | 2,090 | 1,837 |
| La Mesa-Spring Valley CA School District GO | 0.000% | 8/1/25 (14) | 3,635 | 2,952 |
| La Mesa-Spring Valley CA School District GO | 0.000% | 8/1/27 (14) | 1,500 | 1,105 |
| La Mesa-Spring Valley CA School District GO | 0.000% | 8/1/28 (14) | 3,170 | 2,232 |
| La Quinta CA Redevelopment Agency Tax Allocation Revenue | 5.000% | 9/1/30 | 3,125 | 3,526 |
| Long Beach CA Finance Authority Natural Gas Purchase Revenue | 5.250% | 11/15/20 | 50 | 53 |
| Long Beach CA Finance Authority Natural Gas Purchase Revenue | 5.250% | 11/15/23 | 255 | 283 |
| Long Beach CA Finance Authority Natural Gas Purchase Revenue | 5.000% | 11/15/24 | 170 | 189 |
| Long Beach CA Finance Authority Natural Gas Purchase Revenue | 5.500% | 11/15/28 | 210 | 248 |
| Long Beach CA Finance Authority Tax Revenue | 5.500% | 11/1/18 (2) | 5,495 | 5,495 |
162
Intermediate-Term Tax-Exempt Fund
| | | | |
| Face | Market |
| Maturity | Amount | Value• |
| Coupon | Date | ($000) | ($000) |
| Long Beach CA Finance Authority Tax Revenue | 5.500% | 11/1/19 (2) | 3,970 | 4,111 |
| Long Beach CA Finance Authority Tax Revenue | 5.500% | 11/1/20 (2) | 3,250 | 3,468 |
| Long Beach CA Finance Authority Tax Revenue | 5.500% | 11/1/21 (2) | 7,645 | 8,382 |
| Long Beach CA Finance Authority Tax Revenue | 5.500% | 11/1/22 (2) | 3,535 | 3,970 |
| Long Beach CA Harbor Revenue | 5.000% | 12/15/20 | 15,000 | 15,878 |
| Long Beach CA Unified School District GO | 0.000% | 8/1/23 (12) | 1,995 | 1,761 |
| Long Beach CA Unified School District GO | 0.000% | 8/1/26 (12) | 1,475 | 1,159 |
| Los Angeles CA Community College District GO | 5.000% | 8/1/19 (Prere.) | 7,210 | 7,388 |
| Los Angeles CA Community College District GO | 5.250% | 8/1/19 (Prere.) | 4,145 | 4,255 |
| Los Angeles CA Community College District GO | 5.000% | 8/1/27 | 24,895 | 28,465 |
| Los Angeles CA Community College District GO | 5.000% | 8/1/28 | 3,000 | 3,416 |
| Los Angeles CA Community College District GO | 5.000% | 8/1/30 | 30,500 | 34,383 |
| Los Angeles CA Community College District GO | 4.000% | 8/1/32 | 21,000 | 21,908 |
| Los Angeles CA Community College District GO | 4.000% | 8/1/33 | 4,805 | 4,990 |
| Los Angeles CA Community College District GO | 4.000% | 8/1/33 | 20,000 | 20,769 |
| Los Angeles CA Community College District GO | 5.000% | 8/1/36 | 8,465 | 9,559 |
| Los Angeles CA Community College District GO | 4.000% | 8/1/37 | 28,000 | 28,520 |
| Los Angeles CA Department of Airports International Airport Revenue | 5.250% | 5/15/28 | 12,750 | 13,307 |
| Los Angeles CA Department of Airports International Airport Revenue | 5.250% | 5/15/29 | 5,000 | 5,218 |
| Los Angeles CA Department of Water & Power Revenue | 5.000% | 7/1/27 | 7,985 | 9,105 |
| Los Angeles CA Department of Water & Power Revenue | 5.000% | 7/1/31 | 22,715 | 25,210 |
| Los Angeles CA Department of Water & Power Revenue | 5.000% | 7/1/33 | 3,000 | 3,432 |
| Los Angeles CA Department of Water & Power Revenue | 5.000% | 7/1/33 | 11,185 | 12,382 |
| Los Angeles CA Department of Water & Power Revenue | 5.000% | 7/1/34 | 2,300 | 2,622 |
| Los Angeles CA Department of Water & Power Revenue | 5.000% | 7/1/35 | 23,055 | 26,192 |
| Los Angeles CA Department of Water & Power Revenue | 5.000% | 7/1/35 | 2,500 | 2,840 |
| Los Angeles CA Department of Water & Power Revenue | 5.000% | 7/1/36 | 16,270 | 18,409 |
| Los Angeles CA Department of Water & Power Revenue | 5.000% | 7/1/36 | 2,750 | 3,085 |
| Los Angeles CA Department of Water & Power Revenue | 5.000% | 7/1/37 | 11,140 | 12,579 |
| Los Angeles CA Department of Water & Power Revenue | 5.000% | 7/1/38 | 17,720 | 19,954 |
| Los Angeles CA Harbor Department Revenue | 5.000% | 8/1/22 | 1,000 | 1,108 |
| Los Angeles CA Harbor Department Revenue | 5.000% | 8/1/28 | 6,930 | 7,083 |
| Los Angeles CA Municipal Improvement Corp. Lease Revenue | 5.000% | 11/1/29 | 7,000 | 8,075 |
| Los Angeles CA Municipal Improvement Corp. Lease Revenue | 5.000% | 11/1/30 | 10,000 | 11,459 |
| Los Angeles CA Municipal Improvement Corp. Lease Revenue | 4.000% | 11/1/34 | 10,875 | 11,275 |
| Los Angeles CA Unified School District GO | 5.000% | 7/1/20 | 33,000 | 34,678 |
| Los Angeles CA Unified School District GO | 5.000% | 7/1/22 | 49,000 | 54,130 |
| Los Angeles CA Unified School District GO | 5.000% | 7/1/22 | 20,000 | 22,094 |
| Los Angeles CA Unified School District GO | 5.250% | 7/1/23 | 8,835 | 9,034 |
| Los Angeles CA Unified School District GO | 5.000% | 7/1/26 | 7,500 | 7,652 |
| Los Angeles CA Unified School District GO | 5.000% | 7/1/26 | 20,000 | 22,704 |
| Los Angeles CA Unified School District GO | 5.000% | 7/1/27 | 10,625 | 12,555 |
| Los Angeles CA Unified School District GO | 5.000% | 7/1/28 | 22,590 | 25,516 |
| Los Angeles CA Unified School District GO | 5.250% | 7/1/28 | 8,000 | 8,416 |
| Los Angeles CA Unified School District GO | 5.000% | 7/1/29 | 13,650 | 15,380 |
| Los Angeles CA Unified School District GO | 5.200% | 7/1/29 | 6,295 | 6,427 |
| Los Angeles CA Unified School District GO | 3.000% | 7/1/31 | 20,135 | 19,182 |
| Los Angeles CA Unified School District GO | 5.000% | 7/1/34 | 10,000 | 11,505 |
| Los Angeles CA Unified School District GO | 5.000% | 7/1/35 | 27,000 | 30,948 |
| Los Angeles CA Unified School District GO | 5.000% | 7/1/36 | 25,525 | 29,148 |
| Los Angeles CA Unified School District GO | 5.000% | 7/1/37 | 12,500 | 14,242 |
| Los Angeles CA Wastewater System Revenue | 5.000% | 6/1/19 (Prere.) | 6,520 | 6,643 |
| Los Angeles CA Wastewater System Revenue | 5.000% | 6/1/31 | 2,000 | 2,327 |
| Los Angeles CA Wastewater System Revenue | 5.000% | 6/1/31 | 5,000 | 5,817 |
| Los Angeles CA Wastewater System Revenue | 5.000% | 6/1/32 | 5,025 | 5,817 |
| Los Angeles CA Wastewater System Revenue | 5.000% | 6/1/33 | 2,500 | 2,884 |
| Los Angeles CA Wastewater System Revenue | 5.000% | 6/1/35 | 3,000 | 3,429 |
| Los Angeles CA Wastewater System Revenue | 5.000% | 6/1/35 | 2,000 | 2,286 |
| Los Angeles CA Wastewater System Revenue | 5.000% | 6/1/36 | 4,000 | 4,549 |
| Los Angeles County CA Metropolitan Transportation Authority Sales Tax Revenue | 5.000% | 6/1/27 | 2,750 | 3,247 |
| Los Angeles County CA Metropolitan Transportation Authority Sales Tax Revenue | 5.000% | 7/1/27 | 4,010 | 4,739 |
| Los Angeles County CA Metropolitan Transportation Authority Sales Tax Revenue | 5.000% | 6/1/28 | 8,625 | 10,125 |
| Los Angeles County CA Metropolitan Transportation Authority Sales Tax Revenue | 5.000% | 6/1/29 | 9,145 | 10,680 |
| Los Angeles County CA Metropolitan Transportation Authority Sales Tax Revenue | 5.000% | 7/1/31 | 16,000 | 18,597 |
| Los Angeles County CA Metropolitan Transportation Authority Sales Tax Revenue | 5.000% | 7/1/32 | 18,870 | 21,855 |
| Los Angeles County CA Metropolitan Transportation Authority Sales Tax Revenue | 5.000% | 6/1/33 | 5,210 | 5,938 |
| Los Angeles County CA Metropolitan Transportation Authority Sales Tax Revenue | 5.000% | 7/1/33 | 14,815 | 17,097 |
| Los Angeles County CA Metropolitan Transportation Authority Sales Tax Revenue | 5.000% | 7/1/34 | 12,500 | 14,364 |
| Los Angeles County CA Metropolitan Transportation Authority Sales Tax Revenue | 5.000% | 7/1/35 | 16,845 | 19,287 |
| Los Angeles County CA Metropolitan Transportation Authority Sales Tax Revenue | 5.000% | 7/1/36 | 16,000 | 18,254 |
163
Intermediate-Term Tax-Exempt Fund
| | | | | |
| Face | Market |
| Maturity | Amount | Value• |
| | Coupon | Date | ($000) | ($000) |
| Los Angeles County CA Metropolitan Transportation Authority Sales Tax Revenue | 5.000% | 7/1/37 | 20,500 | 23,338 |
| Los Angeles County CA Public Works Financing Authority Lease Revenue | 5.000% | 8/1/27 | 1,475 | 1,617 |
| Los Angeles County CA Public Works Financing Authority Lease Revenue | 5.000% | 8/1/28 | 2,000 | 2,188 |
| Los Angeles County CA Public Works Financing Authority Lease Revenue | 5.000% | 8/1/29 | 2,365 | 2,583 |
| Los Angeles County CA Public Works Financing Authority Lease Revenue | 5.000% | 8/1/32 | 3,000 | 3,268 |
| M-S-R California Energy Authority Revenue | 7.000% | 11/1/34 | 6,000 | 8,190 |
| Menifee CA Union School District Public Financing Authority Revenue | 5.000% | 9/1/21 | 1,090 | 1,162 |
| Menifee CA Union School District Public Financing Authority Revenue | 5.000% | 9/1/23 | 1,000 | 1,104 |
| Menifee CA Union School District Public Financing Authority Revenue | 5.000% | 9/1/27 | 1,000 | 1,137 |
| Menifee CA Union School District Public Financing Authority Revenue | 5.000% | 9/1/31 (14) | 1,310 | 1,463 |
| Mount Diablo CA Unified School District GO | 5.000% | 8/1/29 | 6,415 | 7,038 |
| Mount Diablo CA Unified School District GO | 5.000% | 8/1/30 | 5,510 | 6,033 |
| Mount Diablo CA Unified School District GO | 5.000% | 8/1/32 | 12,910 | 14,086 |
| 10 | Mount San Antonio CA Community College District GO | 0.000% | 8/1/28 | 3,000 | 2,851 |
| Napa Valley CA Unified School District GO | 4.000% | 8/1/26 | 2,655 | 2,826 |
| Napa Valley CA Unified School District GO | 4.000% | 8/1/27 | 5,130 | 5,437 |
| Napa Valley CA Unified School District GO | 4.000% | 8/1/28 | 6,000 | 6,337 |
| 11 | Napa Valley CA Community College District GO | 0.000% | 8/1/29 | 6,065 | 5,922 |
| 11 | Napa Valley CA Community College District GO | 0.000% | 8/1/32 | 6,000 | 5,726 |
| Oakland CA Redevelopment Agency Tax Allocation Revenue (Central District Project) | 5.000% | 9/1/21 | 4,500 | 4,835 |
| Oakland CA Redevelopment Agency Tax Allocation Revenue (Central District Project) | 5.000% | 9/1/22 | 1,500 | 1,642 |
| Oakland CA Unified School District GO | 6.250% | 8/1/19 | 1,150 | 1,188 |
| Oakland CA Unified School District GO | 5.000% | 8/1/23 (4) | 2,000 | 2,241 |
| Orange County CA Airport Revenue | 5.250% | 7/1/25 | 6,480 | 6,636 |
| Orange County CA Sanitation District COP | 5.000% | 2/1/19 (Prere.) | 7,250 | 7,311 |
| Orange County CA Sanitation District COP | 5.000% | 2/1/19 (Prere.) | 4,510 | 4,548 |
| Palo Alto CA Unified School District GO | 0.000% | 8/1/23 | 13,900 | 12,365 |
| Palo Alto CA Unified School District GO | 0.000% | 8/1/28 | 20,320 | 15,056 |
| Palo Alto CA Unified School District GO | 0.000% | 8/1/29 | 19,530 | 13,826 |
| Palo Alto CA Unified School District GO | 0.000% | 8/1/31 | 12,305 | 7,936 |
| Palomar Pomerado Health California GO | 0.000% | 8/1/32 (12) | 9,300 | 5,374 |
| Paramount CA Redevelopment Agency Successor Agency Tax Allocation Revenue | | | | |
| | (Redevelopment Project Area No. 1) | 0.000% | 8/1/26 (14) | 5,000 | 3,672 |
| Peralta CA Community College District Revenue | 5.000% | 8/1/28 | 3,000 | 3,401 |
| Perris CA Public Financing Authority Tax Allocation Revenue | 5.000% | 10/1/22 | 1,135 | 1,257 |
| Perris CA Public Financing Authority Tax Allocation Revenue | 5.000% | 10/1/23 | 1,200 | 1,354 |
| Perris CA Public Financing Authority Tax Allocation Revenue | 5.000% | 10/1/24 | 1,260 | 1,447 |
| Perris CA Public Financing Authority Tax Allocation Revenue | 5.000% | 10/1/25 | 1,315 | 1,532 |
| Perris CA Public Financing Authority Tax Allocation Revenue | 5.000% | 10/1/31 | 3,220 | 3,609 |
| Poway CA Redevelopment Agency Successor Agency Tax Allocation Revenue | 5.000% | 12/15/24 | 3,550 | 4,094 |
| Poway CA Redevelopment Agency Successor Agency Tax Allocation Revenue | 5.000% | 12/15/25 | 5,580 | 6,528 |
| Poway CA Redevelopment Agency Successor Agency Tax Allocation Revenue | 5.000% | 6/15/28 | 2,190 | 2,536 |
| Poway CA Redevelopment Agency Successor Agency Tax Allocation Revenue | 5.000% | 12/15/28 | 2,190 | 2,533 |
| Poway CA Redevelopment Agency Successor Agency Tax Allocation Revenue | 5.000% | 12/15/29 | 4,830 | 5,562 |
| Poway CA Unified School District GO | 0.000% | 8/1/29 | 5,000 | 3,506 |
| Poway CA Unified School District Public Financing Authority Special Tax Revenue | 5.000% | 9/1/27 (15) | 2,750 | 3,109 |
| Poway CA Unified School District Public Financing Authority Special Tax Revenue | 5.000% | 9/1/29 (15) | 2,230 | 2,506 |
| Poway CA Unified School District Public Financing Authority Special Tax Revenue | 5.000% | 9/1/30 (15) | 1,735 | 1,941 |
| Rancho Santiago CA Community College District GO | 5.000% | 9/1/25 | 6,690 | 7,534 |
| Rancho Santiago CA Community College District GO | 5.000% | 9/1/26 | 16,145 | 18,127 |
| Rialto CA Redevelopment Agency Successor Agency Tax Allocation Revenue | 5.000% | 9/1/30 (15) | 2,885 | 3,262 |
| Rialto CA Redevelopment Agency Successor Agency Tax Allocation Revenue | 5.000% | 9/1/31 (15) | 3,050 | 3,430 |
| Rialto CA Redevelopment Agency Successor Agency Tax Allocation Revenue | 5.000% | 9/1/32 (15) | 3,125 | 3,502 |
| Riverside CA Redevelopment Successor Agency Tax Allocation Revenue | 5.000% | 10/1/27 (4) | 1,150 | 1,340 |
| Riverside CA Redevelopment Successor Agency Tax Allocation Revenue | 5.000% | 10/1/28 (4) | 1,500 | 1,737 |
| Riverside CA Redevelopment Successor Agency Tax Allocation Revenue | 5.000% | 10/1/30 (4) | 1,375 | 1,570 |
| Riverside County CA Public Financing Authority Lease Revenue | 5.000% | 11/1/31 | 9,575 | 10,782 |
| Riverside County CA Public Financing Authority Lease Revenue | 5.000% | 11/1/33 | 3,495 | 3,926 |
| Riverside County CA Public Financing Authority Lease Revenue | 5.000% | 11/1/34 | 12,070 | 13,543 |
| Riverside County CA Transportation Commission Sales Tax Revenue | 5.250% | 6/1/23 (Prere.) | 4,980 | 5,673 |
| Riverside County CA Transportation Commission Sales Tax Revenue | 5.250% | 6/1/23 (Prere.) | 7,365 | 8,390 |
| Riverside County CA Transportation Commission Sales Tax Revenue | 5.000% | 6/1/37 | 2,600 | 2,949 |
| Riverside County CA Transportation Commission Sales Tax Revenue | 5.000% | 6/1/37 | 4,060 | 4,632 |
| Riverside County CA Transportation Commission Toll Revenue | 0.000% | 6/1/25 | 8,790 | 6,919 |
| Riverside County CA Transportation Commission Toll Revenue | 0.000% | 6/1/26 | 3,375 | 2,526 |
| Riverside County CA Transportation Commission Toll Revenue | 0.000% | 6/1/27 | 6,415 | 4,590 |
| Riverside County CA Transportation Commission Toll Revenue | 0.000% | 6/1/28 | 9,395 | 6,416 |
| Riverside County CA Transportation Commission Toll Revenue | 0.000% | 6/1/29 | 11,075 | 7,201 |
| Rocklin CA Unified School District GO | 0.000% | 8/1/22 (14) | 5,450 | 4,962 |
| Roseville CA Joint Union High School District GO | 0.000% | 8/1/27 (4) | 2,915 | 2,239 |
164
Intermediate-Term Tax-Exempt Fund
| | | | |
| Face | Market |
| Maturity | Amount | Value• |
| Coupon | Date | ($000) | ($000) |
| Roseville CA Natural Gas Financing Authority Gas Revenue | 5.000% | 2/15/20 | 4,745 | 4,895 |
| Roseville CA Natural Gas Financing Authority Gas Revenue | 5.000% | 2/15/23 | 115 | 125 |
| Roseville CA Natural Gas Financing Authority Gas Revenue | 5.000% | 2/15/25 | 235 | 260 |
| Roseville CA Natural Gas Financing Authority Gas Revenue | 5.000% | 2/15/26 | 200 | 223 |
| Roseville CA Natural Gas Financing Authority Gas Revenue | 5.000% | 2/15/28 | 160 | 179 |
| Sacramento CA City Financing Authority Revenue | 5.000% | 12/1/21 (15) | 1,810 | 1,966 |
| Sacramento CA City Financing Authority Revenue | 5.000% | 12/1/23 (15) | 750 | 847 |
| Sacramento CA City Financing Authority Revenue | 5.000% | 12/1/24 (15) | 1,515 | 1,738 |
| Sacramento CA City Financing Authority Tax Allocation Revenue | 0.000% | 12/1/25 (14) | 13,125 | 10,490 |
| Sacramento CA City Financing Authority Tax Allocation Revenue | 0.000% | 12/1/30 (14) | 11,000 | 6,931 |
| Sacramento CA Regional Transportation District Farebox Revenue | 5.000% | 9/1/20 (Prere.) | 270 | 285 |
| Sacramento CA Regional Transportation District Farebox Revenue | 5.000% | 9/1/20 (Prere.) | 445 | 470 |
| Sacramento CA Regional Transportation District Farebox Revenue | 5.000% | 3/1/26 | 755 | 790 |
| Sacramento County CA GO | 5.250% | 2/1/19 | 4,940 | 4,978 |
| Sacramento County CA GO | 5.500% | 2/1/20 | 4,700 | 4,906 |
| Sacramento County CA Sanitation Districts Financing Authority Revenue | 5.000% | 8/1/26 | 1,000 | 1,163 |
| Sacramento County CA Sanitation Districts Financing Authority Revenue | 5.000% | 8/1/28 | 1,120 | 1,290 |
| Sacramento County CA Sanitation Districts Financing Authority Revenue | 5.000% | 12/1/30 | 2,000 | 2,247 |
| Sacramento County CA Sanitation Districts Financing Authority Revenue | 5.000% | 8/1/31 | 1,000 | 1,133 |
| Sacramento County CA Sanitation Districts Financing Authority Revenue | 5.000% | 12/1/31 | 3,000 | 3,362 |
| Sacramento County CA Sanitation Districts Financing Authority Revenue | 5.000% | 8/1/35 | 1,000 | 1,121 |
| San Bernardino CA City Unified School District GO | 5.000% | 8/1/29 (4) | 1,960 | 2,176 |
| San Bernardino CA City Unified School District GO | 5.000% | 8/1/30 (4) | 1,180 | 1,307 |
| San Bernardino CA City Unified School District GO | 5.000% | 8/1/31 (4) | 1,320 | 1,458 |
| San Bernardino CA City Unified School District GO | 5.000% | 8/1/32 (4) | 1,400 | 1,544 |
| San Bernardino CA Community College District GO | 0.000% | 8/1/22 (4) | 3,535 | 3,227 |
| San Bernardino CA Community College District GO | 0.000% | 8/1/23 (4) | 5,000 | 4,419 |
| San Bernardino CA Community College District GO | 5.000% | 8/1/24 | 12,065 | 13,545 |
| San Bernardino CA Community College District GO | 5.000% | 8/1/25 | 13,965 | 15,644 |
| San Bernardino CA Community College District GO | 5.000% | 8/1/26 | 14,080 | 15,760 |
| San Bernardino County CA Medical Center (Arrowhead Project) COP | 5.000% | 8/1/19 | 8,500 | 8,696 |
| San Diego CA Community College District GO | 5.250% | 8/1/19 (Prere.) | 3,325 | 3,413 |
| San Diego CA Community College District GO | 5.000% | 8/1/21 (Prere.) | 7,400 | 8,009 |
| San Diego CA Community College District GO | 5.000% | 8/1/21 (Prere.) | 3,895 | 4,216 |
| San Diego CA Community College District GO | 5.000% | 8/1/21 (Prere.) | 8,350 | 9,037 |
| San Diego CA Community College District GO | 5.000% | 8/1/21 (Prere.) | 4,000 | 4,329 |
| San Diego CA Community College District GO | 5.000% | 8/1/21 (Prere.) | 4,315 | 4,670 |
| San Diego CA Community College District GO | 4.000% | 8/1/32 | 19,065 | 20,171 |
| San Diego CA Public Facilities Financing Authority Water Revenue | 5.000% | 8/1/28 | 6,000 | 6,991 |
| San Diego CA Public Facilities Financing Authority Water Revenue | 5.000% | 8/1/29 | 8,560 | 9,908 |
| San Diego CA Public Facilities Financing Authority Water Revenue | 5.000% | 8/1/31 | 5,160 | 5,911 |
| San Diego CA Public Facilities Financing Authority Water Revenue | 5.000% | 8/1/32 | 4,790 | 5,465 |
| San Diego CA Public Facilities Financing Authority Water Revenue | 5.000% | 8/1/33 | 15,835 | 18,009 |
| San Diego CA Public Facilities Financing Authority Water Revenue | 5.000% | 8/1/34 | 12,645 | 14,334 |
| San Diego CA Public Facilities Financing Authority Water Revenue | 5.000% | 8/1/35 | 12,100 | 13,663 |
| San Diego CA Public Facilities Financing Authority Water Revenue | 5.000% | 8/1/36 | 9,255 | 10,417 |
| San Diego CA Unified School District GO | 5.500% | 7/1/27 (4) | 17,020 | 21,094 |
| San Diego CA Unified School District GO | 0.000% | 7/1/30 | 17,310 | 11,456 |
| San Diego CA Unified School District GO | 0.000% | 7/1/36 | 1,000 | 492 |
| San Diego CA Unified School District GO | 0.000% | 7/1/38 | 5,220 | 2,336 |
| San Diego County CA Regional Airport Authority Revenue | 5.000% | 7/1/28 | 2,500 | 2,615 |
| San Diego County CA Water Authority Revenue | 5.000% | 5/1/30 | 5,275 | 6,086 |
| San Diego County CA Water Authority Revenue | 5.000% | 5/1/34 | 10,500 | 11,931 |
| San Francisco CA Bay Area Rapid Transit District GO | 5.000% | 8/1/30 | 5,000 | 5,741 |
| San Francisco CA Bay Area Rapid Transit District Sales Tax Revenue | 5.000% | 7/1/26 | 1,430 | 1,661 |
| San Francisco CA City & County COP | 5.000% | 4/1/28 | 10,790 | 12,441 |
| San Francisco CA City & County COP | 4.000% | 4/1/30 | 16,775 | 17,644 |
| San Francisco CA City & County COP | 4.000% | 4/1/33 | 12,465 | 12,969 |
| San Francisco CA City & County COP | 4.000% | 4/1/35 | 10,000 | 10,329 |
| San Francisco CA City & County COP | 4.000% | 4/1/36 | 10,000 | 10,280 |
| San Francisco CA City & County GO | 5.000% | 6/15/27 | 10,000 | 11,195 |
| San Francisco CA City & County GO | 4.000% | 6/15/28 | 25,000 | 26,559 |
| San Francisco CA City & County GO | 4.000% | 6/15/29 | 15,000 | 15,828 |
| San Francisco CA City & County International Airport Revenue | 5.000% | 5/1/20 (Prere.) | 2,135 | 2,231 |
| San Francisco CA City & County International Airport Revenue | 5.000% | 5/1/20 (Prere.) | 3,900 | 4,075 |
| San Francisco CA City & County International Airport Revenue | 5.000% | 5/1/21 | 2,865 | 2,989 |
| San Francisco CA City & County International Airport Revenue | 5.250% | 5/1/22 | 5,500 | 5,594 |
| San Francisco CA City & County International Airport Revenue | 5.500% | 5/1/26 | 3,370 | 3,433 |
| San Francisco CA City & County Public Utilities Commission Wastewater Revenue | 5.000% | 10/1/33 | 2,545 | 2,878 |
| San Francisco CA City & County Public Utilities Commission Wastewater Revenue | 5.000% | 10/1/33 | 9,030 | 10,210 |
165
Intermediate-Term Tax-Exempt Fund
| | | | |
| Face | Market |
| Maturity | Amount | Value• |
| Coupon | Date | ($000) | ($000) |
| San Francisco CA City & County Public Utilities Commission Water Revenue | 5.000% | 5/1/22 (Prere.) | 14,000 | 15,432 |
| San Francisco CA City & County Public Utilities Commission Water Revenue | 5.000% | 11/1/28 | 10,105 | 11,894 |
| San Francisco CA City & County Public Utilities Commission Water Revenue | 4.000% | 11/1/30 | 15,050 | 15,992 |
| San Francisco CA City & County Public Utilities Commission Water Revenue | 4.000% | 11/1/30 | 8,040 | 8,591 |
| San Francisco CA City & County Public Utilities Commission Water Revenue | 4.000% | 11/1/30 | 1,870 | 1,998 |
| San Francisco CA City & County Public Utilities Commission Water Revenue | 5.000% | 11/1/31 | 8,000 | 9,210 |
| San Francisco CA City & County Public Utilities Commission Water Revenue | 5.000% | 10/1/32 | 10,000 | 10,977 |
| San Francisco CA City & County Public Utilities Commission Water Revenue | 5.000% | 11/1/32 | 2,000 | 2,253 |
| San Francisco CA City & County Public Utilities Commission Water Revenue | 5.000% | 11/1/33 | 20,010 | 23,128 |
| San Francisco CA City & County Unified School District GO | 4.000% | 6/15/31 | 13,670 | 14,093 |
| San Francisco CA City & County Unified School District GO | 4.000% | 6/15/32 | 3,950 | 4,063 |
| San Francisco CA City & County Unified School District GO | 4.000% | 6/15/33 | 8,885 | 9,210 |
| San Francisco CA County Transportation Authority Sales Tax Revenue | 4.000% | 2/1/28 | 8,465 | 9,399 |
| San Joaquin County CA Transportation Authority Revenue | 5.000% | 3/1/31 | 1,650 | 1,915 |
| San Joaquin County CA Transportation Authority Revenue | 5.000% | 3/1/34 | 3,000 | 3,446 |
| San Joaquin County CA Transportation Authority Revenue | 5.000% | 3/1/35 | 3,110 | 3,560 |
| San Joaquin County CA Transportation Authority Revenue | 5.000% | 3/1/36 | 3,000 | 3,420 |
| San Joaquin Hills CA Transportation Corridor Agency Toll Road Revenue | 0.000% | 1/15/21 (14) | 12,385 | 11,695 |
| San Jose CA Airport Revenue | 5.000% | 3/1/27 | 2,275 | 2,558 |
| San Jose CA Airport Revenue | 5.000% | 3/1/28 | 2,235 | 2,509 |
| San Jose CA Redevelopment Agency Tax Allocation Revenue | 5.250% | 8/1/20 (Prere.) | 2,400 | 2,539 |
| San Jose CA Redevelopment Agency Tax Allocation Revenue | 5.375% | 8/1/20 (Prere.) | 1,175 | 1,246 |
| San Jose-Evergreen CA Community College District GO | 5.000% | 9/1/29 | 1,510 | 1,715 |
| San Jose-Evergreen CA Community College District GO | 5.000% | 9/1/30 | 2,745 | 3,110 |
| San Jose-Evergreen CA Community College District GO | 5.000% | 9/1/30 | 3,445 | 3,903 |
| San Jose-Evergreen CA Community College District GO | 5.000% | 9/1/31 | 3,010 | 3,405 |
| San Jose-Evergreen CA Community College District GO | 5.000% | 9/1/31 | 3,840 | 4,344 |
| San Jose-Evergreen CA Community College District GO | 5.000% | 9/1/32 | 3,095 | 3,496 |
| San Marcos CA Unified School District GO | 5.000% | 8/1/36 | 3,330 | 3,743 |
| San Mateo County CA Joint Powers Financing Authority Lease Revenue | | | | |
| (Maple Street Correctional Center) | 5.000% | 6/15/27 | 2,000 | 2,263 |
| San Mateo County CA Joint Powers Financing Authority Lease Revenue | | | | |
| (Maple Street Correctional Center) | 5.000% | 6/15/28 | 2,520 | 2,844 |
| San Mateo County CA Joint Powers Financing Authority Lease Revenue | | | | |
| (Maple Street Correctional Center) | 5.000% | 6/15/29 | 1,675 | 1,886 |
| San Ramon CA Public Financing Authority Tax Allocation Revenue | 0.000% | 2/1/29 (2) | 3,535 | 2,384 |
| San Ramon CA Public Financing Authority Tax Allocation Revenue | 0.000% | 2/1/30 (2) | 3,535 | 2,267 |
| San Ramon CA Public Financing Authority Tax Allocation Revenue | 0.000% | 2/1/32 (2) | 3,535 | 2,041 |
| San Ramon Valley CA Unified School District GO | 5.000% | 8/1/26 | 3,385 | 3,786 |
| San Ramon Valley CA Unified School District GO | 5.000% | 8/1/27 | 1,080 | 1,206 |
| Santa Ana CA Unified School District GO | 0.000% | 8/1/29 (14) | 3,315 | 2,264 |
| Santa Ana CA Unified School District GO | 0.000% | 8/1/30 (14) | 2,150 | 1,396 |
| Santa Clara Valley CA Transportation Authority Sales Tax Revenue | 5.000% | 4/1/26 | 700 | 810 |
| Santa Clara Valley CA Transportation Authority Sales Tax Revenue | 5.000% | 4/1/28 | 1,000 | 1,145 |
| Santa Clara Valley CA Transportation Authority Sales Tax Revenue | 5.000% | 4/1/29 | 1,035 | 1,180 |
| Santa Clara Valley CA Transportation Authority Sales Tax Revenue | 5.000% | 4/1/30 | 1,010 | 1,143 |
| Santa Clara Valley CA Transportation Authority Sales Tax Revenue | 5.000% | 4/1/31 | 1,000 | 1,128 |
| Santa Clara Valley CA Transportation Authority Sales Tax Revenue | 5.000% | 4/1/32 | 1,500 | 1,687 |
| Santa Clara Valley CA Transportation Authority Sales Tax Revenue | 5.000% | 4/1/33 | 1,500 | 1,682 |
| Santa Clara Valley CA Transportation Authority Sales Tax Revenue | 5.000% | 4/1/35 | 2,650 | 2,957 |
| Santa Clara Valley CA Transportation Authority Sales Tax Revenue | 5.000% | 4/1/36 | 1,750 | 1,951 |
| Santa Clara Valley CA Water District Revenue | 5.000% | 6/1/32 | 2,000 | 2,273 |
| Santa Clara Valley CA Water District Revenue | 5.000% | 6/1/33 | 2,000 | 2,266 |
| Santa Monica CA Community College District GO | 0.000% | 8/1/23 | 9,045 | 8,046 |
| Santa Monica CA Community College District GO | 5.000% | 8/1/24 | 4,210 | 4,736 |
| Santa Monica CA Community College District GO | 5.000% | 8/1/25 | 5,000 | 5,616 |
| Santa Monica CA Community College District GO | 5.000% | 8/1/26 | 8,650 | 9,694 |
| Santa Monica CA Community College District GO | 0.000% | 8/1/27 | 6,565 | 5,047 |
| Santa Monica CA Community College District GO | 5.000% | 8/1/27 | 5,145 | 5,749 |
| Santa Monica CA Community College District GO | 0.000% | 8/1/28 | 7,105 | 5,229 |
| Santa Monica CA Community College District GO | 0.000% | 8/1/29 | 12,640 | 8,882 |
| Santa Monica CA Community College District GO | 5.000% | 8/1/35 | 4,000 | 4,578 |
| Santa Monica CA Community College District GO | 5.000% | 8/1/36 | 4,250 | 4,847 |
| Santa Rosa CA Wastewater Revenue | 0.000% | 9/1/27 (2) | 11,125 | 8,391 |
| Simi Valley CA Unified School District GO | 0.000% | 6/1/29 (14) | 6,000 | 4,062 |
| Simi Valley CA Unified School District GO | 0.000% | 8/1/29 (4) | 5,000 | 3,390 |
| Southern California Public Power Authority Revenue | 5.000% | 7/1/29 | 2,500 | 2,617 |
| Southern California Public Power Authority Revenue (Canyon Power Project) | 5.000% | 7/1/22 | 3,895 | 4,199 |
| Southern California Public Power Authority Revenue (Natural Gas Project) | 5.250% | 11/1/27 | 445 | 508 |
| State Center California Community College District GO | 5.000% | 8/1/29 | 6,005 | 6,915 |
166
Intermediate-Term Tax-Exempt Fund
| | | | |
| Face | Market |
| Maturity | Amount | Value• |
| Coupon | Date | ($000) | ($000) |
| State Center California Community College District GO | 5.000% | 8/1/30 | 3,335 | 3,830 |
| State Center California Community College District GO | 5.000% | 8/1/31 | 5,070 | 5,805 |
| Sweetwater CA Unified School District GO | 5.000% | 8/1/29 (15) | 3,300 | 3,690 |
| Tahoe-Truckee CA Unified School District GO | 5.000% | 8/1/28 | 635 | 743 |
| Tahoe-Truckee CA Unified School District GO | 5.000% | 8/1/29 | 440 | 511 |
| Tahoe-Truckee CA Unified School District GO | 5.000% | 8/1/30 | 790 | 913 |
| Tahoe-Truckee CA Unified School District GO | 5.000% | 8/1/31 | 590 | 680 |
| Tahoe-Truckee CA Unified School District GO | 5.000% | 8/1/33 | 1,070 | 1,221 |
| Tahoe-Truckee CA Unified School District GO | 5.000% | 8/1/36 | 1,585 | 1,784 |
| Tulare County CA Transportation Authority Sales Tax Revenue | 4.000% | 2/1/34 | 3,000 | 3,021 |
| Tulare County CA Transportation Authority Sales Tax Revenue | 4.000% | 2/1/35 | 2,000 | 2,018 |
| Tuolumne CA Wind Project Authority Revenue | 5.000% | 1/1/19 | 3,000 | 3,016 |
| Tuolumne CA Wind Project Authority Revenue | 5.000% | 1/1/19 (Prere.) | 13,130 | 13,201 |
| Tuolumne CA Wind Project Authority Revenue | 5.000% | 1/1/19 (Prere.) | 13,465 | 13,538 |
| Tuolumne CA Wind Project Authority Revenue | 5.625% | 1/1/19 (Prere.) | 9,000 | 9,058 |
| Turlock CA Irrigation District Revenue | 5.000% | 1/1/20 (Prere.) | 3,935 | 4,080 |
| Turlock CA Irrigation District Revenue | 5.000% | 1/1/20 (Prere.) | 4,160 | 4,313 |
| Turlock CA Irrigation District Revenue | 5.000% | 1/1/20 (Prere.) | 4,335 | 4,495 |
| Turlock CA Irrigation District Revenue | 5.000% | 1/1/20 (Prere.) | 2,250 | 2,333 |
| Union CA Elementary School District GO | 0.000% | 9/1/27 (14) | 7,295 | 5,594 |
| Union CA Elementary School District GO | 0.000% | 9/1/28 (14) | 4,625 | 3,392 |
| Union CA Elementary School District GO | 0.000% | 9/1/28 (14) | 6,275 | 4,602 |
| University of California Revenue | 5.250% | 5/15/19 (Prere.) | 4,245 | 4,326 |
| University of California Revenue | 5.500% | 5/15/19 (Prere.) | 14,675 | 14,975 |
| University of California Revenue | 5.000% | 5/15/21 (Prere.) | 235 | 252 |
| University of California Revenue | 5.000% | 5/15/21 (Prere.) | 5,535 | 5,938 |
| University of California Revenue | 5.000% | 5/15/21 (Prere.) | 2,145 | 2,301 |
| University of California Revenue | 5.000% | 5/15/21 (Prere.) | 1,210 | 1,298 |
| University of California Revenue | 5.000% | 5/15/23 | 1,265 | 1,360 |
| University of California Revenue | 5.000% | 5/15/23 (Prere.) | 8,050 | 9,077 |
| University of California Revenue | 5.000% | 5/15/27 | 6,100 | 7,026 |
| University of California Revenue | 5.000% | 5/15/28 | 5,500 | 6,324 |
| University of California Revenue | 5.000% | 5/15/28 | 12,500 | 14,309 |
| University of California Revenue | 5.000% | 5/15/28 | 17,945 | 20,012 |
| University of California Revenue | 5.000% | 5/15/29 | 19,010 | 21,675 |
| University of California Revenue | 5.000% | 5/15/30 | 1,620 | 1,727 |
| University of California Revenue | 5.000% | 5/15/30 | 8,750 | 10,195 |
| University of California Revenue | 4.000% | 5/15/31 | 18,505 | 19,511 |
| University of California Revenue | 5.000% | 5/15/31 | 11,000 | 12,436 |
| University of California Revenue | 5.000% | 5/15/31 | 3,720 | 4,343 |
| University of California Revenue | 5.000% | 5/15/32 | 21,820 | 23,968 |
| University of California Revenue | 5.000% | 5/15/32 | 9,000 | 10,443 |
| University of California Revenue | 5.000% | 5/15/32 | 4,050 | 4,566 |
| University of California Revenue | 4.000% | 5/15/33 | 33,500 | 34,877 |
| University of California Revenue | 5.000% | 5/15/33 | 31,200 | 34,230 |
| University of California Revenue | 5.000% | 5/15/33 | 5,750 | 6,625 |
| University of California Revenue | 4.000% | 5/15/34 | 17,000 | 17,563 |
| University of California Revenue | 4.000% | 5/15/34 | 28,825 | 29,880 |
| University of California Revenue | 5.000% | 5/15/34 | 38,420 | 42,083 |
| University of California Revenue | 5.000% | 5/15/34 | 5,625 | 6,432 |
| University of California Revenue | 4.000% | 5/15/35 | 5,665 | 5,851 |
| University of California Revenue | 5.000% | 5/15/35 | 6,000 | 6,834 |
| University of California Revenue | 5.000% | 5/15/36 | 9,000 | 10,219 |
| University of California Revenue | 5.000% | 5/15/36 | 7,175 | 7,988 |
| University of California Revenue | 5.000% | 5/15/37 | 6,640 | 7,505 |
| University of California Revenue PUT | 5.000% | 5/15/23 | 127,175 | 143,110 |
| Ventura County CA Community College District GO | 0.000% | 8/1/23 | 6,155 | 5,440 |
| Ventura County CA Community College District GO | 0.000% | 8/1/24 | 8,050 | 6,947 |
| Ventura County CA Community College District GO | 0.000% | 8/1/25 | 8,000 | 6,662 |
| Ventura County CA Community College District GO | 0.000% | 8/1/26 | 8,500 | 6,801 |
| Ventura County CA Community College District GO | 0.000% | 8/1/27 | 8,500 | 6,495 |
| Ventura County CA Community College District GO | 5.000% | 8/1/27 | 1,000 | 1,128 |
| Ventura County CA Community College District GO | 5.000% | 8/1/28 | 1,000 | 1,125 |
| Ventura County CA Community College District GO | 5.000% | 8/1/29 | 1,000 | 1,122 |
| Ventura County CA Public Financing Authority COP | 5.625% | 8/15/19 (Prere.) | 1,000 | 1,031 |
| Ventura County CA Public Financing Authority COP | 5.750% | 8/15/19 (Prere.) | 1,750 | 1,806 |
| Ventura County CA Public Financing Authority COP | 5.750% | 8/15/19 (Prere.) | 1,750 | 1,806 |
| Victor Valley CA Community College District GO | 5.375% | 8/1/19 (Prere.) | 4,250 | 4,367 |
| Vista CA Joint Powers Financing Authority Revenue | 5.250% | 5/1/32 | 6,155 | 7,022 |
| Vista CA Joint Powers Financing Authority Revenue | 5.250% | 5/1/33 | 6,815 | 7,753 |
167
Intermediate-Term Tax-Exempt Fund
| | | | |
| Face | Market |
| Maturity | Amount | Value• |
| Coupon | Date | ($000) | ($000) |
| Vista CA Joint Powers Financing Authority Revenue | 5.250% | 5/1/34 | 7,355 | 8,344 |
| Walnut CA Energy Center Authority Revenue | 5.000% | 1/1/29 | 2,510 | 2,596 |
| Walnut CA Energy Center Authority Revenue | 5.000% | 1/1/30 | 3,775 | 3,902 |
| West Contra Costa CA Unified School District GO | 0.000% | 8/1/19 (12) | 4,190 | 4,129 |
| West Contra Costa CA Unified School District GO | 0.000% | 8/1/20 (12) | 6,000 | 5,781 |
| West Contra Costa CA Unified School District GO | 5.000% | 8/1/27 | 2,405 | 2,722 |
| West Contra Costa CA Unified School District GO | 0.000% | 8/1/28 (14) | 5,230 | 3,783 |
| West Contra Costa CA Unified School District GO | 5.000% | 8/1/29 | 3,500 | 3,946 |
| West Contra Costa CA Unified School District GO | 0.000% | 8/1/30 (4) | 13,450 | 8,876 |
| West Contra Costa CA Unified School District GO | 0.000% | 8/1/31 (14) | 6,670 | 4,138 |
| West Contra Costa CA Unified School District GO | 0.000% | 8/1/32 (4) | 18,000 | 10,714 |
| West Contra Costa CA Unified School District GO | 0.000% | 8/1/32 (12) | 5,000 | 2,976 |
| West Contra Costa CA Unified School District GO | 5.000% | 8/1/32 (4) | 6,270 | 6,851 |
| West Contra Costa CA Unified School District GO | 0.000% | 8/1/33 (12) | 2,810 | 1,562 |
| West Contra Costa CA Unified School District GO | 0.000% | 8/1/34 (14) | 17,000 | 9,000 |
| West Contra Costa CA Unified School District | 0.000% | 8/1/33 (3) | 5,000 | 2,784 |
| Westlands CA Water District Revenue | 5.000% | 9/1/26 (4) | 1,000 | 1,089 |
| | | | 6,156,926 |
| Colorado (1.6%) | | | | |
| Adams & Arapahoe CO Joint School District No. 28J GO | 5.000% | 12/1/32 | 4,050 | 4,596 |
| Adams County CO COP | 5.000% | 12/1/30 | 600 | 676 |
| Adams County CO COP | 5.000% | 12/1/33 | 1,000 | 1,118 |
| Adams County CO COP | 5.000% | 12/1/34 | 725 | 808 |
| Aurora CO COP | 5.000% | 12/1/19 | 1,050 | 1,083 |
| Aurora CO COP | 5.000% | 12/1/20 | 2,000 | 2,062 |
| Aurora CO COP | 5.000% | 12/1/21 | 3,505 | 3,613 |
| Aurora CO COP | 5.000% | 12/1/22 | 4,730 | 4,876 |
| Aurora CO COP | 5.000% | 12/1/23 | 4,465 | 4,602 |
| Aurora CO COP | 5.000% | 12/1/24 | 4,215 | 4,344 |
| Aurora CO COP | 5.000% | 12/1/25 | 5,475 | 5,643 |
| Boulder Valley CO School District GO | 5.000% | 12/1/34 | 3,055 | 3,455 |
| Boulder Valley CO School District GO | 5.000% | 12/1/35 | 8,590 | 9,680 |
| Boulder Valley CO School District GO | 5.000% | 12/1/36 | 9,020 | 10,129 |
| Boulder Valley CO School District GO | 5.000% | 12/1/37 | 3,915 | 4,387 |
| Broomfield CO City & County COP | 5.000% | 12/1/20 (Prere.) | 2,685 | 2,842 |
| Broomfield CO City & County COP | 5.000% | 12/1/20 (Prere.) | 2,820 | 2,984 |
| Broomfield CO City & County COP | 5.000% | 12/1/20 (Prere.) | 2,965 | 3,138 |
| Broomfield CO City & County COP | 5.000% | 12/1/20 (Prere.) | 7,470 | 7,906 |
| Colorado (UCDHSC Fitzsimons Academic Projects) COP | 5.250% | 11/1/23 | 5,000 | 5,642 |
| Colorado COP | 4.000% | 12/15/33 | 23,200 | 23,684 |
| Colorado COP | 4.000% | 12/15/34 | 13,400 | 13,634 |
| Colorado COP | 4.000% | 12/15/35 | 11,375 | 11,526 |
| Colorado Educational & Cultural Facilities Authority Revenue (University of Denver) | 4.000% | 3/1/31 | 850 | 885 |
| Colorado Educational & Cultural Facilities Authority Revenue (University of Denver) | 4.000% | 3/1/32 | 1,000 | 1,037 |
| Colorado Educational & Cultural Facilities Authority Revenue (University of Denver) | 4.000% | 3/1/33 | 1,000 | 1,034 |
| Colorado Educational & Cultural Facilities Authority Revenue (University of Denver) | 4.000% | 3/1/34 | 1,075 | 1,107 |
| Colorado Health Facilities Authority Hospital Revenue | | | | |
| (The Evangelical Lutheran Good Samaritan Society Project) | 5.000% | 6/1/26 | 915 | 1,017 |
| Colorado Health Facilities Authority Hospital Revenue | | | | |
| (The Evangelical Lutheran Good Samaritan Society Project) | 5.000% | 6/1/27 | 1,025 | 1,144 |
| Colorado Health Facilities Authority Hospital Revenue | | | | |
| (The Evangelical Lutheran Good Samaritan Society Project) | 5.000% | 6/1/28 | 1,405 | 1,557 |
| Colorado Health Facilities Authority Hospital Revenue | | | | |
| (The Evangelical Lutheran Good Samaritan Society Project) | 5.000% | 6/1/29 | 1,605 | 1,767 |
| Colorado Health Facilities Authority Hospital Revenue | | | | |
| (The Evangelical Lutheran Good Samaritan Society Project) | 5.000% | 6/1/30 | 2,960 | 3,238 |
| Colorado Health Facilities Authority Hospital Revenue | | | | |
| (The Evangelical Lutheran Good Samaritan Society Project) | 5.000% | 6/1/35 | 3,015 | 3,246 |
| Colorado Health Facilities Authority Retirement Facilities Revenue (Liberty Heights Project) | 0.000% | 7/15/24 (ETM) | 52,000 | 44,400 |
| Colorado Health Facilities Authority Revenue | | | | |
| (Adventist Health System/Sunbelt Obligated Group) PUT | 5.000% | 11/15/23 | 19,510 | 21,668 |
| Colorado Health Facilities Authority Revenue | | | | |
| (Adventist Health System/Sunbelt Obligated Group) PUT | 5.000% | 11/15/26 | 20,155 | 22,999 |
| Colorado Health Facilities Authority Revenue (Catholic Health Initiatives) | 6.125% | 10/1/28 | 10,000 | 10,033 |
| Colorado Health Facilities Authority Revenue (Catholic Health Initiatives) | 5.500% | 7/1/29 | 50,000 | 51,153 |
| Colorado Health Facilities Authority Revenue (Catholic Health Initiatives) | 5.250% | 2/1/31 | 17,000 | 17,798 |
| Colorado Health Facilities Authority Revenue (Catholic Health Initiatives) | 5.000% | 1/1/33 | 8,385 | 8,798 |
| Colorado Health Facilities Authority Revenue (Christian Living Communities) | 5.000% | 1/1/25 | 600 | 640 |
| Colorado Health Facilities Authority Revenue (Christian Living Communities) | 5.000% | 1/1/26 | 750 | 801 |
168
Intermediate-Term Tax-Exempt Fund
| | | | |
| Face | Market |
| Maturity | Amount | Value• |
| Coupon | Date | ($000) | ($000) |
| Colorado Health Facilities Authority Revenue (Covenant Retirement Community Inc.) | 5.000% | 12/1/23 | 2,000 | 2,162 |
| Colorado Health Facilities Authority Revenue (Covenant Retirement Community Inc.) | 5.000% | 12/1/24 | 2,500 | 2,722 |
| Colorado Health Facilities Authority Revenue (Covenant Retirement Community Inc.) | 5.000% | 12/1/25 | 2,540 | 2,767 |
| Colorado Health Facilities Authority Revenue (Covenant Retirement Community Inc.) | 5.000% | 12/1/26 | 1,865 | 2,019 |
| Colorado Health Facilities Authority Revenue (Covenant Retirement Community Inc.) | 5.000% | 12/1/27 | 1,375 | 1,482 |
| Colorado Health Facilities Authority Revenue (Covenant Retirement Community Inc.) | 5.000% | 12/1/27 | 2,025 | 2,162 |
| Colorado Health Facilities Authority Revenue (Covenant Retirement Community Inc.) | 5.000% | 12/1/28 | 1,030 | 1,105 |
| Colorado Health Facilities Authority Revenue (Covenant Retirement Community Inc.) | 5.000% | 12/1/30 | 1,405 | 1,493 |
| Colorado Health Facilities Authority Revenue (Covenant Retirement Community Inc.) | 5.000% | 12/1/33 | 6,750 | 7,092 |
| Colorado Health Facilities Authority Revenue (NCMC Inc.) | 4.000% | 5/15/29 | 5,070 | 5,278 |
| Colorado Health Facilities Authority Revenue (NCMC Inc.) | 4.000% | 5/15/30 | 8,500 | 8,785 |
| Colorado Health Facilities Authority Revenue (NCMC Inc.) | 4.000% | 5/15/31 | 5,390 | 5,535 |
| Colorado Health Facilities Authority Revenue (NCMC Inc.) | 4.000% | 5/15/32 | 5,500 | 5,629 |
| Colorado Health Facilities Authority Revenue (Sisters of Charity of Leavenworth Health System) | 5.000% | 1/1/22 | 6,100 | 6,298 |
| Colorado Health Facilities Authority Revenue (Sisters of Charity of Leavenworth Health System) | 5.000% | 1/1/22 | 13,175 | 13,602 |
| Colorado Health Facilities Authority Revenue (Sisters of Charity of Leavenworth Health System) | 5.250% | 1/1/30 | 20,955 | 21,653 |
| Commerce City CO Sales & Use Tax Revenue | 5.000% | 8/1/31 (4) | 2,415 | 2,649 |
| Commerce City CO Sales & Use Tax Revenue | 5.000% | 8/1/33 (4) | 2,410 | 2,635 |
| Denver CO City & County Airport Revenue | 5.000% | 11/15/24 | 3,080 | 3,494 |
| Denver CO City & County Airport Revenue | 5.000% | 11/15/25 | 3,920 | 4,483 |
| Denver CO City & County Airport Revenue | 5.000% | 11/15/25 | 15,190 | 16,517 |
| Denver CO City & County Airport Revenue | 5.000% | 11/15/26 | 5,750 | 6,246 |
| Denver CO City & County Airport Revenue | 5.000% | 12/1/27 | 750 | 868 |
| Denver CO City & County Airport Revenue | 5.250% | 11/15/28 | 3,040 | 3,385 |
| Denver CO City & County Airport Revenue | 5.000% | 12/1/28 | 500 | 581 |
| Denver CO City & County Airport Revenue | 5.250% 11/15/29 | | 5,000 | 5,559 |
| Denver CO City & County Airport Revenue | 5.000% | 12/1/29 | 750 | 865 |
| Denver CO City & County Airport Revenue | 5.250% | 11/15/30 | 14,400 | 15,989 |
| Denver CO City & County Airport Revenue | 5.000% | 12/1/30 | 760 | 871 |
| Denver CO City & County Airport Revenue | 5.000% | 11/15/31 | 4,035 | 4,537 |
| Denver CO City & County Airport Revenue | 5.000% | 12/1/31 | 750 | 860 |
| Denver CO City & County Airport Revenue | 5.000% | 11/15/32 | 6,020 | 6,742 |
| Denver CO City & County Airport Revenue | 5.000% | 12/1/32 | 1,150 | 1,312 |
| Denver CO City & County Airport Revenue | 5.000% | 11/15/33 | 6,535 | 7,370 |
| Denver CO City & County Airport Revenue | 5.000% | 12/1/33 | 600 | 682 |
| Denver CO City & County Airport Revenue | 5.000% | 12/1/34 | 2,000 | 2,264 |
| Denver CO City & County Airport Revenue | 4.000% | 12/1/36 | 2,000 | 2,023 |
| Denver CO City & County Airport Revenue | 5.000% | 12/1/36 | 4,725 | 5,305 |
| Denver CO City & County Airport Revenue | 5.000% | 12/1/37 | 5,505 | 6,166 |
| Denver CO City & County Airport Revenue | 5.000% | 12/1/38 | 5,985 | 6,688 |
| Denver CO City & County COP | 5.000% | 6/1/33 | 750 | 836 |
| Denver CO City & County COP | 5.000% | 6/1/34 | 1,000 | 1,112 |
| Denver CO City & County COP | 5.000% | 6/1/35 | 2,100 | 2,324 |
| Denver CO City & County COP | 5.000% | 6/1/36 | 3,925 | 4,330 |
| Denver CO City & County COP | 5.000% | 6/1/37 | 3,000 | 3,304 |
| Denver CO City & County COP | 5.000% | 6/1/38 | 3,375 | 3,707 |
| Denver CO City & County Dedicated Tax Revenue | 0.000% | 8/1/30 | 1,000 | 638 |
| Denver CO City & County Dedicated Tax Revenue | 0.000% | 8/1/31 | 1,000 | 608 |
| Denver CO City & County Dedicated Tax Revenue | 0.000% | 8/1/32 | 1,000 | 581 |
| Denver CO City & County Dedicated Tax Revenue | 0.000% | 8/1/33 | 2,100 | 1,164 |
| Denver CO City & County Dedicated Tax Revenue | 0.000% | 8/1/34 | 2,200 | 1,163 |
| Denver CO City & County School District GO | 4.000% | 12/1/31 | 7,000 | 7,280 |
| Denver CO City & County School District GO | 5.000% | 12/1/33 | 5,095 | 5,782 |
| Denver CO City & County School District GO | 5.000% | 12/1/34 | 11,455 | 12,965 |
| Denver CO City & County School District GO | 5.000% | 12/1/35 | 14,630 | 16,503 |
| Denver CO City & County School District GO | 5.000% | 12/1/36 | 23,510 | 26,430 |
| E-470 Public Highway Authority Colorado Revenue | 0.000% | 9/1/19 (14) | 15,100 | 14,835 |
| E-470 Public Highway Authority Colorado Revenue | 0.000% | 9/1/21 (14) | 27,500 | 25,611 |
| E-470 Public Highway Authority Colorado Revenue | 0.000% | 9/1/22 (14) | 11,315 | 10,218 |
| E-470 Public Highway Authority Colorado Revenue | 0.000% | 9/1/23 (14) | 15,435 | 13,495 |
| E-470 Public Highway Authority Colorado Revenue | 0.000% | 9/1/24 (14) | 20,000 | 16,832 |
| E-470 Public Highway Authority Colorado Revenue | 5.250% | 9/1/25 | 1,510 | 1,591 |
| E-470 Public Highway Authority Colorado Revenue | 5.375% | 9/1/26 | 2,500 | 2,637 |
| Eagle County CO School District GO | 5.000% | 12/1/32 | 4,600 | 5,203 |
| Eagle County CO School District GO | 5.000% | 12/1/33 | 7,475 | 8,398 |
| Eagle County CO School District GO | 5.000% | 12/1/34 | 6,000 | 6,723 |
| Eagle County CO School District GO | 5.000% | 12/1/35 | 3,335 | 3,724 |
| Eagle County CO School District GO | 5.000% | 12/1/36 | 1,400 | 1,558 |
| El Paso County CO School District No. 20 Academy GO | 5.000% | 12/15/33 | 2,900 | 3,282 |
| El Paso County CO School District No. 20 Academy GO | 5.000% | 12/15/34 | 2,015 | 2,274 |
169
Intermediate-Term Tax-Exempt Fund
| | | | |
| Face | Market |
| Maturity | Amount | Value• |
| Coupon | Date | ($000) | ($000) |
| El Paso County CO School District No. 20 Academy GO | 5.000% | 12/15/35 | 1,775 | 1,996 |
| El Paso County CO School District No. 20 Academy GO | 5.000% | 12/15/36 | 2,000 | 2,242 |
| El Paso County CO School District No. 20 Academy GO | 5.000% | 12/15/37 | 2,000 | 2,237 |
| El Paso County CO School District No. 3 Widefield GO | 5.000% | 12/1/28 | 620 | 679 |
| El Paso County CO School District No. 3 Widefield GO | 5.000% | 12/1/32 | 710 | 775 |
| Garfield, Pitkin, & Eagle County CO School District GO | 4.000% | 12/15/32 | 4,010 | 4,174 |
| Garfield, Pitkin, & Eagle County CO School District GO | 4.000% | 12/15/33 | 7,535 | 7,794 |
| Garfield, Pitkin, & Eagle County CO School District GO | 4.000% | 12/15/34 | 7,075 | 7,300 |
| 1 Interlocken CO Metropolitan District GO | 5.000% | 12/1/26 (4) | 500 | 569 |
| 1 Interlocken CO Metropolitan District GO | 5.000% | 12/1/26 (4) | 200 | 228 |
| 1 Interlocken CO Metropolitan District GO | 5.000% | 12/1/27 (4) | 1,000 | 1,144 |
| 1 Interlocken CO Metropolitan District GO | 5.000% | 12/1/28 (4) | 750 | 861 |
| Jefferson County CO School District No. R-1 GO | 4.000% | 12/15/29 | 1,000 | 1,072 |
| Larimer County CO School District No. R-1 Poudre GO | 5.000% | 12/15/28 | 2,240 | 2,659 |
| Larimer County CO School District No. R-1 Poudre GO | 5.000% | 12/15/29 | 2,000 | 2,358 |
| Larimer County CO School District No. R-1 Poudre GO | 5.000% | 12/15/30 | 3,000 | 3,503 |
| Larimer County CO School District No. R-1 Poudre GO | 4.000% | 12/15/32 | 3,000 | 3,140 |
| Larimer County CO School District No. R-1 Poudre GO | 4.000% | 12/15/33 | 2,500 | 2,606 |
| Larimer County CO School District No. R-1 Poudre GO | 4.000% | 12/15/35 | 3,340 | 3,441 |
| Mesa County CO School District No. 51 GO | 5.000% | 12/1/29 | 2,000 | 2,318 |
| Mesa County CO School District No. 51 GO | 5.000% | 12/1/30 | 1,795 | 2,069 |
| Park Creek CO Metropolitan District Limited Property Tax Revenue | 5.000% | 12/1/23 | 1,520 | 1,677 |
| Park Creek CO Metropolitan District Limited Property Tax Revenue | 5.000% | 12/1/26 | 1,000 | 1,127 |
| Park Creek CO Metropolitan District Limited Property Tax Revenue | 5.000% | 12/1/29 | 2,000 | 2,216 |
| Park Creek CO Metropolitan District Limited Property Tax Revenue | 5.000% | 12/1/31 | 1,500 | 1,650 |
| Park Creek CO Metropolitan District Limited Property Tax Revenue | 5.000% | 12/1/33 | 1,080 | 1,178 |
| Park Creek CO Metropolitan District Limited Property Tax Revenue | 5.000% | 12/1/34 | 1,250 | 1,359 |
| Park Creek CO Metropolitan District Limited Property Tax Revenue | 5.000% | 12/1/35 | 1,125 | 1,216 |
| Public Authority for Colorado Energy Revenue | 6.250% | 11/15/28 | 2,000 | 2,424 |
| Regional Transportation District of Colorado COP | 5.000% | 6/1/20 (Prere.) | 2,000 | 2,089 |
| Regional Transportation District of Colorado COP | 5.000% | 6/1/20 (Prere.) | 1,000 | 1,044 |
| Regional Transportation District of Colorado COP | 5.000% | 6/1/20 (Prere.) | 1,000 | 1,044 |
| Regional Transportation District of Colorado Sales Tax Revenue | | | | |
| (Denver Transit Partners Eagle P3 Project) | 6.000% | 1/15/26 | 2,970 | 3,073 |
| Regional Transportation District of Colorado Sales Tax Revenue (FasTracks Project) | 5.000% | 11/1/24 | 5,000 | 5,489 |
| Regional Transportation District of Colorado Sales Tax Revenue (FasTracks Project) | 5.000% | 11/1/25 | 5,875 | 6,433 |
| Southlands CO Metropolitan District GO | 3.500% | 12/1/27 | 600 | 584 |
| 1 Thornton CO COP | 4.000% | 12/1/35 | 3,940 | 3,992 |
| 1 Thornton CO COP | 4.000% | 12/1/36 | 4,100 | 4,127 |
| University of Colorado Enterprise System Revenue | 5.500% | 6/1/19 (Prere.) | 2,750 | 2,807 |
| University of Colorado Enterprise System Revenue | 5.000% | 6/1/22 (Prere.) | 2,720 | 2,979 |
| University of Colorado Enterprise System Revenue | 5.000% | 6/1/22 (Prere.) | 1,850 | 2,026 |
| University of Colorado Enterprise System Revenue | 5.000% | 6/1/22 (Prere.) | 1,950 | 2,136 |
| University of Colorado Enterprise System Revenue | 5.000% | 6/1/22 (Prere.) | 3,155 | 3,455 |
| University of Colorado Enterprise System Revenue | 5.000% | 6/1/22 (Prere.) | 1,250 | 1,369 |
| University of Colorado Enterprise System Revenue | 5.000% | 6/1/22 (Prere.) | 2,085 | 2,283 |
| University of Colorado Enterprise System Revenue | 5.000% | 6/1/22 (Prere.) | 2,480 | 2,716 |
| University of Colorado Enterprise System Revenue | 5.000% | 6/1/22 (Prere.) | 2,445 | 2,678 |
| University of Colorado Enterprise System Revenue | 5.000% | 6/1/24 (Prere.) | 1,500 | 1,698 |
| University of Colorado Enterprise System Revenue | 5.000% | 6/1/24 (Prere.) | 2,000 | 2,264 |
| University of Colorado Enterprise System Revenue | 5.000% | 6/1/24 (Prere.) | 2,250 | 2,548 |
| University of Colorado Enterprise System Revenue | 5.000% | 6/1/26 | 3,030 | 3,532 |
| University of Colorado Enterprise System Revenue | 5.000% | 6/1/27 | 2,000 | 2,350 |
| University of Colorado Enterprise System Revenue | 4.000% | 6/1/28 | 5,600 | 5,939 |
| University of Colorado Enterprise System Revenue | 5.000% | 6/1/28 | 3,540 | 4,177 |
| University of Colorado Enterprise System Revenue | 5.000% | 6/1/29 | 4,000 | 4,676 |
| University of Colorado Enterprise System Revenue | 5.000% | 6/1/30 | 2,525 | 2,909 |
| University of Colorado Enterprise System Revenue | 5.000% | 6/1/30 | 5,015 | 5,822 |
| University of Colorado Enterprise System Revenue | 4.000% | 6/1/33 | 3,700 | 3,855 |
| University of Colorado Enterprise System Revenue | 4.000% | 6/1/33 | 1,375 | 1,439 |
| University of Colorado Enterprise System Revenue | 4.000% | 6/1/34 | 10,000 | 10,387 |
| University of Colorado Enterprise System Revenue | 4.000% | 6/1/35 | 5,100 | 5,268 |
| University of Colorado Enterprise System Revenue | 4.000% | 6/1/36 | 8,355 | 8,583 |
| University of Colorado Hospital Authority Revenue | 5.000% | 11/15/27 | 6,000 | 6,558 |
| University of Colorado Hospital Authority Revenue | 6.000% | 11/15/29 | 9,850 | 10,220 |
| | | | 928,294 |
| Connecticut (1.3%) | | | | |
| Connecticut GO | 5.000% | 3/15/20 | 7,770 | 8,037 |
| 2 Connecticut GO | 2.850% | 4/15/20 | 17,000 | 17,169 |
170
Intermediate-Term Tax-Exempt Fund
| | | | |
| Face | Market |
| Maturity | Amount | Value• |
| Coupon | Date | ($000) | ($000) |
| Connecticut GO | 5.000% | 11/1/20 | 4,970 | 5,210 |
| 2 Connecticut GO | 2.350% | 3/1/21 | 4,305 | 4,313 |
| Connecticut GO | 5.000% | 11/1/21 | 5,000 | 5,341 |
| Connecticut GO | 4.000% | 3/15/22 | 14,405 | 14,994 |
| Connecticut GO | 5.000% | 4/15/22 | 6,005 | 6,451 |
| Connecticut GO | 5.000% | 5/15/22 | 11,310 | 11,998 |
| Connecticut GO | 5.000% | 6/1/22 | 8,010 | 8,623 |
| Connecticut GO | 5.000% | 6/15/22 | 9,355 | 10,079 |
| Connecticut GO | 5.000% | 9/15/22 | 6,830 | 7,385 |
| Connecticut GO | 5.000% | 11/15/22 | 5,000 | 5,419 |
| Connecticut GO | 5.000% | 11/15/22 | 7,120 | 7,717 |
| Connecticut GO | 5.000% | 3/15/23 | 14,555 | 15,807 |
| Connecticut GO | 5.000% | 11/1/23 | 10,125 | 10,764 |
| Connecticut GO | 5.000% | 11/15/23 | 7,715 | 8,446 |
| Connecticut GO | 5.000% | 11/15/23 | 14,275 | 15,628 |
| Connecticut GO | 5.000% | 3/15/24 | 10,000 | 10,979 |
| Connecticut GO | 5.000% | 6/1/24 | 10,000 | 10,691 |
| Connecticut GO | 5.000% | 9/1/24 | 20,000 | 22,057 |
| Connecticut GO | 5.000% | 10/15/24 | 10,805 | 11,609 |
| Connecticut GO | 5.000% | 11/15/24 | 6,440 | 7,116 |
| Connecticut GO | 5.000% | 11/15/24 | 10,025 | 11,078 |
| Connecticut GO | 5.000% | 3/1/25 | 19,440 | 20,917 |
| Connecticut GO | 5.000% | 9/1/25 | 19,395 | 21,227 |
| Connecticut GO | 5.000% | 9/1/26 | 13,170 | 14,348 |
| Connecticut GO | 5.000% | 11/1/26 | 9,650 | 10,165 |
| Connecticut GO | 5.000% | 3/15/27 | 9,800 | 10,708 |
| Connecticut GO | 5.000% | 3/1/30 | 8,900 | 9,544 |
| Connecticut GO | 5.000% | 4/15/32 | 4,000 | 4,178 |
| Connecticut GO | 5.000% | 8/15/32 | 20,000 | 21,193 |
| 7 Connecticut GO TOB VRDO | 1.640% | 11/7/18 LOC | 24,750 | 24,750 |
| Connecticut Health & Educational Facilities Authority Revenue (Hartford Healthcare) | 5.000% | 7/1/32 | 4,145 | 4,356 |
| Connecticut Health & Educational Facilities Authority Revenue (Quinnipiac University) | 5.000% | 7/1/24 | 5,475 | 6,059 |
| Connecticut Health & Educational Facilities Authority Revenue (Quinnipiac University) | 5.000% | 7/1/25 | 5,190 | 5,806 |
| Connecticut Health & Educational Facilities Authority Revenue (Stamford Hospital) | 5.000% | 7/1/32 | 15,000 | 15,904 |
| Connecticut Health & Educational Facilities Authority Revenue (University of New Haven) | 5.000% | 7/1/26 | 1,000 | 1,105 |
| Connecticut Health & Educational Facilities Authority Revenue (University of New Haven) | 5.000% | 7/1/27 | 1,150 | 1,273 |
| Connecticut Health & Educational Facilities Authority Revenue (University of New Haven) | 5.000% | 7/1/28 | 1,125 | 1,248 |
| Connecticut Health & Educational Facilities Authority Revenue (University of New Haven) | 5.000% | 7/1/29 | 1,500 | 1,652 |
| Connecticut Health & Educational Facilities Authority Revenue (University of New Haven) | 5.000% | 7/1/30 | 2,390 | 2,618 |
| Connecticut Health & Educational Facilities Authority Revenue (Wesleyan University) | 5.000% | 7/1/20 (Prere.) | 8,550 | 8,955 |
| Connecticut Health & Educational Facilities Authority Revenue (Yale University) PUT | 5.000% | 7/1/22 | 33,360 | 36,507 |
| Connecticut Health & Educational Facilities Authority Revenue (Yale University) PUT | 5.000% | 2/1/23 | 32,275 | 35,671 |
| Connecticut Health & Educational Facilities Authority Revenue (Yale University) PUT | 2.000% | 7/1/26 | 8,000 | 7,383 |
| Connecticut Health & Educational Facilities Authority Revenue (Yale University) PUT | 5.000% | 2/1/28 | 24,340 | 28,567 |
| Connecticut Special Tax Revenue | 5.000% | 10/1/31 | 10,105 | 11,178 |
| Connecticut Special Tax Revenue | 5.000% | 10/1/32 | 12,080 | 13,310 |
| Connecticut Special Tax Revenue | 5.000% | 10/1/34 | 18,005 | 19,697 |
| Connecticut Special Tax Revenue | 5.000% | 10/1/36 | 5,000 | 5,431 |
| Connecticut Special Tax Revenue (Transportation Infrastructure) | 5.000% | 9/1/22 | 5,000 | 5,423 |
| Connecticut Special Tax Revenue (Transportation Infrastructure) | 5.000% | 11/1/24 | 10,880 | 10,880 |
| Connecticut Special Tax Revenue (Transportation Infrastructure) | 5.000% | 1/1/25 | 19,455 | 21,133 |
| Connecticut Special Tax Revenue (Transportation Infrastructure) | 5.000% | 11/1/25 | 12,515 | 12,515 |
| Connecticut Special Tax Revenue (Transportation Infrastructure) | 5.000% | 1/1/26 | 8,225 | 8,898 |
| Connecticut Special Tax Revenue (Transportation Infrastructure) | 5.000% | 1/1/27 | 15,030 | 16,198 |
| Connecticut Special Tax Revenue (Transportation Infrastructure) | 5.000% | 1/1/28 | 11,000 | 12,338 |
| Connecticut Special Tax Revenue (Transportation Infrastructure) | 5.000% | 1/1/31 | 15,015 | 16,532 |
| Connecticut Special Tax Revenue (Transportation Infrastructure) | 5.000% | 9/1/31 | 10,025 | 10,828 |
| Connecticut Special Tax Revenue (Transportation Infrastructure) | 5.000% | 9/1/32 | 6,000 | 6,464 |
| Connecticut Special Tax Revenue (Transportation Infrastructure) | 5.000% | 1/1/33 | 15,000 | 16,369 |
| Connecticut Special Tax Revenue (Transportation Infrastructure) | 5.000% | 9/1/34 | 3,745 | 4,010 |
| Connecticut Special Tax Revenue (Transportation Infrastructure) | 5.000% | 8/1/35 | 1,900 | 2,047 |
| Harbor Point CT Infrastructure Improvement District Revenue (Harbor Point Project) | 5.000% | 4/1/30 | 11,595 | 12,263 |
| Hartford County CT Metropolitan District GO | 5.000% | 7/15/26 | 1,000 | 1,134 |
| Hartford County CT Metropolitan District GO | 5.000% | 7/15/27 | 1,595 | 1,821 |
| Hartford County CT Metropolitan District GO | 5.000% | 7/15/29 | 1,845 | 2,105 |
| Hartford County CT Metropolitan District GO | 5.000% | 7/15/30 | 1,350 | 1,532 |
| Hartford County CT Metropolitan District GO | 5.000% | 7/15/31 | 1,365 | 1,541 |
| Hartford County CT Metropolitan District GO | 5.000% | 7/15/32 | 1,755 | 1,971 |
| Hartford County CT Metropolitan District GO | 5.000% | 7/15/35 | 1,750 | 1,940 |
| University of Connecticut GO | 5.000% | 2/15/27 | 8,000 | 8,780 |
| | | | 757,383 |
171
Intermediate-Term Tax-Exempt Fund
| | | | |
| Face | Market |
| Maturity | Amount | Value• |
| Coupon | Date | ($000) | ($000) |
| Delaware (0.1%) | | | | |
| Delaware GO | 5.000% | 2/1/24 | 3,000 | 3,389 |
| Delaware GO | 5.000% | 2/1/25 | 2,000 | 2,294 |
| Delaware GO | 5.000% | 1/1/26 | 2,000 | 2,319 |
| Delaware GO | 5.000% | 2/1/26 | 3,000 | 3,481 |
| Delaware GO | 5.000% | 1/1/27 | 6,000 | 7,024 |
| Delaware GO | 5.000% | 3/1/27 | 3,000 | 3,519 |
| Delaware GO | 5.000% | 1/1/28 | 7,000 | 8,268 |
| Delaware Transportation Authority Transportation System Revenue | 5.000% | 7/1/19 (Prere.) | 10,000 | 10,204 |
| Delaware Transportation Authority Transportation System Revenue | 5.000% | 7/1/21 | 8,300 | 8,895 |
| Delaware Transportation Authority Transportation System Revenue | 5.000% | 7/1/22 | 6,000 | 6,566 |
| University of Delaware Revenue | 5.000% | 11/1/22 | 1,000 | 1,028 |
| | | | 56,987 |
| District of Columbia (0.4%) | | | | |
| District of Columbia GO | 5.000% | 6/1/21 | 5,000 | 5,350 |
| District of Columbia GO | 5.000% | 6/1/28 | 2,030 | 2,352 |
| District of Columbia GO | 5.000% | 6/1/29 | 1,040 | 1,198 |
| District of Columbia GO | 5.000% | 6/1/31 | 5,500 | 6,237 |
| District of Columbia GO | 5.000% | 6/1/31 | 7,300 | 8,326 |
| District of Columbia GO | 5.000% | 6/1/32 | 8,270 | 9,347 |
| District of Columbia GO | 4.000% | 6/1/33 | 7,000 | 7,231 |
| District of Columbia GO | 5.000% | 6/1/33 | 19,325 | 21,769 |
| District of Columbia GO | 5.000% | 6/1/34 | 5,020 | 5,669 |
| District of Columbia GO | 5.000% | 6/1/34 | 10,000 | 11,235 |
| District of Columbia GO | 5.000% | 6/1/35 | 4,380 | 4,904 |
| District of Columbia GO | 5.000% | 6/1/36 | 17,345 | 19,450 |
| District of Columbia GO | 5.000% | 6/1/36 | 10,250 | 11,494 |
| District of Columbia GO | 5.000% | 6/1/37 | 3,345 | 3,743 |
| District of Columbia GO | 5.000% | 6/1/38 | 10,920 | 12,185 |
| District of Columbia Hospital Revenue (Children’s Hospital Obligated Group) | 5.000% | 7/15/24 | 2,150 | 2,416 |
| District of Columbia Hospital Revenue (Children’s Hospital Obligated Group) | 5.000% | 7/15/25 | 2,325 | 2,642 |
| District of Columbia Income Tax Revenue | 5.000% | 12/1/22 | 3,500 | 3,866 |
| District of Columbia Income Tax Revenue | 5.000% | 12/1/24 | 4,000 | 4,407 |
| District of Columbia Income Tax Revenue | 5.000% | 12/1/24 | 9,500 | 10,466 |
| District of Columbia Income Tax Revenue | 5.000% | 12/1/32 | 5,210 | 5,670 |
| District of Columbia Revenue (Methodist Home of the District of Columbia) | 4.500% | 1/1/25 | 1,470 | 1,424 |
| District of Columbia Revenue (National Public Radio, Inc.) | 5.000% | 4/1/25 | 4,170 | 4,695 |
| District of Columbia Revenue (National Public Radio, Inc.) | 5.000% | 4/1/26 | 3,985 | 4,520 |
| District of Columbia Revenue (National Public Radio, Inc.) | 5.000% | 4/1/28 | 2,150 | 2,416 |
| District of Columbia Water & Sewer Authority Public Utility Revenue | 5.000% | 10/1/31 | 9,595 | 10,432 |
| District of Columbia Water & Sewer Authority Public Utility Revenue | 5.000% | 10/1/31 | 5,115 | 5,561 |
| District of Columbia Water & Sewer Authority Public Utility Revenue | 5.000% | 10/1/32 | 5,000 | 5,430 |
| District of Columbia Water & Sewer Authority Public Utility Revenue | 5.000% | 10/1/32 | 5,000 | 5,430 |
| Metropolitan Washington DC/VA Airports Authority Dulles Toll Road Revenue | | | | |
| (Dulles Metrorail & Capital Improvement Projects) | 0.000% | 10/1/37 | 51,700 | 21,512 |
| Washington DC Convention & Sports Authority Revenue | 5.000% | 10/1/25 | 2,000 | 2,277 |
| Washington DC Convention & Sports Authority Revenue | 5.000% | 10/1/26 | 6,500 | 7,469 |
| Washington DC Convention & Sports Authority Revenue | 5.000% | 10/1/27 | 6,020 | 6,971 |
| Washington DC Convention & Sports Authority Revenue | 5.000% | 10/1/28 | 5,020 | 5,792 |
| Washington DC Convention & Sports Authority Revenue | 5.000% | 10/1/29 | 5,000 | 5,743 |
| | | | 249,629 |
| Florida (5.0%) | | | | |
| Alachua County FL Health Facilities Authority Revenue | | | | |
| (Shands Teaching Hospital & Clinics, Inc. Project) | 5.000% | 12/1/25 | 1,000 | 1,108 |
| Alachua County FL Health Facilities Authority Revenue | | | | |
| (Shands Teaching Hospital & Clinics, Inc. Project) | 5.000% | 12/1/26 | 1,250 | 1,378 |
| Alachua County FL Health Facilities Authority Revenue | | | | |
| (Shands Teaching Hospital & Clinics, Inc. Project) | 5.000% | 12/1/27 | 1,325 | 1,454 |
| Alachua County FL Health Facilities Authority Revenue | | | | |
| (Shands Teaching Hospital & Clinics, Inc. Project) | 5.000% | 12/1/34 | 22,010 | 23,641 |
| Brevard County FL Health Facilities Authority Revenue (Health First Inc. Project) | 5.000% | 4/1/22 | 5,050 | 5,445 |
| Brevard County FL Health Facilities Authority Revenue (Health First Inc. Project) | 5.000% | 4/1/23 | 1,110 | 1,216 |
| Brevard County FL Health Facilities Authority Revenue (Health First Inc. Project) | 5.000% | 4/1/23 | 5,065 | 5,549 |
| Brevard County FL Health Facilities Authority Revenue (Health First Inc. Project) | 5.000% | 4/1/24 | 2,935 | 3,257 |
| Brevard County FL Health Facilities Authority Revenue (Health First Inc. Project) | 5.000% | 4/1/24 | 5,595 | 6,156 |
| Brevard County FL Health Facilities Authority Revenue (Health First Inc. Project) | 5.000% | 4/1/25 | 2,440 | 2,720 |
| Brevard County FL Health Facilities Authority Revenue (Health First Inc. Project) | 5.000% | 4/1/25 | 5,890 | 6,460 |
| Brevard County FL Health Facilities Authority Revenue (Health First Inc. Project) | 5.000% | 4/1/26 | 6,200 | 6,781 |
| Brevard County FL Health Facilities Authority Revenue (Health First Inc. Project) | 5.000% | 4/1/27 | 2,620 | 2,898 |
172
Intermediate-Term Tax-Exempt Fund
| | | | | |
| Face | Market |
| Maturity | Amount | Value• |
| | Coupon | Date | ($000) | ($000) |
| Brevard County FL Health Facilities Authority Revenue (Health First Inc. Project) | 5.000% | 4/1/27 | 6,280 | 6,844 |
| Brevard County FL Health Facilities Authority Revenue (Health First Inc. Project) | 5.000% | 4/1/28 | 5,795 | 6,367 |
| Brevard County FL Health Facilities Authority Revenue (Health First Inc. Project) | 5.000% | 4/1/29 | 4,355 | 4,760 |
| Brevard County FL Health Facilities Authority Revenue (Health First Inc. Project) | 5.000% | 4/1/30 | 3,290 | 3,579 |
| Brevard County FL Health Facilities Authority Revenue (Health First Inc. Project) | 5.000% | 4/1/31 | 4,500 | 4,874 |
| Brevard County FL Health Facilities Authority Revenue (Health First Inc. Project) | 5.000% | 4/1/31 | 7,000 | 7,497 |
| Brevard County FL Health Facilities Authority Revenue (Health First Inc. Project) | 5.000% | 4/1/32 | 9,000 | 9,706 |
| Brevard County FL Health Facilities Authority Revenue (Health First Inc. Project) | 5.000% | 4/1/33 | 6,750 | 7,252 |
| Brevard County FL School Board COP | 5.000% | 7/1/25 | 1,000 | 1,106 |
| Broward County FL Airport System Revenue | 5.000% | 10/1/25 | 2,000 | 2,165 |
| Broward County FL Airport System Revenue | 5.000% | 10/1/26 | 2,745 | 2,966 |
| Broward County FL Airport System Revenue | 5.000% | 10/1/27 | 5,785 | 6,240 |
| Broward County FL Airport System Revenue | 5.000% | 10/1/28 | 5,000 | 5,384 |
| Broward County FL Airport System Revenue | 5.500% | 10/1/31 | 7,210 | 8,087 |
| Broward County FL Airport System Revenue | 5.500% | 10/1/32 | 7,610 | 8,521 |
| Broward County FL Airport System Revenue | 5.500% | 10/1/33 | 8,025 | 8,970 |
| Broward County FL GO | 5.000% | 1/1/20 | 9,185 | 9,499 |
| Broward County FL Port Facilities Revenue | 5.500% | 9/1/29 | 5,500 | 5,644 |
| Broward County FL School Board COP | 5.000% | 7/1/26 | 15,220 | 17,492 |
| Cape Coral FL Water & Sewer System Revenue | 5.000% | 10/1/27 | 1,015 | 1,176 |
| Cape Coral FL Water & Sewer System Revenue | 5.000% | 10/1/29 | 1,100 | 1,261 |
| Cape Coral FL Water & Sewer System Revenue | 4.000% | 10/1/35 | 1,500 | 1,517 |
| Cape Coral FL Water & Sewer System Revenue | 4.000% | 10/1/36 | 1,400 | 1,410 |
| Cape Coral FL Water & Sewer System Revenue | 4.000% | 10/1/37 | 4,000 | 4,006 |
| Capital Trust Agency Florida Retirement Facility Revenue | | | | |
| | (Sarasota-Manatee Jewish Housing Council Inc.) | 5.000% | 7/1/27 | 2,915 | 3,044 |
| Capital Trust Agency Florida Retirement Facility Revenue | | | | |
| | (Sarasota-Manatee Jewish Housing Council Inc.) | 5.000% | 7/1/32 | 2,040 | 2,076 |
| Central Florida Expressway Authority Revenue | 5.000% | 7/1/27 | 5,430 | 6,220 |
| Central Florida Expressway Authority Revenue | 5.000% | 7/1/28 | 4,135 | 4,713 |
| Central Florida Expressway Authority Revenue | 4.000% | 7/1/32 | 6,500 | 6,694 |
| Central Florida Expressway Authority Revenue | 4.000% | 7/1/33 | 9,500 | 9,720 |
| Central Florida Expressway Authority Revenue | 5.000% | 7/1/33 | 4,830 | 5,403 |
| Central Florida Expressway Authority Revenue | 5.000% | 7/1/34 | 7,035 | 7,829 |
| Central Florida Expressway Authority Revenue | 5.000% | 7/1/37 | 2,000 | 2,211 |
| Central Florida Expressway Authority Revenue | 5.000% | 7/1/38 | 3,855 | 4,250 |
| Citizens Property Insurance Corp. Florida Revenue (Coastal Account) | 5.000% | 6/1/20 | 19,000 | 19,571 |
| Citizens Property Insurance Corp. Florida Revenue (Coastal Account) | 5.000% | 6/1/22 | 30,835 | 33,220 |
| Citizens Property Insurance Corp. Florida Revenue (Coastal Account) | 5.000% | 6/1/25 | 20,645 | 23,217 |
| Citizens Property Insurance Corp. Florida Revenue | | | | |
| | (Personal Lines Account/Commercial Lines Account) | 5.000% | 6/1/19 | 19,150 | 19,467 |
| Citizens Property Insurance Corp. Florida Revenue | | | | |
| | (Personal Lines Account/Commercial Lines Account) | 5.000% | 6/1/20 | 21,100 | 21,982 |
| 1,17 Cityplace FL Community Development District Special Assessment Revenue | 0.000% | 5/1/28 (4) | 3,000 | 2,326 |
| 1,6 Cityplace FL Community Development District Special Assessment Revenue | 0.000% | 5/1/33 (4) | 4,000 | 3,026 |
| Duval County FL School Board COP | 5.000% | 7/1/27 | 4,025 | 4,526 |
| Duval County FL School Board COP | 5.000% | 7/1/33 | 14,415 | 15,951 |
| Escambia County FL Sales Tax Revenue | 5.000% | 10/1/33 | 3,180 | 3,540 |
| Escambia County FL Sales Tax Revenue | 5.000% | 10/1/34 | 2,340 | 2,597 |
| Escambia County FL Sales Tax Revenue | 5.000% | 10/1/35 | 3,510 | 3,885 |
| Escambia County FL Sales Tax Revenue | 5.000% | 10/1/36 | 2,185 | 2,409 |
| Escambia County FL Sales Tax Revenue | 5.000% | 10/1/37 | 2,870 | 3,160 |
| Florida Board of Education Lottery Revenue | 5.000% | 7/1/19 | 2,910 | 2,969 |
| Florida Board of Education Lottery Revenue | 5.000% | 7/1/26 | 25,950 | 30,251 |
| Florida Board of Education Lottery Revenue | 5.000% | 7/1/26 | 3,335 | 3,888 |
| Florida Board of Education Lottery Revenue | 4.000% | 7/1/27 | 2,750 | 2,878 |
| Florida Board of Education Public Education Capital Outlay GO | 5.000% | 6/1/19 | 2,905 | 2,957 |
| Florida Board of Education Public Education Capital Outlay GO | 5.000% | 6/1/19 (Prere.) | 2,125 | 2,184 |
| Florida Board of Education Public Education Capital Outlay GO | 5.000% | 6/1/20 | 9,020 | 9,430 |
| Florida Board of Education Public Education Capital Outlay GO | 5.000% | 6/1/20 | 10,000 | 10,455 |
| Florida Board of Education Public Education Capital Outlay GO | 5.000% | 6/1/20 | 5,585 | 5,736 |
| Florida Board of Education Public Education Capital Outlay GO | 5.000% | 6/1/21 | 8,200 | 8,786 |
| Florida Board of Education Public Education Capital Outlay GO | 5.000% | 6/1/21 | 35,250 | 37,767 |
| Florida Board of Education Public Education Capital Outlay GO | 5.000% | 6/1/21 | 7,945 | 8,512 |
| Florida Board of Education Public Education Capital Outlay GO | 5.000% | 6/1/21 | 4,000 | 4,286 |
| Florida Board of Education Public Education Capital Outlay GO | 5.000% | 6/1/22 | 8,700 | 9,528 |
| Florida Board of Education Public Education Capital Outlay GO | 5.000% | 6/1/22 | 7,050 | 7,721 |
| Florida Board of Education Public Education Capital Outlay GO | 5.000% | 6/1/22 | 3,040 | 3,329 |
| Florida Board of Education Public Education Capital Outlay GO | 5.000% | 6/1/22 | 10,000 | 10,952 |
| Florida Board of Education Public Education Capital Outlay GO | 5.000% | 6/1/23 | 10,000 | 11,154 |
173
Intermediate-Term Tax-Exempt Fund
| | | | |
| Face | Market |
| Maturity | Amount | Value• |
| Coupon | Date | ($000) | ($000) |
| Florida Board of Education Public Education Capital Outlay GO | 5.000% | 6/1/23 | 10,440 | 11,644 |
| Florida Board of Education Public Education Capital Outlay GO | 6.000% | 6/1/23 | 7,000 | 8,110 |
| Florida Board of Education Public Education Capital Outlay GO | 5.000% | 6/1/25 | 20,515 | 23,205 |
| Florida Board of Education Public Education Capital Outlay GO | 4.000% | 6/1/27 | 12,000 | 12,566 |
| Florida Board of Education Public Education Capital Outlay GO | 4.000% | 6/1/28 | 13,030 | 13,609 |
| Florida Board of Education Public Education Capital Outlay GO | 4.000% | 6/1/29 | 2,700 | 2,884 |
| Florida Board of Education Public Education Capital Outlay GO | 4.000% | 6/1/29 | 16,000 | 16,666 |
| Florida Board of Education Public Education Capital Outlay GO | 5.000% | 6/1/31 | 5,000 | 5,329 |
| Florida Board of Education Public Education Capital Outlay GO | 4.000% | 6/1/32 | 16,000 | 16,754 |
| Florida Board of Education Public Education Capital Outlay GO | 4.000% | 6/1/33 | 5,570 | 5,849 |
| Florida Board of Education Public Education Capital Outlay GO | 4.000% | 6/1/35 | 15,580 | 16,200 |
| Florida Board of Education Public Education Capital Outlay GO | 4.000% | 6/1/36 | 17,715 | 18,340 |
| Florida Department of Environmental Protection & Preservation Revenue | 5.000% | 7/1/20 | 4,025 | 4,211 |
| Florida Department of Transportation GO | 5.000% | 7/1/19 | 7,895 | 8,056 |
| Florida Department of Transportation GO | 5.000% | 7/1/21 | 4,120 | 4,423 |
| Florida Department of Transportation GO | 5.000% | 7/1/22 | 22,060 | 24,239 |
| Florida Department of Transportation GO | 5.000% | 7/1/26 | 5,540 | 6,446 |
| Florida Department of Transportation GO | 5.000% | 7/1/27 | 4,500 | 5,276 |
| Florida Department of Transportation GO | 4.000% | 7/1/34 | 4,030 | 4,180 |
| Florida Department of Transportation GO | 4.000% | 7/1/35 | 8,350 | 8,627 |
| Florida Department of Transportation GO | 4.000% | 7/1/36 | 7,000 | 7,203 |
| Florida GO | 4.000% | 6/1/27 | 15,000 | 15,795 |
| Florida Higher Educational Facilities Financing Authority Revenue (Jacksonville University) | 4.500% | 6/1/33 | 2,800 | 2,824 |
| Florida Higher Educational Facilities Financing Authority Revenue (Nova Southeastern University) | 5.000% | 4/1/33 | 1,800 | 1,949 |
| Florida Higher Educational Facilities Financing Authority Revenue (Nova Southeastern University) | 5.000% | 4/1/34 | 1,500 | 1,620 |
| Florida Higher Educational Facilities Financing Authority Revenue (Ringling College Project) | 5.000% | 3/1/30 | 2,045 | 2,208 |
| Florida Higher Educational Facilities Financing Authority Revenue (Ringling College Project) | 5.000% | 3/1/33 | 2,305 | 2,460 |
| Florida Higher Educational Facilities Financing Authority Revenue (Ringling College Project) | 5.000% | 3/1/35 | 3,615 | 3,842 |
| Florida Higher Educational Facilities Financing Authority Revenue (Ringling College Project) | 5.000% | 3/1/36 | 3,795 | 4,023 |
| Florida Higher Educational Facilities Financing Authority Revenue (University of Tampa Project) | 5.000% | 4/1/32 | 1,000 | 1,067 |
| Florida Mid-Bay Bridge Authority Revenue | 5.000% | 10/1/23 | 2,060 | 2,271 |
| Florida Mid-Bay Bridge Authority Revenue | 5.000% | 10/1/24 | 1,750 | 1,949 |
| Florida Mid-Bay Bridge Authority Revenue | 5.000% | 10/1/25 | 1,250 | 1,403 |
| Florida Mid-Bay Bridge Authority Revenue | 5.000% | 10/1/30 | 2,750 | 2,978 |
| Florida Municipal Power Agency Revenue | 5.250% | 10/1/19 (4) | 10,000 | 10,291 |
| Florida Municipal Power Agency Revenue | 5.750% | 10/1/19 (Prere.) | 3,000 | 3,102 |
| Florida Municipal Power Agency Revenue | 5.000% | 10/1/21 | 5,000 | 5,375 |
| Florida Municipal Power Agency Revenue | 5.000% | 10/1/23 | 1,750 | 1,951 |
| Florida Municipal Power Agency Revenue | 5.000% | 10/1/24 | 1,065 | 1,205 |
| Florida Municipal Power Agency Revenue | 5.000% | 10/1/25 | 1,730 | 1,981 |
| Florida Municipal Power Agency Revenue | 5.000% | 10/1/26 | 1,060 | 1,206 |
| Florida Municipal Power Agency Revenue | 5.000% | 10/1/27 | 1,370 | 1,550 |
| Florida Municipal Power Agency Revenue | 4.000% | 10/1/28 | 3,500 | 3,732 |
| Florida Municipal Power Agency Revenue | 5.000% | 10/1/28 | 1,370 | 1,544 |
| Florida Municipal Power Agency Revenue | 5.000% | 10/1/29 | 3,475 | 3,901 |
| Florida Municipal Power Agency Revenue | 5.000% | 10/1/29 | 5,025 | 5,705 |
| Florida Municipal Power Agency Revenue | 5.000% | 10/1/30 | 10,020 | 11,324 |
| Florida Municipal Power Agency Revenue | 5.000% | 10/1/31 | 8,500 | 9,568 |
| Florida Ports Financing Commission Revenue | 5.000% | 10/1/24 | 2,075 | 2,219 |
| Florida Ports Financing Commission Revenue | 5.000% | 10/1/26 | 1,420 | 1,519 |
| Florida Ports Financing Commission Revenue | 5.000% | 10/1/28 | 2,000 | 2,139 |
| Florida Turnpike Authority Revenue | 5.000% | 7/1/25 | 9,275 | 10,653 |
| Florida Turnpike Authority Revenue | 4.000% | 7/1/33 | 9,030 | 9,282 |
| Florida Turnpike Authority Revenue | 4.000% | 7/1/34 | 7,000 | 7,176 |
| Florida Turnpike Authority Revenue | 4.000% | 7/1/34 | 12,355 | 12,667 |
| Florida Water Pollution Control Financing Corp. Revenue | 5.000% | 1/15/20 | 1,254 | 1,262 |
| Fort Lauderdale FL Water & Sewer Revenue | 4.000% | 3/1/37 | 4,645 | 4,756 |
| Fort Lauderdale FL Water & Sewer Revenue | 4.000% | 9/1/37 | 4,770 | 4,884 |
| Fort Lauderdale FL Water & Sewer Revenue | 4.000% | 3/1/38 | 4,840 | 4,926 |
| Gainesville FL Utilities System Revenue | 5.000% | 10/1/25 | 3,540 | 4,077 |
| Gainesville FL Utilities System Revenue | 5.000% | 10/1/26 | 3,510 | 4,087 |
| Gainesville FL Utilities System Revenue | 5.000% | 10/1/27 | 3,010 | 3,524 |
| Gainesville FL Utilities System Revenue | 5.000% | 10/1/28 | 5,000 | 5,811 |
| Gainesville FL Utilities System Revenue | 5.000% | 10/1/29 | 7,050 | 8,146 |
| Gainesville FL Utilities System Revenue | 5.000% | 10/1/30 | 4,000 | 4,598 |
| Gainesville FL Utilities System Revenue | 5.000% | 10/1/34 | 5,000 | 5,664 |
| Gainesville FL Utilities System Revenue | 5.000% | 10/1/35 | 5,000 | 5,643 |
| Greater Orlando Aviation Authority Florida Airport Facilities Revenue | 5.000% | 10/1/25 | 1,690 | 1,777 |
| Halifax Hospital Medical Center Florida Hospital Revenue | 5.000% | 6/1/23 | 1,320 | 1,440 |
| Halifax Hospital Medical Center Florida Hospital Revenue | 5.000% | 6/1/24 | 1,110 | 1,225 |
174
Intermediate-Term Tax-Exempt Fund
| | | | |
| Face | Market |
| Maturity | Amount | Value• |
| Coupon | Date | ($000) | ($000) |
| Halifax Hospital Medical Center Florida Hospital Revenue | 5.000% | 6/1/25 | 1,365 | 1,519 |
| Halifax Hospital Medical Center Florida Hospital Revenue | 5.000% | 6/1/27 | 1,445 | 1,594 |
| Halifax Hospital Medical Center Florida Hospital Revenue | 5.000% | 6/1/28 | 2,090 | 2,293 |
| Halifax Hospital Medical Center Florida Hospital Revenue | 5.000% | 6/1/29 | 2,045 | 2,232 |
| Halifax Hospital Medical Center Florida Hospital Revenue | 5.000% | 6/1/30 | 2,000 | 2,172 |
| Hernando County FL School District COP | 5.000% | 7/1/27 (4) | 6,000 | 6,790 |
| Hernando County FL School District COP | 5.000% | 7/1/31 (4) | 5,925 | 6,577 |
| Highlands County FL Health Facilities Authority Hospital Revenue | | | | |
| (Adventist Health System/Sunbelt Obligated Group) | 5.000% | 11/15/18 (ETM) | 5 | 5 |
| Highlands County FL Health Facilities Authority Hospital Revenue | | | | |
| (Adventist Health System/Sunbelt Obligated Group) | 5.000% | 11/15/18 | 2,995 | 2,998 |
| Highlands County FL Health Facilities Authority Hospital Revenue | | | | |
| (Adventist Health System/Sunbelt Obligated Group) | 5.000% | 11/15/18 | 2,000 | 2,002 |
| Highlands County FL Health Facilities Authority Hospital Revenue | | | | |
| (Adventist Health System/Sunbelt Obligated Group) | 5.000% | 11/15/19 (Prere.) | 20 | 21 |
| Highlands County FL Health Facilities Authority Hospital Revenue | | | | |
| (Adventist Health System/Sunbelt Obligated Group) | 5.250% | 11/15/19 (Prere.) | 5 | 5 |
| Highlands County FL Health Facilities Authority Hospital Revenue | | | | |
| (Adventist Health System/Sunbelt Obligated Group) | 5.625% | 11/15/19 (Prere.) | 20 | 21 |
| Highlands County FL Health Facilities Authority Hospital Revenue | | | | |
| (Adventist Health System/Sunbelt Obligated Group) | 5.000% | 11/15/20 | 6,980 | 7,173 |
| Highlands County FL Health Facilities Authority Hospital Revenue | | | | |
| (Adventist Health System/Sunbelt Obligated Group) | 5.000% | 11/15/20 | 2,155 | 2,215 |
| Highlands County FL Health Facilities Authority Hospital Revenue | | | | |
| (Adventist Health System/Sunbelt Obligated Group) | 4.500% | 11/15/21 | 2,250 | 2,294 |
| Highlands County FL Health Facilities Authority Hospital Revenue | | | | |
| (Adventist Health System/Sunbelt Obligated Group) | 5.250% | 11/15/21 | 1,995 | 2,054 |
| Highlands County FL Health Facilities Authority Hospital Revenue | | | | |
| (Adventist Health System/Sunbelt Obligated Group) | 5.625% | 11/15/37 | 7,980 | 8,243 |
| Hillsborough County FL Community Investment Tax Revenue | 5.000% | 11/1/26 | 28,000 | 32,386 |
| Hillsborough County FL Industrial Development Authority Hospital Revenue | | | | |
| (Tampa General Hospital Project) | 5.000% | 10/1/28 | 12,300 | 13,369 |
| Hillsborough County FL Industrial Development Authority Hospital Revenue | | | | |
| (Tampa General Hospital Project) | 5.000% | 10/1/31 | 26,515 | 28,432 |
| Hillsborough County FL Industrial Development Authority Hospital Revenue | | | | |
| (Tampa General Hospital Project) | 5.000% | 10/1/34 | 3,070 | 3,263 |
| Hillsborough County FL Industrial Development Authority Revenue | | | | |
| (University Community Hospital) | 6.500% | 8/15/19 (ETM) | 790 | 818 |
| Hillsborough County FL School Board (Master Lease Program) COP | 5.000% | 7/1/22 (Prere.) | 13,590 | 14,882 |
| Hillsborough County FL School Board (Master Lease Program) COP | 5.000% | 7/1/22 (Prere.) | 5,030 | 5,508 |
| Hillsborough County FL School Board (Master Lease Program) COP | 5.000% | 7/1/27 | 8,545 | 9,285 |
| Hillsborough County FL School Board (Master Lease Program) COP | 5.000% | 7/1/27 | 2,465 | 2,851 |
| Hillsborough County FL School Board (Master Lease Program) COP | 5.000% | 7/1/28 | 410 | 445 |
| Hillsborough County FL School Board (Master Lease Program) COP | 5.000% | 7/1/28 | 5,040 | 5,796 |
| Hillsborough County FL School Board (Master Lease Program) COP | 5.000% | 7/1/29 | 15,070 | 16,326 |
| 1 Hillsborough County FL School Board (Master Lease Program) COP | 5.000% | 7/1/30 | 9,000 | 10,293 |
| Hillsborough County FL School Board COP | 5.000% | 7/1/24 | 16,305 | 17,003 |
| Hillsborough County FL School Board COP | 5.000% | 7/1/25 | 6,000 | 6,254 |
| Jacksonville FL Electric Authority Electric System Revenue | 5.000% | 4/1/20 (Prere.) | 2,500 | 2,601 |
| Jacksonville FL Electric Authority Electric System Revenue | 5.000% | 4/1/20 (Prere.) | 3,900 | 4,058 |
| Jacksonville FL Electric Authority Electric System Revenue | 5.000% | 4/1/20 (Prere.) | 2,075 | 2,159 |
| Jacksonville FL Electric Authority Electric System Revenue | 5.000% | 4/1/21 (Prere.) | 3,805 | 4,056 |
| Jacksonville FL Electric Authority Electric System Revenue | 5.000% | 10/1/22 | 635 | 689 |
| Jacksonville FL Electric Authority Electric System Revenue | 5.000% | 10/1/22 (Prere.) | 2,665 | 2,927 |
| Jacksonville FL Electric Authority Electric System Revenue | 5.000% | 10/1/22 (Prere.) | 285 | 313 |
| Jacksonville FL Electric Authority Electric System Revenue | 5.000% | 10/1/22 (Prere.) | 755 | 829 |
| Jacksonville FL Electric Authority Electric System Revenue | 5.000% | 10/1/22 (Prere.) | 1,705 | 1,872 |
| Jacksonville FL Electric Authority Electric System Revenue | 5.000% | 10/1/23 | 465 | 508 |
| Jacksonville FL Electric Authority Electric System Revenue | 5.000% | 4/1/24 (Prere.) | 1,020 | 1,149 |
| Jacksonville FL Electric Authority Electric System Revenue | 5.000% | 10/1/24 | 4,360 | 4,788 |
| Jacksonville FL Electric Authority Electric System Revenue | 5.000% | 10/1/25 | 1,305 | 1,433 |
| Jacksonville FL Electric Authority Electric System Revenue | 5.000% | 10/1/26 | 15,000 | 17,213 |
| Jacksonville FL Electric Authority Electric System Revenue | 5.000% | 10/1/27 | 2,785 | 3,052 |
| Jacksonville FL Electric Authority Electric System Revenue | 5.000% | 10/1/28 | 10,000 | 11,453 |
| Jacksonville FL Electric Authority Electric System Revenue | 5.000% | 10/1/29 | 2,355 | 2,489 |
| Jacksonville FL Electric Authority Electric System Revenue | 5.000% | 10/1/29 | 5,990 | 6,820 |
| Jacksonville FL Electric Authority Electric System Revenue | 5.000% | 10/1/29 | 980 | 1,093 |
| Jacksonville FL Electric Authority Electric System Revenue | 5.000% | 10/1/30 | 5,015 | 5,681 |
| Jacksonville FL Electric Authority Electric System Revenue | 5.000% | 10/1/31 | 7,000 | 7,901 |
| Jacksonville FL Electric Authority Electric System Revenue | 5.000% | 10/1/32 | 7,000 | 7,872 |
175
Intermediate-Term Tax-Exempt Fund
| | | | |
| Face | Market |
| Maturity | Amount | Value• |
| Coupon | Date | ($000) | ($000) |
| Jacksonville FL Electric Authority Electric System Revenue | 5.000% | 10/1/33 | 9,000 | 10,084 |
| Jacksonville FL Electric Authority Electric System Revenue | 4.000% | 10/1/35 | 2,000 | 2,024 |
| Jacksonville FL Electric Authority Electric System Revenue | 4.000% | 10/1/36 | 2,500 | 2,520 |
| Jacksonville FL Electric Authority Electric System Revenue | 4.000% | 10/1/37 | 4,000 | 4,009 |
| Jacksonville FL Electric Authority Revenue (St. John’s River Power Park) | 5.000% | 10/1/20 (ETM) | 22,255 | 23,412 |
| Jacksonville FL Electric Authority Water & Sewer Revenue | 5.000% | 10/1/26 | 1,235 | 1,408 |
| Jacksonville FL Electric Authority Water & Sewer Revenue | 5.000% | 10/1/27 | 21,000 | 24,228 |
| Jacksonville FL Electric Authority Water & Sewer Revenue | 5.000% | 10/1/28 | 3,145 | 3,589 |
| Jacksonville FL Electric Authority Water & Sewer Revenue | 5.000% | 10/1/29 | 5,580 | 6,330 |
| Jacksonville FL Electric Authority Water & Sewer Revenue | 4.000% | 10/1/30 | 3,000 | 3,099 |
| Jacksonville FL Electric Authority Water & Sewer Revenue | 5.000% | 10/1/30 | 1,925 | 2,173 |
| Jacksonville FL Electric Authority Water & Sewer Revenue | 4.000% | 10/1/33 | 11,205 | 11,596 |
| Jacksonville FL Health Care Facilities Revenue (Baptist Health System Obligated Group) | 5.000% | 8/15/29 | 2,255 | 2,565 |
| Jacksonville FL Health Care Facilities Revenue (Baptist Health System Obligated Group) | 5.000% | 8/15/31 | 1,785 | 2,007 |
| Jacksonville FL Health Care Facilities Revenue (Baptist Health System Obligated Group) | 5.000% | 8/15/33 | 1,615 | 1,803 |
| Jacksonville FL Health Care Facilities Revenue (Brooks Rehabilitation) | 5.000% | 11/1/29 | 3,890 | 4,287 |
| Jacksonville FL Health Care Facilities Revenue (Brooks Rehabilitation) | 5.000% | 11/1/30 | 3,000 | 3,287 |
| Jacksonville FL Health Care Facilities Revenue (Brooks Rehabilitation) | 5.000% | 11/1/31 | 3,790 | 4,140 |
| Jacksonville FL Health Care Facilities Revenue (Brooks Rehabilitation) | 5.000% | 11/1/32 | 4,510 | 4,908 |
| Jacksonville FL Health Care Facilities Revenue (Brooks Rehabilitation) | 5.000% | 11/1/33 | 4,730 | 5,133 |
| Jacksonville FL Health Care Facilities Revenue (Brooks Rehabilitation) | 5.000% | 11/1/34 | 4,970 | 5,382 |
| Jacksonville FL Health Care Facilities Revenue (Brooks Rehabilitation) | 5.000% | 11/1/35 | 5,220 | 5,640 |
| Jacksonville FL Health Care Facilities Revenue (Brooks Rehabilitation) | 5.000% | 11/1/36 | 5,475 | 5,894 |
| Jacksonville FL Health Care Facilities Revenue (Brooks Rehabilitation) | 5.000% | 11/1/37 | 5,755 | 6,182 |
| Jacksonville FL Health Care Facilities Revenue (Brooks Rehabilitation) | 5.000% | 11/1/38 | 2,950 | 3,130 |
| Jacksonville FL Special Revenue | 5.000% | 10/1/19 (Prere.) | 4,800 | 4,931 |
| Jacksonville FL Special Revenue | 5.000% | 10/1/20 | 15,420 | 16,168 |
| Jacksonville FL Special Revenue | 5.000% | 10/1/25 | 4,550 | 4,966 |
| Jacksonville FL Special Revenue | 5.000% | 10/1/26 | 7,710 | 8,669 |
| Jacksonville FL Special Revenue | 5.000% | 10/1/28 | 6,485 | 7,257 |
| Jacksonville FL Special Revenue | 5.000% | 10/1/29 | 7,750 | 8,651 |
| Jacksonville FL Special Revenue | 5.000% | 10/1/30 | 3,145 | 3,501 |
| Jacksonville FL Special Revenue | 5.000% | 10/1/32 | 1,750 | 1,899 |
| Jacksonville FL Special Revenue | 5.000% | 10/1/33 | 3,105 | 3,390 |
| Jacksonville FL Special Revenue | 5.000% | 10/1/34 | 1,765 | 1,924 |
| Jacksonville FL Water & Sewer Revenue | 5.000% | 10/1/28 | 2,340 | 2,684 |
| Jacksonville FL Water & Sewer Revenue | 5.000% | 10/1/27 | 7,250 | 8,352 |
| Lake County FL School Board COP | 5.000% | 6/1/28 (4) | 1,500 | 1,645 |
| Lake County FL School Board COP | 5.000% | 6/1/29 (4) | 1,750 | 1,914 |
| Lake County FL School Board COP | 5.000% | 6/1/30 (4) | 3,000 | 3,272 |
| Lake County FL School Board COP | 5.000% | 6/1/31 (4) | 5,000 | 5,477 |
| Lakeland FL Educational Facilities Revenue (Florida Southern College Project) | 5.000% | 9/1/31 | 500 | 526 |
| Lakeland FL Hospital Revenue (Lakeland Regional Health Systems) | 5.000% | 11/15/25 | 2,000 | 2,256 |
| Lakeland FL Hospital Revenue (Lakeland Regional Health Systems) | 5.000% | 11/15/27 | 5,000 | 5,645 |
| Lakeland FL Hospital Revenue (Lakeland Regional Health Systems) | 5.000% | 11/15/33 | 3,755 | 4,061 |
| Lakeland FL Hospital Revenue (Lakeland Regional Health Systems) | 5.000% | 11/15/35 | 3,135 | 3,375 |
| Lee County FL Non-Ad Valorem Revenue | 5.000% | 10/1/22 | 1,750 | 1,916 |
| Lee County FL Non-Ad Valorem Revenue | 5.000% | 10/1/23 | 2,750 | 3,061 |
| Lee County FL Non-Ad Valorem Revenue | 5.000% | 10/1/24 | 3,000 | 3,383 |
| Lee County FL School Board COP | 5.000% | 8/1/22 | 1,600 | 1,745 |
| Lee County FL School Board COP | 5.000% | 8/1/23 | 1,130 | 1,255 |
| Lee County FL School Board COP | 5.000% | 8/1/24 | 2,310 | 2,594 |
| Lee County FL School Board COP | 5.000% | 8/1/27 | 5,000 | 5,591 |
| Lee County FL School Board COP | 5.000% | 8/1/28 | 4,080 | 4,549 |
| Lee County FL School Board COP | 5.000% | 8/1/34 | 3,500 | 3,861 |
| Lee County FL School Board COP | 5.000% | 8/1/35 | 4,270 | 4,695 |
| Lee County FL Transportation Facilities Revenue | 5.000% | 10/1/26 (4) | 1,000 | 1,120 |
| Lee County FL Transportation Facilities Revenue | 5.000% | 10/1/28 (4) | 3,055 | 3,405 |
| Lee County FL Transportation Facilities Revenue | 5.000% | 10/1/30 (4) | 3,300 | 3,659 |
| Lee County FL Transportation Facilities Revenue | 5.000% | 10/1/32 (4) | 1,820 | 2,010 |
| Lee County FL Transportation Facilities Revenue | 5.000% | 10/1/33 (4) | 1,000 | 1,101 |
| Lee County FL Transportation Facilities Revenue | 5.000% | 10/1/34 (4) | 1,000 | 1,099 |
| Lee County FL Transportation Facilities Revenue | 5.000% | 10/1/35 (4) | 1,000 | 1,097 |
| Lee County FL Water & Sewer Revenue | 5.250% | 10/1/25 | 5,950 | 6,426 |
| Manatee County FL Revenue | 5.000% | 10/1/22 | 1,255 | 1,377 |
| Manatee County FL Revenue | 5.000% | 10/1/23 | 1,300 | 1,451 |
| Manatee County FL Revenue | 5.000% | 10/1/25 | 1,325 | 1,478 |
| Manatee County FL Revenue | 5.000% | 10/1/26 | 1,520 | 1,692 |
| Manatee County FL Revenue | 5.000% | 10/1/27 | 1,580 | 1,755 |
| Marco Island FL Utility System Revenue | 5.250% | 10/1/32 | 3,300 | 3,662 |
176
Intermediate-Term Tax-Exempt Fund
| | | | |
| Face | Market |
| Maturity | Amount | Value• |
| Coupon | Date | ($000) | ($000) |
| Marco Island FL Utility System Revenue | 5.250% | 10/1/33 | 2,000 | 2,219 |
| Miami Beach FL Health Facilities Authority Revenue (Mount Sinai Medical Center) | 5.000% | 11/15/20 | 2,850 | 2,982 |
| Miami Beach FL Health Facilities Authority Revenue (Mount Sinai Medical Center) | 5.000% | 11/15/21 | 3,415 | 3,640 |
| Miami Beach FL Health Facilities Authority Revenue (Mount Sinai Medical Center) | 5.000% | 11/15/22 | 3,000 | 3,248 |
| Miami Beach FL Health Facilities Authority Revenue (Mount Sinai Medical Center) | 5.000% | 11/15/23 | 2,670 | 2,863 |
| Miami Beach FL Health Facilities Authority Revenue (Mount Sinai Medical Center) | 5.000% | 11/15/29 | 1,355 | 1,446 |
| Miami Beach FL Health Facilities Authority Revenue (Mount Sinai Medical Center) | 5.000% | 11/15/30 | 1,000 | 1,064 |
| Miami Beach FL Redevelopment Agency Tax Allocation Revenue | 5.000% | 2/1/34 | 4,000 | 4,408 |
| Miami Beach FL Redevelopment Agency Tax Allocation Revenue | 5.000% | 2/1/35 | 5,200 | 5,733 |
| Miami Beach FL Resort Tax Revenue | 5.000% | 9/1/26 | 1,060 | 1,200 |
| Miami Beach FL Resort Tax Revenue | 5.000% | 9/1/28 | 1,300 | 1,465 |
| Miami Beach FL Resort Tax Revenue | 5.000% | 9/1/29 | 1,000 | 1,125 |
| Miami Beach FL Resort Tax Revenue | 5.000% | 9/1/30 | 1,585 | 1,777 |
| Miami Beach FL Resort Tax Revenue | 5.000% | 9/1/35 | 1,500 | 1,659 |
| Miami Beach FL Stormwater Revenue | 5.000% | 9/1/26 | 1,500 | 1,720 |
| Miami Beach FL Stormwater Revenue | 5.000% | 9/1/28 | 1,550 | 1,777 |
| Miami Beach FL Stormwater Revenue | 5.000% | 9/1/29 | 3,920 | 4,465 |
| Miami Beach FL Stormwater Revenue | 4.000% | 9/1/30 | 3,165 | 3,262 |
| Miami Beach FL Stormwater Revenue | 4.000% | 9/1/31 | 2,500 | 2,564 |
| Miami Beach FL Stormwater Revenue | 4.000% | 9/1/32 | 2,230 | 2,275 |
| Miami Beach FL Stormwater Revenue | 4.000% | 9/1/33 | 2,400 | 2,436 |
| Miami Beach FL Stormwater Revenue | 4.000% | 9/1/34 | 2,555 | 2,585 |
| Miami Beach FL Stormwater Revenue | 4.000% | 9/1/35 | 2,760 | 2,782 |
| Miami Beach FL Water & Sewer Revenue | 5.000% | 9/1/26 | 950 | 1,095 |
| Miami Beach FL Water & Sewer Revenue | 5.000% | 9/1/28 | 700 | 808 |
| Miami Beach FL Water & Sewer Revenue | 5.000% | 9/1/29 | 1,000 | 1,144 |
| Miami Beach FL Water & Sewer Revenue | 5.000% | 9/1/30 | 1,200 | 1,364 |
| Miami Beach FL Water & Sewer Revenue | 5.000% | 10/1/30 | 7,000 | 7,854 |
| Miami Beach FL Water & Sewer Revenue | 5.000% | 10/1/31 | 10,000 | 11,161 |
| Miami Beach FL Water & Sewer Revenue | 5.000% | 10/1/32 | 11,500 | 12,790 |
| Miami Beach FL Water & Sewer Revenue | 5.000% | 10/1/33 | 10,000 | 11,056 |
| Miami Beach FL Water & Sewer Revenue | 4.000% | 10/1/34 | 11,000 | 11,282 |
| Miami Beach FL Water & Sewer Revenue | 4.000% | 10/1/35 | 10,000 | 10,218 |
| Miami Beach FL Water & Sewer Revenue | 4.000% | 10/1/36 | 23,005 | 23,419 |
| Miami Beach FL Water & Sewer Revenue | 4.000% | 10/1/37 | 11,510 | 11,674 |
| Miami Beach FL Water & Sewer Revenue | 4.000% | 10/1/38 | 13,500 | 13,590 |
| Miami Beach FL Water & Sewer Revenue | 4.000% | 10/1/38 | 18,605 | 18,729 |
| Miami-Dade County FL Aviation Revenue (Miami International Airport) | 5.000% | 10/1/19 (Prere.) | 4,010 | 4,120 |
| Miami-Dade County FL Aviation Revenue (Miami International Airport) | 5.750% | 10/1/19 (Prere.) | 5,000 | 5,171 |
| Miami-Dade County FL Aviation Revenue (Miami International Airport) | 5.000% | 10/1/20 (Prere.) | 555 | 584 |
| Miami-Dade County FL Aviation Revenue (Miami International Airport) | 5.000% | 10/1/23 | 1,460 | 1,531 |
| Miami-Dade County FL Aviation Revenue (Miami International Airport) | 5.000% | 10/1/24 | 2,630 | 2,758 |
| Miami-Dade County FL Aviation Revenue (Miami International Airport) | 5.000% | 10/1/25 | 2,885 | 3,220 |
| Miami-Dade County FL Aviation Revenue (Miami International Airport) | 5.000% | 10/1/26 | 6,500 | 6,810 |
| Miami-Dade County FL Aviation Revenue (Miami International Airport) | 5.000% | 10/1/29 | 6,645 | 6,945 |
| Miami-Dade County FL Aviation Revenue (Miami International Airport) | 5.000% | 10/1/30 | 6,545 | 7,343 |
| Miami-Dade County FL Aviation Revenue (Miami International Airport) | 5.000% | 10/1/30 | 5,500 | 5,754 |
| Miami-Dade County FL Aviation Revenue (Miami International Airport) | 5.000% | 10/1/31 | 2,055 | 2,257 |
| Miami-Dade County FL Aviation Revenue (Miami International Airport) | 5.000% | 10/1/31 | 4,765 | 5,325 |
| Miami-Dade County FL Aviation Revenue (Miami International Airport) | 5.000% | 10/1/34 | 4,005 | 4,432 |
| Miami-Dade County FL Aviation Revenue (Miami International Airport) | 5.000% | 10/1/35 | 2,450 | 2,702 |
| Miami-Dade County FL Building Better Communities GO | 5.000% | 7/1/27 | 3,610 | 4,154 |
| Miami-Dade County FL Building Better Communities GO | 5.000% | 7/1/29 | 5,100 | 5,809 |
| Miami-Dade County FL Building Better Communities GO | 5.000% | 7/1/35 | 15,390 | 17,017 |
| Miami-Dade County FL Building Better Communities GO | 5.000% | 7/1/35 | 8,210 | 9,113 |
| Miami-Dade County FL Building Better Communities GO | 5.000% | 7/1/36 | 8,620 | 9,525 |
| Miami-Dade County FL Building Better Communities GO | 5.000% | 7/1/36 | 14,000 | 15,430 |
| Miami-Dade County FL Expressway Authority Toll System Revenue | 5.000% | 7/1/23 | 4,040 | 4,493 |
| Miami-Dade County FL Expressway Authority Toll System Revenue | 5.000% | 7/1/24 | 4,295 | 4,849 |
| Miami-Dade County FL Expressway Authority Toll System Revenue | 5.000% | 7/1/25 | 4,055 | 4,544 |
| Miami-Dade County FL Expressway Authority Toll System Revenue | 5.000% | 7/1/26 | 3,420 | 3,827 |
| Miami-Dade County FL Expressway Authority Toll System Revenue | 5.000% | 7/1/27 | 2,270 | 2,534 |
| Miami-Dade County FL Expressway Authority Toll System Revenue | 5.000% | 7/1/31 | 2,000 | 2,190 |
| Miami-Dade County FL Expressway Authority Toll System Revenue | 5.000% | 7/1/32 | 2,550 | 2,789 |
| Miami-Dade County FL Expressway Authority Toll System Revenue | 5.000% | 7/1/33 | 5,000 | 5,460 |
| Miami-Dade County FL Health Facilities Authority Hospital Revenue (Nicklaus Children’s Hospital) | 5.000% | 8/1/35 | 1,020 | 1,117 |
| Miami-Dade County FL Health Facilities Authority Hospital Revenue (Nicklaus Children’s Hospital) | 5.000% | 8/1/37 | 1,000 | 1,089 |
| Miami-Dade County FL Industrial Development Authority Revenue (Biscayne Properties LLC) | 5.000% | 6/1/30 | 2,450 | 2,499 |
| Miami-Dade County FL Public Health Trust GO | 4.000% | 7/1/31 | 6,270 | 6,546 |
| Miami-Dade County FL Public Health Trust GO | 4.000% | 7/1/32 | 4,775 | 4,953 |
177
Intermediate-Term Tax-Exempt Fund
| | | | |
| Face | Market |
| Maturity | Amount | Value• |
| Coupon | Date | ($000) | ($000) |
| Miami-Dade County FL Public Health Trust GO | 4.000% | 7/1/33 | 6,785 | 6,993 |
| Miami-Dade County FL School Board COP | 5.000% | 11/1/26 | 8,020 | 9,007 |
| Miami-Dade County FL School Board COP | 5.000% | 11/1/27 | 10,000 | 11,183 |
| Miami-Dade County FL School Board COP | 5.000% | 11/1/28 | 10,035 | 11,187 |
| Miami-Dade County FL School Board COP | 5.000% | 11/1/29 | 10,000 | 11,114 |
| Miami-Dade County FL Seaport Revenue | 5.750% | 10/1/30 | 2,300 | 2,570 |
| Miami-Dade County FL Seaport Revenue | 5.750% | 10/1/32 | 2,600 | 2,899 |
| Miami-Dade County FL Special Obligation Revenue | 5.000% | 10/1/24 | 2,000 | 2,186 |
| Miami-Dade County FL Special Obligation Revenue | 5.000% | 10/1/25 | 3,000 | 3,269 |
| Miami-Dade County FL Special Obligation Revenue | 5.000% | 10/1/26 | 11,340 | 12,315 |
| Miami-Dade County FL Special Obligation Revenue | 5.000% | 10/1/27 | 2,510 | 2,718 |
| Miami-Dade County FL Special Obligation Revenue | 5.000% | 10/1/28 | 8,840 | 9,556 |
| Miami-Dade County FL Special Obligation Revenue | 0.000% | 10/1/29 | 5,000 | 3,280 |
| Miami-Dade County FL Special Obligation Revenue | 5.000% | 10/1/29 | 10,035 | 10,844 |
| Miami-Dade County FL Special Obligation Revenue | 4.000% | 4/1/30 | 12,555 | 13,078 |
| Miami-Dade County FL Special Obligation Revenue | 5.000% | 10/1/30 | 12,160 | 13,131 |
| Miami-Dade County FL Special Obligation Revenue | 5.000% | 10/1/30 | 4,000 | 4,319 |
| Miami-Dade County FL Special Obligation Revenue | 4.000% | 4/1/31 | 11,270 | 11,657 |
| Miami-Dade County FL Special Obligation Revenue | 0.000% | 10/1/31 | 2,155 | 1,273 |
| Miami-Dade County FL Special Obligation Revenue | 5.000% | 10/1/31 | 13,500 | 14,562 |
| Miami-Dade County FL Special Obligation Revenue | 0.000% | 10/1/32 | 2,890 | 1,623 |
| Miami-Dade County FL Special Obligation Revenue | 5.000% | 10/1/32 | 11,550 | 12,454 |
| Miami-Dade County FL Special Obligation Revenue | 0.000% | 10/1/39 | 14,500 | 5,694 |
| Miami-Dade County FL Transit Sales Surtax Revenue | 5.000% | 7/1/27 | 4,000 | 4,338 |
| Miami-Dade County FL Transit Sales Surtax Revenue | 5.000% | 7/1/28 | 2,060 | 2,232 |
| Miami-Dade County FL Transit Sales Surtax Revenue | 4.000% | 7/1/30 | 10,965 | 11,428 |
| Miami-Dade County FL Transit Sales Surtax Revenue | 5.000% | 7/1/30 | 8,000 | 8,658 |
| Miami-Dade County FL Transit Sales Surtax Revenue | 4.000% | 7/1/31 | 10,000 | 10,367 |
| Miami-Dade County FL Transit Sales Surtax Revenue | 5.000% | 7/1/31 | 6,265 | 6,773 |
| Miami-Dade County FL Transit Sales Surtax Revenue | 5.000% | 7/1/32 | 1,680 | 1,814 |
| Miami-Dade County FL Water & Sewer Revenue | 5.250% | 10/1/21 | 20,000 | 21,647 |
| Miami-Dade County FL Water & Sewer Revenue | 5.000% | 10/1/22 | 14,020 | 15,379 |
| North Brevard County FL Hospital District Revenue | 5.000% | 1/1/28 | 5,200 | 5,683 |
| North Brevard County FL Hospital District Revenue | 5.000% | 1/1/29 | 4,795 | 5,194 |
| North Brevard County FL Hospital District Revenue | 5.000% | 1/1/30 | 5,000 | 5,388 |
| North Brevard County FL Hospital District Revenue | 5.000% | 1/1/31 | 5,000 | 5,364 |
| North Brevard County FL Hospital District Revenue | 5.000% | 1/1/32 | 4,525 | 4,830 |
| North Brevard County FL Hospital District Revenue | 5.000% | 1/1/33 | 9,480 | 10,081 |
| North Brevard County FL Hospital District Revenue | 5.000% | 1/1/34 | 3,955 | 4,193 |
| Orange County FL Health Facilities Authority Hospital Revenue (Orlando Health Inc.) | 5.250% | 10/1/21 | 8,000 | 8,230 |
| Orange County FL Health Facilities Authority Hospital Revenue (Orlando Health Inc.) | 4.000% | 10/1/28 | 1,890 | 1,963 |
| Orange County FL Health Facilities Authority Hospital Revenue (Orlando Health Inc.) | 5.000% | 10/1/29 | 3,055 | 3,403 |
| Orange County FL Health Facilities Authority Hospital Revenue (Orlando Health Inc.) | 5.000% | 10/1/30 | 1,500 | 1,661 |
| Orange County FL Health Facilities Authority Hospital Revenue (Orlando Health Inc.) | 5.000% | 10/1/33 | 5,150 | 5,631 |
| Orange County FL Health Facilities Authority Hospital Revenue (Orlando Health Inc.) | 5.000% | 10/1/35 | 6,415 | 6,969 |
| Orange County FL Health Facilities Authority Hospital Revenue (Orlando Health Inc.) | 5.000% | 10/1/36 | 5,000 | 5,417 |
| Orange County FL Health Facilities Authority Revenue (Presbyterian Retirement Communities Inc.) | 5.000% | 8/1/31 | 2,400 | 2,593 |
| Orange County FL Health Facilities Authority Revenue (Presbyterian Retirement Communities Inc.) | 5.000% | 8/1/36 | 4,750 | 5,083 |
| Orange County FL Tourist Development Revenue | 5.000% | 10/1/26 | 6,715 | 7,793 |
| Orange County FL Tourist Development Revenue | 5.000% | 10/1/27 | 2,150 | 2,510 |
| Orlando & Orange County FL Expressway Authority Revenue | 5.000% | 7/1/20 (Prere.) | 5,000 | 5,232 |
| Orlando & Orange County FL Expressway Authority Revenue | 5.000% | 7/1/20 (Prere.) | 3,500 | 3,663 |
| Orlando & Orange County FL Expressway Authority Revenue | 5.000% | 7/1/20 (Prere.) | 7,780 | 8,142 |
| Orlando & Orange County FL Expressway Authority Revenue | 5.000% | 7/1/31 | 13,030 | 14,293 |
| Orlando FL Capital Improvement Revenue | 5.000% | 10/1/21 | 1,000 | 1,077 |
| Orlando FL Capital Improvement Revenue | 5.000% | 10/1/24 | 1,145 | 1,298 |
| Orlando FL Capital Improvement Revenue | 5.000% | 10/1/26 | 1,200 | 1,395 |
| Orlando FL Capital Improvement Revenue | 5.000% | 10/1/26 | 1,265 | 1,470 |
| Orlando FL Tourist Development Tax Revenue | 5.000% | 11/1/26 (4) | 2,285 | 2,639 |
| Orlando FL Tourist Development Tax Revenue | 5.000% | 11/1/27 (4) | 1,325 | 1,526 |
| Orlando FL Tourist Development Tax Revenue | 5.000% | 11/1/28 (4) | 2,010 | 2,291 |
| Orlando FL Tourist Development Tax Revenue | 5.000% | 11/1/29 (4) | 2,020 | 2,279 |
| Orlando FL Tourist Development Tax Revenue | 5.000% | 11/1/31 (4) | 5,425 | 6,066 |
| Orlando FL Tourist Development Tax Revenue | 5.000% | 11/1/33 (4) | 2,095 | 2,319 |
| Orlando FL Tourist Development Tax Revenue | 5.000% | 11/1/34 (4) | 4,000 | 4,405 |
| Orlando FL Tourist Development Tax Revenue | 5.000% | 11/1/35 (4) | 3,125 | 3,428 |
| Orlando FL Tourist Development Tax Revenue | 5.000% | 11/1/37 (4) | 2,020 | 2,203 |
| Orlando FL Utility Commission Utility System Revenue | 5.250% | 10/1/22 | 3,245 | 3,600 |
| Orlando FL Utility Commission Utility System Revenue | 5.000% | 10/1/23 | 4,000 | 4,473 |
| Orlando FL Utility Commission Utility System Revenue | 5.000% | 10/1/29 | 1,505 | 1,724 |
178
Intermediate-Term Tax-Exempt Fund
| | | | | |
| Face | Market |
| Maturity | Amount | Value• |
| | Coupon | Date | ($000) | ($000) |
| 12 | Osceola County FL Expressway System Revenue (Poinciana Parkway Project) | 0.000% | 10/1/29 | 1,000 | 814 |
| 13 | Osceola County FL Expressway System Revenue (Poinciana Parkway Project) | 0.000% | 10/1/30 | 1,400 | 1,147 |
| 14 | Osceola County FL Expressway System Revenue (Poinciana Parkway Project) | 0.000% | 10/1/31 | 1,600 | 1,318 |
| 8 | Osceola County FL Expressway System Revenue (Poinciana Parkway Project) | 0.000% | 10/1/32 | 2,060 | 1,688 |
| 9 | Osceola County FL Expressway System Revenue (Poinciana Parkway Project) | 0.000% | 10/1/33 | 3,000 | 2,455 |
| Palm Beach County FL Health Facilities Authority Hospital Revenue (BRRH Corp. Obligated Group) | 5.000% | 12/1/22 | 910 | 985 |
| Palm Beach County FL Health Facilities Authority Hospital Revenue (BRRH Corp. Obligated Group) | 5.000% | 12/1/23 | 1,250 | 1,365 |
| Palm Beach County FL Health Facilities Authority Hospital Revenue (BRRH Corp. Obligated Group) | 5.000% | 12/1/24 | 1,000 | 1,103 |
| Palm Beach County FL Public Improvement Revenue | 5.000% | 5/1/33 | 6,000 | 6,736 |
| Palm Beach County FL Public Improvement Revenue | 5.000% | 5/1/37 | 7,810 | 8,647 |
| Palm Beach County FL School Board COP | 5.000% | 8/1/23 | 15,020 | 16,705 |
| Palm Beach County FL School Board COP | 5.000% | 8/1/25 | 15,000 | 17,075 |
| Palm Beach County FL School Board COP | 5.000% | 8/1/26 | 2,000 | 2,297 |
| Palm Beach County FL School Board COP | 5.000% | 8/1/28 | 6,115 | 6,592 |
| Palm Beach County FL School Board COP | 5.000% | 8/1/29 | 3,595 | 4,033 |
| Palm Beach County FL School Board COP | 5.000% | 8/1/29 | 5,970 | 6,434 |
| Palm Beach County FL School Board COP | 5.000% | 8/1/31 | 10,660 | 11,891 |
| Palm Beach County FL School Board COP | 5.000% | 8/1/32 | 3,445 | 3,832 |
| Palm Beach County FL School Board COP | 5.000% | 8/1/32 | 12,010 | 13,358 |
| Palm Beach County FL Solid Waste Authority Revenue | 5.000% | 10/1/26 | 2,275 | 2,590 |
| Palm Beach County FL Solid Waste Authority Revenue | 5.000% | 10/1/27 | 4,000 | 4,543 |
| Pasco County FL School Board COP | 5.000% | 8/1/24 | 2,315 | 2,548 |
| Port St. Lucie FL Utility Revenue | 5.000% | 9/1/27 | 920 | 1,046 |
| Port St. Lucie FL Utility Revenue | 5.000% | 9/1/28 | 2,920 | 3,303 |
| Port St. Lucie FL Utility Revenue | 5.000% | 9/1/29 | 2,035 | 2,290 |
| Port St. Lucie FL Utility Revenue | 4.000% | 9/1/30 | 2,200 | 2,279 |
| Port St. Lucie FL Utility Revenue | 5.000% | 9/1/30 | 2,000 | 2,187 |
| Port St. Lucie FL Utility Revenue | 4.000% | 9/1/31 | 2,500 | 2,581 |
| Port St. Lucie FL Utility Revenue | 5.000% | 9/1/31 | 2,100 | 2,293 |
| Reedy Creek FL Improvement District GO | 4.000% | 6/1/31 | 3,000 | 3,110 |
| Reedy Creek FL Improvement District GO | 4.000% | 6/1/32 | 3,100 | 3,200 |
| Reedy Creek FL Improvement District GO | 5.250% | 6/1/32 | 9,600 | 10,674 |
| Reedy Creek FL Improvement District GO | 5.250% | 6/1/33 | 10,000 | 11,128 |
| Reedy Creek FL Improvement District GO | 4.000% | 6/1/34 | 10,000 | 10,236 |
| Reedy Creek FL Improvement District GO | 4.000% | 6/1/35 | 4,685 | 4,777 |
| Reedy Creek FL Improvement District GO | 5.000% | 6/1/37 | 5,000 | 5,544 |
| Reedy Creek FL Improvement District Utilities Revenue | 5.000% | 10/1/23 | 2,505 | 2,794 |
| Sarasota County FL Infrastructure Sales Surtax Revenue | 5.000% | 10/1/23 | 1,035 | 1,159 |
| Sarasota County FL Infrastructure Sales Surtax Revenue | 5.000% | 10/1/24 | 1,550 | 1,760 |
| Sarasota County FL Public Hospital District Hospital Revenue (Sarasota Memorial Hospital Project) | 5.000% | 7/1/38 | 10,550 | 11,548 |
| Sarasota County FL School Board COP | 5.000% | 7/1/20 | 2,855 | 2,987 |
| Sarasota County FL School Board COP | 5.000% | 7/1/20 (Prere.) | 5,380 | 5,635 |
| Sarasota County FL School Board COP | 5.000% | 7/1/20 (Prere.) | 5,050 | 5,289 |
| Seacoast FL Utility Authority Water & Sewer Revenue | 5.000% | 3/1/20 | 2,000 | 2,077 |
| Seacoast FL Utility Authority Water & Sewer Revenue | 5.000% | 3/1/21 | 1,750 | 1,862 |
| Seacoast FL Utility Authority Water & Sewer Revenue | 5.000% | 3/1/22 | 1,750 | 1,905 |
| South Broward FL Hospital District Revenue | 4.000% | 5/1/33 | 11,090 | 11,248 |
| South Florida Water Management District COP | 5.000% | 10/1/26 | 9,265 | 10,601 |
| South Miami FL Health Facilities Authority Revenue (Baptist Health South Florida Obligated Group) | 5.000% | 8/15/26 | 4,345 | 4,980 |
| South Miami FL Health Facilities Authority Revenue (Baptist Health South Florida Obligated Group) | 5.000% | 8/15/27 | 5,010 | 5,774 |
| South Miami FL Health Facilities Authority Revenue (Baptist Health South Florida Obligated Group) | 5.000% | 8/15/28 | 3,500 | 3,988 |
| South Miami FL Health Facilities Authority Revenue (Baptist Health South Florida Obligated Group) | 5.000% | 8/15/29 | 4,000 | 4,521 |
| South Miami FL Health Facilities Authority Revenue (Baptist Health South Florida Obligated Group) | 4.000% | 8/15/33 | 9,025 | 9,078 |
| St. Johns County FL Development Authority Revenue | | | | |
| | (Presbyterian Retirement Communities Project) | 5.750% | 8/1/20 (Prere.) | 1,500 | 1,589 |
| St. Lucie County FL School Board COP | 5.000% | 7/1/24 | 1,595 | 1,749 |
| Sumter County FL Industrial Development Authority Hospital Revenue | | | | |
| | (Central Florida Health Alliance Project) | 5.000% | 7/1/24 | 500 | 552 |
| Sumter County FL Industrial Development Authority Hospital Revenue | | | | |
| | (Central Florida Health Alliance Project) | 5.000% | 7/1/28 | 500 | 541 |
| Sumter County FL Industrial Development Authority Hospital Revenue | | | | |
| | (Central Florida Health Alliance Project) | 5.000% | 7/1/29 | 500 | 538 |
| Sumter County FL Industrial Development Authority Hospital Revenue | | | | |
| | (Central Florida Health Alliance Project) | 5.125% | 7/1/34 | 1,135 | 1,207 |
| Sunshine State Governmental Financing Commission Florida Revenue | | | | |
| | (Miami Dade County Program) | 5.000% | 9/1/23 | 5,985 | 6,400 |
| Sunshine State Governmental Financing Commission Florida Revenue | | | | |
| | (Miami Dade County Program) | 5.125% | 9/1/24 | 4,625 | 4,960 |
| Sunshine State Governmental Financing Commission Florida Revenue | | | | |
| | (Miami Dade County Program) | 5.000% | 9/1/27 | 4,250 | 4,670 |
179
Intermediate-Term Tax-Exempt Fund
| | | | |
| Face | Market |
| Maturity | Amount | Value• |
| Coupon | Date | ($000) | ($000) |
| Sunshine State Governmental Financing Commission Florida Revenue | | | | |
| (Miami Dade County Program) | 5.000% | 9/1/28 | 4,450 | 4,879 |
| Tallahassee FL Energy System Revenue | 5.000% | 10/1/29 | 3,000 | 3,392 |
| Tallahassee FL Energy System Revenue | 5.000% | 10/1/30 | 2,000 | 2,258 |
| Tallahassee FL Energy System Revenue | 5.000% | 10/1/31 | 2,080 | 2,345 |
| Tallahassee FL Energy System Revenue | 5.000% | 10/1/34 | 5,000 | 5,590 |
| Tallahassee FL Energy System Revenue | 5.000% | 10/1/35 | 6,455 | 7,168 |
| Tallahassee FL Energy System Revenue | 5.000% | 10/1/36 | 3,350 | 3,711 |
| Tallahassee FL Energy System Revenue | 5.000% | 10/1/37 | 3,000 | 3,313 |
| Tallahassee FL Health Facilities Revenue (Tallahassee Memorial HealthCare Inc. Project) | 5.000% | 12/1/24 | 955 | 1,054 |
| Tallahassee FL Health Facilities Revenue (Tallahassee Memorial HealthCare Inc. Project) | 5.000% | 12/1/25 | 1,650 | 1,831 |
| Tallahassee FL Health Facilities Revenue (Tallahassee Memorial HealthCare Inc. Project) | 5.000% | 12/1/27 | 1,100 | 1,210 |
| Tallahassee FL Health Facilities Revenue (Tallahassee Memorial HealthCare Inc. Project) | 5.000% | 12/1/28 | 1,450 | 1,587 |
| Tallahassee FL Utility System Revenue | 5.000% | 10/1/25 | 1,270 | 1,445 |
| Tallahassee FL Utility System Revenue | 5.000% | 10/1/26 | 1,210 | 1,375 |
| Tallahassee FL Utility System Revenue | 5.000% | 10/1/27 | 1,020 | 1,157 |
| Tallahassee FL Utility System Revenue | 5.000% | 10/1/28 | 1,000 | 1,133 |
| Tallahassee FL Utility System Revenue | 5.000% | 10/1/31 | 1,250 | 1,409 |
| Tallahassee FL Utility System Revenue | 5.000% | 10/1/32 | 1,335 | 1,503 |
| Tallahassee FL Utility System Revenue | 5.000% | 10/1/33 | 2,000 | 2,248 |
| Tallahassee FL Utility System Revenue | 5.000% | 10/1/35 | 2,100 | 2,327 |
| Tallahassee FL Utility System Revenue | 5.000% | 10/1/36 | 2,100 | 2,324 |
| Tampa Bay FL Water Utility System Revenue | 6.000% | 10/1/29 (14) | 10,000 | 12,671 |
| Tampa Bay FL Water Utility System Revenue | 5.000% | 10/1/32 | 2,305 | 2,551 |
| Tampa FL Cigarette Tax Allocation Revenue (H. Lee Moffitt Cancer Center Project) | 5.000% | 9/1/21 | 1,220 | 1,306 |
| Tampa FL Cigarette Tax Allocation Revenue (H. Lee Moffitt Cancer Center Project) | 5.000% | 9/1/23 | 1,400 | 1,525 |
| Tampa FL Cigarette Tax Allocation Revenue (H. Lee Moffitt Cancer Center Project) | 5.500% | 9/1/28 | 2,500 | 2,910 |
| Tampa FL Cigarette Tax Allocation Revenue (H. Lee Moffitt Cancer Center Project) | 5.500% | 9/1/29 | 2,500 | 2,895 |
| Tampa FL Cigarette Tax Allocation Revenue (H. Lee Moffitt Cancer Center Project) | 5.500% | 9/1/30 | 3,505 | 4,041 |
| Tampa FL Health System Revenue (BayCare Health System) | 5.000% | 11/15/19 | 3,580 | 3,691 |
| Tampa FL Health System Revenue (BayCare Health System) | 5.000% | 11/15/21 | 18,420 | 19,152 |
| Tampa FL Health System Revenue (BayCare Health System) | 5.000% | 11/15/22 | 13,395 | 13,971 |
| Tampa FL Health System Revenue (BayCare Health System) | 5.000% | 11/15/33 | 14,686 | 15,782 |
| Tampa FL Hospital Revenue | 5.000% | 7/1/21 | 1,000 | 1,065 |
| Tampa FL Hospital Revenue | 5.000% | 7/1/22 | 1,075 | 1,165 |
| Tampa FL Hospital Revenue | 5.000% | 7/1/24 | 1,000 | 1,075 |
| Tampa FL Hospital Revenue | 5.000% | 7/1/25 | 1,935 | 2,075 |
| Tampa FL Hospital Revenue | 5.000% | 7/1/26 | 1,500 | 1,605 |
| Tampa FL Hospital Revenue | 5.000% | 7/1/27 | 1,000 | 1,068 |
| Tampa FL Revenue (University of Tampa Project) | 5.000% | 4/1/26 | 1,400 | 1,561 |
| Tampa FL Revenue (University of Tampa Project) | 5.000% | 4/1/30 | 1,650 | 1,819 |
| Tampa FL Revenue (University of Tampa Project) | 5.000% | 4/1/32 | 1,880 | 2,060 |
| Tampa FL Revenue (University of Tampa Project) | 5.000% | 4/1/33 | 2,340 | 2,557 |
| Tampa FL Revenue (University of Tampa Project) | 5.000% | 4/1/34 | 2,505 | 2,730 |
| Tampa FL Revenue (University of Tampa Project) | 5.000% | 4/1/35 | 1,680 | 1,827 |
| Tampa-Hillsborough County FL Expressway Authority Revenue | 4.000% | 7/1/32 | 605 | 623 |
| Tampa-Hillsborough County FL Expressway Authority Revenue | 4.000% | 7/1/33 | 625 | 641 |
| Tampa-Hillsborough County FL Expressway Authority Revenue | 4.000% | 7/1/34 | 650 | 664 |
| Tampa-Hillsborough County FL Expressway Authority Revenue | 4.000% | 7/1/35 | 680 | 690 |
| Tampa-Hillsborough County FL Expressway Authority Revenue | 4.000% | 7/1/36 | 705 | 711 |
| Tampa-Hillsborough County FL Expressway Authority Revenue | 4.000% | 7/1/37 | 5,000 | 5,024 |
| Tohopekaliga FL Water Authority Utility System Revenue | 5.750% | 10/1/21 (Prere.) | 2,300 | 2,527 |
| University of South Florida Financing Corp. COP | 5.000% | 7/1/30 | 6,085 | 6,734 |
| Volusia County FL Educational Facilities Authority Revenue | | | | |
| (Embry-Riddle Aeronautical University Inc.) | 5.000% | 10/15/27 | 1,000 | 1,143 |
| Volusia County FL Educational Facilities Authority Revenue | | | | |
| (Embry-Riddle Aeronautical University Inc.) | 5.000% | 10/15/27 | 1,125 | 1,257 |
| Volusia County FL Educational Facilities Authority Revenue | | | | |
| (Embry-Riddle Aeronautical University Inc.) | 5.000% | 10/15/28 | 1,500 | 1,705 |
| Volusia County FL Educational Facilities Authority Revenue | | | | |
| (Embry-Riddle Aeronautical University Inc.) | 5.000% | 10/15/28 | 1,000 | 1,114 |
| Volusia County FL Educational Facilities Authority Revenue | | | | |
| (Embry-Riddle Aeronautical University Inc.) | 5.000% | 10/15/29 | 1,110 | 1,232 |
| Volusia County FL Educational Facilities Authority Revenue | | | | |
| (Embry-Riddle Aeronautical University Inc.) | 5.000% | 10/15/30 | 1,835 | 2,034 |
| Volusia County FL School Board COP | 5.000% | 8/1/23 | 1,000 | 1,108 |
| Volusia County FL School Board COP | 5.000% | 8/1/24 | 500 | 561 |
| Volusia County FL School Board COP | 5.000% | 8/1/25 | 1,675 | 1,886 |
| Volusia County FL School Board COP | 5.000% | 8/1/27 | 1,835 | 2,047 |
| Volusia County FL School Board COP | 5.000% | 8/1/28 | 1,650 | 1,833 |
180
Intermediate-Term Tax-Exempt Fund
| | | | |
| Face | Market |
| Maturity | Amount | Value• |
| Coupon | Date | ($000) | ($000) |
| Volusia County FL School Board COP | 5.000% | 8/1/29 | 2,350 | 2,600 |
| Volusia County FL School Board COP | 5.000% | 8/1/30 | 3,895 | 4,295 |
| Volusia County FL School Board COP | 5.000% | 8/1/31 | 2,375 | 2,612 |
| Winter Park FL Water & Sewer Revenue | 5.000% | 12/1/19 (Prere.) | 1,975 | 2,038 |
| | | | 2,926,254 |
| Georgia (3.0%) | | | | |
| Athens-Clarke County GA Unified Government Water & Sewerage Revenue | 5.000% | 1/1/27 | 2,325 | 2,641 |
| Athens-Clarke County GA Unified Government Water & Sewerage Revenue | 5.000% | 1/1/28 | 2,500 | 2,829 |
| Athens-Clarke County GA Unified Government Water & Sewerage Revenue | 4.000% | 1/1/32 | 2,000 | 2,064 |
| Atlanta GA Airport Passenger Facility Charge Revenue | 5.000% | 1/1/21 | 4,000 | 4,133 |
| Atlanta GA Airport Passenger Facility Charge Revenue | 5.000% | 1/1/22 | 10,000 | 10,329 |
| Atlanta GA Airport Passenger Facility Charge Revenue | 5.000% | 1/1/24 | 1,715 | 1,925 |
| Atlanta GA Airport Passenger Facility Charge Revenue | 5.000% | 1/1/29 | 3,000 | 3,323 |
| Atlanta GA Airport Passenger Facility Charge Revenue | 5.000% | 1/1/30 | 5,000 | 5,530 |
| Atlanta GA Airport Passenger Facility Charge Revenue | 5.000% | 1/1/31 | 5,025 | 5,550 |
| Atlanta GA Airport Passenger Facility Charge Revenue | 5.000% | 1/1/32 | 5,515 | 6,083 |
| Atlanta GA Airport Passenger Facility Charge Revenue | 5.000% | 1/1/33 | 2,000 | 2,202 |
| Atlanta GA Airport Passenger Facility Charge Revenue | 5.000% | 1/1/34 | 2,010 | 2,211 |
| Atlanta GA Airport Revenue | 5.000% | 1/1/21 | 2,000 | 2,067 |
| Atlanta GA Airport Revenue | 5.000% | 1/1/22 | 2,300 | 2,376 |
| Atlanta GA Airport Revenue | 5.000% | 1/1/24 | 1,000 | 1,122 |
| Atlanta GA Airport Revenue | 5.875% | 1/1/24 | 3,145 | 3,382 |
| Atlanta GA Airport Revenue | 5.000% | 1/1/26 | 1,600 | 1,721 |
| Atlanta GA Airport Revenue | 5.000% | 1/1/27 | 1,390 | 1,493 |
| Atlanta GA Airport Revenue | 5.000% | 1/1/31 | 2,525 | 2,788 |
| Atlanta GA Development Authority Revenue | 5.000% | 7/1/25 | 2,530 | 2,881 |
| Atlanta GA Development Authority Revenue | 5.000% | 7/1/27 | 1,000 | 1,128 |
| Atlanta GA Development Authority Revenue | 5.000% | 7/1/28 | 1,355 | 1,525 |
| Atlanta GA Development Authority Revenue | 5.000% | 7/1/30 | 1,280 | 1,429 |
| Atlanta GA GO | 5.250% | 12/1/19 (12) | 4,925 | 5,098 |
| Atlanta GA GO | 5.250% | 12/1/20 (12) | 3,280 | 3,394 |
| Atlanta GA Water & Wastewater Revenue | 6.000% | 11/1/19 (Prere.) | 1,000 | 1,040 |
| Atlanta GA Water & Wastewater Revenue | 5.000% | 11/1/20 | 1,360 | 1,436 |
| Atlanta GA Water & Wastewater Revenue | 5.500% | 11/1/22 (4) | 9,800 | 10,699 |
| Atlanta GA Water & Wastewater Revenue | 5.000% | 11/1/23 | 3,070 | 3,445 |
| Atlanta GA Water & Wastewater Revenue | 5.000% | 11/1/24 | 3,075 | 3,499 |
| Atlanta GA Water & Wastewater Revenue | 5.000% | 11/1/25 | 2,500 | 2,853 |
| Atlanta GA Water & Wastewater Revenue | 5.750% | 11/1/25 (4) | 6,500 | 7,793 |
| Atlanta GA Water & Wastewater Revenue | 5.750% | 11/1/26 (4) | 15,220 | 18,539 |
| Atlanta GA Water & Wastewater Revenue | 5.750% | 11/1/27 (4) | 5,610 | 6,923 |
| Atlanta GA Water & Wastewater Revenue | 4.000% | 11/1/34 | 2,265 | 2,354 |
| Atlanta GA Water & Wastewater Revenue | 5.000% | 11/1/34 | 6,200 | 7,041 |
| Atlanta GA Water & Wastewater Revenue | 5.000% | 11/1/34 | 3,260 | 3,702 |
| Atlanta GA Water & Wastewater Revenue | 4.000% | 11/1/35 | 2,250 | 2,324 |
| Atlanta GA Water & Wastewater Revenue | 5.000% | 11/1/35 | 4,000 | 4,526 |
| Atlanta GA Water & Wastewater Revenue | 5.000% | 11/1/35 | 4,000 | 4,519 |
| Atlanta GA Water & Wastewater Revenue | 4.000% | 11/1/36 | 2,750 | 2,830 |
| Atlanta GA Water & Wastewater Revenue | 5.000% | 11/1/36 | 14,000 | 15,758 |
| 2 Atlanta GA Water & Wastewater Revenue PUT | 3.037% | 11/1/18 | 21,685 | 21,685 |
| 7 Atlanta GA Water & Wastewater Revenue TOB VRDO | 1.630% | 11/7/18 | 7,000 | 7,000 |
| Augusta GA Water & Sewerage Revenue | 5.000% | 10/1/26 | 9,030 | 10,410 |
| Augusta GA Water & Sewerage Revenue | 5.000% | 10/1/27 | 9,480 | 11,001 |
| Augusta GA Water & Sewerage Revenue | 5.000% | 10/1/28 | 9,960 | 11,491 |
| Bulloch County GA Development Authority Revenue | | | | |
| (Georgia Southern University Housing Foundation) | 5.000% | 7/1/29 | 1,100 | 1,244 |
| Bulloch County GA Development Authority Revenue | | | | |
| (Georgia Southern University Housing Foundation) | 5.000% | 7/1/30 | 1,350 | 1,516 |
| Bulloch County GA Development Authority Revenue | | | | |
| (Georgia Southern University Housing Foundation) | 5.000% | 7/1/32 | 1,795 | 1,992 |
| Bulloch County GA Development Authority Revenue | | | | |
| (Georgia Southern University Housing Foundation) | 5.000% | 7/1/33 | 2,000 | 2,208 |
| Cherokee County GA Board of Education GO | 5.000% | 8/1/29 | 650 | 747 |
| Cherokee County GA Board of Education GO | 5.000% | 8/1/30 | 750 | 859 |
| Cherokee County GA Board of Education GO | 5.000% | 8/1/31 | 1,550 | 1,769 |
| Cherokee County GA Board of Education GO | 5.000% | 8/1/33 | 1,750 | 1,984 |
| Clarke County GA Hospital Authority Revenue (Piedmont Healthcare Inc.) | 5.000% | 7/1/20 | 750 | 784 |
| Clarke County GA Hospital Authority Revenue (Piedmont Healthcare Inc.) | 5.000% | 7/1/30 | 3,285 | 3,667 |
| Clarke County GA Hospital Authority Revenue (Piedmont Healthcare Inc.) | 5.000% | 7/1/31 | 3,225 | 3,582 |
| Cobb County GA Kennestone Hospital Authority Revenue | 5.500% | 4/1/20 (Prere.) | 7,500 | 7,845 |
181
Intermediate-Term Tax-Exempt Fund
| | | | |
| Face | Market |
| Maturity | Amount | Value• |
| Coupon | Date | ($000) | ($000) |
| Cobb County GA Kennestone Hospital Authority Revenue | 6.250% | 4/1/20 (Prere.) | 1,100 | 1,162 |
| Cobb County GA Kennestone Hospital Authority Revenue | 5.000% | 4/1/25 | 400 | 450 |
| Cobb County GA Kennestone Hospital Authority Revenue | 5.000% | 4/1/26 | 700 | 792 |
| Cobb County GA Kennestone Hospital Authority Revenue | 5.000% | 4/1/27 | 900 | 1,024 |
| Cobb County GA Kennestone Hospital Authority Revenue | 5.000% | 4/1/28 | 1,000 | 1,126 |
| Cobb County GA Kennestone Hospital Authority Revenue | 5.000% | 4/1/29 | 1,640 | 1,837 |
| Cobb County GA Kennestone Hospital Authority Revenue | 5.000% | 4/1/30 | 1,230 | 1,371 |
| Cobb County GA Kennestone Hospital Authority Revenue | 5.000% | 4/1/32 | 2,250 | 2,484 |
| Cobb County GA Kennestone Hospital Authority Revenue | 5.000% | 4/1/33 | 2,405 | 2,646 |
| Cobb County GA Kennestone Hospital Authority Revenue | 5.000% | 4/1/34 | 3,350 | 3,670 |
| Cobb County GA Kennestone Hospital Authority Revenue | 5.000% | 4/1/35 | 2,500 | 2,729 |
| Cobb County GA Kennestone Hospital Authority Revenue | 5.000% | 4/1/36 | 4,300 | 4,678 |
| Cobb County GA Kennestone Hospital Authority Revenue | 5.000% | 4/1/37 | 4,500 | 4,886 |
| Dahlonega GA Downtown Development Authority Revenue (North Georgia MAC LLC Project) | 5.000% | 7/1/29 | 1,250 | 1,427 |
| Dahlonega GA Downtown Development Authority Revenue (North Georgia MAC LLC Project) | 5.000% | 7/1/30 | 1,000 | 1,134 |
| Dahlonega GA Downtown Development Authority Revenue (North Georgia MAC LLC Project) | 4.000% | 7/1/32 | 1,000 | 1,024 |
| Dahlonega GA Downtown Development Authority Revenue (North Georgia MAC LLC Project) | 5.000% | 7/1/34 | 1,000 | 1,110 |
| Dahlonega GA Downtown Development Authority Revenue (North Georgia MAC LLC Project) | 5.000% | 7/1/36 | 1,125 | 1,236 |
| Dalton GA Development Authority Revenue (Hamilton Health Care System) | 5.000% | 8/15/22 | 1,675 | 1,819 |
| Dalton GA Development Authority Revenue (Hamilton Health Care System) | 5.000% | 8/15/23 | 1,975 | 2,143 |
| Dalton GA Development Authority Revenue (Hamilton Health Care System) | 5.000% | 8/15/24 | 1,000 | 1,082 |
| Dalton GA Development Authority Revenue (Hamilton Health Care System) | 5.000% | 8/15/27 | 6,880 | 7,399 |
| DeKalb County GA Private Hospital Authority (Children’s Healthcare of Atlanta Inc. Project) RAN | 5.000% | 11/15/20 | 1,400 | 1,444 |
| DeKalb County GA Water & Sewer Revenue | 5.250% | 10/1/23 | 1,410 | 1,529 |
| DeKalb County GA Water & Sewer Revenue | 5.250% | 10/1/24 | 1,500 | 1,627 |
| DeKalb County GA Water & Sewer Revenue | 5.250% | 10/1/31 | 2,225 | 2,397 |
| DeKalb County GA Water & Sewer Revenue | 5.250% | 10/1/32 | 4,000 | 4,305 |
| Fayette County GA Hospital Authority (Fayette Community Hospital Project) RAN | 5.250% | 6/15/23 | 11,395 | 11,590 |
| Forsyth County GA GO | 5.000% | 3/1/20 | 2,145 | 2,228 |
| Forsyth County GA School District GO | 5.000% | 2/1/26 | 1,250 | 1,453 |
| Forsyth County GA School District GO | 5.000% | 2/1/27 | 1,000 | 1,175 |
| Forsyth County GA School District GO | 5.000% | 2/1/28 | 1,000 | 1,185 |
| Forsyth County GA School District GO | 5.000% | 2/1/33 | 3,285 | 3,795 |
| Forsyth County GA School District GO | 5.000% | 2/1/34 | 2,500 | 2,879 |
| Forsyth County GA School District GO | 5.000% | 2/1/35 | 3,790 | 4,349 |
| Forsyth County GA School District GO | 5.000% | 2/1/36 | 3,250 | 3,715 |
| Forsyth County GA School District GO | 5.000% | 2/1/37 | 2,250 | 2,566 |
| Fulton County GA Development Authority Revenue (Piedmont Healthcare Inc. Project) | 5.250% | 6/15/19 (Prere.) | 6,110 | 6,235 |
| Fulton County GA Development Authority Revenue (Piedmont Healthcare Inc. Project) | 5.000% | 7/1/20 | 760 | 794 |
| Fulton County GA Development Authority Revenue (Piedmont Healthcare Inc. Project) | 5.000% | 7/1/30 | 3,010 | 3,360 |
| Fulton County GA Development Authority Revenue (Piedmont Healthcare Inc. Project) | 5.000% | 7/1/32 | 2,640 | 2,919 |
| Fulton County GA Development Hospital Authority Revenue | | | | |
| (WellStar Health System Obligated Group) | 5.000% | 4/1/25 | 400 | 449 |
| Fulton County GA Development Hospital Authority Revenue | | | | |
| (WellStar Health System Obligated Group) | 5.000% | 4/1/26 | 540 | 611 |
| Fulton County GA Development Hospital Authority Revenue | | | | |
| (WellStar Health System Obligated Group) | 5.000% | 4/1/27 | 500 | 568 |
| Fulton County GA Development Hospital Authority Revenue | | | | |
| (WellStar Health System Obligated Group) | 5.000% | 4/1/28 | 560 | 631 |
| Fulton County GA Development Hospital Authority Revenue | | | | |
| (WellStar Health System Obligated Group) | 5.000% | 4/1/29 | 500 | 560 |
| Fulton County GA Development Hospital Authority Revenue | | | | |
| (WellStar Health System Obligated Group) | 5.000% | 4/1/30 | 870 | 970 |
| Fulton County GA Development Hospital Authority Revenue | | | | |
| (WellStar Health System Obligated Group) | 5.000% | 4/1/31 | 900 | 998 |
| Fulton County GA Development Hospital Authority Revenue | | | | |
| (WellStar Health System Obligated Group) | 5.000% | 4/1/35 | 4,700 | 5,131 |
| Fulton County GA Development Hospital Authority Revenue | | | | |
| (WellStar Health System Obligated Group) | 5.000% | 4/1/37 | 2,820 | 3,062 |
| Fulton County GA Residential Care Facilities for the Elderly Authority Revenue (Lenbrook Square) | 4.000% | 7/1/25 | 2,080 | 2,135 |
| Fulton County GA Residential Care Facilities for the Elderly Authority Revenue (Lenbrook Square) | 4.000% | 7/1/26 | 1,680 | 1,719 |
| Fulton County GA Residential Care Facilities for the Elderly Authority Revenue (Lenbrook Square) | 5.000% | 7/1/31 | 7,000 | 7,396 |
| Fulton County GA Water & Sewer Revenue | 5.000% | 1/1/33 | 10,000 | 10,896 |
| Georgia GO | 4.000% | 11/1/19 | 2,500 | 2,550 |
| Georgia GO | 5.000% | 2/1/20 | 34,000 | 35,241 |
| Georgia GO | 5.000% | 7/1/20 | 3,000 | 3,143 |
| Georgia GO | 5.000% | 7/1/20 | 10,000 | 10,477 |
| Georgia GO | 5.000% | 7/1/20 | 18,460 | 19,340 |
| Georgia GO | 5.000% | 11/1/20 | 9,240 | 9,761 |
| Georgia GO | 5.000% | 10/1/21 | 8,010 | 8,649 |
182
Intermediate-Term Tax-Exempt Fund
| | | | |
| Face | Market |
| Maturity | Amount | Value• |
| Coupon | Date | ($000) | ($000) |
| Georgia GO | 5.000% | 1/1/22 | 9,415 | 10,225 |
| Georgia GO | 5.000% | 2/1/22 | 6,590 | 7,169 |
| Georgia GO | 5.000% | 2/1/22 | 13,425 | 14,605 |
| Georgia GO | 4.000% | 10/1/22 | 13,220 | 14,077 |
| Georgia GO | 5.000% | 12/1/22 | 9,000 | 9,960 |
| Georgia GO | 5.000% | 1/1/23 | 6,000 | 6,652 |
| Georgia GO | 5.000% | 2/1/23 | 18,395 | 20,425 |
| Georgia GO | 5.000% | 2/1/23 | 5,025 | 5,579 |
| Georgia GO | 5.000% | 7/1/23 | 20,160 | 22,084 |
| Georgia GO | 5.000% | 7/1/24 | 22,865 | 26,021 |
| Georgia GO | 5.000% | 7/1/24 | 29,915 | 34,044 |
| Georgia GO | 5.000% | 12/1/24 | 10,010 | 11,462 |
| Georgia GO | 5.000% | 2/1/25 | 3,000 | 3,376 |
| Georgia GO | 5.000% | 7/1/26 | 10,000 | 11,688 |
| Georgia GO | 5.000% | 2/1/27 | 10,000 | 11,232 |
| Georgia GO | 5.000% | 2/1/27 | 14,870 | 17,467 |
| Georgia GO | 5.000% | 12/1/27 | 5,175 | 6,046 |
| Georgia GO | 5.000% | 1/1/28 | 5,000 | 5,833 |
| Georgia GO | 5.000% | 7/1/28 | 34,000 | 40,420 |
| Georgia GO | 5.000% | 7/1/29 | 15,000 | 17,721 |
| Georgia GO | 5.000% | 7/1/32 | 38,000 | 44,264 |
| Georgia GO | 4.000% | 7/1/34 | 25,675 | 26,848 |
| Georgia GO | 4.000% | 7/1/35 | 9,500 | 9,894 |
| Georgia GO | 3.250% | 7/1/37 | 9,750 | 9,050 |
| Georgia Municipal Electric Power Authority Revenue | 5.000% | 1/1/22 | 12,120 | 12,959 |
| Georgia Municipal Electric Power Authority Revenue | 5.000% | 1/1/24 | 4,465 | 4,876 |
| Georgia Municipal Electric Power Authority Revenue | 5.000% | 1/1/25 | 1,300 | 1,419 |
| Georgia Road & Tollway Authority Revenue | 5.000% | 10/1/21 | 2,420 | 2,610 |
| Georgia Road & Tollway Authority Revenue | 5.000% | 6/1/26 | 425 | 490 |
| Georgia Road & Tollway Authority Revenue | 5.000% | 6/1/27 | 550 | 639 |
| Georgia Road & Tollway Authority Revenue | 5.000% | 6/1/28 | 700 | 807 |
| Georgia Road & Tollway Authority Revenue | 5.000% | 6/1/29 | 565 | 648 |
| Glynn-Brunswick GA Memorial Hospital Authority Revenue | | | | |
| (Southeast Georgia Health System Obligated Group) | 5.000% | 8/1/30 | 4,365 | 4,763 |
| Glynn-Brunswick GA Memorial Hospital Authority Revenue | | | | |
| (Southeast Georgia Health System Obligated Group) | 5.000% | 8/1/34 | 7,330 | 7,903 |
| Griffin-Spalding County GA Hospital Authority Revenue (WellStar Health System Obligated Group) | 5.000% | 4/1/26 | 500 | 566 |
| Griffin-Spalding County GA Hospital Authority Revenue (WellStar Health System Obligated Group) | 5.000% | 4/1/30 | 500 | 557 |
| Griffin-Spalding County GA Hospital Authority Revenue (WellStar Health System Obligated Group) | 5.000% | 4/1/32 | 1,000 | 1,104 |
| Griffin-Spalding County GA Hospital Authority Revenue (WellStar Health System Obligated Group) | 5.000% | 4/1/34 | 1,250 | 1,369 |
| Griffin-Spalding County GA Hospital Authority Revenue (WellStar Health System Obligated Group) | 5.000% | 4/1/36 | 2,300 | 2,502 |
| Griffin-Spalding County GA Hospital Authority Revenue (WellStar Health System Obligated Group) | 5.000% | 4/1/37 | 2,100 | 2,280 |
| Gwinnett County GA School District GO | 5.000% | 8/1/21 | 23,000 | 24,739 |
| Henry County GA Hospital Authority Revenue (Piedmont Fayette Hospital Project) | 5.000% | 7/1/30 | 5,375 | 5,881 |
| Henry County GA Hospital Authority Revenue (Piedmont Fayette Hospital Project) | 5.000% | 7/1/34 | 10,000 | 10,812 |
| LaGrange-Troup County GA Hospital Authority Revenue (WellStar Health System Obligated Group) | 5.000% | 4/1/25 | 450 | 506 |
| LaGrange-Troup County GA Hospital Authority Revenue (WellStar Health System Obligated Group) | 5.000% | 4/1/26 | 630 | 713 |
| LaGrange-Troup County GA Hospital Authority Revenue (WellStar Health System Obligated Group) | 5.000% | 4/1/28 | 835 | 940 |
| Macon-Bibb County GA Hospital Authority Revenue (Medical Center of Central Georgia) | 5.000% | 8/1/19 (Prere.) | 1,430 | 1,462 |
| Macon-Bibb County GA Hospital Authority Revenue (Medical Center of Central Georgia) | 5.000% | 8/1/19 (Prere.) | 1,250 | 1,278 |
| Main Street Natural Gas Inc. Georgia Gas Project Revenue | 5.250% | 9/15/19 | 30 | 31 |
| Main Street Natural Gas Inc. Georgia Gas Project Revenue | 5.000% | 3/15/20 | 23,970 | 24,794 |
| Main Street Natural Gas Inc. Georgia Gas Project Revenue | 5.000% | 3/15/21 | 37,000 | 39,035 |
| Main Street Natural Gas Inc. Georgia Gas Project Revenue | 5.000% | 3/15/21 | 6,765 | 7,136 |
| Main Street Natural Gas Inc. Georgia Gas Project Revenue | 5.000% | 3/15/22 | 10,720 | 11,494 |
| Main Street Natural Gas Inc. Georgia Gas Project Revenue PUT | 4.000% | 9/1/23 | 127,300 | 132,747 |
| Main Street Natural Gas Inc. Georgia Gas Project Revenue PUT | 4.000% | 12/1/23 | 200,205 | 209,378 |
| Metropolitan Atlanta Rapid Transportation Authority Georgia Sales Tax Revenue | 5.250% | 7/1/26 (14) | 4,810 | 5,672 |
| Metropolitan Atlanta Rapid Transportation Authority Georgia Sales Tax Revenue | 5.000% | 7/1/30 | 5,000 | 5,687 |
| Metropolitan Atlanta Rapid Transportation Authority Georgia Sales Tax Revenue | 5.000% | 7/1/31 | 9,000 | 10,198 |
| Metropolitan Atlanta Rapid Transportation Authority Georgia Sales Tax Revenue | 4.000% | 7/1/33 | 14,000 | 14,529 |
| Metropolitan Atlanta Rapid Transportation Authority Georgia Sales Tax Revenue | 5.000% | 7/1/33 | 29,440 | 33,143 |
| Metropolitan Atlanta Rapid Transportation Authority Georgia Sales Tax Revenue | 4.000% | 7/1/34 | 16,465 | 16,988 |
| Metropolitan Atlanta Rapid Transportation Authority Georgia Sales Tax Revenue | 4.000% | 7/1/35 | 17,095 | 17,523 |
| Metropolitan Atlanta Rapid Transportation Authority Georgia Sales Tax Revenue | 5.000% | 7/1/35 | 5,095 | 5,699 |
| Metropolitan Atlanta Rapid Transportation Authority Georgia Sales Tax Revenue | 5.000% | 7/1/36 | 22,080 | 24,618 |
| Municipal Electric Authority Georgia Revenue | 5.000% | 1/1/19 | 3,580 | 3,597 |
| Municipal Electric Authority Georgia Revenue | 5.750% | 1/1/19 | 13,580 | 13,613 |
| Municipal Electric Authority Georgia Revenue | 5.000% | 4/1/19 | 3,160 | 3,197 |
| Municipal Electric Authority Georgia Revenue | 5.000% | 1/1/20 | 15,025 | 15,486 |
183
Intermediate-Term Tax-Exempt Fund
| | | | |
| Face | Market |
| Maturity | Amount | Value• |
| Coupon | Date | ($000) | ($000) |
| Municipal Electric Authority Georgia Revenue | 4.000% | 1/1/21 | 8,090 | 8,330 |
| Municipal Electric Authority Georgia Revenue | 5.000% | 1/1/21 | 2,810 | 2,952 |
| Municipal Electric Authority Georgia Revenue | 5.000% | 11/1/23 | 14,615 | 15,273 |
| Municipal Electric Authority Georgia Revenue | 5.000% | 11/1/24 | 11,650 | 12,170 |
| Municipal Electric Authority Georgia Revenue | 5.000% | 1/1/25 | 4,765 | 5,261 |
| Municipal Electric Authority Georgia Revenue | 5.000% | 1/1/26 | 4,605 | 5,104 |
| Municipal Electric Authority Georgia Revenue | 5.000% | 1/1/28 | 36,375 | 39,808 |
| Municipal Electric Authority Georgia Revenue | 5.000% | 1/1/28 | 16,290 | 17,828 |
| Municipal Electric Authority Georgia Revenue | 5.000% | 1/1/28 (15) | 28,000 | 31,139 |
| Municipal Electric Authority Georgia Revenue | 5.000% | 1/1/30 | 1,075 | 1,161 |
| Municipal Electric Authority Georgia Revenue | 5.000% | 1/1/33 | 2,115 | 2,260 |
| Municipal Electric Authority Georgia Revenue | 5.000% | 1/1/34 | 2,000 | 2,133 |
| Municipal Electric Authority Georgia Revenue | 5.000% | 1/1/35 | 5,500 | 5,850 |
| Municipal Electric Authority Georgia Revenue (Project One) | 5.000% | 1/1/21 | 7,615 | 8,000 |
| Private Colleges & University Authority of Georgia Revenue (Emory University) | 5.000% | 10/1/23 | 510 | 572 |
| Richmond County GA Hospital Authority (University Health Services Inc. Project) RAN | 5.500% | 1/1/19 (Prere.) | 17,500 | 17,603 |
| Savannah GA Hospital Authority Revenue (St. Joseph’s/Candler Health System, Inc.) | 5.500% | 7/1/30 | 4,000 | 4,434 |
| Savannah GA Hospital Authority Revenue (St. Joseph’s/Candler Health System, Inc.) | 5.500% | 7/1/31 | 4,000 | 4,419 |
| | | | 1,756,177 |
| Guam (0.1%) | | | | |
| Guam Business Privilege Tax Revenue | 5.000% | 1/1/26 | 1,145 | 1,199 |
| Guam Government Business Privilege Tax Revenue | 5.000% | 11/15/21 | 4,655 | 4,952 |
| Guam Government Business Privilege Tax Revenue | 5.000% | 1/1/23 | 1,175 | 1,246 |
| Guam Government Business Privilege Tax Revenue | 5.000% | 11/15/23 | 6,280 | 6,860 |
| Guam Government Business Privilege Tax Revenue | 5.000% | 11/15/24 | 9,240 | 10,146 |
| Guam Government Business Privilege Tax Revenue | 5.000% | 11/15/25 | 7,210 | 7,960 |
| Guam Government Business Privilege Tax Revenue | 5.000% | 11/15/26 | 3,000 | 3,288 |
| Guam Government Business Privilege Tax Revenue | 5.000% | 11/15/30 | 2,950 | 3,167 |
| Guam Government Waterworks Authority Water & Waste Water System Revenue | 5.000% | 7/1/26 | 750 | 820 |
| Guam Government Waterworks Authority Water & Waste Water System Revenue | 5.000% | 7/1/27 | 600 | 656 |
| Guam Government Waterworks Authority Water & Waste Water System Revenue | 5.000% | 7/1/29 | 1,750 | 1,886 |
| Guam Government Waterworks Authority Water & Waste Water System Revenue | 5.000% | 7/1/30 | 1,000 | 1,073 |
| Guam Government Waterworks Authority Water & Waste Water System Revenue | 5.000% | 7/1/32 | 2,230 | 2,375 |
| Guam Government Waterworks Authority Water & Waste Water System Revenue | 5.000% | 7/1/35 | 1,000 | 1,054 |
| Guam Government Waterworks Authority Water & Waste Water System Revenue | 5.000% | 7/1/36 | 300 | 314 |
| Guam International Airport Authority Revenue | 5.000% | 10/1/23 | 2,310 | 2,423 |
| Guam Power Authority Revenue | 5.000% | 10/1/26 | 1,225 | 1,340 |
| Guam Power Authority Revenue | 5.000% | 10/1/27 | 1,230 | 1,348 |
| Guam Power Authority Revenue | 5.000% | 10/1/28 | 1,245 | 1,322 |
| Guam Power Authority Revenue | 5.000% | 10/1/28 | 2,585 | 2,814 |
| Guam Power Authority Revenue | 5.000% | 10/1/29 | 5,425 | 5,866 |
| Guam Power Authority Revenue | 5.000% | 10/1/30 | 5,695 | 6,127 |
| Guam Power Authority Revenue | 5.000% | 10/1/32 | 2,680 | 2,858 |
| Guam Power Authority Revenue | 5.000% | 10/1/34 | 1,825 | 1,933 |
| Guam Power Authority Revenue | 5.000% | 10/1/35 | 2,690 | 2,838 |
| Guam Power Authority Revenue | 5.000% | 10/1/36 | 3,525 | 3,706 |
| Guam Power Authority Revenue | 5.000% | 10/1/37 | 3,000 | 3,147 |
| | | | 82,718 |
| Hawaii (1.2%) | | | | |
| Hawaii Airports System Revenue | 5.250% | 7/1/30 | 13,975 | 14,660 |
| Hawaii County HI GO | 5.000% | 9/1/28 | 1,000 | 1,141 |
| Hawaii County HI GO | 5.000% | 9/1/29 | 2,065 | 2,345 |
| Hawaii County HI GO | 5.000% | 9/1/30 | 1,000 | 1,131 |
| Hawaii GO | 5.000% | 10/1/20 | 5,500 | 5,798 |
| Hawaii GO | 5.000% | 10/1/20 | 9,910 | 10,446 |
| Hawaii GO | 5.000% | 12/1/20 | 4,480 | 4,742 |
| Hawaii GO | 5.000% | 10/1/21 | 3,055 | 3,296 |
| Hawaii GO | 5.000% | 10/1/21 | 7,715 | 8,324 |
| Hawaii GO | 5.000% | 11/1/22 | 11,200 | 12,344 |
| Hawaii GO | 5.000% | 12/1/22 | 10,125 | 10,937 |
| Hawaii GO | 5.000% | 8/1/24 | 14,970 | 16,961 |
| Hawaii GO | 5.000% | 8/1/24 | 8,970 | 10,163 |
| Hawaii GO | 5.000% | 10/1/24 | 10,000 | 11,354 |
| Hawaii GO | 5.000% | 11/1/24 | 22,305 | 24,494 |
| Hawaii GO | 5.000% | 4/1/25 | 19,785 | 22,636 |
| Hawaii GO | 5.000% | 8/1/25 | 2,500 | 2,825 |
| Hawaii GO | 5.000% | 8/1/25 | 4,105 | 4,639 |
| Hawaii GO | 5.000% | 10/1/25 | 12,000 | 13,812 |
| Hawaii GO | 4.000% | 4/1/26 | 26,025 | 28,320 |
184
Intermediate-Term Tax-Exempt Fund
| | | | |
| Face | Market |
| Maturity | Amount | Value• |
| Coupon | Date | ($000) | ($000) |
| Hawaii GO | 5.000% | 1/1/28 | 18,275 | 21,440 |
| Hawaii GO | 5.000% | 5/1/28 | 14,855 | 17,202 |
| Hawaii GO | 5.000% | 10/1/28 | 7,835 | 9,021 |
| Hawaii GO | 5.000% | 10/1/28 | 9,000 | 10,362 |
| Hawaii GO | 5.000% | 1/1/29 | 5,330 | 6,202 |
| Hawaii GO | 4.000% | 4/1/29 | 10,000 | 10,551 |
| Hawaii GO | 5.000% | 8/1/29 | 8,500 | 9,563 |
| Hawaii GO | 5.000% | 10/1/29 | 7,000 | 8,017 |
| Hawaii GO | 4.000% | 4/1/30 | 21,685 | 22,777 |
| Hawaii GO | 4.000% | 5/1/30 | 13,765 | 14,484 |
| Hawaii GO | 4.000% | 10/1/30 | 11,500 | 12,097 |
| Hawaii GO | 4.000% | 4/1/31 | 21,410 | 22,331 |
| Hawaii GO | 4.000% | 5/1/31 | 13,960 | 14,626 |
| Hawaii GO | 4.000% | 5/1/32 | 12,160 | 12,649 |
| Hawaii GO | 4.000% | 10/1/32 | 5,285 | 5,503 |
| Hawaii GO | 5.000% | 1/1/33 | 10,750 | 12,276 |
| Hawaii GO | 5.000% | 8/1/33 | 2,865 | 3,183 |
| Hawaii GO | 4.000% | 1/1/34 | 8,725 | 9,002 |
| Hawaii GO | 5.000% | 1/1/34 | 8,695 | 9,900 |
| Hawaii GO | 5.000% | 1/1/36 | 22,345 | 25,195 |
| Hawaii Highway Revenue | 5.000% | 1/1/32 | 2,180 | 2,425 |
| Hawaii Pacific Health Revenue | 5.625% | 7/1/20 (Prere.) | 2,345 | 2,478 |
| Honolulu HI City & County GO | 5.000% | 10/1/19 | 2,055 | 2,111 |
| Honolulu HI City & County GO | 5.000% | 10/1/19 | 3,365 | 3,457 |
| Honolulu HI City & County GO | 5.000% | 10/1/20 | 3,675 | 3,874 |
| Honolulu HI City & County GO | 5.000% | 10/1/20 | 5,015 | 5,286 |
| Honolulu HI City & County GO | 5.000% | 8/1/21 (Prere.) | 5,000 | 5,377 |
| Honolulu HI City & County GO | 5.000% | 10/1/22 | 4,220 | 4,647 |
| Honolulu HI City & County GO | 5.000% | 10/1/22 | 4,015 | 4,422 |
| Honolulu HI City & County GO | 5.000% | 10/1/22 | 1,000 | 1,101 |
| Honolulu HI City & County GO | 5.000% | 11/1/22 (Prere.) | 3,500 | 3,863 |
| Honolulu HI City & County GO | 5.000% | 11/1/22 | 3,015 | 3,325 |
| Honolulu HI City & County GO | 5.000% | 8/1/24 | 4,535 | 4,855 |
| Honolulu HI City & County GO | 5.000% | 10/1/26 | 7,500 | 8,612 |
| Honolulu HI City & County GO | 5.000% | 10/1/26 | 5,100 | 5,856 |
| Honolulu HI City & County GO | 5.000% | 10/1/27 | 4,020 | 4,597 |
| Honolulu HI City & County GO | 5.000% | 10/1/28 | 4,000 | 4,558 |
| Honolulu HI City & County GO | 5.000% | 10/1/28 | 8,415 | 9,588 |
| Honolulu HI City & County GO | 5.000% | 10/1/29 | 2,270 | 2,577 |
| Honolulu HI City & County GO | 4.000% | 10/1/31 | 6,220 | 6,499 |
| Honolulu HI City & County GO | 5.000% | 10/1/31 | 12,690 | 14,306 |
| Honolulu HI City & County GO | 4.000% | 10/1/32 | 6,705 | 6,982 |
| Honolulu HI City & County GO | 5.000% | 9/1/34 | 8,035 | 9,113 |
| Honolulu HI City & County GO | 4.000% | 9/1/36 | 2,910 | 2,972 |
| Honolulu HI City & County Wastewater System Revenue | 5.000% | 7/1/26 | 3,000 | 3,424 |
| Honolulu HI City & County Wastewater System Revenue | 4.000% | 7/1/28 | 6,175 | 6,568 |
| Honolulu HI City & County Wastewater System Revenue | 4.000% | 7/1/29 | 10,000 | 10,587 |
| Honolulu HI City & County Wastewater System Revenue | 5.000% | 7/1/30 | 8,220 | 9,254 |
| Honolulu HI City & County Wastewater System Revenue | 5.000% | 7/1/31 | 18,060 | 20,238 |
| Honolulu HI City & County Wastewater System Revenue | 5.000% | 7/1/34 | 6,765 | 7,538 |
| Honolulu HI City & County Wastewater System Revenue | 5.000% | 7/1/35 | 6,835 | 7,589 |
| Honolulu HI City & County Wastewater System Revenue | 5.000% | 7/1/36 | 3,000 | 3,383 |
| Honolulu HI City & County Wastewater System Revenue | 5.000% | 7/1/37 | 6,000 | 6,750 |
| Honolulu HI City & County Wastewater System Revenue | 4.000% | 7/1/38 | 7,230 | 7,363 |
| | | | 672,324 |
| Idaho (0.1%) | | | | |
| Idaho Bond Bank Authority Revenue | 5.250% | 3/15/19 (Prere.) | 755 | 764 |
| Idaho Bond Bank Authority Revenue | 5.250% | 3/15/19 (Prere.) | 285 | 288 |
| Idaho Bond Bank Authority Revenue | 5.250% | 3/15/19 (Prere.) | 1,245 | 1,261 |
| Idaho Bond Bank Authority Revenue | 5.250% | 3/15/19 (Prere.) | 715 | 724 |
| 7 Idaho Health Facilities Authority Revenue (Kootenai Health Project) | 4.375% | 7/1/34 | 4,425 | 4,463 |
| Idaho Health Facilities Authority Revenue (St. Lukes Health System Project) | 5.000% | 3/1/28 | 4,000 | 4,532 |
| Idaho Health Facilities Authority Revenue (St. Lukes Health System Project) | 5.000% | 3/1/29 | 4,810 | 5,423 |
| Idaho Health Facilities Authority Revenue (St. Lukes Health System Project) | 5.000% | 3/1/30 | 4,525 | 5,049 |
| Idaho Health Facilities Authority Revenue (Trinity Health Group) | 6.125% | 12/1/18 (Prere.) | 12,050 | 12,092 |
| Idaho Health Facilities Authority Revenue (Trinity Health Group) | 5.000% | 12/1/24 | 1,520 | 1,719 |
| Idaho Health Facilities Authority Revenue (Trinity Health Group) | 5.000% | 12/1/25 | 2,750 | 3,115 |
| Idaho Health Facilities Authority Revenue (Trinity Health Group) | 5.000% | 12/1/30 | 3,250 | 3,496 |
| Idaho Housing & Finance Association RAN | 4.750% | 7/15/19 | 5,000 | 5,091 |
185
Intermediate-Term Tax-Exempt Fund
| | | | |
| Face | Market |
| Maturity | Amount | Value• |
| Coupon | Date | ($000) | ($000) |
| Idaho Housing & Finance Association RAN | 5.000% | 7/15/25 | 2,035 | 2,311 |
| Idaho Housing & Finance Association RAN | 5.000% | 7/15/26 | 1,010 | 1,154 |
| Idaho Housing & Finance Association RAN | 5.000% | 7/15/27 | 5,145 | 5,924 |
| | | | 57,406 |
| Illinois (6.1%) | | | | |
| Berwyn IL GO | 5.000% | 12/1/25 (4) | 1,425 | 1,429 |
| Champaign County IL Community Unit School District No. 4 GO | 5.000% | 1/1/31 | 1,345 | 1,484 |
| Chicago IL GO | 0.000% | 1/1/24 | 4,000 | 3,247 |
| Chicago IL Board of Education GO | 0.000% | 12/1/18 (14) | 4,520 | 4,510 |
| Chicago IL Board of Education GO | 5.000% | 12/1/18 (Prere.) | 1,015 | 1,018 |
| Chicago IL Board of Education GO | 0.000% | 12/1/19 (14) | 5,610 | 5,446 |
| Chicago IL Board of Education GO | 5.000% | 12/1/19 | 3,585 | 3,643 |
| Chicago IL Board of Education GO | 6.000% | 1/1/20 (14) | 5,255 | 5,330 |
| Chicago IL Board of Education GO | 5.000% | 12/1/21 | 20,000 | 20,768 |
| Chicago IL Board of Education GO | 5.500% | 12/1/21 (4)(2) | 4,090 | 4,371 |
| Chicago IL Board of Education GO | 5.000% | 12/1/22 | 18,500 | 18,513 |
| Chicago IL Board of Education GO | 5.000% | 12/1/22 | 2,775 | 2,878 |
| Chicago IL Board of Education GO | 5.000% | 12/1/22 | 12,000 | 12,447 |
| Chicago IL Board of Education GO | 5.500% | 12/1/22 (4) | 9,625 | 10,454 |
| Chicago IL Board of Education GO | 5.000% | 12/1/23 | 15,000 | 15,585 |
| Chicago IL Board of Education GO | 5.000% | 12/1/24 | 20,000 | 20,763 |
| Chicago IL Board of Education GO | 5.250% | 12/1/24 (4) | 1,840 | 1,845 |
| Chicago IL Board of Education GO | 5.250% | 12/1/25 | 8,135 | 8,140 |
| Chicago IL Board of Education GO | 0.000% | 12/1/26 (14) | 5,000 | 3,520 |
| Chicago IL Board of Education GO | 5.000% | 12/1/26 (4) | 3,500 | 3,872 |
| Chicago IL Board of Education GO | 5.250% | 12/1/26 (12) | 3,360 | 3,369 |
| Chicago IL Board of Education GO | 7.000% | 12/1/26 | 19,500 | 22,761 |
| Chicago IL Board of Education GO | 5.000% | 12/1/27 (4) | 2,750 | 3,055 |
| Chicago IL Board of Education GO | 0.000% | 12/1/28 (14) | 4,320 | 2,734 |
| Chicago IL Board of Education GO | 0.000% | 12/1/28 (14) | 10,270 | 6,500 |
| Chicago IL Board of Education GO | 5.000% | 12/1/28 (4) | 3,000 | 3,342 |
| Chicago IL Board of Education GO | 5.000% | 12/1/29 (4) | 2,500 | 2,758 |
| Chicago IL Board of Education GO | 5.000% | 12/1/33 | 20,500 | 20,612 |
| Chicago IL Board of Education GO | 5.250% | 12/1/35 | 12,095 | 12,315 |
| Chicago IL GO | 5.000% | 1/1/26 | 11,835 | 12,656 |
| Chicago IL GO | 5.000% | 1/1/26 | 1,660 | 1,747 |
| Chicago IL GO | 5.000% | 1/1/27 (14) | 4,400 | 4,411 |
| Chicago IL GO | 5.000% | 1/1/28 (14) | 4,400 | 4,411 |
| Chicago IL Housing Authority Revenue | 5.000% | 1/1/27 | 3,765 | 4,248 |
| Chicago IL Housing Authority Revenue | 5.000% | 1/1/28 | 2,000 | 2,260 |
| Chicago IL Housing Authority Revenue | 5.000% | 1/1/30 | 1,250 | 1,396 |
| Chicago IL Housing Authority Revenue | 5.000% | 1/1/31 | 1,250 | 1,391 |
| Chicago IL Housing Authority Revenue | 5.000% | 1/1/33 | 1,885 | 2,079 |
| Chicago IL Housing Authority Revenue | 5.000% | 1/1/34 | 4,205 | 4,623 |
| Chicago IL Housing Authority Revenue | 5.000% | 1/1/36 | 6,140 | 6,695 |
| Chicago IL Metropolitan Water Reclamation District GO | 5.000% | 12/1/30 | 35,000 | 37,140 |
| Chicago IL Midway Airport Revenue | 5.000% | 1/1/23 | 2,500 | 2,726 |
| Chicago IL Midway Airport Revenue | 5.000% | 1/1/24 | 3,400 | 3,757 |
| Chicago IL Midway Airport Revenue | 5.000% | 1/1/26 | 6,140 | 6,665 |
| Chicago IL Midway Airport Revenue | 5.000% | 1/1/32 | 10,000 | 10,771 |
| Chicago IL Midway Airport Revenue | 5.000% | 1/1/33 | 10,000 | 10,756 |
| Chicago IL Midway Airport Revenue | 5.000% | 1/1/34 | 6,725 | 7,224 |
| Chicago IL Midway Airport Revenue | 5.000% | 1/1/35 | 2,200 | 2,360 |
| Chicago IL Motor Fuel Tax Revenue | 5.000% | 1/1/23 | 1,200 | 1,263 |
| Chicago IL Motor Fuel Tax Revenue | 5.000% | 1/1/24 | 1,110 | 1,176 |
| Chicago IL Motor Fuel Tax Revenue | 5.000% | 1/1/27 | 3,500 | 3,667 |
| Chicago IL Motor Fuel Tax Revenue | 5.000% | 1/1/28 | 3,000 | 3,134 |
| Chicago IL Motor Fuel Tax Revenue | 5.000% | 1/1/29 | 2,000 | 2,081 |
| Chicago IL O’Hare International Airport Revenue | 5.500% | 1/1/21 (Prere.) | 10,000 | 10,700 |
| Chicago IL O’Hare International Airport Revenue | 5.500% | 1/1/21 (Prere.) | 13,495 | 14,440 |
| Chicago IL O’Hare International Airport Revenue | 5.000% | 1/1/24 | 3,000 | 3,218 |
| Chicago IL O’Hare International Airport Revenue | 5.250% | 1/1/24 | 1,250 | 1,374 |
| Chicago IL O’Hare International Airport Revenue | 5.000% | 1/1/25 | 7,410 | 7,937 |
| Chicago IL O’Hare International Airport Revenue | 5.000% | 1/1/25 | 5,500 | 6,180 |
| Chicago IL O’Hare International Airport Revenue | 5.500% | 1/1/25 | 1,500 | 1,676 |
| Chicago IL O’Hare International Airport Revenue | 5.000% | 1/1/26 | 4,025 | 4,305 |
| Chicago IL O’Hare International Airport Revenue | 5.000% | 1/1/26 | 1,000 | 1,132 |
| Chicago IL O’Hare International Airport Revenue | 5.000% | 1/1/26 | 760 | 860 |
| Chicago IL O’Hare International Airport Revenue | 5.500% | 1/1/26 | 1,000 | 1,115 |
186
Intermediate-Term Tax-Exempt Fund
| | | | |
| Face | Market |
| Maturity | Amount | Value• |
| Coupon | Date | ($000) | ($000) |
| Chicago IL O’Hare International Airport Revenue | 5.000% | 1/1/27 | 1,185 | 1,347 |
| Chicago IL O’Hare International Airport Revenue | 5.000% | 1/1/27 | 32,400 | 36,834 |
| Chicago IL O’Hare International Airport Revenue | 5.000% | 1/1/27 | 3,560 | 3,802 |
| Chicago IL O’Hare International Airport Revenue | 5.500% | 1/1/27 | 2,435 | 2,711 |
| Chicago IL O’Hare International Airport Revenue | 5.000% | 1/1/28 | 2,010 | 2,267 |
| Chicago IL O’Hare International Airport Revenue | 5.000% | 1/1/28 | 10,775 | 11,915 |
| Chicago IL O’Hare International Airport Revenue | 5.000% | 1/1/28 | 3,000 | 3,199 |
| Chicago IL O’Hare International Airport Revenue | 5.000% | 1/1/28 | 1,130 | 1,274 |
| Chicago IL O’Hare International Airport Revenue | 5.250% | 1/1/28 | 5,000 | 5,727 |
| Chicago IL O’Hare International Airport Revenue | 5.000% | 1/1/29 | 1,825 | 2,043 |
| Chicago IL O’Hare International Airport Revenue | 5.000% | 1/1/29 (4) | 2,300 | 2,487 |
| Chicago IL O’Hare International Airport Revenue | 5.000% | 1/1/29 | 2,000 | 2,213 |
| Chicago IL O’Hare International Airport Revenue | 5.000% | 1/1/29 | 10,300 | 11,341 |
| Chicago IL O’Hare International Airport Revenue | 5.000% | 1/1/29 | 3,000 | 3,195 |
| Chicago IL O’Hare International Airport Revenue | 5.000% | 1/1/29 | 900 | 1,007 |
| Chicago IL O’Hare International Airport Revenue | 5.000% | 1/1/30 | 1,500 | 1,670 |
| Chicago IL O’Hare International Airport Revenue | 5.000% | 1/1/30 | 5,700 | 6,275 |
| Chicago IL O’Hare International Airport Revenue | 5.000% | 1/1/30 | 3,220 | 3,424 |
| Chicago IL O’Hare International Airport Revenue | 5.250% | 1/1/30 | 3,000 | 3,388 |
| Chicago IL O’Hare International Airport Revenue | 5.000% | 1/1/31 | 2,030 | 2,251 |
| Chicago IL O’Hare International Airport Revenue | 5.000% | 1/1/31 | 13,065 | 14,331 |
| Chicago IL O’Hare International Airport Revenue | 5.000% | 1/1/31 | 22,500 | 24,604 |
| Chicago IL O’Hare International Airport Revenue | 5.000% | 1/1/31 | 2,900 | 3,079 |
| Chicago IL O’Hare International Airport Revenue | 5.000% | 1/1/31 | 720 | 798 |
| Chicago IL O’Hare International Airport Revenue | 5.250% | 1/1/31 | 3,595 | 4,046 |
| Chicago IL O’Hare International Airport Revenue | 5.000% | 1/1/32 | 3,500 | 3,828 |
| Chicago IL O’Hare International Airport Revenue | 5.000% | 1/1/32 | 4,750 | 5,195 |
| Chicago IL O’Hare International Airport Revenue | 5.000% | 1/1/32 | 10,000 | 10,894 |
| Chicago IL O’Hare International Airport Revenue | 5.000% | 1/1/33 | 4,750 | 5,179 |
| Chicago IL O’Hare International Airport Revenue | 5.000% | 1/1/33 | 20,040 | 21,774 |
| Chicago IL O’Hare International Airport Revenue | 5.000% | 1/1/33 | 10,010 | 11,015 |
| Chicago IL O’Hare International Airport Revenue | 5.250% | 1/1/33 (4) | 1,000 | 1,089 |
| Chicago IL O’Hare International Airport Revenue | 5.000% | 1/1/34 | 18,750 | 20,381 |
| Chicago IL O’Hare International Airport Revenue | 5.000% | 1/1/34 | 10,010 | 10,978 |
| Chicago IL O’Hare International Airport Revenue | 5.000% | 1/1/35 | 12,250 | 13,276 |
| Chicago IL O’Hare International Airport Revenue | 5.000% | 1/1/35 | 11,930 | 12,929 |
| Chicago IL O’Hare International Airport Revenue | 5.000% | 1/1/35 | 10,500 | 11,477 |
| Chicago IL O’Hare International Airport Revenue | 5.000% | 1/1/36 | 8,750 | 9,454 |
| Chicago IL O’Hare International Airport Revenue | 5.000% | 1/1/37 | 1,040 | 1,120 |
| Chicago IL O’Hare International Airport Revenue | 5.000% | 1/1/37 | 10,885 | 11,725 |
| Chicago IL O’Hare International Airport Revenue | 5.000% | 1/1/37 | 5,000 | 5,428 |
| Chicago IL Park District GO | 5.000% | 1/1/21 | 2,000 | 2,095 |
| Chicago IL Park District GO | 5.000% | 1/1/25 | 4,425 | 4,672 |
| Chicago IL Park District GO | 5.000% | 1/1/25 | 625 | 690 |
| Chicago IL Park District GO | 5.000% | 1/1/26 | 515 | 573 |
| Chicago IL Park District GO | 5.000% | 1/1/27 | 1,000 | 1,108 |
| Chicago IL Park District GO | 5.000% | 1/1/27 | 2,085 | 2,313 |
| Chicago IL Park District GO | 5.000% | 1/1/28 | 1,000 | 1,104 |
| Chicago IL Park District GO | 5.000% | 1/1/28 | 1,420 | 1,581 |
| Chicago IL Park District GO | 5.000% | 1/1/29 | 785 | 859 |
| Chicago IL Park District GO | 5.000% | 1/1/30 | 1,000 | 1,088 |
| Chicago IL Park District GO | 5.000% | 1/1/30 | 2,000 | 2,205 |
| Chicago IL Park District GO | 5.000% | 1/1/31 | 1,000 | 1,080 |
| Chicago IL Park District GO | 5.000% | 1/1/31 | 2,000 | 2,160 |
| Chicago IL Park District GO | 5.000% | 1/1/31 | 1,600 | 1,756 |
| Chicago IL Park District GO | 5.000% | 1/1/31 | 3,070 | 3,370 |
| Chicago IL Park District GO | 5.000% | 1/1/32 | 5,000 | 5,460 |
| Chicago IL Park District GO | 5.000% | 1/1/32 | 5,545 | 6,056 |
| Chicago IL Park District GO | 5.000% | 1/1/32 | 2,625 | 2,794 |
| Chicago IL Park District GO | 5.000% | 1/1/33 | 2,000 | 2,141 |
| Chicago IL Park District GO | 5.000% | 1/1/33 | 1,095 | 1,163 |
| Chicago IL Park District GO | 5.000% | 1/1/33 | 1,720 | 1,871 |
| Chicago IL Park District GO | 5.000% | 1/1/33 | 2,620 | 2,851 |
| Chicago IL Park District GO | 5.000% | 1/1/33 | 5,140 | 5,593 |
| Chicago IL Park District GO | 5.000% | 1/1/33 | 1,000 | 1,062 |
| Chicago IL Park District GO | 5.000% | 1/1/34 | 2,000 | 2,135 |
| Chicago IL Park District GO | 5.000% | 1/1/34 | 1,640 | 1,778 |
| Chicago IL Park District GO | 5.000% | 1/1/34 | 1,500 | 1,590 |
| Chicago IL Park District GO | 5.000% | 1/1/35 | 1,775 | 1,917 |
| Chicago IL Park District GO | 5.000% | 1/1/35 | 1,075 | 1,137 |
187
Intermediate-Term Tax-Exempt Fund
| | | | |
| Face | Market |
| Maturity | Amount | Value• |
| Coupon | Date | ($000) | ($000) |
| Chicago IL Park District Harbor Facilities GO | 5.000% | 1/1/28 | 4,835 | 5,017 |
| Chicago IL Park District Harbor Facilities GO | 5.000% | 1/1/29 | 5,170 | 5,357 |
| Chicago IL Park District Harbor Facilities GO | 5.000% | 1/1/30 | 2,770 | 2,867 |
| Chicago IL Transit Authority Capital Grant Receipts Revenue | 5.000% | 12/1/18 (Prere.) | 3,185 | 3,193 |
| Chicago IL Transit Authority Capital Grant Receipts Revenue | 5.000% | 6/1/26 | 2,075 | 2,294 |
| Chicago IL Transit Authority Capital Grant Receipts Revenue | 5.000% | 6/1/26 | 1,035 | 1,148 |
| Chicago IL Transit Authority Capital Grant Receipts Revenue | 5.000% | 6/1/27 | 13,085 | 13,457 |
| Chicago IL Transit Authority Capital Grant Receipts Revenue | 5.000% | 6/1/27 | 31,170 | 32,056 |
| Chicago IL Transit Authority Capital Grant Receipts Revenue | 5.000% | 6/1/28 | 30,225 | 31,047 |
| Chicago IL Transit Authority Sales Tax Receipts Revenue | 5.000% | 12/1/19 | 9,915 | 10,192 |
| Chicago IL Transit Authority Sales Tax Receipts Revenue | 5.250% | 12/1/30 | 10,000 | 10,597 |
| 7 Chicago IL Transit Authority Sales Tax Receipts Revenue TOB VRDO | 1.800% | 11/7/18 | 15,380 | 15,380 |
| Chicago IL Wastewater Transmission Revenue | 5.000% | 1/1/23 | 2,435 | 2,639 |
| Chicago IL Wastewater Transmission Revenue | 5.000% | 1/1/26 | 3,100 | 3,446 |
| Chicago IL Wastewater Transmission Revenue | 5.000% | 1/1/27 | 2,545 | 2,823 |
| Chicago IL Wastewater Transmission Revenue | 5.000% | 1/1/28 | 3,330 | 3,645 |
| Chicago IL Wastewater Transmission Revenue | 5.000% | 1/1/28 | 9,030 | 9,884 |
| Chicago IL Wastewater Transmission Revenue | 5.000% | 1/1/28 | 1,675 | 1,809 |
| Chicago IL Wastewater Transmission Revenue | 5.000% | 1/1/30 | 1,450 | 1,554 |
| Chicago IL Wastewater Transmission Revenue | 5.000% | 1/1/31 | 2,000 | 2,139 |
| Chicago IL Wastewater Transmission Revenue | 5.000% | 1/1/32 | 1,875 | 1,994 |
| Chicago IL Wastewater Transmission Revenue | 5.000% | 1/1/33 | 2,525 | 2,675 |
| Chicago IL Water Revenue | 5.000% | 11/1/23 | 1,750 | 1,885 |
| Chicago IL Water Revenue | 5.000% | 11/1/24 | 1,585 | 1,700 |
| Chicago IL Water Revenue | 5.000% | 11/1/25 | 2,590 | 2,771 |
| Chicago IL Water Revenue | 5.000% | 11/1/26 | 2,125 | 2,268 |
| Chicago IL Water Revenue | 5.000% | 11/1/28 | 5,550 | 5,901 |
| Chicago IL Water Revenue | 5.000% | 11/1/30 | 3,590 | 3,803 |
| Chicago IL Water Revenue | 5.000% | 11/1/31 | 3,000 | 3,173 |
| Chicago IL Water Revenue | 5.000% | 11/1/32 | 3,075 | 3,249 |
| Chicago IL Waterworks Revenue | 5.000% | 11/1/18 (Prere.) | 10,710 | 10,710 |
| Chicago IL Waterworks Revenue | 5.000% | 11/1/19 (4) | 6,855 | 6,870 |
| Chicago IL Waterworks Revenue | 5.000% | 11/1/22 | 1,425 | 1,543 |
| Chicago IL Waterworks Revenue | 5.000% | 11/1/27 | 10,395 | 11,590 |
| Chicago IL Waterworks Revenue | 5.000% | 11/1/29 | 7,050 | 7,690 |
| Chicago IL Waterworks Revenue | 5.000% | 11/1/29 | 1,030 | 1,112 |
| Chicago IL Waterworks Revenue | 5.000% | 11/1/31 | 2,000 | 2,150 |
| Chicago IL Waterworks Revenue | 5.000% | 11/1/33 | 2,040 | 2,184 |
| Cook County IL Community College District GO | 5.000% | 12/1/24 | 2,000 | 2,111 |
| Cook County IL Community College District GO | 5.250% | 12/1/26 | 2,065 | 2,176 |
| Cook County IL Community College District GO | 5.250% | 12/1/27 | 2,000 | 2,099 |
| Cook County IL Community College District GO | 5.250% | 12/1/28 | 2,020 | 2,113 |
| Cook County IL Forest Preservation District GO | 5.000% | 12/15/24 | 1,520 | 1,612 |
| Cook County IL Forest Preservation District GO | 5.000% | 12/15/25 | 1,000 | 1,056 |
| Cook County IL Forest Preservation District GO | 5.000% | 12/15/26 | 2,485 | 2,614 |
| Cook County IL Forest Preservation District GO | 5.000% | 12/15/26 | 2,225 | 2,341 |
| Cook County IL Forest Preservation District GO | 5.000% | 12/15/27 | 2,605 | 2,731 |
| Cook County IL Forest Preservation District GO | 5.000% | 12/15/27 | 2,335 | 2,448 |
| Cook County IL Forest Preservation District GO | 5.000% | 12/15/28 | 2,240 | 2,344 |
| Cook County IL Forest Preservation District GO | 5.000% | 12/15/28 | 2,455 | 2,569 |
| Cook County IL Forest Preservation District GO | 5.000% | 12/15/32 | 5,000 | 5,206 |
| Cook County IL GO | 5.000% | 11/15/18 | 8,000 | 8,008 |
| Cook County IL GO | 5.000% | 11/15/20 | 7,500 | 7,710 |
| Cook County IL GO | 5.000% | 11/15/21 | 5,410 | 5,556 |
| Cook County IL GO | 5.250% | 11/15/25 | 4,700 | 5,024 |
| Cook County IL GO | 5.000% | 11/15/26 (4) | 2,000 | 2,262 |
| Cook County IL GO | 5.250% | 11/15/28 | 35,500 | 37,684 |
| Cook County IL GO | 5.000% | 11/15/34 | 1,180 | 1,282 |
| Cook County IL GO | 5.000% | 11/15/35 | 1,025 | 1,111 |
| Du Page & Cook Counties IL Community Consolidated School District GO | 5.000% | 6/1/24 | 1,750 | 1,933 |
| Du Page & Cook Counties IL Community Consolidated School District GO | 5.000% | 6/1/25 | 1,820 | 2,008 |
| Du Page & Cook Counties IL Community Consolidated School District GO | 5.000% | 6/1/26 | 4,575 | 5,028 |
| Du Page & Cook Counties IL Community Consolidated School District GO | 5.000% | 6/1/27 | 2,000 | 2,193 |
| Evanston IL GO | 3.500% | 12/1/38 | 2,000 | 1,779 |
| Evanston IL GO | 3.500% | 12/1/39 | 2,000 | 1,764 |
| Illinois Finance Authority Revenue (Advocate Health Care Network) | 5.000% | 4/1/19 (Prere.) | 4,715 | 4,774 |
| Illinois Finance Authority Revenue (Advocate Health Care Network) | 5.000% | 4/1/19 (Prere.) | 5,285 | 5,351 |
| Illinois Finance Authority Revenue (Advocate Health Care Network) | 5.000% | 4/1/19 | 1,500 | 1,518 |
| Illinois Finance Authority Revenue (Advocate Health Care Network) | 5.000% | 4/1/19 (Prere.) | 2,000 | 2,025 |
| Illinois Finance Authority Revenue (Advocate Health Care Network) | 5.000% | 4/1/19 (Prere.) | 6,535 | 6,617 |
188
Intermediate-Term Tax-Exempt Fund
| | | | |
| Face | Market |
| Maturity | Amount | Value• |
| Coupon | Date | ($000) | ($000) |
| Illinois Finance Authority Revenue (Advocate Health Care Network) | 5.000% | 8/1/23 | 1,000 | 1,107 |
| Illinois Finance Authority Revenue (Advocate Health Care Network) | 5.000% | 8/1/24 | 1,210 | 1,359 |
| Illinois Finance Authority Revenue (Advocate Health Care Network) | 5.000% | 8/1/28 | 3,885 | 4,301 |
| Illinois Finance Authority Revenue (Advocate Health Care Network) | 5.000% | 8/1/29 | 5,010 | 5,524 |
| Illinois Finance Authority Revenue (Advocate Health Care Network) PUT | 5.000% | 2/12/20 | 6,595 | 6,822 |
| Illinois Finance Authority Revenue (Art Institute of Chicago) | 5.000% | 3/1/30 | 3,020 | 3,234 |
| Illinois Finance Authority Revenue (Carle Foundation) | 5.625% | 8/15/31 | 10,000 | 10,735 |
| 7 Illinois Finance Authority Revenue (Carle Foundation) TOB VRDO | 1.720% | 11/7/18 (12) | 2,300 | 2,300 |
| Illinois Finance Authority Revenue (Centegra Health System) | 5.000% | 9/1/27 | 15,000 | 16,179 |
| Illinois Finance Authority Revenue (Centegra Health System) | 5.000% | 9/1/28 | 1,290 | 1,431 |
| Illinois Finance Authority Revenue (Centegra Health System) | 5.000% | 9/1/32 | 7,575 | 8,077 |
| Illinois Finance Authority Revenue (Centegra Health System) | 5.000% | 9/1/34 | 5,000 | 5,450 |
| Illinois Finance Authority Revenue (Central DuPage Health) | 5.000% | 11/1/19 (Prere.) | 17,920 | 18,437 |
| Illinois Finance Authority Revenue (Central DuPage Health) | 5.125% | 11/1/19 (Prere.) | 15,000 | 15,451 |
| Illinois Finance Authority Revenue (Christian Homes Inc.) | 5.000% | 5/15/26 | 1,000 | 1,064 |
| Illinois Finance Authority Revenue (Christian Homes Inc.) | 5.000% | 5/15/31 | 2,560 | 2,661 |
| Illinois Finance Authority Revenue (Clean Water Initiative) | 5.000% | 7/1/31 | 6,000 | 6,775 |
| Illinois Finance Authority Revenue (Clean Water Initiative) | 5.000% | 7/1/34 | 6,000 | 6,711 |
| Illinois Finance Authority Revenue (Clean Water Initiative) | 5.000% | 7/1/35 | 5,000 | 5,573 |
| Illinois Finance Authority Revenue (DePaul University) | 5.000% | 10/1/28 | 2,085 | 2,347 |
| Illinois Finance Authority Revenue (DePaul University) | 5.000% | 10/1/29 | 2,030 | 2,273 |
| Illinois Finance Authority Revenue (DePaul University) | 5.000% | 10/1/30 | 1,010 | 1,126 |
| Illinois Finance Authority Revenue (Edward Elmhurst Obligated Group) | 5.000% | 1/1/35 | 5,000 | 5,316 |
| Illinois Finance Authority Revenue (Edward Elmhurst Obligated Group) | 5.000% | 1/1/36 | 6,430 | 6,814 |
| Illinois Finance Authority Revenue (Edward Elmhurst Obligated Group) | 5.000% | 1/1/37 | 6,500 | 6,874 |
| Illinois Finance Authority Revenue (Franciscan Communities Inc.) | 4.000% | 5/15/23 | 1,000 | 1,025 |
| Illinois Finance Authority Revenue (Franciscan Communities Inc.) | 4.000% | 5/15/27 | 3,070 | 3,089 |
| Illinois Finance Authority Revenue (Franciscan Communities Inc.) | 4.750% | 5/15/33 | 8,765 | 8,829 |
| Illinois Finance Authority Revenue (Franciscan Communities Inc.) | 5.000% | 5/15/37 | 2,000 | 2,061 |
| Illinois Finance Authority Revenue (Illinois Wesleyan University) | 5.000% | 9/1/36 | 1,000 | 1,051 |
| Illinois Finance Authority Revenue (Loyola University) | 5.000% | 7/1/25 | 8,750 | 9,406 |
| Illinois Finance Authority Revenue (Loyola University) | 5.000% | 7/1/26 | 3,670 | 3,933 |
| Illinois Finance Authority Revenue (Loyola University) | 5.000% | 7/1/27 | 1,495 | 1,598 |
| Illinois Finance Authority Revenue (Loyola University) | 5.000% | 7/1/28 | 1,570 | 1,675 |
| Illinois Finance Authority Revenue (Loyola University) | 5.000% | 7/1/29 | 1,650 | 1,756 |
| Illinois Finance Authority Revenue (Loyola University) | 5.000% | 7/1/30 | 1,730 | 1,838 |
| Illinois Finance Authority Revenue (Loyola University) | 5.000% | 7/1/31 | 1,815 | 1,926 |
| Illinois Finance Authority Revenue (Loyola University) | 5.000% | 7/1/32 | 1,905 | 2,018 |
| Illinois Finance Authority Revenue (Memorial Health System) | 5.250% | 4/1/29 | 12,670 | 12,834 |
| Illinois Finance Authority Revenue (Mercy Health System) | 5.000% | 12/1/23 | 1,225 | 1,337 |
| Illinois Finance Authority Revenue (Mercy Health System) | 4.000% | 12/1/28 | 7,900 | 8,024 |
| Illinois Finance Authority Revenue (Mercy Health System) | 4.000% | 12/1/31 | 6,525 | 6,440 |
| Illinois Finance Authority Revenue (Mercy Health System) | 4.000% | 12/1/32 | 10,000 | 9,789 |
| Illinois Finance Authority Revenue (Mercy Health System) | 5.000% | 12/1/33 | 3,955 | 4,281 |
| Illinois Finance Authority Revenue (Mercy Health System) | 5.000% | 12/1/34 | 3,500 | 3,779 |
| Illinois Finance Authority Revenue (Northwestern Community Hospital) | 5.750% | 8/15/19 (Prere.) | 9,000 | 9,261 |
| Illinois Finance Authority Revenue (Northwestern Community Hospital) | 5.000% | 7/1/33 | 5,050 | 5,460 |
| Illinois Finance Authority Revenue (Northwestern Community Hospital) | 5.000% | 7/1/35 | 5,500 | 5,912 |
| Illinois Finance Authority Revenue (Northwestern Community Hospital) | 5.000% | 7/1/36 | 2,500 | 2,679 |
| Illinois Finance Authority Revenue (Northwestern Memorial Healthcare) | 5.000% | 7/15/27 | 3,170 | 3,660 |
| Illinois Finance Authority Revenue (Northwestern Memorial Healthcare) | 5.000% | 7/15/28 | 3,225 | 3,729 |
| Illinois Finance Authority Revenue (Northwestern Memorial Healthcare) | 5.000% | 7/15/29 | 2,250 | 2,580 |
| Illinois Finance Authority Revenue (Northwestern Memorial Healthcare) | 4.000% | 7/15/36 | 2,300 | 2,319 |
| Illinois Finance Authority Revenue (Northwestern Memorial Healthcare) | 4.000% | 7/15/37 | 2,500 | 2,515 |
| 7 Illinois Finance Authority Revenue (Northwestern Memorial Hospital) TOB VRDO | 1.630% | 11/7/18 | 8,760 | 8,760 |
| Illinois Finance Authority Revenue (OSF Healthcare System) | 7.000% | 5/15/19 (Prere.) | 10,000 | 10,265 |
| Illinois Finance Authority Revenue (OSF Healthcare System) | 5.000% | 5/15/22 | 2,040 | 2,209 |
| Illinois Finance Authority Revenue (OSF Healthcare System) | 5.000% | 5/15/23 | 3,750 | 4,038 |
| Illinois Finance Authority Revenue (OSF Healthcare System) | 5.000% | 11/15/23 | 1,050 | 1,162 |
| Illinois Finance Authority Revenue (OSF Healthcare System) | 4.500% | 5/15/24 | 5,070 | 5,339 |
| Illinois Finance Authority Revenue (OSF Healthcare System) | 5.000% | 11/15/24 | 1,850 | 2,070 |
| Illinois Finance Authority Revenue (OSF Healthcare System) | 5.000% | 11/15/25 | 2,025 | 2,282 |
| Illinois Finance Authority Revenue (OSF Healthcare System) | 5.000% | 5/15/26 | 1,020 | 1,150 |
| Illinois Finance Authority Revenue (OSF Healthcare System) | 5.000% | 11/15/28 | 1,250 | 1,387 |
| Illinois Finance Authority Revenue (OSF Healthcare System) | 5.000% | 11/15/29 | 2,000 | 2,207 |
| Illinois Finance Authority Revenue (OSF Healthcare System) | 5.000% | 5/15/30 | 2,300 | 2,530 |
| Illinois Finance Authority Revenue (OSF Healthcare System) | 4.000% | 5/15/31 | 2,190 | 2,210 |
| Illinois Finance Authority Revenue (Palos Community Hospital) | 5.375% | 5/15/30 | 24,070 | 24,944 |
| Illinois Finance Authority Revenue (Presence Health Network Obligated Group) | 5.000% | 2/15/24 | 5,065 | 5,664 |
| Illinois Finance Authority Revenue (Presence Health Network Obligated Group) | 5.000% | 2/15/25 | 8,000 | 9,062 |
189
Intermediate-Term Tax-Exempt Fund
| | | | |
| Face | Market |
| Maturity | Amount | Value• |
| Coupon | Date | ($000) | ($000) |
| Illinois Finance Authority Revenue (Presence Health Network Obligated Group) | 5.000% | 2/15/26 | 8,000 | 9,147 |
| Illinois Finance Authority Revenue (Presence Health Network Obligated Group) | 5.000% | 2/15/27 | 10,000 | 11,505 |
| Illinois Finance Authority Revenue (Presence Health Network Obligated Group) | 5.000% | 2/15/28 | 13,750 | 15,699 |
| Illinois Finance Authority Revenue (Presence Health Network Obligated Group) | 5.000% | 2/15/32 | 10,000 | 11,162 |
| Illinois Finance Authority Revenue (Presence Health Network Obligated Group) | 4.000% | 2/15/33 | 1,800 | 1,829 |
| Illinois Finance Authority Revenue (Riverside Health System) | 4.000% | 11/15/30 | 2,540 | 2,540 |
| Illinois Finance Authority Revenue (Riverside Health System) | 4.000% | 11/15/31 | 2,065 | 2,055 |
| Illinois Finance Authority Revenue (Riverside Health System) | 4.000% | 11/15/32 | 2,000 | 1,981 |
| Illinois Finance Authority Revenue (Rush University Medical Center) | 6.375% | 5/1/19 (Prere.) | 7,000 | 7,154 |
| Illinois Finance Authority Revenue (Rush University Medical Center) | 5.000% | 11/15/25 | 2,870 | 3,226 |
| Illinois Finance Authority Revenue (Rush University Medical Center) | 5.000% | 11/15/26 | 4,000 | 4,477 |
| Illinois Finance Authority Revenue (Rush University Medical Center) | 5.000% | 11/15/27 | 4,030 | 4,482 |
| Illinois Finance Authority Revenue (Rush University Medical Center) | 5.000% | 11/15/28 | 4,000 | 4,427 |
| Illinois Finance Authority Revenue (Rush University Medical Center) | 5.000% | 11/15/30 | 4,000 | 4,384 |
| Illinois Finance Authority Revenue (Silver Cross & Medical Centers) | 5.000% | 8/15/25 | 1,015 | 1,120 |
| Illinois Finance Authority Revenue (Silver Cross & Medical Centers) | 5.000% | 8/15/35 | 2,700 | 2,867 |
| Illinois Finance Authority Revenue (Southern Illinois Healthcare) | 5.250% | 3/1/20 (Prere.) | 7,000 | 7,282 |
| Illinois Finance Authority Revenue (Southern Illinois Healthcare) | 5.000% | 3/1/29 | 1,865 | 2,063 |
| Illinois Finance Authority Revenue (Southern Illinois Healthcare) | 5.000% | 3/1/30 | 1,550 | 1,706 |
| Illinois Finance Authority Revenue (Southern Illinois Healthcare) | 4.000% | 3/1/35 | 600 | 584 |
| Illinois Finance Authority Revenue (Three Crowns Park Obligated Group) | 5.250% | 2/15/37 | 1,180 | 1,230 |
| Illinois Finance Authority Revenue (University of Chicago Medical Center) | 5.000% | 8/15/19 | 11,605 | 11,863 |
| Illinois Finance Authority Revenue (University of Chicago Medical Center) | 5.000% | 8/15/20 (Prere.) | 3,355 | 3,516 |
| Illinois Finance Authority Revenue (University of Chicago Medical Center) | 5.000% | 8/15/20 | 3,185 | 3,334 |
| Illinois Finance Authority Revenue (University of Chicago Medical Center) | 5.000% | 8/15/22 | 6,645 | 6,949 |
| Illinois Finance Authority Revenue (University of Chicago Medical Center) | 5.000% | 8/15/24 | 1,145 | 1,283 |
| Illinois Finance Authority Revenue (University of Chicago Medical Center) | 5.000% | 8/15/26 | 1,700 | 1,943 |
| Illinois Finance Authority Revenue (University of Chicago) | 5.000% | 10/1/22 | 2,010 | 2,210 |
| Illinois Finance Authority Revenue (University of Chicago) | 5.000% | 10/1/22 | 2,000 | 2,153 |
| Illinois Finance Authority Revenue (University of Chicago) | 5.000% | 10/1/23 | 5,265 | 5,891 |
| Illinois Finance Authority Revenue (University of Chicago) | 5.000% | 10/1/23 | 4,000 | 4,294 |
| Illinois Finance Authority Revenue (University of Chicago) | 5.000% | 10/1/24 | 5,195 | 5,573 |
| Illinois Finance Authority Revenue (University of Chicago) | 5.000% | 10/1/25 | 2,990 | 3,205 |
| Illinois Finance Authority Revenue (University of Chicago) | 5.000% | 10/1/26 | 3,500 | 3,748 |
| Illinois Finance Authority Revenue (University of Chicago) | 5.000% | 10/1/28 | 15,000 | 16,735 |
| Illinois Finance Authority Revenue (University of Chicago) | 5.000% | 10/1/28 | 4,400 | 4,705 |
| Illinois Finance Authority Revenue (University of Chicago) | 5.000% | 10/1/29 | 12,250 | 13,646 |
| Illinois Finance Authority Revenue (University of Chicago) | 5.000% | 10/1/29 | 4,250 | 4,541 |
| Illinois Finance Authority Revenue (University of Chicago) | 5.000% | 10/1/30 | 5,250 | 5,604 |
| Illinois Finance Authority Revenue (University of Chicago) | 5.000% | 10/1/31 | 15,000 | 16,666 |
| Illinois Finance Authority Revenue (University of Chicago) | 5.000% | 10/1/31 | 5,300 | 5,655 |
| Illinois Finance Authority Revenue (University of Chicago) | 5.000% | 10/1/32 | 15,000 | 16,649 |
| Illinois Finance Authority Revenue (University of Chicago) | 5.000% | 10/1/32 | 1,050 | 1,120 |
| Illinois Finance Authority Revenue (University of Chicago) | 5.000% | 10/1/35 | 28,975 | 32,060 |
| Illinois Finance Authority Student Housing & Academic Facilities Revenue | | | | |
| (University of Illinois at Chicago Project) | 5.000% | 2/15/37 | 1,000 | 1,061 |
| Illinois GO | 5.000% | 11/1/19 | 8,200 | 8,379 |
| Illinois GO | 5.000% | 1/1/20 (4) | 8,635 | 8,860 |
| Illinois GO | 5.000% | 8/1/20 | 2,000 | 2,063 |
| Illinois GO | 5.000% | 11/1/20 | 65,375 | 67,685 |
| Illinois GO | 5.000% | 1/1/21 (4) | 21,470 | 22,041 |
| Illinois GO | 5.250% | 1/1/21 | 7,525 | 7,775 |
| Illinois GO | 5.000% | 5/1/21 | 4,785 | 4,937 |
| Illinois GO | 5.000% | 8/1/21 | 25,000 | 25,853 |
| Illinois GO | 5.000% | 11/1/21 | 90,000 | 93,264 |
| Illinois GO | 5.000% | 1/1/22 | 3,180 | 3,234 |
| Illinois GO | 5.000% | 2/1/22 | 5,230 | 5,407 |
| Illinois GO | 5.000% | 2/1/22 | 7,740 | 8,002 |
| Illinois GO | 5.000% | 7/1/22 | 7,050 | 7,310 |
| Illinois GO | 5.000% | 8/1/22 | 10,000 | 10,372 |
| Illinois GO | 5.000% | 8/1/22 (4) | 11,720 | 12,472 |
| Illinois GO | 5.000% | 10/1/22 | 13,500 | 14,014 |
| Illinois GO | 5.000% | 10/1/22 | 5,385 | 5,590 |
| Illinois GO | 5.000% | 11/1/22 | 10,000 | 10,385 |
| Illinois GO | 5.000% | 11/1/22 | 54,800 | 56,908 |
| Illinois GO | 5.000% | 2/1/23 | 8,500 | 8,839 |
| Illinois GO | 5.000% | 2/1/23 | 7,000 | 7,279 |
| Illinois GO | 5.000% | 7/1/23 | 6,120 | 6,375 |
| Illinois GO | 5.000% | 8/1/23 | 17,050 | 17,765 |
| Illinois GO | 5.000% | 10/1/23 | 5,000 | 5,212 |
190
Intermediate-Term Tax-Exempt Fund
| | | | |
| Face | Market |
| Maturity | Amount | Value• |
| Coupon | Date | ($000) | ($000) |
| Illinois GO | 5.000% | 10/1/23 | 4,500 | 4,691 |
| Illinois GO | 5.000% | 11/1/23 | 37,555 | 39,154 |
| Illinois GO | 4.000% | 1/1/24 | 4,860 | 4,826 |
| Illinois GO | 5.000% | 1/1/24 | 14,060 | 14,610 |
| Illinois GO | 5.000% | 2/1/24 | 6,270 | 6,516 |
| Illinois GO | 4.000% | 5/1/24 | 10,000 | 9,917 |
| Illinois GO | 5.500% | 7/1/24 | 19,000 | 20,443 |
| Illinois GO | 5.000% | 8/1/24 | 25,335 | 26,207 |
| Illinois GO | 5.000% | 10/1/24 | 3,000 | 3,121 |
| Illinois GO | 5.000% | 10/1/24 | 3,000 | 3,121 |
| Illinois GO | 5.000% | 11/1/24 | 38,000 | 39,536 |
| Illinois GO | 5.000% | 2/1/25 | 3,775 | 3,912 |
| Illinois GO | 5.000% | 2/1/25 | 3,250 | 3,380 |
| Illinois GO | 5.000% | 11/1/25 | 18,275 | 19,007 |
| Illinois GO | 5.000% | 1/1/26 | 2,115 | 2,200 |
| Illinois GO | 5.000% | 2/1/26 | 11,175 | 11,533 |
| Illinois GO | 5.000% | 4/1/26 (4) | 16,175 | 17,261 |
| Illinois GO | 5.500% | 7/1/26 | 7,000 | 7,473 |
| Illinois GO | 5.000% | 10/1/26 | 4,800 | 4,987 |
| Illinois GO | 5.000% | 11/1/26 | 51,315 | 53,302 |
| Illinois GO | 5.000% | 12/1/26 | 8,390 | 8,712 |
| Illinois GO | 5.000% | 4/1/27 | 3,840 | 3,946 |
| Illinois GO | 5.500% | 7/1/27 | 8,000 | 8,509 |
| Illinois GO | 5.000% | 12/1/27 | 10,560 | 10,958 |
| Illinois GO | 5.000% | 2/1/28 | 10,305 | 10,620 |
| Illinois GO | 5.000% | 4/1/28 (4) | 4,515 | 4,790 |
| Illinois GO | 5.250% | 7/1/28 | 2,710 | 2,843 |
| Illinois GO | 5.000% | 10/1/28 | 4,000 | 4,133 |
| Illinois GO | 5.000% | 11/1/28 | 14,000 | 14,419 |
| Illinois GO | 5.250% | 2/1/29 | 8,750 | 9,115 |
| Illinois GO | 5.000% | 3/1/29 | 23,000 | 23,465 |
| Illinois GO | 5.000% | 10/1/29 | 4,000 | 4,104 |
| Illinois GO | 5.250% | 2/1/30 | 13,000 | 13,499 |
| Illinois GO | 5.000% | 10/1/30 | 3,000 | 3,066 |
| Illinois GO | 5.000% | 11/1/30 | 5,000 | 5,089 |
| Illinois GO | 5.000% | 1/1/31 | 11,000 | 11,183 |
| Illinois GO | 5.000% | 3/1/31 | 7,985 | 8,122 |
| Illinois GO | 5.250% | 7/1/31 | 6,000 | 6,241 |
| Illinois GO | 5.000% | 11/1/32 | 9,200 | 9,339 |
| Illinois GO | 4.000% | 6/1/33 | 20,880 | 18,897 |
| Illinois GO | 5.500% | 7/1/33 (4) | 3,300 | 3,540 |
| Illinois GO | 5.000% | 10/1/33 | 3,000 | 3,052 |
| Illinois Municipal Electric Agency Power Supply System Revenue | 5.000% | 2/1/29 | 1,155 | 1,284 |
| Illinois Regional Transportation Authority Revenue | 6.250% | 7/1/22 (4) | 5,000 | 5,650 |
| Illinois Regional Transportation Authority Revenue | 6.000% | 7/1/23 (14) | 5,025 | 5,771 |
| Illinois Regional Transportation Authority Revenue | 6.250% | 7/1/23 (4) | 11,475 | 13,303 |
| Illinois Sales Tax Revenue | 5.000% | 6/15/19 | 6,045 | 6,139 |
| Illinois Sales Tax Revenue | 5.000% | 6/15/20 | 3,910 | 3,976 |
| Illinois Sales Tax Revenue | 5.375% | 6/15/20 | 9,635 | 10,045 |
| Illinois Sales Tax Revenue | 5.000% | 6/15/21 | 15,000 | 15,839 |
| 1 Illinois Sales Tax Revenue | 5.000% | 6/15/36 | 4,000 | 4,215 |
| 1 Illinois Sales Tax Revenue | 5.000% | 6/15/37 | 4,000 | 4,202 |
| 1 Illinois Sales Tax Revenue | 5.000% | 6/15/38 | 5,000 | 5,241 |
| Illinois Sports Facility Authority Revenue | 0.000% | 6/15/25 (2) | 9,615 | 7,260 |
| Illinois Toll Highway Authority Revenue | 5.000% | 1/1/22 | 4,100 | 4,428 |
| Illinois Toll Highway Authority Revenue | 5.000% | 12/1/22 | 12,800 | 14,065 |
| Illinois Toll Highway Authority Revenue | 5.000% | 1/1/27 | 1,250 | 1,360 |
| Illinois Toll Highway Authority Revenue | 5.000% | 1/1/28 | 1,250 | 1,359 |
| Illinois Toll Highway Authority Revenue | 5.000% | 1/1/28 | 2,500 | 2,576 |
| Illinois Toll Highway Authority Revenue | 5.000% | 1/1/29 | 3,500 | 3,800 |
| Illinois Toll Highway Authority Revenue | 5.000% | 1/1/30 | 3,745 | 4,062 |
| Illinois Toll Highway Authority Revenue | 5.000% | 1/1/31 | 6,100 | 6,764 |
| Illinois Toll Highway Authority Revenue | 5.000% | 1/1/31 | 8,000 | 8,667 |
| Illinois Toll Highway Authority Revenue | 5.000% | 1/1/31 | 1,410 | 1,547 |
| Illinois Toll Highway Authority Revenue | 5.000% | 12/1/31 | 12,055 | 13,336 |
| Illinois Toll Highway Authority Revenue | 5.000% | 1/1/32 | 9,000 | 9,743 |
| Illinois Toll Highway Authority Revenue | 5.000% | 12/1/32 | 7,055 | 7,781 |
| Illinois Toll Highway Authority Revenue | 5.000% | 1/1/33 | 11,100 | 12,216 |
| Illinois Toll Highway Authority Revenue | 5.000% | 1/1/33 | 9,000 | 9,736 |
| Illinois Toll Highway Authority Revenue | 5.000% | 1/1/33 | 2,500 | 2,729 |
191
Intermediate-Term Tax-Exempt Fund
| | | | |
| Face | Market |
| Maturity | Amount | Value• |
| Coupon | Date | ($000) | ($000) |
| Illinois Toll Highway Authority Revenue | 5.000% | 1/1/34 | 2,000 | 2,187 |
| Illinois Toll Highway Authority Revenue | 5.000% | 1/1/34 | 11,700 | 12,821 |
| Illinois Toll Highway Authority Revenue | 5.000% | 1/1/34 | 3,860 | 4,203 |
| Illinois Toll Highway Authority Revenue | 5.000% | 1/1/35 | 2,060 | 2,242 |
| Illinois Toll Highway Authority Revenue | 5.000% | 1/1/35 | 2,500 | 2,773 |
| Illinois Toll Highway Authority Revenue | 5.000% | 1/1/36 | 2,500 | 2,761 |
| Illinois Toll Highway Authority Revenue | 5.000% | 1/1/37 | 2,000 | 2,197 |
| Illinois Toll Highway Authority Revenue | 5.000% | 1/1/38 | 4,500 | 4,929 |
| Kane McHenry Cook & DeKalb County IL Unit School District GO | 5.000% | 1/1/21 | 1,760 | 1,854 |
| Lake County IL Community High School District No. 127 GO | 0.000% | 2/1/19 (14) | 5,000 | 4,974 |
| Lake County IL Community High School District No. 127 GO | 0.000% | 2/1/20 (14) | 5,000 | 4,856 |
| Lake County IL Community High School District No. 127 GO | 0.000% | 2/1/22 (14) | 5,690 | 5,239 |
| McHenry & Kane Counties IL Community Consolidated School District No. 158 GO | 5.625% | 1/15/31 | 3,500 | 3,819 |
| McHenry & Kane Counties IL Community Consolidated School District No. 158 GO | 5.625% | 1/15/32 | 4,000 | 4,364 |
| McHenry County IL Conservation District GO | 5.000% | 2/1/22 | 3,050 | 3,298 |
| Metropolitan Pier & Exposition Authority Illinois Dedicated Sales Tax Revenue | 0.000% | 12/15/21 (14) | 6,000 | 5,356 |
| Metropolitan Pier & Exposition Authority Illinois Dedicated Sales Tax Revenue | 0.000% | 12/15/23 (14) | 21,070 | 17,255 |
| Metropolitan Pier & Exposition Authority Illinois Dedicated Sales Tax Revenue | 0.000% | 12/15/24 (14) | 23,795 | 18,595 |
| Metropolitan Pier & Exposition Authority Illinois Dedicated Sales Tax Revenue | 0.000% | 12/15/25 (14) | 29,800 | 22,197 |
| Metropolitan Pier & Exposition Authority Illinois Dedicated Sales Tax Revenue | 0.000% | 6/15/26 (4) | 10,735 | 7,880 |
| Metropolitan Pier & Exposition Authority Illinois Dedicated Sales Tax Revenue | 0.000% | 6/15/27 (4) | 9,420 | 6,578 |
| Metropolitan Pier & Exposition Authority Illinois Dedicated Sales Tax Revenue | 0.000% | 12/15/29 (14) | 40,000 | 23,940 |
| Metropolitan Pier & Exposition Authority Illinois Dedicated Sales Tax Revenue | 0.000% | 6/15/30 (4) | 115 | 69 |
| Metropolitan Pier & Exposition Authority Illinois Dedicated Sales Tax Revenue | 0.000% | 12/15/31 (14) | 72,685 | 38,861 |
| Metropolitan Pier & Exposition Authority Illinois Dedicated Sales Tax Revenue | 0.000% | 6/15/33 (14) | 41,400 | 20,255 |
| Metropolitan Pier & Exposition Authority Illinois Dedicated Sales Tax Revenue | 0.000% | 12/15/33 (14) | 7,500 | 3,581 |
| Metropolitan Pier & Exposition Authority Illinois Dedicated Sales Tax Revenue | | | | |
| (McCormick Place Expansion Project) | 0.000% | 6/15/19 (ETM) | 6,415 | 6,334 |
| Metropolitan Pier & Exposition Authority Illinois Dedicated Sales Tax Revenue | | | | |
| (McCormick Place Expansion Project) | 0.000% | 6/15/19 (14) | 31,990 | 31,401 |
| Metropolitan Pier & Exposition Authority Illinois Dedicated Sales Tax Revenue | | | | |
| (McCormick Place Expansion Project) | 5.000% | 12/15/26 | 4,250 | 4,551 |
| Metropolitan Pier & Exposition Authority Illinois Dedicated Sales Tax Revenue | | | | |
| (McCormick Place Expansion Project) | 5.000% | 12/15/28 | 29,840 | 30,886 |
| Metropolitan Pier & Exposition Authority Illinois Dedicated Sales Tax Revenue | | | | |
| (McCormick Place Expansion Project) | 5.000% | 12/15/28 | 2,270 | 2,460 |
| Metropolitan Pier & Exposition Authority Illinois Dedicated Sales Tax Revenue | | | | |
| (McCormick Place Expansion Project) | 0.000% | 6/15/31 (14) | 44,255 | 24,262 |
| Metropolitan Pier & Exposition Authority Illinois Dedicated Sales Tax Revenue | | | | |
| (McCormick Place Expansion Project) | 5.000% | 12/15/31 | 675 | 721 |
| Metropolitan Pier & Exposition Authority Illinois Dedicated Sales Tax Revenue | | | | |
| (McCormick Place Expansion Project) | 5.000% | 12/15/32 | 600 | 638 |
| Metropolitan Pier & Exposition Authority Illinois Dedicated Sales Tax Revenue | | | | |
| (McCormick Place Expansion Project) | 5.000% | 12/15/33 | 450 | 477 |
| Metropolitan Pier & Exposition Authority Illinois Dedicated Sales Tax Revenue | | | | |
| (McCormick Place Expansion Project) | 5.000% | 12/15/34 | 520 | 549 |
| Metropolitan Pier & Exposition Authority Illinois Dedicated Sales Tax Revenue | | | | |
| (McCormick Place Expansion Project) | 0.000% | 6/15/37 (14) | 11,990 | 4,669 |
| 4 Metropolitan Pier & Exposition Authority Illinois Dedicated Sales Tax Revenue | | | | |
| (McCormick Place Expansion Project) | 0.000% | 12/15/37 | 1,800 | 963 |
| Metropolitan Pier & Exposition Authority Illinois Dedicated Sales Tax Revenue | | | | |
| (McCormick Place Expansion Project) | 0.000% | 12/15/23 (ETM) | 755 | 659 |
| Metropolitan Pier & Exposition Authority Illinois Dedicated Sales Tax Revenue | | | | |
| (McCormick Place Expansion Project) | 0.000% | 12/15/23 (14) | 31,770 | 26,018 |
| Metropolitan Pier & Exposition Authority Illinois Dedicated Sales Tax Revenue | | | | |
| (McCormick Place Expansion Project) | 0.000% | 6/15/32 (14) | 25,135 | 13,017 |
| Northern Illinois Municipal Power Agency Project Revenue | 5.000% | 12/1/24 | 1,300 | 1,453 |
| Northern Illinois Municipal Power Agency Project Revenue | 5.000% | 12/1/25 | 3,000 | 3,378 |
| Northern Illinois Municipal Power Agency Project Revenue | 5.000% | 12/1/26 | 3,615 | 4,089 |
| Northern Illinois Municipal Power Agency Project Revenue | 5.000% | 12/1/27 | 2,080 | 2,332 |
| Northern Illinois Municipal Power Agency Project Revenue | 5.000% | 12/1/28 | 6,035 | 6,708 |
| Northern Illinois Municipal Power Agency Project Revenue | 4.000% | 12/1/31 | 1,770 | 1,785 |
| Northern Illinois Municipal Power Agency Project Revenue | 4.000% | 12/1/32 | 2,215 | 2,227 |
| Railsplitter Tobacco Settlement Authority Illinois Tobacco Settlement Revenue | 5.500% | 6/1/21 (Prere.) | 38,000 | 41,029 |
| Railsplitter Tobacco Settlement Authority Illinois Tobacco Settlement Revenue | 6.000% | 6/1/21 (Prere.) | 10,000 | 10,922 |
| Railsplitter Tobacco Settlement Authority Illinois Tobacco Settlement Revenue | 5.000% | 6/1/26 | 22,500 | 25,335 |
| Railsplitter Tobacco Settlement Authority Illinois Tobacco Settlement Revenue | 5.000% | 6/1/27 | 10,580 | 11,807 |
| Railsplitter Tobacco Settlement Authority Illinois Tobacco Settlement Revenue | 5.000% | 6/1/28 | 3,475 | 3,853 |
| Southwestern Illinois Development Authority Health Facilities Revenue | | | | |
| (Hospital Sisters Services Inc.) | 5.000% | 2/15/25 | 3,850 | 4,328 |
192
Intermediate-Term Tax-Exempt Fund
| | | | |
| Face | Market |
| Maturity | Amount | Value• |
| Coupon | Date | ($000) | ($000) |
| Southwestern Illinois Development Authority Health Facilities Revenue | | | | |
| (Hospital Sisters Services Inc.) | 5.000% | 2/15/26 | 3,500 | 3,957 |
| Southwestern Illinois Development Authority Health Facilities Revenue | | | | |
| (Hospital Sisters Services Inc.) | 5.000% | 2/15/27 | 3,615 | 4,108 |
| Southwestern Illinois Development Authority Health Facilities Revenue | | | | |
| (Hospital Sisters Services Inc.) | 5.000% | 2/15/28 | 8,750 | 9,984 |
| Southwestern Illinois Development Authority Revenue (Local Government Program) | 0.000% | 2/1/26 (12) | 2,525 | 1,944 |
| Southwestern Illinois Development Authority Revenue (Local Government Program) | 5.000% | 4/15/30 | 10,000 | 10,388 |
| Springfield IL Water Revenue | 5.000% | 3/1/29 | 2,525 | 2,701 |
| Springfield IL Water Revenue | 5.000% | 3/1/30 | 2,000 | 2,138 |
| Springfield IL Water Revenue | 5.000% | 3/1/31 | 2,785 | 2,975 |
| Springfield IL Water Revenue | 5.000% | 3/1/32 | 3,035 | 3,240 |
| University of Illinois Auxiliary Facilities System Revenue | 5.000% | 4/1/21 | 3,430 | 3,560 |
| University of Illinois Auxiliary Facilities System Revenue | 5.000% | 4/1/22 | 6,015 | 6,227 |
| University of Illinois Auxiliary Facilities System Revenue | 5.000% | 4/1/29 | 2,075 | 2,253 |
| University of Illinois Auxiliary Facilities System Revenue | 5.000% | 4/1/30 | 2,000 | 2,164 |
| University of Illinois Auxiliary Facilities System Revenue | 5.250% | 4/1/30 | 5,000 | 5,172 |
| University of Illinois Auxiliary Facilities System Revenue | 5.000% | 4/1/31 | 2,420 | 2,610 |
| University of Illinois Auxiliary Facilities System Revenue | 5.000% | 4/1/33 | 2,000 | 2,147 |
| University of Illinois Auxiliary Facilities System Revenue | 5.000% | 4/1/34 | 2,000 | 2,142 |
| University of Illinois COP | 4.000% | 8/15/19 | 10,000 | 10,142 |
| University of Illinois COP | 4.000% | 10/1/19 | 5,115 | 5,199 |
| Village of Bolingbrook IL Special Tax Revenue (Will and DuPage Counties) | 4.000% | 3/1/26 (4) | 990 | 1,036 |
| Village of Bolingbrook IL Special Tax Revenue (Will and DuPage Counties) | 4.000% | 3/1/28 (4) | 1,050 | 1,083 |
| Village of Bolingbrook IL Special Tax Revenue (Will and DuPage Counties) | 4.000% | 3/1/29 (4) | 2,750 | 2,813 |
| Waubonsee IL Community College District No. 516 GO | 5.000% | 12/15/23 | 1,715 | 1,855 |
| Waubonsee IL Community College District No. 516 GO | 5.000% | 12/15/24 | 7,950 | 8,585 |
| Waubonsee IL Community College District No. 516 GO | 5.000% | 12/15/25 | 3,405 | 3,677 |
| Will County IL Community High School District No. 210 (Lincoln-Way) GO | 5.000% | 1/1/28 | 9,900 | 9,735 |
| Will County IL Community High School District No. 210 (Lincoln-Way) GO | 0.000% | 1/1/29 | 5,920 | 3,681 |
| Will County IL Community High School District No. 210 (Lincoln-Way) GO | 0.000% | 1/1/30 | 5,680 | 3,327 |
| Will County IL Community High School District No. 210 (Lincoln-Way) GO | 5.000% | 1/1/30 | 5,500 | 5,335 |
| Will County IL Community High School District No. 210 (Lincoln-Way) GO | 5.000% | 1/1/31 | 9,150 | 8,810 |
| Winnebago & Boone Counties IL Rockford School District No. 205 GO | 0.000% | 2/1/24 | 7,980 | 6,679 |
| Winnebago & Boone Counties IL Rockford School District No. 205 GO | 0.000% | 2/1/25 | 4,065 | 3,257 |
| Winnebago & Boone Counties IL Rockford School District No. 205 GO | 0.000% | 2/1/26 | 3,645 | 2,783 |
| Winnebago & Boone Counties IL Rockford School District No. 205 GO | 0.000% | 2/1/27 | 2,000 | 1,453 |
| | | | 3,526,711 |
| Indiana (1.4%) | | | | |
| Carmel IN Local Public Improvement Bond Bank Revenue | 5.000% | 7/15/32 | 8,105 | 9,058 |
| Carmel IN Local Public Improvement Bond Bank Revenue | 5.000% | 7/15/33 | 9,110 | 10,149 |
| Carmel IN Local Public Improvement Bond Bank Revenue | 5.000% | 7/15/34 | 9,630 | 10,700 |
| Carmel IN Local Public Improvement Bond Bank Revenue | 5.000% | 1/15/36 | 13,470 | 14,871 |
| Franklin IN Community Multi-School Building Corp. Revenue | 5.000% | 7/15/23 (4) | 2,480 | 2,740 |
| Hammond IN Multi-School Building Corp. Revenue | 5.000% | 7/15/26 | 1,000 | 1,129 |
| Hammond IN Multi-School Building Corp. Revenue | 5.000% | 1/15/27 | 750 | 847 |
| Hammond IN Multi-School Building Corp. Revenue | 5.000% | 7/15/27 | 1,320 | 1,497 |
| Hammond IN Multi-School Building Corp. Revenue | 5.000% | 1/15/28 | 750 | 850 |
| Hammond IN Multi-School Building Corp. Revenue | 5.000% | 1/15/30 | 1,250 | 1,394 |
| Hammond IN Multi-School Building Corp. Revenue | 5.000% | 7/15/30 | 1,000 | 1,114 |
| Hammond IN Multi-School Building Corp. Revenue | 5.000% | 1/15/31 | 1,000 | 1,108 |
| Hammond IN Multi-School Building Corp. Revenue | 5.000% | 7/15/31 | 1,000 | 1,106 |
| Hammond IN Multi-School Building Corp. Revenue | 5.000% | 7/15/32 | 1,250 | 1,376 |
| Hammond IN Multi-School Building Corp. Revenue | 5.000% | 7/15/33 | 1,000 | 1,096 |
| Hammond IN Multi-School Building Corp. Revenue | 5.000% | 7/15/35 | 1,250 | 1,360 |
| Indiana Bond Bank Special Program Gas Revenue | 5.250% | 10/15/21 | 245 | 263 |
| Indiana Finance Authority Health System Revenue | | | | |
| (Sisters of St. Francis Health Services Inc. Obligated Group) | 5.000% | 11/1/18 | 5,000 | 5,000 |
| Indiana Finance Authority Health System Revenue | | | | |
| (Sisters of St. Francis Health Services Inc. Obligated Group) | 5.000% | 11/1/18 (Prere.) | 3,570 | 3,570 |
| Indiana Finance Authority Health System Revenue | | | | |
| (Sisters of St. Francis Health Services Inc. Obligated Group) | 5.250% | 11/1/18 (Prere.) | 10,855 | 10,855 |
| Indiana Finance Authority Health System Revenue | | | | |
| (Sisters of St. Francis Health Services Inc. Obligated Group) | 5.250% | 11/1/18 (Prere.) | 13,895 | 13,895 |
| Indiana Finance Authority Health System Revenue | | | | |
| (Sisters of St. Francis Health Services Inc. Obligated Group) | 5.250% | 11/1/18 (Prere.) | 14,425 | 14,425 |
| Indiana Finance Authority Health System Revenue | | | | |
| (Sisters of St. Francis Health Services Inc. Obligated Group) | 5.250% | 11/1/18 (Prere.) | 8,615 | 8,615 |
193
Intermediate-Term Tax-Exempt Fund
| | | | |
| Face | Market |
| Maturity | Amount | Value• |
| Coupon | Date | ($000) | ($000) |
| Indiana Finance Authority Health System Revenue | | | | |
| (Sisters of St. Francis Health Services Inc. Obligated Group) | 5.000% | 11/1/20 | 4,370 | 4,381 |
| Indiana Finance Authority Hospital Revenue (Community Health Network) | 5.000% | 5/1/22 | 1,295 | 1,405 |
| Indiana Finance Authority Hospital Revenue (Community Health Network) | 5.000% | 5/1/24 | 2,500 | 2,753 |
| Indiana Finance Authority Hospital Revenue (Community Health Network) | 5.000% | 5/1/25 | 2,500 | 2,742 |
| Indiana Finance Authority Hospital Revenue (Community Health Network) | 5.000% | 5/1/26 | 2,500 | 2,731 |
| Indiana Finance Authority Hospital Revenue (Community Health Network) | 5.000% | 5/1/27 | 2,500 | 2,718 |
| Indiana Finance Authority Hospital Revenue (Indiana University Health Obligated Group) | 5.000% | 12/1/18 | 1,125 | 1,128 |
| Indiana Finance Authority Hospital Revenue (Indiana University Health Obligated Group) | 5.000% | 12/1/24 | 1,420 | 1,612 |
| Indiana Finance Authority Hospital Revenue (Indiana University Health Obligated Group) | 5.000% | 12/1/26 | 1,030 | 1,158 |
| Indiana Finance Authority Hospital Revenue (Indiana University Health Obligated Group) | 5.000% | 12/1/27 | 1,000 | 1,118 |
| Indiana Finance Authority Hospital Revenue (Indiana University Health Obligated Group) | 5.000% | 12/1/28 | 2,600 | 2,892 |
| Indiana Finance Authority Hospital Revenue (Indiana University Health Obligated Group) | 5.000% | 12/1/30 | 1,000 | 1,101 |
| Indiana Finance Authority Hospital Revenue (Indiana University Health Obligated Group) | 5.000% | 12/1/33 | 3,000 | 3,294 |
| Indiana Finance Authority Hospital Revenue (Indiana University Health Obligated Group) | 5.000% | 12/1/34 | 18,515 | 20,294 |
| Indiana Finance Authority Hospital Revenue (Indiana University Health Obligated Group) | 5.000% | 12/1/35 | 19,220 | 21,019 |
| Indiana Finance Authority Hospital Revenue (Parkview Health System) | 5.000% | 11/1/26 | 1,340 | 1,546 |
| Indiana Finance Authority Hospital Revenue (Parkview Health System) | 5.000% | 11/1/29 | 1,380 | 1,612 |
| Indiana Finance Authority Hospital Revenue (Parkview Health Systems Obligated Group) | 5.000% | 5/1/22 (Prere.) | 95 | 104 |
| Indiana Finance Authority Hospital Revenue (Parkview Health Systems Obligated Group) | 5.000% | 5/1/29 | 2,915 | 3,130 |
| Indiana Finance Authority Revenue | 5.000% | 2/1/21 | 3,430 | 3,645 |
| Indiana Finance Authority Revenue | 5.000% | 2/1/23 | 11,035 | 12,238 |
| Indiana Finance Authority Revenue | 5.000% | 2/1/26 | 5,665 | 6,469 |
| Indiana Finance Authority Revenue | 5.000% | 2/1/27 | 4,140 | 4,811 |
| Indiana Finance Authority Revenue (Ascension Health Credit Group) VRDO | 1.610% | 11/7/18 | 23,975 | 23,975 |
| Indiana Finance Authority Revenue (Community Foundation of Northwest Indiana Obligated Group) | 5.000% | 3/1/21 | 1,225 | 1,294 |
| Indiana Finance Authority Revenue (Community Foundation of Northwest Indiana Obligated Group) | 5.000% | 3/1/22 | 1,000 | 1,075 |
| Indiana Finance Authority Revenue (Community Foundation of Northwest Indiana Obligated Group) | 5.000% | 3/1/24 | 2,000 | 2,155 |
| Indiana Finance Authority Revenue (Community Foundation of Northwest Indiana Obligated Group) | 5.000% | 3/1/25 | 1,000 | 1,076 |
| Indiana Finance Authority Revenue (Community Foundation of Northwest Indiana Obligated Group) | 5.000% | 9/1/29 | 1,915 | 2,128 |
| Indiana Finance Authority Revenue (Community Foundation of Northwest Indiana Obligated Group) | 5.000% | 3/1/30 | 3,250 | 3,467 |
| Indiana Finance Authority Revenue (Community Foundation of Northwest Indiana Obligated Group) | 5.000% | 9/1/30 | 1,260 | 1,392 |
| Indiana Finance Authority Revenue (Community Foundation of Northwest Indiana Obligated Group) | 5.000% | 9/1/31 | 1,665 | 1,831 |
| Indiana Finance Authority Revenue (Community Foundation of Northwest Indiana Obligated Group) | 5.000% | 9/1/36 | 2,000 | 2,153 |
| Indiana Finance Authority Revenue (Franciscan Alliance Inc.) | 5.000% | 11/1/26 | 5,825 | 6,679 |
| Indiana Finance Authority Revenue (Franciscan Alliance Inc.) | 5.000% | 11/1/26 | 6,475 | 7,424 |
| Indiana Finance Authority Revenue (Franciscan Alliance Inc.) | 5.000% | 11/1/27 | 6,310 | 7,272 |
| Indiana Finance Authority Revenue (Franciscan Alliance Inc.) | 5.000% | 11/1/27 | 6,785 | 7,819 |
| Indiana Finance Authority Revenue (Franciscan Alliance Inc.) | 5.000% | 11/1/28 | 6,650 | 7,579 |
| Indiana Finance Authority Revenue (Franciscan Alliance Inc.) | 5.000% | 11/1/28 | 6,970 | 7,944 |
| Indiana Finance Authority Revenue (Franciscan Alliance Inc.) | 5.000% | 11/1/29 | 7,400 | 8,372 |
| Indiana Finance Authority Revenue (Franciscan Alliance Inc.) | 5.000% | 11/1/29 | 4,000 | 4,526 |
| Indiana Finance Authority Revenue (Franciscan Alliance Inc.) | 5.000% | 11/1/30 | 19,250 | 21,652 |
| Indiana Finance Authority Revenue (Franciscan Alliance Inc.) | 5.000% | 11/1/31 | 22,000 | 24,654 |
| Indiana Finance Authority Revenue (Franciscan Alliance Inc.) | 5.000% | 11/1/32 | 19,705 | 22,018 |
| Indiana Finance Authority Revenue (Franciscan Alliance Inc.) | 4.000% | 11/1/35 | 16,850 | 16,888 |
| Indiana Finance Authority Revenue (Franciscan Alliance Inc.) | 4.000% | 11/1/36 | 11,140 | 11,112 |
| Indiana Finance Authority Revenue (Franciscan Alliance Inc.) | 4.000% | 11/1/37 | 6,220 | 6,179 |
| Indiana Finance Authority Revenue (Stadium Project) | 5.250% | 2/1/27 | 3,040 | 3,493 |
| Indiana Finance Authority Revenue (Stadium Project) | 5.250% | 2/1/29 | 5,000 | 5,712 |
| Indiana Finance Authority Revenue (Stadium Project) | 5.250% | 2/1/30 | 6,000 | 6,842 |
| Indiana Finance Authority Revenue (Stadium Project) | 5.250% | 2/1/31 | 10,130 | 11,526 |
| Indiana Finance Authority Revenue (State Revolving Fund) | 5.000% | 2/1/32 | 9,150 | 10,019 |
| Indiana Finance Authority Revenue (Trinity Health) | 5.000% | 12/1/20 (Prere.) | 6,295 | 6,649 |
| Indiana Finance Authority Wastewater Utility Revenue (CWA Authority Project) | 5.000% | 10/1/21 | 2,795 | 3,002 |
| Indiana Finance Authority Wastewater Utility Revenue (CWA Authority Project) | 5.000% | 10/1/24 | 1,000 | 1,124 |
| Indiana Finance Authority Wastewater Utility Revenue (CWA Authority Project) | 5.000% | 10/1/27 | 1,000 | 1,119 |
| Indiana Finance Authority Wastewater Utility Revenue (CWA Authority Project) | 5.000% | 10/1/28 | 2,180 | 2,436 |
| Indiana Finance Authority Wastewater Utility Revenue (CWA Authority Project) | 5.000% | 10/1/29 | 2,295 | 2,562 |
| Indiana Finance Authority Wastewater Utility Revenue (CWA Authority Project) | 5.000% | 10/1/29 | 5,000 | 5,479 |
| Indiana Finance Authority Wastewater Utility Revenue (CWA Authority Project) | 5.000% | 10/1/30 | 5,490 | 5,999 |
| Indiana Finance Authority Wastewater Utility Revenue (CWA Authority Project) | 5.000% | 10/1/31 | 3,325 | 3,612 |
| Indiana Finance Authority Wastewater Utility Revenue (CWA Authority Project) | 5.250% | 10/1/31 | 10,020 | 10,795 |
| Indiana Health Facility Financing Authority Revenue (Parkview Health System Obligated Group) | 3.200% | 11/19/18 (2) | 2,875 | 2,875 |
| Indiana Municipal Power Agency Revenue | 5.625% | 1/1/19 (Prere.) | 4,640 | 4,669 |
| Indiana Municipal Power Agency Revenue | 5.750% | 1/1/19 (Prere.) | 2,000 | 2,013 |
| Indiana Municipal Power Agency Revenue | 5.000% | 1/1/30 | 3,530 | 4,052 |
| Indiana Municipal Power Agency Revenue | 5.000% | 1/1/31 | 5,265 | 6,017 |
| Indiana Municipal Power Agency Revenue | 5.000% | 1/1/33 | 6,295 | 7,114 |
| Indiana Municipal Power Agency Revenue | 5.000% | 1/1/33 | 7,245 | 8,099 |
194
Intermediate-Term Tax-Exempt Fund
| | | | |
| Face | Market |
| Maturity | Amount | Value• |
| Coupon | Date | ($000) | ($000) |
| Indiana Municipal Power Agency Revenue | 5.000% | 1/1/34 | 4,070 | 4,575 |
| Indiana Municipal Power Agency Revenue | 5.000% | 1/1/34 | 19,000 | 21,171 |
| Indiana Municipal Power Agency Revenue | 5.000% | 1/1/35 | 1,305 | 1,462 |
| Indiana Municipal Power Agency Revenue | 5.000% | 1/1/35 | 20,000 | 22,085 |
| Indiana Municipal Power Agency Revenue | 5.000% | 1/1/36 | 12,500 | 13,786 |
| Indiana Municipal Power Agency Revenue | 5.000% | 1/1/37 | 2,410 | 2,679 |
| Indiana Office Building Commission Facilities Revenue (New Castle Correctional Facility) | 5.250% | 7/1/19 (14) | 2,515 | 2,570 |
| Indiana University Student Fee Revenue | 5.000% | 8/1/21 | 4,500 | 4,839 |
| Indiana University Student Fee Revenue | 5.000% | 8/1/21 (Prere.) | 1,000 | 1,075 |
| Indiana University Student Fee Revenue | 5.000% | 8/1/21 (Prere.) | 1,000 | 1,075 |
| Indiana University Student Fee Revenue | 5.000% | 8/1/21 (Prere.) | 1,560 | 1,677 |
| Indiana University Student Fee Revenue | 5.000% | 8/1/22 | 6,370 | 6,998 |
| Indiana University Student Fee Revenue | 5.000% | 8/1/23 | 3,510 | 3,858 |
| Indiana University Student Fee Revenue | 5.000% | 8/1/24 | 2,175 | 2,387 |
| Indiana University Student Fee Revenue | 5.000% | 8/1/25 | 2,040 | 2,237 |
| Indianapolis IN Department of Public Utilities Water System Revenue | 5.000% | 10/1/26 | 2,350 | 2,731 |
| Indianapolis IN Department of Public Utilities Water System Revenue | 5.000% | 10/1/27 | 1,655 | 1,940 |
| Indianapolis IN Department of Public Utilities Water System Revenue | 5.000% | 10/1/28 | 1,650 | 1,950 |
| Indianapolis IN Department of Public Utilities Water System Revenue | 5.000% | 10/1/29 | 3,000 | 3,478 |
| Indianapolis IN Department of Public Utilities Water System Revenue | 5.000% | 10/1/30 | 5,000 | 5,764 |
| Indianapolis IN Department of Public Utilities Water System Revenue | 5.000% | 10/1/35 | 7,000 | 7,917 |
| Indianapolis IN Department of Public Utilities Water System Revenue | 5.000% | 10/1/36 | 10,000 | 11,265 |
| Indianapolis IN Department of Public Utilities Water System Revenue Indianapolis Department | | | | |
| of Public Utilities Water System Revenue | 5.000% | 10/1/37 | 4,500 | 5,057 |
| Indianapolis IN Gas Utility Revenue | 5.000% | 8/15/21 (4) | 3,530 | 3,709 |
| Indianapolis IN Gas Utility Revenue | 5.000% | 8/15/22 (4) | 15,655 | 16,421 |
| Indianapolis IN Local Public Improvement Bond Bank Revenue | 5.000% | 1/15/19 | 3,000 | 3,019 |
| Indianapolis IN Local Public Improvement Bond Bank Revenue | 5.000% | 1/15/20 | 1,545 | 1,599 |
| Indianapolis IN Local Public Improvement Bond Bank Revenue | 5.000% | 2/1/20 | 5,050 | 5,087 |
| Indianapolis IN Local Public Improvement Bond Bank Revenue | 5.000% | 1/15/21 | 8,590 | 8,887 |
| Indianapolis IN Local Public Improvement Bond Bank Revenue | 5.000% | 1/15/22 | 7,000 | 7,238 |
| Indianapolis IN Local Public Improvement Bond Bank Revenue (PILOT Infrastructure Project) | 5.000% | 1/1/20 (Prere.) | 3,535 | 3,653 |
| Indianapolis IN Local Public Improvement Bond Bank Revenue (PILOT Infrastructure Project) | 5.000% | 1/1/20 (Prere.) | 4,285 | 4,428 |
| Indianapolis IN Local Public Improvement Bond Bank Revenue (PILOT Infrastructure Project) | 5.000% | 1/1/20 (Prere.) | 7,000 | 7,234 |
| Indianapolis IN Local Public Improvement Bond Bank Revenue | | | | |
| (Qualified Midwestern Disaster Area) | 5.500% | 2/1/28 | 4,065 | 4,338 |
| Indianapolis IN Local Public Improvement Bond Bank Revenue | | | | |
| (Qualified Midwestern Disaster Area) | 5.500% | 2/1/29 | 4,370 | 4,661 |
| Indianapolis IN Local Public Improvement Bond Bank Revenue (Waterworks Project) | 5.500% | 1/1/19 (Prere.) | 1,955 | 1,967 |
| Indianapolis IN Local Public Improvement Bond Bank Revenue (Waterworks Project) | 5.500% | 1/1/29 | 8,045 | 8,091 |
| Indianapolis IN Local Public Improvement Bond Bank Revenue (Waterworks Project) | 5.500% | 1/1/38 (12) | 7,000 | 7,040 |
| Ivy IN Tech Community College Revenue | 5.000% | 7/1/34 | 1,600 | 1,812 |
| Ivy IN Tech Community College Revenue | 5.000% | 7/1/35 | 1,075 | 1,212 |
| Ivy IN Tech Community College Revenue | 5.000% | 7/1/36 | 1,625 | 1,823 |
| Ivy IN Tech Community College Revenue | 5.000% | 7/1/37 | 2,175 | 2,433 |
| Ivy IN Tech Community College Revenue | 5.000% | 7/1/38 | 2,235 | 2,490 |
| Lake Central IN Multi-District School Building Corp. Revenue | 5.000% | 7/15/25 | 4,330 | 4,741 |
| Lake Central IN Multi-District School Building Corp. Revenue | 5.000% | 7/15/26 | 4,855 | 5,306 |
| Purdue University Indiana University COP | 5.000% | 7/1/36 | 1,670 | 1,866 |
| Purdue University Indiana University Student Facilities System Revenue | 4.000% | 7/1/20 | 170 | 175 |
| Purdue University Indiana University Student Facilities System Revenue | 5.000% | 7/1/32 | 1,850 | 2,096 |
| Purdue University Indiana University Student Facilities System Revenue | 5.000% | 7/1/33 | 2,505 | 2,829 |
| Purdue University Indiana University Student Facilities System Revenue | 5.000% | 7/1/34 | 1,590 | 1,790 |
| Purdue University Indiana University Student Facilities System Revenue | 5.000% | 7/1/36 | 1,255 | 1,402 |
| Rockport IN Pollution Control Revenue (Indiana Michigan Power Co. Project) | 2.750% | 6/1/25 | 13,000 | 12,723 |
| Wayne Township School Building Corp. Marion County Indiana Revenue | 5.000% | 7/15/25 | 4,460 | 4,994 |
| | | | 804,431 |
| Iowa (0.3%) | | | | |
| Ames IA Hospital Revenue (Mary Greeley Medical Center) | 5.500% | 6/15/20 (Prere.) | 2,000 | 2,104 |
| Ames IA Hospital Revenue (Mary Greeley Medical Center) | 5.625% | 6/15/20 (Prere.) | 2,000 | 2,107 |
| Iowa Finance Authority Health Facilities Revenue (Iowa Health System) | 5.250% | 8/15/19 (Prere.) | 5,500 | 5,638 |
| Iowa Finance Authority Health Facilities Revenue (Iowa Health System) | 5.250% | 2/15/29 (12) | 13,500 | 13,611 |
| Iowa Finance Authority Midwestern Disaster Area Revenue (Iowa Fertilizer Co. Project) | 5.500% | 12/1/22 | 185 | 185 |
| Iowa Finance Authority Midwestern Disaster Area Revenue (Iowa Fertilizer Co. Project) | 5.250% | 12/1/25 | 500 | 528 |
| 7 Iowa Finance Authority Midwestern Disaster Area Revenue (Iowa Fertilizer Co. Project) | 5.875% | 12/1/27 | 2,955 | 3,128 |
| Iowa Finance Authority Midwestern Disaster Area Revenue (Iowa Fertilizer Co. Project) PUT | 5.250% | 12/1/37 | 59,200 | 62,866 |
| Iowa Finance Authority Revenue | 5.000% | 8/1/20 | 3,000 | 3,147 |
| Iowa Special Obligation Revenue | 5.000% | 6/1/24 | 4,090 | 4,620 |
| Iowa Special Obligation Revenue | 5.000% | 6/1/27 | 5,450 | 6,256 |
195
Intermediate-Term Tax-Exempt Fund
| | | | |
| Face | Market |
| Maturity | Amount | Value• |
| Coupon | Date | ($000) | ($000) |
| Iowa Special Obligation Revenue (Ijobs Program) | 5.000% | 6/1/27 | 5,985 | 6,243 |
| Iowa Special Obligation Revenue (Prison Infrastructure) | 5.000% | 6/15/20 (Prere.) | 4,000 | 4,182 |
| Iowa Special Obligation Revenue (Prison Infrastructure) | 5.000% | 6/15/20 (Prere.) | 1,150 | 1,202 |
| Iowa Special Obligation Revenue (Prison Infrastructure) | 5.000% | 6/15/20 (Prere.) | 2,100 | 2,196 |
| Polk County IA GO | 4.000% | 6/1/22 | 12,620 | 13,335 |
| Polk County IA GO | 4.000% | 6/1/23 | 13,050 | 13,808 |
| | | | 145,156 |
| Kansas (0.7%) | | | | |
| Butler County KS Unified School District No. 385 Andover GO | 4.000% | 9/1/27 | 2,500 | 2,709 |
| Butler County KS Unified School District No. 385 Andover GO | 4.000% | 9/1/28 | 4,000 | 4,279 |
| Butler County KS Unified School District No. 385 Andover GO | 4.000% | 9/1/29 | 3,000 | 3,176 |
| Butler County KS Unified School District No. 385 Andover GO | 4.000% | 9/1/30 | 3,010 | 3,165 |
| Butler County KS Unified School District No. 385 Andover GO | 4.000% | 9/1/31 | 2,000 | 2,089 |
| Butler County KS Unified School District No. 385 Andover GO | 5.000% | 9/1/32 | 2,000 | 2,260 |
| Butler County KS Unified School District No. 385 Andover GO | 5.000% | 9/1/33 | 2,365 | 2,663 |
| Butler County KS Unified School District No. 385 Andover GO | 5.000% | 9/1/34 | 2,680 | 3,009 |
| Geary County KS Unified School District No. 475 GO | 5.000% | 9/1/25 | 355 | 405 |
| Geary County KS Unified School District No. 475 GO | 5.000% | 9/1/26 | 350 | 400 |
| Geary County KS Unified School District No. 475 GO | 5.000% | 9/1/27 | 425 | 485 |
| Geary County KS Unified School District No. 475 GO | 5.000% | 9/1/28 | 635 | 723 |
| Geary County KS Unified School District No. 475 GO | 5.000% | 9/1/29 | 600 | 682 |
| Geary County KS Unified School District No. 475 GO | 5.000% | 9/1/30 | 775 | 877 |
| Geary County KS Unified School District No. 475 GO | 5.000% | 9/1/31 | 650 | 733 |
| Geary County KS Unified School District No. 475 GO | 4.000% | 9/1/33 | 750 | 779 |
| Geary County KS Unified School District No. 475 GO | 4.000% | 9/1/34 | 700 | 718 |
| Geary County KS Unified School District No. 475 GO | 4.000% | 9/1/35 | 2,000 | 2,046 |
| Geary County KS Unified School District No. 475 GO | 4.000% | 9/1/36 | 2,155 | 2,198 |
| Geary County KS Unified School District No. 475 GO | 4.000% | 9/1/37 | 1,835 | 1,868 |
| Hutchison KS Hospital Facilities Revenue (Hutchinson Regional Medical Center Inc.) | 5.000% | 12/1/26 | 600 | 649 |
| Hutchison KS Hospital Facilities Revenue (Hutchinson Regional Medical Center Inc.) | 5.000% | 12/1/27 | 500 | 538 |
| Hutchison KS Hospital Facilities Revenue (Hutchinson Regional Medical Center Inc.) | 5.000% | 12/1/28 | 500 | 535 |
| Hutchison KS Hospital Facilities Revenue (Hutchinson Regional Medical Center Inc.) | 5.000% | 12/1/29 | 500 | 531 |
| Hutchison KS Hospital Facilities Revenue (Hutchinson Regional Medical Center Inc.) | 5.000% | 12/1/30 | 500 | 529 |
| Hutchison KS Hospital Facilities Revenue (Hutchinson Regional Medical Center Inc.) | 5.000% | 12/1/31 | 650 | 686 |
| Johnson County KS Public Building Commission | | | | |
| (Courthouse & Medical Examiners Facilities) Revenue | 4.000% | 9/1/27 | 20,000 | 21,574 |
| Johnson County KS Unified School District No. 233 GO | 5.000% | 9/1/24 | 1,045 | 1,187 |
| Johnson County KS Unified School District No. 233 GO | 5.000% | 9/1/24 | 1,500 | 1,704 |
| Johnson County KS Unified School District No. 233 GO | 4.000% | 9/1/29 | 1,000 | 1,055 |
| Johnson County KS Unified School District No. 233 GO | 4.000% | 9/1/31 | 1,000 | 1,043 |
| Johnson County KS Unified School District No. 233 GO | 4.000% | 9/1/32 | 650 | 674 |
| Johnson County KS Unified School District No. 233 GO | 4.000% | 9/1/33 | 500 | 514 |
| Kansas Department of Transportation Highway Revenue | 5.000% | 9/1/20 | 24,000 | 25,252 |
| Kansas Department of Transportation Highway Revenue | 5.000% | 9/1/21 | 10,015 | 10,789 |
| Kansas Department of Transportation Highway Revenue | 5.000% | 9/1/22 | 7,485 | 8,236 |
| Kansas Department of Transportation Highway Revenue | 5.000% | 9/1/25 | 10,000 | 11,342 |
| Kansas Department of Transportation Highway Revenue | 5.000% | 9/1/26 | 13,300 | 15,062 |
| Kansas Department of Transportation Highway Revenue | 5.000% | 9/1/26 | 2,310 | 2,655 |
| Kansas Department of Transportation Highway Revenue | 5.000% | 9/1/27 | 14,000 | 15,815 |
| Kansas Department of Transportation Highway Revenue | 5.000% | 9/1/28 | 11,400 | 12,851 |
| Kansas Department of Transportation Highway Revenue | 5.000% | 9/1/29 | 15,525 | 17,448 |
| Kansas Development Finance Authority Health Facilities Revenue | | | | |
| (Kansas University Health System) | 5.375% | 3/1/30 | 1,000 | 1,038 |
| Kansas Development Finance Authority Health Facilities Revenue | | | | |
| (Kansas University Health System) | 5.000% | 3/1/31 | 1,000 | 1,032 |
| Kansas Development Finance Authority Health Facilities Revenue | | | | |
| (Kansas University Health System) | 5.000% | 3/1/34 | 2,015 | 2,077 |
| Kansas Development Finance Authority Hospital Revenue | | | | |
| (Adventist Health System/Sunbelt Obligated Group) | 5.500% | 11/15/19 (Prere.) | 230 | 238 |
| Kansas Development Finance Authority Hospital Revenue | | | | |
| (Adventist Health System/Sunbelt Obligated Group) | 5.500% | 11/15/29 | 10,205 | 10,534 |
| 7 Kansas Development Finance Authority Hospital Revenue | | | | |
| (Adventist Health System/Sunbelt Obligated Group) TOB VRDO | 1.650% | 11/7/18 | 8,000 | 8,000 |
| Kansas Development Finance Authority Revenue | 5.000% | 5/1/20 | 11,400 | 11,864 |
| Kansas Development Finance Authority Revenue | 5.000% | 5/1/23 | 10,000 | 11,057 |
| Kansas Development Finance Authority Revenue | 5.000% | 5/1/25 | 10,000 | 10,990 |
| Kansas Development Finance Authority Revenue | 5.000% | 5/1/26 | 13,515 | 14,853 |
| Kansas Development Finance Authority Revenue | 5.000% | 5/1/27 | 23,500 | 25,796 |
| Kansas Development Finance Authority Revenue | 5.000% | 5/1/28 | 7,000 | 7,674 |
196
Intermediate-Term Tax-Exempt Fund
| | | | |
| Face | Market |
| Maturity | Amount | Value• |
| Coupon | Date | ($000) | ($000) |
| Kansas Development Finance Authority Revenue | 5.000% | 4/1/29 | 7,055 | 7,713 |
| Kansas Development Finance Authority Revenue | 5.000% | 4/1/32 | 13,000 | 14,095 |
| Kansas Development Finance Authority Revenue | 5.000% | 4/1/33 | 15,045 | 16,299 |
| Kansas Development Finance Authority Revenue | 5.000% | 4/1/34 | 5,795 | 6,266 |
| Kansas Development Finance Authority Revenue | | | | |
| (Kansas Department of Commerce Impact Program) | 5.000% | 6/1/19 | 6,730 | 6,842 |
| Kansas Development Finance Authority Revenue | | | | |
| (Kansas Department of Commerce Impact Program) | 5.000% | 6/1/20 | 7,070 | 7,372 |
| Kansas Development Finance Authority Revenue | | | | |
| (Sisters of Charity of Leavenworth Health System) | 5.250% | 1/1/20 (Prere.) | 6,510 | 6,738 |
| Kansas Development Finance Authority Revenue | | | | |
| (Sisters of Charity of Leavenworth Health System) | 5.250% | 1/1/25 | 990 | 1,024 |
| Lawrence KS Water & Sewage System Revenue | 5.000% | 11/1/28 | 3,575 | 4,081 |
| Leavenworth County KS Unified School District GO | 4.500% | 3/1/19 (12) | 1,000 | 1,008 |
| Leavenworth County KS Unified School District GO | 4.500% | 9/1/19 (12) | 600 | 612 |
| Leavenworth County KS Unified School District GO | 4.750% | 9/1/19 (Prere.) | 1,265 | 1,293 |
| Leavenworth County KS Unified School District GO | 4.750% | 9/1/19 (Prere.) | 1,165 | 1,191 |
| Leavenworth County KS Unified School District GO | 5.000% | 9/1/19 (Prere.) | 1,360 | 1,393 |
| Leavenworth County KS Unified School District GO | 5.000% | 9/1/19 (Prere.) | 1,060 | 1,086 |
| Leavenworth County KS Unified School District GO | 4.500% | 3/1/20 (12) | 1,115 | 1,138 |
| Sedgwick County KS Unified School District No. 266 (Maize) GO | 5.000% | 9/1/24 | 3,000 | 3,389 |
| Sedgwick County KS Unified School District No. 266 (Maize) GO | 5.000% | 9/1/25 | 1,250 | 1,414 |
| Seward County KS Unified School District No. 480 GO | 4.000% | 9/1/30 | 5,430 | 5,708 |
| Seward County KS Unified School District No. 480 GO | 4.000% | 9/1/31 | 3,000 | 3,144 |
| Seward County KS Unified School District No. 480 GO | 4.000% | 9/1/32 | 2,000 | 2,084 |
| Seward County KS Unified School District No. 480 GO | 4.000% | 9/1/33 | 2,000 | 2,071 |
| Wyandotte County/Kansas City KS Unified Government Utility System Revenue | 5.000% | 9/1/22 | 825 | 901 |
| Wyandotte County/Kansas City KS Unified Government Utility System Revenue | 5.000% | 9/1/23 | 1,595 | 1,768 |
| | | | 389,716 |
| Kentucky (1.2%) | | | | |
| Ashland KY Medical Center Revenue (King’s Daughters Medical Center Project) | 5.000% | 2/1/25 | 720 | 781 |
| Ashland KY Medical Center Revenue (King’s Daughters Medical Center Project) | 5.000% | 2/1/26 | 2,270 | 2,473 |
| Ashland KY Medical Center Revenue (King’s Daughters Medical Center Project) | 5.000% | 2/1/27 | 2,460 | 2,673 |
| Ashland KY Medical Center Revenue (King’s Daughters Medical Center Project) | 5.000% | 2/1/28 | 1,130 | 1,222 |
| Kentucky Asset/Liability Commission Agency Fund Revenue (Federal Highway Trust) | 5.000% | 9/1/21 | 14,160 | 14,823 |
| Kentucky Asset/Liability Commission Agency Fund Revenue (Federal Highway Trust) | 5.000% | 9/1/22 | 7,010 | 7,334 |
| Kentucky Bond Development Corp. Transient Room Tax Revenue | | | | |
| (Lexington Center Corporation Project) | 5.000% | 9/1/27 | 1,835 | 2,084 |
| Kentucky Bond Development Corp. Transient Room Tax Revenue | | | | |
| (Lexington Center Corporation Project) | 5.000% | 9/1/31 | 2,240 | 2,498 |
| Kentucky Bond Development Corp. Transient Room Tax Revenue | | | | |
| (Lexington Center Corporation Project) | 5.000% | 9/1/32 | 1,360 | 1,510 |
| Kentucky Bond Development Corp. Transient Room Tax Revenue | | | | |
| (Lexington Center Corporation Project) | 5.000% | 9/1/33 | 1,380 | 1,527 |
| Kentucky Bond Development Corp. Transient Room Tax Revenue | | | | |
| (Lexington Center Corporation Project) | 5.000% | 9/1/34 | 1,405 | 1,549 |
| Kentucky Bond Development Corp. Transient Room Tax Revenue | | | | |
| (Lexington Center Corporation Project) | 5.000% | 9/1/35 | 1,490 | 1,637 |
| Kentucky Bond Development Corp. Transient Room Tax Revenue | | | | |
| (Lexington Center Corporation Project) | 5.000% | 9/1/36 | 1,880 | 2,057 |
| Kentucky Bond Development Corp. Transient Room Tax Revenue | | | | |
| (Lexington Center Corporation Project) | 5.000% | 9/1/37 | 1,750 | 1,910 |
| Kentucky Bond Development Corp. Transient Room Tax Revenue | | | | |
| (Lexington Center Corporation Project) | 5.000% | 9/1/38 | 1,750 | 1,904 |
| Kentucky Economic Development Finance Authority Health System Revenue | | | | |
| (Baptist Healthcare System) | 5.000% | 8/15/27 | 4,000 | 4,418 |
| Kentucky Economic Development Finance Authority Health System Revenue | | | | |
| (Norton Healthcare Inc. & Affiliates) | 0.000% | 10/1/25 (14) | 12,000 | 9,434 |
| Kentucky Economic Development Finance Authority Hospital Revenue | | | | |
| (Baptist Healthcare System Obligated Group) | 5.000% | 8/15/29 | 2,020 | 2,193 |
| Kentucky Economic Development Finance Authority Hospital Revenue | | | | |
| (Baptist Healthcare System Obligated Group) | 5.000% | 8/15/30 | 1,900 | 2,051 |
| Kentucky Economic Development Finance Authority Hospital Revenue | | | | |
| (Baptist Healthcare System Obligated Group) | 5.000% | 8/15/31 | 1,000 | 1,076 |
| Kentucky Economic Development Finance Authority Hospital Revenue | | | | |
| (Baptist Healthcare System Obligated Group) | 5.000% | 8/15/32 | 1,500 | 1,601 |
| Kentucky Economic Development Finance Authority Hospital Revenue | | | | |
| (Baptist Healthcare System Obligated Group) | 5.000% | 8/15/34 | 2,720 | 2,885 |
197
Intermediate-Term Tax-Exempt Fund
| | | | |
| Face | Market |
| Maturity | Amount | Value• |
| Coupon | Date | ($000) | ($000) |
| Kentucky Economic Development Finance Authority Hospital Revenue | | | | |
| (Baptist Healthcare System Obligated Group) | 5.000% | 8/15/35 | 1,600 | 1,691 |
| Kentucky Economic Development Finance Authority Hospital Revenue | | | | |
| (Baptist Healthcare System Obligated Group) | 5.000% | 8/15/36 | 2,500 | 2,634 |
| Kentucky Economic Development Finance Authority Hospital Revenue | | | | |
| (Baptist Healthcare System Obligated Group) | 5.000% | 8/15/37 | 4,745 | 4,993 |
| Kentucky Economic Development Finance Authority Medical Center Revenue | | | | |
| (King’s Daughters Medical Center Project) | 5.000% | 2/1/19 | 1,475 | 1,483 |
| Kentucky Economic Development Finance Authority Medical Center Revenue | | | | |
| (King’s Daughters Medical Center Project) | 5.000% | 2/1/20 | 2,985 | 3,059 |
| Kentucky Economic Development Finance Authority Medical Center Revenue | | | | |
| (King’s Daughters Medical Center Project) | 5.000% | 2/1/21 | 2,000 | 2,051 |
| Kentucky Economic Development Finance Authority Medical Center Revenue | | | | |
| (King’s Daughters Medical Center Project) | 5.000% | 2/1/30 | 7,000 | 7,128 |
| 2 Kentucky Economic Development Finance Authority Revenue (Catholic Health Initiatives) PUT | 2.434% | 2/1/20 | 40,000 | 40,012 |
| Kentucky Municipal Power Agency Power System Revenue | 5.000% | 9/1/25 (14) | 4,500 | 5,049 |
| Kentucky Municipal Power Agency Power System Revenue | 5.000% | 9/1/27 (14) | 4,425 | 4,939 |
| Kentucky Municipal Power Agency Power System Revenue | 5.000% | 9/1/28 (14) | 3,520 | 3,922 |
| Kentucky Municipal Power Agency Power System Revenue | 5.000% | 9/1/29 (14) | 4,000 | 4,441 |
| Kentucky Municipal Power Agency Power System Revenue | 5.000% | 9/1/30 (14) | 2,370 | 2,621 |
| Kentucky Municipal Power Agency Power System Revenue PUT | 3.450% | 3/1/26 | 16,500 | 16,102 |
| Kentucky Property & Building Commission Revenue | 5.000% | 11/1/18 (Prere.) | 5,000 | 5,000 |
| Kentucky Property & Building Commission Revenue | 5.000% | 11/1/18 (Prere.) | 5,120 | 5,120 |
| Kentucky Property & Building Commission Revenue | 5.250% | 2/1/19 (Prere.) | 5,510 | 5,556 |
| Kentucky Property & Building Commission Revenue | 5.250% | 2/1/19 (Prere.) | 4,425 | 4,462 |
| Kentucky Property & Building Commission Revenue | 5.250% | 2/1/19 (Prere.) | 705 | 711 |
| Kentucky Property & Building Commission Revenue | 5.250% | 2/1/19 (Prere.) | 570 | 575 |
| Kentucky Property & Building Commission Revenue | 5.500% | 8/1/19 (2) | 6,870 | 7,036 |
| Kentucky Property & Building Commission Revenue | 5.000% | 10/1/19 (2) | 5,000 | 5,125 |
| Kentucky Property & Building Commission Revenue | 5.500% | 8/1/20 (2) | 4,320 | 4,548 |
| Kentucky Property & Building Commission Revenue | 5.000% | 8/1/21 | 35,100 | 36,614 |
| Kentucky Property & Building Commission Revenue | 5.000% | 5/1/31 (15) | 2,750 | 3,060 |
| Kentucky Property & Building Commission Revenue | 5.000% | 5/1/32 (15) | 2,000 | 2,217 |
| Kentucky Property & Building Commission Revenue | 5.000% | 5/1/33 (15) | 2,000 | 2,208 |
| Kentucky Property & Building Commission Revenue | 5.000% | 5/1/34 (15) | 1,000 | 1,101 |
| Kentucky Public Energy Authority Gas Supply Revenue PUT | 4.000% | 4/1/24 | 204,875 | 213,062 |
| Kentucky Public Energy Authority Gas Supply Revenue PUT | 4.000% | 1/1/25 | 144,000 | 151,216 |
| Kentucky Public Transportation Infrastructure Authority Toll Revenue | | | | |
| (Downtown Crossing Project) BAN | 0.000% | 7/1/20 | 1,700 | 1,614 |
| Kentucky Public Transportation Infrastructure Authority Toll Revenue | | | | |
| (Downtown Crossing Project) BAN | 0.000% | 7/1/23 | 1,720 | 1,457 |
| Kentucky Turnpike Authority Economic Development Road Revenue (Revitalization Project) | 5.000% | 7/1/22 | 1,025 | 1,117 |
| Kentucky Turnpike Authority Economic Development Road Revenue (Revitalization Project) | 5.000% | 7/1/24 | 1,505 | 1,692 |
| Kentucky Turnpike Authority Economic Development Road Revenue (Revitalization Project) | 5.000% | 7/1/29 | 3,905 | 4,274 |
| Kentucky Turnpike Authority Economic Development Road Revenue (Revitalization Project) | 5.000% | 7/1/31 | 5,210 | 5,691 |
| Louisville & Jefferson County KY Metropolitan Government Health System Revenue | | | | |
| (Norton Healthcare Obligated Group) | 5.000% | 10/1/25 | 1,795 | 2,021 |
| Louisville & Jefferson County KY Metropolitan Government Health System Revenue | | | | |
| (Norton Healthcare Obligated Group) | 5.000% | 10/1/26 | 5,885 | 6,673 |
| Louisville & Jefferson County KY Metropolitan Government Health System Revenue | | | | |
| (Norton Healthcare Obligated Group) | 5.000% | 10/1/27 | 2,320 | 2,601 |
| Louisville & Jefferson County KY Metropolitan Government Revenue (Catholic Health Initiatives) | 5.000% | 12/1/25 | 8,900 | 9,469 |
| Louisville & Jefferson County KY Metropolitan Government Revenue (Catholic Health Initiatives) | 5.000% | 12/1/30 | 14,775 | 15,489 |
| Louisville & Jefferson County KY Metropolitan Government Revenue (Catholic Health Initiatives) | 5.000% | 12/1/31 | 9,000 | 9,416 |
| Paducah KY Electric Plant Board Revenue | 5.000% | 10/1/25 (4) | 1,665 | 1,844 |
| Paducah KY Electric Plant Board Revenue | 5.000% | 10/1/26 (4) | 1,150 | 1,281 |
| University of Kentucky Revenue | 4.000% | 10/1/29 | 3,000 | 3,161 |
| University of Kentucky Revenue | 4.000% | 10/1/31 | 15,070 | 15,758 |
| Warren County KY Hospital Revenue | | | | |
| (Bowling Green-Warren County Community Hospital Corp. Project) | 5.000% | 4/1/20 | 1,180 | 1,225 |
| Warren County KY Hospital Revenue | | | | |
| (Bowling Green-Warren County Community Hospital Corp. Project) | 5.000% | 4/1/28 | 4,000 | 4,321 |
| | | | 706,480 |
| Louisiana (0.8%) | | | | |
| Bossier City LA Utilities Revenue | 5.000% | 10/1/29 | 1,000 | 1,127 |
| Bossier City LA Utilities Revenue | 5.000% | 10/1/31 | 1,000 | 1,124 |
| Bossier City LA Utilities Revenue | 5.000% | 10/1/32 | 1,000 | 1,121 |
| Bossier City LA Utilities Revenue | 5.000% | 10/1/33 | 3,000 | 3,356 |
| East Baton Rouge Parish LA Sales Tax Revenue | 5.000% | 8/1/19 (Prere.) | 5,165 | 5,281 |
198
Intermediate-Term Tax-Exempt Fund
| | | | |
| Face | Market |
| Maturity | Amount | Value• |
| Coupon | Date | ($000) | ($000) |
| Ernest N. Morial New Orleans LA Exhibition Hall Authority Special Tax Revenue | 5.000% | 7/15/27 | 2,800 | 3,020 |
| Jefferson LA Sales Tax District Special Sales Tax Revenue | 5.000% | 12/1/34 (4) | 1,500 | 1,680 |
| Jefferson LA Sales Tax District Special Sales Tax Revenue | 5.000% | 12/1/36 (4) | 2,000 | 2,223 |
| Jefferson Parish LA Environmental Facilities & Community Development Authority Revenue | 5.000% | 4/1/19 | 1,030 | 1,043 |
| Jefferson Parish LA Environmental Facilities & Community Development Authority Revenue | 5.000% | 4/1/19 (Prere.) | 1,000 | 1,013 |
| Jefferson Parish LA Environmental Facilities & Community Development Authority Revenue | 5.000% | 4/1/19 (Prere.) | 1,000 | 1,013 |
| Lafayette LA Communications System Revenue | 5.000% | 11/1/23 (4) | 2,000 | 2,223 |
| Lafayette LA Communications System Revenue | 5.000% | 11/1/24 (4) | 5,310 | 5,960 |
| Lafayette LA Communications System Revenue | 5.000% | 11/1/25 (4) | 1,500 | 1,675 |
| Lafayette LA Utilities Revenue | 5.000% | 11/1/26 (4) | 590 | 679 |
| Lafayette LA Utilities Revenue | 5.000% | 11/1/28 (4) | 1,010 | 1,161 |
| Lafayette LA Utilities Revenue | 5.000% | 11/1/29 (4) | 800 | 913 |
| Lafayette LA Utilities Revenue | 5.000% | 11/1/30 (4) | 1,000 | 1,136 |
| Louisiana Gasoline & Fuel Tax Revenue | 5.000% | 5/1/28 | 5,140 | 5,941 |
| Louisiana Gasoline & Fuel Tax Revenue | 5.000% | 5/1/28 | 4,500 | 5,194 |
| Louisiana Gasoline & Fuel Tax Revenue | 5.000% | 5/1/29 | 2,270 | 2,604 |
| Louisiana Gasoline & Fuel Tax Revenue | 5.000% | 5/1/31 | 6,000 | 6,818 |
| Louisiana Gasoline & Fuel Tax Revenue | 5.000% | 5/1/31 | 20,665 | 22,955 |
| Louisiana Gasoline & Fuel Tax Revenue | 5.000% | 5/1/32 | 3,860 | 4,370 |
| Louisiana Gasoline & Fuel Tax Revenue | 5.000% | 5/1/32 | 10,000 | 11,098 |
| Louisiana Gasoline & Fuel Tax Revenue | 5.000% | 5/1/33 | 4,350 | 4,907 |
| Louisiana Gasoline & Fuel Tax Revenue | 5.000% | 5/1/33 | 5,905 | 6,544 |
| Louisiana Gasoline & Fuel Tax Revenue | 5.000% | 5/1/34 | 4,000 | 4,502 |
| Louisiana Gasoline & Fuel Tax Revenue | 5.000% | 5/1/34 | 4,000 | 4,428 |
| Louisiana Gasoline & Fuel Tax Revenue | 5.000% | 5/1/35 | 3,500 | 3,937 |
| Louisiana Gasoline & Fuel Tax Revenue | 5.000% | 5/1/35 | 7,095 | 7,847 |
| Louisiana Gasoline & Fuel Tax Revenue | 5.000% | 5/1/36 | 5,000 | 5,620 |
| Louisiana Gasoline & Fuel Tax Revenue | 5.000% | 5/1/37 | 5,000 | 5,628 |
| Louisiana GO | 5.000% | 4/1/24 | 5,000 | 5,624 |
| Louisiana GO | 5.000% | 8/1/25 | 2,375 | 2,690 |
| Louisiana GO | 5.000% | 12/1/26 | 7,870 | 8,912 |
| Louisiana GO | 5.000% | 5/1/29 | 14,815 | 16,580 |
| Louisiana GO | 4.000% | 5/15/29 | 16,800 | 17,428 |
| Louisiana GO | 5.000% | 10/1/30 | 2,000 | 2,271 |
| Louisiana GO | 4.000% | 10/1/34 | 10,710 | 10,911 |
| Louisiana Local Government Environmental Facilities & Community Development | | | | |
| Authority Revenue (East Baton Rouge Sewerage Commission Projects) | 5.000% | 2/1/29 | 1,525 | 1,677 |
| Louisiana Local Government Environmental Facilities & Community Development | | | | |
| Authority Revenue (East Baton Rouge Sewerage Commission Projects) | 5.000% | 2/1/31 | 3,140 | 3,433 |
| Louisiana Local Government Environmental Facilities & Community Development | | | | |
| Authority Revenue (East Baton Rouge Sewerage Commission Projects) | 5.000% | 2/1/33 | 3,500 | 3,818 |
| Louisiana Local Government Environmental Facilities & Community Development | | | | |
| Authority Revenue (East Baton Rouge Sewerage Commission Projects) | 5.000% | 2/1/34 | 2,550 | 2,776 |
| Louisiana Local Government Environmental Facilities & Community Development | | | | |
| Authority Revenue (LCTCS Facilities Corp. Project) | 5.000% | 10/1/20 (Prere.) | 2,790 | 2,935 |
| Louisiana Local Government Environmental Facilities & Community Development | | | | |
| Authority Revenue (LCTCS Facilities Corp. Project) | 5.000% | 10/1/20 (Prere.) | 11,000 | 11,572 |
| Louisiana Local Government Environmental Facilities & Community Development | | | | |
| Authority Revenue (LCTCS Facilities Corp. Project) | 5.000% | 10/1/20 (Prere.) | 2,000 | 2,104 |
| Louisiana Local Government Environmental Facilities & Community Development | | | | |
| Authority Revenue (Plaquemines Project) | 5.000% | 9/1/26 (4) | 1,700 | 1,844 |
| Louisiana Local Government Environmental Facilities & Community Development | | | | |
| Authority Revenue (Plaquemines Project) | 5.000% | 9/1/28 (4) | 1,875 | 2,024 |
| Louisiana Local Government Environmental Facilities & Community Development | | | | |
| Authority Revenue (Plaquemines Project) | 5.000% | 9/1/31 (4) | 1,420 | 1,526 |
| Louisiana Local Government Environmental Facilities & Community Development | | | | |
| Authority Revenue (Women’s Hospital Foundation Project) | 5.625% | 10/1/20 (Prere.) | 15,905 | 16,917 |
| Louisiana Local Government Environmental Facilities & Community Development | | | | |
| Authority Revenue (Women’s Hospital Foundation Project) | 5.000% | 10/1/26 | 800 | 903 |
| Louisiana Local Government Environmental Facilities & Community Development | | | | |
| Authority Revenue (Women’s Hospital Foundation Project) | 5.000% | 10/1/27 | 1,250 | 1,417 |
| Louisiana Local Government Environmental Facilities & Community Development | | | | |
| Authority Revenue (Women’s Hospital Foundation Project) | 5.000% | 10/1/28 | 2,135 | 2,408 |
| Louisiana Office Facilities Corp. Lease Revenue (Capitol Complex Project) | 5.000% | 5/1/19 | 4,495 | 4,560 |
| Louisiana Public Facilities Authority Hospital Revenue | | | | |
| (Franciscan Missionaries of Our Lady Health System Obligated Group) | 5.000% | 7/1/25 (Prere.) | 45 | 52 |
| Louisiana Public Facilities Authority Hospital Revenue | | | | |
| (Franciscan Missionaries of Our Lady Health System Obligated Group) | 5.000% | 7/1/25 (Prere.) | 50 | 57 |
| Louisiana Public Facilities Authority Hospital Revenue | | | | |
| (Franciscan Missionaries of Our Lady Health System Obligated Group) | 5.000% | 7/1/31 | 7,010 | 7,639 |
199
Intermediate-Term Tax-Exempt Fund
| | | | |
| Face | Market |
| Maturity | Amount | Value• |
| Coupon | Date | ($000) | ($000) |
| Louisiana Public Facilities Authority Hospital Revenue | | | | |
| (Franciscan Missionaries of Our Lady Health System Obligated Group) | 5.000% | 7/1/32 | 8,390 | 9,116 |
| Louisiana Public Facilities Authority Hospital Revenue (Louisiana Children’s Medical Center) | 5.000% | 6/1/36 | 5,000 | 5,474 |
| Louisiana Public Facilities Authority Hospital Revenue (Louisiana Children’s Medical Center) | 5.000% | 6/1/37 | 6,700 | 7,318 |
| Louisiana Public Facilities Authority Hospital Revenue (Louisiana Children’s Medical Center) | 5.000% | 6/1/38 | 4,040 | 4,399 |
| Louisiana Public Facilities Authority Hospital Revenue (Louisiana Children’s Medical Center) PUT | 5.000% | 6/1/25 | 15,000 | 16,808 |
| Louisiana Public Facilities Authority Revenue (Christus Health) | 5.000% | 7/1/27 | 2,785 | 3,150 |
| Louisiana Public Facilities Authority Revenue (Christus Health) | 5.000% | 7/1/28 | 1,470 | 1,666 |
| Louisiana Public Facilities Authority Revenue (Loyola University) | 5.250% | 10/1/21 (Prere.) | 4,000 | 4,345 |
| Louisiana Public Facilities Authority Revenue (Nineteenth Judicial District Court Building Project) | 5.000% | 6/1/36 (4) | 2,200 | 2,399 |
| Louisiana Public Facilities Authority Revenue (Ochsner Clinic Foundation Project) | 5.000% | 5/15/23 | 400 | 439 |
| Louisiana Public Facilities Authority Revenue (Ochsner Clinic Foundation Project) | 5.000% | 5/15/24 | 525 | 584 |
| Louisiana Public Facilities Authority Revenue (Ochsner Clinic Foundation Project) | 5.000% | 5/15/25 | 850 | 956 |
| Louisiana Public Facilities Authority Revenue (Ochsner Clinic Foundation Project) | 5.000% | 5/15/27 | 1,015 | 1,130 |
| Louisiana Stadium & Exposition District Revenue | 5.000% | 7/1/24 | 2,125 | 2,347 |
| Louisiana Stadium & Exposition District Revenue | 5.000% | 7/1/25 | 5,520 | 6,083 |
| Louisiana Stadium & Exposition District Revenue | 5.000% | 7/1/26 | 5,010 | 5,509 |
| Louisiana Stadium & Exposition District Revenue | 5.000% | 7/1/27 | 3,770 | 4,140 |
| Louisiana Stadium & Exposition District Revenue | 5.000% | 7/1/28 | 3,850 | 4,227 |
| Louisiana State University Revenue | 5.000% | 7/1/29 | 3,180 | 3,463 |
| Louisiana State University Revenue | 5.000% | 7/1/30 | 1,000 | 1,088 |
| Louisiana State University Revenue | 5.000% | 7/1/32 | 2,765 | 2,998 |
| New Orleans LA Aviation Board Revenue | 5.000% | 10/1/28 (4) | 1,000 | 1,138 |
| New Orleans LA Aviation Board Revenue | 5.000% | 10/1/33 (4) | 1,000 | 1,109 |
| New Orleans LA Aviation Board Revenue | 5.000% | 10/1/34 (4) | 1,280 | 1,411 |
| New Orleans LA Aviation Board Revenue | 5.000% | 10/1/35 (4) | 1,480 | 1,628 |
| New Orleans LA Aviation Board Revenue | 5.000% | 10/1/37 (4) | 1,600 | 1,753 |
| New Orleans LA GO | 5.000% | 12/1/23 | 2,250 | 2,447 |
| New Orleans LA GO | 5.000% | 12/1/24 | 2,500 | 2,712 |
| New Orleans LA GO | 5.000% | 12/1/25 | 2,500 | 2,707 |
| New Orleans LA GO | 5.000% | 12/1/26 (4) | 3,770 | 4,080 |
| New Orleans LA GO | 5.000% | 12/1/27 (4) | 2,260 | 2,446 |
| New Orleans LA GO | 5.000% | 12/1/28 (4) | 2,310 | 2,500 |
| New Orleans LA Sewage Service Revenue | 5.000% | 6/1/26 | 500 | 560 |
| New Orleans LA Sewage Service Revenue | 5.000% | 6/1/29 | 1,125 | 1,253 |
| New Orleans LA Sewage Service Revenue | 5.000% | 6/1/34 | 1,385 | 1,520 |
| New Orleans LA Sewage Service Revenue | 5.000% | 6/1/35 | 950 | 1,039 |
| New Orleans LA Water Revenue | 5.000% | 12/1/23 | 655 | 722 |
| New Orleans LA Water Revenue | 5.000% | 12/1/23 | 1,010 | 1,113 |
| New Orleans LA Water Revenue | 5.000% | 12/1/24 | 1,000 | 1,124 |
| New Orleans LA Water Revenue | 5.000% | 12/1/24 | 550 | 618 |
| New Orleans LA Water Revenue | 5.000% | 12/1/25 | 500 | 563 |
| New Orleans LA Water Revenue | 5.000% | 12/1/26 | 1,000 | 1,121 |
| New Orleans LA Water Revenue | 5.000% | 12/1/27 | 865 | 968 |
| New Orleans LA Water Revenue | 5.000% | 12/1/28 | 1,200 | 1,328 |
| New Orleans LA Water Revenue | 5.000% | 12/1/28 | 550 | 614 |
| New Orleans LA Water Revenue | 5.000% | 12/1/29 | 1,000 | 1,104 |
| New Orleans LA Water Revenue | 5.000% | 12/1/29 | 650 | 724 |
| New Orleans LA Water Revenue | 5.000% | 12/1/30 | 500 | 554 |
| New Orleans LA Water Revenue | 5.000% | 12/1/31 | 1,430 | 1,579 |
| New Orleans LA Water Revenue | 5.000% | 12/1/32 | 1,345 | 1,483 |
| New Orleans LA Water Revenue | 5.000% | 12/1/33 | 760 | 834 |
| New Orleans LA Water Revenue | 5.000% | 12/1/34 | 2,600 | 2,831 |
| Shreveport LA Water & Sewer Revenue | 5.000% | 12/1/26 (15) | 1,955 | 2,219 |
| Shreveport LA Water & Sewer Revenue | 5.000% | 12/1/27 (15) | 1,750 | 1,999 |
| Shreveport LA Water & Sewer Revenue | 5.000% | 12/1/28 (15) | 1,150 | 1,321 |
| Shreveport LA Water & Sewer Revenue | 5.000% | 12/1/31 (15) | 1,000 | 1,130 |
| Shreveport LA Water & Sewer Revenue | 5.000% | 12/1/32 (15) | 2,360 | 2,661 |
| Shreveport LA Water & Sewer Revenue | 4.000% | 12/1/34 (15) | 2,175 | 2,218 |
| St. Charles Parish LA Gulf Opportunity Zone Revenue (Valero Energy Corp.) PUT | 4.000% | 6/1/22 | 23,285 | 24,246 |
| Tobacco Settlement Financing Corp. Louisiana Revenue | 5.250% | 5/15/31 | 10,000 | 10,533 |
| Tobacco Settlement Financing Corp. Louisiana Revenue | 5.250% | 5/15/32 | 12,365 | 13,180 |
| Tobacco Settlement Financing Corp. Louisiana Revenue | 5.250% | 5/15/33 | 5,000 | 5,294 |
| | | | 468,242 |
| Maine (0.1%) | | | | |
| Maine Health & Higher Educational Facilities Authority Revenue (Mainehealth) | 5.000% | 7/1/31 | 600 | 670 |
| Maine Health & Higher Educational Facilities Authority Revenue (Mainehealth) | 5.000% | 7/1/32 | 500 | 555 |
| Maine Health & Higher Educational Facilities Authority Revenue (Mainehealth) | 5.000% | 7/1/33 | 560 | 620 |
| Maine Health & Higher Educational Facilities Authority Revenue (Mainehealth) | 5.000% | 7/1/34 | 2,310 | 2,548 |
200
Intermediate-Term Tax-Exempt Fund
| | | | |
| Face | Market |
| Maturity | Amount | Value• |
| Coupon | Date | ($000) | ($000) |
| Maine Health & Higher Educational Facilities Authority Revenue (Mainehealth) | 5.000% | 7/1/35 | 2,250 | 2,472 |
| Maine Health & Higher Educational Facilities Authority Revenue (Mainehealth) | 5.000% | 7/1/36 | 3,315 | 3,628 |
| Maine Health & Higher Educational Facilities Authority Revenue (Mainehealth) | 5.000% | 7/1/37 | 3,365 | 3,675 |
| Maine Health & Higher Educational Facilities Authority Revenue (Mainehealth) | 5.000% | 7/1/38 | 2,400 | 2,613 |
| Maine Health & Higher Educational Facilities Authority Revenue (University of New England) | 5.000% | 7/1/26 | 350 | 397 |
| Maine Health & Higher Educational Facilities Authority Revenue (University of New England) | 5.000% | 7/1/27 | 350 | 398 |
| Maine Health & Higher Educational Facilities Authority Revenue (University of New England) | 5.000% | 7/1/28 | 360 | 407 |
| Maine Health & Higher Educational Facilities Authority Revenue (University of New England) | 5.000% | 7/1/29 | 465 | 521 |
| Maine Municipal Bond Bank Revenue | 5.000% | 11/1/25 | 2,000 | 2,270 |
| Maine Municipal Bond Bank Revenue | 5.000% | 11/1/26 | 2,000 | 2,264 |
| Maine Municipal Bond Bank Revenue | 5.000% | 11/1/27 | 2,215 | 2,503 |
| 1 Maine Municipal Bond Bank Revenue | 4.000% | 11/1/32 | 3,260 | 3,405 |
| 1 Maine Municipal Bond Bank Revenue | 4.000% | 11/1/33 | 2,920 | 3,025 |
| 1 Maine Municipal Bond Bank Revenue GAN | 5.000% | 9/1/26 | 1,000 | 1,156 |
| 1 Maine Municipal Bond Bank Revenue GAN | 5.000% | 9/1/27 | 1,300 | 1,490 |
| 1 Maine Municipal Bond Bank Revenue GAN | 5.000% | 9/1/28 | 2,020 | 2,296 |
| 1 Maine Municipal Bond Bank Revenue GAN | 5.000% | 9/1/29 | 2,010 | 2,270 |
| 1 Maine Municipal Bond Bank Revenue GAN | 5.000% | 9/1/30 | 1,890 | 2,123 |
| Maine Turnpike Authority Revenue | 5.000% | 7/1/30 | 2,000 | 2,308 |
| Maine Turnpike Authority Revenue | 5.000% | 7/1/31 | 1,825 | 2,096 |
| Maine Turnpike Authority Revenue | 5.000% | 7/1/33 | 1,450 | 1,651 |
| Maine Turnpike Authority Revenue | 5.000% | 7/1/34 | 1,750 | 1,987 |
| Portland ME Airport Revenue | 5.000% | 1/1/21 (4) | 1,000 | 1,029 |
| Portland ME Airport Revenue | 5.000% | 1/1/22 (4) | 1,000 | 1,028 |
| Portland ME Airport Revenue | 5.000% | 1/1/23 (4) | 1,000 | 1,028 |
| Portland ME Airport Revenue | 5.000% | 1/1/24 (4) | 1,610 | 1,655 |
| Portland ME Airport Revenue | 5.000% | 1/1/25 (4) | 1,000 | 1,028 |
| Portland ME Airport Revenue | 5.000% | 1/1/26 (4) | 1,720 | 1,768 |
| Portland ME Airport Revenue | 5.000% | 1/1/28 (4) | 1,200 | 1,234 |
| Portland ME Airport Revenue | 5.000% | 1/1/29 (4) | 1,265 | 1,300 |
| | | | 59,418 |
| Maryland (3.3%) | | | | |
| Anne Arundel County MD GO | 5.000% | 4/1/19 | 1,030 | 1,043 |
| Anne Arundel County MD GO | 5.000% | 4/1/19 | 1,885 | 1,909 |
| Anne Arundel County MD GO | 5.000% | 4/1/20 | 830 | 864 |
| Anne Arundel County MD GO | 5.000% | 4/1/20 | 1,855 | 1,931 |
| Anne Arundel County MD GO | 5.000% | 4/1/20 | 2,255 | 2,348 |
| Anne Arundel County MD GO | 5.000% | 10/1/20 | 3,110 | 3,279 |
| Anne Arundel County MD GO | 5.000% | 10/1/20 | 4,735 | 4,992 |
| Anne Arundel County MD GO | 5.000% | 4/1/21 | 1,880 | 2,006 |
| Anne Arundel County MD GO | 5.000% | 4/1/21 | 6,395 | 6,825 |
| Anne Arundel County MD GO | 5.000% | 4/1/21 | 1,135 | 1,211 |
| Anne Arundel County MD GO | 5.000% | 4/1/21 | 2,590 | 2,764 |
| Anne Arundel County MD GO | 5.000% | 10/1/21 | 3,615 | 3,901 |
| Anne Arundel County MD GO | 5.000% | 10/1/21 | 2,125 | 2,293 |
| Anne Arundel County MD GO | 5.000% | 10/1/21 | 3,110 | 3,356 |
| Anne Arundel County MD GO | 5.000% | 10/1/21 | 1,455 | 1,570 |
| Anne Arundel County MD GO | 5.000% | 10/1/21 | 4,715 | 5,088 |
| Anne Arundel County MD GO | 5.000% | 10/1/21 | 6,185 | 6,675 |
| Anne Arundel County MD GO | 5.000% | 10/1/22 | 3,615 | 3,984 |
| Anne Arundel County MD GO | 5.000% | 10/1/22 | 2,125 | 2,342 |
| Anne Arundel County MD GO | 5.000% | 4/1/23 | 4,000 | 4,451 |
| Anne Arundel County MD GO | 5.000% | 10/1/23 | 3,615 | 4,055 |
| Anne Arundel County MD GO | 5.000% | 10/1/23 | 2,125 | 2,384 |
| Anne Arundel County MD GO | 5.000% | 10/1/24 | 3,110 | 3,544 |
| Anne Arundel County MD GO | 5.000% | 10/1/24 | 1,455 | 1,658 |
| Anne Arundel County MD GO | 5.000% | 10/1/24 | 2,445 | 2,786 |
| Anne Arundel County MD GO | 5.000% | 10/1/25 | 3,110 | 3,590 |
| Anne Arundel County MD GO | 5.000% | 10/1/25 | 1,455 | 1,680 |
| Anne Arundel County MD GO | 5.000% | 10/1/25 | 2,400 | 2,771 |
| Anne Arundel County MD GO | 5.000% | 10/1/26 | 3,110 | 3,588 |
| Anne Arundel County MD GO | 5.000% | 10/1/26 | 1,455 | 1,679 |
| Anne Arundel County MD GO | 5.000% | 10/1/27 | 3,110 | 3,582 |
| Baltimore County MD GO | 5.000% | 8/1/21 | 2,600 | 2,797 |
| Baltimore County MD GO | 5.000% | 8/1/21 | 5,000 | 5,378 |
| Baltimore County MD GO | 5.000% | 8/1/21 | 6,705 | 7,212 |
| Baltimore County MD GO | 5.000% | 2/1/22 | 3,000 | 3,262 |
| Baltimore County MD GO | 5.000% | 8/1/26 | 7,595 | 8,747 |
| Baltimore County MD GO | 4.000% | 3/1/30 | 4,000 | 4,253 |
201
Intermediate-Term Tax-Exempt Fund
| | | | |
| Face | Market |
| Maturity | Amount | Value• |
| Coupon | Date | ($000) | ($000) |
| Baltimore MD Consolidated Public Improvement GO | 5.000% | 8/1/20 | 4,050 | 4,250 |
| Baltimore MD Consolidated Public Improvement GO | 5.000% | 8/1/21 | 5,800 | 6,238 |
| Baltimore MD Project Revenue | 5.000% | 7/1/21 (Prere.) | 1,585 | 1,701 |
| Baltimore MD Project Revenue | 5.000% | 7/1/21 (Prere.) | 1,570 | 1,685 |
| Baltimore MD Project Revenue | 5.000% | 7/1/21 (Prere.) | 1,250 | 1,342 |
| Baltimore MD Project Revenue | 5.000% | 7/1/21 (Prere.) | 1,745 | 1,873 |
| Baltimore MD Project Revenue | 5.000% | 7/1/21 (Prere.) | 1,905 | 2,045 |
| Baltimore MD Project Revenue | 5.000% | 7/1/21 (Prere.) | 2,075 | 2,227 |
| Baltimore MD Project Revenue | 5.000% | 7/1/30 | 1,905 | 2,034 |
| Baltimore MD Project Revenue | 5.000% | 7/1/30 | 3,255 | 3,475 |
| Baltimore MD Project Revenue | 5.000% | 7/1/31 | 2,000 | 2,133 |
| 1 Charles County MD GO | 5.000% | 10/1/27 | 4,155 | 4,895 |
| 1 Charles County MD GO | 5.000% | 10/1/28 | 4,370 | 5,192 |
| Frederick County MD GO | 5.000% | 2/1/23 | 4,485 | 4,974 |
| Gaithersburg MD Economic Development Revenue (Asbury Maryland Obligated Group) | 5.000% | 1/1/27 | 2,000 | 2,220 |
| Gaithersburg MD Economic Development Revenue (Asbury Maryland Obligated Group) | 5.000% | 1/1/28 | 2,000 | 2,209 |
| Gaithersburg MD Economic Development Revenue (Asbury Maryland Obligated Group) | 5.000% | 1/1/33 | 5,000 | 5,431 |
| Gaithersburg MD Economic Development Revenue (Asbury Maryland Obligated Group) | 5.000% | 1/1/36 | 2,000 | 2,152 |
| Howard County MD GO | 5.000% | 8/15/20 | 14,125 | 14,842 |
| Howard County MD GO | 5.000% | 8/15/21 (Prere.) | 1,820 | 1,956 |
| Howard County MD GO | 5.000% | 8/15/21 | 14,440 | 15,543 |
| Howard County MD GO | 5.000% | 2/15/22 | 13,605 | 14,806 |
| Howard County MD GO | 5.000% | 8/15/24 | 2,680 | 2,877 |
| Howard County MD GO | 5.000% | 2/15/25 | 4,500 | 5,159 |
| Howard County MD GO | 5.000% | 2/15/26 | 5,320 | 6,170 |
| Howard County MD GO | 5.000% | 2/15/27 | 20,180 | 23,621 |
| Maryland Department of Transportation Revenue | 5.000% | 2/15/20 | 41,400 | 42,952 |
| Maryland Department of Transportation Revenue | 5.000% | 5/1/20 | 13,000 | 13,561 |
| Maryland Department of Transportation Revenue | 5.000% | 6/1/20 | 8,850 | 9,251 |
| Maryland Department of Transportation Revenue | 4.000% | 9/1/20 | 18,480 | 19,110 |
| Maryland Department of Transportation Revenue | 5.000% | 2/15/21 | 46,790 | 49,737 |
| Maryland Department of Transportation Revenue | 5.000% | 5/1/21 | 16,005 | 17,096 |
| Maryland Department of Transportation Revenue | 4.000% | 12/1/23 | 13,000 | 13,638 |
| Maryland Department of Transportation Revenue | 4.000% | 11/1/27 | 8,700 | 9,312 |
| Maryland Department of Transportation Revenue | 4.000% 12/15/28 | 17,390 | 18,438 |
| Maryland Department of Transportation Revenue | 4.000% | 2/1/29 | 14,790 | 15,495 |
| Maryland Department of Transportation Revenue | 4.000% 12/15/29 | 27,000 | 28,482 |
| Maryland Economic Development Corp. Pollution Control Revenue (Potomac Electric Power Co.) | 6.200% | 9/1/22 | 6,020 | 6,100 |
| Maryland Economic Development Corp. Revenue (Constellation Energy Group, Inc. Project) PUT | 2.550% | 6/1/20 | 5,150 | 5,126 |
| Maryland Economic Development Corp. Revenue (Transportation Facilities Project) | 5.000% | 6/1/26 | 2,000 | 2,225 |
| Maryland Economic Development Corp. Revenue (Transportation Facilities Project) | 5.000% | 6/1/27 | 1,350 | 1,509 |
| Maryland Economic Development Corp. Revenue (Transportation Facilities Project) | 5.000% | 6/1/28 | 2,000 | 2,244 |
| Maryland Economic Development Corp. Revenue (Transportation Facilities Project) | 5.000% | 6/1/29 | 1,850 | 2,063 |
| Maryland Economic Development Corp. Revenue (Transportation Facilities Project) | 5.000% | 6/1/30 | 1,250 | 1,385 |
| Maryland GO | 4.500% | 8/1/20 | 13,550 | 14,107 |
| Maryland GO | 5.000% | 8/1/20 | 5,145 | 5,400 |
| Maryland GO | 5.000% | 3/1/21 | 31,755 | 33,808 |
| Maryland GO | 5.000% | 3/1/21 | 13,965 | 14,868 |
| Maryland GO | 5.000% | 3/1/21 | 7,580 | 8,070 |
| Maryland GO | 4.000% | 8/1/21 | 43,490 | 45,600 |
| Maryland GO | 5.000% | 8/1/21 | 33,110 | 35,595 |
| Maryland GO | 5.000% | 8/1/21 | 16,350 | 17,577 |
| Maryland GO | 5.000% | 8/1/21 | 2,230 | 2,397 |
| Maryland GO | 5.000% | 3/1/22 | 32,550 | 35,417 |
| Maryland GO | 5.000% | 3/1/22 (Prere.) | 37,360 | 40,663 |
| Maryland GO | 5.000% | 3/1/22 (Prere.) | 7,150 | 7,782 |
| Maryland GO | 5.000% | 3/15/22 | 5,345 | 5,821 |
| Maryland GO | 5.000% | 8/1/22 | 4,500 | 4,937 |
| Maryland GO | 5.000% | 8/1/22 | 29,215 | 32,053 |
| Maryland GO | 5.000% | 8/1/22 | 71,720 | 78,686 |
| Maryland GO | 5.000% | 8/1/22 | 115,660 | 126,894 |
| Maryland GO | 4.000% | 8/1/23 | 37,875 | 40,630 |
| Maryland GO | 5.000% | 8/1/23 | 81,995 | 91,620 |
| Maryland GO | 5.000% | 8/1/23 | 24,000 | 26,817 |
| Maryland GO | 5.000% | 8/1/23 | 14,805 | 16,543 |
| Maryland GO | 4.000% | 8/1/26 | 28,000 | 29,739 |
| Maryland GO | 5.000% | 8/1/26 | 13,555 | 15,803 |
| Maryland GO | 4.000% | 6/1/29 | 68,270 | 72,510 |
| Maryland GO | 4.000% | 6/1/30 | 68,035 | 71,900 |
| Maryland GO | 5.000% | 3/15/31 | 26,500 | 30,777 |
202
Intermediate-Term Tax-Exempt Fund
| | | | |
| Face | Market |
| Maturity | Amount | Value• |
| Coupon | Date | ($000) | ($000) |
| Maryland Health & Higher Educational Facilities Authority Revenue | | | | |
| (Adventist Healthcare Obligated Group) | 5.500% | 1/1/28 | 5,685 | 6,508 |
| Maryland Health & Higher Educational Facilities Authority Revenue | | | | |
| (Adventist Healthcare Obligated Group) | 5.500% | 1/1/29 | 2,000 | 2,277 |
| Maryland Health & Higher Educational Facilities Authority Revenue | | | | |
| (Adventist Healthcare Obligated Group) | 5.500% | 1/1/30 | 2,180 | 2,469 |
| Maryland Health & Higher Educational Facilities Authority Revenue (Anne Arundel Health System) | 5.000% | 7/1/21 | 800 | 854 |
| Maryland Health & Higher Educational Facilities Authority Revenue (Anne Arundel Health System) | 5.000% | 7/1/23 | 900 | 981 |
| Maryland Health & Higher Educational Facilities Authority Revenue (Anne Arundel Health System) | 5.000% | 7/1/28 | 565 | 636 |
| Maryland Health & Higher Educational Facilities Authority Revenue (Anne Arundel Health System) | 5.000% | 7/1/29 | 425 | 476 |
| Maryland Health & Higher Educational Facilities Authority Revenue (Anne Arundel Health System) | 5.000% | 7/1/30 | 850 | 947 |
| Maryland Health & Higher Educational Facilities Authority Revenue (Anne Arundel Health System) | 5.000% | 7/1/32 | 1,000 | 1,105 |
| Maryland Health & Higher Educational Facilities Authority Revenue (Anne Arundel Health System) | 4.000% | 7/1/33 | 1,000 | 1,014 |
| Maryland Health & Higher Educational Facilities Authority Revenue | | | | |
| (Maryland Institute College of Art) | 5.000% | 6/1/29 | 1,000 | 1,066 |
| Maryland Health & Higher Educational Facilities Authority Revenue (MedStar Health, Inc.) | 5.000% | 8/15/31 | 5,615 | 6,128 |
| Maryland Health & Higher Educational Facilities Authority Revenue (MedStar Health, Inc.) | 5.000% | 8/15/32 | 6,650 | 7,245 |
| Maryland Health & Higher Educational Facilities Authority Revenue (MedStar Health, Inc.) | 5.000% | 8/15/33 | 5,000 | 5,440 |
| Maryland Health & Higher Educational Facilities Authority Revenue (Meritus Medical Center, Inc.) | 5.000% | 7/1/34 | 2,600 | 2,782 |
| Maryland Health & Higher Educational Facilities Authority Revenue | | | | |
| (University of Maryland Medical System) | 5.250% | 7/1/19 | 1,700 | 1,701 |
| Maryland Health & Higher Educational Facilities Authority Revenue | | | | |
| (University of Maryland Medical System) | 4.500% | 7/1/20 | 1,510 | 1,511 |
| Maryland Health & Higher Educational Facilities Authority Revenue | | | | |
| (University of Maryland Medical System) | 5.250% | 7/1/21 | 2,000 | 2,002 |
| Maryland Health & Higher Educational Facilities Authority Revenue | | | | |
| (University of Maryland Medical System) | 4.750% | 7/1/23 | 900 | 900 |
| Maryland Transportation Authority GAN | 5.250% | 3/1/20 | 8,085 | 8,172 |
| Maryland Water Quality Financing Administration Bay Restoration Revolving Loan Fund Revenue | 5.000% | 3/1/23 | 12,970 | 14,371 |
| Maryland Water Quality Financing Administration Bay Restoration Revolving Loan Fund Revenue | 5.000% | 3/1/25 | 14,000 | 15,706 |
| Montgomery County MD GO | 5.000% | 11/1/20 | 11,370 | 12,014 |
| Montgomery County MD GO | 5.000% | 7/1/21 | 2,500 | 2,684 |
| Montgomery County MD GO | 5.000% | 7/1/21 | 2,380 | 2,555 |
| Montgomery County MD GO | 5.000% | 11/1/22 | 39,265 | 43,339 |
| Montgomery County MD GO | 5.000% | 11/1/22 | 13,750 | 15,177 |
| 1 Montgomery County MD GO | 5.000% | 11/1/22 | 14,000 | 15,447 |
| Montgomery County MD GO | 5.000% | 11/1/23 | 18,000 | 20,219 |
| Montgomery County MD GO | 5.000% | 11/1/23 | 14,750 | 16,568 |
| 1 Montgomery County MD GO | 5.000% | 11/1/24 | 15,390 | 17,561 |
| Montgomery County MD GO | 5.000% | 11/1/26 | 8,300 | 9,414 |
| Montgomery County MD GO | 4.000% | 11/1/27 | 5,075 | 5,573 |
| Montgomery County MD GO | 4.000% | 12/1/30 | 14,000 | 14,685 |
| 1 Montgomery County MD GO | 3.750% | 11/1/37 | 15,500 | 15,272 |
| Prince George’s County MD GO | 5.000% | 8/1/21 | 13,745 | 14,780 |
| Prince George’s County MD GO | 5.000% | 9/15/21 | 4,975 | 5,365 |
| Prince George’s County MD GO | 5.000% | 7/15/22 | 12,000 | 13,175 |
| Prince George’s County MD GO | 5.000% | 9/15/22 | 14,030 | 15,452 |
| Prince George’s County MD GO | 5.000% | 9/1/23 | 10,865 | 12,172 |
| Prince George’s County MD GO | 5.000% | 7/15/26 | 22,675 | 26,434 |
| Prince George’s County MD GO | 4.000% | 9/1/26 | 2,000 | 2,154 |
| Rockville MD Mayor & Council Economic Development Revenue (Ingleside at King Farm Project) | 2.500% | 11/1/24 | 2,000 | 1,922 |
| Rockville MD Mayor & Council Economic Development Revenue (Ingleside at King Farm Project) | 3.000% | 11/1/25 | 1,375 | 1,336 |
| Rockville MD Mayor & Council Economic Development Revenue (Ingleside at King Farm Project) | 5.000% | 11/1/26 | 600 | 651 |
| Rockville MD Mayor & Council Economic Development Revenue (Ingleside at King Farm Project) | 5.000% | 11/1/26 | 770 | 835 |
| Rockville MD Mayor & Council Economic Development Revenue (Ingleside at King Farm Project) | 5.000% | 11/1/28 | 1,100 | 1,185 |
| Rockville MD Mayor & Council Economic Development Revenue (Ingleside at King Farm Project) | 5.000% | 11/1/29 | 500 | 535 |
| Rockville MD Mayor & Council Economic Development Revenue (Ingleside at King Farm Project) | 5.000% | 11/1/30 | 800 | 851 |
| Rockville MD Mayor & Council Economic Development Revenue (Ingleside at King Farm Project) | 5.000% | 11/1/32 | 535 | 565 |
| Rockville MD Mayor & Council Economic Development Revenue (Ingleside at King Farm Project) | 5.000% | 11/1/32 | 750 | 792 |
| Rockville MD Mayor & Council Economic Development Revenue (Ingleside at King Farm Project) | 5.000% | 11/1/35 | 1,000 | 1,043 |
| University of Maryland Auxiliary Facility & Tuition Revenue | 4.000% | 4/1/29 | 6,100 | 6,480 |
| University of Maryland Auxiliary Facility & Tuition Revenue | 4.000% | 4/1/30 | 6,345 | 6,683 |
| University of Maryland Auxiliary Facility & Tuition Revenue | 4.000% | 4/1/31 | 6,600 | 6,922 |
| University of Maryland Auxiliary Facility & Tuition Revenue | 5.000% | 4/1/32 | 6,840 | 7,829 |
| University System of Maryland Revenue | 5.000% | 4/1/24 | 4,390 | 4,964 |
| University System of Maryland Revenue | 5.000% | 4/1/25 | 4,315 | 4,953 |
| University System of Maryland Revenue | 5.000% | 4/1/26 | 3,925 | 4,559 |
| Washington MD Suburban Sanitary Commission GO | 4.000% | 6/1/31 | 8,185 | 8,521 |
| Washington MD Suburban Sanitary Commission GO | 4.000% | 6/15/31 | 5,160 | 5,473 |
| Washington MD Suburban Sanitary Commission GO | 4.000% | 6/1/32 | 8,515 | 8,816 |
203
Intermediate-Term Tax-Exempt Fund
| | | | |
| Face | Market |
| Maturity | Amount | Value• |
| Coupon | Date | ($000) | ($000) |
| Washington MD Suburban Sanitary Commission GO | 4.000% | 6/15/33 | 14,315 | 14,952 |
| Washington MD Suburban Sanitation District Maryland GO | 5.000% | 6/15/26 | 10,565 | 12,307 |
| | | | 1,897,091 |
| Massachusetts (2.7%) | | | | |
| Boston MA GO | 5.000% | 4/1/20 | 6,000 | 6,249 |
| Massachusetts Bay Transportation Authority Sales Tax Revenue | 4.000% | 12/1/21 | 78,960 | 83,121 |
| Massachusetts Clean Water Trust Revenue | 5.000% | 2/1/21 | 1,900 | 2,021 |
| Massachusetts Clean Water Trust Revenue | 5.000% | 8/1/21 | 5,000 | 5,381 |
| Massachusetts Clean Water Trust Revenue | 5.000% | 2/1/22 | 750 | 816 |
| Massachusetts Clean Water Trust Revenue | 5.000% | 8/1/22 | 500 | 550 |
| Massachusetts Clean Water Trust Revenue | 5.000% | 2/1/26 | 1,250 | 1,429 |
| Massachusetts Clean Water Trust Revenue | 5.000% | 8/1/26 | 2,950 | 3,444 |
| Massachusetts College Building Authority Revenue | 5.125% | 5/1/19 (Prere.) | 1,420 | 1,443 |
| Massachusetts College Building Authority Revenue | 5.250% | 5/1/19 (Prere.) | 2,250 | 2,288 |
| Massachusetts College Building Authority Revenue | 5.000% | 5/1/20 (Prere.) | 1,290 | 1,345 |
| Massachusetts College Building Authority Revenue | 5.000% | 5/1/29 | 2,905 | 3,146 |
| Massachusetts College Building Authority Revenue | 5.000% | 5/1/30 | 4,820 | 5,213 |
| Massachusetts College Building Authority Revenue | 5.000% | 5/1/31 | 6,040 | 6,522 |
| Massachusetts College Building Authority Revenue | 4.000% | 5/1/33 | 3,490 | 3,593 |
| Massachusetts College Building Authority Revenue | 4.000% | 5/1/34 | 3,715 | 3,813 |
| Massachusetts College Building Authority Revenue | 4.000% | 5/1/35 | 3,865 | 3,951 |
| Massachusetts Department of Transportation Metropolitan Highway System Revenue | 5.000% | 1/1/20 | 2,610 | 2,699 |
| Massachusetts Department of Transportation Metropolitan Highway System Revenue | 5.000% | 1/1/23 | 14,750 | 15,206 |
| Massachusetts Department of Transportation Metropolitan Highway System Revenue | 5.000% | 1/1/26 | 13,625 | 14,032 |
| Massachusetts Department of Transportation Metropolitan Highway System Revenue | 5.000% | 1/1/26 | 5,600 | 6,485 |
| Massachusetts Development Finance Agency Revenue (Berklee College of Music) | 5.000% | 10/1/29 | 3,110 | 3,314 |
| Massachusetts Development Finance Agency Revenue (Berklee College of Music) | 5.000% | 10/1/31 | 1,200 | 1,279 |
| Massachusetts Development Finance Agency Revenue (Berkshire Health System) | 5.000% | 10/1/20 | 1,205 | 1,265 |
| Massachusetts Development Finance Agency Revenue (Berkshire Health System) | 5.000% | 10/1/21 | 1,770 | 1,898 |
| Massachusetts Development Finance Agency Revenue (Berkshire Health System) | 5.000% | 10/1/22 | 2,125 | 2,272 |
| Massachusetts Development Finance Agency Revenue (Berkshire Health System) | 5.000% | 10/1/23 | 2,235 | 2,388 |
| Massachusetts Development Finance Agency Revenue (Berkshire Health System) | 5.000% | 10/1/24 | 1,500 | 1,601 |
| Massachusetts Development Finance Agency Revenue (Berkshire Health System) | 5.000% | 10/1/25 | 1,600 | 1,707 |
| Massachusetts Development Finance Agency Revenue (Berkshire Health System) | 5.000% | 10/1/26 | 1,100 | 1,172 |
| Massachusetts Development Finance Agency Revenue (Berkshire Health System) | 5.000% | 10/1/27 | 1,230 | 1,310 |
| Massachusetts Development Finance Agency Revenue (Boston College) | 5.000% | 7/1/29 | 9,500 | 9,916 |
| Massachusetts Development Finance Agency Revenue (Boston Medical Center) | 5.000% | 7/1/24 | 1,000 | 1,101 |
| Massachusetts Development Finance Agency Revenue (Boston Medical Center) | 5.000% | 7/1/25 | 1,015 | 1,126 |
| Massachusetts Development Finance Agency Revenue (Boston Medical Center) | 5.000% | 7/1/26 | 1,000 | 1,115 |
| Massachusetts Development Finance Agency Revenue (Boston Medical Center) | 5.000% | 7/1/32 | 3,760 | 4,052 |
| Massachusetts Development Finance Agency Revenue (Boston Medical Center) | 5.000% | 7/1/34 | 3,490 | 3,730 |
| Massachusetts Development Finance Agency Revenue (CareGroup Inc.) | 5.000% | 7/1/28 | 5,000 | 5,511 |
| Massachusetts Development Finance Agency Revenue (CareGroup Inc.) | 5.000% | 7/1/29 | 2,800 | 3,105 |
| Massachusetts Development Finance Agency Revenue (CareGroup Inc.) | 5.000% | 7/1/31 | 1,365 | 1,498 |
| Massachusetts Development Finance Agency Revenue (CareGroup Inc.) | 5.000% | 7/1/33 | 1,660 | 1,807 |
| Massachusetts Development Finance Agency Revenue (CareGroup Inc.) | 5.000% | 7/1/34 | 4,355 | 4,726 |
| Massachusetts Development Finance Agency Revenue (CareGroup Inc.) | 5.000% | 7/1/35 | 1,835 | 1,984 |
| Massachusetts Development Finance Agency Revenue (CareGroup Inc.) | 5.000% | 7/1/35 | 5,500 | 5,946 |
| Massachusetts Development Finance Agency Revenue (CareGroup Inc.) | 5.000% | 7/1/36 | 5,000 | 5,385 |
| Massachusetts Development Finance Agency Revenue (CareGroup Inc.) | 5.000% | 7/1/37 | 5,700 | 6,120 |
| Massachusetts Development Finance Agency Revenue (CareGroup Inc.) | 5.000% | 7/1/38 | 5,000 | 5,352 |
| Massachusetts Development Finance Agency Revenue (Dana-Farber Cancer Institute) | 5.000% | 12/1/35 | 5,240 | 5,770 |
| Massachusetts Development Finance Agency Revenue (Emerson College) | 5.500% | 1/1/20 (Prere.) | 13,655 | 14,197 |
| Massachusetts Development Finance Agency Revenue (Emerson College) | 5.500% | 1/1/20 (Prere.) | 1,345 | 1,398 |
| Massachusetts Development Finance Agency Revenue (NewBridge Charles Inc.) | 4.000% | 10/1/26 | 500 | 501 |
| Massachusetts Development Finance Agency Revenue (NewBridge Charles Inc.) | 4.000% | 10/1/27 | 560 | 555 |
| Massachusetts Development Finance Agency Revenue (NewBridge Charles Inc.) | 5.000% | 10/1/37 | 2,000 | 2,070 |
| Massachusetts Development Finance Agency Revenue (Partners Healthcare) | 5.000% | 7/1/27 | 5,055 | 5,867 |
| Massachusetts Development Finance Agency Revenue (Partners Healthcare) | 5.000% | 7/1/28 | 8,000 | 9,252 |
| Massachusetts Development Finance Agency Revenue (Seven Hills Foundation Obligated Group) | 5.000% | 9/1/23 | 1,230 | 1,320 |
| Massachusetts Development Finance Agency Revenue (Seven Hills Foundation Obligated Group) | 5.000% | 9/1/24 | 1,310 | 1,411 |
| Massachusetts Development Finance Agency Revenue (Seven Hills Foundation Obligated Group) | 5.000% | 9/1/25 | 2,770 | 2,985 |
| Massachusetts Development Finance Agency Revenue (Seven Hills Foundation Obligated Group) | 5.000% | 9/1/32 | 17,575 | 18,348 |
| Massachusetts Development Finance Agency Revenue (Simmons College) | 5.000% | 10/1/23 | 835 | 912 |
| Massachusetts Development Finance Agency Revenue (Simmons College) | 5.000% | 10/1/24 | 700 | 772 |
| Massachusetts Development Finance Agency Revenue (Simmons College) | 5.000% | 10/1/25 | 800 | 889 |
| Massachusetts Development Finance Agency Revenue (Suffolk University) | 6.250% | 7/1/19 (Prere.) | 3,195 | 3,286 |
| Massachusetts Development Finance Agency Revenue (Suffolk University) | 6.250% | 7/1/30 | 1,985 | 2,033 |
| Massachusetts Development Finance Agency Revenue (Tufts Medical Center) | 7.250% | 1/1/21 (Prere.) | 6,000 | 6,627 |
204
Intermediate-Term Tax-Exempt Fund
| | | | | |
| Face | Market |
| Maturity | Amount | Value• |
| | Coupon | Date | ($000) | ($000) |
| Massachusetts Development Finance Agency Revenue (Tufts Medical Center) | 7.250% | 1/1/32 | 4,000 | 4,394 |
| Massachusetts Development Finance Agency Revenue (UMass Memorial Medical Center) | 5.125% | 7/1/26 | 2,690 | 2,837 |
| Massachusetts Development Finance Agency Revenue (Western New England University) | 5.000% | 9/1/28 | 1,325 | 1,477 |
| Massachusetts Development Finance Agency Revenue (Western New England University) | 5.000% | 9/1/30 | 1,460 | 1,605 |
| Massachusetts Educational Financing Authority Education Loan Revenue | 5.500% | 1/1/22 | 3,500 | 3,629 |
| Massachusetts Federal Highway GAN (Accelerated Bridge Program) | 5.000% | 6/15/20 | 10,205 | 10,391 |
| Massachusetts Federal Highway GAN (Accelerated Bridge Program) | 5.000% | 6/15/24 | 20,020 | 22,741 |
| Massachusetts Federal Highway Revenue | 5.000% | 6/15/22 | 10,000 | 10,962 |
| Massachusetts GO | 5.000% | 7/1/20 | 3,920 | 4,106 |
| Massachusetts GO | 5.500% | 10/1/20 (14) | 11,065 | 11,767 |
| Massachusetts GO | 5.000% | 4/1/21 (Prere.) | 18,000 | 19,209 |
| Massachusetts GO | 5.000% | 4/1/21 (Prere.) | 26,675 | 28,466 |
| Massachusetts GO | 5.000% | 7/1/21 | 10,170 | 10,919 |
| Massachusetts GO | 5.000% | 8/1/21 (Prere.) | 20,000 | 21,506 |
| Massachusetts GO | 5.250% | 8/1/21 (2) | 4,445 | 4,811 |
| Massachusetts GO | 5.250% | 8/1/21 | 20,885 | 22,602 |
| Massachusetts GO | 5.000% | 8/1/22 | 14,000 | 15,381 |
| Massachusetts GO | 5.000% | 12/1/23 | 23,000 | 25,867 |
| Massachusetts GO | 5.000% | 7/1/24 | 9,575 | 10,864 |
| Massachusetts GO | 5.000% | 7/1/24 | 3,705 | 4,204 |
| Massachusetts GO | 5.000% | 8/1/24 | 65,150 | 74,003 |
| Massachusetts GO | 5.000% | 12/1/24 | 3,000 | 3,424 |
| Massachusetts GO | 5.000% | 7/1/25 | 5,710 | 6,574 |
| Massachusetts GO | 2.120% | 11/1/25 | 22,000 | 21,785 |
| Massachusetts GO | 5.000% | 12/1/25 | 20,015 | 23,159 |
| Massachusetts GO | 5.000% | 7/1/27 | 41,725 | 48,202 |
| Massachusetts GO | 5.000% | 7/1/28 | 21,000 | 24,119 |
| Massachusetts GO | 5.000% | 7/1/28 | 29,520 | 34,902 |
| Massachusetts GO | 5.000% | 12/1/28 | 4,155 | 4,802 |
| Massachusetts GO | 5.000% | 7/1/29 | 5,000 | 5,717 |
| Massachusetts GO | 5.000% | 7/1/29 | 10,425 | 11,756 |
| Massachusetts GO | 5.000% | 7/1/30 | 12,000 | 13,470 |
| Massachusetts GO | 5.000% | 9/1/30 | 11,730 | 13,923 |
| Massachusetts GO | 4.000% | 11/1/30 | 45,000 | 46,238 |
| Massachusetts GO | 5.000% | 11/1/30 | 25,000 | 28,768 |
| Massachusetts GO | 5.000% | 1/1/31 | 24,000 | 27,551 |
| Massachusetts GO | 5.000% | 5/1/31 | 30,000 | 32,930 |
| Massachusetts GO | 5.000% | 9/1/31 | 5,770 | 6,267 |
| Massachusetts GO | 5.000% | 9/1/31 | 15,000 | 17,822 |
| Massachusetts GO | 5.000% | 11/1/31 | 9,650 | 11,064 |
| Massachusetts GO | 5.000% | 9/1/32 | 9,430 | 11,198 |
| Massachusetts GO | 5.000% | 9/1/36 | 23,520 | 26,620 |
| Massachusetts GO | 5.000% | 12/1/36 | 6,500 | 7,249 |
| Massachusetts GO | 5.000% | 9/1/37 | 24,000 | 27,078 |
| Massachusetts GO | 5.000% | 11/1/37 | 20,000 | 22,430 |
| Massachusetts Health & Educational Facilities Authority Revenue (Boston College) | 5.500% | 6/1/30 | 5,000 | 6,098 |
| Massachusetts Health & Educational Facilities Authority Revenue (Harvard University) | 6.250% | 4/1/20 | 1,685 | 1,784 |
| Massachusetts Health & Educational Facilities Authority Revenue (Northeastern University) | 5.000% | 10/1/20 | 3,765 | 3,965 |
| Massachusetts Port Authority Revenue | 5.000% | 7/1/29 | 8,345 | 9,071 |
| Massachusetts Port Authority Revenue | 5.000% | 7/1/31 | 3,000 | 3,333 |
| Massachusetts Port Authority Revenue | 5.000% | 7/1/32 | 3,500 | 3,885 |
| Massachusetts Port Authority Revenue | 5.000% | 7/1/33 | 4,005 | 4,435 |
| Massachusetts Port Authority Revenue | 5.000% | 7/1/34 | 1,470 | 1,624 |
| Massachusetts Port Authority Revenue | 5.000% | 7/1/35 | 2,500 | 2,756 |
| Massachusetts School Building Authority Dedicated Sales Tax Revenue | 5.000% | 8/15/21 | 2,530 | 2,724 |
| Massachusetts School Building Authority Dedicated Sales Tax Revenue | 5.000% | 8/15/24 | 20,010 | 21,927 |
| Massachusetts School Building Authority Dedicated Sales Tax Revenue | 5.000% | 8/15/25 | 2,050 | 2,365 |
| Massachusetts School Building Authority Dedicated Sales Tax Revenue | 5.000% | 8/15/26 | 6,795 | 7,799 |
| Massachusetts School Building Authority Dedicated Sales Tax Revenue | 5.000% | 8/15/27 | 9,000 | 10,269 |
| Massachusetts School Building Authority Dedicated Sales Tax Revenue | 5.000% | 8/15/27 | 5,000 | 5,464 |
| 16 | Massachusetts School Building Authority Dedicated Sales Tax Revenue | 5.000% | 8/15/28 | 32,750 | 35,714 |
| Massachusetts School Building Authority Dedicated Sales Tax Revenue | 5.000% | 8/15/29 | 4,000 | 4,527 |
| Massachusetts School Building Authority Dedicated Sales Tax Revenue | 5.000% | 8/15/31 | 18,500 | 20,804 |
| Massachusetts School Building Authority Dedicated Sales Tax Revenue | 5.000% | 5/15/32 | 6,400 | 7,007 |
| Massachusetts School Building Authority Dedicated Sales Tax Revenue | 4.000% | 8/15/32 | 10,600 | 10,950 |
| Massachusetts School Building Authority Dedicated Sales Tax Revenue | 5.000% 10/15/32 | 8,010 | 8,565 |
| Massachusetts School Building Authority Dedicated Sales Tax Revenue | 5.000% | 5/15/33 | 7,610 | 8,315 |
| Massachusetts School Building Authority Dedicated Sales Tax Revenue | 5.000% 11/15/33 | 20,075 | 22,633 |
| Massachusetts School Building Authority Dedicated Sales Tax Revenue | 5.000% | 8/15/34 | 5,000 | 5,577 |
| Massachusetts School Building Authority Dedicated Sales Tax Revenue | 5.000% 11/15/34 | 9,505 | 10,687 |
205
Intermediate-Term Tax-Exempt Fund
| | | | | |
| Face | Market |
| Maturity | Amount | Value• |
| | Coupon | Date | ($000) | ($000) |
| Massachusetts School Building Authority Dedicated Sales Tax Revenue | 5.000% | 2/15/35 | 9,500 | 10,407 |
| Massachusetts School Building Authority Dedicated Sales Tax Revenue | 5.000% | 8/15/35 | 4,000 | 4,449 |
| Massachusetts School Building Authority Dedicated Sales Tax Revenue | 5.000% | 2/15/36 | 11,000 | 12,023 |
| Massachusetts School Building Authority Dedicated Sales Tax Revenue | 5.000% | 2/15/37 | 2,700 | 2,947 |
| Massachusetts Special Obligation Dedicated Tax Revenue | 5.250% | 1/1/19 (14) | 5,125 | 5,153 |
| Massachusetts Special Obligation Dedicated Tax Revenue | 5.500% | 1/1/26 (14) | 29,860 | 35,272 |
| Massachusetts Special Obligation Dedicated Tax Revenue | 5.500% | 1/1/28 (14) | 11,075 | 13,328 |
| 1 | Massachusetts Development Finance Agency Revenue (Linden Ponds Inc.) | 5.000% | 11/15/28 | 1,500 | 1,557 |
| 1 | Massachusetts Development Finance Agency Revenue (Linden Ponds Inc.) | 5.000% | 11/15/33 | 3,000 | 3,047 |
| Massachusetts Transportation Fund Revenue | 4.000% | 6/1/34 | 7,500 | 7,784 |
| Massachusetts Transportation Fund Revenue | 4.000% | 6/1/35 | 7,500 | 7,754 |
| Massachusetts Transportation Fund Revenue | 4.000% | 6/1/38 | 10,000 | 10,198 |
| Massachusetts Water Pollution Abatement Trust Revenue | 5.250% | 2/1/21 | 5,955 | 6,364 |
| Massachusetts Water Pollution Abatement Trust Revenue | 5.000% | 8/1/23 | 6,440 | 7,214 |
| Massachusetts Water Pollution Abatement Trust Revenue | 5.000% | 8/1/24 | 7,675 | 8,744 |
| Massachusetts Water Resources Authority Revenue | 6.500% | 7/15/19 (ETM) | 2,500 | 2,580 |
| Massachusetts Water Resources Authority Revenue | 5.000% | 8/1/19 | 21,580 | 22,073 |
| Massachusetts Water Resources Authority Revenue | 5.000% | 8/1/21 (Prere.) | 2,350 | 2,520 |
| 16 | Massachusetts Water Resources Authority Revenue | 5.000% | 8/1/21 (Prere.) | 3,500 | 3,754 |
| 16 | Massachusetts Water Resources Authority Revenue | 5.000% | 8/1/21 (Prere.) | 2,000 | 2,145 |
| Massachusetts Water Resources Authority Revenue | 5.000% | 8/1/30 | 5,000 | 5,334 |
| Massachusetts Water Resources Authority Revenue | 5.000% | 8/1/31 | 5,000 | 5,328 |
| Massachusetts Water Resources Authority Revenue | 5.000% | 8/1/35 | 6,800 | 7,619 |
| Metropolitan Boston MA Transit Parking Corp. Revenue | 5.000% | 7/1/26 | 3,065 | 3,267 |
| Metropolitan Boston MA Transit Parking Corp. Revenue | 5.000% | 7/1/27 | 3,440 | 3,664 |
| Metropolitan Boston MA Transit Parking Corp. Revenue | 5.000% | 7/1/28 | 5,100 | 5,429 |
| Metropolitan Boston MA Transit Parking Corp. Revenue | 5.000% | 7/1/29 | 11,580 | 12,315 |
| Metropolitan Boston MA Transit Parking Corp. Revenue | 5.000% | 7/1/30 | 11,000 | 11,689 |
| Metropolitan Boston MA Transit Parking Corp. Revenue | 5.000% | 7/1/31 | 11,575 | 12,291 |
| | | | | 1,578,936 |
| Michigan (2.9%) | | | | |
| Battle Creek MI School District GO | 5.000% | 5/1/24 | 1,000 | 1,119 |
| Battle Creek MI School District GO | 5.000% | 5/1/32 | 2,920 | 3,239 |
| Battle Creek MI School District GO | 5.000% | 5/1/33 | 1,500 | 1,659 |
| Battle Creek MI School District GO | 5.000% | 5/1/34 | 3,065 | 3,381 |
| Birmingham MI City School District GO | 4.000% | 5/1/24 | 1,000 | 1,071 |
| Birmingham MI City School District GO | 4.000% | 5/1/25 | 1,465 | 1,563 |
| Chippewa Valley MI Schools GO | 5.000% | 5/1/25 | 700 | 798 |
| Chippewa Valley MI Schools GO | 5.000% | 5/1/32 | 1,000 | 1,123 |
| Chippewa Valley MI Schools GO | 5.000% | 5/1/34 | 1,080 | 1,202 |
| Chippewa Valley MI Schools GO | 5.000% | 5/1/35 | 800 | 886 |
| Dearborn MI School District GO | 5.000% | 5/1/26 | 3,755 | 4,186 |
| Dearborn MI School District GO | 5.000% | 5/1/27 | 3,700 | 4,125 |
| Dearborn MI School District GO | 5.000% | 5/1/28 | 3,635 | 4,041 |
| Dearborn MI School District GO | 5.000% | 5/1/30 | 4,000 | 4,427 |
| Dearborn MI School District GO | 5.000% | 5/1/32 | 3,165 | 3,486 |
| Detroit MI Sewage Disposal System Revenue | 7.000% | 7/1/19 (Prere.) | 3,890 | 4,016 |
| Detroit MI Water & Sewerage Department Sewage Disposal System Revenue | 5.000% | 7/1/23 | 7,000 | 7,553 |
| Detroit MI Water & Sewerage Department Sewage Disposal System Revenue | 5.000% | 7/1/32 | 14,000 | 14,874 |
| Detroit/Wayne County MI Stadium Authority Revenue | 5.000% | 10/1/19 (4) | 1,300 | 1,331 |
| Detroit/Wayne County MI Stadium Authority Revenue | 5.000% | 10/1/20 (4) | 1,500 | 1,570 |
| Detroit/Wayne County MI Stadium Authority Revenue | 5.000% | 10/1/21 (4) | 1,100 | 1,173 |
| Detroit/Wayne County MI Stadium Authority Revenue | 5.000% | 10/1/22 (4) | 1,000 | 1,075 |
| Downriver MI Utility Wastewater Authority Revenue | 5.000% | 4/1/26 (4) | 1,130 | 1,270 |
| Downriver MI Utility Wastewater Authority Revenue | 5.000% | 4/1/28 (4) | 1,000 | 1,131 |
| Downriver MI Utility Wastewater Authority Revenue | 5.000% | 4/1/30 (4) | 1,750 | 1,949 |
| Downriver MI Utility Wastewater Authority Revenue | 5.000% | 4/1/32 (4) | 2,315 | 2,550 |
| Downriver MI Utility Wastewater Authority Revenue | 5.000% | 4/1/35 (4) | 1,300 | 1,421 |
| Downriver MI Utility Wastewater Authority Revenue | 5.000% | 4/1/37 (4) | 1,600 | 1,738 |
| East Lansing MI School District GO | 5.000% | 5/1/28 | 645 | 742 |
| East Lansing MI School District GO | 5.000% | 5/1/29 | 500 | 572 |
| East Lansing MI School District GO | 5.000% | 5/1/30 | 600 | 683 |
| East Lansing MI School District GO | 5.000% | 5/1/31 | 1,900 | 2,154 |
| East Lansing MI School District GO | 5.000% | 5/1/33 | 755 | 850 |
| East Lansing MI School District GO | 5.000% | 5/1/34 | 1,500 | 1,684 |
| East Lansing MI School District GO | 5.000% | 5/1/36 | 1,100 | 1,222 |
| Eastern Michigan University Revenue | 5.000% | 3/1/26 (15) | 1,510 | 1,707 |
| Eastern Michigan University Revenue | 5.000% | 3/1/30 (15) | 1,250 | 1,400 |
| Eastern Michigan University Revenue | 5.000% | 3/1/31 (15) | 1,000 | 1,115 |
206
Intermediate-Term Tax-Exempt Fund
| | | | |
| Face | Market |
| Maturity | Amount | Value• |
| Coupon | Date | ($000) | ($000) |
| Forest Hills MI Public Schools GO | 5.000% | 5/1/20 | 3,760 | 3,924 |
| Forest Hills MI Public Schools GO | 5.000% | 5/1/21 | 3,365 | 3,588 |
| Great Lakes MI Water Authority Sewer Disposal System Revenue | 5.000% | 7/1/25 | 4,800 | 5,453 |
| Great Lakes MI Water Authority Sewer Disposal System Revenue | 5.000% | 7/1/26 | 1,750 | 2,005 |
| Great Lakes MI Water Authority Sewer Disposal System Revenue | 5.000% | 7/1/26 | 3,000 | 3,437 |
| Great Lakes MI Water Authority Sewer Disposal System Revenue | 5.000% | 7/1/27 | 9,305 | 10,723 |
| Great Lakes MI Water Authority Sewer Disposal System Revenue | 5.000% | 7/1/28 | 23,000 | 26,645 |
| Great Lakes MI Water Authority Sewer Disposal System Revenue | 5.000% | 7/1/29 | 28,000 | 32,605 |
| Great Lakes MI Water Authority Sewer Disposal System Revenue | 5.000% | 7/1/30 | 17,025 | 18,994 |
| Great Lakes MI Water Authority Sewer Disposal System Revenue | 5.000% | 7/1/31 | 4,750 | 5,327 |
| Great Lakes MI Water Authority Sewer Disposal System Revenue | 4.000% | 7/1/33 (4) | 4,750 | 4,835 |
| Great Lakes MI Water Authority Sewer Disposal System Revenue | 5.000% | 7/1/34 | 2,585 | 2,905 |
| Great Lakes MI Water Authority Sewer Disposal System Revenue | 5.000% | 7/1/35 | 2,720 | 3,045 |
| Great Lakes MI Water Authority Sewer Disposal System Revenue | 5.000% | 7/1/35 | 34,080 | 37,273 |
| Great Lakes MI Water Authority Sewer Disposal System Revenue | 5.000% | 7/1/36 | 2,350 | 2,620 |
| Great Lakes MI Water Authority Sewer Disposal System Revenue | 5.000% | 7/1/36 | 64,000 | 69,549 |
| Great Lakes MI Water Authority Sewer Disposal System Revenue | 5.000% | 7/1/37 | 1,495 | 1,663 |
| Great Lakes MI Water Authority Sewer Disposal System Revenue | 5.000% | 7/1/38 | 2,645 | 2,933 |
| Great Lakes MI Water Authority Water Supply System Revenue | 5.000% | 7/1/25 | 10,450 | 11,927 |
| Great Lakes MI Water Authority Water Supply System Revenue | 5.000% | 7/1/26 | 4,000 | 4,576 |
| Great Lakes MI Water Authority Water Supply System Revenue | 5.000% | 7/1/27 | 5,000 | 5,754 |
| Great Lakes MI Water Authority Water Supply System Revenue | 5.000% | 7/1/28 | 14,000 | 15,914 |
| Great Lakes MI Water Authority Water Supply System Revenue | 5.000% | 7/1/28 | 6,500 | 7,530 |
| Great Lakes MI Water Authority Water Supply System Revenue | 5.000% | 7/1/29 | 14,000 | 16,247 |
| Great Lakes MI Water Authority Water Supply System Revenue | 5.000% | 7/1/30 | 5,455 | 6,082 |
| Great Lakes MI Water Authority Water Supply System Revenue | 5.000% | 7/1/31 | 9,210 | 10,229 |
| Great Lakes MI Water Authority Water Supply System Revenue | 4.000% | 7/1/33 (4) | 13,380 | 13,494 |
| Great Lakes MI Water Authority Water Supply System Revenue | 5.000% | 7/1/35 | 4,000 | 4,431 |
| Hudsonville MI Public Schools GO | 5.000% | 5/1/33 | 1,360 | 1,513 |
| Hudsonville MI Public Schools GO | 5.000% | 5/1/34 | 1,095 | 1,215 |
| Hudsonville MI Public Schools GO | 5.000% | 5/1/35 | 1,000 | 1,106 |
| Hudsonville MI Public Schools GO | 5.000% | 5/1/36 | 1,000 | 1,102 |
| Hudsonville MI Public Schools GO | 5.000% | 5/1/37 | 1,000 | 1,099 |
| Kalamazoo MI Hospital Financing Authority Hospital Revenue (Bronson Healthcare Group) | 5.000% | 5/15/20 (Prere.) | 10,145 | 10,567 |
| Kalamazoo MI Hospital Financing Authority Hospital Revenue (Bronson Healthcare Group) | 5.000% | 5/15/30 | 8,225 | 8,478 |
| Karegnondi Water Authority Michigan Water Supply System Revenue (Karegnondi Water Pipeline) | 5.000% | 11/1/22 | 1,000 | 1,090 |
| Karegnondi Water Authority Michigan Water Supply System Revenue (Karegnondi Water Pipeline) | 5.000% | 11/1/23 | 1,000 | 1,108 |
| Karegnondi Water Authority Michigan Water Supply System Revenue (Karegnondi Water Pipeline) | 5.000% | 11/1/25 | 3,250 | 3,556 |
| Karegnondi Water Authority Michigan Water Supply System Revenue (Karegnondi Water Pipeline) | 5.000% | 11/1/25 | 1,000 | 1,123 |
| Karegnondi Water Authority Michigan Water Supply System Revenue (Karegnondi Water Pipeline) | 5.000% | 11/1/27 | 1,120 | 1,274 |
| Karegnondi Water Authority Michigan Water Supply System Revenue (Karegnondi Water Pipeline) | 5.250% | 11/1/29 | 5,325 | 5,838 |
| Karegnondi Water Authority Michigan Water Supply System Revenue (Karegnondi Water Pipeline) | 5.250% | 11/1/30 | 1,750 | 1,918 |
| Karegnondi Water Authority Michigan Water Supply System Revenue (Karegnondi Water Pipeline) | 5.000% | 11/1/31 | 1,020 | 1,132 |
| Karegnondi Water Authority Michigan Water Supply System Revenue (Karegnondi Water Pipeline) | 5.250% | 11/1/31 | 4,750 | 5,199 |
| Karegnondi Water Authority Michigan Water Supply System Revenue (Karegnondi Water Pipeline) | 5.250% | 11/1/32 | 5,000 | 5,477 |
| Karegnondi Water Authority Michigan Water Supply System Revenue (Karegnondi Water Pipeline) | 5.000% | 11/1/33 | 2,140 | 2,353 |
| Karegnondi Water Authority Michigan Water Supply System Revenue (Karegnondi Water Pipeline) | 5.250% | 11/1/34 | 1,500 | 1,635 |
| Karegnondi Water Authority Michigan Water Supply System Revenue (Karegnondi Water Pipeline) | 5.250% | 11/1/35 | 8,730 | 9,504 |
| Karegnondi Water Authority Michigan Water Supply System Revenue (Karegnondi Water Pipeline) | 5.000% | 11/1/37 | 1,145 | 1,237 |
| Lincoln MI Consolidated School District GO | 5.000% | 5/1/25 (4) | 1,000 | 1,132 |
| Lincoln MI Consolidated School District GO | 5.000% | 5/1/26 (4) | 1,265 | 1,439 |
| Macomb MI Interceptor Drain Drainage District Special Assessment Revenue | 5.000% | 5/1/27 | 1,500 | 1,747 |
| Macomb MI Interceptor Drain Drainage District Special Assessment Revenue | 5.000% | 5/1/28 | 1,420 | 1,643 |
| Macomb MI Interceptor Drain Drainage District Special Assessment Revenue | 5.000% | 5/1/29 | 1,600 | 1,838 |
| Macomb MI Interceptor Drain Drainage District Special Assessment Revenue | 5.000% | 5/1/30 | 2,500 | 2,854 |
| Macomb MI Interceptor Drain Drainage District Special Assessment Revenue | 5.000% | 5/1/31 | 2,000 | 2,271 |
| Macomb MI Interceptor Drain Drainage District Special Assessment Revenue | 5.000% | 5/1/33 | 2,165 | 2,441 |
| Macomb MI Interceptor Drain Drainage District Special Assessment Revenue | 5.000% | 5/1/34 | 1,790 | 2,012 |
| Marquette MI Board of Light & Power Electric Utility System Revenue | 5.000% | 7/1/32 | 1,145 | 1,256 |
| Marquette MI Board of Light & Power Electric Utility System Revenue | 5.000% | 7/1/33 | 1,000 | 1,093 |
| Marysville MI Public Schools District GO | 5.000% | 5/1/29 | 2,280 | 2,563 |
| Marysville MI Public Schools District GO | 5.000% | 5/1/32 | 3,010 | 3,333 |
| Marysville MI Public Schools District GO | 5.000% | 5/1/33 | 3,285 | 3,621 |
| Michigan Building Authority Revenue | 5.000% | 10/15/19 | 8,315 | 8,549 |
| Michigan Building Authority Revenue | 5.000% | 10/15/24 | 2,500 | 2,681 |
| Michigan Building Authority Revenue | 5.000% | 10/15/24 | 3,020 | 3,239 |
| Michigan Building Authority Revenue | 5.000% | 4/15/25 | 2,540 | 2,903 |
| Michigan Building Authority Revenue | 5.000% | 4/15/25 | 5,465 | 6,246 |
| Michigan Building Authority Revenue | 5.000% | 10/15/25 | 5,920 | 6,346 |
| Michigan Building Authority Revenue | 5.000% | 4/15/26 | 1,580 | 1,824 |
207
Intermediate-Term Tax-Exempt Fund
| | | | |
| Face | Market |
| Maturity | Amount | Value• |
| Coupon | Date | ($000) | ($000) |
| Michigan Building Authority Revenue | 5.000% | 4/15/26 | 6,520 | 7,478 |
| Michigan Building Authority Revenue | 5.000% | 4/15/27 | 1,565 | 1,803 |
| Michigan Building Authority Revenue | 5.000% | 4/15/28 | 8,135 | 9,231 |
| Michigan Building Authority Revenue | 5.000% | 10/15/28 | 2,205 | 2,518 |
| Michigan Building Authority Revenue | 5.000% | 4/15/29 | 26,630 | 30,074 |
| Michigan Building Authority Revenue | 5.000% | 10/15/29 | 9,625 | 10,640 |
| Michigan Building Authority Revenue | 5.000% | 4/15/30 | 15,095 | 16,977 |
| Michigan Building Authority Revenue | 5.000% | 4/15/31 | 4,040 | 4,522 |
| Michigan Building Authority Revenue | 5.000% | 10/15/31 | 10,415 | 11,651 |
| Michigan Building Authority Revenue | 5.000% | 4/15/32 | 27,195 | 30,332 |
| Michigan Building Authority Revenue | 5.000% | 10/15/32 | 9,095 | 10,209 |
| Michigan Building Authority Revenue | 5.000% | 10/15/32 | 4,660 | 5,188 |
| Michigan Building Authority Revenue | 5.000% | 4/15/33 | 12,000 | 13,313 |
| Michigan Building Authority Revenue | 5.000% | 4/15/35 | 13,405 | 14,828 |
| Michigan Finance Authority Revenue | 5.000% | 10/1/23 | 2,000 | 2,166 |
| Michigan Finance Authority Revenue | 5.000% | 4/1/24 | 5,400 | 5,950 |
| Michigan Finance Authority Revenue | 5.000% | 10/1/24 | 2,010 | 2,202 |
| Michigan Finance Authority Revenue | 5.000% | 4/1/25 | 3,160 | 3,528 |
| Michigan Finance Authority Revenue | 5.000% | 4/1/26 | 1,320 | 1,486 |
| Michigan Finance Authority Revenue | 5.000% | 10/1/26 | 3,300 | 3,633 |
| Michigan Finance Authority Revenue | 5.000% | 11/1/26 | 1,255 | 1,443 |
| Michigan Finance Authority Revenue | 5.000% | 10/1/27 | 3,375 | 3,711 |
| Michigan Finance Authority Revenue | 5.000% | 11/1/27 | 1,270 | 1,471 |
| Michigan Finance Authority Revenue | 5.000% | 10/1/29 | 4,350 | 4,769 |
| Michigan Finance Authority Revenue | 5.000% | 11/1/29 | 1,500 | 1,725 |
| Michigan Finance Authority Revenue | 5.000% | 10/1/30 | 5,240 | 5,736 |
| Michigan Finance Authority Revenue | 5.000% | 11/1/30 | 1,200 | 1,371 |
| Michigan Finance Authority Revenue | 5.000% | 11/1/31 | 1,000 | 1,137 |
| Michigan Finance Authority Revenue | 5.000% | 10/1/32 | 2,500 | 2,728 |
| Michigan Finance Authority Revenue | 5.000% | 11/1/32 | 1,000 | 1,133 |
| Michigan Finance Authority Revenue | 5.000% | 11/1/33 | 1,000 | 1,129 |
| Michigan Finance Authority Revenue | 5.000% | 11/1/34 | 1,250 | 1,406 |
| Michigan Finance Authority Revenue | 5.000% | 11/1/35 | 1,465 | 1,641 |
| Michigan Finance Authority Revenue | 5.000% | 11/1/36 | 1,655 | 1,847 |
| Michigan Finance Authority Revenue | 5.000% | 11/1/37 | 2,490 | 2,767 |
| Michigan Finance Authority Revenue | 5.000% | 11/1/38 | 2,035 | 2,249 |
| Michigan Finance Authority Revenue (Beaumont Health Obligated Group) | 5.000% | 8/1/24 | 7,000 | 7,883 |
| Michigan Finance Authority Revenue (Beaumont Health Obligated Group) | 5.000% | 8/1/25 | 3,000 | 3,367 |
| Michigan Finance Authority Revenue (Beaumont Health Obligated Group) | 5.000% | 8/1/28 | 6,650 | 7,347 |
| Michigan Finance Authority Revenue (Beaumont Health Obligated Group) | 5.000% | 8/1/30 | 11,020 | 12,059 |
| Michigan Finance Authority Revenue (Beaumont Health Obligated Group) | 5.000% | 8/1/32 | 13,580 | 14,757 |
| Michigan Finance Authority Revenue (Detroit Water & Sewer) | 5.000% | 7/1/22 (4) | 24,000 | 26,131 |
| Michigan Finance Authority Revenue (Detroit Water & Sewer) | 5.000% | 7/1/22 (14) | 1,210 | 1,309 |
| Michigan Finance Authority Revenue (Detroit Water & Sewer) | 5.000% | 7/1/23 (4) | 19,000 | 21,034 |
| Michigan Finance Authority Revenue (Detroit Water & Sewer) | 5.000% | 7/1/24 (4) | 15,050 | 16,907 |
| Michigan Finance Authority Revenue (Detroit Water & Sewer) | 5.000% | 7/1/24 (14) | 1,840 | 2,043 |
| Michigan Finance Authority Revenue (Detroit Water & Sewer) | 5.000% | 7/1/25 (4) | 2,950 | 3,289 |
| Michigan Finance Authority Revenue (Detroit Water & Sewer) | 5.000% | 7/1/26 | 1,500 | 1,667 |
| Michigan Finance Authority Revenue (Detroit Water & Sewer) | 5.000% | 7/1/26 (4) | 5,000 | 5,545 |
| Michigan Finance Authority Revenue (Detroit Water & Sewer) | 5.000% | 7/1/26 (4) | 12,235 | 13,568 |
| Michigan Finance Authority Revenue (Detroit Water & Sewer) | 5.000% | 7/1/27 | 1,350 | 1,492 |
| Michigan Finance Authority Revenue (Detroit Water & Sewer) | 5.000% | 7/1/27 (4) | 10,000 | 11,045 |
| Michigan Finance Authority Revenue (Detroit Water & Sewer) | 5.000% | 7/1/28 | 1,000 | 1,100 |
| Michigan Finance Authority Revenue (Detroit Water & Sewer) | 5.000% | 7/1/28 (4) | 7,025 | 7,736 |
| Michigan Finance Authority Revenue (Detroit Water & Sewer) | 5.000% | 7/1/29 | 16,500 | 17,929 |
| Michigan Finance Authority Revenue (Detroit Water & Sewer) | 5.000% | 7/1/30 | 700 | 766 |
| Michigan Finance Authority Revenue (Detroit Water & Sewer) | 5.000% | 7/1/30 | 15,000 | 16,267 |
| Michigan Finance Authority Revenue (Detroit Water & Sewer) | 5.000% | 7/1/31 | 1,200 | 1,308 |
| Michigan Finance Authority Revenue (Detroit Water & Sewer) | 5.000% | 7/1/31 | 10,000 | 10,812 |
| Michigan Finance Authority Revenue (Detroit Water & Sewer) | 5.000% | 7/1/32 | 1,000 | 1,087 |
| Michigan Finance Authority Revenue (Detroit Water & Sewer) | 5.000% | 7/1/32 | 3,120 | 3,382 |
| Michigan Finance Authority Revenue (Detroit Water & Sewer) | 5.000% | 7/1/32 | 7,500 | 8,089 |
| Michigan Finance Authority Revenue (Detroit Water & Sewer) | 5.000% | 7/1/33 | 850 | 921 |
| Michigan Finance Authority Revenue (Detroit Water & Sewer) | 5.000% | 7/1/33 | 3,500 | 3,784 |
| Michigan Finance Authority Revenue (Detroit Water & Sewer) | 5.000% | 7/1/33 | 20,250 | 21,765 |
| Michigan Finance Authority Revenue (Detroit Water & Sewer) | 5.000% | 7/1/34 | 2,000 | 2,158 |
| Michigan Finance Authority Revenue (Detroit Water & Sewer) | 5.000% | 7/1/34 | 6,040 | 6,515 |
| Michigan Finance Authority Revenue (Detroit Water & Sewer) | 5.000% | 7/1/34 | 2,000 | 2,148 |
| Michigan Finance Authority Revenue (Detroit Water & Sewer) | 5.000% | 7/1/34 | 5,000 | 5,384 |
| Michigan Finance Authority Revenue (Detroit Water & Sewer) | 5.000% | 7/1/35 | 1,350 | 1,453 |
208
Intermediate-Term Tax-Exempt Fund
| | | | |
| Face | Market |
| Maturity | Amount | Value• |
| Coupon | Date | ($000) | ($000) |
| Michigan Finance Authority Revenue (Detroit Water & Sewer) | 5.000% | 7/1/35 (4) | 3,500 | 3,794 |
| Michigan Finance Authority Revenue (Henry Ford Health System Obligated Group) | 5.000% | 11/15/24 | 2,395 | 2,677 |
| Michigan Finance Authority Revenue (Henry Ford Health System Obligated Group) | 5.000% | 11/15/26 | 4,000 | 4,549 |
| Michigan Finance Authority Revenue (Henry Ford Health System Obligated Group) | 5.000% | 11/15/32 | 3,655 | 4,020 |
| Michigan Finance Authority Revenue (Henry Ford Health System Obligated Group) | 5.000% | 11/15/34 | 7,000 | 7,643 |
| Michigan Finance Authority Revenue (Henry Ford Health System Obligated Group) | 5.000% | 11/15/37 | 12,000 | 12,972 |
| Michigan Finance Authority Revenue (Kalamazoo College Project) | 5.000% | 12/1/31 | 1,300 | 1,471 |
| Michigan Finance Authority Revenue (Kalamazoo College Project) | 4.000% | 12/1/35 | 1,530 | 1,540 |
| Michigan Finance Authority Revenue (Kalamazoo College Project) | 4.000% | 12/1/37 | 1,655 | 1,651 |
| Michigan Finance Authority Revenue (Kalamazoo College Project) | 5.000% | 12/1/38 | 1,000 | 1,100 |
| Michigan Finance Authority Revenue (McLaren Health Care Corp.) | 5.000% | 5/15/23 | 1,000 | 1,103 |
| Michigan Finance Authority Revenue (McLaren Health Care Corp.) | 5.000% | 5/15/24 | 1,015 | 1,136 |
| Michigan Finance Authority Revenue (McLaren Health Care Corp.) | 5.000% | 5/15/25 | 1,665 | 1,885 |
| Michigan Finance Authority Revenue (McLaren Health Care Corp.) | 5.000% | 5/15/26 | 1,000 | 1,127 |
| Michigan Finance Authority Revenue (McLaren Health Care Corp.) | 5.000% | 5/15/27 | 870 | 975 |
| Michigan Finance Authority Revenue (McLaren Health Care Corp.) | 5.000% | 5/15/28 | 1,000 | 1,115 |
| Michigan Finance Authority Revenue (McLaren Health Care Corp.) | 5.000% | 5/15/29 | 1,015 | 1,126 |
| Michigan Finance Authority Revenue (McLaren Health Care Corp.) | 5.000% | 5/15/30 | 2,580 | 2,852 |
| Michigan Finance Authority Revenue (McLaren Health Care Corp.) | 5.000% | 5/15/31 | 2,655 | 2,922 |
| 2 Michigan Finance Authority Revenue (McLaren Health Care Corp.) PUT | 2.301% | 10/15/20 | 25,000 | 25,146 |
| Michigan Finance Authority Revenue (MidMichigan Obligated Group) | 5.000% | 6/1/28 | 1,355 | 1,498 |
| Michigan Finance Authority Revenue (MidMichigan Obligated Group) | 5.000% | 6/1/29 | 2,000 | 2,202 |
| Michigan Finance Authority Revenue (MidMichigan Obligated Group) | 5.000% | 6/1/30 | 3,000 | 3,290 |
| Michigan Finance Authority Revenue (MidMichigan Obligated Group) | 5.000% | 6/1/31 | 5,000 | 5,462 |
| Michigan Finance Authority Revenue (MidMichigan Obligated Group) | 5.000% | 6/1/32 | 5,000 | 5,449 |
| Michigan Finance Authority Revenue (Sparrow Obligated Group) | 5.000% | 11/15/23 | 840 | 920 |
| Michigan Finance Authority Revenue (Sparrow Obligated Group) | 5.000% | 11/15/24 | 1,310 | 1,474 |
| Michigan Finance Authority Revenue (Sparrow Obligated Group) | 5.000% | 11/15/24 | 465 | 507 |
| Michigan Finance Authority Revenue (Sparrow Obligated Group) | 5.000% | 11/15/25 | 1,190 | 1,294 |
| Michigan Finance Authority Revenue (Sparrow Obligated Group) | 5.000% | 11/15/26 | 400 | 434 |
| Michigan Finance Authority Revenue (State Clean Water Revolving Fund) | 2.000% | 10/1/19 | 1,800 | 1,800 |
| Michigan Finance Authority Revenue (State Clean Water Revolving Fund) | 5.000% | 10/1/22 (Prere.) | 1,500 | 1,650 |
| Michigan Finance Authority Revenue (State Clean Water Revolving Fund) | 5.000% | 10/1/29 | 5,245 | 6,027 |
| Michigan Finance Authority Revenue (State Clean Water Revolving Fund) | 4.000% | 10/1/30 | 7,500 | 7,965 |
| Michigan Finance Authority Revenue (Trinity Health Credit Group) | 5.000% | 12/1/20 (Prere.) | 70 | 74 |
| Michigan Finance Authority Revenue (Trinity Health Credit Group) | 5.000% | 12/1/24 | 4,765 | 5,390 |
| Michigan Finance Authority Revenue (Trinity Health Credit Group) | 5.000% | 12/1/25 | 3,700 | 4,200 |
| Michigan Finance Authority Revenue (Trinity Health Credit Group) | 5.000% | 12/1/25 | 3,585 | 4,103 |
| Michigan Finance Authority Revenue (Trinity Health Credit Group) | 5.000% | 12/1/26 | 3,095 | 3,575 |
| Michigan Finance Authority Revenue (Trinity Health Credit Group) | 5.000% | 12/1/27 | 7,930 | 8,343 |
| Michigan Finance Authority Revenue (Trinity Health Credit Group) | 5.000% | 12/1/27 | 2,790 | 3,196 |
| Michigan Finance Authority Revenue (Trinity Health Credit Group) | 5.000% | 12/1/27 | 2,070 | 2,406 |
| Michigan Finance Authority Revenue (Trinity Health Credit Group) | 5.000% | 12/1/28 | 2,225 | 2,550 |
| Michigan Finance Authority Revenue (Trinity Health Credit Group) | 5.000% | 12/1/29 | 4,880 | 5,527 |
| Michigan Finance Authority Revenue (Trinity Health Credit Group) | 5.000% | 12/1/29 | 1,025 | 1,168 |
| Michigan Finance Authority Revenue (Trinity Health Credit Group) | 5.000% | 12/1/30 | 12,500 | 13,448 |
| Michigan Finance Authority Revenue (Trinity Health Credit Group) | 5.000% | 12/1/30 | 3,770 | 4,248 |
| Michigan Finance Authority Revenue (Trinity Health Credit Group) | 5.000% | 12/1/31 | 2,790 | 3,133 |
| Michigan Finance Authority Revenue (Trinity Health Credit Group) | 5.000% | 12/1/33 | 5,030 | 5,560 |
| Michigan Finance Authority Revenue (Trinity Health Credit Group) | 5.000% | 12/1/34 | 7,870 | 8,666 |
| Michigan Finance Authority Revenue (Trinity Health Credit Group) | 5.000% | 12/1/34 | 5,000 | 5,550 |
| Michigan Finance Authority Revenue (Trinity Health Credit Group) | 5.000% | 12/1/35 | 8,000 | 8,828 |
| Michigan Finance Authority Revenue (Trinity Health Credit Group) | 4.000% | 12/1/36 | 3,310 | 3,317 |
| Michigan GAN | 5.000% | 3/15/23 | 5,095 | 5,632 |
| Michigan GAN | 5.000% | 3/15/26 | 6,915 | 7,941 |
| Michigan GAN | 5.000% | 3/15/27 | 3,845 | 4,438 |
| Michigan GO | 5.000% | 12/1/25 | 7,835 | 9,060 |
| Michigan GO | 5.000% | 12/1/26 | 2,285 | 2,625 |
| Michigan Hospital Finance Authority Revenue (Ascension Health Credit Group) | 5.000% | 11/15/32 | 18,470 | 20,371 |
| Michigan Hospital Finance Authority Revenue (Ascension Health Credit Group) | 5.000% | 11/15/33 | 16,910 | 18,577 |
| Michigan Hospital Finance Authority Revenue (Henry Ford Health System) | 5.250% | 11/15/19 (Prere.) | 5,000 | 5,163 |
| Michigan Hospital Finance Authority Revenue (Henry Ford Health System) | 5.625% | 11/15/19 (Prere.) | 15,775 | 16,348 |
| Michigan Hospital Finance Authority Revenue (McLaren Health Care) | 5.000% | 6/1/27 | 2,000 | 2,155 |
| Michigan Hospital Finance Authority Revenue (McLaren Health Care) | 5.000% | 6/1/28 | 2,600 | 2,798 |
| Michigan Hospital Finance Authority Revenue (MidMichigan Obligated Group) | 5.125% | 6/1/19 (ETM) | 605 | 616 |
| Michigan Hospital Finance Authority Revenue (MidMichigan Obligated Group) | 5.625% | 6/1/19 (Prere.) | 5,000 | 5,106 |
| Michigan Hospital Finance Authority Revenue (MidMichigan Obligated Group) | 6.000% | 6/1/19 (Prere.) | 4,000 | 4,094 |
| Michigan Hospital Finance Authority Revenue (Trinity Health Credit Group) | 5.000% | 12/1/25 | 2,100 | 2,404 |
| Michigan Hospital Finance Authority Revenue (Trinity Health Credit Group) | 5.000% | 12/1/26 | 2,160 | 2,495 |
| Michigan Hospital Finance Authority Revenue (Trinity Health Credit Group) | 5.000% | 12/1/27 | 2,490 | 2,894 |
209
Intermediate-Term Tax-Exempt Fund
| | | | |
| Face | Market |
| Maturity | Amount | Value• |
| Coupon | Date | ($000) | ($000) |
| Michigan Hospital Finance Authority Revenue (Trinity Health Credit Group) | 5.000% | 12/1/28 | 2,290 | 2,624 |
| Michigan Hospital Finance Authority Revenue (Trinity Health Credit Group) | 5.000% | 12/1/29 | 1,410 | 1,606 |
| Michigan Hospital Finance Authority Revenue (Trinity Health Credit Group) | 5.000% | 12/1/30 | 1,865 | 2,114 |
| Michigan Hospital Finance Authority Revenue (Trinity Health Credit Group) | 5.000% | 12/1/31 | 3,035 | 3,427 |
| Michigan Hospital Finance Authority Revenue (Trinity Health Credit Group) | 5.000% | 12/1/32 | 1,520 | 1,706 |
| Michigan Housing Development Authority Revenue | 3.500% | 6/1/47 | 10,700 | 10,885 |
| Michigan Municipal Bond Authority Revenue (State Clean Water Revolving Fund) | 5.000% | 10/1/20 (Prere.) | 4,000 | 4,208 |
| Michigan Strategic Fund Limited Obligation Revenue | | | | |
| (Facility for Rare Isotope Beams Project at Michigan State University) | 5.000% | 3/1/23 | 1,250 | 1,380 |
| Michigan Strategic Fund Limited Obligation Revenue | | | | |
| (Facility for Rare Isotope Beams Project at Michigan State University) | 5.000% | 3/1/24 | 1,715 | 1,920 |
| Michigan Strategic Fund Limited Obligation Revenue | | | | |
| (Facility for Rare Isotope Beams Project at Michigan State University) | 5.000% | 3/1/25 | 1,250 | 1,392 |
| Michigan Strategic Fund Limited Obligation Revenue | | | | |
| (Facility for Rare Isotope Beams Project at Michigan State University) | 5.000% | 3/1/26 | 2,030 | 2,263 |
| Michigan Strategic Fund Limited Obligation Revenue | | | | |
| (Facility for Rare Isotope Beams Project at Michigan State University) | 5.000% | 3/1/27 | 1,700 | 1,888 |
| Michigan Strategic Fund Limited Obligation Revenue | | | | |
| (Facility for Rare Isotope Beams Project at Michigan State University) | 5.000% | 3/1/28 | 1,250 | 1,385 |
| Michigan Strategic Fund Limited Obligation Revenue | | | | |
| (Facility for Rare Isotope Beams Project at Michigan State University) | 5.000% | 3/1/29 | 2,500 | 2,760 |
| Michigan Strategic Fund Limited Obligation Revenue (Senate Offices Project) | 5.000% | 10/15/30 | 1,480 | 1,605 |
| Michigan Strategic Fund Limited Obligation Revenue (Senate Offices Project) | 5.000% | 10/15/34 | 2,170 | 2,339 |
| Michigan Strategic Fund Limited Obligation Revenue (Senate Offices Project) | 5.000% | 10/15/35 | 1,370 | 1,476 |
| Michigan Trunk Line Revenue | 5.000% | 11/15/22 | 7,000 | 7,722 |
| 1 Milan MI Area Schools GO | 5.000% | 5/1/28 | 1,100 | 1,244 |
| 1 Milan MI Area Schools GO | 5.000% | 5/1/29 | 580 | 658 |
| 1 Milan MI Area Schools GO | 5.000% | 5/1/30 | 605 | 681 |
| 1 Milan MI Area Schools GO | 5.000% | 5/1/32 | 1,670 | 1,861 |
| 1 Milan MI Area Schools GO | 5.000% | 5/1/34 | 1,940 | 2,145 |
| Monroe County MI Economic Development Corp. Revenue (Detroit Edison Co. Project) | 6.950% | 9/1/22 (14) | 27,000 | 31,233 |
| Oakland University MI Revenue | 5.000% | 3/1/24 | 530 | 589 |
| Oakland University MI Revenue | 5.000% | 3/1/25 | 540 | 609 |
| Oakland University MI Revenue | 5.000% | 3/1/26 | 500 | 569 |
| Oakland University MI Revenue | 5.000% | 3/1/27 | 765 | 864 |
| Oakland University MI Revenue | 5.000% | 3/1/28 | 1,215 | 1,364 |
| Oakland University MI Revenue | 5.000% | 3/1/29 | 1,735 | 1,938 |
| Oakland University MI Revenue | 5.000% | 3/1/31 | 2,225 | 2,462 |
| Oakland University MI Revenue | 5.000% | 3/1/32 | 3,140 | 3,461 |
| Oakland University MI Revenue | 5.000% | 3/1/33 | 1,775 | 1,951 |
| Oakland University MI Revenue | 5.000% | 3/1/34 | 3,745 | 4,105 |
| Oakland University MI Revenue | 5.000% | 3/1/35 | 2,205 | 2,410 |
| Oakland University MI Revenue | 5.000% | 3/1/36 | 2,025 | 2,205 |
| Portage MI Public Schools GO | 5.000% | 11/1/33 | 2,130 | 2,375 |
| Portage MI Public Schools GO | 5.000% | 11/1/35 | 1,300 | 1,440 |
| Portage MI Public Schools GO | 5.000% | 11/1/36 | 1,500 | 1,656 |
| Rockford MI Public Schools GO | 5.000% | 5/1/32 | 2,000 | 2,220 |
| Rockford MI Public Schools GO | 5.000% | 5/1/33 | 2,470 | 2,728 |
| Romeo MI Community School District GO | 5.000% | 5/1/32 | 1,290 | 1,432 |
| Romeo MI Community School District GO | 5.000% | 5/1/33 | 1,350 | 1,491 |
| Romeo MI Community School District GO | 5.000% | 5/1/34 | 1,425 | 1,568 |
| Romeo MI Community School District GO | 5.000% | 5/1/35 | 1,000 | 1,096 |
| Royal Oak MI Hospital Finance Authority Hospital Revenue (William Beaumont Hospital) | 5.500% | 8/1/19 (ETM) | 5,555 | 5,696 |
| Royal Oak MI Hospital Finance Authority Hospital Revenue (William Beaumont Hospital) | 6.375% | 8/1/19 (Prere.) | 25,000 | 25,795 |
| Royal Oak MI Hospital Finance Authority Hospital Revenue (William Beaumont Hospital) | 5.000% | 9/1/22 | 2,540 | 2,772 |
| Royal Oak MI Hospital Finance Authority Hospital Revenue (William Beaumont Hospital) | 5.000% | 9/1/23 | 2,180 | 2,419 |
| Royal Oak MI Hospital Finance Authority Hospital Revenue (William Beaumont Hospital) | 5.000% | 9/1/26 | 2,245 | 2,489 |
| Saginaw MI Hospital Finance Authority Hospital Revenue (Covenant Medical Center Inc.) | 5.000% | 7/1/19 | 2,300 | 2,339 |
| Saginaw MI Hospital Finance Authority Hospital Revenue (Covenant Medical Center Inc.) | 5.000% | 7/1/30 | 10,000 | 10,376 |
| University of Michigan Revenue | 5.000% | 4/1/33 | 2,750 | 3,143 |
| University of Michigan Revenue | 5.000% | 4/1/34 | 3,485 | 3,972 |
| University of Michigan Revenue | 5.000% | 4/1/35 | 3,300 | 3,748 |
| University of Michigan Revenue | 5.000% | 4/1/36 | 4,000 | 4,524 |
| University of Michigan Revenue | 5.000% | 4/1/37 | 5,000 | 5,643 |
| Warren MI Consolidated School District GO | 5.000% | 5/1/32 | 2,485 | 2,738 |
| Wayne County MI Airport Authority Revenue | 5.000% | 12/1/25 | 2,250 | 2,566 |
| Wayne County MI Airport Authority Revenue | 5.000% | 12/1/26 | 1,935 | 2,215 |
| Wayne County MI Airport Authority Revenue | 5.000% | 12/1/26 | 1,050 | 1,198 |
| Wayne County MI Airport Authority Revenue | 5.000% | 12/1/27 | 1,800 | 2,070 |
| Wayne County MI Airport Authority Revenue | 5.000% | 12/1/27 | 830 | 951 |
210
Intermediate-Term Tax-Exempt Fund
| | | | |
| Face | Market |
| Maturity | Amount | Value• |
| Coupon | Date | ($000) | ($000) |
| Wayne County MI Airport Authority Revenue | 5.000% | 12/1/28 | 1,260 | 1,436 |
| Wayne County MI Airport Authority Revenue | 5.000% | 12/1/28 | 600 | 681 |
| Wayne County MI Airport Authority Revenue | 5.000% | 12/1/29 | 1,525 | 1,704 |
| Wayne County MI Airport Authority Revenue | 5.000% | 12/1/29 | 660 | 748 |
| Wayne County MI Airport Authority Revenue | 5.000% | 12/1/30 | 790 | 889 |
| Wayne County MI Airport Authority Revenue | 5.000% | 12/1/30 | 770 | 869 |
| Wayne County MI Airport Authority Revenue | 5.000% | 12/1/31 | 2,310 | 2,562 |
| Wayne County MI Airport Authority Revenue | 5.000% | 12/1/31 | 545 | 609 |
| Wayne County MI Airport Authority Revenue | 5.000% | 12/1/31 | 420 | 471 |
| Wayne County MI Airport Authority Revenue | 5.000% | 12/1/32 | 2,915 | 3,226 |
| Wayne County MI Airport Authority Revenue | 5.000% | 12/1/32 | 400 | 445 |
| Wayne County MI Airport Authority Revenue | 5.000% | 12/1/32 | 385 | 430 |
| Wayne County MI Airport Authority Revenue | 5.000% | 12/1/33 | 10,165 | 11,221 |
| Wayne County MI Airport Authority Revenue | 5.000% | 12/1/33 | 405 | 451 |
| Wayne County MI Airport Authority Revenue | 5.000% | 12/1/34 | 3,390 | 3,733 |
| Wayne County MI Airport Authority Revenue | 5.000% | 12/1/34 | 2,600 | 2,863 |
| Wayne County MI Airport Authority Revenue | 5.000% | 12/1/34 | 780 | 865 |
| Wayne County MI Airport Authority Revenue | 5.000% | 12/1/35 | 3,870 | 4,254 |
| Wayne County MI Airport Authority Revenue | 5.000% | 12/1/35 | 645 | 711 |
| Wayne County MI Airport Authority Revenue | 5.000% | 12/1/36 | 645 | 709 |
| Wayne County MI Airport Authority Revenue | 5.000% | 12/1/37 | 900 | 983 |
| Wayne County MI Airport Authority Revenue | 5.000% | 12/1/37 | 510 | 559 |
| Wayne County MI Airport Authority Revenue (Detroit Metropolitan Wayne County Airport) | 5.000% | 12/1/27 | 5,655 | 6,138 |
| Wayne County MI Airport Authority Revenue (Detroit Metropolitan Wayne County Airport) | 5.000% | 12/1/28 | 5,935 | 6,433 |
| Wayne County MI Airport Authority Revenue (Detroit Metropolitan Wayne County Airport) | 5.000% | 12/1/29 | 3,895 | 4,211 |
| Wayne County MI Airport Authority Revenue (Detroit Metropolitan Wayne County Airport) | 5.000% | 12/1/30 | 6,540 | 7,060 |
| Wayne County MI Airport Authority Revenue (Detroit Metropolitan Wayne County Airport) | 5.000% | 12/1/31 | 6,370 | 6,871 |
| Wayne County MI Airport Authority Revenue (Detroit Metropolitan Wayne County Airport) | 5.000% | 12/1/32 | 4,300 | 4,633 |
| 1 Wayne County MI Airport Authority Revenue (Detroit Metropolitan Wayne County Airport) | 5.000% | 12/1/35 | 6,000 | 6,665 |
| 1 Wayne County MI Airport Authority Revenue (Detroit Metropolitan Wayne County Airport) | 5.000% | 12/1/36 | 5,000 | 5,532 |
| 1 Wayne County MI Airport Authority Revenue (Detroit Metropolitan Wayne County Airport) | 5.000% | 12/1/37 | 8,000 | 8,831 |
| 1 Wayne County MI Airport Authority Revenue (Detroit Metropolitan Wayne County Airport) | 5.000% | 12/1/38 | 6,015 | 6,624 |
| Wayne State University Michigan Revenue | 5.000% | 11/15/36 | 1,700 | 1,870 |
| Wayne State University Michigan Revenue | 5.000% | 11/15/37 | 1,750 | 1,923 |
| 7 Wayne State University Michigan Revenue TOB VRDO | 1.670% | 11/7/18 (Prere.) | 5,000 | 5,000 |
| Woodhaven-Brownstone MI School District GO | 5.000% | 5/1/29 | 3,800 | 4,301 |
| Woodhaven-Brownstone MI School District GO | 5.000% | 5/1/30 | 3,850 | 4,339 |
| Woodhaven-Brownstone MI School District GO | 5.000% | 5/1/31 | 3,905 | 4,384 |
| | | | 1,704,106 |
| Minnesota (1.1%) | | | | |
| Bloomington MN Independent School District No. 271 GO | 5.000% | 2/1/22 | 3,000 | 3,260 |
| 1 Duluth MN Economic Development Authority Revenue (Essentia Health) | 5.000% | 2/15/33 | 1,200 | 1,313 |
| 1 Duluth MN Economic Development Authority Revenue (Essentia Health) | 5.000% | 2/15/37 | 1,500 | 1,613 |
| Duluth MN Independent School District No. 709 COP | 5.000% | 2/1/22 | 2,150 | 2,301 |
| Farmington MN Independent School District No. 192 GO | 5.000% | 2/1/21 | 2,575 | 2,732 |
| Maple Grove MN Health Care Facilities Revenue (Maple Grove Hospital Corp.) | 5.000% | 5/1/25 | 1,000 | 1,122 |
| Maple Grove MN Health Care Facilities Revenue (Maple Grove Hospital Corp.) | 5.000% | 5/1/26 | 1,350 | 1,526 |
| Maple Grove MN Health Care Facilities Revenue (Maple Grove Hospital Corp.) | 5.000% | 5/1/27 | 1,400 | 1,591 |
| Metropolitan Council (Minneapolis-St. Paul Metropolitan Area) Minnesota GO | 5.000% | 3/1/20 | 4,500 | 4,674 |
| Metropolitan Council (Minneapolis-St. Paul Metropolitan Area) Minnesota GO | 5.000% | 3/1/22 | 3,415 | 3,717 |
| Metropolitan Council (Minneapolis-St. Paul Metropolitan Area) Minnesota GO | 4.000% | 3/1/26 | 2,950 | 3,182 |
| Minneapolis & St. Paul MN Housing & Redevelopment Authority Health Care System Revenue | | | | |
| (Allina Health System) | 5.000% | 11/15/18 | 2,190 | 2,192 |
| Minneapolis & St. Paul MN Metropolitan Airports Commission Revenue | 5.000% | 1/1/28 | 11,500 | 13,253 |
| Minneapolis & St. Paul MN Metropolitan Airports Commission Revenue | 5.000% | 1/1/28 | 300 | 346 |
| Minneapolis & St. Paul MN Metropolitan Airports Commission Revenue | 5.000% | 1/1/28 | 4,000 | 4,370 |
| Minneapolis & St. Paul MN Metropolitan Airports Commission Revenue | 5.000% | 1/1/29 | 5,110 | 5,853 |
| Minneapolis & St. Paul MN Metropolitan Airports Commission Revenue | 5.000% | 1/1/29 | 360 | 412 |
| Minneapolis & St. Paul MN Metropolitan Airports Commission Revenue | 5.000% | 1/1/29 | 2,305 | 2,511 |
| Minneapolis & St. Paul MN Metropolitan Airports Commission Revenue | 5.000% | 1/1/30 | 5,000 | 5,696 |
| Minneapolis & St. Paul MN Metropolitan Airports Commission Revenue | 5.000% | 1/1/30 | 485 | 553 |
| Minneapolis & St. Paul MN Metropolitan Airports Commission Revenue | 5.000% | 1/1/30 | 2,500 | 2,717 |
| Minneapolis & St. Paul MN Metropolitan Airports Commission Revenue | 5.000% | 1/1/31 | 540 | 613 |
| Minneapolis & St. Paul MN Metropolitan Airports Commission Revenue | 5.000% | 1/1/31 | 2,545 | 2,760 |
| Minneapolis & St. Paul MN Metropolitan Airports Commission Revenue | 5.000% | 1/1/32 | 3,935 | 4,443 |
| Minneapolis & St. Paul MN Metropolitan Airports Commission Revenue | 5.000% | 1/1/32 | 600 | 678 |
| Minneapolis & St. Paul MN Metropolitan Airports Commission Revenue | 5.000% | 1/1/33 | 650 | 731 |
| Minneapolis & St. Paul MN Metropolitan Airports Commission Revenue | 5.000% | 1/1/34 | 900 | 1,010 |
| Minneapolis & St. Paul MN Metropolitan Airports Commission Revenue | 5.000% | 1/1/35 | 875 | 979 |
211
Intermediate-Term Tax-Exempt Fund
| | | | |
| Face | Market |
| Maturity | Amount | Value• |
| Coupon | Date | ($000) | ($000) |
| Minneapolis & St. Paul MN Metropolitan Airports Commission Revenue | 5.000% | 1/1/36 | 850 | 948 |
| Minneapolis & St. Paul MN Metropolitan Airports Commission Revenue | 5.000% | 1/1/37 | 925 | 1,030 |
| Minneapolis & St. Paul MN Metropolitan Council Wastewater GO | 5.000% | 3/1/20 | 4,485 | 4,659 |
| Minneapolis & St. Paul MN Metropolitan Council Wastewater GO | 5.000% | 3/1/21 | 5,000 | 5,317 |
| Minneapolis MN Health Care System Revenue (Fairview Health Services) | 6.000% | 11/15/18 (ETM) | 4,955 | 4,962 |
| Minneapolis MN Health Care System Revenue (Fairview Health Services) | 6.625% | 11/15/18 (Prere.) | 15,500 | 15,527 |
| Minneapolis MN Special School District No. 1 COP | 5.000% | 2/1/22 | 6,805 | 7,359 |
| Minneapolis MN Special School District No. 1 COP | 5.000% | 2/1/23 | 7,550 | 8,315 |
| Minneapolis MN Special School District No. 1 COP | 5.000% | 2/1/24 | 8,215 | 9,044 |
| Minneapolis MN Special School District No. 1 COP | 5.000% | 2/1/25 | 5,050 | 5,560 |
| Minneapolis MN Special School District No. 1 COP | 5.000% | 2/1/26 | 7,000 | 7,686 |
| Minneapolis MN Special School District No. 1 COP | 5.000% | 2/1/27 | 10,085 | 11,035 |
| Minneapolis MN Special School District No. 1 COP | 5.000% | 2/1/28 | 10,590 | 11,565 |
| Minneapolis MN Special School District No. 1 GO | 5.000% | 2/1/27 | 1,750 | 2,037 |
| Minnesota 911 Revenue | 5.000% | 6/1/20 | 21,420 | 22,394 |
| Minnesota COP | 5.000% | 6/1/19 | 8,540 | 8,561 |
| Minnesota COP | 5.000% | 6/1/28 | 3,225 | 3,603 |
| Minnesota COP | 5.000% | 6/1/29 | 3,385 | 3,773 |
| Minnesota COP | 5.000% | 6/1/30 | 3,405 | 3,789 |
| Minnesota COP | 5.000% | 6/1/32 | 3,670 | 4,070 |
| Minnesota COP | 5.000% | 6/1/33 | 3,615 | 4,003 |
| Minnesota COP | 5.000% | 6/1/34 | 4,005 | 4,431 |
| Minnesota General Fund Revenue | 5.000% | 3/1/24 | 7,515 | 8,139 |
| Minnesota General Fund Revenue | 5.000% | 3/1/25 | 6,000 | 6,502 |
| Minnesota GO | 5.000% | 8/1/21 | 6,510 | 6,999 |
| Minnesota GO | 5.000% | 8/1/21 | 6,015 | 6,466 |
| Minnesota GO | 5.000% | 8/1/21 | 5,445 | 5,854 |
| Minnesota GO | 5.000% | 10/1/21 | 34,000 | 36,682 |
| Minnesota GO | 5.000% | 10/1/21 (Prere.) | 155 | 167 |
| Minnesota GO | 5.000% | 8/1/22 | 20,500 | 22,499 |
| Minnesota GO | 5.000% | 8/1/23 | 5,290 | 5,914 |
| Minnesota GO | 5.000% | 10/1/23 | 29,530 | 33,097 |
| Minnesota GO | 5.000% | 10/1/23 | 3,690 | 4,136 |
| Minnesota GO | 5.000% | 8/1/24 | 15,500 | 17,606 |
| Minnesota GO | 5.000% | 8/1/24 | 1,350 | 1,533 |
| Minnesota GO | 5.000% | 8/1/24 | 12,355 | 14,034 |
| Minnesota GO | 5.000% | 10/1/24 | 9,845 | 10,570 |
| Minnesota GO | 5.000% | 8/1/25 | 13,500 | 15,565 |
| Minnesota GO | 5.000% | 10/1/25 | 29,320 | 33,866 |
| Minnesota GO | 5.000% | 8/1/26 | 35,060 | 40,259 |
| Minnesota GO | 5.000% | 10/1/26 | 13,030 | 15,243 |
| Minnesota GO | 5.000% | 8/1/27 | 4,000 | 4,574 |
| Minnesota GO | 4.000% | 8/1/35 | 7,300 | 7,605 |
| Minnesota Higher Education Facilities Authority Revenue (Hamline University) | 5.000% | 10/1/26 | 1,030 | 1,140 |
| Minnesota Higher Education Facilities Authority Revenue (Hamline University) | 5.000% | 10/1/27 | 1,080 | 1,190 |
| Minnesota Higher Education Facilities Authority Revenue (Hamline University) | 5.000% | 10/1/28 | 1,135 | 1,242 |
| Minnesota Higher Education Facilities Authority Revenue (Hamline University) | 5.000% | 10/1/29 | 1,195 | 1,298 |
| Minnesota Higher Education Facilities Authority Revenue (Hamline University) | 5.000% | 10/1/30 | 1,250 | 1,352 |
| Minnesota Higher Education Facilities Authority Revenue (Hamline University) | 5.000% | 10/1/31 | 1,310 | 1,412 |
| Minnesota Higher Education Facilities Authority Revenue (Hamline University) | 5.000% | 10/1/32 | 1,380 | 1,482 |
| Minnesota Higher Education Facilities Authority Revenue (Hamline University) | 5.000% | 10/1/33 | 1,445 | 1,548 |
| Minnesota Higher Education Facilities Authority Revenue (Hamline University) | 5.000% | 10/1/34 | 1,520 | 1,622 |
| Minnesota Higher Education Facilities Authority Revenue (University of St. Thomas) | 4.000% | 4/1/19 | 425 | 428 |
| Minnesota Office of Higher Education Revenue (Supplemental Student Loan Program) | 5.000% | 11/1/18 (ETM) | 4,305 | 4,305 |
| Minnesota Public Facilities Authority Revenue (State Revolving Fund) | 5.000% | 3/1/20 (Prere.) | 5,000 | 5,192 |
| Mounds View MN Independent School District No. 621 GO | 5.000% | 2/1/26 | 4,910 | 5,666 |
| Osseo MN Independent School District No. 279 GO | 5.000% | 2/1/20 | 7,410 | 7,677 |
| 1 Osseo MN Independent School District No. 279 GO | 5.000% | 2/1/27 | 1,350 | 1,570 |
| Rochester MN Health Care Facilities Revenue (Mayo Clinic) | 5.000% | 11/15/29 | 7,115 | 8,429 |
| Rochester MN Health Care Facilities Revenue (Mayo Clinic) | 5.000% | 11/15/31 | 8,000 | 9,544 |
| Southern Minnesota Municipal Power Agency Power Supply System Revenue | 5.250% | 1/1/19 (Prere.) | 2,000 | 2,011 |
| St. Cloud MN Health Care Revenue (CentraCare Health System) | 5.000% | 5/1/23 | 2,260 | 2,498 |
| St. Cloud MN Health Care Revenue (CentraCare Health System) | 5.000% | 5/1/24 | 1,500 | 1,682 |
| St. Paul MN Housing & Redevelopment Authority Health Care Revenue | | | | |
| (Allina Health Obligated Group) | 5.000% | 11/15/19 (Prere.) | 805 | 829 |
| St. Paul MN Housing & Redevelopment Authority Health Care Revenue | | | | |
| (Allina Health Obligated Group) | 5.000% | 11/15/19 (Prere.) | 1,120 | 1,154 |
| St. Paul MN Housing & Redevelopment Authority Health Care Revenue | | | | |
| (Allina Health Obligated Group) | 5.000% | 11/15/19 (Prere.) | 1,235 | 1,272 |
212
Intermediate-Term Tax-Exempt Fund
| | | | |
| Face | Market |
| Maturity | Amount | Value• |
| Coupon | Date | ($000) | ($000) |
| St. Paul MN Housing & Redevelopment Authority Health Care Revenue | | | | |
| (Allina Health Obligated Group) | 5.000% | 11/15/19 (Prere.) | 915 | 942 |
| St. Paul MN Housing & Redevelopment Authority Health Care Revenue | | | | |
| (Allina Health Obligated Group) | 5.000% | 11/15/19 (Prere.) | 1,990 | 2,050 |
| St. Paul MN Housing & Redevelopment Authority Health Care Revenue | | | | |
| (Allina Health Obligated Group) | 5.250% | 11/15/19 (Prere.) | 3,550 | 3,665 |
| St. Paul MN Housing & Redevelopment Authority Health Care Revenue | | | | |
| (Allina Health Obligated Group) | 5.000% | 11/15/20 | 780 | 803 |
| St. Paul MN Housing & Redevelopment Authority Health Care Revenue | | | | |
| (Allina Health Obligated Group) | 5.000% | 11/15/20 | 890 | 917 |
| St. Paul MN Housing & Redevelopment Authority Health Care Revenue | | | | |
| (Allina Health Obligated Group) | 5.000% | 11/15/21 | 1,085 | 1,118 |
| St. Paul MN Housing & Redevelopment Authority Health Care Revenue | | | | |
| (Allina Health Obligated Group) | 5.000% | 11/15/21 | 1,935 | 1,993 |
| St. Paul MN Housing & Redevelopment Authority Health Care Revenue | | | | |
| (Allina Health Obligated Group) | 5.000% | 11/15/22 | 1,190 | 1,227 |
| St. Paul MN Housing & Redevelopment Authority Health Care Revenue | | | | |
| (Allina Health Obligated Group) | 5.250% | 11/15/29 | 3,480 | 3,609 |
| St. Paul MN Housing & Redevelopment Authority Health Care Revenue | | | | |
| (Fairview Health Services Obligated Group) | 5.000% | 11/15/28 | 805 | 922 |
| St. Paul MN Housing & Redevelopment Authority Health Care Revenue | | | | |
| (Fairview Health Services Obligated Group) | 5.000% | 11/15/29 | 780 | 887 |
| St. Paul MN Housing & Redevelopment Authority Health Care Revenue | | | | |
| (Fairview Health Services Obligated Group) | 5.000% | 11/15/31 | 1,800 | 2,027 |
| St. Paul MN Housing & Redevelopment Authority Health Care Revenue | | | | |
| (Fairview Health Services Obligated Group) | 5.000% | 11/15/34 | 1,105 | 1,231 |
| St. Paul MN Housing & Redevelopment Authority Health Care Revenue | | | | |
| (Fairview Health Services Obligated Group) | 4.000% | 11/15/35 | 1,245 | 1,246 |
| St. Paul MN Housing & Redevelopment Authority Health Care Revenue | | | | |
| (Fairview Health Services Obligated Group) | 4.000% | 11/15/36 | 1,500 | 1,492 |
| St. Paul MN Housing & Redevelopment Authority Health Care Revenue | | | | |
| (Fairview Health Services Obligated Group) | 4.000% | 11/15/37 | 1,500 | 1,484 |
| University of Minnesota Revenue | 5.000% | 4/1/19 (Prere.) | 500 | 506 |
| University of Minnesota Revenue | 5.000% | 8/1/19 | 1,150 | 1,176 |
| University of Minnesota Revenue | 5.000% | 4/1/20 | 2,895 | 3,012 |
| University of Minnesota Revenue | 5.000% | 4/1/21 | 3,140 | 3,351 |
| University of Minnesota Revenue | 5.000% | 8/1/22 | 1,585 | 1,661 |
| University of Minnesota Revenue | 5.000% | 8/1/23 | 2,500 | 2,619 |
| West St. Paul MN Independent School District No. 197 Revenue (Mendota Heights-Eagan) | 4.000% | 2/1/28 | 3,795 | 4,093 |
| Western Minnesota Municipal Power Agency Revenue | 5.000% | 1/1/26 | 1,000 | 1,150 |
| Western Minnesota Municipal Power Agency Revenue | 5.000% | 1/1/27 | 1,500 | 1,740 |
| Western Minnesota Municipal Power Agency Revenue | 5.000% | 1/1/28 | 1,000 | 1,169 |
| | | | 633,759 |
| Mississippi (0.4%) | | | | |
| Gulfport MS Hospital Facilities Revenue (Memorial Hospital at Gulfport Project) | 5.000% | 7/1/28 | 3,665 | 3,950 |
| Jackson MS Public School District GO | 5.000% | 4/1/23 | 1,500 | 1,647 |
| Jackson MS Public School District GO | 5.000% | 4/1/24 | 3,125 | 3,476 |
| Jackson MS Public School District GO | 5.000% | 4/1/25 | 5,335 | 5,993 |
| Jackson MS Public School District GO | 5.000% | 4/1/26 | 5,000 | 5,664 |
| Jackson MS Public School District GO | 5.000% | 4/1/27 | 4,585 | 5,142 |
| Mississippi Development Bank Special Obligation Revenue (Harrison County Highway Project) | 5.000% | 1/1/24 | 2,500 | 2,775 |
| Mississippi Development Bank Special Obligation Revenue (Madison County Highway Project) | 5.000% | 1/1/24 | 2,510 | 2,786 |
| Mississippi Development Bank Special Obligation Revenue | | | | |
| (Marshall County Industrial Development Highway Refunding Project) | 5.000% | 1/1/26 | 6,000 | 6,764 |
| Mississippi Development Bank Special Obligation Revenue | | | | |
| (Marshall County Industrial Development Highway Refunding Project) | 5.000% | 1/1/27 | 7,985 | 9,035 |
| Mississippi Development Bank Special Obligation Revenue | | | | |
| (Marshall County Industrial Development Highway Refunding Project) | 5.000% | 1/1/28 | 2,265 | 2,577 |
| Mississippi Development Bank Special Obligation Revenue (Rankin County School District) | 5.000% | 6/1/28 | 1,500 | 1,711 |
| Mississippi Development Bank Special Obligation Revenue (Rankin County School District) | 5.000% | 6/1/29 | 1,370 | 1,550 |
| Mississippi Development Bank Special Obligation Revenue (Rankin County School District) | 5.000% | 6/1/31 | 1,060 | 1,189 |
| Mississippi Development Bank Special Obligation Revenue (Rankin County School District) | 4.000% | 6/1/32 | 2,030 | 2,097 |
| Mississippi Development Bank Special Obligation Revenue (Rankin County School District) | 4.000% | 6/1/33 | 1,500 | 1,541 |
| Mississippi GO | 5.000% | 10/1/21 (Prere.) | 12,035 | 12,988 |
| Mississippi GO | 5.000% | 10/1/21 (Prere.) | 11,735 | 12,664 |
| Mississippi GO | 5.000% | 10/1/29 | 15,025 | 17,309 |
| Mississippi GO | 5.000% | 11/1/30 | 4,000 | 4,512 |
| 1 Mississippi GO | 5.000% | 11/1/30 | 1,250 | 1,414 |
| Mississippi GO | 5.000% | 10/1/31 | 19,800 | 22,561 |
213
Intermediate-Term Tax-Exempt Fund
| | | | |
| Face | Market |
| Maturity | Amount | Value• |
| Coupon | Date | ($000) | ($000) |
| 1 Mississippi GO | 5.000% | 11/1/31 | 2,750 | 3,100 |
| Mississippi GO | 5.000% | 12/1/31 | 11,250 | 12,470 |
| 1 Mississippi GO | 5.000% | 11/1/32 | 3,500 | 3,933 |
| Mississippi GO | 5.000% | 12/1/32 | 7,000 | 7,749 |
| Mississippi GO | 5.000% | 10/1/34 | 10,000 | 11,279 |
| 1 Mississippi GO | 5.000% | 11/1/35 | 4,000 | 4,453 |
| Mississippi Institutions of Higher Learning Revenue (University of Mississippi Medical Center) | 4.000% | 6/1/32 | 5,480 | 5,527 |
| Mississippi Institutions of Higher Learning Revenue (University of Mississippi Medical Center) | 4.000% | 6/1/33 | 3,785 | 3,804 |
| Mississippi Institutions of Higher Learning Revenue (University of Mississippi Medical Center) | 4.000% | 6/1/34 | 4,880 | 4,890 |
| Mississippi State University Educational Building Corp. Revenue | 4.000% | 8/1/33 | 800 | 821 |
| Mississippi State University Educational Building Corp. Revenue | 4.000% | 8/1/35 | 2,000 | 2,040 |
| Mississippi State University Educational Building Corp. Revenue | 4.000% | 8/1/36 | 1,100 | 1,118 |
| University of Southern Mississippi Revenue | 4.000% | 3/1/34 | 2,075 | 2,111 |
| University of Southern Mississippi Revenue | 4.000% | 3/1/35 | 2,565 | 2,599 |
| University of Southern Mississippi Revenue | 4.000% | 3/1/36 | 1,500 | 1,513 |
| University of Southern Mississippi Revenue | 4.000% | 3/1/37 | 1,740 | 1,748 |
| University of Southern Mississippi Revenue | 4.000% | 3/1/38 | 3,220 | 3,216 |
| | | | 201,716 |
| Missouri (0.8%) | | | | |
| Bi-State Development Agency of the Missouri-Illinois Metropolitan District Mass Transit | | | | |
| Sales Tax Revenue | 5.000% | 10/1/33 | 7,500 | 8,166 |
| Branson MO Industrial Development Authority Tax Increase Revenue | | | | |
| (Branson Shoppes Redevelopment) | 4.000% | 11/1/25 | 1,000 | 999 |
| Branson MO Industrial Development Authority Tax Increase Revenue | | | | |
| (Branson Shoppes Redevelopment) | 4.000% | 11/1/26 | 750 | 741 |
| Cape Girardeau County MO Industrial Development Authority of the Health Facilities Revenue | | | | |
| (Southeast Health) | 5.000% | 3/1/26 | 2,000 | 2,184 |
| Cape Girardeau County MO Industrial Development Authority of the Health Facilities Revenue | | | | |
| (Southeast Health) | 5.000% | 3/1/27 | 1,000 | 1,095 |
| Cape Girardeau County MO Industrial Development Authority of the Health Facilities Revenue | | | | |
| (Southeast Health) | 5.000% | 3/1/28 | 1,400 | 1,521 |
| Cape Girardeau County MO Industrial Development Authority of the Health Facilities Revenue | | | | |
| (Southeast Health) | 5.000% | 3/1/30 | 840 | 903 |
| Cape Girardeau County MO Industrial Development Authority of the Health Facilities Revenue | | | | |
| (Southeast Health) | 5.000% | 3/1/31 | 870 | 930 |
| Cape Girardeau County MO Industrial Development Authority of the Health Facilities Revenue | | | | |
| (Southeast Health) | 5.000% | 3/1/32 | 750 | 798 |
| Cape Girardeau County MO Industrial Development Authority of the Health Facilities Revenue | | | | |
| (St. Francis Medical Center) | 5.000% | 6/1/26 | 1,000 | 1,073 |
| Cape Girardeau County MO Industrial Development Authority of the Health Facilities Revenue | | | | |
| (St. Francis Medical Center) | 5.000% | 6/1/27 | 1,850 | 1,978 |
| Curators of the University of Missouri System Facilities Revenue | 5.000% | 11/1/26 | 1,830 | 1,968 |
| Curators of the University of Missouri System Facilities Revenue | 5.000% | 11/1/27 | 1,000 | 1,075 |
| Curators of the University of Missouri System Facilities Revenue | 4.000% | 11/1/30 | 3,000 | 3,130 |
| Curators of the University of Missouri System Facilities Revenue | 4.000% | 11/1/31 | 6,415 | 6,668 |
| Jackson County MO School District No. 4 GO (Blue Springs) | 5.500% | 3/1/37 | 1,750 | 2,083 |
| Jackson County MO School District No. 4 GO (Blue Springs) | 6.000% | 3/1/38 | 1,500 | 1,848 |
| Jackson County MO Special Obligation Revenue (Truman Sports Complex Project) | 5.000% | 12/1/20 | 5,055 | 5,324 |
| Jackson County MO Special Obligation Revenue (Truman Sports Complex Project) | 5.000% | 12/1/25 | 6,050 | 6,786 |
| Jackson County MO Special Obligation Revenue (Truman Sports Complex Project) | 5.000% | 12/1/26 | 7,830 | 8,759 |
| Jackson County MO Special Obligation Revenue (Truman Sports Complex Project) | 5.000% | 12/1/27 | 12,745 | 14,234 |
| Jackson County MO Special Obligation Revenue (Truman Sports Complex Project) | 5.000% | 12/1/29 | 13,640 | 15,162 |
| Jackson County MO Special Obligation Revenue (Truman Sports Complex Project) | 5.000% | 12/1/30 | 13,675 | 15,168 |
| Jackson County MO Special Obligation Revenue (Truman Sports Complex Project) | 5.000% | 12/1/31 | 5,535 | 6,123 |
| Kansas City MO Sanitary Sewer System Revenue | 5.000% | 1/1/29 | 2,025 | 2,354 |
| Kansas City MO Sanitary Sewer System Revenue | 4.000% | 1/1/30 | 1,190 | 1,248 |
| Kansas City MO Sanitary Sewer System Revenue | 5.000% | 1/1/30 | 1,615 | 1,868 |
| Kansas City MO Sanitary Sewer System Revenue | 4.000% | 1/1/31 | 1,740 | 1,817 |
| Kansas City MO Sanitary Sewer System Revenue | 5.000% | 1/1/31 | 1,510 | 1,736 |
| Kansas City MO Sanitary Sewer System Revenue | 5.000% | 1/1/33 | 2,000 | 2,279 |
| Kansas City MO Special Obligation Revenue (Downtown Arena Project) | 5.000% | 4/1/32 | 7,225 | 7,996 |
| Kansas City MO Special Obligation Revenue (Downtown Arena Project) | 4.000% | 4/1/35 | 2,000 | 2,021 |
| Kansas City MO Special Obligation Revenue (Downtown Arena Project) | 4.000% | 4/1/36 | 1,850 | 1,865 |
| Kansas City MO Special Obligation Revenue (Performing Arts Center Garage Project) | 0.000% | 2/1/19 | 7,615 | 7,568 |
| Lee’s Summit MO Senior Living Facilities Revenue (John Knox Village) | 5.000% | 8/15/26 | 5,995 | 6,276 |
| Metropolitan St. Louis MO Sewer District Wastewater System Revenue | 5.000% | 5/1/26 | 1,170 | 1,365 |
| Metropolitan St. Louis MO Sewer District Wastewater System Revenue | 5.000% | 5/1/29 | 1,275 | 1,482 |
| Metropolitan St. Louis MO Sewer District Wastewater System Revenue | 5.000% | 5/1/35 | 4,645 | 5,263 |
| Metropolitan St. Louis MO Sewer District Wastewater System Revenue | 5.000% | 5/1/36 | 2,415 | 2,727 |
214
Intermediate-Term Tax-Exempt Fund
| | | | |
| Face | Market |
| Maturity | Amount | Value• |
| Coupon | Date | ($000) | ($000) |
| Missouri Environmental Improvement & Energy Resources Authority Revenue | 2.400% | 11/29/18 (14) | 6,160 | 6,160 |
| Missouri Environmental Improvement & Energy Resources Authority Revenue | 5.000% | 1/1/24 | 2,080 | 2,345 |
| Missouri Environmental Improvement & Energy Resources Authority Revenue | 5.000% | 1/1/25 | 2,910 | 3,330 |
| Missouri Environmental Improvement & Energy Resources Authority Revenue | 5.000% | 7/1/26 | 4,250 | 4,901 |
| Missouri Environmental Improvement & Energy Resources Authority Revenue | 5.000% | 1/1/27 | 1,990 | 2,291 |
| Missouri Health & Educational Facilities Authority Health Facilities Revenue | | | | |
| (Children’s Mercy Hospital) | 5.000% | 5/15/26 | 1,000 | 1,137 |
| Missouri Health & Educational Facilities Authority Health Facilities Revenue (Cox Health) | 5.000% | 11/15/26 | 2,045 | 2,239 |
| Missouri Health & Educational Facilities Authority Health Facilities Revenue (Cox Health) | 5.000% | 11/15/28 | 1,000 | 1,084 |
| Missouri Health & Educational Facilities Authority Health Facilities Revenue | | | | |
| (Freeman Health System) | 5.000% | 2/15/21 | 2,845 | 3,001 |
| Missouri Health & Educational Facilities Authority Health Facilities Revenue | | | | |
| (Freeman Health System) | 5.000% | 2/15/22 | 3,490 | 3,753 |
| Missouri Health & Educational Facilities Authority Health Facilities Revenue | | | | |
| (Freeman Health System) | 5.000% | 2/15/23 | 3,690 | 3,960 |
| Missouri Health & Educational Facilities Authority Health Facilities Revenue | | | | |
| (Freeman Health System) | 5.000% | 2/15/24 | 3,320 | 3,553 |
| Missouri Health & Educational Facilities Authority Health Facilities Revenue (SSM Health System) | 5.000% | 6/1/19 (ETM) | 2,420 | 2,462 |
| Missouri Health & Educational Facilities Authority Health Facilities Revenue (SSM Health System) | 5.000% | 6/1/20 (Prere.) | 5,305 | 5,536 |
| Missouri Health & Educational Facilities Authority Health Facilities Revenue (SSM Health System) | 5.000% | 6/1/26 | 3,015 | 3,354 |
| Missouri Health & Educational Facilities Authority Health Facilities Revenue (SSM Health System) | 5.000% | 6/1/27 | 4,525 | 5,009 |
| Missouri Health & Educational Facilities Authority Health Facilities Revenue (SSM Health System) | 5.000% | 6/1/28 | 3,500 | 3,859 |
| Missouri Health & Educational Facilities Authority Health Facilities Revenue (SSM Health System) | 5.000% | 6/1/29 | 7,015 | 7,704 |
| Missouri Health & Educational Facilities Authority Health Facilities Revenue (SSM Health System) | 5.000% | 6/1/30 | 4,000 | 4,378 |
| Missouri Health & Educational Facilities Authority Health Facilities Revenue (SSM Health System) | 5.000% | 6/1/31 | 3,000 | 3,274 |
| Missouri Health & Educational Facilities Authority Health Facilities Revenue | | | | |
| (St. Luke’s Health System) | 5.000% | 11/15/20 | 3,975 | 4,207 |
| Missouri Health & Educational Facilities Authority Health Facilities Revenue | | | | |
| (St. Luke’s Health System) | 5.250% | 11/15/25 | 8,000 | 8,436 |
| Missouri Health & Educational Facilities Authority Health Facilities Revenue | | | | |
| (St. Luke’s Health System) | 5.000% | 11/15/30 | 5,000 | 5,217 |
| Missouri Health & Educational Facilities Authority Health Facilities Revenue | | | | |
| (St. Luke’s Health System) | 4.000% | 11/15/33 | 5,200 | 5,254 |
| Missouri Health & Educational Facilities Authority Revenue (Children’s Mercy Hospital) | 5.250% | 5/15/19 (Prere.) | 15,960 | 16,244 |
| Missouri Health & Educational Facilities Authority Revenue (Children’s Mercy Hospital) | 4.000% | 5/15/33 | 3,530 | 3,580 |
| Missouri Health & Educational Facilities Authority Revenue (Children’s Mercy Hospital) | 5.000% | 5/15/36 | 2,615 | 2,835 |
| Missouri Health & Educational Facilities Authority Revenue | | | | |
| (Lutheran Senior Services Obligated Group) | 5.000% | 2/1/25 | 850 | 927 |
| Missouri Health & Educational Facilities Authority Revenue | | | | |
| (Lutheran Senior Services Obligated Group) | 5.000% | 2/1/26 | 750 | 820 |
| Missouri Health & Educational Facilities Authority Revenue | | | | |
| (Lutheran Senior Services Obligated Group) | 5.000% | 2/1/28 | 1,000 | 1,085 |
| Missouri Health & Educational Facilities Authority Revenue | | | | |
| (Lutheran Senior Services Obligated Group) | 5.000% | 2/1/29 | 1,150 | 1,240 |
| Missouri Health & Educational Facilities Authority Revenue | | | | |
| (Lutheran Senior Services Obligated Group) | 5.000% | 2/1/30 | 400 | 429 |
| Missouri Health & Educational Facilities Authority Revenue | | | | |
| (Lutheran Senior Services Obligated Group) | 5.000% | 2/1/31 | 1,350 | 1,443 |
| Missouri Health & Educational Facilities Authority Revenue | | | | |
| (Lutheran Senior Services Obligated Group) | 5.000% | 2/1/32 | 500 | 532 |
| Missouri Health & Educational Facilities Authority Revenue | | | | |
| (Lutheran Senior Services Obligated Group) | 5.000% | 2/1/33 | 550 | 584 |
| Missouri Health & Educational Facilities Authority Revenue (Mercy Health) | 5.000% | 11/15/34 | 30,000 | 32,684 |
| Missouri Health & Educational Facilities Authority Revenue (Mercy Health) | 4.000% | 11/15/36 | 1,800 | 1,811 |
| Missouri Health & Educational Facilities Authority Revenue (Mercy Health) | 4.000% | 11/15/37 | 2,500 | 2,504 |
| Missouri Health & Educational Facilities Authority Revenue (Washington University) | 5.000% | 11/15/30 | 15,000 | 16,122 |
| Missouri Highways & Transportation Commission Road Revenue | 5.000% | 5/1/22 | 5,000 | 5,471 |
| Missouri Highways & Transportation Commission Road Revenue | 5.000% | 5/1/24 | 15,020 | 17,012 |
| Missouri Joint Municipal Electric Utility Commission Power Project Revenue | 5.000% | 1/1/24 | 2,820 | 3,139 |
| Missouri Joint Municipal Electric Utility Commission Power Project Revenue | 5.000% | 1/1/26 | 4,570 | 5,116 |
| Missouri Joint Municipal Electric Utility Commission Power Project Revenue | 5.000% | 1/1/27 | 3,260 | 3,642 |
| Missouri Joint Municipal Electric Utility Commission Power Project Revenue | 5.000% | 1/1/28 | 2,250 | 2,487 |
| Missouri Joint Municipal Electric Utility Commission Power Project Revenue | 5.000% | 1/1/29 | 5,000 | 5,508 |
| Missouri Joint Municipal Electric Utility Commission Power Project Revenue | 5.000% | 1/1/30 | 6,455 | 7,085 |
| Missouri Joint Municipal Electric Utility Commission Power Project Revenue | 5.000% | 1/1/31 | 10,000 | 10,935 |
| Missouri Joint Municipal Electric Utility Commission Power Project Revenue | 4.000% | 12/1/32 | 5,245 | 5,408 |
| Missouri Joint Municipal Electric Utility Commission Power Project Revenue | 5.000% | 12/1/36 | 10,000 | 10,991 |
| Missouri Joint Municipal Electric Utility Commission Power Project Revenue (Iatan 2 Project) | 5.000% | 12/1/34 | 10,590 | 11,620 |
| Missouri Joint Municipal Electric Utility Commission Power Project Revenue (Iatan 2 Project) | 5.000% | 12/1/35 | 8,000 | 8,749 |
| Missouri Joint Municipal Electric Utility Commission Power Project Revenue (Prairie Project) | 5.000% | 6/1/24 | 3,050 | 3,416 |
215
Intermediate-Term Tax-Exempt Fund
| | | | |
| Face | Market |
| Maturity | Amount | Value• |
| Coupon | Date | ($000) | ($000) |
| Missouri Joint Municipal Electric Utility Commission Power Project Revenue (Prairie Project) | 5.000% | 12/1/24 | 2,805 | 3,161 |
| Missouri Joint Municipal Electric Utility Commission Power Project Revenue (Prairie Project) | 5.000% | 6/1/25 | 1,850 | 2,095 |
| Missouri Joint Municipal Electric Utility Commission Power Project Revenue (Prairie Project) | 5.000% | 12/1/25 | 2,270 | 2,567 |
| Missouri Joint Municipal Electric Utility Commission Power Project Revenue (Prairie Project) | 5.000% | 12/1/29 | 3,500 | 3,897 |
| Missouri Joint Municipal Electric Utility Commission Power Project Revenue (Prairie Project) | 5.000% | 12/1/34 | 6,800 | 7,521 |
| St. Louis County MO Parkway C-2 School District GO | 5.000% | 3/1/24 | 2,500 | 2,818 |
| St. Louis MO Airport Revenue (Lambert-St. Louis International Airport) | 6.125% | 7/1/24 | 6,000 | 6,155 |
| St. Louis MO Parking Revenue | 5.000% | 12/15/24 (4) | 1,000 | 1,122 |
| St. Louis MO Parking Revenue | 5.000% | 12/15/25 (4) | 1,000 | 1,134 |
| St. Louis MO Parking Revenue | 5.000% | 12/15/26 (4) | 1,000 | 1,133 |
| St. Louis MO Sewer & Wastewater Revenue | 5.000% | 5/1/34 | 3,050 | 3,410 |
| St. Louis MO Sewer & Wastewater Revenue | 5.000% | 5/1/35 | 2,000 | 2,233 |
| St. Louis MO Sewer & Wastewater Revenue | 5.000% | 5/1/36 | 3,000 | 3,344 |
| St. Louis MO Special Administration Board of Transitional School District GO | 4.000% | 4/1/26 | 2,550 | 2,761 |
| St. Louis MO Special Administration Board of Transitional School District GO | 4.000% | 4/1/29 | 4,200 | 4,400 |
| St. Louis MO Special Administration Board of Transitional School District GO | 4.000% | 4/1/30 | 4,835 | 5,024 |
| | | | 489,219 |
| Montana (0.1%) | | | | |
| Forsyth MT Pollution Control Revenue (Northwestern Corporation Colstrip Project) | 2.000% | 8/1/23 | 20,000 | 19,211 |
| Forsyth MT Pollution Control Revenue (Puget Sound Energy Project) | 3.900% | 3/1/31 | 2,935 | 2,959 |
| Montana Facility Finance Authority Health Facilities Revenue | | | | |
| (Bozeman Deaconess Health Services Obligated Group) | 5.000% | 6/1/27 | 500 | 569 |
| Montana Facility Finance Authority Health Facilities Revenue | | | | |
| (Bozeman Deaconess Health Services Obligated Group) | 5.000% | 6/1/28 | 355 | 406 |
| Montana Facility Finance Authority Health Facilities Revenue | | | | |
| (Bozeman Deaconess Health Services Obligated Group) | 5.000% | 6/1/30 | 365 | 411 |
| Montana Facility Finance Authority Health Facilities Revenue | | | | |
| (Bozeman Deaconess Health Services Obligated Group) | 5.000% | 6/1/33 | 405 | 451 |
| Montana Facility Finance Authority Health Facilities Revenue | | | | |
| (Bozeman Deaconess Health Services Obligated Group) | 5.000% | 6/1/34 | 585 | 649 |
| Montana Facility Finance Authority Health Facilities Revenue | | | | |
| (Bozeman Deaconess Health Services Obligated Group) | 5.000% | 6/1/35 | 425 | 470 |
| Montana Facility Finance Authority Health Facilities Revenue | | | | |
| (Bozeman Deaconess Health Services Obligated Group) | 5.000% | 6/1/36 | 670 | 736 |
| Montana Facility Finance Authority Health Facilities Revenue | | | | |
| (Bozeman Deaconess Health Services Obligated Group) | 5.000% | 6/1/37 | 1,260 | 1,380 |
| Montana Facility Finance Authority Health Facilities Revenue | | | | |
| (Bozeman Deaconess Health Services Obligated Group) | 5.000% | 6/1/38 | 1,010 | 1,103 |
| Montana Facility Finance Authority Hospital Revenue (Benefis Health System) | 5.000% | 2/15/28 | 2,500 | 2,802 |
| Montana Facility Finance Authority Hospital Revenue (Benefis Health System) | 5.000% | 2/15/29 | 2,635 | 2,927 |
| Montana Facility Finance Authority Hospital Revenue (Benefis Health System) | 5.000% | 2/15/30 | 2,015 | 2,226 |
| Montana Facility Finance Authority Hospital Revenue (Benefis Health System) | 5.000% | 2/15/31 | 2,000 | 2,197 |
| | | | 38,497 |
| Multiple State (0.1%) | | | | |
| 7 Nuveen Enhanced AMT-Free Municipal Credit Opportunities Fund VRDP VRDO | 1.690% | 11/8/18 LOC | 80,600 | 80,600 |
| | | | |
| Nebraska (0.5%) | | | | |
| Central Plains Energy Project Nebraska Gas Project Revenue (Project No. 3) | 5.000% | 9/1/26 | 4,065 | 4,523 |
| Central Plains Energy Project Nebraska Gas Project Revenue (Project No. 3) | 5.000% | 9/1/27 | 9,770 | 10,497 |
| Central Plains Energy Project Nebraska Gas Project Revenue (Project No. 3) | 5.000% | 9/1/27 | 2,500 | 2,793 |
| Central Plains Energy Project Nebraska Gas Project Revenue (Project No. 3) | 5.000% | 9/1/28 | 3,165 | 3,548 |
| Central Plains Energy Project Nebraska Gas Project Revenue (Project No. 3) | 5.000% | 9/1/29 | 5,000 | 5,618 |
| Central Plains Energy Project Nebraska Gas Project Revenue (Project No. 3) | 5.000% | 9/1/31 | 5,000 | 5,637 |
| Central Plains Energy Project Nebraska Gas Project Revenue (Project No. 3) | 5.000% | 9/1/32 | 5,000 | 5,646 |
| Central Plains Energy Project Nebraska Gas Project Revenue (Project No. 3) | 5.000% | 9/1/32 | 5,375 | 5,775 |
| Central Plains Energy Project Nebraska Gas Project Revenue (Project No. 3) | 5.000% | 9/1/33 | 4,000 | 4,521 |
| Central Plains Energy Project Nebraska Gas Supply Revenue PUT | 5.000% | 12/1/19 | 150,000 | 154,085 |
| Douglas County NE Hospital Authority No. 3 Health Facilities Revenue | | | | |
| (Nebraska Methodist Health System) | 5.000% | 11/1/23 | 1,910 | 2,111 |
| Douglas County NE Hospital Authority No. 3 Health Facilities Revenue | | | | |
| (Nebraska Methodist Health System) | 5.000% | 11/1/24 | 1,400 | 1,566 |
| Douglas County NE Hospital Authority No. 3 Health Facilities Revenue | | | | |
| (Nebraska Methodist Health System) | 5.000% | 11/1/25 | 2,005 | 2,265 |
| Douglas County NE Hospital Authority No. 3 Health Facilities Revenue | | | | |
| (Nebraska Methodist Health System) | 5.000% | 11/1/26 | 1,160 | 1,306 |
| Douglas County NE Hospital Authority No. 3 Health Facilities Revenue | | | | |
| (Nebraska Methodist Health System) | 5.000% | 11/1/27 | 1,770 | 1,980 |
| Douglas County NE Hospital Authority No. 3 Health Facilities Revenue | | | | |
| (Nebraska Methodist Health System) | 5.000% | 11/1/28 | 1,250 | 1,390 |
216
Intermediate-Term Tax-Exempt Fund
| | | | |
| Face | Market |
| Maturity | Amount | Value• |
| Coupon | Date | ($000) | ($000) |
| Douglas County NE Hospital Authority No. 3 Health Facilities Revenue | | | | |
| (Nebraska Methodist Health System) | 5.000% | 11/1/29 | 1,895 | 2,094 |
| Lincoln County NE Hospital Authority No. 1 Hospital Revenue | | | | |
| (Great Plains Regional Medical Center Project) | 4.000% | 11/1/21 | 1,000 | 1,037 |
| Lincoln County NE Hospital Authority No. 1 Hospital Revenue | | | | |
| (Great Plains Regional Medical Center Project) | 4.000% | 11/1/22 | 860 | 890 |
| Lincoln County NE Hospital Authority No. 1 Hospital Revenue | | | | |
| (Great Plains Regional Medical Center Project) | 5.000% | 11/1/24 | 1,320 | 1,406 |
| Lincoln County NE Hospital Authority No. 1 Hospital Revenue | | | | |
| (Great Plains Regional Medical Center Project) | 5.000% | 11/1/25 | 1,000 | 1,063 |
| Lincoln County NE Hospital Authority No. 1 Hospital Revenue | | | | |
| (Great Plains Regional Medical Center Project) | 5.000% | 11/1/32 | 5,050 | 5,318 |
| Lincoln NE Electric System Revenue | 5.000% | 9/1/22 (Prere.) | 1,010 | 1,107 |
| Lincoln NE Electric System Revenue | 5.000% | 9/1/25 | 1,990 | 2,177 |
| Municipal Energy Agency of Nebraska Power Supply System Revenue | 5.000% | 4/1/26 | 3,065 | 3,312 |
| Municipal Energy Agency of Nebraska Power Supply System Revenue | 5.000% | 4/1/29 | 2,125 | 2,290 |
| Municipal Energy Agency of Nebraska Power Supply System Revenue | 5.000% | 4/1/31 | 2,500 | 2,679 |
| Municipal Energy Agency of Nebraska Power Supply System Revenue | 5.000% | 4/1/32 | 2,800 | 2,996 |
| Nebraska Public Power District Revenue | 5.000% | 1/1/30 | 1,000 | 1,071 |
| Nebraska Public Power District Revenue | 5.000% | 1/1/30 | 2,000 | 2,142 |
| Nebraska Public Power District Revenue | 5.000% | 1/1/31 | 1,970 | 2,105 |
| Nebraska Public Power District Revenue | 5.000% | 1/1/31 | 1,250 | 1,335 |
| Nebraska Public Power District Revenue | 5.000% | 1/1/31 | 2,000 | 2,137 |
| Nebraska Public Power District Revenue | 5.000% | 1/1/32 | 2,095 | 2,238 |
| Nebraska Public Power District Revenue | 5.000% | 1/1/32 | 1,470 | 1,570 |
| Nebraska Public Power District Revenue | 5.000% | 1/1/33 | 2,325 | 2,482 |
| Nebraska Public Power District Revenue | 5.000% | 1/1/33 | 1,250 | 1,335 |
| Nebraska Public Power District Revenue | 5.000% | 1/1/33 | 5,025 | 5,365 |
| Nebraska Public Power District Revenue | 5.000% | 1/1/34 | 1,500 | 1,600 |
| Omaha NE Public Power District Electric Revenue | 5.000% | 2/1/27 | 2,375 | 2,731 |
| Omaha NE Public Power District Electric Revenue | 5.000% | 2/1/35 | 3,125 | 3,536 |
| Omaha NE Public Power District Electric Revenue | 5.000% | 2/1/36 | 7,250 | 8,162 |
| Omaha NE Public Power District Electric Revenue | 5.000% | 2/1/37 | 2,500 | 2,808 |
| Scotts Bluff County NE Hospital Authority Revenue (Regional West Medical Center) | 5.000% | 2/1/25 | 1,875 | 1,970 |
| Scotts Bluff County NE Hospital Authority Revenue (Regional West Medical Center) | 5.000% | 2/1/26 | 1,975 | 2,066 |
| Scotts Bluff County NE Hospital Authority Revenue (Regional West Medical Center) | 5.250% | 2/1/27 | 3,470 | 3,689 |
| Scotts Bluff County NE Hospital Authority Revenue (Regional West Medical Center) | 5.250% | 2/1/29 | 1,500 | 1,576 |
| Scotts Bluff County NE Hospital Authority Revenue (Regional West Medical Center) | 5.250% | 2/1/30 | 4,065 | 4,236 |
| Scotts Bluff County NE Hospital Authority Revenue (Regional West Medical Center) | 5.250% | 2/1/31 | 4,030 | 4,188 |
| Scotts Bluff County NE Hospital Authority Revenue (Regional West Medical Center) | 5.250% | 2/1/32 | 4,265 | 4,421 |
| University of Nebraska Student Fee Revenue | 5.000% | 7/1/22 | 4,015 | 4,395 |
| University of Nebraska Student Fee Revenue | 5.000% | 7/1/24 | 1,645 | 1,797 |
| | | | 308,585 |
| Nevada (0.9%) | | | | |
| Carson City NV Hospital Revenue (Carson Tahoe Regional Medical Center) | 5.000% | 9/1/21 | 2,330 | 2,480 |
| Carson City NV Hospital Revenue (Carson Tahoe Regional Medical Center) | 5.000% | 9/1/27 | 3,500 | 3,728 |
| Clark County NV Airport Improvement Revenue | 5.000% | 7/1/21 | 2,000 | 2,063 |
| Clark County NV Airport Improvement Revenue | 5.000% | 7/1/30 | 15,000 | 15,451 |
| Clark County NV GO | 5.000% | 7/1/21 | 6,075 | 6,511 |
| Clark County NV GO | 5.000% | 6/1/26 | 2,000 | 2,315 |
| Clark County NV GO | 5.000% | 7/1/26 | 2,475 | 2,825 |
| Clark County NV GO | 5.000% | 6/1/27 | 2,500 | 2,915 |
| Clark County NV GO | 5.000% | 6/1/28 | 2,100 | 2,465 |
| Clark County NV GO | 4.000% | 6/1/31 | 17,000 | 17,689 |
| Clark County NV GO | 4.000% | 11/1/31 | 4,920 | 5,104 |
| Clark County NV GO | 4.000% | 6/1/32 | 12,000 | 12,396 |
| Clark County NV GO | 4.000% | 11/1/32 | 1,000 | 1,031 |
| Clark County NV GO | 5.000% | 7/1/33 | 16,290 | 17,715 |
| Clark County NV Highway Improvement Motor Vehicle Fuel Tax Revenue | 5.000% | 7/1/21 | 2,810 | 3,008 |
| Clark County NV Highway Improvement Motor Vehicle Fuel Tax Revenue | 5.000% | 7/1/27 | 1,500 | 1,741 |
| Clark County NV Highway Improvement Motor Vehicle Fuel Tax Revenue | 5.000% | 7/1/28 | 1,630 | 1,872 |
| Clark County NV Highway Improvement Motor Vehicle Fuel Tax Revenue | 5.000% | 7/1/29 | 2,060 | 2,352 |
| Clark County NV Highway Improvement Motor Vehicle Fuel Tax Revenue | 5.000% | 7/1/31 | 5,000 | 5,509 |
| Clark County NV Highway Improvement Motor Vehicle Fuel Tax Revenue | 5.000% | 7/1/35 | 10,390 | 11,595 |
| Clark County NV Highway Improvement Motor Vehicle Fuel Tax Revenue | 5.000% | 7/1/36 | 6,600 | 7,339 |
| Clark County NV Highway Improvement Motor Vehicle Fuel Tax Revenue | 5.000% | 7/1/37 | 5,530 | 6,136 |
| Clark County NV Passenger Facility Charge Revenue (Las Vegas McCarran International Airport) | 5.000% | 7/1/30 | 15,000 | 15,451 |
| 1 Clark County NV School District GO | 4.000% | 12/1/36 | 20,440 | 20,710 |
| 1 Clark County NV School District GO | 4.000% | 12/1/37 | 20,000 | 20,214 |
217
Intermediate-Term Tax-Exempt Fund
| | | | |
| Face | Market |
| Maturity | Amount | Value• |
| Coupon | Date | ($000) | ($000) |
| 1 Clark County NV School District GO | 4.000% | 12/1/38 | 21,055 | 21,124 |
| Clark County NV Water Reclamation District GO | 5.000% | 7/1/20 | 3,695 | 3,867 |
| Clark County NV Water Reclamation District GO | 5.000% | 7/1/21 | 3,880 | 4,161 |
| Clark County NV Water Reclamation District GO | 4.000% | 7/1/34 | 2,000 | 2,054 |
| Las Vegas NV Convention & Visitors Authority Revenue | 5.000% | 7/1/25 | 2,080 | 2,363 |
| 1 Las Vegas NV Convention & Visitors Authority Revenue | 5.000% | 7/1/26 | 565 | 647 |
| 1 Las Vegas NV Convention & Visitors Authority Revenue | 5.000% | 7/1/27 | 795 | 882 |
| Las Vegas NV Convention & Visitors Authority Revenue | 5.000% | 7/1/27 | 1,815 | 2,067 |
| 1 Las Vegas NV Convention & Visitors Authority Revenue | 5.000% | 7/1/28 | 730 | 806 |
| 1 Las Vegas NV Convention & Visitors Authority Revenue | 5.000% | 7/1/29 | 500 | 549 |
| 1 Las Vegas NV Convention & Visitors Authority Revenue | 5.000% | 7/1/30 | 600 | 656 |
| 1 Las Vegas NV Convention & Visitors Authority Revenue | 5.000% | 7/1/31 | 725 | 790 |
| 1 Las Vegas NV Convention & Visitors Authority Revenue | 5.000% | 7/1/32 | 500 | 543 |
| 1 Las Vegas NV Convention & Visitors Authority Revenue | 5.000% | 7/1/33 | 500 | 542 |
| 1 Las Vegas NV Convention & Visitors Authority Revenue | 5.000% | 7/1/34 | 400 | 432 |
| Las Vegas NV GO | 4.000% | 6/1/20 | 3,360 | 3,457 |
| Las Vegas NV GO | 4.000% | 6/1/21 | 3,500 | 3,657 |
| Las Vegas NV GO | 5.000% | 6/1/21 | 1,400 | 1,498 |
| Las Vegas NV GO | 5.000% | 9/1/24 | 5,690 | 6,437 |
| Las Vegas NV GO | 5.000% | 9/1/25 | 6,070 | 6,960 |
| Las Vegas NV GO | 4.000% | 6/1/30 | 4,610 | 4,796 |
| Las Vegas NV GO | 4.000% | 6/1/31 | 4,795 | 4,969 |
| Las Vegas NV GO | 4.000% | 6/1/32 | 4,990 | 5,155 |
| Las Vegas Valley Water District Nevada GO | 5.000% | 12/1/19 | 5,000 | 5,161 |
| Las Vegas Valley Water District Nevada GO | 5.000% | 6/1/24 | 2,665 | 3,013 |
| Las Vegas Valley Water District Nevada GO | 5.000% | 6/1/24 | 4,025 | 4,551 |
| Las Vegas Valley Water District Nevada GO | 5.000% | 6/1/25 | 2,050 | 2,348 |
| Las Vegas Valley Water District Nevada GO | 5.000% | 6/1/25 | 2,085 | 2,389 |
| Las Vegas Valley Water District Nevada GO | 5.000% | 6/1/26 | 2,000 | 2,316 |
| Las Vegas Valley Water District Nevada GO | 5.250% | 6/1/27 | 10,460 | 11,229 |
| Las Vegas Valley Water District Nevada GO | 5.000% | 9/15/27 | 4,110 | 4,702 |
| Las Vegas Valley Water District Nevada GO | 5.000% | 6/1/31 | 4,500 | 4,860 |
| Las Vegas Valley Water District Nevada GO | 5.000% | 6/1/31 | 3,500 | 3,939 |
| Las Vegas Valley Water District Nevada GO | 5.000% | 6/1/31 | 4,000 | 4,501 |
| Las Vegas Valley Water District Nevada GO | 5.000% | 6/1/32 | 6,040 | 6,524 |
| Las Vegas Valley Water District Nevada GO | 5.000% | 6/1/32 | 2,000 | 2,160 |
| Las Vegas Valley Water District Nevada GO | 5.000% | 6/1/32 | 3,295 | 3,696 |
| Las Vegas Valley Water District Nevada GO | 5.000% | 6/1/35 | 6,000 | 6,670 |
| Las Vegas Valley Water District Nevada GO | 5.000% | 6/1/35 | 4,150 | 4,614 |
| Nevada GO | 5.000% | 4/1/22 | 17,000 | 18,498 |
| Nevada GO | 5.000% | 11/1/23 | 28,500 | 31,899 |
| Nevada GO | 5.000% | 11/1/25 | 34,000 | 38,871 |
| Nevada Highway Improvement Revenue (Motor Vehicle Fuel Tax) | 5.000% | 12/1/19 | 7,000 | 7,225 |
| Nevada Highway Improvement Revenue (Motor Vehicle Fuel Tax) | 4.000% | 12/1/32 | 28,000 | 29,241 |
| Nevada Highway Improvement Revenue (Motor Vehicle Fuel Tax) | 4.000% | 12/1/33 | 26,170 | 27,132 |
| Reno NV Hospital Revenue (Renown Regional Medical Center) | 5.500% | 6/1/28 (2) | 165 | 165 |
| Reno NV Sales Tax Revenue (Reno Transportation Rail Access) | 5.000% | 6/1/30 | 500 | 568 |
| Reno NV Sales Tax Revenue (Reno Transportation Rail Access) | 5.000% | 6/1/31 | 500 | 566 |
| Reno NV Sales Tax Revenue (Reno Transportation Rail Access) | 5.000% | 6/1/33 (4) | 450 | 497 |
| Reno NV Sales Tax Revenue (Reno Transportation Rail Access) | 5.000% | 6/1/35 | 500 | 557 |
| Reno NV Sales Tax Revenue (Reno Transportation Rail Access) | 5.000% | 6/1/36 | 615 | 682 |
| Reno NV Sales Tax Revenue (Reno Transportation Rail Access) | 5.000% | 6/1/37 | 500 | 553 |
| Reno NV Sales Tax Revenue (Reno Transportation Rail Access) | 5.000% | 6/1/38 (4) | 650 | 709 |
| Reno NV Sales Tax Revenue (Reno Transportation Rail Access) | 5.000% | 6/1/38 | 500 | 552 |
| Truckee Meadows NV Water Authority Water Revenue | 5.000% | 7/1/26 | 4,020 | 4,650 |
| Truckee Meadows NV Water Authority Water Revenue | 5.000% | 7/1/27 | 3,100 | 3,606 |
| Truckee Meadows NV Water Authority Water Revenue | 5.000% | 7/1/30 | 3,500 | 4,005 |
| Truckee Meadows NV Water Authority Water Revenue | 5.000% | 7/1/32 | 4,535 | 5,086 |
| Truckee Meadows NV Water Authority Water Revenue | 5.000% | 7/1/34 | 7,750 | 8,641 |
| Truckee Meadows NV Water Authority Water Revenue | 5.000% | 7/1/35 | 1,750 | 1,945 |
| | | | 527,348 |
| New Hampshire (0.1%) | | | | |
| Manchester NH General Airport Revenue | 5.000% | 1/1/24 | 6,000 | 6,382 |
| New Hampshire Health & Education Facilities Authority Revenue (Concord Hospital) | 5.000% | 10/1/25 | 2,140 | 2,323 |
| New Hampshire Health & Education Facilities Authority Revenue (Concord Hospital) | 5.000% | 10/1/26 | 1,070 | 1,160 |
| New Hampshire Health & Education Facilities Authority Revenue (Concord Hospital) | 5.000% | 10/1/27 | 1,360 | 1,470 |
| New Hampshire Health & Education Facilities Authority Revenue | | | | |
| (Southern New Hampshire Medical Center) | 4.000% | 10/1/28 | 2,920 | 2,983 |
218
Intermediate-Term Tax-Exempt Fund
| | | | |
| Face | Market |
| Maturity | Amount | Value• |
| Coupon | Date | ($000) | ($000) |
| New Hampshire Health & Education Facilities Authority Revenue | | | | |
| (Southern New Hampshire Medical Center) | 4.000% | 10/1/29 | 3,050 | 3,085 |
| New Hampshire Health & Education Facilities Authority Revenue | | | | |
| (Southern New Hampshire University) | 5.000% | 1/1/27 | 2,500 | 2,672 |
| New Hampshire Health & Education Facilities Authority Revenue | | | | |
| (University System of New Hampshire) | 5.500% | 7/1/19 (Prere.) | 10,000 | 10,237 |
| New Hampshire Health & Education Facilities Authority Revenue | | | | |
| (Wentworth Douglas Hospital) | 6.000% | 1/1/21 (Prere.) | 10,000 | 10,783 |
| New Hampshire Municipal Bond Bank Revenue | 5.000% | 2/15/19 | 1,010 | 1,019 |
| New Hampshire Municipal Bond Bank Revenue | 5.000% | 8/15/19 | 1,500 | 1,536 |
| New Hampshire Municipal Bond Bank Revenue | 4.000% | 8/15/28 | 1,500 | 1,586 |
| | | | 45,236 |
| New Jersey (3.3%) | | | | |
| Atlantic County NJ Improvement Authority Revenue | 5.000% | 9/1/25 (4) | 4,955 | 5,595 |
| Atlantic County NJ Improvement Authority Revenue | 5.000% | 9/1/26 (4) | 4,685 | 5,324 |
| Atlantic County NJ Improvement Authority Revenue | 5.000% | 9/1/27 (4) | 3,000 | 3,374 |
| Essex County NJ Improvement Authority Revenue | 5.500% | 10/1/23 (14) | 10,000 | 11,354 |
| Essex County NJ Improvement Authority Revenue | 5.250% | 12/15/23 (2) | 3,635 | 4,120 |
| Essex County NJ Improvement Authority Revenue | 5.250% | 12/15/24 (2) | 3,720 | 4,283 |
| Jersey City NJ GO | 5.000% | 3/1/20 | 1,610 | 1,669 |
| Jersey City NJ GO | 5.000% | 3/1/21 | 1,200 | 1,270 |
| New Jersey Casino Reinvestment Development Authority Revenue (Hotel Room Fee) | 5.250% | 1/1/23 (2) | 3,900 | 3,912 |
| New Jersey Casino Reinvestment Development Authority Revenue (Luxury Tax) | 5.000% | 11/1/24 (4) | 1,000 | 1,086 |
| New Jersey Casino Reinvestment Development Authority Revenue (Luxury Tax) | 5.000% | 11/1/26 (4) | 2,205 | 2,388 |
| New Jersey Casino Reinvestment Development Authority Revenue (Luxury Tax) | 5.000% | 11/1/27 (4) | 2,775 | 2,989 |
| New Jersey COP | 5.250% | 6/15/19 (Prere.) | 1,000 | 1,020 |
| New Jersey COP | 5.250% | 6/15/19 (Prere.) | 4,675 | 4,770 |
| New Jersey Economic Development Authority Revenue | 5.000% | 6/15/21 | 16,500 | 17,367 |
| New Jersey Economic Development Authority Revenue | 5.000% | 6/15/22 | 25,000 | 26,623 |
| New Jersey Economic Development Authority Revenue | 5.000% | 6/15/26 | 2,500 | 2,728 |
| New Jersey Economic Development Authority Revenue | 5.000% | 6/15/27 | 2,500 | 2,724 |
| New Jersey Economic Development Authority Revenue | 5.500% | 6/15/29 | 30,000 | 33,268 |
| New Jersey Economic Development Authority Revenue | 5.500% | 6/15/30 | 33,000 | 36,377 |
| New Jersey Economic Development Authority Revenue | 5.500% | 6/15/31 | 10,300 | 11,309 |
| New Jersey Economic Development Authority Revenue | 5.250% | 6/15/32 | 5,000 | 5,330 |
| New Jersey Economic Development Authority Revenue | 5.250% | 6/15/33 | 8,495 | 9,031 |
| New Jersey Economic Development Authority Revenue (Cigarette Tax) | 5.000% | 6/15/23 | 12,000 | 12,800 |
| New Jersey Economic Development Authority Revenue (Cigarette Tax) | 5.000% | 6/15/24 | 7,550 | 8,016 |
| New Jersey Economic Development Authority Revenue (Motor Vehicle Surcharge) | 5.000% | 7/1/28 (15) | 6,500 | 7,254 |
| New Jersey Economic Development Authority Revenue (School Facilities Construction) | 5.000% | 12/15/18 | 22,500 | 22,567 |
| New Jersey Economic Development Authority Revenue (School Facilities Construction) | 5.500% | 6/15/19 (Prere.) | 3,345 | 3,418 |
| New Jersey Economic Development Authority Revenue (School Facilities Construction) | 5.250% | 9/1/19 (Prere.) | 10,500 | 10,772 |
| New Jersey Economic Development Authority Revenue (School Facilities Construction) | 5.000% | 12/15/19 | 17,410 | 17,885 |
| New Jersey Economic Development Authority Revenue (School Facilities Construction) | 5.250% | 12/15/21 (12) | 5,000 | 5,376 |
| New Jersey Economic Development Authority Revenue (School Facilities Construction) | 5.250% | 12/15/21 (14) | 7,975 | 8,567 |
| New Jersey Economic Development Authority Revenue (School Facilities Construction) | 5.000% | 9/1/23 | 8,690 | 9,074 |
| New Jersey Economic Development Authority Revenue (School Facilities Construction) | 5.500% | 9/1/23 (14) | 51,630 | 56,976 |
| New Jersey Economic Development Authority Revenue (School Facilities Construction) | 5.250% | 9/1/24 | 1,000 | 1,048 |
| New Jersey Economic Development Authority Revenue (School Facilities Construction) | 5.000% | 3/1/25 | 2,985 | 3,171 |
| New Jersey Economic Development Authority Revenue (School Facilities Construction) | 5.500% | 9/1/25 (4) | 18,130 | 20,729 |
| New Jersey Economic Development Authority Revenue (School Facilities Construction) | 5.000% | 3/1/27 | 4,205 | 4,435 |
| New Jersey Economic Development Authority Revenue (School Facilities Construction) | 5.500% | 9/1/27 (14) | 8,000 | 9,167 |
| New Jersey Economic Development Authority Revenue (School Facilities Construction) | 5.000% | 3/1/28 | 5,515 | 5,799 |
| New Jersey Economic Development Authority Revenue (School Facilities Construction) | 5.500% | 12/15/29 | 1,655 | 1,682 |
| 7 New Jersey Economic Development Authority Revenue (School Facilities Construction) | | | | |
| TOB VRDO | 1.700% | 11/7/18 (12) | 3,065 | 3,065 |
| New Jersey Economic Development Authority Revenue (West Campus Housing LLC) | 5.000% | 7/1/26 | 4,345 | 4,573 |
| New Jersey Economic Development Authority Revenue | | | | |
| (Provident Group-Montclair Properties LLC - Montclair State University Student Housing Project) | 5.250% | 6/1/19 | 2,000 | 2,032 |
| New Jersey Economic Development Authority Revenue | | | | |
| (Provident Group-Montclair Properties LLC - Montclair State University Student Housing Project) | 5.250% | 6/1/20 | 2,075 | 2,156 |
| New Jersey Economic Development Authority Revenue | | | | |
| (Provident Group-Montclair Properties LLC - Montclair State University Student Housing Project) | 5.375% | 6/1/20 (Prere.) | 5,000 | 5,255 |
| New Jersey Economic Development Authority Revenue | | | | |
| (Provident Group-Montclair Properties LLC - Montclair State University Student Housing Project) | 5.000% | 6/1/26 (4) | 1,000 | 1,119 |
| New Jersey Economic Development Authority Revenue | | | | |
| (Provident Group-Montclair Properties LLC - Montclair State University Student Housing Project) | 5.000% | 6/1/27 (4) | 1,695 | 1,899 |
| New Jersey Economic Development Authority Revenue( | | | | |
| Provident Group-Montclair Properties LLC - Montclair State University Student Housing Project) | 5.000% | 6/1/28 (4) | 2,000 | 2,222 |
219
Intermediate-Term Tax-Exempt Fund
| | | | |
| Face | Market |
| Maturity | Amount | Value• |
| Coupon | Date | ($000) | ($000) |
| New Jersey Economic Development Authority Revenue | | | | |
| (Provident Group-Montclair Properties LLC - Montclair State University Student Housing Project) | 5.000% | 6/1/29 (4) | 2,000 | 2,208 |
| New Jersey Economic Development Authority Revenue | | | | |
| (Provident Group-Montclair Properties LLC - Montclair State University Student Housing Project) | 5.000% | 6/1/30 (4) | 1,500 | 1,647 |
| New Jersey Educational Facilities Authority Revenue (Kean University) | 5.250% | 9/1/19 (Prere.) | 25,170 | 25,855 |
| New Jersey Educational Facilities Authority Revenue (Kean University) | 5.000% | 7/1/24 (4) | 2,000 | 2,241 |
| New Jersey Educational Facilities Authority Revenue (Kean University) | 5.000% | 7/1/25 (4) | 3,080 | 3,495 |
| New Jersey Educational Facilities Authority Revenue (Kean University) | 5.000% | 7/1/26 (4) | 3,075 | 3,460 |
| New Jersey Educational Facilities Authority Revenue (Kean University) | 5.000% | 7/1/28 (4) | 2,495 | 2,775 |
| New Jersey Educational Facilities Authority Revenue (Princeton University) | 5.000% | 7/1/20 | 8,300 | 8,701 |
| New Jersey Educational Facilities Authority Revenue (Princeton University) | 5.000% | 7/1/22 | 2,360 | 2,601 |
| New Jersey Educational Facilities Authority Revenue (Princeton University) | 5.000% | 7/1/34 | 10,000 | 11,516 |
| New Jersey Educational Facilities Authority Revenue (University Medical & Dentistry) | 7.125% | 6/1/19 (Prere.) | 6,000 | 6,179 |
| New Jersey Equipment Lease Purchase COP | 5.250% | 6/15/19 (Prere.) | 6,180 | 6,306 |
| New Jersey Equipment Lease Purchase COP | 5.250% | 6/15/19 (Prere.) | 5,820 | 5,939 |
| New Jersey Equipment Lease Purchase COP | 5.375% | 6/15/19 (Prere.) | 11,000 | 11,233 |
| New Jersey GO | 5.000% | 8/15/20 | 30,000 | 31,409 |
| New Jersey Health Care Facilities Financing Authority Lease Revenue | | | | |
| (Greystone Park Psychiatric Hospital Project) | 5.000% | 9/15/21 | 8,140 | 8,596 |
| New Jersey Health Care Facilities Financing Authority Lease Revenue | | | | |
| (Greystone Park Psychiatric Hospital Project) | 5.000% | 9/15/24 | 3,415 | 3,674 |
| New Jersey Health Care Facilities Financing Authority Lease Revenue | | | | |
| (Greystone Park Psychiatric Hospital Project) | 5.000% | 9/15/25 | 12,965 | 13,870 |
| New Jersey Health Care Facilities Financing Authority Lease Revenue | | | | |
| (Greystone Park Psychiatric Hospital Project) | 5.000% | 9/15/26 | 12,505 | 13,326 |
| New Jersey Health Care Facilities Financing Authority Lease Revenue | | | | |
| (Greystone Park Psychiatric Hospital Project) | 5.000% | 9/15/28 | 13,835 | 14,636 |
| New Jersey Health Care Facilities Financing Authority Lease Revenue | | | | |
| (Marlboro Psychiatric Hospital Project) | 5.000% | 9/15/29 | 2,735 | 2,890 |
| New Jersey Health Care Facilities Financing Authority Lease Revenue | | | | |
| (Marlboro Psychiatric Hospital Project) | 5.000% | 9/15/33 | 5,000 | 5,228 |
| New Jersey Health Care Facilities Financing Authority Revenue (Barnabas Health) | 4.625% | 7/1/21 (Prere.) | 3,700 | 3,927 |
| New Jersey Health Care Facilities Financing Authority Revenue (Hackensack Meridian Health) | 5.000% | 1/1/19 (ETM) | 995 | 1,000 |
| New Jersey Health Care Facilities Financing Authority Revenue (Hackensack Meridian Health) | 5.000% | 1/1/19 (ETM) | 1,615 | 1,623 |
| New Jersey Health Care Facilities Financing Authority Revenue (Hackensack Meridian Health) | 5.000% | 1/1/20 (Prere.) | 930 | 961 |
| New Jersey Health Care Facilities Financing Authority Revenue (Hackensack Meridian Health) | 5.000% | 1/1/20 (ETM) | 805 | 832 |
| New Jersey Health Care Facilities Financing Authority Revenue (Hackensack Meridian Health) | 5.000% | 1/1/20 (Prere.) | 570 | 589 |
| New Jersey Health Care Facilities Financing Authority Revenue (Hackensack Meridian Health) | 5.000% | 1/1/20 (ETM) | 1,315 | 1,358 |
| New Jersey Health Care Facilities Financing Authority Revenue (Hackensack Meridian Health) | 5.000% | 7/1/20 | 3,010 | 3,145 |
| New Jersey Health Care Facilities Financing Authority Revenue (Hackensack Meridian Health) | 5.000% | 7/1/21 | 2,000 | 2,138 |
| New Jersey Health Care Facilities Financing Authority Revenue (Hackensack Meridian Health) | 5.000% | 7/1/22 | 2,055 | 2,239 |
| New Jersey Health Care Facilities Financing Authority Revenue (Hackensack Meridian Health) | 5.000% | 7/1/26 | 1,000 | 1,087 |
| New Jersey Health Care Facilities Financing Authority Revenue (Inspira Health Obligated Group) | 5.000% | 7/1/28 | 1,985 | 2,242 |
| New Jersey Health Care Facilities Financing Authority Revenue (Inspira Health Obligated Group) | 5.000% | 7/1/30 | 1,000 | 1,118 |
| New Jersey Health Care Facilities Financing Authority Revenue (Inspira Health Obligated Group) | 5.000% | 7/1/31 | 1,100 | 1,222 |
| New Jersey Health Care Facilities Financing Authority Revenue | | | | |
| (Palisades Medical Center Obligated Group) | 5.000% | 7/1/23 (Prere.) | 4,110 | 4,573 |
| New Jersey Health Care Facilities Financing Authority Revenue | | | | |
| (Palisades Medical Center Obligated Group) | 5.000% | 7/1/23 (Prere.) | 890 | 988 |
| New Jersey Health Care Facilities Financing Authority Revenue (Princeton Healthcare System) | 5.000% | 7/1/24 | 2,040 | 2,299 |
| New Jersey Health Care Facilities Financing Authority Revenue (Princeton Healthcare System) | 5.000% | 7/1/25 | 1,345 | 1,534 |
| New Jersey Health Care Facilities Financing Authority Revenue (Princeton Healthcare System) | 5.000% | 7/1/26 | 1,800 | 2,071 |
| New Jersey Health Care Facilities Financing Authority Revenue (St. Joseph’s Healthcare System) | 5.000% | 7/1/24 | 2,415 | 2,628 |
| New Jersey Health Care Facilities Financing Authority Revenue (St. Joseph’s Healthcare System) | 5.000% | 7/1/25 | 1,535 | 1,681 |
| New Jersey Health Care Facilities Financing Authority Revenue (St. Joseph’s Healthcare System) | 5.000% | 7/1/27 | 2,420 | 2,640 |
| New Jersey Health Care Facilities Financing Authority Revenue (St. Joseph’s Healthcare System) | 5.000% | 7/1/29 | 1,250 | 1,350 |
| New Jersey Health Care Facilities Financing Authority Revenue (St. Joseph’s Healthcare System) | 5.000% | 7/1/30 | 1,090 | 1,172 |
| New Jersey Health Care Facilities Financing Authority Revenue (Virtua Health) | 5.750% | 7/1/33 | 20,000 | 20,494 |
| New Jersey Higher Education Assistance Authority Student Loan Revenue | 4.500% | 12/1/20 | 3,150 | 3,210 |
| New Jersey Sports & Exposition Authority Revenue | 4.500% | 9/1/24 | 2,035 | 2,038 |
| New Jersey Transportation Trust Fund Authority Federal Highway Reimbursement Revenue | 5.000% | 6/15/24 | 12,270 | 13,450 |
| New Jersey Transportation Trust Fund Authority Federal Highway Reimbursement Revenue | 5.000% | 6/15/24 | 5,000 | 5,481 |
| New Jersey Transportation Trust Fund Authority Federal Highway Reimbursement Revenue | 5.000% | 6/15/27 | 24,475 | 27,031 |
| New Jersey Transportation Trust Fund Authority Federal Highway Reimbursement Revenue | 5.000% | 6/15/28 | 8,530 | 9,367 |
| New Jersey Transportation Trust Fund Authority Federal Highway Reimbursement Revenue | 5.000% | 6/15/28 | 14,155 | 15,544 |
| New Jersey Transportation Trust Fund Authority Federal Highway Reimbursement Revenue | 5.000% | 6/15/29 | 23,850 | 26,040 |
| New Jersey Transportation Trust Fund Authority Federal Highway Reimbursement Revenue | 5.000% | 6/15/30 | 6,225 | 6,766 |
| New Jersey Transportation Trust Fund Authority Federal Highway Reimbursement Revenue | 5.000% | 6/15/31 | 1,500 | 1,624 |
| New Jersey Transportation Trust Fund Authority Revenue | 5.000% | 12/15/27 | 14,000 | 15,284 |
| New Jersey Transportation Trust Fund Authority Revenue | 5.000% | 12/15/28 | 21,550 | 23,553 |
220
Intermediate-Term Tax-Exempt Fund
| | | | |
| Face | Market |
| Maturity | Amount | Value• |
| Coupon | Date | ($000) | ($000) |
| New Jersey Transportation Trust Fund Authority Revenue | 5.000% | 12/15/30 | 16,000 | 17,196 |
| New Jersey Transportation Trust Fund Authority Revenue | 5.000% | 12/15/33 | 17,550 | 18,637 |
| New Jersey Transportation Trust Fund Authority Revenue | 5.000% | 12/15/34 | 17,550 | 18,578 |
| New Jersey Transportation Trust Fund Authority Revenue | 5.000% | 12/15/35 | 4,675 | 4,925 |
| New Jersey Transportation Trust Fund Authority Transportation Program Revenue | 5.000% | 6/15/20 | 7,105 | 7,372 |
| New Jersey Transportation Trust Fund Authority Transportation Program Revenue | 5.000% | 6/15/22 | 2,025 | 2,162 |
| New Jersey Transportation Trust Fund Authority Transportation Program Revenue | 5.000% | 6/15/23 | 2,500 | 2,706 |
| New Jersey Transportation Trust Fund Authority Transportation Program Revenue | 5.000% | 6/15/24 | 3,265 | 3,555 |
| New Jersey Transportation Trust Fund Authority Transportation Program Revenue | 5.000% | 6/15/25 | 6,000 | 6,561 |
| New Jersey Transportation Trust Fund Authority Transportation Program Revenue | 5.250% | 6/15/27 | 5,000 | 5,473 |
| New Jersey Transportation Trust Fund Authority Transportation Program Revenue | 5.250% | 6/15/28 | 5,025 | 5,475 |
| New Jersey Transportation Trust Fund Authority Transportation Program Revenue | 5.250% | 6/15/33 | 2,500 | 2,673 |
| New Jersey Transportation Trust Fund Authority Transportation Program Revenue | 5.250% | 6/15/34 | 5,000 | 5,321 |
| New Jersey Transportation Trust Fund Authority Transportation System Revenue | 5.000% | 12/15/18 | 1,530 | 1,535 |
| New Jersey Transportation Trust Fund Authority Transportation System Revenue | 5.000% | 12/15/19 | 7,545 | 7,751 |
| New Jersey Transportation Trust Fund Authority Transportation System Revenue | 5.250% | 12/15/19 | 1,610 | 1,658 |
| New Jersey Transportation Trust Fund Authority Transportation System Revenue | 5.250% | 12/15/19 | 1,540 | 1,586 |
| New Jersey Transportation Trust Fund Authority Transportation System Revenue | 5.250% | 12/15/19 | 5,000 | 5,150 |
| New Jersey Transportation Trust Fund Authority Transportation System Revenue | 5.250% | 12/15/19 (14) | 25,000 | 25,751 |
| New Jersey Transportation Trust Fund Authority Transportation System Revenue | 5.000% | 6/15/20 | 3,825 | 3,969 |
| New Jersey Transportation Trust Fund Authority Transportation System Revenue | 5.750% | 6/15/20 | 9,350 | 9,687 |
| New Jersey Transportation Trust Fund Authority Transportation System Revenue | 5.250% | 12/15/20 (4) | 9,000 | 9,502 |
| New Jersey Transportation Trust Fund Authority Transportation System Revenue | 5.250% | 12/15/20 | 17,590 | 18,522 |
| New Jersey Transportation Trust Fund Authority Transportation System Revenue | 5.500% | 12/15/20 (14) | 30,000 | 31,826 |
| New Jersey Transportation Trust Fund Authority Transportation System Revenue | 5.250% | 12/15/21 | 12,100 | 12,953 |
| New Jersey Transportation Trust Fund Authority Transportation System Revenue | 5.500% | 12/15/21 | 14,375 | 15,495 |
| New Jersey Transportation Trust Fund Authority Transportation System Revenue | 5.500% | 12/15/21 (14) | 25,000 | 27,041 |
| New Jersey Transportation Trust Fund Authority Transportation System Revenue | 5.500% | 12/15/21 (12) | 3,745 | 4,059 |
| New Jersey Transportation Trust Fund Authority Transportation System Revenue | 5.250% | 12/15/22 (2) | 30,900 | 33,637 |
| New Jersey Transportation Trust Fund Authority Transportation System Revenue | 5.250% | 12/15/22 | 3,770 | 4,087 |
| New Jersey Transportation Trust Fund Authority Transportation System Revenue | 5.500% | 12/15/22 | 29,000 | 31,718 |
| New Jersey Transportation Trust Fund Authority Transportation System Revenue | 5.250% | 12/15/23 | 2,500 | 2,750 |
| New Jersey Transportation Trust Fund Authority Transportation System Revenue | 5.750% | 6/15/24 (14) | 12,500 | 14,148 |
| New Jersey Transportation Trust Fund Authority Transportation System Revenue | 5.000% | 12/15/24 | 18,240 | 19,934 |
| New Jersey Transportation Trust Fund Authority Transportation System Revenue | 0.000% | 12/15/25 | 1,025 | 769 |
| New Jersey Transportation Trust Fund Authority Transportation System Revenue | 0.000% | 12/15/25 | 72,680 | 54,555 |
| New Jersey Transportation Trust Fund Authority Transportation System Revenue | 5.125% | 6/15/28 | 3,500 | 3,663 |
| New Jersey Transportation Trust Fund Authority Transportation System Revenue | 5.500% | 6/15/31 | 17,500 | 18,413 |
| New Jersey Transportation Trust Fund Authority Transportation System Revenue | 0.000% | 12/15/31 (14) | 25,590 | 14,200 |
| New Jersey Turnpike Authority Revenue | 5.000% | 1/1/19 (Prere.) | 6,895 | 6,931 |
| New Jersey Turnpike Authority Revenue | 5.000% | 1/1/19 (Prere.) | 1,575 | 1,583 |
| New Jersey Turnpike Authority Revenue | 5.000% | 1/1/19 (Prere.) | 12,810 | 12,876 |
| New Jersey Turnpike Authority Revenue | 5.000% | 1/1/19 (Prere.) | 2,925 | 2,940 |
| New Jersey Turnpike Authority Revenue | 5.000% | 1/1/22 (Prere.) | 3,000 | 3,258 |
| New Jersey Turnpike Authority Revenue | 5.000% | 7/1/22 (Prere.) | 20,460 | 22,458 |
| New Jersey Turnpike Authority Revenue | 5.000% | 7/1/22 (Prere.) | 23,590 | 25,894 |
| New Jersey Turnpike Authority Revenue | 5.500% | 1/1/25 (2) | 13,000 | 15,094 |
| New Jersey Turnpike Authority Revenue | 5.000% | 1/1/26 | 8,510 | 9,307 |
| New Jersey Turnpike Authority Revenue | 5.000% | 1/1/27 | 3,370 | 3,886 |
| New Jersey Turnpike Authority Revenue | 5.000% | 1/1/27 | 3,535 | 4,077 |
| New Jersey Turnpike Authority Revenue | 5.000% | 1/1/29 | 17,190 | 19,529 |
| New Jersey Turnpike Authority Revenue | 5.000% | 1/1/29 | 4,000 | 4,612 |
| New Jersey Turnpike Authority Revenue | 5.000% | 1/1/30 | 3,000 | 3,428 |
| New Jersey Turnpike Authority Revenue | 5.000% | 1/1/30 | 29,705 | 33,541 |
| New Jersey Turnpike Authority Revenue | 5.000% | 1/1/32 | 7,000 | 7,905 |
| New Jersey Turnpike Authority Revenue | 4.000% | 1/1/33 | 28,000 | 28,756 |
| New Jersey Turnpike Authority Revenue | 5.000% | 1/1/33 | 5,010 | 5,636 |
| New Jersey Turnpike Authority Revenue | 4.000% | 1/1/34 | 67,500 | 68,901 |
| New Jersey Turnpike Authority Revenue | 4.000% | 1/1/34 | 3,000 | 3,062 |
| New Jersey Turnpike Authority Revenue | 5.000% | 1/1/34 | 5,000 | 5,608 |
| New Jersey Turnpike Authority Revenue | 4.000% | 1/1/35 | 2,000 | 2,034 |
| South Jersey Transportation Authority New Jersey Transportation System Revenue | 5.000% | 11/1/23 | 1,320 | 1,444 |
| South Jersey Transportation Authority New Jersey Transportation System Revenue | 5.000% | 11/1/23 | 2,430 | 2,619 |
| South Jersey Transportation Authority New Jersey Transportation System Revenue | 5.000% | 11/1/24 | 2,800 | 3,008 |
| South Jersey Transportation Authority New Jersey Transportation System Revenue | 5.000% | 11/1/28 | 2,000 | 2,123 |
| South Jersey Transportation Authority New Jersey Transportation System Revenue | 5.000% | 11/1/28 | 1,215 | 1,320 |
| South Jersey Transportation Authority New Jersey Transportation System Revenue | 5.000% | 11/1/29 | 1,500 | 1,623 |
| South Jersey Transportation Authority New Jersey Transportation System Revenue | 5.000% | 11/1/30 | 1,000 | 1,080 |
| South Jersey Transportation Authority New Jersey Transportation System Revenue | 5.000% | 11/1/31 | 1,190 | 1,283 |
| South Jersey Transportation Authority New Jersey Transportation System Revenue | 5.000% | 11/1/32 | 1,000 | 1,076 |
221
Intermediate-Term Tax-Exempt Fund
| | | | |
| Face | Market |
| Maturity | Amount | Value• |
| Coupon | Date | ($000) | ($000) |
| South Jersey Transportation Authority New Jersey Transportation System Revenue | 5.000% | 11/1/34 | 1,000 | 1,069 |
| Sussex County NJ GO | 5.000% | 2/15/23 | 5,485 | 6,070 |
| Sussex County NJ GO | 5.000% | 2/15/24 | 4,366 | 4,912 |
| Tobacco Settlement Financing Corp. New Jersey Revenue | 5.000% | 6/1/26 | 19,510 | 21,787 |
| Tobacco Settlement Financing Corp. New Jersey Revenue | 3.200% | 6/1/27 | 21,500 | 21,110 |
| Tobacco Settlement Financing Corp. New Jersey Revenue | 5.000% | 6/1/27 | 25,180 | 28,156 |
| Tobacco Settlement Financing Corp. New Jersey Revenue | 5.000% | 6/1/28 | 4,005 | 4,477 |
| Tobacco Settlement Financing Corp. New Jersey Revenue | 5.000% | 6/1/29 | 12,250 | 13,566 |
| Tobacco Settlement Financing Corp. New Jersey Revenue | 5.000% | 6/1/30 | 5,500 | 6,058 |
| Tobacco Settlement Financing Corp. New Jersey Revenue | 5.000% | 6/1/31 | 18,500 | 20,300 |
| Tobacco Settlement Financing Corp. New Jersey Revenue | 5.000% | 6/1/32 | 22,165 | 24,191 |
| Tobacco Settlement Financing Corp. New Jersey Revenue | 5.000% | 6/1/33 | 9,000 | 9,785 |
| Tobacco Settlement Financing Corp. New Jersey Revenue | 5.000% | 6/1/34 | 31,990 | 34,673 |
| Tobacco Settlement Financing Corp. New Jersey Revenue | 5.000% | 6/1/35 | 29,775 | 32,149 |
| Tobacco Settlement Financing Corp. New Jersey Revenue | 5.000% | 6/1/36 | 36,700 | 39,475 |
| Tobacco Settlement Financing Corp. New Jersey Revenue | 5.000% | 6/1/37 | 22,500 | 24,146 |
| | | | 1,904,861 |
| New Mexico (0.2%) | | | | |
| Albuquerque NM GO | 5.000% | 7/1/24 | 4,625 | 5,242 |
| Albuquerque NM Municipal School District No. 12 GO | 5.000% | 8/1/29 | 2,560 | 2,934 |
| Albuquerque NM Municipal School District No. 12 GO | 5.000% | 8/1/30 | 1,250 | 1,426 |
| Albuquerque NM Municipal School District No. 12 GO | 5.000% | 8/1/31 | 1,700 | 1,933 |
| Albuquerque NM Municipal School District No. 12 GO | 5.000% | 8/1/32 | 1,910 | 2,165 |
| Farmington NM Pollution Control Revenue | | | | |
| (Southern California Edison Co. Four Corners Project) PUT | 1.875% | 4/1/20 | 16,000 | 15,827 |
| Farmington NM Pollution Control Revenue | | | | |
| (Southern California Edison Co. Four Corners Project) PUT | 1.875% | 4/1/20 | 35,000 | 34,621 |
| New Mexico Educational Assistance Foundation Revenue | 4.000% | 9/1/19 | 5,990 | 6,089 |
| New Mexico Educational Assistance Foundation Revenue | 5.000% | 12/1/19 | 1,500 | 1,548 |
| New Mexico Educational Assistance Foundation Revenue | 4.000% | 12/1/20 | 1,500 | 1,555 |
| New Mexico Finance Authority Revenue | 5.000% | 6/15/22 | 1,800 | 1,968 |
| New Mexico Finance Authority Revenue | 5.000% | 6/15/23 | 1,270 | 1,414 |
| New Mexico Finance Authority Transportation Revenue | 5.000% | 6/15/21 | 2,385 | 2,555 |
| New Mexico Finance Authority Transportation Revenue | 4.000% | 6/15/26 | 17,720 | 18,565 |
| New Mexico GO | 5.000% | 3/1/23 (ETM) | 15,925 | 17,653 |
| New Mexico Hospital Equipment Loan Council Hospital System Revenue | | | | |
| (Presbyterian Healthcare Services) | 5.000% | 8/1/24 | 910 | 1,024 |
| New Mexico Hospital Equipment Loan Council Hospital System Revenue | | | | |
| (Presbyterian Healthcare Services) | 5.000% | 8/1/25 | 1,010 | 1,150 |
| New Mexico Hospital Equipment Loan Council Hospital System Revenue | | | | |
| (Presbyterian Healthcare Services) | 5.000% | 8/1/26 | 1,060 | 1,200 |
| New Mexico Hospital Equipment Loan Council Hospital System Revenue | | | | |
| (Presbyterian Healthcare Services) | 5.000% | 8/1/27 | 1,465 | 1,649 |
| New Mexico Hospital Equipment Loan Council Hospital System Revenue | | | | |
| (Presbyterian Healthcare Services) | 5.000% | 8/1/29 | 3,000 | 3,345 |
| New Mexico Hospital Equipment Loan Council Hospital System Revenue | | | | |
| (Presbyterian Healthcare Services) | 5.000% | 8/1/30 | 3,000 | 3,331 |
| New Mexico Hospital Equipment Loan Council Hospital System Revenue | | | | |
| (Presbyterian Healthcare Services) | 5.000% | 8/1/31 | 3,685 | 4,080 |
| New Mexico Hospital Equipment Loan Council Hospital System Revenue | | | | |
| (Presbyterian Healthcare Services) | 5.000% | 8/1/32 | 2,500 | 2,760 |
| | | | 134,034 |
| New York (15.6%) | | | | |
| Amherst NY Development Corp. Student Housing Facility Revenue | 3.500% | 10/1/19 (ETM) | 1,185 | 1,201 |
| Amherst NY Development Corp. Student Housing Facility Revenue | 4.000% | 10/1/20 (Prere.) | 2,575 | 2,667 |
| Amherst NY Development Corp. Student Housing Facility Revenue | 4.000% | 10/1/20 (Prere.) | 2,680 | 2,776 |
| 7 Battery Park City Authority New York Revenue TOB VRDO | 1.690% | 11/1/18 LOC | 18,200 | 18,200 |
| Brooklyn NY Local Development Corp. PILOT Revenue (Barclays Center Project) | 6.000% | 1/15/20 (Prere.) | 6,735 | 7,057 |
| Brooklyn NY Local Development Corp. PILOT Revenue (Brooklyn Events Center) | 5.000% | 7/15/26 | 3,000 | 3,331 |
| Buffalo & Fort Erie NY Public Bridge Authority Revenue | 5.000% | 1/1/33 | 1,340 | 1,494 |
| Buffalo & Fort Erie NY Public Bridge Authority Revenue | 5.000% | 1/1/34 | 1,000 | 1,112 |
| Buffalo & Fort Erie NY Public Bridge Authority Revenue | 5.000% | 1/1/36 | 1,000 | 1,103 |
| Buffalo & Fort Erie NY Public Bridge Authority Revenue | 5.000% | 1/1/37 | 1,000 | 1,102 |
| Dutchess County NY Local Development Corp. Revenue (Health Quest Systems Inc. Project) | 5.000% | 7/1/24 | 1,240 | 1,387 |
| Dutchess County NY Local Development Corp. Revenue (Health Quest Systems Inc. Project) | 5.000% | 7/1/24 | 1,850 | 2,069 |
| Dutchess County NY Local Development Corp. Revenue (Health Quest Systems Inc. Project) | 5.000% | 7/1/25 | 1,310 | 1,481 |
| Dutchess County NY Local Development Corp. Revenue (Health Quest Systems Inc. Project) | 5.000% | 7/1/25 | 4,190 | 4,739 |
| Dutchess County NY Local Development Corp. Revenue (Health Quest Systems Inc. Project) | 5.000% | 7/1/26 | 1,460 | 1,660 |
| Dutchess County NY Local Development Corp. Revenue (Health Quest Systems Inc. Project) | 5.000% | 7/1/28 | 5,470 | 6,138 |
222
Intermediate-Term Tax-Exempt Fund
| | | | |
| Face | Market |
| Maturity | Amount | Value• |
| Coupon | Date | ($000) | ($000) |
| Erie County NY Fiscal Stability Authority Revenue | 5.000% | 9/1/29 | 325 | 378 |
| Erie County NY Fiscal Stability Authority Revenue | 5.000% | 9/1/29 | 600 | 697 |
| Erie County NY Fiscal Stability Authority Revenue | 5.000% | 9/1/30 | 625 | 721 |
| Erie County NY Fiscal Stability Authority Revenue | 5.000% | 9/1/32 | 550 | 629 |
| Erie County NY Fiscal Stability Authority Revenue | 5.000% | 9/1/33 | 525 | 598 |
| Erie County NY Fiscal Stability Authority Revenue | 5.000% | 9/1/34 | 850 | 966 |
| Erie County NY Fiscal Stability Authority Revenue | 5.000% | 9/1/35 | 1,300 | 1,472 |
| Erie County NY Fiscal Stability Authority Revenue | 5.000% | 9/1/36 | 1,650 | 1,862 |
| Erie County NY Industrial Development Agency School Facility Revenue | | | | |
| (Buffalo City School District Project) | 5.250% | 5/1/26 | 6,775 | 7,266 |
| Erie County NY Industrial Development Agency School Facility Revenue | | | | |
| (Buffalo City School District Project) | 5.250% | 5/1/27 | 8,560 | 9,178 |
| Erie County NY Industrial Development Agency School Facility Revenue | | | | |
| (Buffalo City School District Project) | 5.250% | 5/1/29 | 6,315 | 6,768 |
| Erie County NY Industrial Development Agency School Facility Revenue | | | | |
| (Buffalo City School District Project) | 5.250% | 5/1/31 | 2,500 | 2,678 |
| Freeport NY GO | 5.000% | 1/15/20 | 2,070 | 2,141 |
| Hempstead NY GO | 4.000% | 4/1/28 (4) | 7,125 | 7,568 |
| Hudson Yards Infrastructure Corp. New York Revenue | 5.000% | 2/15/33 | 7,500 | 8,389 |
| Hudson Yards Infrastructure Corp. New York Revenue | 5.000% | 2/15/34 | 12,100 | 13,478 |
| Hudson Yards Infrastructure Corp. New York Revenue | 5.000% | 2/15/36 | 24,300 | 26,883 |
| Hudson Yards Infrastructure Corp. New York Revenue | 5.000% | 2/15/37 | 13,360 | 14,750 |
| Long Island NY Power Authority Electric System Revenue | 5.000% | 4/1/19 (Prere.) | 5,800 | 5,876 |
| Long Island NY Power Authority Electric System Revenue | 5.750% | 4/1/19 (Prere.) | 20,000 | 20,323 |
| Long Island NY Power Authority Electric System Revenue | 5.000% | 9/1/27 | 3,255 | 3,773 |
| Long Island NY Power Authority Electric System Revenue | 5.000% | 9/1/28 | 3,120 | 3,639 |
| Long Island NY Power Authority Electric System Revenue | 5.000% | 9/1/29 | 10,000 | 10,824 |
| Long Island NY Power Authority Electric System Revenue | 5.000% | 9/1/31 | 2,000 | 2,255 |
| Long Island NY Power Authority Electric System Revenue | 5.000% | 9/1/32 | 1,000 | 1,123 |
| Long Island NY Power Authority Electric System Revenue | 5.000% | 9/1/35 | 8,600 | 9,627 |
| Long Island NY Power Authority Electric System Revenue | 5.000% | 9/1/36 | 2,000 | 2,212 |
| Long Island NY Power Authority Electric System Revenue | 5.000% | 9/1/37 | 4,850 | 5,395 |
| Long Island NY Power Authority Electric System Revenue | 5.000% | 9/1/38 | 3,850 | 4,276 |
| Metropolitan Transportation Authority NY BAN | 5.000% | 5/15/21 | 125,000 | 132,958 |
| Metropolitan Transportation Authority Revenue PUT | 5.000% | 11/15/22 | 192,000 | 209,700 |
| Monroe County NY Industrial Development Agency School Facility Revenue | | | | |
| (Rochester Schools Modernization Project) | 5.000% | 5/1/20 | 3,500 | 3,649 |
| Monroe County NY Industrial Development Agency School Facility Revenue | | | | |
| (Rochester Schools Modernization Project) | 5.000% | 5/1/28 | 1,555 | 1,798 |
| Monroe County NY Industrial Development Agency School Facility Revenue | | | | |
| (Rochester Schools Modernization Project) | 5.000% | 5/1/29 | 2,255 | 2,589 |
| Monroe County NY Industrial Development Agency School Facility Revenue | | | | |
| (Rochester Schools Modernization Project) | 5.000% | 5/1/30 | 2,500 | 2,852 |
| Monroe County NY Industrial Development Agency School Facility Revenue | | | | |
| (Rochester Schools Modernization Project) | 5.000% | 5/1/32 | 1,780 | 2,012 |
| Monroe County NY Industrial Development Agency School Facility Revenue | | | | |
| (Rochester Schools Modernization Project) | 5.000% | 5/1/33 | 1,725 | 1,945 |
| Monroe County NY Industrial Development Corp. Mortgage Revenue | | | | |
| (Unity Hospital Rochester Project) | 5.500% | 8/15/23 | 1,100 | 1,104 |
| Monroe County NY Industrial Development Corp. Revenue (University of Rochester Project) | 5.000% | 7/1/25 | 2,000 | 2,304 |
| Monroe County NY Industrial Development Corp. Revenue (University of Rochester Project) | 5.000% | 7/1/25 | 2,780 | 3,202 |
| Monroe County NY Industrial Development Corp. Revenue (University of Rochester Project) | 5.000% | 7/1/26 | 2,515 | 2,928 |
| Monroe County NY Industrial Development Corp. Revenue (University of Rochester Project) | 5.000% | 7/1/27 | 1,620 | 1,903 |
| Monroe County NY Industrial Development Corp. Revenue (University of Rochester Project) | 5.000% | 7/1/27 | 1,880 | 2,209 |
| Nassau County NY GO | 4.000% | 10/1/20 (Prere.) | 5,245 | 5,433 |
| Nassau County NY GO | 5.000% | 4/1/22 | 14,850 | 16,088 |
| Nassau County NY GO | 4.000% | 10/1/22 | 8,755 | 9,000 |
| Nassau County NY GO | 5.000% | 4/1/23 | 15,665 | 17,257 |
| Nassau County NY Local Economic Assistance & Financing Corp. Revenue | | | | |
| (Winthrop University Hospital Association Project) | 5.000% | 7/1/21 | 2,605 | 2,762 |
| Nassau County NY Local Economic Assistance Corp. Revenue | | | | |
| (Catholic Health Services of Long Island Obligated Group Project) | 5.000% | 7/1/25 | 1,400 | 1,548 |
| Nassau County NY Local Economic Assistance Corp. Revenue | | | | |
| (Catholic Health Services of Long Island Obligated Group Project) | 5.000% | 7/1/26 | 1,740 | 1,913 |
| Nassau County NY Local Economic Assistance Corp. Revenue | | | | |
| (Catholic Health Services of Long Island Obligated Group Project) | 5.000% | 7/1/27 | 3,090 | 3,381 |
| New York City NY Build NYC Resource Corp. Revenue (New York Law School Project) | 5.000% | 7/1/24 | 3,245 | 3,512 |
| New York City NY Build NYC Resource Corp. Revenue (New York Law School Project) | 5.000% | 7/1/25 | 3,485 | 3,791 |
| New York City NY Build NYC Resource Corp. Revenue (New York Law School Project) | 5.000% | 7/1/26 | 3,660 | 3,974 |
| New York City NY Build NYC Resource Corp. Revenue (New York Law School Project) | 5.000% | 7/1/27 | 3,245 | 3,498 |
223
Intermediate-Term Tax-Exempt Fund
| | | | |
| Face | Market |
| Maturity | Amount | Value• |
| Coupon | Date | ($000) | ($000) |
| New York City NY Build NYC Resource Corp. Revenue (New York Law School Project) | 5.000% | 7/1/29 | 1,750 | 1,864 |
| New York City NY GO | 5.250% | 3/1/19 (Prere.) | 2,150 | 2,175 |
| New York City NY GO | 5.450% | 4/1/19 (Prere.) | 6,310 | 6,405 |
| New York City NY GO | 5.000% | 5/15/19 (Prere.) | 7,870 | 8,005 |
| New York City NY GO | 5.000% | 6/1/19 (ETM) | 8,675 | 8,832 |
| New York City NY GO | 5.000% | 8/1/19 | 5,000 | 5,112 |
| New York City NY GO | 5.000% | 8/1/19 | 4,500 | 4,601 |
| New York City NY GO | 5.000% | 8/1/19 | 3,100 | 3,169 |
| New York City NY GO | 5.000% | 8/1/20 | 14,000 | 14,690 |
| New York City NY GO | 5.000% | 8/1/20 | 5,000 | 5,246 |
| New York City NY GO | 5.000% | 8/1/20 | 32,355 | 33,083 |
| New York City NY GO | 5.250% | 3/1/21 | 2,105 | 2,128 |
| New York City NY GO | 5.000% | 8/1/21 | 4,000 | 4,296 |
| New York City NY GO | 5.000% | 8/1/21 | 15,750 | 16,518 |
| New York City NY GO | 5.000% | 8/1/21 | 5 | 5 |
| New York City NY GO | 5.000% | 8/1/21 | 58,635 | 59,971 |
| New York City NY GO | 5.000% | 8/1/21 | 5,000 | 5,370 |
| New York City NY GO | 5.000% | 8/1/21 | 10,000 | 10,739 |
| New York City NY GO | 5.000% | 10/1/21 | 7,545 | 8,131 |
| New York City NY GO | 5.000% | 8/1/22 | 6,740 | 7,390 |
| New York City NY GO | 5.000% | 8/1/22 | 2,500 | 2,741 |
| New York City NY GO | 5.000% | 8/1/22 | 1,305 | 1,431 |
| New York City NY GO | 5.000% | 8/1/22 | 7,465 | 8,184 |
| New York City NY GO | 5.000% | 8/1/22 | 6,450 | 7,072 |
| New York City NY GO | 5.000% | 8/1/22 | 5,500 | 6,030 |
| New York City NY GO | 5.000% | 8/1/22 | 32,000 | 32,729 |
| New York City NY GO | 5.000% | 8/1/22 | 18,475 | 19,360 |
| New York City NY GO | 5.000% | 8/1/22 | 6,020 | 6,308 |
| New York City NY GO | 5.250% | 8/15/22 | 5 | 5 |
| New York City NY GO | 5.000% | 8/1/23 | 3,690 | 4,074 |
| New York City NY GO | 5.000% | 8/1/23 | 7,740 | 8,544 |
| New York City NY GO | 5.000% | 8/1/23 | 5,650 | 6,303 |
| New York City NY GO | 5.000% | 8/1/23 | 2,000 | 2,045 |
| New York City NY GO | 5.000% | 8/1/23 | 14,590 | 15,941 |
| New York City NY GO | 5.000% | 8/1/23 | 3,905 | 4,356 |
| New York City NY GO | 5.250% | 8/15/23 | 5 | 5 |
| New York City NY GO | 5.000% | 10/1/23 | 4,465 | 4,896 |
| New York City NY GO | 5.000% | 4/1/24 | 17,335 | 18,768 |
| New York City NY GO | 5.000% | 8/1/24 | 14,000 | 15,870 |
| New York City NY GO | 5.000% | 8/1/24 | 17,010 | 19,283 |
| New York City NY GO | 5.000% | 8/1/24 | 20,010 | 22,236 |
| New York City NY GO | 5.000% | 8/1/24 | 4,025 | 4,389 |
| New York City NY GO | 5.000% | 8/1/24 | 15,000 | 17,004 |
| New York City NY GO | 5.000% | 8/1/24 | 8,085 | 8,469 |
| New York City NY GO | 5.000% | 8/1/24 | 5,310 | 5,673 |
| New York City NY GO | 5.000% | 10/1/24 | 5,000 | 5,361 |
| New York City NY GO | 5.000% | 10/1/24 | 4,500 | 4,924 |
| New York City NY GO | 5.000% | 12/1/24 | 5,000 | 5,695 |
| New York City NY GO | 5.000% | 8/1/25 | 10,640 | 12,189 |
| New York City NY GO | 5.000% | 8/1/25 | 3,300 | 3,558 |
| New York City NY GO | 5.000% | 8/1/25 | 3,630 | 4,159 |
| New York City NY GO | 5.000% | 8/1/25 | 15,500 | 17,757 |
| New York City NY GO | 5.000% | 8/1/25 | 5,000 | 5,448 |
| New York City NY GO | 5.000% | 8/1/25 | 35,335 | 40,480 |
| New York City NY GO | 5.000% | 10/1/25 | 10,985 | 12,011 |
| New York City NY GO | 5.000% | 12/1/25 | 18,050 | 20,759 |
| New York City NY GO | 5.000% | 4/1/26 | 10,000 | 10,813 |
| New York City NY GO | 5.000% | 8/1/26 | 15,685 | 18,179 |
| New York City NY GO | 5.000% | 8/1/26 | 2,640 | 3,060 |
| New York City NY GO | 5.000% | 8/1/26 | 5,040 | 5,488 |
| New York City NY GO | 5.000% | 8/1/26 | 14,215 | 15,722 |
| New York City NY GO | 5.000% | 8/1/26 | 9,735 | 10,767 |
| New York City NY GO | 5.000% | 10/1/26 | 23,890 | 26,103 |
| New York City NY GO | 5.000% | 4/1/27 | 14,780 | 15,967 |
| New York City NY GO | 5.000% | 8/1/27 | 4,705 | 5,065 |
| New York City NY GO | 5.000% | 8/1/27 | 6,600 | 7,294 |
| New York City NY GO | 5.000% | 8/1/27 | 20,000 | 22,954 |
| New York City NY GO | 5.000% | 10/1/27 | 15,000 | 16,372 |
| New York City NY GO | 5.000% | 8/1/28 | 18,000 | 19,354 |
| New York City NY GO | 5.000% | 8/1/28 | 9,300 | 10,405 |
224
Intermediate-Term Tax-Exempt Fund
| | | | |
| Face | Market |
| Maturity | Amount | Value• |
| Coupon | Date | ($000) | ($000) |
| New York City NY GO | 5.000% | 3/1/29 | 27,590 | 30,575 |
| New York City NY GO | 5.000% | 5/15/29 | 30 | 30 |
| New York City NY GO | 5.000% | 8/1/29 | 1,770 | 2,036 |
| New York City NY GO | 5.000% | 8/1/29 | 9,715 | 10,713 |
| New York City NY GO | 5.000% | 3/1/30 | 16,230 | 17,927 |
| New York City NY GO | 5.000% | 8/1/30 | 5,390 | 5,994 |
| New York City NY GO | 5.000% | 8/1/30 | 23,000 | 24,510 |
| New York City NY GO | 5.000% | 8/1/30 | 6,845 | 7,542 |
| New York City NY GO | 5.000% | 8/1/30 | 10,655 | 11,740 |
| New York City NY GO | 5.000% | 3/1/31 | 33,315 | 36,711 |
| New York City NY GO | 5.450% | 4/1/31 | 10 | 10 |
| New York City NY GO | 4.000% | 8/1/31 | 30,000 | 31,174 |
| New York City NY GO | 5.000% | 10/1/31 | 34,050 | 36,368 |
| New York City NY GO | 5.000% | 12/1/31 | 3,000 | 3,395 |
| New York City NY GO | 5.000% | 8/1/32 | 1,475 | 1,568 |
| New York City NY GO | 5.000% | 8/1/33 | 5,000 | 5,518 |
| New York City NY GO | 5.000% | 8/1/33 | 5,000 | 5,660 |
| New York City NY GO | 5.000% | 12/1/33 | 11,750 | 13,201 |
| New York City NY GO | 5.000% | 12/1/34 | 4,000 | 4,479 |
| New York City NY GO | 5.000% | 4/1/35 | 8,000 | 9,003 |
| New York City NY GO | 4.000% | 8/1/35 | 15,000 | 15,330 |
| New York City NY GO | 5.000% | 12/1/35 | 3,000 | 3,348 |
| New York City NY GO | 5.000% | 4/1/36 | 12,750 | 14,294 |
| New York City NY GO | 5.000% | 10/1/36 | 4,000 | 4,475 |
| New York City NY GO VRDO | 1.670% | 11/1/18 | 29,840 | 29,840 |
| New York City NY GO VRDO | 1.700% | 11/1/18 | 9,900 | 9,900 |
| New York City NY GO VRDO | 1.700% | 11/1/18 | 70,425 | 70,425 |
| New York City NY Health & Hospital Corp. Revenue (Health System) | 5.000% | 2/15/24 | 3,500 | 3,624 |
| New York City NY Health & Hospital Corp. Revenue (Health System) | 5.000% | 2/15/30 | 19,200 | 19,823 |
| New York City NY Housing Development Corp. Multi-Family Housing Revenue | 5.000% | 7/1/26 | 12,940 | 14,147 |
| New York City NY Housing Development Corp. Multi-Family Housing Revenue | 5.250% | 7/1/28 | 17,300 | 18,911 |
| New York City NY Housing Development Corp. Multi-Family Housing Revenue | 5.250% | 7/1/29 | 22,000 | 24,018 |
| New York City NY Housing Development Corp. Multi-Family Housing Revenue | 5.250% | 7/1/30 | 12,500 | 13,607 |
| New York City NY Housing Development Corp. Multi-Family Housing Revenue | 3.500% | 11/1/33 | 5,000 | 4,858 |
| New York City NY Housing Development Corp. Multi-Family Housing Revenue | 3.700% | 11/1/38 | 8,000 | 7,736 |
| New York City NY Housing Development Corp. Multi-Family Housing Revenue PUT | 2.950% | 2/1/26 | 34,510 | 33,692 |
| New York City NY Housing Development Corp. Multi-Family Mortgage Revenue (8 Spruce Street) | 3.000% | 2/15/48 | 9,000 | 8,843 |
| New York City NY Housing Development Corp. Multi-Family Mortgage Revenue (8 Spruce Street) | 3.500% | 2/15/48 | 1,000 | 979 |
| New York City NY Municipal Water Finance Authority Water & Sewer System Revenue | 5.000% | 6/15/26 | 35,000 | 37,342 |
| New York City NY Municipal Water Finance Authority Water & Sewer System Revenue | 5.000% | 6/15/26 | 25,880 | 27,612 |
| New York City NY Municipal Water Finance Authority Water & Sewer System Revenue | 5.000% | 6/15/29 | 41,500 | 44,190 |
| New York City NY Municipal Water Finance Authority Water & Sewer System Revenue | 5.000% | 6/15/29 | 5,000 | 5,557 |
| New York City NY Municipal Water Finance Authority Water & Sewer System Revenue | 5.000% | 6/15/29 | 4,500 | 4,689 |
| New York City NY Municipal Water Finance Authority Water & Sewer System Revenue | 5.000% | 6/15/31 | 24,500 | 26,037 |
| New York City NY Municipal Water Finance Authority Water & Sewer System Revenue | 5.000% | 6/15/31 | 9,000 | 9,365 |
| New York City NY Municipal Water Finance Authority Water & Sewer System Revenue | 5.000% | 6/15/31 | 30,000 | 32,612 |
| New York City NY Municipal Water Finance Authority Water & Sewer System Revenue | 5.000% | 6/15/32 | 5,560 | 6,226 |
| New York City NY Municipal Water Finance Authority Water & Sewer System Revenue | 5.000% | 6/15/32 | 17,500 | 18,584 |
| New York City NY Municipal Water Finance Authority Water & Sewer System Revenue | 5.000% | 6/15/32 | 5,545 | 5,888 |
| New York City NY Municipal Water Finance Authority Water & Sewer System Revenue | 5.000% | 6/15/33 | 10,050 | 11,346 |
| New York City NY Municipal Water Finance Authority Water & Sewer System Revenue | 5.250% | 6/15/33 | 5,000 | 5,763 |
| New York City NY Municipal Water Finance Authority Water & Sewer System Revenue | 5.000% | 6/15/34 | 50,000 | 54,553 |
| New York City NY Municipal Water Finance Authority Water & Sewer System Revenue | 5.000% | 6/15/34 | 5,165 | 5,759 |
| New York City NY Municipal Water Finance Authority Water & Sewer System Revenue | 5.000% | 6/15/35 | 10,425 | 11,496 |
| New York City NY Municipal Water Finance Authority Water & Sewer System Revenue | 5.000% | 6/15/35 | 16,700 | 18,600 |
| New York City NY Municipal Water Finance Authority Water & Sewer System Revenue | 5.000% | 6/15/36 | 22,165 | 24,508 |
| New York City NY Municipal Water Finance Authority Water & Sewer System Revenue | 4.000% | 6/15/37 | 13,350 | 13,476 |
| New York City NY Municipal Water Finance Authority Water & Sewer System Revenue | 5.000% | 6/15/38 | 26,945 | 30,076 |
| New York City NY Municipal Water Finance Authority Water & Sewer System Revenue | 5.000% | 6/15/38 | 13,000 | 14,581 |
| New York City NY Sales Tax Asset Receivable Corp. Revenue | 5.000% | 10/15/24 | 15,885 | 18,211 |
| New York City NY Sales Tax Asset Receivable Corp. Revenue | 5.000% | 10/15/28 | 6,000 | 6,775 |
| New York City NY Transitional Finance Authority Building Aid Revenue | 5.000% | 1/15/24 | 7,040 | 7,086 |
| New York City NY Transitional Finance Authority Building Aid Revenue | 5.250% | 1/15/25 | 13,090 | 13,181 |
| New York City NY Transitional Finance Authority Building Aid Revenue | 5.000% | 7/15/25 | 10,085 | 11,531 |
| New York City NY Transitional Finance Authority Building Aid Revenue | 5.250% | 1/15/26 | 8,185 | 8,242 |
| New York City NY Transitional Finance Authority Building Aid Revenue | 5.250% | 1/15/26 | 10,520 | 10,593 |
| New York City NY Transitional Finance Authority Building Aid Revenue | 5.250% | 1/15/27 | 4,615 | 4,647 |
| New York City NY Transitional Finance Authority Building Aid Revenue | 5.125% | 1/15/28 | 3,465 | 3,488 |
| New York City NY Transitional Finance Authority Building Aid Revenue | 5.000% | 7/15/28 | 11,000 | 12,405 |
| New York City NY Transitional Finance Authority Building Aid Revenue | 5.000% | 7/15/29 | 5,000 | 5,613 |
225
Intermediate-Term Tax-Exempt Fund
| | | | |
| Face | Market |
| Maturity | Amount | Value• |
| Coupon | Date | ($000) | ($000) |
| New York City NY Transitional Finance Authority Building Aid Revenue | 5.000% | 1/15/30 | 9,500 | 9,561 |
| New York City NY Transitional Finance Authority Building Aid Revenue | 5.000% | 7/15/30 | 5,025 | 5,612 |
| New York City NY Transitional Finance Authority Building Aid Revenue | 5.000% | 7/15/30 | 9,000 | 10,059 |
| New York City NY Transitional Finance Authority Building Aid Revenue | 5.000% | 7/15/31 | 5,285 | 5,875 |
| New York City NY Transitional Finance Authority Building Aid Revenue | 5.000% | 7/15/31 | 6,000 | 6,492 |
| New York City NY Transitional Finance Authority Building Aid Revenue | 5.000% | 7/15/31 | 14,760 | 16,716 |
| New York City NY Transitional Finance Authority Building Aid Revenue | 5.000% | 7/15/31 | 18,000 | 19,188 |
| New York City NY Transitional Finance Authority Building Aid Revenue | 5.000% | 7/15/32 | 5,020 | 5,561 |
| New York City NY Transitional Finance Authority Building Aid Revenue | 5.000% | 7/15/32 | 3,950 | 4,269 |
| New York City NY Transitional Finance Authority Building Aid Revenue | 5.000% | 7/15/33 | 10,000 | 11,040 |
| New York City NY Transitional Finance Authority Building Aid Revenue | 5.000% | 7/15/34 | 10,000 | 11,002 |
| New York City NY Transitional Finance Authority Building Aid Revenue | 5.000% | 7/15/34 | 10,000 | 11,021 |
| New York City NY Transitional Finance Authority Building Aid Revenue | 5.000% | 7/15/34 | 3,890 | 4,380 |
| New York City NY Transitional Finance Authority Building Aid Revenue | 5.000% | 7/15/35 | 845 | 951 |
| New York City NY Transitional Finance Authority Building Aid Revenue | 5.000% | 7/15/35 | 10,000 | 10,987 |
| New York City NY Transitional Finance Authority Building Aid Revenue | 4.000% | 7/15/38 | 18,665 | 18,694 |
| New York City NY Transitional Finance Authority Building Aid Revenue | 5.000% | 7/15/38 | 3,350 | 3,731 |
| New York City NY Transitional Finance Authority Future Tax Revenue | 5.000% | 5/1/19 (Prere.) | 11,090 | 11,264 |
| New York City NY Transitional Finance Authority Future Tax Revenue | 5.000% | 11/1/19 (Prere.) | 45 | 46 |
| New York City NY Transitional Finance Authority Future Tax Revenue | 5.000% | 11/1/19 | 9,835 | 10,129 |
| New York City NY Transitional Finance Authority Future Tax Revenue | 5.000% | 11/1/19 | 2,535 | 2,611 |
| New York City NY Transitional Finance Authority Future Tax Revenue | 5.000% | 11/1/20 | 13,500 | 14,243 |
| New York City NY Transitional Finance Authority Future Tax Revenue | 5.000% | 11/1/21 | 19,955 | 20,535 |
| New York City NY Transitional Finance Authority Future Tax Revenue | 5.000% | 11/1/21 | 16,050 | 17,361 |
| New York City NY Transitional Finance Authority Future Tax Revenue | 5.000% | 11/1/22 | 4,000 | 4,409 |
| New York City NY Transitional Finance Authority Future Tax Revenue | 5.000% | 5/1/23 | 16,780 | 18,288 |
| New York City NY Transitional Finance Authority Future Tax Revenue | 5.000% | 11/1/23 | 14,020 | 15,706 |
| New York City NY Transitional Finance Authority Future Tax Revenue | 5.000% | 2/1/24 | 6,000 | 6,353 |
| New York City NY Transitional Finance Authority Future Tax Revenue | 5.000% | 11/1/24 | 12,230 | 13,901 |
| New York City NY Transitional Finance Authority Future Tax Revenue | 5.000% | 11/1/24 | 20,000 | 22,733 |
| New York City NY Transitional Finance Authority Future Tax Revenue | 5.000% | 11/1/24 | 1,985 | 2,256 |
| New York City NY Transitional Finance Authority Future Tax Revenue | 5.000% | 11/1/24 | 14,245 | 15,643 |
| New York City NY Transitional Finance Authority Future Tax Revenue | 5.000% | 11/1/24 | 10,030 | 11,316 |
| New York City NY Transitional Finance Authority Future Tax Revenue | 5.000% | 11/1/24 | 6,010 | 6,477 |
| New York City NY Transitional Finance Authority Future Tax Revenue | 5.000% | 11/1/24 | 15,550 | 16,759 |
| New York City NY Transitional Finance Authority Future Tax Revenue | 5.000% | 11/1/24 | 1,095 | 1,180 |
| New York City NY Transitional Finance Authority Future Tax Revenue | 5.000% | 2/1/25 | 4,295 | 4,546 |
| New York City NY Transitional Finance Authority Future Tax Revenue | 5.000% | 11/1/25 | 5,500 | 5,926 |
| New York City NY Transitional Finance Authority Future Tax Revenue | 5.000% | 11/1/25 | 5,000 | 5,387 |
| New York City NY Transitional Finance Authority Future Tax Revenue | 5.000% | 11/1/25 | 5,000 | 5,387 |
| New York City NY Transitional Finance Authority Future Tax Revenue | 5.000% | 2/1/26 | 10,290 | 10,888 |
| New York City NY Transitional Finance Authority Future Tax Revenue | 5.000% | 2/1/26 | 10,795 | 11,422 |
| New York City NY Transitional Finance Authority Future Tax Revenue | 5.000% | 11/1/26 | 2,635 | 2,838 |
| New York City NY Transitional Finance Authority Future Tax Revenue | 5.000% | 11/1/26 | 8,620 | 9,283 |
| New York City NY Transitional Finance Authority Future Tax Revenue | 5.250% | 11/1/26 | 8,255 | 8,744 |
| New York City NY Transitional Finance Authority Future Tax Revenue | 5.000% | 11/1/27 | 1,435 | 1,543 |
| New York City NY Transitional Finance Authority Future Tax Revenue | 5.000% | 11/1/27 | 4,000 | 4,301 |
| New York City NY Transitional Finance Authority Future Tax Revenue | 5.000% | 2/1/28 | 10,000 | 10,746 |
| New York City NY Transitional Finance Authority Future Tax Revenue | 5.000% | 2/1/28 | 25,675 | 27,120 |
| New York City NY Transitional Finance Authority Future Tax Revenue | 5.000% | 8/1/28 | 5,020 | 5,602 |
| New York City NY Transitional Finance Authority Future Tax Revenue | 5.000% | 11/1/28 | 7,000 | 7,949 |
| New York City NY Transitional Finance Authority Future Tax Revenue | 5.000% | 5/1/29 | 12,000 | 13,130 |
| New York City NY Transitional Finance Authority Future Tax Revenue | 4.000% | 5/1/30 | 5,750 | 6,043 |
| New York City NY Transitional Finance Authority Future Tax Revenue | 5.000% | 2/1/31 | 5,000 | 5,275 |
| New York City NY Transitional Finance Authority Future Tax Revenue | 5.000% | 5/1/31 | 19,000 | 20,442 |
| New York City NY Transitional Finance Authority Future Tax Revenue | 5.000% | 11/1/31 | 8,010 | 8,971 |
| New York City NY Transitional Finance Authority Future Tax Revenue | 5.000% | 11/1/31 | 24,475 | 26,253 |
| New York City NY Transitional Finance Authority Future Tax Revenue | 5.000% | 2/1/32 | 12,700 | 13,779 |
| New York City NY Transitional Finance Authority Future Tax Revenue | 5.000% | 2/1/32 | 10,030 | 11,213 |
| New York City NY Transitional Finance Authority Future Tax Revenue | 5.000% | 8/1/32 | 13,750 | 15,207 |
| New York City NY Transitional Finance Authority Future Tax Revenue | 5.000% | 8/1/32 | 15,820 | 17,784 |
| New York City NY Transitional Finance Authority Future Tax Revenue | 5.000% | 11/1/32 | 4,270 | 4,633 |
| New York City NY Transitional Finance Authority Future Tax Revenue | 5.000% | 11/1/32 | 16,500 | 17,694 |
| New York City NY Transitional Finance Authority Future Tax Revenue | 5.000% | 2/1/33 | 17,500 | 18,965 |
| New York City NY Transitional Finance Authority Future Tax Revenue | 5.000% | 5/1/33 | 10,500 | 11,788 |
| New York City NY Transitional Finance Authority Future Tax Revenue | 5.000% | 8/1/33 | 7,985 | 8,929 |
| New York City NY Transitional Finance Authority Future Tax Revenue | 5.000% | 8/1/33 | 12,150 | 13,403 |
| New York City NY Transitional Finance Authority Future Tax Revenue | 5.000% | 8/1/33 | 14,000 | 15,761 |
| New York City NY Transitional Finance Authority Future Tax Revenue | 5.000% | 8/1/33 | 20,000 | 22,516 |
| New York City NY Transitional Finance Authority Future Tax Revenue | 5.000% | 11/1/33 | 13,700 | 15,262 |
226
Intermediate-Term Tax-Exempt Fund
| | | | |
| Face | Market |
| Maturity | Amount | Value• |
| Coupon | Date | ($000) | ($000) |
| New York City NY Transitional Finance Authority Future Tax Revenue | 5.000% | 5/1/34 | 14,415 | 16,127 |
| New York City NY Transitional Finance Authority Future Tax Revenue | 5.000% | 8/1/34 | 10,000 | 11,146 |
| New York City NY Transitional Finance Authority Future Tax Revenue | 5.000% | 8/1/34 | 15,910 | 17,533 |
| New York City NY Transitional Finance Authority Future Tax Revenue | 5.000% | 8/1/34 | 24,110 | 27,045 |
| New York City NY Transitional Finance Authority Future Tax Revenue | 5.000% | 11/1/34 | 11,150 | 12,385 |
| New York City NY Transitional Finance Authority Future Tax Revenue | 5.000% | 11/1/34 | 27,325 | 29,950 |
| New York City NY Transitional Finance Authority Future Tax Revenue | 5.000% | 2/1/35 | 10,000 | 11,047 |
| New York City NY Transitional Finance Authority Future Tax Revenue | 5.000% | 2/1/35 | 9,500 | 10,570 |
| New York City NY Transitional Finance Authority Future Tax Revenue | 5.000% | 5/1/35 | 7,010 | 7,766 |
| New York City NY Transitional Finance Authority Future Tax Revenue | 5.000% | 5/1/35 | 17,060 | 19,033 |
| New York City NY Transitional Finance Authority Future Tax Revenue | 4.000% | 8/1/35 | 8,885 | 9,056 |
| New York City NY Transitional Finance Authority Future Tax Revenue | 5.000% | 8/1/35 | 22,020 | 24,218 |
| New York City NY Transitional Finance Authority Future Tax Revenue | 5.000% | 8/1/35 | 20,000 | 22,371 |
| New York City NY Transitional Finance Authority Future Tax Revenue | 5.000% | 11/1/35 | 13,290 | 14,718 |
| New York City NY Transitional Finance Authority Future Tax Revenue | 5.000% | 2/1/36 | 10,000 | 11,111 |
| New York City NY Transitional Finance Authority Future Tax Revenue | 5.000% | 5/1/36 | 7,240 | 8,066 |
| New York City NY Transitional Finance Authority Future Tax Revenue | 4.000% | 8/1/36 | 7,000 | 7,093 |
| New York City NY Transitional Finance Authority Future Tax Revenue | 5.000% | 8/1/36 | 3,000 | 3,302 |
| New York City NY Transitional Finance Authority Future Tax Revenue | 5.000% | 8/1/36 | 20,000 | 22,339 |
| New York City NY Transitional Finance Authority Future Tax Revenue | 5.000% | 11/1/36 | 4,000 | 4,417 |
| New York City NY Transitional Finance Authority Future Tax Revenue | 5.000% | 2/1/37 | 10,000 | 11,074 |
| New York City NY Transitional Finance Authority Future Tax Revenue | 4.000% | 8/1/37 | 6,895 | 6,981 |
| New York City NY Transitional Finance Authority Future Tax Revenue | 5.000% | 8/1/37 | 19,000 | 21,146 |
| New York City NY Transitional Finance Authority Future Tax Revenue VRDO | 1.670% | 11/1/18 | 41,155 | 41,155 |
| New York City NY Transitional Finance Authority Future Tax Revenue VRDO | 1.680% | 11/1/18 | 40,730 | 40,730 |
| New York City NY Transitional Finance Authority Revenue | 5.000% | 8/1/35 | 23,000 | 25,949 |
| New York City NY Transitional Finance Authority Revenue | 5.000% | 8/1/36 | 47,000 | 53,026 |
| New York City NY Transitional Finance Authority Revenue | 4.000% | 8/1/38 | 2,500 | 2,532 |
| New York City NY Transitional Finance Authority Revenue | 5.000% | 8/1/38 | 5,710 | 6,397 |
| New York City NY Trust for Cultural Resources Revenue | | | | |
| (Lincoln Center for the Performing Arts Inc.) | 5.000% | 12/1/26 | 27,000 | 31,396 |
| New York City NY Trust for Cultural Resources Revenue (Wildlife Conservation Society) | 5.000% | 8/1/33 | 5,270 | 5,765 |
| New York City NY Transitional Finance Authority Future Tax Secured Revenue | 5.000% | 8/1/35 | 15,000 | 16,923 |
| New York City NY Transitional Finance Authority Future Tax Secured Revenue | 5.000% | 8/1/36 | 18,000 | 20,308 |
| New York City NY Transitional Finance Authority Future Tax Secured Revenue | 5.000% | 8/1/37 | 35,000 | 39,241 |
| New York Convention Center Development Corp. Revenue | 0.000% | 11/15/34 | 5,500 | 2,798 |
| New York Liberty Development Corp. Revenue | 5.000% | 11/15/31 | 13,200 | 14,040 |
| New York Liberty Development Corp. Revenue (7 World Trade Center Project) | 5.000% | 9/15/31 | 14,000 | 15,147 |
| New York Liberty Development Corp. Revenue (Goldman Sachs Headquarters) | 5.250% | 10/1/35 | 19,640 | 23,277 |
| New York Metropolitan Transportation Authority Revenue | 5.000% | 11/15/20 | 34,225 | 36,102 |
| New York Metropolitan Transportation Authority Revenue | 5.250% | 11/15/20 (Prere.) | 22,625 | 24,071 |
| New York Metropolitan Transportation Authority Revenue | 5.250% | 11/15/20 (Prere.) | 9,000 | 9,575 |
| New York Metropolitan Transportation Authority Revenue | 5.250% | 11/15/20 (Prere.) | 20,730 | 22,055 |
| New York Metropolitan Transportation Authority Revenue | 5.250% | 11/15/20 (Prere.) | 24,500 | 26,066 |
| New York Metropolitan Transportation Authority Revenue | 4.750% | 11/15/21 (Prere.) | 8,000 | 8,623 |
| New York Metropolitan Transportation Authority Revenue | 5.000% | 11/15/21 | 19,000 | 20,467 |
| New York Metropolitan Transportation Authority Revenue | 5.000% | 11/15/21 (Prere.) | 12,125 | 13,158 |
| New York Metropolitan Transportation Authority Revenue | 5.000% | 11/15/21 (Prere.) | 3,850 | 4,178 |
| New York Metropolitan Transportation Authority Revenue | 5.000% | 11/15/21 (Prere.) | 1,500 | 1,628 |
| New York Metropolitan Transportation Authority Revenue | 5.500% | 11/15/21 (4) | 15,900 | 17,408 |
| New York Metropolitan Transportation Authority Revenue | 5.000% | 11/15/22 | 8,425 | 9,239 |
| New York Metropolitan Transportation Authority Revenue | 5.000% | 11/15/22 | 10,000 | 10,966 |
| New York Metropolitan Transportation Authority Revenue | 5.000% | 11/15/22 (Prere.) | 13,665 | 15,157 |
| New York Metropolitan Transportation Authority Revenue | 5.000% | 11/15/22 (Prere.) | 12,735 | 14,126 |
| New York Metropolitan Transportation Authority Revenue | 5.000% | 11/15/22 (Prere.) | 8,500 | 9,428 |
| New York Metropolitan Transportation Authority Revenue | 5.000% | 5/15/23 (Prere.) | 1,370 | 1,535 |
| New York Metropolitan Transportation Authority Revenue | 5.000% | 5/15/23 (Prere.) | 2,300 | 2,578 |
| New York Metropolitan Transportation Authority Revenue | 5.000% | 5/15/23 (Prere.) | 1,695 | 1,900 |
| New York Metropolitan Transportation Authority Revenue | 5.000% | 5/15/23 (Prere.) | 5,520 | 6,186 |
| New York Metropolitan Transportation Authority Revenue | 5.000% | 5/15/23 (Prere.) | 5,480 | 6,141 |
| New York Metropolitan Transportation Authority Revenue | 5.000% | 5/15/23 (Prere.) | 12,705 | 14,238 |
| New York Metropolitan Transportation Authority Revenue | 5.000% | 11/15/23 | 42,000 | 46,708 |
| New York Metropolitan Transportation Authority Revenue | 5.000% | 11/15/23 | 6,675 | 7,290 |
| New York Metropolitan Transportation Authority Revenue | 5.000% | 11/15/23 | 5,035 | 5,599 |
| New York Metropolitan Transportation Authority Revenue | 5.000% | 11/15/24 | 6,680 | 7,269 |
| New York Metropolitan Transportation Authority Revenue | 5.000% | 11/15/24 | 10,020 | 11,254 |
| New York Metropolitan Transportation Authority Revenue | 5.000% | 11/15/25 | 11,500 | 13,027 |
| New York Metropolitan Transportation Authority Revenue | 5.000% | 11/15/25 | 31,050 | 33,726 |
| New York Metropolitan Transportation Authority Revenue | 5.000% | 11/15/26 | 7,045 | 8,039 |
| New York Metropolitan Transportation Authority Revenue | 5.000% | 11/15/26 | 3,000 | 3,423 |
227
Intermediate-Term Tax-Exempt Fund
| | | | |
| Face | Market |
| Maturity | Amount | Value• |
| Coupon | Date | ($000) | ($000) |
| New York Metropolitan Transportation Authority Revenue | 5.000% | 11/15/26 | 5,400 | 5,857 |
| New York Metropolitan Transportation Authority Revenue | 5.000% | 11/15/26 | 4,000 | 4,564 |
| New York Metropolitan Transportation Authority Revenue | 5.000% | 11/15/27 | 6,165 | 7,066 |
| New York Metropolitan Transportation Authority Revenue | 5.000% | 11/15/27 | 3,410 | 3,908 |
| New York Metropolitan Transportation Authority Revenue | 5.000% | 11/15/27 | 2,150 | 2,464 |
| New York Metropolitan Transportation Authority Revenue | 5.000% | 11/15/28 | 15,000 | 16,239 |
| New York Metropolitan Transportation Authority Revenue | 5.000% | 11/15/28 | 4,515 | 5,170 |
| New York Metropolitan Transportation Authority Revenue | 5.000% | 11/15/28 | 20,500 | 23,236 |
| New York Metropolitan Transportation Authority Revenue | 5.000% | 11/15/29 | 3,585 | 4,064 |
| New York Metropolitan Transportation Authority Revenue | 5.000% | 11/15/30 | 5,000 | 5,624 |
| New York Metropolitan Transportation Authority Revenue | 5.000% | 11/15/30 | 10,260 | 11,075 |
| New York Metropolitan Transportation Authority Revenue | 5.000% | 11/15/30 | 20,000 | 22,657 |
| New York Metropolitan Transportation Authority Revenue | 5.250% | 11/15/30 | 5,500 | 6,227 |
| New York Metropolitan Transportation Authority Revenue | 4.000% | 11/15/31 | 60,000 | 61,873 |
| New York Metropolitan Transportation Authority Revenue | 5.000% | 11/15/31 | 7,000 | 7,683 |
| New York Metropolitan Transportation Authority Revenue | 4.000% | 11/15/32 | 50,000 | 51,236 |
| New York Metropolitan Transportation Authority Revenue | 5.000% | 11/15/33 | 13,055 | 14,040 |
| New York Metropolitan Transportation Authority Revenue | 5.000% | 11/15/33 | 5,000 | 5,470 |
| New York Metropolitan Transportation Authority Revenue | 5.000% | 11/15/34 | 19,605 | 21,049 |
| New York Metropolitan Transportation Authority Revenue | 4.000% | 11/15/37 | 1,000 | 1,001 |
| New York Metropolitan Transportation Authority Revenue (Dedicated Petroleum Tax) | 6.000% | 4/1/20 (ETM) | 10,740 | 11,090 |
| 2 New York Metropolitan Transportation Authority Revenue (Dedicated Tax Fund) | 2.550% | 11/1/19 | 8,000 | 8,055 |
| New York Metropolitan Transportation Authority Revenue (Dedicated Tax Fund) | 5.000% | 11/15/21 (Prere.) | 3,195 | 3,467 |
| New York Metropolitan Transportation Authority Revenue (Dedicated Tax Fund) | 5.000% | 11/15/21 (Prere.) | 4,790 | 5,198 |
| New York Metropolitan Transportation Authority Revenue (Dedicated Tax Fund) | 5.000% | 11/15/21 (Prere.) | 7,245 | 7,862 |
| New York Metropolitan Transportation Authority Revenue (Dedicated Tax Fund) | 5.000% | 11/15/21 (Prere.) | 11,530 | 12,512 |
| New York Metropolitan Transportation Authority Revenue (Dedicated Tax Fund) | 5.000% | 11/15/21 (Prere.) | 6,125 | 6,647 |
| New York Metropolitan Transportation Authority Revenue (Dedicated Tax Fund) | 5.000% | 11/15/21 (Prere.) | 10,360 | 11,242 |
| New York Metropolitan Transportation Authority Revenue (Dedicated Tax Fund) | 5.000% | 11/15/21 (Prere.) | 10,910 | 11,839 |
| New York Metropolitan Transportation Authority Revenue (Dedicated Tax Fund) | 5.000% | 11/15/21 (Prere.) | 11,415 | 12,387 |
| New York Metropolitan Transportation Authority Revenue (Dedicated Tax Fund) | 5.125% | 11/15/21 (Prere.) | 2,000 | 2,178 |
| New York Metropolitan Transportation Authority Revenue (Dedicated Tax Fund) | 5.125% | 11/15/21 (Prere.) | 10,500 | 11,433 |
| New York Metropolitan Transportation Authority Revenue (Dedicated Tax Fund) | 5.000% | 11/15/25 | 6,805 | 7,306 |
| New York Metropolitan Transportation Authority Revenue (Dedicated Tax Fund) | 5.000% | 11/15/26 | 10,210 | 10,958 |
| New York Metropolitan Transportation Authority Revenue (Dedicated Tax Fund) | 5.250% | 11/15/30 | 15,000 | 17,382 |
| New York Metropolitan Transportation Authority Revenue (Dedicated Tax Fund) | 0.000% | 11/15/32 | 8,000 | 4,639 |
| New York Metropolitan Transportation Authority Revenue (Dedicated Tax Fund) | 4.000% | 11/15/32 | 4,000 | 4,176 |
| New York Metropolitan Transportation Authority Revenue (Dedicated Tax Fund) | 4.000% | 11/15/33 | 27,000 | 28,080 |
| New York Metropolitan Transportation Authority Revenue (Dedicated Tax Fund) | 5.000% | 11/15/33 | 10,900 | 12,264 |
| New York Metropolitan Transportation Authority Revenue (Dedicated Tax Fund) | 5.000% | 11/15/34 | 11,445 | 12,843 |
| New York Metropolitan Transportation Authority Revenue (Dedicated Tax Fund) | 5.000% | 11/15/36 | 59,700 | 66,456 |
| New York Metropolitan Transportation Authority Revenue (Dedicated Tax Fund) | 5.000% | 11/15/36 | 12,610 | 14,037 |
| New York Metropolitan Transportation Authority Revenue (Hudson Yards Development) | 5.000% | 11/15/46 | 53,415 | 54,694 |
| New York Metropolitan Transportation Authority Revenue (Hudson Yards Development) | 5.000% | 11/15/51 | 89,720 | 94,277 |
| New York Metropolitan Transportation Authority Revenue (Transit Revenue) | 5.500% | 11/15/18 | 6,805 | 6,814 |
| New York Metropolitan Transportation Authority Revenue (Transit Revenue) | 5.000% | 11/15/22 (Prere.) | 2,000 | 2,218 |
| New York Metropolitan Transportation Authority Revenue (Transit Revenue) | 5.000% | 11/15/26 | 2,500 | 2,711 |
| New York Metropolitan Transportation Authority Revenue (Transit Revenue) PUT | 5.000% | 11/15/19 | 8,450 | 8,692 |
| New York Metropolitan Transportation Authority Revenue PUT | 5.000% | 2/15/20 | 18,000 | 18,617 |
| New York NY GO | 5.000% | 8/1/25 | 10,300 | 11,800 |
| New York NY GO | 5.000% | 8/1/28 | 30,000 | 34,810 |
| New York State Dormitory Authority Lease Revenue (Mental Health Services Facilities) | 5.000% | 2/15/19 (4) | 1,220 | 1,222 |
| New York State Dormitory Authority Lease Revenue (Mental Health Services Facilities) | 5.000% | 8/15/21 | 10,015 | 10,516 |
| New York State Dormitory Authority Lease Revenue (Mental Health Services Facilities) | 5.000% | 8/15/22 | 2,000 | 2,100 |
| New York State Dormitory Authority Lease Revenue (State University Dormitory Facilities) | 5.000% | 7/1/20 (Prere.) | 3,925 | 4,116 |
| New York State Dormitory Authority Lease Revenue (State University Dormitory Facilities) | 5.000% | 7/1/20 (Prere.) | 4,330 | 4,541 |
| New York State Dormitory Authority Lease Revenue (State University Dormitory Facilities) | 5.000% | 7/1/21 (Prere.) | 2,000 | 2,149 |
| New York State Dormitory Authority Lease Revenue (State University Dormitory Facilities) | 5.000% | 7/1/21 (Prere.) | 2,320 | 2,493 |
| New York State Dormitory Authority Revenue | 5.000% | 1/15/26 | 1,500 | 1,727 |
| New York State Dormitory Authority Revenue | 5.000% | 7/1/26 | 1,650 | 1,925 |
| New York State Dormitory Authority Revenue | 5.000% | 10/1/26 (4) | 3,000 | 3,470 |
| New York State Dormitory Authority Revenue | 5.000% | 1/15/27 | 3,755 | 4,354 |
| New York State Dormitory Authority Revenue | 5.000% | 7/1/27 | 1,785 | 2,094 |
| New York State Dormitory Authority Revenue | 5.000% | 10/1/27 (4) | 2,590 | 2,980 |
| New York State Dormitory Authority Revenue | 5.000% | 7/1/28 | 1,115 | 1,317 |
| New York State Dormitory Authority Revenue | 5.000% | 10/1/28 (4) | 2,430 | 2,787 |
| New York State Dormitory Authority Revenue | 5.000% | 10/1/29 (4) | 2,145 | 2,447 |
| New York State Dormitory Authority Revenue | 5.000% | 10/1/31 (4) | 1,315 | 1,488 |
| New York State Dormitory Authority Revenue | 5.000% | 10/1/32 (4) | 1,000 | 1,128 |
| New York State Dormitory Authority Revenue | 5.000% | 3/15/35 | 38,335 | 43,253 |
228
Intermediate-Term Tax-Exempt Fund
| | | | |
| Face | Market |
| Maturity | Amount | Value• |
| Coupon | Date | ($000) | ($000) |
| New York State Dormitory Authority Revenue | 5.000% | 3/15/36 | 26,845 | 30,324 |
| New York State Dormitory Authority Revenue | 5.000% | 7/1/39 | 4,000 | 4,488 |
| New York State Dormitory Authority Revenue (City University System) | 5.000% | 7/1/20 (Prere.) | 215 | 225 |
| New York State Dormitory Authority Revenue (City University System) | 5.000% | 7/1/21 | 4,785 | 5,013 |
| New York State Dormitory Authority Revenue (Columbia University) | 5.000% | 10/1/21 | 19,375 | 20,966 |
| New York State Dormitory Authority Revenue (Department of Health) | 5.000% | 7/1/20 | 6,485 | 6,785 |
| New York State Dormitory Authority Revenue (Department of Health) | 5.000% | 7/1/21 | 3,500 | 3,749 |
| New York State Dormitory Authority Revenue (Fordham University) | 5.000% | 7/1/21 (Prere.) | 1,070 | 1,151 |
| New York State Dormitory Authority Revenue (Fordham University) | 5.125% | 7/1/21 (Prere.) | 1,625 | 1,753 |
| New York State Dormitory Authority Revenue (Fordham University) | 5.200% | 7/1/21 (Prere.) | 1,200 | 1,297 |
| New York State Dormitory Authority Revenue (Icahn School of Medicine at Mount Sinai) | 5.000% | 7/1/24 | 9,345 | 10,466 |
| New York State Dormitory Authority Revenue (Icahn School of Medicine at Mount Sinai) | 5.000% | 7/1/28 | 6,500 | 7,242 |
| New York State Dormitory Authority Revenue (Icahn School of Medicine at Mount Sinai) | 5.000% | 7/1/29 | 10,000 | 11,098 |
| New York State Dormitory Authority Revenue (Icahn School of Medicine at Mount Sinai) | 5.000% | 7/1/30 | 4,500 | 4,977 |
| New York State Dormitory Authority Revenue (Icahn School of Medicine at Mount Sinai) | 5.000% | 7/1/32 | 12,000 | 13,211 |
| New York State Dormitory Authority Revenue (Memorial Sloan-Kettering Cancer Center) | 5.000% | 7/1/26 | 1,500 | 1,622 |
| New York State Dormitory Authority Revenue (Memorial Sloan-Kettering Cancer Center) | 5.000% | 7/1/29 | 1,000 | 1,080 |
| New York State Dormitory Authority Revenue (Memorial Sloan-Kettering Cancer Center) | 5.000% | 7/1/30 | 1,000 | 1,079 |
| New York State Dormitory Authority Revenue (Mental Health Services Facilities Improvement) | 5.000% | 2/15/19 (4) | 70 | 70 |
| New York State Dormitory Authority Revenue (Mental Health Services Facilities Improvement) | 5.000% | 8/15/20 (ETM) | 10 | 11 |
| New York State Dormitory Authority Revenue (Mental Health Services Facilities Improvement) | 5.000% | 8/15/20 | 13,280 | 13,939 |
| New York State Dormitory Authority Revenue (Mental Health Services Facilities Improvement) | 5.000% | 2/15/25 (4) | 215 | 215 |
| New York State Dormitory Authority Revenue (Montefiore Obligated Group) | 5.000% | 8/1/26 | 5,850 | 6,580 |
| New York State Dormitory Authority Revenue (Montefiore Obligated Group) | 5.000% | 8/1/27 | 3,750 | 4,237 |
| New York State Dormitory Authority Revenue (Montefiore Obligated Group) | 5.000% | 8/1/28 | 2,125 | 2,411 |
| New York State Dormitory Authority Revenue (Mount Sinai Hospital Obligated Group) | 5.000% | 7/1/26 | 3,640 | 3,795 |
| New York State Dormitory Authority Revenue | | | | |
| (Mount Sinai School of Medicine of New York University) | 5.000% | 7/1/21 | 1,500 | 1,563 |
| New York State Dormitory Authority Revenue (New York University) | 6.000% | 7/1/19 (14) | 1,700 | 1,746 |
| New York State Dormitory Authority Revenue (New York University) | 5.000% | 7/1/26 | 4,060 | 4,736 |
| New York State Dormitory Authority Revenue (New York University) | 5.000% | 7/1/34 | 15,010 | 16,854 |
| New York State Dormitory Authority Revenue (New York University) | 5.000% | 7/1/35 | 17,500 | 19,575 |
| New York State Dormitory Authority Revenue (New York University) | 5.000% | 7/1/36 | 9,000 | 10,035 |
| New York State Dormitory Authority Revenue (Personal Income Tax) | 5.000% | 3/15/19 (Prere.) | 20,000 | 20,235 |
| New York State Dormitory Authority Revenue (Personal Income Tax) | 5.000% | 3/15/19 (Prere.) | 2,875 | 2,909 |
| New York State Dormitory Authority Revenue (Personal Income Tax) | 5.000% | 2/15/20 (Prere.) | 30 | 31 |
| New York State Dormitory Authority Revenue (Personal Income Tax) | 5.000% | 2/15/20 (Prere.) | 25 | 26 |
| New York State Dormitory Authority Revenue (Personal Income Tax) | 5.000% | 2/15/20 (Prere.) | 5 | 5 |
| New York State Dormitory Authority Revenue (Personal Income Tax) | 5.000% | 2/15/20 (Prere.) | 20 | 21 |
| New York State Dormitory Authority Revenue (Personal Income Tax) | 5.000% | 2/18/20 (Prere.) | 990 | 1,027 |
| New York State Dormitory Authority Revenue (Personal Income Tax) | 5.000% | 2/15/21 | 36,430 | 38,724 |
| New York State Dormitory Authority Revenue (Personal Income Tax) | 5.000% | 2/15/21 | 12,000 | 12,439 |
| New York State Dormitory Authority Revenue (Personal Income Tax) | 5.000% | 2/15/22 | 33,415 | 36,320 |
| New York State Dormitory Authority Revenue (Personal Income Tax) | 5.000% | 2/15/22 | 7,895 | 8,581 |
| New York State Dormitory Authority Revenue (Personal Income Tax) | 5.000% | 2/15/22 | 56,335 | 61,233 |
| New York State Dormitory Authority Revenue (Personal Income Tax) | 5.000% | 2/15/22 (Prere.) | 920 | 997 |
| New York State Dormitory Authority Revenue (Personal Income Tax) | 5.000% | 2/15/22 (Prere.) | 3,835 | 4,157 |
| New York State Dormitory Authority Revenue (Personal Income Tax) | 5.000% | 2/15/22 (Prere.) | 1,340 | 1,453 |
| New York State Dormitory Authority Revenue (Personal Income Tax) | 5.500% | 3/15/22 (2) | 7,000 | 7,729 |
| New York State Dormitory Authority Revenue (Personal Income Tax) | 5.000% | 2/15/23 | 25,000 | 27,685 |
| New York State Dormitory Authority Revenue (Personal Income Tax) | 5.000% | 3/15/23 | 8,500 | 9,426 |
| New York State Dormitory Authority Revenue (Personal Income Tax) | 5.000% | 12/15/23 | 12,500 | 13,767 |
| New York State Dormitory Authority Revenue (Personal Income Tax) | 5.000% | 2/15/24 | 35,905 | 40,399 |
| New York State Dormitory Authority Revenue (Personal Income Tax) | 5.000% | 2/15/24 | 4,695 | 5,075 |
| New York State Dormitory Authority Revenue (Personal Income Tax) | 5.000% | 3/15/25 | 20,040 | 22,922 |
| New York State Dormitory Authority Revenue (Personal Income Tax) | 5.000% | 2/15/26 | 30,480 | 34,620 |
| New York State Dormitory Authority Revenue (Personal Income Tax) | 5.000% | 2/15/26 | 46,160 | 53,237 |
| New York State Dormitory Authority Revenue (Personal Income Tax) | 5.000% | 2/15/26 | 10,015 | 11,205 |
| New York State Dormitory Authority Revenue (Personal Income Tax) | 5.000% | 2/15/26 | 19,540 | 21,091 |
| New York State Dormitory Authority Revenue (Personal Income Tax) | 5.000% | 3/15/26 | 17,630 | 18,725 |
| New York State Dormitory Authority Revenue (Personal Income Tax) | 5.000% | 3/15/26 | 2,585 | 2,746 |
| New York State Dormitory Authority Revenue (Personal Income Tax) | 5.000% | 12/15/26 | 10,300 | 11,314 |
| New York State Dormitory Authority Revenue (Personal Income Tax) | 5.000% | 2/15/27 | 20,000 | 22,593 |
| New York State Dormitory Authority Revenue (Personal Income Tax) | 5.000% | 2/15/27 | 21,000 | 24,411 |
| New York State Dormitory Authority Revenue (Personal Income Tax) | 5.000% | 2/15/27 | 10,045 | 11,191 |
| New York State Dormitory Authority Revenue (Personal Income Tax) | 5.000% | 3/15/27 | 15,120 | 17,104 |
| New York State Dormitory Authority Revenue (Personal Income Tax) | 5.000% | 3/15/27 | 30,650 | 32,554 |
| New York State Dormitory Authority Revenue (Personal Income Tax) | 5.000% | 2/15/28 | 31,410 | 36,311 |
| New York State Dormitory Authority Revenue (Personal Income Tax) | 5.000% | 2/15/28 | 7,000 | 7,869 |
| New York State Dormitory Authority Revenue (Personal Income Tax) | 5.000% | 3/15/28 | 11,580 | 13,028 |
229
Intermediate-Term Tax-Exempt Fund
| | | | |
| Face | Market |
| Maturity | Amount | Value• |
| Coupon | Date | ($000) | ($000) |
| New York State Dormitory Authority Revenue (Personal Income Tax) | 5.000% | 3/15/28 | 25,000 | 26,541 |
| New York State Dormitory Authority Revenue (Personal Income Tax) | 5.000% | 2/15/29 | 39,000 | 44,745 |
| New York State Dormitory Authority Revenue (Personal Income Tax) | 5.000% | 2/15/29 | 10,000 | 11,089 |
| New York State Dormitory Authority Revenue (Personal Income Tax) | 5.000% | 3/15/29 | 25,000 | 26,535 |
| New York State Dormitory Authority Revenue (Personal Income Tax) | 5.000% | 2/15/30 | 10 | 10 |
| New York State Dormitory Authority Revenue (Personal Income Tax) | 5.000% | 2/15/30 | 10,015 | 11,085 |
| New York State Dormitory Authority Revenue (Personal Income Tax) | 5.000% | 2/15/30 | 18,905 | 20,281 |
| New York State Dormitory Authority Revenue (Personal Income Tax) | 5.000% | 3/15/30 | 32,000 | 33,958 |
| New York State Dormitory Authority Revenue (Personal Income Tax) | 5.000% | 3/15/30 | 20,740 | 22,988 |
| New York State Dormitory Authority Revenue (Personal Income Tax) | 5.000% | 3/15/31 | 17,240 | 18,497 |
| New York State Dormitory Authority Revenue (Personal Income Tax) | 5.000% | 2/15/32 | 7,500 | 8,022 |
| New York State Dormitory Authority Revenue (Personal Income Tax) | 4.000% | 2/15/33 | 57,500 | 59,467 |
| New York State Dormitory Authority Revenue (Personal Income Tax) | 5.000% | 2/15/33 | 1,070 | 1,144 |
| New York State Dormitory Authority Revenue (Personal Income Tax) | 5.000% | 3/15/33 | 10,135 | 10,850 |
| New York State Dormitory Authority Revenue (Personal Income Tax) | 4.000% | 2/15/34 | 34,000 | 34,990 |
| New York State Dormitory Authority Revenue (Personal Income Tax) | 5.000% | 3/15/34 | 36,795 | 40,514 |
| New York State Dormitory Authority Revenue (Personal Income Tax) | 4.000% | 2/15/35 | 32,000 | 32,747 |
| New York State Dormitory Authority Revenue (Personal Income Tax) | 5.000% | 2/15/35 | 17,050 | 18,938 |
| New York State Dormitory Authority Revenue (Personal Income Tax) | 5.000% | 2/15/36 | 5,440 | 6,023 |
| New York State Dormitory Authority Revenue (School Districts Financing Program) | 5.000% | 10/1/19 | 3,475 | 3,571 |
| New York State Dormitory Authority Revenue (School Districts Financing Program) | 5.000% | 10/1/19 (12) | 2,500 | 2,570 |
| New York State Dormitory Authority Revenue (School Districts Financing Program) | 5.000% | 10/1/20 (Prere.) | 6,610 | 6,977 |
| New York State Dormitory Authority Revenue (School Districts Financing Program) | 5.000% | 10/1/20 | 10,000 | 10,541 |
| New York State Dormitory Authority Revenue (School Districts Financing Program) | 5.000% | 10/1/21 (Prere.) | 15,575 | 16,827 |
| New York State Dormitory Authority Revenue (School Districts Financing Program) | 5.000% | 10/1/21 (Prere.) | 18,485 | 19,970 |
| New York State Dormitory Authority Revenue (School Districts Financing Program) | 5.000% | 10/1/21 (Prere.) | 4,435 | 4,791 |
| New York State Dormitory Authority Revenue (School Districts Financing Program) | 5.000% | 10/1/21 (4) | 1,250 | 1,346 |
| New York State Dormitory Authority Revenue (School Districts Financing Program) | 5.000% | 10/1/21 | 750 | 807 |
| New York State Dormitory Authority Revenue (School Districts Financing Program) | 5.000% | 10/1/22 (4) | 390 | 410 |
| New York State Dormitory Authority Revenue (School Districts Financing Program) | 5.000% | 10/1/22 | 780 | 835 |
| New York State Dormitory Authority Revenue (School Districts Financing Program) | 5.000% | 10/1/22 | 500 | 548 |
| New York State Dormitory Authority Revenue (School Districts Financing Program) | 5.000% | 10/1/23 | 950 | 1,022 |
| New York State Dormitory Authority Revenue (School Districts Financing Program) | 5.000% | 10/1/23 (4) | 1,035 | 1,134 |
| New York State Dormitory Authority Revenue (School Districts Financing Program) | 5.000% | 10/1/23 | 1,250 | 1,371 |
| New York State Dormitory Authority Revenue (School Districts Financing Program) | 5.000% | 10/1/24 (4) | 1,500 | 1,640 |
| New York State Dormitory Authority Revenue (School Districts Financing Program) | 5.000% | 10/1/24 | 1,000 | 1,097 |
| New York State Dormitory Authority Revenue (School Districts Financing Program) | 5.000% | 10/1/24 | 6,290 | 6,848 |
| New York State Dormitory Authority Revenue (School Districts Financing Program) | 5.000% | 10/1/25 (4) | 1,000 | 1,092 |
| New York State Dormitory Authority Revenue (School Districts Financing Program) | 5.000% | 10/1/25 | 1,000 | 1,097 |
| New York State Dormitory Authority Revenue (School Districts Financing Program) | 5.000% | 10/1/25 | 7,595 | 8,245 |
| New York State Dormitory Authority Revenue (School Districts Financing Program) | 5.000% | 10/1/26 | 65 | 69 |
| New York State Dormitory Authority Revenue (School Districts Financing Program) | 5.000% | 10/1/26 | 750 | 822 |
| New York State Dormitory Authority Revenue (School Districts Financing Program) | 5.000% | 10/1/26 (4) | 1,500 | 1,682 |
| New York State Dormitory Authority Revenue (School Districts Financing Program) | 5.000% | 10/1/27 (4) | 475 | 518 |
| New York State Dormitory Authority Revenue (School Districts Financing Program) | 5.000% | 10/1/27 | 500 | 547 |
| New York State Dormitory Authority Revenue (School Districts Financing Program) | 5.000% | 10/1/28 (4) | 200 | 218 |
| New York State Dormitory Authority Revenue (School Districts Financing Program) | 5.000% | 10/1/28 | 425 | 464 |
| New York State Dormitory Authority Revenue (School Districts Financing Program) | 5.000% | 10/1/29 | 500 | 545 |
| New York State Dormitory Authority Revenue (Service Contract) | 5.000% | 7/1/20 | 6,815 | 6,955 |
| New York State Dormitory Authority Revenue (Service Contract) | 5.000% | 7/1/21 | 17,750 | 18,105 |
| New York State Dormitory Authority Revenue (State University Dormitory Facilities) | 5.000% | 7/1/28 | 1,775 | 2,048 |
| New York State Dormitory Authority Revenue (State University Dormitory Facilities) | 5.000% | 7/1/29 | 1,545 | 1,770 |
| New York State Dormitory Authority Revenue (State University Educational Facilities) | 5.000% | 5/15/22 | 9,240 | 10,102 |
| New York State Dormitory Authority Revenue (State University Educational Facilities) | 5.000% | 5/15/28 | 10,865 | 11,790 |
| New York State Dormitory Authority Revenue (State University Educational Facilities) | 5.000% | 5/15/29 | 3,015 | 3,267 |
| New York State Dormitory Authority Revenue (State University Educational Facilities) | 5.000% | 5/15/30 | 1,000 | 1,083 |
| New York State Dormitory Authority Revenue (The New School) | 5.000% | 7/1/26 | 1,030 | 1,176 |
| New York State Dormitory Authority Revenue (The New School) | 5.000% | 7/1/27 | 2,500 | 2,848 |
| New York State Dormitory Authority Revenue (The New School) | 5.000% | 7/1/35 | 3,000 | 3,301 |
| New York State Dormitory Authority Revenue (The New School) | 5.000% | 7/1/36 | 2,000 | 2,193 |
| New York State Dormitory Authority Sales Tax Revenue | 5.000% | 3/15/21 | 16,000 | 17,048 |
| New York State Dormitory Authority Sales Tax Revenue | 5.000% | 3/15/22 | 19,505 | 21,269 |
| New York State Dormitory Authority Sales Tax Revenue | 5.000% | 3/15/22 | 43,155 | 47,058 |
| New York State Dormitory Authority Sales Tax Revenue | 5.000% | 3/15/23 | 2,715 | 3,014 |
| New York State Dormitory Authority Sales Tax Revenue | 5.000% | 3/15/24 | 14,895 | 16,811 |
| New York State Dormitory Authority Sales Tax Revenue | 5.000% | 3/15/25 | 35,000 | 40,100 |
| New York State Dormitory Authority Sales Tax Revenue | 5.000% | 3/15/25 | 12,810 | 14,676 |
| New York State Dormitory Authority Sales Tax Revenue | 5.000% | 3/15/29 | 9,500 | 11,092 |
| New York State Dormitory Authority Sales Tax Revenue | 5.000% | 3/15/32 | 51,000 | 57,812 |
| New York State Dormitory Authority Sales Tax Revenue | 5.000% | 3/15/33 | 6,000 | 6,737 |
230
Intermediate-Term Tax-Exempt Fund
| | | | |
| Face | Market |
| Maturity | Amount | Value• |
| Coupon | Date | ($000) | ($000) |
| New York State Dormitory Authority Sales Tax Revenue | 5.000% | 3/15/34 | 17,625 | 19,738 |
| New York State Dormitory Authority Sales Tax Revenue | 5.000% | 3/15/34 | 27,610 | 30,706 |
| New York State Dormitory Authority Sales Tax Revenue | 5.000% | 3/15/35 | 14,260 | 15,942 |
| New York State Dormitory Authority Sales Tax Revenue | 5.000% | 3/15/35 | 32,000 | 35,567 |
| New York State Dormitory Authority Sales Tax Revenue | 5.000% | 3/15/36 | 37,165 | 41,464 |
| New York State Dormitory Authority Sales Tax Revenue | 5.000% | 3/15/36 | 18,500 | 20,794 |
| New York State Dormitory Authority Sales Tax Revenue | 5.000% | 3/15/37 | 22,500 | 25,233 |
| New York State Dormitory Authority Sales Tax Revenue | 5.000% | 3/15/37 | 18,835 | 20,926 |
| 7 New York State Dormitory Authority Sales Tax Revenue TOB VRDO | 1.620% | 11/7/18 | 8,940 | 8,940 |
| New York State Energy Research & Development Authority Pollution Control Revenue | | | | |
| (New York State Electric & Gas Corp.) | 3.500% | 10/1/29 | 20,000 | 19,643 |
| New York State Energy Research & Development Authority Pollution Control Revenue | | | | |
| (Rochester Gas & Electric Corp.) PUT | 3.000% | 7/1/25 | 20,000 | 19,761 |
| New York State Environmental Facilities Corp. Revenue (Personal Income Tax) | 5.250% | 12/15/18 (Prere.) | 15,795 | 15,862 |
| New York State Environmental Facilities Corp. Revenue (Personal Income Tax) | 5.250% | 12/15/18 (Prere.) | 7,170 | 7,200 |
| New York State Environmental Facilities Corp. Revenue (Personal Income Tax) | 5.250% | 12/15/24 | 70 | 70 |
| New York State Environmental Facilities Corp. Revenue (Personal Income Tax) | 5.250% | 12/15/25 | 155 | 156 |
| New York State Environmental Facilities Corp. Revenue | | | | |
| (State Clean Water & Drinking Water Revolving Funds) | 5.000% | 6/15/21 | 4,370 | 4,695 |
| New York State Environmental Facilities Corp. Revenue | | | | |
| (State Clean Water & Drinking Water Revolving Funds) | 5.000% | 6/15/23 | 2,250 | 2,518 |
| New York State Environmental Facilities Corp. Revenue | | | | |
| (State Clean Water & Drinking Water Revolving Funds) | 5.000% | 6/15/27 | 10,000 | 10,688 |
| New York State Environmental Facilities Corp. Revenue | | | | |
| (State Clean Water & Drinking Water Revolving Funds) | 5.000% | 6/15/27 | 5,060 | 5,599 |
| New York State Environmental Facilities Corp. Revenue | | | | |
| (State Clean Water & Drinking Water Revolving Funds) | 5.000% | 6/15/28 | 11,460 | 12,242 |
| New York State Environmental Facilities Corp. Revenue | | | | |
| (State Clean Water & Drinking Water Revolving Funds) | 5.000% | 6/15/29 | 17,830 | 19,037 |
| New York State Environmental Facilities Corp. Revenue | | | | |
| (State Clean Water & Drinking Water Revolving Funds) | 5.000% | 6/15/30 | 26,230 | 27,992 |
| New York State Environmental Facilities Corp. Revenue | | | | |
| (State Clean Water & Drinking Water Revolving Funds) | 5.000% | 6/15/31 | 3,670 | 3,915 |
| New York State Environmental Facilities Corp. Revenue | | | | |
| (State Clean Water & Drinking Water Revolving Funds) | 5.000% | 6/15/32 | 5,000 | 5,726 |
| New York State Environmental Facilities Corp. Revenue | | | | |
| (State Clean Water & Drinking Water Revolving Funds) | 5.000% | 6/15/33 | 15,655 | 17,826 |
| New York State Environmental Facilities Corp. Revenue | | | | |
| (State Clean Water & Drinking Water Revolving Funds) | 5.000% | 6/15/33 | 4,360 | 5,021 |
| New York State Environmental Facilities Corp. Revenue | | | | |
| (State Clean Water & Drinking Water Revolving Funds) | 5.000% | 6/15/34 | 8,000 | 9,083 |
| New York State Environmental Facilities Corp. Revenue | | | | |
| (State Clean Water & Drinking Water Revolving Funds) | 5.000% | 6/15/34 | 7,145 | 8,202 |
| New York State Environmental Facilities Corp. Revenue | | | | |
| (State Clean Water & Drinking Water Revolving Funds) | 5.000% | 6/15/35 | 9,500 | 10,741 |
| New York State Environmental Facilities Corp. Revenue | | | | |
| (State Clean Water & Drinking Water Revolving Funds) | 5.000% | 6/15/35 | 5,385 | 6,158 |
| New York State Environmental Facilities Corp. Revenue | | | | |
| (State Clean Water & Drinking Water Revolving Funds) | 5.000% | 6/15/36 | 9,500 | 10,703 |
| New York State Environmental Facilities Corp. Revenue | | | | |
| (State Clean Water & Drinking Water Revolving Funds) | 5.000% | 6/15/36 | 6,830 | 7,780 |
| New York State Environmental Facilities Corp. Revenue | | | | |
| (State Clean Water & Drinking Water Revolving Funds) | 5.000% | 6/15/37 | 4,745 | 5,334 |
| New York State Environmental Facilities Corp. Revenue | | | | |
| (State Clean Water & Drinking Water Revolving Funds) | 5.000% | 6/15/37 | 9,960 | 11,319 |
| New York State Environmental Facilities Corp. Revenue (State Revolving Funds) | 5.000% | 5/15/21 (Prere.) | 5 | 5 |
| New York State Environmental Facilities Corp. Revenue (State Revolving Funds) | 5.000% | 5/15/21 (Prere.) | 5 | 5 |
| New York State Environmental Facilities Corp. Revenue (State Revolving Funds) | 5.000% | 5/15/21 (Prere.) | 5 | 5 |
| New York State Environmental Facilities Corp. Revenue (State Revolving Funds) | 5.000% | 5/15/21 (Prere.) | 5 | 5 |
| New York State Environmental Facilities Corp. Revenue (State Revolving Funds) | 5.000% | 5/15/21 (Prere.) | 5 | 5 |
| New York State Environmental Facilities Corp. Revenue (State Revolving Funds) | 5.000% | 5/15/21 (Prere.) | 5 | 5 |
| New York State Environmental Facilities Corp. Revenue (State Revolving Funds) | 5.000% | 5/15/21 (Prere.) | 10 | 11 |
| New York State Environmental Facilities Corp. Revenue (State Revolving Funds) | 5.000% | 11/15/23 | 3,785 | 4,048 |
| New York State Environmental Facilities Corp. Revenue (State Revolving Funds) | 5.000% | 11/15/24 | 3,470 | 3,706 |
| New York State Environmental Facilities Corp. Revenue (State Revolving Funds) | 5.000% | 11/15/25 | 6,030 | 6,436 |
| New York State Environmental Facilities Corp. Revenue (State Revolving Funds) | 5.000% | 11/15/27 | 3,345 | 3,568 |
| New York State Environmental Facilities Corp. Revenue (State Revolving Funds) | 5.000% | 11/15/28 | 6,150 | 6,557 |
| New York State Environmental Facilities Corp. Revenue (State Revolving Funds) | 5.000% | 11/15/29 | 5,315 | 5,664 |
| New York State Environmental Facilities Corp. Revenue (State Revolving Funds) | 5.000% | 11/15/30 | 1,835 | 1,954 |
| New York State GO | 5.000% | 2/15/30 | 14,000 | 14,840 |
231
Intermediate-Term Tax-Exempt Fund
| | | | |
| Face | Market |
| Maturity | Amount | Value• |
| Coupon | Date | ($000) | ($000) |
| New York State Thruway Authority Revenue | 5.000% | 1/1/26 | 1,725 | 1,981 |
| New York State Thruway Authority Revenue | 5.000% | 1/1/29 | 21,195 | 22,544 |
| New York State Thruway Authority Revenue | 5.000% | 1/1/31 | 7,000 | 7,428 |
| New York State Thruway Authority Revenue | 5.000% | 1/1/34 | 4,000 | 4,390 |
| New York State Thruway Authority Revenue | 5.000% | 1/1/35 | 3,000 | 3,283 |
| New York State Thruway Authority Revenue | 5.000% | 1/1/36 | 4,000 | 4,364 |
| New York State Thruway Authority Revenue (Highway & Bridge Trust Fund) | 5.000% | 4/1/19 (Prere.) | 3,000 | 3,040 |
| New York State Thruway Authority Revenue (Highway & Bridge Trust Fund) | 5.000% | 4/1/27 | 21,600 | 22,977 |
| New York State Thruway Authority Revenue (Highway & Bridge Trust Fund) | 5.000% | 4/1/28 | 13,505 | 14,363 |
| New York State Thruway Authority Revenue (Highway & Bridge Trust Fund) | 5.000% | 4/1/30 | 27,175 | 28,901 |
| New York State Thruway Authority Revenue (Personal Income Tax) | 5.000% | 3/15/19 (Prere.) | 7,000 | 7,084 |
| New York State Urban Development Corp. Revenue | 5.000% | 12/15/18 (Prere.) | 2,615 | 2,625 |
| New York State Urban Development Corp. Revenue | 5.000% | 12/15/18 (Prere.) | 2,000 | 2,008 |
| New York State Urban Development Corp. Revenue | 5.000% | 3/15/35 | 28,890 | 32,231 |
| New York State Urban Development Corp. Revenue | 5.000% | 3/15/36 | 44,080 | 49,009 |
| New York State Urban Development Corp. Revenue | 5.000% | 3/15/37 | 46,400 | 51,481 |
| New York State Urban Development Corp. Revenue (Personal Income Tax) | 4.375% | 3/15/19 (Prere.) | 7,895 | 7,971 |
| New York State Urban Development Corp. Revenue (Personal Income Tax) | 5.000% | 3/15/19 (Prere.) | 6,085 | 6,158 |
| New York State Urban Development Corp. Revenue (Personal Income Tax) | 5.000% | 12/15/19 | 40,760 | 42,134 |
| New York State Urban Development Corp. Revenue (Personal Income Tax) | 5.000% | 12/15/20 | 36,240 | 37,445 |
| New York State Urban Development Corp. Revenue (Personal Income Tax) | 5.500% | 3/15/21 (14) | 10,000 | 10,765 |
| New York State Urban Development Corp. Revenue (Personal Income Tax) | 5.000% | 12/15/21 | 13,310 | 13,751 |
| New York State Urban Development Corp. Revenue (Personal Income Tax) | 4.375% | 3/15/22 | 1,125 | 1,134 |
| New York State Urban Development Corp. Revenue (Personal Income Tax) | 5.000% | 3/15/22 | 6,000 | 6,534 |
| New York State Urban Development Corp. Revenue (Personal Income Tax) | 5.000% | 3/15/22 | 18,695 | 20,360 |
| New York State Urban Development Corp. Revenue (Personal Income Tax) | 5.500% | 3/15/22 (14) | 21,000 | 23,209 |
| New York State Urban Development Corp. Revenue (Personal Income Tax) | 5.000% | 3/15/23 | 11,150 | 12,365 |
| New York State Urban Development Corp. Revenue (Personal Income Tax) | 5.000% | 3/15/24 | 35,500 | 40,009 |
| New York State Urban Development Corp. Revenue (Personal Income Tax) | 5.000% | 3/15/25 | 52,210 | 58,897 |
| New York State Urban Development Corp. Revenue (Personal Income Tax) | 5.000% | 3/15/26 | 40,000 | 44,888 |
| New York State Urban Development Corp. Revenue (Personal Income Tax) | 5.000% | 3/15/26 | 22,375 | 25,857 |
| New York State Urban Development Corp. Revenue (Personal Income Tax) | 5.000% | 3/15/26 | 18,425 | 19,574 |
| New York State Urban Development Corp. Revenue (Personal Income Tax) | 5.000% | 3/15/26 | 18,425 | 21,140 |
| New York State Urban Development Corp. Revenue (Personal Income Tax) | 5.000% | 3/15/27 | 4,790 | 5,501 |
| New York State Urban Development Corp. Revenue (Personal Income Tax) | 5.000% | 3/15/28 | 23,695 | 27,042 |
| New York State Urban Development Corp. Revenue (Personal Income Tax) | 5.000% | 3/15/28 | 865 | 874 |
| New York State Urban Development Corp. Revenue (Personal Income Tax) | 5.000% | 3/15/30 | 14,910 | 15,804 |
| New York State Urban Development Corp. Revenue (Personal Income Tax) | 5.000% | 3/15/31 | 28,030 | 30,670 |
| New York State Urban Development Corp. Revenue (Personal Income Tax) | 5.000% | 3/15/31 | 16,000 | 17,507 |
| New York State Urban Development Corp. Revenue (Personal Income Tax) | 5.000% | 3/15/31 | 10,000 | 10,586 |
| New York State Urban Development Corp. Revenue (Personal Income Tax) | 5.000% | 3/15/31 | 30,000 | 33,818 |
| New York State Urban Development Corp. Revenue (Personal Income Tax) | 5.000% | 3/15/33 | 28,000 | 30,516 |
| New York State Urban Development Corp. Revenue (Personal Income Tax) | 5.000% | 3/15/33 | 30,890 | 33,666 |
| New York State Urban Development Corp. Revenue (Personal Income Tax) | 5.000% | 3/15/34 | 30,025 | 33,549 |
| New York State Urban Development Corp. Revenue (Personal Income Tax) | 5.000% | 3/15/35 | 7,620 | 8,484 |
| New York State Urban Development Corp. Revenue (Service Contract) | 5.000% | 1/1/20 | 8,165 | 8,442 |
| New York State Urban Development Corp. Revenue (Service Contract) | 5.000% | 1/1/21 | 11,345 | 11,721 |
| Niagara NY Area Development Corp. Revenue (Niagara University Project) | 5.000% | 5/1/19 | 350 | 355 |
| Port Authority of New York & New Jersey Revenue | 5.000% | 9/1/27 | 1,250 | 1,413 |
| Port Authority of New York & New Jersey Revenue | 5.000% | 9/1/31 | 2,735 | 3,157 |
| Port Authority of New York & New Jersey Revenue | 5.000% | 10/15/31 | 27,175 | 30,508 |
| Port Authority of New York & New Jersey Revenue | 5.000% | 9/1/32 | 3,720 | 4,274 |
| Port Authority of New York & New Jersey Revenue | 5.000% | 11/15/32 | 3,510 | 3,996 |
| Port Authority of New York & New Jersey Revenue | 5.000% | 9/1/33 | 1,000 | 1,113 |
| Port Authority of New York & New Jersey Revenue | 5.000% | 9/1/33 | 4,000 | 4,574 |
| Port Authority of New York & New Jersey Revenue | 5.000% | 9/1/34 | 4,000 | 4,556 |
| Port Authority of New York & New Jersey Revenue | 5.000% | 11/15/34 | 4,765 | 5,381 |
| Port Authority of New York & New Jersey Revenue | 5.000% | 9/1/35 | 5,000 | 5,673 |
| Port Authority of New York & New Jersey Revenue | 5.000% | 10/15/35 | 7,000 | 7,757 |
| Port Authority of New York & New Jersey Revenue | 5.000% | 9/1/36 | 4,500 | 5,085 |
| Port Authority of New York & New Jersey Revenue | 5.000% | 9/1/37 | 5,000 | 5,637 |
| Port Authority of New York & New Jersey Special Obligation Revenue | | | | |
| (John F. Kennedy International Air Terminal LLC) | 6.500% | 12/1/28 | 25,000 | 26,263 |
| Suffolk County NY GO | 5.000% | 5/15/21 (4) | 9,280 | 9,884 |
| Syracuse NY Industrial Development Agency Civic Facility Revenue | | | | |
| (Syracuse University Project) VRDO | 3.286% | 11/8/18 (2) | 4,350 | 4,350 |
| Tobacco Settlement Financing Corp. New York Revenue | 5.000% | 6/1/25 | 12,000 | 13,325 |
| Tobacco Settlement Financing Corp. New York Revenue | 5.000% | 6/1/25 | 4,500 | 4,861 |
| Tobacco Settlement Financing Corp. New York Revenue | 5.000% | 6/1/26 | 6,050 | 6,756 |
| Tobacco Settlement Financing Corp. New York Revenue | 5.000% | 6/1/27 | 5,500 | 6,163 |
232
Intermediate-Term Tax-Exempt Fund
| | | | |
| Face | Market |
| Maturity | Amount | Value• |
| Coupon | Date | ($000) | ($000) |
| Tobacco Settlement Financing Corp. New York Revenue | 5.000% | 6/1/28 | 7,000 | 7,669 |
| Tobacco Settlement Financing Corp. New York Revenue | 5.000% | 6/1/29 | 7,500 | 8,159 |
| Tobacco Settlement Financing Corp. New York Revenue | 5.000% | 6/1/31 | 10,000 | 10,765 |
| Tobacco Settlement Financing Corp. New York Revenue | 5.000% | 6/1/32 | 8,445 | 9,047 |
| Tobacco Settlement Financing Corp. New York Revenue | 5.000% | 6/1/33 | 5,000 | 5,338 |
| Tobacco Settlement Financing Corp. New York Revenue | 5.000% | 6/1/35 | 5,000 | 5,300 |
| Triborough Bridge & Tunnel Authority New York Revenue | 5.000% | 11/15/18 (Prere.) | 4,575 | 4,580 |
| Triborough Bridge & Tunnel Authority New York Revenue | 5.000% | 11/15/18 (Prere.) | 15,405 | 15,423 |
| Triborough Bridge & Tunnel Authority New York Revenue | 5.000% | 1/1/22 (Prere.) | 15,000 | 16,334 |
| Triborough Bridge & Tunnel Authority New York Revenue | 5.000% | 1/1/22 (Prere.) | 15,000 | 16,334 |
| Triborough Bridge & Tunnel Authority New York Revenue | 5.000% | 11/15/23 | 11,000 | 12,382 |
| Triborough Bridge & Tunnel Authority New York Revenue | 5.000% | 11/15/30 | 2,840 | 2,843 |
| Triborough Bridge & Tunnel Authority New York Revenue | 5.000% | 11/15/30 | 8,185 | 9,357 |
| Triborough Bridge & Tunnel Authority New York Revenue | 5.000% | 11/15/31 | 10,000 | 11,375 |
| Triborough Bridge & Tunnel Authority New York Revenue | 0.000% | 11/15/32 | 28,665 | 16,669 |
| Triborough Bridge & Tunnel Authority New York Revenue | 5.000% | 11/15/32 | 14,270 | 16,153 |
| Triborough Bridge & Tunnel Authority New York Revenue | 5.000% | 11/15/33 | 3,000 | 3,386 |
| Triborough Bridge & Tunnel Authority New York Revenue | 5.000% | 11/15/33 | 5,210 | 5,877 |
| Triborough Bridge & Tunnel Authority New York Revenue | 5.000% | 11/15/33 | 14,900 | 16,704 |
| Triborough Bridge & Tunnel Authority New York Revenue | 5.000% | 11/15/34 | 8,350 | 9,337 |
| Triborough Bridge & Tunnel Authority New York Revenue | 5.000% | 11/15/35 | 11,000 | 12,329 |
| Triborough Bridge & Tunnel Authority New York Revenue | 5.000% | 11/15/35 | 2,500 | 2,802 |
| Triborough Bridge & Tunnel Authority New York Revenue | 5.000% | 11/15/35 | 6,065 | 6,761 |
| Triborough Bridge & Tunnel Authority New York Revenue | 5.000% | 11/15/35 | 2,045 | 2,289 |
| Triborough Bridge & Tunnel Authority New York Revenue | 5.000% | 11/15/35 | 3,460 | 3,873 |
| Triborough Bridge & Tunnel Authority New York Revenue | 5.000% | 11/15/36 | 13,245 | 14,804 |
| Triborough Bridge & Tunnel Authority New York Revenue | 5.000% | 11/15/37 | 2,500 | 2,788 |
| United Nations Development Corp. New York Revenue | 5.000% | 7/1/21 | 7,200 | 7,335 |
| Utility Debt Securitization Authority New York Revenue | 5.000% | 12/15/29 | 33,000 | 36,739 |
| Utility Debt Securitization Authority New York Revenue | 5.000% | 12/15/31 | 5,140 | 5,709 |
| Utility Debt Securitization Authority New York Revenue | 5.000% | 12/15/32 | 20,825 | 23,405 |
| Utility Debt Securitization Authority New York Revenue | 5.000% | 12/15/33 | 24,860 | 27,953 |
| Utility Debt Securitization Authority New York Revenue | 5.000% | 12/15/34 | 38,500 | 42,983 |
| Utility Debt Securitization Authority New York Revenue | 5.000% | 12/15/34 | 15,010 | 16,834 |
| Utility Debt Securitization Authority New York Revenue | 5.000% | 12/15/35 | 50,905 | 56,661 |
| Utility Debt Securitization Authority New York Revenue | 5.000% | 12/15/36 | 30,000 | 33,292 |
| Westchester County NY GO | 5.000% | 7/1/21 (ETM) | 335 | 359 |
| Westchester County NY GO | 5.000% | 7/1/21 (ETM) | 240 | 258 |
| Westchester County NY GO | 4.000% | 7/1/29 | 5,920 | 6,525 |
| Westchester County NY Health Care Corp. Revenue | 6.000% | 11/1/20 (Prere.) | 870 | 935 |
| Westchester County NY Health Care Corp. Revenue | 5.000% | 11/1/30 | 1,935 | 2,029 |
| Westchester County NY Health Care Corp. Revenue | 6.000% | 11/1/30 | 130 | 138 |
| Westchester County NY Local Development Corp. Revenue (Westchester Medical Center) | 5.000% | 11/1/31 | 2,600 | 2,797 |
| Westchester County NY Local Development Corp. Revenue (Westchester Medical Center) | 5.000% | 11/1/32 | 2,375 | 2,544 |
| Westchester County NY Local Development Corp. Revenue (Westchester Medical Center) | 5.000% | 11/1/33 | 2,965 | 3,161 |
| Westchester NY Tobacco Asset Securitization Revenue | 5.000% | 6/1/25 | 1,505 | 1,664 |
| Westchester NY Tobacco Asset Securitization Revenue | 5.000% | 6/1/27 | 4,405 | 4,912 |
| Westchester NY Tobacco Asset Securitization Revenue | 5.000% | 6/1/28 | 3,000 | 3,322 |
| Westchester NY Tobacco Asset Securitization Revenue | 5.000% | 6/1/29 | 4,490 | 4,940 |
| Westchester NY Tobacco Asset Securitization Revenue | 5.000% | 6/1/30 | 4,645 | 5,064 |
| Westchester NY Tobacco Asset Securitization Revenue | 5.000% | 6/1/31 | 2,740 | 2,972 |
| Westchester NY Tobacco Asset Securitization Revenue | 5.000% | 6/1/32 | 2,160 | 2,332 |
| Westchester NY Tobacco Asset Securitization Revenue | 5.000% | 6/1/34 | 2,525 | 2,703 |
| Westchester NY Tobacco Asset Securitization Revenue | 5.000% | 6/1/35 | 3,685 | 3,931 |
| | | | 9,047,116 |
| North Carolina (0.9%) | | | | |
| Buncombe County NC Limited Obligation Revenue | 5.000% | 6/1/20 | 5,280 | 5,521 |
| Cabarrus County NC Installment Financing Contract Revenue | 5.000% | 4/1/19 | 500 | 506 |
| Cabarrus County NC Installment Financing Contract Revenue | 5.000% | 4/1/21 | 1,310 | 1,395 |
| Cary NC Combined Utility Systems Revenue | 5.000% | 12/1/30 | 1,010 | 1,177 |
| Cary NC Combined Utility Systems Revenue | 4.000% | 12/1/32 | 1,430 | 1,500 |
| Cary NC Combined Utility Systems Revenue | 4.000% | 12/1/33 | 3,090 | 3,212 |
| Cary NC Combined Utility Systems Revenue | 4.000% | 12/1/34 | 3,000 | 3,109 |
| Cary NC Combined Utility Systems Revenue | 4.000% | 12/1/35 | 2,500 | 2,579 |
| Charlotte NC Airport Revenue | 5.000% | 7/1/27 | 3,365 | 3,939 |
| Charlotte NC Airport Revenue | 5.000% | 7/1/28 | 2,200 | 2,559 |
| Charlotte NC Airport Revenue | 5.000% | 7/1/29 | 2,210 | 2,556 |
| Charlotte NC Airport Revenue | 5.000% | 7/1/30 | 3,100 | 3,570 |
| Charlotte NC Airport Revenue | 5.000% | 7/1/31 | 1,690 | 1,939 |
233
Intermediate-Term Tax-Exempt Fund
| | | | |
| Face | Market |
| Maturity | Amount | Value• |
| Coupon | Date | ($000) | ($000) |
| Charlotte NC Airport Revenue | 4.000% | 7/1/32 | 1,000 | 1,046 |
| Charlotte NC Airport Revenue | 4.000% | 7/1/33 | 2,465 | 2,568 |
| Charlotte NC Airport Revenue | 5.000% | 7/1/33 | 1,660 | 1,890 |
| Charlotte NC Airport Revenue | 5.000% | 7/1/36 | 1,840 | 2,075 |
| Charlotte NC GO | 5.000% | 7/1/22 | 3,280 | 3,597 |
| Charlotte NC GO | 5.000% | 7/1/23 | 3,355 | 3,676 |
| Durham Capital Financing Corp. North Carolina Limited Obligation Revenue | 5.000% | 6/1/33 | 3,210 | 3,523 |
| Durham County NC GO | 5.000% | 10/1/23 | 5,105 | 5,734 |
| Guilford County NC GO | 5.000% | 3/1/22 | 3,230 | 3,520 |
| Mecklenburg County NC COP | 4.750% | 2/1/19 (Prere.) | 2,500 | 2,518 |
| Mecklenburg County NC COP | 5.000% | 2/1/19 (Prere.) | 1,000 | 1,008 |
| Mecklenburg County NC COP | 5.000% | 2/1/19 (Prere.) | 1,200 | 1,209 |
| Mecklenburg County NC COP | 5.000% | 2/1/19 (Prere.) | 3,390 | 3,417 |
| Mecklenburg County NC GO | 5.000% | 3/1/19 (Prere.) | 3,715 | 3,754 |
| Mecklenburg County NC GO | 5.000% | 2/1/21 | 1,120 | 1,191 |
| Mecklenburg County NC GO | 5.000% | 12/1/27 | 2,585 | 3,020 |
| Mecklenburg County NC GO | 5.000% | 4/1/29 | 5,000 | 5,682 |
| New Hanover County NC Hospital Revenue (New Hanover Regional Medical Center Project) | 5.000% | 10/1/19 (Prere.) | 9,900 | 10,163 |
| New Hanover County NC Hospital Revenue (New Hanover Regional Medical Center Project) | 5.000% | 10/1/28 | 4,000 | 4,538 |
| New Hanover County NC Hospital Revenue (New Hanover Regional Medical Center Project) | 5.000% | 10/1/35 | 1,500 | 1,648 |
| New Hanover County NC Hospital Revenue (New Hanover Regional Medical Center Project) | 5.000% | 10/1/36 | 1,250 | 1,367 |
| North Carolina Capital Facilities Financial Solid Waste Disposal Revenue (Duke Energy) | 4.375% | 10/1/31 | 4,260 | 4,386 |
| North Carolina Capital Improvement Revenue | 5.000% | 5/1/19 | 15,500 | 15,739 |
| North Carolina Capital Improvement Revenue | 5.000% | 5/1/20 (Prere.) | 30,510 | 31,817 |
| North Carolina Capital Improvement Revenue | 5.000% | 5/1/20 (Prere.) | 28,585 | 29,809 |
| North Carolina Capital Improvement Revenue | 5.000% | 5/1/20 | 15,385 | 16,051 |
| North Carolina Capital Improvement Revenue | 5.000% | 5/1/21 | 13,495 | 14,425 |
| North Carolina Eastern Municipal Power Agency Power Systems Revenue | 5.500% | 1/1/19 (Prere.) | 3,000 | 3,018 |
| North Carolina GAN | 5.000% | 3/1/21 | 2,075 | 2,204 |
| North Carolina GAN | 5.000% | 3/1/24 | 13,000 | 14,605 |
| North Carolina GAN | 5.000% | 3/1/25 | 19,100 | 21,771 |
| North Carolina GAN | 5.000% | 3/1/27 | 5,955 | 6,714 |
| North Carolina GAN | 5.000% | 3/1/29 | 15,000 | 16,745 |
| North Carolina GO | 5.000% | 6/1/21 | 5,515 | 5,913 |
| North Carolina GO | 4.000% | 5/1/23 | 39,470 | 42,374 |
| North Carolina Medical Care Commission Health Care Facilities Revenue | | | | |
| (Cape Fear Valley Health System) | 5.000% | 10/1/21 | 8,610 | 9,209 |
| North Carolina Medical Care Commission Health Care Facilities Revenue | | | | |
| (Cape Fear Valley Health System) | 5.000% | 10/1/22 | 9,155 | 9,971 |
| North Carolina Medical Care Commission Health Care Facilities Revenue | | | | |
| (Novant Health Obligated Group) | 5.000% | 11/1/30 | 2,435 | 2,552 |
| North Carolina Medical Care Commission Health Care Facilities Revenue (Vidant Health) | 5.000% | 6/1/28 | 1,275 | 1,419 |
| North Carolina Medical Care Commission Health Care Facilities Revenue (Vidant Health) | 5.000% | 6/1/29 | 2,010 | 2,224 |
| North Carolina Medical Care Commission Health Care Facilities Revenue (WakeMed) | 5.000% | 10/1/27 | 4,000 | 4,361 |
| North Carolina Medical Care Commission Health Care Facilities Revenue (WakeMed) | 5.000% | 10/1/31 | 12,630 | 13,648 |
| North Carolina Medical Care Commission Health System Revenue (Mission Health System Inc.) | 5.000% | 10/1/28 | 1,050 | 1,050 |
| North Carolina Medical Care Commission Health System Revenue (Mission Health System Inc.) | 5.000% | 10/1/29 | 1,000 | 999 |
| North Carolina Medical Care Commission Health System Revenue (Mission Health System Inc.) | 5.000% | 10/1/31 | 1,000 | 999 |
| North Carolina Medical Care Commission Health System Revenue (Mission Health System Inc.) | 5.000% | 10/1/32 | 1,800 | 1,796 |
| North Carolina Medical Care Commission Hospital (Moses Cone Health System) VRDO | 1.590% | 11/7/18 | 37,140 | 37,140 |
| North Carolina Medical Care Commission Hospital Revenue (North Carolina Baptist Hospital) | 5.000% | 6/1/20 | 1,420 | 1,481 |
| North Carolina Medical Care Commission Hospital Revenue (North Carolina Baptist Hospital) | 5.000% | 6/1/21 | 5,000 | 5,210 |
| North Carolina Medical Care Commission Hospital Revenue (North Carolina Baptist Hospital) | 5.000% | 6/1/22 | 5,020 | 5,231 |
| North Carolina Medical Care Commission Hospital Revenue | | | | |
| (Southeastern Regional Medical Center) | 5.000% | 6/1/23 | 1,825 | 1,980 |
| North Carolina Medical Care Commission Hospital Revenue | | | | |
| (Southeastern Regional Medical Center) | 5.000% | 6/1/25 | 1,035 | 1,120 |
| North Carolina Medical Care Commission Retirement Facilities Revenue | | | | |
| (United Methodist Retirement Homes Inc.) | 5.000% | 10/1/27 | 175 | 191 |
| North Carolina Medical Care Commission Retirement Facilities Revenue | | | | |
| (United Methodist Retirement Homes Inc.) | 5.000% | 10/1/29 | 635 | 688 |
| North Carolina Medical Care Commission Retirement Facilities Revenue | | | | |
| (United Methodist Retirement Homes Inc.) | 5.000% | 10/1/31 | 650 | 698 |
| North Carolina Medical Care Commission Retirement Facilities Revenue | | | | |
| (United Methodist Retirement Homes Inc.) | 5.000% | 10/1/32 | 500 | 536 |
| North Carolina Municipal Power Agency No. 1 Revenue (Catawba Electric) | 5.000% | 1/1/19 (Prere.) | 3,205 | 3,222 |
| North Carolina Municipal Power Agency No. 1 Revenue (Catawba Electric) | 5.000% | 1/1/30 | 1,295 | 1,301 |
| North Carolina Revenue | 5.000% | 5/1/29 | 25,060 | 28,978 |
| North Carolina State University at Raleigh General Revenue | 5.000% | 10/1/25 | 2,655 | 2,971 |
| North Carolina Turnpike Authority Revenue | 5.000% | 1/1/25 | 1,785 | 1,983 |
234
Intermediate-Term Tax-Exempt Fund
| | | | |
| Face | Market |
| Maturity | Amount | Value• |
| Coupon | Date | ($000) | ($000) |
| North Carolina Turnpike Authority Revenue | 5.000% | 1/1/26 (4) | 1,805 | 2,046 |
| North Carolina Turnpike Authority Revenue | 5.000% | 1/1/28 (4) | 2,250 | 2,554 |
| North Carolina Turnpike Authority Revenue | 5.000% | 1/1/29 (4) | 2,600 | 2,930 |
| University of North Carolina at Charlotte Revenue | 4.000% | 10/1/33 | 1,000 | 1,034 |
| University of North Carolina at Charlotte Revenue | 4.000% | 10/1/34 | 1,250 | 1,289 |
| University of North Carolina at Charlotte Revenue | 4.000% | 10/1/35 | 1,100 | 1,127 |
| University of North Carolina at Greensboro Revenue | 4.000% | 4/1/34 | 3,000 | 3,085 |
| University of North Carolina at Greensboro Revenue | 4.000% | 4/1/36 | 1,385 | 1,412 |
| University of North Carolina University System Revenue | 5.250% | 10/1/19 (Prere.) | 1,720 | 1,770 |
| University of North Carolina University System Revenue | 5.250% | 10/1/19 (Prere.) | 1,590 | 1,637 |
| Wake County NC GO | 5.000% | 3/1/20 | 9,340 | 9,705 |
| Wake County NC GO | 5.000% | 3/1/21 | 5,125 | 5,459 |
| Wake County NC GO | 5.000% | 3/1/22 | 9,000 | 9,808 |
| Wake County NC GO | 5.000% | 3/1/23 | 18,730 | 20,819 |
| Wake County NC Limited Obligation Revenue | 5.000% | 6/1/19 (Prere.) | 3,000 | 3,054 |
| Wake County NC Limited Obligation Revenue | 5.000% | 12/1/20 | 6,380 | 6,749 |
| Wake County NC Public Improvement GO | 5.000% | 9/1/21 | 2,400 | 2,586 |
| | | | 544,299 |
| North Dakota (0.0%) | | | | |
| Burleigh County ND Health Care Revenue (St. Alexis Medical Center Project) | 5.000% | 7/1/21 (Prere.) | 1,500 | 1,604 |
| Burleigh County ND Health Care Revenue (St. Alexis Medical Center Project) | 5.000% | 7/1/21 (Prere.) | 1,000 | 1,069 |
| Burleigh County ND Health Care Revenue (St. Alexis Medical Center Project) | 5.000% | 7/1/21 (Prere.) | 1,300 | 1,390 |
| Grand Forks ND Health Care System Revenue (Altru Health System Obligated Group) | 5.000% | 12/1/25 | 3,000 | 3,338 |
| Grand Forks ND Health Care System Revenue (Altru Health System Obligated Group) | 5.000% | 12/1/26 | 5,060 | 5,658 |
| Ward County ND Health Care Facilities Revenue (Trinity Health Obligated Group) | 5.000% | 6/1/29 | 2,000 | 2,154 |
| Ward County ND Health Care Facilities Revenue (Trinity Health Obligated Group) | 5.000% | 6/1/30 | 1,800 | 1,929 |
| Ward County ND Health Care Facilities Revenue (Trinity Health Obligated Group) | 5.000% | 6/1/31 | 1,800 | 1,920 |
| | | | 19,062 |
| Ohio (3.0%) | | | | |
| Akron OH Bath & Copley Joint Township Hospital District Revenue | | | | |
| (Children’s Hospital Medical Center of Akron) | 5.000% | 11/15/32 | 7,500 | 8,013 |
| Akron OH Bath & Copley Joint Township Hospital District Revenue | | | | |
| (Summa Health System Obligated Group) | 5.250% | 11/15/27 | 1,340 | 1,499 |
| Akron OH Bath & Copley Joint Township Hospital District Revenue | | | | |
| (Summa Health System Obligated Group) | 5.250% | 11/15/28 | 1,210 | 1,345 |
| Akron OH Bath & Copley Joint Township Hospital District Revenue | | | | |
| (Summa Health System Obligated Group) | 5.250% | 11/15/29 | 1,315 | 1,451 |
| Akron OH Bath & Copley Joint Township Hospital District Revenue | | | | |
| (Summa Health System Obligated Group) | 5.250% | 11/15/31 | 1,000 | 1,094 |
| Akron OH Bath & Copley Joint Township Hospital District Revenue | | | | |
| (Summa Health System Obligated Group) | 5.250% | 11/15/34 | 3,540 | 3,841 |
| Akron OH Income Tax Revenue (Community Learning Centers) | 5.000% | 12/1/27 | 5,830 | 6,330 |
| Akron OH Income Tax Revenue (Community Learning Centers) | 4.000% | 12/1/31 | 2,125 | 2,214 |
| Akron OH Income Tax Revenue (Community Learning Centers) | 4.000% | 12/1/32 | 1,650 | 1,711 |
| Akron OH Income Tax Revenue (Community Learning Centers) | 4.000% | 12/1/33 | 1,150 | 1,179 |
| Allen County OH Hospital Facilities Revenue (Catholic Healthcare Partners) | 5.250% | 9/1/20 (Prere.) | 30,000 | 31,599 |
| Allen County OH Hospital Facilities Revenue (Mercy Health) | 5.000% | 8/1/26 | 12,045 | 13,619 |
| Allen County OH Hospital Facilities Revenue (Mercy Health) | 5.000% | 8/1/27 | 10,250 | 11,639 |
| Allen County OH Hospital Facilities Revenue (Mercy Health) | 5.000% | 8/1/28 | 6,010 | 6,808 |
| Allen County OH Hospital Facilities Revenue (Mercy Health) | 5.000% | 8/1/29 | 11,040 | 12,422 |
| Allen County OH Hospital Facilities Revenue (Mercy Health) | 4.000% | 8/1/36 | 5,750 | 5,663 |
| Allen County OH Hospital Facilities Revenue (Mercy Health) | 4.000% | 8/1/37 | 10,000 | 9,729 |
| Allen County OH Hospital Facilities Revenue (Mercy Health) | 4.000% | 8/1/38 | 3,600 | 3,490 |
| American Municipal Power Ohio Inc. Revenue | 5.000% | 2/15/24 | 11,430 | 11,821 |
| American Municipal Power Ohio Inc. Revenue | 5.000% | 2/15/25 | 10,000 | 10,339 |
| American Municipal Power Ohio Inc. Revenue (Fremont Energy Center Project) | 5.000% | 2/15/22 (Prere.) | 2,375 | 2,578 |
| American Municipal Power Ohio Inc. Revenue (Fremont Energy Center Project) | 5.250% | 2/15/22 (Prere.) | 6,120 | 6,690 |
| American Municipal Power Ohio Inc. Revenue (Fremont Energy Center Project) | 5.000% | 2/15/31 | 9,145 | 9,796 |
| American Municipal Power Ohio Inc. Revenue (Fremont Energy Center Project) | 5.000% | 2/15/32 | 13,480 | 14,426 |
| American Municipal Power Ohio Inc. Revenue (Hydroelectric Projects) | 5.250% | 2/15/19 | 13,050 | 13,173 |
| American Municipal Power Ohio Inc. Revenue (Hydroelectric Projects) | 5.000% | 2/15/20 | 10,530 | 10,888 |
| American Municipal Power Ohio Inc. Revenue (Hydroelectric Projects) | 5.000% | 2/15/26 | 8,480 | 9,648 |
| American Municipal Power Ohio Inc. Revenue (Hydroelectric Projects) | 5.000% | 2/15/27 | 7,465 | 8,535 |
| American Municipal Power Ohio Inc. Revenue (Hydroelectric Projects) | 5.000% | 2/15/28 | 3,060 | 3,515 |
| American Municipal Power Ohio Inc. Revenue (Hydroelectric Projects) | 5.000% | 2/15/29 | 3,805 | 4,315 |
| American Municipal Power Ohio Inc. Revenue (Hydroelectric Projects) | 4.000% | 2/15/30 | 1,825 | 1,861 |
| American Municipal Power Ohio Inc. Revenue (Hydroelectric Projects) | 4.000% | 2/15/31 | 1,565 | 1,590 |
| American Municipal Power Ohio Inc. Revenue (Hydroelectric Projects) | 4.000% | 2/15/32 | 1,850 | 1,871 |
| American Municipal Power Ohio Inc. Revenue (Prairie State Energy Campus Project) | 5.000% | 2/15/19 (Prere.) | 5,000 | 5,045 |
235
Intermediate-Term Tax-Exempt Fund
| | | | |
| Face | Market |
| Maturity | Amount | Value• |
| Coupon | Date | ($000) | ($000) |
| American Municipal Power Ohio Inc. Revenue (Prairie State Energy Campus Project) | 5.000% | 2/15/34 | 4,520 | 5,008 |
| American Municipal Power Ohio Inc. Revenue (Prairie State Energy Campus Project) | 5.000% | 2/15/35 | 3,000 | 3,311 |
| American Municipal Power Ohio Inc. Revenue (Prairie State Energy Campus Project) | 5.000% | 2/15/37 | 4,220 | 4,630 |
| American Municipal Power Ohio Inc. Revenue (Prairie State Energy Campus Project) | 5.000% | 2/15/38 | 2,335 | 2,554 |
| American Municipal Power Ohio Inc. Revenue (Prairie State Energy Campus Project) PUT | 5.000% | 8/15/19 | 7,000 | 7,058 |
| Bluffton OH Hospital Facilities Revenue (Blanchard Valley Health System Obligated Group | 5.000% | 12/1/30 | 1,025 | 1,134 |
| Bluffton OH Hospital Facilities Revenue (Blanchard Valley Health System Obligated Group) | 5.000% | 12/1/25 | 2,020 | 2,266 |
| Bluffton OH Hospital Facilities Revenue (Blanchard Valley Health System Obligated Group) | 5.000% | 12/1/26 | 2,360 | 2,653 |
| Bluffton OH Hospital Facilities Revenue (Blanchard Valley Health System Obligated Group) | 5.000% | 12/1/27 | 1,800 | 2,032 |
| Bluffton OH Hospital Facilities Revenue (Blanchard Valley Health System Obligated Group) | 5.000% | 12/1/28 | 1,780 | 1,991 |
| Bluffton OH Hospital Facilities Revenue (Blanchard Valley Health System Obligated Group) | 5.000% | 12/1/31 | 1,105 | 1,218 |
| Bluffton OH Hospital Facilities Revenue (Blanchard Valley Health System Obligated Group) | 4.000% | 12/1/32 | 2,000 | 1,989 |
| Chillicothe OH Hospital Facilities Revenue (Adena Health System Obligated Group) | 5.000% | 12/1/26 | 2,985 | 3,385 |
| Chillicothe OH Hospital Facilities Revenue (Adena Health System Obligated Group) | 5.000% | 12/1/27 | 2,025 | 2,303 |
| Chillicothe OH Hospital Facilities Revenue (Adena Health System Obligated Group) | 5.000% | 12/1/37 | 5,715 | 6,088 |
| Cincinnati OH City School District GO | 5.250% | 6/1/20 (Prere.) | 3,810 | 3,988 |
| Cincinnati OH City School District GO | 5.250% | 6/1/20 (Prere.) | 3,180 | 3,328 |
| Cincinnati OH City School District GO | 5.250% | 12/1/20 (14) | 7,000 | 7,433 |
| Cincinnati OH City School District GO | 5.250% | 12/1/21 (14) | 5,710 | 6,212 |
| Cincinnati OH City School District GO | 5.250% | 12/1/22 (14) | 10,030 | 11,139 |
| Cincinnati OH GO | 5.000% | 12/1/26 | 1,225 | 1,419 |
| Cincinnati OH GO | 5.000% | 12/1/27 | 770 | 898 |
| Cincinnati OH GO | 4.000% | 12/1/28 | 1,020 | 1,091 |
| Cincinnati OH GO | 4.000% | 12/1/31 | 750 | 787 |
| Cincinnati OH GO | 4.000% | 12/1/32 | 800 | 835 |
| Cincinnati OH GO | 4.000% | 12/1/33 | 2,150 | 2,233 |
| Cincinnati OH Water System Revenue | 4.000% | 12/1/28 | 2,000 | 2,173 |
| Cincinnati OH Water System Revenue | 4.000% | 12/1/29 | 1,300 | 1,404 |
| Cleveland Heights & University Heights OH City School District GO | 4.000% | 12/1/33 | 1,395 | 1,438 |
| Cleveland Heights & University Heights OH City School District GO | 4.000% | 12/1/35 | 1,770 | 1,806 |
| Cleveland Heights & University Heights OH City School District GO | 4.000% | 12/1/36 | 3,605 | 3,665 |
| Cleveland Heights & University Heights OH City School District GO | 4.000% | 12/1/37 | 2,325 | 2,355 |
| Cleveland OH Airport System Revenue | 5.000% | 1/1/23 (4) | 1,510 | 1,654 |
| Cleveland OH Airport System Revenue | 5.000% | 1/1/24 (4) | 1,075 | 1,194 |
| Cleveland OH GO | 5.000% | 12/1/19 | 1,780 | 1,835 |
| Cleveland OH Income Tax Revenue | 5.000% | 10/1/23 (Prere.) | 5,035 | 5,638 |
| Cleveland OH Income Tax Revenue | 5.000% | 10/1/23 (Prere.) | 4,800 | 5,375 |
| Cleveland OH Income Tax Revenue | 5.000% | 10/1/23 (Prere.) | 10,035 | 11,237 |
| Cleveland OH Municipal School District GO | 5.000% | 12/1/26 | 1,660 | 1,817 |
| Cleveland OH Municipal School District GO | 5.000% | 12/1/27 | 1,050 | 1,147 |
| Cleveland OH Water Revenue | 5.000% | 1/1/22 (Prere.) | 2,400 | 2,605 |
| Cleveland OH Water Revenue | 5.000% | 1/1/22 (Prere.) | 2,500 | 2,714 |
| Cleveland OH Water Revenue | 5.000% | 1/1/22 (Prere.) | 2,250 | 2,442 |
| Cleveland State University Ohio General Receipts Revenue | 5.000% | 6/1/29 | 5,000 | 5,339 |
| Cleveland State University Ohio General Receipts Revenue | 5.000% | 6/1/30 | 5,225 | 5,575 |
| Cleveland State University Ohio General Receipts Revenue | 5.000% | 6/1/31 | 8,640 | 9,213 |
| Cleveland State University Ohio General Receipts Revenue | 5.000% | 6/1/32 | 9,060 | 9,658 |
| Cleveland-Cuyahoga County OH Port Authority Revenue | | | | |
| (Euclid Avenue Development Corp. Project) | 5.000% | 8/1/31 | 3,175 | 3,436 |
| Cleveland-Cuyahoga County OH Port Authority Revenue | | | | |
| (Euclid Avenue Development Corp. Project) | 5.000% | 8/1/32 | 3,340 | 3,608 |
| Columbus OH City School District GO | 0.000% | 12/1/27 (4) | 14,060 | 10,389 |
| Columbus OH City School District GO | 0.000% | 12/1/29 (4) | 11,170 | 7,555 |
| Columbus OH City School District School Facilities Construction & Improvement GO | 4.000% | 12/1/19 | 2,000 | 2,021 |
| Columbus OH GO | 5.000% | 2/15/21 | 7,190 | 7,648 |
| Columbus OH GO | 5.000% | 2/15/22 | 3,000 | 3,263 |
| Columbus OH GO | 4.000% | 4/1/23 | 16,605 | 17,762 |
| Columbus OH GO | 5.000% | 7/1/24 | 5,690 | 6,462 |
| Columbus OH GO | 4.000% | 8/15/24 | 3,425 | 3,700 |
| Columbus OH GO | 5.000% | 8/15/24 | 10,305 | 11,726 |
| Columbus OH GO | 4.000% | 4/1/26 | 16,170 | 17,528 |
| Columbus OH GO | 4.000% | 8/15/27 | 7,500 | 8,091 |
| Columbus OH Metropolitan Library Special Obligation Revenue | 5.000% | 12/1/20 (Prere.) | 1,325 | 1,402 |
| Columbus OH Sewer Revenue | 5.000% | 6/1/29 | 12,000 | 13,669 |
| Columbus OH Sewer Revenue | 5.000% | 6/1/30 | 10,280 | 11,657 |
| Columbus OH Sewer Revenue | 5.000% | 6/1/32 | 3,400 | 3,826 |
| Cuyahoga County OH Economic Development Revenue (Med Mart/Convention Center Project) | 5.000% | 12/1/20 | 7,000 | 7,380 |
| Cuyahoga County OH Economic Development Revenue (Med Mart/Convention Center Project) | 5.000% | 12/1/21 | 7,300 | 7,709 |
| Cuyahoga County OH Excise Tax Revenue (Sports Facilities Improvement Project) | 5.000% | 12/1/26 | 1,500 | 1,660 |
| Cuyahoga County OH GO | 5.000% | 12/1/19 | 2,120 | 2,189 |
236
Intermediate-Term Tax-Exempt Fund
| | | | |
| Face | Market |
| Maturity | Amount | Value• |
| Coupon | Date | ($000) | ($000) |
| Cuyahoga County OH Hospital Revenue (MetroHealth System) | 5.000% | 2/15/26 | 3,000 | 3,247 |
| Cuyahoga County OH Hospital Revenue (MetroHealth System) | 5.000% | 2/15/27 | 2,845 | 3,081 |
| Cuyahoga County OH Hospital Revenue (MetroHealth System) | 5.000% | 2/15/30 | 7,145 | 7,618 |
| Cuyahoga County OH Hospital Revenue (MetroHealth System) | 5.000% | 2/15/32 | 5,385 | 5,691 |
| Cuyahoga County OH Hospital Revenue (MetroHealth System) | 5.000% | 2/15/37 | 16,500 | 17,180 |
| Cuyahoga County OH Sales Tax Revenue | 5.000% | 12/1/26 | 1,500 | 1,705 |
| Cuyahoga County OH Sales Tax Revenue | 5.000% | 12/1/28 | 2,000 | 2,262 |
| Cuyahoga County OH Sales Tax Revenue | 5.000% | 12/1/29 | 3,725 | 4,202 |
| Cuyahoga OH Community College District GO | 4.000% | 12/1/31 | 2,000 | 2,081 |
| Cuyahoga OH Community College District GO | 4.000% | 12/1/33 | 1,300 | 1,343 |
| Cuyahoga OH Community College District Revenue | 5.000% | 2/1/20 (Prere.) | 2,500 | 2,590 |
| Cuyahoga OH Community College District Revenue | 5.000% | 2/1/20 (Prere.) | 3,470 | 3,595 |
| Cuyahoga OH Community College District Revenue | 5.000% | 2/1/20 (Prere.) | 6,610 | 6,849 |
| Dayton OH City School District GO | 5.000% | 11/1/21 | 9,210 | 9,871 |
| Dayton OH City School District GO | 5.000% | 11/1/22 | 5,500 | 5,996 |
| Fairfield County OH Hospital Facilities Revenue (Fairfield Medical Center) | 5.125% | 6/15/33 | 11,000 | 11,488 |
| Franklin County OH Convention Facilities Authority Revenue | 5.000% | 12/1/20 | 6,000 | 6,328 |
| Franklin County OH Convention Facilities Authority Revenue | 5.000% | 12/1/28 | 7,000 | 7,835 |
| Franklin County OH Convention Facilities Authority Revenue | 5.000% | 12/1/29 | 5,050 | 5,640 |
| Franklin County OH Convention Facilities Authority Revenue | 5.000% | 12/1/30 | 8,640 | 9,639 |
| Franklin County OH Convention Facilities Authority Revenue | 5.000% | 12/1/31 | 10,000 | 11,139 |
| Franklin County OH Convention Facilities Authority Revenue | 5.000% | 12/1/32 | 10,000 | 11,127 |
| Franklin County OH Convention Facilities Authority Revenue | 5.000% | 12/1/33 | 10,000 | 11,104 |
| Franklin County OH Hospital Improvement Revenue (Nationwide Children’s Hospital Project) | 5.000% | 11/1/29 | 1,135 | 1,304 |
| Franklin County OH Hospital Improvement Revenue (Nationwide Children’s Hospital Project) | 5.000% | 11/1/30 | 2,645 | 3,024 |
| Franklin County OH Hospital Improvement Revenue (Nationwide Children’s Hospital Project) | 5.000% | 11/1/32 | 1,750 | 1,974 |
| Franklin County OH Sales Tax Revenue | 5.000% | 6/1/26 | 1,225 | 1,422 |
| Hamilton County OH Healthcare Revenue (Life Enriching Communities) | 5.000% | 1/1/25 | 1,125 | 1,213 |
| Hamilton County OH Healthcare Revenue (Life Enriching Communities) | 5.000% | 1/1/26 | 700 | 758 |
| Hamilton County OH Healthcare Revenue (Life Enriching Communities) | 4.000% | 1/1/27 | 1,225 | 1,243 |
| Hamilton County OH Healthcare Revenue (Life Enriching Communities) | 5.000% | 1/1/31 | 1,500 | 1,581 |
| Hamilton County OH Healthcare Revenue (Life Enriching Communities) | 5.000% | 1/1/32 | 1,635 | 1,727 |
| Hamilton County OH Hospital Facilities Revenue (TriHealth Obligated Group) | 5.000% | 8/15/33 | 8,115 | 8,874 |
| Hamilton County OH Hospital Facilities Revenue (TriHealth Obligated Group) | 5.000% | 8/15/34 | 11,540 | 12,593 |
| Hamilton County OH Hospital Facilities Revenue (TriHealth Obligated Group) | 5.000% | 8/15/35 | 13,965 | 15,195 |
| Hamilton County OH Hospital Facilities Revenue (TriHealth Obligated Group) | 5.000% | 8/15/36 | 12,955 | 14,046 |
| Hamilton County OH Sales Tax Revenue | 5.000% | 12/1/23 | 3,250 | 3,634 |
| Hamilton County OH Sales Tax Revenue | 5.000% | 12/1/24 | 3,300 | 3,741 |
| Huber Heights OH City School District GO | 4.750% | 12/1/19 (Prere.) | 890 | 916 |
| Huber Heights OH City School District GO | 4.875% | 12/1/19 (Prere.) | 150 | 155 |
| Huber Heights OH City School District GO | 5.000% | 12/1/19 (Prere.) | 1,000 | 1,032 |
| Huber Heights OH City School District GO | 5.000% | 12/1/19 (Prere.) | 1,000 | 1,032 |
| Kent State University Ohio Revenue | 5.000% | 5/1/29 | 1,000 | 1,078 |
| Kent State University Ohio Revenue | 5.000% | 5/1/30 | 1,750 | 1,883 |
| Kent State University Ohio Revenue | 5.000% | 5/1/31 | 4,000 | 4,298 |
| Lake County OH Hospital Facilities Revenue (Lake Hospital System Inc.) | 5.000% | 8/15/25 | 2,675 | 2,992 |
| Lake County OH Hospital Facilities Revenue (Lake Hospital System Inc.) | 5.000% | 8/15/26 | 1,170 | 1,301 |
| Lake County OH Hospital Facilities Revenue (Lake Hospital System Inc.) | 5.000% | 8/15/28 | 2,255 | 2,473 |
| Lake County OH Hospital Facilities Revenue (Lake Hospital System Inc.) | 5.000% | 8/15/29 | 1,745 | 1,900 |
| Lucas County OH Hospital Revenue (ProMedica Healthcare Obligated Group) | 5.000% | 11/15/21 (Prere.) | 4,245 | 4,582 |
| Lucas County OH Hospital Revenue (ProMedica Healthcare Obligated Group) | 5.750% | 11/15/21 (Prere.) | 6,000 | 6,607 |
| Lucas County OH Hospital Revenue (ProMedica Healthcare Obligated Group) | 5.000% | 11/15/26 | 7,675 | 8,049 |
| Miami University of Ohio General Receipts Revenue | 5.000% | 9/1/31 | 2,000 | 2,127 |
| Miami Valley OH Career Technology Center GO | 5.000% | 12/1/31 | 1,700 | 1,955 |
| Miami Valley OH Career Technology Center GO | 5.000% | 12/1/32 | 750 | 859 |
| Ohio Building Authority Revenue (Administration Building Fund) | 5.000% | 4/1/19 (Prere.) | 1,975 | 2,001 |
| Ohio Building Authority Revenue (Administration Building Fund) | 5.000% | 10/1/19 | 5,000 | 5,138 |
| Ohio Building Authority Revenue (Adult Correctional Building) | 5.125% | 4/1/21 (Prere.) | 1,475 | 1,575 |
| Ohio Capital Facilities Lease-Appropriation Revenue (Administrative Building Fund Projects) | 4.000% | 10/1/22 | 2,250 | 2,385 |
| Ohio Capital Facilities Lease-Appropriation Revenue (Administrative Building Fund Projects) | 5.000% | 4/1/37 | 3,000 | 3,335 |
| Ohio Capital Facilities Lease-Appropriation Revenue (Adult Correctional Building Fund Projects) | 4.000% | 10/1/22 | 1,000 | 1,060 |
| Ohio Capital Facilities Lease-Appropriation Revenue (Adult Correctional Building Fund Projects) | 4.000% | 10/1/22 | 1,805 | 1,914 |
| Ohio Capital Facilities Lease-Appropriation Revenue (Adult Correctional Building Fund Projects) | 5.000% | 10/1/23 | 1,000 | 1,117 |
| Ohio Capital Facilities Lease-Appropriation Revenue (Adult Correctional Building Fund Projects) | 5.000% | 10/1/23 | 3,425 | 3,825 |
| Ohio Capital Facilities Lease-Appropriation Revenue (Adult Correctional Building Fund Projects) | 5.000% | 10/1/26 | 1,420 | 1,646 |
| Ohio Capital Facilities Lease-Appropriation Revenue (Adult Correctional Building Fund Projects) | 5.000% | 10/1/26 | 2,570 | 2,979 |
| Ohio Capital Facilities Lease-Appropriation Revenue (Adult Correctional Building Fund Projects) | 5.000% | 10/1/27 | 2,230 | 2,601 |
| Ohio Capital Facilities Lease-Appropriation Revenue (Adult Correctional Building Fund Projects) | 5.000% | 10/1/28 | 1,025 | 1,182 |
| Ohio Capital Facilities Lease-Appropriation Revenue (Adult Correctional Building Fund Projects) | 5.000% | 10/1/29 | 1,190 | 1,365 |
| Ohio Capital Facilities Lease-Appropriation Revenue (Adult Correctional Building Fund Projects) | 5.000% | 10/1/32 | 1,620 | 1,834 |
237
Intermediate-Term Tax-Exempt Fund
| | | | |
| Face | Market |
| Maturity | Amount | Value• |
| Coupon | Date | ($000) | ($000) |
| Ohio Capital Facilities Lease-Appropriation Revenue (Adult Correctional Building Fund Projects) | 5.000% | 10/1/35 | 1,450 | 1,625 |
| Ohio Capital Facilities Lease-Appropriation Revenue | | | | |
| (Mental Health Facilities Improvement Fund Projects) | 4.000% | 2/1/22 | 5,670 | 5,966 |
| Ohio Capital Facilities Lease-Appropriation Revenue | | | | |
| (Mental Health Facilities Improvement Fund Projects) | 5.000% | 2/1/23 | 2,075 | 2,292 |
| Ohio Capital Facilities Lease-Appropriation Revenue | | | | |
| (Mental Health Facilities Improvement Fund Projects) | 5.000% | 2/1/23 | 5,375 | 5,938 |
| Ohio Common Schools GO | 5.000% | 6/15/20 | 7,730 | 8,090 |
| Ohio GO | 5.000% | 9/15/19 | 9,025 | 9,263 |
| Ohio GO | 5.000% | 4/1/21 | 4,440 | 4,728 |
| Ohio GO | 5.000% | 9/15/22 | 9,865 | 10,849 |
| Ohio GO | 5.000% | 9/15/22 | 4,000 | 4,399 |
| Ohio GO | 5.000% | 11/1/22 | 11,100 | 12,243 |
| Ohio GO | 5.000% | 2/1/24 | 4,685 | 5,277 |
| Ohio GO | 5.000% | 9/15/24 | 12,500 | 14,218 |
| Ohio GO | 5.000% | 2/1/25 | 9,655 | 11,037 |
| Ohio GO | 5.000% | 5/1/25 | 19,550 | 22,464 |
| Ohio GO | 5.000% | 11/1/25 | 7,805 | 9,018 |
| Ohio GO | 5.000% | 2/1/26 | 12,660 | 14,637 |
| Ohio GO | 5.000% | 8/1/26 | 25,275 | 29,409 |
| Ohio GO | 5.000% | 9/1/26 | 10,000 | 11,644 |
| Ohio GO | 5.000% | 11/1/26 | 7,080 | 8,272 |
| Ohio GO | 4.000% | 2/1/27 | 8,220 | 8,613 |
| Ohio GO | 5.000% | 2/1/27 | 11,595 | 13,323 |
| Ohio GO | 5.000% | 5/1/27 | 13,540 | 15,879 |
| Ohio GO | 5.000% | 11/1/27 | 6,545 | 7,717 |
| Ohio GO | 5.000% | 5/1/28 | 8,450 | 9,968 |
| Ohio GO | 5.000% | 8/1/28 | 19,000 | 22,437 |
| Ohio GO | 5.000% | 9/15/28 | 2,835 | 3,353 |
| Ohio GO | 5.000% | 6/15/33 | 16,465 | 18,477 |
| Ohio GO | 5.000% | 6/15/35 | 19,795 | 22,076 |
| Ohio GO | 5.000% | 3/15/36 | 5,000 | 5,505 |
| Ohio GO | 5.000% | 6/15/36 | 18,000 | 20,011 |
| Ohio Higher Educational Facility Commission Revenue | | | | |
| (Cleveland Clinic Health System Obligated Group) | 5.000% | 1/1/29 | 4,500 | 4,831 |
| Ohio Higher Educational Facility Commission Revenue | | | | |
| (Cleveland Clinic Health System Obligated Group) VRDO | 1.640% | 11/1/18 | 21,755 | 21,755 |
| Ohio Highway Capital Improvements GO | 5.000% | 5/1/22 (Prere.) | 10,220 | 11,157 |
| Ohio Hospital Revenue (Cleveland Clinic Health System Obligated Group) | 5.000% | 1/1/19 (Prere.) | 9,330 | 9,376 |
| Ohio Hospital Revenue (Cleveland Clinic Health System Obligated Group) | 5.125% | 1/1/19 (Prere.) | 11,670 | 11,730 |
| Ohio Hospital Revenue (Cleveland Clinic Health System Obligated Group) | 5.000% | 1/1/29 | 3,035 | 3,523 |
| Ohio Hospital Revenue (Cleveland Clinic Health System Obligated Group) | 5.000% | 1/1/30 | 2,200 | 2,541 |
| Ohio Hospital Revenue (Cleveland Clinic Health System Obligated Group) | 5.000% | 1/1/31 | 1,500 | 1,724 |
| Ohio Hospital Revenue (Cleveland Clinic Health System Obligated Group) | 5.000% | 1/1/33 | 3,100 | 3,524 |
| Ohio Hospital Revenue (Cleveland Clinic Health System Obligated Group) | 4.000% | 1/1/34 | 7,825 | 8,073 |
| Ohio Hospital Revenue (Cleveland Clinic Health System Obligated Group) | 4.000% | 1/1/36 | 3,000 | 3,072 |
| Ohio Hospital Revenue (University Hospitals Health System Inc.) VRDO | 1.950% | 11/1/18 | 10,500 | 10,500 |
| Ohio Infrastructure Improvement GO | 5.000% | 9/1/31 | 9,370 | 10,384 |
| Ohio Infrastructure Improvement GO | 5.000% | 9/1/32 | 9,850 | 10,900 |
| Ohio Infrastructure Improvement GO | 5.000% | 9/1/33 | 10,355 | 11,443 |
| Ohio Infrastructure Improvement GO | 5.000% | 9/1/34 | 10,885 | 12,012 |
| Ohio Infrastructure Improvement GO | 5.000% | 9/1/35 | 11,445 | 12,612 |
| Ohio Major New State Infrastructure Project Revenue | 5.000% | 12/15/22 | 5,235 | 5,770 |
| Ohio Major New State Infrastructure Project Revenue | 5.000% | 12/15/23 | 3,260 | 3,552 |
| Ohio Major New State Infrastructure Project Revenue | 5.000% | 12/15/23 | 4,025 | 4,512 |
| Ohio Major New State Infrastructure Project Revenue | 5.000% | 12/15/25 | 9,000 | 10,357 |
| Ohio Major New State Infrastructure Project Revenue | 5.000% | 12/15/26 | 22,225 | 25,788 |
| Ohio Major New State Infrastructure Project Revenue | 5.000% | 12/15/27 | 9,150 | 10,696 |
| Ohio Major New State Infrastructure Project Revenue | 5.000% | 12/15/28 | 23,250 | 26,515 |
| Ohio Major New State Infrastructure Project Revenue | 5.000% | 12/15/29 | 15,800 | 17,938 |
| Ohio Parks & Recreation Capital Facilities Revenue | 5.000% | 2/1/27 | 3,150 | 3,525 |
| Ohio Parks & Recreation Capital Facilities Revenue | 5.000% | 2/1/28 | 3,310 | 3,690 |
| Ohio Parks & Recreation Capital Facilities Revenue | 5.000% | 2/1/29 | 3,475 | 3,862 |
| Ohio Revenue (Transportation Building Fund Projects) | 5.000% | 4/1/25 | 1,000 | 1,141 |
| Ohio Revenue (Transportation Building Fund Projects) | 5.000% | 4/1/31 | 2,450 | 2,797 |
| Ohio Revenue (Transportation Building Fund Projects) | 5.000% | 4/1/32 | 2,200 | 2,502 |
| Ohio Revenue (Transportation Building Fund Projects) | 5.000% | 4/1/33 | 1,610 | 1,824 |
| Ohio State University General Receipts Revenue | 5.000% | 12/1/18 (Prere.) | 250 | 251 |
| Ohio State University General Receipts Revenue | 5.000% | 12/1/19 (Prere.) | 215 | 222 |
| Ohio State University General Receipts Revenue | 5.000% | 12/1/20 | 3,535 | 3,647 |
238
Intermediate-Term Tax-Exempt Fund
| | | | |
| Face | Market |
| Maturity | Amount | Value• |
| Coupon | Date | ($000) | ($000) |
| Ohio Turnpike Commission Turnpike Revenue | 5.000% | 2/15/20 (Prere.) | 7,195 | 7,463 |
| Ohio Turnpike Commission Turnpike Revenue | 5.000% | 2/15/20 (Prere.) | 1,750 | 1,815 |
| Ohio Turnpike Commission Turnpike Revenue | 5.500% | 2/15/20 (14) | 9,000 | 9,379 |
| Ohio Turnpike Commission Turnpike Revenue | 5.000% | 2/15/28 | 2,000 | 2,181 |
| Ohio Turnpike Commission Turnpike Revenue | 5.250% | 2/15/29 | 3,000 | 3,305 |
| Ohio Turnpike Commission Turnpike Revenue | 4.000% | 2/15/32 | 16,510 | 17,079 |
| Ohio Turnpike Commission Turnpike Revenue | 4.000% | 2/15/33 | 13,980 | 14,406 |
| Ohio Turnpike Commission Turnpike Revenue | 5.000% | 2/15/35 | 10,000 | 11,214 |
| Ohio Turnpike Commission Turnpike Revenue | 5.000% | 2/15/36 | 17,060 | 19,059 |
| Ohio Turnpike Commission Turnpike Revenue | 5.000% | 2/15/37 | 7,385 | 8,232 |
| Ohio Water Development Authority Drinking Water Assistance Fund Revenue | 5.250% | 12/1/19 | 5,775 | 5,923 |
| Ohio Water Development Authority Drinking Water Assistance Fund Revenue | 5.250% | 12/1/20 | 5,570 | 5,857 |
| Ohio Water Development Authority Pollution Control Revenue | 5.000% | 12/1/23 | 5,800 | 6,520 |
| Ohio Water Development Authority Pollution Control Revenue (Water Quality) | 5.000% | 12/1/21 | 5,310 | 5,749 |
| Ohio Water Development Authority Pollution Control Revenue (Water Quality) | 5.000% | 6/1/24 | 3,350 | 3,799 |
| Ohio Water Development Authority Water Pollution Control Loan Fund Revenue | 5.000% | 12/1/19 | 5,000 | 5,161 |
| Ohio Water Development Authority Water Pollution Control Loan Fund Revenue | 5.000% | 6/1/21 | 9,160 | 9,809 |
| Ohio Water Development Authority Water Pollution Control Loan Fund Revenue | 5.000% | 12/1/26 | 10,525 | 12,297 |
| Ohio Water Development Authority Water Pollution Control Loan Fund Revenue | 5.000% | 6/1/27 | 20,000 | 23,452 |
| Ohio Water Development Authority Water Pollution Control Loan Fund Revenue | 5.000% | 12/1/27 | 16,000 | 18,748 |
| Ohio Water Development Authority Water Pollution Control Loan Fund Revenue | 5.000% | 6/1/28 | 23,000 | 26,835 |
| Ohio Water Development Authority Water Pollution Control Loan Fund Revenue | 5.000% | 12/1/28 | 24,665 | 28,737 |
| Penta Career Center Ohio COP | 5.250% | 4/1/23 | 2,480 | 2,694 |
| University of Akron Ohio General Receipts Revenue | 5.000% | 1/1/20 (Prere.) | 3,150 | 3,255 |
| University of Akron Ohio General Receipts Revenue | 5.000% | 1/1/23 (4) | 4,860 | 5,014 |
| University of Akron Ohio General Receipts Revenue | 5.000% | 1/1/24 (4) | 3,335 | 3,440 |
| University of Akron Ohio General Receipts Revenue | 5.000% | 1/1/25 (4) | 2,500 | 2,578 |
| University of Akron Ohio General Receipts Revenue | 5.000% | 1/1/26 (4) | 2,000 | 2,062 |
| University of Akron Ohio General Receipts Revenue | 5.000% | 1/1/27 (4) | 2,000 | 2,061 |
| University of Akron Ohio General Receipts Revenue | 5.000% | 1/1/28 (4) | 2,500 | 2,575 |
| University of Akron Ohio General Receipts Revenue | 5.000% | 1/1/31 | 2,175 | 2,376 |
| University of Cincinnati Ohio General Receipts Revenue | 5.000% | 6/1/22 | 2,455 | 2,679 |
| University of Cincinnati Ohio General Receipts Revenue | 5.000% | 6/1/29 | 6,385 | 6,908 |
| University of Cincinnati Ohio General Receipts Revenue | 5.000% | 6/1/30 | 1,000 | 1,081 |
| | | | 1,761,038 |
| Oklahoma (0.4%) | | | | |
| Edmond OK Public Works Authority Sales Tax & Utility System Revenue | 4.000% | 7/1/26 | 760 | 824 |
| Edmond OK Public Works Authority Sales Tax & Utility System Revenue | 4.000% | 7/1/27 | 1,500 | 1,629 |
| Edmond OK Public Works Authority Sales Tax & Utility System Revenue | 4.000% | 7/1/28 | 1,750 | 1,891 |
| Edmond OK Public Works Authority Sales Tax & Utility System Revenue | 5.000% | 7/1/29 | 1,000 | 1,151 |
| Grand River Dam Authority Oklahoma Revenue | 5.000% | 6/1/28 | 7,570 | 8,714 |
| Norman OK Regional Hospital Authority Revenue | 5.000% | 9/1/19 | 795 | 812 |
| Norman OK Regional Hospital Authority Revenue | 5.000% | 9/1/20 | 835 | 871 |
| Norman OK Regional Hospital Authority Revenue | 5.000% | 9/1/21 | 880 | 936 |
| Norman OK Regional Hospital Authority Revenue | 5.000% | 9/1/22 | 925 | 1,000 |
| Norman OK Regional Hospital Authority Revenue | 5.000% | 9/1/23 | 970 | 1,061 |
| Norman OK Regional Hospital Authority Revenue | 5.000% | 9/1/24 | 5,000 | 5,525 |
| Norman OK Regional Hospital Authority Revenue | 5.000% | 9/1/24 | 1,020 | 1,127 |
| Norman OK Regional Hospital Authority Revenue | 5.000% | 9/1/25 | 3,525 | 3,927 |
| Norman OK Regional Hospital Authority Revenue | 5.000% | 9/1/25 | 1,075 | 1,198 |
| Norman OK Regional Hospital Authority Revenue | 5.000% | 9/1/26 | 5,325 | 5,988 |
| Norman OK Regional Hospital Authority Revenue | 5.000% | 9/1/26 | 1,130 | 1,271 |
| Norman OK Regional Hospital Authority Revenue | 5.000% | 9/1/27 | 2,100 | 2,341 |
| Norman OK Regional Hospital Authority Revenue | 5.000% | 9/1/27 | 1,185 | 1,326 |
| Norman OK Regional Hospital Authority Revenue | 5.000% | 9/1/28 | 2,000 | 2,218 |
| Norman OK Regional Hospital Authority Revenue | 5.000% | 9/1/29 | 1,310 | 1,446 |
| Norman OK Regional Hospital Authority Revenue | 5.000% | 9/1/30 | 1,380 | 1,515 |
| Norman OK Regional Hospital Authority Revenue | 5.000% | 9/1/31 | 1,450 | 1,586 |
| Oklahoma Capitol Improvement Authority Facilities Revenue | 5.000% | 7/1/23 | 2,515 | 2,801 |
| Oklahoma Capitol Improvement Authority Facilities Revenue | 5.000% | 7/1/24 | 1,500 | 1,690 |
| Oklahoma Capitol Improvement Authority Facilities Revenue | 5.000% | 7/1/25 | 3,000 | 3,380 |
| Oklahoma Capitol Improvement Authority Facilities Revenue | 5.000% | 7/1/26 | 13,500 | 15,143 |
| Oklahoma Capitol Improvement Authority Facilities Revenue | 5.000% | 7/1/27 | 3,050 | 3,409 |
| Oklahoma Capitol Improvement Authority Facilities Revenue | 5.000% | 7/1/28 | 2,020 | 2,255 |
| Oklahoma Capitol Improvement Authority Facilities Revenue | 5.000% | 7/1/29 | 2,500 | 2,778 |
| Oklahoma Capitol Improvement Authority Facilities Revenue | 5.000% | 7/1/30 | 2,500 | 2,768 |
| 1 Oklahoma Capitol Improvement Authority Facilities Revenue | 4.000% | 7/1/38 | 20,400 | 20,317 |
| Oklahoma City OK Water Utilities Trust Water & Sewer Revenue | 5.000% | 7/1/23 | 1,545 | 1,726 |
| Oklahoma City OK Water Utilities Trust Water & Sewer Revenue | 5.000% | 7/1/29 | 3,600 | 4,135 |
239
Intermediate-Term Tax-Exempt Fund
| | | | |
| Face | Market |
| Maturity | Amount | Value• |
| Coupon | Date | ($000) | ($000) |
| Oklahoma City OK Water Utilities Trust Water & Sewer Revenue | 5.000% | 7/1/31 | 4,255 | 4,707 |
| Oklahoma City OK Water Utilities Trust Water & Sewer Revenue | 5.000% | 7/1/32 | 5,000 | 5,521 |
| Oklahoma City OK Water Utilities Trust Water & Sewer Revenue | 5.000% | 7/1/32 | 1,850 | 2,100 |
| Oklahoma City OK Water Utilities Trust Water & Sewer Revenue | 5.000% | 7/1/33 | 2,500 | 2,829 |
| Oklahoma City OK Water Utilities Trust Water & Sewer Revenue | 5.000% | 7/1/34 | 4,385 | 4,949 |
| Oklahoma Development Finance Authority Health System Revenue | | | | |
| (Integris Health Obligated Group) | 5.000% | 8/15/25 | 2,010 | 2,285 |
| Oklahoma Development Finance Authority Health System Revenue | | | | |
| (Integris Health Obligated Group) | 5.000% | 8/15/26 | 1,010 | 1,142 |
| Oklahoma Development Finance Authority Health System Revenue | | | | |
| (Integris Health Obligated Group) | 5.000% | 8/15/27 | 1,810 | 2,033 |
| Oklahoma Development Finance Authority Health System Revenue | | | | |
| (Integris Health Obligated Group) | 5.000% | 8/15/28 | 1,750 | 1,957 |
| Oklahoma Development Finance Authority Health System Revenue | | | | |
| (Integris Health Obligated Group) | 5.000% | 8/15/29 | 1,760 | 1,959 |
| Oklahoma Development Finance Authority Health System Revenue (OU Medicine) | 5.000% | 8/15/26 | 1,270 | 1,413 |
| Oklahoma Development Finance Authority Health System Revenue (OU Medicine) | 5.000% | 8/15/27 | 2,075 | 2,317 |
| Oklahoma Development Finance Authority Health System Revenue (OU Medicine) | 5.000% | 8/15/29 | 1,300 | 1,439 |
| Oklahoma Development Finance Authority Health System Revenue (OU Medicine) | 5.000% | 8/15/33 | 4,500 | 4,857 |
| Oklahoma Development Finance Authority Health System Revenue (OU Medicine) | 5.000% | 8/15/38 | 9,000 | 9,440 |
| Oklahoma Municipal Power Authority Power Supply System Revenue | 5.000% | 1/1/29 | 350 | 393 |
| Oklahoma Municipal Power Authority Power Supply System Revenue | 5.000% | 1/1/32 | 3,770 | 4,191 |
| Oklahoma Municipal Power Authority Power Supply System Revenue | 5.000% | 1/1/33 | 6,055 | 6,724 |
| Oklahoma Municipal Power Authority Power Supply System Revenue | 5.000% | 1/1/33 | 1,500 | 1,659 |
| Oklahoma Turnpike Authority Revenue | 5.000% | 1/1/21 (Prere.) | 1,160 | 1,230 |
| Oklahoma Turnpike Authority Revenue | 5.000% | 1/1/34 | 2,500 | 2,804 |
| Oklahoma Turnpike Authority Revenue | 5.000% | 1/1/35 | 3,500 | 3,909 |
| Oklahoma Turnpike Authority Revenue | 4.000% | 1/1/38 | 2,300 | 2,314 |
| Oklahoma Turnpike Authority Revenue | 4.000% | 1/1/39 | 3,350 | 3,361 |
| Tulsa County OK Industrial Authority Educational Facilities Lease Revenue | 5.000% | 9/1/24 | 3,550 | 4,004 |
| Tulsa County OK Industrial Authority Educational Facilities Lease Revenue | 5.000% | 9/1/25 | 6,175 | 7,043 |
| Tulsa County OK Industrial Authority Senior Living Community Revenue (Montereau Inc.) | 5.000% 11/15/25 | 1,000 | 1,091 |
| Tulsa County OK Industrial Authority Senior Living Community Revenue (Montereau Inc.) | 5.000% 11/15/26 | 350 | 383 |
| Tulsa County OK Public Facilities Authority Revenue | 4.000% | 10/1/28 | 10,805 | 11,444 |
| Tulsa County OK Public Facilities Authority Revenue | 4.000% | 10/1/29 | 11,370 | 11,928 |
| University of Oklahoma Revenue | 5.000% | 7/1/29 | 1,895 | 2,016 |
| University of Oklahoma Revenue | 5.000% | 7/1/30 | 2,230 | 2,370 |
| University of Oklahoma Revenue | 5.000% | 7/1/31 | 2,000 | 2,125 |
| University of Oklahoma Revenue | 5.000% | 7/1/32 | 680 | 722 |
| | | | 227,418 |
| Oregon (1.0%) | | | | |
| Clackamas County OR School District No. 12 North Clackamas GO | 5.000% | 6/15/33 | 11,875 | 13,474 |
| Clackamas County OR School District No. 12 North Clackamas GO | 5.000% | 6/15/37 | 16,370 | 18,351 |
| Clackamas County OR School District No. 12 Sandy GO | 5.000% | 6/15/28 | 3,500 | 4,074 |
| Clackamas County OR School District No. 12 Sandy GO | 5.000% | 6/15/29 | 3,000 | 3,472 |
| Clackamas County OR School District No. 12 Sandy GO | 5.000% | 6/15/30 | 2,245 | 2,582 |
| Clatsop County OR School District No. 10 Seaside GO | 5.000% | 6/15/29 | 1,425 | 1,647 |
| Clatsop County OR School District No. 10 Seaside GO | 5.000% | 6/15/32 | 2,015 | 2,296 |
| Clatsop County OR School District No. 10 Seaside GO | 5.000% | 6/15/34 | 2,455 | 2,780 |
| Clatsop County OR School District No. 10 Seaside GO | 5.000% | 6/15/35 | 2,000 | 2,256 |
| Clatsop County OR School District No. 10 Seaside GO | 5.000% | 6/15/36 | 2,500 | 2,810 |
| Forest Grove OR Campus Improvement Revenue (Pacific University Project) | 5.000% | 5/1/30 | 550 | 595 |
| Forest Grove OR Campus Improvement Revenue (Pacific University Project) | 5.000% | 5/1/36 | 2,500 | 2,658 |
| Marion & Polk Counties OR School District GO (No. 24J Salem) | 5.000% | 6/15/36 | 10,000 | 11,321 |
| Marion & Polk Counties OR School District GO (No. 24J Salem) | 5.000% | 6/15/37 | 12,460 | 14,073 |
| Marion & Polk Counties OR School District GO (No. 24J Salem) | 5.000% | 6/15/38 | 10,000 | 11,259 |
| Metro OR GO | 5.000% | 6/1/26 | 1,640 | 1,908 |
| Multnomah and Clackamas Counties OR School District GO | 5.000% | 6/15/26 | 2,005 | 2,319 |
| Multnomah County OR School District GO | 5.000% | 6/15/20 | 21,515 | 22,499 |
| Multnomah County OR School District GO | 5.000% | 6/15/21 | 36,255 | 38,844 |
| Oregon Department of Administrative Services COP | 5.000% | 5/1/19 (Prere.) | 3,520 | 3,574 |
| Oregon Department of Administrative Services COP | 5.000% | 5/1/19 (Prere.) | 2,220 | 2,254 |
| Oregon Department of Administrative Services COP | 5.000% | 5/1/19 (Prere.) | 1,750 | 1,777 |
| Oregon Department of Administrative Services COP | 5.000% | 5/1/19 (Prere.) | 3,130 | 3,178 |
| Oregon Department of Administrative Services COP | 5.000% | 11/1/19 | 2,000 | 2,059 |
| Oregon Department of Administrative Services COP | 5.000% | 11/1/19 (Prere.) | 4,310 | 4,434 |
| Oregon Department of Administrative Services COP | 5.000% | 11/1/20 | 5,350 | 5,507 |
| Oregon Department of Administrative Services Lottery Revenue | 5.250% | 4/1/21 (Prere.) | 5,340 | 5,723 |
| Oregon Department of Administrative Services Lottery Revenue | 5.000% | 4/1/23 | 3,500 | 3,890 |
240
Intermediate-Term Tax-Exempt Fund
| | | | |
| Face | Market |
| Maturity | Amount | Value• |
| Coupon | Date | ($000) | ($000) |
| Oregon Department of Administrative Services Lottery Revenue | 5.000% | 4/1/23 | 2,110 | 2,345 |
| Oregon Department of Administrative Services Lottery Revenue | 5.000% | 4/1/23 | 1,430 | 1,589 |
| Oregon Department of Administrative Services Lottery Revenue | 5.000% | 4/1/23 | 6,355 | 7,063 |
| Oregon Department of Administrative Services Lottery Revenue | 5.000% | 4/1/24 | 7,000 | 7,911 |
| Oregon Department of Administrative Services Lottery Revenue | 5.000% | 4/1/25 | 5,440 | 6,234 |
| Oregon Department of Administrative Services Lottery Revenue | 5.000% | 4/1/25 | 2,130 | 2,397 |
| Oregon Department of Administrative Services Lottery Revenue | 5.000% | 4/1/25 | 8,015 | 9,019 |
| Oregon Department of Administrative Services Lottery Revenue | 5.000% | 4/1/26 | 2,445 | 2,790 |
| Oregon Department of Administrative Services Lottery Revenue | 5.000% | 4/1/26 | 2,275 | 2,596 |
| Oregon Department of Administrative Services Lottery Revenue | 5.000% | 4/1/29 | 8,000 | 9,042 |
| Oregon Department of Administrative Services Lottery Revenue | 5.000% | 4/1/30 | 2,000 | 2,299 |
| Oregon Department of Administrative Services Lottery Revenue | 5.000% | 4/1/30 | 4,705 | 5,408 |
| Oregon Department of Administrative Services Lottery Revenue | 5.000% | 4/1/31 | 11,010 | 12,033 |
| Oregon Department of Administrative Services Lottery Revenue | 5.000% | 4/1/31 | 3,480 | 3,983 |
| Oregon Department of Administrative Services Lottery Revenue | 5.250% | 4/1/31 | 860 | 917 |
| Oregon Department of Administrative Services Lottery Revenue | 5.000% | 4/1/32 | 5,560 | 6,074 |
| Oregon Department of Administrative Services Lottery Revenue | 5.000% | 4/1/33 | 5,545 | 6,048 |
| Oregon Department of Administrative Services Lottery Revenue | 5.000% | 4/1/33 | 4,000 | 4,543 |
| Oregon Department of Administrative Services Lottery Revenue | 5.000% | 4/1/34 | 2,585 | 2,928 |
| Oregon Department of Administrative Services Lottery Revenue | 5.000% | 4/1/35 | 4,000 | 4,499 |
| Oregon Department of Administrative Services Lottery Revenue | 5.000% | 4/1/36 | 1,670 | 1,872 |
| Oregon Department of Transportation Highway User Tax Revenue | 5.000% | 11/15/24 | 3,020 | 3,448 |
| Oregon Department of Transportation Highway User Tax Revenue | 5.000% | 11/15/27 | 2,020 | 2,286 |
| Oregon Department of Transportation Highway User Tax Revenue | 5.000% | 11/15/28 | 5,500 | 6,203 |
| Oregon Department of Transportation Highway User Tax Revenue | 5.000% | 11/15/29 | 9,500 | 10,676 |
| Oregon Department of Transportation Highway User Tax Revenue | 5.000% | 11/15/30 | 2,500 | 2,808 |
| Oregon Facilities Authority Revenue (Legacy Health Project) | 5.250% | 5/1/20 | 7,610 | 7,949 |
| Oregon Facilities Authority Revenue (Legacy Health Project) | 5.250% | 5/1/21 | 7,705 | 8,246 |
| Oregon Facilities Authority Revenue (Legacy Health Project) | 5.000% | 6/1/32 | 4,000 | 4,427 |
| Oregon Facilities Authority Revenue (Legacy Health Project) | 5.000% | 6/1/33 | 4,000 | 4,408 |
| Oregon Facilities Authority Revenue (PeaceHealth) | 5.000% | 11/15/22 | 1,000 | 1,097 |
| Oregon Facilities Authority Revenue (PeaceHealth) | 5.000% | 11/15/23 | 1,250 | 1,393 |
| Oregon Facilities Authority Revenue (PeaceHealth) | 5.000% | 11/15/26 | 1,810 | 2,010 |
| Oregon Facilities Authority Revenue (PeaceHealth) | 5.000% | 11/15/27 | 2,025 | 2,238 |
| Oregon Facilities Authority Revenue (PeaceHealth) | 5.000% | 11/15/28 | 2,500 | 2,755 |
| Oregon Facilities Authority Revenue (PeaceHealth) | 5.000% | 11/15/29 | 1,420 | 1,559 |
| Oregon Facilities Authority Revenue (PeaceHealth) VRDO | 1.680% | 11/1/18 LOC | 41,900 | 41,900 |
| Oregon Facilities Authority Revenue (Samaritan Health Services Project) | 5.000% | 10/1/26 | 1,080 | 1,221 |
| Oregon Facilities Authority Revenue (Samaritan Health Services Project) | 5.000% | 10/1/27 | 2,725 | 3,033 |
| Oregon Facilities Authority Revenue (Samaritan Health Services Project) | 5.000% | 10/1/28 | 3,965 | 4,390 |
| Oregon Facilities Authority Revenue (University of Portland) | 5.000% | 4/1/27 | 595 | 672 |
| Oregon Facilities Authority Revenue (University of Portland) | 5.000% | 4/1/29 | 750 | 841 |
| Oregon Facilities Authority Revenue (University of Portland) | 5.000% | 4/1/30 | 700 | 782 |
| Oregon Facilities Authority Revenue (University of Portland) | 5.000% | 4/1/31 | 700 | 780 |
| Oregon Facilities Authority Revenue (University of Portland) | 5.000% | 4/1/32 | 1,000 | 1,111 |
| Oregon Facilities Authority Revenue (University of Portland) | 5.000% | 4/1/33 | 1,100 | 1,217 |
| Oregon Facilities Authority Revenue (University of Portland) | 5.000% | 4/1/34 | 1,280 | 1,410 |
| Oregon Facilities Authority Revenue (University of Portland) | 5.000% | 4/1/35 | 1,200 | 1,318 |
| Oregon GO | 5.000% | 5/1/21 (Prere.) | 1,570 | 1,679 |
| Oregon GO | 5.000% | 5/1/21 (Prere.) | 2,415 | 2,582 |
| Oregon GO | 5.000% | 5/1/21 (Prere.) | 5,165 | 5,522 |
| Oregon GO | 5.000% | 5/1/21 (Prere.) | 5,685 | 6,078 |
| Oregon GO | 5.000% | 5/1/21 (Prere.) | 3,370 | 3,603 |
| Oregon GO | 5.000% | 5/1/21 (Prere.) | 1,490 | 1,593 |
| Oregon GO | 5.000% | 5/1/21 (Prere.) | 2,460 | 2,630 |
| Oregon GO | 5.000% | 5/1/21 (Prere.) | 2,755 | 2,946 |
| Oregon GO | 5.000% | 5/1/21 (Prere.) | 2,890 | 3,090 |
| Oregon GO | 5.000% | 5/1/21 (Prere.) | 1,760 | 1,882 |
| Oregon GO | 5.000% | 5/1/31 | 2,915 | 3,196 |
| Oregon GO | 5.000% | 5/1/32 | 3,320 | 3,793 |
| Oregon GO | 5.000% | 5/1/32 | 2,060 | 2,256 |
| Oregon GO | 5.000% | 11/1/32 | 1,440 | 1,590 |
| Oregon GO | 5.000% | 5/1/33 | 3,000 | 3,416 |
| Oregon GO | 5.000% | 5/1/34 | 2,675 | 3,033 |
| Oregon GO | 5.000% | 5/1/35 | 2,750 | 3,107 |
| Oregon GO | 5.000% | 5/1/37 | 4,360 | 4,898 |
| Oregon GO (Oregon University System Projects) | 5.250% | 8/2/21 (Prere.) | 2,865 | 3,100 |
| Oregon GO (Oregon University System Projects) | 5.250% | 8/2/21 (Prere.) | 3,015 | 3,262 |
| Oregon GO (Oregon University System Projects) | 5.250% | 8/2/21 (Prere.) | 1,650 | 1,785 |
| Oregon GO (Oregon University System Projects) | 5.250% | 8/2/21 (Prere.) | 2,050 | 2,218 |
241
Intermediate-Term Tax-Exempt Fund
| | | | |
| Face | Market |
| Maturity | Amount | Value• |
| Coupon | Date | ($000) | ($000) |
| Oregon GO (Oregon University System Projects) | 5.250% | 8/2/21 (Prere.) | 2,585 | 2,797 |
| Oregon GO (Oregon University System Projects) | 5.250% | 8/2/21 (Prere.) | 2,725 | 2,949 |
| Port of Portland OR International Airport Revenue | 5.000% | 7/1/29 | 1,650 | 1,848 |
| Port of Portland OR International Airport Revenue | 5.000% | 7/1/30 | 1,000 | 1,116 |
| Port of Portland OR International Airport Revenue | 5.000% | 7/1/32 | 1,065 | 1,182 |
| Port of Portland OR International Airport Revenue | 5.000% | 7/1/34 | 3,000 | 3,310 |
| Portland OR Community College District GO | 5.000% | 6/15/25 | 1,500 | 1,726 |
| Portland OR Community College District GO | 5.000% | 6/15/26 | 1,150 | 1,339 |
| Portland OR Sewer System Revenue | 5.000% | 6/1/20 | 43,210 | 45,147 |
| Tri-County Metropolitan Transportation District of Oregon Capital Grant Receipt Revenue | 5.000% | 10/1/26 | 1,115 | 1,277 |
| Tri-County Metropolitan Transportation District of Oregon Capital Grant Receipt Revenue | 5.000% | 10/1/27 | 1,395 | 1,606 |
| Tri-County Metropolitan Transportation District of Oregon Payroll Tax Revenue | 5.000% | 9/1/32 | 1,610 | 1,827 |
| Tri-County Metropolitan Transportation District of Oregon Payroll Tax Revenue | 5.000% | 9/1/33 | 2,310 | 2,613 |
| Tri-County Metropolitan Transportation District of Oregon Payroll Tax Revenue | 5.000% | 9/1/34 | 2,500 | 2,820 |
| Washington & Clackamas Counties OR School District No. 23J GO | 5.000% | 6/15/31 | 5,460 | 6,239 |
| Washington & Clackamas Counties OR School District No. 23J GO | 5.000% | 6/15/32 | 4,105 | 4,674 |
| Washington County OR School District No. 48J Beaverton GO | 5.000% | 6/15/35 | 10,000 | 11,250 |
| Washington County OR School District No. 48J Beaverton GO | 5.000% | 6/15/36 | 12,075 | 13,536 |
| | | | 587,897 |
| Pennsylvania (5.0%) | | | | |
| Allegheny County PA GO | 5.000% | 11/1/19 (Prere.) | 15,000 | 15,441 |
| Allegheny County PA GO | 5.000% | 11/1/25 | 7,445 | 8,479 |
| Allegheny County PA GO | 5.000% | 11/1/29 | 12,020 | 13,618 |
| Allegheny County PA Higher Education Building Authority University Revenue | | | | |
| (Carnegie Mellon University) VRDO | 1.630% | 11/1/18 | 18,632 | 18,632 |
| Allegheny County PA Higher Education Building Authority University Revenue | | | | |
| (Duquesne University) | 5.500% | 3/1/21 (Prere.) | 1,290 | 1,386 |
| Allegheny County PA Higher Education Building Authority University Revenue | | | | |
| (Duquesne University) | 5.500% | 3/1/21 (Prere.) | 2,720 | 2,921 |
| Allegheny County PA Hospital Development Authority Revenue | 5.000% | 4/1/26 | 5,000 | 5,576 |
| Allegheny County PA Hospital Development Authority Revenue | 5.000% | 4/1/27 | 15,000 | 16,755 |
| Allegheny County PA Hospital Development Authority Revenue | 5.000% | 4/1/28 | 8,000 | 8,955 |
| Allegheny County PA Hospital Development Authority Revenue | 5.000% | 4/1/29 | 8,500 | 9,436 |
| Allegheny County PA Hospital Development Authority Revenue | 5.000% | 4/1/30 | 7,000 | 7,723 |
| Allegheny County PA Hospital Development Authority Revenue | 5.000% | 4/1/31 | 10,000 | 10,983 |
| Allegheny County PA Hospital Development Authority Revenue | 5.000% | 4/1/32 | 11,000 | 12,027 |
| Allegheny County PA Hospital Development Authority Revenue | 5.000% | 4/1/33 | 11,000 | 11,982 |
| Allegheny County PA Hospital Development Authority Revenue | 5.000% | 4/1/34 | 8,475 | 9,203 |
| Allegheny County PA Hospital Development Authority Revenue | 5.000% | 4/1/35 | 6,000 | 6,491 |
| Allegheny County PA Hospital Development Authority Revenue | 5.000% | 4/1/36 | 4,750 | 5,119 |
| Allegheny County PA Hospital Development Authority Revenue | 4.000% | 4/1/37 | 7,000 | 6,683 |
| Allegheny County PA Hospital Development Authority Revenue | 4.000% | 4/1/38 | 6,500 | 6,179 |
| Allegheny County PA Hospital Development Authority Revenue | | | | |
| (University of Pittsburgh Medical Center) | 2.290% | 2/1/21 | 8,770 | 8,806 |
| 7 Allegheny County PA Hospital Development Authority Revenue | | | | |
| (University of Pittsburgh Medical Center) TOB VRDO | 1.690% | 11/1/18 LOC | 10,800 | 10,800 |
| Allegheny County PA Port Authority Revenue | 5.750% | 3/1/29 | 17,000 | 18,291 |
| Allegheny County PA Sanitary Authority Sewer Revenue | 5.000% | 12/1/23 | 3,475 | 3,866 |
| Allegheny County PA Sanitary Authority Sewer Revenue | 5.000% | 12/1/24 | 2,500 | 2,820 |
| Allentown PA Neighborhood Improvement Zone Development Authority Tax Revenue | 5.000% | 5/1/24 | 2,795 | 2,972 |
| Allentown PA Neighborhood Improvement Zone Development Authority Tax Revenue | 5.000% | 5/1/25 | 2,500 | 2,644 |
| Allentown PA Neighborhood Improvement Zone Development Authority Tax Revenue | 5.000% | 5/1/26 | 2,000 | 2,103 |
| Allentown PA Neighborhood Improvement Zone Development Authority Tax Revenue | 5.000% | 5/1/27 | 5,500 | 5,885 |
| Allentown PA Neighborhood Improvement Zone Development Authority Tax Revenue | 5.000% | 5/1/28 | 2,500 | 2,688 |
| Allentown PA Neighborhood Improvement Zone Development Authority Tax Revenue | 5.000% | 5/1/28 | 2,310 | 2,410 |
| Allentown PA Neighborhood Improvement Zone Development Authority Tax Revenue | 5.000% | 5/1/29 | 3,740 | 3,891 |
| Allentown PA Neighborhood Improvement Zone Development Authority Tax Revenue | 5.000% | 5/1/31 | 3,000 | 3,102 |
| Allentown PA Neighborhood Improvement Zone Development Authority Tax Revenue | 5.000% | 5/1/32 | 2,575 | 2,657 |
| Allentown PA Neighborhood Improvement Zone Development Authority Tax Revenue | 5.000% | 5/1/35 | 1,200 | 1,232 |
| Allentown PA School District GO | 5.000% | 6/1/33 (15) | 1,545 | 1,675 |
| Allentown PA School District GO | 5.000% | 6/1/34 (15) | 2,000 | 2,162 |
| Allentown PA School District GO | 5.000% | 6/1/37 (15) | 1,500 | 1,607 |
| Berks County PA Industrial Development Authority Health System Revenue (Tower Health Project) | 5.000% | 11/1/26 | 1,015 | 1,144 |
| Berks County PA Industrial Development Authority Health System Revenue (Tower Health Project) | 5.000% | 11/1/27 | 2,050 | 2,314 |
| Berks County PA Industrial Development Authority Health System Revenue (Tower Health Project) | 5.000% | 11/1/28 | 2,500 | 2,781 |
| Berks County PA Industrial Development Authority Health System Revenue (Tower Health Project) | 5.000% | 11/1/29 | 2,250 | 2,485 |
| Berks County PA Industrial Development Authority Health System Revenue (Tower Health Project) | 5.000% | 11/1/30 | 2,760 | 3,032 |
| Berks County PA Industrial Development Authority Health System Revenue (Tower Health Project) | 4.000% | 11/1/31 | 5,525 | 5,550 |
| Berks County PA Industrial Development Authority Health System Revenue (Tower Health Project) | 4.000% | 11/1/32 | 1,700 | 1,703 |
242
Intermediate-Term Tax-Exempt Fund
| | | | |
| Face | Market |
| Maturity | Amount | Value• |
| Coupon | Date | ($000) | ($000) |
| Berks County PA Industrial Development Authority Health System Revenue (Tower Health Project) | 5.000% | 11/1/34 | 2,500 | 2,711 |
| Berks County PA Industrial Development Authority Health System Revenue (Tower Health Project) | 5.000% | 11/1/36 | 1,815 | 1,948 |
| Berks County PA Industrial Development Authority Health System Revenue (Tower Health Project) | 5.000% | 11/1/37 | 2,500 | 2,674 |
| Bucks County PA Water & Sewer Authority Water System Revenue | 5.000% | 12/1/25 (4) | 1,195 | 1,364 |
| Bucks County PA Water & Sewer Authority Water System Revenue | 5.000% | 12/1/26 (4) | 1,000 | 1,151 |
| Bucks County PA Water & Sewer Authority Water System Revenue | 5.000% | 12/1/27 (4) | 530 | 615 |
| Bucks County PA Water & Sewer Authority Water System Revenue | 5.000% | 12/1/29 (4) | 1,000 | 1,147 |
| Canonsburg-Houston PA Joint Authority Sewer Revenue | 5.000% | 12/1/31 | 1,825 | 1,999 |
| Canonsburg-Houston PA Joint Authority Sewer Revenue | 5.000% | 12/1/32 | 1,915 | 2,094 |
| Capital Region Water Pennsylvania Sewer System Revenue | 5.000% | 7/15/26 | 1,000 | 1,137 |
| Capital Region Water Pennsylvania Sewer System Revenue | 5.000% | 7/15/27 | 1,000 | 1,142 |
| Capital Region Water Pennsylvania Sewer System Revenue | 5.000% | 7/15/28 | 1,500 | 1,718 |
| Central Bradford PA Progress Authority Revenue (Guthrie Healthcare System) | 5.500% | 12/1/31 | 12,500 | 13,644 |
| Central Bucks County PA School District GO | 5.000% | 5/15/20 (ETM) | 625 | 651 |
| Central Bucks County PA School District GO | 5.000% | 5/15/20 | 1,645 | 1,716 |
| Chester County PA Health & Education Facilities Authority Revenue | | | | |
| (Main Line Health System Inc. Obligated Group) | 5.000% | 10/1/31 | 1,350 | 1,525 |
| Chester County PA Health & Education Facilities Authority Revenue | | | | |
| (Main Line Health System Inc. Obligated Group) | 5.000% | 10/1/34 | 2,100 | 2,343 |
| Coatesville PA School District GO | 5.000% | 8/1/24 (4) | 5,385 | 5,967 |
| Coatesville PA School District GO | 5.000% | 8/1/25 (4) | 3,020 | 3,380 |
| Commonwealth Financing Authority Pennsylvania Revenue | 5.000% | 6/1/21 (4) | 3,940 | 4,100 |
| Commonwealth Financing Authority Pennsylvania Revenue | 5.000% | 6/1/25 | 5,500 | 6,135 |
| Commonwealth Financing Authority Pennsylvania Revenue | 5.000% | 6/1/25 | 875 | 940 |
| Commonwealth Financing Authority Pennsylvania Revenue | 5.000% | 6/1/26 | 8,500 | 9,535 |
| Commonwealth Financing Authority Pennsylvania Revenue | 5.000% | 6/1/27 | 3,500 | 3,936 |
| Commonwealth Financing Authority Pennsylvania Revenue | 5.000% | 6/1/28 | 9,020 | 10,199 |
| Commonwealth Financing Authority Pennsylvania Revenue | 5.000% | 6/1/29 | 4,000 | 4,485 |
| Commonwealth Financing Authority Pennsylvania Revenue | 5.000% | 6/1/30 | 3,000 | 3,338 |
| Commonwealth Financing Authority Pennsylvania Revenue | 5.000% | 6/1/32 | 7,000 | 7,457 |
| Commonwealth Financing Authority Pennsylvania Revenue | 5.000% | 6/1/34 | 1,875 | 2,053 |
| Commonwealth Financing Authority Pennsylvania Revenue | 5.000% | 6/1/35 | 4,100 | 4,471 |
| Commonwealth Financing Authority Pennsylvania Revenue | 4.000% | 6/1/39 (4) | 2,000 | 1,961 |
| Cumberland County PA Municipal Authority Revenue (Diakon Lutheran Social Ministries Project) | 5.750% | 1/1/19 (Prere.) | 3,075 | 3,093 |
| Cumberland County PA Municipal Authority Revenue (Diakon Lutheran Social Ministries Project) | 6.000% | 1/1/19 (Prere.) | 3,770 | 3,794 |
| Cumberland County PA Municipal Authority Revenue (Diakon Lutheran Social Ministries Project) | 5.750% | 1/1/20 | 340 | 342 |
| Cumberland County PA Municipal Authority Revenue (Diakon Lutheran Social Ministries Project) | 6.000% | 1/1/21 | 420 | 423 |
| Dauphin County PA General Authority Health System Revenue (Pinnacle Health System Project) | 6.000% | 6/1/19 (Prere.) | 7,060 | 7,225 |
| Dauphin County PA General Authority Health System Revenue (Pinnacle Health System Project) | 5.000% | 6/1/29 | 1,525 | 1,702 |
| Delaware River Joint Toll Bridge Commission Pennsylvania & New Jersey Revenue | 5.000% | 7/1/30 | 2,035 | 2,330 |
| Delaware River Joint Toll Bridge Commission Pennsylvania & New Jersey Revenue | 5.000% | 7/1/37 | 3,500 | 3,909 |
| Delaware River Port Authority Pennsylvania & New Jersey Revenue | 5.000% | 1/1/23 | 4,850 | 5,284 |
| Harrisburg PA School District GO | 5.000% | 11/15/26 (4) | 4,560 | 5,144 |
| Harrisburg PA School District GO | 5.000% | 11/15/27 (4) | 1,375 | 1,557 |
| Lancaster County PA Hospital Authority Health System Revenue | | | | |
| (University of Pennsylvania Health System) | 5.000% | 8/15/26 | 6,730 | 7,759 |
| Lancaster County PA Hospital Authority Revenue (University of Pennsylvania Health System) | 5.000% | 8/15/28 | 1,430 | 1,633 |
| Lancaster County PA Hospital Authority Revenue (University of Pennsylvania Health System) | 5.000% | 8/15/29 | 1,385 | 1,573 |
| Lancaster County PA Hospital Authority Revenue (University of Pennsylvania Health System) | 5.000% | 8/15/33 | 3,000 | 3,358 |
| Lancaster County PA Hospital Authority Revenue (University of Pennsylvania Health System) | 5.000% | 8/15/34 | 3,000 | 3,350 |
| Lancaster County PA Solid Waste Management Authority Solid Waste Disposal System Revenue | 5.000% | 12/15/33 | 5,750 | 6,286 |
| Luzerne County PA GO | 5.000% | 12/15/25 (4) | 400 | 444 |
| Luzerne County PA GO | 5.000% | 12/15/25 (4) | 500 | 555 |
| Luzerne County PA GO | 5.000% | 12/15/26 (4) | 500 | 557 |
| Luzerne County PA GO | 5.000% | 12/15/26 (4) | 1,000 | 1,113 |
| Luzerne County PA GO | 5.000% | 12/15/27 (4) | 500 | 558 |
| Luzerne County PA GO | 5.000% | 12/15/27 (4) | 500 | 558 |
| Luzerne County PA Industrial Development Authority Lease Revenue | 5.000% | 12/15/26 (4) | 530 | 585 |
| Luzerne County PA Industrial Development Authority Lease Revenue | 5.000% | 12/15/27 (4) | 5,490 | 6,052 |
| Lycoming County PA Authority College Revenue (Pennsylvania College of Technology) | 5.000% | 10/1/21 | 1,000 | 1,065 |
| Lycoming County PA Authority College Revenue (Pennsylvania College of Technology) | 5.000% | 10/1/22 | 1,025 | 1,110 |
| Lycoming County PA Authority College Revenue (Pennsylvania College of Technology) | 5.000% | 10/1/24 | 585 | 647 |
| Lycoming County PA Authority College Revenue (Pennsylvania College of Technology) | 5.000% | 10/1/25 | 1,085 | 1,202 |
| Lycoming County PA Authority College Revenue (Pennsylvania College of Technology) | 5.000% | 10/1/26 | 675 | 752 |
| Middletown PA School District GO | 5.000% | 3/1/22 (Prere.) | 3,030 | 3,297 |
| Middletown PA School District GO | 5.000% | 3/1/22 (Prere.) | 3,375 | 3,672 |
| Monroeville PA Finance Authority Revenue (UPMC Health System) | 5.000% | 2/15/29 | 7,125 | 7,700 |
| Montgomery County PA Higher Education & Health Authority Hospital Revenue | | | | |
| (Abington Memorial Hospital) | 5.000% | 6/1/19 (Prere.) | 5,765 | 5,864 |
243
Intermediate-Term Tax-Exempt Fund
| | | | |
| Face | Market |
| Maturity | Amount | Value• |
| Coupon | Date | ($000) | ($000) |
| Montgomery County PA Higher Education & Health Authority Hospital Revenue | | | | |
| (Abington Memorial Hospital) | 5.000% | 6/1/22 (Prere.) | 7,000 | 7,641 |
| Montgomery County PA Higher Education & Health Authority Hospital Revenue | | | | |
| (Abington Memorial Hospital) | 5.000% | 6/1/22 (Prere.) | 6,000 | 6,549 |
| Montgomery County PA Higher Education & Health Authority Hospital Revenue | | | | |
| (Abington Memorial Hospital) | 5.000% | 6/1/22 (Prere.) | 8,500 | 9,278 |
| Montgomery County PA Higher Education & Health Authority Revenue | | | | |
| (Thomas Jefferson University) | 5.000% | 9/1/26 | 2,000 | 2,264 |
| Montgomery County PA Higher Education & Health Authority Revenue | | | | |
| (Thomas Jefferson University) | 5.000% | 9/1/27 | 2,165 | 2,463 |
| Montgomery County PA Higher Education & Health Authority Revenue | | | | |
| (Thomas Jefferson University) | 5.000% | 9/1/28 | 2,250 | 2,569 |
| Montgomery County PA Higher Education & Health Authority Revenue | | | | |
| (Thomas Jefferson University) | 5.000% | 9/1/29 | 4,125 | 4,680 |
| Montgomery County PA Higher Education & Health Authority Revenue | | | | |
| (Thomas Jefferson University) | 5.000% | 9/1/30 | 4,000 | 4,509 |
| Montgomery County PA Industrial Development Authority Health Services Revenue | | | | |
| (Albert Einstein Healthcare Network) | 5.000% | 1/15/23 | 8,000 | 8,555 |
| Montgomery County PA Industrial Development Authority Health Services Revenue | | | | |
| (Albert Einstein Healthcare Network) | 5.000% | 1/15/24 | 4,665 | 5,039 |
| Montgomery County PA Industrial Development Authority Health Services Revenue | | | | |
| (Albert Einstein Healthcare Network) | 5.000% | 1/15/25 | 7,840 | 8,540 |
| Montgomery County PA Industrial Development Authority Health Services Revenue | | | | |
| (Albert Einstein Healthcare Network) | 5.250% | 1/15/26 | 7,435 | 8,159 |
| Montgomery County PA Industrial Development Authority Health Services Revenue | | | | |
| (Albert Einstein Healthcare Network) | 5.250% | 1/15/27 | 3,500 | 3,820 |
| Montgomery County PA Industrial Development Authority Health Services Revenue | | | | |
| (Albert Einstein Healthcare Network) | 5.250% | 1/15/29 | 3,850 | 4,165 |
| Montgomery County PA Industrial Development Authority Health Services Revenue | | | | |
| (Albert Einstein Healthcare Network) | 5.250% | 1/15/31 | 8,350 | 8,970 |
| Montgomery County PA Industrial Development Authority Health Services Revenue | | | | |
| (Albert Einstein Healthcare Network) | 5.250% | 1/15/32 | 9,055 | 9,691 |
| Montgomery County PA Industrial Development Authority Pollution Control Revenue | | | | |
| (Exelon Generation Co., LLC) PUT | 2.500% | 4/1/20 | 4,255 | 4,237 |
| Montgomery County PA Industrial Development Authority Pollution Control Revenue | | | | |
| (Exelon Generation Co., LLC) PUT | 2.500% | 4/1/20 | 3,250 | 3,237 |
| Montgomery County PA Industrial Development Authority Pollution Control Revenue | | | | |
| (Exelon Generation Co., LLC) PUT | 2.550% | 6/1/20 | 19,000 | 18,912 |
| Montour PA School District GO | 5.000% | 4/1/32 (4) | 3,245 | 3,598 |
| Moon Industrial Development Authority Pennsylvania Revenue | | | | |
| (Baptist Home Society Obligated Group) | 5.625% | 7/1/30 | 5,855 | 6,134 |
| Moon Industrial Development Authority Pennsylvania Revenue | | | | |
| (Baptist Home Society Obligated Group) | 5.750% | 7/1/35 | 6,925 | 7,204 |
| Mount Lebanon PA Hospital Authority Revenue (St. Clair Memorial Hospital Project) | 5.000% | 7/1/32 | 1,500 | 1,680 |
| Mount Lebanon PA Hospital Authority Revenue (St. Clair Memorial Hospital Project) | 5.000% | 7/1/33 | 1,090 | 1,216 |
| Mount Lebanon PA Hospital Authority Revenue (St. Clair Memorial Hospital Project) | 5.000% | 7/1/34 | 1,000 | 1,113 |
| Mount Lebanon PA Hospital Authority Revenue (St. Clair Memorial Hospital Project) | 5.000% | 7/1/35 | 1,000 | 1,108 |
| Mount Lebanon PA Hospital Authority Revenue (St. Clair Memorial Hospital Project) | 5.000% | 7/1/36 | 1,250 | 1,380 |
| Mount Lebanon PA Hospital Authority Revenue (St. Clair Memorial Hospital Project) | 5.000% | 7/1/37 | 2,505 | 2,759 |
| Northampton County PA General Purpose Authority Hospital Revenue (St. Luke’s Hospital Project) | 5.000% | 8/15/24 | 2,815 | 3,134 |
| Northampton County PA General Purpose Authority Hospital Revenue (St. Luke’s Hospital Project) | 5.000% | 8/15/25 | 2,025 | 2,277 |
| Northampton County PA General Purpose Authority Hospital Revenue (St. Luke’s Hospital Project) | 5.000% | 8/15/27 | 2,975 | 3,324 |
| Northampton County PA General Purpose Authority Hospital Revenue (St. Luke’s Hospital Project) | 5.000% | 8/15/29 | 5,205 | 5,755 |
| Northampton County PA General Purpose Authority Hospital Revenue (St. Luke’s Hospital Project) | 5.000% | 8/15/30 | 7,720 | 8,497 |
| Northampton County PA General Purpose Authority Hospital Revenue (St. Luke’s Hospital Project) | 5.000% | 8/15/31 | 8,130 | 8,920 |
| Pennsylvania Economic Development Financing Authority Governmental Lease Revenue | | | | |
| (Forum Place Project) | 5.000% | 3/1/34 | 6,000 | 6,206 |
| Pennsylvania Economic Development Financing Authority Health System Revenue | | | | |
| (Albert Einstein Healthcare Network) | 6.250% | 10/15/19 (Prere.) | 2,100 | 2,180 |
| Pennsylvania Economic Development Financing Authority Pollution Control Revenue | | | | |
| (PPL Electric Utilities Corp. Project) | 4.000% | 10/1/23 | 17,500 | 18,037 |
| Pennsylvania Economic Development Financing Authority Revenue (UPMC Obligated Group) | 5.000% | 2/1/23 | 1,405 | 1,545 |
| Pennsylvania Economic Development Financing Authority Revenue (UPMC Obligated Group) | 5.000% | 2/1/24 | 3,050 | 3,404 |
| Pennsylvania Economic Development Financing Authority Revenue (UPMC Obligated Group) | 5.000% | 2/1/25 | 2,265 | 2,550 |
| Pennsylvania Economic Development Financing Authority Revenue (UPMC Obligated Group) | 5.000% | 11/15/25 | 2,000 | 2,281 |
| Pennsylvania Economic Development Financing Authority Revenue (UPMC Obligated Group) | 5.000% | 2/1/26 | 3,035 | 3,397 |
| Pennsylvania Economic Development Financing Authority Revenue (UPMC Obligated Group) | 5.000% | 11/15/26 | 5,180 | 5,959 |
| Pennsylvania Economic Development Financing Authority Revenue (UPMC Obligated Group) | 5.000% | 2/1/27 | 4,705 | 5,235 |
| Pennsylvania Economic Development Financing Authority Revenue (UPMC Obligated Group) | 5.000% | 11/15/27 | 4,130 | 4,779 |
| Pennsylvania Economic Development Financing Authority Revenue (UPMC Obligated Group) | 5.000% | 11/15/28 | 10,015 | 11,420 |
244
Intermediate-Term Tax-Exempt Fund
| | | | |
| Face | Market |
| Maturity | Amount | Value• |
| Coupon | Date | ($000) | ($000) |
| Pennsylvania Economic Development Financing Authority Revenue (UPMC Obligated Group) | 5.000% | 2/1/29 | 6,000 | 6,609 |
| Pennsylvania Economic Development Financing Authority Revenue (UPMC Obligated Group) | 5.000% | 3/15/29 | 9,000 | 10,092 |
| Pennsylvania Economic Development Financing Authority Revenue (UPMC Obligated Group) | 5.000% | 11/15/29 | 4,000 | 4,534 |
| Pennsylvania Economic Development Financing Authority Revenue (UPMC Obligated Group) | 5.000% | 11/15/30 | 2,020 | 2,278 |
| Pennsylvania Economic Development Financing Authority Revenue (UPMC Obligated Group) | 5.000% | 2/1/31 | 12,965 | 14,159 |
| Pennsylvania Economic Development Financing Authority Revenue (UPMC Obligated Group) | 5.000% | 11/15/31 | 2,000 | 2,247 |
| Pennsylvania Economic Development Financing Authority Revenue (UPMC Obligated Group) | 5.000% | 2/1/32 | 6,865 | 7,471 |
| Pennsylvania Economic Development Financing Authority Revenue (UPMC Obligated Group) | 5.000% | 11/15/32 | 2,250 | 2,521 |
| Pennsylvania Economic Development Financing Authority Revenue (UPMC Obligated Group) | 5.000% | 2/1/33 | 10,000 | 10,856 |
| Pennsylvania Economic Development Financing Authority Revenue (UPMC Obligated Group) | 5.000% | 7/1/33 | 10,000 | 10,774 |
| Pennsylvania Economic Development Financing Authority Revenue (UPMC Obligated Group) | 4.000% | 11/15/34 | 5,000 | 5,019 |
| Pennsylvania Economic Development Financing Authority Water Facilities Revenue | | | | |
| (Aqua Pennsylvania Inc. Project) | 5.000% | 11/15/40 | 16,500 | 16,936 |
| Pennsylvania GO | 5.000% | 5/1/19 | 15,000 | 15,220 |
| Pennsylvania GO | 5.000% | 7/1/19 | 14,925 | 15,214 |
| Pennsylvania GO | 5.000% | 6/1/21 | 20,000 | 21,319 |
| Pennsylvania GO | 5.000% | 7/1/21 | 32,365 | 34,557 |
| Pennsylvania GO | 5.375% | 7/1/21 | 4,950 | 5,333 |
| Pennsylvania GO | 5.000% | 11/15/21 (Prere.) | 4,705 | 5,093 |
| Pennsylvania GO | 5.000% | 6/1/22 | 19,450 | 21,119 |
| Pennsylvania GO | 5.000% | 4/1/23 (Prere.) | 7,500 | 8,345 |
| Pennsylvania GO | 4.000% | 7/1/23 | 13,000 | 13,771 |
| Pennsylvania GO | 5.000% | 8/15/23 | 43,000 | 47,553 |
| Pennsylvania GO | 5.000% | 1/1/24 | 34,200 | 37,949 |
| Pennsylvania GO | 5.000% | 8/15/24 | 24,500 | 27,415 |
| Pennsylvania GO | 5.000% | 3/15/25 | 7,000 | 7,879 |
| Pennsylvania GO | 5.000% | 1/1/26 | 35,000 | 39,601 |
| Pennsylvania GO | 5.000% | 9/15/26 | 24,500 | 27,911 |
| Pennsylvania GO | 5.000% | 9/15/27 | 15,375 | 17,332 |
| Pennsylvania GO | 5.000% | 3/15/28 | 6,000 | 6,654 |
| Pennsylvania GO | 4.000% | 10/15/28 | 11,550 | 11,986 |
| Pennsylvania GO | 4.000% | 8/15/29 (4) | 17,000 | 17,812 |
| Pennsylvania GO | 4.000% | 6/15/30 | 24,400 | 25,180 |
| Pennsylvania GO | 4.000% | 8/15/30 (4) | 19,000 | 19,826 |
| Pennsylvania GO | 4.000% | 3/1/33 (4) | 40,000 | 40,685 |
| Pennsylvania GO | 4.000% | 3/1/34 (4) | 43,000 | 43,601 |
| Pennsylvania GO | 4.000% | 3/1/35 (15) | 18,900 | 19,090 |
| Pennsylvania GO | 4.000% | 3/1/37 (15) | 17,440 | 17,507 |
| 7 Pennsylvania GO TOB VRDO | 1.620% | 11/7/18 | 2,540 | 2,540 |
| Pennsylvania Higher Education Assistance Agency Revenue | 5.000% | 12/15/20 | 2,560 | 2,691 |
| Pennsylvania Higher Education Assistance Agency Revenue | 5.000% | 12/15/21 | 1,830 | 1,932 |
| Pennsylvania Higher Educational Facilities Authority Revenue | 4.000% | 6/15/32 | 8,500 | 8,656 |
| Pennsylvania Higher Educational Facilities Authority Revenue | 4.000% | 6/15/33 | 10,000 | 10,137 |
| Pennsylvania Higher Educational Facilities Authority Revenue | | | | |
| (Foundation for Indiana University of Pennsylvania Student Housing) | 5.000% | 7/1/22 (Prere.) | 1,745 | 1,904 |
| Pennsylvania Higher Educational Facilities Authority Revenue (Higher Education System) | 5.000% | 6/15/29 | 4,125 | 4,298 |
| Pennsylvania Higher Educational Facilities Authority Revenue (Higher Education System) | 5.000% | 6/15/29 | 1,300 | 1,372 |
| Pennsylvania Higher Educational Facilities Authority Revenue (La Salle University) | 5.000% | 5/1/24 | 1,435 | 1,532 |
| Pennsylvania Higher Educational Facilities Authority Revenue (La Salle University) | 5.000% | 5/1/25 | 1,670 | 1,776 |
| Pennsylvania Higher Educational Facilities Authority Revenue (La Salle University) | 5.000% | 5/1/26 | 1,690 | 1,790 |
| Pennsylvania Higher Educational Facilities Authority Revenue (Temple University) | 5.000% | 4/1/25 | 2,065 | 2,226 |
| Pennsylvania Higher Educational Facilities Authority Revenue (Temple University) | 5.000% | 4/1/26 | 1,140 | 1,227 |
| Pennsylvania Higher Educational Facilities Authority Revenue (Temple University) | 5.000% | 4/1/27 | 1,120 | 1,204 |
| Pennsylvania Higher Educational Facilities Authority Revenue (Temple University) | 5.000% | 4/1/28 | 3,085 | 3,310 |
| Pennsylvania Higher Educational Facilities Authority Revenue (Temple University) | 5.000% | 4/1/30 | 2,985 | 3,191 |
| Pennsylvania Higher Educational Facilities Authority Revenue (Temple University) | 5.000% | 4/1/31 | 3,500 | 3,738 |
| Pennsylvania Higher Educational Facilities Authority Revenue (Thomas Jefferson University) | 5.250% | 9/1/19 (2) | 2,935 | 3,010 |
| Pennsylvania Higher Educational Facilities Authority Revenue (Thomas Jefferson University) | 5.000% | 3/1/27 | 700 | 753 |
| Pennsylvania Higher Educational Facilities Authority Revenue (Thomas Jefferson University) | 5.000% | 3/1/28 | 1,650 | 1,774 |
| Pennsylvania Higher Educational Facilities Authority Revenue (Thomas Jefferson University) | 5.000% | 3/1/30 | 500 | 537 |
| Pennsylvania Higher Educational Facilities Authority Revenue (Thomas Jefferson University) | 5.000% | 3/1/32 | 1,000 | 1,073 |
| Pennsylvania Higher Educational Facilities Authority Revenue | | | | |
| (Trustees of the University of Pennsylvania) | 5.000% | 3/1/21 (Prere.) | 2,405 | 2,562 |
| Pennsylvania Higher Educational Facilities Authority Revenue | | | | |
| (Trustees of the University of Pennsylvania) | 5.000% | 10/1/23 | 8,220 | 9,237 |
| Pennsylvania Higher Educational Facilities Authority Revenue | | | | |
| (Trustees of the University of Pennsylvania) | 5.000% | 10/1/24 | 7,000 | 7,985 |
| Pennsylvania Higher Educational Facilities Authority Revenue | | | | |
| (Trustees of the University of Pennsylvania) | 5.000% | 10/1/25 | 5,000 | 5,786 |
245
Intermediate-Term Tax-Exempt Fund
| | | | |
| Face | Market |
| Maturity | Amount | Value• |
| Coupon | Date | ($000) | ($000) |
| Pennsylvania Higher Educational Facilities Authority Revenue | | | | |
| (Trustees of the University of Pennsylvania) | 5.000% | 10/1/26 | 4,625 | 5,314 |
| Pennsylvania Higher Educational Facilities Authority Revenue | | | | |
| (Trustees of the University of Pennsylvania) | 5.000% | 10/1/26 | 9,550 | 10,972 |
| Pennsylvania Higher Educational Facilities Authority Revenue | | | | |
| (University of Pennsylvania Health System) | 5.000% | 8/15/27 | 2,040 | 2,367 |
| Pennsylvania Higher Educational Facilities Authority Revenue | | | | |
| (University of Pennsylvania Health System) | 5.000% | 8/15/28 | 1,510 | 1,738 |
| Pennsylvania Higher Educational Facilities Authority Revenue | | | | |
| (University of Pennsylvania Health System) | 4.000% | 8/15/34 | 6,500 | 6,625 |
| Pennsylvania Higher Educational Facilities Authority Revenue | | | | |
| (University of Pennsylvania Health System) | 4.000% | 8/15/35 | 5,000 | 5,078 |
| Pennsylvania Higher Educational Facilities Authority Revenue | | | | |
| (University of Pennsylvania Health System) | 4.000% | 8/15/36 | 7,630 | 7,720 |
| Pennsylvania Higher Educational Facilities Authority Revenue | | | | |
| (University of Pittsburgh Medical Center) | 5.000% | 5/15/31 | 500 | 519 |
| Pennsylvania Higher Educational Facilities Authority Revenue (University of the Sciences) | 5.000% | 11/1/33 | 5,805 | 6,372 |
| Pennsylvania Housing Finance Agency Single Family Mortgage Revenue | 5.000% | 10/1/19 | 2,000 | 2,052 |
| Pennsylvania Housing Finance Agency Single Family Mortgage Revenue | 5.000% | 10/1/20 | 1,500 | 1,578 |
| Pennsylvania Public School Building Authority Lease Revenue (School District of Philadelphia) | 5.000% | 4/1/20 | 1,265 | 1,311 |
| Pennsylvania Public School Building Authority Lease Revenue (School District of Philadelphia) | 5.000% | 4/1/21 | 1,545 | 1,631 |
| Pennsylvania Public School Building Authority Lease Revenue (School District of Philadelphia) | 5.000% | 6/1/21 | 4,630 | 4,904 |
| Pennsylvania State University Revenue | 5.000% | 9/1/21 | 620 | 668 |
| Pennsylvania State University Revenue | 5.000% | 9/1/21 | 1,400 | 1,507 |
| Pennsylvania State University Revenue | 4.000% | 9/1/27 | 4,800 | 5,143 |
| Pennsylvania State University Revenue | 5.000% | 9/1/28 | 5,000 | 5,768 |
| Pennsylvania State University Revenue | 5.000% | 9/1/29 | 5,000 | 5,738 |
| Pennsylvania State University Revenue | 5.000% | 9/1/30 | 1,780 | 2,033 |
| Pennsylvania State University Revenue | 5.000% | 9/1/30 | 1,650 | 1,885 |
| Pennsylvania State University Revenue | 5.000% | 9/1/34 | 5,125 | 5,855 |
| Pennsylvania State University Revenue | 4.000% | 9/1/35 | 1,650 | 1,696 |
| Pennsylvania State University Revenue | 5.000% | 9/1/35 | 1,350 | 1,518 |
| Pennsylvania State University Revenue | 5.000% | 9/1/35 | 4,400 | 5,009 |
| Pennsylvania State University Revenue | 5.000% | 9/1/36 | 1,325 | 1,485 |
| Pennsylvania Turnpike Commission Motor License Fund Revenue | 5.500% | 12/1/20 (Prere.) | 4,010 | 4,272 |
| Pennsylvania Turnpike Commission Motor License Fund Revenue | 5.500% | 12/1/20 (Prere.) | 2,265 | 2,418 |
| Pennsylvania Turnpike Commission Motor License Fund Revenue | 5.000% | 12/1/22 (Prere.) | 2,190 | 2,416 |
| Pennsylvania Turnpike Commission Motor License Fund Revenue | 5.000% | 12/1/22 (Prere.) | 2,165 | 2,389 |
| Pennsylvania Turnpike Commission Motor License Fund Revenue | 5.000% | 12/1/22 (Prere.) | 1,825 | 2,014 |
| Pennsylvania Turnpike Commission Motor License Fund Revenue | 5.000% | 12/1/23 | 1,770 | 1,926 |
| Pennsylvania Turnpike Commission Motor License Fund Revenue | 5.000% | 6/1/25 | 2,070 | 2,325 |
| Pennsylvania Turnpike Commission Motor License Fund Revenue | 5.000% | 6/1/26 | 3,340 | 3,783 |
| Pennsylvania Turnpike Commission Motor License Fund Revenue | 5.000% | 12/1/31 | 5,570 | 6,201 |
| Pennsylvania Turnpike Commission Motor License Fund Revenue | 5.000% | 12/1/33 | 7,250 | 8,006 |
| Pennsylvania Turnpike Commission Motor License Fund Revenue | 5.000% | 12/1/35 | 2,215 | 2,428 |
| Pennsylvania Turnpike Commission Motor License Fund Revenue | 5.000% | 12/1/36 | 3,970 | 4,336 |
| Pennsylvania Turnpike Commission Motor License Fund Revenue | 5.000% | 12/1/37 | 5,865 | 6,392 |
| Pennsylvania Turnpike Commission Oil Franchise Tax Revenue | 5.000% | 12/1/23 | 2,905 | 3,209 |
| Pennsylvania Turnpike Commission Oil Franchise Tax Revenue | 5.000% | 12/1/26 | 1,460 | 1,660 |
| Pennsylvania Turnpike Commission Oil Franchise Tax Revenue | 5.000% | 12/1/27 | 1,650 | 1,867 |
| Pennsylvania Turnpike Commission Revenue | 5.000% | 6/1/19 (Prere.) | 4,520 | 4,600 |
| Pennsylvania Turnpike Commission Revenue | 5.000% | 6/1/19 (Prere.) | 3,535 | 3,597 |
| Pennsylvania Turnpike Commission Revenue | 5.000% | 6/1/19 (Prere.) | 8,585 | 8,737 |
| Pennsylvania Turnpike Commission Revenue | 5.000% | 6/1/19 (Prere.) | 9,020 | 9,179 |
| Pennsylvania Turnpike Commission Revenue | 5.000% | 6/1/19 (Prere.) | 40,980 | 41,705 |
| Pennsylvania Turnpike Commission Revenue | 5.250% | 6/1/19 (Prere.) | 4,715 | 4,805 |
| Pennsylvania Turnpike Commission Revenue | 5.000% | 12/1/19 (Prere.) | 7,280 | 7,511 |
| 2 Pennsylvania Turnpike Commission Revenue | 2.870% | 12/1/20 | 22,700 | 22,986 |
| Pennsylvania Turnpike Commission Revenue | 5.000% | 12/1/20 (Prere.) | 1,250 | 1,322 |
| Pennsylvania Turnpike Commission Revenue | 5.000% | 12/1/20 (Prere.) | 1,500 | 1,586 |
| Pennsylvania Turnpike Commission Revenue | 5.000% | 12/1/20 (Prere.) | 1,335 | 1,411 |
| Pennsylvania Turnpike Commission Revenue | 5.000% | 12/1/20 (Prere.) | 1,035 | 1,094 |
| Pennsylvania Turnpike Commission Revenue | 5.000% | 12/1/20 (Prere.) | 1,500 | 1,586 |
| Pennsylvania Turnpike Commission Revenue | 5.250% | 12/1/20 (Prere.) | 1,710 | 1,817 |
| Pennsylvania Turnpike Commission Revenue | 5.250% | 12/1/20 (Prere.) | 4,015 | 4,265 |
| Pennsylvania Turnpike Commission Revenue | 5.625% | 12/1/20 (Prere.) | 1,790 | 1,915 |
| Pennsylvania Turnpike Commission Revenue | 5.625% | 12/1/20 (Prere.) | 5,985 | 6,403 |
| Pennsylvania Turnpike Commission Revenue | 5.625% | 12/1/20 (Prere.) | 2,225 | 2,381 |
| 2 Pennsylvania Turnpike Commission Revenue | 2.580% | 12/1/21 | 37,500 | 37,949 |
| Pennsylvania Turnpike Commission Revenue | 5.000% | 12/1/21 | 6,955 | 7,161 |
246
Intermediate-Term Tax-Exempt Fund
| | | | | |
| Face | Market |
| Maturity | Amount | Value• |
| | Coupon | Date | ($000) | ($000) |
| Pennsylvania Turnpike Commission Revenue | 5.000% | 12/1/21 | 16,750 | 17,271 |
| Pennsylvania Turnpike Commission Revenue | 5.000% | 6/1/24 | 27,855 | 30,894 |
| Pennsylvania Turnpike Commission Revenue | 5.000% | 6/1/25 | 11,910 | 13,300 |
| Pennsylvania Turnpike Commission Revenue | 5.000% | 6/1/25 | 37,630 | 42,022 |
| Pennsylvania Turnpike Commission Revenue | 5.000% | 12/1/25 | 3,025 | 3,433 |
| Pennsylvania Turnpike Commission Revenue | 5.000% | 6/1/26 (4) | 35,000 | 39,638 |
| Pennsylvania Turnpike Commission Revenue | 5.000% | 6/1/26 | 9,845 | 10,920 |
| Pennsylvania Turnpike Commission Revenue | 5.000% | 6/1/26 | 35,035 | 39,425 |
| Pennsylvania Turnpike Commission Revenue | 5.000% | 12/1/26 | 2,320 | 2,573 |
| Pennsylvania Turnpike Commission Revenue | 5.000% | 12/1/26 | 3,300 | 3,778 |
| Pennsylvania Turnpike Commission Revenue | 5.000% | 6/1/27 | 1,210 | 1,365 |
| Pennsylvania Turnpike Commission Revenue | 5.000% | 6/1/27 | 5,275 | 5,835 |
| Pennsylvania Turnpike Commission Revenue | 5.000% | 6/1/27 | 5,085 | 5,734 |
| Pennsylvania Turnpike Commission Revenue | 5.000% | 12/1/27 | 3,640 | 4,193 |
| Pennsylvania Turnpike Commission Revenue | 5.000% | 12/1/27 | 1,050 | 1,189 |
| Pennsylvania Turnpike Commission Revenue | 5.000% | 6/1/28 | 5,140 | 5,657 |
| Pennsylvania Turnpike Commission Revenue | 5.000% | 6/1/28 | 1,760 | 1,954 |
| Pennsylvania Turnpike Commission Revenue | 5.000% | 6/1/28 | 8,875 | 9,854 |
| 15 | Pennsylvania Turnpike Commission Revenue | 0.000% | 12/1/28 | 3,500 | 3,903 |
| Pennsylvania Turnpike Commission Revenue | 5.000% | 12/1/28 | 1,000 | 1,109 |
| Pennsylvania Turnpike Commission Revenue | 5.000% | 12/1/28 | 1,000 | 1,130 |
| Pennsylvania Turnpike Commission Revenue | 5.000% | 12/1/28 | 1,010 | 1,125 |
| Pennsylvania Turnpike Commission Revenue | 5.000% | 6/1/29 | 3,030 | 3,323 |
| Pennsylvania Turnpike Commission Revenue | 5.000% | 6/1/29 | 7,635 | 8,360 |
| Pennsylvania Turnpike Commission Revenue | 5.000% | 12/1/29 | 2,000 | 2,206 |
| Pennsylvania Turnpike Commission Revenue | 5.000% | 12/1/29 | 1,330 | 1,494 |
| Pennsylvania Turnpike Commission Revenue | 5.000% | 12/1/29 | 1,165 | 1,290 |
| Pennsylvania Turnpike Commission Revenue | 5.000% | 6/1/30 | 5,095 | 5,536 |
| Pennsylvania Turnpike Commission Revenue | 5.000% | 12/1/30 | 4,000 | 4,390 |
| Pennsylvania Turnpike Commission Revenue | 5.000% | 12/1/30 | 1,500 | 1,643 |
| Pennsylvania Turnpike Commission Revenue | 5.000% | 12/1/30 | 2,750 | 3,073 |
| Pennsylvania Turnpike Commission Revenue | 5.000% | 6/1/31 | 7,020 | 7,604 |
| Pennsylvania Turnpike Commission Revenue | 5.000% | 12/1/31 | 3,785 | 4,143 |
| Pennsylvania Turnpike Commission Revenue | 5.000% | 12/1/31 | 25,500 | 27,914 |
| Pennsylvania Turnpike Commission Revenue | 5.000% | 12/1/31 | 3,030 | 3,373 |
| Pennsylvania Turnpike Commission Revenue | 5.000% | 6/1/32 | 14,615 | 15,770 |
| Pennsylvania Turnpike Commission Revenue | 5.000% | 6/1/32 | 3,110 | 3,379 |
| Pennsylvania Turnpike Commission Revenue | 5.000% | 6/1/32 | 17,500 | 19,011 |
| Pennsylvania Turnpike Commission Revenue | 5.000% | 12/1/32 | 31,195 | 34,058 |
| Pennsylvania Turnpike Commission Revenue | 5.000% | 12/1/32 | 3,250 | 3,548 |
| Pennsylvania Turnpike Commission Revenue | 5.000% | 6/1/33 | 9,950 | 10,703 |
| 15 | Pennsylvania Turnpike Commission Revenue | 0.000% | 12/1/33 | 4,500 | 4,923 |
| Pennsylvania Turnpike Commission Revenue | 5.000% | 12/1/33 | 4,940 | 5,337 |
| Pennsylvania Turnpike Commission Revenue | 5.000% | 12/1/33 | 23,000 | 25,045 |
| Pennsylvania Turnpike Commission Revenue | 5.000% | 12/1/33 | 2,000 | 2,209 |
| Pennsylvania Turnpike Commission Revenue | 5.000% | 6/1/34 (4) | 8,160 | 8,927 |
| Pennsylvania Turnpike Commission Revenue | 5.000% | 12/1/34 | 2,770 | 2,985 |
| Pennsylvania Turnpike Commission Revenue | 5.000% | 12/1/34 | 2,575 | 2,833 |
| Pennsylvania Turnpike Commission Revenue | 5.000% | 12/1/34 | 4,025 | 4,335 |
| Pennsylvania Turnpike Commission Revenue | 5.000% | 6/1/35 | 22,500 | 24,049 |
| Pennsylvania Turnpike Commission Revenue | 5.000% | 12/1/35 | 4,000 | 4,293 |
| Pennsylvania Turnpike Commission Revenue | 5.000% | 12/1/35 | 30,420 | 32,632 |
| Pennsylvania Turnpike Commission Revenue | 5.000% | 6/1/36 | 25,765 | 27,452 |
| Pennsylvania Turnpike Commission Revenue | 5.000% | 12/1/36 | 4,000 | 4,270 |
| Pennsylvania Turnpike Commission Revenue | 5.000% | 12/1/37 | 5,000 | 5,342 |
| Philadelphia PA Airport Revenue | 5.000% | 6/15/23 | 2,000 | 2,083 |
| Philadelphia PA Authority for Industrial Development Revenue (Cultural & Commercial Corridors) | 5.000% | 12/1/26 | 5,025 | 5,621 |
| Philadelphia PA Authority for Industrial Development Revenue (Temple University) | 5.000% | 4/1/24 | 6,500 | 7,266 |
| Philadelphia PA Authority for Industrial Development Revenue (Temple University) | 5.000% | 4/1/25 | 7,890 | 8,927 |
| Philadelphia PA Authority for Industrial Development Revenue (Temple University) | 5.000% | 4/1/26 | 12,860 | 14,542 |
| Philadelphia PA Authority for Industrial Development Revenue (Temple University) | 5.000% | 4/1/27 | 6,750 | 7,603 |
| Philadelphia PA Authority for Industrial Development Revenue (Temple University) | 5.000% | 4/1/28 | 3,525 | 3,953 |
| Philadelphia PA Authority for Industrial Development Revenue (Temple University) | 5.000% | 4/1/29 | 2,500 | 2,794 |
| Philadelphia PA Authority for Industrial Development Revenue (Temple University) | 5.000% | 4/1/34 | 3,250 | 3,577 |
| Philadelphia PA Authority for Industrial Development Revenue (Temple University) | 5.000% | 4/1/35 | 7,135 | 7,839 |
| Philadelphia PA Authority for Industrial Development Revenue | | | | |
| | (The Children’s Hospital of Philadelphia Project) | 5.000% | 7/1/31 | 1,010 | 1,147 |
| Philadelphia PA Authority for Industrial Development Revenue | | | | |
| | (The Children’s Hospital of Philadelphia Project) | 5.000% | 7/1/33 | 1,900 | 2,143 |
247
Intermediate-Term Tax-Exempt Fund
| | | | |
| Face | Market |
| Maturity | Amount | Value• |
| Coupon | Date | ($000) | ($000) |
| Philadelphia PA Authority for Industrial Development Revenue | | | | |
| (The Children’s Hospital of Philadelphia Project) | 5.000% | 7/1/34 | 3,830 | 4,302 |
| Philadelphia PA Authority for Industrial Development Revenue | | | | |
| (The Children’s Hospital of Philadelphia Project) | 4.000% | 7/1/35 | 2,850 | 2,885 |
| Philadelphia PA Authority for Industrial Development Revenue | | | | |
| (The Children’s Hospital of Philadelphia Project) | 4.000% | 7/1/36 | 6,220 | 6,265 |
| Philadelphia PA Authority for Industrial Development Revenue (Thomas Jefferson University) | 5.000% | 9/1/37 | 3,000 | 3,262 |
| Philadelphia PA Gas Works Revenue | 5.000% | 10/1/21 | 7,220 | 7,726 |
| Philadelphia PA Gas Works Revenue | 5.000% | 10/1/23 | 5,550 | 6,123 |
| Philadelphia PA Gas Works Revenue | 5.000% | 8/1/24 | 6,400 | 7,128 |
| Philadelphia PA Gas Works Revenue | 5.000% | 10/1/24 | 2,145 | 2,393 |
| Philadelphia PA Gas Works Revenue | 5.000% | 10/1/25 | 2,525 | 2,842 |
| Philadelphia PA Gas Works Revenue | 5.000% | 10/1/26 | 1,750 | 1,982 |
| Philadelphia PA Gas Works Revenue | 5.000% | 8/1/28 | 1,000 | 1,114 |
| Philadelphia PA Gas Works Revenue | 5.000% | 8/1/30 | 2,000 | 2,232 |
| Philadelphia PA Gas Works Revenue | 5.000% | 8/1/31 | 3,500 | 3,892 |
| Philadelphia PA Gas Works Revenue | 5.000% | 8/1/32 | 6,820 | 7,558 |
| Philadelphia PA Gas Works Revenue | 5.000% | 8/1/33 | 5,000 | 5,521 |
| Philadelphia PA Gas Works Revenue | 5.000% | 8/1/34 | 2,875 | 3,166 |
| Philadelphia PA Gas Works Revenue | 5.000% | 8/1/35 | 1,595 | 1,749 |
| Philadelphia PA Gas Works Revenue | 5.000% | 8/1/36 | 770 | 841 |
| Philadelphia PA Gas Works Revenue | 5.000% | 8/1/37 | 1,400 | 1,524 |
| Philadelphia PA GO | 5.000% | 8/1/23 | 7,310 | 8,037 |
| Philadelphia PA GO | 5.000% | 8/1/29 | 5,000 | 5,488 |
| Philadelphia PA Hospitals & Higher Education Facilities Authority Hospital Revenue | | | | |
| (Temple University Health System Obligated Group) | 5.000% | 7/1/25 | 5,920 | 6,447 |
| Philadelphia PA Hospitals & Higher Education Facilities Authority Hospital Revenue | | | | |
| (Temple University Health System Obligated Group) | 5.000% | 7/1/26 | 15,155 | 16,532 |
| Philadelphia PA Hospitals & Higher Education Facilities Authority Hospital Revenue | | | | |
| (Temple University Health System Obligated Group) | 5.000% | 7/1/27 | 6,885 | 7,522 |
| Philadelphia PA Hospitals & Higher Education Facilities Authority Hospital Revenue | | | | |
| (Temple University Health System Obligated Group) | 5.000% | 7/1/28 | 2,670 | 2,902 |
| Philadelphia PA Municipal Authority Revenue | 6.375% | 4/1/19 (Prere.) | 3,500 | 3,565 |
| Philadelphia PA School District GO | 5.000% | 9/1/21 | 6,300 | 6,555 |
| Philadelphia PA School District GO | 5.000% | 6/1/24 (4)(3) | 2,000 | 2,167 |
| Philadelphia PA School District GO | 5.000% | 9/1/25 (15) | 19,910 | 22,300 |
| Philadelphia PA School District GO | 5.000% | 9/1/26 | 2,295 | 2,547 |
| Philadelphia PA School District GO | 5.000% | 9/1/32 | 2,100 | 2,278 |
| Philadelphia PA Water & Wastewater Revenue | 5.000% | 7/1/20 | 1,300 | 1,359 |
| Philadelphia PA Water & Wastewater Revenue | 5.000% | 7/1/26 | 5,510 | 6,138 |
| Philadelphia PA Water & Wastewater Revenue | 5.000% | 11/1/28 | 1,625 | 1,866 |
| Philadelphia PA Water & Wastewater Revenue | 5.000% | 10/1/37 | 1,750 | 1,935 |
| Philadelphia PA Water & Wastewater Revenue | 5.000% | 8/1/20 (Prere.) | 3,000 | 3,146 |
| Philadelphia PA Water & Wastewater Revenue | 5.000% | 1/1/23 | 2,385 | 2,623 |
| Philadelphia PA Water & Wastewater Revenue | 5.000% | 7/1/23 | 2,000 | 2,218 |
| Philadelphia PA Water & Wastewater Revenue | 5.000% | 7/1/24 | 3,800 | 4,277 |
| Philadelphia PA Water & Wastewater Revenue | 5.000% | 10/1/26 | 6,410 | 7,390 |
| Philadelphia PA Water & Wastewater Revenue | 5.000% | 11/1/26 | 1,175 | 1,355 |
| Philadelphia PA Water & Wastewater Revenue | 5.000% | 10/1/27 | 3,875 | 4,487 |
| Philadelphia PA Water & Wastewater Revenue | 5.000% | 11/1/27 | 1,585 | 1,836 |
| Philadelphia PA Water & Wastewater Revenue | 5.000% | 11/1/29 | 4,665 | 5,325 |
| Philadelphia PA Water & Wastewater Revenue | 5.000% | 11/1/30 | 5,925 | 6,723 |
| Philadelphia PA Water & Wastewater Revenue | 5.000% | 11/1/31 | 5,750 | 6,496 |
| Philadelphia PA Water & Wastewater Revenue | 5.000% | 10/1/33 | 1,250 | 1,402 |
| Philadelphia PA Water & Wastewater Revenue | 4.000% | 7/1/34 | 6,380 | 6,496 |
| Philadelphia PA Water & Wastewater Revenue | 4.000% | 7/1/35 | 11,000 | 11,154 |
| Philadelphia PA Water & Wastewater Revenue | 5.000% | 10/1/35 | 2,000 | 2,226 |
| Philadelphia PA Water & Wastewater Revenue | 5.000% | 10/1/36 | 1,660 | 1,841 |
| Plum Borough PA School District GO | 5.000% | 9/15/23 (15) | 1,000 | 1,102 |
| Pocono Mountain PA School District GO | 4.000% | 9/1/22 (4) | 2,155 | 2,269 |
| Reading PA School District GO | 5.000% | 3/1/26 (4) | 1,235 | 1,391 |
| Reading PA School District GO | 5.000% | 3/1/35 (4) | 1,100 | 1,211 |
| Reading PA School District GO | 5.000% | 3/1/36 (4) | 1,250 | 1,371 |
| Reading PA School District GO | 5.000% | 3/1/37 (4) | 2,000 | 2,188 |
| 1 Rose Tree PA Media School District GO | 5.000% | 4/1/26 | 2,750 | 3,154 |
| 1 Rose Tree PA Media School District GO | 5.000% | 4/1/27 | 1,800 | 2,052 |
| 1 Rose Tree PA Media School District GO | 5.000% | 4/1/28 | 1,650 | 1,871 |
| 1 Rose Tree PA Media School District GO | 5.000% | 4/1/29 | 700 | 789 |
| Saint Mary PA Hospital Authority Health System Revenue (Trinity Health Corp Obligated Group) | 5.000% | 11/15/27 | 2,000 | 2,301 |
248
Intermediate-Term Tax-Exempt Fund
| | | | |
| Face | Market |
| Maturity | Amount | Value• |
| Coupon | Date | ($000) | ($000) |
| Scranton PA School District GO | 5.000% | 6/1/25 | 2,500 | 2,702 |
| Southeastern Pennsylvania Transportation Authority Revenue | 5.000% | 3/1/20 (Prere.) | 4,690 | 4,867 |
| Southeastern Pennsylvania Transportation Authority Revenue | 5.000% | 3/1/20 (Prere.) | 3,845 | 3,990 |
| Southeastern Pennsylvania Transportation Authority Revenue | 5.000% | 3/1/27 | 800 | 925 |
| Southeastern Pennsylvania Transportation Authority Revenue | 5.000% | 3/1/27 | 1,410 | 1,459 |
| Southeastern Pennsylvania Transportation Authority Revenue | 5.000% | 3/1/28 | 1,460 | 1,686 |
| Southeastern Pennsylvania Transportation Authority Revenue | 5.000% | 3/1/28 | 1,155 | 1,195 |
| St. Mary Hospital Authority Pennsylvania Health System Revenue (Catholic Health Initiatives) | 5.000% | 5/15/20 (Prere.) | 2,440 | 2,541 |
| St. Mary Hospital Authority Pennsylvania Health System Revenue (Catholic Health Initiatives) | 5.000% | 5/15/20 (Prere.) | 2,465 | 2,571 |
| St. Mary Hospital Authority Pennsylvania Health System Revenue (Catholic Health Initiatives) | 5.000% | 5/15/20 (Prere.) | 15,385 | 16,049 |
| State Public School Building Authority Pennsylvania College Revenue | | | | |
| (Delaware County Community College Project) | 5.000% | 10/1/24 (15) | 2,635 | 2,955 |
| State Public School Building Authority Pennsylvania College Revenue | | | | |
| (Delaware County Community College Project) | 5.000% | 10/1/25 (15) | 2,880 | 3,233 |
| State Public School Building Authority Pennsylvania College Revenue | | | | |
| (Delaware County Community College Project) | 5.000% | 10/1/26 (15) | 3,445 | 3,870 |
| State Public School Building Authority Pennsylvania College Revenue | | | | |
| (Delaware County Community College Project) | 5.000% | 10/1/27 (15) | 3,130 | 3,516 |
| State Public School Building Authority Pennsylvania College Revenue | | | | |
| (Montgomery County Community College) | 5.000% | 5/1/24 | 3,290 | 3,660 |
| State Public School Building Authority Pennsylvania Lease Revenue | | | | |
| (School District of Philadelphia) | 5.000% | 4/1/22 | 2,000 | 2,144 |
| State Public School Building Authority Pennsylvania Lease Revenue | | | | |
| (School District of Philadelphia) | 5.000% | 4/1/24 | 1,365 | 1,452 |
| State Public School Building Authority Pennsylvania Lease Revenue | | | | |
| (School District of Philadelphia) | 5.000% | 6/1/24 (15) | 21,000 | 23,177 |
| State Public School Building Authority Pennsylvania Lease Revenue | | | | |
| (School District of Philadelphia) | 5.000% | 6/1/25 (4) | 9,505 | 10,596 |
| State Public School Building Authority Pennsylvania Lease Revenue | | | | |
| (School District of Philadelphia) | 5.000% | 6/1/26 (4) | 31,500 | 35,334 |
| State Public School Building Authority Pennsylvania Lease Revenue | | | | |
| (School District of Philadelphia) | 5.000% | 6/1/33 (4) | 8,400 | 9,132 |
| Swarthmore Borough PA Authority College Revenue (Swarthmore College) | 5.000% | 9/15/35 | 3,195 | 3,672 |
| Swarthmore Borough PA Authority College Revenue (Swarthmore College) | 5.000% | 9/15/36 | 3,360 | 3,847 |
| Swarthmore Borough PA Authority College Revenue (Swarthmore College) | 5.000% | 9/15/37 | 2,530 | 2,890 |
| Swarthmore Borough PA Authority College Revenue (Swarthmore College) | 5.000% | 9/15/38 | 2,460 | 2,801 |
| Unionville-Chadds Ford PA School District GO | 5.000% | 6/1/24 | 1,255 | 1,419 |
| University of Pittsburgh of the Commonwealth System of Higher Education | | | | |
| Pennsylvania Revenue (University Capital Project) | 5.000% | 3/15/19 (Prere.) | 2,650 | 2,681 |
| University of Pittsburgh of the Commonwealth System of Higher Education | | | | |
| Pennsylvania Revenue (University Capital Project) | 5.500% | 3/15/19 (Prere.) | 9,000 | 9,121 |
| University of Pittsburgh of the Commonwealth System of Higher Education | | | | |
| Pennsylvania Revenue (University Capital Project) | 5.250% | 9/15/19 (Prere.) | 12,500 | 12,856 |
| University of Pittsburgh of the Commonwealth System of Higher Education | | | | |
| Pennsylvania Revenue (University Capital Project) | 5.250% | 9/15/19 (Prere.) | 2,375 | 2,443 |
| University of Pittsburgh of the Commonwealth System of Higher Education | | | | |
| Pennsylvania Revenue (University Capital Project) | 5.250% | 9/15/19 (Prere.) | 11,250 | 11,570 |
| West Cornwall PA Healthcare Facilities Revenue | | | | |
| (Pleasant View Retirement Community Obligated Group) | 4.000% | 12/15/28 | 1,375 | 1,386 |
| West Cornwall PA Healthcare Facilities Revenue | | | | |
| (Pleasant View Retirement Community Obligated Group) | 5.000% | 12/15/38 | 2,195 | 2,311 |
| Westmoreland County PA Industrial Development Authority Revenue (Excela Health Project) | 5.000% | 7/1/19 | 1,235 | 1,258 |
| Westmoreland County PA Industrial Development Authority Revenue (Excela Health Project) | 5.250% | 7/1/20 | 2,330 | 2,441 |
| Westmoreland County PA Industrial Development Authority Revenue (Excela Health Project) | 5.000% | 7/1/25 | 4,500 | 4,662 |
| Westmoreland County PA Municipal Authority Revenue | 5.000% | 8/15/23 (Prere.) | 15,000 | 16,760 |
| Westmoreland County PA Municipal Authority Revenue | 4.000% | 8/15/34 (15) | 5,000 | 5,063 |
| Wilkes-Barre PA Finance Authority Revenue (University of Scranton Project) | 5.000% | 11/1/20 (Prere.) | 1,015 | 1,070 |
| Wilkes-Barre PA Finance Authority Revenue (University of Scranton Project) | 5.000% | 11/1/20 (Prere.) | 1,160 | 1,223 |
| Wilkes-Barre PA Finance Authority Revenue (University of Scranton Project) | 5.000% | 11/1/20 (Prere.) | 1,350 | 1,423 |
| Wilkes-Barre PA Finance Authority Revenue (University of Scranton Project) | 5.000% | 11/1/20 (Prere.) | 1,420 | 1,497 |
| Wilkes-Barre PA Finance Authority Revenue (University of Scranton Project) | 5.000% | 11/1/20 (Prere.) | 1,465 | 1,544 |
| Wilkes-Barre PA Finance Authority Revenue (University of Scranton Project) | 5.000% | 11/1/20 (Prere.) | 6,185 | 6,520 |
| | | | 2,904,031 |
| Puerto Rico (0.1%) | | | | |
| Puerto Rico Electric Power Authority Revenue | 5.000% | 7/1/19 (14) | 10,430 | 10,489 |
| Puerto Rico Electric Power Authority Revenue | 5.000% | 7/1/20 (14) | 18,245 | 18,408 |
| Puerto Rico Electric Power Authority Revenue | 5.000% | 7/1/21 (14) | 24,290 | 24,495 |
| Puerto Rico Electric Power Authority Revenue | 5.250% | 7/1/21 (14) | 5,000 | 5,188 |
| Puerto Rico Electric Power Authority Revenue | 5.250% | 7/1/22 (14) | 10,000 | 10,474 |
249
Intermediate-Term Tax-Exempt Fund
| | | | |
| Face | Market |
| Maturity | Amount | Value• |
| Coupon | Date | ($000) | ($000) |
| Puerto Rico Highway & Transportation Authority Revenue | 5.250% | 7/1/21 (13)(3) | 5,300 | 5,660 |
| Puerto Rico Sales Tax Financing Corp. Revenue | 5.500% | 8/1/19 (Prere.) | 255 | 262 |
| | | | 74,976 |
| Rhode Island (0.2%) | | | | |
| Rhode Island & Providence Plantations GO | 5.500% | 8/1/21 (Prere.) | 9,805 | 10,674 |
| Rhode Island & Providence Plantations GO | 5.500% | 8/1/21 (Prere.) | 3,610 | 3,930 |
| Rhode Island Commerce Corp. Airport Revenue | 5.000% | 7/1/28 | 515 | 575 |
| Rhode Island Commerce Corp. Airport Revenue | 5.000% | 7/1/32 | 650 | 712 |
| Rhode Island Commerce Corp. Airport Revenue | 5.000% | 7/1/35 | 1,575 | 1,712 |
| Rhode Island Commerce Corp. Airport Revenue | 5.000% | 7/1/37 | 500 | 539 |
| Rhode Island Economic Development Corp. Revenue (Department of Transportation) | 5.250% | 6/15/19 (Prere.) | 25,000 | 25,517 |
| Rhode Island Economic Development Corp. Revenue (Department of Transportation) | 5.250% | 6/15/19 (Prere.) | 20,000 | 20,414 |
| Rhode Island Health & Educational Building Corp. Higher Education Facilities Revenue | | | | |
| (University of Rhode Island) | 5.000% | 9/15/27 | 2,000 | 2,255 |
| Rhode Island Health & Educational Building Corp. Hospital Financing Revenue | | | | |
| (Care New England Health System Obligated Group) | 5.500% | 9/1/23 (Prere.) | 6,000 | 6,843 |
| Rhode Island Health & Educational Building Corp. Hospital Financing Revenue | | | | |
| (Care New England Health System Obligated Group) | 6.000% | 9/1/23 (Prere.) | 5,500 | 6,398 |
| Rhode Island Health & Educational Building Corp. Hospital Financing Revenue | | | | |
| (Care New England Health System Obligated Group) | 5.000% | 9/1/25 | 5,000 | 5,342 |
| Rhode Island Health & Educational Building Corp. Hospital Financing Revenue | | | | |
| (Care New England Health System Obligated Group) | 5.000% | 9/1/26 | 5,000 | 5,343 |
| Rhode Island Health & Educational Building Corp. Hospital Financing Revenue | | | | |
| (Care New England Health System Obligated Group) | 5.000% | 9/1/31 | 3,000 | 3,132 |
| Rhode Island Health & Educational Building Corp. Hospital Financing Revenue | | | | |
| (Lifespan Obligated Group) | 5.000% | 5/15/24 | 2,350 | 2,592 |
| Rhode Island Health & Educational Building Corp. Hospital Financing Revenue | | | | |
| (Lifespan Obligated Group) | 5.000% | 5/15/25 | 4,500 | 5,008 |
| Rhode Island Health & Educational Building Corp. Hospital Financing Revenue | | | | |
| (Lifespan Obligated Group) | 5.000% | 5/15/26 | 2,000 | 2,238 |
| Tobacco Settlement Financing Corp. Rhode Island Revenue | 2.250% | 6/1/41 | 13,105 | 13,096 |
| | | | 116,320 |
| South Carolina (1.0%) | | | | |
| Aiken County SC Consolidated School District | 5.000% | 3/1/24 | 7,980 | 8,982 |
| Beaufort County SC School District GO | 5.000% | 3/1/21 | 3,245 | 3,455 |
| Berkeley County SC Utility Revenue | 5.000% | 6/1/30 | 8,170 | 8,941 |
| Charleston County SC GO | 5.000% | 11/1/21 | 2,765 | 2,990 |
| Charleston County SC GO | 5.000% | 11/1/26 | 12,690 | 14,886 |
| Charleston County SC GO | 4.000% | 11/1/33 | 6,955 | 7,216 |
| Charleston County SC GO | 4.000% | 11/1/34 | 7,410 | 7,659 |
| Charleston SC Educational Excellence Financing Corp. Revenue | | | | |
| (Charleston County School District, South Carolina Project) | 5.000% | 12/1/27 | 10,100 | 11,211 |
| Columbia SC Waterworks & Sewer System Revenue | 4.000% | 2/1/29 | 1,750 | 1,864 |
| Columbia SC Waterworks & Sewer System Revenue | 4.000% | 2/1/30 | 1,000 | 1,056 |
| Columbia SC Waterworks & Sewer System Revenue | 4.000% | 2/1/31 | 1,000 | 1,048 |
| Columbia SC Waterworks & Sewer System Revenue | 4.000% | 2/1/32 | 1,250 | 1,304 |
| Darlington County SC School District GO | 5.000% | 3/1/26 | 4,025 | 4,640 |
| Dorchester County SC School District No. 2 Installment Purchase Revenue | 4.000% | 12/1/25 | 8,805 | 9,332 |
| Dorchester County SC School District No. 2 Installment Purchase Revenue | 4.000% | 12/1/26 | 9,760 | 10,301 |
| Greenville County SC School District Installment Revenue | 5.500% | 12/1/19 | 32,480 | 33,745 |
| Greenwood County SC Hospital Revenue (Self Regional Healthcare) | 4.000% | 10/1/35 | 5,000 | 5,000 |
| Greenwood County SC Hospital Revenue (Self Regional Healthcare) | 4.000% | 10/1/36 | 4,000 | 3,965 |
| Horry County SC School District GO | 5.000% | 3/1/23 | 3,890 | 4,315 |
| Kershaw County SC Public Schools Foundation Installment Purchase Revenue | 5.000% | 12/1/24 | 1,115 | 1,249 |
| Kershaw County SC Public Schools Foundation Installment Purchase Revenue | 5.000% | 12/1/25 | 1,080 | 1,223 |
| Kershaw County SC School District GO | 5.000% | 3/1/29 | 8,210 | 9,455 |
| Lexington County SC Health Services District Inc. Hospital Revenue | 5.000% | 11/1/26 | 1,055 | 1,190 |
| Lexington County SC Health Services District Inc. Hospital Revenue | 5.000% | 11/1/26 | 6,245 | 6,544 |
| Lexington County SC Health Services District Inc. Hospital Revenue | 5.000% | 11/1/27 | 1,025 | 1,161 |
| Lexington County SC Health Services District Inc. Hospital Revenue | 5.000% | 11/1/28 | 1,645 | 1,826 |
| Lexington County SC Health Services District Inc. Hospital Revenue | 5.000% | 11/1/29 | 1,080 | 1,189 |
| Lexington County SC Health Services District Inc. Hospital Revenue | 4.000% | 11/1/31 | 1,525 | 1,533 |
| Lexington County SC Health Services District Inc. Hospital Revenue | 4.000% | 11/1/32 | 2,250 | 2,255 |
| Lexington County SC Health Services District Inc. Hospital Revenue | 4.000% | 11/1/33 | 400 | 399 |
| Lexington County SC Health Services District Inc. Hospital Revenue | 4.000% | 11/1/34 | 300 | 298 |
| Lexington County SC Health Services District Inc. Hospital Revenue | 4.000% | 11/1/35 | 300 | 296 |
| Lexington County SC Health Services District Inc. Hospital Revenue | 5.000% | 11/1/35 | 3,000 | 3,205 |
| Lexington County SC Health Services District Inc. Hospital Revenue | 4.000% | 11/1/36 | 375 | 367 |
| Lexington County SC Health Services District Inc. Hospital Revenue | 5.000% | 11/1/36 | 5,065 | 5,394 |
250
Intermediate-Term Tax-Exempt Fund
| | | | |
| Face | Market |
| Maturity | Amount | Value• |
| Coupon | Date | ($000) | ($000) |
| Lexington County SC Health Services District Inc. Hospital Revenue | 5.000% | 11/1/37 | 11,305 | 12,001 |
| Myrtle Beach SC Hospitality Fee Revenue | 5.000% | 6/1/26 | 1,000 | 1,108 |
| Myrtle Beach SC Hospitality Fee Revenue | 5.000% | 6/1/27 | 2,075 | 2,281 |
| Myrtle Beach SC Hospitality Fee Revenue | 5.000% | 6/1/30 | 1,000 | 1,089 |
| Myrtle Beach SC Hospitality Fee Revenue | 5.000% | 6/1/31 | 2,500 | 2,714 |
| Myrtle Beach SC Hospitality Fee Revenue | 5.000% | 6/1/33 | 2,750 | 2,972 |
| Newberry County SC School District Installment Purchase Revenue | 5.000% | 12/1/26 | 4,000 | 4,489 |
| Newberry County SC School District Installment Purchase Revenue | 5.000% | 12/1/29 | 3,390 | 3,758 |
| Newberry County SC School District Installment Purchase Revenue | 5.000% | 12/1/30 | 5,210 | 5,764 |
| Patriots Energy Group Finance Authority South Carolina Gas Supply Revenue PUT | 4.000% | 2/1/24 | 53,000 | 55,449 |
| Piedmont SC Municipal Power Agency Revenue | 5.000% | 1/1/20 | 14,100 | 14,557 |
| Piedmont SC Municipal Power Agency Revenue | 0.000% | 1/1/22 (14) | 9,950 | 9,089 |
| Piedmont SC Municipal Power Agency Revenue | 0.000% | 1/1/23 (14) | 8,780 | 7,753 |
| Piedmont SC Municipal Power Agency Revenue | 5.000% | 1/1/23 | 1,335 | 1,464 |
| Piedmont SC Municipal Power Agency Revenue | 0.000% | 1/1/24 (14) | 2,400 | 2,049 |
| Piedmont SC Municipal Power Agency Revenue | 5.000% | 1/1/24 | 2,050 | 2,278 |
| Piedmont SC Municipal Power Agency Revenue | 5.000% | 1/1/24 | 3,535 | 3,708 |
| Piedmont SC Municipal Power Agency Revenue | 5.000% | 1/1/25 | 3,000 | 3,366 |
| Piedmont SC Municipal Power Agency Revenue | 5.000% | 1/1/25 | 8,020 | 8,403 |
| Piedmont SC Municipal Power Agency Revenue | 5.000% | 1/1/29 (4) | 8,600 | 9,093 |
| Piedmont SC Municipal Power Agency Revenue | 5.000% | 1/1/29 (4) | 2,800 | 2,961 |
| South Carolina Association of Governmental Organizations Educational Facilities Corp. Revenue | | | | |
| (Pickens School District) | 5.000% | 12/1/23 | 2,065 | 2,297 |
| South Carolina Association of Governmental Organizations Educational Facilities Corp. Revenue | | | | |
| (Pickens School District) | 5.000% | 12/1/24 | 2,445 | 2,755 |
| South Carolina Association of Governmental Organizations Educational Facilities Corp. Revenue | | | | |
| (Pickens School District) | 5.000% | 12/1/26 | 2,000 | 2,244 |
| South Carolina Association of Governmental Organizations Educational Facilities Corp. Revenue | | | | |
| (Pickens School District) | 5.000% | 12/1/27 | 2,500 | 2,785 |
| South Carolina Higher Education Revenue (Clemson University) | 5.000% | 5/1/22 | 4,860 | 5,305 |
| South Carolina Jobs Economic Development Authority Hospital Revenue (AnMed Health Project) | 5.000% | 2/1/27 | 3,725 | 4,191 |
| South Carolina Jobs Economic Development Authority Hospital Revenue (AnMed Health Project) | 5.000% | 2/1/28 | 2,500 | 2,792 |
| South Carolina Jobs Economic Development Authority Hospital Revenue (AnMed Health Project) | 5.000% | 2/1/29 | 2,185 | 2,423 |
| South Carolina Jobs Economic Development Authority Hospital Revenue (Palmetto Health) | 5.000% | 8/1/23 (Prere.) | 11,740 | 13,079 |
| South Carolina Jobs Economic Development Authority Hospital Revenue (Palmetto Health) | 5.000% | 8/1/23 (Prere.) | 7,850 | 8,745 |
| South Carolina Public Service Authority Revenue | 5.000% | 12/1/23 | 10,010 | 10,957 |
| South Carolina Public Service Authority Revenue | 5.000% | 12/1/24 | 13,900 | 15,369 |
| South Carolina Public Service Authority Revenue | 5.000% | 12/1/25 | 5,630 | 6,189 |
| South Carolina Public Service Authority Revenue | 5.000% | 12/1/26 | 5,000 | 5,465 |
| South Carolina Public Service Authority Revenue | 5.000% | 12/1/27 | 4,295 | 4,665 |
| South Carolina Public Service Authority Revenue | 5.000% | 12/1/28 | 15,130 | 16,354 |
| South Carolina Public Service Authority Revenue | 5.000% | 12/1/29 | 6,065 | 6,525 |
| South Carolina Public Service Authority Revenue | 5.000% | 12/1/30 | 10,955 | 11,711 |
| South Carolina Public Service Authority Revenue | 5.000% | 12/1/31 | 14,180 | 15,088 |
| South Carolina Public Service Authority Revenue | 5.000% | 12/1/32 | 8,535 | 9,062 |
| South Carolina Public Service Authority Revenue | 5.000% | 12/1/33 | 10,465 | 11,077 |
| South Carolina Public Service Authority Revenue | 5.000% | 12/1/35 | 3,025 | 3,223 |
| South Carolina Public Service Authority Revenue | 5.000% | 12/1/37 | 20,000 | 21,135 |
| South Carolina Public Service Authority Revenue | 5.000% | 12/1/37 | 3,500 | 3,717 |
| South Carolina Public Service Authority Revenue | 5.000% | 12/1/38 | 22,500 | 23,399 |
| Sumter Two School Facilities Inc. South Carolina Installment Purchase Revenue | 5.000% | 12/1/24 (15) | 1,000 | 1,106 |
| Sumter Two School Facilities Inc. South Carolina Installment Purchase Revenue | 5.000% | 12/1/25 (15) | 1,440 | 1,607 |
| York County SC School District GO (Fort Mill School District No. 4) | 4.000% | 3/1/31 | 2,890 | 3,028 |
| York County SC School District No. 1 GO | 4.000% | 3/1/29 | 2,805 | 2,956 |
| | | | 555,089 |
| South Dakota (0.1%) | | | | |
| Educational Enhancement Funding Corp. South Dakota Tobacco Settlement Revenue | 5.000% | 6/1/23 | 1,000 | 1,091 |
| South Dakota Building Authority Revenue | 5.000% | 6/1/33 | 4,000 | 4,352 |
| South Dakota Health & Educational Facilities Authority Revenue (Avera Health Obligated Group) | 5.000% | 7/1/33 | 1,800 | 1,996 |
| South Dakota Health & Educational Facilities Authority Revenue (Avera Health Obligated Group) | 5.000% | 7/1/35 | 2,730 | 2,993 |
| South Dakota Health & Educational Facilities Authority Revenue | | | | |
| (Regional Health System Obligated Group) | 5.000% | 9/1/28 | 2,235 | 2,539 |
| South Dakota Health & Educational Facilities Authority Revenue | | | | |
| (Regional Health System Obligated Group) | 5.000% | 9/1/29 | 1,735 | 1,959 |
| South Dakota Health & Educational Facilities Authority Revenue | | | | |
| (Regional Health System Obligated Group) | 5.000% | 9/1/31 | 4,830 | 5,399 |
| South Dakota Health & Educational Facilities Authority Revenue | | | | |
| (Regional Health System Obligated Group) | 5.000% | 9/1/32 | 1,100 | 1,223 |
251
Intermediate-Term Tax-Exempt Fund
| | | | |
| Face | Market |
| Maturity | Amount | Value• |
| Coupon | Date | ($000) | ($000) |
| South Dakota Health & Educational Facilities Authority Revenue | | | | |
| (Regional Health System Obligated Group) | 5.000% | 9/1/33 | 3,640 | 4,028 |
| South Dakota Health & Educational Facilities Authority Revenue | | | | |
| (Regional Health System Obligated Group) | 4.000% | 9/1/34 | 11,985 | 11,957 |
| South Dakota Health & Educational Facilities Authority Revenue | | | | |
| (Regional Health System Obligated Group) | 4.000% | 9/1/35 | 1,685 | 1,667 |
| South Dakota Health & Educational Facilities Authority Revenue (Sanford Health) | 5.000% | 11/1/23 | 670 | 745 |
| South Dakota Health & Educational Facilities Authority Revenue (Sanford Health) | 5.000% | 11/1/24 | 650 | 732 |
| South Dakota Health & Educational Facilities Authority Revenue (Sanford Health) | 5.000% | 11/1/25 | 600 | 673 |
| South Dakota Health & Educational Facilities Authority Revenue (Sanford Health) | 5.000% | 11/1/26 | 675 | 754 |
| South Dakota Health & Educational Facilities Authority Revenue (Sanford Health) | 5.000% | 11/1/27 | 1,025 | 1,138 |
| South Dakota Health & Educational Facilities Authority Revenue (Sanford Health) | 5.000% | 11/1/28 | 825 | 911 |
| South Dakota Health & Educational Facilities Authority Revenue (Sanford Health) | 5.000% | 11/1/29 | 1,415 | 1,555 |
| South Dakota Health & Educational Facilities Authority Revenue (Sanford Health) | 5.250% | 11/1/29 | 2,000 | 2,055 |
| 7 South Dakota Health & Educational Facilities Authority Revenue (Sanford Health) | 4.000% | 11/1/34 | 26,000 | 25,607 |
| South Dakota Health & Educational Facilities Authority Revenue (Sanford Health) | 5.000% | 11/1/34 | 8,250 | 8,900 |
| | | | 82,274 |
| Tennessee (0.8%) | | | | |
| Chattanooga TN Electric System Revenue | 5.000% | 9/1/28 | 2,315 | 2,636 |
| Chattanooga TN Electric System Revenue | 5.000% | 9/1/31 | 2,250 | 2,530 |
| Chattanooga-Hamilton County TN Hospital Authority Hospital Revenue | 5.000% | 10/1/23 | 650 | 706 |
| Chattanooga-Hamilton County TN Hospital Authority Hospital Revenue | 5.000% | 10/1/24 | 745 | 815 |
| Chattanooga-Hamilton County TN Hospital Authority Hospital Revenue | 5.000% | 10/1/26 | 1,485 | 1,615 |
| Chattanooga-Hamilton County TN Hospital Authority Hospital Revenue | 5.000% | 10/1/28 | 2,400 | 2,588 |
| Chattanooga-Hamilton County TN Hospital Authority Hospital Revenue | 5.000% | 10/1/29 | 5,325 | 5,716 |
| Chattanooga-Hamilton County TN Hospital Authority Hospital Revenue | 5.000% | 10/1/30 | 5,615 | 6,002 |
| Chattanooga-Hamilton County TN Hospital Authority Hospital Revenue | 5.000% | 10/1/32 | 6,520 | 6,934 |
| Chattanooga-Hamilton County TN Hospital Authority Hospital Revenue | 5.000% | 10/1/33 | 6,340 | 6,722 |
| Chattanooga-Hamilton County TN Hospital Authority Hospital Revenue | 5.000% | 10/1/34 | 2,590 | 2,741 |
| Greeneville TN Health & Educational Facilities Board Hospital Revenue (Ballad Health) | 5.000% | 7/1/26 | 2,315 | 2,596 |
| Greeneville TN Health & Educational Facilities Board Hospital Revenue (Ballad Health) | 5.000% | 7/1/28 | 1,680 | 1,897 |
| Greeneville TN Health & Educational Facilities Board Hospital Revenue (Ballad Health) | 5.000% | 7/1/29 | 1,500 | 1,688 |
| Greeneville TN Health & Educational Facilities Board Hospital Revenue (Ballad Health) | 5.000% | 7/1/30 | 1,360 | 1,520 |
| Jackson TN Hospital Improvement Revenue (Jackson-Madison County General Hospital Project) | 5.000% | 4/1/19 | 1,145 | 1,159 |
| Jackson TN Hospital Improvement Revenue (Jackson-Madison County General Hospital Project) | 5.000% | 4/1/20 | 3,480 | 3,612 |
| Jackson TN Hospital Improvement Revenue (Jackson-Madison County General Hospital Project) | 5.250% | 4/1/23 | 2,235 | 2,241 |
| Jackson TN Hospital Improvement Revenue (Jackson-Madison County General Hospital Project) | 5.375% | 4/1/28 | 2,165 | 2,171 |
| Jackson TN Hospital Improvement Revenue (Jackson-Madison County General Hospital Project) | 5.250% | 4/1/31 | 5,880 | 6,473 |
| Jackson TN Hospital Improvement Revenue (Jackson-Madison County General Hospital Project) | 5.250% | 4/1/32 | 8,780 | 9,640 |
| Jackson TN Hospital Improvement Revenue (Jackson-Madison County General Hospital Project) | 5.250% | 4/1/33 | 9,240 | 10,123 |
| Jackson TN Hospital Improvement Revenue (Jackson-Madison County General Hospital Project) | 5.250% | 4/1/34 | 7,725 | 8,449 |
| Knox County TN Health Educational & Housing Facilities Board Hospital Facilities Revenue | | | | |
| (Covenant Healthcare) | 5.000% | 1/1/21 | 2,500 | 2,632 |
| Knox County TN Health Educational & Housing Facilities Board Hospital Facilities Revenue | | | | |
| (Covenant Healthcare) | 5.000% | 1/1/22 | 1,100 | 1,181 |
| Knox County TN Health Educational & Housing Facilities Board Hospital Facilities Revenue | | | | |
| (Covenant Healthcare) | 5.000% | 1/1/23 | 4,860 | 5,305 |
| Knox County TN Health Educational & Housing Facilities Board Hospital Facilities Revenue | | | | |
| (Covenant Healthcare) | 5.000% | 1/1/35 | 5,360 | 5,792 |
| Knox County TN Health Educational & Housing Facilities Board Hospital Facilities Revenue | | | | |
| (Covenant Healthcare) | 5.000% | 1/1/36 | 4,000 | 4,308 |
| Knox County TN Health Educational & Housing Facilities Board Hospital Facilities Revenue | | | | |
| (Covenant Healthcare) | 5.000% | 1/1/37 | 6,435 | 6,916 |
| Memphis TN Gas System Revenue | 4.000% | 12/1/33 | 1,030 | 1,062 |
| Memphis TN GO | 5.000% | 5/1/28 | 3,145 | 3,349 |
| Memphis TN GO | 5.000% | 5/1/30 | 1,715 | 1,824 |
| Memphis TN Sanitary Sewerage System Revenue | 4.000% | 10/1/34 | 2,060 | 2,103 |
| Memphis TN Sanitary Sewerage System Revenue | 4.000% | 10/1/35 | 2,245 | 2,283 |
| Memphis TN Sanitary Sewerage System Revenue | 4.000% | 10/1/36 | 930 | 942 |
| Memphis TN Sanitary Sewerage System Revenue | 4.000% | 10/1/37 | 2,435 | 2,461 |
| Memphis TN Sanitary Sewerage System Revenue | 4.000% | 10/1/38 | 1,285 | 1,295 |
| Memphis TN Water System Revenue | 4.000% | 12/1/33 | 1,000 | 1,038 |
| Metropolitan Government of Nashville & Davidson County TN Electric Revenue | 5.000% | 5/15/28 | 1,040 | 1,213 |
| Metropolitan Government of Nashville & Davidson County TN Electric Revenue | 5.000% | 5/15/29 | 1,000 | 1,158 |
| Metropolitan Government of Nashville & Davidson County TN Electric Revenue | 5.000% | 5/15/29 | 1,000 | 1,158 |
| Metropolitan Government of Nashville & Davidson County TN Electric Revenue | 5.000% | 5/15/30 | 1,250 | 1,440 |
| Metropolitan Government of Nashville & Davidson County TN Electric Revenue | 5.000% | 5/15/30 | 1,155 | 1,331 |
| Metropolitan Government of Nashville & Davidson County TN Electric Revenue | 5.000% | 5/15/31 | 750 | 860 |
| Metropolitan Government of Nashville & Davidson County TN Electric Revenue | 5.000% | 5/15/31 | 1,015 | 1,164 |
252
Intermediate-Term Tax-Exempt Fund
| | | | |
| Face | Market |
| Maturity | Amount | Value• |
| Coupon | Date | ($000) | ($000) |
| Metropolitan Government of Nashville & Davidson County TN Electric Revenue | 5.000% | 5/15/32 | 600 | 687 |
| Metropolitan Government of Nashville & Davidson County TN Electric Revenue | 5.000% | 5/15/33 | 1,000 | 1,140 |
| Metropolitan Government of Nashville & Davidson County TN Electric Revenue | 5.000% | 5/15/34 | 1,200 | 1,363 |
| Metropolitan Government of Nashville & Davidson County TN Electric Revenue | 5.000% | 5/15/36 | 1,250 | 1,411 |
| Metropolitan Government of Nashville & Davidson County TN Electric Revenue | 5.000% | 5/15/37 | 1,000 | 1,126 |
| Metropolitan Government of Nashville & Davidson County TN Health & | | | | |
| Educational Facilities Board Revenue (Ascension Health Credit Group) PUT | 1.550% | 11/3/20 | 9,885 | 9,712 |
| Metropolitan Government of Nashville & Davidson County TN Health & | | | | |
| Educational Facilities Board Revenue (Blakeford at Green Hills) | 5.000% | 7/1/27 | 1,000 | 1,052 |
| Murfreesboro TN GO | 4.000% | 6/1/26 | 4,770 | 5,159 |
| Murfreesboro TN GO | 4.000% | 6/1/27 | 4,965 | 5,336 |
| Murfreesboro TN GO | 4.000% | 6/1/28 | 5,160 | 5,507 |
| Shelby County TN GO | 5.000% | 4/1/19 (ETM) | 100 | 101 |
| Shelby County TN GO | 5.000% | 4/1/19 | 400 | 405 |
| Shelby County TN Health Educational & Housing Facility Board Revenue | | | | |
| (Baptist Memorial Health Care) | 5.000% | 9/1/19 | 2,000 | 2,043 |
| Shelby County TN Health Educational & Housing Facility Board Revenue | | | | |
| (Methodist Le Bonheur Healthcare) | 5.000% | 5/1/25 | 1,365 | 1,547 |
| Shelby County TN Health Educational & Housing Facility Board Revenue | | | | |
| (Methodist Le Bonheur Healthcare) | 5.000% | 5/1/28 | 1,490 | 1,702 |
| Tennessee Energy Acquisition Corp. Gas Revenue | 5.250% | 9/1/21 | 340 | 364 |
| Tennessee Energy Acquisition Corp. Gas Revenue | 5.000% | 2/1/22 | 10,175 | 10,849 |
| Tennessee Energy Acquisition Corp. Gas Revenue | 5.000% | 2/1/24 | 10,975 | 12,005 |
| Tennessee Energy Acquisition Corp. Gas Revenue | 5.000% | 2/1/25 | 5,815 | 6,427 |
| Tennessee Energy Acquisition Corp. Gas Revenue | 5.250% | 9/1/26 | 2,240 | 2,542 |
| Tennessee Energy Acquisition Corp. Gas Revenue | 5.000% | 2/1/27 | 18,000 | 20,014 |
| Tennessee Energy Acquisition Corp. Gas Revenue PUT | 4.000% | 5/1/23 | 67,985 | 70,506 |
| Tennessee Energy Acquisition Corp. Gas Revenue PUT | 4.000% | 11/1/25 | 72,500 | 75,051 |
| Tennessee GO | 5.000% | 8/1/20 | 2,200 | 2,310 |
| Tennessee GO | 5.000% | 8/1/21 | 2,000 | 2,152 |
| Tennessee GO | 5.000% | 8/1/21 | 3,420 | 3,680 |
| Tennessee GO | 5.000% | 8/1/22 | 3,000 | 3,298 |
| Tennessee GO | 5.000% | 8/1/22 | 2,000 | 2,199 |
| Tennessee GO | 5.000% | 8/1/23 | 3,525 | 3,949 |
| Tennessee GO | 5.000% | 9/1/27 | 2,000 | 2,273 |
| Tennessee GO | 5.000% | 9/1/27 | 4,300 | 4,887 |
| Tennessee GO | 5.000% | 9/1/28 | 1,850 | 2,095 |
| Tennessee Housing Development Agency Homeownership Program Revenue | 4.500% | 7/1/37 | 1,195 | 1,229 |
| Tennessee School Bond Authority Higher Educational Facilities Revenue (2nd Program) | 5.000% | 11/1/22 | 3,035 | 3,347 |
| Tennessee School Bond Authority Higher Educational Facilities Revenue (2nd Program) | 5.000% | 11/1/23 | 3,540 | 3,973 |
| Tennessee School Bond Authority Higher Educational Facilities Revenue (2nd Program) | 5.000% | 11/1/24 | 2,510 | 2,861 |
| Tennessee School Bond Authority Higher Educational Facilities Revenue (2nd Program) | 5.000% | 11/1/25 | 5,000 | 5,689 |
| Tennessee School Bond Authority Higher Educational Facilities Revenue (2nd Program) | 5.000% | 11/1/26 | 2,055 | 2,330 |
| Tennessee School Bond Authority Higher Educational Facilities Revenue (2nd Program) | 5.000% | 11/1/27 | 2,305 | 2,601 |
| Tennessee School Bond Authority Higher Educational Facilities Revenue (2nd Program) | 5.000% | 11/1/28 | 1,555 | 1,747 |
| Tennessee School Bond Authority Higher Educational Facilities Revenue (2nd Program) | 5.000% | 11/1/29 | 1,400 | 1,567 |
| Tennessee School Bond Authority Higher Educational Facilities Revenue (2nd Program) | 5.000% | 11/1/31 | 1,500 | 1,669 |
| Tennessee School Bond Authority Higher Educational Facilities Revenue (2nd Program) | 5.000% | 11/1/34 | 1,150 | 1,270 |
| Williamson County TN GO | 4.000% | 5/1/27 | 3,000 | 3,171 |
| | | | 435,735 |
| Texas (9.1%) | | | | |
| Alamo Heights TX Independent School District GO | 4.000% | 2/1/30 | 820 | 867 |
| Alamo Heights TX Independent School District GO | 4.000% | 2/1/31 | 800 | 841 |
| Alamo TX Regional Mobility Authority Revenue | 5.000% | 6/15/26 | 2,670 | 3,024 |
| Alamo TX Regional Mobility Authority Revenue | 5.000% | 6/15/27 | 1,500 | 1,690 |
| Alamo TX Regional Mobility Authority Revenue | 5.000% | 6/15/29 | 3,090 | 3,453 |
| Alamo TX Regional Mobility Authority Revenue | 5.000% | 6/15/31 | 3,055 | 3,388 |
| Alamo TX Regional Mobility Authority Revenue | 5.000% | 6/15/33 | 3,755 | 4,141 |
| Alamo TX Regional Mobility Authority Revenue | 5.000% | 6/15/34 | 3,945 | 4,338 |
| Alamo TX Regional Mobility Authority Revenue | 5.000% | 6/15/35 | 4,140 | 4,540 |
| Alamo TX Regional Mobility Authority Revenue | 5.000% | 6/15/36 | 4,350 | 4,757 |
| Aldine TX Independent School District GO | 4.000% | 2/15/31 | 12,120 | 12,668 |
| Aldine TX Independent School District GO | 4.000% | 2/15/32 | 12,660 | 13,144 |
| Aldine TX Independent School District GO | 5.000% | 2/15/37 | 1,065 | 1,199 |
| Aldine TX Independent School District GO | 5.000% | 2/15/38 | 6,315 | 7,081 |
| Alief TX Independent School District GO | 5.000% | 2/15/26 | 2,635 | 3,035 |
| Alief TX Independent School District GO | 4.000% | 2/15/29 | 2,780 | 2,949 |
| Allen TX Independent School District GO | 5.000% | 2/15/31 | 1,020 | 1,150 |
| Allen TX Independent School District GO | 5.000% | 2/15/32 | 1,000 | 1,123 |
253
Intermediate-Term Tax-Exempt Fund
| | | | |
| Face | Market |
| Maturity | Amount | Value• |
| Coupon | Date | ($000) | ($000) |
| Alvin TX Independent School District GO | 5.000% | 2/15/29 | 5,275 | 5,975 |
| Arlington TX Independent School District GO | 5.000% | 2/15/20 | 1,705 | 1,768 |
| Arlington TX Independent School District GO | 5.000% | 2/15/24 | 4,525 | 5,079 |
| Arlington TX Independent School District GO | 5.000% | 2/15/27 | 1,000 | 1,143 |
| Arlington TX Independent School District GO | 5.000% | 2/15/29 | 1,500 | 1,700 |
| Arlington TX Special Tax Revenue | 5.000% | 2/15/27 (15) | 1,195 | 1,357 |
| Arlington TX Special Tax Revenue | 5.000% | 2/15/28 (15) | 750 | 856 |
| Arlington TX Special Tax Revenue | 5.000% | 2/15/29 (15) | 1,000 | 1,138 |
| Arlington TX Special Tax Revenue | 5.000% | 2/15/30 (15) | 1,000 | 1,132 |
| Arlington TX Special Tax Revenue | 5.000% | 2/15/31 (15) | 1,565 | 1,764 |
| Arlington TX Special Tax Revenue | 5.000% | 2/15/33 (15) | 1,700 | 1,899 |
| Arlington TX Special Tax Revenue | 5.000% | 2/15/34 (15) | 2,000 | 2,224 |
| Arlington TX Special Tax Revenue | 5.000% | 2/15/35 (4) | 3,300 | 3,698 |
| Arlington TX Special Tax Revenue | 5.000% | 2/15/35 (15) | 2,235 | 2,473 |
| Arlington TX Special Tax Revenue | 5.000% | 2/15/36 (15) | 3,850 | 4,237 |
| Arlington TX Special Tax Revenue | 5.000% | 2/15/36 (4) | 4,485 | 5,007 |
| Arlington TX Special Tax Revenue | 5.000% | 2/15/37 (15) | 4,000 | 4,386 |
| Arlington TX Special Tax Revenue | 5.000% | 2/15/37 (4) | 2,750 | 3,063 |
| Arlington TX Special Tax Revenue | 5.000% | 2/15/38 (4) | 5,015 | 5,561 |
| Austin Convention Enterprises Inc. Texas Convention Center Revenue | 5.000% | 1/1/25 | 700 | 779 |
| Austin Convention Enterprises Inc. Texas Convention Center Revenue | 5.000% | 1/1/26 | 750 | 838 |
| Austin Convention Enterprises Inc. Texas Convention Center Revenue | 5.000% | 1/1/26 | 715 | 779 |
| Austin Convention Enterprises Inc. Texas Convention Center Revenue | 5.000% | 1/1/27 | 2,030 | 2,277 |
| Austin Convention Enterprises Inc. Texas Convention Center Revenue | 5.000% | 1/1/27 | 550 | 600 |
| Austin TX Airport System Revenue | 5.000% | 11/15/33 | 2,020 | 2,240 |
| Austin TX Airport System Revenue | 5.000% | 11/15/34 | 2,200 | 2,431 |
| Austin TX Airport System Revenue | 5.000% | 11/15/37 | 4,500 | 4,930 |
| Austin TX Community College District Public Facilities Corp. Lease Revenue | 5.000% | 8/1/23 | 1,250 | 1,380 |
| Austin TX Community College District Public Facilities Corp. Lease Revenue | 5.000% | 8/1/24 | 1,000 | 1,118 |
| Austin TX Community College District Public Facilities Corp. Lease Revenue | 5.000% | 8/1/25 | 1,500 | 1,695 |
| Austin TX Community College District Public Facilities Corp. Lease Revenue | 5.000% | 8/1/26 | 1,035 | 1,175 |
| Austin TX Community College District Public Facilities Corp. Lease Revenue | 5.000% | 8/1/28 | 1,750 | 1,973 |
| Austin TX Electric Utility System Revenue | 5.000% | 11/15/25 | 4,750 | 5,217 |
| Austin TX Electric Utility System Revenue | 4.000% | 11/15/29 | 3,000 | 3,110 |
| Austin TX Electric Utility System Revenue | 5.000% | 11/15/33 | 6,015 | 6,741 |
| Austin TX Electric Utility System Revenue | 5.000% | 11/15/34 | 3,935 | 4,398 |
| Austin TX Electric Utility System Revenue | 5.000% | 11/15/35 | 3,000 | 3,342 |
| Austin TX GO | 5.000% | 9/1/26 | 10,000 | 11,459 |
| Austin TX GO | 5.000% | 9/1/27 | 6,530 | 7,534 |
| Austin TX GO | 5.000% | 9/1/29 | 2,855 | 3,204 |
| Austin TX GO | 5.000% | 9/1/30 | 1,240 | 1,386 |
| Austin TX GO | 5.000% | 9/1/31 | 2,140 | 2,382 |
| Austin TX GO | 5.000% | 9/1/33 | 4,315 | 4,783 |
| Austin TX Independent School District GO | 5.000% | 8/1/30 | 1,225 | 1,371 |
| Austin TX Independent School District GO | 4.000% | 8/1/33 | 9,000 | 9,278 |
| Austin TX Water & Wastewater System Revenue | 5.000% | 11/15/19 (Prere.) | 2,500 | 2,577 |
| Austin TX Water & Wastewater System Revenue | 5.000% | 11/15/21 (ETM) | 350 | 378 |
| Austin TX Water & Wastewater System Revenue | 5.000% | 11/15/30 | 5,000 | 5,457 |
| Austin TX Water & Wastewater System Revenue | 5.000% | 11/15/31 | 4,000 | 4,362 |
| Austin TX Water & Wastewater System Revenue | 5.000% | 11/15/32 | 10,705 | 11,887 |
| Austin TX Water & Wastewater System Revenue | 5.000% | 11/15/33 | 11,410 | 12,646 |
| Austin TX Water & Wastewater System Revenue | 5.000% | 11/15/34 | 5,545 | 6,201 |
| Austin TX Water & Wastewater System Revenue | 5.000% | 11/15/34 | 12,075 | 13,357 |
| Austin TX Water & Wastewater System Revenue | 5.000% | 11/15/37 | 7,900 | 8,759 |
| Beaumont TX Independent School District GO | 5.000% | 2/15/26 | 1,560 | 1,799 |
| Bexar County TX GO | 5.000% | 6/15/20 | 3,400 | 3,554 |
| Bexar County TX GO | 5.000% | 6/15/27 | 5,000 | 5,746 |
| Bexar County TX GO | 5.000% | 6/15/28 | 3,375 | 3,859 |
| Bexar County TX GO | 5.000% | 6/15/29 | 4,500 | 5,112 |
| Bexar County TX GO | 4.000% | 6/15/33 | 2,750 | 2,841 |
| Bexar County TX GO | 4.000% | 6/15/34 | 2,000 | 2,060 |
| Bexar County TX GO | 4.000% | 6/15/34 | 3,020 | 3,125 |
| Bexar County TX Hospital District GO | 5.000% | 2/15/25 | 1,630 | 1,847 |
| Bexar County TX Hospital District GO | 5.000% | 2/15/26 | 2,155 | 2,465 |
| Bexar County TX Hospital District GO | 5.000% | 2/15/29 | 1,000 | 1,088 |
| Bexar County TX Hospital District GO | 5.000% | 2/15/30 | 1,895 | 2,057 |
| Bexar County TX Hospital District GO | 5.000% | 2/15/31 | 1,895 | 2,096 |
| Bexar County TX Hospital District GO | 5.000% | 2/15/32 | 2,750 | 3,030 |
| Camino Real Texas Mobility Authority Revenue | 5.250% | 2/15/19 | 12,595 | 12,629 |
| Camino Real Texas Mobility Authority Revenue | 5.250% | 8/15/19 | 12,925 | 12,959 |
254
Intermediate-Term Tax-Exempt Fund
| | | | |
| Face | Market |
| Maturity | Amount | Value• |
| Coupon | Date | ($000) | ($000) |
| Camino Real Texas Mobility Authority Revenue | 5.250% | 2/15/20 | 13,265 | 13,300 |
| Camino Real Texas Mobility Authority Revenue | 5.250% | 8/15/20 | 9,930 | 9,956 |
| Carrollton-Farmers Branch TX Independent School District GO | 4.000% | 2/15/20 | 5,060 | 5,183 |
| Central Texas Regional Mobility Authority Revenue | 5.000% | 1/1/19 | 735 | 738 |
| Central Texas Regional Mobility Authority Revenue | 5.000% | 1/1/20 | 1,550 | 1,594 |
| Central Texas Regional Mobility Authority Revenue | 5.750% | 1/1/20 | 1,150 | 1,194 |
| Central Texas Regional Mobility Authority Revenue | 5.750% | 1/1/20 (Prere.) | 2,925 | 3,048 |
| Central Texas Regional Mobility Authority Revenue | 5.000% | 1/1/21 | 1,170 | 1,229 |
| Central Texas Regional Mobility Authority Revenue | 5.750% | 1/1/21 (Prere.) | 4,000 | 4,288 |
| Central Texas Regional Mobility Authority Revenue | 5.000% | 1/1/22 | 750 | 803 |
| Central Texas Regional Mobility Authority Revenue | 5.000% | 1/1/23 | 725 | 789 |
| Central Texas Regional Mobility Authority Revenue | 5.000% | 1/1/24 | 2,375 | 2,632 |
| Central Texas Regional Mobility Authority Revenue | 5.000% | 1/1/24 | 1,180 | 1,301 |
| Central Texas Regional Mobility Authority Revenue | 0.000% | 1/1/25 | 4,650 | 3,780 |
| Central Texas Regional Mobility Authority Revenue | 5.000% | 1/1/25 | 1,350 | 1,506 |
| Central Texas Regional Mobility Authority Revenue | 0.000% | 1/1/26 | 6,490 | 5,051 |
| Central Texas Regional Mobility Authority Revenue | 0.000% | 1/1/27 | 7,850 | 5,838 |
| Central Texas Regional Mobility Authority Revenue | 5.000% | 1/1/27 | 2,900 | 3,230 |
| Central Texas Regional Mobility Authority Revenue | 0.000% | 1/1/28 | 5,500 | 3,913 |
| Central Texas Regional Mobility Authority Revenue | 5.000% | 1/1/28 | 1,275 | 1,421 |
| Central Texas Regional Mobility Authority Revenue | 0.000% | 1/1/29 | 5,220 | 3,543 |
| Central Texas Regional Mobility Authority Revenue | 0.000% | 1/1/30 | 4,355 | 2,820 |
| Central Texas Regional Mobility Authority Revenue | 5.000% | 1/1/30 | 2,825 | 3,125 |
| Central Texas Regional Mobility Authority Revenue | 5.000% | 1/1/30 | 1,000 | 1,093 |
| Central Texas Regional Mobility Authority Revenue | 0.000% | 1/1/31 | 4,880 | 3,004 |
| Central Texas Regional Mobility Authority Revenue | 5.000% | 1/1/31 | 1,275 | 1,388 |
| Central Texas Regional Mobility Authority Revenue | 5.000% | 1/1/32 | 1,985 | 2,151 |
| Central Texas Regional Mobility Authority Revenue | 0.000% | 1/1/33 | 4,000 | 2,217 |
| Central Texas Regional Mobility Authority Revenue | 5.000% | 1/1/33 | 3,500 | 3,735 |
| Central Texas Regional Mobility Authority Revenue | 5.000% | 1/1/33 | 1,440 | 1,570 |
| Central Texas Regional Mobility Authority Revenue | 5.000% | 1/1/33 | 1,310 | 1,415 |
| Central Texas Regional Mobility Authority Revenue | 5.000% | 1/1/33 | 2,000 | 2,186 |
| Central Texas Regional Mobility Authority Revenue | 0.000% | 1/1/34 | 4,000 | 2,101 |
| Central Texas Regional Mobility Authority Revenue | 5.000% | 1/1/34 | 1,245 | 1,354 |
| Central Texas Regional Mobility Authority Revenue | 5.000% | 1/1/34 | 1,355 | 1,459 |
| Central Texas Regional Mobility Authority Revenue | 5.000% | 1/1/34 | 3,700 | 4,032 |
| Central Texas Regional Mobility Authority Revenue | 0.000% | 1/1/35 | 4,950 | 2,461 |
| Central Texas Regional Mobility Authority Revenue | 5.000% | 1/1/35 | 2,500 | 2,710 |
| Central Texas Regional Mobility Authority Revenue | 5.000% | 1/1/35 | 2,000 | 2,147 |
| Central Texas Regional Mobility Authority Revenue | 5.000% | 1/1/35 | 3,350 | 3,639 |
| Central Texas Regional Mobility Authority Revenue | 5.000% | 1/1/36 | 3,250 | 3,520 |
| Central Texas Regional Mobility Authority Revenue | 0.000% | 1/1/37 | 5,525 | 2,462 |
| Central Texas Regional Mobility Authority Revenue | 0.000% | 1/1/38 | 3,500 | 1,475 |
| Central Texas Regional Mobility Authority Revenue | 0.000% | 1/1/39 | 4,500 | 1,802 |
| Central Texas Regional Mobility Authority Revenue | 0.000% | 1/1/40 | 5,700 | 2,168 |
| Clifton TX Higher Education Finance Corp. Revenue (Baylor University) | 5.250% | 3/1/25 | 5,080 | 5,404 |
| Clifton TX Higher Education Finance Corp. Revenue (Baylor University) | 5.250% | 3/1/26 | 4,305 | 4,579 |
| Clifton TX Higher Education Finance Corp. Revenue (Baylor University) | 5.250% | 3/1/27 | 5,995 | 6,377 |
| Clifton TX Higher Education Finance Corp. Revenue (Baylor University) | 5.250% | 3/1/28 | 6,180 | 6,574 |
| Clifton TX Higher Education Finance Corp. Revenue (Baylor University) | 5.250% | 3/1/29 | 3,190 | 3,393 |
| Clifton TX Higher Education Finance Corp. Revenue (Baylor University) | 5.250% | 3/1/30 | 6,535 | 6,928 |
| Colorado River TX Municipal Water District Revenue | 5.000% | 1/1/26 | 1,690 | 1,932 |
| Colorado River TX Municipal Water District Revenue | 5.000% | 1/1/28 | 2,800 | 3,243 |
| Colorado River TX Municipal Water District Revenue | 5.000% | 1/1/29 | 1,500 | 1,726 |
| Comal TX Independent School District GO | 5.000% | 2/1/27 | 6,345 | 7,264 |
| Comal TX Independent School District GO | 5.000% | 2/1/29 | 7,200 | 8,177 |
| 1 Conroe TX GO | 5.000% | 11/15/26 | 880 | 1,019 |
| 1 Conroe TX GO | 5.000% | 11/15/27 | 1,015 | 1,184 |
| 1 Conroe TX GO | 5.000% | 11/15/28 | 1,715 | 2,012 |
| Conroe TX Independent School District GO | 5.000% | 2/15/21 (Prere.) | 5,325 | 5,665 |
| Conroe TX Independent School District GO | 5.000% | 2/15/28 | 7,650 | 8,747 |
| 7 Conroe TX Independent School District GO TOB VRDO | 1.640% | 11/1/18 | 17,700 | 17,700 |
| Corpus Christi TX GO | 4.000% | 3/1/21 | 3,000 | 3,116 |
| Corpus Christi TX GO | 5.000% | 3/1/24 | 6,180 | 6,923 |
| Corpus Christi TX GO | 5.000% | 3/1/25 | 2,125 | 2,410 |
| Corpus Christi TX GO | 5.000% | 3/1/29 | 5,235 | 5,697 |
| Corpus Christi TX GO | 5.000% | 3/1/30 | 5,495 | 5,975 |
| Corpus Christi TX GO | 5.000% | 3/1/31 | 5,770 | 6,269 |
| Corpus Christi TX Independent School District GO | 4.000% | 8/15/33 | 3,500 | 3,610 |
| Corpus Christi TX Independent School District GO | 4.000% | 8/15/35 | 2,000 | 2,049 |
255
Intermediate-Term Tax-Exempt Fund
| | | | |
| Face | Market |
| Maturity | Amount | Value• |
| Coupon | Date | ($000) | ($000) |
| Cypress-Fairbanks TX Independent School District GO | 5.000% | 2/15/20 | 2,720 | 2,821 |
| Cypress-Fairbanks TX Independent School District GO | 5.000% | 2/15/23 | 9,785 | 10,828 |
| Cypress-Fairbanks TX Independent School District GO | 5.000% | 2/15/25 | 5,015 | 5,721 |
| Dallas County TX Community College District GO | 5.000% | 2/15/26 | 3,440 | 3,962 |
| Dallas County TX Community College District GO | 5.000% | 2/15/27 | 3,610 | 4,191 |
| Dallas County TX GO | 5.000% | 8/15/22 | 3,700 | 4,060 |
| Dallas County TX Utility & Reclamation District GO | 5.000% | 2/15/24 | 8,000 | 8,896 |
| Dallas County TX Utility & Reclamation District GO | 5.000% | 2/15/25 | 8,390 | 9,447 |
| Dallas County TX Utility & Reclamation District GO | 5.000% | 2/15/26 | 8,060 | 9,164 |
| Dallas County TX Utility & Reclamation District GO | 5.000% | 2/15/27 | 8,265 | 9,469 |
| Dallas TX Area Rapid Transit Sales Tax Revenue | 5.000% | 12/1/25 | 7,950 | 9,007 |
| Dallas TX Area Rapid Transit Sales Tax Revenue | 5.000% | 12/1/27 | 2,295 | 2,515 |
| Dallas TX Area Rapid Transit Sales Tax Revenue | 5.000% | 12/1/29 | 1,195 | 1,304 |
| Dallas TX Area Rapid Transit Sales Tax Revenue | 5.000% | 12/1/30 | 2,160 | 2,352 |
| Dallas TX Area Rapid Transit Sales Tax Revenue | 5.000% | 12/1/35 | 1,300 | 1,449 |
| Dallas TX Area Rapid Transit Sales Tax Revenue | 4.000% | 12/1/37 | 7,000 | 7,101 |
| Dallas TX Area Rapid Transit Sales Tax Revenue | 4.000% | 12/1/38 | 5,000 | 5,055 |
| Dallas TX Civic Center Improvement Revenue | 5.000% | 8/15/23 (12) | 9,880 | 10,097 |
| Dallas TX Civic Center Improvement Revenue | 5.000% | 8/15/24 (12) | 8,345 | 8,526 |
| Dallas TX Civic Center Improvement Revenue | 5.000% | 8/15/25 (12) | 5,050 | 5,158 |
| Dallas TX Civic Center Improvement Revenue | 5.000% | 8/15/26 (12) | 1,650 | 1,685 |
| Dallas TX GO | 5.000% | 2/15/22 (ETM) | 45 | 49 |
| Dallas TX Independent School District GO | 5.000% | 2/15/24 | 17,450 | 18,525 |
| Dallas TX Waterworks & Sewer System Revenue | 5.000% | 10/1/21 | 10,000 | 10,765 |
| Dallas TX Waterworks & Sewer System Revenue | 4.000% | 10/1/31 | 3,000 | 3,166 |
| Dallas TX Waterworks & Sewer System Revenue | 4.000% | 10/1/32 | 4,870 | 5,118 |
| Dallas-Fort Worth TX International Airport Revenue | 5.000% | 11/1/28 | 7,335 | 7,673 |
| Dallas-Fort Worth TX International Airport Revenue | 5.250% | 11/1/28 | 2,235 | 2,477 |
| Dallas-Fort Worth TX International Airport Revenue | 5.000% | 11/1/29 | 6,360 | 6,649 |
| Dallas-Fort Worth TX International Airport Revenue | 5.250% | 11/1/29 | 14,950 | 16,522 |
| Dallas-Fort Worth TX International Airport Revenue | 5.000% | 11/1/30 | 6,680 | 6,966 |
| Dallas-Fort Worth TX International Airport Revenue | 5.000% | 11/1/30 | 14,195 | 15,268 |
| Dallas-Fort Worth TX International Airport Revenue | 5.250% | 11/1/30 | 12,545 | 13,846 |
| Dallas-Fort Worth TX International Airport Revenue | 5.000% | 11/1/31 | 7,775 | 8,354 |
| Dallas-Fort Worth TX International Airport Revenue | 5.000% | 11/1/32 | 5,785 | 6,211 |
| Dallas-Fort Worth TX International Airport Revenue | 5.000% | 11/1/33 | 9,040 | 9,695 |
| Denton County TX GO | 5.000% | 7/15/21 | 1,515 | 1,625 |
| Denton County TX GO | 5.000% | 7/15/24 | 1,570 | 1,778 |
| Denton County TX GO | 5.000% | 7/15/25 | 1,575 | 1,806 |
| Denton County TX GO | 4.000% | 7/15/32 | 3,025 | 3,144 |
| Denton County TX GO | 4.000% | 7/15/33 | 2,000 | 2,071 |
| Denton TX Independent School District GO | 5.000% | 8/15/37 | 10,000 | 11,174 |
| Denton TX Independent School District GO | 5.000% | 8/15/38 | 10,000 | 11,134 |
| Duncanville TX Independent School District GO | 5.000% | 2/15/30 | 10,785 | 12,025 |
| Duncanville TX Independent School District GO | 5.000% | 2/15/31 | 11,120 | 12,358 |
| El Paso TX GO | 4.000% | 8/15/30 | 3,425 | 3,564 |
| El Paso TX GO | 5.000% | 8/15/31 | 4,000 | 4,493 |
| El Paso TX GO | 5.000% | 8/15/32 | 3,625 | 4,055 |
| El Paso TX GO | 5.000% | 8/15/34 | 4,570 | 5,073 |
| El Paso TX GO | 5.000% | 8/15/35 | 4,795 | 5,295 |
| El Paso TX GO | 5.000% | 8/15/36 | 4,000 | 4,394 |
| El Paso TX GO | 5.000% | 8/15/36 | 5,035 | 5,531 |
| El Paso TX Independent School District GO | 5.000% | 8/15/35 | 5,380 | 5,980 |
| El Paso TX Independent School District GO | 5.000% | 8/15/36 | 5,000 | 5,539 |
| El Paso TX Independent School District GO | 5.000% | 8/15/37 | 3,000 | 3,317 |
| El Paso TX Municipal Drainage Utility System Revenue | 4.000% | 3/1/29 | 2,000 | 2,128 |
| El Paso TX Water & Sewer Revenue | 5.000% | 3/1/25 | 1,085 | 1,235 |
| El Paso TX Water & Sewer Revenue | 4.000% | 3/1/32 | 1,150 | 1,207 |
| El Paso TX Water & Sewer Revenue | 4.000% | 3/1/33 | 2,100 | 2,197 |
| El Paso TX Water & Sewer Revenue | 4.000% | 3/1/34 | 1,700 | 1,773 |
| Fort Bend County TX GO | 5.000% | 3/1/20 | 2,500 | 2,594 |
| Fort Bend County TX GO | 5.000% | 3/1/21 | 2,750 | 2,924 |
| Fort Bend County TX GO | 5.000% | 3/1/28 | 5,000 | 5,615 |
| Fort Bend TX Independent School District GO | 5.000% | 2/15/26 | 7,720 | 8,909 |
| Fort Bend TX Independent School District GO | 5.000% | 2/15/27 | 6,725 | 7,828 |
| Fort Worth TX Water & Sewer Revenue | 5.000% | 2/15/21 | 5,000 | 5,311 |
| Fort Worth TX Water & Sewer Revenue | 5.000% | 2/15/29 | 6,155 | 6,519 |
| Fort Worth TX Water & Sewer Revenue | 5.000% | 2/15/30 | 6,430 | 6,804 |
| Fort Worth TX Water & Sewer Revenue | 5.000% | 2/15/31 | 6,255 | 6,616 |
| Frisco TX GO | 5.000% | 2/15/27 | 5,475 | 6,244 |
256
Intermediate-Term Tax-Exempt Fund
| | | | | |
| Face | Market |
| Maturity | Amount | Value• |
| | Coupon | Date | ($000) | ($000) |
| Frisco TX Independent School District GO | 5.000% | 8/15/25 | 4,545 | 5,201 |
| Frisco TX Independent School District GO | 5.000% | 8/15/26 | 3,430 | 3,962 |
| Frisco TX Independent School District GO | 5.000% | 8/15/27 | 3,585 | 4,150 |
| Frisco TX Independent School District GO | 4.000% | 8/15/32 | 3,700 | 3,848 |
| Galena Park TX Independent School District GO | 5.000% | 8/15/26 | 1,050 | 1,218 |
| Galena Park TX Independent School District GO | 5.000% | 8/15/27 | 1,510 | 1,763 |
| Galena Park TX Independent School District GO | 5.000% | 8/15/28 | 1,600 | 1,870 |
| Galena Park TX Independent School District GO | 5.000% | 8/15/36 | 2,850 | 3,218 |
| Galena Park TX Independent School District GO | 5.000% | 8/15/37 | 2,830 | 3,185 |
| Galveston County TX GO | 4.000% | 2/1/26 | 1,575 | 1,706 |
| Galveston County TX GO | 4.000% | 2/1/27 | 1,395 | 1,507 |
| Galveston County TX GO | 4.000% | 2/1/28 | 1,435 | 1,539 |
| Galveston County TX GO | 4.000% | 2/1/29 | 1,015 | 1,079 |
| Galveston County TX GO | 5.000% | 2/1/30 | 1,000 | 1,142 |
| Galveston County TX GO | 4.000% | 2/1/32 | 1,195 | 1,242 |
| Garland TX Independent School District GO | 5.000% | 2/15/22 | 3,000 | 3,255 |
| Garland TX Independent School District GO | 5.000% | 2/15/26 | 4,125 | 4,678 |
| 19 | Grand Parkway Transportation Corp. Texas System Toll Revenue | 0.000% | 10/1/31 | 2,875 | 2,670 |
| 20 | Grand Parkway Transportation Corp. Texas System Toll Revenue | 0.000% | 10/1/32 | 5,320 | 4,939 |
| 3 | Grand Parkway Transportation Corp. Texas System Toll Revenue | 0.000% | 10/1/33 | 18,100 | 16,798 |
| Grand Parkway Transportation Corp. Texas System Toll Revenue | 5.000% | 10/1/37 | 5,000 | 5,580 |
| Grand Parkway Transportation Corp. TX BAN | 5.000% | 2/1/23 | 69,800 | 76,257 |
| Grapevine-Colleyville TX Independent School District GO | 5.000% | 8/15/26 | 3,315 | 3,778 |
| Grapevine-Colleyville TX Independent School District GO | 5.000% | 8/15/28 | 3,000 | 3,395 |
| Gulf Coast TX Industrial Development Authority Revenue (ExxonMobil Project) VRDO | 1.680% | 11/1/18 | 31,970 | 31,970 |
| 7 | Harris County TX Cultural Education Facilities Finance Corp. Hospital Revenue | | | | |
| | (Memorial Hermann Healthcare System) VRDO | 1.690% | 11/1/18 LOC | 4,200 | 4,200 |
| Harris County TX Cultural Education Facilities Finance Corp. Revenue (Texas Children’s Hospital) | 5.000% | 10/1/23 | 2,015 | 2,245 |
| Harris County TX Cultural Education Facilities Finance Corp. Revenue (Texas Children’s Hospital) | 5.000% | 10/1/24 | 3,170 | 3,581 |
| Harris County TX Cultural Education Facilities Finance Corp. Revenue (Texas Children’s Hospital) | 5.000% | 10/1/28 | 3,110 | 3,496 |
| Harris County TX Cultural Education Facilities Finance Corp. Revenue (Texas Children’s Hospital) | 5.000% | 10/1/29 | 7,340 | 8,211 |
| Harris County TX Cultural Education Facilities Finance Corp. Revenue (Texas Children’s Hospital) | 5.000% | 10/1/30 | 2,185 | 2,434 |
| Harris County TX Cultural Education Facilities Finance Corp. Thermal Utility Revenue | | | | |
| | (TECO Project) | 5.000% | 11/15/26 | 1,030 | 1,186 |
| Harris County TX Cultural Education Facilities Finance Corp. Thermal Utility Revenue | | | | |
| | (TECO Project) | 5.000% | 11/15/27 | 1,000 | 1,160 |
| Harris County TX Cultural Education Facilities Finance Corp. Thermal Utility Revenue | | | | |
| | (TECO Project) | 5.000% | 11/15/28 | 1,045 | 1,197 |
| Harris County TX Cultural Education Facilities Finance Corp. Thermal Utility Revenue | | | | |
| | (TECO Project) | 5.000% | 11/15/29 | 1,205 | 1,369 |
| Harris County TX Cultural Education Facilities Finance Corp. Thermal Utility Revenue | | | | |
| | (TECO Project) | 5.000% | 11/15/31 | 1,500 | 1,683 |
| Harris County TX Cultural Education Facilities Finance Corp. Thermal Utility Revenue | | | | |
| | (TECO Project) | 4.000% | 11/15/32 | 1,725 | 1,770 |
| Harris County TX Cultural Education Facilities Finance Corp. Thermal Utility Revenue | | | | |
| | (TECO Project) | 4.000% | 11/15/34 | 8,415 | 8,575 |
| Harris County TX Cultural Education Facilities Finance Corp. Thermal Utility Revenue | | | | |
| | (TECO Project) | 4.000% | 11/15/35 | 1,300 | 1,320 |
| Harris County TX Flood Control District GO | 5.000% | 10/1/26 | 6,025 | 6,781 |
| Harris County TX Flood Control District GO | 5.000% | 10/1/27 | 5,000 | 5,616 |
| Harris County TX Flood Control District GO | 5.000% | 10/1/28 | 3,000 | 3,363 |
| Harris County TX Flood Control District GO | 5.000% | 10/1/29 | 2,000 | 2,243 |
| Harris County TX Flood Control District GO | 5.000% | 10/1/29 | 10,000 | 11,340 |
| Harris County TX Flood Control District Revenue | 5.000% | 10/1/32 | 5,015 | 5,718 |
| Harris County TX Flood Control District Revenue | 4.000% | 10/1/35 | 4,115 | 4,227 |
| Harris County TX Flood Control District Revenue | 4.000% | 10/1/36 | 5,865 | 6,002 |
| Harris County TX GO | 5.000% | 10/1/20 | 1,020 | 1,074 |
| Harris County TX GO | 5.000% | 10/1/21 | 8,000 | 8,431 |
| Harris County TX GO | 5.000% | 10/1/25 | 8,000 | 9,213 |
| Harris County TX GO | 5.000% | 10/1/25 | 5,755 | 6,616 |
| Harris County TX GO | 5.000% | 8/15/26 | 2,570 | 2,977 |
| Harris County TX GO | 5.000% | 10/1/27 | 6,335 | 7,210 |
| Harris County TX GO | 5.000% | 10/1/28 | 6,660 | 7,557 |
| Harris County TX GO | 5.000% | 10/1/29 | 6,490 | 7,329 |
| Harris County TX GO | 5.000% | 10/1/30 | 5,405 | 6,090 |
| Harris County TX GO | 5.000% | 8/15/34 | 3,120 | 3,486 |
| Harris County TX GO | 5.000% | 10/1/34 | 2,700 | 3,054 |
| Harris County TX GO | 5.000% | 10/1/35 | 4,215 | 4,713 |
| Harris County TX GO | 5.000% | 10/1/36 | 6,545 | 7,309 |
257
Intermediate-Term Tax-Exempt Fund
| | | | |
| Face | Market |
| Maturity | Amount | Value• |
| Coupon | Date | ($000) | ($000) |
| Harris County TX Health Facilities Development Corp. Hospital Revenue | | | | |
| (Memorial Hermann Healthcare System) | 7.000% | 12/1/18 (Prere.) | 5,000 | 5,020 |
| Harris County TX Health Facilities Development Corp. Hospital Revenue | | | | |
| (Texas Children’s Hospital) | 5.000% | 10/1/24 | 8,500 | 8,705 |
| Harris County TX Metropolitan Transit Authority Revenue | 5.000% | 11/1/19 (Prere.) | 3,000 | 3,089 |
| Harris County TX Metropolitan Transit Authority Revenue | 5.000% | 11/1/19 (Prere.) | 6,475 | 6,667 |
| Harris County TX Metropolitan Transit Authority Revenue | 5.000% | 11/1/19 (Prere.) | 5,665 | 5,833 |
| 7 Harris County TX Metropolitan Transit Authority Revenue TOB VRDO | 1.650% | 11/7/18 | 7,745 | 7,745 |
| Harris County TX Metropolitan Transportation Authority Lease Revenue | 5.625% | 11/1/18 (Prere.) | 4,535 | 4,535 |
| Harris County TX Metropolitan Transportation Authority Lease Revenue | 5.875% | 11/1/18 (Prere.) | 3,640 | 3,640 |
| Harris County TX Metropolitan Transportation Authority Lease Revenue | 6.000% | 11/1/18 (Prere.) | 4,295 | 4,295 |
| Harris County TX Sports Authority Revenue | 0.000% | 11/15/23 (14) | 7,000 | 5,797 |
| Harris County TX Sports Authority Revenue | 5.000% | 11/15/24 | 2,025 | 2,245 |
| Harris County TX Sports Authority Revenue | 5.000% | 11/15/25 | 1,000 | 1,103 |
| Harris County TX Sports Authority Revenue | 5.000% | 11/15/26 | 1,000 | 1,100 |
| Harris County TX Sports Authority Revenue | 5.000% | 11/15/27 | 1,530 | 1,673 |
| Harris County TX Sports Authority Revenue | 5.000% | 11/15/28 | 5,160 | 5,702 |
| Harris County TX Sports Authority Revenue | 5.000% | 11/15/29 | 12,000 | 13,218 |
| Harris County TX Sports Authority Revenue | 5.000% | 11/15/30 | 5,025 | 5,518 |
| Harris County TX Toll Road Revenue | 5.000% | 8/15/20 | 2,000 | 2,047 |
| Harris County TX Toll Road Revenue | 5.000% | 8/15/25 | 3,455 | 3,764 |
| Harris County TX Toll Road Revenue | 5.000% | 8/15/27 | 22,185 | 24,117 |
| Harris County TX Toll Road Revenue | 5.000% | 8/15/32 | 4,115 | 4,616 |
| Hays County TX GO | 5.000% | 2/15/26 | 1,260 | 1,441 |
| Hays County TX GO | 5.000% | 2/15/26 | 1,045 | 1,195 |
| Hays County TX GO | 5.000% | 2/15/27 | 1,065 | 1,226 |
| Hays County TX GO | 5.000% | 2/15/28 | 1,695 | 1,942 |
| Hays County TX GO | 5.000% | 2/15/28 | 1,000 | 1,146 |
| Hays County TX GO | 5.000% | 2/15/29 | 1,500 | 1,709 |
| Hays County TX GO | 5.000% | 2/15/29 | 1,600 | 1,823 |
| Hays County TX GO | 5.000% | 2/15/30 | 2,175 | 2,468 |
| Hays County TX GO | 5.000% | 2/15/30 | 1,750 | 1,986 |
| Hays County TX GO | 5.000% | 2/15/31 | 1,545 | 1,746 |
| Hays County TX GO | 5.000% | 2/15/31 | 1,825 | 2,062 |
| Hays County TX GO | 5.000% | 2/15/32 | 1,780 | 2,002 |
| Hays County TX GO | 5.000% | 2/15/34 | 1,035 | 1,157 |
| Houston TX Airport System Revenue | 5.000% | 7/1/25 | 1,030 | 1,099 |
| Houston TX Airport System Revenue | 5.000% | 7/1/26 | 4,650 | 5,334 |
| Houston TX Airport System Revenue | 5.000% | 7/1/26 | 3,000 | 3,198 |
| Houston TX Airport System Revenue | 5.000% | 7/1/27 | 3,530 | 4,074 |
| Houston TX Airport System Revenue | 5.000% | 7/1/28 | 3,700 | 4,300 |
| Houston TX Airport System Revenue | 5.000% | 7/1/32 | 2,805 | 3,182 |
| Houston TX Airport System Revenue | 5.000% | 7/1/33 | 3,000 | 3,390 |
| Houston TX Airport System Revenue | 5.000% | 7/1/34 | 5,500 | 6,190 |
| Houston TX Airport System Revenue | 5.000% | 7/1/35 | 4,450 | 4,989 |
| Houston TX Airport System Revenue | 5.000% | 7/1/36 | 10,000 | 11,168 |
| Houston TX Airport System Revenue | 5.000% | 7/1/37 | 5,500 | 6,124 |
| Houston TX Community College System Revenue | 5.000% | 4/15/21 (10) | 3,145 | 3,152 |
| Houston TX GO | 5.000% | 3/1/21 | 2,000 | 2,126 |
| Houston TX GO | 5.000% | 3/1/22 | 12,250 | 13,308 |
| Houston TX GO | 5.000% | 3/1/22 | 5,000 | 5,432 |
| Houston TX GO | 5.000% | 3/1/22 (Prere.) | 8,345 | 9,052 |
| Houston TX GO | 5.000% | 3/1/23 | 4,000 | 4,425 |
| Houston TX GO | 5.000% | 3/1/23 | 8,335 | 9,041 |
| Houston TX GO | 5.000% | 3/1/24 | 1,860 | 2,092 |
| Houston TX GO | 5.000% | 3/1/25 | 1,600 | 1,826 |
| Houston TX GO | 5.000% | 3/1/26 | 10,000 | 11,113 |
| Houston TX GO | 5.000% | 3/1/26 | 10,000 | 11,527 |
| Houston TX GO | 5.000% | 3/1/27 | 9,750 | 11,114 |
| Houston TX GO | 5.000% | 3/1/27 | 6,000 | 6,970 |
| Houston TX GO | 5.000% | 3/1/28 | 10,000 | 11,456 |
| Houston TX GO | 5.000% | 3/1/29 | 6,000 | 6,836 |
| Houston TX GO | 5.000% | 3/1/30 | 4,000 | 4,395 |
| Houston TX GO | 5.000% | 3/1/31 | 5,180 | 5,799 |
| Houston TX GO | 5.000% | 3/1/32 | 3,840 | 4,280 |
| Houston TX GO | 4.000% | 3/1/33 | 5,000 | 5,143 |
| Houston TX GO | 4.000% | 3/1/34 | 5,000 | 5,128 |
| Houston TX GO | 4.000% | 3/1/35 | 3,000 | 3,066 |
| Houston TX Hotel Occupancy Tax & Special Revenue (Convention & Entertainment Facilities) | 0.000% | 9/1/21 (2) | 22,720 | 21,112 |
| Houston TX Hotel Occupancy Tax & Special Revenue (Convention & Entertainment Facilities) | 5.000% | 9/1/26 | 1,650 | 1,824 |
258
Intermediate-Term Tax-Exempt Fund
| | | | |
| Face | Market |
| Maturity | Amount | Value• |
| Coupon | Date | ($000) | ($000) |
| Houston TX Hotel Occupancy Tax & Special Revenue (Convention & Entertainment Facilities) | 5.000% | 9/1/28 | 2,100 | 2,311 |
| Houston TX Hotel Occupancy Tax & Special Revenue (Convention & Entertainment Facilities) | 5.000% | 9/1/29 | 1,520 | 1,668 |
| Houston TX Independent School District GO | 5.000% | 2/15/20 | 6,000 | 6,222 |
| Houston TX Independent School District GO | 5.000% | 2/15/21 | 15,895 | 16,889 |
| Houston TX Independent School District GO | 5.000% | 2/15/26 | 1,320 | 1,520 |
| Houston TX Independent School District GO | 5.000% | 2/15/27 | 10,425 | 11,897 |
| Houston TX Independent School District GO | 5.000% | 2/15/28 | 22,050 | 25,368 |
| Houston TX Independent School District GO | 4.000% | 2/15/32 | 4,000 | 4,143 |
| Houston TX Independent School District GO PUT | 1.375% | 6/1/19 | 10,000 | 9,958 |
| Houston TX Utility System Revenue | 5.250% | 11/15/20 (Prere.) | 13,250 | 14,061 |
| Houston TX Utility System Revenue | 5.000% | 5/15/21 | 2,945 | 3,146 |
| Houston TX Utility System Revenue | 5.000% | 5/15/23 | 7,000 | 7,765 |
| Houston TX Utility System Revenue | 5.000% | 11/15/23 | 3,000 | 3,353 |
| Houston TX Utility System Revenue | 5.000% | 5/15/24 | 9,095 | 10,244 |
| Houston TX Utility System Revenue | 5.000% | 5/15/25 | 6,075 | 6,829 |
| Houston TX Utility System Revenue | 5.000% | 11/15/26 | 2,510 | 2,905 |
| Houston TX Utility System Revenue | 5.000% | 11/15/26 | 3,295 | 3,813 |
| Houston TX Utility System Revenue | 5.000% | 11/15/27 | 6,050 | 6,813 |
| Houston TX Utility System Revenue | 5.000% | 11/15/27 | 1,250 | 1,458 |
| Houston TX Utility System Revenue | 5.000% | 11/15/30 | 15,000 | 16,979 |
| Houston TX Utility System Revenue | 5.000% | 11/15/30 | 14,670 | 15,665 |
| Houston TX Utility System Revenue | 5.000% | 11/15/30 | 8,020 | 8,564 |
| Houston TX Utility System Revenue | 4.000% | 11/15/31 | 17,535 | 18,119 |
| Houston TX Utility System Revenue | 5.000% | 11/15/31 | 10,335 | 11,023 |
| Houston TX Utility System Revenue | 5.000% | 11/15/31 | 10,000 | 10,666 |
| Houston TX Utility System Revenue | 5.000% | 11/15/32 | 8,190 | 8,726 |
| Houston TX Utility System Revenue | 5.000% | 11/15/32 | 10,000 | 10,654 |
| Houston TX Utility System Revenue | 5.000% | 11/15/34 | 3,800 | 4,212 |
| Houston TX Utility System Revenue | 5.000% | 11/15/35 | 30,000 | 33,306 |
| 2 Houston TX Utility System Revenue PUT | 2.500% | 5/1/20 | 10,000 | 10,055 |
| Humble TX Independent School District GO | 5.000% | 2/15/21 | 5,125 | 5,447 |
| Humble TX Independent School District GO | 5.500% | 2/15/24 | 14,235 | 16,352 |
| Hurst-Euless-Bedford TX Independent School District GO | 5.000% | 8/15/22 | 3,290 | 3,605 |
| Hurst-Euless-Bedford TX Independent School District GO | 5.000% | 8/15/26 | 14,240 | 16,461 |
| Katy TX Independent School District GO | 5.000% | 2/15/34 | 7,560 | 8,407 |
| Klein TX Independent School District GO | 5.000% | 8/1/35 | 2,000 | 2,238 |
| Klein TX Independent School District GO | 5.000% | 8/1/37 | 3,000 | 3,339 |
| Lake Travis TX Independent School District GO | 5.000% | 2/15/21 (Prere.) | 2,665 | 2,832 |
| Lamar TX Consolidated Independent School District GO | 5.000% | 2/15/25 | 5,000 | 5,710 |
| Lamar TX Consolidated Independent School District GO | 5.000% | 2/15/26 | 2,020 | 2,331 |
| Lamar TX Consolidated Independent School District GO | 5.000% | 2/15/26 | 4,500 | 5,100 |
| Lamar TX Consolidated Independent School District GO | 5.000% | 2/15/27 | 2,425 | 2,821 |
| Lamar TX Consolidated Independent School District GO | 5.000% | 2/15/28 | 4,220 | 4,858 |
| Laredo TX Community College District GO | 5.000% | 8/1/22 | 1,500 | 1,633 |
| Laredo TX Community College District GO | 5.000% | 8/1/30 | 2,000 | 2,213 |
| Laredo TX Community College District GO | 5.000% | 8/1/32 | 1,250 | 1,380 |
| Laredo TX Community College District GO | 5.000% | 8/1/34 | 1,500 | 1,646 |
| Leander TX Independent School District GO | 0.000% | 8/16/24 | 8,500 | 7,179 |
| Leander TX Independent School District GO | 0.000% | 8/16/25 | 10,000 | 8,144 |
| Lone Star College System Texas GO | 5.000% | 2/15/21 | 3,650 | 3,876 |
| Lone Star College System Texas GO | 5.000% | 2/15/21 | 1,140 | 1,210 |
| Lower Colorado River Authority Texas Revenue | 5.000% | 5/15/19 | 1,230 | 1,249 |
| Lower Colorado River Authority Texas Revenue | 5.250% | 5/15/19 (Prere.) | 5 | 5 |
| Lower Colorado River Authority Texas Revenue | 5.250% | 5/15/19 (Prere.) | 5 | 5 |
| Lower Colorado River Authority Texas Revenue | 5.250% | 5/15/19 (Prere.) | 105 | 107 |
| Lower Colorado River Authority Texas Revenue | 5.250% | 5/15/19 (Prere.) | 5 | 5 |
| Lower Colorado River Authority Texas Revenue | 5.000% | 5/15/29 | 10,000 | 10,605 |
| Lower Colorado River Authority Texas Revenue | 5.250% | 5/15/29 | 2,380 | 2,419 |
| Lower Colorado River Authority Texas Revenue | 5.250% | 5/15/29 | 9,070 | 9,217 |
| Lower Colorado River Authority Texas Revenue | 5.000% | 5/15/30 | 4,000 | 4,239 |
| Lower Colorado River Authority Texas Revenue | 5.000% | 5/15/30 | 10,000 | 10,379 |
| Lower Colorado River Authority Texas Revenue | 5.000% | 5/15/32 | 13,955 | 15,174 |
| Lower Colorado River Authority Texas Revenue | 5.000% | 5/15/33 | 8,500 | 9,231 |
| Lower Colorado River Authority Texas Revenue | 5.500% | 5/15/36 | 4,000 | 4,069 |
| Lower Colorado River Authority Texas Transmission Contract Revenue | | | | |
| (LCRA Transmission Services Corp.) | 5.000% | 5/15/19 | 1,300 | 1,320 |
| Lower Colorado River Authority Texas Transmission Contract Revenue | | | | |
| (LCRA Transmission Services Corp.) | 5.000% | 5/15/24 | 1,140 | 1,282 |
| Lower Colorado River Authority Texas Transmission Contract Revenue | | | | |
| (LCRA Transmission Services Corp.) | 5.000% | 5/15/24 | 2,295 | 2,581 |
259
Intermediate-Term Tax-Exempt Fund
| | | | |
| Face | Market |
| Maturity | Amount | Value• |
| Coupon | Date | ($000) | ($000) |
| Lower Colorado River Authority Texas Transmission Contract Revenue | | | | |
| (LCRA Transmission Services Corp.) | 5.000% | 5/15/25 | 1,350 | 1,536 |
| Lower Colorado River Authority Texas Transmission Contract Revenue | | | | |
| (LCRA Transmission Services Corp.) | 5.000% | 5/15/27 | 5,250 | 5,836 |
| Lower Colorado River Authority Texas Transmission Contract Revenue | | | | |
| (LCRA Transmission Services Corp.) | 5.000% | 5/15/28 | 4,500 | 4,982 |
| Lower Colorado River Authority Texas Transmission Contract Revenue | | | | |
| (LCRA Transmission Services Corp.) | 5.000% | 5/15/29 | 4,470 | 4,935 |
| Lower Colorado River Authority Texas Transmission Contract Revenue | | | | |
| (LCRA Transmission Services Corp.) | 5.000% | 5/15/31 | 1,635 | 1,807 |
| Lower Colorado River Authority Texas Transmission Contract Revenue | | | | |
| (LCRA Transmission Services Corp.) | 5.000% | 5/15/31 | 3,000 | 3,266 |
| Lower Colorado River Authority Texas Transmission Contract Revenue | | | | |
| (LCRA Transmission Services Corp.) | 5.000% | 5/15/31 | 1,375 | 1,527 |
| Lower Colorado River Authority Texas Transmission Contract Revenue | | | | |
| (LCRA Transmission Services Corp.) | 5.000% | 5/15/32 | 1,420 | 1,566 |
| Lower Colorado River Authority Texas Transmission Contract Revenue | | | | |
| (LCRA Transmission Services Corp.) | 5.000% | 5/15/34 | 2,000 | 2,241 |
| Lower Colorado River Authority Texas Transmission Contract Revenue | | | | |
| (LCRA Transmission Services Corp.) | 5.000% | 5/15/35 | 3,000 | 3,347 |
| Lubbock TX GO | 5.000% | 2/15/23 | 700 | 759 |
| Lubbock TX GO | 5.000% | 2/15/27 | 5,735 | 6,072 |
| Lubbock TX GO | 5.000% | 2/15/29 | 4,335 | 4,587 |
| Lubbock TX GO | 5.000% | 2/15/30 | 6,660 | 7,044 |
| Lubbock TX GO | 4.000% | 2/15/31 | 1,500 | 1,563 |
| Lubbock TX GO | 5.000% | 2/15/31 | 4,120 | 4,356 |
| Lubbock TX GO | 4.000% | 2/15/32 | 1,425 | 1,476 |
| Lubbock TX GO | 4.000% | 2/15/33 | 1,000 | 1,031 |
| Mansfield TX Independent School District GO | 4.000% | 2/15/29 | 6,000 | 6,259 |
| Mansfield TX Independent School District GO | 4.000% | 2/15/29 | 6,100 | 6,363 |
| Mesquite TX Health Facilities Development Corp. Retirement Facility Revenue | | | | |
| (Christian Care Centers Inc. Project) | 5.125% | 2/15/30 | 1,000 | 1,029 |
| Montgomery County TX GO | 5.000% | 3/1/31 | 16,450 | 18,542 |
| Montgomery County TX GO | 5.000% | 3/1/32 | 16,910 | 18,978 |
| New Hope TX Cultural Education Facilities FinanceCorp. Hospital Revenue | | | | |
| (Children’s Health System of Texas Obligated Group) | 5.000% | 8/15/26 | 2,355 | 2,720 |
| New Hope TX Cultural Education Facilities FinanceCorp. Hospital Revenue | | | | |
| (Children’s Health System of Texas Obligated Group) | 5.000% | 8/15/27 | 3,260 | 3,790 |
| New Hope TX Cultural Education Facilities FinanceCorp. Hospital Revenue | | | | |
| (Children’s Health System of Texas Obligated Group) | 5.000% | 8/15/29 | 2,030 | 2,313 |
| New Hope TX Cultural Education Facilities FinanceCorp. Hospital Revenue | | | | |
| (Children’s Health System of Texas Obligated Group) | 5.000% | 8/15/30 | 2,000 | 2,267 |
| New Hope TX Cultural Education Facilities FinanceCorp. Hospital Revenue | | | | |
| (Children’s Health System of Texas Obligated Group) | 4.000% | 8/15/33 | 3,125 | 3,197 |
| New Hope TX Cultural Education Facilities FinanceCorp. Hospital Revenue | | | | |
| (Children’s Health System of Texas Obligated Group) | 4.000% | 8/15/34 | 3,310 | 3,374 |
| New Hope TX Cultural Education Facilities FinanceCorp. Hospital Revenue | | | | |
| (Children’s Health System of Texas Obligated Group) | 4.000% | 8/15/36 | 3,750 | 3,780 |
| New Hope TX Cultural Education Facilities FinanceCorp. Hospital Revenue | | | | |
| (Children’s Health System of Texas Obligated Group) | 4.000% | 8/15/37 | 2,500 | 2,509 |
| New Hope TX Cultural Education Facilities FinanceCorp. Retirement Facilities Revenue | | | | |
| (MRC Crestview Project) | 4.000% | 11/15/26 | 2,000 | 1,993 |
| New Hope TX Cultural Education Facilities FinanceCorp. Retirement Facilities Revenue | | | | |
| (Wesleyan Homes Inc. Project) | 5.000% | 1/1/24 | 1,300 | 1,350 |
| New Hope TX Cultural Education Facilities FinanceCorp. Retirement Facilities Revenue | | | | |
| (Wesleyan Homes Inc. Project) | 5.250% | 1/1/29 | 1,595 | 1,667 |
| New Hope TX Cultural Education Facilities FinanceCorp. Retirement Facilities Revenue | | | | |
| (Wesleyan Homes Inc. Project) | 5.500% | 1/1/35 | 1,400 | 1,469 |
| New Hope TX Cultural Education Facilities FinanceCorp. Student Housing Revenue | | | | |
| (Children’s Health System of Texas Project) | 4.000% | 8/15/35 | 3,000 | 3,042 |
| New Hope TX Cultural Education Facilities FinanceCorp. Student Housing Revenue | | | | |
| (Tarleton State University Project) | 5.000% | 4/1/29 | 725 | 766 |
| New Hope TX Cultural Education Facilities FinanceCorp. Student Housing Revenue | | | | |
| (Tarleton State University Project) | 5.000% | 4/1/30 | 845 | 896 |
| New Hope TX Cultural Education Facilities FinanceCorp. Student Housing Revenue | | | | |
| (Tarleton State University Project) | 5.000% | 4/1/35 | 1,000 | 1,045 |
| New Hope TX Cultural Education Facilities FinanceCorp. Student Housing Revenue | | | | |
| (Texas A&M University Project) | 5.000% | 7/1/25 | 4,000 | 3,524 |
| New Hope TX Cultural Education Facilities FinanceCorp. Student Housing Revenue | | | | |
| (Texas A&M University Project) | 5.000% | 7/1/30 | 12,500 | 10,868 |
260
Intermediate-Term Tax-Exempt Fund
| | | | |
| Face | Market |
| Maturity | Amount | Value• |
| Coupon | Date | ($000) | ($000) |
| New Hope TX Cultural Education Facilities FinanceCorp. Student Housing Revenue | | | | |
| (Texas A&M University Project) | 5.000% | 7/1/35 | 15,900 | 13,735 |
| North East TX Regional Mobility Authority Revenue | 5.000% | 1/1/25 | 1,350 | 1,486 |
| North East TX Regional Mobility Authority Revenue | 5.000% | 1/1/26 | 1,415 | 1,566 |
| North East TX Regional Mobility Authority Revenue | 5.000% | 1/1/27 | 1,485 | 1,635 |
| North East TX Regional Mobility Authority Revenue | 5.000% | 1/1/28 | 1,560 | 1,716 |
| North East TX Regional Mobility Authority Revenue | 5.000% | 1/1/29 | 1,640 | 1,783 |
| North East TX Regional Mobility Authority Revenue | 5.000% | 1/1/30 | 1,470 | 1,592 |
| North East TX Regional Mobility Authority Revenue | 5.000% | 1/1/36 | 9,000 | 9,625 |
| North Harris County TX Regional Water Authority Revenue | 5.125% | 12/15/18 (Prere.) | 8,040 | 8,071 |
| North Harris County TX Regional Water Authority Revenue | 5.125% | 12/15/18 (Prere.) | 8,920 | 8,955 |
| North Harris County TX Regional Water Authority Revenue | 5.125% | 12/15/18 (Prere.) | 6,225 | 6,249 |
| North Harris County TX Regional Water Authority Revenue | 5.125% | 12/15/18 (Prere.) | 5,250 | 5,270 |
| North Harris County TX Regional Water Authority Revenue | 5.125% | 12/15/18 (Prere.) | 5,895 | 5,918 |
| North Harris County TX Regional Water Authority Revenue | 5.125% | 12/15/18 (Prere.) | 7,410 | 7,439 |
| North Texas Municipal Water District Water System Revenue | 5.000% | 9/1/20 | 6,935 | 7,280 |
| North Texas Municipal Water District Water System Revenue | 5.000% | 9/1/21 | 7,275 | 7,823 |
| North Texas Municipal Water District Water System Revenue | 5.000% | 9/1/22 | 6,000 | 6,586 |
| North Texas Municipal Water District Water System Revenue | 5.000% | 9/1/23 | 7,000 | 7,825 |
| North Texas Tollway Authority System Revenue | 6.000% | 1/1/19 (Prere.) | 2,620 | 2,637 |
| North Texas Tollway Authority System Revenue | 5.000% | 9/1/21 (Prere.) | 3,150 | 3,380 |
| North Texas Tollway Authority System Revenue | 5.000% | 9/1/21 (Prere.) | 4,000 | 4,292 |
| North Texas Tollway Authority System Revenue | 5.000% | 9/1/21 (Prere.) | 9,000 | 9,657 |
| North Texas Tollway Authority System Revenue | 5.000% | 9/1/21 (Prere.) | 28,500 | 30,580 |
| North Texas Tollway Authority System Revenue | 5.250% | 9/1/21 (Prere.) | 4,130 | 4,460 |
| North Texas Tollway Authority System Revenue | 5.500% | 9/1/21 (Prere.) | 1,250 | 1,358 |
| North Texas Tollway Authority System Revenue | 5.000% | 1/1/23 | 1,865 | 2,043 |
| North Texas Tollway Authority System Revenue | 5.000% | 1/1/23 | 7,915 | 8,702 |
| North Texas Tollway Authority System Revenue | 6.250% | 2/1/23 | 46,470 | 48,548 |
| North Texas Tollway Authority System Revenue | 5.000% | 1/1/24 | 1,420 | 1,579 |
| North Texas Tollway Authority System Revenue | 5.000% | 1/1/24 | 9,175 | 10,232 |
| North Texas Tollway Authority System Revenue | 5.000% | 1/1/25 | 2,140 | 2,411 |
| North Texas Tollway Authority System Revenue | 5.000% | 1/1/25 | 8,285 | 9,236 |
| North Texas Tollway Authority System Revenue | 5.000% | 1/1/25 | 3,445 | 3,896 |
| North Texas Tollway Authority System Revenue | 5.000% | 1/1/26 | 10,720 | 11,890 |
| North Texas Tollway Authority System Revenue | 5.000% | 1/1/26 | 1,400 | 1,525 |
| North Texas Tollway Authority System Revenue | 5.000% | 1/1/26 | 1,055 | 1,158 |
| North Texas Tollway Authority System Revenue | 5.000% | 1/1/27 | 2,000 | 2,237 |
| North Texas Tollway Authority System Revenue | 5.000% | 1/1/27 | 4,430 | 4,891 |
| North Texas Tollway Authority System Revenue | 5.000% | 1/1/27 | 2,395 | 2,707 |
| North Texas Tollway Authority System Revenue | 5.000% | 1/1/27 | 3,910 | 4,427 |
| North Texas Tollway Authority System Revenue | 6.000% | 1/1/28 | 600 | 604 |
| North Texas Tollway Authority System Revenue | 5.000% | 1/1/29 | 5,020 | 5,578 |
| North Texas Tollway Authority System Revenue | 5.000% | 1/1/30 | 5,400 | 5,902 |
| North Texas Tollway Authority System Revenue | 5.000% | 1/1/30 | 1,560 | 1,735 |
| North Texas Tollway Authority System Revenue | 5.000% | 1/1/30 | 6,035 | 6,742 |
| North Texas Tollway Authority System Revenue | 5.000% | 1/1/31 | 15,180 | 16,688 |
| North Texas Tollway Authority System Revenue | 5.000% | 1/1/31 | 3,055 | 3,400 |
| North Texas Tollway Authority System Revenue | 5.000% | 1/1/31 | 11,150 | 12,164 |
| North Texas Tollway Authority System Revenue | 5.000% | 1/1/31 | 5,020 | 5,548 |
| North Texas Tollway Authority System Revenue | 5.000% | 1/1/31 | 9,260 | 10,257 |
| North Texas Tollway Authority System Revenue | 5.000% | 1/1/31 | 12,400 | 13,255 |
| North Texas Tollway Authority System Revenue | 4.000% | 1/1/32 | 13,500 | 13,859 |
| North Texas Tollway Authority System Revenue | 5.000% | 1/1/32 | 48,045 | 52,593 |
| North Texas Tollway Authority System Revenue | 5.000% | 1/1/32 | 16,290 | 17,966 |
| North Texas Tollway Authority System Revenue | 5.000% | 1/1/32 | 4,700 | 5,225 |
| North Texas Tollway Authority System Revenue | 5.000% | 1/1/32 | 3,595 | 3,984 |
| North Texas Tollway Authority System Revenue | 4.000% | 1/1/33 | 2,475 | 2,532 |
| North Texas Tollway Authority System Revenue | 5.000% | 1/1/33 | 44,500 | 48,557 |
| North Texas Tollway Authority System Revenue | 5.000% | 1/1/33 | 10,225 | 11,259 |
| North Texas Tollway Authority System Revenue | 5.000% | 1/1/33 | 2,400 | 2,654 |
| North Texas Tollway Authority System Revenue | 5.000% | 1/1/33 | 6,895 | 7,670 |
| North Texas Tollway Authority System Revenue | 4.000% | 1/1/34 (4) | 2,035 | 2,092 |
| North Texas Tollway Authority System Revenue | 5.000% | 1/1/34 | 33,000 | 35,912 |
| North Texas Tollway Authority System Revenue | 5.000% | 1/1/34 | 7,000 | 8,102 |
| 1 North Texas Tollway Authority System Revenue | 5.000% | 1/1/34 | 1,400 | 1,555 |
| North Texas Tollway Authority System Revenue | 5.000% | 1/1/34 | 4,260 | 4,726 |
| North Texas Tollway Authority System Revenue | 5.000% | 1/1/34 | 1,500 | 1,651 |
| North Texas Tollway Authority System Revenue | 4.000% | 1/1/35 (4) | 3,000 | 3,069 |
| North Texas Tollway Authority System Revenue | 5.000% | 1/1/35 | 5,000 | 5,517 |
261
Intermediate-Term Tax-Exempt Fund
| | | | |
| Face | Market |
| Maturity | Amount | Value• |
| Coupon | Date | ($000) | ($000) |
| 1 North Texas Tollway Authority System Revenue | 5.000% | 1/1/35 | 2,045 | 2,263 |
| North Texas Tollway Authority System Revenue | 5.000% | 1/1/35 | 6,500 | 7,055 |
| North Texas Tollway Authority System Revenue | 5.000% | 1/1/35 | 1,000 | 1,098 |
| North Texas Tollway Authority System Revenue | 4.000% | 1/1/36 | 13,245 | 13,327 |
| North Texas Tollway Authority System Revenue | 4.000% | 1/1/36 (4) | 3,000 | 3,052 |
| North Texas Tollway Authority System Revenue | 5.000% | 1/1/36 | 7,015 | 7,714 |
| 1 North Texas Tollway Authority System Revenue | 5.000% | 1/1/36 | 2,900 | 3,190 |
| North Texas Tollway Authority System Revenue | 5.000% | 1/1/36 | 1,920 | 2,098 |
| North Texas Tollway Authority System Revenue | 4.000% | 1/1/37 | 15,885 | 15,917 |
| 1 North Texas Tollway Authority System Revenue | 4.000% | 1/1/37 | 3,000 | 2,981 |
| North Texas Tollway Authority System Revenue | 5.000% | 1/1/37 | 10,000 | 10,975 |
| 1 North Texas Tollway Authority System Revenue | 4.000% | 1/1/38 | 3,000 | 2,968 |
| North Texas Tollway Authority System Revenue | 5.000% | 1/1/38 | 11,285 | 12,453 |
| Northside Independent School District Texas GO | 5.000% | 2/15/23 | 3,110 | 3,444 |
| Northside Independent School District Texas GO | 5.000% | 6/15/23 | 3,015 | 3,359 |
| Northside Independent School District Texas GO | 5.000% | 2/15/24 | 5,015 | 5,637 |
| Northside Independent School District Texas GO | 4.000% | 6/1/27 | 3,645 | 3,811 |
| Northside Independent School District Texas GO | 4.000% | 6/1/28 | 3,020 | 3,149 |
| Northwest Independent School District Texas GO | 5.000% | 2/15/25 | 10,000 | 11,358 |
| Northwest Independent School District Texas GO | 5.000% | 2/15/26 | 6,380 | 7,239 |
| Northwest Independent School District Texas GO | 4.000% | 2/15/20 | 3,240 | 3,319 |
| Odessa TX Junior College District GO | 5.000% | 8/15/26 | 750 | 862 |
| Odessa TX Junior College District GO | 5.000% | 8/15/28 | 660 | 759 |
| Odessa TX Junior College District GO | 4.000% | 8/15/35 | 2,170 | 2,199 |
| Odessa TX Junior College District GO | 4.000% | 8/15/36 | 1,000 | 1,010 |
| Odessa TX Junior College District GO | 4.000% | 8/15/37 | 2,885 | 2,906 |
| Pasadena TX GO | 4.000% | 2/15/29 | 1,000 | 1,052 |
| Pasadena TX GO | 4.000% | 2/15/30 | 1,750 | 1,832 |
| Pearland TX Independent School District GO | 5.000% | 2/15/28 | 1,965 | 2,234 |
| Pearland TX Independent School District GO | 5.000% | 2/15/29 | 1,750 | 1,980 |
| Pearland TX Independent School District GO | 5.000% | 2/15/30 | 1,260 | 1,419 |
| Plano TX Independent School District GO | 5.000% | 2/15/21 | 7,000 | 7,425 |
| Plano TX Independent School District GO | 5.000% | 2/15/28 | 12,505 | 14,271 |
| Port of Corpus Christi TX Authority Nueces County Revenue | 4.000% | 12/1/35 | 1,655 | 1,692 |
| Port of Corpus Christi TX Authority Nueces County Revenue | 5.000% | 12/1/36 | 1,280 | 1,431 |
| Port of Corpus Christi TX Authority Nueces County Revenue | 5.000% | 12/1/37 | 1,500 | 1,673 |
| Port of Corpus Christi TX Authority Nueces County Revenue | 5.000% | 12/1/38 | 1,185 | 1,318 |
| Prosper TX Independent School District GO | 5.000% | 2/15/37 | 2,160 | 2,429 |
| Prosper TX Independent School District GO | 5.000% | 2/15/38 | 2,000 | 2,243 |
| Red River TX Education Finance Corp. Revenue (Edwards University Project) | 5.000% | 6/1/25 | 1,000 | 1,113 |
| Red River TX Education Finance Corp. Revenue (Edwards University Project) | 5.000% | 6/1/26 | 850 | 951 |
| Red River TX Education Finance Corp. Revenue (Edwards University Project) | 5.000% | 6/1/27 | 900 | 999 |
| Red River TX Education Finance Corp. Revenue (Edwards University Project) | 5.000% | 6/1/28 | 705 | 776 |
| Red River TX Education Finance Corp. Revenue (Edwards University Project) | 5.000% | 6/1/29 | 1,420 | 1,556 |
| Red River TX Education Finance Corp. Revenue (Edwards University Project) | 4.000% | 6/1/36 | 1,000 | 967 |
| Richardson TX Independent School District GO | 5.000% | 2/15/21 | 3,000 | 3,184 |
| SA Energy Acquisition Public Facility Corp. Texas Gas Supply Revenue | 5.500% | 8/1/19 | 22,010 | 22,541 |
| SA Energy Acquisition Public Facility Corp. Texas Gas Supply Revenue | 5.500% | 8/1/20 | 9,505 | 9,996 |
| SA Energy Acquisition Public Facility Corp. Texas Gas Supply Revenue | 5.500% | 8/1/21 | 3,060 | 3,297 |
| SA Energy Acquisition Public Facility Corp. Texas Gas Supply Revenue | 5.500% | 8/1/23 | 215 | 239 |
| Sam Rayburn TX Municipal Power Agency Revenue | 5.000% | 10/1/20 | 1,000 | 1,046 |
| San Antonio TX Electric & Gas Systems Revenue | 5.000% | 2/1/20 | 5,860 | 6,069 |
| San Antonio TX Electric & Gas Systems Revenue | 5.000% | 2/1/22 | 20,160 | 21,873 |
| San Antonio TX Electric & Gas Systems Revenue | 5.000% | 2/1/23 | 40,055 | 44,303 |
| 1 San Antonio TX Electric & Gas Systems Revenue | 5.000% | 2/1/27 | 11,690 | 13,609 |
| San Antonio TX Electric & Gas Systems Revenue | 4.000% | 2/1/28 | 7,530 | 8,041 |
| 1 San Antonio TX Electric & Gas Systems Revenue | 5.000% | 2/1/28 | 13,760 | 16,137 |
| San Antonio TX Electric & Gas Systems Revenue | 5.000% | 2/1/30 | 2,710 | 3,005 |
| San Antonio TX Electric & Gas Systems Revenue | 5.000% | 2/1/31 | 3,000 | 3,318 |
| San Antonio TX Electric & Gas Systems Revenue | 4.000% | 2/1/33 | 5,000 | 5,154 |
| San Antonio TX Electric & Gas Systems Revenue | 4.000% | 2/1/34 | 10,000 | 10,275 |
| San Antonio TX Electric & Gas Systems Revenue | 5.000% | 2/1/36 | 4,000 | 4,448 |
| San Antonio TX Energy Acquisition Public Facility Corp. Texas Gas Supply Revenue | 5.500% | 8/1/25 | 4,520 | 5,149 |
| San Antonio TX Energy Acquisition Public Facility Corp. Texas Gas Supply Revenue | 5.500% | 8/1/26 | 7,000 | 8,050 |
| San Antonio TX Energy Acquisition Public Facility Corp. Texas Gas Supply Revenue | 5.500% | 8/1/27 | 1,580 | 1,830 |
| San Antonio TX GO | 5.000% | 2/1/23 | 12,630 | 13,970 |
| San Antonio TX GO | 5.000% | 2/1/24 | 8,000 | 8,994 |
| San Antonio TX GO | 5.000% | 2/1/25 | 10,000 | 11,406 |
| San Antonio TX GO | 5.000% | 2/1/26 | 5,800 | 6,555 |
| San Antonio TX GO | 5.000% | 2/1/26 | 2,500 | 2,807 |
262
Intermediate-Term Tax-Exempt Fund
| | | | |
| Face | Market |
| Maturity | Amount | Value• |
| Coupon | Date | ($000) | ($000) |
| San Antonio TX GO | 5.000% | 2/1/27 | 4,915 | 5,534 |
| San Antonio TX GO | 5.000% | 2/1/27 | 1,750 | 1,963 |
| San Antonio TX GO | 5.000% | 2/1/28 | 1,000 | 1,120 |
| San Antonio TX GO | 4.000% | 2/1/29 | 4,395 | 4,584 |
| San Antonio TX GO | 5.000% | 2/1/29 | 1,330 | 1,488 |
| San Antonio TX GO | 4.000% | 8/1/35 | 9,170 | 9,423 |
| San Antonio TX Independent School District GO | 5.000% | 8/15/27 | 5,880 | 6,770 |
| San Antonio TX Independent School District GO | 5.000% | 8/15/27 | 1,500 | 1,707 |
| San Antonio TX Independent School District GO | 5.000% | 8/15/28 | 1,720 | 1,950 |
| San Antonio TX Independent School District GO | 5.000% | 8/15/35 | 3,000 | 3,339 |
| San Antonio TX Independent School District GO | 5.000% | 8/15/36 | 3,000 | 3,329 |
| San Antonio TX Independent School District GO | 5.000% | 8/15/38 | 2,820 | 3,104 |
| San Antonio TX Water Revenue | 5.000% | 5/15/33 | 6,210 | 6,959 |
| San Antonio TX Water Revenue | 5.000% | 5/15/34 | 7,000 | 7,818 |
| San Antonio TX Water Revenue | 5.000% | 5/15/35 | 6,500 | 7,231 |
| San Antonio TX Water Revenue | 5.000% | 5/15/35 | 2,655 | 3,001 |
| San Antonio TX Water Revenue | 5.000% | 5/15/36 | 4,370 | 4,920 |
| San Antonio TX Water Revenue | 5.000% | 5/15/37 | 5,075 | 5,701 |
| San Antonio TX Water Revenue | 5.000% | 5/15/38 | 5,500 | 6,154 |
| Socorro TX Independent School District GO | 4.000% | 8/15/31 | 9,000 | 9,470 |
| Socorro TX Independent School District GO | 5.000% | 8/15/29 | 3,980 | 4,577 |
| Socorro TX Independent School District GO | 4.000% | 8/15/32 | 3,000 | 3,133 |
| Southwest Texas Higher Education Authority Inc. Revenue (Southern Methodist University Project) | 5.000% | 10/1/19 (Prere.) | 4,375 | 4,496 |
| Southwest Texas Higher Education Authority Inc. Revenue (Southern Methodist University Project) | 5.000% | 10/1/19 (Prere.) | 2,250 | 2,312 |
| Southwest Texas Higher Education Authority Inc. Revenue (Southern Methodist University Project) | 5.000% | 10/1/19 (Prere.) | 9,100 | 9,352 |
| Southwest Texas Higher Education Authority Inc. Revenue (Southern Methodist University Project) | 5.000% | 10/1/25 | 750 | 858 |
| Southwest Texas Higher Education Authority Inc. Revenue (Southern Methodist University Project) | 5.000% | 10/1/25 | 4,345 | 4,974 |
| Southwest Texas Higher Education Authority Inc. Revenue (Southern Methodist University Project) | 5.000% | 10/1/26 | 700 | 810 |
| Southwest Texas Higher Education Authority Inc. Revenue (Southern Methodist University Project) | 5.000% | 10/1/26 | 2,445 | 2,824 |
| Southwest Texas Higher Education Authority Inc. Revenue (Southern Methodist University Project) | 5.000% | 10/1/28 | 650 | 751 |
| Southwest Texas Higher Education Authority Inc. Revenue (Southern Methodist University Project) | 5.000% | 10/1/28 | 2,725 | 3,113 |
| Southwest Texas Higher Education Authority Inc. Revenue (Southern Methodist University Project) | 5.000% | 10/1/29 | 1,540 | 1,769 |
| Southwest Texas Higher Education Authority Inc. Revenue (Southern Methodist University Project) | 4.000% | 10/1/35 | 2,200 | 2,268 |
| Southwest Texas Higher Education Authority Inc. Revenue (Southern Methodist University Project) | 4.000% | 10/1/36 | 2,710 | 2,784 |
| Spring Branch TX Independent School District GO | 5.000% | 2/1/20 | 3,830 | 3,967 |
| Spring Branch TX Independent School District GO | 5.000% | 2/1/21 | 2,500 | 2,652 |
| Spring Branch TX Independent School District GO | 5.000% | 2/1/26 | 3,465 | 3,986 |
| Spring TX Independent School District GO | 5.000% | 8/15/24 | 5,080 | 5,748 |
| Spring TX Independent School District GO | 5.000% | 8/15/25 | 3,655 | 4,190 |
| Spring TX Independent School District GO | 5.000% | 8/15/28 | 7,850 | 8,879 |
| Spring TX Independent School District GO | 5.000% | 8/15/28 | 2,170 | 2,469 |
| Spring TX Independent School District GO | 5.000% | 8/15/29 | 4,315 | 4,864 |
| Spring TX Independent School District GO | 5.000% | 8/15/32 | 6,165 | 6,905 |
| Spring TX Independent School District GO | 5.000% | 8/15/33 | 8,565 | 9,613 |
| Spring TX Independent School District GO | 5.000% | 8/15/34 | 8,995 | 10,083 |
| Spring TX Independent School District GO | 5.000% | 8/15/35 | 6,000 | 6,717 |
| Spring TX Independent School District GO | 5.000% | 8/15/36 | 6,915 | 7,716 |
| Spring TX Independent School District GO | 5.000% | 8/15/37 | 5,000 | 5,568 |
| Stephen F Austin TX State University Revenue | 5.000% | 10/15/25 | 620 | 707 |
| Stephen F Austin TX State University Revenue | 5.000% | 10/15/26 | 1,880 | 2,164 |
| Stephen F Austin TX State University Revenue | 5.000% | 10/15/29 | 1,000 | 1,131 |
| Sugar Land TX GO | 5.000% | 2/15/20 (Prere.) | 3,445 | 3,571 |
| Sugar Land TX GO | 4.000% | 2/15/32 | 1,500 | 1,567 |
| Sugar Land TX GO | 4.000% | 2/15/34 | 1,000 | 1,035 |
| Sugar Land TX GO | 4.000% | 2/15/35 | 1,300 | 1,341 |
| Tarrant County TX Cultural Education Facilities Finance Corp. Hospital Revenue | | | | |
| (Baylor Scott & White Healthcare Project) | 5.000% | 11/15/28 | 3,815 | 4,299 |
| Tarrant County TX Cultural Education Facilities Finance Corp. Hospital Revenue | | | | |
| (Baylor Scott & White Healthcare Project) | 5.000% | 11/15/29 | 5,600 | 6,282 |
| Tarrant County TX Cultural Education Facilities Finance Corp. Hospital Revenue | | | | |
| (Baylor Scott & White Healthcare Project) | 5.000% | 11/15/30 | 3,055 | 3,412 |
| Tarrant County TX Cultural Education Facilities Finance Corp. Hospital Revenue | | | | |
| (Baylor Scott & White Healthcare Project) | 5.000% | 11/15/31 | 1,535 | 1,709 |
| Tarrant County TX Cultural Education Facilities Finance Corp. Hospital Revenue | | | | |
| (Baylor Scott & White Healthcare Project) | 5.000% | 11/15/32 | 2,750 | 3,056 |
| Tarrant County TX Cultural Education Facilities Finance Corp. Hospital Revenue | | | | |
| (Baylor Scott & White Healthcare Project) | 4.000% | 11/15/34 | 3,000 | 3,021 |
| Tarrant County TX Cultural Education Facilities Finance Corp. Hospital Revenue | | | | |
| (Baylor Scott & White Healthcare Project) | 4.000% | 11/15/35 | 3,500 | 3,504 |
263
Intermediate-Term Tax-Exempt Fund
| | | | |
| Face | Market |
| Maturity | Amount | Value• |
| Coupon | Date | ($000) | ($000) |
| Tarrant County TX Cultural Education Facilities Finance Corp. Hospital Revenue | | | | |
| (Baylor Scott & White Healthcare Project) | 4.000% | 11/15/36 | 2,000 | 1,992 |
| Tarrant County TX Cultural Education Facilities Finance Corp. Hospital Revenue | | | | |
| (Methodist Hospitals of Dallas) | 5.250% | 10/1/31 | 21,880 | 24,040 |
| Tarrant County TX Cultural Education Facilities Finance Corp. Hospital Revenue | | | | |
| (Scott & White Healthcare Project) | 5.000% | 8/15/20 (Prere.) | 13,495 | 14,153 |
| Tarrant County TX Cultural Education Facilities Finance Corp. Hospital Revenue | | | | |
| (Scott & White Healthcare Project) | 5.000% | 8/15/20 (Prere.) | 23,855 | 25,039 |
| Tarrant County TX Cultural Education Facilities Finance Corp. Hospital Revenue | | | | |
| (Scott & White Healthcare Project) | 5.000% | 8/15/20 (Prere.) | 2,985 | 3,131 |
| Tarrant County TX Cultural Education Facilities Finance Corp. Revenue (CHRISTUS Health) | 5.000% | 7/1/19 | 9,455 | 9,635 |
| Tarrant County TX Cultural Education Facilities Finance Corp. Revenue (CHRISTUS Health) | 5.000% | 7/1/27 | 3,420 | 3,869 |
| Tarrant County TX Cultural Education Facilities Finance Corp. Revenue (CHRISTUS Health) | 5.000% | 7/1/28 | 3,350 | 3,797 |
| Tarrant County TX Cultural Education Facilities Finance Corp. Revenue (CHRISTUS Health) | 6.250% | 7/1/28 (12) | 16,510 | 16,631 |
| Texas A&M University System Permanent University Fund Revenue | 5.000% | 7/1/19 | 3,335 | 3,402 |
| Texas A&M University System Permanent University Fund Revenue | 5.000% | 7/1/24 | 3,130 | 3,546 |
| Texas A&M University System Revenue Board of Regents Revenue | 5.000% | 5/15/22 | 10,935 | 11,948 |
| Texas A&M University System Revenue Financing System Revenue | 5.000% | 7/1/21 (Prere.) | 3,940 | 4,229 |
| Texas GO | 5.000% | 10/1/20 | 3,000 | 3,161 |
| Texas GO | 5.000% | 10/1/20 | 3,845 | 4,051 |
| Texas GO | 5.000% | 4/1/21 | 5,150 | 5,490 |
| Texas GO | 5.000% | 10/1/22 | 19,055 | 20,947 |
| Texas GO | 5.000% | 10/1/24 | 4,000 | 4,546 |
| Texas GO | 5.000% | 10/1/25 | 5,420 | 6,231 |
| Texas GO | 5.000% | 10/1/26 | 8,000 | 9,060 |
| Texas GO | 5.000% | 4/1/27 | 10,015 | 11,227 |
| Texas GO | 5.000% | 10/1/27 | 33,600 | 37,629 |
| Texas GO | 5.000% | 10/1/27 | 5,295 | 5,984 |
| Texas GO | 5.000% | 10/1/28 | 31,975 | 35,690 |
| Texas GO | 5.000% | 10/1/30 | 16,745 | 19,248 |
| Texas GO | 5.000% | 10/1/33 | 7,455 | 8,451 |
| Texas GO | 5.000% | 10/1/35 | 21,475 | 24,186 |
| Texas Municipal Gas Acquisition & Supply Corp. Revenue | 5.000% | 12/15/20 | 5,000 | 5,251 |
| Texas Municipal Gas Acquisition & Supply Corp. Revenue | 5.000% | 12/15/21 | 6,000 | 6,425 |
| Texas Municipal Gas Acquisition & Supply Corp. Revenue | 5.250% | 12/15/21 | 10,820 | 11,663 |
| Texas Municipal Gas Acquisition & Supply Corp. Revenue | 5.000% | 12/15/22 | 4,400 | 4,792 |
| Texas Municipal Gas Acquisition & Supply Corp. Revenue | 5.250% | 12/15/22 | 4,040 | 4,429 |
| Texas Municipal Gas Acquisition & Supply Corp. Revenue | 5.000% | 12/15/23 | 8,000 | 8,696 |
| Texas Municipal Gas Acquisition & Supply Corp. Revenue | 5.250% | 12/15/23 | 1,650 | 1,833 |
| Texas Municipal Gas Acquisition & Supply Corp. Revenue | 5.000% | 12/15/25 | 5,000 | 5,407 |
| Texas Municipal Gas Acquisition & Supply Corp. Revenue | 6.250% | 12/15/26 | 32,710 | 37,294 |
| Texas Municipal Gas Acquisition & Supply Corp. Revenue | 5.000% | 12/15/27 | 12,000 | 12,894 |
| Texas Municipal Gas Acquisition & Supply Corp. Revenue | 5.000% | 12/15/28 | 1,285 | 1,376 |
| Texas Municipal Gas Acquisition & Supply Corp. Revenue | 5.000% | 12/15/29 | 21,255 | 22,686 |
| Texas Municipal Gas Acquisition & Supply Corp. Revenue | 5.000% | 12/15/31 | 12,150 | 12,910 |
| Texas Municipal Gas Acquisition & Supply Corp. Revenue | 5.000% | 12/15/32 | 2,575 | 2,732 |
| Texas Municipal Power Agency Revenue | 5.000% | 9/1/26 | 450 | 472 |
| Texas Municipal Power Agency Revenue | 5.000% | 9/1/28 | 600 | 628 |
| Texas Municipal Power Agency Revenue | 5.000% | 9/1/29 | 450 | 471 |
| Texas Municipal Power Agency Revenue | 5.000% | 9/1/30 | 550 | 575 |
| Texas Municipal Power Agency Revenue | 5.000% | 9/1/31 | 550 | 575 |
| Texas Municipal Power Agency Revenue | 5.000% | 9/1/32 | 475 | 497 |
| Texas Municipal Power Agency Revenue | 5.000% | 9/1/33 | 500 | 522 |
| Texas Municipal Power Agency Revenue | 5.000% | 9/1/34 | 1,000 | 1,044 |
| Texas Municipal Power Agency Revenue | 5.000% | 9/1/35 | 700 | 731 |
| Texas Municipal Power Agency Revenue | 5.000% | 9/1/36 | 785 | 819 |
| Texas Municipal Power Agency Revenue | 5.000% | 9/1/37 | 590 | 615 |
| Texas Private Activity Surface Transportation Corp. Revenue | 7.500% | 12/31/31 | 32,000 | 33,762 |
| Texas Private Activity Surface Transportation Corp. Revenue | 7.500% | 6/30/32 | 47,510 | 51,075 |
| Texas Public Finance Authority GO | 4.000% | 10/1/33 | 3,500 | 3,647 |
| Texas State University System Financing System Revenue | 5.000% | 3/15/25 | 765 | 844 |
| Texas State University System Financing System Revenue | 5.000% | 3/15/27 | 1,215 | 1,336 |
| Texas State University System Financing System Revenue | 5.000% | 3/15/28 | 3,870 | 4,100 |
| Texas State University System Financing System Revenue | 5.000% | 3/15/31 | 4,480 | 4,747 |
| Texas State University System Financing System Revenue | 5.000% | 3/15/33 | 1,500 | 1,682 |
| Texas State University System Financing System Revenue | 5.000% | 3/15/34 | 1,200 | 1,342 |
| Texas State University System Financing System Revenue | 5.000% | 3/15/35 | 1,500 | 1,671 |
| Texas State University System Financing System Revenue | 5.000% | 3/15/36 | 1,500 | 1,665 |
| Texas Transportation Commission GO | 5.000% | 4/1/20 | 9,500 | 9,888 |
| Texas Transportation Commission GO | 5.000% | 10/1/20 | 14,910 | 15,708 |
264
Intermediate-Term Tax-Exempt Fund
| | | | |
| Face | Market |
| Maturity | Amount | Value• |
| Coupon | Date | ($000) | ($000) |
| Texas Transportation Commission GO | 5.000% | 4/1/21 | 5,500 | 5,863 |
| Texas Transportation Commission GO | 5.000% | 10/1/21 | 3,500 | 3,772 |
| Texas Transportation Commission GO | 5.000% | 4/1/22 | 14,010 | 15,255 |
| Texas Transportation Commission GO | 5.000% | 4/1/22 | 5,000 | 5,444 |
| Texas Transportation Commission GO | 5.000% | 4/1/22 | 10,245 | 11,155 |
| Texas Transportation Commission GO | 5.000% | 10/1/22 | 7,000 | 7,695 |
| Texas Transportation Commission GO | 5.000% | 10/1/23 | 13,080 | 14,634 |
| Texas Transportation Commission GO | 5.000% | 4/1/24 | 6,095 | 6,878 |
| Texas Transportation Commission GO | 5.000% | 10/1/24 | 20,680 | 23,505 |
| Texas Transportation Commission GO | 5.000% | 4/1/25 | 10,050 | 11,347 |
| Texas Transportation Commission GO | 5.000% | 10/1/25 | 33,710 | 38,335 |
| Texas Transportation Commission GO | 5.000% | 10/1/25 | 16,250 | 18,681 |
| Texas Transportation Commission GO | 5.000% | 4/1/26 | 13,560 | 15,237 |
| Texas Transportation Commission GO | 5.000% | 10/1/32 | 12,145 | 13,818 |
| 7 Texas Transportation Commission GO TOB VRDO PUT | 1.640% | 11/1/18 | 20,225 | 20,225 |
| Texas Transportation Commission Mobility Fund GO | 5.000% | 10/1/34 | 11,500 | 12,999 |
| Texas Transportation Commission Revenue | 5.000% | 10/1/20 | 20,750 | 21,877 |
| Texas Transportation Commission Revenue | 5.000% | 4/1/21 | 21,300 | 22,694 |
| Texas Transportation Commission Revenue | 5.000% | 4/1/22 | 13,550 | 14,749 |
| Texas Transportation Commission Revenue | 5.000% | 4/1/23 | 4,500 | 4,991 |
| Texas Transportation Commission Revenue | 5.000% | 10/1/24 | 35,095 | 39,828 |
| Texas Transportation Commission Revenue | 5.000% | 10/1/25 | 25,540 | 29,361 |
| Texas Transportation Commission Revenue | 5.000% | 10/1/25 | 4,145 | 4,765 |
| Texas Transportation Commission Revenue PUT | 4.000% | 10/1/21 | 11,530 | 12,049 |
| Texas Transportation Commission Turnpike System Revenue | 5.000% | 8/15/29 | 4,075 | 4,395 |
| Texas Transportation Commission Turnpike System Revenue | 5.000% | 8/15/30 | 10,385 | 11,160 |
| Texas Transportation Commission Turnpike System Revenue | 5.000% | 8/15/31 | 36,165 | 38,767 |
| Texas Transportation Commission Turnpike System Revenue | 5.000% | 8/15/32 | 15,000 | 16,407 |
| Texas Transportation Commission Turnpike System Revenue | 5.000% | 8/15/32 | 40,730 | 43,529 |
| Texas Transportation Commission Turnpike System Revenue | 5.000% | 8/15/33 | 54,915 | 58,541 |
| Texas Transportation Commission Turnpike System Revenue | 5.000% | 8/15/34 | 10,135 | 10,777 |
| Texas Transportation Commission Turnpike System Revenue | 5.000% | 8/15/37 | 15,000 | 16,234 |
| Texas Turnpike Authority Central Texas Turnpike System Revenue | 0.000% | 8/15/20 (ETM) | 3,515 | 3,373 |
| Texas Turnpike Authority Central Texas Turnpike System Revenue | 0.000% | 8/15/20 (2) | 6,485 | 6,207 |
| Texas Water Development Board Revenue | 4.000% | 4/15/20 | 2,300 | 2,364 |
| Texas Water Development Board Revenue | 5.000% | 10/15/20 | 1,000 | 1,055 |
| Texas Water Development Board Revenue | 5.000% | 4/15/21 | 3,000 | 3,197 |
| Texas Water Development Board Revenue | 5.000% | 4/15/21 | 4,950 | 5,275 |
| Texas Water Development Board Revenue | 5.000% | 10/15/21 | 3,300 | 3,555 |
| Texas Water Development Board Revenue | 5.000% | 4/15/23 | 16,195 | 17,970 |
| Texas Water Development Board Revenue | 5.000% | 4/15/25 | 6,225 | 7,123 |
| Texas Water Development Board Revenue | 5.000% | 4/15/25 | 5,500 | 6,293 |
| Texas Water Development Board Revenue | 5.000% | 10/15/25 | 2,660 | 3,062 |
| Texas Water Development Board Revenue | 5.000% | 4/15/26 | 4,670 | 5,404 |
| Texas Water Development Board Revenue | 5.000% | 8/1/26 | 7,500 | 8,710 |
| Texas Water Development Board Revenue | 5.000% | 4/15/27 | 5,000 | 5,835 |
| Texas Water Development Board Revenue | 5.000% | 8/1/27 | 4,750 | 5,560 |
| Texas Water Development Board Revenue | 5.000% | 4/15/28 | 7,545 | 8,786 |
| Texas Water Development Board Revenue | 5.000% | 8/1/28 | 4,060 | 4,708 |
| Texas Water Development Board Revenue | 5.000% | 4/15/29 | 6,750 | 7,820 |
| Texas Water Development Board Revenue | 5.000% | 10/15/31 | 8,090 | 9,098 |
| Texas Water Development Board Revenue | 4.000% | 10/15/32 | 7,000 | 7,314 |
| Texas Water Development Board Revenue | 4.000% | 10/15/33 | 9,000 | 9,352 |
| Texas Water Development Board Revenue | 4.000% | 10/15/33 | 4,980 | 5,183 |
| Texas Water Development Board Revenue | 5.000% | 8/1/34 | 3,435 | 3,895 |
| Texas Water Development Board Revenue | 4.000% | 10/15/34 | 18,500 | 19,098 |
| Texas Water Development Board Revenue | 4.000% | 10/15/34 | 5,910 | 6,085 |
| Texas Water Development Board Revenue | 4.000% | 10/15/35 | 35,500 | 36,350 |
| Texas Water Development Board Revenue | 4.000% | 10/15/35 | 6,000 | 6,131 |
| Texas Water Development Board Revenue | 4.000% | 10/15/35 | 9,000 | 9,278 |
| Texas Water Development Board Revenue | 4.000% | 10/15/36 | 8,680 | 8,823 |
| Texas Water Development Board Revenue | 4.000% | 10/15/36 | 3,815 | 3,920 |
| Texas Water Financial Assistance GO | 5.000% | 8/1/20 | 2,000 | 2,045 |
| Texas Water Financial Assistance GO | 5.000% | 8/1/30 | 3,800 | 4,062 |
| Tomball TX Independent School District GO | 5.000% | 2/15/23 | 5,000 | 5,522 |
| Tomball TX Independent School District GO | 5.000% | 2/15/24 | 10,000 | 11,225 |
| Travis TX GO | 5.000% | 3/1/27 | 2,500 | 2,862 |
| Travis TX GO | 5.000% | 3/1/28 | 6,110 | 6,960 |
| Trinity River Authority of Texas Regional Wastewater System Revenue | 5.000% | 8/1/27 | 6,940 | 7,996 |
| Trinity River Authority of Texas Regional Wastewater System Revenue | 5.000% | 8/1/33 | 4,000 | 4,566 |
265
Intermediate-Term Tax-Exempt Fund
| | | | |
| Face | Market |
| Maturity | Amount | Value• |
| Coupon | Date | ($000) | ($000) |
| Trinity River Authority of Texas Regional Wastewater System Revenue | 5.000% | 8/1/34 | 3,500 | 3,983 |
| Trinity River Authority of Texas Regional Wastewater System Revenue | 5.000% | 8/1/35 | 4,500 | 5,101 |
| Trinity River Authority of Texas Regional Wastewater System Revenue | 5.000% | 8/1/36 | 3,800 | 4,291 |
| Trinity River Authority of Texas Regional Wastewater System Revenue | 5.000% | 8/1/37 | 4,000 | 4,506 |
| University of Houston Texas Revenue | 5.000% | 2/15/21 (Prere.) | 255 | 270 |
| University of Houston Texas Revenue | 5.000% | 2/15/21 (Prere.) | 4,745 | 5,043 |
| University of Houston Texas Revenue | 4.750% | 2/15/28 (4) | 1,255 | 1,258 |
| University of Houston Texas Revenue | 4.000% | 2/15/29 | 4,340 | 4,564 |
| University of Houston Texas Revenue | 4.000% | 2/15/31 | 4,865 | 5,057 |
| University of Houston Texas Revenue | 4.000% | 2/15/32 | 4,875 | 5,039 |
| University of Houston Texas Revenue | 4.000% | 2/15/32 | 11,375 | 11,767 |
| University of Houston Texas Revenue | 4.000% | 2/15/33 | 10,000 | 10,293 |
| University of Houston Texas Revenue | 4.000% | 2/15/35 | 15,080 | 15,366 |
| University of North Texas Revenue | 5.000% | 4/15/32 | 3,560 | 4,037 |
| University of North Texas Revenue | 5.000% | 4/15/33 | 1,000 | 1,130 |
| University of North Texas Revenue | 4.000% | 4/15/34 | 2,400 | 2,453 |
| University of North Texas Revenue | 5.000% | 4/15/34 | 1,125 | 1,268 |
| University of North Texas Revenue | 4.000% | 4/15/35 | 2,660 | 2,706 |
| University of North Texas Revenue | 5.000% | 4/15/35 | 1,665 | 1,870 |
| University of North Texas Revenue | 5.000% | 4/15/36 | 2,000 | 2,241 |
| University of North Texas Revenue | 5.000% | 4/15/37 | 1,800 | 2,013 |
| University of North Texas Revenue | 5.000% | 4/15/38 | 2,100 | 2,341 |
| University of Texas Permanent University Fund Revenue | 5.000% | 7/1/26 | 6,250 | 7,129 |
| University of Texas System Revenue Financing System Revenue | 5.000% | 8/15/20 | 4,370 | 4,589 |
| University of Texas System Revenue Financing System Revenue | 5.000% | 8/15/20 | 2,700 | 2,835 |
| University of Texas System Revenue Financing System Revenue | 5.000% | 8/15/22 (Prere.) | 9,835 | 10,815 |
| University of Texas System Revenue Financing System Revenue | 5.000% | 8/15/22 (Prere.) | 4,180 | 4,596 |
| University of Texas System Revenue Financing System Revenue | 5.000% | 8/15/22 | 5,000 | 5,487 |
| University of Texas System Revenue Financing System Revenue | 5.000% | 8/15/23 | 9,010 | 10,059 |
| University of Texas System Revenue Financing System Revenue | 5.000% | 8/15/25 | 10,010 | 11,502 |
| University of Texas System Revenue Financing System Revenue | 5.000% | 8/15/26 | 6,500 | 7,538 |
| University of Texas System Revenue Financing System Revenue | 5.000% | 8/15/27 | 2,200 | 2,571 |
| University of Texas System Revenue Financing System Revenue | 5.000% | 8/15/29 | 2,500 | 2,888 |
| University of Texas System Revenue Financing System Revenue VRDO | 1.570% | 11/7/18 | 29,140 | 29,140 |
| West Travis County TX Public Utility Agency Revenue | 5.000% | 8/15/26 (15) | 1,115 | 1,280 |
| West Travis County TX Public Utility Agency Revenue | 5.000% | 8/15/28 (15) | 1,615 | 1,857 |
| West Travis County TX Public Utility Agency Revenue | 4.000% | 8/15/33 (15) | 1,025 | 1,050 |
| West Travis County TX Public Utility Agency Revenue | 4.000% | 8/15/34 (15) | 1,495 | 1,527 |
| Williamson County TX GO | 5.000% | 2/15/23 | 6,000 | 6,500 |
| Ysleta TX Independent School District GO | 5.000% | 8/15/34 | 1,750 | 1,955 |
| Ysleta TX Independent School District GO | 5.000% | 8/15/35 | 2,080 | 2,315 |
| Ysleta TX Independent School District GO | 5.000% | 8/15/37 | 2,350 | 2,598 |
| | | | 5,293,563 |
| Utah (0.4%) | | | | |
| Alpine UT School District GO | 5.000% | 3/15/20 | 12,135 | 12,621 |
| 1 Canyons UT School District GO | 5.000% | 6/15/27 | 1,700 | 1,994 |
| Central UT Water Conservancy District Revenue | 4.000% | 10/1/32 | 4,080 | 4,283 |
| Central UT Water Conservancy District Revenue | 4.000% | 10/1/33 | 2,555 | 2,672 |
| Central UT Water Conservancy District Revenue | 4.000% | 10/1/34 | 4,000 | 4,155 |
| Central UT Water Conservancy District Revenue | 4.000% | 10/1/35 | 3,000 | 3,105 |
| Central UT Water Conservancy District Revenue | 4.000% | 10/1/36 | 3,345 | 3,449 |
| Central UT Water Conservancy District Revenue | 4.000% | 10/1/37 | 2,600 | 2,665 |
| Central Utah Water Conservancy District GO | 5.000% | 4/1/26 | 6,155 | 6,529 |
| Central Utah Water Conservancy District GO | 5.000% | 4/1/27 | 4,000 | 4,243 |
| Central Utah Water Conservancy District GO | 5.000% | 4/1/28 | 3,000 | 3,183 |
| Central Utah Water Conservancy District GO | 5.000% | 4/1/28 | 765 | 812 |
| Central Utah Water Conservancy District GO | 5.000% | 4/1/29 | 7,000 | 7,422 |
| Central Utah Water Conservancy District GO | 5.000% | 10/1/32 | 5,640 | 6,134 |
| Jordan Valley UT Water Conservancy District Revenue | 4.000% | 10/1/33 | 1,005 | 1,043 |
| Jordan Valley UT Water Conservancy District Revenue | 4.000% | 10/1/34 | 1,000 | 1,035 |
| Jordan Valley UT Water Conservancy District Revenue | 4.000% | 10/1/35 | 1,350 | 1,392 |
| Jordan Valley UT Water Conservancy District Revenue | 4.000% | 10/1/36 | 1,000 | 1,027 |
| Jordan Valley UT Water Conservancy District Revenue | 4.000% | 10/1/37 | 1,440 | 1,470 |
| Riverton UT Hospital Revenue (IHC Health Services Inc.) | 5.000% | 8/15/19 (ETM) | 2,100 | 2,150 |
| Salt Lake & Sandy UT Metropolitan Water District Revenue | 5.000% | 7/1/32 | 2,000 | 2,164 |
| Salt Lake City UT Airport Revenue | 5.000% | 7/1/33 | 1,715 | 1,918 |
| Salt Lake City UT Airport Revenue | 5.000% | 7/1/34 | 1,650 | 1,837 |
| Salt Lake City UT Airport Revenue | 5.000% | 7/1/36 | 1,300 | 1,437 |
| Salt Lake City UT Airport Revenue | 5.000% | 7/1/37 | 1,610 | 1,776 |
266
Intermediate-Term Tax-Exempt Fund
| | | | |
| Face | Market |
| Maturity | Amount | Value• |
| Coupon | Date | ($000) | ($000) |
| Salt Lake City UT Sales Tax Revenue | 5.000% | 2/1/29 | 1,095 | 1,263 |
| Salt Lake City UT Sales Tax Revenue | 5.000% | 2/1/31 | 1,275 | 1,455 |
| Salt Lake City UT Sales Tax Revenue | 5.000% | 2/1/32 | 1,000 | 1,136 |
| Salt Lake City UT Sales Tax Revenue | 5.000% | 2/1/34 | 1,000 | 1,129 |
| Salt Lake City UT Sales Tax Revenue | 5.000% | 2/1/35 | 1,085 | 1,220 |
| Salt Lake City UT Sales Tax Revenue | 5.000% | 2/1/36 | 1,250 | 1,401 |
| Salt Lake City UT Sales Tax Revenue | 5.000% | 2/1/37 | 1,160 | 1,298 |
| Utah Associated Municipal Power Systems Revenue (Horse Butte Wind Project) | 5.000% | 9/1/22 (Prere.) | 4,060 | 4,452 |
| Utah Associated Municipal Power Systems Revenue (Horse Butte Wind Project) | 5.000% | 9/1/22 (Prere.) | 4,260 | 4,671 |
| Utah Board of Regents Student Loan Revenue | 5.000% | 11/1/22 | 10,800 | 11,422 |
| Utah Board of Regents Student Loan Revenue | 5.000% | 11/1/23 | 4,200 | 4,441 |
| Utah County UT Hospital Revenue (IHC Health Services) | 5.000% | 5/15/36 | 2,000 | 2,240 |
| Utah County UT Hospital Revenue (IHC Health Services) | 5.000% | 5/15/37 | 1,400 | 1,561 |
| Utah County UT Hospital Revenue (IHC Health Services) | 5.000% | 5/15/38 | 1,265 | 1,405 |
| Utah GO | 5.000% | 7/1/22 | 5,100 | 5,596 |
| Utah GO | 5.000% | 7/1/23 | 14,500 | 16,215 |
| Utah GO | 5.000% | 7/1/24 | 9,000 | 10,237 |
| Utah Transit Authority Sales Tax Revenue | 5.000% | 6/15/26 | 1,420 | 1,607 |
| Utah Transit Authority Sales Tax Revenue | 5.000% | 6/15/27 | 2,230 | 2,513 |
| Utah Transit Authority Sales Tax Revenue | 5.000% | 6/15/28 | 2,250 | 2,527 |
| Utah Transit Authority Sales Tax Revenue | 5.000% | 6/15/29 | 9,005 | 10,073 |
| Utah Transit Authority Sales Tax Revenue | 4.000% | 12/15/29 | 3,100 | 3,237 |
| Utah Transit Authority Sales Tax Revenue | 5.000% | 6/15/30 | 6,680 | 7,451 |
| Utah Transit Authority Sales Tax Revenue | 5.000% | 6/15/31 | 4,515 | 5,033 |
| Utah Transit Authority Sales Tax Revenue | 5.000% | 6/15/32 | 10,330 | 11,490 |
| Utah Transit Authority Sales Tax Revenue | 5.000% | 6/15/33 | 10,510 | 11,656 |
| Utah Transit Authority Sales Tax Revenue | 5.000% | 6/15/34 | 7,105 | 7,858 |
| Washington County UT School District GO | 5.000% | 3/1/21 | 6,150 | 6,543 |
| | | | 221,646 |
| Vermont (0.1%) | | | | |
| Vermont Educational & Health Buildings Financing Agency Revenue (Champlain College Project) | 5.000% | 10/15/31 | 1,180 | 1,275 |
| Vermont Educational & Health Buildings Financing Agency Revenue (Champlain College Project) | 5.000% | 10/15/32 | 1,290 | 1,387 |
| Vermont Educational & Health Buildings Financing Agency Revenue (Champlain College Project) | 5.000% | 10/15/33 | 1,405 | 1,506 |
| Vermont Educational & Health Buildings Financing Agency Revenue (Champlain College Project) | 5.000% | 10/15/34 | 1,530 | 1,638 |
| Vermont Educational & Health Buildings Financing Agency Revenue (Champlain College Project) | 5.000% | 10/15/35 | 2,660 | 2,836 |
| Vermont Educational & Health Buildings Financing Agency Revenue (Champlain College Project) | 5.000% | 10/15/36 | 2,795 | 2,970 |
| Vermont Educational & Health Buildings Financing Agency Revenue (Middlebury College Project) | 5.000% | 11/1/31 | 4,130 | 4,497 |
| Vermont Educational & Health Buildings Financing Agency Revenue | | | | |
| (University of Vermont Health Network) | 5.000% | 12/1/34 | 7,910 | 8,727 |
| Vermont Municipal Bond Bank Revenue | 5.000% | 10/1/27 | 2,250 | 2,624 |
| Vermont Municipal Bond Bank Revenue | 5.000% | 10/1/28 | 3,575 | 4,137 |
| Vermont Municipal Bond Bank Revenue | 5.000% | 10/1/29 | 1,425 | 1,639 |
| Vermont Municipal Bond Bank Revenue | 5.000% | 10/1/30 | 2,275 | 2,607 |
| Vermont Municipal Bond Bank Revenue | 5.000% | 10/1/31 | 2,140 | 2,444 |
| Vermont Municipal Bond Bank Revenue | 5.000% | 10/1/32 | 1,490 | 1,694 |
| Vermont Municipal Bond Bank Revenue | 4.000% | 10/1/33 | 1,050 | 1,086 |
| | | | 41,067 |
| Virginia (2.0%) | | | | |
| Chesapeake VA GO | 5.000% | 8/1/26 | 3,670 | 4,287 |
| Chesapeake VA GO | 5.000% | 8/1/29 | 3,045 | 3,541 |
| Chesapeake VA Toll Road Revenue | 5.000% | 7/15/23 | 1,600 | 1,724 |
| Chesterfield County VA Water & Sewer Revenue | 5.000% | 11/1/22 | 6,000 | 6,623 |
| Fairfax County VA Economic Development Authority Facilities Revenue (County Facilities Project) | 5.000% | 10/1/22 | 7,945 | 8,718 |
| Fairfax County VA Economic Development Authority Facilities Revenue (County Facilities Project) | 5.000% | 10/1/24 | 5,195 | 5,880 |
| Fairfax County VA Economic Development Authority Facilities Revenue (County Facilities Project) | 5.000% | 10/1/33 | 2,000 | 2,229 |
| Fairfax County VA Economic Development Authority Transportation District | | | | |
| Improvement Revenue (Silver Line Phase I Project) | 5.000% | 4/1/20 (Prere.) | 4,890 | 5,088 |
| Fairfax County VA Economic Development Authority Transportation District | | | | |
| Improvement Revenue (Silver Line Phase I Project) | 5.000% | 4/1/20 (Prere.) | 9,730 | 10,125 |
| Fairfax County VA Economic Development Authority Transportation District | | | | |
| Improvement Revenue (Silver Line Phase I Project) | 5.000% | 4/1/20 (Prere.) | 5,000 | 5,203 |
| Fairfax County VA GO | 5.000% | 10/1/20 | 6,000 | 6,326 |
| Fairfax County VA GO | 5.000% | 10/1/21 | 1,000 | 1,080 |
| Fairfax County VA GO | 5.000% | 10/1/23 | 10,000 | 11,238 |
| Fairfax County VA GO | 4.000% | 10/1/25 | 4,000 | 4,379 |
| Fairfax County VA GO | 5.000% | 10/1/25 | 5,000 | 5,763 |
| Fairfax County VA GO | 5.000% | 10/1/25 | 4,000 | 4,554 |
| Fairfax County VA GO | 4.000% | 10/1/27 | 1,285 | 1,388 |
| Fairfax County VA GO | 4.000% | 10/1/30 | 11,420 | 12,211 |
267
Intermediate-Term Tax-Exempt Fund
| | | | |
| Face | Market |
| Maturity | Amount | Value• |
| Coupon | Date | ($000) | ($000) |
| Fairfax County VA GO | 4.000% | 10/1/31 | 11,420 | 12,167 |
| Fairfax County VA GO | 4.000% | 10/1/32 | 10,000 | 10,616 |
| Fairfax County VA Industrial Development Authority Health Care Revenue | | | | |
| (Inova Health System Obligated Group) | 5.000% | 5/15/19 (Prere.) | 2,000 | 2,033 |
| Fairfax County VA Public Improvement GO | 5.000% | 10/1/21 | 4,315 | 4,660 |
| Fairfax County VA Public Improvement GO | 5.000% | 10/1/21 (Prere.) | 7,315 | 7,886 |
| Fairfax County VA Water Authority Revenue | 5.000% | 4/1/25 | 2,500 | 2,729 |
| Fredericksburg VA Economic Development Authority Hospital Facilities Revenue | | | | |
| (MediCorp Health System Obligated Group) | 5.250% | 6/15/23 | 2,500 | 2,748 |
| Hampton Roads VA Transportation Accountability Commission Revenue | 5.000% | 7/1/37 | 7,260 | 8,204 |
| Hampton Roads VA Transportation Accountability Commission Revenue | 5.000% | 7/1/38 | 3,185 | 3,586 |
| Hampton VA GO | 5.000% | 1/15/20 | 3,000 | 3,018 |
| Hanover County VA Economic Development Authority Residential Care Facility Revenue | | | | |
| (Covenant Woods) | 5.000% | 7/1/38 | 270 | 277 |
| Henrico County VA Water & Sewer Revenue | 5.000% | 5/1/28 | 3,175 | 3,654 |
| Newport News VA Economical Development Authority Residential Care Facilities Revenue | 5.000% | 12/1/24 | 1,720 | 1,852 |
| Newport News VA Economical Development Authority Residential Care Facilities Revenue | 5.000% | 12/1/25 | 1,750 | 1,893 |
| Newport News VA GO | 5.000% | 8/1/28 | 2,975 | 3,485 |
| Newport News VA GO | 5.000% | 8/1/29 | 2,970 | 3,449 |
| Norfolk VA Economic Development Authority Hospital Facilities Revenue | | | | |
| (Sentara Healthcare) PUT | 5.000% | 11/1/28 | 4,500 | 5,239 |
| Norfolk VA GO | 5.000% | 9/1/25 | 2,750 | 3,135 |
| Norfolk VA GO | 5.000% | 9/1/26 | 5,485 | 6,253 |
| Norfolk VA GO | 5.000% | 9/1/27 | 4,410 | 5,028 |
| Norfolk VA GO | 5.000% | 9/1/28 | 5,345 | 6,090 |
| Norfolk VA GO | 5.000% | 9/1/29 | 2,000 | 2,277 |
| Norfolk VA GO | 5.000% | 9/1/30 | 2,000 | 2,274 |
| Norfolk VA GO | 5.000% | 9/1/31 | 3,000 | 3,408 |
| Norfolk VA GO | 5.000% | 9/1/32 | 3,000 | 3,404 |
| Norfolk VA GO | 5.000% | 9/1/33 | 2,000 | 2,267 |
| Norfolk VA GO | 5.000% | 9/1/34 | 3,000 | 3,397 |
| Norfolk VA GO | 5.000% | 9/1/35 | 3,000 | 3,377 |
| Norfolk VA Water Revenue | 5.000% | 11/1/19 | 2,615 | 2,693 |
| Norfolk VA Water Revenue | 5.000% | 11/1/25 | 15,935 | 18,456 |
| Norfolk VA Water Revenue | 5.000% | 11/1/26 | 8,705 | 10,191 |
| Norfolk VA Water Revenue | 5.000% | 11/1/33 | 3,760 | 4,308 |
| Norfolk VA Water Revenue | 5.000% | 11/1/34 | 2,800 | 3,191 |
| Norfolk VA Water Revenue | 5.000% | 11/1/35 | 1,975 | 2,243 |
| Norfolk VA Water Revenue | 5.000% | 11/1/36 | 2,075 | 2,348 |
| Norfolk VA Water Revenue | 5.000% | 11/1/37 | 2,180 | 2,461 |
| Peninsula Town Center Community Development Authority Virginia Revenue | 4.500% | 9/1/28 | 725 | 748 |
| Peninsula Town Center Community Development Authority Virginia Revenue | 5.000% | 9/1/37 | 1,750 | 1,813 |
| Richmond VA GO | 5.000% | 3/1/24 | 1,100 | 1,244 |
| Richmond VA GO | 5.000% | 3/1/25 | 2,500 | 2,872 |
| Richmond VA GO | 5.000% | 3/1/26 | 3,380 | 3,921 |
| Richmond VA GO | 5.000% | 3/1/27 | 2,685 | 3,141 |
| Richmond VA GO | 5.000% | 3/1/28 | 2,025 | 2,387 |
| Richmond VA GO | 5.000% | 3/1/29 | 2,500 | 2,956 |
| Richmond VA GO | 5.000% | 3/1/30 | 1,800 | 2,138 |
| Richmond VA GO | 5.000% | 3/1/31 | 1,100 | 1,310 |
| Richmond VA Public Utility Revenue | 5.000% | 1/15/28 | 4,000 | 4,587 |
| Richmond VA Public Utility Revenue | 5.000% | 1/15/29 | 10,000 | 11,412 |
| Roanoke VA Economic Development Authority Hospital Revenue (Carilion Clinic Obligated Group) | 5.000% | 7/1/21 | 2,500 | 2,672 |
| Roanoke VA Economic Development Authority Hospital Revenue (Carilion Clinic Obligated Group) | 5.000% | 7/1/22 | 3,040 | 3,317 |
| Roanoke VA Economic Development Authority Hospital Revenue (Carilion Clinic Obligated Group) | 5.000% | 7/1/25 | 10,405 | 10,890 |
| Roanoke VA Economic Development Authority Hospital Revenue (Carilion Clinic Obligated Group) | 5.000% | 7/1/25 | 1,400 | 1,511 |
| Roanoke VA Economic Development Authority Hospital Revenue (Carilion Clinic Obligated Group) | 5.000% | 7/1/26 | 1,475 | 1,589 |
| Stafford County VA Economic Development Authority Hospital Facilities Revenue | | | | |
| (Mary Washington Healthcare Obligated Group) | 5.000% | 6/15/25 | 1,000 | 1,110 |
| Stafford County VA Economic Development Authority Hospital Facilities Revenue | | | | |
| (Mary Washington Healthcare Obligated Group) | 5.000% | 6/15/26 | 1,700 | 1,897 |
| Stafford County VA Economic Development Authority Hospital Facilities Revenue | | | | |
| (Mary Washington Healthcare Obligated Group) | 5.000% | 6/15/27 | 1,500 | 1,665 |
| Stafford County VA Economic Development Authority Hospital Facilities Revenue | | | | |
| (Mary Washington Healthcare Obligated Group) | 5.000% | 6/15/28 | 1,550 | 1,712 |
| Stafford County VA Economic Development Authority Hospital Facilities Revenue | | | | |
| (Mary Washington Healthcare Obligated Group) | 5.000% | 6/15/33 | 1,000 | 1,082 |
| Stafford County VA Economic Development Authority Hospital Facilities Revenue | | | | |
| (Mary Washington Healthcare Obligated Group) | 5.000% | 6/15/34 | 2,500 | 2,698 |
268
Intermediate-Term Tax-Exempt Fund
| | | | |
| Face | Market |
| Maturity | Amount | Value• |
| Coupon | Date | ($000) | ($000) |
| Stafford County VA Economic Development Authority Hospital Facilities Revenue | | | | |
| (Mary Washington Healthcare Obligated Group) | 5.000% | 6/15/35 | 2,500 | 2,690 |
| Virginia Beach VA Development Authority Residential Care Facility Revenue | | | | |
| (Westminster-Canterbury on Chesapeake Bay) | 5.000% | 9/1/27 | 755 | 845 |
| Virginia Beach VA Development Authority Residential Care Facility Revenue | | | | |
| (Westminster-Canterbury on Chesapeake Bay) | 5.000% | 9/1/31 | 1,000 | 1,097 |
| Virginia Beach VA Development Authority Residential Care Facility Revenue | | | | |
| (Westminster-Canterbury on Chesapeake Bay) | 5.000% | 9/1/34 | 1,155 | 1,257 |
| Virginia Beach VA Development Authority Residential Care Facility Revenue | | | | |
| (Westminster-Canterbury on Chesapeake Bay) | 5.000% | 9/1/35 | 1,210 | 1,314 |
| Virginia Beach VA Development Authority Residential Care Facility Revenue | | | | |
| (Westminster-Canterbury on Chesapeake Bay) | 5.000% | 9/1/36 | 725 | 785 |
| Virginia Beach VA GO | 4.000% | 9/15/20 | 6,195 | 6,412 |
| Virginia Beach VA GO | 5.000% | 5/1/22 | 4,300 | 4,703 |
| Virginia Beach VA GO | 5.000% | 5/1/23 | 4,300 | 4,793 |
| Virginia Beach VA GO | 5.000% | 5/1/24 | 4,300 | 4,873 |
| Virginia College Building Authority Educational Facilities Revenue | | | | |
| (21st Century College & Equipment Programs) | 5.000% | 2/1/21 | 17,540 | 18,630 |
| Virginia College Building Authority Educational Facilities Revenue | | | | |
| (21st Century College & Equipment Programs) | 5.000% | 2/1/21 (Prere.) | 5,840 | 6,208 |
| Virginia College Building Authority Educational Facilities Revenue | | | | |
| (21st Century College & Equipment Programs) | 5.000% | 2/1/22 | 1,000 | 1,086 |
| Virginia College Building Authority Educational Facilities Revenue | | | | |
| (21st Century College & Equipment Programs) | 5.000% | 2/1/28 | 10,015 | 11,603 |
| Virginia College Building Authority Educational Facilities Revenue | | | | |
| (21st Century College & Equipment Programs) | 4.000% | 2/1/29 | 16,065 | 16,942 |
| Virginia College Building Authority Educational Facilities Revenue | | | | |
| (21st Century College & Equipment Programs) | 4.000% | 2/1/30 | 4,080 | 4,263 |
| Virginia College Building Authority Educational Facilities Revenue | | | | |
| (21st Century College & Equipment Programs) | 4.000% | 2/1/31 | 4,300 | 4,470 |
| Virginia College Building Authority Educational Facilities Revenue | | | | |
| (21st Century College & Equipment Programs) | 4.000% | 2/1/32 | 20,225 | 20,919 |
| Virginia College Building Authority Educational Facilities Revenue | | | | |
| (21st Century College & Equipment Programs) | 4.000% | 2/1/33 | 35,505 | 36,869 |
| Virginia College Building Authority Educational Facilities Revenue | | | | |
| (21st Century College & Equipment Programs) | 4.000% | 2/1/33 | 21,035 | 21,689 |
| Virginia College Building Authority Educational Facilities Revenue | | | | |
| (21st Century College & Equipment Programs) | 4.000% | 2/1/34 | 22,500 | 23,299 |
| Virginia College Building Authority Educational Facilities Revenue | | | | |
| (Public Higher Education Financing Program) | 5.000% | 9/1/20 | 3,715 | 3,907 |
| Virginia College Building Authority Educational Facilities Revenue | | | | |
| (Public Higher Education Financing Program) | 5.000% | 9/1/22 | 18,000 | 19,786 |
| Virginia College Building Authority Educational Facilities Revenue | | | | |
| (Public Higher Education Financing Program) | 4.000% | 9/1/30 | 4,515 | 4,722 |
| Virginia Commonwealth Transportation Board Revenue | 5.000% | 3/15/20 | 2,500 | 2,598 |
| Virginia Commonwealth Transportation Board Revenue | 5.000% | 9/15/20 | 5,000 | 5,262 |
| Virginia Commonwealth Transportation Board Revenue | 5.000% | 3/15/21 | 4,400 | 4,689 |
| Virginia Commonwealth Transportation Board Revenue | 5.000% | 5/15/21 (Prere.) | 13,765 | 14,718 |
| Virginia Commonwealth Transportation Board Revenue | 5.000% | 5/15/21 (Prere.) | 30,140 | 32,226 |
| Virginia Commonwealth Transportation Board Revenue | 5.000% | 5/15/21 (Prere.) | 31,550 | 33,733 |
| Virginia Commonwealth Transportation Board Revenue | 5.000% | 9/15/21 | 2,000 | 2,156 |
| Virginia Commonwealth Transportation Board Revenue | 5.000% | 3/15/22 | 2,000 | 2,177 |
| Virginia Commonwealth Transportation Board Revenue | 5.000% | 5/15/22 (Prere.) | 21,000 | 22,990 |
| Virginia Commonwealth Transportation Board Revenue | 5.000% | 5/15/22 (Prere.) | 12,560 | 13,750 |
| Virginia Commonwealth Transportation Board Revenue | 5.000% | 5/15/22 (Prere.) | 10,000 | 10,947 |
| Virginia Commonwealth Transportation Board Revenue | 5.000% | 9/15/22 (Prere.) | 2,790 | 3,074 |
| Virginia Commonwealth Transportation Board Revenue | 5.000% | 9/15/22 (Prere.) | 5,040 | 5,553 |
| Virginia Commonwealth Transportation Board Revenue | 5.000% | 9/15/22 (Prere.) | 2,100 | 2,314 |
| Virginia Commonwealth Transportation Board Revenue | 5.000% | 9/15/22 (Prere.) | 1,800 | 1,983 |
| Virginia Commonwealth Transportation Board Revenue | 5.000% | 9/15/22 (Prere.) | 5,035 | 5,547 |
| Virginia Commonwealth Transportation Board Revenue | 5.000% | 9/15/22 (Prere.) | 2,000 | 2,203 |
| Virginia Commonwealth Transportation Board Revenue | 5.000% | 9/15/22 (Prere.) | 5,260 | 5,795 |
| Virginia Commonwealth Transportation Board Revenue | 5.000% | 5/15/23 | 7,960 | 8,855 |
| Virginia Commonwealth Transportation Board Revenue | 5.000% | 5/15/23 | 10,000 | 11,125 |
| Virginia Commonwealth Transportation Board Revenue | 5.000% | 5/15/25 | 4,090 | 4,695 |
| Virginia Commonwealth Transportation Board Revenue | 5.000% | 9/15/25 | 15,015 | 17,299 |
| Virginia Commonwealth Transportation Board Revenue | 5.000% | 3/15/26 | 9,155 | 10,606 |
| Virginia Commonwealth Transportation Board Revenue | 5.000% | 3/15/26 | 15,040 | 17,424 |
| Virginia Commonwealth Transportation Board Revenue | 5.000% | 5/15/26 | 3,015 | 3,501 |
| Virginia Commonwealth Transportation Board Revenue | 5.000% | 5/15/26 | 4,565 | 5,300 |
269
Intermediate-Term Tax-Exempt Fund
| | | | |
| Face | Market |
| Maturity | Amount | Value• |
| Coupon | Date | ($000) | ($000) |
| Virginia Commonwealth Transportation Board Revenue | 5.000% | 9/15/26 | 10,000 | 11,651 |
| Virginia Commonwealth Transportation Board Revenue | 5.000% | 3/15/27 | 13,000 | 15,184 |
| Virginia Commonwealth Transportation Board Revenue | 5.000% | 5/15/27 | 4,640 | 5,429 |
| Virginia Commonwealth Transportation Board Revenue | 5.000% | 5/15/27 | 4,605 | 5,388 |
| Virginia Commonwealth Transportation Board Revenue | 5.000% | 9/15/27 | 10,000 | 11,743 |
| Virginia Commonwealth Transportation Board Revenue | 5.000% | 3/15/28 | 11,990 | 14,018 |
| Virginia Commonwealth Transportation Board Revenue | 5.000% | 5/15/28 | 5,075 | 5,943 |
| Virginia Commonwealth Transportation Board Revenue | 5.000% | 5/15/29 | 6,000 | 6,985 |
| Virginia Commonwealth Transportation Board Revenue | 5.000% | 9/15/29 | 8,465 | 9,688 |
| Virginia Commonwealth Transportation Board Revenue | 4.000% | 5/15/30 | 10,190 | 10,701 |
| Virginia Commonwealth Transportation Board Revenue | 5.000% | 9/15/30 | 2,000 | 2,277 |
| Virginia Commonwealth Transportation Board Revenue | 4.000% | 5/15/31 | 7,000 | 7,271 |
| Virginia Commonwealth Transportation Board Revenue | 4.000% | 5/15/31 | 10,600 | 11,084 |
| Virginia Commonwealth Transportation Board Revenue | 4.000% | 5/15/32 | 11,855 | 12,396 |
| Virginia Commonwealth Transportation Board Revenue | 4.000% | 5/15/32 | 11,020 | 11,481 |
| Virginia Commonwealth Transportation Board Revenue | 4.000% | 5/15/34 | 8,790 | 9,114 |
| Virginia Commonwealth Transportation Board Revenue | 4.000% | 5/15/35 | 10,000 | 10,262 |
| Virginia Commonwealth Transportation Board Revenue | 4.000% | 5/15/35 | 8,070 | 8,292 |
| Virginia Commonwealth University Health System Authority Revenue | 4.000% | 7/1/35 | 2,000 | 2,025 |
| Virginia Commonwealth University Health System Authority Revenue | 4.000% | 7/1/35 | 1,895 | 1,918 |
| Virginia Commonwealth University Health System Authority Revenue | 4.000% | 7/1/36 | 3,000 | 3,022 |
| Virginia Commonwealth University Health System Authority Revenue | 4.000% | 7/1/36 | 1,800 | 1,813 |
| Virginia Commonwealth University Health System Authority Revenue | 4.000% | 7/1/37 | 3,100 | 3,111 |
| Virginia Commonwealth University Health System Authority Revenue | 4.000% | 7/1/37 | 1,500 | 1,505 |
| Virginia GO | 4.000% | 6/1/20 | 14,530 | 14,966 |
| Virginia GO | 4.000% | 6/1/24 | 10,145 | 10,877 |
| Virginia Public Building Authority Public Facilities Revenue | 5.000% | 8/1/19 | 8,290 | 8,476 |
| Virginia Public Building Authority Public Facilities Revenue | 5.000% | 8/1/20 | 8,715 | 9,145 |
| Virginia Public Building Authority Public Facilities Revenue | 5.000% | 8/1/20 | 7,660 | 8,038 |
| Virginia Public Building Authority Public Facilities Revenue | 5.000% | 8/1/21 (Prere.) | 11,540 | 12,412 |
| Virginia Public Building Authority Public Facilities Revenue | 5.000% | 8/1/21 | 9,165 | 9,853 |
| Virginia Public Building Authority Public Facilities Revenue | 5.000% | 8/1/21 | 8,055 | 8,659 |
| Virginia Public Building Authority Public Facilities Revenue | 5.000% | 8/1/24 | 8,500 | 9,636 |
| Virginia Public Building Authority Public Facilities Revenue | 5.000% | 8/1/26 | 3,485 | 4,052 |
| Virginia Public School Authority Revenue | 4.000% | 8/1/20 | 8,000 | 8,259 |
| Virginia Public School Authority Revenue | 5.000% | 8/1/20 | 2,500 | 2,554 |
| Virginia Public School Authority Revenue | 5.000% | 3/1/22 | 3,780 | 4,122 |
| Virginia Public School Authority Revenue | 5.000% | 3/1/26 | 5,125 | 5,952 |
| Virginia Public School Authority Revenue | 5.000% | 8/1/26 | 6,500 | 7,588 |
| Virginia Public School Authority Revenue | 5.000% | 8/1/29 | 8,500 | 9,775 |
| Virginia Public School Authority School Technology & Security Notes Revenue | 5.000% | 4/15/20 | 5,705 | 5,945 |
| Virginia Public School Authority School Technology & Security Notes Revenue | 5.000% | 4/15/21 | 11,000 | 11,756 |
| Virginia Resources Authority Clean Water Revenue (State Revolving Fund) | 5.000% | 10/1/22 | 7,760 | 8,558 |
| Virginia Resources Authority Clean Water Revenue (State Revolving Fund) | 5.000% | 10/1/22 | 8,500 | 9,374 |
| Virginia Resources Authority Clean Water Revenue (State Revolving Fund) | 5.000% | 10/1/23 | 5,870 | 6,585 |
| Virginia Resources Authority Clean Water Revenue (State Revolving Fund) | 5.000% | 10/1/23 | 9,985 | 11,201 |
| Virginia Upper Occoquan Sewage Authority Revenue | 4.000% | 7/1/32 | 1,180 | 1,231 |
| Winchester VA Economic Development Authority Hospital Revenue | | | | |
| (Valley Health Obligated Group) | 5.000% | 1/1/31 | 3,000 | 3,313 |
| Winchester VA Economic Development Authority Hospital Revenue | | | | |
| (Valley Health Obligated Group) | 5.000% | 1/1/32 | 2,115 | 2,323 |
| Winchester VA Economic Development Authority Hospital Revenue | | | | |
| (Valley Health Obligated Group) | 5.000% | 1/1/33 | 2,500 | 2,732 |
| Winchester VA Economic Development Authority Hospital Revenue | | | | |
| (Valley Health Obligated Group) | 5.000% | 1/1/34 | 3,000 | 3,273 |
| | | | 1,189,964 |
| Washington (3.5%) | | | | |
| Central Puget Sound WA Regional Transit Authority Sales & Use Tax Revenue | 5.000% | 11/1/25 | 1,010 | 1,167 |
| Central Puget Sound WA Regional Transit Authority Sales & Use Tax Revenue | 5.000% | 11/1/27 | 1,270 | 1,473 |
| Central Puget Sound WA Regional Transit Authority Sales & Use Tax Revenue | 5.000% | 11/1/28 | 1,020 | 1,177 |
| Central Puget Sound WA Regional Transit Authority Sales & Use Tax Revenue | 5.000% | 11/1/29 | 1,250 | 1,432 |
| Central Puget Sound WA Regional Transit Authority Sales & Use Tax Revenue | 5.000% | 11/1/30 | 2,190 | 2,498 |
| Central Puget Sound WA Regional Transit Authority Sales & Use Tax Revenue | 5.000% | 11/1/31 | 1,510 | 1,711 |
| Central Puget Sound WA Regional Transit Authority Sales & Use Tax Revenue | 5.000% | 11/1/32 | 2,550 | 2,881 |
| Central Puget Sound WA Regional Transit Authority Sales & Use Tax Revenue | 5.000% | 11/1/33 | 2,510 | 2,827 |
| Central Puget Sound WA Regional Transit Authority Sales & Use Tax Revenue | 5.000% | 11/1/34 | 4,520 | 5,076 |
| Central Puget Sound WA Regional Transit Authority Sales & Use Tax Revenue | 5.000% | 11/1/36 | 3,420 | 3,816 |
| Clark County WA School District No. 117 GO | 5.000% | 12/1/31 | 7,000 | 8,010 |
| Clark County WA School District No. 117 GO | 5.000% | 12/1/32 | 8,000 | 9,127 |
270
Intermediate-Term Tax-Exempt Fund
| | | | |
| Face | Market |
| Maturity | Amount | Value• |
| Coupon | Date | ($000) | ($000) |
| Energy Northwest Washington Electric Revenue (Bonneville Power Administration) | 5.000% | 7/1/28 | 5,150 | 5,990 |
| Energy Northwest Washington Electric Revenue (Columbia Generating Station) | 5.000% | 7/1/20 | 20,115 | 21,057 |
| Energy Northwest Washington Electric Revenue (Columbia Generating Station) | 5.000% | 7/1/22 | 3,250 | 3,557 |
| Energy Northwest Washington Electric Revenue (Columbia Generating Station) | 5.000% | 7/1/23 | 3,670 | 4,089 |
| Energy Northwest Washington Electric Revenue (Columbia Generating Station) | 5.000% | 7/1/24 | 1,275 | 1,444 |
| Energy Northwest Washington Electric Revenue (Columbia Generating Station) | 5.000% | 7/1/30 | 6,000 | 6,690 |
| Energy Northwest Washington Electric Revenue (Columbia Generating Station) | 5.000% | 7/1/30 | 3,250 | 3,665 |
| Energy Northwest Washington Electric Revenue (Columbia Generating Station) | 5.000% | 7/1/31 | 10,000 | 11,117 |
| Energy Northwest Washington Electric Revenue (Columbia Generating Station) | 5.000% | 7/1/31 | 1,000 | 1,125 |
| Energy Northwest Washington Electric Revenue (Columbia Generating Station) | 5.000% | 7/1/32 | 5,000 | 5,547 |
| Energy Northwest Washington Electric Revenue (Project No. 1) | 5.000% | 7/1/24 | 1,635 | 1,851 |
| Energy Northwest Washington Electric Revenue (Project No. 1) | 5.000% | 7/1/25 | 12,610 | 14,484 |
| Energy Northwest Washington Electric Revenue (Project No. 1) | 5.000% | 7/1/25 | 5,420 | 6,225 |
| Energy Northwest Washington Electric Revenue (Project No. 1) | 5.000% | 7/1/26 | 13,155 | 14,029 |
| Energy Northwest Washington Electric Revenue (Project No. 1) | 5.000% | 7/1/27 | 19,010 | 21,334 |
| Energy Northwest Washington Electric Revenue (Project No. 3) | 5.000% | 7/1/26 | 11,060 | 12,835 |
| Energy Northwest Washington Electric Revenue (Project No. 3) | 5.000% | 7/1/27 | 19,795 | 22,838 |
| Energy Northwest Washington Electric Revenue (Project No. 3) | 5.000% | 7/1/27 | 7,075 | 8,289 |
| Energy Northwest Washington Electric Revenue (Project No. 3) | 5.000% | 7/1/28 | 13,000 | 14,567 |
| Grays Harbor County WA Public Utility District No. 1 Revenue | 5.000% | 1/1/27 | 1,000 | 1,117 |
| Grays Harbor County WA Public Utility District No. 1 Revenue | 5.000% | 1/1/28 | 1,000 | 1,112 |
| Grays Harbor County WA Public Utility District No. 1 Revenue | 5.000% | 1/1/29 | 1,200 | 1,329 |
| Grays Harbor County WA Public Utility District No. 1 Revenue | 5.000% | 1/1/30 | 1,575 | 1,738 |
| Grays Harbor County WA Public Utility District No. 1 Revenue | 5.000% | 1/1/31 | 1,625 | 1,786 |
| King County WA (Bellevue School District) GO | 5.000% | 6/1/21 (Prere.) | 16,505 | 17,679 |
| King County WA (Bellevue School District) GO | 5.000% | 6/1/21 (Prere.) | 17,335 | 18,568 |
| King County WA (Bellevue School District) GO | 5.000% | 6/1/21 (Prere.) | 18,200 | 19,495 |
| King County WA GO | 5.000% | 7/1/20 | 5,075 | 5,317 |
| King County WA GO | 4.000% | 12/1/32 | 3,300 | 3,442 |
| King County WA School District GO | 5.000% | 12/1/25 | 13,000 | 14,264 |
| King County WA School District No. 401 Highline GO | 5.000% | 12/1/24 | 7,105 | 7,807 |
| King County WA School District No. 405 GO | 5.000% | 12/1/23 | 4,200 | 4,719 |
| King County WA School District No. 408 GO | 5.000% | 12/1/35 | 2,000 | 2,250 |
| King County WA School District No. 411 GO | 5.000% | 12/1/28 | 2,055 | 2,378 |
| King County WA School District No. 411 Issaquah Revenue | 4.000% | 12/1/28 | 11,910 | 12,489 |
| King County WA School District No. 414 GO | 5.000% | 6/1/19 | 1,620 | 1,649 |
| King County WA School District No. 414 GO | 5.000% | 12/1/20 | 5,615 | 5,938 |
| King County WA School District No. 414 GO | 5.000% | 12/1/21 | 14,785 | 15,998 |
| King County WA Sewer Revenue | 5.000% | 1/1/20 | 4,000 | 4,136 |
| King County WA Sewer Revenue | 4.000% | 7/1/32 | 5,450 | 5,669 |
| King County WA Sewer Revenue | 4.000% | 7/1/32 | 7,225 | 7,484 |
| King County WA Sewer Revenue | 4.000% | 7/1/33 | 12,500 | 12,959 |
| Kitsap County WA School District No. 401 GO | 4.000% | 12/1/32 | 1,025 | 1,069 |
| Kitsap County WA School District No. 401 GO | 4.000% | 12/1/34 | 1,555 | 1,610 |
| Northwest Energy Washington Electric Revenue (Bonneville Power Administration) | 5.000% | 7/1/28 | 8,500 | 9,236 |
| Northwest Energy Washington Electric Revenue (Columbia Generating Station) | 5.000% | 7/1/33 | 8,445 | 9,553 |
| Northwest Energy Washington Electric Revenue (Columbia Generating Station) | 5.000% | 7/1/34 | 6,000 | 6,768 |
| Northwest Energy Washington Electric Revenue (Columbia Generating Station) | 5.000% | 7/1/35 | 26,210 | 29,459 |
| Pierce County WA School District No. 3 Puyallup GO | 5.000% | 12/1/25 | 6,500 | 7,124 |
| Pierce County WA School District No. 10 (Tacoma) GO | 4.000% | 6/1/20 | 2,000 | 2,060 |
| Pierce County WA School District No. 10 (Tacoma) GO | 5.000% | 12/1/20 | 3,600 | 3,807 |
| Pierce County WA School District No. 320 (Sumner) GO | 5.000% | 12/1/28 | 10,575 | 12,242 |
| Pierce County WA School District No. 402 GO | 4.000% | 12/1/32 | 1,455 | 1,523 |
| Pierce County WA School District No. 402 GO | 4.000% | 12/1/34 | 3,080 | 3,189 |
| Pierce County WA School District No. 402 GO | 4.000% | 12/1/35 | 2,615 | 2,687 |
| Port of Seattle WA Passenger Facility Charge Revenue | 5.000% | 12/1/20 | 3,000 | 3,170 |
| Port of Seattle WA Passenger Facility Charge Revenue | 5.000% | 12/1/22 | 5,525 | 5,831 |
| Port of Seattle WA Revenue | 5.000% | 6/1/22 | 2,000 | 2,083 |
| Port of Seattle WA Revenue | 5.000% | 2/1/25 | 1,705 | 1,931 |
| Port of Seattle WA Revenue | 5.000% | 3/1/25 | 1,515 | 1,703 |
| Port of Seattle WA Revenue | 5.000% | 2/1/26 | 2,840 | 3,251 |
| Port of Seattle WA Revenue | 5.000% | 3/1/26 | 1,055 | 1,181 |
| Port of Seattle WA Revenue | 5.000% | 3/1/27 | 1,000 | 1,118 |
| Port of Seattle WA Revenue | 5.000% | 8/1/27 | 8,650 | 9,412 |
| Port of Seattle WA Revenue | 5.000% | 3/1/28 | 1,780 | 1,986 |
| Port of Seattle WA Revenue | 5.000% | 8/1/28 | 7,485 | 8,133 |
| Port of Seattle WA Revenue | 5.000% | 3/1/29 | 2,025 | 2,252 |
| Port of Seattle WA Revenue | 5.000% | 3/1/30 | 2,000 | 2,216 |
| Port of Seattle WA Revenue | 5.000% | 6/1/30 | 6,000 | 6,236 |
| Port of Seattle WA Revenue | 5.000% | 8/1/30 | 8,000 | 8,663 |
271
Intermediate-Term Tax-Exempt Fund
| | | | |
| Face | Market |
| Maturity | Amount | Value• |
| Coupon | Date | ($000) | ($000) |
| Port of Seattle WA Revenue | 5.000% | 8/1/31 | 5,560 | 6,011 |
| Seattle WA GO | 5.000% | 6/1/21 | 16,395 | 17,566 |
| Seattle WA GO | 5.000% | 6/1/23 | 7,315 | 8,166 |
| Seattle WA Municipal Light & Power Revenue | 5.000% | 2/1/20 | 7,945 | 8,231 |
| Seattle WA Water System Revenue | 5.000% | 9/1/23 | 14,315 | 15,707 |
| Seattle WA Water System Revenue | 5.000% | 5/1/24 | 12,610 | 14,261 |
| Seattle WA Water System Revenue | 4.000% | 5/1/31 | 1,805 | 1,873 |
| Skagit County WA Public Hospital District Revenue | 4.000% | 12/1/24 | 2,295 | 2,389 |
| Skagit County WA Public Hospital District Revenue | 4.000% | 12/1/25 | 3,760 | 3,918 |
| Snohomish County WA GO | 4.000% | 12/1/26 | 3,515 | 3,715 |
| Snohomish County WA School District No. 15 (Edmonds) GO | 5.000% | 12/1/29 | 3,700 | 4,126 |
| Snohomish County WA School District No. 15 (Edmonds) GO | 5.000% | 12/1/30 | 3,000 | 3,340 |
| Snohomish County WA School District No. 15 (Edmonds) GO | 5.000% | 12/1/31 | 3,650 | 4,056 |
| Thurston County WA School District No. 111 Olympia Revenue | 4.000% | 12/1/32 | 3,150 | 3,272 |
| University of Washington Revenue | 5.000% | 7/1/27 | 6,925 | 7,560 |
| University of Washington Revenue | 5.000% | 4/1/28 | 10,195 | 10,838 |
| University of Washington Revenue | 5.000% | 7/1/28 | 11,490 | 12,519 |
| University of Washington Revenue | 5.000% | 7/1/29 | 7,500 | 8,152 |
| University of Washington Revenue | 5.000% | 4/1/30 | 9,315 | 9,891 |
| University of Washington Revenue | 5.000% | 7/1/30 | 10,495 | 11,385 |
| University of Washington Revenue | 5.000% | 4/1/31 | 10,500 | 11,141 |
| University of Washington Revenue | 5.000% | 4/1/32 | 11,375 | 12,064 |
| University of Washington Revenue | 5.000% | 7/1/32 | 5,000 | 5,407 |
| Washington (Motor Vehicle Fuel Tax) GO | 5.000% | 8/1/19 (Prere.) | 3,185 | 3,258 |
| Washington (Motor Vehicle Fuel Tax) GO | 5.000% | 7/1/20 | 5,780 | 6,053 |
| Washington (Motor Vehicle Fuel Tax) GO | 5.000% | 8/1/23 | 5,435 | 5,944 |
| Washington (Motor Vehicle Fuel Tax) GO | 5.000% | 8/1/25 | 5,260 | 5,739 |
| Washington (Motor Vehicle Fuel Tax) GO | 5.000% | 8/1/26 | 6,175 | 6,731 |
| Washington (Motor Vehicle Fuel Tax) GO | 5.000% | 7/1/27 | 14,900 | 16,815 |
| Washington (Motor Vehicle Fuel Tax) GO | 5.000% | 7/1/27 | 5,000 | 5,643 |
| Washington (Motor Vehicle Fuel Tax) GO | 5.000% | 7/1/28 | 19,725 | 22,177 |
| Washington (Motor Vehicle Fuel Tax) GO | 5.000% | 6/1/29 | 10,545 | 11,219 |
| Washington (Motor Vehicle Fuel Tax) GO | 5.000% | 6/1/30 | 7,525 | 8,002 |
| Washington (Motor Vehicle Fuel Tax) GO | 4.000% | 7/1/31 | 23,685 | 24,737 |
| Washington (Motor Vehicle Fuel Tax) GO | 5.000% | 8/1/33 | 6,800 | 7,460 |
| Washington (Motor Vehicle Fuel Tax) GO | 5.000% | 8/1/34 | 11,640 | 12,754 |
| Washington Economic Development Finance Authority Lease Revenue | | | | |
| (Washington Biomedical Research Properties 2) | 5.000% | 6/1/27 | 1,410 | 1,590 |
| Washington Economic Development Finance Authority Lease Revenue | | | | |
| (Washington Biomedical Research Properties 2) | 5.000% | 6/1/29 | 1,435 | 1,609 |
| Washington Economic Development Finance Authority Lease Revenue | | | | |
| (Washington Biomedical Research Properties 2) | 5.000% | 6/1/31 | 2,165 | 2,414 |
| Washington Economic Development Finance Authority Lease Revenue | | | | |
| (Washington Biomedical Research Properties 2) | 5.000% | 6/1/32 | 1,460 | 1,624 |
| Washington GO | 5.000% | 2/1/19 (Prere.) | 6,790 | 6,843 |
| Washington GO | 5.000% | 7/1/19 | 6,940 | 7,081 |
| Washington GO | 5.000% | 8/1/19 (Prere.) | 4,845 | 4,955 |
| Washington GO | 0.000% | 6/1/20 (14) | 5,500 | 5,309 |
| Washington GO | 5.000% | 7/1/20 | 10,720 | 11,227 |
| Washington GO | 5.000% | 2/1/21 (Prere.) | 10,000 | 10,628 |
| Washington GO | 5.000% | 2/1/21 (Prere.) | 9,650 | 10,256 |
| Washington GO | 5.000% | 8/1/21 (Prere.) | 20,980 | 22,560 |
| Washington GO | 5.000% | 8/1/21 | 5,600 | 6,016 |
| Washington GO | 5.000% | 2/1/22 (Prere.) | 6,170 | 6,710 |
| Washington GO | 5.000% | 7/1/22 | 20,000 | 21,894 |
| Washington GO | 5.000% | 7/1/22 | 9,845 | 10,777 |
| Washington GO | 5.000% | 7/1/22 | 23,500 | 25,725 |
| Washington GO | 5.000% | 8/1/22 | 5,470 | 5,997 |
| Washington GO | 5.000% | 8/1/22 | 5,530 | 6,063 |
| Washington GO | 5.000% | 7/1/23 | 10,025 | 10,967 |
| Washington GO | 5.000% | 7/1/24 | 5,135 | 5,602 |
| Washington GO | 5.000% | 7/1/24 | 2,875 | 3,257 |
| Washington GO | 5.000% | 1/1/25 | 1,750 | 1,847 |
| Washington GO | 5.000% | 7/1/25 | 50,585 | 57,024 |
| Washington GO | 4.000% | 7/1/27 | 27,500 | 28,778 |
| Washington GO | 4.000% | 7/1/27 | 72,500 | 75,868 |
| Washington GO | 5.000% | 7/1/27 | 8,620 | 9,728 |
| Washington GO | 5.000% | 8/1/27 | 7,495 | 8,537 |
| Washington GO | 5.000% | 8/1/27 | 42,000 | 49,158 |
| Washington GO | 4.000% | 7/1/28 | 82,900 | 86,515 |
272
Intermediate-Term Tax-Exempt Fund
| | | | |
| Face | Market |
| Maturity | Amount | Value• |
| Coupon | Date | ($000) | ($000) |
| Washington GO | 4.000% | 7/1/28 | 10,000 | 10,436 |
| Washington GO | 5.000% | 8/1/28 | 20,210 | 22,925 |
| Washington GO | 4.000% | 7/1/29 | 9,000 | 9,401 |
| Washington GO | 5.000% | 2/1/30 | 8,545 | 9,456 |
| Washington GO | 5.000% | 2/1/30 | 13,740 | 15,369 |
| Washington GO | 5.000% | 7/1/30 | 6,790 | 7,650 |
| Washington GO | 5.000% | 8/1/30 | 45,000 | 51,579 |
| Washington GO | 5.000% | 8/1/30 | 21,425 | 24,557 |
| Washington GO | 5.000% | 6/1/31 | 5,250 | 5,581 |
| Washington GO | 5.000% | 7/1/31 | 12,950 | 14,405 |
| Washington GO | 5.000% | 8/1/31 | 13,860 | 15,444 |
| Washington GO | 5.000% | 8/1/31 | 43,000 | 49,039 |
| Washington GO | 5.000% | 8/1/31 | 32,640 | 37,224 |
| Washington GO | 5.000% | 6/1/32 | 5,500 | 5,840 |
| Washington GO | 5.000% | 8/1/32 | 29,775 | 32,736 |
| Washington GO | 5.000% | 8/1/32 | 26,470 | 30,079 |
| Washington GO | 5.000% | 8/1/36 | 16,960 | 19,179 |
| Washington GO | 5.000% | 8/1/36 | 7,000 | 7,847 |
| Washington GO | 5.000% | 8/1/37 | 20,005 | 22,570 |
| Washington GO | 5.000% | 8/1/38 | 18,960 | 21,324 |
| Washington GO | 5.000% | 8/1/39 | 6,000 | 6,619 |
| Washington Health Care Facilities Authority Revenue | | | | |
| (Central Washington Health Services Association) | 5.000% | 7/1/27 | 2,675 | 2,920 |
| Washington Health Care Facilities Authority Revenue | | | | |
| (Central Washington Health Services Association) | 5.000% | 7/1/28 | 2,160 | 2,347 |
| Washington Health Care Facilities Authority Revenue | | | | |
| (Central Washington Health Services Association) | 5.000% | 7/1/29 | 1,755 | 1,898 |
| Washington Health Care Facilities Authority Revenue (MultiCare Health System) | 5.250% | 8/15/19 | 3,800 | 3,894 |
| Washington Health Care Facilities Authority Revenue (MultiCare Health System) | 5.250% | 8/15/20 | 4,250 | 4,355 |
| Washington Health Care Facilities Authority Revenue (MultiCare Health System) | 5.250% | 8/15/21 | 6,525 | 6,683 |
| Washington Health Care Facilities Authority Revenue (MultiCare Health System) | 5.250% | 8/15/22 | 5,500 | 5,630 |
| Washington Health Care Facilities Authority Revenue (MultiCare Health System) | 5.000% | 8/15/26 | 1,070 | 1,233 |
| Washington Health Care Facilities Authority Revenue (MultiCare Health System) | 5.000% | 8/15/27 | 1,220 | 1,413 |
| Washington Health Care Facilities Authority Revenue (MultiCare Health System) | 5.000% | 8/15/28 | 1,195 | 1,376 |
| Washington Health Care Facilities Authority Revenue (MultiCare Health System) | 5.000% | 8/15/30 | 1,845 | 2,099 |
| Washington Health Care Facilities Authority Revenue (MultiCare Health System) | 5.000% | 8/15/31 | 1,260 | 1,428 |
| Washington Health Care Facilities Authority Revenue (MultiCare Health System) | 5.000% | 8/15/35 | 9,480 | 10,591 |
| Washington Health Care Facilities Authority Revenue (MultiCare Health System) | 5.000% | 8/15/36 | 19,390 | 21,580 |
| Washington Health Care Facilities Authority Revenue (MultiCare Health System) | 5.000% | 8/15/37 | 9,680 | 10,749 |
| Washington Health Care Facilities Authority Revenue (PeaceHealth) | 5.000% | 11/1/18 | 23,015 | 23,015 |
| Washington Health Care Facilities Authority Revenue (PeaceHealth) | 5.000% | 11/15/23 | 1,500 | 1,670 |
| Washington Health Care Facilities Authority Revenue (PeaceHealth) | 5.000% | 11/1/24 | 19,830 | 20,339 |
| Washington Health Care Facilities Authority Revenue (PeaceHealth) | 5.000% | 11/15/25 | 1,710 | 1,898 |
| Washington Health Care Facilities Authority Revenue (PeaceHealth) | 5.000% | 11/15/27 | 1,045 | 1,148 |
| Washington Health Care Facilities Authority Revenue (Providence Health & Services) | 5.000% | 10/1/28 | 2,050 | 2,392 |
| Washington Health Care Facilities Authority Revenue (Providence Health & Services) | 5.000% | 10/1/29 | 4,000 | 4,611 |
| Washington Health Care Facilities Authority Revenue (Providence Health & Services) | 5.000% | 10/1/30 | 4,000 | 4,585 |
| Washington Health Care Facilities Authority Revenue (Providence Health & Services) | 5.000% | 10/1/32 | 3,785 | 4,093 |
| Washington Health Care Facilities Authority Revenue (Providence Health & Services) PUT | 4.000% | 10/1/21 | 2,700 | 2,824 |
| Washington Health Care Facilities Authority Revenue (Seattle Cancer Care Alliance) | 5.000% | 3/1/32 | 2,800 | 3,041 |
| Washington Health Care Facilities Authority Revenue | | | | |
| (Virginia Mason Medical Center Obligated Group) | 5.000% | 8/15/26 | 2,040 | 2,257 |
| Washington Health Care Facilities Authority Revenue | | | | |
| (Virginia Mason Medical Center Obligated Group) | 5.000% | 8/15/27 | 2,175 | 2,415 |
| Washington Health Care Facilities Authority Revenue | | | | |
| (Virginia Mason Medical Center Obligated Group) | 5.000% | 8/15/28 | 3,700 | 4,090 |
| Washington Health Care Facilities Authority Revenue | | | | |
| (Virginia Mason Medical Center Obligated Group) | 5.000% | 8/15/29 | 2,500 | 2,748 |
| Washington Health Care Facilities Authority Revenue | | | | |
| (Virginia Mason Medical Center Obligated Group) | 5.000% | 8/15/30 | 2,595 | 2,838 |
| Washington Health Care Facilities Authority Revenue | | | | |
| (Virginia Mason Medical Center Obligated Group) | 5.000% | 8/15/31 | 2,250 | 2,452 |
| Washington Health Care Facilities Authority Revenue | | | | |
| (Virginia Mason Medical Center Obligated Group) | 5.000% | 8/15/32 | 2,500 | 2,714 |
| Washington Health Care Facilities Authority Revenue | | | | |
| (Virginia Mason Medical Center Obligated Group) | 5.000% | 8/15/33 | 3,125 | 3,381 |
| Washington Health Care Facilities Authority Revenue | | | | |
| (Virginia Mason Medical Center Obligated Group) | 5.000% | 8/15/34 | 3,805 | 4,105 |
| Washington Higher Education Facilities Authority Revenue (Gonzaga University Project) | 5.000% | 4/1/19 (Prere.) | 2,580 | 2,612 |
| Washington Higher Education Facilities Authority Revenue (Gonzaga University Project) | 5.000% | 4/1/19 (Prere.) | 3,005 | 3,043 |
273
Intermediate-Term Tax-Exempt Fund
| | | | |
| Face | Market |
| Maturity | Amount | Value• |
| Coupon | Date | ($000) | ($000) |
| Washington Higher Education Facilities Authority Revenue (Gonzaga University Project) | 5.000% | 4/1/19 (Prere.) | 4,470 | 4,526 |
| Washington Higher Education Facilities Authority Revenue (Gonzaga University Project) | 5.000% | 4/1/19 (Prere.) | 2,000 | 2,025 |
| Washington Higher Education Facilities Authority Revenue (Seattle University Project) | 4.000% | 5/1/34 | 2,500 | 2,551 |
| Washington Higher Education Facilities Authority Revenue (Seattle University Project) | 4.000% | 5/1/35 | 4,370 | 4,442 |
| Washington Higher Education Facilities Authority Revenue (Seattle University Project) | 4.000% | 5/1/36 | 4,545 | 4,604 |
| Washington Housing Finance Commission Multi-Family Housing Revenue | | | | |
| (Emerald Heights Project) | 5.000% | 7/1/28 | 1,675 | 1,795 |
| Washington Housing Finance Commission Multi-Family Housing Revenue | | | | |
| (Emerald Heights Project) | 5.000% | 7/1/33 | 2,840 | 3,003 |
| Washington Housing Finance Commission Multi-Family Housing Revenue | | | | |
| (The Hearthstone Project) | 4.500% | 7/1/28 | 965 | 980 |
| Washington Housing Finance Commission Multi-Family Housing Revenue | | | | |
| (The Hearthstone Project) | 5.000% | 7/1/38 | 830 | 841 |
| Washington State University General Revenue | 5.000% | 10/1/28 | 3,070 | 3,284 |
| Washington State University General Revenue | 5.000% | 10/1/29 | 3,070 | 3,283 |
| Washington State University General Revenue | 5.000% | 10/1/30 | 3,140 | 3,357 |
| Washington State University General Revenue | 5.000% | 10/1/31 | 3,170 | 3,385 |
| | | | 2,007,226 |
| West Virginia (0.5%) | | | | |
| West Virginia Commissioner of Highways Revenue (Surface Transportation Improvements) | 5.000% | 9/1/21 | 11,210 | 12,050 |
| West Virginia Commissioner of Highways Revenue (Surface Transportation Improvements) | 5.000% | 9/1/22 | 5,120 | 5,608 |
| West Virginia Commissioner of Highways Revenue (Surface Transportation Improvements) | 5.000% | 9/1/25 | 4,030 | 4,610 |
| West Virginia Commissioner of Highways Revenue (Surface Transportation Improvements) | 5.000% | 9/1/26 | 6,000 | 6,922 |
| West Virginia Commissioner of Highways Revenue (Surface Transportation Improvements) | 5.000% | 9/1/27 | 4,165 | 4,835 |
| West Virginia Commissioner of Highways Revenue (Surface Transportation Improvements) | 5.000% | 9/1/32 | 3,000 | 3,383 |
| West Virginia Commissioner of Highways Revenue (Surface Transportation Improvements) | 5.000% | 9/1/33 | 3,000 | 3,368 |
| West Virginia Economic Development Authority Lottery Revenue | 5.000% | 6/15/19 (ETM) | 1,395 | 1,421 |
| West Virginia Economic Development Authority Lottery Revenue | 5.000% | 6/15/20 (Prere.) | 3,500 | 3,659 |
| West Virginia Economic Development Authority Lottery Revenue | 5.000% | 6/15/20 (Prere.) | 2,055 | 2,148 |
| West Virginia Economic Development Authority Lottery Revenue | 5.000% | 6/15/20 (Prere.) | 5,085 | 5,316 |
| West Virginia Economic Development Authority Lottery Revenue | 5.000% | 6/15/20 (Prere.) | 1,745 | 1,824 |
| West Virginia Economic Development Authority Lottery Revenue | 5.000% | 6/15/20 (Prere.) | 2,445 | 2,556 |
| West Virginia Economic Development Authority Lottery Revenue | 5.000% | 6/15/26 | 5,340 | 6,165 |
| West Virginia Economic Development Authority Lottery Revenue | 5.000% | 6/15/27 | 5,610 | 6,512 |
| West Virginia Economic Development Authority Lottery Revenue | 5.000% | 6/15/28 | 5,890 | 6,788 |
| West Virginia Economic Development Authority Lottery Revenue | 5.000% | 6/15/29 | 5,000 | 5,730 |
| West Virginia Economic Development Authority Lottery Revenue | 4.000% | 6/15/32 | 7,025 | 7,258 |
| West Virginia Economic Development Authority Lottery Revenue | 4.000% | 6/15/33 | 7,300 | 7,514 |
| West Virginia Economic Development Authority Lottery Revenue | 4.000% | 6/15/35 | 7,900 | 8,079 |
| West Virginia Economic Development Authority Lottery Revenue | 4.000% | 6/15/36 | 8,215 | 8,371 |
| West Virginia Economic Development Authority Lottery Revenue | 4.000% | 6/15/37 | 7,000 | 7,117 |
| West Virginia GO | 5.000% | 12/1/33 | 10,000 | 11,413 |
| West Virginia GO | 5.000% | 12/1/35 | 16,375 | 18,559 |
| West Virginia GO | 5.000% | 6/1/36 | 14,890 | 16,811 |
| West Virginia GO | 5.000% | 6/1/37 | 2,870 | 3,230 |
| West Virginia Higher Education Policy Commission Revenue | 5.000% | 4/1/25 | 2,000 | 2,160 |
| West Virginia Higher Education Policy Commission Revenue | 5.000% | 7/1/26 | 2,425 | 2,776 |
| West Virginia Higher Education Policy Commission Revenue | 5.000% | 4/1/27 | 1,500 | 1,614 |
| West Virginia Higher Education Policy Commission Revenue | 5.000% | 7/1/27 | 1,545 | 1,779 |
| West Virginia Higher Education Policy Commission Revenue | 5.000% | 4/1/28 | 2,000 | 2,150 |
| West Virginia Higher Education Policy Commission Revenue | 5.000% | 7/1/28 | 1,510 | 1,724 |
| West Virginia Higher Education Policy Commission Revenue | 5.000% | 4/1/29 | 2,000 | 2,146 |
| West Virginia Higher Education Policy Commission Revenue | 5.000% | 7/1/29 | 1,670 | 1,893 |
| West Virginia Higher Education Policy Commission Revenue | 5.000% | 7/1/31 | 1,720 | 1,928 |
| West Virginia Higher Education Policy Commission Revenue | 5.000% | 7/1/32 | 1,880 | 2,098 |
| West Virginia Higher Education Policy Commission Revenue | 5.000% | 7/1/33 | 2,050 | 2,278 |
| West Virginia Higher Education Policy Commission Revenue | 5.000% | 7/1/35 | 2,365 | 2,608 |
| West Virginia Higher Education Policy Commission Revenue | 5.000% | 7/1/36 | 2,860 | 3,142 |
| West Virginia Higher Education Policy Commission Revenue | 5.000% | 7/1/37 | 2,975 | 3,262 |
| West Virginia Hospital Finance Authority Hospital Revenue (Cabell Huntington Hospital Inc.) | 5.000% | 1/1/27 | 1,460 | 1,632 |
| West Virginia Hospital Finance Authority Hospital Revenue (Cabell Huntington Hospital Inc.) | 5.000% | 1/1/28 | 1,190 | 1,333 |
| West Virginia Hospital Finance Authority Hospital Revenue (Charleston Area Medical Center Inc.) | 5.000% | 9/1/19 | 2,990 | 3,053 |
| West Virginia Hospital Finance Authority Hospital Revenue (Charleston Area Medical Center Inc.) | 5.000% | 9/1/20 | 3,570 | 3,640 |
| West Virginia Hospital Finance Authority Hospital Revenue (Charleston Area Medical Center Inc.) | 5.125% | 9/1/21 | 3,365 | 3,434 |
| West Virginia Hospital Finance Authority Hospital Revenue (Charleston Area Medical Center Inc.) | 5.000% | 9/1/24 | 3,020 | 3,289 |
| West Virginia Hospital Finance Authority Hospital Revenue (Charleston Area Medical Center Inc.) | 5.000% | 9/1/25 | 2,990 | 3,226 |
| West Virginia Hospital Finance Authority Hospital Revenue (Charleston Area Medical Center Inc.) | 5.000% | 9/1/26 | 2,475 | 2,649 |
| West Virginia Hospital Finance Authority Hospital Revenue (Charleston Area Medical Center Inc.) | 5.000% | 9/1/27 | 3,170 | 3,377 |
| West Virginia Hospital Finance Authority Hospital Revenue (Charleston Area Medical Center Inc.) | 5.000% | 9/1/28 | 3,210 | 3,406 |
274
Intermediate-Term Tax-Exempt Fund
| | | | |
| Face | Market |
| Maturity | Amount | Value• |
| Coupon | Date | ($000) | ($000) |
| West Virginia Hospital Finance Authority Hospital Revenue (Charleston Area Medical Center Inc.) | 5.625% | 9/1/32 | 12,650 | 12,939 |
| West Virginia Hospital Finance Authority Hospital Revenue | | | | |
| (United Health System Obligated Group) | 5.000% | 6/1/19 (Prere.) | 12,620 | 12,839 |
| West Virginia Hospital Finance Authority Hospital Revenue | | | | |
| (United Health System Obligated Group) | 4.000% | 6/1/29 | 5,580 | 5,705 |
| West Virginia Hospital Finance Authority Hospital Revenue | | | | |
| (United Health System Obligated Group) | 4.000% | 6/1/31 | 3,335 | 3,376 |
| West Virginia Hospital Finance Authority Hospital Revenue | | | | |
| (United Health System Obligated Group) | 4.000% | 6/1/32 | 8,750 | 8,818 |
| West Virginia Hospital Finance Authority Hospital Revenue | | | | |
| (United Health System Obligated Group) | 4.000% | 6/1/35 | 4,540 | 4,507 |
| West Virginia Parkways Authority Turnpike Toll Revenue | 5.000% | 6/1/32 | 1,000 | 1,142 |
| West Virginia Parkways Authority Turnpike Toll Revenue | 5.000% | 6/1/34 | 2,000 | 2,269 |
| West Virginia Parkways Authority Turnpike Toll Revenue | 5.000% | 6/1/35 | 1,000 | 1,130 |
| West Virginia Parkways Authority Turnpike Toll Revenue | 5.000% | 6/1/36 | 2,000 | 2,251 |
| West Virginia Parkways Authority Turnpike Toll Revenue | 5.000% | 6/1/37 | 1,500 | 1,684 |
| West Virginia State School Building Authority Lottery Revenue | 5.000% | 7/1/26 | 2,590 | 2,988 |
| West Virginia State School Building Authority Lottery Revenue | 5.000% | 7/1/27 | 2,720 | 3,155 |
| West Virginia State School Building Authority Lottery Revenue | 5.000% | 7/1/28 | 2,855 | 3,323 |
| West Virginia University Revenue | 5.000% | 10/1/30 | 3,000 | 3,197 |
| West Virginia Water Development Authority Infrastructure Excess Lottery Revenue | | | | |
| (Chesapeake Bay/Greenbrier River Projects) | 5.000% | 7/1/27 | 2,745 | 3,096 |
| West Virginia Water Development Authority Infrastructure Excess Lottery Revenue | | | | |
| (Chesapeake Bay/Greenbrier River Projects) | 5.000% | 7/1/31 | 3,435 | 3,847 |
| West Virginia Water Development Authority Infrastructure Excess Lottery Revenue | | | | |
| (Chesapeake Bay/Greenbrier River Projects) | 5.000% | 7/1/33 | 3,690 | 4,110 |
| | | | 312,220 |
| Wisconsin (1.3%) | | | | |
| Central Brown County WI Water Authority Water System Revenue | 5.000% | 11/1/30 | 1,890 | 2,085 |
| Central Brown County WI Water Authority Water System Revenue | 5.000% | 11/1/31 | 2,000 | 2,202 |
| Central Brown County WI Water Authority Water System Revenue | 5.000% | 11/1/32 | 2,000 | 2,204 |
| Central Brown County WI Water Authority Water System Revenue | 5.000% | 11/1/33 | 1,500 | 1,647 |
| Central Brown County WI Water Authority Water System Revenue | 5.000% | 11/1/34 | 1,500 | 1,645 |
| Central Brown County WI Water Authority Water System Revenue | 5.000% | 11/1/35 | 1,500 | 1,651 |
| Green Bay WI Area Public School District GO | 4.000% | 4/1/30 | 3,560 | 3,694 |
| Green Bay WI Area Public School District GO | 4.000% | 4/1/31 | 3,685 | 3,809 |
| Green Bay WI Area Public School District GO | 4.000% | 4/1/32 | 3,825 | 3,941 |
| Madison WI Area Technical College GO | 5.000% | 3/1/22 | 4,055 | 4,401 |
| Madison WI Area Technical College GO | 5.000% | 3/1/23 | 4,345 | 4,807 |
| Madison WI Area Technical College GO | 4.000% | 3/1/24 | 4,590 | 4,936 |
| Madison WI Area Technical College GO | 4.000% | 3/1/25 | 3,000 | 3,251 |
| Madison WI Area Technical College GO | 4.000% | 3/1/27 | 5,340 | 5,830 |
| Madison WI Area Technical College GO | 4.000% | 3/1/28 | 5,530 | 5,969 |
| Madison WI Community Development Authority Revenue (Wisconsin Alumni Research Project) | 5.000% | 10/1/19 | 3,705 | 3,806 |
| Milwaukee WI GO | 4.000% | 3/15/20 | 9,930 | 10,193 |
| Milwaukee WI GO | 4.000% | 4/1/32 | 6,100 | 6,334 |
| Milwaukee WI Metropolitan Sewer District GO | 5.250% | 10/1/22 | 2,690 | 2,989 |
| 1 Verona WI Area School District GO | 5.000% | 4/1/26 | 3,485 | 4,017 |
| Wisconsin General Fund Annual Appropriation Revenue | 6.000% | 5/1/19 (Prere.) | 945 | 964 |
| Wisconsin General Fund Annual Appropriation Revenue | 6.000% | 5/1/27 | 9,055 | 9,238 |
| Wisconsin GO | 5.000% | 5/1/20 (Prere.) | 2,305 | 2,402 |
| Wisconsin GO | 5.000% | 5/1/20 | 1,000 | 1,043 |
| Wisconsin GO | 5.000% | 5/1/20 | 2,915 | 3,040 |
| Wisconsin GO | 5.000% | 5/1/21 | 9,335 | 9,978 |
| Wisconsin GO | 5.000% | 5/1/21 (Prere.) | 10,425 | 11,133 |
| Wisconsin GO | 5.000% | 5/1/22 | 1,195 | 1,244 |
| Wisconsin GO | 5.000% | 5/1/22 (Prere.) | 110 | 120 |
| Wisconsin GO | 5.000% | 5/1/22 (Prere.) | 40 | 44 |
| Wisconsin GO | 5.000% | 11/1/23 | 5,000 | 5,611 |
| Wisconsin GO | 5.000% | 5/1/25 | 7,405 | 8,050 |
| Wisconsin GO | 5.000% | 5/1/26 | 9,000 | 9,943 |
| Wisconsin GO | 5.000% | 5/1/27 | 1,400 | 1,517 |
| Wisconsin GO | 5.000% | 5/1/27 | 2,835 | 3,071 |
| Wisconsin GO | 5.000% | 5/1/28 | 2,060 | 2,229 |
| Wisconsin GO | 5.000% | 11/1/28 | 30,070 | 34,968 |
| Wisconsin GO | 5.000% | 5/1/29 | 1,715 | 1,854 |
| Wisconsin GO | 5.000% | 5/1/29 | 5,055 | 5,560 |
| Wisconsin GO | 5.000% | 5/1/29 | 16,840 | 19,059 |
| Wisconsin GO | 5.000% | 5/1/30 | 7,760 | 8,729 |
275
Intermediate-Term Tax-Exempt Fund
| | | | |
| Face | Market |
| Maturity | Amount | Value• |
| Coupon | Date | ($000) | ($000) |
| Wisconsin GO | 4.000% | 11/1/34 | 4,000 | 4,134 |
| Wisconsin GO | 5.000% | 5/1/35 | 13,090 | 14,592 |
| Wisconsin GO | 5.000% | 5/1/36 | 24,590 | 27,381 |
| Wisconsin GO | 5.000% | 5/1/36 | 21,325 | 23,746 |
| Wisconsin Health & Educational Facilities Authority Health Facilities Revenue (SSM Health Care) | 5.000% | 6/1/19 (ETM) | 4,110 | 4,181 |
| Wisconsin Health & Educational Facilities Authority Health Facilities Revenue (SSM Health Care) | 5.000% | 6/1/20 (ETM) | 3,240 | 3,381 |
| Wisconsin Health & Educational Facilities Authority Health Facilities Revenue (SSM Health Care) | 5.000% | 6/1/20 (Prere.) | 5,230 | 5,458 |
| Wisconsin Health & Educational Facilities Authority Health Facilities Revenue (SSM Health Care) | 5.000% | 6/1/20 (Prere.) | 3,295 | 3,439 |
| Wisconsin Health & Educational Facilities Authority Revenue (Agnesian HealthCare Inc.) | 5.000% | 7/1/29 | 1,175 | 1,308 |
| Wisconsin Health & Educational Facilities Authority Revenue (Agnesian HealthCare Inc.) | 5.000% | 7/1/30 | 1,410 | 1,561 |
| Wisconsin Health & Educational Facilities Authority Revenue | | | | |
| (Ascension Health Alliance Credit Group) | 4.000% | 11/15/32 | 8,015 | 8,177 |
| Wisconsin Health & Educational Facilities Authority Revenue | | | | |
| (Ascension Health Alliance Credit Group) | 4.000% | 11/15/33 | 50,545 | 51,401 |
| Wisconsin Health & Educational Facilities Authority Revenue | | | | |
| (Ascension Health Alliance Credit Group) | 4.000% | 11/15/34 | 38,835 | 39,390 |
| Wisconsin Health & Educational Facilities Authority Revenue | | | | |
| (Ascension Health Alliance Credit Group) | 4.000% | 11/15/35 | 17,075 | 17,263 |
| Wisconsin Health & Educational Facilities Authority Revenue | | | | |
| (Ascension Health Alliance Credit Group) | 5.000% | 11/15/36 | 4,460 | 4,875 |
| Wisconsin Health & Educational Facilities Authority Revenue | | | | |
| (Ascension Health Alliance Credit Group) PUT | 5.000% | 6/1/21 | 34,215 | 36,295 |
| Wisconsin Health & Educational Facilities Authority Revenue (Ascension Health Credit Group | 4.500% | 11/15/39 | 9,490 | 9,815 |
| Wisconsin Health & Educational Facilities Authority Revenue (Aurora Health Care Inc.) | 5.500% | 4/15/20 (Prere.) | 11,730 | 12,292 |
| Wisconsin Health & Educational Facilities Authority Revenue (Aurora Health Care Inc.) | 5.000% | 7/15/21 (Prere.) | 8,500 | 9,121 |
| Wisconsin Health & Educational Facilities Authority Revenue | | | | |
| (Beaver Dam Community Hospitals Inc.) | 5.250% | 8/15/34 | 2,715 | 2,819 |
| Wisconsin Health & Educational Facilities Authority Revenue (Beloit College) | 5.000% | 7/1/28 | 765 | 774 |
| Wisconsin Health & Educational Facilities Authority Revenue (Beloit College) | 5.000% | 7/1/29 | 685 | 688 |
| Wisconsin Health & Educational Facilities Authority Revenue (Beloit College) | 5.000% | 7/1/30 | 940 | 940 |
| Wisconsin Health & Educational Facilities Authority Revenue (Beloit College) | 5.000% | 7/1/31 | 990 | 985 |
| Wisconsin Health & Educational Facilities Authority Revenue (Beloit College) | 5.000% | 7/1/32 | 1,045 | 1,035 |
| Wisconsin Health & Educational Facilities Authority Revenue | | | | |
| (Children’s Hospital of Wisconsin Inc.) | 5.375% | 2/15/20 (Prere.) | 5,900 | 6,144 |
| Wisconsin Health & Educational Facilities Authority Revenue | | | | |
| (Children’s Hospital of Wisconsin Inc.) | 5.000% | 8/15/26 | 840 | 961 |
| Wisconsin Health & Educational Facilities Authority Revenue | | | | |
| (Children’s Hospital of Wisconsin Inc.) | 5.000% | 8/15/27 | 850 | 977 |
| Wisconsin Health & Educational Facilities Authority Revenue | | | | |
| (Children’s Hospital of Wisconsin Inc.) | 5.000% | 8/15/28 | 810 | 924 |
| Wisconsin Health & Educational Facilities Authority Revenue | | | | |
| (Children’s Hospital of Wisconsin Inc.) | 5.000% | 8/15/29 | 800 | 907 |
| Wisconsin Health & Educational Facilities Authority Revenue | | | | |
| (Children’s Hospital of Wisconsin Inc.) | 4.000% | 8/15/30 | 8,305 | 8,553 |
| Wisconsin Health & Educational Facilities Authority Revenue | | | | |
| (Children’s Hospital of Wisconsin Inc.) | 4.000% | 8/15/31 | 6,000 | 6,156 |
| Wisconsin Health & Educational Facilities Authority Revenue | | | | |
| (Children’s Hospital of Wisconsin Inc.) | 4.000% | 8/15/32 | 5,345 | 5,464 |
| Wisconsin Health & Educational Facilities Authority Revenue | | | | |
| (Children’s Hospital of Wisconsin Inc.) | 4.000% | 8/15/36 | 4,715 | 4,725 |
| Wisconsin Health & Educational Facilities Authority Revenue | | | | |
| (Children’s Hospital of Wisconsin Inc.) | 4.000% | 8/15/37 | 5,910 | 5,910 |
| Wisconsin Health & Educational Facilities Authority Revenue (Froedtert Health Inc.) | 5.000% | 4/1/25 | 2,500 | 2,832 |
| Wisconsin Health & Educational Facilities Authority Revenue (Froedtert Health Inc.) | 5.000% | 4/1/27 | 1,855 | 2,136 |
| Wisconsin Health & Educational Facilities Authority Revenue (Froedtert Health Inc.) | 5.000% | 4/1/33 | 4,000 | 4,455 |
| Wisconsin Health & Educational Facilities Authority Revenue (Froedtert Health Inc.) | 5.000% | 4/1/34 | 6,845 | 7,593 |
| Wisconsin Health & Educational Facilities Authority Revenue (Froedtert Health Inc.) | 5.000% | 4/1/35 | 5,450 | 6,025 |
| Wisconsin Health & Educational Facilities Authority Revenue | | | | |
| (Hospital Sisters Services Inc. Obligated Group) | 5.000% | 11/15/28 | 12,130 | 13,362 |
| Wisconsin Health & Educational Facilities Authority Revenue | | | | |
| (Hospital Sisters Services Inc. Obligated Group) | 5.000% | 11/15/29 | 12,020 | 13,199 |
| Wisconsin Health & Educational Facilities Authority Revenue (Marquette University) | 5.000% | 10/1/24 | 700 | 766 |
| Wisconsin Health & Educational Facilities Authority Revenue (Marquette University) | 5.000% | 10/1/28 | 1,865 | 2,027 |
| Wisconsin Health & Educational Facilities Authority Revenue (Marquette University) | 5.000% | 10/1/29 | 1,500 | 1,627 |
| Wisconsin Health & Educational Facilities Authority Revenue (Marquette University) | 5.000% | 10/1/30 | 1,660 | 1,796 |
| Wisconsin Health & Educational Facilities Authority Revenue | | | | |
| (Marshfield Clinic Health System Obligated Group) | 5.000% | 2/15/24 | 2,310 | 2,551 |
| Wisconsin Health & Educational Facilities Authority Revenue | | | | |
| (Marshfield Clinic Health System Obligated Group) | 5.000% | 2/15/25 | 2,435 | 2,714 |
276
Intermediate-Term Tax-Exempt Fund
| | | | | |
| Face | Market |
| Maturity | Amount | Value• |
| | Coupon | Date | ($000) | ($000) |
| Wisconsin Health & Educational Facilities Authority Revenue | | | | |
| | (Marshfield Clinic Health System Obligated Group) | 5.000% | 2/15/26 | 940 | 1,053 |
| Wisconsin Health & Educational Facilities Authority Revenue | | | | |
| | (Marshfield Clinic Health System Obligated Group) | 5.000% | 2/15/27 | 1,685 | 1,860 |
| Wisconsin Health & Educational Facilities Authority Revenue | | | | |
| | (Marshfield Clinic Health System Obligated Group) | 5.000% | 2/15/32 | 4,200 | 4,535 |
| Wisconsin Health & Educational Facilities Authority Revenue (Medical College Wisconsin) | 5.000% | 12/1/34 | 11,035 | 12,108 |
| Wisconsin Health & Educational Facilities Authority Revenue (Medical College Wisconsin) | 5.000% | 12/1/35 | 6,350 | 6,949 |
| 1 | Wisconsin Health & Educational Facilities Authority Revenue | | | | |
| | (Milwaukee Regional Medical Center Thermal Service) | 5.000% | 4/1/26 | 1,000 | 1,142 |
| 1 | Wisconsin Health & Educational Facilities Authority Revenue | | | | |
| | (Milwaukee Regional Medical Center Thermal Service) | 5.000% | 4/1/27 | 850 | 976 |
| 1 | Wisconsin Health & Educational Facilities Authority Revenue | | | | |
| | (Milwaukee Regional Medical Center Thermal Service) | 5.000% | 4/1/28 | 900 | 1,036 |
| Wisconsin Health & Educational Facilities Authority Revenue (Ministry Health Care Inc.) | 5.000% | 8/15/22 (Prere.) | 11,800 | 12,908 |
| Wisconsin Health & Educational Facilities Authority Revenue (ProHealth Care Obligated Group) | 5.000% | 8/15/30 | 2,075 | 2,266 |
| Wisconsin Health & Educational Facilities Authority Revenue (ProHealth Care Obligated Group) | 5.000% | 8/15/31 | 1,650 | 1,795 |
| Wisconsin Health & Educational Facilities Authority Revenue (ProHealth Care Obligated Group) | 5.000% | 8/15/33 | 1,300 | 1,403 |
| Wisconsin Health & Educational Facilities Authority Revenue (ProHealth Care Obligated Group) | 5.000% | 8/15/34 | 1,260 | 1,355 |
| Wisconsin Health & Educational Facilities Authority Revenue (Senior Housing Inc.) | 5.000% | 8/1/28 | 1,235 | 1,246 |
| Wisconsin Health & Educational Facilities Authority Revenue (Senior Housing Inc.) | 5.000% | 8/1/33 | 1,870 | 1,841 |
| Wisconsin Health & Educational Facilities Authority Revenue (Senior Housing Inc.) | 5.125% | 8/1/38 | 4,780 | 4,655 |
| Wisconsin Public Finance Authority Hospital Revenue (Renown Regional Medical Center) | 5.000% | 6/1/25 | 2,130 | 2,408 |
| Wisconsin Public Finance Authority Hospital Revenue (Renown Regional Medical Center) | 5.000% | 6/1/26 | 6,285 | 7,082 |
| Wisconsin Public Finance Authority Hospital Revenue (Renown Regional Medical Center) | 5.000% | 6/1/27 | 4,875 | 5,444 |
| Wisconsin Public Finance Authority Hospital Revenue (Renown Regional Medical Center) | 5.000% | 6/1/28 | 6,955 | 7,732 |
| Wisconsin Public Finance Authority Hospital Revenue (Renown Regional Medical Center) | 5.000% | 6/1/29 | 4,295 | 4,764 |
| Wisconsin Public Finance Authority Hospital Revenue (Renown Regional Medical Center) | 5.000% | 6/1/30 | 7,675 | 8,470 |
| Wisconsin Public Finance Authority Hospital Revenue (Renown Regional Medical Center) | 5.000% | 6/1/33 | 5,895 | 6,450 |
| Wisconsin Public Finance Authority Revenue | | | | |
| | (Retirement Housing Foundation National Obligated Group) | 5.000% | 11/15/27 | 2,350 | 2,581 |
| Wisconsin Public Finance Authority Revenue | | | | |
| | (Retirement Housing Foundation National Obligated Group) | 5.000% | 11/15/28 | 2,595 | 2,851 |
| Wisconsin Public Finance Authority Revenue | | | | |
| | (Retirement Housing Foundation National Obligated Group) | 5.000% | 11/15/29 | 1,475 | 1,618 |
| Wisconsin Public Finance Authority Revenue | | | | |
| | (Retirement Housing Foundation National Obligated Group) | 5.000% | 11/15/30 | 1,500 | 1,644 |
| Wisconsin Public Power System Power Supply System Revenue | 5.000% | 7/1/32 | 4,000 | 4,366 |
| Wisconsin Public Power System Power Supply System Revenue | 5.000% | 7/1/33 | 3,550 | 3,871 |
| Wisconsin Transportation Revenue | 5.000% | 7/1/22 (Prere.) | 5,000 | 5,485 |
| Wisconsin Transportation Revenue | 5.000% | 7/1/31 | 13,200 | 15,103 |
| Wisconsin Transportation Revenue | 5.000% | 7/1/34 | 4,440 | 4,921 |
| Wisconsin Transportation Revenue | 5.000% | 7/1/35 | 3,700 | 4,095 |
| Wisconsin Transportation Revenue | 5.000% | 7/1/37 | 3,085 | 3,402 |
| | | | | 755,478 |
| Wyoming (0.0%) | | | | |
| Wyoming Municipal Power Agency Power Supply Revenue | 5.000% | 1/1/25 (15) | 1,000 | 1,120 |
| Wyoming Municipal Power Agency Power Supply Revenue | 5.000% | 1/1/28 (15) | 1,000 | 1,123 |
| Wyoming Municipal Power Agency Power Supply Revenue | 5.000% | 1/1/29 (15) | 1,000 | 1,117 |
| Wyoming Municipal Power Agency Power Supply Revenue | 5.000% | 1/1/31 (15) | 1,105 | 1,223 |
| Wyoming Municipal Power Agency Power Supply Revenue | 5.000% | 1/1/32 (15) | 1,050 | 1,157 |
| Wyoming Municipal Power Agency Power Supply Revenue | 5.000% | 1/1/35 (15) | 1,450 | 1,583 |
| | | | | 7,323 |
| Total Tax-Exempt Municipal Bonds (Cost $57,784,967) | | | | 57,629,993 |
| |
| Shares | |
| Temporary Cash Investment (0.7%) | | | | |
| Money Market Fund (0.7%) | | | | |
| 21 | Vanguard Municipal Cash Management Fund (Cost $398,150) | 1.620% | 3,981,577 | 398,158 |
| Total Investments (99.8%) (Cost $58,183,117) | | | | 58,028,151 |
277
Intermediate-Term Tax-Exempt Fund
| |
| Amount |
| ($000) |
| Other Assets and Liabilities (0.2%) | |
| Other Assets | |
| Investment in Vanguard | 2,977 |
| Receivables for Investment Securities Sold | 106,548 |
| Receivables for Accrued Income | 740,898 |
| Receivables for Capital Shares Issued | 62,248 |
| Variation Margin Receivable—Futures Contracts | 1,813 |
| Other Assets | 1,813 |
| Total Other Assets | 916,297 |
| Liabilities | |
| Payables for Investment Securities Purchased | (612,012) |
| Payables for Capital Shares Redeemed | (121,253) |
| Payables for Distributions | (40,210) |
| Payables to Vanguard | (26,497) |
| Variation Margin Payable—Futures Contracts | (3,160) |
| Total Liabilities | (803,132) |
| Net Assets (100%) | 58,141,316 |
| |
| At October 31, 2018, net assets consisted of: | |
| Amount |
| ($000) |
| Paid-in Capital | 58,445,668 |
| Total Distributable Earnings (Loss) | (304,352) |
| Net Assets | 58,141,316 |
| |
| Investor Shares—Net Assets | |
| Applicable to 250,750,650 outstanding $.001 par value shares of beneficial interest (unlimited authorization) | 3,427,156 |
| Net Asset Value Per Share—Investor Shares | $13.67 |
| |
| Admiral Shares—Net Assets | |
| Applicable to 4,003,201,283 outstanding $.001 par value shares of beneficial interest (unlimited authorization) | 54,714,160 |
| Net Asset Value Per Share—Admiral Shares | $13.67 |
* Non-income-producing security—security in default.
• See Note A in Notes to Financial Statements.
1 Security purchased on a when-issued or delayed-delivery basis for which the fund has not taken delivery as of October 31, 2018.
2 Adjustable-rate security based upon SIFMA Municipal Swap Index Yield plus spread.
3 5.400% coupon rate will be effective October 2023.
4 4.700% coupon rate will be effective June 2031.
5 6.125% coupon rate will be effective January 2024.
6 4.000% coupon rate will be effective November 2025.
7 Security exempt from registration under Rule 144A of the Securities Act of 1933. Such securities may be sold in transactions exempt from registration, normally to qualified institutional buyers.
At October 31, 2018, the aggregate value of these securities was $278,403,000, representing 0.5% of net assets.
8 5.800% coupon rate will be effective October 2024.
9 5.900% coupon rate will be effective October 2024.
10 5.875% coupon rate will be effective August 2023.
11 4.000% coupon rate will be effective February 2021.
12 5.550% coupon rate will be effective October 2024.
13 5.650% coupon rate will be effective October 2024.
14 5.750% coupon rate will be effective October 2024.
15 5.000% coupon rate will be effective December 2018.
16 Securities with a value of $8,407,000 have been segregated as initial margin for open futures contracts.
17 3.650% coupon rate will be effective November 2025.
18 6.200% coupon rate will be effective January 2024.
19 5.200% coupon rate will be effective October 2023.
20 5.300% coupon rate will be effective October 2023.
21 Affiliated money market fund available only to Vanguard funds and certain trusts and accounts managed by Vanguard. Rate shown is the 7-day yield.
A key to abbreviations and other references follows the Statement of Net Assets.
See accompanying Notes, which are an integral part of the Financial Statements.
278
Intermediate-Term Tax-Exempt Fund
Key to Abbreviations
ARS—Auction Rate Security.
BAN—Bond Anticipation Note.
COP—Certificate of Participation.
CP—Commercial Paper.
FR—Floating Rate.
GAN—Grant Anticipation Note.
GO—General Obligation Bond.
PILOT – Payments in Lieu of Taxes.
PUT—Put Option Obligation.
RAN—Revenue Anticipation Note.
TAN—Tax Anticipation Note.
TOB—Tender Option Bond.
TRAN—Tax Revenue Anticipation Note.
VRDO—Variable Rate Demand Obligation.
VRDP—Variable Rate Demand Preferred.
(ETM)—Escrowed to Maturity.
(Prere.)—Prerefunded.
Scheduled principal and interest payments are guaranteed by:
(1) MBIA (Municipal Bond Investors Assurance).
(2) AMBAC (Ambac Assurance Corporation).
(3) FGIC (Financial Guaranty Insurance Company).
(4) AGM (Assured Guaranty Municipal Corporation).
(5) BIGI (Bond Investors Guaranty Insurance).
(6) Connie Lee Inc.
(7) FHA (Federal Housing Authority).
(8) CapMAC (Capital Markets Assurance Corporation).
(9) American Capital Access Financial Guaranty Corporation.
(10) XL Capital Assurance Inc.
(11) CIFG (CDC IXIS Financial Guaranty).
(12) AGC (Assured Guaranty Corporation).
(13) BHAC (Berkshire Hathaway Assurance Corporation).
(14) NPFG (National Public Finance Guarantee Corporation).
(15) BAM (Build America Mutual Assurance Company).
(16) MAC (Municipal Assurance Corporation).
(17) RAA (Radian Asset Assurance Inc.).
(18) SBLF (Michigan School Bond Loan Fund).
(19) TPSF (Texas Permanent School Fund).
The insurance does not guarantee the market value of the municipal bonds.
LOC—Scheduled principal and interest payments are guaranteed by bank letter of credit.
| | | | |
| Derivative Financial Instruments Outstanding as of Period End | | | | |
| |
| Futures Contracts | | | | |
| ($000) |
| Value and |
| Number of | Unrealized |
| Long (Short) | Notional | Appreciation |
| Expiration | Contracts | Amount | (Depreciation) |
| Long Futures Contracts | | |
| 2-Year U.S. Treasury Note | December 2018 | 8,811 | 1,856,092 | (508) |
| Ultra 10-Year U.S. Treasury Note | December 2018 | 4,031 | 504,316 | 1,042 |
| 10-Year U.S. Treasury Note | December 2018 | 3,898 | 461,669 | (410) |
| | | | 124 |
| |
| Short Futures Contracts | | | | |
| 30-Year U.S. Treasury Bond | December 2018 | (1,984) | (274,040) | 4,592 |
| 5-Year U.S. Treasury Note | December 2018 | (131) | (14,722) | 59 |
| | | | 4,651 |
| | | | 4,775 |
See accompanying Notes, which are an integral part of the Financial Statements.
279
Intermediate-Term Tax-Exempt Fund
Statement of Operations
Statement of Changes in Net Assets
| | | |
| Year Ended |
| October 31, 2018 |
| | ($000) |
| Investment Income | | |
| Income | | |
| Interest1 | 1,715,539 |
| Total Income | 1,715,539 |
| Expenses | | |
| The Vanguard Group—Note B | | |
| Investment Advisory Services | 7,085 |
| Management and Administrative— | |
| Investor Shares | 5,251 |
| Management and Administrative— | |
| Admiral Shares | 36,919 |
| Marketing and Distribution— | | |
| Investor Shares | 718 |
| Marketing and Distribution— | | |
| Admiral Shares | 3,827 |
| Custodian Fees | 321 |
| Auditing Fees | 35 |
| Shareholders’ Reports and Proxy— | |
| Investor Shares | 188 |
| Shareholders’ Reports and Proxy— | |
| Admiral Shares | 541 |
| Trustees’ Fees and Expenses | 34 |
| Total Expenses | 54,919 |
| Net Investment Income 1,660,620 |
| Realized Net Gain (Loss) | | |
| Investment Securities Sold1 | (42,005) |
| Futures Contracts | (46,519) |
| Realized Net Gain (Loss) | (88,524) |
| Change in Unrealized Appreciation | |
| (Depreciation) | | |
| Investment Securities1 | (2,027,260) |
| Futures Contracts | 17,373 |
| Change in Unrealized Appreciation | |
| (Depreciation) | (2,009,887) |
| Net Increase (Decrease) in Net Assets | |
| Resulting from Operations | (437,791) |
| | | |
| Year Ended October 31, |
| 2018 | 2017 |
| ($000) | ($000) |
| Increase (Decrease) in Net Assets | | |
| Operations | | |
| Net Investment Income | 1,660,620 | 1,485,518 |
| Realized Net Gain (Loss) | (88,524) | (33,357) |
| Change in Unrealized Appreciation (Depreciation) | (2,009,887) | (511,930) |
| Net Increase (Decrease) in Net Assets Resulting from Operations | (437,791) | 940,231 |
| Distributions | | |
| Net Investment Income | | |
| Investor Shares | (104,559) | (111,632) |
| Admiral Shares | (1,547,716) | (1,373,258) |
| Realized Capital Gain | | |
| Investor Shares | — | — |
| Admiral Shares | — | — |
| Total Distributions | (1,652,275) | (1,484,890) |
| Capital Share Transactions | | |
| Investor Shares | (477,310) | (421,746) |
| Admiral Shares | 4,667,759 | 4,021,643 |
| Net Increase (Decrease) from Capital Share Transactions | 4,190,449 | 3,599,897 |
| Total Increase (Decrease) | 2,100,383 | 3,055,238 |
| Net Assets |
| Beginning of Period | 56,040,933 | 52,985,695 |
| End of Period | 58,141,316 | 56,040,933 |
1 Interest income, realized net gain (loss), and change in unrealized appreciation (depreciation) from an affiliated company of the fund were $6,665,000, ($1,000) and $8,000, respectively. Purchases and sales are for temporary cash investment purposes.
See accompanying Notes, which are an integral part of the Financial Statements.
280
Intermediate-Term Tax-Exempt Fund
Financial Highlights
Investor Shares
| | | | | | |
| For a Share Outstanding | | | | Year Ended October 31, |
| Throughout Each Period | 2018 | 2017 | 2016 | 2015 | 2014 |
| Net Asset Value, Beginning of Period | | $14.17 | $14.31 | $14.19 | $14.26 | $13.84 |
| Investment Operations | |
| Net Investment Income | | . 3901 | .3851 | .393 | .413 | .440 |
| Net Realized and Unrealized Gain (Loss) | | | | | | |
| on Investments | | (.502) | (.140) | .120 | (.070) | .420 |
| Total from Investment Operations | | (.112) | .245 | .513 | .343 | .860 |
| Distributions | | |
| Dividends from Net Investment Income | | (.388) | (.385) | (.393) | (.413) | (.440) |
| Distributions from Realized Capital Gains | — | — | — | — | — |
| Total Distributions | | (.388) | (.385) | (.393) | (.413) | (.440) |
| Net Asset Value, End of Period | | $13.67 | $14.17 | $14.31 | $14.19 | $14.26 |
| |
| Total Return 2 | | -0.80% | 1.76% | 3.63% | 2.44% | 6.31% |
| |
| Ratios/Supplemental Data | | |
| Net Assets, End of Period (Millions) | | $3,427 | $4,040 | $4,513 | $4,416 | $4,637 |
| Ratio of Total Expenses to Average Net Assets | 0.17% | 0.19% | 0.19% | 0.20% | 0.20% |
| Ratio of Net Investment Income to | | | | | | |
| Average Net Assets | | 2.81% | 2.73% | 2.72% | 2.91% | 3.13% |
| Portfolio Turnover Rate | | 15% | 15% | 9% | 12% | 12% |
1 Calculation based on average shares outstanding.
2 Total returns do not include account service fees that may have applied in the periods shown. Fund prospectuses provide information about any applicable account service fees.
| | | | | | |
| Admiral Shares | | | | | | |
| | | | | | |
| For a Share Outstanding | | | | Year Ended October 31, |
| Throughout Each Period | 2018 | 2017 | 2016 | 2015 | 2014 |
| Net Asset Value, Beginning of Period | | $14.17 | $14.31 | $14.19 | $14.26 | $13.84 |
| Investment Operations | |
| Net Investment Income | | . 4011 | .3991 | .407 | .425 | .451 |
| Net Realized and Unrealized Gain (Loss) | | | | | | |
| on Investments | | (.502) | (.140) | .120 | (.070) | .420 |
| Total from Investment Operations | | (.101) | .259 | .527 | .355 | .871 |
| Distributions | | |
| Dividends from Net Investment Income | | (.399) | (.399) | (.407) | (.425) | (.451) |
| Distributions from Realized Capital Gains | — | — | — | — | — |
| Total Distributions | | (.399) | (.399) | (.407) | (.425) | (.451) |
| Net Asset Value, End of Period | | $13.67 | $14.17 | $14.31 | $14.19 | $14.26 |
| |
| Total Return 2 | | -0.72% | 1.86% | 3.73% | 2.53% | 6.39% |
| |
| Ratios/Supplemental Data | | |
| Net Assets, End of Period (Millions) | | $54,714 | $52,001 | $48,473 | $40,302 | $34,927 |
| Ratio of Total Expenses to Average Net Assets | 0.09% | 0.09% | 0.09% | 0.12% | 0.12% |
| Ratio of Net Investment Income to | | | | | | |
| Average Net Assets | | 2.89% | 2.83% | 2.82% | 2.99% | 3.21% |
| Portfolio Turnover Rate | | 15% | 15% | 9% | 12% | 12% |
1 Calculation based on average shares outstanding.
2 Total returns do not include account service fees that may have applied in the periods shown. Fund prospectuses provide information about any applicable account service fees.
See accompanying Notes, which are an integral part of the Financial Statements.
281
Intermediate-Term Tax-Exempt Fund
Notes to Financial Statements
Vanguard Intermediate-Term Tax-Exempt Fund is registered under the Investment Company Act of 1940 as an open-end investment company, or mutual fund. The fund invests in debt instruments of many municipal issuers; the issuers’ abilities to meet their obligations may be affected by economic and political developments in a specific state or region. The fund offers two classes of shares: Investor Shares and Admiral Shares. Investor Shares are available to any investor who meets the fund’s minimum purchase requirements. Admiral Shares are designed for investors who meet certain administrative, service, and account-size criteria.
A. The following significant accounting policies conform to generally accepted accounting principles for U.S. investment companies. The fund consistently follows such policies in preparing its financial statements.
1. Security Valuation: Securities are valued as of the close of trading on the New York Stock Exchange (generally 4 p.m., Eastern time) on the valuation date. Bonds and temporary cash investments are valued using the latest bid prices or using valuations based on a matrix system (which considers such factors as security prices, yields, maturities, and ratings), both as furnished by independent pricing services. Investments in Vanguard Municipal Cash Management Fund are valued at that fund’s net asset value. Securities for which market quotations are not readily available, or whose values have been affected by events occurring before the fund’s pricing time but after the close of the securities’ primary markets, are valued by methods deemed by the board of trustees to represent fair value.
2. Futures Contracts: The fund uses futures contracts to invest in fixed income asset classes with greater efficiency and lower cost than is possible through direct investment, to add value when these instruments are attractively priced, or to adjust sensitivity to changes in interest rates. The primary risks associated with the use of futures contracts are imperfect correlation between changes in market values of bonds held by the fund and the prices of futures contracts, and the possibility of an illiquid market. Counterparty risk involving futures is mitigated because a regulated clearinghouse is the counterparty instead of the clearing broker. To further mitigate counterparty risk, the fund trades futures contracts on an exchange, monitors the financial strength of its clearing brokers and clearinghouse, and has entered into clearing agreements with its clearing brokers. The clearinghouse imposes initial margin requirements to secure the fund’s performance and requires daily settlement of variation margin representing changes in the market value of each contract. Any assets pledged as initial margin for open contracts are noted in the Statement of Net Assets.
Futures contracts are valued at their quoted daily settlement prices. The notional amounts of the contracts are not recorded in the Statement of Net Assets. Fluctuations in the value of the contracts are recorded in the Statement of Net Assets as an asset (liability) and in the Statement of Operations as unrealized appreciation (depreciation) until the contracts are closed, when they are recorded as realized futures gains (losses).
During the year ended October 31, 2018, the fund’s average investments in long and short futures contracts represented 5% and 1% of net assets, respectively, based on the average of the notional amounts at each quarter-end during the period.
3. Federal Income Taxes: The fund intends to continue to qualify as a regulated investment company and distribute all of its income. Management has analyzed the fund’s tax positions taken for all open federal income tax years (October 31, 2015–2018), and has concluded that no provision for federal income tax is required in the fund’s financial statements.
4. Distributions: Distributions from net investment income are declared daily and paid on the first business day of the following month. Annual distributions from realized capital gains, if any, are recorded on the ex-dividend date. Distributions are determined on a tax basis and may differ from net investment income and realized capital gains for financial reporting purposes.
5. Credit Facility: The fund and certain other funds managed by The Vanguard Group (“Vanguard”) participate in a $3.1 billion committed credit facility provided by a syndicate of lenders pursuant to a credit agreement that may be renewed annually; each fund is individually liable for its borrowings, if any, under the credit facility. Borrowings may be utilized for temporary and emergency purposes, and are subject to the fund’s regulatory and contractual borrowing restrictions. The participating funds are charged administrative fees and an annual commitment fee of 0.10% of the undrawn amount of the facility; these fees are allocated to the funds based on a method approved by the fund’s board of trustees and included in Management and Administrative expenses on the fund’s Statement of Operations. Any borrowings under this facility bear interest at a rate based upon the higher of the one-month London Interbank Offered Rate, federal funds effective rate, or overnight bank funding rate plus an agreed-upon spread.
282
Intermediate-Term Tax-Exempt Fund
The fund had no borrowings outstanding at October 31, 2018, or at any time during the period then ended.
6. Other: Interest income includes income distributions received from Vanguard Municipal Cash Management Fund and is accrued daily. Premiums and discounts on debt securities purchased are amortized and accreted, respectively, to interest income over the lives of the respective securities. Security transactions are accounted for on the date securities are bought or sold. Costs used to determine realized gains (losses) on the sale of investment securities are those of the specific securities sold.
Each class of shares has equal rights as to assets and earnings, except that each class separately bears certain class-specific expenses related to maintenance of shareholder accounts (included in Management and Administrative expenses), shareholder reporting, and the proxy. Marketing and distribution expenses are allocated to each class of shares based on a method approved by the board of trustees. Income, other non-class-specific expenses, and gains and losses on investments are allocated to each class of shares based on its relative net assets.
B. In accordance with the terms of a Funds’ Service Agreement (the “FSA”) between Vanguard and the fund, Vanguard furnishes to the fund investment advisory, corporate management, administrative, marketing, and distribution services at Vanguard’s cost of operations (as defined by the FSA). These costs of operations are allocated to the fund based on methods and guidelines approved by the board of trustees. Vanguard does not require reimbursement in the current period for certain costs of operations (such as deferred compensation/benefits and risk/insurance costs); the fund’s liability for these costs of operations is included in Payables to Vanguard on the Statement of Net Assets. All other costs of operations payable to Vanguard are generally settled twice a month.
Upon the request of Vanguard, the fund may invest up to 0.40% of its net assets as capital in Vanguard. At October 31, 2018, the fund had contributed to Vanguard capital in the amount of $2,977,000, representing 0.01% of the fund’s net assets and 1.19% of Vanguard’s capitalization. The fund’s trustees and officers are also directors and employees, respectively, of Vanguard.
C. Various inputs may be used to determine the value of the fund’s investments. These inputs are summarized in three broad levels for financial statement purposes. The inputs or methodologies used to value securities are not necessarily an indication of the risk associated with investing in those securities.
Level 1—Quoted prices in active markets for identical securities.
Level 2—Other significant observable inputs (including quoted prices for similar securities, interest rates, prepayment speeds, credit risk, etc.).
Level 3—Significant unobservable inputs (including the fund’s own assumptions used to determine the fair value of investments). Any investments valued with significant unobservable inputs are noted on the Statement of Net Assets.
The following table summarizes the market value of the fund’s investments as of October 31, 2018, based on the inputs used to value them:
| | | |
| Level 1 | Level 2 | Level 3 |
| Investments | ($000) | ($000) | ($000) |
| Tax-Exempt Municipal Bonds | — | 57,629,993 | — |
| Temporary Cash Investments | 398,158 | — | — |
| Futures Contracts—Assets1 | 1,813 | — | — |
| Futures Contracts—Liabilities1 | (3,160) | — | — |
| Total | 396,811 | 57,629,993 | — |
| 1 Represents variation margin on the last day of the reporting period. | | | |
D. Permanent differences between book-basis and tax-basis components of net assets, if any, are reclassified among capital accounts in the financial statements to reflect their tax character. These reclassifications have no effect on net assets or net asset value per share.
283
Intermediate-Term Tax-Exempt Fund
Temporary differences between book-basis and tax-basis components of total distributable earnings (loss) arise when certain items of income, gain, or loss are recognized in different periods for financial statement and tax purposes; these differences will reverse at some time in the future. The differences are primarily related to the tax deferral of losses on wash sales and straddles, the realization of unrealized gains or losses on certain futures contracts, and payables for distributions. As of period end, the tax-basis components of total distributable earnings (loss) are detailed in the table as follows:
| |
| Amount |
| ($000) |
| Undistributed Ordinary Income | — |
| Undistributed Tax-Exempt Income | 64,142 |
| Undistributed Long-Term Gains | — |
| Capital Loss Carryforwards* | (150,194) |
| Net Unrealized Gains (Losses) | (156,426) |
* Includes 18,686,000, which may be used to offset future net capital gains through October 31, 2019, as well as capital losses of $131,508,000, which may be carried forward indefinitely but must be used before any expiring loss carryforwards.
As of October, 2018, gross unrealized appreciation and depreciation for investments and derivatives based on cost for U.S. federal income tax purposes were as follows:
| |
| Amount |
| ($000) |
| Tax Cost | 58,184,577 |
| Gross Unrealized Appreciation | 692,277 |
| Gross Unrealized Depreciation | (848,703) |
| Net Unrealized Appreciation (Depreciation) | (156,426) |
E. During the year ended October 31, 2018, the fund purchased $13,764,604,000 of investment securities and sold $8,465,823,000 of investment securities, other than temporary cash investments.
The fund purchased securities from and sold securities to other Vanguard funds or accounts managed by Vanguard or its affiliates, in accordance with procedures adopted by the board of trustees in compliance with Rule 17a-7 of the Investment Company Act of 1940. For the year ended October 31, 2018, such purchases and sales were $1,866,275,000 and $1,513,230,000 respectively; these amounts are included in the purchases and sales of investment securities noted above.
F. Capital share transactions for each class of shares were:
| | | | |
| | | Year Ended October 31, |
| | 2018 | | 2017 |
| Amount | Shares | Amount | Shares |
| ($000) | (000) | ($000) | (000) |
| Investor Shares | | | | |
| Issued | 712,374 | 51,132 | 961,038 | 68,383 |
| Issued in Lieu of Cash Distributions | 86,243 | 6,208 | 91,656 | 6,516 |
| Redeemed | (1,275,927) | (91,692) | (1,474,440) | (105,142) |
| Net Increase (Decrease)—Investor Shares | (477,310) | (34,352) | (421,746) | (30,243) |
| Admiral Shares | | | | |
| Issued | 16,050,639 | 1,153,908 | 13,763,573 | 979,548 |
| Issued in Lieu of Cash Distributions | 1,083,816 | 78,038 | 966,948 | 68,708 |
| Redeemed | (12,466,696) | (898,243) (10,708,878) | (765,754) |
| Net Increase (Decrease)—Admiral Shares | 4,667,759 | 333,703 | 4,021,643 | 282,502 |
G. Management has determined that no events or transactions occurred subsequent to October 31, 2018, that would require recognition or disclosure in these financial statements.
284
Long-Term Tax-Exempt Fund
Fund Profile
As of October 31, 2018
| | |
| Share-Class Characteristics | | |
| Investor | Admiral |
| Shares | Shares |
| Ticker Symbol | VWLTX | VWLUX |
| Expense Ratio1 | 0.19% | 0.09% |
| 30-Day SEC Yield | 3.16% | 3.21% |
| | |
| Financial Attributes | | |
| | Bloomberg |
| Barclays |
| Municipal |
| Bond |
| Fund | Index |
| Number of Bonds | 1,831 | 53,575 |
| Yield to Maturity | | |
| (before expenses) | 3.3% | 3.0% |
| Average Coupon | 4.7% | 4.7% |
| Average Duration | 7.3 years | 6.5 years |
| Average Stated Maturity | 16.9 years | 13.0 years |
| Short-Term Reserves | 2.1% | — |
| |
| Largest Area Concentrations2 | |
| |
| New York | 14.1% |
| California | 14.1 |
| Texas | 8.6 |
| Illinois | 7.3 |
| Pennsylvania | 5.4 |
| Florida | 4.6 |
| Ohio | 3.3 |
| New Jersey | 2.9 |
| Michigan | 2.8 |
| Maryland | 2.6 |
| Top Ten | 65.7% |
| |
| Volatility Measures | |
| Bloomberg |
| Barclays |
| Municipal |
| Bond Index |
| R-Squared | 0.98 |
| Beta | 1.12 |
These measures show the degree and timing of the fund’s fluctuations compared with the indexes over 36 months.
| |
| Distribution by Stated Maturity (% of portfolio) |
| |
| Under 1 Year | 3.9% |
| 1–3 Years | 3.9 |
| 3–5 Years | 2.6 |
| 5–10 Years | 7.2 |
| 10–20 Years | 44.5 |
| 20–30 Years | 33.6 |
| Over 30 Years | 4.3 |
| |
| Distribution by Credit Quality (% of portfolio) |
| |
| AAA | 16.7% |
| AA | 45.7 |
| A | 24.2 |
| BBB | 10.0 |
| BB | 0.6 |
| B or Lower | 0.9 |
| Not Rated | 1.9 |
Credit-quality ratings are obtained from Moody’s and S&P, and the higher rating for each issue is shown. “Not Rated” is used to classify securities for which a rating is not available. Not rated securities include a fund’s investment in Vanguard Market Liquidity Fund or Vanguard Municipal Cash Management Fund, each of which invests in high-quality money market instruments and may serve as a cash management vehicle for the Vanguard funds, trusts, and accounts. For more information about these ratings, see the Glossary entry for Credit Quality.
Investment Focus
1 The expense ratios shown are from the prospectus dated February 23, 2018, and represent estimated costs for the current fiscal year. For the fiscal year ended October 31, 2018, the expense ratios were 0.17% for Investor Shares and 0.09% for Admiral Shares. 2 Percentage of net assets, excluding any futures contracts.
285
Long-Term Tax-Exempt Fund
Performance Summary
All of the returns in this report represent past performance, which is not a guarantee of future results that may be achieved by the fund. (Current performance may be lower or higher than the performance data cited. For performance data current to the most recent month-end, visit our website at vanguard.com/performance.) Note, too, that both investment returns and principal value can fluctuate widely, so an investor’s shares, when sold, could be worth more or less than their original cost. The returns shown do not reflect taxes that a shareholder would pay on fund distributions or on the sale of fund shares.
Cumulative Performance: October 31, 2008–October 31, 2018
Initial Investment of $10,000
| | | | |
| | Average Annual Total Returns | Final Value |
| | Periods Ended October 31, 2018 | of a $10,000 |
| One Year | Five Years | Ten Years | Investment |
| Long-Term Tax-Exempt Fund | | | | |
| Investor Shares | -0.59% | 3.91% | 5.11% | $16,464 |
| Bloomberg Barclays Municipal Bond Index | -0.51 | 3.25 | 4.80 | 15,976 |
| General & Insured Municipal Debt | | | | |
| Funds Average1 | -0.37 | 3.30 | 4.75 | 15,908 |
| | | | |
| Final Value |
| of a $50,000 |
| One Year | Five Years | Ten Years | Investment |
| Long-Term Tax-Exempt Fund Admiral Shares | -0.51% | 4.00% | 5.20% | $83,010 |
| Bloomberg Barclays Municipal Bond Index | -0.51 | 3.25 | 4.80 | 79,878 |
1 Derived from data provided by Lipper, a Thomson Reuters Company.
See Financial Highlights for dividend and capital gains information.
286
Long-Term Tax-Exempt Fund
| | | | |
| Fiscal-Year Total Returns (%): October 31, 2008–October 31, 2018 | | | |
| Bloomberg |
| Barclays |
| Municipal |
| | Investor Shares | Bond Index |
| Income | Capital | Total | Total |
| Fiscal Year | Returns | Returns | Returns | Returns |
| 2009 | 5.09% | 8.23% | 13.32% | 13.60% |
| 2010 | 4.50 | 3.02 | 7.52 | 7.78 |
| 2011 | 4.36 | -1.07 | 3.29 | 3.78 |
| 2012 | 4.07 | 6.20 | 10.27 | 9.03 |
| 2013 | 3.68 | -5.75 | -2.07 | -1.72 |
| 2014 | 4.22 | 5.30 | 9.52 | 7.82 |
| 2015 | 3.73 | -0.54 | 3.19 | 2.87 |
| 2016 | 3.62 | 1.77 | 5.39 | 4.06 |
| 2017 | 3.50 | -1.19 | 2.31 | 2.19 |
| 2018 | 3.36 | -3.95 | -0.59 | -0.51 |
Average Annual Total Returns: Periods Ended September 30, 2018
This table presents returns through the latest calendar quarter—rather than through the end of the fiscal period.
Securities and Exchange Commission rules require that we provide this information.
| | | | | | |
| | | | | Ten Years |
| Inception Date | One Year | Five Years | Income | Capital | Total |
| Investor Shares | 9/1/1977 | 0.46% | 4.25% | 4.01% | 1.01% | 5.02% |
| Admiral Shares | 2/12/2001 | 0.55 | 4.35 | 4.10 | 1.01 | 5.11 |
287
Long-Term Tax-Exempt Fund
Financial Statements
Statement of Net Assets
As of October 31, 2018
The fund reports a complete list of its holdings in regulatory filings four times in each fiscal year, at the quarter-ends. For the second and fourth fiscal quarters, the lists appear in the fund’s semiannual and annual reports to shareholders. For the first and third fiscal quarters, the fund files the lists with the Securities and Exchange Commission on Form N-Q. Shareholders can look up the fund’s Forms N-Q on the SEC’s website at sec.gov.
| | | | |
| Face | Market |
| Maturity | Amount | Value• |
| Coupon | Date | ($000) | ($000) |
| Tax-Exempt Municipal Bonds (97.8%) | | | | |
| Alabama (1.2%) | | | | |
| Alabama GO | 4.000% | 11/1/29 | 5,950 | 6,275 |
| Alabama GO | 4.000% | 11/1/30 | 6,195 | 6,468 |
| Alabama GO | 4.000% | 11/1/31 | 6,445 | 6,691 |
| Alabama Incentives Financing Authority Special Obligation Revenue | 5.000% | 9/1/37 | 10,985 | 11,676 |
| Alabama Incentives Financing Authority Special Obligation Revenue | 5.000% | 9/1/42 | 3,325 | 3,527 |
| Alabama Port Authority Docks Facilities Revenue | 6.000% | 10/1/20 (Prere.) | 5,000 | 5,363 |
| Auburn University Alabama General Fee Revenue | 5.000% | 6/1/42 | 8,455 | 9,034 |
| Birmingham AL GO | 5.000% | 3/1/37 | 2,500 | 2,693 |
| Birmingham AL Water Works Board Water Revenue | 5.000% | 1/1/32 | 7,145 | 8,035 |
| Birmingham AL Water Works Board Water Revenue | 5.000% | 1/1/43 | 5,000 | 5,472 |
| Huntsville AL GO | 5.000% | 5/1/26 | 325 | 346 |
| Huntsville AL GO | 5.000% | 5/1/32 | 3,190 | 3,654 |
| Jefferson County AL Board of Education GO | 5.000% | 2/1/46 | 3,000 | 3,237 |
| 1 Jefferson County AL Sewer Revenue | 0.000% | 10/1/42 (4) | 12,500 | 10,825 |
| Jefferson County AL Sewer Revenue | 6.000% | 10/1/42 | 8,780 | 9,913 |
| Jefferson County AL Sewer Revenue | 7.000% | 10/1/51 | 10,000 | 11,807 |
| Jefferson County AL Sewer Revenue | 6.500% | 10/1/53 | 15,545 | 17,994 |
| Selma AL Industrial Development Board Revenue (International Paper Co. Project) | 5.375% | 12/1/35 | 2,000 | 2,162 |
| Southeast Alabama Gas Supply District Revenue PUT | 4.000% | 6/1/24 | 5,415 | 5,646 |
| Tuscaloosa AL City Board of Education School Tax Warrants Revenue | 5.000% | 8/1/46 | 7,040 | 7,686 |
| University of South Alabama University Facilities Revenue | 5.000% | 10/1/29 (15) | 1,000 | 1,133 |
| University of South Alabama University Facilities Revenue | 5.000% | 10/1/30 (15) | 1,000 | 1,127 |
| University of South Alabama University Facilities Revenue | 5.000% | 10/1/31 (15) | 1,000 | 1,123 |
| University of South Alabama University Facilities Revenue | 5.000% | 10/1/32 (15) | 750 | 839 |
| University of South Alabama University Facilities Revenue | 5.000% | 10/1/33 (15) | 1,365 | 1,522 |
| | | | 144,248 |
| Alaska (0.2%) | | | | |
| Alaska Housing Finance Corp. General Housing Revenue | 5.000% | 12/1/26 | 6,620 | 7,447 |
| Alaska Housing Finance Corp. General Housing Revenue | 5.000% | 12/1/28 | 3,995 | 4,454 |
| Alaska Industrial Development & Export Authority Revenue (Providence Health & Services) | 5.500% | 10/1/41 | 6,000 | 6,412 |
| | | | 18,313 |
| Arizona (1.0%) | | | | |
| Arizona Board of Regents Arizona State University System Revenue | 5.000% | 7/1/37 | 1,000 | 1,103 |
| Arizona Board of Regents Arizona State University System Revenue | 5.000% | 7/1/42 | 3,200 | 3,546 |
| Arizona Industrial Development Authority Revenue (Eastern Michigan University Parking Project) | 5.000% | 5/1/43 | 1,200 | 1,276 |
| Arizona Industrial Development Authority Revenue (Eastern Michigan University Parking Project) | 5.000% | 5/1/48 | 1,100 | 1,165 |
| Arizona Industrial Development Authority Revenue (Eastern Michigan University Parking Project) | 5.000% | 5/1/51 | 1,100 | 1,162 |
| Buckeye AZ Excise Tax Revenue | 5.000% | 7/1/35 | 4,480 | 4,946 |
| Buckeye AZ Excise Tax Revenue | 5.000% | 7/1/43 | 11,690 | 12,745 |
| La Paz County AZ Industrial Development Authority (Harmony Public Schools Project) Revenue | 5.000% | 2/15/48 | 1,350 | 1,392 |
| Maricopa County AZ Industrial Development Authority Health Facilities Revenue | | | | |
| (Banner Health Obligated Group) | 4.000% | 1/1/41 | 7,000 | 6,898 |
| Maricopa County AZ Pollution Control Corp. Revenue (Southern California Edison Co.) | 5.000% | 6/1/35 | 5,500 | 5,704 |
| Mesa AZ Utility System Revenue | 4.000% | 7/1/31 | 7,275 | 7,617 |
| Phoenix AZ Civic Improvement Corp. Airport Revenue | 4.000% | 7/1/40 | 3,000 | 2,996 |
| Phoenix AZ Civic Improvement Corp. Wastewater System Revenue | 5.000% | 7/1/31 | 3,080 | 3,565 |
| Phoenix AZ Civic Improvement Corp. Wastewater System Revenue | 5.000% | 7/1/32 | 3,000 | 3,459 |
| Phoenix AZ Civic Improvement Corp. Wastewater System Revenue | 5.000% | 7/1/33 | 2,135 | 2,452 |
| Phoenix AZ Civic Improvement Corp. Wastewater System Revenue | 5.000% | 7/1/34 | 2,000 | 2,290 |
| Phoenix AZ Civic Improvement Corp. Wastewater System Revenue | 5.000% | 7/1/35 | 2,085 | 2,378 |
| Phoenix AZ Civic Improvement Corp. Wastewater System Revenue | 5.000% | 7/1/36 | 3,025 | 3,437 |
| Phoenix AZ Civic Improvement Corp. Wastewater System Revenue | 5.000% | 7/1/37 | 3,350 | 3,797 |
| Phoenix AZ Civic Improvement Corp. Wastewater System Revenue | 5.000% | 7/1/38 | 3,440 | 3,887 |
| Phoenix AZ Industrial Development Authority Lease Revenue | | | | |
| (Downtown Phoenix Student Housing LLC) | 5.000% | 7/1/37 | 3,750 | 4,017 |
288
Long-Term Tax-Exempt Fund
| | | | |
| Face | Market |
| Maturity | Amount | Value• |
| Coupon | Date | ($000) | ($000) |
| Phoenix AZ Industrial Development Authority Lease Revenue | | | | |
| (Downtown Phoenix Student Housing LLC) | 5.000% | 7/1/42 | 3,000 | 3,186 |
| Pinal County AZ Electric District Revenue | 4.000% | 7/1/32 | 1,000 | 1,027 |
| Salt River Project Arizona Agricultural Improvement & Power District Revenue | 5.000% | 1/1/33 | 6,010 | 6,915 |
| Salt River Project Arizona Agricultural Improvement & Power District Revenue | 5.000% | 1/1/34 | 10,010 | 11,482 |
| Salt River Project Arizona Agricultural Improvement & Power District Revenue | 5.000% | 1/1/35 | 10,000 | 11,428 |
| Salt Verde AZ Financial Corp. Gas Revenue | 5.250% | 12/1/20 | 515 | 543 |
| Salt Verde AZ Financial Corp. Gas Revenue | 5.250% | 12/1/24 | 2,220 | 2,492 |
| Salt Verde AZ Financial Corp. Gas Revenue | 5.250% | 12/1/27 | 820 | 936 |
| | | | 117,841 |
| Arkansas (0.1%) | | | | |
| Springdale AR Sales and Use Revenue | 5.000% | 4/1/33 (15) | 1,895 | 2,062 |
| Springdale AR Sales and Use Revenue | 5.000% | 4/1/34 (15) | 2,360 | 2,563 |
| University of Arkansas Revenue (Fayetteville Campus) | 5.000% | 11/1/31 | 2,170 | 2,411 |
| University of Arkansas Revenue (Fayetteville Campus) | 5.000% | 11/1/32 | 2,855 | 3,167 |
| | | | 10,203 |
| California (14.1%) | | | | |
| Alameda CA Corridor Transportation Authority Revenue | 0.000% | 10/1/30 (2) | 5,000 | 3,047 |
| Alameda CA Corridor Transportation Authority Revenue | 0.000% | 10/1/31 (14) | 8,450 | 5,067 |
| Alameda CA Corridor Transportation Authority Revenue | 0.000% | 10/1/33 (14) | 12,000 | 6,475 |
| Alameda County CA Joint Powers Authority Lease Revenue | 5.250% | 12/1/29 | 8,300 | 9,399 |
| Alameda County CA Unified School District GO | 5.000% | 8/1/39 | 11,455 | 12,807 |
| Bay Area Toll Authority California Toll Bridge Revenue (San Francisco Bay Area) | 5.000% | 4/1/23 (Prere.) | 2,060 | 2,316 |
| Bay Area Toll Authority California Toll Bridge Revenue (San Francisco Bay Area) | 4.000% | 4/1/32 | 10,330 | 10,788 |
| Bay Area Toll Authority California Toll Bridge Revenue (San Francisco Bay Area) | 5.000% | 10/1/54 | 5,615 | 6,018 |
| 2 Bay Area Toll Authority California Toll Bridge Revenue (San Francisco Bay Area) | 5.000% | 4/1/56 | 8,000 | 8,728 |
| California Community College Financing Authority Revenue (NCCD-Orange Coast Properties LLC) | 5.250% | 5/1/48 | 3,500 | 3,737 |
| California Department of Water Resources Water System Revenue (Central Valley Project) | 5.000% | 12/1/24 (Prere.) | 30 | 35 |
| California Educational Facilities Authority Revenue (Claremont McKenna College) | 4.000% | 1/1/39 | 10,000 | 10,130 |
| California Educational Facilities Authority Revenue (Pepperdine College) | 5.000% | 9/1/40 | 5,000 | 5,555 |
| California Educational Facilities Authority Revenue (Pepperdine College) | 5.000% | 10/1/49 | 5,000 | 5,510 |
| California Educational Facilities Authority Revenue (Santa Clara University) | 5.000% | 4/1/36 | 3,000 | 3,338 |
| California Educational Facilities Authority Revenue (Santa Clara University) | 5.000% | 4/1/45 | 14,000 | 15,416 |
| California Educational Facilities Authority Revenue (Stanford University) | 5.000% | 5/1/45 | 1,050 | 1,285 |
| California GO | 6.500% | 4/1/19 (Prere.) | 22,475 | 22,927 |
| California GO | 5.625% | 4/1/26 | 21,900 | 22,236 |
| California GO | 5.000% | 10/1/29 | 5,000 | 5,654 |
| California GO | 5.000% | 10/1/30 | 12,600 | 14,196 |
| California GO | 5.000% | 9/1/31 | 15,025 | 17,130 |
| California GO | 6.000% | 3/1/33 | 4,000 | 4,215 |
| California GO | 6.500% | 4/1/33 | 19,025 | 19,376 |
| California GO | 4.000% | 8/1/33 | 5,000 | 5,192 |
| California GO | 5.000% | 8/1/33 | 16,090 | 18,204 |
| California GO | 5.000% | 8/1/34 | 5,000 | 5,571 |
| California GO | 4.000% | 11/1/34 | 20,000 | 20,688 |
| California GO | 5.000% | 8/1/35 | 1,170 | 1,316 |
| California GO | 5.000% | 9/1/35 | 13,220 | 14,885 |
| California GO | 5.000% | 10/1/35 | 2,190 | 2,453 |
| California GO | 4.000% | 11/1/35 | 11,435 | 11,766 |
| California GO | 6.000% | 11/1/35 | 10,000 | 10,394 |
| California GO | 5.000% | 9/1/36 | 3,250 | 3,530 |
| California GO | 5.000% | 9/1/41 | 5,000 | 5,359 |
| California GO | 5.000% | 9/1/42 | 11,360 | 12,274 |
| California GO | 5.000% | 2/1/43 | 5,500 | 5,929 |
| California GO | 5.000% | 4/1/43 | 1,000 | 1,081 |
| California GO | 5.000% | 11/1/43 | 5,000 | 5,454 |
| California GO | 5.000% | 12/1/43 | 8,250 | 9,010 |
| California GO | 5.000% | 8/1/45 | 7,280 | 7,977 |
| California GO | 4.000% | 8/1/46 | 5,000 | 5,060 |
| California Health Facilities Financing Authority Revenue (Adventist Health System/West) | 5.750% | 9/1/19 (Prere.) | 5,500 | 5,679 |
| California Health Facilities Financing Authority Revenue (Catholic Healthcare West) | 6.000% | 7/1/19 (Prere.) | 4,500 | 4,627 |
| California Health Facilities Financing Authority Revenue (Children’s Hospital of Los Angeles) | 5.000% | 8/15/42 | 7,000 | 7,639 |
| California Health Facilities Financing Authority Revenue (Children’s Hospital of Los Angeles) | 5.000% | 8/15/47 | 5,000 | 5,429 |
| California Health Facilities Financing Authority Revenue (El Camino Hospital) | 5.000% | 2/1/42 | 1,115 | 1,224 |
| California Health Facilities Financing Authority Revenue (El Camino Hospital) | 5.000% | 2/1/47 | 1,555 | 1,701 |
| California Health Facilities Financing Authority Revenue (Kaiser Permanente) | 4.000% | 11/1/44 | 10,000 | 10,083 |
| California Health Facilities Financing Authority Revenue | | | | |
| (Providence St. Joseph Health Obligated Group) | 4.000% | 10/1/36 | 5,000 | 5,071 |
| California Health Facilities Financing Authority Revenue (St. Joseph Health System) | 5.000% | 7/1/33 | 2,000 | 2,183 |
289
Long-Term Tax-Exempt Fund
| | | | |
| Face | Market |
| Maturity | Amount | Value• |
| Coupon | Date | ($000) | ($000) |
| California Health Facilities Financing Authority Revenue (St. Joseph Health System) | 5.750% | 7/1/39 | 8,000 | 8,201 |
| California Health Facilities Financing Authority Revenue (Sutter Health) | 5.875% | 8/15/20 (Prere.) | 6,000 | 6,421 |
| California Health Facilities Financing Authority Revenue (Sutter Health) | 6.000% | 8/15/20 (Prere.) | 15,000 | 16,086 |
| California Health Facilities Financing Authority Revenue (Sutter Health) | 5.000% | 11/15/34 | 3,500 | 3,985 |
| California Health Facilities Financing Authority Revenue (Sutter Health) | 4.000% | 11/15/42 | 2,600 | 2,557 |
| California Health Facilities Financing Authority Revenue (Sutter Health) | 5.000% | 11/15/46 | 29,100 | 31,593 |
| California Health Facilities Financing Authority Revenue (Sutter Health) | 4.000% | 11/15/48 | 5,000 | 4,872 |
| California Health Facilities Financing Authority Revenue (Sutter Health) | 5.000% | 11/15/48 | 5,000 | 5,483 |
| California Health Facilities Financing Authority Revenue (Sutter Health) | 5.000% | 11/15/48 | 7,800 | 8,554 |
| California Infrastructure & Economic Development Bank Revenue | | | | |
| (Independent System Operator Corp. Project) | 5.000% | 2/1/34 | 13,800 | 14,990 |
| California Municipal Finance Authority Revenue (Anaheim Electric Utility Distribution System) | 5.000% | 10/1/31 | 2,075 | 2,352 |
| California Municipal Finance Authority Revenue | | | | |
| (Community Hospitals of Central California Obligated Group) | 5.000% | 2/1/30 | 1,855 | 2,075 |
| California Municipal Finance Authority Revenue (Eisenhower Medical Center) | 4.000% | 7/1/47 | 10,000 | 9,476 |
| California Municipal Finance Authority Revenue (Eisenhower Medical Center) | 5.000% | 7/1/47 | 5,000 | 5,325 |
| California Municipal Finance Authority Revenue (NorthBay Healthcare Group) | 5.250% | 11/1/36 | 2,235 | 2,388 |
| California Municipal Finance Authority Revenue (University of La Verne) | 6.250% | 6/1/20 (Prere.) | 5,000 | 5,334 |
| California Municipal Finance Authority Water Revenue | | | | |
| (San Bernardino Municipal Water Department) | 5.000% | 8/1/41 (15) | 5,000 | 5,441 |
| California Public Finance Authority Revenue (Sharp Healthcare Obligated Group) | 4.000% | 8/1/47 | 5,630 | 5,620 |
| California Public Works Board Lease Revenue (Department of General Services) | 6.250% | 4/1/19 (Prere.) | 10,000 | 10,191 |
| California Public Works Board Lease Revenue (Various Capital Projects) | 5.000% | 10/1/28 | 4,000 | 4,318 |
| California Public Works Board Lease Revenue (Various Capital Projects) | 5.500% | 11/1/30 | 1,320 | 1,489 |
| California Public Works Board Lease Revenue (Various Capital Projects) | 5.250% | 11/1/32 | 7,280 | 8,110 |
| California Public Works Board Lease Revenue (Various Capital Projects) | 5.000% | 4/1/37 | 14,705 | 15,741 |
| California Public Works Board Lease Revenue (Various Capital Projects) | 5.000% | 11/1/37 | 5,000 | 5,409 |
| California State University Systemwide Revenue | 5.250% | 5/1/19 (Prere.) | 8,600 | 8,755 |
| California State University Systemwide Revenue | 5.000% | 11/1/29 | 3,750 | 4,315 |
| California State University Systemwide Revenue | 5.000% | 11/1/34 | 2,000 | 2,279 |
| California State University Systemwide Revenue | 5.000% | 11/1/36 | 6,000 | 6,769 |
| California State University Systemwide Revenue | 5.000% | 11/1/37 | 5,000 | 5,625 |
| California State University Systemwide Revenue | 5.000% | 11/1/38 | 2,000 | 2,237 |
| California State University Systemwide Revenue | 5.000% | 11/1/41 | 15,950 | 17,571 |
| California State University Systemwide Revenue | 5.000% | 11/1/43 | 3,190 | 3,539 |
| California State University Systemwide Revenue | 5.000% | 11/1/45 | 1,000 | 1,099 |
| California Statewide Communities Development Authority Revenue | | | | |
| (Buck Institute for Age Research) | 5.000% | 11/15/49 (4) | 6,200 | 6,709 |
| California Statewide Communities Development Authority Revenue | | | | |
| (Huntington Memorial Hospital) | 4.000% | 7/1/48 | 4,000 | 3,945 |
| California Statewide Communities Development Authority Revenue (Kaiser Permanente) | 5.000% | 4/1/42 | 24,250 | 25,666 |
| California Statewide Communities Development Authority Revenue | | | | |
| (Loma Linda University Medical Center) | 5.500% | 12/1/58 | 2,500 | 2,623 |
| California Statewide Communities Development Authority Revenue (Trinity Health) | 5.000% | 12/1/41 | 14,220 | 15,355 |
| California Statewide Communities Development Authority Senior Living Revenue | | | | |
| (Southern California Presbyterian Homes) | 7.250% | 11/15/41 | 3,000 | 3,139 |
| Centinela Valley CA Union High School District GO | 4.000% | 8/1/41 (15) | 5,645 | 5,701 |
| Chabot-Las Positas CA Community College District GO | 4.000% | 8/1/42 | 4,940 | 5,009 |
| Chabot-Las Positas CA Community College District GO | 4.000% | 8/1/47 | 4,500 | 4,536 |
| Chaffey CA Union High School District GO | 5.250% | 8/1/47 | 3,000 | 3,401 |
| Charter Oak CA Unified School District GO | 5.000% | 8/1/40 (4) | 5,270 | 5,768 |
| Chino CA Public Financing Authority Special Tax Revenue | 5.000% | 9/1/31 (4) | 1,050 | 1,160 |
| Chino CA Public Financing Authority Special Tax Revenue | 5.000% | 9/1/33 (4) | 3,130 | 3,447 |
| Chino CA Public Financing Authority Special Tax Revenue | 5.000% | 9/1/34 (4) | 1,100 | 1,206 |
| Chino CA Public Financing Authority Special Tax Revenue | 5.000% | 9/1/35 (4) | 865 | 945 |
| Chula Vista CA Municipal Financing Authority Special Tax Revenue | 5.000% | 9/1/34 | 2,840 | 3,054 |
| Clovis CA Unified School District GO | 5.000% | 8/1/38 | 3,850 | 4,228 |
| Coast CA Community College District GO | 4.000% | 8/1/30 | 4,500 | 4,787 |
| Coast CA Community College District GO | 4.000% | 8/1/32 | 7,205 | 7,525 |
| Corona-Norco CA Unified School District GO | 5.000% | 8/1/44 | 6,625 | 7,377 |
| Corona-Norco CA Unified School District Special Tax Revenue | | | | |
| (Community Facilities District No. 98-1) | 5.000% | 9/1/29 | 1,705 | 1,860 |
| Corona-Norco CA Unified School District Special Tax Revenue | | | | |
| (Community Facilities District No. 98-1) | 5.000% | 9/1/32 | 1,500 | 1,630 |
| El Camino CA Community College District GO | 4.000% | 8/1/41 | 7,000 | 7,116 |
| El Dorado CA Irrigation District Revenue | 5.000% | 3/1/34 (4) | 1,480 | 1,640 |
| Escondido CA GO | 5.000% | 9/1/32 | 3,855 | 4,394 |
| Escondido CA Union School District GO | 4.000% | 8/1/47 | 7,500 | 7,505 |
| Foothill-De Anza CA Community College District GO | 4.000% | 8/1/34 | 2,185 | 2,274 |
| Foothill-De Anza CA Community College District GO | 4.000% | 8/1/35 | 2,000 | 2,071 |
290
Long-Term Tax-Exempt Fund
| | | | |
| Face | Market |
| Maturity | Amount | Value• |
| Coupon | Date | ($000) | ($000) |
| Foothill-De Anza CA Community College District GO | 5.000% | 8/1/36 | 1,645 | 1,840 |
| Foothill/Eastern Transportation Corridor Agency California Toll Road Revenue | 5.750% | 1/15/46 | 10,000 | 11,172 |
| Fresno CA Joint Powers Financing Authority Lease Revenue | 5.000% | 4/1/29 (4) | 1,155 | 1,312 |
| Fresno CA Unified School District GO | 4.000% | 8/1/43 | 7,000 | 7,069 |
| Gilroy CA School Facilities Finance Authority Revenue | 5.000% | 8/1/46 | 3,000 | 3,266 |
| Gilroy CA Unified School District GO | 4.000% | 8/1/46 | 2,000 | 2,012 |
| Glendale CA Community College District GO | 5.000% | 8/1/37 | 1,710 | 1,938 |
| Grossmont CA Healthcare District GO | 6.125% | 7/15/21 (Prere.) | 5,000 | 5,547 |
| Grossmont CA Union High School District GO | 4.000% | 8/1/29 | 1,775 | 1,896 |
| Grossmont CA Union High School District GO | 4.000% | 8/1/30 | 1,750 | 1,852 |
| Grossmont-Cuyamaca CA Community College District GO | 4.000% | 8/1/47 | 2,000 | 2,005 |
| Imperial CA Irrigation District Electric Revenue | 6.250% | 11/1/20 (Prere.) | 2,225 | 2,413 |
| Jefferson CA Union High School District GO | 5.000% | 8/1/29 (15) | 2,210 | 2,497 |
| Jefferson CA Union High School District GO | 5.000% | 8/1/31 (15) | 3,265 | 3,646 |
| Kern County CA GO | 6.000% | 2/1/19 (Prere.) | 2,500 | 2,527 |
| Long Beach CA Harbor Revenue | 5.000% | 5/15/37 | 4,365 | 4,858 |
| Long Beach CA Harbor Revenue | 5.000% | 5/15/42 | 1,500 | 1,662 |
| 2 Los Angeles CA Community College District GO | 6.000% | 8/1/19 (Prere.) | 10,000 | 10,321 |
| Los Angeles CA Community College District GO | 4.000% | 8/1/32 | 10,000 | 10,433 |
| Los Angeles CA Department of Water & Power Revenue | 5.000% | 7/1/33 | 1,555 | 1,738 |
| Los Angeles CA Department of Water & Power Revenue | 5.000% | 7/1/35 | 2,500 | 2,781 |
| Los Angeles CA Department of Water & Power Revenue | 5.000% | 7/1/43 | 5,000 | 5,418 |
| Los Angeles CA Department of Water & Power Revenue | 5.000% | 7/1/43 | 3,500 | 3,793 |
| Los Angeles CA Department of Water & Power Revenue | 5.000% | 7/1/43 | 9,000 | 9,753 |
| Los Angeles CA Department of Water & Power Revenue | 5.000% | 7/1/46 | 5,200 | 5,721 |
| Los Angeles CA Municipal Improvement Corp. Lease Revenue | 4.000% | 11/1/36 | 4,560 | 4,689 |
| Los Angeles CA Unified School District GO | 5.000% | 7/1/29 | 10,000 | 11,785 |
| Los Angeles CA Unified School District GO | 4.000% | 7/1/33 | 6,000 | 6,195 |
| Los Angeles CA Unified School District GO | 4.000% | 7/1/34 | 6,000 | 6,173 |
| Los Angeles CA Unified School District GO | 5.000% | 7/1/34 | 5,205 | 5,988 |
| Los Angeles CA Unified School District GO | 5.000% | 7/1/34 | 11,190 | 12,874 |
| Los Angeles CA Unified School District GO | 5.000% | 7/1/35 | 500 | 573 |
| Los Angeles CA Unified School District GO | 5.000% | 7/1/36 | 500 | 571 |
| Los Angeles CA Unified School District GO | 5.000% | 7/1/36 | 9,470 | 10,814 |
| Los Angeles CA Unified School District GO | 5.000% | 7/1/37 | 3,565 | 4,062 |
| Los Angeles CA Unified School District GO | 5.000% | 7/1/37 | 10,000 | 11,394 |
| Los Angeles CA Wastewater System Revenue | 5.750% | 6/1/19 (Prere.) | 6,145 | 6,286 |
| Los Angeles CA Wastewater System Revenue | 5.750% | 6/1/19 (Prere.) | 4,935 | 5,049 |
| Los Angeles CA Wastewater System Revenue | 5.000% | 6/1/29 | 2,085 | 2,382 |
| Los Angeles CA Wastewater System Revenue | 5.000% | 6/1/30 | 2,000 | 2,270 |
| Los Angeles CA Wastewater System Revenue | 5.000% | 6/1/30 | 1,735 | 1,970 |
| Los Angeles CA Wastewater System Revenue | 5.000% | 6/1/31 | 4,090 | 4,622 |
| Los Angeles CA Wastewater System Revenue | 5.000% | 6/1/32 | 4,815 | 5,429 |
| Los Angeles County CA Facilities Inc. Lease Revenue | 4.000% | 12/1/48 | 7,600 | 7,443 |
| Los Angeles County CA Metropolitan Transportation Authority Sales Tax Revenue | 5.000% | 7/1/38 | 10,000 | 11,336 |
| Los Angeles County CA Redevelopment Authority Tax Allocation Revenue | | | | |
| (Long Beach Project Area) | 5.000% | 8/1/29 | 4,140 | 4,729 |
| Los Angeles County CA Redevelopment Authority Tax Allocation Revenue | | | | |
| (Long Beach Project Area) | 5.000% | 8/1/30 | 4,685 | 5,318 |
| Los Angeles County CA Redevelopment Authority Tax Allocation Revenue | | | | |
| (Long Beach Project Area) | 5.000% | 8/1/31 | 7,180 | 8,112 |
| Los Angeles County CA Redevelopment Authority Tax Allocation Revenue | | | | |
| (Long Beach Project Area) | 5.000% | 8/1/32 | 6,465 | 7,279 |
| M-S-R California Public Power Agency Revenue (San Juan Project) | 6.750% | 7/1/20 (ETM) | 2,335 | 2,450 |
| Marin CA Healthcare District GO | 4.000% | 8/1/40 | 7,825 | 7,945 |
| Metropolitan Water District of Southern California Revenue | 5.000% | 7/1/40 | 1,745 | 1,942 |
| Modesto CA Irrigation District Financing Authority Revenue (Woodland Project) | 6.500% | 10/1/22 (ETM) | 9,010 | 9,828 |
| Monterey Peninsula CA Unified School District GO | 4.000% | 8/1/41 | 5,000 | 5,046 |
| Monterey Peninsula CA Unified School District GO | 4.000% | 8/1/45 | 2,000 | 2,004 |
| 3 Mount San Antonio CA Community College District GO | 0.000% | 8/1/28 | 3,025 | 2,875 |
| Newport Beach CA Revenue (Hoag Memorial Hospital Presbyterian) | 6.000% | 12/1/21 (Prere.) | 3,500 | 3,918 |
| Oakland CA GO | 5.000% | 1/15/35 | 4,025 | 4,497 |
| Oakland CA Unified School District GO | 5.000% | 8/1/29 (4) | 1,540 | 1,751 |
| Oakland CA Unified School District GO | 5.000% | 8/1/30 (4) | 1,000 | 1,134 |
| Orange County CA Water District Revenue | 4.000% | 8/15/37 | 1,770 | 1,815 |
| Orange County CA Water District Revenue | 4.000% | 8/15/41 | 2,500 | 2,544 |
| Palomar Pomerado Health California GO | 0.000% | 8/1/37 | 5,000 | 2,159 |
| 4 Palomar Pomerado Health California GO | 0.000% | 8/1/38 (12) | 10,000 | 12,160 |
| Poway CA Unified School District GO | 0.000% | 8/1/46 | 9,600 | 2,713 |
| Poway CA Unified School District GO | 0.000% | 8/1/51 | 20,000 | 4,422 |
291
Long-Term Tax-Exempt Fund
| | | | |
| Face | Market |
| Maturity | Amount | Value• |
| Coupon | Date | ($000) | ($000) |
| Riverside CA Community College District GO | 5.000% | 8/1/29 | 5,820 | 6,656 |
| Riverside CA Community College District GO | 5.000% | 8/1/30 | 5,555 | 6,334 |
| Riverside CA Redevelopment Successor Agency Tax Allocation Revenue | 4.000% | 10/1/33 (4) | 4,345 | 4,460 |
| Riverside CA Redevelopment Successor Agency Tax Allocation Revenue | 4.000% | 10/1/34 (4) | 4,000 | 4,093 |
| Riverside County CA Public Financing Authority Lease Revenue | 5.000% | 11/1/29 | 9,420 | 10,646 |
| Riverside County CA Public Financing Authority Lease Revenue | 5.250% | 11/1/40 | 8,330 | 9,443 |
| Riverside County CA Public Financing Authority Lease Revenue | 5.250% | 11/1/45 | 10,000 | 11,303 |
| Riverside County CA Transportation Commission Toll Revenue | 0.000% | 6/1/41 | 2,500 | 897 |
| Riverside County CA Transportation Commission Toll Revenue | 5.750% | 6/1/44 | 3,000 | 3,267 |
| Riverside County CA Transportation Commission Toll Revenue | 5.750% | 6/1/48 | 1,000 | 1,087 |
| Sacramento CA City Financing Authority Tax Allocation Revenue | 0.000% | 12/1/28 (14) | 15,815 | 11,070 |
| Sacramento CA Unified School District GO | 5.000% | 8/1/28 (4) | 2,000 | 2,291 |
| Sacramento CA Unified School District GO | 5.000% | 8/1/29 (4) | 1,240 | 1,412 |
| San Bernardino CA Community College District GO | 5.000% | 8/1/48 | 3,750 | 4,128 |
| San Bernardino County CA Medical Center COP | 6.875% | 8/1/24 (ETM) | 13,000 | 15,130 |
| San Diego CA Public Facilities Financing Authority Water Revenue | 5.000% | 8/1/37 | 4,740 | 5,325 |
| San Diego CA Public Facilities Financing Authority Water Revenue | 5.000% | 8/1/38 | 3,000 | 3,361 |
| San Diego CA Unified School District GO | 4.000% | 7/1/31 | 13,000 | 13,729 |
| San Diego CA Unified School District GO | 0.000% | 7/1/33 | 2,500 | 1,425 |
| San Diego CA Unified School District GO | 0.000% | 7/1/35 | 3,605 | 1,860 |
| San Diego CA Unified School District GO | 0.000% | 7/1/37 | 14,000 | 6,576 |
| San Diego CA Unified School District GO | 4.000% | 7/1/45 | 24,000 | 24,195 |
| San Diego County CA Regional Airport Authority Revenue | 5.000% | 7/1/43 | 5,450 | 5,913 |
| San Dieguito CA Union High School District GO | 4.000% | 8/1/32 | 4,960 | 5,193 |
| San Dieguito CA Union High School District GO | 4.000% | 8/1/33 | 1,820 | 1,896 |
| San Dieguito CA Union High School District GO | 4.000% | 8/1/42 | 7,805 | 7,893 |
| San Francisco CA Bay Area Rapid Transit District GO | 5.000% | 8/1/37 | 1,125 | 1,244 |
| San Francisco CA City & County COP | 4.000% | 9/1/34 | 5,085 | 5,224 |
| San Francisco CA City & County International Airport Revenue | 5.000% | 5/3/21 (Prere.) | 390 | 419 |
| San Francisco CA City & County International Airport Revenue | 5.000% | 5/1/44 | 2,000 | 2,190 |
| San Francisco CA City & County International Airport Revenue | 5.000% | 5/1/47 | 8,875 | 9,744 |
| San Francisco CA City & County Public Utilities Commission Water Revenue | 5.000% | 11/1/29 | 8,835 | 10,309 |
| San Francisco CA City & County Public Utilities Commission Water Revenue | 5.000% | 11/1/30 | 7,660 | 8,674 |
| San Francisco CA City & County Public Utilities Commission Water Revenue | 5.000% | 11/1/34 | 7,500 | 8,525 |
| San Francisco CA City & County Public Utilities Commission Water Revenue | 5.000% | 11/1/35 | 7,500 | 8,486 |
| San Francisco CA City & County Public Utilities Commission Water Revenue | 5.000% | 11/1/36 | 8,585 | 9,576 |
| San Francisco CA City & County Public Utilities Commission Water Revenue | 5.000% | 11/1/40 | 2,290 | 2,521 |
| San Francisco CA City & County Public Utilities Commission Water Revenue | 5.000% | 11/1/41 | 2,885 | 3,173 |
| San Francisco CA City & County Public Utilities Commission Water Revenue | 5.000% | 11/1/42 | 2,105 | 2,313 |
| San Francisco CA City & County Public Utilities Commission Water Revenue | 5.000% | 11/1/43 | 3,670 | 4,028 |
| San Francisco CA City & County Public Utilities Commission Water Revenue | 5.000% | 11/1/44 | 3,850 | 4,221 |
| San Francisco CA City & County Public Utilities Commission Water Revenue | 5.000% | 11/1/45 | 2,565 | 2,809 |
| San Joaquin Hills CA Transportation Corridor Agency Toll Road Revenue | 0.000% | 1/15/25 (14) | 9,250 | 7,514 |
| San Jose CA Airport Revenue | 5.000% | 3/1/47 | 5,000 | 5,481 |
| San Luis & Delta Mendota CA Water Authority Revenue | 5.000% | 3/1/43 (15) | 4,640 | 4,996 |
| San Mateo CA Union High School District GO | 4.000% | 9/1/31 | 6,240 | 6,587 |
| San Ramon Valley CA Unified School District GO | 4.000% | 8/1/29 | 3,495 | 3,683 |
| San Ramon Valley CA Unified School District GO | 4.000% | 8/1/31 | 1,855 | 1,956 |
| San Ramon Valley CA Unified School District GO | 4.000% | 8/1/33 | 2,200 | 2,279 |
| Santa Clara CA Unified School District GO | 4.000% | 7/1/41 | 10,000 | 10,145 |
| Santa Clara Valley CA Joint Powers Authority Revenue | 5.000% | 8/1/41 | 1,750 | 1,941 |
| Santa Clara Valley CA Joint Powers Authority Revenue | 5.000% | 8/1/46 | 2,050 | 2,266 |
| Santa Rosa CA High School District GO | 5.000% | 8/1/43 (4) | 3,265 | 3,625 |
| Southwestern California Community College District GO | 5.000% | 8/1/44 | 7,800 | 8,656 |
| Stockton CA Unified School District GO | 5.000% | 8/1/42 (4) | 4,650 | 5,040 |
| Twin Rivers CA Unified School District GO | 5.000% | 8/1/40 (15) | 5,000 | 5,414 |
| University of California Regents Medical Center Pooled Revenue | 4.000% | 5/15/37 | 9,700 | 9,832 |
| University of California Regents Medical Center Pooled Revenue | 4.000% | 5/15/44 | 6,755 | 6,733 |
| University of California Revenue | 4.000% | 5/15/35 | 5,000 | 5,142 |
| University of California Revenue | 5.000% | 5/15/35 | 10,000 | 11,271 |
| University of California Revenue | 5.250% | 5/15/37 | 3,000 | 3,376 |
| University of California Revenue | 5.000% | 5/15/38 | 20,000 | 21,773 |
| University of California Revenue | 5.250% | 5/15/38 | 10,000 | 11,232 |
| University of California Revenue | 5.250% | 5/15/42 | 6,750 | 7,685 |
| University of California Revenue | 5.000% | 5/15/43 | 5,000 | 5,599 |
| University of California Revenue | 5.000% | 5/15/44 | 4,000 | 4,407 |
| University of California Revenue | 5.000% | 5/15/46 | 3,000 | 3,298 |
| University of California Revenue | 4.000% | 5/15/47 | 9,000 | 9,013 |
| University of California Revenue | 5.000% | 5/15/48 | 25,250 | 28,168 |
| University of California Revenue | 5.000% | 5/15/58 | 15,000 | 16,555 |
292
Long-Term Tax-Exempt Fund
| | | | |
| Face | Market |
| Maturity | Amount | Value• |
| Coupon | Date | ($000) | ($000) |
| Victor Valley CA Community College District GO | 6.000% | 8/1/19 (Prere.) | 12,000 | 12,380 |
| Vista CA Joint Powers Financing Authority Revenue | 5.250% | 5/1/31 | 5,110 | 5,842 |
| Walnut Valley CA Unified School District GO | 4.000% | 8/1/29 | 1,000 | 1,072 |
| Walnut Valley CA Unified School District GO | 4.000% | 8/1/30 | 2,000 | 2,123 |
| Walnut Valley CA Unified School District GO | 4.000% | 8/1/31 | 2,000 | 2,109 |
| Washington Township CA Health Care District GO | 5.500% | 8/1/38 | 5,125 | 5,843 |
| West Contra Costa CA Unified School District GO | 5.000% | 8/1/45 | 8,000 | 8,934 |
| West Contra Costa CA Unified School District GO | 5.000% | 8/1/45 | 4,250 | 4,746 |
| Western Placer CA Unified School District COP | 4.000% | 8/1/41 (4) | 5,365 | 5,390 |
| 5 Western Placer CA Unified School District GO | 4.000% | 8/1/43 | 4,050 | 4,037 |
| Western Placer CA Unified School District GO | 4.000% | 8/1/47 (15) | 5,000 | 4,924 |
| Whittier CA Health Facilities Revenue (Presbyterian Intercommunity Hospital Obligated Group) | 5.000% | 6/1/44 | 10,500 | 11,117 |
| | | | 1,646,674 |
| Colorado (1.6%) | | | | |
| Adams & Arapahoe CO Joint School District No. 28J GO | 5.000% | 12/1/31 | 8,000 | 9,103 |
| Adams & Weld County CO School District No. 27J GO | 4.000% | 12/1/30 | 1,050 | 1,102 |
| Adams & Weld County CO School District No. 27J GO | 4.000% | 12/1/31 | 1,515 | 1,585 |
| Colorado Board of Governors State University Enterprise System Revenue | 5.000% | 3/1/41 | 2,000 | 2,203 |
| Colorado Educational & Cultural Facilities Authority Revenue (Stargate Charter School) | 5.000% | 12/1/38 | 1,000 | 1,081 |
| Colorado Educational & Cultural Facilities Authority Revenue (Stargate Charter School) | 4.000% | 12/1/48 | 2,500 | 2,334 |
| Colorado Educational & Cultural Facilities Authority Revenue (University of Denver) | 5.000% | 3/1/40 | 3,500 | 3,842 |
| Colorado Educational & Cultural Facilities Authority Revenue (University of Denver) | 5.000% | 3/1/43 | 4,750 | 5,203 |
| Colorado Educational & Cultural Facilities Authority Revenue (University of Denver) | 5.000% | 3/1/47 | 7,000 | 7,647 |
| Colorado Health Facilities Authority Revenue (Catholic Health Initiatives) | 5.250% | 2/1/31 | 4,000 | 4,188 |
| Colorado Health Facilities Authority Revenue (Covenant Retirement Community Inc.) | 5.000% | 12/1/33 | 5,000 | 5,253 |
| Colorado Springs CO Utility System Revenue | 5.000% | 11/15/47 | 6,000 | 6,638 |
| Commerce City CO Sales & Use Tax Revenue | 5.000% | 8/1/44 (4) | 4,000 | 4,310 |
| Denver CO City & County Airport Revenue | 5.000% | 11/15/43 | 8,000 | 8,692 |
| Denver CO City & County Airport Revenue | 5.000% | 12/1/43 | 10,000 | 11,094 |
| Denver CO City & County Airport Revenue | 5.000% | 12/1/48 | 9,500 | 10,497 |
| E-470 Public Highway Authority Colorado Revenue | 0.000% | 9/1/23 (14) | 20,775 | 18,164 |
| E-470 Public Highway Authority Colorado Revenue | 0.000% | 9/1/25 (14) | 9,700 | 7,809 |
| E-470 Public Highway Authority Colorado Revenue | 0.000% | 9/1/30 (14) | 6,520 | 4,105 |
| Garfield, Pitkin, & Eagle County CO School District GO | 4.000% | 12/15/31 | 4,470 | 4,664 |
| Regional Transportation District of Colorado Sales Tax Revenue | | | | |
| (Denver Transit Partners Eagle P3 Project) | 6.000% | 1/15/34 | 5,000 | 5,173 |
| Regional Transportation District of Colorado Sales Tax Revenue | | | | |
| (Denver Transit Partners Eagle P3 Project) | 6.000% | 1/15/41 | 15,015 | 15,516 |
| Regional Transportation District of Colorado Sales Tax Revenue (FasTracks Project) | 5.000% | 11/1/36 | 4,440 | 4,970 |
| 5 Thornton CO COP | 4.000% | 12/1/39 | 7,305 | 7,274 |
| University of Colorado COP | 4.000% | 11/1/30 | 12,675 | 13,164 |
| University of Colorado Enterprise System Revenue | 4.000% | 6/1/34 | 4,280 | 4,446 |
| University of Colorado Enterprise System Revenue | 4.000% | 6/1/38 | 10,000 | 10,151 |
| University of Colorado Enterprise System Revenue | 4.000% | 6/1/39 | 5,500 | 5,570 |
| | | | 185,778 |
| Connecticut (0.5%) | | | | |
| Connecticut GO | 5.000% | 4/15/26 | 5,000 | 5,297 |
| Connecticut GO | 5.000% | 10/15/26 | 4,140 | 4,416 |
| Connecticut GO | 5.000% | 11/1/26 | 3,000 | 3,160 |
| Connecticut GO | 5.000% | 4/15/28 | 5,000 | 5,569 |
| Connecticut GO | 5.000% | 10/15/31 | 1,850 | 1,947 |
| Connecticut Health & Educational Facilities Authority Revenue (Hartford Healthcare) | 5.000% | 7/1/42 | 10,000 | 10,435 |
| Connecticut Housing Finance Authority Revenue Housing Mortgage Finance Program | 4.000% | 11/15/32 | 2,640 | 2,697 |
| Connecticut Housing Finance Authority Revenue Housing Mortgage Finance Program | 4.000% | 11/15/44 | 1,540 | 1,580 |
| Connecticut Special Tax Revenue (Transportation Infrastructure) | 5.000% | 10/1/31 | 7,500 | 8,070 |
| Connecticut Special Tax Revenue (Transportation Infrastructure) | 5.000% | 9/1/33 | 7,000 | 7,519 |
| Hartford County CT Metropolitan District GO | 5.000% | 7/15/33 | 1,045 | 1,168 |
| Hartford County CT Metropolitan District GO | 5.000% | 7/15/36 | 1,750 | 1,931 |
| | | | 53,789 |
| Delaware (0.2%) | | | | |
| Delaware Health Facilities Authority Revenue (Bayhealth Medical Center Obligated Group) | 4.000% | 7/1/40 | 4,000 | 4,000 |
| Delaware Health Facilities Authority Revenue (Bayhealth Medical Center Obligated Group) | 4.000% | 7/1/43 | 5,000 | 4,923 |
| Delaware Transportation Authority Transportation System Revenue | 5.000% | 6/1/55 | 8,940 | 9,602 |
| University of Delaware Revenue | 5.000% | 11/1/32 | 1,990 | 2,179 |
| University of Delaware Revenue | 5.000% | 11/1/33 | 1,000 | 1,093 |
| | | | 21,797 |
293
Long-Term Tax-Exempt Fund
| | | | |
| Face | Market |
| Maturity | Amount | Value• |
| Coupon | Date | ($000) | ($000) |
| District of Columbia (0.7%) | | | | |
| District of Columbia GO | 5.000% | 6/1/28 | 2,750 | 3,115 |
| District of Columbia GO | 4.000% | 6/1/34 | 8,000 | 8,240 |
| District of Columbia GO | 5.000% | 6/1/38 | 10,015 | 10,913 |
| District of Columbia Hospital Revenue (Children’s Hospital Obligated Group) | 5.000% | 7/15/33 | 9,235 | 10,073 |
| District of Columbia Revenue (Catholic University of America) | 5.000% | 10/1/47 | 7,000 | 7,531 |
| District of Columbia Revenue (National Public Radio, Inc.) | 5.000% | 4/1/29 | 3,560 | 3,977 |
| District of Columbia Revenue (National Public Radio, Inc.) | 5.000% | 4/1/30 | 3,025 | 3,365 |
| District of Columbia Water & Sewer Authority Public Utility Revenue | 5.000% | 10/1/34 | 5,795 | 6,462 |
| District of Columbia Water & Sewer Authority Public Utility Revenue | 5.000% | 10/1/36 | 7,945 | 8,805 |
| District of Columbia Water & Sewer Authority Public Utility Revenue | 5.000% | 10/1/37 | 10,000 | 10,787 |
| Metropolitan Washington DC/VA Airports Authority Dulles Toll Road Revenue | | | | |
| (Dulles Metrorail & Capital Improvement Projects) | 5.000% | 10/1/53 | 7,500 | 7,822 |
| Washington DC Convention & Sports Authority Revenue | 5.000% | 10/1/30 | 5,000 | 5,710 |
| | | | 86,800 |
| Florida (4.6%) | | | | |
| Alachua County FL Health Facilities Authority Revenue (East Ridge Retirement Village) | 6.250% | 11/15/44 | 3,750 | 3,883 |
| Alachua County FL Health Facilities Authority Revenue | | | | |
| (Shands Teaching Hospital & Clinics, Inc. Project) | 5.000% | 12/1/44 | 10,075 | 10,608 |
| Brevard County FL Health Facilities Authority Revenue (Health First Inc. Project) | 7.000% | 4/1/19 (Prere.) | 7,000 | 7,145 |
| Broward County FL Airport System Revenue | 5.375% | 10/1/29 | 1,500 | 1,543 |
| Broward County FL Airport System Revenue | 5.250% | 10/1/38 | 14,000 | 15,355 |
| Broward County FL Port Facilities Revenue | 6.000% | 9/1/25 | 2,000 | 2,063 |
| Broward County FL Sales Tax Revenue (Main Courthouse Project) | 5.250% | 10/1/20 (Prere.) | 17,500 | 18,525 |
| Clearwater FL Water & Sewer Revenue | 5.250% | 12/1/19 (Prere.) | 5,000 | 5,174 |
| Collier County FL Special Obligation Revenue | 5.000% | 7/1/20 (Prere.) | 3,000 | 3,142 |
| Deerfield Beach FL Capital Improvement Revenue | 5.250% | 12/1/41 | 5,550 | 6,344 |
| Escambia County FL Sales Tax Revenue | 5.000% | 10/1/43 | 8,930 | 9,755 |
| Florida Board of Education Public Education Capital Outlay GO | 4.000% | 6/1/33 | 15,995 | 16,700 |
| Florida Municipal Power Agency Revenue | 6.250% | 10/1/19 (Prere.) | 2,000 | 2,077 |
| Florida Water Pollution Control Financing Corp. Revenue | 5.000% | 1/15/25 | 3,000 | 3,019 |
| Gainesville FL Utilities System Revenue | 5.000% | 10/1/33 | 6,000 | 6,817 |
| Gainesville FL Utilities System Revenue | 5.000% | 10/1/36 | 7,575 | 8,519 |
| Highlands County FL Health Facilities Authority Hospital Revenue | | | | |
| (Adventist Health System/Sunbelt Obligated Group) | 5.625% | 11/15/19 (Prere.) | 10 | 10 |
| Highlands County FL Health Facilities Authority Hospital Revenue | | | | |
| (Adventist Health System/Sunbelt Obligated Group) | 5.625% | 11/15/37 | 4,990 | 5,155 |
| Hillsborough County FL Industrial Development Authority Hospital Revenue | | | | |
| (Tampa General Hospital Project) | 5.000% | 10/1/34 | 13,030 | 13,851 |
| Hillsborough County FL Industrial Development Authority Revenue | | | | |
| (University Community Hospital) | 6.500% | 8/15/19 (ETM) | 1,920 | 1,987 |
| Hillsborough County FL School Board COP | 5.000% | 7/1/25 | 2,500 | 2,606 |
| Jacksonville FL Electric Authority Electric System Revenue | 4.000% | 10/1/35 | 2,015 | 2,039 |
| Jacksonville FL Electric Authority Revenue (St. John’s River Power Park) | 5.000% | 10/1/37 | 4,500 | 4,511 |
| Jacksonville FL Health Care Facilities Revenue (Baptist Health System Obligated Group) | 5.000% | 8/15/35 | 1,440 | 1,598 |
| Jacksonville FL Health Care Facilities Revenue (Baptist Health System Obligated Group) | 5.000% | 8/15/36 | 1,000 | 1,105 |
| Jacksonville FL Transportation Revenue | 5.000% | 10/1/31 | 2,000 | 2,167 |
| Lakeland FL Hospital Revenue (Lakeland Regional Health Systems) | 5.000% | 11/15/40 | 2,500 | 2,669 |
| Martin County FL Health Facilities Authority Revenue (Martin Memorial Medical Center) | 5.000% | 11/15/45 | 6,940 | 7,166 |
| Miami Beach FL Health Facilities Authority Revenue (Mount Sinai Medical Center) | 5.000% | 11/15/44 | 5,000 | 5,165 |
| Miami Beach FL Parking Revenue | 5.000% | 9/1/31 (15) | 1,635 | 1,822 |
| Miami Beach FL Parking Revenue | 5.000% | 9/1/40 (15) | 1,850 | 2,023 |
| Miami Beach FL Resort Tax Revenue | 5.000% | 9/1/31 | 1,015 | 1,135 |
| Miami Beach FL Stormwater Revenue | 5.000% | 9/1/47 | 5,000 | 5,352 |
| Miami Beach FL Water & Sewer Revenue | 4.000% | 10/1/35 | 4,830 | 4,935 |
| Miami Beach FL Water & Sewer Revenue | 4.000% | 10/1/37 | 10,000 | 10,142 |
| Miami Beach FL Water & Sewer Revenue | 4.000% | 10/1/37 | 6,000 | 6,085 |
| Miami FL Special Obligation Revenue (Marlins Stadium Project) | 5.250% | 7/1/35 (4) | 2,010 | 2,100 |
| Miami-Dade County FL Aviation Revenue (Miami International Airport) | 5.500% | 10/1/19 (Prere.) | 9,000 | 9,287 |
| Miami-Dade County FL Aviation Revenue (Miami International Airport) | 5.750% | 10/1/19 (Prere.) | 4,720 | 4,881 |
| Miami-Dade County FL Aviation Revenue (Miami International Airport) | 5.375% | 10/1/20 (Prere.) | 4,110 | 4,356 |
| Miami-Dade County FL Aviation Revenue (Miami International Airport) | 5.000% | 10/1/23 | 3,000 | 3,147 |
| Miami-Dade County FL Aviation Revenue (Miami International Airport) | 5.000% | 10/1/24 | 3,000 | 3,146 |
| Miami-Dade County FL Aviation Revenue (Miami International Airport) | 5.000% | 10/1/28 | 2,000 | 2,094 |
| Miami-Dade County FL Aviation Revenue (Miami International Airport) | 5.375% | 10/1/35 | 1,090 | 1,147 |
| Miami-Dade County FL Building Better Communities GO | 5.000% | 7/1/41 | 20,480 | 22,442 |
| Miami-Dade County FL Health Facilities Authority Hospital Revenue (Nicklaus Children’s Hospital) | 5.000% | 8/1/36 | 885 | 965 |
| Miami-Dade County FL Industrial Development Authority Revenue (Biscayne Properties LLC) | 5.000% | 6/1/48 | 10,000 | 9,848 |
| Miami-Dade County FL Public Facilities Revenue (Public Health Trust) | 5.000% | 6/1/35 | 3,320 | 3,635 |
294
Long-Term Tax-Exempt Fund
| | | | |
| Face | Market |
| Maturity | Amount | Value• |
| Coupon | Date | ($000) | ($000) |
| Miami-Dade County FL Public Facilities Revenue (Public Health Trust) | 5.000% | 6/1/36 | 3,775 | 4,118 |
| Miami-Dade County FL Public Facilities Revenue (Public Health Trust) | 5.000% | 6/1/37 | 12,485 | 13,592 |
| Miami-Dade County FL Seaport Revenue | 5.750% | 10/1/32 | 5,150 | 5,743 |
| Miami-Dade County FL Seaport Revenue | 5.500% | 10/1/42 | 5,000 | 5,457 |
| Miami-Dade County FL Special Obligation Revenue | 5.000% | 10/1/31 | 10,000 | 10,787 |
| Miami-Dade County FL Special Obligation Revenue | 5.000% | 10/1/37 | 2,560 | 2,746 |
| Miami-Dade County FL Transit Sales Surtax Revenue | 4.000% | 7/1/32 | 11,860 | 12,207 |
| Miami-Dade County FL Transit Sales Surtax Revenue | 5.000% | 7/1/37 | 7,575 | 8,159 |
| North Brevard County FL Hospital District Revenue | 5.000% | 1/1/42 | 4,575 | 4,766 |
| North Brevard County FL Hospital District Revenue | 5.000% | 1/1/48 | 13,555 | 14,059 |
| Orange County FL Health Facilities Authority Hospital Revenue (Orlando Health Inc.) | 5.000% | 10/1/42 | 6,940 | 7,318 |
| Orange County FL Health Facilities Authority Hospital Revenue (Orlando Health Inc.) | 5.000% | 10/1/42 | 2,090 | 2,204 |
| Orange County FL Health Facilities Authority Revenue (Presbyterian Retirement Communities Inc.) | 5.000% | 8/1/47 | 7,500 | 7,923 |
| Orlando & Orange County FL Expressway Authority Revenue | 5.000% | 7/1/32 | 1,500 | 1,643 |
| Orlando FL Tourist Development Tax Revenue | 5.000% | 11/1/36 (4) | 2,250 | 2,461 |
| Orlando FL Tourist Development Tax Revenue | 5.000% | 11/1/38 (4) | 2,335 | 2,528 |
| 6 Osceola County FL Expressway System Revenue (Poinciana Parkway Project) | 0.000% | 10/1/39 | 6,000 | 4,848 |
| 7 Osceola County FL Expressway System Revenue (Poinciana Parkway Project) | 0.000% | 10/1/42 | 7,540 | 6,062 |
| Osceola County FL Expressway System Revenue (Poinciana Parkway Project) | 5.375% | 10/1/47 | 2,125 | 2,252 |
| Putnam County FL Development Authority Revenue (Seminole Electric Cooperative Inc.) | 5.000% | 3/15/42 | 12,000 | 13,000 |
| Sarasota County FL Health Facilities Authority Revenue (Sunnyside Village Project) | 5.000% | 5/15/48 | 3,550 | 3,783 |
| Sarasota County FL Public Hospital District Hospital Revenue (Sarasota Memorial Hospital Project) | 5.625% | 7/1/19 (Prere.) | 10,000 | 10,238 |
| Sarasota County FL Public Hospital District Hospital Revenue (Sarasota Memorial Hospital Project) | 5.000% | 7/1/41 | 15,000 | 16,254 |
| Sarasota County FL School Board COP | 5.375% | 7/1/19 (Prere.) | 3,000 | 3,069 |
| South Miami FL Health Facilities Authority Revenue (Baptist Health South Florida Obligated Group) | 5.000% | 8/15/47 | 16,035 | 17,460 |
| St. Johns County FL Development Authority Revenue | | | | |
| (Presbyterian Retirement Communities Project) | 6.000% | 8/1/20 (Prere.) | 5,000 | 5,319 |
| St. Petersburg FL Health Facilities Authority Revenue (All Children’s Hospital Inc. Obligated Group) | 6.500% | 11/15/19 (Prere.) | 2,000 | 2,090 |
| Sumter County FL Industrial Development Authority Hospital Revenue | | | | |
| (Central Florida Health Alliance Project) | 5.250% | 7/1/44 | 3,000 | 3,170 |
| Tallahassee FL Energy System Revenue | 5.000% | 10/1/30 | 3,350 | 3,792 |
| Tallahassee FL Energy System Revenue | 5.000% | 10/1/31 | 2,610 | 2,941 |
| Tallahassee FL Energy System Revenue | 5.000% | 10/1/32 | 2,250 | 2,529 |
| Tallahassee FL Energy System Revenue | 5.000% | 10/1/33 | 5,265 | 5,900 |
| Tallahassee FL Health Facilities Revenue (Tallahassee Memorial HealthCare Inc. Project) | 5.000% | 12/1/44 | 6,860 | 7,172 |
| Tampa FL Cigarette Tax Allocation Revenue (H. Lee Moffitt Cancer Center Project) | 5.000% | 9/1/26 | 1,000 | 1,084 |
| Tampa FL Cigarette Tax Allocation Revenue (H. Lee Moffitt Cancer Center Project) | 5.000% | 9/1/28 | 1,700 | 1,839 |
| Tampa FL Cigarette Tax Allocation Revenue (H. Lee Moffitt Cancer Center Project) | 5.000% | 9/1/29 | 2,050 | 2,217 |
| Tampa FL Health System Revenue (BayCare Health System) | 5.000% | 11/15/33 | 7,407 | 7,960 |
| Tampa-Hillsborough County FL Expressway Authority Revenue | 5.000% | 7/1/48 | 4,500 | 4,903 |
| Tohopekaliga FL Water Authority Utility System Revenue | 5.750% | 10/1/21 (Prere.) | 1,600 | 1,758 |
| Tohopekaliga FL Water Authority Utility System Revenue | 5.750% | 10/1/21 (Prere.) | 1,525 | 1,676 |
| Tohopekaliga FL Water Authority Utility System Revenue | 5.750% | 10/1/21 (Prere.) | 1,750 | 1,923 |
| West Palm Beach FL Revenue | 5.000% | 10/1/37 | 10,655 | 11,728 |
| West Palm Beach FL Revenue | 5.000% | 10/1/40 | 11,000 | 12,036 |
| | | | 531,954 |
| Georgia (2.1%) | | | | |
| Atlanta GA Airport Revenue | 5.000% | 1/1/33 | 5,000 | 5,349 |
| Atlanta GA Airport Revenue | 5.000% | 1/1/33 | 2,615 | 2,798 |
| Atlanta GA Airport Revenue | 5.000% | 1/1/34 | 5,000 | 5,343 |
| Atlanta GA Airport Revenue | 5.000% | 1/1/34 | 2,750 | 2,939 |
| Atlanta GA Airport Revenue | 5.000% | 1/1/37 | 6,010 | 6,402 |
| Atlanta GA Development Authority Revenue | 5.250% | 7/1/40 | 2,500 | 2,772 |
| Atlanta GA Development Authority Revenue | 5.250% | 7/1/44 | 5,500 | 6,085 |
| Atlanta GA Water & Wastewater Revenue | 5.000% | 11/1/35 | 5,000 | 5,530 |
| Clarke County GA Hospital Authority Revenue (Piedmont Healthcare Inc.) | 4.000% | 7/1/32 | 3,275 | 3,320 |
| Cobb County GA Kennestone Hospital Authority Revenue | 5.000% | 4/1/42 | 7,425 | 7,907 |
| Cobb County GA Kennestone Hospital Authority Revenue | 5.000% | 4/1/47 | 6,510 | 6,885 |
| Dalton GA Combined Utilities Revenue | 4.000% | 3/1/34 | 750 | 750 |
| Dalton GA Combined Utilities Revenue | 4.000% | 3/1/35 | 1,000 | 995 |
| Dalton GA Combined Utilities Revenue | 4.000% | 3/1/36 | 1,430 | 1,414 |
| Dalton GA Combined Utilities Revenue | 4.000% | 3/1/37 | 1,615 | 1,590 |
| Dalton GA Combined Utilities Revenue | 4.000% | 3/1/38 | 2,000 | 1,958 |
| Dalton GA Development Authority Revenue (Hamilton Health Care System) | 5.500% | 8/15/26 (14) | 10,555 | 11,626 |
| DeKalb County GA Water & Sewer Revenue | 5.250% | 10/1/36 | 3,060 | 3,278 |
| Fayette County GA Hospital Authority Revenue (Piedmont Healthcare Inc.) | 5.000% | 7/1/46 | 15,000 | 16,022 |
| Forsyth County GA School District GO | 5.000% | 2/1/38 | 2,000 | 2,274 |
| Fulton County GA Development Authority Revenue (Piedmont Healthcare Inc. Project) | 4.000% | 7/1/31 | 1,865 | 1,899 |
| Gainesville & Hall County GA Hospital Authority Revenue | | | | |
| (Northeast Georgia Health System Inc. Project) | 4.000% | 2/15/42 | 5,000 | 4,752 |
295
Long-Term Tax-Exempt Fund
| | | | |
| Face | Market |
| Maturity | Amount | Value• |
| Coupon | Date | ($000) | ($000) |
| Gainesville & Hall County GA Hospital Authority Revenue | | | | |
| (Northeast Georgia Health System Inc. Project) | 5.000% | 2/15/45 | 5,000 | 5,349 |
| Gainesville & Hall County GA Hospital Authority Revenue | | | | |
| (Northeast Georgia Health System Inc. Project) | 5.500% | 8/15/54 | 10,000 | 11,161 |
| Georgia GO | 5.000% | 7/1/21 (Prere.) | 2,000 | 2,147 |
| Georgia GO | 5.000% | 2/1/29 | 6,500 | 7,552 |
| Georgia GO | 5.000% | 2/1/30 | 11,420 | 13,213 |
| Georgia Municipal Electric Power Authority Revenue | 5.000% | 1/1/30 | 4,265 | 4,603 |
| Georgia Municipal Electric Power Authority Revenue | 5.000% | 1/1/39 | 7,000 | 7,507 |
| Glynn-Brunswick GA Memorial Hospital Authority Revenue | | | | |
| (Southeast Georgia Health System Obligated Group) | 5.000% | 8/1/43 | 3,000 | 3,188 |
| Glynn-Brunswick GA Memorial Hospital Authority Revenue | | | | |
| (Southeast Georgia Health System Obligated Group) | 5.000% | 8/1/47 | 3,420 | 3,618 |
| Gwinnett County GA School District GO | 5.000% | 2/1/36 | 5,000 | 5,456 |
| Henry County GA School District GO | 4.000% | 8/1/30 | 5,000 | 5,308 |
| Macon-Bibb County GA Hospital Authority Revenue (Medical Center of Central Georgia) | 5.000% | 8/1/19 (Prere.) | 3,405 | 3,480 |
| Macon-Bibb County GA Hospital Authority Revenue (Medical Center of Central Georgia) | 5.000% | 8/1/19 (Prere.) | 4,500 | 4,599 |
| Main Street Natural Gas Inc. Georgia Gas Project Revenue | 5.500% | 9/15/25 | 15,000 | 17,162 |
| Metropolitan Atlanta Rapid Transportation Authority Georgia Sales Tax Revenue | 5.000% | 7/1/36 | 12,000 | 13,380 |
| Metropolitan Atlanta Rapid Transportation Authority Georgia Sales Tax Revenue | 5.000% | 7/1/37 | 15,835 | 17,621 |
| Municipal Electric Authority Georgia Revenue | 5.500% | 1/1/26 | 1,820 | 1,843 |
| Municipal Electric Authority Georgia Revenue | 5.000% | 1/1/28 | 2,000 | 2,189 |
| Municipal Electric Authority Georgia Revenue (Plant Voltage Units 3 & 4 Project J) | 5.500% | 7/1/60 | 5,000 | 5,244 |
| Private Colleges & University Authority of Georgia Revenue (Emory University) | 5.000% | 9/1/32 | 1,500 | 1,537 |
| Richmond County GA Hospital Authority Revenue (University Health Services Inc. Project) | 4.000% | 1/1/34 | 5,000 | 5,010 |
| | | | 243,055 |
| Guam (0.1%) | | | | |
| Guam Government Business Privilege Tax Revenue | 5.000% | 11/15/31 | 2,950 | 3,156 |
| Guam Government Business Privilege Tax Revenue | 5.000% | 1/1/32 | 1,165 | 1,202 |
| Guam Government Waterworks Authority Water & Waste Water System Revenue | 5.000% | 7/1/33 | 1,315 | 1,396 |
| Guam Government Waterworks Authority Water & Waste Water System Revenue | 5.000% | 7/1/34 | 1,500 | 1,586 |
| Guam Government Waterworks Authority Water & Waste Water System Revenue | 5.000% | 7/1/35 | 1,040 | 1,096 |
| Guam Government Waterworks Authority Water & Waste Water System Revenue | 5.000% | 7/1/36 | 1,000 | 1,050 |
| Guam Power Authority Revenue | 5.000% | 10/1/38 | 1,350 | 1,412 |
| Guam Power Authority Revenue | 5.000% | 10/1/40 | 2,375 | 2,472 |
| | | | 13,370 |
| Hawaii (1.2%) | | | | |
| Hawaii Department of Budget & Finance Special Purpose Revenue | | | | |
| (Hawaii Pacific Health Obligated Group) | 5.500% | 7/1/38 | 4,360 | 4,769 |
| Hawaii GO | 4.000% | 10/1/27 | 3,745 | 4,033 |
| Hawaii GO | 5.000% | 1/1/30 | 3,000 | 3,472 |
| Hawaii GO | 4.000% | 4/1/30 | 7,500 | 7,878 |
| Hawaii GO | 4.000% | 10/1/30 | 15,460 | 16,263 |
| Hawaii GO | 4.000% | 4/1/31 | 7,500 | 7,823 |
| Hawaii GO | 4.000% | 10/1/31 | 6,640 | 6,938 |
| Hawaii GO | 5.000% | 1/1/33 | 3,125 | 3,569 |
| Hawaii GO | 4.000% | 10/1/33 | 3,750 | 3,876 |
| Hawaii GO | 5.000% | 1/1/35 | 7,700 | 8,715 |
| Hawaii GO | 5.000% | 1/1/37 | 18,700 | 21,038 |
| Hawaii Harbor System Revenue | 5.500% | 7/1/35 | 5,000 | 5,251 |
| Hawaii Harbor System Revenue | 5.625% | 7/1/40 | 5,000 | 5,262 |
| Honolulu HI City & County GO | 5.000% | 10/1/32 | 6,840 | 7,697 |
| Honolulu HI City & County Wastewater System Revenue | 4.000% | 7/1/29 | 9,610 | 10,174 |
| Honolulu HI City & County Wastewater System Revenue | 5.000% | 7/1/40 | 10,000 | 11,015 |
| Honolulu HI City & County Wastewater System Revenue | 4.000% | 7/1/42 | 7,500 | 7,505 |
| University of Hawaii Revenue | 6.000% | 10/1/19 (Prere.) | 2,500 | 2,591 |
| | | | 137,869 |
| Idaho (0.3%) | | | | |
| 8 Idaho Health Facilities Authority Revenue (Kootenai Health Project) | 4.750% | 7/1/44 | 6,630 | 6,748 |
| 8 Idaho Health Facilities Authority Revenue (Kootenai Health Project) | 5.000% | 7/1/47 | 15,180 | 16,054 |
| Idaho Health Facilities Authority Revenue (St. Lukes Health System Project) | 5.000% | 3/1/36 | 4,200 | 4,574 |
| Idaho Health Facilities Authority Revenue (St. Lukes Health System Project) | 5.000% | 3/1/37 | 3,060 | 3,322 |
| Idaho Health Facilities Authority Revenue (Trinity Health Group) | 6.250% | 12/1/18 (Prere.) | 6,000 | 6,021 |
| Idaho Health Facilities Authority Revenue (Trinity Health Group) | 5.000% | 12/1/47 | 1,250 | 1,344 |
| | | | 38,063 |
| Illinois (7.3%) | | | | |
| Chicago IL Board of Education GO | 5.500% | 12/1/26 (14) | 5,895 | 6,332 |
| Chicago IL Board of Education GO | 0.000% | 12/1/27 (14) | 9,030 | 6,034 |
296
Long-Term Tax-Exempt Fund
| | | | |
| Face | Market |
| Maturity | Amount | Value• |
| Coupon | Date | ($000) | ($000) |
| Chicago IL Board of Education GO | 5.500% | 12/1/30 (2) | 3,490 | 3,742 |
| Chicago IL Board of Education GO | 5.000% | 12/1/31 (4) | 625 | 683 |
| Chicago IL Board of Education GO | 5.000% | 12/1/32 (4) | 1,500 | 1,634 |
| Chicago IL Board of Education GO | 5.000% | 12/1/35 (4) | 1,000 | 1,077 |
| Chicago IL Board of Education GO | 5.250% | 12/1/41 | 3,140 | 3,164 |
| Chicago IL Board of Education GO | 5.000% | 12/1/42 | 15,500 | 15,244 |
| Chicago IL Board of Education GO | 5.000% | 12/1/44 | 5,000 | 5,007 |
| Chicago IL Board of Education GO | 5.000% | 12/1/46 | 12,000 | 11,999 |
| Chicago IL Board of Education GO | 7.000% | 12/1/46 | 1,815 | 2,115 |
| Chicago IL GO | 5.000% | 1/1/34 | 8,000 | 8,219 |
| Chicago IL GO | 5.000% | 1/1/38 | 2,000 | 2,048 |
| Chicago IL Metropolitan Water Reclamation District GO | 5.000% | 12/1/31 | 7,500 | 7,952 |
| Chicago IL Midway Airport Revenue | 5.000% | 1/1/35 | 7,800 | 8,367 |
| Chicago IL Midway Airport Revenue | 5.000% | 1/1/36 | 2,000 | 2,143 |
| Chicago IL O’Hare International Airport Revenue | 6.500% | 1/1/21 (Prere.) | 3,000 | 3,272 |
| Chicago IL O’Hare International Airport Revenue | 5.000% | 1/1/30 | 26,870 | 29,476 |
| Chicago IL O’Hare International Airport Revenue | 5.000% | 1/1/33 | 5,615 | 6,101 |
| Chicago IL O’Hare International Airport Revenue | 5.000% | 1/1/36 | 5,000 | 5,447 |
| Chicago IL O’Hare International Airport Revenue | 5.000% | 1/1/38 | 7,000 | 7,527 |
| Chicago IL O’Hare International Airport Revenue | 5.000% | 1/1/41 | 3,400 | 3,640 |
| Chicago IL O’Hare International Airport Revenue | 5.250% | 1/1/42 | 12,000 | 13,167 |
| Chicago IL O’Hare International Airport Revenue | 5.750% | 1/1/43 | 9,000 | 9,973 |
| Chicago IL Park District GO | 5.000% | 1/1/36 | 4,000 | 4,140 |
| Chicago IL Park District GO | 5.000% | 1/1/40 | 6,505 | 6,852 |
| Chicago IL Public Building Commission GO | 7.000% | 1/1/20 (ETM) | 27,500 | 28,370 |
| Chicago IL Sales Tax Revenue | 5.000% | 1/1/20 (Prere.) | 4,265 | 4,405 |
| Chicago IL Sales Tax Revenue | 5.250% | 1/1/22 (Prere.) | 2,055 | 2,240 |
| Chicago IL Transit Authority Sales Tax Receipts Revenue | 5.250% | 12/1/36 | 6,400 | 6,728 |
| Chicago IL Wastewater Transmission Revenue | 5.000% | 1/1/39 | 1,500 | 1,578 |
| Chicago IL Wastewater Transmission Revenue | 5.250% | 1/1/42 (4) | 2,000 | 2,161 |
| Chicago IL Wastewater Transmission Revenue | 5.000% | 1/1/44 | 9,750 | 10,251 |
| Chicago IL Wastewater Transmission Revenue | 5.000% | 1/1/47 | 2,500 | 2,610 |
| 8 Chicago IL Water Revenue TOB VRDO | 1.780% | 11/7/18 | 6,470 | 6,470 |
| Chicago IL Waterworks Revenue | 5.000% | 11/1/44 | 7,500 | 7,896 |
| Cook County IL Community College District GO | 5.125% | 12/1/38 | 4,250 | 4,346 |
| Cook County IL Community College District GO | 5.000% | 12/1/47 (15) | 7,500 | 7,839 |
| Cook County IL Forest Preservation District GO | 5.000% | 12/15/32 | 1,000 | 1,041 |
| Cook County IL Forest Preservation District GO | 5.000% | 12/15/37 | 2,500 | 2,581 |
| Illinois Finance Authority Revenue (Advocate Health Care Network) | 5.000% | 6/1/42 | 16,580 | 17,444 |
| Illinois Finance Authority Revenue (Art Institute of Chicago) | 5.000% | 3/1/22 (Prere.) | 45 | 49 |
| Illinois Finance Authority Revenue (Art Institute of Chicago) | 5.000% | 3/1/34 | 7,705 | 8,210 |
| Illinois Finance Authority Revenue (Ascension Health Credit Group) | 5.000% | 11/15/37 | 5,000 | 5,321 |
| Illinois Finance Authority Revenue (Ascension Health Credit Group) | 5.000% | 11/15/42 | 17,895 | 18,996 |
| Illinois Finance Authority Revenue (Carle Foundation) | 6.000% | 8/15/41 (4) | 1,500 | 1,623 |
| Illinois Finance Authority Revenue (Carle Foundation) | 6.000% | 8/15/41 | 5,000 | 5,410 |
| Illinois Finance Authority Revenue (Carle Foundation) | 5.000% | 2/15/45 | 20,000 | 21,369 |
| Illinois Finance Authority Revenue (Central DuPage Health) | 5.250% | 11/1/19 (Prere.) | 4,000 | 4,125 |
| Illinois Finance Authority Revenue (Chicago University) | 5.500% | 8/15/19 (Prere.) | 15,000 | 15,406 |
| Illinois Finance Authority Revenue (Edward Elmhurst Obligated Group) | 5.000% | 1/1/34 | 5,000 | 5,345 |
| Illinois Finance Authority Revenue (Franciscan Communities Inc.) | 5.125% | 5/15/43 | 3,250 | 3,322 |
| Illinois Finance Authority Revenue (Franciscan Communities Inc.) | 5.250% | 5/15/47 | 10,375 | 10,661 |
| Illinois Finance Authority Revenue (Illinois Wesleyan University) | 5.000% | 9/1/36 | 1,000 | 1,051 |
| Illinois Finance Authority Revenue (Loyola University) | 5.000% | 7/1/42 | 2,000 | 2,108 |
| Illinois Finance Authority Revenue (Mercy Health System) | 5.000% | 12/1/46 | 20,000 | 21,122 |
| Illinois Finance Authority Revenue (OSF Healthcare System) | 7.000% | 5/15/19 (Prere.) | 15,000 | 15,398 |
| Illinois Finance Authority Revenue (OSF Healthcare System) | 6.000% | 5/15/20 (Prere.) | 4,085 | 4,316 |
| Illinois Finance Authority Revenue (OSF Healthcare System) | 4.000% | 5/15/32 | 3,080 | 3,098 |
| Illinois Finance Authority Revenue (OSF Healthcare System) | 4.000% | 5/15/33 | 1,110 | 1,113 |
| Illinois Finance Authority Revenue (OSF Healthcare System) | 4.000% | 5/15/34 | 2,800 | 2,768 |
| Illinois Finance Authority Revenue (OSF Healthcare System) | 6.000% | 5/15/39 | 1,275 | 1,327 |
| Illinois Finance Authority Revenue (OSF Healthcare System) | 5.000% | 5/15/41 | 6,000 | 6,276 |
| Illinois Finance Authority Revenue (OSF Healthcare System) | 5.000% | 11/15/45 | 5,000 | 5,310 |
| Illinois Finance Authority Revenue (Presence Health Network Obligated Group) | 5.000% | 2/15/41 | 2,000 | 2,171 |
| Illinois Finance Authority Revenue (Riverside Health System) | 6.250% | 11/15/19 (Prere.) | 2,775 | 2,894 |
| Illinois Finance Authority Revenue (Riverside Health System) | 6.250% | 11/15/35 | 1,825 | 1,896 |
| Illinois Finance Authority Revenue (Rush University Medical Center) | 5.000% | 11/15/33 | 5,000 | 5,432 |
| Illinois Finance Authority Revenue (Silver Cross & Medical Centers) | 7.000% | 8/15/19 (Prere.) | 16,000 | 16,612 |
| Illinois Finance Authority Revenue (Southern Illinois Healthcare) | 5.375% | 3/1/20 (Prere.) | 5,120 | 5,335 |
| Illinois Finance Authority Revenue (Trinity Health Corp.) | 5.000% | 12/1/21 (Prere.) | 3,000 | 3,237 |
| Illinois Finance Authority Revenue (University of Chicago) | 5.000% | 10/1/32 | 790 | 842 |
297
Long-Term Tax-Exempt Fund
| | | | |
| Face | Market |
| Maturity | Amount | Value• |
| Coupon | Date | ($000) | ($000) |
| Illinois Finance Authority Revenue (University of Chicago) | 5.000% | 10/1/33 | 10,000 | 11,088 |
| Illinois GO | 5.000% | 3/1/21 | 4,000 | 4,119 |
| Illinois GO | 5.000% | 8/1/21 | 7,000 | 7,239 |
| Illinois GO | 5.000% | 12/1/22 | 7,450 | 7,742 |
| Illinois GO | 5.000% | 11/1/23 | 5,000 | 5,213 |
| Illinois GO | 5.000% | 11/1/23 | 9,860 | 10,280 |
| Illinois GO | 5.000% | 8/1/24 | 9,000 | 9,310 |
| Illinois GO | 5.000% | 2/1/25 | 1,630 | 1,689 |
| Illinois GO | 5.500% | 7/1/25 | 2,800 | 3,002 |
| Illinois GO | 5.000% | 8/1/25 | 5,110 | 5,275 |
| Illinois GO | 5.000% | 11/1/26 | 55,125 | 57,259 |
| Illinois GO | 5.000% | 10/1/27 | 4,000 | 4,151 |
| Illinois GO | 5.000% | 10/1/28 | 3,000 | 3,099 |
| Illinois GO | 5.000% | 10/1/29 | 2,000 | 2,052 |
| Illinois GO | 5.250% | 7/1/30 | 5,000 | 5,213 |
| Illinois GO | 5.000% | 10/1/30 | 1,500 | 1,533 |
| Illinois GO | 5.250% | 2/1/32 | 8,075 | 8,336 |
| Illinois GO | 5.250% | 2/1/33 (4) | 5,200 | 5,622 |
| Illinois GO | 5.500% | 7/1/33 (4) | 3,350 | 3,594 |
| Illinois GO | 5.000% | 10/1/33 | 1,500 | 1,526 |
| Illinois GO | 4.000% | 12/1/33 | 12,000 | 10,822 |
| Illinois GO | 5.250% | 2/1/34 (4) | 3,125 | 3,377 |
| Illinois GO | 5.000% | 5/1/34 | 2,000 | 2,028 |
| Illinois GO | 5.500% | 7/1/38 | 7,500 | 7,841 |
| Illinois Regional Transportation Authority Revenue | 7.200% | 11/1/20 (2) | 5,830 | 6,119 |
| Illinois Sports Facility Authority Revenue | 5.500% | 6/15/30 (2) | 7,085 | 7,102 |
| Illinois Toll Highway Authority Revenue | 5.000% | 1/1/36 | 10,000 | 10,850 |
| Illinois Toll Highway Authority Revenue | 5.000% | 1/1/38 | 10,000 | 10,684 |
| Illinois Toll Highway Authority Revenue | 5.000% | 1/1/40 | 15,400 | 16,599 |
| Illinois Toll Highway Authority Revenue | 5.000% | 1/1/42 | 14,000 | 15,188 |
| Metropolitan Pier & Exposition Authority Illinois Dedicated Sales Tax Revenue | 0.000% | 6/15/25 (14) | 10,000 | 7,629 |
| Metropolitan Pier & Exposition Authority Illinois Dedicated Sales Tax Revenue | 0.000% | 12/15/31 (14) | 17,500 | 9,356 |
| Metropolitan Pier & Exposition Authority Illinois Dedicated Sales Tax Revenue | 0.000% | 6/15/33 (14) | 7,500 | 3,669 |
| Metropolitan Pier & Exposition Authority Illinois Dedicated Sales Tax Revenue | 0.000% | 12/15/33 (14) | 10,000 | 4,774 |
| Metropolitan Pier & Exposition Authority Illinois Dedicated Sales Tax Revenue | 0.000% | 12/15/34 (14) | 4,870 | 2,197 |
| Metropolitan Pier & Exposition Authority Illinois Dedicated Sales Tax Revenue | 0.000% | 6/15/44 (4) | 6,000 | 1,710 |
| Metropolitan Pier & Exposition Authority Illinois Dedicated Sales Tax Revenue | | | | |
| (McCormick Place Expansion Project) | 0.000% | 12/15/24 (14) | 2,715 | 2,122 |
| Metropolitan Pier & Exposition Authority Illinois Dedicated Sales Tax Revenue | | | | |
| (McCormick Place Expansion Project) | 0.000% | 6/15/31 (14) | 17,500 | 9,594 |
| Metropolitan Pier & Exposition Authority Illinois Dedicated Sales Tax Revenue | | | | |
| (McCormick Place Expansion Project) | 0.000% | 6/15/37 (14) | 4,500 | 1,752 |
| Metropolitan Pier & Exposition Authority Illinois Dedicated Sales Tax Revenue | | | | |
| (McCormick Place Expansion Project) | 5.000% | 6/15/42 | 3,965 | 4,028 |
| Metropolitan Pier & Exposition Authority Illinois Dedicated Sales Tax Revenue | | | | |
| (McCormick Place Expansion Project) | 0.000% | 12/15/51 | 21,500 | 3,620 |
| Metropolitan Pier & Exposition Authority Illinois Dedicated Sales Tax Revenue | | | | |
| (McCormick Place Expansion Project) | 5.500% | 6/15/53 | 1,000 | 1,055 |
| Metropolitan Pier & Exposition Authority Illinois Dedicated Sales Tax Revenue | | | | |
| (McCormick Place Expansion Project) | 0.000% | 12/15/56 | 54,500 | 6,966 |
| Metropolitan Pier & Exposition Authority IllinoisDedicated Sales Tax Revenue | | | | |
| (McCormick Place Expansion Project) | 0.000% | 6/15/32 (14) | 7,500 | 3,884 |
| Northern Illinois Municipal Power Agency Project Revenue | 5.000% | 12/1/41 | 6,375 | 6,780 |
| Railsplitter Tobacco Settlement Authority Illinois Tobacco Settlement Revenue | 6.000% | 6/1/21 (Prere.) | 15,000 | 16,383 |
| Springfield IL Water Revenue | 5.000% | 3/1/37 | 8,000 | 8,459 |
| University of Illinois Auxiliary Facilities System Revenue | 5.500% | 4/1/31 | 3,000 | 3,188 |
| Will County IL Community High School District No. 210 (Lincoln-Way) GO | 5.000% | 1/1/27 | 115 | 114 |
| Will County IL Community High School District No. 210 (Lincoln-Way) GO | 5.000% | 1/1/29 | 9,100 | 8,880 |
| Will County IL Community High School District No. 210 (Lincoln-Way) GO | 0.000% | 1/1/32 | 16,500 | 8,635 |
| | | | 846,205 |
| Indiana (1.5%) | | | | |
| Ball State University Student Fee Indiana Revenue | 5.000% | 7/1/29 | 1,295 | 1,488 |
| Ball State University Student Fee Indiana Revenue | 5.000% | 7/1/30 | 850 | 968 |
| Ball State University Student Fee Indiana Revenue | 5.000% | 7/1/31 | 400 | 453 |
| Carmel IN Local Public Improvement Bond Bank Revenue | 5.000% | 7/15/33 | 9,215 | 10,266 |
| Hammond IN Multi-School Building Corp. Revenue | 5.000% | 7/15/38 | 3,000 | 3,236 |
| Indiana Finance Authority Health Facilities Revenue (Baptist Healthcare System Obligated Group) | 5.000% | 8/15/51 | 13,000 | 13,457 |
| Indiana Finance Authority Health System Revenue | | | | |
| (Sisters of St. Francis Health Services Inc. Obligated Group) | 5.250% | 11/1/19 (Prere.) | 3,000 | 3,094 |
298
Long-Term Tax-Exempt Fund
| | | | | |
| Face | Market |
| Maturity | Amount | Value• |
| | Coupon | Date | ($000) | ($000) |
| Indiana Finance Authority Health System Revenue | | | | |
| | (Sisters of St. Francis Health Services Inc. Obligated Group) | 5.000% | 11/1/41 | 12,815 | 13,793 |
| Indiana Finance Authority Revenue (BHI Senior Living) | 6.000% | 11/15/41 | 10,000 | 11,120 |
| Indiana Finance Authority Revenue (Community Foundation of Northwest Indiana Obligated Group) | 5.000% | 3/1/41 | 6,500 | 6,850 |
| Indiana Finance Authority Revenue (Marquette Project) | 5.000% | 3/1/30 | 1,100 | 1,161 |
| Indiana Finance Authority Revenue (Marquette Project) | 5.000% | 3/1/39 | 2,770 | 2,875 |
| Indiana Finance Authority Revenue (Stadium Project) | 5.250% | 2/1/32 | 6,130 | 6,974 |
| Indiana Finance Authority Revenue (Stadium Project) | 5.250% | 2/1/33 | 12,610 | 14,331 |
| Indiana Finance Authority Revenue (Stadium Project) | 5.250% | 2/1/34 | 8,760 | 9,950 |
| Indiana Finance Authority Revenue (Stadium Project) | 5.250% | 2/1/35 | 2,500 | 2,835 |
| Indiana Finance Authority Wastewater Utility Revenue (CWA Authority Project) | 5.000% | 10/1/37 | 7,000 | 7,535 |
| Indiana Finance Authority Wastewater Utility Revenue (CWA Authority Project) | 5.000% | 10/1/39 | 7,000 | 7,662 |
| Indiana Finance Authority Water Utilities Revenue | 5.000% | 10/1/41 | 11,335 | 12,297 |
| Indiana Finance Authority Water Utilities Revenue | 5.000% | 10/1/46 | 7,140 | 7,726 |
| Indianapolis IN Local Public Improvement Bond Bank Revenue | | | | |
| | (Qualified Midwestern Disaster Area) | 5.750% | 2/1/36 | 8,800 | 9,385 |
| Indianapolis IN Local Public Improvement Bond Bank Revenue (Waterworks Project) | 5.750% | 1/1/19 (Prere.) | 1,955 | 1,967 |
| Indianapolis IN Local Public Improvement Bond Bank Revenue (Waterworks Project) | 5.750% | 1/1/38 | 8,045 | 8,094 |
| Northern Indiana Commuter Transportation District Revenue | 5.000% | 7/1/32 | 1,000 | 1,101 |
| Purdue University Indiana University Student Fee Revenue | 5.000% | 7/1/32 | 6,945 | 7,842 |
| Purdue University Indiana University Student Fee Revenue | 5.000% | 7/1/33 | 5,575 | 6,278 |
| Purdue University Indiana University Student Fee Revenue | 5.000% | 7/1/34 | 4,810 | 5,399 |
| | | | | 178,137 |
| Iowa (0.4%) | | | | |
| Iowa Finance Authority Midwestern Disaster Area Revenue (Iowa Fertilizer Co. Project) | 5.500% | 12/1/22 | 35 | 35 |
| Iowa Finance Authority Midwestern Disaster Area Revenue (Iowa Fertilizer Co. Project) | 5.250% | 12/1/25 | 15,000 | 15,847 |
| Iowa Finance Authority Midwestern Disaster Area Revenue (Iowa Fertilizer Co. Project) PUT | 5.250% | 12/1/37 | 6,240 | 6,626 |
| Iowa Finance Authority Revenue (Lifespace Communities Inc. Obligated Group) | 5.000% | 5/15/41 | 1,345 | 1,377 |
| Iowa Finance Authority Revenue (Lifespace Communities Inc. Obligated Group) | 5.000% | 5/15/47 | 12,340 | 12,588 |
| Iowa Higher Education Loan Authority Revenue Private College Facility (Grinnell College Project) | 5.000% | 12/1/46 | 10,700 | 11,853 |
| | | | | 48,326 |
| Kansas (0.4%) | | | | |
| Johnson County KS Unified School District No. 233 GO | 4.000% | 9/1/30 | 5,000 | 5,254 |
| Johnson County KS Unified School District No. 233 GO | 4.000% | 9/1/31 | 4,000 | 4,181 |
| Kansas Development Finance Authority Revenue | 5.000% | 5/1/29 | 2,275 | 2,491 |
| Kansas Development Finance Authority Revenue | 5.000% | 5/1/30 | 4,165 | 4,555 |
| Kansas Development Finance Authority Revenue | 5.000% | 5/1/31 | 4,975 | 5,428 |
| Kansas Development Finance Authority Revenue | 5.000% | 5/1/32 | 5,225 | 5,694 |
| Kansas Development Finance Authority Revenue | 5.000% | 5/1/33 | 1,610 | 1,752 |
| Kansas Development Finance Authority Revenue | 5.000% | 5/1/34 | 1,590 | 1,726 |
| Kansas Development Finance Authority Revenue | 5.000% | 4/1/35 | 16,585 | 17,911 |
| Wyandotte County/Kansas City KS Unified Government Utility System Revenue | 5.000% | 9/1/44 | 2,750 | 2,988 |
| | | | | 51,980 |
| Kentucky (0.7%) | | | | |
| Kentucky Economic Development Finance Authority Hospital Revenue | | | | |
| | (Baptist Healthcare System Obligated Group) | 5.000% | 8/15/41 | 6,700 | 6,985 |
| Kentucky Economic Development Finance Authority Hospital Revenue | | | | |
| | (Baptist Healthcare System Obligated Group) | 5.000% | 8/15/42 | 6,240 | 6,444 |
| Kentucky Economic Development Finance Authority Hospital Revenue | | | | |
| | (Baptist Healthcare System Obligated Group) | 5.000% | 8/15/46 | 5,300 | 5,506 |
| Kentucky Public Energy Authority Gas Supply Revenue PUT | 4.000% | 4/1/24 | 9,585 | 9,968 |
| Kentucky Public Energy Authority Gas Supply Revenue PUT | 4.000% | 1/1/25 | 10,000 | 10,501 |
| 9 | Kentucky Public Transportation Infrastructure Authority Toll Revenue | | | | |
| | (Downtown Crossing Project) BAN | 0.000% | 7/1/34 | 2,000 | 1,846 |
| 10 | Kentucky Public Transportation Infrastructure Authority Toll Revenue | | | | |
| | (Downtown Crossing Project) BAN | 0.000% | 7/1/43 | 10,000 | 9,152 |
| Kentucky Public Transportation Infrastructure Authority Toll Revenue | | | | |
| | (Downtown Crossing Project) BAN | 5.750% | 7/1/49 | 11,900 | 12,761 |
| Kentucky Public Transportation Infrastructure Authority Toll Revenue | | | | |
| | (Downtown Crossing Project) BAN | 6.000% | 7/1/53 | 5,000 | 5,420 |
| Louisville & Jefferson County KY Metropolitan Government Health System Revenue | | | | |
| | (Norton Healthcare Obligated Group) | 5.750% | 10/1/42 | 13,020 | 14,338 |
| Louisville & Jefferson County KY Metropolitan Government Revenue (Catholic Health Initiatives) | 5.000% | 12/1/35 | 1,065 | 1,108 |
| Warren County KY Hospital Revenue | | | | |
| | (Bowling Green-Warren County Community Hospital Corp. Project) | 5.000% | 4/1/35 | 1,620 | 1,720 |
| | | | | 85,749 |
299
Long-Term Tax-Exempt Fund
| | | | |
| Face | Market |
| Maturity | Amount | Value• |
| Coupon | Date | ($000) | ($000) |
| Louisiana (0.6%) | | | | |
| East Baton Rouge Parish LA Sewer Commission Revenue | 5.000% | 2/1/33 | 5,405 | 5,984 |
| East Baton Rouge Parish LA Sewer Commission Revenue | 5.000% | 2/1/34 | 5,290 | 5,841 |
| Jefferson LA Sales Tax District Special Sales Tax Revenue | 5.000% | 12/1/30 (4) | 1,300 | 1,475 |
| Jefferson LA Sales Tax District Special Sales Tax Revenue | 5.000% | 12/1/32 (4) | 1,500 | 1,691 |
| Lafayette LA Communications System Revenue | 5.000% | 11/1/26 (4) | 3,185 | 3,565 |
| Lafayette LA Communications System Revenue | 5.000% | 11/1/28 (4) | 1,280 | 1,429 |
| Lafayette LA Utilities Revenue | 4.000% | 11/1/31 (4) | 1,270 | 1,321 |
| Lafayette LA Utilities Revenue | 4.000% | 11/1/32 (4) | 1,500 | 1,546 |
| Lafayette LA Utilities Revenue | 4.000% | 11/1/33 (4) | 1,000 | 1,024 |
| Lafayette LA Utilities Revenue | 4.000% | 11/1/34 (4) | 1,175 | 1,199 |
| Louisiana Local Government Environmental Facilities & Community Development | | | | |
| Authority Revenue (East Baton Rouge Sewerage Commission Projects) | 5.000% | 2/1/39 | 4,250 | 4,608 |
| Louisiana Local Government Environmental Facilities & Community Development | | | | |
| Authority Revenue (LCTCS Facilities Corp. Project) | 5.000% | 10/1/35 | 5,180 | 5,676 |
| Louisiana Local Government Environmental Facilities & Community Development | | | | |
| Authority Revenue (Women’s Hospital Foundation Project) | 5.875% | 10/1/20 (Prere.) | 14,000 | 14,956 |
| Louisiana Stadium & Exposition District Revenue | 5.000% | 7/1/28 | 4,000 | 4,391 |
| Louisiana Stadium & Exposition District Revenue | 5.000% | 7/1/29 | 3,000 | 3,292 |
| Louisiana State University Revenue | 5.000% | 7/1/24 | 1,000 | 1,102 |
| Louisiana State University Revenue | 5.000% | 7/1/25 | 505 | 555 |
| Shreveport LA Water & Sewer Revenue | 5.000% | 12/1/36 (4) | 1,280 | 1,412 |
| Shreveport LA Water & Sewer Revenue | 5.000% | 12/1/37 (4) | 1,360 | 1,496 |
| Shreveport LA Water & Sewer Revenue | 5.000% | 12/1/41 (4) | 2,000 | 2,183 |
| St. Charles Parish LA Gulf Opportunity Zone Revenue (Valero Energy Corp.) PUT | 4.000% | 6/1/22 | 4,000 | 4,165 |
| St. Tammany Parish LA Hospital Service District No. 1 Hospital Revenue | 5.000% | 7/1/48 | 5,000 | 5,339 |
| | | | 74,250 |
| Maine (0.2%) | | | | |
| Maine Health & Higher Educational Facilities Authority Revenue (Bates College) | 5.000% | 7/1/38 | 4,010 | 4,325 |
| Maine Health & Higher Educational Facilities Authority Revenue (Mainehealth) | 5.000% | 7/1/43 | 2,250 | 2,442 |
| Maine Health & Higher Educational Facilities Authority Revenue (Mainehealth) | 5.000% | 7/1/48 | 3,020 | 3,265 |
| Maine Health & Higher Educational Facilities Authority Revenue | | | | |
| (Stephens Memorial Hospital Association) | 5.000% | 7/1/39 | 5,100 | 5,444 |
| 5 Maine Municipal Bond Bank Revenue | 4.000% | 11/1/34 | 1,650 | 1,701 |
| Maine Turnpike Authority Revenue | 4.000% | 7/1/37 | 1,500 | 1,517 |
| Maine Turnpike Authority Revenue | 4.000% | 7/1/38 | 1,850 | 1,865 |
| | | | 20,559 |
| Maryland (2.6%) | | | | |
| Anne Arundel County MD GO | 5.000% | 10/1/31 | 3,615 | 4,129 |
| Anne Arundel County MD GO | 5.000% | 10/1/31 | 2,075 | 2,370 |
| Anne Arundel County MD GO | 5.000% | 10/1/32 | 3,615 | 4,115 |
| Anne Arundel County MD GO | 5.000% | 10/1/32 | 2,125 | 2,419 |
| Anne Arundel County MD GO | 5.000% | 10/1/33 | 3,615 | 4,102 |
| Anne Arundel County MD GO | 5.000% | 10/1/33 | 2,090 | 2,372 |
| Baltimore MD Consolidated Public Improvement GO | 5.000% | 8/1/30 | 5,000 | 5,597 |
| Baltimore MD Project Revenue | 5.000% | 7/1/38 | 5,000 | 5,470 |
| Frederick County MD GO | 5.000% | 2/1/28 | 1,550 | 1,829 |
| Frederick County MD GO | 5.000% | 2/1/29 | 1,400 | 1,660 |
| Frederick County MD GO | 5.000% | 2/1/30 | 2,685 | 3,197 |
| Howard County MD GO | 4.000% | 2/15/33 | 8,200 | 8,552 |
| Maryland Economic Development Corp. Pollution Control Revenue (Potomac Electric Power Co.) | 6.200% | 9/1/22 | 4,000 | 4,053 |
| Maryland Economic Development Corp. Revenue (Transportation Facilities Project) | 5.000% | 6/1/35 | 2,000 | 2,171 |
| Maryland GO | 5.000% | 3/15/27 | 27,250 | 31,938 |
| Maryland GO | 4.000% | 6/1/29 | 25,000 | 26,553 |
| Maryland GO | 5.000% | 3/15/31 | 20,000 | 23,228 |
| Maryland Health & Higher Educational Facilities Authority Revenue | | | | |
| (LifeBridge Health Obligated Group) | 4.000% | 7/1/42 | 3,830 | 3,795 |
| Maryland Health & Higher Educational Facilities Authority Revenue (MedStar Health, Inc.) | 5.000% | 8/15/38 | 10,000 | 10,728 |
| Maryland Health & Higher Educational Facilities Authority Revenue | | | | |
| (University of Maryland Medical System) | 7.000% | 7/1/22 (ETM) | 7,330 | 8,202 |
| Maryland Health & Higher Educational Facilities Authority Revenue | | | | |
| (University of Maryland Medical System) | 4.000% | 7/1/48 | 7,000 | 6,729 |
| Montgomery County MD GO | 4.000% | 12/1/34 | 15,000 | 15,424 |
| 5 Montgomery County MD GO | 3.750% | 11/1/38 | 16,500 | 16,181 |
| Prince Georges County MD GO | 5.000% | 7/15/33 | 20,240 | 23,385 |
| Prince Georges County MD GO | 5.000% | 7/15/34 | 18,740 | 21,584 |
| Prince Georges County MD GO | 5.000% | 10/1/43 | 15,780 | 17,428 |
| University System of Maryland Revenue | 5.000% | 4/1/27 | 4,235 | 4,967 |
| University System of Maryland Revenue | 5.000% | 4/1/30 | 6,180 | 7,187 |
300
Long-Term Tax-Exempt Fund
| | | | |
| Face | Market |
| Maturity | Amount | Value• |
| Coupon | Date | ($000) | ($000) |
| Washington MD Suburban Sanitary Commission GO | 4.000% | 6/15/32 | 14,725 | 15,492 |
| Washington MD Suburban Sanitary Commission GO | 4.000% | 6/15/47 | 10,205 | 10,264 |
| Washington Suburban Sanitation District Maryland GO | 4.000% | 6/1/34 | 7,315 | 7,510 |
| | | | 302,631 |
| Massachusetts (2.3%) | | | | |
| Massachusetts Bay Transportation Authority General Transportation Revenue | 7.000% | 3/1/21 | 5,605 | 5,939 |
| Massachusetts Bay Transportation Authority Sales Tax Revenue | 4.000% | 7/1/33 | 2,390 | 2,458 |
| Massachusetts College Building Authority Revenue | 5.000% | 5/1/20 (Prere.) | 2,500 | 2,607 |
| Massachusetts Development Finance Agency Revenue (Baystate Medical Obligated Group) | 5.000% | 7/1/44 | 5,000 | 5,290 |
| Massachusetts Development Finance Agency Revenue (Boston Medical Center) | 5.000% | 7/1/33 | 3,205 | 3,439 |
| Massachusetts Development Finance Agency Revenue (CareGroup Inc.) | 5.000% | 7/1/30 | 2,770 | 3,053 |
| Massachusetts Development Finance Agency Revenue (CareGroup Inc.) | 5.000% | 7/1/43 | 15,000 | 15,944 |
| Massachusetts Development Finance Agency Revenue (CareGroup Inc.) | 5.000% | 7/1/48 | 7,500 | 7,954 |
| Massachusetts Development Finance Agency Revenue (CareGroup Inc.) | 5.000% | 7/1/53 | 2,500 | 2,643 |
| Massachusetts Development Finance Agency Revenue (Emerson College) | 5.250% | 1/1/42 | 4,800 | 5,128 |
| Massachusetts Development Finance Agency Revenue (Emerson College) | 5.000% | 1/1/43 | 1,515 | 1,599 |
| Massachusetts Development Finance Agency Revenue (Emmanuel College) | 4.000% | 10/1/46 | 4,845 | 4,433 |
| Massachusetts Development Finance Agency Revenue (Harvard University) | 5.000% | 7/15/33 | 24,745 | 28,162 |
| 5 Massachusetts Development Finance Agency Revenue (Linden Ponds Inc.) | 5.000% | 11/15/38 | 2,000 | 2,000 |
| 5 Massachusetts Development Finance Agency Revenue (Linden Ponds Inc.) | 5.125% | 11/15/46 | 3,000 | 2,999 |
| Massachusetts Development Finance Agency Revenue (Partners Healthcare) | 5.000% | 7/1/47 | 6,695 | 7,183 |
| Massachusetts Development Finance Agency Revenue (Wellesley College) | 5.000% | 7/1/42 | 5,000 | 5,391 |
| Massachusetts Development Finance Agency Revenue (Western New England University) | 5.000% | 9/1/43 | 3,015 | 3,197 |
| Massachusetts GO | 4.000% | 9/1/31 | 12,500 | 13,020 |
| Massachusetts GO | 4.000% | 9/1/32 | 7,500 | 7,781 |
| Massachusetts GO | 3.000% | 11/1/35 | 3,000 | 2,650 |
| Massachusetts GO | 5.000% | 8/1/36 | 9,855 | 10,472 |
| Massachusetts GO | 5.000% | 1/1/38 | 5,175 | 5,783 |
| Massachusetts GO | 5.000% | 7/1/40 | 1,250 | 1,368 |
| Massachusetts GO | 5.000% | 11/1/42 | 4,500 | 4,981 |
| Massachusetts GO | 4.000% | 5/1/48 | 10,000 | 9,847 |
| Massachusetts GO | 5.000% | 9/1/48 | 15,000 | 16,659 |
| Massachusetts School Building Authority Dedicated Sales Tax Revenue | 5.000% | 8/15/30 | 10,100 | 10,980 |
| Massachusetts School Building Authority Dedicated Sales Tax Revenue | 4.000% | 8/15/32 | 8,800 | 9,090 |
| Massachusetts School Building Authority Dedicated Sales Tax Revenue | 5.250% | 10/15/35 | 3,000 | 3,216 |
| Massachusetts School Building Authority Dedicated Sales Tax Revenue | 5.000% | 11/15/46 | 3,000 | 3,306 |
| Massachusetts School Building Authority Dedicated Sales Tax Revenue | 5.250% | 2/15/48 | 7,500 | 8,469 |
| Massachusetts Special Obligation Dedicated Tax Revenue | 5.500% | 1/1/27 (14) | 7,190 | 8,598 |
| Massachusetts Water Resources Authority Revenue | 6.500% | 7/15/19 (ETM) | 1,335 | 1,378 |
| Massachusetts Water Resources Authority Revenue | 5.000% | 8/1/21 (Prere.) | 180 | 193 |
| Massachusetts Water Resources Authority Revenue | 5.000% | 8/1/21 (Prere.) | 820 | 880 |
| Massachusetts Water Resources Authority Revenue | 5.000% | 8/1/32 | 9,665 | 10,942 |
| Massachusetts Water Resources Authority Revenue | 5.000% | 8/1/32 | 5,640 | 6,385 |
| Massachusetts Water Resources Authority Revenue | 5.000% | 8/1/33 | 2,000 | 2,255 |
| Massachusetts Water Resources Authority Revenue | 5.000% | 8/1/33 | 1,145 | 1,318 |
| Massachusetts Water Resources Authority Revenue | 5.000% | 8/1/34 | 4,000 | 4,591 |
| Massachusetts Water Resources Authority Revenue | 5.000% | 8/1/35 | 3,500 | 3,992 |
| Metropolitan Boston MA Transit Parking Corp. Revenue | 5.250% | 7/1/36 | 4,500 | 4,783 |
| University of Massachusetts Building Authority Revenue | 5.000% | 11/1/39 | 3,000 | 3,244 |
| | | | 265,600 |
| Michigan (2.8%) | | | | |
| Detroit MI Water & Sewerage Department Sewage Disposal System Revenue | 5.250% | 7/1/39 | 1,000 | 1,059 |
| Detroit/Wayne County MI Stadium Authority Revenue | 5.000% | 10/1/26 (4) | 2,500 | 2,669 |
| Downriver Utility Wastewater Authority Michigan Revenue | 5.000% | 4/1/43 (4) | 2,250 | 2,418 |
| East Lansing MI School District GO | 5.000% | 5/1/39 | 1,000 | 1,096 |
| East Lansing MI School District GO | 5.000% | 5/1/42 | 2,000 | 2,176 |
| Eastern Michigan University Revenue | 5.000% | 3/1/33 (15) | 1,000 | 1,107 |
| Eastern Michigan University Revenue | 5.000% | 3/1/36 (15) | 1,000 | 1,096 |
| Great Lakes MI Water Authority Water Supply System Revenue | 4.000% | 7/1/33 (4) | 10,000 | 10,085 |
| Great Lakes MI Water Authority Water Supply System Revenue | 5.000% | 7/1/46 | 20,000 | 21,403 |
| Karegnondi Water Authority Michigan Water Supply System Revenue (Karegnondi Water Pipeline) | 5.250% | 11/1/40 | 17,330 | 18,784 |
| Karegnondi Water Authority Michigan Water Supply System Revenue (Karegnondi Water Pipeline) | 5.000% | 11/1/41 | 3,300 | 3,529 |
| Karegnondi Water Authority Michigan Water Supply System Revenue (Karegnondi Water Pipeline) | 5.000% | 11/1/45 | 3,000 | 3,199 |
| Kent Hospital Finance Authority Michigan Revenue (Spectrum Health System) PUT | 5.000% | 1/15/42 | 10,840 | 11,325 |
| Kentwood MI Economic Development Corp. Revenue (Holland Home Obligated Group) | 5.000% | 11/15/37 | 3,875 | 4,068 |
| Macomb MI Interceptor Drain Drainage District Special Assessment Revenue | 5.000% | 5/1/42 | 8,320 | 9,205 |
| Michigan Building Authority Revenue | 5.000% | 4/15/29 | 3,070 | 3,467 |
| Michigan Building Authority Revenue | 5.000% | 10/15/29 | 1,560 | 1,725 |
| Michigan Building Authority Revenue | 5.000% | 4/15/31 | 12,020 | 13,454 |
301
Long-Term Tax-Exempt Fund
| | | | |
| Face | Market |
| Maturity | Amount | Value• |
| Coupon | Date | ($000) | ($000) |
| Michigan Building Authority Revenue | 5.000% | 4/15/38 | 2,015 | 2,217 |
| Michigan Building Authority Revenue | 5.000% | 4/15/41 | 1,890 | 2,062 |
| Michigan Building Authority Revenue | 5.000% | 10/15/45 | 4,900 | 5,366 |
| Michigan Building Authority Revenue | 5.250% | 10/15/47 | 2,000 | 2,185 |
| Michigan Building Authority Revenue | 5.000% | 10/15/51 | 8,000 | 8,625 |
| Michigan Finance Authority Revenue | 5.000% | 10/1/39 | 13,195 | 14,369 |
| Michigan Finance Authority Revenue | 5.000% | 11/1/43 | 6,000 | 6,584 |
| Michigan Finance Authority Revenue (Detroit Water & Sewer) | 5.000% | 7/1/27 | 500 | 556 |
| Michigan Finance Authority Revenue (Detroit Water & Sewer) | 5.000% | 7/1/28 (4) | 3,000 | 3,335 |
| Michigan Finance Authority Revenue (Detroit Water & Sewer) | 5.000% | 7/1/29 | 1,000 | 1,100 |
| Michigan Finance Authority Revenue (Detroit Water & Sewer) | 5.000% | 7/1/32 | 5,000 | 5,390 |
| Michigan Finance Authority Revenue (Detroit Water & Sewer) | 5.000% | 7/1/32 (14) | 2,210 | 2,374 |
| Michigan Finance Authority Revenue (Detroit Water & Sewer) | 5.000% | 7/1/34 | 7,500 | 8,053 |
| Michigan Finance Authority Revenue (Detroit Water & Sewer) | 5.000% | 7/1/34 (14) | 1,165 | 1,246 |
| Michigan Finance Authority Revenue (Detroit Water & Sewer) | 5.000% | 7/1/44 | 3,670 | 3,880 |
| Michigan Finance Authority Revenue (McLaren Health Care Corp.) | 5.000% | 5/15/33 | 4,000 | 4,367 |
| Michigan Finance Authority Revenue (McLaren Health Care Corp.) | 5.000% | 5/15/38 | 13,500 | 14,535 |
| Michigan Finance Authority Revenue (MidMichigan Obligated Group) | 5.000% | 6/1/39 | 6,000 | 6,443 |
| Michigan Finance Authority Revenue (Trinity Health Credit Group) | 4.000% | 12/1/36 | 2,345 | 2,350 |
| Michigan Finance Authority Revenue (Trinity Health Credit Group) | 5.000% | 12/1/37 | 3,500 | 3,831 |
| Michigan Finance Authority Revenue (Trinity Health Credit Group) | 5.000% | 12/1/42 | 1,875 | 2,039 |
| Michigan Finance Authority Revenue (Trinity Health Credit Group) | 5.000% | 12/1/47 | 4,000 | 4,240 |
| Michigan GO | 4.000% | 5/1/29 | 17,425 | 18,623 |
| Michigan Hospital Finance Authority Revenue (Henry Ford Health System) | 5.750% | 11/15/19 (Prere.) | 5,000 | 5,188 |
| Michigan Hospital Finance Authority Revenue (MidMichigan Obligated Group) | 6.125% | 6/1/19 (Prere.) | 9,000 | 9,217 |
| Michigan Hospital Finance Authority Revenue (Trinity Health) | 5.000% | 12/1/48 | 2,300 | 2,427 |
| Michigan State University Revenue | 5.000% | 8/15/27 | 1,060 | 1,175 |
| Michigan Strategic Fund Limited Obligation Revenue (Holland Home Obligated Group) | 5.000% | 11/15/42 | 4,765 | 4,983 |
| Michigan Strategic Fund Limited Obligation Revenue (Senate Offices Project) | 5.250% | 10/15/40 | 5,500 | 6,015 |
| Rockford MI Public Schools GO | 5.000% | 5/1/44 | 1,225 | 1,323 |
| Royal Oak MI GO | 5.000% | 4/1/43 | 2,600 | 2,832 |
| Royal Oak MI Hospital Finance Authority Hospital Revenue (William Beaumont Hospital) | 6.000% | 8/1/19 (Prere.) | 8,000 | 8,232 |
| Royal Oak MI Hospital Finance Authority Hospital Revenue (William Beaumont Hospital) | 5.000% | 9/1/39 | 8,245 | 8,792 |
| University of Michigan Revenue | 5.000% | 4/1/47 | 13,375 | 14,898 |
| Wayne County MI Airport Authority Revenue | 5.000% | 12/1/42 | 2,520 | 2,742 |
| Wayne County MI Airport Authority Revenue | 5.000% | 12/1/45 | 5,000 | 5,424 |
| Wayne County MI Airport Authority Revenue | 5.000% | 12/1/47 | 3,500 | 3,795 |
| Wayne County MI Airport Authority Revenue (Detroit Metropolitan Wayne County Airport) | 5.000% | 12/1/39 (15) | 3,000 | 3,275 |
| Wayne County MI Airport Authority Revenue (Detroit Metropolitan Wayne County Airport) | 5.000% | 12/1/40 | 2,890 | 3,145 |
| Wayne State University Michigan Revenue | 5.000% | 11/15/35 | 1,100 | 1,213 |
| Wayne State University Michigan Revenue | 5.000% | 11/15/38 | 2,220 | 2,438 |
| Woodhaven-Brownstone MI School District GO | 5.000% | 5/1/27 | 3,675 | 4,205 |
| Woodhaven-Brownstone MI School District GO | 5.000% | 5/1/28 | 3,705 | 4,215 |
| | | | 331,169 |
| Minnesota (1.2%) | | | | |
| 5 Duluth MN Economic Development Authority Revenue (Essentia Health) | 4.250% | 2/15/43 | 5,000 | 4,838 |
| 5 Duluth MN Economic Development Authority Revenue (Essentia Health) | 4.250% | 2/15/48 | 5,000 | 4,774 |
| 5 Duluth MN Economic Development Authority Revenue (Essentia Health) | 5.000% | 2/15/58 | 6,250 | 6,446 |
| Duluth MN Independent School District No. 709 COP | 5.000% | 2/1/26 | 2,000 | 2,241 |
| Duluth MN Independent School District No. 709 COP | 4.000% | 2/1/27 | 1,200 | 1,256 |
| Hastings MN Independent School District No. 200 GO | 0.000% | 2/1/29 | 3,425 | 2,429 |
| Minneapolis & St. Paul MN Metropolitan Airports Commission Revenue | 5.000% | 1/1/41 | 3,510 | 3,878 |
| Minneapolis MN Health Care System Revenue (Fairview Health Services) | 6.750% | 11/15/18 (Prere.) | 4,250 | 4,258 |
| Minneapolis MN Health Care System Revenue (Fairview Health Services) | 4.000% | 11/15/48 | 5,000 | 4,773 |
| Minneapolis MN Special School District No. 1 COP | 4.000% | 2/1/29 | 11,120 | 11,641 |
| Minneapolis MN Special School District No. 1 COP | 4.000% | 2/1/30 | 11,505 | 12,016 |
| Minnesota COP | 5.000% | 6/1/31 | 3,730 | 4,145 |
| Minnesota GO | 5.000% | 8/1/34 | 18,000 | 20,195 |
| Minnesota Higher Education Facilities Authority Revenue (University of St. Thomas) | 4.000% | 10/1/34 | 400 | 408 |
| Minnesota Higher Education Facilities Authority Revenue (University of St. Thomas) | 4.000% | 10/1/35 | 400 | 407 |
| Minnesota Higher Education Facilities Authority Revenue (University of St. Thomas) | 4.000% | 10/1/36 | 500 | 507 |
| Minnesota Higher Education Facilities Authority Revenue (University of St. Thomas) | 4.000% | 10/1/37 | 500 | 506 |
| Prior Lake-Savage MN Independent School District No. 719 GO | 0.000% | 2/1/29 | 5,690 | 3,982 |
| Rochester MN Electric Utility Revenue | 5.000% | 12/1/42 | 3,660 | 4,033 |
| Rochester MN Electric Utility Revenue | 5.000% | 12/1/47 | 1,990 | 2,188 |
| Rochester MN Health Care Facilities Revenue (Mayo Clinic) | 5.000% | 11/15/33 | 5,000 | 5,994 |
| Rochester MN Health Care Facilities Revenue (Mayo Clinic) | 5.000% | 11/15/34 | 10,000 | 12,006 |
| Rochester MN Health Care Facilities Revenue (Mayo Clinic) | 5.000% | 11/15/35 | 2,500 | 3,000 |
302
Long-Term Tax-Exempt Fund
| | | | |
| Face | Market |
| Maturity | Amount | Value• |
| Coupon | Date | ($000) | ($000) |
| St. Paul MN Housing & Redevelopment Authority Health Care Revenue | | | | |
| (Fairview Health Services Obligated Group) | 4.000% | 11/15/43 | 3,480 | 3,378 |
| St. Paul MN Housing & Redevelopment Authority Health Care Revenue | | | | |
| (Fairview Health Services Obligated Group) | 5.000% | 11/15/47 | 5,000 | 5,337 |
| University of Minnesota Revenue | 5.000% | 4/1/36 | 1,810 | 2,016 |
| Western Minnesota Municipal Power Agency Revenue | 5.000% | 1/1/49 | 12,250 | 13,618 |
| | | | 140,270 |
| Mississippi (0.3%) | | | | |
| Jackson MS Public School District GO | 5.000% | 4/1/28 | 1,695 | 1,887 |
| Mississippi Hospital Equipment & Facilities Authority Revenue (Baptist Health System) | 5.000% | 9/1/41 | 5,000 | 5,213 |
| Mississippi State University Educational Building Corp. Revenue | 5.250% | 8/1/23 (Prere.) | 2,500 | 2,825 |
| S.M. Educational Building Corp. Mississippi Revenue | | | | |
| (Residence Hall Construction & Refunding Project) | 5.000% | 3/1/23 (Prere.) | 14,490 | 16,093 |
| Warren County MS Gulf Opportunity Zone Revenue (International Paper Co. Projects) | 5.375% | 12/1/35 | 4,750 | 5,135 |
| | | | 31,153 |
| Missouri (1.3%) | | | | |
| Bi-State Development Agency of the Missouri-Illinois Metropolitan District | | | | |
| Mass Transit Sales Tax Revenue | 5.000% | 10/1/44 | 4,670 | 5,061 |
| Curators of the University of Missouri System Facilities Revenue | 4.000% | 11/1/33 | 5,000 | 5,164 |
| Jackson County MO Special Obligation Revenue (Truman Sports Complex Project) | 5.000% | 12/1/30 | 5,205 | 5,774 |
| Jackson County MO Special Obligation Revenue (Truman Sports Complex Project) | 5.000% | 12/1/31 | 10,120 | 11,196 |
| Kansas City MO Sanitary Sewer System Revenue | 4.000% | 1/1/35 | 1,520 | 1,565 |
| Kansas City MO Sanitary Sewer System Revenue | 4.000% | 1/1/36 | 2,500 | 2,564 |
| Kansas City MO Sanitary Sewer System Revenue | 4.000% | 1/1/37 | 1,250 | 1,279 |
| Kansas City MO Sanitary Sewer System Revenue | 4.000% | 1/1/38 | 2,500 | 2,536 |
| Kansas City MO Special Obligation Revenue (Downtown Arena Project) | 5.000% | 4/1/29 | 2,755 | 3,069 |
| Kansas City MO Special Obligation Revenue (Downtown Arena Project) | 5.000% | 4/1/30 | 6,905 | 7,675 |
| Kansas City MO Special Obligation Revenue (Downtown Arena Project) | 5.000% | 4/1/40 | 6,750 | 7,331 |
| Kansas City MO Special Obligation Revenue (Kansas City Downtown Redevelopment District) | 5.000% | 9/1/39 | 3,150 | 3,409 |
| Metropolitan St. Louis MO Sewer District Wastewater System Revenue | 5.000% | 5/1/31 | 4,280 | 4,921 |
| Metropolitan St. Louis MO Sewer District Wastewater System Revenue | 5.000% | 5/1/46 | 3,000 | 3,309 |
| Missouri Health & Educational Facilities Authority Health Facilities Revenue (Cox Health) | 5.500% | 11/15/18 (Prere.) | 2,800 | 2,804 |
| Missouri Health & Educational Facilities Authority Health Facilities Revenue (Cox Health) | 5.500% | 11/15/33 | 740 | 742 |
| Missouri Health & Educational Facilities Authority Health Facilities Revenue (SSM Health System) | 5.000% | 6/1/48 | 12,500 | 13,425 |
| Missouri Health & Educational Facilities Authority Revenue (Children’s Mercy Hospital) | 4.000% | 5/15/34 | 5,000 | 5,058 |
| Missouri Health & Educational Facilities Authority Revenue (Children’s Mercy Hospital) | 4.000% | 5/15/39 | 5,000 | 4,938 |
| Missouri Health & Educational Facilities Authority Revenue (Mercy Health) | 4.000% | 5/15/42 | 5,000 | 4,888 |
| Missouri Health & Educational Facilities Authority Revenue (Mercy Health) | 5.000% | 11/15/42 | 5,000 | 5,439 |
| Missouri Health & Educational Facilities Authority Revenue (Mercy Health) | 4.000% | 11/15/49 | 10,000 | 9,621 |
| Missouri Health & Educational Facilities Authority Revenue (Washington University) | 5.000% | 11/15/37 | 14,950 | 16,004 |
| St. Louis MO Sewer & Wastewater Revenue | 5.000% | 5/1/30 | 3,380 | 3,817 |
| St. Louis MO Sewer & Wastewater Revenue | 5.000% | 5/1/30 | 8,245 | 9,527 |
| St. Louis MO Sewer & Wastewater Revenue | 5.000% | 5/1/31 | 2,000 | 2,248 |
| St. Louis MO Sewer & Wastewater Revenue | 5.000% | 5/1/45 | 10,000 | 10,999 |
| | | | 154,363 |
| Montana (0.2%) | | | | |
| Forsyth MT Pollution Control Revenue (Puget Sound Energy Project) | 3.900% | 3/1/31 | 3,575 | 3,605 |
| Lewis & Clark County MT School District No. 1 GO | 4.000% | 7/1/33 | 1,685 | 1,747 |
| Lewis & Clark County MT School District No. 1 GO | 4.000% | 7/1/34 | 1,505 | 1,556 |
| Lewis & Clark County MT School District No. 1 GO | 4.000% | 7/1/35 | 1,050 | 1,082 |
| Lewis & Clark County MT School District No. 1 GO | 4.000% | 7/1/36 | 910 | 934 |
| Montana Facility Finance Authority Health Facilities Revenue | | | | |
| (Bozeman Deaconess Health Services Obligated Group) | 5.000% | 6/1/48 | 9,230 | 9,974 |
| Montana Facility Finance Authority Hospital Revenue (Benefis Health System) | 5.000% | 2/15/41 | 2,650 | 2,837 |
| | | | 21,735 |
| Nebraska (0.3%) | | | | |
| Central Plains Energy Project Nebraska Gas Project Revenue (Project No. 1) | 5.250% | 12/1/20 | 5,000 | 5,279 |
| Central Plains Energy Project Nebraska Gas Project Revenue (Project No. 3) | 5.000% | 9/1/28 | 4,100 | 4,597 |
| Central Plains Energy Project Nebraska Gas Project Revenue (Project No. 3) | 5.000% | 9/1/36 | 2,500 | 2,803 |
| Central Plains Energy Project Nebraska Gas Project Revenue (Project No. 3) | 5.000% | 9/1/37 | 3,000 | 3,343 |
| Douglas County NE Hospital Authority No. 2 Health Facilities Revenue | | | | |
| (Children’s Hospital Obligated Group) | 5.000% | 11/15/34 | 1,000 | 1,104 |
| Douglas County NE Hospital Authority No. 2 Health Facilities Revenue | | | | |
| (Children’s Hospital Obligated Group) | 5.000% | 11/15/35 | 2,000 | 2,201 |
| Douglas County NE Hospital Authority No. 2 Health Facilities Revenue | | | | |
| (Children’s Hospital Obligated Group) | 5.000% | 11/15/37 | 1,000 | 1,094 |
| Douglas County NE Hospital Authority No. 3 Health Facilities Revenue | | | | |
| (Nebraska Methodist Health System) | 5.000% | 11/1/45 | 2,500 | 2,670 |
303
Long-Term Tax-Exempt Fund
| | | | |
| Face | Market |
| Maturity | Amount | Value• |
| Coupon | Date | ($000) | ($000) |
| Municipal Energy Agency of Nebraska Power Supply System Revenue | 5.375% | 4/1/19 (Prere.) | 3,000 | 3,043 |
| Omaha NE Public Power District Electric Revenue | 5.000% | 2/1/36 | 1,010 | 1,137 |
| Scotts Bluff County NE Hospital Authority Revenue (Regional West Medical Center) | 5.250% | 2/1/37 | 6,000 | 6,149 |
| University of Nebraska Student Fee Revenue | 5.000% | 7/1/37 | 5,000 | 5,356 |
| | | | 38,776 |
| Nevada (0.8%) | | | | |
| Clark County NV GO | 4.000% | 6/1/32 | 4,000 | 4,132 |
| Clark County NV GO | 4.000% | 7/1/47 | 10,000 | 9,848 |
| 5 Clark County NV School District GO | 4.000% | 12/1/39 | 23,100 | 23,119 |
| Las Vegas NV Convention & Visitors Authority Revenue | 5.000% | 7/1/43 | 15,000 | 16,254 |
| Las Vegas NV GO | 4.000% | 9/1/32 | 8,860 | 9,144 |
| Las Vegas NV GO | 4.000% | 9/1/33 | 9,220 | 9,455 |
| Las Vegas Valley Water District Nevada GO | 5.000% | 6/1/29 | 7,470 | 8,090 |
| Las Vegas Valley Water District Nevada GO | 5.000% | 6/1/32 | 2,800 | 3,141 |
| Nevada Highway Improvement Revenue (Motor Vehicle Fuel Tax) | 4.000% | 12/1/33 | 5,000 | 5,184 |
| | | | 88,367 |
| New Hampshire (0.2%) | | | | |
| New Hampshire Health & Education Facilities Authority Revenue (Dartmouth College) | 6.000% | 8/1/19 (Prere.) | 2,400 | 2,471 |
| New Hampshire Health & Education Facilities Authority Revenue | | | | |
| (Southern New Hampshire University) | 5.000% | 1/1/34 | 1,375 | 1,457 |
| New Hampshire Health & Education Facilities Authority Revenue | | | | |
| (Southern New Hampshire University) | 5.000% | 1/1/42 | 7,955 | 8,382 |
| New Hampshire Health & Education Facilities Authority Revenue (Wentworth Douglas Hospital) | 7.000% | 1/1/21 (Prere.) | 8,000 | 8,785 |
| New Hampshire Municipal Bond Bank Revenue | 4.000% | 8/15/30 | 1,000 | 1,044 |
| New Hampshire Municipal Bond Bank Revenue | 4.000% | 8/15/31 | 640 | 665 |
| New Hampshire Municipal Bond Bank Revenue | 4.000% | 8/15/32 | 1,000 | 1,035 |
| | | | 23,839 |
| New Jersey (2.9%) | | | | |
| Camden County NJ Improvement Authority Health Care Redevelopment Project Revenue | | | | |
| (Cooper Health System Obligated Group) | 5.750% | 2/15/42 | 5,000 | 5,335 |
| New Jersey Economic Development Authority Revenue | 5.000% | 6/15/36 | 2,000 | 2,085 |
| New Jersey Economic Development Authority Revenue (School Facilities Construction) | 5.000% | 3/1/26 | 3,000 | 3,189 |
| New Jersey Economic Development Authority Revenue (School Facilities Construction) | 5.500% | 9/1/27 (14) | 9,000 | 10,313 |
| New Jersey Economic Development Authority Revenue (School Facilities Construction) | 5.000% | 3/1/28 | 20,000 | 21,088 |
| New Jersey Economic Development Authority Revenue | | | | |
| (Provident Group-Montclair Properties LLC - Montclair State University Student Housing Project) | 5.000% | 6/1/31 (4) | 1,760 | 1,923 |
| New Jersey Economic Development Authority Revenue | | | | |
| (Provident Group-Montclair Properties LLC - Montclair State University Student Housing Project) | 4.000% | 6/1/32 (4) | 2,250 | 2,266 |
| New Jersey Educational Facilities Authority Revenue (College of New Jersey) | 4.000% | 7/1/34 | 1,000 | 1,018 |
| New Jersey Educational Facilities Authority Revenue (University Medical & Dentistry) | 7.500% | 6/1/19 (Prere.) | 7,250 | 7,482 |
| New Jersey Health Care Facilities Financing Authority Lease Revenue | | | | |
| (Greystone Park Psychiatric Hospital Project) | 5.000% | 9/15/29 | 7,335 | 7,749 |
| New Jersey Health Care Facilities Financing Authority Revenue (Inspira Health Obligated Group) | 4.000% | 7/1/47 | 10,025 | 9,692 |
| New Jersey Health Care Facilities Financing Authority Revenue | | | | |
| (Inspira Health Obligated Group) | 5.000% | 7/1/27 | 5,755 | 6,479 |
| New Jersey Health Care Facilities Financing Authority Revenue | | | | |
| (Inspira Health Obligated Group) | 5.000% | 7/1/29 | 2,670 | 2,966 |
| New Jersey Health Care Facilities Financing Authority Revenue (St. Joseph’s Healthcare System) | 5.000% | 7/1/41 | 3,600 | 3,741 |
| New Jersey Health Care Facilities Financing Authority Revenue (Virtua Health) | 5.750% | 7/1/33 | 8,190 | 8,392 |
| New Jersey Housing & Mortgage Finance Agency Single Family Housing Revenue | 4.250% | 10/1/32 | 550 | 560 |
| New Jersey Transportation Trust Fund Authority Federal Highway Reimbursement Revenue | 5.000% | 6/15/27 | 1,000 | 1,104 |
| New Jersey Transportation Trust Fund Authority Federal Highway Reimbursement Revenue | 5.000% | 6/15/28 | 2,500 | 2,745 |
| New Jersey Transportation Trust Fund Authority Federal Highway Reimbursement Revenue | 5.000% | 6/15/29 | 4,200 | 4,586 |
| New Jersey Transportation Trust Fund Authority Federal Highway Reimbursement Revenue | 5.000% | 6/15/30 | 2,550 | 2,772 |
| New Jersey Transportation Trust Fund Authority Federal Highway Reimbursement Revenue | 5.000% | 6/15/30 | 2,550 | 2,772 |
| New Jersey Transportation Trust Fund Authority Federal Highway Reimbursement Revenue | 5.000% | 6/15/31 | 2,000 | 2,166 |
| New Jersey Transportation Trust Fund Authority Revenue | 5.000% | 12/15/33 | 3,045 | 3,234 |
| New Jersey Transportation Trust Fund Authority Revenue | 5.000% | 12/15/34 | 3,045 | 3,223 |
| New Jersey Transportation Trust Fund Authority Revenue | 5.000% | 12/15/35 | 1,420 | 1,496 |
| New Jersey Transportation Trust Fund Authority Revenue | 4.000% | 12/15/37 | 2,795 | 2,736 |
| New Jersey Transportation Trust Fund Authority Revenue | 4.250% | 12/15/38 | 3,055 | 2,927 |
| New Jersey Transportation Trust Fund Authority Transportation Program Revenue | 5.000% | 6/15/28 | 12,000 | 12,688 |
| New Jersey Transportation Trust Fund Authority Transportation Program Revenue | 5.000% | 6/15/29 | 1,925 | 2,015 |
| New Jersey Transportation Trust Fund Authority Transportation Program Revenue | 5.500% | 6/15/39 | 5,300 | 5,623 |
| New Jersey Transportation Trust Fund Authority Transportation Program Revenue | 5.250% | 6/15/41 | 7,300 | 7,640 |
| New Jersey Transportation Trust Fund Authority Transportation Program Revenue | 5.000% | 6/15/44 | 10,000 | 10,265 |
| New Jersey Transportation Trust Fund Authority Transportation System Revenue | 5.500% | 12/15/21 | 5,180 | 5,584 |
| New Jersey Transportation Trust Fund Authority Transportation System Revenue | 5.250% | 6/15/22 | 5,000 | 5,299 |
| New Jersey Transportation Trust Fund Authority Transportation System Revenue | 5.250% | 12/15/22 (2) | 8,500 | 9,253 |
304
Long-Term Tax-Exempt Fund
| | | | |
| Face | Market |
| Maturity | Amount | Value• |
| Coupon | Date | ($000) | ($000) |
| New Jersey Transportation Trust Fund Authority Transportation System Revenue | 0.000% | 12/15/25 (2) | 5,000 | 3,779 |
| New Jersey Transportation Trust Fund Authority Transportation System Revenue | 5.250% | 6/15/26 | 2,000 | 2,106 |
| New Jersey Transportation Trust Fund Authority Transportation System Revenue | 0.000% | 12/15/27 | 12,000 | 8,141 |
| New Jersey Transportation Trust Fund Authority Transportation System Revenue | 5.000% | 6/15/32 | 7,400 | 7,798 |
| New Jersey Transportation Trust Fund Authority Transportation System Revenue | 0.000% | 12/15/32 (4) | 17,000 | 9,246 |
| New Jersey Turnpike Authority Revenue | 5.000% | 7/1/22 (Prere.) | 10,795 | 11,849 |
| New Jersey Turnpike Authority Revenue | 5.000% | 1/1/31 | 12,000 | 13,486 |
| New Jersey Turnpike Authority Revenue | 5.000% | 1/1/32 | 5,000 | 5,589 |
| New Jersey Turnpike Authority Revenue | 4.000% | 1/1/35 | 17,150 | 17,439 |
| New Jersey Turnpike Authority Revenue | 5.000% | 1/1/37 | 9,000 | 9,998 |
| New Jersey Turnpike Authority Revenue | 4.000% | 1/1/43 | 3,420 | 3,394 |
| South Jersey Transportation Authority New Jersey Transportation System Revenue | 5.000% | 11/1/27 | 2,000 | 2,129 |
| Tobacco Settlement Financing Corp. New Jersey Revenue | 5.000% | 6/1/34 | 2,000 | 2,168 |
| Tobacco Settlement Financing Corp. New Jersey Revenue | 5.000% | 6/1/35 | 1,900 | 2,051 |
| Tobacco Settlement Financing Corp. New Jersey Revenue | 5.000% | 6/1/46 | 31,385 | 32,397 |
| Tobacco Settlement Financing Corp. New Jersey Revenue | 5.000% | 6/1/46 | 24,000 | 24,309 |
| | | | 338,285 |
| New Mexico (0.5%) | | | | |
| Albuquerque NM Municipal School District No. 12 GO | 5.000% | 8/1/27 | 1,515 | 1,755 |
| Albuquerque NM Municipal School District No. 12 GO | 5.000% | 8/1/30 | 1,650 | 1,883 |
| New Mexico Hospital Equipment Loan Council Hospital System Revenue | | | | |
| (Presbyterian Healthcare Services) | 5.000% | 8/1/19 (Prere.) | 6,500 | 6,646 |
| New Mexico Hospital Equipment Loan Council Hospital System Revenue | | | | |
| (Presbyterian Healthcare Services) | 4.000% | 8/1/33 | 6,705 | 6,781 |
| New Mexico Hospital Equipment Loan Council Hospital System Revenue | | | | |
| (Presbyterian Healthcare Services) | 4.000% | 8/1/34 | 9,860 | 9,941 |
| New Mexico Hospital Equipment Loan Council Hospital System Revenue | | | | |
| (Presbyterian Healthcare Services) | 5.000% | 8/1/42 | 15,025 | 16,109 |
| New Mexico Hospital Equipment Loan Council Hospital System Revenue | | | | |
| (Presbyterian Healthcare Services) | 5.000% | 8/1/44 | 10,100 | 10,902 |
| | | | 54,017 |
| New York (14.1%) | | | | |
| Brooklyn NY Local Development Corp. PILOT Revenue (Barclays Center Project) | 6.375% | 1/15/20 (Prere.) | 6,000 | 6,314 |
| Hempstead NY GO | 4.000% | 4/1/27 (4) | 6,850 | 7,329 |
| Hempstead NY GO | 4.000% | 4/1/30 (4) | 7,720 | 8,085 |
| Hudson Yards Infrastructure Corp. New York Revenue | 5.750% | 2/15/21 (Prere.) | 17,785 | 19,234 |
| Hudson Yards Infrastructure Corp. New York Revenue | 5.000% | 2/15/34 | 2,455 | 2,735 |
| Hudson Yards Infrastructure Corp. New York Revenue | 5.000% | 2/15/45 | 5,000 | 5,464 |
| Hudson Yards Infrastructure Corp. New York Revenue | 5.750% | 2/15/47 | 10,945 | 11,712 |
| Long Island NY Power Authority Electric System Revenue | 5.000% | 9/1/37 | 2,000 | 2,207 |
| Long Island NY Power Authority Electric System Revenue | 5.000% | 9/1/39 | 2,000 | 2,181 |
| Long Island NY Power Authority Electric System Revenue | 5.000% | 9/1/41 | 3,250 | 3,542 |
| Long Island NY Power Authority Electric System Revenue | 5.000% | 9/1/44 | 17,000 | 18,502 |
| Long Island NY Power Authority Electric System Revenue | 5.000% | 9/1/46 | 1,735 | 1,885 |
| Monroe County NY Industrial Development Corp. Revenue (Rochester General Hospital) | 5.000% | 12/1/46 | 3,000 | 3,201 |
| Nassau County NY Local Economic Assistance & Financing Corp. Revenue | | | | |
| (Winthrop University Hospital Association Project) | 5.000% | 7/1/32 | 3,000 | 3,152 |
| New York City NY GO | 5.000% | 8/1/26 | 8,065 | 9,213 |
| New York City NY GO | 5.000% | 8/1/31 | 5,000 | 5,321 |
| New York City NY GO | 5.000% | 3/1/32 | 5,000 | 5,454 |
| New York City NY GO | 4.000% | 8/1/32 | 5,000 | 5,172 |
| New York City NY GO | 5.000% | 8/1/32 | 5,000 | 5,315 |
| New York City NY GO | 5.000% | 10/1/32 | 5,260 | 5,704 |
| New York City NY GO | 5.000% | 4/1/34 | 7,000 | 7,908 |
| New York City NY GO | 5.000% | 12/1/34 | 16,310 | 18,262 |
| New York City NY GO | 5.000% | 8/1/35 | 1,500 | 1,591 |
| New York City NY GO | 5.000% | 10/1/35 | 5,000 | 5,615 |
| New York City NY GO | 4.000% | 8/1/36 | 7,500 | 7,665 |
| New York City NY GO | 5.000% | 8/1/37 | 7,690 | 8,505 |
| New York City NY GO | 5.000% | 10/1/37 | 5,000 | 5,586 |
| New York City NY GO | 5.000% | 12/1/38 | 14,545 | 16,112 |
| New York City NY Housing Development Corp. Multi-Family Housing Revenue | 4.000% | 11/1/53 | 9,000 | 8,671 |
| New York City NY Industrial Development Agency PILOT Revenue (Yankee Stadium Project) | 0.000% | 3/1/20 (12) | 8,400 | 8,115 |
| New York City NY Industrial Development Agency PILOT Revenue (Yankee Stadium Project) | 0.000% | 3/1/22 (12) | 4,585 | 4,182 |
| New York City NY Industrial Development Agency PILOT Revenue (Yankee Stadium Project) | 0.000% | 3/1/24 (12) | 9,670 | 8,264 |
| New York City NY Municipal Water Finance Authority Water & Sewer System Revenue | 5.000% | 6/15/21 (Prere.) | 13,775 | 14,784 |
| New York City NY Municipal Water Finance Authority Water & Sewer System Revenue | 5.000% | 6/15/21 (Prere.) | 10,000 | 10,732 |
| New York City NY Municipal Water Finance Authority Water & Sewer System Revenue | 5.000% | 6/15/32 | 8,000 | 8,959 |
| New York City NY Municipal Water Finance Authority Water & Sewer System Revenue | 5.000% | 6/15/32 | 6,580 | 6,987 |
305
Long-Term Tax-Exempt Fund
| | | | |
| Face | Market |
| Maturity | Amount | Value• |
| Coupon | Date | ($000) | ($000) |
| New York City NY Municipal Water Finance Authority Water & Sewer System Revenue | 5.000% | 6/15/34 | 3,500 | 3,795 |
| New York City NY Municipal Water Finance Authority Water & Sewer System Revenue | 5.000% | 6/15/34 | 9,000 | 9,819 |
| New York City NY Municipal Water Finance Authority Water & Sewer System Revenue | 5.000% | 6/15/35 | 4,150 | 4,576 |
| New York City NY Municipal Water Finance Authority Water & Sewer System Revenue | 5.000% | 6/15/36 | 5,000 | 5,503 |
| New York City NY Municipal Water Finance Authority Water & Sewer System Revenue | 5.250% | 6/15/37 | 10,000 | 11,372 |
| New York City NY Municipal Water Finance Authority Water & Sewer System Revenue | 5.000% | 6/15/39 | 20,000 | 21,882 |
| New York City NY Municipal Water Finance Authority Water & Sewer System Revenue | 5.375% | 6/15/43 | 21,000 | 22,287 |
| New York City NY Municipal Water Finance Authority Water & Sewer System Revenue | 5.500% | 6/15/43 | 1,500 | 1,596 |
| New York City NY Municipal Water Finance Authority Water & Sewer System Revenue | 5.000% | 6/15/44 | 5,000 | 5,334 |
| New York City NY Municipal Water Finance Authority Water & Sewer System Revenue | 5.000% | 6/15/45 | 6,320 | 6,807 |
| New York City NY Municipal Water Finance Authority Water & Sewer System Revenue | 5.000% | 6/15/46 | 5,000 | 5,436 |
| New York City NY Municipal Water Finance Authority Water & Sewer System Revenue | 5.000% | 6/15/46 | 20,000 | 21,996 |
| New York City NY Municipal Water Finance Authority Water & Sewer System Revenue | 4.000% | 6/15/47 | 1,150 | 1,138 |
| New York City NY Municipal Water Finance Authority Water & Sewer System Revenue | 4.000% | 6/15/48 | 10,000 | 9,863 |
| New York City NY Municipal Water Finance Authority Water & Sewer System Revenue | 5.000% | 6/15/48 | 5,000 | 5,491 |
| New York City NY Transitional Finance Authority Building Aid Revenue | 5.000% | 7/15/31 | 5,000 | 5,410 |
| New York City NY Transitional Finance Authority Building Aid Revenue | 5.000% | 7/15/32 | 16,000 | 17,034 |
| New York City NY Transitional Finance Authority Building Aid Revenue | 5.000% | 7/15/32 | 800 | 865 |
| New York City NY Transitional Finance Authority Building Aid Revenue | 5.000% | 7/15/32 | 4,200 | 4,789 |
| New York City NY Transitional Finance Authority Building Aid Revenue | 5.000% | 7/15/33 | 5,000 | 5,319 |
| New York City NY Transitional Finance Authority Building Aid Revenue | 5.000% | 7/15/37 | 10,000 | 10,761 |
| New York City NY Transitional Finance Authority Building Aid Revenue | 5.250% | 7/15/37 | 2,750 | 2,952 |
| New York City NY Transitional Finance Authority Building Aid Revenue | 4.000% | 7/15/38 | 10,500 | 10,516 |
| New York City NY Transitional Finance Authority Building Aid Revenue | 5.000% | 7/15/40 | 8,000 | 8,701 |
| New York City NY Transitional Finance Authority Future Tax Revenue | 5.000% | 11/1/29 | 15,055 | 16,394 |
| New York City NY Transitional Finance Authority Future Tax Revenue | 5.000% | 2/1/30 | 5,000 | 5,575 |
| New York City NY Transitional Finance Authority Future Tax Revenue | 5.000% | 11/1/31 | 16,965 | 19,221 |
| New York City NY Transitional Finance Authority Future Tax Revenue | 5.000% | 2/1/32 | 10,000 | 11,065 |
| New York City NY Transitional Finance Authority Future Tax Revenue | 5.000% | 2/1/33 | 2,500 | 2,709 |
| New York City NY Transitional Finance Authority Future Tax Revenue | 5.000% | 11/1/33 | 5,000 | 5,360 |
| New York City NY Transitional Finance Authority Future Tax Revenue | 5.000% | 2/1/34 | 4,215 | 4,668 |
| New York City NY Transitional Finance Authority Future Tax Revenue | 5.000% | 5/1/34 | 315 | 319 |
| New York City NY Transitional Finance Authority Future Tax Revenue | 5.000% | 5/1/34 | 15,675 | 17,723 |
| New York City NY Transitional Finance Authority Future Tax Revenue | 5.000% | 8/1/34 | 11,335 | 12,715 |
| New York City NY Transitional Finance Authority Future Tax Revenue | 5.000% | 11/1/34 | 7,000 | 7,775 |
| New York City NY Transitional Finance Authority Future Tax Revenue | 5.000% | 2/1/35 | 8,940 | 9,421 |
| New York City NY Transitional Finance Authority Future Tax Revenue | 5.000% | 11/1/35 | 10,000 | 10,946 |
| New York City NY Transitional Finance Authority Future Tax Revenue | 4.000% | 2/1/36 | 10,000 | 10,112 |
| New York City NY Transitional Finance Authority Future Tax Revenue | 4.000% | 8/1/36 | 8,000 | 8,106 |
| New York City NY Transitional Finance Authority Future Tax Revenue | 5.000% | 2/1/37 | 9,000 | 9,795 |
| New York City NY Transitional Finance Authority Future Tax Revenue | 4.000% | 5/1/37 | 7,000 | 7,086 |
| New York City NY Transitional Finance Authority Future Tax Revenue | 4.000% | 8/1/37 | 6,000 | 6,075 |
| New York City NY Transitional Finance Authority Future Tax Revenue | 5.000% | 8/1/37 | 7,135 | 7,820 |
| New York City NY Transitional Finance Authority Future Tax Revenue | 4.000% | 8/1/38 | 6,190 | 6,263 |
| New York City NY Transitional Finance Authority Future Tax Revenue | 5.000% | 11/1/39 | 15,875 | 16,631 |
| New York City NY Transitional Finance Authority Future Tax Revenue | 5.000% | 5/1/40 | 6,810 | 7,446 |
| New York City NY Transitional Finance Authority Future Tax Revenue | 5.000% | 2/1/41 | 23,000 | 24,973 |
| New York City NY Transitional Finance Authority Future Tax Revenue | 4.000% | 8/1/41 | 5,000 | 4,978 |
| New York City NY Transitional Finance Authority Future Tax Revenue | 5.000% | 2/1/42 | 4,500 | 4,762 |
| New York City NY Transitional Finance Authority Future Tax Revenue | 4.000% | 5/1/42 | 10,510 | 10,447 |
| New York City NY Transitional Finance Authority Future Tax Revenue | 4.000% | 8/1/42 | 10,000 | 9,939 |
| New York City NY Transitional Finance Authority Future Tax Revenue | 4.000% | 8/1/43 | 5,000 | 4,961 |
| New York City NY Transitional Finance Authority Revenue | 4.000% | 8/1/39 | 8,000 | 8,012 |
| New York City NY Transitional Finance Authority Building Aid Revenue | 5.000% | 7/15/33 | 5,000 | 5,669 |
| New York City NY Transitional Finance Authority Building Aid Revenue | 5.000% | 7/15/34 | 5,000 | 5,630 |
| New York City NY Transitional Finance Authority Building Aid Revenue | 5.000% | 7/15/35 | 9,550 | 10,745 |
| New York City NY Transitional Finance Authority Future Tax Secured Revenue | 5.000% | 8/1/38 | 10,000 | 11,203 |
| New York Convention Center Development Corp. Revenue | 0.000% | 11/15/40 | 3,500 | 1,285 |
| New York Convention Center Development Corp. Revenue | 0.000% | 11/15/43 | 2,500 | 793 |
| New York Convention Center Development Corp. Revenue | 5.000% | 11/15/45 | 5,130 | 5,593 |
| 8 New York Counties Tobacco Trust Revenue | 6.250% | 6/1/41 | 14,465 | 14,884 |
| New York Liberty Development Corp. Revenue | 5.000% | 11/15/31 | 3,000 | 3,191 |
| New York Liberty Development Corp. Revenue | 5.000% | 11/15/44 | 7,550 | 7,976 |
| New York Liberty Development Corp. Revenue | 5.750% | 11/15/51 | 18,500 | 20,168 |
| New York Liberty Development Corp. Revenue (Goldman Sachs Headquarters) | 5.250% | 10/1/35 | 10,250 | 12,148 |
| New York Metropolitan Transportation Authority Revenue | 5.250% | 11/15/20 (Prere.) | 7,500 | 7,979 |
| New York Metropolitan Transportation Authority Revenue | 5.250% | 11/15/21 (Prere.) | 4,675 | 5,107 |
| New York Metropolitan Transportation Authority Revenue | 5.250% | 11/15/21 (Prere.) | 1,325 | 1,448 |
| New York Metropolitan Transportation Authority Revenue | 5.000% | 11/15/22 (Prere.) | 4,500 | 4,991 |
| New York Metropolitan Transportation Authority Revenue | 5.000% | 5/15/23 (Prere.) | 5,000 | 5,603 |
306
Long-Term Tax-Exempt Fund
| | | | |
| Face | Market |
| Maturity | Amount | Value• |
| Coupon | Date | ($000) | ($000) |
| New York Metropolitan Transportation Authority Revenue | 5.000% | 5/15/23 (Prere.) | 11,935 | 13,376 |
| New York Metropolitan Transportation Authority Revenue | 5.000% | 11/15/30 | 4,750 | 5,127 |
| New York Metropolitan Transportation Authority Revenue | 5.000% | 11/15/30 | 6,000 | 6,595 |
| New York Metropolitan Transportation Authority Revenue | 5.000% | 11/15/31 | 6,030 | 6,618 |
| New York Metropolitan Transportation Authority Revenue | 5.250% | 11/15/31 | 10,000 | 11,282 |
| New York Metropolitan Transportation Authority Revenue | 5.000% | 11/15/33 | 5,400 | 5,807 |
| New York Metropolitan Transportation Authority Revenue | 5.250% | 11/15/37 | 11,105 | 12,222 |
| New York Metropolitan Transportation Authority Revenue | 5.000% | 11/15/38 | 5,000 | 5,325 |
| New York Metropolitan Transportation Authority Revenue | 5.000% | 11/15/38 | 8,550 | 9,106 |
| New York Metropolitan Transportation Authority Revenue | 5.000% | 11/15/45 | 7,000 | 7,478 |
| New York Metropolitan Transportation Authority Revenue | 5.250% | 11/15/56 | 4,625 | 5,029 |
| New York Metropolitan Transportation Authority Revenue | 5.250% | 11/15/56 | 5,500 | 6,008 |
| New York Metropolitan Transportation Authority Revenue | 5.250% | 11/15/57 | 3,000 | 3,280 |
| New York Metropolitan Transportation Authority Revenue (Dedicated Petroleum Tax) | 5.000% | 11/15/19 (Prere.) | 3,750 | 3,869 |
| New York Metropolitan Transportation Authority Revenue (Dedicated Tax Fund) | 5.000% | 11/15/21 (Prere.) | 3,000 | 3,256 |
| New York Metropolitan Transportation Authority Revenue (Dedicated Tax Fund) | 5.000% | 11/15/21 (Prere.) | 5,000 | 5,426 |
| New York Metropolitan Transportation Authority Revenue (Dedicated Tax Fund) | 5.125% | 11/15/21 (Prere.) | 2,000 | 2,178 |
| New York Metropolitan Transportation Authority Revenue (Dedicated Tax Fund) | 5.000% | 11/15/28 | 10,250 | 11,178 |
| New York Metropolitan Transportation Authority Revenue (Dedicated Tax Fund) | 5.250% | 11/15/29 | 11,530 | 13,442 |
| New York Metropolitan Transportation Authority Revenue (Dedicated Tax Fund) | 5.250% | 11/15/32 | 18,220 | 20,973 |
| New York Metropolitan Transportation Authority Revenue (Dedicated Tax Fund) | 5.000% | 11/15/36 | 9,155 | 10,218 |
| New York Metropolitan Transportation Authority Revenue (Hudson Yards Development) | 5.000% | 11/15/51 | 12,925 | 13,581 |
| New York Metropolitan Transportation Authority Revenue (Transit Revenue) | 5.000% | 11/15/21 (Prere.) | 3,000 | 3,256 |
| New York Metropolitan Transportation Authority Revenue (Transit Revenue) | 5.000% | 11/1/25 | 5,575 | 6,051 |
| New York Metropolitan Transportation Authority Revenue (Transit Revenue) | 5.000% | 11/15/38 | 10,035 | 10,753 |
| 8 New York Metropolitan Transportation Authority Revenue (Transit Revenue) TOB VRDO | 1.660% | 11/7/18 LOC | 13,955 | 13,955 |
| New York NY GO | 3.500% | 4/1/46 | 5,110 | 4,631 |
| New York State Dormitory Authority Revenue | 5.000% | 3/15/29 | 33,090 | 38,636 |
| New York State Dormitory Authority Revenue | 5.000% | 10/1/32 | 5,000 | 5,625 |
| New York State Dormitory Authority Revenue | 5.000% | 10/1/33 | 3,000 | 3,359 |
| New York State Dormitory Authority Revenue | 5.000% | 7/1/36 | 2,000 | 2,262 |
| New York State Dormitory Authority Revenue | 5.000% | 7/1/38 | 2,900 | 3,262 |
| New York State Dormitory Authority Revenue | 4.000% | 3/15/48 | 29,000 | 28,999 |
| New York State Dormitory Authority Revenue (Mental Health Services Facilities Improvement) | 5.000% | 8/15/19 (ETM) | 10 | 10 |
| New York State Dormitory Authority Revenue (New York University) | 5.750% | 7/1/27 (14) | 10,000 | 11,638 |
| New York State Dormitory Authority Revenue (New York University) | 5.000% | 7/1/37 | 2,300 | 2,484 |
| New York State Dormitory Authority Revenue (Personal Income Tax) | 5.000% | 12/15/21 (ETM) | 5 | 5 |
| New York State Dormitory Authority Revenue (Personal Income Tax) | 5.000% | 12/15/30 | 26,330 | 28,707 |
| New York State Dormitory Authority Revenue (Personal Income Tax) | 4.000% | 2/15/31 | 7,000 | 7,222 |
| New York State Dormitory Authority Revenue (Personal Income Tax) | 5.000% | 2/15/31 | 9,120 | 9,769 |
| New York State Dormitory Authority Revenue (Personal Income Tax) | 5.000% | 3/15/33 | 10,000 | 10,706 |
| New York State Dormitory Authority Revenue (Personal Income Tax) | 5.000% | 3/15/34 | 22,000 | 23,231 |
| New York State Dormitory Authority Revenue (Personal Income Tax) | 4.000% | 2/15/36 | 10,000 | 10,162 |
| New York State Dormitory Authority Revenue (Personal Income Tax) | 5.000% | 2/15/36 | 10,000 | 11,101 |
| New York State Dormitory Authority Revenue (Personal Income Tax) | 5.000% | 2/15/37 | 2,250 | 2,399 |
| New York State Dormitory Authority Revenue (Personal Income Tax) | 5.000% | 3/15/38 | 7,500 | 8,203 |
| New York State Dormitory Authority Revenue (Personal Income Tax) | 5.000% | 2/15/39 | 20,000 | 21,761 |
| New York State Dormitory Authority Revenue (Personal Income Tax) | 4.000% | 2/15/44 | 20,000 | 19,999 |
| New York State Dormitory Authority Revenue (The New School) | 6.000% | 7/1/20 (Prere.) | 5,000 | 5,320 |
| New York State Dormitory Authority Revenue (The New School) | 5.000% | 7/1/46 | 1,000 | 1,084 |
| New York State Dormitory Authority Sales Tax Revenue | 5.000% | 3/15/30 | 10,000 | 11,385 |
| New York State Dormitory Authority Sales Tax Revenue | 5.000% | 3/15/34 | 1,300 | 1,446 |
| New York State Dormitory Authority Sales Tax Revenue | 5.000% | 3/15/37 | 3,805 | 4,267 |
| New York State Dormitory Authority Sales Tax Revenue | 5.000% | 3/15/38 | 22,110 | 24,857 |
| New York State Dormitory Authority Sales Tax Revenue | 5.000% | 3/15/38 | 10,705 | 11,978 |
| New York State Dormitory Authority Sales Tax Revenue | 5.000% | 3/15/38 | 5,000 | 5,594 |
| New York State Dormitory Authority Sales Tax Revenue | 5.000% | 3/15/39 | 18,000 | 19,916 |
| New York State Dormitory Authority Sales Tax Revenue | 5.000% | 3/15/40 | 5,000 | 5,565 |
| New York State Environmental Facilities Corp. Revenue | | | | |
| (State Clean Water & Drinking Water Revolving Funds) | 5.000% | 6/15/29 | 5,860 | 6,433 |
| New York State Environmental Facilities Corp. Revenue | | | | |
| (State Clean Water & Drinking Water Revolving Funds) | 5.000% | 6/15/36 | 3,500 | 3,725 |
| New York State Environmental Facilities Corp. Revenue (State Revolving Funds) | 5.000% | 5/15/43 | 5,000 | 5,414 |
| New York State Thruway Authority Revenue | 5.000% | 1/1/29 | 2,000 | 2,313 |
| New York State Thruway Authority Revenue | 5.000% | 1/1/30 | 2,065 | 2,374 |
| New York State Thruway Authority Revenue (Highway & Bridge Trust Fund) | 5.000% | 4/1/30 | 5,000 | 5,418 |
| New York State Thruway Authority Revenue (Highway & Bridge Trust Fund) | 5.000% | 4/1/31 | 6,265 | 6,785 |
| New York State Urban Development Corp. Revenue (Personal Income Tax) | 5.000% | 3/15/29 | 5,025 | 5,713 |
| New York State Urban Development Corp. Revenue (Personal Income Tax) | 5.000% | 3/15/32 | 11,170 | 12,198 |
307
Long-Term Tax-Exempt Fund
| | | | |
| Face | Market |
| Maturity | Amount | Value• |
| Coupon | Date | ($000) | ($000) |
| New York State Urban Development Corp. Revenue (Personal Income Tax) | 5.000% | 3/15/32 | 5,835 | 6,461 |
| New York State Urban Development Corp. Revenue (Personal Income Tax) | 5.000% | 3/15/33 | 10,000 | 10,899 |
| Port Authority of New York & New Jersey Revenue | 5.000% | 10/15/28 | 4,000 | 4,566 |
| Port Authority of New York & New Jersey Revenue | 5.000% | 10/15/31 | 2,000 | 2,245 |
| Port Authority of New York & New Jersey Revenue | 5.000% | 9/1/33 | 3,905 | 4,346 |
| Port Authority of New York & New Jersey Revenue | 5.250% | 11/15/56 | 10,000 | 11,069 |
| Port Authority of New York & New Jersey Special Obligation Revenue | | | | |
| (John F. Kennedy International Air Terminal LLC) | 6.000% | 12/1/42 | 10,000 | 10,707 |
| Tobacco Settlement Financing Corp. New York Revenue | 5.000% | 6/1/28 | 5,500 | 6,026 |
| Tobacco Settlement Financing Corp. New York Revenue | 5.000% | 6/1/35 | 6,020 | 6,382 |
| Tobacco Settlement Financing Corp. New York Revenue | 5.000% | 6/1/45 | 20,000 | 19,653 |
| Triborough Bridge & Tunnel Authority New York Revenue | 6.125% | 1/1/21 (ETM) | 6,140 | 6,371 |
| Triborough Bridge & Tunnel Authority New York Revenue | 5.000% | 11/15/29 | 6,710 | 7,648 |
| Triborough Bridge & Tunnel Authority New York Revenue | 5.000% | 11/15/38 | 7,000 | 7,780 |
| Triborough Bridge & Tunnel Authority New York Revenue | 5.000% | 11/15/47 | 5,500 | 6,053 |
| Utility Debt Securitization Authority New York Revenue | 5.000% | 12/15/32 | 14,480 | 16,334 |
| Utility Debt Securitization Authority New York Revenue | 4.000% | 12/15/37 | 7,500 | 7,706 |
| Utility Debt Securitization Authority New York Revenue | 5.000% | 12/15/37 | 19,000 | 21,046 |
| Westchester County NY Local Development Corp. Revenue (Westchester Medical Center) | 5.000% | 11/1/46 | 9,835 | 10,211 |
| | | | 1,649,460 |
| North Carolina (0.9%) | | | | |
| Board of Governors of the University of North Carolina Revenue | | | | |
| (University of North Carolina at Charlotte) | 5.000% | 10/1/42 | 4,500 | 4,962 |
| Board of Governors of the University of North Carolina Revenue | | | | |
| (University of North Carolina at Charlotte) | 5.000% | 10/1/47 | 5,350 | 5,878 |
| Buncombe County NC Limited Obligation Revenue | 5.000% | 6/1/28 | 1,500 | 1,697 |
| Cabarrus County NC Installment Financing Contract Revenue | 5.000% | 4/1/28 | 1,000 | 1,140 |
| Cabarrus County NC Installment Financing Contract Revenue | 5.000% | 4/1/30 | 1,000 | 1,129 |
| Cabarrus County NC Installment Financing Contract Revenue | 5.000% | 4/1/32 | 1,825 | 2,048 |
| Cabarrus County NC Installment Financing Contract Revenue | 4.000% | 6/1/34 | 1,000 | 1,032 |
| Charlotte NC Airport Revenue | 5.000% | 7/1/36 | 2,000 | 2,120 |
| New Hanover County NC Hospital Revenue (New Hanover Regional Medical Center Project) | 4.000% | 10/1/31 | 3,010 | 3,053 |
| North Carolina Capital Facilities Finance Agency Revenue (Duke University Project) | 5.000% | 10/1/55 | 6,000 | 6,602 |
| North Carolina GAN | 5.000% | 3/1/28 | 20,020 | 22,460 |
| North Carolina Medical Care Commission Health Care Facilities Revenue (Vidant Health) | 5.000% | 6/1/36 | 580 | 614 |
| North Carolina Medical Care Commission Hospital Revenue (North Carolina Baptist Hospital) | 5.250% | 6/1/29 | 3,025 | 3,159 |
| North Carolina Medical Care Commission Retirement Facilities Mortgage Revenue | | | | |
| (Salemtowne Project) | 5.375% | 10/1/45 | 10,000 | 10,454 |
| North Carolina Medical Care Commission Retirement Facilities Revenue | | | | |
| (United Methodist Retirement Homes Inc.) | 5.000% | 10/1/37 | 1,100 | 1,151 |
| North Carolina Medical Care Commission Retirement Facilities Revenue | | | | |
| (United Methodist Retirement Homes Inc.) | 5.000% | 10/1/42 | 1,155 | 1,200 |
| North Carolina Medical Care Commission Retirement Facilities Revenue | | | | |
| (United Methodist Retirement Homes Inc.) | 5.000% | 10/1/47 | 2,500 | 2,581 |
| North Carolina Municipal Power Agency No. 1 Revenue (Catawba Electric) | 5.000% | 1/1/31 | 12,000 | 13,356 |
| University of North Carolina at Charlotte Revenue | 4.000% | 10/1/36 | 1,130 | 1,150 |
| University of North Carolina at Charlotte Revenue | 4.000% | 10/1/37 | 1,105 | 1,120 |
| University of North Carolina at Greensboro Revenue | 4.000% | 4/1/33 | 1,750 | 1,813 |
| University of North Carolina Hospitals at Chapel Hill Revenue | 5.000% | 2/1/46 | 5,000 | 5,378 |
| Winston-Salem NC Water & Sewer System Revenue | 4.000% | 6/1/30 | 1,610 | 1,707 |
| Winston-Salem NC Water & Sewer System Revenue | 4.000% | 6/1/31 | 1,500 | 1,581 |
| Winston-Salem NC Water & Sewer System Revenue | 4.000% | 6/1/32 | 2,000 | 2,093 |
| | | | 99,478 |
| North Dakota (0.1%) | | | | |
| Ward County ND Health Care Facilities Revenue (Trinity Health Obligated Group) | 5.000% | 6/1/48 | 4,000 | 4,092 |
| Ward County ND Health Care Facilities Revenue (Trinity Health Obligated Group) | 5.000% | 6/1/53 | 5,000 | 5,095 |
| | | | 9,187 |
| Ohio (3.3%) | | | | |
| Akron OH Bath & Copley Joint Township Hospital District Revenue | | | | |
| (Summa Health System Obligated Group) | 5.250% | 11/15/46 | 18,000 | 19,151 |
| Allen County OH Hospital Facilities Revenue (Catholic Healthcare Partners) | 5.250% | 9/1/20 (Prere.) | 10,000 | 10,533 |
| Allen County OH Hospital Facilities Revenue (Catholic Healthcare Partners) | 5.000% | 5/1/42 | 1,300 | 1,376 |
| Allen County OH Hospital Facilities Revenue (Mercy Health) | 4.000% | 8/1/36 | 2,250 | 2,216 |
| Allen County OH Hospital Facilities Revenue (Mercy Health) | 4.000% | 8/1/37 | 3,750 | 3,648 |
| Allen County OH Hospital Facilities Revenue (Mercy Health) | 4.000% | 8/1/38 | 7,600 | 7,367 |
| American Municipal Power Ohio Inc. Revenue (Fremont Energy Center Project) | 5.000% | 2/15/22 (Prere.) | 4,000 | 4,341 |
| American Municipal Power Ohio Inc. Revenue (Prairie State Energy Campus Project) | 5.000% | 2/15/36 | 2,445 | 2,689 |
| Big Walnut OH School District School Facilities Construction & Improvement GO | 5.000% | 12/1/55 | 6,000 | 6,619 |
| Bluffton OH Hospital Facilities Revenue (Blanchard Valley Health System Obligated Group) | 4.000% | 12/1/33 | 2,050 | 2,029 |
308
Long-Term Tax-Exempt Fund
| | | | |
| Face | Market |
| Maturity | Amount | Value• |
| Coupon | Date | ($000) | ($000) |
| Brunswick OH City School District GO | 5.250% | 12/1/48 | 4,000 | 4,390 |
| Brunswick OH City School District GO | 5.250% | 12/1/53 | 8,200 | 8,962 |
| Butler County OH Hospital Facilities Revenue (Kettering Health Network) | 6.375% | 4/1/36 | 5,490 | 5,970 |
| Butler County OH Hospital Facilities Revenue (Kettering Health Network) | 5.625% | 4/1/41 | 5,000 | 5,320 |
| Butler County OH Hospital Facilities Revenue (UC Health) | 5.000% 11/15/45 | 8,810 | 9,354 |
| Cleveland OH Water Revenue | 4.000% | 1/1/31 | 1,355 | 1,402 |
| Cleveland OH Water Revenue | 4.000% | 1/1/32 | 1,500 | 1,546 |
| Cleveland-Cuyahoga County OH Port Authority Revenue | | | | |
| (Euclid Avenue Development Corp. Project) | 5.000% | 8/1/33 | 3,510 | 3,784 |
| Cleveland-Cuyahoga County OH Port Authority Revenue | | | | |
| (Euclid Avenue Development Corp. Project) | 5.000% | 8/1/34 | 3,690 | 3,970 |
| Columbus OH City School District GO | 5.000% | 12/1/42 | 8,000 | 8,826 |
| Cuyahoga County OH Hospital Revenue (MetroHealth System) | 5.000% | 2/15/42 | 14,500 | 14,955 |
| Cuyahoga County OH Hospital Revenue (MetroHealth System) | 4.750% | 2/15/47 | 10,100 | 9,794 |
| Cuyahoga County OH Hospital Revenue (MetroHealth System) | 5.250% | 2/15/47 | 2,000 | 2,101 |
| Cuyahoga County OH Hospital Revenue (MetroHealth System) | 5.500% | 2/15/52 | 3,000 | 3,159 |
| Cuyahoga County OH Hospital Revenue (MetroHealth System) | 5.500% | 2/15/57 | 5,000 | 5,244 |
| Cuyahoga OH Community College District GO | 4.000% | 12/1/34 | 3,000 | 3,093 |
| Euclid OH City School District GO | 4.750% | 1/15/54 | 6,685 | 6,924 |
| Franklin County OH Health Care Facilities Improvement Revenue (OPRS Communities) | 5.000% | 7/1/29 | 2,235 | 2,380 |
| Franklin County OH Health Care Facilities Improvement Revenue (OPRS Communities) | 5.000% | 7/1/38 | 11,975 | 12,493 |
| Franklin County OH Hospital Facilities Revenue (OhioHealth Corp.) | 4.000% | 5/15/47 | 9,000 | 8,746 |
| Franklin County OH Revenue (Trinity Health Corp.) | 5.000% | 12/1/47 | 2,380 | 2,560 |
| Hamilton County OH Hospital Facilities Revenue (TriHealth Obligated Group) | 5.000% | 8/15/42 | 30,000 | 32,110 |
| Hamilton County OH Sales Tax Revenue | 4.000% | 12/1/32 | 4,700 | 4,841 |
| Highland OH Local School District GO | 5.250% | 12/1/54 | 3,000 | 3,276 |
| Lucas County OH Hospital Revenue (ProMedica Healthcare Obligated Group) | 5.000% | 11/15/21 (Prere.) | 1,875 | 2,024 |
| Lucas County OH Hospital Revenue (ProMedica Healthcare Obligated Group) | 5.250% | 11/15/21 (Prere.) | 1,155 | 1,255 |
| Lucas County OH Hospital Revenue (ProMedica Healthcare Obligated Group) | 5.250% | 11/15/21 (Prere.) | 2,135 | 2,320 |
| Lucas County OH Hospital Revenue (ProMedica Healthcare Obligated Group) | 6.000% | 11/15/21 (Prere.) | 3,220 | 3,569 |
| Lucas County OH Hospital Revenue (ProMedica Healthcare Obligated Group) | 5.000% | 11/15/29 | 3,395 | 3,534 |
| Lucas County OH Hospital Revenue (ProMedica Healthcare Obligated Group) | 5.250% | 11/15/48 | 7,250 | 7,566 |
| North Royalton OH City School District GO | 4.000% | 12/1/32 | 600 | 619 |
| Northeast Ohio Regional Sewer District Wastewater Revenue | 5.000% | 11/15/49 | 5,000 | 5,464 |
| Ohio GO | 5.000% | 6/15/30 | 8,995 | 10,195 |
| Ohio GO | 5.000% | 2/1/32 | 10,000 | 11,238 |
| Ohio GO | 5.000% | 2/1/34 | 8,490 | 9,483 |
| Ohio GO | 5.000% | 2/1/36 | 9,885 | 10,973 |
| Ohio Hospital Revenue (University Hospitals Health System Inc.) | 5.000% | 1/15/41 | 1,750 | 1,822 |
| Ohio Infrastructure Improvement GO | 5.000% | 9/1/36 | 12,030 | 13,238 |
| Ohio Infrastructure Improvement GO | 5.000% | 9/1/37 | 9,650 | 10,604 |
| Ohio State University General Receipts Revenue | 5.000% | 6/1/38 | 7,000 | 7,614 |
| Ohio Turnpike Commission Turnpike Revenue | 4.000% | 2/15/30 | 7,570 | 7,898 |
| Ohio Turnpike Commission Turnpike Revenue | 4.000% | 2/15/31 | 19,600 | 20,355 |
| Ohio Water Development Authority Water Pollution Control Loan Fund Revenue | 5.000% | 6/1/29 | 20,000 | 23,186 |
| Union County OH Memorial Hospital Revenue | 5.000% | 12/1/47 | 2,500 | 2,712 |
| Upper Arlington OH School District GO | 5.000% | 12/1/48 | 4,000 | 4,447 |
| | | | 385,285 |
| Oklahoma (0.4%) | | | | |
| Edmond OK Public Works Authority Sales Tax & Utility System Revenue | 5.000% | 7/1/47 | 2,000 | 2,201 |
| Oklahoma Capitol Improvement Authority Highway Improvement Revenue | 4.000% | 7/1/34 | 2,000 | 2,071 |
| Oklahoma City OK Water Utilities Trust Water & Sewer Revenue | 5.000% | 7/1/38 | 5,500 | 6,140 |
| Oklahoma Turnpike Authority Revenue | 4.000% | 1/1/35 | 5,000 | 5,128 |
| Oklahoma Turnpike Authority Revenue | 4.000% | 1/1/36 | 5,030 | 5,127 |
| Oklahoma Turnpike Authority Revenue | 5.000% | 1/1/47 | 5,000 | 5,487 |
| Oklahoma Turnpike Authority Revenue | 4.000% | 1/1/48 | 8,890 | 8,754 |
| Tulsa County OK Public Facilities Authority Revenue | 4.000% | 10/1/30 | 12,575 | 13,077 |
| | | | 47,985 |
| Oregon (1.2%) | | | | |
| Clackamas County OR School District No. 7J Lake Oswego GO | 4.000% | 6/1/33 | 1,400 | 1,457 |
| Clackamas County OR School District No. 7J Lake Oswego GO | 4.000% | 6/1/34 | 1,575 | 1,628 |
| Clackamas County OR School District No. 7J Lake Oswego GO | 4.000% | 6/1/39 | 6,000 | 6,091 |
| Clackamas County OR School District No. 7J Lake Oswego GO | 4.000% | 6/1/43 | 4,000 | 4,014 |
| Deschutes County OR Hospital Facilities Authority Revenue (St. Charles Memorial Hospital Inc.) | 4.000% | 1/1/33 | 1,000 | 1,007 |
| Deschutes County OR Hospital Facilities Authority Revenue (St. Charles Memorial Hospital Inc.) | 4.000% | 1/1/34 | 500 | 502 |
| Deschutes County OR Hospital Facilities Authority Revenue (St. Charles Memorial Hospital Inc.) | 4.000% | 1/1/35 | 1,000 | 999 |
| Deschutes County OR Hospital Facilities Authority Revenue (St. Charles Memorial Hospital Inc.) | 5.000% | 1/1/48 | 5,000 | 5,289 |
| Eugene OR Electric Utility System Revenue | 4.000% | 8/1/31 | 700 | 733 |
| Multnomah County OR GO | 4.000% | 6/1/39 | 3,405 | 3,482 |
309
Long-Term Tax-Exempt Fund
| | | | |
| Face | Market |
| Maturity | Amount | Value• |
| Coupon | Date | ($000) | ($000) |
| Multnomah County OR GO | 4.000% | 6/1/40 | 3,545 | 3,617 |
| Multnomah County OR GO | 4.000% | 6/1/41 | 3,685 | 3,757 |
| Multnomah County OR GO | 4.000% | 6/1/42 | 3,830 | 3,874 |
| Oregon Department of Administrative Services Lottery Revenue | 5.250% | 4/1/30 | 555 | 592 |
| Oregon Department of Administrative Services Lottery Revenue | 5.000% | 4/1/31 | 3,670 | 4,200 |
| Oregon Department of Administrative Services Lottery Revenue | 5.000% | 4/1/32 | 4,000 | 4,559 |
| Oregon Department of Administrative Services Lottery Revenue | 5.000% | 4/1/37 | 6,185 | 6,918 |
| Oregon Department of Transportation Highway User Tax Revenue | 5.000% | 11/15/30 | 4,365 | 4,903 |
| Oregon Facilities Authority Revenue (Reed College Projects) | 4.000% | 7/1/41 | 4,700 | 4,741 |
| Oregon GO | 5.000% | 5/1/31 | 685 | 796 |
| Oregon GO | 5.000% | 6/1/31 | 645 | 750 |
| Oregon GO | 5.000% | 5/1/32 | 460 | 532 |
| Oregon GO | 5.000% | 6/1/32 | 305 | 353 |
| Oregon GO | 4.000% | 8/1/32 | 3,000 | 3,158 |
| Oregon GO | 5.000% | 5/1/33 | 280 | 323 |
| Oregon GO | 5.000% | 6/1/33 | 390 | 450 |
| Oregon GO | 5.000% | 5/1/34 | 1,280 | 1,469 |
| Oregon GO | 5.000% | 6/1/34 | 500 | 574 |
| Oregon GO | 5.000% | 6/1/35 | 500 | 572 |
| Oregon GO | 5.000% | 5/1/36 | 1,000 | 1,139 |
| Oregon GO | 5.000% | 6/1/36 | 685 | 781 |
| Oregon GO | 5.000% | 5/1/37 | 700 | 795 |
| Oregon GO | 5.000% | 6/1/37 | 1,560 | 1,774 |
| Oregon GO | 5.000% | 5/1/38 | 650 | 736 |
| Port of Portland OR International Airport Revenue | 5.000% | 7/1/47 | 3,000 | 3,277 |
| Portland OR Sewer System Revenue | 4.500% | 5/1/32 | 9,475 | 10,257 |
| Salem OR Hospital Facilities Authority Revenue (Capital Manor Inc.) | 5.000% | 5/15/43 | 750 | 799 |
| Salem OR Hospital Facilities Authority Revenue (Capital Manor Inc.) | 5.000% | 5/15/48 | 1,000 | 1,061 |
| Salem OR Hospital Facilities Authority Revenue (Capital Manor Inc.) | 5.000% | 5/15/53 | 2,500 | 2,640 |
| Salem OR Hospital Facilities Authority Revenue (Salem Health Project) | 5.000% | 5/15/46 | 5,000 | 5,339 |
| Tri-County Metropolitan Transportation District of Oregon Capital Grant Receipt Revenue | 5.000% | 10/1/29 | 5,020 | 5,736 |
| Tri-County Metropolitan Transportation District of Oregon Capital Grant Receipt Revenue | 5.000% | 10/1/30 | 4,760 | 5,410 |
| Tri-County Metropolitan Transportation District of Oregon Payroll Tax Revenue | 5.000% | 9/1/43 | 17,000 | 18,990 |
| Umatilla County OR Hospital Facility Authority Revenue (Catholic Health Initiatives) | 5.000% | 5/1/22 | 7,585 | 7,648 |
| Washington & Clackamas Counties OR School District No. 23J GO | 5.000% | 6/15/33 | 2,850 | 3,234 |
| | | | 140,956 |
| Pennsylvania (5.4%) | | | | |
| 2 Allegheny County PA GO | 5.000% | 11/1/28 | 5,045 | 5,742 |
| Allegheny County PA Hospital Development Authority Revenue | 4.000% | 4/1/44 | 5,000 | 4,667 |
| Allegheny County PA Hospital Development Authority Revenue | 5.000% | 4/1/47 | 16,000 | 16,897 |
| Allegheny County PA Port Authority Revenue | 5.750% | 3/1/29 | 8,000 | 8,607 |
| Allegheny County PA Sanitary Authority Sewer Revenue | 5.000% | 6/1/43 | 3,000 | 3,287 |
| Allegheny County PA Sanitary Authority Sewer Revenue | 4.000% | 6/1/48 | 3,500 | 3,382 |
| Altoona PA Area School District PA GO | 5.000% | 12/1/39 (15) | 2,000 | 2,168 |
| Altoona PA Area School District PA GO | 5.000% | 12/1/45 (15) | 1,500 | 1,618 |
| Berks County PA Industrial Development Authority Health System Revenue (Tower Health Project) | 5.000% | 11/1/36 | 1,815 | 1,948 |
| Berks County PA Industrial Development Authority Health System Revenue (Tower Health Project) | 5.000% | 11/1/37 | 2,500 | 2,674 |
| Berks County PA Industrial Development Authority Health System Revenue (Tower Health Project) | 5.000% | 11/1/50 | 7,500 | 7,883 |
| Centre County PA Hospital Authority Revenue (Mount Nittany Medical Center Project) | 5.000% | 11/15/32 | 3,000 | 3,223 |
| Cheltenham Township PA School District GO | 5.000% | 3/15/41 | 15,210 | 16,439 |
| Chester County PA Health & Education Facilities Authority Revenue | | | | |
| (Main Line Health System Inc. Obligated Group) | 5.000% | 10/1/32 | 1,490 | 1,677 |
| Chester County PA Health & Education Facilities Authority Revenue | | | | |
| (Main Line Health System Inc. Obligated Group) | 4.000% | 10/1/36 | 1,800 | 1,811 |
| Chester County PA Health & Education Facilities Authority Revenue | | | | |
| (Main Line Health System Inc. Obligated Group) | 4.000% | 10/1/42 | 6,000 | 5,891 |
| Commonwealth Financing Authority Pennsylvania Revenue | 5.000% | 6/1/34 | 1,875 | 2,053 |
| Commonwealth Financing Authority Pennsylvania Revenue | 5.000% | 6/1/35 | 6,000 | 6,543 |
| Commonwealth Financing Authority Pennsylvania Revenue | 4.000% | 6/1/39 (4) | 2,625 | 2,574 |
| Delaware County PA Authority University Revenue (Villanova University) | 4.000% | 12/1/30 | 1,905 | 1,986 |
| Delaware County PA Authority University Revenue (Villanova University) | 5.000% | 8/1/31 | 825 | 924 |
| Delaware County PA Authority University Revenue (Villanova University) | 5.000% | 8/1/32 | 920 | 1,029 |
| Delaware County PA Authority University Revenue (Villanova University) | 5.000% | 8/1/33 | 2,625 | 2,928 |
| Delaware County PA Authority University Revenue (Villanova University) | 5.000% | 8/1/34 | 2,000 | 2,224 |
| Delaware County PA Authority University Revenue (Villanova University) | 5.000% | 8/1/35 | 2,160 | 2,397 |
| Delaware River Port Authority Pennsylvania & New Jersey Revenue VRDO | 1.580% | 11/7/18 LOC | 4,400 | 4,400 |
| Franklin County PA Industrial Development Authority Revenue (Chambersburg Hospital Project) | 5.375% | 7/1/42 | 4,325 | 4,511 |
| Geisinger Authority Health System Pennsylvania Revenue (Geisinger Health System) | 5.000% | 2/15/39 | 5,600 | 6,107 |
| Geisinger Authority Health System Pennsylvania Revenue (Geisinger Health System) | 4.000% | 2/15/47 | 5,000 | 4,843 |
310
Long-Term Tax-Exempt Fund
| | | | | |
| Face | Market |
| Maturity | Amount | Value• |
| | Coupon | Date | ($000) | ($000) |
| Monroe County PA Hospital Authority Revenue (Pocono Medical Center) | 5.000% | 7/1/36 | 2,000 | 2,161 |
| Monroeville PA Finance Authority Revenue (UPMC Health System) | 5.000% | 2/15/27 | 3,155 | 3,625 |
| Montgomery County PA Higher Education & Health Authority Revenue (Hill School Project) | 4.000% | 8/15/50 | 4,000 | 3,760 |
| Montgomery County PA Higher Education & Health Authority Revenue | | | | |
| | (Thomas Jefferson University) | 5.000% | 9/1/32 | 2,625 | 2,931 |
| Montgomery County PA Higher Education & Health Authority Revenue | | | | |
| | (Thomas Jefferson University) | 5.000% | 9/1/33 | 2,000 | 2,221 |
| Montgomery County PA Industrial Development Authority Health Services Revenue | | | | |
| | (Albert Einstein Healthcare Network) | 5.250% | 1/15/45 | 5,000 | 5,267 |
| Montgomery County PA Industrial Development Authority Revenue | | | | |
| | (Philadelphia Presbyterian Homes Inc. Project) | 7.000% | 12/1/21 (Prere.) | 3,000 | 3,419 |
| Montgomery County PA Industrial Development Authority Revenue | | | | |
| | (Philadelphia Presbyterian Homes Inc. Project) | 7.000% | 12/1/21 (Prere.) | 2,390 | 2,724 |
| Moon Industrial Development Authority Pennsylvania Revenue | | | | |
| | (Baptist Home Society Obligated Group) | 6.000% | 7/1/45 | 6,140 | 6,420 |
| Moon Industrial Development Authority Pennsylvania Revenue | | | | |
| | (Baptist Home Society Obligated Group) | 6.125% | 7/1/50 | 5,015 | 5,264 |
| Mount Lebanon PA Hospital Authority Revenue (St. Clair Memorial Hospital Project) | 4.000% | 7/1/48 | 12,000 | 11,438 |
| Pennsylvania COP | 5.000% | 7/1/43 | 2,000 | 2,137 |
| Pennsylvania Economic Development Financing Authority Revenue (UPMC Obligated Group) | 5.000% | 2/1/30 | 13,955 | 15,302 |
| Pennsylvania Economic Development Financing Authority Revenue (UPMC Obligated Group) | 5.000% | 2/1/34 | 3,000 | 3,252 |
| Pennsylvania Economic Development Financing Authority Revenue (UPMC Obligated Group) | 4.000% | 11/15/35 | 6,660 | 6,644 |
| Pennsylvania Economic Development Financing Authority Revenue (UPMC Obligated Group) | 5.000% | 7/1/38 | 12,000 | 12,848 |
| Pennsylvania GO | 4.000% | 8/15/28 (4) | 15,000 | 15,792 |
| Pennsylvania GO | 4.000% | 3/1/33 (4) | 10,000 | 10,171 |
| Pennsylvania GO | 4.000% | 3/1/34 (4) | 10,000 | 10,140 |
| Pennsylvania Higher Educational Facilities Authority Revenue (Bryn Mawr College) | 5.000% | 12/1/38 | 4,500 | 5,026 |
| Pennsylvania Higher Educational Facilities Authority Revenue (Higher Education System) | 5.000% | 6/15/29 | 1,000 | 1,056 |
| Pennsylvania Higher Educational Facilities Authority Revenue (St. Joseph’s University) | 5.000% | 11/1/40 | 5,160 | 5,347 |
| Pennsylvania Higher Educational Facilities Authority Revenue (Temple University) | 5.000% | 4/1/28 | 3,100 | 3,326 |
| Pennsylvania Higher Educational Facilities Authority Revenue (Temple University) | 5.000% | 4/1/30 | 3,000 | 3,207 |
| Pennsylvania Higher Educational Facilities Authority Revenue (Temple University) | 5.000% | 4/1/31 | 1,500 | 1,602 |
| Pennsylvania Higher Educational Facilities Authority Revenue (Temple University) | 5.000% | 4/1/32 | 1,500 | 1,601 |
| Pennsylvania Higher Educational Facilities Authority Revenue (Thomas Jefferson University) | 5.000% | 9/1/45 | 2,000 | 2,157 |
| Pennsylvania Higher Educational Facilities Authority Revenue (Thomas Jefferson University) | 5.250% | 9/1/50 | 18,000 | 19,614 |
| Pennsylvania Higher Educational Facilities Authority Revenue | | | | |
| | (Trustees of the University of Pennsylvania) | 4.000% | 8/15/32 | 2,750 | 2,862 |
| Pennsylvania Higher Educational Facilities Authority Revenue | | | | |
| | (Trustees of the University of Pennsylvania) | 4.000% | 8/15/33 | 1,555 | 1,611 |
| Pennsylvania Higher Educational Facilities Authority Revenue | | | | |
| | (University of Pennsylvania Health System) | 5.000% | 8/15/33 | 2,850 | 3,194 |
| Pennsylvania Higher Educational Facilities Authority Revenue | | | | |
| | (University of Pennsylvania Health System) | 5.000% | 8/15/40 | 8,000 | 8,709 |
| Pennsylvania Higher Educational Facilities Authority Student Housing Revenue | | | | |
| | (University Properties Inc.) | 5.000% | 7/1/42 | 4,790 | 4,866 |
| Pennsylvania State University Revenue | 5.000% | 9/1/27 | 830 | 963 |
| Pennsylvania State University Revenue | 5.000% | 9/1/28 | 1,000 | 1,142 |
| Pennsylvania State University Revenue | 5.000% | 9/1/28 | 3,000 | 3,426 |
| Pennsylvania Turnpike Commission Motor License Fund Revenue | 5.500% | 12/1/23 (Prere.) | 9,015 | 10,335 |
| Pennsylvania Turnpike Commission Motor License Fund Revenue | 5.500% | 12/1/23 (Prere.) | 7,255 | 8,317 |
| Pennsylvania Turnpike Commission Motor License Fund Revenue | 5.000% | 12/1/42 | 1,000 | 1,058 |
| Pennsylvania Turnpike Commission Motor License Fund Revenue | 5.000% | 12/1/43 | 5,000 | 5,289 |
| Pennsylvania Turnpike Commission Oil Franchise Tax Revenue | 5.000% | 12/1/43 | 5,100 | 5,564 |
| Pennsylvania Turnpike Commission Revenue | 5.000% | 6/1/19 (Prere.) | 1,085 | 1,104 |
| Pennsylvania Turnpike Commission Revenue | 5.000% | 6/1/19 (Prere.) | 4,915 | 5,002 |
| Pennsylvania Turnpike Commission Revenue | 5.000% | 12/1/19 (Prere.) | 15,990 | 16,496 |
| Pennsylvania Turnpike Commission Revenue | 6.500% | 12/1/20 (Prere.) | 6,000 | 6,524 |
| Pennsylvania Turnpike Commission Revenue | 5.000% | 6/1/27 | 11,325 | 12,527 |
| Pennsylvania Turnpike Commission Revenue | 5.000% | 6/1/28 | 7,555 | 8,314 |
| Pennsylvania Turnpike Commission Revenue | 5.000% | 6/1/28 | 1,785 | 1,964 |
| Pennsylvania Turnpike Commission Revenue | 5.000% | 6/1/29 | 4,030 | 4,412 |
| Pennsylvania Turnpike Commission Revenue | 5.000% | 6/1/29 (4) | 13,000 | 14,416 |
| Pennsylvania Turnpike Commission Revenue | 5.000% | 12/1/33 | 9,200 | 10,018 |
| 11 | Pennsylvania Turnpike Commission Revenue | 0.000% | 12/1/34 | 3,500 | 3,220 |
| Pennsylvania Turnpike Commission Revenue | 4.000% | 12/1/34 | 11,670 | 11,574 |
| Pennsylvania Turnpike Commission Revenue | 5.000% | 12/1/35 | 5,050 | 5,427 |
| Pennsylvania Turnpike Commission Revenue | 5.000% | 12/1/36 | 14,920 | 15,952 |
| 12 | Pennsylvania Turnpike Commission Revenue | 0.000% | 12/1/37 | 6,000 | 5,510 |
| Pennsylvania Turnpike Commission Revenue | 5.000% | 6/1/39 | 12,270 | 12,999 |
| Pennsylvania Turnpike Commission Revenue | 5.000% | 12/1/39 | 5,025 | 5,403 |
311
Long-Term Tax-Exempt Fund
| | | | |
| Face | Market |
| Maturity | Amount | Value• |
| Coupon | Date | ($000) | ($000) |
| Pennsylvania Turnpike Commission Revenue | 5.000% | 12/1/40 | 16,400 | 17,319 |
| Pennsylvania Turnpike Commission Revenue | 5.000% | 12/1/40 | 6,400 | 6,874 |
| Pennsylvania Turnpike Commission Revenue | 0.000% | 12/1/41 | 11,450 | 3,954 |
| Pennsylvania Turnpike Commission Revenue | 5.250% | 12/1/44 | 12,000 | 13,052 |
| Pennsylvania Turnpike Commission Revenue | 5.250% | 12/1/45 | 3,500 | 3,808 |
| Philadelphia PA Authority for Industrial Development Revenue (Temple University) | 5.000% | 4/1/45 | 6,035 | 6,544 |
| Philadelphia PA Authority for Industrial Development Revenue | | | | |
| (The Children’s Hospital of Philadelphia Project) | 4.000% | 7/1/37 | 5,000 | 5,018 |
| Philadelphia PA Authority for Industrial Development Revenue (Thomas Jefferson University) | 4.000% | 9/1/47 | 6,150 | 5,798 |
| Philadelphia PA Gas Works Revenue | 5.000% | 8/1/34 | 1,115 | 1,228 |
| Philadelphia PA Gas Works Revenue | 5.000% | 8/1/35 | 1,150 | 1,261 |
| Philadelphia PA Gas Works Revenue | 5.000% | 8/1/36 | 1,700 | 1,856 |
| Philadelphia PA Gas Works Revenue | 5.000% | 8/1/37 | 1,600 | 1,742 |
| Philadelphia PA Gas Works Revenue | 5.000% | 8/1/42 | 3,700 | 3,988 |
| Philadelphia PA Gas Works Revenue | 5.000% | 8/1/47 | 7,000 | 7,517 |
| Philadelphia PA GO | 5.000% | 8/1/29 | 5,735 | 6,295 |
| Philadelphia PA Hospitals & Higher Education Facilities Authority Hospital Revenue | | | | |
| (Temple University Health System Obligated Group) | 5.625% | 7/1/42 | 3,000 | 3,152 |
| Philadelphia PA School District GO | 5.000% | 9/1/25 (15) | 5,500 | 6,160 |
| Philadelphia PA Water & Wastewater Revenue | 5.000% | 7/1/45 | 10,500 | 11,269 |
| State Public School Building Authority Pennsylvania Lease Revenue | | | | |
| (School District of Philadelphia) | 5.000% | 6/1/25 (4) | 10,000 | 11,148 |
| State Public School Building Authority Pennsylvania Lease Revenue | | | | |
| (School District of Philadelphia) | 5.000% | 6/1/33 (4) | 2,500 | 2,718 |
| Westmoreland County PA Municipal Authority Revenue | 5.000% | 8/15/23 (Prere.) | 3,000 | 3,352 |
| Westmoreland County PA Municipal Authority Revenue | 5.000% | 8/15/23 (Prere.) | 4,210 | 4,704 |
| York County PA GO | 4.000% | 3/1/35 | 3,000 | 3,056 |
| | | | 628,896 |
| Rhode Island (0.2%) | | | | |
| Rhode Island & Providence Plantations GO | 5.500% | 8/1/21 (Prere.) | 7,355 | 8,007 |
| Rhode Island & Providence Plantations GO | 5.500% | 8/1/21 (Prere.) | 2,520 | 2,743 |
| Rhode Island Housing & Mortgage Finance Corp. Revenue | 4.000% | 10/1/40 | 425 | 435 |
| Tobacco Settlement Financing Corp. Rhode Island Revenue | 5.000% | 6/1/35 | 10,000 | 10,520 |
| | | | 21,705 |
| South Carolina (1.6%) | | | | |
| Charleston County SC Airport District System Revenue | 5.000% | 7/1/43 | 5,000 | 5,409 |
| Charleston County SC GO | 4.000% | 11/1/30 | 5,715 | 6,006 |
| Charleston County SC GO | 4.000% | 11/1/31 | 6,110 | 6,397 |
| Charleston County SC GO | 4.000% | 11/1/32 | 6,520 | 6,790 |
| Charleston SC Educational Excellence Financing Corp. Revenue | | | | |
| (Charleston County School District, South Carolina Project) | 5.000% | 12/1/29 | 2,500 | 2,780 |
| 8 Charleston SC Educational Excellence Financing Corp. Revenue | | | | |
| (Charleston County School District, South Carolina Project) TOB VRDO | 1.650% | 11/7/18 | 7,250 | 7,250 |
| Lexington County SC Health Services District Inc. Hospital Revenue | 4.000% | 11/1/30 | 1,000 | 1,009 |
| Lexington County SC Health Services District Inc. Hospital Revenue | 4.000% | 11/1/32 | 1,400 | 1,403 |
| Lexington County SC Health Services District Inc. Hospital Revenue | 5.000% | 11/1/34 | 1,165 | 1,250 |
| North Charleston SC Revenue | 5.000% | 10/1/40 | 7,000 | 7,466 |
| Patriots Energy Group Finance Authority SC Gas Supply Revenue PUT | 4.000% | 2/1/24 | 10,000 | 10,462 |
| Piedmont SC Municipal Power Agency Revenue | 5.750% | 1/1/34 (4) | 10,000 | 10,787 |
| South Carolina Association of Governmental Organizations Educational Facilities Corp. Revenue | | | | |
| (Pickens School District) | 5.000% | 12/1/30 | 1,500 | 1,649 |
| South Carolina Jobs Economic Development Authority Hospital Revenue (AnMed Health Project) | 5.000% | 2/1/38 | 5,305 | 5,705 |
| South Carolina Jobs Economic Development Authority Hospital Revenue (Conway Hospitals Inc.) | 5.250% | 7/1/47 | 12,600 | 13,374 |
| South Carolina Public Service Authority Revenue | 5.000% | 1/1/19 (Prere.) | 1,070 | 1,075 |
| South Carolina Public Service Authority Revenue | 5.500% | 1/1/19 (Prere.) | 9,205 | 9,259 |
| South Carolina Public Service Authority Revenue | 5.500% | 1/1/19 (Prere.) | 795 | 800 |
| South Carolina Public Service Authority Revenue | 5.000% | 12/1/26 | 2,500 | 2,627 |
| South Carolina Public Service Authority Revenue | 5.000% | 12/1/31 | 5,000 | 5,320 |
| South Carolina Public Service Authority Revenue | 5.000% | 12/1/33 | 5,000 | 5,344 |
| South Carolina Public Service Authority Revenue | 5.000% | 12/1/33 | 2,500 | 2,682 |
| South Carolina Public Service Authority Revenue | 5.000% | 12/1/38 | 10,085 | 10,488 |
| South Carolina Public Service Authority Revenue | 5.000% | 12/1/39 | 4,325 | 4,518 |
| South Carolina Public Service Authority Revenue | 5.000% | 12/1/43 | 1,085 | 1,114 |
| South Carolina Public Service Authority Revenue | 5.125% | 12/1/43 | 1,715 | 1,786 |
| South Carolina Public Service Authority Revenue | 5.000% | 12/1/50 | 5,935 | 6,147 |
| South Carolina Public Service Authority Revenue | 5.500% | 12/1/54 | 10,000 | 10,595 |
| South Carolina Public Service Authority Revenue | 5.250% | 12/1/55 | 10,500 | 11,110 |
| South Carolina Public Service Authority Revenue | 5.000% | 12/1/56 | 12,500 | 12,979 |
| University of South Carolina Athletic Facilities Revenue | 5.000% | 5/1/30 | 1,870 | 2,140 |
| University of South Carolina Athletic Facilities Revenue | 5.000% | 5/1/31 | 2,045 | 2,330 |
312
Long-Term Tax-Exempt Fund
| | | | |
| Face | Market |
| Maturity | Amount | Value• |
| Coupon | Date | ($000) | ($000) |
| University of South Carolina Athletic Facilities Revenue | 5.000% | 5/1/32 | 2,145 | 2,435 |
| University of South Carolina Athletic Facilities Revenue | 5.000% | 5/1/34 | 865 | 976 |
| University of South Carolina Athletic Facilities Revenue | 5.000% | 5/1/40 | 9,075 | 10,068 |
| | | | 191,530 |
| South Dakota (0.2%) | | | | |
| South Dakota Health & Educational Facilities Authority Revenue (Avera Health Obligated Group) | 4.000% | 7/1/34 | 9,710 | 9,731 |
| South Dakota Health & Educational Facilities Authority Revenue (Sanford Health) | 5.000% | 11/1/35 | 3,020 | 3,276 |
| South Dakota Health & Educational Facilities Authority Revenue (Sanford Health) | 5.000% | 11/1/37 | 10,045 | 10,726 |
| South Dakota Health & Educational Facilities Authority Revenue (Sanford Health) | 5.000% | 11/1/45 | 1,000 | 1,063 |
| | | | 24,796 |
| Tennessee (1.3%) | | | | |
| Chattanooga TN Health Educational & Housing Facility Board Revenue | | | | |
| (Catholic Health Initiatives) | 5.250% | 1/1/45 | 14,005 | 14,724 |
| Knox County TN Health Educational & Housing Facilities Board Hospital Facilities Revenue | | | | |
| (University Health System Inc.) | 5.000% | 4/1/36 | 2,545 | 2,686 |
| Knox County TN Health Educational & Housing Facilities Board Hospital Facilities Revenue | | | | |
| (University Health System Inc.) | 5.000% | 9/1/36 | 2,500 | 2,675 |
| Knox County TN Health Educational & Housing Facilities Board Hospital Facilities Revenue | | | | |
| (University Health System Inc.) | 5.000% | 9/1/47 | 11,315 | 11,898 |
| Metropolitan Government of Nashville & Davidson County TN Electric Revenue | 5.000% | 5/15/42 | 8,880 | 9,932 |
| Metropolitan Government of Nashville & Davidson County TN GO | 4.000% | 7/1/33 | 7,000 | 7,244 |
| Metropolitan Government of Nashville & Davidson County TN Health & | | | | |
| Educational Facilities Board Revenue (Vanderbilt University) | 5.000% | 7/1/46 | 6,000 | 6,380 |
| Metropolitan Government of Nashville & Davidson County TN Health and | | | | |
| Educational Facilities Revenue (Vanderbilt University Medical Center) | 5.000% | 7/1/48 | 5,000 | 5,348 |
| Tennessee Energy Acquisition Corp. Gas Revenue | 5.250% | 9/1/20 | 760 | 797 |
| Tennessee Energy Acquisition Corp. Gas Revenue | 5.250% | 9/1/22 | 1,025 | 1,117 |
| Tennessee Energy Acquisition Corp. Gas Revenue | 5.000% | 2/1/23 | 9,905 | 10,710 |
| Tennessee Energy Acquisition Corp. Gas Revenue | 5.250% | 9/1/23 | 3,735 | 4,126 |
| Tennessee Energy Acquisition Corp. Gas Revenue | 5.250% | 9/1/24 | 6,175 | 6,888 |
| Tennessee Energy Acquisition Corp. Gas Revenue | 5.250% | 9/1/26 | 2,160 | 2,452 |
| Tennessee Energy Acquisition Corp. Gas Revenue | 5.000% | 2/1/27 | 19,950 | 22,182 |
| Tennessee Energy Acquisition Corp. Gas Revenue PUT | 4.000% | 11/1/25 | 15,000 | 15,528 |
| Tennessee GO | 5.000% | 9/1/28 | 5,750 | 6,512 |
| Tennessee GO | 5.000% | 9/1/29 | 2,500 | 2,824 |
| Tennessee GO | 5.000% | 8/1/30 | 1,345 | 1,534 |
| Tennessee GO | 5.000% | 9/1/34 | 700 | 781 |
| Tennessee Housing Development Agency Homeownership Program Revenue | 4.500% | 7/1/37 | 625 | 643 |
| Tennessee Housing Development Agency Homeownership Program Revenue | 4.000% | 7/1/38 | 1,510 | 1,540 |
| Tennessee School Bond Authority Higher Educational Facilities Revenue (2nd Program) | 5.000% | 11/1/47 | 5,000 | 5,562 |
| Washington County TN GO | 4.000% | 6/1/29 | 3,260 | 3,455 |
| | | | 147,538 |
| Texas (8.6%) | | | | |
| Arlington TX Independent School District GO | 4.000% | 2/15/30 | 2,000 | 2,106 |
| Arlington TX Special Tax Revenue | 5.000% | 2/15/41 (15) | 6,000 | 6,437 |
| Arlington TX Special Tax Revenue | 5.000% | 2/15/48 (4) | 7,600 | 8,301 |
| Arlington TX Special Tax Revenue | 5.000% | 2/15/48 (15) | 15,000 | 15,906 |
| Austin TX Airport System Revenue | 5.000% | 11/15/41 | 6,500 | 7,073 |
| Austin TX Airport System Revenue | 5.000% | 11/15/46 | 11,010 | 11,941 |
| Austin TX Community College District Public Facilities Corp. Lease Revenue | 5.000% | 8/1/29 | 3,315 | 3,726 |
| Austin TX Community College District Public Facilities Corp. Lease Revenue | 5.000% | 8/1/31 | 7,140 | 7,988 |
| Austin TX Community College District Public Facilities Corp. Lease Revenue | 5.000% | 8/1/31 | 600 | 674 |
| Austin TX Community College District Public Facilities Corp. Lease Revenue | 4.000% | 8/1/32 | 1,000 | 1,024 |
| Austin TX Community College District Public Facilities Corp. Lease Revenue | 4.000% | 8/1/33 | 485 | 495 |
| Austin TX Community College District Public Facilities Corp. Lease Revenue | 5.000% | 8/1/36 | 755 | 835 |
| Austin TX Community College District Public Facilities Corp. Lease Revenue | 5.000% | 8/1/37 | 525 | 579 |
| Austin TX GO | 5.000% | 9/1/32 | 1,300 | 1,442 |
| Austin TX Independent School District GO | 5.000% | 8/1/26 | 1,425 | 1,629 |
| Austin TX Water & Wastewater System Revenue | 5.000% | 11/15/28 | 3,135 | 3,633 |
| Austin TX Water & Wastewater System Revenue | 5.000% | 11/15/29 | 5,160 | 5,945 |
| Austin TX Water & Wastewater System Revenue | 5.000% | 11/15/42 | 7,000 | 7,756 |
| Austin TX Water & Wastewater System Revenue | 5.000% | 11/15/46 | 5,000 | 5,524 |
| Belton TX Independent School District GO | 5.000% | 2/15/36 | 2,500 | 2,790 |
| Belton TX Independent School District GO | 5.000% | 2/15/42 | 7,500 | 8,298 |
| Central Texas Regional Mobility Authority Revenue | 5.750% | 1/1/21 (Prere.) | 4,260 | 4,567 |
| Central Texas Regional Mobility Authority Revenue | 6.250% | 1/1/21 (Prere.) | 1,000 | 1,082 |
| Central Texas Regional Mobility Authority Revenue | 6.750% | 1/1/21 (Prere.) | 2,000 | 2,185 |
| Central Texas Regional Mobility Authority Revenue | 5.000% | 1/1/45 | 6,000 | 6,420 |
| Clear Creek TX Independent School District GO | 5.000% | 2/15/30 | 10,000 | 11,144 |
313
Long-Term Tax-Exempt Fund
| | | | | |
| Face | Market |
| Maturity | Amount | Value• |
| | Coupon | Date | ($000) | ($000) |
| Clifton TX Higher Education Finance Corp. Revenue (Baylor University) | 5.250% | 3/1/29 | 3,000 | 3,191 |
| Dallas County TX Utility & Reclamation District GO | 5.000% | 2/15/28 | 5,000 | 5,770 |
| Dallas TX Area Rapid Transit Sales Tax Revenue | 5.000% | 12/1/41 | 8,950 | 9,856 |
| Dallas TX Area Rapid Transit Sales Tax Revenue | 5.000% | 12/1/46 | 3,580 | 3,931 |
| Dallas TX Civic Center Improvement Revenue | 5.000% | 8/15/28 (12) | 2,125 | 2,170 |
| Dallas-Fort Worth TX International Airport Revenue | 5.250% | 11/1/31 | 5,825 | 6,420 |
| Dallas-Fort Worth TX International Airport Revenue | 5.000% | 11/1/37 | 5,000 | 5,343 |
| Dallas-Fort Worth TX International Airport Revenue | 5.000% | 11/1/38 | 6,445 | 6,882 |
| Denton TX Independent School District GO | 5.000% | 8/15/45 | 12,000 | 13,154 |
| El Paso County TX Community College District Revenue | 5.000% | 4/1/42 (4) | 5,000 | 5,428 |
| El Paso TX GO | 5.000% | 8/15/27 | 3,625 | 4,147 |
| El Paso TX Independent School District GO | 4.000% | 8/15/33 | 2,500 | 2,605 |
| El Paso TX Independent School District GO | 5.000% | 8/15/42 | 10,000 | 10,964 |
| El Paso TX Water & Sewer Revenue | 5.000% | 3/1/30 | 3,545 | 4,036 |
| El Paso TX Water & Sewer Revenue | 5.000% | 3/1/31 | 1,120 | 1,265 |
| El Paso TX Water & Sewer Revenue | 4.000% | 3/1/35 | 1,750 | 1,819 |
| Friendswood TX Independent School District GO | 4.000% | 2/15/32 | 3,630 | 3,779 |
| 13 | Grand Parkway Transportation Corp. Texas System Toll Revenue | 0.000% | 10/1/35 | 21,495 | 19,867 |
| 13 | Grand Parkway Transportation Corp. Texas System Toll Revenue | 0.000% | 10/1/36 | 8,510 | 7,829 |
| Grand Parkway Transportation Corp. Texas System Toll Revenue | 5.250% | 10/1/51 | 12,000 | 13,202 |
| Harris County TX Cultural Education Facilities Finance Corp. Hospital Revenue | | | | |
| | (Memorial Hermann Healthcare System) | 5.000% | 12/1/35 | 8,240 | 8,809 |
| Harris County TX GO | 5.000% | 10/1/26 | 3,000 | 3,426 |
| Harris County TX Health Facilities Development Corp. Hospital Revenue | | | | |
| | (Memorial Hermann Healthcare System) | 7.125% | 12/1/18 (Prere.) | 3,250 | 3,264 |
| Harris County TX Sports Authority Revenue | 5.000% | 11/15/27 (4) | 2,150 | 2,395 |
| Harris County TX Sports Authority Revenue | 5.000% | 11/15/28 | 1,465 | 1,596 |
| Harris County TX Sports Authority Revenue | 5.000% | 11/15/30 | 2,790 | 3,022 |
| Hays County TX GO | 4.000% | 2/15/31 | 2,265 | 2,370 |
| Hays County TX GO | 4.000% | 2/15/32 | 3,820 | 3,972 |
| Hays County TX GO | 4.000% | 2/15/32 | 3,135 | 3,270 |
| Hays County TX GO | 4.000% | 2/15/33 | 865 | 896 |
| Hays County TX GO | 4.000% | 2/15/33 | 3,320 | 3,438 |
| Hays County TX GO | 5.000% | 2/15/42 | 4,000 | 4,395 |
| Houston TX Airport System Revenue | 5.000% | 7/1/29 | 12,075 | 13,901 |
| Houston TX Airport System Revenue | 5.000% | 7/1/30 | 9,515 | 10,895 |
| Houston TX Airport System Revenue | 5.000% | 7/1/32 | 3,000 | 3,228 |
| Houston TX Airport System Revenue | 5.000% | 7/1/38 | 6,765 | 7,514 |
| Houston TX GO | 5.000% | 3/1/27 | 13,350 | 15,217 |
| Houston TX Utility System Revenue | 5.250% | 11/15/20 (Prere.) | 5,000 | 5,306 |
| Houston TX Utility System Revenue | 5.000% | 5/15/28 | 3,105 | 3,463 |
| Houston TX Utility System Revenue | 5.000% | 11/15/32 | 28,425 | 31,918 |
| Humble TX Independent School District GO | 4.000% | 2/15/28 | 10,290 | 10,887 |
| Lake Travis TX Independent School District GO | 4.000% | 2/15/33 | 1,000 | 1,041 |
| Lake Travis TX Independent School District GO | 4.000% | 2/15/34 | 1,000 | 1,038 |
| Lamar TX Consolidated Independent School District GO | 4.000% | 2/15/30 | 10,000 | 10,510 |
| Lamar TX Consolidated Independent School District GO | 4.000% | 2/15/31 | 5,000 | 5,235 |
| Lamar TX Consolidated Independent School District GO | 4.000% | 2/15/32 | 6,835 | 7,124 |
| Laredo TX Community College District GO | 5.000% | 8/1/30 | 2,015 | 2,230 |
| Laredo TX Community College District GO | 5.000% | 8/1/32 | 1,250 | 1,380 |
| Laredo TX Community College District GO | 5.000% | 8/1/34 | 1,500 | 1,646 |
| Lone Star College System Texas GO | 4.000% | 2/15/29 | 1,150 | 1,215 |
| Lower Colorado River Authority Texas Revenue | 5.625% | 5/15/19 (Prere.) | 5 | 5 |
| Lower Colorado River Authority Texas Revenue | 5.625% | 5/15/19 (Prere.) | 10 | 10 |
| Lower Colorado River Authority Texas Revenue | 5.625% | 5/15/19 (Prere.) | 205 | 209 |
| Lower Colorado River Authority Texas Revenue | 5.625% | 5/15/19 (Prere.) | 20 | 20 |
| Lower Colorado River Authority Texas Revenue | 5.000% | 5/15/40 | 5,000 | 5,174 |
| Lower Colorado River Authority Texas Transmission Contract Revenue | | | | |
| | (LCRA Transmission Services Corp.) | 5.000% | 5/15/30 | 5,070 | 5,575 |
| Lower Colorado River Authority Texas Transmission Contract Revenue | | | | |
| | (LCRA Transmission Services Corp.) | 5.000% | 5/15/31 | 3,460 | 3,794 |
| Lower Colorado River Authority Texas Transmission Contract Revenue | | | | |
| | (LCRA Transmission Services Corp.) | 5.000% | 5/15/40 | 5,540 | 5,998 |
| Lubbock TX GO | 4.000% | 2/15/30 | 1,250 | 1,310 |
| Mansfield TX Independent School District GO | 5.000% | 2/15/45 | 5,000 | 5,458 |
| Matagorda County TX Navigation District No. 1 Pollution Control Revenue | | | | |
| | (Central Power & Light Co. Project) | 6.300% | 11/1/29 | 7,500 | 7,842 |
| Missouri City TX GO | 4.000% | 6/15/32 | 1,085 | 1,125 |
| New Hope TX Cultural Education Facilities Finance Corp. Revenue | | | | |
| | (CHF-Collegiate Housing Denton LLC) | 5.000% | 7/1/58 (4) | 1,000 | 1,045 |
314
Long-Term Tax-Exempt Fund
| | | | |
| Face | Market |
| Maturity | Amount | Value• |
| Coupon | Date | ($000) | ($000) |
| New Hope TX Cultural Education Facilities FinanceCorp. First Mortgage Revenue | | | | |
| (Morningside Ministries Project) | 6.500% | 1/1/48 | 10,350 | 11,233 |
| New Hope TX Cultural Education Facilities FinanceCorp. Hospital Revenue | | | | |
| (Children’s Health System of Texas Obligated Group) | 5.000% | 8/15/47 | 5,040 | 5,441 |
| New Hope TX Cultural Education Facilities FinanceCorp. Retirement Facilities Revenue | | | | |
| (Legacy at Willow Bend Retirement Community Project) | 5.000% | 11/1/46 | 3,870 | 3,926 |
| New Hope TX Cultural Education Facilities FinanceCorp. Retirement Facilities Revenue | | | | |
| (Wesleyan Homes Inc. Project) | 5.500% | 1/1/43 | 1,600 | 1,670 |
| New Hope TX Cultural Education Facilities FinanceCorp. Retirement Facilities Revenue | | | | |
| (Wesleyan Homes Inc. Project) | 5.500% | 1/1/49 | 1,600 | 1,665 |
| New Hope TX Cultural Education Facilities FinanceCorp. Revenue | | | | |
| (Collegiate Housing Denton, LLC Texas Woman’s University Housing Project) | 5.000% | 7/1/58 (4) | 3,670 | 3,835 |
| North East TX Regional Mobility Authority Revenue | 5.000% | 1/1/46 | 5,000 | 5,299 |
| North Texas Tollway Authority System Revenue | 6.250% | 1/1/19 (Prere.) | 4,880 | 4,914 |
| North Texas Tollway Authority System Revenue | 6.000% | 1/1/21 (Prere.) | 12,500 | 13,492 |
| North Texas Tollway Authority System Revenue | 5.000% | 9/1/21 (Prere.) | 9,000 | 9,657 |
| North Texas Tollway Authority System Revenue | 5.000% | 9/1/21 (Prere.) | 2,000 | 2,146 |
| North Texas Tollway Authority System Revenue | 6.000% | 9/1/21 (Prere.) | 2,500 | 2,751 |
| North Texas Tollway Authority System Revenue | 6.250% | 2/1/23 | 10,000 | 10,447 |
| North Texas Tollway Authority System Revenue | 5.000% | 1/1/30 | 10,000 | 11,035 |
| North Texas Tollway Authority System Revenue | 5.000% | 1/1/32 | 3,000 | 3,284 |
| North Texas Tollway Authority System Revenue | 5.000% | 1/1/33 | 13,675 | 14,575 |
| North Texas Tollway Authority System Revenue | 5.000% | 1/1/34 | 14,355 | 15,286 |
| North Texas Tollway Authority System Revenue | 5.000% | 1/1/38 | 5,900 | 6,306 |
| North Texas Tollway Authority System Revenue | 5.000% | 1/1/39 | 5,000 | 5,501 |
| North Texas Tollway Authority System Revenue | 5.000% | 1/1/39 | 6,500 | 7,043 |
| North Texas Tollway Authority System Revenue | 5.000% | 1/1/43 | 10,515 | 11,483 |
| North Texas Tollway Authority System Revenue | 5.000% | 1/1/43 | 23,900 | 25,670 |
| North Texas Tollway Authority System Revenue | 5.000% | 1/1/48 | 15,080 | 16,142 |
| Olmos Park TX Higher Education Facilities Corp. Revenue | | | | |
| (University of the Incarnate Word Project) | 5.000% | 12/1/23 | 1,000 | 1,088 |
| Olmos Park TX Higher Education Facilities Corp. Revenue | | | | |
| (University of the Incarnate Word Project) | 5.000% | 12/1/24 | 4,325 | 4,693 |
| Olmos Park TX Higher Education Facilities Corp. Revenue | | | | |
| (University of the Incarnate Word Project) | 5.000% | 12/1/25 | 4,520 | 4,895 |
| Olmos Park TX Higher Education Facilities Corp. Revenue | | | | |
| (University of the Incarnate Word Project) | 5.000% | 12/1/26 | 2,250 | 2,436 |
| Olmos Park TX Higher Education Facilities Corp. Revenue | | | | |
| (University of the Incarnate Word Project) | 5.000% | 12/1/27 | 1,845 | 1,997 |
| Pasadena TX GO | 4.000% | 2/15/32 | 1,500 | 1,556 |
| Round Rock TX Independent School District GO | 4.000% | 8/1/30 | 3,130 | 3,290 |
| SA Energy Acquisition Public Facility Corp. Texas Gas Supply Revenue | 5.500% | 8/1/22 | 5,620 | 6,175 |
| SA Energy Acquisition Public Facility Corp. Texas Gas Supply Revenue | 5.500% | 8/1/23 | 6,200 | 6,901 |
| San Antonio TX Electric & Gas Systems Revenue | 5.000% | 2/1/38 | 6,500 | 6,996 |
| San Antonio TX Electric & Gas Systems Revenue | 5.000% | 2/1/47 | 5,000 | 5,484 |
| San Antonio TX GO | 4.000% | 8/1/31 | 6,305 | 6,648 |
| San Antonio TX GO | 4.000% | 8/1/32 | 7,360 | 7,699 |
| San Antonio TX GO | 4.000% | 8/1/33 | 8,710 | 9,037 |
| San Jacinto TX Community College District GO | 5.000% | 2/15/29 | 3,860 | 4,356 |
| San Jacinto TX Community College District GO | 5.000% | 2/15/30 | 4,055 | 4,557 |
| San Jacinto TX Community College District GO | 5.000% | 2/15/31 | 2,250 | 2,519 |
| San Jacinto TX Community College District GO | 5.000% | 2/15/32 | 2,000 | 2,225 |
| Tarrant County TX Cultural Education Facilities Finance Corp. Hospital Revenue | | | | |
| (Baylor Scott & White Healthcare Project) | 5.000% | 11/15/37 | 4,500 | 4,919 |
| Texas GO | 4.000% | 5/15/32 | 2,250 | 2,335 |
| Texas GO | 5.000% | 10/1/44 | 10,205 | 11,205 |
| Texas Municipal Gas Acquisition & Supply Corp. Revenue | 5.250% | 12/15/20 | 650 | 687 |
| Texas Municipal Gas Acquisition & Supply Corp. Revenue | 5.250% | 12/15/23 | 1,550 | 1,722 |
| Texas Municipal Gas Acquisition & Supply Corp. Revenue | 5.250% | 12/15/24 | 6,680 | 7,502 |
| Texas Municipal Gas Acquisition & Supply Corp. Revenue | 5.250% | 12/15/25 | 2,665 | 3,018 |
| Texas Municipal Gas Acquisition & Supply Corp. Revenue | 5.000% | 12/15/26 | 2,740 | 2,953 |
| Texas Municipal Gas Acquisition & Supply Corp. Revenue | 5.250% | 12/15/26 | 1,490 | 1,700 |
| Texas Municipal Gas Acquisition & Supply Corp. Revenue | 5.000% | 12/15/29 | 5,000 | 5,337 |
| Texas Private Activity Surface Transportation Corp. Revenue | 7.500% | 12/31/31 | 4,000 | 4,220 |
| Texas Private Activity Surface Transportation Corp. Revenue | 6.875% | 12/31/39 | 9,060 | 9,471 |
| Texas Private Activity Surface Transportation Corp. Revenue | 7.000% | 6/30/40 | 29,910 | 31,843 |
| Texas State University System Financing System Revenue | 5.000% | 3/15/38 | 3,340 | 3,642 |
| Texas State University System Financing System Revenue | 5.000% | 3/15/42 | 2,000 | 2,116 |
| Texas Transportation Commission Revenue | 5.000% | 8/15/41 | 3,815 | 4,024 |
| Texas Transportation Commission Turnpike System Revenue | 5.000% | 8/15/34 | 6,000 | 6,380 |
315
Long-Term Tax-Exempt Fund
| | | | |
| Face | Market |
| Maturity | Amount | Value• |
| Coupon | Date | ($000) | ($000) |
| Texas Transportation Commission Turnpike System Revenue | 5.000% | 8/15/37 | 6,450 | 6,981 |
| Texas Turnpike Authority Central Texas Turnpike System Revenue | 0.000% | 8/15/26 (2) | 9,445 | 7,354 |
| Texas Turnpike Authority Central Texas Turnpike System Revenue | 0.000% | 8/15/26 (ETM) | 555 | 441 |
| Texas Turnpike Authority Central Texas Turnpike System Revenue | 0.000% | 8/15/28 (2) | 29,955 | 21,249 |
| Texas Turnpike Authority Central Texas Turnpike System Revenue | 0.000% | 8/15/28 (ETM) | 50 | 36 |
| Texas Water Development Board Revenue | 5.000% | 4/15/29 | 3,000 | 3,476 |
| Texas Water Development Board Revenue | 5.000% | 10/15/30 | 10,040 | 11,332 |
| Texas Water Development Board Revenue | 4.000% | 10/15/32 | 5,000 | 5,214 |
| Texas Water Development Board Revenue | 4.000% | 10/15/33 | 12,000 | 12,470 |
| Texas Water Development Board Revenue | 4.000% | 10/15/34 | 13,000 | 13,421 |
| United TX Independent School District GO | 5.000% | 8/15/28 | 2,355 | 2,665 |
| United TX Independent School District GO | 5.000% | 8/15/29 | 2,535 | 2,859 |
| University of Houston Texas Revenue | 4.000% | 2/15/30 | 4,610 | 4,816 |
| University of Houston Texas Revenue | 4.000% | 2/15/37 | 16,205 | 16,419 |
| University of North Texas Revenue | 5.000% | 4/15/33 | 3,200 | 3,599 |
| University of North Texas Revenue | 5.000% | 4/15/34 | 3,000 | 3,363 |
| University of North Texas Revenue | 5.000% | 4/15/36 | 3,000 | 3,337 |
| Ysleta TX Independent School District GO | 5.000% | 8/15/41 | 7,065 | 7,713 |
| Ysleta TX Independent School District GO | 5.000% | 8/15/45 | 10,905 | 11,864 |
| Ysleta TX Independent School District GO | 5.000% | 8/15/47 | 10,000 | 10,936 |
| | | | 1,001,296 |
| Utah (0.6%) | | | | |
| Salt Lake City UT Airport Revenue | 5.000% | 7/1/42 | 5,000 | 5,466 |
| Salt Lake City UT Airport Revenue | 5.000% | 7/1/47 | 10,000 | 10,894 |
| University of Utah Revenue | 4.000% | 8/1/33 | 1,000 | 1,041 |
| University of Utah Revenue | 4.000% | 8/1/33 | 2,100 | 2,186 |
| University of Utah Revenue | 4.000% | 8/1/34 | 1,175 | 1,220 |
| University of Utah Revenue | 4.000% | 8/1/35 | 1,000 | 1,034 |
| Utah Charter Academies Inc. School Revenue | 5.000% | 10/15/38 | 720 | 782 |
| Utah Charter Academies Inc. School Revenue | 5.000% | 10/15/43 | 1,150 | 1,240 |
| Utah Charter Academies Inc. School Revenue | 5.000% | 10/15/48 | 1,200 | 1,289 |
| Utah County UT Hospital Revenue (IHC Health Services) | 5.000% | 5/15/41 | 16,500 | 18,070 |
| Utah Transit Authority Sales Tax Revenue | 5.000% | 6/15/22 (Prere.) | 3,110 | 3,409 |
| Utah Transit Authority Sales Tax Revenue | 4.000% | 12/15/30 | 6,200 | 6,427 |
| Utah Transit Authority Sales Tax Revenue | 5.000% | 6/15/38 | 17,325 | 19,128 |
| | | | 72,186 |
| Virginia (1.8%) | | | | |
| Chesapeake Bay VA Bridge & Tunnel District Revenue | 5.000% | 7/1/41 (4) | 5,000 | 5,504 |
| Chesapeake Bay VA Bridge & Tunnel District Revenue | 5.000% | 7/1/51 | 5,000 | 5,334 |
| Fairfax County VA Economic Development Authority Facilities Revenue (County Facilities Project) | 5.000% | 10/1/32 | 1,800 | 2,009 |
| Fairfax County VA Economic Development Authority Facilities Revenue (County Facilities Project) | 5.000% | 10/1/34 | 1,145 | 1,274 |
| Fairfax County VA Economic Development Authority Transportation District | | | | |
| Improvement Revenue (Silver Line Phase I Project) | 4.000% | 4/1/31 | 3,810 | 3,976 |
| Fairfax County VA Economic Development Authority Transportation District | | | | |
| Improvement Revenue (Silver Line Phase I Project) | 4.000% | 4/1/32 | 11,190 | 11,619 |
| Fairfax County VA GO | 5.000% | 10/1/29 | 11,190 | 13,069 |
| Fairfax County VA Industrial Development Authority Health Care Revenue | | | | |
| (Inova Health System Obligated Group) | 5.500% | 5/15/19 (Prere.) | 3,530 | 3,598 |
| Fairfax County VA Industrial Development Authority Health Care Revenue | | | | |
| (Inova Health System Obligated Group) | 5.500% | 5/15/19 (Prere.) | 6,470 | 6,594 |
| Fairfax County VA Sewer Revenue | 4.000% | 7/15/32 | 2,515 | 2,655 |
| Hampton Roads VA Sanitation & Wastewater District Revenue | 5.000% | 10/1/38 | 1,725 | 1,931 |
| Hampton Roads VA Sanitation & Wastewater District Revenue | 5.000% | 10/1/43 | 2,770 | 3,081 |
| Henrico County VA Economic Development Authority Revenue (Bon Secours Health System) | 5.250% | 11/1/42 (12) | 3,500 | 3,695 |
| Lexington VA Industrial Development Authority Residential Care Facility Revenue | | | | |
| (Kendall at Lexington Corp.) | 5.000% | 1/1/42 | 695 | 735 |
| Lexington VA Industrial Development Authority Residential Care Facility Revenue | | | | |
| (Kendall at Lexington Corp.) | 5.000% | 1/1/48 | 1,250 | 1,317 |
| Loudoun County VA GO | 4.000% | 12/1/32 | 6,900 | 7,234 |
| Loudoun County VA GO | 4.000% | 12/1/33 | 6,895 | 7,206 |
| Norfolk VA Water Revenue | 5.000% | 11/1/27 | 9,215 | 10,850 |
| Richmond VA GO | 3.375% | 3/1/41 | 3,000 | 2,648 |
| Roanoke VA Economic Development Authority Hospital Revenue (Carilion Clinic Obligated Group) | 5.000% | 7/1/28 | 1,640 | 1,759 |
| University of Virginia Revenue | 5.000% | 6/1/37 | 8,000 | 8,788 |
| University of Virginia Revenue | 5.000% | 4/1/45 | 5,000 | 5,564 |
| Virginia Beach VA GO | 5.000% | 4/1/29 | 7,305 | 8,600 |
| Virginia Commonwealth Transportation Board Revenue | 5.000% | 5/15/21 (Prere.) | 17,375 | 18,577 |
| Virginia Commonwealth Transportation Board Revenue | 5.000% | 5/15/21 (Prere.) | 4,000 | 4,277 |
| Virginia Commonwealth Transportation Board Revenue | 5.000% | 5/15/22 (Prere.) | 28,875 | 31,611 |
316
Long-Term Tax-Exempt Fund
| | | | |
| Face | Market |
| Maturity | Amount | Value• |
| Coupon | Date | ($000) | ($000) |
| Virginia Public Building Authority Public Facilities Revenue | 4.000% | 8/1/23 (Prere.) | 8,335 | 8,957 |
| Virginia Public Building Authority Public Facilities Revenue | 4.000% | 8/1/23 (Prere.) | 8,675 | 9,322 |
| Virginia Public Building Authority Public Facilities Revenue | 4.000% | 8/1/30 | 4,000 | 4,242 |
| Virginia Public Building Authority Public Facilities Revenue | 4.000% | 8/1/31 | 4,420 | 4,671 |
| Virginia Public Building Authority Revenue | 5.000% | 8/1/32 | 9,370 | 10,823 |
| | | | 211,520 |
| Washington (1.4%) | | | | |
| Central Puget Sound WA Regional Transit Authority Sales & Use Tax Revenue | 5.000% | 11/1/41 | 13,500 | 14,922 |
| Central Puget Sound WA Regional Transit Authority Sales & Use Tax Revenue | 5.000% | 11/1/46 | 5,000 | 6,139 |
| Grant County WA Public Utility District No. 2 Electric System Revenue | 5.000% | 1/1/42 | 2,075 | 2,293 |
| Grant County WA Public Utility District No. 2 Electric System Revenue | 5.000% | 1/1/47 | 3,450 | 3,799 |
| King County WA Sewer Revenue | 4.000% | 7/1/30 | 3,300 | 3,446 |
| King County WA Sewer Revenue | 4.000% | 7/1/31 | 3,320 | 3,456 |
| Port of Seattle WA Revenue | 5.000% | 8/1/29 | 10,500 | 11,398 |
| Port of Seattle WA Revenue | 5.000% | 6/1/30 | 2,000 | 2,079 |
| Port of Seattle WA Revenue | 5.000% | 4/1/31 | 3,260 | 3,605 |
| Port of Seattle WA Revenue | 5.000% | 4/1/32 | 3,425 | 3,776 |
| Port of Seattle WA Revenue | 5.000% | 3/1/33 | 4,380 | 4,811 |
| Port of Seattle WA Revenue | 5.000% | 4/1/34 | 3,665 | 4,022 |
| Port of Seattle WA Revenue | 5.000% | 3/1/35 | 3,240 | 3,542 |
| Seattle WA Municipal Light & Power Revenue | 5.250% | 2/1/21 (Prere.) | 2,000 | 2,137 |
| Seattle WA Municipal Light & Power Revenue | 4.000% | 4/1/29 | 3,825 | 4,049 |
| Snohomish County WA Public Utility District No. 1 Revenue | 5.000% | 12/1/40 | 5,000 | 5,493 |
| Tobacco Settlement Authority Washington Revenue | 5.250% | 6/1/30 | 9,065 | 9,197 |
| University of Washington Revenue | 5.000% | 7/1/34 | 2,000 | 2,157 |
| Washington GO | 5.000% | 2/1/35 | 10,000 | 10,700 |
| Washington GO | 5.000% | 8/1/35 | 2,000 | 2,123 |
| Washington Health Care Facilities Authority Revenue (MultiCare Health System) | 5.000% | 8/15/33 | 2,315 | 2,604 |
| Washington Health Care Facilities Authority Revenue (MultiCare Health System) | 5.000% | 8/15/34 | 3,860 | 4,328 |
| Washington Health Care Facilities Authority Revenue (MultiCare Health System) | 5.000% | 8/15/44 | 5,000 | 5,396 |
| Washington Health Care Facilities Authority Revenue (Providence Health & Services) | 5.000% | 10/1/33 | 7,500 | 8,102 |
| Washington Health Care Facilities Authority Revenue (Seattle Children’s Hospital) | 5.625% | 10/1/19 (Prere.) | 12,000 | 12,391 |
| Washington Health Care Facilities Authority Revenue (Seattle Children’s Hospital) | 5.000% | 10/1/40 | 2,215 | 2,307 |
| Washington Health Care Facilities Authority Revenue (Swedish Health Services) | 6.250% | 5/15/21 (Prere.) | 6,500 | 7,148 |
| Washington Health Care Facilities Authority Revenue | | | | |
| (Virginia Mason Medical Center Obligated Group) | 5.000% | 8/15/35 | 3,000 | 3,225 |
| Washington Health Care Facilities Authority Revenue | | | | |
| (Virginia Mason Medical Center Obligated Group) | 5.000% | 8/15/36 | 2,500 | 2,678 |
| Washington Health Care Facilities Authority Revenue | | | | |
| (Virginia Mason Medical Center Obligated Group) | 5.000% | 8/15/37 | 2,400 | 2,563 |
| Washington Housing Finance Commission Multi-Family Housing Revenue | | | | |
| (The Hearthstone Project) | 5.000% | 7/1/48 | 2,400 | 2,403 |
| Washington Housing Finance Commission Multi-Family Housing Revenue | | | | |
| (The Hearthstone Project) | 5.000% | 7/1/53 | 2,245 | 2,238 |
| Washington Housing Finance Commission Revenue (Horizon House Project) | 5.000% | 1/1/48 | 4,500 | 4,650 |
| | | | 163,177 |
| West Virginia (0.6%) | | | | |
| Morgantown WV Combined Utility System Revenue | 5.000% | 12/1/41 (4) | 7,000 | 7,615 |
| Morgantown WV Combined Utility System Revenue | 5.000% | 12/1/46 (4) | 6,320 | 6,852 |
| West Virginia Economic Development Authority Lottery Revenue | 4.000% | 6/15/34 | 7,595 | 7,796 |
| West Virginia Economic Development Authority Solid Waste Facilities Disposal Revenue | | | | |
| (Appalachian Power Co. - Amos Project) | 5.375% | 12/1/38 | 2,500 | 2,632 |
| West Virginia Hospital Finance Authority Hospital Revenue (Charleston Area Medical Center Inc.) | 5.625% | 9/1/32 | 6,500 | 6,648 |
| West Virginia Hospital Finance Authority Hospital Revenue | | | | |
| (United Health System Obligated Group) | 5.500% | 6/1/44 | 20,000 | 21,530 |
| West Virginia Hospital Finance Authority Hospital Revenue | | | | |
| (United Health System Obligated Group) | 4.000% | 6/1/51 | 2,500 | 2,272 |
| West Virginia Hospital Finance Authority Hospital Revenue | | | | |
| (United Health System Obligated Group) | 5.000% | 6/1/52 | 2,500 | 2,636 |
| West Virginia State School Building Authority Lottery Revenue | 5.000% | 7/1/29 | 3,000 | 3,462 |
| West Virginia State School Building Authority Lottery Revenue | 5.000% | 7/1/30 | 2,975 | 3,412 |
| West Virginia University Revenue | 5.000% | 10/1/36 | 5,985 | 6,339 |
| West Virginia Water Development Authority Infrastructure Excess Lottery Revenue | | | | |
| (Chesapeake Bay/Greenbrier River Projects) | 5.000% | 7/1/30 | 3,000 | 3,368 |
| | | | 74,562 |
| Wisconsin (1.7%) | | | | |
| Mount Pleasant WI Revenue (Village of Mount Pleasant) | 5.000% | 4/1/48 | 15,000 | 16,167 |
| Wisconsin GO | 6.000% | 5/1/19 (Prere.) | 10,000 | 10,205 |
| Wisconsin GO | 5.000% | 5/1/31 | 8,635 | 9,702 |
317
Long-Term Tax-Exempt Fund
| | | | | |
| Face | Market |
| Maturity | Amount | Value• |
| | Coupon | Date | ($000) | ($000) |
| Wisconsin GO | 5.000% | 11/1/33 | 5,000 | 5,669 |
| Wisconsin Health & Educational Facilities Authority Health Care Facilities Revenue | | | | |
| | (Luther Hospital) | 5.750% | 11/15/30 | 7,500 | 7,648 |
| Wisconsin Health & Educational Facilities Authority Health Facilities Revenue (SSM Health Care) | 5.250% | 6/1/20 (Prere.) | 6,785 | 7,107 |
| Wisconsin Health & Educational Facilities Authority Revenue | | | | |
| | (Advocate Aurora Health Obligated Group) | 4.000% | 8/15/35 | 1,440 | 1,442 |
| Wisconsin Health & Educational Facilities Authority Revenue | | | | |
| | (Advocate Aurora Health Obligated Group) | 4.000% | 8/15/36 | 1,600 | 1,594 |
| Wisconsin Health & Educational Facilities Authority Revenue | | | | |
| | (Advocate Aurora Health Obligated Group) | 4.000% | 8/15/37 | 5,000 | 4,961 |
| Wisconsin Health & Educational Facilities Authority Revenue (Agnesian HealthCare Inc.) | 5.750% | 7/1/20 (Prere.) | 2,270 | 2,401 |
| Wisconsin Health & Educational Facilities Authority Revenue (Agnesian HealthCare Inc.) | 5.750% | 7/1/20 (Prere.) | 3,880 | 4,104 |
| Wisconsin Health & Educational Facilities Authority Revenue (Agnesian HealthCare Inc.) | 5.000% | 7/1/42 | 4,000 | 4,290 |
| Wisconsin Health & Educational Facilities Authority Revenue | | | | |
| | (Ascension Health Alliance Credit Group) | 4.000% | 11/15/36 | 15,000 | 15,116 |
| Wisconsin Health & Educational Facilities Authority Revenue | | | | |
| | (Ascension Health Alliance Credit Group) | 4.000% | 11/15/39 | 5,000 | 5,006 |
| Wisconsin Health & Educational Facilities Authority Revenue (Aurora Health Care Inc.) | 5.625% | 4/15/20 (Prere.) | 12,110 | 12,712 |
| Wisconsin Health & Educational Facilities Authority Revenue | | | | |
| | (Children’s Hospital of Wisconsin Inc.) | 4.000% | 8/15/42 | 10,000 | 9,715 |
| Wisconsin Health & Educational Facilities Authority Revenue (Froedtert & Community Health Inc.) | 5.000% | 4/1/42 | 20,690 | 21,808 |
| Wisconsin Health & Educational Facilities Authority Revenue (Froedtert Health Inc.) | 5.000% | 4/1/31 | 5,145 | 5,775 |
| Wisconsin Health & Educational Facilities Authority Revenue (Froedtert Health Inc.) | 5.000% | 4/1/32 | 2,380 | 2,660 |
| Wisconsin Health & Educational Facilities Authority Revenue (Froedtert Health Inc.) | 5.000% | 4/1/48 | 6,120 | 6,640 |
| Wisconsin Health & Educational Facilities Authority Revenue (Marquette University) | 5.000% | 10/1/30 | 3,260 | 3,527 |
| Wisconsin Health & Educational Facilities Authority Revenue (Marquette University) | 4.000% | 10/1/31 | 1,000 | 1,018 |
| Wisconsin Health & Educational Facilities Authority Revenue (Marquette University) | 4.000% | 10/1/32 | 1,080 | 1,095 |
| Wisconsin Health & Educational Facilities Authority Revenue (Marquette University) | 4.000% | 10/1/33 | 1,385 | 1,395 |
| Wisconsin Health & Educational Facilities Authority Revenue (Marquette University) | 4.000% | 10/1/34 | 1,570 | 1,578 |
| Wisconsin Health & Educational Facilities Authority Revenue | | | | |
| | (Marshfield Clinic Health System Obligated Group) | 4.000% | 2/15/34 | 5,630 | 5,592 |
| Wisconsin Health & Educational Facilities Authority Revenue | | | | |
| | (Marshfield Clinic Health System Obligated Group) | 4.000% | 2/15/35 | 5,055 | 4,989 |
| Wisconsin Health & Educational Facilities Authority Revenue (Medical College Wisconsin) | 5.000% | 12/1/41 | 15,000 | 16,242 |
| Wisconsin Public Finance Authority Education Revenue (Coral Academy of Science) | 5.000% | 7/1/48 | 1,530 | 1,563 |
| Wisconsin Public Finance Authority Education Revenue (Coral Academy of Science) | 5.000% | 7/1/55 | 4,135 | 4,192 |
| Wisconsin Transportation Revenue | 5.000% | 7/1/22 (Prere.) | 2,815 | 3,088 |
| Wisconsin Transportation Revenue | 5.000% | 7/1/36 | 2,130 | 2,351 |
| Wisconsin Transportation Revenue | 5.000% | 7/1/37 | 2,000 | 2,206 |
| | | | | 203,558 |
| Total Tax-Exempt Municipal Bonds (Cost $11,364,583) | | | | 11,418,280 |
| |
| Shares | |
| Temporary Cash Investment (1.8%) | | | | |
| Money Market Fund (1.8%) | | | | |
| 14 | Vanguard Municipal Cash Management Fund (Cost $213,827) | 1.620% | | 2,138,280 | 213,828 |
| Total Investments (99.6%) (Cost $11,578,410) | | | | 11,632,108 |
318
Long-Term Tax-Exempt Fund
| |
| Amount |
| ($000) |
| Other Assets and Liabilities (0.4%) | |
| Other Assets | |
| Investment in Vanguard | 599 |
| Receivables for Investment Securities Sold | 74,815 |
| Receivables for Accrued Income | 153,623 |
| Receivables for Capital Shares Issued | 13,440 |
| Variation Margin Receivable—Futures Contracts | 470 |
| Other Assets | 1,130 |
| Total Other Assets | 244,077 |
| Liabilities | |
| Payables for Investment Securities Purchased | (161,078) |
| Payables for Capital Shares Redeemed | (17,084) |
| Payables for Distributions | (10,952) |
| Payables to Vanguard | (7,301) |
| Variation Margin Payable—Futures Contracts | (816) |
| Other Liabilities | (3) |
| Total Liabilities | (197,234) |
| Net Assets (100%) | 11,678,951 |
| |
| At October 31, 2018, net assets consisted of: | |
| Amount |
| ($000) |
| Paid-in Capital | 11,621,216 |
| Total Distributable Earnings (Loss) | 57,735 |
| Net Assets | 11,678,951 |
| |
| Investor Shares—Net Assets | |
| Applicable to 76,492,245 outstanding $.001 par value shares of beneficial interest (unlimited authorization) | 853,471 |
| Net Asset Value Per Share—Investor Shares | $11.16 |
| |
| Admiral Shares—Net Assets | |
| Applicable to 970,232,065 outstanding $.001 par value shares of beneficial interest (unlimited authorization) | 10,825,480 |
| Net Asset Value Per Share—Admiral Shares | $11.16 |
• See Note A in Notes to Financial Statements.
1 6.600% coupon rate will be effective October 2023.
2 Securities with a value of $2,270,000 have been segregated as initial margin for open futures contracts.
3 5.875% coupon rate will be effective October 2023.
4 7.000% coupon rate will be effective August 2019.
5 Security purchased on a when-issued or delayed-delivery basis for which the fund has not taken delivery as of October 31, 2018.
6 6.150% coupon rate will be effective October 2024.
7 6.250% coupon rate will be effective October 2024.
8 Security exempt from registration under Rule 144A of the Securities Act of 1933. Such securities may be sold in transactions exempt from registration, normally to qualified institutional buyers.
At October 31, 2018, the aggregate value of these securities was $65,361,000, representing 0.6% of net assets.
9 6.450% coupon rate will be effective July 2023.
10 6.750% coupon rate will be effective July 2023.
11 4.500% coupon rate will be effective December 2021.
12 4.750% coupon rate will be effective December 2021.
13 5.500% coupon rate will be effective October 2023.
14 Affiliated money market fund available only to Vanguard funds and certain trusts and accounts managed by Vanguard. Rate shown is the 7-day yield.
A key to abbreviations and other references follows the Statement of Net Assets.
See accompanying Notes, which are an integral part of the Financial Statements.
319
Long-Term Tax-Exempt Fund
Key to Abbreviations
ARS—Auction Rate Security.
BAN—Bond Anticipation Note.
COP—Certificate of Participation.
CP—Commercial Paper.
FR—Floating Rate.
GAN—Grant Anticipation Note.
GO—General Obligation Bond.
PILOT—Payments in Lieu of Taxes.
PUT—Put Option Obligation.
RAN—Revenue Anticipation Note.
TAN—Tax Anticipation Note.
TOB—Tender Option Bond.
TRAN—Tax Revenue Anticipation Note.
VRDO—Variable Rate Demand Obligation.
VRDP—Variable Rate Demand Preferred.
(ETM)—Escrowed to Maturity.
(Prere.)—Prerefunded.
Scheduled principal and interest payments are guaranteed by:
(1) MBIA (Municipal Bond Investors Assurance).
(2) AMBAC (Ambac Assurance Corporation).
(3) FGIC (Financial Guaranty Insurance Company).
(4) AGM (Assured Guaranty Municipal Corporation).
(5) BIGI (Bond Investors Guaranty Insurance).
(6) Connie Lee Inc.
(7) FHA (Federal Housing Authority).
(8) CapMAC (Capital Markets Assurance Corporation).
(9) American Capital Access Financial Guaranty Corporation.
(10) XL Capital Assurance Inc.
(11) CIFG (CDC IXIS Financial Guaranty).
(12) AGC (Assured Guaranty Corporation).
(13) BHAC (Berkshire Hathaway Assurance Corporation).
(14) NPFG (National Public Finance Guarantee Corporation).
(15) BAM (Build America Mutual Assurance Company).
(16) MAC (Municipal Assurance Corporation).
(17) RAA (Radian Asset Assurance Inc.).
(18) SBLF (Michigan School Bond Loan Fund).
(19) TPSF (Texas Permanent School Fund).
The insurance does not guarantee the market value of the municipal bonds.
LOC—Scheduled principal and interest payments are guaranteed by bank letter of credit.
| | | | |
| Derivative Financial Instruments Outstanding as of Period End | | | | |
| |
| Futures Contracts | | | | |
| ($000) |
| Value and |
| Number of | Unrealized |
| Long (Short) | Notional | Appreciation |
| Expiration | Contracts | Amount | (Depreciation) |
| Long Futures Contracts | |
| 2-Year U.S. Treasury Note | December 2018 | 1,391 | 293,023 | 85 |
| Ultra 10-Year U.S. Treasury Note | December 2018 | 1,121 | 140,248 | — |
| 10-Year U.S. Treasury Note | December 2018 | 431 | 51,047 | (51) |
| 5-Year U.S. Treasury Note | December 2018 | 378 | 42,481 | 29 |
| | | | 63 |
| |
| Short Futures Contracts | |
| Ultra Long U.S. Treasury Bond | December 2018 | (341) | (50,884) | 410 |
| | | | 473 |
See accompanying Notes, which are an integral part of the Financial Statements.
320
Long-Term Tax-Exempt Fund
Statement of Operations
Statement of Changes in Net Assets
| | | |
| Year Ended |
| October 31, 2018 |
| | ($000) |
| Investment Income | | |
| Income | | |
| Interest1 | 416,145 |
| Total Income | 416,145 |
| Expenses | | |
| The Vanguard Group—Note B | | |
| Investment Advisory Services | 1,418 |
| Management and Administrative— | |
| Investor Shares | 1,226 |
| Management and Administrative— | |
| Admiral Shares | 7,330 |
| Marketing and Distribution— | | |
| Investor Shares | 172 |
| Marketing and Distribution— | | |
| Admiral Shares | 690 |
| Custodian Fees | 65 |
| Auditing Fees | 35 |
| Shareholders’ Reports and Proxy— | |
| Investor Shares | 61 |
| Shareholders’ Reports and Proxy— | |
| Admiral Shares | 130 |
| Trustees’ Fees and Expenses | 7 |
| Total Expenses | 11,134 |
| Net Investment Income | 405,011 |
| Realized Net Gain (Loss) | | |
| Investment Securities Sold1 | 18,312 |
| Futures Contracts | (8,110) |
| Realized Net Gain (Loss) | 10,202 |
| Change in Unrealized Appreciation | |
| (Depreciation) | | |
| Investment Securities1 (479,879) |
| Futures Contracts | 1,422 |
| Change in Unrealized Appreciation | |
| (Depreciation) (478,457) |
| Net Increase (Decrease) in Net Assets | |
| Resulting from Operations | (63,244) |
1 Interest income, realized net gain (loss), and change in unrealized appreciation (depreciation) from an affiliated company of the fund were $1,152,000, $6,000, and $1,000, respectively. Purchases and sales are for temporary cash investment purposes.
| | | |
| Year Ended October 31, |
| 2018 | 2017 |
| ($000) | ($000) |
| Increase (Decrease) in Net Assets | | |
| Operations | | |
| Net Investment Income | 405,011 | 367,416 |
| Realized Net Gain (Loss) | 10,202 | 34,537 |
| Change in Unrealized Appreciation (Depreciation) | (478,457) | (151,978) |
| Net Increase (Decrease) in Net Assets Resulting from Operations | (63,244) | 249,975 |
| Distributions | | |
| Net Investment Income | | |
| Investor Shares | (31,812) | (32,926) |
| Admiral Shares | (372,962) | (333,514) |
| Realized Capital Gain1 | | |
| Investor Shares | (2,593) | (3,051) |
| Admiral Shares | (26,879) | (29,276) |
| Total Distributions | (434,246) | (398,767) |
| Capital Share Transactions | | |
| Investor Shares | (87,158) | (10,619) |
| Admiral Shares | 1,335,938 | 841,740 |
| Net Increase (Decrease) from Capital Share Transactions | 1,248,780 | 831,121 |
| Total Increase (Decrease) | 751,290 | 682,329 |
| Net Assets |
| Beginning of Period | 10,927,661 | 10,245,332 |
| End of Period | 11,678,951 | 10,927,661 |
1 Includes fiscal 2018 and 2017 short-term gain distributions totaling $948,000 and $8,018,000, respectively. Short-term gain distributions are treated as ordinary income dividends for tax purposes.
See accompanying Notes, which are an integral part of the Financial Statements.
321
Long-Term Tax-Exempt Fund
Financial Highlights
Investor Shares
| | | | | | |
| For a Share Outstanding | | | | Year Ended October 31, |
| Throughout Each Period | 2018 | 2017 | 2016 | 2015 | 2014 |
| Net Asset Value, Beginning of Period | | $11.65 | $11.83 | $11.64 | $11.73 | $11.14 |
| Investment Operations | |
| Net Investment Income | | . 3931 | .4031 | .418 | .430 | .450 |
| Net Realized and Unrealized Gain (Loss) | | | | | | |
| on Investments | | (.459) | (.143) | .206 | (.063) | .590 |
| Total from Investment Operations | | (.066) | .260 | .624 | .367 | 1.040 |
| Distributions | | |
| Dividends from Net Investment Income | | (.393) | (.402) | (.418) | (.430) | (.450) |
| Distributions from Realized Capital Gains | | (.031) | (.038) | (.016) | (.027) | — |
| Total Distributions | | (.424) | (.440) | (.434) | (.457) | (.450) |
| Net Asset Value, End of Period | | $11.16 | $11.65 | $11.83 | $11.64 | $11.73 |
| |
| Total Return 2 | | -0.59% | 2.31% | 5.39% | 3.19% | 9.52% |
| |
| Ratios/Supplemental Data | | |
| Net Assets, End of Period (Millions) | | $853 | $980 | $1,007 | $928 | $958 |
| Ratio of Total Expenses to Average Net Assets | 0.17% | 0.19% | 0.19% | 0.20% | 0.20% |
| Ratio of Net Investment Income to | | | | | | |
| Average Net Assets | | 3.44% | 3.49% | 3.52% | 3.69% | 3.95% |
| Portfolio Turnover Rate | | 16% | 19% | 13% | 18% | 21% |
1 Calculated based on average shares outstanding.
2 Total returns do not include account service fees that may have applied in the periods shown. Fund prospectuses provide information about any applicable account service fees.
| | | | | | |
| Admiral Shares | | | | | | |
| | | | | | |
| For a Share Outstanding | | | | Year Ended October 31, |
| Throughout Each Period | 2018 | 2017 | 2016 | 2015 | 2014 |
| Net Asset Value, Beginning of Period | | $11.65 | $11.83 | $11.64 | $11.73 | $11.14 |
| Investment Operations | |
| Net Investment Income | | . 4021 | .4151 | .430 | .439 | .459 |
| Net Realized and Unrealized Gain (Loss) | | | | | | |
| on Investments | | (.459) | (.143) | .206 | (.063) | .590 |
| Total from Investment Operations | | (.057) | .272 | .636 | .376 | 1.049 |
| Distributions | | |
| Dividends from Net Investment Income | | (.402) | (.414) | (.430) | (.439) | (.459) |
| Distributions from Realized Capital Gains | | (.031) | (.038) | (.016) | (.027) | — |
| Total Distributions | | (.433) | (.452) | (.446) | (.466) | (.459) |
| Net Asset Value, End of Period | | $11.16 | $11.65 | $11.83 | $11.64 | $11.73 |
| |
| Total Return 2 | | -0.51% | 2.42% | 5.50% | 3.27% | 9.60% |
| |
| Ratios/Supplemental Data | | |
| Net Assets, End of Period (Millions) | | $10,825 | $9,947 | $9,238 | $8,088 | $7,480 |
| Ratio of Total Expenses to Average Net Assets | 0.09% | 0.09% | 0.09% | 0.12% | 0.12% |
| Ratio of Net Investment Income to | | | | | | |
| Average Net Assets | | 3.52% | 3.59% | 3.62% | 3.77% | 4.03% |
| Portfolio Turnover Rate | | 16% | 19% | 13% | 18% | 21% |
1 Calculated based on average shares outstanding.
2 Total returns do not include account service fees that may have applied in the periods shown. Fund prospectuses provide information about any applicable account service fees.
See accompanying Notes, which are an integral part of the Financial Statements.
322
Long-Term Tax-Exempt Fund
Notes to Financial Statements
Vanguard Long-Term Tax-Exempt Fund is registered under the Investment Company Act of 1940 as an open-end investment company, or mutual fund. The fund invests in debt instruments of many municipal issuers; the issuers’ abilities to meet their obligations may be affected by economic and political developments in a specific state or region. The fund offers two classes of shares: Investor Shares and Admiral Shares. Investor Shares are available to any investor who meets the fund’s minimum purchase requirements. Admiral Shares are designed for investors who meet certain administrative, service, and account-size criteria.
A. The following significant accounting policies conform to generally accepted accounting principles for U.S. investment companies. The fund consistently follows such policies in preparing its financial statements.
1. Security Valuation: Securities are valued as of the close of trading on the New York Stock Exchange (generally 4 p.m., Eastern time) on the valuation date. Bonds and temporary cash investments are valued using the latest bid prices or using valuations based on a matrix system (which considers such factors as security prices, yields, maturities, and ratings), both as furnished by independent pricing services. Investments in Vanguard Municipal Cash Management Fund are valued at that fund’s net asset value. Securities for which market quotations are not readily available, or whose values have been affected by events occurring before the fund’s pricing time but after the close of the securities’ primary markets, are valued by methods deemed by the board of trustees to represent fair value.
2. Futures Contracts: The fund uses futures contracts to invest in fixed income asset classes with greater efficiency and lower cost than is possible through direct investment, to add value when these instruments are attractively priced, or to adjust sensitivity to changes in interest rates. The primary risks associated with the use of futures contracts are imperfect correlation between changes in market values of bonds held by the fund and the prices of futures contracts, and the possibility of an illiquid market. Counterparty risk involving futures is mitigated because a regulated clearinghouse is the counterparty instead of the clearing broker. To further mitigate counterparty risk, the fund trades futures contracts on an exchange, monitors the financial strength of its clearing brokers and clearinghouse, and has entered into clearing agreements with its clearing brokers. The clearinghouse imposes initial margin requirements to secure the fund’s performance and requires daily settlement of variation margin representing changes in the market value of each contract. Any assets pledged as initial margin for open contracts are noted in the Statement of Net Assets.
Futures contracts are valued at their quoted daily settlement prices. The notional amounts of the contracts are not recorded in the Statement of Net Assets. Fluctuations in the value of the contracts are recorded in the Statement of Net Assets as an asset (liability) and in the Statement of Operations as unrealized appreciation (depreciation) until the contracts are closed, when they are recorded as realized futures gains (losses).
During the year ended October 31, 2018, the fund’s average investments in long and short futures contracts represented 4% and 1% of net assets, respectively, based on the average of the notional amounts at each quarter-end during the period.
3. Federal Income Taxes: The fund intends to continue to qualify as a regulated investment company and distribute all of its income. Management has analyzed the fund’s tax positions taken for all open federal income tax years (October 31, 2015–2018), and has concluded that no provision for federal income tax is required in the fund’s financial statements.
4. Distributions: Distributions from net investment income are declared daily and paid on the first business day of the following month. Annual distributions from realized capital gains, if any, are recorded on the ex-dividend date. Distributions are determined on a tax basis and may differ from net investment income and realized capital gains for financial reporting purposes.
5. Credit Facility: The fund and certain other funds managed by The Vanguard Group (“Vanguard”) participate in a $3.1 billion committed credit facility provided by a syndicate of lenders pursuant to a credit agreement that may be renewed annually; each fund is individually liable for its borrowings, if any, under the credit facility. Borrowings may be utilized for temporary and emergency purposes, and are subject to the fund’s regulatory and contractual borrowing restrictions. The participating funds are charged administrative fees and an annual commitment fee of 0.10% of the undrawn amount of the facility; these fees are allocated to the funds based on a method approved by the fund’s board of trustees and included in Management and Administrative expenses on the fund’s Statement of Operations. Any borrowings under this facility bear interest at a rate based upon the higher of the one-month London Interbank Offered Rate, federal funds effective rate, or overnight bank funding rate plus an agreed-upon spread.
The fund had no borrowings outstanding at October 31, 2018, or at any time during the period then ended.
323
Long-Term Tax-Exempt Fund
6. Other: Interest income includes income distributions received from Vanguard Municipal Cash Management Fund and is accrued daily. Premiums and discounts on debt securities purchased are amortized and accreted, respectively, to interest income over the lives of the respective securities. Security transactions are accounted for on the date securities are bought or sold. Costs used to determine realized gains (losses) on the sale of investment securities are those of the specific securities sold.
Each class of shares has equal rights as to assets and earnings, except that each class separately bears certain class-specific expenses related to maintenance of shareholder accounts (included in Management and Administrative expenses), shareholder reporting, and the proxy. Marketing and distribution expenses are allocated to each class of shares based on a method approved by the board of trustees. Income, other non-class-specific expenses, and gains and losses on investments are allocated to each class of shares based on its relative net assets.
B. In accordance with the terms of a Funds’ Service Agreement (the “FSA”) between Vanguard and the fund, Vanguard furnishes to the fund investment advisory, corporate management, administrative, marketing, and distribution services at Vanguard’s cost of operations (as defined by the FSA). These costs of operations are allocated to the fund based on methods and guidelines approved by the board of trustees. Vanguard does not require reimbursement in the current period for certain costs of operations (such as deferred compensation/benefits and risk/insurance costs); the fund’s liability for these costs of operations is included in Payables to Vanguard on the Statement of Net Assets. All other costs of operations payable to Vanguard are generally settled twice a month.
Upon the request of Vanguard, the fund may invest up to 0.40% of its net assets as capital in Vanguard. At October 31, 2018, the fund had contributed to Vanguard capital in the amount of $599,000, representing 0.01% of the fund’s net assets and 0.24% of Vanguard’s capitalization. The fund’s trustees and officers are also directors and employees, respectively, of Vanguard.
C. Various inputs may be used to determine the value of the fund’s investments. These inputs are summarized in three broad levels for financial statement purposes. The inputs or methodologies used to value securities are not necessarily an indication of the risk associated with investing in those securities.
Level 1—Quoted prices in active markets for identical securities.
Level 2—Other significant observable inputs (including quoted prices for similar securities, interest rates, prepayment speeds, credit risk, etc.).
Level 3—Significant unobservable inputs (including the fund’s own assumptions used to determine the fair value of investments). Any investments valued with significant unobservable inputs are noted on the Statement of Net Assets.
The following table summarizes the market value of the fund’s investments as of October 31, 2018, based on the inputs used to value them:
| | | |
| Level 1 | Level 2 | Level 3 |
| Investments | ($000) | ($000) | ($000) |
| Tax-Exempt Municipal Bonds | — | 11,418,280 | — |
| Temporary Cash Investments | 213,828 | — | — |
| Futures Contracts—Assets1 | 470 | — | — |
| Futures Contracts—Liabilities1 | (816) | — | — |
| Total | 213,482 | 11,418,280 | — |
| 1 Represents variation margin on the last day of the reporting period. | | | |
D. Permanent differences between book-basis and tax-basis components of net assets are reclassified among capital accounts in the financial statements to reflect their tax character. These reclassifications have no effect on net assets or net asset value per share. As of period end, the following permanent differences primarily attributable to the accounting for distributions in connection with fund share redemptions were reclassified to the following accounts:
| |
| Amount |
| ($000) |
| Paid-in Capital | 1,211 |
| Total Distributable Earnings (Loss) | (1,211) |
324
Long-Term Tax-Exempt Fund
Temporary differences between book-basis and tax-basis components of total distributable earnings (loss) arise when certain items of income, gain, or loss are recognized in different periods for financial statement and tax purposes; these differences will reverse at some time in the future. The differences are primarily related to the tax deferral of losses on wash sales and straddles, the realization of unrealized gains or losses on certain futures contracts, and payables for distributions. As of period end, the tax-basis components of total distributable earnings (loss) are detailed in the table as follows:
| |
| Amount |
| ($000) |
| Undistributed Ordinary Income | — |
| Undistributed Tax-Exempt Income | 17,963 |
| Undistributed Long-Term Gains | 5,669 |
| Capital Loss Carryforwards (Non-expiring) | — |
| Net Unrealized Gains (Losses) | 51,787 |
As of October 31, 2018, gross unrealized appreciation and depreciation for investments and derivatives based on cost for U.S. federal income tax purposes were as follows:
| |
| Amount |
| ($000) |
| Tax Cost | 11,580,321 |
| Gross Unrealized Appreciation | 228,229 |
| Gross Unrealized Depreciation | (176,442) |
| Net Unrealized Appreciation (Depreciation) | 51,787 |
E. During the year ended October 31, 2018, the fund purchased $3,141,778,000 of investment securities and sold $1,782,499,000 of investment securities, other than temporary cash investments.
The fund purchased securities from and sold securities to other Vanguard funds or accounts managed by Vanguard or its affiliates, in accordance with procedures adopted by the board of trustees in compliance with Rule 17a-7 of the Investment Company Act of 1940. For the year ended October 31, 2018, such purchases and sales were $446,745,000 and $739,609,000, respectively; these amounts are included in the purchases and sales of investment securities noted above.
| | | | |
| F. Capital share transactions for each class of shares were: | | | |
| | | Year Ended October 31, |
| | 2018 | | 2017 |
| Amount | Shares | Amount | Shares |
| ($000) | (000) | ($000) | (000) |
| Investor Shares | | | | |
| Issued | 145,879 | 12,720 | 229,477 | 19,880 |
| Issued in Lieu of Cash Distributions | 28,002 | 2,449 | 29,180 | 2,535 |
| Redeemed | (261,039) | (22,829) | (269,276) | (23,379) |
| Net Increase (Decrease)—Investor Shares | (87,158) | (7,660) | (10,619) | (964) |
| Admiral Shares | | | | |
| Issued | 3,112,340 | 272,703 | 2,250,307 | 195,501 |
| Issued in Lieu of Cash Distributions | 268,301 | 23,483 | 239,133 | 20,768 |
| Redeemed | (2,044,703) | (179,726) | (1,647,700) | (143,485) |
| Net Increase (Decrease)—Admiral Shares | 1,335,938 | 116,460 | 841,740 | 72,784 |
G. Management has determined that no events or transactions occurred subsequent to October 31, 2018, that would require recognition or disclosure in these financial statements.
325
High-Yield Tax-Exempt Fund
Fund Profile
As of October 31, 2018
| | |
| Share-Class Characteristics | | |
| Investor | Admiral |
| Shares | Shares |
| Ticker Symbol | VWAHX | VWALX |
| Expense Ratio1 | 0.19% | 0.09% |
| 30-Day SEC Yield | 3.54% | 3.59% |
| | |
| Financial Attributes | | |
| | Bloomberg |
| Barclays |
| Municipal |
| Bond |
| Fund | Index |
| Number of Bonds | 2,232 | 53,575 |
| Yield to Maturity | | |
| (before expenses) | 3.6% | 3.0% |
| Average Coupon | 4.7% | 4.7% |
| Average Duration | 7.2 years | 6.5 years |
| Average Stated Maturity | 18.0 years | 13.0 years |
| Short-Term Reserves | 2.8% | — |
| |
| Largest Area Concentrations2 | |
| |
| California | 10.3% |
| Illinois | 10.3 |
| New York | 9.7 |
| Texas | 7.3 |
| New Jersey | 6.6 |
| Pennsylvania | 6.6 |
| Florida | 6.4 |
| Michigan | 3.5 |
| Colorado | 2.7 |
| Wisconsin | 2.5 |
| Top Ten | 65.9% |
| |
| Volatility Measures | |
| Bloomberg |
| Barclays |
| Municipal |
| Bond Index |
| R-Squared | 0.96 |
| Beta | 1.13 |
These measures show the degree and timing of the fund’s fluctuations compared with the indexes over 36 months.
| |
| Distribution by Stated Maturity (% of portfolio) |
| |
| Under 1 Year | 5.0% |
| 1–3 Years | 3.4 |
| 3–5 Years | 3.5 |
| 5–10 Years | 8.6 |
| 10–20 Years | 34.4 |
| 20–30 Years | 37.5 |
| Over 30 Years | 7.6 |
| |
| Distribution by Credit Quality (% of portfolio) |
| |
| AAA | 5.4% |
| AA | 19.7 |
| A | 34.1 |
| BBB | 24.2 |
| BB | 4.6 |
| B or Lower | 2.6 |
| Not Rated | 9.4 |
Credit-quality ratings are obtained from Moody’s and S&P, and the higher rating for each issue is shown. “Not Rated” is used to classify securities for which a rating is not available. Not rated securities include a fund’s investment in Vanguard Market Liquidity Fund or Vanguard Municipal Cash Management Fund, each of which invests in high-quality money market instruments and may serve as a cash management vehicle for the Vanguard funds, trusts, and accounts. For more information about these ratings, see the Glossary entry for Credit Quality.
Investment Focus
1 The expense ratios shown are from the prospectus dated February 23, 2018, and represent estimated costs for the current fiscal year. For the fiscal year ended October 31, 2018, the expense ratios were 0.17% for Investor Shares and 0.09% for Admiral Shares. 2 Percentage of net assets, excluding any futures contracts.
326
High-Yield Tax-Exempt Fund
Performance Summary
All of the returns in this report represent past performance, which is not a guarantee of future results that may be achieved by the fund. (Current performance may be lower or higher than the performance data cited. For performance data current to the most recent month-end, visit our website at vanguard.com/performance.) Note, too, that both investment returns and principal value can fluctuate widely, so an investor’s shares, when sold, could be worth more or less than their original cost. The returns shown do not reflect taxes that a shareholder would pay on fund distributions or on the sale of fund shares.
Cumulative Performance: October 31, 2008–October 31, 2018
Initial Investment of $10,000

| | | | |
| | Average Annual Total Returns | Final Value |
| | Periods Ended October 31, 2018 | of a $10,000 |
| One Year | Five Years | Ten Years | Investment |
| High-Yield Tax-Exempt Fund Investor Shares | 0.35% | 4.50% | 5.89% | $17,722 |
| Bloomberg Barclays Municipal Bond Index | -0.51 | 3.25 | 4.80 | 15,976 |
| General & Insured Municipal Debt | | | | |
| Funds Average1 | -0.37 | 3.30 | 4.75 | 15,908 |
| | | | |
| Final Value |
| of a $50,000 |
| One Year | Five Years | Ten Years | Investment |
| High-Yield Tax-Exempt Fund Admiral Shares | 0.43% | 4.59% | 5.98% | $89,351 |
| Bloomberg Barclays Municipal Bond Index | -0.51 | 3.25 | 4.80 | 79,878 |
1 Derived from data provided by Lipper, a Thomson Reuters Company.
See Financial Highlights for dividend and capital gains information.
327
High-Yield Tax-Exempt Fund
| | | | |
| Fiscal-Year Total Returns (%): October 31, 2008–October 31, 2018 | | | |
| Bloomberg |
| Barclays |
| Municipal |
| | Investor Shares | Bond Index |
| Income | Capital | Total | Total |
| Fiscal Year | Returns | Returns | Returns | Returns |
| 2009 | 5.65% | 10.44% | 16.09% | 13.60% |
| 2010 | 4.76 | 4.00 | 8.76 | 7.78 |
| 2011 | 4.57 | -1.31 | 3.26 | 3.78 |
| 2012 | 4.21 | 7.22 | 11.43 | 9.03 |
| 2013 | 3.74 | -5.85 | -2.11 | -1.72 |
| 2014 | 4.23 | 5.64 | 9.87 | 7.82 |
| 2015 | 3.74 | -0.27 | 3.47 | 2.87 |
| 2016 | 3.74 | 2.41 | 6.15 | 4.06 |
| 2017 | 3.78 | -0.87 | 2.91 | 2.19 |
| 2018 | 3.69 | -3.34 | 0.35 | -0.51 |
Average Annual Total Returns: Periods Ended September 30, 2018
This table presents returns through the latest calendar quarter—rather than through the end of the fiscal period.
Securities and Exchange Commission rules require that we provide this information.
| | | | | | |
| | | | | Ten Years |
| Inception Date | One Year | Five Years | Income | Capital | Total |
| Investor Shares | 12/27/1978 | 1.52% | 4.85% | 4.20% | 1.35% | 5.55% |
| Admiral Shares | 11/12/2001 | 1.60 | 4.94 | 4.29 | 1.35 | 5.64 |
328
High-Yield Tax-Exempt Fund
Financial Statements
Statement of Net Assets
As of October 31, 2018
The fund reports a complete list of its holdings in regulatory filings four times in each fiscal year, at the quarter-ends. For the second and fourth fiscal quarters, the lists appear in the fund’s semiannual and annual reports to shareholders. For the first and third fiscal quarters, the fund files the lists with the Securities and Exchange Commission on Form N-Q. Shareholders can look up the fund’s Forms N-Q on the SEC’s website at sec.gov.
| | | | |
| Face | Market |
| Maturity | Amount | Value• |
| Coupon | Date | ($000) | ($000) |
| Tax-Exempt Municipal Bonds (96.9%) | | | | |
| Alabama (1.0%) | | | | |
| Alabama Port Authority Docks Facilities Revenue | 6.000% | 10/1/20 (Prere.) | 3,000 | 3,218 |
| Birmingham AL GO | 5.000% | 3/1/37 | 2,500 | 2,693 |
| 1 Birmingham AL GO | 0.000% | 3/1/40 | 3,000 | 3,134 |
| 1 Birmingham AL GO | 0.000% | 3/1/45 | 4,000 | 4,216 |
| Birmingham AL Special Care Facilities Financing Authority Revenue | | | | |
| (Methodist Home for the Aging) | 5.750% | 6/1/45 | 2,500 | 2,672 |
| Houston County AL Health Care Authority Revenue | 5.000% | 10/1/30 | 6,785 | 7,216 |
| Jefferson County AL Revenue | 5.000% | 9/15/26 | 3,200 | 3,636 |
| Jefferson County AL Revenue | 5.000% | 9/15/31 | 7,500 | 8,344 |
| Jefferson County AL Revenue | 5.000% | 9/15/35 | 2,750 | 3,016 |
| 2 Jefferson County AL Sewer Revenue | 0.000% | 10/1/38 (4) | 7,500 | 6,526 |
| Jefferson County AL Sewer Revenue | 6.000% | 10/1/42 | 3,750 | 4,234 |
| Jefferson County AL Sewer Revenue | 7.000% | 10/1/51 | 34,230 | 40,416 |
| Jefferson County AL Sewer Revenue | 6.500% | 10/1/53 | 24,250 | 28,071 |
| Montgomery AL Higher Education Building Authority Revenue (Faulkner University) | 5.000% | 10/1/36 | 2,820 | 2,859 |
| Montgomery AL Higher Education Building Authority Revenue (Faulkner University) | 5.000% | 10/1/43 | 5,080 | 5,080 |
| Selma AL Industrial Development Board Revenue (International Paper Co. Project) | 5.375% | 12/1/35 | 4,000 | 4,324 |
| | | | 129,655 |
| Alaska (0.1%) | | | | |
| Alaska Industrial Development & Export Authority Revenue (Providence Health & Services) | 5.500% | 10/1/41 | 6,105 | 6,524 |
| Anchorage AK Electric Utility Revenue | 5.000% | 12/1/35 | 5,000 | 5,502 |
| Anchorage AK Electric Utility Revenue | 5.000% | 12/1/36 | 5,000 | 5,494 |
| Northern Alaska Tobacco Securitization Corp. Revenue | 4.625% | 6/1/23 | 530 | 530 |
| | | | 18,050 |
| American Samoa (0.0%) | | | | |
| American Samoa Economic Development Authority Revenue | 6.625% | 9/1/35 | 5,000 | 4,726 |
| | | | |
| Arizona (0.8%) | | | | |
| Arizona Health Facilities Authority Hospital System Revenue (Phoenix Children’s Hospital) | 5.000% | 2/1/33 | 1,700 | 1,792 |
| Arizona Health Facilities Authority Hospital System Revenue (Phoenix Children’s Hospital) | 5.000% | 2/1/34 | 8,250 | 8,715 |
| Glendale AZ Industrial Development Authority Revenue (Beatitudes Campus Project) | 5.000% | 11/15/36 | 2,195 | 2,164 |
| Glendale AZ Industrial Development Authority Revenue (Beatitudes Campus Project) | 5.000% | 11/15/40 | 2,500 | 2,419 |
| Glendale AZ Industrial Development Authority Revenue (Beatitudes Campus Project) | 5.000% | 11/15/45 | 1,000 | 957 |
| Glendale AZ Industrial Development Authority Revenue (Beatitudes Campus Project) | 5.000% | 11/15/53 | 6,370 | 6,038 |
| Glendale AZ Industrial Development Authority Revenue (Terraces of Phoenix Project) | 5.000% | 7/1/33 | 250 | 259 |
| Glendale AZ Industrial Development Authority Revenue (Terraces of Phoenix Project) | 5.000% | 7/1/38 | 300 | 307 |
| Glendale AZ Industrial Development Authority Revenue (Terraces of Phoenix Project) | 5.000% | 7/1/48 | 1,515 | 1,541 |
| Maricopa County AZ Pollution Control Corp. Revenue (Southern California Edison Co.) | 5.000% | 6/1/35 | 12,500 | 12,963 |
| Phoenix AZ Civic Improvement Corp. Airport Revenue | 5.000% | 7/1/32 | 2,000 | 2,226 |
| Phoenix AZ Civic Improvement Corp. Airport Revenue | 5.000% | 7/1/33 | 1,000 | 1,109 |
| Phoenix AZ Civic Improvement Corp. Airport Revenue | 5.000% | 7/1/34 | 1,260 | 1,392 |
| Phoenix AZ Civic Improvement Corp. Airport Revenue | 5.000% | 7/1/35 | 1,700 | 1,872 |
| Phoenix AZ Civic Improvement Corp. Airport Revenue | 5.000% | 7/1/36 | 2,205 | 2,419 |
| Phoenix AZ Civic Improvement Corp. Water System Revenue | 5.000% | 7/1/33 | 5,925 | 6,570 |
| Phoenix AZ Civic Improvement Corp. Water System Revenue | 5.000% | 7/1/34 | 5,520 | 6,109 |
| Pima County AZ Industrial Development Authority Revenue (Tucson Electric Power Co. Project) | 4.000% | 9/1/29 | 3,000 | 3,094 |
| Salt Verde AZ Financial Corp. Gas Revenue | 5.250% | 12/1/26 | 8,545 | 9,718 |
| Salt Verde AZ Financial Corp. Gas Revenue | 5.250% | 12/1/27 | 17,105 | 19,516 |
| Tempe AZ Industrial Development Authority Revenue (Mirabella at ASU Project) | 6.125% | 10/1/47 | 1,400 | 1,503 |
| Tempe AZ Industrial Development Authority Revenue (Mirabella at ASU Project) | 6.125% | 10/1/52 | 1,400 | 1,498 |
| University Medical Center Corp. Arizona Hospital Revenue | 6.500% | 7/1/19 (Prere.) | 2,500 | 2,573 |
| | | | 96,754 |
| Arkansas (0.1%) | | | | |
| Arkansas Development Finance Authority Hospital Revenue (Washington Regional Medical Center) | 5.000% | 2/1/24 | 1,600 | 1,753 |
| Arkansas Development Finance Authority Hospital Revenue (Washington Regional Medical Center) | 5.000% | 2/1/30 | 5,045 | 5,466 |
329
High-Yield Tax-Exempt Fund
| | | | |
| Face | Market |
| Maturity | Amount | Value• |
| Coupon | Date | ($000) | ($000) |
| Arkansas Development Finance Authority Hospital Revenue (Washington Regional Medical Center) | 5.000% | 2/1/33 | 1,645 | 1,763 |
| Arkansas Development Finance Authority Hospital Revenue (Washington Regional Medical Center) | 5.000% | 2/1/33 | 1,425 | 1,527 |
| | | | 10,509 |
| California (10.3%) | | | | |
| Alameda CA Corridor Transportation Authority Revenue | 0.000% | 10/1/30 (2) | 1,000 | 609 |
| Alameda CA Corridor Transportation Authority Revenue | 4.000% | 10/1/35 (4) | 3,750 | 3,811 |
| Alameda CA Corridor Transportation Authority Revenue | 5.000% | 10/1/35 (4) | 3,850 | 4,238 |
| Alameda CA Corridor Transportation Authority Revenue | 5.000% | 10/1/36 (4) | 2,210 | 2,421 |
| Alameda CA Corridor Transportation Authority Revenue | 4.000% | 10/1/37 (4) | 1,500 | 1,514 |
| Alameda CA Corridor Transportation Authority Revenue | 5.000% | 10/1/37 | 15,420 | 16,608 |
| Bay Area Toll Authority California Toll Bridge Revenue (San Francisco Bay Area) | 5.000% | 4/1/56 | 10,000 | 10,910 |
| Beaumont CA Public Improvement Wastewater Revenue | 5.000% | 9/1/43 (4) | 5,000 | 5,616 |
| Beaumont CA Public Improvement Wastewater Revenue | 5.000% | 9/1/49 (4) | 1,000 | 1,117 |
| California Educational Facilities Authority Revenue (Loma Linda University) | 5.000% | 4/1/42 | 2,620 | 2,864 |
| California Educational Facilities Authority Revenue (Loma Linda University) | 5.000% | 4/1/47 | 6,090 | 6,630 |
| California GO | 6.500% | 4/1/19 (Prere.) | 13,000 | 13,261 |
| California GO | 5.000% | 9/1/29 | 4,565 | 4,914 |
| California GO | 5.000% | 10/1/30 | 12,600 | 14,196 |
| California GO | 6.000% | 3/1/33 | 3,000 | 3,161 |
| California GO | 6.500% | 4/1/33 | 11,000 | 11,203 |
| California GO | 4.000% | 11/1/34 | 5,000 | 5,172 |
| California GO | 5.000% | 9/1/36 | 3,250 | 3,530 |
| California GO | 5.000% | 2/1/38 | 6,375 | 6,890 |
| California GO | 5.000% | 2/1/43 | 2,100 | 2,264 |
| California GO | 5.000% | 11/1/43 | 12,500 | 13,634 |
| California Health Facilities Financing Authority Revenue (Adventist Health System/West) | 5.750% | 9/1/19 (Prere.) | 4,500 | 4,647 |
| California Health Facilities Financing Authority Revenue (Adventist Health System/West) | 4.000% | 3/1/33 | 5,000 | 5,069 |
| California Health Facilities Financing Authority Revenue (Adventist Health System/West) | 4.000% | 3/1/39 | 10,000 | 9,876 |
| California Health Facilities Financing Authority Revenue (Catholic Healthcare West) | 6.000% | 7/1/19 (Prere.) | 7,500 | 7,712 |
| California Health Facilities Financing Authority Revenue (Children’s Hospital of Los Angeles) | 5.000% | 8/15/47 | 5,230 | 5,679 |
| California Health Facilities Financing Authority Revenue (El Camino Hospital) | 5.000% | 2/1/31 | 1,200 | 1,355 |
| California Health Facilities Financing Authority Revenue (El Camino Hospital) | 5.000% | 2/1/37 | 2,625 | 2,901 |
| California Health Facilities Financing Authority Revenue (El Camino Hospital) | 5.000% | 2/1/42 | 5,250 | 5,762 |
| California Health Facilities Financing Authority Revenue (El Camino Hospital) | 5.000% | 2/1/47 | 5,500 | 6,016 |
| California Health Facilities Financing Authority Revenue | | | | |
| (Lucile Salter Packard Children’s Hospital at Stanford) | 5.000% | 8/15/55 | 3,000 | 3,251 |
| California Health Facilities Financing Authority Revenue (Sutter Health) | 6.000% | 8/15/20 (Prere.) | 12,000 | 12,868 |
| California Health Facilities Financing Authority Revenue (Sutter Health) | 5.000% | 11/15/46 | 18,000 | 19,542 |
| California Infrastructure & Economic Development Bank Revenue | | | | |
| (Independent System Operator Corp. Project) | 5.000% | 2/1/34 | 13,770 | 14,957 |
| California Municipal Finance Authority Charter School Lease Revenue | | | | |
| (Bella Mente Montessori Academy) | 5.000% | 6/1/28 | 430 | 458 |
| California Municipal Finance Authority Charter School Lease Revenue | | | | |
| (Bella Mente Montessori Academy) | 5.000% | 6/1/38 | 840 | 866 |
| California Municipal Finance Authority Charter School Lease Revenue | | | | |
| (Bella Mente Montessori Academy) | 5.000% | 6/1/48 | 1,150 | 1,176 |
| California Municipal Finance Authority Revenue | 5.000% | 12/31/37 | 7,500 | 8,102 |
| California Municipal Finance Authority Revenue | 5.000% | 12/31/38 | 4,000 | 4,304 |
| California Municipal Finance Authority Revenue | 5.000% | 12/31/43 | 5,000 | 5,343 |
| California Municipal Finance Authority Revenue | 4.000% | 12/31/47 (4) | 8,000 | 7,785 |
| California Municipal Finance Authority Revenue | 5.000% | 12/31/47 | 3,500 | 3,729 |
| California Municipal Finance Authority Revenue (Azusa Pacific University) | 5.000% | 4/1/35 | 2,000 | 2,086 |
| California Municipal Finance Authority Revenue (Biola University) | 5.000% | 10/1/26 | 360 | 413 |
| California Municipal Finance Authority Revenue (Biola University) | 5.000% | 10/1/27 | 435 | 502 |
| California Municipal Finance Authority Revenue (Eisenhower Medical Center) | 5.000% | 7/1/26 | 1,000 | 1,119 |
| California Municipal Finance Authority Revenue (Eisenhower Medical Center) | 5.000% | 7/1/27 | 1,000 | 1,122 |
| California Municipal Finance Authority Revenue (Eisenhower Medical Center) | 5.000% | 7/1/29 | 1,000 | 1,108 |
| California Municipal Finance Authority Revenue (Eisenhower Medical Center) | 5.000% | 7/1/47 | 4,250 | 4,526 |
| California Municipal Finance Authority Revenue (Eisenhower Medical Center) | 5.000% | 7/1/47 | 5,000 | 5,325 |
| California Municipal Finance Authority Revenue (NorthBay Healthcare Group) | 5.000% | 11/1/47 | 3,785 | 3,896 |
| California Municipal Finance Authority Revenue (NorthBay Healthcare Group) | 5.250% | 11/1/47 | 3,900 | 4,105 |
| California Municipal Finance Authority Revenue (University of La Verne) | 6.250% | 6/1/20 (Prere.) | 3,585 | 3,824 |
| California Municipal Finance Authority Revenue (University of La Verne) | 5.000% | 6/1/31 | 1,000 | 1,133 |
| California Municipal Finance Authority Revenue (University of La Verne) | 5.000% | 6/1/33 | 1,010 | 1,132 |
| California Municipal Finance Authority Revenue (University of La Verne) | 5.000% | 6/1/35 | 1,000 | 1,111 |
| California Municipal Finance Authority Revenue (University of La Verne) | 5.000% | 6/1/36 | 1,000 | 1,105 |
| California Municipal Finance Authority Revenue (University of La Verne) | 5.000% | 6/1/43 | 6,620 | 7,212 |
| California Public Works Board Lease Revenue | 5.000% | 10/1/26 | 120 | 140 |
| California Public Works Board Lease Revenue | 5.000% | 3/1/32 | 5,000 | 5,657 |
330
High-Yield Tax-Exempt Fund
| | | | |
| Face | Market |
| Maturity | Amount | Value• |
| Coupon | Date | ($000) | ($000) |
| California Public Works Board Lease Revenue (Department of Corrections) | 4.500% | 9/1/35 | 10,000 | 10,577 |
| California Public Works Board Lease Revenue (Judicial Council Projects) | 5.000% | 12/1/28 | 3,600 | 3,900 |
| California Public Works Board Lease Revenue (Judicial Council Projects) | 5.000% | 3/1/34 | 7,380 | 8,012 |
| California Public Works Board Lease Revenue (Various Capital Projects) | 5.000% | 12/1/21 (Prere.) | 10,000 | 10,914 |
| California Public Works Board Lease Revenue (Various Capital Projects) | 4.000% | 4/1/31 | 10,305 | 10,774 |
| California Public Works Board Lease Revenue (Various Capital Projects) | 5.000% | 11/1/37 | 9,035 | 9,775 |
| California School Finance Authority Charter School Revenue (Ednovate Obligated Group) | 5.000% | 6/1/30 | 1,000 | 1,043 |
| California School Finance Authority Charter School Revenue (Ednovate Obligated Group) | 5.000% | 6/1/48 | 1,000 | 1,010 |
| California School Finance Authority Charter School Revenue (Ednovate Obligated Group) | 5.000% | 6/1/56 | 1,000 | 1,003 |
| California State University Systemwide Revenue | 4.000% | 11/1/38 | 5,560 | 5,683 |
| California State University Systemwide Revenue | 4.000% | 11/1/45 | 2,750 | 2,778 |
| California Statewide Communities Development Authority Revenue (899 Charleston Project) | 5.250% | 11/1/44 | 2,000 | 2,077 |
| California Statewide Communities Development Authority Revenue (899 Charleston Project) | 5.375% | 11/1/49 | 9,200 | 9,614 |
| California Statewide Communities Development Authority Revenue | | | | |
| (Adventist Health System/West) | 5.000% | 3/1/35 | 4,500 | 4,982 |
| California Statewide Communities Development Authority Revenue (Kaiser Permanente) | 5.000% | 4/1/42 | 18,930 | 20,036 |
| California Statewide Communities Development Authority Revenue | | | | |
| (Loma Linda University Medical Center Obligated Group) | 5.250% | 12/1/44 | 10,000 | 10,454 |
| California Statewide Communities Development Authority Revenue | | | | |
| (Loma Linda University Medical Center) | 5.000% | 12/1/36 | 15,650 | 16,198 |
| California Statewide Communities Development Authority Revenue | | | | |
| (Loma Linda University Medical Center) | 5.000% | 12/1/41 | 23,125 | 23,592 |
| California Statewide Communities Development Authority Revenue | | | | |
| (Loma Linda University Medical Center) | 5.000% | 12/1/46 | 3,000 | 3,051 |
| California Statewide Communities Development Authority Revenue | | | | |
| (Loma Linda University Medical Center) | 5.500% | 12/1/54 | 12,000 | 12,586 |
| California Statewide Communities Development Authority Revenue | | | | |
| (Loma Linda University Medical Center) | 5.250% | 12/1/56 | 3,865 | 3,989 |
| California Statewide Communities Development Authority Revenue | | | | |
| (Loma Linda University Medical Center) | 5.500% | 12/1/58 | 20,000 | 20,986 |
| California Statewide Communities Development Authority Revenue | | | | |
| (Redlands Community Hospital) | 5.000% | 10/1/26 | 1,120 | 1,253 |
| California Statewide Communities Development Authority Revenue | | | | |
| (Redlands Community Hospital) | 5.000% | 10/1/46 | 2,650 | 2,826 |
| Corona-Norco CA School District Public Financing Authority Special Tax Revenue | 5.000% | 9/1/32 | 1,125 | 1,223 |
| Corona-Norco CA School District Public Financing Authority Special Tax Revenue | 5.000% | 9/1/35 | 585 | 633 |
| Dublin CA Community Facilities District Improvement Area No. 1 Special Tax Revenue | | | | |
| (Dublin Crossing) | 5.000% | 9/1/47 | 2,840 | 3,025 |
| El Camino CA Healthcare District GO | 4.000% | 8/1/35 | 4,200 | 4,331 |
| El Camino CA Healthcare District GO | 4.000% | 8/1/36 | 6,000 | 6,161 |
| Elk Grove CA Finance Authority Special Tax Revenue | 5.000% | 9/1/38 (15) | 1,465 | 1,607 |
| Folsom Ranch CA Financing Authority Special Tax Revenue | 5.000% | 9/1/47 | 3,000 | 3,196 |
| 3 Foothill/Eastern Transportation Corridor Agency California Toll Road Revenue | 0.000% | 1/15/42 | 6,000 | 5,344 |
| Foothill/Eastern Transportation Corridor Agency California Toll Road Revenue | 6.500% | 1/15/43 | 8,730 | 10,019 |
| Foothill/Eastern Transportation Corridor Agency California Toll Road Revenue | 5.750% | 1/15/46 | 18,000 | 20,110 |
| Golden State Tobacco Securitization Corp. California Revenue | 0.000% | 6/1/27 (2) | 10,000 | 7,609 |
| Golden State Tobacco Securitization Corp. California Revenue | 5.000% | 6/1/32 | 4,500 | 4,977 |
| Golden State Tobacco Securitization Corp. California Revenue | 5.000% | 6/1/34 | 10,000 | 10,986 |
| Golden State Tobacco Securitization Corp. California Revenue | 5.000% | 6/1/35 | 15,100 | 16,523 |
| Golden State Tobacco Securitization Corp. California Revenue | 5.300% | 6/1/37 | 7,000 | 7,156 |
| Golden State Tobacco Securitization Corp. California Revenue | 5.000% | 6/1/47 | 12,000 | 11,684 |
| Grossmont CA Healthcare District GO | 6.125% | 7/15/21 (Prere.) | 5,000 | 5,547 |
| Grossmont-Cuyamaca CA Community College District GO | 4.000% | 8/1/47 | 2,000 | 2,005 |
| Irvine CA Unified School District Community Facilities District No. 09-1 Special Tax Revenue | 5.000% | 9/1/49 | 1,000 | 1,072 |
| Irvine CA Unified School District Community Facilities District No. 09-1 Special Tax Revenue | 5.000% | 3/1/57 | 7,285 | 7,783 |
| Lee Lake CA Public Financing Authority Revenue | 5.000% | 9/1/28 | 2,805 | 3,070 |
| Lee Lake CA Public Financing Authority Revenue | 5.000% | 9/1/29 | 2,825 | 3,083 |
| Lee Lake CA Public Financing Authority Revenue | 5.000% | 9/1/32 | 3,500 | 3,768 |
| Lee Lake CA Public Financing Authority Revenue | 5.125% | 9/1/35 | 2,350 | 2,522 |
| Long Beach CA Harbor Revenue | 5.000% | 5/15/30 | 2,000 | 2,226 |
| Los Angeles CA Department of Airports International Airport Revenue | 5.000% | 5/15/29 | 1,200 | 1,348 |
| Los Angeles CA Department of Airports International Airport Revenue | 5.000% | 5/15/30 | 1,300 | 1,451 |
| Los Angeles CA Department of Airports International Airport Revenue | 5.000% | 5/15/31 | 1,550 | 1,720 |
| Los Angeles CA Department of Airports International Airport Revenue | 5.000% | 5/15/32 | 1,070 | 1,181 |
| Los Angeles CA Department of Airports International Airport Revenue | 4.000% | 5/15/34 | 2,500 | 2,547 |
| Los Angeles CA Department of Airports International Airport Revenue | 5.000% | 5/15/34 | 1,750 | 1,923 |
| Los Angeles CA Department of Airports International Airport Revenue | 5.000% | 5/15/35 | 1,770 | 1,936 |
| Los Angeles CA Department of Airports International Airport Revenue | 5.000% | 5/15/35 | 1,750 | 1,903 |
| Los Angeles CA Department of Airports International Airport Revenue | 4.000% | 5/15/36 | 1,500 | 1,512 |
| Los Angeles CA Department of Airports International Airport Revenue | 5.000% | 5/15/41 | 10,000 | 10,807 |
331
High-Yield Tax-Exempt Fund
| | | | |
| Face | Market |
| Maturity | Amount | Value• |
| Coupon | Date | ($000) | ($000) |
| Los Angeles CA Department of Airports International Airport Revenue | 5.000% | 5/15/41 | 11,000 | 11,843 |
| Los Angeles CA Department of Airports International Airport Revenue | 5.000% | 5/15/44 | 10,000 | 10,952 |
| Los Angeles CA Department of Airports Revenue | 5.000% | 5/15/35 | 3,450 | 3,828 |
| Los Angeles CA Municipal Improvement Corp. Lease Revenue | 4.000% | 11/1/33 | 8,275 | 8,614 |
| Los Angeles CA Municipal Improvement Corp. Lease Revenue | 4.000% | 11/1/34 | 6,345 | 6,578 |
| Los Angeles CA Municipal Improvement Corp. Lease Revenue | 4.000% | 11/1/36 | 2,575 | 2,648 |
| Los Angeles CA Regional Airports Improvement Corp. Lease Revenue (LAXFuel Corp.) | 5.000% | 1/1/32 | 4,000 | 4,173 |
| Los Angeles CA Unified School District GO | 4.000% | 7/1/34 | 6,000 | 6,173 |
| Los Angeles CA Wastewater System Revenue | 5.750% | 6/1/19 (Prere.) | 4,315 | 4,414 |
| Los Angeles CA Wastewater System Revenue | 5.750% | 6/1/19 (Prere.) | 3,465 | 3,545 |
| Los Angeles County CA Facilities Inc. Lease Revenue | 4.000% | 12/1/48 | 7,600 | 7,443 |
| Los Angeles County CA Public Works Financing Authority Lease Revenue | 5.000% | 8/1/33 | 2,500 | 2,718 |
| Los Angeles County CA Public Works Financing Authority Lease Revenue | 4.000% | 12/1/36 | 750 | 770 |
| Los Angeles County CA Public Works Financing Authority Lease Revenue | 4.000% | 12/1/40 | 2,000 | 2,022 |
| Los Angeles County CA Sanitation Districts Financing Authority Revenue | 4.000% | 10/1/42 | 9,425 | 9,410 |
| M-S-R California Energy Authority Revenue | 6.500% | 11/1/39 | 5,510 | 7,360 |
| Marin CA Healthcare District GO | 4.000% | 8/1/40 | 8,000 | 8,123 |
| Northstar Community Services District California Community Facilities | | | | |
| District No. 1 Special Tax Revenue | 5.000% | 9/1/37 | 5,000 | 5,029 |
| Oakland CA Unified School District GO | 6.125% | 8/1/19 (Prere.) | 4,000 | 4,132 |
| Oakland CA Unified School District GO | 6.625% | 8/1/21 (Prere.) | 4,000 | 4,501 |
| Oakland CA Unified School District GO | 5.500% | 8/1/22 (Prere.) | 3,000 | 3,378 |
| Oakland CA Unified School District GO | 5.000% | 8/1/32 | 1,000 | 1,129 |
| Palomar Pomerado Health California GO | 0.000% | 8/1/33 (12) | 8,805 | 4,832 |
| 4 Palomar Pomerado Health California GO | 0.000% | 8/1/38 (12) | 10,740 | 13,059 |
| Palomar Pomerado Health California Revenue | 5.000% | 11/1/28 | 3,500 | 3,830 |
| Palomar Pomerado Health California Revenue | 5.000% | 11/1/29 | 4,605 | 5,013 |
| Palomar Pomerado Health California Revenue | 5.000% | 11/1/30 | 3,335 | 3,609 |
| Palomar Pomerado Health California Revenue | 5.000% | 11/1/31 | 2,485 | 2,677 |
| Peralta CA Community College District Revenue | 4.000% | 8/1/39 | 7,000 | 7,086 |
| Peralta CA Community College District Revenue | 4.000% | 8/1/39 | 5,000 | 5,062 |
| Port of Oakland CA Revenue | 5.000% | 5/1/28 | 10,000 | 10,804 |
| Port of Oakland CA Revenue | 5.000% | 5/1/29 | 10,000 | 10,797 |
| Port of Oakland CA Revenue | 5.000% | 5/1/29 | 2,250 | 2,381 |
| Port of Oakland CA Revenue | 5.125% | 5/1/30 | 2,000 | 2,119 |
| Port of Oakland CA Revenue | 5.125% | 5/1/31 | 2,000 | 2,116 |
| Poway CA Unified School District GO | 0.000% | 8/1/46 | 2,500 | 707 |
| Poway CA Unified School District Public Financing Authority Special Tax Revenue | 5.000% | 9/1/28 (15) | 1,330 | 1,500 |
| Poway CA Unified School District Public Financing Authority Special Tax Revenue | 5.000% | 9/1/31 (15) | 3,705 | 4,135 |
| Poway CA Unified School District Public Financing Authority Special Tax Revenue | 5.000% | 9/1/32 (15) | 2,470 | 2,749 |
| Poway CA Unified School District Public Financing Authority Special Tax Revenue | 5.000% | 9/1/34 (15) | 2,975 | 3,292 |
| Rancho Cucamonga CA Redevelopment Agency Successor Agency Tax Allocation Revenue | | | | |
| (Rancho Redevelopment Project) | 4.000% | 9/1/31 (14) | 2,000 | 2,082 |
| Rancho Cucamonga CA Redevelopment Agency Successor Agency Tax Allocation Revenue | | | | |
| (Rancho Redevelopment Project) | 4.000% | 9/1/32 (14) | 3,205 | 3,323 |
| Rancho Cucamonga CA Redevelopment Agency Successor Agency Tax Allocation Revenue | | | | |
| (Rancho Redevelopment Project) | 4.000% | 9/1/34 (14) | 2,140 | 2,198 |
| Riverside County CA Transportation Commission Toll Revenue | 0.000% | 6/1/41 | 2,500 | 897 |
| Riverside County CA Transportation Commission Toll Revenue | 0.000% | 6/1/42 | 13,000 | 4,448 |
| Riverside County CA Transportation Commission Toll Revenue | 0.000% | 6/1/43 | 6,500 | 2,120 |
| Roseville CA Financing Authority Electric System Revenue | 5.000% | 2/1/20 (Prere.) | 11,000 | 11,424 |
| Roseville CA Joint Union High School District GO | 4.000% | 8/1/45 | 10,000 | 10,070 |
| Roseville CA Natural Gas Financing Authority Gas Revenue | 5.000% | 2/15/21 | 425 | 448 |
| Sacramento County CA Airport Revenue | 5.000% | 7/1/31 | 2,000 | 2,258 |
| Sacramento County CA Airport Revenue | 5.000% | 7/1/34 | 5,675 | 6,333 |
| Sacramento County CA Airport Revenue | 5.000% | 7/1/36 | 6,000 | 6,644 |
| Sacramento County CA Airport Revenue | 5.000% | 7/1/41 | 2,525 | 2,769 |
| Sacramento County CA Airport Revenue | 5.000% | 7/1/41 | 6,000 | 6,558 |
| San Bernardino CA City Unified School District GO | 5.000% | 8/1/28 (4) | 1,500 | 1,670 |
| San Bernardino County CA Medical Center COP | 7.000% | 8/1/20 | 12,180 | 13,203 |
| San Bernardino County CA Medical Center COP | 6.875% | 8/1/24 (ETM) | 25,220 | 29,352 |
| San Diego CA Community College District GO | 5.250% | 8/1/19 (Prere.) | 5,500 | 5,646 |
| San Diego CA Tobacco Settlement Funding Corp. Revenue | 4.000% | 6/1/32 | 1,225 | 1,241 |
| San Diego CA Unified School District GO | 0.000% | 7/1/30 | 15,000 | 9,928 |
| San Diego CA Unified School District GO | 4.000% | 7/1/47 | 15,220 | 15,341 |
| San Diego CA Unified School District GO | 5.000% | 7/1/47 | 5,000 | 5,588 |
| San Diego County CA Regional Airport Authority Revenue | 5.000% | 7/1/30 | 1,000 | 1,127 |
| San Diego County CA Regional Airport Authority Revenue | 5.000% | 7/1/31 | 1,360 | 1,526 |
| San Diego County CA Regional Airport Authority Revenue | 5.000% | 7/1/32 | 1,400 | 1,565 |
| San Diego County CA Regional Airport Authority Revenue | 5.000% | 7/1/34 | 1,000 | 1,106 |
332
High-Yield Tax-Exempt Fund
| | | | |
| Face | Market |
| Maturity | Amount | Value• |
| Coupon | Date | ($000) | ($000) |
| San Diego County CA Regional Airport Authority Revenue | 5.000% | 7/1/35 | 500 | 551 |
| San Diego County CA Regional Airport Authority Revenue | 5.000% | 7/1/36 | 1,000 | 1,098 |
| San Diego County CA Regional Airport Authority Revenue | 5.000% | 7/1/47 | 2,750 | 2,979 |
| San Francisco CA City & County International Airport Revenue | 5.000% | 5/1/31 | 645 | 689 |
| San Francisco CA City & County International Airport Revenue | 5.250% | 5/1/33 | 10,000 | 10,892 |
| San Francisco CA City & County International Airport Revenue | 5.000% | 5/1/39 | 2,500 | 2,698 |
| San Francisco CA City & County International Airport Revenue | 5.000% | 5/1/40 | 5,000 | 5,393 |
| San Francisco CA City & County International Airport Revenue | 5.000% | 5/1/47 | 15,000 | 16,172 |
| San Francisco CA City & County Public Utilities Commission Water Revenue | 4.000% | 10/1/42 | 5,990 | 6,024 |
| San Francisco CA City & County Redevelopment Agency Community Facilities | | | | |
| District No. 7 Special Tax Revenue (Hunters Point Shipyard Improvements) | 5.000% | 8/1/39 | 2,240 | 2,376 |
| San Francisco CA City & County Redevelopment Agency Community Facilities | | | | |
| District No. 7 Special Tax Revenue (Hunters Point Shipyard Improvements) | 5.000% | 8/1/44 | 2,500 | 2,646 |
| San Francisco CA City & County Redevelopment Financing Authority Tax Allocation Revenue | | | | |
| (Mission Bay North) | 6.625% | 8/1/19 (Prere.) | 2,000 | 2,073 |
| San Francisco CA City & County Redevelopment Financing Authority Tax Allocation Revenue | | | | |
| (Mission Bay South) | 7.000% | 2/1/21 (Prere.) | 1,500 | 1,667 |
| 5 San Francisco CA City & County Redevelopment Financing Authority Tax Allocation Revenue | | | | |
| (Mission Bays Redevelopment Project) | 3.000% | 8/1/21 | 6,000 | 6,022 |
| 5 San Francisco CA City & County Redevelopment Financing Authority Tax Allocation Revenue | | | | |
| (Mission Bays Redevelopment Project) | 0.000% | 8/1/23 | 2,000 | 1,611 |
| 5 San Francisco CA City & County Redevelopment Financing Authority Tax Allocation Revenue | | | | |
| (Mission Bays Redevelopment Project) | 0.000% | 8/1/26 | 3,000 | 2,076 |
| 5 San Francisco CA City & County Redevelopment Financing Authority Tax Allocation Revenue | | | | |
| (Mission Bays Redevelopment Project) | 0.000% | 8/1/31 | 6,000 | 3,185 |
| 5 San Francisco CA City & County Redevelopment Financing Authority Tax Allocation Revenue | | | | |
| (Mission Bays Redevelopment Project) | 0.000% | 8/1/43 | 9,000 | 2,508 |
| San Francisco CA Office of Community Investment & Infrastructure Special Tax Revenue | | | | |
| (Mission Bay) | 5.000% | 8/1/28 | 1,510 | 1,641 |
| San Francisco CA Office of Community Investment & Infrastructure Special Tax Revenue | | | | |
| (Mission Bay) | 5.000% | 8/1/30 | 1,000 | 1,081 |
| San Francisco CA Office of Community Investment & Infrastructure Special Tax Revenue | | | | |
| (Mission Bay) | 5.000% | 8/1/33 | 1,335 | 1,433 |
| San Joaquin Hills CA Transportation Corridor Agency Toll Road Revenue | 0.000% | 1/15/24 (14) | 2,000 | 1,697 |
| San Joaquin Hills CA Transportation Corridor Agency Toll Road Revenue | 0.000% | 1/15/25 (14) | 15,910 | 12,924 |
| San Jose CA Airport Revenue | 5.000% | 3/1/31 | 2,055 | 2,289 |
| San Jose CA Airport Revenue | 5.000% | 3/1/32 | 1,500 | 1,665 |
| San Jose CA Airport Revenue | 5.000% | 3/1/33 | 1,500 | 1,660 |
| San Jose CA Airport Revenue | 5.000% | 3/1/34 | 1,500 | 1,657 |
| San Jose CA Airport Revenue | 5.000% | 3/1/35 | 2,520 | 2,776 |
| San Jose CA Airport Revenue | 5.000% | 3/1/36 | 2,230 | 2,451 |
| San Jose CA Airport Revenue | 5.000% | 3/1/37 | 2,515 | 2,759 |
| San Jose CA Airport Revenue | 4.000% | 3/1/42 (15) | 6,755 | 6,604 |
| San Jose CA Airport Revenue | 5.000% | 3/1/47 | 10,000 | 10,842 |
| San Mateo CA Community Facilities District No. 2008-1 Special Tax Revenue (Bay Meadows) | 5.000% | 9/1/42 | 2,000 | 2,098 |
| Santa Clara County CA Financing Authority Lease Revenue (Multiple Facilities Projects) | 4.000% | 5/15/32 | 11,270 | 11,697 |
| Southern California Public Power Authority Revenue (Natural Gas Project) | 5.250% | 11/1/20 | 1,700 | 1,794 |
| Stockton CA Public Financing Authority Revenue | 4.000% | 9/2/31 (15) | 1,000 | 1,048 |
| Stockton CA Public Financing Authority Water Revenue (Delta Water Supply Project) | 6.250% | 10/1/40 | 6,200 | 7,169 |
| Sweetwater CA Unified School District GO | 4.000% | 8/1/42 | 2,000 | 2,007 |
| Turlock CA Irrigation District Revenue | 5.000% | 1/1/20 (Prere.) | 6,385 | 6,620 |
| Ukiah CA Unified School District GO | 0.000% | 8/1/31 (10) | 9,245 | 5,750 |
| University of California Regents Medical Center Pooled Revenue | 5.000% | 5/15/41 | 10,000 | 10,972 |
| University of California Regents Medical Center Pooled Revenue | 4.000% | 5/15/44 | 12,500 | 12,460 |
| University of California Revenue | 4.000% | 5/15/34 | 5,000 | 5,166 |
| University of California Revenue | 5.000% | 5/15/43 | 12,500 | 13,998 |
| University of California Revenue | 5.000% | 5/15/46 | 2,425 | 2,666 |
| University of California Revenue | 4.000% | 5/15/47 | 20,000 | 20,028 |
| University of California Revenue | 5.000% | 5/15/58 | 15,000 | 16,555 |
| University of California Revenue | 5.250% | 5/15/58 | 8,000 | 9,023 |
| Victor Valley CA Community College District GO | 6.000% | 8/1/19 (Prere.) | 8,000 | 8,254 |
| Washington Township CA Health Care District Revenue | 4.000% | 7/1/34 | 2,800 | 2,727 |
| Washington Township CA Health Care District Revenue | 4.000% | 7/1/37 | 1,265 | 1,210 |
| Washington Township CA Health Care District Revenue | 5.000% | 7/1/42 | 2,800 | 2,965 |
| Washington Township CA Health Care District Revenue | 4.125% | 7/1/47 | 5,000 | 4,654 |
| Whittier CA Health Facilities Revenue (Presbyterian Intercommunity Hospital Obligated Group) | 5.000% | 6/1/44 | 18,865 | 19,974 |
| | | | 1,324,968 |
333
High-Yield Tax-Exempt Fund
| | | | |
| Face | Market |
| Maturity | Amount | Value• |
| Coupon | Date | ($000) | ($000) |
| Colorado (2.7%) | | | | |
| Adonea CO Metropolitan District No. 2 GO | 5.125% | 12/1/37 | 3,195 | 3,174 |
| Adonea CO Metropolitan District No. 2 GO | 5.125% | 12/1/45 | 4,940 | 4,823 |
| Adonea CO Metropolitan District No. 2 GO | 7.500% | 12/15/45 | 3,111 | 3,009 |
| Bradburn CO Metropolitan District No. 2 GO | 4.000% | 12/1/28 | 500 | 484 |
| Bradburn CO Metropolitan District No. 2 GO | 5.000% | 12/1/38 | 600 | 609 |
| Bradburn CO Metropolitan District No. 2 GO | 5.000% | 12/1/47 | 1,200 | 1,208 |
| Bromley Park CO Metropolitan District No. 2 GO | 6.375% | 12/15/47 | 1,000 | 969 |
| Castle Oaks CO Metropolitan District GO | 4.000% | 12/1/40 | 2,000 | 1,965 |
| Centerra CO Metropolitan District No. 1 Tax Allocation Revenue | 2.700% | 12/1/19 | 705 | 706 |
| Centerra CO Metropolitan District No. 1 Tax Allocation Revenue | 5.000% | 12/1/20 | 750 | 783 |
| Centerra CO Metropolitan District No. 1 Tax Allocation Revenue | 5.000% | 12/1/21 | 1,475 | 1,558 |
| Centerra CO Metropolitan District No. 1 Tax Allocation Revenue | 5.000% | 12/1/22 | 1,920 | 2,044 |
| Centerra CO Metropolitan District No. 1 Tax Allocation Revenue | 5.000% | 12/1/29 | 17,265 | 18,168 |
| Colorado Building Excellent Schools COP | 4.000% | 3/15/30 | 6,000 | 6,346 |
| Colorado Educational & Cultural Facilities Authority Revenue (Regis University) | 5.000% | 10/1/26 | 2,390 | 2,622 |
| Colorado Educational & Cultural Facilities Authority Revenue (Regis University) | 5.000% | 10/1/27 | 2,515 | 2,740 |
| Colorado Educational & Cultural Facilities Authority Revenue (Regis University) | 5.000% | 10/1/28 | 2,300 | 2,490 |
| Colorado Educational & Cultural Facilities Authority Revenue (Regis University) | 5.000% | 10/1/30 | 1,615 | 1,735 |
| Colorado Health Facilities Authority Revenue (Catholic Health Initiatives) | 5.000% | 7/1/31 | 4,580 | 4,816 |
| Colorado Health Facilities Authority Revenue (Christian Living Communities) | 5.000% | 1/1/31 | 1,400 | 1,459 |
| Colorado Health Facilities Authority Revenue (Covenant Retirement Community Inc.) | 5.000% | 12/1/33 | 3,250 | 3,415 |
| Colorado Health Facilities Authority Revenue (Covenant Retirement Community Inc.) | 5.000% | 12/1/35 | 7,250 | 7,627 |
| Colorado High Performance Transportation Enterprise Revenue | 5.000% | 12/31/47 | 3,650 | 3,856 |
| Colorado High Performance Transportation Enterprise Revenue | 5.000% | 12/31/51 | 6,455 | 6,804 |
| Colorado High Performance Transportation Enterprise Revenue | 5.000% | 12/31/56 | 7,000 | 7,363 |
| Colorado Housing & Finance Authority Single Family Mortgage Revenue VRDO | 1.600% | 11/7/18 | 6,050 | 6,050 |
| Denver CO City & County Airport Revenue | 5.000% | 11/15/28 | 7,610 | 8,607 |
| Denver CO City & County Airport Revenue | 5.000% | 12/1/30 | 7,240 | 8,180 |
| Denver CO City & County Airport Revenue | 4.000% | 12/1/33 | 20,000 | 20,099 |
| Denver CO City & County Airport Revenue | 5.250% | 11/15/36 | 7,500 | 7,720 |
| Denver CO City & County Airport Revenue | 5.250% | 11/15/43 | 8,000 | 8,714 |
| Denver CO City & County Airport Revenue | 4.000% | 12/1/48 | 5,000 | 4,748 |
| Denver CO City & County Airport Revenue | 5.000% | 12/1/48 | 30,000 | 32,494 |
| Denver CO City & County Airport Revenue (United Airlines Inc. Project) | 5.000% | 10/1/32 | 7,000 | 7,347 |
| Denver CO City & County COP | 4.000% | 6/1/48 | 3,505 | 3,475 |
| Denver CO City & County Dedicated Tax Revenue | 5.000% | 12/1/43 | 3,250 | 3,534 |
| Denver CO Urban Renewal Authority Revenue | 5.250% | 12/1/39 | 3,000 | 2,970 |
| E-470 Public Highway Authority Colorado Revenue | 0.000% | 9/1/24 (14) | 29,225 | 24,595 |
| E-470 Public Highway Authority Colorado Revenue | 0.000% | 9/1/25 (14) | 14,900 | 11,995 |
| E-470 Public Highway Authority Colorado Revenue | 0.000% | 9/1/29 (14) | 21,610 | 14,314 |
| E-470 Public Highway Authority Colorado Revenue | 0.000% | 9/1/30 (14) | 10,045 | 6,324 |
| Larimer County CO School District No. R-1 Poudre GO | 5.000% | 12/15/39 | 5,425 | 6,118 |
| Larimer County CO School District No. R-1 Poudre GO | 5.000% | 12/15/40 | 5,000 | 5,625 |
| Plaza CO Metropolitan District No. 1 Tax Allocation Revenue | 5.000% | 12/1/18 | 1,375 | 1,378 |
| Plaza CO Metropolitan District No. 1 Tax Allocation Revenue | 5.000% | 12/1/20 | 1,000 | 1,042 |
| Plaza CO Metropolitan District No. 1 Tax Allocation Revenue | 5.000% | 12/1/21 | 1,000 | 1,054 |
| Plaza CO Metropolitan District No. 1 Tax Allocation Revenue | 5.000% | 12/1/22 | 500 | 531 |
| Prairie Center CO Metropolitan District No. 3 Limited Property Tax Revenue | 4.125% | 12/15/27 | 2,500 | 2,486 |
| Regional Transportation District of Colorado Sales Tax Revenue | | | | |
| (Denver Transit Partners Eagle P3 Project) | 6.000% | 1/15/34 | 6,000 | 6,207 |
| Regional Transportation District of Colorado Sales Tax Revenue | | | | |
| (Denver Transit Partners Eagle P3 Project) | 6.000% | 1/15/41 | 18,865 | 19,495 |
| Solaris CO Metropolitan District GO | 3.750% | 12/1/26 | 650 | 641 |
| Solaris CO Metropolitan District GO | 5.000% | 12/1/36 | 850 | 868 |
| Solaris CO Metropolitan District GO | 5.000% | 12/1/46 | 1,880 | 1,903 |
| Southglenn CO Metropolitan District Revenue | 3.000% | 12/1/21 | 1,433 | 1,406 |
| Southglenn CO Metropolitan District Revenue | 3.500% | 12/1/26 | 6,000 | 5,648 |
| Southglenn CO Metropolitan District Revenue | 5.000% | 12/1/30 | 2,285 | 2,300 |
| Southlands CO Metropolitan District GO | 5.000% | 12/1/37 | 1,615 | 1,691 |
| Southlands CO Metropolitan District GO | 5.000% | 12/1/47 | 2,590 | 2,686 |
| Southlands CO Metropolitan District GO | 5.000% | 12/1/47 | 325 | 337 |
| 6 Thornton CO COP | 4.000% | 12/1/39 | 6,000 | 5,974 |
| University of Colorado Hospital Authority Revenue | 5.000% | 11/15/36 | 8,000 | 8,664 |
| University of Colorado Hospital Authority Revenue | 5.000% | 11/15/42 | 12,500 | 13,478 |
| | | | 351,471 |
| Connecticut (0.8%) | | | | |
| Connecticut GO | 5.000% | 6/15/31 (4) | 10,010 | 10,952 |
| Connecticut GO | 5.000% | 6/15/31 (15) | 1,800 | 2,000 |
334
High-Yield Tax-Exempt Fund
| | | | |
| Face | Market |
| Maturity | Amount | Value• |
| Coupon | Date | ($000) | ($000) |
| Connecticut GO | 5.000% | 11/15/31 | 1,550 | 1,673 |
| Connecticut GO | 5.000% | 6/15/32 (15) | 5,000 | 5,522 |
| Connecticut GO | 5.000% | 6/15/33 (15) | 1,800 | 1,980 |
| Connecticut GO | 5.000% | 9/15/34 | 3,000 | 3,255 |
| Connecticut GO | 5.000% | 9/15/35 | 4,275 | 4,617 |
| Connecticut GO | 5.000% | 11/15/35 | 1,000 | 1,066 |
| Connecticut GO | 5.000% | 9/15/37 | 2,250 | 2,415 |
| Connecticut GO | 5.000% | 6/15/38 (15) | 1,500 | 1,624 |
| Connecticut Health & Educational Facilities Authority Revenue (Church Home of Hartford Inc.) | 5.000% | 9/1/53 | 2,600 | 2,587 |
| Connecticut Health & Educational Facilities Authority Revenue (Fairfield University) | 4.000% | 7/1/42 | 7,000 | 6,750 |
| Connecticut Health & Educational Facilities Authority Revenue (Hartford Healthcare) | 5.000% | 7/1/32 | 3,660 | 3,846 |
| Connecticut Health & Educational Facilities Authority Revenue (Quinnipiac University) | 5.000% | 7/1/34 | 2,345 | 2,566 |
| Connecticut Health & Educational Facilities Authority Revenue (Quinnipiac University) | 5.000% | 7/1/35 | 1,650 | 1,800 |
| Connecticut Health & Educational Facilities Authority Revenue (Quinnipiac University) | 5.000% | 7/1/36 | 1,725 | 1,876 |
| Connecticut Health & Educational Facilities Authority Revenue (Stamford Hospital) | 5.000% | 7/1/37 | 6,500 | 6,851 |
| Connecticut Health & Educational Facilities Authority Revenue (Stamford Hospital) | 4.000% | 7/1/46 | 3,000 | 2,773 |
| Connecticut Special Tax Revenue (Transportation Infrastructure) | 5.000% | 1/1/31 | 10,000 | 11,010 |
| Connecticut Special Tax Revenue (Transportation Infrastructure) | 5.000% | 1/1/37 | 10,000 | 10,792 |
| Connecticut Special Tax Revenue (Transportation Infrastructure) | 5.000% | 1/1/38 | 8,000 | 8,621 |
| Harbor Point CT Infrastructure Improvement District Revenue (Harbor Point Project) | 5.000% | 4/1/39 | 7,000 | 7,218 |
| | | | 101,794 |
| Delaware (0.0%) | | | | |
| Delaware Economic Development Authority Revenue (Delaware State University Project) | 5.000% | 10/1/36 | 3,390 | 3,582 |
| |
| District of Columbia (1.1%) | | | | |
| District of Columbia GO | 5.000% | 6/1/37 | 8,000 | 9,025 |
| District of Columbia Hospital Revenue (Children’s Hospital Obligated Group) | 5.000% | 7/15/31 | 6,000 | 6,600 |
| District of Columbia Hospital Revenue (Children’s Hospital Obligated Group) | 5.000% | 7/15/32 | 3,445 | 3,774 |
| District of Columbia Hospital Revenue (Children’s Hospital Obligated Group) | 5.000% | 7/15/34 | 1,000 | 1,087 |
| District of Columbia Revenue (Ingleside at Rock Creek Retirement Community) | 5.000% | 7/1/32 | 1,000 | 1,021 |
| District of Columbia Revenue (Ingleside at Rock Creek Retirement Community) | 5.000% | 7/1/37 | 815 | 815 |
| District of Columbia Revenue (Ingleside at Rock Creek Retirement Community) | 5.000% | 7/1/42 | 1,350 | 1,333 |
| District of Columbia Revenue (Ingleside at Rock Creek Retirement Community) | 5.000% | 7/1/52 | 3,000 | 2,910 |
| District of Columbia Revenue (Methodist Home of the District of Columbia) | 5.125% | 1/1/35 | 1,560 | 1,468 |
| District of Columbia Revenue (Methodist Home of the District of Columbia) | 5.250% | 1/1/39 | 1,015 | 949 |
| District of Columbia Student Dormitory Revenue (Provident Group - Howard Properties LLC) | 5.000% | 10/1/30 | 5,500 | 5,543 |
| District of Columbia Student Dormitory Revenue (Provident Group - Howard Properties LLC) | 5.000% | 10/1/45 | 8,390 | 8,054 |
| Metropolitan Washington DC/VA Airports Authority Airport System Revenue | 5.000% | 10/1/26 | 13,885 | 15,744 |
| Metropolitan Washington DC/VA Airports Authority Airport System Revenue | 5.000% | 10/1/27 | 12,345 | 14,118 |
| Metropolitan Washington DC/VA Airports Authority Airport System Revenue | 5.000% | 10/1/27 | 2,500 | 2,859 |
| Metropolitan Washington DC/VA Airports Authority Airport System Revenue | 5.000% | 10/1/28 | 4,300 | 4,933 |
| Metropolitan Washington DC/VA Airports Authority Airport System Revenue | 5.000% | 10/1/29 | 7,500 | 8,459 |
| Metropolitan Washington DC/VA Airports Authority Airport System Revenue | 5.000% | 10/1/29 | 4,150 | 4,727 |
| Metropolitan Washington DC/VA Airports Authority Airport System Revenue | 5.000% | 10/1/30 | 3,260 | 3,687 |
| Metropolitan Washington DC/VA Airports Authority Airport System Revenue | 5.000% | 10/1/30 | 4,000 | 4,378 |
| Metropolitan Washington DC/VA Airports Authority Airport System Revenue | 5.000% | 10/1/33 | 1,500 | 1,661 |
| Metropolitan Washington DC/VA Airports Authority Airport System Revenue | 5.000% | 10/1/34 | 2,000 | 2,209 |
| Metropolitan Washington DC/VA Airports Authority Airport System Revenue | 5.000% | 10/1/35 | 2,865 | 3,150 |
| Metropolitan Washington DC/VA Airports Authority Airport System Revenue | 5.000% | 10/1/44 | 2,500 | 2,678 |
| Metropolitan Washington DC/VA Airports Authority Dulles Toll Road Revenue | | | | |
| (Dulles Metrorail & Capital Improvement Projects) | 0.000% | 10/1/37 | 50,000 | 20,805 |
| Metropolitan Washington DC/VA Airports Authority Dulles Toll Road Revenue | | | | |
| (Dulles Metrorail & Capital Improvement Projects) | 5.000% | 10/1/53 | 7,500 | 7,822 |
| | | | 139,809 |
| Florida (6.4%) | | | | |
| Alachua County FL Health Facilities Authority Revenue | | | | |
| (Shands Teaching Hospital & Clinics, Inc. Project) | 5.000% | 12/1/44 | 20,000 | 21,058 |
| Brevard County FL Health Facilities Authority Revenue (Health First Inc. Project) | 5.000% | 4/1/39 | 15,000 | 15,880 |
| Broward County FL Airport System Revenue | 5.000% | 10/1/37 | 7,780 | 8,262 |
| Broward County FL Airport System Revenue | 5.000% | 10/1/40 | 2,000 | 2,150 |
| Broward County FL Airport System Revenue | 5.000% | 10/1/42 | 5,000 | 5,372 |
| Broward County FL Airport System Revenue | 5.000% | 10/1/45 | 7,455 | 7,989 |
| Cape Coral FL Health Facilities Authority Senior Housing Revenue (Gulf Care Inc. Project) | 5.875% | 7/1/40 | 4,000 | 4,205 |
| Cape Coral FL Health Facilities Authority Senior Housing Revenue (Gulf Care Inc. Project) | 6.000% | 7/1/50 | 6,250 | 6,582 |
| Capital Trust Agency Florida Educational Facilities Revenue | | | | |
| (Florida Charter Educational Foundation Inc.) | 5.375% | 6/15/38 | 1,105 | 1,073 |
| Capital Trust Agency Florida Educational Facilities Revenue | | | | |
| (Florida Charter Educational Foundation Inc.) | 5.375% | 6/15/48 | 2,070 | 1,971 |
335
High-Yield Tax-Exempt Fund
| | | | |
| Face | Market |
| Maturity | Amount | Value• |
| Coupon | Date | ($000) | ($000) |
| Capital Trust Agency Florida Retirement Facility Revenue | | | | |
| (Sarasota-Manatee Jewish Housing Council Inc.) | 5.000% | 7/1/37 | 1,765 | 1,775 |
| Capital Trust Agency Florida Retirement Facility Revenue | | | | |
| (Sarasota-Manatee Jewish Housing Council Inc.) | 5.000% | 7/1/46 | 3,275 | 3,231 |
| Capital Trust Agency Florida Revenue (Tallahassee Tapestry Senior Housing Project) | 7.000% | 12/1/45 | 3,000 | 3,079 |
| Capital Trust Agency Florida Revenue (Tallahassee Tapestry Senior Housing Project) | 7.125% | 12/1/50 | 2,000 | 2,061 |
| Capital Trust Agency Florida Revenue (Tallahassee Tapestry Senior Housing Project) | 7.000% | 7/1/52 | 5,000 | 5,130 |
| Capital Trust Agency Florida Student Housing Revenue (University Bridge LLC) | 5.250% | 12/1/43 | 1,000 | 986 |
| Capital Trust Agency Florida Student Housing Revenue (University Bridge LLC) | 5.250% | 12/1/58 | 7,500 | 7,254 |
| Central Florida Expressway Authority Revenue | 4.000% | 7/1/30 | 2,525 | 2,637 |
| Central Florida Expressway Authority Revenue | 4.000% | 7/1/33 | 9,500 | 9,720 |
| Central Florida Expressway Authority Revenue | 4.000% | 7/1/41 | 7,500 | 7,390 |
| East Homestead Community Development District Florida Special Assessment Revenue | 7.250% | 5/1/21 | 350 | 359 |
| Florida Department of Transportation GO | 4.000% | 7/1/30 | 4,000 | 4,267 |
| Florida Higher Educational Facilities Financing Authority Revenue (Jacksonville University) | 4.750% | 6/1/38 | 2,150 | 2,178 |
| Florida Higher Educational Facilities Financing Authority Revenue (Jacksonville University) | 5.000% | 6/1/48 | 3,200 | 3,278 |
| Florida Higher Educational Facilities Financing Authority Revenue (Nova Southeastern University) | 5.000% | 4/1/30 | 1,325 | 1,453 |
| Florida Higher Educational Facilities Financing Authority Revenue (Ringling College Project) | 5.000% | 3/1/42 | 9,855 | 10,340 |
| Florida Higher Educational Facilities Financing Authority Revenue (Ringling College Project) | 5.000% | 3/1/47 | 10,650 | 11,136 |
| Florida Housing Finance Corp. Homeowner Mortgage Revenue | 5.000% | 7/1/41 | 525 | 534 |
| Florida Mid-Bay Bridge Authority Revenue | 5.000% | 10/1/35 | 1,780 | 1,900 |
| Florida Mid-Bay Bridge Authority Revenue | 5.000% | 10/1/40 | 1,000 | 1,058 |
| Florida Municipal Power Agency Revenue | 6.250% | 10/1/19 (Prere.) | 3,250 | 3,376 |
| Greater Orlando Aviation Authority Florida Airport Facilities Revenue | 5.000% | 10/1/29 | 5,740 | 6,413 |
| Greater Orlando Aviation Authority Florida Airport Facilities Revenue | 5.000% | 10/1/34 | 8,695 | 9,519 |
| Greater Orlando Aviation Authority Florida Airport Facilities Revenue | 5.000% | 10/1/42 | 20,500 | 22,055 |
| Greater Orlando Aviation Authority Florida Airport Facilities Revenue | 5.000% | 10/1/52 | 9,000 | 9,613 |
| Halifax Hospital Medical Center Florida Hospital Revenue | 5.000% | 6/1/35 | 1,000 | 1,066 |
| Halifax Hospital Medical Center Florida Hospital Revenue | 5.000% | 6/1/46 | 3,850 | 4,037 |
| Hernando County FL School District COP | 5.000% | 7/1/28 (4) | 5,825 | 6,558 |
| Hernando County FL School District COP | 5.000% | 7/1/29 (4) | 6,645 | 7,437 |
| Hernando County FL School District COP | 5.000% | 7/1/30 (4) | 6,975 | 7,772 |
| Highlands County FL Health Facilities Authority Hospital Revenue | | | | |
| (Adventist Health System/Sunbelt Obligated Group) | 6.000% | 11/15/19 (Prere.) | 10 | 10 |
| Highlands County FL Health Facilities Authority Hospital Revenue | | | | |
| (Adventist Health System/Sunbelt Obligated Group) | 6.000% | 11/15/37 | 4,990 | 5,187 |
| Hillsborough County FL Aviation Authority Revenue (Tampa International Airport) | 5.000% | 10/1/44 | 10,000 | 10,690 |
| Jacksonville FL Educational Facilities Revenue | 5.000% | 6/1/53 | 3,250 | 3,304 |
| Lakeland FL Educational Facilities Revenue (Florida Southern College Project) | 5.000% | 9/1/37 | 750 | 779 |
| Lakeland FL Educational Facilities Revenue (Florida Southern College Project) | 5.000% | 9/1/42 | 1,500 | 1,547 |
| Lakeland FL Hospital Revenue (Lakeland Regional Health Systems) | 5.000% | 11/15/40 | 6,250 | 6,672 |
| Lakeland FL Hospital Revenue (Lakeland Regional Health Systems) | 5.000% | 11/15/45 | 13,980 | 14,885 |
| 5 Lee County FL Industrial Development Authority Health Care Facility Revenue | | | | |
| (The Preserve Project) | 5.750% | 12/1/52 | 5,000 | 4,985 |
| Lee County FL Solid Waste System Revenue | 5.000% | 10/1/22 | 2,000 | 2,138 |
| Lee County FL Solid Waste System Revenue | 5.000% | 10/1/23 | 2,815 | 3,036 |
| Lee County FL Solid Waste System Revenue | 5.000% | 10/1/24 | 3,175 | 3,447 |
| Lee County FL Solid Waste System Revenue | 5.000% | 10/1/26 | 1,465 | 1,608 |
| Lee Memorial Health System Florida Hospital Revenue | 5.250% | 4/1/35 (14) | 13,350 | 13,615 |
| Martin County FL Health Facilities Authority Revenue (Martin Memorial Medical Center) | 5.000% | 11/15/28 | 8,640 | 9,124 |
| Martin County FL Industrial Development Authority Revenue | | | | |
| (Indiantown Cogeneration, LP Project) | 3.950% | 12/15/21 | 14,900 | 15,186 |
| Martin County FL Industrial Development Authority Revenue | | | | |
| (Indiantown Cogeneration, LP Project) | 4.200% | 12/15/25 | 19,000 | 19,261 |
| Miami Beach FL Health Facilities Authority Revenue (Mount Sinai Medical Center) | 5.000% | 11/15/29 | 2,175 | 2,321 |
| Miami Beach FL Parking Revenue | 5.000% | 9/1/45 | 5,000 | 5,484 |
| Miami Beach FL Water & Sewer Revenue | 4.000% | 10/1/35 | 3,000 | 3,065 |
| Miami Beach FL Water & Sewer Revenue | 4.000% | 10/1/36 | 8,885 | 9,045 |
| Miami Beach FL Water & Sewer Revenue | 4.000% | 10/1/37 | 6,000 | 6,085 |
| Miami Beach FL Water & Sewer Revenue | 4.000% | 10/1/37 | 8,095 | 8,210 |
| Miami-Dade County FL Aviation Revenue (Miami International Airport) | 5.000% | 10/1/25 | 5,030 | 5,428 |
| Miami-Dade County FL Aviation Revenue (Miami International Airport) | 5.000% | 10/1/26 | 5,000 | 5,386 |
| Miami-Dade County FL Aviation Revenue (Miami International Airport) | 5.000% | 10/1/27 | 7,215 | 7,758 |
| Miami-Dade County FL Aviation Revenue (Miami International Airport) | 5.000% | 10/1/28 | 6,280 | 6,740 |
| Miami-Dade County FL Aviation Revenue (Miami International Airport) | 5.000% | 10/1/29 | 17,000 | 18,214 |
| Miami-Dade County FL Aviation Revenue (Miami International Airport) | 5.000% | 10/1/31 | 4,980 | 5,320 |
| Miami-Dade County FL Aviation Revenue (Miami International Airport) | 5.000% | 10/1/32 | 11,860 | 12,869 |
| Miami-Dade County FL Aviation Revenue (Miami International Airport) | 5.000% | 10/1/33 | 29,095 | 31,504 |
| Miami-Dade County FL Aviation Revenue (Miami International Airport) | 5.000% | 10/1/38 | 5,000 | 5,381 |
| Miami-Dade County FL Aviation Revenue (Miami International Airport) | 5.000% | 10/1/40 | 8,000 | 8,626 |
336
High-Yield Tax-Exempt Fund
| | | | |
| Face | Market |
| Maturity | Amount | Value• |
| Coupon | Date | ($000) | ($000) |
| Miami-Dade County FL Aviation Revenue (Miami International Airport) | 5.000% | 10/1/41 | 18,660 | 20,324 |
| Miami-Dade County FL Health Facilities Authority Hospital Revenue (Miami Children’s Hospital) | 6.125% | 8/1/20 (Prere.) | 2,575 | 2,743 |
| Miami-Dade County FL Health Facilities Authority Hospital Revenue (Miami Children’s Hospital) | 6.125% | 8/1/42 | 925 | 978 |
| Miami-Dade County FL Health Facilities Authority Hospital Revenue (Nicklaus Children’s Hospital) | 5.000% | 8/1/47 | 3,155 | 3,383 |
| Miami-Dade County FL Industrial Development Authority Revenue (Biscayne Properties LLC) | 5.000% | 6/1/40 | 5,805 | 5,790 |
| Miami-Dade County FL Industrial Development Authority Revenue (Biscayne Properties LLC) | 5.000% | 6/1/48 | 9,875 | 9,725 |
| Miami-Dade County FL Public Facilities Revenue (Jackson Memorial Hospital) | 5.750% | 6/1/19 (Prere.) | 5,250 | 5,365 |
| Miami-Dade County FL Public Facilities Revenue (Public Health Trust) | 5.000% | 6/1/39 | 2,610 | 2,821 |
| Miami-Dade County FL Seaport Revenue | 6.000% | 10/1/24 | 1,590 | 1,804 |
| Miami-Dade County FL Seaport Revenue | 6.000% | 10/1/25 | 1,680 | 1,904 |
| Miami-Dade County FL Seaport Revenue | 6.250% | 10/1/38 | 5,000 | 5,637 |
| Miami-Dade County FL Special Obligation Revenue | 0.000% | 10/1/31 | 5,000 | 2,953 |
| Miami-Dade County FL Special Obligation Revenue | 5.000% | 10/1/31 | 4,170 | 4,498 |
| Miami-Dade County FL Special Obligation Revenue | 5.000% | 10/1/32 | 2,460 | 2,653 |
| Miami-Dade County FL Special Obligation Revenue | 5.000% | 10/1/35 | 6,610 | 7,105 |
| North Brevard County FL Hospital District Revenue | 5.000% | 1/1/42 | 3,410 | 3,552 |
| North Brevard County FL Hospital District Revenue | 5.000% | 1/1/48 | 10,200 | 10,579 |
| Orange County FL Health Facilities Authority Hospital Revenue (Orlando Health Inc.) | 5.000% | 10/1/37 | 1,385 | 1,498 |
| Orange County FL Health Facilities Authority Hospital Revenue (Orlando Health Inc.) | 5.000% | 10/1/42 | 7,500 | 7,908 |
| Orange County FL Health Facilities Authority Revenue (Presbyterian Retirement Communities Inc.) | 5.000% | 8/1/41 | 5,000 | 5,303 |
| Orlando & Orange County FL Expressway Authority Revenue | 5.000% | 7/1/35 | 10,015 | 10,958 |
| 7 Osceola County FL Expressway System Revenue (Poinciana Parkway Project) | 0.000% | 10/1/39 | 6,000 | 4,848 |
| 8 Osceola County FL Expressway System Revenue (Poinciana Parkway Project) | 0.000% | 10/1/42 | 7,540 | 6,062 |
| Osceola County FL Expressway System Revenue (Poinciana Parkway Project) | 5.375% | 10/1/47 | 2,000 | 2,120 |
| Palm Beach County FL Health Facilities Authority Retirement Communities Revenue | | | | |
| (ACTS Retirement - Life Communities Inc. Obligated Group) | 5.500% | 11/15/20 (Prere.) | 2,005 | 2,136 |
| Palm Beach County FL Health Facilities Authority Revenue (Jupiter Medical Center Inc. Project) | 5.000% | 11/1/43 | 3,250 | 3,336 |
| Palm Beach County FL Health Facilities Authority Revenue | | | | |
| (Lifespace Communities Inc. Obligated Group) | 5.000% | 5/15/47 | 4,970 | 5,070 |
| Palm Beach County FL Health Facilities Authority Revenue (Sinai Residences Boca Raton Project) | 7.500% | 6/1/49 | 3,000 | 3,386 |
| Port St. Lucie FL Utility Revenue | 4.000% | 9/1/32 | 5,000 | 5,135 |
| Port St. Lucie FL Utility Revenue | 4.000% | 9/1/33 | 4,000 | 4,086 |
| Port St. Lucie FL Utility Revenue | 4.000% | 9/1/34 | 3,000 | 3,052 |
| Port St. Lucie FL Utility Revenue | 4.000% | 9/1/36 | 5,000 | 5,037 |
| Sarasota County FL Health Facilities Authority Revenue (Village of Isle Project) | 2.700% | 1/1/22 | 1,100 | 1,078 |
| Sarasota County FL Health Facilities Authority Revenue (Village of Isle Project) | 3.300% | 1/1/23 | 1,500 | 1,490 |
| Sarasota County FL Health Facilities Authority Revenue (Village of Isle Project) | 5.000% | 1/1/25 | 1,145 | 1,225 |
| Sarasota County FL Health Facilities Authority Revenue (Village of Isle Project) | 5.000% | 1/1/26 | 2,100 | 2,253 |
| Sarasota County FL Health Facilities Authority Revenue (Village of Isle Project) | 5.000% | 1/1/27 | 2,000 | 2,149 |
| Sarasota County FL Health Facilities Authority Revenue (Village of Isle Project) | 5.000% | 1/1/28 | 2,310 | 2,468 |
| Sarasota County FL Health Facilities Authority Revenue (Village of Isle Project) | 5.000% | 1/1/29 | 1,100 | 1,168 |
| Sarasota County FL Health Facilities Authority Revenue (Village of Isle Project) | 5.000% | 1/1/30 | 1,000 | 1,056 |
| Sarasota County FL Health Facilities Authority Revenue (Village of Isle Project) | 5.000% | 1/1/32 | 1,100 | 1,154 |
| Sarasota County FL Public Hospital District Hospital Revenue (Sarasota Memorial Hospital Project) | 5.500% | 7/1/19 (Prere.) | 3,500 | 3,580 |
| Sarasota County FL Public Hospital District Hospital Revenue (Sarasota Memorial Hospital Project) | 5.000% | 7/1/41 | 15,000 | 16,254 |
| Seminole County FL Industrial Development Authority Revenue (Legacy Pointe at UCF Project) | 10.000% | 12/28/21 | 2,500 | 2,957 |
| South Miami FL Health Facilities Authority Revenue (Baptist Health South Florida Obligated Group) | 5.000% | 8/15/42 | 14,000 | 15,299 |
| St. Petersburg FL Health Facilities Authority Revenue (All Children’s Hospital Inc. Obligated Group) | 6.500% | 11/15/19 (Prere.) | 8,000 | 8,361 |
| Tallahassee FL Health Facilities Revenue (Tallahassee Memorial HealthCare Inc. Project) | 5.000% | 12/1/40 | 7,185 | 7,554 |
| Tallahassee FL Health Facilities Revenue (Tallahassee Memorial HealthCare Inc. Project) | 5.000% | 12/1/44 | 5,000 | 5,228 |
| Tampa FL Cigarette Tax Allocation Revenue (H. Lee Moffitt Cancer Center Project) | 5.250% | 9/1/27 | 2,800 | 3,228 |
| Tampa FL Health System Revenue (BayCare Health System) | 5.000% | 11/15/33 | 7,407 | 7,960 |
| Tampa FL Health System Revenue (BayCare Health System) | 5.000% | 11/15/46 | 8,500 | 9,192 |
| Tampa FL Hospital Revenue (H. Lee Moffitt Cancer Center Project) | 5.000% | 7/1/37 | 5,860 | 6,291 |
| Tampa FL Revenue (University of Tampa Project) | 5.000% | 4/1/45 | 6,050 | 6,470 |
| Tampa-Hillsborough County FL Expressway Authority Revenue | 4.000% | 7/1/42 | 27,500 | 27,249 |
| Tampa-Hillsborough County FL Expressway Authority Revenue | 5.000% | 7/1/47 | 7,000 | 7,599 |
| Tampa-Hillsborough County FL Expressway Authority Revenue | 5.000% | 7/1/48 | 4,500 | 4,903 |
| University of South Florida Financing Corp. COP | 5.000% | 7/1/29 | 5,740 | 6,374 |
| University of South Florida Financing Corp. COP | 5.000% | 7/1/33 | 7,140 | 7,874 |
| Volusia County FL Educational Facilities Authority Revenue | | | | |
| (Embry-Riddle Aeronautical University Inc.) | 5.000% | 10/15/42 | 1,500 | 1,624 |
| Volusia County FL Educational Facilities Authority Revenue | | | | |
| (Embry-Riddle Aeronautical University Inc.) | 5.000% | 10/15/45 | 6,405 | 6,940 |
| Volusia County FL Educational Facilities Authority Revenue | | | | |
| (Embry-Riddle Aeronautical University Inc.) | 5.000% | 10/15/47 | 3,500 | 3,775 |
| | | | 823,566 |
337
High-Yield Tax-Exempt Fund
| | | | |
| Face | Market |
| Maturity | Amount | Value• |
| Coupon | Date | ($000) | ($000) |
| Georgia (1.3%) | | | | |
| Americus & Sumter County GA Hospital Authority Revenue (Magnolia Manor Obligated Group) | 6.375% | 5/15/43 | 5,615 | 6,021 |
| Atlanta GA Development Authority Senior Healthcare Facilities Revenue | | | | |
| (Georgia Proton Treatment Center) | 7.000% | 1/1/40 | 5,500 | 5,340 |
| Atlanta GA Water & Wastewater Revenue | 6.250% | 11/1/19 (Prere.) | 2,500 | 2,605 |
| Atlanta GA Water & Wastewater Revenue | 6.250% | 11/1/19 (Prere.) | 15,000 | 15,632 |
| Bulloch County GA Development Authority Revenue | | | | |
| (Georgia Southern University Housing Foundation) | 5.000% | 7/1/34 | 1,000 | 1,101 |
| Bulloch County GA Development Authority Revenue | | | | |
| (Georgia Southern University Housing Foundation) | 5.000% | 7/1/36 | 2,220 | 2,429 |
| Bulloch County GA Development Authority Revenue | | | | |
| (Georgia Southern University Housing Foundation) | 5.000% | 7/1/37 | 2,435 | 2,660 |
| Bulloch County GA Development Authority Revenue | | | | |
| (Georgia Southern University Housing Foundation) | 5.000% | 7/1/38 | 1,230 | 1,343 |
| Cedartown Polk County GA Hospital Authority Revenue (Polk Medical Center Project) | 5.000% | 7/1/34 | 5,630 | 6,013 |
| Cedartown Polk County GA Hospital Authority Revenue (Polk Medical Center Project) | 5.000% | 7/1/39 | 5,000 | 5,256 |
| Clarke County GA Hospital Authority Revenue (Piedmont Healthcare Inc.) | 5.000% | 7/1/46 | 7,000 | 7,477 |
| Dahlonega GA Downtown Development Authority Revenue (North Georgia MAC LLC Project) | 4.000% | 7/1/37 | 1,100 | 1,104 |
| Dahlonega GA Downtown Development Authority Revenue (North Georgia MAC LLC Project) | 4.000% | 7/1/38 | 1,350 | 1,351 |
| Dahlonega GA Downtown Development Authority Revenue (North Georgia MAC LLC Project) | 5.000% | 7/1/39 | 1,000 | 1,087 |
| Fulton County GA Development Hospital Authority Revenue | | | | |
| (WellStar Health System Obligated Group) | 5.000% | 4/1/42 | 5,805 | 6,182 |
| Fulton County GA Development Hospital Authority Revenue | | | | |
| (WellStar Health System Obligated Group) | 5.000% | 4/1/47 | 8,500 | 8,990 |
| Fulton County GA Residential Care Facilities for the Elderly Authority Revenue (Lenbrook Square) | 5.000% | 7/1/36 | 4,050 | 4,233 |
| Fulton County GA Residential Care Facilities for the Elderly Authority Revenue (Lenbrook Square) | 5.000% | 7/1/42 | 8,800 | 9,151 |
| Georgia Municipal Electric Power Authority Revenue | 5.000% | 1/1/26 | 1,000 | 1,095 |
| Glynn-Brunswick GA Memorial Hospital Authority Revenue | | | | |
| (Southeast Georgia Health System Obligated Group) | 5.000% | 8/1/29 | 5,775 | 6,331 |
| Main Street Natural Gas Inc. Georgia Gas Project Revenue | 5.500% | 9/15/22 | 2,330 | 2,560 |
| Main Street Natural Gas Inc. Georgia Gas Project Revenue | 5.500% | 9/15/23 | 2,380 | 2,658 |
| Main Street Natural Gas Inc. Georgia Gas Project Revenue | 5.500% | 9/15/26 | 5,630 | 6,507 |
| Main Street Natural Gas Inc. Georgia Gas Project Revenue | 5.500% | 9/15/27 | 530 | 615 |
| Main Street Natural Gas Inc. Georgia Gas Project Revenue PUT | 4.000% | 9/1/23 | 15,000 | 15,642 |
| Municipal Electric Authority Georgia Revenue | 5.000% | 1/1/26 | 6,490 | 7,193 |
| Municipal Electric Authority Georgia Revenue | 5.000% | 7/1/60 | 900 | 903 |
| Municipal Electric Authority Georgia Revenue | 5.500% | 7/1/60 | 5,000 | 5,186 |
| Municipal Electric Authority Georgia Revenue (Plant Voltage Units 3 & 4 Project J) | 5.500% | 7/1/60 | 5,000 | 5,244 |
| Municipal Electric Authority Georgia Revenue (Project One) | 5.000% | 1/1/31 | 435 | 468 |
| Private Colleges & University Authority of Georgia Revenue (Mercer University) | 5.000% | 10/1/45 | 20,000 | 20,720 |
| | | | 163,097 |
| Guam (0.3%) | | | | |
| Guam Government Business Privilege Tax Revenue | 5.000% | 11/15/27 | 2,000 | 2,178 |
| Guam Government Business Privilege Tax Revenue | 5.000% | 1/1/31 | 3,400 | 3,514 |
| Guam Government Business Privilege Tax Revenue | 5.000% | 1/1/32 | 6,000 | 6,191 |
| Guam Government Business Privilege Tax Revenue | 5.000% | 11/15/39 | 1,000 | 1,056 |
| Guam Government Business Privilege Tax Revenue | 5.000% | 1/1/42 | 2,500 | 2,566 |
| Guam Government Waterworks Authority Water & Waste Water System Revenue | 5.000% | 1/1/46 | 5,500 | 5,691 |
| Guam International Airport Authority Revenue | 6.250% | 10/1/34 | 5,500 | 5,986 |
| Guam International Airport Authority Revenue | 6.375% | 10/1/43 | 3,000 | 3,309 |
| Guam Power Authority Revenue | 5.000% | 10/1/38 | 1,350 | 1,412 |
| Guam Power Authority Revenue | 5.000% | 10/1/40 | 2,375 | 2,472 |
| | | | 34,375 |
| Hawaii (0.6%) | | | | |
| Hawaii Airports System Revenue | 5.000% | 7/1/35 | 2,500 | 2,766 |
| Hawaii Airports System Revenue | 5.000% | 7/1/43 | 11,750 | 12,782 |
| Hawaii Airports System Revenue | 5.000% | 7/1/45 | 25,465 | 27,575 |
| Hawaii Department of Budget & Finance Special Purpose Revenue (Hawaiian Electric Co. Inc.) | 4.000% | 3/1/37 | 6,000 | 5,671 |
| Hawaii Department of Transportation - Airports Division Lease Revenue COP | 5.250% | 8/1/25 | 2,750 | 3,017 |
| Hawaii Department of Transportation - Airports Division Lease Revenue COP | 5.250% | 8/1/26 | 3,515 | 3,838 |
| Hawaii Harbor System Revenue | 5.500% | 7/1/35 | 5,000 | 5,251 |
| Hawaii Harbor System Revenue | 5.625% | 7/1/40 | 5,000 | 5,262 |
| Hawaii Pacific Health Revenue | 5.500% | 7/1/20 (Prere.) | 7,000 | 7,382 |
| Hawaii Pacific Health Revenue | 5.750% | 7/1/20 (Prere.) | 2,365 | 2,504 |
| | | | 76,048 |
| Idaho (0.2%) | | | | |
| 5 Idaho Health Facilities Authority Revenue (Kootenai Health Project) | 4.750% | 7/1/44 | 6,630 | 6,748 |
| Idaho Health Facilities Authority Revenue (Trinity Health Group) | 5.000% | 12/1/47 | 1,250 | 1,344 |
| Idaho Housing & Finance Association (Compass Public Charter School Inc.) Revenue | 6.000% | 7/1/39 | 370 | 384 |
338
High-Yield Tax-Exempt Fund
| | | | |
| Face | Market |
| Maturity | Amount | Value• |
| Coupon | Date | ($000) | ($000) |
| Idaho Housing & Finance Association (Compass Public Charter School Inc.) Revenue | 6.000% | 7/1/49 | 775 | 796 |
| Idaho Housing & Finance Association (Compass Public Charter School Inc.) Revenue | 6.000% | 7/1/54 | 570 | 583 |
| Idaho Housing & Finance Association RAN | 5.000% | 7/15/19 (Prere.) | 8,430 | 8,609 |
| Idaho Housing & Finance Association RAN | 5.000% | 7/15/19 (Prere.) | 7,000 | 7,149 |
| | | | 25,613 |
| Illinois (10.3%) | | | | |
| Chicago IL Board of Education GO | 0.000% | 12/1/28 (14) | 5,000 | 3,164 |
| Chicago IL Board of Education GO | 6.750% | 12/1/30 | 4,000 | 4,743 |
| Chicago IL Board of Education GO | 5.000% | 12/1/31 | 2,105 | 2,113 |
| Chicago IL Board of Education GO | 5.000% | 12/1/31 (4) | 625 | 683 |
| Chicago IL Board of Education GO | 5.125% | 12/1/32 | 6,225 | 6,347 |
| Chicago IL Board of Education GO | 5.000% | 12/1/33 | 8,750 | 8,798 |
| Chicago IL Board of Education GO | 5.000% | 12/1/33 (4) | 1,000 | 1,085 |
| Chicago IL Board of Education GO | 5.000% | 12/1/34 | 5,540 | 5,562 |
| Chicago IL Board of Education GO | 5.000% | 12/1/34 (4) | 1,250 | 1,352 |
| Chicago IL Board of Education GO | 5.250% | 12/1/35 | 6,480 | 6,598 |
| Chicago IL Board of Education GO | 5.250% | 12/1/39 | 19,475 | 19,696 |
| Chicago IL Board of Education GO | 5.500% | 12/1/39 | 2,925 | 2,970 |
| Chicago IL Board of Education GO | 5.250% | 12/1/41 | 350 | 353 |
| Chicago IL Board of Education GO | 5.000% | 12/1/42 | 25,740 | 25,314 |
| Chicago IL Board of Education GO | 7.000% | 12/1/44 | 38,500 | 43,556 |
| Chicago IL Board of Education GO | 6.500% | 12/1/46 | 14,500 | 16,206 |
| Chicago IL Board of Education GO | 7.000% | 12/1/46 | 3,185 | 3,711 |
| Chicago IL GO | 5.000% | 1/1/26 | 2,750 | 2,894 |
| Chicago IL GO | 4.750% | 1/1/30 (4) | 570 | 572 |
| Chicago IL GO | 0.000% | 1/1/31 | 4,915 | 2,754 |
| Chicago IL GO | 5.500% | 1/1/31 | 3,230 | 3,450 |
| Chicago IL GO | 5.000% | 1/1/34 | 6,660 | 6,784 |
| Chicago IL GO | 5.000% | 1/1/34 | 2,000 | 2,055 |
| Chicago IL GO | 5.000% | 1/1/35 | 4,370 | 4,513 |
| Chicago IL GO | 5.000% | 1/1/36 | 5,000 | 5,118 |
| Chicago IL GO | 5.000% | 1/1/38 | 13,000 | 13,314 |
| Chicago IL GO | 5.500% | 1/1/39 | 3,700 | 3,883 |
| Chicago IL GO | 5.500% | 1/1/42 | 2,000 | 2,096 |
| Chicago IL Midway Airport Revenue | 5.000% | 1/1/27 | 2,000 | 2,203 |
| Chicago IL Midway Airport Revenue | 5.000% | 1/1/28 | 1,765 | 1,931 |
| Chicago IL Midway Airport Revenue | 5.000% | 1/1/29 | 16,180 | 17,396 |
| Chicago IL Midway Airport Revenue | 5.000% | 1/1/29 | 2,220 | 2,413 |
| Chicago IL Midway Airport Revenue | 5.000% | 1/1/31 | 6,945 | 7,426 |
| Chicago IL Midway Airport Revenue | 5.000% | 1/1/33 | 7,200 | 7,674 |
| Chicago IL Midway Airport Revenue | 5.375% | 1/1/33 | 4,000 | 4,343 |
| Chicago IL Midway Airport Revenue | 5.000% | 1/1/34 | 7,105 | 7,563 |
| Chicago IL Midway Airport Revenue | 5.000% | 1/1/41 | 11,700 | 12,397 |
| Chicago IL O’Hare International Airport Revenue | 5.625% | 1/1/21 (Prere.) | 5,650 | 6,060 |
| Chicago IL O’Hare International Airport Revenue | 5.750% | 1/1/21 (Prere.) | 2,515 | 2,704 |
| Chicago IL O’Hare International Airport Revenue | 5.000% | 1/1/27 | 3,765 | 4,224 |
| Chicago IL O’Hare International Airport Revenue | 4.000% | 1/1/29 | 10,955 | 10,997 |
| Chicago IL O’Hare International Airport Revenue | 5.000% | 1/1/30 | 2,000 | 2,189 |
| Chicago IL O’Hare International Airport Revenue | 5.000% | 1/1/30 | 11,000 | 11,628 |
| Chicago IL O’Hare International Airport Revenue | 5.000% | 1/1/30 | 13,400 | 14,723 |
| Chicago IL O’Hare International Airport Revenue | 5.250% | 1/1/30 | 3,655 | 3,770 |
| Chicago IL O’Hare International Airport Revenue | 5.000% | 1/1/31 | 1,500 | 1,635 |
| Chicago IL O’Hare International Airport Revenue | 5.000% | 1/1/31 | 15,595 | 16,461 |
| Chicago IL O’Hare International Airport Revenue | 5.000% | 1/1/31 | 11,000 | 11,933 |
| Chicago IL O’Hare International Airport Revenue | 5.000% | 1/1/32 | 1,200 | 1,303 |
| Chicago IL O’Hare International Airport Revenue | 5.000% | 1/1/33 | 1,500 | 1,623 |
| Chicago IL O’Hare International Airport Revenue | 5.000% | 1/1/34 | 5,600 | 6,033 |
| Chicago IL O’Hare International Airport Revenue | 5.625% | 1/1/35 | 1,350 | 1,427 |
| Chicago IL O’Hare International Airport Revenue | 5.000% | 1/1/37 | 2,720 | 2,904 |
| Chicago IL O’Hare International Airport Revenue | 5.000% | 1/1/37 | 3,500 | 3,737 |
| Chicago IL O’Hare International Airport Revenue | 5.750% | 1/1/38 | 12,000 | 13,337 |
| Chicago IL O’Hare International Airport Revenue | 5.750% | 1/1/39 | 485 | 514 |
| Chicago IL O’Hare International Airport Revenue | 5.000% | 1/1/42 | 2,500 | 2,649 |
| Chicago IL O’Hare International Airport Revenue | 5.000% | 1/1/46 | 3,565 | 3,794 |
| Chicago IL O’Hare International Airport Revenue | 5.000% | 7/1/48 | 5,000 | 5,282 |
| Chicago IL O’Hare International Airport Revenue | 5.000% | 1/1/52 | 8,125 | 8,697 |
| Chicago IL O’Hare International Airport Revenue | 5.000% | 1/1/52 | 4,500 | 4,737 |
| Chicago IL Park District GO | 5.000% | 1/1/40 | 7,500 | 7,864 |
| Chicago IL Park District GO | 4.000% | 1/1/41 (15) | 4,000 | 3,840 |
339
High-Yield Tax-Exempt Fund
| | | | |
| Face | Market |
| Maturity | Amount | Value• |
| Coupon | Date | ($000) | ($000) |
| Chicago IL Public Building Commission GO | 7.000% | 1/1/20 (ETM) | 10,000 | 10,317 |
| Chicago IL Sales Tax Revenue | 5.250% | 1/1/22 (Prere.) | 7,300 | 7,956 |
| Chicago IL Transit Authority Sales Tax Receipts Revenue | 5.250% | 12/1/30 | 2,950 | 3,126 |
| Chicago IL Transit Authority Sales Tax Receipts Revenue | 5.250% | 12/1/36 | 5,400 | 5,677 |
| Chicago IL Wastewater Transmission Revenue | 5.000% | 1/1/34 | 2,525 | 2,669 |
| Chicago IL Wastewater Transmission Revenue | 5.000% | 1/1/34 | 2,500 | 2,656 |
| Chicago IL Wastewater Transmission Revenue | 5.000% | 1/1/35 | 2,000 | 2,122 |
| Chicago IL Wastewater Transmission Revenue | 5.000% | 1/1/39 | 9,000 | 9,467 |
| Chicago IL Water Revenue | 5.250% | 11/1/18 (Prere.) | 16,315 | 16,315 |
| Chicago IL Waterworks Revenue | 5.000% | 11/1/39 | 1,000 | 1,053 |
| Chicago IL Waterworks Revenue | 5.000% | 11/1/44 | 7,000 | 7,370 |
| Cook County IL GO | 5.000% | 11/15/34 | 1,150 | 1,250 |
| Cook County IL GO | 5.000% | 11/15/35 | 1,025 | 1,111 |
| Illinois Finance Authority Revenue (Advocate Health Care Network) | 5.000% | 6/1/42 | 1,500 | 1,578 |
| Illinois Finance Authority Revenue (Benedictine University) | 5.000% | 10/1/38 | 4,000 | 4,151 |
| Illinois Finance Authority Revenue (Carle Foundation) | 6.000% | 8/15/41 (4) | 1,500 | 1,623 |
| Illinois Finance Authority Revenue (Carle Foundation) | 6.000% | 8/15/41 | 2,000 | 2,164 |
| Illinois Finance Authority Revenue (Carle Foundation) | 5.000% | 2/15/45 | 10,000 | 10,685 |
| Illinois Finance Authority Revenue (Centegra Health System) | 5.000% | 9/1/38 | 7,500 | 7,925 |
| Illinois Finance Authority Revenue (Centegra Health System) | 5.000% | 9/1/39 | 8,150 | 8,794 |
| Illinois Finance Authority Revenue (Centegra Health System) | 5.000% | 9/1/42 | 2,000 | 2,153 |
| Illinois Finance Authority Revenue (Christian Homes Inc.) | 5.000% | 5/15/26 | 1,695 | 1,803 |
| Illinois Finance Authority Revenue (Christian Homes Inc.) | 5.000% | 5/15/36 | 1,400 | 1,439 |
| Illinois Finance Authority Revenue (Christian Homes Inc.) | 5.000% | 5/15/40 | 1,275 | 1,301 |
| Illinois Finance Authority Revenue (Columbia College) | 5.000% | 12/1/37 | 12,325 | 12,501 |
| Illinois Finance Authority Revenue (DePaul University) | 4.000% | 10/1/32 | 2,735 | 2,780 |
| Illinois Finance Authority Revenue (DePaul University) | 5.000% | 10/1/32 | 500 | 553 |
| Illinois Finance Authority Revenue (DePaul University) | 4.000% | 10/1/34 | 1,620 | 1,636 |
| Illinois Finance Authority Revenue (DePaul University) | 5.000% | 10/1/36 | 1,360 | 1,485 |
| Illinois Finance Authority Revenue (DePaul University) | 5.000% | 10/1/41 | 7,875 | 8,510 |
| Illinois Finance Authority Revenue (Franciscan Communities Inc.) | 5.125% | 5/15/43 | 10,585 | 10,819 |
| Illinois Finance Authority Revenue (Franciscan Communities Inc.) | 5.000% | 5/15/47 | 1,155 | 1,181 |
| Illinois Finance Authority Revenue (Friendship Village Schaumburg) | 5.000% | 2/15/37 | 5,000 | 4,595 |
| Illinois Finance Authority Revenue (Friendship Village Schaumburg) | 5.125% | 2/15/45 | 3,000 | 2,702 |
| Illinois Finance Authority Revenue (Illinois Wesleyan University) | 5.000% | 9/1/46 | 2,200 | 2,288 |
| Illinois Finance Authority Revenue (Lutheran Home & Services) | 5.625% | 5/15/42 | 5,500 | 5,676 |
| Illinois Finance Authority Revenue (Lutheran Home & Services) | 5.750% | 5/15/46 | 6,290 | 6,507 |
| Illinois Finance Authority Revenue (Mercy Health System) | 5.000% | 12/1/40 | 2,950 | 3,127 |
| Illinois Finance Authority Revenue (Mercy Health System) | 5.000% | 12/1/46 | 29,500 | 31,155 |
| Illinois Finance Authority Revenue (Montgomery Place) | 5.250% | 5/15/37 | 4,000 | 3,921 |
| Illinois Finance Authority Revenue (Montgomery Place) | 5.250% | 5/15/48 | 5,000 | 4,776 |
| Illinois Finance Authority Revenue (Northwestern Memorial Hospital) PUT | 5.000% | 8/15/37 | 6,250 | 6,692 |
| Illinois Finance Authority Revenue (OSF Healthcare System) | 7.000% | 5/15/19 (Prere.) | 10,000 | 10,265 |
| Illinois Finance Authority Revenue (OSF Healthcare System) | 6.000% | 5/15/20 (Prere.) | 4,020 | 4,248 |
| Illinois Finance Authority Revenue (OSF Healthcare System) | 5.000% | 11/15/34 | 1,915 | 2,074 |
| Illinois Finance Authority Revenue (OSF Healthcare System) | 5.000% | 11/15/35 | 1,875 | 2,025 |
| Illinois Finance Authority Revenue (OSF Healthcare System) | 6.000% | 5/15/39 | 1,255 | 1,306 |
| Illinois Finance Authority Revenue (OSF Healthcare System) | 5.000% | 5/15/41 | 6,000 | 6,276 |
| Illinois Finance Authority Revenue (OSF Healthcare System) | 5.000% | 11/15/45 | 19,750 | 20,975 |
| Illinois Finance Authority Revenue (Plymouth Place Inc.) | 5.000% | 5/15/37 | 2,750 | 2,785 |
| Illinois Finance Authority Revenue (Plymouth Place Inc.) | 5.250% | 5/15/45 | 1,000 | 1,027 |
| Illinois Finance Authority Revenue (Plymouth Place Inc.) | 5.250% | 5/15/50 | 2,845 | 2,883 |
| Illinois Finance Authority Revenue (Presence Health Network Obligated Group) | 5.000% | 2/15/33 | 5,000 | 5,554 |
| Illinois Finance Authority Revenue (Presence Health Network Obligated Group) | 5.000% | 2/15/34 | 4,580 | 5,067 |
| Illinois Finance Authority Revenue (Presence Health Network Obligated Group) | 5.000% | 2/15/36 | 5,000 | 5,479 |
| Illinois Finance Authority Revenue (Presence Health Network Obligated Group) | 5.000% | 2/15/41 | 2,000 | 2,171 |
| Illinois Finance Authority Revenue (Rehabilitation Institute of Chicago) | 6.000% | 7/1/43 | 10,000 | 10,834 |
| Illinois Finance Authority Revenue (Riverside Health System) | 6.250% | 11/15/19 (Prere.) | 2,775 | 2,894 |
| Illinois Finance Authority Revenue (Riverside Health System) | 4.000% | 11/15/33 | 4,555 | 4,484 |
| Illinois Finance Authority Revenue (Riverside Health System) | 4.000% | 11/15/34 | 2,425 | 2,374 |
| Illinois Finance Authority Revenue (Riverside Health System) | 6.250% | 11/15/35 | 1,825 | 1,896 |
| Illinois Finance Authority Revenue (Rush University Medical Center) | 5.000% | 11/15/38 | 8,900 | 9,555 |
| Illinois Finance Authority Revenue (Silver Cross & Medical Centers) | 6.875% | 8/15/19 (Prere.) | 500 | 519 |
| Illinois Finance Authority Revenue (Silver Cross & Medical Centers) | 7.000% | 8/15/19 (Prere.) | 14,000 | 14,536 |
| Illinois Finance Authority Revenue (Silver Cross & Medical Centers) | 5.000% | 8/15/35 | 7,300 | 7,752 |
| Illinois Finance Authority Revenue (Silver Cross & Medical Centers) | 5.000% | 8/15/44 | 1,750 | 1,830 |
| Illinois Finance Authority Revenue (Southern Illinois Healthcare) | 5.000% | 3/1/31 | 1,075 | 1,178 |
| Illinois Finance Authority Revenue (Southern Illinois Healthcare) | 5.000% | 3/1/47 | 5,150 | 5,452 |
| Illinois Finance Authority Revenue (Swedish Covenant Hospital) | 5.250% | 8/15/27 | 3,000 | 3,338 |
| Illinois Finance Authority Revenue (Swedish Covenant Hospital) | 5.250% | 8/15/28 | 2,605 | 2,883 |
340
High-Yield Tax-Exempt Fund
| | | | |
| Face | Market |
| Maturity | Amount | Value• |
| Coupon | Date | ($000) | ($000) |
| Illinois Finance Authority Revenue (Swedish Covenant Hospital) | 5.250% | 8/15/29 | 5,850 | 6,442 |
| Illinois Finance Authority Revenue (Swedish Covenant Hospital) | 5.000% | 8/15/32 | 3,500 | 3,734 |
| Illinois Finance Authority Revenue (Swedish Covenant Hospital) | 5.000% | 8/15/33 | 1,695 | 1,803 |
| Illinois Finance Authority Revenue (Swedish Covenant Hospital) | 5.000% | 8/15/35 | 1,000 | 1,057 |
| Illinois Finance Authority Revenue (Swedish Covenant Hospital) | 5.000% | 8/15/36 | 1,250 | 1,317 |
| Illinois Finance Authority Revenue (Swedish Covenant Hospital) | 5.000% | 8/15/37 | 1,265 | 1,331 |
| Illinois Finance Authority Revenue (Three Crowns Park Obligated Group) | 3.250% | 2/15/22 | 500 | 497 |
| Illinois Finance Authority Revenue (Three Crowns Park Obligated Group) | 4.000% | 2/15/27 | 785 | 782 |
| Illinois Finance Authority Revenue (Three Crowns Park Obligated Group) | 5.000% | 2/15/32 | 1,150 | 1,196 |
| Illinois Finance Authority Student Housing & Academic Facilities Revenue | | | | |
| (University of Illinois at Chicago Project) | 5.000% | 2/15/47 | 2,400 | 2,520 |
| Illinois Finance Authority Student Housing & Academic Facilities Revenue | | | | |
| (University of Illinois at Chicago Project) | 5.000% | 2/15/50 | 1,200 | 1,255 |
| Illinois GO | 5.000% | 1/1/20 (4) | 2,930 | 3,006 |
| Illinois GO | 5.000% | 2/1/20 | 19,750 | 20,210 |
| Illinois GO | 5.000% | 3/1/21 | 3,560 | 3,666 |
| Illinois GO | 5.000% | 8/1/21 | 8,000 | 8,273 |
| Illinois GO | 5.000% | 3/1/22 | 6,600 | 6,828 |
| Illinois GO | 5.000% | 5/1/22 | 1,150 | 1,191 |
| Illinois GO | 5.000% | 8/1/22 | 15,475 | 16,051 |
| Illinois GO | 5.000% | 12/1/22 | 9,500 | 9,872 |
| Illinois GO | 5.000% | 2/1/23 | 6,000 | 6,239 |
| Illinois GO | 5.000% | 3/1/23 | 6,165 | 6,359 |
| Illinois GO | 5.000% | 8/1/23 | 13,850 | 14,430 |
| Illinois GO | 5.000% | 3/1/24 | 5,050 | 5,212 |
| Illinois GO | 5.000% | 8/1/24 | 13,660 | 14,130 |
| Illinois GO | 5.000% | 11/1/24 | 8,000 | 8,323 |
| Illinois GO | 5.000% | 2/1/25 | 2,270 | 2,352 |
| Illinois GO | 5.000% | 3/1/25 | 3,130 | 3,225 |
| Illinois GO | 5.000% | 8/1/25 | 3,000 | 3,097 |
| Illinois GO | 5.500% | 7/1/26 | 5,845 | 6,240 |
| Illinois GO | 5.000% | 11/1/26 | 21,390 | 22,218 |
| Illinois GO | 5.000% | 12/1/26 | 1,610 | 1,672 |
| Illinois GO | 5.000% | 10/1/27 | 8,000 | 8,303 |
| Illinois GO | 5.000% | 11/1/27 | 10,000 | 10,374 |
| Illinois GO | 5.000% | 2/1/28 | 10,000 | 10,306 |
| Illinois GO | 5.000% | 10/1/28 | 6,000 | 6,199 |
| Illinois GO | 5.000% | 11/1/28 | 2,600 | 2,671 |
| Illinois GO | 5.000% | 5/1/29 | 10,000 | 10,259 |
| Illinois GO | 5.000% | 5/1/29 | 6,125 | 6,252 |
| Illinois GO | 5.000% | 10/1/29 | 3,000 | 3,078 |
| Illinois GO | 5.000% | 10/1/30 | 2,500 | 2,555 |
| Illinois GO | 5.250% | 2/1/32 | 9,575 | 9,884 |
| Illinois GO | 5.000% | 1/1/33 | 3,490 | 3,541 |
| Illinois GO | 5.250% | 2/1/33 (4) | 6,200 | 6,703 |
| Illinois GO | 5.000% | 3/1/33 | 1,000 | 1,015 |
| Illinois GO | 5.500% | 7/1/33 (4) | 3,350 | 3,594 |
| Illinois GO | 5.000% | 10/1/33 | 3,000 | 3,052 |
| Illinois GO | 4.000% | 12/1/33 | 12,000 | 10,822 |
| Illinois GO | 5.000% | 1/1/34 | 4,205 | 4,265 |
| Illinois GO | 5.250% | 2/1/34 (4) | 3,125 | 3,377 |
| Illinois GO | 5.000% | 5/1/34 | 2,500 | 2,535 |
| Illinois GO | 5.000% | 3/1/35 | 2,065 | 2,094 |
| Illinois GO | 5.000% | 4/1/35 | 1,100 | 1,119 |
| Illinois GO | 5.000% | 3/1/36 | 885 | 896 |
| Illinois GO | 5.000% | 3/1/37 | 985 | 996 |
| Illinois GO | 5.500% | 7/1/38 | 6,500 | 6,795 |
| Illinois Sports Facility Authority Revenue | 5.500% | 6/15/30 (2) | 6,120 | 6,135 |
| Illinois Toll Highway Authority Revenue | 5.000% | 1/1/31 | 6,000 | 6,174 |
| Illinois Toll Highway Authority Revenue | 5.000% | 1/1/37 | 5,000 | 5,418 |
| Illinois Toll Highway Authority Revenue | 5.000% | 1/1/40 | 9,400 | 10,132 |
| Illinois Toll Highway Authority Revenue | 5.000% | 1/1/41 | 8,100 | 8,741 |
| Illinois Toll Highway Authority Revenue | 5.000% | 1/1/42 | 2,000 | 2,170 |
| Metropolitan Pier & Exposition Authority Illinois Dedicated Sales Tax Revenue | 0.000% | 12/15/29 (14) | 10,000 | 5,985 |
| Metropolitan Pier & Exposition Authority Illinois Dedicated Sales Tax Revenue | 0.000% | 12/15/31 (14) | 10,020 | 5,357 |
| Metropolitan Pier & Exposition Authority Illinois Dedicated Sales Tax Revenue | 0.000% | 6/15/38 (14) | 10,000 | 3,674 |
| Metropolitan Pier & Exposition Authority Illinois Dedicated Sales Tax Revenue | 0.000% | 6/15/44 (4) | 10,000 | 2,850 |
| Metropolitan Pier & Exposition Authority Illinois Dedicated Sales Tax Revenue | | | | |
| (McCormick Place Expansion Project) | 5.000% | 6/15/57 | 12,255 | 12,589 |
341
High-Yield Tax-Exempt Fund
| | | | |
| Face | Market |
| Maturity | Amount | Value• |
| Coupon | Date | ($000) | ($000) |
| Metropolitan Pier & Exposition Authority Illinois Dedicated Sales Tax Revenue | | | | |
| (McCormick Place Expansion Project) | 0.000% | 6/15/31 (14) | 10,000 | 5,482 |
| Metropolitan Pier & Exposition Authority Illinois Dedicated Sales Tax Revenue | | | | |
| (McCormick Place Expansion Project) | 5.000% | 12/15/40 | 1,000 | 1,033 |
| Metropolitan Pier & Exposition Authority Illinois Dedicated Sales Tax Revenue | | | | |
| (McCormick Place Expansion Project) | 5.000% | 6/15/42 | 6,500 | 6,603 |
| Metropolitan Pier & Exposition Authority Illinois Dedicated Sales Tax Revenue | | | | |
| (McCormick Place Expansion Project) | 5.000% | 6/15/50 | 6,805 | 6,808 |
| Metropolitan Pier & Exposition Authority Illinois Dedicated Sales Tax Revenue | | | | |
| (McCormick Place Expansion Project) | 0.000% | 12/15/51 | 21,500 | 3,620 |
| Metropolitan Pier & Exposition Authority Illinois Dedicated Sales Tax Revenue | | | | |
| (McCormick Place Expansion Project) | 5.000% | 6/15/52 | 5,905 | 5,979 |
| Metropolitan Pier & Exposition Authority Illinois Dedicated Sales Tax Revenue | | | | |
| (McCormick Place Expansion Project) | 5.000% | 6/15/53 | 7,500 | 7,689 |
| Metropolitan Pier & Exposition Authority Illinois Dedicated Sales Tax Revenue | | | | |
| (McCormick Place Expansion Project) | 5.500% | 6/15/53 | 14,000 | 14,774 |
| Metropolitan Pier & Exposition Authority Illinois Dedicated Sales Tax Revenue | | | | |
| (McCormick Place Expansion Project) | 0.000% | 12/15/56 (4) | 33,690 | 5,015 |
| Metropolitan Pier & Exposition Authority Illinois Dedicated Sales Tax Revenue | | | | |
| (McCormick Place Expansion Project) | 0.000% | 12/15/56 | 100,500 | 12,846 |
| Metropolitan Pier & Exposition Authority Illinois Dedicated Sales Tax Revenue | | | | |
| (McCormick Place Expansion Project) | 0.000% | 12/15/30 (14) | 13,555 | 7,665 |
| Metropolitan Pier & Exposition Authority Illinois Dedicated Sales Tax Revenue | | | | |
| (McCormick Place Expansion Project) | 0.000% | 6/15/32 (14) | 10,000 | 5,179 |
| Northern Illinois Municipal Power Agency Project Revenue | 4.000% | 12/1/33 | 4,000 | 4,008 |
| Northern Illinois Municipal Power Agency Project Revenue | 4.000% | 12/1/35 | 5,000 | 4,963 |
| Northern Illinois Municipal Power Agency Project Revenue | 4.000% | 12/1/36 | 4,500 | 4,437 |
| Northern Illinois Municipal Power Agency Project Revenue | 5.000% | 12/1/41 | 19,625 | 20,870 |
| Railsplitter Tobacco Settlement Authority Illinois Tobacco Settlement Revenue | 6.000% | 6/1/21 (Prere.) | 1,200 | 1,311 |
| Railsplitter Tobacco Settlement Authority Illinois Tobacco Settlement Revenue | 5.000% | 6/1/27 | 9,750 | 10,881 |
| Romeoville IL Revenue (Lewis University Project) | 5.000% | 10/1/35 | 3,190 | 3,323 |
| Romeoville IL Revenue (Lewis University Project) | 5.000% | 10/1/42 | 5,000 | 5,155 |
| Romeoville IL Revenue (Lewis University Project) | 4.125% | 10/1/46 | 2,250 | 2,040 |
| Will County IL Community High School District No. 210 (Lincoln-Way) GO | 5.000% | 1/1/27 | 1,260 | 1,248 |
| Will County IL Community High School District No. 210 (Lincoln-Way) GO | 0.000% | 1/1/31 | 13,330 | 7,389 |
| Will County IL Community High School District No. 210 (Lincoln-Way) GO | 5.000% | 1/1/31 | 9,150 | 8,810 |
| | | | 1,315,930 |
| Indiana (1.5%) | | | | |
| Gary/Chicago IN International Airport Authority Industrial Development Zone Revenue | 5.000% | 2/1/29 | 2,000 | 2,171 |
| Gary/Chicago IN International Airport Authority Industrial Development Zone Revenue | 5.250% | 2/1/34 | 2,650 | 2,877 |
| Gary/Chicago IN International Airport Authority Industrial Development Zone Revenue | 5.000% | 2/1/39 | 3,300 | 3,493 |
| Indiana Finance Authority Health Facilities Revenue (Baptist Healthcare System Obligated Group) | 5.000% | 8/15/51 | 23,915 | 24,756 |
| Indiana Finance Authority Health System Revenue | | | | |
| (Sisters of St. Francis Health Services Inc. Obligated Group) | 5.000% | 11/1/51 | 10,005 | 10,642 |
| Indiana Finance Authority Hospital Revenue (Deaconess Health System Obligated Group) | 5.000% | 3/1/32 | 5,000 | 5,348 |
| Indiana Finance Authority Hospital Revenue (Deaconess Health System Obligated Group) | 5.000% | 3/1/35 | 6,000 | 6,388 |
| Indiana Finance Authority Revenue (Community Foundation of Northwest Indiana Obligated Group) | 5.000% | 3/1/41 | 5,500 | 5,796 |
| Indiana Finance Authority Revenue (Deaconess Health System Obligated Group) | 5.000% | 3/1/39 | 7,205 | 7,721 |
| Indiana Finance Authority Revenue (Ohio River Bridges East End Crossing Project) | 5.000% | 7/1/40 | 2,500 | 2,625 |
| Indiana Finance Authority Revenue (Ohio River Bridges East End Crossing Project) | 5.000% | 7/1/44 | 25,550 | 26,748 |
| Indiana Finance Authority Revenue (Ohio River Bridges East End Crossing Project) | 5.000% | 7/1/48 | 28,025 | 29,266 |
| Indiana Health Facility Financing Authority Hospital Revenue (Ancilla System Inc. Obligated Group) | 7.375% | 7/1/23 (ETM) | 19,400 | 22,848 |
| Indiana Municipal Power Agency Revenue | 6.000% | 1/1/19 (Prere.) | 13,275 | 13,365 |
| Indiana Municipal Power Agency Revenue | 5.000% | 1/1/42 | 6,595 | 7,267 |
| Indianapolis IN Local Public Improvement Bond Bank Revenue | | | | |
| (Indianapolis Airport Authority Project) | 5.000% | 1/1/31 | 5,000 | 5,383 |
| Indianapolis IN Local Public Improvement Bond Bank Revenue | | | | |
| (Indianapolis Airport Authority Project) | 5.000% | 1/1/32 | 4,500 | 4,836 |
| Indianapolis IN Local Public Improvement Bond Bank Revenue | | | | |
| (Indianapolis Airport Authority Project) | 5.000% | 1/1/33 | 3,150 | 3,379 |
| Indianapolis IN Local Public Improvement Bond Bank Revenue | | | | |
| (Qualified Midwestern Disaster Area) | 5.750% | 2/1/36 | 5,000 | 5,332 |
| Ivy IN Tech Community College Revenue | 5.000% | 7/1/28 | 1,000 | 1,170 |
| Ivy IN Tech Community College Revenue | 5.000% | 7/1/31 | 1,175 | 1,347 |
| | | | 192,758 |
| Iowa (0.5%) | | | | |
| Iowa Finance Authority Health Facilities Revenue (UnityPoint Health) | 4.000% | 8/15/36 | 3,725 | 3,674 |
| Iowa Finance Authority Midwestern Disaster Area Revenue (Iowa Fertilizer Co. Project) | 5.500% | 12/1/22 | 140 | 140 |
| Iowa Finance Authority Midwestern Disaster Area Revenue (Iowa Fertilizer Co. Project) | 5.250% | 12/1/25 | 18,400 | 19,439 |
| 5 Iowa Finance Authority Midwestern Disaster Area Revenue (Iowa Fertilizer Co. Project) | 5.875% | 12/1/26 | 5,995 | 6,300 |
342
High-Yield Tax-Exempt Fund
| | | | | |
| Face | Market |
| Maturity | Amount | Value• |
| | Coupon | Date | ($000) | ($000) |
| Iowa Finance Authority Midwestern Disaster Area Revenue (Iowa Fertilizer Co. Project) PUT | 5.250% | 12/1/37 | 27,515 | 29,219 |
| Xenia IA Rural Water District Revenue | 5.000% | 12/1/31 | 1,600 | 1,715 |
| Xenia IA Rural Water District Revenue | 5.000% | 12/1/36 | 2,000 | 2,111 |
| Xenia IA Rural Water District Revenue | 5.000% | 12/1/41 | 2,000 | 2,092 |
| | | | | 64,690 |
| Kansas (0.6%) | | | | |
| 5 | Coffeyville KS Electric System Revenue | 5.000% | 6/1/38 (14) | 6,000 | 6,380 |
| 5 | Coffeyville KS Electric System Revenue | 5.000% | 6/1/42 (14) | 3,500 | 3,730 |
| Ford County KS Unified School District No. 443 GO | 4.000% | 3/1/28 (15) | 1,000 | 1,056 |
| Hutchison KS Hospital Facilities Revenue (Hutchinson Regional Medical Center Inc.) | 5.000% | 12/1/36 | 1,500 | 1,557 |
| Hutchison KS Hospital Facilities Revenue (Hutchinson Regional Medical Center Inc.) | 5.000% | 12/1/41 | 1,600 | 1,643 |
| Johnson County KS Unified School District No. 233 GO | 4.000% | 9/1/31 | 1,000 | 1,041 |
| Seward County KS Unified School District No. 480 GO | 4.000% | 9/1/32 | 3,895 | 4,058 |
| Seward County KS Unified School District No. 480 GO | 4.000% | 9/1/33 | 4,080 | 4,225 |
| Seward County KS Unified School District No. 480 GO | 4.000% | 9/1/34 | 5,000 | 5,151 |
| Wichita KS GO | 5.000% | 12/1/34 | 2,280 | 2,529 |
| Wichita KS GO | 5.000% | 12/1/35 | 2,365 | 2,612 |
| Wichita KS GO | 5.000% | 12/1/39 | 11,305 | 12,397 |
| Wichita KS Health Care Facilities Revenue | 6.375% | 5/15/43 | 7,000 | 7,430 |
| Wichita KS Health Care Facilities Revenue | 6.500% | 5/15/48 | 8,000 | 8,531 |
| Wichita KS Health Care Facilities Revenue (Larksfield Place Obligated Group) | 7.375% 12/15/43 | 5,000 | 5,274 |
| Wyandotte County/Kansas City KS Unified Government Sales Tax Revenue | 4.500% | 6/1/40 | 2,500 | 2,453 |
| | | | | 70,067 |
| Kentucky (0.7%) | | | | |
| Ashland KY Medical Center Revenue (King’s Daughters Medical Center Project) | 5.000% | 2/1/29 | 1,010 | 1,086 |
| Ashland KY Medical Center Revenue (King’s Daughters Medical Center Project) | 5.000% | 2/1/40 | 6,915 | 7,196 |
| Kentucky Economic Development Finance Authority Hospital Revenue | | | | |
| | (Baptist Healthcare System Obligated Group) | 5.000% | 8/15/41 | 9,550 | 9,956 |
| Kentucky Economic Development Finance Authority Hospital Revenue | | | | |
| | (Baptist Healthcare System Obligated Group) | 5.000% | 8/15/46 | 2,950 | 3,065 |
| Kentucky Economic Development Finance Authority Hospital Revenue | | | | |
| | (Baptist Healthcare System Obligated Group) | 5.250% | 8/15/46 | 11,680 | 12,158 |
| Kentucky Economic Development Finance Authority Revenue (Owensboro Health, Inc.) | 5.000% | 6/1/37 | 5,000 | 5,162 |
| Kentucky Public Energy Authority Gas Supply Revenue PUT | 4.000% | 1/1/25 | 10,000 | 10,501 |
| 9 | Kentucky Public Transportation Infrastructure Authority Toll Revenue | | | | |
| | (Downtown Crossing Project) BAN | 0.000% | 7/1/33 | 3,065 | 2,833 |
| 10 | Kentucky Public Transportation Infrastructure Authority Toll Revenue | | | | |
| | (Downtown Crossing Project) BAN | 0.000% | 7/1/39 | 3,000 | 2,745 |
| Kentucky Public Transportation Infrastructure Authority Toll Revenue | | | | |
| | (Downtown Crossing Project) BAN | 6.000% | 7/1/53 | 12,025 | 13,036 |
| Louisville & Jefferson County KY Metropolitan Government Health System Revenue | | | | |
| | (Norton Healthcare Obligated Group) | 5.750% | 10/1/42 | 9,500 | 10,461 |
| Louisville & Jefferson County KY Metropolitan Government Revenue (Catholic Health Initiatives) | 5.000% | 6/1/22 (Prere.) | 4,775 | 5,221 |
| Louisville & Jefferson County KY Metropolitan Government Revenue (Catholic Health Initiatives) | 5.000% | 12/1/35 | 4,970 | 5,169 |
| | | | | 88,589 |
| Louisiana (1.3%) | | | | |
| Greater New Orleans LA Expressway Commission Revenue | 5.000% | 11/1/42 (4) | 4,000 | 4,364 |
| Greater New Orleans LA Expressway Commission Revenue | 5.000% | 11/1/47 (4) | 4,000 | 4,351 |
| Louisiana Local Government Environmental Facilities & Community Development | | | | |
| | Authority Revenue | 5.650% | 11/1/37 | 1,500 | 1,507 |
| Louisiana Local Government Environmental Facilities & Community Development | | | | |
| | Authority Revenue (East Baton Rouge Sewerage Commission Projects) | 5.000% | 2/1/39 | 3,250 | 3,524 |
| Louisiana Local Government Environmental Facilities & Community Development | | | | |
| | Authority Revenue (Women’s Hospital Foundation Project) | 5.875% | 10/1/20 (Prere.) | 9,990 | 10,672 |
| Louisiana Local Government Environmental Facilities & Community Development | | | | |
| | Authority Revenue (Women’s Hospital Foundation Project) | 6.000% | 10/1/20 (Prere.) | 8,095 | 8,667 |
| 5 | Louisiana Public Facilities Authority Dock & Wharf Revenue (Impala Warehousing LLC Project) | 6.500% | 7/1/36 | 26,750 | 29,035 |
| Louisiana Public Facilities Authority Hospital Revenue | | | | |
| | (Franciscan Missionaries of Our Lady Health System Obligated Group) | 5.000% | 7/1/25 (Prere.) | 105 | 120 |
| Louisiana Public Facilities Authority Hospital Revenue | | | | |
| | (Franciscan Missionaries of Our Lady Health System Obligated Group) | 5.000% | 7/1/39 | 17,395 | 18,592 |
| Louisiana Public Facilities Authority Hospital Revenue | | | | |
| | (Franciscan Missionaries of Our Lady Health System Project) | 5.000% | 7/1/42 | 8,000 | 8,434 |
| Louisiana Public Facilities Authority Hospital Revenue | | | | |
| | (Franciscan Missionaries of Our Lady Health System Project) | 5.000% | 7/1/47 | 5,000 | 5,306 |
| Louisiana Public Facilities Authority Revenue (Nineteenth Judicial District Court Building Project) | 5.000% | 6/1/42 (4) | 3,500 | 3,780 |
| New Orleans LA Aviation Board Revenue | 6.000% | 1/1/19 (Prere.) | 5,000 | 5,034 |
| New Orleans LA Aviation Board Revenue | 5.000% | 1/1/28 | 750 | 833 |
| New Orleans LA Aviation Board Revenue | 5.000% | 1/1/29 | 750 | 827 |
| New Orleans LA Aviation Board Revenue | 5.000% | 1/1/30 | 860 | 943 |
343
High-Yield Tax-Exempt Fund
| | | | |
| Face | Market |
| Maturity | Amount | Value• |
| Coupon | Date | ($000) | ($000) |
| New Orleans LA Aviation Board Revenue | 5.000% | 1/1/31 | 595 | 650 |
| New Orleans LA Aviation Board Revenue | 5.000% | 1/1/32 | 500 | 544 |
| New Orleans LA Aviation Board Revenue | 5.000% | 1/1/33 | 750 | 813 |
| New Orleans LA Aviation Board Revenue | 5.000% | 1/1/34 | 2,725 | 2,906 |
| New Orleans LA Aviation Board Revenue | 5.000% | 1/1/34 | 500 | 540 |
| New Orleans LA Aviation Board Revenue | 5.000% | 1/1/35 | 2,025 | 2,156 |
| New Orleans LA Aviation Board Revenue | 5.000% | 1/1/43 | 2,250 | 2,391 |
| New Orleans LA Aviation Board Revenue | 5.000% | 1/1/48 | 5,000 | 5,295 |
| New Orleans LA Water Revenue | 5.000% | 12/1/44 | 7,000 | 7,515 |
| Port of New Orleans LA Board of Commissioners Port Facility Revenue | 5.000% | 4/1/30 | 1,210 | 1,285 |
| Port of New Orleans LA Board of Commissioners Port Facility Revenue | 5.000% | 4/1/32 | 2,720 | 2,873 |
| Port of New Orleans LA Board of Commissioners Port Facility Revenue | 5.000% | 4/1/43 (4) | 10,140 | 11,028 |
| Port of New Orleans LA Board of Commissioners Port Facility Revenue | 5.000% | 4/1/45 (4) | 2,655 | 2,883 |
| Port of New Orleans LA Board of Commissioners Port Facility Revenue | 5.000% | 4/1/48 (4) | 3,500 | 3,792 |
| St. Charles Parish LA Gulf Opportunity Zone Revenue (Valero Energy Corp.) PUT | 4.000% | 6/1/22 | 12,515 | 13,032 |
| | | | 163,692 |
| Maine (0.2%) | | | | |
| Maine Health & Higher Educational Facilities Authority Revenue (Eastern Maine Medical Center) | 5.000% | 7/1/41 | 3,500 | 3,617 |
| Maine Health & Higher Educational Facilities Authority Revenue (Eastern Maine Medical Center) | 5.000% | 7/1/46 | 7,750 | 7,983 |
| Maine Health & Higher Educational Facilities Authority Revenue (Mainehealth) | 5.000% | 7/1/43 | 2,250 | 2,442 |
| Maine Health & Higher Educational Facilities Authority Revenue (Mainehealth) | 5.000% | 7/1/48 | 3,000 | 3,243 |
| Maine Health & Higher Educational Facilities Authority Revenue (University of New England) | 4.000% | 7/1/31 | 775 | 787 |
| Maine Health & Higher Educational Facilities Authority Revenue (University of New England) | 4.000% | 7/1/32 | 545 | 550 |
| Maine Health & Higher Educational Facilities Authority Revenue (University of New England) | 5.000% | 7/1/33 | 1,100 | 1,210 |
| Maine Health & Higher Educational Facilities Authority Revenue (University of New England) | 4.000% | 7/1/34 | 750 | 752 |
| Maine Health & Higher Educational Facilities Authority Revenue (University of New England) | 5.000% | 7/1/35 | 900 | 985 |
| Maine Health & Higher Educational Facilities Authority Revenue (University of New England) | 4.000% | 7/1/37 | 2,105 | 2,075 |
| Maine Housing Authority Mortgage Revenue | 4.500% | 11/15/28 | 1,145 | 1,179 |
| | | | 24,823 |
| Maryland (1.2%) | | | | |
| Anne Arundel County MD Special Tax Revenue (Villages at 2 Rivers Project) | 5.125% | 7/1/36 | 1,030 | 1,023 |
| Anne Arundel County MD Special Tax Revenue (Villages at 2 Rivers Project) | 5.250% | 7/1/44 | 2,150 | 2,123 |
| Baltimore County MD GO | 4.000% | 3/1/48 | 10,000 | 10,038 |
| Baltimore MD Convention Center Hotel Revenue | 5.000% | 9/1/31 | 1,000 | 1,106 |
| Baltimore MD Convention Center Hotel Revenue | 5.000% | 9/1/32 | 1,000 | 1,102 |
| Baltimore MD Convention Center Hotel Revenue | 5.000% | 9/1/33 | 1,000 | 1,102 |
| Baltimore MD Convention Center Hotel Revenue | 5.000% | 9/1/35 | 1,000 | 1,082 |
| Baltimore MD Convention Center Hotel Revenue | 5.000% | 9/1/36 | 1,000 | 1,077 |
| Baltimore MD Convention Center Hotel Revenue | 5.000% | 9/1/39 | 1,000 | 1,055 |
| Baltimore MD Convention Center Hotel Revenue | 5.000% | 9/1/42 | 1,000 | 1,052 |
| Baltimore MD Special Obligation Revenue (Harbor Point Project) | 5.000% | 6/1/36 | 1,250 | 1,265 |
| Baltimore MD Special Obligation Revenue (Harbor Point Project) | 5.125% | 6/1/43 | 3,650 | 3,706 |
| Frederick County MD Educational Facilities Revenue (Mount St. Mary’s University Inc.) | 5.000% | 9/1/45 | 2,100 | 2,160 |
| Frederick County MD Special Tax Revenue (Jefferson Technology Park) | 7.125% | 7/1/43 | 4,980 | 5,275 |
| Howard County MD Retirement Community Revenue (Columbia Vantage House Corp.) | 5.000% | 4/1/21 | 470 | 482 |
| Howard County MD Retirement Community Revenue (Columbia Vantage House Corp.) | 5.000% | 4/1/26 | 1,565 | 1,631 |
| Howard County MD Retirement Community Revenue (Columbia Vantage House Corp.) | 5.000% | 4/1/36 | 1,715 | 1,731 |
| Howard County MD Retirement Community Revenue (Columbia Vantage House Corp.) | 5.000% | 4/1/36 | 1,730 | 1,746 |
| Howard County MD Retirement Community Revenue (Columbia Vantage House Corp.) | 5.000% | 4/1/44 | 1,250 | 1,246 |
| Howard County MD Retirement Community Revenue (Columbia Vantage House Corp.) | 5.000% | 4/1/46 | 7,205 | 7,162 |
| Howard County MD Special Obligation Revenue (Downtown Columbia Project) | 4.000% | 2/15/28 | 500 | 503 |
| Howard County MD Special Obligation Revenue (Downtown Columbia Project) | 4.125% | 2/15/34 | 1,000 | 975 |
| Howard County MD Special Obligation Revenue (Downtown Columbia Project) | 4.375% | 2/15/39 | 1,000 | 981 |
| Maryland Economic Development Corp. Revenue (Transportation Facilities Project) | 5.000% | 6/1/31 | 1,000 | 1,103 |
| Maryland Economic Development Corp. Revenue (Transportation Facilities Project) | 5.000% | 6/1/32 | 1,000 | 1,096 |
| Maryland Economic Development Corp. Student Housing Revenue (Towson University Project) | 5.000% | 7/1/25 | 200 | 224 |
| Maryland Economic Development Corp. Student Housing Revenue (Towson University Project) | 5.000% | 7/1/26 | 175 | 195 |
| Maryland Economic Development Corp. Student Housing Revenue (Towson University Project) | 5.000% | 7/1/27 | 145 | 162 |
| Maryland Economic Development Corp. Student Housing Revenue (Towson University Project) | 5.000% | 7/1/28 | 175 | 194 |
| Maryland Economic Development Corp. Student Housing Revenue (Towson University Project) | 5.000% | 7/1/29 | 190 | 209 |
| Maryland Economic Development Corp. Student Housing Revenue (Towson University Project) | 5.000% | 7/1/30 | 325 | 354 |
| Maryland Economic Development Corp. Student Housing Revenue (Towson University Project) | 5.000% | 7/1/31 | 375 | 405 |
| Maryland Economic Development Corp. Student Housing Revenue (Towson University Project) | 5.000% | 7/1/32 | 325 | 349 |
| Maryland Economic Development Corp. Student Housing Revenue (Towson University Project) | 5.000% | 7/1/36 | 600 | 642 |
| Maryland Health & Higher Educational Facilities Authority Revenue | | | | |
| (LifeBridge Health Obligated Group) | 5.000% | 7/1/40 | 2,035 | 2,200 |
| Maryland Health & Higher Educational Facilities Authority Revenue | | | | |
| (LifeBridge Health Obligated Group) | 5.000% | 7/1/47 | 15,000 | 16,151 |
344
High-Yield Tax-Exempt Fund
| | | | |
| Face | Market |
| Maturity | Amount | Value• |
| Coupon | Date | ($000) | ($000) |
| Maryland Health & Higher Educational Facilities Authority Revenue | | | | |
| (Maryland Institute College of Art) | 4.000% | 6/1/42 | 2,500 | 2,379 |
| Maryland Health & Higher Educational Facilities Authority Revenue (MedStar Health, Inc.) | 5.000% | 8/15/26 | 4,000 | 4,393 |
| Maryland Health & Higher Educational Facilities Authority Revenue | | | | |
| (University of Maryland Medical System) | 5.000% | 7/1/33 | 6,750 | 7,232 |
| Maryland Health & Higher Educational Facilities Authority Revenue | | | | |
| (University of Maryland Medical System) | 4.000% | 7/1/48 | 7,000 | 6,729 |
| Prince Georges County MD GO | 5.000% | 10/1/48 | 21,000 | 23,101 |
| Prince Georges County MD Revenue (Collington Episcopal Life Care Community Inc.) | 5.250% | 4/1/37 | 6,000 | 6,269 |
| Prince Georges County MD Revenue (Collington Episcopal Life Care Community Inc.) | 5.250% | 4/1/47 | 6,030 | 6,249 |
| Rockville MD Mayor & Council Economic Development Revenue (Ingleside at King Farm Project) | 5.000% | 11/1/37 | 1,250 | 1,297 |
| Rockville MD Mayor & Council Economic Development Revenue (Ingleside at King Farm Project) | 5.000% | 11/1/42 | 2,500 | 2,573 |
| Rockville MD Mayor & Council Economic Development Revenue (Ingleside at King Farm Project) | 5.000% | 11/1/47 | 2,250 | 2,307 |
| Washington MD Suburban Sanitary Commission GO | 4.000% | 6/15/47 | 10,000 | 10,058 |
| Westminster MD Revenue (Lutheran Village at Miller’s Grant) | 6.125% | 7/1/39 | 750 | 791 |
| Westminster MD Revenue (Lutheran Village at Miller’s Grant) | 6.250% | 7/1/44 | 2,000 | 2,122 |
| | | | 148,407 |
| Massachusetts (2.1%) | | | | |
| Massachusetts Development Finance Agency Revenue (Boston Medical Center) | 5.000% | 7/1/22 (Prere.) | 120 | 131 |
| Massachusetts Development Finance Agency Revenue (Boston Medical Center) | 5.000% | 7/1/22 (Prere.) | 745 | 813 |
| Massachusetts Development Finance Agency Revenue (Boston Medical Center) | 5.000% | 7/1/29 | 635 | 670 |
| Massachusetts Development Finance Agency Revenue (Boston Medical Center) | 5.000% | 7/1/31 | 1,830 | 1,981 |
| Massachusetts Development Finance Agency Revenue (Boston Medical Center) | 5.000% | 7/1/33 | 5,000 | 5,365 |
| Massachusetts Development Finance Agency Revenue (Boston Medical Center) | 5.000% | 7/1/34 | 5,000 | 5,344 |
| Massachusetts Development Finance Agency Revenue (Boston Medical Center) | 5.000% | 7/1/35 | 4,065 | 4,331 |
| Massachusetts Development Finance Agency Revenue (Boston Medical Center) | 5.000% | 7/1/36 | 2,750 | 2,921 |
| Massachusetts Development Finance Agency Revenue (Boston Medical Center) | 5.000% | 7/1/37 | 4,000 | 4,237 |
| Massachusetts Development Finance Agency Revenue (Boston University) | 4.000% | 10/1/34 | 1,000 | 1,018 |
| Massachusetts Development Finance Agency Revenue (CareGroup Inc.) | 5.000% | 7/1/43 | 15,000 | 15,944 |
| Massachusetts Development Finance Agency Revenue (CareGroup Inc.) | 5.000% | 7/1/48 | 7,500 | 7,954 |
| Massachusetts Development Finance Agency Revenue (CareGroup Inc.) | 5.000% | 7/1/53 | 2,500 | 2,643 |
| Massachusetts Development Finance Agency Revenue (Emerson College) | 5.000% | 1/1/41 | 7,000 | 7,286 |
| Massachusetts Development Finance Agency Revenue (Emerson College) | 5.000% | 1/1/47 | 13,170 | 13,798 |
| Massachusetts Development Finance Agency Revenue (Emmanuel College) | 5.000% | 10/1/43 | 2,490 | 2,609 |
| Massachusetts Development Finance Agency Revenue | | | | |
| (Lawrence General Hospital Obligated Group) | 5.000% | 7/1/26 | 950 | 1,023 |
| Massachusetts Development Finance Agency Revenue | | | | |
| (Lawrence General Hospital Obligated Group) | 5.000% | 7/1/27 | 1,000 | 1,071 |
| Massachusetts Development Finance Agency Revenue | | | | |
| (Lawrence General Hospital Obligated Group) | 5.000% | 7/1/28 | 1,050 | 1,140 |
| Massachusetts Development Finance Agency Revenue | | | | |
| (Lawrence General Hospital Obligated Group) | 5.000% | 7/1/29 | 1,100 | 1,187 |
| Massachusetts Development Finance Agency Revenue | | | | |
| (Lawrence General Hospital Obligated Group) | 5.000% | 7/1/30 | 1,150 | 1,235 |
| Massachusetts Development Finance Agency Revenue | | | | |
| (Lawrence General Hospital Obligated Group) | 5.000% | 7/1/31 | 1,200 | 1,283 |
| Massachusetts Development Finance Agency Revenue | | | | |
| (Lawrence General Hospital Obligated Group) | 5.000% | 7/1/34 | 1,175 | 1,243 |
| Massachusetts Development Finance Agency Revenue | | | | |
| (Lawrence General Hospital Obligated Group) | 5.000% | 7/1/37 | 1,825 | 1,915 |
| Massachusetts Development Finance Agency Revenue | | | | |
| (Lawrence General Hospital Obligated Group) | 5.000% | 7/1/42 | 2,295 | 2,386 |
| Massachusetts Development Finance Agency Revenue | | | | |
| (Lawrence General Hospital Obligated Group) | 5.000% | 7/1/47 | 1,500 | 1,554 |
| Massachusetts Development Finance Agency Revenue (Lowell General Hospital) | 5.000% | 7/1/44 | 7,165 | 7,417 |
| Massachusetts Development Finance Agency Revenue (Merrimack College) | 5.125% | 7/1/44 | 4,000 | 4,207 |
| Massachusetts Development Finance Agency Revenue (Milford Regional Medical Center) | 5.750% | 7/15/43 | 3,750 | 3,966 |
| Massachusetts Development Finance Agency Revenue (NewBridge Charles Inc.) | 5.000% | 10/1/47 | 2,000 | 2,046 |
| Massachusetts Development Finance Agency Revenue (NewBridge Charles Inc.) | 5.000% | 10/1/57 | 6,500 | 6,603 |
| Massachusetts Development Finance Agency Revenue (Suffolk University) | 6.250% | 7/1/19 (Prere.) | 3,195 | 3,286 |
| Massachusetts Development Finance Agency Revenue (Suffolk University) | 6.250% | 7/1/30 | 1,805 | 1,849 |
| Massachusetts Development Finance Agency Revenue (Suffolk University) | 5.000% | 7/1/32 | 3,085 | 3,363 |
| Massachusetts Development Finance Agency Revenue (Suffolk University) | 5.000% | 7/1/33 | 2,380 | 2,585 |
| Massachusetts Development Finance Agency Revenue (Tufts Medical Center) | 6.875% | 1/1/21 (Prere.) | 1,050 | 1,152 |
| Massachusetts Development Finance Agency Revenue (Tufts Medical Center) | 7.250% | 1/1/21 (Prere.) | 2,100 | 2,320 |
| Massachusetts Development Finance Agency Revenue (Tufts Medical Center) | 7.250% | 1/1/32 | 1,400 | 1,538 |
| Massachusetts Development Finance Agency Revenue (Tufts Medical Center) | 6.875% | 1/1/41 | 700 | 762 |
| Massachusetts Development Finance Agency Revenue (Western New England University) | 5.000% | 9/1/48 | 2,000 | 2,108 |
| Massachusetts Development Finance Agency Revenue (WGBH Educational Foundation) | 4.000% | 1/1/32 | 1,645 | 1,700 |
345
High-Yield Tax-Exempt Fund
| | | | |
| Face | Market |
| Maturity | Amount | Value• |
| Coupon | Date | ($000) | ($000) |
| Massachusetts Development Finance Agency Revenue (WGBH Educational Foundation) | 4.000% | 1/1/33 | 1,000 | 1,030 |
| Massachusetts Educational Financing Authority Education Loan Revenue | 5.000% | 7/1/20 | 5,000 | 5,200 |
| Massachusetts Educational Financing Authority Education Loan Revenue | 4.000% | 7/1/21 | 1,205 | 1,247 |
| Massachusetts Educational Financing Authority Education Loan Revenue | 5.000% | 7/1/21 | 5,000 | 5,300 |
| Massachusetts Educational Financing Authority Education Loan Revenue | 5.000% | 7/1/22 | 1,500 | 1,616 |
| Massachusetts Educational Financing Authority Education Loan Revenue | 5.000% | 1/1/24 | 7,000 | 7,686 |
| Massachusetts Educational Financing Authority Education Loan Revenue | 5.000% | 7/1/27 | 7,500 | 8,460 |
| Massachusetts Educational Financing Authority Education Loan Revenue | 5.000% | 7/1/28 | 2,500 | 2,829 |
| Massachusetts GO | 5.000% | 1/1/39 | 5,000 | 5,575 |
| Massachusetts GO | 4.000% | 5/1/42 | 9,900 | 9,811 |
| Massachusetts GO | 5.000% | 1/1/43 | 8,205 | 9,088 |
| Massachusetts GO | 5.000% | 11/1/44 | 7,000 | 7,736 |
| Massachusetts GO | 4.000% | 2/1/45 | 10,000 | 9,856 |
| Massachusetts GO | 4.000% | 2/1/46 | 10,000 | 9,853 |
| Massachusetts Port Authority Revenue | 5.000% | 7/1/40 | 2,000 | 2,149 |
| Massachusetts Port Authority Revenue | 5.000% | 7/1/45 | 3,500 | 3,747 |
| Massachusetts Port Authority Revenue | 4.000% | 7/1/46 | 22,060 | 21,624 |
| Massachusetts Port Authority Revenue | 5.000% | 7/1/47 | 3,110 | 3,362 |
| Massachusetts School Building Authority Dedicated Sales Tax Revenue | 5.250% | 2/15/48 | 15,000 | 16,938 |
| | | | 269,091 |
| Michigan (3.5%) | | | | |
| Chippewa Valley MI Schools GO | 5.000% | 5/1/28 | 1,535 | 1,752 |
| Chippewa Valley MI Schools GO | 5.000% | 5/1/31 | 1,000 | 1,129 |
| Detroit MI Water & Sewerage Department Sewage Disposal System Revenue | 5.250% | 7/1/39 | 4,735 | 5,012 |
| Detroit MI Water Supply System Revenue | 5.000% | 7/1/31 | 5,000 | 5,217 |
| Detroit MI Water Supply System Revenue | 5.250% | 7/1/41 | 2,045 | 2,166 |
| Genesee County MI GO | 5.250% | 2/1/40 (15) | 12,330 | 13,408 |
| Grand Rapids MI Economic Development Corp. Revenue (Beacon Hill Eastgate Project) | 5.000% | 11/1/37 | 600 | 615 |
| Grand Rapids MI Economic Development Corp. Revenue (Beacon Hill Eastgate Project) | 5.000% | 11/1/47 | 1,385 | 1,408 |
| Grand Rapids MI Economic Development Corp. Revenue (Beacon Hill Eastgate Project) | 5.000% | 11/1/52 | 1,185 | 1,200 |
| Grand Traverse County MI Hospital Finance Authority Revenue | 5.000% | 7/1/44 | 1,730 | 1,831 |
| Grand Traverse County MI Hospital Finance Authority Revenue | 5.000% | 7/1/47 | 3,550 | 3,752 |
| Great Lakes MI Water Authority Sewer Disposal System Revenue | 5.000% | 7/1/31 | 4,000 | 4,486 |
| Great Lakes MI Water Authority Sewer Disposal System Revenue | 5.000% | 7/1/36 | 5,000 | 5,434 |
| Great Lakes MI Water Authority Water Supply System Revenue | 5.000% | 7/1/31 | 6,000 | 6,664 |
| Jackson County MI Hospital Finance Authority Hospital Revenue (Allegiance Health) | 5.250% | 6/1/20 (Prere.) | 10,000 | 10,474 |
| Kalamazoo MI Hospital Financing Authority Hospital Revenue (Bronson Healthcare Group) | 5.000% | 5/15/20 (Prere.) | 5,525 | 5,755 |
| Kalamazoo MI Hospital Financing Authority Hospital Revenue (Bronson Healthcare Group) | 5.000% | 5/15/30 | 4,475 | 4,612 |
| Kalamazoo MI Hospital Financing Authority Hospital Revenue (Bronson Healthcare Group) | 4.000% | 5/15/31 | 3,040 | 3,066 |
| Kalamazoo MI Hospital Financing Authority Hospital Revenue (Bronson Healthcare Group) | 4.000% | 5/15/32 | 3,350 | 3,367 |
| Kalamazoo MI Hospital Financing Authority Hospital Revenue (Bronson Healthcare Group) | 4.000% | 5/15/33 | 4,750 | 4,762 |
| Karegnondi Water Authority Michigan Water Supply System Revenue (Karegnondi Water Pipeline) | 5.250% | 11/1/40 | 7,500 | 8,129 |
| Karegnondi Water Authority Michigan Water Supply System Revenue (Karegnondi Water Pipeline) | 5.000% | 11/1/43 | 16,110 | 17,126 |
| Lincoln MI Consolidated School District GO | 5.000% | 5/1/40 (4) | 1,250 | 1,354 |
| Livonia MI Public Schools School District GO | 5.000% | 5/1/45 (4) | 4,500 | 4,837 |
| Marquette MI Board of Light & Power Electric Utility System Revenue | 5.000% | 7/1/27 | 850 | 953 |
| Marquette MI Board of Light & Power Electric Utility System Revenue | 5.000% | 7/1/28 | 1,000 | 1,116 |
| Marquette MI Board of Light & Power Electric Utility System Revenue | 5.000% | 7/1/29 | 1,000 | 1,109 |
| Marquette MI Board of Light & Power Electric Utility System Revenue | 5.000% | 7/1/30 | 1,000 | 1,104 |
| Marquette MI Board of Light & Power Electric Utility System Revenue | 5.000% | 7/1/31 | 1,000 | 1,100 |
| Marysville MI Public Schools District GO | 5.000% | 5/1/37 | 2,135 | 2,320 |
| Michigan Building Authority Revenue | 5.000% | 4/15/34 | 11,135 | 12,324 |
| Michigan Building Authority Revenue | 5.000% 11/15/36 (4) | 6,500 | 6,978 |
| Michigan Building Authority Revenue | 5.000% | 4/15/38 | 5,000 | 5,501 |
| Michigan Building Authority Revenue | 5.000% 10/15/50 | 6,000 | 6,551 |
| Michigan Finance Authority Revenue | 4.500% | 10/1/29 | 5,000 | 5,181 |
| Michigan Finance Authority Revenue | 5.000% | 10/1/33 | 3,000 | 3,269 |
| Michigan Finance Authority Revenue | 5.000% | 10/1/34 | 3,670 | 4,015 |
| Michigan Finance Authority Revenue | 5.000% | 11/1/43 | 5,500 | 6,035 |
| Michigan Finance Authority Revenue | 4.000% | 11/1/48 | 11,000 | 10,572 |
| Michigan Finance Authority Revenue (Beaumont Health Obligated Group) | 5.000% | 8/1/33 | 5,515 | 5,978 |
| Michigan Finance Authority Revenue (Beaumont Health Obligated Group) | 5.000% | 11/1/44 | 8,630 | 9,190 |
| Michigan Finance Authority Revenue (Detroit Water & Sewer) | 5.000% | 7/1/29 | 2,500 | 2,717 |
| Michigan Finance Authority Revenue (Detroit Water & Sewer) | 5.000% | 7/1/30 | 2,805 | 3,042 |
| Michigan Finance Authority Revenue (Detroit Water & Sewer) | 5.000% | 7/1/32 (4) | 4,400 | 4,795 |
| Michigan Finance Authority Revenue (Detroit Water & Sewer) | 5.000% | 7/1/33 | 2,000 | 2,150 |
| Michigan Finance Authority Revenue (Detroit Water & Sewer) | 5.000% | 7/1/34 | 1,500 | 1,611 |
| Michigan Finance Authority Revenue (Detroit Water & Sewer) | 5.000% | 7/1/34 | 5,500 | 5,922 |
| Michigan Finance Authority Revenue (Detroit Water & Sewer) | 5.000% | 7/1/35 | 4,500 | 4,826 |
346
High-Yield Tax-Exempt Fund
| | | | |
| Face | Market |
| Maturity | Amount | Value• |
| Coupon | Date | ($000) | ($000) |
| Michigan Finance Authority Revenue (Detroit Water & Sewer) | 5.000% | 7/1/44 | 17,830 | 18,848 |
| Michigan Finance Authority Revenue (Detroit Water & Sewer) | 5.000% | 7/1/44 | 7,510 | 7,870 |
| Michigan Finance Authority Revenue (Henry Ford Health System Obligated Group) | 5.000% | 11/15/41 | 10,000 | 10,731 |
| Michigan Finance Authority Revenue (Kalamazoo College Project) | 5.000% | 12/1/43 | 6,390 | 6,971 |
| Michigan Finance Authority Revenue (Lawrence Technological University Project) | 5.000% | 2/1/47 | 4,000 | 4,147 |
| Michigan Finance Authority Revenue (McLaren Health Care Corp.) | 5.000% | 5/15/32 | 2,340 | 2,565 |
| Michigan Finance Authority Revenue (McLaren Health Care Corp.) | 5.000% | 5/15/32 | 4,670 | 5,119 |
| Michigan Finance Authority Revenue (McLaren Health Care Corp.) | 5.000% | 5/15/33 | 4,025 | 4,395 |
| Michigan Finance Authority Revenue (McLaren Health Care Corp.) | 5.000% | 5/15/34 | 2,200 | 2,394 |
| Michigan Finance Authority Revenue (McLaren Health Care Corp.) | 5.000% | 5/15/35 | 2,515 | 2,726 |
| Michigan Finance Authority Revenue (MidMichigan Obligated Group) | 5.000% | 6/1/33 | 2,750 | 2,991 |
| Michigan Finance Authority Revenue (MidMichigan Obligated Group) | 5.000% | 6/1/34 | 3,025 | 3,284 |
| Michigan Finance Authority Revenue (Sparrow Obligated Group) | 5.000% | 11/15/27 | 3,540 | 3,953 |
| Michigan Finance Authority Revenue (Sparrow Obligated Group) | 5.000% | 11/15/28 | 2,020 | 2,246 |
| Michigan Finance Authority Revenue (Sparrow Obligated Group) | 5.000% | 11/15/36 | 2,510 | 2,684 |
| Michigan Finance Authority Revenue (Trinity Health Credit Group) | 4.000% | 12/1/36 | 2,345 | 2,350 |
| Michigan Finance Authority Revenue (Trinity Health Credit Group) | 4.000% | 12/1/40 | 4,750 | 4,681 |
| Michigan Finance Authority Revenue (Trinity Health Credit Group) | 5.000% | 12/1/42 | 1,875 | 2,039 |
| Michigan Finance Authority Revenue (Trinity Health Credit Group) | 5.000% | 12/1/45 | 10,000 | 10,716 |
| Michigan Hospital Finance Authority Revenue (McLaren Health Care) | 5.000% | 6/1/35 | 2,115 | 2,252 |
| Michigan Hospital Finance Authority Revenue (MidMichigan Obligated Group) | 6.125% | 6/1/19 (Prere.) | 4,315 | 4,419 |
| Michigan Strategic Fund Fac. Rev. (Waste Management Inc.) PUT | 2.850% | 8/2/21 | 3,800 | 3,784 |
| Michigan Tobacco Settlement Financing Authority Revenue | 5.250% | 6/1/22 | 3,410 | 3,395 |
| Michigan Tobacco Settlement Financing Authority Revenue | 6.875% | 6/1/42 | 21,330 | 21,375 |
| Oakland University MI Revenue | 5.000% | 3/1/41 | 5,000 | 5,394 |
| Oakland University MI Revenue | 5.000% | 3/1/47 | 9,000 | 9,667 |
| Rockford MI Public Schools GO | 5.000% | 5/1/37 | 1,240 | 1,352 |
| Rockford MI Public Schools GO | 5.000% | 5/1/38 | 1,025 | 1,114 |
| Rockford MI Public Schools GO | 5.000% | 5/1/39 | 1,025 | 1,112 |
| Rockford MI Public Schools GO | 5.000% | 5/1/40 | 1,025 | 1,110 |
| Rockford MI Public Schools GO | 5.000% | 5/1/41 | 1,025 | 1,110 |
| Rockford MI Public Schools GO | 5.000% | 5/1/44 | 2,250 | 2,431 |
| Romeo MI Community School District GO | 5.000% | 5/1/37 | 1,825 | 1,989 |
| Romeo MI Community School District GO | 5.000% | 5/1/41 | 2,000 | 2,165 |
| Royal Oak MI Hospital Finance Authority Hospital Revenue (William Beaumont Hospital) | 6.000% | 8/1/19 (Prere.) | 7,000 | 7,203 |
| Saginaw MI Hospital Finance Authority Hospital Revenue (Covenant Medical Center Inc.) | 5.000% | 7/1/30 | 10,000 | 10,376 |
| Wayne County MI Airport Authority Revenue | 5.000% | 12/1/28 | 1,905 | 2,124 |
| Wayne County MI Airport Authority Revenue | 5.000% | 12/1/29 | 1,980 | 2,191 |
| Wayne County MI Airport Authority Revenue | 5.000% | 12/1/30 | 1,800 | 1,981 |
| Wayne County MI Airport Authority Revenue | 5.000% | 12/1/31 | 2,455 | 2,689 |
| Wayne County MI Airport Authority Revenue | 5.000% | 12/1/32 | 2,160 | 2,359 |
| Wayne County MI Airport Authority Revenue | 5.000% | 12/1/34 | 5,000 | 5,421 |
| Wayne County MI Airport Authority Revenue | 5.000% | 12/1/38 | 4,000 | 4,311 |
| Wayne County MI Airport Authority Revenue | 5.000% | 12/1/42 | 2,800 | 2,996 |
| Wayne County MI Airport Authority Revenue (Detroit Metropolitan Wayne County Airport) | 5.000% | 12/1/28 | 6,125 | 6,604 |
| Wayne County MI Airport Authority Revenue (Detroit Metropolitan Wayne County Airport) | 5.000% | 12/1/32 | 2,065 | 2,205 |
| Wayne County MI Airport Authority Revenue (Detroit Metropolitan Wayne County Airport) | 5.000% | 12/1/37 | 2,000 | 2,117 |
| Wayne County MI Airport Authority Revenue (Detroit Metropolitan Wayne County Airport) | 5.000% | 12/1/39 | 1,700 | 1,827 |
| Wayne County MI Airport Authority Revenue (Detroit Metropolitan Wayne County Airport) | 5.000% | 12/1/44 | 2,000 | 2,144 |
| | | | 445,842 |
| Minnesota (0.6%) | | | | |
| Anoka MN Healthcare & Housing Facilities Revenue (Homestead at Anoka Inc.) | 5.375% | 11/1/34 | 1,135 | 1,182 |
| Anoka MN Healthcare & Housing Facilities Revenue (Homestead at Anoka Inc.) | 5.125% | 11/1/49 | 4,050 | 4,091 |
| Anoka MN Housing Revenue (Homestead at Anoka Inc.) | 5.000% | 11/1/46 | 1,500 | 1,516 |
| Anoka MN Housing Revenue (Homestead at Anoka Inc.) | 5.500% | 11/1/46 | 2,000 | 2,109 |
| 6 Duluth MN Economic Development Authority Revenue (Essentia Health) | 4.250% | 2/15/43 | 5,000 | 4,838 |
| 6 Duluth MN Economic Development Authority Revenue (Essentia Health) | 4.250% | 2/15/48 | 5,000 | 4,774 |
| 6 Duluth MN Economic Development Authority Revenue (Essentia Health) | 5.000% | 2/15/58 | 6,250 | 6,446 |
| Maple Grove MN Health Care Facilities Revenue (Maple Grove Hospital Corp.) | 5.000% | 5/1/28 | 1,000 | 1,123 |
| Maple Grove MN Health Care Facilities Revenue (Maple Grove Hospital Corp.) | 5.000% | 5/1/29 | 1,000 | 1,116 |
| Maple Grove MN Health Care Facilities Revenue (Maple Grove Hospital Corp.) | 5.000% | 5/1/30 | 850 | 942 |
| Maple Grove MN Health Care Facilities Revenue (Maple Grove Hospital Corp.) | 5.000% | 5/1/31 | 500 | 551 |
| Maple Grove MN Health Care Facilities Revenue (Maple Grove Hospital Corp.) | 5.000% | 5/1/32 | 500 | 548 |
| Minneapolis & St. Paul MN Metropolitan Airports Commission Revenue | 5.000% | 1/1/31 | 200 | 221 |
| Minneapolis & St. Paul MN Metropolitan Airports Commission Revenue | 5.000% | 1/1/32 | 225 | 248 |
| Minneapolis & St. Paul MN Metropolitan Airports Commission Revenue | 5.000% | 1/1/33 | 225 | 247 |
| Minneapolis & St. Paul MN Metropolitan Airports Commission Revenue | 5.000% | 1/1/34 | 250 | 274 |
| Minneapolis & St. Paul MN Metropolitan Airports Commission Revenue | 5.000% | 1/1/35 | 230 | 251 |
| Minneapolis & St. Paul MN Metropolitan Airports Commission Revenue | 5.000% | 1/1/36 | 250 | 272 |
347
High-Yield Tax-Exempt Fund
| | | | |
| Face | Market |
| Maturity | Amount | Value• |
| Coupon | Date | ($000) | ($000) |
| Minneapolis & St. Paul MN Metropolitan Airports Commission Revenue | 5.000% | 1/1/37 | 300 | 326 |
| Minneapolis & St. Paul MN Metropolitan Airports Commission Revenue | 5.000% | 1/1/41 | 750 | 809 |
| Minneapolis MN Health Care System Revenue (Fairview Health Services) | 6.750% | 11/15/18 (Prere.) | 8,250 | 8,265 |
| Minnesota Higher Education Facilities Authority Revenue (Augsburg College) | 5.000% | 5/1/46 | 3,000 | 3,112 |
| Minnesota Higher Education Facilities Authority Revenue (Hamline University) | 5.000% | 10/1/36 | 1,175 | 1,249 |
| Minnesota Higher Education Facilities Authority Revenue (Hamline University) | 5.000% | 10/1/38 | 850 | 899 |
| Minnesota Higher Education Facilities Authority Revenue (Hamline University) | 5.000% | 10/1/39 | 1,000 | 1,057 |
| Minnesota Higher Education Facilities Authority Revenue (Hamline University) | 5.000% | 10/1/40 | 625 | 660 |
| Minnesota Higher Education Facilities Authority Revenue (Hamline University) | 5.000% | 10/1/47 | 2,000 | 2,100 |
| Minnesota Housing Finance Agency Residential Housing Revenue | 4.000% | 7/1/40 | 210 | 213 |
| Minnesota Municipal Power Agency Revenue | 5.000% | 10/1/33 | 1,380 | 1,541 |
| Minnesota Municipal Power Agency Revenue | 5.000% | 10/1/36 | 880 | 974 |
| Rochester MN Health Care & Housing Facility Revenue (Homestead At Rochester, Inc. Project) | 6.875% | 12/1/48 | 10,000 | 11,115 |
| Rochester MN Health Care & Housing Facility Revenue (Samaritan Bethany Inc. Project) | 5.000% | 8/1/37 | 1,000 | 1,020 |
| Rochester MN Health Care & Housing Facility Revenue (Samaritan Bethany Inc. Project) | 5.000% | 8/1/48 | 3,910 | 3,936 |
| St. Francis MN Independent School District No. 15 GO | 4.000% | 2/1/33 | 410 | 419 |
| St. Francis MN Independent School District No. 15 GO | 4.000% | 2/1/34 | 325 | 331 |
| St. Francis MN Independent School District No. 15 GO | 4.000% | 2/1/35 | 575 | 585 |
| St. Francis MN Independent School District No. 15 GO | 4.000% | 2/1/36 | 750 | 761 |
| St. Francis MN Independent School District No. 15 GO | 4.000% | 2/1/37 | 400 | 405 |
| St. Paul MN Housing & Redevelopment Authority Charter School Lease Revenue | | | | |
| (Metro Deaf School) | 5.000% | 6/15/38 | 700 | 690 |
| St. Paul MN Housing & Redevelopment Authority Charter School Lease Revenue | | | | |
| (Metro Deaf School) | 5.000% | 6/15/48 | 1,285 | 1,233 |
| St. Paul MN Housing & Redevelopment Authority Charter School Lease Revenue | | | | |
| (Metro Deaf School) | 5.000% | 6/15/53 | 1,615 | 1,517 |
| West St. Paul MN Housing & Health Care Facilities Revenue | | | | |
| (Walker Westwood Ridge Obligated Group) | 5.000% | 11/1/37 | 500 | 508 |
| West St. Paul MN Housing & Health Care Facilities Revenue | | | | |
| (Walker Westwood Ridge Obligated Group) | 5.000% | 11/1/49 | 1,500 | 1,512 |
| | | | 75,986 |
| Mississippi (0.3%) | | | | |
| Gulfport MS Hospital Facilities Revenue (Memorial Hospital at Gulfport Project) | 5.000% | 7/1/29 | 4,165 | 4,466 |
| Gulfport MS Hospital Facilities Revenue (Memorial Hospital at Gulfport Project) | 5.000% | 7/1/30 | 2,450 | 2,615 |
| Gulfport MS Hospital Facilities Revenue (Memorial Hospital at Gulfport Project) | 5.000% | 7/1/31 | 2,000 | 2,127 |
| Mississippi Hospital Equipment & Facilities Authority Revenue (Baptist Health System) | 5.000% | 9/1/46 | 17,500 | 18,188 |
| Warren County MS Gulf Opportunity Zone Revenue (International Paper Co. Projects) | 5.375% | 12/1/35 | 5,500 | 5,945 |
| | | | 33,341 |
| Missouri (1.3%) | | | | |
| Cape Girardeau County MO Industrial Development Authority of the Health Facilities Revenue | | | | |
| (Southeast Health) | 5.000% | 3/1/36 | 2,690 | 2,826 |
| Cape Girardeau County MO Industrial Development Authority of the Health Facilities Revenue | | | | |
| (St. Francis Medical Center) | 5.000% | 6/1/33 | 10,000 | 10,552 |
| Conley Road Transportation Development District Missouri Transportation Sales Tax Revenue | 4.250% | 5/1/33 | 4,285 | 4,212 |
| Joplin MO Industrial Development Authority Health Facilities Revenue (Freeman Health System) | 5.000% | 2/15/29 | 1,105 | 1,192 |
| Kansas City MO Sanitary Sewer System Revenue | 4.000% | 1/1/42 | 4,250 | 4,286 |
| Kirkwood MO Industrial Development Authority Retirement Community Revenue | | | | |
| (Aberdeen Heights Project) | 8.250% | 5/15/20 (Prere.) | 5,000 | 5,444 |
| Kirkwood MO Industrial Development Authority Retirement Community Revenue | | | | |
| (Aberdeen Heights Project) | 8.250% | 5/15/20 (Prere.) | 5,000 | 5,444 |
| Lee’s Summit MO Senior Living Facilities Revenue (John Knox Village) | 5.000% | 8/15/32 | 5,000 | 5,116 |
| Lee’s Summit MO Senior Living Facilities Revenue (John Knox Village) | 5.000% | 8/15/42 | 5,000 | 4,891 |
| Lee’s Summit MO TAN | 4.000% | 11/1/27 | 1,850 | 1,774 |
| Metropolitan St. Louis MO Sewer District Wastewater System Revenue | 5.000% | 5/1/42 | 3,500 | 3,910 |
| Metropolitan St. Louis MO Sewer District Wastewater System Revenue | 5.000% | 5/1/47 | 4,000 | 4,450 |
| Missouri Health & Educational Facilities Authority Educational Facilities Revenue | | | | |
| (St. Louis College of Pharmacy Project) | 5.000% | 5/1/40 | 1,410 | 1,461 |
| Missouri Health & Educational Facilities Authority Educational Facilities Revenue | | | | |
| (St. Louis College of Pharmacy Project) | 5.500% | 5/1/43 | 8,500 | 8,934 |
| Missouri Health & Educational Facilities Authority Educational Facilities Revenue | | | | |
| (St. Louis College of Pharmacy Project) | 5.000% | 5/1/45 | 2,000 | 2,067 |
| Missouri Health & Educational Facilities Authority Health Facilities Revenue (Cox Health) | 5.500% | 11/15/18 (Prere.) | 5,200 | 5,207 |
| Missouri Health & Educational Facilities Authority Health Facilities Revenue (Cox Health) | 5.500% | 11/15/33 | 1,300 | 1,303 |
| Missouri Health & Educational Facilities Authority Health Facilities Revenue (Cox Health) | 5.000% | 11/15/48 | 2,475 | 2,598 |
| Missouri Health & Educational Facilities Authority Health Facilities Revenue | | | | |
| (St. Luke’s Health System) | 4.000% | 11/15/48 | 5,000 | 4,864 |
| Missouri Health & Educational Facilities Authority Revenue | | | | |
| (Lutheran Senior Services Obligated Group) | 5.000% | 2/1/35 | 1,065 | 1,125 |
348
High-Yield Tax-Exempt Fund
| | | | | |
| Face | Market |
| Maturity | Amount | Value• |
| | Coupon | Date | ($000) | ($000) |
| Missouri Health & Educational Facilities Authority Revenue | | | | |
| | (Lutheran Senior Services Obligated Group) | 5.000% | 2/1/46 | 4,000 | 4,185 |
| Missouri Health & Educational Facilities Authority Revenue (Mercy Health) | 5.000% | 11/15/45 | 5,000 | 5,354 |
| Missouri Health & Educational Facilities Authority Revenue (Mercy Health) | 4.000% | 5/15/48 | 12,500 | 12,079 |
| Missouri Joint Municipal Electric Utility Commission Power Project Revenue | 4.000% | 12/1/32 | 9,000 | 9,279 |
| Missouri Joint Municipal Electric Utility Commission Power Project Revenue | 4.000% | 12/1/33 | 17,450 | 17,956 |
| Missouri Joint Municipal Electric Utility Commission Power Project Revenue (Prairie Project) | 5.000% | 12/1/27 | 1,770 | 1,981 |
| Missouri Joint Municipal Electric Utility Commission Power Project Revenue (Prairie Project) | 5.000% | 6/1/28 | 2,715 | 3,034 |
| St. Louis County MO Industrial Development Authority Revenue | | | | |
| | (Ballpark Village Development Project) | 3.875% | 11/15/29 | 1,405 | 1,398 |
| St. Louis County MO Industrial Development Authority Revenue | | | | |
| | (Ballpark Village Development Project) | 4.375% | 11/15/35 | 5,500 | 5,520 |
| St. Louis County MO Industrial Development Authority Revenue | | | | |
| | (Ranken-Jordan Pediatric Specialty Hospital) | 4.000% | 11/15/36 | 1,400 | 1,250 |
| St. Louis County MO Industrial Development Authority Revenue | | | | |
| | (Ranken-Jordan Pediatric Specialty Hospital) | 5.000% | 11/15/41 | 1,000 | 1,005 |
| St. Louis County MO Industrial Development Authority Revenue | | | | |
| | (Ranken-Jordan Pediatric Specialty Hospital) | 5.000% | 11/15/46 | 1,750 | 1,752 |
| St. Louis County MO Industrial Development Authority Revenue | | | | |
| | (St. Louis Innovation District Project) | 4.375% | 5/15/36 | 3,000 | 2,881 |
| St. Louis County MO Industrial Development Authority Senior Living Facilities Revenue | | | | |
| | (Friendship Village Obligated Group) | 5.000% | 9/1/48 | 3,000 | 3,008 |
| St. Louis County MO Industrial Development Authority Senior Living Facilities Revenue | | | | |
| | (St. Andrew’s Resources for Seniors Obligated Group) | 5.000% | 12/1/35 | 2,000 | 2,053 |
| St. Louis County MO Industrial Development Authority Senior Living Facilities Revenue | | | | |
| | (St. Andrew’s Resources for Seniors Obligated Group) | 5.125% | 12/1/45 | 4,250 | 4,363 |
| St. Louis MO Airport Revenue (Lambert-St. Louis International Airport) | 5.000% | 7/1/31 (4) | 1,450 | 1,605 |
| St. Louis MO Airport Revenue (Lambert-St. Louis International Airport) | 5.000% | 7/1/32 (4) | 1,570 | 1,731 |
| St. Louis MO Airport Revenue (Lambert-St. Louis International Airport) | 5.000% | 7/1/33 (4) | 1,000 | 1,100 |
| St. Louis MO Airport Revenue (Lambert-St. Louis International Airport) | 5.000% | 7/1/35 (4) | 1,000 | 1,093 |
| St. Louis MO Airport Revenue (Lambert-St. Louis International Airport) | 5.000% | 7/1/36 (4) | 1,000 | 1,090 |
| St. Louis MO Airport Revenue (Lambert-St. Louis International Airport) | 5.000% | 7/1/37 (4) | 1,000 | 1,088 |
| | | | | 166,461 |
| Nebraska (0.3%) | | | | |
| Central Plains Energy Project Nebraska Gas Project Revenue (Project No. 3) | 5.000% | 9/1/32 | 2,500 | 2,686 |
| Central Plains Energy Project Nebraska Gas Project Revenue (Project No. 3) | 5.000% | 9/1/36 | 2,500 | 2,803 |
| Central Plains Energy Project Nebraska Gas Project Revenue (Project No. 3) | 5.000% | 9/1/37 | 3,000 | 3,343 |
| Central Plains Energy Project Nebraska Gas Project Revenue (Project No. 3) | 5.000% | 9/1/42 | 14,420 | 15,494 |
| Douglas County NE Hospital Authority No. 2 Health Facilities Revenue | | | | |
| | (Children’s Hospital Obligated Group) | 5.000% | 11/15/47 | 4,000 | 4,284 |
| Municipal Energy Agency of Nebraska Power Supply System Revenue | 4.000% | 4/1/32 | 2,010 | 2,040 |
| Municipal Energy Agency of Nebraska Power Supply System Revenue | 4.000% | 4/1/33 | 1,785 | 1,802 |
| Omaha NE Public Power District Electric Revenue | 5.000% | 2/1/41 | 3,680 | 3,974 |
| Scotts Bluff County NE Hospital Authority Revenue (Regional West Medical Center) | 5.250% | 2/1/37 | 6,500 | 6,661 |
| | | | | 43,087 |
| Nevada (0.1%) | | | | |
| Carson City NV Hospital Revenue (Carson Tahoe Regional Medical Center) | 5.000% | 9/1/33 | 9,500 | 9,985 |
| Las Vegas NV Convention & Visitors Authority Revenue | 5.000% | 7/1/28 | 2,000 | 2,266 |
| Las Vegas NV Convention & Visitors Authority Revenue | 5.000% | 7/1/29 | 2,000 | 2,247 |
| Reno NV Sales Tax Revenue (Reno Transportation Rail Access) | 0.000% | 7/1/58 | 30,000 | 3,075 |
| | | | | 17,573 |
| New Hampshire (0.3%) | | | | |
| 11 | National Finance Authority Solid Waste Disposal Refunding Revenue PUT | | | | |
| | (Waste Management, Inc. Project) | 2.350% | 10/1/21 | 7,250 | 7,250 |
| New Hampshire Health & Education Facilities Authority Revenue (Elliott Hospital Obligated Group) | 5.000% | 10/1/38 | 4,000 | 4,214 |
| New Hampshire Health & Education Facilities Authority Revenue (Hillside Village Entrance Fee) | 3.500% | 7/1/22 | 2,200 | 2,200 |
| New Hampshire Health & Education Facilities Authority Revenue | | | | |
| | (Southern New Hampshire University) | 5.000% | 1/1/34 | 1,375 | 1,457 |
| New Hampshire Health & Education Facilities Authority Revenue | | | | |
| | (Southern New Hampshire University) | 5.000% | 1/1/42 | 3,750 | 4,012 |
| New Hampshire Health & Education Facilities Authority Revenue | | | | |
| | (Southern New Hampshire University) | 5.000% | 1/1/42 | 4,450 | 4,689 |
| New Hampshire Health & Education Facilities Authority Revenue | | | | |
| | (Southern New Hampshire University) | 5.000% | 1/1/47 | 7,870 | 8,400 |
| New Hampshire Health & Education Facilities Authority Revenue (Wentworth Douglas Hospital) | 7.000% | 1/1/21 (Prere.) | 7,000 | 7,687 |
| | | | | 39,909 |
349
High-Yield Tax-Exempt Fund
| | | | |
| Face | Market |
| Maturity | Amount | Value• |
| Coupon | Date | ($000) | ($000) |
| New Jersey (6.6%) | | | | |
| Atlantic City NJ GO | 4.000% | 11/1/24 (4) | 4,805 | 4,957 |
| Atlantic City NJ GO | 4.000% | 11/1/25 (4) | 2,405 | 2,466 |
| Camden County NJ Improvement Authority Health Care Redevelopment Project Revenue | | | | |
| (Cooper Health System Obligated Group) | 5.750% | 2/15/42 | 5,000 | 5,335 |
| Camden County NJ Improvement Authority Lease Revenue | | | | |
| (Rowan University School of Osteopathic Medicine Project) | 5.000% | 12/1/25 | 1,195 | 1,316 |
| Gloucester County NJ Improvement Authority Revenue (Rowan University) | 5.000% | 11/1/27 (4) | 1,225 | 1,389 |
| Gloucester County NJ Pollution Control Financing Authority Revenue (Logan Project) | 5.000% | 12/1/24 | 12,875 | 13,613 |
| New Jersey Casino Reinvestment Development Authority Revenue (Hotel Room Fee) | 5.250% | 1/1/23 (2) | 1,450 | 1,454 |
| New Jersey COP | 5.250% | 6/15/19 (Prere.) | 5,000 | 5,102 |
| New Jersey Economic Development Authority Revenue | 5.000% | 6/15/23 | 10,000 | 10,798 |
| New Jersey Economic Development Authority Revenue | 5.000% | 6/15/30 | 2,940 | 3,133 |
| New Jersey Economic Development Authority Revenue | 5.500% | 6/15/30 | 3,000 | 3,307 |
| New Jersey Economic Development Authority Revenue | 5.000% | 6/15/31 | 5,000 | 5,309 |
| New Jersey Economic Development Authority Revenue | 5.500% | 6/15/31 | 6,700 | 7,356 |
| New Jersey Economic Development Authority Revenue | 5.000% | 6/15/32 | 4,000 | 4,232 |
| New Jersey Economic Development Authority Revenue | 5.250% | 6/15/40 | 2,500 | 2,633 |
| New Jersey Economic Development Authority Revenue | 5.000% | 6/15/42 | 3,000 | 3,097 |
| New Jersey Economic Development Authority Revenue (Bancroft Neuro Health Project) | 5.000% | 6/1/36 | 3,800 | 3,874 |
| New Jersey Economic Development Authority Revenue (Goethals Bridge Replacement Project) | 5.375% | 1/1/43 | 3,250 | 3,477 |
| New Jersey Economic Development Authority Revenue (Motor Vehicle Surcharges) | 5.250% | 7/1/24 (14) | 18,055 | 19,928 |
| New Jersey Economic Development Authority Revenue (Motor Vehicle Surcharges) | 5.000% | 7/1/33 | 2,000 | 2,109 |
| New Jersey Economic Development Authority Revenue (School Facilities Construction) | 5.250% | 9/1/19 (Prere.) | 10,200 | 10,465 |
| New Jersey Economic Development Authority Revenue (School Facilities Construction) | 5.500% | 3/1/21 (Prere.) | 2,055 | 2,205 |
| New Jersey Economic Development Authority Revenue (School Facilities Construction) | 5.000% | 9/1/21 | 6,745 | 7,060 |
| New Jersey Economic Development Authority Revenue (School Facilities Construction) | 5.500% | 9/1/21 | 755 | 799 |
| New Jersey Economic Development Authority Revenue (School Facilities Construction) | 5.250% | 12/15/21 (14) | 4,500 | 4,834 |
| New Jersey Economic Development Authority Revenue (School Facilities Construction) | 5.000% | 3/1/22 | 8,325 | 8,830 |
| New Jersey Economic Development Authority Revenue (School Facilities Construction) | 5.000% | 3/1/22 | 4,750 | 5,038 |
| New Jersey Economic Development Authority Revenue (School Facilities Construction) | 5.750% | 9/1/23 | 700 | 743 |
| New Jersey Economic Development Authority Revenue (School Facilities Construction) | 5.500% | 9/1/24 (2) | 6,300 | 7,061 |
| New Jersey Economic Development Authority Revenue (School Facilities Construction) | 5.000% | 3/1/27 | 1,650 | 1,729 |
| New Jersey Economic Development Authority Revenue (School Facilities Construction) | 5.250% | 9/1/27 | 2,385 | 2,490 |
| New Jersey Economic Development Authority Revenue (School Facilities Construction) | 5.000% | 3/1/32 | 3,000 | 3,119 |
| New Jersey Economic Development Authority Revenue (School Facilities Construction) | 5.000% | 6/15/40 | 19,485 | 20,041 |
| New Jersey Economic Development Authority Revenue | | | | |
| (State Capitol Joint Management Commission) | 4.500% | 6/15/40 | 1,870 | 1,837 |
| New Jersey Economic Development Authority Revenue | | | | |
| (State Capitol Joint Management Commission) | 5.000% | 6/15/43 | 8,955 | 9,278 |
| New Jersey Economic Development Authority Revenue (West Campus Housing LLC) | 5.000% | 7/1/35 | 1,150 | 1,174 |
| New Jersey Economic Development Authority Revenue (West Campus Housing LLC) | 4.500% | 7/1/41 | 2,750 | 2,582 |
| New Jersey Economic Development Authority Revenue | | | | |
| (Provident Group-Montclair Properties LLC - Montclair State University Student Housing Project) | 5.750% | 6/1/20 (Prere.) | 4,000 | 4,227 |
| New Jersey Economic Development Authority Special Facility Revenue (Port Newark Container) | 5.000% | 10/1/37 | 10,000 | 10,453 |
| New Jersey Economic Development Authority Special Facility Revenue (Port Newark Container) | 5.000% | 10/1/47 | 10,000 | 10,363 |
| New Jersey Economic Development Authority Special Facility Revenue | | | | |
| (Continental Airlines Inc. Project) | 5.125% | 9/15/23 | 12,730 | 13,571 |
| New Jersey Economic Development Authority Special Facility Revenue | | | | |
| (Continental Airlines Inc. Project) | 5.250% | 9/15/29 | 9,750 | 10,448 |
| New Jersey Educational Facilities Authority Revenue (College of St. Elizabeth) | 5.000% | 7/1/46 | 4,000 | 3,788 |
| New Jersey Educational Facilities Authority Revenue (Stockton University) | 5.000% | 7/1/32 | 3,000 | 3,233 |
| New Jersey Educational Facilities Authority Revenue (Stockton University) | 5.000% | 7/1/33 | 3,000 | 3,223 |
| New Jersey Educational Facilities Authority Revenue (University Medical & Dentistry) | 7.500% | 6/1/19 (Prere.) | 6,500 | 6,708 |
| New Jersey Health Care Facilities Financing Authority Lease Revenue | | | | |
| (Marlboro Psychiatric Hospital Project) | 5.000% | 9/15/29 | 5,000 | 5,282 |
| New Jersey Health Care Facilities Financing Authority Revenue | | | | |
| (Hackensack University Medical Center) | 5.000% | 7/1/27 | 6,715 | 7,772 |
| New Jersey Health Care Facilities Financing Authority Revenue | | | | |
| (Hackensack University Medical Center) | 5.000% | 7/1/32 | 2,370 | 2,675 |
| New Jersey Health Care Facilities Financing Authority Revenue | | | | |
| (Hackensack University Medical Center) | 5.000% | 7/1/33 | 3,315 | 3,729 |
| New Jersey Health Care Facilities Financing Authority Revenue | | | | |
| (Hackensack University Medical Center) | 5.000% | 7/1/35 | 2,925 | 3,269 |
| New Jersey Health Care Facilities Financing Authority Revenue | | | | |
| (Hackensack University Medical Center) | 5.000% | 7/1/38 | 7,720 | 8,554 |
| New Jersey Health Care Facilities Financing Authority Revenue | | | | |
| (Hackensack University Medical Center) | 5.000% | 7/1/39 | 3,000 | 3,317 |
| New Jersey Health Care Facilities Financing Authority Revenue | | | | |
| (Hackensack University Medical Center) | 5.000% | 7/1/57 | 2,000 | 2,153 |
350
High-Yield Tax-Exempt Fund
| | | | |
| Face | Market |
| Maturity | Amount | Value• |
| Coupon | Date | ($000) | ($000) |
| New Jersey Health Care Facilities Financing Authority Revenue | | | | |
| (Hackensack University Medical Center) | 5.250% | 7/1/57 | 2,250 | 2,480 |
| New Jersey Health Care Facilities Financing Authority Revenue (St. Joseph’s Healthcare System) | 4.000% | 7/1/48 | 13,540 | 12,272 |
| New Jersey Health Care Facilities Financing Authority Revenue (University Hospital) | 4.125% | 7/1/38 (4) | 8,000 | 7,920 |
| New Jersey Health Care Facilities Financing Authority Revenue (Virtua Health) | 5.750% | 7/1/33 | 6,700 | 6,866 |
| New Jersey Higher Education Assistance Authority Student Loan Revenue | 5.000% | 12/1/20 | 205 | 214 |
| New Jersey Higher Education Assistance Authority Student Loan Revenue | 5.000% | 12/1/20 | 5,000 | 5,229 |
| New Jersey Higher Education Assistance Authority Student Loan Revenue | 5.000% | 12/1/21 | 5,000 | 5,315 |
| New Jersey Higher Education Assistance Authority Student Loan Revenue | 5.000% | 12/1/21 | 2,835 | 3,014 |
| New Jersey Higher Education Assistance Authority Student Loan Revenue | 5.000% | 12/1/22 | 2,500 | 2,691 |
| New Jersey Higher Education Assistance Authority Student Loan Revenue | 5.000% | 12/1/22 | 1,900 | 2,045 |
| New Jersey Higher Education Assistance Authority Student Loan Revenue | 5.000% | 12/1/23 | 4,150 | 4,514 |
| New Jersey Higher Education Assistance Authority Student Loan Revenue | 5.000% | 12/1/24 | 3,750 | 4,116 |
| New Jersey Higher Education Assistance Authority Student Loan Revenue | 5.000% | 12/1/25 | 3,380 | 3,736 |
| New Jersey Higher Education Assistance Authority Student Loan Revenue | 5.000% | 12/1/26 | 2,300 | 2,555 |
| New Jersey Higher Education Assistance Authority Student Loan Revenue | 5.000% | 12/1/27 | 2,870 | 3,198 |
| New Jersey Higher Education Assistance Authority Student Loan Revenue | 5.000% | 12/1/27 | 2,600 | 2,869 |
| New Jersey Higher Education Assistance Authority Student Loan Revenue | 3.250% | 12/1/28 | 4,500 | 4,353 |
| New Jersey Higher Education Assistance Authority Student Loan Revenue | 5.000% | 12/1/28 | 1,405 | 1,560 |
| New Jersey Higher Education Assistance Authority Student Loan Revenue | 5.750% | 12/1/28 | 1,135 | 1,194 |
| New Jersey Higher Education Assistance Authority Student Loan Revenue | 3.250% | 12/1/29 | 5,000 | 4,801 |
| New Jersey Higher Education Assistance Authority Student Loan Revenue | 3.500% | 12/1/29 | 6,170 | 6,156 |
| New Jersey Higher Education Assistance Authority Student Loan Revenue | 3.250% | 12/1/30 | 5,500 | 5,148 |
| New Jersey Higher Education Assistance Authority Student Loan Revenue | 3.500% | 12/1/31 | 9,500 | 8,983 |
| New Jersey Transportation Trust Fund Authority Federal Highway Reimbursement Revenue | 5.000% | 6/15/27 | 7,910 | 8,736 |
| New Jersey Transportation Trust Fund Authority Federal Highway Reimbursement Revenue | 5.000% | 6/15/28 | 10,550 | 11,585 |
| New Jersey Transportation Trust Fund Authority Federal Highway Reimbursement Revenue | 5.000% | 6/15/30 | 3,775 | 4,103 |
| New Jersey Transportation Trust Fund Authority Federal Highway Reimbursement Revenue | 5.000% | 6/15/31 | 100 | 108 |
| New Jersey Transportation Trust Fund Authority Revenue | 5.000% | 12/15/33 | 3,045 | 3,234 |
| New Jersey Transportation Trust Fund Authority Revenue | 5.000% | 12/15/34 | 3,045 | 3,223 |
| New Jersey Transportation Trust Fund Authority Revenue | 5.000% | 12/15/35 | 1,420 | 1,496 |
| New Jersey Transportation Trust Fund Authority Revenue | 5.000% | 12/15/36 | 6,360 | 6,663 |
| New Jersey Transportation Trust Fund Authority Revenue | 4.000% | 12/15/37 | 5,595 | 5,478 |
| New Jersey Transportation Trust Fund Authority Revenue | 4.250% | 12/15/38 | 4,590 | 4,398 |
| New Jersey Transportation Trust Fund Authority Transportation Program Revenue | 5.000% | 6/15/22 | 1,500 | 1,604 |
| New Jersey Transportation Trust Fund Authority Transportation Program Revenue | 5.250% | 6/15/23 | 2,740 | 2,902 |
| New Jersey Transportation Trust Fund Authority Transportation Program Revenue | 5.250% | 6/15/33 | 5,000 | 5,304 |
| New Jersey Transportation Trust Fund Authority Transportation Program Revenue | 5.000% | 6/15/36 | 5,000 | 5,175 |
| New Jersey Transportation Trust Fund Authority Transportation Program Revenue | 5.000% | 6/15/38 | 13,000 | 13,443 |
| New Jersey Transportation Trust Fund Authority Transportation Program Revenue | 5.500% | 6/15/39 | 5,300 | 5,623 |
| New Jersey Transportation Trust Fund Authority Transportation Program Revenue | 5.000% | 6/15/44 | 19,665 | 20,186 |
| New Jersey Transportation Trust Fund Authority Transportation System Revenue | 5.500% | 12/15/21 (14) | 5,250 | 5,679 |
| New Jersey Transportation Trust Fund Authority Transportation System Revenue | 5.500% | 12/15/21 | 2,140 | 2,307 |
| New Jersey Transportation Trust Fund Authority Transportation System Revenue | 5.500% | 12/15/21 (12) | 5,855 | 6,346 |
| New Jersey Transportation Trust Fund Authority Transportation System Revenue | 5.250% | 12/15/22 (2) | 6,565 | 7,146 |
| New Jersey Transportation Trust Fund Authority Transportation System Revenue | 5.750% | 6/15/23 (14) | 10,050 | 11,215 |
| New Jersey Transportation Trust Fund Authority Transportation System Revenue | 5.250% | 12/15/23 | 2,500 | 2,750 |
| New Jersey Transportation Trust Fund Authority Transportation System Revenue | 0.000% | 12/15/25 (2) | 30,000 | 22,676 |
| New Jersey Transportation Trust Fund Authority Transportation System Revenue | 0.000% | 12/15/27 | 7,025 | 4,766 |
| New Jersey Transportation Trust Fund Authority Transportation System Revenue | 5.625% | 12/15/28 | 20,000 | 20,085 |
| New Jersey Transportation Trust Fund Authority Transportation System Revenue | 5.500% | 6/15/31 | 24,940 | 26,241 |
| New Jersey Transportation Trust Fund Authority Transportation System Revenue | 5.000% | 6/15/32 | 10,000 | 10,538 |
| New Jersey Transportation Trust Fund Authority Transportation System Revenue | 5.250% | 6/15/32 | 7,000 | 7,470 |
| New Jersey Transportation Trust Fund Authority Transportation System Revenue | 5.250% | 6/15/36 | 22,000 | 22,904 |
| New Jersey Transportation Trust Fund Authority Transportation System Revenue | 0.000% | 12/15/37 | 5,700 | 2,221 |
| New Jersey Transportation Trust Fund Authority Transportation System Revenue | 0.000% | 12/15/38 | 5,000 | 1,840 |
| New Jersey Transportation Trust Fund Authority Transportation System Revenue | 0.000% | 12/15/38 | 5,000 | 1,840 |
| New Jersey Transportation Trust Fund Authority Transportation System Revenue | 5.500% | 6/15/41 | 3,000 | 3,131 |
| New Jersey Turnpike Authority Revenue | 5.000% | 7/1/22 (Prere.) | 3,140 | 3,447 |
| New Jersey Turnpike Authority Revenue | 5.000% | 7/1/22 (Prere.) | 8,295 | 9,105 |
| New Jersey Turnpike Authority Revenue | 5.000% | 7/1/22 (Prere.) | 6,785 | 7,448 |
| New Jersey Turnpike Authority Revenue | 5.000% | 7/1/22 (Prere.) | 15,000 | 16,465 |
| New Jersey Turnpike Authority Revenue | 5.000% | 1/1/31 | 10,000 | 11,238 |
| New Jersey Turnpike Authority Revenue | 5.000% | 1/1/31 | 2,500 | 2,840 |
| New Jersey Turnpike Authority Revenue | 5.000% | 1/1/32 | 10,000 | 11,177 |
| New Jersey Turnpike Authority Revenue | 5.000% | 1/1/32 | 5,400 | 6,098 |
| New Jersey Turnpike Authority Revenue | 5.000% | 1/1/33 | 10,000 | 11,139 |
| New Jersey Turnpike Authority Revenue | 4.000% | 1/1/35 | 15,500 | 15,761 |
| New Jersey Turnpike Authority Revenue | 5.000% | 1/1/43 | 1,860 | 1,990 |
351
High-Yield Tax-Exempt Fund
| | | | | |
| Face | Market |
| Maturity | Amount | Value• |
| | Coupon | Date | ($000) | ($000) |
| Salem County NJ Pollution Control Financing Authority Revenue (Chambers Project) | 5.000% | 12/1/23 | 32,895 | 34,594 |
| South Jersey NJ Port Corp. Revenue | 5.000% | 1/1/34 | 1,150 | 1,231 |
| South Jersey NJ Port Corp. Revenue | 5.000% | 1/1/35 | 1,250 | 1,333 |
| South Jersey NJ Port Corp. Revenue | 5.000% | 1/1/37 | 1,370 | 1,453 |
| Tobacco Settlement Financing Corp. New Jersey Revenue | 5.000% | 6/1/46 | 18,160 | 18,745 |
| Tobacco Settlement Financing Corp. New Jersey Revenue | 5.000% | 6/1/46 | 21,980 | 22,263 |
| Tobacco Settlement Financing Corp. New Jersey Revenue | 5.250% | 6/1/46 | 13,340 | 14,101 |
| | | | | 851,008 |
| New Mexico (0.0%) | | | | |
| New Mexico Hospital Equipment Loan Council Hospital System Revenue | | | | |
| | (Gerald Champion Regional Medical Center) | 5.500% | 7/1/42 | 5,000 | 5,291 |
| | | | | |
| New York (9.7%) | | | | |
| Brooklyn NY Local Development Corp. PILOT Revenue (Barclays Center Project) | 6.375% | 1/15/20 (Prere.) | 5,000 | 5,262 |
| Brooklyn NY Local Development Corp. PILOT Revenue (Brooklyn Events Center) | 5.000% | 7/15/28 | 3,750 | 4,128 |
| Brooklyn NY Local Development Corp. PILOT Revenue (Brooklyn Events Center) | 5.000% | 7/15/42 | 5,900 | 6,250 |
| Hempstead NY Local Development Corp. Revenue (Molloy College) | 5.000% | 7/1/33 | 475 | 513 |
| Hempstead NY Local Development Corp. Revenue (Molloy College) | 5.000% | 7/1/35 | 850 | 913 |
| Hempstead NY Local Development Corp. Revenue (Molloy College) | 5.000% | 7/1/36 | 670 | 717 |
| Hempstead NY Local Development Corp. Revenue (Molloy College) | 5.000% | 7/1/39 | 1,500 | 1,567 |
| Hudson Yards Infrastructure Corp. New York Revenue | 5.750% | 2/15/21 (Prere.) | 15,725 | 17,006 |
| 5 | Jefferson County NY Industrial Development Agency Solid Waste Disposal Revenue | 4.750% | 1/1/20 | 2,235 | 2,215 |
| 5 | Jefferson County NY Industrial Development Agency Solid Waste Disposal Revenue | 5.250% | 1/1/24 | 3,780 | 3,609 |
| Long Island NY Power Authority Electric System Revenue | 5.000% | 9/1/29 | 1,000 | 1,115 |
| Long Island NY Power Authority Electric System Revenue | 5.000% | 9/1/29 | 4,500 | 5,087 |
| Long Island NY Power Authority Electric System Revenue | 5.000% | 9/1/30 | 1,510 | 1,697 |
| Long Island NY Power Authority Electric System Revenue | 5.000% | 9/1/31 | 1,000 | 1,110 |
| Long Island NY Power Authority Electric System Revenue | 5.000% | 9/1/31 | 5,000 | 5,597 |
| Long Island NY Power Authority Electric System Revenue | 5.000% | 9/1/32 | 1,000 | 1,108 |
| Long Island NY Power Authority Electric System Revenue | 5.000% | 9/1/33 | 1,600 | 1,766 |
| Long Island NY Power Authority Electric System Revenue | 5.000% | 9/1/34 | 1,500 | 1,654 |
| Long Island NY Power Authority Electric System Revenue | 5.000% | 9/1/36 | 1,000 | 1,097 |
| Long Island NY Power Authority Electric System Revenue | 5.000% | 9/1/44 | 12,040 | 13,104 |
| Monroe County NY Industrial Development Corp. Revenue (Rochester General Hospital) | 5.000% | 12/1/31 | 1,010 | 1,120 |
| Monroe County NY Industrial Development Corp. Revenue (Rochester General Hospital) | 5.000% | 12/1/46 | 3,000 | 3,201 |
| Nassau County NY Local Economic Assistance Corp. Revenue | | | | |
| | (Catholic Health Services of Long Island Obligated Group Project) | 5.000% | 7/1/30 | 1,500 | 1,618 |
| New York City NY Build NYC Resource Corp. Revenue (New York Law School Project) | 5.000% | 7/1/28 | 4,035 | 4,323 |
| New York City NY Build NYC Resource Corp. Revenue (New York Law School Project) | 5.000% | 7/1/31 | 4,425 | 4,684 |
| New York City NY Build NYC Resource Corp. Revenue (New York Law School Project) | 5.000% | 7/1/41 | 5,905 | 6,098 |
| New York City NY GO | 5.000% | 8/1/36 | 15,000 | 16,394 |
| New York City NY GO | 4.000% | 3/1/42 | 10,000 | 10,015 |
| New York City NY GO | 5.000% | 3/1/44 | 10,000 | 11,051 |
| New York City NY GO VRDO | 1.680% | 11/1/18 | 8,600 | 8,600 |
| New York City NY GO VRDO | 1.700% | 11/1/18 LOC | 8,200 | 8,200 |
| New York City NY Housing Development Corp. Multi-Family Mortgage Revenue (8 Spruce Street) | 3.500% | 2/15/48 | 1,000 | 979 |
| New York City NY Industrial Development Agency Airport Facilities Revenue | | | | |
| | (TRIPS Obligated Group) | 5.000% | 7/1/28 | 4,000 | 4,207 |
| New York City NY Municipal Water Finance Authority Water & Sewer System Revenue | 5.000% | 6/15/35 | 10,000 | 10,883 |
| New York City NY Municipal Water Finance Authority Water & Sewer System Revenue | 5.000% | 6/15/45 | 8,000 | 8,532 |
| New York City NY Municipal Water Finance Authority Water & Sewer System Revenue | 4.000% | 6/15/46 | 4,775 | 4,735 |
| New York City NY Municipal Water Finance Authority Water & Sewer System Revenue | 5.000% | 6/15/46 | 16,235 | 17,652 |
| New York City NY Municipal Water Finance Authority Water & Sewer System Revenue | 5.000% | 6/15/48 | 6,385 | 7,012 |
| 5 | New York City NY Municipal Water Finance Authority Water & Sewer System Revenue | | | | |
| | TOB VRDO | 1.700% | 11/1/18 LOC | 12,600 | 12,600 |
| New York City NY Municipal Water Finance Authority Water & Sewer System Revenue VRDO | 1.700% | 11/1/18 | 23,700 | 23,700 |
| New York City NY Municipal Water Finance Authority Water & Sewer System Revenue VRDO | 1.700% | 11/1/18 | 15,500 | 15,500 |
| 12 | New York City NY Transitional Finance Authority Building Aid Revenue | 5.000% | 7/15/37 | 20,000 | 21,522 |
| New York City NY Transitional Finance Authority Building Aid Revenue | 5.000% | 7/15/41 | 8,000 | 8,696 |
| New York City NY Transitional Finance Authority Future Tax Revenue | 5.000% | 5/1/35 | 15,000 | 16,882 |
| New York City NY Transitional Finance Authority Future Tax Revenue | 5.000% | 2/1/36 | 15,000 | 16,347 |
| New York City NY Transitional Finance Authority Future Tax Revenue | 4.000% | 5/1/37 | 2,825 | 2,860 |
| New York City NY Transitional Finance Authority Future Tax Revenue | 5.000% | 11/1/37 | 11,250 | 12,399 |
| New York City NY Transitional Finance Authority Future Tax Revenue | 4.000% | 8/1/38 | 25,000 | 25,293 |
| New York City NY Transitional Finance Authority Future Tax Revenue | 5.000% | 11/1/38 | 7,865 | 8,586 |
| New York City NY Transitional Finance Authority Future Tax Revenue | 4.000% | 5/1/42 | 8,250 | 8,200 |
| New York City NY Transitional Finance Authority Future Tax Revenue | 4.000% | 5/1/42 | 7,000 | 6,958 |
| New York City NY Transitional Finance Authority Future Tax Revenue | 4.000% | 2/1/44 | 1,950 | 1,932 |
| New York City NY Transitional Finance Authority Future Tax Revenue VRDO | 1.700% | 11/1/18 | 16,790 | 16,790 |
| New York City NY Transitional Finance Authority Revenue | 4.000% | 8/1/39 | 8,000 | 8,012 |
352
High-Yield Tax-Exempt Fund
| | | | |
| Face | Market |
| Maturity | Amount | Value• |
| Coupon | Date | ($000) | ($000) |
| New York City Transitional Finance Authority Building Aid Revenue | 5.000% | 7/15/33 | 5,000 | 5,669 |
| New York City Transitional Finance Authority Building Aid Revenue | 5.000% | 7/15/34 | 5,000 | 5,630 |
| New York City Transitional Finance Authority Building Aid Revenue | 5.000% | 7/15/35 | 5,000 | 5,625 |
| New York City Transitional Finance Authority Future Tax Secured Revenue | 5.000% | 8/1/38 | 10,000 | 11,203 |
| New York Convention Center Development Corp. Revenue | 0.000% | 11/15/40 | 3,500 | 1,285 |
| New York Convention Center Development Corp. Revenue | 5.000% | 11/15/40 | 7,465 | 8,163 |
| New York Convention Center Development Corp. Revenue | 0.000% | 11/15/43 | 2,500 | 793 |
| 5 New York Counties Tobacco Trust Revenue | 6.250% | 6/1/41 | 19,900 | 20,477 |
| New York Counties Tobacco Trust Revenue | 5.000% | 6/1/45 | 3,750 | 3,906 |
| New York Counties Tobacco Trust Revenue | 5.000% | 6/1/51 | 10,875 | 11,108 |
| New York Liberty Development Corp. Revenue | 5.000% | 11/15/31 | 2,000 | 2,127 |
| New York Liberty Development Corp. Revenue | 5.125% | 1/15/44 | 5,000 | 5,157 |
| New York Liberty Development Corp. Revenue | 5.000% | 11/15/44 | 5,080 | 5,367 |
| New York Liberty Development Corp. Revenue | 6.375% | 7/15/49 | 10,870 | 11,294 |
| New York Liberty Development Corp. Revenue | 5.750% | 11/15/51 | 11,000 | 11,992 |
| New York Liberty Development Corp. Revenue (Goldman Sachs Headquarters) | 5.250% | 10/1/35 | 4,910 | 5,819 |
| New York Liberty Development Corp. Revenue (Goldman Sachs Headquarters) | 5.500% | 10/1/37 | 5,005 | 6,115 |
| New York Metropolitan Transportation Authority Revenue | 5.250% | 11/15/20 (Prere.) | 13,000 | 13,831 |
| New York Metropolitan Transportation Authority Revenue | 5.000% | 11/15/21 (Prere.) | 9,000 | 9,767 |
| New York Metropolitan Transportation Authority Revenue | 5.250% | 11/15/21 (Prere.) | 6,625 | 7,238 |
| New York Metropolitan Transportation Authority Revenue | 5.250% | 11/15/21 (Prere.) | 1,875 | 2,048 |
| New York Metropolitan Transportation Authority Revenue | 5.000% | 5/15/23 (Prere.) | 2,000 | 2,241 |
| New York Metropolitan Transportation Authority Revenue | 5.000% | 5/15/23 (Prere.) | 2,000 | 2,241 |
| New York Metropolitan Transportation Authority Revenue | 5.250% | 11/15/23 (Prere.) | 2,250 | 2,570 |
| New York Metropolitan Transportation Authority Revenue | 5.250% | 11/15/23 (Prere.) | 2,500 | 2,855 |
| New York Metropolitan Transportation Authority Revenue | 5.250% | 11/15/36 | 9,225 | 10,158 |
| New York Metropolitan Transportation Authority Revenue | 5.000% | 11/15/37 | 6,875 | 7,521 |
| New York Metropolitan Transportation Authority Revenue | 5.000% | 11/15/38 | 8,575 | 9,132 |
| New York Metropolitan Transportation Authority Revenue | 5.000% | 11/15/40 | 3,000 | 3,228 |
| New York Metropolitan Transportation Authority Revenue | 5.250% | 11/15/56 | 5,500 | 6,008 |
| New York Metropolitan Transportation Authority Revenue | 5.250% | 11/15/56 | 7,000 | 7,612 |
| New York Metropolitan Transportation Authority Revenue (Dedicated Petroleum Tax) | 5.000% | 11/15/19 (Prere.) | 3,250 | 3,354 |
| New York Metropolitan Transportation Authority Revenue (Dedicated Petroleum Tax) | 6.000% | 4/1/20 (ETM) | 4,760 | 4,915 |
| New York Metropolitan Transportation Authority Revenue (Dedicated Tax Fund) | 5.000% | 11/15/47 | 7,000 | 7,693 |
| New York Metropolitan Transportation Authority Revenue (Hudson Yards Development) | 5.000% | 11/15/51 | 10,000 | 10,508 |
| New York Metropolitan Transportation Authority Revenue (Hudson Yards Development) | 5.000% | 11/15/56 | 15,900 | 16,722 |
| New York State Dormitory Authority Revenue | 5.000% | 3/15/43 | 15,000 | 16,744 |
| New York State Dormitory Authority Revenue | 4.000% | 3/15/48 | 10,000 | 10,000 |
| New York State Dormitory Authority Revenue (Fordham University) | 5.000% | 7/1/41 | 3,750 | 4,062 |
| New York State Dormitory Authority Revenue (Icahn School of Medicine at Mount Sinai) | 5.000% | 7/1/34 | 18,370 | 20,131 |
| New York State Dormitory Authority Revenue (New York University) | 4.000% | 7/1/39 | 6,000 | 6,087 |
| New York State Dormitory Authority Revenue (New York University) | 4.000% | 7/1/43 | 6,500 | 6,564 |
| New York State Dormitory Authority Revenue (Orange Regional Medical Center Obligated Group) | 5.000% | 12/1/24 | 1,800 | 1,986 |
| New York State Dormitory Authority Revenue (Orange Regional Medical Center Obligated Group) | 5.000% | 12/1/29 | 2,400 | 2,631 |
| New York State Dormitory Authority Revenue (Orange Regional Medical Center Obligated Group) | 5.000% | 12/1/31 | 1,600 | 1,739 |
| New York State Dormitory Authority Revenue (Orange Regional Medical Center Obligated Group) | 5.000% | 12/1/32 | 4,000 | 4,336 |
| New York State Dormitory Authority Revenue (Orange Regional Medical Center Obligated Group) | 5.000% | 12/1/33 | 700 | 756 |
| New York State Dormitory Authority Revenue (Orange Regional Medical Center Obligated Group) | 5.000% | 12/1/34 | 1,000 | 1,077 |
| New York State Dormitory Authority Revenue (Orange Regional Medical Center Obligated Group) | 5.000% | 12/1/37 | 400 | 427 |
| New York State Dormitory Authority Revenue (Personal Income Tax) | 5.000% | 3/15/31 | 4,295 | 4,761 |
| New York State Dormitory Authority Revenue (Personal Income Tax) | 5.000% | 3/15/32 | 8,920 | 9,926 |
| New York State Dormitory Authority Revenue (Personal Income Tax) | 4.000% | 2/15/36 | 6,920 | 7,032 |
| New York State Dormitory Authority Revenue (Personal Income Tax) | 4.000% | 2/15/37 | 8,500 | 8,601 |
| New York State Dormitory Authority Revenue (Personal Income Tax) | 5.000% | 2/15/39 | 9,000 | 9,893 |
| New York State Dormitory Authority Revenue (Personal Income Tax) | 5.000% | 2/15/39 | 3,000 | 3,264 |
| New York State Dormitory Authority Revenue (St. John’s University) | 5.000% | 7/1/34 | 1,000 | 1,104 |
| New York State Dormitory Authority Revenue (The New School) | 5.500% | 7/1/20 (Prere.) | 5,000 | 5,280 |
| New York State Dormitory Authority Revenue (The New School) | 5.000% | 7/1/28 | 1,000 | 1,131 |
| New York State Dormitory Authority Revenue (The New School) | 5.000% | 7/1/29 | 1,000 | 1,125 |
| New York State Dormitory Authority Revenue (The New School) | 5.000% | 7/1/30 | 1,500 | 1,679 |
| New York State Dormitory Authority Revenue (The New School) | 5.000% | 7/1/31 | 2,600 | 2,898 |
| New York State Dormitory Authority Revenue (The New School) | 5.000% | 7/1/32 | 2,500 | 2,777 |
| New York State Dormitory Authority Revenue (Yeshiva University) | 4.250% | 9/1/24 | 870 | 879 |
| New York State Dormitory Authority Sales Tax Revenue | 5.000% | 3/15/38 | 15,000 | 16,783 |
| New York State Dormitory Authority Sales Tax Revenue | 4.000% | 3/15/44 | 7,180 | 7,202 |
| New York State Liberty Development Corp. Liberty Revenue (3 World Trade Center Project) | 5.150% | 11/15/34 | 5,000 | 5,154 |
| New York State Liberty Development Corp. Liberty Revenue (3 World Trade Center Project) | 5.375% | 11/15/40 | 800 | 824 |
| New York State Liberty Development Corp. Liberty Revenue (3 World Trade Center Project) | 5.000% | 11/15/44 | 14,000 | 14,336 |
| New York State Thruway Authority Revenue | 5.000% | 1/1/41 | 8,500 | 9,206 |
| New York State Thruway Authority Revenue | 5.000% | 3/15/42 | 5,000 | 5,531 |
353
High-Yield Tax-Exempt Fund
| | | | |
| Face | Market |
| Maturity | Amount | Value• |
| Coupon | Date | ($000) | ($000) |
| New York State Thruway Authority Revenue | 5.000% | 1/1/51 | 6,800 | 7,290 |
| New York State Thruway Authority Revenue | 5.250% | 1/1/56 | 5,000 | 5,438 |
| New York Transportation Development Corp. Special Facility Revenue (La Guardia Airport) | 5.000% | 1/1/32 | 13,500 | 14,645 |
| New York Transportation Development Corp. Special Facility Revenue (La Guardia Airport) | 5.000% | 1/1/33 | 8,000 | 8,647 |
| New York Transportation Development Corp. Special Facility Revenue (La Guardia Airport) | 5.000% | 1/1/34 | 5,500 | 5,927 |
| New York Transportation Development Corp. Special Facility Revenue (La Guardia Airport) | 4.000% | 7/1/35 (4) | 5,000 | 5,030 |
| New York Transportation Development Corp. Special Facility Revenue (La Guardia Airport) | 4.000% | 1/1/36 | 5,000 | 4,854 |
| New York Transportation Development Corp. Special Facility Revenue (La Guardia Airport) | 5.000% | 1/1/36 | 5,000 | 5,348 |
| New York Transportation Development Corp. Special Facility Revenue (La Guardia Airport) | 4.000% | 7/1/36 (4) | 5,500 | 5,519 |
| New York Transportation Development Corp. Special Facility Revenue | | | | |
| (JFK International Airport Project) | 5.000% | 8/1/26 | 17,500 | 18,200 |
| New York Transportation Development Corp. Special Facility Revenue | | | | |
| (JFK International Airport Project) | 5.000% | 8/1/31 | 38,270 | 39,495 |
| Niagara NY Frontier Transportation Authority Airport Revenue (Buffalo Niagara International Airport) | 5.000% | 4/1/25 | 2,000 | 2,203 |
| Niagara NY Frontier Transportation Authority Airport Revenue (Buffalo Niagara International Airport) | 5.000% | 4/1/26 | 3,775 | 4,128 |
| Port Authority of New York & New Jersey Revenue | 5.000% | 9/15/25 | 3,835 | 4,041 |
| Port Authority of New York & New Jersey Revenue | 5.000% | 9/1/27 | 1,695 | 1,865 |
| Port Authority of New York & New Jersey Revenue | 5.000% | 10/15/28 | 5,625 | 6,274 |
| Port Authority of New York & New Jersey Revenue | 4.000% | 3/15/30 | 30,000 | 31,140 |
| Port Authority of New York & New Jersey Revenue | 5.000% | 10/15/32 | 9,900 | 10,542 |
| Port Authority of New York & New Jersey Revenue | 5.000% | 12/1/33 | 5,000 | 5,446 |
| Port Authority of New York & New Jersey Revenue | 5.000% | 10/15/36 | 2,665 | 2,884 |
| Port Authority of New York & New Jersey Revenue | 5.000% | 10/15/37 | 4,665 | 5,033 |
| Port Authority of New York & New Jersey Revenue | 5.000% | 10/15/41 | 2,755 | 3,017 |
| Port Authority of New York & New Jersey Revenue | 5.000% | 11/15/42 | 5,000 | 5,435 |
| Port Authority of New York & New Jersey Revenue | 5.000% | 10/15/44 | 10,000 | 10,694 |
| Port Authority of New York & New Jersey Revenue | 5.000% | 11/15/46 | 9,530 | 10,447 |
| Port Authority of New York & New Jersey Revenue | 5.000% | 11/15/47 | 5,000 | 5,411 |
| Port Authority of New York & New Jersey Special Obligation Revenue | | | | |
| (John F. Kennedy International Air Terminal LLC) | 5.500% | 12/1/31 | 4,000 | 4,252 |
| Port Authority of New York & New Jersey Special Obligation Revenue | | | | |
| (John F. Kennedy International Air Terminal LLC) | 6.000% | 12/1/42 | 13,000 | 13,919 |
| Suffolk County NY Economic Development Corp. Revenue (Catholic Health Services) | 5.000% | 7/1/30 | 2,315 | 2,497 |
| Suffolk County NY Economic Development Corp. Revenue (Catholic Health Services) | 5.000% | 7/1/31 | 2,000 | 2,149 |
| Syracuse NY Industrial Development Agency Revenue (Carousel Center Project) | 5.000% | 1/1/30 | 2,750 | 2,943 |
| Syracuse NY Industrial Development Agency Revenue (Carousel Center Project) | 5.000% | 1/1/31 | 1,000 | 1,065 |
| Syracuse NY Industrial Development Agency Revenue (Carousel Center Project) | 5.000% | 1/1/32 | 2,370 | 2,518 |
| Tobacco Settlement Financing Corp. New York Revenue | 5.000% | 6/1/36 | 7,050 | 7,447 |
| Tobacco Settlement Financing Corp. New York Revenue | 5.000% | 6/1/41 | 11,205 | 11,471 |
| Tobacco Settlement Financing Corp. New York Revenue | 5.000% | 6/1/45 | 13,550 | 13,315 |
| Triborough Bridge & Tunnel Authority New York Revenue | 5.000% | 11/15/42 | 10,930 | 12,080 |
| Triborough Bridge & Tunnel Authority New York Revenue | 5.000% | 11/15/46 | 10,000 | 10,979 |
| Troy NY Capital Resource Corp. Revenue (Rensselaer Polytechnic Institute Project) | 5.000% | 8/1/32 | 1,000 | 1,099 |
| Westchester County NY Health Care Corp. Revenue | 6.125% | 11/1/20 (Prere.) | 2,665 | 2,872 |
| Westchester County NY Health Care Corp. Revenue | 6.125% | 11/1/37 | 335 | 356 |
| Westchester County NY Industrial Development Agency Facilities Revenue | | | | |
| (Million Air Two LLC Obligated Group) | 7.000% | 6/1/46 | 7,035 | 7,123 |
| Westchester County NY Local Development Corp. Revenue (Pace University) | 5.000% | 5/1/34 | 2,050 | 2,189 |
| Westchester County NY Local Development Corp. Revenue (Pace University) | 5.500% | 5/1/42 | 9,000 | 9,734 |
| Westchester County NY Local Development Corp. Revenue (Westchester Medical Center) | 5.000% | 11/1/46 | 27,500 | 28,552 |
| Westchester NY Tobacco Asset Securitization Revenue | 5.000% | 6/1/41 | 4,000 | 4,193 |
| Westchester NY Tobacco Asset Securitization Revenue | 5.000% | 6/1/45 | 12,000 | 12,073 |
| | | | 1,240,173 |
| North Carolina (0.7%) | | | | |
| New Hanover County NC Hospital Revenue (New Hanover Regional Medical Center Project) | 5.000% | 10/1/42 | 5,000 | 5,418 |
| New Hanover County NC Hospital Revenue (New Hanover Regional Medical Center Project) | 5.000% | 10/1/47 | 6,000 | 6,479 |
| North Carolina Medical Care Commission Health Care Facilities Revenue (Maryfield Inc.) | 5.000% | 10/1/25 | 2,000 | 2,155 |
| North Carolina Medical Care Commission Health Care Facilities Revenue (Maryfield Inc.) | 5.000% | 10/1/30 | 2,000 | 2,083 |
| North Carolina Medical Care Commission Health Care Facilities Revenue (Maryfield Inc.) | 5.000% | 10/1/35 | 2,250 | 2,323 |
| North Carolina Medical Care Commission Health Care Facilities Revenue (Vidant Health) | 5.000% | 6/1/30 | 4,000 | 4,404 |
| North Carolina Medical Care Commission Health Care Facilities Revenue (Vidant Health) | 5.000% | 6/1/32 | 5,000 | 5,459 |
| North Carolina Medical Care Commission Health Care Facilities Revenue (Vidant Health) | 5.000% | 6/1/36 | 2,000 | 2,119 |
| North Carolina Medical Care Commission Health Care Facilities Revenue (Vidant Health) | 5.000% | 6/1/40 | 10,000 | 10,681 |
| North Carolina Medical Care Commission Health System Revenue (Mission Health System Inc.) | 5.000% | 10/1/34 | 1,500 | 1,497 |
| North Carolina Medical Care Commission Health System Revenue (Mission Health System Inc.) | 5.000% | 10/1/35 | 1,620 | 1,616 |
| North Carolina Medical Care Commission Health System Revenue (Mission Health System Inc.) | 5.000% | 10/1/36 | 1,655 | 1,651 |
| North Carolina Medical Care Commission Retirement Facilities Mortgage Revenue (Aldersgate) | 6.250% | 7/1/35 | 5,810 | 6,374 |
| North Carolina Medical Care Commission Retirement Facilities Mortgage Revenue | | | | |
| (Salemtowne Project) | 5.000% | 10/1/20 | 2,380 | 2,446 |
354
High-Yield Tax-Exempt Fund
| | | | |
| Face | Market |
| Maturity | Amount | Value• |
| Coupon | Date | ($000) | ($000) |
| North Carolina Medical Care Commission Retirement Facilities Mortgage Revenue | | | | |
| (Salemtowne Project) | 5.000% | 10/1/26 | 5,000 | 5,312 |
| North Carolina Medical Care Commission Retirement Facilities Mortgage Revenue | | | | |
| (Salemtowne Project) | 5.000% | 10/1/30 | 3,000 | 3,119 |
| North Carolina Medical Care Commission Retirement Facilities Revenue (Southminster Inc.) | 5.000% | 10/1/31 | 1,750 | 1,836 |
| North Carolina Medical Care Commission Retirement Facilities Revenue (Southminster Inc.) | 5.000% | 10/1/37 | 4,800 | 4,932 |
| North Carolina Medical Care Commission Retirement Facilities Revenue | | | | |
| (Aldersgate United Methodist Retirement Community, Inc.) | 5.000% | 7/1/47 | 1,150 | 1,194 |
| North Carolina Medical Care Commission Retirement Facilities Revenue | | | | |
| (United Church Homes & Services Obligated Group) | 5.000% | 9/1/41 | 2,115 | 2,163 |
| North Carolina Medical Care Commission Retirement Facilities Revenue | | | | |
| (United Church Homes & Services Obligated Group) | 5.000% | 9/1/46 | 3,160 | 3,221 |
| North Carolina Turnpike Authority Revenue | 5.000% | 1/1/30 | 3,300 | 3,661 |
| North Carolina Turnpike Authority Revenue (Monroe Expressway Toll) | 5.000% | 7/1/47 | 3,610 | 3,829 |
| North Carolina Turnpike Authority Revenue (Monroe Expressway Toll) | 5.000% | 7/1/51 | 4,800 | 5,088 |
| | | | 89,060 |
| North Dakota (0.1%) | | | | |
| Ward County ND Health Care Facilities Revenue (Trinity Health Obligated Group) | 5.000% | 6/1/34 | 4,705 | 4,961 |
| Ward County ND Health Care Facilities Revenue (Trinity Health Obligated Group) | 5.000% | 6/1/38 | 6,000 | 6,222 |
| Ward County ND Health Care Facilities Revenue (Trinity Health Obligated Group) | 5.000% | 6/1/43 | 5,000 | 5,134 |
| | | | 16,317 |
| Ohio (2.2%) | | | | |
| Allen County OH Hospital Facilities Revenue (Catholic Healthcare Partners) | 5.250% | 9/1/20 (Prere.) | 10,000 | 10,533 |
| American Municipal Power Ohio Inc. Revenue (Hydroelectric Projects) | 4.000% | 2/15/33 | 2,530 | 2,551 |
| American Municipal Power Ohio Inc. Revenue (Hydroelectric Projects) | 5.000% | 2/15/41 | 3,000 | 3,213 |
| American Municipal Power Ohio Inc. Revenue (Hydroelectric Projects) | 5.000% | 2/15/41 | 3,065 | 3,293 |
| Bowling Green State University Ohio Student Housing Revenue | | | | |
| (CFP I LLC - State University Project) | 5.750% | 6/1/20 (Prere.) | 5,000 | 5,280 |
| Buckeye Tobacco Settlement Financing Authority Ohio Revenue | 6.250% | 6/1/37 | 5,000 | 5,047 |
| Buckeye Tobacco Settlement Financing Authority Ohio Revenue | 6.500% | 6/1/47 | 10,545 | 10,658 |
| Butler County OH Hospital Facilities Revenue (Kettering Health Network) | 6.375% | 4/1/36 | 3,750 | 4,078 |
| Butler County OH Hospital Facilities Revenue (Kettering Health Network) | 5.625% | 4/1/41 | 5,000 | 5,320 |
| Butler County OH Hospital Facilities Revenue (UC Health) | 5.250% | 11/1/20 (Prere.) | 3,380 | 3,576 |
| Butler County OH Hospital Facilities Revenue (UC Health) | 5.000% | 11/15/45 | 8,810 | 9,354 |
| Butler County OH Port Authority Revenue (StoryPoint Fairfield Project) | 6.250% | 1/15/34 | 1,100 | 1,126 |
| Butler County OH Port Authority Revenue (StoryPoint Fairfield Project) | 6.500% | 1/15/52 | 3,975 | 4,071 |
| Centerville OH Health Care Revenue (Graceworks Lutheran Services) | 5.250% | 11/1/37 | 1,750 | 1,819 |
| Centerville OH Health Care Revenue (Graceworks Lutheran Services) | 5.250% | 11/1/47 | 3,195 | 3,278 |
| Centerville OH Health Care Revenue (Graceworks Lutheran Services) | 5.250% | 11/1/50 | 2,500 | 2,556 |
| Chillicothe OH Hospital Facilities Revenue (Adena Health System Obligated Group) | 5.000% | 12/1/37 | 5,700 | 6,072 |
| Chillicothe OH Hospital Facilities Revenue (Adena Health System Obligated Group) | 5.000% | 12/1/47 | 7,200 | 7,542 |
| Cuyahoga County OH Hospital Revenue (MetroHealth System) | 5.000% | 2/15/31 | 5,630 | 5,979 |
| Cuyahoga County OH Hospital Revenue (MetroHealth System) | 5.000% | 2/15/37 | 4,455 | 4,639 |
| Cuyahoga County OH Hospital Revenue (MetroHealth System) | 5.000% | 2/15/42 | 5,000 | 5,157 |
| Cuyahoga County OH Hospital Revenue (MetroHealth System) | 5.250% | 2/15/47 | 10,250 | 10,769 |
| Cuyahoga County OH Hospital Revenue (MetroHealth System) | 5.500% | 2/15/52 | 10,000 | 10,529 |
| Cuyahoga County OH Hospital Revenue (MetroHealth System) | 5.000% | 2/15/57 | 10,050 | 10,090 |
| Cuyahoga County OH Hospital Revenue (MetroHealth System) | 5.500% | 2/15/57 | 6,000 | 6,292 |
| Dayton-Montgomery County OH Port Authority Revenue (StoryPoint Troy Project) | 7.125% | 1/15/50 | 10,000 | 10,267 |
| Franklin County OH Hospital Facilities Revenue (OhioHealth Corp.) | 4.000% | 5/15/47 | 10,000 | 9,718 |
| Franklin County OH Revenue (Trinity Health Corp.) | 5.000% | 12/1/47 | 2,385 | 2,565 |
| Hamilton County OH Healthcare Revenue (Life Enriching Communities) | 5.000% | 1/1/36 | 1,500 | 1,557 |
| Hamilton County OH Healthcare Revenue (Life Enriching Communities) | 5.000% | 1/1/37 | 1,000 | 1,039 |
| Hamilton County OH Healthcare Revenue (Life Enriching Communities) | 5.000% | 1/1/46 | 2,100 | 2,134 |
| Hamilton County OH Healthcare Revenue (Life Enriching Communities) | 5.000% | 1/1/47 | 1,500 | 1,526 |
| Hamilton County OH Healthcare Revenue (Life Enriching Communities) | 5.000% | 1/1/51 | 6,100 | 6,180 |
| Hamilton County OH Healthcare Revenue (Life Enriching Communities) | 5.000% | 1/1/52 | 1,130 | 1,146 |
| Hamilton County OH Hospital Facilities Revenue (TriHealth Obligated Group) | 5.000% | 8/15/42 | 15,000 | 16,055 |
| Hamilton County OH Hospital Facilities Revenue (TriHealth Obligated Group) | 5.000% | 8/15/47 | 11,520 | 12,287 |
| Hamilton County OH Hospital Facilities Revenue (UC Health) | 5.000% | 2/1/44 | 450 | 474 |
| JobsOhio Beverage System Statewide Liquor Profits Revenue | 5.000% | 1/1/38 | 7,280 | 7,837 |
| Lake County OH Port & Economic Development Lease Revenue (Tapestry Wickliffe LLC) | 6.750% | 12/1/52 | 4,500 | 4,638 |
| Lucas County OH Hospital Revenue (ProMedica Healthcare Obligated Group) | 5.250% | 11/15/21 (Prere.) | 2,670 | 2,901 |
| Lucas County OH Hospital Revenue (ProMedica Healthcare Obligated Group) | 6.000% | 11/15/21 (Prere.) | 3,000 | 3,326 |
| Lucas County OH Hospital Revenue (ProMedica Healthcare Obligated Group) | 5.250% | 11/15/48 | 13,250 | 13,828 |
| Ohio Air Quality Development Authority Revenue (Pratt Paper OH Inc.) | 3.750% | 1/15/28 | 3,000 | 2,965 |
| Ohio Air Quality Development Authority Revenue (Pratt Paper OH Inc.) | 4.250% | 1/15/38 | 19,670 | 19,314 |
| Ohio Air Quality Development Authority Revenue (Pratt Paper OH Inc.) | 4.500% | 1/15/48 | 5,000 | 5,000 |
| Ohio Higher Educational Facility Commission Revenue (Oberlin College Project) | 4.000% | 7/1/47 | 2,000 | 1,963 |
355
High-Yield Tax-Exempt Fund
| | | | | |
| Face | Market |
| Maturity | Amount | Value• |
| | Coupon | Date | ($000) | ($000) |
| Ohio Hospital Revenue (University Hospitals Health System Inc.) | 5.000% | 1/15/41 | 2,235 | 2,327 |
| Ohio Private Activity Revenue (Portsmouth Gateway Group LLC) | 5.000% | 12/31/39 | 3,540 | 3,735 |
| Ohio Private Activity Revenue (Portsmouth Gateway Group LLC) | 5.000% | 6/30/53 | 4,000 | 4,179 |
| Ohio State University General Receipts Revenue VRDO | 1.560% | 11/7/18 | 2,700 | 2,700 |
| Penta Career Center Ohio COP | 5.250% | 4/1/26 | 3,505 | 3,798 |
| | | | | 286,281 |
| Oklahoma (0.8%) | | | | |
| Norman OK Regional Hospital Authority Revenue | 5.000% | 9/1/28 | 1,000 | 1,109 |
| Norman OK Regional Hospital Authority Revenue | 5.000% | 9/1/30 | 1,900 | 2,087 |
| Norman OK Regional Hospital Authority Revenue | 5.000% | 9/1/31 | 1,000 | 1,096 |
| Norman OK Regional Hospital Authority Revenue | 5.000% | 9/1/37 | 7,390 | 7,895 |
| Oklahoma Development Finance Authority Health System Revenue (OU Medicine) | 5.500% | 8/15/57 | 23,000 | 24,615 |
| Oklahoma Development Finance Authority Health System Revenue (OU Medicine) | 5.250% | 8/15/43 | 8,500 | 9,027 |
| Oklahoma Development Finance Authority Health System Revenue (OU Medicine) | 5.250% | 8/15/48 | 10,000 | 10,588 |
| Oklahoma Development Finance Authority Health System Revenue (OU Medicine) | 5.500% | 8/15/52 | 12,000 | 12,891 |
| Oklahoma Development Finance Authority Health System Revenue | | | | |
| | (Provident Oklahoma Education Resources Inc.) | 5.250% | 8/1/57 | 3,000 | 2,761 |
| Oklahoma Development Finance Authority Revenue | | | | |
| | (Provident Oklahoma Education Resources Inc.) | 5.000% | 8/1/47 | 4,575 | 4,220 |
| Oklahoma Municipal Power Authority Power Supply System Revenue | 4.000% | 1/1/35 | 580 | 591 |
| Oklahoma Municipal Power Authority Power Supply System Revenue | 4.000% | 1/1/36 | 295 | 299 |
| Oklahoma Municipal Power Authority Power Supply System Revenue | 5.000% | 1/1/38 | 3,500 | 3,868 |
| Oklahoma Turnpike Authority Revenue | 4.000% | 1/1/34 | 4,000 | 4,128 |
| Oklahoma Turnpike Authority Revenue | 4.000% | 1/1/42 | 4,500 | 4,486 |
| Oklahoma Turnpike Authority Revenue | 4.000% | 1/1/48 | 8,890 | 8,754 |
| Tulsa County OK Industrial Authority Senior Living Community Revenue (Montereau Inc.) | 5.000% | 11/15/28 | 540 | 586 |
| Tulsa County OK Industrial Authority Senior Living Community Revenue (Montereau Inc.) | 5.000% | 11/15/29 | 400 | 432 |
| Tulsa County OK Industrial Authority Senior Living Community Revenue (Montereau Inc.) | 5.000% | 11/15/31 | 1,870 | 2,006 |
| Tulsa County OK Industrial Authority Senior Living Community Revenue (Montereau Inc.) | 5.000% | 11/15/32 | 700 | 748 |
| Tulsa County OK Industrial Authority Senior Living Community Revenue (Montereau Inc.) | 5.250% | 11/15/37 | 1,000 | 1,081 |
| Tulsa County OK Industrial Authority Senior Living Community Revenue (Montereau Inc.) | 5.250% | 11/15/45 | 2,250 | 2,417 |
| | | | | 105,685 |
| Oregon (0.6%) | | | | |
| Clackamas County OR Hospital Facilities Authority Revenue (Willamette View Inc.) | 5.000% | 11/15/47 | 1,000 | 1,050 |
| Clackamas County OR Hospital Facilities Authority Revenue (Willamette View Inc.) | 5.000% | 11/15/52 | 1,500 | 1,569 |
| Clackamas County OR School District No. 12 North Clackamas GO | 5.000% | 6/15/30 | 2,120 | 2,433 |
| Clackamas County OR School District No. 12 North Clackamas GO | 5.000% | 6/15/32 | 3,635 | 4,139 |
| Oregon Facilities Authority Revenue (Samaritan Health Services Project) | 5.000% | 10/1/32 | 1,800 | 1,957 |
| 12 | Oregon Health & Science University Revenue | 5.750% | 7/1/19 (Prere.) | 6,750 | 6,916 |
| Oregon Housing & Community Service Department Single Family Mortgage Revenue | 4.000% | 7/1/44 | 1,590 | 1,630 |
| Oregon State Business Development Division Revenue (RED Rock Biofuels LLC) | 6.500% | 4/1/31 | 3,000 | 2,896 |
| Oregon State Business Development Division Revenue (RED Rock Biofuels LLC) | 6.500% | 4/1/31 | 10,550 | 10,184 |
| Port of Portland OR International Airport Revenue | 5.000% | 7/1/34 | 3,160 | 3,430 |
| Port of Portland OR International Airport Revenue | 5.000% | 7/1/37 | 2,870 | 3,124 |
| Port of Portland OR International Airport Revenue | 5.000% | 7/1/42 | 5,000 | 5,396 |
| Port of Portland OR International Airport Revenue | 5.000% | 7/1/47 | 5,000 | 5,377 |
| Salem OR Hospital Facilities Authority Revenue (Salem Health Project) | 5.000% | 5/15/46 | 8,000 | 8,543 |
| Tri-County Metropolitan Transportation District of Oregon Payroll Tax Revenue | 5.000% | 9/1/48 | 11,000 | 12,243 |
| Yamhill County OR Hospital Authority Revenue (Friendsview Manor) | 5.000% | 11/15/46 | 2,250 | 2,324 |
| | | | | 73,211 |
| Pennsylvania (6.6%) | | | | |
| Allegheny County PA GO | 5.000% | 11/1/19 (Prere.) | 3,265 | 3,361 |
| Allegheny County PA Higher Education Building Authority University Revenue | | | | |
| | (Chatham University) | 5.000% | 9/1/30 | 500 | 519 |
| Allegheny County PA Higher Education Building Authority University Revenue | | | | |
| | (Chatham University) | 5.000% | 9/1/35 | 2,175 | 2,237 |
| Allegheny County PA Higher Education Building Authority University Revenue | | | | |
| | (Robert Morris University) | 5.000% | 10/15/47 | 1,625 | 1,704 |
| 5 | Allegheny County PA Hospital Development Authority Revenue | | | | |
| | (University of Pittsburgh Medical Center) TOB VRDO | 1.690% | 11/1/18 LOC | 7,435 | 7,435 |
| Allegheny County PA Sanitary Authority Sewer Revenue | 4.000% | 12/1/31 (4) | 1,000 | 1,029 |
| Allegheny County PA Sanitary Authority Sewer Revenue | 4.000% | 12/1/32 (4) | 1,385 | 1,420 |
| Allegheny County PA Sanitary Authority Sewer Revenue | 4.000% | 12/1/33 (4) | 2,000 | 2,043 |
| Allentown PA Neighborhood Improvement Zone Development Authority Tax Revenue | 5.000% | 5/1/30 | 2,650 | 2,748 |
| Allentown PA Neighborhood Improvement Zone Development Authority Tax Revenue | 5.000% | 5/1/33 | 1,250 | 1,328 |
| Allentown PA Neighborhood Improvement Zone Development Authority Tax Revenue | 5.000% | 5/1/42 | 14,500 | 14,779 |
| Allentown PA Neighborhood Improvement Zone Development Authority Tax Revenue | 5.000% | 5/1/42 | 12,850 | 13,345 |
| Allentown PA Neighborhood Improvement Zone Development Authority Tax Revenue | 5.000% | 5/1/42 | 3,500 | 3,648 |
356
High-Yield Tax-Exempt Fund
| | | | |
| Face | Market |
| Maturity | Amount | Value• |
| Coupon | Date | ($000) | ($000) |
| Berks County PA Industrial Development Authority Healthcare Facilities Revenue | | | | |
| (Highlands at Wyomissing) | 5.000% | 5/15/32 | 445 | 474 |
| Berks County PA Industrial Development Authority Healthcare Facilities Revenue | | | | |
| (Highlands at Wyomissing) | 5.000% | 5/15/42 | 500 | 522 |
| Blythe Township PA Solid Waste Authority Revenue | 7.750% | 12/1/37 | 3,000 | 3,078 |
| Bucks County PA Industrial Development Authority Revenue (New Hope Manor Project) | 4.000% | 3/1/25 | 1,170 | 1,224 |
| Bucks County PA Industrial Development Authority Revenue (New Hope Manor Project) | 5.000% | 3/1/33 | 1,865 | 2,037 |
| Bucks County PA Industrial Development Authority Revenue (New Hope Manor Project) | 4.000% | 3/1/41 | 2,630 | 2,588 |
| Capital Region Water Pennsylvania Sewer System Revenue | 5.000% | 7/15/42 | 4,000 | 4,331 |
| Capital Region Water Pennsylvania Sewer System Revenue | 5.000% | 7/15/47 | 12,290 | 13,260 |
| Chester County PA Industrial Development Authority Special Obligation Revenue | | | | |
| (Woodlands at Greystone Project) | 4.375% | 3/1/28 | 275 | 269 |
| Chester County PA Industrial Development Authority Special Obligation Revenue | | | | |
| (Woodlands at Greystone Project) | 5.000% | 3/1/38 | 650 | 648 |
| Chester County PA Industrial Development Authority Special Obligation Revenue | | | | |
| (Woodlands at Greystone Project) | 5.125% | 3/1/48 | 1,050 | 1,049 |
| Commonwealth Financing Authority Pennsylvania Revenue | 5.000% | 6/1/34 | 8,250 | 9,032 |
| Commonwealth Financing Authority Pennsylvania Revenue | 5.000% | 6/1/35 | 6,000 | 6,543 |
| Commonwealth Financing Authority Pennsylvania Revenue | 4.000% | 6/1/39 (4) | 4,625 | 4,536 |
| Cumberland County PA Municipal Authority Revenue | | | | |
| (Asbury Pennsylvania CCRC Obligated Group) | 5.250% | 1/1/41 | 4,000 | 4,061 |
| Doylestown PA Hospital Authority Revenue | 5.000% | 7/1/41 | 3,500 | 3,635 |
| East Hempfield Township PA Industrial Development Authority Revenue | | | | |
| (Millersville University Student Housing Project) | 5.000% | 7/1/35 | 1,060 | 1,113 |
| East Hempfield Township PA Industrial Development Authority Revenue | | | | |
| (Millersville University Student Housing Project) | 5.000% | 7/1/39 | 1,625 | 1,690 |
| East Hempfield Township PA Industrial Development Authority Revenue | | | | |
| (Millersville University Student Housing Project) | 5.000% | 7/1/46 | 3,175 | 3,290 |
| Franklin County PA Industrial Development Authority Revenue (Menno-Haven Inc. Project) | 5.000% | 12/1/38 | 1,000 | 1,014 |
| Franklin County PA Industrial Development Authority Revenue (Menno-Haven Inc. Project) | 5.000% | 12/1/43 | 1,200 | 1,211 |
| Franklin County PA Industrial Development Authority Revenue (Menno-Haven Inc. Project) | 5.000% | 12/1/53 | 1,900 | 1,901 |
| Lackawanna County PA Industrial Development Authority Revenue (University of Scranton) | 4.000% | 11/1/40 | 3,975 | 3,790 |
| Lancaster County PA Hospital Authority Health System Revenue | | | | |
| (University of Pennsylvania Health System) | 5.000% | 8/15/46 | 7,000 | 7,650 |
| Lancaster County PA Hospital Authority Revenue (Brethren Village Project) | 5.125% | 7/1/37 | 1,500 | 1,550 |
| Lancaster County PA Hospital Authority Revenue (Brethren Village Project) | 5.250% | 7/1/41 | 1,500 | 1,557 |
| Lehigh County PA Authority Water & Sewer Revenue | 5.000% | 12/1/43 | 4,440 | 4,771 |
| Lehigh County PA General Purpose Authority Revenue | | | | |
| (Bible Fellowship Church Homes Inc. Project) | 5.125% | 7/1/32 | 2,710 | 2,717 |
| Lehigh County PA General Purpose Authority Revenue | | | | |
| (Bible Fellowship Church Homes Inc. Project) | 5.250% | 7/1/42 | 4,150 | 4,161 |
| Lehigh County PA General Purpose Hospital Authority Revenue (Lehigh Valley Health Network) | 4.000% | 7/1/33 | 2,940 | 2,914 |
| Lehigh County PA General Purpose Hospital Authority Revenue (Lehigh Valley Health Network) | 4.000% | 7/1/35 | 10,050 | 9,728 |
| Montgomery County PA Higher Education & Health Authority Revenue (Arcadia University) | 5.750% | 4/1/40 | 3,530 | 3,772 |
| Montgomery County PA Higher Education & Health Authority Revenue (Ursinus College) | 5.000% | 11/1/38 | 5,060 | 5,287 |
| Montgomery County PA Higher Education & Health Authority Revenue (Ursinus College) | 5.250% | 11/1/42 | 3,640 | 3,849 |
| Montgomery County PA Industrial Development Authority Health Services Revenue | | | | |
| (Albert Einstein Healthcare Network) | 5.250% | 1/15/36 | 11,250 | 11,920 |
| Montgomery County PA Industrial Development Authority Health Services Revenue | | | | |
| (Albert Einstein Healthcare Network) | 5.250% | 1/15/45 | 10,000 | 10,534 |
| Montgomery County PA Industrial Development Authority Health Services Revenue | | | | |
| (Albert Einstein Healthcare Network) | 5.250% | 1/15/46 | 1,700 | 1,790 |
| Montgomery County PA Industrial Development Authority Revenue (Foulkeways at Gwynedd) | 5.000% | 12/1/46 | 1,750 | 1,824 |
| Montgomery County PA Industrial Development Authority Revenue | | | | |
| (Philadelphia Presbyterian Homes Inc. Project) | 7.000% | 12/1/21 (Prere.) | 2,670 | 3,043 |
| Montgomery County PA Industrial Development Authority Revenue | | | | |
| (Philadelphia Presbyterian Homes Inc. Project) | 7.000% | 12/1/21 (Prere.) | 2,500 | 2,849 |
| Montgomery County PA Industrial Development Authority Revenue | | | | |
| (Philadelphia Presbyterian Homes Inc. Project) | 5.000% | 12/1/32 | 2,750 | 2,979 |
| Montgomery County PA Industrial Development Authority Revenue | | | | |
| (Philadelphia Presbyterian Homes Inc. Project) | 5.000% | 12/1/37 | 2,800 | 3,000 |
| Montgomery County PA Industrial Development Authority Revenue | | | | |
| (Philadelphia Presbyterian Homes Inc. Project) | 5.000% | 12/1/47 | 2,000 | 2,123 |
| Montgomery County PA Industrial Development Authority Revenue | | | | |
| (Whitemarsh Continuing Care Retirement Community Inc.) | 5.250% | 1/1/40 | 5,000 | 4,881 |
| Montgomery County PA Industrial Development Authority Revenue | | | | |
| (Whitemarsh Continuing Care Retirement Community Inc.) | 5.375% | 1/1/50 | 10,120 | 9,946 |
| Moon Industrial Development Authority Pennsylvania Revenue | | | | |
| (Baptist Home Society Obligated Group) | 6.000% | 7/1/45 | 1,600 | 1,673 |
357
High-Yield Tax-Exempt Fund
| | | | | |
| Face | Market |
| Maturity | Amount | Value• |
| | Coupon | Date | ($000) | ($000) |
| Moon Industrial Development Authority Pennsylvania Revenue | | | | |
| | (Baptist Home Society Obligated Group) | 6.125% | 7/1/50 | 15,000 | 15,746 |
| Mount Lebanon PA Hospital Authority Revenue (St. Clair Memorial Hospital Project) | 4.000% | 7/1/48 | 12,000 | 11,438 |
| Northeastern Pennsylvania Hospital & Educational Authority Revenue (Wilkes University Project) | 5.000% | 3/1/37 | 765 | 801 |
| Pennsylvania Economic Development Financing Authority Exempt Facilities Revenue | | | | |
| | (National Gypsum Co.) | 5.500% | 11/1/44 | 5,000 | 5,167 |
| Pennsylvania Economic Development Financing Authority Resource Recovery Revenue | | | | |
| | (Colver Project) | 4.625% | 12/1/18 (2) | 3,125 | 3,150 |
| Pennsylvania Economic Development Financing Authority Revenue (PA Bridges Financing Corp.) | 5.000% | 12/31/38 | 4,000 | 4,197 |
| Pennsylvania Economic Development Financing Authority Revenue | | | | |
| | (Rapid Bridge Replacement Project) | 5.000% | 12/31/25 | 225 | 248 |
| Pennsylvania Economic Development Financing Authority Revenue | | | | |
| | (Rapid Bridge Replacement Project) | 5.000% | 12/31/29 | 10,000 | 10,825 |
| Pennsylvania Economic Development Financing Authority Revenue (UPMC Obligated Group) | 4.000% | 11/15/36 | 8,965 | 8,874 |
| Pennsylvania Economic Development Financing Authority Revenue (UPMC Obligated Group) | 4.000% | 11/15/37 | 10,000 | 9,843 |
| Pennsylvania GO | 5.000% | 8/1/32 | 8,235 | 8,961 |
| Pennsylvania GO | 5.000% | 8/1/33 | 6,440 | 6,988 |
| Pennsylvania GO | 4.000% | 3/1/37 (15) | 5,000 | 5,019 |
| Pennsylvania Higher Educational Facilities Authority Revenue | 4.000% | 2/15/43 | 5,000 | 5,034 |
| Pennsylvania Higher Educational Facilities Authority Revenue | | | | |
| | (Foundation for Indiana University of Pennsylvania Student Housing) | 5.000% | 7/1/22 (Prere.) | 2,275 | 2,483 |
| Pennsylvania Higher Educational Facilities Authority Revenue (Thomas Jefferson University) | 5.250% | 9/1/50 | 15,120 | 16,476 |
| Pennsylvania Turnpike Commission Revenue | 5.000% | 6/1/19 (Prere.) | 720 | 733 |
| Pennsylvania Turnpike Commission Revenue | 5.000% | 6/1/19 (Prere.) | 3,270 | 3,328 |
| Pennsylvania Turnpike Commission Revenue | 5.000% | 6/1/19 (Prere.) | 6,865 | 6,986 |
| Pennsylvania Turnpike Commission Revenue | 6.500% | 12/1/20 (Prere.) | 4,000 | 4,350 |
| Pennsylvania Turnpike Commission Revenue | 5.500% | 12/1/23 (Prere.) | 4,110 | 4,722 |
| Pennsylvania Turnpike Commission Revenue | 5.000% | 6/1/27 | 30,000 | 33,183 |
| Pennsylvania Turnpike Commission Revenue | 5.000% | 12/1/30 | 10,000 | 10,915 |
| Pennsylvania Turnpike Commission Revenue | 5.000% | 12/1/31 | 10,000 | 10,879 |
| Pennsylvania Turnpike Commission Revenue | 5.000% | 12/1/33 | 9,200 | 10,018 |
| Pennsylvania Turnpike Commission Revenue | 5.000% | 12/1/33 | 5,000 | 5,445 |
| Pennsylvania Turnpike Commission Revenue | 5.000% | 12/1/35 | 4,000 | 4,385 |
| Pennsylvania Turnpike Commission Revenue | 4.000% | 12/1/36 | 5,000 | 4,955 |
| Pennsylvania Turnpike Commission Revenue | 5.000% | 6/1/37 | 6,245 | 6,654 |
| Pennsylvania Turnpike Commission Revenue | 5.000% | 6/1/39 | 12,000 | 12,713 |
| 13 | Pennsylvania Turnpike Commission Revenue | 0.000% | 12/1/39 | 8,000 | 6,672 |
| Pennsylvania Turnpike Commission Revenue | 5.250% | 12/1/39 | 13,045 | 14,240 |
| Pennsylvania Turnpike Commission Revenue | 5.000% | 12/1/40 | 6,400 | 6,874 |
| Pennsylvania Turnpike Commission Revenue | 5.000% | 12/1/40 | 16,415 | 17,335 |
| Pennsylvania Turnpike Commission Revenue | 5.000% | 12/1/40 | 11,225 | 12,112 |
| Pennsylvania Turnpike Commission Revenue | 5.000% | 12/1/41 | 5,000 | 5,399 |
| Pennsylvania Turnpike Commission Revenue | 5.000% | 12/1/41 | 17,000 | 17,931 |
| Pennsylvania Turnpike Commission Revenue | 5.000% | 12/1/42 | 9,500 | 10,323 |
| Pennsylvania Turnpike Commission Revenue | 5.250% | 12/1/45 | 3,500 | 3,808 |
| Pennsylvania Turnpike Commission Revenue | 5.000% | 12/1/46 | 10,530 | 11,061 |
| Pennsylvania Turnpike Commission Revenue | 5.000% | 12/1/47 | 10,000 | 10,826 |
| Philadelphia PA Airport Revenue | 5.000% | 7/1/33 | 2,500 | 2,733 |
| Philadelphia PA Airport Revenue | 5.000% | 7/1/34 | 5,680 | 6,188 |
| Philadelphia PA Airport Revenue | 5.000% | 7/1/35 | 7,640 | 8,293 |
| Philadelphia PA Airport Revenue | 5.000% | 7/1/37 | 4,000 | 4,318 |
| Philadelphia PA Airport Revenue | 5.000% | 7/1/42 | 7,350 | 7,872 |
| Philadelphia PA Airport Revenue | 5.000% | 7/1/47 | 5,000 | 5,336 |
| Philadelphia PA Authority for Industrial Development Revenue (Cultural & Commercial Corridors) | 5.000% | 12/1/27 | 5,000 | 5,566 |
| Philadelphia PA Authority for Industrial Development Revenue (Thomas Jefferson University) | 5.000% | 9/1/42 | 6,600 | 7,107 |
| Philadelphia PA Authority for Industrial Development Revenue (University of Sciences) | 5.000% | 11/1/47 | 12,000 | 12,893 |
| Philadelphia PA Gas Works Revenue | 5.000% | 8/1/26 | 3,545 | 3,973 |
| Philadelphia PA Gas Works Revenue | 5.000% | 8/1/27 | 2,000 | 2,234 |
| Philadelphia PA Gas Works Revenue | 5.000% | 8/1/28 | 2,000 | 2,227 |
| Philadelphia PA Gas Works Revenue | 5.000% | 10/1/30 | 4,200 | 4,663 |
| Philadelphia PA Gas Works Revenue | 5.000% | 10/1/32 | 3,335 | 3,678 |
| Philadelphia PA Gas Works Revenue | 5.000% | 8/1/33 | 1,000 | 1,096 |
| Philadelphia PA Gas Works Revenue | 5.000% | 8/1/34 | 1,000 | 1,094 |
| Philadelphia PA Gas Works Revenue | 4.000% | 10/1/35 | 1,845 | 1,847 |
| Philadelphia PA Gas Works Revenue | 4.000% | 10/1/36 | 1,750 | 1,743 |
| Philadelphia PA Gas Works Revenue | 5.000% | 8/1/42 | 6,300 | 6,790 |
| Philadelphia PA Gas Works Revenue | 5.000% | 8/1/47 | 9,255 | 9,939 |
| Philadelphia PA Hospitals & Higher Education Facilities Authority Hospital Revenue | | | | |
| | (Temple University Health System Obligated Group) | 5.000% | 7/1/30 | 2,950 | 3,164 |
358
High-Yield Tax-Exempt Fund
| | | | | |
| Face | Market |
| Maturity | Amount | Value• |
| | Coupon | Date | ($000) | ($000) |
| Philadelphia PA Hospitals & Higher Education Facilities Authority Hospital Revenue | | | | |
| | (Temple University Health System Obligated Group) | 5.000% | 7/1/31 | 1,750 | 1,865 |
| Philadelphia PA Hospitals & Higher Education Facilities Authority Hospital Revenue | | | | |
| | (Temple University Health System Obligated Group) | 5.000% | 7/1/32 | 1,500 | 1,591 |
| Philadelphia PA Hospitals & Higher Education Facilities Authority Hospital Revenue | | | | |
| | (Temple University Health System Obligated Group) | 5.000% | 7/1/33 | 1,000 | 1,055 |
| Philadelphia PA Hospitals & Higher Education Facilities Authority Hospital Revenue | | | | |
| | (Temple University Health System Obligated Group) | 5.000% | 7/1/34 | 1,000 | 1,052 |
| Philadelphia PA Hospitals & Higher Education Facilities Authority Hospital Revenue | | | | |
| | (Temple University Health System Obligated Group) | 5.625% | 7/1/36 | 5,850 | 6,177 |
| Philadelphia PA Hospitals & Higher Education Facilities Authority Hospital Revenue | | | | |
| | (Temple University Health System Obligated Group) | 5.625% | 7/1/42 | 7,930 | 8,332 |
| Philadelphia PA School District GO | 5.000% | 9/1/29 | 1,100 | 1,224 |
| Philadelphia PA School District GO | 5.000% | 9/1/30 | 1,445 | 1,599 |
| Philadelphia PA School District GO | 5.000% | 9/1/31 | 1,515 | 1,669 |
| Philadelphia PA School District GO | 5.000% | 9/1/32 | 1,500 | 1,648 |
| Philadelphia PA School District GO | 5.000% | 9/1/34 | 1,450 | 1,582 |
| Philadelphia PA School District GO | 5.000% | 9/1/36 | 1,200 | 1,299 |
| Philadelphia PA School District GO | 5.000% | 9/1/38 | 1,250 | 1,345 |
| Philadelphia PA Water & Waste Water Revenue | 5.000% | 7/1/40 | 3,510 | 3,776 |
| Philadelphia PA Water & Waste Water Revenue | 5.000% | 10/1/42 | 7,850 | 8,600 |
| Philadelphia PA Water & Waste Water Revenue | 5.000% | 10/1/47 | 25,035 | 27,327 |
| Philadelphia PA Water & Waste Water Revenue | 5.000% | 10/1/52 | 2,500 | 2,709 |
| Philadelphia PA Water & Waste Water Revenue | 5.250% | 10/1/52 | 7,000 | 7,772 |
| Pittsburgh PA GO | 5.000% | 9/1/25 | 500 | 563 |
| Pittsburgh PA GO | 5.000% | 9/1/27 | 625 | 712 |
| Pittsburgh PA GO | 5.000% | 9/1/28 | 590 | 673 |
| Pittsburgh PA GO | 4.000% | 9/1/32 | 500 | 515 |
| Pittsburgh PA GO | 4.000% | 9/1/33 | 500 | 513 |
| Pocono Mountains Industrial Park Authority Pennsylvania Hospital Revenue | | | | |
| | (St. Luke’s Hospital Obligated Group) | 5.000% | 8/15/40 | 8,125 | 8,600 |
| Quakertown PA General Authority Health Facilities Revenue (LifeQuest Obligated Group) | 3.125% | 7/1/21 | 8,365 | 8,196 |
| Scranton-Lackawanna PA Health & Welfare Authority Revenue (Marywood University Project) | 5.000% | 6/1/36 | 4,000 | 3,986 |
| Scranton-Lackawanna PA Health & Welfare Authority Revenue (Marywood University Project) | 5.000% | 6/1/46 | 3,875 | 3,740 |
| Susquehanna PA Area Regional Airport Authority System Revenue | 4.000% | 1/1/33 | 10,000 | 9,767 |
| Susquehanna PA Area Regional Airport Authority System Revenue | 5.000% | 1/1/35 | 1,000 | 1,059 |
| Susquehanna PA Area Regional Airport Authority System Revenue | 5.000% | 1/1/38 | 1,500 | 1,582 |
| Washington County PA Redevelopment Authority Tax Allocation Revenue | 4.000% | 7/1/23 | 1,085 | 1,079 |
| 5 | Westmoreland County PA Industrial Development Authority Revenue | 4.720% | 7/1/35 | 35,000 | 35,137 |
| | | | | 842,005 |
| Puerto Rico (0.3%) | | | | |
| Puerto Rico Aqueduct & Sewer Authority Revenue | 5.250% | 7/1/24 | 5,380 | 5,017 |
| Puerto Rico Aqueduct & Sewer Authority Revenue | 5.000% | 7/1/33 | 55 | 51 |
| Puerto Rico Aqueduct & Sewer Authority Revenue | 5.125% | 7/1/37 | 95 | 88 |
| Puerto Rico Aqueduct & Sewer Authority Revenue | 5.750% | 7/1/37 | 5,025 | 4,711 |
| Puerto Rico Aqueduct & Sewer Authority Revenue | 5.250% | 7/1/42 | 4,185 | 3,871 |
| Puerto Rico Highway & Transportation Authority Transportation Revenue | 5.250% | 7/1/41 (12) | 5,000 | 5,542 |
| 14 | Puerto Rico Sales Tax Financing Corp. Revenue | 5.250% | 8/1/40 | 8,000 | 6,500 |
| 14 | Puerto Rico Sales Tax Financing Corp. Revenue | 0.000% | 8/1/44 (14) | 15,000 | 4,000 |
| 14 | Puerto Rico Sales Tax Financing Corp. Revenue | 0.000% | 8/1/46 (14) | 41,000 | 9,866 |
| | | | | 39,646 |
| Rhode Island (0.7%) | | | | |
| Rhode Island Commerce Corp. Airport Revenue | 5.000% | 7/1/41 | 1,000 | 1,071 |
| Rhode Island Health & Educational Building Corp. Higher Education Facilities Revenue | | | | |
| | (Providence College) | 5.000% | 11/1/42 | 2,000 | 2,192 |
| Rhode Island Health & Educational Building Corp. Higher Education Facilities Revenue | | | | |
| | (Providence College) | 5.000% | 11/1/47 | 8,350 | 9,120 |
| Rhode Island Health & Educational Building Corp. Higher Education Facilities Revenue | | | | |
| | (University of Rhode Island) | 5.000% | 9/15/28 | 2,505 | 2,809 |
| Rhode Island Health & Educational Building Corp. Higher Education Facilities Revenue | | | | |
| | (University of Rhode Island) | 5.000% | 9/15/29 | 5,170 | 5,771 |
| Rhode Island Health & Educational Building Corp. Higher Education Facilities Revenue | | | | |
| | (University of Rhode Island) | 5.000% | 9/15/30 | 2,105 | 2,336 |
| Rhode Island Health & Educational Building Corp. Higher Education Facilities Revenue | | | | |
| | (University of Rhode Island) | 4.000% | 9/15/31 | 1,000 | 1,021 |
| Rhode Island Health & Educational Building Corp. Higher Education Facilities Revenue | | | | |
| | (University of Rhode Island) | 4.000% | 9/15/32 | 1,250 | 1,272 |
| Rhode Island Health & Educational Building Corp. Higher Education Facilities Revenue | | | | |
| | (University of Rhode Island) | 4.000% | 9/15/33 | 1,350 | 1,369 |
359
High-Yield Tax-Exempt Fund
| | | | |
| Face | Market |
| Maturity | Amount | Value• |
| Coupon | Date | ($000) | ($000) |
| Rhode Island Health & Educational Building Corp. Higher Education Facilities Revenue | | | | |
| (University of Rhode Island) | 4.000% | 9/15/34 | 1,325 | 1,340 |
| Rhode Island Health & Educational Building Corp. Higher Education Facilities Revenue | | | | |
| (University of Rhode Island) | 4.000% | 9/15/35 | 1,000 | 1,004 |
| Rhode Island Health & Educational Building Corp. Higher Education Facilities Revenue | | | | |
| (University of Rhode Island) | 4.000% | 9/15/35 | 1,685 | 1,692 |
| Rhode Island Health & Educational Building Corp. Higher Education Facilities Revenue | | | | |
| (University of Rhode Island) | 4.000% | 9/15/36 | 1,000 | 1,001 |
| Rhode Island Health & Educational Building Corp. Higher Education Facilities Revenue | | | | |
| (University of Rhode Island) | 4.000% | 9/15/36 | 1,590 | 1,591 |
| Rhode Island Health & Educational Building Corp. Higher Education Facilities Revenue | | | | |
| (University of Rhode Island) | 4.000% | 9/15/37 | 1,250 | 1,247 |
| Rhode Island Health & Educational Building Corp. Higher Education Facilities Revenue | | | | |
| (University of Rhode Island) | 4.000% | 9/15/37 | 1,270 | 1,266 |
| Rhode Island Health & Educational Building Corp. Hospital Financing Revenue | | | | |
| (Care New England Health System Obligated Group) | 5.000% | 9/1/31 | 4,500 | 4,698 |
| Rhode Island Health & Educational Building Corp. Hospital Financing Revenue | | | | |
| (Care New England Health System Obligated Group) | 5.000% | 9/1/36 | 8,500 | 8,710 |
| Rhode Island Health & Educational Building Corp. Providence Public Schools Revenue | | | | |
| (Providence Public Buildings Authority) | 5.000% | 5/15/27 (4) | 10,040 | 11,192 |
| Rhode Island Student Loan Authority Student Loan Revenue | 5.000% | 12/1/22 | 875 | 936 |
| Rhode Island Student Loan Authority Student Loan Revenue | 5.000% | 12/1/23 | 750 | 810 |
| Rhode Island Student Loan Authority Student Loan Revenue | 5.000% | 12/1/24 | 750 | 817 |
| Rhode Island Student Loan Authority Student Loan Revenue | 5.000% | 12/1/25 | 850 | 931 |
| Rhode Island Student Loan Authority Student Loan Revenue | 3.800% | 12/1/31 | 3,000 | 2,997 |
| Tobacco Settlement Financing Corp. Rhode Island Revenue | 5.000% | 6/1/29 | 4,530 | 4,863 |
| Tobacco Settlement Financing Corp. Rhode Island Revenue | 5.000% | 6/1/30 | 4,000 | 4,272 |
| Tobacco Settlement Financing Corp. Rhode Island Revenue | 2.250% | 6/1/41 | 7,155 | 7,150 |
| | | | 83,478 |
| South Carolina (1.7%) | | | | |
| Greenwood County SC Hospital Revenue (Self Regional Healthcare) | 4.000% | 10/1/38 | 7,650 | 7,425 |
| Greenwood County SC Hospital Revenue (Self Regional Healthcare) | 4.000% | 10/1/39 | 1,500 | 1,440 |
| Lexington County SC Health Services District Inc. Hospital Revenue | 5.000% | 11/1/41 | 10,000 | 10,530 |
| Patriots Energy Group Finance Authority SC Gas Supply Revenue PUT | 4.000% | 2/1/24 | 10,000 | 10,462 |
| Piedmont SC Municipal Power Agency Revenue | 5.750% | 1/1/34 (4) | 10,000 | 10,786 |
| South Carolina Jobs Economic Development Authority Hospital Revenue (AnMed Health Project) | 5.000% | 2/1/25 | 2,180 | 2,452 |
| South Carolina Jobs Economic Development Authority Hospital Revenue (Conway Hospitals Inc.) | 5.250% | 7/1/47 | 7,500 | 7,961 |
| South Carolina Jobs Economic Development Authority Revenue (Care Alliance Health Services) | 5.250% | 8/15/46 | 15,000 | 15,832 |
| South Carolina Ports Authority Revenue | 5.000% | 7/1/27 | 4,000 | 4,564 |
| South Carolina Ports Authority Revenue | 5.000% | 7/1/28 | 2,000 | 2,295 |
| South Carolina Ports Authority Revenue | 5.000% | 7/1/29 | 2,040 | 2,323 |
| South Carolina Ports Authority Revenue | 5.000% | 7/1/30 | 2,000 | 2,260 |
| South Carolina Ports Authority Revenue | 5.250% | 7/1/55 | 10,245 | 11,049 |
| South Carolina Public Service Authority Revenue | 5.500% | 1/1/19 (Prere.) | 1,190 | 1,197 |
| South Carolina Public Service Authority Revenue | 5.500% | 1/1/19 (Prere.) | 13,810 | 13,892 |
| South Carolina Public Service Authority Revenue | 5.000% | 12/1/26 | 5,000 | 5,465 |
| South Carolina Public Service Authority Revenue | 5.000% | 12/1/30 | 3,755 | 3,904 |
| South Carolina Public Service Authority Revenue | 5.000% | 12/1/30 | 2,500 | 2,615 |
| South Carolina Public Service Authority Revenue | 5.000% | 12/1/31 | 2,165 | 2,304 |
| South Carolina Public Service Authority Revenue | 5.000% | 12/1/31 | 1,150 | 1,230 |
| South Carolina Public Service Authority Revenue | 5.000% | 12/1/31 | 3,295 | 3,551 |
| South Carolina Public Service Authority Revenue | 5.000% | 12/1/31 | 2,150 | 2,326 |
| South Carolina Public Service Authority Revenue | 5.500% | 12/1/33 | 1,305 | 1,420 |
| South Carolina Public Service Authority Revenue | 5.000% | 12/1/35 | 990 | 1,051 |
| South Carolina Public Service Authority Revenue | 5.000% | 12/1/35 | 7,940 | 8,360 |
| South Carolina Public Service Authority Revenue | 5.000% | 12/1/36 | 5,030 | 5,342 |
| South Carolina Public Service Authority Revenue | 5.000% | 12/1/37 | 3,685 | 3,894 |
| South Carolina Public Service Authority Revenue | 5.000% | 12/1/38 | 410 | 426 |
| South Carolina Public Service Authority Revenue | 5.000% | 12/1/38 | 5,500 | 5,720 |
| South Carolina Public Service Authority Revenue | 5.000% | 12/1/38 | 11,000 | 11,617 |
| South Carolina Public Service Authority Revenue | 5.000% | 12/1/39 | 5,000 | 5,223 |
| South Carolina Public Service Authority Revenue | 5.000% | 12/1/43 | 8,325 | 8,549 |
| South Carolina Public Service Authority Revenue | 5.125% | 12/1/43 | 340 | 354 |
| South Carolina Public Service Authority Revenue | 5.000% | 12/1/46 | 9,215 | 9,582 |
| South Carolina Public Service Authority Revenue | 5.000% | 12/1/48 | 500 | 517 |
| South Carolina Public Service Authority Revenue | 5.000% | 12/1/49 | 4,605 | 4,768 |
| South Carolina Public Service Authority Revenue | 5.000% | 12/1/50 | 10,550 | 10,926 |
| South Carolina Public Service Authority Revenue | 5.000% | 12/1/55 | 2,600 | 2,684 |
360
High-Yield Tax-Exempt Fund
| | | | |
| Face | Market |
| Maturity | Amount | Value• |
| Coupon | Date | ($000) | ($000) |
| South Carolina Public Service Authority Revenue | 5.250% | 12/1/55 | 5,195 | 5,497 |
| South Carolina Public Service Authority Revenue | 5.000% | 12/1/56 | 8,185 | 8,499 |
| | | | 220,292 |
| South Dakota (0.2%) | | | | |
| South Dakota Building Authority Revenue | 5.000% | 6/1/38 | 4,000 | 4,319 |
| South Dakota Health & Educational Facilities Authority Revenue | | | | |
| (Regional Health System Obligated Group) | 5.000% | 9/1/40 | 10,000 | 10,815 |
| South Dakota Health & Educational Facilities Authority Revenue (Sanford Health) | 5.000% | 11/1/37 | 10,000 | 10,678 |
| South Dakota Health & Educational Facilities Authority Revenue (Sanford Health) | 5.000% | 11/1/44 | 5,000 | 5,316 |
| | | | 31,128 |
| Tennessee (0.9%) | | | | |
| Blount County TN Health & Educational Facilities Board Revenue (Asbury Inc.) | 5.000% | 1/1/31 | 1,700 | 1,761 |
| Blount County TN Health & Educational Facilities Board Revenue (Asbury Inc.) | 5.000% | 1/1/37 | 375 | 383 |
| Blount County TN Health & Educational Facilities Board Revenue (Asbury Inc.) | 5.000% | 1/1/47 | 2,125 | 2,153 |
| Chattanooga TN Health Educational & Housing Facility Board Revenue (Catholic Health Initiatives) | 5.250% | 1/1/45 | 6,500 | 6,834 |
| Chattanooga-Hamilton County TN Hospital Authority Hospital Revenue | 5.000% | 10/1/39 | 7,600 | 7,964 |
| Chattanooga-Hamilton County TN Hospital Authority Hospital Revenue | 5.000% | 10/1/44 | 10,280 | 10,723 |
| Clarksville TN Public Building Authority Revenue (Pooled Financing) VRDO | 1.710% | 11/1/18 LOC | 5,700 | 5,700 |
| Metropolitan Government of Nashville & Davidson County TN Health & | | | | |
| Educational Facilities Board Revenue (Vanderbilt University) | 5.000% | 7/1/40 | 4,000 | 4,270 |
| Metropolitan Government of Nashville & Davidson County TN Health & | | | | |
| Educational Facilities Board Revenue (Vanderbilt University) | 5.000% | 7/1/46 | 5,000 | 5,317 |
| Metropolitan Government of Nashville & Davidson County TN Industrial Development | | | | |
| Board Revenue (Waste Management Inc. Tennessee Project) PUT | 2.850% | 8/2/21 | 3,000 | 2,987 |
| Tennessee Energy Acquisition Corp. Gas Revenue | 5.250% | 9/1/21 | 2,350 | 2,514 |
| Tennessee Energy Acquisition Corp. Gas Revenue | 5.000% | 2/1/22 | 1,010 | 1,077 |
| Tennessee Energy Acquisition Corp. Gas Revenue | 5.250% | 9/1/22 | 6,285 | 6,852 |
| Tennessee Energy Acquisition Corp. Gas Revenue | 5.000% | 2/1/23 | 2,190 | 2,368 |
| Tennessee Energy Acquisition Corp. Gas Revenue | 5.250% | 9/1/23 | 1,665 | 1,839 |
| Tennessee Energy Acquisition Corp. Gas Revenue | 5.000% | 2/1/24 | 5,790 | 6,333 |
| Tennessee Energy Acquisition Corp. Gas Revenue | 5.250% | 9/1/24 | 8,060 | 8,991 |
| Tennessee Energy Acquisition Corp. Gas Revenue | 5.250% | 9/1/26 | 3,535 | 4,012 |
| Tennessee Energy Acquisition Corp. Gas Revenue | 5.000% | 2/1/27 | 16,325 | 18,152 |
| Tennessee Energy Acquisition Corp. Gas Revenue PUT | 4.000% | 11/1/25 | 17,000 | 17,598 |
| Tennessee Housing Development Agency Homeownership Program Revenue | 4.500% | 1/1/38 | 580 | 596 |
| Tennessee Housing Development Agency Residential Finance Program Revenue | 4.000% | 7/1/39 | 2,140 | 2,192 |
| | | | 120,616 |
| Texas (7.3%) | | | | |
| Austin Convention Enterprises Inc. Texas Convention Center Revenue | 5.000% | 1/1/28 | 1,200 | 1,338 |
| Austin Convention Enterprises Inc. Texas Convention Center Revenue | 5.000% | 1/1/28 | 600 | 655 |
| Austin Convention Enterprises Inc. Texas Convention Center Revenue | 5.000% | 1/1/29 | 1,175 | 1,303 |
| Austin Convention Enterprises Inc. Texas Convention Center Revenue | 5.000% | 1/1/29 | 500 | 546 |
| Austin Convention Enterprises Inc. Texas Convention Center Revenue | 5.000% | 1/1/30 | 1,025 | 1,136 |
| Austin Convention Enterprises Inc. Texas Convention Center Revenue | 5.000% | 1/1/30 | 500 | 541 |
| Austin Convention Enterprises Inc. Texas Convention Center Revenue | 5.000% | 1/1/31 | 1,200 | 1,329 |
| Austin Convention Enterprises Inc. Texas Convention Center Revenue | 5.000% | 1/1/32 | 1,100 | 1,212 |
| Austin Convention Enterprises Inc. Texas Convention Center Revenue | 5.000% | 1/1/32 | 850 | 915 |
| Austin Convention Enterprises Inc. Texas Convention Center Revenue | 5.000% | 1/1/33 | 1,800 | 1,981 |
| Austin Convention Enterprises Inc. Texas Convention Center Revenue | 5.000% | 1/1/34 | 500 | 533 |
| Austin TX Airport System Revenue | 5.000% | 11/15/26 | 1,000 | 1,106 |
| Austin TX Airport System Revenue | 5.000% | 11/15/31 | 1,035 | 1,140 |
| Austin TX Airport System Revenue | 5.000% | 11/15/33 | 1,155 | 1,261 |
| Austin TX Airport System Revenue | 5.000% | 11/15/35 | 1,255 | 1,361 |
| Austin TX Airport System Revenue | 5.000% | 11/15/37 | 1,410 | 1,521 |
| Austin TX Airport System Revenue | 5.000% | 11/15/39 | 5,890 | 6,334 |
| Austin TX Airport System Revenue | 5.000% | 11/15/41 | 4,000 | 4,287 |
| Austin TX Airport System Revenue | 5.000% | 11/15/46 | 5,015 | 5,357 |
| Brownsville TX Utility System Revenue | 4.000% | 9/1/30 | 10,000 | 10,355 |
| Central Texas Regional Mobility Authority Revenue | 6.250% | 1/1/21 (Prere.) | 1,500 | 1,624 |
| Central Texas Regional Mobility Authority Revenue | 0.000% | 1/1/32 | 4,090 | 2,391 |
| Central Texas Regional Mobility Authority Revenue | 0.000% | 1/1/33 | 3,000 | 1,663 |
| Central Texas Regional Mobility Authority Revenue | 5.000% | 1/1/33 | 6,590 | 6,978 |
| Central Texas Regional Mobility Authority Revenue | 5.000% | 1/1/33 | 1,300 | 1,404 |
| Central Texas Regional Mobility Authority Revenue | 5.000% | 1/1/34 | 1,350 | 1,453 |
| Central Texas Regional Mobility Authority Revenue | 5.000% | 1/1/35 | 1,650 | 1,793 |
| Central Texas Regional Mobility Authority Revenue | 5.000% | 1/1/36 | 1,375 | 1,489 |
| Central Texas Regional Mobility Authority Revenue | 4.000% | 1/1/41 | 6,000 | 5,794 |
| Central Texas Regional Mobility Authority Revenue | 5.000% | 1/1/43 | 750 | 791 |
| Central Texas Regional Mobility Authority Revenue | 5.000% | 1/1/45 | 1,000 | 1,070 |
361
High-Yield Tax-Exempt Fund
| | | | | |
| Face | Market |
| Maturity | Amount | Value• |
| | Coupon | Date | ($000) | ($000) |
| Central Texas Regional Mobility Authority Revenue | 5.000% | 1/1/46 | 7,000 | 7,495 |
| 5 | Conroe TX Independent School District GO TOB VRDO | 1.640% | 11/1/18 | 9,635 | 9,635 |
| Dallas TX Area Rapid Transit Sales Tax Revenue | 5.000% | 12/1/41 | 8,000 | 8,810 |
| Dallas TX Waterworks & Sewer System Revenue | 4.000% | 10/1/33 | 5,065 | 5,280 |
| Dallas TX Waterworks & Sewer System Revenue | 4.000% | 10/1/34 | 5,175 | 5,368 |
| Dallas-Fort Worth TX International Airport Revenue | 5.250% | 11/1/26 | 2,000 | 2,205 |
| Dallas-Fort Worth TX International Airport Revenue | 5.000% | 11/1/35 | 3,780 | 3,915 |
| Dallas-Fort Worth TX International Airport Revenue | 5.000% | 11/1/35 | 7,085 | 7,338 |
| Dallas-Fort Worth TX International Airport Revenue | 5.000% | 11/1/38 | 7,085 | 7,330 |
| Dallas-Fort Worth TX International Airport Revenue | 5.000% | 11/1/38 | 21,305 | 22,225 |
| Dallas-Fort Worth TX International Airport Revenue | 5.000% | 11/1/42 | 10,000 | 10,415 |
| Dallas-Fort Worth TX International Airport Revenue | 5.000% | 11/1/42 | 16,940 | 17,642 |
| Dallas-Fort Worth TX International Airport Revenue | 5.000% | 11/1/43 | 11,000 | 11,369 |
| 15 | Grand Parkway Transportation Corp. Texas System Toll Revenue | 0.000% | 10/1/34 | 19,500 | 18,068 |
| Grand Parkway Transportation Corp. Texas System Toll Revenue | 5.250% | 10/1/51 | 8,000 | 8,801 |
| Harris County TX Cultural Education Facilities Finance Corp. Hospital Revenue | | | | |
| | (Memorial Hermann Healthcare System) | 5.000% | 12/1/31 | 8,000 | 8,607 |
| Harris County TX Cultural Education Facilities Finance Corp. Revenue | | | | |
| | (YMCA of the Greater Houston Area) | 5.000% | 6/1/38 | 2,500 | 2,600 |
| Harris County TX Health Facilities Development Corp. Revenue | | | | |
| | (Methodist Hospital System) VRDO | 1.700% | 11/1/18 | 11,200 | 11,200 |
| Harris County TX Health Facilities Development Corp. Revenue | | | | |
| | (Methodist Hospital System) VRDO | 1.700% | 11/1/18 | 4,715 | 4,715 |
| Harris County TX Sports Authority Revenue | 5.000% | 11/15/31 | 500 | 541 |
| Harris County TX Sports Authority Revenue | 5.000% | 11/15/32 | 500 | 540 |
| Harris County TX Sports Authority Revenue | 5.000% | 11/15/34 | 1,100 | 1,183 |
| Hays County TX Special Assessment Revenue | 7.000% | 9/15/45 | 4,500 | 4,306 |
| Houston TX Airport System Revenue | 5.000% | 7/1/31 | 900 | 961 |
| Houston TX Airport System Revenue | 5.000% | 7/1/32 | 5,000 | 5,328 |
| Houston TX Airport System Revenue | 5.000% | 7/15/35 | 5,000 | 5,261 |
| Houston TX Airport System Special Facilities Revenue | | | | |
| | (Continental Airlines Inc. Terminal Improvement Projects) | 4.750% | 7/1/24 | 17,500 | 18,512 |
| Houston TX Airport System Special Facilities Revenue | | | | |
| | (Continental Airlines Inc. Terminal Improvement Projects) | 5.000% | 7/1/29 | 13,150 | 13,974 |
| Houston TX Airport System Special Facilities Revenue | | | | |
| | (Continental Airlines Inc. Terminal Improvement Projects) | 6.500% | 7/15/30 | 4,000 | 4,299 |
| Houston TX Utility System Revenue | 5.000% | 11/15/43 | 1,625 | 1,805 |
| Lower Colorado River Authority Texas Revenue | 5.625% | 5/15/19 (Prere.) | 5 | 5 |
| Lower Colorado River Authority Texas Revenue | 5.625% | 5/15/19 (Prere.) | 10 | 10 |
| Lower Colorado River Authority Texas Revenue | 5.625% | 5/15/19 (Prere.) | 205 | 209 |
| Lower Colorado River Authority Texas Revenue | 5.625% | 5/15/19 (Prere.) | 15 | 15 |
| Lower Colorado River Authority Texas Revenue | 5.000% | 5/15/30 | 5,000 | 5,190 |
| Lower Colorado River Authority Texas Revenue | 5.500% | 5/15/36 | 10,000 | 10,172 |
| Lower Colorado River Authority Texas Transmission Contract Revenue | | | | |
| | (LCRA Transmission Services Corp.) | 5.000% | 5/15/28 | 1,410 | 1,590 |
| Lower Colorado River Authority Texas Transmission Contract Revenue | | | | |
| | (LCRA Transmission Services Corp.) | 5.000% | 5/15/29 | 1,035 | 1,160 |
| Lower Colorado River Authority Texas Transmission Contract Revenue | | | | |
| | (LCRA Transmission Services Corp.) | 5.000% | 5/15/30 | 1,385 | 1,545 |
| Lower Colorado River Authority Texas Transmission Contract Revenue | | | | |
| | (LCRA Transmission Services Corp.) | 5.000% | 5/15/45 | 9,500 | 10,257 |
| Mesquite TX Health Facilities Development Corp. Retirement Facility Revenue | | | | |
| | (Christian Care Centers Inc. Project) | 5.125% | 2/15/42 | 2,750 | 2,778 |
| New Hope TX Cultural Education Facilities Finance Corp. First Mortgage Revenue | | | | |
| | (Legacy Preparatory Charter Academy) | 6.000% | 8/15/37 | 3,500 | 3,562 |
| New Hope TX Cultural Education Facilities Finance Corp. First Mortgage Revenue | | | | |
| | (Legacy Preparatory Charter Academy) | 6.000% | 8/15/47 | 3,500 | 3,524 |
| New Hope TX Cultural Education Facilities Finance Corp. First Mortgage Revenue | | | | |
| | (Morningside Ministries Project) | 6.500% | 1/1/43 | 4,370 | 4,752 |
| New Hope TX Cultural Education Facilities Finance Corp. Hospital Revenue | | | | |
| | (Children’s Health System of Texas Obligated Group) | 4.000% | 8/15/36 | 3,750 | 3,780 |
| New Hope TX Cultural Education Facilities Finance Corp. Hospital Revenue | | | | |
| | (Children’s Health System of Texas Obligated Group) | 4.000% | 8/15/37 | 2,500 | 2,509 |
| New Hope TX Cultural Education Facilities Finance Corp. Retirement Facilities Revenue | | | | |
| | (Carillon Life Care Community Project) | 5.000% | 7/1/36 | 2,220 | 2,244 |
| New Hope TX Cultural Education Facilities Finance Corp. Retirement Facilities Revenue | | | | |
| | (Carillon Life Care Community Project) | 5.000% | 7/1/46 | 2,250 | 2,251 |
| New Hope TX Cultural Education Facilities Finance Corp. Retirement Facilities Revenue | | | | |
| | (Legacy at Midtown Park Inc. Obligated Group) | 5.500% | 7/1/54 | 9,180 | 8,820 |
362
High-Yield Tax-Exempt Fund
| | | | | |
| Face | Market |
| Maturity | Amount | Value• |
| | Coupon | Date | ($000) | ($000) |
| New Hope TX Cultural Education Facilities Finance Corp. Retirement Facilities Revenue | | | | |
| | (Legacy at Willow Bend Retirement Community Project) | 5.000% | 11/1/36 | 4,605 | 4,736 |
| New Hope TX Cultural Education Facilities Finance Corp. Retirement Facilities Revenue | | | | |
| | (Legacy at Willow Bend Retirement Community Project) | 5.000% | 11/1/46 | 3,000 | 3,043 |
| New Hope TX Cultural Education Facilities Finance Corp. Retirement Facilities Revenue | | | | |
| | (Legacy at Willow Bend Retirement Community Project) | 5.000% | 11/1/51 | 4,750 | 4,803 |
| New Hope TX Cultural Education Facilities Finance Corp. Retirement Facilities Revenue | | | | |
| | (MRC Crestview Project) | 3.000% | 11/15/21 | 30 | 30 |
| New Hope TX Cultural Education Facilities Finance Corp. Retirement Facilities Revenue | | | | |
| | (MRC Crestview Project) | 5.000% | 11/15/31 | 850 | 892 |
| New Hope TX Cultural Education Facilities Finance Corp. Retirement Facilities Revenue | | | | |
| | (MRC Crestview Project) | 5.000% | 11/15/36 | 550 | 570 |
| New Hope TX Cultural Education Facilities Finance Corp. Retirement Facilities Revenue | | | | |
| | (MRC Crestview Project) | 5.000% | 11/15/46 | 3,200 | 3,274 |
| New Hope TX Cultural Education Facilities Finance Corp. Retirement Facilities Revenue | | | | |
| | (MRC Crestview Project) | 5.500% | 11/15/46 | 1,500 | 1,477 |
| New Hope TX Cultural Education Facilities Finance Corp. Retirement Facilities Revenue | | | | |
| | (MRC Crestview Project) | 5.500% | 11/15/52 | 1,150 | 1,122 |
| New Hope TX Cultural Education Facilities Finance Corp. Retirement Facilities Revenue | | | | |
| | (Westminster Manor Project) | 5.000% | 11/1/31 | 1,000 | 1,074 |
| New Hope TX Cultural Education Facilities Finance Corp. Retirement Facilities Revenue | | | | |
| | (Westminster Manor Project) | 5.000% | 11/1/40 | 1,000 | 1,059 |
| New Hope TX Cultural Education Facilities Finance Corp. Student Housing Revenue | | | | |
| | (Children’s Health System of Texas Project) | 4.000% | 8/15/35 | 3,000 | 3,042 |
| New Hope TX Cultural Education Facilities Finance Corp. Student Housing Revenue | | | | |
| | (Tarleton State University Project) | 5.000% | 4/1/35 | 1,500 | 1,567 |
| New Hope TX Cultural Education Facilities Finance Corp. Student Housing Revenue | | | | |
| | (Tarleton State University Project) | 5.000% | 4/1/47 | 4,000 | 4,126 |
| New Hope TX Cultural Education Facilities Finance Corp. Student Housing Revenue | | | | |
| | (Texas A&M University Project) | 5.000% | 7/1/35 | 4,200 | 3,628 |
| New Hope TX Cultural Education Facilities Finance Corp. Student Housing Revenue | | | | |
| | (Texas A&M University Project) | 5.000% | 7/1/47 | 21,370 | 18,280 |
| North East TX Regional Mobility Authority Revenue | 5.000% | 1/1/41 | 5,860 | 6,229 |
| North East TX Regional Mobility Authority Revenue | 5.000% | 1/1/41 | 990 | 1,046 |
| North East TX Regional Mobility Authority Revenue | 5.000% | 1/1/46 | 7,700 | 8,160 |
| North East TX Regional Mobility Authority Revenue | 5.000% | 1/1/46 | 4,150 | 4,372 |
| North Texas Tollway Authority System Revenue | 6.000% | 1/1/19 (Prere.) | 7,350 | 7,398 |
| North Texas Tollway Authority System Revenue | 6.250% | 1/1/19 (Prere.) | 12,585 | 12,672 |
| North Texas Tollway Authority System Revenue | 5.000% | 9/1/21 (Prere.) | 7,000 | 7,511 |
| North Texas Tollway Authority System Revenue | 6.000% | 9/1/21 (Prere.) | 5,000 | 5,501 |
| North Texas Tollway Authority System Revenue | 6.250% | 2/1/23 | 20,000 | 20,894 |
| North Texas Tollway Authority System Revenue | 6.000% | 1/1/28 | 1,705 | 1,715 |
| North Texas Tollway Authority System Revenue | 5.000% | 1/1/30 | 10,000 | 11,035 |
| North Texas Tollway Authority System Revenue | 5.000% | 1/1/32 | 13,020 | 13,897 |
| North Texas Tollway Authority System Revenue | 5.000% | 1/1/35 | 4,500 | 5,207 |
| North Texas Tollway Authority System Revenue | 5.000% | 1/1/39 | 5,000 | 5,501 |
| North Texas Tollway Authority System Revenue | 5.000% | 1/1/48 | 13,200 | 14,309 |
| North Texas Tollway Authority System Revenue | 5.000% | 1/1/48 | 35,700 | 38,215 |
| Red River TX Education Finance Corp. Revenue (Edwards University Project) | 5.000% | 6/1/46 | 2,250 | 2,379 |
| Red River TX Education Finance Corp. Revenue (Houston Baptist University Project) | 5.500% | 10/1/46 | 4,250 | 4,577 |
| SA Energy Acquisition Public Facility Corp. Texas Gas Supply Revenue | 5.500% | 8/1/20 | 1,180 | 1,241 |
| SA Energy Acquisition Public Facility Corp. Texas Gas Supply Revenue | 5.500% | 8/1/24 | 7,790 | 8,784 |
| San Antonio TX Electric & Gas Systems Revenue | 5.000% | 2/1/47 | 4,755 | 5,215 |
| San Antonio TX Electric & Gas Systems Revenue | 5.000% | 2/1/48 | 30,000 | 32,139 |
| San Antonio TX Energy Acquisition Public Facility Corp. Texas Gas Supply Revenue | 5.500% | 8/1/25 | 1,000 | 1,139 |
| San Antonio TX GO | 4.000% | 8/1/34 | 4,060 | 4,189 |
| Tarrant County TX Cultural Education Facilities Finance Corp. Hospital Revenue | | | | |
| | (Air Force Villages Project) | 5.000% | 5/15/37 | 6,000 | 6,124 |
| Tarrant County TX Cultural Education Facilities Finance Corp. Retirement Facilities Revenue | | | | |
| | (Buckner Senior Living Inc.) | 4.500% | 11/15/23 | 6,500 | 6,511 |
| Tarrant County TX Cultural Education Facilities Finance Corp. Retirement Facilities Revenue | | | | |
| | (Buckner Senior Living Inc.) | 6.750% | 11/15/47 | 2,000 | 2,167 |
| Tarrant County TX Cultural Education Facilities Finance Corp. Retirement Facilities Revenue | | | | |
| | (Buckner Senior Living Inc.) | 6.750% | 11/15/52 | 2,500 | 2,700 |
| 14 | Tarrant County TX Cultural Education Facilities Finance Corp. Retirement Facilities Revenue | | | | |
| | (CorpusChristi, Mirador Senior Living Inc.) | 4.125% | 11/15/28 | 2,825 | 1,970 |
| Tarrant County TX Cultural Education Facilities Finance Corp. Retirement Facilities Revenue | | | | |
| | (Stayton at Museum Way Project) | 8.250% | 11/15/44 | 3,000 | 2,905 |
| Texas Municipal Gas Acquisition & Supply Corp. Revenue | 5.000% | 12/15/21 | 1,120 | 1,199 |
| Texas Municipal Gas Acquisition & Supply Corp. Revenue | 5.000% | 12/15/23 | 1,170 | 1,272 |
363
High-Yield Tax-Exempt Fund
| | | | | |
| Face | Market |
| Maturity | Amount | Value• |
| | Coupon | Date | ($000) | ($000) |
| Texas Municipal Gas Acquisition & Supply Corp. Revenue | 5.000% | 12/15/24 | 1,645 | 1,784 |
| Texas Municipal Gas Acquisition & Supply Corp. Revenue | 5.250% | 12/15/24 | 7,500 | 8,423 |
| Texas Municipal Gas Acquisition & Supply Corp. Revenue | 5.000% | 12/15/25 | 16,500 | 17,842 |
| Texas Municipal Gas Acquisition & Supply Corp. Revenue | 5.000% | 12/15/26 | 3,050 | 3,287 |
| Texas Municipal Gas Acquisition & Supply Corp. Revenue | 5.250% | 12/15/26 | 6,995 | 7,981 |
| Texas Municipal Gas Acquisition & Supply Corp. Revenue | 6.250% | 12/15/26 | 14,935 | 17,028 |
| Texas Municipal Gas Acquisition & Supply Corp. Revenue | 5.000% | 12/15/27 | 3,650 | 3,922 |
| Texas Municipal Gas Acquisition & Supply Corp. Revenue | 5.000% | 12/15/28 | 2,970 | 3,179 |
| Texas Municipal Gas Acquisition & Supply Corp. Revenue | 5.000% | 12/15/29 | 4,355 | 4,648 |
| Texas Municipal Gas Acquisition & Supply Corp. Revenue | 5.000% | 12/15/30 | 425 | 452 |
| Texas Municipal Gas Acquisition & Supply Corp. Revenue | 5.000% | 12/15/32 | 6,480 | 6,875 |
| Texas Private Activity Surface Transportation Corp. Revenue | 7.500% | 12/31/31 | 3,705 | 3,909 |
| Texas Private Activity Surface Transportation Corp. Revenue | 7.500% | 6/30/32 | 20,000 | 21,501 |
| Texas Private Activity Surface Transportation Corp. Revenue | 7.500% | 6/30/33 | 10,000 | 10,749 |
| Texas Private Activity Surface Transportation Corp. Revenue | 7.000% | 12/31/38 | 13,175 | 15,233 |
| Texas Private Activity Surface Transportation Corp. Revenue | 6.875% | 12/31/39 | 23,525 | 24,592 |
| Texas Private Activity Surface Transportation Corp. Revenue | 7.000% | 6/30/40 | 2,640 | 2,811 |
| Texas Private Activity Surface Transportation Corp. Revenue | 6.750% | 6/30/43 | 24,790 | 28,281 |
| Texas Private Activity Surface Transportation Corp. Revenue (Blueridge Transportation Group) | 5.000% | 12/31/40 | 4,450 | 4,665 |
| Texas Private Activity Surface Transportation Corp. Revenue (Blueridge Transportation Group) | 5.000% | 12/31/45 | 5,000 | 5,226 |
| Texas Private Activity Surface Transportation Corp. Revenue (Blueridge Transportation Group) | 5.000% | 12/31/50 | 6,000 | 6,260 |
| Texas Transportation Commission Turnpike System Revenue | 5.000% | 8/15/33 | 6,280 | 6,695 |
| Texas Transportation Commission Turnpike System Revenue | 5.000% | 8/15/34 | 31,900 | 33,921 |
| Texas Transportation Commission Turnpike System Revenue | 5.000% | 8/15/37 | 17,925 | 18,908 |
| Texas Water Development Board Revenue | 4.000% | 10/15/33 | 5,010 | 5,205 |
| West Travis County TX Public Utility Agency Revenue | 4.000% | 8/15/35 (15) | 1,600 | 1,627 |
| West Travis County TX Public Utility Agency Revenue | 4.000% | 8/15/37 (15) | 1,500 | 1,511 |
| West Travis County TX Public Utility Agency Revenue | 4.000% | 8/15/41 (15) | 2,750 | 2,730 |
| West Travis County TX Public Utility Agency Revenue | 4.000% | 8/15/45 (15) | 1,700 | 1,670 |
| Westlake TX Special Assessment Revenue | 6.250% | 9/1/40 | 2,500 | 2,447 |
| Westlake TX Special Assessment Revenue | 6.375% | 9/1/45 | 2,500 | 2,454 |
| | | | | 941,474 |
| Utah (1.0%) | | | | |
| Salt Lake City UT Airport Revenue | 5.000% | 7/1/42 | 16,000 | 17,209 |
| Salt Lake City UT Airport Revenue | 5.000% | 7/1/47 | 28,000 | 30,010 |
| Salt Lake City UT Airport Revenue | 5.000% | 7/1/48 | 7,500 | 8,102 |
| Utah Associated Municipal Power Systems Revenue (Horse Butte Wind Project) | 5.000% | 9/1/22 (Prere.) | 4,475 | 4,907 |
| Utah Associated Municipal Power Systems Revenue (Horse Butte Wind Project) | 5.000% | 9/1/22 (Prere.) | 3,700 | 4,057 |
| Utah Associated Municipal Power Systems Revenue (Horse Butte Wind Project) | 5.000% | 9/1/22 (Prere.) | 4,685 | 5,137 |
| Utah Associated Municipal Power Systems Revenue (Horse Butte Wind Project) | 5.000% | 9/1/22 (Prere.) | 3,500 | 3,838 |
| Utah County UT Hospital Revenue (IHC Health Services) | 5.000% | 5/15/41 | 16,500 | 18,070 |
| Utah Transit Authority Sales Tax Revenue | 5.000% | 6/15/22 (Prere.) | 4,805 | 5,267 |
| Utah Transit Authority Sales Tax Revenue | 4.000% | 12/15/29 | 1,265 | 1,321 |
| Utah Transit Authority Sales Tax Revenue | 4.000% | 12/15/30 | 4,500 | 4,664 |
| Utah Transit Authority Sales Tax Revenue | 4.000% | 12/15/31 | 4,000 | 4,130 |
| Utah Transit Authority Sales Tax Revenue | 5.000% | 12/15/40 (15) | 17,100 | 18,929 |
| | | | | 125,641 |
| Vermont (0.3%) | | | | |
| Vermont Educational & Health Buildings Financing Agency Revenue (Champlain College Project) | 5.000% | 10/15/41 | 6,800 | 7,146 |
| Vermont Educational & Health Buildings Financing Agency Revenue (Champlain College Project) | 5.000% | 10/15/46 | 5,800 | 6,075 |
| Vermont Educational & Health Buildings Financing Agency Revenue | | | | |
| | (University of Vermont Health Network) | 5.000% | 12/1/37 | 1,500 | 1,641 |
| Vermont Educational & Health Buildings Financing Agency Revenue | | | | |
| | (University of Vermont Health Network) | 5.000% | 12/1/38 | 1,785 | 1,948 |
| Vermont Educational & Health Buildings Financing Agency Revenue | | | | |
| | (University of Vermont Health Network) | 5.000% | 12/1/39 | 1,130 | 1,231 |
| Vermont Housing Finance Agency Revenue | 4.125% | 11/1/42 | 775 | 787 |
| Vermont Student Assistance Corp. Education Loan Revenue | 5.000% | 6/15/25 | 1,010 | 1,093 |
| Vermont Student Assistance Corp. Education Loan Revenue | 5.000% | 6/15/26 | 1,375 | 1,489 |
| Vermont Student Assistance Corp. Education Loan Revenue | 5.000% | 6/15/27 | 850 | 913 |
| Vermont Student Assistance Corp. Education Loan Revenue | 5.000% | 6/15/28 | 1,325 | 1,415 |
| Vermont Student Assistance Corp. Education Loan Revenue | 4.000% | 6/15/31 | 1,250 | 1,220 |
| Vermont Student Assistance Corp. Education Loan Revenue | 4.000% | 6/15/32 | 1,250 | 1,213 |
| 11 | Vermont Student Assistance Corp. Education Loan Revenue | 5.398% | 12/3/35 | 10,000 | 10,406 |
| | | | | 36,577 |
| Virgin Islands (0.1%) | | | | |
| Virgin Islands Port Authority Marine Revenue | 5.000% | 9/1/29 | 3,500 | 3,465 |
| Virgin Islands Port Authority Marine Revenue | 5.000% | 9/1/33 | 4,695 | 4,601 |
| Virgin Islands Port Authority Marine Revenue | 5.000% | 9/1/44 | 1,910 | 1,700 |
364
High-Yield Tax-Exempt Fund
| | | | | |
| Face | Market |
| Maturity | Amount | Value• |
| | Coupon | Date | ($000) | ($000) |
| Virgin Islands Public Finance Authority Revenue | 5.000% | 9/1/30 | 5,000 | 5,187 |
| Virgin Islands Public Finance Authority Revenue | 5.000% | 9/1/33 | 3,000 | 3,086 |
| | | | | 18,039 |
| Virginia (2.0%) | | | | |
| Alexandria VA Redevelopment & Housing Authority Multi-Family Housing Mortgage Revenue | | | | |
| | (Portals West Apartment) | 8.250% | 4/1/32 (ETM) | 385 | 498 |
| Ballston Quarter VA Community Development Authority Revenue | 5.500% | 3/1/46 | 2,500 | 2,556 |
| Chesapeake Bay VA Bridge & Tunnel District Revenue | 5.000% | 7/1/51 | 13,500 | 14,401 |
| 16 | Chesapeake VA Toll Road Revenue | 0.000% | 7/15/40 | 7,800 | 6,567 |
| Chesterfield County VA Economic Development Authority Retirement Facilities Revenue | | | | |
| | (Brandermill Woods Project) | 5.125% | 1/1/43 | 4,750 | 4,834 |
| Fairfax County VA Industrial Development Authority Health Care Revenue | | | | |
| | (Inova Health System Obligated Group) | 4.000% | 5/15/48 | 5,000 | 4,881 |
| Fredericksburg VA Economic Development Authority Hospital Facilities Revenue | | | | |
| | (Mary Washington Healthcare Obligated Group) | 5.000% | 6/15/29 | 1,425 | 1,546 |
| Fredericksburg VA Economic Development Authority Hospital Facilities Revenue | | | | |
| | (Mary Washington Healthcare Obligated Group) | 5.000% | 6/15/30 | 2,000 | 2,164 |
| Fredericksburg VA Economic Development Authority Hospital Facilities Revenue | | | | |
| | (Mary Washington Healthcare Obligated Group) | 5.000% | 6/15/31 | 1,155 | 1,248 |
| Fredericksburg VA Economic Development Authority Hospital Facilities Revenue | | | | |
| | (Mary Washington Healthcare Obligated Group) | 5.000% | 6/15/33 | 1,000 | 1,075 |
| Hanover County VA Economic Development Authority Residential Care Facility Revenue | | | | |
| | (Covenant Woods) | 5.000% | 7/1/42 | 5,550 | 5,603 |
| Hanover County VA Economic Development Authority Residential Care Facility Revenue | | | | |
| | (Covenant Woods) | 5.000% | 7/1/48 | 1,435 | 1,458 |
| Hanover County VA Economic Development Authority Residential Care Facility Revenue | | | | |
| | (Covenant Woods) | 5.000% | 7/1/51 | 1,690 | 1,714 |
| Lexington VA Industrial Development Authority Residential Care Facility Revenue | | | | |
| | (Kendall at Lexington Corp.) | 4.000% | 1/1/31 | 750 | 752 |
| Newport News VA Economical Development Authority Residential Care Facilities Revenue | 5.000% | 12/1/31 | 5,000 | 5,246 |
| Newport News VA Economical Development Authority Residential Care Facilities Revenue | 5.000% | 12/1/38 | 10,000 | 10,312 |
| 5 | Newport News VA Industrial Development Authority Health System Revenue | 5.330% | 7/1/45 | 17,000 | 17,468 |
| Peninsula Town Center Community Development Authority VA Revenue | 5.000% | 9/1/45 | 2,300 | 2,361 |
| Prince William County VA Industrial Development Agency Revenue | | | | |
| | (Westminster Presbyterian Retirement Community Inc.) | 5.000% | 1/1/31 | 1,700 | 1,804 |
| Prince William County VA Industrial Development Agency Revenue | | | | |
| | (Westminster Presbyterian Retirement Community Inc.) | 5.000% | 1/1/37 | 1,000 | 1,045 |
| Prince William County VA Industrial Development Agency Revenue | | | | |
| | (Westminster Presbyterian Retirement Community Inc.) | 5.000% | 1/1/46 | 4,000 | 4,143 |
| Virginia College Building Authority Educational Facilities Revenue (Marymount University Project) | 5.250% | 7/1/30 | 1,000 | 1,059 |
| Virginia College Building Authority Educational Facilities Revenue (Marymount University Project) | 5.000% | 7/1/35 | 1,295 | 1,333 |
| Virginia College Building Authority Educational Facilities Revenue (Marymount University Project) | 5.250% | 7/1/35 | 2,000 | 2,087 |
| Virginia College Building Authority Educational Facilities Revenue (Marymount University Project) | 5.000% | 7/1/45 | 1,755 | 1,785 |
| Virginia College Building Authority Educational Facilities Revenue (Marymount University Project) | 5.000% | 7/1/45 | 8,000 | 8,135 |
| Virginia Commonwealth Transportation Board Revenue | 4.000% | 5/15/33 | 11,465 | 11,902 |
| Virginia Small Business Financing Authority Revenue (Elizabeth River Crossings Project) | 5.250% | 1/1/32 | 12,670 | 13,443 |
| Virginia Small Business Financing Authority Revenue (Elizabeth River Crossings Project) | 6.000% | 1/1/37 | 12,310 | 13,394 |
| Virginia Small Business Financing Authority Revenue (Elizabeth River Crossings Project) | 5.500% | 1/1/42 | 13,350 | 14,235 |
| Virginia Small Business Financing Authority Revenue (Express Lanes LLC) | 5.000% | 7/1/34 | 15,000 | 15,709 |
| Virginia Small Business Financing Authority Revenue (Express Lanes LLC) | 5.000% | 7/1/34 | 11,500 | 12,046 |
| Virginia Small Business Financing Authority Revenue (Transform 66 P3 Project) | 5.000% | 12/31/52 | 8,000 | 8,360 |
| Virginia Small Business Financing Authority Revenue (Transform 66 P3 Project) | 5.000% | 12/31/56 | 54,075 | 56,348 |
| | | | | 251,512 |
| Washington (1.6%) | | | | |
| Chelan County WA Public Utility District No. 1 Consolidated System Revenue (Chelan Hydro) | 5.500% | 7/1/25 | 2,500 | 2,685 |
| Chelan County WA Public Utility District No. 1 Consolidated System Revenue (Chelan Hydro) | 5.500% | 7/1/26 | 4,000 | 4,296 |
| Port of Seattle WA Revenue | 5.000% | 9/1/25 | 3,000 | 3,191 |
| Port of Seattle WA Revenue | 5.000% | 5/1/29 | 4,000 | 4,478 |
| Port of Seattle WA Revenue | 5.000% | 5/1/30 | 9,215 | 10,266 |
| Port of Seattle WA Revenue | 5.000% | 5/1/31 | 8,000 | 8,875 |
| Port of Seattle WA Revenue | 5.000% | 4/1/33 | 2,500 | 2,714 |
| Port of Seattle WA Revenue | 5.000% | 5/1/33 | 5,500 | 6,059 |
| Port of Seattle WA Revenue | 5.000% | 5/1/34 | 2,500 | 2,747 |
| Port of Seattle WA Revenue | 5.000% | 4/1/35 | 6,150 | 6,646 |
| Port of Seattle WA Revenue | 5.000% | 5/1/35 | 10,000 | 10,948 |
| Port of Seattle WA Revenue | 5.000% | 5/1/35 | 3,680 | 4,029 |
| Port of Seattle WA Revenue | 5.000% | 4/1/40 | 5,000 | 5,353 |
| Port of Tacoma WA Revenue | 5.000% | 12/1/37 | 8,835 | 9,618 |
| Port of Tacoma WA Revenue | 5.000% | 12/1/38 | 9,275 | 10,070 |
365
High-Yield Tax-Exempt Fund
| | | | |
| Face | Market |
| Maturity | Amount | Value• |
| Coupon | Date | ($000) | ($000) |
| Seattle WA Municipal Light & Power Revenue | 4.000% | 1/1/47 | 13,360 | 13,270 |
| Snohomish County WA School District No. 4 (Lake Stevens) GO | 4.000% | 12/1/29 | 1,785 | 1,888 |
| Tobacco Settlement Authority Washington Revenue | 5.250% | 6/1/31 | 5,000 | 5,185 |
| Washington Economic Development Finance Authority Environmental Facilities Revenue | | | | |
| (Columbia Pulp) | 7.500% | 1/1/32 | 4,000 | 4,466 |
| Washington GO | 5.000% | 2/1/39 | 19,435 | 21,262 |
| Washington Health Care Facilities Authority Revenue | | | | |
| (Central Washington Health Services Association) | 5.000% | 7/1/39 | 4,500 | 4,739 |
| Washington Health Care Facilities Authority Revenue (Seattle Cancer Care Alliance) | 5.000% | 3/1/38 | 10,010 | 10,697 |
| Washington Higher Education Facilities Authority Revenue (Seattle University Project) | 5.250% | 5/1/19 (Prere.) | 5,000 | 5,081 |
| Washington Higher Education Facilities Authority Revenue (Seattle University Project) | 4.000% | 5/1/37 | 4,735 | 4,783 |
| Washington Higher Education Facilities Authority Revenue (Seattle University Project) | 4.000% | 5/1/38 | 4,720 | 4,744 |
| Washington Higher Education Facilities Authority Revenue (Whitworth University Project) | 5.000% | 10/1/40 | 4,040 | 4,236 |
| Washington Housing Finance Commission Multi-Family Housing Revenue | | | | |
| (Heron’s Key Obligated Group) | 6.750% | 7/1/35 | 820 | 871 |
| Washington Housing Finance Commission Multi-Family Housing Revenue | | | | |
| (Heron’s Key Obligated Group) | 7.000% | 7/1/45 | 2,000 | 2,124 |
| Washington Housing Finance Commission Multi-Family Housing Revenue | | | | |
| (Heron’s Key Obligated Group) | 7.000% | 7/1/50 | 2,000 | 2,118 |
| Washington Housing Finance Commission Multi-Family Housing Revenue | | | | |
| (Presbyterian Retirement Communities Northwest Obligated Group) | 5.000% | 1/1/36 | 2,125 | 2,226 |
| Washington Housing Finance Commission Multi-Family Housing Revenue | | | | |
| (Presbyterian Retirement Communities Northwest Obligated Group) | 5.000% | 1/1/46 | 4,500 | 4,664 |
| Washington Housing Finance Commission Multi-Family Housing Revenue | �� | | | |
| (Presbyterian Retirement Communities Northwest Obligated Group) | 5.000% | 1/1/51 | 7,300 | 7,542 |
| Washington Housing Finance Commission Revenue (Wesley Homes Lea Hill Project) | 5.000% | 7/1/31 | 1,910 | 1,971 |
| Washington Housing Finance Commission Revenue (Wesley Homes Lea Hill Project) | 5.000% | 7/1/36 | 1,000 | 1,018 |
| Washington Housing Finance Commission Revenue (Wesley Homes Lea Hill Project) | 5.000% | 7/1/41 | 1,100 | 1,110 |
| Washington Housing Finance Commission Revenue (Wesley Homes Lea Hill Project) | 5.000% | 7/1/46 | 2,500 | 2,516 |
| Washington Housing Finance Commission Revenue (Wesley Homes Lea Hill Project) | 5.000% | 7/1/51 | 3,800 | 3,812 |
| | | | 202,298 |
| West Virginia (0.5%) | | | | |
| Harrison County WV County Commission Revenue (Monogahela Power Company) PUT | 3.000% | 10/15/21 | 10,000 | 9,919 |
| 5 Monongalia County WV Commission Special District Excise Tax Revenue | | | | |
| (Monongalia County Commission Special District) | 4.500% | 6/1/27 | 2,000 | 1,960 |
| West Virginia Economic Development Authority Solid Waste Facilities Disposal Revenue | | | | |
| (Appalachian Power Co. - Amos Project) | 5.375% | 12/1/38 | 2,500 | 2,632 |
| West Virginia Hospital Finance Authority Hospital Revenue (Charleston Area Medical Center Inc.) | 5.625% | 9/1/32 | 6,000 | 6,137 |
| West Virginia Hospital Finance Authority Hospital Revenue | | | | |
| (United Health System Obligated Group) | 5.500% | 6/1/19 (Prere.) | 400 | 408 |
| West Virginia Hospital Finance Authority Hospital Revenue | | | | |
| (United Health System Obligated Group) | 5.375% | 6/1/38 | 5,130 | 5,527 |
| West Virginia Hospital Finance Authority Hospital Revenue | | | | |
| (United Health System Obligated Group) | 5.500% | 6/1/44 | 5,000 | 5,382 |
| West Virginia Hospital Finance Authority Hospital Revenue | | | | |
| (United Health System Obligated Group) | 4.000% | 6/1/51 | 7,500 | 6,814 |
| West Virginia Hospital Finance Authority Hospital Revenue | | | | |
| (United Health System Obligated Group) | 5.000% | 6/1/52 | 7,500 | 7,908 |
| West Virginia Hospital Finance Authority Hospital Revenue (Valley Health System Obligated Group) | 5.000% | 1/1/44 | 2,250 | 2,356 |
| West Virginia Hospital Finance Authority Hospital Revenue (Valley Health System Obligated Group) | 5.000% | 1/1/44 | 2,000 | 2,089 |
| West Virginia Hospital Finance Authority Hospital Revenue | | | | |
| (West Virginia University Health System Obligated Group) | 5.000% | 6/1/47 | 6,985 | 7,384 |
| West Virginia Parkways Authority Turnpike Toll Revenue | 5.000% | 6/1/39 | 1,135 | 1,268 |
| West Virginia Parkways Authority Turnpike Toll Revenue | 5.000% | 6/1/43 | 5,000 | 5,559 |
| | | | 65,343 |
| Wisconsin (2.5%) | | | | |
| Platteville WI Redevelopment Authority Revenue (Platteville Real Estate) | 5.000% | 7/1/42 | 3,000 | 3,054 |
| Wisconsin General Fund Annual Appropriation Revenue | 6.000% | 5/1/19 (Prere.) | 1,610 | 1,643 |
| Wisconsin Health & Educational Facilities Authority Revenue (Agnesian HealthCare Inc.) | 5.500% | 7/1/20 (Prere.) | 5,675 | 5,980 |
| Wisconsin Health & Educational Facilities Authority Revenue (Aurora Health Care Inc.) | 5.625% | 4/15/20 (Prere.) | 10,810 | 11,347 |
| Wisconsin Health & Educational Facilities Authority Revenue (Beloit College) | 5.000% | 7/1/33 | 1,105 | 1,088 |
| Wisconsin Health & Educational Facilities Authority Revenue (Beloit College) | 5.000% | 7/1/36 | 625 | 603 |
| Wisconsin Health & Educational Facilities Authority Revenue (Beloit College) | 5.000% | 7/1/39 | 1,550 | 1,470 |
| Wisconsin Health & Educational Facilities Authority Revenue (Benevolent Corp. Cedar Community) | 5.000% | 6/1/37 | 1,110 | 1,128 |
| Wisconsin Health & Educational Facilities Authority Revenue (Benevolent Corp. Cedar Community) | 5.000% | 6/1/41 | 955 | 967 |
| Wisconsin Health & Educational Facilities Authority Revenue | | | | |
| (Children’s Hospital of Wisconsin Inc.) | 5.375% | 2/15/20 (Prere.) | 5,000 | 5,207 |
| Wisconsin Health & Educational Facilities Authority Revenue | | | | |
| (Children’s Hospital of Wisconsin Inc.) | 4.000% | 8/15/36 | 4,715 | 4,725 |
366
High-Yield Tax-Exempt Fund
| | | | | |
| Face | Market |
| Maturity | Amount | Value• |
| | Coupon | Date | ($000) | ($000) |
| Wisconsin Health & Educational Facilities Authority Revenue | | | | |
| | (Children’s Hospital of Wisconsin Inc.) | 4.000% | 8/15/37 | 5,905 | 5,905 |
| Wisconsin Health & Educational Facilities Authority Revenue (Gundersen Lutheran) | 5.250% | 10/15/39 | 6,765 | 7,157 |
| Wisconsin Health & Educational Facilities Authority Revenue (Marquette University) | 5.000% | 10/1/46 | 20,425 | 21,870 |
| Wisconsin Health & Educational Facilities Authority Revenue (Ministry Health Care Inc.) | 5.000% | 8/15/22 (Prere.) | 5,500 | 6,016 |
| Wisconsin Health & Educational Facilities Authority Revenue (ProHealth Care Obligated Group) | 5.000% | 8/15/39 | 20,000 | 21,235 |
| Wisconsin Health & Educational Facilities Authority Revenue (Senior Housing Inc.) | 5.250% | 8/1/48 | 10,000 | 9,764 |
| Wisconsin Health & Educational Facilities Authority Revenue (ThedaCare Inc. Obligated Group) | 5.000% | 12/15/34 | 9,300 | 9,967 |
| Wisconsin Health & Educational Facilities Authority Revenue (ThedaCare Inc. Obligated Group) | 5.000% | 12/15/44 | 3,155 | 3,305 |
| Wisconsin Public Finance Authority Airport Facilities Revenue (AFCO Investors II Portfolio) | 5.000% | 10/1/23 | 5,600 | 5,608 |
| Wisconsin Public Finance Authority Airport Facilities Revenue (TRIPS Obligated Group) | 5.000% | 7/1/22 | 7,590 | 7,958 |
| Wisconsin Public Finance Authority Airport Facilities Revenue (TRIPS Obligated Group) | 5.250% | 7/1/28 | 3,050 | 3,282 |
| Wisconsin Public Finance Authority Airport Facilities Revenue (TRIPS Obligated Group) | 5.250% | 7/1/28 | 12,000 | 12,745 |
| Wisconsin Public Finance Authority Airport Facilities Revenue (TRIPS Obligated Group) | 5.000% | 7/1/42 | 4,500 | 4,666 |
| Wisconsin Public Finance Authority Airport Facilities Revenue (TRIPS Obligated Group) | 5.000% | 7/1/42 | 6,825 | 7,086 |
| Wisconsin Public Finance Authority CCRC Revenue (Glenridge on Palmer Ranch Inc. Project) | 8.250% | 6/1/46 | 14,500 | 16,323 |
| Wisconsin Public Finance Authority Exempt Facilities Revenue (National Gypsum Co.) | 5.250% | 4/1/30 | 10,000 | 10,460 |
| Wisconsin Public Finance Authority Exempt Facilities Revenue (National Gypsum Co.) | 4.000% | 8/1/35 | 7,000 | 6,536 |
| Wisconsin Public Finance Authority Higher Educational Facilities Revenue | | | | |
| | (Gannon University Project) | 5.000% | 5/1/42 | 1,100 | 1,146 |
| Wisconsin Public Finance Authority Higher Educational Facilities Revenue | | | | |
| | (Gannon University Project) | 5.000% | 5/1/47 | 1,100 | 1,142 |
| Wisconsin Public Finance Authority Hospital Revenue (Renown Regional Medical Center) | 5.000% | 6/1/31 | 3,000 | 3,284 |
| Wisconsin Public Finance Authority Hospital Revenue (Renown Regional Medical Center) | 5.000% | 6/1/32 | 4,745 | 5,180 |
| Wisconsin Public Finance Authority Retirement Facilities First Mortgage Revenue (Whitestone) | 5.000% | 3/1/37 | 625 | 655 |
| Wisconsin Public Finance Authority Retirement Facilities First Mortgage Revenue (Whitestone) | 5.000% | 3/1/52 | 1,800 | 1,862 |
| 5 | Wisconsin Public Finance Authority Revenue (Alabama Proton Therapy Center) | 6.850% | 10/1/47 | 4,500 | 4,211 |
| Wisconsin Public Finance Authority Revenue (American Dream at the Meadowlands Project) | 6.250% | 8/1/27 | 10,000 | 10,444 |
| Wisconsin Public Finance Authority Revenue (American Dream at the Meadowlands Project) | 5.000% | 12/1/27 | 12,000 | 12,443 |
| Wisconsin Public Finance Authority Revenue (American Dream at the Meadowlands Project) | 7.000% | 12/1/50 | 9,500 | 10,688 |
| Wisconsin Public Finance Authority Revenue (Bancroft NeuroHealth Obligated Group) | 5.000% | 6/1/22 | 1,425 | 1,494 |
| Wisconsin Public Finance Authority Revenue (Bancroft NeuroHealth Obligated Group) | 5.000% | 6/1/23 | 1,000 | 1,053 |
| Wisconsin Public Finance Authority Revenue (Bancroft NeuroHealth Obligated Group) | 5.000% | 6/1/36 | 1,500 | 1,503 |
| Wisconsin Public Finance Authority Revenue (Bancroft NeuroHealth Obligated Group) | 5.125% | 6/1/48 | 5,000 | 5,014 |
| Wisconsin Public Finance Authority Revenue (Celanese Corp.) | 4.300% | 11/1/30 | 7,210 | 7,307 |
| Wisconsin Public Finance Authority Revenue (Church Home of Hartford Inc.) | 5.000% | 9/1/38 | 4,050 | 4,099 |
| Wisconsin Public Finance Authority Revenue (Denver International Airport) | 5.000% | 9/30/49 | 5,000 | 5,291 |
| Wisconsin Public Finance Authority Revenue (Maryland Proton Treatment Center LLC) | 6.375% | 1/1/48 | 10,000 | 10,078 |
| Wisconsin Public Finance Authority Senior Living Revenue (Mary’s Woods at Marylhurst Inc.) | 3.000% | 11/15/22 | 2,200 | 2,200 |
| Wisconsin Public Finance Authority Senior Living Revenue (Mary’s Woods at Marylhurst Inc.) | 3.500% | 11/15/23 | 1,600 | 1,602 |
| Wisconsin Public Finance Authority Senior Living Revenue (Mary’s Woods at Marylhurst Inc.) | 3.950% | 11/15/24 | 1,250 | 1,257 |
| Wisconsin Public Finance Authority Senior Living Revenue (Mary’s Woods at Marylhurst Inc.) | 5.250% | 5/15/37 | 1,000 | 1,041 |
| Wisconsin Public Finance Authority Senior Living Revenue (Mary’s Woods at Marylhurst Inc.) | 5.250% | 5/15/42 | 1,230 | 1,271 |
| Wisconsin Public Finance Authority Senior Living Revenue (Mary’s Woods at Marylhurst Inc.) | 5.250% | 5/15/47 | 1,225 | 1,261 |
| Wisconsin Public Finance Authority Senior Living Revenue (Mary’s Woods at Marylhurst Inc.) | 5.250% | 5/15/52 | 2,300 | 2,360 |
| Wisconsin Public Finance Authority Special Facility Revenue | | | | |
| | (Million Air Two LLC Obligation Group) | 7.125% | 6/1/41 | 16,000 | 16,016 |
| Wisconsin Public Finance Authority Student Housing Revenue | | | | |
| | (Western Carolina University Project) | 5.250% | 7/1/47 | 3,250 | 3,368 |
| | | | | 314,365 |
| Total Tax-Exempt Municipal Bonds (Cost $12,389,941) | | | | 12,423,703 |
| |
| Shares | |
| Temporary Cash Investment (1.7%) | | | | |
| Money Market Fund (1.7%) | | | | |
| 17 | Vanguard Municipal Cash Management Fund (Cost $222,599) | 1.620% | 2,225,936 | 222,594 |
| Total Investments (98.6%) (Cost $12,612,540) | | | | 12,646,297 |
367
High-Yield Tax-Exempt Fund
| |
| Amount |
| ($000) |
| Other Assets and Liabilities (1.4%) | |
| Other Assets | |
| Investment in Vanguard | 663 |
| Receivables for Investment Securities Sold | 45,203 |
| Receivables for Accrued Income | 179,676 |
| Receivables for Capital Shares Issued | 12,372 |
| Variation Margin Receivable — Futures Contracts | 575 |
| Other Assets | 3,002 |
| Total Other Assets | 241,491 |
| Liabilities | |
| Payables for Investment Securities Purchased | (31,284) |
| Payables for Capital Shares Redeemed | (14,610) |
| Payables for Distributions | (11,880) |
| Payables to Vanguard | (6,121) |
| Variation Margin Payable — Futures Contracts | (1,112) |
| Total Liabilities | (65,007) |
| Net Assets (100%) | 12,822,781 |
| |
| At October 31, 2018, net assets consisted of: | |
| Amount |
| ($000) |
| Paid-in Capital | 12,808,868 |
| Total Distributable Earnings (Loss) | 13,913 |
| Net Assets | 12,822,781 |
| |
| Investor Shares—Net Assets | |
| Applicable to 162,940,105 outstanding $.001 par value shares of beneficial interest (unlimited authorization) | 1,790,492 |
| Net Asset Value Per Share—Investor Shares | $10.99 |
| |
| Admiral Shares—Net Assets | |
| Applicable to 1,003,971,203 outstanding $.001 par value shares of beneficial interest (unlimited authorization) | 11,032,289 |
| Net Asset Value Per Share—Admiral Shares | $10.99 |
• See Note A in Notes to Financial Statements.
1 5.000% coupon rate will be effective March 2019.
2 6.500% coupon rate will be effective October 2023.
3 6.850% coupon rate will be effective January 2024.
4 7.000% coupon rate will be effective August 2019.
5 Security exempt from registration under Rule 144A of the Securities Act of 1933. Such securities may be sold in transactions exempt from registration, normally to qualified institutional buyers.
At October 31, 2018, the aggregate value of these securities was $187,327,000, representing 1.5% of net assets.
6 Security purchased on a when-issued or delayed-delivery basis for which the fund has not taken delivery as of October 31, 2018.
7 6.150% coupon rate will be effective October 2024.
8 6.250% coupon rate will be effective October 2024.
9 6.400% coupon rate will be effective July 2023.
10 6.600% coupon rate will be effective July 2023.
11 Adjustable-rate security based upon SIFMA Municipal Swap Index Yield plus spread.
12 Securities with a value of $2,926,000 have been segregated as initial margin for open futures contracts.
13 5.125% coupon rate will be effective June 2024.
14 Non-income-producing security—security in default.
15 5.450% coupon rate will be effective October 2023.
16 4.875% coupon rate will be effective July 2023.
17 Affiliated money market fund available only to Vanguard funds and certain trusts and accounts managed by Vanguard. Rate shown is the 7-day yield.
A key to abbreviations and other references follows the Statement of Net Assets.
See accompanying Notes, which are an integral part of the Financial Statements.
368
High-Yield Tax-Exempt Fund
Key to Abbreviations
ARS—Auction Rate Security.
BAN—Bond Anticipation Note.
COP—Certificate of Participation.
CP—Commercial Paper.
FR—Floating Rate.
GAN—Grant Anticipation Note.
GO—General Obligation Bond.
PILOT – Payments in Lieu of Taxes.
PUT—Put Option Obligation.
RAN—Revenue Anticipation Note.
TAN—Tax Anticipation Note.
TOB—Tender Option Bond.
TRAN—Tax Revenue Anticipation Note.
VRDO—Variable Rate Demand Obligation.
VRDP—Variable Rate Demand Preferred.
(ETM)—Escrowed to Maturity.
(Prere.)—Prerefunded.
Scheduled principal and interest payments are guaranteed by:
(1) MBIA (Municipal Bond Investors Assurance).
(2) AMBAC (Ambac Assurance Corporation).
(3) FGIC (Financial Guaranty Insurance Company).
(4) AGM (Assured Guaranty Municipal Corporation).
(5) BIGI (Bond Investors Guaranty Insurance).
(6) Connie Lee Inc.
(7) FHA (Federal Housing Authority).
(8) CapMAC (Capital Markets Assurance Corporation).
(9) American Capital Access Financial Guaranty Corporation.
(10) XL Capital Assurance Inc.
(11) CIFG (CDC IXIS Financial Guaranty).
(12) AGC (Assured Guaranty Corporation).
(13) BHAC (Berkshire Hathaway Assurance Corporation).
(14) NPFG (National Public Finance Guarantee Corporation).
(15) BAM (Build America Mutual Assurance Company).
(16) MAC (Municipal Assurance Corporation).
(17) RAA (Radian Asset Assurance Inc.).
(18) SBLF (Michigan School Bond Loan Fund).
(19) TPSF (Texas Permanent School Fund).
The insurance does not guarantee the market value of the municipal bonds.
LOC—Scheduled principal and interest payments are guaranteed by bank letter of credit.
| | | | |
| Derivative Financial Instruments Outstanding as of Period End | | | | |
| |
| Futures Contracts | | | | |
| ($000) |
| Value and |
| Number of | Unrealized |
| Long (Short) | Notional | Appreciation |
| Expiration | Contracts | Amount | (Depreciation) |
| Long Futures Contracts | | |
| Ultra 10-Year U.S. Treasury Note | December 2018 | 1,119 | 139,997 | 62 |
| 2-Year U.S. Treasury Note | December 2018 | 452 | 95,217 | 1 |
| 10-Year U.S. Treasury Note | December 2018 | 693 | 82,077 | (196) |
| | | | (133) |
| |
| Short Futures Contracts | | |
| 5-Year U.S. Treasury Note | December 2018 | (582) | (65,407) | 18 |
| Ultra Long U.S. Treasury Bond | December 2018 | (341) | (50,884) | 454 |
| 30-Year U.S. Treasury Bond | December 2018 | (85) | (11,741) | (49) |
| | | | 423 |
| | | | 290 |
|
| See accompanying Notes, which are an integral part of the Financial Statements. |
369
High-Yield Tax-Exempt Fund
Statement of Operations
Statement of Changes in Net Assets
| | | |
| Year Ended |
| October 31, 2018 |
| | ($000) |
| Investment Income | | |
| Income | | |
| Interest1 495,881 |
| Total Income 495,881 |
| Expenses | | |
| The Vanguard Group—Note B | | |
| Investment Advisory Services | 1,573 |
| Management and Administrative— | |
| Investor Shares | 2,391 |
| Management and Administrative— | |
| Admiral Shares | 7,371 |
| Marketing and Distribution— | | |
| Investor Shares | 406 |
| Marketing and Distribution— | | |
| Admiral Shares | 832 |
| Custodian Fees | 76 |
| Auditing Fees | 35 |
| Shareholders’ Reports and Proxy— | |
| Investor Shares | 124 |
| Shareholders’ Reports and Proxy— | |
| Admiral Shares | 164 |
| Trustees’ Fees and Expenses | 8 |
| Total Expenses | 12,980 |
| Net Investment Income | 482,901 |
| Realized Net Gain (Loss) | | |
| Investment Securities Sold1 | 33,912 |
| Futures Contracts | (12,898) |
| Realized Net Gain (Loss) | 21,014 |
| Change in Unrealized Appreciation | |
| (Depreciation) | | |
| Investment Securities1 (465,310) |
| Futures Contracts | 2,329 |
| Change in Unrealized Appreciation | |
| (Depreciation) (462,981) |
| Net Increase (Decrease) in Net Assets | |
| Resulting from Operations | 40,934 |
| | | |
| Year Ended October 31, |
| 2018 | 2017 |
| ($000) | ($000) |
| Increase (Decrease) in Net Assets | | |
| Operations | | |
| Net Investment Income | 482,901 | 436,823 |
| Realized Net Gain (Loss) | 21,014 | 7,477 |
| Change in Unrealized Appreciation (Depreciation) | (462,981) | (105,868) |
| Net Increase (Decrease) in Net Assets Resulting from Operations | 40,934 | 338,432 |
| Distributions | | |
| Net Investment Income | | |
| Investor Shares | (69,776) | (68,546) |
| Admiral Shares | (417,024) | (361,150) |
| Realized Capital Gain | | |
| Investor Shares | — | — |
| Admiral Shares | — | — |
| Total Distributions | (486,800) | (429,696) |
| Capital Share Transactions | | |
| Investor Shares | (48,748) | (56,843) |
| Admiral Shares | 984,904 | 1,269,214 |
| Net Increase (Decrease) from Capital Share Transactions | 936,156 | 1,212,371 |
| Total Increase (Decrease) | 490,290 | 1,121,107 |
| Net Assets |
| Beginning of Period | 12,332,491 | 11,211,384 |
| End of Period | 12,822,781 | 12,332,491 |
1 Interest income, realized net gain (loss), and change in unrealized appreciation (depreciation) from an affiliated company of the fund were $1,187,000, ($1,000), and ($6,000), respectively. Purchases and sales are for temporary cash investment purposes.
See accompanying Notes, which are an integral part of the Financial Statements.
370
High-Yield Tax-Exempt Fund
Financial Highlights
Investor Shares
| | | | | | |
| For a Share Outstanding | | | | Year Ended October 31, |
| Throughout Each Period | 2018 | 2017 | 2016 | 2015 | 2014 |
| Net Asset Value, Beginning of Period | | $11.37 | $11.47 | $11.20 | $11.23 | $10.63 |
| Investment Operations | |
| Net Investment Income | | . 4181 | . 4271 | .413 | .414 | .430 |
| Net Realized and Unrealized Gain (Loss) | | | | | | |
| on Investments | | (.377) | (.108) | .270 | (.030) | .600 |
| Total from Investment Operations | | .041 | .319 | .683 | .384 | 1.030 |
| Distributions | | |
| Dividends from Net Investment Income | | (.421) | (.419) | (.413) | (.414) | (.430) |
| Distributions from Realized Capital Gains | — | — | — | — | — |
| Total Distributions | | (.421) | (.419) | (.413) | (.414) | (.430) |
| Net Asset Value, End of Period | | $10.99 | $11.37 | $11.47 | $11.20 | $11.23 |
| |
| Total Return 2 | | 0.35% | 2.91% | 6.15% | 3.47% | 9.87% |
| |
| Ratios/Supplemental Data | | |
| Net Assets, End of Period (Millions) | | $1,790 | $1,904 | $1,980 | $1,614 | $1,484 |
| Ratio of Total Expenses to Average Net Assets | 0.17% | 0.19% | 0.19% | 0.20% | 0.20% |
| Ratio of Net Investment Income to | | | | | | |
| Average Net Assets | | 3.72% | 3.80% | 3.59% | 3.69% | 3.94% |
| Portfolio Turnover Rate | | 17% | 21% | 19% | 21% | 28% |
1 Calculated based on average shares outstanding
2 Total returns do not include account service fees that may have applied in the periods shown. Fund prospectuses provide information about any applicable account service fees.
| | | | | | |
| Admiral Shares | | | | | | |
| | | | | | |
| For a Share Outstanding | | | | Year Ended October 31, |
| Throughout Each Period | 2018 | 2017 | 2016 | 2015 | 2014 |
| Net Asset Value, Beginning of Period | | $11.37 | $11.47 | $11.20 | $11.23 | $10.63 |
| Investment Operations | |
| Net Investment Income | | . 4271 | . 4371 | .425 | .423 | .438 |
| Net Realized and Unrealized Gain (Loss) | | | | | | |
| on Investments | | (.377) | (.106) | .270 | (.030) | .600 |
| Total from Investment Operations | | .050 | .331 | .695 | .393 | 1.038 |
| Distributions | | |
| Dividends from Net Investment Income | | (.430) | (.431) | (.425) | (.423) | (.438) |
| Distributions from Realized Capital Gains | — | — | — | — | — |
| Total Distributions | | (.430) | (.431) | (.425) | (.423) | (.438) |
| Net Asset Value, End of Period | | $10.99 | $11.37 | $11.47 | $11.20 | $11.23 |
| |
| Total Return 2 | | 0.43% | 3.01% | 6.26% | 3.56% | 9.96% |
| |
| Ratios/Supplemental Data | | |
| Net Assets, End of Period (Millions) | | $11,032 | $10,429 | $9,231 | $7,398 | $6,608 |
| Ratio of Total Expenses to Average Net Assets | 0.09% | 0.09% | 0.09% | 0.12% | 0.12% |
| Ratio of Net Investment Income to | | | | | | |
| Average Net Assets | | 3.80% | 3.90% | 3.69% | 3.77% | 4.02% |
| Portfolio Turnover Rate | | 17% | 21% | 19% | 21% | 28% |
1 Calculated based on average shares outstanding
2 Total returns do not include account service fees that may have applied in the periods shown. Fund prospectuses provide information about any applicable account service fees.
See accompanying Notes, which are an integral part of the Financial Statements.
371
High-Yield Tax-Exempt Fund
Notes to Financial Statements
Vanguard High-Yield Tax-Exempt Fund is registered under the Investment Company Act of 1940 as an open-end investment company, or mutual fund. The fund invests in debt instruments of many municipal issuers; the issuers’ abilities to meet their obligations may be affected by economic and political developments in a specific state or region. The fund offers two classes of shares: Investor Shares and Admiral Shares. Investor Shares are available to any investor who meets the fund’s minimum purchase requirements. Admiral Shares are designed for investors who meet certain administrative, service, and account-size criteria.
A. The following significant accounting policies conform to generally accepted accounting principles for U.S. investment companies. The fund consistently follows such policies in preparing its financial statements.
1. Security Valuation: Securities are valued as of the close of trading on the New York Stock Exchange (generally 4 p.m., Eastern time) on the valuation date. Bonds and temporary cash investments are valued using the latest bid prices or using valuations based on a matrix system (which considers such factors as security prices, yields, maturities, and ratings), both as furnished by independent pricing services. Investments in Vanguard Municipal Cash Management Fund are valued at that fund’s net asset value. Securities for which market quotations are not readily available, or whose values have been affected by events occurring before the fund’s pricing time but after the close of the securities’ primary markets, are valued by methods deemed by the board of trustees to represent fair value.
2. Futures Contracts: The fund uses futures contracts to invest in fixed income asset classes with greater efficiency and lower cost than is possible through direct investment, to add value when these instruments are attractively priced, or to adjust sensitivity to changes in interest rates. The primary risks associated with the use of futures contracts are imperfect correlation between changes in market values of bonds held by the fund and the prices of futures contracts, and the possibility of an illiquid market. Counterparty risk involving futures is mitigated because a regulated clearinghouse is the counterparty instead of the clearing broker. To further mitigate counterparty risk, the fund trades futures contracts on an exchange, monitors the financial strength of its clearing brokers and clearinghouse, and has entered into clearing agreements with its clearing brokers. The clearinghouse imposes initial margin requirements to secure the fund’s performance and requires daily settlement of variation margin representing changes in the market value of each contract. Any assets pledged as initial margin for open contracts are noted in the Statement of Net Assets.
Futures contracts are valued at their quoted daily settlement prices. The notional amounts of the contracts are not recorded in the Statement of Net Assets. Fluctuations in the value of the contracts are recorded in the Statement of Net Assets as an asset (liability) and in the Statement of Operations as unrealized appreciation (depreciation) until the contracts are closed, when they are recorded as realized futures gains (losses).
During the year ended October 31, 2018, the fund’s average investments in long and short futures contracts represented 4% and 1% of net assets, respectively, based on the average of the notional amounts at each quarter-end during the period.
3. Federal Income Taxes: The fund intends to continue to qualify as a regulated investment company and distribute all of its income. Management has analyzed the fund’s tax positions taken for all open federal income tax years (October 31, 2015–2018), and has concluded that no provision for federal income tax is required in the fund’s financial statements.
4. Distributions: Distributions from net investment income are declared daily and paid on the first business day of the following month. Annual distributions from realized capital gains, if any, are recorded on the ex-dividend date. Distributions are determined on a tax basis and may differ from net investment income and realized capital gains for financial reporting purposes.
5. Credit Facility: The fund and certain other funds managed by The Vanguard Group (“Vanguard”) participate in a $3.1 billion committed credit facility provided by a syndicate of lenders pursuant to a credit agreement that may be renewed annually; each fund is individually liable for its borrowings, if any, under the credit facility. Borrowings may be utilized for temporary and emergency purposes, and are subject to the fund’s regulatory and contractual borrowing restrictions. The participating funds are charged administrative fees and an annual commitment fee of 0.10% of the undrawn amount of the facility; these fees are allocated to the funds based on a method approved by the fund’s board of trustees and included in Management and Administrative expenses on the fund’s Statement of Operations. Any borrowings under this facility bear interest at a rate based upon the higher of the one-month London Interbank Offered Rate, federal funds effective rate, or overnight bank funding rate plus an agreed-upon spread.
372
High-Yield Tax-Exempt Fund
The fund had no borrowings outstanding at October 31, 2018, or at any time during the period then ended.
6. Other: Interest income includes income distributions received from Vanguard Municipal Cash Management Fund and is accrued daily. Premiums and discounts on debt securities purchased are amortized and accreted, respectively, to interest income over the lives of the respective securities. Security transactions are accounted for on the date securities are bought or sold. Costs used to determine realized gains (losses) on the sale of investment securities are those of the specific securities sold.
Each class of shares has equal rights as to assets and earnings, except that each class separately bears certain class-specific expenses related to maintenance of shareholder accounts (included in Management and Administrative expenses), shareholder reporting, and the proxy. Marketing and distribution expenses are allocated to each class of shares based on a method approved by the board of trustees. Income, other non-class-specific expenses, and gains and losses on investments are allocated to each class of shares based on its relative net assets.
B. In accordance with the terms of a Funds’ Service Agreement (the “FSA”) between Vanguard and the fund, Vanguard furnishes to the fund investment advisory, corporate management, administrative, marketing, and distribution services at Vanguard’s cost of operations (as defined by the FSA). These costs of operations are allocated to the fund based on methods and guidelines approved by the board of trustees. Vanguard does not require reimbursement in the current period for certain costs of operations (such as deferred compensation/benefits and risk/insurance costs); the fund’s liability for these costs of operations is included in Payables to Vanguard on the Statement of Net Assets. All other costs of operations payable to Vanguard are generally settled twice a month.
Upon the request of Vanguard, the fund may invest up to 0.40% of its net assets as capital in Vanguard. At October 31, 2018, the fund had contributed to Vanguard capital in the amount of $663,000, representing 0.01% of the fund’s net assets and 0.27% of Vanguard’s capitalization. The fund’s trustees and officers are also directors and employees, respectively, of Vanguard.
C. Various inputs may be used to determine the value of the fund’s investments. These inputs are summarized in three broad levels for financial statement purposes. The inputs or methodologies used to value securities are not necessarily an indication of the risk associated with investing in those securities.
Level 1—Quoted prices in active markets for identical securities.
Level 2—Other significant observable inputs (including quoted prices for similar securities, interest rates, prepayment speeds, credit risk, etc.).
Level 3—Significant unobservable inputs (including the fund’s own assumptions used to determine the fair value of investments). Any investments valued with significant unobservable inputs are noted on the Statement of Net Assets.
The following table summarizes the market value of the fund’s investments as of October 31, 2018, based on the inputs used to value them:
| | | |
| Level 1 | Level 2 | Level 3 |
| Investments | ($000) | ($000) | ($000) |
| Tax-Exempt Municipal Bonds | — | 12,423,703 | — |
| Temporary Cash Investments | 222,594 | — | — |
| Futures Contracts—Assets1 | 575 | — | — |
| Futures Contracts—Liabilities1 | (1,112) | — | — |
| Total | 222,057 | 12,423,703 | — |
| 1 Represents variation margin on the last day of the reporting period. | | | |
D. Permanent differences between book-basis and tax-basis components of net assets, if any, are reclassified among capital accounts in the financial statements to reflect their tax character. These reclassifications have no effect on net assets or net asset value per share.
373
High-Yield Tax-Exempt Fund
Temporary differences between book-basis and tax-basis components of total distributable earnings (loss) arise when certain items of income, gain, or loss are recognized in different periods for financial statement and tax purposes; these differences will reverse at some time in the future. The differences are primarily related to the tax deferral of losses on wash sales and straddles, the realization of unrealized gains or losses on certain futures contracts, and payables for distributions. As of period end, the tax-basis components of total distributable earnings (loss) are detailed in the table as follows:
| |
| Amount |
| ($000) |
| Undistributed Ordinary Income | — |
| Undistributed Tax-Exempt Income | 20,101 |
| Undistributed Long-Term Gains | — |
| Capital Loss Carryforwards* | (22,174) |
| Net Unrealized Gains (Losses) | 33,226 |
* Includes $22,174,000, which may be used to offset future net capital gains through October 31, 2019. The fund used capital loss carryforwards of $20,408,000 to offset taxable capital gains realized during the year ended October 31, 2018, reducing the amount of capital gains that would otherwise be available to distribute to shareholders.
As of October 31, 2018, gross unrealized appreciation and depreciation for investments and derivatives based on cost for U.S. federal income tax purposes were as follows:
| |
| Amount |
| ($000) |
| Tax Cost | 12,613,071 |
| Gross Unrealized Appreciation | 255,686 |
| Gross Unrealized Depreciation | (222,460) |
| Net Unrealized Appreciation (Depreciation) | 33,226 |
E. During the year ended October 31, 2018, the fund purchased $2,975,985,000 of investment securities and sold $2,151,331,000 of investment securities, other than temporary cash investments.
The fund purchased securities from and sold securities to other Vanguard funds or accounts managed by Vanguard or its affiliates, in accordance with procedures adopted by the board of trustees in compliance with Rule 17a-7 of the Investment Company Act of 1940. For the year ended October 31, 2018, such purchases and sales were $550,790,000 and $974,846,000 respectively; these amounts are included in the purchases and sales of investment securities noted above.
F. Capital share transactions for each class of shares were:
| | | | |
| | | Year Ended October 31, |
| | 2018 | | 2017 |
| Amount | Shares | Amount | Shares |
| ($000) | (000) | ($000) | (000) |
| Investor Shares | | | | |
| Issued | 551,059 | 48,936 | 609,504 | 54,458 |
| Issued in Lieu of Cash Distributions | 58,183 | 5,184 | 56,855 | 5,077 |
| Redeemed | (657,990) | (58,560) | (723,202) | (64,797) |
| Net Increase (Decrease)—Investor Shares | (48,748) | (4,440) | (56,843) | (5,262) |
| Admiral Shares | | | | |
| Issued | 2,909,605 | 258,614 | 3,080,836 | 275,381 |
| Issued in Lieu of Cash Distributions | 283,166 | 25,236 | 243,455 | 21,728 |
| Redeemed | (2,207,867) | (196,917) | (2,055,077) | (184,792) |
| Net Increase (Decrease)—Admiral Shares | 984,904 | 86,933 | 1,269,214 | 112,317 |
G. Management has determined that no events or transactions occurred subsequent to October 31, 2018, that would require recognition or disclosure in these financial statements.
374
Report of Independent Registered Public Accounting Firm
To the Board of Trustees of Vanguard Municipal Bond Funds and Shareholders of Vanguard Short-Term Tax-Exempt Fund, Vanguard Limited-Term Tax-Exempt Fund, Vanguard Intermediate-Term Tax-Exempt Fund, Vanguard Long-Term Tax-Exempt Fund and Vanguard High-Yield Tax-Exempt Fund
Opinions on the Financial Statements
We have audited the accompanying statements of net assets of Vanguard Short-Term Tax-Exempt Fund, Vanguard Limited-Term Tax-Exempt Fund, Vanguard Intermediate-Term Tax-Exempt Fund, Vanguard Long-Term Tax-Exempt Fund and Vanguard High-Yield Tax-Exempt Fund (five of the funds constituting Vanguard Municipal Bond Funds, hereafter collectively referred to as the “Funds”) as of October 31, 2018, the related statements of operations for the year ended October 31, 2018, the statements of changes in net assets for each of the two years in the period ended October 31, 2018, including the related notes, and the financial highlights for each of the five years in the period ended October 31, 2018 (collectively referred to as the “financial statements”). In our opinion, the financial statements present fairly, in all material respects, the financial position of each of the Funds as of October 31, 2018, the results of each of their operations for the year then ended, the changes in each of their net assets for each of the two years in the period ended October 31, 2018 and each of the financial highlights for each of the five years in the period ended October 31, 2018 in conformity with accounting principles generally accepted in the United States of America.
Basis for Opinions
These financial statements are the responsibility of the Funds’ management. Our responsibility is to express an opinion on the Funds’ financial statements based on our audits. We are a public accounting firm registered with the Public Company Accounting Oversight Board (United States) (“PCAOB”) and are required to be independent with respect to the Funds in accordance with the U.S. federal securities laws and the applicable rules and regulations of the Securities and Exchange Commission and the PCAOB.
We conducted our audits of these financial statements in accordance with the standards of the PCAOB. Those standards require that we plan and perform the audit to obtain reasonable assurance about whether the financial statements are free of material misstatement, whether due to error or fraud.
Our audits included performing procedures to assess the risks of material misstatement of the financial statements, whether due to error or fraud, and performing procedures that respond to those risks. Such procedures included examining, on a test basis, evidence regarding the amounts and disclosures in the financial statements. Our audits also included evaluating the accounting principles used and significant estimates made by management, as well as evaluating the overall presentation of the financial statements. Our procedures included confirmation of securities owned as of October 31, 2018 by correspondence with the custodian and brokers and by agreement to the underlying ownership records of the transfer agent; when replies were not received from brokers, we performed other auditing procedures. We believe that our audits provide a reasonable basis for our opinions.
/s/PricewaterhouseCoopers LLP
Philadelphia, Pennsylvania
December 18, 2018
We have served as the auditor of one or more investment companies in The Vanguard Group of Funds since 1975.
375
Special 2018 tax information (unaudited) for Vanguard Short-Term Tax-Exempt Fund
This information for the fiscal year ended October 31, 2018, is included pursuant to provisions of the
Internal Revenue Code.
The fund designates 100% of its income dividends as exempt-interest dividends.
Special 2018 tax information (unaudited) for Vanguard Limited-Term Tax-Exempt Fund
This information for the fiscal year ended October 31, 2018, is included pursuant to provisions of the Internal Revenue Code.
The fund designates 100% of its income dividends as exempt-interest dividends.
Special 2018 tax information (unaudited) for Vanguard Intermediate-Term Tax-Exempt Fund
This information for the fiscal year ended October 31, 2018, is included pursuant to provisions of the
Internal Revenue Code.
The fund designates 100% of its income dividends as exempt-interest dividends.
Special 2018 tax information (unaudited) for Vanguard Long-Term Tax-Exempt Fund
This information for the fiscal year ended October 31, 2018, is included pursuant to provisions of the Internal Revenue Code.
The fund distributed $29,736,000 as capital gain dividends (20% rate gain distributions) to shareholders during the fiscal year.
The fund designates 100% of its income dividends as exempt-interest dividends.
Special 2018 tax information (unaudited) for Vanguard High-Yield Tax-Exempt Fund
This information for the fiscal year ended October 31, 2018, is included pursuant to provisions of the Internal Revenue Code.
The fund designates 100% of its income dividends as exempt-interest dividends.
376
About Your Fund’s Expenses
As a shareholder of the fund, you incur ongoing costs, which include costs for portfolio management, administrative services, and shareholder reports (like this one), among others. Operating expenses, which are deducted from a fund’s gross income, directly reduce the investment return of the fund.
A fund’s expenses are expressed as a percentage of its average net assets. This figure is known as the expense ratio. The following examples are intended to help you understand the ongoing costs (in dollars) of investing in your fund and to compare these costs with those of other mutual funds. The examples are based on an investment of $1,000 made at the beginning of the period shown and held for the entire period.
The accompanying table illustrates your fund’s costs in two ways:
• Based on actual fund return. This section helps you to estimate the actual expenses that you paid over the period. The “Ending Account Value” shown is derived from the fund’s actual return, and the third column shows the dollar amount that would have been paid by an investor who started with $1,000 in the fund. You may use the information in this table, together with the amount you invested, to estimate the expenses that you paid over the period.
To do so, simply divide your account value by $1,000 (for example, an $8,600 account value divided by $1,000 = 8.6), then multiply the result by the number given for your fund under the heading “Expenses Paid During Period.”
• Based on hypothetical 5% yearly return. This section is intended to help you compare your fund’s costs with those of other mutual funds. It assumes that the fund had a yearly return of 5% before expenses, but that the expense ratio is unchanged. In this case—because the return used is not the fund’s actual return—the results do not apply to your investment. The example is useful in making comparisons because the Securities and Exchange Commission requires all mutual funds to calculate expenses based on a 5% return. You can assess your fund’s costs by comparing this hypothetical example with the hypothetical examples that appear in shareholder reports of other funds.
Note that the expenses shown in the table are meant to highlight and help you compare ongoing costs only and do not reflect transaction costs incurred by the fund for buying and selling securities. Further, the expenses do not include any purchase, redemption, or account service fees described in the fund prospectus. If such fees were applied to your account, your costs would be higher. Your fund does not carry a “sales load.” The calculations assume no shares were bought or sold during the period. Your actual costs may have been higher or lower, depending on the amount of your investment and the timing of any purchases or redemptions.
You can find more information about the fund’s expenses, including annual expense ratios, in the Financial Statements section of this report. For additional information on operating expenses and other shareholder costs, please refer to your fund’s current prospectus.
377
| | | | |
| Six Months Ended October 31, 2018 | | | |
| Beginning | Ending | Expenses |
| Account Value | Account Value | Paid During |
| Tax-Exempt Fund | 4/30/2018 | 10/31/2018 | Period1 |
| Based on Actual Fund Return | |
| Short-Term | |
| Investor Shares | $1,000.00 | $1,007.48 | $0.76 |
| Admiral Shares | 1,000.00 | 1,007.79 | 0.46 |
| Limited-Term | |
| Investor Shares | $1,000.00 | $1,007.42 | $0.76 |
| Admiral Shares | 1,000.00 | 1,007.73 | 0.46 |
| Intermediate-Term | |
| Investor Shares | $1,000.00 | $1,004.78 | $0.76 |
| Admiral Shares | 1,000.00 | 1,005.08 | 0.45 |
| Long-Term | |
| Investor Shares | $1,000.00 | $1,002.30 | $0.76 |
| Admiral Shares | 1,000.00 | 1,002.60 | 0.45 |
| High-Yield | |
| Investor Shares | $1,000.00 | $1,004.49 | $0.76 |
| Admiral Shares | 1,000.00 | 1,004.80 | 0.45 |
| Based on Hypothetical 5% Yearly Return | |
| Short-Term | |
| Investor Shares | $1,000.00 | $1,024.45 | $0.77 |
| Admiral Shares | 1,000.00 | 1,024.75 | 0.46 |
| Limited-Term | |
| Investor Shares | $1,000.00 | $1,024.45 | $0.77 |
| Admiral Shares | 1,000.00 | 1,024.75 | 0.46 |
| Intermediate-Term | |
| Investor Shares | $1,000.00 | $1,024.23 | $0.92 |
| Admiral Shares | 1,000.00 | 1,024.84 | 0.31 |
| Long-Term | |
| Investor Shares | $1,000.00 | $1,024.45 | $0.77 |
| Admiral Shares | 1,000.00 | 1,024.75 | 0.46 |
| High-Yield | |
| Investor Shares | $1,000.00 | $1,024.45 | $0.77 |
| Admiral Shares | 1,000.00 | 1,024.75 | 0.46 |
1 The calculations are based on expenses incurred in the most recent six-month period. The funds’ annualized six-month expense ratios for that period: are for the Short-Term Tax-Exempt Fund, 0.15% for Investor Shares and 0.09% for Admiral Shares; for the Limited-Term Tax-Exempt Fund, 0.15% for Investor Shares and 0.09% for Admiral Shares; for the Intermediate-Term Tax-Exempt Fund, 0.15% for Investor Shares and 0.09% for Admiral Shares; for the Long-Term Tax-Exempt Fund, 0.15% for Investor Shares and 0.09% for Admiral Shares; and for the High-Yield Tax-Exempt Fund, 0.15% for Investor Shares and 0.09% for Admiral Shares. The dollar amounts shown as “Expenses Paid” are equal to the annualized expense ratio multiplied by the average account value over the period, multiplied by the number of days in the most recent six-month period, then divided by the number of days in the most recent 12-month period (184/365).
378
Glossary
30-Day SEC Yield. A fund’s 30-day SEC yield is derived using a formula specified by the U.S. Securities and Exchange Commission. Under the formula, data related to the fund’s security holdings in the previous 30 days are used to calculate the fund’s hypothetical net income for that period, which is then annualized and divided by the fund’s estimated average net assets over the calculation period. For the purposes of this calculation, a security’s income is based on its current market yield to maturity (for bonds), its actual income (for asset-backed securities), or its projected dividend yield (for stocks). Because the SEC yield represents hypothetical annualized income, it will differ—at times significantly—from the fund’s actual experience. As a result, the fund’s income distributions may be higher or lower than implied by the SEC yield.
Average Coupon. The average interest rate paid on the fixed income securities held by a fund. It is expressed as a percentage of face value.
Average Duration. An estimate of how much the value of the bonds held by a fund will fluctuate in response to a change in interest rates. To see how the value could change, multiply the average duration by the change in rates. If interest rates rise by 1 percentage point, the value of the bonds in a fund with an average duration of five years would decline by about 5%. If rates decrease by a percentage point, the value would rise by 5%.
Average Stated Maturity. The average length of time until fixed income securities held by a fund reach maturity and are repaid using the maturity date of the security. The figure reflects the proportion of fund assets represented by each security; it also reflects any futures contracts held. In general, the longer the average stated maturity, the more a fund’s share price will fluctuate in response to changes in market interest rates.
Beta. A measure of the magnitude of a fund’s past share-price fluctuations in relation to the ups and downs of a given market index. The index is assigned a beta of 1.00. Compared with a given index, a fund with a beta of 1.20 typically would have seen its share price rise or fall by 12% when the index rose or fell by 10%. For this report, beta is based on returns over the past 36 months for both the fund and the index. Note that a fund’s beta should be reviewed in conjunction with its R-squared (see definition). The lower the R-squared, the less correlation there is between the fund and the index, and the less reliable beta is as an indicator of volatility.
Credit Quality. Credit-quality ratings are measured on a scale that generally ranges from AAA (highest) to D (lowest). Credit-quality ratings are obtained from Moody’s and S&P, and the higher rating for each issue is used. “Not Rated” is used to classify securities for which a rating is not available. Not rated securities include a fund’s investment in Vanguard Market Liquidity Fund or Vanguard Municipal Cash Management Fund, each of which invests in high-quality money market instruments and may serve as a cash management vehicle for the Vanguard funds, trusts, and accounts.
Expense Ratio. A fund’s total annual operating expenses expressed as a percentage of the fund’s average net assets. The expense ratio includes management and administrative expenses, but does not include the transaction costs of buying and selling portfolio securities.
Inception Date. The date on which the assets of a fund (or one of its share classes) are first invested in accordance with the fund’s investment objective. For funds with a subscription period, the inception date is the day after that period ends. Investment performance is measured from the inception date.
R-Squared. A measure of how much of a fund’s past returns can be explained by the returns from the market in general, as measured by a given index. If a fund’s total returns were precisely synchronized with an index’s returns, its R-squared would be 1.00. If the fund’s returns bore no relationship to the index’s returns, its R-squared would be 0. For this report, R-squared is based on returns over the past 36 months for both the fund and the index.
Short-Term Reserves. The percentage of a fund invested in highly liquid, short-term securities that can be readily converted to cash.
Yield to Maturity. The rate of return an investor would receive if the fixed income securities held by a fund were held to their maturity dates.
379
BLOOMBERG is a trademark and service mark of Bloomberg Finance L.P. BARCLAYS is a trademark and service mark of Barclays Bank Plc, used under license. Bloomberg Finance L.P. and its affiliates, including Bloomberg Index Services Limited (BISL) (collectively, Bloomberg), or Bloomberg’s licensors, own all proprietary rights in the Bloomberg Barclays 1 Year Municipal Bond Index, Bloomberg Barclays 1–5 Year Municipal Bond Index, Bloomberg Barclays 1–15 Year Municipal Bond Index, and Bloomberg Barclays Municipal Bond Index (Indices or Bloomberg Barclays Indices).
Neither Barclays Bank Plc, Barclays Capital Inc., or any affiliate (collectively Barclays) or Bloomberg is the issuer or producer of the Municipal Bond Funds and neither Bloomberg nor Barclays has any responsibilities, obligations or duties to investors in the Municipal Bond Funds. The Indices are licensed for use by The Vanguard Group, Inc. (Vanguard) as the sponsor of the Municipal Bond Funds. Bloomberg and Barclays’ only relationship with Vanguard in respect of the Indices is the licensing of the Indices, which are determined, composed and calculated by BISL, or any successor thereto, without regard to the Issuer or the Municipal Bond Funds or the owners of the Municipal Bond Funds.
Additionally, Vanguard may for itself execute transaction(s) with Barclays in or relating to the Indices in connection with the Municipal Bond Funds. Investors acquire the Municipal Bond Funds from Vanguard and investors neither acquire any interest in the Indices nor enter into any relationship of any kind whatsoever with Bloomberg or Barclays upon making an investment in the Municipal Bond Funds. The Municipal Bond Funds are not sponsored, endorsed, sold or promoted by Bloomberg or Barclays. Neither Bloomberg nor Barclays makes any representation or warranty, express or implied regarding the advisability of investing in the Municipal Bond Funds or the advisability of investing in securities generally or the ability of the Indices to track corresponding or relative market performance. Neither Bloomberg nor Barclays has passed on the legality or suitability of the Municipal Bond Funds with respect to any person or entity. Neither Bloomberg nor Barclays is responsible for and has not participated in the determination of the timing of, prices at, or quantities of the Municipal Bond Funds to be issued. Neither Bloomberg nor Barclays has any obligation to take the needs of the Issuer or the owners of the Municipal Bond Funds or any other third party into consideration in determining, composing or calculating the Indices. Neither Bloomberg nor Barclays has any obligation or liability in connection with administration, marketing or trading of the Municipal Bond Funds.
The licensing agreement between Bloomberg and Barclays is solely for the benefit of Bloomberg and Barclays and not for the benefit of the owners of the Municipal Bond Funds, investors or other third parties. In addition, the licensing agreement between Vanguard and Bloomberg is solely for the benefit of Vanguard and Bloomberg and not for the benefit of the owners of the Municipal Bond Funds, investors or other third parties.
NEITHER BLOOMBERG NOR BARCLAYS SHALL HAVE ANY LIABILITY TO THE ISSUER, INVESTORS OR TO OTHER THIRD PARTIES FOR THE QUALITY, ACCURACY AND/OR COMPLETENESS OF THE BLOOMBERG BARCLAYS INDICES OR ANY DATA INCLUDED THEREIN OR FOR INTERRUPTIONS IN THE DELIVERY OF THE BLOOMBERG BARCLAYS INDICES. NEITHER BLOOMBERG NOR BARCLAYS MAKES ANY WARRANTY, EXPRESS OR IMPLIED, AS TO RESULTS TO BE OBTAINED BY THE ISSUER, THE INVESTORS OR ANY OTHER PERSON OR ENTITY FROM THE USE OF THE BLOOMBERG BARCLAYS INDICES OR ANY DATA INCLUDED THEREIN. NEITHER BLOOMBERG NOR BARCLAYS MAKES ANY EXPRESS OR IMPLIED WARRANTIES, AND EACH HEREBY EXPRESSLY DISCLAIMS ALL WARRANTIES OF MERCHANTABILITY OR FITNESS FOR A PARTICULAR PURPOSE OR USE WITH RESPECT TO THE BLOOMBERG BARCLAYS INDICES OR ANY DATA INCLUDED THEREIN. BLOOMBERG RESERVES THE RIGHT TO CHANGE THE METHODS OF CALCULATION OR PUBLICATION, OR TO CEASE THE CALCULATION OR PUBLICATION OF THE BLOOMBERG BARCLAYS INDICES, AND NEITHER BLOOMBERG NOR BARCLAYS SHALL BE LIABLE FOR ANY MISCALCULATION OF OR ANY INCORRECT, DELAYED OR INTERRUPTED PUBLICATION WITH RESPECT TO ANY OF THE BLOOMBERG BARCLAYS INDICES. NEITHER BLOOMBERG NOR BARCLAYS SHALL BE LIABLE FOR ANY DAMAGES, INCLUDING, WITHOUT LIMITATION, ANY SPECIAL, INDIRECT OR CONSEQUENTIAL DAMAGES, OR ANY LOST PROFITS AND EVEN IF ADVISED OF THE POSSIBILITY OF SUCH, RESULTING FROM THE USE OF THE BLOOMBERG BARCLAYS INDICES OR ANY DATA INCLUDED THEREIN OR WITH RESPECT TO THE MUNICIPAL BOND FUNDS.
None of the information supplied by Bloomberg or Barclays and used in this publication may be reproduced in any manner without the prior written permission of both Bloomberg and Barclays Capital, the investment banking division of Barclays Bank Plc. Barclays Bank Plc is registered in England No. 1026167. Registered office 1 Churchill Place London E14 5HP.
© 2018 Bloomberg. Used with Permission.
Source: Bloomberg Index Services Limited. Copyright 2018, Bloomberg. All rights reserved.
This page intentionally left blank.
This page intentionally left blank.
This page intentionally left blank.
The People Who Govern Your Fund
The trustees of your mutual fund are there to see that the fund is operated and managed in your best interests since, as a shareholder, you are a part owner of the fund. Your fund’s trustees also serve on the board of directors of The Vanguard Group, Inc., which is owned by the Vanguard funds and provides services to them on an at-cost basis.
A majority of Vanguard’s board members are independent, meaning that they have no affiliation with Vanguard or the funds they oversee, apart from the sizable personal investments they have made as private individuals. The independent board members have distinguished backgrounds in business, academia, and public service. Each of the trustees and executive officers oversees 211 Vanguard funds.
Information for each trustee and executive officer of the fund appears below. The mailing address of the trustees and officers is P.O. Box 876, Valley Forge, PA 19482. More information about the trustees is in the Statement of Additional Information, which can be obtained, without charge, by contacting Vanguard at 800-662-7447, or online at vanguard.com.
Interested Trustees1
F. William McNabb III
Born in 1957. Trustee since July 2009. Principal occupation(s) during the past five years and other experience: chairman of the board (January 2010–present) of Vanguard and of each of the investment companies served by Vanguard, trustee (2009–present) of each of the investment companies served by Vanguard, and director (2008–present) of Vanguard. Chief executive officer and president (2008–2017) of Vanguard and each of the investment companies served by Vanguard, managing director (1995–2008) of Vanguard, and director (1997–2018) of Vanguard Marketing Corporation. Director (2018–present) of UnitedHealth Group.
Mortimer J. Buckley
Born in 1969. Trustee since January 2018. Principal occupation(s) during the past five years and other experience: chief executive officer (January 2018–present) of Vanguard; chief executive officer, president, and trustee (January 2018–present) of each of the investment companies served by Vanguard; president and director (2017–present) of Vanguard; and president (February 2018–present) of Vanguard Marketing Corporation. Chief investment officer (2013–2017), managing director (2002–2017), head of the Retail Investor Group (2006–2012), and chief information officer (2001–2006) of Vanguard. Chairman of the board (2011–2017) of the Children’s Hospital of Philadelphia.
Independent Trustees
Emerson U. Fullwood
Born in 1948. Trustee since January 2008. Principal occupation(s) during the past five years and other experience: executive chief staff and marketing officer for North America and corporate vice president (retired 2008) of Xerox Corporation (document management products and services). Former president of the Worldwide Channels Group, Latin America, and Worldwide Customer Service and executive chief staff officer of Developing Markets of Xerox. Executive in residence and 2009–2010 Distinguished Minett Professor at the Rochester Institute of Technology. Lead director of SPX FLOW, Inc. (multi-industry manufacturing). Director of the University of Rochester Medical Center, the Monroe Community College Foundation, the United Way of Rochester, North Carolina A&T University, and Roberts Wesleyan College. Trustee of the University of Rochester.
Amy Gutmann
Born in 1949. Trustee since June 2006. Principal occupation(s) during the past five years and other experience: president (2004–present) of the University of Pennsylvania. Christopher H. Browne Distinguished Professor of Political Science, School of Arts and Sciences, and professor of communication, Annenberg School for Communication, with secondary faculty appointments in the Department of Philosophy, School of Arts and Sciences, and at the Graduate School of Education, University of Pennsylvania. Trustee of the National Constitution Center.
JoAnn Heffernan Heisen
Born in 1950. Trustee since July 1998. Principal occupation(s) during the past five years and other experience: corporate vice president of Johnson & Johnson (pharmaceuticals/medical devices/consumer products) and member of its executive committee (1997–2008). Chief global diversity officer (retired 2008), vice president and chief information officer (1997–2006), controller (1995–1997), treasurer (1991–1995), and assistant treasurer (1989–1991) of Johnson & Johnson. Director of Skytop Lodge Corporation (hotels) and the Robert Wood Johnson Foundation. Member of the advisory board of the Institute for Women’s Leadership at Rutgers University.
F. Joseph Loughrey
Born in 1949. Trustee since October 2009. Principal occupation(s) during the past five years and other experience: president and chief operating officer (retired 2009) and vice chairman of the board (2008–2009) of Cummins Inc. (industrial machinery). Chairman of the board of Hillenbrand, Inc. (specialized consumer services), Oxfam America, and the Lumina Foundation for Education. Director of the V Foundation for Cancer Research. Member of the advisory council for the College of Arts and Letters and chair of the advisory board to the Kellogg Institute for International Studies, both at the University of Notre Dame.
Mark Loughridge
Born in 1953. Trustee since March 2012. Principal occupation(s) during the past five years and other experience: senior vice president and chief financial officer (retired 2013) of IBM (information technology services). Fiduciary member of IBM’s Retirement Plan Committee (2004–2013), senior vice president and general manager (2002–2004) of IBM Global Financing, vice president and controller (1998–2002) of IBM, and a variety of other prior management roles at IBM. Member of the Council on Chicago Booth.
Scott C. Malpass
Born in 1962. Trustee since March 2012. Principal occupation(s) during the past five years and other experience: chief investment officer (1989–present) and vice president (1996–present) of the University of Notre Dame. Assistant professor of finance at the Mendoza College of Business, University of Notre Dame, and member of the Notre Dame 403(b) Investment Committee. Chairman of the board of TIFF Advisory Services, Inc. Member of the board of Catholic Investment Services, Inc. (investment advisors), the board of advisors for Spruceview Capital Partners, and the board of superintendence of the Institute for the Works of Religion.
Deanna Mulligan
Born in 1963. Trustee since January 2018. Principal occupation(s) during the past five years and other experience: president (2010–present) and chief executive officer (2011–present) of The Guardian Life Insurance Company of America. Chief operating officer (2010–2011) and executive vice president (2008–2010) of Individual Life and Disability of The Guardian Life Insurance Company of America. Member of the board of The Guardian Life Insurance Company of America, the American Council of Life Insurers, the Partnership for New York City (business leadership), and the Committee Encouraging Corporate Philanthropy. Trustee of the Economic Club of New York and the Bruce Museum (arts and science). Member of the Advisory Council for the Stanford Graduate School of Business.
André F. Perold
Born in 1952. Trustee since December 2004. Principal occupation(s) during the past five years and other experience: George Gund Professor of Finance and Banking, Emeritus at the Harvard Business School (retired 2011). Chief investment officer and co-managing partner of HighVista Strategies LLC (private investment firm). Overseer of the Museum of Fine Arts Boston.
Sarah Bloom Raskin
Born in 1961. Trustee since January 2018. Principal occupation(s) during the past five years and other experience: deputy secretary (2014–2017) of the United States Department of the Treasury. Governor (2010–2014) of the Federal Reserve Board. Commissioner (2007–2010) of financial regulation for the State of Maryland. Member of the board of directors (2012–2014) of Neighborhood Reinvestment Corporation. Director of i(x) Investments, LLC.
1 Mr. McNabb and Mr. Buckley are considered “interested persons,” as defined in the Investment Company Act of 1940, because they are officers of the Vanguard funds.
Peter F. Volanakis
Born in 1955. Trustee since July 2009. Principal occupation(s) during the past five years and other experience: president and chief operating officer (retired 2010) of Corning Incorporated (communications equipment) and director of Corning Incorporated (2000–2010) and Dow Corning (2001–2010). Director (2012) of SPX Corporation (multi-industry manufacturing). Overseer of the Amos Tuck School of Business Administration, Dartmouth College (2001–2013). Chairman of the board of trustees of Colby-Sawyer College. Member of the Board of Hypertherm Inc. (industrial cutting systems, software, and consumables).
Executive Officers
Glenn Booraem
Born in 1967. Principal occupation(s) during the past five years and other experience: principal of Vanguard. Investment stewardship officer (2017–present), treasurer (2015–2017), controller (2010–2015), and assistant controller (2001–2010) of each of the investment companies served by Vanguard.
Christine M. Buchanan
Born in 1970. Principal occupation(s) during the past five years and other experience: principal of Vanguard and global head of Fund Administration at Vanguard. Treasurer (2017–present) of each of the investment companies served by Vanguard. Partner (2005–2017) at KPMG LLP (audit, tax, and advisory services).
Brian Dvorak
Born in 1973. Principal occupation(s) during the past five years and other experience: principal of Vanguard. Chief compliance officer (2017–present) of Vanguard and each of the investment companies served by Vanguard. Assistant vice president (2017–present) of Vanguard Marketing Corporation. Vice president and director of Enterprise Risk Management (2011–2013) at Oppenheimer Funds, Inc.
Thomas J. Higgins
Born in 1957. Principal occupation(s) during the past five years and other experience: principal of Vanguard. Chief financial officer (2008–present) and treasurer (1998–2008) of each of the investment companies served by Vanguard.
Peter Mahoney
Born in 1974. Principal occupation(s) during the past five years and other experience: principal of Vanguard. Controller (2015–present) of each of the investment companies served by Vanguard. Head of International Fund Services (2008–2014) at Vanguard.
Anne E. Robinson
Born in 1970. Principal occupation(s) during the past five years and other experience: general counsel (2016–present) of Vanguard. Secretary (2016–present) of Vanguard and of each of the investment companies served by Vanguard. Managing director (2016–present) of Vanguard. Director and senior vice president (2016–2018) of Vanguard Marketing Corporation. Managing director and general counsel of Global Cards and Consumer Services (2014–2016) at Citigroup. Counsel (2003–2014) at American Express.
Michael Rollings
Born in 1963. Principal occupation(s) during the past five years and other experience: finance director (2017–present) and treasurer (2017) of each of the investment companies served by Vanguard. Managing director (2016–present) of Vanguard. Chief financial officer (2016–present) of Vanguard. Director (2016–present) of Vanguard Marketing Corporation. Executive vice president and chief financial officer (2006–2016) of MassMutual Financial Group.
| |
| Vanguard Senior Management Team |
| |
| Joseph Brennan | Chris D. McIsaac |
| Mortimer J. Buckley | James M. Norris |
| Gregory Davis | Thomas M. Rampulla |
| John James | Karin A. Risi |
| Martha G. King | Anne E. Robinson |
| John T. Marcante | Michael Rollings |
Chairman Emeritus and Senior Advisor
John J. Brennan
Chairman, 1996–2009
Chief Executive Officer and President, 1996–2008
Founder
John C. Bogle
Chairman and Chief Executive Officer, 1974–1996
|  |
| | P.O. Box 2600 |
| | Valley Forge, PA 19482-2600 |
| |
| |
| |
| |
| Connect with Vanguard® > vanguard.com | |
| |
| |
| |
| |
| Fund Information > 800-662-7447 | All comparative mutual fund data are from Lipper, |
| | a Thomson Reuters Company, or Morningstar, Inc., |
| Direct Investor Account Services > 800-662-2739 | |
| | unless otherwise noted. |
| |
| Institutional Investor Services > 800-523-1036 | You can obtain a free copy of Vanguard’s proxy voting |
| Text Telephone for People | guidelines by visiting vanguard.com/proxyreporting or |
| Who Are Deaf or Hard of Hearing > 800-749-7273 | by calling Vanguard at 800-662-2739. The guidelines |
| | are also available from the SEC’s website, sec.gov. |
| | In addition, you may obtain a free report on how your |
| |
| This material may be used in conjunction | fund voted the proxies for securities it owned during |
| | the 12 months ended June 30. To get the report, visit |
| with the offering of shares of any Vanguard | either vanguard.com/proxyreporting or sec.gov. |
| fund only if preceded or accompanied by the | |
| fund’s current prospectus. | You can review information about your fund on the SEC’s |
| | website, and you can receive copies of this information, |
| CFA® is a registered trademark owned by CFA Institute. | for a fee, by sending a request via email addressed to |
| | publicinfo@sec.gov. |
| |
| |
| |
| |
| | © 2018 The Vanguard Group, Inc. |
| | All rights reserved. |
| | Vanguard Marketing Corporation, Distributor. |
| | Q950 122018 |

Annual Report | October 31, 2018
Vanguard Tax-Exempt Bond Index Fund
Vanguard’s Principles for Investing Success
We want to give you the best chance of investment success. These principles, grounded in Vanguard’s research and experience, can put you on the right path.
Goals. Create clear, appropriate investment goals.
Balance. Develop a suitable asset allocation using broadly diversified funds. Cost. Minimize cost.
Discipline. Maintain perspective and long-term discipline.
A single theme unites these principles: Focus on the things you can control.
We believe there is no wiser course for any investor.
| |
| Contents | |
| Your Fund’s Performance at a Glance. | 1 |
| CEO’s Perspective. | 4 |
| Fund Profile. | 6 |
| Performance Summary. | 7 |
| Financial Statements. | 10 |
| About Your Fund’s Expenses. | 149 |
| Glossary. | 151 |
Please note: The opinions expressed in this report are just that—informed opinions. They should not be considered promises or advice. Also, please keep in mind that the information and opinions cover the period through the date on the front of this report. Of course, the risks of investing in your fund are spelled out in the prospectus.
See the Glossary for definitions of investment terms used in this report.
Your Fund’s Performance at a Glance
• For the 12 months ended October 31, 2018, Vanguard Tax-Exempt Bond Index Fund returned –0.93% for Investor Shares, –0.85% for ETF Shares (based on net asset value), and –0.84% for Admiral Shares. Those performances were in line with the benchmark index return of –0.72% but lagged the average return of –0.37% for peer funds.
• The Federal Reserve raised its federal funds target rate four times, bringing it to 2%–2.25%. Longer-term rates also moved higher amid raised expectations for inflation and intensifying trade tensions.
• While fundamentals remained solid, municipal bonds went through a bumpy patch early on, when tax reforms affected both supply and demand. With yields rising, prices of municipal bonds finished the period down across the maturity spectrum but mainly toward the intermediate and long end.
• By maturity, intermediate-term munis performed the worst. By quality, lower-rated investment-grade munis tended to fare better than their higher-rated counterparts.
• Please note that shortly after the close of the period, Vanguard lowered the investment minimum for your fund’s Admiral Shares from $10,000 to $3,000.
| | | | | |
| Total Returns: Fiscal Year Ended October 31, 2018 | | | | |
| | | Taxable- | | | |
| | 30-Day SEC | Equivalent | Income | Capital | Total |
| | Yield | Yield | Returns | Returns | Returns |
| Vanguard Tax-Exempt Bond Index Fund | | | | | |
| Investor Shares | 2.79% | 4.71% | 2.07% | -3.00% | -0.93% |
| ETF Shares | 2.84 | 4.80 | | | |
| Market Price | | | | | -0.78 |
| Net Asset Value | | | | | -0.85 |
| Admiral™ Shares | 2.84 | 4.80 | 2.17 | -3.01 | -0.84 |
| S&P National AMT-Free Municipal Bond Index | | | | | -0.72 |
| General Municipal Funds Average | | | | | -0.37 |
The calculation of taxable-equivalent yield assumes a typical itemized tax return and is based on the maximum federal tax rate of 40.8%. State and local taxes were not considered. Please see the prospectus for a detailed explanation of the calculation.
General Municipal Funds Average: Derived from data provided by Lipper, a Thomson Reuters Company.
Admiral Shares carry lower expenses and are available to investors who meet certain account-balance requirements. The Vanguard ETF® Shares shown are traded on the NYSE Arca exchange and are available only through brokers. The table provides ETF returns based on both the NYSE Arca market price and the net asset value for a share. U.S. Pat. Nos. 6,879,964; 7,337,138; 7,720,749; 7,925,573; 8,090,646; and 8,417,623.
For the ETF Shares, the market price is determined by the midpoint of the bid-offer spread as of the closing time of the New York Stock Exchange (generally 4 p.m., Eastern time). The net asset value is also determined as of the NYSE closing time. For more information about how the ETF Shares' market prices have compared with their net asset value, visit vanguard.com, select your ETF, and then select the Price and Performance tab. The ETF premium/discount analysis there shows the percentages of days on which the ETF Shares' market price was above or below the NAV.
1
| |
| Total Returns: Inception Through October 31, 2018 | |
| | Average |
| | Annual Return |
| Tax-Exempt Bond Index Fund Investor Shares (Returns since inception: 8/21/2015) | 1.84% |
| S&P National AMT-Free Municipal Bond Index | 1.97 |
| General Municipal Funds Average | 2.01 |
| General Municipal Funds Average: Derived from data provided by Lipper, a Thomson Reuters Company. | |
The figures shown represent past performance, which is not a guarantee of future results. (Current performance may be lower or higher than the performance data cited. For performance data current to the most recent month-end, visit our website at vanguard.com/performance.) Note, too, that both investment returns and principal value can fluctuate widely, so an investor’s shares, when sold, could be worth more or less than their original cost.
2
| | | | |
| Expense Ratios | | | | |
| Your Fund Compared With Its Peer Group | | | | |
| | Investor | ETF | Admiral | Peer Group |
| | Shares | Shares | Shares | Average |
| Tax-Exempt Bond Index Fund | 0.19% | 0.09% | 0.09% | 0.86% |
The fund expense ratios shown are from the prospectus dated February 23, 2018, and represent estimated costs for the current fiscal year. For the fiscal year ended October 31, 2018, the fund’s expense ratios were 0.17% for Investor Shares, 0.08% for ETF Shares, and 0.09% for Admiral Shares. The peer-group expense ratio is derived from data provided by Lipper, a Thomson Reuters Company, and captures information through year-end 2017.
Peer group: General Municipal Funds Average.
3
CEO’s Perspective

Tim Buckley
President and Chief Executive Officer
Dear Shareholder,
Over the years, I’ve found that prudent investors exhibit a common trait: discipline. No matter how the markets move or what new investing fad hits the headlines, those who stay focused on their goals and tune out the noise are set up for long-term success.
The prime gateway to investing is saving, and you don’t usually become a saver without a healthy dose of discipline. Savers make the decision to sock away part of their income, which means spending less and delaying gratification, no matter how difficult that may be.
Of course, disciplined investing extends beyond diligent saving. The financial markets, in the short term especially, are unpredictable; I have yet to meet the investor who can time them perfectly. It takes discipline to resist the urge to go all-in when markets are frothy or to retreat when things look bleak.
Staying put with your investments is one strategy for handling volatility. Another, rebalancing, requires even more discipline because it means steering your money away from strong performers and toward poorer performers.
Patience—a form of discipline—is also the friend of long-term investors. Higher returns are the potential reward for weathering the market’s turbulence and uncertainty.
4
We have been enjoying one of the longest bull markets in history, but it won’t continue forever. Prepare yourself now for how you will react when volatility comes back. Don’t panic. Don’t chase returns or look for answers outside the asset classes you trust. And be sure to rebalance periodically, even when there’s turmoil.
Whether you’re a master of self-control, get a boost from technology, or work with a professional advisor, know that discipline
is necessary to get the most out of your investment portfolio. And know that Vanguard is with you for the entire ride.
Thank you for your continued loyalty.

Mortimer J. Buckley
President and Chief Executive Officer
November 16, 2018
| | | |
| Market Barometer | | | |
| | | Average Annual Total Returns |
| | | Periods Ended October 31, 2018 |
| | One Year | Three Years | Five Years |
| Stocks | | | |
| Russell 1000 Index (Large-caps) | 6.98% | 11.31% | 11.05% |
| Russell 2000 Index (Small-caps) | 1.85 | 10.68 | 8.01 |
| Russell 3000 Index (Broad U.S. market) | 6.60 | 11.27 | 10.81 |
| FTSE All-World ex US Index (International) | -7.99 | 4.57 | 2.01 |
| |
| Bonds | | | |
| Bloomberg Barclays U.S. Aggregate Bond Index | | | |
| (Broad taxable market) | -2.05% | 1.04% | 1.83% |
| Bloomberg Barclays Municipal Bond Index | | | |
| (Broad tax-exempt market) | -0.51 | 1.90 | 3.25 |
| FTSE Three-Month U. S. Treasury Bill Index | 1.67 | 0.86 | 0.52 |
| |
| CPI | | | |
| Consumer Price Index | 2.52% | 2.07% | 1.60% |
5
Tax-Exempt Bond Index Fund
Fund Profile
As of October 31, 2018
| | | |
| Share-Class Characteristics | | |
| | Investor | ETF | Admiral |
| | Shares | Shares | Shares |
| Ticker Symbol | VTEBX | VTEB | VTEAX |
| Expense Ratio1 | 0.19% | 0.09% | 0.09% |
| 30-Day SEC Yield | 2.79% | 2.84% | 2.84% |
| | |
| Financial Attributes | | |
| | | S&P |
| | | National |
| | | AMT-Free |
| | Fund | Muni Bond Idx |
| Number of Bonds | 4,191 | 11,854 |
| Yield to Maturity (before | | |
| expenses) | 3.0% | 2.9% |
| Average Coupon | 4.7% | 4.6% |
| Average Duration | 5.9 years | 5.8 years |
| Average Stated Maturity | 13.4 years | 13.0 years |
| Short-Term Reserves | 0.9% | — |
| |
| Largest Area Concentrations | |
| New York | 19.8% |
| California | 13.3 |
| Texas | 10.2 |
| New Jersey | 5.6 |
| Illinois | 5.3 |
| Massachusetts | 4.6 |
| Pennsylvania | 4.3 |
| Florida | 3.7 |
| Washington | 3.4 |
| Maryland | 3.0 |
| Top Ten | 73.2% |
"Largest Area Concentration" figures exclude any fixed income futures contracts.
| |
| Distribution by Effective Maturity | |
| (% of portfolio) | |
| Under 1 Year | 5.3% |
| 1 - 3 Years | 10.3 |
| 3 - 5 Years | 9.2 |
| 5 - 10 Years | 17.1 |
| 10 - 20 Years | 30.4 |
| 20 - 30 Years | 24.8 |
| Over 30 Years | 2.9 |
Distribution by Credit Quality (% of portfolio)
| |
| AAA | 24.0% |
| AA | 49.1 |
| A | 17.2 |
| BBB | 8.6 |
| Not Rated | 1.1 |
Credit-quality ratings are from Moody's and S&P. The higher rating for each issue is shown. "Not Rated" is used to classify securities for which a rating is not available. For more information about these ratings, see the Glossary entry for Credit Quality.
Investment Focus
1 The expense ratios shown are from the prospectus dated February 23, 2018, and represent estimated costs for the current fiscal year. For the fiscal year ended October 31, 2018, the expense ratios were 0.17% for Investor Shares, 0.08% for ETF Shares, and 0.09% for Admiral Shares.
6
Tax-Exempt Bond Index Fund
Performance Summary
All of the returns in this report represent past performance, which is not a guarantee of future results that may be achieved by the fund. (Current performance may be lower or higher than the performance data cited. For performance data current to the most recent month-end, visit our website at vanguard.com/performance.) Note, too, that both investment returns and principal value can fluctuate widely, so an investor’s shares, when sold, could be worth more or less than their original cost. The returns shown do not reflect taxes that a shareholder would pay on fund distributions or on the sale of fund shares.
Cumulative Performance: August 21, 2015, Through October 31, 2018
Initial Investment of $10,000
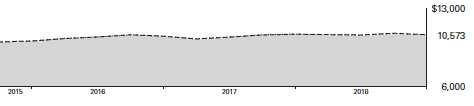
| | | |
| | Average Annual Total Returns | |
| | Periods Ended October 31, 2018 | |
| |
| | | Since | Final Value |
| | One | Inception | of a $10,000 |
| | Year | (8/21/2015) | Investment |
| Tax-Exempt Bond Index Fund Investor | | | |
| Shares | -1.17% | 1.76% | $10,573 |
| S&P National AMT-Free Municipal Bond | | | |
| Index | -0.72 | 1.97 | 10,643 |
| |
| General Municipal Funds Average | -0.37 | 2.01 | 10,657 |
General Municipal Funds Average: Derived from data provided by Lipper, a Thomson Reuters Company.
"Since Inception" performance is calculated from the Investor Shares’ inception date for both the fund and its comparative standards.
| | | |
| | | Since | Final Value |
| | One | Inception | of a $10,000 |
| | Year | (8/21/2015) | Investment |
| Tax-Exempt Bond Index Fund | | | |
| ETF Shares Net Asset Value | -0.85% | 1.92% | $10,626 |
| Tax-Exempt Bond Index Fund | | | |
| ETF Shares Market Price | -0.78 | 1.94 | 10,633 |
| S&P National AMT-Free Municipal Bond | | | |
| Index | -0.72 | 1.97 | 10,643 |
"Since Inception" performance is calculated from the ETF Shares’ inception date for both the fund and its comparative standard.
Vanguard fund returns are adjusted to reflect the 0.25% fee on purchases of fund shares. The fee does not apply to the ETF Shares. The Fiscal-Year Total Returns table is not adjusted for fees.
See Financial Highlights for dividend and capital gains information.
7
Tax-Exempt Bond Index Fund
| | | |
| | Average Annual Total Returns | |
| | Periods Ended October 31, 2018 | |
| |
| | | Since | Final Value |
| | One | Inception | of a $10,000 |
| | Year | (8/25/2015) | Investment |
| Tax-Exempt Bond Index Fund Admiral | | | |
| Shares | -1.09% | 1.88% | $10,612 |
| S&P National AMT-Free Municipal Bond | | | |
| Index | -0.72 | 2.01 | 10,643 |
"Since Inception" performance is calculated from the Admiral Shares’ inception date for both the fund and its comparative standard.
| | |
| Cumulative Returns of ETF Shares: August 21, 2015, Through October 31, 2018 | |
| |
| | | Since |
| | One | Inception |
| | Year | (8/21/2015) |
| Tax-Exempt Bond Index Fund ETF Shares Market | | |
| Price | -0.78% | 6.33% |
| Tax-Exempt Bond Index Fund ETF Shares Net Asset | | |
| Value | -0.85 | 6.26 |
| S&P National AMT-Free Municipal Bond Index | -0.72 | 6.43 |
"Since Inception" performance is calculated from the ETF Shares’ inception date for both the fund and its comparative standard.
| | | | |
| Fiscal-Year Total Returns (%): August 21, 2015, Through October 31, 2018 | |
| | | | | S&P |
| | | | | National |
| | | | | AMT-Free |
| | | | Investor Shares | Muni Bond Idx |
| Fiscal Year | Income Returns | Capital Returns | Total Returns | Total Returns |
| 2015 | 0.32% | 0.50% | 0.82% | 0.83% |
| 2016 | 1.49 | 2.79 | 4.28 | 4.32 |
| 2017 | 1.86 | -0.10 | 1.76 | 1.92 |
| 2018 | 2.07 | -3.00 | -0.93 | -0.72 |
Vanguard fund returns are adjusted to reflect the 0.25% fee on purchases of fund shares. The fee does not apply to the ETF Shares. The Fiscal-Year Total Returns table is not adjusted for fees.
8
Tax-Exempt Bond Index Fund
Average Annual Total Returns: Periods Ended September 30, 2018
This table presents returns through the latest calendar quarter—rather than through the end of the fiscal period.
Securities and Exchange Commission rules require that we provide this information.
| | | | | |
| | | | | | Since Inception |
| | Inception Date | One Year | Income | Capital | Total |
| Investor Shares | 8/21/2015 | -0.09% | 1.80% | 0.32% | 2.12% |
| Fee-Adjusted Returns | | -0.34 | | | 2.03 |
| ETF Shares | 8/21/2015 | | | | |
| Market Price | | -0.10 | | | 2.17 |
| Net Asset Value | | -0.05 | | | 2.19 |
| Admiral Shares | 8/25/2015 | -0.00 | 1.91 | 0.34 | 2.25 |
| Fee-Adjusted Returns | | -0.25 | | | 2.16 |
Vanguard fund returns are adjusted to reflect the 0.25% fee on purchases of fund shares. The fee does not apply to the ETF Shares. The Fiscal-Year Total Returns table is not adjusted for fees.
9
Tax-Exempt Bond Index Fund
Financial Statements
Statement of Net Assets
As of October 31, 2018
The fund reports a complete list of its holdings in regulatory filings four times in each fiscal year, at the quarter-ends. For the second and fourth fiscal quarters, the lists appear in the fund’s semiannual and annual reports to shareholders. For the first and third fiscal quarters, the fund files the lists with the Securities and Exchange Commission on Form N-Q. Shareholders can look up the fund’s Forms N-Q on the SEC’s website at sec.gov.
| | | | |
| | | | Face | Market |
| | | Maturity | Amount | Value • |
| | Coupon | Date | ($000) | ($000) |
| Tax-Exempt Municipal Bonds (98.3%) | | | | |
| Alabama (0.6%) | | | | |
| Alabama Federal Aid Highway Finance | | | | |
| Authority GAN | 5.000% | 9/1/19 | 300 | 307 |
| Alabama Federal Aid Highway Finance | | | | |
| Authority GAN | 5.000% | 9/1/21 | 180 | 193 |
| Alabama Federal Aid Highway Finance | | | | |
| Authority GAN | 5.000% | 9/1/22 (Prere.) | 290 | 319 |
| Alabama Federal Aid Highway Finance | | | | |
| Authority GAN | 5.000% | 9/1/22 (Prere.) | 165 | 182 |
| Alabama Federal Aid Highway Finance | | | | |
| Authority GAN | 5.000% | 9/1/27 | 890 | 1,001 |
| Alabama Federal Aid Highway Finance | | | | |
| Authority Special Obligation Revenue | 5.000% | 9/1/28 | 720 | 808 |
| Alabama Federal Aid Highway Finance | | | | |
| Authority Special Obligation Revenue | 5.000% | 9/1/30 | 645 | 719 |
| Alabama Federal Aid Highway Finance | | | | |
| Authority Special Obligation Revenue | 4.000% | 9/1/32 | 555 | 572 |
| Alabama Federal Aid Highway Finance | | | | |
| Authority Special Obligation Revenue | 5.000% | 9/1/36 | 665 | 745 |
| Alabama Federal Aid Highway Finance | | | | |
| Authority Special Obligation Revenue | 4.000% | 6/1/37 | 1,250 | 1,279 |
| Alabama Incentives Financing Authority | | | | |
| Special Obligation Revenue | 5.000% | 9/1/37 | 380 | 404 |
| Alabama Port Authority Docks Facilities | | | | |
| Revenue | 6.000% | 10/1/20 (Prere.) | 100 | 107 |
| Alabama Public School & College Authority | | | | |
| Capital Improvement Revenue | 5.000% | 1/1/23 | 235 | 260 |
| Alabama Public School & College Authority | | | | |
| Capital Improvement Revenue | 5.000% | 1/1/25 | 450 | 507 |
| Alabama Public School & College Authority | | | | |
| Revenue | 5.000% | 1/1/21 | 710 | 752 |
| Alabama Public School & College Authority | | | | |
| Revenue | 5.000% | 1/1/26 | 2,685 | 3,019 |
| Alabama Public School & College Authority | | | | |
| Revenue | 5.000% | 1/1/27 | 1,535 | 1,721 |
| Auburn University Alabama General Fee | | | | |
| Revenue | 5.000% | 6/1/28 | 300 | 344 |
10
| | | | |
| Tax-Exempt Bond Index Fund | | | | |
| |
| |
| |
| | | | Face | Market |
| | | Maturity | Amount | Value • |
| | Coupon | Date | ($000) | ($000) |
| Auburn University Alabama General Fee | | | | |
| Revenue | 4.000% | 6/1/41 | 2,945 | 2,972 |
| Birmingham AL Airport Authority Revenue | 5.250% | 7/1/30 (4) | 170 | 177 |
| Birmingham AL Airport Authority Revenue | 5.500% | 7/1/40 (4) | 140 | 147 |
| Birmingham AL Water Works Board Water | | | | |
| Revenue | 5.000% | 1/1/21 (Prere.) | 1,460 | 1,549 |
| Birmingham AL Water Works Board Water | | | | |
| Revenue | 4.000% | 1/1/36 | 250 | 252 |
| Birmingham AL Water Works Board Water | | | | |
| Revenue | 5.000% | 1/1/43 | 1,890 | 2,069 |
| Jefferson County AL Board of Education GO | 5.000% | 2/1/46 | 2,165 | 2,336 |
| Jefferson County AL Revenue | 5.000% | 9/15/33 | 500 | 552 |
| Jefferson County AL Revenue | 5.000% | 9/15/34 | 250 | 275 |
| Jefferson County AL Revenue | 5.000% | 9/15/35 | 250 | 274 |
| | | | | 23,842 |
| Alaska (0.1%) | | | | |
| Alaska Municipal Bond Bank Authority | | | | |
| Revenue | 5.000% | 3/1/27 | 170 | 190 |
| Anchorage AK Electric Utility Revenue | 5.000% | 12/1/41 | 1,220 | 1,324 |
| Anchorage AK Electric Utility Revenue | 4.000% | 12/1/44 | 350 | 344 |
| | | | | 1,858 |
| Arizona (1.5%) | | | | |
| Arizona Board of Regents COP (Arizona State | | | | |
| University) | 5.000% | 9/1/23 | 1,500 | 1,672 |
| Arizona Board Regents Arizona State | | | | |
| University System Revenue | 5.000% | 7/1/22 (Prere.) | 390 | 427 |
| Arizona COP | 5.250% | 10/1/20 (4) | 120 | 123 |
| Arizona COP | 5.000% | 10/1/29 (4) | 2,945 | 3,018 |
| Arizona School Facilities Board COP | 5.000% | 9/1/19 | 840 | 861 |
| Arizona School Facilities Board COP | 5.000% | 9/1/20 | 100 | 105 |
| Arizona School Facilities Board COP | 5.000% | 9/1/21 | 590 | 634 |
| Arizona School Facilities Board COP | 5.000% | 9/1/23 | 555 | 620 |
| Arizona Transportation Board Excise Tax | | | | |
| Revenue | 5.250% | 7/1/19 (Prere.) | 135 | 138 |
| Arizona Transportation Board Excise Tax | | | | |
| Revenue | 5.000% | 7/1/22 | 1,000 | 1,095 |
| Arizona Transportation Board Excise Tax | | | | |
| Revenue | 5.000% | 7/1/23 | 215 | 240 |
| Arizona Transportation Board Excise Tax | | | | |
| Revenue | 5.000% | 7/1/23 | 195 | 218 |
| Arizona Transportation Board Excise Tax | | | | |
| Revenue | 5.000% | 7/1/24 | 585 | 663 |
| Arizona Transportation Board Excise Tax | | | | |
| Revenue | 5.000% | 7/1/25 | 335 | 378 |
| Arizona Transportation Board Excise Tax | | | | |
| Revenue (Maricopa County Regional Area) | 5.000% | 7/1/19 (Prere.) | 415 | 423 |
| Arizona Transportation Board Highway | | | | |
| Revenue | 5.000% | 7/1/21 | 1,255 | 1,346 |
| Arizona Transportation Board Highway | | | | |
| Revenue | 5.000% | 7/1/22 (Prere.) | 570 | 623 |
| Arizona Transportation Board Highway | | | | |
| Revenue | 5.000% | 7/1/24 | 280 | 318 |
| Arizona Transportation Board Highway | | | | |
| Revenue | 5.000% | 7/1/24 | 1,040 | 1,112 |
11
| | | | |
| Tax-Exempt Bond Index Fund | | | | |
| |
| |
| |
| | | | Face | Market |
| | | Maturity | Amount | Value • |
| | Coupon | Date | ($000) | ($000) |
| Arizona Transportation Board Highway | | | | |
| Revenue | 5.000% | 7/1/25 | 590 | 642 |
| Arizona Transportation Board Highway | | | | |
| Revenue | 5.000% | 7/1/25 | 150 | 160 |
| Arizona Transportation Board Highway | | | | |
| Revenue | 5.000% | 7/1/26 | 2,765 | 3,008 |
| Arizona Transportation Board Highway | | | | |
| Revenue | 5.000% | 7/1/29 | 995 | 1,114 |
| Arizona Transportation Board Highway | | | | |
| Revenue | 5.000% | 7/1/31 | 2,280 | 2,549 |
| Arizona Transportation Board Highway | | | | |
| Revenue | 5.000% | 7/1/32 | 60 | 67 |
| Arizona Water Infrastructure Finance Authority | | | | |
| Revenue | 5.000% | 10/1/20 (Prere.) | 250 | 263 |
| Arizona Water Infrastructure Finance Authority | | | | |
| Revenue | 5.000% | 10/1/22 (ETM) | 720 | 793 |
| Arizona Water Infrastructure Finance Authority | | | | |
| Revenue | 5.000% | 10/1/22 | 1,130 | 1,245 |
| Arizona Water Infrastructure Finance Authority | | | | |
| Revenue | 5.000% | 10/1/23 | 175 | 196 |
| Arizona Water Infrastructure Finance Authority | | | | |
| Revenue | 5.000% | 10/1/24 | 175 | 199 |
| Maricopa County AZ Community College | | | | |
| District GO | 5.000% | 7/1/21 | 225 | 241 |
| Maricopa County AZ Community College | | | | |
| District GO | 5.000% | 7/1/23 | 100 | 112 |
| Phoenix AZ Civic Improvement Corp. Airport | | | | |
| Revenue | 5.000% | 7/1/20 (Prere.) | 515 | 539 |
| Phoenix AZ Civic Improvement Corp. Airport | | | | |
| Revenue | 5.250% | 7/1/20 (Prere.) | 730 | 767 |
| Phoenix AZ Civic Improvement Corp. Airport | | | | |
| Revenue | 4.000% | 7/1/40 | 2,950 | 2,946 |
| Phoenix AZ Civic Improvement Corp. Excise | | | | |
| Tax Revenue | 5.000% | 7/1/19 | 860 | 877 |
| Phoenix AZ Civic Improvement Corp. Transit | | | | |
| Excise Tax Revenue (Light Rail Project) | 5.000% | 7/1/20 | 1,210 | 1,267 |
| Phoenix AZ Civic Improvement Corp. Water | | | | |
| System Revenue | 5.000% | 7/1/19 (Prere.) | 1,500 | 1,531 |
| Phoenix AZ Civic Improvement Corp. Water | | | | |
| System Revenue | 5.000% | 7/1/20 | 700 | 733 |
| Phoenix AZ Civic Improvement Corp. Water | | | | |
| System Revenue | 5.000% | 7/1/22 | 775 | 849 |
| Phoenix AZ Civic Improvement Corp. Water | | | | |
| System Revenue | 5.000% | 7/1/26 | 845 | 953 |
| Phoenix AZ Civic Improvement Corp. Water | | | | |
| System Revenue | 4.750% | 7/1/44 | 160 | 170 |
| Phoenix AZ GO | 4.000% | 7/1/21 | 1,330 | 1,393 |
| Phoenix AZ GO | 4.000% | 7/1/22 | 335 | 355 |
| Phoenix AZ GO | 4.000% | 7/1/24 | 470 | 509 |
| Phoenix AZ GO | 4.000% | 7/1/25 | 750 | 809 |
| Phoenix AZ GO | 5.000% | 7/1/26 | 220 | 256 |
| Phoenix AZ Industrial Development Authority | | | | |
| Lease Revenue (Downtown Phoenix Student | | | | |
| Housing LLC) | 5.000% | 7/1/42 | 250 | 266 |
12
| | | | |
| Tax-Exempt Bond Index Fund | | | | |
| |
| |
| |
| | | | Face | Market |
| | | Maturity | Amount | Value • |
| | Coupon | Date | ($000) | ($000) |
| Phoenix AZ Industrial Development Authority | | | | |
| Lease Revenue (Rowan University) | 5.250% | 6/1/34 | 85 | 91 |
| Pima County AZ Industrial Development | | | | |
| Authority Lease Revenue (Clark County | | | | |
| Detention Facilities Project) | 5.000% | 9/1/39 | 270 | 271 |
| Pima County AZ Sewer Revenue | 5.000% | 7/1/24 | 220 | 249 |
| Pinal County AZ Electric District Revenue | 5.250% | 7/1/21 (Prere.) | 125 | 135 |
| Salt River Project Arizona Agricultural | | | | |
| Improvement & Power District Revenue | 5.000% | 1/1/19 (Prere.) | 75 | 75 |
| Salt River Project Arizona Agricultural | | | | |
| Improvement & Power District Revenue | 5.000% | 1/1/19 (Prere.) | 50 | 50 |
| Salt River Project Arizona Agricultural | | | | |
| Improvement & Power District Revenue | 5.000% | 1/1/19 (Prere.) | 750 | 754 |
| Salt River Project Arizona Agricultural | | | | |
| Improvement & Power District Revenue | 5.000% | 12/1/19 | 305 | 315 |
| Salt River Project Arizona Agricultural | | | | |
| Improvement & Power District Revenue | 5.000% | 1/1/21 | 395 | 419 |
| Salt River Project Arizona Agricultural | | | | |
| Improvement & Power District Revenue | 5.000% | 1/1/23 | 520 | 575 |
| Salt River Project Arizona Agricultural | | | | |
| Improvement & Power District Revenue | 5.000% | 1/1/24 | 120 | 135 |
| Salt River Project Arizona Agricultural | | | | |
| Improvement & Power District Revenue | 5.000% | 12/1/27 | 465 | 500 |
| Salt River Project Arizona Agricultural | | | | |
| Improvement & Power District Revenue | 5.000% | 1/1/28 | 105 | 124 |
| Salt River Project Arizona Agricultural | | | | |
| Improvement & Power District Revenue | 5.000% | 12/1/28 | 235 | 253 |
| Salt River Project Arizona Agricultural | | | | |
| Improvement & Power District Revenue | 5.000% | 12/1/29 | 720 | 778 |
| Salt River Project Arizona Agricultural | | | | |
| Improvement & Power District Revenue | 5.000% | 12/1/31 | 6,715 | 7,227 |
| Salt River Project Arizona Agricultural | | | | |
| Improvement & Power District Revenue | 5.000% | 12/1/35 | 225 | 251 |
| Salt River Project Arizona Agricultural | | | | |
| Improvement & Power District Revenue | 5.000% | 12/1/36 | 20 | 22 |
| Salt River Project Arizona Agricultural | | | | |
| Improvement & Power District Revenue | 5.000% | 12/1/41 | 2,400 | 2,650 |
| Salt River Project Arizona Agricultural | | | | |
| Improvement & Power District Revenue | 5.000% | 12/1/45 | 1,700 | 1,873 |
| | | | | 55,570 |
| Arkansas (0.1%) | | | | |
| Arkansas GO | 5.000% | 6/15/21 | 375 | 402 |
| Springdale AR Sales and Use Revenue | 5.000% | 4/1/37 (15) | 1,200 | 1,295 |
| Springdale AR School District No. 50 GO | 4.000% | 6/1/33 | 395 | 408 |
| | | | | 2,105 |
| California (13.3%) | | | | |
| Alameda CA Corridor Transportation Authority | | | | |
| Revenue | 0.000% | 10/1/19 (2)(ETM) | 235 | 231 |
| Alameda CA Corridor Transportation Authority | | | | |
| Revenue | 0.000% | 10/1/19 (2) | 15 | 15 |
| Alameda CA Corridor Transportation Authority | | | | |
| Revenue | 0.000% | 10/1/20 (2)(ETM) | 240 | 231 |
| Alameda CA Corridor Transportation Authority | | | | |
| Revenue | 0.000% | 10/1/20 (2) | 5 | 5 |
13
| | | | |
| Tax-Exempt Bond Index Fund | | | | |
| |
| |
| |
| | | | Face | Market |
| | | Maturity | Amount | Value • |
| | Coupon | Date | ($000) | ($000) |
| Alameda CA Corridor Transportation Authority | | | | |
| Revenue | 5.000% | 10/1/34 | 250 | 272 |
| Alameda CA Corridor Transportation Authority | | | | |
| Revenue | 0.000% | 10/1/35 (14) | 315 | 154 |
| Alameda CA Corridor Transportation Authority | | | | |
| Revenue | 5.000% | 10/1/35 (4) | 125 | 138 |
| Alameda CA Corridor Transportation Authority | | | | |
| Revenue | 5.000% | 10/1/35 | 2,240 | 2,425 |
| Alameda CA Corridor Transportation Authority | | | | |
| Revenue | 5.000% | 10/1/36 | 500 | 540 |
| Alameda CA Corridor Transportation Authority | | | | |
| Revenue | 4.000% | 10/1/37 (4) | 395 | 399 |
| 1 Allan Hancock CA Joint Community College | | | | |
| GO | 0.000% | 8/1/47 | 250 | 143 |
| Alvord CA Unified School District GO | 0.000% | 8/1/41 (4) | 220 | 80 |
| Alvord CA Unified School District GO | 0.000% | 8/1/43 (4) | 400 | 137 |
| Anaheim CA Housing & Public Improvements | | | | |
| Authority Revenue (Electric Utility | | | | |
| Distribution System) | 5.000% | 10/1/33 | 1,890 | 2,031 |
| Anaheim CA Housing & Public Improvements | | | | |
| Authority Revenue (Electric Utility | | | | |
| Distribution System) | 5.000% | 10/1/34 | 1,505 | 1,615 |
| Anaheim CA Housing & Public Improvements | | | | |
| Authority Revenue (Electric Utility | | | | |
| Distribution System) | 5.000% | 10/1/35 | 1,250 | 1,340 |
| Anaheim CA Housing & Public Improvements | | | | |
| Authority Revenue (Electric Utility | | | | |
| Distribution System) | 5.000% | 10/1/41 | 375 | 400 |
| Anaheim CA Public Financing Authority | | | | |
| Lease Revenue | 0.000% | 9/1/32 (4) | 1,500 | 855 |
| Anaheim CA Public Financing Authority | | | | |
| Lease Revenue | 0.000% | 9/1/36 (4) | 1,490 | 692 |
| Anaheim CA Public Financing Authority | | | | |
| Lease Revenue | 5.000% | 5/1/39 | 3,500 | 3,839 |
| Baldwin Park CA Unified School District GO | 0.000% | 8/1/42 (15) | 200 | 48 |
| Bay Area Toll Authority California Toll Bridge | | | | |
| Revenue (San Francisco Bay Area) | 5.125% | 4/1/19 (Prere.) | 115 | 117 |
| Bay Area Toll Authority California Toll Bridge | | | | |
| Revenue (San Francisco Bay Area) | 5.250% | 4/1/19 (Prere.) | 525 | 533 |
| Bay Area Toll Authority California Toll Bridge | | | | |
| Revenue (San Francisco Bay Area) | 5.250% | 4/1/19 (Prere.) | 225 | 228 |
| Bay Area Toll Authority California Toll Bridge | | | | |
| Revenue (San Francisco Bay Area) | 5.000% | 4/1/23 (Prere.) | 100 | 112 |
| Bay Area Toll Authority California Toll Bridge | | | | |
| Revenue (San Francisco Bay Area) | 5.000% | 4/1/23 (Prere.) | 245 | 275 |
| Bay Area Toll Authority California Toll Bridge | | | | |
| Revenue (San Francisco Bay Area) | 4.000% | 4/1/35 | 1,000 | 1,032 |
| Bay Area Toll Authority California Toll Bridge | | | | |
| Revenue (San Francisco Bay Area) | 4.000% | 4/1/37 | 1,000 | 1,024 |
| Bay Area Toll Authority California Toll Bridge | | | | |
| Revenue (San Francisco Bay Area) | 4.000% | 4/1/47 | 5,400 | 5,415 |
| Bay Area Toll Authority California Toll Bridge | | | | |
| Revenue (San Francisco Bay Area) | 4.000% | 4/1/49 | 1,000 | 1,001 |
| Bay Area Toll Authority California Toll Bridge | | | | |
| Revenue (San Francisco Bay Area) | 5.000% | 4/1/54 | 4,315 | 4,605 |
14
| | | | |
| Tax-Exempt Bond Index Fund | | | | |
| |
| |
| |
| | | | Face | Market |
| | | Maturity | Amount | Value • |
| | Coupon | Date | ($000) | ($000) |
| Bay Area Toll Authority California Toll Bridge | | | | |
| Revenue (San Francisco Bay Area) | 5.000% | 10/1/54 | 305 | 327 |
| Bay Area Toll Authority California Toll Bridge | | | | |
| Revenue (San Francisco Bay Area) | 4.000% | 4/1/56 | 365 | 362 |
| Bay Area Toll Authority California Toll Bridge | | | | |
| Revenue (San Francisco Bay Area) | 5.000% | 4/1/56 | 1,500 | 1,636 |
| Bay Area Toll Authority California Toll Bridge | | | | |
| Revenue (San Francisco Bay Area) PUT | 1.875% | 4/1/19 | 200 | 200 |
| Bay Area Toll Authority California Toll Bridge | | | | |
| Revenue (San Francisco Bay Area) PUT | 2.000% | 4/1/21 | 250 | 248 |
| Bay Area Toll Authority California Toll Bridge | | | | |
| Revenue (San Francisco Bay Area) PUT | 2.100% | 4/1/22 | 500 | 496 |
| Beverly Hills CA Unified School District GO | 0.000% | 8/1/33 | 100 | 58 |
| California Department of Water Resources | | | | |
| Power Supply Revenue | 5.000% | 5/1/19 | 175 | 178 |
| California Department of Water Resources | | | | |
| Power Supply Revenue | 5.000% | 5/1/20 | 645 | 675 |
| California Department of Water Resources | | | | |
| Power Supply Revenue | 5.000% | 5/1/21 | 1,825 | 1,960 |
| California Department of Water Resources | | | | |
| Water System Revenue (Central Valley | | | | |
| Project) | 5.000% | 12/1/19 (Prere.) | 100 | 104 |
| California Department of Water Resources | | | | |
| Water System Revenue (Central Valley | | | | |
| Project) | 5.000% | 12/1/22 | 225 | 252 |
| California Department of Water Resources | | | | |
| Water System Revenue (Central Valley | | | | |
| Project) | 5.000% | 12/1/26 | 100 | 116 |
| California Department of Water Resources | | | | |
| Water System Revenue (Central Valley | | | | |
| Project) | 5.000% | 12/1/29 | 325 | 374 |
| California Department of Water Resources | | | | |
| Water System Revenue (Central Valley | | | | |
| Project) | 5.000% | 12/1/33 | 210 | 241 |
| California Economic Recovery GO | 5.000% | 7/1/19 (Prere.) | 325 | 332 |
| California Economic Recovery GO | 5.000% | 7/1/19 (ETM) | 405 | 414 |
| California Educational Facilities Authority | | | | |
| Revenue (Loma Linda University) | 5.000% | 4/1/42 | 325 | 355 |
| California Educational Facilities Authority | | | | |
| Revenue (Stanford University) | 5.000% | 3/15/39 | 880 | 1,055 |
| California Educational Facilities Authority | | | | |
| Revenue (Stanford University) | 5.000% | 5/1/45 | 1,800 | 2,203 |
| California Educational Facilities Authority | | | | |
| Revenue (Stanford University) | 5.000% | 6/1/46 | 1,035 | 1,270 |
| California GO | 5.000% | 2/1/19 | 300 | 302 |
| California GO | 5.500% | 4/1/19 | 225 | 228 |
| California GO | 6.000% | 4/1/19 | 165 | 168 |
| California GO | 6.000% | 4/1/19 (Prere.) | 720 | 733 |
| California GO | 6.000% | 4/1/19 (Prere.) | 2,210 | 2,250 |
| California GO | 6.500% | 4/1/19 (Prere.) | 3,340 | 3,407 |
| California GO | 5.000% | 8/1/19 | 225 | 230 |
| California GO | 5.000% | 8/1/19 | 100 | 102 |
| California GO | 5.000% | 9/1/19 | 135 | 139 |
| California GO | 5.000% | 10/1/19 | 310 | 319 |
| California GO | 5.000% | 2/1/20 | 225 | 234 |
15
| | | | |
| Tax-Exempt Bond Index Fund | | | | |
| |
| |
| |
| | | | Face | Market |
| | | Maturity | Amount | Value • |
| | Coupon | Date | ($000) | ($000) |
| California GO | 5.000% | 2/1/20 | 110 | 114 |
| California GO | 5.000% | 8/1/20 | 500 | 526 |
| California GO | 5.000% | 9/1/20 | 100 | 105 |
| California GO | 5.000% | 9/1/20 | 100 | 105 |
| California GO | 5.000% | 10/1/20 | 515 | 544 |
| California GO | 5.000% | 10/1/20 | 1,090 | 1,152 |
| California GO | 5.000% | 10/1/20 | 445 | 470 |
| California GO | 5.250% | 10/1/20 | 500 | 516 |
| California GO | 5.500% | 4/1/21 | 430 | 437 |
| California GO | 5.000% | 8/1/21 | 235 | 254 |
| California GO | 5.000% | 9/1/21 | 1,010 | 1,093 |
| California GO | 5.000% | 9/1/21 | 245 | 265 |
| California GO | 5.000% | 10/1/21 | 160 | 173 |
| California GO | 5.000% | 12/1/21 | 265 | 288 |
| California GO | 5.000% | 2/1/22 | 175 | 191 |
| California GO | 5.250% | 4/1/22 | 20 | 20 |
| California GO | 5.000% | 9/1/22 | 200 | 220 |
| California GO | 5.000% | 9/1/22 | 500 | 551 |
| California GO | 5.000% | 10/1/22 | 110 | 121 |
| California GO | 5.250% | 10/1/22 | 135 | 150 |
| California GO | 5.000% | 11/1/22 | 2,000 | 2,212 |
| California GO | 5.000% | 12/1/22 | 175 | 194 |
| California GO | 5.000% | 2/1/23 | 250 | 273 |
| California GO | 5.000% | 9/1/23 | 905 | 1,015 |
| California GO | 5.000% | 9/1/23 | 200 | 221 |
| California GO | 5.250% | 9/1/23 | 100 | 109 |
| California GO | 5.000% | 10/1/23 | 355 | 399 |
| California GO | 5.000% | 11/1/23 | 160 | 180 |
| California GO | 5.000% | 12/1/23 | 295 | 332 |
| California GO | 5.000% | 12/1/23 | 375 | 422 |
| California GO | 5.000% | 3/1/24 | 550 | 622 |
| California GO | 5.500% | 4/1/24 | 175 | 178 |
| California GO | 5.000% | 5/1/24 | 300 | 340 |
| California GO | 5.000% | 8/1/24 | 250 | 284 |
| California GO | 5.000% | 8/1/24 | 365 | 415 |
| California GO | 5.000% | 8/1/24 | 725 | 825 |
| California GO | 5.250% | 9/1/24 | 25 | 27 |
| California GO | 5.000% | 10/1/24 | 100 | 114 |
| California GO | 5.000% | 10/1/24 | 3,400 | 3,877 |
| California GO | 5.000% | 12/1/24 | 1,250 | 1,411 |
| California GO | 5.625% | 4/1/25 | 310 | 315 |
| California GO | 5.000% | 8/1/25 | 630 | 726 |
| California GO | 5.000% | 8/1/25 | 1,150 | 1,325 |
| California GO | 5.000% | 8/1/25 | 3,325 | 3,831 |
| California GO | 5.000% | 9/1/25 | 895 | 1,032 |
| California GO | 5.000% | 10/1/25 | 735 | 844 |
| California GO | 5.000% | 10/1/25 | 590 | 678 |
| California GO | 5.000% | 11/1/25 | 250 | 289 |
| California GO | 5.000% | 3/1/26 | 2,940 | 3,357 |
| California GO | 5.000% | 3/1/26 | 840 | 959 |
| California GO | 5.000% | 8/1/26 | 1,765 | 2,027 |
| California GO | 5.000% | 8/1/26 | 100 | 116 |
| California GO | 5.000% | 8/1/26 | 800 | 911 |
| California GO | 5.000% | 8/1/26 | 800 | 931 |
| California GO | 5.000% | 9/1/26 | 275 | 316 |
16
| | | | |
| Tax-Exempt Bond Index Fund | | | | |
| |
| |
| |
| | | | Face | Market |
| | | Maturity | Amount | Value • |
| | Coupon | Date | ($000) | ($000) |
| California GO | 5.000% | 10/1/26 | 120 | 137 |
| California GO | 5.000% | 11/1/26 | 3,475 | 4,055 |
| California GO | 5.000% | 2/1/27 (2) | 120 | 140 |
| California GO | 5.000% | 3/1/27 | 1,465 | 1,663 |
| California GO | 5.000% | 8/1/27 | 175 | 203 |
| California GO | 5.000% | 8/1/27 | 100 | 114 |
| California GO | 5.000% | 8/1/27 | 920 | 1,077 |
| California GO | 4.000% | 9/1/27 | 100 | 105 |
| California GO | 5.000% | 9/1/27 | 325 | 363 |
| California GO | 5.000% | 9/1/27 | 2,955 | 3,436 |
| California GO | 5.000% | 9/1/27 | 1,175 | 1,366 |
| California GO | 5.000% | 10/1/27 | 100 | 111 |
| California GO | 5.000% | 10/1/27 | 170 | 194 |
| California GO | 5.000% | 11/1/27 | 500 | 560 |
| California GO | 5.000% | 11/1/27 | 1,830 | 2,148 |
| California GO | 5.000% | 3/1/28 | 500 | 565 |
| California GO | 5.750% | 4/1/28 | 295 | 300 |
| California GO | 5.000% | 8/1/28 | 330 | 375 |
| California GO | 5.000% | 8/1/28 | 2,225 | 2,593 |
| California GO | 5.000% | 8/1/28 | 2,020 | 2,334 |
| California GO | 5.000% | 8/1/28 | 1,000 | 1,155 |
| California GO | 5.000% | 8/1/28 | 425 | 495 |
| California GO | 4.000% | 9/1/28 | 125 | 131 |
| California GO | 4.000% | 9/1/28 | 200 | 213 |
| California GO | 5.000% | 9/1/28 | 805 | 896 |
| California GO | 5.000% | 9/1/28 | 1,450 | 1,677 |
| California GO | 5.000% | 9/1/28 | 325 | 370 |
| California GO | 5.000% | 10/1/28 | 930 | 1,055 |
| California GO | 5.000% | 8/1/29 | 555 | 628 |
| California GO | 5.000% | 8/1/29 | 190 | 220 |
| California GO | 5.000% | 8/1/29 | 125 | 144 |
| California GO | 3.000% | 9/1/29 | 105 | 101 |
| California GO | 5.000% | 9/1/29 | 4,960 | 5,704 |
| California GO | 5.000% | 9/1/29 | 550 | 632 |
| California GO | 5.000% | 10/1/29 | 250 | 283 |
| California GO | 5.000% | 10/1/29 | 140 | 144 |
| California GO | 5.250% | 10/1/29 | 110 | 113 |
| California GO | 5.000% | 11/1/29 | 4,125 | 4,793 |
| California GO | 5.000% | 12/1/29 | 100 | 112 |
| California GO | 5.000% | 3/1/30 | 160 | 179 |
| California GO | 5.000% | 8/1/30 | 50 | 56 |
| California GO | 5.000% | 8/1/30 | 1,000 | 1,127 |
| California GO | 5.000% | 8/1/30 | 3,785 | 4,363 |
| California GO | 5.000% | 8/1/30 | 1,600 | 1,845 |
| California GO | 5.000% | 9/1/30 | 1,215 | 1,390 |
| California GO | 5.000% | 9/1/30 | 1,460 | 1,570 |
| California GO | 5.000% | 9/1/30 | 2,200 | 2,517 |
| California GO | 5.000% | 9/1/30 | 200 | 226 |
| California GO | 5.000% | 10/1/30 | 340 | 383 |
| California GO | 5.000% | 11/1/30 | 720 | 799 |
| California GO | 5.000% | 12/1/30 | 950 | 1,056 |
| California GO | 5.000% | 2/1/31 | 50 | 55 |
| California GO | 5.750% | 4/1/31 | 835 | 848 |
| California GO | 5.000% | 5/1/31 | 2,220 | 2,477 |
| California GO | 5.000% | 8/1/31 | 300 | 336 |
17
| | | | |
| Tax-Exempt Bond Index Fund | | | | |
| |
| |
| |
| | | | Face | Market |
| | | Maturity | Amount | Value • |
| | Coupon | Date | ($000) | ($000) |
| California GO | 5.000% | 8/1/31 | 4,815 | 5,371 |
| California GO | 3.250% | 9/1/31 | 115 | 112 |
| California GO | 4.000% | 9/1/31 | 120 | 126 |
| California GO | 5.000% | 9/1/31 | 200 | 215 |
| California GO | 5.000% | 9/1/31 | 2,200 | 2,508 |
| California GO | 5.000% | 9/1/31 | 510 | 563 |
| California GO | 5.000% | 10/1/31 | 340 | 382 |
| California GO | 5.000% | 11/1/31 | 145 | 161 |
| California GO | 5.000% | 11/1/31 | 400 | 461 |
| California GO | 5.000% | 11/1/31 | 500 | 576 |
| California GO | 5.000% | 2/1/32 | 180 | 197 |
| California GO | 5.000% | 5/1/32 | 50 | 56 |
| California GO | 5.000% | 8/1/32 | 250 | 278 |
| California GO | 5.000% | 8/1/32 | 2,340 | 2,615 |
| California GO | 5.000% | 8/1/32 | 180 | 204 |
| California GO | 5.250% | 8/1/32 (4) | 1,080 | 1,295 |
| California GO | 5.000% | 9/1/32 | 1,200 | 1,346 |
| California GO | 5.000% | 9/1/32 | 685 | 778 |
| California GO | 4.625% | 10/1/32 | 385 | 406 |
| California GO | 5.250% | 10/1/32 | 255 | 276 |
| California GO | 5.000% | 11/1/32 | 1,475 | 1,633 |
| California GO | 5.000% | 11/1/32 | 1,435 | 1,646 |
| California GO | 5.000% | 2/1/33 | 510 | 556 |
| California GO | 6.500% | 4/1/33 | 2,825 | 2,877 |
| California GO | 5.000% | 8/1/33 | 375 | 416 |
| California GO | 5.000% | 8/1/33 | 1,300 | 1,449 |
| California Go | 5.000% | 8/1/33 | 2,285 | 2,604 |
| California GO | 5.000% | 8/1/33 | 325 | 363 |
| California GO | 3.000% | 9/1/33 | 1,170 | 1,062 |
| California GO | 3.375% | 9/1/33 | 210 | 202 |
| California GO | 4.000% | 9/1/33 | 575 | 597 |
| California GO | 4.000% | 9/1/33 | 500 | 519 |
| California GO | 5.000% | 9/1/33 | 1,000 | 1,133 |
| California GO | 5.000% | 10/1/33 | 2,430 | 2,717 |
| California GO | 4.000% | 8/1/34 | 275 | 284 |
| California GO | 5.000% | 8/1/34 | 1,730 | 1,928 |
| California GO | 4.000% | 9/1/34 | 250 | 259 |
| California GO | 4.000% | 9/1/34 | 355 | 368 |
| California GO | 5.000% | 9/1/34 | 1,225 | 1,384 |
| California GO | 5.000% | 9/1/34 | 775 | 864 |
| California GO | 5.500% | 11/1/34 | 100 | 103 |
| California GO | 5.500% | 11/1/34 | 145 | 150 |
| California GO | 6.250% | 11/1/34 | 1,500 | 1,564 |
| California GO | 4.250% | 4/1/35 | 300 | 309 |
| California GO | 5.250% | 4/1/35 | 300 | 326 |
| California GO | 6.000% | 4/1/35 | 985 | 1,001 |
| California GO | 5.000% | 8/1/35 | 725 | 804 |
| California GO | 5.000% | 8/1/35 | 965 | 1,085 |
| California GO | 4.000% | 9/1/35 | 250 | 258 |
| California GO | 4.000% | 11/1/35 | 4,540 | 4,671 |
| California GO | 5.000% | 11/1/35 | 1,155 | 1,312 |
| California GO | 5.375% | 11/1/35 | 50 | 53 |
| California GO | 3.750% | 12/1/35 | 450 | 451 |
| California GO | 5.000% | 8/1/36 | 6,760 | 7,681 |
| California GO | 4.000% | 9/1/36 | 250 | 257 |
18
| | | | |
| Tax-Exempt Bond Index Fund | | | | |
| |
| |
| |
| | | | Face | Market |
| | | Maturity | Amount | Value • |
| | Coupon | Date | ($000) | ($000) |
| California GO | 4.000% | 9/1/36 | 2,000 | 2,053 |
| California GO | 5.000% | 9/1/36 | 145 | 158 |
| California GO | 5.000% | 4/1/37 | 500 | 543 |
| California GO | 4.000% | 9/1/37 | 250 | 256 |
| California GO | 4.000% | 9/1/37 | 365 | 371 |
| California GO | 5.000% | 10/1/37 | 110 | 122 |
| California GO | 4.000% | 11/1/37 | 685 | 699 |
| California GO | 5.000% | 2/1/38 | 1,605 | 1,717 |
| California GO | 5.000% | 2/1/38 | 755 | 816 |
| California GO | 6.000% | 4/1/38 | 2,540 | 2,581 |
| California GO | 5.000% | 10/1/39 | 2,005 | 2,213 |
| California GO | 5.000% | 10/1/39 | 1,000 | 1,110 |
| California GO | 5.500% | 11/1/39 | 400 | 414 |
| California GO | 6.000% | 11/1/39 | 425 | 441 |
| California GO | 5.000% | 9/1/41 | 1,025 | 1,099 |
| California GO | 5.000% | 10/1/41 | 3,725 | 3,999 |
| California GO | 4.375% | 4/1/42 | 100 | 102 |
| California GO | 5.000% | 4/1/42 | 400 | 429 |
| California GO | 5.000% | 9/1/42 | 3,355 | 3,625 |
| California GO | 5.000% | 2/1/43 | 535 | 577 |
| California GO | 5.000% | 4/1/43 | 2,285 | 2,470 |
| California GO | 4.875% | 11/1/43 | 265 | 283 |
| California GO | 5.000% | 11/1/43 | 1,800 | 1,963 |
| California GO | 4.500% | 12/1/43 | 405 | 425 |
| California GO | 5.000% | 3/1/45 | 600 | 654 |
| California GO | 5.000% | 8/1/45 | 655 | 718 |
| California GO | 5.000% | 9/1/45 | 500 | 555 |
| California GO | 5.000% | 8/1/46 | 1,000 | 1,107 |
| California GO | 5.000% | 10/1/47 | 2,000 | 2,205 |
| California GO | 4.000% | 11/1/47 | 4,755 | 4,773 |
| California GO | 5.000% | 11/1/47 | 1,000 | 1,113 |
| California GO PUT | 3.000% | 12/1/19 | 125 | 126 |
| California Municipal Finance Authority | | | | |
| Revenue (Orange County Civic Center | | | | |
| Infrastructure Improvement Program) | 5.000% | 6/1/42 | 400 | 448 |
| California Municipal Finance Authority | | | | |
| Revenue (Orange County Civic Center | | | | |
| Infrastructure Improvement Program) | 4.000% | 6/1/47 | 1,185 | 1,179 |
| California Public Works Board Lease Revenue | 5.000% | 5/1/24 | 545 | 618 |
| California Public Works Board Lease Revenue | 5.000% | 10/1/26 | 200 | 233 |
| California Public Works Board Lease Revenue | 5.000% | 10/1/27 | 515 | 605 |
| California Public Works Board Lease Revenue | 5.000% | 10/1/28 | 1,500 | 1,747 |
| California Public Works Board Lease Revenue | 5.000% | 10/1/29 | 500 | 579 |
| California Public Works Board Lease Revenue | | | | |
| (Department of Corrections) | 5.000% | 9/1/20 | 100 | 105 |
| California Public Works Board Lease Revenue | | | | |
| (Department of Corrections) | 5.000% | 9/1/21 | 465 | 502 |
| California Public Works Board Lease Revenue | | | | |
| (Department of Corrections) | 5.000% | 9/1/26 | 100 | 113 |
| California Public Works Board Lease Revenue | | | | |
| (Department of Corrections) | 4.000% | 6/1/28 | 160 | 167 |
| California Public Works Board Lease Revenue | | | | |
| (Department of Corrections) | 5.000% | 9/1/29 | 240 | 268 |
| California Public Works Board Lease Revenue | | | | |
| (Department of Corrections) | 5.000% | 9/1/32 | 245 | 272 |
19
| | | | |
| Tax-Exempt Bond Index Fund | | | | |
| |
| |
| |
| | | | Face | Market |
| | | Maturity | Amount | Value • |
| | Coupon | Date | ($000) | ($000) |
| California Public Works Board Lease Revenue | | | | |
| (Department of Corrections) | 5.000% | 9/1/33 | 650 | 719 |
| California Public Works Board Lease Revenue | | | | |
| (Department of Corrections) | 5.000% | 9/1/39 | 640 | 699 |
| California Public Works Board Lease Revenue | | | | |
| (Department of State Hospitals) | 5.000% | 6/1/26 | 365 | 405 |
| California Public Works Board Lease Revenue | | | | |
| (Judicial Council Projects) | 5.250% | 12/1/25 | 250 | 273 |
| California Public Works Board Lease Revenue | | | | |
| (Regents of The University of California) | 5.000% | 12/1/21 (Prere.) | 205 | 224 |
| California Public Works Board Lease Revenue | | | | |
| (Various Capital Projects) | 5.750% | 10/1/19 (Prere.) | 200 | 207 |
| California Public Works Board Lease Revenue | | | | |
| (Various Capital Projects) | 6.000% | 11/1/19 (Prere.) | 100 | 104 |
| California Public Works Board Lease Revenue | | | | |
| (Various Capital Projects) | 6.125% | 11/1/19 (Prere.) | 100 | 104 |
| California Public Works Board Lease Revenue | | | | |
| (Various Capital Projects) | 5.000% | 4/1/20 | 350 | 365 |
| California Public Works Board Lease Revenue | | | | |
| (Various Capital Projects) | 5.000% | 5/1/20 | 1,000 | 1,045 |
| California Public Works Board Lease Revenue | | | | |
| (Various Capital Projects) | 5.000% | 4/1/21 | 605 | 646 |
| California Public Works Board Lease Revenue | | | | |
| (Various Capital Projects) | 5.000% | 5/1/21 | 755 | 808 |
| California Public Works Board Lease Revenue | | | | |
| (Various Capital Projects) | 5.250% | 11/1/28 | 300 | 336 |
| California Public Works Board Lease Revenue | | | | |
| (Various Capital Projects) | 5.000% | 4/1/29 | 125 | 135 |
| California Public Works Board Lease Revenue | | | | |
| (Various Capital Projects) | 5.000% | 11/1/29 | 150 | 166 |
| California Public Works Board Lease Revenue | | | | |
| (Various Capital Projects) | 5.125% | 10/1/31 | 35 | 38 |
| California Public Works Board Lease Revenue | | | | |
| (Various Capital Projects) | 5.000% | 4/1/37 | 405 | 434 |
| California Public Works Board Lease Revenue | | | | |
| (Various Capital Projects) | 5.000% | 11/1/37 | 255 | 276 |
| California Public Works Board Lease Revenue | | | | |
| (Various Capital Projects) | 5.000% | 11/1/38 | 345 | 376 |
| California State University Systemwide | | | | |
| Revenue | 5.250% | 5/1/19 (Prere.) | 500 | 509 |
| California State University Systemwide | | | | |
| Revenue | 5.250% | 5/1/19 (Prere.) | 90 | 92 |
| California State University Systemwide | | | | |
| Revenue | 5.000% | 11/1/29 | 255 | 289 |
| California State University Systemwide | | | | |
| Revenue | 5.000% | 11/1/30 | 100 | 115 |
| California State University Systemwide | | | | |
| Revenue | 4.000% | 11/1/31 | 1,130 | 1,194 |
| California State University Systemwide | | | | |
| Revenue | 5.000% | 11/1/31 | 510 | 582 |
| California State University Systemwide | | | | |
| Revenue | 5.000% | 11/1/31 | 150 | 169 |
| California State University Systemwide | | | | |
| Revenue | 5.000% | 11/1/32 | 50 | 57 |
20
| | | | |
| Tax-Exempt Bond Index Fund | | | | |
| |
| |
| |
| | | | Face | Market |
| | | Maturity | Amount | Value • |
| | Coupon | Date | ($000) | ($000) |
| California State University Systemwide | | | | |
| Revenue | 4.000% | 11/1/34 | 125 | 130 |
| California State University Systemwide | | | | |
| Revenue | 5.000% | 11/1/34 | 650 | 725 |
| California State University Systemwide | | | | |
| Revenue | 4.000% | 11/1/35 | 235 | 243 |
| California State University Systemwide | | | | |
| Revenue | 5.000% | 11/1/35 | 375 | 425 |
| California State University Systemwide | | | | |
| Revenue | 5.000% | 11/1/36 | 1,025 | 1,156 |
| California State University Systemwide | | | | |
| Revenue | 4.000% | 11/1/37 | 375 | 385 |
| California State University Systemwide | | | | |
| Revenue | 5.000% | 11/1/37 | 1,590 | 1,737 |
| California State University Systemwide | | | | |
| Revenue | 5.000% | 11/1/37 | 390 | 418 |
| California State University Systemwide | | | | |
| Revenue | 5.000% | 11/1/37 | 565 | 636 |
| California State University Systemwide | | | | |
| Revenue | 5.000% | 11/1/37 | 180 | 202 |
| California State University Systemwide | | | | |
| Revenue | 4.000% | 11/1/38 | 2,360 | 2,412 |
| California State University Systemwide | | | | |
| Revenue | 5.000% | 11/1/38 | 650 | 729 |
| California State University Systemwide | | | | |
| Revenue | 5.000% | 11/1/38 | 1,285 | 1,438 |
| California State University Systemwide | | | | |
| Revenue | 5.000% | 11/1/39 | 380 | 418 |
| California State University Systemwide | | | | |
| Revenue | 5.000% | 11/1/41 | 325 | 358 |
| California State University Systemwide | | | | |
| Revenue | 5.000% | 11/1/42 | 100 | 111 |
| California State University Systemwide | | | | |
| Revenue | 4.000% | 11/1/45 | 3,635 | 3,673 |
| California State University Systemwide | | | | |
| Revenue | 5.000% | 11/1/45 | 1,340 | 1,472 |
| California State University Systemwide | | | | |
| Revenue | 5.000% | 11/1/47 | 115 | 127 |
| California Statewide Communities | | | | |
| Development Authority Student Housing | | | | |
| Revenue (CHF-Irvine LLC - UCI East | | | | |
| Campus Apartments Phase II) | 5.000% | 5/15/40 | 100 | 108 |
| California Statewide Communities | | | | |
| Development Authority Student Housing | | | | |
| Revenue (CHF-Irvine LLC - UCI East | | | | |
| Campus Apartments Phase IV) | 5.000% | 5/15/42 | 105 | 114 |
| Centinela Valley CA Union High School | | | | |
| District GO | 4.000% | 8/1/50 (4) | 300 | 299 |
| Chabot-Las Positas CA Community College | | | | |
| District GO | 4.000% | 8/1/47 | 1,000 | 1,008 |
| Clovis CA Unified School District GO | 4.000% | 8/1/40 | 150 | 152 |
| Coast CA Community College District GO | 4.000% | 8/1/38 | 125 | 127 |
| Coast CA Community College District GO | 5.000% | 8/1/38 | 3,025 | 3,319 |
| Colton CA Joint Unified School District GO | 0.000% | 8/1/42 (4) | 300 | 105 |
21
| | | | |
| Tax-Exempt Bond Index Fund | | | | |
| |
| |
| |
| | | | Face | Market |
| | | Maturity | Amount | Value • |
| | Coupon | Date | ($000) | ($000) |
| Contra Costa CA Community College District | | | | |
| GO | 5.000% | 8/1/38 | 180 | 198 |
| Corona-Norco CA Unified School District GO | 0.000% | 8/1/39 (4) | 675 | 271 |
| Corona-Norco CA Unified School District GO | 4.000% | 8/1/43 | 3,750 | 3,783 |
| Cypress CA Elementary School District GO | 0.000% | 8/1/40 | 250 | 94 |
| East Bay CA Municipal Utility District Water | | | | |
| System Revenue | 5.000% | 6/1/19 | 150 | 153 |
| East Bay CA Municipal Utility District Water | | | | |
| System Revenue | 5.000% | 6/1/22 | 300 | 332 |
| East Bay CA Municipal Utility District Water | | | | |
| System Revenue | 5.000% | 6/1/30 | 90 | 102 |
| East Bay CA Municipal Utility District Water | | | | |
| System Revenue | 5.000% | 6/1/37 | 150 | 167 |
| East Bay CA Municipal Utility District Water | | | | |
| System Revenue | 4.000% | 6/1/45 | 120 | 121 |
| Eastern California Municipal Water District | | | | |
| Water & Wastewater Revenue | 5.000% | 7/1/47 | 535 | 596 |
| El Camino CA Community College District GO | 0.000% | 8/1/33 | 190 | 111 |
| El Camino CA Community College District GO | 0.000% | 8/1/38 | 500 | 221 |
| Foothill-De Anza CA Community College | | | | |
| District GO | 0.000% | 8/1/32 | 1,560 | 955 |
| Foothill/Eastern Transportation Corridor | | | | |
| Agency California Toll Road Revenue | 5.750% | 1/15/46 | 250 | 279 |
| Foothill/Eastern Transportation Corridor | | | | |
| Agency California Toll Road Revenue | 6.000% | 1/15/49 | 2,595 | 2,959 |
| Foothill/Eastern Transportation Corridor | | | | |
| Agency California Toll Road Revenue | 6.000% | 1/15/53 | 1,500 | 1,707 |
| Fremont CA Union High School District GO | 4.000% | 8/1/40 | 725 | 735 |
| Fresno CA Joint Powers Financing Authority | | | | |
| Lease Revenue | 5.000% | 4/1/31 (4) | 420 | 472 |
| Fresno CA Unified School District GO | 4.000% | 8/1/41 | 500 | 507 |
| Gilroy CA School Facilities Finance Authority | | | | |
| Revenue | 4.000% | 8/1/42 | 520 | 522 |
| Golden State Tobacco Securitization Corp. | | | | |
| California Revenue | 5.000% | 6/1/21 | 3,750 | 4,021 |
| Grossmont-Cuyamaca CA Community | | | | |
| College District GO | 4.000% | 8/1/47 | 500 | 501 |
| Hayward CA Area Recreation & Park District | | | | |
| GO | 4.000% | 8/1/46 | 1,500 | 1,520 |
| Imperial CA Irrigation District Electric Revenue | 5.000% | 11/1/18 (Prere.) | 105 | 105 |
| Long Beach CA Community College District | | | | |
| GO | 5.000% | 8/1/22 (Prere.) | 100 | 111 |
| Long Beach CA Community College District | | | | |
| GO | 4.000% | 8/1/42 | 500 | 505 |
| Long Beach CA Unified School District GO | 0.000% | 8/1/32 | 100 | 59 |
| Long Beach CA Unified School District GO | 4.000% | 8/1/45 | 350 | 352 |
| Los Angeles CA Community College District | | | | |
| GO | 5.000% | 8/1/19 | 125 | 128 |
| Los Angeles CA Community College District | | | | |
| GO | 6.000% | 8/1/19 (Prere.) | 1,000 | 1,032 |
| Los Angeles CA Community College District | | | | |
| GO | 5.000% | 8/1/25 | 170 | 195 |
| Los Angeles CA Community College District | | | | |
| GO | 5.000% | 8/1/26 | 175 | 201 |
22
| | | | |
| Tax-Exempt Bond Index Fund | | | | |
| |
| |
| |
| | | | Face | Market |
| | | Maturity | Amount | Value • |
| | Coupon | Date | ($000) | ($000) |
| Los Angeles CA Community College District | | | | |
| GO | 5.000% | 8/1/28 | 570 | 649 |
| Los Angeles CA Community College District | | | | |
| GO | 5.000% | 8/1/29 | 370 | 419 |
| Los Angeles CA Community College District | | | | |
| GO | 5.000% | 8/1/30 | 285 | 321 |
| Los Angeles CA Community College District | | | | |
| GO | 5.000% | 8/1/31 | 670 | 753 |
| Los Angeles CA Community College District | | | | |
| GO | 4.000% | 8/1/32 | 100 | 104 |
| Los Angeles CA Community College District | | | | |
| GO | 5.000% | 8/1/36 | 100 | 113 |
| Los Angeles CA Community College District | | | | |
| GO | 4.000% | 8/1/37 | 1,000 | 1,026 |
| Los Angeles CA Community College District | | | | |
| GO | 5.000% | 8/1/38 | 1,030 | 1,156 |
| Los Angeles CA Community College District | | | | |
| GO | 4.000% | 8/1/39 | 325 | 331 |
| Los Angeles CA Department of Airports | | | | |
| International Airport Revenue | 5.000% | 5/15/29 | 100 | 101 |
| Los Angeles CA Department of Airports | | | | |
| International Airport Revenue | 5.250% | 5/15/29 | 250 | 254 |
| Los Angeles CA Department of Airports | | | | |
| International Airport Revenue | 5.000% | 5/15/35 | 160 | 170 |
| Los Angeles CA Department of Airports | | | | |
| International Airport Revenue | 5.000% | 5/15/40 | 3,065 | 3,176 |
| Los Angeles CA Department of Water & | | | | |
| Power Revenue | 5.000% | 11/1/18 | 2,825 | 2,825 |
| Los Angeles CA Department of Water & | | | | |
| Power Revenue | 5.000% | 7/1/20 | 370 | 389 |
| Los Angeles CA Department of Water & | | | | |
| Power Revenue | 5.000% | 7/1/24 | 230 | 256 |
| Los Angeles CA Department of Water & | | | | |
| Power Revenue | 5.000% | 7/1/25 | 100 | 115 |
| Los Angeles CA Department of Water & | | | | |
| Power Revenue | 5.000% | 7/1/29 | 245 | 273 |
| Los Angeles CA Department of Water & | | | | |
| Power Revenue | 5.000% | 7/1/29 | 140 | 154 |
| Los Angeles CA Department of Water & | | | | |
| Power Revenue | 5.000% | 7/1/32 | 130 | 144 |
| Los Angeles CA Department of Water & | | | | |
| Power Revenue | 5.000% | 7/1/34 | 2,500 | 2,791 |
| Los Angeles CA Department of Water & | | | | |
| Power Revenue | 5.000% | 7/1/35 | 1,350 | 1,469 |
| Los Angeles CA Department of Water & | | | | |
| Power Revenue | 5.000% | 7/1/35 | 300 | 334 |
| Los Angeles CA Department of Water & | | | | |
| Power Revenue | 5.000% | 7/1/36 | 500 | 544 |
| Los Angeles CA Department of Water & | | | | |
| Power Revenue | 5.000% | 7/1/38 | 1,575 | 1,711 |
| Los Angeles CA Department of Water & | | | | |
| Power Revenue | 5.000% | 7/1/39 | 1,535 | 1,695 |
| Los Angeles CA Department of Water & | | | | |
| Power Revenue | 5.000% | 7/1/39 | 1,300 | 1,435 |
23
| | | | |
| Tax-Exempt Bond Index Fund | | | | |
| |
| |
| |
| | | | Face | Market |
| | | Maturity | Amount | Value • |
| | Coupon | Date | ($000) | ($000) |
| Los Angeles CA Department of Water & | | | | |
| Power Revenue | 5.000% | 7/1/40 | 265 | 294 |
| Los Angeles CA Department of Water & | | | | |
| Power Revenue | 5.000% | 7/1/41 | 155 | 172 |
| Los Angeles CA Department of Water & | | | | |
| Power Revenue | 5.000% | 7/1/41 | 240 | 253 |
| Los Angeles CA Department of Water & | | | | |
| Power Revenue | 5.000% | 7/1/42 | 1,010 | 1,118 |
| Los Angeles CA Department of Water & | | | | |
| Power Revenue | 5.000% | 7/1/43 | 180 | 195 |
| Los Angeles CA Department of Water & | | | | |
| Power Revenue | 5.000% | 7/1/43 | 1,725 | 1,869 |
| Los Angeles CA Department of Water & | | | | |
| Power Revenue | 5.000% | 7/1/43 | 1,515 | 1,642 |
| Los Angeles CA Department of Water & | | | | |
| Power Revenue | 5.000% | 7/1/44 | 4,930 | 5,416 |
| Los Angeles CA Department of Water & | | | | |
| Power Revenue | 5.000% | 7/1/44 | 555 | 610 |
| Los Angeles CA Department of Water & | | | | |
| Power Revenue | 4.000% | 7/1/47 | 400 | 401 |
| Los Angeles CA Harbor Department Revenue | 5.000% | 8/1/44 | 375 | 416 |
| Los Angeles CA Metropolitan Transportation | | | | |
| Authority Sales Tax Revenue | 5.000% | 7/1/42 | 175 | 197 |
| Los Angeles CA Municipal Improvement | | | | |
| Corp. Lease Revenue | 5.000% | 11/1/25 | 85 | 99 |
| Los Angeles CA Municipal Improvement | | | | |
| Corp. Lease Revenue | 5.000% | 11/1/31 | 235 | 268 |
| Los Angeles CA Municipal Improvement | | | | |
| Corp. Lease Revenue | 4.000% | 11/1/33 | 860 | 895 |
| Los Angeles CA Municipal Improvement | | | | |
| Corp. Lease Revenue | 4.000% | 11/1/35 | 900 | 929 |
| Los Angeles CA Unified School District GO | 5.000% | 7/1/19 | 70 | 72 |
| Los Angeles CA Unified School District GO | 5.000% | 7/1/20 | 985 | 1,035 |
| Los Angeles CA Unified School District GO | 5.000% | 7/1/22 | 195 | 215 |
| Los Angeles CA Unified School District GO | 5.000% | 7/1/22 | 405 | 447 |
| Los Angeles CA Unified School District GO | 5.000% | 7/1/23 | 100 | 113 |
| Los Angeles CA Unified School District GO | 5.000% | 7/1/25 | 295 | 343 |
| Los Angeles CA Unified School District GO | 5.000% | 7/1/26 | 145 | 168 |
| Los Angeles CA Unified School District GO | 5.000% | 7/1/27 | 275 | 311 |
| Los Angeles CA Unified School District GO | 5.000% | 7/1/28 | 395 | 446 |
| Los Angeles CA Unified School District GO | 5.000% | 7/1/28 | 115 | 123 |
| Los Angeles CA Unified School District GO | 5.000% | 7/1/29 | 370 | 424 |
| Los Angeles CA Unified School District GO | 5.200% | 7/1/29 | 200 | 204 |
| Los Angeles CA Unified School District GO | 5.000% | 7/1/30 | 500 | 563 |
| Los Angeles CA Unified School District GO | 3.000% | 7/1/32 | 700 | 658 |
| Los Angeles CA Unified School District GO | 5.000% | 7/1/32 | 300 | 322 |
| Los Angeles CA Unified School District GO | 5.000% | 1/1/34 | 140 | 143 |
| Los Angeles CA Unified School District GO | 5.000% | 1/1/34 | 740 | 754 |
| Los Angeles CA Unified School District GO | 4.000% | 7/1/40 | 835 | 845 |
| Los Angeles CA Unified School District GO | 5.000% | 7/1/40 | 385 | 428 |
| Los Angeles CA Unified School District GO | 5.250% | 7/1/42 | 2,000 | 2,296 |
| Los Angeles CA Unified School District GO | 5.250% | 7/1/42 | 2,000 | 2,296 |
| Los Angeles CA Wastewater System Revenue | 5.000% | 6/1/23 | 280 | 316 |
| Los Angeles CA Wastewater System Revenue | 5.000% | 6/1/31 | 1,000 | 1,090 |
24
| | | | |
| Tax-Exempt Bond Index Fund | | | | |
| |
| |
| |
| | | | Face | Market |
| | | Maturity | Amount | Value • |
| | Coupon | Date | ($000) | ($000) |
| Los Angeles CA Wastewater System Revenue | 5.000% | 6/1/35 | 500 | 549 |
| Los Angeles CA Wastewater System Revenue | 5.000% | 6/1/43 | 8,235 | 8,975 |
| Los Angeles CA Wastewater System Revenue | 5.000% | 6/1/45 | 250 | 277 |
| Los Angeles CA Wastewater System Revenue | 5.000% | 6/1/48 | 5,000 | 5,600 |
| Los Angeles County CA Metropolitan | | | | |
| Transportation Authority Sales Tax Revenue | 5.000% | 7/1/21 (Prere.) | 900 | 972 |
| Los Angeles County CA Metropolitan | | | | |
| Transportation Authority Sales Tax Revenue | 5.000% | 7/1/38 | 455 | 516 |
| Los Angeles County CA Public Works | | | | |
| Financing Authority Lease Revenue | 5.000% | 8/1/37 | 555 | 601 |
| Los Angeles County CA Public Works | | | | |
| Financing Authority Lease Revenue | 4.000% | 12/1/40 | 1,405 | 1,421 |
| Los Angeles County CA Public Works | | | | |
| Financing Authority Lease Revenue | 5.000% | 8/1/42 | 400 | 432 |
| Los Angeles County CA Public Works | | | | |
| Financing Authority Lease Revenue | 5.000% | 12/1/44 | 370 | 409 |
| Los Angeles County CA Sanitation Districts | | | | |
| Financing Authority Revenue | 5.000% | 10/1/20 | 55 | 58 |
| Los Angeles County CA Sanitation Districts | | | | |
| Financing Authority Revenue | 4.000% | 10/1/42 | 250 | 250 |
| Los Angeles County Facilities Inc. Lease | | | | |
| Revenue | 4.000% | 12/1/48 | 3,960 | 3,878 |
| Mendocino-Lake CA Union School District | | | | |
| Public Financing Authority Revenue | 0.000% | 8/1/21 (Prere.) | 310 | 29 |
| Metropolitan Water District of Southern | | | | |
| California Revenue | 5.000% | 7/1/35 | 100 | 102 |
| Metropolitan Water District of Southern | | | | |
| California Revenue | 5.000% | 1/1/39 | 950 | 955 |
| Mount Diablo CA Unified School District GO | 5.000% | 6/1/37 | 250 | 271 |
| 2 Mount San Antonio CA Community College | | | | |
| District GO | 0.000% | 8/1/43 | 150 | 119 |
| New Haven CA Unified School District GO | 0.000% | 8/1/33 (12) | 325 | 182 |
| New Haven CA Unified School District GO | 0.000% | 8/1/34 (12) | 170 | 90 |
| Newport Mesa CA Unified School District GO | 0.000% | 8/1/34 | 300 | 167 |
| Newport Mesa CA Unified School District GO | 0.000% | 8/1/36 | 400 | 201 |
| Newport Mesa CA Unified School District GO | 0.000% | 8/1/45 | 1,000 | 336 |
| Norwalk-La Mirada CA Unified School District | | | | |
| GO | 0.000% | 8/1/38 (12) | 525 | 219 |
| Oak Grove CA Unified School District GO | 0.000% | 6/1/21 (Prere.) | 265 | 59 |
| Oakland CA Unified School District GO | 5.000% | 8/1/40 | 280 | 310 |
| Orange County CA Sanitation District | | | | |
| Wastewater Revenue | 3.000% | 2/1/31 | 250 | 246 |
| Orange County CA Sanitation District | | | | |
| Wastewater Revenue | 4.000% | 2/1/32 | 1,185 | 1,216 |
| Orange County CA Water District Revenue | 5.000% | 8/15/19 (Prere.) | 125 | 128 |
| 3 Palomar CA Community College District GO | 0.000% | 8/1/45 | 1,000 | 736 |
| Palomar CA Community College District GO | 4.000% | 8/1/45 | 350 | 353 |
| Pasadena CA Unified School District GO | 5.000% | 8/1/26 | 10 | 12 |
| Peralta CA Community College District | | | | |
| Revenue | 4.000% | 8/1/39 | 350 | 354 |
| Placentia-Yorba Linda CA Unified School | | | | |
| District GO | 0.000% | 8/1/49 | 500 | 124 |
| Poway CA Unified School District GO | 0.000% | 8/1/33 | 1,800 | 1,018 |
| Poway CA Unified School District GO | 0.000% | 8/1/46 | 250 | 71 |
25
| | | | |
| Tax-Exempt Bond Index Fund | | | | |
| |
| |
| |
| | | | Face | Market |
| | | Maturity | Amount | Value • |
| | Coupon | Date | ($000) | ($000) |
| Riverside CA Sewer Revenue | 5.000% | 8/1/40 | 320 | 351 |
| Riverside County CA Transportation | | | | |
| Commission Sales Tax Revenue | 5.250% | 6/1/23 (Prere.) | 565 | 644 |
| Sacramento CA City Unified School District | | | | |
| GO | 4.000% | 5/1/47 | 570 | 574 |
| Sacramento CA Financing Authority Lease | | | | |
| Revenue | 5.250% | 12/1/30 (2) | 310 | 359 |
| Sacramento CA Municipal Utility District | | | | |
| Revenue | 5.000% | 8/15/20 | 195 | 206 |
| Sacramento CA Municipal Utility District | | | | |
| Revenue | 5.000% | 8/15/37 | 545 | 603 |
| Sacramento CA Municipal Utility District | | | | |
| Revenue | 5.000% | 8/15/41 | 170 | 188 |
| Sacramento CA Regional Transportation | | | | |
| District Farebox Revenue | 5.000% | 3/1/42 | 150 | 156 |
| Sacramento CA Water Revenue | 5.000% | 9/1/38 | 425 | 468 |
| Sacramento County CA Airport Revenue | 5.000% | 7/1/40 | 1,225 | 1,279 |
| Sacramento County CA Sanitation Districts | | | | |
| Financing Authority Revenue | 5.000% | 12/1/44 | 250 | 275 |
| San Bernardino CA Community College | | | | |
| District GO | 4.000% | 8/1/29 | 1,900 | 2,007 |
| San Bernardino CA Community College | | | | |
| District GO | 4.000% | 8/1/33 | 665 | 693 |
| San Diego CA Community College District GO | 5.000% | 8/1/27 | 80 | 95 |
| San Diego CA Community College District GO | 4.000% | 8/1/41 | 225 | 229 |
| San Diego CA Community College District GO | 5.000% | 8/1/43 | 910 | 999 |
| San Diego CA Public Facilities Financing | | | | |
| Authority Lease Revenue | 5.000% | 9/1/20 (Prere.) | 125 | 132 |
| San Diego CA Public Facilities Financing | | | | |
| Authority Sewer Revenue | 5.000% | 5/15/19 (Prere.) | 180 | 183 |
| San Diego CA Public Facilities Financing | | | | |
| Authority Sewer Revenue | 5.250% | 5/15/19 (Prere.) | 1,170 | 1,193 |
| San Diego CA Public Facilities Financing | | | | |
| Authority Sewer Revenue | 5.250% | 5/15/19 (Prere.) | 250 | 255 |
| San Diego CA Public Facilities Financing | | | | |
| Authority Sewer Revenue | 5.500% | 5/15/19 (Prere.) | 300 | 306 |
| San Diego CA Public Facilities Financing | | | | |
| Authority Sewer Revenue | 5.250% | 5/15/20 (Prere.) | 100 | 105 |
| San Diego CA Public Facilities Financing | | | | |
| Authority Sewer Revenue | 5.000% | 5/15/22 | 245 | 271 |
| San Diego CA Public Facilities Financing | | | | |
| Authority Sewer Revenue | 5.000% | 5/15/27 | 380 | 448 |
| San Diego CA Public Facilities Financing | | | | |
| Authority Water Revenue | 5.375% | 8/1/19 (Prere.) | 1,000 | 1,027 |
| San Diego CA Public Facilities Financing | | | | |
| Authority Water Revenue | 5.000% | 8/1/27 | 200 | 235 |
| San Diego CA Unified School District GO | 5.000% | 7/1/26 | 150 | 174 |
| San Diego CA Unified School District GO | 5.000% | 7/1/28 | 100 | 116 |
| San Diego CA Unified School District GO | 4.000% | 7/1/29 | 100 | 107 |
| San Diego CA Unified School District GO | 0.000% | 7/1/31 | 170 | 107 |
| San Diego CA Unified School District GO | 4.000% | 7/1/32 | 500 | 522 |
| San Diego CA Unified School District GO | 4.000% | 7/1/33 | 250 | 260 |
| San Diego CA Unified School District GO | 0.000% | 7/1/35 | 575 | 297 |
| San Diego CA Unified School District GO | 0.000% | 7/1/35 | 295 | 152 |
26
| | | | |
| Tax-Exempt Bond Index Fund | | | | |
| |
| |
| |
| | | | Face | Market |
| | | Maturity | Amount | Value • |
| | Coupon | Date | ($000) | ($000) |
| San Diego CA Unified School District GO | 5.000% | 7/1/35 | 100 | 110 |
| San Diego CA Unified School District GO | 0.000% | 7/1/36 | 340 | 167 |
| San Diego CA Unified School District GO | 0.000% | 7/1/36 | 2,000 | 980 |
| San Diego CA Unified School District GO | 0.000% | 7/1/36 | 895 | 440 |
| San Diego CA Unified School District GO | 0.000% | 7/1/37 | 375 | 176 |
| San Diego CA Unified School District GO | 0.000% | 7/1/38 | 170 | 76 |
| San Diego CA Unified School District GO | 0.000% | 7/1/39 | 100 | 43 |
| San Diego CA Unified School District GO | 5.000% | 7/1/40 | 950 | 1,066 |
| 4 San Diego CA Unified School District GO | 0.000% | 7/1/42 | 150 | 94 |
| San Diego CA Unified School District GO | 3.125% | 7/1/42 | 1,855 | 1,626 |
| San Diego CA Unified School District GO | 0.000% | 7/1/43 | 785 | 280 |
| San Diego CA Unified School District GO | 0.000% | 7/1/45 | 575 | 187 |
| San Diego CA Unified School District GO | 4.000% | 7/1/45 | 225 | 227 |
| San Diego CA Unified School District GO | 5.000% | 7/1/45 | 1,530 | 1,715 |
| San Diego CA Unified School District GO | 0.000% | 7/1/47 | 250 | 74 |
| 5 San Diego CA Unified School District GO | 0.000% | 7/1/47 | 1,495 | 920 |
| San Diego CA Unified School District GO | 4.000% | 7/1/47 | 3,000 | 3,024 |
| 6 San Diego CA Unified School District GO | 0.000% | 7/1/48 | 120 | 89 |
| San Diego CA Unified School District GO | 0.000% | 7/1/49 | 535 | 144 |
| San Diego County CA Regional Airport | | | | |
| Authority Revenue | 5.000% | 7/1/43 | 125 | 136 |
| San Diego County CA Regional Airport | | | | |
| Authority Revenue | 5.000% | 7/1/47 | 1,000 | 1,103 |
| San Diego County CA Regional Airport | | | | |
| Authority Revenue | 5.000% | 4/1/48 | 3,365 | 3,634 |
| San Diego County CA Regional Building | | | | |
| Authority Lease Revenue (County Operations | | | | |
| Center & Annex Redevelopment Project) | 5.375% | 2/1/19 (Prere.) | 400 | 404 |
| San Diego County CA Regional Transportation | | | | |
| Commission Sales Tax Revenue | 5.000% | 4/1/42 | 350 | 379 |
| San Diego County CA Regional Transportation | | | | |
| Commission Sales Tax Revenue | 5.000% | 4/1/44 | 575 | 635 |
| San Diego County CA Regional Transportation | | | | |
| Commission Sales Tax Revenue | 4.750% | 4/1/48 | 465 | 503 |
| San Francisco CA Bay Area Rapid Transit | | | | |
| District GO | 4.000% | 8/1/34 | 500 | 524 |
| San Francisco CA Bay Area Rapid Transit | | | | |
| District GO | 4.000% | 8/1/34 | 230 | 240 |
| San Francisco CA City & County (War | | | | |
| Memorial Veterans Building Seismic Upgrade | | | | |
| & Improvements) COP | 4.000% | 4/1/45 | 405 | 407 |
| San Francisco CA City & County COP | 5.000% | 4/1/28 | 500 | 577 |
| San Francisco CA City & County GO | 5.000% | 10/1/28 | 100 | 105 |
| San Francisco CA City & County International | | | | |
| Airport Revenue | 5.000% | 5/1/19 | 230 | 234 |
| San Francisco CA City & County International | | | | |
| Airport Revenue | 4.900% | 5/1/29 | 95 | 98 |
| San Francisco CA City & County International | | | | |
| Airport Revenue | 5.000% | 5/1/43 | 130 | 141 |
| San Francisco CA City & County International | | | | |
| Airport Revenue | 5.000% | 5/1/48 | 3,000 | 3,318 |
| San Francisco CA City & County Public | | | | |
| Utilities Commission Wastewater Revenue | 4.000% | 10/1/39 | 135 | 136 |
27
| | | | |
| Tax-Exempt Bond Index Fund | | | | |
| |
| |
| |
| | | | Face | Market |
| | | Maturity | Amount | Value • |
| | Coupon | Date | ($000) | ($000) |
| San Francisco CA City & County Public Utilities | | | | |
| Commission Water Revenue | 5.000% | 11/1/19 (Prere.) | 100 | 103 |
| San Francisco CA City & County Public Utilities | | | | |
| Commission Water Revenue | 5.000% | 11/1/33 | 175 | 200 |
| San Francisco CA City & County Public Utilities | | | | |
| Commission Water Revenue | 4.000% | 11/1/36 | 100 | 103 |
| San Francisco CA City & County Public Utilities | | | | |
| Commission Water Revenue | 5.000% | 11/1/36 | 100 | 108 |
| San Francisco CA City & County Public Utilities | | | | |
| Commission Water Revenue | 4.000% | 11/1/39 | 125 | 127 |
| San Francisco CA City & County Public Utilities | | | | |
| Commission Water Revenue | 4.000% | 11/1/41 | 250 | 251 |
| San Francisco CA City & County Public Utilities | | | | |
| Commission Water Revenue | 5.000% | 11/1/41 | 1,175 | 1,262 |
| San Francisco CA City & County Public Utilities | | | | |
| Commission Water Revenue | 5.000% | 11/1/43 | 750 | 808 |
| San Joaquin Hills CA Transportation Corridor | | | | |
| Agency Toll Road Revenue | 0.000% | 1/1/28 (ETM) | 100 | 77 |
| San Joaquin Hills CA Transportation Corridor | | | | |
| Agency Toll Road Revenue | 0.000% | 1/15/32 (14) | 185 | 107 |
| San Joaquin Hills CA Transportation Corridor | | | | |
| Agency Toll Road Revenue | 5.000% | 1/15/34 | 135 | 145 |
| San Joaquin Hills CA Transportation Corridor | | | | |
| Agency Toll Road Revenue | 5.000% | 1/15/44 | 900 | 959 |
| San Joaquin Hills CA Transportation Corridor | | | | |
| Agency Toll Road Revenue | 5.250% | 1/15/49 | 1,000 | 1,067 |
| San Joaquin Hills CA Transportation Corridor | | | | |
| Agency Toll Road Revenue | 5.000% | 1/15/50 | 115 | 122 |
| San Jose CA Airport Revenue | 5.000% | 3/1/47 | 500 | 548 |
| San Jose CA Finance Authority Revenue (Civic | | | | |
| Center Project) | 5.000% | 6/1/39 | 615 | 671 |
| San Marcos CA Unified School District GO | 0.000% | 8/1/32 | 150 | 89 |
| San Marcos CA Unified School District GO | 0.000% | 8/1/51 | 100 | 24 |
| San Mateo CA Union High School District GO | 5.000% | 9/1/21 (Prere.) | 10 | 11 |
| San Mateo CA Union High School District GO | 4.000% | 9/1/34 | 800 | 831 |
| 7 San Mateo CA Union High School District GO | 0.000% | 9/1/41 | 100 | 82 |
| Santa Barbara CA Secondary/High School | | | | |
| District GO | 0.000% | 8/1/36 | 200 | 93 |
| Santa Barbara CA Secondary/High School | | | | |
| District GO | 0.000% | 8/1/40 | 565 | 218 |
| Santa Clara CA GO | 3.250% | 8/1/39 | 645 | 596 |
| Santa Clara County CA GO | 5.000% | 8/1/19 (Prere.) | 250 | 256 |
| Santa Clara Valley CA Water District Revenue | 5.000% | 6/1/46 | 1,085 | 1,201 |
| Southern California Public Power Authority | | | | |
| Revenue | 5.000% | 1/1/19 (Prere.) | 1,000 | 1,006 |
| Southern California Public Power Authority | | | | |
| Revenue (Windy Point/Windy Flats Project) | 5.000% | 7/1/25 | 120 | 126 |
| Southern California Water Replenishment | | | | |
| District Financing Authority Revenue | 5.000% | 8/1/41 | 5,025 | 5,596 |
| Southwestern California Community College | | | | |
| District GO | 0.000% | 8/1/46 | 320 | 92 |
| Southwestern California Community College | | | | |
| District GO | 4.000% | 8/1/47 | 2,505 | 2,510 |
28
| | | | |
| Tax-Exempt Bond Index Fund | | | | |
| |
| |
| |
| | | | Face | Market |
| | | Maturity | Amount | Value • |
| | Coupon | Date | ($000) | ($000) |
| Tulare County CA Transportation Authority | | | | |
| Sales Tax Revenue | 5.000% | 2/1/29 | 120 | 134 |
| Turlock CA Irrigation District Revenue | 5.500% | 1/1/41 | 1,660 | 1,763 |
| University of California Regents Medical | | | | |
| Center Pooled Revenue | 4.000% | 5/15/37 | 300 | 304 |
| University of California Revenue | 5.000% | 5/15/21 | 150 | 162 |
| University of California Revenue | 5.000% | 5/15/22 | 510 | 564 |
| University of California Revenue | 5.000% | 5/15/22 (Prere.) | 115 | 127 |
| University of California Revenue | 5.000% | 5/15/22 (Prere.) | 1,360 | 1,498 |
| University of California Revenue | 5.000% | 5/15/23 (Prere.) | 520 | 586 |
| University of California Revenue | 5.000% | 5/15/23 | 510 | 576 |
| University of California Revenue | 5.000% | 5/15/25 | 165 | 193 |
| University of California Revenue | 5.000% | 5/15/25 | 95 | 104 |
| University of California Revenue | 5.000% | 5/15/27 | 110 | 127 |
| University of California Revenue | 5.000% | 5/15/28 | 100 | 115 |
| University of California Revenue | 5.000% | 5/15/29 | 775 | 862 |
| University of California Revenue | 5.000% | 5/15/29 | 670 | 764 |
| University of California Revenue | 5.000% | 5/15/32 | 1,000 | 1,127 |
| University of California Revenue | 5.000% | 5/15/32 | 240 | 264 |
| University of California Revenue | 5.000% | 5/15/33 | 700 | 768 |
| University of California Revenue | 5.000% | 5/15/35 | 175 | 195 |
| University of California Revenue | 4.000% | 5/15/36 | 525 | 537 |
| University of California Revenue | 5.000% | 5/15/36 | 395 | 443 |
| University of California Revenue | 5.000% | 5/15/36 | 275 | 309 |
| University of California Revenue | 5.000% | 5/15/37 | 1,130 | 1,226 |
| University of California Revenue | 5.000% | 5/15/38 | 800 | 871 |
| University of California Revenue | 5.000% | 5/15/39 | 355 | 386 |
| University of California Revenue | 5.000% | 5/15/40 | 140 | 155 |
| University of California Revenue | 5.000% | 5/15/41 | 105 | 116 |
| University of California Revenue | 5.000% | 5/15/42 | 710 | 768 |
| University of California Revenue | 5.000% | 5/15/42 | 2,730 | 3,019 |
| University of California Revenue | 5.000% | 5/15/43 | 1,000 | 1,120 |
| University of California Revenue | 4.000% | 5/15/46 | 1,000 | 1,002 |
| University of California Revenue | 5.000% | 5/15/46 | 2,170 | 2,385 |
| University of California Revenue | 4.000% | 5/15/47 | 560 | 561 |
| University of California Revenue | 5.000% | 5/15/47 | 450 | 499 |
| University of California Revenue | 4.000% | 5/15/48 | 7,405 | 7,417 |
| University of California Revenue | 5.000% | 5/15/58 | 4,500 | 4,966 |
| University of California Revenue PUT | 5.000% | 5/15/23 | 905 | 1,018 |
| Ventura County CA Public Financing Authority | | | | |
| Lease Revenue | 5.000% | 11/1/38 | 905 | 986 |
| Ventura County CA Public Financing Authority | | | | |
| Lease Revenue | 4.000% | 11/1/43 | 115 | 116 |
| Ventura County CA Public Financing Authority | | | | |
| Lease Revenue | 5.000% | 11/1/43 | 205 | 223 |
| West Contra Costa CA Unified School District | | | | |
| GO | 0.000% | 8/1/34 (14) | 1,000 | 529 |
| Westside Union CA School District GO | 0.000% | 8/1/45 | 265 | 79 |
| William S. Hart Union High School District | | | | |
| California GO | 0.000% | 8/1/35 (4) | 300 | 153 |
| William S. Hart Union High School District | | | | |
| California GO | 4.000% | 8/1/38 | 100 | 100 |
| Yosemite CA Community College District GO | 5.000% | 8/1/32 | 155 | 178 |
| 8 Yosemite CA Community College District GO | 0.000% | 8/1/42 | 1,180 | 777 |
| | | | | 492,927 |
29
| | | | |
| Tax-Exempt Bond Index Fund | | | | |
| |
| |
| |
| | | | Face | Market |
| | | Maturity | Amount | Value • |
| | Coupon | Date | ($000) | ($000) |
| Colorado (1.4%) | | | | |
| Adams CO 12 Five Star Schools GO | 5.000% | 12/15/35 | 300 | 336 |
| Adams County CO COP | 4.000% | 12/1/45 | 280 | 277 |
| Board of Governors of the Colorado State | | | | |
| University System Enterprise Revenue | 5.000% | 3/1/25 (Prere.) | 175 | 200 |
| Board of Governors of the Colorado State | | | | |
| University System Enterprise Revenue | 5.000% | 3/1/25 (Prere.) | 70 | 80 |
| Board of Governors of the Colorado State | | | | |
| University System Enterprise Revenue | 4.000% | 3/1/35 | 2,775 | 2,846 |
| Board of Governors of the Colorado State | | | | |
| University System Enterprise Revenue | 4.000% | 3/1/47 | 1,000 | 978 |
| Boulder Larimer & Weld Counties CO St. Vrain | | | | |
| Valley School District GO | 5.000% | 12/15/18 (Prere.) | 100 | 100 |
| Colorado Building Excellent Schools COP | 5.000% | 3/15/21 (Prere.) | 450 | 479 |
| Colorado COP | 5.000% | 12/15/30 | 1,000 | 1,154 |
| Colorado COP | 5.000% | 12/15/31 | 2,005 | 2,294 |
| Colorado Educational & Cultural Facilities | | | | |
| Authority Revenue (University of Denver) | 4.000% | 3/1/35 | 750 | 769 |
| Colorado High Performance Transportation | | | | |
| Enterprise Revenue | 5.000% | 12/31/47 | 235 | 248 |
| Colorado High Performance Transportation | | | | |
| Enterprise Revenue | 5.000% | 12/31/56 | 1,000 | 1,052 |
| Colorado Higher Education Capital | | | | |
| Construction Lease Purchase Financing | | | | |
| Program COP | 5.250% | 11/1/18 (Prere.) | 155 | 155 |
| Colorado Higher Education Capital | | | | |
| Construction Lease Purchase Financing | | | | |
| Program COP | 5.500% | 11/1/18 (Prere.) | 400 | 400 |
| Colorado Public Highway Authority Capital | | | | |
| Appreciation Revenue | 0.000% | 9/1/35 | 235 | 118 |
| Colorado Springs CO Utility System Revenue | 5.000% | 11/15/43 | 50 | 55 |
| Denver City & County CO School District | | | | |
| No 1. CP | 5.000% | 12/1/34 | 4,225 | 4,435 |
| Denver City & County CO School District | | | | |
| No 1. CP | 5.000% | 12/1/36 | 5,775 | 6,056 |
| Denver CO City & County Airport Revenue | 5.000% | 11/15/25 | 275 | 315 |
| Denver CO City & County Airport Revenue | 5.250% | 11/15/27 | 150 | 155 |
| Denver CO City & County Airport Revenue | 4.000% | 11/15/31 | 110 | 113 |
| Denver CO City & County Airport Revenue | 5.250% | 11/15/31 | 4,465 | 4,951 |
| Denver CO City & County Airport Revenue | 5.000% | 11/15/33 | 200 | 216 |
| Denver CO City & County Airport Revenue | 5.250% | 11/15/36 | 785 | 808 |
| Denver CO City & County Airport Revenue | 5.000% | 12/1/48 | 1,000 | 1,105 |
| Denver CO City & County Dedicated Tax | | | | |
| Revenue | 0.000% | 8/1/35 | 3,500 | 1,759 |
| Denver CO City & County Dedicated Tax | | | | |
| Revenue | 0.000% | 8/1/36 | 3,000 | 1,432 |
| Denver CO City & County Dedicated Tax | | | | |
| Revenue | 0.000% | 8/1/37 | 3,000 | 1,361 |
| Denver CO City & County Dedicated Tax | | | | |
| Revenue | 0.000% | 8/1/38 | 2,500 | 1,077 |
| Denver CO City & County Dedicated Tax | | | | |
| Revenue | 0.000% | 8/1/39 | 2,500 | 1,026 |
| Denver CO City & County Dedicated Tax | | | | |
| Revenue | 5.000% | 8/1/44 | 515 | 564 |
30
| | | | |
| Tax-Exempt Bond Index Fund | | | | |
| |
| |
| |
| | | | Face | Market |
| | | Maturity | Amount | Value • |
| | Coupon | Date | ($000) | ($000) |
| Denver CO City & County Dedicated Tax | | | | |
| Revenue | 4.000% | 8/1/46 | 150 | 149 |
| Denver CO City & County School District GO | 4.000% | 12/1/31 | 1,000 | 1,040 |
| Denver CO City & County School District GO | 4.000% | 12/1/41 | 200 | 203 |
| E-470 Public Highway Authority Colorado | | | | |
| Revenue | 0.000% | 9/1/25 (14) | 85 | 68 |
| E-470 Public Highway Authority Colorado | | | | |
| Revenue | 0.000% | 9/1/29 (14) | 270 | 179 |
| E-470 Public Highway Authority Colorado | | | | |
| Revenue | 0.000% | 9/1/30 (14) | 785 | 494 |
| E-470 Public Highway Authority Colorado | | | | |
| Revenue | 0.000% | 9/1/32 (14) | 155 | 89 |
| E-470 Public Highway Authority Colorado | | | | |
| Revenue | 0.000% | 9/1/37 (14) | 350 | 148 |
| E-470 Public Highway Authority Colorado | | | | |
| Revenue | 0.000% | 9/1/40 | 390 | 155 |
| Regional Transportation District of Colorado | | | | |
| COP | 5.000% | 6/1/20 (Prere.) | 230 | 240 |
| Regional Transportation District of Colorado | | | | |
| COP | 4.375% | 6/1/39 | 1,200 | 1,239 |
| Regional Transportation District of Colorado | | | | |
| COP | 5.000% | 6/1/39 | 245 | 263 |
| Regional Transportation District of Colorado | | | | |
| COP | 4.000% | 6/1/40 | 365 | 367 |
| Regional Transportation District of Colorado | | | | |
| COP | 4.500% | 6/1/44 | 1,250 | 1,297 |
| Regional Transportation District of Colorado | | | | |
| Sales Tax Revenue | 5.000% | 11/1/34 | 520 | 591 |
| Regional Transportation District of Colorado | | | | |
| Sales Tax Revenue | 4.000% | 11/1/36 | 2,525 | 2,584 |
| Regional Transportation District of Colorado | | | | |
| Sales Tax Revenue (FasTracks Project) | 5.000% | 11/1/26 | 50 | 55 |
| Regional Transportation District of Colorado | | | | |
| Sales Tax Revenue (FasTracks Project) | 5.000% | 11/1/27 | 1,855 | 2,026 |
| Regional Transportation District of Colorado | | | | |
| Sales Tax Revenue (FasTracks Project) | 5.000% | 11/1/27 | 50 | 59 |
| Regional Transportation District of Colorado | | | | |
| Sales Tax Revenue (FasTracks Project) | 5.000% | 11/1/28 | 100 | 109 |
| Regional Transportation District of Colorado | | | | |
| Sales Tax Revenue (FasTracks Project) | 5.000% | 11/1/28 | 240 | 283 |
| Regional Transportation District of Colorado | | | | |
| Sales Tax Revenue (FasTracks Project) | 5.000% | 11/1/29 | 25 | 30 |
| Regional Transportation District of Colorado | | | | |
| Sales Tax Revenue (FasTracks Project) | 5.000% | 11/1/29 | 350 | 382 |
| Regional Transportation District of Colorado | | | | |
| Sales Tax Revenue (FasTracks Project) | 5.000% | 11/1/33 | 35 | 40 |
| University of Colorado Enterprise System | | | | |
| Revenue | 5.000% | 6/1/23 (Prere.) | 250 | 279 |
| University of Colorado Enterprise System | | | | |
| Revenue | 5.000% | 6/1/23 (Prere.) | 125 | 139 |
| University of Colorado Enterprise System | | | | |
| Revenue | 5.000% | 6/1/24 (Prere.) | 165 | 187 |
| University of Colorado Enterprise System | | | | |
| Revenue | 4.000% | 6/1/36 | 500 | 514 |
31
| | | | |
| Tax-Exempt Bond Index Fund | | | | |
| |
| |
| |
| | | | Face | Market |
| | | Maturity | Amount | Value • |
| | Coupon | Date | ($000) | ($000) |
| University of Colorado Enterprise System | | | | |
| Revenue | 4.000% | 6/1/43 | 3,000 | 3,024 |
| | | | | 53,147 |
| Connecticut (1.8%) | | | | |
| Connecticut GO | 5.000% | 11/1/18 | 125 | 125 |
| Connecticut GO | 5.000% | 11/15/18 | 4,000 | 4,004 |
| Connecticut GO | 5.000% | 4/15/19 | 200 | 202 |
| Connecticut GO | 5.000% | 6/15/19 | 100 | 102 |
| Connecticut GO | 5.000% | 11/1/19 | 255 | 262 |
| Connecticut GO | 5.250% | 6/1/20 (2) | 280 | 292 |
| Connecticut GO | 5.000% | 10/15/20 | 150 | 157 |
| Connecticut GO | 5.000% | 11/1/20 | 3,150 | 3,302 |
| Connecticut GO | 5.000% | 5/15/21 | 150 | 159 |
| Connecticut GO | 5.000% | 10/15/21 | 645 | 688 |
| Connecticut GO | 5.000% | 11/1/21 | 1,025 | 1,095 |
| Connecticut GO | 5.000% | 12/1/21 | 400 | 411 |
| Connecticut GO | 5.000% | 6/1/22 | 265 | 285 |
| Connecticut GO | 5.000% | 10/15/22 | 170 | 184 |
| Connecticut GO | 5.000% | 10/15/22 | 180 | 195 |
| Connecticut GO | 5.000% | 11/15/22 | 135 | 146 |
| Connecticut GO | 5.000% | 5/15/23 | 600 | 633 |
| Connecticut GO | 5.000% | 6/1/23 | 305 | 327 |
| Connecticut GO | 5.000% | 10/15/23 | 650 | 711 |
| Connecticut GO | 5.000% | 11/15/23 | 630 | 690 |
| Connecticut GO | 5.000% | 3/15/24 | 410 | 450 |
| Connecticut GO | 5.000% | 6/1/24 | 1,325 | 1,417 |
| Connecticut GO | 5.000% | 8/15/24 | 100 | 109 |
| Connecticut GO | 5.000% | 10/15/24 | 120 | 130 |
| Connecticut GO | 5.000% | 11/1/24 | 105 | 111 |
| Connecticut GO | 5.000% | 2/15/25 | 100 | 101 |
| Connecticut GO | 5.000% | 5/15/25 | 390 | 432 |
| Connecticut GO | 5.000% | 6/15/25 | 800 | 886 |
| Connecticut GO | 5.000% | 10/15/25 | 155 | 168 |
| Connecticut GO | 5.000% | 10/15/25 | 5,160 | 5,725 |
| Connecticut GO | 5.000% | 11/15/25 | 545 | 605 |
| Connecticut GO | 5.000% | 6/15/26 | 800 | 881 |
| Connecticut GO | 5.000% | 10/15/26 | 725 | 808 |
| Connecticut GO | 5.000% | 10/15/26 | 295 | 318 |
| Connecticut GO | 5.000% | 11/1/26 | 315 | 315 |
| Connecticut GO | 5.000% | 11/15/26 | 710 | 785 |
| Connecticut GO | 5.000% | 4/15/27 | 125 | 139 |
| Connecticut GO | 5.000% | 5/15/27 | 315 | 348 |
| Connecticut GO | 5.000% | 8/15/27 | 500 | 553 |
| Connecticut GO | 5.000% | 11/15/27 | 620 | 681 |
| Connecticut GO | 5.000% | 4/15/28 | 1,000 | 1,114 |
| Connecticut GO | 4.000% | 9/15/28 | 265 | 270 |
| Connecticut GO | 5.000% | 11/15/28 | 300 | 328 |
| Connecticut GO | 5.000% | 4/15/29 | 400 | 440 |
| Connecticut GO | 5.000% | 9/15/31 | 160 | 168 |
| Connecticut GO | 5.000% | 11/1/31 | 170 | 177 |
| Connecticut GO | 5.000% | 10/15/33 | 1,000 | 1,080 |
| Connecticut GO | 5.000% | 10/15/34 | 750 | 808 |
| Connecticut GO | 5.000% | 6/15/35 | 500 | 531 |
32
| | | | |
| Tax-Exempt Bond Index Fund | | | | |
| |
| |
| |
| | | | Face | Market |
| | | Maturity | Amount | Value • |
| | Coupon | Date | ($000) | ($000) |
| Connecticut Health & Educational Facilities | | | | |
| Authority Revenue (Quinnipiac University) | 5.000% | 7/1/45 | 1,550 | 1,661 |
| Connecticut Health & Educational Facilities | | | | |
| Authority Revenue (Yale University) PUT | 5.000% | 7/1/20 | 1,605 | 1,681 |
| Connecticut Health & Educational Facilities | | | | |
| Authority Revenue (Yale University) PUT | 2.050% | 7/12/21 | 5,000 | 4,961 |
| Connecticut Health & Educational Facilities | | | | |
| Authority Revenue (Yale University) PUT | 5.000% | 7/1/22 | 500 | 547 |
| Connecticut Health & Educational Facilities | | | | |
| Authority Revenue (Yale University) PUT | 2.000% | 7/1/26 | 1,100 | 1,015 |
| Connecticut Health & Educational Facilities | | | | |
| Authority Revenue (Yale University) PUT | 5.000% | 2/1/28 | 2,250 | 2,641 |
| Connecticut Special Tax Revenue | | | | |
| (Transportation Infrastructure) | 5.000% | 2/1/19 | 345 | 347 |
| Connecticut Special Tax Revenue | | | | |
| (Transportation Infrastructure) | 5.000% | 9/1/19 | 2,285 | 2,338 |
| Connecticut Special Tax Revenue | | | | |
| (Transportation Infrastructure) | 5.000% | 9/1/21 | 225 | 240 |
| Connecticut Special Tax Revenue | | | | |
| (Transportation Infrastructure) | 5.000% | 8/1/23 | 850 | 934 |
| Connecticut Special Tax Revenue | | | | |
| (Transportation Infrastructure) | 5.000% | 8/1/23 | 240 | 264 |
| Connecticut Special Tax Revenue | | | | |
| (Transportation Infrastructure) | 5.000% | 9/1/24 | 350 | 389 |
| Connecticut Special Tax Revenue | | | | |
| (Transportation Infrastructure) | 5.000% | 9/1/24 | 140 | 156 |
| Connecticut Special Tax Revenue | | | | |
| (Transportation Infrastructure) | 5.000% | 1/1/25 | 500 | 543 |
| Connecticut Special Tax Revenue | | | | |
| (Transportation Infrastructure) | 5.000% | 10/1/25 | 3,640 | 3,993 |
| Connecticut Special Tax Revenue | | | | |
| (Transportation Infrastructure) | 5.000% | 8/1/26 | 180 | 200 |
| Connecticut Special Tax Revenue | | | | |
| (Transportation Infrastructure) | 5.000% | 9/1/26 | 410 | 451 |
| Connecticut Special Tax Revenue | | | | |
| (Transportation Infrastructure) | 5.000% | 9/1/26 | 1,095 | 1,230 |
| Connecticut Special Tax Revenue | | | | |
| (Transportation Infrastructure) | 5.000% | 8/1/27 | 130 | 144 |
| Connecticut Special Tax Revenue | | | | |
| (Transportation Infrastructure) | 5.000% | 9/1/27 | 835 | 929 |
| Connecticut Special Tax Revenue | | | | |
| (Transportation Infrastructure) | 5.000% | 9/1/27 | 4,550 | 4,982 |
| Connecticut Special Tax Revenue | | | | |
| (Transportation Infrastructure) | 5.000% | 8/1/28 | 320 | 353 |
| Connecticut Special Tax Revenue | | | | |
| (Transportation Infrastructure) | 5.000% | 1/1/29 | 395 | 423 |
| Connecticut Special Tax Revenue | | | | |
| (Transportation Infrastructure) | 5.000% | 9/1/29 | 680 | 749 |
| Connecticut Special Tax Revenue | | | | |
| (Transportation Infrastructure) | 5.000% | 9/1/29 | 150 | 163 |
| Connecticut Special Tax Revenue | | | | |
| (Transportation Infrastructure) | 5.000% | 10/1/29 | 175 | 189 |
| Connecticut Special Tax Revenue | | | | |
| (Transportation Infrastructure) | 5.000% | 8/1/30 | 435 | 476 |
33
| | | | |
| Tax-Exempt Bond Index Fund | | | | |
| |
| |
| |
| | | | Face | Market |
| | | Maturity | Amount | Value • |
| | Coupon | Date | ($000) | ($000) |
| Connecticut Special Tax Revenue | | | | |
| (Transportation Infrastructure) | 5.000% | 9/1/30 | 155 | 170 |
| Connecticut Special Tax Revenue | | | | |
| (Transportation Infrastructure) | 5.000% | 10/1/30 | 225 | 243 |
| Connecticut Special Tax Revenue | | | | |
| (Transportation Infrastructure) | 5.000% | 8/1/31 | 405 | 442 |
| Connecticut Special Tax Revenue | | | | |
| (Transportation Infrastructure) | 5.000% | 10/1/33 | 100 | 107 |
| Connecticut Special Tax Revenue | | | | |
| (Transportation Infrastructure) | 5.000% | 8/1/35 | 500 | 539 |
| | | | | 67,348 |
| Delaware (0.1%) | | | | |
| Delaware GO | 5.000% | 7/1/23 | 2,500 | 2,796 |
| Delaware GO | 5.000% | 1/1/28 | 500 | 591 |
| Delaware Transportation Authority | | | | |
| Transportation System Revenue | 5.000% | 6/1/55 | 450 | 483 |
| | | | | 3,870 |
| District of Columbia (1.2%) | | | | |
| District of Columbia GO | 5.000% | 6/1/22 | 2,000 | 2,188 |
| District of Columbia GO | 5.000% | 6/1/23 | 805 | 897 |
| District of Columbia GO | 5.000% | 6/1/24 | 515 | 583 |
| District of Columbia GO | 5.000% | 6/1/24 | 130 | 144 |
| District of Columbia GO | 5.000% | 6/1/30 | 1,085 | 1,203 |
| District of Columbia GO | 5.000% | 6/1/33 | 5,315 | 5,849 |
| District of Columbia GO | 4.000% | 6/1/34 | 1,030 | 1,061 |
| District of Columbia GO | 5.000% | 6/1/34 | 180 | 203 |
| District of Columbia GO | 5.000% | 6/1/35 | 750 | 844 |
| District of Columbia GO | 4.000% | 6/1/36 | 500 | 511 |
| District of Columbia GO | 5.000% | 6/1/36 | 300 | 332 |
| District of Columbia GO | 4.000% | 6/1/37 | 750 | 764 |
| District of Columbia GO | 5.000% | 6/1/37 | 160 | 179 |
| District of Columbia GO | 5.000% | 6/1/38 | 865 | 943 |
| District of Columbia GO | 4.000% | 6/1/41 | 170 | 171 |
| District of Columbia GO | 5.000% | 6/1/41 | 985 | 1,086 |
| District of Columbia Income Tax Revenue | 5.000% | 12/1/19 | 125 | 129 |
| District of Columbia Income Tax Revenue | 5.000% | 12/1/23 | 340 | 375 |
| District of Columbia Income Tax Revenue | 5.000% | 12/1/26 | 475 | 495 |
| District of Columbia Income Tax Revenue | 5.250% | 12/1/26 | 520 | 537 |
| District of Columbia Income Tax Revenue | 5.000% | 12/1/27 | 375 | 391 |
| District of Columbia Income Tax Revenue | 5.000% | 12/1/27 | 2,500 | 2,737 |
| District of Columbia Income Tax Revenue | 5.000% | 12/1/28 | 230 | 239 |
| District of Columbia Income Tax Revenue | 5.000% | 12/1/30 | 120 | 129 |
| District of Columbia Income Tax Revenue | 5.000% | 12/1/30 | 100 | 104 |
| District of Columbia Income Tax Revenue | 5.000% | 12/1/31 | 700 | 763 |
| District of Columbia Income Tax Revenue | 5.250% | 12/1/34 | 475 | 490 |
| District of Columbia Income Tax Revenue | 5.000% | 12/1/36 | 2,630 | 2,807 |
| District of Columbia Revenue (Georgetown | | | | |
| University) | 5.000% | 4/1/30 | 430 | 486 |
| District of Columbia Revenue (Georgetown | | | | |
| University) | 5.000% | 4/1/34 | 270 | 300 |
| District of Columbia Water & Sewer Authority | | | | |
| Public Utility Revenue | 5.500% | 10/1/23 (4) | 105 | 115 |
| District of Columbia Water & Sewer Authority | | | | |
| Public Utility Revenue | 5.000% | 10/1/36 | 915 | 1,014 |
34
| | | | |
| Tax-Exempt Bond Index Fund | | | | |
| |
| |
| |
| | | | Face | Market |
| | | Maturity | Amount | Value • |
| | Coupon | Date | ($000) | ($000) |
| District of Columbia Water & Sewer Authority | | | | |
| Public Utility Revenue | 5.000% | 10/1/39 | 200 | 221 |
| District of Columbia Water & Sewer Authority | | | | |
| Public Utility Revenue | 5.250% | 10/1/40 | 100 | 113 |
| District of Columbia Water & Sewer Authority | | | | |
| Public Utility Revenue | 5.000% | 10/1/44 | 940 | 1,031 |
| District of Columbia Water & Sewer Authority | | | | |
| Public Utility Revenue | 5.000% | 10/1/45 | 1,055 | 1,155 |
| District of Columbia Water & Sewer Authority | | | | |
| Public Utility Revenue | 5.000% | 10/1/48 | 3,000 | 3,246 |
| Metropolitan Washington DC Transit Authority | | | | |
| Revenue | 5.000% | 7/1/36 | 750 | 841 |
| Metropolitan Washington DC/VA Airports | | | | |
| Authority Airport System Revenue | 5.000% | 10/1/35 | 2,860 | 2,989 |
| Metropolitan Washington DC/VA Airports | | | | |
| Authority Airport System Revenue | 5.000% | 10/1/39 | 240 | 251 |
| Metropolitan Washington DC/VA Airports | | | | |
| Authority Dulles Toll Road Revenue (Dulles | | | | |
| Metrorail & Capital Improvement Projects) | 0.000% | 10/1/31 (12) | 305 | 179 |
| Metropolitan Washington DC/VA Airports | | | | |
| Authority Dulles Toll Road Revenue (Dulles | | | | |
| Metrorail & Capital Improvement Projects) | 0.000% | 10/1/37 | 1,610 | 670 |
| Metropolitan Washington DC/VA Airports | | | | |
| Authority Dulles Toll Road Revenue (Dulles | | | | |
| Metrorail & Capital Improvement Projects) | 0.000% | 10/1/39 | 90 | 35 |
| Metropolitan Washington DC/VA Airports | | | | |
| Authority Dulles Toll Road Revenue (Dulles | | | | |
| Metrorail & Capital Improvement Projects) | 0.000% | 10/1/39 (12) | 100 | 39 |
| Metropolitan Washington DC/VA Airports | | | | |
| Authority Dulles Toll Road Revenue (Dulles | | | | |
| Metrorail & Capital Improvement Projects) | 5.000% | 10/1/39 | 20 | 20 |
| Metropolitan Washington DC/VA Airports | | | | |
| Authority Dulles Toll Road Revenue (Dulles | | | | |
| Metrorail & Capital Improvement Projects) | 0.000% | 10/1/40 (12) | 1,000 | 368 |
| Metropolitan Washington DC/VA Airports | | | | |
| Authority Dulles Toll Road Revenue (Dulles | | | | |
| Metrorail & Capital Improvement Projects) | 5.250% | 10/1/44 | 20 | 20 |
| Metropolitan Washington DC/VA Airports | | | | |
| Authority Dulles Toll Road Revenue (Dulles | | | | |
| Metrorail & Capital Improvement Projects) | 5.000% | 10/1/53 | 3,820 | 3,984 |
| | | | | 43,231 |
| Florida (3.7%) | | | | |
| Broward County FL Airport System Revenue | 5.375% | 10/1/29 | 150 | 154 |
| Broward County FL Airport System Revenue | 5.000% | 10/1/37 | 2,950 | 3,156 |
| Broward County FL Airport System Revenue | 5.250% | 10/1/38 | 500 | 548 |
| Broward County FL Airport System Revenue | 4.000% | 10/1/42 | 345 | 346 |
| Broward County FL Airport System Revenue | 5.000% | 10/1/42 | 420 | 449 |
| Broward County FL School Board COP | 5.000% | 7/1/24 | 125 | 141 |
| Broward County FL School Board COP | 5.000% | 7/1/25 | 100 | 114 |
| Broward County FL Water & Sewer Utility | | | | |
| Revenue | 5.000% | 10/1/37 | 380 | 413 |
| Cape Coral FL Water & Sewer System | | | | |
| Revenue | 5.000% | 10/1/21 (Prere.) | 710 | 766 |
35
| | | | |
| Tax-Exempt Bond Index Fund | | | | |
| |
| |
| |
| | | | Face | Market |
| | | Maturity | Amount | Value • |
| | Coupon | Date | ($000) | ($000) |
| Cape Coral FL Water & Sewer System | | | | |
| Revenue | 5.000% | 10/1/21 (Prere.) | 100 | 108 |
| Cape Coral FL Water & Sewer System | | | | |
| Revenue | 4.000% | 10/1/42 | 3,895 | 3,824 |
| Central Florida Expressway Authority BAN | 4.000% | 7/1/37 | 740 | 744 |
| Central Florida Expressway Authority Revenue | 5.000% | 7/1/26 | 580 | 668 |
| Central Florida Expressway Authority Revenue | 4.000% | 7/1/30 | 525 | 548 |
| Central Florida Expressway Authority Revenue | 4.000% | 7/1/31 | 850 | 881 |
| Central Florida Expressway Authority Revenue | 5.000% | 7/1/34 | 190 | 211 |
| Central Florida Expressway Authority Revenue | 4.000% | 7/1/35 | 500 | 507 |
| Central Florida Expressway Authority Revenue | 3.250% | 7/1/36 | 150 | 133 |
| Central Florida Expressway Authority Revenue | 4.000% | 7/1/36 | 640 | 645 |
| Central Florida Expressway Authority Revenue | 4.000% | 7/1/38 | 885 | 888 |
| Central Florida Expressway Authority Revenue | 4.000% | 7/1/39 | 450 | 448 |
| Central Florida Expressway Authority Revenue | 4.000% | 7/1/40 | 2,000 | 1,980 |
| Central Florida Expressway Authority Revenue | 4.000% | 7/1/41 | 1,860 | 1,833 |
| Citizens Property Insurance Corp. Florida | | | | |
| Revenue (Personal Lines Account/Commercial | | | | |
| Lines Account) | 5.000% | 6/1/19 | 310 | 315 |
| Clearwater FL Water & Sewer Revenue | 5.250% | 12/1/19 (Prere.) | 280 | 290 |
| Florida Board of Education Lottery Revenue | 5.000% | 7/1/20 | 5,525 | 5,784 |
| Florida Board of Education Lottery Revenue | 5.000% | 7/1/21 | 150 | 161 |
| Florida Board of Education Lottery Revenue | 5.000% | 7/1/24 | 1,115 | 1,266 |
| Florida Board of Education Lottery Revenue | 5.000% | 7/1/25 | 1,750 | 2,017 |
| Florida Board of Education Lottery Revenue | 5.000% | 7/1/28 | 340 | 401 |
| Florida Board of Education Public Education | | | | |
| Capital Outlay GO | 5.000% | 6/1/19 | 100 | 102 |
| Florida Board of Education Public Education | | | | |
| Capital Outlay GO | 5.000% | 6/1/20 | 640 | 669 |
| Florida Board of Education Public Education | | | | |
| Capital Outlay GO | 5.000% | 6/1/20 | 1,000 | 1,045 |
| Florida Board of Education Public Education | | | | |
| Capital Outlay GO | 5.000% | 6/1/20 (Prere.) | 215 | 225 |
| Florida Board of Education Public Education | | | | |
| Capital Outlay GO | 5.000% | 6/1/21 | 290 | 303 |
| Florida Board of Education Public Education | | | | |
| Capital Outlay GO | 5.000% | 6/1/21 | 2,430 | 2,604 |
| Florida Board of Education Public Education | | | | |
| Capital Outlay GO | 5.000% | 6/1/22 | 1,200 | 1,314 |
| Florida Board of Education Public Education | | | | |
| Capital Outlay GO | 5.000% | 6/1/22 | 3,695 | 4,047 |
| Florida Board of Education Public Education | | | | |
| Capital Outlay GO | 5.000% | 6/1/23 | 150 | 167 |
| Florida Board of Education Public Education | | | | |
| Capital Outlay GO | 5.000% | 6/1/25 | 265 | 283 |
| Florida Board of Education Public Education | | | | |
| Capital Outlay GO | 5.000% | 6/1/25 | 300 | 327 |
| Florida Department of Transportation GO | 4.000% | 7/1/30 | 730 | 779 |
| Florida Department of Transportation GO | 4.000% | 7/1/36 | 1,685 | 1,734 |
| Florida Department of Transportation GO | 4.000% | 7/1/43 | 1,200 | 1,206 |
| Florida Higher Educational Facilities Financing | | | | |
| Authority Revenue (Ringling College Project) | 5.000% | 3/1/42 | 500 | 525 |
| Florida Higher Educational Facilities Financing | | | | |
| Authority Revenue (Ringling College Project) | 5.000% | 3/1/47 | 500 | 523 |
36
| | | | |
| Tax-Exempt Bond Index Fund | | | | |
| |
| |
| |
| | | | Face | Market |
| | | Maturity | Amount | Value • |
| | Coupon | Date | ($000) | ($000) |
| Florida Mid-Bay Bridge Authority Revenue | 4.000% | 10/1/40 (4) | 270 | 269 |
| Florida Municipal Power Agency Revenue | 5.250% | 10/1/19 | 485 | 499 |
| Florida Municipal Power Agency Revenue | 5.000% | 10/1/22 | 290 | 318 |
| Florida Municipal Power Agency Revenue | 5.000% | 10/1/24 | 350 | 396 |
| Florida Municipal Power Agency Revenue | 5.000% | 10/1/27 | 100 | 115 |
| Florida Municipal Power Agency Revenue | 5.000% | 10/1/28 | 170 | 194 |
| Florida Municipal Power Agency Revenue | 5.000% | 10/1/29 | 105 | 119 |
| Florida Turnpike Authority Revenue | 4.500% | 7/1/37 | 50 | 52 |
| Florida Turnpike Authority Revenue | 5.000% | 7/1/40 | 1,850 | 1,945 |
| Florida Water Pollution Control Financing | | | | |
| Corp. Revenue | 5.000% | 1/15/20 | 124 | 125 |
| Greater Orlando Aviation Authority Florida | | | | |
| Airport Facilities Revenue | 5.000% | 10/1/39 | 400 | 419 |
| Hillsborough County FL Aviation Authority | | | | |
| Revenue (Tampa International Airport) | 5.000% | 10/1/44 | 505 | 541 |
| Hillsborough County FL School Board (Master | | | | |
| Lease Program) COP | 5.000% | 7/1/26 | 155 | 176 |
| Hillsborough County FL School Board (Master | | | | |
| Lease Program) COP | 5.000% | 7/1/29 | 1,325 | 1,435 |
| Jacksonville FL Electric Authority Electric | | | | |
| System Revenue | 5.000% | 10/1/22 (Prere.) | 385 | 423 |
| Jacksonville FL Electric Authority Electric | | | | |
| System Revenue | 5.000% | 4/1/23 (Prere.) | 440 | 488 |
| Jacksonville FL Electric Authority Electric | | | | |
| System Revenue | 5.000% | 10/1/23 | 625 | 687 |
| Jacksonville FL Electric Authority Electric | | | | |
| System Revenue | 5.000% | 10/1/23 (Prere.) | 10 | 11 |
| Jacksonville FL Electric Authority Electric | | | | |
| System Revenue | 5.000% | 10/1/26 | 225 | 258 |
| Jacksonville FL Electric Authority Electric | | | | |
| System Revenue | 5.000% | 10/1/28 | 360 | 394 |
| Jacksonville FL Electric Authority Electric | | | | |
| System Revenue | 5.000% | 10/1/30 | 450 | 510 |
| Jacksonville FL Electric Authority Electric | | | | |
| System Revenue | 4.000% | 10/1/38 | 2,200 | 2,197 |
| Jacksonville FL Electric Authority Electric | | | | |
| System Revenue | 5.000% | 10/1/39 | 30 | 32 |
| Jacksonville FL Special Revenue | 5.000% | 10/1/30 | 525 | 586 |
| JEA Electric System Revenue | 5.000% | 10/1/27 | 1,250 | 1,440 |
| Miami Beach FL Redevelopment Agency Tax | | | | |
| Allocation Revenue | 5.000% | 2/1/44 (4) | 235 | 258 |
| Miami Beach FL Resort Tax Revenue | 5.000% | 9/1/45 | 1,900 | 2,071 |
| Miami Beach FL Stormwater Revenue | 5.000% | 9/1/47 | 3,000 | 3,211 |
| Miami Beach FL Water & Sewer Revenue | 4.000% | 10/1/36 | 1,750 | 1,782 |
| Miami Beach FL Water & Sewer Revenue | 4.000% | 10/1/38 | 4,275 | 4,304 |
| Miami Beach FL Water & Sewer Revenue | 4.000% | 10/1/44 | 1,740 | 1,723 |
| Miami-Dade County FL Aviation Revenue | | | | |
| (Miami International Airport) | 5.500% | 10/1/19 (Prere.) | 1,000 | 1,032 |
| Miami-Dade County FL Aviation Revenue | | | | |
| (Miami International Airport) | 5.500% | 10/1/19 (Prere.) | 665 | 686 |
| Miami-Dade County FL Aviation Revenue | | | | |
| (Miami International Airport) | 5.500% | 10/1/19 (Prere.) | 110 | 113 |
| Miami-Dade County FL Aviation Revenue | | | | |
| (Miami International Airport) | 5.375% | 10/1/20 (Prere.) | 240 | 254 |
37
| | | | |
| Tax-Exempt Bond Index Fund | | | | |
| |
| |
| |
| | | | Face | Market |
| | | Maturity | Amount | Value • |
| | Coupon | Date | ($000) | ($000) |
| Miami-Dade County FL Aviation Revenue | | | | |
| (Miami International Airport) | 5.500% | 10/1/20 (Prere.) | 155 | 165 |
| Miami-Dade County FL Aviation Revenue | | | | |
| (Miami International Airport) | 5.000% | 10/1/28 | 125 | 142 |
| Miami-Dade County FL Aviation Revenue | | | | |
| (Miami International Airport) | 5.000% | 10/1/28 | 750 | 785 |
| Miami-Dade County FL Aviation Revenue | | | | |
| (Miami International Airport) | 5.000% | 10/1/29 | 115 | 120 |
| Miami-Dade County FL Aviation Revenue | | | | |
| (Miami International Airport) | 5.000% | 10/1/30 | 250 | 280 |
| Miami-Dade County FL Aviation Revenue | | | | |
| (Miami International Airport) | 5.375% | 10/1/35 | 60 | 63 |
| Miami-Dade County FL Aviation Revenue | | | | |
| (Miami International Airport) | 5.000% | 10/1/37 | 320 | 348 |
| Miami-Dade County FL Aviation Revenue | | | | |
| (Miami International Airport) | 5.000% | 10/1/41 | 395 | 412 |
| Miami-Dade County FL Aviation Revenue | | | | |
| (Miami International Airport) | 5.000% | 10/1/41 | 465 | 506 |
| Miami-Dade County FL Educational Facilities | | | | |
| Authority Revenue (University of Miami) | 5.000% | 4/1/40 | 100 | 108 |
| Miami-Dade County FL Educational Facilities | | | | |
| Authority Revenue (University of Miami) | 4.000% | 4/1/45 | 250 | 250 |
| Miami-Dade County FL Educational Facilities | | | | |
| Authority Revenue (University of Miami) | 5.000% | 4/1/45 | 785 | 845 |
| Miami-Dade County FL Expressway Authority | | | | |
| Toll System Revenue | 5.000% | 7/1/24 | 225 | 254 |
| Miami-Dade County FL Expressway Authority | | | | |
| Toll System Revenue | 4.000% | 7/1/35 | 110 | 112 |
| Miami-Dade County FL Expressway Authority | | | | |
| Toll System Revenue | 5.000% | 7/1/40 | 4,030 | 4,184 |
| Miami-Dade County FL Professional Sports | | | | |
| Franchise Facilities Tax Revenue | 5.375% | 10/1/19 (Prere.) | 150 | 155 |
| Miami-Dade County FL Professional Sports | | | | |
| Franchise Facilities Tax Revenue | 0.000% | 10/1/48 (12) | 515 | 132 |
| Miami-Dade County FL Professional Sports | | | | |
| Franchise Facilities Tax Revenue | 0.000% | 4/1/49 (12) | 1,975 | 486 |
| Miami-Dade County FL School Board COP | 5.375% | 2/1/19 (Prere.) | 355 | 358 |
| Miami-Dade County FL School Board COP | 5.000% | 2/1/24 | 185 | 206 |
| Miami-Dade County FL School Board COP | 5.000% | 2/1/25 | 135 | 152 |
| Miami-Dade County FL School Board COP | 5.000% | 2/1/26 | 405 | 461 |
| Miami-Dade County FL School Board COP | 5.625% | 5/1/31 | 65 | 70 |
| Miami-Dade County FL School District GO | 5.000% | 3/15/46 | 3,000 | 3,264 |
| Miami-Dade County FL Seaport Revenue | 5.500% | 10/1/42 | 2,890 | 3,154 |
| Miami-Dade County FL Special Obligation | | | | |
| Revenue | 5.000% | 10/1/29 | 765 | 827 |
| Miami-Dade County FL Special Obligation | | | | |
| Revenue | 5.000% | 10/1/30 | 100 | 108 |
| Miami-Dade County FL Special Obligation | | | | |
| Revenue | 5.000% | 10/1/31 | 100 | 108 |
| Miami-Dade County FL Special Obligation | | | | |
| Revenue | 5.000% | 10/1/32 | 590 | 636 |
| Miami-Dade County FL Special Obligation | | | | |
| Revenue | 5.000% | 10/1/34 | 465 | 511 |
38
| | | | |
| Tax-Exempt Bond Index Fund | | | | |
| |
| |
| |
| | | | Face | Market |
| | | Maturity | Amount | Value • |
| | Coupon | Date | ($000) | ($000) |
| Miami-Dade County FL Special Obligation | | | | |
| Revenue | 5.000% | 10/1/35 | 570 | 625 |
| Miami-Dade County FL Special Obligation | | | | |
| Revenue | 5.000% | 10/1/35 | 1,080 | 1,161 |
| Miami-Dade County FL Special Obligation | | | | |
| Revenue | 4.000% | 10/1/39 | 135 | 135 |
| Miami-Dade County FL Special Obligation | | | | |
| Revenue | 0.000% | 10/1/42 | 130 | 44 |
| Miami-Dade County FL Transit Sales Surtax | | | | |
| Revenue | 5.000% | 7/1/37 | 560 | 603 |
| Miami-Dade County FL Transit Sales Surtax | | | | |
| Revenue | 4.000% | 7/1/38 | 1,000 | 1,007 |
| Miami-Dade County FL Transit Sales Surtax | | | | |
| Revenue | 4.000% | 7/1/42 | 190 | 188 |
| Miami-Dade County FL Transit Sales Surtax | | | | |
| Revenue | 5.000% | 7/1/42 | 2,430 | 2,594 |
| Miami-Dade County FL Water & Sewer | | | | |
| Revenue | 5.250% | 10/1/19 (4) | 200 | 206 |
| Miami-Dade County FL Water & Sewer | | | | |
| Revenue | 5.000% | 10/1/20 (Prere.) | 1,475 | 1,554 |
| Miami-Dade County FL Water & Sewer | | | | |
| Revenue | 5.000% | 10/1/20 (Prere.) | 1,200 | 1,265 |
| Miami-Dade County FL Water & Sewer | | | | |
| Revenue | 5.000% | 10/1/22 | 120 | 132 |
| Miami-Dade County FL Water & Sewer | | | | |
| Revenue | 5.000% | 10/1/23 | 405 | 452 |
| Miami-Dade County FL Water & Sewer | | | | |
| Revenue | 5.000% | 10/1/24 | 1,960 | 2,220 |
| Miami-Dade County FL Water & Sewer | | | | |
| Revenue | 5.000% | 10/1/25 | 435 | 499 |
| Miami-Dade County FL Water & Sewer | | | | |
| Revenue | 5.000% | 10/1/26 | 615 | 702 |
| Miami-Dade County FL Water & Sewer | | | | |
| Revenue | 5.250% | 10/1/29 | 250 | 278 |
| Miami-Dade County FL Water & Sewer | | | | |
| Revenue | 5.000% | 10/1/42 | 1,680 | 1,801 |
| Miami-Dade County FL Water & Sewer | | | | |
| Revenue | 3.375% | 10/1/47 | 1,215 | 1,014 |
| Orange County FL School Board COP | 5.500% | 8/1/19 (Prere.) | 600 | 616 |
| Orange County FL School Board COP | 5.000% | 8/1/31 | 1,060 | 1,184 |
| Orange County FL School Board COP | 5.000% | 8/1/33 | 865 | 968 |
| Orange County FL School Board COP | 5.000% | 8/1/34 | 160 | 179 |
| Orange County FL Tourist Development | | | | |
| Revenue | 5.000% | 10/1/22 | 225 | 247 |
| Orange County FL Tourist Development | | | | |
| Revenue | 5.000% | 10/1/24 | 195 | 221 |
| Orange County FL Tourist Development | | | | |
| Revenue | 4.000% | 10/1/34 | 1,000 | 1,017 |
| Orange County FL Tourist Development Tax | | | | |
| Revenue | 4.000% | 10/1/33 | 2,000 | 2,046 |
| Orlando & Orange County FL Expressway | | | | |
| Authority Revenue | 5.000% | 7/1/20 (Prere.) | 865 | 905 |
| Orlando & Orange County FL Expressway | | | | |
| Authority Revenue | 5.000% | 7/1/20 (Prere.) | 670 | 701 |
39
| | | | | |
| Tax-Exempt Bond Index Fund | | | | |
| |
| |
| |
| | | | | Face | Market |
| | | | Maturity | Amount | Value • |
| | | Coupon | Date | ($000) | ($000) |
| | Orlando & Orange County FL Expressway | | | | |
| | Authority Revenue | 5.000% | 7/1/20 (Prere.) | 120 | 126 |
| | Orlando & Orange County FL Expressway | | | | |
| | Authority Revenue | 5.000% | 7/1/22 | 100 | 109 |
| | Orlando FL Contract Tourist Development Tax | | | | |
| | Payments Revenue | 5.000% | 5/1/24 (Prere.) | 1,445 | 1,634 |
| | Orlando FL Contract Tourist Development Tax | | | | |
| | Payments Revenue | 5.000% | 5/1/24 (Prere.) | 310 | 351 |
| | Orlando FL Contract Tourist Development Tax | | | | |
| | Payments Revenue | 5.250% | 5/1/24 (Prere.) | 200 | 229 |
| | Orlando FL Utility Commission Utility System | | | | |
| | Revenue | 5.000% | 4/1/19 (Prere.) | 1,350 | 1,367 |
| | Orlando FL Utility Commission Utility System | | | | |
| | Revenue | 5.000% | 10/1/23 | 175 | 196 |
| | Orlando FL Utility Commission Utility System | | | | |
| | Revenue | 5.000% | 10/1/25 | 205 | 236 |
| | Osceola County FL Expressway System | | | | |
| | Revenue (Poinciana Parkway Project) | 0.000% | 10/1/21 | 115 | 105 |
| | Osceola County FL Expressway System | | | | |
| | Revenue (Poinciana Parkway Project) | 0.000% | 10/1/22 | 50 | 44 |
| 9 | Osceola County FL Expressway System | | | | |
| | Revenue (Poinciana Parkway Project) | 0.000% | 10/1/32 | 45 | 37 |
| 10 | Osceola County FL Expressway System | | | | |
| | Revenue (Poinciana Parkway Project) | 0.000% | 10/1/39 | 590 | 477 |
| | Osceola County FL Expressway System | | | | |
| | Revenue (Poinciana Parkway Project) | 5.375% | 10/1/47 | 380 | 403 |
| | Palm Beach County FL School Board COP | 5.000% | 8/1/26 | 850 | 976 |
| | Palm Beach County FL School Board COP | 5.000% | 8/1/27 | 175 | 202 |
| | Palm Beach County FL School Board COP | 5.000% | 8/1/31 | 100 | 112 |
| | Palm Beach County FL Solid Waste Authority | | | | |
| | Revenue | 5.000% | 10/1/21 (Prere.) | 5 | 5 |
| | Palm Beach County FL Solid Waste Authority | | | | |
| | Revenue | 5.000% | 10/1/24 | 145 | 156 |
| | Palm Beach County FL Solid Waste Authority | | | | |
| | Revenue | 5.000% | 10/1/31 | 690 | 739 |
| | Reedy Creek FL Improvement District GO | 5.000% | 6/1/38 | 290 | 317 |
| | South Florida Water Management District COP | 5.000% | 10/1/33 | 340 | 377 |
| | Tallahassee FL Energy System Revenue | 5.000% | 10/1/33 | 1,000 | 1,124 |
| | Tampa Bay FL Water Utility System Revenue | 5.000% | 10/1/19 (ETM) | 410 | 421 |
| | Tampa FL Cigarette Tax Allocation Revenue | | | | |
| | (H. Lee Moffitt Cancer Center Project) | 5.250% | 9/1/27 | 635 | 732 |
| | Tampa FL Cigarette Tax Allocation Revenue | | | | |
| | (H. Lee Moffitt Cancer Center Project) | 5.500% | 9/1/30 | 250 | 288 |
| | Tampa-Hillsborough County FL Expressway | | | | |
| | Authority Revenue | 5.000% | 7/1/22 (Prere.) | 210 | 230 |
| | Tampa-Hillsborough County FL Expressway | | | | |
| | Authority Revenue | 5.000% | 7/1/37 | 3,495 | 3,743 |
| | Tampa-Hillsborough County FL Expressway | | | | |
| | Authority Revenue | 4.000% | 7/1/42 | 4,250 | 4,211 |
| | | | | | 137,368 |
| Georgia (1.9%) | | | | |
| | Athens-Clarke County GA Unified Government | | | | |
| | Water & Sewerage Revenue | 5.625% | 1/1/19 (Prere.) | 110 | 111 |
40
| | | | |
| Tax-Exempt Bond Index Fund | | | | |
| |
| |
| |
| | | | Face | Market |
| | | Maturity | Amount | Value • |
| | Coupon | Date | ($000) | ($000) |
| Atlanta GA Airport Passenger Facility Charge | | | | |
| Revenue | 5.000% | 1/1/19 | 120 | 121 |
| Atlanta GA Airport Passenger Facility Charge | | | | |
| Revenue | 5.000% | 1/1/24 | 240 | 248 |
| Atlanta GA Airport Passenger Facility Charge | | | | |
| Revenue | 5.000% | 1/1/29 | 165 | 183 |
| Atlanta GA Water & Wastewater Revenue | 5.250% | 11/1/19 (Prere.) | 780 | 805 |
| Atlanta GA Water & Wastewater Revenue | 5.375% | 11/1/19 (Prere.) | 60 | 62 |
| Atlanta GA Water & Wastewater Revenue | 6.000% | 11/1/19 (Prere.) | 50 | 52 |
| Atlanta GA Water & Wastewater Revenue | 6.000% | 11/1/19 (Prere.) | 245 | 255 |
| Atlanta GA Water & Wastewater Revenue | 6.000% | 11/1/19 (Prere.) | 575 | 598 |
| Atlanta GA Water & Wastewater Revenue | 6.000% | 11/1/19 (Prere.) | 100 | 104 |
| Atlanta GA Water & Wastewater Revenue | 6.250% | 11/1/19 (Prere.) | 1,200 | 1,251 |
| Atlanta GA Water & Wastewater Revenue | 6.250% | 11/1/19 (Prere.) | 1,000 | 1,042 |
| Atlanta GA Water & Wastewater Revenue | 5.250% | 11/1/27 (4) | 150 | 176 |
| Atlanta GA Water & Wastewater Revenue | 5.500% | 11/1/27 (14) | 715 | 838 |
| Atlanta GA Water & Wastewater Revenue | 5.000% | 11/1/28 | 155 | 175 |
| Atlanta GA Water & Wastewater Revenue | 5.000% | 11/1/29 | 190 | 214 |
| Atlanta GA Water & Wastewater Revenue | 5.000% | 11/1/33 | 565 | 628 |
| Atlanta GA Water & Wastewater Revenue | 5.250% | 11/1/34 (4) | 610 | 628 |
| Atlanta GA Water & Wastewater Revenue | 5.000% | 11/1/35 | 230 | 254 |
| Atlanta GA Water & Wastewater Revenue | 5.375% | 11/1/39 (4) | 95 | 98 |
| Atlanta GA Water & Wastewater Revenue | 5.000% | 11/1/40 | 1,305 | 1,431 |
| Atlanta GA Water & Wastewater Revenue | 5.000% | 11/1/43 | 535 | 586 |
| DeKalb County GA School District GO | 4.000% | 10/1/19 | 1,500 | 1,528 |
| DeKalb County GA Water & Sewer Revenue | 5.250% | 10/1/41 | 545 | 582 |
| Georgia GO | 5.000% | 1/1/19 (Prere.) | 350 | 352 |
| Georgia GO | 5.000% | 7/1/19 | 100 | 102 |
| Georgia GO | 5.000% | 7/1/19 | 665 | 678 |
| Georgia GO | 5.000% | 2/1/20 | 2,500 | 2,591 |
| Georgia GO | 5.000% | 9/1/20 | 100 | 105 |
| Georgia GO | 5.000% | 7/1/21 | 3,145 | 3,377 |
| Georgia GO | 5.000% | 7/1/21 | 1,300 | 1,396 |
| Georgia GO | 5.000% | 10/1/21 | 250 | 270 |
| Georgia GO | 5.000% | 2/1/22 | 125 | 136 |
| Georgia GO | 4.000% | 10/1/22 | 2,500 | 2,662 |
| Georgia GO | 4.500% | 11/1/22 | 135 | 144 |
| Georgia GO | 5.000% | 2/1/23 | 6,225 | 6,912 |
| Georgia GO | 4.000% | 1/1/25 | 1,145 | 1,247 |
| Georgia GO | 5.000% | 1/1/25 | 375 | 414 |
| Georgia GO | 5.000% | 12/1/25 | 100 | 116 |
| Georgia GO | 5.000% | 7/1/26 | 800 | 935 |
| Georgia GO | 5.000% | 7/1/27 | 240 | 261 |
| Georgia GO | 5.000% | 7/1/28 | 700 | 822 |
| Georgia GO | 5.000% | 7/1/28 | 105 | 122 |
| Georgia GO | 4.000% | 7/1/34 | 3,325 | 3,477 |
| Georgia Municipal Electric Power Authority | | | | |
| Revenue | 5.000% | 1/1/22 | 730 | 783 |
| Georgia Road & Tollway Authority Revenue | 5.000% | 6/1/19 | 405 | 412 |
| Georgia Road & Tollway Authority Revenue | 5.000% | 6/1/19 (Prere.) | 300 | 305 |
| Georgia Road & Tollway Authority Revenue | 5.000% | 6/1/21 | 1,425 | 1,525 |
| Gwinnett County GA School District GO | 5.000% | 8/1/20 | 3,185 | 3,344 |
| Gwinnett County GA School District GO | 5.000% | 8/1/21 | 1,680 | 1,807 |
| Gwinnett County GA School District GO | 5.000% | 8/1/22 | 1,000 | 1,099 |
41
| | | | |
| Tax-Exempt Bond Index Fund | | | | |
| |
| |
| |
| | | | Face | Market |
| | | Maturity | Amount | Value • |
| | Coupon | Date | ($000) | ($000) |
| Metropolitan Atlanta Rapid Transportation | | | | |
| Authority Georgia Sales Tax Revenue | 5.000% | 7/1/19 (Prere.) | 375 | 383 |
| Metropolitan Atlanta Rapid Transportation | | | | |
| Authority Georgia Sales Tax Revenue | 5.000% | 7/1/19 (14) | 85 | 87 |
| Metropolitan Atlanta Rapid Transportation | | | | |
| Authority Georgia Sales Tax Revenue | 5.250% | 7/1/19 (Prere.) | 1,250 | 1,278 |
| Metropolitan Atlanta Rapid Transportation | | | | |
| Authority Georgia Sales Tax Revenue | 5.000% | 7/1/20 (14) | 1,695 | 1,775 |
| Metropolitan Atlanta Rapid Transportation | | | | |
| Authority Georgia Sales Tax Revenue | 4.000% | 7/1/29 | 2,125 | 2,268 |
| Municipal Electric Authority Georgia Revenue | 5.000% | 1/1/20 | 1,600 | 1,649 |
| Municipal Electric Authority Georgia Revenue | 5.000% | 1/1/26 | 200 | 222 |
| Municipal Electric Authority Georgia Revenue | 5.000% | 1/1/28 | 3,600 | 3,940 |
| Municipal Electric Authority Georgia Revenue | 5.000% | 7/1/60 | 2,395 | 2,403 |
| Municipal Electric Authority Georgia Revenue | 5.000% | 7/1/60 | 2,000 | 2,029 |
| Municipal Electric Authority Georgia Revenue | 5.500% | 7/1/60 | 600 | 622 |
| Municipal Electric Authority Georgia Revenue | | | | |
| (Project One) | 5.000% | 1/1/21 | 2,280 | 2,395 |
| Paulding County GA Water & Sewerage | | | | |
| Revenue | 3.000% | 12/1/48 | 100 | 78 |
| Private Colleges & University Authority of | | | | |
| Georgia Revenue (Emory University) | 5.000% | 9/1/29 | 100 | 102 |
| Private Colleges & University Authority of | | | | |
| Georgia Revenue (Emory University) | 4.000% | 10/1/38 | 2,000 | 2,039 |
| Private Colleges & University Authority of | | | | |
| Georgia Revenue (Emory University) | 5.000% | 10/1/46 | 1,250 | 1,385 |
| Private Colleges & University Authority of | | | | |
| Georgia Revenue (Savannah College of Art | | | | |
| & Design) | 5.000% | 4/1/44 | 575 | 606 |
| Sandy Springs GA Public Facilities Authority | | | | |
| (City Center Project) | 4.000% | 5/1/47 | 190 | 191 |
| | | | | 70,816 |
| Hawaii (1.1%) | | | | |
| Hawaii Airports System Revenue | 5.000% | 7/1/34 | 100 | 104 |
| Hawaii Airports System Revenue | 5.000% | 7/1/39 | 100 | 104 |
| Hawaii GO | 5.000% | 11/1/18 | 625 | 625 |
| Hawaii GO | 5.000% | 11/1/18 | 100 | 100 |
| Hawaii GO | 5.000% | 12/1/18 | 680 | 682 |
| Hawaii GO | 5.000% | 2/1/20 | 2,500 | 2,591 |
| Hawaii GO | 5.000% | 8/1/21 | 3,000 | 3,225 |
| Hawaii GO | 5.000% | 11/1/21 | 125 | 135 |
| Hawaii GO | 5.000% | 12/1/21 (Prere.) | 90 | 97 |
| Hawaii GO | 5.000% | 12/1/21 (Prere.) | 490 | 529 |
| Hawaii GO | 5.000% | 12/1/21 (Prere.) | 460 | 497 |
| Hawaii GO | 5.000% | 12/1/21 (Prere.) | 135 | 146 |
| Hawaii GO | 5.000% | 12/1/21 (Prere.) | 125 | 135 |
| Hawaii GO | 5.000% | 12/1/21 (Prere.) | 65 | 70 |
| Hawaii GO | 5.000% | 12/1/21 (Prere.) | 260 | 282 |
| Hawaii GO | 5.000% | 12/1/21 (Prere.) | 195 | 211 |
| Hawaii GO | 5.000% | 12/1/21 (Prere.) | 100 | 108 |
| Hawaii GO | 5.000% | 8/1/23 (Prere.) | 80 | 89 |
| Hawaii GO | 5.000% | 8/1/23 | 320 | 358 |
| Hawaii GO | 5.000% | 8/1/23 (Prere.) | 40 | 45 |
| Hawaii GO | 5.000% | 10/1/23 | 795 | 891 |
42
| | | | |
| Tax-Exempt Bond Index Fund | | | | |
| |
| |
| |
| | | | Face | Market |
| | | Maturity | Amount | Value • |
| | Coupon | Date | ($000) | ($000) |
| Hawaii GO | 5.000% | 10/1/23 | 1,900 | 2,129 |
| Hawaii GO | 5.000% | 1/1/24 | 5,000 | 5,615 |
| Hawaii GO | 5.000% | 8/1/24 | 265 | 300 |
| Hawaii GO | 5.000% | 10/1/24 | 360 | 409 |
| Hawaii GO | 5.000% | 8/1/25 | 695 | 785 |
| Hawaii GO | 5.000% | 8/1/25 | 865 | 978 |
| Hawaii GO | 5.000% | 1/1/26 | 2,425 | 2,798 |
| Hawaii GO | 5.000% | 10/1/26 | 275 | 316 |
| Hawaii GO | 4.000% | 4/1/28 | 110 | 118 |
| Hawaii GO | 5.000% | 8/1/28 | 70 | 79 |
| Hawaii GO | 5.000% | 10/1/28 | 225 | 259 |
| Hawaii GO | 4.000% | 4/1/29 | 1,750 | 1,846 |
| Hawaii GO | 5.000% | 8/1/29 | 150 | 169 |
| Hawaii GO | 5.000% | 8/1/30 | 45 | 50 |
| Hawaii GO | 5.000% | 8/1/30 | 830 | 929 |
| Hawaii GO | 4.000% | 5/1/31 | 325 | 341 |
| Hawaii GO | 5.000% | 10/1/31 | 390 | 447 |
| Hawaii GO | 4.000% | 5/1/32 | 500 | 520 |
| Hawaii GO | 4.000% | 1/1/34 | 2,675 | 2,760 |
| Hawaii GO | 4.000% | 5/1/36 | 500 | 511 |
| Honolulu HI City & County GO | 5.000% | 11/1/22 (Prere.) | 525 | 579 |
| Honolulu HI City & County GO | 5.000% | 11/1/22 (Prere.) | 300 | 331 |
| Honolulu HI City & County GO | 5.000% | 10/1/23 | 1,225 | 1,372 |
| Honolulu HI City & County Wastewater | | | | |
| System Revenue | 5.250% | 7/1/21 (Prere.) | 250 | 270 |
| Honolulu HI City & County Wastewater | | | | |
| System Revenue | 5.000% | 7/1/22 (Prere.) | 185 | 203 |
| Honolulu HI City & County Wastewater | | | | |
| System Revenue | 4.000% | 7/1/31 | 295 | 308 |
| Honolulu HI City & County Wastewater | | | | |
| System Revenue | 4.000% | 7/1/33 | 575 | 594 |
| Honolulu HI City & County Wastewater | | | | |
| System Revenue | 4.000% | 7/1/38 | 500 | 509 |
| Honolulu HI City & County Wastewater | | | | |
| System Revenue | 5.000% | 7/1/40 | 1,485 | 1,636 |
| Honolulu HI City & County Wastewater | | | | |
| System Revenue | 4.000% | 7/1/42 | 1,000 | 1,001 |
| Honolulu HI City & County Wastewater | | | | |
| System Revenue | 5.000% | 7/1/45 | 355 | 390 |
| | | | | 39,576 |
| Idaho (0.0%) | | | | |
| Idaho Housing & Finance Association RAN | 5.000% | 7/15/26 | 705 | 806 |
| |
| Illinois (5.3%) | | | | |
| Chicago IL Board of Education GO | 5.750% | 4/1/33 | 100 | 113 |
| Chicago IL Board of Education GO | 5.750% | 4/1/34 | 100 | 112 |
| Chicago IL Board of Education GO | 5.750% | 4/1/35 | 350 | 392 |
| Chicago IL Board of Education GO | 6.000% | 4/1/46 | 2,415 | 2,754 |
| Chicago IL GO | 5.000% | 1/1/22 | 125 | 131 |
| Chicago IL GO | 5.000% | 1/1/23 | 35 | 37 |
| Chicago IL GO | 5.000% | 12/1/23 (2) | 90 | 90 |
| Chicago IL GO | 5.000% | 1/1/24 | 715 | 758 |
| Chicago IL GO | 5.000% | 1/1/25 (14) | 305 | 306 |
| Chicago IL GO | 5.000% | 1/1/25 | 3,260 | 3,477 |
43
| | | | |
| Tax-Exempt Bond Index Fund | | | | |
| |
| |
| |
| | | | Face | Market |
| | | Maturity | Amount | Value • |
| | Coupon | Date | ($000) | ($000) |
| Chicago IL GO | 5.000% | 1/1/26 | 495 | 529 |
| Chicago IL GO | 5.000% | 1/1/27 (4) | 200 | 205 |
| Chicago IL GO | 5.000% | 1/1/28 (4) | 100 | 102 |
| Chicago IL GO | 5.250% | 1/1/28 | 160 | 170 |
| Chicago IL GO | 5.000% | 1/1/29 (4) | 100 | 102 |
| Chicago IL GO | 4.750% | 1/1/30 (4) | 515 | 517 |
| Chicago IL GO | 5.625% | 1/1/30 | 400 | 443 |
| Chicago IL GO | 5.625% | 1/1/31 | 200 | 221 |
| Chicago IL GO | 5.000% | 1/1/32 (14) | 335 | 336 |
| Chicago IL GO | 5.500% | 1/1/33 | 510 | 541 |
| Chicago IL GO | 5.750% | 1/1/33 | 515 | 568 |
| Chicago IL GO | 5.500% | 1/1/34 | 150 | 159 |
| Chicago IL GO | 5.500% | 1/1/34 | 310 | 328 |
| Chicago IL GO | 5.000% | 1/1/35 | 700 | 718 |
| Chicago IL GO | 4.750% | 1/1/36 (4) | 175 | 176 |
| Chicago IL GO | 5.000% | 1/1/38 | 155 | 159 |
| Chicago IL GO | 6.000% | 1/1/38 | 3,675 | 4,077 |
| Chicago IL GO | 5.500% | 1/1/39 | 335 | 352 |
| Chicago IL Housing Authority Revenue | 5.000% | 1/1/30 | 1,250 | 1,396 |
| Chicago IL Metropolitan Water Reclamation | | | | |
| District GO | 5.000% | 12/1/18 | 100 | 100 |
| Chicago IL Metropolitan Water Reclamation | | | | |
| District GO | 5.000% | 12/1/24 | 275 | 308 |
| Chicago IL Metropolitan Water Reclamation | | | | |
| District GO | 5.000% | 12/1/25 | 110 | 125 |
| Chicago IL Metropolitan Water Reclamation | | | | |
| District GO | 5.000% | 12/1/26 | 215 | 245 |
| Chicago IL Metropolitan Water Reclamation | | | | |
| District GO | 5.000% | 12/1/27 | 795 | 903 |
| Chicago IL Metropolitan Water Reclamation | | | | |
| District GO | 5.000% | 12/1/30 | 340 | 379 |
| Chicago IL Midway Airport Revenue | 5.000% | 1/1/25 | 75 | 82 |
| Chicago IL Midway Airport Revenue | 5.000% | 1/1/27 | 60 | 66 |
| Chicago IL Midway Airport Revenue | 5.000% | 1/1/41 | 390 | 414 |
| Chicago IL Midway Airport Revenue | 5.000% | 1/1/46 | 485 | 513 |
| Chicago IL O’Hare International Airport | | | | |
| Revenue | 5.500% | 1/1/21 (Prere.) | 100 | 107 |
| Chicago IL O’Hare International Airport | | | | |
| Revenue | 5.625% | 1/1/21 (Prere.) | 1,530 | 1,641 |
| Chicago IL O’Hare International Airport | | | | |
| Revenue | 5.750% | 1/1/21 (Prere.) | 1,845 | 1,984 |
| Chicago IL O’Hare International Airport | | | | |
| Revenue | 6.000% | 1/1/21 (Prere.) | 100 | 108 |
| Chicago IL O’Hare International Airport | | | | |
| Revenue | 6.500% | 1/1/21 (Prere.) | 2,110 | 2,302 |
| Chicago IL O’Hare International Airport | | | | |
| Revenue | 5.000% | 1/1/24 | 185 | 206 |
| Chicago IL O’Hare International Airport | | | | |
| Revenue | 5.000% | 1/1/25 | 175 | 197 |
| Chicago IL O’Hare International Airport | | | | |
| Revenue | 5.000% | 1/1/26 | 100 | 112 |
| Chicago IL O’Hare International Airport | | | | |
| Revenue | 5.000% | 1/1/28 | 85 | 94 |
44
| | | | |
| Tax-Exempt Bond Index Fund | | | | |
| |
| |
| |
| | | | Face | Market |
| | | Maturity | Amount | Value • |
| | Coupon | Date | ($000) | ($000) |
| Chicago IL O’Hare International Airport | | | | |
| Revenue | 5.000% | 1/1/28 | 1,695 | 1,808 |
| Chicago IL O’Hare International Airport | | | | |
| Revenue | 5.000% | 1/1/30 | 200 | 219 |
| Chicago IL O’Hare International Airport | | | | |
| Revenue | 5.000% | 1/1/33 | 500 | 545 |
| Chicago IL O’Hare International Airport | | | | |
| Revenue | 5.000% | 1/1/34 | 500 | 543 |
| Chicago IL O’Hare International Airport | | | | |
| Revenue | 5.000% | 1/1/34 | 605 | 656 |
| Chicago IL O’Hare International Airport | | | | |
| Revenue | 5.000% | 1/1/35 | 50 | 51 |
| Chicago IL O’Hare International Airport | | | | |
| Revenue | 5.625% | 1/1/35 | 585 | 618 |
| Chicago IL O’Hare International Airport | | | | |
| Revenue | 5.000% | 1/1/37 | 400 | 431 |
| Chicago IL O’Hare International Airport | | | | |
| Revenue | 5.000% | 1/1/38 | 240 | 260 |
| Chicago IL O’Hare International Airport | | | | |
| Revenue | 5.750% | 1/1/38 | 2,000 | 2,223 |
| Chicago IL O’Hare International Airport | | | | |
| Revenue | 5.000% | 1/1/39 | 525 | 559 |
| Chicago IL O’Hare International Airport | | | | |
| Revenue | 5.000% | 1/1/39 | 650 | 703 |
| Chicago IL O’Hare International Airport | | | | |
| Revenue | 5.750% | 1/1/39 | 505 | 535 |
| Chicago IL O’Hare International Airport | | | | |
| Revenue | 5.000% | 1/1/44 | 350 | 372 |
| Chicago IL O’Hare International Airport | | | | |
| Revenue | 5.000% | 1/1/46 | 590 | 632 |
| Chicago IL O’Hare International Airport | | | | |
| Revenue | 5.000% | 1/1/47 | 4,030 | 4,328 |
| Chicago IL O’Hare International Airport | | | | |
| Revenue | 5.000% | 1/1/52 | 5,995 | 6,417 |
| Chicago IL Park District GO | 5.000% | 1/1/36 | 1,845 | 1,985 |
| Chicago IL Park District GO | 4.000% | 1/1/41 (15) | 1,000 | 960 |
| Chicago IL Transit Authority Sales Tax Receipts | | | | |
| Revenue | 5.250% | 12/1/49 | 250 | 272 |
| Chicago IL Transit Authority Sales Tax Receipts | | | | |
| Revenue | 5.000% | 12/1/51 (4) | 500 | 524 |
| Chicago IL Transit Authority Sales Tax Receipts | | | | |
| Revenue | 5.000% | 12/1/51 | 500 | 518 |
| Chicago IL Wastewater Transmission Revenue | 5.000% | 1/1/20 | 500 | 514 |
| Chicago IL Wastewater Transmission Revenue | 0.000% | 1/1/28 (14) | 330 | 230 |
| Chicago IL Wastewater Transmission Revenue | 5.000% | 1/1/39 | 150 | 158 |
| Chicago IL Wastewater Transmission Revenue | 5.250% | 1/1/42 (4) | 2,500 | 2,701 |
| Chicago IL Wastewater Transmission Revenue | 5.000% | 1/1/47 | 500 | 522 |
| Chicago IL Water Revenue | 5.250% | 11/1/18 (Prere.) | 350 | 350 |
| Chicago IL Water Revenue | 5.000% | 11/1/29 | 50 | 53 |
| Chicago IL Waterworks Revenue | 4.000% | 11/1/18 | 150 | 150 |
| Chicago IL Waterworks Revenue | 5.000% | 11/1/30 | 250 | 273 |
| Cook County IL Community College District | | | | |
| GO | 5.500% | 12/1/38 | 200 | 208 |
45
| | | | |
| Tax-Exempt Bond Index Fund | | | | |
| |
| |
| |
| | | | Face | Market |
| | | Maturity | Amount | Value • |
| | Coupon | Date | ($000) | ($000) |
| Cook County IL Community College District | | | | |
| GO | 5.000% | 12/1/47 (15) | 500 | 523 |
| Cook County IL GO | 4.000% | 11/15/18 | 300 | 300 |
| Cook County IL GO | 5.000% | 11/15/18 | 605 | 606 |
| Cook County IL GO | 5.000% | 11/15/19 | 115 | 118 |
| Cook County IL GO | 5.000% | 11/15/21 | 125 | 128 |
| Cook County IL GO | 5.250% | 11/15/22 | 360 | 380 |
| Cook County IL GO | 5.000% | 11/15/23 | 335 | 373 |
| Cook County IL GO | 5.000% | 11/15/24 | 430 | 466 |
| Cook County IL GO | 5.250% | 11/15/24 | 200 | 214 |
| Cook County IL GO | 5.000% | 11/15/25 | 295 | 318 |
| Cook County IL GO | 5.250% | 11/15/25 | 100 | 107 |
| Cook County IL GO | 5.000% | 11/15/26 | 135 | 152 |
| Cook County IL GO | 5.000% | 11/15/28 | 85 | 88 |
| Cook County IL GO | 5.250% | 11/15/28 | 1,175 | 1,247 |
| Cook County IL GO | 4.000% | 11/15/29 | 215 | 221 |
| Cook County IL GO | 5.000% | 11/15/31 | 500 | 548 |
| Cook County IL Sales Tax Revenue | 5.000% | 11/15/37 | 375 | 397 |
| Evanston IL GO | 3.500% | 12/1/38 | 645 | 574 |
| Evanston IL GO | 3.500% | 12/1/39 | 755 | 666 |
| Illinois Finance Authority Revenue (DePaul | | | | |
| University) | 6.125% | 4/1/21 (Prere.) | 300 | 327 |
| Illinois Finance Authority Revenue (Illinois | | | | |
| Wesleyan University) | 5.000% | 9/1/46 | 140 | 146 |
| Illinois Finance Authority Revenue (University | | | | |
| of Chicago) | 4.000% | 10/1/32 | 90 | 92 |
| Illinois Finance Authority Revenue (University | | | | |
| of Chicago) | 4.000% | 10/1/33 | 50 | 51 |
| Illinois Finance Authority Revenue (University | | | | |
| of Chicago) | 4.000% | 10/1/49 | 235 | 226 |
| Illinois Finance Authority Revenue (University | | | | |
| of Chicago) | 5.000% | 10/1/51 | 75 | 79 |
| Illinois GO | 5.000% | 11/1/18 | 115 | 115 |
| Illinois GO | 5.000% | 2/1/19 | 1,705 | 1,715 |
| Illinois GO | 5.000% | 6/1/19 | 1,000 | 1,013 |
| Illinois GO | 5.000% | 7/1/19 | 5,000 | 5,075 |
| Illinois GO | 5.000% | 8/1/19 | 4,120 | 4,189 |
| Illinois GO | 4.000% | 9/1/19 | 25 | 25 |
| Illinois GO | 5.000% | 11/1/19 | 5,000 | 5,109 |
| Illinois GO | 4.000% | 2/1/20 | 100 | 101 |
| Illinois GO | 5.000% | 2/1/20 | 2,865 | 2,932 |
| Illinois GO | 5.000% | 7/1/20 | 125 | 129 |
| Illinois GO | 5.000% | 8/1/20 (4) | 650 | 674 |
| Illinois GO | 4.000% | 9/1/20 | 135 | 137 |
| Illinois GO | 5.000% | 11/1/20 | 1,675 | 1,734 |
| Illinois GO | 4.000% | 1/1/21 | 310 | 312 |
| Illinois GO | 5.000% | 1/1/21 | 100 | 103 |
| Illinois GO | 5.250% | 1/1/21 | 275 | 284 |
| Illinois GO | 4.000% | 2/1/21 | 100 | 101 |
| Illinois GO | 5.000% | 7/1/21 | 375 | 388 |
| Illinois GO | 5.000% | 8/1/21 | 1,830 | 1,892 |
| Illinois GO | 5.000% | 11/1/21 | 2,500 | 2,591 |
| Illinois GO | 5.000% | 1/1/22 | 800 | 814 |
| Illinois GO | 5.000% | 2/1/22 | 1,050 | 1,085 |
46
| | | | |
| Tax-Exempt Bond Index Fund | | | | |
| |
| |
| |
| | | | Face | Market |
| | | Maturity | Amount | Value • |
| | Coupon | Date | ($000) | ($000) |
| Illinois GO | 5.000% | 2/1/22 | 240 | 248 |
| Illinois GO | 5.000% | 5/1/22 | 55 | 57 |
| Illinois GO | 5.000% | 5/1/22 | 2,500 | 2,590 |
| Illinois GO | 5.250% | 5/1/22 | 3,830 | 3,999 |
| Illinois GO | 5.000% | 8/1/22 (4) | 200 | 213 |
| Illinois GO | 4.000% | 9/1/22 | 115 | 115 |
| Illinois GO | 4.000% | 9/1/22 | 200 | 200 |
| Illinois GO | 5.000% | 2/1/23 | 200 | 208 |
| Illinois GO | 5.000% | 2/1/23 | 220 | 229 |
| Illinois GO | 5.000% | 5/1/23 | 225 | 234 |
| Illinois GO | 5.000% | 7/1/23 | 580 | 604 |
| Illinois GO | 5.000% | 11/1/23 | 2,500 | 2,606 |
| Illinois GO | 5.000% | 12/1/23 | 2,000 | 2,086 |
| Illinois GO | 5.000% | 1/1/24 | 290 | 294 |
| Illinois GO | 5.000% | 2/1/24 | 125 | 130 |
| Illinois GO | 5.500% | 7/1/24 | 600 | 646 |
| Illinois GO | 5.000% | 11/1/24 | 3,000 | 3,121 |
| Illinois GO | 5.000% | 3/1/25 | 390 | 402 |
| Illinois GO | 5.500% | 7/1/25 | 470 | 504 |
| Illinois GO | 4.000% | 8/1/25 | 580 | 570 |
| Illinois GO | 5.000% | 8/1/25 | 60 | 62 |
| Illinois GO | 5.000% | 11/1/25 | 5,500 | 5,720 |
| Illinois GO | 5.000% | 5/1/26 | 150 | 155 |
| Illinois GO | 5.500% | 7/1/26 | 470 | 502 |
| Illinois GO | 5.000% | 11/1/26 | 5,000 | 5,194 |
| Illinois GO | 5.000% | 2/1/27 | 50 | 51 |
| Illinois GO | 5.000% | 5/1/27 | 250 | 257 |
| Illinois GO | 5.000% | 10/1/27 | 650 | 675 |
| Illinois GO | 5.000% | 11/1/27 | 1,000 | 1,037 |
| Illinois GO | 5.000% | 10/1/28 | 1,000 | 1,033 |
| Illinois GO | 5.000% | 11/1/28 | 6,555 | 6,751 |
| Illinois GO | 5.250% | 2/1/29 | 2,500 | 2,604 |
| Illinois GO | 5.000% | 5/1/29 | 75 | 77 |
| Illinois GO | 5.250% | 7/1/29 | 295 | 308 |
| Illinois GO | 5.000% | 10/1/29 | 1,000 | 1,026 |
| Illinois GO | 5.000% | 11/1/29 | 2,500 | 2,558 |
| Illinois GO | 4.000% | 2/1/31 (4) | 250 | 251 |
| Illinois GO | 5.250% | 2/1/31 | 100 | 104 |
| Illinois GO | 5.000% | 3/1/32 | 50 | 51 |
| Illinois GO | 4.000% | 12/1/33 | 925 | 834 |
| Illinois GO | 5.000% | 1/1/34 | 665 | 674 |
| Illinois GO | 5.000% | 5/1/35 | 150 | 152 |
| Illinois GO | 5.000% | 12/1/35 | 1,500 | 1,522 |
| Illinois GO | 5.000% | 5/1/36 | 365 | 368 |
| Illinois GO | 5.500% | 7/1/38 | 1,125 | 1,176 |
| Illinois GO | 5.000% | 2/1/39 | 285 | 287 |
| Illinois GO | 5.000% | 5/1/39 | 2,000 | 2,015 |
| Illinois GO | 5.000% | 5/1/39 | 555 | 557 |
| Illinois GO | 5.000% | 1/1/41 | 100 | 100 |
| Illinois GO | 4.000% | 6/1/41 | 60 | 51 |
| Illinois Municipal Electric Agency Power Supply | | | | |
| System Revenue | 5.000% | 2/1/22 | 100 | 108 |
| Illinois Municipal Electric Agency Power Supply | | | | |
| System Revenue | 5.000% | 2/1/23 | 230 | 252 |
47
| | | | |
| Tax-Exempt Bond Index Fund | | | | |
| |
| |
| |
| | | | Face | Market |
| | | Maturity | Amount | Value • |
| | Coupon | Date | ($000) | ($000) |
| Illinois Municipal Electric Agency Power Supply | | | | |
| System Revenue | 5.000% | 2/1/29 | 40 | 44 |
| Illinois Municipal Electric Agency Power Supply | | | | |
| System Revenue | 5.000% | 2/1/31 | 1,000 | 1,105 |
| Illinois Municipal Electric Agency Power Supply | | | | |
| System Revenue | 4.000% | 2/1/33 | 250 | 255 |
| Illinois Regional Transportation Authority | | | | |
| Revenue | 5.750% | 6/1/21 (4) | 120 | 130 |
| Illinois Regional Transportation Authority | | | | |
| Revenue | 6.500% | 7/1/26 (14) | 170 | 207 |
| Illinois Regional Transportation Authority | | | | |
| Revenue | 5.750% | 6/1/34 (4) | 175 | 214 |
| Illinois Sales Tax Revenue | 4.750% | 6/15/19 (Prere.) | 225 | 229 |
| Illinois Sales Tax Revenue | 5.250% | 6/15/19 (Prere.) | 160 | 163 |
| Illinois Sales Tax Revenue | 5.000% | 6/15/20 | 270 | 280 |
| Illinois Sales Tax Revenue | 5.000% | 6/15/20 | 250 | 259 |
| Illinois Sales Tax Revenue | 4.000% | 6/15/21 | 350 | 353 |
| Illinois Sales Tax Revenue | 5.000% | 6/15/21 | 175 | 185 |
| Illinois Sales Tax Revenue | 5.000% | 6/15/22 | 625 | 669 |
| Illinois Sales Tax Revenue | 5.000% | 6/15/22 | 210 | 225 |
| Illinois Sales Tax Revenue | 5.000% | 6/15/24 | 185 | 200 |
| Illinois Sales Tax Revenue | 5.000% | 6/15/25 | 100 | 108 |
| Illinois Sales Tax Revenue | 5.000% | 6/15/26 | 1,510 | 1,619 |
| Illinois Sports Facility Authority Revenue | 0.000% | 6/15/26 (2) | 245 | 176 |
| Illinois Sports Facility Authority Revenue | 5.000% | 6/15/27 (4) | 990 | 1,065 |
| Illinois Toll Highway Authority Revenue | 5.000% | 12/1/18 | 100 | 100 |
| Illinois Toll Highway Authority Revenue | 5.000% | 1/1/21 | 100 | 106 |
| Illinois Toll Highway Authority Revenue | 5.000% | 12/1/21 | 150 | 162 |
| Illinois Toll Highway Authority Revenue | 5.000% | 12/1/22 | 2,000 | 2,198 |
| Illinois Toll Highway Authority Revenue | 5.000% | 1/1/24 | 100 | 112 |
| Illinois Toll Highway Authority Revenue | 5.000% | 1/1/29 | 325 | 335 |
| Illinois Toll Highway Authority Revenue | 4.000% | 12/1/31 | 185 | 189 |
| Illinois Toll Highway Authority Revenue | 5.000% | 12/1/32 | 675 | 744 |
| Illinois Toll Highway Authority Revenue | 5.000% | 1/1/35 | 1,600 | 1,775 |
| Illinois Toll Highway Authority Revenue | 5.000% | 1/1/36 | 750 | 815 |
| Illinois Toll Highway Authority Revenue | 5.000% | 1/1/36 | 360 | 390 |
| Illinois Toll Highway Authority Revenue | 5.000% | 1/1/36 | 1,800 | 1,988 |
| Illinois Toll Highway Authority Revenue | 5.000% | 1/1/37 | 375 | 406 |
| Illinois Toll Highway Authority Revenue | 5.000% | 1/1/37 | 1,000 | 1,085 |
| Illinois Toll Highway Authority Revenue | 5.000% | 1/1/37 | 120 | 129 |
| Illinois Toll Highway Authority Revenue | 5.000% | 1/1/38 | 2,245 | 2,399 |
| Illinois Toll Highway Authority Revenue | 5.000% | 1/1/38 | 1,000 | 1,087 |
| Illinois Toll Highway Authority Revenue | 5.000% | 1/1/39 | 235 | 254 |
| Illinois Toll Highway Authority Revenue | 5.000% | 1/1/40 | 3,180 | 3,428 |
| Illinois Toll Highway Authority Revenue | 5.000% | 1/1/40 | 1,050 | 1,141 |
| Metropolitan Pier & Exposition Authority | | | | |
| Illinois Dedicated Sales Tax Revenue | 0.000% | 6/15/27 (4) | 755 | 527 |
| Metropolitan Pier & Exposition Authority | | | | |
| Illinois Dedicated Sales Tax Revenue | 0.000% | 6/15/28 (14) | 205 | 133 |
| Metropolitan Pier & Exposition Authority | | | | |
| Illinois Dedicated Sales Tax Revenue | 0.000% | 12/15/29 (14) | 70 | 42 |
| Metropolitan Pier & Exposition Authority | | | | |
| Illinois Dedicated Sales Tax Revenue | 0.000% | 6/15/30 (4) | 150 | 90 |
48
| | | | |
| Tax-Exempt Bond Index Fund | | | | |
| |
| |
| |
| | | | Face | Market |
| | | Maturity | Amount | Value • |
| | Coupon | Date | ($000) | ($000) |
| Metropolitan Pier & Exposition Authority | | | | |
| Illinois Dedicated Sales Tax Revenue | 0.000% | 6/15/33 (14) | 165 | 81 |
| Metropolitan Pier & Exposition Authority | | | | |
| Illinois Dedicated Sales Tax Revenue | 0.000% | 12/15/34 (14) | 410 | 185 |
| Metropolitan Pier & Exposition Authority | | | | |
| Illinois Dedicated Sales Tax Revenue | 0.000% | 6/15/36 (14) | 2,270 | 935 |
| Metropolitan Pier & Exposition Authority | | | | |
| Illinois Dedicated Sales Tax Revenue | 0.000% | 6/15/44 (4) | 520 | 148 |
| Metropolitan Pier & Exposition Authority | | | | |
| Illinois Dedicated Sales Tax Revenue | 0.000% | 6/15/46 (4) | 615 | 158 |
| Metropolitan Pier & Exposition Authority | | | | |
| Illinois Dedicated Sales Tax Revenue | 0.000% | 6/15/47 (4) | 120 | 29 |
| Metropolitan Pier & Exposition Authority | | | | |
| Illinois Dedicated Sales Tax Revenue | | | | |
| (McCormick Place Expansion Project) | 0.000% | 6/15/31 (14) | 290 | 159 |
| Metropolitan Pier & Exposition Authority | | | | |
| Illinois Dedicated Sales Tax Revenue | | | | |
| (McCormick Place Expansion Project) | 0.000% | 6/15/37 (14) | 290 | 113 |
| Metropolitan Pier & Exposition Authority | | | | |
| Illinois Dedicated Sales Tax Revenue | | | | |
| (McCormick Place Expansion Project) | 0.000% | 12/15/56 (4) | 5,500 | 819 |
| Metropolitan Pier & Exposition Authority | | | | |
| IllinoisDedicated Sales Tax Revenue | | | | |
| (McCormick Place Expansion Project) | 0.000% | 6/15/20 (14) | 290 | 275 |
| Metropolitan Pier & Exposition Authority | | | | |
| IllinoisDedicated Sales Tax Revenue | | | | |
| (McCormick Place Expansion Project) | 5.650% | 6/15/22 (ETM) | 30 | 33 |
| Metropolitan Pier & Exposition Authority | | | | |
| IllinoisDedicated Sales Tax Revenue | | | | |
| (McCormick Place Expansion Project) | 5.650% | 6/15/22 (14) | 265 | 287 |
| Metropolitan Pier & Exposition Authority | | | | |
| IllinoisDedicated Sales Tax Revenue | | | | |
| (McCormick Place Expansion Project) | 0.000% | 12/15/23 (ETM) | 5 | 4 |
| Metropolitan Pier & Exposition Authority | | | | |
| IllinoisDedicated Sales Tax Revenue | | | | |
| (McCormick Place Expansion Project) | 0.000% | 12/15/23 (14) | 235 | 192 |
| Metropolitan Pier & Exposition Authority | | | | |
| IllinoisDedicated Sales Tax Revenue | | | | |
| (McCormick Place Expansion Project) | 0.000% | 12/15/30 (14) | 250 | 141 |
| Metropolitan Pier & Exposition Authority | | | | |
| IllinoisDedicated Sales Tax Revenue | | | | |
| (McCormick Place Expansion Project) | 0.000% | 6/15/32 (14) | 430 | 223 |
| Metropolitan Pier & Exposition Authority | | | | |
| IllinoisDedicated Sales Tax Revenue | | | | |
| (McCormick Place Expansion Project) | 0.000% | 6/15/34 (14) | 250 | 116 |
| Metropolitan Pier & Exposition Authority | | | | |
| IllinoisDedicated Sales Tax Revenue | | | | |
| (McCormick Place Expansion Project) | 0.000% | 6/15/43 (4) | 320 | 96 |
| Metropolitan Pier & Exposition Authority | | | | |
| IllinoisDedicated Sales Tax Revenue | | | | |
| (McCormick Place Expansion Project) | 0.000% | 6/15/45 (4) | 340 | 92 |
| Metropolitan Pier & Exposition Authority | | | | |
| IllinoisDedicated Sales Tax Revenue | | | | |
| (McCormick Place Expansion Project) | 5.000% | 6/15/50 (4) | 350 | 359 |
49
| | | | |
| Tax-Exempt Bond Index Fund | | | | |
| |
| |
| |
| | | | Face | Market |
| | | Maturity | Amount | Value • |
| | Coupon | Date | ($000) | ($000) |
| Metropolitan Pier & Exposition Authority | | | | |
| Illinois Dedicated Sales Tax Revenue | | | | |
| (McCormick Place Expansion Project) | 0.000% | 12/15/51 (4) | 570 | 109 |
| Northern Illinois Municipal Power Agency | | | | |
| Project Revenue | 4.000% | 12/1/32 | 175 | 176 |
| Northern Illinois Municipal Power Agency | | | | |
| Project Revenue | 4.000% | 12/1/35 | 185 | 184 |
| Northern Illinois Municipal Power Agency | | | | |
| Project Revenue | 5.000% | 12/1/41 | 1,565 | 1,664 |
| Sales Tax Securitization Corp. IL Revenue | 5.000% | 1/1/40 | 2,350 | 2,517 |
| Sales Tax Securitization Corp. IL Revenue | 5.000% | 1/1/48 | 2,615 | 2,789 |
| Springfield IL Electric Revenue | 5.000% | 3/1/33 | 500 | 541 |
| Will County IL Community High School | | | | |
| District No. 210 (Lincoln-Way) GO | 0.000% | 1/1/31 | 190 | 105 |
| Will County IL Community High School | | | | |
| District No. 210 (Lincoln-Way) GO | 0.000% | 1/1/32 | 90 | 47 |
| Will County IL Community High School | | | | |
| District No. 210 (Lincoln-Way) GO | 0.000% | 1/1/33 | 300 | 148 |
| Will County IL GO | 5.000% | 11/15/45 | 2,000 | 2,151 |
| | | | | 195,903 |
| Indiana (0.4%) | | | | |
| Carmel IN Redevelopment Authority | 4.000% | 2/1/38 | 675 | 682 |
| Indiana Finance Authority Highway Revenue | 5.000% | 12/1/21 | 140 | 151 |
| Indiana Finance Authority Highway Revenue | 5.000% | 12/1/23 | 385 | 432 |
| Indiana Finance Authority Highway Revenue | 5.000% | 12/1/25 | 980 | 1,133 |
| Indiana Finance Authority Highway Revenue | 5.000% | 6/1/29 | 350 | 414 |
| Indiana Finance Authority Revenue | 5.000% | 2/1/20 | 105 | 109 |
| Indiana Finance Authority Revenue | 5.000% | 2/1/24 | 210 | 237 |
| Indiana Finance Authority Revenue | 5.000% | 2/1/25 | 100 | 114 |
| Indiana Finance Authority Revenue (Stadium | | | | |
| Project) | 5.250% | 2/1/33 | 175 | 199 |
| Indiana Finance Authority Revenue (Stadium | | | | |
| Project) | 5.250% | 2/1/34 | 210 | 239 |
| Indiana Finance Authority Revenue (Stadium | | | | |
| Project) | 5.250% | 2/1/37 | 320 | 362 |
| Indiana Finance Authority Revenue (State | | | | |
| Revolving Fund) | 5.000% | 2/1/21 (Prere.) | 680 | 723 |
| Indiana Finance Authority Revenue (State | | | | |
| Revolving Fund) | 5.000% | 2/1/29 | 810 | 947 |
| Indiana Finance Authority Wastewater Utility | | | | |
| Revenue (CWA Authority Project) | 5.250% | 10/1/31 | 2,030 | 2,187 |
| Indiana Finance Authority Wastewater Utility | | | | |
| Revenue (CWA Authority Project) | 5.000% | 10/1/41 | 250 | 265 |
| Indiana Finance Authority Wastewater Utility | | | | |
| Revenue (CWA Authority Project) | 5.000% | 10/1/41 (14) | 500 | 545 |
| Indiana Municipal Power Agency Revenue | 6.000% | 1/1/19 (Prere.) | 100 | 101 |
| Indiana Municipal Power Agency Revenue | 4.000% | 1/1/42 | 110 | 110 |
| Indiana Municipal Power Agency Revenue | 5.000% | 1/1/42 | 1,715 | 1,874 |
| Indianapolis IN Local Public Improvement | | | | |
| Bond Bank Revenue (PILOT Infrastructure | | | | |
| Project) | 5.000% | 1/1/20 (Prere.) | 1,600 | 1,653 |
| Indianapolis IN Local Public Improvement | | | | |
| Bond Bank Revenue (Waterworks Project) | 5.250% | 1/1/19 (Prere.) | 10 | 10 |
50
| | | | |
| Tax-Exempt Bond Index Fund | | | | |
| |
| |
| |
| | | | Face | Market |
| | | Maturity | Amount | Value • |
| | Coupon | Date | ($000) | ($000) |
| Indianapolis IN Local Public Improvement | | | | |
| Bond Bank Revenue (Waterworks Project) | 5.500% | 1/1/19 (Prere.) | 30 | 30 |
| Indianapolis IN Local Public Improvement | | | | |
| Bond Bank Revenue (Waterworks Project) | 5.750% | 1/1/19 (Prere.) | 20 | 20 |
| Indianapolis IN Local Public Improvement | | | | |
| Bond Bank Revenue (Waterworks Project) | 5.250% | 1/1/24 (14) | 1,355 | 1,530 |
| Indianapolis IN Local Public Improvement | | | | |
| Bond Bank Revenue (Waterworks Project) | 5.250% | 1/1/29 (12) | 50 | 50 |
| Indianapolis IN Local Public Improvement | | | | |
| Bond Bank Revenue (Waterworks Project) | 5.500% | 1/1/29 | 120 | 121 |
| Indianapolis IN Local Public Improvement | | | | |
| Bond Bank Revenue (Waterworks Project) | 5.500% | 1/1/38 (12) | 1,000 | 1,006 |
| Indianapolis IN Local Public Improvement | | | | |
| Bond Bank Revenue (Waterworks Project) | 5.750% | 1/1/38 | 120 | 121 |
| Lake Central IN Multi-District School Building | | | | |
| Corp. Revenue | 5.000% | 1/15/30 | 320 | 348 |
| | | | | 15,713 |
| Iowa (0.2%) | | | | |
| Des Moines IA Stormwater Utility Special | | | | |
| Assessment Revenue | 3.250% | 6/1/34 | 1,990 | 1,838 |
| Iowa Finance Authority Revenue | 5.000% | 8/1/20 | 395 | 414 |
| Iowa Higher Education Loan Authority | | | | |
| Revenue Private College Facility (Grinnell | | | | |
| College Project) | 5.000% | 12/1/46 | 3,000 | 3,323 |
| Iowa Special Obligation Revenue | 4.000% | 6/1/26 | 240 | 261 |
| Iowa Special Obligation Revenue | 5.000% | 6/1/27 | 125 | 143 |
| Iowa Special Obligation Revenue | 5.000% | 6/1/28 | 625 | 714 |
| Iowa Special Obligation Revenue (Ijobs | | | | |
| Program) | 5.000% | 6/1/19 (Prere.) | 105 | 107 |
| Iowa Special Obligation Revenue (Ijobs | | | | |
| Program) | 5.000% | 6/1/19 (Prere.) | 555 | 565 |
| | | | | 7,365 |
| Kansas (0.4%) | | | | |
| Geary County KS Unified School District | | | | |
| No. 475 GO | 4.000% | 9/1/43 | 2,000 | 2,002 |
| Kansas Department of Transportation Highway | | | | |
| Revenue | 5.500% | 3/1/19 (4) | 350 | 354 |
| Kansas Department of Transportation Highway | | | | |
| Revenue | 5.000% | 9/1/20 | 250 | 263 |
| Kansas Department of Transportation Highway | | | | |
| Revenue | 5.000% | 9/1/21 | 1,200 | 1,293 |
| Kansas Department of Transportation Highway | | | | |
| Revenue | 5.000% | 9/1/24 | 640 | 728 |
| Kansas Department of Transportation Highway | | | | |
| Revenue | 5.000% | 9/1/25 | 260 | 300 |
| Kansas Department of Transportation Highway | | | | |
| Revenue | 5.000% | 9/1/25 | 185 | 210 |
| Kansas Department of Transportation Highway | | | | |
| Revenue | 5.000% | 9/1/26 | 320 | 368 |
| Kansas Department of Transportation Highway | | | | |
| Revenue | 5.000% | 9/1/27 | 655 | 752 |
| Kansas Department of Transportation Highway | | | | |
| Revenue | 5.000% | 9/1/30 | 750 | 853 |
51
| | | | |
| Tax-Exempt Bond Index Fund | | | | |
| |
| |
| |
| | | | Face | Market |
| | | Maturity | Amount | Value • |
| | Coupon | Date | ($000) | ($000) |
| Kansas Department of Transportation Highway | | | | |
| Revenue | 5.000% | 9/1/34 | 220 | 247 |
| Kansas Development Finance Authority | | | | |
| Revenue (Kansas Department of Health & | | | | |
| Environment) | 5.000% | 3/1/21 | 545 | 566 |
| Sedgwick County KS Unified School District | | | | |
| No. 266 (Maize) GO | 5.000% | 9/1/25 | 1,790 | 2,024 |
| Seward County KS Unified School District | | | | |
| No. 480 GO | 5.000% | 9/1/22 (Prere.) | 410 | 450 |
| Seward County KS Unified School District | | | | |
| No. 480 GO | 5.000% | 9/1/29 | 1,000 | 1,119 |
| Seward County KS Unified School District | | | | |
| No. 480 GO | 5.000% | 9/1/39 | 90 | 98 |
| Wyandotte County KS Unified School District | | | | |
| No. 500 GO | 4.125% | 9/1/37 | 765 | 787 |
| Wyandotte County/Kansas City KS Unified | | | | |
| Government Utility System Revenue | 5.000% | 9/1/32 | 750 | 811 |
| Wyandotte County/Kansas City KS Unified | | | | |
| Government Utility System Revenue | 4.250% | 9/1/39 | 525 | 533 |
| Wyandotte County/Kansas City KS Unified | | | | |
| Government Utility System Revenue | 5.000% | 9/1/40 | 75 | 82 |
| | | | | 13,840 |
| Kentucky (0.9%) | | | | |
| Kentucky Asset/Liability Commission Agency | | | | |
| Fund Revenue (Federal Highway Trust) | 5.250% | 9/1/19 (14) | 300 | 308 |
| Kentucky Asset/Liability Commission Agency | | | | |
| Fund Revenue (Federal Highway Trust) | 5.250% | 9/1/25 | 295 | 328 |
| Kentucky Asset/Liability Commission Agency | | | | |
| Fund Revenue (Federal Highway Trust) | 5.000% | 9/1/26 | 700 | 781 |
| Kentucky Bond Development Corp. Revenue | | | | |
| (Lexington Center Corporation Project) | 4.000% | 9/1/48 | 6,000 | 5,631 |
| Kentucky Bond Development Corp. Transient | | | | |
| Room Tax Revenue (Lexington Center | | | | |
| Corporation Project) | 5.000% | 9/1/48 | 2,000 | 2,153 |
| Kentucky Municipal Power Agency Power | | | | |
| System Revenue | 4.000% | 9/1/39 (14) | 135 | 133 |
| Kentucky Municipal Power Agency Power | | | | |
| System Revenue | 5.000% | 9/1/42 (14) | 150 | 162 |
| Kentucky Property & Building Commission | | | | |
| Revenue | 5.000% | 11/1/18 (Prere.) | 120 | 120 |
| Kentucky Property & Building Commission | | | | |
| Revenue | 5.000% | 11/1/18 | 500 | 500 |
| Kentucky Property & Building Commission | | | | |
| Revenue | 5.375% | 11/1/18 (Prere.) | 160 | 160 |
| Kentucky Property & Building Commission | | | | |
| Revenue | 5.500% | 11/1/18 (Prere.) | 320 | 320 |
| Kentucky Property & Building Commission | | | | |
| Revenue | 5.500% | 11/1/18 (Prere.) | 30 | 30 |
| Kentucky Property & Building Commission | | | | |
| Revenue | 5.250% | 2/1/19 (Prere.) | 230 | 232 |
| Kentucky Property & Building Commission | | | | |
| Revenue | 5.250% | 2/1/19 (Prere.) | 15 | 15 |
| Kentucky Property & Building Commission | | | | |
| Revenue | 5.250% | 2/1/19 (Prere.) | 800 | 807 |
52
| | | | |
| Tax-Exempt Bond Index Fund | | | | |
| |
| |
| |
| | | | Face | Market |
| | | Maturity | Amount | Value • |
| | Coupon | Date | ($000) | ($000) |
| Kentucky Property & Building Commission | | | | |
| Revenue | 5.000% | 8/1/19 | 500 | 510 |
| Kentucky Property & Building Commission | | | | |
| Revenue | 5.000% | 8/1/19 | 1,275 | 1,301 |
| Kentucky Property & Building Commission | | | | |
| Revenue | 5.000% | 8/1/21 | 170 | 177 |
| Kentucky Property & Building Commission | | | | |
| Revenue | 5.000% | 8/1/22 | 600 | 650 |
| Kentucky Property & Building Commission | | | | |
| Revenue | 5.000% | 11/1/22 | 1,800 | 1,952 |
| Kentucky Property & Building Commission | | | | |
| Revenue | 5.000% | 8/1/23 | 770 | 845 |
| Kentucky Property & Building Commission | | | | |
| Revenue | 5.000% | 8/1/24 | 100 | 111 |
| Kentucky Property & Building Commission | | | | |
| Revenue | 5.000% | 5/1/29 | 750 | 830 |
| Kentucky Property & Building Commission | | | | |
| Revenue | 5.000% | 5/1/37 | 2,000 | 2,167 |
| Kentucky Public Transportation Infrastructure | | | | |
| Authority Toll Revenue (Downtown Crossing | | | | |
| Project) BAN | 6.000% | 7/1/53 | 200 | 217 |
| Kentucky Turnpike Authority Economic | | | | |
| Development Road Revenue (Revitalization | | | | |
| Project) | 5.000% | 7/1/27 | 525 | 599 |
| Louisville & Jefferson County KY | | | | |
| Metropolitan Sewer & Drain System Revenue | 5.000% | 5/15/30 | 6,250 | 6,691 |
| Louisville & Jefferson County KY Metropolitan | | | | |
| Sewer & Drain System Revenue | 5.000% | 5/15/34 | 3,195 | 3,412 |
| Louisville & Jefferson County KY Metropolitan | | | | |
| Sewer & Drain System Revenue | 3.000% | 5/15/46 | 610 | 495 |
| Owensboro KY Electric Light & Power System | | | | |
| Revenue | 5.000% | 1/1/23 (4) | 2,300 | 2,370 |
| | | | | 34,007 |
| Louisiana (0.5%) | | | | |
| East Baton Rouge Parish LA Sewer | | | | |
| Commission Revenue | 5.250% | 2/1/19 (Prere.) | 275 | 277 |
| East Baton Rouge Parish LA Sewer | | | | |
| Commission Revenue | 5.250% | 2/1/19 (Prere.) | 55 | 55 |
| East Baton Rouge Parish LA Sewer | | | | |
| Commission Revenue | 5.000% | 2/1/39 | 100 | 110 |
| Louisiana Citizens Property Insurance Corp. | | | | |
| Assessment Revenue | 5.000% | 6/1/20 | 100 | 104 |
| Louisiana Citizens Property Insurance Corp. | | | | |
| Assessment Revenue | 5.000% | 6/1/22 (4) | 130 | 142 |
| Louisiana Citizens Property Insurance Corp. | | | | |
| Assessment Revenue | 5.000% | 6/1/23 | 625 | 691 |
| Louisiana Citizens Property Insurance Corp. | | | | |
| Assessment Revenue | 5.000% | 6/1/26 | 620 | 708 |
| Louisiana Gasoline & Fuel Tax Revenue | 5.000% | 5/1/20 (Prere.) | 855 | 891 |
| Louisiana Gasoline & Fuel Tax Revenue | 5.000% | 5/1/22 (Prere.) | 155 | 169 |
| Louisiana Gasoline & Fuel Tax Revenue | 5.000% | 5/1/22 | 2,280 | 2,485 |
| Louisiana Gasoline & Fuel Tax Revenue | 5.000% | 5/1/23 | 420 | 458 |
| Louisiana Gasoline & Fuel Tax Revenue | 5.000% | 5/1/26 | 1,305 | 1,413 |
| Louisiana Gasoline & Fuel Tax Revenue | 5.000% | 5/1/36 | 1,095 | 1,210 |
53
| | | | |
| Tax-Exempt Bond Index Fund | | | | |
| |
| |
| |
| | | | Face | Market |
| | | Maturity | Amount | Value • |
| | Coupon | Date | ($000) | ($000) |
| Louisiana Gasoline & Fuel Tax Revenue | 4.500% | 5/1/39 | 2,325 | 2,407 |
| Louisiana Gasoline & Fuel Tax Revenue | 5.000% | 5/1/41 | 160 | 175 |
| Louisiana Gasoline & Fuel Tax Revenue | 4.000% | 5/1/45 | 1,000 | 995 |
| Louisiana GO | 5.000% | 7/15/20 | 515 | 539 |
| Louisiana GO | 5.000% | 7/15/23 | 2,040 | 2,234 |
| Louisiana GO | 5.000% | 7/15/24 | 475 | 520 |
| Louisiana GO | 5.000% | 8/1/25 | 50 | 57 |
| Louisiana GO | 5.000% | 8/1/27 | 400 | 456 |
| Louisiana GO | 4.000% | 5/15/29 | 610 | 633 |
| Louisiana Local Government Environmental | | | | |
| Facilities & Community Development | | | | |
| Authority Revenue (EastBaton Rouge | | | | |
| Sewerage Commission Projects) | 5.000% | 2/1/43 | 100 | 107 |
| Louisiana Local Government Environmental | | | | |
| Facilities & Community Development | | | | |
| Authority Revenue (EastBaton Rouge | | | | |
| Sewerage Commission Projects) | 5.000% | 2/1/44 | 400 | 433 |
| Louisiana Public Facilities Authority Lease | | | | |
| Revenue | 5.000% | 7/1/51 | 150 | 158 |
| Louisiana Public Facilities Authority Lease | | | | |
| Revenue | 4.000% | 1/1/56 | 100 | 96 |
| Louisiana Public Facilities Authority Lease | | | | |
| Revenue | 5.000% | 7/1/56 | 2,290 | 2,386 |
| Louisiana Public Facilities Authority Revenue | | | | |
| (Loyola University) | 5.000% | 10/1/41 | 315 | 320 |
| | | | | 20,229 |
| Maine (0.0%) | | | | |
| Maine GO | 5.000% | 6/1/21 | 500 | 535 |
| Maine Turnpike Authority Revenue | 5.000% | 7/1/47 | 1,000 | 1,109 |
| | | | | 1,644 |
| Maryland (3.0%) | | | | |
| Anne Arundel County MD GO | 4.750% | 4/1/19 (Prere.) | 100 | 101 |
| Baltimore County MD GO | 4.000% | 3/1/48 | 3,000 | 3,011 |
| Baltimore MD Project Revenue | 5.000% | 7/1/38 | 60 | 66 |
| Baltimore MD Project Revenue | 5.000% | 7/1/38 | 810 | 886 |
| Baltimore MD Project Revenue | 5.000% | 7/1/41 | 660 | 701 |
| Baltimore MD Project Revenue | 5.000% | 7/1/44 | 200 | 217 |
| Howard County MD GO | 5.000% | 2/15/27 | 770 | 901 |
| Howard County MD GO | 3.000% | 2/15/30 | 100 | 97 |
| Maryland Department of Transportation | | | | |
| Revenue | 5.000% | 12/15/20 | 2,400 | 2,542 |
| Maryland Department of Transportation | | | | |
| Revenue | 4.000% | 9/1/21 | 1,000 | 1,049 |
| Maryland Department of Transportation | | | | |
| Revenue | 5.000% | 9/1/22 | 130 | 143 |
| Maryland Department of Transportation | | | | |
| Revenue | 5.000% | 2/15/23 | 1,490 | 1,652 |
| Maryland Department of Transportation | | | | |
| Revenue | 5.000% | 9/1/23 | 1,000 | 1,119 |
| Maryland Department of Transportation | | | | |
| Revenue | 5.000% | 9/1/24 | 950 | 1,079 |
| Maryland Department of Transportation | | | | |
| Revenue | 4.000% | 12/15/26 | 150 | 160 |
54
| | | | |
| Tax-Exempt Bond Index Fund | | | | |
| |
| |
| |
| | | | Face | Market |
| | | Maturity | Amount | Value • |
| | Coupon | Date | ($000) | ($000) |
| Maryland Department of Transportation | | | | |
| Revenue | 5.000% | 9/1/27 | 1,115 | 1,310 |
| Maryland Department of Transportation | | | | |
| Revenue | 4.000% | 11/1/27 | 550 | 589 |
| Maryland Department of Transportation | | | | |
| Revenue | 3.000% | 12/15/30 | 755 | 716 |
| Maryland GO | 5.000% | 3/1/19 | 110 | 111 |
| Maryland GO | 5.000% | 3/1/19 (Prere.) | 60 | 61 |
| Maryland GO | 5.000% | 3/15/19 | 125 | 126 |
| Maryland GO | 5.000% | 8/1/19 (Prere.) | 200 | 205 |
| Maryland GO | 4.000% | 3/15/20 (Prere.) | 125 | 128 |
| Maryland GO | 4.000% | 3/15/20 (Prere.) | 1,455 | 1,492 |
| Maryland GO | 5.000% | 6/1/20 | 135 | 141 |
| Maryland GO | 4.000% | 8/1/20 (Prere.) | 1,570 | 1,620 |
| Maryland GO | 5.000% | 8/1/20 (Prere.) | 520 | 545 |
| Maryland GO | 5.000% | 8/1/20 | 500 | 525 |
| Maryland GO | 5.000% | 8/1/20 | 1,000 | 1,050 |
| Maryland GO | 5.250% | 8/1/20 | 2,000 | 2,108 |
| Maryland GO | 5.000% | 3/1/21 (Prere.) | 1,400 | 1,490 |
| Maryland GO | 5.000% | 3/1/21 (Prere.) | 1,865 | 1,984 |
| Maryland GO | 5.000% | 3/1/21 (Prere.) | 1,480 | 1,575 |
| Maryland GO | 5.000% | 3/1/21 | 125 | 133 |
| Maryland GO | 4.500% | 8/1/21 | 220 | 234 |
| Maryland GO | 5.000% | 8/1/21 (Prere.) | 100 | 107 |
| Maryland GO | 5.000% | 8/1/21 | 150 | 161 |
| Maryland GO | 5.000% | 8/1/21 (Prere.) | 460 | 494 |
| Maryland GO | 5.000% | 8/1/21 (Prere.) | 100 | 107 |
| Maryland GO | 5.000% | 8/1/21 | 3,985 | 4,284 |
| Maryland GO | 4.000% | 3/1/22 (Prere.) | 1,300 | 1,373 |
| Maryland GO | 5.000% | 3/1/22 (Prere.) | 250 | 272 |
| Maryland GO | 5.000% | 3/15/22 | 1,000 | 1,089 |
| Maryland GO | 5.000% | 6/1/22 | 840 | 919 |
| Maryland GO | 5.000% | 8/1/22 | 1,585 | 1,739 |
| Maryland GO | 5.000% | 8/1/22 (Prere.) | 840 | 922 |
| Maryland GO | 5.000% | 8/1/22 | 2,420 | 2,655 |
| Maryland GO | 5.000% | 8/1/22 | 2,750 | 3,017 |
| Maryland GO | 5.000% | 8/1/22 (Prere.) | 350 | 384 |
| Maryland GO | 5.000% | 3/1/23 (Prere.) | 2,130 | 2,361 |
| Maryland GO | 5.000% | 3/1/23 (Prere.) | 200 | 222 |
| Maryland GO | 5.000% | 3/1/23 | 200 | 222 |
| Maryland GO | 5.000% | 3/1/23 (Prere.) | 730 | 809 |
| Maryland GO | 5.000% | 3/15/23 | 1,595 | 1,771 |
| Maryland GO | 5.000% | 6/1/23 | 305 | 340 |
| Maryland GO | 5.000% | 8/1/23 (Prere.) | 115 | 128 |
| Maryland GO | 5.000% | 8/1/23 | 2,275 | 2,542 |
| Maryland GO | 5.000% | 8/1/23 | 175 | 196 |
| Maryland GO | 5.000% | 3/15/24 | 1,500 | 1,695 |
| Maryland GO | 4.000% | 8/1/24 | 1,775 | 1,921 |
| Maryland GO | 5.000% | 8/1/24 | 245 | 278 |
| Maryland GO | 5.000% | 8/1/24 | 5,175 | 5,878 |
| Maryland GO | 4.000% | 6/1/25 | 1,605 | 1,730 |
| Maryland GO | 5.000% | 3/15/26 | 450 | 522 |
| Maryland GO | 5.000% | 6/1/26 | 1,310 | 1,472 |
| Maryland GO | 4.000% | 8/1/26 | 1,000 | 1,062 |
55
| | | | |
| Tax-Exempt Bond Index Fund | | | | |
| |
| |
| |
| | | | Face | Market |
| | | Maturity | Amount | Value • |
| | Coupon | Date | ($000) | ($000) |
| Maryland GO | 5.000% | 8/1/26 | 2,030 | 2,367 |
| Maryland GO | 3.000% | 3/1/27 | 350 | 352 |
| Maryland GO | 5.000% | 3/15/27 | 1,540 | 1,805 |
| Maryland GO | 4.000% | 6/1/27 | 850 | 911 |
| Maryland GO | 4.000% | 8/1/27 | 960 | 1,015 |
| Maryland GO | 5.000% | 8/1/27 | 585 | 688 |
| Maryland GO | 3.000% | 3/1/28 | 295 | 293 |
| Maryland GO | 4.000% | 6/1/28 | 1,000 | 1,066 |
| Maryland GO | 3.000% | 3/1/30 | 200 | 193 |
| Maryland GO | 4.000% | 8/1/32 | 6,645 | 7,030 |
| Maryland Stadium Authority Revenue | | | | |
| (Baltimore City Public Schools Construction | | | | |
| & Revitalization Program Revenue Bonds) | 5.000% | 5/1/41 | 2,650 | 2,894 |
| Maryland Stadium Authority Revenue | | | | |
| (Baltimore City Public Schools Construction | | | | |
| & Revitalization Program Revenue Bonds) | 5.000% | 5/1/42 | 1,000 | 1,104 |
| Maryland Stadium Authority Revenue | | | | |
| (Baltimore City Public Schools Construction | | | | |
| & Revitalization Program Revenue Bonds) | 5.000% | 5/1/46 | 950 | 1,034 |
| Maryland Transportation Authority GAN | 5.250% | 3/1/19 | 545 | 551 |
| Montgomery County MD GO | 5.000% | 7/1/21 | 245 | 263 |
| Montgomery County MD GO | 5.000% | 11/1/23 | 2,955 | 3,319 |
| Montgomery County MD GO | 5.000% | 11/1/24 | 100 | 114 |
| Montgomery County MD GO | 5.000% | 11/1/24 (Prere.) | 115 | 131 |
| Montgomery County MD GO | 5.000% | 11/1/24 (Prere.) | 755 | 862 |
| Montgomery County MD GO | 5.000% | 10/1/27 | 3,000 | 3,538 |
| Prince George MD Consolidated Public | | | | |
| Improvement GO | 4.000% | 7/15/30 | 5,145 | 5,512 |
| Prince Georges County MD GO | 3.000% | 9/15/29 | 130 | 128 |
| Prince Georges County MD GO | 5.000% | 10/1/48 | 5,045 | 5,550 |
| | | | | 111,259 |
| Massachusetts (4.6%) | | | | |
| Massachusetts Bay Transportation Authority | | | | |
| Assessment Revenue | 5.000% | 7/1/20 | 2,885 | 3,022 |
| Massachusetts Bay Transportation Authority | | | | |
| Assessment Revenue | 5.000% | 7/1/25 | 875 | 1,007 |
| Massachusetts Bay Transportation Authority | | | | |
| Assessment Revenue | 4.050% | 7/1/41 | 50 | 50 |
| Massachusetts Bay Transportation Authority | | | | |
| Assessment Revenue | 5.000% | 7/1/41 | 670 | 720 |
| Massachusetts Bay Transportation Authority | | | | |
| Sales Tax Revenue | 5.000% | 7/1/25 | 145 | 167 |
| Massachusetts Bay Transportation Authority | | | | |
| Sales Tax Revenue | 5.000% | 7/1/28 | 80 | 95 |
| Massachusetts Bay Transportation Authority | | | | |
| Sales Tax Revenue | 5.000% | 7/1/31 | 155 | 184 |
| Massachusetts Bay Transportation Authority | | | | |
| Sales Tax Revenue | 4.000% | 7/1/35 | 1,000 | 1,021 |
| Massachusetts Bay Transportation Authority | | | | |
| Sales Tax Revenue | 5.000% | 7/1/40 | 2,470 | 2,715 |
| Massachusetts Bay Transportation Authority | | | | |
| Sales Tax Revenue | 5.000% | 7/1/45 | 3,225 | 3,536 |
| Massachusetts Department of Transportation | | | | |
| Metropolitan Highway System Revenue | 5.000% | 1/1/26 | 1,130 | 1,164 |
56
| | | | |
| Tax-Exempt Bond Index Fund | | | | |
| |
| |
| |
| | | | Face | Market |
| | | Maturity | Amount | Value • |
| | Coupon | Date | ($000) | ($000) |
| Massachusetts Department of Transportation | | | | |
| Metropolitan Highway System Revenue | 5.000% | 1/1/27 | 1,000 | 1,029 |
| Massachusetts Department of Transportation | | | | |
| Metropolitan Highway System Revenue | 5.000% | 1/1/32 | 1,235 | 1,269 |
| Massachusetts Department of Transportation | | | | |
| Metropolitan Highway System Revenue | 5.000% | 1/1/35 | 1,570 | 1,618 |
| Massachusetts Department of Transportation | | | | |
| Metropolitan Highway System Revenue | 5.000% | 1/1/37 | 710 | 728 |
| Massachusetts Development Finance Agency | | | | |
| Revenue (Boston College) | 4.000% | 7/1/42 | 930 | 937 |
| Massachusetts Development Finance Agency | | | | |
| Revenue (Boston University) | 4.000% | 10/1/46 | 850 | 844 |
| Massachusetts Development Finance Agency | | | | |
| Revenue (Brandeis University) | 5.000% | 10/1/35 | 835 | 856 |
| Massachusetts Development Finance Agency | | | | |
| Revenue (Emerson College) | 5.000% | 1/1/41 | 1,030 | 1,072 |
| Massachusetts Development Finance Agency | | | | |
| Revenue (Emerson College) | 5.000% | 1/1/47 | 500 | 524 |
| Massachusetts Development Finance Agency | | | | |
| Revenue (Emmanuel College) | 5.000% | 10/1/30 | 780 | 842 |
| Massachusetts Development Finance Agency | | | | |
| Revenue (Emmanuel College) | 5.000% | 10/1/32 | 980 | 1,051 |
| Massachusetts Development Finance Agency | | | | |
| Revenue (Emmanuel College) | 5.000% | 10/1/43 | 500 | 524 |
| Massachusetts Development Finance Agency | | | | |
| Revenue (Harvard University) | 5.000% | 10/15/20 (Prere.) | 1,130 | 1,192 |
| Massachusetts Development Finance Agency | | | | |
| Revenue (Harvard University) | 5.000% | 7/15/22 | 290 | 319 |
| Massachusetts Development Finance Agency | | | | |
| Revenue (Harvard University) | 5.000% | 7/15/24 | 150 | 171 |
| Massachusetts Development Finance Agency | | | | |
| Revenue (Harvard University) | 4.000% | 7/15/29 | 1,000 | 1,074 |
| Massachusetts Development Finance Agency | | | | |
| Revenue (Harvard University) | 5.000% | 7/15/36 | 1,360 | 1,635 |
| Massachusetts Development Finance Agency | | | | |
| Revenue (Harvard University) | 5.000% | 7/15/40 | 1,315 | 1,591 |
| Massachusetts Development Finance Agency | | | | |
| Revenue (Suffolk University) | 5.000% | 7/1/29 | 500 | 552 |
| Massachusetts Development Finance Agency | | | | |
| Revenue (Western New England University) | 5.000% | 9/1/48 | 2,000 | 2,108 |
| Massachusetts Development Finance Agency | | | | |
| Revenue (Williams College) | 5.000% | 7/1/43 | 380 | 415 |
| Massachusetts Federal Highway GAN | | | | |
| (Accelerated Bridge Program) | 5.000% | 6/15/24 | 75 | 85 |
| Massachusetts Federal Highway Revenue | 5.000% | 6/15/26 | 1,000 | 1,148 |
| Massachusetts GO | 5.000% | 3/1/19 (Prere.) | 1,350 | 1,364 |
| Massachusetts GO | 5.000% | 7/1/19 (Prere.) | 50 | 51 |
| Massachusetts GO | 5.000% | 8/1/19 | 600 | 614 |
| Massachusetts GO | 5.000% | 4/1/20 | 2,500 | 2,602 |
| Massachusetts GO | 5.250% | 8/1/20 | 165 | 174 |
| Massachusetts GO | 5.500% | 10/1/20 (14) | 3,200 | 3,403 |
| Massachusetts GO | 5.000% | 4/1/21 (Prere.) | 200 | 213 |
| Massachusetts GO | 5.000% | 4/1/21 (Prere.) | 100 | 107 |
| Massachusetts GO | 5.000% | 8/1/21 (Prere.) | 310 | 333 |
57
| | | | |
| Tax-Exempt Bond Index Fund | | | | |
| |
| |
| |
| | | | Face | Market |
| | | Maturity | Amount | Value • |
| | Coupon | Date | ($000) | ($000) |
| Massachusetts GO | 5.250% | 8/1/21 | 75 | 81 |
| Massachusetts GO | 5.250% | 9/1/21 (4) | 550 | 596 |
| Massachusetts GO | 5.000% | 10/1/21 (Prere.) | 150 | 162 |
| Massachusetts GO | 5.000% | 12/1/21 (Prere.) | 1,010 | 1,094 |
| Massachusetts GO | 5.000% | 3/1/22 | 1,875 | 2,043 |
| Massachusetts GO | 5.000% | 7/1/22 (Prere.) | 1,215 | 1,333 |
| Massachusetts GO | 5.000% | 7/1/22 (Prere.) | 450 | 494 |
| Massachusetts GO | 5.000% | 7/1/22 (Prere.) | 160 | 176 |
| Massachusetts GO | 5.000% | 7/1/22 | 4,000 | 4,388 |
| Massachusetts GO | 5.000% | 7/1/22 | 590 | 647 |
| Massachusetts GO | 5.000% | 7/1/22 (Prere.) | 1,585 | 1,739 |
| Massachusetts GO | 5.000% | 8/1/22 | 445 | 489 |
| Massachusetts GO | 5.250% | 8/1/22 | 335 | 371 |
| Massachusetts GO | 5.000% | 10/1/22 | 330 | 364 |
| Massachusetts GO | 5.000% | 11/1/22 (Prere.) | 205 | 226 |
| Massachusetts GO | 5.000% | 11/1/22 (Prere.) | 1,000 | 1,104 |
| Massachusetts GO | 5.000% | 11/1/22 (Prere.) | 300 | 331 |
| Massachusetts GO | 5.000% | 3/1/23 | 510 | 566 |
| Massachusetts GO | 5.000% | 7/1/23 | 475 | 530 |
| Massachusetts GO | 5.000% | 7/1/23 | 295 | 329 |
| Massachusetts GO | 5.000% | 8/1/23 | 285 | 319 |
| Massachusetts GO | 5.250% | 8/1/23 | 975 | 1,101 |
| Massachusetts GO | 5.000% | 7/1/24 | 430 | 488 |
| Massachusetts GO | 4.000% | 5/1/25 | 1,000 | 1,063 |
| Massachusetts GO | 5.000% | 7/1/25 | 1,615 | 1,859 |
| Massachusetts GO | 5.000% | 7/1/25 | 295 | 340 |
| Massachusetts GO | 5.000% | 8/1/25 | 260 | 300 |
| Massachusetts GO | 5.250% | 9/1/25 (4) | 455 | 532 |
| Massachusetts GO | 5.000% | 10/1/25 | 200 | 231 |
| Massachusetts GO | 5.000% | 4/1/26 | 1,500 | 1,740 |
| Massachusetts GO | 5.000% | 7/1/26 | 1,930 | 2,246 |
| Massachusetts GO | 5.000% | 10/1/26 | 400 | 467 |
| Massachusetts GO | 5.000% | 7/1/27 | 765 | 898 |
| Massachusetts GO | 5.000% | 7/1/27 | 585 | 686 |
| Massachusetts GO | 5.000% | 7/1/27 | 235 | 276 |
| Massachusetts GO | 4.000% | 10/1/27 | 225 | 232 |
| Massachusetts GO | 5.000% | 7/1/29 | 485 | 555 |
| Massachusetts GO | 5.000% | 9/1/29 | 1,000 | 1,088 |
| Massachusetts GO | 4.000% | 11/1/29 | 100 | 104 |
| Massachusetts GO | 5.000% | 7/1/30 | 505 | 567 |
| Massachusetts GO | 5.500% | 8/1/30 (2) | 645 | 791 |
| Massachusetts GO | 4.000% | 7/1/31 | 200 | 205 |
| Massachusetts GO | 5.000% | 7/1/31 | 4,600 | 5,192 |
| Massachusetts GO | 5.000% | 7/1/33 | 100 | 111 |
| Massachusetts GO | 4.000% | 9/1/33 | 3,700 | 3,823 |
| Massachusetts GO | 5.000% | 2/1/35 | 110 | 123 |
| Massachusetts GO | 5.000% | 7/1/35 | 1,000 | 1,105 |
| Massachusetts GO | 5.000% | 8/1/35 | 100 | 106 |
| Massachusetts GO | 4.000% | 9/1/35 | 595 | 607 |
| Massachusetts GO | 3.375% | 10/1/35 | 200 | 187 |
| Massachusetts GO | 3.000% | 11/1/35 | 5,495 | 4,854 |
| Massachusetts GO | 5.000% | 12/1/35 | 100 | 112 |
| Massachusetts GO | 5.000% | 2/1/36 | 205 | 229 |
| Massachusetts GO | 5.000% | 7/1/36 | 940 | 1,036 |
58
| | | | |
| Tax-Exempt Bond Index Fund | | | | |
| |
| |
| |
| | | | Face | Market |
| | | Maturity | Amount | Value • |
| | Coupon | Date | ($000) | ($000) |
| Massachusetts GO | 4.000% | 9/1/37 | 200 | 201 |
| Massachusetts GO | 4.000% | 9/1/37 | 100 | 101 |
| Massachusetts GO | 5.000% | 12/1/38 | 750 | 832 |
| Massachusetts GO | 5.000% | 11/1/39 | 900 | 1,003 |
| Massachusetts GO | 4.250% | 12/1/39 | 1,525 | 1,556 |
| Massachusetts GO | 4.000% | 5/1/40 | 100 | 100 |
| Massachusetts GO | 5.000% | 3/1/41 | 3,200 | 3,482 |
| Massachusetts GO | 3.000% | 4/1/41 | 645 | 538 |
| Massachusetts GO | 4.000% | 4/1/42 | 1,390 | 1,377 |
| Massachusetts GO | 4.500% | 12/1/43 | 4,000 | 4,145 |
| Massachusetts GO | 4.000% | 2/1/44 | 500 | 494 |
| Massachusetts GO | 3.000% | 4/1/44 | 635 | 522 |
| Massachusetts GO | 5.000% | 7/1/45 | 400 | 436 |
| Massachusetts GO | 4.000% | 2/1/46 | 1,000 | 985 |
| Massachusetts GO | 5.000% | 3/1/46 | 1,000 | 1,085 |
| Massachusetts GO | 4.000% | 4/1/46 | 1,880 | 1,852 |
| Massachusetts GO | 3.000% | 9/1/46 | 4,795 | 3,895 |
| Massachusetts GO | 5.000% | 4/1/47 | 1,505 | 1,651 |
| Massachusetts GO | 5.000% | 4/1/47 | 360 | 395 |
| Massachusetts GO | 5.250% | 4/1/47 | 200 | 226 |
| Massachusetts Health & Educational Facilities | | | | |
| Authority Revenue (Berklee College of Music, | | | | |
| Inc.) | 5.000% | 10/1/37 | 10 | 10 |
| Massachusetts Health & Educational Facilities | | | | |
| Authority Revenue (Harvard University) | 5.000% | 12/15/19 (Prere.) | 335 | 346 |
| Massachusetts Health & Educational Facilities | | | | |
| Authority Revenue (MIT) | 5.250% | 7/1/33 | 125 | 154 |
| Massachusetts Health & Educational Facilities | | | | |
| Authority Revenue (Northeastern University) | 5.000% | 10/1/35 | 750 | 783 |
| Massachusetts Port Authority Revenue | 5.000% | 7/1/45 | 160 | 175 |
| Massachusetts School Building Authority | | | | |
| Dedicated Sales Tax Revenue | 5.000% | 8/15/19 | 75 | 77 |
| Massachusetts School Building Authority | | | | |
| Dedicated Sales Tax Revenue | 5.000% | 10/15/19 | 670 | 690 |
| Massachusetts School Building Authority | | | | |
| Dedicated Sales Tax Revenue | 5.000% | 8/15/21 | 125 | 135 |
| Massachusetts School Building Authority | | | | |
| Dedicated Sales Tax Revenue | 5.000% | 10/15/21 | 410 | 443 |
| Massachusetts School Building Authority | | | | |
| Dedicated Sales Tax Revenue | 5.000% | 8/15/22 | 3,430 | 3,773 |
| Massachusetts School Building Authority | | | | |
| Dedicated Sales Tax Revenue | 5.000% | 8/15/26 | 260 | 284 |
| Massachusetts School Building Authority | | | | |
| Dedicated Sales Tax Revenue | 3.050% | 8/15/28 | 1,135 | 1,126 |
| Massachusetts School Building Authority | | | | |
| Dedicated Sales Tax Revenue | 5.000% | 8/15/29 | 1,270 | 1,382 |
| Massachusetts School Building Authority | | | | |
| Dedicated Sales Tax Revenue | 5.000% | 8/15/30 | 1,400 | 1,522 |
| Massachusetts School Building Authority | | | | |
| Dedicated Sales Tax Revenue | 5.000% | 8/15/31 | 1,000 | 1,125 |
| Massachusetts School Building Authority | | | | |
| Dedicated Sales Tax Revenue | 5.000% | 10/15/32 | 275 | 294 |
| Massachusetts School Building Authority | | | | |
| Dedicated Sales Tax Revenue | 5.250% | 10/15/35 | 3,555 | 3,811 |
59
| | | | |
| Tax-Exempt Bond Index Fund | | | | |
| |
| |
| |
| | | | Face | Market |
| | | Maturity | Amount | Value • |
| | Coupon | Date | ($000) | ($000) |
| Massachusetts School Building Authority | | | | |
| Dedicated Sales Tax Revenue | 4.000% | 11/15/35 | 2,450 | 2,511 |
| Massachusetts School Building Authority | | | | |
| Dedicated Sales Tax Revenue | 5.000% | 10/15/41 | 1,330 | 1,411 |
| Massachusetts School Building Authority | | | | |
| Dedicated Sales Tax Revenue | 4.000% | 2/15/43 | 500 | 495 |
| Massachusetts School Building Authority | | | | |
| Dedicated Sales Tax Revenue | 5.000% | 5/15/43 | 375 | 407 |
| Massachusetts School Building Authority | | | | |
| Dedicated Sales Tax Revenue | 5.000% | 11/15/46 | 1,315 | 1,449 |
| Massachusetts School Building Authority | | | | |
| Dedicated Sales Tax Revenue | 5.250% | 2/15/48 | 1,550 | 1,750 |
| Massachusetts Special Obligation Dedicated | | | | |
| Tax Revenue | 5.500% | 1/1/30 (14) | 140 | 169 |
| Massachusetts Transportation Fund Revenue | 5.000% | 6/1/26 | 120 | 140 |
| Massachusetts Transportation Fund Revenue | | | | |
| (Accelerated Bridge Program) | 5.000% | 6/1/44 | 1,200 | 1,313 |
| Massachusetts Transportation Fund Revenue | | | | |
| (Accelerated Bridge Program) | 4.000% | 6/1/46 | 300 | 301 |
| Massachusetts Transportation Fund Revenue | | | | |
| (Rail Enhancement Program) | 5.000% | 6/1/41 | 1,750 | 1,926 |
| Massachusetts Transportation Fund Revenue | | | | |
| (Rail Enhancement Program) | 4.000% | 6/1/45 | 150 | 150 |
| Massachusetts Water Pollution Abatement | | | | |
| Trust Revenue | 5.250% | 8/1/19 | 100 | 102 |
| Massachusetts Water Pollution Abatement | | | | |
| Trust Revenue | 5.000% | 8/1/23 | 6,820 | 7,640 |
| Massachusetts Water Pollution Abatement | | | | |
| Trust Revenue | 5.000% | 8/1/24 | 945 | 1,077 |
| Massachusetts Water Pollution Abatement | | | | |
| Trust Revenue | 5.000% | 8/1/38 | 2,450 | 2,498 |
| Massachusetts Water Resources Authority | | | | |
| Revenue | 5.000% | 8/1/19 (Prere.) | 170 | 174 |
| Massachusetts Water Resources Authority | | | | |
| Revenue | 5.000% | 8/1/19 (Prere.) | 210 | 215 |
| Massachusetts Water Resources Authority | | | | |
| Revenue | 5.500% | 8/1/20 (ETM) | 15 | 16 |
| Massachusetts Water Resources Authority | | | | |
| Revenue | 5.500% | 8/1/20 (ETM) | 330 | 349 |
| Massachusetts Water Resources Authority | | | | |
| Revenue | 5.000% | 8/1/21 (Prere.) | 120 | 129 |
| Massachusetts Water Resources Authority | | | | |
| Revenue | 5.500% | 8/1/21 (4) | 765 | 833 |
| Massachusetts Water Resources Authority | | | | |
| Revenue | 5.000% | 8/1/24 | 1,000 | 1,073 |
| Massachusetts Water Resources Authority | | | | |
| Revenue | 5.250% | 8/1/26 (4) | 850 | 1,006 |
| Massachusetts Water Resources Authority | | | | |
| Revenue | 5.000% | 8/1/31 | 130 | 148 |
| Massachusetts Water Resources Authority | | | | |
| Revenue | 5.250% | 8/1/31 (4) | 80 | 98 |
| Massachusetts Water Resources Authority | | | | |
| Revenue | 4.000% | 8/1/36 | 245 | 251 |
60
| | | | |
| Tax-Exempt Bond Index Fund | | | | |
| |
| |
| |
| | | | Face | Market |
| | | Maturity | Amount | Value • |
| | Coupon | Date | ($000) | ($000) |
| Massachusetts Water Resources Authority | | | | |
| Revenue | 5.000% | 8/1/37 | 140 | 151 |
| Massachusetts Water Resources Authority | | | | |
| Revenue | 4.000% | 8/1/40 | 500 | 504 |
| Massachusetts Water Resources Authority | | | | |
| Revenue | 5.000% | 8/1/40 | 1,500 | 1,661 |
| Massachusetts Water Resources Authority | | | | |
| Revenue | 5.250% | 8/1/42 | 100 | 107 |
| Metropolitan Boston MA Transit Parking Corp. | | | | |
| Revenue | 5.250% | 7/1/36 | 1,310 | 1,392 |
| University of Massachusetts Building Authority | | | | |
| Revenue | 5.000% | 11/1/39 | 295 | 319 |
| University of Massachusetts Building Authority | | | | |
| Revenue | 5.000% | 11/1/40 | 4,320 | 4,759 |
| University of Massachusetts Building Authority | | | | |
| Revenue | 5.250% | 11/1/42 | 120 | 137 |
| University of Massachusetts Building Authority | | | | |
| Revenue | 5.000% | 11/1/44 | 135 | 147 |
| | | | | 172,576 |
| Michigan (1.6%) | | | | |
| Detroit MI City School District GO | 5.250% | 5/1/27 (4) | 130 | 149 |
| Detroit MI City School District GO | 5.250% | 5/1/30 (4) | 3,000 | 3,500 |
| Detroit MI City School District GO | 5.250% | 5/1/32 (4) | 125 | 145 |
| Detroit MI Water Supply System Revenue | 5.250% | 7/1/41 | 500 | 530 |
| Downriver Utility Wastewater Authority | | | | |
| Michigan Revenue | 5.000% | 4/1/43 (4) | 750 | 806 |
| Great Lakes MI Water Authority Water Supply | | | | |
| System Revenue | 5.000% | 7/1/27 | 155 | 176 |
| Great Lakes MI Water Authority Water Supply | | | | |
| System Revenue | 5.000% | 7/1/33 | 620 | 691 |
| Great Lakes MI Water Authority Water Supply | | | | |
| System Revenue | 5.000% | 7/1/46 | 1,775 | 1,936 |
| Holland MI Electric Utility System Revenue | 5.000% | 7/1/27 | 250 | 266 |
| Holland MI Electric Utility System Revenue | 5.000% | 7/1/33 | 780 | 828 |
| Holland MI Electric Utility System Revenue | 5.000% | 7/1/39 | 3,170 | 3,359 |
| Karegnondi Water Authority Michigan Water | | | | |
| Supply System Revenue (Karegnondi Water | | | | |
| Pipeline) | 5.250% | 11/1/28 | 500 | 549 |
| Karegnondi Water Authority Michigan Water | | | | |
| Supply System Revenue (Karegnondi Water | | | | |
| Pipeline) | 5.250% | 11/1/40 | 230 | 249 |
| Lansing MI Board of Water & Light Utility | | | | |
| System Revenue | 5.000% | 7/1/37 | 950 | 1,006 |
| Lansing MI Board of Water & Light Utility | | | | |
| System Revenue | 5.500% | 7/1/41 | 250 | 269 |
| Michigan Building Authority Revenue | 5.000% | 4/15/19 | 445 | 451 |
| Michigan Building Authority Revenue | 5.000% | 4/15/22 | 610 | 665 |
| Michigan Building Authority Revenue | 5.000% | 4/15/23 | 195 | 217 |
| Michigan Building Authority Revenue | 5.000% | 10/15/29 | 75 | 83 |
| Michigan Building Authority Revenue | 5.000% | 10/15/32 | 1,275 | 1,431 |
| Michigan Building Authority Revenue | 5.000% | 4/15/33 | 485 | 538 |
| Michigan Building Authority Revenue | 5.000% | 10/15/33 | 335 | 375 |
| Michigan Building Authority Revenue | 5.000% | 4/15/38 | 1,130 | 1,243 |
| Michigan Building Authority Revenue | 5.000% | 4/15/41 | 500 | 546 |
61
| | | | |
| Tax-Exempt Bond Index Fund | | | | |
| |
| |
| |
| | | | Face | Market |
| | | Maturity | Amount | Value • |
| | Coupon | Date | ($000) | ($000) |
| Michigan Building Authority Revenue | 5.500% | 10/15/45 | 3,000 | 3,227 |
| Michigan Building Authority Revenue | 5.000% | 10/15/50 | 110 | 120 |
| Michigan Building Authority Revenue | 5.000% | 10/15/51 | 500 | 539 |
| Michigan Finance Authority Revenue | 5.000% | 4/1/19 | 250 | 253 |
| Michigan Finance Authority Revenue | 5.000% | 4/1/20 | 300 | 310 |
| Michigan Finance Authority Revenue | 5.000% | 4/1/21 | 250 | 264 |
| Michigan Finance Authority Revenue | 5.000% | 10/1/39 | 2,910 | 3,169 |
| Michigan Finance Authority Revenue | 5.000% | 11/1/43 | 1,500 | 1,646 |
| Michigan Finance Authority Revenue | 5.000% | 7/1/44 | 720 | 755 |
| Michigan Finance Authority Revenue | 4.000% | 11/1/48 | 2,000 | 1,922 |
| Michigan Finance Authority Revenue (Detroit | | | | |
| Water & Sewer) | 5.000% | 7/1/25 (4) | 400 | 446 |
| Michigan Finance Authority Revenue (Detroit | | | | |
| Water & Sewer) | 5.000% | 7/1/25 (4) | 250 | 279 |
| Michigan Finance Authority Revenue (Detroit | | | | |
| Water & Sewer) | 5.000% | 7/1/26 (4) | 310 | 344 |
| Michigan Finance Authority Revenue (Detroit | | | | |
| Water & Sewer) | 5.000% | 7/1/26 (4) | 1,000 | 1,109 |
| Michigan Finance Authority Revenue (Detroit | | | | |
| Water & Sewer) | 5.000% | 7/1/27 | 250 | 276 |
| Michigan Finance Authority Revenue (Detroit | | | | |
| Water & Sewer) | 5.000% | 7/1/28 | 750 | 825 |
| Michigan Finance Authority Revenue (Detroit | | | | |
| Water & Sewer) | 5.000% | 7/1/32 (4) | 115 | 125 |
| Michigan Finance Authority Revenue (Detroit | | | | |
| Water & Sewer) | 5.000% | 7/1/33 | 250 | 270 |
| Michigan Finance Authority Revenue (Detroit | | | | |
| Water & Sewer) | 5.000% | 7/1/34 | 985 | 1,062 |
| Michigan Finance Authority Revenue (Detroit | | | | |
| Water & Sewer) | 5.000% | 7/1/34 | 700 | 754 |
| Michigan Finance Authority Revenue (Detroit | | | | |
| Water & Sewer) | 5.000% | 7/1/35 | 750 | 804 |
| Michigan Finance Authority Revenue (Detroit | | | | |
| Water & Sewer) | 5.000% | 7/1/44 | 250 | 264 |
| Michigan Finance Authority Revenue (Great | | | | |
| Lakes Water Authority Water Supply System) | 5.000% | 7/1/23 (4) | 1,635 | 1,810 |
| Michigan Finance Authority Revenue (State | | | | |
| Clean Water Revolving Fund) | 5.000% | 10/1/23 | 1,250 | 1,378 |
| Michigan Finance Authority Revenue | | | | |
| (Unemployment Obligation Assessment) | 5.000% | 7/1/19 | 1,950 | 1,989 |
| Michigan Finance Authority Revenue | | | | |
| (Unemployment Obligation Assessment) | 5.000% | 7/1/20 | 110 | 112 |
| Michigan Finance Authority Revenue | | | | |
| (Unemployment Obligation Assessment) | 5.000% | 1/1/21 | 210 | 214 |
| Michigan GAN | 5.000% | 3/15/22 | 770 | 836 |
| Michigan GAN | 5.000% | 3/15/23 | 3,235 | 3,576 |
| Michigan GAN | 5.000% | 3/15/24 | 170 | 191 |
| Michigan GAN | 5.000% | 3/15/25 | 970 | 1,105 |
| Michigan GAN | 5.000% | 3/15/26 | 680 | 781 |
| Michigan GAN | 5.000% | 3/15/27 | 595 | 687 |
| Michigan GO | 5.000% | 11/1/18 (Prere.) | 50 | 50 |
| Michigan GO | 5.000% | 5/1/19 | 65 | 65 |
| Michigan GO | 4.000% | 5/1/29 | 3,000 | 3,206 |
| Michigan State University Revenue | 5.000% | 8/15/38 | 200 | 219 |
62
| | | | |
| Tax-Exempt Bond Index Fund | | | | |
| |
| |
| |
| | | | Face | Market |
| | | Maturity | Amount | Value • |
| | Coupon | Date | ($000) | ($000) |
| Michigan Strategic Fund Limited Obligation | | | | |
| Revenue (Cadillac Place Project) | 5.250% | 10/15/31 | 295 | 319 |
| Michigan Trunk Line Revenue | 5.500% | 11/1/18 | 65 | 65 |
| Michigan Trunk Line Revenue | 5.000% | 11/1/19 | 50 | 52 |
| University of Michigan Revenue | 5.000% | 4/1/23 | 200 | 223 |
| University of Michigan Revenue | 5.000% | 4/1/40 | 1,000 | 1,112 |
| Wayne County MI Airport Authority Revenue | 5.000% | 12/1/25 | 1,325 | 1,445 |
| Wayne County MI Airport Authority Revenue | | | | |
| (Detroit Metropolitan Wayne County Airport) | 5.000% | 12/1/42 (4) | 255 | 273 |
| Wayne State University Michigan Revenue | 5.000% | 11/15/18 (Prere.) | 155 | 155 |
| Wayne State University Michigan Revenue | 5.000% | 11/15/18 (Prere.) | 200 | 200 |
| | | | | 58,834 |
| Minnesota (0.9%) | | | | |
| Minneapolis & St. Paul MN Metropolitan | | | | |
| Airports Commission Revenue | 5.000% | 1/1/25 | 560 | 637 |
| Minnesota General Fund Revenue | 5.000% | 3/1/22 | 430 | 468 |
| Minnesota General Fund Revenue | 5.000% | 3/1/27 | 500 | 541 |
| Minnesota General Fund Revenue | 5.000% | 3/1/29 | 760 | 823 |
| Minnesota GO | 5.000% | 11/1/19 | 75 | 77 |
| Minnesota GO | 5.000% | 8/1/20 | 500 | 525 |
| Minnesota GO | 5.000% | 8/1/20 (Prere.) | 5 | 5 |
| Minnesota GO | 5.000% | 8/1/20 (Prere.) | 2,825 | 2,965 |
| Minnesota GO | 5.000% | 8/1/20 (Prere.) | 375 | 393 |
| Minnesota GO | 5.000% | 8/1/21 | 480 | 503 |
| Minnesota GO | 5.000% | 8/1/21 | 1,100 | 1,182 |
| Minnesota GO | 5.000% | 8/1/21 | 2,940 | 3,161 |
| Minnesota GO | 5.000% | 8/1/22 | 100 | 110 |
| Minnesota GO | 5.000% | 8/1/22 | 1,290 | 1,416 |
| Minnesota GO | 5.000% | 8/1/23 | 5,425 | 6,064 |
| Minnesota GO | 5.000% | 8/1/24 | 2,720 | 3,090 |
| Minnesota GO | 4.000% | 10/1/24 | 860 | 922 |
| Minnesota GO | 5.000% | 10/1/24 | 1,000 | 1,138 |
| Minnesota GO | 5.000% | 8/1/25 | 2,025 | 2,335 |
| Minnesota GO | 3.250% | 8/1/36 | 2,780 | 2,557 |
| Minnesota Municipal Power Agency Revenue | 5.000% | 1/1/40 | 415 | 454 |
| Minnesota Public Facilities Authority Revenue | | | | |
| (State Revolving Fund) | 5.000% | 3/1/23 | 1,125 | 1,249 |
| University of Minnesota Revenue | 5.000% | 12/1/18 | 1,000 | 1,002 |
| | | | | 31,617 |
| Mississippi (0.3%) | | | | |
| Mississippi Development Bank Special | | | | |
| Obligation Revenue | 5.250% | 8/1/20 (Prere.) | 715 | 754 |
| Mississippi Development Bank Special | | | | |
| Obligation Revenue | 5.250% | 8/1/20 (Prere.) | 500 | 527 |
| Mississippi GO | 5.000% | 10/1/19 | 2,000 | 2,054 |
| Mississippi GO | 5.000% | 10/1/20 | 230 | 242 |
| Mississippi GO | 5.000% | 10/1/21 (Prere.) | 1,355 | 1,462 |
| Mississippi GO | 5.000% | 11/1/21 | 315 | 340 |
| Mississippi GO | 5.000% | 10/1/27 | 605 | 708 |
| Mississippi GO | 5.000% | 10/1/28 | 935 | 1,080 |
| Mississippi GO | 5.000% | 10/1/34 | 115 | 130 |
| Mississippi GO | 4.000% | 10/1/35 | 3,675 | 3,733 |
| Mississippi GO | 4.000% | 10/1/36 | 1,190 | 1,199 |
| | | | | 12,229 |
63
| | | | |
| Tax-Exempt Bond Index Fund | | | | |
| |
| |
| |
| | | | Face | Market |
| | | Maturity | Amount | Value • |
| | Coupon | Date | ($000) | ($000) |
| Missouri (0.3%) | | | | |
| Bi-State Development Agency of the | | | | |
| Missouri-Illinois Metropolitan District Mass | | | | |
| Transit Sales Tax Revenue | 5.000% | 10/1/28 | 250 | 250 |
| Bi-State Development Agency of the | | | | |
| Missouri-Illinois Metropolitan District Mass | | | | |
| Transit Sales Tax Revenue | 5.000% | 10/1/33 | 2,085 | 2,270 |
| Jackson County MO Special Obligation | | | | |
| Revenue (Truman Sports Complex Project) | 5.000% | 12/1/31 | 220 | 243 |
| Kansas City MO Sanitary Sewer System | | | | |
| Revenue | 4.000% | 1/1/42 | 750 | 756 |
| Kansas City MO Special Obligation Revenue | | | | |
| (Downtown Arena Project) | 5.000% | 4/1/40 | 500 | 543 |
| Metropolitan St. Louis MO Sewer District | | | | |
| Wastewater System Revenue | 5.000% | 5/1/23 (Prere.) | 50 | 56 |
| Missouri Highways & Transportation | | | | |
| Commission Road Revenue | 5.000% | 5/1/23 | 230 | 256 |
| Missouri Highways & Transportation | | | | |
| Commission Road Revenue | 5.000% | 5/1/25 | 1,495 | 1,691 |
| Missouri Joint Municipal Electric Utility | | | | |
| Commission Power Project Revenue | | | | |
| (Iatan 2 Project) | 6.000% | 1/1/19 (Prere.) | 115 | 116 |
| Springfield MO Public Utility Revenue | 5.000% | 8/1/20 | 250 | 263 |
| Springfield MO Public Utility Revenue | 5.000% | 8/1/26 | 375 | 429 |
| Springfield MO Public Utility Revenue | 4.000% | 8/1/31 | 130 | 136 |
| St. Louis MO Airport Revenue (Lambert-St. | | | | |
| Louis International Airport) | 5.500% | 7/1/30 (14) | 75 | 91 |
| St. Louis MO Sewer & Wastewater Revenue | 5.000% | 5/1/42 | 1,510 | 1,624 |
| St. Louis MO Sewer & Wastewater Revenue | 5.000% | 5/1/45 | 610 | 671 |
| | | | | 9,395 |
| Nebraska (0.1%) | | | | |
| Nebraska GO (Lincoln-West Haymarket Joint | | | | |
| Public Agency) | 5.000% | 12/15/42 | 50 | 54 |
| Nebraska Public Power District Revenue | 5.000% | 1/1/40 | 1,535 | 1,626 |
| Nebraska Public Power District Revenue | 4.000% | 1/1/44 | 810 | 802 |
| Omaha NE Public Power District Electric | | | | |
| Revenue | 5.000% | 2/1/21 | 150 | 159 |
| Omaha NE Public Power District Electric | | | | |
| Revenue | 5.000% | 2/1/22 (Prere.) | 420 | 456 |
| Omaha NE Public Power District Electric | | | | |
| Revenue | 5.000% | 2/1/28 | 310 | 355 |
| Omaha NE Public Power District Electric | | | | |
| Revenue | 5.000% | 2/1/31 | 155 | 173 |
| Omaha NE Public Power District Electric | | | | |
| Revenue | 4.000% | 2/1/38 | 175 | 176 |
| Omaha NE Public Power District Electric | | | | |
| Revenue | 4.000% | 2/1/42 | 150 | 150 |
| Omaha NE Public Power District Electric | | | | |
| Revenue | 4.000% | 2/1/42 | 1,480 | 1,492 |
| Omaha NE Public Power District Electric | | | | |
| Revenue | 5.250% | 2/1/42 | 135 | 150 |
| | | | | 5,593 |
64
| | | | |
| Tax-Exempt Bond Index Fund | | | | |
| |
| |
| |
| | | | Face | Market |
| | | Maturity | Amount | Value • |
| | Coupon | Date | ($000) | ($000) |
| Nevada (1.4%) | | | | |
| Clark County NV Airport Improvement | | | | |
| Revenue | 5.000% | 7/1/24 (4) | 555 | 566 |
| Clark County NV Airport Improvement | | | | |
| Revenue | 5.000% | 7/1/25 (4) | 215 | 219 |
| Clark County NV Airport Improvement | | | | |
| Revenue | 5.125% | 7/1/36 | 5,205 | 5,362 |
| Clark County NV Airport Improvement | | | | |
| Revenue | 5.000% | 7/1/40 | 825 | 910 |
| Clark County NV GO | 5.000% | 11/1/19 | 125 | 129 |
| Clark County NV GO | 5.000% | 11/1/26 | 560 | 651 |
| Clark County NV GO | 5.000% | 11/1/27 | 155 | 180 |
| Clark County NV GO | 4.000% | 6/1/31 | 565 | 588 |
| Clark County NV GO | 3.000% | 11/1/38 | 2,595 | 2,179 |
| Clark County NV GO | 4.000% | 7/1/44 | 5,000 | 4,952 |
| Clark County NV GO | 4.000% | 7/1/47 | 1,310 | 1,290 |
| Clark County NV Highway Improvement | | | | |
| Motor Vehicle Fuel Tax Revenue | 5.000% | 7/1/19 (Prere.) | 500 | 510 |
| Clark County NV Passenger Facility Charge | | | | |
| Revenue (Las Vegas McCarran International | | | | |
| Airport) | 5.000% | 7/1/30 | 610 | 628 |
| Clark County NV Passenger Facility Charge | | | | |
| Revenue (Las Vegas McCarran International | | | | |
| Airport) | 5.125% | 7/1/34 | 1,490 | 1,533 |
| Clark County NV Passenger Facility Charge | | | | |
| Revenue (Las Vegas McCarran International | | | | |
| Airport) | 5.250% | 7/1/39 (4) | 175 | 181 |
| Clark County NV Passenger Facility Charge | | | | |
| Revenue (Las Vegas McCarran International | | | | |
| Airport) | 5.250% | 7/1/42 | 135 | 139 |
| Clark County NV School District GO | 5.000% | 6/15/19 | 700 | 712 |
| Clark County NV School District GO | 5.000% | 6/15/20 | 175 | 183 |
| Clark County NV School District GO | 5.000% | 6/15/23 | 1,140 | 1,251 |
| Clark County NV School District GO | 5.000% | 6/15/23 | 180 | 197 |
| Clark County NV School District GO | 5.000% | 6/15/23 | 2,000 | 2,194 |
| Clark County NV School District GO | 5.000% | 6/15/25 | 1,050 | 1,177 |
| Clark County NV School District GO | 5.000% | 6/15/25 | 1,250 | 1,401 |
| Clark County NV School District GO | 5.000% | 6/15/25 | 275 | 308 |
| Clark County NV School District GO | 5.000% | 6/15/26 | 100 | 113 |
| Clark County NV School District GO | 5.000% | 6/15/27 | 1,000 | 1,116 |
| Clark County NV School District GO | 5.000% | 6/15/28 | 1,700 | 1,889 |
| Clark County NV Water Reclamation District | | | | |
| GO | 5.250% | 7/1/19 (Prere.) | 275 | 281 |
| Clark County NV Water Reclamation District | | | | |
| GO | 5.000% | 7/1/23 | 260 | 290 |
| Las Vegas NV Convention & Visitors Authority | | | | |
| Revenue | 5.000% | 7/1/28 | 155 | 176 |
| Las Vegas NV Convention & Visitors Authority | | | | |
| Revenue | 5.000% | 7/1/29 | 160 | 180 |
| Las Vegas NV Convention & Visitors Authority | | | | |
| Revenue | 5.000% | 7/1/43 | 5,000 | 5,418 |
| Las Vegas NV GO | 6.000% | 4/1/19 (Prere.) | 350 | 356 |
| Las Vegas Valley Water District Nevada GO | 5.000% | 6/1/33 | 500 | 557 |
| Las Vegas Valley Water District Nevada GO | 5.000% | 6/1/34 | 250 | 278 |
65
| | | | |
| Tax-Exempt Bond Index Fund | | | | |
| |
| |
| |
| | | | Face | Market |
| | | Maturity | Amount | Value • |
| | Coupon | Date | ($000) | ($000) |
| Las Vegas Valley Water District Nevada GO | 5.000% | 6/1/37 | 520 | 559 |
| Las Vegas Valley Water District Nevada GO | 5.000% | 6/1/38 | 3,035 | 3,212 |
| Las Vegas Valley Water District Nevada GO | 5.000% | 6/1/39 | 1,380 | 1,510 |
| Las Vegas Valley Water District Nevada GO | 4.000% | 6/1/42 | 645 | 645 |
| Las Vegas Valley Water District Nevada GO | 5.000% | 6/1/42 | 1,020 | 1,093 |
| Nevada Capital Improvement & Cultural Affairs | | | | |
| GO | 5.000% | 3/1/22 | 155 | 168 |
| Nevada Capital Improvement GO | 5.000% | 4/1/20 | 250 | 260 |
| Nevada GO | 5.000% | 4/1/24 | 210 | 237 |
| Nevada GO | 5.000% | 11/1/24 | 140 | 159 |
| Nevada GO | 5.000% | 11/1/26 | 440 | 500 |
| Nevada Highway Improvement Revenue | | | | |
| (Motor Vehicle Fuel Tax) | 5.000% | 12/1/20 | 1,000 | 1,057 |
| Nevada Highway Improvement Revenue | | | | |
| (Motor Vehicle Fuel Tax) | 5.000% | 12/1/25 | 100 | 115 |
| Nevada Highway Improvement Revenue | | | | |
| (Motor Vehicle Fuel Tax) | 5.000% | 12/1/26 | 170 | 197 |
| Nevada Highway Improvement Revenue | | | | |
| (Motor Vehicle Fuel Tax) | 5.000% | 12/1/27 | 265 | 305 |
| Nevada Highway Improvement Revenue | | | | |
| (Motor Vehicle Fuel Tax) | 5.000% | 12/1/30 | 345 | 395 |
| Nevada Highway Improvement Revenue | | | | |
| (Motor Vehicle Fuel Tax) | 5.000% | 12/1/31 | 540 | 615 |
| Nevada Highway Improvement Revenue | | | | |
| (Motor Vehicle Fuel Tax) | 4.000% | 12/1/32 | 100 | 104 |
| Truckee Meadows NV Water Authority Water | | | | |
| Revenue | 5.000% | 7/1/33 | 100 | 112 |
| Washoe County NV Highway Fuel Tax | | | | |
| Revenue | 5.000% | 2/1/29 | 885 | 891 |
| Washoe County NV Highway Fuel Tax | | | | |
| Revenue | 5.000% | 2/1/38 | 140 | 141 |
| | | | | 50,369 |
| New Hampshire (0.1%) | | | | |
| New Hampshire Health & Education Facilities | | | | |
| Authority Revenue (Dartmouth College) | 5.250% | 6/1/19 (Prere.) | 585 | 596 |
| New Hampshire Municipal Bond Bank | | | | |
| Revenue | 5.000% | 8/15/20 (Prere.) | 550 | 578 |
| New Hampshire Municipal Bond Bank | | | | |
| Revenue | 4.000% | 8/15/46 | 1,000 | 1,003 |
| | | | | 2,177 |
| New Jersey (5.6%) | | | | |
| Garden State Preservation Trust New Jersey | | | | |
| Revenue | 5.125% | 11/1/19 (4) | 135 | 139 |
| Garden State Preservation Trust New Jersey | | | | |
| Revenue (Open Space & Farmland | | | | |
| Preservation) | 5.000% | 11/1/20 | 520 | 543 |
| Garden State Preservation Trust New Jersey | | | | |
| Revenue (Open Space & Farmland | | | | |
| Preservation) | 5.250% | 11/1/21 (4) | 585 | 630 |
| Garden State Preservation Trust New Jersey | | | | |
| Revenue (Open Space & Farmland | | | | |
| Preservation) | 5.000% | 11/1/22 | 485 | 524 |
66
| | | | |
| Tax-Exempt Bond Index Fund | | | | |
| |
| |
| |
| | | | Face | Market |
| | | Maturity | Amount | Value • |
| | Coupon | Date | ($000) | ($000) |
| Garden State Preservation Trust New Jersey | | | | |
| Revenue (Open Space & Farmland | | | | |
| Preservation) | 0.000% | 11/1/27 (4) | 500 | 369 |
| Garden State Preservation Trust New Jersey | | | | |
| Revenue (Open Space & Farmland | | | | |
| Preservation) | 0.000% | 11/1/28 (4) | 500 | 353 |
| Garden State Preservation Trust New Jersey | | | | |
| Revenue (Open Space & Farmland | | | | |
| Preservation) | 5.750% | 11/1/28 (4) | 300 | 347 |
| Hudson County NJ Improvement Authority | | | | |
| Lease Revenue | 5.250% | 5/1/51 | 100 | 110 |
| New Brunswick NJ Parking Authority Revenue | 5.000% | 9/1/39 (15) | 660 | 724 |
| New Jersey Building Authority Revenue | 5.000% | 12/15/18 | 1,585 | 1,590 |
| New Jersey Building Authority Revenue | 5.000% | 6/15/19 | 2,000 | 2,031 |
| New Jersey COP | 5.250% | 6/15/19 (Prere.) | 1,960 | 2,000 |
| New Jersey COP | 5.250% | 6/15/19 (Prere.) | 420 | 429 |
| New Jersey COP | 5.250% | 6/15/19 (Prere.) | 675 | 689 |
| New Jersey Economic Development Authority | | | | |
| Lease Revenue (Rutgers State University) | 5.000% | 6/15/38 | 140 | 153 |
| New Jersey Economic Development Authority | | | | |
| Lease Revenue (Rutgers State University) | 5.000% | 6/15/46 | 1,495 | 1,630 |
| New Jersey Economic Development Authority | | | | |
| Revenue | 5.000% | 11/1/20 | 2,110 | 2,206 |
| New Jersey Economic Development Authority | | | | |
| Revenue | 5.000% | 6/15/22 | 200 | 213 |
| New Jersey Economic Development Authority | | | | |
| Revenue | 5.000% | 11/1/22 | 550 | 591 |
| New Jersey Economic Development Authority | | | | |
| Revenue | 5.000% | 3/1/23 | 310 | 328 |
| New Jersey Economic Development Authority | | | | |
| Revenue | 5.000% | 6/15/23 | 885 | 956 |
| New Jersey Economic Development Authority | | | | |
| Revenue | 4.000% | 6/15/24 | 770 | 792 |
| New Jersey Economic Development Authority | | | | |
| Revenue | 4.000% | 11/1/25 | 405 | 416 |
| New Jersey Economic Development Authority | | | | |
| Revenue | 5.000% | 11/1/26 | 1,860 | 2,033 |
| New Jersey Economic Development Authority | | | | |
| Revenue | 5.250% | 6/15/27 | 3,030 | 3,311 |
| New Jersey Economic Development Authority | | | | |
| Revenue | 5.250% | 6/15/29 | 5,000 | 5,402 |
| New Jersey Economic Development Authority | | | | |
| Revenue | 5.500% | 6/15/29 | 100 | 111 |
| New Jersey Economic Development Authority | | | | |
| Revenue | 5.000% | 6/15/36 | 240 | 250 |
| New Jersey Economic Development Authority | | | | |
| Revenue | 5.000% | 6/15/41 | 620 | 640 |
| New Jersey Economic Development Authority | | | | |
| Revenue | 5.000% | 6/15/42 | 1,000 | 1,032 |
| New Jersey Economic Development Authority | | | | |
| Revenue (Cigarette Tax) | 5.000% | 6/15/19 | 1,000 | 1,016 |
| New Jersey Economic Development Authority | | | | |
| Revenue (Cigarette Tax) | 5.000% | 6/15/22 | 650 | 696 |
67
| | | | |
| Tax-Exempt Bond Index Fund | | | | |
| |
| |
| |
| | | | Face | Market |
| | | Maturity | Amount | Value • |
| | Coupon | Date | ($000) | ($000) |
| New Jersey Economic Development Authority | | | | |
| Revenue (Cigarette Tax) | 5.000% | 6/15/24 | 835 | 887 |
| New Jersey Economic Development Authority | | | | |
| Revenue (Cigarette Tax) | 4.250% | 6/15/27 | 320 | 328 |
| New Jersey Economic Development Authority | | | | |
| Revenue (Cigarette Tax) | 5.000% | 6/15/28 | 250 | 262 |
| New Jersey Economic Development Authority | | | | |
| Revenue (Motor Vehicle Surcharge) | 4.000% | 7/1/32 | 1,000 | 966 |
| New Jersey Economic Development Authority | | | | |
| Revenue (Motor Vehicle Surcharge) | 5.000% | 7/1/33 | 1,425 | 1,503 |
| New Jersey Economic Development Authority | | | | |
| Revenue (School Facilities Construction) | 5.000% | 12/15/18 | 465 | 466 |
| New Jersey Economic Development Authority | | | | |
| Revenue (School Facilities Construction) | 5.000% | 3/1/19 (ETM) | 3,500 | 3,535 |
| New Jersey Economic Development Authority | | | | |
| Revenue (School Facilities Construction) | 5.000% | 6/15/19 | 600 | 609 |
| New Jersey Economic Development Authority | | | | |
| Revenue (School Facilities Construction) | 5.000% | 6/15/19 | 700 | 711 |
| New Jersey Economic Development Authority | | | | |
| Revenue (School Facilities Construction) | 5.000% | 6/15/19 | 1,075 | 1,092 |
| New Jersey Economic Development Authority | | | | |
| Revenue (School Facilities Construction) | 5.250% | 9/1/19 (ETM) | 1,130 | 1,159 |
| New Jersey Economic Development Authority | | | | |
| Revenue (School Facilities Construction) | 5.250% | 9/1/19 | 235 | 240 |
| New Jersey Economic Development Authority | | | | |
| Revenue (School Facilities Construction) | 5.000% | 12/15/19 | 1,725 | 1,772 |
| New Jersey Economic Development Authority | | | | |
| Revenue (School Facilities Construction) | 5.500% | 12/15/19 (2) | 590 | 609 |
| New Jersey Economic Development Authority | | | | |
| Revenue (School Facilities Construction) | 5.000% | 3/1/20 | 220 | 227 |
| New Jersey Economic Development Authority | | | | |
| Revenue (School Facilities Construction) | 5.000% | 9/1/20 (ETM) | 760 | 796 |
| New Jersey Economic Development Authority | | | | |
| Revenue (School Facilities Construction) | 5.000% | 9/1/20 (ETM) | 240 | 252 |
| New Jersey Economic Development Authority | | | | |
| Revenue (School Facilities Construction) | 5.000% | 3/1/21 | 510 | 534 |
| New Jersey Economic Development Authority | | | | |
| Revenue (School Facilities Construction) | 5.250% | 3/1/21 (Prere.) | 300 | 320 |
| New Jersey Economic Development Authority | | | | |
| Revenue (School Facilities Construction) | 5.500% | 3/1/21 (Prere.) | 105 | 113 |
| New Jersey Economic Development Authority | | | | |
| Revenue (School Facilities Construction) | 5.000% | 9/1/21 | 610 | 639 |
| New Jersey Economic Development Authority | | | | |
| Revenue (School Facilities Construction) | 5.250% | 12/15/21 (14) | 100 | 107 |
| New Jersey Economic Development Authority | | | | |
| Revenue (School Facilities Construction) | 5.000% | 3/1/22 | 1,135 | 1,204 |
| New Jersey Economic Development Authority | | | | |
| Revenue (School Facilities Construction) | 5.000% | 3/1/22 | 725 | 769 |
| New Jersey Economic Development Authority | | | | |
| Revenue (School Facilities Construction) | 5.000% | 3/1/23 | 1,590 | 1,711 |
| New Jersey Economic Development Authority | | | | |
| Revenue (School Facilities Construction) | 5.000% | 9/1/23 | 420 | 439 |
| New Jersey Economic Development Authority | | | | |
| Revenue (School Facilities Construction) | 3.000% | 3/1/24 | 710 | 695 |
68
| | | | |
| Tax-Exempt Bond Index Fund | | | | |
| |
| |
| |
| | | | Face | Market |
| | | Maturity | Amount | Value • |
| | Coupon | Date | ($000) | ($000) |
| New Jersey Economic Development Authority | | | | |
| Revenue (School Facilities Construction) | 5.000% | 3/1/24 | 1,210 | 1,295 |
| New Jersey Economic Development Authority | | | | |
| Revenue (School Facilities Construction) | 5.250% | 9/1/24 | 250 | 262 |
| New Jersey Economic Development Authority | | | | |
| Revenue (School Facilities Construction) | 5.000% | 3/1/25 | 285 | 301 |
| New Jersey Economic Development Authority | | | | |
| Revenue (School Facilities Construction) | 5.000% | 3/1/25 | 2,095 | 2,236 |
| New Jersey Economic Development Authority | | | | |
| Revenue (School Facilities Construction) | 5.250% | 9/1/25 | 470 | 492 |
| New Jersey Economic Development Authority | | | | |
| Revenue (School Facilities Construction) | 5.000% | 3/1/26 | 920 | 978 |
| New Jersey Economic Development Authority | | | | |
| Revenue (School Facilities Construction) | 5.000% | 3/1/26 | 500 | 526 |
| New Jersey Economic Development Authority | | | | |
| Revenue (School Facilities Construction) | 4.250% | 6/15/26 | 1,900 | 1,954 |
| New Jersey Economic Development Authority | | | | |
| Revenue (School Facilities Construction) | 5.000% | 6/15/26 | 2,855 | 3,095 |
| New Jersey Economic Development Authority | | | | |
| Revenue (School Facilities Construction) | 5.000% | 6/15/26 | 190 | 204 |
| New Jersey Economic Development Authority | | | | |
| Revenue (School Facilities Construction) | 5.000% | 3/1/27 | 305 | 320 |
| New Jersey Economic Development Authority | | | | |
| Revenue (School Facilities Construction) | 5.000% | 3/1/27 | 475 | 503 |
| New Jersey Economic Development Authority | | | | |
| Revenue (School Facilities Construction) | 4.375% | 6/15/27 | 110 | 113 |
| New Jersey Economic Development Authority | | | | |
| Revenue (School Facilities Construction) | 5.000% | 6/15/27 | 165 | 176 |
| New Jersey Economic Development Authority | | | | |
| Revenue (School Facilities Construction) | 4.000% | 11/1/27 | 95 | 96 |
| New Jersey Economic Development Authority | | | | |
| Revenue (School Facilities Construction) | 5.000% | 3/1/28 | 600 | 633 |
| New Jersey Economic Development Authority | | | | |
| Revenue (School Facilities Construction) | 5.000% | 3/1/29 | 285 | 299 |
| New Jersey Economic Development Authority | | | | |
| Revenue (School Facilities Construction) | 5.000% | 3/1/30 | 1,555 | 1,628 |
| New Jersey Economic Development Authority | | | | |
| Revenue (School Facilities Construction) | 5.000% | 6/15/31 | 100 | 105 |
| New Jersey Economic Development Authority | | | | |
| Revenue (School Facilities Construction) | 5.000% | 6/15/34 | 1,110 | 1,161 |
| New Jersey Economic Development Authority | | | | |
| Revenue (School Facilities Construction) | 5.000% | 6/15/35 | 375 | 391 |
| New Jersey Economic Development Authority | | | | |
| Revenue (School Facilities Construction) | 5.000% | 6/15/36 | 160 | 166 |
| New Jersey Economic Development Authority | | | | |
| Revenue (School Facilities Construction) | 5.000% | 3/1/38 | 150 | 154 |
| New Jersey Economic Development Authority | | | | |
| Revenue (School Facilities Construction) | 5.000% | 6/15/40 | 250 | 257 |
| New Jersey Economic Development Authority | | | | |
| Revenue (Provident Group-Rowan Properties | | | | |
| LLC - Rowan University Housing Project) | 5.000% | 1/1/48 | 100 | 103 |
| New Jersey Economic Development Authority | | | | |
| Sublease Revenue (New Jersey Transit Corp. | | | | |
| Light Rail Transit System Project) | 5.000% | 5/1/19 | 215 | 218 |
69
| | | | |
| Tax-Exempt Bond Index Fund | | | | |
| |
| |
| |
| | | | Face | Market |
| | | Maturity | Amount | Value • |
| | Coupon | Date | ($000) | ($000) |
| New Jersey Economic Development Authority | | | | |
| Sublease Revenue (New Jersey Transit Corp. | | | | |
| Projects) | 5.000% | 11/1/19 | 350 | 359 |
| New Jersey Economic Development Authority | | | | |
| Sublease Revenue (New Jersey Transit Corp. | | | | |
| Projects) | 5.000% | 11/1/21 | 4,310 | 4,564 |
| New Jersey Economic Development Authority | | | | |
| Sublease Revenue (New Jersey Transit Corp. | | | | |
| Projects) | 5.000% | 11/1/23 | 250 | 272 |
| New Jersey Economic Development Authority | | | | |
| Sublease Revenue (New Jersey Transit Corp. | | | | |
| Projects) | 5.000% | 11/1/25 | 340 | 371 |
| New Jersey Educational Facilities Authority | | | | |
| Revenue (Higher Education Capital | | | | |
| Improvement Fund) | 4.000% | 9/1/25 | 195 | 200 |
| New Jersey GO | 5.250% | 7/1/19 | 125 | 128 |
| New Jersey GO | 5.250% | 7/15/19 (2) | 170 | 174 |
| New Jersey GO | 5.000% | 6/1/20 | 300 | 313 |
| New Jersey GO | 5.000% | 8/15/20 | 500 | 523 |
| New Jersey GO | 5.000% | 6/1/22 | 700 | 758 |
| New Jersey GO | 5.000% | 6/1/28 | 125 | 140 |
| New Jersey Higher Education Assistance | | | | |
| Authority Student Loan Revenue | 5.625% | 6/1/30 | 125 | 127 |
| New Jersey Transportation Trust Fund | | | | |
| Authority Federal Highway Reimbursement | | | | |
| Revenue | 5.000% | 6/15/19 | 1,310 | 1,332 |
| New Jersey Transportation Trust Fund | | | | |
| Authority Federal Highway Reimbursement | | | | |
| Revenue | 5.000% | 6/15/20 | 200 | 208 |
| New Jersey Transportation Trust Fund | | | | |
| Authority Federal Highway Reimbursement | | | | |
| Revenue | 5.000% | 6/15/23 | 100 | 108 |
| New Jersey Transportation Trust Fund | | | | |
| Authority Federal Highway Reimbursement | | | | |
| Revenue | 5.000% | 6/15/25 | 200 | 221 |
| New Jersey Transportation Trust Fund | | | | |
| Authority Federal Highway Reimbursement | | | | |
| Revenue | 5.000% | 6/15/28 | 300 | 329 |
| New Jersey Transportation Trust Fund | | | | |
| Authority Federal Highway Reimbursement | | | | |
| Revenue | 5.000% | 6/15/29 | 700 | 764 |
| New Jersey Transportation Trust Fund | | | | |
| Authority Federal Highway Reimbursement | | | | |
| Revenue | 5.000% | 6/15/29 | 1,050 | 1,146 |
| New Jersey Transportation Trust Fund | | | | |
| Authority Federal Highway Reimbursement | | | | |
| Revenue | 5.000% | 6/15/30 | 150 | 163 |
| New Jersey Transportation Trust Fund | | | | |
| Authority Federal Highway Reimbursement | | | | |
| Revenue | 5.000% | 6/15/30 | 1,800 | 1,957 |
| New Jersey Transportation Trust Fund | | | | |
| Authority Federal Highway Reimbursement | | | | |
| Revenue | 5.000% | 6/15/31 | 3,000 | 3,248 |
70
| | | | |
| Tax-Exempt Bond Index Fund | | | | |
| |
| |
| |
| | | | Face | Market |
| | | Maturity | Amount | Value • |
| | Coupon | Date | ($000) | ($000) |
| New Jersey Transportation Trust Fund | | | | |
| Authority Federal Highway Reimbursement | | | | |
| Revenue | 0.000% | 12/15/35 (2) | 270 | 120 |
| New Jersey Transportation Trust Fund | | | | |
| Authority Revenue | 5.000% | 12/15/32 | 4,000 | 4,265 |
| New Jersey Transportation Trust Fund | | | | |
| Authority Revenue | 5.000% | 12/15/33 | 2,435 | 2,586 |
| New Jersey Transportation Trust Fund | | | | |
| Authority Revenue | 5.000% | 12/15/34 | 2,435 | 2,578 |
| New Jersey Transportation Trust Fund | | | | |
| Authority Revenue | 5.000% | 12/15/35 | 1,145 | 1,206 |
| New Jersey Transportation Trust Fund | | | | |
| Authority Revenue | 5.000% | 12/15/36 | 1,270 | 1,331 |
| New Jersey Transportation Trust Fund | | | | |
| Authority Transportation Program Revenue | 5.250% | 6/15/23 | 325 | 344 |
| New Jersey Transportation Trust Fund | | | | |
| Authority Transportation Program Revenue | 5.250% | 12/15/23 | 625 | 627 |
| New Jersey Transportation Trust Fund | | | | |
| Authority Transportation Program Revenue | 5.000% | 6/15/25 | 580 | 613 |
| New Jersey Transportation Trust Fund | | | | |
| Authority Transportation Program Revenue | 5.000% | 12/15/25 (2) | 470 | 471 |
| New Jersey Transportation Trust Fund | | | | |
| Authority Transportation Program Revenue | 5.375% | 12/15/25 | 100 | 100 |
| New Jersey Transportation Trust Fund | | | | |
| Authority Transportation Program Revenue | 5.000% | 6/15/27 | 630 | 669 |
| New Jersey Transportation Trust Fund | | | | |
| Authority Transportation Program Revenue | 5.000% | 6/15/28 | 1,085 | 1,138 |
| New Jersey Transportation Trust Fund | | | | |
| Authority Transportation Program Revenue | 5.000% | 6/15/28 | 350 | 370 |
| New Jersey Transportation Trust Fund | | | | |
| Authority Transportation Program Revenue | 5.250% | 6/15/30 | 335 | 357 |
| New Jersey Transportation Trust Fund | | | | |
| Authority Transportation Program Revenue | 4.000% | 6/15/31 | 120 | 117 |
| New Jersey Transportation Trust Fund | | | | |
| Authority Transportation Program Revenue | 5.750% | 12/15/31 | 870 | 874 |
| New Jersey Transportation Trust Fund | | | | |
| Authority Transportation Program Revenue | 5.000% | 6/15/32 | 750 | 778 |
| New Jersey Transportation Trust Fund | | | | |
| Authority Transportation Program Revenue | 5.000% | 6/15/33 | 145 | 150 |
| New Jersey Transportation Trust Fund | | | | |
| Authority Transportation Program Revenue | 5.000% | 6/15/36 | 800 | 828 |
| New Jersey Transportation Trust Fund | | | | |
| Authority Transportation Program Revenue | 0.000% | 12/15/36 | 170 | 70 |
| New Jersey Transportation Trust Fund | | | | |
| Authority Transportation Program Revenue | 4.750% | 6/15/38 | 885 | 905 |
| New Jersey Transportation Trust Fund | | | | |
| Authority Transportation Program Revenue | 5.000% | 6/15/38 | 450 | 465 |
| New Jersey Transportation Trust Fund | | | | |
| Authority Transportation Program Revenue | 5.000% | 6/15/38 | 2,135 | 2,187 |
| New Jersey Transportation Trust Fund | | | | |
| Authority Transportation Program Revenue | 5.250% | 6/15/41 | 140 | 147 |
| New Jersey Transportation Trust Fund | | | | |
| Authority Transportation Program Revenue | 5.000% | 6/15/44 | 1,610 | 1,653 |
| New Jersey Transportation Trust Fund | | | | |
| Authority Transportation Program Revenue | 5.000% | 6/15/44 | 400 | 412 |
71
| | | | |
| Tax-Exempt Bond Index Fund | | | | |
| |
| |
| |
| | | | Face | Market |
| | | Maturity | Amount | Value • |
| | Coupon | Date | ($000) | ($000) |
| New Jersey Transportation Trust Fund | | | | |
| Authority Transportation Program Revenue | 5.000% | 6/15/45 | 445 | 458 |
| New Jersey Transportation Trust Fund | | | | |
| Authority Transportation Program Revenue | 5.000% | 6/15/46 | 50 | 51 |
| New Jersey Transportation Trust Fund | | | | |
| Authority Transportation System Revenue | 5.000% | 12/15/19 | 800 | 822 |
| New Jersey Transportation Trust Fund | | | | |
| Authority Transportation System Revenue | 5.250% | 12/15/19 | 500 | 515 |
| New Jersey Transportation Trust Fund | | | | |
| Authority Transportation System Revenue | 5.250% | 12/15/19 | 325 | 335 |
| New Jersey Transportation Trust Fund | | | | |
| Authority Transportation System Revenue | 5.500% | 12/15/19 (14) | 175 | 181 |
| New Jersey Transportation Trust Fund | | | | |
| Authority Transportation System Revenue | 5.000% | 6/15/20 | 225 | 233 |
| New Jersey Transportation Trust Fund | | | | |
| Authority Transportation System Revenue | 5.250% | 12/15/20 | 120 | 126 |
| New Jersey Transportation Trust Fund | | | | |
| Authority Transportation System Revenue | 5.500% | 12/15/20 (14) | 480 | 509 |
| New Jersey Transportation Trust Fund | | | | |
| Authority Transportation System Revenue | 5.500% | 12/15/21 | 740 | 798 |
| New Jersey Transportation Trust Fund | | | | |
| Authority Transportation System Revenue | 5.000% | 6/15/22 | 125 | 133 |
| New Jersey Transportation Trust Fund | | | | |
| Authority Transportation System Revenue | 5.250% | 6/15/22 | 235 | 249 |
| New Jersey Transportation Trust Fund | | | | |
| Authority Transportation System Revenue | 5.250% | 12/15/22 | 800 | 867 |
| New Jersey Transportation Trust Fund | | | | |
| Authority Transportation System Revenue | 5.500% | 12/15/22 | 1,085 | 1,187 |
| New Jersey Transportation Trust Fund | | | | |
| Authority Transportation System Revenue | 5.500% | 12/15/22 (4) | 1,280 | 1,415 |
| New Jersey Transportation Trust Fund | | | | |
| Authority Transportation System Revenue | 5.500% | 12/15/22 (14) | 5,000 | 5,507 |
| New Jersey Transportation Trust Fund | | | | |
| Authority Transportation System Revenue | 5.000% | 6/15/23 | 115 | 122 |
| New Jersey Transportation Trust Fund | | | | |
| Authority Transportation System Revenue | 5.000% | 12/15/23 | 980 | 1,067 |
| New Jersey Transportation Trust Fund | | | | |
| Authority Transportation System Revenue | 5.250% | 12/15/23 | 600 | 660 |
| New Jersey Transportation Trust Fund | | | | |
| Authority Transportation System Revenue | 5.250% | 12/15/23 | 240 | 264 |
| New Jersey Transportation Trust Fund | | | | |
| Authority Transportation System Revenue | 5.250% | 12/15/23 (2) | 255 | 281 |
| New Jersey Transportation Trust Fund | | | | |
| Authority Transportation System Revenue | 5.500% | 12/15/23 | 425 | 473 |
| New Jersey Transportation Trust Fund | | | | |
| Authority Transportation System Revenue | 5.000% | 6/15/24 | 140 | 152 |
| New Jersey Transportation Trust Fund | | | | |
| Authority Transportation System Revenue | 0.000% | 12/15/24 (2) | 885 | 702 |
| New Jersey Transportation Trust Fund | | | | |
| Authority Transportation System Revenue | 5.000% | 12/15/24 | 650 | 710 |
| New Jersey Transportation Trust Fund | | | | |
| Authority Transportation System Revenue | 5.375% | 12/15/24 | 230 | 231 |
| New Jersey Transportation Trust Fund | | | | |
| Authority Transportation System Revenue | 0.000% | 12/15/25 | 380 | 285 |
72
| | | | |
| Tax-Exempt Bond Index Fund | | | | |
| |
| |
| |
| | | | Face | Market |
| | | Maturity | Amount | Value • |
| | Coupon | Date | ($000) | ($000) |
| New Jersey Transportation Trust Fund | | | | |
| Authority Transportation System Revenue | 5.250% | 6/15/26 | 450 | 474 |
| New Jersey Transportation Trust Fund | | | | |
| Authority Transportation System Revenue | 0.000% | 12/15/26 | 355 | 253 |
| New Jersey Transportation Trust Fund | | | | |
| Authority Transportation System Revenue | 0.000% | 12/15/26 (2) | 1,600 | 1,149 |
| New Jersey Transportation Trust Fund | | | | |
| Authority Transportation System Revenue | 5.000% | 12/15/26 (2) | 200 | 200 |
| New Jersey Transportation Trust Fund | | | | |
| Authority Transportation System Revenue | 5.000% | 12/15/27 (2) | 155 | 155 |
| New Jersey Transportation Trust Fund | | | | |
| Authority Transportation System Revenue | 0.000% | 12/15/28 | 1,380 | 890 |
| New Jersey Transportation Trust Fund | | | | |
| Authority Transportation System Revenue | 0.000% | 12/15/28 | 360 | 232 |
| New Jersey Transportation Trust Fund | | | | |
| Authority Transportation System Revenue | 0.000% | 12/15/28 (2) | 1,880 | 1,220 |
| New Jersey Transportation Trust Fund | | | | |
| Authority Transportation System Revenue | 5.625% | 12/15/28 | 100 | 100 |
| New Jersey Transportation Trust Fund | | | | |
| Authority Transportation System Revenue | 0.000% | 12/15/29 | 1,190 | 726 |
| New Jersey Transportation Trust Fund | | | | |
| Authority Transportation System Revenue | 0.000% | 12/15/29 (4) | 140 | 89 |
| New Jersey Transportation Trust Fund | | | | |
| Authority Transportation System Revenue | 0.000% | 12/15/30 (14) | 310 | 182 |
| New Jersey Transportation Trust Fund | | | | |
| Authority Transportation System Revenue | 0.000% | 12/15/30 | 1,725 | 995 |
| New Jersey Transportation Trust Fund | | | | |
| Authority Transportation System Revenue | 5.500% | 6/15/31 | 460 | 484 |
| New Jersey Transportation Trust Fund | | | | |
| Authority Transportation System Revenue | 0.000% | 12/15/31 | 1,325 | 723 |
| New Jersey Transportation Trust Fund | | | | |
| Authority Transportation System Revenue | 0.000% | 12/15/31 (14) | 990 | 549 |
| New Jersey Transportation Trust Fund | | | | |
| Authority Transportation System Revenue | 5.000% | 6/15/32 | 700 | 738 |
| New Jersey Transportation Trust Fund | | | | |
| Authority Transportation System Revenue | 5.250% | 6/15/32 | 875 | 934 |
| New Jersey Transportation Trust Fund | | | | |
| Authority Transportation System Revenue | 0.000% | 12/15/32 (4) | 1,555 | 846 |
| New Jersey Transportation Trust Fund | | | | |
| Authority Transportation System Revenue | 0.000% | 12/15/32 | 140 | 72 |
| New Jersey Transportation Trust Fund | | | | |
| Authority Transportation System Revenue | 5.000% | 12/15/32 (2) | 1,940 | 1,943 |
| New Jersey Transportation Trust Fund | | | | |
| Authority Transportation System Revenue | 0.000% | 12/15/33 | 750 | 366 |
| New Jersey Transportation Trust Fund | | | | |
| Authority Transportation System Revenue | 0.000% | 12/15/33 | 430 | 210 |
| New Jersey Transportation Trust Fund | | | | |
| Authority Transportation System Revenue | 0.000% | 12/15/34 | 640 | 296 |
| New Jersey Transportation Trust Fund | | | | |
| Authority Transportation System Revenue | 5.000% | 12/15/34 (2) | 715 | 716 |
| New Jersey Transportation Trust Fund | | | | |
| Authority Transportation System Revenue | 6.000% | 6/15/35 | 1,735 | 1,861 |
| New Jersey Transportation Trust Fund | | | | |
| Authority Transportation System Revenue | 0.000% | 12/15/35 | 975 | 426 |
73
| | | | |
| Tax-Exempt Bond Index Fund | | | | |
| |
| |
| |
| | | | Face | Market |
| | | Maturity | Amount | Value • |
| | Coupon | Date | ($000) | ($000) |
| New Jersey Transportation Trust Fund | | | | |
| Authority Transportation System Revenue | 5.250% | 6/15/36 | 250 | 260 |
| New Jersey Transportation Trust Fund | | | | |
| Authority Transportation System Revenue | 0.000% | 12/15/36 (2) | 760 | 318 |
| New Jersey Transportation Trust Fund | | | | |
| Authority Transportation System Revenue | 0.000% | 12/15/37 | 3,340 | 1,302 |
| New Jersey Transportation Trust Fund | | | | |
| Authority Transportation System Revenue | 0.000% | 12/15/37 | 720 | 281 |
| New Jersey Transportation Trust Fund | | | | |
| Authority Transportation System Revenue | 4.750% | 12/15/37 (2) | 2,250 | 2,253 |
| New Jersey Transportation Trust Fund | | | | |
| Authority Transportation System Revenue | 0.000% | 12/15/38 | 1,595 | 587 |
| New Jersey Transportation Trust Fund | | | | |
| Authority Transportation System Revenue | 0.000% | 12/15/38 | 250 | 92 |
| New Jersey Transportation Trust Fund | | | | |
| Authority Transportation System Revenue | 5.875% | 12/15/38 | 9,795 | 9,840 |
| New Jersey Transportation Trust Fund | | | | |
| Authority Transportation System Revenue | 6.000% | 12/15/38 | 1,510 | 1,517 |
| New Jersey Transportation Trust Fund | | | | |
| Authority Transportation System Revenue | 0.000% | 12/15/39 | 2,110 | 734 |
| New Jersey Transportation Trust Fund | | | | |
| Authority Transportation System Revenue | 0.000% | 12/15/40 | 1,215 | 400 |
| New Jersey Transportation Trust Fund | | | | |
| Authority Transportation System Revenue | 5.500% | 6/15/41 | 1,105 | 1,153 |
| New Jersey Transportation Trust Fund | | | | |
| Authority Transportation System Revenue | 5.000% | 6/15/42 | 370 | 380 |
| New Jersey Transportation Trust Fund | | | | |
| Authority Transportation System Revenue | 5.000% | 6/15/42 | 2,225 | 2,274 |
| New Jersey Turnpike Authority Revenue | 5.000% | 1/1/19 | 130 | 131 |
| New Jersey Turnpike Authority Revenue | 5.000% | 1/1/19 (Prere.) | 70 | 70 |
| New Jersey Turnpike Authority Revenue | 5.000% | 1/1/19 (Prere.) | 340 | 342 |
| New Jersey Turnpike Authority Revenue | 5.250% | 1/1/19 (Prere.) | 460 | 462 |
| New Jersey Turnpike Authority Revenue | 5.000% | 1/1/20 | 285 | 295 |
| New Jersey Turnpike Authority Revenue | 5.000% | 1/1/20 (Prere.) | 1,885 | 1,949 |
| New Jersey Turnpike Authority Revenue | 5.000% | 1/1/20 (Prere.) | 1,055 | 1,091 |
| New Jersey Turnpike Authority Revenue | 5.000% | 1/1/22 (Prere.) | 965 | 1,048 |
| New Jersey Turnpike Authority Revenue | 5.000% | 1/1/22 (Prere.) | 385 | 418 |
| New Jersey Turnpike Authority Revenue | 5.000% | 1/1/22 | 1,250 | 1,350 |
| New Jersey Turnpike Authority Revenue | 5.000% | 7/1/22 (Prere.) | 150 | 165 |
| New Jersey Turnpike Authority Revenue | 5.000% | 7/1/22 (Prere.) | 875 | 960 |
| New Jersey Turnpike Authority Revenue | 5.000% | 7/1/22 (Prere.) | 960 | 1,054 |
| New Jersey Turnpike Authority Revenue | 5.000% | 7/1/22 (Prere.) | 50 | 55 |
| New Jersey Turnpike Authority Revenue | 5.000% | 7/1/22 (Prere.) | 485 | 532 |
| New Jersey Turnpike Authority Revenue | 5.000% | 7/1/22 (Prere.) | 175 | 192 |
| New Jersey Turnpike Authority Revenue | 5.000% | 7/1/22 (Prere.) | 925 | 1,015 |
| New Jersey Turnpike Authority Revenue | 5.000% | 7/1/22 (Prere.) | 100 | 110 |
| New Jersey Turnpike Authority Revenue | 5.000% | 1/1/25 | 415 | 455 |
| New Jersey Turnpike Authority Revenue | 5.000% | 1/1/26 | 265 | 290 |
| New Jersey Turnpike Authority Revenue | 5.000% | 1/1/27 | 670 | 750 |
| New Jersey Turnpike Authority Revenue | 5.000% | 1/1/27 | 275 | 317 |
| New Jersey Turnpike Authority Revenue | 5.000% | 1/1/27 | 300 | 346 |
| New Jersey Turnpike Authority Revenue | 5.000% | 1/1/27 | 365 | 398 |
| New Jersey Turnpike Authority Revenue | 5.250% | 1/1/27 (4) | 295 | 346 |
| New Jersey Turnpike Authority Revenue | 5.000% | 1/1/28 | 430 | 479 |
74
| | | | |
| Tax-Exempt Bond Index Fund | | | | |
| |
| |
| |
| | | | Face | Market |
| | | Maturity | Amount | Value • |
| | Coupon | Date | ($000) | ($000) |
| New Jersey Turnpike Authority Revenue | 5.000% | 1/1/28 | 2,000 | 2,173 |
| New Jersey Turnpike Authority Revenue | 5.000% | 1/1/29 | 560 | 636 |
| New Jersey Turnpike Authority Revenue | 5.000% | 1/1/29 | 250 | 278 |
| New Jersey Turnpike Authority Revenue | 5.000% | 1/1/30 | 535 | 592 |
| New Jersey Turnpike Authority Revenue | 5.000% | 1/1/30 | 260 | 294 |
| New Jersey Turnpike Authority Revenue | 5.000% | 1/1/30 | 500 | 571 |
| New Jersey Turnpike Authority Revenue | 5.000% | 1/1/31 | 480 | 530 |
| New Jersey Turnpike Authority Revenue | 5.000% | 1/1/31 | 290 | 321 |
| New Jersey Turnpike Authority Revenue | 5.000% | 1/1/32 | 105 | 117 |
| New Jersey Turnpike Authority Revenue | 5.000% | 1/1/32 | 110 | 123 |
| New Jersey Turnpike Authority Revenue | 5.000% | 1/1/32 | 1,435 | 1,581 |
| New Jersey Turnpike Authority Revenue | 5.000% | 1/1/33 | 500 | 563 |
| New Jersey Turnpike Authority Revenue | 5.000% | 1/1/33 | 425 | 467 |
| New Jersey Turnpike Authority Revenue | 5.000% | 1/1/33 | 440 | 484 |
| New Jersey Turnpike Authority Revenue | 5.000% | 1/1/34 | 830 | 922 |
| New Jersey Turnpike Authority Revenue | 5.000% | 1/1/34 | 670 | 736 |
| New Jersey Turnpike Authority Revenue | 5.000% | 1/1/34 | 405 | 444 |
| New Jersey Turnpike Authority Revenue | 4.000% | 1/1/35 | 580 | 590 |
| New Jersey Turnpike Authority Revenue | 5.000% | 1/1/37 | 695 | 772 |
| New Jersey Turnpike Authority Revenue | 3.250% | 1/1/38 | 1,160 | 1,072 |
| New Jersey Turnpike Authority Revenue | 5.000% | 1/1/40 | 1,185 | 1,307 |
| New Jersey Turnpike Authority Revenue | 4.000% | 1/1/43 | 1,495 | 1,483 |
| New Jersey Turnpike Authority Revenue | 5.000% | 1/1/43 | 500 | 535 |
| New Jersey Turnpike Authority Revenue | 5.000% | 1/1/45 | 3,715 | 3,998 |
| Newark NJ Housing Authority Port | | | | |
| Authority-Port Newark Marine Terminal | | | | |
| Revenue (City of Newark Redevelopment | | | | |
| Projects) | 5.000% | 1/1/32 (14) | 210 | 233 |
| North Hudson NJ Sewerage Authority | | | | |
| Revenue | 0.000% | 8/1/25 (14)(ETM) | 2,000 | 1,649 |
| Rutgers State University New Jersey Revenue | 5.000% | 5/1/19 (Prere.) | 315 | 320 |
| South Jersey Transportation Authority New | | | | |
| Jersey Transportation System Revenue | 5.000% | 11/1/20 | 130 | 136 |
| South Jersey Transportation Authority New | | | | |
| Jersey Transportation System Revenue | 5.000% | 11/1/39 | 80 | 85 |
| | | | | 208,816 |
| New Mexico (0.1%) | | | | |
| New Mexico Finance Authority Transportation | | | | |
| Revenue | 4.000% | 6/15/19 | 210 | 213 |
| New Mexico Finance Authority Transportation | | | | |
| Revenue | 5.000% | 6/15/19 | 350 | 356 |
| New Mexico Finance Authority Transportation | | | | |
| Revenue | 5.000% | 6/15/20 | 565 | 591 |
| New Mexico Finance Authority Transportation | | | | |
| Revenue | 5.000% | 6/15/21 | 550 | 589 |
| New Mexico Finance Authority Transportation | | | | |
| Revenue | 5.000% | 6/15/22 | 325 | 355 |
| New Mexico Severance Tax Revenue | 4.000% | 7/1/20 | 2,260 | 2,328 |
| New Mexico Severance Tax Revenue | 4.000% | 7/1/21 | 125 | 131 |
| New Mexico Severance Tax Revenue | 4.000% | 7/1/22 | 155 | 164 |
| | | | | 4,727 |
| New York (19.8%) | | | | |
| Brooklyn NY Local Development Corp. PILOT | | | | |
| Revenue (Barclays Center Project) | 0.000% | 7/15/46 | 175 | 45 |
75
| | | | |
| Tax-Exempt Bond Index Fund | | | | |
| |
| |
| |
| | | | Face | Market |
| | | Maturity | Amount | Value • |
| | Coupon | Date | ($000) | ($000) |
| Brooklyn NY Local Development Corp. PILOT | | | | |
| Revenue (Barclays Center Project) | 0.000% | 7/15/47 | 240 | 59 |
| Brooklyn NY Local Development Corp. PILOT | | | | |
| Revenue (Brooklyn Events Center) | 5.000% | 7/15/28 | 1,000 | 1,101 |
| Brooklyn NY Local Development Corp. PILOT | | | | |
| Revenue (Brooklyn Events Center) | 5.000% | 7/15/30 | 1,500 | 1,635 |
| Brooklyn NY Local Development Corp. PILOT | | | | |
| Revenue (Brooklyn Events Center) | 5.000% | 7/15/42 | 790 | 837 |
| Hudson Yards Infrastructure Corp. New York | | | | |
| Revenue | 5.250% | 2/15/21 (Prere.) | 15 | 16 |
| Hudson Yards Infrastructure Corp. New York | | | | |
| Revenue | 5.000% | 2/15/32 | 540 | 607 |
| Hudson Yards Infrastructure Corp. New York | | | | |
| Revenue | 5.000% | 2/15/33 | 500 | 559 |
| Hudson Yards Infrastructure Corp. New York | | | | |
| Revenue | 5.000% | 2/15/34 | 500 | 557 |
| Hudson Yards Infrastructure Corp. New York | | | | |
| Revenue | 5.000% | 2/15/35 | 3,490 | 3,879 |
| Hudson Yards Infrastructure Corp. New York | | | | |
| Revenue | 4.000% | 2/15/36 | 525 | 529 |
| Hudson Yards Infrastructure Corp. New York | | | | |
| Revenue | 5.000% | 2/15/37 | 760 | 839 |
| Hudson Yards Infrastructure Corp. New York | | | | |
| Revenue | 5.000% | 2/15/39 | 500 | 549 |
| Hudson Yards Infrastructure Corp. New York | | | | |
| Revenue | 4.000% | 2/15/44 | 3,050 | 3,026 |
| Hudson Yards Infrastructure Corp. New York | | | | |
| Revenue | 5.000% | 2/15/45 | 1,025 | 1,120 |
| Hudson Yards Infrastructure Corp. New York | | | | |
| Revenue | 5.250% | 2/15/47 | 285 | 302 |
| Hudson Yards Infrastructure Corp. New York | | | | |
| Revenue | 5.750% | 2/15/47 | 590 | 631 |
| Long Island NY Power Authority Electric | | | | |
| System Revenue | 5.500% | 4/1/19 (Prere.) | 400 | 406 |
| Long Island NY Power Authority Electric | | | | |
| System Revenue | 5.750% | 4/1/19 (Prere.) | 250 | 254 |
| Long Island NY Power Authority Electric | | | | |
| System Revenue | 5.750% | 4/1/19 (Prere.) | 135 | 137 |
| Long Island NY Power Authority Electric | | | | |
| System Revenue | 5.750% | 4/1/19 (Prere.) | 840 | 854 |
| Long Island NY Power Authority Electric | | | | |
| System Revenue | 6.250% | 4/1/19 (Prere.) | 1,935 | 1,970 |
| Long Island NY Power Authority Electric | | | | |
| System Revenue | 5.500% | 5/1/19 (Prere.) | 575 | 585 |
| Long Island NY Power Authority Electric | | | | |
| System Revenue | 6.000% | 5/1/19 (Prere.) | 550 | 561 |
| Long Island NY Power Authority Electric | | | | |
| System Revenue | 5.000% | 5/1/21 (Prere.) | 2,025 | 2,167 |
| Long Island NY Power Authority Electric | | | | |
| System Revenue | 5.000% | 5/1/21 (Prere.) | 600 | 642 |
| Long Island NY Power Authority Electric | | | | |
| System Revenue | 0.000% | 6/1/22 (4) | 100 | 91 |
| Long Island NY Power Authority Electric | | | | |
| System Revenue | 0.000% | 6/1/26 (4) | 110 | 86 |
76
| | | | |
| Tax-Exempt Bond Index Fund | | | | |
| |
| |
| |
| | | | Face | Market |
| | | Maturity | Amount | Value • |
| | Coupon | Date | ($000) | ($000) |
| Long Island NY Power Authority Electric | | | | |
| System Revenue | 5.000% | 9/1/26 | 100 | 109 |
| Long Island NY Power Authority Electric | | | | |
| System Revenue | 0.000% | 6/1/28 (4) | 270 | 193 |
| Long Island NY Power Authority Electric | | | | |
| System Revenue | 5.000% | 9/1/30 | 300 | 340 |
| Long Island NY Power Authority Electric | | | | |
| System Revenue | 5.000% | 9/1/37 | 500 | 537 |
| Long Island NY Power Authority Electric | | | | |
| System Revenue | 5.000% | 9/1/42 | 710 | 760 |
| Long Island NY Power Authority Electric | | | | |
| System Revenue | 5.000% | 9/1/44 | 1,000 | 1,088 |
| Long Island NY Power Authority Electric | | | | |
| System Revenue | 5.000% | 9/1/45 | 210 | 228 |
| Long Island NY Power Authority Electric | | | | |
| System Revenue | 5.000% | 9/1/47 | 2,680 | 2,921 |
| Metropolitan Transportation Authority NY | | | | |
| BAN | 5.000% | 5/15/21 | 10,000 | 10,637 |
| Metropolitan Transportation Authority NY | | | | |
| Revenue | 5.000% | 11/15/24 | 1,015 | 1,140 |
| Metropolitan Transportation Authority NY | | | | |
| Revenue | 5.000% | 11/15/24 | 1,235 | 1,387 |
| Metropolitan Transportation Authority Revenue | 0.000% | 11/15/33 | 3,135 | 1,694 |
| Monroe County NY Industrial Development | | | | |
| Corp. Revenue (Rochester General Hospital) | 4.000% | 7/1/43 | 350 | 346 |
| Nassau County NY GO | 5.000% | 1/1/22 | 100 | 108 |
| Nassau County NY GO | 5.000% | 10/1/27 | 900 | 1,030 |
| Nassau County NY GO | 5.000% | 4/1/39 | 250 | 266 |
| Nassau County NY GO | 5.000% | 4/1/43 | 390 | 411 |
| New York City NY GO | 5.500% | 11/15/18 (Prere.) | 100 | 100 |
| New York City NY GO | 5.375% | 4/1/19 (Prere.) | 1,000 | 1,015 |
| New York City NY GO | 5.000% | 5/15/19 (Prere.) | 100 | 102 |
| New York City NY GO | 5.000% | 5/15/19 (Prere.) | 285 | 290 |
| New York City NY GO | 4.000% | 8/1/19 | 90 | 91 |
| New York City NY GO | 5.000% | 8/1/19 | 600 | 613 |
| New York City NY GO | 5.000% | 8/1/19 | 945 | 966 |
| New York City NY GO | 5.000% | 8/1/19 | 495 | 506 |
| New York City NY GO | 5.000% | 8/1/19 | 175 | 179 |
| New York City NY GO | 5.000% | 8/1/19 | 500 | 511 |
| New York City NY GO | 5.000% | 8/1/19 | 395 | 404 |
| New York City NY GO | 5.000% | 8/1/19 | 500 | 511 |
| New York City NY GO | 5.000% | 8/1/19 | 860 | 879 |
| New York City NY GO | 5.000% | 8/1/19 | 635 | 649 |
| New York City NY GO | 5.000% | 8/1/20 | 200 | 210 |
| New York City NY GO | 5.000% | 8/1/20 | 875 | 918 |
| New York City NY GO | 5.000% | 8/1/20 | 3,800 | 3,987 |
| New York City NY GO | 5.000% | 8/1/20 | 425 | 446 |
| New York City NY GO | 5.000% | 8/1/20 | 150 | 157 |
| New York City NY GO | 5.000% | 8/1/20 | 150 | 157 |
| New York City NY GO | 5.000% | 8/1/20 | 1,455 | 1,527 |
| New York City NY GO | 5.000% | 8/1/20 | 455 | 477 |
| New York City NY GO | 5.000% | 8/1/20 | 675 | 708 |
| New York City NY GO | 5.000% | 4/1/21 | 1,870 | 1,993 |
| New York City NY GO | 5.000% | 8/1/21 | 240 | 258 |
77
| | | | |
| Tax-Exempt Bond Index Fund | | | | |
| |
| |
| |
| | | | Face | Market |
| | | Maturity | Amount | Value • |
| | Coupon | Date | ($000) | ($000) |
| New York City NY GO | 5.000% | 8/1/21 | 710 | 763 |
| New York City NY GO | 5.000% | 8/1/21 | 125 | 134 |
| New York City NY GO | 5.000% | 8/1/21 | 100 | 107 |
| New York City NY GO | 5.000% | 8/1/21 | 2,355 | 2,529 |
| New York City NY GO | 5.000% | 8/1/21 | 2,500 | 2,685 |
| New York City NY GO | 5.000% | 8/1/21 | 175 | 188 |
| New York City NY GO | 5.000% | 8/1/21 | 705 | 757 |
| New York City NY GO | 5.000% | 8/1/21 | 1,500 | 1,611 |
| New York City NY GO | 5.000% | 8/1/21 | 125 | 134 |
| New York City NY GO | 5.000% | 8/1/21 | 180 | 184 |
| New York City NY GO | 5.000% | 8/1/22 | 700 | 767 |
| New York City NY GO | 5.000% | 8/1/22 | 2,350 | 2,547 |
| New York City NY GO | 5.000% | 8/1/22 | 170 | 186 |
| New York City NY GO | 5.000% | 8/1/22 | 145 | 159 |
| New York City NY GO | 5.000% | 8/1/22 | 275 | 302 |
| New York City NY GO | 5.000% | 8/1/22 | 200 | 219 |
| New York City NY GO | 5.000% | 8/1/22 | 1,000 | 1,096 |
| New York City NY GO | 5.000% | 8/1/22 | 300 | 329 |
| New York City NY GO | 5.000% | 8/1/22 | 60 | 66 |
| New York City NY GO | 5.000% | 8/1/22 | 3,495 | 3,832 |
| New York City NY GO | 5.000% | 8/1/22 | 5,000 | 5,482 |
| New York City NY GO | 5.000% | 4/1/23 | 1,975 | 2,142 |
| New York City NY GO | 5.000% | 8/1/23 | 290 | 323 |
| New York City NY GO | 5.000% | 8/1/23 | 140 | 156 |
| New York City NY GO | 5.000% | 8/1/23 | 115 | 128 |
| New York City NY GO | 5.000% | 8/1/23 | 125 | 128 |
| New York City NY GO | 5.000% | 8/1/23 | 250 | 267 |
| New York City NY GO | 5.000% | 8/1/23 | 5,000 | 5,577 |
| New York City NY GO | 5.000% | 8/1/24 | 805 | 913 |
| New York City NY GO | 5.000% | 8/1/24 | 710 | 805 |
| New York City NY GO | 5.000% | 8/1/24 | 310 | 338 |
| New York City NY GO | 5.000% | 8/1/24 | 210 | 229 |
| New York City NY GO | 5.000% | 8/1/24 | 1,055 | 1,196 |
| New York City NY GO | 5.000% | 8/1/24 | 150 | 167 |
| New York City NY GO | 5.000% | 8/1/24 | 360 | 408 |
| New York City NY GO | 5.000% | 8/1/24 | 630 | 714 |
| New York City NY GO | 5.000% | 8/1/25 | 180 | 206 |
| New York City NY GO | 5.000% | 8/1/25 | 465 | 533 |
| New York City NY GO | 5.000% | 8/1/25 | 160 | 181 |
| New York City NY GO | 5.000% | 8/1/25 | 210 | 239 |
| New York City NY GO | 5.000% | 8/1/25 | 245 | 281 |
| New York City NY GO | 5.000% | 8/1/25 | 490 | 561 |
| New York City NY GO | 5.000% | 8/1/25 | 1,080 | 1,237 |
| New York City NY GO | 5.000% | 8/1/25 | 200 | 220 |
| New York City NY GO | 5.000% | 8/1/25 | 595 | 660 |
| New York City NY GO | 5.000% | 8/1/26 | 1,120 | 1,288 |
| New York City NY GO | 5.000% | 8/1/26 | 250 | 290 |
| New York City NY GO | 5.000% | 8/1/26 | 500 | 544 |
| New York City NY GO | 5.000% | 4/1/27 | 275 | 297 |
| New York City NY GO | 5.000% | 8/1/27 | 200 | 227 |
| New York City NY GO | 5.000% | 8/1/27 | 230 | 259 |
| New York City NY GO | 5.000% | 8/1/27 | 450 | 513 |
| New York City NY GO | 5.000% | 8/1/28 | 100 | 115 |
| New York City NY GO | 5.000% | 8/1/28 | 685 | 789 |
78
| | | | |
| Tax-Exempt Bond Index Fund | | | | |
| |
| |
| |
| | | | Face | Market |
| | | Maturity | Amount | Value • |
| | Coupon | Date | ($000) | ($000) |
| New York City NY GO | 5.000% | 8/1/28 | 300 | 337 |
| New York City NY GO | 5.000% | 8/1/28 | 55 | 62 |
| New York City NY GO | 5.000% | 8/1/28 | 370 | 432 |
| New York City NY GO | 5.000% | 10/1/28 | 725 | 790 |
| New York City NY GO | 5.000% | 8/1/29 | 285 | 314 |
| New York City NY GO | 5.000% | 8/1/29 | 365 | 408 |
| New York City NY GO | 5.000% | 8/1/29 | 600 | 656 |
| New York City NY GO | 5.000% | 8/1/29 | 100 | 109 |
| New York City NY GO | 5.000% | 8/1/29 | 7,620 | 8,272 |
| New York City NY GO | 5.000% | 8/1/29 | 4,665 | 5,312 |
| New York City NY GO | 5.000% | 3/1/30 | 100 | 109 |
| New York City NY GO | 5.000% | 8/1/30 | 290 | 328 |
| New York City NY GO | 5.000% | 8/1/30 | 3,440 | 3,895 |
| New York City NY GO | 5.000% | 8/1/30 | 445 | 511 |
| New York City NY GO | 5.000% | 10/1/30 | 690 | 738 |
| New York City NY GO | 5.000% | 5/15/31 | 160 | 162 |
| New York City NY GO | 5.000% | 8/1/31 | 2,000 | 2,283 |
| New York City NY GO | 5.250% | 10/1/31 | 1,500 | 1,742 |
| New York City NY GO | 5.000% | 8/1/32 | 500 | 569 |
| New York City NY GO | 5.000% | 8/1/32 | 110 | 122 |
| New York City NY GO | 5.000% | 10/1/32 | 185 | 197 |
| New York City NY GO | 5.000% | 8/1/33 | 1,000 | 1,098 |
| New York City NY GO | 5.000% | 8/1/35 | 50 | 53 |
| New York City NY GO | 5.000% | 10/1/35 | 500 | 561 |
| New York City NY GO | 5.000% | 5/15/36 | 890 | 903 |
| New York City NY GO | 5.000% | 6/1/36 | 100 | 110 |
| New York City NY GO | 5.000% | 4/1/37 | 1,265 | 1,415 |
| New York City NY GO | 5.000% | 10/1/37 | 2,000 | 2,234 |
| New York City NY GO | 5.000% | 12/1/41 | 315 | 347 |
| New York City NY GO | 4.000% | 12/1/43 | 265 | 265 |
| New York City NY Housing Development Corp. | | | | |
| Multi-Family Housing Revenue | 3.950% | 11/1/48 | 2,000 | 1,932 |
| New York City NY Industrial Development | | | | |
| Agency PILOT Revenue (Queens Baseball | | | | |
| Stadium Project) | 6.375% | 1/1/39 (12) | 2,495 | 2,512 |
| New York City NY Industrial Development | | | | |
| Agency PILOT Revenue (Queens Baseball | | | | |
| Stadium Project) | 4.750% | 1/1/42 (2) | 10 | 10 |
| New York City NY Industrial Development | | | | |
| Agency PILOT Revenue (Yankee Stadium | | | | |
| Project) | 5.000% | 3/1/31 (3) | 20 | 20 |
| New York City NY Industrial Development | | | | |
| Agency PILOT Revenue (Yankee Stadium | | | | |
| Project) | 5.000% | 3/1/36 (14) | 100 | 100 |
| New York City NY Industrial Development | | | | |
| Agency PILOT Revenue (Yankee Stadium | | | | |
| Project) | 4.500% | 3/1/39 (3) | 790 | 790 |
| New York City NY Industrial Development | | | | |
| Agency PILOT Revenue (Yankee Stadium | | | | |
| Project) | 0.000% | 3/1/44 (12) | 150 | 48 |
| New York City NY Industrial Development | | | | |
| Agency PILOT Revenue (Yankee Stadium | | | | |
| Project) | 4.750% | 3/1/46 (14) | 130 | 130 |
79
| | | | |
| Tax-Exempt Bond Index Fund | | | | |
| |
| |
| |
| | | | Face | Market |
| | | Maturity | Amount | Value • |
| | Coupon | Date | ($000) | ($000) |
| New York City NY Industrial Development | | | | |
| Agency PILOT Revenue (Yankee Stadium | | | | |
| Project) | 5.000% | 3/1/46 (3) | 565 | 568 |
| New York City NY Industrial Development | | | | |
| Agency PILOT Revenue (Yankee Stadium | | | | |
| Project) | 7.000% | 3/1/49 (12) | 120 | 122 |
| New York City NY Municipal Water Finance | | | | |
| Authority Water & Sewer System Revenue | 5.000% | 6/15/21 (Prere.) | 1,000 | 1,073 |
| New York City NY Municipal Water Finance | | | | |
| Authority Water & Sewer System Revenue | 5.000% | 6/15/21 (Prere.) | 910 | 977 |
| New York City NY Municipal Water Finance | | | | |
| Authority Water & Sewer System Revenue | 5.000% | 6/15/23 (Prere.) | 965 | 1,083 |
| New York City NY Municipal Water Finance | | | | |
| Authority Water & Sewer System Revenue | 5.000% | 6/15/26 | 250 | 267 |
| New York City NY Municipal Water Finance | | | | |
| Authority Water & Sewer System Revenue | 5.000% | 6/15/29 | 235 | 261 |
| New York City NY Municipal Water Finance | | | | |
| Authority Water & Sewer System Revenue | 5.000% | 6/15/29 | 235 | 243 |
| New York City NY Municipal Water Finance | | | | |
| Authority Water & Sewer System Revenue | 5.250% | 6/15/30 | 2,555 | 2,808 |
| New York City NY Municipal Water Finance | | | | |
| Authority Water & Sewer System Revenue | 5.000% | 6/15/31 | 80 | 83 |
| New York City NY Municipal Water Finance | | | | |
| Authority Water & Sewer System Revenue | 5.000% | 6/15/32 | 2,085 | 2,214 |
| New York City NY Municipal Water Finance | | | | |
| Authority Water & Sewer System Revenue | 5.000% | 6/15/32 | 1,500 | 1,680 |
| New York City NY Municipal Water Finance | | | | |
| Authority Water & Sewer System Revenue | 5.250% | 6/15/32 | 2,110 | 2,150 |
| New York City NY Municipal Water Finance | | | | |
| Authority Water & Sewer System Revenue | 4.000% | 6/15/34 | 170 | 173 |
| New York City NY Municipal Water Finance | | | | |
| Authority Water & Sewer System Revenue | 5.000% | 6/15/34 | 1,000 | 1,115 |
| New York City NY Municipal Water Finance | | | | |
| Authority Water & Sewer System Revenue | 5.000% | 6/15/34 | 510 | 556 |
| New York City NY Municipal Water Finance | | | | |
| Authority Water & Sewer System Revenue | 5.000% | 6/15/34 | 1,125 | 1,220 |
| New York City NY Municipal Water Finance | | | | |
| Authority Water & Sewer System Revenue | 5.000% | 6/15/35 | 100 | 110 |
| New York City NY Municipal Water Finance | | | | |
| Authority Water & Sewer System Revenue | 5.000% | 6/15/35 | 670 | 681 |
| New York City NY Municipal Water Finance | | | | |
| Authority Water & Sewer System Revenue | 5.000% | 6/15/35 | 1,095 | 1,192 |
| New York City NY Municipal Water Finance | | | | |
| Authority Water & Sewer System Revenue | 5.000% | 6/15/35 | 3,000 | 3,341 |
| New York City NY Municipal Water Finance | | | | |
| Authority Water & Sewer System Revenue | 5.000% | 6/15/36 | 500 | 559 |
| New York City NY Municipal Water Finance | | | | |
| Authority Water & Sewer System Revenue | 5.000% | 6/15/36 | 1,030 | 1,134 |
| New York City NY Municipal Water Finance | | | | |
| Authority Water & Sewer System Revenue | 5.000% | 6/15/36 | 875 | 963 |
| New York City NY Municipal Water Finance | | | | |
| Authority Water & Sewer System Revenue | 5.000% | 6/15/36 | 3,500 | 3,870 |
| New York City NY Municipal Water Finance | | | | |
| Authority Water & Sewer System Revenue | 5.000% | 6/15/37 | 355 | 389 |
80
| | | | |
| Tax-Exempt Bond Index Fund | | | | |
| |
| |
| |
| | | | Face | Market |
| | | Maturity | Amount | Value • |
| | Coupon | Date | ($000) | ($000) |
| New York City NY Municipal Water Finance | | | | |
| Authority Water & Sewer System Revenue | 5.000% | 6/15/38 | 350 | 380 |
| New York City NY Municipal Water Finance | | | | |
| Authority Water & Sewer System Revenue | 5.000% | 6/15/38 | 800 | 889 |
| New York City NY Municipal Water Finance | | | | |
| Authority Water & Sewer System Revenue | 5.000% | 6/15/38 | 1,000 | 1,122 |
| New York City NY Municipal Water Finance | | | | |
| Authority Water & Sewer System Revenue | 4.500% | 6/15/39 | 2,345 | 2,453 |
| New York City NY Municipal Water Finance | | | | |
| Authority Water & Sewer System Revenue | 5.000% | 6/15/39 | 575 | 584 |
| New York City NY Municipal Water Finance | | | | |
| Authority Water & Sewer System Revenue | 5.000% | 6/15/39 | 425 | 464 |
| New York City NY Municipal Water Finance | | | | |
| Authority Water & Sewer System Revenue | 5.000% | 6/15/39 | 1,265 | 1,285 |
| New York City NY Municipal Water Finance | | | | |
| Authority Water & Sewer System Revenue | 5.000% | 6/15/39 | 2,050 | 2,241 |
| New York City NY Municipal Water Finance | | | | |
| Authority Water & Sewer System Revenue | 5.000% | 6/15/39 | 210 | 230 |
| New York City NY Municipal Water Finance | | | | |
| Authority Water & Sewer System Revenue | 5.000% | 6/15/39 | 455 | 498 |
| New York City NY Municipal Water Finance | | | | |
| Authority Water & Sewer System Revenue | 5.000% | 6/15/39 | 1,650 | 1,811 |
| New York City NY Municipal Water Finance | | | | |
| Authority Water & Sewer System Revenue | 5.000% | 6/15/40 | 1,255 | 1,273 |
| New York City NY Municipal Water Finance | | | | |
| Authority Water & Sewer System Revenue | 5.000% | 6/15/40 | 1,470 | 1,614 |
| New York City NY Municipal Water Finance | | | | |
| Authority Water & Sewer System Revenue | 5.250% | 6/15/40 | 3,135 | 3,190 |
| New York City NY Municipal Water Finance | | | | |
| Authority Water & Sewer System Revenue | 5.375% | 6/15/40 | 115 | 122 |
| New York City NY Municipal Water Finance | | | | |
| Authority Water & Sewer System Revenue | 5.500% | 6/15/40 | 895 | 913 |
| New York City NY Municipal Water Finance | | | | |
| Authority Water & Sewer System Revenue | 5.375% | 6/15/43 | 1,680 | 1,783 |
| New York City NY Municipal Water Finance | | | | |
| Authority Water & Sewer System Revenue | 5.500% | 6/15/43 | 1,425 | 1,516 |
| New York City NY Municipal Water Finance | | | | |
| Authority Water & Sewer System Revenue | 5.000% | 6/15/44 | 115 | 125 |
| New York City NY Municipal Water Finance | | | | |
| Authority Water & Sewer System Revenue | 5.000% | 6/15/44 | 1,470 | 1,568 |
| New York City NY Municipal Water Finance | | | | |
| Authority Water & Sewer System Revenue | 5.250% | 6/15/44 | 685 | 740 |
| New York City NY Municipal Water Finance | | | | |
| Authority Water & Sewer System Revenue | 4.000% | 6/15/45 | 190 | 189 |
| New York City NY Municipal Water Finance | | | | |
| Authority Water & Sewer System Revenue | 5.000% | 6/15/45 | 140 | 152 |
| New York City NY Municipal Water Finance | | | | |
| Authority Water & Sewer System Revenue | 5.000% | 6/15/45 | 2,935 | 3,130 |
| New York City NY Municipal Water Finance | | | | |
| Authority Water & Sewer System Revenue | 5.000% | 6/15/45 | 140 | 151 |
| New York City NY Municipal Water Finance | | | | |
| Authority Water & Sewer System Revenue | 4.000% | 6/15/46 | 415 | 412 |
| New York City NY Municipal Water Finance | | | | |
| Authority Water & Sewer System Revenue | 4.625% | 6/15/46 | 3,000 | 3,121 |
81
| | | | |
| Tax-Exempt Bond Index Fund | | | | |
| |
| |
| |
| | | | Face | Market |
| | | Maturity | Amount | Value • |
| | Coupon | Date | ($000) | ($000) |
| New York City NY Municipal Water Finance | | | | |
| Authority Water & Sewer System Revenue | 5.000% | 6/15/46 | 1,725 | 1,850 |
| New York City NY Municipal Water Finance | | | | |
| Authority Water & Sewer System Revenue | 5.000% | 6/15/46 | 200 | 219 |
| New York City NY Municipal Water Finance | | | | |
| Authority Water & Sewer System Revenue | 5.000% | 6/15/47 | 2,355 | 2,545 |
| New York City NY Municipal Water Finance | | | | |
| Authority Water & Sewer System Revenue | 5.000% | 6/15/47 | 250 | 274 |
| New York City NY Municipal Water Finance | | | | |
| Authority Water & Sewer System Revenue | 5.000% | 6/15/47 | 1,080 | 1,158 |
| New York City NY Municipal Water Finance | | | | |
| Authority Water & Sewer System Revenue | 5.000% | 6/15/47 | 3,175 | 3,449 |
| New York City NY Municipal Water Finance | | | | |
| Authority Water & Sewer System Revenue | 5.000% | 6/15/47 | 250 | 268 |
| New York City NY Municipal Water Finance | | | | |
| Authority Water & Sewer System Revenue | 5.000% | 6/15/48 | 500 | 549 |
| New York City NY Municipal Water Finance | | | | |
| Authority Water & Sewer System Revenue | | | | |
| VRDO | 5.000% | 6/15/35 | 640 | 697 |
| New York City NY Sales Tax Asset Receivable | | | | |
| Corp. Revenue | 5.000% | 10/15/21 | 250 | 270 |
| New York City NY Sales Tax Asset Receivable | | | | |
| Corp. Revenue | 5.000% | 10/15/22 | 270 | 299 |
| New York City NY Sales Tax Asset Receivable | | | | |
| Corp. Revenue | 5.000% | 10/15/26 | 765 | 867 |
| New York City NY Sales Tax Asset Receivable | | | | |
| Corp. Revenue | 5.000% | 10/15/27 | 680 | 769 |
| New York City NY Sales Tax Asset Receivable | | | | |
| Corp. Revenue | 5.000% | 10/15/28 | 495 | 559 |
| New York City NY Sales Tax Asset Receivable | | | | |
| Corp. Revenue | 5.000% | 10/15/29 | 335 | 377 |
| New York City NY Sales Tax Asset Receivable | | | | |
| Corp. Revenue | 5.000% | 10/15/30 | 1,100 | 1,233 |
| New York City NY Sales Tax Asset Receivable | | | | |
| Corp. Revenue | 5.000% | 10/15/31 | 1,855 | 2,073 |
| New York City NY Sales Tax Asset Receivable | | | | |
| Corp. Revenue | 4.000% | 10/15/32 | 3,500 | 3,641 |
| New York City NY Transitional Finance | | | | |
| Authority Building Aid Revenue | 5.000% | 7/15/21 | 115 | 124 |
| New York City NY Transitional Finance | | | | |
| Authority Building Aid Revenue | 5.000% | 7/15/25 | 160 | 171 |
| New York City NY Transitional Finance | | | | |
| Authority Building Aid Revenue | 3.250% | 7/15/27 | 100 | 101 |
| New York City NY Transitional Finance | | | | |
| Authority Building Aid Revenue | 5.000% | 7/15/28 | 640 | 736 |
| New York City NY Transitional Finance | | | | |
| Authority Building Aid Revenue | 5.000% | 7/15/29 | 100 | 114 |
| New York City NY Transitional Finance | | | | |
| Authority Building Aid Revenue | 5.250% | 1/15/30 | 80 | 81 |
| New York City NY Transitional Finance | | | | |
| Authority Building Aid Revenue | 5.000% | 7/15/30 | 800 | 866 |
| New York City NY Transitional Finance | | | | |
| Authority Building Aid Revenue | 5.000% | 1/15/31 | 305 | 307 |
82
| | | | |
| Tax-Exempt Bond Index Fund | | | | |
| |
| |
| |
| | | | Face | Market |
| | | Maturity | Amount | Value • |
| | Coupon | Date | ($000) | ($000) |
| New York City NY Transitional Finance | | | | |
| Authority Building Aid Revenue | 5.000% | 7/15/31 | 80 | 89 |
| New York City NY Transitional Finance | | | | |
| Authority Building Aid Revenue | 5.000% | 7/15/32 | 170 | 181 |
| New York City NY Transitional Finance | | | | |
| Authority Building Aid Revenue | 5.000% | 7/15/32 | 430 | 465 |
| New York City NY Transitional Finance | | | | |
| Authority Building Aid Revenue | 5.125% | 1/15/33 | 630 | 634 |
| New York City NY Transitional Finance | | | | |
| Authority Building Aid Revenue | 5.500% | 1/15/33 | 415 | 418 |
| New York City NY Transitional Finance | | | | |
| Authority Building Aid Revenue | 5.000% | 7/15/33 | 140 | 151 |
| New York City NY Transitional Finance | | | | |
| Authority Building Aid Revenue | 5.250% | 1/15/34 | 370 | 373 |
| New York City NY Transitional Finance | | | | |
| Authority Building Aid Revenue | 5.375% | 1/15/34 | 140 | 141 |
| New York City NY Transitional Finance | | | | |
| Authority Building Aid Revenue | 5.000% | 7/15/34 | 1,000 | 1,126 |
| New York City NY Transitional Finance | | | | |
| Authority Building Aid Revenue | 5.000% | 7/15/35 | 750 | 823 |
| New York City NY Transitional Finance | | | | |
| Authority Building Aid Revenue | 5.000% | 7/15/35 | 2,000 | 2,228 |
| New York City NY Transitional Finance | | | | |
| Authority Building Aid Revenue | 5.250% | 7/15/35 | 1,000 | 1,151 |
| New York City NY Transitional Finance | | | | |
| Authority Building Aid Revenue | 4.000% | 7/15/36 | 265 | 267 |
| New York City NY Transitional Finance | | | | |
| Authority Building Aid Revenue | 4.000% | 7/15/36 | 3,030 | 3,054 |
| New York City NY Transitional Finance | | | | |
| Authority Building Aid Revenue | 5.000% | 7/15/36 | 100 | 106 |
| New York City NY Transitional Finance | | | | |
| Authority Building Aid Revenue | 5.000% | 7/15/36 | 250 | 272 |
| New York City NY Transitional Finance | | | | |
| Authority Building Aid Revenue | 4.000% | 7/15/38 | 1,000 | 1,002 |
| New York City NY Transitional Finance | | | | |
| Authority Building Aid Revenue | 5.250% | 1/15/39 | 5,155 | 5,191 |
| New York City NY Transitional Finance | | | | |
| Authority Building Aid Revenue | 5.500% | 1/15/39 | 265 | 267 |
| New York City NY Transitional Finance | | | | |
| Authority Building Aid Revenue | 5.750% | 1/15/39 | 430 | 433 |
| New York City NY Transitional Finance | | | | |
| Authority Building Aid Revenue | 4.000% | 7/15/40 | 1,230 | 1,218 |
| New York City NY Transitional Finance | | | | |
| Authority Building Aid Revenue | 5.000% | 7/15/40 | 350 | 370 |
| New York City NY Transitional Finance | | | | |
| Authority Building Aid Revenue | 5.000% | 7/15/40 | 1,485 | 1,615 |
| New York City NY Transitional Finance | | | | |
| Authority Building Aid Revenue | 5.000% | 7/15/40 | 110 | 119 |
| New York City NY Transitional Finance | | | | |
| Authority Building Aid Revenue | 5.000% | 7/15/43 | 100 | 108 |
| New York City NY Transitional Finance | | | | |
| Authority Building Aid Revenue | 5.000% | 7/15/43 | 2,080 | 2,299 |
| New York City NY Transitional Finance | | | | |
| Authority Building Aid Revenue | 5.000% | 7/15/43 | 3,400 | 3,672 |
83
| | | | |
| Tax-Exempt Bond Index Fund | | | | |
| |
| |
| |
| | | | Face | Market |
| | | Maturity | Amount | Value • |
| | Coupon | Date | ($000) | ($000) |
| New York City NY Transitional Finance | | | | |
| Authority Building Aid Revenue | 3.500% | 7/15/47 | 1,395 | 1,246 |
| New York City NY Transitional Finance | | | | |
| Authority Future Tax Revenue | 5.000% | 11/1/18 | 250 | 250 |
| New York City NY Transitional Finance | | | | |
| Authority Future Tax Revenue | 5.000% | 11/1/18 | 100 | 100 |
| New York City NY Transitional Finance | | | | |
| Authority Future Tax Revenue | 5.000% | 5/1/19 (Prere.) | 135 | 137 |
| New York City NY Transitional Finance | | | | |
| Authority Future Tax Revenue | 5.000% | 11/1/19 | 100 | 103 |
| New York City NY Transitional Finance | | | | |
| Authority Future Tax Revenue | 5.000% | 11/1/19 (Prere.) | 55 | 57 |
| New York City NY Transitional Finance | | | | |
| Authority Future Tax Revenue | 5.000% | 11/1/20 | 310 | 319 |
| New York City NY Transitional Finance | | | | |
| Authority Future Tax Revenue | 5.000% | 11/1/20 | 240 | 253 |
| New York City NY Transitional Finance | | | | |
| Authority Future Tax Revenue | 5.000% | 11/1/20 | 475 | 501 |
| New York City NY Transitional Finance | | | | |
| Authority Future Tax Revenue | 5.500% | 11/1/20 (Prere.) | 205 | 218 |
| New York City NY Transitional Finance | | | | |
| Authority Future Tax Revenue | 5.000% | 8/1/21 | 225 | 242 |
| New York City NY Transitional Finance | | | | |
| Authority Future Tax Revenue | 5.000% | 11/1/21 | 205 | 222 |
| New York City NY Transitional Finance | | | | |
| Authority Future Tax Revenue | 5.000% | 11/1/21 | 350 | 379 |
| New York City NY Transitional Finance | | | | |
| Authority Future Tax Revenue | 5.000% | 11/1/21 | 170 | 184 |
| New York City NY Transitional Finance | | | | |
| Authority Future Tax Revenue | 5.250% | 2/1/22 | 470 | 502 |
| New York City NY Transitional Finance | | | | |
| Authority Future Tax Revenue | 5.000% | 11/1/22 | 245 | 265 |
| New York City NY Transitional Finance | | | | |
| Authority Future Tax Revenue | 5.000% | 11/1/22 | 105 | 116 |
| New York City NY Transitional Finance | | | | |
| Authority Future Tax Revenue | 5.000% | 11/1/22 | 210 | 231 |
| New York City NY Transitional Finance | | | | |
| Authority Future Tax Revenue | 5.000% | 8/1/24 | 2,375 | 2,691 |
| New York City NY Transitional Finance | | | | |
| Authority Future Tax Revenue | 5.000% | 11/1/24 | 595 | 641 |
| New York City NY Transitional Finance | | | | |
| Authority Future Tax Revenue | 5.000% | 8/1/25 | 140 | 153 |
| New York City NY Transitional Finance | | | | |
| Authority Future Tax Revenue | 5.000% | 11/1/25 | 195 | 224 |
| New York City NY Transitional Finance | | | | |
| Authority Future Tax Revenue | 5.000% | 11/1/25 | 1,080 | 1,236 |
| New York City NY Transitional Finance | | | | |
| Authority Future Tax Revenue | 5.000% | 11/1/26 | 125 | 137 |
| New York City NY Transitional Finance | | | | |
| Authority Future Tax Revenue | 5.000% | 11/1/26 | 400 | 455 |
| New York City NY Transitional Finance | | | | |
| Authority Future Tax Revenue | 5.000% | 8/1/27 | 510 | 571 |
| New York City NY Transitional Finance | | | | |
| Authority Future Tax Revenue | 5.000% | 11/1/27 | 115 | 131 |
84
| | | | |
| Tax-Exempt Bond Index Fund | | | | |
| |
| |
| |
| | | | Face | Market |
| | | Maturity | Amount | Value • |
| | Coupon | Date | ($000) | ($000) |
| New York City NY Transitional Finance | | | | |
| Authority Future Tax Revenue | 5.000% | 11/1/27 | 100 | 113 |
| New York City NY Transitional Finance | | | | |
| Authority Future Tax Revenue | 5.000% | 8/1/28 | 110 | 123 |
| New York City NY Transitional Finance | | | | |
| Authority Future Tax Revenue | 5.000% | 11/1/28 | 590 | 679 |
| New York City NY Transitional Finance | | | | |
| Authority Future Tax Revenue | 5.000% | 2/1/29 | 375 | 424 |
| New York City NY Transitional Finance | | | | |
| Authority Future Tax Revenue | 5.000% | 11/1/29 | 850 | 926 |
| New York City NY Transitional Finance | | | | |
| Authority Future Tax Revenue | 5.000% | 11/1/29 | 135 | 154 |
| New York City NY Transitional Finance | | | | |
| Authority Future Tax Revenue | 5.000% | 2/1/30 | 215 | 244 |
| New York City NY Transitional Finance | | | | |
| Authority Future Tax Revenue | 5.000% | 5/1/30 | 210 | 229 |
| New York City NY Transitional Finance | | | | |
| Authority Future Tax Revenue | 5.000% | 8/1/30 | 150 | 171 |
| New York City NY Transitional Finance | | | | |
| Authority Future Tax Revenue | 5.000% | 11/1/30 | 1,305 | 1,457 |
| New York City NY Transitional Finance | | | | |
| Authority Future Tax Revenue | 5.000% | 2/1/31 | 610 | 683 |
| New York City NY Transitional Finance | | | | |
| Authority Future Tax Revenue | 5.000% | 5/1/31 | 60 | 65 |
| New York City NY Transitional Finance | | | | |
| Authority Future Tax Revenue | 5.000% | 8/1/31 | 810 | 905 |
| New York City NY Transitional Finance | | | | |
| Authority Future Tax Revenue | 5.000% | 8/1/31 | 720 | 797 |
| New York City NY Transitional Finance | | | | |
| Authority Future Tax Revenue | 5.000% | 8/1/31 | 300 | 332 |
| New York City NY Transitional Finance | | | | |
| Authority Future Tax Revenue | 5.000% | 11/1/31 | 150 | 161 |
| New York City NY Transitional Finance | | | | |
| Authority Future Tax Revenue | 5.000% | 11/1/31 | 255 | 277 |
| New York City NY Transitional Finance | | | | |
| Authority Future Tax Revenue | 5.000% | 11/1/31 | 185 | 207 |
| New York City NY Transitional Finance | | | | |
| Authority Future Tax Revenue | 5.000% | 5/1/32 | 2,500 | 2,796 |
| New York City NY Transitional Finance | | | | |
| Authority Future Tax Revenue | 5.000% | 5/1/32 | 2,000 | 2,242 |
| New York City NY Transitional Finance | | | | |
| Authority Future Tax Revenue | 5.000% | 8/1/32 | 150 | 166 |
| New York City NY Transitional Finance | | | | |
| Authority Future Tax Revenue | 5.000% | 8/1/32 | 890 | 992 |
| New York City NY Transitional Finance | | | | |
| Authority Future Tax Revenue | 5.000% | 8/1/32 | 125 | 140 |
| New York City NY Transitional Finance | | | | |
| Authority Future Tax Revenue | 5.000% | 11/1/32 | 510 | 562 |
| New York City NY Transitional Finance | | | | |
| Authority Future Tax Revenue | 5.000% | 11/1/32 | 905 | 970 |
| New York City NY Transitional Finance | | | | |
| Authority Future Tax Revenue | 5.000% | 11/1/32 | 100 | 109 |
| New York City NY Transitional Finance | | | | |
| Authority Future Tax Revenue | 5.000% | 5/1/33 | 205 | 229 |
85
| | | | |
| Tax-Exempt Bond Index Fund | | | | |
| |
| |
| |
| | | | Face | Market |
| | | Maturity | Amount | Value • |
| | Coupon | Date | ($000) | ($000) |
| New York City NY Transitional Finance | | | | |
| Authority Future Tax Revenue | 5.000% | 8/1/33 | 140 | 154 |
| New York City NY Transitional Finance | | | | |
| Authority Future Tax Revenue | 5.000% | 11/1/33 | 400 | 420 |
| New York City NY Transitional Finance | | | | |
| Authority Future Tax Revenue | 5.000% | 5/1/34 | 355 | 394 |
| New York City NY Transitional Finance | | | | |
| Authority Future Tax Revenue | 5.000% | 5/1/34 | 465 | 505 |
| New York City NY Transitional Finance | | | | |
| Authority Future Tax Revenue | 5.000% | 8/1/34 | 590 | 653 |
| New York City NY Transitional Finance | | | | |
| Authority Future Tax Revenue | 5.000% | 8/1/34 | 395 | 435 |
| New York City NY Transitional Finance | | | | |
| Authority Future Tax Revenue | 5.000% | 8/1/34 | 2,000 | 2,229 |
| New York City NY Transitional Finance | | | | |
| Authority Future Tax Revenue | 5.000% | 8/1/34 | 1,015 | 1,139 |
| New York City NY Transitional Finance | | | | |
| Authority Future Tax Revenue | 5.000% | 11/1/34 | 195 | 217 |
| New York City NY Transitional Finance | | | | |
| Authority Future Tax Revenue | 5.000% | 2/1/35 | 305 | 321 |
| New York City NY Transitional Finance | | | | |
| Authority Future Tax Revenue | 5.000% | 2/1/35 | 100 | 110 |
| New York City NY Transitional Finance | | | | |
| Authority Future Tax Revenue | 5.000% | 5/1/35 | 5,040 | 5,672 |
| New York City NY Transitional Finance | | | | |
| Authority Future Tax Revenue | 4.000% | 8/1/35 | 1,000 | 1,019 |
| New York City NY Transitional Finance | | | | |
| Authority Future Tax Revenue | 5.000% | 8/1/35 | 2,295 | 2,524 |
| New York City NY Transitional Finance | | | | |
| Authority Future Tax Revenue | 5.000% | 11/1/35 | 660 | 731 |
| New York City NY Transitional Finance | | | | |
| Authority Future Tax Revenue | 5.000% | 2/1/36 | 705 | 762 |
| New York City NY Transitional Finance | | | | |
| Authority Future Tax Revenue | 5.000% | 2/1/36 | 705 | 783 |
| New York City NY Transitional Finance | | | | |
| Authority Future Tax Revenue | 4.000% | 5/1/36 | 360 | 364 |
| New York City NY Transitional Finance | | | | |
| Authority Future Tax Revenue | 5.000% | 8/1/36 | 1,285 | 1,410 |
| New York City NY Transitional Finance | | | | |
| Authority Future Tax Revenue | 5.000% | 8/1/36 | 5,615 | 6,181 |
| New York City NY Transitional Finance | | | | |
| Authority Future Tax Revenue | 5.000% | 11/1/36 | 1,270 | 1,389 |
| New York City NY Transitional Finance | | | | |
| Authority Future Tax Revenue | 5.000% | 2/1/37 | 395 | 437 |
| New York City NY Transitional Finance | | | | |
| Authority Future Tax Revenue | 4.000% | 5/1/37 | 1,000 | 1,012 |
| New York City NY Transitional Finance | | | | |
| Authority Future Tax Revenue | 5.000% | 5/1/37 | 330 | 363 |
| New York City NY Transitional Finance | | | | |
| Authority Future Tax Revenue | 5.000% | 8/1/37 | 700 | 769 |
| New York City NY Transitional Finance | | | | |
| Authority Future Tax Revenue | 5.000% | 2/1/38 | 1,090 | 1,180 |
| New York City NY Transitional Finance | | | | |
| Authority Future Tax Revenue | 5.000% | 2/1/38 | 1,585 | 1,733 |
86
| | | | |
| Tax-Exempt Bond Index Fund | | | | |
| |
| |
| |
| | | | Face | Market |
| | | Maturity | Amount | Value • |
| | Coupon | Date | ($000) | ($000) |
| New York City NY Transitional Finance | | | | |
| Authority Future Tax Revenue | 5.000% | 5/1/38 | 2,160 | 2,340 |
| New York City NY Transitional Finance | | | | |
| Authority Future Tax Revenue | 5.000% | 5/1/38 | 1,500 | 1,519 |
| New York City NY Transitional Finance | | | | |
| Authority Future Tax Revenue | 5.000% | 8/1/38 | 900 | 981 |
| New York City NY Transitional Finance | | | | |
| Authority Future Tax Revenue | 5.000% | 11/1/38 | 5,985 | 6,343 |
| New York City NY Transitional Finance | | | | |
| Authority Future Tax Revenue | 5.000% | 11/1/38 | 1,960 | 2,140 |
| New York City NY Transitional Finance | | | | |
| Authority Future Tax Revenue | 5.000% | 5/1/39 | 350 | 372 |
| New York City NY Transitional Finance | | | | |
| Authority Future Tax Revenue | 4.000% | 8/1/39 | 690 | 691 |
| New York City NY Transitional Finance | | | | |
| Authority Future Tax Revenue | 5.000% | 8/1/39 | 1,910 | 2,080 |
| New York City NY Transitional Finance | | | | |
| Authority Future Tax Revenue | 5.000% | 11/1/39 | 3,355 | 3,515 |
| New York City NY Transitional Finance | | | | |
| Authority Future Tax Revenue | 5.000% | 2/1/40 | 1,030 | 1,123 |
| New York City NY Transitional Finance | | | | |
| Authority Future Tax Revenue | 5.000% | 5/1/40 | 3,755 | 4,105 |
| New York City NY Transitional Finance | | | | |
| Authority Future Tax Revenue | 5.000% | 2/1/41 | 6,130 | 6,656 |
| New York City NY Transitional Finance | | | | |
| Authority Future Tax Revenue | 4.000% | 2/1/42 | 150 | 149 |
| New York City NY Transitional Finance | | | | |
| Authority Future Tax Revenue | 4.000% | 5/1/42 | 225 | 224 |
| New York City NY Transitional Finance | | | | |
| Authority Future Tax Revenue | 5.000% | 5/1/42 | 600 | 647 |
| New York City NY Transitional Finance | | | | |
| Authority Future Tax Revenue | 5.000% | 8/1/42 | 3,125 | 3,396 |
| New York City NY Transitional Finance | | | | |
| Authority Future Tax Revenue | 5.000% | 11/1/42 | 495 | 538 |
| New York City NY Transitional Finance | | | | |
| Authority Future Tax Revenue | 4.000% | 2/1/44 | 750 | 743 |
| New York City NY Transitional Finance | | | | |
| Authority Future Tax Revenue | 5.000% | 8/1/45 | 3,000 | 3,301 |
| New York City NY Transitional Finance | | | | |
| Authority Revenue | 4.000% | 8/1/39 | 4,250 | 4,257 |
| New York Convention Center Development | | | | |
| Corp. Revenue | 0.000% | 11/15/39 (4) | 500 | 203 |
| New York Convention Center Development | | | | |
| Corp. Revenue | 0.000% | 11/15/40 | 650 | 239 |
| New York Convention Center Development | | | | |
| Corp. Revenue | 5.000% | 11/15/40 | 700 | 765 |
| New York Liberty Development Corp. | | | | |
| Revenue | 5.000% | 12/15/41 | 1,300 | 1,386 |
| New York Liberty Development Corp. | | | | |
| Revenue | 5.000% | 11/15/44 | 3,440 | 3,634 |
| New York Liberty Development Corp. | | | | |
| Revenue | 5.750% | 11/15/51 | 1,425 | 1,553 |
| New York Metropolitan Transportation | | | | |
| Authority Revenue | 5.000% | 11/15/18 | 245 | 245 |
87
| | | | |
| Tax-Exempt Bond Index Fund | | | | |
| |
| |
| |
| | | | Face | Market |
| | | Maturity | Amount | Value • |
| | Coupon | Date | ($000) | ($000) |
| New York Metropolitan Transportation | | | | |
| Authority Revenue | 5.000% | 11/15/18 | 70 | 70 |
| New York Metropolitan Transportation | | | | |
| Authority Revenue | 5.000% | 11/15/18 (Prere.) | 100 | 100 |
| New York Metropolitan Transportation | | | | |
| Authority Revenue | 6.500% | 11/15/18 (Prere.) | 50 | 50 |
| New York Metropolitan Transportation | | | | |
| Authority Revenue | 5.000% | 11/15/19 | 175 | 180 |
| New York Metropolitan Transportation | | | | |
| Authority Revenue | 5.000% | 11/15/19 | 430 | 443 |
| New York Metropolitan Transportation | | | | |
| Authority Revenue | 5.000% | 11/15/19 | 50 | 51 |
| New York Metropolitan Transportation | | | | |
| Authority Revenue | 5.000% | 11/15/20 (Prere.) | 395 | 418 |
| New York Metropolitan Transportation | | | | |
| Authority Revenue | 5.000% | 11/15/20 | 1,075 | 1,134 |
| New York Metropolitan Transportation | | | | |
| Authority Revenue | 5.250% | 11/15/20 (Prere.) | 1,070 | 1,138 |
| New York Metropolitan Transportation | | | | |
| Authority Revenue | 5.250% | 11/15/20 (Prere.) | 1,910 | 2,032 |
| New York Metropolitan Transportation | | | | |
| Authority Revenue | 5.000% | 11/15/21 (Prere.) | 400 | 434 |
| New York Metropolitan Transportation | | | | |
| Authority Revenue | 5.000% | 11/15/21 (Prere.) | 1,645 | 1,785 |
| New York Metropolitan Transportation | | | | |
| Authority Revenue | 5.000% | 11/15/21 | 215 | 232 |
| New York Metropolitan Transportation | | | | |
| Authority Revenue | 5.000% | 11/15/21 | 260 | 280 |
| New York Metropolitan Transportation | | | | |
| Authority Revenue | 5.000% | 11/15/21 (Prere.) | 700 | 760 |
| New York Metropolitan Transportation | | | | |
| Authority Revenue | 5.000% | 11/15/21 (Prere.) | 150 | 163 |
| New York Metropolitan Transportation | | | | |
| Authority Revenue | 5.000% | 11/15/21 (Prere.) | 245 | 266 |
| New York Metropolitan Transportation | | | | |
| Authority Revenue | 5.000% | 11/15/21 | 255 | 275 |
| New York Metropolitan Transportation | | | | |
| Authority Revenue | 5.000% | 11/15/21 (Prere.) | 475 | 515 |
| New York Metropolitan Transportation | | | | |
| Authority Revenue | 5.250% | 11/15/21 (Prere.) | 435 | 475 |
| New York Metropolitan Transportation | | | | |
| Authority Revenue | 5.250% | 11/15/21 (Prere.) | 80 | 87 |
| New York Metropolitan Transportation | | | | |
| Authority Revenue | 5.250% | 11/15/21 (Prere.) | 175 | 191 |
| New York Metropolitan Transportation | | | | |
| Authority Revenue | 5.000% | 11/1/22 | 535 | 586 |
| New York Metropolitan Transportation | | | | |
| Authority Revenue | 5.000% | 11/15/22 | 225 | 247 |
| New York Metropolitan Transportation | | | | |
| Authority Revenue | 5.000% | 11/15/22 (Prere.) | 50 | 55 |
| New York Metropolitan Transportation | | | | |
| Authority Revenue | 5.000% | 11/15/22 (Prere.) | 220 | 244 |
| New York Metropolitan Transportation | | | | |
| Authority Revenue | 5.000% | 11/15/22 (Prere.) | 385 | 427 |
88
| | | | |
| Tax-Exempt Bond Index Fund | | | | |
| |
| |
| |
| | | | Face | Market |
| | | Maturity | Amount | Value • |
| | Coupon | Date | ($000) | ($000) |
| New York Metropolitan Transportation | | | | |
| Authority Revenue | 5.000% | 11/15/22 (Prere.) | 210 | 233 |
| New York Metropolitan Transportation | | | | |
| Authority Revenue | 5.000% | 5/15/23 (Prere.) | 240 | 269 |
| New York Metropolitan Transportation | | | | |
| Authority Revenue | 5.000% | 11/15/23 (Prere.) | 115 | 130 |
| New York Metropolitan Transportation | | | | |
| Authority Revenue | 5.000% | 11/15/23 | 60 | 67 |
| New York Metropolitan Transportation | | | | |
| Authority Revenue | 5.000% | 11/15/24 | 505 | 550 |
| New York Metropolitan Transportation | | | | |
| Authority Revenue | 5.000% | 11/15/24 | 1,845 | 2,072 |
| New York Metropolitan Transportation | | | | |
| Authority Revenue | 5.000% | 11/15/25 | 300 | 326 |
| New York Metropolitan Transportation | | | | |
| Authority Revenue | 5.000% | 11/15/27 | 610 | 628 |
| New York Metropolitan Transportation | | | | |
| Authority Revenue | 5.000% | 11/15/27 | 250 | 282 |
| New York Metropolitan Transportation | | | | |
| Authority Revenue | 5.000% | 11/15/27 | 1,020 | 1,169 |
| New York Metropolitan Transportation | | | | |
| Authority Revenue | 5.000% | 11/15/28 | 1,010 | 1,159 |
| New York Metropolitan Transportation | | | | |
| Authority Revenue | 5.000% | 11/15/28 | 1,090 | 1,180 |
| New York Metropolitan Transportation | | | | |
| Authority Revenue | 6.500% | 11/15/28 | 155 | 155 |
| New York Metropolitan Transportation | | | | |
| Authority Revenue | 5.000% | 11/15/29 | 150 | 162 |
| New York Metropolitan Transportation | | | | |
| Authority Revenue | 5.000% | 11/15/29 | 1,800 | 2,047 |
| New York Metropolitan Transportation | | | | |
| Authority Revenue | 5.000% | 11/15/30 | 635 | 685 |
| New York Metropolitan Transportation | | | | |
| Authority Revenue | 5.000% | 11/15/30 | 110 | 119 |
| New York Metropolitan Transportation | | | | |
| Authority Revenue | 5.250% | 11/15/30 | 1,800 | 2,038 |
| New York Metropolitan Transportation | | | | |
| Authority Revenue | 0.000% | 11/15/32 | 3,620 | 2,052 |
| New York Metropolitan Transportation | | | | |
| Authority Revenue | 4.000% | 11/15/32 | 1,000 | 1,025 |
| New York Metropolitan Transportation | | | | |
| Authority Revenue | 5.000% | 11/15/33 | 1,320 | 1,474 |
| New York Metropolitan Transportation | | | | |
| Authority Revenue | 5.000% | 11/15/34 | 385 | 422 |
| New York Metropolitan Transportation | | | | |
| Authority Revenue | 4.000% | 11/15/35 | 1,195 | 1,207 |
| New York Metropolitan Transportation | | | | |
| Authority Revenue | 5.000% | 11/15/35 | 945 | 1,033 |
| New York Metropolitan Transportation | | | | |
| Authority Revenue | 3.250% | 11/15/36 | 275 | 247 |
| New York Metropolitan Transportation | | | | |
| Authority Revenue | 4.000% | 11/15/37 | 500 | 500 |
| New York Metropolitan Transportation | | | | |
| Authority Revenue | 5.000% | 11/15/37 | 380 | 416 |
89
| | | | |
| Tax-Exempt Bond Index Fund | | | | |
| |
| |
| |
| | | | Face | Market |
| | | Maturity | Amount | Value • |
| | Coupon | Date | ($000) | ($000) |
| New York Metropolitan Transportation | | | | |
| Authority Revenue | 5.000% | 11/15/37 | 600 | 648 |
| New York Metropolitan Transportation | | | | |
| Authority Revenue | 4.000% | 11/15/38 | 2,000 | 1,986 |
| New York Metropolitan Transportation | | | | |
| Authority Revenue | 5.000% | 11/15/38 | 770 | 820 |
| New York Metropolitan Transportation | | | | |
| Authority Revenue | 5.000% | 11/15/38 | 135 | 144 |
| New York Metropolitan Transportation | | | | |
| Authority Revenue | 5.000% | 11/15/38 | 545 | 580 |
| New York Metropolitan Transportation | | | | |
| Authority Revenue | 5.000% | 11/15/38 | 150 | 161 |
| New York Metropolitan Transportation | | | | |
| Authority Revenue | 0.000% | 11/15/39 | 1,170 | 471 |
| New York Metropolitan Transportation | | | | |
| Authority Revenue | 4.250% | 11/15/39 | 100 | 102 |
| New York Metropolitan Transportation | | | | |
| Authority Revenue | 5.000% | 11/15/39 | 2,485 | 2,678 |
| New York Metropolitan Transportation | | | | |
| Authority Revenue | 0.000% | 11/15/40 | 755 | 289 |
| New York Metropolitan Transportation | | | | |
| Authority Revenue | 5.000% | 11/15/41 | 225 | 241 |
| New York Metropolitan Transportation | | | | |
| Authority Revenue | 5.000% | 11/15/42 | 795 | 850 |
| New York Metropolitan Transportation | | | | |
| Authority Revenue | 5.000% | 11/15/42 | 10 | 11 |
| New York Metropolitan Transportation | | | | |
| Authority Revenue | 5.000% | 11/15/42 | 1,000 | 1,058 |
| New York Metropolitan Transportation | | | | |
| Authority Revenue | 4.000% | 11/15/43 | 615 | 606 |
| New York Metropolitan Transportation | | | | |
| Authority Revenue | 5.000% | 11/15/43 | 2,275 | 2,418 |
| New York Metropolitan Transportation | | | | |
| Authority Revenue | 5.000% | 11/15/43 | 895 | 951 |
| New York Metropolitan Transportation | | | | |
| Authority Revenue | 5.000% | 11/15/44 | 980 | 1,041 |
| New York Metropolitan Transportation | | | | |
| Authority Revenue | 5.250% | 11/15/44 | 795 | 878 |
| New York Metropolitan Transportation | | | | |
| Authority Revenue | 4.000% | 11/15/45 | 100 | 98 |
| New York Metropolitan Transportation | | | | |
| Authority Revenue | 5.000% | 11/15/45 | 895 | 956 |
| New York Metropolitan Transportation | | | | |
| Authority Revenue | 5.000% | 11/15/46 | 150 | 162 |
| New York Metropolitan Transportation | | | | |
| Authority Revenue | 5.250% | 11/15/55 | 55 | 60 |
| New York Metropolitan Transportation | | | | |
| Authority Revenue | 5.000% | 11/15/56 | 1,100 | 1,173 |
| New York Metropolitan Transportation | | | | |
| Authority Revenue | 5.250% | 11/15/56 | 910 | 994 |
| New York Metropolitan Transportation | | | | |
| Authority Revenue | 5.250% | 11/15/56 | 1,165 | 1,267 |
| New York Metropolitan Transportation | | | | |
| Authority Revenue | 5.250% | 11/15/57 | 1,435 | 1,569 |
90
| | | | |
| Tax-Exempt Bond Index Fund | | | | |
| |
| |
| |
| | | | Face | Market |
| | | Maturity | Amount | Value • |
| | Coupon | Date | ($000) | ($000) |
| New York Metropolitan Transportation | | | | |
| Authority Revenue (Dedicated Petroleum | | | | |
| Tax) | 5.000% | 11/15/19 (Prere.) | 1,745 | 1,801 |
| New York Metropolitan Transportation | | | | |
| Authority Revenue (Dedicated Tax Fund) | 5.000% | 11/15/24 | 370 | 407 |
| New York Metropolitan Transportation | | | | |
| Authority Revenue (Dedicated Tax Fund) | 5.000% | 11/15/24 | 200 | 225 |
| New York Metropolitan Transportation | | | | |
| Authority Revenue (Dedicated Tax Fund) | 5.000% | 11/15/25 | 2,220 | 2,436 |
| New York Metropolitan Transportation | | | | |
| Authority Revenue (Dedicated Tax Fund) | 0.000% | 11/15/30 | 2,140 | 1,359 |
| New York Metropolitan Transportation | | | | |
| Authority Revenue (Dedicated Tax Fund) | 5.250% | 11/15/30 | 115 | 133 |
| New York Metropolitan Transportation | | | | |
| Authority Revenue (Dedicated Tax Fund) | 5.000% | 11/15/31 | 695 | 756 |
| New York Metropolitan Transportation | | | | |
| Authority Revenue (Dedicated Tax Fund) | 0.000% | 11/15/32 | 800 | 464 |
| New York Metropolitan Transportation | | | | |
| Authority Revenue (Dedicated Tax Fund) | 4.000% | 11/15/33 | 1,010 | 1,050 |
| New York Metropolitan Transportation | | | | |
| Authority Revenue (Dedicated Tax Fund) | 5.250% | 11/15/34 | 125 | 143 |
| New York Metropolitan Transportation | | | | |
| Authority Revenue (Dedicated Tax Fund) | 5.000% | 11/15/35 | 100 | 113 |
| New York Metropolitan Transportation | | | | |
| Authority Revenue (Dedicated Tax Fund) | 5.250% | 11/15/35 | 350 | 399 |
| New York Metropolitan Transportation | | | | |
| Authority Revenue (Dedicated Tax Fund) | 5.000% | 11/15/36 | 1,605 | 1,787 |
| New York Metropolitan Transportation | | | | |
| Authority Revenue (Dedicated Tax Fund) | 5.000% | 11/15/42 | 815 | 899 |
| New York Metropolitan Transportation | | | | |
| Authority Revenue (Dedicated Tax Fund) | 5.000% | 11/15/43 | 550 | 582 |
| New York Metropolitan Transportation | | | | |
| Authority Revenue (Dedicated Tax Fund) | 5.000% | 11/15/46 | 715 | 787 |
| New York Metropolitan Transportation | | | | |
| Authority Revenue (Hudson Yards | | | | |
| Development) | 5.000% | 11/15/46 | 4,240 | 4,342 |
| New York Metropolitan Transportation | | | | |
| Authority Revenue (Hudson Yards | | | | |
| Development) | 5.000% | 11/15/51 | 665 | 699 |
| New York Metropolitan Transportation | | | | |
| Authority Revenue (Hudson Yards | | | | |
| Development) | 5.000% | 11/15/56 | 2,075 | 2,182 |
| New York Metropolitan Transportation | | | | |
| Authority Revenue (Transit Revenue) | 5.000% | 11/15/20 | 200 | 211 |
| New York Metropolitan Transportation | | | | |
| Authority Revenue (Transit Revenue) | 5.000% | 11/15/22 | 135 | 148 |
| New York Metropolitan Transportation | | | | |
| Authority Revenue (Transit Revenue) | 5.000% | 11/15/24 (Prere.) | 340 | 390 |
| New York Metropolitan Transportation | | | | |
| Authority Revenue (Transit Revenue) | 5.000% | 11/15/38 | 1,845 | 1,977 |
| New York Metropolitan Transportation | | | | |
| Authority Revenue (Transit Revenue) PUT | 5.000% | 11/15/19 | 1,900 | 1,954 |
| New York NY GO | 5.300% | 4/1/19 (Prere.) | 190 | 193 |
| New York NY GO | 5.000% | 8/1/19 | 285 | 291 |
91
| | | | |
| Tax-Exempt Bond Index Fund | | | | |
| |
| |
| |
| | | | Face | Market |
| | | Maturity | Amount | Value • |
| | Coupon | Date | ($000) | ($000) |
| New York NY GO | 5.000% | 8/1/25 | 1,140 | 1,306 |
| New York NY GO | 5.000% | 8/1/26 | 5,045 | 5,847 |
| New York NY GO | 5.300% | 4/1/27 | 10 | 10 |
| New York NY GO | 5.000% | 8/1/27 | 1,230 | 1,434 |
| New York NY GO | 5.000% | 8/1/28 | 1,800 | 2,089 |
| New York NY GO | 3.500% | 4/1/46 | 2,000 | 1,813 |
| New York State Dormitory Authority Lease | | | | |
| Revenue (City of New York Court Facilities) | 5.250% | 5/15/19 (2) | 50 | 51 |
| New York State Dormitory Authority Lease | | | | |
| Revenue (City of New York Court Facilities) | 5.500% | 5/15/20 (2) | 200 | 210 |
| New York State Dormitory Authority Lease | | | | |
| Revenue (City of New York Court Facilities) | 5.500% | 5/15/22 (2) | 775 | 860 |
| New York State Dormitory Authority Lease | | | | |
| Revenue (State University Dormitory | | | | |
| Facilities) | 5.000% | 7/1/35 | 1,400 | 1,488 |
| New York State Dormitory Authority Lease | | | | |
| Revenue (State University Dormitory | | | | |
| Facilities) | 5.000% | 7/1/41 | 125 | 133 |
| New York State Dormitory Authority Lease | | | | |
| Revenue (State University Dormitory | | | | |
| Facilities) | 5.000% | 7/1/45 | 250 | 275 |
| New York State Dormitory Authority Revenue | 5.000% | 10/1/28 | 1,000 | 1,144 |
| New York State Dormitory Authority Revenue | 5.000% | 3/15/32 | 2,500 | 2,864 |
| New York State Dormitory Authority Revenue | 5.000% | 7/1/38 | 600 | 675 |
| New York State Dormitory Authority Revenue | 4.000% | 3/15/48 | 1,000 | 1,000 |
| New York State Dormitory Authority Revenue | | | | |
| (Columbia University) | 5.000% | 10/1/41 | 400 | 423 |
| New York State Dormitory Authority Revenue | | | | |
| (Columbia University) | 5.000% | 10/1/46 | 415 | 512 |
| New York State Dormitory Authority Revenue | | | | |
| (Columbia University) | 5.000% | 10/1/47 | 3,720 | 4,597 |
| New York State Dormitory Authority Revenue | | | | |
| (Cornell University) | 5.000% | 7/1/39 | 2,050 | 2,089 |
| New York State Dormitory Authority Revenue | | | | |
| (Fordham University) | 5.500% | 7/1/21 (Prere.) | 415 | 452 |
| New York State Dormitory Authority Revenue | | | | |
| (Mount Sinai School of Medicine of New York | | | | |
| University) | 5.125% | 7/1/19 (Prere.) | 350 | 357 |
| New York State Dormitory Authority Revenue | | | | |
| (New York University) | 5.000% | 7/1/19 (Prere.) | 470 | 480 |
| New York State Dormitory Authority Revenue | | | | |
| (New York University) | 5.500% | 7/1/31 (2) | 50 | 59 |
| New York State Dormitory Authority Revenue | | | | |
| (New York University) | 5.000% | 7/1/32 | 1,000 | 1,126 |
| New York State Dormitory Authority Revenue | | | | |
| (New York University) | 4.000% | 7/1/35 | 750 | 772 |
| New York State Dormitory Authority Revenue | | | | |
| (New York University) | 5.000% | 7/1/35 | 115 | 128 |
| New York State Dormitory Authority Revenue | | | | |
| (New York University) | 5.000% | 7/1/36 | 170 | 190 |
| New York State Dormitory Authority Revenue | | | | |
| (New York University) | 4.000% | 7/1/41 | 655 | 662 |
| New York State Dormitory Authority Revenue | | | | |
| (New York University) | 5.000% | 7/1/43 | 800 | 871 |
92
| | | | |
| Tax-Exempt Bond Index Fund | | | | |
| |
| |
| |
| | | | Face | Market |
| | | Maturity | Amount | Value • |
| | Coupon | Date | ($000) | ($000) |
| New York State Dormitory Authority Revenue | | | | |
| (New York University) | 5.000% | 7/1/45 | 100 | 110 |
| New York State Dormitory Authority Revenue | | | | |
| (New York University) | 5.000% | 7/1/48 | 190 | 209 |
| New York State Dormitory Authority Revenue | | | | |
| (Personal Income Tax) | 5.000% | 2/15/19 (Prere.) | 225 | 227 |
| New York State Dormitory Authority Revenue | | | | |
| (Personal Income Tax) | 5.250% | 2/15/19 (Prere.) | 385 | 389 |
| New York State Dormitory Authority Revenue | | | | |
| (Personal Income Tax) | 5.000% | 3/15/19 (Prere.) | 120 | 121 |
| New York State Dormitory Authority Revenue | | | | |
| (Personal Income Tax) | 5.000% | 3/15/19 (Prere.) | 135 | 137 |
| New York State Dormitory Authority Revenue | | | | |
| (Personal Income Tax) | 5.000% | 3/15/19 | 100 | 101 |
| New York State Dormitory Authority Revenue | | | | |
| (Personal Income Tax) | 5.000% | 3/15/19 (Prere.) | 100 | 101 |
| New York State Dormitory Authority Revenue | | | | |
| (Personal Income Tax) | 5.750% | 3/15/19 (Prere.) | 2,445 | 2,480 |
| New York State Dormitory Authority Revenue | | | | |
| (Personal Income Tax) | 5.000% | 6/15/19 | 200 | 204 |
| New York State Dormitory Authority Revenue | | | | |
| (Personal Income Tax) | 5.000% | 2/15/20 | 300 | 311 |
| New York State Dormitory Authority Revenue | | | | |
| (Personal Income Tax) | 5.000% | 2/15/20 | 1,020 | 1,059 |
| New York State Dormitory Authority Revenue | | | | |
| (Personal Income Tax) | 5.000% | 3/15/20 | 1,240 | 1,290 |
| New York State Dormitory Authority Revenue | | | | |
| (Personal Income Tax) | 5.000% | 3/15/20 | 60 | 62 |
| New York State Dormitory Authority Revenue | | | | |
| (Personal Income Tax) | 5.000% | 12/15/20 | 395 | 418 |
| New York State Dormitory Authority Revenue | | | | |
| (Personal Income Tax) | 5.000% | 2/15/21 | 190 | 202 |
| New York State Dormitory Authority Revenue | | | | |
| (Personal Income Tax) | 5.000% | 2/15/21 | 580 | 617 |
| New York State Dormitory Authority Revenue | | | | |
| (Personal Income Tax) | 5.000% | 2/15/21 | 1,430 | 1,520 |
| New York State Dormitory Authority Revenue | | | | |
| (Personal Income Tax) | 5.000% | 3/15/21 | 1,090 | 1,161 |
| New York State Dormitory Authority Revenue | | | | |
| (Personal Income Tax) | 5.000% | 3/15/21 | 550 | 586 |
| New York State Dormitory Authority Revenue | | | | |
| (Personal Income Tax) | 5.000% | 3/15/21 | 435 | 463 |
| New York State Dormitory Authority Revenue | | | | |
| (Personal Income Tax) | 5.000% | 8/15/21 | 265 | 285 |
| New York State Dormitory Authority Revenue | | | | |
| (Personal Income Tax) | 5.000% | 12/15/21 | 1,210 | 1,310 |
| New York State Dormitory Authority Revenue | | | | |
| (Personal Income Tax) | 5.000% | 2/15/22 | 155 | 168 |
| New York State Dormitory Authority Revenue | | | | |
| (Personal Income Tax) | 5.000% | 2/15/22 | 2,290 | 2,489 |
| New York State Dormitory Authority Revenue | | | | |
| (Personal Income Tax) | 5.000% | 3/15/22 | 100 | 109 |
| New York State Dormitory Authority Revenue | | | | |
| (Personal Income Tax) | 5.000% | 3/15/22 | 385 | 419 |
93
| | | | |
| Tax-Exempt Bond Index Fund | | | | |
| |
| |
| |
| | | | Face | Market |
| | | Maturity | Amount | Value • |
| | Coupon | Date | ($000) | ($000) |
| New York State Dormitory Authority Revenue | | | | |
| (Personal Income Tax) | 4.000% | 12/15/22 | 305 | 325 |
| New York State Dormitory Authority Revenue | | | | |
| (Personal Income Tax) | 5.000% | 12/15/22 | 300 | 332 |
| New York State Dormitory Authority Revenue | | | | |
| (Personal Income Tax) | 5.000% | 2/15/23 | 100 | 111 |
| New York State Dormitory Authority Revenue | | | | |
| (Personal Income Tax) | 5.000% | 2/15/23 | 115 | 127 |
| New York State Dormitory Authority Revenue | | | | |
| (Personal Income Tax) | 5.000% | 2/15/23 | 500 | 554 |
| New York State Dormitory Authority Revenue | | | | |
| (Personal Income Tax) | 5.000% | 2/15/23 | 1,500 | 1,661 |
| New York State Dormitory Authority Revenue | | | | |
| (Personal Income Tax) | 5.000% | 3/15/23 | 390 | 433 |
| New York State Dormitory Authority Revenue | | | | |
| (Personal Income Tax) | 5.000% | 2/15/24 | 115 | 129 |
| New York State Dormitory Authority Revenue | | | | |
| (Personal Income Tax) | 5.000% | 2/15/24 | 165 | 186 |
| New York State Dormitory Authority Revenue | | | | |
| (Personal Income Tax) | 5.000% | 2/15/24 | 2,000 | 2,250 |
| New York State Dormitory Authority Revenue | | | | |
| (Personal Income Tax) | 5.000% | 3/15/24 | 365 | 411 |
| New York State Dormitory Authority Revenue | | | | |
| (Personal Income Tax) | 5.000% | 3/15/24 | 110 | 117 |
| New York State Dormitory Authority Revenue | | | | |
| (Personal Income Tax) | 5.000% | 3/15/24 | 250 | 271 |
| New York State Dormitory Authority Revenue | | | | |
| (Personal Income Tax) | 5.000% | 12/15/24 | 675 | 743 |
| New York State Dormitory Authority Revenue | | | | |
| (Personal Income Tax) | 5.000% | 2/15/25 | 360 | 411 |
| New York State Dormitory Authority Revenue | | | | |
| (Personal Income Tax) | 5.000% | 2/15/25 | 2,000 | 2,251 |
| New York State Dormitory Authority Revenue | | | | |
| (Personal Income Tax) | 5.000% | 2/15/25 | 1,505 | 1,719 |
| New York State Dormitory Authority Revenue | | | | |
| (Personal Income Tax) | 5.000% | 3/15/25 | 245 | 280 |
| New York State Dormitory Authority Revenue | | | | |
| (Personal Income Tax) | 5.000% | 3/15/25 | 405 | 463 |
| New York State Dormitory Authority Revenue | | | | |
| (Personal Income Tax) | 5.000% | 2/15/26 | 3,245 | 3,742 |
| New York State Dormitory Authority Revenue | | | | |
| (Personal Income Tax) | 5.000% | 2/15/26 | 1,740 | 2,007 |
| New York State Dormitory Authority Revenue | | | | |
| (Personal Income Tax) | 5.000% | 2/15/26 | 260 | 291 |
| New York State Dormitory Authority Revenue | | | | |
| (Personal Income Tax) | 5.000% | 2/15/27 | 450 | 519 |
| New York State Dormitory Authority Revenue | | | | |
| (Personal Income Tax) | 5.250% | 2/15/27 | 15 | 15 |
| New York State Dormitory Authority Revenue | | | | |
| (Personal Income Tax) | 5.000% | 12/15/27 | 640 | 703 |
| New York State Dormitory Authority Revenue | | | | |
| (Personal Income Tax) | 5.000% | 2/15/28 | 860 | 990 |
| New York State Dormitory Authority Revenue | | | | |
| (Personal Income Tax) | 5.000% | 2/15/28 | 875 | 973 |
94
| | | | |
| Tax-Exempt Bond Index Fund | | | | |
| |
| |
| |
| | | | Face | Market |
| | | Maturity | Amount | Value • |
| | Coupon | Date | ($000) | ($000) |
| New York State Dormitory Authority Revenue | | | | |
| (Personal Income Tax) | 5.000% | 3/15/28 | 120 | 138 |
| New York State Dormitory Authority Revenue | | | | |
| (Personal Income Tax) | 5.000% | 12/15/28 | 1,595 | 1,746 |
| New York State Dormitory Authority Revenue | | | | |
| (Personal Income Tax) | 5.000% | 2/15/29 | 80 | 89 |
| New York State Dormitory Authority Revenue | | | | |
| (Personal Income Tax) | 5.000% | 2/15/29 | 100 | 116 |
| New York State Dormitory Authority Revenue | | | | |
| (Personal Income Tax) | 5.000% | 3/15/29 | 680 | 761 |
| New York State Dormitory Authority Revenue | | | | |
| (Personal Income Tax) | 5.000% | 3/15/29 | 1,755 | 1,889 |
| New York State Dormitory Authority Revenue | | | | |
| (Personal Income Tax) | 5.000% | 12/15/29 | 100 | 109 |
| New York State Dormitory Authority Revenue | | | | |
| (Personal Income Tax) | 5.000% | 3/15/30 | 1,680 | 1,870 |
| New York State Dormitory Authority Revenue | | | | |
| (Personal Income Tax) | 5.000% | 3/15/30 | 520 | 576 |
| New York State Dormitory Authority Revenue | | | | |
| (Personal Income Tax) | 5.000% | 3/15/30 | 5,830 | 6,265 |
| New York State Dormitory Authority Revenue | | | | |
| (Personal Income Tax) | 5.000% | 12/15/30 | 580 | 632 |
| New York State Dormitory Authority Revenue | | | | |
| (Personal Income Tax) | 4.000% | 2/15/31 | 1,000 | 1,032 |
| New York State Dormitory Authority Revenue | | | | |
| (Personal Income Tax) | 5.000% | 3/15/31 | 200 | 223 |
| New York State Dormitory Authority Revenue | | | | |
| (Personal Income Tax) | 5.000% | 3/15/31 | 930 | 1,031 |
| New York State Dormitory Authority Revenue | | | | |
| (Personal Income Tax) | 5.000% | 3/15/31 | 1,985 | 2,130 |
| New York State Dormitory Authority Revenue | | | | |
| (Personal Income Tax) | 5.000% | 6/15/31 | 645 | 702 |
| New York State Dormitory Authority Revenue | | | | |
| (Personal Income Tax) | 5.000% | 2/15/32 | 150 | 166 |
| New York State Dormitory Authority Revenue | | | | |
| (Personal Income Tax) | 5.000% | 2/15/32 | 3,215 | 3,621 |
| New York State Dormitory Authority Revenue | | | | |
| (Personal Income Tax) | 5.000% | 3/15/32 | 370 | 409 |
| New York State Dormitory Authority Revenue | | | | |
| (Personal Income Tax) | 5.000% | 2/15/33 | 3,525 | 3,881 |
| New York State Dormitory Authority Revenue | | | | |
| (Personal Income Tax) | 5.250% | 3/15/33 | 2,600 | 2,942 |
| New York State Dormitory Authority Revenue | | | | |
| (Personal Income Tax) | 4.000% | 2/15/34 | 1,000 | 1,029 |
| New York State Dormitory Authority Revenue | | | | |
| (Personal Income Tax) | 5.000% | 3/15/34 | 215 | 227 |
| New York State Dormitory Authority Revenue | | | | |
| (Personal Income Tax) | 5.000% | 3/15/34 | 1,370 | 1,517 |
| New York State Dormitory Authority Revenue | | | | |
| (Personal Income Tax) | 5.000% | 2/15/35 | 4,300 | 4,441 |
| New York State Dormitory Authority Revenue | | | | |
| (Personal Income Tax) | 5.000% | 3/15/35 | 765 | 839 |
| New York State Dormitory Authority Revenue | | | | |
| (Personal Income Tax) | 5.000% | 2/15/36 | 2,000 | 2,220 |
95
| | | | |
| Tax-Exempt Bond Index Fund | | | | |
| |
| |
| |
| | | | Face | Market |
| | | Maturity | Amount | Value • |
| | Coupon | Date | ($000) | ($000) |
| New York State Dormitory Authority Revenue | | | | |
| (Personal Income Tax) | 5.000% | 3/15/36 | 1,850 | 2,036 |
| New York State Dormitory Authority Revenue | | | | |
| (Personal Income Tax) | 5.000% | 3/15/36 | 1,640 | 1,800 |
| New York State Dormitory Authority Revenue | | | | |
| (Personal Income Tax) | 5.000% | 2/15/37 | 370 | 404 |
| New York State Dormitory Authority Revenue | | | | |
| (Personal Income Tax) | 5.000% | 2/15/38 | 1,070 | 1,165 |
| New York State Dormitory Authority Revenue | | | | |
| (Personal Income Tax) | 5.000% | 2/15/38 | 900 | 999 |
| New York State Dormitory Authority Revenue | | | | |
| (Personal Income Tax) | 5.000% | 2/15/38 | 500 | 552 |
| New York State Dormitory Authority Revenue | | | | |
| (Personal Income Tax) | 5.000% | 3/15/38 | 255 | 279 |
| New York State Dormitory Authority Revenue | | | | |
| (Personal Income Tax) | 5.000% | 8/15/38 | 145 | 154 |
| New York State Dormitory Authority Revenue | | | | |
| (Personal Income Tax) | 5.000% | 2/15/39 | 1,000 | 1,099 |
| New York State Dormitory Authority Revenue | | | | |
| (Personal Income Tax) | 5.000% | 2/15/39 | 1,190 | 1,295 |
| New York State Dormitory Authority Revenue | | | | |
| (Personal Income Tax) | 5.000% | 2/15/41 | 1,100 | 1,205 |
| New York State Dormitory Authority Revenue | | | | |
| (Personal Income Tax) | 5.000% | 3/15/41 | 4,955 | 5,223 |
| New York State Dormitory Authority Revenue | | | | |
| (Personal Income Tax) | 5.000% | 2/15/42 | 120 | 127 |
| New York State Dormitory Authority Revenue | | | | |
| (Personal Income Tax) | 5.000% | 2/15/42 | 1,000 | 1,105 |
| New York State Dormitory Authority Revenue | | | | |
| (Personal Income Tax) | 5.000% | 3/15/42 | 260 | 276 |
| New York State Dormitory Authority Revenue | | | | |
| (Personal Income Tax) | 5.000% | 2/15/43 | 500 | 543 |
| New York State Dormitory Authority Revenue | | | | |
| (Personal Income Tax) | 5.000% | 2/15/43 | 330 | 364 |
| New York State Dormitory Authority Revenue | | | | |
| (Personal Income Tax) | 5.000% | 2/15/44 | 5,000 | 5,423 |
| New York State Dormitory Authority Revenue | | | | |
| (Rockefeller University) | 5.000% | 7/1/40 | 925 | 941 |
| New York State Dormitory Authority Revenue | | | | |
| (Service Contract) | 5.000% | 7/1/19 | 115 | 117 |
| New York State Dormitory Authority Revenue | | | | |
| (Service Contract) | 5.000% | 7/1/20 | 600 | 612 |
| New York State Dormitory Authority Revenue | | | | |
| (State University Dormitory Facilities) | 5.000% | 7/1/37 | 600 | 643 |
| New York State Dormitory Authority Revenue | | | | |
| (State University Educational Facilities) | 4.000% | 5/15/19 | 225 | 228 |
| New York State Dormitory Authority Revenue | | | | |
| (State University Educational Facilities) | 4.000% | 5/15/20 | 175 | 180 |
| New York State Dormitory Authority Revenue | | | | |
| (State University Educational Facilities) | 5.000% | 5/15/20 | 175 | 183 |
| New York State Dormitory Authority Revenue | | | | |
| (State University Educational Facilities) | 5.000% | 5/15/21 | 145 | 155 |
| New York State Dormitory Authority Revenue | | | | |
| (State University Educational Facilities) | 5.000% | 5/15/23 | 65 | 71 |
96
| | | | |
| Tax-Exempt Bond Index Fund | | | | |
| |
| |
| |
| | | | Face | Market |
| | | Maturity | Amount | Value • |
| | Coupon | Date | ($000) | ($000) |
| New York State Dormitory Authority Revenue | | | | |
| (State University Educational Facilities) | 5.000% | 5/15/24 | 100 | 109 |
| New York State Dormitory Authority Revenue | | | | |
| (State University Educational Facilities) | 5.000% | 5/15/27 | 750 | 814 |
| New York State Dormitory Authority Revenue | | | | |
| (State University Educational Facilities) | 5.000% | 5/15/29 | 665 | 721 |
| New York State Dormitory Authority Revenue | | | | |
| (The New School) | 4.000% | 7/1/43 | 500 | 488 |
| New York State Dormitory Authority Revenue | | | | |
| Sales Tax Revenue | 5.000% | 3/15/44 | 740 | 822 |
| New York State Dormitory Authority Sales Tax | | | | |
| Revenue | 5.000% | 3/15/21 | 3,660 | 3,900 |
| New York State Dormitory Authority Sales Tax | | | | |
| Revenue | 5.000% | 3/15/23 | 655 | 727 |
| New York State Dormitory Authority Sales Tax | | | | |
| Revenue | 5.000% | 3/15/24 | 120 | 133 |
| New York State Dormitory Authority Sales Tax | | | | |
| Revenue | 5.000% | 3/15/24 | 1,000 | 1,129 |
| New York State Dormitory Authority Sales Tax | | | | |
| Revenue | 5.000% | 3/15/25 | 130 | 149 |
| New York State Dormitory Authority Sales Tax | | | | |
| Revenue | 5.000% | 3/15/25 | 1,000 | 1,146 |
| New York State Dormitory Authority Sales Tax | | | | |
| Revenue | 5.000% | 3/15/26 | 570 | 649 |
| New York State Dormitory Authority Sales Tax | | | | |
| Revenue | 5.000% | 3/15/26 | 380 | 426 |
| New York State Dormitory Authority Sales Tax | | | | |
| Revenue | 5.000% | 3/15/27 | 215 | 245 |
| New York State Dormitory Authority Sales Tax | | | | |
| Revenue | 5.000% | 3/15/27 | 515 | 597 |
| New York State Dormitory Authority Sales Tax | | | | |
| Revenue | 5.000% | 3/15/27 | 280 | 313 |
| New York State Dormitory Authority Sales Tax | | | | |
| Revenue | 5.000% | 3/15/28 | 380 | 424 |
| New York State Dormitory Authority Sales Tax | | | | |
| Revenue | 5.000% | 3/15/28 | 1,020 | 1,122 |
| New York State Dormitory Authority Sales Tax | | | | |
| Revenue | 5.000% | 3/15/28 | 295 | 335 |
| New York State Dormitory Authority Sales Tax | | | | |
| Revenue | 5.000% | 3/15/29 | 1,300 | 1,518 |
| New York State Dormitory Authority Sales Tax | | | | |
| Revenue | 5.000% | 3/15/30 | 180 | 203 |
| New York State Dormitory Authority Sales Tax | | | | |
| Revenue | 5.000% | 3/15/30 | 2,000 | 2,277 |
| New York State Dormitory Authority Sales Tax | | | | |
| Revenue | 5.000% | 3/15/30 | 1,940 | 2,221 |
| New York State Dormitory Authority Sales Tax | | | | |
| Revenue | 5.000% | 3/15/30 | 1,225 | 1,363 |
| New York State Dormitory Authority Sales Tax | | | | |
| Revenue | 5.000% | 3/15/31 | 215 | 241 |
| New York State Dormitory Authority Sales Tax | | | | |
| Revenue | 5.000% | 3/15/31 | 175 | 198 |
| New York State Dormitory Authority Sales Tax | | | | |
| Revenue | 5.000% | 3/15/32 | 370 | 413 |
97
| | | | |
| Tax-Exempt Bond Index Fund | | | | |
| |
| |
| |
| | | | Face | Market |
| | | Maturity | Amount | Value • |
| | Coupon | Date | ($000) | ($000) |
| New York State Dormitory Authority Sales Tax | | | | |
| Revenue | 5.000% | 3/15/32 | 1,435 | 1,588 |
| New York State Dormitory Authority Sales Tax | | | | |
| Revenue | 5.000% | 3/15/33 | 520 | 584 |
| New York State Dormitory Authority Sales Tax | | | | |
| Revenue | 5.000% | 3/15/33 | 185 | 206 |
| New York State Dormitory Authority Sales Tax | | | | |
| Revenue | 5.000% | 3/15/33 | 100 | 110 |
| New York State Dormitory Authority Sales Tax | | | | |
| Revenue | 5.000% | 3/15/34 | 590 | 663 |
| New York State Dormitory Authority Sales Tax | | | | |
| Revenue | 5.000% | 3/15/36 | 1,965 | 2,186 |
| New York State Dormitory Authority Sales Tax | | | | |
| Revenue | 5.000% | 3/15/38 | 1,355 | 1,503 |
| New York State Dormitory Authority Sales Tax | | | | |
| Revenue | 5.000% | 3/15/43 | 600 | 651 |
| New York State Dormitory Authority Sales Tax | | | | |
| Revenue | 5.000% | 3/15/43 | 500 | 551 |
| New York State Dormitory Authority Sales Tax | | | | |
| Revenue | 5.000% | 3/15/44 | 3,120 | 3,368 |
| New York State Environmental Facilities Corp. | | | | |
| Revenue (State Clean Water & Drinking | | | | |
| Water RevolvingFunds) | 5.000% | 6/15/20 | 155 | 162 |
| New York State Environmental Facilities Corp. | | | | |
| Revenue (State Clean Water & Drinking | | | | |
| Water RevolvingFunds) | 5.000% | 6/15/32 | 100 | 109 |
| New York State Environmental Facilities Corp. | | | | |
| Revenue (State Clean Water & Drinking | | | | |
| Water RevolvingFunds) | 5.000% | 6/15/41 | 325 | 344 |
| New York State Environmental Facilities Corp. | | | | |
| Revenue (State Clean Water & Drinking | | | | |
| Water RevolvingFunds) | 4.000% | 6/15/46 | 125 | 124 |
| New York State Environmental Facilities Corp. | | | | |
| Revenue (State Revolving Funds) | 5.000% | 5/15/41 | 425 | 450 |
| New York State GO | 5.000% | 2/15/39 | 100 | 101 |
| New York State Housing Finance Agency | | | | |
| Housing Revenue | 4.000% | 11/1/38 | 950 | 952 |
| New York State Thruway Authority Revenue | 5.000% | 5/1/19 | 6,125 | 6,216 |
| New York State Thruway Authority Revenue | 5.000% | 1/1/20 | 475 | 491 |
| New York State Thruway Authority Revenue | 5.000% | 1/1/23 | 110 | 121 |
| New York State Thruway Authority Revenue | 5.000% | 1/1/25 | 130 | 145 |
| New York State Thruway Authority Revenue | 5.000% | 1/1/26 | 350 | 374 |
| New York State Thruway Authority Revenue | 5.000% | 1/1/31 | 275 | 304 |
| New York State Thruway Authority Revenue | 5.000% | 1/1/31 | 330 | 350 |
| New York State Thruway Authority Revenue | 5.000% | 3/15/32 | 955 | 1,073 |
| New York State Thruway Authority Revenue | 5.000% | 1/1/37 | 2,435 | 2,567 |
| New York State Thruway Authority Revenue | 5.000% | 1/1/41 | 675 | 731 |
| New York State Thruway Authority Revenue | 4.125% | 1/1/42 | 250 | 254 |
| New York State Thruway Authority Revenue | 5.000% | 1/1/42 | 2,830 | 2,975 |
| New York State Thruway Authority Revenue | 5.000% | 1/1/46 | 440 | 475 |
| New York State Thruway Authority Revenue | 5.000% | 1/1/51 | 515 | 552 |
| New York State Thruway Authority Revenue | 4.000% | 1/1/56 | 685 | 659 |
| New York State Thruway Authority Revenue | 5.250% | 1/1/56 | 1,000 | 1,088 |
| New York State Thruway Authority Revenue | | | | |
| (Highway & Bridge Trust Fund) | 5.000% | 4/1/20 | 345 | 359 |
98
| | | | |
| Tax-Exempt Bond Index Fund | | | | |
| |
| |
| |
| | | | Face | Market |
| | | Maturity | Amount | Value • |
| | Coupon | Date | ($000) | ($000) |
| New York State Thruway Authority Revenue | | | | |
| (Highway & Bridge Trust Fund) | 5.500% | 4/1/20 (2) | 385 | 404 |
| New York State Thruway Authority Revenue | | | | |
| (Highway & Bridge Trust Fund) | 5.000% | 4/1/21 | 90 | 96 |
| New York State Thruway Authority Revenue | | | | |
| (Highway & Bridge Trust Fund) | 5.000% | 4/1/22 | 395 | 431 |
| New York State Thruway Authority Revenue | | | | |
| (Highway & Bridge Trust Fund) | 5.000% | 4/1/31 | 500 | 531 |
| New York State Thruway Authority Revenue | | | | |
| (Personal Income Tax) | 5.000% | 3/15/20 | 300 | 312 |
| New York State Thruway Authority Revenue | | | | |
| (Personal Income Tax) | 5.000% | 3/15/23 | 200 | 213 |
| New York State Thruway Authority Revenue | | | | |
| (Personal Income Tax) | 5.000% | 3/15/30 | 170 | 182 |
| New York State Thruway Authority Revenue | | | | |
| (Personal Income Tax) | 5.000% | 3/15/31 | 250 | 268 |
| New York State Urban Development Corp. | | | | |
| Revenue | 5.500% | 1/1/19 | 400 | 402 |
| New York State Urban Development Corp. | | | | |
| Revenue | 5.000% | 3/15/20 | 240 | 250 |
| New York State Urban Development Corp. | | | | |
| Revenue (Personal Income Tax) | 5.000% | 12/15/18 | 145 | 146 |
| New York State Urban Development Corp. | | | | |
| Revenue (Personal Income Tax) | 5.000% | 3/15/19 (Prere.) | 295 | 299 |
| New York State Urban Development Corp. | | | | |
| Revenue (Personal Income Tax) | 5.000% | 3/15/19 | 100 | 101 |
| New York State Urban Development Corp. | | | | |
| Revenue (Personal Income Tax) | 5.250% | 3/15/19 (Prere.) | 250 | 253 |
| New York State Urban Development Corp. | | | | |
| Revenue (Personal Income Tax) | 5.000% | 12/15/19 | 270 | 279 |
| New York State Urban Development Corp. | | | | |
| Revenue (Personal Income Tax) | 5.000% | 3/15/20 | 100 | 104 |
| New York State Urban Development Corp. | | | | |
| Revenue (Personal Income Tax) | 5.000% | 3/15/21 | 220 | 234 |
| New York State Urban Development Corp. | | | | |
| Revenue (Personal Income Tax) | 5.000% | 3/15/21 | 2,000 | 2,130 |
| New York State Urban Development Corp. | | | | |
| Revenue (Personal Income Tax) | 5.000% | 3/15/22 | 210 | 229 |
| New York State Urban Development Corp. | | | | |
| Revenue (Personal Income Tax) | 5.000% | 3/15/22 | 715 | 779 |
| New York State Urban Development Corp. | | | | |
| Revenue (Personal Income Tax) | 5.000% | 3/15/22 | 2,575 | 2,804 |
| New York State Urban Development Corp. | | | | |
| Revenue (Personal Income Tax) | 5.000% | 3/15/23 | 520 | 577 |
| New York State Urban Development Corp. | | | | |
| Revenue (Personal Income Tax) | 5.000% | 3/15/24 | 360 | 398 |
| New York State Urban Development Corp. | | | | |
| Revenue (Personal Income Tax) | 5.000% | 3/15/24 | 180 | 203 |
| New York State Urban Development Corp. | | | | |
| Revenue (Personal Income Tax) | 5.000% | 3/15/24 | 500 | 564 |
| New York State Urban Development Corp. | | | | |
| Revenue (Personal Income Tax) | 5.000% | 3/15/25 | 125 | 143 |
| New York State Urban Development Corp. | | | | |
| Revenue (Personal Income Tax) | 5.000% | 3/15/25 | 150 | 172 |
99
| | | | |
| Tax-Exempt Bond Index Fund | | | | |
| |
| |
| |
| | | | Face | Market |
| | | Maturity | Amount | Value • |
| | Coupon | Date | ($000) | ($000) |
| New York State Urban Development Corp. | | | | |
| Revenue (Personal Income Tax) | 5.000% | 3/15/25 | 320 | 354 |
| New York State Urban Development Corp. | | | | |
| Revenue (Personal Income Tax) | 5.000% | 3/15/26 | 730 | 844 |
| New York State Urban Development Corp. | | | | |
| Revenue (Personal Income Tax) | 5.000% | 3/15/28 | 250 | 285 |
| New York State Urban Development Corp. | | | | |
| Revenue (Personal Income Tax) | 5.000% | 3/15/28 | 270 | 308 |
| New York State Urban Development Corp. | | | | |
| Revenue (Personal Income Tax) | 5.000% | 3/15/29 | 5,105 | 5,601 |
| New York State Urban Development Corp. | | | | |
| Revenue (Personal Income Tax) | 5.000% | 3/15/29 | 865 | 949 |
| New York State Urban Development Corp. | | | | |
| Revenue (Personal Income Tax) | 5.000% | 3/15/29 | 175 | 195 |
| New York State Urban Development Corp. | | | | |
| Revenue (Personal Income Tax) | 5.000% | 3/15/29 | 760 | 863 |
| New York State Urban Development Corp. | | | | |
| Revenue (Personal Income Tax) | 5.000% | 3/15/30 | 85 | 93 |
| New York State Urban Development Corp. | | | | |
| Revenue (Personal Income Tax) | 5.000% | 3/15/30 | 65 | 71 |
| New York State Urban Development Corp. | | | | |
| Revenue (Personal Income Tax) | 5.000% | 3/15/30 | 640 | 710 |
| New York State Urban Development Corp. | | | | |
| Revenue (Personal Income Tax) | 5.000% | 3/15/31 | 1,000 | 1,140 |
| New York State Urban Development Corp. | | | | |
| Revenue (Personal Income Tax) | 5.000% | 3/15/31 | 115 | 122 |
| New York State Urban Development Corp. | | | | |
| Revenue (Personal Income Tax) | 5.000% | 3/15/32 | 1,320 | 1,491 |
| New York State Urban Development Corp. | | | | |
| Revenue (Personal Income Tax) | 5.000% | 3/15/32 | 335 | 366 |
| New York State Urban Development Corp. | | | | |
| Revenue (Personal Income Tax) | 5.000% | 3/15/33 | 525 | 572 |
| New York State Urban Development Corp. | | | | |
| Revenue (Personal Income Tax) | 5.000% | 3/15/33 | 350 | 381 |
| New York State Urban Development Corp. | | | | |
| Revenue (Personal Income Tax) | 5.000% | 3/15/33 | 660 | 739 |
| New York State Urban Development Corp. | | | | |
| Revenue (Personal Income Tax) | 5.000% | 3/15/34 | 665 | 734 |
| New York State Urban Development Corp. | | | | |
| Revenue (Personal Income Tax) | 5.000% | 3/15/35 | 250 | 277 |
| New York State Urban Development Corp. | | | | |
| Revenue (Service Contract) | 5.250% | 1/1/20 | 320 | 322 |
| New York State Urban Development Corp. | | | | |
| Revenue (Service Contract) | 5.000% | 1/1/21 | 460 | 475 |
| Port Authority of New York & New Jersey | | | | |
| Revenue | 5.000% | 12/1/20 | 250 | 265 |
| Port Authority of New York & New Jersey | | | | |
| Revenue | 5.000% | 12/1/21 | 135 | 146 |
| Port Authority of New York & New Jersey | | | | |
| Revenue | 5.000% | 5/1/26 | 120 | 137 |
| Port Authority of New York & New Jersey | | | | |
| Revenue | 5.000% | 12/1/26 | 155 | 174 |
| Port Authority of New York & New Jersey | | | | |
| Revenue | 5.000% | 10/15/27 | 145 | 166 |
100
| | | | |
| Tax-Exempt Bond Index Fund | | | | |
| |
| |
| |
| | | | Face | Market |
| | | Maturity | Amount | Value • |
| | Coupon | Date | ($000) | ($000) |
| Port Authority of New York & New Jersey | | | | |
| Revenue | 5.000% | 12/1/30 | 70 | 78 |
| Port Authority of New York & New Jersey | | | | |
| Revenue | 5.000% | 7/15/32 | 800 | 836 |
| Port Authority of New York & New Jersey | | | | |
| Revenue | 5.000% | 10/15/32 | 500 | 512 |
| Port Authority of New York & New Jersey | | | | |
| Revenue | 5.000% | 10/15/32 | 265 | 297 |
| Port Authority of New York & New Jersey | | | | |
| Revenue | 5.000% | 6/1/33 | 255 | 282 |
| Port Authority of New York & New Jersey | | | | |
| Revenue | 4.000% | 7/15/33 | 40 | 41 |
| Port Authority of New York & New Jersey | | | | |
| Revenue | 5.000% | 9/1/34 | 65 | 72 |
| Port Authority of New York & New Jersey | | | | |
| Revenue | 5.000% | 7/15/35 | 75 | 78 |
| Port Authority of New York & New Jersey | | | | |
| Revenue | 5.000% | 9/1/36 | 60 | 66 |
| Port Authority of New York & New Jersey | | | | |
| Revenue | 4.750% | 11/1/36 | 240 | 242 |
| Port Authority of New York & New Jersey | | | | |
| Revenue | 5.000% | 5/1/37 | 120 | 125 |
| Port Authority of New York & New Jersey | | | | |
| Revenue | 4.500% | 10/15/37 | 620 | 631 |
| Port Authority of New York & New Jersey | | | | |
| Revenue | 5.000% | 5/1/39 | 4,500 | 4,555 |
| Port Authority of New York & New Jersey | | | | |
| Revenue | 5.000% | 7/15/39 | 1,215 | 1,266 |
| Port Authority of New York & New Jersey | | | | |
| Revenue | 5.000% | 9/1/39 | 210 | 231 |
| Port Authority of New York & New Jersey | | | | |
| Revenue | 4.500% | 9/15/39 | 725 | 736 |
| Port Authority of New York & New Jersey | | | | |
| Revenue | 5.000% | 5/1/40 | 100 | 109 |
| Port Authority of New York & New Jersey | | | | |
| Revenue | 5.000% | 1/15/41 | 2,030 | 2,133 |
| Port Authority of New York & New Jersey | | | | |
| Revenue | 5.000% | 10/15/41 | 2,755 | 3,017 |
| Port Authority of New York & New Jersey | | | | |
| Revenue | 5.000% | 11/15/41 | 200 | 220 |
| Port Authority of New York & New Jersey | | | | |
| Revenue | 5.000% | 10/15/42 | 350 | 387 |
| Port Authority of New York & New Jersey | | | | |
| Revenue | 4.000% | 9/1/43 | 1,720 | 1,707 |
| Port Authority of New York & New Jersey | | | | |
| Revenue | 5.000% | 12/1/43 | 100 | 109 |
| Port Authority of New York & New Jersey | | | | |
| Revenue | 5.000% | 5/1/45 | 420 | 457 |
| Port Authority of New York & New Jersey | | | | |
| Revenue | 5.000% | 11/15/46 | 1,225 | 1,343 |
| Port Authority of New York & New Jersey | | | | |
| Revenue | 5.250% | 10/15/55 | 250 | 276 |
| Port Authority of New York & New Jersey | | | | |
| Revenue | 5.250% | 10/15/57 | 1,150 | 1,277 |
101
| | | | |
| Tax-Exempt Bond Index Fund | | | | |
| |
| |
| |
| | | | Face | Market |
| | | Maturity | Amount | Value • |
| | Coupon | Date | ($000) | ($000) |
| Port Authority of New York & New Jersey | | | | |
| Revenue | 5.250% | 11/15/57 | 1,250 | 1,397 |
| Port Authority of New York & New Jersey | | | | |
| Revenue | 6.125% | 6/1/94 | 200 | 232 |
| Suffolk County NY Water Authority Water | | | | |
| System Revenue | 3.000% | 6/1/32 | 150 | 143 |
| Triborough Bridge & Tunnel Authority New | | | | |
| York Revenue | 5.000% | 11/15/18 | 110 | 110 |
| Triborough Bridge & Tunnel Authority New | | | | |
| York Revenue | 5.000% | 11/15/18 (Prere.) | 500 | 501 |
| Triborough Bridge & Tunnel Authority New | | | | |
| York Revenue | 5.000% | 11/15/19 | 230 | 237 |
| Triborough Bridge & Tunnel Authority New | | | | |
| York Revenue | 5.000% | 1/1/20 (ETM) | 150 | 153 |
| Triborough Bridge & Tunnel Authority New | | | | |
| York Revenue | 5.500% | 11/15/20 (14) | 185 | 197 |
| Triborough Bridge & Tunnel Authority New | | | | |
| York Revenue | 4.000% | 11/15/21 | 100 | 105 |
| Triborough Bridge & Tunnel Authority New | | | | |
| York Revenue | 5.000% | 11/15/21 | 165 | 179 |
| Triborough Bridge & Tunnel Authority New | | | | |
| York Revenue | 5.000% | 11/15/21 | 295 | 320 |
| Triborough Bridge & Tunnel Authority New | | | | |
| York Revenue | 5.000% | 1/1/22 (Prere.) | 150 | 163 |
| Triborough Bridge & Tunnel Authority New | | | | |
| York Revenue | 5.000% | 1/1/22 (Prere.) | 345 | 376 |
| Triborough Bridge & Tunnel Authority New | | | | |
| York Revenue | 5.250% | 1/1/22 (Prere.) | 100 | 110 |
| Triborough Bridge & Tunnel Authority New | | | | |
| York Revenue | 5.000% | 11/15/22 | 920 | 1,017 |
| Triborough Bridge & Tunnel Authority New | | | | |
| York Revenue | 5.000% | 11/15/23 | 210 | 236 |
| Triborough Bridge & Tunnel Authority New | | | | |
| York Revenue | 5.000% | 11/15/24 | 245 | 280 |
| Triborough Bridge & Tunnel Authority New | | | | |
| York Revenue | 5.000% | 11/15/25 | 1,155 | 1,278 |
| Triborough Bridge & Tunnel Authority New | | | | |
| York Revenue | 5.000% | 11/15/28 | 235 | 278 |
| Triborough Bridge & Tunnel Authority New | | | | |
| York Revenue | 0.000% | 11/15/29 | 400 | 267 |
| Triborough Bridge & Tunnel Authority New | | | | |
| York Revenue | 0.000% | 11/15/30 | 2,575 | 1,637 |
| Triborough Bridge & Tunnel Authority New | | | | |
| York Revenue | 0.000% | 11/15/31 | 2,820 | 1,709 |
| Triborough Bridge & Tunnel Authority New | | | | |
| York Revenue | 0.000% | 11/15/32 | 2,770 | 1,611 |
| Triborough Bridge & Tunnel Authority New | | | | |
| York Revenue | 0.000% | 11/15/32 | 1,790 | 1,034 |
| Triborough Bridge & Tunnel Authority New | | | | |
| York Revenue | 5.000% | 11/15/38 | 1,000 | 1,088 |
| Triborough Bridge & Tunnel Authority New | | | | |
| York Revenue | 5.000% | 11/15/38 | 355 | 355 |
| Triborough Bridge & Tunnel Authority New | | | | |
| York Revenue | 5.375% | 11/15/38 | 1,730 | 1,732 |
102
| | | | |
| Tax-Exempt Bond Index Fund | | | | |
| |
| |
| |
| | | | Face | Market |
| | | Maturity | Amount | Value • |
| | Coupon | Date | ($000) | ($000) |
| Triborough Bridge & Tunnel Authority New | | | | |
| York Revenue | 5.000% | 11/15/40 | 190 | 209 |
| Triborough Bridge & Tunnel Authority New | | | | |
| York Revenue | 5.000% | 11/15/42 | 100 | 111 |
| Triborough Bridge & Tunnel Authority New | | | | |
| York Revenue | 5.000% | 11/15/46 | 90 | 99 |
| Triborough Bridge & Tunnel Authority New | | | | |
| York Revenue | 4.000% | 11/15/47 | 2,000 | 1,966 |
| Troy NY Capital Resource Corp. Revenue | | | | |
| (Rensselaer Polytechnic Institute Project) | 5.125% | 9/1/40 | 1,460 | 1,518 |
| Utility Debt Securitization Authority New York | | | | |
| Revenue | 5.000% | 12/15/24 | 1,115 | 1,229 |
| Utility Debt Securitization Authority New York | | | | |
| Revenue | 5.000% | 6/15/25 | 270 | 300 |
| Utility Debt Securitization Authority New York | | | | |
| Revenue | 5.000% | 12/15/26 | 920 | 1,045 |
| Utility Debt Securitization Authority New York | | | | |
| Revenue | 5.000% | 12/15/27 | 150 | 172 |
| Utility Debt Securitization Authority New York | | | | |
| Revenue | 5.000% | 12/15/30 | 245 | 272 |
| Utility Debt Securitization Authority New York | | | | |
| Revenue | 5.000% | 12/15/31 | 180 | 200 |
| Utility Debt Securitization Authority New York | | | | |
| Revenue | 5.000% | 12/15/32 | 285 | 320 |
| Utility Debt Securitization Authority New York | | | | |
| Revenue | 5.000% | 12/15/34 | 155 | 172 |
| Utility Debt Securitization Authority New York | | | | |
| Revenue | 5.000% | 12/15/34 | 335 | 376 |
| Utility Debt Securitization Authority New York | | | | |
| Revenue | 5.000% | 12/15/35 | 325 | 362 |
| Utility Debt Securitization Authority New York | | | | |
| Revenue | 5.000% | 12/15/35 | 270 | 299 |
| Utility Debt Securitization Authority New York | | | | |
| Revenue | 5.000% | 12/15/36 | 640 | 710 |
| Utility Debt Securitization Authority New York | | | | |
| Revenue | 5.000% | 12/15/37 | 900 | 997 |
| Utility Debt Securitization Authority New York | | | | |
| Revenue | 5.000% | 12/15/41 | 1,320 | 1,429 |
| | | | | 734,154 |
| North Carolina (1.3%) | | | | |
| Charlotte NC COP | 3.000% | 6/1/22 | 200 | 200 |
| Charlotte NC COP | 5.000% | 6/1/34 | 1,280 | 1,300 |
| Charlotte NC Water & Sewer System Revenue | 5.000% | 7/1/21 | 325 | 349 |
| Charlotte NC Water & Sewer System Revenue | 5.000% | 7/1/23 | 3,000 | 3,353 |
| Charlotte NC Water & Sewer System Revenue | 5.000% | 7/1/38 | 125 | 130 |
| Charlotte NC Water & Sewer System Revenue | 4.000% | 7/1/47 | 2,480 | 2,496 |
| Mecklenburg County NC GO | 5.000% | 4/1/21 | 1,205 | 1,286 |
| Mecklenburg County NC GO | 5.000% | 12/1/21 | 1,150 | 1,246 |
| Mecklenburg County NC Public Facilities Corp. | | | | |
| Revenue | 5.000% | 2/1/23 | 455 | 505 |
| North Carolina Capital Facilities Finance | | | | |
| Agency Revenue (Duke University Project) | 5.000% | 4/1/19 (Prere.) | 910 | 922 |
| North Carolina Capital Facilities Finance | | | | |
| Agency Revenue (Duke University Project) | 5.000% | 10/1/41 | 250 | 278 |
103
| | | | |
| Tax-Exempt Bond Index Fund | | | | |
| |
| |
| |
| | | | Face | Market |
| | | Maturity | Amount | Value • |
| | Coupon | Date | ($000) | ($000) |
| North Carolina Capital Facilities Finance | | | | |
| Agency Revenue (Duke University Project) | 5.000% | 10/1/55 | 500 | 550 |
| North Carolina Capital Improvement Revenue | 4.500% | 5/1/20 (Prere.) | 640 | 663 |
| North Carolina Capital Improvement Revenue | 5.000% | 5/1/21 (Prere.) | 140 | 150 |
| North Carolina Eastern Municipal Power | | | | |
| Agency Power Systems Revenue | 5.000% | 1/1/19 (Prere.) | 2,475 | 2,488 |
| North Carolina Eastern Municipal Power | | | | |
| Agency Power Systems Revenue | 5.000% | 1/1/20 (ETM) | 105 | 109 |
| North Carolina Eastern Municipal Power | | | | |
| Agency Power Systems Revenue | 5.000% | 1/1/21 (ETM) | 300 | 317 |
| North Carolina Eastern Municipal Power | | | | |
| Agency Power Systems Revenue | 5.000% | 1/1/21 (ETM) | 3,250 | 3,447 |
| North Carolina Eastern Municipal Power | | | | |
| Agency Power Systems Revenue | 6.000% | 1/1/22 (ETM) | 792 | 883 |
| North Carolina Eastern Municipal Power | | | | |
| Agency Power Systems Revenue | 6.000% | 1/1/22 (Prere.) | 205 | 229 |
| North Carolina GAN | 5.250% | 3/1/19 (Prere.) | 250 | 253 |
| North Carolina GAN | 5.000% | 3/1/20 | 650 | 674 |
| North Carolina GAN | 5.000% | 3/1/23 | 1,845 | 2,040 |
| North Carolina GAN | 5.000% | 3/1/26 | 200 | 227 |
| North Carolina GO | 5.000% | 5/1/19 | 120 | 122 |
| North Carolina GO | 5.000% | 6/1/19 | 500 | 509 |
| North Carolina GO | 4.000% | 5/1/20 | 1,165 | 1,198 |
| North Carolina GO | 5.000% | 5/1/20 | 150 | 156 |
| North Carolina GO | 5.000% | 5/1/20 | 1,790 | 1,868 |
| North Carolina GO | 5.000% | 5/1/20 (Prere.) | 90 | 94 |
| North Carolina GO | 5.000% | 5/1/20 (Prere.) | 30 | 31 |
| North Carolina GO | 4.000% | 6/1/20 | 4,100 | 4,224 |
| North Carolina GO | 4.000% | 5/1/21 | 890 | 931 |
| North Carolina GO | 5.000% | 5/1/22 | 500 | 547 |
| North Carolina GO | 5.000% | 6/1/22 | 100 | 110 |
| North Carolina Municipal Power Agency No. 1 | | | | |
| Revenue (Catawba Electric) | 5.000% | 1/1/19 (Prere.) | 1,525 | 1,533 |
| North Carolina Municipal Power Agency No. 1 | | | | |
| Revenue (Catawba Electric) | 5.000% | 1/1/24 | 115 | 129 |
| North Carolina Municipal Power Agency No. 1 | | | | |
| Revenue (Catawba Electric) | 5.000% | 1/1/30 | 55 | 55 |
| North Carolina Revenue | 5.000% | 11/1/18 | 100 | 100 |
| North Carolina Revenue | 5.000% | 11/1/19 | 450 | 464 |
| North Carolina Revenue | 5.000% | 11/1/20 | 300 | 317 |
| North Carolina Revenue | 5.000% | 5/1/22 | 485 | 530 |
| North Carolina Revenue | 5.000% | 5/1/25 | 1,630 | 1,841 |
| North Carolina Revenue | 5.000% | 5/1/25 | 1,035 | 1,189 |
| North Carolina Revenue | 5.000% | 6/1/25 | 110 | 126 |
| North Carolina Revenue | 5.000% | 5/1/26 | 790 | 917 |
| North Carolina Revenue | 5.000% | 5/1/27 | 345 | 404 |
| North Carolina Revenue | 5.000% | 5/1/29 | 2,360 | 2,729 |
| North Carolina Turnpike Authority Revenue | 5.750% | 1/1/19 (Prere.) | 195 | 196 |
| North Carolina Turnpike Authority Revenue | | | | |
| (Monroe Expressway Toll) | 5.000% | 7/1/47 | 200 | 212 |
| North Carolina Turnpike Authority Revenue | | | | |
| (Monroe Expressway Toll) | 5.000% | 7/1/51 | 200 | 212 |
| Raleigh NC Combined Enterprise System | | | | |
| Revenue | 5.000% | 3/1/21 (Prere.) | 265 | 282 |
104
| | | | |
| Tax-Exempt Bond Index Fund | | | | |
| |
| |
| |
| | | | Face | Market |
| | | Maturity | Amount | Value • |
| | Coupon | Date | ($000) | ($000) |
| University of North Carolina at Greensboro | | | | |
| Revenue | 4.000% | 4/1/35 | 1,300 | 1,332 |
| Wake County NC GO | 5.000% | 3/1/21 | 600 | 639 |
| Wake County NC GO | 5.000% | 3/1/23 | 300 | 333 |
| | | | | 47,425 |
| Ohio (1.6%) | | | | |
| American Municipal Power Ohio Inc. Revenue | 5.000% | 2/15/22 (Prere.) | 70 | 76 |
| American Municipal Power Ohio Inc. Revenue | 4.000% | 2/15/42 | 1,395 | 1,370 |
| American Municipal Power Ohio Inc. Revenue | 5.000% | 2/15/42 | 255 | 270 |
| American Municipal Power Ohio Inc. Revenue | 4.375% | 2/15/44 | 140 | 142 |
| American Municipal Power Ohio Inc. Revenue | | | | |
| (Prairie State Energy Campus Project) | 5.000% | 2/15/26 | 130 | 143 |
| American Municipal Power Ohio Inc. Revenue | | | | |
| (Prairie State Energy Campus Project) | 5.250% | 2/15/30 (15) | 5,585 | 6,061 |
| American Municipal Power Ohio Inc. Revenue | | | | |
| (Prairie State Energy Campus Project) PUT | 5.000% | 8/15/19 | 400 | 403 |
| American Municipal Power Ohio Inc. Revenue | | | | |
| (Prairie State Energy Campus Project) PUT | 5.000% | 8/15/20 | 745 | 771 |
| Berea OH City School District GO | 4.000% | 12/1/53 (15) | 250 | 244 |
| Brunswick OH City School District GO | 5.250% | 12/1/48 | 500 | 549 |
| Brunswick OH City School District GO | 5.250% | 12/1/53 | 640 | 699 |
| Cleveland Heights OH City School District GO | 4.500% | 12/1/47 | 1,870 | 1,906 |
| Cleveland OH Airport System Revenue | 5.000% | 1/1/22 (4) | 355 | 382 |
| Cleveland OH Airport System Revenue | 5.000% | 1/1/24 (4) | 2,040 | 2,267 |
| Cleveland OH Airport System Revenue | 5.000% | 1/1/29 | 200 | 213 |
| Cleveland State University Ohio General | | | | |
| Receipts Revenue | 5.000% | 6/1/37 | 120 | 127 |
| Columbus OH GO | 5.000% | 7/1/25 | 1,370 | 1,573 |
| Columbus OH GO | 5.000% | 7/1/26 | 100 | 116 |
| Columbus OH Sewer Revenue | 5.000% | 6/1/27 | 125 | 142 |
| Columbus OH Sewer Revenue | 5.000% | 6/1/28 | 2,500 | 2,825 |
| Columbus OH Sewer Revenue | 5.000% | 6/1/32 | 1,500 | 1,688 |
| Cuyahoga County OH Economic Development | | | | |
| Revenue (Med Mart/Convention Center | | | | |
| Project) | 5.250% | 12/1/25 | 225 | 238 |
| Cuyahoga OH Community College District | | | | |
| Revenue | 5.000% | 8/1/28 | 275 | 298 |
| Hamilton County OH Sales Tax Revenue | 4.000% | 12/1/31 | 410 | 424 |
| Hamilton County OH Sewer System Revenue | 5.000% | 12/1/38 | 260 | 285 |
| Northeast Ohio Regional Sewer District | | | | |
| Wastewater Revenue | 5.000% | 5/15/23 (Prere.) | 1,065 | 1,186 |
| Northeast Ohio Regional Sewer District | | | | |
| Wastewater Revenue | 5.000% | 5/15/23 (Prere.) | 600 | 668 |
| Northeast Ohio Regional Sewer District | | | | |
| Wastewater Revenue | 5.000% | 11/15/39 | 300 | 330 |
| Northeast Ohio Regional Sewer District | | | | |
| Wastewater Revenue | 5.000% | 11/15/44 | 3,215 | 3,523 |
| Northeast Ohio Regional Sewer District | | | | |
| Wastewater Revenue | 4.000% | 11/15/49 | 255 | 251 |
| Ohio GO | 5.000% | 9/15/21 | 200 | 215 |
| Ohio GO | 5.000% | 9/15/24 | 570 | 648 |
| Ohio GO | 5.000% | 8/1/25 | 4,900 | 5,640 |
| Ohio GO | 5.000% | 9/1/25 | 200 | 230 |
| Ohio GO | 5.000% | 8/1/26 | 3,000 | 3,491 |
105
| | | | |
| Tax-Exempt Bond Index Fund | | | | |
| |
| |
| |
| | | | Face | Market |
| | | Maturity | Amount | Value • |
| | Coupon | Date | ($000) | ($000) |
| Ohio GO | 5.000% | 5/1/27 | 125 | 147 |
| Ohio GO | 5.000% | 5/1/34 | 3,000 | 3,333 |
| Ohio GO | 5.000% | 3/15/37 | 1,635 | 1,798 |
| Ohio Higher Educational Facility Commission | | | | |
| Revenue (Case Western Reserve University | | | | |
| Project) | 5.000% | 12/1/40 | 285 | 313 |
| Ohio Major New State Infrastructure Project | | | | |
| Revenue | 5.000% | 12/15/28 | 1,000 | 1,140 |
| Ohio State University General Receipts | | | | |
| Revenue | 5.000% | 12/1/39 | 645 | 712 |
| Ohio Turnpike Commission Turnpike Revenue | 5.000% | 2/15/20 (Prere.) | 100 | 104 |
| Ohio Turnpike Commission Turnpike Revenue | 5.250% | 2/15/30 | 250 | 275 |
| Ohio Turnpike Commission Turnpike Revenue | 5.000% | 2/15/33 | 2,000 | 2,258 |
| Ohio Turnpike Commission Turnpike Revenue | 0.000% | 2/15/36 | 600 | 291 |
| Ohio Turnpike Commission Turnpike Revenue | 0.000% | 2/15/37 | 50 | 23 |
| Ohio Turnpike Commission Turnpike Revenue | 0.000% | 2/15/38 | 980 | 431 |
| Ohio Turnpike Commission Turnpike Revenue | 5.250% | 2/15/39 | 105 | 115 |
| Ohio Turnpike Commission Turnpike Revenue | 0.000% | 2/15/40 | 170 | 68 |
| Ohio Turnpike Commission Turnpike Revenue | 0.000% | 2/15/42 | 615 | 223 |
| Ohio Turnpike Commission Turnpike Revenue | 0.000% | 2/15/43 | 605 | 210 |
| Ohio Turnpike Commission Turnpike Revenue | 5.000% | 2/15/48 | 3,630 | 3,902 |
| Ohio Water Development Authority Pollution | | | | |
| Control Revenue (Water Quality) | 5.000% | 12/1/21 | 380 | 411 |
| Ohio Water Development Authority Revenue | 5.000% | 6/1/28 | 770 | 893 |
| Ohio Water Development Authority Water | | | | |
| Pollution Control Loan Fund Revenue | 5.000% | 12/1/19 (Prere.) | 1,060 | 1,094 |
| Ohio Water Development Authority Water | | | | |
| Pollution Control Loan Fund Revenue | 5.000% | 6/1/25 | 100 | 115 |
| Revere OH Local School District GO | 5.000% | 6/1/22 (Prere.) | 265 | 290 |
| South-Western City OH School District GO | 4.000% | 12/1/42 | 220 | 221 |
| Willoughby-Eastlake City OH School District | | | | |
| GO | 5.000% | 12/1/46 | 295 | 320 |
| Willoughby-Eastlake City OH School District | | | | |
| GO | 4.000% | 12/1/50 | 1,000 | 970 |
| Winton Woods City OH School District GO | 5.000% | 5/1/22 (Prere.) | 500 | 547 |
| | | | | 59,598 |
| Oklahoma (0.4%) | | | | |
| Canadian County OK Educational Facilities | | | | |
| Authority Lease Revenue (Mustang Public | | | | |
| Schools Project) | 5.000% | 9/1/28 | 620 | 704 |
| Edmond OK Public Works Authority Sales | | | | |
| Tax & Utility System Revenue | 4.000% | 7/1/47 | 1,000 | 993 |
| Grand River Dam Authority Oklahoma | | | | |
| Revenue | 5.000% | 6/1/20 (Prere.) | 220 | 230 |
| Oklahoma Agricultural & Mechanical Colleges | | | | |
| Revenue (Oklahoma State University) | 4.400% | 8/1/39 | 345 | 349 |
| Oklahoma Capitol Improvement Authority | | | | |
| Facilities Revenue | 4.000% | 7/1/38 | 1,290 | 1,285 |
| Oklahoma Capitol Improvement Authority | | | | |
| Highway Improvement Revenue | 4.000% | 7/1/34 | 680 | 704 |
| Oklahoma Grand River Dam Authority | | | | |
| Revenue | 5.250% | 6/1/20 (Prere.) | 1,030 | 1,081 |
| Oklahoma Municipal Power Authority Power | | | | |
| Supply System Revenue | 5.000% | 1/1/47 | 200 | 216 |
106
| | | | |
| Tax-Exempt Bond Index Fund | | | | |
| |
| |
| |
| | | | Face | Market |
| | | Maturity | Amount | Value • |
| | Coupon | Date | ($000) | ($000) |
| Oklahoma Turnpike Authority Revenue | 5.000% | 1/1/22 | 235 | 249 |
| Oklahoma Turnpike Authority Revenue | 5.000% | 1/1/28 | 100 | 117 |
| Oklahoma Turnpike Authority Revenue | 4.000% | 1/1/42 | 500 | 498 |
| Oklahoma Turnpike Authority Revenue | 5.000% | 1/1/42 | 500 | 546 |
| Oklahoma Turnpike Authority Revenue | 4.000% | 1/1/47 | 1,180 | 1,164 |
| Oklahoma Turnpike Authority Revenue | 4.000% | 1/1/48 | 5,220 | 5,140 |
| | | | | 13,276 |
| Oregon (0.6%) | | | | |
| Clackamas County OR School District No. 12 | | | | |
| North Clackamas GO | 0.000% | 6/15/35 | 400 | 203 |
| Clackamas County OR School District No. 12 | | | | |
| North Clackamas GO | 0.000% | 6/15/36 | 710 | 341 |
| Clackamas County OR School District No. 12 | | | | |
| North Clackamas GO | 0.000% | 6/15/39 | 500 | 206 |
| Clatsop County OR School District No. 10 | | | | |
| Seaside GO | 0.000% | 6/15/37 | 500 | 228 |
| Multnomah County OR GO | 4.000% | 6/1/27 | 2,105 | 2,204 |
| Oregon Department of Administrative | | | | |
| Services Lottery Revenue | 5.000% | 4/1/19 (Prere.) | 700 | 709 |
| Oregon Department of Administrative | | | | |
| Services Lottery Revenue | 5.250% | 4/1/19 (Prere.) | 150 | 152 |
| Oregon Department of Administrative | | | | |
| Services Lottery Revenue | 5.000% | 4/1/25 | 775 | 872 |
| Oregon Department of Administrative | | | | |
| Services Lottery Revenue | 5.000% | 4/1/28 | 150 | 170 |
| Oregon Department of Administrative | | | | |
| Services Lottery Revenue | 5.000% | 4/1/29 | 215 | 243 |
| Oregon Department of Transportation | | | | |
| Highway User Tax Revenue | 5.000% | 11/15/27 | 5,000 | 5,657 |
| Oregon Department of Transportation | | | | |
| Highway User Tax Revenue | 5.000% | 11/15/29 | 980 | 1,101 |
| Oregon Department of Transportation | | | | |
| Highway User Tax Revenue | 5.000% | 11/15/30 | 665 | 747 |
| Oregon Department of Transportation | | | | |
| Highway User Tax Revenue | 5.000% | 11/15/31 | 430 | 482 |
| Oregon Department of Transportation | | | | |
| Highway User Tax Revenue | 5.000% | 11/15/38 | 1,500 | 1,652 |
| Oregon GO | 5.000% | 12/1/23 | 500 | 563 |
| Oregon GO | 5.000% | 8/1/43 | 780 | 851 |
| Oregon GO (Veterans Welfare) | 4.700% | 6/1/41 | 370 | 380 |
| Portland OR Sewer System Revenue | 5.000% | 6/1/20 | 1,065 | 1,113 |
| Portland OR Sewer System Revenue | 5.000% | 6/1/21 | 505 | 541 |
| Portland OR Sewer System Revenue | 5.000% | 3/1/35 | 120 | 124 |
| Tri-County Metropolitan Transportation | | | | |
| District of Oregon Capital Grant Receipt | | | | |
| Revenue | 5.000% | 11/1/18 | 300 | 300 |
| Washington County OR School District | | | | |
| No. 48J Beaverton GO | 5.000% | 6/15/28 | 500 | 560 |
| Washington County OR School District | | | | |
| No. 48J Beaverton GO | 5.000% | 6/15/36 | 950 | 1,065 |
| | | | | 20,464 |
| Pennsylvania (4.3%) | | | | |
| Allegheny County PA GO | 5.000% | 11/1/19 (Prere.) | 725 | 746 |
| Allegheny County PA GO | 5.000% | 11/1/27 | 745 | 853 |
107
| | | | |
| Tax-Exempt Bond Index Fund | | | | |
| |
| |
| |
| | | | Face | Market |
| | | Maturity | Amount | Value • |
| | Coupon | Date | ($000) | ($000) |
| Allegheny County PA GO | 5.000% | 11/1/28 | 520 | 592 |
| Allegheny County PA GO | 5.000% | 12/1/37 | 235 | 253 |
| Allegheny County PA GO | 5.000% | 11/1/41 | 100 | 110 |
| Allegheny County PA Sanitary Authority Sewer | | | | |
| Revenue | 5.000% | 12/1/20 | 145 | 153 |
| Allegheny County PA Sanitary Authority Sewer | | | | |
| Revenue | 5.000% | 12/1/22 | 260 | 285 |
| Allegheny County PA Sanitary Authority Sewer | | | | |
| Revenue | 5.000% | 6/1/40 (4) | 180 | 188 |
| Allegheny County PA Sanitary Authority Sewer | | | | |
| Revenue | 5.000% | 6/1/43 | 1,000 | 1,096 |
| Allegheny County PA Sanitary Authority Sewer | | | | |
| Revenue | 4.000% | 6/1/48 | 1,000 | 966 |
| Allentown PA Neighborhood Improvement | | | | |
| Zone Development Authority Tax Revenue | 5.000% | 5/1/25 | 335 | 354 |
| Allentown PA Neighborhood Improvement | | | | |
| Zone Development Authority Tax Revenue | 5.000% | 5/1/30 | 150 | 156 |
| Capital Region Water Pennsylvania Sewer | | | | |
| System Revenue | 5.000% | 7/15/28 | 375 | 424 |
| Chester County PA GO | 5.000% | 7/15/19 (Prere.) | 75 | 77 |
| Chester County PA GO | 5.000% | 7/15/28 | 25 | 26 |
| Coatesville PA School District GO | 5.000% | 8/1/23 (4) | 285 | 312 |
| Commonwealth Financing Authority | | | | |
| Pennsylvania Revenue | 5.000% | 6/1/35 | 100 | 109 |
| Commonwealth Financing Authority | | | | |
| Pennsylvania Revenue | 5.000% | 6/1/36 | 100 | 106 |
| Commonwealth Financing Authority | | | | |
| Pennsylvania Revenue | 5.000% | 6/1/42 | 280 | 296 |
| Delaware River Port Authority Pennsylvania & | | | | |
| New Jersey Revenue | 5.000% | 1/1/26 | 195 | 210 |
| Delaware River Port Authority Pennsylvania & | | | | |
| New Jersey Revenue | 4.500% | 1/1/32 | 240 | 252 |
| Delaware River Port Authority Pennsylvania & | | | | |
| New Jersey Revenue | 5.000% | 1/1/35 | 2,550 | 2,615 |
| Delaware River Port Authority Pennsylvania & | | | | |
| New Jersey Revenue | 5.000% | 1/1/40 | 580 | 594 |
| Delaware Valley PA Regional Finance | | | | |
| Authority Revenue | 5.500% | 8/1/28 (2) | 595 | 696 |
| Delaware Valley PA Regional Finance | | | | |
| Authority Revenue | 5.750% | 7/1/32 | 1,960 | 2,383 |
| Lehigh County PA Authority Water & Sewer | | | | |
| Revenue | 5.000% | 12/1/43 | 300 | 322 |
| Montgomery County PA Higher Education & | | | | |
| Health Authority Revenue (Thomas Jefferson | | | | |
| University) | 5.000% | 9/1/48 | 1,000 | 1,075 |
| Montgomery County PA Higher Education & | | | | |
| Health Authority Revenue (Thomas Jefferson | | | | |
| University) | 4.000% | 9/1/49 | 1,000 | 952 |
| Montgomery County PA Higher Education & | | | | |
| Health Authority Revenue (Ursinus College) | 5.250% | 11/1/42 | 400 | 423 |
| Northampton County PA General Purpose | | | | |
| Authority College Revenue (Lafayette | | | | |
| College) | 5.000% | 11/1/34 | 225 | 253 |
| Pennsylvania COP | 5.000% | 7/1/28 | 400 | 447 |
108
| | | | |
| Tax-Exempt Bond Index Fund | | | | |
| |
| |
| |
| | | | Face | Market |
| | | Maturity | Amount | Value • |
| | Coupon | Date | ($000) | ($000) |
| Pennsylvania Economic Development | | | | |
| Financing Authority Governmental Lease | | | | |
| Revenue (Forum Place Project) | 5.000% | 3/1/34 | 3,000 | 3,103 |
| Pennsylvania Economic Development | | | | |
| Financing Authority Unemployment | | | | |
| Compensation Revenue | 5.000% | 1/1/19 | 390 | 392 |
| Pennsylvania Economic Development | | | | |
| Financing Authority Unemployment | | | | |
| Compensation Revenue | 5.000% | 1/1/20 | 400 | 408 |
| Pennsylvania Economic Development | | | | |
| Financing Authority Unemployment | | | | |
| Compensation Revenue | 5.000% | 1/1/21 | 110 | 111 |
| Pennsylvania GO | 5.000% | 11/15/18 | 150 | 150 |
| Pennsylvania GO | 5.000% | 2/15/19 | 1,775 | 1,790 |
| Pennsylvania GO | 5.000% | 4/15/19 (Prere.) | 200 | 203 |
| Pennsylvania GO | 5.000% | 4/15/19 (Prere.) | 150 | 152 |
| Pennsylvania GO | 5.000% | 5/1/19 | 200 | 203 |
| Pennsylvania GO | 5.000% | 7/1/19 | 2,335 | 2,380 |
| Pennsylvania GO | 5.000% | 9/15/19 | 650 | 666 |
| Pennsylvania GO | 5.000% | 10/15/19 | 120 | 123 |
| Pennsylvania GO | 5.000% | 7/1/20 | 1,665 | 1,739 |
| Pennsylvania GO | 5.000% | 9/15/20 | 135 | 142 |
| Pennsylvania GO | 5.000% | 1/15/21 | 400 | 423 |
| Pennsylvania GO | 5.000% | 7/1/21 | 380 | 406 |
| Pennsylvania GO | 5.000% | 7/1/21 | 275 | 294 |
| Pennsylvania GO | 5.000% | 7/1/21 | 500 | 534 |
| Pennsylvania GO | 5.000% | 10/15/21 | 390 | 419 |
| Pennsylvania GO | 5.000% | 11/15/21 (Prere.) | 1,205 | 1,304 |
| Pennsylvania GO | 5.000% | 11/15/21 (Prere.) | 1,545 | 1,672 |
| Pennsylvania GO | 5.000% | 11/15/21 (Prere.) | 390 | 422 |
| Pennsylvania GO | 5.000% | 1/15/22 | 2,000 | 2,156 |
| Pennsylvania GO | 5.000% | 4/1/22 | 440 | 476 |
| Pennsylvania GO | 5.000% | 6/1/22 | 300 | 326 |
| Pennsylvania GO | 5.000% | 6/1/22 (Prere.) | 110 | 120 |
| Pennsylvania GO | 5.000% | 6/1/22 (Prere.) | 500 | 548 |
| Pennsylvania GO | 5.000% | 7/1/22 | 780 | 848 |
| Pennsylvania GO | 5.000% | 7/1/22 | 100 | 109 |
| Pennsylvania GO | 5.000% | 9/15/22 | 1,000 | 1,091 |
| Pennsylvania GO | 5.000% | 3/15/23 | 525 | 577 |
| Pennsylvania GO | 5.000% | 4/1/23 (Prere.) | 250 | 278 |
| Pennsylvania GO | 5.000% | 4/1/23 (Prere.) | 770 | 857 |
| Pennsylvania GO | 5.000% | 6/15/24 (Prere.) | 100 | 114 |
| Pennsylvania GO | 5.000% | 6/15/24 | 225 | 251 |
| Pennsylvania GO | 5.000% | 7/1/24 | 180 | 201 |
| Pennsylvania GO | 5.000% | 8/15/24 | 1,000 | 1,119 |
| Pennsylvania GO | 5.000% | 9/15/24 | 705 | 790 |
| Pennsylvania GO | 5.000% | 1/15/25 | 1,000 | 1,123 |
| Pennsylvania GO | 5.000% | 8/15/25 | 500 | 565 |
| Pennsylvania GO | 5.000% | 9/15/25 | 1,275 | 1,442 |
| Pennsylvania GO | 5.000% | 9/15/25 (4) | 1,250 | 1,418 |
| Pennsylvania GO | 5.000% | 1/1/26 | 2,000 | 2,263 |
| Pennsylvania GO | 5.000% | 3/15/26 | 920 | 1,030 |
| Pennsylvania GO | 5.000% | 8/1/26 | 225 | 253 |
| Pennsylvania GO | 5.000% | 9/15/26 | 1,150 | 1,310 |
109
| | | | |
| Tax-Exempt Bond Index Fund | | | | |
| |
| |
| |
| | | | Face | Market |
| | | Maturity | Amount | Value • |
| | Coupon | Date | ($000) | ($000) |
| Pennsylvania GO | 5.000% | 9/15/26 | 280 | 319 |
| Pennsylvania GO | 5.000% | 9/15/27 | 100 | 113 |
| Pennsylvania GO | 5.000% | 1/1/28 | 2,000 | 2,252 |
| Pennsylvania GO | 4.000% | 10/15/28 | 100 | 104 |
| Pennsylvania GO | 5.000% | 3/15/29 | 1,160 | 1,282 |
| Pennsylvania GO | 4.000% | 6/1/29 | 250 | 259 |
| Pennsylvania GO | 5.000% | 9/15/29 | 750 | 839 |
| Pennsylvania GO | 4.000% | 1/1/30 | 3,500 | 3,608 |
| Pennsylvania GO | 5.000% | 3/15/31 | 3,555 | 3,908 |
| Pennsylvania GO | 4.000% | 4/1/32 | 1,000 | 1,019 |
| Pennsylvania GO | 4.000% | 6/15/32 | 395 | 404 |
| Pennsylvania GO | 5.000% | 10/15/32 | 430 | 467 |
| Pennsylvania GO | 5.000% | 3/15/33 | 980 | 1,068 |
| Pennsylvania GO | 4.375% | 10/15/33 | 100 | 104 |
| Pennsylvania GO | 4.000% | 3/15/34 | 200 | 203 |
| Pennsylvania GO | 4.000% | 9/15/34 | 735 | 746 |
| Pennsylvania GO | 4.000% | 3/1/35 | 2,000 | 2,005 |
| Pennsylvania GO | 4.000% | 3/1/36 | 4,500 | 4,489 |
| Pennsylvania Higher Educational Facilities | | | | |
| Authority Revenue | 4.000% | 2/15/43 | 3,000 | 3,021 |
| Pennsylvania Higher Educational Facilities | | | | |
| Authority Revenue | 3.000% | 6/15/45 | 130 | 105 |
| Pennsylvania Higher Educational Facilities | | | | |
| Authority Revenue (Drexel University) | 5.125% | 5/1/21 (Prere.) | 110 | 118 |
| Pennsylvania Higher Educational Facilities | | | | |
| Authority Revenue (Drexel University) | 5.125% | 5/1/36 | 5 | 5 |
| Pennsylvania Higher Educational Facilities | | | | |
| Authority Revenue (Higher Education System) | 5.000% | 6/15/30 | 895 | 911 |
| Pennsylvania Higher Educational Facilities | | | | |
| Authority Revenue (Temple University) | 5.000% | 4/1/42 | 100 | 106 |
| Pennsylvania Higher Educational Facilities | | | | |
| Authority Revenue (Thomas Jefferson | | | | |
| University) | 4.000% | 9/1/45 | 200 | 190 |
| Pennsylvania Public School Building Authority | | | | |
| Lease Revenue (School District of | | | | |
| Philadelphia) | 5.000% | 6/1/29 (4) | 345 | 389 |
| Pennsylvania Public School Building Authority | | | | |
| Revenue (Harrisburg School District) | 4.750% | 5/15/19 (Prere.) | 435 | 442 |
| Pennsylvania Turnpike Commission Motor | | | | |
| License Fund Revenue | 5.000% | 12/1/34 | 2,700 | 2,971 |
| Pennsylvania Turnpike Commission Motor | | | | |
| License Fund Revenue | 5.000% | 12/1/43 | 145 | 153 |
| Pennsylvania Turnpike Commission Motor | | | | |
| License Fund Revenue | 5.250% | 12/1/43 | 50 | 55 |
| Pennsylvania Turnpike Commission Oil | | | | |
| Franchise Tax Revenue | 5.000% | 12/1/18 (Prere.) | 350 | 351 |
| Pennsylvania Turnpike Commission Oil | | | | |
| Franchise Tax Revenue | 0.000% | 12/1/38 | 230 | 95 |
| Pennsylvania Turnpike Commission Oil | | | | |
| Franchise Tax Revenue | 5.000% | 12/1/43 | 500 | 545 |
| Pennsylvania Turnpike Commission Oil | | | | |
| Franchise Tax Revenue | 5.000% | 12/1/43 | 1,000 | 1,094 |
| Pennsylvania Turnpike Commission Oil | | | | |
| Franchise Tax Revenue | 5.000% | 12/1/48 | 3,250 | 3,588 |
110
| | | | |
| Tax-Exempt Bond Index Fund | | | | |
| |
| |
| |
| | | | Face | Market |
| | | Maturity | Amount | Value • |
| | Coupon | Date | ($000) | ($000) |
| Pennsylvania Turnpike Commission Revenue | 5.000% | 12/1/18 | 115 | 115 |
| Pennsylvania Turnpike Commission Revenue | 5.000% | 6/1/19 (Prere.) | 20 | 20 |
| Pennsylvania Turnpike Commission Revenue | 5.000% | 6/1/19 (Prere.) | 55 | 56 |
| Pennsylvania Turnpike Commission Revenue | 5.000% | 6/1/19 (Prere.) | 20 | 20 |
| Pennsylvania Turnpike Commission Revenue | 5.000% | 6/1/19 (Prere.) | 255 | 260 |
| Pennsylvania Turnpike Commission Revenue | 5.000% | 6/1/19 (Prere.) | 70 | 71 |
| Pennsylvania Turnpike Commission Revenue | 5.000% | 6/1/19 (Prere.) | 140 | 142 |
| Pennsylvania Turnpike Commission Revenue | 5.250% | 6/1/19 (Prere.) | 415 | 423 |
| Pennsylvania Turnpike Commission Revenue | 5.250% | 6/1/19 (Prere.) | 1,210 | 1,233 |
| Pennsylvania Turnpike Commission Revenue | 5.250% | 6/1/19 (Prere.) | 120 | 122 |
| Pennsylvania Turnpike Commission Revenue | 5.250% | 6/1/19 (Prere.) | 100 | 102 |
| Pennsylvania Turnpike Commission Revenue | 5.250% | 6/1/19 (Prere.) | 10 | 10 |
| Pennsylvania Turnpike Commission Revenue | 5.750% | 6/1/19 (Prere.) | 370 | 378 |
| Pennsylvania Turnpike Commission Revenue | 4.500% | 12/1/19 (Prere.) | 255 | 262 |
| Pennsylvania Turnpike Commission Revenue | 5.000% | 12/1/19 (Prere.) | 1,095 | 1,130 |
| Pennsylvania Turnpike Commission Revenue | 5.000% | 12/1/19 (Prere.) | 2,155 | 2,223 |
| Pennsylvania Turnpike Commission Revenue | 5.000% | 12/1/19 (Prere.) | 5 | 5 |
| Pennsylvania Turnpike Commission Revenue | 5.000% | 12/1/19 (Prere.) | 65 | 67 |
| Pennsylvania Turnpike Commission Revenue | 5.125% | 12/1/19 (Prere.) | 1,685 | 1,741 |
| Pennsylvania Turnpike Commission Revenue | 5.300% | 12/1/19 (Prere.) | 1,440 | 1,488 |
| Pennsylvania Turnpike Commission Revenue | 5.300% | 12/1/19 (Prere.) | 270 | 279 |
| Pennsylvania Turnpike Commission Revenue | 5.500% | 12/1/19 (Prere.) | 730 | 757 |
| Pennsylvania Turnpike Commission Revenue | 5.000% | 12/1/20 (Prere.) | 300 | 317 |
| Pennsylvania Turnpike Commission Revenue | 5.350% | 12/1/20 (Prere.) | 20 | 21 |
| Pennsylvania Turnpike Commission Revenue | 5.350% | 12/1/20 (Prere.) | 20 | 21 |
| Pennsylvania Turnpike Commission Revenue | 5.350% | 12/1/20 (Prere.) | 15 | 16 |
| Pennsylvania Turnpike Commission Revenue | 5.350% | 12/1/20 (Prere.) | 360 | 383 |
| Pennsylvania Turnpike Commission Revenue | 5.450% | 12/1/20 (Prere.) | 965 | 1,029 |
| Pennsylvania Turnpike Commission Revenue | 5.500% | 12/1/20 (Prere.) | 2,750 | 2,935 |
| Pennsylvania Turnpike Commission Revenue | 5.750% | 12/1/20 (Prere.) | 575 | 617 |
| Pennsylvania Turnpike Commission Revenue | 5.750% | 12/1/20 (Prere.) | 55 | 59 |
| Pennsylvania Turnpike Commission Revenue | 5.750% | 12/1/20 (Prere.) | 100 | 107 |
| Pennsylvania Turnpike Commission Revenue | 6.000% | 12/1/20 (Prere.) | 90 | 97 |
| Pennsylvania Turnpike Commission Revenue | 6.000% | 12/1/20 (Prere.) | 115 | 124 |
| Pennsylvania Turnpike Commission Revenue | 6.000% | 12/1/20 (Prere.) | 2,410 | 2,597 |
| Pennsylvania Turnpike Commission Revenue | 6.500% | 12/1/20 (Prere.) | 285 | 310 |
| Pennsylvania Turnpike Commission Revenue | 5.000% | 12/1/21 | 95 | 98 |
| Pennsylvania Turnpike Commission Revenue | 5.000% | 12/1/23 | 1,310 | 1,351 |
| Pennsylvania Turnpike Commission Revenue | 5.000% | 12/1/25 | 3,595 | 3,707 |
| Pennsylvania Turnpike Commission Revenue | 5.000% | 6/1/26 | 300 | 338 |
| Pennsylvania Turnpike Commission Revenue | 5.000% | 6/1/28 | 125 | 138 |
| Pennsylvania Turnpike Commission Revenue | 5.000% | 6/1/28 | 1,000 | 1,110 |
| Pennsylvania Turnpike Commission Revenue | 5.000% | 12/1/30 | 250 | 274 |
| Pennsylvania Turnpike Commission Revenue | 6.000% | 12/1/30 | 325 | 390 |
| Pennsylvania Turnpike Commission Revenue | 5.000% | 6/1/32 | 1,000 | 1,086 |
| Pennsylvania Turnpike Commission Revenue | 6.250% | 6/1/33 (4) | 515 | 615 |
| Pennsylvania Turnpike Commission Revenue | 5.000% | 12/1/33 | 1,050 | 1,137 |
| Pennsylvania Turnpike Commission Revenue | 5.000% | 6/1/34 (4) | 145 | 159 |
| Pennsylvania Turnpike Commission Revenue | 4.000% | 12/1/35 | 100 | 101 |
| Pennsylvania Turnpike Commission Revenue | 5.000% | 12/1/36 | 135 | 144 |
| Pennsylvania Turnpike Commission Revenue | 6.375% | 12/1/38 | 1,060 | 1,272 |
| Pennsylvania Turnpike Commission Revenue | 4.000% | 6/1/39 | 1,000 | 963 |
| Pennsylvania Turnpike Commission Revenue | 5.000% | 12/1/39 | 435 | 468 |
| Pennsylvania Turnpike Commission Revenue | 5.250% | 12/1/39 | 250 | 273 |
111
| | | | |
| Tax-Exempt Bond Index Fund | | | | |
| |
| |
| |
| | | | Face | Market |
| | | Maturity | Amount | Value • |
| | Coupon | Date | ($000) | ($000) |
| Pennsylvania Turnpike Commission Revenue | 5.000% | 12/1/40 | 1,675 | 1,807 |
| Pennsylvania Turnpike Commission Revenue | 5.000% | 12/1/40 | 4,000 | 4,246 |
| Pennsylvania Turnpike Commission Revenue | 5.000% | 12/1/42 | 3,405 | 3,616 |
| Pennsylvania Turnpike Commission Revenue | 5.000% | 12/1/42 | 500 | 543 |
| Pennsylvania Turnpike Commission Revenue | 5.000% | 12/1/42 | 225 | 238 |
| Pennsylvania Turnpike Commission Revenue | 5.000% | 12/1/43 | 1,010 | 1,068 |
| Pennsylvania Turnpike Commission Revenue | 5.000% | 12/1/43 | 1,000 | 1,071 |
| Pennsylvania Turnpike Commission Revenue | 5.000% | 12/1/44 | 370 | 396 |
| Pennsylvania Turnpike Commission Revenue | 5.000% | 12/1/44 | 250 | 268 |
| Pennsylvania Turnpike Commission Revenue | 5.250% | 12/1/44 (15) | 240 | 263 |
| Pennsylvania Turnpike Commission Revenue | 5.000% | 12/1/45 | 375 | 403 |
| Pennsylvania Turnpike Commission Revenue | 5.000% | 12/1/45 | 150 | 158 |
| Pennsylvania Turnpike Commission Revenue | 5.000% | 12/1/46 | 500 | 525 |
| Pennsylvania Turnpike Commission Revenue | 5.000% | 12/1/46 | 760 | 818 |
| Pennsylvania Turnpike Commission Revenue | 5.250% | 6/1/47 | 2,500 | 2,686 |
| Pennsylvania Turnpike Commission Revenue | 5.000% | 12/1/47 | 4,000 | 4,330 |
| Philadelphia PA Airport Revenue | 5.250% | 6/15/29 | 125 | 131 |
| Philadelphia PA Airport Revenue | 5.000% | 6/15/40 | 1,700 | 1,757 |
| Philadelphia PA Authority for Industrial | | | | |
| Development Revenue (Thomas Jefferson | | | | |
| University) | 4.000% | 9/1/42 | 100 | 95 |
| Philadelphia PA Authority for Industrial | | | | |
| Development Revenue (Thomas Jefferson | | | | |
| University) | 5.000% | 9/1/42 | 450 | 485 |
| Philadelphia PA Authority for Industrial | | | | |
| Development Revenue (Thomas Jefferson | | | | |
| University) | 5.000% | 9/1/47 | 775 | 832 |
| Philadelphia PA Gas Works Revenue | 5.250% | 8/1/20 (Prere.) | 145 | 153 |
| Philadelphia PA Gas Works Revenue | 5.000% | 10/1/24 | 255 | 284 |
| Philadelphia PA Gas Works Revenue | 4.000% | 10/1/35 | 85 | 85 |
| Philadelphia PA Gas Works Revenue | 5.250% | 8/1/40 | 230 | 241 |
| Philadelphia PA Gas Works Revenue | 5.000% | 8/1/47 | 1,500 | 1,611 |
| Philadelphia PA GO | 6.000% | 8/1/20 (Prere.) | 275 | 293 |
| Philadelphia PA GO | 5.000% | 8/1/30 (4) | 500 | 561 |
| Philadelphia PA School District GO | 5.000% | 9/1/25 | 335 | 373 |
| Philadelphia PA School District GO | 5.000% | 6/1/27 (14) | 100 | 112 |
| Philadelphia PA School District GO | 4.000% | 9/1/43 (4) | 1,050 | 1,011 |
| Philadelphia PA Water & Wastewater | | | | |
| Revenue | 5.000% | 1/1/36 | 1,250 | 1,309 |
| Philadelphia PA Water & Wastewater | | | | |
| Revenue | 5.000% | 7/1/40 | 1,200 | 1,291 |
| Philadelphia PA Water & Wastewater | | | | |
| Revenue | 5.000% | 1/1/41 | 1,115 | 1,165 |
| Philadelphia PA Water & Wastewater | | | | |
| Revenue | 5.125% | 1/1/43 | 50 | 53 |
| State Public School Building Authority | | | | |
| Pennsylvania Lease Revenue (School District | | | | |
| of Philadelphia) | 5.000% | 6/1/29 | 250 | 275 |
| State Public School Building Authority | | | | |
| Pennsylvania Lease Revenue (School District | | | | |
| of Philadelphia) | 5.000% | 6/1/32 (4) | 250 | 273 |
| University of Pittsburgh of the Commonwealth | | | | |
| System of Higher Education Pennsylvania | | | | |
| Revenue (University Capital Project) | 5.000% | 3/15/19 (Prere.) | 470 | 475 |
112
| | | | |
| Tax-Exempt Bond Index Fund | | | | |
| |
| |
| |
| | | | Face | Market |
| | | Maturity | Amount | Value • |
| | Coupon | Date | ($000) | ($000) |
| Westmoreland County PA Municipal Authority | | | | |
| Revenue | 5.000% | 8/15/23 (Prere.) | 375 | 419 |
| Westmoreland County PA Municipal Authority | | | | |
| Revenue | 5.000% | 8/15/42 (15) | 250 | 269 |
| | | | | 160,103 |
| Rhode Island (0.1%) | | | | |
| Rhode Island Commerce Corp. Grant | | | | |
| Anticipation Revenue | 5.000% | 6/15/21 | 1,125 | 1,201 |
| Rhode Island Commerce Corp. Grant | | | | |
| Anticipation Revenue | 5.000% | 6/15/23 | 175 | 194 |
| Rhode Island Economic Development Corp. | | | | |
| Revenue (Department of Transportation) | 5.250% | 6/15/19 (Prere.) | 150 | 153 |
| Rhode Island Economic Development Corp. | | | | |
| Revenue (Department of Transportation) | 5.000% | 6/15/20 | 770 | 805 |
| Rhode Island Economic Development Corp. | | | | |
| Revenue (Department of Transportation) | 5.000% | 6/15/24 | 485 | 545 |
| Rhode Island Economic Development Corp. | | | | |
| Revenue (Department of Transportation) | 5.000% | 6/15/28 | 320 | 362 |
| Rhode Island Health & Educational Building | | | | |
| Corp. Higher Education Facilities Revenue | | | | |
| (Brown University) | 5.000% | 9/1/29 | 130 | 152 |
| | | | | 3,412 |
| South Carolina (1.0%) | | | | |
| Charleston SC Educational Excellence | | | | |
| Financing Corp. Revenue (Charleston County | | | | |
| School District, South Carolina Project) | 5.000% | 12/1/24 | 175 | 195 |
| Charleston SC Educational Excellence | | | | |
| Financing Corp. Revenue (Charleston County | | | | |
| School District, South Carolina Project) | 5.000% | 12/1/25 | 125 | 139 |
| Charleston SC Educational Excellence | | | | |
| Financing Corp. Revenue (Charleston County | | | | |
| School District, South Carolina Project) | 5.000% | 12/1/27 | 1,045 | 1,160 |
| Charleston SC Educational Excellence | | | | |
| Financing Corp. Revenue (Charleston County | | | | |
| School District, South Carolina Project) | 5.000% | 12/1/30 | 780 | 862 |
| Charleston SC Waterworks & Sewer Capital | | | | |
| Improvement Revenue | 5.000% | 1/1/21 (Prere.) | 110 | 117 |
| Columbia SC Waterworks & Sewer System | | | | |
| Revenue | 5.000% | 2/1/20 (Prere.) | 50 | 52 |
| Horry County SC School District GO | 5.000% | 3/1/21 | 270 | 287 |
| Piedmont SC Municipal Power Agency | | | | |
| Revenue | 5.000% | 1/1/22 | 275 | 289 |
| South Carolina GO | 5.000% | 6/1/19 | 600 | 611 |
| South Carolina Public Service Authority | | | | |
| Revenue | 5.000% | 12/1/18 (ETM) | 150 | 150 |
| South Carolina Public Service Authority | | | | |
| Revenue | 5.250% | 1/1/19 (Prere.) | 2,645 | 2,660 |
| South Carolina Public Service Authority | | | | |
| Revenue | 5.250% | 1/1/19 (Prere.) | 100 | 101 |
| South Carolina Public Service Authority | | | | |
| Revenue | 5.500% | 1/1/19 (Prere.) | 495 | 498 |
| South Carolina Public Service Authority | | | | |
| Revenue | 5.000% | 12/1/19 (ETM) | 435 | 449 |
113
| | | | |
| Tax-Exempt Bond Index Fund | | | | |
| |
| |
| |
| | | | Face | Market |
| | | Maturity | Amount | Value • |
| | Coupon | Date | ($000) | ($000) |
| South Carolina Public Service Authority | | | | |
| Revenue | 5.000% | 1/1/20 (Prere.) | 950 | 981 |
| South Carolina Public Service Authority | | | | |
| Revenue | 5.000% | 12/1/21 | 115 | 123 |
| South Carolina Public Service Authority | | | | |
| Revenue | 5.000% | 12/1/21 | 100 | 107 |
| South Carolina Public Service Authority | | | | |
| Revenue | 4.000% | 1/1/32 | 105 | 104 |
| South Carolina Public Service Authority | | | | |
| Revenue | 5.000% | 12/1/33 | 350 | 374 |
| South Carolina Public Service Authority | | | | |
| Revenue | 5.000% | 12/1/34 | 290 | 309 |
| South Carolina Public Service Authority | | | | |
| Revenue | 5.000% | 12/1/35 | 15 | 16 |
| South Carolina Public Service Authority | | | | |
| Revenue | 5.000% | 12/1/36 | 1,395 | 1,433 |
| South Carolina Public Service Authority | | | | |
| Revenue | 5.000% | 12/1/36 | 365 | 386 |
| South Carolina Public Service Authority | | | | |
| Revenue | 5.000% | 12/1/37 | 355 | 377 |
| South Carolina Public Service Authority | | | | |
| Revenue | 5.000% | 12/1/37 | 595 | 629 |
| South Carolina Public Service Authority | | | | |
| Revenue | 5.000% | 12/1/38 | 680 | 707 |
| South Carolina Public Service Authority | | | | |
| Revenue | 5.000% | 12/1/39 | 110 | 115 |
| South Carolina Public Service Authority | | | | |
| Revenue | 5.000% | 12/1/43 | 970 | 996 |
| South Carolina Public Service Authority | | | | |
| Revenue | 5.125% | 12/1/43 | 310 | 323 |
| South Carolina Public Service Authority | | | | |
| Revenue | 5.125% | 12/1/43 | 160 | 167 |
| South Carolina Public Service Authority | | | | |
| Revenue | 4.000% | 12/1/45 | 90 | 85 |
| South Carolina Public Service Authority | | | | |
| Revenue | 5.000% | 12/1/46 | 1,545 | 1,606 |
| South Carolina Public Service Authority | | | | |
| Revenue | 5.000% | 12/1/48 | 3,390 | 3,505 |
| South Carolina Public Service Authority | | | | |
| Revenue | 5.000% | 12/1/49 | 2,295 | 2,376 |
| South Carolina Public Service Authority | | | | |
| Revenue | 5.000% | 12/1/50 | 4,425 | 4,583 |
| South Carolina Public Service Authority | | | | |
| Revenue | 5.500% | 12/1/53 | 1,635 | 1,724 |
| South Carolina Public Service Authority | | | | |
| Revenue | 5.500% | 12/1/54 | 1,150 | 1,218 |
| South Carolina Public Service Authority | | | | |
| Revenue | 5.000% | 12/1/55 | 1,805 | 1,863 |
| South Carolina Public Service Authority | | | | |
| Revenue | 5.250% | 12/1/55 | 940 | 995 |
| South Carolina Public Service Authority | | | | |
| Revenue | 5.000% | 12/1/56 | 350 | 363 |
| South Carolina Transportation Infrastructure | | | | |
| Revenue | 5.250% | 10/1/19 (Prere.) | 3,395 | 3,492 |
114
| | | | |
| Tax-Exempt Bond Index Fund | | | | |
| |
| |
| |
| | | | Face | Market |
| | | Maturity | Amount | Value • |
| | Coupon | Date | ($000) | ($000) |
| South Carolina Transportation Infrastructure | | | | |
| Revenue | 5.000% | 10/1/20 | 275 | 289 |
| | | | | 36,816 |
| Tennessee (0.4%) | | | | |
| Memphis TN Center City Revenue Finance | | | | |
| Corp Revenue | 5.250% | 11/1/21 (Prere.) | 770 | 836 |
| Memphis TN Electric System Revenue | 5.000% | 12/1/18 | 250 | 251 |
| Memphis TN GO | 5.000% | 4/1/26 | 2,000 | 2,278 |
| Memphis-Shelby County TN Airport Authority | | | | |
| Revenue | 5.000% | 4/1/35 | 500 | 528 |
| Memphis-Shelby County TN Sports Authority | | | | |
| Revenue (Memphis Arena) | 5.375% | 11/1/29 | 235 | 242 |
| Metropolitan Government of Nashville & | | | | |
| Davidson County TN Electric Revenue | 5.000% | 5/15/27 | 450 | 496 |
| Metropolitan Government of Nashville & | | | | |
| Davidson County TN GO | 5.000% | 7/1/22 | 725 | 795 |
| Metropolitan Government of Nashville & | | | | |
| Davidson County TN GO | 5.000% | 1/1/23 (Prere.) | 410 | 454 |
| Metropolitan Government of Nashville & | | | | |
| Davidson County TN GO | 5.000% | 1/1/24 | 380 | 428 |
| Metropolitan Government of Nashville & | | | | |
| Davidson County TN GO | 5.000% | 1/1/25 | 100 | 114 |
| Metropolitan Government of Nashville & | | | | |
| Davidson County TN GO | 5.000% | 1/1/27 | 720 | 832 |
| Metropolitan Government of Nashville & | | | | |
| Davidson County TN GO | 4.000% | 7/1/33 | 500 | 516 |
| Metropolitan Government of Nashville & | | | | |
| Davidson County TN GO | 4.000% | 7/1/33 | 3,000 | 3,104 |
| Metropolitan Government of Nashville & | | | | |
| Davidson County TN GO | 4.000% | 7/1/34 | 750 | 769 |
| Shelby County TN GO | 5.000% | 3/1/24 | 675 | 762 |
| Tennessee GO | 5.000% | 8/1/21 | 1,365 | 1,469 |
| Tennessee School Bond Authority Higher | | | | |
| Educational Facilities Revenue (2nd Program) | 5.000% | 11/1/40 | 165 | 181 |
| Tennessee School Bond Authority Higher | | | | |
| Educational Facilities Revenue (2nd Program) | 5.000% | 11/1/43 | 420 | 452 |
| | | | | 14,507 |
| Texas (10.2%) | | | | |
| Alamo Heights TX Independent School District | | | | |
| GO | 4.000% | 2/1/30 | 330 | 349 |
| Alamo TX Community College District GO | 4.500% | 8/15/33 (14) | 60 | 60 |
| Alamo TX Regional Mobility Authority | | | | |
| Revenue | 5.000% | 6/15/46 | 310 | 334 |
| Aldine TX Independent School District GO | 5.000% | 2/15/22 | 1,250 | 1,357 |
| Austin TX Community College District Public | | | | |
| Facilities Corp. Lease Revenue | 4.000% | 8/1/33 | 350 | 357 |
| Austin TX Community College District Public | | | | |
| Facilities Corp. Lease Revenue | 4.000% | 8/1/42 | 1,000 | 973 |
| Austin TX GO | 5.000% | 9/1/20 | 1,250 | 1,312 |
| Austin TX Water & Wastewater System | | | | |
| Revenue | 5.000% | 11/15/37 | 320 | 347 |
| Austin TX Water & Wastewater System | | | | |
| Revenue | 5.000% | 11/15/39 | 460 | 504 |
115
| | | | |
| Tax-Exempt Bond Index Fund | | | | |
| |
| |
| |
| | | | Face | Market |
| | | Maturity | Amount | Value • |
| | Coupon | Date | ($000) | ($000) |
| Austin TX Water & Wastewater System | | | | |
| Revenue | 5.000% | 11/15/41 | 200 | 213 |
| Austin TX Water & Wastewater System | | | | |
| Revenue | 5.000% | 11/15/42 | 105 | 114 |
| Austin TX Water & Wastewater System | | | | |
| Revenue | 5.000% | 11/15/43 | 1,350 | 1,477 |
| Bexar County TX GO | 5.000% | 6/15/38 | 1,500 | 1,656 |
| Bexar County TX Hospital District GO | 4.000% | 2/15/43 | 2,000 | 1,975 |
| Brownsville TX Utility System Revenue | 4.000% | 9/1/30 | 170 | 176 |
| Central Texas Regional Mobility Authority | | | | |
| Revenue | 6.000% | 1/1/21 (Prere.) | 205 | 221 |
| Central Texas Regional Mobility Authority | | | | |
| Revenue | 6.250% | 1/1/21 (Prere.) | 275 | 298 |
| Central Texas Regional Mobility Authority | | | | |
| Revenue | 5.000% | 1/1/40 | 300 | 321 |
| Central Texas Regional Mobility Authority | | | | |
| Revenue | 5.000% | 1/1/43 | 1,050 | 1,107 |
| Central Texas Regional Mobility Authority | | | | |
| Revenue | 5.000% | 1/1/45 | 100 | 107 |
| Central Texas Regional Mobility Authority | | | | |
| Revenue | 5.000% | 1/1/46 | 730 | 782 |
| Clear Creek TX Independent School District | | | | |
| GO PUT | 1.450% | 8/14/20 | 130 | 128 |
| Colorado River Municipal Water District Texas | | | | |
| Water System Revenue | 5.000% | 1/1/21 (Prere.) | 160 | 170 |
| Cypress-Fairbanks TX Independent School | | | | |
| District GO | 5.000% | 2/15/25 | 265 | 302 |
| Cypress-Fairbanks TX Independent School | | | | |
| District GO | 5.000% | 2/15/26 | 350 | 404 |
| Cypress-Fairbanks TX Independent School | | | | |
| District GO | 5.000% | 2/15/27 | 370 | 410 |
| Cypress-Fairbanks TX Independent School | | | | |
| District GO | 5.000% | 2/15/27 | 230 | 264 |
| Cypress-Fairbanks TX Independent School | | | | |
| District GO | 5.000% | 2/15/29 | 945 | 1,059 |
| Cypress-Fairbanks TX Independent School | | | | |
| District GO | 5.000% | 2/15/44 | 1,500 | 1,630 |
| Dallas County TX Community College District | | | | |
| GO | 4.000% | 2/15/28 | 730 | 784 |
| Dallas TX Area Rapid Transit Sales Tax | | | | |
| Revenue | 4.750% | 12/1/18 (Prere.) | 55 | 55 |
| Dallas TX Area Rapid Transit Sales Tax | | | | |
| Revenue | 5.000% | 12/1/18 (Prere.) | 190 | 190 |
| Dallas TX Area Rapid Transit Sales Tax | | | | |
| Revenue | 5.250% | 12/1/18 (Prere.) | 225 | 226 |
| Dallas TX Area Rapid Transit Sales Tax | | | | |
| Revenue | 5.250% | 12/1/18 (Prere.) | 425 | 426 |
| Dallas TX Area Rapid Transit Sales Tax | | | | |
| Revenue | 5.250% | 12/1/18 (Prere.) | 260 | 261 |
| Dallas TX Area Rapid Transit Sales Tax | | | | |
| Revenue | 5.250% | 12/1/18 (Prere.) | 60 | 60 |
| Dallas TX Area Rapid Transit Sales Tax | | | | |
| Revenue | 5.250% | 12/1/29 (2) | 180 | 217 |
116
| | | | |
| Tax-Exempt Bond Index Fund | | | | |
| |
| |
| |
| | | | Face | Market |
| | | Maturity | Amount | Value • |
| | Coupon | Date | ($000) | ($000) |
| Dallas TX Area Rapid Transit Sales Tax | | | | |
| Revenue | 5.250% | 12/1/30 (2) | 270 | 327 |
| Dallas TX Area Rapid Transit Sales Tax | | | | |
| Revenue | 5.000% | 12/1/46 | 245 | 269 |
| Dallas TX Area Rapid Transit Sales Tax | | | | |
| Revenue | 5.000% | 12/1/48 | 105 | 115 |
| Dallas TX GO | 5.000% | 2/15/27 | 1,565 | 1,732 |
| Dallas TX GO | 5.000% | 2/15/28 | 2,200 | 2,431 |
| Dallas TX Independent School District GO | 5.000% | 8/15/24 | 380 | 431 |
| Dallas TX Independent School District GO | 5.000% | 2/15/26 | 1,715 | 1,819 |
| Dallas TX Independent School District GO | 5.000% | 8/15/28 | 1,075 | 1,216 |
| Dallas TX Independent School District GO | 5.000% | 8/15/29 | 175 | 191 |
| Dallas TX Waterworks & Sewer System | | | | |
| Revenue | 5.000% | 10/1/23 | 365 | 408 |
| Dallas TX Waterworks & Sewer System | | | | |
| Revenue | 5.000% | 10/1/24 | 1,250 | 1,417 |
| Dallas TX Waterworks & Sewer System | | | | |
| Revenue | 5.000% | 10/1/27 | 1,755 | 2,000 |
| Dallas TX Waterworks & Sewer System | | | | |
| Revenue | 5.000% | 10/1/29 | 550 | 627 |
| Dallas TX Waterworks & Sewer System | | | | |
| Revenue | 5.000% | 10/1/30 | 390 | 443 |
| Dallas TX Waterworks & Sewer System | | | | |
| Revenue | 5.000% | 10/1/31 | 115 | 130 |
| Dallas TX Waterworks & Sewer System | | | | |
| Revenue | 5.000% | 10/1/36 | 105 | 112 |
| Dallas TX Waterworks & Sewer System | | | | |
| Revenue | 5.000% | 10/1/37 | 510 | 560 |
| Dallas TX Waterworks & Sewer System | | | | |
| Revenue | 5.000% | 10/1/39 | 315 | 330 |
| Dallas TX Waterworks & Sewer System | | | | |
| Revenue | 5.000% | 10/1/41 | 50 | 54 |
| Dallas-Fort Worth TX International Airport | | | | |
| Revenue | 5.000% | 11/1/23 | 370 | 388 |
| Dallas-Fort Worth TX International Airport | | | | |
| Revenue | 5.250% | 11/1/25 | 230 | 248 |
| Dallas-Fort Worth TX International Airport | | | | |
| Revenue | 5.000% | 11/1/29 | 120 | 125 |
| Dallas-Fort Worth TX International Airport | | | | |
| Revenue | 5.000% | 11/1/30 | 410 | 445 |
| Dallas-Fort Worth TX International Airport | | | | |
| Revenue | 5.000% | 11/1/31 | 925 | 966 |
| Dallas-Fort Worth TX International Airport | | | | |
| Revenue | 5.250% | 11/1/31 | 100 | 110 |
| Dallas-Fort Worth TX International Airport | | | | |
| Revenue | 5.000% | 11/1/33 | 175 | 183 |
| Dallas-Fort Worth TX International Airport | | | | |
| Revenue | 5.250% | 11/1/33 | 125 | 137 |
| Dallas-Fort Worth TX International Airport | | | | |
| Revenue | 5.000% | 11/1/34 | 1,720 | 1,794 |
| Dallas-Fort Worth TX International Airport | | | | |
| Revenue | 5.000% | 11/1/35 | 5,710 | 5,937 |
| Dallas-Fort Worth TX International Airport | | | | |
| Revenue | 5.000% | 11/1/35 | 145 | 151 |
117
| | | | |
| Tax-Exempt Bond Index Fund | | | | |
| |
| |
| |
| | | | Face | Market |
| | | Maturity | Amount | Value • |
| | Coupon | Date | ($000) | ($000) |
| Dallas-Fort Worth TX International Airport | | | | |
| Revenue | 5.000% | 11/1/38 | 100 | 107 |
| Dallas-Fort Worth TX International Airport | | | | |
| Revenue | 5.000% | 11/1/43 | 195 | 208 |
| Dallas-Fort Worth TX International Airport | | | | |
| Revenue | 5.000% | 11/1/44 | 375 | 399 |
| Dallas-Fort Worth TX International Airport | | | | |
| Revenue | 4.000% | 11/1/45 | 140 | 134 |
| Dallas-Fort Worth TX International Airport | | | | |
| Revenue | 5.000% | 11/1/45 | 395 | 411 |
| Dallas-Fort Worth TX International Airport | | | | |
| Revenue | 5.000% | 11/1/45 | 1,370 | 1,434 |
| El Paso TX Municipal Drainage Utility System | | | | |
| Revenue | 4.000% | 3/1/29 | 665 | 708 |
| Fort Bend County TX GO | 5.000% | 3/1/28 | 2,350 | 2,639 |
| Fort Bend TX Grand Parkway Toll Road | | | | |
| Authority Revenue | 5.000% | 3/1/32 | 50 | 54 |
| Fort Bend TX Grand Parkway Toll Road | | | | |
| Authority Revenue | 5.000% | 3/1/37 | 580 | 619 |
| Fort Bend TX Grand Parkway Toll Road | | | | |
| Authority Revenue | 4.000% | 3/1/46 | 460 | 464 |
| Fort Bend TX Independent School District GO | 5.000% | 8/15/19 | 175 | 179 |
| Fort Worth TX Independent School District GO | 5.000% | 2/15/34 | 300 | 305 |
| Fort Worth TX Water & Sewer Revenue | 5.000% | 2/15/23 | 725 | 803 |
| Grand Parkway Transportation Corp. Texas | | | | |
| System Toll Revenue | 5.000% | 10/1/43 | 2,000 | 2,208 |
| Grand Parkway Transportation Corp. Texas | | | | |
| System Toll Revenue | 5.000% | 10/1/48 | 2,000 | 2,200 |
| Grand Parkway Transportation Corp. Texas | | | | |
| System Toll Revenue | 5.250% | 10/1/51 | 940 | 1,034 |
| Grand Parkway Transportation Corp. Texas | | | | |
| System Toll Revenue | 5.000% | 4/1/53 | 2,470 | 2,652 |
| Grand Parkway Transportation Corp. Texas | | | | |
| BAN | 5.000% | 2/1/23 | 4,500 | 4,916 |
| Harris County TX Cultural Education Facilities | | | | |
| Finance Corp. Thermal Utility Revenue | | | | |
| (TECO Project) | 4.000% | 11/15/32 | 1,000 | 1,026 |
| Harris County TX Cultural Education Facilities | | | | |
| Finance Corp. Thermal Utility Revenue | | | | |
| (TECO Project) | 4.000% | 11/15/34 | 750 | 764 |
| Harris County TX Cultural Education Facilities | | | | |
| Finance Corp. Thermal Utility Revenue | | | | |
| (TECO Project) | 4.000% | 11/15/36 | 400 | 405 |
| Harris County TX Cultural Education Facilities | | | | |
| Finance Corp. Thermal Utility Revenue | | | | |
| (TECO Project) | 4.000% | 11/15/37 | 375 | 378 |
| Harris County TX Flood Control District | | | | |
| Revenue | 5.000% | 10/1/20 (Prere.) | 1,840 | 1,937 |
| Harris County TX Flood Control District | | | | |
| Revenue | 5.000% | 10/1/20 (Prere.) | 595 | 627 |
| Harris County TX GO | 5.000% | 8/15/19 (Prere.) | 95 | 97 |
| Harris County TX GO | 5.000% | 8/15/22 | 660 | 723 |
| Harris County TX GO | 5.000% | 10/1/23 | 205 | 216 |
| Harris County TX GO | 5.000% | 10/1/24 | 280 | 308 |
| Harris County TX GO | 5.000% | 10/1/24 | 515 | 565 |
118
| | | | |
| Tax-Exempt Bond Index Fund | | | | |
| |
| |
| |
| | | | Face | Market |
| | | Maturity | Amount | Value • |
| | Coupon | Date | ($000) | ($000) |
| Harris County TX GO | 5.000% | 10/1/26 | 860 | 982 |
| Harris County TX GO | 5.000% | 10/1/27 | 2,500 | 2,845 |
| Harris County TX GO | 5.000% | 8/15/28 | 250 | 284 |
| Harris County TX GO | 5.000% | 10/1/28 | 645 | 732 |
| Harris County TX GO | 5.000% | 8/15/30 | 210 | 236 |
| Harris County TX Metropolitan Transit | | | | |
| Authority Sales & Use Tax Revenue | 5.000% | 11/1/36 | 845 | 900 |
| Harris County TX Sports Authority Revenue | 5.000% | 11/15/25 (4) | 625 | 701 |
| Harris County TX Sports Authority Revenue | 5.000% | 11/15/30 | 190 | 209 |
| Harris County TX Sports Authority Revenue | 0.000% | 11/15/34 (4) | 560 | 274 |
| Harris County TX Sports Authority Revenue | 0.000% | 11/15/43 (4) | 200 | 63 |
| Harris County TX Toll Road Revenue | 5.000% | 8/15/19 (Prere.) | 900 | 921 |
| Harris County TX Toll Road Revenue | 5.000% | 8/15/23 | 405 | 452 |
| Harris County TX Toll Road Revenue | 5.000% | 8/15/24 | 985 | 1,115 |
| Harris County TX Toll Road Revenue | 5.000% | 8/15/29 | 840 | 912 |
| Harris County TX Toll Road Revenue | 5.000% | 8/15/30 | 150 | 163 |
| Harris County TX Toll Road Revenue | 5.000% | 8/15/36 | 990 | 1,097 |
| Harris County TX Toll Road Revenue | 5.000% | 8/15/40 | 1,445 | 1,475 |
| Hidalgo County TX GO | 4.000% | 8/15/43 | 2,000 | 1,963 |
| Houston TX Airport System Revenue | 5.000% | 7/1/26 | 75 | 80 |
| Houston TX Airport System Revenue | 5.000% | 7/1/29 | 500 | 576 |
| Houston TX Airport System Revenue | 5.000% | 7/1/30 | 500 | 573 |
| Houston TX Community College System GO | 5.000% | 2/15/33 | 415 | 451 |
| Houston TX Community College System GO | 5.000% | 2/15/34 | 130 | 141 |
| Houston TX Community College System GO | 5.000% | 2/15/36 | 1,200 | 1,239 |
| Houston TX Community College System GO | 5.000% | 2/15/43 | 5,765 | 6,218 |
| Houston TX GO | 5.000% | 3/1/19 | 350 | 354 |
| Houston TX GO | 5.000% | 3/1/19 (Prere.) | 500 | 505 |
| Houston TX GO | 5.000% | 3/1/19 (Prere.) | 90 | 91 |
| Houston TX GO | 5.000% | 3/1/19 | 100 | 101 |
| Houston TX GO | 5.000% | 3/1/22 (Prere.) | 225 | 244 |
| Houston TX GO | 5.000% | 3/1/22 | 1,035 | 1,124 |
| Houston TX GO | 5.000% | 3/1/23 | 165 | 183 |
| Houston TX GO | 5.000% | 3/1/24 | 225 | 244 |
| Houston TX GO | 5.000% | 3/1/24 | 10 | 10 |
| Houston TX GO | 5.000% | 3/1/25 | 100 | 114 |
| Houston TX GO | 5.000% | 3/1/26 | 500 | 576 |
| Houston TX GO | 5.000% | 3/1/26 | 4,000 | 4,611 |
| Houston TX GO | 5.000% | 3/1/27 | 185 | 215 |
| Houston TX GO | 5.000% | 3/1/28 | 200 | 227 |
| Houston TX GO | 4.000% | 3/1/35 | 1,500 | 1,533 |
| Houston TX Independent School District GO | 5.000% | 2/15/21 | 100 | 106 |
| Houston TX Independent School District GO | 5.000% | 2/15/21 | 260 | 276 |
| Houston TX Independent School District GO | 5.000% | 2/15/22 | 180 | 195 |
| Houston TX Independent School District GO | 5.000% | 2/15/22 | 1,040 | 1,127 |
| Houston TX Independent School District GO | 5.000% | 2/15/23 | 405 | 447 |
| Houston TX Independent School District GO | 5.000% | 2/15/24 | 150 | 168 |
| Houston TX Independent School District GO | 5.000% | 2/15/25 | 580 | 660 |
| Houston TX Independent School District GO | 5.000% | 2/15/26 | 175 | 201 |
| Houston TX Independent School District GO | 5.000% | 2/15/27 | 125 | 143 |
| Houston TX Independent School District GO | 5.000% | 2/15/29 | 150 | 170 |
| Houston TX Independent School District GO | 5.000% | 2/15/30 | 585 | 661 |
| Houston TX Independent School District GO | 5.000% | 2/15/31 | 435 | 490 |
| Houston TX Independent School District GO | 4.000% | 2/15/33 | 500 | 514 |
119
| | | | |
| Tax-Exempt Bond Index Fund | | | | |
| |
| |
| |
| | | | Face | Market |
| | | Maturity | Amount | Value • |
| | Coupon | Date | ($000) | ($000) |
| Houston TX Independent School District GO | 4.000% | 2/15/42 | 1,905 | 1,896 |
| Houston TX Independent School District GO | | | | |
| PUT | 2.400% | 6/1/21 | 2,500 | 2,493 |
| Houston TX Utility System Revenue | 5.000% | 11/15/18 | 2,100 | 2,102 |
| Houston TX Utility System Revenue | 5.000% | 5/15/19 (Prere.) | 215 | 219 |
| Houston TX Utility System Revenue | 5.375% | 5/15/19 (Prere.) | 170 | 173 |
| Houston TX Utility System Revenue | 6.000% | 5/15/19 (Prere.) | 1,000 | 1,022 |
| Houston TX Utility System Revenue | 5.250% | 11/15/20 (Prere.) | 170 | 180 |
| Houston TX Utility System Revenue | 5.250% | 11/15/20 (Prere.) | 215 | 228 |
| Houston TX Utility System Revenue | 5.250% | 11/15/20 (Prere.) | 2,450 | 2,600 |
| Houston TX Utility System Revenue | 5.000% | 5/15/21 | 100 | 107 |
| Houston TX Utility System Revenue | 5.000% | 5/15/22 | 385 | 420 |
| Houston TX Utility System Revenue | 5.000% | 5/15/23 | 170 | 189 |
| Houston TX Utility System Revenue | 5.000% | 5/15/24 | 280 | 315 |
| Houston TX Utility System Revenue | 5.000% | 11/15/24 | 125 | 142 |
| Houston TX Utility System Revenue | 5.000% | 5/15/27 | 575 | 642 |
| Houston TX Utility System Revenue | 5.000% | 11/15/30 | 1,000 | 1,132 |
| Houston TX Utility System Revenue | 5.000% | 11/15/31 | 750 | 800 |
| Houston TX Utility System Revenue | 5.000% | 11/15/33 | 175 | 186 |
| Houston TX Utility System Revenue | 5.000% | 11/15/35 | 225 | 250 |
| Houston TX Utility System Revenue | 5.000% | 11/15/36 | 375 | 398 |
| Houston TX Utility System Revenue | 5.000% | 11/15/36 | 275 | 304 |
| Houston TX Utility System Revenue | 4.000% | 11/15/37 | 60 | 61 |
| Houston TX Utility System Revenue | 5.000% | 11/15/39 | 515 | 566 |
| Houston TX Utility System Revenue | 5.000% | 11/15/40 | 100 | 106 |
| Houston TX Utility System Revenue | 5.000% | 11/15/44 | 75 | 82 |
| Irving TX Combination Tax & Hotel Occupancy | | | | |
| Revenue GO | 5.000% | 2/15/19 (Prere.) | 485 | 489 |
| Judson TX Independent School District GO | 4.000% | 6/15/29 | 2,450 | 2,601 |
| Judson TX Independent School District GO | 4.000% | 2/1/41 | 495 | 490 |
| Katy TX Independent School District GO | 5.000% | 2/15/42 | 420 | 464 |
| Keller TX Independent School District GO | 5.250% | 2/15/19 (Prere.) | 250 | 252 |
| Keller TX Independent School District GO | 5.500% | 2/15/19 (Prere.) | 995 | 1,005 |
| Lake Travis TX Independent School District GO | 5.000% | 2/15/21 (Prere.) | 325 | 345 |
| Lake Travis TX Independent School District GO | 5.000% | 2/15/21 (Prere.) | 120 | 128 |
| Lake Travis TX Independent School District GO | 5.000% | 2/15/21 (Prere.) | 65 | 69 |
| Leander TX Independent School District GO | 5.000% | 8/15/26 | 440 | 489 |
| Leander TX Independent School District GO | 5.000% | 8/15/38 | 450 | 493 |
| Leander TX Independent School District GO | 5.000% | 8/15/40 | 400 | 437 |
| Leander TX Independent School District GO | 0.000% | 8/16/42 | 1,630 | 606 |
| Leander TX Independent School District GO | 4.000% | 8/15/49 | 425 | 415 |
| Leander TX Independent School District GO | 5.000% | 8/15/49 | 2,000 | 2,190 |
| Lewisville TX Independent School District GO | 5.000% | 2/15/19 (Prere.) | 125 | 126 |
| Lewisville TX Independent School District GO | 5.000% | 2/15/19 (Prere.) | 200 | 202 |
| Lewisville TX Independent School District GO | 5.000% | 2/15/19 (Prere.) | 325 | 328 |
| Lewisville TX Independent School District GO | 5.000% | 8/15/20 | 465 | 488 |
| Lewisville TX Independent School District GO | 5.000% | 8/15/25 | 235 | 269 |
| Lewisville TX Independent School District GO | 4.000% | 8/15/26 | 400 | 433 |
| Little Elm TX Independent School District GO | 5.000% | 8/15/46 | 1,000 | 1,111 |
| Lone Star College System Texas Financing | | | | |
| Revenue | 5.000% | 2/15/43 | 525 | 554 |
| Lone Star College System Texas GO | 5.000% | 2/15/24 | 175 | 197 |
| Lone Star College System Texas GO | 5.000% | 8/15/38 | 35 | 35 |
| Lower Colorado River Authority Texas | | | | |
| Revenue | 5.250% | 5/15/29 | 150 | 152 |
120
| | | | |
| Tax-Exempt Bond Index Fund | | | | |
| |
| |
| |
| | | | Face | Market |
| | | Maturity | Amount | Value • |
| | Coupon | Date | ($000) | ($000) |
| Lower Colorado River Authority Texas | | | | |
| Revenue | 5.500% | 5/15/33 | 195 | 198 |
| Lower Colorado River Authority Texas | | | | |
| Revenue | 5.000% | 5/15/35 | 875 | 907 |
| Lower Colorado River Authority Texas | | | | |
| Revenue | 5.500% | 5/15/36 | 3,000 | 3,052 |
| Lower Colorado River Authority Texas | | | | |
| Revenue | 5.000% | 5/15/39 | 2,500 | 2,695 |
| Lower Colorado River Authority Texas | | | | |
| Revenue | 5.625% | 5/15/39 | 145 | 148 |
| Lower Colorado River Authority Texas | | | | |
| Revenue | 5.000% | 5/15/40 | 665 | 688 |
| Lower Colorado River Authority Texas | | | | |
| Transmission Contract Revenue (LCRA | | | | |
| Transmission Services Corp.) | 5.000% | 5/15/22 | 2,215 | 2,356 |
| Lower Colorado River Authority Texas | | | | |
| TransmissionContract Revenue (LCRA | | | | |
| Transmission Services Corp.) | 4.000% | 5/15/31 | 1,250 | 1,291 |
| Lower Colorado River Authority Texas | | | | |
| TransmissionContract Revenue (LCRA | | | | |
| Transmission Services Corp.) | 5.000% | 5/15/40 (4) | 100 | 103 |
| Lower Colorado River Authority Texas | | | | |
| TransmissionContract Revenue (LCRA | | | | |
| Transmission Services Corp.) | 5.000% | 5/15/41 | 275 | 289 |
| Lower Colorado River Authority Texas | | | | |
| TransmissionContract Revenue (LCRA | | | | |
| Transmission Services Corp.) | 5.000% | 5/15/48 | 2,050 | 2,225 |
| Midland County TX Fresh Water Supply | | | | |
| Revenue | 5.000% | 9/15/40 | 440 | 474 |
| Montgomery County TX Toll Road Authority | | | | |
| Revenue | 5.000% | 9/15/43 | 2,000 | 2,114 |
| Montgomery County TX Toll Road Authority | | | | |
| Revenue | 5.000% | 9/15/48 | 2,000 | 2,108 |
| North East TX Regional Mobility Authority | | | | |
| Revenue | 5.000% | 1/1/20 | 210 | 216 |
| North East TX Regional Mobility Authority | | | | |
| Revenue | 5.000% | 1/1/22 | 600 | 639 |
| North East TX Regional Mobility Authority | | | | |
| Revenue | 5.000% | 1/1/46 | 130 | 138 |
| North Harris County TX Regional Water | | | | |
| Authority Revenue | 5.250% | 12/15/18 (Prere.) | 485 | 487 |
| North Harris County TX Regional Water | | | | |
| Authority Revenue | 5.375% | 12/15/18 (Prere.) | 375 | 377 |
| North Harris County TX Regional Water | | | | |
| Authority Revenue | 5.000% | 12/15/30 (15) | 3,380 | 3,671 |
| North Texas Municipal Water District | | | | |
| Regional Wastewater System Revenue | 4.000% | 6/1/31 | 360 | 376 |
| North Texas Tollway Authority System | | | | |
| Revenue | 5.750% | 1/1/19 (Prere.) | 1,250 | 1,258 |
| North Texas Tollway Authority System | | | | |
| Revenue | 6.000% | 1/1/19 (Prere.) | 40 | 40 |
| North Texas Tollway Authority System | | | | |
| Revenue | 6.000% | 1/1/19 (Prere.) | 215 | 216 |
121
| | | | |
| Tax-Exempt Bond Index Fund | | | | |
| |
| |
| |
| | | | Face | Market |
| | | Maturity | Amount | Value • |
| | Coupon | Date | ($000) | ($000) |
| North Texas Tollway Authority System | | | | |
| Revenue | 6.000% | 1/1/19 (Prere.) | 250 | 252 |
| North Texas Tollway Authority System | | | | |
| Revenue | 6.250% | 1/1/19 (Prere.) | 440 | 443 |
| North Texas Tollway Authority System | | | | |
| Revenue | 5.000% | 1/1/20 | 300 | 310 |
| North Texas Tollway Authority System | | | | |
| Revenue | 5.000% | 1/1/21 | 455 | 481 |
| North Texas Tollway Authority System | | | | |
| Revenue | 6.000% | 1/1/21 (Prere.) | 670 | 723 |
| North Texas Tollway Authority System | | | | |
| Revenue | 6.000% | 1/1/21 (Prere.) | 3,035 | 3,276 |
| North Texas Tollway Authority System | | | | |
| Revenue | 5.000% | 9/1/21 (Prere.) | 2,345 | 2,516 |
| North Texas Tollway Authority System | | | | |
| Revenue | 5.000% | 9/1/21 (Prere.) | 170 | 182 |
| North Texas Tollway Authority System | | | | |
| Revenue | 5.000% | 9/1/21 (Prere.) | 125 | 134 |
| North Texas Tollway Authority System | | | | |
| Revenue | 5.000% | 9/1/21 (Prere.) | 625 | 671 |
| North Texas Tollway Authority System | | | | |
| Revenue | 5.000% | 9/1/21 (Prere.) | 1,790 | 1,921 |
| North Texas Tollway Authority System | | | | |
| Revenue | 5.250% | 9/1/21 (Prere.) | 205 | 221 |
| North Texas Tollway Authority System | | | | |
| Revenue | 5.250% | 9/1/21 (Prere.) | 265 | 286 |
| North Texas Tollway Authority System | | | | |
| Revenue | 5.250% | 9/1/21 (Prere.) | 220 | 238 |
| North Texas Tollway Authority System | | | | |
| Revenue | 5.500% | 9/1/21 (Prere.) | 170 | 185 |
| North Texas Tollway Authority System | | | | |
| Revenue | 5.500% | 9/1/21 (Prere.) | 1,960 | 2,130 |
| North Texas Tollway Authority System | | | | |
| Revenue | 5.000% | 1/1/23 | 1,500 | 1,643 |
| North Texas Tollway Authority System | | | | |
| Revenue | 6.000% | 1/1/23 | 10 | 10 |
| North Texas Tollway Authority System | | | | |
| Revenue | 6.250% | 2/1/23 | 100 | 104 |
| North Texas Tollway Authority System | | | | |
| Revenue | 5.000% | 1/1/26 | 1,000 | 1,109 |
| North Texas Tollway Authority System | | | | |
| Revenue | 5.000% | 1/1/27 | 985 | 1,087 |
| North Texas Tollway Authority System | | | | |
| Revenue | 6.000% | 1/1/28 | 80 | 80 |
| North Texas Tollway Authority System | | | | |
| Revenue | 0.000% | 1/1/29 (12) | 315 | 220 |
| North Texas Tollway Authority System | | | | |
| Revenue | 5.000% | 1/1/29 | 1,385 | 1,552 |
| North Texas Tollway Authority System | | | | |
| Revenue | 5.000% | 1/1/30 | 375 | 410 |
| North Texas Tollway Authority System | | | | |
| Revenue | 5.000% | 1/1/30 | 230 | 254 |
| North Texas Tollway Authority System | | | | |
| Revenue | 5.000% | 1/1/30 | 1,000 | 1,117 |
122
| | | | |
| Tax-Exempt Bond Index Fund | | | | |
| |
| |
| |
| | | | Face | Market |
| | | Maturity | Amount | Value • |
| | Coupon | Date | ($000) | ($000) |
| North Texas Tollway Authority System | | | | |
| Revenue | 5.000% | 1/1/31 | 1,000 | 1,113 |
| North Texas Tollway Authority System | | | | |
| Revenue | 5.000% | 1/1/31 | 1,000 | 1,108 |
| North Texas Tollway Authority System | | | | |
| Revenue | 5.000% | 1/1/31 | 560 | 611 |
| North Texas Tollway Authority System | | | | |
| Revenue | 0.000% | 1/1/32 (12) | 155 | 95 |
| North Texas Tollway Authority System | | | | |
| Revenue | 5.000% | 1/1/32 | 1,410 | 1,543 |
| North Texas Tollway Authority System | | | | |
| Revenue | 0.000% | 1/1/33 (12) | 105 | 61 |
| North Texas Tollway Authority System | | | | |
| Revenue | 5.000% | 1/1/33 | 250 | 273 |
| North Texas Tollway Authority System | | | | |
| Revenue | 0.000% | 1/1/34 (12) | 235 | 131 |
| North Texas Tollway Authority System | | | | |
| Revenue | 0.000% | 1/1/35 (12) | 200 | 106 |
| North Texas Tollway Authority System | | | | |
| Revenue | 4.000% | 1/1/35 (4) | 250 | 256 |
| North Texas Tollway Authority System | | | | |
| Revenue | 5.000% | 1/1/35 | 370 | 402 |
| North Texas Tollway Authority System | | | | |
| Revenue | 0.000% | 1/1/36 (12) | 1,000 | 508 |
| North Texas Tollway Authority System | | | | |
| Revenue | 4.000% | 1/1/36 | 4,350 | 4,377 |
| North Texas Tollway Authority System | | | | |
| Revenue | 0.000% | 1/1/37 (12) | 235 | 114 |
| North Texas Tollway Authority System | | | | |
| Revenue | 4.000% | 1/1/38 | 1,000 | 1,002 |
| North Texas Tollway Authority System | | | | |
| Revenue | 5.000% | 1/1/38 | 600 | 647 |
| North Texas Tollway Authority System | | | | |
| Revenue | 4.000% | 1/1/39 | 215 | 216 |
| North Texas Tollway Authority System | | | | |
| Revenue | 5.000% | 1/1/39 | 4,000 | 4,340 |
| North Texas Tollway Authority System | | | | |
| Revenue | 5.000% | 1/1/40 (4) | 640 | 686 |
| North Texas Tollway Authority System | | | | |
| Revenue | 5.000% | 1/1/40 | 1,100 | 1,176 |
| North Texas Tollway Authority System | | | | |
| Revenue | 5.000% | 1/1/42 | 190 | 202 |
| North Texas Tollway Authority System | | | | |
| Revenue | 4.000% | 1/1/43 | 3,990 | 3,881 |
| North Texas Tollway Authority System | | | | |
| Revenue | 5.000% | 1/1/43 | 1,500 | 1,638 |
| North Texas Tollway Authority System | | | | |
| Revenue | 5.000% | 1/1/43 | 3,410 | 3,663 |
| North Texas Tollway Authority System | | | | |
| Revenue | 5.250% | 1/1/44 | 25 | 25 |
| North Texas Tollway Authority System | | | | |
| Revenue | 5.000% | 1/1/45 | 835 | 897 |
| North Texas Tollway Authority System | | | | |
| Revenue | 5.000% | 1/1/48 | 800 | 867 |
123
| | | | |
| Tax-Exempt Bond Index Fund | | | | |
| |
| |
| |
| | | | Face | Market |
| | | Maturity | Amount | Value • |
| | Coupon | Date | ($000) | ($000) |
| North Texas Tollway Authority System | | | | |
| Revenue | 5.000% | 1/1/48 | 3,260 | 3,490 |
| North Texas Tollway Authority System | | | | |
| Revenue | 4.250% | 1/1/49 | 2,000 | 1,963 |
| North Texas Tollway Authority System | | | | |
| Revenue PUT | 1.950% | 1/1/19 | 500 | 500 |
| Northside Independent School District GO PUT | 2.750% | 8/1/23 | 1,320 | 1,325 |
| Port of Houston Authority of Harris County | | | | |
| Texas Tax Revenue | 5.000% | 10/1/35 | 135 | 140 |
| Red River TX Education Finance Corp. | | | | |
| Revenue (Texas Christian University Project) | 5.000% | 3/15/43 | 85 | 92 |
| Richardson TX Independent School District GO | 5.000% | 2/15/25 | 1,360 | 1,548 |
| Round Rock TX Independent School District | | | | |
| GO | 5.000% | 8/1/33 | 200 | 200 |
| Round Rock TX Independent School District | | | | |
| GO | 5.250% | 8/1/34 (Prere.) | 65 | 65 |
| Round Rock TX Independent School District | | | | |
| GO | 5.250% | 8/1/34 | 585 | 600 |
| San Antonio TX Electric & Gas Systems | | | | |
| Revenue | 5.000% | 2/1/19 | 200 | 202 |
| San Antonio TX Electric & Gas Systems | | | | |
| Revenue | 5.000% | 2/1/19 | 245 | 247 |
| San Antonio TX Electric & Gas Systems | | | | |
| Revenue | 5.000% | 2/1/20 | 3,000 | 3,107 |
| San Antonio TX Electric & Gas Systems | | | | |
| Revenue | 5.000% | 2/1/20 | 240 | 249 |
| San Antonio TX Electric & Gas Systems | | | | |
| Revenue | 5.000% | 2/1/21 | 1,220 | 1,295 |
| San Antonio TX Electric & Gas Systems | | | | |
| Revenue | 5.000% | 2/1/22 | 1,360 | 1,476 |
| San Antonio TX Electric & Gas Systems | | | | |
| Revenue | 5.000% | 2/1/22 | 220 | 239 |
| San Antonio TX Electric & Gas Systems | | | | |
| Revenue | 5.000% | 2/1/23 | 1,135 | 1,255 |
| San Antonio TX Electric & Gas Systems | | | | |
| Revenue | 5.000% | 2/1/23 | 490 | 542 |
| San Antonio TX Electric & Gas Systems | | | | |
| Revenue | 5.250% | 2/1/24 | 1,425 | 1,620 |
| San Antonio TX Electric & Gas Systems | | | | |
| Revenue | 5.250% | 2/1/25 | 360 | 416 |
| San Antonio TX Electric & Gas Systems | | | | |
| Revenue | 5.000% | 2/1/27 | 610 | 701 |
| San Antonio TX Electric & Gas Systems | | | | |
| Revenue | 5.000% | 2/1/29 | 150 | 171 |
| San Antonio TX Electric & Gas Systems | | | | |
| Revenue | 5.000% | 2/1/32 | 150 | 168 |
| San Antonio TX Electric & Gas Systems | | | | |
| Revenue | 5.000% | 2/1/39 | 535 | 581 |
| San Antonio TX Electric & Gas Systems | | | | |
| Revenue | 5.000% | 2/1/43 | 115 | 123 |
| San Antonio TX Electric & Gas Systems | | | | |
| Revenue | 5.000% | 2/1/44 | 190 | 205 |
| San Antonio TX Electric & Gas Systems | | | | |
| Revenue | 5.000% | 2/1/48 | 3,000 | 3,214 |
| San Antonio TX GO | 5.000% | 2/1/20 | 200 | 207 |
124
| | | | |
| Tax-Exempt Bond Index Fund | | | | |
| |
| |
| |
| | | | Face | Market |
| | | Maturity | Amount | Value • |
| | Coupon | Date | ($000) | ($000) |
| San Antonio TX Independent School District | | | | |
| GO | 5.000% | 2/15/24 | 480 | 539 |
| San Antonio TX Public Facilities Corp. Lease | | | | |
| Revenue | 4.000% | 9/15/33 | 140 | 143 |
| San Antonio TX Public Facilities Corp. Lease | | | | |
| Revenue | 4.000% | 9/15/34 | 70 | 71 |
| San Antonio TX Water Revenue | 5.250% | 11/15/18 (Prere.) | 470 | 471 |
| San Antonio TX Water Revenue | 5.000% | 5/15/26 | 705 | 777 |
| San Antonio TX Water Revenue | 5.000% | 5/15/33 | 575 | 644 |
| San Antonio TX Water Revenue | 5.000% | 5/15/48 | 2,000 | 2,209 |
| San Jacinto TX Community College District GO | 5.000% | 2/15/19 (Prere.) | 1,025 | 1,034 |
| Socorro TX Independent School District GO | 5.000% | 8/15/21 (Prere.) | 1,075 | 1,156 |
| Tarrant Regional Water District Texas Water | | | | |
| Revenue | 5.000% | 3/1/37 | 5,640 | 6,030 |
| Tarrant Regional Water District Texas Water | | | | |
| Revenue | 5.000% | 3/1/52 | 1,955 | 2,076 |
| Texas A&M University System Revenue Board | | | | |
| of Regents Revenue | 5.000% | 5/15/25 | 975 | 1,119 |
| Texas GO | 5.000% | 4/1/20 | 210 | 219 |
| Texas GO | 5.000% | 10/1/20 | 600 | 632 |
| Texas GO | 5.000% | 4/1/21 | 200 | 213 |
| Texas GO | 5.000% | 10/1/22 | 610 | 671 |
| Texas GO | 5.000% | 10/1/25 | 1,010 | 1,138 |
| Texas GO | 5.000% | 10/1/26 | 125 | 140 |
| Texas GO | 5.000% | 4/1/27 | 210 | 235 |
| Texas GO | 5.000% | 10/1/27 | 295 | 333 |
| Texas GO | 5.000% | 10/1/27 | 125 | 143 |
| Texas GO | 5.000% | 10/1/28 | 100 | 112 |
| Texas GO | 5.000% | 10/1/29 | 190 | 220 |
| Texas GO | 5.000% | 10/1/31 | 500 | 572 |
| Texas GO | 5.000% | 4/1/44 | 925 | 1,009 |
| Texas GO | 5.000% | 10/1/44 | 4,415 | 4,847 |
| Texas Municipal Power Agency Revenue | 5.000% | 9/1/40 | 215 | 224 |
| Texas Private Activity Surface Transportation | | | | |
| Corp. Revenue | 6.875% | 12/31/39 | 4,255 | 4,448 |
| Texas Private Activity Surface Transportation | | | | |
| Corp. Revenue | 7.000% | 6/30/40 | 1,645 | 1,751 |
| Texas Private Activity Surface Transportation | | | | |
| Corp. Revenue (LBJ Infrastructure Group) | 7.000% | 6/30/34 | 255 | 272 |
| Texas Revenue | 4.000% | 8/29/19 | 5,000 | 5,079 |
| Texas State University System Financing | | | | |
| System Revenue | 5.000% | 3/15/20 | 170 | 177 |
| Texas State University System Financing | | | | |
| System Revenue | 5.000% | 3/15/21 | 210 | 223 |
| Texas State University System Financing | | | | |
| System Revenue | 5.000% | 3/15/27 | 1,380 | 1,598 |
| Texas Transportation Commission GO | 5.000% | 10/1/20 | 260 | 274 |
| Texas Transportation Commission GO | 5.000% | 10/1/21 | 600 | 647 |
| Texas Transportation Commission GO | 5.000% | 4/1/22 | 105 | 114 |
| Texas Transportation Commission GO | 5.000% | 4/1/23 | 310 | 344 |
| Texas Transportation Commission GO | 5.000% | 4/1/24 | 100 | 113 |
| Texas Transportation Commission GO | 5.000% | 10/1/24 | 2,055 | 2,336 |
| Texas Transportation Commission GO | 5.000% | 10/1/25 | 755 | 859 |
| Texas Transportation Commission GO | 5.000% | 4/1/26 | 240 | 261 |
125
| | | | |
| Tax-Exempt Bond Index Fund | | | | |
| |
| |
| |
| | | | Face | Market |
| | | Maturity | Amount | Value • |
| | Coupon | Date | ($000) | ($000) |
| Texas Transportation Commission GO | 5.000% | 4/1/26 | 300 | 337 |
| Texas Transportation Commission GO | 5.000% | 10/1/26 | 815 | 935 |
| Texas Transportation Commission GO | 5.000% | 4/1/29 | 200 | 223 |
| Texas Transportation Commission GO | 5.000% | 10/1/29 | 585 | 662 |
| Texas Transportation Commission GO | 5.000% | 10/1/30 | 670 | 751 |
| Texas Transportation Commission GO | 5.000% | 10/1/30 | 1,665 | 1,914 |
| Texas Transportation Commission GO | 5.000% | 4/1/31 | 300 | 333 |
| Texas Transportation Commission GO | 5.000% | 4/1/44 | 860 | 940 |
| Texas Transportation Commission Mobility | | | | |
| Fund GO | 5.000% | 10/1/23 | 150 | 168 |
| Texas Transportation Commission Mobility | | | | |
| Fund GO | 5.000% | 10/1/28 | 215 | 244 |
| Texas Transportation Commission Mobility | | | | |
| Fund GO | 5.000% | 10/1/34 | 160 | 181 |
| Texas Transportation Commission Revenue | 5.000% | 4/1/19 | 140 | 142 |
| Texas Transportation Commission Revenue | 5.000% | 4/1/20 | 2,480 | 2,582 |
| Texas Transportation Commission Revenue | 5.000% | 10/1/20 | 500 | 527 |
| Texas Transportation Commission Revenue | 5.000% | 4/1/21 | 835 | 890 |
| Texas Transportation Commission Revenue | 5.000% | 10/1/21 | 1,960 | 2,111 |
| Texas Transportation Commission Revenue | 5.000% | 10/1/21 | 310 | 334 |
| Texas Transportation Commission Revenue | 5.000% | 4/1/22 | 3,630 | 3,951 |
| Texas Transportation Commission Revenue | 5.000% | 10/1/22 | 655 | 720 |
| Texas Transportation Commission Revenue | 5.000% | 4/1/24 | 1,715 | 1,933 |
| Texas Transportation Commission Revenue | 5.000% | 10/1/24 | 165 | 187 |
| Texas Transportation Commission Revenue | 5.000% | 10/1/24 | 140 | 159 |
| Texas Transportation Commission Revenue | 5.000% | 4/1/25 | 270 | 304 |
| Texas Transportation Commission Revenue | 5.000% | 10/1/25 | 485 | 558 |
| Texas Transportation Commission Revenue | 5.000% | 10/1/25 | 500 | 575 |
| Texas Transportation Commission Revenue | 5.000% | 10/1/26 | 495 | 575 |
| Texas Transportation Commission Revenue | 5.000% | 10/1/30 | 1,000 | 1,136 |
| Texas Transportation Commission Revenue | 5.000% | 4/1/34 | 100 | 111 |
| Texas Transportation Commission Revenue | 5.000% | 8/15/41 | 1,033 | 1,090 |
| Texas Transportation Commission Turnpike | | | | |
| System Revenue | 5.000% | 8/15/31 | 425 | 456 |
| Texas Transportation Commission Turnpike | | | | |
| System Revenue | 5.000% | 8/15/33 | 565 | 602 |
| Texas Transportation Commission Turnpike | | | | |
| System Revenue | 5.000% | 8/15/34 | 1,575 | 1,675 |
| Texas Transportation Commission Turnpike | | | | |
| System Revenue | 5.000% | 8/15/37 | 875 | 947 |
| Texas Transportation Commission Turnpike | | | | |
| System Revenue | 5.000% | 8/15/42 | 1,400 | 1,467 |
| Texas Transportation Commission Turnpike | | | | |
| System Revenue PUT | 5.000% | 4/1/20 | 2,585 | 2,679 |
| Texas Turnpike Authority Central Texas | | | | |
| Turnpike System Revenue | 0.000% | 8/15/22 (2) | 95 | 86 |
| Texas Turnpike Authority Central Texas | | | | |
| Turnpike System Revenue | 0.000% | 8/15/36 | 725 | 335 |
| Texas Turnpike Authority Central Texas | | | | |
| Turnpike System Revenue | 0.000% | 8/15/37 | 3,630 | 1,597 |
| Texas Water Development Board Revenue | 5.000% | 4/15/25 | 115 | 132 |
| Texas Water Development Board Revenue | 5.000% | 10/15/29 | 450 | 509 |
| Texas Water Development Board Revenue | 5.000% | 4/15/30 | 1,000 | 1,165 |
| Texas Water Development Board Revenue | 5.000% | 10/15/30 | 195 | 220 |
126
| | | | |
| Tax-Exempt Bond Index Fund | | | | |
| |
| |
| |
| | | | Face | Market |
| | | Maturity | Amount | Value • |
| | Coupon | Date | ($000) | ($000) |
| Texas Water Development Board Revenue | 5.000% | 10/15/31 | 535 | 602 |
| Texas Water Development Board Revenue | 4.000% | 10/15/33 | 1,000 | 1,039 |
| Texas Water Development Board Revenue | 4.000% | 10/15/33 | 1,000 | 1,041 |
| Texas Water Development Board Revenue | 4.000% | 10/15/34 | 1,985 | 2,047 |
| Texas Water Development Board Revenue | 4.000% | 10/15/34 | 1,500 | 1,549 |
| Texas Water Development Board Revenue | 4.000% | 10/15/35 | 4,135 | 4,234 |
| Texas Water Development Board Revenue | 5.000% | 10/15/40 | 1,885 | 2,073 |
| Texas Water Development Board Revenue | 4.000% | 10/15/42 | 1,000 | 998 |
| Texas Water Development Board Revenue | 4.000% | 10/15/45 | 3,065 | 3,030 |
| Texas Water Development Board Revenue | 5.000% | 10/15/45 | 440 | 482 |
| Texas Water Development Board Revenue | 4.000% | 10/15/47 | 2,000 | 1,966 |
| Texas Water Financial Assistance GO | 5.000% | 8/1/39 | 100 | 102 |
| University of Houston Texas Revenue | 4.000% | 2/15/24 | 2,245 | 2,407 |
| University of Houston Texas Revenue | 5.000% | 2/15/29 | 2,250 | 2,539 |
| University of Houston Texas Revenue | 4.000% | 2/15/49 | 1,375 | 1,375 |
| University of Texas Permanent University | | | | |
| Fund Revenue | 5.000% | 7/1/24 | 640 | 725 |
| University of Texas Permanent University | | | | |
| Fund Revenue | 5.000% | 7/1/27 | 235 | 265 |
| University of Texas Permanent University | | | | |
| Fund Revenue | 5.250% | 7/1/30 | 160 | 192 |
| University of Texas Permanent University | | | | |
| Fund Revenue | 4.000% | 7/1/41 | 1,280 | 1,293 |
| University of Texas Permanent University | | | | |
| Fund Revenue | 5.000% | 7/1/41 | 300 | 328 |
| University of Texas System Revenue | | | | |
| Financing System Revenue | 5.000% | 8/15/20 | 110 | 116 |
| University of Texas System Revenue | | | | |
| Financing System Revenue | 5.000% | 8/15/21 | 155 | 167 |
| University of Texas System Revenue | | | | |
| Financing System Revenue | 5.000% | 8/15/21 | 305 | 328 |
| University of Texas System Revenue | | | | |
| Financing System Revenue | 5.000% | 8/15/22 | 4,015 | 4,406 |
| University of Texas System Revenue | | | | |
| Financing System Revenue | 5.000% | 8/15/23 | 285 | 318 |
| University of Texas System Revenue | | | | |
| Financing System Revenue | 5.000% | 8/15/23 | 100 | 112 |
| University of Texas System Revenue | | | | |
| Financing System Revenue | 5.375% | 8/15/23 | 510 | 578 |
| University of Texas System Revenue | | | | |
| Financing System Revenue | 5.000% | 8/15/24 | 160 | 182 |
| University of Texas System Revenue | | | | |
| Financing System Revenue | 5.000% | 8/15/24 | 1,865 | 2,116 |
| University of Texas System Revenue | | | | |
| Financing System Revenue | 5.000% | 8/15/25 | 345 | 396 |
| University of Texas System Revenue | | | | |
| Financing System Revenue | 5.000% | 8/15/25 | 620 | 712 |
| University of Texas System Revenue | | | | |
| Financing System Revenue | 5.000% | 8/15/25 | 595 | 684 |
| University of Texas System Revenue | | | | |
| Financing System Revenue | 5.000% | 8/15/26 | 2,770 | 3,212 |
| University of Texas System Revenue | | | | |
| Financing System Revenue | 5.000% | 8/15/26 | 2,480 | 2,876 |
127
| | | | |
| Tax-Exempt Bond Index Fund | | | | |
| |
| |
| |
| | | | Face | Market |
| | | Maturity | Amount | Value • |
| | Coupon | Date | ($000) | ($000) |
| University of Texas System Revenue | | | | |
| Financing System Revenue | 5.000% | 8/15/43 | 885 | 956 |
| West Travis County TX Public Utility Agency | | | | |
| Revenue | 5.000% | 8/15/21 (Prere.) | 795 | 855 |
| West Travis County TX Public Utility Agency | | | | |
| Revenue | 4.000% | 8/15/41 (15) | 1,000 | 993 |
| Ysleta TX Independent School District GO | 5.000% | 8/15/45 | 2,560 | 2,785 |
| Ysleta TX Independent School District GO | 5.000% | 8/15/47 | 1,550 | 1,695 |
| | | | | 382,305 |
| Utah (0.4%) | | | | |
| Intermountain Power Agency Utah Power | | | | |
| Supply Revenue | 5.000% | 7/1/21 | 360 | 385 |
| University of Utah Revenue | 5.000% | 8/1/23 (Prere.) | 95 | 106 |
| University of Utah Revenue | 5.000% | 8/1/23 (Prere.) | 565 | 632 |
| University of Utah Revenue | 5.000% | 8/1/32 | 40 | 44 |
| University of Utah Revenue | 4.000% | 8/1/33 | 400 | 417 |
| Utah GO | 5.000% | 7/1/19 | 800 | 816 |
| Utah GO | 5.000% | 7/1/20 | 1,400 | 1,467 |
| Utah GO | 5.000% | 7/1/21 (Prere.) | 250 | 268 |
| Utah Transit Authority Sales Tax Revenue | 5.000% | 6/15/26 | 160 | 183 |
| Utah Transit Authority Sales Tax Revenue | 5.000% | 6/15/27 | 340 | 388 |
| Utah Transit Authority Sales Tax Revenue | 5.000% | 6/15/28 | 125 | 142 |
| Utah Transit Authority Sales Tax Revenue | 5.000% | 6/15/30 | 180 | 204 |
| Utah Transit Authority Sales Tax Revenue | 4.000% | 12/15/30 | 3,900 | 4,043 |
| Utah Transit Authority Sales Tax Revenue | 0.000% | 12/15/32 | 500 | 279 |
| Utah Transit Authority Sales Tax Revenue | 5.000% | 6/15/37 | 270 | 296 |
| Utah Transit Authority Sales Tax Revenue | 5.000% | 6/15/38 | 1,250 | 1,380 |
| Utah Transit Authority Sales Tax Revenue | 4.000% | 12/15/41 | 2,765 | 2,753 |
| | | | | 13,803 |
| Vermont (0.0%) | | | | |
| University of Vermont & State Agricultural | | | | |
| College GO | 4.000% | 10/1/40 | 100 | 100 |
| Vermont Educational & Health Buildings | | | | |
| Financing Agency Revenue (Champlain | | | | |
| College Project) | 5.000% | 10/15/41 | 200 | 210 |
| Vermont Educational & Health Buildings | | | | |
| Financing Agency Revenue (Champlain | | | | |
| College Project) | 5.000% | 10/15/46 | 200 | 210 |
| | | | | 520 |
| Virginia (1.2%) | | | | |
| Arlington County VA GO | 5.000% | 8/1/22 | 140 | 154 |
| Chesapeake Bay VA Bridge & Tunnel District | | | | |
| Revenue | 5.000% | 7/1/51 | 500 | 533 |
| Fairfax County VA Economic Development | | | | |
| Authority Transportation District | | | | |
| Improvement Revenue (Silver Line Phase I | | | | |
| Project) | 5.000% | 4/1/20 (Prere.) | 3,000 | 3,122 |
| Fairfax County VA GO | 5.000% | 10/1/23 | 780 | 876 |
| Fairfax County VA GO | 4.000% | 10/1/27 | 2,410 | 2,602 |
| Fairfax County VA Public Improvement GO | 5.000% | 4/1/21 | 380 | 406 |
| Fairfax County VA Public Improvement GO | 5.000% | 4/1/23 | 110 | 123 |
| Fairfax County VA Sewer Revenue | 5.000% | 7/15/24 | 500 | 570 |
128
| | | | |
| Tax-Exempt Bond Index Fund | | | | |
| |
| |
| |
| | | | Face | Market |
| | | Maturity | Amount | Value • |
| | Coupon | Date | ($000) | ($000) |
| Fairfax VA GO | 4.000% | 1/15/31 | 120 | 124 |
| Loudoun County VA GO | 5.000% | 11/1/19 | 100 | 103 |
| Loudoun County VA Sanitation Authority Water | | | | |
| & Sewer Revenue | 5.000% | 1/1/24 | 1,460 | 1,646 |
| Richmond VA GO | 3.375% | 3/1/41 | 1,450 | 1,280 |
| Richmond VA Public Utility Revenue | 5.000% | 1/15/19 (Prere.) | 120 | 121 |
| Richmond VA Public Utility Revenue | 5.000% | 1/15/28 | 140 | 160 |
| University of Virginia Revenue | 5.000% | 8/1/21 | 1,000 | 1,076 |
| University of Virginia Revenue | 5.000% | 6/1/43 | 400 | 438 |
| Virginia College Building Authority Educational | | | | |
| Facilities Revenue (21st Century College & | | | | |
| Equipment Programs) | 5.000% | 2/1/25 (Prere.) | 1,000 | 1,146 |
| Virginia College Building Authority Educational | | | | |
| Facilities Revenue (21st Century College & | | | | |
| Equipment Programs) | 4.000% | 2/1/28 | 1,295 | 1,372 |
| Virginia College Building Authority Educational | | | | |
| Facilities Revenue (21st Century College & | | | | |
| Equipment Programs) | 5.000% | 2/1/30 | 1,100 | 1,261 |
| Virginia College Building Authority Educational | | | | |
| Facilities Revenue (21st Century College & | | | | |
| Equipment Programs) | 3.000% | 2/1/35 | 295 | 261 |
| Virginia Commonwealth Transportation | | | | |
| Board Revenue | 4.500% | 5/15/21 (Prere.) | 335 | 354 |
| Virginia Commonwealth Transportation Board | | | | |
| Revenue | 5.000% | 5/15/21 (Prere.) | 50 | 53 |
| Virginia Commonwealth Transportation Board | | | | |
| Revenue | 5.000% | 5/15/21 (Prere.) | 100 | 107 |
| Virginia Commonwealth Transportation Board | | | | |
| Revenue | 5.000% | 5/15/23 | 250 | 278 |
| Virginia Commonwealth Transportation Board | | | | |
| Revenue | 5.000% | 9/15/23 | 400 | 447 |
| Virginia Commonwealth Transportation Board | | | | |
| Revenue | 5.000% | 3/15/26 | 1,500 | 1,738 |
| Virginia Commonwealth Transportation Board | | | | |
| Revenue | 5.000% | 5/15/26 | 500 | 580 |
| Virginia Commonwealth Transportation Board | | | | |
| Revenue | 5.000% | 3/15/27 | 1,375 | 1,594 |
| Virginia Commonwealth Transportation Board | | | | |
| Revenue | 5.000% | 5/15/27 | 100 | 117 |
| Virginia Commonwealth Transportation Board | | | | |
| Revenue | 5.000% | 5/15/28 | 200 | 234 |
| Virginia Commonwealth Transportation Board | | | | |
| Revenue | 5.000% | 5/15/29 | 200 | 233 |
| Virginia Commonwealth Transportation Board | | | | |
| Revenue | 4.000% | 5/15/31 | 700 | 727 |
| Virginia Commonwealth Transportation Board | | | | |
| Revenue | 5.000% | 9/15/31 | 1,000 | 1,135 |
| Virginia Commonwealth Transportation Board | | | | |
| Revenue | 4.000% | 5/15/32 | 380 | 390 |
| Virginia Commonwealth Transportation Board | | | | |
| Revenue | 4.000% | 5/15/34 | 1,785 | 1,851 |
| Virginia Commonwealth Transportation Board | | | | |
| Revenue | 4.000% | 5/15/35 | 250 | 257 |
129
| | | | |
| Tax-Exempt Bond Index Fund | | | | |
| |
| |
| |
| | | | Face | Market |
| | | Maturity | Amount | Value • |
| | Coupon | Date | ($000) | ($000) |
| Virginia Commonwealth Transportation Board | | | | |
| Revenue | 4.000% | 5/15/36 | 250 | 256 |
| Virginia Commonwealth Transportation Board | | | | |
| Revenue | 4.000% | 5/15/42 | 4,520 | 4,572 |
| Virginia GO | 5.000% | 6/1/19 | 200 | 203 |
| Virginia GO | 5.000% | 6/1/27 | 180 | 207 |
| Virginia Public Building Authority Public | | | | |
| Facilities Revenue | 5.000% | 8/1/24 (4) | 2,315 | 2,579 |
| Virginia Public Building Authority Public | | | | |
| Facilities Revenue | 5.000% | 8/1/24 | 2,250 | 2,551 |
| Virginia Public Building Authority Public | | | | |
| Facilities Revenue | 5.000% | 8/1/25 | 300 | 345 |
| Virginia Public Building Authority Public | | | | |
| Facilities Revenue | 5.000% | 8/1/27 | 2,030 | 2,381 |
| Virginia Public School Authority Revenue | 5.000% | 8/1/19 | 230 | 235 |
| Virginia Public School Authority Revenue | 5.000% | 8/1/22 | 445 | 489 |
| Virginia Public School Authority Revenue | 5.000% | 8/1/22 | 80 | 88 |
| Virginia Public School Authority Revenue | 5.000% | 8/1/23 | 705 | 773 |
| Virginia Public School Authority Revenue | 5.000% | 8/1/25 | 505 | 581 |
| Virginia Public School Authority Revenue | 5.000% | 8/1/26 | 310 | 355 |
| Virginia Public School Authority Revenue | 5.000% | 8/1/27 | 500 | 571 |
| Virginia Public School Authority School | | | | |
| Technology & Security Notes Revenue | 4.000% | 8/1/19 | 1,350 | 1,371 |
| Virginia Small Business Financing Authority | | | | |
| Revenue (Hampton University) | 4.000% | 10/1/38 | 300 | 289 |
| | | | | 45,315 |
| Washington (3.4%) | | | | |
| Central Puget Sound WA Regional Transit | | | | |
| Authority Sales & Use Tax Revenue | 5.000% | 11/1/31 | 575 | 650 |
| Central Puget Sound WA Regional Transit | | | | |
| Authority Sales & Use Tax Revenue | 5.000% | 11/1/32 | 695 | 784 |
| Central Puget Sound WA Regional Transit | | | | |
| Authority Sales & Use Tax Revenue | 5.000% | 11/1/35 | 815 | 911 |
| Central Puget Sound WA Regional Transit | | | | |
| Authority Sales & Use Tax Revenue | 5.000% | 11/1/36 | 200 | 223 |
| Central Puget Sound WA Regional Transit | | | | |
| Authority Sales & Use Tax Revenue | 5.000% | 11/1/45 | 1,400 | 1,544 |
| Central Puget Sound WA Regional Transit | | | | |
| Authority Sales & Use Tax Revenue | 5.000% | 11/1/46 | 1,720 | 2,112 |
| Energy Northwest Washington Electric | | | | |
| Revenue (Bonneville Power Administration) | 5.000% | 7/1/25 | 380 | 436 |
| Energy Northwest Washington Electric | | | | |
| Revenue (Columbia Generating Station) | 5.000% | 7/1/19 | 2,315 | 2,361 |
| Energy Northwest Washington Electric | | | | |
| Revenue (Columbia Generating Station) | 5.000% | 7/1/20 | 100 | 105 |
| Energy Northwest Washington Electric | | | | |
| Revenue (Columbia Generating Station) | 5.000% | 7/1/20 | 175 | 183 |
| Energy Northwest Washington Electric | | | | |
| Revenue (Columbia Generating Station) | 5.000% | 7/1/21 | 235 | 252 |
| Energy Northwest Washington Electric | | | | |
| Revenue (Columbia Generating Station) | 5.000% | 7/1/21 | 1,050 | 1,126 |
| Energy Northwest Washington Electric | | | | |
| Revenue (Columbia Generating Station) | 5.000% | 7/1/22 | 1,000 | 1,094 |
130
| | | | |
| Tax-Exempt Bond Index Fund | | | | |
| |
| |
| |
| | | | Face | Market |
| | | Maturity | Amount | Value • |
| | Coupon | Date | ($000) | ($000) |
| Energy Northwest Washington Electric | | | | |
| Revenue (Columbia Generating Station) | 5.000% | 7/1/30 | 240 | 268 |
| Energy Northwest Washington Electric | | | | |
| Revenue (Columbia Generating Station) | 5.000% | 7/1/31 | 5,855 | 6,110 |
| Energy Northwest Washington Electric | | | | |
| Revenue (Columbia Generating Station) | 5.000% | 7/1/40 | 1,290 | 1,416 |
| Energy Northwest Washington Electric | | | | |
| Revenue (Project No. 1) | 5.000% | 7/1/25 | 325 | 367 |
| Energy Northwest Washington Electric | | | | |
| Revenue (Project No. 1) | 5.000% | 7/1/25 | 100 | 115 |
| Energy Northwest Washington Electric | | | | |
| Revenue (Project No. 1) | 5.000% | 7/1/26 | 2,755 | 2,938 |
| Energy Northwest Washington Electric | | | | |
| Revenue (Project No. 1) | 5.000% | 7/1/27 | 440 | 515 |
| Energy Northwest Washington Electric | | | | |
| Revenue (Project No. 1) | 5.000% | 7/1/27 | 1,390 | 1,560 |
| Energy Northwest Washington Electric | | | | |
| Revenue (Project No. 1) | 5.000% | 7/1/28 | 865 | 904 |
| Energy Northwest Washington Electric | | | | |
| Revenue (Project No. 1) | 5.000% | 7/1/28 | 125 | 145 |
| Energy Northwest Washington Electric | | | | |
| Revenue (Project No. 1) | 5.000% | 7/1/28 | 330 | 379 |
| Energy Northwest Washington Electric | | | | |
| Revenue (Project No. 3) | 5.000% | 7/1/27 | 1,835 | 2,117 |
| King County WA GO | 4.000% | 7/1/30 | 4,780 | 5,052 |
| King County WA Sewer Revenue | 5.000% | 1/1/19 (Prere.) | 550 | 553 |
| King County WA Sewer Revenue | 5.000% | 7/1/20 (Prere.) | 30 | 31 |
| King County WA Sewer Revenue | 5.000% | 7/1/20 (Prere.) | 95 | 99 |
| King County WA Sewer Revenue | 5.125% | 1/1/21 (Prere.) | 35 | 37 |
| King County WA Sewer Revenue | 5.125% | 1/1/21 (Prere.) | 30 | 32 |
| King County WA Sewer Revenue | 4.000% | 7/1/33 | 415 | 430 |
| King County WA Sewer Revenue | 5.000% | 7/1/39 | 1,890 | 2,055 |
| King County WA Sewer Revenue | 4.000% | 7/1/45 | 710 | 708 |
| King County WA Sewer Revenue | 5.000% | 1/1/52 | 405 | 430 |
| Northwest Energy Washington Electric | | | | |
| Revenue (Bonneville Power Administration) | 5.000% | 7/1/28 | 525 | 570 |
| Northwest Energy Washington Electric | | | | |
| Revenue (Columbia Generating Station) | 5.000% | 7/1/22 | 470 | 503 |
| Northwest Energy Washington Electric | | | | |
| Revenue (Columbia Generating Station) | 5.000% | 7/1/33 | 250 | 283 |
| Pierce County WA School District No. 10 | | | | |
| (Tacoma) GO | 5.000% | 12/1/39 | 1,000 | 1,102 |
| Pierce County WA Sewer Revenue | 4.000% | 8/1/42 | 55 | 55 |
| Port of Seattle WA Revenue | 5.000% | 2/1/30 | 465 | 523 |
| Port of Seattle WA Revenue | 5.000% | 8/1/30 | 6,000 | 6,497 |
| Port of Seattle WA Revenue | 5.000% | 8/1/31 | 5,100 | 5,513 |
| Port of Tacoma WA GO | 5.000% | 12/1/27 | 2,000 | 2,311 |
| Seattle WA GO | 4.000% | 10/1/27 | 1,230 | 1,295 |
| Seattle WA GO | 4.000% | 12/1/27 | 1,430 | 1,508 |
| Seattle WA Municipal Light & Power Revenue | 5.000% | 2/1/20 | 100 | 104 |
| Seattle WA Municipal Light & Power Revenue | 5.000% | 2/1/20 (Prere.) | 15 | 16 |
| Seattle WA Municipal Light & Power Revenue | 5.250% | 2/1/21 (Prere.) | 270 | 288 |
| Seattle WA Municipal Light & Power Revenue | 5.000% | 2/1/23 | 75 | 78 |
| Seattle WA Municipal Light & Power Revenue | 4.000% | 1/1/46 | 6,750 | 6,716 |
131
| | | | |
| Tax-Exempt Bond Index Fund | | | | |
| |
| |
| |
| | | | Face | Market |
| | | Maturity | Amount | Value • |
| | Coupon | Date | ($000) | ($000) |
| Seattle WA Municipal Light & Power Revenue | 4.000% | 9/1/47 | 500 | 493 |
| Seattle WA Water System Revenue | 4.000% | 7/1/47 | 750 | 745 |
| Snohomish County WA School District No. 201 | | | | |
| (Edmonds) GO | 5.250% | 12/1/18 (Prere.) | 340 | 341 |
| Tacoma WA Electric System Revenue | 5.000% | 1/1/38 | 4,295 | 4,647 |
| University of Washington Biomedical Research | | | | |
| Properties Lease Revenue | 4.000% | 1/1/48 | 230 | 228 |
| Washington (Motor Vehicle Fuel Tax) GO | 5.000% | 8/1/19 (Prere.) | 510 | 522 |
| Washington (Motor Vehicle Fuel Tax) GO | 5.000% | 7/1/21 | 465 | 487 |
| Washington (Motor Vehicle Fuel Tax) GO | 4.000% | 7/1/25 | 100 | 102 |
| Washington (Motor Vehicle Fuel Tax) GO | 5.000% | 7/1/25 | 365 | 398 |
| Washington (Motor Vehicle Fuel Tax) GO | 5.000% | 7/1/29 | 200 | 224 |
| Washington (Motor Vehicle Fuel Tax) GO | 5.000% | 2/1/31 | 1,750 | 1,934 |
| Washington (Motor Vehicle Fuel Tax) GO | 5.000% | 8/1/33 | 585 | 642 |
| Washington (Motor Vehicle Fuel Tax) GO | 5.000% | 6/1/41 | 3,335 | 3,514 |
| Washington Federal Highway Grant | | | | |
| Anticipation Revenue (520 Corridor Program) | 5.000% | 9/1/19 | 210 | 215 |
| Washington Federal Highway Grant | | | | |
| Anticipation Revenue (520 Corridor Program) | 5.000% | 9/1/21 | 125 | 134 |
| Washington Federal Highway Grant | | | | |
| Anticipation Revenue (520 Corridor Program) | 5.000% | 9/1/22 | 230 | 252 |
| Washington Federal Highway Grant | | | | |
| Anticipation Revenue (520 Corridor Program) | 5.000% | 9/1/22 | 515 | 564 |
| Washington Federal Highway Grant | | | | |
| Anticipation Revenue (520 Corridor Program) | 5.000% | 9/1/23 | 340 | 372 |
| Washington Federal Highway Grant | | | | |
| Anticipation Revenue (520 Corridor Program) | 5.000% | 9/1/24 | 580 | 632 |
| Washington GO | 5.000% | 1/1/19 (Prere.) | 85 | 85 |
| Washington GO | 5.000% | 2/1/19 (Prere.) | 60 | 60 |
| Washington GO | 5.000% | 7/1/19 | 1,000 | 1,020 |
| Washington GO | 5.000% | 7/1/19 | 1,625 | 1,658 |
| Washington GO | 5.000% | 1/1/20 | 185 | 191 |
| Washington GO | 4.000% | 2/1/20 (Prere.) | 250 | 256 |
| Washington GO | 5.000% | 7/1/20 | 500 | 524 |
| Washington GO | 5.000% | 7/1/20 | 345 | 361 |
| Washington GO | 5.000% | 7/1/20 | 110 | 115 |
| Washington GO | 5.000% | 7/1/20 | 1,180 | 1,236 |
| Washington GO | 5.000% | 8/1/20 (Prere.) | 1,025 | 1,076 |
| Washington GO | 5.000% | 1/1/21 | 150 | 159 |
| Washington GO | 5.250% | 2/1/21 (Prere.) | 700 | 748 |
| Washington GO | 5.000% | 7/1/21 | 280 | 300 |
| Washington GO | 5.000% | 7/1/21 | 120 | 129 |
| Washington GO | 5.000% | 8/1/21 | 700 | 752 |
| Washington GO | 5.000% | 7/1/22 | 100 | 109 |
| Washington GO | 5.000% | 7/1/22 | 220 | 236 |
| Washington GO | 5.000% | 7/1/23 | 1,170 | 1,305 |
| Washington GO | 5.000% | 7/1/23 | 125 | 139 |
| Washington GO | 5.000% | 7/1/23 | 150 | 167 |
| Washington GO | 5.000% | 8/1/23 | 120 | 134 |
| Washington GO | 5.000% | 7/1/24 | 475 | 538 |
| Washington GO | 5.000% | 7/1/24 | 515 | 583 |
| Washington GO | 5.000% | 7/1/24 | 135 | 147 |
| Washington GO | 5.000% | 7/1/24 | 125 | 142 |
| Washington GO | 4.000% | 7/1/25 | 1,455 | 1,530 |
132
| | | | |
| Tax-Exempt Bond Index Fund | | | | |
| |
| |
| |
| | | | Face | Market |
| | | Maturity | Amount | Value • |
| | Coupon | Date | ($000) | ($000) |
| Washington GO | 5.000% | 7/1/25 | 395 | 430 |
| Washington GO | 5.000% | 7/1/25 | 210 | 239 |
| Washington GO | 5.000% | 7/1/25 | 220 | 253 |
| Washington GO | 5.000% | 8/1/25 | 150 | 172 |
| Washington GO | 4.000% | 7/1/26 | 475 | 485 |
| Washington GO | 5.000% | 7/1/26 | 150 | 173 |
| Washington GO | 4.000% | 7/1/27 | 4,170 | 4,364 |
| Washington GO | 5.000% | 7/1/28 | 135 | 154 |
| Washington GO | 5.000% | 7/1/28 | 100 | 112 |
| Washington GO | 3.000% | 7/1/29 | 275 | 270 |
| Washington GO | 5.000% | 7/1/30 | 840 | 937 |
| Washington GO | 5.000% | 8/1/30 | 2,000 | 2,270 |
| Washington GO | 5.000% | 8/1/30 | 75 | 83 |
| Washington GO | 5.000% | 7/1/31 | 130 | 145 |
| Washington GO | 5.000% | 7/1/31 | 2,000 | 2,225 |
| Washington GO | 5.000% | 8/1/31 | 970 | 1,068 |
| Washington GO | 5.000% | 8/1/31 | 310 | 350 |
| Washington GO | 5.000% | 7/1/32 | 150 | 167 |
| Washington GO | 5.000% | 7/1/32 | 225 | 250 |
| Washington GO | 5.000% | 7/1/33 | 275 | 304 |
| Washington GO | 5.000% | 7/1/33 | 525 | 584 |
| Washington GO | 5.000% | 8/1/33 | 100 | 112 |
| Washington GO | 5.000% | 8/1/34 | 130 | 142 |
| Washington GO | 5.000% | 8/1/35 | 1,430 | 1,518 |
| Washington GO | 5.000% | 8/1/36 | 1,100 | 1,218 |
| Washington GO | 5.000% | 8/1/37 | 480 | 532 |
| Washington GO | 5.000% | 8/1/37 | 1,300 | 1,437 |
| Washington GO | 5.000% | 2/1/38 | 1,000 | 1,090 |
| Washington GO | 5.000% | 8/1/38 | 200 | 218 |
| Washington GO | 5.000% | 8/1/39 | 500 | 552 |
| Washington GO | 5.000% | 8/1/39 | 1,520 | 1,673 |
| Washington GO | 5.000% | 8/1/40 | 675 | 742 |
| Washington GO | 5.000% | 8/1/43 | 1,300 | 1,450 |
| Washington St Convention Center Revenue | 5.000% | 7/1/48 | 2,500 | 2,720 |
| Washington St Convention Center Revenue | 5.000% | 7/1/48 | 2,500 | 2,709 |
| Washington State University General Revenue | 5.000% | 4/1/40 | 165 | 181 |
| | | | | 126,879 |
| West Virginia (0.0%) | | | | |
| West Virginia Economic Development | | | | |
| Authority Lottery Revenue | 5.000% | 6/15/20 (Prere.) | 160 | 167 |
| West Virginia University Revenue | 5.000% | 10/1/35 | 1,000 | 1,078 |
| West Virginia University Revenue | 5.000% | 10/1/36 | 115 | 122 |
| | | | | 1,367 |
| Wisconsin (1.1%) | | | | |
| University of Kansas Public Finance Authority | | | | |
| Revenue (Campus Development Corporation) | 5.000% | 3/1/29 | 410 | 457 |
| University of Kansas Public Finance Authority | | | | |
| Revenue (Campus Development Corporation) | 5.000% | 3/1/35 | 875 | 953 |
| Wisconsin Center District Tax revenue | 5.250% | 12/15/27 (4) | 210 | 236 |
| Wisconsin General Fund Annual Appropriation | | | | |
| Revenue | 5.750% | 5/1/19 (Prere.) | 10 | 10 |
| Wisconsin General Fund Annual Appropriation | | | | |
| Revenue | 5.750% | 5/1/19 (Prere.) | 125 | 127 |
133
| | | | |
| Tax-Exempt Bond Index Fund | | | | |
| |
| |
| |
| | | | Face | Market |
| | | Maturity | Amount | Value • |
| | Coupon | Date | ($000) | ($000) |
| Wisconsin General Fund Annual Appropriation | | | | |
| Revenue | 5.750% | 5/1/19 (Prere.) | 1,250 | 1,274 |
| Wisconsin General Fund Annual Appropriation | | | | |
| Revenue | 5.000% | 5/1/21 | 2,000 | 2,031 |
| Wisconsin General Fund Annual Appropriation | | | | |
| Revenue | 5.750% | 5/1/29 | 90 | 92 |
| Wisconsin GO | 5.000% | 5/1/19 (2) | 175 | 178 |
| Wisconsin GO | 6.000% | 5/1/19 (Prere.) | 550 | 561 |
| Wisconsin GO | 5.000% | 5/1/20 | 100 | 104 |
| Wisconsin GO | 5.000% | 11/1/20 | 2,325 | 2,455 |
| Wisconsin GO | 5.000% | 11/1/20 | 680 | 718 |
| Wisconsin GO | 5.000% | 11/1/20 | 3,000 | 3,168 |
| Wisconsin GO | 5.000% | 5/1/21 | 160 | 171 |
| Wisconsin GO | 5.000% | 11/1/21 | 100 | 108 |
| Wisconsin GO | 5.000% | 5/1/22 | 6,660 | 7,277 |
| Wisconsin GO | 5.000% | 11/1/22 | 250 | 270 |
| Wisconsin GO | 5.000% | 5/1/23 (Prere.) | 520 | 579 |
| Wisconsin GO | 5.000% | 11/1/23 | 205 | 230 |
| Wisconsin GO | 5.000% | 11/1/23 | 3,075 | 3,377 |
| Wisconsin GO | 5.000% | 5/1/24 | 2,685 | 2,972 |
| Wisconsin GO | 5.000% | 11/1/24 | 1,185 | 1,350 |
| Wisconsin GO | 5.000% | 5/1/25 | 90 | 98 |
| Wisconsin GO | 5.000% | 5/1/26 | 75 | 85 |
| Wisconsin GO | 5.000% | 11/1/26 | 1,555 | 1,813 |
| Wisconsin GO | 5.000% | 11/1/28 | 2,000 | 2,293 |
| Wisconsin GO | 5.000% | 5/1/29 | 1,000 | 1,100 |
| Wisconsin GO | 5.000% | 11/1/29 | 200 | 228 |
| Wisconsin GO | 5.000% | 5/1/33 | 1,750 | 1,933 |
| Wisconsin GO | 4.000% | 11/1/34 | 1,000 | 1,034 |
| Wisconsin Health & Educational Facilities | | | | |
| Authority Revenue (Medical College | | | | |
| Wisconsin) | 4.000% | 12/1/46 | 300 | 288 |
| Wisconsin Public Finance Authority Lease | | | | |
| Development Revenue (Central District | | | | |
| Development Project) | 5.000% | 3/1/41 | 245 | 264 |
| Wisconsin Public Power System Power | | | | |
| Supply System Revenue | 5.000% | 7/1/37 | 670 | 728 |
| Wisconsin Transportation Revenue | 5.000% | 7/1/19 (14) | 90 | 92 |
| Wisconsin Transportation Revenue | 5.000% | 7/1/22 (Prere.) | 780 | 856 |
| Wisconsin Transportation Revenue | 5.000% | 7/1/22 | 140 | 153 |
| Wisconsin Transportation Revenue | 5.000% | 7/1/29 | 500 | 561 |
| Wisconsin Transportation Revenue | 5.000% | 7/1/30 | 1,900 | 2,126 |
| | | | | 42,350 |
| Wyoming (0.0%) | | | | |
| Campbell County WY Solid Waste Facilities | | | | |
| Revenue (Basin Electric Power Cooperative - | | | | |
| Dry Fork Station Facilities) | 5.750% | 7/15/39 | 250 | 256 |
| Total Tax-Exempt Municipal Bonds (Cost $3,728,274) | | | 3,651,307 |
134
Tax-Exempt Bond Index Fund
| | | |
| | | | Market |
| | | | Value• |
| | Coupon | Shares | ($000) |
| Temporary Cash Investment (0.9%) | | | |
| Money Market Fund (0.9%) | | | |
| 11 Vanguard Municipal Cash Management | | | |
| Fund (Cost $33,193) | 1.620% | 331,938 | 33,194 |
| Total Investments (99.2%) (Costs $3,761,467) | | | 3,684,501 |
| |
| | Amount |
| | ($000) |
| Other Assets and Liabilities (0.8%) | |
| Other Assets | |
| Investment in Vanguard | 193 |
| Receivables for Investment Securities Sold | 896 |
| Receivables for Accrued Income | 47,780 |
| Receivables for Capital Shares Issued | 3,546 |
| Other Assets | 5 |
| Total Other Assets | 52,420 |
| Liabilities | |
| Payables for Investment Securities Purchased | (23,225) |
| Payables for Capital Shares Redeemed | (2) |
| Payables for Distributions | (86) |
| Payables to Vanguard | (81) |
| Total Liabilities | (23,394) |
| Net Assets (100%) | 3,713,527 |
135
| |
| Tax-Exempt Bond Index Fund | |
| |
| |
| At October 31, 2018, net assets consisted of: | |
| | Amount |
| | ($000) |
| Paid-in Capital | 3,787,730 |
| Total Distributable Earnings (Loss) | (74,203) |
| Net Assets | 3,713,527 |
| |
| Investor Shares—Net Assets | |
| Applicable to 534,444 outstanding $.001 par value shares of | |
| beneficial interest (unlimited authorization) | 5,349 |
| Net Asset Value Per Share—Investor Shares | $10.01 |
| |
| ETF Shares—Net Assets | |
| Applicable to 70,005,057 outstanding $.001 par value shares of | |
| beneficial interest (unlimited authorization) | 3,508,500 |
| Net Asset Value Per Share—ETF Shares | $50.12 |
| |
| Admiral Shares—Net Assets | |
| Applicable to 9,978,799 outstanding $.001 par value shares of | |
| beneficial interest (unlimited authorization) | 199,678 |
| Net Asset Value Per Share—Admiral Shares | $20.01 |
• See Note A in Notes to Financial Statements.
1 5.600% coupon rate will be effective August 2033.
2 6.250% coupon rate will be effective August 2028.
3 5.800% coupon rate will be effective October 2024.
4 6.150% coupon rate will be effective October 2024.
5 6.375% coupon rate will be effective August 2030.
6 6.625% coupon rate will be effective July 2030.
7 5.250% coupon rate will be effective July 2032.
8 5.375% coupon rate will be effective July 2032.
9 6.700 % coupon rate will be effective September 2028.
10 6.550% coupon rate will be effective August 2032.
11 Affiliated money market fund available only to Vanguard funds and certain trusts and accounts managed by Vanguard. Rate shown
is the 7-day yield.
A key to abbreviations and other references follows the Statement of Net Assets.
See accompanying Notes, which are an integral part of the Financial Statements.
136
Tax-Exempt Bond Index Fund
Key to Abbreviations
ARS—Auction Rate Security.
BAN—Bond Anticipation Note.
COP—Certificate of Participation.
CP—Commercial Paper.
FR—Floating Rate.
GAN—Grant Anticipation Note.
GO—General Obligation Bond.
PILOT—Payments in Lieu of Taxes.
PUT—Put Option Obligation.
RAN—Revenue Anticipation Note.
TAN—Tax Anticipation Note.
TOB—Tender Option Bond.
TRAN—Tax Revenue Anticipation Note.
VRDO—Variable Rate Demand Obligation.
VRDP—Variable Rate Demand Preferred.
(ETM)—Escrowed to Maturity.
(Prere.)—Prerefunded.
Scheduled principal and interest payments are guaranteed by:
(1) MBIA (Municipal Bond Investors Assurance).
(2) AMBAC (Ambac Assurance Corporation).
(3) FGIC (Financial Guaranty Insurance Company).
(4) AGM (Assured Guaranty Municipal Corporation).
(5) BIGI (Bond Investors Guaranty Insurance).
(6) Connie Lee Inc.
(7) FHA (Federal Housing Authority).
(8) CapMAC (Capital Markets Assurance Corporation).
(9) American Capital Access Financial Guaranty Corporation.
(10) XL Capital Assurance Inc.
(11) CIFG (CDC IXIS Financial Guaranty).
(12) AGC (Assured Guaranty Corporation).
(13) BHAC (Berkshire Hathaway Assurance Corporation).
(14) NPFG (National Public Finance Guarantee Corporation).
(15) BAM (Build America Mutual Assurance Company).
(16) MAC (Municipal Assurance Corporation).
(17) RAA (Radian Asset Assurance Inc.).
(18) SBLF (Michigan School Bond Loan Fund).
(19) TPSF (Texas Permanent School Fund).
The insurance does not guarantee the market value of the municipal bonds.
LOC—Scheduled principal and interest payments are guaranteed by bank letter of credit.
137
Tax-Exempt Bond Index Fund
Statement of Operations
| |
| | Year Ended |
| | October 31, 2018 |
| | ($000) |
| Investment Income | |
| Income | |
| Interest1 | 70,934 |
| Total Income | 70,934 |
| Expenses | |
| The Vanguard Group—Note B | |
| Investment Advisory Services | 373 |
| Management and Administrative—Investor Shares | 6 |
| Management and Administrative—ETF Shares | 1,564 |
| Management and Administrative—Admiral Shares | 119 |
| Marketing and Distribution—Investor Shares | 1 |
| Marketing and Distribution—ETF Shares | 170 |
| Marketing and Distribution—Admiral Shares | 14 |
| Custodian Fees | 24 |
| Auditing Fees | 38 |
| Shareholders’ Reports and Proxy—Investor Shares | 1 |
| Shareholders’ Reports and Proxy—ETF Shares | 126 |
| Shareholders’ Reports and Proxy—Admiral Shares | 1 |
| Trustees’ Fees and Expenses | 2 |
| Total Expenses | 2,439 |
| Net Investment Income | 68,495 |
| Realized Net Gain (Loss) on Investment Securities Sold1,2 | (7,000) |
| Change in Unrealized Appreciation (Depreciation) of Investment Securities1 | (90,949) |
| Net Increase (Decrease) in Net Assets Resulting from Operations | (29,454) |
1 Interest income, realized net gain (loss), and change in unrealized appreciation (depreciation) from an affiliated company of the fund were $616,000, ($2,000), and $1,000, respectively. Purchases and sales are for temporary cash investment purposes.
2 Includes ($2,437,000) of net gain (loss) resulting from in-kind redemptions; such gain (loss) is not taxable to the fund.
See accompanying Notes, which are an integral part of the Financial Statements.
138
Tax-Exempt Bond Index Fund
Statement of Changes in Net Assets
| | |
| | Year Ended October 31, |
| | 2018 | 2017 |
| | ($000) | ($000) |
| Increase (Decrease) in Net Assets | | |
| Operations | | |
| Net Investment Income | 68,495 | 25,060 |
| Realized Net Gain (Loss) | (7,000) | (236) |
| Change in Unrealized Appreciation (Depreciation) | (90,949) | 12,906 |
| Net Increase (Decrease) in Net Assets Resulting from Operations | (29,454) | 37,730 |
| Distributions | | |
| Net Investment Income | | |
| Investor Shares | (101) | (48) |
| ETF Shares | (59,904) | (20,706) |
| Admiral Shares | (3,994) | (2,022) |
| Realized Capital Gain | | |
| Investor Shares | — | — |
| ETF Shares | — | — |
| Admiral Shares | — | — |
| Total Distributions | (63,999) | (22,776) |
| Capital Share Transactions | | |
| Investor Shares | 1,905 | 1,269 |
| ETF Shares | 1,711,008 | 1,320,247 |
| Admiral Shares | 71,556 | 64,227 |
| Net Increase (Decrease) from Capital Share Transactions | 1,784,469 | 1,385,743 |
| Total Increase (Decrease) | 1,691,016 | 1,400,697 |
| Net Assets | | |
| Beginning of Period | 2,022,511 | 621,814 |
| End of Period | 3,713,527 | 2,022,511 |
See accompanying Notes, which are an integral part of the Financial Statements.
139
Tax-Exempt Bond Index Fund
Financial Highlights
Investor Shares
| | | | |
| | | | | Aug. 21, |
| | | | | 20151 to |
| | Year Ended October 31, | Oct. 31, |
| For a Share Outstanding Throughout Each Period | 2018 | 2017 | 2016 | 2015 |
| Net Asset Value, Beginning of Period | $10.32 | $10.33 | $10.05 | $10.00 |
| Investment Operations | | | | |
| Net Investment Income | . 223 2 | .1972 | .149 | .034 |
| Net Realized and Unrealized Gain (Loss) on Investments 3 | (.317) | (.019) | .280 | .048 |
| Total from Investment Operations | (.094) | .178 | .429 | .082 |
| Distributions | | | | |
| Dividends from Net Investment Income | (. 216) | (.188) | (.149) | (. 032) |
| Distributions from Realized Capital Gains | — | — | — | — |
| Total Distributions | (. 216) | (.188) | (.149) | (. 032) |
| Net Asset Value, End of Period | $10.01 | $10.32 | $10.33 | $10.05 |
| |
| Total Return4 | -0.93% | 1.76% | 4.28% | 0.82% |
| |
| Ratios/Supplemental Data | | | | |
| Net Assets, End of Period (Millions) | $5 | $4 | $2 | $5 |
| Ratio of Total Expenses to Average Net Assets | 0.17% | 0.19% | 0.19% | 0.20%5 |
| Ratio of Net Investment Income to Average Net Assets | 2.19% | 1.94% | 1.61% | 1.88%5 |
| Portfolio Turnover Rate 6 | 22% | 18% | 8% | 1% |
1 Inception.
2 Calculation based on average shares outstanding.
3 Includes increases from purchase fees of $.00, $.01, $.00, and $.06.
4 Total returns do not include transaction or account service fees that may have applied in the periods shown. Fund prospectuses provide
information about any applicable transaction and account service fees.
5 Annualized.
6 Excludes the value of portfolio securities received or delivered as a result of in-kind purchases or redemptions of the fund’s capital
shares, including ETF Creation Units.
See accompanying Notes, which are an integral part of the Financial Statements.
140
Tax-Exempt Bond Index Fund
Financial Highlights
ETF Shares
| | | | |
| | | | | Aug. 21, |
| | | | | 20151 to |
| | Year Ended October 31, | Oct. 31, |
| For a Share Outstanding Throughout Each Period | 2018 | 2017 | 2016 | 2015 |
| Net Asset Value, Beginning of Period | $51.65 | $51.67 | $50.33 | $50.00 |
| Investment Operations | | | | |
| Net Investment Income | 1.1612 | 1.0452 | .810 | .170 |
| Net Realized and Unrealized Gain (Loss) on Investments 3 | (1.595) | (.090) | 1.343 | .255 |
| Total from Investment Operations | (.434) | .955 | 2.153 | .425 |
| Distributions | | | | |
| Dividends from Net Investment Income | (1.096) | (.975) | (.813) | (.095) |
| Distributions from Realized Capital Gains | — | — | — | — |
| Total Distributions | (1.096) | (.975) | (.813) | (.095) |
| Net Asset Value, End of Period | $50.12 | $51.65 | $51.67 | $50.33 |
| |
| Total Return | -0.85% | 1.89% | 4.29% | 0.85% |
| |
| Ratios/Supplemental Data | | | | |
| Net Assets, End of Period (Millions) | $3,509 | $1,885 | $550 | $60 |
| Ratio of Total Expenses to Average Net Assets | 0.08% | 0.09% | 0.09% | 0.12%4 |
| Ratio of Net Investment Income to Average Net Assets | 2.28% | 2.04% | 1.71% | 1.96%4 |
| Portfolio Turnover Rate 5 | 22% | 18% | 8% | 1% |
1 Inception.
2 Calculation based on average shares outstanding.
3 Includes increases from purchase fees of $.00, $.02, $.02, and $.00.
4 Annualized.
5 Excludes the value of portfolio securities received or delivered as a result of in-kind purchases or redemptions of the fund’s capital
shares, including ETF Creation Units.
See accompanying Notes, which are an integral part of the Financial Statements.
141
Tax-Exempt Bond Index Fund
Financial Highlights
Admiral Shares
| | | | |
| | | | | Aug. 25, |
| | | | | 20151 to |
| | Year Ended October 31, | Oct. 31, |
| For a Share Outstanding Throughout Each Period | 2018 | 2017 | 2016 | 2015 |
| Net Asset Value, Beginning of Period | $20.63 | $20.65 | $20.10 | $19.98 |
| Investment Operations | | | | |
| Net Investment Income | . 4612 | .4152 | .324 | .066 |
| Net Realized and Unrealized Gain (Loss) on Investments 3 | (. 633) | (. 039) | . 550 | .120 |
| Total from Investment Operations | (.172) | .376 | .874 | .186 |
| Distributions | | | | |
| Dividends from Net Investment Income | (. 448) | (. 396) | (. 324) | (. 066) |
| Distributions from Realized Capital Gains | — | — | — | — |
| Total Distributions | (. 448) | (. 396) | (. 324) | (. 066) |
| Net Asset Value, End of Period | $20.01 | $20.63 | $20.65 | $20.10 |
| |
| Total Return4 | -0.84% | 1.86% | 4.36% | 0.93% |
| |
| Ratios/Supplemental Data | | | | |
| Net Assets, End of Period (Millions) | $200 | $134 | $69 | $7 |
| Ratio of Total Expenses to Average Net Assets | 0.09% | 0.09% | 0.09% | 0.12%5 |
| Ratio of Net Investment Income to Average Net Assets | 2.27% | 2.04% | 1.71% | 1.96%5 |
| Portfolio Turnover Rate 6 | 22% | 18% | 8% | 1% |
1 Inception.
2 Calculation based on average shares outstanding.
3 Includes increases from purchase fees of $.00, $.01, $.01, and $.00.
4 Total returns do not include transaction or account service fees that may have applied in the periods shown. Fund prospectuses provide
information about any applicable transaction and account service fees.
5 Annualized.
6 Excludes the value of portfolio securities received or delivered as a result of in-kind purchases or redemptions of the fund’s capital
shares, including ETF Creation Units.
See accompanying Notes, which are an integral part of the Financial Statements.
142
Tax-Exempt Bond Index Fund
Notes to Financial Statements
Vanguard Tax-Exempt Bond Index Fund is registered under the Investment Company Act of 1940 as an open-end investment company, or mutual fund. The fund invests in debt instruments of many municipal issuers; the issuers’ abilities to meet their obligations may be affected by economic and political developments in a specific state or region. The fund offers three classes of shares: Investor Shares, ETF Shares, and Admiral Shares. Investor Shares are available to any investor who meets the fund’s minimum purchase requirements. ETF Shares are listed for trading on NYSE Arca; they can be purchased and sold through a broker. Admiral Shares are designed for investors who meet certain administrative, service, and account-size criteria.
A. The following significant accounting policies conform to generally accepted accounting principles for U.S. investment companies. The fund consistently follows such policies in preparing its financial statements.
1. Security Valuation: Securities are valued as of the close of trading on the New York Stock Exchange (generally 4 p.m., Eastern time) on the valuation date. Bonds and temporary cash investments are valued using the latest bid prices or using valuations based on a matrix system (which considers such factors as security prices, yields, maturities, and ratings), both as furnished by independent pricing services. Investments in Vanguard Municipal Cash Management Fund are valued at that fund’s net asset value. Securities for which market quotations are not readily available, or whose values have been affected by events occurring before the fund’s pricing time but after the close of the securities’ primary markets, are valued by methods deemed by the board of trustees to represent fair value.
2. Federal Income Taxes: The fund intends to continue to qualify as a regulated investment company and distribute all of its income. Management has analyzed the fund’s tax positions taken for all open federal income tax years (October 31, 2015–2018), and has concluded that no provision for federal income tax is required in the fund’s financial statements.
3. Distributions: Distributions to shareholders are recorded on the ex-dividend date. Distributions are determined on a tax basis and may differ from net investment income and realized capital gains for financial reporting purposes.
4. Credit Facility: The fund and certain other funds managed by The Vanguard Group (“Vanguard”) participate in a $3.1 billion committed credit facility provided by a syndicate of lenders pursuant to a credit agreement that may be renewed annually; each fund is individually liable for its borrowings, if any, under the credit facility. Borrowings may be utilized for temporary and emergency purposes, and are subject to the fund’s regulatory and contractual borrowing restrictions. The participating funds are charged administrative fees and an annual commitment fee of 0.10% of the undrawn amount of the facility; these fees are allocated to the funds based on a method approved by the fund’s board of trustees and included in Management and Administrative expenses on the fund’s Statement of Operations. Any borrowings under this facility bear interest at a rate based upon the higher of the one-month London Interbank Offered Rate, federal funds effective rate, or overnight bank funding rate plus an agreed-upon spread.
The fund had no borrowings outstanding at October 31, 2018, or at any time during the period then ended.
143
Tax-Exempt Bond Index Fund
5. Other: Interest income includes income distributions received from Vanguard Municipal Cash Management Fund and is accrued daily. Premiums and discounts on debt securities purchased are amortized and accreted, respectively, to interest income over the lives of the respective securities. Security transactions are accounted for on the date securities are bought or sold. Costs used to determine realized gains (losses) on the sale of investment securities are those of the specific securities sold. Fees assessed on capital share transactions are credited to paid-in capital.
Each class of shares has equal rights as to assets and earnings, except that each class separately bears certain class-specific expenses related to maintenance of shareholder accounts (included in Management and Administrative expenses), shareholder reporting, and the proxy. Marketing and distribution expenses are allocated to each class of shares based on a method approved by the board of trustees. Income, other non-class-specific expenses, and gains and losses on investments are allocated to each class of shares based on its relative net assets.
B. In accordance with the terms of a Funds’ Service Agreement (the “FSA”) between Vanguard and the fund, Vanguard furnishes to the fund investment advisory, corporate management, administrative, marketing, and distribution services at Vanguard’s cost of operations (as defined by the FSA). These costs of operations are allocated to the fund based on methods and guidelines approved by the board of trustees. Vanguard does not require reimbursement in the current period for certain costs of operations (such as deferred compensation/benefits and risk/insurance costs); the fund’s liability for these costs of operations is included in Payables to Vanguard on the Statement of Net Assets. All other costs of operations payable to Vanguard are generally settled twice a month.
Upon the request of Vanguard, the fund may invest up to 0.40% of its net assets as capital in Vanguard. At October 31, 2018, the fund had contributed to Vanguard capital in the amount of $193,000, representing 0.01% of the fund’s net assets and 0.08% of Vanguard’s capitalization. The fund’s trustees and officers are also directors and employees, respectively, of Vanguard.
C. Various inputs may be used to determine the value of the fund’s investments. These inputs are summarized in three broad levels for financial statement purposes. The inputs or methodologies used to value securities are not necessarily an indication of the risk associated with investing in those securities.
Level 1—Quoted prices in active markets for identical securities.
Level 2—Other significant observable inputs (including quoted prices for similar securities, interest rates, prepayment speeds, credit risk, etc.).
Level 3—Significant unobservable inputs (including the fund’s own assumptions used to determine the fair value of investments). Any investments valued with significant unobservable inputs are noted on the Statement of Net Assets.
144
Tax-Exempt Bond Index Fund
The following table summarizes the market value of the fund’s investments as of October 31, 2018, based on the inputs used to value them:
| | | |
| | Level 1 | Level 2 | Level 3 |
| Investments | ($000) | ($000) | ($000) |
| Tax-Exempt Municipal Bonds | — | 3,651,307 | — |
| Temporary Cash Investments | 33,194 | — | — |
| Total | 33,194 | 3,651,307 | — |
D. Permanent differences between book-basis and tax-basis components of net assets are reclassified among capital accounts in the financial statements to reflect their tax character. These reclassifications have no effect on net assets or net asset value per share. As of period end, the following permanent differences primarily attributable to the accounting for in-kind redemptions were reclassified to the following accounts:
| |
| | Amount |
| | ($000) |
| Paid-in Capital | (2,437) |
| Total Distributable Earnings (Loss) | 2,437 |
Temporary differences between book-basis and tax-basis components of total distributable earnings (loss) arise when certain items of income, gain, or loss are recognized in different periods for financial statement and tax purposes; these differences will reverse at some time in the future. The differences are primarily related to the tax deferral of losses on wash sales and payables for distributions. As of period end, the tax-basis components of total distributable earnings (loss) are detailed in the table as follows:
| |
| | Amount |
| | ($000) |
| Undistributed Ordinary Income | 7,717 |
| Undistributed Long-term Gains | — |
| Capital Loss Carryforwards (Non-expiring) | (4,798) |
| Net Unrealized Gains (Losses) | (76,966) |
As of October 31, 2018, gross unrealized appreciation and depreciation for investments and derivatives based on cost for U.S. federal income tax purposes were as follows:
| |
| | Amount |
| | ($000) |
| Tax Cost | 3,761,467 |
| Gross Unrealized Appreciation | 1,523 |
| Gross Unrealized Depreciation | (78,489) |
| Net Unrealized Appreciation (Depreciation) | (76,966) |
145
Tax-Exempt Bond Index Fund
E. During the year ended October 31, 2018, the fund purchased $2,536,219,000 of investment securities and sold $742,582,000 of investment securities, other than temporary cash investments. Purchases and sales include $1,613,243,000 and $101,080,000, respectively, in connection with in-kind purchases and redemptions of the fund’s capital shares.
| | | | |
| F. Capital share transactions for each class of shares were: | | | |
| | | | Year Ended October 31, |
| | | 2018 | | 2017 |
| | Amount | Shares | Amount | Shares |
| | ($000) | (000) | ($000) | (000) |
| Investor Shares | | | | |
| Issued1 | 4,953 | 485 | 3,083 | 300 |
| Issued in Lieu of Cash Distributions | 86 | 8 | 37 | 4 |
| Redeemed | (3,134) | (306) | (1,851) | (181) |
| Net Increase (Decrease)—Investor Shares | 1,905 | 187 | 1,269 | 123 |
| ETF Shares | | | | |
| Issued1 | 1,826,481 | 35,804 | 1,361,141 | 26,650 |
| Issued in Lieu of Cash Distributions | — | — | — | — |
| Redeemed | (115,473) | (2,300) | (40,894) | (800) |
| Net Increase (Decrease)—ETF Shares | 1,711,008 | 33,504 | 1,320,247 | 25,850 |
| Admiral Shares | | | | |
| Issued1 | 118,420 | 5,798 | 88,668 | 4,343 |
| Issued in Lieu of Cash Distributions | 3,218 | 159 | 1,656 | 81 |
| Redeemed | (50,082) | (2,465) | (26,097) | (1,286) |
| Net Increase (Decrease)—Admiral Shares | 71,556 | 3,492 | 64,227 | 3,138 |
1 Includes purchase fees for fiscal 2018 and 2017 of $306,000 and $236,000, respectively (fund totals).
G. Management has determined that no events or transactions occurred subsequent to October 31, 2018, that would require recognition or disclosure in these financial statements.
146
Report of Independent Registered Public Accounting Firm
To the Board of Trustees of Vanguard Municipal Bond Funds and Shareholders of Vanguard Tax-Exempt Bond Index Fund
Opinion on the Financial Statements
We have audited the accompanying statement of net assets of Vanguard Tax-Exempt Bond Index Fund (one of the funds constituting Vanguard Municipal Bond Funds, referred to hereafter as the “Fund”) as of October 31, 2018, the related statement of operations for the year ended October 31, 2018, the statement of changes in net assets for each of the two years in the period ended October 31, 2018, including the related notes, and the financial highlights for each of the periods indicated therein (collectively referred to as the “financial statements”). In our opinion, the financial statements present fairly, in all material respects, the financial position of the Fund as of October 31, 2018, the results of its operations for the year then ended, the changes in its net assets for each of the two years in the period ended October 31, 2018 and the financial highlights for each of the periods indicated therein in conformity with accounting principles generally accepted in the United States of America.
Basis for Opinion
These financial statements are the responsibility of the Fund’s management. Our responsibility is to express an opinion on the Fund’s financial statements based on our audits. We are a public accounting firm registered with the Public Company Accounting Oversight Board (United States) (“PCAOB”) and are required to be independent with respect to the Fund in accordance with the U.S. federal securities laws and the applicable rules and regulations of the Securities and Exchange Commission and the PCAOB.
We conducted our audits of these financial statements in accordance with the standards of the PCAOB. Those standards require that we plan and perform the audit to obtain reasonable assurance about whether the financial statements are free of material misstatement, whether due to error or fraud.
Our audits included performing procedures to assess the risks of material misstatement of the financial statements, whether due to error or fraud, and performing procedures that respond to those risks. Such procedures included examining, on a test basis, evidence regarding the amounts and disclosures in the financial statements. Our audits also included evaluating the accounting principles used and significant estimates made by management, as well as evaluating the overall presentation of the financial statements. Our procedures included confirmation of securities owned as of October 31, 2018 by correspondence with the custodian and brokers and by agreement to the underlying ownership records of the transfer agent; when replies were not received from brokers, we performed other auditing procedures. We believe that our audits provide a reasonable basis for our opinion.
/s/PricewaterhouseCoopers LLP
Philadelphia, Pennsylvania
December 18, 2018
We have served as the auditor of one or more investment companies in The Vanguard Group of Funds since 1975.
147
Special 2018 tax information (unaudited) for Vanguard Tax-Exempt Bond Index Fund
This information for the fiscal year ended October 31, 2018, is included pursuant to provisions
of the Internal Revenue Code.
The fund designates 100% of its income dividends as exempt-interest dividends.
148
About Your Fund’s Expenses
As a shareholder of the fund, you incur ongoing costs, which include costs for portfolio management, administrative services, and shareholder reports (like this one), among others. Operating expenses, which are deducted from a fund’s gross income, directly reduce the investment return of the fund.
A fund’s expenses are expressed as a percentage of its average net assets. This figure is known as the expense ratio. The following examples are intended to help you understand the ongoing costs (in dollars) of investing in your fund and to compare these costs with those of other mutual funds. The examples are based on an investment of $1,000 made at the beginning of the period shown and held for the entire period.
The accompanying table illustrates your fund’s costs in two ways:
• Based on actual fund return. This section helps you to estimate the actual expenses that you paid over the period. The ”Ending Account Value“ shown is derived from the fund‘s actual return, and the third column shows the dollar amount that would have been paid by an investor who started with $1,000 in the fund. You may use the information here, together with the amount you invested, to estimate the expenses that you paid over the period.
To do so, simply divide your account value by $1,000 (for example, an $8,600 account value divided by $1,000 = 8.6), then multiply the result by the number given for your fund under the heading ”Expenses Paid During Period.“
• Based on hypothetical 5% yearly return. This section is intended to help you compare your fund‘s costs with those of other mutual funds. It assumes that the fund had a yearly return of 5% before expenses, but that the expense ratio is unchanged. In this case—because the return used is not the fund’s actual return—the results do not apply to your investment. The example is useful in making comparisons because the Securities and Exchange Commission requires all mutual funds to calculate expenses based on a 5% return. You can assess your fund’s costs by comparing this hypothetical example with the hypothetical examples that appear in shareholder reports of other funds.
Note that the expenses shown in the table are meant to highlight and help you compare ongoing costs only and do not reflect transaction costs incurred by the fund for buying and selling securities. Further, the expenses do not include any purchase, redemption, or account service fees described in the fund prospectus. If such fees were applied to your account, your costs would be higher. Your fund does not carry a “sales load.”
The calculations assume no shares were bought or sold during the period. Your actual costs may have been higher or lower, depending on the amount of your investment and the timing of any purchases or redemptions.
You can find more information about the fund’s expenses, including annual expense ratios, in the Financial Statements section of this report. For additional information on operating expenses and other shareholder costs, please refer to your fund’s current prospectus.
149
| | | |
| Six Months Ended October 31, 2018 | | | |
| | Beginning | Ending | Expenses |
| | Account Value | Account Value | Paid During |
| Tax-Exempt Bond Index Fund | 4/30/2018 | 10/31/2018 | Period |
| Based on Actual Fund Return | | | |
| Investor Shares | $1,000.00 | $1,003.19 | $0.76 |
| ETF Shares | 1,000.00 | 1,003.14 | 0.35 |
| Admiral Shares | 1,000.00 | 1,003.04 | 0.45 |
| Based on Hypothetical 5% Yearly Return | | | |
| Investor Shares | $1,000.00 | $1,024.45 | $0.77 |
| ETF Shares | 1,000.00 | 1,024.85 | 0.36 |
| Admiral Shares | 1,000.00 | 1,024.75 | 0.46 |
The calculations are based on expenses incurred in the most recent six-month period. The fund’s annualized six-month expense ratios for that period are 0.15% for Investor Shares, 0.07% for ETF Shares, and 0.09% for Admiral Shares. The dollar amounts shown as “Expenses Paid” are equal to the annualized expense ratio multiplied by the average account value over the period, multiplied by the number of days in the most recent six-month period, then divided by the number of days in the most recent 12-month period (184/365).
150
Glossary
30-Day SEC Yield. A fund’s 30-day SEC yield is derived using a formula specified by the U.S. Securities and Exchange Commission. Under the formula, data related to the fund’s security holdings in the previous 30 days are used to calculate the fund’s hypothetical net income for that period, which is then annualized and divided by the fund’s estimated average net assets over the calculation period. For the purposes of this calculation, a security’s income is based on its current market yield to maturity (for bonds), its actual income (for asset-backed securities), or its projected dividend yield (for stocks). Because the SEC yield represents hypothetical annualized income, it will differ—at times significantly—from the fund’s actual experience. As a result, the fund’s income distributions may be higher or lower than implied by the SEC yield.
Average Coupon. The average interest rate paid on the fixed income securities held by a fund. It is expressed as a percentage of face value.
Average Duration. An estimate of how much the value of the bonds held by a fund will fluctuate in response to a change in interest rates. To see how the value could change, multiply the average duration by the change in rates. If interest rates rise by 1 percentage point, the value of the bonds in a fund with an average duration of five years would decline by about 5%. If rates decrease by a percentage point, the value would rise by 5%.
Average Stated Maturity. The average length of time until fixed income securities held by a fund reach maturity and are repaid using the maturity date of the security. The figure reflects the proportion of fund assets represented by each security; it also reflects any futures contracts held. In general, the longer the average stated maturity, the more a fund’s share price will fluctuate in response to changes in market interest rates.
Credit Quality. Credit-quality ratings are measured on a scale that generally ranges from AAA (highest) to D (lowest). Credit-quality ratings are obtained from Moody’s and S&P, and the higher rating for each issue is used. ”Not Rated” is used to classify securities for which a rating is not available.
Expense Ratio. A fund’s total annual operating expenses expressed as a percentage of the fund’s average net assets. The expense ratio includes management and administrative expenses, but does not include the transaction costs of buying and selling portfolio securities.
Inception Date. The date on which the assets of a fund (or one of its share classes) are first invested in accordance with the fund’s investment objective. For funds with a subscription period, the inception date is the day after that period ends. Investment performance is measured from the inception date.
Short-Term Reserves. The percentage of a fund invested in highly liquid, short-term securities that can be readily converted to cash.
Yield to Maturity. The rate of return an investor would receive if the fixed income securities held by a fund were held to their maturity dates.
151
This page intentionally left blank.
This page intentionally left blank.
This page intentionally left blank.
The People Who Govern Your Fund
The trustees of your mutual fund are there to see that the fund is operated and managed in your best interests since, as a shareholder, you are a part owner of the fund. Your fund’s trustees also serve on the board of directors of The Vanguard Group, Inc., which is owned by the Vanguard funds and provides services to them on an at-cost basis.
A majority of Vanguard’s board members are independent, meaning that they have no affiliation with Vanguard or the funds they oversee, apart from the sizable personal investments they have made as private individuals. The independent board members have distinguished backgrounds in business, academia, and public service. Each of the trustees and executive officers oversees 211 Vanguard funds.
Information for each trustee and executive officer of the fund appears below. The mailing address of the trustees and officers is P.O. Box 876, Valley Forge, PA 19482. More information about the trustees is in the Statement of Additional Information, which can be obtained, without charge, by contacting Vanguard at 800-662-7447, or online at vanguard.com.
Interested Trustees1
F. William McNabb III
Born in 1957. Trustee since July 2009. Principal occupation(s) during the past five years and other experience: chairman of the board (January 2010–present) of Vanguard and of each of the investment companies served by Vanguard, trustee (2009–present) of each of the investment companies served by Vanguard, and director (2008–present) of Vanguard. Chief executive officer and president (2008–2017) of Vanguard and each of the investment companies served by Vanguard, managing director (1995–2008) of Vanguard, and director (1997–2018) of Vanguard Marketing Corporation. Director (2018–present) of UnitedHealth Group.
Mortimer J. Buckley
Born in 1969. Trustee since January 2018. Principal occupation(s) during the past five years and other experience: chief executive officer (January 2018–present) of Vanguard; chief executive officer, president, and trustee (January 2018–present) of each of the investment companies served by Vanguard; president and director (2017–present) of Vanguard; and president (February 2018–present) of Vanguard Marketing Corporation. Chief investment officer (2013–2017), managing director (2002–2017), head of the Retail Investor Group (2006–2012), and chief information officer (2001–2006) of Vanguard. Chairman of the board (2011–2017) of the Children’s Hospital of Philadelphia.
Independent Trustees
Emerson U. Fullwood
Born in 1948. Trustee since January 2008. Principal occupation(s) during the past five years and other experience: executive chief staff and marketing officer for North America and corporate vice president (retired 2008) of Xerox Corporation (document management products and services). Former president of the Worldwide Channels Group, Latin America, and Worldwide Customer Service and executive chief staff officer of Developing Markets of Xerox. Executive in residence and 2009–2010 Distinguished Minett Professor at the Rochester Institute of Technology. Lead director of SPX FLOW, Inc. (multi-industry manufacturing). Director of the University of Rochester Medical Center, the Monroe Community College Foundation, the United Way of Rochester, North Carolina A&T University, and Roberts Wesleyan College. Trustee of the University of Rochester.
Amy Gutmann
Born in 1949. Trustee since June 2006. Principal occupation(s) during the past five years and other experience: president (2004–present) of the University of Pennsylvania. Christopher H. Browne Distinguished Professor of Political Science, School of Arts and Sciences, and professor of communication, Annenberg School for Communication, with secondary faculty appointments in the Department of Philosophy, School of Arts and Sciences, and at the Graduate School of Education, University of Pennsylvania. Trustee of the National Constitution Center.
1 Mr. McNabb and Mr. Buckley are considered “interested persons,” as defined in the Investment Company Act of 1940, because they are officers of the Vanguard funds.
JoAnn Heffernan Heisen
Born in 1950. Trustee since July 1998. Principal occupation(s) during the past five years and other experience: corporate vice president of Johnson & Johnson (pharmaceuticals/medical devices/consumer products) and member of its executive committee (1997–2008). Chief global diversity officer (retired 2008), vice president and chief information officer (1997–2006), controller (1995–1997), treasurer (1991–1995), and assistant treasurer (1989–1991) of Johnson & Johnson. Director of Skytop Lodge Corporation (hotels) and the Robert Wood Johnson Foundation. Member of the advisory board of the Institute for Women’s Leadership at Rutgers University.
F. Joseph Loughrey
Born in 1949. Trustee since October 2009. Principal occupation(s) during the past five years and other experience: president and chief operating officer (retired 2009) and vice chairman of the board (2008–2009) of Cummins Inc. (industrial machinery). Chairman of the board of Hillenbrand, Inc. (specialized consumer services), Oxfam America, and the Lumina Foundation for Education. Director of the V Foundation for Cancer Research. Member of the advisory council for the College of Arts and Letters and chair of the advisory board to the Kellogg Institute for International Studies, both at the University of Notre Dame.
Mark Loughridge
Born in 1953. Trustee since March 2012. Principal occupation(s) during the past five years and other experience: senior vice president and chief financial officer (retired 2013) of IBM (information technology services). Fiduciary member of IBM’s Retirement Plan Committee (2004–2013), senior vice president and general manager (2002–2004) of IBM Global Financing, vice president and controller (1998–2002) of IBM, and a variety of other prior management roles at IBM. Member of the Council on Chicago Booth.
Scott C. Malpass
Born in 1962. Trustee since March 2012. Principal occupation(s) during the past five years and other experience: chief investment officer (1989–present) and vice president (1996–present) of the University of Notre Dame. Assistant professor of finance at the Mendoza College of Business, University of Notre Dame, and member of the Notre Dame 403(b) Investment Committee. Chairman of the board of TIFF Advisory Services, Inc. Member of the board of Catholic Investment Services, Inc. (investment advisors), the board of advisors for Spruceview Capital Partners, and the board of superintendence of the Institute for the Works of Religion.
Deanna Mulligan
Born in 1963. Trustee since January 2018. Principal occupation(s) during the past five years and other experience: president (2010–present) and chief executive officer (2011–present) of The Guardian Life Insurance Company of America. Chief operating officer (2010–2011) and executive vice president (2008–2010) of Individual Life and Disability of The Guardian Life Insurance Company of America. Member of the board of The Guardian Life Insurance Company of America, the American Council of Life Insurers, the Partnership for New York City (business leadership), and the Committee Encouraging Corporate Philanthropy. Trustee of the Economic Club of New York and the Bruce Museum (arts and science). Member of the Advisory Council for the Stanford Graduate School of Business.
André F. Perold
Born in 1952. Trustee since December 2004. Principal occupation(s) during the past five years and other experience: George Gund Professor of Finance and Banking, Emeritus at the Harvard Business School (retired 2011). Chief investment officer and co-managing partner of HighVista Strategies LLC (private investment firm). Overseer of the Museum of Fine Arts Boston.
Sarah Bloom Raskin
Born in 1961. Trustee since January 2018. Principal occupation(s) during the past five years and other experience: deputy secretary (2014–2017) of the United States Department of the Treasury. Governor (2010–2014) of the Federal Reserve Board. Commissioner (2007–2010) of financial regulation for the State of Maryland. Member of the board of directors (2012–2014) of Neighborhood Reinvestment Corporation. Director of i(x) Investments, LLC.
Peter F. Volanakis
Born in 1955. Trustee since July 2009. Principal occupation(s) during the past five years and other experience: president and chief operating officer (retired 2010) of Corning Incorporated (communications equipment) and director of Corning Incorporated (2000–2010) and Dow Corning (2001–2010). Director (2012) of SPX Corporation (multi-industry manufacturing). Overseer of the Amos Tuck School of Business Administration, Dartmouth College (2001–2013). Chairman of the board of trustees of Colby-Sawyer College. Member of the Board of Hypertherm Inc. (industrial cutting systems, software, and consumables).
Executive Officers
Glenn Booraem
Born in 1967. Principal occupation(s) during the past five years and other experience: principal of Vanguard. Investment stewardship officer (2017–present), treasurer (2015–2017), controller (2010–2015), and assistant controller (2001–2010) of each of the investment companies served by Vanguard.
Christine M. Buchanan
Born in 1970. Principal occupation(s) during the past five years and other experience: principal of Vanguard and global head of Fund Administration at Vanguard. Treasurer (2017–present) of each of the investment companies served by Vanguard. Partner (2005–2017) at KPMG LLP (audit, tax, and advisory services).
Brian Dvorak
Born in 1973. Principal occupation(s) during the past five years and other experience: principal of Vanguard. Chief compliance officer (2017–present) of Vanguard and each of the investment companies served by Vanguard. Assistant vice president (2017–present) of Vanguard Marketing Corporation. Vice president and director of Enterprise Risk Management (2011–2013) at Oppenheimer Funds, Inc.
Thomas J. Higgins
Born in 1957. Principal occupation(s) during the past five years and other experience: principal of Vanguard. Chief financial officer (2008–present) and treasurer (1998–2008) of each of the investment companies served by Vanguard.
Peter Mahoney
Born in 1974. Principal occupation(s) during the past five years and other experience: principal of Vanguard. Controller (2015–present) of each of the investment companies served by Vanguard. Head of International Fund Services (2008–2014) at Vanguard.
Anne E. Robinson
Born in 1970. Principal occupation(s) during the past five years and other experience: general counsel (2016–present) of Vanguard. Secretary (2016–present) of Vanguard and of each of the investment companies served by Vanguard. Managing director (2016–present) of Vanguard. Director and senior vice president (2016–2018) of Vanguard Marketing Corporation. Managing director and general counsel of Global Cards and Consumer Services (2014–2016) at Citigroup. Counsel (2003–2014) at American Express.
Michael Rollings
Born in 1963. Principal occupation(s) during the past five years and other experience: finance director (2017–present) and treasurer (2017) of each of the investment companies served by Vanguard. Managing director (2016–present) of Vanguard. Chief financial officer (2016–present) of Vanguard. Director (2016–present) of Vanguard Marketing Corporation. Executive vice president and chief financial officer (2006–2016) of MassMutual Financial Group.
| |
| Vanguard Senior Management Team |
| |
| Joseph Brennan | Chris D. McIsaac |
| Mortimer J. Buckley | James M. Norris |
| Gregory Davis | Thomas M. Rampulla |
| John James | Karin A. Risi |
| Martha G. King | Anne E. Robinson |
| John T. Marcante | Michael Rollings |
Chairman Emeritus and Senior Advisor
John J. Brennan
Chairman, 1996–2009
Chief Executive Officer and President, 1996–2008
Founder
John C. Bogle
Chairman and Chief Executive Officer, 1974–1996

| |
| | P.O. Box 2600 |
| | Valley Forge, PA 19482-2600 |
| |
| |
| |
| Connect with Vanguard® > vanguard.com |
| |
| |
| |
| Fund Information > 800-662-7447 | The index is a product of S&P Dow Jones Indices LLC |
| Direct Investor Account Services > 800-662-2739 | (“SPDJI”), and has been licensed for use by Vanguard. |
| | Standard & Poor’s® and S&P® are registered |
| Institutional Investor Services > 800-523-1036 | trademarks of Standard & Poor’s Financial Services LLC |
| Text Telephone for People | (“S&P”); Dow Jones® is a registered trademark of Dow |
| Who Are Deaf or Hard of Hearing > 800-749-7273 | Jones Trademark Holdings LLC (“Dow Jones”); S&P® |
| | and S&P 500® are trademarks of S&P; and these |
| This material may be used in conjunction | trademarks have been licensed for use by SPDJI and |
| with the offering of shares of any Vanguard | sublicensed for certain purposes by Vanguard. |
| fund only if preceded or accompanied by | Vanguard product(s) are not sponsored, endorsed, sold |
| | or promoted by SPDJI, Dow Jones, S&P, or their |
| the fund’s current prospectus. | respective affiliates and none of such parties make any |
| All comparative mutual fund data are from Lipper, a | representation regarding the advisability of investing in |
| Thomson Reuters Company, or Morningstar, Inc., unless | such product(s) nor do they have any liability for any |
| otherwise noted. | errors, omissions, or interruptions of the index. |
| |
| You can obtain a free copy of Vanguard’s proxy voting | Source for Bloomberg Barclays indexes: Bloomberg |
| guidelines by visiting vanguard.com/proxyreporting or by | Index Services Limited. Copyright 2018, Bloomberg. All |
| calling Vanguard at 800-662-2739. The guidelines are | rights reserved. |
| also available from the SEC’s website, sec.gov. In | |
| addition, you may obtain a free report on how your fund | |
| voted the proxies for securities it owned during the 12 | |
| months ended June 30. To get the report, visit either | |
| vanguard.com/proxyreporting or sec.gov. | |
| |
| You can review information about your fund on the | |
| SEC’s website, and you can receive copies of this | |
| information, for a fee, by sending a request via email | |
| addressed to publicinfo@sec.gov. | |
| |
| |
| |
| |
| | © 2018 The Vanguard Group, Inc. |
| | All rights reserved. |
| | Vanguard Marketing Corporation, Distributor. |
| |
| | Q14910 122018 |

Annual Report | October 31, 2018
Vanguard Municipal Money Market Fund
Vanguard’s Principles for Investing Success
We want to give you the best chance of investment success. These principles, grounded in Vanguard’s research and experience, can put you on the right path.
Goals. Create clear, appropriate investment goals.
Balance. Develop a suitable asset allocation using broadly diversified funds. Cost. Minimize cost.
Discipline. Maintain perspective and long-term discipline.
A single theme unites these principles: Focus on the things you can control.
We believe there is no wiser course for any investor.
| |
| Contents | |
| Your Fund’s Performance at a Glance. | 1 |
| CEO’s Perspective. | 3 |
| Advisor’s Report. | 5 |
| Fund Profile. | 8 |
| Performance Summary. | 9 |
| Financial Statements. | 11 |
| About Your Fund’s Expenses. | 58 |
| Glossary. | 60 |
Please note: The opinions expressed in this report are just that—informed opinions. They should not be considered promises or advice. Also, please keep in mind that the information and opinions cover the period through the date on the front of this report. Of course, the risks of investing in your fund are spelled out in the prospectus.
See the Glossary for definitions of investment terms used in this report.
Your Fund’s Performance at a Glance
• For the 12 months ended October 31, 2018, Vanguard Municipal Money Market Fund returned 1.21%, exceeding the 0.89% average return of its tax-exempt money market peers.
• The Federal Reserve raised its target for the federal funds rate four times during the period, ending at a range of 2%–2.5%. If the Fed continues to raise rates, the short end of the curve is likely to eventually provide a higher yield to money market investors.
• We made tactical moves based on the market volatility caused by federal tax legislation in late 2017 and favored variable-rate demand notes over similar securities with fixed rates. Those strategies added incremental value.
• Your fund’s portfolio is diversified among multiple states. We continue to monitor areas where fiscal woes could pressure bond prices.
| | | | | |
| Total Returns: Fiscal Year Ended October 31, 2018 | | | | |
| | | Taxable- | | | |
| | 7-Day SEC | Equivalent | Income | Capital | Total |
| | Yield | Yield¹ | Return | Return | Return |
| Vanguard Municipal Money Market Fund | 1.52% | 2.57% | 1.21% | 0.00% | 1.21% |
| Tax-Exempt Money Market Funds Average ² | | | | | 0.89 |
1 This calculation, which assumes a typical itemized tax return, is based on the maximum federal income tax rate of 40.8%. State and local taxes were not considered. Please see the prospectus for a detailed explanation of the calculation.
| |
| 2 Derived from data provided by Lipper, a Thomson Reuters Company. | |
| |
| |
| Total Returns: Ten Years Ended October 31, 2018 | |
| | Average |
| | Annual Return |
| Municipal Money Market Fund | 0.30% |
| Tax-Exempt Money Market Funds Average | 0.16 |
Tax-Exempt Money Market Funds Average: Derived from data provided by Lipper, a Thomson Reuters Company.
The figures shown represent past performance, which is not a guarantee of future results. (Current performance may be lower or higher than the performance data cited. For performance data current to the most recent month-end, visit our website at vanguard.com/performance.) Note, too, that both investment returns and principal value can fluctuate widely, so an investor’s shares, when sold, could be worth more or less than their original cost.
1
| | |
| Expense Ratios | | |
| Your Fund Compared With Its Peer Group | | |
| | | Peer Group |
| | Fund | Average |
| Municipal Money Market Fund | 0.15% | 0.41% |
The fund expense ratio shown is from the prospectus dated February 23, 2018, and represents estimated costs for the current fiscal year. For the fiscal year ended October 31, 2018, the fund’s expense ratio was 0.15%. The peer-group expense ratio is derived from data provided by Lipper, a Thomson Reuters Company, and captures information through year-end 2017.
Peer Group: Tax-Exempt Money Market Funds.
2
CEO’s Perspective

Tim Buckley
President and Chief Executive Officer
Dear Shareholder,
Over the years, I’ve found that prudent investors exhibit a common trait: discipline. No matter how the markets move or what new investing fad hits the headlines, those who stay focused on their goals and tune out the noise are set up for long-term success.
The prime gateway to investing is saving, and you don’t usually become a saver without a healthy dose of discipline. Savers make the decision to sock away part of their income, which means spending less and delaying gratification, no matter how difficult that may be.
Of course, disciplined investing extends beyond diligent saving. The financial markets, in the short term especially, are unpredictable; I have yet to meet the investor who can time them perfectly. It takes discipline to resist the urge to go all-in when markets are frothy or to retreat when things look bleak.
Staying put with your investments is one strategy for handling volatility. Another, rebalancing, requires even more discipline because it means steering your money away from strong performers and toward poorer performers.
Patience—a form of discipline—is also the friend of long-term investors. Higher returns are the potential reward for weathering the market’s turbulence and uncertainty.
3
We have been enjoying one of the longest bull markets in history, but it won’t continue forever. Prepare yourself now for how you will react when volatility comes back. Don’t panic. Don’t chase returns or look for answers outside the asset classes you trust. And be sure to rebalance periodically, even when there’s turmoil.
Whether you’re a master of self-control, get a boost from technology, or work with a professional advisor, know that discipline
is necessary to get the most out of your investment portfolio. And know that Vanguard is with you for the entire ride.
Thank you for your continued loyalty.

Mortimer J. Buckley
President and Chief Executive Officer
November 16, 2018
| | | |
| Market Barometer | | | |
| | | Average Annual Total Returns |
| | | Periods Ended October 31, 2018 |
| | One Year | Three Years | Five Years |
| Stocks | | | |
| Russell 1000 Index (Large-caps) | 6.98% | 11.31% | 11.05% |
| Russell 2000 Index (Small-caps) | 1.85 | 10.68 | 8.01 |
| Russell 3000 Index (Broad U.S. market) | 6.60 | 11.27 | 10.81 |
| FTSE All-World ex US Index (International) | -7.99 | 4.57 | 2.01 |
| |
| Bonds | | | |
| Bloomberg Barclays U.S. Aggregate Bond Index | | | |
| (Broad taxable market) | -2.05% | 1.04% | 1.83% |
| Bloomberg Barclays Municipal Bond Index | | | |
| (Broad tax-exempt market) | -0.51 | 1.90 | 3.25 |
| FTSE Three-Month U. S. Treasury Bill Index | 1.67 | 0.86 | 0.52 |
| |
| CPI | | | |
| Consumer Price Index | 2.52% | 2.07% | 1.60% |
4
Advisor’s Report
For the 12 months ended October 31, 2018, Vanguard Municipal Money Market Fund returned 1.21%, exceeding the 0.89% return of its tax-exempt money market peers.
Please note that as of October 31, 2018, your fund owned securities that would generate income distributions subject to the alternative minimum tax.
Investment environment
Macroeconomic fundamentals were supportive throughout the fiscal year. The U.S. economy continued to expand at a robust pace, boosted by tax cuts and more government spending on top of solid business investment and consumer spending. The unemployment rate dropped to 3.7%, an almost 50-year low. Job creation averaged well over 200,000
per month. While that resulted in some modest upward pressure on wages, inflation, as measured by the U.S. core personal consumption expenditures (PCE) price index, moved up only modestly to near the Federal Reserve’s target of 2%.
Acknowledging the health of the economy, the Fed moved further down the path of monetary policy normalization. The pace of shrinking its holdings in Treasuries and mortgage-backed securities amassed in the wake of the global financial crisis accelerated from $20 billion per month in October 2017 to $50 billion per month at the close of the fund’s fiscal year. The Fed also raised the federal funds target rate by a quarter percentage point in December, March, June, and September, putting it at 2%–2.25%.
| | |
| Yields of Municipal Securities | | |
| (AAA-Rated General Obligation Issues) | | |
| | October 31, | October 31, |
| Maturity | 2017 | 2018 |
| 2 years | 1.09% | 2.08% |
| 5 years | 1.42 | 2.32 |
| 10 years | 2.01 | 2.76 |
| 30 years | 2.83 | 3.44 |
| Source: Vanguard. | | |
5
Even with this robust macroeconomic backdrop, investors abruptly began to see the glass as half empty toward the end of January. Long-awaited signs of wage increases and higher inflation, coupled with the outlook for faster growth from tax cuts and increased government spending, raised fears that the Fed might start hiking rates more aggressively.
Market volatility spiked again in October. Stocks dropped sharply and bond yields rose amid an intensification of trade tensions with China, and some large corporations signaled that earnings growth might have peaked. The possibility of more aggressive monetary tightening was again a concern, fueled in part by comments from Fed Chairman Jerome Powell about the strength of the economy and how much higher rates might go.
The muni market also had to contend with new federal tax laws passed in December 2017. One significant change is that municipalities can no longer issue bonds to advance-refund outstanding tax-exempt debt. There was also worry—which ended up being unfounded—that the law would no longer let municipalities issue tax-exempt private activity bonds to fund public benefit projects such as hospitals and airports.
With municipalities rushing to issue both advance refunding and private activity bonds ahead of the law’s passage, supply was more than three times higher in December 2017 than it had been a year earlier. It’s been lower than usual since then.
The reduction in the statutory federal corporate tax rate to 21% also affected demand for munis. Their tax-equivalent yields became a little less attractive to nontraditional buyers such as banks and insurance companies. However, that resulted in municipalities beginning to structure issuance geared more toward traditional buyers, which boosted usable supply for retail investors and mutual funds. In addition, a cap on deductions for state and local taxes and mortgage interest payments may make munis a little more attractive for investors in states with high taxes and expensive real estate markets. Those forces contributed to supply and demand being fairly well-matched this fiscal year.
Early volatility aside, muni bond yields largely took their cues from the Treasury market, where yields across the maturity spectrum ended higher. The 2-year U.S. Treasury note climbed 127 basis points to 2.87%, its highest level in more than a decade. The yield of the bellwether 10-year Treasury note rose 76 basis points to 3.14%. (A basis point is one one-hundredth of a percentage point.)
Management of the fund
As noted, the passage of new federal tax legislation temporarily disrupted the supply-and-demand dynamics in the muni bond market. We made tactical moves as an increase in new issuance and volatility translated into attractive yields on the short end of the curve relative to taxable money market options. Those decisions added incremental value.
6
We maintained our view that interest rates would rise in the near to medium term. We increased the fund’s exposure to variable-rate demand notes, which reset at certain periods in the very near future at the prevailing interest rate. The fund’s weighted average maturity increased modestly from recent periods. Given our expectation for the number of Fed interest rate hikes over the course of the year, if break-even interest rates look attractive, we will seek opportunities to extend the portfolio’s maturity.
Your fund’s portfolio is diversified among issues in multiple states. Although state finances in general have been in decent shape, we continue to monitor the situation in areas where fiscal woes could pressure bond prices.
Outlook
In the absence of any external shocks, the U.S. economy is on pace to break above its long-term potential growth rate in 2018 and 2019—based on the front-loaded effects of tax cuts and increased government spending on top of solid fundamentals—before dropping back toward 2%. That growth, along with some upward pressure on wages from the tight labor market, may push up the U.S. core PCE price index through the first part of 2019. The Fed is likely to keep raising rates and trimming the amount of Treasuries and mortgage-backed securities on its balance sheet this year and into 2019.
We regard this bounce as cyclical, however, and still expect long-term structural pressures from an aging population, global sourcing of goods and labor, and technological disruptions to result in moderate long-run growth and inflation.
We may see more bouts of volatility in the bond market related to shifting inflation and interest rate expectations. Other potential volatility triggers we’ll be watching include an intensification of trade disputes, flare-ups in geopolitical tensions, Brexit uncertainty, and government spending in Italy.
We anticipate a convergence in global monetary policy, with central banks in developed countries adopting less accommodative stances—some raising rates, some planning to do so, some reducing quantitative easing. Withdrawing that accommodation unexpectedly or too quickly could rattle the markets.
As always, our experienced team of portfolio managers, credit analysts, and traders will continue to seek out opportunities to add to the fund’s performance whatever the markets may bring.
Paul M. Malloy, CFA,
Principal, Head of Municipal Bond Group Justin A. Schwartz, CFA, Portfolio Manager, Head of Municipal Money Market Funds Vanguard Fixed Income Group November 21, 2018
7
Municipal Money Market Fund
Fund Profile
As of October 31, 2018
| |
| Financial Attributes | |
| Ticker Symbol | VMSXX |
| Expense Ratio1 | 0.15% |
| 7-Day SEC Yield | 1.52% |
| Average Weighted | |
| Maturity | 44 days |
| |
| Largest Area Concentrations | |
| New York | 13.4% |
| Texas | 12.4 |
| Illinois | 5.0 |
| Wisconsin | 4.5 |
| Florida | 4.1 |
| Massachusetts | 4.0 |
| Ohio | 3.3 |
| Tennessee | 2.8 |
| Colorado | 2.5 |
| Washington | 2.4 |
| Top Ten | 54.4% |
1 The expense ratio shown is from the prospectus dated February 23, 2018, and represents estimated costs for the current fiscal year. For the fiscal year ended October 31, 2018, the expense ratio was 0.15%.
8
Municipal Money Market Fund
Performance Summary
Investment returns will fluctuate. All of the returns in this report represent past performance, which is not a guarantee of future results that may be achieved by the fund. (Current performance may be lower or higher than the performance data cited. For performance data current to the most recent month-end, visit our website at vanguard.com/performance.) The returns shown do not reflect taxes that a shareholder would pay on fund distributions. The fund is only available to retail investors (natural persons). You could lose money by investing in the fund. Although the fund seeks to preserve the value of your investment at $1 per share, it cannot guarantee it will do so. The fund may impose a fee upon the sale of your shares or may temporarily suspend your ability to sell shares if the fund’s liquidity falls below required minimums because of market conditions or other factors. An investment in the fund is not insured or guaranteed by the Federal Deposit Insurance Corporation or any other government agency. The fund’s sponsor has no legal obligation to provide financial support to the fund, and you should not expect that the sponsor will provide financial support to the fund at any time. The fund’s 7-day SEC yield reflects its current earnings more closely than do the average annual returns.
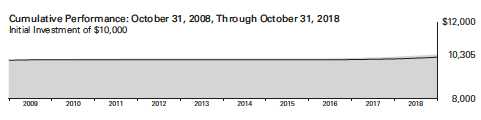
| | | | |
| | Average Annual Total Returns | |
| | Periods Ended October 31, 2018 | |
| |
| | | | | Final Value |
| | One | Five | Ten | of a $10,000 |
| | Year | Years | Years | Investment |
| |
| Municipal Money Market Fund | 1.21% | 0.43% | 0.30% | $10,305 |
| Tax-Exempt Money Market Funds | | | | |
| Average | 0.89 | 0.27 | 0.16 | 10,161 |
Tax-Exempt Money Market Funds Average: Derived from data provided by Lipper, a Thomson Reuters Company.
.
See Financial Highlights for dividend information.
9
| | |
| Municipal Money Market Fund | | |
| |
| |
| |
| |
| Fiscal-Year Total Returns (%): October 31, 2008, Through October 31, 2018 | |
| | | Tax-Exempt |
| | | Money Mkt |
| | | Funds Average |
| Fiscal Year | Total Returns | Total Returns1 |
| 2009 | 0.60% | 0.27% |
| 2010 | 0.14 | 0.00 |
| 2011 | 0.09 | 0.00 |
| 2012 | 0.04 | 0.00 |
| 2013 | 0.02 | 0.00 |
| 2014 | 0.01 | 0.01 |
| 2015 | 0.01 | 0.01 |
| 2016 | 0.25 | 0.07 |
| 2017 | 0.66 | 0.35 |
| 2018 | 1.21 | 0.89 |
| 7-day SEC yield (10/31/2018): 1.52% | | |
| 1 Derived from data provided by Lipper, a Thomson Reuters Company. | | |
Average Annual Total Returns: Periods Ended September 30, 2018
This table presents returns through the latest calendar quarter—rather than through the end of the fiscal period.
Securities and Exchange Commission rules require that we provide this information.
| | | | |
| | Inception | One | Five | Ten |
| | Date | Year | Years | Years |
| Municipal Money Market Fund | 6/10/1980 | 1.15% | 0.40% | 0.32% |
10
Municipal Money Market Fund
Financial Statements
Statement of Net Assets
As of October 31, 2018
The fund reports a complete list of its holdings in various monthly and quarterly regulatory filings. The fund publishes its holdings on a monthly basis at vanguard.com and files them with the Securities and Exchange Commission on Form N-MFP. The fund’s Form N-MFP filings may be viewed at sec.gov or via a link on the “Portfolio Holdings” page on vanguard.com. For the second and fourth fiscal quarters, the lists appear in the fund’s semiannual and annual reports to shareholders. For the first and third fiscal quarters, the fund files the lists with the SEC on Form N-Q. Shareholders can look up the fund’s Forms N-Q on the SEC’s website at sec.gov.
| | | | |
| | | | Face | Market |
| | | Maturity | Amount | Value • |
| | Coupon | Date | ($000) | ($000) |
| Tax-Exempt Municipal Bonds (96.0%) | | | | |
| Alabama (1.4%) | | | | |
| 1 Alabama Federal Aid Highway Finance Authority | | | | |
| Special Obligation Revenue TOB VRDO | 1.630% | 11/7/18 | 5,000 | 5,000 |
| Tuscaloosa County AL Industrial Development | | | | |
| Authority Gulf Opportunity Zone Revenue | | | | |
| (Hunt Refining Project) VRDO | 1.630% | 11/7/18 LOC | 27,350 | 27,350 |
| Tuscaloosa County AL Industrial Development | | | | |
| Authority Gulf Opportunity Zone Revenue | | | | |
| (Hunt Refining Project) VRDO | 1.630% | 11/7/18 LOC | 9,200 | 9,200 |
| Tuscaloosa County AL Industrial Development | | | | |
| Authority Gulf Opportunity Zone Revenue | | | | |
| (Hunt Refining Project) VRDO | 1.630% | 11/7/18 LOC | 102,450 | 102,450 |
| Tuscaloosa County AL Industrial Development | | | | |
| Authority Gulf Opportunity Zone Revenue | | | | |
| (Hunt Refining Project) VRDO | 1.630% | 11/7/18 LOC | 23,700 | 23,700 |
| Tuscaloosa County AL Industrial Development | | | | |
| Authority Gulf Opportunity Zone Revenue | | | | |
| (Hunt Refining Project) VRDO | 1.630% | 11/7/18 LOC | 3,600 | 3,600 |
| Tuscaloosa County AL Industrial Development | | | | |
| Authority Gulf Opportunity Zone Revenue | | | | |
| (Hunt Refining Project) VRDO | 1.630% | 11/7/18 LOC | 20,000 | 20,000 |
| Tuscaloosa County AL Industrial Development | | | | |
| Authority Gulf Opportunity Zone Revenue | | | | |
| (Hunt Refining Project) VRDO | 1.630% | 11/7/18 LOC | 24,000 | 24,000 |
| Tuscaloosa County AL Industrial Development | | | | |
| Authority Gulf Opportunity Zone Revenue | | | | |
| (Hunt Refining Project) VRDO | 1.630% | 11/7/18 LOC | 20,000 | 20,000 |
| Tuscaloosa County AL Industrial Development | | | | |
| Authority Gulf Opportunity Zone Revenue | | | | |
| (Hunt Refining Project) VRDO | 1.640% | 11/7/18 LOC | 6,000 | 6,000 |
| | | | | 241,300 |
| Alaska (0.0%) | | | | |
| Alaska Student Loan Corp. Education Loan | | | | |
| Revenue VRDO | 1.630% | 11/7/18 LOC | 4,555 | 4,555 |
11
| | | | | |
| Municipal Money Market Fund | | | | |
| |
| |
| |
| | | | | Face | Market |
| | | | Maturity | Amount | Value • |
| | | Coupon | Date | ($000) | ($000) |
| Arizona (0.8%) | | | | |
| 1 | Arizona Health Facilities Authority Revenue | | | | |
| | (Banner Health) TOB VRDO | 1.630% | 11/7/18 | 21,000 | 21,000 |
| 1 | Maricopa County AZ Industrial Development | | | | |
| | Authority Health Facilities Revenue | | | | |
| | (Banner Health Obligated Group) TOB VRDO | 1.620% | 11/7/18 | 5,730 | 5,730 |
| | Maricopa County AZ Industrial Development | | | | |
| | Authority Health Facilities Revenue | | | | |
| | (Banner Health Obligated Group) VRDO | 1.620% | 11/7/18 | 50,200 | 50,200 |
| 1,2 | Mesa AZ Utility System Revenue TOB PUT | 1.750% | 12/13/18 | 11,910 | 11,910 |
| 1 | Phoenix AZ Civic Improvement Corp. | | | | |
| | Water System Revenue TOB VRDO | 1.630% | 11/7/18 (Prere.) | 5,000 | 5,000 |
| 1 | Phoenix AZ Civic Improvement Corp. | | | | |
| | Water System Revenue TOB VRDO | 1.630% | 11/7/18 (Prere.) | 7,715 | 7,715 |
| 1,2 | Salt River Project Arizona Agricultural | | | | |
| | Improvement & Power District Revenue | | | | |
| | TOB PUT | 1.750% | 11/8/18 | 16,000 | 16,000 |
| 1 | Salt River Project Arizona Agricultural | | | | |
| | Improvement & Power District Revenue | | | | |
| | TOB VRDO | 1.630% | 11/7/18 | 5,650 | 5,650 |
| 1 | Salt River Project Arizona Agricultural | | | | |
| | Improvement & Power District Revenue | | | | |
| | TOB VRDO | 1.630% | 11/7/18 | 4,000 | 4,000 |
| 1 | Tempe AZ Union High School District | | | | |
| | No. 213 GO TOB VRDO | 1.630% | 11/7/18 | 6,840 | 6,840 |
| 1 | University of Arizona Revenue TOB VRDO | 1.630% | 11/7/18 | 6,715 | 6,715 |
| | | | | | 140,760 |
| California (1.1%) | | | | |
| 1 | California Health Facilities Financing Authority | | | | |
| | Revenue (Sutter Health) TOB VRDO | 1.610% | 11/7/18 | 7,700 | 7,700 |
| 1 | California Health Facilities Financing Authority | | | | |
| | Revenue (Sutter Health) TOB VRDO | 1.610% | 11/7/18 | 5,000 | 5,000 |
| 1 | California Health Facilities Financing Authority | | | | |
| | Revenue (Sutter Health) TOB VRDO | 1.620% | 11/7/18 | 3,660 | 3,660 |
| 1 | California Health Facilities Financing Authority | | | | |
| | Revenue (Sutter Health) TOB VRDO | 1.620% | 11/7/18 | 1,350 | 1,350 |
| | California Statewide Communities | | | | |
| | Development Authority Revenue | | | | |
| | (Kaiser Permanente) CP | 1.920% | 4/2/19 | 10,000 | 10,000 |
| 1 | Foothill-De Anza CA Community College | | | | |
| | District GO TOB VRDO | 1.630% | 11/7/18 | 7,500 | 7,500 |
| 1 | Los Angeles CA Department of Airports | | | | |
| | International Airport Revenue TOB VRDO | 1.620% | 11/7/18 | 4,395 | 4,395 |
| 1 | Nuveen California Dividend Advantage | | | | |
| | Municipal Fund VRDP VRDO | 1.690% | 11/7/18 LOC | 20,000 | 20,000 |
| 1 | Nuveen California Dividend Advantage | | | | |
| | Municipal Fund VRDP VRDO | 1.750% | 11/7/18 LOC | 59,500 | 59,500 |
| 1 | Nuveen California Dividend Advantage | | | | |
| | Municipal Fund VRDP VRDO | 1.750% | 11/7/18 LOC | 10,000 | 10,000 |
| | Otay CA Water District (Capital Project) | | | | |
| | COP VRDO | 1.700% | 11/7/18 LOC | 3,210 | 3,210 |
| 1 | Regents of the University of California | | | | |
| | Revenue TOB VRDO | 1.630% | 11/7/18 | 14,270 | 14,270 |
12
| | | | |
| Municipal Money Market Fund | | | | |
| |
| |
| |
| | | | Face | Market |
| | | Maturity | Amount | Value • |
| | Coupon | Date | ($000) | ($000) |
| 1 Regents of the University of California | | | | |
| Revenue TOB VRDO | 1.630% | 11/7/18 | 7,600 | 7,600 |
| 1 San Diego CA Community College District | | | | |
| GO TOB VRDO | 1.650% | 11/7/18 (Prere.) | 1,165 | 1,165 |
| 1 San Diego CA Public Facilities Financing | | | | |
| Authority Water Revenue TOB VRDO | 1.600% | 11/7/18 (Prere.) | 6,105 | 6,105 |
| San Francisco CA City & County International | | | | |
| Airport Revenue CP | 1.790% | 1/15/19 LOC | 22,500 | 22,500 |
| 1 San Mateo County CA Community College | | | | |
| District GO TOB VRDO | 1.630% | 11/7/18 | 8,810 | 8,810 |
| 1 West Valley-Mission CA Community College | | | | |
| District GO TOB VRDO | 1.630% | 11/7/18 | 8,500 | 8,500 |
| | | | | 201,265 |
| Colorado (2.5%) | | | | |
| 1 Adams CO 12 Five Star Schools | | | | |
| GO TOB VRDO | 1.630% | 11/7/18 LOC | 12,500 | 12,500 |
| 1 Adams County CO COP TOB VRDO | 1.650% | 11/7/18 | 6,825 | 6,825 |
| 1 Board of Governors of the Colorado State | | | | |
| University System Enterprise Revenue | | | | |
| TOB VRDO | 1.650% | 11/7/18 | 9,750 | 9,750 |
| 1 Boulder Larimer & Weld Counties CO | | | | |
| St. Vrain Valley School District | | | | |
| GO TOB VRDO | 1.630% | 11/7/18 LOC | 5,000 | 5,000 |
| Colorado General Fund Revenue | 4.000% | 6/26/19 | 50,500 | 51,194 |
| 1 Colorado Health Facilities Authority Hospital | | | | |
| Revenue (Adventist Health System/ | | | | |
| Sunbelt Obligated Group) TOB VRDO | 1.630% | 11/7/18 | 12,690 | 12,690 |
| 1 Colorado Health Facilities Authority Revenue | | | | |
| (Adventist Health System/Sunbelt Obligated | | | | |
| Group) TOB VRDO | 1.630% | 11/7/18 | 1,950 | 1,950 |
| 1 Colorado Health Facilities Authority Revenue | | | | |
| (Sisters of Charity of Leavenworth Health | | | | |
| System) TOB VRDO | 1.630% | 11/7/18 | 6,750 | 6,750 |
| 1 Colorado Health Facilities Authority Revenue | | | | |
| (Sisters of Charity of Leavenworth Health | | | | |
| System) TOB VRDO | 1.630% | 11/7/18 | 13,635 | 13,635 |
| 1 Colorado Health Facilities Authority Revenue | | | | |
| (Sisters of Charity of Leavenworth Health | | | | |
| System) TOB VRDO | 1.630% | 11/7/18 | 20,295 | 20,295 |
| 1 Colorado Health Facilities Authority Revenue | | | | |
| (Sisters of Charity of Leavenworth Health | | | | |
| System) TOB VRDO | 1.640% | 11/7/18 | 7,175 | 7,175 |
| Colorado Health Facilities Authority Revenue | | | | |
| (Sisters of Charity of Leavenworth Health | | | | |
| System) VRDO | 1.580% | 11/7/18 | 25,110 | 25,110 |
| Colorado Health Facilities Authority Revenue | | | | |
| (Sisters of Charity of Leavenworth Health | | | | |
| System) VRDO | 1.590% | 11/7/18 | 7,315 | 7,315 |
| Colorado Housing & Finance Authority | | | | |
| Multi-Family Mortgage Revenue VRDO | 1.610% | 11/7/18 | 3,135 | 3,135 |
| Colorado Housing & Finance Authority | | | | |
| Multi-Family Mortgage Revenue VRDO | 1.610% | 11/7/18 | 4,310 | 4,310 |
| Colorado Housing & Finance Authority | | | | |
| Single Family Mortgage Revenue VRDO | 1.610% | 11/7/18 | 5,000 | 5,000 |
13
| | | | | |
| Municipal Money Market Fund | | | | |
| |
| |
| |
| | | | | Face | Market |
| | | | Maturity | Amount | Value • |
| | | Coupon | Date | ($000) | ($000) |
| | Colorado Housing & Finance Authority | | | | |
| | Single Family Mortgage Revenue VRDO | 1.620% | 11/7/18 | 4,695 | 4,695 |
| | Colorado Housing & Finance Authority | | | | |
| | Single Family Mortgage Revenue VRDO | 1.650% | 11/7/18 | 18,600 | 18,600 |
| | Colorado Housing & Finance Authority | | | | |
| | Single Family Mortgage Revenue VRDO | 1.650% | 11/7/18 | 1,800 | 1,800 |
| | Colorado Housing & Finance Authority | | | | |
| | Single Family Mortgage Revenue VRDO | 1.650% | 11/7/18 | 5,900 | 5,900 |
| 1 | Colorado Springs CO Utility System Revenue | | | | |
| | TOB VRDO | 1.630% | 11/7/18 | 9,810 | 9,810 |
| 1 | Denver CO City & County Airport Revenue | | | | |
| | TOB VRDO | 1.670% | 11/7/18 LOC | 23,995 | 23,995 |
| 1 | Denver CO City & County Airport System | | | | |
| | Revenue TOB VRDO | 1.730% | 11/7/18 LOC | 3,250 | 3,250 |
| 1,2 | Denver CO City & County Board of Water | | | | |
| | Commissioners Water Revenue TOB PUT | 1.750% | 12/6/18 | 6,715 | 6,715 |
| 1 | Denver CO City & County CP TOB VRDO | 1.700% | 11/7/18 | 4,930 | 4,930 |
| 1 | Denver CO City & County Dedicated Tax | | | | |
| | Revenue TOB VRDO | 1.630% | 11/7/18 | 5,000 | 5,000 |
| 1 | Denver CO Wastewater Management Division | | | | |
| | Department of Public Works Revenue | | | | |
| | TOB VRDO | 1.650% | 11/1/18 | 21,100 | 21,100 |
| 1,2 | University of Colorado Hospital Authority | | | | |
| | Revenue TOB PUT | 1.750% | 12/20/18 | 11,040 | 11,040 |
| 1 | University of Colorado Hospital Authority | | | | |
| | Revenue TOB VRDO | 1.630% | 11/7/18 | 80,705 | 80,705 |
| | University of Colorado Hospital Authority | | | | |
| | Revenue VRDO | 1.610% | 11/7/18 | 6,745 | 6,745 |
| | University of Colorado Hospital Authority | | | | |
| | Revenue VRDO | 1.610% | 11/7/18 | 22,210 | 22,210 |
| | University of Colorado Hospital Authority | | | | |
| | Revenue VRDO | 1.610% | 11/7/18 | 25,000 | 25,000 |
| | | | | | 444,129 |
| Connecticut (0.3%) | | | | |
| 1 | Connecticut GO TOB VRDO | 1.630% | 11/7/18 LOC | 5,000 | 5,000 |
| 1 | Connecticut GO TOB VRDO | 1.630% | 11/7/18 LOC | 5,000 | 5,000 |
| 1 | Connecticut Health & Educational Facilities | | | | |
| | Authority Revenue (Trinity Health Corp.) | | | | |
| | TOB VRDO | 1.630% | 11/7/18 | 3,200 | 3,200 |
| 1 | Connecticut Health & Educational Facilities | | | | |
| | Authority Revenue (Trinity Health Corp.) | | | | |
| | TOB VRDO | 1.630% | 11/7/18 | 8,000 | 8,000 |
| | Connecticut Housing Finance Authority | | | | |
| | Revenue Housing Mortgage Finance | | | | |
| | Program VRDO | 1.600% | 11/7/18 | 5,500 | 5,500 |
| | Connecticut Housing Finance Authority | | | | |
| | Revenue Housing Mortgage Finance | | | | |
| | Program VRDO | 1.600% | 11/7/18 | 10,000 | 10,000 |
| | Connecticut Housing Finance Authority | | | | |
| | Revenue Housing Mortgage Finance | | | | |
| | Program VRDO | 1.600% | 11/7/18 | 6,875 | 6,875 |
| | Connecticut Housing Finance Authority | | | | |
| | Revenue Housing Mortgage Finance | | | | |
| | Program VRDO | 1.650% | 11/7/18 | 7,900 | 7,900 |
| | | | | | 51,475 |
14
| | | | | |
| Municipal Money Market Fund | | | | |
| |
| |
| |
| | | | | Face | Market |
| | | | Maturity | Amount | Value • |
| | | Coupon | Date | ($000) | ($000) |
| Delaware (0.1%) | | | | |
| | New Castle County DE Student Housing | | | | |
| | Revenue (University Courtyard Apartments) | | | | |
| | VRDO | 1.610% | 11/7/18 LOC | 12,910 | 12,910 |
| |
| District of Columbia (1.3%) | | | | |
| 1,2 | District of Columbia GO TOB PUT | 1.750% | 11/29/18 | 4,000 | 4,000 |
| 1 | District of Columbia GO TOB VRDO | 1.630% | 11/7/18 LOC | 7,500 | 7,500 |
| 1 | District of Columbia GO TOB VRDO | 1.630% | 11/7/18 LOC | 45,200 | 45,200 |
| 1 | District of Columbia GO TOB VRDO | 1.750% | 11/1/18 | 8,360 | 8,360 |
| 1 | District of Columbia Income Tax Revenue | | | | |
| | TOB VRDO | 1.630% | 11/7/18 | 7,855 | 7,855 |
| 1 | District of Columbia Income Tax Revenue | | | | |
| | TOB VRDO | 1.630% | 11/7/18 | 11,250 | 11,250 |
| | District of Columbia Revenue | | | | |
| | (The Pew Charitable Trust) VRDO | 1.600% | 11/7/18 LOC | 7,845 | 7,845 |
| 1,2 | District of Columbia Water & Sewer Authority | | | | |
| | Public Utility Revenue TOB PUT | 1.750% | 11/29/18 | 9,740 | 9,740 |
| 1 | District of Columbia Water & Sewer Authority | | | | |
| | Public Utility Revenue TOB VRDO | 1.630% | 11/7/18 | 6,650 | 6,650 |
| 1 | District of Columbia Water & Sewer Authority | | | | |
| | Public Utility Revenue TOB VRDO | 1.630% | 11/7/18 | 3,750 | 3,750 |
| 1 | District of Columbia Water & Sewer Authority | | | | |
| | Public Utility Revenue TOB VRDO | 1.630% | 11/7/18 | 6,190 | 6,190 |
| 1 | District of Columbia Water & Sewer Authority | | | | |
| | Public Utility Revenue TOB VRDO | 1.630% | 11/7/18 | 11,870 | 11,870 |
| | District of Columbia Water & Sewer Authority | | | | |
| | Public Utility Revenue VRDO | 1.600% | 11/7/18 | 10,000 | 10,000 |
| 1 | Metropolitan Washington DC/VA Airports | | | | |
| | Authority Airport System Revenue | | | | |
| | TOB VRDO | 1.680% | 11/7/18 | 5,700 | 5,700 |
| | Metropolitan Washington DC/VA Airports | | | | |
| | Authority Airport System Revenue VRDO | 1.630% | 11/7/18 LOC | 51,375 | 51,375 |
| | Metropolitan Washington DC/VA Airports | | | | |
| | Authority Dulles Toll Road Revenue CP | 1.730% | 11/23/18 LOC | 15,000 | 15,000 |
| | Metropolitan Washington DC/VA Airports | | | | |
| | Authority Revenue VRDO | 1.650% | 11/7/18 LOC | 20,000 | 20,000 |
| | | | | | 232,285 |
| Florida (4.1%) | | | | |
| 1 | Broward County FL Airport System Revenue | | | | |
| | TOB VRDO | 1.630% | 11/7/18 LOC | 31,335 | 31,335 |
| 1,2 | Clearwater FL Water & Sewer Revenue | | | | |
| | TOB PUT | 1.750% | 11/29/18 | 6,500 | 6,500 |
| 1,2 | Florida Board of Education Public Education | | | | |
| | Capital Outlay GO TOB PUT | 1.750% | 11/1/18 | 4,510 | 4,510 |
| 1,2 | Florida Board of Education Public Education | | | | |
| | Capital Outlay GO TOB PUT | 1.750% | 12/13/18 | 5,000 | 5,000 |
| 1,2 | Florida Board of Education Public Education | | | | |
| | Capital Outlay GO TOB PUT | 1.750% | 12/20/18 | 3,640 | 3,640 |
| 1 | Florida Department of Management Services | | | | |
| | COP TOB VRDO | 1.630% | 11/7/18 | 6,960 | 6,960 |
| 1,2 | Florida Department of Transportation | | | | |
| | GO TOB PUT | 1.750% | 12/13/18 | 22,000 | 22,000 |
15
| | | | | |
| Municipal Money Market Fund | | | | |
| |
| |
| |
| | | | | Face | Market |
| | | | Maturity | Amount | Value • |
| | | Coupon | Date | ($000) | ($000) |
| 1 | Florida Department of Transportation | | | | |
| | GO TOB VRDO | 1.630% | 11/7/18 | 3,815 | 3,815 |
| 1 | Florida Housing Finance Corp. TOB VRDO | 1.630% | 11/7/18 | 7,500 | 7,500 |
| 1 | Florida Housing Finance Corp. TOB VRDO | 1.630% | 11/7/18 | 7,000 | 7,000 |
| 1 | Florida Housing Finance Corp. TOB VRDO | 1.630% | 11/7/18 | 5,000 | 5,000 |
| 1 | Florida Turnpike Authority Revenue TOB PUT | 1.750% | 11/1/18 | 10,825 | 10,825 |
| 1,2 | Gainesville FL Utilities System Revenue | | | | |
| | TOB PUT | 1.750% | 11/8/18 | 27,085 | 27,085 |
| 1,2 | Greater Orlando Aviation Authority Florida | | | | |
| | Airport Facilities Revenue TOB PUT | 1.850% | 4/1/19 LOC | 5,000 | 5,000 |
| 1 | Greater Orlando Aviation Authority Florida | | | | |
| | Airport Facilities Revenue TOB VRDO | 1.630% | 11/7/18 | 12,000 | 12,000 |
| | Halifax Hospital Medical Center Florida | | | | |
| | Hospital Revenue VRDO | 1.640% | 11/7/18 LOC | 1,900 | 1,900 |
| 1,2 | Hillsborough FL Solid Waste & Resource | | | | |
| | Recovery Revenue TOB PUT | 1.800% | 3/1/19 LOC | 5,000 | 5,000 |
| 1 | Miami Beach FL Resort Tax Revenue | | | | |
| | TOB VRDO | 1.640% | 11/7/18 | 10,000 | 10,000 |
| 1 | Miami Beach FL Resort Tax Revenue | | | | |
| | TOB VRDO | 1.650% | 11/7/18 | 3,750 | 3,750 |
| 1 | Miami Beach FL Resort Tax Revenue | | | | |
| | TOB VRDO | 1.650% | 11/7/18 | 6,665 | 6,665 |
| 1 | Miami-Dade County FL Building Better | | | | |
| | Communities GO TOB VRDO | 1.620% | 11/7/18 | 9,940 | 9,940 |
| 1 | Miami-Dade County FL Building Better | | | | |
| | Communities GO TOB VRDO | 1.630% | 11/7/18 LOC | 22,315 | 22,315 |
| 1 | Miami-Dade County FL Building Better | | | | |
| | Communities GO TOB VRDO | 1.630% | 11/7/18 | 10,530 | 10,530 |
| 1 | Miami-Dade County FL Educational Facilities | | | | |
| | Authority Revenue (University of Miami) | | | | |
| | TOB VRDO | 1.640% | 11/7/18 LOC | 4,000 | 4,000 |
| 1 | Miami-Dade County FL School Board | | | | |
| | COP TOB VRDO | 1.680% | 11/7/18 (Prere.) | 20,000 | 20,000 |
| | Miami-Dade County FL Seaport A1 CP | 1.900% | 1/2/19 LOC | 10,000 | 10,000 |
| | Miami-Dade County FL Seaport Revenue | | | | |
| | VRDO | 1.600% | 11/7/18 LOC | 67,320 | 67,320 |
| | Miami-Dade County FL Seaport Revenue | | | | |
| | VRDO | 1.630% | 11/7/18 LOC | 19,150 | 19,150 |
| 1 | Miami-Dade County FL Transit Sales Surtax | | | | |
| | Revenue TOB VRDO | 1.640% | 11/7/18 | 7,600 | 7,600 |
| | Orange County FL Health Facilities Authority | | | | |
| | Hospital Revenue (Orlando Regional | | | | |
| | Healthcare System) VRDO | 1.620% | 11/7/18 LOC | 4,010 | 4,010 |
| 1 | Orange County FL Sales Tax Revenue | | | | |
| | TOB VRDO | 1.630% | 11/7/18 | 10,230 | 10,230 |
| 1 | Orange County FL School Board | | | | |
| | COP TOB VRDO | 1.670% | 11/7/18 (Prere.) | 19,070 | 19,070 |
| 1 | Orange County FL Tourist Development | | | | |
| | Revenue TOB VRDO | 1.630% | 11/7/18 | 16,665 | 16,665 |
| 1 | Orlando & Orange County FL Expressway | | | | |
| | Authority Revenue TOB VRDO | 1.630% | 11/7/18 LOC | 41,680 | 41,680 |
| | Orlando FL Utility Commission Utility System | | | | |
| | Revenue VRDO | 1.600% | 11/7/18 | 36,095 | 36,095 |
16
| | | | | |
| Municipal Money Market Fund | | | | |
| |
| |
| |
| | | | | Face | Market |
| | | | Maturity | Amount | Value • |
| | | Coupon | Date | ($000) | ($000) |
| | Orlando FL Utility Commission Utility System | | | | |
| | Revenue VRDO | 1.600% | 11/7/18 | 31,925 | 31,925 |
| | Orlando FL Utility Commission Utility System | | | | |
| | Revenue VRDO | 1.620% | 11/7/18 | 6,200 | 6,200 |
| | Palm Beach County FL Revenue (Community | | | | |
| | Foundation Palm Beach Project) VRDO | 1.610% | 11/7/18 LOC | 4,800 | 4,800 |
| 1 | Palm Beach County FL School Board | | | | |
| | COP TOB VRDO | 1.630% | 11/7/18 | 6,590 | 6,590 |
| | Palm Beach County FL School District TAN | 3.000% | 8/30/19 | 98,250 | 99,066 |
| | Pinellas County School Board Revenue TAN | 3.000% | 6/28/19 | 41,250 | 41,533 |
| 1 | Reedy Creek FL Improvement District | | | | |
| | GO TOB VRDO | 1.630% | 11/7/18 LOC | 7,600 | 7,600 |
| 1 | Tallahassee Memorial HealthCare Inc. | | | | |
| | TOB VRDO | 1.720% | 11/7/18 LOC | 21,000 | 21,000 |
| 1 | Tampa Bay FL Water Utility System Revenue | | | | |
| | TOB VRDO | 1.630% | 11/7/18 | 8,960 | 8,960 |
| | Tampa FL Health System Revenue | | | | |
| | (BayCare Health System) | 1.900% | 5/29/19 | 13,500 | 13,500 |
| 1 | Tampa FL Health System Revenue | | | | |
| | TOB VRDO | 1.630% | 11/7/18 | 4,800 | 4,800 |
| | | | | | 730,064 |
| Georgia (2.2%) | | | | |
| 1 | Atlanta GA GO TOB VRDO | 1.630% | 11/7/18 LOC | 10,000 | 10,000 |
| 1 | Atlanta GA Water & Wastewater Revenue | | | | |
| | TOB VRDO | 1.630% | 11/7/18 | 27,855 | 27,855 |
| 1 | Burke County GA Development Authority | | | | |
| | Pollution Control Revenue (Oglethorpe | | | | |
| | Power Corp. Vogtle Project) TOB VRDO | 1.660% | 11/7/18 LOC | 27,000 | 27,000 |
| 1 | Burke County GA Development Authority | | | | |
| | Pollution Control Revenue (Oglethorpe | | | | |
| | Power Corp. Vogtle Project) TOB VRDO | 1.660% | 11/7/18 LOC | 12,335 | 12,335 |
| | Cobb County GA Hospital Authority Revenue | | | | |
| | (Equipment Pool Project) VRDO | 1.600% | 11/7/18 LOC | 7,100 | 7,100 |
| | Cobb County GA Hospital Authority Revenue | | | | |
| | (Equipment Pool Project) VRDO | 1.600% | 11/7/18 LOC | 25,000 | 25,000 |
| 1 | Dalton Whitfield County GA Development | | | | |
| | Authority Revenue (Hamilton Health Care | | | | |
| | System) TOB VRDO | 1.640% | 11/7/18 | 18,805 | 18,805 |
| 1 | DeKalb County GA Water & Sewer Revenue | | | | |
| | TOB VRDO | 1.630% | 11/7/18 | 11,990 | 11,990 |
| 1 | DeKalb County GA Water & Sewer Revenue | | | | |
| | TOB VRDO | 1.650% | 11/7/18 | 9,600 | 9,600 |
| 1 | DeKalb GA Water & Sewerage Revenue | | | | |
| | TOB VRDO | 1.630% | 11/7/18 (4) | 4,800 | 4,800 |
| 1 | Fulton County GA Development Authority | | | | |
| | Revenue (Piedmont Healthcare Inc. Project) | | | | |
| | TOB VRDO | 1.630% | 11/7/18 (Prere.) | 16,635 | 16,635 |
| | Fulton County GA Development Authority | | | | |
| | Revenue (Shepherd Center Inc. Project) | | | | |
| | VRDO | 1.640% | 11/7/18 LOC | 51,200 | 51,200 |
| | Georgia GO | 5.000% | 2/1/19 | 2,085 | 2,101 |
| 1,2 | Metropolitan Atlanta Rapid Transportation | | | | |
| | Authority Georgia Sales Tax Revenue | | | | |
| | TOB PUT | 1.750% | 11/15/18 | 12,015 | 12,015 |
17
Municipal Money Market Fund
| | | | | |
| | | | | Face | Market |
| | | | Maturity | Amount | Value • |
| | | Coupon | Date | ($000) | ($000) |
| | Municipal Electric Authority Georgia Revenue | | | | |
| | (Project One) CP | 1.750% | 12/20/18 LOC | 24,112 | 24,112 |
| | Municipal Electric Authority Georgia Revenue | | | | |
| | (Project One) CP | 1.750% | 12/20/18 LOC | 24,112 | 24,112 |
| | Municipal Electric Authority Georgia Revenue | | | | |
| | (Project One) VRDO | 1.780% | 11/7/18 LOC | 33,885 | 33,885 |
| | Private Colleges & Universities Authority | | | | |
| | GA VRDO | 1.790% | 1/23/19 | 40,000 | 40,000 |
| | Private Colleges & Universities Authority | | | | |
| | GA VRDO | 1.830% | 2/7/19 | 20,011 | 20,011 |
| 1 | Private Colleges & University Authority of | | | | |
| | Georgia Revenue (Emory University) | | | | |
| | TOB VRDO | 1.630% | 11/7/18 | 5,635 | 5,635 |
| | | | | | 384,191 |
| Hawaii (0.5%) | | | | |
| | Hawaii Department of Budget & Finance | | | | |
| | Special Purpose Revenue (Queens Health | | | | |
| | System) PUT | 2.050% | 5/29/19 | 37,645 | 37,645 |
| | Hawaii Department of Budget & Finance | | | | |
| | Special Purpose Revenue (Queens Health | | | | |
| | System) PUT | 2.050% | 5/29/19 | 17,445 | 17,445 |
| | Hawaii GO | 5.000% | 11/1/18 | 16,155 | 16,155 |
| 1,2 | Hawaii GO TOB PUT | 1.750% | 1/17/19 | 9,260 | 9,260 |
| 1 | Honolulu HI City & County GO TOB VRDO | 1.630% | 11/7/18 LOC | 7,350 | 7,350 |
| | | | | | 87,855 |
| Idaho (0.2%) | | | | |
| | Idaho Building Authority Revenue | | | | |
| | (Prison Facilities Project) VRDO | 1.600% | 11/7/18 | 24,965 | 24,965 |
| 1 | Idaho Building Authority Revenue | | | | |
| | (State Office Campus Project) TOB VRDO | 1.650% | 11/7/18 | 4,310 | 4,310 |
| | Idaho TAN | 4.000% | 6/28/19 | 6,450 | 6,535 |
| | | | | | 35,810 |
| Illinois (5.0%) | | | | |
| | Channahon IL Revenue (Morris Hospital) VRDO | 1.600% | 11/7/18 LOC | 3,985 | 3,985 |
| | Channahon IL Revenue (Morris Hospital) VRDO | 1.600% | 11/7/18 LOC | 6,215 | 6,215 |
| | Channahon IL Revenue (Morris Hospital) VRDO | 1.600% | 11/7/18 LOC | 3,460 | 3,460 |
| | Channahon IL Revenue (Morris Hospital) VRDO | 1.600% | 11/7/18 LOC | 4,375 | 4,375 |
| | Channahon IL Revenue (Morris Hospital) VRDO | 1.600% | 11/7/18 LOC | 3,290 | 3,290 |
| 1 | Chicago IL Metropolitan Water Reclamation | | | | |
| | District GO TOB VRDO | 1.680% | 11/7/18 | 12,000 | 12,000 |
| | Chicago IL Midway Airport Revenue VRDO | 1.650% | 11/7/18 LOC | 34,275 | 34,275 |
| 1 | Chicago IL O’Hare International Airport | | | | |
| | Revenue TOB VRDO | 1.700% | 11/7/18 LOC | 4,170 | 4,170 |
| | Du Page County IL Revenue | | | | |
| | (Morton Arboretum) VRDO | 1.600% | 11/7/18 LOC | 26,100 | 26,100 |
| | Illinois Development Finance Authority | | | | |
| | Revenue (American College of Surgeons) | | | | |
| | VRDO | 1.590% | 11/7/18 LOC | 16,500 | 16,500 |
| | Illinois Development Finance Authority | | | | |
| | Revenue (Chicago Horticultural Society) | | | | |
| | VRDO | 1.620% | 11/7/18 LOC | 16,000 | 16,000 |
| | Illinois Educational Facilities Authority | | | | |
| | (Pooled Financing Program) CP | 1.740% | 11/2/18 LOC | 18,491 | 18,491 |
18
| | | | |
| Municipal Money Market Fund | | | | |
| |
| |
| |
| | | | Face | Market |
| | | Maturity | Amount | Value • |
| | Coupon | Date | ($000) | ($000) |
| 1 Illinois Educational Facilities Authority | | | | |
| Revenue (University of Chicago) TOB VRDO | 1.630% | 11/7/18 | 5,200 | 5,200 |
| Illinois Educational Facilities Authority | | | | |
| Revenue (University of Chicago) VRDO | 1.580% | 11/7/18 | 14,140 | 14,140 |
| Illinois Finance Authority Revenue | | | | |
| (Advocate Health Care Network) PUT | 1.900% | 5/29/19 | 6,500 | 6,500 |
| 1 Illinois Finance Authority Revenue | | | | |
| (Advocate Health Care Network) TOB VRDO | 1.630% | 11/7/18 | 2,250 | 2,250 |
| 1 Illinois Finance Authority Revenue | | | | |
| (Advocate Health Care Network) TOB VRDO | 1.630% | 11/7/18 | 11,760 | 11,760 |
| 1 Illinois Finance Authority Revenue | | | | |
| (Advocate Health Care Network) TOB VRDO | 1.630% | 11/7/18 | 8,000 | 8,000 |
| 1 Illinois Finance Authority Revenue | | | | |
| (Ann & Robert H. Lurie Children’s Hospital | | | | |
| of Chicago) TOB VRDO | 1.630% | 11/7/18 | 10,000 | 10,000 |
| Illinois Finance Authority Revenue | | | | |
| (Carle Foundation) VRDO | 1.580% | 11/7/18 LOC | 10,200 | 10,200 |
| Illinois Finance Authority Revenue | | | | |
| (Chicago Horticulture Project) VRDO | 1.620% | 11/7/18 LOC | 24,000 | 24,000 |
| Illinois Finance Authority Revenue | | | | |
| (Evangelical Project) VRDO | 1.600% | 11/7/18 LOC | 7,830 | 7,830 |
| Illinois Finance Authority Revenue | | | | |
| (Illinois College) VRDO | 1.580% | 11/7/18 LOC | 5,050 | 5,050 |
| 1 Illinois Finance Authority Revenue | | | | |
| (NorthShore University Health System) | | | | |
| TOB VRDO | 1.630% | 11/7/18 | 6,375 | 6,375 |
| Illinois Finance Authority Revenue | | | | |
| (Northwest Community Hospital) VRDO | 1.610% | 11/7/18 LOC | 10,585 | 10,585 |
| 1 Illinois Finance Authority Revenue | | | | |
| (Northwestern Memorial Hospital) | | | | |
| TOB VRDO | 1.630% | 11/7/18 | 33,585 | 33,585 |
| 1 Illinois Finance Authority Revenue | | | | |
| (Northwestern Memorial Hospital) | | | | |
| TOB VRDO | 1.630% | 11/7/18 | 9,000 | 9,000 |
| 1 Illinois Finance Authority Revenue | | | | |
| (Northwestern Memorial Hospital) | | | | |
| TOB VRDO | 1.630% | 11/7/18 | 8,990 | 8,990 |
| Illinois Finance Authority Revenue | | | | |
| (Northwestern Memorial Hospital) VRDO | 1.670% | 11/1/18 | 13,200 | 13,200 |
| Illinois Finance Authority Revenue | | | | |
| (Northwestern Memorial Hospital) VRDO | 1.640% | 11/7/18 | 32,610 | 32,610 |
| Illinois Finance Authority Revenue | | | | |
| (Northwestern Memorial Hospital) VRDO | 1.640% | 11/7/18 | 17,315 | 17,315 |
| 1 Illinois Finance Authority Revenue | | | | |
| (University of Chicago Medical Center) | | | | |
| TOB VRDO | 1.630% | 11/7/18 (Prere.) | 10,200 | 10,200 |
| 1 Illinois Finance Authority Revenue | | | | |
| (University of Chicago) TOB VRDO | 1.630% | 11/7/18 | 6,665 | 6,665 |
| 1 Illinois Finance Authority Revenue | | | | |
| (University of Chicago) TOB VRDO | 1.630% | 11/7/18 | 6,400 | 6,400 |
| 1 Illinois Finance Authority Revenue | | | | |
| (University of Chicago) TOB VRDO | 1.650% | 11/7/18 (Prere.) | 30,825 | 30,825 |
| Illinois Finance Authority Revenue | | | | |
| (University of Chicago) VRDO | 1.580% | 11/7/18 | 13,205 | 13,205 |
19
| | | | |
| Municipal Money Market Fund | | | | |
| |
| |
| |
| | | | Face | Market |
| | | Maturity | Amount | Value • |
| | Coupon | Date | ($000) | ($000) |
| Illinois Health Facilities Authority Revenue | | | | |
| (Evanston Hospital Corp.) VRDO | 1.610% | 11/7/18 | 14,475 | 14,475 |
| Illinois Housing Development Authority | | | | |
| Revenue (Lakeshore Plaza) VRDO | 1.640% | 11/7/18 | 19,860 | 19,860 |
| Illinois Housing Development Authority | | | | |
| Revenue (Larkin Village) VRDO | 1.680% | 11/7/18 | 10,930 | 10,930 |
| 1 Illinois Housing Development Authority | | | | |
| Revenue TOB VRDO | 1.630% | 11/7/18 | 6,790 | 6,790 |
| 1 Illinois Toll Highway Authority Revenue | | | | |
| TOB VRDO | 1.630% | 11/7/18 LOC | 71,155 | 71,155 |
| 1 Illinois Toll Highway Authority Revenue | | | | |
| TOB VRDO | 1.650% | 11/7/18 | 3,100 | 3,100 |
| Illinois Toll Highway Authority Revenue VRDO | 1.600% | 11/7/18 LOC | 40,550 | 40,550 |
| Illinois Toll Highway Authority Revenue VRDO | 1.600% | 11/7/18 LOC | 101,885 | 101,885 |
| Illinois Toll Highway Authority Revenue VRDO | 1.600% | 11/7/18 | 21,625 | 21,625 |
| Illinois Toll Highway Authority Revenue VRDO | 1.620% | 11/7/18 LOC | 5,000 | 5,000 |
| Illinois Toll Highway Authority Revenue VRDO | 1.620% | 11/7/18 | 50,340 | 50,340 |
| 1 Illinois Toll Highway Authority Toll Highway | | | | |
| Revenue TOB VRDO | 1.630% | 11/7/18 | 10,210 | 10,210 |
| 1 Illinois Toll Highway Authority Toll Highway | | | | |
| Revenue TOB VRDO | 1.700% | 11/7/18 | 30,565 | 30,565 |
| Illinois Toll Highway Authority Toll Highway | | | | |
| Revenue VRDO | 1.610% | 11/7/18 LOC | 5,940 | 5,940 |
| 1 Northwestern Memorial Healthcare Obligated | | | | |
| Group TOB VRDO | 1.630% | 11/7/18 | 5,600 | 5,600 |
| 1 Will County IL GO TOB VRDO | 1.630% | 11/7/18 LOC | 5,000 | 5,000 |
| 1 Will County IL GO TOB VRDO | 1.630% | 11/7/18 | 20,280 | 20,280 |
| | | | | 876,051 |
| Indiana (0.8%) | | | | |
| Indiana Finance Authority Environmental | | | | |
| Improvement Revenue (Ispat Inland Inc. | | | | |
| Project) VRDO | 1.630% | 11/7/18 LOC | 33,140 | 33,140 |
| 1 Indiana Finance Authority Health System | | | | |
| Revenue (Sisters of St. Francis Health | | | | |
| Services Inc. Obligated Group) TOB VRDO | 1.640% | 11/7/18 | 2,500 | 2,500 |
| 1 Indiana Finance Authority Hospital Revenue | | | | |
| (Indiana University Health Obligated Group) | | | | |
| TOB VRDO | 1.650% | 11/7/18 | 12,000 | 12,000 |
| Indiana Finance Authority Hospital Revenue | | | | |
| (Indiana University Health) VRDO | 1.580% | 11/7/18 LOC | 13,885 | 13,885 |
| Indiana Financial Authority Revenue | 1.720% | 11/1/18 | 50,000 | 50,000 |
| Indiana Health Facility Financing Authority | | | | |
| Revenue (Ascension Health Credit Group) | | | | |
| VRDO | 1.610% | 11/7/18 | 3,200 | 3,200 |
| 1 Indianapolis IN Local Public Improvement | | | | |
| Bond Bank Revenue TOB VRDO | 1.800% | 11/7/18 | 13,360 | 13,360 |
| Rockport IN Pollution Control Revenue | | | | |
| (AEP Generating Company Project) VRDO | 1.600% | 11/7/18 LOC | 14,925 | 14,925 |
| | | | | 143,010 |
| Iowa (0.3%) | | | | |
| Iowa Finance Authority Revenue | | | | |
| (Trinity Health) VRDO | 1.590% | 11/7/18 | 11,215 | 11,215 |
| Iowa Finance Authority Single Family | | | | |
| Mortgage Revenue VRDO | 1.600% | 11/7/18 | 6,000 | 6,000 |
20
| | | | | |
| Municipal Money Market Fund | | | | |
| |
| |
| |
| | | | | Face | Market |
| | | | Maturity | Amount | Value • |
| | | Coupon | Date | ($000) | ($000) |
| | Iowa Finance Authority Single Family | | | | |
| | Mortgage Revenue VRDO | 1.600% | 11/7/18 | 20,000 | 20,000 |
| 1 | Iowa Special Obligation Revenue | | | | |
| | (Ijobs Program) TOB VRDO | 1.680% | 11/7/18 (Prere.) | 8,500 | 8,500 |
| | | | | | 45,715 |
| Kansas (0.3%) | | | | |
| 1,2 | Johnson County KS Water District Revenue | | | �� | |
| | TOB PUT | 1.750% | 11/8/18 | 12,435 | 12,435 |
| 1 | Kansas Department of Transportation Highway | | | | |
| | Revenue TOB VRDO | 1.630% | 11/7/18 | 6,400 | 6,400 |
| 1 | Kansas Development Finance Authority | | | | |
| | Hospital Revenue (Adventist Health System/ | | | | |
| | Sunbelt Obligated Group) TOB VRDO | 1.630% | 11/7/18 | 7,425 | 7,425 |
| 1 | Wyandotte County KS Unified School District | | | | |
| | No. 500 GO TOB VRDO | 1.620% | 11/7/18 | 10,100 | 10,100 |
| 1 | Wyandotte County KS Unified School District | | | | |
| | No. 500 GO TOB VRDO | 1.630% | 11/7/18 LOC | 7,500 | 7,500 |
| 1 | Wyandotte County KS Unified School District | | | | |
| | No. 500 GO TOB VRDO | 1.730% | 11/7/18 | 12,400 | 12,400 |
| | | | | | 56,260 |
| Kentucky (0.5%) | | | | |
| 1 | Kentucky Infrastructure Authority Wastewater | | | | |
| | & Drinking Water Revenue TOB VRDO | 1.620% | 11/7/18 | 6,945 | 6,945 |
| 1 | Kentucky Infrastructure Authority Wastewater | | | | |
| | & Drinking Water Revenue TOB VRDO | 1.630% | 11/7/18 | 7,190 | 7,190 |
| 1 | Louisville & Jefferson County KY Metropolitan | | | | |
| | Government Parking Revenue TOB VRDO | 1.630% | 11/7/18 (Prere.) | 6,130 | 6,130 |
| 3 | Louisville & Jefferson County KY Metropolitan | | | | |
| | Sewer & Drain System Revenue | 4.000% | 11/1/19 | 50,000 | 50,920 |
| 1,2 | Louisville & Jefferson County KY Metropolitan | | | | |
| | Sewer & Drain System Revenue TOB PUT | 1.750% | 1/10/19 | 11,190 | 11,190 |
| | | | | | 82,375 |
| Louisiana (1.1%) | | | | |
| | East Baton Rouge Parish LA Industrial | | | | |
| | Development Board Revenue | | | | |
| | (ExxonMobil Project) VRDO | 1.690% | 11/1/18 | 4,900 | 4,900 |
| 1 | Louisiana Gasoline & Fuel Tax Revenue | | | | |
| | TOB VRDO | 1.630% | 11/7/18 | 8,250 | 8,250 |
| 1 | Louisiana Gasoline & Fuel Tax Revenue | | | | |
| | TOB VRDO | 1.630% | 11/7/18 | 5,415 | 5,415 |
| 1 | Louisiana GO TOB VRDO | 1.630% | 11/7/18 LOC | 10,000 | 10,000 |
| | St. James Parish LA Revenue | | | | |
| | (NuStar Logistics LP Project) VRDO | 1.640% | 11/7/18 LOC | 34,300 | 34,300 |
| | St. James Parish LA Revenue | | | | |
| | (Nustar Logistics LP Project) VRDO | 1.640% | 11/7/18 LOC | 31,200 | 31,200 |
| | St. James Parish LA Revenue | | | | |
| | (NuStar Logistics LP Project) VRDO | 1.650% | 11/7/18 LOC | 55,440 | 55,440 |
| | St. James Parish LA Revenue | | | | |
| | (NuStar Logistics LP Project) VRDO | 1.650% | 11/7/18 LOC | 47,200 | 47,200 |
| | | | | | 196,705 |
| Maine (0.0%) | | | | |
| 1 | Maine Housing Authority TOB VRDO | 1.630% | 11/7/18 | 7,500 | 7,500 |
21
| | | | | |
| Municipal Money Market Fund | | | | |
| |
| |
| |
| | | | | Face | Market |
| | | | Maturity | Amount | Value • |
| | | Coupon | Date | ($000) | ($000) |
| Maryland (2.4%) | | | | |
| | Baltimore County MD GO | 4.000% | 3/18/19 | 91,480 | 92,326 |
| 1,2 | Baltimore MD Project Revenue TOB PUT | 1.800% | 1/2/19 LOC | 5,000 | 5,000 |
| 1 | Baltimore MD Project Revenue TOB VRDO | 1.630% | 11/7/18 | 6,000 | 6,000 |
| 1 | Baltimore MD Project Revenue TOB VRDO | 1.630% | 11/7/18 | 5,080 | 5,080 |
| 1 | BlackRock Maryland Municipal Bond Trust | | | | |
| | VRDO | 1.750% | 11/7/18 LOC | 3,600 | 3,600 |
| 1 | Maryland Health & Higher Educational | | | | |
| | Facilities Authority Revenue (Johns Hopkins | | | | |
| | Health System) TOB VRDO | 1.630% | 11/7/18 | 6,665 | 6,665 |
| 1 | Maryland Health & Higher Educational | | | | |
| | Facilities Authority Revenue (Johns Hopkins | | | | |
| | University) TOB VRDO | 1.630% | 11/7/18 | 11,165 | 11,165 |
| | Maryland Health & Higher Educational | | | | |
| | Facilities Authority Revenue (University of | | | | |
| | Maryland Medical System) VRDO | 1.610% | 11/7/18 LOC | 54,950 | 54,950 |
| | Maryland Health & Higher Educational | | | | |
| | acilities Authority Revenue VRDO | 1.600% | 11/7/18 LOC | 26,150 | 26,150 |
| 1 | Maryland Health and Higher Educational | | | | |
| | Facilities Authority Revenue (University of | | | | |
| | Maryland Medical System) TOB VRDO | 1.640% | 11/7/18 LOC | 7,390 | 7,390 |
| 1,2 | Maryland Transportation Authority Facilities | | | | |
| | Projects Revenue TOB PUT | 1.730% | 1/17/19 | 10,000 | 10,000 |
| | Maryland Transportation Authority Passenger | | | | |
| | Facility Charge Revenue (Baltimore/ | | | | |
| | Washington International Airport) VRDO | 1.640% | 11/7/18 LOC | 23,640 | 23,640 |
| | Montgomery County MD GO CP | 1.690% | 11/7/18 | 12,700 | 12,700 |
| | Montgomery County MD GO CP | 1.700% | 11/7/18 | 25,000 | 25,000 |
| | Montgomery County MD GO CP | 1.670% | 11/8/18 | 65,000 | 65,000 |
| | Montgomery County MD Revenue | | | | |
| | (CHE Trinity Health Credit Group) PUT | 1.750% | 12/3/18 | 15,000 | 15,000 |
| 1,2 | University of Maryland Auxiliary Facility | | | | |
| | & Tuition Revenue TOB PUT | 1.750% | 12/13/18 | 6,700 | 6,700 |
| | Washington MD Suburban Sanitary | | | | |
| | Commission BAN VRDO | 1.610% | 11/7/18 | 19,700 | 19,700 |
| | Washington Suburban Sanitation District | | | | |
| | Maryland GO VRDO | 1.610% | 11/7/18 | 30,100 | 30,100 |
| | | | | | 426,166 |
| Massachusetts (4.0%) | | | | |
| 1,2 | Billerica MA GO TOB PUT | 1.750% | 11/8/18 | 4,300 | 4,300 |
| | Massachusetts Bay Transportation Authority | | | | |
| | Sales Tax Revenue PUT | 1.900% | 5/29/19 | 8,220 | 8,220 |
| 1 | Massachusetts Bay Transportation Authority | | | | |
| | Sales Tax Revenue TOB VRDO | 1.620% | 11/7/18 | 9,900 | 9,900 |
| | Massachusetts Department of Transportation | | | | |
| | Metropolitan Highway System Revenue | | | | |
| | VRDO | 1.610% | 11/7/18 | 37,345 | 37,345 |
| 1 | Massachusetts Development Finance Agency | | | | |
| | Revenue (Partners Healthcare) TOB VRDO | 1.600% | 11/7/18 | 4,740 | 4,740 |
| 1 | Massachusetts Development Finance Agency | | | | |
| | Revenue (Partners Healthcare) TOB VRDO | 1.620% | 11/7/18 | 4,000 | 4,000 |
| | Massachusetts GO | 4.000% | 5/23/19 | 129,700 | 131,282 |
| | Massachusetts GO | 4.000% | 6/20/19 | 130,000 | 131,770 |
| 1 | Massachusetts GO TOB VRDO | 1.620% | 11/7/18 | 4,484 | 4,484 |
22
| | | | | |
| Municipal Money Market Fund | | | | |
| |
| |
| |
| | | | | Face | Market |
| | | | Maturity | Amount | Value • |
| | | Coupon | Date | ($000) | ($000) |
| 1 | Massachusetts GO TOB VRDO | 1.620% | 11/7/18 LOC | 15,000 | 15,000 |
| 1 | Massachusetts GO TOB VRDO | 1.630% | 11/7/18 | 15,000 | 15,000 |
| 1 | Massachusetts GO TOB VRDO | 1.630% | 11/7/18 | 10,000 | 10,000 |
| 1 | Massachusetts GO TOB VRDO | 1.630% | 11/7/18 | 3,750 | 3,750 |
| 1 | Massachusetts GO TOB VRDO | 1.630% | 11/7/18 LOC | 85,000 | 85,000 |
| 1 | Massachusetts GO TOB VRDO | 1.630% | 11/7/18 | 3,335 | 3,335 |
| 1 | Massachusetts GO TOB VRDO | 1.630% | 11/7/18 (Prere.) | 3,750 | 3,750 |
| 1 | Massachusetts Health & Educational | | | | |
| | Facilities Authority Revenue | | | | |
| | (Partners Healthcare System) TOB VRDO | 1.630% | 11/7/18 (Prere.) | 8,900 | 8,900 |
| | Massachusetts Health & Educational | | | | |
| | Facilities Authority Revenue | | | | |
| | (Pool Loan Program) VRDO | 1.590% | 11/7/18 LOC | 6,800 | 6,800 |
| 1,2 | Massachusetts School Building Authority | | | | |
| | Dedicated Sales Tax Revenue TOB PUT | 1.750% | 11/22/18 | 3,900 | 3,900 |
| 1 | Massachusetts School Building Authority | | | | |
| | Dedicated Sales Tax Revenue TOB VRDO | 1.620% | 11/7/18 | 4,600 | 4,600 |
| 1 | Massachusetts School Building Authority | | | | |
| | Dedicated Sales Tax Revenue TOB VRDO | 1.630% | 11/7/18 | 7,000 | 7,000 |
| 1 | Massachusetts School Building Authority | | | | |
| | Dedicated Sales Tax Revenue TOB VRDO | 1.630% | 11/7/18 | 4,125 | 4,125 |
| 1 | Massachusetts School Building Authority | | | | |
| | TOB VRDO | 1.630% | 11/7/18 | 12,135 | 12,135 |
| 1,2 | Massachusetts Special Obligation Dedicated | | | | |
| | Tax Revenue TOB PUT | 1.780% | 1/2/19 LOC | 4,000 | 4,000 |
| 1 | Massachusetts Water Resources Authority | | | | |
| | Revenue TOB VRDO | 1.630% | 11/7/18 (Prere.) | 5,000 | 5,000 |
| 1 | Nuveen Quality Municipal Income Fund | | | | |
| | VRDP VRDO | 1.750% | 11/7/18 LOC | 92,400 | 92,400 |
| | Quincy MA BAN | 2.500% | 1/18/19 | 14,056 | 14,088 |
| | University of Massachusetts Building | | | | |
| | Authority Revenue PUT | 1.900% | 5/29/19 | 60,585 | 60,585 |
| 1 | University of Massachusetts Building | | | | |
| | Authority Revenue TOB VRDO | 1.630% | 11/7/18 | 8,000 | 8,000 |
| 1 | University of Massachusetts Building | | | | |
| | Authority Revenue TOB VRDO | 1.630% | 11/7/18 | 7,500 | 7,500 |
| 1 | University of Massachusetts Building | | | | |
| | Authority TOB VRDO | 1.620% | 11/7/18 | 3,935 | 3,935 |
| | | | | | 714,844 |
| Michigan (2.2%) | | | | |
| 1 | Clarkston MI Community Schools | | | | |
| | GO TOB VRDO | 1.630% | 11/7/18 LOC | 5,000 | 5,000 |
| 1 | Detroit MI Sewage Disposal System Revenue | | | | |
| | TOB VRDO | 1.630% | 11/7/18 (13) | 18,150 | 18,150 |
| 1 | Detroit MI Sewage Disposal System Revenue | | | | |
| | TOB VRDO | 1.630% | 11/7/18 (13) | 20,095 | 20,095 |
| | Kent Hospital Finance Authority Michigan | | | | |
| | Revenue (Spectrum Health System) PUT | 1.850% | 5/29/19 | 38,255 | 38,255 |
| 1 | Michigan Building Authority Revenue | | | | |
| | TOB VRDO | 1.660% | 11/7/18 | 8,500 | 8,500 |
| | Michigan Building Authority Revenue VRDO | 1.600% | 11/7/18 LOC | 48,435 | 48,435 |
| | Michigan Finance Authority Revenue | | | | |
| | (Trinity Health Credit Group) PUT | 1.750% | 12/3/18 | 6,500 | 6,500 |
23
| | | | |
| Municipal Money Market Fund | | | | |
| |
| |
| |
| | | | Face | Market |
| | | Maturity | Amount | Value • |
| | Coupon | Date | ($000) | ($000) |
| 1 Michigan Finance Authority Revenue | | | | |
| (Trinity Health Credit Group) TOB VRDO | 1.630% | 11/7/18 LOC | 14,300 | 14,300 |
| 1 Michigan Finance Authority Revenue | | | | |
| (Trinity Health Credit Group) TOB VRDO | 1.630% | 11/7/18 | 3,000 | 3,000 |
| 1 Michigan Finance Authority Revenue | | | | |
| (Trinity Health Credit Group) TOB VRDO | 1.630% | 11/7/18 | 3,780 | 3,780 |
| 1 Michigan Finance Authority Revenue | | | | |
| (Trinity Health Credit Group) TOB VRDO | 1.640% | 11/7/18 | 4,070 | 4,070 |
| 1 Michigan Hospital Finance Authority Revenue | | | | |
| (Ascension Health Credit Group) TOB VRDO | 1.630% | 11/7/18 | 4,475 | 4,475 |
| 1 Michigan Housing Development Authority | | | | |
| Revenue TOB VRDO | 1.630% | 11/7/18 | 7,500 | 7,500 |
| Michigan Housing Development Authority | | | | |
| Revenue VRDO | 1.620% | 11/7/18 | 112,150 | 112,150 |
| 1 Michigan Housing Development Authority | | | | |
| Single Family Mortgage Revenue TOB VRDO | 1.630% | 11/7/18 | 15,835 | 15,835 |
| Michigan Housing Development Authority | | | | |
| Single Family Mortgage Revenue VRDO | 1.620% | 11/7/18 | 42,315 | 42,315 |
| 1 Michigan State Building Authority TOB VRDO | 1.750% | 11/7/18 | 5,015 | 5,015 |
| 1 Michigan State Housing Development | | | | |
| Authority TOB VRDO | 1.630% | 11/7/18 | 7,500 | 7,500 |
| Regents of the University of Michigan CP | 1.670% | 11/5/18 | 15,000 | 15,000 |
| 1 University of Michigan Revenue TOB VRDO | 1.630% | 11/7/18 | 5,977 | 5,977 |
| 1 University of Michigan Revenue TOB VRDO | 1.630% | 11/7/18 | 2,700 | 2,700 |
| | | | | 388,552 |
| Minnesota (0.2%) | | | | |
| 1 Minnesota GO TOB VRDO | 1.630% | 11/7/18 | 3,510 | 3,510 |
| Minnesota Housing Finance Agency | | | | |
| Residential Housing Revenue VRDO | 1.600% | 11/7/18 | 4,500 | 4,500 |
| Minnesota Housing Finance Agency | | | | |
| Residential Housing Revenue VRDO | 1.630% | 11/7/18 | 13,150 | 13,150 |
| St. Paul MN Housing & Redevelopment | | | | |
| Authority Revenue (Highland Ridge Project) | | | | |
| VRDO | 1.600% | 11/7/18 LOC | 5,250 | 5,250 |
| 1 Western Minnesota Municipal Power Agency | | | | |
| Revenue TOB VRDO | 1.630% | 11/7/18 | 6,665 | 6,665 |
| | | | | 33,075 |
| Mississippi (0.8%) | | | | |
| Mississippi Business Finance Corp. Gulf | | | | |
| Opportunity Zone Industrial Development | | | | |
| Revenue (Chevron USA Inc. Project) VRDO | 1.670% | 11/1/18 | 18,855 | 18,855 |
| Mississippi Business Finance Corp. Gulf | | | | |
| Opportunity Zone Industrial Development | | | | |
| Revenue (Chevron USA Inc. Project) VRDO | 1.670% | 11/1/18 | 14,050 | 14,050 |
| Mississippi Business Finance Corp. Gulf | | | | |
| Opportunity Zone Industrial Development | | | | |
| Revenue (Chevron USA Inc. Project) VRDO | 1.670% | 11/1/18 | 9,900 | 9,900 |
| Mississippi Business Finance Corp. Gulf | | | | |
| Opportunity Zone Industrial Development | | | | |
| Revenue (Chevron USA Inc. Project) VRDO | 1.670% | 11/1/18 | 9,320 | 9,320 |
| Mississippi Business Finance Corp. Gulf | | | | |
| Opportunity Zone Industrial Development | | | | |
| Revenue (Chevron USA Inc. Project) VRDO | 1.670% | 11/1/18 | 7,325 | 7,325 |
24
| | | | | |
| Municipal Money Market Fund | | | | |
| |
| |
| |
| | | | | Face | Market |
| | | | Maturity | Amount | Value • |
| | | Coupon | Date | ($000) | ($000) |
| | Mississippi Business Finance Corp. Gulf | | | | |
| | Opportunity Zone Industrial Development | | | | |
| | Revenue (Chevron USA Inc. Project) VRDO | 1.710% | 11/1/18 | 29,000 | 29,000 |
| | Mississippi Business Finance Corp. Gulf | | | | |
| | Opportunity Zone Industrial Development | | | | |
| | Revenue (Chevron USA Inc. Project) VRDO | 1.710% | 11/1/18 | 10,000 | 10,000 |
| | Mississippi Business Finance Corp. Gulf | | | | |
| | Opportunity Zone Industrial Development | | | | |
| | Revenue (Chevron USA Inc. Project) VRDO | 1.610% | 11/7/18 | 3,250 | 3,250 |
| | Mississippi Business Finance Corp. Gulf | | | | |
| | Opportunity Zone Industrial Development | | | | |
| | Revenue (Chevron USA Inc. Project) VRDO | 1.610% | 11/7/18 | 23,650 | 23,650 |
| | Mississippi Hospital Equipment & | | | | |
| | Facilities Authority Revenue (North | | | | |
| | Mississippi Health Services) VRDO | 1.610% | 11/7/18 | 8,200 | 8,200 |
| | | | | | 133,550 |
| Missouri (1.1%) | | | | |
| 1 | BJC Healthcare Obligated Group Revenue | | | | |
| | TOB VRDO | 1.630% | 11/7/18 | 5,000 | 5,000 |
| 1,2 | Kansas City MO Water Revenue TOB PUT | 1.750% | 11/29/18 | 8,610 | 8,610 |
| 1 | Missouri Health & Educational Facilities | | | | |
| | Authority Health Facilities Revenue | | | | |
| | (BJC Health System) TOB VRDO | 1.630% | 11/7/18 | 7,500 | 7,500 |
| 1 | Missouri Health & Educational Facilities | | | | |
| | Authority Health Facilities Revenue | | | | |
| | (BJC Health System) TOB VRDO | 1.630% | 11/7/18 | 8,000 | 8,000 |
| | Missouri Health & Educational Facilities | | | | |
| | Authority Health Facilities Revenue | | | | |
| | (BJC Health System) VRDO | 1.580% | 11/7/18 | 8,950 | 8,950 |
| | Missouri Health & Educational Facilities | | | | |
| | Authority Health Facilities Revenue | | | | |
| | (BJC Health System) VRDO | 1.580% | 11/7/18 | 1,070 | 1,070 |
| 1 | Missouri Health & Educational Facilities | | | | |
| | Authority Health Facilities Revenue | | | | |
| | (Mercy Health) TOB VRDO | 1.630% | 11/7/18 | 13,975 | 13,975 |
| 1 | Missouri Health & Educational Facilities | | | | |
| | Authority Health Facilities Revenue | | | | |
| | (Mercy Health) TOB VRDO | 1.630% | 11/7/18 | 4,170 | 4,170 |
| | Missouri Health & Educational Facilities | | | | |
| | Authority Health Facilities Revenue | | | | |
| | (SSM Health System) VRDO | 1.610% | 11/7/18 | 27,750 | 27,750 |
| | Missouri Health & Educational Facilities | | | | |
| | Authority Health Facilities Revenue | | | | |
| | (SSM Health System) VRDO | 1.610% | 11/7/18 | 15,700 | 15,700 |
| 1 | Missouri Health & Educational Facilities | | | | |
| | Authority Medical Research Facilities | | | | |
| | (Stowers Institute for Medical Research) | | | | |
| | TOB VRDO | 1.660% | 11/7/18 LOC | 50,000 | 50,000 |
| | Missouri Health & Educational Facilities | | | | |
| | Authority Revenue (St. Louis University) | | | | |
| | VRDO | 1.650% | 11/1/18 LOC | 6,600 | 6,600 |
| 1 | Missouri Health & Educational Facilities | | | | |
| | Authority Revenue (Washington University) | | | | |
| | TOB VRDO | 1.630% | 11/7/18 | 5,570 | 5,570 |
25
Municipal Money Market Fund
| | | | | |
| | | | | Face | Market |
| | | | Maturity | Amount | Value • |
| | | Coupon | Date | ($000) | ($000) |
| 1 | Missouri Health & Educational Facilities | | | | |
| | Authority Revenue (Washington University) | | | | |
| | TOB VRDO | 1.630% | 11/7/18 | 6,665 | 6,665 |
| | St. Joseph MO Industrial Development | | | | |
| | Authority Health Facilities Revenue | | | | |
| | (Heartland Regional Medical Center) VRDO | 1.650% | 11/1/18 LOC | 16,890 | 16,890 |
| 1 | St. Louis MO Sewer & Wastewater Revenue | | | | |
| | TOB VRDO | 1.630% | 11/7/18 | 3,335 | 3,335 |
| 1 | St. Louis MO Sewer & Wastewater Revenue | | | | |
| | TOB VRDO | 1.630% | 11/7/18 | 5,340 | 5,340 |
| | | | | | 195,125 |
| Multiple States (10.7%) | | | | |
| 4 | Federal Home Loan Mortgage Corp. | | | | |
| | Multifamily Housing Revenue TOB VRDO | 1.620% | 11/7/18 LOC | 44,805 | 44,805 |
| 4 | Federal Home Loan Mortgage Corp. | | | | |
| | Multifamily Housing Revenue TOB VRDO | 1.630% | 11/7/18 LOC | 12,115 | 12,115 |
| 4 | Federal Home Loan Mortgage Corp. | | | | |
| | Multifamily Housing Revenue TOB VRDO | 1.630% | 11/7/18 LOC | 43,275 | 43,275 |
| 1,4 | Federal Home Loan Mortgage Corp. | | | | |
| | Multifamily Housing Revenue TOB VRDO | 1.640% | 11/7/18 LOC | 355,105 | 355,105 |
| 1,4 | Federal Home Loan Mortgage Corp. | | | | |
| | Multifamily Housing Revenue TOB VRDO | 1.640% | 11/7/18 LOC | 274,085 | 274,085 |
| 4 | Federal Home Loan Mortgage Corp. | | | | |
| | Multifamily Housing Revenue TOB VRDO | 1.650% | 11/7/18 LOC | 24,595 | 24,595 |
| 4 | Federal Home Loan Mortgage Corp. | | | | |
| | Multifamily Housing Revenue TOB VRDO | 1.650% | 11/7/18 LOC | 9,691 | 9,691 |
| 4 | Federal Home Loan Mortgage Corp. | | | | |
| | Multifamily Housing Revenue TOB VRDO | 1.660% | 11/7/18 LOC | 60,690 | 60,690 |
| 1 | Nuveen AMT-Free Municipal Income Fund | | | | |
| | VRDP VRDO | 1.680% | 11/7/18 | 31,500 | 31,500 |
| 1 | Nuveen AMT-Free Municipal Income Fund | | | | |
| | VRDP VRDO | 1.680% | 11/7/18 LOC | 7,000 | 7,000 |
| 1 | Nuveen AMT-Free Quality Municipal Income | | | | |
| | Fund VRDP VRDO | 1.650% | 11/7/18 LOC | 106,300 | 106,300 |
| 1 | Nuveen California AMT-Free Quality Municipal | | | | |
| | Income Fund VRDP VRDO | 1.690% | 11/7/18 LOC | 35,000 | 35,000 |
| 1 | Nuveen Enhanced AMT-Free Municipal Credit | | | | |
| | Opportunities Fund VRDP VRDO | 1.680% | 11/7/18 | 172,000 | 172,000 |
| 1 | Nuveen Enhanced AMT-Free Municipal Credit | | | | |
| | Opportunities Fund VRDP VRDO | 1.680% | 11/7/18 LOC | 127,800 | 127,800 |
| 1 | Nuveen Enhanced AMT-Free Municipal Credit | | | | |
| | Opportunities Fund VRDP VRDO | 1.690% | 11/7/18 LOC | 117,700 | 117,700 |
| 1 | Nuveen Municipal Credit Income Fund | | | | |
| | VRDP VRDO | 1.720% | 11/7/18 LOC | 107,000 | 107,000 |
| 1 | Nuveen Quality Municipal Income Fund | | | | |
| | VRDP VRDO | 1.750% | 11/7/18 LOC | 111,100 | 111,100 |
| 1 | Nuveen Quality Municipal Income Fund | | | | |
| | VRDP VRDO | 1.750% | 11/7/18 LOC | 43,000 | 43,000 |
| 1 | Western Asset Intermediate Municipal | | | | |
| | Fund Inc. VRDP VRDO | 1.750% | 11/7/18 LOC | 18,200 | 18,200 |
| 1 | Western Asset Managed Municipals Fund Inc. | | | | |
| | VRDP VRDO | 1.750% | 11/7/18 LOC | 144,075 | 144,075 |
| 1 | Western Asset Municipal Partners Fund Inc. | | | | |
| | VRDP VRDO | 1.750% | 11/7/18 LOC | 50,200 | 50,200 |
| | | | | | 1,895,236 |
26
| | | | | |
| Municipal Money Market Fund | | | | |
| |
| |
| |
| | | | | Face | Market |
| | | | Maturity | Amount | Value • |
| | | Coupon | Date | ($000) | ($000) |
| Nebraska (1.5%) | | | | |
| 1 | Douglas County NE Hospital Authority | | | | |
| | No. 3 HealthFacilities Revenue (Nebraska | | | | |
| | Methodist Health System) TOB VRDO | 1.630% | 11/7/18 (13)(Prere.) | 10,060 | 10,060 |
| 1,2 | Douglas County NE School District No. 1 | | | | |
| | GO TOB PUT | 1.750% | 11/1/18 | 8,930 | 8,930 |
| | Lincoln NE Electric System Revenue CP | 1.740% | 11/5/18 | 32,750 | 32,750 |
| 1 | Nebraska Investment Finance Authority | | | | |
| | MultifamilyHousing Revenue (Riverbend | | | | |
| | Apartments Project) VRDO | 1.670% | 11/7/18 LOC | 5,245 | 5,245 |
| 1 | Nebraska Investment Finance Authority | | | | |
| | Single Family Housing Revenue TOB VRDO | 1.630% | 11/7/18 | 7,500 | 7,500 |
| 1 | Nebraska Investment Finance Authority | | | | |
| | Single Family Housing Revenue TOB VRDO | 1.630% | 11/7/18 | 7,500 | 7,500 |
| | Nebraska Investment Finance Authority | | | | |
| | Single Family Housing Revenue VRDO | 1.620% | 11/7/18 | 33,310 | 33,310 |
| | Nebraska Investment Finance Authority | | | | |
| | Single Family Housing Revenue VRDO | 1.690% | 11/7/18 | 27,810 | 27,810 |
| | Nebraska Investment Finance Authority | | | | |
| | Single Family Housing Revenue VRDO | 1.690% | 11/7/18 | 23,000 | 23,000 |
| 1 | Nebraska Public Power Agency Revenue | | | | |
| | TOB VRDO | 1.630% | 11/7/18 (13) | 27,500 | 27,500 |
| 1 | Nebraska Public Power Generation Agency | | | | |
| | Revenue (Whelan Energy Center Unit 2) | | | | |
| | TOB VRDO | 1.630% | 11/7/18 (13) | 76,870 | 76,870 |
| 1 | Omaha NE Public Power District Electric | | | | |
| | Revenue TOB VRDO | 1.630% | 11/7/18 | 7,400 | 7,400 |
| | | | | | 267,875 |
| Nevada (2.4%) | | | | |
| | Clark County NV Airport Improvement | | | | |
| | Revenue VRDO | 1.600% | 11/7/18 LOC | 4,050 | 4,050 |
| | Clark County NV Airport Improvement | | | | |
| | Revenue VRDO | 1.670% | 11/7/18 LOC | 20,300 | 20,300 |
| | Clark County NV Airport System Revenue | | | | |
| | VRDO | 1.650% | 11/7/18 LOC | 39,940 | 39,940 |
| | Clark County NV GO | 5.000% | 11/1/18 | 12,655 | 12,655 |
| 1,2 | Clark County NV GO TOB PUT | 1.750% | 11/1/18 | 6,400 | 6,400 |
| 1,2 | Clark County NV GO TOB PUT | 1.750% | 12/20/18 | 8,635 | 8,635 |
| 1 | Clark County NV Water Reclamation District | | | | |
| | GO TOB VRDO | 1.630% | 11/7/18 (Prere.) | 14,805 | 14,805 |
| 1 | Clark NV GO TOB VRDO | 1.630% | 11/7/18 | 11,000 | 11,000 |
| 1 | Las Vegas NV Convention & Visitors Authority | | | | |
| | Revenue (Clark County) GO TOB VRDO | 1.630% | 11/7/18 | 6,840 | 6,840 |
| 1 | Las Vegas NV GO TOB VRDO | 1.630% | 11/7/18 (Prere.) | 8,330 | 8,330 |
| 1 | Las Vegas NV GO TOB VRDO | 1.640% | 11/7/18 (Prere.) | 10,850 | 10,850 |
| 1 | Las Vegas Valley Water District Nevada | | | | |
| | GO TOB VRDO | 1.630% | 11/7/18 LOC | 10,000 | 10,000 |
| | Las Vegas Valley Water District Nevada GO CP | 1.660% | 11/15/18 | 50,000 | 50,000 |
| | Las Vegas Valley Water District Nevada GO CP | 1.700% | 12/5/18 | 50,000 | 50,000 |
| | Las Vegas Valley Water District Nevada GO CP | 1.780% | 12/13/18 | 50,000 | 50,000 |
| | Las Vegas Valley Water District Nevada GO CP | 1.820% | 3/1/19 | 22,000 | 22,000 |
| 1 | Las Vegas Valley Water District Nevada | | | | |
| | GO TOB VRDO | 1.630% | 11/7/18 | 22,475 | 22,475 |
27
| | | | | |
| Municipal Money Market Fund | | | | |
| |
| |
| |
| | | | | Face | Market |
| | | | Maturity | Amount | Value • |
| | | Coupon | Date | ($000) | ($000) |
| 1 | Las Vegas Valley Water District Nevada | | | | |
| | GO TOB VRDO | 1.630% | 11/7/18 | 16,500 | 16,500 |
| 1 | Las Vegas Valley Water District Nevada | | | | |
| | GO TOB VRDO | 1.640% | 11/7/18 | 7,185 | 7,185 |
| 1,2 | Nevada Highway Improvement Revenue | | | | |
| | (Motor Vehicle Fuel Tax) TOB PUT | 1.750% | 12/6/18 | 11,870 | 11,870 |
| | Reno NV Hospital Revenue (Renown Regional | | | | |
| | Medical Center Project) VRDO | 1.630% | 11/7/18 LOC | 27,305 | 27,305 |
| | Truckee Meadows NV Water Authority Water | | | | |
| | Revenue | 1.720% | 12/4/18 LOC | 5,875 | 5,875 |
| | | | | | 417,015 |
| New Hampshire (0.1%) | | | | |
| 1 | New Hampshire Health & Education Facilities | | | | |
| | Authority Revenue (Dartmouth College) | | | | |
| | TOB VRDO | 1.630% | 11/7/18 | 8,000 | 8,000 |
| 1 | New Hampshire Health & Education Facilities | | | | |
| | Authority Revenue (Dartmouth College) | | | | |
| | TOB VRDO | 1.630% | 11/7/18 | 13,225 | 13,225 |
| | | | | | 21,225 |
| New Jersey (2.4%) | | | | |
| | Bergen County NJ GO | 2.500% | 12/13/18 | 40,000 | 40,051 |
| | Bergen County NJ Improvement Authority | | | | |
| | Revenue (Emerson/Oradell Land Acquisition | | | | |
| | Project) | 2.500% | 12/12/18 | 7,500 | 7,509 |
| | Burlington County NJ Bridge Commission | | | | |
| | Revenue | 2.500% | 12/12/18 | 7,500 | 7,508 |
| | Burlington County NJ GO | 3.000% | 5/9/19 | 50,000 | 50,281 |
| | Cape May NJ GO | 3.000% | 10/30/19 | 23,000 | 23,206 |
| 3 | Fort Lee NJ BAN | 4.000% | 11/8/19 | 35,185 | 35,819 |
| | Freehold NJ BAN | 2.500% | 11/7/18 | 5,000 | 5,001 |
| | Hudson County NJ BAN | 3.000% | 12/12/18 | 76,000 | 76,127 |
| | Mahwah Township NJ BAN | 2.750% | 8/2/19 | 12,250 | 12,336 |
| | Mahwah Township NJ BAN | 3.000% | 10/4/19 | 3,900 | 3,933 |
| | Monroe Township NJ BAN | 3.000% | 6/11/19 | 18,000 | 18,133 |
| 3 | Montclair NJ BAN | 3.500% | 11/1/19 | 6,000 | 6,080 |
| | Montclair NJ GO | 2.500% | 11/2/18 | 6,270 | 6,270 |
| | New Jersey Economic Development Authority | | | | |
| | Industrial Development Revenue (Ocean | | | | |
| | Spray Cranberries Inc. Project) VRDO | 1.750% | 11/7/18 LOC | 8,000 | 8,000 |
| | New Jersey Educational Facilities Authority | | | | |
| | Revenue (Institute for Advanced Studies) | | | | |
| | VRDO | 1.590% | 11/7/18 | 1,550 | 1,550 |
| | New Jersey Housing & Mortgage Finance | | | | |
| | Agency Multi-Family Housing Revenue | | | | |
| | VRDO | 1.550% | 11/7/18 LOC | 4,795 | 4,795 |
| 1 | New Jersey Housing & Mortgage Finance | | | | |
| | Agency Multi-Family Housing Revenue | | | | |
| | TOB VRDO | 1.650% | 11/7/18 | 15,000 | 15,000 |
| | New Jersey Housing & Mortgage Finance | | | | |
| | Agency Single Family Housing Revenue | | | | |
| | VRDO | 1.650% | 11/7/18 | 12,295 | 12,295 |
| | Ocean Township NJ Monmouth County BAN | 3.000% | 1/23/19 | 7,326 | 7,349 |
| | Paramus NJ BAN | 3.000% | 10/18/19 | 5,471 | 5,512 |
28
| | | | |
| Municipal Money Market Fund | | | | |
| |
| |
| |
| | | | Face | Market |
| | | Maturity | Amount | Value • |
| | Coupon | Date | ($000) | ($000) |
| Passaic County NJ Improvement Authority | | | | |
| Government Loan Revenue (City of | | | | |
| Paterson Project) | 3.250% | 8/27/19 | 11,605 | 11,722 |
| Rutgers State University New Jersey CP | 1.800% | 12/17/18 | 8,177 | 8,177 |
| Secaucus NJ BAN | 2.750% | 8/9/19 | 9,000 | 9,059 |
| Somerset County NJ Improvement Authority | | | | |
| Capital Equipment Lease Revenue | 3.000% | 12/14/18 | 5,000 | 5,009 |
| South Brunswick Township NJ BAN | 3.000% | 10/2/19 | 15,313 | 15,441 |
| Teaneck NJ BAN | 3.000% | 8/9/19 | 9,750 | 9,833 |
| West Milford NJ BAN | 3.000% | 9/20/19 | 11,000 | 11,094 |
| | | | | 417,090 |
| New Mexico (0.6%) | | | | |
| 1 New Mexico Educational Assistance | | | | |
| Foundation Revenue TOB VRDO | 1.670% | 11/7/18 LOC | 37,425 | 37,425 |
| New Mexico Hospital Equipment Loan | | | | |
| Council Hospital System Revenue | | | | |
| (Presbyterian Healthcare Services) VRDO | 1.670% | 11/1/18 | 14,400 | 14,400 |
| New Mexico Hospital Equipment Loan | | | | |
| Council Hospital System Revenue | | | | |
| (Presbyterian Healthcare Services) VRDO | 1.640% | 11/7/18 | 54,350 | 54,350 |
| | | | | 106,175 |
| New York (13.4%) | | | | |
| Amherst NY BAN | 2.000% | 11/8/18 | 16,946 | 16,949 |
| Bellmore NY Union Free School District BAN | 3.000% | 6/28/19 | 2,700 | 2,716 |
| Connetquot NY Central School District of | | | | |
| Islip GO | 3.000% | 6/27/19 | 15,700 | 15,811 |
| East Irondequoit NY Central School District | | | | |
| BAN | 2.750% | 6/28/19 | 6,500 | 6,527 |
| Hampton Bays NY Union Free School District | | | | |
| BAN | 3.000% | 6/19/19 | 5,500 | 5,532 |
| Hampton Bays NY Union Free School District | | | | |
| BAN | 3.000% | 6/20/19 | 6,200 | 6,238 |
| Hauppauge NY Union Free School District | | | | |
| TAN | 3.000% | 6/21/19 | 12,300 | 12,387 |
| Herricks NY Union Free School District TAN | 3.000% | 6/21/19 | 2,900 | 2,918 |
| 3 Jefferson NY BAN | 3.000% | 11/1/19 | 6,500 | 6,557 |
| Longwood NY Central School District Suffolk | | | | |
| County GO | 3.000% | 6/21/19 | 23,000 | 23,173 |
| Mechanicville NY School District BAN | 3.000% | 6/21/19 | 11,600 | 11,687 |
| Middle Country NY Central School District | | | | |
| Centereach GO | 3.000% | 6/25/19 | 28,500 | 28,714 |
| New Rochelle NY BAN | 2.500% | 3/1/19 | 8,100 | 8,126 |
| New Rochelle NY City School District BAN | 3.000% | 7/12/19 | 25,000 | 25,208 |
| 1 New York City NY GO TOB VRDO | 1.630% | 11/7/18 | 8,250 | 8,250 |
| New York City NY GO VRDO | 1.700% | 11/1/18 | 11,285 | 11,285 |
| New York City NY GO VRDO | 1.600% | 11/7/18 LOC | 21,460 | 21,460 |
| New York City NY GO VRDO | 1.600% | 11/7/18 LOC | 21,475 | 21,475 |
| New York City NY GO VRDO | 1.600% | 11/7/18 LOC | 46,700 | 46,700 |
| New York City NY GO VRDO | 1.600% | 11/7/18 LOC | 28,310 | 28,310 |
| New York City NY GO VRDO | 1.610% | 11/7/18 LOC | 7,550 | 7,550 |
| New York City NY GO VRDO | 1.680% | 11/7/18 LOC | 35,160 | 35,160 |
| New York City NY Housing Development | | | | |
| Corp. Multi-Family Housing Revenue | | | | |
| (201 Pearl Street) VRDO | 1.620% | 11/7/18 LOC | 35,200 | 35,200 |
29
Municipal Money Market Fund
| | | | |
| | | | Face | Market |
| | | Maturity | Amount | Value • |
| | Coupon | Date | ($000) | ($000) |
| New York City NY Housing Development | | | | |
| Corp. Multi-Family Mortgage Revenue | | | | |
| (1405 Fifth Avenue Apartments) VRDO | 1.650% | 11/7/18 LOC | 3,765 | 3,765 |
| New York City NY Housing Development | | | | |
| Corp. Multi-Family Mortgage Revenue | | | | |
| (Elliot Chelsea Development) VRDO | 1.600% | 11/7/18 LOC | 14,170 | 14,170 |
| New York City NY Housing Development | | | | |
| Corp. Multi-Family Mortgage Revenue | | | | |
| (Morris Avenue Apartments) VRDO | 1.650% | 11/7/18 LOC | 14,700 | 14,700 |
| New York City NY Housing Development | | | | |
| Corp. Multi-Family Mortgage Revenue | | | | |
| (West 26th Street Development) VRDO | 1.620% | 11/7/18 LOC | 11,450 | 11,450 |
| New York City NY Housing Development | | | | |
| Corp. Multi-Family Rental Housing Revenue | | | | |
| (2 Gold Street) VRDO | 1.620% | 11/7/18 LOC | 114,000 | 114,000 |
| New York City NY Housing Development | | | | |
| Corp. Multi-Family Rental Housing Revenue | | | | |
| (90 West Street) VRDO | 1.620% | 11/7/18 LOC | 24,200 | 24,200 |
| New York City NY Housing Development | | | | |
| Corp. Multi-Family Rental Housing Revenue | | | | |
| (Atlantic Court Apartments) VRDO | 1.670% | 11/7/18 LOC | 48,200 | 48,200 |
| New York City NY Housing Development | | | | |
| Corp. Revenue VRDO | 1.670% | 11/7/18 LOC | 15,400 | 15,400 |
| New York City NY Housing Finance Agency | | | | |
| Revenue (211 North End Avenue) VRDO | 1.620% | 11/7/18 LOC | 50,400 | 50,400 |
| New York City NY Housing Finance Agency | | | | |
| Revenue (900 Eighth Avenue) VRDO | 1.650% | 11/7/18 LOC | 74,400 | 74,400 |
| New York City NY Industrial Development | | | | |
| Agency Special Facility Revenue ( | | | | |
| New York Stock Exchange Project) VRDO | 1.640% | 11/7/18 LOC | 4,900 | 4,900 |
| 1 New York City NY Municipal Water Finance | | | | |
| Authority Water & Sewer System Revenue | | | | |
| TOB VRDO | 1.700% | 11/1/18 LOC | 9,300 | 9,300 |
| 1 New York City NY Municipal Water Finance | | | | |
| Authority Water & Sewer System Revenue | | | | |
| TOB VRDO | 1.630% | 11/7/18 | 5,000 | 5,000 |
| 1 New York City NY Municipal Water Finance | | | | |
| Authority Water & Sewer System Revenue | | | | |
| TOB VRDO | 1.630% | 11/7/18 | 16,800 | 16,800 |
| 1 New York City NY Municipal Water Finance | | | | |
| Authority Water & Sewer System Revenue | | | | |
| TOB VRDO | 1.630% | 11/7/18 | 7,800 | 7,800 |
| 1 New York City NY Municipal Water Finance | | | | |
| Authority Water & Sewer System Revenue | | | | |
| TOB VRDO | 1.630% | 11/7/18 | 28,000 | 28,000 |
| 1 New York City NY Municipal Water Finance | | | | |
| Authority Water & Sewer System Revenue | | | | |
| TOB VRDO | 1.630% | 11/7/18 | 5,650 | 5,650 |
| 1 New York City NY Municipal Water Finance | | | | |
| Authority Water & Sewer System Revenue | | | | |
| TOB VRDO | 1.630% | 11/7/18 | 14,030 | 14,030 |
| New York City NY Municipal Water Finance | | | | |
| Authority Water & Sewer System Revenue | | | | |
| VRDO | 1.700% | 11/1/18 | 4,300 | 4,300 |
30
| | | | |
| Municipal Money Market Fund | | | | |
| |
| |
| |
| | | | Face | Market |
| | | Maturity | Amount | Value • |
| | Coupon | Date | ($000) | ($000) |
| New York City NY Municipal Water Finance | | | | |
| Authority Water & Sewer System Revenue | | | | |
| VRDO | 1.600% | 11/7/18 | 48,000 | 48,000 |
| New York City NY Municipal Water Finance | | | | |
| Authority Water & Sewer System Revenue | | | | |
| VRDO | 1.600% | 11/7/18 | 29,000 | 29,000 |
| New York City NY Municipal Water Finance | | | | |
| Authority Water & Sewer System Revenue | | | | |
| VRDO | 1.600% | 11/7/18 | 7,000 | 7,000 |
| 1 New York City NY Transitional Finance | | | | |
| Authority Building Aid Revenue TOB VRDO | 1.620% | 11/7/18 | 8,205 | 8,205 |
| 1 New York City NY Transitional Finance | | | | |
| Authority Building Aid Revenue TOB VRDO | 1.630% | 11/7/18 | 10,535 | 10,535 |
| 1 New York City NY Transitional Finance | | | | |
| Authority Future Tax Revenue TOB VRDO | 1.620% | 11/7/18 | 4,200 | 4,200 |
| 1 New York City NY Transitional Finance | | | | |
| Authority Future Tax Revenue TOB VRDO | 1.630% | 11/7/18 | 17,020 | 17,020 |
| 1 New York City NY Transitional Finance | | | | |
| Authority Future Tax Revenue TOB VRDO | 1.630% | 11/7/18 | 25,000 | 25,000 |
| 1 New York City NY Transitional Finance | | | | |
| Authority Future Tax Revenue TOB VRDO | 1.630% | 11/7/18 | 1,500 | 1,500 |
| 1 New York City NY Transitional Finance | | | | |
| Authority Future Tax Revenue TOB VRDO | 1.630% | 11/7/18 | 6,000 | 6,000 |
| 1 New York City NY Transitional Finance | | | | |
| Authority Future Tax Revenue TOB VRDO | 1.630% | 11/7/18 | 6,200 | 6,200 |
| New York City NY Transitional Finance | | | | |
| Authority Future Tax Revenue VRDO | 1.590% | 11/7/18 | 47,975 | 47,975 |
| 1 New York City NY Transitional Finance | | | | |
| Authority Future Tax Secured Revenue | | | | |
| TOB VRDO | 1.620% | 11/7/18 | 4,600 | 4,600 |
| 1 New York City Transitional Finance Authority | | | | |
| Future Tax Secured Revenue TOB VRDO | 1.700% | 11/1/18 LOC | 22,500 | 22,500 |
| 1 New York Liberty Development Corp. | | | | |
| Revenue (Bank of America Tower at | | | | |
| One Bryant Park Project) TOB VRDO | 1.630% | 11/7/18 | 9,000 | 9,000 |
| New York Liberty Development Corp. | | | | |
| Revenue (Greenwich LLC) VRDO | 1.640% | 11/7/18 LOC | 7,700 | 7,700 |
| 1 New York Liberty Development Corp. | | | | |
| Revenue (Port Authority Consolidated | | | | |
| Bonds) TOB VRDO | 1.650% | 11/7/18 | 22,200 | 22,200 |
| New York Metropolitan Transportation | | | | |
| Authority Revenue (Dedicated Tax Fund) | | | | |
| VRDO | 1.600% | 11/7/18 LOC | 48,700 | 48,700 |
| 1 New York Metropolitan Transportation | | | | |
| Authority Revenue TOB VRDO | 1.620% | 11/7/18 | 7,350 | 7,350 |
| New York Metropolitan Transportation | | | | |
| Authority Revenue VRDO | 1.600% | 11/7/18 LOC | 9,620 | 9,620 |
| 1 New York State Dormitory Authority Lease | | | | |
| Revenue (State University Dormitory | | | | |
| Facilities) TOB VRDO | 1.620% | 11/7/18 | 5,820 | 5,820 |
| New York State Dormitory Authority Revenue | | | | |
| (City University System) VRDO | 1.630% | 11/7/18 LOC | 77,810 | 77,810 |
| 1 New York State Dormitory Authority Revenue | | | | |
| (Personal Income Tax) TOB VRDO | 1.630% | 11/7/18 (Prere.) | 6,730 | 6,730 |
31
Municipal Money Market Fund
| | | | |
| | | | Face | Market |
| | | Maturity | Amount | Value • |
| | Coupon | Date | ($000) | ($000) |
| 1 New York State Dormitory Authority Revenue | | | | |
| (Personal Income Tax) TOB VRDO | 1.630% | 11/7/18 | 25,700 | 25,700 |
| 1 New York State Dormitory Authority Revenue | | | | |
| (Personal Income Tax) TOB VRDO | 1.630% | 11/7/18 (Prere.) | 6,425 | 6,425 |
| 1 New York State Dormitory Authority Revenue | | | | |
| (Personal Income Tax) TOB VRDO | 1.630% | 11/7/18 | 5,000 | 5,000 |
| 1 New York State Dormitory Authority Revenue | | | | |
| (Personal Income Tax) TOB VRDO | 1.630% | 11/7/18 | 1,875 | 1,875 |
| 1 New York State Dormitory Authority Revenue | | | | |
| (Personal Income Tax) TOB VRDO | 1.630% | 11/7/18 | 11,860 | 11,860 |
| 1 New York State Dormitory Authority Sales | | | | |
| Tax Revenue TOB VRDO | 1.620% | 11/7/18 | 16,770 | 16,770 |
| 1 New York State Dormitory Authority Sales | | | | |
| Tax Revenue TOB VRDO | 1.620% | 11/7/18 | 7,800 | 7,800 |
| 1 New York State Dormitory Authority Sales | | | | |
| Tax Revenue TOB VRDO | 1.620% | 11/7/18 | 10,600 | 10,600 |
| 1 New York State Dormitory Authority | | | | |
| TOB VRDO | 1.620% | 11/7/18 | 20,245 | 20,245 |
| 1 New York State Dormitory Authority | | | | |
| TOB VRDO | 1.630% | 11/7/18 | 21,870 | 21,870 |
| New York State Energy Research & | | | | |
| Development Authority Pollution Control | | | | |
| Revenue (Consolidated Edison Co. of | | | | |
| New York Inc. Project) VRDO | 1.650% | 11/7/18 LOC | 9,300 | 9,300 |
| New York State Energy Research & | | | | |
| Development Authority Revenue | | | | |
| (Consolidated Edison Co. of New York, Inc. | | | | |
| Project) VRDO | 1.630% | 11/7/18 LOC | 18,100 | 18,100 |
| New York State Environmental Facilities Corp. | | | | |
| Solid Waste Disposal Revenue | | | | |
| (Waste Management Inc.) VRDO | 1.640% | 11/7/18 LOC | 16,100 | 16,100 |
| New York State Housing Finance Agency | | | | |
| Housing Revenue (100 Maiden Lane) VRDO | 1.600% | 11/7/18 LOC | 18,430 | 18,430 |
| New York State Housing Finance Agency | | | | |
| Housing Revenue (20 River Terrace Housing) | | | | |
| VRDO | 1.620% | 11/7/18 LOC | 91,900 | 91,900 |
| New York State Housing Finance Agency | | | | |
| Housing Revenue (316 11th Avenue) VRDO | 1.680% | 11/7/18 LOC | 34,000 | 34,000 |
| New York State Housing Finance Agency | | | | |
| Housing Revenue (316 11th Avenue) VRDO | 1.620% | 11/7/18 LOC | 25,000 | 25,000 |
| New York State Housing Finance Agency | | | | |
| Housing Revenue (600 W 42nd Street) | | | | |
| VRDO | 1.650% | 11/7/18 LOC | 23,650 | 23,650 |
| New York State Housing Finance Agency | | | | |
| Housing Revenue (8 East 102nd Street) | | | | |
| VRDO | 1.580% | 11/7/18 LOC | 13,135 | 13,135 |
| New York State Housing Finance Agency | | | | |
| Housing Revenue (Clinton Park Phase II) | | | | |
| VRDO | 1.620% | 11/7/18 LOC | 37,000 | 37,000 |
| New York State Housing Finance Agency | | | | |
| Housing Revenue (Dock Street) VRDO | 1.610% | 11/7/18 LOC | 4,305 | 4,305 |
| New York State Housing Finance Agency | | | | |
| Housing Revenue (East 84th Street) VRDO | 1.670% | 11/7/18 LOC | 15,000 | 15,000 |
32
Municipal Money Market Fund
| | | | |
| | | | Face | Market |
| | | Maturity | Amount | Value • |
| | Coupon | Date | ($000) | ($000) |
| New York State Housing Finance Agency | | | | |
| Housing Revenue (West 20th Street) VRDO | 1.650% | 11/7/18 LOC | 10,000 | 10,000 |
| New York State Housing Finance Agency | | | | |
| Housing Revenue (West 23rd Street) VRDO | 1.620% | 11/7/18 LOC | 13,000 | 13,000 |
| New York State Housing Finance Agency | | | | |
| Revenue (750 6th Ave) VRDO | 1.680% | 11/7/18 LOC | 39,500 | 39,500 |
| New York State Housing Finance Agency | | | | |
| Revenue (Baltimore Tower) VRDO | 1.680% | 11/7/18 LOC | 24,500 | 24,500 |
| New York State Housing Finance Agency | | | | |
| Revenue (Helena Housing) VRDO | 1.650% | 11/7/18 LOC | 22,000 | 22,000 |
| New York State Housing Finance Agency | | | | |
| Revenue (Service Contract) VRDO | 1.670% | 11/7/18 LOC | 2,130 | 2,130 |
| New York State Housing Finance Agency | | | | |
| Revenue (Tower 31) VRDO | 1.680% | 11/7/18 LOC | 45,800 | 45,800 |
| New York State Housing Finance Agency | | | | |
| Revenue (West 38th Street) VRDO | 1.620% | 11/7/18 LOC | 16,800 | 16,800 |
| New York State Housing Finance Agency | | | | |
| Revenue VRDO | 1.680% | 11/7/18 LOC | 9,900 | 9,900 |
| New York State Housing Financing Agency | | | | |
| Revenue (Tribeca Park Housing) VRDO | 1.680% | 11/7/18 LOC | 47,300 | 47,300 |
| New York State Local Government | | | | |
| Assistance Corp. Revenue VRDO | 1.620% | 11/7/18 | 53,855 | 53,855 |
| New York State Mortgage Agency | | | | |
| Homeowner Mortgage Revenue VRDO | 1.720% | 11/1/18 | 7,700 | 7,700 |
| New York State Mortgage Agency | | | | |
| Homeowner Mortgage Revenue VRDO | 1.650% | 11/7/18 | 35,000 | 35,000 |
| New York State Mortgage Agency Revenue | | | | |
| VRDO | 1.650% | 11/7/18 | 11,590 | 11,590 |
| New York State Urban Development Corp. | | | | |
| Revenue (Service Contract) VRDO | 1.610% | 11/7/18 | 14,605 | 14,605 |
| New York State Urban Development Corp. | | | | |
| Revenue (Service Contract) VRDO | 1.620% | 11/7/18 LOC | 6,315 | 6,315 |
| New York State Urban Development Corp. | | | | |
| Revenue (Service Contract) VRDO | 1.620% | 11/7/18 LOC | 30,540 | 30,540 |
| 1 New York State Urban Development Corp. | | | | |
| TOB VRDO | 1.620% | 11/7/18 | 13,230 | 13,230 |
| 1 Nuveen New York AMT-Free Quality | | | | |
| Municipal Income Fund VRDP VRDO | 1.640% | 11/7/18 LOC | 21,200 | 21,200 |
| 1 Nuveen New York AMT-Free Quality | | | | |
| Municipal Income Fund VRDP VRDO | 1.660% | 11/7/18 LOC | 10,000 | 10,000 |
| 1 Nuveen New York AMT-Free Quality | | | | |
| Municipal Income Fund VRDP VRDO | 1.660% | 11/7/18 LOC | 8,500 | 8,500 |
| 1 Nuveen New York AMT-Free Quality | | | | |
| Municipal Income Fund VRDP VRDO | 1.660% | 11/7/18 LOC | 34,200 | 34,200 |
| 1 Nuveen New York Quality Municipal Fund | | | | |
| VRDP VRDO | 1.710% | 11/7/18 LOC | 33,700 | 33,700 |
| Nyack NY Union Free School District BAN | 2.750% | 6/21/19 | 9,480 | 9,540 |
| 1 Port Authority of New York & New Jersey | | | | |
| Revenue TOB VRDO | 1.620% | 11/7/18 | 2,620 | 2,620 |
| 1 Port Authority of New York & New Jersey | | | | |
| Revenue TOB VRDO | 1.610% | 11/7/18 | 9,750 | 9,750 |
| 1 Port Authority of New York & New Jersey | | | | |
| Revenue TOB VRDO | 1.620% | 11/7/18 | 11,195 | 11,195 |
33
| | | | | |
| Municipal Money Market Fund | | | | |
| |
| |
| |
| | | | | Face | Market |
| | | | Maturity | Amount | Value • |
| | | Coupon | Date | ($000) | ($000) |
| 1 | Port Authority of New York & New Jersey | | | | |
| | Revenue TOB VRDO | 1.620% | 11/7/18 | 7,320 | 7,320 |
| 1 | Port Authority of New York & New Jersey | | | | |
| | Revenue TOB VRDO | 1.630% | 11/7/18 | 3,055 | 3,055 |
| 1 | Port Authority of New York & New Jersey | | | | |
| | Revenue TOB VRDO | 1.660% | 11/7/18 | 4,500 | 4,500 |
| | Riverhead NY Central School District TAN | 3.500% | 6/27/19 | 5,000 | 5,047 |
| | Southampton NY Union Free School District | | | | |
| | TAN | 2.750% | 6/26/19 | 5,000 | 5,027 |
| 1 | Triborough Bridge & Tunnel Authority | | | | |
| | New York TOB VRDO | 1.620% | 11/7/18 | 14,000 | 14,000 |
| 1 | Utility Debt Securitization Authority | | | | |
| | New York Revenue TOB VRDO | 1.630% | 11/7/18 | 37,500 | 37,500 |
| | Wappingers NY Central School District BAN | 3.250% | 8/14/19 | 12,500 | 12,611 |
| | Washingtonville NY Central School District | | | | |
| | BAN | 2.750% | 6/26/19 | 10,300 | 10,366 |
| | West Babylon NY Union Free School District | | | | |
| | TAN | 3.000% | 6/21/19 | 7,500 | 7,550 |
| | | | | | 2,372,574 |
| North Carolina (1.0%) | | | | |
| 1,2 | Appalachian State University TOB PUT | 1.750% | 11/22/18 | 12,260 | 12,260 |
| | Board of Governors of the University of | | | | |
| | North Carolina Revenue (University of | | | | |
| | North Carolina Hospitals at Chapel Hill) | | | | |
| | VRDO | 1.580% | 11/7/18 | 16,945 | 16,945 |
| 1 | Charlotte-Mecklenburg NC Hospital Authority | | | | |
| | Health Care System Revenue (Carolinas | | | | |
| | HealthCare System) TOB VRDO | 1.630% | 11/7/18 | 7,495 | 7,495 |
| 1 | Charlotte-Mecklenburg NC Hospital Authority | | | | |
| | Health Care System Revenue (Carolinas | | | | |
| | HealthCare System) TOB VRDO | 1.650% | 11/7/18 | 1,335 | 1,335 |
| | Charlotte-Mecklenburg NC Hospital Authority | | | | |
| | Health Care System Revenue (Carolinas | | | | |
| | HealthCare System) VRDO | 1.680% | 11/1/18 | 1,200 | 1,200 |
| 1,2 | Mecklenburg County NC GO TOB PUT | 1.750% | 12/13/18 | 5,600 | 5,600 |
| | North Carolina Capital Facilities Finance | | | | |
| | Agency (Duke University Project) CP | 1.670% | 11/13/18 | 17,602 | 17,602 |
| | North Carolina Capital Facilities Finance | | | | |
| | Agency (Duke University Project) CP | 1.750% | 12/21/18 | 6,262 | 6,262 |
| 1 | North Carolina Capital Facilities Finance | | | | |
| | Agency Revenue (Duke University Project) | | | | |
| | TOB VRDO | 1.620% | 11/7/18 | 19,640 | 19,640 |
| 1 | North Carolina Capital Facilities Finance | | | | |
| | Agency Revenue (Duke University Project) | | | | |
| | TOB VRDO | 1.630% | 11/7/18 (Prere.) | 2,495 | 2,495 |
| 1 | North Carolina Capital Facilities Finance | | | | |
| | Agency Revenue (Duke University Project) | | | | |
| | TOB VRDO | 1.630% | 11/7/18 | 2,285 | 2,285 |
| 1 | North Carolina Capital Facilities Finance | | | | |
| | Agency Revenue (Duke University Project) | | | | |
| | TOB VRDO | 1.630% | 11/7/18 | 1,901 | 1,901 |
| 1 | North Carolina Housing Finance Agency | | | | |
| | Homeownership Revenue TOB VRDO | 1.630% | 11/7/18 | 1,885 | 1,885 |
34
| | | | | |
| Municipal Money Market Fund | | | | |
| |
| |
| |
| | | | | Face | Market |
| | | | Maturity | Amount | Value • |
| | | Coupon | Date | ($000) | ($000) |
| 1 | North Carolina Housing Finance Agency | | | | |
| | Homeownership Revenue TOB VRDO | 1.630% | 11/7/18 | 1,955 | 1,955 |
| 1 | North Carolina Housing Finance Agency | | | | |
| | Revenue TOB VRDO | 1.630% | 11/7/18 | 7,125 | 7,125 |
| 1 | North Carolina Housing Finance Agency | | | | |
| | TOB VRDO | 1.630% | 11/7/18 | 7,500 | 7,500 |
| | North Carolina Medical Care Commission | | | | |
| | Health Care Facilities Revenue | | | | |
| | (Lenoir Memorial Hospital Project) VRDO | 1.580% | 11/7/18 LOC | 14,195 | 14,195 |
| | North Carolina Medical Care Commission | | | | |
| | Hospital (Moses Cone Health System) | | | | |
| | VRDO | 1.540% | 11/7/18 | 1,190 | 1,190 |
| | North Carolina Medical Care Commission | | | | |
| | Hospital Revenue (Moses Cone Health | | | | |
| | System) PUT | 1.950% | 5/29/19 | 19,810 | 19,810 |
| 1 | North Carolina Revenue TOB VRDO | 1.630% | 11/7/18 | 6,800 | 6,800 |
| 1 | North Carolina Turnpike Authority Revenue | | | | |
| | TOB VRDO | 1.630% | 11/7/18 | 8,455 | 8,455 |
| 1 | Raleigh NC Combined Enterprise System | | | | |
| | Revenue TOB VRDO PUT | 1.640% | 11/1/18 | 2,100 | 2,100 |
| 1,2 | Union County NC Enterprise System Revenue | | | | |
| | TOB PUT | 1.750% | 11/29/18 | 7,850 | 7,850 |
| | | | | | 173,885 |
| North Dakota (0.0%) | | | | |
| 1 | North Dakota Housing Finance Agency | | | | |
| | Revenue TOB VRDO | 1.630% | 11/7/18 | 7,220 | 7,220 |
| |
| Ohio (3.3%) | | | | |
| | American Municipal Power Ohio Inc. RAN | 3.000% | 6/27/19 | 3,000 | 3,021 |
| | Avon Lake OH BAN | 3.000% | 7/10/19 | 14,500 | 14,605 |
| 1 | Cincinnati OH City School District | | | | |
| | GO TOB VRDO | 1.630% | 11/7/18 | 5,000 | 5,000 |
| | Cleveland Clinic Health System Obligated | | | | |
| | Group Revenue VRDO | 1.750% | 12/11/18 | 36,650 | 36,650 |
| 1 | Cleveland OH Department of Public Utilities | | | | |
| | Division of Water TOB VRDO | 1.630% | 11/7/18 LOC | 17,150 | 17,150 |
| | Cleveland-Cuyahoga County OH | | | | |
| | Port Authority Revenue (Cleveland | | | | |
| | Museum of Art Project) VRDO | 1.590% | 11/7/18 | 7,900 | 7,900 |
| | Cleveland-Cuyahoga County OH | | | | |
| | Port Authority Revenue (Cleveland | | | | |
| | Museum of Art Project) VRDO | 1.600% | 11/7/18 | 18,000 | 18,000 |
| | Columbus OH Regional Airport Authority | | | | |
| | Airport Revenue (FlightSafety International | | | | |
| | Inc. Project) VRDO | 1.750% | 11/7/18 (13) | 51,430 | 51,430 |
| | Columbus OH Regional Airport Authority | | | | |
| | Airport Revenue (OASBO Expanded Asset | | | | |
| | Program) VRDO | 1.590% | 11/7/18 LOC | 10,380 | 10,380 |
| | Columbus OH Regional Airport Authority | | | | |
| | Airport Revenue (OASBO Expanded Asset | | | | |
| | Program) VRDO | 1.590% | 11/7/18 LOC | 3,740 | 3,740 |
| | Columbus OH Regional Airport Authority | | | | |
| | Revenue (Pooled Financing Program) VRDO | 1.590% | 11/7/18 LOC | 6,030 | 6,030 |
| 1 | Euclid OH City School District TOB GO VRDO | 1.630% | 11/7/18 LOC | 11,200 | 11,200 |
35
| | | | |
| Municipal Money Market Fund | | | | |
| |
| |
| |
| | | | Face | Market |
| | | Maturity | Amount | Value • |
| | Coupon | Date | ($000) | ($000) |
| 1 Franklin County OH Hospital Facilities | | | | |
| Revenue (OhioHealth Corp.) TOB VRDO | 1.640% | 11/7/18 | 2,665 | 2,665 |
| Franklin County OH Hospital Facilities | | | | |
| Revenue (OhioHealth Corp.) VRDO | 1.600% | 11/7/18 | 16,000 | 16,000 |
| Franklin County OH Hospital Facilities | | | | |
| Revenue (OhioHealth Corp.) VRDO | 1.600% | 11/7/18 | 7,100 | 7,100 |
| Franklin County OH Hospital Facilities | | | | |
| Revenue (OhioHealth Corp.) VRDO | 1.600% | 11/7/18 | 15,480 | 15,480 |
| Franklin County OH Hospital Facilities | | | | |
| Revenue (US Health Corp. of Columbus) | | | | |
| VRDO | 1.600% | 11/7/18 LOC | 2,860 | 2,860 |
| Franklin County OH Hospital Revenue | | | | |
| (Nationwide Children’s Hospital Project) | | | | |
| VRDO | 1.610% | 11/7/18 | 19,650 | 19,650 |
| Hamilton County OH Hospital Facilities | | | | |
| Revenue (Cincinnati Children’s Hospital | | | | |
| Medical Center) VRDO | 1.610% | 11/7/18 | 14,160 | 14,160 |
| 1 Hamilton County OH Sewer System Revenue | | | | |
| TOB VRDO | 1.630% | 11/7/18 | 12,750 | 12,750 |
| Independence OH BAN | 2.000% | 12/5/18 | 9,400 | 9,403 |
| Lake County OH Building Facilities | | | | |
| Improvements BAN | 2.000% | 1/17/19 | 5,200 | 5,204 |
| Lakewood OH Income Tax Revenue | 2.500% | 3/28/19 | 15,100 | 15,148 |
| Mason OH City School District BAN | 3.000% | 1/23/19 | 4,360 | 4,374 |
| 1 Miami University of Ohio General Receipts | | | | |
| Revenue TOB VRDO | 1.630% | 11/7/18 | 3,785 | 3,785 |
| Middletown OH Hospital Facilities Revenue | | | | |
| (Atrium Medical Center) VRDO | 1.610% | 11/7/18 LOC | 17,425 | 17,425 |
| 1 Northeast OH Regional Sewer District | | | | |
| Revenue (Wastewater Revenue | | | | |
| Improvement) TOB VRDO | 1.630% | 11/7/18 | 6,800 | 6,800 |
| Ohio GO VRDO | 1.480% | 11/7/18 | 26,475 | 26,475 |
| Ohio GO VRDO | 1.480% | 11/7/18 | 4,885 | 4,885 |
| Ohio Higher Educational Facility Commission | | | | |
| Revenue (Cleveland Clinic Health System | | | | |
| Obligated Group) CP | 1.740% | 11/8/18 | 37,000 | 37,000 |
| Ohio Higher Educational Facility Commission | | | | |
| Revenue (Cleveland Clinic Health System | | | | |
| Obligated Group) CP | 1.820% | 1/17/19 | 17,495 | 17,495 |
| 1 Ohio Hospital Revenue (Cleveland Clinic | | | | |
| Health System Obligated Group) TOB VRDO | 1.630% | 11/7/18 (Prere.) | 10,995 | 10,995 |
| Ohio Housing Finance Agency Residential | | | | |
| Mortgage Revenue VRDO | 1.600% | 11/7/18 | 3,455 | 3,455 |
| Ohio Housing Finance Agency Residential | | | | |
| Mortgage Revenue VRDO | 1.630% | 11/7/18 | 6,970 | 6,970 |
| Ohio Housing Finance Agency Residential | | | | |
| Mortgage Revenue VRDO | 1.650% | 11/7/18 | 12,540 | 12,540 |
| Ohio Housing Finance Agency Residential | | | | |
| Mortgage Revenue VRDO | 1.660% | 11/7/18 | 21,875 | 21,875 |
| Ohio Infrastructure Improvement GO VRDO | 1.480% | 11/7/18 | 1,395 | 1,395 |
| Ohio State University General Receipts | | | | |
| Revenue CP | 1.820% | 1/4/19 | 15,990 | 15,990 |
| Ohio State University General Receipts | | | | |
| Revenue CP | 1.810% | 1/11/19 | 16,630 | 16,630 |
36
| | | | | |
| Municipal Money Market Fund | | | | |
| |
| |
| |
| | | | | Face | Market |
| | | | Maturity | Amount | Value • |
| | | Coupon | Date | ($000) | ($000) |
| | Ohio State University General Receipts | | | | |
| | Revenue CP | 1.870% | 3/14/19 | 17,180 | 17,180 |
| 1 | Ohio State University General Receipts | | | | |
| | Revenue TOB VRDO | 1.660% | 11/7/18 | 5,750 | 5,750 |
| 1 | Ohio State University General Receipts | | | | |
| | Revenue TOB VRDO | 1.660% | 11/7/18 | 5,750 | 5,750 |
| 1,2 | Ohio University General Receipts Revenue | | | | |
| | TOB PUT | 1.800% | 12/3/18 LOC | 5,000 | 5,000 |
| | Strongsville OH BAN | 3.000% | 6/27/19 | 4,000 | 4,030 |
| 1 | Toledo OH Waterworks Revenue TOB VRDO | 1.680% | 11/7/18 | 8,000 | 8,000 |
| | Union Township OH BAN | 3.000% | 9/5/19 | 12,843 | 12,960 |
| 1 | Warren County OH Port Authority Revenue | | | | |
| | (Corridor 75 Park Project) | 7.000% | 12/1/18 (Prere.) | 4,765 | 4,787 |
| | | | | | 577,072 |
| Oklahoma (0.0%) | | | | |
| 1 | Oklahoma Turnpike Authority Revenue | | | | |
| | TOB VRDO | 1.630% | 11/7/18 | 7,500 | 7,500 |
| |
| Oregon (0.9%) | | | | |
| 1,2 | Clackamas County OR School District | | | | |
| | No. 7J Lake Oswego GO TOB PUT | 1.750% | 12/27/18 | 13,110 | 13,110 |
| | Oregon Facilities Authority Revenue | | | | |
| | (Reed College Projects) VRDO | 1.620% | 11/7/18 | 35,845 | 35,845 |
| 1 | Oregon Housing & Community Service | | | | |
| | Department Single Family Mortgage | | | | |
| | Revenue TOB VRDO | 1.680% | 11/7/18 | 2,555 | 2,555 |
| | Oregon Housing & Community Service | | | | |
| | Department Single Family Mortgage | | | | |
| | Revenue VRDO | 1.660% | 11/7/18 | 14,900 | 14,900 |
| | Oregon Housing & Community Service | | | | |
| | Department Single Family Mortgage | | | | |
| | Revenue VRDO | 1.690% | 11/7/18 | 39,000 | 39,000 |
| | Oregon Facilities Authority Revenue | | | | |
| | (PeaceHealth) | 1.680% | 11/1/18 LOC | 20,000 | 20,000 |
| | Oregon Facilities Authority Revenue | | | | |
| | (PeaceHealth) | 1.680% | 11/1/18 LOC | 8,100 | 8,100 |
| | Portland OR TAN | 4.000% | 6/26/19 | 15,000 | 15,198 |
| 1,2 | Portland OR Water System Revenue | | | | |
| | TOB PUT | 1.750% | 12/6/18 | 9,500 | 9,500 |
| 1 | Washington & Clackamas Counties OR | | | | |
| | School District No. 23J Tigard-Tualatin | | | | |
| | GO TOB VRDO | 1.630% | 11/7/18 LOC | 5,000 | 5,000 |
| | | | | | 163,208 |
| Pennsylvania (1.2%) | | | | |
| 1 | Allegheny County PA Hospital Development | | | | |
| | Authority Revenue (University of Pittsburgh | | | | |
| | Medical Center) TOB VRDO | 1.690% | 11/1/18 LOC | 6,420 | 6,420 |
| 1 | Allegheny County PA Hospital Development | | | | |
| | Authority Revenue (University of Pittsburgh | | | | |
| | Medical Center) TOB VRDO | 1.700% | 11/1/18 LOC | 36,600 | 36,600 |
| 1 | Allegheny County PA Hospital Development | | | | |
| | Authority Revenue (University of Pittsburgh | | | | |
| | Medical Center) TOB VRDO | 1.630% | 11/7/18 LOC | 9,890 | 9,890 |
37
| | | | | |
| Municipal Money Market Fund | | | | |
| |
| |
| |
| | | | | Face | Market |
| | | | Maturity | Amount | Value • |
| | | Coupon | Date | ($000) | ($000) |
| | Delaware County PA Industrial Development | | | | |
| | Authority Solid Waste Revenue | | | | |
| | (Scott Paper Co.) VRDO | 1.660% | 11/7/18 | 2,000 | 2,000 |
| | Delaware County PA Industrial Development | | | | |
| | Authority Solid Waste Revenue | | | | |
| | (Scott Paper Co.) VRDO | 1.660% | 11/7/18 | 3,200 | 3,200 |
| | Delaware County PA Industrial Development | | | | |
| | Authority Solid Waste Revenue | | | | |
| | (Scott Paper Co.) VRDO | 1.660% | 11/7/18 | 12,100 | 12,100 |
| | Jackson PA Authority for Industrial | | | | |
| | Development Revenue (StoneRidge | | | | |
| | Retirement Living) VRDO | 1.610% | 11/7/18 LOC | 6,400 | 6,400 |
| 1 | Pennsylvania Higher Educational Facilities | | | | |
| | Authority Revenue (Presbyterian Medical | | | | |
| | Center) TOB VRDO | 1.630% | 11/7/18 (Prere.) | 7,200 | 7,200 |
| 1 | Pennsylvania Housing Finance Agency | | | | |
| | Single Family Mortgage Revenue TOB VRDO | 1.630% | 11/7/18 | 1,250 | 1,250 |
| | Pennsylvania Housing Finance Agency | | | | |
| | Single Family Mortgage Revenue VRDO | 1.650% | 11/7/18 | 11,890 | 11,890 |
| | Pennsylvania Housing Finance Agency | | | | |
| | Single Family Mortgage Revenue VRDO | 1.650% | 11/7/18 | 625 | 625 |
| | Pennsylvania Housing Finance Agency | | | | |
| | Single Family Mortgage Revenue VRDO | 1.650% | 11/7/18 | 10,215 | 10,215 |
| | Pennsylvania Housing Finance Agency | | | | |
| | Single Family Mortgage Revenue VRDO | 1.650% | 11/7/18 | 7,980 | 7,980 |
| 1 | Pennsylvania Turnpike Commission Revenue | | | | |
| | TOB VRDO | 1.630% | 11/7/18 LOC | 60,000 | 60,000 |
| | Philadelphia PA Airport Revenue VRDO | 1.640% | 11/7/18 LOC | 21,700 | 21,700 |
| 1 | University of Pittsburgh of the Commonwealth | | | | |
| | System of Higher Education Pennsylvania | | | | |
| | Revenue (University Capital Project) | | | | |
| | TOB VRDO | 1.620% | 11/7/18 (Prere.) | 7,500 | 7,500 |
| | | | | | 204,970 |
| Rhode Island (0.1%) | | | | |
| | Rhode Island Health & Educational Building | | | | |
| | Corp. Higher Education Facility Revenue | | | | |
| | (Rhode Island School of Design) VRDO | 1.600% | 11/7/18 LOC | 12,195 | 12,195 |
| |
| South Carolina (1.4%) | | | | |
| 1,2 | Berkeley County SC School District | | | | |
| | GO TOB PUT | 1.750% | 11/15/18 | 4,845 | 4,845 |
| | Charleston County SC School District BAN | 5.000% | 5/15/19 | 60,035 | 61,072 |
| 1 | Charleston SC Waterworks & Sewer Capital | | | | |
| | Improvement Revenue TOB VRDO | 1.630% | 11/7/18 | 11,000 | 11,000 |
| 1 | Charleston SC Waterworks & Sewer Capital | | | | |
| | Improvement Revenue TOB VRDO | 1.630% | 11/7/18 (Prere.) | 7,500 | 7,500 |
| 1,2 | Columbia SC Waterworks & Sewer System | | | | |
| | Revenue TOB PUT | 1.750% | 1/10/19 | 14,900 | 14,900 |
| | Columbia SC Waterworks & Sewer System | | | | |
| | Revenue VRDO | 1.600% | 11/7/18 LOC | 13,160 | 13,160 |
| 1,2 | Lancaster County SC School District TOB PUT | 1.750% | 12/6/18 | 5,520 | 5,520 |
| 1,2 | Lexington County SC School District No.1 | | | | |
| | GO TOB PUT | 1.750% | 11/1/18 | 6,000 | 6,000 |
| 1 | McLeod Health Obligated Group TOB VRDO | 1.630% | 11/7/18 | 7,795 | 7,795 |
38
| | | | |
| Municipal Money Market Fund | | | | |
| |
| |
| |
| | | | Face | Market |
| | | Maturity | Amount | Value • |
| | Coupon | Date | ($000) | ($000) |
| South Carolina Association of Governmental | | | | |
| Organizations CP | 3.000% | 3/1/19 | 57,766 | 57,993 |
| South Carolina Educational Facilities Authority | | | | |
| Revenue (Columbia College) VRDO | 1.720% | 11/7/18 LOC | 3,400 | 3,400 |
| South Carolina GO | 5.000% | 6/1/19 | 5,000 | 5,090 |
| South Carolina Jobs Economic Development | | | | |
| Authority Industrial Revenue (South Carolina | | | | |
| Electric & Gas Co. Project) VRDO | 1.650% | 11/7/18 LOC | 34,555 | 34,555 |
| South Carolina Jobs Economic Development | | | | |
| Authority Revenue (Heathwood Hall | | | | |
| Episcopal School) VRDO | 1.600% | 11/7/18 LOC | 1,500 | 1,500 |
| 1 South Carolina Public Service Authority | | | | |
| Revenue TOB VRDO | 1.700% | 11/7/18 (Prere.) | 10,640 | 10,640 |
| University of South Carolina School of | | | | |
| Medicine Educational Trust Healthcare | | | | |
| Facilities Revenue VRDO | 1.600% | 11/7/18 LOC | 2,505 | 2,505 |
| | | | | 247,475 |
| Tennessee (2.8%) | | | | |
| Blount County & Alcoa & Maryville TN | | | | |
| Industrial Development Board Revenue | | | | |
| (Local Government Public Improvement) | | | | |
| VRDO | 1.640% | 11/7/18 LOC | 7,365 | 7,365 |
| Blount County TN Public Building Authority | | | | |
| Revenue (Local Government Public | | | | |
| Improvement) VRDO | 1.600% | 11/7/18 | 37,925 | 37,925 |
| Blount County TN Public Building Authority | | | | |
| Revenue (Local Government Public | | | | |
| Improvement) VRDO | 1.600% | 11/7/18 | 19,860 | 19,860 |
| Blount County TN Public Building Authority | | | | |
| Revenue (Local Government Public | | | | |
| Improvement) VRDO | 1.640% | 11/7/18 LOC | 9,145 | 9,145 |
| 1 Memphis TN GO TOB VRDO | 1.630% | 11/7/18 LOC | 5,000 | 5,000 |
| Metropolitan Government of Nashville | | | | |
| & Davidson County TN GO CP | 1.820% | 3/1/19 | 16,250 | 16,250 |
| Metropolitan Government of Nashville | | | | |
| & Davidson County TN GO (Extendible) CP | 1.810% | 7/22/19 | 25,000 | 25,000 |
| 1 Metropolitan Government of Nashville | | | | |
| & Davidson County TN GO TOB VRDO | 1.620% | 11/7/18 | 7,500 | 7,500 |
| 1 Metropolitan Government of Nashville | | | | |
| & Davidson County TN Health | | | | |
| & Educational Facilities Board Revenue | | | | |
| (Vanderbilt University) TOB VRDO | 1.630% | 11/7/18 | 8,250 | 8,250 |
| 1 Rutherford County TN Health & Educational | | | | |
| Facilities Board Revenue (Ascension Health | | | | |
| Credit Group) TOB VRDO | 1.630% | 11/7/18 | 6,250 | 6,250 |
| Sevier County TN Public Building Authority | | | | |
| Local Government Public Improvement | | | | |
| Revenue VRDO | 1.600% | 11/7/18 LOC | 11,600 | 11,600 |
| Sevier County TN Public Building Authority | | | | |
| Local Government Public Improvement | | | | |
| Revenue VRDO | 1.600% | 11/7/18 | 40,500 | 40,500 |
| Sevier County TN Public Building Authority | | | | |
| Local Government Public Improvement | | | | |
| Revenue VRDO | 1.650% | 11/7/18 LOC | 29,680 | 29,680 |
39
| | | | | |
| Municipal Money Market Fund | | | | |
| |
| |
| |
| | | | | Face | Market |
| | | | Maturity | Amount | Value • |
| | | Coupon | Date | ($000) | ($000) |
| | Shelby County TN GO VRDO | 1.620% | 11/7/18 | 99,620 | 99,620 |
| | Tennessee GO CP | 1.770% | 12/7/18 | 43,443 | 43,443 |
| | Tennessee GO CP | 1.800% | 1/7/19 | 15,000 | 15,000 |
| | Tennessee GO CP | 1.860% | 2/11/19 | 36,096 | 36,096 |
| | Tennessee GO CP | 1.860% | 3/8/19 | 31,974 | 31,974 |
| 1 | Tennessee Housing Development Agency | | | | |
| | Residential Finance Program Revenue | | | | |
| | TOB VRDO | 1.630% | 11/7/18 | 7,500 | 7,500 |
| 1 | Tennessee Housing Development Agency | | | | |
| | Residential Finance Program Revenue | | | | |
| | TOB VRDO | 1.630% | 11/7/18 | 7,500 | 7,500 |
| 1 | Tennessee Housing Development Agency | | | | |
| | Residential Finance Program Revenue | | | | |
| | TOB VRDO | 1.630% | 11/7/18 | 7,500 | 7,500 |
| 1 | Tennessee School Bond Authority Higher | | | | |
| | Educational Facilities Revenue (2nd Program) | | | | |
| | TOB VRDO | 1.640% | 11/7/18 | 19,040 | 19,040 |
| | | | | | 491,998 |
| Texas (12.4%) | | | | |
| 1 | Alamo TX Regional Mobility Authority | | | | |
| | Revenue TOB VRDO | 1.660% | 11/7/18 | 7,500 | 7,500 |
| 1 | Aldine TX Independent School District | | | | |
| | GO TOB VRDO | 1.620% | 11/7/18 | 8,205 | 8,205 |
| 1,2 | Austin TX Electric Utility System Revenue | | | | |
| | TOB PUT | 1.750% | 11/15/18 | 7,245 | 7,245 |
| 1 | Austin TX Independent School District | | | | |
| | GO TOB VRDO | 1.630% | 11/7/18 LOC | 7,000 | 7,000 |
| 1 | Bexar County TX GO TOB VRDO | 1.630% | 11/7/18 LOC | 5,000 | 5,000 |
| | Board of Regents of the Texas A&M | | | | |
| | University System Revenue Financing | | | | |
| | System Revenue CP | 1.730% | 11/1/18 | 9,080 | 9,080 |
| | Board of Regents of the Texas A&M | | | | |
| | University System Revenue Financing | | | | |
| | System Revenue CP | 1.720% | 11/20/18 | 19,714 | 19,714 |
| | Board of Regents of the Texas A&M | | | | |
| | University System Revenue Financing | | | | |
| | System Revenue CP | 1.740% | 12/7/18 | 50,000 | 50,000 |
| | Board of Regents of the Texas A&M | | | | |
| | University System Revenue Financing | | | | |
| | System Revenue CP | 1.800% | 3/5/19 | 50,000 | 50,000 |
| 1 | Corsicana TX Independent School District | | | | |
| | GO TOB VRDO | 1.630% | 11/7/18 LOC | 9,410 | 9,410 |
| 1 | Dallas TX Area Rapid Transit Sales Tax | | | | |
| | Revenue TOB VRDO | 1.630% | 11/7/18 | 5,500 | 5,500 |
| 1 | Dallas TX Waterworks & Sewer System | | | | |
| | Revenue TOB VRDO | 1.620% | 11/7/18 | 7,640 | 7,640 |
| 1 | Denton TX GO TOB VRDO | 1.630% | 11/7/18 LOC | 8,980 | 8,980 |
| | Denton TX Independent School District | | | | |
| | GO VRDO | 1.600% | 11/7/18 | 27,880 | 27,880 |
| 1 | Denton TX Independent School District | | | | |
| | TOB VRDO | 1.630% | 11/7/18 | 3,750 | 3,750 |
| 1 | Duncanville TX Independent School District | | | | |
| | GO TOB VRDO | 1.630% | 11/7/18 LOC | 9,500 | 9,500 |
| 1 | El Paso TX GO TOB VRDO | 1.630% | 11/7/18 LOC | 7,000 | 7,000 |
40
| | | | | |
| Municipal Money Market Fund | | | | |
| |
| |
| |
| | | | | Face | Market |
| | | | Maturity | Amount | Value • |
| | | Coupon | Date | ($000) | ($000) |
| 1 | Grand Parkway Transportation Corp. | | | | |
| | Texas System Toll Revenue TOB VRDO | 1.630% | 11/7/18 | 17,820 | 17,820 |
| 1 | Grand Parkway Transportation Corp. | | | | |
| | Texas System Toll Revenue TOB VRDO | 1.630% | 11/7/18 | 23,145 | 23,145 |
| 1 | Grand Parkway TX Transportation Corp. | | | | |
| | TOB VRDO | 1.630% | 11/7/18 | 8,625 | 8,625 |
| 1 | Grand Parkway TX Transportation Corp. | | | | |
| | TOB VRDO | 1.640% | 11/7/18 | 19,765 | 19,765 |
| | Gulf Coast TX Industrial Development | | | | |
| | Authority Revenue (ExxonMobil Project) | | | | |
| | VRDO | 1.680% | 11/1/18 | 5,600 | 5,600 |
| 1 | Harris County TX Cultural Education Facilities | | | | |
| | Finance Corp. Hospital Revenue | | | | |
| | (Children’s Hospital Project) TOB VRDO | 1.630% | 11/7/18 | 8,200 | 8,200 |
| 1 | Harris County TX Cultural Education Facilities | | | | |
| | Finance Corp. Hospital Revenue (Memorial | | | | |
| | Hermann Healthcare System) TOB VRDO | 1.690% | 11/1/18 LOC | 8,800 | 8,800 |
| | Harris County TX Cultural Education Facilities | | | | |
| | Finance Corp. Revenue (Memorial Hermann | | | | |
| | Health System) VRDO | 1.620% | 11/7/18 | 56,980 | 56,980 |
| | Harris County TX Cultural Education Facilities | | | | |
| | Finance Corp. Revenue (Methodist Hospital | | | | |
| | System) CP | 1.740% | 11/8/18 | 90,000 | 90,000 |
| | Harris County TX Cultural Education Facilities | | | | |
| | Finance Corp. Revenue (Methodist Hospital | | | | |
| | System) CP | 1.750% | 12/4/18 | 20,000 | 20,000 |
| | Harris County TX Cultural Education Facilities | | | | |
| | Finance Corp. Revenue (Methodist Hospital | | | | |
| | System) CP | 1.820% | 1/3/19 | 45,000 | 45,000 |
| | Harris County TX Cultural Education Facilities | | | | |
| | Finance Corp. Revenue (Methodist Hospital | | | | |
| | System) CP | 1.820% | 1/3/19 | 20,105 | 20,105 |
| | Harris County TX Cultural Education Facilities | | | | |
| | Finance Corp. Revenue (Methodist Hospital | | | | |
| | System) CP | 1.800% | 1/15/19 | 6,800 | 6,800 |
| 1 | Harris County TX Cultural Education Facilities | | | | |
| | Finance Corp. Revenue (Texas Children’s | | | | |
| | Hospital) TOB VRDO | 1.700% | 11/7/18 | 4,800 | 4,800 |
| 1 | Harris County TX GO TOB VRDO | 1.630% | 11/7/18 | 8,160 | 8,160 |
| 1 | Harris County TX GO TOB VRDO | 1.630% | 11/7/18 LOC | 10,000 | 10,000 |
| 1 | Harris County TX GO TOB VRDO | 1.630% | 11/7/18 | 8,070 | 8,070 |
| | Harris County TX Hospital District Revenue | | | | |
| | VRDO | 1.620% | 11/7/18 LOC | 37,375 | 37,375 |
| 1 | Harris County TX Revenue TOB VRDO | 1.630% | 11/7/18 | 7,500 | 7,500 |
| 1,2 | Hays TX Consolidated Independent School | | | | |
| | District GO TOB PUT | 1.750% | 1/10/19 | 4,670 | 4,670 |
| 1 | Houston TX Community College System | | | | |
| | TOB VRDO | 1.630% | 11/7/18 | 5,625 | 5,625 |
| 1 | Houston TX Community College System | | | | |
| | TOB VRDO | 1.630% | 11/7/18 | 5,560 | 5,560 |
| | Houston TX GO CP | 1.840% | 2/28/19 LOC | 5,000 | 5,000 |
| 1 | Houston TX GO TOB VRDO | 1.630% | 11/7/18 LOC | 5,000 | 5,000 |
| 1 | Houston TX Higher Education Finance Corp. | | | | |
| | Revenue (Rice University Project) TOB VRDO | 1.630% | 11/7/18 | 6,665 | 6,665 |
41
| | | | | |
| Municipal Money Market Fund | | | | |
| |
| |
| |
| | | | | Face | Market |
| | | | Maturity | Amount | Value • |
| | | Coupon | Date | ($000) | ($000) |
| | Houston TX TRAN | 5.000% | 6/28/19 | 1,000 | 1,019 |
| | Houston TX Utility System Revenue | 5.000% | 11/15/18 | 4,000 | 4,005 |
| 1 | Houston TX Utility System Revenue | | | | |
| | TOB VRDO | 1.630% | 11/7/18 | 12,240 | 12,240 |
| | Houston TX Utility System Revenue VRDO | 1.600% | 11/7/18 LOC | 8,600 | 8,600 |
| | Houston TX Utility System Revenue VRDO | 1.600% | 11/7/18 | 95,000 | 95,000 |
| | Houston TX Utility System Revenue VRDO | 1.600% | 11/7/18 LOC | 49,825 | 49,825 |
| | Houston TX Utility System Revenue VRDO | 1.600% | 11/7/18 LOC | 23,300 | 23,300 |
| 1 | Humble TX Independent School District | | | | |
| | GO TOB VRDO | 1.630% | 11/7/18 | 8,000 | 8,000 |
| 1,2 | Judson TX Independent School District | | | | |
| | GO TOB PUT | 1.750% | 11/22/18 | 10,600 | 10,600 |
| 1 | Katy TX Independent School District | | | | |
| | TOB VRDO | 1.640% | 11/7/18 | 5,015 | 5,015 |
| 1 | Lamar TX Consolidated Independent School | | | | |
| | District GO TOB VRDO | 1.630% | 11/7/18 LOC | 5,000 | 5,000 |
| 1 | Lone Star TX College System GO TOB VRDO | 1.630% | 11/7/18 LOC | 19,065 | 19,065 |
| 1 | Lower Colorado River Authority Revenue | | | | |
| | Texas TOB VRDO (Transmission Contract) | 1.630% | 11/7/18 LOC | 5,000 | 5,000 |
| | Mesquite TX Independent School District | | | | |
| | School Building VRDO | 1.640% | 11/7/18 (19) | 13,675 | 13,675 |
| 1 | Montgomery TX Independent School District | | | | |
| | GO TOB VRDO | 1.630% | 11/7/18 LOC | 5,000 | 5,000 |
| 1 | New Hope Cultural Education Facilities | | | | |
| | Finance Corp. (Children’s Health System of | | | | |
| | Texas) TOB VRDO | 1.630% | 11/7/18 | 3,985 | 3,985 |
| | North East TX Independent School District CP | 1.790% | 1/28/19 | 20,000 | 20,000 |
| | Northwest Independent School District Texas | | | | |
| | GO VRDO | 1.640% | 11/7/18 | 12,870 | 12,870 |
| 1 | Princeton TX Independent School District | | | | |
| | GO TOB VRDO | 1.630% | 11/7/18 LOC | 5,600 | 5,600 |
| | Red River TX Education Finance Corp. | | | | |
| | Revenue (Texas Christian University Project) | | | | |
| | VRDO | 1.600% | 11/7/18 | 15,500 | 15,500 |
| | Riesel TX Industrial Development Corp. | | | | |
| | Solid Waste Disposal Revenue (Sandy Creek | | | | |
| | Energy Associates,LP) VRDO | 1.640% | 11/7/18 LOC | 50,000 | 50,000 |
| | Riesel TX Industrial Development Corp. | | | | |
| | Solid Waste Disposal Revenue (Sandy Creek | | | | |
| | Energy Associates,LP) VRDO | 1.640% | 11/7/18 LOC | 50,000 | 50,000 |
| 1 | San Antonio TX Electric & Gas Systems | | | | |
| | Revenue TOB VRDO | 1.620% | 11/7/18 | 7,500 | 7,500 |
| 1 | San Antonio TX Electric & Gas Systems | | | | |
| | Revenue TOB VRDO | 1.640% | 11/7/18 | 14,465 | 14,465 |
| | San Antonio TX Water Revenue CP | 1.680% | 11/6/18 | 60,995 | 60,995 |
| 1 | Tarrant County TX Cultural Education Facilities | | | | |
| | Finance Corp. Hospital Revenue (Baylor | | | | |
| | Health Care System Project) TOB VRDO | 1.650% | 11/7/18 | 5,555 | 5,555 |
| 1 | Tarrant County TX Cultural Education Facilities | | | | |
| | Finance Corp. Hospital Revenue (Baylor Scott | | | | |
| | & White Healthcare Project) TOB VRDO | 1.630% | 11/7/18 | 17,305 | 17,305 |
| 1 | Tarrant County TX Cultural Education Facilities | | | | |
| | Finance Corp. Hospital Revenue (Baylor Scott | | | | |
| | & White Health Obligated Group) TOB VRDO | 1.630% | 11/7/18 | 6,460 | 6,460 |
42
| | | | |
| Municipal Money Market Fund | | | | |
| |
| |
| |
| | | | Face | Market |
| | | Maturity | Amount | Value • |
| | Coupon | Date | ($000) | ($000) |
| Tarrant County TX Cultural Education Facilities | | | | |
| Finance Corp. Revenue (CHRISTUS Health) | | | | |
| VRDO | 1.640% | 11/7/18 LOC | 20,010 | 20,010 |
| Tarrant County TX Cultural Education Facilities | | | | |
| Finance Corp. Revenue (CHRISTUS Health) | | | | |
| VRDO | 1.640% | 11/7/18 LOC | 43,900 | 43,900 |
| 1 Tarrant County TX Cultural Education Facilities | | | | |
| Finance Corp. Revenue (Texas Health | | | | |
| Resources) TOB VRDO | 1.630% | 11/7/18 | 6,250 | 6,250 |
| 1 Tarrant County TX Cultural Education Facilities | | | | |
| Finance Corp. Revenue (Texas Health | | | | |
| Resources) TOB VRDO | 1.630% | 11/7/18 | 5,000 | 5,000 |
| Tarrant County TX Cultural Education Facilities | | | | |
| Finance Corp. Revenue (Texas Health | | | | |
| Resources) VRDO | 1.610% | 11/7/18 | 38,090 | 38,090 |
| Tarrant County TX Cultural Education Facilities | | | | |
| Finance Corp. Revenue (Texas Health | | | | |
| Resources) VRDO | 1.630% | 11/7/18 | 9,650 | 9,650 |
| Texas (Veterans Housing Assistance Program) | | | | |
| GO VRDO | 1.640% | 11/7/18 | 4,770 | 4,770 |
| 1 Texas Department of Housing & Community | | | | |
| Affairs Revenue TOB VRDO | 1.630% | 11/7/18 | 4,000 | 4,000 |
| Texas Department of Housing & Community | | | | |
| Affairs Single Mortgage Revenue VRDO | 1.640% | 11/7/18 | 15,785 | 15,785 |
| 1 Texas GO TOB VRDO | 1.630% | 11/7/18 LOC | 5,000 | 5,000 |
| Texas GO VRDO | 1.640% | 11/7/18 | 30,000 | 30,000 |
| Texas GO VRDO | 1.680% | 11/7/18 | 25,000 | 25,000 |
| Texas Revenue | 4.000% | 8/29/19 | 470,050 | 477,963 |
| Texas State University System Financing | | | | |
| System Revenue (Extendible) CP | 1.770% | 6/14/19 | 55,600 | 55,600 |
| Texas Transportation Commission Revenue | | | | |
| VRDO | 1.570% | 11/7/18 | 44,295 | 44,295 |
| 1 Texas Water Development Board Revenue | | | | |
| TOB VRDO | 1.630% | 11/7/18 | 5,900 | 5,900 |
| 1 Texas Water Development Board Revenue | | | | |
| TOB VRDO | 1.630% | 11/7/18 | 9,500 | 9,500 |
| 1 Texas Water Development Board Revenue | | | | |
| TOB VRDO | 1.630% | 11/7/18 | 3,300 | 3,300 |
| 1 Texas Water Development Board Revenue | | | | |
| TOB VRDO | 1.630% | 11/7/18 | 3,750 | 3,750 |
| 1 Texas Water Development Board TOB VRDO | 1.620% | 11/7/18 | 10,190 | 10,190 |
| 1 Texas Water Development Board TOB VRDO | 1.620% | 11/7/18 | 30,000 | 30,000 |
| 1 Texas Water Development Board TOB VRDO | 1.620% | 11/7/18 | 5,200 | 5,200 |
| 1 Texas Water Development Board TOB VRDO | 1.640% | 11/7/18 | 6,640 | 6,640 |
| University of Texas System Revenue | | | | |
| Financing System Revenue | 5.000% | 8/15/19 | 10,050 | 10,293 |
| University of Texas System Revenue | | | | |
| Financing System Revenue CP | 1.730% | 11/6/18 | 12,500 | 12,500 |
| University of Texas System Revenue | | | | |
| Financing System Revenue CP | 1.640% | 11/7/18 | 23,500 | 23,500 |
| University of Texas System Revenue | | | | |
| Financing System Revenue CP | 1.750% | 12/3/18 | 12,500 | 12,500 |
| University of Texas System Revenue | | | | |
| Financing System Revenue CP | 1.750% | 12/6/18 | 20,000 | 20,000 |
43
| | | | | |
| Municipal Money Market Fund | | | | |
| |
| |
| |
| | | | | Face | Market |
| | | | Maturity | Amount | Value • |
| | | Coupon | Date | ($000) | ($000) |
| | University of Texas System Revenue | | | | |
| | Financing System Revenue CP | 1.820% | 4/2/19 | 25,000 | 25,000 |
| 1 | Whitehouse TX Independent School District | | | | |
| | GO TOB VRDO | 1.630% | 11/7/18 LOC | 4,750 | 4,750 |
| | | | | | 2,186,584 |
| Utah (0.2%) | | | | |
| 1 | University of Utah Revenue TOB VRDO | 1.670% | 11/7/18 (Prere.) | 7,680 | 7,680 |
| | Utah County UT Hospital Revenue | | | | |
| | (IHC Health Services) VRDO | 1.600% | 11/7/18 | 22,150 | 22,150 |
| | Utah Housing Finance Agency Single Family | | | | |
| | Mortgage Revenue VRDO | 1.640% | 11/7/18 | 2,665 | 2,665 |
| 1 | Utah Transit Authority Sales Tax Revenue | | | | |
| | TOB VRDO | 1.630% | 11/7/18 | 3,300 | 3,300 |
| | | | | | 35,795 |
| Virginia (0.7%) | | | | |
| 1,2 | Alexandria VA GO TOB PUT | 1.750% | 1/10/19 | 4,800 | 4,800 |
| | Fairfax County VA GO | 4.000% | 10/1/19 | 5,345 | 5,444 |
| 1,2 | Hampton Roads VA Sanitation & | | | | |
| | Wastewater District Revenue TOB PUT | 1.750% | 11/1/18 | 11,000 | 11,000 |
| 1 | Hampton Roads VA Transportation | | | | |
| | Accountability Commission Revenue | | | | |
| | TOB VRDO | 1.630% | 11/7/18 | 7,830 | 7,830 |
| 1 | Hampton Roads VA Transportation | | | | |
| | Accountability Commission Revenue | | | | |
| | TOB VRDO | 1.630% | 11/7/18 | 11,250 | 11,250 |
| | Loudoun County VA Industrial Development | | | | |
| | Authority Revenue (Howard Hughes | | | | |
| | Medical Institute) VRDO | 1.620% | 11/7/18 | 7,400 | 7,400 |
| 1,2 | Portsmouth VA GO TOB PUT | 1.750% | 11/22/18 | 11,580 | 11,580 |
| | Stafford County VA Industrial Development | | | | |
| | Authority Revenue (VML/VACo | | | | |
| | Commonwealth Loan Program) VRDO | 1.770% | 11/7/18 LOC | 1,805 | 1,805 |
| 1,2 | Suffolk VA GO TOB PUT | 1.730% | 1/24/19 | 4,620 | 4,620 |
| 1,2 | University of Virginia Revenue TOB PUT | 1.750% | 11/29/18 | 5,300 | 5,300 |
| | Virginia College Building Authority Educational | | | | |
| | Facilities Revenue (21st Century College & | | | | |
| | Equipment Programs) | 5.000% | 2/1/19 | 9,565 | 9,640 |
| | Virginia College Building Authority Educational | | | | |
| | Facilities Revenue (21st Century College & | | | | |
| | Equipment Programs) | 5.000% | 2/1/19 | 2,000 | 2,016 |
| 1 | Virginia College Building Authority Educational | | | | |
| | Facilities Revenue (21st Century College & | | | | |
| | Equipment Programs) TOB VRDO | 1.630% | 11/7/18 | 4,025 | 4,025 |
| 1 | Virginia Commonwealth Transportation Board | | | | |
| | Revenue TOB VRDO | 1.620% | 11/7/18 | 5,000 | 5,000 |
| 1 | Virginia Housing Development Authority | | | | |
| | Commonwealth Mortgage Revenue | | | | |
| | TOB VRDO | 1.620% | 11/7/18 | 5,000 | 5,000 |
| | Virginia Public Building Authority Public | | | | |
| | Facilities Revenue VRDO | 1.590% | 11/7/18 | 29,900 | 29,900 |
| | | | | | 126,610 |
44
| | | | | |
| Municipal Money Market Fund | | | | |
| |
| |
| |
| | | | | Face | Market |
| | | | Maturity | Amount | Value • |
| | | Coupon | Date | ($000) | ($000) |
| Washington (2.4%) | | | | |
| 1 | Central Puget Sound WA Regional Transit | | | | |
| | Authority Sales & Use Tax Revenue | | | | |
| | TOB VRDO | 1.630% | 11/7/18 | 2,885 | 2,885 |
| 1 | Central Puget Sound WA Regional Transit | | | | |
| | Authority Sales & Use Tax Revenue | | | | |
| | TOB VRDO | 1.630% | 11/7/18 | 2,665 | 2,665 |
| 1 | City of Seattle WA Municipal Light | | | | |
| | & Power Revenue TOB VRDO | 1.630% | 11/7/18 | 3,000 | 3,000 |
| 1 | City of Seattle WA Municipal Light | | | | |
| | & Power Revenue TOB VRDO | 1.630% | 11/7/18 | 3,000 | 3,000 |
| 1 | King County WA Public Hospital District No 2. | | | | |
| | GO TOB VRDO | 1.630% | 11/7/18 LOC | 5,000 | 5,000 |
| 1 | King County WA School District No. 401 | | | | |
| | GO TOB VRDO | 1.630% | 11/7/18 LOC | 5,000 | 5,000 |
| | King County WA School District No. 414 GO | 4.000% | 12/1/18 | 2,950 | 2,956 |
| 1,2 | King County WA School District No. 414 | | | | |
| | GO TOB PUT | 1.730% | 1/24/19 | 8,800 | 8,800 |
| 1 | King County WA Sewer Revenue TOB VRDO | 1.630% | 11/7/18 | 2,100 | 2,100 |
| 1 | Lewis & Thurston Counties WA School | | | | |
| | District No. 401 Centralia GO TOB VRDO | 1.630% | 11/7/18 LOC | 5,000 | 5,000 |
| 1 | Northwest Energy Washington Electric | | | | |
| | Revenue (Columbia Generating Station) | | | | |
| | TOB VRDO | 1.630% | 11/7/18 | 8,250 | 8,250 |
| 1 | Pierce County WA School District No. 10 | | | | |
| | (Tacoma) GO TOB VRDO | 1.630% | 11/7/18 | 2,650 | 2,650 |
| | Port of Seattle WA Revenue VRDO | 1.630% | 11/7/18 LOC | 49,340 | 49,340 |
| 1 | Port of Tacoma WA TOB VRDO | 1.680% | 11/7/18 | 6,000 | 6,000 |
| 1 | Seattle WA Drain and Wastewater Revenue | | | | |
| | TOB PUT | 1.650% | 11/1/18 | 11,090 | 11,090 |
| 1,2 | Seattle WA GO TOB PUT | 1.750% | 1/10/19 | 4,490 | 4,490 |
| 1,2 | Seattle WA Municipal Light & Power Revenue | | | | |
| | TOB PUT | 1.750% | 12/27/18 | 10,220 | 10,220 |
| 1,2 | Seattle WA Water System Revenue TOB PUT | 1.730% | 1/24/19 | 11,775 | 11,775 |
| 1 | TES Properties Washington Lease Revenue | | | | |
| | TOB VRDO | 1.680% | 11/7/18 (Prere.) | 10,125 | 10,125 |
| | University of Washington Revenue CP | 1.800% | 2/20/19 | 25,000 | 25,000 |
| | Washington GO | 5.000% | 7/1/19 | 6,770 | 6,910 |
| 1 | Washington GO TOB VRDO | 1.630% | 11/7/18 | 8,325 | 8,325 |
| 1 | Washington GO TOB VRDO | 1.630% | 11/7/18 | 5,100 | 5,100 |
| 1 | Washington GO TOB VRDO | 1.630% | 11/7/18 | 2,250 | 2,250 |
| 1 | Washington GO TOB VRDO | 1.630% | 11/7/18 | 4,700 | 4,700 |
| 1 | Washington Health Care Facilities Authority | | | | |
| | Revenue (Children’s Hospital & Regional | | | | |
| | Medical Center) TOB VRDO | 1.630% | 11/7/18 | 21,280 | 21,280 |
| 1 | Washington Health Care Facilities Authority | | | | |
| | Revenue (Providence Health & Services) | | | | |
| | TOB VRDO | 1.630% | 11/7/18 | 1,875 | 1,875 |
| | Washington Health Care Facilities Authority | | | | |
| | Revenue (Providence Health & Services) | | | | |
| | VRDO | 1.600% | 11/7/18 | 18,235 | 18,235 |
| | Washington Health Care Facilities Authority | | | | |
| | Revenue (Providence Health & Services) | | | | |
| | VRDO | 1.600% | 11/7/18 | 73,625 | 73,625 |
45
Municipal Money Market Fund
| | | | | |
| | | | | Face | Market |
| | | | Maturity | Amount | Value • |
| | | Coupon | Date | ($000) | ($000) |
| 1 | Washington Health Care Facilities Authority | | | | |
| | Revenue (Seattle Children’s Hospital) | | | | |
| | TOB VRDO | 1.630% | 11/7/18 | 3,275 | 3,275 |
| | Washington Higher Education Facilities | | | | |
| | Authority Revenue (Seattle University) VRDO | 1.590% | 11/7/18 LOC | 11,965 | 11,965 |
| | Washington Higher Education Facilities | | | | |
| | Authority Revenue (Whitman College Project) | | | | |
| | VRDO | 1.610% | 11/7/18 | 21,900 | 21,900 |
| | Washington Housing Finance Commission | | | | |
| | Multi-Family Housing Revenue | | | | |
| | (Merrill Gardens at Kirkland Project) VRDO | 1.640% | 11/7/18 LOC | 24,600 | 24,600 |
| | Washington Housing Finance Commission | | | | |
| | Multi-Family Housing Revenue (Reserve at | | | | |
| | SeaTac Apartments Project) VRDO | 1.610% | 11/7/18 LOC | 33,000 | 33,000 |
| | Washington Housing Finance Commission | | | | |
| | Multi-Family Housing Revenue (Vintage at | | | | |
| | Silverdale Senior Living Project) VRDO | 1.660% | 11/7/18 LOC | 14,880 | 14,880 |
| | | | | | 431,266 |
| West Virginia (0.7%) | | | | |
| 1 | Morgantown WV Combined Utility System | | | | |
| | Revenue TOB VRDO | 1.700% | 11/7/18 LOC | 1,475 | 1,475 |
| | West Virginia Hospital Finance Authority | | | | |
| | Hospital Revenue (Cabell Huntington | | | | |
| | Hospital Inc.) VRDO | 1.600% | 11/7/18 LOC | 7,800 | 7,800 |
| | West Virginia Hospital Finance Authority | | | | |
| | Hospital Revenue (Charleston Area Medical | | | | |
| | Center Inc.) VRDO | 1.620% | 11/7/18 LOC | 105,815 | 105,815 |
| | | | | | 115,090 |
| Wisconsin (4.5%) | | | | |
| | Madison WI Metropolitan School District | | | | |
| | TRAN | 3.000% | 9/6/19 | 69,000 | 69,607 |
| 1,2 | Milwaukee WI Metropolitan Sewer District | | | | |
| | GO TOB PUT | 1.750% | 12/13/18 | 5,400 | 5,400 |
| | Milwaukee WI RAN | 4.000% | 5/16/19 | 100,000 | 101,149 |
| | Milwaukee WI Revenue | 4.000% | 9/30/19 | 160,000 | 162,908 |
| | University of Wisconsin Hospitals | | | | |
| | & Clinics Authority Revenue VRDO | 1.590% | 11/7/18 LOC | 30,650 | 30,650 |
| 1,2 | Verona WI Area School District GO TOB PUT | 1.750% | 11/1/18 | 17,790 | 17,790 |
| 1 | Wisconsin Annual Appropriation Revenue | | | | |
| | TOB VRDO | 1.630% | 11/7/18 (Prere.) | 11,085 | 11,085 |
| | Wisconsin Department of Transportation | | | | |
| | Revenue CP | 1.730% | 11/30/18 | 10,000 | 10,000 |
| | Wisconsin GO (Extendible) CP | 1.710% | 6/28/19 | 57,494 | 57,494 |
| | Wisconsin GO (Extendible) CP | 1.750% | 6/30/19 | 43,523 | 43,523 |
| | Wisconsin GO (Extendible) CP | 1.820% | 6/30/19 | 18,864 | 18,864 |
| | Wisconsin GO (Extendible) CP | 1.780% | 7/7/19 | 45,910 | 45,910 |
| | Wisconsin GO (Extendible) CP | 1.790% | 7/8/19 | 42,574 | 42,574 |
| | Wisconsin GO CP | 1.580% | 11/5/18 | 21,125 | 21,125 |
| 1 | Wisconsin Health & Educational Facilities | | | | |
| | Authority Revenue (Ascension Health | | | | |
| | Credit Group) TOB VRDO | 1.630% | 11/7/18 | 5,000 | 5,000 |
| 1 | Wisconsin Health & Educational Facilities | | | | |
| | Authority Revenue (Ascension Health | | | | |
| | Credit Group) TOB VRDO | 1.630% | 11/7/18 | 5,000 | 5,000 |
46
| | | | |
| Municipal Money Market Fund | | | | |
| |
| |
| |
| | | | Face | Market |
| | | Maturity | Amount | Value • |
| | Coupon | Date | ($000) | ($000) |
| 1 Wisconsin Health & Educational Facilities | | | | |
| Authority Revenue (Ascension Health | | | | |
| Credit Group) TOB VRDO | 1.630% | 11/7/18 | 9,000 | 9,000 |
| 1 Wisconsin Health & Educational Facilities | | | | |
| Authority Revenue (Ascension Health | | | | |
| Credit Group) TOB VRDO | 1.630% | 11/7/18 | 1,500 | 1,500 |
| 1 Wisconsin Health & Educational Facilities | | | | |
| Authority Revenue (Children’s Hospital of | | | | |
| Wisconsin Inc.) TOB VRDO | 1.630% | 11/7/18 | 5,000 | 5,000 |
| 1 Wisconsin Health & Educational Facilities | | | | |
| Authority Revenue (Children’s Hospital of | | | | |
| Wisconsin Inc.) TOB VRDO | 1.650% | 11/7/18 | 2,000 | 2,000 |
| 1 Wisconsin Health & Educational Facilities | | | | |
| Authority Revenue (Medical College | | | | |
| Wisconsin) TOB VRDO | 1.630% | 11/7/18 | 3,320 | 3,320 |
| 1 Wisconsin Health & Educational Facilities | | | | |
| Authority Revenue (Medical College | | | | |
| Wisconsin) TOB VRDO | 1.630% | 11/7/18 | 11,615 | 11,615 |
| Wisconsin Housing & Economic Development | | | | |
| Authority Home Ownership Revenue VRDO | 1.600% | 11/7/18 | 26,000 | 26,000 |
| Wisconsin Housing & Economic Development | | | | |
| Authority Home Ownership Revenue VRDO | 1.600% | 11/7/18 | 9,150 | 9,150 |
| Wisconsin Housing & Economic Development | | | | |
| Authority Home Ownership Revenue VRDO | 1.600% | 11/7/18 | 20,200 | 20,200 |
| Wisconsin Housing & Economic Development | | | | |
| Authority Multi-Family Revenue VRDO | 1.600% | 11/7/18 | 23,380 | 23,380 |
| 1 Wisconsin Public Finance Authority Lease | | | | |
| Development Revenue (KU Campus | | | | |
| Development Corp. - Central District | | | | |
| Development Project) TOB VRDO | 1.710% | 11/7/18 | 32,140 | 32,140 |
| | | | | 791,384 |
| Wyoming (0.1%) | | | | |
| Sweetwater County WY Pollution Control | | | | |
| Revenue (PacifiCorp Projects) VRDO | 1.620% | 11/7/18 LOC | 17,710 | 17,710 |
| Total Tax-Exempt Municipal Bonds (Cost $16,952,679) | | | 16,952,679 |
| |
| | | | Shares | |
| Temporary Cash Investment (4.1%) | | | | |
| Money Market Fund (4.1%) | | | | |
| 5 Vanguard Municipal Cash Management Fund | | | | |
| (Cost $721,701) | 1.620% | | 7,216,998 | 721,700 |
| Total Investments (100.1%) (Cost $17,674,380) | | | | 17,674,379 |
47
Municipal Money Market Fund
| |
| | Amount |
| | ($000) |
| Other Assets and Liabilities (-0.1%) | |
| Other Assets | |
| Investment in Vanguard | 886 |
| Receivables for Investment Securities Sold | 12,280 |
| Receivables for Accrued Income | 53,881 |
| Receivables for Capital Shares Issued | 48,581 |
| Other Assets | 24,611 |
| Total Other Assets | 140,239 |
| Liabilities | |
| Payables for Investment Securities Purchased | 122,775 |
| Payables for Capital Shares Redeemed | 25,823 |
| Payables for Distributions | 1,847 |
| Payables to Vanguard | 1,377 |
| Total Liabilities | 151,822 |
| Net Assets (100%) | |
| Applicable to 17,660,817,805 outstanding $.001 par value shares of | |
| beneficial interest (unlimited authorization) | 17,662,796 |
| Net Asset Value Per Share | $1.00 |
| |
| At October 31, 2018, net assets consisted of: | |
| | Amount |
| | ($000) |
| Paid-in Capital | 17,662,809 |
| Total Distributable Earnings (Loss) | (13) |
| Net Assets | 17,662,796 |
• See Note A in Notes to Financial Statements.
1 Security exempt from registration under Rule 144A of the Securities Act of 1933. Such securities may be sold in transactions
exempt from registration, normally to qualified institutional buyers. At October 31, 2018, the aggregate value of these securities
was $6,326,584,000, representing 35.8% of net assets.
2 Adjustable-rate security based upon SIFMA Municipal Swap Index Yield plus spread.
3 Security purchased on a when-issued or delayed-delivery basis for which the fund has not taken delivery as of October 31, 2018.
4 The issuer was placed under federal conservatorship in September 2008; since that time, its daily operations have been managed
by the Federal Housing Finance Agency and it receives capital from the U.S. Treasury, as needed to maintain a positive net worth,
in exchange for senior preferred stock.
5 Affiliated money market fund available only to Vanguard funds and certain trusts and accounts managed by Vanguard. Rate shown
is the 7-day yield.
A key to abbreviations and other references follows the Statement of Net Assets.
See accompanying Notes, which are an integral part of the Financial Statements.
48
Municipal Money Market Fund
Key to Abbreviations
ARS—Auction Rate Security.
BAN—Bond Anticipation Note.
COP—Certificate of Participation.
CP—Commercial Paper.
FR—Floating Rate.
GAN—Grant Anticipation Note.
GO—General Obligation Bond.
PILOT—Payments in Lieu of Taxes.
PUT—Put Option Obligation.
RAN—Revenue Anticipation Note.
TAN—Tax Anticipation Note.
TOB—Tender Option Bond.
TRAN—Tax Revenue Anticipation Note.
VRDO—Variable Rate Demand Obligation.
VRDP—Variable Rate Demand Preferred.
(ETM)—Escrowed to Maturity.
(Prere.)—Prerefunded.
Scheduled principal and interest payments are guaranteed by:
(1) MBIA (Municipal Bond Investors Assurance).
(2) AMBAC (Ambac Assurance Corporation).
(3) FGIC (Financial Guaranty Insurance Company).
(4) AGM (Assured Guaranty Municipal Corporation).
(5) BIGI (Bond Investors Guaranty Insurance).
(6) Connie Lee Inc.
(7) FHA (Federal Housing Authority).
(8) CapMAC (Capital Markets Assurance Corporation).
(9) American Capital Access Financial Guaranty Corporation.
(10) XL Capital Assurance Inc.
(11) CIFG (CDC IXIS Financial Guaranty).
(12) AGC (Assured Guaranty Corporation).
(13) BHAC (Berkshire Hathaway Assurance Corporation).
(14) NPFG (National Public Finance Guarantee Corporation).
(15) BAM (Build America Mutual Assurance Company).
(16) MAC (Municipal Assurance Corporation).
(17) RAA (Radian Asset Assurance Inc.).
(18) SBLF (Michigan School Bond Loan Fund).
(19) TPSF (Texas Permanent School Fund).
The insurance does not guarantee the market value of the municipal bonds.
LOC—Scheduled principal and interest payments are guaranteed by bank letter of credit.
49
Municipal Money Market Fund
Statement of Operations
| |
| | Year Ended |
| | October 31, 2018 |
| | ($000) |
| Investment Income | |
| Income | |
| Interest1 | 239,498 |
| Total Income | 239,498 |
| Expenses | |
| The Vanguard Group—Note B | |
| Investment Advisory Services | 4,358 |
| Management and Administrative | 18,253 |
| Marketing and Distribution | 3,863 |
| Custodian Fees | 117 |
| Auditing Fees | 29 |
| Shareholders’ Reports and Proxy | 49 |
| Trustees’ Fees and Expenses | 11 |
| Total Expenses | 26,680 |
| Expenses Paid Indirectly | (62) |
| Net Expenses | 26,618 |
| Net Investment Income | 212,880 |
| Realized Net Gain (Loss) on Investment Securities Sold1 | (2) |
| Change in Unrealized Appreciation (Depreciation) of Investment Securities1 | (2) |
| Net Increase (Decrease) in Net Assets Resulting from Operations | 212,876 |
1 Interest income, realized net gain (loss), and change in unrealized appreciation (depreciation) from an affiliated company of the fund were $9,123,000, ($1,000), and ($2,000), respectively. Purchases and sales are for temporary cash investment purposes.
See accompanying Notes, which are an integral part of the Financial Statements.
50
Municipal Money Market Fund
Statement of Changes in Net Assets
| | |
| | Year Ended October 31, |
| | 2018 | 2017 |
| | ($000) | ($000) |
| Increase (Decrease) in Net Assets | | |
| Operations | | |
| Net Investment Income | 212,880 | 111,756 |
| Realized Net Gain (Loss) | (2) | 27 |
| Change in Unrealized Appreciation (Depreciation) | (2) | — |
| Net Increase (Decrease) in Net Assets Resulting from Operations | 212,876 | 111,783 |
| Distributions | | |
| Net Investment Income | (212,911) | (111,737) |
| Realized Capital Gain | — | — |
| Total Distributions | (212,911) | (111,737) |
| Capital Share Transactions (at $1.00 per share) | | |
| Issued | 12,478,236 | 11,065,557 |
| Issued in Lieu of Cash Distributions | 194,145 | 102,800 |
| Redeemed | (12,369,854) | (9,931,863) |
| Net Increase (Decrease) from Capital Share Transactions | 302,527 | 1,236,494 |
| Total Increase (Decrease) | 302,492 | 1,236,540 |
| Net Assets | | |
| Beginning of Period | 17,360,304 | 16,123,764 |
| End of Period | 17,662,796 | 17,360,304 |
See accompanying Notes, which are an integral part of the Financial Statements.
51
Municipal Money Market Fund
Financial Highlights
| | | | | |
| For a Share Outstanding | | | Year Ended October 31, |
| Throughout Each Period | 2018 | 2017 | 2016 | 2015 | 2014 |
| Net Asset Value, Beginning of Period | $1.00 | $1.00 | $1.00 | $1.00 | $1.00 |
| Investment Operations | | | | | |
| Net Investment Income | . 0121 | .0071 | .0025 | .0001 | .0001 |
| Net Realized and Unrealized Gain (Loss) | | | | | |
| on Investments | — | — | — | — | — |
| Total from Investment Operations | .012 | .007 | .0025 | .0001 | .0001 |
| Distributions | | | | | |
| Dividends from Net Investment Income | (. 012) | (. 007) | (. 0025) | (. 0001) | (. 0001) |
| Distributions from Realized Capital Gains | — | — | — | — | — |
| Total Distributions | (. 012) | (. 007) | (. 0025) | (. 0001) | (. 0001) |
| Net Asset Value, End of Period | $1.00 | $1.00 | $1.00 | $1.00 | $1.00 |
| |
| Total Return2 | 1.21% | 0.66% | 0.25% | 0.01% | 0.01% |
| |
| Ratios/Supplemental Data | | | | | |
| Net Assets, End of Period (Millions) | $17,663 | $17,360 | $16,124 | $17,222 | $17,393 |
| Ratio of Total Expenses to Average Net Assets3 | 0.15% | 0.15% | 0.12% | 0.07% | 0.09% |
| Ratio of Net Investment Income to | | | | | |
| Average Net Assets | 1.20% | 0.66% | 0.24% | 0.01% | 0.01% |
1 Calculated based on average shares outstanding.
2 Total returns do not include account service fees that may have applied in the periods shown. Fund prospectuses provide information about any applicable account service fees.
3 Vanguard and the board of trustees have agreed to temporarily limit certain net operating expenses in excess of the fund’s daily yield in order to maintain a zero or positive yield for the fund. Vanguard and the board of trustees may terminate the temporary expense limitation at any time. The fund is not obligated to repay this amount to Vanguard. The ratio of total expenses to average net assets before an expense reduction was 0.15% in 2016, 0.15% in 2015, and 0.16% in 2014. For the years ended October 31, 2018 and 2017, there were no expense reductions.
See accompanying Notes, which are an integral part of the Financial Statements.
52
Municipal Money Market Fund
Notes to Financial Statements
Vanguard Municipal Money Market Fund is registered under the Investment Company Act of 1940 as an open-end investment company, or mutual fund. The fund invests in debt instruments of many municipal issuers; the issuers’ abilities to meet their obligations may be affected by economic and political developments in a specific state or region.
A. The following significant accounting policies conform to generally accepted accounting principles for U.S. investment companies. The fund consistently follows such policies in preparing its financial statements.
1. Security Valuation: Securities are valued as of the close of trading on the New York Stock Exchange (generally 4 p.m., Eastern time) on the valuation date. Securities are valued at amortized cost, which approximates market value. Investments in Vanguard Municipal Cash Management Fund are valued at the fund’s net asset value.
2. Federal Income Taxes: The fund intends to continue to qualify as a regulated investment company and distribute all of its income. Management has analyzed the fund’s tax positions taken for all open federal income tax years (October 31, 2015–2018), and has concluded that no provision for federal income tax is required in the fund’s financial statements.
3. Distributions: Distributions from net investment income are declared daily and paid on the first business day of the following month. Annual distributions from realized capital gains, if any, are recorded on the ex-dividend date. Distributions are determined on a tax basis and may differ from net investment income and realized capital gains for financial reporting purposes.
4. Credit Facility: The fund and certain other funds managed by The Vanguard Group (“Vanguard”) participate in a $3.1 billion committed credit facility provided by a syndicate of lenders pursuant to a credit agreement that may be renewed annually; each fund is individually liable for its borrowings, if any, under the credit facility. Borrowings may be utilized for temporary and emergency purposes, and are subject to the fund’s regulatory and contractual borrowing restrictions. The participating funds are charged administrative fees and an annual commitment fee of 0.10% of the undrawn amount of the facility; these fees are allocated to the funds based on a method approved by the fund’s board of trustees and included in Management and Administrative expenses on the fund’s Statement of Operations. Any borrowings under this facility bear interest at a rate based upon the higher of the one-month London Interbank Offered Rate, federal funds effective rate, or overnight bank funding rate plus an agreed-upon spread.
The fund had no borrowings outstanding at October 31, 2018, or at any time during the period then ended.
5. Other: Interest income includes income distributions received from Vanguard Municipal Cash Management Fund and is accrued daily. Premiums and discounts on debt securities purchased are amortized and accreted, respectively, to interest income over the lives of the respective securities. Security transactions are accounted for on the date securities are bought or sold. Costs used to determine realized gains (losses) on the sale of investment securities are those of the specific securities sold.
53
Municipal Money Market Fund
B. In accordance with the terms of a Funds’ Service Agreement (the “FSA”) between Vanguard and the fund, Vanguard furnishes to the fund investment advisory, corporate management, administrative, marketing, and distribution services at Vanguard’s cost of operations (as defined by the FSA). These costs of operations are allocated to the fund based on methods and guidelines approved by the board of trustees. Vanguard does not require reimbursement in the current period for certain costs of operations (such as deferred compensation/benefits and risk/insurance costs); the fund’s liability for these costs of operations is included in Payables to Vanguard on the Statement of Net Assets. All other costs of operations payable to Vanguard are generally settled twice a month.
Upon the request of Vanguard, the fund may invest up to 0.40% of its net assets as capital in Vanguard. At October 31, 2018, the fund had contributed to Vanguard capital in the amount of $886,000, representing 0.01% of the fund’s net assets and 0.35% of Vanguard’s capitalization. The fund’s trustees and officers are also directors and employees, respectively, of Vanguard.
C. The fund’s custodian bank has agreed to reduce its fees when the fund maintains cash on deposit in the non-interest-bearing custody account. For the year ended October 31, 2018, custodian fee offset arrangements reduced the fund’s expenses by $62,000 (an annual rate of 0.00% of average net assets).
D. Various inputs may be used to determine the value of the fund’s investments. These inputs are summarized in three broad levels for financial statement purposes. The inputs or methodologies used to value securities are not necessarily an indication of the risk associated with investing in those securities.
Level 1—Quoted prices in active markets for identical securities.
Level 2—Other significant observable inputs (including quoted prices for similar securities, interest rates, prepayment speeds, credit risk, etc.).
Level 3—Significant unobservable inputs (including the fund’s own assumptions used to determine the fair value of investments). Any investments valued with significant unobservable inputs are noted on the Statement of Net Assets.
The fund’s investment in Vanguard Municipal Cash Management Fund is valued based on Level 1 inputs. All of the fund’s other investments were valued using amortized cost, in accordance with rules under the Investment Company Act of 1940. Amortized cost approximates the current fair value of a security, but since the value is not obtained from a quoted price in an active market, securities valued at amortized cost are considered to be valued using Level 2 inputs.
E. Permanent differences between book-basis and tax-basis components of net assets are reclassified among capital accounts in the financial statements to reflect their tax character. These reclassifications have no effect on net assets or net asset value per share.
| |
| | Amount |
| | ($000) |
| Paid-in Capital | 5 |
| Total Distributable Earnings (Loss) | (5) |
54
Municipal Money Market Fund
Temporary differences between book-basis and tax-basis components of total distributable earnings (loss) arise when certain items of income, gain, or loss are recognized in different periods for financial statement and tax purposes; these differences will reverse at some time in the future. The differences are primarily related to the tax deferral of losses on wash sales and payables for distributions. As of period end, the tax-basis components of total distributable earnings (loss) are detailed in the table as follows:
| |
| | Amount |
| | ($000) |
| Undistributed Ordinary Income | — |
| Undistributed Tax-Exempt Income | 1,836 |
| Undistributed Long-Term Gains | — |
| Capital Loss Carryforwards (Non-expiring) | (2) |
| Net Unrealized Gains (Losses) | (1) |
As of October 31, 2018, gross unrealized appreciation and depreciation for investments based on cost for U.S. federal income tax purposes were as follows:
| |
| | Amount |
| | ($000) |
| Tax Cost | 17,674,380 |
| Gross Unrealized Appreciation | — |
| Gross Unrealized Depreciation | (1) |
| Net Unrealized Appreciation (Depreciation) | (1) |
F. The fund purchased securities from and sold securities to other Vanguard funds or accounts managed by Vanguard or its affiliates, in accordance with procedures adopted by the board of trustees in compliance with Rule 17a-7 of the Investment Company Act of 1940. For the year ended October 31, 2018, such purchases and sales were $1,316,447,000 and $1,832,034,000, respectively.
G. Management has determined that no events or transactions occurred subsequent to October 31, 2018, that would require recognition or disclosure in these financial statements.
55
Report of Independent Registered Public Accounting Firm
To the Board of Trustees of Vanguard Municipal Bond Funds and Shareholders of Vanguard Municipal Money Market Fund
Opinion on the Financial Statements
We have audited the accompanying statement of net assets of Vanguard Municipal Money Market Fund (one of the funds constituting Vanguard Municipal Bond Funds, referred to hereafter as the “Fund”) as of October 31, 2018, the related statement of operations for the year ended October 31, 2018, the statement of changes in net assets for each of the two years in the period ended October 31, 2018, including the related notes, and the financial highlights for each of the five years in the period ended October 31, 2018 (collectively referred to as the “financial statements”). In our opinion, the financial statements present fairly, in all material respects, the financial position of the Fund as of October 31, 2018, the results of its operations for the year then ended, the changes in its net assets for each of the two years in the period ended October 31, 2018 and the financial highlights for each of the five years in the period ended October 31, 2018 in conformity with accounting principles generally accepted in the United States of America.
Basis for Opinion
These financial statements are the responsibility of the Fund’s management. Our responsibility is to express an opinion on the Fund’s financial statements based on our audits. We are a public accounting firm registered with the Public Company Accounting Oversight Board (United States) (“PCAOB”) and are required to be independent with respect to the Fund in accordance with the U.S. federal securities laws and the applicable rules and regulations of the Securities and Exchange Commission and the PCAOB.
We conducted our audits of these financial statements in accordance with the standards of the PCAOB. Those standards require that we plan and perform the audit to obtain reasonable assurance about whether the financial statements are free of material misstatement, whether due to error or fraud.
Our audits included performing procedures to assess the risks of material misstatement of the financial statements, whether due to error or fraud, and performing procedures that respond to those risks. Such procedures included examining, on a test basis, evidence regarding the amounts and disclosures in the financial statements. Our audits also included evaluating the accounting principles used and significant estimates made by management, as well as evaluating the overall presentation of the financial statements. Our procedures included confirmation of securities owned as of October 31, 2018 by correspondence with the custodian and brokers and by agreement to the underlying ownership records of the transfer agent; when replies were not received from brokers, we performed other auditing procedures. We believe that our audits provide a reasonable basis for our opinion.
/s/PricewaterhouseCoopers LLP
Philadelphia, Pennsylvania
December 13, 2018
We have served as the auditor of one or more investment companies in The Vanguard Group of Funds since 1975.
56
Special 2018 tax information (unaudited) for Vanguard Municipal Money Market Fund
This information for the fiscal year ended October 31, 2018, is included pursuant to provisions of
the Internal Revenue Code.
The fund designates 100% of its income dividends as exempt-interest dividends.
57
About Your Fund’s Expenses
As a shareholder of the fund, you incur ongoing costs, which include costs for portfolio management, administrative services, and shareholder reports (like this one), among others. Operating expenses, which are deducted from a fund’s gross income, directly reduce the investment return of the fund.
A fund’s expenses are expressed as a percentage of its average net assets. This figure is known as the expense ratio. The following examples are intended to help you understand the ongoing costs (in dollars) of investing in your fund and to compare these costs with those of other mutual funds. The examples are based on an investment of $1,000 made at the beginning of the period shown and held for the entire period.
The accompanying table illustrates your fund’s costs in two ways:
• Based on actual fund return. This section helps you to estimate the actual expenses that you paid over the period. The ”Ending Account Value“ shown is derived from the fund‘s actual return, and the third column shows the dollar amount that would have been paid by an investor who started with $1,000 in the fund. You may use the information here, together with the amount you invested, to estimate the expenses that you paid over the period.
To do so, simply divide your account value by $1,000 (for example, an $8,600 account value divided by $1,000 = 8.6), then multiply the result by the number given for your fund under the heading ”Expenses Paid During Period.“
• Based on hypothetical 5% yearly return. This section is intended to help you compare your fund‘s costs with those of other mutual funds. It assumes that the fund had a yearly return of 5% before expenses, but that the expense ratio is unchanged. In this case—because the return used is not the fund’s actual return—the results do not apply to your investment. The example is useful in making comparisons because the Securities and Exchange Commission requires all mutual funds to calculate expenses based on a 5% return. You can assess your fund’s costs by comparing this hypothetical example with the hypothetical examples that appear in shareholder reports of other funds.
Note that the expenses shown in the table are meant to highlight and help you compare ongoing costs only and do not reflect transaction costs incurred by the fund for buying and selling securities. Further, the expenses do not include any purchase, redemption, or account service fees described in the fund prospectus. If such fees were applied to your account, your costs would be higher. Your fund does not carry a “sales load.”
The calculations assume no shares were bought or sold during the period. Your actual costs may have been higher or lower, depending on the amount of your investment and the timing of any purchases or redemptions.
You can find more information about the fund’s expenses, including annual expense ratios, in the Financial Statements section of this report. For additional information on operating expenses and other shareholder costs, please refer to your fund’s current prospectus.
58
| | | |
| Six Months Ended October 31, 2018 | | | |
| | Beginning | Ending | Expenses |
| | Account Value | Account Value | Paid During |
| Municipal Money Market Fund | 4/30/2018 | 10/31/2018 | Period |
| Based on Actual Fund Return | $1,000.00 | $1,006.56 | $0.76 |
| Based on Hypothetical 5% Yearly Return | 1,000.00 | 1,024.45 | 0.77 |
The calculations are based on expenses incurred in the most recent six-month period. The fund’s annualized six-month expense ratios for that period is 0.15%. The dollar amounts shown as “Expenses Paid” are equal to the annualized expense ratio multiplied by the average account value over the period, multiplied by the number of days in the most recent six-month period, then divided by the number of days in the most recent 12-month period (184/365).
59
Glossary
Average Weighted Maturity. The average length of time until fixed income securities held by a fund reach maturity and are repaid. The figure reflects the proportion of fund assets represented by each security.
Expense Ratio. A fund’s total annual operating expenses expressed as a percentage of the fund’s average net assets. The expense ratio includes management and administrative expenses, but does not include the transaction costs of buying and selling portfolio securities.
Inception Date. The date on which the assets of a fund (or one of its share classes) are first invested in accordance with the fund’s investment objective. For funds with a subscription period, the inception date is the day after that period ends. Investment performance is measured from the inception date.
Yield. A money market fund’s 7-day SEC yield is calculated by annualizing its income distributions for the previous seven days, as required by the U.S. Securities and Exchange Commission.
60
This page intentionally left blank.
This page intentionally left blank.
The People Who Govern Your Fund
The trustees of your mutual fund are there to see that the fund is operated and managed in your best interests since, as a shareholder, you are a part owner of the fund. Your fund’s trustees also serve on the board of directors of The Vanguard Group, Inc., which is owned by the Vanguard funds and provides services to them on an at-cost basis.
A majority of Vanguard’s board members are independent, meaning that they have no affiliation with Vanguard or the funds they oversee, apart from the sizable personal investments they have made as private individuals. The independent board members have distinguished backgrounds in business, academia, and public service. Each of the trustees and executive officers oversees 211 Vanguard funds.
Information for each trustee and executive officer of the fund appears below. The mailing address of the trustees and officers is P.O. Box 876, Valley Forge, PA 19482. More information about the trustees is in the Statement of Additional Information, which can be obtained, without charge, by contacting Vanguard at 800-662-7447, or online at vanguard.com.
Interested Trustees1
F. William McNabb III
Born in 1957. Trustee since July 2009. Principal occupation(s) during the past five years and other experience: chairman of the board (January 2010–present) of Vanguard and of each of the investment companies served by Vanguard, trustee (2009–present) of each of the investment companies served by Vanguard, and director (2008–present) of Vanguard. Chief executive officer and president (2008–2017) of Vanguard and each of the investment companies served by Vanguard, managing director (1995–2008) of Vanguard, and director (1997–2018) of Vanguard Marketing Corporation. Director (2018–present) of UnitedHealth Group.
Mortimer J. Buckley
Born in 1969. Trustee since January 2018. Principal occupation(s) during the past five years and other experience: chief executive officer (January 2018–present) of Vanguard; chief executive officer, president, and trustee (January 2018–present) of each of the investment companies served by Vanguard; president and director (2017–present) of Vanguard; and president (February 2018–present) of Vanguard Marketing Corporation. Chief investment officer (2013–2017), managing director (2002–2017), head of the Retail Investor Group (2006–2012), and chief information officer (2001–2006) of Vanguard. Chairman of the board (2011–2017) of the Children’s Hospital of Philadelphia.
Independent Trustees
Emerson U. Fullwood
Born in 1948. Trustee since January 2008. Principal occupation(s) during the past five years and other experience: executive chief staff and marketing officer for North America and corporate vice president (retired 2008) of Xerox Corporation (document management products and services). Former president of the Worldwide Channels Group, Latin America, and Worldwide Customer Service and executive chief staff officer of Developing Markets of Xerox. Executive in residence and 2009–2010 Distinguished Minett Professor at the Rochester Institute of Technology. Lead director of SPX FLOW, Inc. (multi-industry manufacturing). Director of the University of Rochester Medical Center, the Monroe Community College Foundation, the United Way of Rochester, North Carolina A&T University, and Roberts Wesleyan College. Trustee of the University of Rochester.
Amy Gutmann
Born in 1949. Trustee since June 2006. Principal occupation(s) during the past five years and other experience: president (2004–present) of the University of Pennsylvania. Christopher H. Browne Distinguished Professor of Political Science, School of Arts and Sciences, and professor of communication, Annenberg School for Communication, with secondary faculty appointments in the Department of Philosophy, School of Arts and Sciences, and at the Graduate School of Education, University of Pennsylvania. Trustee of the National Constitution Center.
1 Mr. McNabb and Mr. Buckley are considered “interested persons,” as defined in the Investment Company Act of 1940, because they are officers of the Vanguard funds.
JoAnn Heffernan Heisen
Born in 1950. Trustee since July 1998. Principal occupation(s) during the past five years and other experience: corporate vice president of Johnson & Johnson (pharmaceuticals/medical devices/consumer products) and member of its executive committee (1997–2008). Chief global diversity officer (retired 2008), vice president and chief information officer (1997–2006), controller (1995–1997), treasurer (1991–1995), and assistant treasurer (1989–1991) of Johnson & Johnson. Director of Skytop Lodge Corporation (hotels) and the Robert Wood Johnson Foundation. Member of the advisory board of the Institute for Women’s Leadership at Rutgers University.
F. Joseph Loughrey
Born in 1949. Trustee since October 2009. Principal occupation(s) during the past five years and other experience: president and chief operating officer (retired 2009) and vice chairman of the board (2008–2009) of Cummins Inc. (industrial machinery). Chairman of the board of Hillenbrand, Inc. (specialized consumer services), Oxfam America, and the Lumina Foundation for Education. Director of the V Foundation for Cancer Research. Member of the advisory council for the College of Arts and Letters and chair of the advisory board to the Kellogg Institute for International Studies, both at the University of Notre Dame.
Mark Loughridge
Born in 1953. Trustee since March 2012. Principal occupation(s) during the past five years and other experience: senior vice president and chief financial officer (retired 2013) of IBM (information technology services). Fiduciary member of IBM’s Retirement Plan Committee (2004–2013), senior vice president and general manager (2002–2004) of IBM Global Financing, vice president and controller (1998–2002) of IBM, and a variety of other prior management roles at IBM. Member of the Council on Chicago Booth.
Scott C. Malpass
Born in 1962. Trustee since March 2012. Principal occupation(s) during the past five years and other experience: chief investment officer (1989–present) and vice president (1996–present) of the University of Notre Dame. Assistant professor of finance at the Mendoza College of Business, University of Notre Dame, and member of the Notre Dame 403(b) Investment Committee. Chairman of the board of TIFF Advisory Services, Inc. Member of the board of Catholic Investment Services, Inc. (investment advisors), the board of advisors for Spruceview Capital Partners, and the board of superintendence of the Institute for the Works of Religion.
Deanna Mulligan
Born in 1963. Trustee since January 2018. Principal occupation(s) during the past five years and other experience: president (2010–present) and chief executive officer (2011–present) of The Guardian Life Insurance Company of America. Chief operating officer (2010–2011) and executive vice president (2008–2010) of Individual Life and Disability of The Guardian Life Insurance Company of America. Member of the board of The Guardian Life Insurance Company of America, the American Council of Life Insurers, the Partnership for New York City (business leadership), and the Committee Encouraging Corporate Philanthropy. Trustee of the Economic Club of New York and the Bruce Museum (arts and science). Member of the Advisory Council for the Stanford Graduate School of Business.
André F. Perold
Born in 1952. Trustee since December 2004. Principal occupation(s) during the past five years and other experience: George Gund Professor of Finance and Banking, Emeritus at the Harvard Business School (retired 2011). Chief investment officer and co-managing partner of HighVista Strategies LLC (private investment firm). Overseer of the Museum of Fine Arts Boston.
Sarah Bloom Raskin
Born in 1961. Trustee since January 2018. Principal occupation(s) during the past five years and other experience: deputy secretary (2014–2017) of the United States Department of the Treasury. Governor (2010–2014) of the Federal Reserve Board. Commissioner (2007–2010) of financial regulation for the State of Maryland. Member of the board of directors (2012–2014) of Neighborhood Reinvestment Corporation. Director of i(x) Investments, LLC.
Peter F. Volanakis
Born in 1955. Trustee since July 2009. Principal occupation(s) during the past five years and other experience: president and chief operating officer (retired 2010) of Corning Incorporated (communications equipment) and director of Corning Incorporated (2000–2010) and Dow Corning (2001–2010). Director (2012) of SPX Corporation (multi-industry manufacturing). Overseer of the Amos Tuck School of Business Administration, Dartmouth College (2001–2013). Chairman of the board of trustees of Colby-Sawyer College. Member of the Board of Hypertherm Inc. (industrial cutting systems, software, and consumables).
Executive Officers
Glenn Booraem
Born in 1967. Principal occupation(s) during the past five years and other experience: principal of Vanguard. Investment stewardship officer (2017–present), treasurer (2015–2017), controller (2010–2015), and assistant controller (2001–2010) of each of the investment companies served by Vanguard.
Christine M. Buchanan
Born in 1970. Principal occupation(s) during the past five years and other experience: principal of Vanguard and global head of Fund Administration at Vanguard. Treasurer (2017–present) of each of the investment companies served by Vanguard. Partner (2005–2017) at KPMG LLP (audit, tax, and advisory services).
Brian Dvorak
Born in 1973. Principal occupation(s) during the past five years and other experience: principal of Vanguard. Chief compliance officer (2017–present) of Vanguard and each of the investment companies served by Vanguard. Assistant vice president (2017–present) of Vanguard Marketing Corporation. Vice president and director of Enterprise Risk Management (2011–2013) at Oppenheimer Funds, Inc.
Thomas J. Higgins
Born in 1957. Principal occupation(s) during the past five years and other experience: principal of Vanguard. Chief financial officer (2008–present) and treasurer (1998–2008) of each of the investment companies served by Vanguard.
Peter Mahoney
Born in 1974. Principal occupation(s) during the past five years and other experience: principal of Vanguard. Controller (2015–present) of each of the investment companies served by Vanguard. Head of International Fund Services (2008–2014) at Vanguard.
Anne E. Robinson
Born in 1970. Principal occupation(s) during the past five years and other experience: general counsel (2016–present) of Vanguard. Secretary (2016–present) of Vanguard and of each of the investment companies served by Vanguard. Managing director (2016–present) of Vanguard. Director and senior vice president (2016–2018) of Vanguard Marketing Corporation. Managing director and general counsel of Global Cards and Consumer Services (2014–2016) at Citigroup. Counsel (2003–2014) at American Express.
Michael Rollings
Born in 1963. Principal occupation(s) during the past five years and other experience: finance director (2017–present) and treasurer (2017) of each of the investment companies served by Vanguard. Managing director (2016–present) of Vanguard. Chief financial officer (2016–present) of Vanguard. Director (2016–present) of Vanguard Marketing Corporation. Executive vice president and chief financial officer (2006–2016) of MassMutual Financial Group.
| |
| Vanguard Senior Management Team |
| |
| Joseph Brennan | Chris D. McIsaac |
| Mortimer J. Buckley | James M. Norris |
| Gregory Davis | Thomas M. Rampulla |
| John James | Karin A. Risi |
| Martha G. King | Anne E. Robinson |
| John T. Marcante | Michael Rollings |
Chairman Emeritus and Senior Advisor
John J. Brennan
Chairman, 1996–2009
Chief Executive Officer and President, 1996–2008
Founder
John C. Bogle
Chairman and Chief Executive Officer, 1974–1996
|  |
| | P.O. Box 2600 |
| | Valley Forge, PA 19482-2600 |
| |
| |
| |
| Connect with Vanguard® > vanguard.com |
| |
| |
| |
| Fund Information > 800-662-7447 | Source for Bloomberg Barclays indexes: Bloomberg |
| Direct Investor Account Services > 800-662-2739 | Index Services Limited. Copyright 2018, Bloomberg. All |
| | rights reserved. |
| Institutional Investor Services > 800-523-1036 | |
| | CFA® is a registered trademark owned by CFA Institute. |
| Text Telephone for People | |
| Who Are Deaf or Hard of Hearing > 800-749-7273 | |
| |
| This material may be used in conjunction | |
| with the offering of shares of any Vanguard | |
| fund only if preceded or accompanied by | |
| the fund’s current prospectus. | |
| |
| All comparative mutual fund data are from Lipper, a | |
| Thomson Reuters Company, or Morningstar, Inc., unless | |
| otherwise noted. | |
| |
| You can obtain a free copy of Vanguard’s proxy voting | |
| guidelines by visiting vanguard.com/proxyreporting or by | |
| calling Vanguard at 800-662-2739. The guidelines are | |
| also available from the SEC’s website, sec.gov. In | |
| addition, you may obtain a free report on how your fund | |
| voted the proxies for securities it owned during the 12 | |
| months ended June 30. To get the report, visit either | |
| vanguard.com/proxyreporting or sec.gov. | |
| |
| You can review information about your fund on the | |
| SEC’s website, and you can receive copies of this | |
| information, for a fee, by sending a request via email | |
| addressed to publicinfo@sec.gov. | |
| |
| |
| |
| |
| | © 2018 The Vanguard Group, Inc. |
| | All rights reserved. |
| | Vanguard Marketing Corporation, Distributor. |
| |
| | Q450 122018 |
Item 2: Code of Ethics. The Registrant has adopted a code of ethics that applies to the Registrant’s principal executive officer, principal financial officer, principal accounting officer or controller or persons performing similar functions. The Code of Ethics was amended during the reporting period covered by this report to make certain technical, non-material changes.
Item 3: Audit Committee Financial Expert. All members of the Audit Committee have been determined by the Registrant’s Board of Trustees to be Audit Committee Financial Experts and to be independent: JoAnn Heffernan Heisen, F. Joseph Loughrey, Mark Loughridge, Sarah Bloom Raskin, and Peter F. Volanakis.
Item 4: Principal Accountant Fees and Services.
(a) Audit Fees.
Audit Fees of the Registrant.
Fiscal Year Ended October 31, 2018: $238,000
Fiscal Year Ended October 31, 2017: $248,000
Aggregate Audit Fees of Registered Investment Companies in the Vanguard Group.
Fiscal Year Ended October 31, 2018: $9,734,277
Fiscal Year Ended October 31, 2017: $8,424,459
Includes fees billed in connection with audits of the Registrant, other registered investment companies in the Vanguard complex, The Vanguard Group, Inc. and Vanguard Marketing Corporation.
(b) Audit-Related Fees.
Fiscal Year Ended October 31, 2018: $5,581,336
Fiscal Year Ended October 31, 2017: $3,194,093
Includes fees billed in connection with assurance and related services provided to the Registrant, other registered investment companies in the Vanguard complex, The Vanguard Group, Inc., and Vanguard Marketing Corporation.
(c) Tax Fees.
Fiscal Year Ended October 31, 2018: $347,985
Fiscal Year Ended October 31, 2017: $274,313
Includes fees billed in connection with tax compliance, planning, and advice services provided to the Registrant, other registered investment companies in the Vanguard complex, The Vanguard Group, Inc., and Vanguard Marketing Corporation.
(d) All Other Fees.
Fiscal Year Ended October 31, 2018: $0
Fiscal Year Ended October 31, 2017: $0
Includes fees billed for services related to tax reported information provided to the Registrant, other registered investment companies in the Vanguard complex, The Vanguard Group, Inc., and Vanguard Marketing Corporation.
(e) (1) Pre-Approval Policies. The policy of the Registrant’s Audit Committee is to consider and, if appropriate, approve before the principal accountant is engaged for such services, all specific audit and non-audit services provided to: the Registrant, other registered investment companies in the Vanguard complex, The Vanguard Group, Inc., and entities controlled by The Vanguard Group, Inc. that provide ongoing services to the Registrant. In making a determination, the Audit Committee considers whether the services are consistent with maintaining the principal accountant’s independence.
In the event of a contingency situation in which the principal accountant is needed to provide services in between scheduled Audit Committee meetings, the Chairman of the Audit Committee would be called on to consider and, if appropriate, pre-approve audit or permitted non-audit services in an amount sufficient to complete services through the next Audit Committee meeting, and to determine if such services would be consistent with maintaining the accountant’s independence. At the next scheduled Audit Committee meeting, services and fees would be presented to the Audit Committee for formal consideration, and, if appropriate, approval by the entire Audit Committee. The Audit Committee would again consider whether such services and fees are consistent with maintaining the principal accountant’s independence.
The Registrant’s Audit Committee is informed at least annually of all audit and non-audit services provided by the principal accountant to the Vanguard complex, whether such services are provided to: the Registrant, other registered investment companies in the Vanguard complex, The Vanguard Group, Inc., or other entities controlled by The Vanguard Group, Inc. that provide ongoing services to the Registrant.
(2) No percentage of the principal accountant’s fees or services were approved pursuant to the waiver provision of paragraph (c)(7)(i)(C) of Rule 2-01 of Regulation S-X.
(f) For the most recent fiscal year, over 50% of the hours worked under the principal accountant’s engagement were not performed by persons other than full-time, permanent employees of the principal accountant.
(g) Aggregate Non-Audit Fees.
Fiscal Year Ended October 31, 2018: $347,985
Fiscal Year Ended October 31, 2017: $274,313
Includes fees billed for non-audit services provided to the Registrant, other registered investment companies in the Vanguard complex, The Vanguard Group, Inc., and Vanguard Marketing Corporation.
(h) For the most recent fiscal year, the Audit Committee has determined that the provision of all non-audit services was consistent with maintaining the principal accountant’s independence.
Item 5: Audit Committee of Listed Registrants.
The Registrant is a listed issuer as defined in rule 10A-3 under the Securities Exchange Act of 1934 (“Exchange Act”). The Registrant has a separately-designated standing audit committee established in accordance with Section 3(a)(58)(A) of the Exchange Act. The Registrant’s audit committee members are: JoAnn Heffernan Heisen, F. Joseph Loughrey, Mark Loughridge, Sarah Bloom Raskin, and Peter F. Volanakis.
Item 6: Investments.
Not Applicable.
Item 7: Disclosure of Proxy Voting Policies and Procedures for Closed-End Management Investment Companies.
Not Applicable.
Item 8: Portfolio Managers of Closed-End Management Investment Companies.
Not Applicable.
Item 9: Purchase of Equity Securities by Closed-End Management Investment Company and Affiliated Purchasers.
Not Applicable.
Item 10: Submission of Matters to a Vote of Security Holders.
Not Applicable.
Item 11: Controls and Procedures.
(a) Disclosure Controls and Procedures. The Principal Executive and Financial Officers concluded that the Registrant’s Disclosure Controls and Procedures are effective based
on their evaluation of the Disclosure Controls and Procedures as of a date within 90 days of the filing date of this report.
(b) Internal Control Over Financial Reporting. There were no significant changes in Registrant’s Internal Control Over Financial Reporting or in other factors that could significantly affect this control subsequent to the date of the evaluation, including any corrective actions with regard to significant deficiencies and material weaknesses.
Item 12: Disclosure of Securities Lending Activities for Closed-End Management Investment Companies.
Not Applicable.
Item 13: Exhibits.
(a) Code of Ethics.
(b) Certifications.
Pursuant to the requirements of the Securities Exchange Act of 1934 and the Investment Company Act of 1940, the registrant has duly caused this report to be signed on its behalf by the undersigned, thereunto duly authorized.
| |
| | VANGUARD MUNICIPAL BOND FUNDS |
| |
| |
| BY: | /s/ MORTIMER J. BUCKLEY* |
| MORTIMER J. BUCKLEY |
| | CHIEF EXECUTIVE OFFICER |
| |
| Date: December 18, 2018 |
Pursuant to the requirements of the Securities Exchange Act of 1934 and the Investment Company Act of 1940, this report has been signed below by the following persons on behalf of the registrant and in the capacities and on the dates indicated.
| |
| | VANGUARD MUNICIPAL BOND FUNDS |
| |
| |
| |
| BY: | /s/ MORTIMER J. BUCKLEY * |
| MORTIMER J. BUCKLEY |
| | CHIEF EXECUTIVE OFFICER |
|
| Date: December 18, 2018 |
| VANGUARD MUNICIPAL BOND FUNDS |
| |
BY: | /s/ THOMAS J. HIGGINS*
THOMAS J. HIGGINS
CHIEF FINANCIAL OFFICER |
| Date: December 18, 2018 |
* By: /s/ Anne E. Robinson
Anne E. Robinson, pursuant to a Power of Attorney filed on January 18, 2018 see file Number
33-32216, Incorporated by Reference.