UNITED STATES
SECURITIES AND EXCHANGE COMMISSION
Washington, D.C. 20549
FORM N-CSR
CERTIFIED SHAREHOLDER REPORT
OF
REGISTERED MANAGEMENT INVESTMENT COMPANIES
| | |
| Investment Company Act file number: | 811-02687 |
Name of Registrant: | Vanguard Municipal Bond Funds |
Address of Registrant: | P.O. Box 2600 |
| | Valley Forge, PA 19482 |
Name and address of agent for service: | Anne E. Robinson, Esquire |
| | P.O. Box 876 |
| | Valley Forge, PA 19482 |
Registrant’s telephone number, including area code: (610) 669-1000 |
Date of fiscal year end: October 31 |
Date of reporting period: November 1, 2015 – October 31, 2016 |
Item 1: Reports to Shareholders |
 |
| Annual Report | October 31, 2016 |
| |
| Vanguard Municipal Bond Funds |
| Vanguard Short-Term Tax-Exempt Fund |
| Vanguard Limited-Term Tax-Exempt Fund |
| Vanguard Intermediate-Term Tax-Exempt Fund |
| Vanguard Long-Term Tax-Exempt Fund |
| Vanguard High-Yield Tax-Exempt Fund |
A new format, unwavering commitment
As you begin reading this report, you’ll notice that we’ve made some improvements to the opening sections—based on feedback from you, our clients.
Page 1 starts with a new “Your Fund’s Performance at a Glance,” a concise, handy summary of how your fund performed during the period.
In the renamed “Chairman’s Perspective,” Bill McNabb will focus on enduring principles and investment insights.
We’ve modified some tables, and eliminated some redundancy, but we haven’t removed any information.
At Vanguard, we’re always looking for better ways to communicate and to help you make sound investment decisions. Thank you for entrusting your assets to us.
| |
| Contents | |
| |
| Your Fund’s Performance at a Glance | 1 |
| Chairman’s Perspective | 3 |
| Advisor’s Report | 5 |
| Short-Term Tax-Exempt Fund | 7 |
| Limited-Term Tax-Exempt Fund | 50 |
| Intermediate-Term Tax-Exempt Fund | 124 |
| Long-Term Tax-Exempt Fund | 233 |
| High-Yield Tax-Exempt Fund | 269 |
| About Your Fund’s Expenses | 311 |
| Glossary | 313 |
Please note: The opinions expressed in this report are just that—informed opinions. They should not be considered promises or advice. Also, please keep in mind that the information and
opinions cover the period through the date on the front of this report. Of course, the risks of investing in your fund are spelled out in the prospectus.
See the Glossary for definitions of investment terms used in this report.
About the cover: No matter what language you speak, Vanguard has one consistent message and set of principles. Our primary focus is on you, our clients. We conduct our business
with integrity as a faithful steward of your assets. This message is shown translated into seven languages, reflecting our expanding global presence.
Your Fund’s Performance at a Glance
• For the 12 months ended October 31, 2016, the returns for the five tax-exempt bond funds discussed in this report ranged from 0.64% for Investor Shares of the Short-Term Fund to 6.26% for Admiral Shares of the High-Yield Fund. All five funds outpaced their benchmark indexes and peer groups.
• With investors continuing to reach for yield through much of the fiscal year, the funds added value by having higher weightings than their benchmarks in municipal securities rated A and BBB and in sectors where credit spreads tend to be wider.
• Security selection and an overweight allocation to premium callable bonds were positives for the funds. Overweighting securities at the long end of the yield curve in the longer funds also worked out well.
• For the decade ended October 31, 2016, the funds’ returns ranged from close to 2% to almost 5%. The funds’ returns were higher than their peer-group averages but mixed compared with results for their benchmark indexes.
| | | | | |
| Total Returns: Fiscal Year Ended October 31, 2016 | | | | |
| | 30-Day | Taxable- | | | |
| | SEC | Equivalent | Income | Capital | Total |
| | Yield | Yield1 | Returns | Returns | Returns |
| Vanguard Short-Term Tax-Exempt Fund | | | | | |
| Investor Shares | 0.88% | 1.55% | 0.83% | -0.19% | 0.64% |
| Admiral ™ Shares2 | 1.00 | 1.77 | 0.93 | -0.19 | 0.74 |
| Bloomberg Barclays 1 Year Municipal Bond Index | | | | 0.40 |
| 1–2 Year Municipal Funds Average3 | | | | | 0.25 |
| |
| Vanguard Limited-Term Tax-Exempt Fund | | | | | |
| Investor Shares | 1.08% | 1.91% | 1.49% | -0.18% | 1.31% |
| Admiral Shares 2 | 1.20 | 2.12 | 1.59 | -0.18 | 1.41 |
| Bloomberg Barclays 1–5 Year Municipal Bond Index | | | | 1.09 |
| 1–5 Year Municipal Funds Average3 | | | | | 0.94 |
| |
| Vanguard Intermediate-Term Tax-Exempt Fund | | | | | |
| Investor Shares | 1.50% | 2.65% | 2.78% | 0.85% | 3.63% |
| Admiral Shares 2 | 1.62 | 2.86 | 2.88 | 0.85 | 3.73 |
| Bloomberg Barclays 1–15 Year Municipal Bond Index | | | | 3.10 |
| Intermediate Municipal Funds Average3 | | | | | 3.32 |
| |
| Vanguard Long-Term Tax-Exempt Fund | | | | | |
| Investor Shares | 1.99% | 3.52% | 3.62% | 1.77% | 5.39% |
| Admiral Shares 2 | 2.11 | 3.73 | 3.73 | 1.77 | 5.50 |
| Bloomberg Barclays Municipal Bond Index | | | | | 4.06 |
| General & Insured Municipal Debt Funds Average3 | | | | 4.34 |
| |
| Vanguard High-Yield Tax-Exempt Fund | | | | | |
| Investor Shares | 2.49% | 4.40% | 3.74% | 2.41% | 6.15% |
| Admiral Shares 2 | 2.61 | 4.61 | 3.85 | 2.41 | 6.26 |
| Bloomberg Barclays Municipal Bond Index | | | | | 4.06 |
| General & Insured Municipal Debt Funds Average3 | | | | 4.34 |
1 This calculation, which assumes a typical itemized tax return, is based on the maximum federal income tax rate of 43.4%. State and local
taxes were not considered. Please see the prospectus for a detailed explanation of the calculation.
2 Admiral Shares carry lower expenses and are available to investors who meet certain account-balance requirements.
3 Derived from data provided by Lipper, a Thomson Reuters Company.
1
| |
| Total Returns: Ten Years Ended October 31, 2016 | |
| | Average Annual |
| | Return |
| Short-Term Tax-Exempt Fund Investor Shares | 1.72% |
| Bloomberg Barclays 1 Year Municipal Bond Index | 1.89 |
| 1–2 Year Municipal Funds Average1 | 0.46 |
| |
| Limited-Term Tax-Exempt Fund Investor Shares | 2.55% |
| Bloomberg Barclays 1–5 Year Municipal Bond Index | 3.02 |
| 1–5 Year Municipal Funds Average1 | 1.89 |
| |
| Intermediate-Term Tax-Exempt Fund Investor Shares | 4.20% |
| Bloomberg Barclays 1–15 Year Municipal Bond Index | 4.28 |
| Intermediate Municipal Funds Average1 | 3.55 |
| |
| Long-Term Tax-Exempt Fund Investor Shares | 4.67% |
| Bloomberg Barclays Municipal Bond Index | 4.57 |
| General & Insured Municipal Debt Funds Average1 | 3.92 |
| |
| High-Yield Tax-Exempt Fund Investor Shares | 4.85% |
| Bloomberg Barclays Municipal Bond Index | 4.57 |
| General & Insured Municipal Debt Funds Average1 | 3.92 |
| 1 Derived from data provided by Lipper, a Thomson Reuters Company. | |
The figures shown represent past performance, which is not a guarantee of future results. (Current performance may be lower or higher than the performance data cited. For performance data current to the most recent month-end, visit our website at vanguard.com/performance.) Note, too, that both investment returns and principal value can fluctuate widely, so an investor’s shares, when sold, could be worth more or less than their original cost.
| | | |
| Expense Ratios1 | | | |
| Your Fund Compared With Its Peer Group | | | |
| |
| | Investor | Admiral | Peer Group |
| | Shares | Shares | Average2 |
| Short-Term Tax-Exempt Fund | 0.20% | 0.12% | 0.60% |
| Limited-Term Tax-Exempt Fund | 0.20 | 0.12 | 0.69 |
| Intermediate-Term Tax-Exempt Fund | 0.20 | 0.12 | 0.82 |
| Long-Term Tax-Exempt Fund | 0.20 | 0.12 | 0.94 |
| High-Yield Tax-Exempt Fund | 0.20 | 0.12 | 0.94 |
1 The fund expense ratios shown are from the prospectus dated February 26, 2016, and represent estimated costs for the current fiscal year.
For the fiscal year ended October 31, 2016, the funds’ expense ratios were: for the Short-Term Tax-Exempt Fund, 0.19% for Investor Shares
and 0.09% for Admiral Shares; for the Limited-Term Tax-Exempt Fund, 0.19% for Investor Shares and 0.09% for Admiral Shares; for the
Intermediate-Term Tax-Exempt Fund, 0.19% for Investor Shares and 0.09% for Admiral Shares; for the Long-Term Tax-Exempt Fund, 0.19%
for Investor Shares and 0.09% for Admiral Shares; and for the High-Yield Tax-Exempt Fund, 0.19% for Investor Shares and 0.09% for
Admiral Shares.
2 Peer groups are: for the Short-Term Tax-Exempt Fund, 1–2 Year Municipal Funds; for the Limited-Term Tax-Exempt Fund, 1–5 Year
Municipal Funds; for the Intermediate-Term Tax-Exempt Fund, Intermediate Municipal Funds; for the Long-Term Tax-Exempt Fund and
High-Yield Tax-Exempt Fund, General & Insured Municipal Debt Funds. Peer-group values are derived from data provided by Lipper, a
Thomson Reuters Company, and capture information through year-end 2015.
2
Chairman’s Perspective

Bill McNabb
Chairman and Chief Executive Officer
Dear Shareholder,
Over the three years ended August 31, 2016, investors poured more than $1 trillion into index funds. Indexing now accounts for nearly a third of all mutual fund assets—more than double what it did a decade ago and eight times its share two decades ago.1
By contrast, active management’s commercial struggles have reflected its disappointing investment performance. Over the decade ended December 31, 2015, 82% of actively managed stock funds and 81% of active bond funds have either underperformed their benchmarks or shut down.
This subpar performance has fueled the explosion of asset growth in indexing among individual, retirement, and nonprofit investors. So what might the trend mean for the future of actively managed funds?
Our research and experience indicate that active management can survive—and even succeed—but only if it’s offered at much lower expense.
High costs, which limit a manager’s ability to deliver benchmark-beating returns to clients, are the biggest reason why active has lagged. Industrywide as of December 31, 2015, the average expense ratio for all active stock funds is 1.14%, compared with 0.76% for stock index funds. And the expense advantage is even wider for bonds; the average expense ratio for an active bond fund is 0.93%, compared with 0.43% for bond index funds.
But even these big differences understate the real gap. These days, it’s not hard to find an index fund that charges maybe 0.05% or 0.10%. So even if you have identified active managers who are skilled at selecting stocks and bonds, to match the return of a comparable (much cheaper) index fund would require significant outperformance. Think about it. Any fund that charges 1.00% in expenses—not even the high end of the range—will find it extraordinarily difficult to overcome the index fund’s head start.
Active management also has taken a hit from a regulatory environment that has been favorable to low-cost strategies. The U.S. Department of Labor several
| | | |
| Market Barometer | | | |
| | | Average Annual Total Returns |
| | | Periods Ended October 31, 2016 |
| | One | Three | Five |
| | Year | Years | Years |
| Stocks | | | |
| Russell 1000 Index (Large-caps) | 4.26% | 8.48% | 13.51% |
| Russell 2000 Index (Small-caps) | 4.11 | 4.12 | 11.51 |
| Russell 3000 Index (Broad U.S. market) | 4.24 | 8.13 | 13.35 |
| FTSE All-World ex US Index (International) | 0.64 | -0.94 | 4.09 |
| |
| Bonds | | | |
| Bloomberg Barclays U.S. Aggregate Bond Index | | | |
| (Broad taxable market) | 4.37% | 3.48% | 2.90% |
| Bloomberg Barclays Municipal Bond Index | | | |
| (Broad tax-exempt market) | 4.06 | 4.89 | 4.34 |
| Citigroup Three-Month U.S. Treasury Bill Index | 0.22 | 0.07 | 0.07 |
| |
| CPI | | | |
| Consumer Price Index | 1.64% | 1.15% | 1.32% |
1 Sources: Wall Street Journal; Morningstar, Inc.; and Investment Company Institute, 2016.
3
years ago mandated greater disclosure of retirement plan fees. And its new fiduciary rule, which is set to take effect in April, requires financial advisors to demonstrate that their recommendations are aligned with their clients’ best interest. Both changes encourage the use of lower-cost investments, including index funds.
The future of active management
In light of all this, people have been asking me whether active management is “dead.” My response is both yes and no. High-cost active management is dead, and rightly so It has never been a winning proposition for investors. Low-cost active funds, though, can potentially play an important role for investors who seek to outperform the market.
Paying less for your funds is the only sure-fire way to improve your odds of achieving success in active management. But even if you have found an active manager with low costs, the odds of outperforming the market are still long. You have to be able to identify talented stock and bond portfolio managers with long time horizons and clear investment
strategies. Look for managers with consistent track records and the discipline to stick closely to their investment strategy.
Know what you own and why
Despite the well-deserved reputation of indexing and the challenges for active managers, there’s still a place for traditional active strategies that are low-cost, diversified, and highly disciplined, and are run by talented managers who focus on the long term.
Vanguard has always applied these principles to our active strategies, and investors have benefited as a majority of our active funds outperformed their benchmarks and bested their peers’ average annual return over the ten years ended September 30, 2016.
But it’s crucial for investors to be patient. Even active managers with the best track records frequently underperform their benchmarks when their investment styles are out of favor. Such periods, though temporary, can persist. So it’s important when entrusting your assets to an active strategy to be in it for the long haul.
Make sure you know what you’re buying and what the risks are. Active strategies are becoming more complex, so it’s important to clearly understand what the investments in your portfolio are designed to accomplish and why you want to hold them. Otherwise, you run the risk of selecting strategies that don’t fit your needs or objectives.
Keeping these considerations in mind can potentially boost your chances of success in identifying active strategies that may be able to help you reach your goals.
As always, thank you for investing with Vanguard.
Sincerely,

F. William McNabb III
Chairman and Chief Executive Officer
November 9, 2016
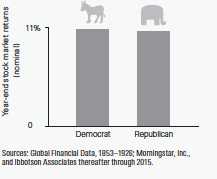
Worried about the election’s impact on your portfolio?
The 2016 presidential election season was one of the most intense and unpredictable in U.S. history. In its aftermath, investors may be left with lingering questions about what the outcome will mean for their portfolios. The answer, based on Vanguard research into decades of historical data, is that presidential elections typically have no long-term effect on market performance.
These findings hold true regardless of the market’s initial reaction. Whether there’s a swoon or bounce immediately after an election, investors shouldn’t extrapolate that performance to the long term.
As you can see in the accompanying chart, data going back to 1853 show that stock market returns are virtually identical no matter which party controls the White House. Although headlines out of Washington at any given time may still cause concern, investors
shouldn’t overreact to short-term events. Instead, it’s best to maintain a balanced and diversified portfolio and stay focused on your long-term goals.
Average annual stock market returns based on party control of the White House (1853–2015)
4
Advisor’s Report
For the 12 months ended October 31, 2016, Vanguard’s five national tax-exempt bond funds posted returns that ranged from 0.64% for the Investor Shares of Vanguard Short-Term Tax-Exempt Fund to 6.26% for the Admiral Shares of Vanguard High-Yield Tax-Exempt Fund. All of the funds outpaced their benchmark indexes and peer groups.
With the municipal yield curve flattening, the 30-day SEC yields for Vanguard Short-Term Tax-Exempt Fund and Limited-Term Tax-Exempt Fund rose, while those of Vanguard Intermediate-Term Tax-Exempt Fund, Long-Term Tax-Exempt Fund, and High-Yield Tax-Exempt Fund fell.
Please note that the funds are permitted to invest in securities that would generate income distributions subject to the alternative minimum tax (AMT). During the fiscal year, only the High-Yield Fund owned such securities.
The investment environment
The period began and ended with investors speculating about when, and by how much, the Federal Reserve would raise short-term interest rates.
In December, for the first time in a decade, the Fed increased the target range for the federal funds rate, bumping it to 0.25%–0.50% from near zero. The Fed cited an improving labor market and its confidence that inflation would rise to its 2% objective. Investors interpreted the increase as a signal that the U.S. economy was on sturdy footing and that monetary policy
was normalizing, although rates remained below historical standards. Market expectations were for future hikes to be gradual, with four likely to come in the next year.
Those expectations were dampened in early 2016 as steep declines in commodity prices and unanticipated sluggish global economic growth, especially in China, triggered a move toward less risky assets. In subsequent meetings, the Fed seemed less inclined to raise rates as it became unclear whether inflation and employment targets would be realized, which seemed less likely when the United Kingdom voted in June to leave the European Union. The voting results sparked uncertainty in global financial markets, but by the end of the summer the initial impact was mostly retraced as better economic data led to shifting sentiments at key central banks. Investors were soon anticipating that the next hike would come at the Fed’s December meeting.
That anticipation was bolstered partly by third-quarter GDP. The U.S. economy posted weak results in the early part of your fund’s fiscal year. A strong dollar and soft global economic and financial conditions were likely behind the slow growth. The economy showed a little more steam in the third quarter of 2016, growing 2.9% amid a surge in exports, an uptick in inventory investment, and more government spending. We expect growth to moderate around 2% over the near term.
Employment gains were a bright spot, with payrolls increasing by an average of around 203,000 per month over the trailing 12 months. The unemployment rate dipped as low as 4.7%; at the end of the period it stood at 4.9%. The participation rate, which reflects the percentage of the population working or seeking work, was little changed over the period. Strong employment gains were coupled with a slight increase in wages. That and a rebound in commodity prices could be spurring a rise in inflation, which is nearing the Fed’s 2% objective.
Municipal bond issuance climbed to record monthly levels in the fall as issuers took advantage of low rates before any future rate hikes. Supply was met by strong demand through most of the period. Municipal bond funds saw 54 consecutive weeks of inflows through mid-October as investors looked to improve on low or even negative global bond yields by buying high-quality U.S. bonds.
Although there were some notable pockets of credit weakness, they didn’t spill over to the broader municipal market during the period. Puerto Rico defaulted on bond payments after Congress passed a bill at the end of June to put in place a federal control board to restructure the commonwealth’s debt. That process is likely to unfold slowly and generate more news headlines. The finances of Illinois and Chicago remained strained as well because of structural deficits and pension funding shortfalls.
Management of the funds
We maintained a modestly overweight allocation to the longer end of the yield curve in the longer-dated funds. That added value as the municipal bond yield curve flattened over the period. The yield of the AAA-rated 2-year generic general obligation bond increased 31 basis points to 0.85%, while the yield of the comparable
| | |
| Yields of Municipal Securities | | |
| (AAA-Rated General-Obligation Issues) | | |
| | October 31, | October 31, |
| Maturity | 2015 | 2016 |
| 2 years | 0.54% | 0.85% |
| 5 years | 1.17 | 1.14 |
| 10 years | 2.04 | 1.74 |
| 30 years | 3.07 | 2.56 |
| Source: Vanguard. | | |
5
10-year bond fell 30 basis points to 1.74%, and those of longer-dated bonds fell even more than that.
Being overweighted in A-rated and BBB-rated bonds, which are at the lower end of the investment-grade spectrum, was another positive as investors continued to reach for yield.
Security selection remained a strength for the funds. Our holdings of premium callable bonds performed well. Because these bonds may be redeemed before maturity, exposing investors to reinvestment risk, they offer attractive yields and favorable total return potential across many interest rate scenarios.
Favoring sectors that tend to offer wider credit spreads also played out well. They included hospital, university, corporate-backed, and project finance bonds in the Intermediate-Term and Long-Term Funds. Those segments were also significant contributors to the High-Yield Fund’s return, as were airport/port and transportation bonds.
In all but the High-Yield Fund, our exposure to Puerto Rico debt as of October 31 was either to bonds insured by third parties or to prerefunded bonds backed by high-quality assets in escrow until maturity.
The outlook
We expect the Fed to raise rates gradually, compared with prior periods of economic recovery. The pace of future rate hikes is likely to depend on future economic growth (which we expect to be modest) and inflation (which we expect to remain tame).
The dollar will likely remain strong as long as central banks such as the Bank of Japan and the European Central Bank continue to maintain the accommodative monetary stances that have produced negative interest rates in those regions.
Of course, market conditions could change, especially given the results of the U.S. presidential election and the possibility that job growth and inflation could exceed expectations. But we are confident that our team of experienced managers, analysts, and traders can handle whatever the market brings and find opportunities that will produce competitive returns.
Christopher W. Alwine, CFA, Principal,
Head of Municipal Group
Marlin G. Brown, Portfolio Manager
James M. D’Arcy, CFA, Portfolio Manager
Mathew M. Kiselak, Principal,
Portfolio Manager
Justin A. Schwartz, CFA, Portfolio Manager,
Head of Municipal Money Market Funds
Vanguard Fixed Income Group
November 17, 2016
6
Short-Term Tax-Exempt Fund
Fund Profile
As of October 31, 2016
| | |
| Share-Class Characteristics | | |
| | Investor | Admiral |
| | Shares | Shares |
| Ticker Symbol | VWSTX | VWSUX |
| Expense Ratio1 | 0.20% | 0.12% |
| 30-Day SEC Yield | 0.88% | 1.00% |
| | | |
| Financial Attributes | | |
| | | Bloomberg | |
| | | Barclays | Bloomberg |
| | | 1 Year | Barclays |
| | | Municipal | Municipal |
| | | Bond | Bond |
| | Fund | Index | Index |
| Number of Bonds | 1,901 | 4,352 | 49,796 |
| Yield to Maturity | | | |
| (before expenses) | 1.0% | 1.0% | 2.0% |
| Average Coupon | 3.0% | 4.9% | 4.8% |
| Average Duration | 1.2 years | 1.4 years | 5.9 years |
| Average Stated | | | |
| Maturity | 1.4 years | 1.5 years | 12.9 years |
| Short-Term Reserves | 13.4% | — | — |
| |
| Largest Area Concentrations2 | |
| New York | 15.9% |
| Texas | 14.6 |
| California | 9.9 |
| Pennsylvania | 5.3 |
| Massachusetts | 4.4 |
| New Jersey | 4.2 |
| Illinois | 3.7 |
| Florida | 3.7 |
| Connecticut | 3.5 |
| Maryland | 3.3 |
| Top Ten | 68.5% |
| | |
| Volatility Measures | | |
| | Bloomberg | |
| | Barclays | Bloomberg |
| | 1 Year | Barclays |
| | Municipal | Municipal |
| | Bond Index | Bond Index |
| R-Squared | 0.63 | 0.38 |
| Beta | 0.85 | 0.10 |
These measures show the degree and timing of the fund’s fluctuations compared with the indexes over 36 months.
| |
| Distribution by Stated Maturity (% of portfolio) |
| Under 6 Months | 30.2% |
| 6 Months–1 Year | 12.3 |
| 1–2 Years | 25.5 |
| 2–3 Years | 19.1 |
| 3–4 Years | 11.7 |
| 4–5 Years | 1.0 |
| Over 5 Years | 0.2 |
| |
| Distribution by Credit Quality (% of portfolio) |
| AAA | 21.8% |
| AA | 58.3 |
| A | 13.7 |
| BBB | 3.6 |
| BB | 0.3 |
| B or lower | 0.1 |
| Not Rated | 2.2 |
Credit-quality ratings are obtained from Moody’s and S&P, and the higher rating for each issue is shown. “Not Rated” is used to classify securities for which a rating is not available. Not rated securities include a fund’s investment in Vanguard Market Liquidity Fund or Vanguard Municipal Cash Management Fund, each of which invests in high-quality money market instruments and may serve as a cash management vehicle for the Vanguard funds, trusts, and accounts. For more information about these ratings, see the Glossary entry for Credit Quality.
Investment Focus

1 The expense ratios shown are from the prospectus dated February 26, 2016, and represent estimated costs for the current fiscal year. For the fiscal year ended October 31, 2016, the expense ratios Investor Shares and 0.09% for Admiral Shares.
2 Percentage of net assets, excluding any futures contracts.
7
Short-Term Tax-Exempt Fund
Performance Summary
All of the returns in this report represent past performance, which is not a guarantee of future results that may be achieved by the fund. (Current performance may be lower or higher than the performance data cited. For performance data current to the most recent month-end, visit our website at vanguard.com/performance.) Note, too, that both investment returns and principal value can fluctuate widely, so an investor’s shares, when sold, could be worth more or less than their original cost. The returns shown do not reflect taxes that a shareholder would pay on fund distributions or on the sale of fund shares.
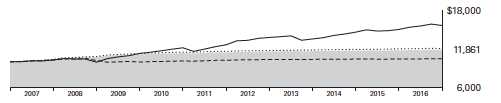
Cumulative Performance: October 31, 2006–October 31, 2016
Initial Investment of $10,000
| | | | |
| | | Average Annual Total Returns | Final Value |
| | | Periods Ended October 31, 2016 | of a $10,000 |
| | One Year | Five Years | Ten Years | Investment |
| Short-Term Tax-Exempt Fund Investor Shares | 0.64% | 0.72% | 1.72% | $11,861 |
| Bloomberg Barclays 1 Year Municipal | | | | |
| Bond Index | 0.40 | 0.72 | 1.89 | 12,061 |
| 1–2 Year Municipal Funds Average1 | 0.25 | 0.44 | 0.46 | 10,469 |
| Bloomberg Barclays Municipal Bond Index | 4.06 | 4.34 | 4.57 | 15,637 |
| | | | |
| | | | | Final Value |
| | | | | of a $50,000 |
| | One Year | Five Years | Ten Years | Investment |
| Short-Term Tax-Exempt Fund Admiral Shares | 0.74% | 0.80% | 1.80% | $59,782 |
| Bloomberg Barclays 1 Year Municipal Bond Index | 0.40 | 0.72 | 1.89 | 60,306 |
| Bloomberg Barclays Municipal Bond Index | 4.06 | 4.34 | 4.57 | 78,184 |
1 Derived from data provided by Lipper, a Thomson Reuters Company.
See Financial Highlights for dividend and capital gains information.
8
Short-Term Tax-Exempt Fund
| | | | |
| Fiscal-Year Total Returns (%): October 31, 2006–October 31, 2016 | | | |
| | | | | Bloomberg |
| | | | | Barclays |
| | | | | 1 Year |
| | | | | Municipal |
| | | | Investor Shares | Bond Index |
| | Income | Capital | Total | Total |
| Fiscal Year | Returns | Returns | Returns | Returns |
| 2007 | 3.44% | 0.26% | 3.70% | 3.82% |
| 2008 | 3.30 | 0.38 | 3.68 | 4.22 |
| 2009 | 2.31 | 1.28 | 3.59 | 4.40 |
| 2010 | 1.38 | 0.44 | 1.82 | 1.81 |
| 2011 | 1.23 | -0.31 | 0.92 | 1.18 |
| 2012 | 1.08 | 0.19 | 1.27 | 1.01 |
| 2013 | 0.89 | -0.38 | 0.51 | 0.74 |
| 2014 | 0.72 | -0.06 | 0.66 | 0.72 |
| 2015 | 0.70 | -0.19 | 0.51 | 0.76 |
| 2016 | 0.83 | -0.19 | 0.64 | 0.40 |
Average Annual Total Returns: Periods Ended September 30, 2016
This table presents returns through the latest calendar quarter—rather than through the end of the fiscal period.
Securities and Exchange Commission rules require that we provide this information.
| | | | | | |
| | | | | | | Ten Years |
| | Inception Date | One Year | Five Years | Income | Capital | Total |
| Investor Shares | 9/1/1977 | 0.73% | 0.70% | 1.60% | 0.15% | 1.75% |
| Admiral Shares | 2/12/2001 | 0.83 | 0.78 | 1.68 | 0.15 | 1.83 |
9
Short-Term Tax-Exempt Fund
Financial Statements
Statement of Net Assets
As of October 31, 2016
The fund reports a complete list of its holdings in regulatory filings four times in each fiscal year, at the quarter-ends. For the second and fourth fiscal quarters, the lists appear in the fund’s semiannual and annual reports to shareholders. For the first and third fiscal quarters, the fund files the lists with the Securities and Exchange Commission on Form N-Q. Shareholders can look up the fund’s Forms N-Q on the SEC’s website at sec.gov. Forms N-Q may also be reviewed and copied at the SEC’s Public Reference Room (see the back cover of this report for further information).
| | | | |
| | | | Face | Market |
| | | Maturity | Amount | Value• |
| | Coupon | Date | ($000) | ($000) |
| Tax-Exempt Municipal Bonds (100.7%) | | | | |
| Alabama (0.8%) | | | | |
| Alabama Special Care Facilities Financing Authority Birmingham Revenue | | | | |
| (Ascension Health Credit Group) PUT | 4.100% | 11/3/16 | 31,500 | 31,506 |
| 1 Alabama Special Care Facilities Financing Authority Birmingham Revenue | | | | |
| (Ascension Health Credit Group) TOB VRDO | 0.660% | 11/7/16 | 12,755 | 12,755 |
| Chatom AL Industrial Development Board Gulf Opportunity Zone Revenue | | | | |
| (Power South Energy Cooperative Projects) PUT | 0.875% | 11/15/16 | 24,945 | 24,945 |
| Chatom AL Industrial Development Board Gulf Opportunity Zone Revenue | | | | |
| (Power South Energy Cooperative Projects) PUT | 0.875% | 12/1/16 | 9,200 | 9,199 |
| Chatom AL Industrial Development Board Gulf Opportunity Zone Revenue | | | | |
| (Power South Energy Cooperative Projects) PUT VRDO | 0.875% | 2/1/17 | 12,100 | 12,095 |
| Jefferson County AL Sewer Revenue | 5.000% | 10/1/17 | 1,625 | 1,676 |
| Jefferson County AL Sewer Revenue | 5.000% | 10/1/18 | 1,500 | 1,580 |
| Mobile AL Industrial Development Board Pollution Control Revenue (Alabama Power Co.) PUT | 1.625% | 10/2/18 | 10,000 | 10,071 |
| Mobile County AL Board of School Commissioners GO | 5.000% | 3/1/19 | 850 | 927 |
| Mobile County AL Board of School Commissioners GO | 5.000% | 3/1/20 | 1,275 | 1,434 |
| | | | | 106,188 |
| Alaska (0.3%) | | | | |
| Alaska Railroad Corp. Capital Grant Receipt Revenue | 5.000% | 8/1/19 | 7,505 | 8,213 |
| Alaska Railroad Corp. Capital Grant Receipt Revenue | 5.000% | 8/1/20 | 6,900 | 7,731 |
| Matanuska-Susitna Borough AK GO | 5.000% | 3/1/18 | 3,775 | 3,982 |
| North Slope Borough AK GO | 4.000% | 6/30/17 | 9,000 | 9,198 |
| North Slope Borough AK GO | 4.000% | 6/30/18 | 1,200 | 1,258 |
| North Slope Borough AK GO | 4.000% | 6/30/18 | 5,340 | 5,600 |
| | | | | 35,982 |
| Arizona (0.9%) | | | | |
| 2 Arizona Board Regents University of Arizona System Revenue | 4.000% | 6/1/18 | 1,000 | 1,048 |
| Arizona Health Facilities Authority Hospital System Revenue (Phoenix Children’s Hospital) | 4.000% | 2/1/17 | 2,000 | 2,015 |
| Arizona Health Facilities Authority Hospital System Revenue (Phoenix Children’s Hospital) | 5.000% | 2/1/18 | 1,000 | 1,047 |
| 1 Arizona Health Facilities Authority Revenue (Banner Health) TOB VRDO | 0.750% | 11/7/16 | 5,000 | 5,000 |
| 3 Arizona Health Facilities Authority Revenue (Phoenix Children’s Hospital) PUT | 2.480% | 2/5/20 | 12,500 | 12,720 |
| Arizona Health Facilities Authority Revenue (Scottsdale Lincoln Hospitals Project) | 5.000% | 12/1/16 | 375 | 376 |
| Arizona Health Facilities Authority Revenue (Scottsdale Lincoln Hospitals Project) | 5.000% | 12/1/17 | 750 | 783 |
| Arizona Health Facilities Authority Revenue (Scottsdale Lincoln Hospitals Project) | 5.000% | 12/1/18 | 500 | 540 |
| Arizona School Facilities Board COP | 5.000% | 9/1/17 | 1,800 | 1,862 |
| Arizona School Facilities Board COP | 5.000% | 9/1/18 | 1,500 | 1,606 |
| Arizona School Facilities Board COP | 5.000% | 9/1/19 | 7,500 | 8,297 |
| Arizona Transportation Board Excise Tax Revenue | 5.000% | 7/1/20 | 2,000 | 2,278 |
| Arizona Transportation Board Excise Tax Revenue (Maricopa County Regional Area) | 5.000% | 7/1/18 | 1,050 | 1,121 |
| Arizona Transportation Board Highway Revenue | 5.000% | 7/1/18 | 4,500 | 4,808 |
| Glendale AZ GO | 4.000% | 7/1/19 (4) | 1,600 | 1,708 |
| Glendale AZ GO | 4.000% | 7/1/20 (4) | 2,920 | 3,175 |
| Goodyear Public Improvement Corp. Municipal Facilities Revenue | 5.000% | 7/1/17 | 1,400 | 1,440 |
| Maricopa County AZ COP | 5.000% | 7/1/17 | 15,000 | 15,420 |
| Maricopa County AZ COP | 5.000% | 7/1/18 | 10,000 | 10,661 |
| 2 Maricopa County AZ Industrial Development Authority Health Facilities Revenue | | | | |
| (Banner Health Obligated Group) | 4.000% | 1/1/19 | 3,000 | 3,183 |
| Maricopa County AZ Unified School District No. 4 (Mesa) GO | 4.000% | 7/1/19 | 3,750 | 4,043 |
| Phoenix AZ Civic Improvement Corp. Excise Tax Revenue | 5.000% | 7/1/17 | 4,250 | 4,372 |
| Phoenix AZ Civic Improvement Corp. Excise Tax Revenue | 4.000% | 7/1/18 | 2,690 | 2,825 |
| Phoenix AZ Industrial Development Authority Revenue (Mayo Clinic) VRDO | 0.470% | 11/1/16 | 30,000 | 30,000 |
| Pima County AZ Sewer Revenue | 4.000% | 7/1/17 | 2,000 | 2,044 |
| Pima County AZ Tucson Unified School District No. 1 GO | 4.000% | 7/1/19 (15) | 1,355 | 1,457 |
| Tempe AZ Excise Tax Revenue | 5.000% | 7/1/19 | 2,000 | 2,208 |
| Tucson AZ Water System Revenue | 5.000% | 7/1/19 | 2,050 | 2,264 |
| Yuma AZ Industrial Development Authority Hospital Revenue (Yuma Regional Medical Center) | 5.000% | 8/1/19 | 1,000 | 1,094 |
| | | | | 129,395 |
10
Short-Term Tax-Exempt Fund
| | | | |
| | | | Face | Market |
| | | Maturity | Amount | Value• |
| | Coupon | Date | ($000) | ($000) |
| Arkansas (0.2%) | | | | |
| Arkansas Development Finance Authority Healthcare Revenue (Baptist Health) | 3.000% | 12/1/16 | 7,485 | 7,499 |
| Arkansas Development Finance Authority Hospital Revenue | | | | |
| (Washington Regional Medical Center) | 3.000% | 2/1/18 | 1,000 | 1,022 |
| Arkansas Federal Highway Grant Anticipation & Tax Revenue GO | 5.000% | 4/1/17 | 6,980 | 7,105 |
| Arkansas Federal Highway Grant Anticipation & Tax Revenue GO | 5.000% | 10/1/17 | 7,155 | 7,433 |
| Baxter County AR Hospital Revenue | 5.000% | 9/1/18 | 1,000 | 1,064 |
| Baxter County AR Hospital Revenue | 5.000% | 9/1/19 | 620 | 678 |
| Little Rock AR Sewer Revenue | 5.000% | 10/1/17 (Prere.) | 7,500 | 7,788 |
| | | | | 32,589 |
| California (9.9%) | | | | |
| 1 Bakersfield CA Wastewater Revenue TOB VRDO | 0.850% | 11/7/16 | 5,315 | 5,315 |
| Bay Area Toll Authority California Toll Bridge Revenue (San Francisco Bay Area) PUT | 1.000% | 4/3/17 | 7,250 | 7,252 |
| Bay Area Toll Authority California Toll Bridge Revenue (San Francisco Bay Area) PUT | 1.367% | 8/1/17 | 31,500 | 31,570 |
| Bay Area Toll Authority California Toll Bridge Revenue (San Francisco Bay Area) PUT | 1.450% | 8/1/17 | 10,040 | 10,059 |
| Bay Area Toll Authority California Toll Bridge Revenue (San Francisco Bay Area) PUT | 1.450% | 8/1/17 | 7,000 | 7,012 |
| Bay Area Toll Authority California Toll Bridge Revenue (San Francisco Bay Area) PUT | 1.500% | 4/2/18 | 62,400 | 62,718 |
| Bay Area Toll Authority California Toll Bridge Revenue (San Francisco Bay Area) PUT | 1.875% | 4/1/19 | 8,950 | 9,073 |
| Bay Area Toll Authority California Toll Bridge Revenue (San Francisco Bay Area) PUT | 1.875% | 4/1/20 | 7,500 | 7,614 |
| Brea CA Redevelopment Agency Successor Agency Tax Allocation Revenue | | | | |
| (Redevelopment Project AB) | 5.000% | 8/1/17 | 1,150 | 1,186 |
| California County CA Tobacco Securitization Agency Revenue | 4.000% | 6/1/17 | 575 | 584 |
| California County CA Tobacco Securitization Agency Revenue | 4.000% | 6/1/18 | 1,000 | 1,041 |
| 3 California Department of Water Resources Water System Revenue (Central Valley Project) PUT | 1.250% | 9/1/17 | 60,175 | 60,220 |
| 3 California Department of Water Resources Water System Revenue (Central Valley Project) PUT | 0.930% | 12/1/17 | 32,250 | 32,171 |
| 1 California Department of Water resources Water System Revenue (Central Valley Project) | | | | |
| TOB VRDO | 0.660% | 11/7/16 | 11,910 | 11,910 |
| California GO | 5.000% | 9/1/17 | 4,250 | 4,403 |
| California GO | 5.000% | 10/1/17 | 35,000 | 36,381 |
| California GO | 5.000% | 4/1/18 | 10,385 | 11,002 |
| 2 California GO | 5.000% | 8/1/18 | 57,715 | 61,898 |
| California GO | 5.000% | 2/1/19 | 825 | 900 |
| California GO | 5.500% | 4/1/19 | 17,830 | 19,775 |
| California GO | 5.000% | 9/1/19 | 29,690 | 33,052 |
| California GO | 5.000% | 9/1/19 | 5,000 | 5,566 |
| California GO | 5.000% | 9/1/19 | 9,005 | 10,025 |
| California GO | 5.000% | 9/1/19 | 38,795 | 43,188 |
| California GO | 5.000% | 9/1/20 | 5,500 | 6,306 |
| California GO | 5.000% | 9/1/20 | 14,105 | 16,172 |
| 3 California GO PUT | 1.072% | 12/1/17 | 14,250 | 14,278 |
| California GO PUT | 4.000% | 12/1/17 | 8,350 | 8,505 |
| 3 California GO PUT | 1.080% | 5/1/18 | 29,500 | 29,420 |
| 3 California GO PUT | 1.202% | 12/3/18 | 7,600 | 7,641 |
| California GO PUT | 3.000% | 12/1/19 | 28,825 | 30,182 |
| 1 California GO TOB VRDO | 0.750% | 11/7/16 | 33,860 | 33,860 |
| 1 California GO TOB VRDO | 0.810% | 11/7/16 LOC | 16,755 | 16,755 |
| 1 California GO TOB VRDO | 0.810% | 11/7/16 LOC | 14,960 | 14,960 |
| 1 California GO TOB VRDO | 0.830% | 11/7/16 | 15,925 | 15,925 |
| 3 California Health Facilities Financing Authority Revenue (Children’s Hospital of Los Angeles) PUT | 2.430% | 7/1/17 | 8,825 | 8,871 |
| California Health Facilities Financing Authority Revenue (City of Hope Medical Center) | 5.000% | 11/15/16 | 1,005 | 1,007 |
| California Health Facilities Financing Authority Revenue (Memorial Health Services) | 5.000% | 10/1/17 | 1,000 | 1,040 |
| California Health Facilities Financing Authority Revenue | | | | |
| (Providence St. Joseph Health Obligated Group) PUT | 1.250% | 10/1/20 | 6,400 | 6,371 |
| California Health Facilities Financing Authority Revenue (St. Joseph Health System) PUT | 5.000% | 10/17/17 | 9,400 | 9,769 |
| California Health Facilities Financing Authority Revenue (Sutter Health) PUT | 1.000% | 8/15/19 | 6,000 | 5,972 |
| 3 California Infrastructure & Economic Development Bank Revenue | | | | |
| (Index-Museum Art Project) PUT | 2.124% | 8/1/18 | 20,515 | 20,889 |
| 3 California Infrastructure & Economic Development Bank Revenue (J. Paul Getty Trust) PUT | 0.910% | 4/3/17 | 3,925 | 3,921 |
| 3 California Infrastructure & Economic Development Bank Revenue (J. Paul Getty Trust) PUT | 0.910% | 4/3/17 | 22,500 | 22,478 |
| California Municipal Finance Authority | | | | |
| (Community Hospitals of Central California Obligated Group) COP | 5.000% | 2/1/17 | 1,100 | 1,111 |
| California Municipal Finance Authority Multifamily Housing Revenue | | | | |
| (Stevenson House Apartments) | 0.850% | 11/1/17 | 3,000 | 2,997 |
| 3 California Municipal Finance Authority Revenue (Anaheim Electric Utility Distribution System) PUT | 1.130% | 4/2/18 | 14,000 | 13,946 |
| California Municipal Finance Authority Revenue (NorthBay Healthcare Group) | 5.000% | 11/1/16 | 1,610 | 1,610 |
| California Municipal Finance Authority Solid Waste Revenue (Republic Services Inc. Project) PUT | 0.950% | 1/3/17 | 13,000 | 13,000 |
| California Public Works Board Lease Revenue (Department of Corrections) | 5.000% | 6/1/17 | 5,000 | 5,125 |
| California Public Works Board Lease Revenue (Department of Corrections) | 5.000% | 6/1/17 | 8,205 | 8,410 |
| California Public Works Board Lease Revenue (Department of Corrections) | 5.000% | 6/1/18 | 10,650 | 11,333 |
11
Short-Term Tax-Exempt Fund
| | | | | |
| | | | | Face | Market |
| | | | Maturity | Amount | Value• |
| | | Coupon | Date | ($000) | ($000) |
| | California Public Works Board Lease Revenue (Department of Corrections) | 5.000% | 6/1/18 | 2,500 | 2,660 |
| | California Public Works Board Lease Revenue (Department of State Hospitals) | 4.000% | 6/1/17 | 5,000 | 5,096 |
| | California Public Works Board Lease Revenue (Department of State Hospitals) | 4.000% | 6/1/18 | 5,000 | 5,243 |
| | California Public Works Board Lease Revenue (Judicial Council Projects) | 5.000% | 12/1/16 | 1,500 | 1,505 |
| | California Public Works Board Lease Revenue (Various Capital Projects) | 5.000% | 1/1/17 | 6,220 | 6,265 |
| | California Public Works Board Lease Revenue (Various Capital Projects) | 5.000% | 4/1/17 | 2,710 | 2,759 |
| | California Public Works Board Lease Revenue (Various Capital Projects) | 5.000% | 4/1/18 | 1,000 | 1,058 |
| | California Public Works Board Lease Revenue (Various Capital Projects) | 5.000% | 4/1/19 | 8,760 | 9,589 |
| | California State University Systemwide Revenue PUT | 3.000% | 11/1/19 | 21,000 | 21,971 |
| | California Statewide Communities Development Authority Health Facility Revenue | | | | |
| | (Catholic Healthcare West) | 0.880% | 11/4/16 (4) | 30,450 | 30,450 |
| | California Statewide Communities Development Authority Health Facility Revenue | | | | |
| | (Catholic Healthcare West) | 0.890% | 11/4/16 (4) | 3,075 | 3,075 |
| | California Statewide Communities Development Authority Revenue | | | | |
| | (Adventist Health System/West) | 3.000% | 3/1/17 | 350 | 353 |
| | California Statewide Communities Development Authority Revenue | | | | |
| | (Adventist Health System/West) | 3.000% | 3/1/18 | 375 | 386 |
| | California Statewide Communities Development Authority Revenue | | | | |
| | (Adventist Health System/West) | 4.000% | 3/1/19 | 500 | 534 |
| 1 | California Statewide Communities Development Authority Revenue | | | | |
| | (Cottage Health System Obligated Group) TOB VRDO | 0.780% | 11/7/16 | 8,555 | 8,555 |
| 3 | California Statewide Communities Development Authority Revenue (Kaiser Permanente) PUT | 1.580% | 5/1/17 | 1,250 | 1,252 |
| | California Statewide Communities Development Authority Revenue (Kaiser Permanente) PUT | 5.000% | 5/1/17 | 6,380 | 6,513 |
| | California Statewide Communities Development Authority Revenue (Kaiser Permanente) PUT | 5.000% | 5/1/17 | 7,500 | 7,656 |
| 1 | California Statewide Communities Development Authority Revenue (Kaiser Permanente) | | | | |
| | TOB VRDO | 0.830% | 11/7/16 | 10,010 | 10,010 |
| | California Statewide Communities Development Authority Revenue | | | | |
| | (Rady Children’s Hospital - San Diego) | 4.000% | 8/15/18 | 1,565 | 1,649 |
| 1 | California Statewide Communities Development Authority Revenue | | | | |
| | (St. Joseph Health System) TOB VRDO | 0.670% | 11/7/16 (4) | 17,832 | 17,832 |
| | California Statewide Communities Development Authority Senior Living Health Facility Revenue | | | | |
| | (Los Angeles Jewish Home for the Aging) | 2.500% | 8/1/20 | 1,165 | 1,166 |
| | California Statewide Communities Development Authority Student Housing Revenue | | | | |
| | (CHF-Irvine LLC - UCI East Campus Apartments Phase II) | 5.000% | 5/15/19 | 500 | 546 |
| | California Statewide Communities Development Authority Student Housing Revenue | | | | |
| | (CHF-Irvine LLC - UCI East Campus Apartments Phase II) | 5.000% | 5/15/20 | 500 | 559 |
| | Capistrano CA Unified School District Special Tax Revenue | 5.000% | 9/1/17 | 1,500 | 1,549 |
| | Capistrano CA Unified School District Special Tax Revenue | 5.000% | 9/1/18 (15) | 2,000 | 2,147 |
| | Capistrano CA Unified School District Special Tax Revenue | 5.000% | 9/1/19 (15) | 2,080 | 2,310 |
| | Chula Vista CA Industrial Development Revenue (San Diego Gas & Electric Co.) | 1.650% | 7/1/18 | 4,700 | 4,704 |
| | Chula Vista CA Municipal Financing Authority Special Tax Revenue | 5.000% | 9/1/17 | 565 | 584 |
| 1,3 | Eaton Vance California Municipal Bond Fund II | 1.480% | 7/1/19 | 8,250 | 8,251 |
| 2 | El Camino CA Healthcare District GO | 4.000% | 8/1/18 | 2,105 | 2,217 |
| | El Dorado CA Irrigation District Revenue | 4.000% | 3/1/17 (4) | 1,500 | 1,517 |
| 1 | Fontana CA Public Financing Authority Tax Allocation Revenue TOB VRDO | 0.880% | 11/7/16 LOC | 9,000 | 9,000 |
| | Foothill/Eastern Transportation Corridor Agency California Toll Road Revenue PUT | 5.000% | 1/15/18 | 19,485 | 19,959 |
| | Foothill/Eastern Transportation Corridor Agency California Toll Road Revenue PUT | 5.000% | 1/15/20 | 1,475 | 1,594 |
| 1 | Golden State Tobacco Securitization Corp. California Revenue TOB VRDO | 0.840% | 11/7/16 LOC | 9,720 | 9,720 |
| | Jurupa CA Public Financing Authority Special Tax Revenue | 3.500% | 9/1/17 | 425 | 433 |
| | Jurupa CA Public Financing Authority Special Tax Revenue | 4.000% | 9/1/18 | 380 | 399 |
| | Jurupa CA Public Financing Authority Special Tax Revenue | 5.000% | 9/1/19 | 610 | 674 |
| | La Verne CA (Brethren Hillcrest Homes) COP | 3.000% | 5/15/17 | 575 | 580 |
| | La Verne CA (Brethren Hillcrest Homes) COP | 4.000% | 5/15/18 | 235 | 244 |
| | Long Beach CA Finance Authority Natural Gas Purchase Revenue | 5.250% | 11/15/18 | 1,185 | 1,265 |
| | Long Beach CA Harbor Revenue | 5.000% | 11/15/18 | 32,500 | 35,212 |
| | Long Beach CA Unified School District GO | 5.000% | 8/1/19 | 2,740 | 3,042 |
| | Los Angeles CA GO | 5.000% | 9/1/18 | 12,900 | 13,878 |
| | Los Angeles CA Unified School District GO | 5.000% | 7/1/18 | 23,335 | 24,946 |
| | Los Angeles CA Unified School District GO | 5.000% | 7/1/18 | 73,395 | 78,462 |
| | Los Angeles CA Unified School District GO | 5.000% | 7/1/18 | 9,830 | 10,509 |
| | Los Angeles County CA Metropolitan Transportation Authority Sales Tax Revenue | 5.000% | 7/1/18 | 12,750 | 13,639 |
| | Los Angeles County CA Redevelopment Authority Tax Allocation Revenue (Various Project Areas) | 5.000% | 9/1/17 | 3,815 | 3,944 |
| | Los Angeles County CA Redevelopment Authority Tax Allocation Revenue (Various Project Areas) | 5.000% | 9/1/18 | 1,000 | 1,071 |
| 3 | Metropolitan Water District of Southern California Revenue PUT | 0.790% | 7/10/17 | 9,500 | 9,500 |
| 3 | Metropolitan Water District of Southern California Revenue PUT | 0.790% | 7/10/17 | 5,500 | 5,500 |
| 3 | Metropolitan Water District of Southern California Revenue PUT | 0.790% | 7/10/17 | 5,000 | 4,998 |
| 3 | Metropolitan Water District of Southern California Revenue PUT | 1.010% | 3/27/18 | 3,000 | 3,001 |
| 3 | Metropolitan Water District of Southern California Revenue PUT | 1.010% | 3/27/18 | 10,250 | 10,253 |
| 3 | Metropolitan Water District of Southern California Revenue PUT | 1.010% | 3/27/18 | 10,750 | 10,743 |
| 3 | Metropolitan Water District of Southern California Revenue PUT | 1.010% | 3/27/18 | 20,000 | 19,987 |
12
Short-Term Tax-Exempt Fund
| | | | |
| | | | Face | Market |
| | | Maturity | Amount | Value• |
| | Coupon | Date | ($000) | ($000) |
| Modesto CA Irrigation District Electric Revenue | 5.000% | 7/1/17 | 1,055 | 1,086 |
| Mount Diablo CA Unified School District GO | 5.000% | 8/1/18 | 1,500 | 1,605 |
| Mount Diablo CA Unified School District GO | 5.000% | 8/1/19 | 650 | 721 |
| North Orange County CA Community College District GO | 4.000% | 8/1/19 | 10,990 | 11,905 |
| Northern California Gas Authority No. 1 Revenue | 1.197% | 7/1/19 | 12,800 | 12,675 |
| 1 Nuveen California AMT-Free Municipal Income Fund VRDP VRDO | 1.100% | 7/1/18 | 14,000 | 14,000 |
| Nuveen Insured California AMT-Free Municipal Income Fund VRDP VRDO | 0.720% | 11/7/16 LOC | 5,000 | 5,000 |
| Oakland CA Redevelopment Agency Tax Allocation Revenue (Central District Project) | 5.000% | 9/1/17 | 3,500 | 3,619 |
| Oakland CA Redevelopment Agency Tax Allocation Revenue (Central District Project) | 5.000% | 9/1/18 | 1,550 | 1,660 |
| Oakland CA Redevelopment Agency Tax Allocation Revenue (Central District Project) | 5.000% | 9/1/19 | 1,500 | 1,658 |
| Palomar Pomerado Health California Revenue | 4.000% | 11/1/18 | 815 | 848 |
| 3 Riverside CA Water Revenue PUT | 0.780% | 2/1/17 | 2,000 | 2,000 |
| Riverside County CA Asset Leasing Corp. Leasehold Revenue (Riverside County Hospital Project) | 4.000% | 6/1/17 | 2,000 | 2,037 |
| Riverside County CA Asset Leasing Corp. Leasehold Revenue (Riverside County Hospital Project) | 5.000% | 6/1/17 | 3,705 | 3,796 |
| Riverside County CA Transportation Commission Sales Tax Revenue | 5.000% | 6/1/18 | 500 | 533 |
| Roseville CA Special Tax Revenue | 3.000% | 9/1/18 | 275 | 283 |
| Roseville CA Special Tax Revenue | 4.000% | 9/1/19 | 875 | 936 |
| 1 Sacramento CA Municipal Utility District Revenue TOB VRDO | 0.960% | 11/7/16 | 4,985 | 4,985 |
| San Joaquin Hills CA Transportation Corridor Agency Toll Road Revenue | 5.000% | 1/15/17 | 12,025 | 12,124 |
| Southern California Public Power Authority Revenue (Canyon Power Project) | 5.000% | 7/1/20 | 1,250 | 1,428 |
| University of California Revenue | 5.000% | 5/15/18 | 3,000 | 3,193 |
| University of California Revenue | 5.000% | 5/15/18 | 8,565 | 9,118 |
| Western CA Municipal Water District Revenue PUT | 1.500% | 10/1/20 | 2,325 | 2,345 |
| | | | | 1,365,838 |
| Colorado (2.2%) | | | | |
| Adams County CO COP | 4.000% | 12/1/19 | 1,250 | 1,356 |
| Colorado Education Loan Program Revenue | 2.000% | 6/29/17 | 79,700 | 80,343 |
| Colorado Education Loan Program Revenue | 5.000% | 6/29/17 | 19,100 | 19,628 |
| Colorado General Fund Revenue | 2.000% | 6/27/17 | 44,050 | 44,403 |
| Colorado Health Facilities Authority Revenue (Catholic Health Initiatives) PUT | 1.875% | 11/6/19 | 6,000 | 6,045 |
| 3 Colorado Health Facilities Authority Revenue (Catholic Health Initiatives) PUT | 1.609% | 11/12/20 | 5,000 | 4,964 |
| 3 Colorado Health Facilities Authority Revenue (Catholic Health Initiatives) PUT | 1.609% | 11/12/20 | 7,500 | 7,445 |
| 1 Colorado Health Facilities Authority Revenue (Catholic Health Initiatives) TOB VRDO | 0.780% | 11/7/16 | 10,000 | 10,000 |
| 1 Colorado Health Facilities Authority Revenue (Catholic Health Initiatives) TOB VRDO | 0.880% | 11/7/16 LOC | 11,805 | 11,805 |
| Colorado Health Facilities Authority Revenue (Christian Living Communities) | 1.250% | 1/1/17 | 175 | 175 |
| Colorado Health Facilities Authority Revenue (Christian Living Communities) | 4.000% | 1/1/18 | 250 | 257 |
| Colorado Health Facilities Authority Revenue (Christian Living Communities) | 4.000% | 1/1/20 | 500 | 530 |
| Colorado Health Facilities Authority Revenue (Covenant Retirement Community Inc.) | 4.000% | 12/1/16 | 1,000 | 1,002 |
| Colorado Health Facilities Authority Revenue (Covenant Retirement Community Inc.) | 3.000% | 12/1/17 | 700 | 713 |
| Colorado Health Facilities Authority Revenue (Covenant Retirement Community Inc.) | 5.000% | 12/1/17 | 1,580 | 1,643 |
| Colorado Health Facilities Authority Revenue (Covenant Retirement Community Inc.) | 3.150% | 12/1/18 | 3,640 | 3,645 |
| Colorado Health Facilities Authority Revenue (Covenant Retirement Community Inc.) | 4.000% | 12/1/18 | 600 | 630 |
| Colorado Health Facilities Authority Revenue | | | | |
| (Evangelical Lutheran Good Samaritan Society Project) | 3.000% | 6/1/17 | 500 | 506 |
| Colorado Health Facilities Authority Revenue | | | | |
| (Evangelical Lutheran Good Samaritan Society Project) | 3.000% | 6/1/18 | 600 | 616 |
| Colorado Health Facilities Authority Revenue | | | | |
| (Evangelical Lutheran Good Samaritan Society Project) | 4.000% | 6/1/19 | 1,000 | 1,061 |
| Denver CO City & County Airport Revenue | 0.850% | 11/3/16 (12) | 14,600 | 14,600 |
| Denver CO City & County Airport Revenue | 0.880% | 11/4/16 (12) | 14,700 | 14,700 |
| Denver CO City & County School District GO | 3.000% | 12/1/16 | 13,515 | 13,542 |
| 3 E-470 Public Highway Authority Colorado Revenue PUT | 1.810% | 8/31/17 | 7,540 | 7,528 |
| 3 E-470 Public Highway Authority Colorado Revenue PUT | 2.380% | 9/1/17 (14) | 7,000 | 7,011 |
| Park Creek CO Metropolitan District Limited Property Tax Revenue | 4.000% | 12/1/18 | 350 | 367 |
| Park Creek CO Metropolitan District Limited Property Tax Revenue | 4.000% | 12/1/20 | 1,055 | 1,144 |
| Regional Transportation District of Colorado Sales Tax Revenue (FasTracks Project) | 5.000% | 11/1/16 (Prere.) | 14,230 | 14,230 |
| Regional Transportation District of Colorado Sales Tax Revenue (FasTracks Project) | 5.000% | 11/1/16 (Prere.) | 11,280 | 11,280 |
| University of Colorado Hospital Authority Revenue | 0.880% | 5/30/17 | 12,500 | 12,500 |
| University of Colorado Hospital Authority Revenue PUT | 0.880% | 5/30/17 | 10,000 | 10,000 |
| | | | | 303,669 |
| Connecticut (3.5%) | | | | |
| Bridgeport CT GO | 5.000% | 8/15/20 (4) | 7,115 | 8,019 |
| Connecticut GO | 5.000% | 11/1/16 | 7,000 | 7,000 |
| Connecticut GO | 0.690% | 11/7/16 | 12,740 | 12,740 |
| Connecticut GO | 0.690% | 11/7/16 | 15,825 | 15,825 |
| Connecticut GO | 0.760% | 11/7/16 | 31,935 | 31,935 |
| Connecticut GO | 5.000% | 12/1/16 | 5,000 | 5,018 |
| 3 Connecticut GO | 0.880% | 1/1/17 | 10,210 | 10,210 |
| 3 Connecticut GO | 0.940% | 3/1/17 | 3,000 | 3,000 |
13
Short-Term Tax-Exempt Fund
| | | | |
| | | | Face | Market |
| | | Maturity | Amount | Value• |
| | Coupon | Date | ($000) | ($000) |
| 3 Connecticut GO | 0.970% | 3/1/17 | 7,415 | 7,415 |
| 3 Connecticut GO | 1.310% | 4/15/17 | 4,200 | 4,200 |
| 3 Connecticut GO | 1.400% | 5/15/17 | 3,120 | 3,125 |
| 3 Connecticut GO | 1.330% | 6/15/17 | 25,000 | 25,031 |
| 3 Connecticut GO | 1.330% | 6/15/17 | 35,240 | 35,284 |
| Connecticut GO | 5.000% | 7/15/17 | 5,000 | 5,148 |
| 3 Connecticut GO | 1.150% | 9/15/17 | 1,850 | 1,850 |
| Connecticut GO | 4.000% | 11/15/17 | 7,000 | 7,227 |
| Connecticut GO | 4.000% | 11/15/17 | 40,795 | 42,119 |
| 3 Connecticut GO | 0.980% | 1/1/18 | 4,905 | 4,894 |
| 3 Connecticut GO | 1.510% | 4/15/18 | 2,250 | 2,253 |
| 3 Connecticut GO | 1.550% | 5/15/18 | 10,675 | 10,695 |
| 3 Connecticut GO | 1.400% | 9/15/18 | 4,000 | 4,002 |
| Connecticut GO | 5.000% | 11/15/18 | 8,540 | 9,218 |
| 3 Connecticut GO | 1.730% | 5/15/19 | 5,000 | 5,028 |
| 3 Connecticut GO | 1.550% | 9/15/19 | 1,000 | 1,000 |
| 3 Connecticut GO PUT | 1.280% | 9/15/17 | 10,215 | 10,215 |
| 3 Connecticut GO PUT | 1.980% | 3/1/18 | 17,500 | 17,501 |
| Connecticut Health & Educational Facilities Authority Revenue (Trinity Health Corp.) | 5.000% | 12/1/18 | 350 | 379 |
| Connecticut Health & Educational Facilities Authority Revenue (Trinity Health Corp.) | 3.000% | 12/1/19 | 750 | 793 |
| Connecticut Health & Educational Facilities Authority Revenue (Yale University) PUT | 0.600% | 2/1/17 | 35,000 | 34,995 |
| Connecticut Health & Educational Facilities Authority Revenue (Yale University) PUT | 0.800% | 7/26/17 | 40,000 | 40,021 |
| Connecticut Health & Educational Facilities Authority Revenue (Yale University) PUT | 0.900% | 2/1/18 | 4,000 | 4,002 |
| Connecticut Health & Educational Facilities Authority Revenue (Yale University) PUT | 1.375% | 7/11/18 | 57,000 | 57,422 |
| Connecticut Health & Educational Facilities Authority Revenue (Yale University) PUT | 1.000% | 7/1/19 | 17,550 | 17,509 |
| Connecticut Health & Educational Facilities Authority Revenue (Yale University) PUT | 1.000% | 7/1/19 | 8,450 | 8,428 |
| 1 Connecticut Health & Educational Facilities Authority Revenue (Yale University) TOB VRDO | 0.660% | 11/7/16 | 3,600 | 3,600 |
| Hartford CT GO | 5.000% | 8/15/18 (15) | 3,500 | 3,729 |
| Hartford CT GO | 5.000% | 4/1/19 (ETM) | 2,150 | 2,357 |
| Hartford CT GO | 5.000% | 7/1/19 (4) | 700 | 762 |
| Hartford CT GO | 5.000% | 10/1/19 (ETM) | 1,525 | 1,700 |
| New Britain CT BAN | 2.000% | 3/23/17 | 12,500 | 12,559 |
| New Britain CT GO | 5.000% | 3/1/17 (15) | 600 | 608 |
| New Britain CT GO | 5.000% | 3/1/19 (15) | 1,000 | 1,086 |
| New Britain CT GO | 5.000% | 3/1/20 (15) | 1,175 | 1,314 |
| South Central CT Regional Water Authority Water System Revenue | 5.000% | 8/1/18 (Prere.) | 5,000 | 5,359 |
| | | | | 486,575 |
| Delaware (0.2%) | | | | |
| Delaware GO | 5.000% | 7/1/18 | 2,000 | 2,138 |
| Delaware GO | 5.000% | 2/1/19 | 1,000 | 1,091 |
| Delaware GO | 5.000% | 3/1/19 | 1,000 | 1,094 |
| Delaware Transportation Authority Transportation System Revenue | 5.000% | 7/1/18 | 1,030 | 1,101 |
| Delaware Transportation Authority Transportation System Revenue | 5.000% | 7/1/19 | 3,500 | 3,869 |
| Delaware Transportation Authority Transportation System Revenue | 5.000% | 7/1/20 | 785 | 895 |
| New Castle County DE GO | 5.000% | 7/15/18 | 1,770 | 1,895 |
| 1 University of Delaware Revenue TOB VRDO | 0.720% | 11/7/16 | 8,670 | 8,670 |
| | | | | 20,753 |
| District of Columbia (0.3%) | | | | |
| 3 District of Columbia Income Tax Revenue | 0.830% | 12/1/16 | 6,135 | 6,135 |
| 3 District of Columbia Income Tax Revenue | 0.930% | 12/1/17 | 11,250 | 11,251 |
| District of Columbia Water & Sewer Authority Public Utility Revenue | 5.000% | 10/1/19 | 500 | 557 |
| Metropolitan Washington DC Transit Authority Revenue | 5.000% | 7/1/18 | 12,500 | 13,335 |
| Metropolitan Washington DC Transit Authority Revenue | 4.000% | 7/1/19 | 8,000 | 8,389 |
| | | | | 39,667 |
| Florida (3.7%) | | | | |
| Brevard County FL Health Facilities Authority Revenue (Health First Inc. Project) | 5.000% | 4/1/18 | 425 | 448 |
| Brevard County FL Health Facilities Authority Revenue (Health First Inc. Project) | 5.000% | 4/1/19 | 750 | 815 |
| Broward County FL Airport System Revenue | 5.000% | 10/1/17 | 1,050 | 1,090 |
| Broward County FL Airport System Revenue | 5.000% | 10/1/18 | 700 | 753 |
| Broward County FL School Board COP | 5.000% | 7/1/17 | 5,000 | 5,137 |
| Broward County FL School Board COP | 5.000% | 7/1/18 | 4,415 | 4,701 |
| Broward County FL School Board COP | 5.000% | 7/1/19 | 2,355 | 2,588 |
| Broward County FL School Board COP | 5.000% | 7/1/20 | 5,400 | 6,105 |
| Broward County FL School District TAN | 1.500% | 6/15/17 | 49,000 | 49,218 |
| Cape Coral FL Special Obligation Revenue | 4.000% | 10/1/17 | 1,905 | 1,959 |
| Cape Coral FL Special Obligation Revenue | 4.000% | 10/1/18 | 600 | 634 |
| Central Florida Expressway Authority BAN | 1.625% | 1/1/19 | 54,595 | 54,920 |
| Citizens Property Insurance Corp. Florida Revenue (Coastal Account) | 5.000% | 6/1/18 | 5,555 | 5,799 |
14
Short-Term Tax-Exempt Fund
| | | | |
| | | | Face | Market |
| | | Maturity | Amount | Value• |
| | Coupon | Date | ($000) | ($000) |
| Citizens Property Insurance Corp. Florida Revenue | | | | |
| (Personal Lines Account/Commercial Lines Account) | 5.000% | 6/1/17 | 6,260 | 6,415 |
| Citizens Property Insurance Corp. Florida Revenue | | | | |
| (Personal Lines Account/Commercial Lines Account) | 5.000% | 6/1/18 | 36,700 | 38,998 |
| Citizens Property Insurance Corp. Florida Revenue | | | | |
| (Personal Lines Account/Commercial Lines Account) | 5.000% | 6/1/19 | 6,700 | 7,362 |
| Escambia County FL Pollution Control Revenue (Gulf Power Co. Project) PUT | 1.150% | 6/21/18 | 6,000 | 5,992 |
| Escambia County FL Solid Waste Disposal System Revenue (Gulf Power Co. Project) PUT | 1.400% | 12/1/17 | 6,500 | 6,522 |
| Florida Board of Education Public Education Capital Outlay GO | 5.000% | 6/1/18 | 6,845 | 7,294 |
| Florida Board of Education Public Education Capital Outlay GO | 5.000% | 6/1/19 | 8,135 | 8,973 |
| Florida Board of Education Public Education Capital Outlay GO | 5.000% | 6/1/19 | 17,095 | 18,855 |
| Florida Department of Environmental Protection & Preservation Revenue | 5.000% | 7/1/20 | 13,160 | 14,948 |
| Florida Municipal Power Agency Revenue | 5.000% | 10/1/17 | 700 | 726 |
| Florida Municipal Power Agency Revenue | 5.000% | 10/1/18 | 800 | 858 |
| Florida Municipal Power Agency Revenue | 5.000% | 10/1/19 | 800 | 886 |
| Florida Municipal Power Agency Revenue | 5.000% | 10/1/20 | 6,000 | 6,828 |
| Florida Municipal Power Agency Revenue (Stanton II Project) | 4.000% | 10/1/17 | 1,650 | 1,697 |
| Halifax Hospital Medical Center Florida Hospital Revenue | 3.000% | 6/1/17 | 1,000 | 1,011 |
| Halifax Hospital Medical Center Florida Hospital Revenue | 3.000% | 6/1/17 | 1,000 | 1,012 |
| Halifax Hospital Medical Center Florida Hospital Revenue | 4.000% | 6/1/18 | 500 | 522 |
| Halifax Hospital Medical Center Florida Hospital Revenue | 4.000% | 6/1/18 | 2,000 | 2,089 |
| Halifax Hospital Medical Center Florida Hospital Revenue | 5.000% | 6/1/19 | 250 | 273 |
| Halifax Hospital Medical Center Florida Hospital Revenue | 5.000% | 6/1/19 | 825 | 902 |
| Halifax Hospital Medical Center Florida Hospital Revenue | 5.000% | 6/1/20 | 300 | 337 |
| Highlands County FL Health Facilities Authority Hospital Revenue | | | | |
| (Adventist Health System/Sunbelt Obligated Group) | 5.125% | 11/15/16 (Prere.) | 2,075 | 2,074 |
| Hollywood FL Community Redevelopment Agency Tax Allocation Revenue | 5.000% | 3/1/18 | 2,000 | 2,098 |
| Hollywood FL Community Redevelopment Agency Tax Allocation Revenue | 5.000% | 3/1/19 | 2,000 | 2,159 |
| Jacksonville FL Electric Authority Electric System Revenue CP | 0.950% | 11/9/16 | 27,200 | 27,200 |
| Jacksonville FL Electric Authority Water & Sewer Revenue | 4.000% | 10/1/17 | 1,500 | 1,544 |
| Jacksonville FL Special Revenue | 5.000% | 10/1/18 | 500 | 538 |
| Jacksonville FL Special Revenue | 5.000% | 10/1/19 | 2,200 | 2,443 |
| Jacksonville FL Special Revenue | 5.000% | 10/1/20 | 2,500 | 2,854 |
| Jacksonville FL Special Revenue | 5.000% | 10/1/20 | 760 | 868 |
| 3 Lakeland FL Energy System Revenue | 1.380% | 10/1/17 | 10,000 | 10,004 |
| Lakeland FL Energy System Revenue | 5.000% | 10/1/19 | 1,000 | 1,114 |
| Lee County FL Non-Ad Valorem Revenue | 5.000% | 10/1/17 | 1,220 | 1,266 |
| Lee County FL School Board COP | 5.000% | 8/1/17 | 4,000 | 4,128 |
| Lee County FL School Board COP | 5.000% | 8/1/18 | 3,530 | 3,778 |
| Miami Beach FL Health Facilities Authority Revenue (Mount Sinai Medical Center) | 4.000% | 11/15/17 | 1,965 | 2,017 |
| Miami Beach FL Health Facilities Authority Revenue (Mount Sinai Medical Center) | 4.000% | 11/15/18 | 1,125 | 1,179 |
| Miami Beach FL Resort Tax Revenue | 4.000% | 9/1/17 | 1,250 | 1,283 |
| Miami Beach FL Resort Tax Revenue | 5.000% | 9/1/19 | 1,615 | 1,789 |
| Miami Beach FL Resort Tax Revenue | 5.000% | 9/1/20 | 1,135 | 1,293 |
| 1 Miami Beach FL Resort Tax Revenue TOB VRDO | 0.680% | 11/7/16 | 4,620 | 4,620 |
| Miami-Dade County FL Health Facilities Authority Hospital Revenue (Miami Children’s Hospital) | 5.000% | 8/1/17 | 400 | 412 |
| Miami-Dade County FL Health Facilities Authority Hospital Revenue (Miami Children’s Hospital) | 4.000% | 8/1/18 | 505 | 530 |
| Miami-Dade County FL Industrial Development Authority Solid Waste Disposal Revenue | | | | |
| (Waste Management Inc. of Florida Project) PUT | 1.500% | 10/1/18 | 4,500 | 4,530 |
| 1 Miami-Dade County FL Public Facilities Revenue (Jackson Health System) TOB VRDO | 0.660% | 11/7/16 (12) | 10,395 | 10,395 |
| Miami-Dade County FL School Board COP | 5.000% | 2/1/20 | 2,250 | 2,517 |
| 1 Miami-Dade County FL School Board COP TOB VRDO | 0.710% | 11/7/16 (12) | 26,000 | 26,000 |
| 1 Miami-Dade County FL Water & Sewer Revenue TOB VRDO | 0.750% | 11/7/16 | 8,510 | 8,510 |
| Orlando FL Utility Commission Utility System Revenue | 5.000% | 10/1/18 | 12,195 | 13,137 |
| Orlando Utilities Commission Revenue PUT | 0.880% | 5/30/17 | 10,510 | 10,510 |
| Palm Beach County FL Health Facilities Authority Hospital Revenue | | | | |
| (BRRH Corp. Obligated Group) | 3.000% | 12/1/16 | 1,000 | 1,002 |
| Palm Beach County FL Health Facilities Authority Hospital Revenue | | | | |
| (BRRH Corp. Obligated Group) | 3.000% | 12/1/17 | 1,000 | 1,019 |
| Palm Beach County FL Health Facilities Authority Hospital Revenue | | | | |
| (BRRH Corp. Obligated Group) | 4.000% | 12/1/18 | 750 | 790 |
| Palm Beach County FL Health Facilities Authority Revenue (Jupiter Medical Center Inc. Project) | 4.000% | 11/1/17 | 2,095 | 2,143 |
| Palm Beach County FL School Board COP | 5.000% | 8/1/18 | 4,725 | 5,047 |
| Palm Beach County FL School District TAN | 2.000% | 8/31/17 | 37,315 | 37,687 |
| Pasco County FL School Board COP | 1.150% | 11/4/16 (2) | 9,100 | 9,100 |
| Port St. Lucie FL Special Assessment Revenue | 1.000% | 7/1/17 | 475 | 475 |
| Port St. Lucie FL Special Assessment Revenue | 1.125% | 7/1/18 | 680 | 678 |
| Reedy Creek FL Improvement District GO | 4.000% | 6/1/17 | 1,760 | 1,793 |
| Reedy Creek FL Improvement District GO | 5.000% | 6/1/18 | 2,825 | 3,005 |
| Reedy Creek FL Improvement District Utilities Revenue | 5.000% | 10/1/17 | 785 | 814 |
15
Short-Term Tax-Exempt Fund
| | | | |
| | | | Face | Market |
| | | Maturity | Amount | Value• |
| | Coupon | Date | ($000) | ($000) |
| 2 Sarasota County FL Health Facilities Authority Revenue (Village of Isle Project) | 4.000% | 1/1/18 | 400 | 413 |
| 2 Sarasota County FL Health Facilities Authority Revenue (Village of Isle Project) | 4.000% | 1/1/19 | 500 | 527 |
| South Broward FL Hospital District Revenue | 5.000% | 5/1/20 | 4,190 | 4,718 |
| South Florida Water Management District COP | 5.000% | 10/1/19 | 1,750 | 1,949 |
| South Florida Water Management District COP | 5.000% | 10/1/20 | 2,000 | 2,293 |
| 1 South Miami FL Health Facilities Authority Hospital Revenue | | | | |
| (Baptist Health South Florida Obligated Group) TOB VRDO | 0.700% | 11/7/16 | 6,350 | 6,350 |
| Tallahassee FL Health Facilities Revenue (Tallahassee Memorial HealthCare Inc. Project) | 5.000% | 12/1/17 | 1,000 | 1,042 |
| Tallahassee FL Health Facilities Revenue (Tallahassee Memorial HealthCare Inc. Project) | 5.000% | 12/1/20 | 1,600 | 1,817 |
| Tampa FL Hospital Revenue | 4.000% | 7/1/17 | 1,525 | 1,554 |
| 2 Tampa FL Hospital Revenue (H. Lee Moffitt Cancer Center Project) | 5.000% | 7/1/17 | 3,425 | 3,514 |
| Volusia County FL School Board COP | 4.000% | 8/1/18 (15) | 400 | 421 |
| Volusia County FL School Board COP | 4.000% | 8/1/19 (15) | 500 | 538 |
| Volusia County FL School Board COP | 5.000% | 8/1/20 (15) | 350 | 398 |
| | | | | 506,544 |
| Georgia (3.2%) | | | | |
| Athens-Clarke County GA Unified Government Water & Sewerage Revenue | 5.000% | 1/1/17 | 2,500 | 2,518 |
| Athens-Clarke County GA Unified Government Water & Sewerage Revenue | 5.000% | 1/1/18 | 3,000 | 3,146 |
| Atlanta GA Airport Revenue | 5.000% | 1/1/18 | 500 | 524 |
| 1 Atlanta GA Airport Revenue TOB VRDO | 0.830% | 11/7/16 (4) | 10,000 | 10,000 |
| 3 Atlanta GA Water & Wastewater Revenue PUT | 1.858% | 11/1/18 | 56,750 | 57,350 |
| Bartow County GA Development Authority Pollution Control Revenue | | | | |
| (Georgia Power Co. Plant Bowen Project) PUT | 2.375% | 8/10/17 | 8,000 | 8,081 |
| Burke County GA Development Authority Pollution Control Revenue | | | | |
| (Georgia Power Co. Plant Vogtle Project) PUT | 1.375% | 4/4/17 | 2,275 | 2,279 |
| Burke County GA Development Authority Pollution Control Revenue | | | | |
| (Georgia Power Co. Plant Vogtle Project) PUT | 1.750% | 6/1/17 | 10,025 | 10,064 |
| Burke County GA Development Authority Pollution Control Revenue | | | | |
| (Georgia Power Co. Plant Vogtle Project) PUT | 1.800% | 4/3/18 | 5,250 | 5,295 |
| Burke County GA Development Authority Pollution Control Revenue | | | | |
| (Georgia Power Co. Plant Vogtle Project) PUT | 1.300% | 5/3/18 | 11,500 | 11,566 |
| Burke County GA Development Authority Pollution Control Revenue | | | | |
| (Georgia Power Co. Plant Vogtle Project) PUT | 2.350% | 12/11/20 | 3,200 | 3,297 |
| 2 Clarke County GA Hospital Authority Revenue (Piedmont Healthcare Inc.) | 5.000% | 7/1/18 | 750 | 797 |
| 2 Clarke County GA Hospital Authority Revenue (Piedmont Healthcare Inc.) | 5.000% | 7/1/19 | 700 | 769 |
| 1 Cobb County GA Development Authority Parking Facilities Lease Revenue | | | | |
| (KSU Central Parking Deck) TOB VRDO | 0.660% | 11/7/16 LOC | 15,075 | 15,075 |
| Dalton GA Development Authority Revenue (Hamilton Health Care System) | 5.000% | 8/15/17 | 1,500 | 1,549 |
| DeKalb County GA Water & Sewer Revenue | 5.000% | 10/1/17 | 1,000 | 1,039 |
| DeKalb County GA Water & Sewer Revenue | 5.000% | 10/1/17 | 500 | 519 |
| DeKalb County GA Water & Sewer Revenue | 5.000% | 10/1/18 | 800 | 863 |
| Forsyth County GA GO | 5.000% | 3/1/18 | 3,580 | 3,779 |
| 2 Fulton County GA Development Authority Revenue (Piedmont Healthcare Inc. Project) | 5.000% | 7/1/18 | 625 | 665 |
| 2 Fulton County GA Development Authority Revenue (Piedmont Healthcare Inc. Project) | 5.000% | 7/1/19 | 700 | 769 |
| Fulton County GA Residential Care Facilities for the Elderly Authority Revenue (Lenbrook Square) | 3.000% | 7/1/19 | 500 | 516 |
| Fulton County GA Residential Care Facilities for the Elderly Authority Revenue (Lenbrook Square) | 3.000% | 7/1/20 | 1,410 | 1,462 |
| 3 Gainesville & Hall County GA Hospital Authority Revenue | | | | |
| (Northeast Georgia Health System Inc. Project) PUT | 1.580% | 2/18/20 | 17,675 | 17,763 |
| Georgia GO | 5.000% | 11/1/16 | 2,400 | 2,400 |
| Georgia GO | 5.000% | 7/1/17 | 5,280 | 5,432 |
| Georgia GO | 5.000% | 2/1/18 | 32,085 | 33,762 |
| Georgia GO | 5.000% | 7/1/18 | 72,620 | 77,621 |
| Georgia GO | 5.000% | 7/1/18 (Prere.) | 3,350 | 3,579 |
| Georgia GO | 4.000% | 1/1/19 | 1,085 | 1,157 |
| Georgia GO | 5.000% | 10/1/19 | 3,765 | 4,203 |
| Georgia Municipal Electric Power Authority Revenue | 5.000% | 1/1/17 | 1,825 | 1,838 |
| Georgia Municipal Electric Power Authority Revenue | 5.000% | 1/1/18 | 1,400 | 1,467 |
| Georgia Municipal Electric Power Authority Revenue | 5.000% | 1/1/18 | 1,825 | 1,912 |
| Georgia Municipal Gas Authority Revenue | 5.000% | 10/1/19 | 5,000 | 5,554 |
| Glynn County GA School District GO | 5.000% | 8/1/18 | 4,000 | 4,284 |
| Glynn County GA School District GO | 5.000% | 8/1/19 | 7,000 | 7,752 |
| Gwinnett County GA School District GO | 3.000% | 8/1/18 | 4,525 | 4,695 |
| Gwinnett County GA School District GO | 3.000% | 2/1/19 | 25,000 | 26,164 |
| Gwinnett County GA School District GO | 3.000% | 8/1/19 | 24,225 | 25,579 |
| Gwinnett County GA School District GO | 4.000% | 2/1/20 | 16,725 | 18,327 |
| Main Street Natural Gas Inc. Georgia Gas Project Revenue | 5.000% | 3/15/17 | 250 | 253 |
| Main Street Natural Gas Inc. Georgia Gas Project Revenue | 5.125% | 9/15/17 | 240 | 247 |
| 3 Metropolitan Atlanta GA Rapid Transportation Authority Georgia Sales Tax Revenue PUT | 0.910% | 7/1/17 | 18,000 | 17,988 |
| 3 Metropolitan Atlanta GA Rapid Transportation Authority Georgia Sales Tax Revenue PUT | 0.930% | 7/1/17 | 17,500 | 17,493 |
16
Short-Term Tax-Exempt Fund
| | | | |
| | | | Face | Market |
| | | Maturity | Amount | Value• |
| | Coupon | Date | ($000) | ($000) |
| Monroe County GA Development Authority Pollution Control Revenue | | | | |
| (Georgia Power Co. Plant Scherer Project) PUT | 2.000% | 6/13/19 | 2,000 | 2,031 |
| Monroe County GA Development Authority Pollution Control Revenue | | | | |
| (Georgia Power Co. Plant Scherer Project) PUT | 2.350% | 12/11/20 | 5,700 | 5,872 |
| Municipal Electric Authority Georgia Revenue | 5.000% | 4/1/18 | 3,565 | 3,768 |
| Municipal Electric Authority Georgia Revenue (Combined Cycle Project) | 5.000% | 11/1/16 | 1,325 | 1,325 |
| Municipal Electric Authority Georgia Revenue (Combined Cycle Project) | 5.000% | 11/1/17 | 1,700 | 1,771 |
| | | | | 436,159 |
| Guam (0.0%) | | | | |
| Guam Government Business Privilege Tax Revenue | 5.000% | 11/15/19 | 1,000 | 1,096 |
| |
| Hawaii (0.5%) | | | | |
| Hawaii County HI GO | 4.000% | 9/1/18 | 1,585 | 1,674 |
| Hawaii County HI GO | 5.000% | 9/1/18 | 1,395 | 1,499 |
| Hawaii County HI GO | 5.000% | 9/1/19 | 3,625 | 4,026 |
| Hawaii Department of Budget & Finance Special Purpose Revenue (Queens Health System) PUT | 1.080% | 5/30/17 | 4,855 | 4,855 |
| Hawaii Department of Budget & Finance Special Purpose Revenue (Queens Health System) PUT | 1.080% | 5/30/17 | 2,510 | 2,510 |
| Hawaii GO | 5.000% | 10/1/18 | 15,000 | 16,167 |
| Hawaii GO | 5.000% | 10/1/19 | 4,000 | 4,455 |
| Hawaii GO | 5.000% | 4/1/20 | 10,000 | 11,304 |
| Hawaii GO | 5.000% | 10/1/20 | 2,750 | 3,154 |
| Honolulu HI City & County GO | 5.000% | 11/1/16 | 7,265 | 7,265 |
| Honolulu HI City & County GO | 5.000% | 7/1/17 (Prere.) | 1,000 | 1,028 |
| Honolulu HI City & County GO | 3.000% | 10/1/18 | 1,595 | 1,656 |
| Honolulu HI City & County GO | 4.000% | 10/1/18 | 1,500 | 1,586 |
| Honolulu HI City & County GO | 5.000% | 10/1/18 | 1,815 | 1,954 |
| Honolulu HI City & County GO | 5.000% | 10/1/18 | 3,120 | 3,358 |
| | | | | 66,491 |
| Idaho (0.2%) | | | | |
| Idaho Housing & Finance Association RAN | 5.000% | 7/15/18 | 7,545 | 8,027 |
| Idaho Housing & Finance Association RAN | 5.000% | 7/15/19 | 6,580 | 7,225 |
| Idaho TAN | 2.000% | 6/30/17 | 7,500 | 7,567 |
| | | | | 22,819 |
| Illinois (3.7%) | | | | |
| Chicago IL Board of Education GO | 5.000% | 12/1/16 | 2,855 | 2,852 |
| Chicago IL Board of Education GO | 5.000% | 12/1/17 (4) | 3,000 | 3,082 |
| 3 Chicago IL Board of Education GO PUT | 4.630% | 3/1/17 | 10,000 | 9,990 |
| 1 Chicago IL GO TOB VRDO | 1.030% | 11/7/16 | 15,180 | 15,180 |
| Chicago IL Metropolitan Water Reclamation District GO | 5.000% | 12/1/17 | 5,000 | 5,225 |
| Chicago IL Metropolitan Water Reclamation District GO | 5.000% | 12/1/17 | 4,000 | 4,180 |
| Chicago IL Metropolitan Water Reclamation District GO | 5.000% | 12/1/18 | 5,000 | 5,406 |
| Chicago IL O’Hare International Airport Revenue | 5.250% | 1/1/17 (14) | 4,540 | 4,573 |
| Chicago IL O’Hare International Airport Revenue | 5.000% | 1/1/19 | 4,420 | 4,781 |
| Chicago IL O’Hare International Airport Revenue | 5.000% | 1/1/20 | 4,000 | 4,460 |
| 1 Chicago IL O’Hare International Airport Revenue TOB VRDO | 0.750% | 11/7/16 (4) | 2,500 | 2,500 |
| 1 Chicago IL O’Hare International Airport Revenue TOB VRDO | 0.780% | 11/7/16 (4) | 21,645 | 21,645 |
| Chicago IL Park District Harbor Facilities GO | 5.000% | 1/1/18 | 600 | 624 |
| Chicago IL Park District Harbor Facilities GO | 5.000% | 1/1/19 | 990 | 1,060 |
| 1 Chicago IL Transit Authority Sales Tax Receipts Revenue TOB VRDO | 0.830% | 11/7/16 | 22,895 | 22,895 |
| 1 Chicago IL Transit Authority Sales Tax Receipts Revenue TOB VRDO | 0.830% | 11/7/16 | 25,500 | 25,500 |
| Chicago IL Wastewater Transmission Revenue | 5.000% | 1/1/19 | 1,975 | 2,110 |
| Chicago IL Wastewater Transmission Revenue | 5.000% | 1/1/20 | 1,000 | 1,094 |
| Chicago IL Water Revenue | 5.000% | 11/1/18 | 675 | 720 |
| 1 Chicago IL Water Revenue TOB VRDO | 0.830% | 11/7/16 | 7,495 | 7,495 |
| 1 Chicago IL Water Revenue TOB VRDO | 0.830% | 11/7/16 | 5,250 | 5,250 |
| 1 Cook County IL GO TOB VRDO | 0.830% | 11/7/16 LOC | 7,500 | 7,500 |
| Illinois Educational Facilities Authority Revenue (University of Chicago) PUT | 1.550% | 2/13/20 | 5,000 | 5,049 |
| 1 Illinois Educational Facilities Authority Revenue (University of Chicago) TOB VRDO | 0.690% | 11/7/16 | 9,185 | 9,185 |
| Illinois Finance Authority Revenue (Advocate Health Care Network) PUT | 0.930% | 5/30/17 | 5,750 | 5,750 |
| Illinois Finance Authority Revenue (Advocate Health Care Network) PUT | 5.000% | 5/1/19 | 5,000 | 5,474 |
| Illinois Finance Authority Revenue (Ascension Health Credit Group) PUT | 5.000% | 5/1/17 | 4,500 | 4,593 |
| 1 Illinois Finance Authority Revenue (Carle Foundation) TOB VRDO | 0.750% | 11/7/16 (12) | 12,680 | 12,680 |
| Illinois Finance Authority Revenue (Centegra Health System) | 5.000% | 9/1/18 | 235 | 249 |
| Illinois Finance Authority Revenue (Hospital Sister Services Inc.) | 5.000% | 8/15/17 | 2,000 | 2,063 |
| Illinois Finance Authority Revenue (Hospital Sister Services Inc.) | 5.000% | 8/15/18 | 1,635 | 1,748 |
| Illinois Finance Authority Revenue (Illinois Wesleyan University) | 4.000% | 9/1/17 | 100 | 102 |
| Illinois Finance Authority Revenue (Illinois Wesleyan University) | 4.000% | 9/1/18 | 155 | 162 |
| Illinois Finance Authority Revenue (Illinois Wesleyan University) | 4.000% | 9/1/19 | 200 | 213 |
| Illinois Finance Authority Revenue (Illinois Wesleyan University) | 4.000% | 9/1/20 | 260 | 280 |
17
Short-Term Tax-Exempt Fund
| | | | |
| | | | Face | Market |
| | | Maturity | Amount | Value• |
| | Coupon | Date | ($000) | ($000) |
| Illinois Finance Authority Revenue (Northwestern Community Hospital) | 5.000% | 7/1/19 | 1,000 | 1,097 |
| Illinois Finance Authority Revenue (Northwestern Community Hospital) | 5.000% | 7/1/20 | 1,030 | 1,160 |
| Illinois Finance Authority Revenue (Presbyterian Homes) | 2.000% | 11/1/16 | 850 | 850 |
| Illinois Finance Authority Revenue (Presbyterian Homes) | 3.000% | 11/1/17 | 800 | 815 |
| Illinois Finance Authority Revenue (Presbyterian Homes) | 4.000% | 11/1/18 | 550 | 580 |
| Illinois Finance Authority Revenue (Presbyterian Homes) | 4.000% | 11/1/19 | 1,000 | 1,075 |
| Illinois Finance Authority Revenue (Presbyterian Homes) | 5.000% | 11/1/20 | 1,875 | 2,125 |
| 3 Illinois Finance Authority Revenue (Presbyterian Homes) PUT | 1.719% | 5/1/21 | 2,500 | 2,510 |
| Illinois Finance Authority Revenue (Presence Health Network Obligated Group) | 5.000% | 2/15/20 | 5,575 | 6,080 |
| Illinois Finance Authority Revenue (Presence Health Network Obligated Group) | 5.000% | 2/15/21 | 3,055 | 3,390 |
| Illinois Finance Authority Revenue (Rush University Medical Center) | 5.000% | 11/15/16 | 1,395 | 1,397 |
| Illinois Finance Authority Revenue (Rush University Medical Center) | 5.000% | 11/15/17 | 1,000 | 1,041 |
| Illinois Finance Authority Revenue (Rush University Medical Center) | 5.000% | 11/15/18 | 750 | 808 |
| Illinois Finance Authority Revenue (Rush University Medical Center) | 5.000% | 11/15/19 | 500 | 555 |
| Illinois Finance Authority Revenue (Silver Cross & Medical Centers) | 5.000% | 8/15/17 | 750 | 772 |
| Illinois Finance Authority Revenue (Trinity Health Corp.) | 3.000% | 12/1/16 | 1,865 | 1,868 |
| 1 Illinois Finance Authority Revenue (University of Chicago) TOB VRDO | 0.660% | 11/7/16 | 2,960 | 2,960 |
| 1 Illinois Finance Authority Revenue (University of Chicago) TOB VRDO | 0.680% | 11/7/16 | 15,000 | 15,000 |
| Illinois Finance Authority Solid Waste Disposal Revenue (Prairie Power Inc. Project) PUT | 1.300% | 5/8/17 | 2,340 | 2,340 |
| Illinois GO | 4.000% | 1/1/17 | 2,935 | 2,949 |
| Illinois GO | 5.000% | 1/1/17 (4) | 3,000 | 3,020 |
| Illinois GO | 5.000% | 5/1/17 | 8,100 | 8,244 |
| Illinois GO | 4.000% | 2/1/18 | 4,000 | 4,095 |
| 2 Illinois GO | 5.000% | 2/1/18 | 15,000 | 15,541 |
| Illinois GO | 5.000% | 4/1/18 | 2,500 | 2,600 |
| Illinois GO | 5.000% | 5/1/18 | 8,000 | 8,334 |
| Illinois GO | 5.000% | 8/1/18 | 22,160 | 23,202 |
| Illinois GO | 4.000% | 2/1/19 | 7,500 | 7,750 |
| 2 Illinois GO | 5.000% | 2/1/19 | 7,505 | 7,917 |
| Illinois GO | 5.000% | 2/1/19 | 875 | 923 |
| Illinois GO | 5.000% | 5/1/19 | 12,000 | 12,707 |
| Illinois GO | 5.000% | 7/1/19 | 4,725 | 5,014 |
| Illinois GO | 5.000% | 8/1/19 | 15,000 | 15,938 |
| Illinois Housing Development Authority Multi-Family Housing Revenue | | | | |
| (J. Michael Fitzgerald Apartments Project) PUT | 0.900% | 1/1/18 | 5,125 | 5,116 |
| Illinois Municipal Electric Agency Power Supply System Revenue | 5.000% | 2/1/17 (Prere.) | 16,700 | 16,879 |
| Illinois Regional Transportation Authority Revenue PUT | 0.900% | 11/1/16 | 23,800 | 23,800 |
| Illinois Toll Highway Authority Revenue | 5.000% | 12/1/17 | 6,500 | 6,786 |
| 1 Illinois Toll Highway Authority Toll Highway Revenue TOB VRDO | 0.660% | 11/7/16 | 325 | 325 |
| Illinois Unemployment Insurance Fund Building Receipts Revenue | 5.000% | 6/15/17 | 24,125 | 24,373 |
| Illinois Unemployment Insurance Fund Building Receipts Revenue | 5.000% | 12/15/17 | 7,500 | 7,539 |
| Illinois Unemployment Insurance Fund Building Receipts Revenue | 5.000% | 6/15/18 | 14,540 | 14,614 |
| 1 Lake, Cook, Kane, & McHenry Counties IL Community Unified School District GO TOB VRDO | 0.660% | 11/7/16 | 10,360 | 10,360 |
| McHenry County IL Conservation District GO | 4.000% | 2/1/17 | 3,000 | 3,025 |
| Northern Illinois Municipal Power Agency Project Revenue | 5.000% | 12/1/18 | 1,000 | 1,077 |
| Northern Illinois Municipal Power Agency Project Revenue | 5.000% | 12/1/19 | 1,340 | 1,487 |
| Northern Illinois Municipal Power Agency Project Revenue | 5.000% | 12/1/20 | 1,000 | 1,138 |
| Railsplitter Tobacco Settlement Authority Illinois Tobacco Settlement Revenue | 5.000% | 6/1/17 | 4,990 | 5,105 |
| Railsplitter Tobacco Settlement Authority Illinois Tobacco Settlement Revenue | 5.000% | 6/1/18 | 1,875 | 1,984 |
| Romeoville IL Revenue (Lewis University Project) | 4.000% | 10/1/17 | 365 | 374 |
| Romeoville IL Revenue (Lewis University Project) | 4.000% | 10/1/18 | 500 | 523 |
| Springfield IL Electric Revenue | 5.000% | 3/1/20 | 2,000 | 2,230 |
| 1 Will County IL GO TOB VRDO | 0.690% | 11/7/16 | 10,125 | 10,125 |
| | | | | 507,187 |
| Indiana (0.8%) | | | | |
| Ball State University Housing & Dining System Indiana Revenue | 5.000% | 7/1/18 | 250 | 267 |
| Ball State University Housing & Dining System Indiana Revenue | 5.000% | 7/1/19 | 200 | 221 |
| Ball State University Housing & Dining System Indiana Revenue | 5.000% | 7/1/20 | 350 | 397 |
| Carmel IN Local Public Improvement Bond Bank Revenue | 4.000% | 1/15/18 | 400 | 415 |
| Carmel IN Local Public Improvement Bond Bank Revenue | 4.000% | 7/15/18 | 500 | 526 |
| Carmel IN Local Public Improvement Bond Bank Revenue | 5.000% | 1/15/19 | 750 | 815 |
| Carmel IN Local Public Improvement Bond Bank Revenue | 5.000% | 7/15/19 | 1,000 | 1,105 |
| Carmel IN Local Public Improvement Bond Bank Revenue | 5.000% | 1/15/20 | 1,000 | 1,122 |
| Carmel IN Local Public Improvement Bond Bank Revenue | 5.000% | 7/15/20 | 805 | 917 |
| Indiana Finance Authority Economic Development Revenue (Republic Services Inc. Project) PUT | 0.700% | 12/1/16 | 6,000 | 6,000 |
| Indiana Finance Authority Hospital Revenue (Community Health Network) | 5.000% | 5/1/17 | 520 | 531 |
| Indiana Finance Authority Hospital Revenue (Indiana University Health Obligated Group) | 3.000% | 12/1/16 | 1,400 | 1,403 |
| Indiana Finance Authority Hospital Revenue (Indiana University Health Obligated Group) | 5.000% | 3/1/17 | 4,350 | 4,412 |
| Indiana Finance Authority Hospital Revenue (Indiana University Health Obligated Group) | 4.000% | 12/1/18 | 1,500 | 1,594 |
18
Short-Term Tax-Exempt Fund
| | | | |
| | | | Face | Market |
| | | Maturity | Amount | Value• |
| | Coupon | Date | ($000) | ($000) |
| Indiana Finance Authority Hospital Revenue (Parkview Health System) | 4.000% | 5/1/17 | 500 | 508 |
| Indiana Finance Authority Revenue | 5.000% | 2/1/18 | 1,415 | 1,489 |
| Indiana Finance Authority Revenue | 5.000% | 2/1/19 | 3,730 | 4,064 |
| Indiana Finance Authority Revenue | 5.000% | 2/1/19 | 815 | 889 |
| Indiana Finance Authority Revenue | 5.000% | 2/1/20 | 1,860 | 2,096 |
| Indiana Finance Authority Revenue | | | | |
| (Community Foundation of Northwest Indiana Obligated Group) | 5.000% | 3/1/17 | 1,000 | 1,014 |
| Indiana Finance Authority Wastewater Utility Revenue (CWA Authority Project) | 5.000% | 10/1/17 | 350 | 363 |
| Indiana Finance Authority Wastewater Utility Revenue (CWA Authority Project) | 5.000% | 10/1/18 | 410 | 441 |
| Indiana Health & Educational Facility Financing Authority Revenue | | | | |
| (Ascension Health Credit Group) PUT | 4.100% | 11/3/16 | 2,080 | 2,080 |
| Indiana Health Facility Financing Authority Revenue (Ascension Health Credit Group) PUT | 4.100% | 11/3/16 | 1,000 | 1,000 |
| Indiana Health Facility Financing Authority Revenue (Ascension Health Credit Group) PUT | 1.600% | 2/1/17 (Prere.) | 50 | 50 |
| Indiana Health Facility Financing Authority Revenue (Ascension Health Credit Group) PUT | 1.600% | 2/1/17 | 9,950 | 9,966 |
| Indiana Health Facility Financing Authority Revenue (Ascension Health Credit Group) PUT | 1.150% | 12/1/17 | 2,770 | 2,772 |
| Indiana Health Facility Financing Authority Revenue (Ascension Health Credit Group) PUT | 1.250% | 5/1/20 | 2,300 | 2,286 |
| Indiana Health Facility Financing Authority Revenue (Ascension Health Credit Group) PUT | 1.500% | 5/1/20 | 3,690 | 3,695 |
| Indiana Health Facility Financing Authority Revenue (Ascension Health Credit Group) PUT | 1.500% | 5/1/20 | 5,000 | 5,006 |
| Indiana Housing & Community Development Authority Revenue | | | | |
| (Edgewood Group Apartment Project) PUT | 1.150% | 3/1/18 | 5,425 | 5,428 |
| Indiana Municipal Power Agency Revenue | 5.000% | 1/1/17 | 1,250 | 1,259 |
| 1 Indianapolis IN Local Public Improvement Bond Bank Revenue TOB VRDO | 0.780% | 11/7/16 | 23,935 | 23,935 |
| Purdue University Indiana University COP | 5.000% | 7/1/19 | 1,000 | 1,105 |
| Richmond IN Hospital Authority Revenue (Reid Hospital & Health Care Services Inc.) | 4.000% | 1/1/18 | 1,960 | 2,027 |
| Richmond IN Hospital Authority Revenue (Reid Hospital & Health Care Services Inc.) | 5.000% | 1/1/19 | 1,000 | 1,079 |
| Rockport IN Pollution Control Revenue (Indiana Michigan Power Co. Project) PUT | 1.750% | 6/1/18 | 5,500 | 5,525 |
| 1 Zionsville IN Community Schools Building Corp. Revenue TOB VRDO | 0.760% | 11/7/16 (4)LOC | 5,980 | 5,980 |
| | | | | 103,782 |
| Iowa (0.3%) | | | | |
| Iowa Board of Regents Hospital Revenue (University of Iowa Hospitals & Clinics) | 4.000% | 9/1/18 | 3,525 | 3,720 |
| Iowa Finance Authority Revenue | 5.000% | 8/1/19 | 6,700 | 7,433 |
| Iowa Special Obligation Revenue | 5.000% | 6/1/18 | 11,055 | 11,765 |
| Iowa Special Obligation Revenue | 5.000% | 6/1/19 | 5,500 | 6,055 |
| Iowa Special Obligation Revenue | 5.000% | 6/1/20 | 8,000 | 9,083 |
| | | | | 38,056 |
| Kansas (0.4%) | | | | |
| Johnson County KS Unified School District No. 233 GO | 2.000% | 9/1/17 | 750 | 758 |
| Johnson County KS Unified School District No. 233 GO | 2.000% | 9/1/18 | 1,250 | 1,274 |
| Johnson County KS Unified School District No. 233 GO | 5.000% | 9/1/20 | 1,250 | 1,428 |
| 3 Kansas Department of Transportation Highway Revenue | 0.593% | 9/1/17 | 4,100 | 4,095 |
| 3 Kansas Department of Transportation Highway Revenue | 0.673% | 9/1/18 | 3,500 | 3,477 |
| Kansas Department of Transportation Highway Revenue | 5.000% | 9/1/18 | 1,000 | 1,075 |
| 3 Kansas Department of Transportation Highway Revenue | 0.753% | 9/1/19 | 3,000 | 2,972 |
| Kansas Development Finance Authority Revenue | 5.000% | 5/1/20 | 1,340 | 1,512 |
| Wichita KS GO | 1.250% | 10/13/17 | 39,295 | 39,327 |
| Wichita KS Hospital Facilities Revenue (Via Christi Health System Inc.) | 5.000% | 11/15/16 (ETM) | 750 | 751 |
| Wyandotte County/Kansas City KS Unified Government Utility System Revenue | 4.000% | 9/1/17 | 1,000 | 1,026 |
| Wyandotte County/Kansas City KS Unified Government Utility System Revenue | 5.000% | 9/1/19 | 500 | 553 |
| | | | | 58,248 |
| Kentucky (1.1%) | | | | |
| Ashland KY Medical Center Revenue (King’s Daughters Medical Center Project) | 4.000% | 2/1/17 | 325 | 327 |
| Ashland KY Medical Center Revenue (King’s Daughters Medical Center Project) | 4.000% | 2/1/18 | 325 | 335 |
| Ashland KY Medical Center Revenue (King’s Daughters Medical Center Project) | 4.000% | 2/1/19 | 375 | 393 |
| Ashland KY Medical Center Revenue (King’s Daughters Medical Center Project) | 4.000% | 2/1/20 | 400 | 427 |
| Carroll County KY Pollution Control Revenue (Kentucky Utilities Co. Project) PUT | 1.050% | 9/1/19 | 6,875 | 6,800 |
| Kentucky Asset/Liability Commission Agency Fund Revenue (Federal Highway Trust) | 5.000% | 9/1/17 | 1,500 | 1,551 |
| Kentucky Bond Development Corp. Hospital Facilities Revenue (St. Elizabeth Medical Center, Inc.) | 5.000% | 5/1/18 | 1,280 | 1,357 |
| Kentucky Bond Development Corp. Hospital Facilities Revenue (St. Elizabeth Medical Center, Inc.) | 5.000% | 5/1/19 | 2,665 | 2,922 |
| Kentucky Bond Development Corp. Hospital Facilities Revenue (St. Elizabeth Medical Center, Inc.) | 5.000% | 5/1/20 | 1,000 | 1,129 |
| Kentucky Economic Development Finance Authority Medical Center Revenue | | | | |
| (King’s Daughters Medical Center Project) | 5.000% | 2/1/17 | 510 | 515 |
| Kentucky Economic Development Finance Authority Solid Waste Revenue | | | | |
| (Republic Services Inc. Project) PUT | 0.700% | 12/1/16 | 3,500 | 3,500 |
| Kentucky Municipal Power Agency Power System Revenue | 5.000% | 9/1/17 (14) | 500 | 516 |
| Kentucky Municipal Power Agency Power System Revenue | 5.000% | 9/1/18 (14) | 1,500 | 1,598 |
| Kentucky Property & Building Commission Revenue | 5.000% | 8/1/17 | 2,800 | 2,888 |
| Kentucky Property & Building Commission Revenue | 5.000% | 8/1/18 | 2,715 | 2,896 |
| Kentucky Property & Building Commission Revenue | 5.000% | 8/1/18 | 10,175 | 10,854 |
| Kentucky Property & Building Commission Revenue | 5.000% | 8/1/19 | 2,550 | 2,806 |
19
Short-Term Tax-Exempt Fund
| | | | |
| | | | Face | Market |
| | | Maturity | Amount | Value• |
| | Coupon | Date | ($000) | ($000) |
| Kentucky Property & Building Commission Revenue | 5.000% | 8/1/19 | 13,270 | 14,604 |
| Kentucky Property & Building Commission Revenue | 5.000% | 8/1/20 | 2,600 | 2,939 |
| Kentucky Property & Building Commission Revenue | 5.000% | 8/1/20 | 20,985 | 23,721 |
| Kentucky Public Transportation Infrastructure Authority Toll Revenue | | | | |
| (Downtown Crossing Project) BAN | 3.000% | 7/1/17 | 250 | 254 |
| Kentucky Public Transportation Infrastructure Authority Toll Revenue | | | | |
| (Downtown Crossing Project) BAN | 5.000% | 7/1/17 | 38,775 | 39,792 |
| Louisville & Jefferson County KY Metropolitan Government Health System Revenue | | | | |
| (Norton Healthcare Obligated Group) | 5.500% | 10/1/17 | 5,445 | 5,671 |
| Louisville & Jefferson County KY Metropolitan Government Revenue (Catholic Health Initiatives) | 5.000% | 12/1/17 | 2,500 | 2,600 |
| Louisville & Jefferson County KY Metropolitan Government Revenue (Catholic Health Initiatives) | 5.000% | 12/1/18 | 1,750 | 1,876 |
| 2 Louisville & Jefferson County KY Metropolitan Sewer & Drain System BAN | 3.500% | 11/15/17 | 25,000 | 25,683 |
| Warren County KY Hospital Revenue | | | | |
| (Bowling Green-Warren County Community Hospital Corp. Project) | 4.000% | 4/1/17 | 200 | 203 |
| | | | | 158,157 |
| Louisiana (1.4%) | | | | |
| Bossier City LA Utilities Revenue | 5.500% | 10/1/18 (Prere.) | 19,215 | 20,879 |
| East Baton Rouge Parish LA Pollution Control Revenue (Exxon Corp.) VRDO | 0.490% | 11/1/16 | 16,100 | 16,100 |
| 3 East Baton Rouge Parish LA Sewer Commission Revenue PUT | 0.870% | 8/1/18 | 24,005 | 23,889 |
| Lafayette LA Communications System Revenue | 5.000% | 11/1/17 (4) | 585 | 608 |
| Lafayette LA Communications System Revenue | 5.000% | 11/1/18 (4) | 1,620 | 1,740 |
| Lafayette LA Communications System Revenue | 5.000% | 11/1/19 (4) | 2,500 | 2,766 |
| Louisiana Citizens Property Insurance Corp. Assessment Revenue | 5.000% | 6/1/17 | 8,500 | 8,700 |
| Louisiana Citizens Property Insurance Corp. Assessment Revenue | 5.000% | 6/1/18 | 5,000 | 5,301 |
| Louisiana Citizens Property Insurance Corp. Assessment Revenue | 5.000% | 6/1/19 | 10,645 | 11,651 |
| 3 Louisiana Gasoline & Fuel Tax Revenue PUT | 0.839% | 5/1/17 | 55,500 | 55,519 |
| 3 Louisiana Gasoline & Fuel Tax Revenue PUT | 0.840% | 5/1/18 | 13,500 | 13,461 |
| 3 Louisiana Gasoline & Fuel Tax Revenue PUT | 0.919% | 5/1/18 | 9,535 | 9,507 |
| Louisiana Offshore Terminal Authority Deep Water Port Revenue (LOOP LLC Project) PUT | 2.200% | 10/1/17 | 4,125 | 4,155 |
| 1 Louisiana Public Facilities Authority Hospital Revenue | | | | |
| (Franciscan Missionaries of Our Lady Health System Project) TOB VRDO | 0.750% | 11/7/16 (4) | 5,000 | 5,000 |
| Louisiana Public Facilities Authority Revenue (Ochsner Clinic Foundation Project) | 3.000% | 5/15/17 | 250 | 253 |
| Louisiana Public Facilities Authority Revenue (Ochsner Clinic Foundation Project) | 3.000% | 5/15/18 | 300 | 309 |
| Louisiana Public Facilities Authority Revenue (Ochsner Clinic Foundation Project) | 4.000% | 5/15/19 | 300 | 320 |
| New Orleans LA GO | 4.000% | 12/1/18 | 700 | 743 |
| New Orleans LA GO | 4.000% | 12/1/19 | 775 | 840 |
| New Orleans LA Sewage Service Revenue | 5.000% | 6/1/17 | 1,000 | 1,024 |
| New Orleans LA Water Revenue | 5.000% | 12/1/17 | 290 | 302 |
| New Orleans LA Water Revenue | 5.000% | 12/1/18 | 500 | 538 |
| Tobacco Settlement Financing Corp. Louisiana Revenue | 5.000% | 5/15/17 | 3,730 | 3,811 |
| Tobacco Settlement Financing Corp. Louisiana Revenue | 5.000% | 5/15/18 | 9,000 | 9,496 |
| Tobacco Settlement Financing Corp. Louisiana Revenue | 5.000% | 5/15/19 | 2,740 | 2,982 |
| | | | | 199,894 |
| Maine (0.0%) | | | | |
| Maine GO | 5.000% | 6/1/18 | 3,855 | 4,109 |
| Maine GO | 4.250% | 6/1/19 | 1,000 | 1,084 |
| | | | | 5,193 |
| Maryland (3.3%) | | | | |
| Anne Arundel County MD GO | 5.000% | 4/1/17 | 6,960 | 7,086 |
| Anne Arundel County MD GO | 5.000% | 4/1/18 | 2,000 | 2,117 |
| Anne Arundel County MD GO | 5.000% | 4/1/18 | 2,585 | 2,736 |
| Anne Arundel County MD GO | 5.000% | 4/1/18 | 980 | 1,037 |
| Anne Arundel County MD GO | 5.000% | 4/1/18 | 11,300 | 11,961 |
| Anne Arundel County MD GO | 5.000% | 4/1/18 | 2,590 | 2,742 |
| Anne Arundel County MD GO | 5.000% | 4/1/18 | 6,960 | 7,367 |
| Anne Arundel County MD GO | 5.000% | 10/1/18 | 4,295 | 4,631 |
| Anne Arundel County MD GO | 5.000% | 10/1/18 | 3,085 | 3,326 |
| Anne Arundel County MD GO | 5.000% | 10/1/18 | 1,455 | 1,569 |
| Anne Arundel County MD GO | 5.000% | 4/1/19 | 12,750 | 13,979 |
| Baltimore County MD GO | 5.000% | 2/1/19 | 2,800 | 3,055 |
| Baltimore MD Consolidated Public Improvement GO | 4.000% | 8/1/20 | 4,730 | 5,256 |
| Baltimore MD Consolidated Public Improvement GO | 5.000% | 8/1/20 | 3,795 | 4,347 |
| Frederick County MD GO | 5.000% | 8/1/18 | 2,800 | 3,002 |
| Frederick County MD GO | 5.000% | 8/1/19 | 2,945 | 3,269 |
| Frederick County MD GO | 5.000% | 8/1/20 | 2,145 | 2,457 |
| Harford County MD Public Improvement GO | 5.000% | 2/1/19 | 6,980 | 7,615 |
| Howard County MD GO | 5.000% | 8/15/19 | 1,375 | 1,528 |
| Maryland Department of Transportation Revenue | 5.000% | 12/15/18 | 16,020 | 17,409 |
| Maryland Department of Transportation Revenue | 5.000% | 12/15/19 | 17,875 | 20,087 |
20
Short-Term Tax-Exempt Fund
| | | | |
| | | | Face | Market |
| | | Maturity | Amount | Value• |
| | Coupon | Date | ($000) | ($000) |
| Maryland Economic Development Corp. Revenue (Constellation Energy Group, Inc. Project) PUT | 2.550% | 6/1/20 | 8,900 | 9,007 |
| Maryland Economic Development Corp. Student Housing Revenue | | | | |
| (University of Maryland College Park) | 4.000% | 6/1/17 (4) | 1,250 | 1,274 |
| Maryland Economic Development Corp. Student Housing Revenue | | | | |
| (University of Maryland College Park) | 4.000% | 6/1/18 (4) | 810 | 849 |
| Maryland Economic Development Corp. Student Housing Revenue | | | | |
| (University of Maryland College Park) | 4.000% | 6/1/19 (4) | 675 | 726 |
| Maryland GO | 5.000% | 3/1/17 | 1,450 | 1,471 |
| Maryland GO | 5.000% | 3/1/18 | 3,395 | 3,584 |
| Maryland GO | 5.000% | 3/15/18 | 5,000 | 5,286 |
| Maryland GO | 5.000% | 8/1/18 | 2,200 | 2,359 |
| Maryland GO | 5.000% | 11/1/18 | 1,375 | 1,488 |
| Maryland GO | 5.000% | 3/1/19 | 10,000 | 10,942 |
| Maryland GO | 5.000% | 3/1/19 | 3,420 | 3,742 |
| Maryland GO | 5.000% | 3/15/19 | 1,090 | 1,194 |
| Maryland GO | 5.000% | 3/15/19 | 9,285 | 10,174 |
| Maryland GO | 5.000% | 6/1/19 | 18,490 | 20,409 |
| Maryland GO | 5.000% | 8/1/19 | 5,000 | 5,550 |
| Maryland GO | 5.000% | 11/1/19 | 7,855 | 8,792 |
| Maryland GO | 5.000% | 6/1/20 | 44,410 | 50,607 |
| Maryland Health & Higher Educational Facilities Authority Revenue (Anne Arundel Health System) | 4.000% | 7/1/17 | 500 | 511 |
| Maryland Health & Higher Educational Facilities Authority Revenue | | | | |
| (Johns Hopkins Health System Obligated Group) | 5.000% | 7/1/18 | 1,000 | 1,070 |
| 3 Maryland Health & Higher Educational Facilities Authority Revenue | | | | |
| (Johns Hopkins Health System Obligated Group) PUT | 1.183% | 11/15/17 | 11,905 | 11,897 |
| 3 Maryland Health & Higher Educational Facilities Authority Revenue | | | | |
| (Johns Hopkins Health System Obligated Group) PUT | 0.933% | 5/15/18 | 4,900 | 4,890 |
| 3 Maryland Health & Higher Educational Facilities Authority Revenue | | | | |
| (Johns Hopkins Health System Obligated Group) PUT | 0.953% | 5/15/18 | 9,625 | 9,609 |
| Maryland Health & Higher Educational Facilities Authority Revenue (MedStar Health, Inc.) | 5.000% | 8/15/17 | 2,020 | 2,087 |
| Maryland Health & Higher Educational Facilities Authority Revenue (MedStar Health, Inc.) | 5.000% | 8/15/18 | 2,000 | 2,142 |
| Maryland Health & Higher Educational Facilities Authority Revenue (MedStar Health, Inc.) | 5.000% | 8/15/19 | 2,600 | 2,877 |
| Maryland Health & Higher Educational Facilities Authority Revenue (Meritus Medical Center, Inc.) | 5.000% | 7/1/17 | 500 | 514 |
| Maryland Health & Higher Educational Facilities Authority Revenue (Meritus Medical Center, Inc.) | 5.000% | 7/1/19 | 900 | 988 |
| Maryland Health & Higher Educational Facilities Authority Revenue | | | | |
| (Peninsula Regional Medical Center) | 5.000% | 7/1/17 | 1,790 | 1,841 |
| Maryland Health & Higher Educational Facilities Authority Revenue | | | | |
| (Peninsula Regional Medical Center) | 5.000% | 7/1/18 | 1,695 | 1,809 |
| Maryland Health & Higher Educational Facilities Authority Revenue | | | | |
| (Western Maryland Health System) | 5.000% | 7/1/17 | 5,000 | 5,132 |
| Maryland Health & Higher Educational Facilities Authority Revenue | | | | |
| (Western Maryland Health System) | 5.000% | 7/1/18 | 6,195 | 6,580 |
| Maryland Water Quality Financing Administration Bay Restoration Revolving Loan Fund Revenue | 5.000% | 3/1/19 | 10,570 | 11,555 |
| Montgomery County MD GO | 5.000% | 11/1/16 | 5,800 | 5,800 |
| Montgomery County MD GO | 5.000% | 11/1/17 | 4,800 | 5,005 |
| Montgomery County MD GO | 5.000% | 7/1/19 | 12,820 | 14,191 |
| Montgomery County MD GO | 5.000% | 8/1/19 | 1,570 | 1,743 |
| Montgomery County MD GO | 5.000% | 12/1/19 | 14,950 | 16,779 |
| Prince Georges County MD GO | 5.000% | 9/1/17 | 8,015 | 8,302 |
| Prince Georges County MD GO | 5.000% | 3/1/18 | 5,280 | 5,572 |
| Prince Georges County MD GO | 5.000% | 8/1/19 | 5,075 | 5,629 |
| Prince Georges County MD GO | 5.000% | 3/1/20 | 1,950 | 2,203 |
| University of Maryland Auxiliary Facility & Tuition Revenue | 5.000% | 4/1/19 | 4,800 | 5,263 |
| University of Maryland Auxiliary Facility & Tuition Revenue | 5.000% | 4/1/20 | 4,040 | 4,574 |
| Washington MD Suburban Sanitary Commission GO | 5.000% | 6/1/19 | 4,285 | 4,730 |
| Washington MD Suburban Sanitary Commission GO | 4.000% | 6/1/20 | 12,870 | 14,214 |
| Washington Suburban Sanitation District Maryland GO | 5.000% | 6/1/18 | 7,290 | 7,768 |
| Washington Suburban Sanitation District Maryland GO | 5.000% | 6/1/18 | 2,000 | 2,131 |
| Washington Suburban Sanitation District Maryland GO | 5.000% | 6/1/19 | 7,585 | 8,372 |
| Washington Suburban Sanitation District Maryland GO | 5.000% | 6/1/19 | 7,260 | 8,013 |
| Washington Suburban Sanitation District Maryland GO | 5.000% | 6/1/20 | 4,820 | 5,493 |
| Washington Suburban Sanitation District Maryland GO | 5.000% | 6/1/20 | 2,500 | 2,849 |
| Westminster MD Educational Facilities Revenue (McDaniel College Inc.) | 5.000% | 11/1/19 | 1,640 | 1,801 |
| Westminster MD Educational Facilities Revenue (McDaniel College Inc.) | 5.000% | 11/1/20 | 1,735 | 1,952 |
| Westminster MD Revenue (Lutheran Village at Miller’s Grant) | 3.875% | 7/1/19 | 1,065 | 1,083 |
| | | | | 460,999 |
| Massachusetts (4.4%) | | | | |
| Boston MA GO | 5.000% | 2/1/18 | 7,965 | 8,383 |
| Boston MA GO | 5.000% | 8/1/18 | 4,045 | 4,338 |
21
Short-Term Tax-Exempt Fund
| | | | | |
| | | | | Face | Market |
| | | | Maturity | Amount | Value• |
| | | Coupon | Date | ($000) | ($000) |
| | Boston MA GO | 5.000% | 3/1/20 | 1,850 | 1,876 |
| 1,3 | Eaton Vance Massachusetts Municipal Bond Fund | 1.630% | 7/1/19 | 6,475 | 6,434 |
| | Massachusetts Bay Transportation Authority Sales Tax Revenue | 5.250% | 7/1/18 | 1,000 | 1,072 |
| | Massachusetts Bay Transportation Authority Sales Tax Revenue | 5.000% | 7/1/19 | 9,500 | 10,495 |
| | Massachusetts Bay Transportation Authority Sales Tax Revenue PUT | 0.930% | 5/30/17 | 29,195 | 29,195 |
| 1 | Massachusetts Bay Transportation Authority Sales Tax Revenue TOB VRDO | 0.720% | 11/1/16 | 25,435 | 25,435 |
| 1 | Massachusetts Bay Transportation Authority Sales Tax Revenue TOB VRDO | 0.730% | 11/7/16 | 29,957 | 29,957 |
| | Massachusetts Clean Water Trust Revenue | 5.000% | 2/1/19 | 3,305 | 3,607 |
| 3 | Massachusetts Development Finance Agency Revenue (Partners Healthcare) PUT | 1.180% | 1/30/18 | 8,785 | 8,785 |
| 3 | Massachusetts Development Finance Agency Revenue (Partners Healthcare) PUT | 1.110% | 1/29/20 | 5,500 | 5,397 |
| | Massachusetts Development Finance Agency Revenue (South Shore Hospital Inc.) | 3.000% | 7/1/17 | 2,310 | 2,341 |
| | Massachusetts Development Finance Agency Revenue (South Shore Hospital Inc.) | 3.000% | 7/1/18 | 1,000 | 1,030 |
| | Massachusetts Development Finance Agency Revenue (South Shore Hospital Inc.) | 4.000% | 7/1/19 | 800 | 855 |
| | Massachusetts Development Finance Agency Revenue (South Shore Hospital Inc.) | 4.000% | 7/1/20 | 600 | 654 |
| | Massachusetts Development Finance Agency Revenue (UMass Memorial Medical Center) | 5.000% | 7/1/17 | 2,260 | 2,318 |
| | Massachusetts Development Finance Agency Revenue (UMass Memorial Medical Center) | 5.000% | 7/1/18 | 500 | 530 |
| | Massachusetts Development Finance Agency Revenue (UMass Memorial Medical Center) | 5.000% | 7/1/20 | 1,435 | 1,603 |
| 3 | Massachusetts Development Finance Agency Revenue (Williams College) PUT | 0.910% | 7/1/17 | 15,360 | 15,342 |
| | Massachusetts GO | 5.500% | 12/1/16 (4) | 2,500 | 2,510 |
| 3 | Massachusetts GO | 0.970% | 1/1/17 | 14,100 | 14,100 |
| 3 | Massachusetts GO | 0.750% | 2/1/17 | 65,000 | 65,000 |
| 3 | Massachusetts GO | 0.990% | 2/1/17 | 15,485 | 15,485 |
| | Massachusetts GO | 2.000% | 4/24/17 | 31,850 | 32,047 |
| | Massachusetts GO | 2.000% | 5/22/17 | 83,000 | 83,569 |
| | Massachusetts GO | 2.000% | 6/26/17 | 40,000 | 40,358 |
| 3 | Massachusetts GO | 1.060% | 1/1/18 | 9,100 | 9,103 |
| 4 | Massachusetts GO | 5.000% | 8/1/18 (Prere.) | 4,185 | 4,484 |
| 3 | Massachusetts GO PUT | 0.930% | 8/1/17 | 25,000 | 24,989 |
| | Massachusetts GO PUT | 1.050% | 7/1/20 | 23,500 | 23,249 |
| 1 | Massachusetts GO TOB VRDO | 0.720% | 11/1/16 (4)LOC | 14,765 | 14,765 |
| 1 | Massachusetts GO TOB VRDO | 0.660% | 11/7/16 | 1,850 | 1,850 |
| | Massachusetts Health & Educational Facilities Authority Revenue (Amherst College) PUT | 1.700% | 11/1/16 | 9,355 | 9,355 |
| | Massachusetts Health & Educational Facilities Authority Revenue (Amherst College) PUT | 0.800% | 12/1/17 | 2,000 | 1,996 |
| | Massachusetts Health & Educational Facilities Authority Revenue (MIT) | 6.000% | 7/1/18 (Prere.) | 3,115 | 3,376 |
| | Massachusetts Health & Educational Facilities Authority Revenue (Partners Healthcare System) | 0.890% | 11/2/16 (4) | 22,545 | 22,545 |
| | Massachusetts Health & Educational Facilities Authority Revenue (Partners Healthcare System) | 0.850% | 11/3/16 (4) | 6,000 | 6,000 |
| | Massachusetts Health & Educational Facilities Authority Revenue (Partners Healthcare System) | 0.840% | 11/4/16 (4) | 9,000 | 9,000 |
| | Massachusetts Health & Educational Facilities Authority Revenue | | | | |
| | (UMass Memorial Medical Center) | 5.000% | 7/1/20 | 1,500 | 1,676 |
| | Massachusetts Port Authority Revenue | 4.000% | 7/1/18 | 1,320 | 1,388 |
| | Massachusetts School Building Authority Dedicated Sales Tax Revenue | 5.000% | 5/15/19 (ETM) | 775 | 853 |
| | Massachusetts School Building Authority Dedicated Sales Tax Revenue | 5.000% | 5/15/19 | 225 | 248 |
| | Massachusetts Water Pollution Abatement Trust Revenue | 5.250% | 8/1/19 | 1,000 | 1,117 |
| 1,3 | Massachusetts Water Resources Authority Revenue TOB PUT | 0.830% | 1/3/17 LOC | 4,750 | 4,750 |
| 1 | Massachusetts Water Resources Authority Revenue TOB VRDO | 0.750% | 11/7/16 (4)LOC | 19,350 | 19,350 |
| 1 | Massachusetts Water Resources Authority Revenue TOB VRDO | 0.750% | 11/7/16 LOC | 30,115 | 30,115 |
| | University of Massachusetts Building Authority Revenue PUT | 0.930% | 5/30/17 | 9,390 | 9,390 |
| | | | | | 612,315 |
| Michigan (2.3%) | | | | |
| 1 | Detroit MI City School District GO TOB VRDO | 0.930% | 11/7/16 (18) | 10,245 | 10,245 |
| 1 | Detroit MI City School District GO TOB VRDO | 1.490% | 11/7/16 (18) | 17,845 | 17,845 |
| | Detroit MI Water Supply System Revenue | 5.000% | 11/14/16 (Prere.) | 5,900 | 5,909 |
| | East Lansing MI School District GO | 5.000% | 5/1/17 | 650 | 664 |
| | East Lansing MI School District GO | 5.000% | 5/1/18 | 335 | 355 |
| | East Lansing MI School District GO | 5.000% | 5/1/19 | 450 | 493 |
| 1 | Great Lakes MI Water Authority Sewer Disposal System Revenue TOB VRDO | 0.830% | 11/7/16 (4) | 6,235 | 6,235 |
| | Kent Hospital Finance Authority Michigan Revenue (Spectrum Health System) | 5.000% | 11/15/18 | 1,500 | 1,616 |
| | Lansing MI School District GO | 4.000% | 5/1/18 | 1,395 | 1,458 |
| | Lansing MI School District GO | 5.000% | 5/1/19 | 765 | 838 |
| | Lincoln MI Consolidated School District GO | 5.000% | 5/1/17 (4) | 1,000 | 1,020 |
| | Lincoln MI Consolidated School District GO | 5.000% | 5/1/19 (4) | 1,100 | 1,199 |
| | Lincoln MI Consolidated School District GO | 5.000% | 5/1/20 (4) | 1,000 | 1,120 |
| | Livonia MI Public Schools School District GO | 4.000% | 5/1/17 (15) | 1,000 | 1,014 |
| | Livonia MI Public Schools School District GO | 5.000% | 5/1/18 (15) | 850 | 900 |
| | Marysville MI Public Schools District GO | 4.000% | 5/1/19 | 1,425 | 1,526 |
| | Michigan Building Authority Revenue | 5.000% | 4/15/18 | 2,750 | 2,911 |
| | Michigan Building Authority Revenue | 5.000% | 10/15/18 | 6,020 | 6,487 |
| | Michigan Building Authority Revenue | 5.000% | 4/15/19 | 8,300 | 9,089 |
| | Michigan Finance Authority Revenue | 4.000% | 10/1/17 | 1,155 | 1,185 |
22
Short-Term Tax-Exempt Fund
| | | | |
| | | | Face | Market |
| | | Maturity | Amount | Value• |
| | Coupon | Date | ($000) | ($000) |
| Michigan Finance Authority Revenue | 5.000% | 10/1/18 | 1,135 | 1,214 |
| Michigan Finance Authority Revenue | 5.000% | 4/1/19 | 23,360 | 25,284 |
| Michigan Finance Authority Revenue | 5.000% | 4/1/20 | 3,800 | 4,218 |
| Michigan Finance Authority Revenue | 5.000% | 4/1/21 | 4,350 | 4,935 |
| Michigan Finance Authority Revenue (Beaumont Health Obligated Group) | 4.000% | 8/1/18 | 1,500 | 1,574 |
| Michigan Finance Authority Revenue (Beaumont Health Obligated Group) | 4.000% | 8/1/19 | 3,000 | 3,218 |
| Michigan Finance Authority Revenue (Beaumont Health Obligated Group) | 4.000% | 8/1/20 | 1,250 | 1,368 |
| 1 Michigan Finance Authority Revenue (Beaumont Health Obligated Group) TOB VRDO | 0.830% | 11/7/16 | 6,060 | 6,060 |
| Michigan Finance Authority Revenue (Detroit Water & Sewer) | 5.000% | 7/1/17 | 1,355 | 1,389 |
| Michigan Finance Authority Revenue (Detroit Water & Sewer) | 5.000% | 7/1/17 (14) | 5,000 | 5,134 |
| Michigan Finance Authority Revenue (Detroit Water & Sewer) | 5.000% | 7/1/17 | 5,000 | 5,130 |
| Michigan Finance Authority Revenue (Detroit Water & Sewer) | 5.000% | 7/1/17 | 500 | 512 |
| Michigan Finance Authority Revenue (Detroit Water & Sewer) | 5.000% | 7/1/18 | 1,000 | 1,058 |
| Michigan Finance Authority Revenue (Detroit Water & Sewer) | 5.000% | 7/1/18 (14) | 6,000 | 6,372 |
| Michigan Finance Authority Revenue (Detroit Water & Sewer) | 5.000% | 7/1/18 (14) | 5,500 | 5,841 |
| Michigan Finance Authority Revenue (Detroit Water & Sewer) | 5.000% | 7/1/18 | 1,150 | 1,216 |
| Michigan Finance Authority Revenue (Detroit Water & Sewer) | 5.000% | 7/1/19 (14) | 2,855 | 3,125 |
| Michigan Finance Authority Revenue (Detroit Water & Sewer) | 5.000% | 7/1/19 | 800 | 873 |
| Michigan Finance Authority Revenue (Detroit Water & Sewer) | 5.000% | 7/1/19 (14) | 3,500 | 3,831 |
| Michigan Finance Authority Revenue (Detroit Water & Sewer) | 5.000% | 7/1/20 | 300 | 335 |
| Michigan Finance Authority Revenue (Sparrow Obligated Group) | 4.000% | 11/15/16 | 800 | 801 |
| Michigan Finance Authority Revenue (Sparrow Obligated Group) | 4.000% | 11/15/17 | 350 | 361 |
| Michigan Finance Authority Revenue (Sparrow Obligated Group) | 4.000% | 11/15/18 | 750 | 793 |
| 2 Michigan Finance Authority Revenue (State Clean Water Revolving Fund) | 3.000% | 10/1/18 | 1,770 | 1,840 |
| Michigan Finance Authority Revenue (State Clean Water Revolving Fund) | 5.000% | 10/1/19 | 2,005 | 2,236 |
| Michigan Finance Authority Revenue (Trinity Health Credit Group) | 5.000% | 12/1/18 | 250 | 271 |
| Michigan Finance Authority Revenue (Trinity Health Credit Group) | 5.000% | 12/1/19 | 500 | 559 |
| Michigan Finance Authority Revenue (Unemployment Obligation Assessment) | 5.000% | 1/1/18 | 6,425 | 6,738 |
| Michigan Finance Authority Revenue (Unemployment Obligation Assessment) | 5.000% | 7/1/18 | 10,275 | 10,983 |
| Michigan Finance Authority Revenue (Unemployment Obligation Assessment) | 5.000% | 1/1/19 | 22,000 | 23,916 |
| Michigan Finance Authority Revenue (Unemployment Obligation Assessment) | 5.000% | 1/1/20 | 6,335 | 7,002 |
| Michigan GO | 5.000% | 12/1/17 | 2,715 | 2,839 |
| Michigan Hospital Finance Authority Revenue (Ascension Health Credit Group) PUT | 1.500% | 3/15/17 | 7,875 | 7,892 |
| Michigan Hospital Finance Authority Revenue (Ascension Health Credit Group) PUT | 0.950% | 2/1/18 (Prere.) | 360 | 360 |
| Michigan Hospital Finance Authority Revenue (Ascension Health Credit Group) PUT | 0.950% | 2/1/18 | 10,640 | 10,629 |
| Michigan Hospital Finance Authority Revenue (Ascension Health Credit Group) PUT | 2.000% | 5/30/18 | 15,000 | 15,209 |
| Michigan Hospital Finance Authority Revenue (Ascension Health Credit Group) PUT | 1.400% | 6/29/18 | 11,750 | 11,804 |
| Michigan Hospital Finance Authority Revenue (Ascension Health Credit Group) PUT | 1.500% | 5/1/20 | 3,165 | 3,176 |
| Michigan Hospital Finance Authority Revenue (McLaren Health Care) | 5.000% | 6/1/17 | 2,100 | 2,151 |
| Michigan Hospital Finance Authority Revenue (McLaren Health Care) | 5.750% | 5/15/18 (Prere.) | 2,500 | 2,686 |
| Michigan Strategic Fund Limited Obligation Revenue | | | | |
| (Facility for Rare Isotope Beams Project at Michigan State University) | 4.000% | 3/1/17 | 250 | 253 |
| Michigan Strategic Fund Limited Obligation Revenue | | | | |
| (Facility for Rare Isotope Beams Project at Michigan State University) | 4.000% | 3/1/18 | 500 | 520 |
| Michigan Trunk Line Revenue | 5.000% | 11/15/16 | 5,000 | 5,009 |
| Michigan Trunk Line Revenue | 5.000% | 11/15/17 | 13,500 | 14,095 |
| Portage MI Public Schools GO | 5.000% | 11/1/18 | 1,180 | 1,272 |
| Portage MI Public Schools GO | 5.000% | 5/1/19 | 525 | 575 |
| Portage MI Public Schools GO | 5.000% | 11/1/19 | 1,465 | 1,630 |
| Portage MI Public Schools GO | 5.000% | 11/1/20 | 750 | 857 |
| Rockford MI Public Schools GO | 3.000% | 5/1/18 | 845 | 870 |
| Rockford MI Public Schools GO | 4.000% | 5/1/19 | 1,360 | 1,456 |
| Royal Oak MI City School District GO | 5.000% | 5/1/17 | 1,300 | 1,328 |
| Royal Oak MI City School District GO | 5.000% | 5/1/18 | 1,000 | 1,060 |
| 1 Saginaw Valley State University Michigan Revenue TOB VRDO | 0.800% | 11/7/16 (4) | 5,000 | 5,000 |
| St. Johns MI Public Schools School District GO | 5.000% | 5/1/19 (18) | 7,250 | 7,918 |
| University of Michigan Revenue | 5.000% | 4/1/19 | 2,215 | 2,431 |
| University of Michigan Revenue | 5.000% | 4/1/20 | 1,500 | 1,701 |
| 1 Wayne State University Michigan Revenue TOB VRDO | 0.780% | 11/7/16 | 2,500 | 2,500 |
| | | | | 315,517 |
| Minnesota (1.3%) | | | | |
| Hennepin County MN GO | 5.000% | 12/1/16 | 1,180 | 1,184 |
| Hennepin County MN GO | 5.000% | 12/1/16 | 4,035 | 4,050 |
| Hennepin County MN GO | 5.000% | 12/15/17 | 4,355 | 4,563 |
| Hennepin County MN GO | 5.000% | 12/1/18 | 4,605 | 4,997 |
| Minneapolis & St. Paul MN Metropolitan Council Transit GO | 5.000% | 3/1/18 | 3,130 | 3,304 |
| Minneapolis & St. Paul MN Metropolitan Council Transit GO | 5.000% | 3/1/19 | 3,230 | 3,534 |
| Minneapolis & St. Paul MN Metropolitan Council Wastewater GO | 5.000% | 3/1/19 | 4,485 | 4,906 |
| Minneapolis MN GO | 2.000% | 12/1/18 | 12,800 | 13,086 |
23
Short-Term Tax-Exempt Fund
| | | | |
| | | | Face | Market |
| | | Maturity | Amount | Value• |
| | Coupon | Date | ($000) | ($000) |
| Minneapolis MN Health Care System Revenue (Fairview Health Services) | 4.000% | 11/15/18 | 750 | 792 |
| Minneapolis MN Health Care System Revenue (Fairview Health Services) | 5.000% | 11/15/19 | 750 | 831 |
| Minnesota General Fund Revenue | 5.000% | 3/1/17 | 2,000 | 2,029 |
| Minnesota GO | 5.000% | 10/1/17 | 3,545 | 3,684 |
| Minnesota GO | 5.000% | 8/1/18 | 3,295 | 3,532 |
| Minnesota GO | 5.000% | 8/1/19 | 2,275 | 2,524 |
| Minnesota GO | 5.000% | 8/1/19 | 12,920 | 14,342 |
| Minnesota GO | 5.000% | 8/1/19 | 5,940 | 6,590 |
| Minnesota GO | 5.000% | 8/1/20 | 10,000 | 11,455 |
| Minnesota GO | 5.000% | 8/1/20 | 10,750 | 12,305 |
| Minnesota GO | 5.000% | 8/1/20 | 32,940 | 37,705 |
| Minnesota GO | 5.000% | 8/1/20 | 13,070 | 14,961 |
| Minnesota Higher Education Facilities Authority Revenue (Carleton College) VRDO | 0.690% | 11/7/16 | 5,575 | 5,575 |
| Minnesota Public Facilities Authority Revenue (State Revolving Fund) | 5.000% | 3/1/18 | 7,860 | 8,297 |
| Minnesota Public Facilities Authority Revenue (State Revolving Fund) | 5.000% | 3/1/19 | 4,125 | 4,514 |
| Minnesota Public Facilities Authority Water Pollution Control Revenue | 5.000% | 3/1/19 | 5,700 | 6,237 |
| Shakopee MN Healthcare Facilities Revenue (St. Francis Regional Medical Center) | 5.000% | 9/1/17 | 465 | 481 |
| Shakopee MN Healthcare Facilities Revenue (St. Francis Regional Medical Center) | 5.000% | 9/1/18 | 885 | 946 |
| Shakopee MN Healthcare Facilities Revenue (St. Francis Regional Medical Center) | 5.000% | 9/1/19 | 555 | 612 |
| University of Minnesota Revenue | 5.000% | 12/1/18 | 1,750 | 1,897 |
| | | | | 178,933 |
| Mississippi (0.5%) | | | | |
| Gulfport MS Hospital Facilities Revenue (Memorial Hospital at Gulfport Project) | 5.000% | 7/1/19 | 1,250 | 1,357 |
| Gulfport MS Hospital Facilities Revenue (Memorial Hospital at Gulfport Project) | 5.000% | 7/1/20 | 1,000 | 1,110 |
| Jackson County MS Pollution Control Revenue (Chevron USA Inc.) VRDO | 0.500% | 11/1/16 | 9,700 | 9,700 |
| Jackson MS Public School District GO | 5.000% | 4/1/18 | 500 | 527 |
| Jackson MS Public School District GO | 5.000% | 4/1/19 | 1,660 | 1,804 |
| Jackson MS Public School District GO | 5.000% | 4/1/20 | 1,500 | 1,677 |
| Mississippi Business Finance Corp. Mississippi Gulf Opportunity Zone | | | | |
| (Chevron USA Inc. Project) VRDO | 0.500% | 11/1/16 | 35,125 | 35,125 |
| Mississippi GO | 5.250% | 11/1/16 (14) | 2,550 | 2,550 |
| 3 Mississippi GO | 1.160% | 9/1/17 | 5,390 | 5,395 |
| 3 Mississippi Hospital Equipment & Facilities Authority Revenue (Baptist Health System) PUT | 1.930% | 8/15/20 | 7,850 | 7,787 |
| | | | | 67,032 |
| Missouri (0.7%) | | | | |
| Curators of the University of Missouri System Facilities Revenue | 5.000% | 11/1/19 | 5,000 | 5,594 |
| Jackson County MO Special Obligation Revenue (Truman Sports Complex Project) | 5.000% | 12/1/17 | 2,000 | 2,090 |
| Joplin MO Industrial Development Authority Health Facilities Revenue (Freeman Health System) | 5.000% | 2/15/18 | 425 | 446 |
| Joplin MO Industrial Development Authority Health Facilities Revenue (Freeman Health System) | 5.000% | 2/15/19 | 645 | 697 |
| Kansas City MO Airport Revenue | 5.000% | 9/1/17 | 1,250 | 1,292 |
| Kansas City MO Special Obligation Revenue | 5.000% | 10/1/18 | 925 | 993 |
| Kansas City MO Special Obligation Revenue | 5.000% | 10/1/18 | 5,000 | 5,366 |
| Kansas City MO Special Obligation Revenue | 5.000% | 10/1/19 | 2,510 | 2,776 |
| Kansas City MO Special Obligation Revenue | 5.000% | 10/1/19 | 2,750 | 3,041 |
| Kansas City MO Special Obligation Revenue | 5.000% | 10/1/20 | 1,260 | 1,431 |
| Kansas City MO Special Obligation Revenue | 5.000% | 10/1/20 | 2,000 | 2,271 |
| Kansas City MO Special Obligation Revenue (Downtown Arena Project) | 5.000% | 4/1/18 | 3,675 | 3,877 |
| Kansas City MO Special Obligation Revenue (Downtown Arena Project) | 5.000% | 4/1/19 | 2,000 | 2,178 |
| Kansas City MO Special Obligation Revenue (Downtown Arena Project) | 5.000% | 4/1/20 | 2,660 | 2,980 |
| Missouri Environmental Improvement & Energy Resources Authority Revenue | 5.000% | 1/1/19 | 1,000 | 1,088 |
| Missouri Environmental Improvement & Energy Resources Authority Revenue | 5.000% | 1/1/20 | 1,000 | 1,124 |
| Missouri Environmental Improvement & Energy Resources Authority Revenue | | | | |
| (Kansas City Power & Light) | 1.250% | 7/1/17 | 4,000 | 4,012 |
| Missouri Highways & Transportation Commission Road Revenue | 5.250% | 5/1/17 (Prere.) | 11,000 | 11,245 |
| Missouri Highways & Transportation Commission Road Revenue | 5.000% | 5/1/19 | 1,000 | 1,101 |
| Missouri Highways & Transportation Commission Road Revenue | 5.000% | 5/1/20 | 1,145 | 1,298 |
| Missouri Joint Municipal Electric Utility Commission Power Project Revenue | 5.000% | 1/1/17 | 2,420 | 2,437 |
| Missouri Joint Municipal Electric Utility Commission Power Project Revenue | 5.000% | 1/1/18 | 2,400 | 2,510 |
| Springfield MO Public Utility Revenue | 5.000% | 8/1/18 | 16,375 | 17,540 |
| St. Louis County MO Rockwood School District GO | 4.000% | 2/1/20 | 12,775 | 13,973 |
| St. Louis MO Parking Revenue | 5.000% | 12/15/17 (4) | 1,285 | 1,341 |
| St. Louis MO Parking Revenue | 5.000% | 12/15/19 (4) | 1,000 | 1,114 |
| St. Louis MO Parking Revenue | 5.000% | 12/15/20 (4) | 1,000 | 1,139 |
| | | | | 94,954 |
| Montana (0.0%) | | | | |
| Montana Facility Finance Authority Revenue (Sisters of Charity of Leavenworth Health System) | 5.000% | 1/1/18 | 1,875 | 1,964 |
24
Short-Term Tax-Exempt Fund
| | | | | |
| | | | | Face | Market |
| | | | Maturity | Amount | Value• |
| | | Coupon | Date | ($000) | ($000) |
| Multiple States (0.5%) | | | | |
| 1,3 | Eaton Vance Municipal Bond Fund II | 1.680% | 7/1/19 | 8,850 | 8,851 |
| 1 | Nuveen AMT-Free Municipal Income Fund VRDP VRDO | 0.770% | 11/7/16 LOC | 18,700 | 18,700 |
| 1 | Nuveen AMT-Free Quality Municipal Income Fund VRDP VRDO | 0.730% | 11/7/16 LOC | 37,600 | 37,600 |
| | Nuveen Enhanced AMT-Free Municipal Credit Opportunities Fund VRDP VRDO | 0.730% | 11/7/16 LOC | 10,000 | 10,000 |
| | | | | | 75,151 |
| Nebraska (0.5%) | | | | |
| | Central Plains Energy Project Nebraska Gas Supply Revenue PUT | 5.000% | 12/1/19 | 30,000 | 33,090 |
| | Douglas County NE GO | 4.000% | 12/15/18 | 2,500 | 2,660 |
| | Douglas County NE GO | 5.000% | 12/15/19 | 2,605 | 2,916 |
| | Douglas County NE Hospital Authority No. 3 Health Facilities Revenue | | | | |
| | (Nebraska Methodist Health System) | 3.000% | 11/1/16 | 685 | 685 |
| | Douglas County NE Hospital Authority No. 3 Health Facilities Revenue | | | | |
| | (Nebraska Methodist Health System) | 3.000% | 11/1/17 | 700 | 713 |
| | Douglas County NE Hospital Authority No. 3 Health Facilities Revenue | | | | |
| | (Nebraska Methodist Health System) | 4.000% | 11/1/18 | 925 | 974 |
| | Lincoln County NE Hospital Authority No. 1 Hospital Revenue | | | | |
| | (Great Plains Regional Medical Center Project) | 4.000% | 11/1/16 | 500 | 500 |
| | Lincoln County NE Hospital Authority No. 1 Hospital Revenue | | | | |
| | (Great Plains Regional Medical Center Project) | 4.000% | 11/1/17 | 500 | 514 |
| | University of Nebraska Facilities Corp. Revenue | 5.000% | 7/15/18 | 4,685 | 5,005 |
| | University of Nebraska Facilities Corp. Revenue | 3.000% | 7/15/19 | 5,530 | 5,812 |
| | University of Nebraska Student Fee Revenue | 5.000% | 7/1/17 | 1,105 | 1,136 |
| | University of Nebraska Student Fee Revenue | 4.000% | 7/1/18 | 2,785 | 2,926 |
| | University of Nebraska Student Fee Revenue | 4.000% | 7/1/19 | 2,395 | 2,580 |
| | University of Nebraska Student Health & Recreation Project Revenue | 4.000% | 5/15/18 | 1,070 | 1,120 |
| | University of Nebraska Student Health & Recreation Project Revenue | 4.000% | 5/15/19 | 1,110 | 1,192 |
| | | | | | 61,823 |
| Nevada (0.4%) | | | | |
| | Clark County NV School District GO | 5.000% | 6/15/17 | 11,105 | 11,400 |
| | Clark County NV School District GO | 5.000% | 6/15/17 | 7,015 | 7,201 |
| | Clark County NV School District GO | 5.000% | 6/15/18 | 3,865 | 4,118 |
| | Humboldt County NV Pollution Control Revenue (Sierra Pacific Power Co.) PUT | 1.250% | 6/3/19 | 1,750 | 1,749 |
| | Nevada GO | 5.000% | 4/1/19 | 16,405 | 17,953 |
| | Nevada Unemployment Compensation Revenue | 5.000% | 6/1/17 | 10,000 | 10,252 |
| | | | | | 52,673 |
| New Hampshire (0.1%) | | | | |
| 2 | New Hampshire Health & Education Facilities Authority Revenue (Elliott Hospital Obligated Group) | 5.000% | 10/1/18 | 450 | 478 |
| 2 | New Hampshire Health & Education Facilities Authority Revenue (Elliott Hospital Obligated Group) | 5.000% | 10/1/19 | 600 | 654 |
| 2 | New Hampshire Health & Education Facilities Authority Revenue (Elliott Hospital Obligated Group) | 5.000% | 10/1/20 | 1,265 | 1,411 |
| 1 | New Hampshire Health & Education Facilities Authority Revenue (LRGHealthcare) TOB VRDO | 0.670% | 11/7/16 | 15,645 | 15,645 |
| 2 | New Hampshire Health & Education Facilities Authority Revenue | | | | |
| | (Southern New Hampshire Medical Center) | 3.000% | 10/1/19 | 1,230 | 1,287 |
| | | | | | 19,475 |
| New Jersey (4.2%) | | | | |
| | Camden County NJ Improvement Authority Health Care Redevelopment Project Revenue | | | | |
| | (Cooper Health System Obligated Group) | 5.000% | 2/15/18 | 2,775 | 2,906 |
| | Camden County NJ Improvement Authority Health Care Redevelopment Project Revenue | | | | |
| | (Cooper Health System Obligated Group) | 5.000% | 2/15/19 | 3,050 | 3,292 |
| 1,3 | Eaton Vance New Jersey Municipal Bond Fund II | 1.630% | 7/1/19 | 8,700 | 8,701 |
| | Essex County NJ Utilities Authority Revenue | 3.000% | 11/4/16 | 5,625 | 5,626 |
| | Howell Township NJ BAN | 2.000% | 10/19/17 | 11,850 | 11,959 |
| | Hudson County NJ Improvement Authority Essential Purpose Pooled Governmental | | | | |
| | Loan Revenue VRDO | 0.640% | 11/7/16 LOC | 1,100 | 1,100 |
| | Long Branch NJ BAN | 1.750% | 2/10/17 | 10,600 | 10,620 |
| | Monmouth County NJ GO | 4.000% | 1/15/17 | 1,075 | 1,082 |
| | Monmouth County NJ GO | 4.000% | 1/15/18 | 1,350 | 1,402 |
| | Monmouth County NJ Improvement Authority Revenue (Pooled Government Loan) | 5.000% | 12/1/20 | 2,575 | 2,973 |
| | Monroe Township NJ Board of Education GO | 4.000% | 8/1/17 | 1,085 | 1,109 |
| | Monroe Township NJ Board of Education GO | 4.000% | 8/1/18 | 2,070 | 2,171 |
| | New Jersey Economic Development Authority Revenue | 5.000% | 3/1/18 | 14,425 | 15,041 |
| | New Jersey Economic Development Authority Revenue | 5.000% | 6/15/19 | 50,000 | 53,808 |
| | New Jersey Economic Development Authority Revenue (Cigarette Tax) | 5.000% | 6/15/17 | 5,800 | 5,913 |
| | New Jersey Economic Development Authority Revenue (Cigarette Tax) | 5.000% | 6/15/18 | 3,235 | 3,386 |
| | New Jersey Economic Development Authority Revenue (School Facilities Construction) | 5.000% | 12/15/16 | 2,055 | 2,064 |
| 3 | New Jersey Economic Development Authority Revenue (School Facilities Construction) | 1.530% | 2/1/17 | 19,160 | 19,159 |
| 1 | New Jersey Economic Development Authority Revenue (School Facilities Construction) | | | | |
| | TOB VRDO | 0.780% | 11/7/16 LOC | 18,310 | 18,310 |
25
Short-Term Tax-Exempt Fund
| | | | | |
| | | | | Face | Market |
| | | | Maturity | Amount | Value• |
| | | Coupon | Date | ($000) | ($000) |
| | New Jersey Economic Development Authority Revenue (School Facilities Construction) VRDO | 1.360% | 2/1/17 | 29,000 | 28,986 |
| | New Jersey Equipment Lease Purchase COP | 5.000% | 6/15/18 | 4,550 | 4,789 |
| | New Jersey Health Care Facilities Financing Authority Revenue (AHS Hospital Corp.) | 5.000% | 7/1/18 (ETM) | 2,390 | 2,553 |
| | New Jersey Health Care Facilities Financing Authority Revenue (AHS Hospital Corp.) | 5.000% | 7/1/18 | 110 | 117 |
| | New Jersey Health Care Facilities Financing Authority Revenue (Holy Name Medical Center) | 4.000% | 7/1/17 | 1,000 | 1,018 |
| | New Jersey Health Care Facilities Financing Authority Revenue | | | | |
| | (Hospital Capital Asset Pooled Program) VRDO | 0.630% | 11/7/16 LOC | 6,300 | 6,300 |
| | New Jersey Health Care Facilities Financing Authority Revenue | | | | |
| | (Meridian Health System Obligated Group) | 5.000% | 7/1/17 | 2,000 | 2,054 |
| | New Jersey Health Care Facilities Financing Authority Revenue | | | | |
| | (Palisades Medical Center Obligated Group) | 5.000% | 7/1/17 | 1,305 | 1,337 |
| | New Jersey Health Care Facilities Financing Authority Revenue (Princeton Healthcare System) | 4.000% | 7/1/17 | 1,500 | 1,529 |
| | New Jersey Health Care Facilities Financing Authority Revenue (Princeton Healthcare System) | 5.000% | 7/1/20 | 2,100 | 2,364 |
| | New Jersey Health Care Facilities Financing Authority Revenue | | | | |
| | (Robert Wood Johnson University) VRDO | 0.590% | 11/7/16 LOC | 3,400 | 3,400 |
| | New Jersey Health Care Facilities Financing Authority Revenue (St. Joseph’s Healthcare System) | 4.000% | 7/1/17 | 5,105 | 5,205 |
| | New Jersey Health Care Facilities Financing Authority Revenue (St. Joseph’s Healthcare System) | 3.000% | 7/1/18 | 1,300 | 1,337 |
| | New Jersey Health Care Facilities Financing Authority Revenue (St. Joseph’s Healthcare System) | 4.000% | 7/1/19 | 1,200 | 1,280 |
| | New Jersey Health Care Facilities Financing Authority Revenue (St. Joseph’s Healthcare System) | 4.000% | 7/1/20 | 1,000 | 1,085 |
| | New Jersey Health Care Facilities Financing Authority Revenue (Virtua Health) | 4.000% | 7/1/18 | 750 | 785 |
| | New Jersey Health Care Facilities Financing Authority Revenue (Virtua Health) | 4.000% | 7/1/19 | 2,000 | 2,142 |
| | New Jersey Health Care Facilities Financing Authority Revenue (Virtua Health) | 5.000% | 7/1/19 | 1,000 | 1,097 |
| 1 | New Jersey Higher Education Assistance Authority Student Loan Revenue TOB VRDO | 0.850% | 11/7/16 | 5,000 | 5,000 |
| | New Jersey Housing & Mortgage Finance Agency Multi-Family Housing Revenue | 1.000% | 11/1/17 | 3,100 | 3,099 |
| | New Jersey Housing & Mortgage Finance Agency Multi-Family Housing Revenue | 1.050% | 5/1/18 | 7,000 | 6,982 |
| | New Jersey Transportation Corp. GAN | 5.000% | 9/15/17 | 14,500 | 14,919 |
| | New Jersey Transportation Corp. GAN | 5.000% | 9/15/18 | 16,345 | 17,265 |
| 2 | New Jersey Transportation Trust Fund Authority Federal Highway Reimbursement Revenue | 5.000% | 6/15/19 | 38,550 | 41,507 |
| 2 | New Jersey Transportation Trust Fund Authority Federal Highway Reimbursement Revenue | 5.000% | 6/15/20 | 42,510 | 46,583 |
| 2 | New Jersey Transportation Trust Fund Authority Federal Highway Reimbursement Revenue | 5.000% | 6/15/21 | 27,350 | 28,615 |
| | New Jersey Transportation Trust Fund Authority Transportation Program Revenue | 5.000% | 6/15/17 | 5,000 | 5,120 |
| | New Jersey Transportation Trust Fund Authority Transportation Program Revenue | 5.000% | 6/15/18 | 6,000 | 6,315 |
| | New Jersey Transportation Trust Fund Authority Transportation Program Revenue | 5.750% | 6/15/18 | 7,140 | 7,601 |
| 3 | New Jersey Transportation Trust Fund Authority Transportation Program Revenue PUT | 1.630% | 12/15/19 | 35,000 | 34,353 |
| | New Jersey Transportation Trust Fund Authority Transportation System Revenue | 5.000% | 6/15/17 | 4,200 | 4,301 |
| | New Jersey Transportation Trust Fund Authority Transportation System Revenue | 5.000% | 12/15/17 | 13,425 | 13,969 |
| | New Jersey Transportation Trust Fund Authority Transportation System Revenue | 5.000% | 6/15/18 | 9,070 | 9,547 |
| 1 | New Jersey Transportation Trust Fund Authority Transportation System Revenue TOB VRDO | 0.900% | 11/7/16 | 10,850 | 10,850 |
| 3 | New Jersey Turnpike Authority Revenue | 1.110% | 1/1/17 | 35,000 | 35,004 |
| 3 | New Jersey Turnpike Authority Revenue PUT | 1.250% | 1/1/17 | 30,000 | 30,002 |
| 3 | New Jersey Turnpike Authority Revenue PUT | 1.250% | 1/1/17 | 2,500 | 2,500 |
| 3 | New Jersey Turnpike Authority Revenue PUT | 1.310% | 1/1/18 | 5,000 | 5,014 |
| 1 | New Jersey Turnpike Authority Revenue TOB VRDO | 0.830% | 11/7/16 (4) | 6,500 | 6,500 |
| | Tobacco Settlement Financing Corp. New Jersey Revenue | 5.000% | 6/1/17 | 3,000 | 3,075 |
| | | | | | 576,121 |
| New Mexico (0.5%) | | | | |
| | Farmington NM Pollution Control Revenue (El Paso Electric Co. Four Corners Project) PUT | 1.875% | 9/1/17 | 4,500 | 4,517 |
| 3 | New Mexico Municipal Energy Acquisition Authority Gas Supply Revenue | 0.923% | 2/1/18 | 5,010 | 4,999 |
| 3 | New Mexico Municipal Energy Acquisition Authority Gas Supply Revenue | 0.973% | 8/1/18 | 5,200 | 5,189 |
| 3 | New Mexico Municipal Energy Acquisition Authority Gas Supply Revenue PUT | 1.103% | 8/1/19 | 37,500 | 37,321 |
| | New Mexico Severance Tax Revenue | 4.000% | 7/1/18 (Prere.) | 16,245 | 17,087 |
| | | | | | 69,113 |
| New York (15.9%) | | | | |
| | Binghamton NY City School District BAN | 2.000% | 11/18/16 | 29,680 | 29,696 |
| | Binghamton NY City School District BAN | 1.500% | 6/30/17 | 5,600 | 5,617 |
| | Brooklyn NY Local Development Corp. PILOT Revenue (Brooklyn Events Center) | 5.000% | 7/15/17 | 250 | 257 |
| | Brooklyn NY Local Development Corp. PILOT Revenue (Brooklyn Events Center) | 5.000% | 7/15/20 | 500 | 561 |
| | Buffalo & Erie County NY Industrial Land Development Corp. Revenue | 5.000% | 11/15/18 | 1,000 | 1,065 |
| | Buffalo & Erie County NY Industrial Land Development Corp. Revenue | 5.000% | 11/15/19 | 680 | 743 |
| | Central Islip NY Union Free School District BAN | 2.000% | 8/16/17 | 8,500 | 8,564 |
| | Clarence NY BAN | 2.000% | 7/21/17 | 6,200 | 6,247 |
| | Dobbs Ferry NY Union Free School District BAN | 2.000% | 7/28/17 | 3,800 | 3,826 |
| 1,3 | Eaton Vance New York Municipal Bond Fund II | 1.480% | 7/1/19 | 5,750 | 5,751 |
| | Erie County NY Industrial Development Agency School Facility Revenue | | | | |
| | (Buffalo City School District Project) | 5.000% | 5/1/17 | 3,435 | 3,512 |
| | Frontier NY Central School District BAN | 2.000% | 6/27/17 | 26,025 | 26,187 |
| | Guilderland NY Central School District BAN | 2.000% | 7/14/17 | 3,268 | 3,287 |
| | Hempstead NY BAN | 2.000% | 12/16/16 | 26,634 | 26,670 |
| 1 | Hudson Yards Infrastructure Corp. New York Revenue TOB VRDO | 0.700% | 11/7/16 LOC | 6,065 | 6,065 |
26
Short-Term Tax-Exempt Fund
| | | | |
| | | | Face | Market |
| | | Maturity | Amount | Value• |
| | Coupon | Date | ($000) | ($000) |
| Johnson City Central School District BAN | 2.000% | 6/22/17 | 8,070 | 8,119 |
| Lewiston-Porter Central School District BAN | 2.000% | 6/15/17 | 9,000 | 9,051 |
| Long Island NY Power Authority Electric System Revenue | 5.000% | 5/1/17 | 1,000 | 1,021 |
| Long Island NY Power Authority Electric System Revenue | 5.000% | 9/1/17 | 9,950 | 10,289 |
| 3 Long Island NY Power Authority Electric System Revenue PUT | 1.249% | 11/1/18 | 17,000 | 17,097 |
| Monroe County NY Industrial Development Agency School Facility Revenue | | | | |
| (Rochester Schools Modernization Project) | 5.000% | 5/1/17 | 3,730 | 3,809 |
| Monroe County NY Industrial Development Agency School Facility Revenue | | | | |
| (Rochester Schools Modernization Project) | 5.000% | 5/1/17 | 1,450 | 1,481 |
| Monroe County NY Industrial Development Agency School Facility Revenue | | | | |
| (Rochester Schools Modernization Project) | 5.000% | 5/1/18 | 2,000 | 2,121 |
| Mount Vernon City School District BAN | 2.000% | 8/18/17 | 8,560 | 8,616 |
| Nassau County NY Health Care Corp. RAN | 2.000% | 1/17/17 | 9,000 | 9,013 |
| Nassau County NY Local Economic Assistance & Financing Corp. Revenue | | | | |
| (Catholic Health Services) | 5.000% | 7/1/19 | 1,305 | 1,426 |
| Nassau County NY Local Economic Assistance & Financing Corp. Revenue | | | | |
| (South Nassau Communities Hospital) | 5.000% | 7/1/17 | 1,320 | 1,354 |
| Nassau County NY Local Economic Assistance & Financing Corp. Revenue | | | | |
| (Winthrop University Hospital Association Project) | 4.000% | 7/1/17 | 1,500 | 1,527 |
| Nassau County NY Local Economic Assistance Corp. Revenue | | | | |
| (Catholic Health Services of Long Island Obligated Group Project) | 3.000% | 7/1/17 | 900 | 912 |
| Nassau County NY Local Economic Assistance Corp. Revenue | | | | |
| (Catholic Health Services of Long Island Obligated Group Project) | 4.000% | 7/1/18 | 800 | 837 |
| Nassau County NY Local Economic Assistance Corp. Revenue | | | | |
| (Catholic Health Services of Long Island Obligated Group Project) | 4.000% | 7/1/19 | 375 | 400 |
| New Rochelle NY School District TAN | 2.000% | 6/29/17 | 6,000 | 6,041 |
| New York City NY GO | 0.890% | 11/2/16 (4) | 30,325 | 30,325 |
| New York City NY GO | 0.840% | 11/3/16 (4) | 2,000 | 2,000 |
| New York City NY GO | 0.890% | 11/3/16 (4) | 51,000 | 51,000 |
| New York City NY GO | 0.840% | 11/4/16 (12) | 7,500 | 7,500 |
| New York City NY GO | 0.840% | 11/4/16 (4) | 9,800 | 9,800 |
| New York City NY GO | 0.840% | 11/7/16 (4) | 20,200 | 20,200 |
| New York City NY GO | 0.840% | 11/7/16 (12) | 27,800 | 27,800 |
| New York City NY GO | 0.890% | 11/8/16 (4) | 9,500 | 9,500 |
| New York City NY GO | 4.000% | 8/1/17 | 5,705 | 5,846 |
| New York City NY GO | 5.000% | 8/1/17 | 4,305 | 4,444 |
| New York City NY GO | 5.000% | 8/1/17 | 10,000 | 10,323 |
| New York City NY GO | 5.000% | 8/1/17 | 33,680 | 34,767 |
| New York City NY GO | 5.000% | 8/1/17 | 34,730 | 35,850 |
| New York City NY GO | 5.000% | 8/1/17 | 7,280 | 7,515 |
| New York City NY GO | 5.000% | 8/1/17 | 3,715 | 3,835 |
| New York City NY GO | 5.000% | 8/1/17 | 20,000 | 20,645 |
| New York City NY GO | 5.000% | 8/1/18 | 3,250 | 3,479 |
| New York City NY GO | 5.000% | 8/1/18 | 8,790 | 9,408 |
| New York City NY GO | 5.000% | 8/1/19 | 15,425 | 17,065 |
| New York City NY GO | 5.000% | 8/1/19 | 6,190 | 6,848 |
| 3 New York City NY GO | 1.100% | 8/1/21 | 6,325 | 6,325 |
| New York City NY GO VRDO | 0.500% | 11/1/16 | 73,650 | 73,650 |
| New York City NY GO VRDO | 0.510% | 11/1/16 LOC | 2,505 | 2,505 |
| New York City NY GO VRDO | 0.530% | 11/1/16 | 15,900 | 15,900 |
| New York City NY Housing Development Corp. Multi-Family Housing Revenue | 1.100% | 11/1/16 | 2,115 | 2,115 |
| New York City NY Housing Development Corp. Multi-Family Housing Revenue | 0.850% | 11/1/17 | 6,215 | 6,213 |
| New York City NY Housing Development Corp. Multi-Family Housing Revenue | 0.850% | 11/1/17 | 2,000 | 2,000 |
| New York City NY Housing Development Corp. Multi-Family Housing Revenue | 1.250% | 5/1/18 | 12,010 | 12,012 |
| New York City NY Housing Development Corp. Multi-Family Housing Revenue | 1.250% | 5/1/18 | 2,390 | 2,392 |
| New York City NY Housing Development Corp. Multi-Family Housing Revenue | 1.350% | 5/1/18 | 10,000 | 10,012 |
| New York City NY Housing Development Corp. Multi-Family Housing Revenue | 1.250% | 11/1/18 | 27,500 | 27,528 |
| New York City NY Housing Development Corp. Multi-Family Housing Revenue | 1.500% | 11/1/18 | 13,090 | 13,114 |
| New York City NY Housing Development Corp. Multi-Family Housing Revenue | 1.500% | 11/1/18 | 17,105 | 17,136 |
| New York City NY Housing Development Corp. Multi-Family Housing Revenue | 1.650% | 5/1/19 | 24,685 | 24,736 |
| New York City NY Housing Development Corp. Multi-Family Housing Revenue | 1.650% | 5/1/19 | 3,005 | 3,010 |
| New York City NY Housing Development Corp. Multi-Family Housing Revenue PUT | 1.000% | 10/26/17 | 4,705 | 4,705 |
| New York City NY Housing Development Corp. Sustainable Neighborhood Revenue | 1.300% | 11/1/19 | 13,500 | 13,474 |
| New York City NY Housing Development Corp. Sustainable Neighborhood Revenue | 1.375% | 5/1/20 | 5,750 | 5,762 |
| New York City NY Housing Development Corp. Sustainable Neighborhood Revenue PUT | 1.450% | 4/29/20 | 4,000 | 3,984 |
| New York City NY Municipal Water Finance Authority Water & Sewer System Revenue | 5.000% | 6/15/18 | 4,180 | 4,203 |
| New York City NY Municipal Water Finance Authority Water & Sewer System Revenue | 5.000% | 6/15/19 | 3,100 | 3,246 |
| 1 New York City NY Municipal Water Finance Authority Water & Sewer System Revenue | | | | |
| TOB VRDO | 0.730% | 11/7/16 | 18,500 | 18,500 |
| New York City NY Municipal Water Finance Authority Water & Sewer System Revenue VRDO | 0.500% | 11/1/16 | 4,800 | 4,800 |
27
Short-Term Tax-Exempt Fund
| | | | |
| | | | Face | Market |
| | | Maturity | Amount | Value• |
| | Coupon | Date | ($000) | ($000) |
| New York City NY Municipal Water Finance Authority Water & Sewer System Revenue VRDO | 0.500% | 11/1/16 | 11,600 | 11,600 |
| New York City NY Transitional Finance Authority Future Tax Revenue | 3.000% | 11/1/16 | 2,560 | 2,560 |
| New York City NY Transitional Finance Authority Future Tax Revenue | 5.000% | 11/1/16 (ETM) | 465 | 465 |
| New York City NY Transitional Finance Authority Future Tax Revenue | 5.000% | 11/1/16 | 3,535 | 3,535 |
| New York City NY Transitional Finance Authority Future Tax Revenue | 5.000% | 11/1/16 (ETM) | 160 | 160 |
| New York City NY Transitional Finance Authority Future Tax Revenue | 5.000% | 11/1/16 | 9,840 | 9,840 |
| New York City NY Transitional Finance Authority Future Tax Revenue | 5.000% | 11/1/16 (ETM) | 2,990 | 2,990 |
| New York City NY Transitional Finance Authority Future Tax Revenue | 5.000% | 11/1/16 | 2,505 | 2,505 |
| New York City NY Transitional Finance Authority Future Tax Revenue | 0.800% | 11/3/16 (4) | 20,000 | 20,000 |
| New York City NY Transitional Finance Authority Future Tax Revenue | 0.880% | 11/4/16 (4) | 64,150 | 64,150 |
| New York City NY Transitional Finance Authority Future Tax Revenue | 5.000% | 11/1/17 (Prere.) | 11,805 | 12,310 |
| New York City NY Transitional Finance Authority Future Tax Revenue | 5.000% | 11/1/17 | 26,270 | 27,386 |
| New York City NY Transitional Finance Authority Future Tax Revenue | 5.000% | 8/1/19 | 1,300 | 1,442 |
| New York City NY Transitional Finance Authority Future Tax Revenue | 5.000% | 11/1/19 | 18,700 | 20,913 |
| New York City NY Transitional Finance Authority Future Tax Revenue | 5.000% | 11/1/19 | 2,110 | 2,360 |
| 1 New York City NY Transitional Finance Authority Future Tax Revenue TOB VRDO | 0.620% | 11/1/16 | 13,145 | 13,145 |
| New York City NY Transitional Finance Authority Recovery Revenue VRDO | 0.510% | 11/1/16 | 8,805 | 8,805 |
| New York City NY Trust for Cultural Resources Revenue (Museum of Modern Art) | 4.000% | 8/1/17 (ETM) | 6,250 | 6,403 |
| 1 New York Liberty Development Corp. Revenue (Port Authority Consolidated Bonds) TOB VRDO | 0.680% | 11/7/16 | 43,705 | 43,705 |
| 1 New York Liberty Development Corp. Revenue (Port Authority Consolidated Bonds) TOB VRDO | 0.780% | 11/7/16 | 27,435 | 27,435 |
| 3 New York Metropolitan Transportation Authority Revenue | 1.043% | 11/1/16 | 3,500 | 3,500 |
| New York Metropolitan Transportation Authority Revenue | 5.000% | 11/15/16 | 2,650 | 2,655 |
| 3 New York Metropolitan Transportation Authority Revenue | 1.183% | 11/1/17 | 2,950 | 2,954 |
| New York Metropolitan Transportation Authority Revenue | 5.000% | 11/15/17 | 1,190 | 1,242 |
| New York Metropolitan Transportation Authority Revenue | 5.000% | 11/15/17 | 12,500 | 13,046 |
| New York Metropolitan Transportation Authority Revenue | 5.000% | 11/15/18 | 3,500 | 3,786 |
| New York Metropolitan Transportation Authority Revenue | 5.000% | 11/15/18 | 4,055 | 4,386 |
| New York Metropolitan Transportation Authority Revenue (Dedicated Tax Fund) | 2.000% | 3/1/17 | 10,000 | 10,045 |
| New York Metropolitan Transportation Authority Revenue (Dedicated Tax Fund) | 2.000% | 3/1/17 | 5,000 | 5,021 |
| New York Metropolitan Transportation Authority Revenue (Dedicated Tax Fund) | 2.000% | 6/1/17 | 5,000 | 5,035 |
| New York Metropolitan Transportation Authority Revenue (Dedicated Tax Fund) | 2.000% | 6/1/17 | 19,065 | 19,202 |
| New York Metropolitan Transportation Authority Revenue (Dedicated Tax Fund) | 4.000% | 6/1/17 | 67,725 | 69,006 |
| 3 New York Metropolitan Transportation Authority Revenue (Dedicated Tax Fund) PUT | 1.010% | 6/1/17 | 19,905 | 19,878 |
| 3 New York Metropolitan Transportation Authority Revenue (Dedicated Tax Fund) PUT | 1.000% | 11/1/18 | 2,000 | 2,001 |
| 3 New York Metropolitan Transportation Authority Revenue (Dedicated Tax Fund) PUT | 1.080% | 11/1/19 | 2,750 | 2,750 |
| 3 New York Metropolitan Transportation Authority Revenue (Dedicated Tax Fund) PUT | 1.210% | 11/1/19 | 21,000 | 21,048 |
| New York Metropolitan Transportation Authority Revenue (Transit Revenue) | 4.000% | 11/15/16 | 1,000 | 1,001 |
| New York Metropolitan Transportation Authority Revenue (Transit Revenue) | 5.000% | 11/15/16 | 2,250 | 2,254 |
| New York Metropolitan Transportation Authority Revenue (Transit Revenue) | 5.000% | 11/15/17 | 1,200 | 1,252 |
| 1 New York Metropolitan Transportation Authority Revenue (Transit Revenue) TOB VRDO | 0.750% | 11/7/16 LOC | 11,250 | 11,250 |
| 3 New York Metropolitan Transportation Authority Revenue PUT | 1.203% | 11/1/16 | 15,760 | 15,760 |
| 3 New York Metropolitan Transportation Authority Revenue PUT | 0.834% | 5/15/17 (4) | 18,500 | 18,499 |
| 3 New York Metropolitan Transportation Authority Revenue PUT | 0.703% | 11/1/17 | 7,310 | 7,306 |
| 3 New York Metropolitan Transportation Authority Revenue PUT | 0.990% | 11/15/17 | 49,600 | 49,547 |
| 3 New York Metropolitan Transportation Authority Revenue PUT | 0.964% | 5/15/18 (4) | 10,750 | 10,757 |
| 3 New York Metropolitan Transportation Authority Revenue PUT | 0.653% | 11/1/19 | 12,320 | 12,231 |
| New York Metropolitan Transportation Authority Revenue PUT | 5.000% | 2/15/20 | 69,000 | 77,086 |
| 3 New York Metropolitan Transportation Authority Revenue PUT | 1.210% | 6/1/20 | 87,500 | 87,398 |
| 1 New York Metropolitan Transportation Authority Revenue TOB VRDO | 0.750% | 11/7/16 | 12,500 | 12,500 |
| New York State Dormitory Authority Revenue (Columbia University) | 5.000% | 10/1/19 | 4,275 | 4,774 |
| New York State Dormitory Authority Revenue (Columbia University) | 5.000% | 10/1/20 | 1,125 | 1,296 |
| New York State Dormitory Authority Revenue (New York University Hospitals Center) | 5.000% | 7/1/17 | 1,000 | 1,027 |
| New York State Dormitory Authority Revenue (New York University Hospitals Center) | 5.000% | 7/1/18 | 1,000 | 1,066 |
| New York State Dormitory Authority Revenue (North Shore - Long Island Jewish Obligated Group) | 5.000% | 5/1/17 | 2,000 | 2,041 |
| New York State Dormitory Authority Revenue (North Shore - Long Island Jewish Obligated Group) | 5.000% | 5/1/18 | 2,500 | 2,646 |
| New York State Dormitory Authority Revenue (Personal Income Tax) | 5.000% | 2/15/18 | 22,110 | 23,277 |
| New York State Dormitory Authority Revenue (Personal Income Tax) | 5.000% | 2/15/19 | 16,215 | 17,684 |
| New York State Dormitory Authority Revenue (Personal Income Tax) | 5.000% | 2/15/19 | 10,120 | 11,037 |
| New York State Dormitory Authority Revenue (Personal Income Tax) | 5.000% | 2/15/19 | 1,000 | 1,091 |
| New York State Dormitory Authority Revenue (Personal Income Tax) | 5.000% | 6/15/19 | 9,765 | 10,771 |
| New York State Dormitory Authority Revenue (Personal Income Tax) | 5.000% | 3/15/20 | 4,750 | 5,349 |
| 1 New York State Dormitory Authority Revenue (Personal Income Tax) TOB VRDO | 0.660% | 11/7/16 | 565 | 565 |
| New York State Dormitory Authority Revenue (Rockefeller University) VRDO | 0.630% | 11/7/16 | 2,000 | 2,000 |
| New York State Dormitory Authority Revenue (School Districts Financing Program) | 5.000% | 10/1/17 | 3,445 | 3,576 |
| New York State Dormitory Authority Revenue (School Districts Financing Program) | 5.000% | 10/1/17 (4) | 3,300 | 3,427 |
| New York State Dormitory Authority Revenue (School Districts Financing Program) | 5.000% | 10/1/17 (15) | 500 | 519 |
| New York State Dormitory Authority Revenue (School Districts Financing Program) | 5.000% | 10/1/18 | 2,160 | 2,324 |
| New York State Dormitory Authority Revenue (School Districts Financing Program) | 5.000% | 10/1/18 (15) | 1,000 | 1,077 |
| New York State Dormitory Authority Revenue (State University Dormitory Facilities) | 5.000% | 7/1/17 | 6,865 | 7,060 |
| New York State Dormitory Authority Revenue (Yeshiva University) | 5.000% | 11/1/18 (ETM) | 370 | 397 |

Short-Term Tax-Exempt Fund
| | | | | |
| | | | | Face | Market |
| | | | Maturity | Amount | Value• |
| | | Coupon | Date | ($000) | ($000) |
| | New York State Dormitory Authority Revenue (Yeshiva University) | 5.000% | 11/1/18 | 630 | 655 |
| | New York State Dormitory Authority Revenue (Yeshiva University) | 5.000% | 11/1/19 (ETM) | 600 | 661 |
| | New York State Dormitory Authority Revenue (Yeshiva University) | 5.000% | 11/1/19 | 1,025 | 1,082 |
| | New York State Dormitory Authority Sales Tax Revenue | 5.000% | 3/15/18 | 42,810 | 45,216 |
| | New York State Dormitory Authority Sales Tax Revenue | 5.000% | 3/15/18 | 23,100 | 24,398 |
| | New York State Dormitory Authority Sales Tax Revenue | 5.000% | 3/15/19 | 31,555 | 34,520 |
| | New York State Dormitory Authority Sales Tax Revenue | 5.000% | 3/15/19 | 24,300 | 26,583 |
| | New York State Housing Finance Agency Affordable Housing Revenue | 0.800% | 11/1/16 | 2,750 | 2,750 |
| | New York State Housing Finance Agency Affordable Housing Revenue | 0.800% | 11/1/16 | 2,500 | 2,500 |
| | New York State Housing Finance Agency Affordable Housing Revenue | 0.750% | 5/1/17 | 4,850 | 4,848 |
| | New York State Housing Finance Agency Affordable Housing Revenue | 0.750% | 5/1/17 | 2,505 | 2,503 |
| | New York State Housing Finance Agency Affordable Housing Revenue | 0.750% | 5/1/17 | 3,000 | 2,999 |
| | New York State Housing Finance Agency Affordable Housing Revenue | 0.850% | 11/1/17 | 6,890 | 6,883 |
| | New York State Housing Finance Agency Affordable Housing Revenue | 0.850% | 11/1/17 | 10,000 | 9,990 |
| | New York State Housing Finance Agency Affordable Housing Revenue | 0.900% | 11/1/17 | 3,000 | 2,996 |
| | New York State Housing Finance Agency Affordable Housing Revenue | 1.150% | 5/1/18 | 4,190 | 4,192 |
| | New York State Housing Finance Agency Affordable Housing Revenue | 1.150% | 5/1/18 | 3,900 | 3,904 |
| | New York State Housing Finance Agency Affordable Housing Revenue | 1.150% | 5/1/18 | 1,250 | 1,251 |
| | New York State Housing Finance Agency Affordable Housing Revenue | 1.250% | 5/1/18 | 2,500 | 2,505 |
| | New York State Housing Finance Agency Affordable Housing Revenue | 1.250% | 5/1/18 | 6,250 | 6,262 |
| | New York State Housing Finance Agency Housing Revenue | 0.900% | 11/1/17 | 5,000 | 4,999 |
| | New York State Housing Finance Agency Housing Revenue | 0.900% | 11/1/17 | 6,000 | 6,001 |
| | New York State Housing Finance Agency Revenue | 1.050% | 5/1/19 | 850 | 847 |
| | New York State Housing Finance Agency Revenue | 1.100% | 11/1/19 | 1,000 | 994 |
| | New York State Housing Finance Agency Revenue | 1.250% | 5/1/20 | 7,500 | 7,465 |
| | New York State Local Government Assistance Corp. Revenue | 5.000% | 4/1/19 | 2,365 | 2,503 |
| | New York State Thruway Authority Revenue | 5.000% | 1/1/17 (ETM) | 460 | 463 |
| | New York State Thruway Authority Revenue | 5.000% | 1/1/17 | 1,540 | 1,551 |
| | New York State Thruway Authority Revenue | 5.000% | 1/1/18 | 1,500 | 1,571 |
| | New York State Thruway Authority Revenue | 5.000% | 5/1/19 | 41,875 | 45,957 |
| | New York State Urban Development Corp. Revenue (Personal Income Tax) | 5.000% | 3/15/17 | 10,090 | 10,255 |
| | New York State Urban Development Corp. Revenue (Personal Income Tax) | 5.000% | 3/15/19 | 3,900 | 4,266 |
| | New York State Urban Development Corp. Revenue (Service Contract) | 5.250% | 1/1/20 | 1,500 | 1,638 |
| | North Syracuse NY Central School District BAN | 2.000% | 8/11/17 | 4,448 | 4,479 |
| | North Syracuse NY Central School District RAN | 2.000% | 6/28/17 | 10,000 | 10,059 |
| 1,3 | Nuveen New York AMT-Free Municipal Income Fund iMTP | 1.250% | 10/1/17 | 17,500 | 17,501 |
| 1 | Nuveen New York AMT-Free Municipal Income Fund VRDP VRDO | 0.720% | 11/7/16 LOC | 36,000 | 36,000 |
| 1 | Nuveen New York AMT-Free Municipal Income Fund VRDP VRDO | 0.780% | 11/7/16 LOC | 23,500 | 23,500 |
| | Onondaga County NY Civic Development Corp. Revenue (St. Joseph’s Hospital & Health Center) | 5.000% | 7/1/19 (ETM) | 500 | 539 |
| | Oyster Bay NY BAN | 2.750% | 2/3/17 | 15,000 | 15,030 |
| | Oyster Bay NY GO | 3.250% | 8/1/17 | 4,155 | 4,174 |
| | Port Authority of New York & New Jersey Revenue | 5.000% | 8/15/18 (4) | 2,855 | 2,952 |
| | Schenectady NY BAN | 2.000% | 5/11/17 | 41,962 | 42,178 |
| | Suffolk County NY GO | 5.000% | 2/1/17 (4) | 3,415 | 3,451 |
| | Suffolk County NY GO | 5.000% | 5/15/19 | 8,565 | 9,360 |
| | Triborough Bridge & Tunnel Authority New York Revenue | 5.000% | 11/15/16 | 8,570 | 8,584 |
| 3 | Triborough Bridge & Tunnel Authority New York Revenue | 0.880% | 1/1/17 (4) | 10,700 | 10,700 |
| 3 | Triborough Bridge & Tunnel Authority New York Revenue | 0.980% | 1/1/18 (4) | 5,000 | 4,999 |
| 3 | Triborough Bridge & Tunnel Authority New York Revenue | 1.070% | 1/1/19 (4) | 1,800 | 1,799 |
| 3 | Triborough Bridge & Tunnel Authority New York Revenue PUT | 0.653% | 11/1/16 | 9,105 | 9,105 |
| 3 | Triborough Bridge & Tunnel Authority New York Revenue PUT | 0.873% | 1/3/17 | 7,500 | 7,499 |
| 3 | Triborough Bridge & Tunnel Authority New York Revenue PUT | 0.753% | 2/1/19 | 10,350 | 10,252 |
| | Utility Debt Securitization Authority New York Revenue | 5.000% | 12/15/18 | 1,710 | 1,719 |
| | Westchester County NY GO | 5.000% | 1/1/19 | 500 | 544 |
| | Westchester County NY GO | 5.000% | 1/1/20 | 3,350 | 3,768 |
| | Westchester County NY GO | 5.000% | 1/1/21 | 1,550 | 1,798 |
| | Windsor Central School District BAN | 1.500% | 8/18/17 | 7,250 | 7,269 |
| | Yonkers NY GO | 4.000% | 3/15/17 (4) | 600 | 607 |
| | Yonkers NY GO | 3.000% | 7/1/17 | 1,005 | 1,018 |
| | Yonkers NY GO | 3.000% | 8/15/17 | 510 | 518 |
| | | | | | 2,198,353 |
| North Carolina (1.9%) | | | | |
| | Cape Fear NC Public Utility Authority Water & Sewer System Revenue | 5.000% | 8/1/19 | 2,750 | 3,048 |
| | Charlotte NC GO | 5.000% | 7/1/17 | 2,000 | 2,058 |
| | Charlotte NC GO | 5.000% | 12/1/17 | 5,335 | 5,581 |
| 2 | Charlotte NC GO | 3.000% | 7/1/18 | 3,015 | 3,123 |
| | Charlotte NC GO | 5.000% | 7/1/18 | 5,000 | 5,344 |
| | Charlotte NC GO | 5.000% | 12/1/18 | 4,000 | 4,341 |
| | Charlotte NC Water & Sewer System Revenue | 5.000% | 12/1/16 | 1,390 | 1,395 |
29
Short-Term Tax-Exempt Fund
| | | | |
| | | | Face | Market |
| | | Maturity | Amount | Value• |
| | Coupon | Date | ($000) | ($000) |
| Charlotte NC Water & Sewer System Revenue | 5.000% | 12/1/19 | 1,350 | 1,515 |
| 2 Charlotte-Mecklenburg NC Hospital Authority Health Care System Revenue | | | | |
| (Carolinas HealthCare System) | 4.000% | 1/15/18 | 4,105 | 4,249 |
| 2 Charlotte-Mecklenburg NC Hospital Authority Health Care System Revenue | | | | |
| (Carolinas HealthCare System) | 5.000% | 1/15/19 | 3,575 | 3,873 |
| East Carolina University North Carolina Revenue | 5.000% | 10/1/19 | 3,525 | 3,925 |
| East Carolina University North Carolina Revenue | 5.000% | 10/1/20 | 3,660 | 4,190 |
| Fayetteville NC Public Works Commission Revenue | 5.000% | 3/1/19 | 3,500 | 3,825 |
| Guilford County NC GO | 4.000% | 2/1/20 | 3,360 | 3,680 |
| 1 Johnston NC Memorial Hospital Authority Revenue TOB VRDO | 0.690% | 11/7/16 (4) | 4,920 | 4,920 |
| 1 Johnston NC Memorial Hospital Authority Revenue TOB VRDO | 0.700% | 11/7/16 (4) | 8,565 | 8,565 |
| Mecklenburg County NC GO | 5.000% | 8/1/18 | 4,000 | 4,289 |
| Mecklenburg County NC GO | 5.000% | 12/1/18 | 4,780 | 5,187 |
| Mecklenburg County NC GO | 5.000% | 3/1/19 | 5,000 | 5,471 |
| Mecklenburg County NC GO | 4.000% | 12/1/19 | 1,200 | 1,310 |
| New Hanover County NC Hospital Revenue (New Hanover Regional Medical Center Project) | 4.000% | 10/1/17 | 2,585 | 2,656 |
| New Hanover County NC Hospital Revenue (New Hanover Regional Medical Center Project) | 4.000% | 10/1/18 | 1,480 | 1,560 |
| North Carolina Capital Facilities Finance Agency Solid Waste Disposal Revenue | | | | |
| (Republic Services, Inc. Project) PUT | 0.700% | 12/1/16 | 27,500 | 27,500 |
| North Carolina Eastern Municipal Power Agency Power Systems Revenue | 5.000% | 1/1/17 (ETM) | 10,555 | 10,630 |
| North Carolina Eastern Municipal Power Agency Power Systems Revenue | 5.000% | 1/1/17 (ETM) | 5,000 | 5,036 |
| North Carolina Eastern Municipal Power Agency Power Systems Revenue | 5.000% | 1/1/19 (ETM) | 2,245 | 2,439 |
| North Carolina GO | 5.000% | 3/1/18 | 4,770 | 5,024 |
| North Carolina GO | 5.000% | 3/1/19 | 3,865 | 4,229 |
| North Carolina GO | 5.000% | 5/1/19 | 6,835 | 7,523 |
| North Carolina GO | 5.000% | 5/1/19 | 1,525 | 1,678 |
| North Carolina GO | 5.000% | 6/1/19 | 6,145 | 6,783 |
| North Carolina Medical Care Commission Health Care Facilities Revenue | | | | |
| (Cape Fear Valley Health System) | 4.000% | 10/1/17 | 3,725 | 3,826 |
| North Carolina Medical Care Commission Health Care Facilities Revenue | | | | |
| (Cape Fear Valley Health System) | 5.000% | 10/1/18 | 3,780 | 4,049 |
| 3 North Carolina Medical Care Commission Health Care Facilities Revenue | | | | |
| (Wake Forest Baptist Obligated Group) PUT | 1.370% | 12/1/17 | 7,960 | 7,940 |
| North Carolina Medical Care Commission Hospital Revenue (Moses Cone Health System) PUT | 0.980% | 5/30/17 | 12,625 | 12,625 |
| North Carolina Medical Care Commission Hospital Revenue | | | | |
| (Southeastern Regional Medical Center) | 4.000% | 6/1/17 | 620 | 631 |
| North Carolina Medical Care Commission Hospital Revenue | | | | |
| (Southeastern Regional Medical Center) | 4.000% | 6/1/18 | 500 | 522 |
| 2 North Carolina Medical Care Commission Retirement Facilities Revenue (Southminster Inc.) | 5.000% | 10/1/20 | 670 | 735 |
| Orange County NC Public Facilities Co. Revenue | 5.000% | 10/1/18 | 1,695 | 1,827 |
| Wake County NC GO | 4.000% | 2/1/17 | 6,440 | 6,494 |
| Wake County NC GO | 5.000% | 9/1/17 | 9,000 | 9,322 |
| Wake County NC GO | 5.000% | 2/1/18 | 16,090 | 16,931 |
| 2 Wake County NC GO | 5.000% | 3/1/18 | 17,300 | 18,262 |
| Wake County NC GO | 5.000% | 5/1/18 | 1,050 | 1,115 |
| 2 Wake County NC GO | 5.000% | 3/1/19 | 22,555 | 24,680 |
| | | | | 263,906 |
| North Dakota (0.0%) | | | | |
| 1 North Dakota Public Finance Authority Revenue TOB VRDO | 0.720% | 11/7/16 | 5,095 | 5,095 |
| |
| Ohio (1.5%) | | | | |
| Akron OH Income Tax Revenue (Packaging Facilities) | 5.000% | 12/1/17 | 2,875 | 3,003 |
| Akron OH Income Tax Revenue (Packaging Facilities) | 5.000% | 12/1/18 | 1,145 | 1,239 |
| Akron OH Income Tax Revenue (Packaging Facilities) | 5.000% | 12/1/19 | 1,590 | 1,776 |
| Alliance OH Hospital Revenue VRDO | 0.520% | 11/1/16 LOC | 1,200 | 1,200 |
| American Municipal Power Ohio Inc. Revenue | 5.250% | 2/15/18 (Prere.) | 1,595 | 1,685 |
| American Municipal Power Ohio Inc. Revenue (Fremont Energy Center Project) | 5.000% | 2/15/17 | 1,000 | 1,012 |
| American Municipal Power Ohio Inc. Revenue (Fremont Energy Center Project) | 5.000% | 2/15/18 | 1,480 | 1,556 |
| American Municipal Power Ohio Inc. Revenue (Prairie State Energy Campus Project) | 5.250% | 2/15/18 (Prere.) | 2,135 | 2,255 |
| American Municipal Power Ohio Inc. Revenue (Prairie State Energy Campus Project) PUT | 5.000% | 8/15/19 | 24,250 | 26,354 |
| Central Ohio Solid Waste Authority GO | 4.000% | 12/1/16 (ETM) | 150 | 150 |
| Central Ohio Solid Waste Authority GO | 4.000% | 12/1/16 | 1,550 | 1,554 |
| Central Ohio Solid Waste Authority GO | 4.000% | 12/1/17 (ETM) | 150 | 155 |
| Central Ohio Solid Waste Authority GO | 4.000% | 12/1/17 | 1,525 | 1,576 |
| Cleveland OH Airport System Revenue | 5.000% | 1/1/18 (4) | 340 | 356 |
| Cleveland OH Airport System Revenue | 5.000% | 1/1/19 (4) | 410 | 443 |
| Cleveland OH Airport System Revenue | 5.000% | 1/1/20 (4) | 430 | 478 |
| Cleveland-Cuyahoga County OH Port Authority Revenue | | | | |
| (Cleveland Museum of Art Project) VRDO | 0.640% | 11/7/16 | 1,935 | 1,935 |
30
Short-Term Tax-Exempt Fund
| | | | |
| | | | Face | Market |
| | | Maturity | Amount | Value• |
| | Coupon | Date | ($000) | ($000) |
| Columbus OH GO | 5.000% | 2/15/18 | 10,000 | 10,537 |
| Columbus OH GO | 5.000% | 8/15/18 | 1,250 | 1,342 |
| Cuyahoga County OH Excise Tax Revenue (Sports Facilities Improvement Project) | 3.000% | 12/1/17 | 470 | 480 |
| Cuyahoga County OH Excise Tax Revenue (Sports Facilities Improvement Project) | 5.000% | 12/1/18 | 1,000 | 1,079 |
| Dayton OH City School District GO | 4.000% | 11/1/16 | 3,000 | 3,000 |
| Fairfield County OH Hospital Facilities Revenue (Fairfield Medical Center) | 5.000% | 6/15/18 | 1,000 | 1,050 |
| Franklin County OH Hospital Facilities Revenue (OhioHealth Corp.) PUT | 5.000% | 7/12/17 | 7,615 | 7,832 |
| Franklin County OH Hospital Revenue (Nationwide Children’s Hospital Project) VRDO | 0.600% | 11/7/16 | 1,295 | 1,295 |
| Hamilton County OH Healthcare Revenue (Life Enriching Communities) | 4.000% | 1/1/18 | 280 | 288 |
| Hamilton County OH Healthcare Revenue (Life Enriching Communities) | 4.000% | 1/1/19 | 560 | 587 |
| Hamilton County OH Healthcare Revenue (Life Enriching Communities) | 4.000% | 1/1/20 | 575 | 611 |
| Hamilton County OH Hospital Facilities Revenue (UC Health) | 4.000% | 2/1/17 | 375 | 378 |
| Hamilton County OH Hospital Facilities Revenue (UC Health) | 4.000% | 2/1/18 | 525 | 543 |
| Hamilton County OH Sales Tax Revenue | 5.000% | 12/1/17 (2) | 1,150 | 1,154 |
| Hamilton County OH Sales Tax Revenue | 4.000% | 12/1/18 | 1,500 | 1,590 |
| Hamilton County OH Sales Tax Revenue | 5.000% | 12/1/18 | 2,900 | 3,135 |
| Hamilton County OH Sales Tax Revenue | 5.000% | 12/1/19 | 3,000 | 3,349 |
| 1 JobsOhio Beverage System Statewide Liquor Profits Revenue TOB VRDO | 0.840% | 11/7/16 | 23,200 | 23,200 |
| Lake County OH Hospital Facilities Revenue (Lake Hospital System Inc.) | 5.000% | 8/15/19 | 810 | 888 |
| 1 Montgomery County OH Revenue (Catholic Health Initiatives) TOB VRDO | 0.810% | 11/7/16 | 10,460 | 10,460 |
| 2 Newark OH BAN | 2.000% | 11/7/17 | 2,050 | 2,065 |
| Ohio Air Quality Development Authority Pollution Control Revenue | | | | |
| (FirstEnergy Generation Corp. Project) PUT | 3.100% | 3/1/19 | 3,000 | 2,744 |
| Ohio Common Schools GO | 5.000% | 3/15/18 | 10,860 | 11,480 |
| Ohio Higher Educational Facility Commission Revenue | | | | |
| (Cleveland Clinic Health System Obligated Group) VRDO | 0.470% | 11/1/16 | 4,700 | 4,700 |
| Ohio Higher Educational Facility Commission Revenue (University of Dayton Project) | 4.000% | 12/1/16 | 625 | 627 |
| Ohio Hospital Revenue (University Hospitals Health System Inc.) VRDO | 0.760% | 11/1/16 | 5,250 | 5,250 |
| Ohio Hospital Revenue (University Hospitals Health System Inc.) VRDO | 0.760% | 11/7/16 | 4,250 | 4,250 |
| Ohio Hospital Revenue (University Hospitals Health System Inc.) VRDO | 0.760% | 11/7/16 | 7,250 | 7,250 |
| Ohio Revitalization Revenue | 5.000% | 4/1/18 (Prere.) | 1,000 | 1,058 |
| 1 Ohio Water Development Authority Fresh Water Revenue TOB VRDO | 0.730% | 11/7/16 | 10,645 | 10,645 |
| Ohio Water Development Authority Pollution Control Revenue | | | | |
| (FirstEnergy Generation Corp. Project) | 3.000% | 5/15/19 | 10,540 | 9,484 |
| Ohio Water Development Authority Pollution Control Revenue (Water Quality) | 5.000% | 6/1/18 | 6,660 | 7,097 |
| Ohio Water Development Authority Pollution Control Revenue (Water Quality) | 5.000% | 12/1/18 | 3,880 | 4,209 |
| Ross County OH Hospital Facilities Revenue (Adena Health System) | 5.000% | 12/1/16 | 2,495 | 2,503 |
| Ross County OH Hospital Facilities Revenue (Adena Health System) | 5.250% | 12/1/17 | 2,215 | 2,307 |
| Ross County OH Hospital Facilities Revenue (Adena Health System) | 5.250% | 12/1/18 | 1,510 | 1,620 |
| Sandusky OH BAN | 2.000% | 10/5/17 | 1,500 | 1,512 |
| Scioto County OH Hospital Facilities Revenue (Southern Ohio Medical Center) | 3.000% | 2/15/17 | 770 | 775 |
| Scioto County OH Hospital Facilities Revenue (Southern Ohio Medical Center) | 5.000% | 2/15/18 | 750 | 787 |
| Toledo OH GO | 4.000% | 12/1/16 (4) | 535 | 536 |
| Toledo OH GO | 4.000% | 12/1/18 (4) | 1,880 | 1,986 |
| University of Akron Ohio General Receipts Revenue | 4.000% | 1/1/19 | 1,000 | 1,061 |
| University of Cincinnati Ohio General Receipts Revenue | 5.000% | 6/1/17 | 2,180 | 2,235 |
| Warren County OH Health Care Facilities Improvement Revenue (Otterbein Homes Project) | 5.000% | 7/1/18 | 1,555 | 1,652 |
| Wright State University Ohio General Revenue | 5.000% | 5/1/17 | 1,195 | 1,219 |
| | | | | 208,577 |
| Oklahoma (0.2%) | | | | |
| Cleveland County OK Educational Facilities Authority Lease Revenue | | | | |
| (Norman Public Schools Project) | 5.000% | 7/1/17 | 760 | 781 |
| Cleveland County OK Educational Facilities Authority Lease Revenue | | | | |
| (Norman Public Schools Project) | 5.000% | 7/1/18 | 1,325 | 1,411 |
| Cleveland County OK Educational Facilities Authority Lease Revenue | | | | |
| (Norman Public Schools Project) | 5.000% | 7/1/19 | 2,250 | 2,473 |
| Comanche County OK Hospital Authority Revenue | 5.000% | 7/1/18 | 2,990 | 3,114 |
| 2 Norman OK Regional Hospital Authority Revenue | 3.000% | 9/1/17 | 1,000 | 1,014 |
| 2 Norman OK Regional Hospital Authority Revenue | 4.000% | 9/1/18 | 1,000 | 1,046 |
| 2 Norman OK Regional Hospital Authority Revenue | 4.000% | 9/1/19 | 2,000 | 2,133 |
| 2 Norman OK Regional Hospital Authority Revenue | 5.000% | 9/1/20 | 1,170 | 1,310 |
| Oklahoma City OK GO | 4.000% | 3/1/18 | 2,480 | 2,585 |
| Oklahoma City OK GO | 4.000% | 3/1/19 | 2,775 | 2,972 |
| Oklahoma City OK GO | 5.000% | 3/1/19 | 4,080 | 4,461 |
| Oklahoma GO | 5.000% | 7/15/18 | 4,165 | 4,457 |
| Oklahoma GO | 5.000% | 7/15/18 | 1,480 | 1,584 |
| Oklahoma Water Resources Board Revolving Fund Revenue | 5.000% | 4/1/19 | 3,000 | 3,290 |
| | | | | 32,631 |
31
Short-Term Tax-Exempt Fund
| | | | | |
| | | | | Face | Market |
| | | | Maturity | Amount | Value• |
| | | Coupon | Date | ($000) | ($000) |
| Oregon (0.6%) | | | | |
| | Multnomah County OR School District GO | 5.000% | 6/15/17 | 10,000 | 10,269 |
| | Multnomah County OR School District GO | 5.000% | 6/15/18 | 10,000 | 10,666 |
| 3 | Oregon Facilities Authority Revenue (Providence Health & Services) PUT | 1.510% | 10/1/17 | 8,750 | 8,750 |
| | Oregon GO | 5.000% | 11/1/16 | 3,000 | 3,000 |
| | Oregon GO | 5.000% | 5/1/18 | 1,500 | 1,594 |
| | Oregon GO | 5.000% | 5/1/18 | 1,125 | 1,195 |
| | Oregon GO | 5.000% | 11/1/18 | 3,750 | 4,057 |
| | Oregon GO | 3.000% | 5/1/19 | 2,500 | 2,628 |
| | Oregon GO | 3.000% | 6/1/19 | 1,000 | 1,053 |
| | Oregon GO | 3.000% | 11/1/19 | 1,000 | 1,060 |
| | Oregon GO | 5.000% | 5/1/20 | 2,725 | 3,094 |
| | Oregon Health & Science University Revenue | 5.000% | 7/1/18 | 1,000 | 1,064 |
| | Tri-County Metropolitan Transportation District of Oregon Capital Grant Receipt Revenue | 4.000% | 11/1/17 | 9,820 | 9,983 |
| | Tri-County Metropolitan Transportation District of Oregon Capital Grant Receipt Revenue | 3.000% | 11/1/18 | 4,490 | 4,538 |
| | Tri-County Metropolitan Transportation District of Oregon Capital Grant Receipt Revenue | 5.000% | 11/1/18 | 13,520 | 13,802 |
| | Tri-County Metropolitan Transportation District of Oregon Capital Grant Receipt Revenue | 3.000% | 11/1/19 | 4,835 | 4,984 |
| 1 | Washington, Clackamas, & Yamhill County OR School District GO TOB VRDO | 0.790% | 11/7/16 LOC | 7,200 | 7,200 |
| | | | | | 88,937 |
| Pennsylvania (5.3%) | | | | |
| | Allegheny County PA Hospital Development Authority Revenue | | | | |
| | (University of Pittsburgh Medical Center) | 5.000% | 5/15/18 | 1,000 | 1,062 |
| | Allegheny County PA Hospital Development Authority Revenue | | | | |
| | (University of Pittsburgh Medical Center) | 1.227% | 2/1/21 | 7,190 | 7,182 |
| 1,3 | Allegheny County PA Hospital Development Authority Revenue | | | | |
| | (University of Pittsburgh Medical Center) TOB PUT | 0.830% | 12/1/16 LOC | 10,000 | 10,000 |
| 1,3 | Allegheny County PA Hospital Development Authority Revenue | | | | |
| | (University of Pittsburgh Medical Center) TOB PUT | 0.830% | 1/3/17 LOC | 10,255 | 10,255 |
| 1 | Allegheny County PA Hospital Development Authority Revenue | | | | |
| | (University of Pittsburgh Medical Center) TOB VRDO | 0.620% | 11/1/16 LOC | 31,300 | 31,300 |
| | Beaver County PA Industrial Development Authority Pollution Control Revenue | | | | |
| | (FirstEnergy Generation Project) PUT | 2.500% | 6/1/17 | 10,000 | 9,855 |
| 1 | Berks County PA Municipal Authority Revenue (Reading Hospital & Medical Center Project) | | | | |
| | TOB VRDO | 0.660% | 11/7/16 | 8,420 | 8,420 |
| 1 | Berks County PA Municipal Authority Revenue (Reading Hospital & Medical Center Project) | | | | |
| | TOB VRDO | 0.660% | 11/7/16 | 9,750 | 9,750 |
| 3 | Bethlehem PA Area School District Authority Revenue PUT | 0.800% | 1/1/18 | 3,995 | 3,988 |
| | Bethlehem PA Water Authority Revenue | 4.000% | 11/15/16 (15) | 1,525 | 1,527 |
| | Bethlehem PA Water Authority Revenue | 5.000% | 11/15/17 (15) | 650 | 676 |
| | Bethlehem PA Water Authority Revenue | 5.000% | 11/15/18 (15) | 500 | 537 |
| | Bucks County PA GO | 5.000% | 5/1/18 | 500 | 531 |
| | Bucks County PA GO | 5.000% | 5/1/19 | 1,500 | 1,649 |
| | Bucks County PA Water & Sewer Authority Water System Revenue | 1.500% | 6/1/17 (15) | 750 | 753 |
| | Bucks County PA Water & Sewer Authority Water System Revenue | 4.000% | 6/1/17 (15) | 885 | 901 |
| | Bucks County PA Water & Sewer Authority Water System Revenue | 2.000% | 6/1/18 (15) | 500 | 507 |
| | Bucks County PA Water & Sewer Authority Water System Revenue | 4.000% | 6/1/18 (15) | 1,025 | 1,071 |
| | Bucks County PA Water & Sewer Authority Water System Revenue | 4.000% | 6/1/19 (15) | 500 | 534 |
| | Butler County PA General Authority Revenue (North Allegheny School District Project) VRDO | 0.630% | 11/7/16 | 11,985 | 11,985 |
| | Clarion County PA Industrial Development Authority Revenue | | | | |
| | (Clarion University Foundation Inc. Student Housing Project) | 5.000% | 7/1/18 | 920 | 966 |
| | Clarion County PA Industrial Development Authority Revenue | | | | |
| | (Clarion University Foundation Inc. Student Housing Project) | 5.000% | 7/1/19 | 970 | 1,043 |
| | Dauphin County PA General Authority Health System Revenue (Pinnacle Health System Project) | 3.000% | 6/1/17 | 1,020 | 1,032 |
| | Dauphin County PA General Authority Health System Revenue (Pinnacle Health System Project) | 4.000% | 6/1/19 | 1,250 | 1,337 |
| | Delaware County PA GO | 5.000% | 10/1/19 | 3,000 | 3,346 |
| | Delaware County PA GO | 5.000% | 10/1/20 | 2,680 | 3,077 |
| | Delaware County PA Industrial Development Authority Solid Waste Revenue | | | | |
| | (Scott Paper Co.) VRDO | 0.670% | 11/7/16 | 4,000 | 4,000 |
| | Delaware River Port Authority Pennsylvania & New Jersey Revenue | 5.000% | 1/1/17 | 1,070 | 1,078 |
| 3 | Downingtown PA Area School District GO PUT | 1.330% | 5/1/19 | 5,075 | 5,081 |
| 3 | Hempfield PA School District GO PUT | 0.903% | 8/1/19 | 8,865 | 8,797 |
| | Hempfield PA School District GO VRDO | 0.873% | 8/1/19 | 1,905 | 1,889 |
| 1 | Lancaster County PA Hospital Authority Health System Revenue | | | | |
| | (Lancaster General Hospital Project) TOB VRDO | 0.660% | 11/7/16 | 3,465 | 3,465 |
| | Lancaster County PA Solid Waste Management Authority Solid Waste Disposal System Revenue | 2.500% | 12/15/17 | 3,075 | 3,130 |
| | Lehigh County PA General Purpose Hospital Authority Revenue (Lehigh Valley Health Network) | 4.000% | 7/1/18 | 600 | 629 |
| | Lehigh County PA General Purpose Hospital Authority Revenue (Lehigh Valley Health Network) | 5.000% | 7/1/19 | 500 | 550 |
| | Lehigh County PA General Purpose Hospital Authority Revenue (Lehigh Valley Health Network) | 5.000% | 7/1/20 | 820 | 926 |
| | Lower Merion PA School District GO | 4.000% | 9/15/17 | 565 | 581 |
32
Short-Term Tax-Exempt Fund
| | | | |
| | | | Face | Market |
| | | Maturity | Amount | Value• |
| | Coupon | Date | ($000) | ($000) |
| Lower Merion PA School District GO | 4.000% | 9/15/18 | 3,670 | 3,882 |
| Lower Merion PA School District GO | 5.000% | 9/15/19 | 4,535 | 5,050 |
| 3 Manheim Township PA School District GO | 0.639% | 5/1/17 | 1,400 | 1,396 |
| 3 Manheim Township PA School District GO PUT | 0.759% | 5/1/18 | 6,850 | 6,777 |
| 2 Monroe County PA Hospital Authority Revenue (Pocono Medical Center) | 3.000% | 1/1/17 | 1,000 | 1,002 |
| 2 Monroe County PA Hospital Authority Revenue (Pocono Medical Center) | 4.000% | 7/1/18 | 1,100 | 1,147 |
| Montgomery County PA GO | 5.000% | 4/1/19 | 1,840 | 2,015 |
| Montgomery County PA GO VRDO | 0.480% | 11/1/16 | 8,350 | 8,350 |
| Montgomery County PA Higher Education & Health Authority Hospital Revenue | | | | |
| (Abington Memorial Hospital) | 5.000% | 6/1/19 | 1,000 | 1,094 |
| Montgomery County PA Higher Education & Health Authority Revenue | | | | |
| (Holy Redeemer Health System) | 4.000% | 10/1/18 | 1,000 | 1,046 |
| Montgomery County PA Higher Education & Health Authority Revenue | | | | |
| (Holy Redeemer Health System) | 4.000% | 10/1/19 | 500 | 533 |
| Montgomery County PA Industrial Development Authority Health Services Revenue | | | | |
| (Albert Einstein Healthcare Network) | 5.000% | 1/15/18 | 1,000 | 1,042 |
| Montgomery County PA Industrial Development Authority Health Services Revenue | | | | |
| (Albert Einstein Healthcare Network) | 5.000% | 1/15/19 | 1,500 | 1,605 |
| Montgomery County PA Industrial Development Authority Pollution Control Revenue | | | | |
| (Exelon Generation Co., LLC) PUT | 2.500% | 4/1/20 | 8,000 | 8,061 |
| Montgomery County PA Industrial Development Authority Pollution Control Revenue | | | | |
| (Exelon Generation Co., LLC) PUT | 2.500% | 4/1/20 | 5,000 | 5,038 |
| Montgomery County PA Industrial Development Authority Revenue | | | | |
| (New Regional Medical Center Project) | 5.000% | 2/1/17 (ETM) | 995 | 1,006 |
| 1 Mount Lebanon PA School District GO TOB VRDO | 0.770% | 11/7/16 | 15,500 | 15,500 |
| 3 North Penn PA Water Authority Revenue | 0.623% | 11/1/17 | 1,100 | 1,098 |
| 3 North Penn PA Water Authority Revenue | 0.703% | 11/1/18 | 700 | 696 |
| 3 North Penn PA Water Authority Revenue PUT | 0.853% | 11/1/19 | 2,500 | 2,485 |
| Northampton County PA General Purpose Authority Hospital Revenue | | | | |
| (St. Luke’s Hospital Project) | 4.000% | 8/15/19 | 940 | 1,006 |
| Northampton County PA General Purpose Authority Hospital Revenue | | | | |
| (St. Luke’s Hospital Project) | 5.000% | 8/15/20 | 1,000 | 1,128 |
| 3 Northampton County PA General Purpose Authority Hospital Revenue | | | | |
| (St. Luke’s Hospital Project) PUT | 2.030% | 8/15/20 | 8,125 | 8,133 |
| Northampton County PA General Purpose Authority University Revenue | | | | |
| (Lafayette College) VRDO | 0.650% | 11/7/16 | 6,790 | 6,790 |
| Pennsylvania Economic Development Financing Authority Solid Waste Disposal Revenue | | | | |
| (Republic Services Inc. Project) PUT | 1.000% | 1/3/17 | 2,360 | 2,360 |
| Pennsylvania Economic Development Financing Authority Unemployment Compensation Revenue | 5.000% | 7/1/18 | 6,545 | 6,990 |
| Pennsylvania Economic Development Financing Authority Unemployment Compensation Revenue | 5.000% | 7/1/19 | 4,830 | 5,336 |
| Pennsylvania Economic Development Financing Authority Unemployment Compensation Revenue | 5.000% | 1/1/20 | 1,090 | 1,206 |
| Pennsylvania Economic Development Financing Authority Unemployment Compensation Revenue | 5.000% | 7/1/20 | 5,170 | 5,718 |
| Pennsylvania Economic Development Financing Authority Unemployment Compensation Revenue | 5.000% | 1/1/22 | 8,000 | 8,226 |
| Pennsylvania Economic Development Financing Authority Unemployment Compensation Revenue | 5.000% | 7/1/22 | 11,130 | 11,245 |
| Pennsylvania GO | 5.000% | 4/1/17 | 11,150 | 11,351 |
| Pennsylvania GO | 5.000% | 4/1/18 | 35,410 | 37,392 |
| Pennsylvania GO | 5.000% | 7/1/18 | 2,675 | 2,850 |
| Pennsylvania GO | 5.000% | 8/15/18 | 15,170 | 16,230 |
| Pennsylvania GO | 5.000% | 8/15/18 | 48,540 | 51,931 |
| Pennsylvania Higher Educational Facilities Authority Revenue | | | | |
| (Foundation for Indiana University of Pennsylvania Student Housing) | 1.017% | 7/1/17 (10) | 1,020 | 1,017 |
| Pennsylvania Higher Educational Facilities Authority Revenue | | | | |
| (Slippery Rock University Foundation) | 5.000% | 7/1/17 (Prere.) | 5,000 | 5,141 |
| Pennsylvania Higher Educational Facilities Authority Revenue | | | | |
| (University of Pennsylvania Health System) | 5.000% | 8/15/17 | 7,000 | 7,230 |
| Pennsylvania Higher Educational Facilities Authority Revenue (York College) PUT | 1.000% | 5/1/17 | 1,300 | 1,300 |
| Pennsylvania State University Revenue | 4.000% | 9/1/17 | 785 | 806 |
| Pennsylvania State University Revenue | 4.000% | 9/1/17 | 1,680 | 1,726 |
| Pennsylvania State University Revenue | 5.000% | 9/1/18 | 815 | 875 |
| Pennsylvania State University Revenue | 5.000% | 9/1/18 | 2,850 | 3,061 |
| Pennsylvania State University Revenue | 5.000% | 9/1/19 | 500 | 555 |
| Pennsylvania State University Revenue | 5.000% | 9/1/19 | 4,200 | 4,664 |
| Pennsylvania Turnpike Commission Oil Franchise Tax Revenue | 5.000% | 12/1/18 | 1,250 | 1,348 |
| Pennsylvania Turnpike Commission Oil Franchise Tax Revenue | 5.000% | 12/1/19 | 1,260 | 1,401 |
| Pennsylvania Turnpike Commission Revenue | 5.000% | 12/1/16 | 3,150 | 3,161 |
| 3 Pennsylvania Turnpike Commission Revenue | 0.969% | 12/1/17 | 59,405 | 59,363 |
| 3 Pennsylvania Turnpike Commission Revenue | 1.080% | 12/1/17 | 15,000 | 14,965 |
| 3 Pennsylvania Turnpike Commission Revenue | 1.230% | 12/1/17 | 10,405 | 10,400 |
| Pennsylvania Turnpike Commission Revenue | 5.000% | 6/1/18 (12) | 2,650 | 2,814 |
| 3 Pennsylvania Turnpike Commission Revenue | 1.069% | 12/1/18 | 16,940 | 16,912 |
33
Short-Term Tax-Exempt Fund
| | | | |
| | | | Face | Market |
| | | Maturity | Amount | Value• |
| | Coupon | Date | ($000) | ($000) |
| 3 Pennsylvania Turnpike Commission Revenue | 1.230% | 12/1/18 | 8,750 | 8,723 |
| Pennsylvania Turnpike Commission Revenue | 5.000% | 6/1/19 | 1,320 | 1,447 |
| Pennsylvania Turnpike Commission Revenue | 5.000% | 6/1/20 | 18,520 | 20,856 |
| 3 Pennsylvania Turnpike Commission Revenue PUT | 1.430% | 12/1/18 | 6,500 | 6,500 |
| 1 Pennsylvania Turnpike Commission Revenue TOB VRDO | 0.750% | 11/7/16 (12) | 3,245 | 3,245 |
| Philadelphia PA Authority for Industrial Development Revenue (Cultural & Commercial Corridors) | 4.000% | 12/1/17 | 4,190 | 4,310 |
| Philadelphia PA Authority for Industrial Development Revenue (Temple University) | 5.000% | 4/1/18 | 1,615 | 1,704 |
| Philadelphia PA Authority for Industrial Development Revenue (Temple University) | 5.000% | 4/1/19 | 1,650 | 1,799 |
| Philadelphia PA Gas Works Revenue | 5.000% | 10/1/17 (Prere.) | 2,645 | 2,748 |
| Philadelphia PA Gas Works Revenue | 5.000% | 10/1/17 | 4,500 | 4,664 |
| Philadelphia PA Gas Works Revenue | 5.375% | 7/1/18 (ETM) | 2,775 | 2,980 |
| Philadelphia PA Gas Works Revenue | 5.000% | 10/1/18 (2) | 2,355 | 2,441 |
| Philadelphia PA Gas Works Revenue | 5.000% | 10/1/18 | 7,500 | 8,035 |
| Philadelphia PA Gas Works Revenue | 5.000% | 10/1/19 | 6,500 | 7,169 |
| Philadelphia PA Gas Works Revenue | 5.000% | 10/1/20 | 3,500 | 3,954 |
| Philadelphia PA Hospitals & Higher Education Facilities Authority Hospital Revenue | | | | |
| (Children’s Hospital of Philadelphia Project) VRDO | 0.520% | 11/1/16 | 2,100 | 2,100 |
| 2 Philadelphia PA School District GO | 5.000% | 9/1/17 | 1,000 | 1,027 |
| Philadelphia PA School District GO | 5.000% | 9/1/17 | 5,095 | 5,236 |
| 2 Philadelphia PA School District GO | 5.000% | 9/1/18 | 1,000 | 1,057 |
| Philadelphia PA School District GO | 5.000% | 9/1/18 | 6,400 | 6,773 |
| 2 Philadelphia PA School District GO | 5.000% | 9/1/19 | 1,750 | 1,895 |
| 2 Philadelphia PA School District GO | 5.000% | 9/1/19 | 1,750 | 1,895 |
| 2 Philadelphia PA School District GO | 5.000% | 9/1/20 | 2,975 | 3,287 |
| 2 Philadelphia PA School District GO | 5.000% | 9/1/20 | 4,000 | 4,420 |
| Philadelphia PA TRAN | 2.000% | 6/30/17 | 19,270 | 19,416 |
| Philadelphia PA Water & Waste Water Revenue VRDO | 0.600% | 11/7/16 LOC | 10,000 | 10,000 |
| 1 Southcentral Pennsylvania General Authority Revenue | | | | |
| (WellSpan Health Obligated Group) TOB VRDO | 0.670% | 11/7/16 | 9,710 | 9,710 |
| State Public School Building Authority Pennsylvania College Revenue | | | | |
| (Delaware County Community College Project) | 5.000% | 10/1/18 (15) | 500 | 537 |
| 2 State Public School Building Authority Pennsylvania Lease Revenue | | | | |
| (School District of Philadelphia) | 5.000% | 6/1/17 | 2,250 | 2,294 |
| Swarthmore Borough PA Authority College Revenue (Swarthmore College) | 5.000% | 9/15/19 | 3,395 | 3,780 |
| Swarthmore Borough PA Authority College Revenue (Swarthmore College) | 5.000% | 9/15/20 | 3,515 | 4,034 |
| 3 University Area Joint Authority Pennsylvania Sewer Revenue PUT | 1.030% | 11/1/17 | 2,900 | 2,897 |
| West Chester University Pennsylvania Student Housing Revenue BAN | 0.650% | 2/1/17 | 8,700 | 8,697 |
| West Shore PA Area Authority Revenue (Messiah Lifeways Obligated Group) | 4.000% | 7/1/19 | 1,685 | 1,774 |
| 3 York County PA GO PUT | 0.659% | 6/1/17 | 31,555 | 31,524 |
| | | | | 739,792 |
| Rhode Island (0.3%) | | | | |
| Rhode Island Health & Educational Building Corp. Hospital Financing Revenue | | | | |
| (Care New England Health System Obligated Group) | 5.000% | 9/1/17 (ETM) | 2,640 | 2,732 |
| Rhode Island Health & Educational Building Corp. Hospital Financing Revenue | | | | |
| (Care New England Health System Obligated Group) | 5.000% | 9/1/18 | 2,990 | 3,141 |
| Rhode Island Health & Educational Building Corp. Hospital Financing Revenue | | | | |
| (Care New England Health System Obligated Group) | 5.000% | 9/1/18 (ETM) | 1,325 | 1,420 |
| Rhode Island Health & Educational Building Corp. Hospital Financing Revenue | | | | |
| (Lifespan Obligated Group) | 5.000% | 5/15/17 | 14,715 | 15,028 |
| Rhode Island Health & Educational Building Corp. Hospital Financing Revenue | | | | |
| (Lifespan Obligated Group) | 5.000% | 5/15/18 | 1,250 | 1,322 |
| Rhode Island Health & Educational Building Corp. Hospital Financing Revenue | | | | |
| (Lifespan Obligated Group) | 5.000% | 5/15/19 | 1,760 | 1,916 |
| Rhode Island Health & Educational Building Corp. Hospital Financing Revenue | | | | |
| (Lifespan Obligated Group) | 5.000% | 5/15/20 | 1,500 | 1,676 |
| Rhode Island Health & Educational Building Corp. Providence Public Schools Revenue | | | | |
| (Providence Public Buildings Authority) | 3.000% | 5/15/17 (4) | 1,815 | 1,834 |
| Rhode Island Health & Educational Building Corp. Providence Public Schools Revenue | | | | |
| (Providence Public Buildings Authority) | 4.000% | 5/15/17 | 2,000 | 2,031 |
| Rhode Island Health & Educational Building Corp. Providence Public Schools Revenue | | | | |
| (Providence Public Buildings Authority) | 3.000% | 5/15/18 (4) | 5,535 | 5,679 |
| Rhode Island Health & Educational Building Corp. Providence Public Schools Revenue | | | | |
| (Providence Public Buildings Authority) | 5.000% | 5/15/18 | 1,500 | 1,586 |
| | | | | 38,365 |
| South Carolina (0.9%) | | | | |
| 3 Charleston SC Waterworks & Sewer Capital Improvement Revenue PUT | 1.042% | 1/1/18 | 8,770 | 8,762 |
| Kershaw County SC Public Schools Foundation Installment Purchase Revenue | 5.000% | 12/1/18 | 700 | 752 |
| Kershaw County SC Public Schools Foundation Installment Purchase Revenue | 5.000% | 12/1/19 | 1,000 | 1,105 |
| Lexington County SC Health Services District Inc. Hospital Revenue | 5.000% | 11/1/16 | 1,750 | 1,750 |
34
Short-Term Tax-Exempt Fund
| | | | |
| | | | Face | Market |
| | | Maturity | Amount | Value• |
| | Coupon | Date | ($000) | ($000) |
| Myrtle Beach SC Tax Increase Revenue (Myrtle Beach Air Force Base Redevelopment Project) | 5.000% | 10/1/20 | 1,000 | 1,131 |
| Richland County SC School District No. 2 GO | 5.000% | 4/1/19 | 5,525 | 6,059 |
| South Carolina Association of Governmental Organizations COP | 2.000% | 3/1/17 | 47,500 | 47,710 |
| South Carolina Association of Governmental Organizations Educational Facilities Corp. Revenue | | | | |
| (Pickens School District) | 5.000% | 12/1/16 | 1,300 | 1,305 |
| South Carolina Association of Governmental Organizations Educational Facilities Corp. Revenue | | | | |
| (Pickens School District) | 5.000% | 12/1/17 | 2,305 | 2,405 |
| South Carolina Association of Governmental Organizations Educational Facilities Corp. Revenue | | | | |
| (Pickens School District) | 5.000% | 12/1/18 | 1,000 | 1,080 |
| South Carolina GO | 4.000% | 4/1/17 | 2,520 | 2,555 |
| South Carolina GO | 5.000% | 4/1/17 | 1,880 | 1,914 |
| South Carolina GO | 5.000% | 4/1/18 | 635 | 672 |
| South Carolina GO | 5.000% | 4/1/18 | 765 | 810 |
| South Carolina GO | 5.000% | 4/1/18 | 1,975 | 2,091 |
| South Carolina GO | 4.000% | 4/1/19 | 1,170 | 1,256 |
| South Carolina GO | 5.000% | 4/1/19 | 805 | 883 |
| South Carolina GO | 5.000% | 4/1/19 | 2,520 | 2,766 |
| South Carolina GO | 5.000% | 4/1/19 | 745 | 818 |
| South Carolina GO | 5.000% | 4/1/19 | 665 | 730 |
| South Carolina GO | 5.000% | 4/1/19 | 2,610 | 2,864 |
| South Carolina GO | 4.000% | 4/1/20 | 1,535 | 1,689 |
| South Carolina GO | 5.000% | 8/1/20 | 10,000 | 11,455 |
| South Carolina Jobs Economic Development Authority Hospital Revenue (Palmetto Health) | 5.000% | 8/1/17 | 650 | 669 |
| South Carolina Jobs Economic Development Authority Hospital Revenue (Palmetto Health) | 5.000% | 8/1/18 | 870 | 926 |
| South Carolina Public Service Authority Revenue | 5.500% | 1/1/19 (Prere.) | 7,205 | 7,888 |
| 1 South Carolina Public Service Authority Revenue TOB VRDO | 0.720% | 11/7/16 | 6,525 | 6,525 |
| Sumter Two School Facilities Inc. South Carolina Installment Purchase Revenue | 4.000% | 12/1/17 (15) | 675 | 696 |
| Sumter Two School Facilities Inc. South Carolina Installment Purchase Revenue | 4.000% | 12/1/18 (15) | 1,715 | 1,809 |
| | | | | 121,075 |
| South Dakota (0.0%) | | | | |
| South Dakota Health & Educational Facilities Authority Revenue (Sanford Health) | 2.000% | 11/1/16 | 410 | 410 |
| South Dakota Health & Educational Facilities Authority Revenue (Sanford Health) | 3.000% | 11/1/16 | 500 | 500 |
| South Dakota Health & Educational Facilities Authority Revenue (Sanford Health) | 3.000% | 11/1/17 | 450 | 459 |
| South Dakota Health & Educational Facilities Authority Revenue (Sanford Health) | 3.000% | 11/1/17 | 500 | 510 |
| South Dakota Health & Educational Facilities Authority Revenue (Sanford Health) | 3.000% | 11/1/18 | 500 | 519 |
| South Dakota Health & Educational Facilities Authority Revenue (Sanford Health) | 4.000% | 11/1/18 | 675 | 714 |
| South Dakota Health & Educational Facilities Authority Revenue (Sanford Health) | 4.000% | 11/1/19 | 395 | 428 |
| South Dakota Health & Educational Facilities Authority Revenue (Sanford Health) | 5.000% | 11/1/19 | 600 | 666 |
| | | | | 4,206 |
| Tennessee (1.1%) | | | | |
| 1 Blount County TN Public Building Authority Revenue TOB VRDO | 0.640% | 11/7/16 LOC | 13,485 | 13,485 |
| Chattanooga TN Electric System Revenue | 5.000% | 9/1/18 | 2,375 | 2,552 |
| Jackson TN Hospital Improvement Revenue (Jackson-Madison County General Hospital Project) | 3.000% | 4/1/17 | 2,130 | 2,148 |
| Jackson TN Hospital Improvement Revenue (Jackson-Madison County General Hospital Project) | 4.000% | 4/1/18 | 2,000 | 2,082 |
| Knox County TN Health Educational & Housing Facilities Board Hospital Facilities Revenue | | | | |
| (Covenant Healthcare) | 5.000% | 1/1/19 | 2,925 | 3,157 |
| 2 Knox County TN Health Educational & Housing Facilities Board Hospital Facilities Revenue | | | | |
| (University Health System Inc.) | 5.000% | 9/1/19 | 385 | 421 |
| 2 Knox County TN Health Educational & Housing Facilities Board Hospital Facilities Revenue | | | | |
| (University Health System Inc.) | 5.000% | 9/1/20 | 1,000 | 1,123 |
| Memphis TN Electric System Revenue | 5.000% | 12/1/17 | 5,230 | 5,470 |
| Memphis TN GO | 5.000% | 11/1/19 | 4,720 | 5,274 |
| Metropolitan Government of Nashville & Davidson County TN GO | 5.500% | 7/1/19 | 13,640 | 15,255 |
| 2 Metropolitan Government of Nashville & Davidson County TN Health & | | | | |
| Educational Facilities Board Revenue (Ascension Health Credit Group) PUT | 1.550% | 11/3/20 | 11,500 | 11,519 |
| 1 Metropolitan Government of Nashville & Davidson County TN Health & | | | | |
| Educational Facilities Board Revenue (Vanderbilt University) TOB VRDO | 0.660% | 11/7/16 | 9,900 | 9,900 |
| Metropolitan Government of Nashville & Davidson County TN Water & Sewer Revenue | 5.000% | 7/1/17 | 5,500 | 5,655 |
| Montgomery County TN Public Building Auth. Pooled Financial Rev. | | | | |
| (Tennessee County Loan Pool) VRDO | 0.590% | 11/1/16 LOC | 3,000 | 3,000 |
| Montgomery County TN Public Building Authority Pooled Financial Revenue | | | | |
| (Tennessee County Loan Pool) VRDO | 0.590% | 11/1/16 LOC | 2,100 | 2,100 |
| Murfreesboro TN GO | 5.000% | 6/1/19 | 2,160 | 2,382 |
| Shelby County TN GO | 4.000% | 4/1/18 | 600 | 627 |
| Shelby County TN GO | 5.000% | 4/1/18 | 4,085 | 4,325 |
| Shelby County TN GO | 5.000% | 4/1/18 | 7,060 | 7,475 |
| Shelby County TN GO | 5.000% | 4/1/19 | 750 | 822 |
| Shelby County TN Health Educational & Housing Facility Board Revenue | | | | |
| (Methodist Le Bonheur Healthcare) VRDO | 0.520% | 11/1/16 (4) | 2,500 | 2,500 |
35
Short-Term Tax-Exempt Fund
| | | | |
| | | | Face | Market |
| | | Maturity | Amount | Value• |
| | Coupon | Date | ($000) | ($000) |
| Tennessee Energy Acquisition Corp. Gas Revenue | 5.000% | 2/1/17 | 5,000 | 5,047 |
| Tennessee Energy Acquisition Corp. Gas Revenue | 5.250% | 9/1/17 | 3,165 | 3,268 |
| Tennessee Energy Acquisition Corp. Gas Revenue | 5.000% | 2/1/18 | 5,150 | 5,380 |
| Tennessee Energy Acquisition Corp. Gas Revenue | 5.000% | 2/1/19 | 8,815 | 9,487 |
| Tennessee Energy Acquisition Corp. Gas Revenue | 5.250% | 9/1/19 | 15,000 | 16,537 |
| Tennessee GO | 5.000% | 10/1/18 | 1,030 | 1,111 |
| Tennessee GO | 5.000% | 8/1/19 | 8,125 | 9,021 |
| Williamson County TN GO | 5.000% | 4/1/19 | 4,070 | 4,470 |
| | | | | 155,593 |
| Texas (14.6%) | | | | |
| Aldine TX Independent School District GO | 4.000% | 2/15/18 | 1,755 | 1,825 |
| Aldine TX Independent School District GO | 5.000% | 2/15/19 | 2,320 | 2,529 |
| Arlington TX Independent School District GO | 4.000% | 2/15/18 | 1,375 | 1,430 |
| Arlington TX Independent School District GO | 4.000% | 2/15/19 | 1,225 | 1,308 |
| Arlington TX Independent School District GO | 5.000% | 2/15/20 | 1,200 | 1,351 |
| Austin TX Community College District Public Facilities Corp. Lease Revenue | 5.000% | 8/1/18 | 500 | 533 |
| Austin TX GO | 5.000% | 9/1/19 | 1,250 | 1,389 |
| Bexar County TX GO | 5.000% | 6/15/20 | 7,840 | 8,894 |
| Bexar County TX GO | 5.000% | 6/15/20 | 2,595 | 2,944 |
| Board of Regents of the Texas A&M University System Revenue Financing System Revenue | 4.000% | 5/15/17 | 4,500 | 4,581 |
| Board of Regents of the Texas A&M University System Revenue Financing System Revenue | 4.000% | 5/15/17 | 2,000 | 2,036 |
| Brazosport TX Independent School District GO | 5.000% | 2/15/19 | 5,690 | 6,203 |
| Brownsville TX Utility System Revenue | 5.000% | 9/1/18 | 2,250 | 2,410 |
| Carrollton-Farmers Branch TX Independent School District GO | 3.000% | 2/15/18 | 7,800 | 8,005 |
| Central Texas Regional Mobility Authority Revenue | 5.000% | 1/1/17 | 500 | 503 |
| Central Texas Regional Mobility Authority Revenue | 5.000% | 1/1/18 | 500 | 523 |
| Central Texas Regional Mobility Authority Revenue PUT | 5.000% | 1/7/21 | 5,500 | 6,109 |
| Coastal Bend TX Health Facilities Development Corp. Hospital Revenue (CHRISTUS Health) | 0.880% | 11/3/16 (4) | 24,350 | 24,350 |
| Conroe TX Independent School District GO | 5.000% | 2/15/19 | 3,345 | 3,646 |
| Conroe TX Independent School District GO | 5.000% | 2/15/20 | 2,230 | 2,510 |
| Cypress-Fairbanks TX Independent School District GO PUT | 0.900% | 8/15/18 | 7,590 | 7,544 |
| Cypress-Fairbanks TX Independent School District GO PUT | 3.000% | 8/15/18 | 9,865 | 10,193 |
| Cypress-Fairbanks TX Independent School District GO PUT | 4.000% | 8/15/19 | 19,290 | 20,753 |
| Dallas TX Area Rapid Transit Sales Tax Revenue | 5.000% | 12/1/16 (Prere.) | 1,250 | 1,254 |
| Dallas TX Area Rapid Transit Sales Tax Revenue | 5.250% | 12/1/18 (Prere.) | 12,000 | 13,078 |
| Dallas TX GO | 5.000% | 2/15/17 | 4,150 | 4,203 |
| Dallas TX GO | 5.000% | 2/15/18 | 3,250 | 3,422 |
| Dallas TX GO | 5.000% | 2/15/19 | 6,215 | 6,776 |
| Dallas TX GO | 5.000% | 2/15/19 | 8,565 | 9,339 |
| Dallas TX GO | 5.000% | 2/15/20 | 1,245 | 1,402 |
| Dallas TX GO | 5.000% | 2/15/20 | 7,165 | 8,068 |
| Dallas TX Independent School District GO | 5.000% | 2/15/19 | 5,500 | 6,001 |
| Dallas TX Independent School District GO PUT | 3.000% | 2/15/17 | 7,000 | 7,045 |
| Dallas TX Independent School District GO PUT | 1.500% | 8/15/18 | 24,500 | 24,645 |
| Dallas TX Independent School District GO PUT | 5.000% | 2/15/19 | 14,000 | 15,206 |
| Dallas TX Independent School District GO PUT | 5.000% | 2/15/20 | 12,500 | 13,984 |
| Dallas TX Waterworks & Sewer System Revenue | 5.000% | 10/1/20 | 3,000 | 3,444 |
| Dallas-Fort Worth TX International Airport Revenue | 5.000% | 11/1/21 | 2,000 | 2,000 |
| Denton County TX GO | 4.000% | 7/15/19 | 1,250 | 1,349 |
| Denton County TX GO | 5.000% | 7/15/20 | 1,100 | 1,254 |
| Denton TX Independent School District GO | 5.000% | 8/15/18 | 3,450 | 3,700 |
| Denton TX Independent School District GO PUT | 2.000% | 8/1/18 | 4,855 | 4,928 |
| Eagle Mountain & Saginaw TX Independent School District GO | 5.000% | 8/15/19 | 1,435 | 1,591 |
| Eagle Mountain & Saginaw TX Independent School District GO PUT | 2.000% | 8/1/19 | 9,000 | 9,194 |
| El Paso TX GO | 5.000% | 8/15/18 | 5,000 | 5,353 |
| El Paso TX GO | 5.000% | 8/15/19 | 3,500 | 3,871 |
| El Paso TX Water & Sewer Revenue | 3.000% | 3/1/17 | 2,045 | 2,061 |
| El Paso TX Water & Sewer Revenue | 4.000% | 3/1/18 | 1,500 | 1,562 |
| El Paso TX Water & Sewer Revenue | 4.000% | 3/1/19 | 1,000 | 1,068 |
| El Paso TX Water & Sewer Revenue | 4.000% | 3/1/19 | 1,475 | 1,575 |
| Fort Bend County TX GO | 5.000% | 3/1/19 | 2,000 | 2,182 |
| Fort Bend TX Independent School District GO PUT | 2.000% | 8/1/17 | 14,715 | 14,835 |
| Fort Bend TX Independent School District GO PUT | 0.900% | 8/1/18 | 5,500 | 5,478 |
| Fort Worth TX GO | 4.000% | 3/1/18 | 5,080 | 5,291 |
| Fort Worth TX GO | 5.000% | 3/1/19 | 5,000 | 5,460 |
| Fort Worth TX Independent School District GO | 5.000% | 2/15/18 | 1,815 | 1,911 |
| Fort Worth TX Water & Sewer Revenue | 5.000% | 2/15/20 | 4,005 | 4,510 |
| Friendswood TX Independent School District GO | 5.000% | 2/15/19 | 1,810 | 1,972 |
| Frisco TX GO | 4.000% | 2/15/18 | 6,270 | 6,520 |
36
Short-Term Tax-Exempt Fund
| | | | |
| | | | Face | Market |
| | | Maturity | Amount | Value• |
| | Coupon | Date | ($000) | ($000) |
| Frisco TX GO | 4.000% | 2/15/19 | 7,650 | 8,165 |
| Frisco TX GO | 5.000% | 2/15/20 | 8,435 | 9,480 |
| Garland TX GO | 5.000% | 2/15/18 | 10,730 | 11,299 |
| Garland TX GO | 5.000% | 2/15/19 | 3,000 | 3,270 |
| 2 Garland TX Independent School District GO | 2.000% | 2/15/17 | 6,070 | 6,094 |
| 2 Garland TX Independent School District GO | 4.000% | 2/15/18 | 13,005 | 13,524 |
| Georgetown TX Independent School District GO PUT | 2.500% | 8/1/17 | 9,345 | 9,456 |
| Grand Parkway Transportation Corp. Texas System Toll Revenue BAN | 3.000% | 12/15/16 | 195,465 | 195,930 |
| Grand Prairie TX Independent School District GO | 5.000% | 2/15/18 | 1,135 | 1,195 |
| Grand Prairie TX Independent School District GO | 5.000% | 2/15/19 | 2,420 | 2,638 |
| 1 Grapevine-Colleyville TX Independent School District GO TOB PUT | 0.700% | 11/3/16 | 22,090 | 22,090 |
| Harlandale TX Independent School District GO PUT | 2.000% | 8/15/18 | 25,000 | 25,373 |
| Harris County TX Cultural Education Facilities Finance Corp. Revenue (Texas Children’s Hospital) | 5.000% | 10/1/17 | 3,500 | 3,631 |
| Harris County TX Cultural Education Facilities Finance Corp. Revenue (Texas Children’s Hospital) | 5.000% | 10/1/18 | 2,000 | 2,150 |
| Harris County TX GO | 5.000% | 10/1/18 | 3,675 | 3,960 |
| Harris County TX GO | 5.000% | 10/1/18 | 2,800 | 3,017 |
| Harris County TX GO | 5.000% | 10/1/19 | 1,550 | 1,728 |
| Harris County TX GO | 5.000% | 8/15/20 | 4,250 | 4,859 |
| Harris County TX GO | 5.000% | 10/1/20 | 4,635 | 5,317 |
| Harris County TX GO | 5.000% | 10/1/20 | 3,005 | 3,447 |
| Harris County TX Health Facilities Development Corp. Hospital Revenue (CHRISTUS Health) | 0.890% | 11/3/16 (4) | 19,475 | 19,475 |
| Harris County TX Health Facilities Development Corp. Hospital Revenue (CHRISTUS Health) | 0.890% | 11/3/16 (4) | 10,600 | 10,600 |
| Harris County TX Health Facilities Development Corp. Revenue | | | | |
| (Methodist Hospital System) VRDO | 0.540% | 11/1/16 | 3,300 | 3,300 |
| 1 Harris County TX Metropolitan Transit Authority Sales & Use Tax Revenue TOB VRDO | 0.680% | 11/7/16 | 6,660 | 6,660 |
| 3 Harris County TX Toll Road Revenue | 1.260% | 8/15/17 | 5,260 | 5,261 |
| 3 Harris County TX Toll Road Revenue PUT | 1.330% | 8/15/18 | 34,250 | 34,235 |
| 1 Houston TX Airport System Revenue TOB VRDO | 0.660% | 11/7/16 | 12,000 | 12,000 |
| 1 Houston TX Airport System Revenue TOB VRDO | 0.780% | 11/7/16 (4)(3) | 49,500 | 49,500 |
| Houston TX GO | 4.000% | 3/1/17 | 2,075 | 2,098 |
| Houston TX GO | 4.000% | 3/1/17 | 9,000 | 9,100 |
| Houston TX GO | 5.000% | 3/1/18 | 11,835 | 12,474 |
| Houston TX GO | 5.000% | 3/1/20 | 15,000 | 16,834 |
| Houston TX GO | 5.000% | 3/1/20 | 3,030 | 3,401 |
| Houston TX GO | 5.000% | 3/1/20 | 11,775 | 12,865 |
| Houston TX GO | 5.000% | 3/1/21 | 17,700 | 20,402 |
| Houston TX Independent School District GO | 5.000% | 2/15/19 | 17,515 | 19,093 |
| Houston TX Independent School District GO | 5.000% | 2/15/20 | 18,970 | 21,353 |
| Houston TX Independent School District GO PUT | 0.950% | 6/1/17 | 16,000 | 16,005 |
| Houston TX Independent School District GO PUT | 4.000% | 6/1/17 | 3,400 | 3,460 |
| Houston TX Independent School District Public Facilities Corp. Lease Revenue | 5.000% | 9/15/17 | 8,040 | 8,332 |
| Houston TX Utility System Revenue | 3.000% | 11/15/16 | 1,865 | 1,867 |
| Houston TX Utility System Revenue | 5.000% | 11/15/16 | 2,000 | 2,003 |
| Houston TX Utility System Revenue | 5.000% | 11/15/17 | 3,000 | 3,131 |
| Houston TX Utility System Revenue | 5.000% | 11/15/17 | 2,000 | 2,087 |
| Houston TX Utility System Revenue | 5.250% | 11/15/17 (4) | 4,260 | 4,458 |
| Houston TX Utility System Revenue | 5.000% | 11/15/18 | 5,495 | 5,942 |
| Houston TX Utility System Revenue | 5.000% | 11/15/18 | 1,750 | 1,892 |
| Houston TX Utility System Revenue | 5.000% | 11/15/19 | 3,285 | 3,673 |
| 3 Houston TX Utility System Revenue PUT | 1.530% | 5/1/20 | 19,500 | 19,415 |
| Humble TX Independent School District GO | 5.000% | 2/15/19 | 1,135 | 1,237 |
| Humble TX Independent School District GO | 5.000% | 2/15/20 | 5,260 | 5,921 |
| Humble TX Independent School District GO | 5.000% | 2/15/20 | 2,060 | 2,318 |
| Irving TX Independent School District GO | 5.000% | 2/15/20 | 2,000 | 2,251 |
| Katy TX Independent School District GO | 5.000% | 2/15/19 | 2,500 | 2,728 |
| 3 Katy TX Independent School District GO PUT | 0.908% | 8/15/19 | 14,590 | 14,665 |
| Kerrville TX Health Facilities Development Corp. Hospital Revenue | | | | |
| (Peterson Regional Medical Center Project) | 4.000% | 8/15/17 | 1,000 | 1,022 |
| Kerrville TX Health Facilities Development Corp. Hospital Revenue | | | | |
| (Peterson Regional Medical Center Project) | 4.000% | 8/15/18 | 1,055 | 1,105 |
| Kerrville TX Health Facilities Development Corp. Hospital Revenue | | | | |
| (Peterson Regional Medical Center Project) | 4.000% | 8/15/19 | 1,100 | 1,172 |
| Klein TX Independent School District GO | 5.000% | 8/1/18 | 1,500 | 1,607 |
| Klein TX Independent School District GO | 5.000% | 8/1/19 | 2,000 | 2,214 |
| Lewisville TX Independent School District GO | 5.000% | 8/15/19 | 3,500 | 3,880 |
| Longview TX Independent School District GO | 5.000% | 2/15/20 | 1,000 | 1,124 |
| Lubbock TX GO | 5.000% | 2/15/18 | 1,240 | 1,303 |
| Lubbock TX GO | 5.000% | 2/15/18 | 4,080 | 4,288 |
| Lubbock TX GO | 5.000% | 2/15/18 | 2,500 | 2,627 |
| Lubbock TX GO | 5.000% | 2/15/19 | 1,000 | 1,087 |
37
Short-Term Tax-Exempt Fund
| | | | |
| | | | Face | Market |
| | | Maturity | Amount | Value• |
| | Coupon | Date | ($000) | ($000) |
| Lubbock TX GO | 5.000% | 2/15/20 | 1,150 | 1,288 |
| Lubbock TX GO | 5.000% | 2/15/20 | 1,000 | 1,120 |
| Mission TX Economic Development Corp. Solid Waste Disposal Revenue | | | | |
| (Allied Waste Inc. Project) PUT | 1.000% | 1/3/17 | 9,475 | 9,475 |
| Missouri City TX GO | 4.000% | 6/15/19 | 1,000 | 1,074 |
| New Hope TX Cultural Education Facilities FinanceCorp. Retirement Facilities Revenue | | | | |
| (Westminster Manor Project) | 4.000% | 11/1/21 | 730 | 800 |
| North Central TX Health Facilities Development Corp. Hospital Revenue | | | | |
| (Children’s Medical Center of Dallas Project) | 5.000% | 8/15/18 | 750 | 803 |
| North East TX Independent School District GO PUT | 2.000% | 8/1/18 | 4,815 | 4,889 |
| North Texas Tollway Authority System Revenue | 3.000% | 1/1/17 | 1,000 | 1,003 |
| North Texas Tollway Authority System Revenue | 5.000% | 9/1/17 | 1,000 | 1,035 |
| North Texas Tollway Authority System Revenue | 4.000% | 1/1/18 | 600 | 621 |
| North Texas Tollway Authority System Revenue | 5.750% | 1/1/18 (Prere.) | 2,500 | 2,642 |
| North Texas Tollway Authority System Revenue | 5.000% | 1/1/19 | 2,265 | 2,453 |
| North Texas Tollway Authority System Revenue | 5.000% | 1/1/19 | 700 | 757 |
| North Texas Tollway Authority System Revenue | 5.000% | 1/1/20 | 2,075 | 2,317 |
| 3 North Texas Tollway Authority System Revenue PUT | 1.300% | 1/1/20 | 29,690 | 29,771 |
| Northside Independent School District Texas GO | 5.000% | 2/15/19 | 2,505 | 2,729 |
| Northside Independent School District Texas GO PUT | 1.650% | 8/1/18 | 11,250 | 11,353 |
| Northside Independent School District Texas GO PUT | 2.125% | 8/1/20 | 6,470 | 6,485 |
| Pasadena TX Independent School District GO | 5.000% | 2/15/18 | 2,295 | 2,419 |
| Pflugerville TX Independent School District GO | 5.000% | 2/15/17 (Prere.) | 3,760 | 3,807 |
| Pflugerville TX Independent School District GO | 5.000% | 2/15/20 | 1,700 | 1,914 |
| Plano TX Independent School District GO | 5.000% | 2/15/19 | 2,335 | 2,545 |
| Plano TX Independent School District GO | 5.000% | 2/15/19 | 17,220 | 18,772 |
| Plano TX Independent School District GO | 5.000% | 2/15/20 | 20,980 | 23,615 |
| Richardson TX Independent School District GO | 5.000% | 2/15/19 | 1,920 | 2,095 |
| Rockwall TX GO | 4.000% | 8/1/18 | 1,505 | 1,584 |
| Rockwall TX GO | 5.000% | 8/1/19 | 2,300 | 2,543 |
| 2 Round Rock TX Independent School District GO | 4.000% | 8/1/18 | 5,435 | 5,727 |
| Round Rock TX Independent School District GO | 4.500% | 8/1/18 | 1,335 | 1,418 |
| Round Rock TX Independent School District GO | 5.000% | 8/1/19 | 1,795 | 1,987 |
| Round Rock TX Independent School District GO | 5.000% | 8/1/20 | 1,000 | 1,141 |
| San Antonio TX Electric & Gas Systems Revenue | 5.000% | 2/1/18 | 6,000 | 6,309 |
| San Antonio TX Electric & Gas Systems Revenue | 5.000% | 2/1/19 | 16,360 | 17,814 |
| San Antonio TX Electric & Gas Systems Revenue PUT | 2.000% | 12/1/16 | 7,850 | 7,858 |
| 3 San Antonio TX Electric & Gas Systems Revenue PUT | 0.910% | 2/1/17 | 45,000 | 44,992 |
| 3 San Antonio TX Electric & Gas Systems Revenue PUT | 1.010% | 2/1/18 | 27,250 | 27,175 |
| San Antonio TX Electric & Gas Systems Revenue PUT | 2.000% | 12/1/18 | 10,150 | 10,300 |
| San Antonio TX Electric & Gas Systems Revenue PUT | 3.000% | 12/1/19 | 45,000 | 47,306 |
| San Antonio TX GO | 5.000% | 2/1/18 | 3,250 | 3,418 |
| San Antonio TX Independent School District GO | 5.000% | 2/15/18 | 5,525 | 5,824 |
| San Antonio TX Independent School District GO PUT | 2.000% | 8/1/18 | 7,270 | 7,382 |
| San Antonio TX Water Revenue | 5.000% | 5/15/18 | 500 | 531 |
| San Antonio TX Water Revenue | 5.000% | 5/15/19 | 250 | 275 |
| 3 San Antonio TX Water Revenue PUT | 1.310% | 11/1/16 | 22,940 | 22,939 |
| 3 San Antonio TX Water Revenue PUT | 1.030% | 11/1/17 | 19,375 | 19,381 |
| Spring Branch TX Independent School District GO | 5.000% | 2/1/18 | 2,095 | 2,202 |
| Spring Branch TX Independent School District GO | 5.000% | 2/1/18 | 3,000 | 3,154 |
| Spring Branch TX Independent School District GO | 5.000% | 2/1/18 | 1,390 | 1,461 |
| Spring Branch TX Independent School District GO | 5.000% | 2/1/19 | 10,000 | 10,886 |
| Spring Branch TX Independent School District GO | 5.000% | 2/1/19 | 2,615 | 2,847 |
| Spring Branch TX Independent School District GO | 5.000% | 2/1/20 | 1,915 | 2,153 |
| Spring Branch TX Independent School District GO PUT | 1.050% | 6/15/17 | 38,000 | 38,000 |
| Spring TX Independent School District GO | 4.000% | 8/15/18 | 3,000 | 3,161 |
| Spring TX Independent School District GO | 5.000% | 8/15/19 | 1,000 | 1,108 |
| Tarrant County TX Cultural Education Facilities Finance Corp. Hospital Revenue | | | | |
| (Methodist Hospitals of Dallas) | 5.000% | 10/1/17 | 1,100 | 1,142 |
| Tarrant County TX Cultural Education Facilities Finance Corp. Hospital Revenue | | | | |
| (Methodist Hospitals of Dallas) | 4.000% | 10/1/18 | 1,350 | 1,427 |
| Tarrant County TX Cultural Education Facilities Finance Corp. Retirement Facilities Revenue | | | | |
| (Buckingham Senior Living Community Inc.) | 3.875% | 11/15/20 | 1,750 | 1,762 |
| Tarrant County TX GO | 5.000% | 7/15/18 (Prere.) | 2,000 | 2,140 |
| Texas A&M University System Revenue Board of Regents Revenue | 5.000% | 5/15/20 | 7,000 | 7,942 |
| Texas GO | 5.000% | 10/1/18 | 4,650 | 5,015 |
| Texas GO | 5.000% | 10/1/18 | 3,400 | 3,667 |
| Texas GO | 5.000% | 10/1/19 | 14,150 | 15,784 |
| Texas GO PUT | 2.000% | 2/1/18 | 2,625 | 2,625 |
| Texas Municipal Gas Acquisition & Supply Corp. Revenue | 5.000% | 12/15/16 | 5,335 | 5,362 |
38
Short-Term Tax-Exempt Fund
| | | | |
| | | | Face | Market |
| | | Maturity | Amount | Value• |
| | Coupon | Date | ($000) | ($000) |
| Texas Municipal Gas Acquisition & Supply Corp. Revenue | 5.000% | 12/15/17 | 4,000 | 4,159 |
| Texas Municipal Gas Acquisition & Supply Corp. Revenue | 5.250% | 12/15/17 | 10,900 | 11,367 |
| Texas Municipal Gas Acquisition & Supply Corp. Revenue | 5.625% | 12/15/17 | 9,945 | 10,218 |
| Texas Municipal Gas Acquisition & Supply Corp. Revenue | 5.000% | 12/15/18 | 4,500 | 4,818 |
| Texas Public Finance Authority Revenue | 5.000% | 2/1/17 | 1,800 | 1,820 |
| Texas Public Finance Authority Revenue | 5.000% | 2/1/17 | 2,800 | 2,831 |
| Texas Public Finance Authority Revenue | 5.000% | 2/1/18 | 1,100 | 1,155 |
| Texas Public Finance Authority Revenue | 5.000% | 2/1/18 | 2,205 | 2,315 |
| Texas Public Finance Authority Revenue (Texas Southern University) | 5.000% | 11/1/16 (15) | 1,000 | 1,000 |
| Texas Public Finance Authority Revenue (Texas Southern University) | 5.000% | 11/1/17 (15) | 2,615 | 2,714 |
| Texas Public Finance Authority Revenue (Unemployment Compensation) | 4.000% | 7/1/17 | 21,000 | 21,312 |
| Texas Transportation Commission GO | 5.000% | 10/1/17 | 5,660 | 5,882 |
| 2 Texas Transportation Commission GO | 5.000% | 4/1/18 | 6,400 | 6,773 |
| Texas Transportation Commission GO | 5.000% | 10/1/18 | 17,930 | 19,336 |
| Texas Transportation Commission GO | 5.000% | 4/1/19 | 2,800 | 3,073 |
| 2 Texas Transportation Commission GO | 5.000% | 4/1/19 | 5,335 | 5,846 |
| Texas Transportation Commission GO | 5.000% | 10/1/20 | 2,350 | 2,701 |
| 3 Texas Transportation Commission Mobility Fund GO PUT | 1.010% | 10/1/18 | 50,000 | 49,736 |
| Texas Transportation Commission Revenue | 4.000% | 10/1/17 | 35,350 | 36,410 |
| Texas Transportation Commission Revenue | 5.000% | 4/1/18 | 6,500 | 6,880 |
| Texas Transportation Commission Revenue | 4.000% | 10/1/18 | 30,000 | 31,766 |
| Texas Transportation Commission Revenue | 5.000% | 10/1/18 | 33,425 | 36,026 |
| Texas Transportation Commission Revenue | 5.000% | 4/1/19 | 4,000 | 4,384 |
| Texas Transportation Commission Revenue | 5.000% | 10/1/19 | 16,000 | 17,833 |
| Texas Transportation Commission Revenue | 5.000% | 10/1/19 | 18,470 | 20,586 |
| Texas Transportation Commission Revenue | 5.000% | 10/1/20 | 19,000 | 21,813 |
| 3 Texas Transportation Commission Revenue PUT | 0.980% | 4/1/17 | 57,950 | 57,926 |
| Texas Transportation Commission Turnpike System Revenue PUT | 5.000% | 4/1/20 | 19,500 | 21,834 |
| Texas Water Development Board Revenue | 4.000% | 4/15/18 | 4,360 | 4,561 |
| Texas Water Development Board Revenue | 4.000% | 10/15/18 | 7,380 | 7,827 |
| Texas Water Development Board Revenue | 5.000% | 4/15/19 | 6,940 | 7,610 |
| Texas Water Development Board Revenue | 4.000% | 10/15/19 | 2,200 | 2,389 |
| Texas Water Financial Assistance GO | 5.000% | 8/1/20 | 1,825 | 2,088 |
| 2 Tomball TX Independent School District GO | 5.000% | 2/15/18 | 1,350 | 1,421 |
| Tomball TX Independent School District GO PUT | 1.100% | 8/15/19 | 4,500 | 4,465 |
| University of North Texas Revenue | 5.000% | 4/15/17 | 725 | 739 |
| University of Texas Permanent University Fund Revenue | 5.000% | 7/1/18 | 1,235 | 1,320 |
| University of Texas Permanent University Fund Revenue | 5.000% | 7/1/18 | 2,095 | 2,239 |
| University of Texas Permanent University Fund Revenue | 5.000% | 7/1/19 | 3,210 | 3,551 |
| University of Texas Permanent University Fund Revenue | 5.000% | 7/1/20 | 1,000 | 1,139 |
| University of Texas System Revenue Financing System Revenue | 4.000% | 8/15/18 | 3,850 | 4,063 |
| University of Texas System Revenue Financing System Revenue | 5.000% | 8/15/18 | 2,900 | 3,112 |
| 2 University of Texas System Revenue Financing System Revenue | 5.000% | 8/15/18 | 5,520 | 5,911 |
| University of Texas System Revenue Financing System Revenue | 5.000% | 8/15/19 | 10,000 | 11,100 |
| University of Texas System Revenue Financing System Revenue | 5.000% | 8/15/19 | 2,300 | 2,553 |
| University of Texas System Revenue Financing System Revenue | 5.000% | 8/15/19 | 4,010 | 4,451 |
| University of Texas System Revenue Financing System Revenue | 5.000% | 8/15/20 | 3,660 | 4,189 |
| Williamson County TX GO | 5.000% | 2/15/20 | 1,055 | 1,186 |
| Williamson County TX GO PUT | 1.450% | 8/15/18 | 5,000 | 5,022 |
| | | | | 2,022,163 |
| Utah (0.3%) | | | | |
| University of Utah Revenue | 4.000% | 8/1/18 | 725 | 764 |
| University of Utah Revenue | 5.000% | 8/1/19 | 1,000 | 1,107 |
| Utah Associated Municipal Power Systems Revenue (Horse Butte Wind Project) | 5.000% | 9/1/18 | 1,015 | 1,082 |
| Utah GO | 5.000% | 7/1/17 | 2,715 | 2,793 |
| Utah GO | 5.000% | 7/1/18 | 2,925 | 3,127 |
| Utah Transit Authority Sales Tax Revenue | 1.350% | 12/15/16 (Prere.) | 37,000 | 37,028 |
| Utah Transit Authority Sales Tax Revenue | 5.250% | 6/15/20 (4) | 1,035 | 1,187 |
| | | | | 47,088 |
| Vermont (0.0%) | | | | |
| Vermont Educational & Health Buildings Financing Agency Revenue | | | | |
| (University of Vermont Health Network) | 3.000% | 12/1/16 | 1,000 | 1,002 |
| Vermont Educational & Health Buildings Financing Agency Revenue | | | | |
| (University of Vermont Health Network) | 3.000% | 12/1/17 | 500 | 511 |
| Vermont Educational & Health Buildings Financing Agency Revenue | | | | |
| (University of Vermont Health Network) | 3.000% | 12/1/18 | 500 | 519 |
| Vermont Educational & Health Buildings Financing Agency Revenue | | | | |
| (University of Vermont Health Network) | 4.000% | 12/1/19 | 475 | 513 |
39
Short-Term Tax-Exempt Fund
| | | | |
| | | | Face | Market |
| | | Maturity | Amount | Value• |
| | Coupon | Date | ($000) | ($000) |
| Vermont Educational & Health Buildings Financing Agency Revenue | | | | |
| (University of Vermont Health Network) | 4.000% | 12/1/20 | 500 | 551 |
| Vermont GO | 4.000% | 8/15/19 | 2,615 | 2,835 |
| | | | | 5,931 |
| Virgin Islands (0.1%) | | | | |
| Virgin Islands Public Finance Authority Revenue | 4.000% | 9/1/17 | 600 | 610 |
| Virgin Islands Public Finance Authority Revenue | 5.000% | 10/1/17 | 3,480 | 3,548 |
| Virgin Islands Public Finance Authority Revenue | 5.000% | 10/1/17 | 1,500 | 1,516 |
| Virgin Islands Public Finance Authority Revenue | 5.000% | 9/1/19 | 2,000 | 2,151 |
| | | | | 7,825 |
| Virginia (1.6%) | | | | |
| Chesterfield County VA GO | 5.000% | 1/1/19 | 5,375 | 5,847 |
| Chesterfield County VA GO | 5.000% | 1/1/20 | 8,940 | 10,055 |
| Chesterfield County VA Water & Sewer Revenue | 5.000% | 11/1/18 | 4,610 | 4,988 |
| Chesterfield County VA Water & Sewer Revenue | 5.000% | 11/1/19 | 5,160 | 5,776 |
| Fairfax County VA Economic Development Authority Facilities Revenue (County Facilities Project) | 4.000% | 10/1/17 | 3,730 | 3,841 |
| Fairfax County VA Economic Development Authority Facilities Revenue (County Facilities Project) | 4.000% | 10/1/18 | 2,150 | 2,276 |
| Fairfax County VA Economic Development Authority Facilities Revenue (County Facilities Project) | 5.000% | 10/1/19 | 2,000 | 2,228 |
| Fairfax County VA GO | 4.000% | 4/1/20 | 1,100 | 1,209 |
| 3 Fredericksburg VA Economic Development Authority Hospital Facilities Revenue | | | | |
| (Mary Washington Healthcare Obligated Group) PUT | 2.530% | 2/1/17 | 6,500 | 6,512 |
| Henrico County VA Economic Development Authority Revenue (Bon Secours Health System) | 4.000% | 11/1/16 | 1,390 | 1,390 |
| Henrico County VA GO | 5.000% | 8/1/18 | 1,565 | 1,678 |
| Lexington VA Industrial Development Authority Residential Care Facility Revenue | | | | |
| (Kendall at Lexington Corp.) | 3.000% | 1/1/19 | 300 | 310 |
| Lexington VA Industrial Development Authority Residential Care Facility Revenue | | | | |
| (Kendall at Lexington Corp.) | 3.000% | 1/1/20 | 450 | 469 |
| Loudoun County VA GO | 5.000% | 12/1/18 | 5,120 | 5,556 |
| Loudoun County VA GO | 5.000% | 12/1/19 | 5,105 | 5,733 |
| Louisa VA Industrial Development Authority Poll Control Revenue | | | | |
| (Virginia Electric & Power Co.) PUT | 0.700% | 12/1/16 | 6,250 | 6,249 |
| Louisa VA Industrial Development Authority Poll Control Revenue | | | | |
| (Virginia Electric & Power Co.) PUT | 1.750% | 5/16/19 | 10,000 | 10,131 |
| Newport News VA Economical Development Authority Residential Care Facilities Revenue | 2.000% | 12/1/18 | 450 | 449 |
| Newport News VA Economical Development Authority Residential Care Facilities Revenue | 4.000% | 12/1/19 | 1,215 | 1,275 |
| Newport News VA Economical Development Authority Residential Care Facilities Revenue | 4.000% | 12/1/20 | 2,705 | 2,865 |
| Norfolk VA Water Revenue | 5.000% | 11/1/18 | 725 | 783 |
| Peninsula VA Ports Authority Coal Terminal Revenue PUT | 1.550% | 10/1/19 | 1,875 | 1,869 |
| Richmond VA GO | 5.000% | 3/1/18 | 3,330 | 3,513 |
| Richmond VA GO | 5.000% | 3/1/19 | 3,710 | 4,053 |
| Roanoke VA Economic Development Authority Hospital Revenue (Carilion Clinic Obligated Group) | 5.000% | 7/1/17 | 3,500 | 3,595 |
| Virginia Beach VA Development Authority Public Facility Revenue | 5.000% | 3/1/18 | 3,170 | 3,345 |
| Virginia Beach VA Development Authority Public Facility Revenue | 5.000% | 3/1/19 | 1,000 | 1,092 |
| Virginia Beach VA GO | 5.000% | 4/1/19 | 1,025 | 1,125 |
| Virginia College Building Authority Educational Facilities Revenue | | | | |
| (21st Century College & Equipment Programs) | 5.000% | 2/1/18 | 11,275 | 11,857 |
| Virginia College Building Authority Educational Facilities Revenue | | | | |
| (21st Century College & Equipment Programs) | 5.000% | 2/1/19 | 4,095 | 4,461 |
| Virginia College Building Authority Educational Facilities Revenue | | | | |
| (21st Century College & Equipment Programs) | 5.000% | 2/1/19 | 1,000 | 1,089 |
| Virginia College Building Authority Educational Facilities Revenue | | | | |
| (21st Century College & Equipment Programs) | 5.000% | 2/1/19 | 14,875 | 16,204 |
| Virginia College Building Authority Educational Facilities Revenue | | | | |
| (Public Higher Education Financing Program) | 5.000% | 9/1/20 | 10,295 | 11,776 |
| Virginia Commonwealth Transportation Board Revenue | 5.000% | 5/15/18 | 8,030 | 8,544 |
| Virginia Commonwealth Transportation Board Revenue | 5.000% | 5/15/19 | 6,755 | 7,441 |
| Virginia Commonwealth Transportation Board Revenue | 5.000% | 5/15/20 | 7,095 | 8,069 |
| Virginia GO | 5.000% | 6/1/17 | 1,000 | 1,025 |
| Virginia Public Building Authority Public Facilities Revenue | 5.000% | 8/1/18 | 7,890 | 8,453 |
| Virginia Public Building Authority Public Facilities Revenue | 5.000% | 8/1/18 | 10,170 | 10,896 |
| Virginia Public School Authority Revenue | 5.000% | 8/1/18 | 4,325 | 4,639 |
| Virginia Public School Authority Revenue | 5.000% | 8/1/20 | 6,015 | 6,885 |
| Virginia Public School Authority School Technology & Security Notes Revenue | 5.000% | 4/15/17 | 12,385 | 12,631 |
| Virginia Public School Authority School Technology & Security Notes Revenue | 5.000% | 4/15/18 | 13,000 | 13,782 |
| | | | | 225,964 |
| Washington (2.5%) | | | | |
| 3 Everett WA GO PUT | 1.030% | 12/1/19 | 3,725 | 3,672 |
| 3 Grant County WA Public Utility District No. 2 Electric System Revenue PUT | 0.950% | 12/1/17 | 10,000 | 9,969 |
| King County WA (Bellevue School District) GO | 5.000% | 12/1/16 | 3,125 | 3,136 |
40
Short-Term Tax-Exempt Fund
| | | | |
| | | | Face | Market |
| | | Maturity | Amount | Value• |
| | Coupon | Date | ($000) | ($000) |
| King County WA GO | 5.000% | 1/1/18 | 2,000 | 2,098 |
| King County WA GO | 5.000% | 7/1/18 | 7,515 | 8,033 |
| King County WA GO | 5.000% | 12/1/18 | 2,745 | 2,976 |
| King County WA GO | 4.000% | 6/1/19 | 3,610 | 3,887 |
| King County WA GO | 5.000% | 12/1/19 | 2,885 | 3,233 |
| King County WA Sewer Revenue | 5.250% | 1/1/18 (Prere.) | 35,000 | 36,796 |
| 4 King County WA Sewer Revenue | 5.750% | 1/1/18 (Prere.) | 2,500 | 2,643 |
| Pierce County WA School District No. 10 (Tacoma) GO | 3.000% | 6/1/18 | 6,500 | 6,716 |
| Pierce County WA School District No. 10 (Tacoma) GO | 5.000% | 12/1/18 | 5,000 | 5,417 |
| Pierce County WA School District No. 10 (Tacoma) GO | 4.000% | 6/1/19 | 5,000 | 5,380 |
| Pierce County WA School District No. 10 (Tacoma) GO | 5.000% | 12/1/19 | 3,500 | 3,919 |
| Port of Seattle WA Revenue | 5.000% | 3/1/19 | 4,500 | 4,914 |
| Seattle WA GO | 5.000% | 6/1/18 | 6,455 | 6,880 |
| Seattle WA Municipal Light & Power Revenue | 5.000% | 9/1/17 | 3,320 | 3,438 |
| 3 Seattle WA Municipal Light & Power Revenue PUT | 1.310% | 11/1/18 | 6,750 | 6,751 |
| 3 Seattle WA Municipal Light & Power Revenue PUT | 1.310% | 11/1/18 | 8,250 | 8,251 |
| Seattle WA Water System Revenue | 5.000% | 5/1/18 | 5,850 | 6,211 |
| 1 TES Properties Washington Lease Revenue TOB VRDO | 0.660% | 11/7/16 | 10,125 | 10,125 |
| Tobacco Settlement Authority Washington Revenue | 5.000% | 6/1/17 | 4,130 | 4,228 |
| Tobacco Settlement Authority Washington Revenue | 5.000% | 6/1/18 | 3,215 | 3,409 |
| 2 University of Washington Revenue | 5.000% | 12/1/18 | 1,135 | 1,230 |
| Washington (Motor Vehicle Fuel Tax) GO | 5.000% | 2/1/18 | 1,995 | 2,098 |
| Washington (Motor Vehicle Fuel Tax) GO | 4.000% | 7/1/18 | 2,300 | 2,419 |
| Washington (Motor Vehicle Fuel Tax) GO | 5.000% | 7/1/20 | 4,890 | 5,570 |
| Washington Economic Development Finance Authority Solid Waste Disposal Revenue | | | | |
| (Waste Management Inc. Project) PUT | 1.250% | 11/1/17 | 2,525 | 2,531 |
| Washington Federal Highway Grant Anticipation Revenue (520 Corridor Program) | 5.000% | 9/1/18 | 13,957 | 14,960 |
| Washington Federal Highway Grant Anticipation Revenue (520 Corridor Program) | 5.000% | 9/1/18 | 5,000 | 5,359 |
| Washington Federal Highway Grant Anticipation Revenue (520 Corridor Program) | 5.000% | 9/1/19 | 19,645 | 21,716 |
| Washington GO | 5.000% | 2/1/18 | 4,375 | 4,601 |
| Washington GO | 5.500% | 7/1/18 | 21,675 | 23,335 |
| Washington GO | 5.000% | 8/1/18 | 4,280 | 4,586 |
| Washington GO | 5.000% | 8/1/18 | 11,745 | 12,585 |
| Washington GO | 5.000% | 1/1/19 (Prere.) | 2,000 | 2,173 |
| Washington GO | 5.000% | 2/1/19 | 4,590 | 4,998 |
| Washington GO | 5.000% | 2/1/19 | 7,365 | 8,019 |
| Washington GO | 5.000% | 7/1/19 | 22,835 | 25,220 |
| Washington GO | 5.000% | 7/1/19 | 21,620 | 23,878 |
| Washington GO | 5.000% | 8/1/19 | 4,500 | 4,984 |
| 1 Washington Health Care Facilities Authority Revenue (MultiCare Health System) TOB VRDO | 0.750% | 11/7/16 | 9,690 | 9,690 |
| Washington Health Care Facilities Authority Revenue (Providence Health & Services) | 5.000% | 10/1/17 | 1,375 | 1,427 |
| Washington Health Care Facilities Authority Revenue (Seattle Cancer Care Alliance) | 5.000% | 3/1/17 | 300 | 304 |
| Washington Health Care Facilities Authority Revenue (Seattle Cancer Care Alliance) | 5.000% | 3/1/18 | 250 | 262 |
| Washington Housing Finance Commission Multi-Family Housing Revenue | | | | |
| (Heron’s Key Obligated Group) | 4.375% | 1/1/21 | 6,500 | 6,548 |
| | | | | 340,575 |
| West Virginia (0.1%) | | | | |
| Mason County WV Pollution Control Revenue (Appalachian Power Co. Project) PUT | 1.625% | 10/1/18 | 6,000 | 6,028 |
| West Virginia Economic Development Authority Solid Waste Facilities Disposal Revenue | | | | |
| (Appalachian Power Co. - Amos Project) PUT | 1.900% | 4/1/19 | 5,000 | 5,018 |
| West Virginia GO | 5.000% | 6/1/20 | 1,400 | 1,591 |
| 3 West Virginia University Revenue PUT | 1.160% | 10/1/19 | 3,500 | 3,494 |
| | | | | 16,131 |
| Wisconsin (1.5%) | | | | |
| Milwaukee WI GO | 2.000% | 10/1/17 | 53,750 | 54,345 |
| Milwaukee WI GO | 4.000% | 3/15/18 | 15,085 | 15,728 |
| Milwaukee WI GO | 3.000% | 3/1/19 | 13,575 | 14,196 |
| Milwaukee WI GO | 4.000% | 3/1/20 | 13,130 | 14,380 |
| Wisconsin GO | 4.000% | 11/1/16 | 6,205 | 6,205 |
| Wisconsin GO | 5.000% | 5/1/17 | 1,000 | 1,022 |
| Wisconsin GO | 5.000% | 5/1/18 | 13,160 | 13,979 |
| Wisconsin GO | 5.000% | 5/1/19 (2) | 4,000 | 4,399 |
| Wisconsin GO | 5.000% | 5/1/19 | 13,270 | 14,595 |
| Wisconsin Health & Educational Facilities Authority Revenue | | | | |
| (Ascension Health Alliance Credit Group) PUT | 4.000% | 3/1/18 | 7,500 | 7,805 |
| Wisconsin Health & Educational Facilities Authority Revenue | | | | |
| (Ascension Health Alliance Credit Group) PUT | 4.000% | 5/30/19 | 13,325 | 14,312 |
| 2 Wisconsin Health & Educational Facilities Authority Revenue | | | | |
| (Ascension Health Alliance Credit Group) PUT | 1.375% | 12/3/19 | 21,000 | 20,997 |
41
Short-Term Tax-Exempt Fund
| | | | |
| | | | Face | Market |
| | | Maturity | Amount | Value• |
| | Coupon | Date | ($000) | ($000) |
| 1 Wisconsin Health & Educational Facilities Authority Revenue | | | | |
| (Ascension Health Credit Group) TOB VRDO | 0.660% | 11/7/16 | 750 | 750 |
| Wisconsin Health & Educational Facilities Authority Revenue (Aurora Health Care Inc.) | 5.000% | 7/15/17 | 1,235 | 1,268 |
| Wisconsin Health & Educational Facilities Authority Revenue (Aurora Health Care Inc.) PUT | 1.250% | 8/15/17 | 11,345 | 11,370 |
| Wisconsin Health & Educational Facilities Authority Revenue | | | | |
| (Hospital Sisters Services Inc. Obligated Group) | 5.000% | 11/15/16 | 1,660 | 1,663 |
| Wisconsin Health & Educational Facilities Authority Revenue | | | | |
| (Hospital Sisters Services Inc. Obligated Group) | 5.000% | 11/15/17 | 1,000 | 1,043 |
| Wisconsin Health & Educational Facilities Authority Revenue | | | | |
| (Hospital Sisters Services Inc. Obligated Group) | 5.000% | 11/15/18 | 750 | 810 |
| Wisconsin Public Finance Authority Revenue (Church Home of Hartford Inc.) | 4.000% | 9/1/20 | 425 | 446 |
| Wisconsin Transportation Revenue | 5.000% | 7/1/19 | 2,220 | 2,454 |
| | | | | 201,767 |
| Total Tax-Exempt Municipal Bonds (Cost $13,916,281) | | | | 13,934,326 |
| |
| | | | Shares | |
| Temporary Cash Investment (2.0%) | | | | |
| Money Market Fund (2.0%) | | | | |
| 5 Vanguard Municipal Cash Management Fund (Cost $284,365) | 0.614% | | 2,843,649 | 284,365 |
| Total Investments (102.7%) (Cost $14,200,646) | | | | 14,218,691 |
| |
| | | | | Amount |
| | | | | ($000) |
| Other Assets and Liabilities (-2.7%) | | | | |
| Other Assets | | | | |
| Investment in Vanguard | | | | 1,017 |
| Receivables for Investment Securities Sold | | | | 58,505 |
| Receivables for Accrued Income | | | | 100,923 |
| Receivables for Capital Shares Issued | | | | 19,032 |
| Other Assets4 | | | | 3,343 |
| Total Other Assets | | | | 182,820 |
| Liabilities | | | | |
| Payables for Investment Securities Purchased | | | | (529,400) |
| Payables for Capital Shares Redeemed | | | | (20,561) |
| Payables for Distributions | | | | (3,584) |
| Payables to Vanguard | | | | (9,148) |
| Other Liabilities | | | | (144) |
| Total Liabilities | | | | (562,837) |
| Net Assets (100%) | | | | 13,838,674 |
42
Short-Term Tax-Exempt Fund
| |
| At October 31, 2016, net assets consisted of: | |
| | Amount |
| | ($000) |
| Paid-in Capital | 13,829,782 |
| Undistributed Net Investment Income | 15 |
| Accumulated Net Realized Losses | (9,302) |
| Unrealized Appreciation (Depreciation) | |
| Investment Securities | 18,045 |
| Futures Contracts | 134 |
| Net Assets | 13,838,674 |
| |
| Investor Shares—Net Assets | |
| Applicable to 78,123,236 outstanding $.001 par value shares of beneficial interest (unlimited authorization) | 1,234,301 |
| Net Asset Value Per Share—Investor Shares | $15.80 |
| |
| Admiral Shares—Net Assets | |
| Applicable to 797,774,230 outstanding $.001 par value shares of beneficial interest (unlimited authorization) | 12,604,373 |
| Net Asset Value Per Share—Admiral Shares | $15.80 |
• See Note A in Notes to Financial Statements.
1 Security exempt from registration under Rule 144A of the Securities Act of 1933. Such securities may be sold in transactions exempt from registration, normally to qualified institutional buyers. At October 31, 2016,
the aggregate value of these securities was $1,356,443,000, representing 9.8% of net assets.
2 Security purchased on a when-issued or delayed-delivery basis for which the fund has not taken delivery as of October 31, 2016.
3 Adjustable-rate security.
4 Securities with a value of $1,170,000 and cash of $1,913,000 have been segregated as initial margin for open futures contracts.
5 Affiliated money market fund available only to Vanguard funds and certain trusts and accounts managed by Vanguard. Rate shown is the 7-day yield.
A key to abbreviations and other references follows the Statement of Net Assets.
See accompanying Notes, which are an integral part of the Financial Statements.
43
Short-Term Tax-Exempt Fund
Key to Abbreviations
ARS—Auction Rate Security.
BAN—Bond Anticipation Note.
COP—Certificate of Participation.
CP—Commercial Paper.
FR—Floating Rate.
GAN—Grant Anticipation Note.
GO—General Obligation Bond.
PILOT—Payments in Lieu of Taxes.
PUT—Put Option Obligation.
RAN—Revenue Anticipation Note.
TAN—Tax Anticipation Note.
TOB—Tender Option Bond.
TRAN—Tax Revenue Anticipation Note.
VRDO—Variable Rate Demand Obligation.
VRDP—Variable Rate Demand Preferred.
(ETM)—Escrowed to Maturity.
(Prere.)—Prerefunded.
Scheduled principal and interest payments are guaranteed by:
(1) MBIA (Municipal Bond Investors Assurance).
(2) AMBAC (Ambac Assurance Corporation).
(3) FGIC (Financial Guaranty Insurance Company).
(4) AGM (Assured Guaranty Municipal Corporation).
(5) BIGI (Bond Investors Guaranty Insurance).
(6) Connie Lee Inc.
(7) FHA (Federal Housing Authority).
(8) CapMAC (Capital Markets Assurance Corporation).
(9) American Capital Access Financial Guaranty Corporation.
(10) XL Capital Assurance Inc.
(11) CIFG (CDC IXIS Financial Guaranty).
(12) AGC (Assured Guaranty Corporation).
(13) BHAC (Berkshire Hathaway Assurance Corporation).
(14) NPFG (National Public Finance Guarantee Corporation).
(15) BAM (Build America Mutual Assurance Company).
(16) MAC (Municipal Assurance Corporation).
(17) RAA (Radian Asset Assurance Inc.).
(18) SBLF (Michigan School Bond Loan Fund).
The insurance does not guarantee the market value of the municipal bonds.
LOC—Scheduled principal and interest payments are guaranteed by bank letter of credit.
44
Short-Term Tax-Exempt Fund
| |
| Statement of Operations |
| |
| | Year Ended |
| October 31, 2016 |
| | ($000) |
| Investment Income | |
| Income | |
| Interest1 | 130,062 |
| Total Income | 130,062 |
| Expenses | |
| The Vanguard Group—Note B | |
| Investment Advisory Services | 1,360 |
| Management and Administrative— | |
| Investor Shares | 1,881 |
| Management and Administrative— | |
| Admiral Shares | 7,602 |
| Marketing and Distribution— | |
| Investor Shares | 349 |
| Marketing and Distribution— | |
| Admiral Shares | 1,276 |
| Custodian Fees | 134 |
| Auditing Fees | 34 |
| Shareholders’ Reports—Investor Shares | 56 |
| Shareholders’ Reports—Admiral Shares | 96 |
| Trustees’ Fees and Expenses | 6 |
| Total Expenses | 12,794 |
| Net Investment Income | 117,268 |
| Realized Net Gain (Loss) | |
| Investment Securities Sold1 | 3,099 |
| Futures Contracts | 1,172 |
| Realized Net Gain (Loss) | 4,271 |
| Change in Unrealized Appreciation | |
| (Depreciation) | |
| Investment Securities | (29,824) |
| Futures Contracts | 134 |
| Change in Unrealized Appreciation | |
| (Depreciation) | (29,690) |
| Net Increase (Decrease) in Net Assets | |
| Resulting from Operations | 91,849 |
1 Interest income and realized net gain (loss) from an affiliated company of the fund were $694,000 and $0, respectively.
| | |
| Statement of Changes in Net Assets | | |
| |
| | Year Ended October 31, |
| | 2016 | 2015 |
| | ($000) | ($000) |
| Increase (Decrease) in Net Assets | | |
| Operations | | |
| Net Investment Income | 117,268 | 96,261 |
| Realized Net Gain (Loss) | 4,271 | 3,187 |
| Change in Unrealized Appreciation (Depreciation) | (29,690) | (29,986) |
| Net Increase (Decrease) in Net Assets Resulting from Operations | 91,849 | 69,462 |
| Distributions | | |
| Net Investment Income | | |
| Investor Shares | (10,656) | (10,509) |
| Admiral Shares | (106,557) | (85,757) |
| Realized Capital Gain | | |
| Investor Shares | — | — |
| Admiral Shares | — | — |
| Total Distributions | (117,213) | (96,266) |
| Capital Share Transactions | | |
| Investor Shares | (129,503) | (342,747) |
| Admiral Shares | 1,598,387 | (47,403) |
| Net Increase (Decrease) from Capital Share Transactions | 1,468,884 | (390,150) |
| Total Increase (Decrease) | 1,443,520 | (416,954) |
| Net Assets | | |
| Beginning of Period | 12,395,154 | 12,812,108 |
| End of Period1 | 13,838,674 | 12,395,154 |
1 Net Assets—End of Period includes undistributed (overdistributed) net investment income of $15,000 and ($3,000).
See accompanying Notes, which are an integral part of the Financial Statements.
45
Short-Term Tax-Exempt Fund
Financial Highlights
| | | | | |
| Investor Shares | | | | | |
| |
| For a Share Outstanding | | | Year Ended October 31, |
| Throughout Each Period | 2016 | 2015 | 2014 | 2013 | 2012 |
| Net Asset Value, Beginning of Period | $15.83 | $15.86 | $15.87 | $15.93 | $15.90 |
| Investment Operations | | | | | |
| Net Investment Income | .131 | .110 | .115 | .141 | .171 |
| Net Realized and Unrealized Gain (Loss) | | | | | |
| on Investments | (. 030) | (. 030) | (.010) | (. 060) | .030 |
| Total from Investment Operations | .101 | .080 | .105 | . 081 | .201 |
| Distributions | | | | | |
| Dividends from Net Investment Income | (.131) | (.110) | (.115) | (.141) | (.171) |
| Distributions from Realized Capital Gains | — | — | — | — | — |
| Total Distributions | (.131) | (.110) | (.115) | (.141) | (.171) |
| Net Asset Value, End of Period | $15.80 | $15.83 | $15.86 | $15.87 | $15.93 |
| |
| Total Return1 | 0.64% | 0.51% | 0.66% | 0.51% | 1.27% |
| |
| Ratios/Supplemental Data | | | | | |
| Net Assets, End of Period (Millions) | $1,234 | $1,366 | $1,713 | $1,822 | $2,103 |
| Ratio of Total Expenses to Average Net Assets | 0.19% | 0.20% | 0.20% | 0.20% | 0.20% |
| Ratio of Net Investment Income to | | | | | |
| Average Net Assets | 0.83% | 0.70% | 0.72% | 0.89% | 1.07% |
| Portfolio Turnover Rate | 29% | 32% | 27% | 30% | 29% |
1 Total returns do not include account service fees that may have applied in the periods shown. Fund prospectuses provide information about any applicable account service fees.
| | | | | |
| Admiral Shares | | | | | |
| |
| For a Share Outstanding | | | Year Ended October 31, |
| Throughout Each Period | 2016 | 2015 | 2014 | 2013 | 2012 |
| Net Asset Value, Beginning of Period | $15.83 | $15.86 | $15.87 | $15.93 | $15.90 |
| Investment Operations | | | | | |
| Net Investment Income | .147 | .123 | .128 | .154 | .183 |
| Net Realized and Unrealized Gain (Loss) | | | | | |
| on Investments | (. 030) | (. 030) | (.010) | (. 060) | .030 |
| Total from Investment Operations | .117 | .093 | .118 | .094 | .213 |
| Distributions | | | | | |
| Dividends from Net Investment Income | (.147) | (.123) | (.128) | (.154) | (.183) |
| Distributions from Realized Capital Gains | — | — | — | — | — |
| Total Distributions | (.147) | (.123) | (.128) | (.154) | (.183) |
| Net Asset Value, End of Period | $15.80 | $15.83 | $15.86 | $15.87 | $15.93 |
| |
| Total Return1 | 0.74% | 0.59% | 0.74% | 0.59% | 1.35% |
| |
| Ratios/Supplemental Data | | | | | |
| Net Assets, End of Period (Millions) | $12,604 | $11,029 | $11,100 | $10,240 | $9,351 |
| Ratio of Total Expenses to Average Net Assets | 0.09% | 0.12% | 0.12% | 0.12% | 0.12% |
| Ratio of Net Investment Income to | | | | | |
| Average Net Assets | 0.93% | 0.78% | 0.80% | 0.97% | 1.15% |
| Portfolio Turnover Rate | 29% | 32% | 27% | 30% | 29% |
1 Total returns do not include account service fees that may have applied in the periods shown. Fund prospectuses provide information about any applicable account service fees.
See accompanying Notes, which are an integral part of the Financial Statements.
46
Short-Term Tax-Exempt Fund
Notes to Financial Statements
Vanguard Short-Term Tax-Exempt Fund is registered under the Investment Company Act of 1940 as an open-end investment company, or mutual fund. The fund invests in debt instruments of many municipal issuers; the issuers’ abilities to meet their obligations may be affected by economic and political developments in a specific state or region. The fund offers two classes of shares: Investor Shares and Admiral Shares. Investor Shares are available to any investor who meets the fund’s minimum purchase requirements. Admiral Shares are designed for investors who meet certain administrative, service, and account-size criteria.
A. The following significant accounting policies conform to generally accepted accounting principles for U.S. investment companies. The fund consistently follows such policies in preparing its financial statements.
1. Security Valuation: Securities are valued as of the close of trading on the New York Stock Exchange (generally 4 p.m., Eastern time) on the valuation date. Bonds and temporary cash investments acquired over 60 days to maturity are valued using the latest bid prices or using valuations based on a matrix system (which considers such factors as security prices, yields, maturities, and ratings), both as furnished by independent pricing services. Investments in Vanguard Municipal Cash Management Fund are valued at that fund’s net asset value. Other temporary cash investments are valued at amortized cost, which approximates market value. Securities for which market quotations are not readily available, or whose values have been affected by events occurring before the fund’s pricing time but after the close of the securities’ primary markets, are valued by methods deemed by the board of trustees to represent fair value.
2. Futures Contracts: The fund uses futures contracts to invest in fixed income asset classes with greater efficiency and lower cost than is possible through direct investment, to add value when these instruments are attractively priced, or to adjust sensitivity to changes in interest rates. The primary risks associated with the use of futures contracts are imperfect correlation between changes in market values of bonds held by the fund and the prices of futures contracts, and the possibility of an illiquid market. Counterparty risk involving futures is mitigated because a regulated clearinghouse is the counterparty instead of the clearing broker. To further mitigate counterparty risk, the fund trades futures contracts on an exchange, monitors the financial strength of its clearing brokers and clearinghouse, and has entered into clearing agreements with its clearing brokers. The clearinghouse imposes initial margin requirements to secure the fund’s performance and requires daily settlement of variation margin representing changes in the market value of each contract.
Futures contracts are valued at their quoted daily settlement prices. The aggregate settlement values of the contracts are not recorded in the Statement of Net Assets. Fluctuations in the value of the contracts are recorded in the Statement of Net Assets as an asset (liability) and in the Statement of Operations as unrealized appreciation (depreciation) until the contracts are closed, when they are recorded as realized futures gains (losses).
During the year ended October 31, 2016, the fund’s average investments in long and short futures contracts each represented less than 1% of net assets, based on the average of aggregate settlement values at each quarter-end during the period.
3. Federal Income Taxes: The fund intends to continue to qualify as a regulated investment company and distribute all of its income. Management has analyzed the fund’s tax positions taken for all open federal income tax years (October 31, 2013–2016), and has concluded that no provision for federal income tax is required in the fund’s financial statements.
4. Distributions: Distributions from net investment income are declared daily and paid on the first business day of the following month. Annual distributions from realized capital gains, if any, are recorded on the ex-dividend date.
5. Credit Facility: The fund and certain other funds managed by The Vanguard Group (“Vanguard”) participate in a $3.1 billion committed credit facility provided by a syndicate of lenders pursuant to a credit agreement that may be renewed annually; each fund is individually liable for its borrowings, if any, under the credit facility. Borrowings may be utilized for temporary and emergency purposes, and are subject to the fund’s regulatory and contractual borrowing restrictions. The participating funds are charged administrative fees and an annual commitment fee of 0.10% of the undrawn amount of the facility; these fees are allocated to the funds based on a method approved by the fund’s board of trustees and included in Management and Administrative expenses on the fund’s Statement of Operations. Any borrowings under this facility bear interest at a rate based upon the higher of the one-month London Interbank Offered Rate, federal funds effective rate, or overnight bank funding rate plus an agreed-upon spread.
The fund had no borrowings outstanding at October 31, 2016, or at any time during the period then ended.
47
Short-Term Tax-Exempt Fund
6. Other: Interest income includes income distributions received from Vanguard Municipal Cash Management Fund and is accrued daily. Premiums and discounts on debt securities purchased are amortized and accreted, respectively, to interest income over the lives of the respective securities. Security transactions are accounted for on the date securities are bought or sold. Costs used to determine realized gains (losses) on the sale of investment securities are those of the specific securities sold.
Each class of shares has equal rights as to assets and earnings, except that each class separately bears certain class-specific expenses related to maintenance of shareholder accounts (included in Management and Administrative expenses) and shareholder reporting. Marketing and distribution expenses are allocated to each class of shares based on a method approved by the board of trustees. Income, other non-class-specific expenses, and gains and losses on investments are allocated to each class of shares based on its relative net assets.
B. In accordance with the terms of a Funds’ Service Agreement (the “FSA”) between Vanguard and the fund, Vanguard furnishes to the fund investment advisory, corporate management, administrative, marketing, and distribution services at Vanguard’s cost of operations (as defined by the FSA). These costs of operations are allocated to the fund based on methods and guidelines approved by the board of trustees. Vanguard does not require reimbursement in the current period for certain costs of operations (such as deferred compensation/benefits and risk/insurance costs); the fund’s liability for these costs of operations is included in Payables to Vanguard on the Statement of Net Assets.
Upon the request of Vanguard, the fund may invest up to 0.40% of its net assets as capital in Vanguard. At October 31, 2016, the fund had contributed to Vanguard capital in the amount of $1,017,000, representing 0.01% of the fund’s net assets and 0.41% of Vanguard’s capitalization. The fund’s trustees and officers are also directors and employees, respectively, of Vanguard.
C. Various inputs may be used to determine the value of the fund’s investments. These inputs are summarized in three broad levels for financial statement purposes. The inputs or methodologies used to value securities are not necessarily an indication of the risk associated with investing in those securities.
Level 1—Quoted prices in active markets for identical securities.
Level 2—Other significant observable inputs (including quoted prices for similar securities, interest rates, prepayment speeds, credit risk, etc.).
Level 3—Significant unobservable inputs (including the fund’s own assumptions used to determine the fair value of investments).
The following table summarizes the market value of the fund’s investments as of October 31, 2016, based on the inputs used to value them:
| | | |
| | Level 1 | Level 2 | Level 3 |
| Investments | ($000) | ($000) | ($000) |
| Tax-Exempt Municipal Bonds | — | 13,934,326 | — |
| Temporary Cash Investments | 284,365 | — | — |
| Futures Contracts—Assets1 | 176 | — | — |
| Futures Contracts—Liabilities1 | (46) | — | — |
| Total | 284,495 | 13,934,326 | — |
| 1 Represents variation margin on the last day of the reporting period. | | | |
D. At October 31, 2016, the aggregate settlement value of open futures contracts and the related unrealized appreciation (depreciation) were:
| | | | |
| | | | | ($000) |
| | | | Aggregate | |
| | | Number of | Settlement | Unrealized |
| | | Long (Short) | Value | Appreciation |
| Futures Contracts | Expiration | Contracts | Long (Short) | (Depreciation) |
| 2-Year U.S. Treasury Note | December 2016 | (650) | (141,792) | 50 |
| 10-Year U.S. Treasury Note | December 2016 | 518 | 67,146 | 84 |
Unrealized appreciation (depreciation) on open futures contracts is required to be treated as realized gain (loss) for tax purposes.
48
Short-Term Tax-Exempt Fund
E. Capital gain distributions are determined on a tax basis and may differ from realized capital gains for financial reporting purposes. Differences may be permanent or temporary. Permanent differences are reclassified among capital accounts in the financial statements to reflect their tax character. Temporary differences arise when gains or losses are recognized in different periods for financial statement and tax purposes. These differences will reverse at some time in the future.
The fund used capital loss carryforwards of $4,054,000 to offset taxable capital gains realized during the year ended October 31, 2016. At October 31, 2016, the fund had available capital losses totaling $9,023,000 to offset future net capital gains through October 31, 2019.
At October 31, 2016, the cost of investment securities for tax purposes was $14,200,790,000. Net unrealized appreciation of investment securities for tax purposes was $17,901,000, consisting of unrealized gains of $31,032,000 on securities that had risen in value since their purchase and $13,131,000 in unrealized losses on securities that had fallen in value since their purchase.
F. During the year ended October 31, 2016, the fund purchased $3,709,642,000 of investment securities and sold $2,978,523,000 of investment securities, other than temporary cash investments.
The fund purchased securities from and sold securities to other Vanguard funds or accounts managed by Vanguard or its affiliates, in accordance with procedures adopted by the board of trustees in compliance with Rule 17a-7 of the Investment Company Act of 1940. For the year ended October 31, 2016, such purchases and sales were $907,225,000 and $1,506,683,000 respectively; these amounts are included in the purchases and sales of investment securities noted above.
G. Capital share transactions for each class of shares were:
| | | | |
| | | | Year Ended October 31, |
| | | 2016 | | 2015 |
| | Amount | Shares | Amount | Shares |
| | ($000) | (000) | ($000) | (000) |
| Investor Shares | | | | |
| Issued | 369,389 | 23,343 | 401,348 | 25,349 |
| Issued in Lieu of Cash Distributions | 8,661 | 547 | 8,366 | 529 |
| Redeemed | (507,553) | (32,076) | (752,461) | (47,532) |
| Net Increase (Decrease) —Investor Shares | (129,503) | (8,186) | (342,747) | (21,654) |
| Admiral Shares | | | | |
| Issued | 5,819,980 | 367,752 | 4,552,621 | 287,626 |
| Issued in Lieu of Cash Distributions | 75,295 | 4,758 | 61,696 | 3,898 |
| Redeemed | (4,296,888) | (271,522) | (4,661,720) | (294,494) |
| Net Increase (Decrease) —Admiral Shares | 1,598,387 | 100,988 | (47,403) | (2,970) |
H. Management has determined that no material events or transactions occurred subsequent to October 31, 2016, that would require recognition or disclosure in these financial statements.
49
Limited-Term Tax-Exempt Fund
Fund Profile
As of October 31, 2016
| | |
| Share-Class Characteristics | | |
| | Investor | Admiral |
| | Shares | Shares |
| Ticker Symbol | VMLTX | VMLUX |
| Expense Ratio1 | 0.20% | 0.12% |
| 30-Day SEC Yield | 1.08% | 1.20% |
| | | |
| Financial Attributes | | |
| | | Bloomberg | |
| | | Barclays | Bloomberg |
| | | 1–5 Year | Barclays |
| | | Municipal | Municipal |
| | | Bond | Bond |
| | Fund | Index | Index |
| Number of Bonds | 3,834 | 16,635 | 49,796 |
| Yield to Maturity | | | |
| (before expenses) | 1.2% | 1.2% | 2.0% |
| Average Coupon | 3.9% | 4.9% | 4.8% |
| Average Duration | 2.5 years | 2.7 years | 5.9 years |
| Average Stated | | | |
| Maturity | 3.2 years | 3.2 years | 12.9 years |
| Short-Term Reserves | 8.8% | — | — |
| |
| Largest Area Concentrations2 | |
| New York | 13.3% |
| Texas | 10.8 |
| California | 10.7 |
| Pennsylvania | 5.2 |
| New Jersey | 5.0 |
| Massachusetts | 4.8 |
| Ohio | 4.2 |
| Illinois | 4.1 |
| Florida | 4.0 |
| Maryland | 3.5 |
| Top Ten | 65.6% |
| | |
| Volatility Measures | | |
| | Bloomberg | |
| | Barclays | Bloomberg |
| | 1–5 Year | Barclays |
| | Municipal | Municipal |
| | Bond Index | Bond Index |
| R-Squared | 0.95 | 0.69 |
| Beta | 0.99 | 0.37 |
These measures show the degree and timing of the fund’s fluctuations compared with the indexes over 36 months.
| |
| Distribution by Stated Maturity (% of portfolio) |
| Under 6 Months | 14.8% |
| 6 Months–1 Year | 7.1 |
| 1–2 Years | 15.0 |
| 2–3 Years | 13.0 |
| 3–4 Years | 14.5 |
| 4–5 Years | 13.4 |
| Over 5 Years | 22.2 |
| |
| Distribution by Credit Quality (% of portfolio) |
| |
| AAA | 18.7% |
| AA | 55.4 |
| A | 19.1 |
| BBB | 4.8 |
| BB | 0.4 |
| B or Lower | 0.4 |
| Not Rated | 1.2 |
Credit-quality ratings are obtained from Moody’s and S&P, and the higher rating for each issue is shown. “Not Rated” is used to classify securities for which a rating is not available. Not rated securities include a fund’s investment in Vanguard Market Liquidity Fund or Vanguard Municipal Cash Management Fund, each of which invests in high-quality money market instruments and may serve as a cash management vehicle for the Vanguard funds, trusts, and accounts. For more information about these ratings, see the Glossary entry for Credit Quality.
Investment Focus

1 The expense ratios shown are from the prospectus dated February 26, 2016, and represent estimated costs for the current fiscal year. For the fiscal year ended October 31, 2016, the expense
Investor Shares and 0.09% for Admiral Shares.
2 Percentage of net assets, excluding any futures contracts.
50
Limited-Term Tax-Exempt Fund
Performance Summary
All of the returns in this report represent past performance, which is not a guarantee of future results that may be achieved by the fund. (Current performance may be lower or higher than the performance data cited. For performance data current to the most recent month-end, visit our website at vanguard.com/performance.) Note, too, that both investment returns and principal value can fluctuate widely, so an investor’s shares, when sold, could be worth more or less than their original cost. The returns shown do not reflect taxes that a shareholder would pay on fund distributions or on the sale of fund shares.
Cumulative Performance: October 31, 2006–October 31, 2016
Initial Investment of $10,000
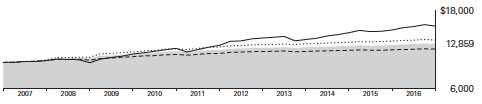
| | | | |
| | | Average Annual Total Returns | Final Value |
| | | Periods Ended October 31, 2016 | of a $10,000 |
| | One Year | Five Years | Ten Years | Investment |
| Limited-Term Tax-Exempt Fund | | | | |
| Investor Shares | 1.31% | 1.56% | 2.55% | $12,859 |
| Bloomberg Barclays 1–5 Year Municipal | | | | |
| Bond Index | 1.09 | 1.71 | 3.02 | 13,464 |
| 1–5 Year Municipal Funds Average1 | 0.94 | 1.13 | 1.89 | 12,060 |
| Bloomberg Barclays Municipal Bond Index | 4.06 | 4.34 | 4.57 | 15,637 |
| | | | |
| | | | | Final Value |
| | | | | of a $50,000 |
| | One Year | Five Years | Ten Years | Investment |
| Limited-Term Tax-Exempt Fund Admiral Shares | 1.41% | 1.64% | 2.63% | $64,810 |
| Bloomberg Barclays 1–5 Year Municipal Bond Index | 1.09 | 1.71 | 3.02 | 67,318 |
| Bloomberg Barclays Municipal Bond Index | 4.06 | 4.34 | 4.57 | 78,184 |
1 Derived from data provided by Lipper, a Thomson Reuters Company.
See Financial Highlights for dividend and capital gains information.
51
Limited-Term Tax-Exempt Fund
| | | | |
| Fiscal-Year Total Returns (%): October 31, 2006–October 31, 2016 | | | |
| | | | | Bloomberg |
| | | | | Barclays |
| | | | | 1–5 Year |
| | | | | Municipal |
| | | | Investor Shares | Bond Index |
| | Income | Capital | Total | Total |
| Fiscal Year | Returns | Returns | Returns | Returns |
| 2007 | 3.53% | 0.09% | 3.62% | 3.90% |
| 2008 | 3.43 | -0.75 | 2.68 | 3.92 |
| 2009 | 2.92 | 3.00 | 5.92 | 7.51 |
| 2010 | 2.40 | 1.64 | 4.04 | 4.32 |
| 2011 | 2.25 | -0.72 | 1.53 | 2.15 |
| 2012 | 1.94 | 0.99 | 2.93 | 3.17 |
| 2013 | 1.67 | -1.07 | 0.60 | 0.93 |
| 2014 | 1.63 | 0.18 | 1.81 | 1.98 |
| 2015 | 1.51 | -0.36 | 1.15 | 1.39 |
| 2016 | 1.49 | -0.18 | 1.31 | 1.09 |
Average Annual Total Returns: Periods Ended September 30, 2016
This table presents returns through the latest calendar quarter—rather than through the end of the fiscal period.
Securities and Exchange Commission rules require that we provide this information.
| | | | | | |
| | | | | | | Ten Years |
| | Inception Date | One Year | Five Years | Income | Capital | Total |
| Investor Shares | 8/31/1987 | 1.76% | 1.51% | 2.29% | 0.30% | 2.59% |
| Admiral Shares | 2/12/2001 | 1.86 | 1.60 | 2.37 | 0.30 | 2.67 |
52
Limited-Term Tax-Exempt Fund
Financial Statements
Statement of Net Assets
As of October 31, 2016
The fund reports a complete list of its holdings in regulatory filings four times in each fiscal year, at the quarter-ends. For the second and fourth fiscal quarters, the lists appear in the fund’s semiannual and annual reports to shareholders. For the first and third fiscal quarters, the fund files the lists with the Securities and Exchange Commission on Form N-Q. Shareholders can look up the fund’s Forms N-Q on the SEC’s website at sec.gov. Forms N-Q may also be reviewed and copied at the SEC’s Public Reference Room (see the back cover of this report for further information).
| | | | |
| | | | Face | Market |
| | | Maturity | Amount | Value• |
| | Coupon | Date | ($000) | ($000) |
| Tax-Exempt Municipal Bonds (100.9%) | | | | |
| Alabama (0.5%) | | | | |
| Alabama Public School & College Authority Capital Improvement Revenue | 5.000% | 1/1/23 | 14,310 | 17,193 |
| 1 Alabama Special Care Facilities Financing Authority Birmingham Revenue | | | | |
| (Ascension Health Credit Group) PUT | 1.850% | 11/1/22 | 9,000 | 8,985 |
| Auburn University Alabama General Fee Revenue | 5.000% | 6/1/19 | 2,000 | 2,203 |
| Baldwin County AL Board of Education Revenue | 5.000% | 6/1/21 | 1,000 | 1,165 |
| Baldwin County AL Board of Education Revenue | 5.000% | 6/1/22 | 1,500 | 1,784 |
| Birmingham AL Special Care Facilities Financing Authority Revenue | | | | |
| (Ascension Health Credit Group) PUT | 1.500% | 5/1/20 | 4,425 | 4,428 |
| Birmingham AL Water Works Board Water Revenue | 5.000% | 1/1/23 | 1,000 | 1,205 |
| Birmingham AL Water Works Board Water Revenue | 5.000% | 1/1/23 | 430 | 514 |
| Black Belt Energy Gas District Alabama Gas Supply Revenue PUT | 4.000% | 6/1/21 | 10,000 | 11,005 |
| Houston County AL Health Care Authority Revenue | 5.000% | 10/1/24 | 2,000 | 2,357 |
| Houston County AL Health Care Authority Revenue | 5.000% | 10/1/25 | 1,000 | 1,187 |
| Huntsville AL Water System Revenue | 5.000% | 11/1/20 | 1,000 | 1,151 |
| Infirmary Health System Special Care Facilities Financing Authority Mobile Alabama Revenue | | | | |
| (Infirmary Health System Inc.) | 5.000% | 2/1/21 | 3,065 | 3,495 |
| Infirmary Health System Special Care Facilities Financing Authority Mobile Alabama Revenue | | | | |
| (Infirmary Health System Inc.) | 5.000% | 2/1/22 | 4,365 | 5,060 |
| Infirmary Health System Special Care Facilities Financing Authority Mobile Alabama Revenue | | | | |
| (Infirmary Health System Inc.) | 5.000% | 2/1/23 | 4,565 | 5,387 |
| Jefferson County AL Sewer Revenue | 5.000% | 10/1/17 | 1,620 | 1,671 |
| Jefferson County AL Sewer Revenue | 5.000% | 10/1/18 | 1,500 | 1,580 |
| Jefferson County AL Sewer Revenue | 5.000% | 10/1/21 | 1,300 | 1,429 |
| Mobile AL Industrial Development Board Pollution Control Revenue (Alabama Power Co.) PUT | 1.625% | 10/2/18 | 10,000 | 10,071 |
| Mobile AL Infirmary Health System Special Care Facilities Financing Authority Revenue | | | | |
| (Infirmary Health System Inc.) | 5.000% | 2/1/17 | 2,475 | 2,496 |
| Mobile County AL Board of School Commissioners GO | 5.000% | 3/1/22 | 600 | 709 |
| Mobile County AL Board of School Commissioners GO | 5.000% | 3/1/22 | 1,000 | 1,182 |
| Tuscaloosa AL Public Educational Building Authority Student Housing Revenue | | | | |
| (Ridgecrest Student Housing LLC) | 5.000% | 7/1/22 (15) | 3,485 | 4,105 |
| Tuscaloosa AL Public Educational Building Authority Student Housing Revenue | | | | |
| (Ridgecrest Student Housing LLC) | 5.000% | 7/1/23 (15) | 3,660 | 4,389 |
| Tuscaloosa AL Public Educational Building Authority Student Housing Revenue | | | | |
| (Ridgecrest Student Housing LLC) | 5.000% | 7/1/24 (15) | 3,845 | 4,678 |
| University of Alabama at Birmingham Revenue | 5.000% | 10/1/17 | 1,630 | 1,693 |
| University of Alabama at Birmingham Revenue | 5.000% | 10/1/17 | 3,565 | 3,703 |
| University of Alabama General Revenue | 5.000% | 7/1/18 | 4,680 | 4,997 |
| University of Alabama General Revenue | 5.000% | 7/1/19 | 5,345 | 5,903 |
| University of South Alabama University Facilities Revenue | 5.000% | 11/1/20 | 1,395 | 1,590 |
| University of South Alabama University Facilities Revenue | 5.000% | 11/1/21 | 825 | 961 |
| University of South Alabama University Facilities Revenue | 5.000% | 11/1/22 | 1,080 | 1,281 |
| | | | | 119,557 |
| Alaska (0.4%) | | | | |
| Alaska GO | 5.000% | 8/1/22 | 5,590 | 6,660 |
| Alaska Municipal Bond Bank Authority Revenue | 5.000% | 12/1/21 | 2,265 | 2,629 |
| Alaska Municipal Bond Bank Authority Revenue | 5.000% | 12/1/22 | 2,410 | 2,852 |
| 1 Alaska Municipal Bond Bank Authority Revenue | 5.000% | 12/1/22 | 1,740 | 2,059 |
| Alaska Municipal Bond Bank Authority Revenue | 5.000% | 12/1/23 | 2,530 | 3,021 |
| 1 Alaska Municipal Bond Bank Authority Revenue | 5.000% | 12/1/23 | 4,785 | 5,712 |
| Alaska Railroad Corp. Capital Grant Receipt Revenue | 5.000% | 8/1/19 | 2,000 | 2,189 |
| Alaska Railroad Corp. Capital Grant Receipt Revenue | 5.000% | 8/1/21 | 10,140 | 11,618 |
| Alaska Railroad Corp. Capital Grant Receipt Revenue | 5.000% | 8/1/22 | 10,265 | 11,992 |
| Alaska Railroad Corp. Capital Grant Receipt Revenue | 5.000% | 8/1/23 | 13,515 | 16,051 |
| Alaska State International Airport Revenue | 5.000% | 10/1/23 | 500 | 611 |
| Alaska State International Airport Revenue | 5.000% | 10/1/24 | 1,500 | 1,856 |
53
Limited-Term Tax-Exempt Fund
| | | | |
| | | | Face | Market |
| | | Maturity | Amount | Value• |
| | Coupon | Date | ($000) | ($000) |
| Anchorage AK GO | 5.000% | 9/1/21 | 2,000 | 2,339 |
| Anchorage AK GO | 5.000% | 9/1/21 | 2,605 | 3,046 |
| Anchorage AK GO | 5.000% | 9/1/21 | 1,000 | 1,169 |
| Anchorage AK GO | 5.000% | 9/1/22 | 2,000 | 2,395 |
| Anchorage AK GO | 5.000% | 9/1/22 | 1,665 | 1,994 |
| Matanuska-Susitna Borough AK Lease Revenue (Goose Creek Correctional Center) GO | 5.000% | 9/1/20 | 1,725 | 1,954 |
| Matanuska-Susitna Borough AK Lease Revenue (Goose Creek Correctional Center) GO | 5.000% | 9/1/21 | 1,950 | 2,259 |
| Matanuska-Susitna Borough AK Lease Revenue (Goose Creek Correctional Center) GO | 5.000% | 9/1/22 | 1,450 | 1,714 |
| Matanuska-Susitna Borough AK Lease Revenue (Goose Creek Correctional Center) GO | 5.000% | 9/1/23 | 4,150 | 4,985 |
| North Slope Borough AK GO | 5.000% | 6/30/18 | 13,035 | 13,886 |
| | | | | 102,991 |
| Arizona (1.5%) | | | | |
| Arizona Board of Regents Arizona State University System Revenue | 5.000% | 8/1/19 | 2,140 | 2,369 |
| Arizona Board of Regents Arizona State University System Revenue | 5.000% | 7/1/20 | 6,000 | 6,836 |
| Arizona Board of Regents Arizona State University System Revenue | 5.000% | 8/1/20 | 1,700 | 1,939 |
| Arizona Board of Regents Arizona State University System Revenue | 5.000% | 7/1/21 | 975 | 1,142 |
| Arizona Board of Regents Arizona State University System Revenue | 5.000% | 7/1/21 | 300 | 351 |
| Arizona Board of Regents Arizona State University System Revenue | 5.000% | 7/1/21 | 5,000 | 5,857 |
| Arizona Board of Regents Arizona State University System Revenue | 5.000% | 7/1/21 | 10,000 | 11,715 |
| Arizona Board of Regents Arizona State University System Revenue | 5.000% | 7/1/21 | 625 | 732 |
| Arizona Board of Regents Arizona State University System Revenue | 5.000% | 7/1/22 | 455 | 546 |
| Arizona Board of Regents Arizona State University System Revenue | 5.000% | 7/1/22 | 3,190 | 3,826 |
| Arizona Board of Regents Arizona State University System Revenue | 5.000% | 7/1/22 | 3,185 | 3,820 |
| Arizona Board of Regents Arizona State University System Revenue | 5.000% | 7/1/22 | 425 | 510 |
| Arizona Board of Regents Arizona State University System Revenue | 5.000% | 7/1/22 | 600 | 720 |
| Arizona Board of Regents Arizona State University System Revenue | 5.000% | 7/1/23 | 650 | 794 |
| Arizona Board of Regents Arizona State University System Revenue | 5.000% | 7/1/23 | 750 | 916 |
| Arizona Board of Regents Arizona State University System Revenue | 5.000% | 7/1/23 | 1,500 | 1,831 |
| Arizona COP | 5.000% | 10/1/17 | 1,000 | 1,038 |
| Arizona COP | 5.000% | 10/1/18 | 900 | 968 |
| Arizona COP | 4.000% | 9/1/19 | 1,500 | 1,620 |
| Arizona COP | 5.000% | 9/1/20 | 4,300 | 4,899 |
| Arizona COP | 5.000% | 9/1/21 | 6,380 | 7,447 |
| Arizona COP | 5.000% | 10/1/22 | 4,880 | 5,829 |
| Arizona COP | 5.000% | 10/1/23 | 6,500 | 7,891 |
| Arizona Health Facilities Authority Hospital System Revenue (Phoenix Children’s Hospital) | 5.000% | 2/1/18 | 1,000 | 1,047 |
| Arizona Health Facilities Authority Hospital System Revenue (Phoenix Children’s Hospital) | 5.000% | 2/1/19 | 2,600 | 2,808 |
| Arizona Health Facilities Authority Hospital System Revenue (Phoenix Children’s Hospital) | 5.000% | 2/1/20 | 4,550 | 5,058 |
| 2 Arizona Health Facilities Authority Revenue (Banner Health) TOB VRDO | 0.750% | 11/7/16 | 5,500 | 5,500 |
| 3 Arizona Health Facilities Authority Revenue (Phoenix Children’s Hospital) PUT | 2.480% | 2/5/20 | 20,000 | 20,352 |
| 3 Arizona Health Facilities Authority Revenue (Phoenix Children’s Hospital) PUT | 2.480% | 2/5/20 | 5,000 | 5,088 |
| Arizona Health Facilities Authority Revenue (Scottsdale Lincoln Hospitals Project) | 5.000% | 12/1/19 | 600 | 668 |
| Arizona Health Facilities Authority Revenue (Scottsdale Lincoln Hospitals Project) | 5.000% | 12/1/20 | 1,000 | 1,146 |
| Arizona Health Facilities Authority Revenue (Scottsdale Lincoln Hospitals Project) | 5.000% | 12/1/21 | 1,000 | 1,175 |
| Arizona Health Facilities Authority Revenue (Scottsdale Lincoln Hospitals Project) | 5.000% | 12/1/22 | 800 | 962 |
| Arizona School Facilities Board COP | 5.000% | 9/1/18 | 1,500 | 1,606 |
| Arizona School Facilities Board COP | 5.000% | 9/1/20 | 11,000 | 12,514 |
| Arizona School Facilities Board COP | 5.000% | 9/1/21 | 7,000 | 8,162 |
| Arizona State University Revenue (McAllister Academic Village LLC) | 5.000% | 7/1/20 | 1,505 | 1,705 |
| Arizona State University Revenue (McAllister Academic Village LLC) | 5.000% | 7/1/22 | 1,770 | 2,097 |
| Arizona Transportation Board Excise Tax Revenue | 5.000% | 7/1/21 | 9,000 | 10,543 |
| Arizona Transportation Board Excise Tax Revenue | 5.000% | 7/1/22 | 3,000 | 3,587 |
| Arizona Transportation Board Excise Tax Revenue | 5.000% | 7/1/23 | 3,500 | 4,263 |
| Arizona Transportation Board Highway Revenue | 5.000% | 7/1/20 | 3,360 | 3,831 |
| 2 Arizona Transportation Board Highway Revenue TOB VRDO | 0.660% | 11/7/16 | 6,605 | 6,605 |
| Arizona Water Infrastructure Finance Authority Revenue | 5.000% | 10/1/19 (ETM) | 530 | 591 |
| Arizona Water Infrastructure Finance Authority Revenue | 5.000% | 10/1/19 | 1,470 | 1,638 |
| Glendale AZ GO | 4.000% | 7/1/21 (4) | 3,400 | 3,759 |
| Glendale AZ GO | 5.000% | 7/1/22 (4) | 1,670 | 1,961 |
| Glendale AZ Industrial Development Authority Revenue (Midwestern University) | 5.000% | 5/15/17 | 3,115 | 3,177 |
| Glendale AZ Industrial Development Authority Senior Living Facilities Revenue | | | | |
| (Royal Oaks Life Care Community) | 4.000% | 5/15/20 | 450 | 490 |
| Glendale AZ Industrial Development Authority Senior Living Facilities Revenue | | | | |
| (Royal Oaks Life Care Community) | 4.000% | 5/15/21 | 750 | 830 |
| Glendale AZ Industrial Development Authority Senior Living Facilities Revenue | | | | |
| (Royal Oaks Life Care Community) | 4.000% | 5/15/22 | 750 | 838 |
| Glendale AZ Industrial Development Authority Senior Living Facilities Revenue | | | | |
| (Royal Oaks Life Care Community) | 4.000% | 5/15/23 | 750 | 847 |
| Glendale AZ Senior Excise Tax Revenue | 5.000% | 7/1/20 | 2,770 | 3,141 |
54
Limited-Term Tax-Exempt Fund
| | | | |
| | | | Face | Market |
| | | Maturity | Amount | Value• |
| | Coupon | Date | ($000) | ($000) |
| Glendale AZ Senior Excise Tax Revenue | 5.000% | 7/1/21 | 2,900 | 3,371 |
| Glendale AZ Senior Excise Tax Revenue | 5.000% | 7/1/22 | 3,100 | 3,687 |
| Goodyear Public Improvement Corp. Municipal Facilities Revenue | 5.000% | 7/1/21 | 800 | 931 |
| Goodyear Public Improvement Corp. Municipal Facilities Revenue | 5.000% | 7/1/22 | 1,500 | 1,785 |
| Goodyear Public Improvement Corp. Municipal Facilities Revenue | 5.000% | 7/1/24 | 900 | 1,108 |
| 1 Maricopa County AZ Industrial Development Authority Health Facilities Revenue | | | | |
| (Banner Health Obligated Group) | 5.000% | 1/1/21 | 3,500 | 4,018 |
| 1 Maricopa County AZ Industrial Development Authority Health Facilities Revenue | | | | |
| (Banner Health Obligated Group) | 5.000% | 1/1/22 | 3,650 | 4,289 |
| 1 Maricopa County AZ Industrial Development Authority Health Facilities Revenue | | | | |
| (Banner Health Obligated Group) | 5.000% | 1/1/23 | 5,500 | 6,569 |
| 1 Maricopa County AZ Industrial Development Authority Health Facilities Revenue | | | | |
| (Banner Health Obligated Group) | 5.000% | 1/1/24 | 2,250 | 2,734 |
| Maricopa County AZ Unified School District No. 4 (Mesa) GO | 4.000% | 7/1/18 | 3,220 | 3,383 |
| Maricopa County AZ Unified School District No. 4 (Mesa) GO | 4.000% | 7/1/19 | 3,750 | 4,043 |
| Phoenix AZ Civic Improvement Corp. Airport Revenue | 5.000% | 7/1/20 | 450 | 510 |
| Phoenix AZ Civic Improvement Corp. Airport Revenue | 5.000% | 7/1/21 | 335 | 388 |
| Phoenix AZ Civic Improvement Corp. Airport Revenue | 5.000% | 7/1/22 | 200 | 238 |
| Phoenix AZ Civic Improvement Corp. Excise Tax Revenue | 5.000% | 7/1/17 | 3,310 | 3,405 |
| Phoenix AZ Civic Improvement Corp. Excise Tax Revenue | 5.000% | 7/1/21 | 2,000 | 2,341 |
| Phoenix AZ Civic Improvement Corp. Excise Tax Revenue | 5.000% | 7/1/22 | 1,775 | 2,130 |
| Phoenix AZ Civic Improvement Corp. Water System Revenue | 5.000% | 7/1/20 | 17,055 | 19,465 |
| Phoenix AZ Civic Improvement Corp. Water System Revenue | 5.000% | 7/1/21 | 12,360 | 14,485 |
| Phoenix AZ Industrial Development Authority Revenue (Mayo Clinic) VRDO | 0.470% | 11/1/16 | 25,850 | 25,850 |
| Pima County AZ Regional Transportation Authority Excise Tax Revenue | 5.000% | 6/1/19 | 3,155 | 3,475 |
| Pima County AZ Regional Transportation Authority Excise Tax Revenue | 5.000% | 6/1/20 | 2,840 | 3,227 |
| Pima County AZ Regional Transportation Authority Excise Tax Revenue | 5.000% | 6/1/21 | 3,000 | 3,503 |
| Pima County AZ Sewer Revenue | 5.000% | 7/1/19 | 1,000 | 1,105 |
| Pima County AZ Sewer Revenue | 5.000% | 7/1/22 | 7,250 | 8,696 |
| Pima County AZ Tucson Unified School District No. 1 GO | 5.000% | 7/1/21 (15) | 400 | 465 |
| Pima County AZ Tucson Unified School District No. 1 GO | 5.000% | 7/1/22 (15) | 1,000 | 1,190 |
| Regional Public Transportation Authority Arizona Excise Tax Revenue | | | | |
| (Maricopa County Public Transportation) | 5.250% | 7/1/20 | 4,850 | 5,568 |
| Salt River Project Arizona Agricultural Improvement & Power District Revenue | 4.000% | 12/1/17 | 1,000 | 1,035 |
| Salt River Project Arizona Agricultural Improvement & Power District Revenue | 5.000% | 12/1/18 | 4,520 | 4,898 |
| Salt Verde AZ Financial Corp. Gas Revenue | 5.000% | 12/1/18 | 165 | 176 |
| Salt Verde AZ Financial Corp. Gas Revenue | 5.250% | 12/1/19 | 1,565 | 1,726 |
| Scottsdale AZ GO | 5.000% | 7/1/17 | 2,700 | 2,778 |
| Scottsdale AZ GO | 5.000% | 7/1/19 | 1,860 | 2,058 |
| Scottsdale AZ GO | 4.000% | 7/1/20 | 11,150 | 12,330 |
| University Medical Center Corp. Arizona Hospital Revenue | 5.000% | 7/1/21 (ETM) | 2,740 | 3,207 |
| Yavapai County AZ Industrial Development Authority Hospital Facility Revenue | | | | |
| (Northern Arizona Healthcare System) | 5.000% | 10/1/17 | 1,445 | 1,499 |
| Yavapai County AZ Industrial Development Authority Hospital Facility Revenue | | | | |
| (Northern Arizona Healthcare System) | 5.000% | 10/1/18 | 2,185 | 2,346 |
| Yuma AZ Industrial Development Authority Hospital Revenue (Yuma Regional Medical Center) | 5.000% | 8/1/20 | 1,000 | 1,124 |
| Yuma AZ Industrial Development Authority Hospital Revenue (Yuma Regional Medical Center) | 5.000% | 8/1/21 | 750 | 860 |
| Yuma AZ Industrial Development Authority Hospital Revenue (Yuma Regional Medical Center) | 5.000% | 8/1/22 | 1,000 | 1,169 |
| Yuma AZ Industrial Development Authority Hospital Revenue (Yuma Regional Medical Center) | 5.000% | 8/1/23 | 1,000 | 1,184 |
| | | | | 357,934 |
| Arkansas (0.2%) | | | | |
| Arkansas Development Finance Authority Healthcare Revenue (Baptist Health) | 5.000% | 12/1/20 | 4,225 | 4,831 |
| Arkansas Development Finance Authority Healthcare Revenue (Baptist Health) | 5.000% | 12/1/21 | 4,560 | 5,344 |
| Arkansas Development Finance Authority Healthcare Revenue (Baptist Health) | 5.000% | 12/1/22 | 700 | 839 |
| Arkansas Development Finance Authority Hospital Revenue | | | | |
| (Washington Regional Medical Center) | 5.000% | 2/1/21 | 920 | 1,047 |
| Arkansas Development Finance Authority Hospital Revenue | | | | |
| (Washington Regional Medical Center) | 5.000% | 2/1/22 | 760 | 883 |
| Arkansas Federal Highway Grant Anticipation & Tax Revenue GO | 5.000% | 10/1/21 | 5,000 | 5,897 |
| Baxter County AR Hospital Revenue | 5.000% | 9/1/20 | 780 | 872 |
| Baxter County AR Hospital Revenue | 5.000% | 9/1/21 | 1,140 | 1,296 |
| Baxter County AR Hospital Revenue | 5.000% | 9/1/22 | 1,000 | 1,153 |
| Baxter County AR Hospital Revenue | 5.000% | 9/1/23 | 960 | 1,114 |
| Independence County AR Pollution Control Revenue (Entergy Arkansas, Inc. Project) | 2.375% | 1/1/21 | 15,000 | 15,614 |
| Jefferson County AR Pollution Control Revenue (Entergy Arkansas, Inc. Project) | 1.550% | 10/1/17 | 10,000 | 10,056 |
| | | | | 48,946 |
| California (10.7%) | | | | |
| ABAG Finance Authority for Nonprofit Corps. California Revenue (Jackson Laboratory) | 5.000% | 7/1/18 | 1,000 | 1,066 |
| ABAG Finance Authority for Nonprofit Corps. California Revenue (Jackson Laboratory) | 5.000% | 7/1/19 | 1,050 | 1,158 |
55
Limited-Term Tax-Exempt Fund
| | | | |
| | | | Face | Market |
| | | Maturity | Amount | Value• |
| | Coupon | Date | ($000) | ($000) |
| ABAG Finance Authority for Nonprofit Corps. California Revenue (Sharp Healthcare) | 5.000% | 8/1/19 | 1,000 | 1,108 |
| ABAG Finance Authority for Nonprofit Corps. California Revenue (Sharp Healthcare) | 4.000% | 8/1/20 | 500 | 552 |
| Alameda CA Corridor Transportation Authority Revenue | 5.000% | 10/1/19 | 1,000 | 1,115 |
| Alameda CA Corridor Transportation Authority Revenue | 0.000% | 10/1/20 (ETM) | 5,485 | 5,220 |
| Alameda CA Corridor Transportation Authority Revenue | 0.000% | 10/1/20 (2) | 115 | 108 |
| Alameda CA Corridor Transportation Authority Revenue | 5.000% | 10/1/20 | 1,730 | 1,985 |
| 1 Alameda County CA Joint Powers Authority Lease Revenue | 5.000% | 12/1/21 | 1,200 | 1,416 |
| 1 Alameda County CA Joint Powers Authority Lease Revenue | 5.000% | 12/1/22 | 1,540 | 1,854 |
| 1 Alameda County CA Joint Powers Authority Lease Revenue | 5.000% | 12/1/23 | 1,820 | 2,231 |
| Antelope Valley-East Kern CA Water Agency Revenue | 4.000% | 6/1/21 | 1,000 | 1,124 |
| 2 Bakersfield CA Wastewater Revenue TOB VRDO | 0.850% | 11/7/16 | 5,315 | 5,315 |
| Bay Area Toll Authority California Toll Bridge Revenue (San Francisco Bay Area) | 5.000% | 4/1/17 (Prere.) | 13,870 | 14,114 |
| Bay Area Toll Authority California Toll Bridge Revenue (San Francisco Bay Area) | 5.000% | 4/1/17 (Prere.) | 12,205 | 12,420 |
| Bay Area Toll Authority California Toll Bridge Revenue (San Francisco Bay Area) | 4.000% | 4/1/21 | 3,350 | 3,767 |
| Bay Area Toll Authority California Toll Bridge Revenue (San Francisco Bay Area) PUT | 1.367% | 8/1/17 | 28,500 | 28,563 |
| Bay Area Toll Authority California Toll Bridge Revenue (San Francisco Bay Area) PUT | 1.450% | 8/1/17 | 7,000 | 7,012 |
| Bay Area Toll Authority California Toll Bridge Revenue (San Francisco Bay Area) PUT | 1.450% | 8/1/17 | 17,000 | 17,032 |
| Bay Area Toll Authority California Toll Bridge Revenue (San Francisco Bay Area) PUT | 1.500% | 4/2/18 | 13,500 | 13,569 |
| Bay Area Toll Authority California Toll Bridge Revenue (San Francisco Bay Area) PUT | 1.875% | 4/1/19 | 15,200 | 15,410 |
| 3 Bay Area Toll Authority California Toll Bridge Revenue (San Francisco Bay Area) PUT | 1.330% | 10/1/19 | 9,825 | 9,828 |
| Bay Area Toll Authority California Toll Bridge Revenue (San Francisco Bay Area) PUT | 1.875% | 4/1/20 | 27,500 | 27,919 |
| 3 Bay Area Toll Authority California Toll Bridge Revenue (San Francisco Bay Area) PUT | 1.530% | 5/1/23 | 28,500 | 28,479 |
| 3 Bay Area Toll Authority California Toll Bridge Revenue (San Francisco Bay Area) PUT | 1.530% | 5/1/23 | 4,000 | 3,997 |
| 2 Bay Area Toll Authority California Toll Bridge Revenue (San Francisco Bay Area) TOB VRDO | 0.670% | 11/7/16 | 4,910 | 4,910 |
| Brea CA Redevelopment Agency Successor Agency Tax Allocation Revenue | | | | |
| (Redevelopment Project AB) | 5.000% | 8/1/18 | 1,200 | 1,284 |
| Brea CA Redevelopment Agency Successor Agency Tax Allocation Revenue | | | | |
| (Redevelopment Project AB) | 5.000% | 8/1/19 | 2,000 | 2,212 |
| Brea CA Redevelopment Agency Successor Agency Tax Allocation Revenue | | | | |
| (Redevelopment Project AB) | 5.000% | 8/1/20 | 2,200 | 2,505 |
| California County CA Tobacco Securitization Agency Revenue | 5.000% | 6/1/19 | 1,000 | 1,089 |
| California County CA Tobacco Securitization Agency Revenue | 5.000% | 6/1/20 | 1,200 | 1,340 |
| California Department of Water Resources Power Supply Revenue | 5.000% | 5/1/17 | 22,000 | 22,484 |
| California Department of Water Resources Power Supply Revenue | 5.000% | 5/1/19 | 10,000 | 11,010 |
| California Department of Water Resources Power Supply Revenue | 5.000% | 5/1/21 | 23,000 | 26,917 |
| California Department of Water Resources Power Supply Revenue | 5.000% | 5/1/22 | 54,000 | 64,870 |
| California Department of Water Resources Water System Revenue (Central Valley Project) | 5.000% | 12/1/17 (ETM) | 10 | 10 |
| California Department of Water Resources Water System Revenue (Central Valley Project) | 5.000% | 12/1/17 | 2,490 | 2,608 |
| California Department of Water Resources Water System Revenue (Central Valley Project) | 5.000% | 12/1/18 (ETM) | 5 | 5 |
| California Department of Water Resources Water System Revenue (Central Valley Project) | 5.000% | 12/1/18 | 1,360 | 1,477 |
| California Department of Water Resources Water System Revenue (Central Valley Project) | 5.000% | 12/1/19 (ETM) | 10 | 11 |
| California Department of Water Resources Water System Revenue (Central Valley Project) | 5.000% | 12/1/19 | 3,990 | 4,482 |
| 3 California Department of Water Resources Water System Revenue (Central Valley Project) PUT | 0.930% | 12/1/17 | 32,250 | 32,171 |
| California Economic Recovery GO | 5.000% | 7/1/17 (ETM) | 15,090 | 15,524 |
| California Economic Recovery GO | 5.000% | 7/1/18 (ETM) | 32,295 | 34,525 |
| California Economic Recovery GO | 5.000% | 7/1/18 (ETM) | 9,305 | 9,947 |
| 2 California Educational Facilities Authority Revenue (University of Southern California) TOB VRDO | 0.660% | 11/7/16 | 6,310 | 6,310 |
| California GO | 5.000% | 11/1/16 (2) | 5,375 | 5,375 |
| California GO | 5.000% | 12/1/16 | 2,500 | 2,509 |
| California GO | 6.000% | 2/1/17 (2) | 3,500 | 3,547 |
| California GO | 5.000% | 3/1/17 | 3,755 | 3,810 |
| 3 California GO | 1.380% | 5/1/17 | 3,700 | 3,700 |
| California GO | 5.000% | 9/1/17 | 4,250 | 4,403 |
| California GO | 5.000% | 9/1/17 | 2,805 | 2,906 |
| California GO | 5.000% | 10/1/17 | 20,000 | 20,789 |
| California GO | 5.000% | 10/1/17 | 4,005 | 4,163 |
| California GO | 5.000% | 9/1/18 | 32,260 | 34,712 |
| California GO | 5.000% | 9/1/18 | 8,050 | 8,662 |
| California GO | 5.000% | 10/1/18 | 34,000 | 36,697 |
| California GO | 5.000% | 2/1/19 | 11,000 | 12,001 |
| California GO | 5.000% | 9/1/19 | 19,000 | 21,151 |
| California GO | 5.000% | 9/1/19 | 17,825 | 19,843 |
| California GO | 5.000% | 2/1/20 | 44,500 | 50,144 |
| California GO | 5.000% | 11/1/20 | 21,520 | 24,802 |
| California GO | 5.000% | 12/1/20 | 25,475 | 29,435 |
| California GO | 5.000% | 2/1/21 | 10,000 | 11,588 |
| California GO | 5.000% | 9/1/21 | 52,595 | 61,906 |
| California GO | 5.000% | 10/1/21 | 28,000 | 33,036 |
| California GO | 5.000% | 10/1/21 | 41,940 | 49,482 |
| California GO | 5.000% | 11/1/21 | 49,440 | 58,469 |
56
Limited-Term Tax-Exempt Fund
| | | | |
| | | | Face | Market |
| | | Maturity | Amount | Value• |
| | Coupon | Date | ($000) | ($000) |
| California GO | 4.000% | 9/1/22 | 10,000 | 11,479 |
| California GO | 5.000% | 9/1/22 | 10,000 | 12,039 |
| California GO | 5.000% | 9/1/22 | 43,025 | 51,796 |
| 3 California GO PUT | 1.072% | 12/1/17 | 14,250 | 14,278 |
| 3 California GO PUT | 1.080% | 5/1/18 | 29,500 | 29,420 |
| 3 California GO PUT | 1.202% | 12/3/18 | 6,500 | 6,535 |
| California GO PUT | 4.000% | 12/1/21 | 20,700 | 23,202 |
| 2 California GO TOB VRDO | 0.730% | 11/7/16 LOC | 18,740 | 18,740 |
| 2 California GO TOB VRDO | 0.810% | 11/7/16 LOC | 16,750 | 16,750 |
| 2 California GO TOB VRDO | 0.810% | 11/7/16 LOC | 15,080 | 15,080 |
| California Health Facilities Financing Authority Revenue (Adventist Health System/West) | 2.000% | 3/1/18 | 5,980 | 6,069 |
| California Health Facilities Financing Authority Revenue (Adventist Health System/West) | 3.000% | 3/1/19 | 6,045 | 6,317 |
| California Health Facilities Financing Authority Revenue (Adventist Health System/West) | 3.000% | 3/1/20 | 6,290 | 6,667 |
| California Health Facilities Financing Authority Revenue (Adventist Health System/West) | 4.000% | 3/1/21 | 850 | 948 |
| California Health Facilities Financing Authority Revenue (Catholic Healthcare West) | 5.000% | 3/1/19 | 5,125 | 5,607 |
| California Health Facilities Financing Authority Revenue (Cedars-Sinai Medical Center) | 5.000% | 8/15/17 | 3,000 | 3,100 |
| California Health Facilities Financing Authority Revenue (Cedars-Sinai Medical Center) | 5.000% | 8/15/18 | 3,000 | 3,218 |
| 3 California Health Facilities Financing Authority Revenue (Children’s Hospital of Los Angeles) PUT | 2.430% | 7/1/17 | 8,825 | 8,871 |
| California Health Facilities Financing Authority Revenue (City of Hope Medical Center) | 4.000% | 11/15/18 | 1,000 | 1,063 |
| California Health Facilities Financing Authority Revenue (El Camino Hospital) | 4.000% | 2/1/21 | 1,500 | 1,657 |
| California Health Facilities Financing Authority Revenue (El Camino Hospital) | 5.000% | 2/1/22 | 1,000 | 1,172 |
| California Health Facilities Financing Authority Revenue | | | | |
| (Lucile Salter Packard Children’s Hospital at Stanford) PUT | 1.450% | 3/15/17 (Prere.) | 5,000 | 5,013 |
| California Health Facilities Financing Authority Revenue (Providence Health & Services) | 5.000% | 10/1/21 | 750 | 890 |
| California Health Facilities Financing Authority Revenue (Providence Health & Services) | 5.000% | 10/1/22 | 2,205 | 2,682 |
| California Health Facilities Financing Authority Revenue | | | | |
| (Providence St. Joseph Health Obligated Group) PUT | 1.250% | 10/1/20 | 6,400 | 6,371 |
| California Health Facilities Financing Authority Revenue (St. Joseph Health System) PUT | 5.000% | 10/15/19 | 23,500 | 26,082 |
| California Health Facilities Financing Authority Revenue (St. Joseph Health System) PUT | 5.000% | 10/15/20 | 10,000 | 11,428 |
| California Health Facilities Financing Authority Revenue (St. Joseph Health System) PUT | 1.700% | 10/18/22 | 10,000 | 9,982 |
| California Health Facilities Financing Authority Revenue (St. Joseph Health System) PUT | 5.000% | 10/18/22 | 6,000 | 7,230 |
| California Health Facilities Financing Authority Revenue (Sutter Health) | 4.000% | 8/15/17 | 5,000 | 5,133 |
| California Health Facilities Financing Authority Revenue (Sutter Health) PUT | 1.000% | 8/15/19 | 6,000 | 5,972 |
| California Infrastructure & Economic Development Bank Revenue | | | | |
| (Academy of Motion Picture Arts & Sciences Obligated Group) | 5.000% | 11/1/22 | 1,000 | 1,203 |
| 3 California Infrastructure & Economic Development Bank Revenue | | | | |
| (Academy of Motion Picture Arts & Sciences Obligated Group) PUT | 1.324% | 11/1/20 | 20,000 | 20,137 |
| 2 California Infrastructure & Economic Development Bank Revenue | | | | |
| (Academy of Motion Picture Arts & Sciences Obligated Group) TOB VRDO | 0.830% | 11/7/16 | 6,670 | 6,670 |
| 2 California Infrastructure & Economic Development Bank Revenue | | | | |
| (Bay Area Toll Bridges Seismic Retrofit) TOB VRDO | 0.620% | 11/1/16 (Prere.) | 9,000 | 9,000 |
| 3 California Infrastructure & Economic Development Bank Revenue | | | | |
| (Index-Museum Art Project) PUT | 2.124% | 8/1/18 | 29,000 | 29,528 |
| 3 California Infrastructure & Economic Development Bank Revenue (J. Paul Getty Trust) PUT | 0.910% | 4/3/17 | 8,500 | 8,492 |
| 3 California Infrastructure & Economic Development Bank Revenue (J. Paul Getty Trust) PUT | 0.910% | 4/3/17 | 32,200 | 32,169 |
| 3 California Infrastructure & Economic Development Bank Revenue (J. Paul Getty Trust) PUT | 0.910% | 4/1/18 | 30,000 | 30,041 |
| California Municipal Finance Authority | | | | |
| (Community Hospitals of Central California Obligated Group) COP | 5.000% | 2/1/17 | 1,145 | 1,157 |
| California Municipal Finance Authority Revenue (Anaheim Electric Utility Distribution System) | 5.000% | 10/1/21 | 1,300 | 1,537 |
| 3 California Municipal Finance Authority Revenue (Anaheim Electric Utility Distribution System) PUT | 1.130% | 4/2/18 | 14,000 | 13,946 |
| California Municipal Finance Authority Solid Waste Revenue (Republic Services Inc. Project) PUT | 0.950% | 1/3/17 | 13,000 | 13,000 |
| California Public Works Board Lease Revenue (Department of Corrections) | 5.000% | 6/1/17 | 5,000 | 5,125 |
| California Public Works Board Lease Revenue (Department of Corrections) | 4.000% | 9/1/17 | 4,500 | 4,622 |
| California Public Works Board Lease Revenue (Department of Corrections) | 5.000% | 10/1/17 | 5,820 | 6,045 |
| California Public Works Board Lease Revenue (Department of Corrections) | 5.000% | 6/1/18 | 10,650 | 11,333 |
| California Public Works Board Lease Revenue (Department of Corrections) | 5.000% | 6/1/18 | 2,500 | 2,660 |
| California Public Works Board Lease Revenue (Department of Corrections) | 5.000% | 9/1/18 | 5,790 | 6,217 |
| California Public Works Board Lease Revenue (Department of Corrections) | 5.000% | 10/1/18 | 1,845 | 1,987 |
| California Public Works Board Lease Revenue (Department of Corrections) | 5.250% | 11/1/18 (14) | 1,180 | 1,280 |
| California Public Works Board Lease Revenue (Department of Corrections) | 5.000% | 6/1/19 | 16,620 | 18,295 |
| California Public Works Board Lease Revenue (Department of Corrections) | 5.000% | 10/1/20 | 1,690 | 1,936 |
| California Public Works Board Lease Revenue (Department of State Hospitals) | 5.000% | 6/1/19 | 5,600 | 6,165 |
| California Public Works Board Lease Revenue (Department of State Hospitals) | 5.000% | 6/1/20 | 5,200 | 5,898 |
| California Public Works Board Lease Revenue (Judicial Council Projects) | 5.000% | 12/1/17 | 5,200 | 5,435 |
| California Public Works Board Lease Revenue (Judicial Council Projects) | 5.000% | 12/1/18 | 4,000 | 4,333 |
| California Public Works Board Lease Revenue (Judicial Council Projects) | 5.000% | 3/1/20 | 1,175 | 1,323 |
| California Public Works Board Lease Revenue (Judicial Council Projects) | 5.000% | 10/1/20 | 1,240 | 1,421 |
| California Public Works Board Lease Revenue (Regents of The University of California) | 5.000% | 10/1/18 (ETM) | 2,665 | 2,876 |
| California Public Works Board Lease Revenue (Regents of The University of California) | 5.000% | 10/1/19 (ETM) | 2,960 | 3,303 |
| California Public Works Board Lease Revenue (Various Capital Projects) | 5.000% | 4/1/17 | 2,385 | 2,428 |
57
Limited-Term Tax-Exempt Fund
| | | | | |
| | | | | Face | Market |
| | | | Maturity | Amount | Value• |
| | | Coupon | Date | ($000) | ($000) |
| | California Public Works Board Lease Revenue (Various Capital Projects) | 5.000% | 10/1/17 | 3,000 | 3,116 |
| | California Public Works Board Lease Revenue (Various Capital Projects) | 5.000% | 11/1/17 | 1,000 | 1,042 |
| | California Public Works Board Lease Revenue (Various Capital Projects) | 5.000% | 1/1/18 | 11,710 | 12,271 |
| | California Public Works Board Lease Revenue (Various Capital Projects) | 5.000% | 4/1/18 | 1,000 | 1,058 |
| | California Public Works Board Lease Revenue (Various Capital Projects) | 5.000% | 10/1/18 | 3,500 | 3,769 |
| | California Public Works Board Lease Revenue (Various Capital Projects) | 5.000% | 11/1/18 | 1,200 | 1,296 |
| | California Public Works Board Lease Revenue (Various Capital Projects) | 5.000% | 11/1/18 | 2,500 | 2,700 |
| | California Public Works Board Lease Revenue (Various Capital Projects) | 5.000% | 1/1/19 | 7,755 | 8,416 |
| | California Public Works Board Lease Revenue (Various Capital Projects) | 5.000% | 11/1/19 | 2,000 | 2,232 |
| | California Public Works Board Lease Revenue (Various Capital Projects) | 5.000% | 11/1/19 | 2,750 | 3,068 |
| | California Public Works Board Lease Revenue (Various Capital Projects) | 5.000% | 4/1/20 | 3,050 | 3,443 |
| | California Public Works Board Lease Revenue (Various Capital Projects) | 5.000% | 11/1/20 | 2,000 | 2,297 |
| | California Public Works Board Lease Revenue (Various Capital Projects) | 5.000% | 11/1/21 | 3,500 | 4,119 |
| | California Public Works Board Lease Revenue (Various Capital Projects) | 5.000% | 4/1/22 | 5,885 | 6,990 |
| | California Public Works Board Lease Revenue (Various Capital Projects) | 5.000% | 11/1/22 | 5,000 | 6,021 |
| | California Public Works Board Lease Revenue (Various Capital Projects) | 5.000% | 4/1/23 | 6,620 | 7,967 |
| | California Public Works Board Lease Revenue (Various Capital Projects) | 5.000% | 11/1/23 | 5,000 | 6,092 |
| | California State University Systemwide Revenue | 5.000% | 11/1/17 | 5,505 | 5,743 |
| | California State University Systemwide Revenue | 5.000% | 11/1/18 | 4,000 | 4,330 |
| | California State University Systemwide Revenue | 5.000% | 11/1/21 | 8,525 | 10,124 |
| | California State University Systemwide Revenue | 5.000% | 11/1/22 | 2,700 | 3,291 |
| | California State University Systemwide Revenue | 5.000% | 11/1/23 | 2,270 | 2,822 |
| | California State University Systemwide Revenue PUT | 4.000% | 11/1/21 | 26,800 | 29,930 |
| | California State University Systemwide Revenue PUT | 4.000% | 11/1/23 | 4,000 | 4,595 |
| | California Statewide Communities Development Authority Pollution Control Revenue | | | | |
| | (Southern California Edison Co.) PUT | 1.375% | 4/2/18 | 45,200 | 45,422 |
| 2 | California Statewide Communities Development Authority Revenue | | | | |
| | (Cottage Health System Obligated Group) TOB VRDO | 0.780% | 11/7/16 | 4,880 | 4,880 |
| | California Statewide Communities Development Authority Revenue | | | | |
| | (Huntington Memorial Hospital) | 5.000% | 7/1/19 | 500 | 550 |
| | California Statewide Communities Development Authority Revenue | | | | |
| | (Huntington Memorial Hospital) | 5.000% | 7/1/20 | 325 | 368 |
| | California Statewide Communities Development Authority Revenue | | | | |
| | (Huntington Memorial Hospital) | 5.000% | 7/1/21 | 275 | 319 |
| | California Statewide Communities Development Authority Revenue | | | | |
| | (Huntington Memorial Hospital) | 5.000% | 7/1/22 | 250 | 297 |
| 2 | California Statewide Communities Development Authority Revenue (Kaiser Permanente) | | | | |
| | TOB VRDO | 0.830% | 11/7/16 | 6,630 | 6,630 |
| 2 | California Statewide Communities Development Authority Revenue (St. Joseph Health System) | | | | |
| | TOB VRDO | 0.670% | 11/7/16 (4) | 39,400 | 39,400 |
| | California Statewide Communities Development Authority Senior Living Health Facility Revenue | | | | |
| | (Los Angeles Jewish Home for the Aging) | 2.500% | 8/1/20 | 1,165 | 1,166 |
| | California Statewide Communities Development Authority Senior Living Health Facility Revenue | | | | |
| | (Los Angeles Jewish Home for the Aging) | 3.000% | 8/1/21 | 2,600 | 2,604 |
| | Capistrano CA Unified School District Special Tax Revenue | 5.000% | 9/1/20 (15) | 4,810 | 5,322 |
| | Chula Vista CA Industrial Development Revenue (San Diego Gas & Electric Co.) | 1.650% | 7/1/18 | 9,000 | 9,007 |
| | Chula Vista CA Municipal Financing Authority Special Tax Revenue | 5.000% | 9/1/17 | 570 | 589 |
| | Chula Vista CA Municipal Financing Authority Special Tax Revenue | 5.000% | 9/1/18 | 2,310 | 2,474 |
| | Chula Vista CA Municipal Financing Authority Special Tax Revenue | 5.000% | 9/1/19 | 2,610 | 2,885 |
| | Contra Costa CA Municipal Water District Revenue | 5.000% | 10/1/18 | 2,000 | 2,160 |
| | Contra Costa CA Municipal Water District Revenue | 5.000% | 10/1/19 | 2,100 | 2,348 |
| | Contra Costa CA Municipal Water District Revenue | 5.000% | 10/1/20 | 1,500 | 1,731 |
| | Contra Costa CA Municipal Water District Revenue | 5.000% | 10/1/21 | 2,000 | 2,370 |
| | East Bay CA Municipal Utility District Water System Revenue | 5.000% | 6/1/17 | 2,450 | 2,513 |
| | East Bay CA Municipal Utility District Water System Revenue | 5.000% | 6/1/19 | 2,000 | 2,211 |
| 2,3 | Eaton Vance California Municipal Bond Fund II | 1.480% | 7/1/19 | 8,250 | 8,251 |
| | Foothill/Eastern Transportation Corridor Agency California Toll Road Revenue | 0.000% | 1/15/21 (4) | 4,115 | 3,798 |
| | Foothill/Eastern Transportation Corridor Agency California Toll Road Revenue PUT | 5.000% | 1/15/18 | 20,495 | 20,993 |
| | Foothill/Eastern Transportation Corridor Agency California Toll Road Revenue PUT | 5.000% | 1/15/20 | 52,515 | 56,762 |
| | Glendale CA Redevelopment Agency Successor Agency Tax Allocation Revenue | | | | |
| | (Central Glendale Redevelopment Project) | 4.000% | 12/1/17 (4) | 2,500 | 2,585 |
| | Glendale CA Redevelopment Agency Successor Agency Tax Allocation Revenue | | | | |
| | (Central Glendale Redevelopment Project) | 4.000% | 12/1/18 (4) | 1,185 | 1,258 |
| | Glendale CA Redevelopment Agency Successor Agency Tax Allocation Revenue | | | | |
| | (Central Glendale Redevelopment Project) | 4.000% | 12/1/19 (4) | 2,910 | 3,160 |
| | Glendale CA Redevelopment Agency Successor Agency Tax Allocation Revenue | | | | |
| | (Central Glendale Redevelopment Project) | 5.000% | 12/1/21 (4) | 1,725 | 2,031 |
| | Irvine CA Reassessment District No. 13-1 Improvement Revenue | 4.000% | 9/2/18 | 1,450 | 1,521 |
| | La Quinta CA Redevelopment Agency Tax Allocation Revenue | 4.000% | 9/1/17 | 1,130 | 1,160 |
| | La Quinta CA Redevelopment Agency Tax Allocation Revenue | 5.000% | 9/1/18 | 1,745 | 1,872 |
58
Limited-Term Tax-Exempt Fund
| | | | |
| | | | Face | Market |
| | | Maturity | Amount | Value• |
| | Coupon | Date | ($000) | ($000) |
| La Quinta CA Redevelopment Agency Tax Allocation Revenue | 5.000% | 9/1/19 | 1,150 | 1,274 |
| La Quinta CA Redevelopment Agency Tax Allocation Revenue | 5.000% | 9/1/20 | 1,045 | 1,191 |
| La Quinta CA Redevelopment Agency Tax Allocation Revenue | 5.000% | 9/1/21 | 1,250 | 1,458 |
| La Verne CA (Brethren Hillcrest Homes) COP | 5.000% | 5/15/20 | 640 | 710 |
| La Verne CA (Brethren Hillcrest Homes) COP | 5.000% | 5/15/21 | 310 | 351 |
| La Verne CA (Brethren Hillcrest Homes) COP | 5.000% | 5/15/22 | 725 | 837 |
| Long Beach CA Finance Authority Natural Gas Purchase Revenue | 5.250% | 11/15/20 | 1,505 | 1,683 |
| Long Beach CA Harbor Revenue | 5.000% | 11/15/18 | 32,500 | 35,212 |
| Los Angeles CA Community College District GO | 5.000% | 8/1/21 | 5,000 | 5,894 |
| Los Angeles CA Community College District GO | 5.000% | 8/1/22 | 3,030 | 3,664 |
| Los Angeles CA Community College District GO | 3.000% | 8/1/23 | 1,500 | 1,660 |
| Los Angeles CA Department of Airports International Airport Revenue | 5.000% | 5/15/19 | 1,000 | 1,105 |
| Los Angeles CA Department of Airports International Airport Revenue | 5.000% | 5/15/20 | 1,275 | 1,455 |
| Los Angeles CA GO | 5.000% | 9/1/17 | 32,500 | 33,675 |
| Los Angeles CA GO | 5.000% | 9/1/19 | 5,000 | 5,568 |
| Los Angeles CA Unified School District GO | 5.000% | 7/1/17 | 19,090 | 19,640 |
| Los Angeles CA Unified School District GO | 5.000% | 7/1/19 | 13,205 | 14,621 |
| Los Angeles CA Unified School District GO | 5.000% | 7/1/19 | 7,035 | 7,789 |
| Los Angeles CA Unified School District GO | 5.000% | 7/1/19 | 8,510 | 9,422 |
| Los Angeles CA Unified School District GO | 5.000% | 7/1/20 | 17,195 | 19,645 |
| Los Angeles CA Unified School District GO | 5.000% | 7/1/20 | 22,525 | 25,734 |
| Los Angeles CA Unified School District GO | 5.000% | 7/1/20 | 20,920 | 23,901 |
| Los Angeles CA Unified School District GO | 5.000% | 7/1/20 | 14,755 | 16,857 |
| Los Angeles CA Unified School District GO | 5.000% | 7/1/22 | 16,340 | 19,717 |
| Los Angeles County CA Metropolitan Transportation Authority Sales Tax Revenue | 5.000% | 7/1/19 | 20,000 | 22,156 |
| Los Angeles County CA Public Works Financing Authority Lease Revenue | 5.000% | 8/1/17 | 5,000 | 5,161 |
| Los Angeles County CA Public Works Financing Authority Lease Revenue | 5.000% | 8/1/18 | 750 | 804 |
| Los Angeles County CA Public Works Financing Authority Lease Revenue | 5.000% | 8/1/19 | 1,000 | 1,109 |
| Los Angeles County CA Public Works Financing Authority Lease Revenue | 5.000% | 8/1/20 | 500 | 571 |
| Los Angeles County CA Redevelopment Authority Tax Allocation Revenue (Various Project Areas) | 5.000% | 9/1/18 | 1,000 | 1,071 |
| Los Angeles County CA Redevelopment Authority Tax Allocation Revenue (Various Project Areas) | 5.000% | 9/1/19 | 2,000 | 2,207 |
| Los Angeles County CA Redevelopment Authority Tax Allocation Revenue (Various Project Areas) | 5.000% | 9/1/20 | 5,495 | 6,215 |
| Los Angeles County CA Redevelopment Authority Tax Allocation Revenue (Various Project Areas) | 5.000% | 9/1/21 (4) | 5,000 | 5,847 |
| Los Angeles County CA Regional Financing Authority Revenue (MonteCedro Inc. Project) | 3.000% | 11/15/21 | 805 | 806 |
| 3 Metropolitan Water District of Southern California Revenue PUT | 0.790% | 7/10/17 | 9,500 | 9,500 |
| 3 Metropolitan Water District of Southern California Revenue PUT | 0.790% | 7/10/17 | 5,500 | 5,500 |
| 3 Metropolitan Water District of Southern California Revenue PUT | 0.790% | 7/10/17 | 5,000 | 4,998 |
| 3 Metropolitan Water District of Southern California Revenue PUT | 1.010% | 3/27/18 | 3,000 | 3,001 |
| 3 Metropolitan Water District of Southern California Revenue PUT | 1.010% | 3/27/18 | 25,710 | 25,694 |
| 3 Metropolitan Water District of Southern California Revenue PUT | 1.010% | 3/27/18 | 15,290 | 15,280 |
| Modesto CA Irrigation District Electric Revenue | 5.000% | 7/1/18 | 750 | 802 |
| Modesto CA Irrigation District Electric Revenue | 5.000% | 7/1/19 | 3,000 | 3,322 |
| Modesto CA Irrigation District Electric Revenue | 5.000% | 7/1/19 | 500 | 554 |
| Modesto CA Irrigation District Electric Revenue | 5.000% | 7/1/20 | 750 | 857 |
| Northern California Gas Authority No. 1 Revenue | 1.197% | 7/1/19 | 12,815 | 12,690 |
| Nuveen California AMT-Free Municipal Income Fund VRDP VRDO | 0.780% | 11/7/16 LOC | 35,500 | 35,500 |
| Nuveen Insured California AMT-Free Municipal Income Fund VRDP VRDO | 0.720% | 11/7/16 LOC | 5,000 | 5,000 |
| Oakland CA Redevelopment Agency Tax Allocation Revenue (Central District Project) | 5.000% | 9/1/17 | 3,500 | 3,619 |
| Oakland CA Redevelopment Agency Tax Allocation Revenue (Central District Project) | 5.000% | 9/1/18 | 1,550 | 1,660 |
| Oakland CA Redevelopment Agency Tax Allocation Revenue (Central District Project) | 5.000% | 9/1/19 | 1,500 | 1,658 |
| Oakland CA Redevelopment Agency Tax Allocation Revenue (Central District Project) | 5.000% | 9/1/20 | 6,000 | 6,810 |
| Orange County CA Transportation Authority Toll Road Revenue | 5.000% | 8/15/19 | 1,000 | 1,114 |
| Palomar Pomerado Health California COP | 5.000% | 11/1/16 (ETM) | 3,500 | 3,500 |
| Palomar Pomerado Health California Revenue | 5.000% | 11/1/22 | 2,680 | 3,078 |
| 2 Riverside CA Electric Revenue TOB VRDO | 0.660% | 11/7/16 | 2,400 | 2,400 |
| Riverside County CA Asset Leasing Corp. Leasehold Revenue (Riverside County Hospital Project) | 5.000% | 6/1/18 | 6,500 | 6,911 |
| Riverside County CA Transportation Commission Sales Tax Revenue | 5.000% | 6/1/18 | 500 | 533 |
| Riverside County CA Transportation Commission Sales Tax Revenue | 5.000% | 6/1/19 | 850 | 938 |
| Riverside County CA Transportation Commission Sales Tax Revenue | 5.000% | 6/1/20 | 1,750 | 1,995 |
| Roseville CA Natural Gas Financing Authority Gas Revenue | 5.000% | 2/15/18 | 50 | 52 |
| 2 Sacramento CA Municipal Utility District Revenue TOB VRDO | 0.960% | 11/7/16 | 4,985 | 4,985 |
| San Bernardino CA City Unified School District GO | 5.000% | 8/1/18 | 850 | 909 |
| San Bernardino CA City Unified School District GO | 5.000% | 8/1/19 (4) | 600 | 665 |
| 2 San Diego CA Public Facilities Financing Authority Water Revenue TOB VRDO | 0.660% | 11/7/16 | 6,105 | 6,105 |
| San Diego County CA Water Authority Revenue | 5.000% | 5/1/21 | 1,450 | 1,699 |
| San Diego County CA Water Authority Revenue | 5.000% | 5/1/22 | 1,200 | 1,444 |
| San Francisco CA City & County International Airport Revenue | 5.000% | 5/1/17 | 16,555 | 16,916 |
| San Francisco CA City & County Public Utilities Commission Water Revenue | 5.000% | 11/1/20 | 13,145 | 15,170 |
| San Francisco CA City & County Public Utilities Commission Water Revenue | 5.000% | 11/1/21 | 9,940 | 11,789 |
| San Francisco CA City & County Public Utilities Commission Water Revenue | 5.000% | 11/1/22 | 11,270 | 13,707 |
59
Limited-Term Tax-Exempt Fund
| | | | |
| | | | Face | Market |
| | | Maturity | Amount | Value• |
| | Coupon | Date | ($000) | ($000) |
| San Francisco CA City & County Public Utilities Commission Water Revenue | 5.000% | 11/1/23 | 6,000 | 7,436 |
| San Francisco CA City & County Public Utilities Commission Water Revenue | 5.000% | 11/1/24 | 5,000 | 6,289 |
| San Francisco CA City & County Redevelopment Financing Authority Tax Allocation Revenue | | | | |
| (Redevelopment Projects) | 4.000% | 8/1/17 (ETM) | 230 | 236 |
| San Francisco CA City & County Redevelopment Financing Authority Tax Allocation Revenue | | | | |
| (Redevelopment Projects) | 4.000% | 8/1/17 | 2,170 | 2,221 |
| San Francisco CA City & County Redevelopment Financing Authority Tax Allocation Revenue | | | | |
| (Redevelopment Projects) | 5.000% | 8/1/18 (ETM) | 340 | 364 |
| San Francisco CA City & County Redevelopment Financing Authority Tax Allocation Revenue | | | | |
| (Redevelopment Projects) | 5.000% | 8/1/18 | 2,660 | 2,844 |
| San Francisco CA City & County Redevelopment Financing Authority Tax Allocation Revenue | | | | |
| (Redevelopment Projects) | 5.000% | 8/1/19 | 2,000 | 2,211 |
| San Francisco CA City & County Redevelopment Financing Authority Tax Allocation Revenue | | | | |
| (Redevelopment Projects) | 5.000% | 8/1/20 | 1,500 | 1,707 |
| San Francisco CA City & County Redevelopment Financing Authority Tax Allocation Revenue | | | | |
| (Redevelopment Projects) | 5.000% | 8/1/21 | 2,000 | 2,335 |
| San Juan CA Unified School District GO | 5.000% | 8/1/19 | 1,090 | 1,210 |
| San Juan CA Unified School District GO | 5.000% | 8/1/21 | 1,000 | 1,179 |
| San Mateo County CA Joint Powers Financing Authority Lease Revenue | | | | |
| (Maple Street Correctional Center) | 5.000% | 6/15/17 | 1,000 | 1,027 |
| San Mateo County CA Joint Powers Financing Authority Lease Revenue | | | | |
| (Maple Street Correctional Center) | 5.000% | 6/15/18 | 1,000 | 1,067 |
| San Mateo County CA Joint Powers Financing Authority Lease Revenue | | | | |
| (Maple Street Correctional Center) | 5.000% | 6/15/19 | 1,000 | 1,106 |
| San Mateo County CA Joint Powers Financing Authority Lease Revenue | | | | |
| (Maple Street Correctional Center) | 5.000% | 6/15/20 | 1,000 | 1,140 |
| San Mateo County CA Joint Powers Financing Authority Lease Revenue | | | | |
| (Maple Street Correctional Center) | 5.000% | 6/15/21 | 500 | 586 |
| San Pablo CA Redevelopment Agency Successor Agency Tax Allocation Revenue | 5.000% | 6/15/20 (4) | 1,045 | 1,187 |
| San Pablo CA Redevelopment Agency Successor Agency Tax Allocation Revenue | 5.000% | 6/15/21 (4) | 500 | 583 |
| South Orange County CA Public Financing Authority Special Tax Revenue | 5.000% | 8/15/19 | 1,000 | 1,098 |
| South Orange County CA Public Financing Authority Special Tax Revenue | 5.000% | 8/15/20 | 600 | 674 |
| Southern California Public Power Authority Revenue | 5.000% | 7/1/18 | 2,000 | 2,138 |
| Southern California Public Power Authority Revenue (Natural Gas Project) | 5.000% | 11/1/17 | 1,000 | 1,036 |
| Southern California Public Power Authority Revenue (Transmission Project) | 5.000% | 7/1/17 | 9,895 | 10,180 |
| University of California Regents Medical Center Pooled Revenue | 5.000% | 5/15/21 | 5,000 | 5,855 |
| University of California Regents Medical Center Pooled Revenue | 5.000% | 5/15/22 | 4,000 | 4,806 |
| University of California Regents Medical Center Pooled Revenue | 5.000% | 5/15/23 | 8,000 | 9,831 |
| University of California Revenue | 5.000% | 5/15/17 | 2,250 | 2,303 |
| University of California Revenue | 5.000% | 5/15/18 | 2,000 | 2,129 |
| University of California Revenue | 5.000% | 5/15/19 | 4,435 | 4,891 |
| University of California Revenue | 5.000% | 5/15/21 | 2,725 | 3,197 |
| University of California Revenue | 5.000% | 5/15/21 | 8,250 | 9,666 |
| University of California Revenue PUT | 1.400% | 5/15/21 | 12,700 | 12,750 |
| Western CA Municipal Water District Revenue PUT | 1.500% | 10/1/20 | 2,325 | 2,345 |
| | | | | 2,551,897 |
| Colorado (1.5%) | | | | |
| Adams County CO COP | 5.000% | 12/1/21 | 1,000 | 1,175 |
| Adams County CO COP | 5.000% | 12/1/22 | 1,250 | 1,500 |
| Castle Rock CO Water & Sewer Revenue | 4.000% | 12/1/20 | 350 | 390 |
| Castle Rock CO Water & Sewer Revenue | 4.000% | 12/1/22 | 225 | 260 |
| Castle Rock CO Water & Sewer Revenue | 5.000% | 12/1/23 | 250 | 310 |
| Colorado (UCDHSC Fitzsimons Academic Projects) COP | 5.000% | 11/1/18 | 3,080 | 3,313 |
| Colorado Education Loan Program Revenue | 2.000% | 6/29/17 | 42,200 | 42,541 |
| Colorado Education Loan Program Revenue | 5.000% | 6/29/17 | 56,600 | 58,163 |
| Colorado Educational & Cultural Facilities Authority Revenue (Johnson & Wales University) | 5.000% | 4/1/20 | 2,500 | 2,793 |
| Colorado General Fund Revenue | 2.000% | 6/27/17 | 44,050 | 44,403 |
| Colorado Health Facilities Authority Revenue | | | | |
| (Adventist Health System/Sunbelt Obligated Group) PUT | 5.000% | 11/15/23 | 27,000 | 32,691 |
| Colorado Health Facilities Authority Revenue (Catholic Health Initiatives) | 5.000% | 7/1/18 | 3,000 | 3,187 |
| 3 Colorado Health Facilities Authority Revenue (Catholic Health Initiatives) PUT | 1.609% | 11/12/20 | 5,000 | 4,964 |
| 3 Colorado Health Facilities Authority Revenue (Catholic Health Initiatives) PUT | 1.609% | 11/12/20 | 7,500 | 7,445 |
| 2 Colorado Health Facilities Authority Revenue (Catholic Health Initiatives) TOB VRDO | 0.780% | 11/7/16 | 10,000 | 10,000 |
| 2 Colorado Health Facilities Authority Revenue (Catholic Health Initiatives) TOB VRDO | 0.810% | 11/7/16 | 18,750 | 18,750 |
| Colorado Health Facilities Authority Revenue (Children’s Hospital) | 5.000% | 12/1/20 | 1,320 | 1,513 |
| Colorado Health Facilities Authority Revenue (Children’s Hospital) | 5.000% | 12/1/21 | 1,655 | 1,945 |
| Colorado Health Facilities Authority Revenue (Children’s Hospital) | 5.000% | 12/1/22 | 680 | 817 |
| Colorado Health Facilities Authority Revenue (Children’s Hospital) | 5.000% | 12/1/22 | 1,350 | 1,622 |
| Colorado Health Facilities Authority Revenue (Christian Living Communities) | 4.000% | 1/1/21 | 350 | 375 |
60
Limited-Term Tax-Exempt Fund
| | | | |
| | | | Face | Market |
| | | Maturity | Amount | Value• |
| | Coupon | Date | ($000) | ($000) |
| Colorado Health Facilities Authority Revenue (Christian Living Communities) | 4.000% | 1/1/22 | 400 | 433 |
| Colorado Health Facilities Authority Revenue (Christian Living Communities) | 5.000% | 1/1/23 | 750 | 856 |
| Colorado Health Facilities Authority Revenue (Christian Living Communities) | 5.000% | 1/1/24 | 750 | 862 |
| Colorado Health Facilities Authority Revenue (Covenant Retirement Community Inc.) | 3.150% | 12/1/18 | 3,640 | 3,645 |
| Colorado Health Facilities Authority Revenue (Covenant Retirement Community Inc.) | 4.000% | 12/1/19 | 625 | 666 |
| Colorado Health Facilities Authority Revenue (Covenant Retirement Community Inc.) | 5.000% | 12/1/20 | 2,055 | 2,299 |
| Colorado Health Facilities Authority Revenue | | | | |
| (Evangelical Lutheran Good Samaritan Society Project) | 4.000% | 6/1/20 | 1,000 | 1,075 |
| Colorado Health Facilities Authority Revenue | | | | |
| (Evangelical Lutheran Good Samaritan Society Project) | 5.000% | 6/1/21 | 2,000 | 2,266 |
| Colorado Health Facilities Authority Revenue | | | | |
| (Evangelical Lutheran Good Samaritan Society Project) | 5.000% | 6/1/22 | 2,300 | 2,648 |
| Colorado Health Facilities Authority Revenue | | | | |
| (Evangelical Lutheran Good Samaritan Society Project) | 5.000% | 6/1/23 | 2,000 | 2,334 |
| Colorado Health Facilities Authority Revenue (Sisters of Charity of Leavenworth Health System) | 5.000% | 1/1/17 | 7,920 | 7,976 |
| Colorado Health Facilities Authority Revenue (Sisters of Charity of Leavenworth Health System) | 5.000% | 1/1/17 | 3,715 | 3,741 |
| Colorado Springs CO Utility System Revenue | 4.000% | 11/15/16 | 1,250 | 1,252 |
| Colorado Springs CO Utility System Revenue | 5.000% | 11/15/17 | 2,100 | 2,192 |
| Colorado Springs CO Utility System Revenue | 5.000% | 11/15/18 | 2,000 | 2,164 |
| Colorado Springs CO Utility System Revenue | 5.000% | 11/15/19 | 3,000 | 3,356 |
| Denver CO City & County Airport Revenue | 5.000% | 11/15/16 | 2,500 | 2,504 |
| Denver CO City & County Airport Revenue | 5.000% | 11/15/19 | 1,310 | 1,463 |
| Denver CO City & County Excise Tax Revenue | 5.250% | 9/1/18 (ETM) | 2,555 | 2,757 |
| E-470 Public Highway Authority Colorado Revenue | 5.000% | 9/1/17 (14) | 500 | 516 |
| E-470 Public Highway Authority Colorado Revenue | 5.000% | 9/1/19 | 1,545 | 1,707 |
| E-470 Public Highway Authority Colorado Revenue | 0.000% | 9/1/20 (14) | 2,000 | 1,863 |
| E-470 Public Highway Authority Colorado Revenue | 5.000% | 9/1/20 | 1,000 | 1,134 |
| 3 E-470 Public Highway Authority Colorado Revenue PUT | 1.810% | 8/31/17 | 7,500 | 7,488 |
| 3 E-470 Public Highway Authority Colorado Revenue PUT | 2.380% | 9/1/17 (14) | 7,000 | 7,011 |
| Park Creek CO Metropolitan District Limited Property Tax Revenue | 4.000% | 12/1/20 | 1,055 | 1,144 |
| Park Creek CO Metropolitan District Limited Property Tax Revenue | 5.000% | 12/1/22 | 1,250 | 1,459 |
| Regional Transportation District of Colorado COP | 5.000% | 6/1/21 | 2,785 | 3,159 |
| Regional Transportation District of Colorado COP | 5.000% | 6/1/22 | 2,000 | 2,259 |
| 2 Regional Transportation District of Colorado COP TOB VRDO | 0.760% | 11/7/16 LOC | 8,000 | 8,000 |
| 4 Regional Transportation District of Colorado Sales Tax Revenue (FasTracks Project) | 5.000% | 11/1/16 (Prere.) | 22,500 | 22,500 |
| University of Colorado Enterprise System Revenue | 5.000% | 6/1/18 | 2,000 | 2,132 |
| University of Colorado Enterprise System Revenue | 5.000% | 6/1/19 | 1,000 | 1,104 |
| University of Colorado Enterprise System Revenue | 5.000% | 6/1/19 | 2,500 | 2,761 |
| University of Colorado Hospital Authority Revenue | 5.000% | 11/15/16 | 1,290 | 1,292 |
| University of Colorado Hospital Authority Revenue | 0.880% | 5/30/17 | 12,500 | 12,500 |
| University of Colorado Hospital Authority Revenue PUT | 0.880% | 5/30/17 | 10,000 | 10,000 |
| | | | | 370,675 |
| Connecticut (2.5%) | | | | |
| Bridgeport CT GO | 5.000% | 8/15/22 (4) | 5,635 | 6,613 |
| Bridgeport CT GO | 5.000% | 8/15/22 (4) | 7,015 | 8,233 |
| Bridgeport CT GO | 5.000% | 8/15/23 (4) | 1,110 | 1,320 |
| Bridgeport CT GO | 5.000% | 8/15/23 (4) | 7,460 | 8,871 |
| Connecticut GO | 0.690% | 11/7/16 | 12,735 | 12,735 |
| Connecticut GO | 0.690% | 11/7/16 | 15,825 | 15,825 |
| Connecticut GO | 0.760% | 11/7/16 | 13,315 | 13,315 |
| Connecticut GO | 5.000% | 12/1/16 (Prere.) | 15,000 | 15,053 |
| Connecticut GO | 5.000% | 4/1/17 | 1,165 | 1,186 |
| 3 Connecticut GO | 1.400% | 5/15/17 | 23,000 | 23,035 |
| Connecticut GO | 5.000% | 7/15/17 | 5,000 | 5,148 |
| 3 Connecticut GO | 1.150% | 9/15/17 | 1,750 | 1,750 |
| 3 Connecticut GO | 0.980% | 1/1/18 | 4,905 | 4,894 |
| 3 Connecticut GO | 1.050% | 3/1/18 | 2,500 | 2,500 |
| 3 Connecticut GO | 1.510% | 4/15/18 | 6,750 | 6,759 |
| Connecticut GO | 5.000% | 6/1/18 | 14,955 | 15,892 |
| Connecticut GO | 5.000% | 7/15/18 | 10,000 | 10,672 |
| 3 Connecticut GO | 1.510% | 8/15/18 | 3,000 | 3,003 |
| Connecticut GO | 5.000% | 11/1/18 | 1,000 | 1,078 |
| 3 Connecticut GO | 1.120% | 3/1/19 | 2,300 | 2,301 |
| 3 Connecticut GO | 1.180% | 3/1/19 | 2,000 | 2,000 |
| 3 Connecticut GO | 1.730% | 4/15/19 | 6,000 | 6,032 |
| 3 Connecticut GO | 1.730% | 5/15/19 | 5,000 | 5,028 |
| Connecticut GO | 5.000% | 6/1/19 | 34,265 | 37,492 |
| 3 Connecticut GO | 1.550% | 9/15/19 | 4,000 | 4,001 |
| 3 Connecticut GO | 1.280% | 3/1/20 | 7,500 | 7,500 |
61
Limited-Term Tax-Exempt Fund
| | | | |
| | | | Face | Market |
| | | Maturity | Amount | Value• |
| | Coupon | Date | ($000) | ($000) |
| Connecticut GO | 5.000% | 6/15/20 | 17,975 | 20,242 |
| Connecticut GO | 5.000% | 12/15/20 | 5,865 | 6,691 |
| Connecticut GO | 5.000% | 3/15/21 | 7,035 | 8,072 |
| Connecticut GO | 5.000% | 11/15/21 | 7,075 | 8,249 |
| Connecticut GO | 5.000% | 11/15/21 | 10,000 | 11,659 |
| Connecticut GO | 5.000% | 3/15/22 | 9,620 | 11,243 |
| Connecticut GO | 5.000% | 11/15/22 | 12,500 | 14,805 |
| 3 Connecticut GO PUT | 1.280% | 9/15/17 | 7,150 | 7,150 |
| 3 Connecticut GO PUT | 1.980% | 3/1/18 | 17,500 | 17,501 |
| Connecticut Health & Educational Facilities Authority Revenue | | | | |
| (Connecticut State University System) | 5.000% | 11/1/21 | 2,080 | 2,431 |
| Connecticut Health & Educational Facilities Authority Revenue | | | | |
| (Connecticut State University System) | 5.000% | 11/1/22 | 2,135 | 2,550 |
| Connecticut Health & Educational Facilities Authority Revenue | | | | |
| (Connecticut State University System) | 5.000% | 11/1/23 | 2,295 | 2,781 |
| Connecticut Health & Educational Facilities Authority Revenue (Hartford Healthcare) | 5.000% | 7/1/17 | 2,090 | 2,146 |
| Connecticut Health & Educational Facilities Authority Revenue (Hartford Healthcare) | 5.000% | 7/1/18 | 3,500 | 3,724 |
| Connecticut Health & Educational Facilities Authority Revenue (Hartford Healthcare) | 5.000% | 7/1/19 | 4,270 | 4,687 |
| Connecticut Health & Educational Facilities Authority Revenue (Quinnipiac University) | 5.000% | 7/1/21 | 850 | 983 |
| Connecticut Health & Educational Facilities Authority Revenue (Quinnipiac University) | 5.000% | 7/1/22 | 1,250 | 1,474 |
| Connecticut Health & Educational Facilities Authority Revenue (Quinnipiac University) | 5.000% | 7/1/23 | 1,950 | 2,334 |
| Connecticut Health & Educational Facilities Authority Revenue (Stamford Hospital) | 5.000% | 7/1/17 | 2,865 | 2,944 |
| Connecticut Health & Educational Facilities Authority Revenue (Stamford Hospital) | 5.000% | 7/1/20 | 1,525 | 1,704 |
| Connecticut Health & Educational Facilities Authority Revenue (Yale University) PUT | 0.800% | 7/26/17 | 40,000 | 40,021 |
| Connecticut Health & Educational Facilities Authority Revenue (Yale University) PUT | 0.900% | 2/1/18 | 20,000 | 20,010 |
| Connecticut Health & Educational Facilities Authority Revenue (Yale University) PUT | 1.375% | 7/11/18 | 28,000 | 28,207 |
| Connecticut Health & Educational Facilities Authority Revenue (Yale University) PUT | 1.000% | 2/6/19 | 2,000 | 1,996 |
| Connecticut Health & Educational Facilities Authority Revenue (Yale University) PUT | 1.000% | 7/1/19 | 21,950 | 21,898 |
| Connecticut Health & Educational Facilities Authority Revenue (Yale University) PUT | 1.000% | 7/1/19 | 10,550 | 10,522 |
| 3 Connecticut Health & Educational Facilities Authority Revenue | | | | |
| (Yale-New Haven Hospital Inc.) PUT | 0.903% | 7/1/19 | 15,000 | 14,961 |
| Connecticut Housing Finance Authority Revenue Housing Mortgage Finance Program | 4.000% | 11/15/44 | 7,460 | 8,056 |
| Connecticut Housing Finance Authority Revenue Housing Mortgage Finance Program | 4.000% | 11/15/44 | 5,080 | 5,307 |
| Connecticut Housing Finance Authority Revenue Housing Mortgage Finance Program | 4.000% | 11/15/44 | 2,460 | 2,617 |
| Connecticut Housing Finance Authority Revenue Housing Mortgage Finance Program | 3.500% | 11/15/45 | 11,920 | 12,594 |
| Connecticut Housing Finance Authority Revenue Housing Mortgage Finance Program | 4.000% | 11/15/45 | 12,285 | 13,215 |
| Connecticut Special Tax Revenue (Transportation Infrastructure) | 5.000% | 1/1/17 | 5,000 | 5,036 |
| Connecticut Special Tax Revenue (Transportation Infrastructure) | 5.000% | 11/1/18 | 1,475 | 1,591 |
| Connecticut Special Tax Revenue (Transportation Infrastructure) | 5.000% | 12/1/19 | 4,915 | 5,494 |
| Connecticut Special Tax Revenue (Transportation Infrastructure) | 5.000% | 10/1/20 | 4,085 | 4,661 |
| Connecticut Special Tax Revenue (Transportation Infrastructure) | 5.000% | 9/1/21 | 11,340 | 13,239 |
| Greater New Haven CT Water Pollution Control Authority Regional Wastewater System Revenue | 5.000% | 8/15/20 | 200 | 228 |
| Greater New Haven CT Water Pollution Control Authority Regional Wastewater System Revenue | 5.000% | 8/15/22 | 400 | 479 |
| New Haven CT GO | 5.000% | 8/15/18 (4) | 3,000 | 3,204 |
| New Haven CT GO | 5.000% | 8/15/19 (4) | 2,500 | 2,754 |
| New Haven CT GO | 5.000% | 8/1/20 (4) | 2,015 | 2,276 |
| New Haven CT GO | 5.000% | 8/15/20 (4) | 1,500 | 1,696 |
| New Haven CT GO | 5.000% | 8/15/21 (4) | 1,500 | 1,735 |
| University of Connecticut GO | 5.000% | 2/15/22 | 10,250 | 12,068 |
| University of Connecticut GO | 5.000% | 2/15/22 | 2,940 | 3,462 |
| | | | | 592,933 |
| Delaware (0.3%) | | | | |
| Delaware GO | 5.000% | 7/1/17 | 5,250 | 5,401 |
| Delaware GO | 5.000% | 10/1/18 | 3,540 | 3,820 |
| Delaware GO | 5.000% | 7/1/21 | 15,510 | 18,223 |
| Delaware River & Bay Authority Delaware Revenue | 5.000% | 1/1/18 | 6,155 | 6,448 |
| Delaware River & Bay Authority Delaware Revenue | 5.000% | 1/1/19 | 3,760 | 4,076 |
| Delaware River & Bay Authority Delaware Revenue | 5.000% | 1/1/20 | 225 | 252 |
| Delaware River & Bay Authority Delaware Revenue | 5.000% | 1/1/20 | 2,575 | 2,881 |
| Delaware River & Bay Authority Delaware Revenue | 5.000% | 1/1/21 | 250 | 287 |
| Delaware River & Bay Authority Delaware Revenue | 5.000% | 1/1/21 | 2,295 | 2,638 |
| Delaware River & Bay Authority Delaware Revenue | 5.000% | 1/1/22 | 325 | 382 |
| Delaware River & Bay Authority Delaware Revenue | 5.000% | 1/1/22 | 3,000 | 3,525 |
| Delaware Transportation Authority Transportation System Revenue | 5.000% | 7/1/21 | 335 | 393 |
| Delaware Transportation Authority Transportation System Revenue | 5.000% | 7/1/22 | 2,500 | 3,003 |
| Delaware Transportation Authority Transportation System Revenue | 5.000% | 7/1/23 | 3,295 | 4,037 |
| New Castle County DE GO | 5.000% | 10/1/21 | 7,575 | 8,969 |
| New Castle County DE GO | 5.000% | 10/1/22 | 7,995 | 9,709 |
62
Limited-Term Tax-Exempt Fund
| | | | |
| | | | Face | Market |
| | | Maturity | Amount | Value• |
| | Coupon | Date | ($000) | ($000) |
| District of Columbia (0.4%) | | | | |
| District of Columbia Hospital Revenue (Children’s Hospital Obligated Group) | 5.000% | 7/15/20 | 1,000 | 1,136 |
| District of Columbia Hospital Revenue (Children’s Hospital Obligated Group) | 5.000% | 7/15/22 | 1,700 | 2,032 |
| District of Columbia Hospital Revenue (Children’s Hospital Obligated Group) | 5.000% | 7/15/23 | 1,350 | 1,646 |
| 2 District of Columbia Hospital Revenue TOB VRDO | 0.830% | 11/7/16 | 10,295 | 10,295 |
| 3 District of Columbia Income Tax Revenue | 0.930% | 12/1/17 | 11,275 | 11,277 |
| District of Columbia Income Tax Revenue | 5.000% | 12/1/18 | 5,500 | 5,963 |
| District of Columbia Income Tax Revenue | 5.000% | 12/1/18 | 5,250 | 5,692 |
| District of Columbia Income Tax Revenue | 5.000% | 12/1/19 | 1,500 | 1,681 |
| 2 District of Columbia Income Tax Revenue TOB VRDO | 0.660% | 11/7/16 | 7,425 | 7,425 |
| District of Columbia Revenue (MedStar Health, Inc.) VRDO | 0.530% | 11/1/16 LOC | 9,500 | 9,500 |
| District of Columbia Revenue (National Public Radio, Inc.) | 5.000% | 4/1/21 | 1,000 | 1,151 |
| District of Columbia Revenue (National Public Radio, Inc.) | 5.000% | 4/1/22 | 1,885 | 2,216 |
| District of Columbia Revenue (National Public Radio, Inc.) | 5.000% | 4/1/23 | 1,965 | 2,353 |
| 2 District of Columbia Water & Sewer Authority Public Utility Revenue TOB VRDO | 0.660% | 11/7/16 | 3,980 | 3,980 |
| Metropolitan Washington DC Transit Authority Revenue | 5.000% | 7/1/18 | 12,500 | 13,335 |
| Metropolitan Washington DC Transit Authority Revenue | 4.000% | 7/1/19 | 8,000 | 8,389 |
| | | | | 88,071 |
| Florida (4.0%) | | | | |
| Boynton Beach FL Utility System Revenue | 5.500% | 11/1/18 (14) | 3,125 | 3,357 |
| Brevard County FL Health Facilities Authority Revenue (Health First Inc. Project) | 5.000% | 4/1/20 | 500 | 559 |
| Brevard County FL Health Facilities Authority Revenue (Health First Inc. Project) | 5.000% | 4/1/21 | 1,000 | 1,147 |
| Brevard County FL Health Facilities Authority Revenue (Health First Inc. Project) | 5.000% | 4/1/22 | 1,000 | 1,172 |
| Broward County FL Airport System Revenue | 5.000% | 10/1/19 | 750 | 833 |
| Broward County FL Airport System Revenue | 5.000% | 10/1/19 | 500 | 556 |
| Broward County FL Airport System Revenue | 5.000% | 10/1/20 | 1,060 | 1,211 |
| Broward County FL Airport System Revenue | 5.000% | 10/1/21 | 480 | 563 |
| Broward County FL School Board COP | 5.000% | 7/1/18 | 4,400 | 4,685 |
| Broward County FL School Board COP | 5.000% | 7/1/19 | 8,140 | 8,958 |
| Broward County FL School District TAN | 1.500% | 6/15/17 | 49,000 | 49,218 |
| Central Florida Expressway Authority BAN | 1.625% | 1/1/19 | 54,600 | 54,925 |
| Citizens Property Insurance Corp. Florida Revenue (Coastal Account) | 5.000% | 3/1/17 (ETM) | 1,100 | 1,116 |
| Citizens Property Insurance Corp. Florida Revenue (Coastal Account) | 5.250% | 6/1/17 | 19,000 | 19,498 |
| Citizens Property Insurance Corp. Florida Revenue (Coastal Account) | 5.000% | 6/1/18 | 6,000 | 6,376 |
| Citizens Property Insurance Corp. Florida Revenue (Coastal Account) | 5.000% | 6/1/22 | 29,750 | 34,881 |
| Citizens Property Insurance Corp. Florida Revenue | | | | |
| (Personal Lines Account/Commercial Lines Account) | 5.000% | 6/1/17 | 35,445 | 36,322 |
| Citizens Property Insurance Corp. Florida Revenue | | | | |
| (Personal Lines Account/Commercial Lines Account) | 5.000% | 6/1/18 | 36,770 | 39,073 |
| Citizens Property Insurance Corp. Florida Revenue | | | | |
| (Personal Lines Account/Commercial Lines Account) | 5.000% | 6/1/19 | 19,150 | 21,043 |
| Citizens Property Insurance Corp. Florida Revenue | | | | |
| (Personal Lines Account/Commercial Lines Account) | 5.000% | 6/1/22 | 5,030 | 5,956 |
| Duval County FL School Board COP | 5.000% | 7/1/20 | 750 | 850 |
| Duval County FL School Board COP | 5.000% | 7/1/21 | 1,020 | 1,185 |
| Duval County FL School Board COP | 5.000% | 7/1/22 | 1,030 | 1,221 |
| Escambia County FL Pollution Control Revenue (Gulf Power Co. Project) PUT | 2.100% | 4/11/19 | 2,500 | 2,547 |
| Escambia County FL School Board Sales Tax Revenue | 5.000% | 9/1/21 | 225 | 263 |
| Escambia County FL School Board Sales Tax Revenue | 5.000% | 9/1/22 | 300 | 358 |
| Escambia County FL School Board Sales Tax Revenue | 5.000% | 9/1/23 | 275 | 334 |
| Florida Board of Education Lottery Revenue | 5.000% | 7/1/17 | 2,500 | 2,572 |
| Florida Board of Education Public Education Capital Outlay GO | 5.000% | 6/1/17 | 13,700 | 14,049 |
| Florida Board of Education Public Education Capital Outlay GO | 5.000% | 6/1/18 | 3,615 | 3,852 |
| Florida Board of Education Public Education Capital Outlay GO | 5.000% | 6/1/18 | 11,240 | 11,977 |
| Florida Board of Education Public Education Capital Outlay GO | 5.000% | 6/1/20 | 16,340 | 18,602 |
| Florida Board of Education Public Education Capital Outlay GO | 5.000% | 6/1/21 | 17,140 | 20,065 |
| Florida Board of Education Public Education Capital Outlay GO | 5.000% | 6/1/22 | 14,480 | 17,374 |
| Florida Department of Environmental Protection & Preservation Revenue | 5.000% | 7/1/18 | 8,585 | 9,158 |
| Florida Department of Environmental Protection & Preservation Revenue | 5.000% | 7/1/19 | 9,015 | 9,949 |
| Florida Department of Environmental Protection & Preservation Revenue | 5.000% | 7/1/22 | 14,510 | 17,302 |
| Florida Municipal Power Agency Revenue | 5.000% | 10/1/20 | 500 | 569 |
| Florida Municipal Power Agency Revenue | 5.000% | 10/1/21 | 7,000 | 8,164 |
| Florida Municipal Power Agency Revenue | 5.000% | 10/1/21 | 850 | 990 |
| Florida Municipal Power Agency Revenue | 5.000% | 10/1/22 | 8,000 | 9,526 |
| Florida Municipal Power Agency Revenue | 5.000% | 10/1/22 | 1,450 | 1,727 |
| Florida Municipal Power Agency Revenue | 5.000% | 10/1/23 | 9,000 | 10,906 |
| Florida Municipal Power Agency Revenue (Stanton II Project) | 5.000% | 10/1/19 | 2,800 | 3,109 |
| Florida Turnpike Authority Revenue | 5.000% | 7/1/19 | 10,000 | 11,053 |
| Florida Turnpike Authority Revenue | 5.000% | 7/1/21 | 6,965 | 8,163 |
63
Limited-Term Tax-Exempt Fund
| | | | |
| | | | Face | Market |
| | | Maturity | Amount | Value• |
| | Coupon | Date | ($000) | ($000) |
| Florida Turnpike Authority Revenue | 5.000% | 7/1/21 | 4,095 | 4,799 |
| Florida Turnpike Authority Revenue | 5.000% | 7/1/22 | 3,210 | 3,846 |
| Florida Turnpike Authority Revenue | 5.000% | 7/1/22 | 8,595 | 10,298 |
| Greater Orlando Aviation Authority Florida Airport Facilities Revenue | 5.000% | 10/1/21 | 330 | 388 |
| Greater Orlando Aviation Authority Florida Airport Facilities Revenue | 5.000% | 10/1/22 | 575 | 689 |
| Greater Orlando Aviation Authority Florida Airport Facilities Revenue | 5.000% | 10/1/24 | 910 | 1,125 |
| Halifax Hospital Medical Center Florida Hospital Revenue | 5.000% | 6/1/19 | 825 | 902 |
| Halifax Hospital Medical Center Florida Hospital Revenue | 5.000% | 6/1/20 | 765 | 859 |
| Halifax Hospital Medical Center Florida Hospital Revenue | 5.000% | 6/1/21 | 350 | 402 |
| Halifax Hospital Medical Center Florida Hospital Revenue | 5.000% | 6/1/21 | 1,195 | 1,373 |
| Halifax Hospital Medical Center Florida Hospital Revenue | 5.000% | 6/1/22 | 1,000 | 1,174 |
| Halifax Hospital Medical Center Florida Hospital Revenue | 5.000% | 6/1/23 | 775 | 923 |
| Highlands County FL Health Facilities Authority Hospital Revenue | | | | |
| (Adventist Health System/Sunbelt Obligated Group) | 5.000% | 11/15/16 | 2,000 | 2,003 |
| Highlands County FL Health Facilities Authority Hospital Revenue | | | | |
| (Adventist Health System/Sunbelt Obligated Group) | 5.000% | 11/15/19 | 3,000 | 3,343 |
| Hillsborough County FL Community Investment Tax Revenue | 5.000% | 11/1/21 | 8,705 | 10,225 |
| Hillsborough County FL School Board Sales Tax Revenue | 5.000% | 10/1/20 (4) | 2,200 | 2,512 |
| Hillsborough County FL School Board Sales Tax Revenue | 5.000% | 10/1/21 (4) | 1,700 | 1,990 |
| Hillsborough County FL School Board Sales Tax Revenue | 5.000% | 10/1/22 (4) | 1,500 | 1,794 |
| Hollywood FL Community Redevelopment Agency Tax Allocation Revenue | 5.000% | 3/1/20 | 1,570 | 1,737 |
| Hollywood FL Community Redevelopment Agency Tax Allocation Revenue | 5.000% | 3/1/21 | 2,250 | 2,545 |
| Hollywood FL Community Redevelopment Agency Tax Allocation Revenue | 5.000% | 3/1/22 | 2,865 | 3,293 |
| Jacksonville FL Electric Authority Electric System Revenue | 5.000% | 10/1/17 | 1,000 | 1,039 |
| Jacksonville FL Electric Authority Electric System Revenue | 5.000% | 10/1/20 | 1,600 | 1,828 |
| Jacksonville FL Electric Authority Water & Sewer Revenue | 5.000% | 10/1/18 | 1,200 | 1,293 |
| Jacksonville FL Special Revenue | 5.000% | 10/1/21 | 1,750 | 2,048 |
| Jacksonville FL Special Revenue | 5.000% | 10/1/21 | 760 | 890 |
| Jacksonville FL Special Revenue | 5.000% | 10/1/22 | 1,660 | 1,985 |
| Jacksonville FL Special Revenue | 5.000% | 10/1/22 | 1,055 | 1,261 |
| Jacksonville FL Special Revenue | 5.000% | 10/1/23 | 1,500 | 1,821 |
| Jacksonville FL Special Revenue | 5.000% | 10/1/23 | 2,460 | 2,986 |
| 3 Lakeland FL Energy System Revenue | 1.380% | 10/1/17 | 10,000 | 10,004 |
| Lakeland FL Energy System Revenue | 5.000% | 10/1/22 | 5,000 | 6,021 |
| Lakeland FL Hospital Revenue (Lakeland Regional Health Systems) | 5.000% | 11/15/21 | 365 | 426 |
| Lakeland FL Hospital Revenue (Lakeland Regional Health Systems) | 5.000% | 11/15/22 | 500 | 596 |
| Lakeland FL Hospital Revenue (Lakeland Regional Health Systems) | 5.000% | 11/15/23 | 1,200 | 1,446 |
| Lee County FL School Board COP | 5.000% | 8/1/20 | 2,530 | 2,876 |
| Lee County FL School Board COP | 5.000% | 8/1/21 | 2,005 | 2,338 |
| Martin County FL Health Facilities Authority Revenue (Martin Memorial Medical Center) | 5.000% | 11/15/20 | 750 | 846 |
| Martin County FL Health Facilities Authority Revenue (Martin Memorial Medical Center) | 5.000% | 11/15/21 | 1,220 | 1,399 |
| Martin County FL Health Facilities Authority Revenue (Martin Memorial Medical Center) | 5.000% | 11/15/22 | 1,575 | 1,835 |
| Martin County FL Health Facilities Authority Revenue (Martin Memorial Medical Center) | 5.000% | 11/15/23 | 500 | 589 |
| Miami Beach FL Health Facilities Authority Revenue (Mount Sinai Medical Center) | 4.000% | 11/15/16 | 400 | 400 |
| Miami Beach FL Health Facilities Authority Revenue (Mount Sinai Medical Center) | 4.000% | 11/15/17 | 325 | 335 |
| Miami Beach FL Health Facilities Authority Revenue (Mount Sinai Medical Center) | 4.000% | 11/15/18 | 1,125 | 1,179 |
| Miami Beach FL Health Facilities Authority Revenue (Mount Sinai Medical Center) | 4.000% | 11/15/18 | 385 | 406 |
| Miami Beach FL Health Facilities Authority Revenue (Mount Sinai Medical Center) | 5.000% | 11/15/19 | 1,650 | 1,825 |
| Miami Beach FL Health Facilities Authority Revenue (Mount Sinai Medical Center) | 5.000% | 11/15/20 | 400 | 453 |
| Miami Beach FL Resort Tax Revenue | 5.000% | 9/1/21 | 1,125 | 1,314 |
| Miami Beach FL Resort Tax Revenue | 4.000% | 9/1/22 | 1,025 | 1,163 |
| Miami-Dade County FL Expressway Authority Toll System Revenue | 5.000% | 7/1/18 | 2,000 | 2,131 |
| Miami-Dade County FL Expressway Authority Toll System Revenue | 5.000% | 7/1/19 | 1,900 | 2,094 |
| Miami-Dade County FL Expressway Authority Toll System Revenue | 5.000% | 7/1/20 | 2,525 | 2,863 |
| Miami-Dade County FL Expressway Authority Toll System Revenue | 5.000% | 7/1/20 | 1,500 | 1,701 |
| Miami-Dade County FL Expressway Authority Toll System Revenue | 5.000% | 7/1/21 | 1,000 | 1,163 |
| Miami-Dade County FL Expressway Authority Toll System Revenue | 5.000% | 7/1/21 | 2,250 | 2,607 |
| Miami-Dade County FL Expressway Authority Toll System Revenue | 5.000% | 7/1/22 | 625 | 742 |
| Miami-Dade County FL GO | 5.000% | 7/1/22 | 10,260 | 12,256 |
| Miami-Dade County FL Health Facilities Authority Hospital Revenue (Miami Children’s Hospital) | 5.000% | 8/1/19 | 1,000 | 1,101 |
| Miami-Dade County FL Health Facilities Authority Hospital Revenue (Miami Children’s Hospital) | 4.000% | 8/1/20 | 2,180 | 2,381 |
| Miami-Dade County FL Health Facilities Authority Hospital Revenue (Miami Children’s Hospital) | 5.000% | 8/1/21 | 1,300 | 1,503 |
| Miami-Dade County FL Health Facilities Authority Hospital Revenue (Miami Children’s Hospital) | 5.000% | 8/1/22 | 1,400 | 1,654 |
| Miami-Dade County FL Health Facilities Authority Hospital Revenue (Miami Children’s Hospital) | 5.000% | 8/1/23 | 1,000 | 1,202 |
| Miami-Dade County FL Industrial Development Authority Revenue (Biscayne Properties LLC) | 4.500% | 6/1/21 | 840 | 901 |
| Miami-Dade County FL Industrial Development Authority Revenue (Biscayne Properties LLC) | 5.000% | 6/1/22 | 985 | 1,089 |
| Miami-Dade County FL School Board COP | 5.000% | 8/1/18 | 4,850 | 5,184 |
| Miami-Dade County FL School Board COP | 5.000% | 2/1/23 | 9,290 | 11,011 |
| 2 Miami-Dade County FL School Board COP TOB VRDO | 0.710% | 11/7/16 (12) | 26,500 | 26,500 |
| Miami-Dade County FL School District GO | 5.000% | 3/15/22 | 3,795 | 4,475 |
64
Limited-Term Tax-Exempt Fund
| | | | |
| | | | Face | Market |
| | | Maturity | Amount | Value• |
| | Coupon | Date | ($000) | ($000) |
| Miami-Dade County FL Special Obligation Revenue | 5.000% | 4/1/23 | 9,340 | 11,268 |
| Miami-Dade County FL Transit Sales Surtax Revenue | 5.000% | 7/1/17 | 1,110 | 1,141 |
| Miami-Dade County FL Transit Sales Surtax Revenue | 5.000% | 7/1/19 (12) | 2,000 | 2,206 |
| Miami-Dade County FL Transit Sales Surtax Revenue | 5.000% | 7/1/19 | 1,250 | 1,378 |
| 2 Miami-Dade County FL Water & Sewer Revenue TOB VRDO | 0.690% | 11/7/16 (12) | 23,750 | 23,750 |
| 2 Miami-Dade County FL Water & Sewer Revenue TOB VRDO | 0.750% | 11/7/16 | 8,505 | 8,505 |
| 2 Miami-Dade County FL Water & Sewer Revenue TOB VRDO | 0.780% | 11/7/16 (4) | 13,995 | 13,995 |
| 2 Miami-Dade County FL Water & Sewer Revenue TOB VRDO | 0.780% | 11/7/16 (4) | 11,735 | 11,735 |
| Orange County FL Health Facilities Authority Hospital Revenue | | | | |
| (Orlando Regional Healthcare System) | 6.250% | 10/1/18 (14) | 5,770 | 6,174 |
| Orange County FL School Board COP | 5.000% | 8/1/17 | 1,500 | 1,548 |
| Orange County FL School Board COP | 5.000% | 8/1/18 | 1,400 | 1,499 |
| Orange County FL School Board COP | 5.000% | 8/1/19 | 1,765 | 1,955 |
| Orange County FL Tourist Development Revenue | 5.000% | 10/1/20 | 2,525 | 2,885 |
| Orlando & Orange County FL Expressway Authority Revenue | 5.000% | 7/1/17 | 2,000 | 2,056 |
| Orlando & Orange County FL Expressway Authority Revenue | 5.000% | 7/1/17 | 4,690 | 4,820 |
| Orlando & Orange County FL Expressway Authority Revenue | 5.000% | 7/1/18 | 2,785 | 2,969 |
| Orlando & Orange County FL Expressway Authority Revenue | 5.000% | 7/1/18 | 9,000 | 9,593 |
| Orlando & Orange County FL Expressway Authority Revenue | 5.000% | 7/1/19 | 3,770 | 4,156 |
| Orlando & Orange County FL Expressway Authority Revenue | 5.000% | 7/1/19 | 10,725 | 11,824 |
| Orlando FL Capital Improvement Revenue | 5.000% | 10/1/22 | 4,200 | 5,039 |
| Orlando FL Capital Improvement Revenue | 5.000% | 10/1/22 | 1,040 | 1,248 |
| Orlando FL Capital Improvement Revenue | 5.000% | 10/1/23 | 1,090 | 1,330 |
| Orlando FL Capital Improvement Revenue | 5.000% | 10/1/23 | 1,500 | 1,831 |
| Orlando FL Utility Commission Utility System Revenue | 5.000% | 10/1/17 | 3,000 | 3,116 |
| Orlando FL Utility Commission Utility System Revenue | 5.000% | 10/1/19 | 5,500 | 6,125 |
| Orlando Utilities Commission Revenue PUT | 0.880% | 5/30/17 | 10,400 | 10,400 |
| Palm Beach County FL Health Facilities Authority Hospital Revenue (BRRH Corp. Obligated Group) | 4.000% | 12/1/18 | 750 | 790 |
| Palm Beach County FL Health Facilities Authority Hospital Revenue (BRRH Corp. Obligated Group) | 4.000% | 12/1/19 | 1,000 | 1,072 |
| Palm Beach County FL Health Facilities Authority Hospital Revenue (BRRH Corp. Obligated Group) | 5.000% | 12/1/20 | 850 | 958 |
| Palm Beach County FL Health Facilities Authority Hospital Revenue (BRRH Corp. Obligated Group) | 5.000% | 12/1/21 | 1,165 | 1,341 |
| Palm Beach County FL Health Facilities Authority Revenue (Jupiter Medical Center Inc. Project) | 4.000% | 11/1/18 | 635 | 662 |
| Palm Beach County FL Health Facilities Authority Revenue (Jupiter Medical Center Inc. Project) | 5.000% | 11/1/19 | 2,740 | 2,987 |
| Palm Beach County FL Health Facilities Authority Revenue (Jupiter Medical Center Inc. Project) | 5.000% | 11/1/20 | 1,500 | 1,669 |
| Palm Beach County FL Health Facilities Authority Revenue (Jupiter Medical Center Inc. Project) | 5.000% | 11/1/21 | 750 | 850 |
| Palm Beach County FL School Board COP | 5.000% | 8/1/21 | 1,845 | 2,147 |
| Palm Beach County FL School District TAN | 2.000% | 8/31/17 | 37,310 | 37,682 |
| Port St. Lucie FL Special Assessment Revenue | 1.250% | 7/1/19 | 1,000 | 995 |
| Port St. Lucie FL Special Assessment Revenue | 1.375% | 7/1/20 | 1,000 | 991 |
| Port St. Lucie FL Special Assessment Revenue | 1.500% | 7/1/21 | 1,000 | 989 |
| Port St. Lucie FL Special Assessment Revenue | 1.750% | 7/1/22 | 1,265 | 1,252 |
| Port St. Lucie FL Special Assessment Revenue | 2.000% | 7/1/23 | 2,245 | 2,230 |
| Port St. Lucie FL Special Assessment Revenue | 2.000% | 7/1/24 | 1,580 | 1,542 |
| Port St. Lucie FL Utility Revenue | 4.000% | 9/1/21 | 240 | 270 |
| Port St. Lucie FL Utility Revenue | 5.000% | 9/1/22 | 750 | 894 |
| Port St. Lucie FL Utility Revenue | 5.000% | 9/1/23 | 500 | 606 |
| Reedy Creek FL Improvement District GO | 5.000% | 6/1/20 | 1,000 | 1,134 |
| Reedy Creek FL Improvement District GO | 5.000% | 6/1/20 | 1,000 | 1,134 |
| Reedy Creek FL Improvement District GO | 5.000% | 6/1/21 | 730 | 850 |
| Reedy Creek FL Improvement District GO | 5.000% | 6/1/22 | 400 | 477 |
| Reedy Creek FL Improvement District GO | 5.000% | 6/1/23 | 1,175 | 1,428 |
| Reedy Creek FL Improvement District Utilities Revenue | 5.000% | 10/1/18 | 750 | 804 |
| 1 Sarasota County FL Health Facilities Authority Revenue (Village of Isle Project) | 5.000% | 1/1/21 | 1,715 | 1,927 |
| 1 Sarasota County FL Health Facilities Authority Revenue (Village of Isle Project) | 5.000% | 1/1/22 | 750 | 859 |
| 1 Sarasota County FL Health Facilities Authority Revenue (Village of Isle Project) | 5.000% | 1/1/23 | 1,000 | 1,161 |
| 1 Sarasota County FL Health Facilities Authority Revenue (Village of Isle Project) | 5.000% | 1/1/24 | 1,250 | 1,471 |
| Sarasota County FL Infrastructure Sales Surtax Revenue | 5.000% | 10/1/21 | 1,500 | 1,763 |
| Seacoast FL Utility Authority Water & Sewer Revenue | 5.500% | 3/1/19 (14) | 3,595 | 3,959 |
| South Florida Water Management District COP | 5.000% | 10/1/21 | 1,750 | 2,055 |
| South Florida Water Management District COP | 5.000% | 10/1/22 | 2,000 | 2,399 |
| South Florida Water Management District COP | 5.000% | 10/1/23 | 3,000 | 3,657 |
| Sunrise FL Utility System Revenue | 5.200% | 10/1/20 (Prere.) | 7,255 | 8,249 |
| Sunshine State Governmental Financing Commission Florida Revenue | | | | |
| (Miami Dade County Program) | 5.000% | 9/1/19 | 2,390 | 2,644 |
| Sunshine State Governmental Financing Commission Florida Revenue | | | | |
| (Miami Dade County Program) | 5.000% | 9/1/19 | 2,360 | 2,610 |
| Sunshine State Governmental Financing Commission Florida Revenue | | | | |
| (Miami Dade County Program) | 5.000% | 9/1/20 | 2,830 | 3,219 |
| Sunshine State Governmental Financing Commission Florida Revenue | | | | |
| (Miami Dade County Program) | 5.000% | 9/1/20 | 1,185 | 1,348 |
65
Limited-Term Tax-Exempt Fund
| | | | |
| | | | Face | Market |
| | | Maturity | Amount | Value• |
| | Coupon | Date | ($000) | ($000) |
| Sunshine State Governmental Financing Commission Florida Revenue | | | | |
| (Miami Dade County Program) | 5.000% | 9/1/21 | 2,090 | 2,438 |
| Sunshine State Governmental Financing Commission Florida Revenue | | | | |
| (Miami Dade County Program) | 5.000% | 9/1/21 | 1,500 | 1,749 |
| Tallahassee FL Health Facilities Revenue (Tallahassee Memorial HealthCare Inc. Project) | 5.000% | 12/1/22 | 1,510 | 1,777 |
| Tallahassee FL Health Facilities Revenue (Tallahassee Memorial HealthCare Inc. Project) | 5.000% | 12/1/23 | 390 | 465 |
| Tampa FL Cigarette Tax Allocation Revenue (H. Lee Moffitt Cancer Center Project) | 5.000% | 9/1/20 | 1,650 | 1,866 |
| Tampa FL Health System Revenue (BayCare Health System) | 5.000% | 11/15/16 | 3,000 | 3,005 |
| Tampa FL Hospital Revenue | 4.000% | 7/1/18 | 1,625 | 1,695 |
| Tampa FL Hospital Revenue | 5.000% | 7/1/19 | 1,755 | 1,913 |
| Tampa FL Hospital Revenue | 4.000% | 7/1/20 | 1,100 | 1,192 |
| 1 Tampa FL Hospital Revenue (H. Lee Moffitt Cancer Center Project) | 5.000% | 7/1/23 | 1,675 | 1,971 |
| Tohopekaliga FL Water Authority Utility System Revenue | 5.000% | 10/1/17 | 4,505 | 4,679 |
| Tohopekaliga FL Water Authority Utility System Revenue | 5.000% | 10/1/19 | 1,165 | 1,296 |
| Tohopekaliga FL Water Authority Utility System Revenue | 5.000% | 10/1/20 | 1,825 | 2,090 |
| Tohopekaliga FL Water Authority Utility System Revenue | 4.000% | 10/1/22 | 3,425 | 3,922 |
| Volusia County FL Educational Facilities Authority Revenue | | | | |
| (Embry-Riddle Aeronautical University Inc.) | 5.000% | 10/15/23 | 755 | 900 |
| Volusia County FL Educational Facilities Authority Revenue (Stetson University) | 5.000% | 6/1/19 | 1,300 | 1,424 |
| Volusia County FL Educational Facilities Authority Revenue (Stetson University) | 5.000% | 6/1/21 | 1,485 | 1,706 |
| Volusia County FL School Board COP | 5.000% | 8/1/21 (15) | 450 | 525 |
| Volusia County FL School Board COP | 5.000% | 8/1/22 (15) | 750 | 895 |
| | | | | 957,823 |
| Georgia (2.5%) | | | | |
| Atlanta GA Airport Passenger Facility Charge Revenue | 5.000% | 1/1/18 | 2,520 | 2,641 |
| Atlanta GA Airport Revenue | 5.000% | 1/1/18 | 8,500 | 8,907 |
| Atlanta GA Airport Revenue | 5.000% | 1/1/18 | 500 | 524 |
| Atlanta GA Airport Revenue | 5.000% | 1/1/19 | 1,675 | 1,819 |
| Atlanta GA Airport Revenue | 5.000% | 1/1/20 | 1,205 | 1,351 |
| Atlanta GA Airport Revenue | 5.000% | 1/1/21 | 750 | 863 |
| Atlanta GA Water & Wastewater Revenue | 5.000% | 11/1/16 | 9,385 | 9,385 |
| Atlanta GA Water & Wastewater Revenue | 5.000% | 11/1/21 | 2,000 | 2,352 |
| Atlanta GA Water & Wastewater Revenue | 5.000% | 11/1/22 | 2,500 | 3,010 |
| 3 Atlanta GA Water & Wastewater Revenue PUT | 1.858% | 11/1/18 | 47,300 | 47,800 |
| 2 Atlanta GA Water & Wastewater Revenue TOB VRDO | 0.750% | 11/7/16 | 9,995 | 9,995 |
| Bartow County GA Development Authority Pollution Control Revenue | | | | |
| (Georgia Power Co. Plant Bowen Project) PUT | 2.700% | 8/23/18 | 9,000 | 9,240 |
| Burke County GA Development Authority Pollution Control Revenue | | | | |
| (Georgia Power Co. Plant Vogtle Project) PUT | 1.750% | 6/1/17 | 20,000 | 20,078 |
| Burke County GA Development Authority Pollution Control Revenue | | | | |
| (Georgia Power Co. Plant Vogtle Project) PUT | 1.750% | 6/1/17 | 13,000 | 13,050 |
| Burke County GA Development Authority Pollution Control Revenue | | | | |
| (Georgia Power Co. Plant Vogtle Project) PUT | 1.800% | 4/3/18 | 5,250 | 5,295 |
| Burke County GA Development Authority Pollution Control Revenue | | | | |
| (Georgia Power Co. Plant Vogtle Project) PUT | 1.300% | 5/3/18 | 5,000 | 5,029 |
| Burke County GA Development Authority Pollution Control Revenue | | | | |
| (Georgia Power Co. Plant Vogtle Project) PUT | 2.200% | 4/2/19 | 3,500 | 3,567 |
| Burke County GA Development Authority Pollution Control Revenue | | | | |
| (Georgia Power Co. Plant Vogtle Project) PUT | 2.200% | 4/2/19 | 10,000 | 10,192 |
| Burke County GA Development Authority Pollution Control Revenue | | | | |
| (Georgia Power Co. Plant Vogtle Project) PUT | 2.200% | 4/2/19 | 7,500 | 7,644 |
| Burke County GA Development Authority Pollution Control Revenue | | | | |
| (Georgia Power Co. Plant Vogtle Project) PUT | 2.200% | 4/2/19 | 10,000 | 10,192 |
| Burke County GA Development Authority Pollution Control Revenue | | | | |
| (Georgia Power Co. Plant Vogtle Project) PUT | 2.350% | 12/11/20 | 6,800 | 7,005 |
| Burke County GA Development Authority Pollution Control Revenue | | | | |
| (Georgia Power Co. Plant Vogtle Project) PUT | 1.650% | 6/18/21 | 15,000 | 14,959 |
| Carroll County GA School District GO | 5.000% | 4/1/18 | 5,075 | 5,370 |
| Cherokee County GA Board of Education GO | 5.000% | 2/1/21 | 400 | 463 |
| Cherokee County GA Board of Education GO | 5.000% | 2/1/22 | 1,000 | 1,186 |
| Cherokee County GA Board of Education GO | 5.000% | 8/1/22 | 3,000 | 3,602 |
| Cherokee County GA Board of Education GO | 5.000% | 2/1/23 | 800 | 968 |
| Cobb County GA Kennestone Hospital Authority Revenue | 5.000% | 4/1/17 | 1,250 | 1,271 |
| Cobb County GA Kennestone Hospital Authority Revenue | 5.000% | 4/1/18 | 1,000 | 1,055 |
| Cobb County GA Kennestone Hospital Authority Revenue | 5.000% | 4/1/18 | 1,250 | 1,319 |
| Cobb County GA Kennestone Hospital Authority Revenue | 5.000% | 4/1/19 | 250 | 273 |
| Cobb County GA Kennestone Hospital Authority Revenue | 5.000% | 4/1/20 | 350 | 393 |
| Dalton GA Development Authority Revenue (Hamilton Health Care System) | 4.000% | 8/15/18 | 1,000 | 1,051 |
| Dalton GA Development Authority Revenue (Hamilton Health Care System) | 5.000% | 8/15/19 | 1,000 | 1,102 |
66
Limited-Term Tax-Exempt Fund
| | | | |
| | | | Face | Market |
| | | Maturity | Amount | Value• |
| | Coupon | Date | ($000) | ($000) |
| Dalton GA Development Authority Revenue (Hamilton Health Care System) | 5.000% | 8/15/20 | 1,500 | 1,695 |
| Dalton GA Development Authority Revenue (Hamilton Health Care System) | 5.000% | 8/15/21 | 1,890 | 2,187 |
| DeKalb County GA Water & Sewer Revenue | 5.000% | 10/1/18 | 1,000 | 1,078 |
| DeKalb County GA Water & Sewer Revenue | 5.000% | 10/1/19 | 1,000 | 1,116 |
| DeKalb County GA Water & Sewer Revenue | 5.000% | 10/1/19 | 1,300 | 1,450 |
| DeKalb County GA Water & Sewer Revenue | 5.000% | 10/1/20 | 1,250 | 1,437 |
| Fulton County GA Residential Care Facilities for the Elderly Authority Revenue (Lenbrook Square) | 3.000% | 7/1/21 | 1,900 | 1,977 |
| Fulton County GA Residential Care Facilities for the Elderly Authority Revenue (Lenbrook Square) | 4.000% | 7/1/22 | 1,045 | 1,143 |
| Fulton County GA Residential Care Facilities for the Elderly Authority Revenue (Lenbrook Square) | 4.000% | 7/1/23 | 1,635 | 1,797 |
| Fulton County GA Residential Care Facilities for the Elderly Authority Revenue (Lenbrook Square) | 4.000% | 7/1/24 | 1,130 | 1,245 |
| 3 Gainesville & Hall County GA Hospital Authority Revenue | | | | |
| (Northeast Georgia Health System Inc. Project) PUT | 1.580% | 2/18/20 | 17,575 | 17,662 |
| Georgia GO | 5.000% | 7/1/17 | 13,695 | 14,090 |
| Georgia GO | 5.000% | 7/1/17 | 2,840 | 2,922 |
| Georgia GO | 5.000% | 7/1/18 | 2,340 | 2,501 |
| Georgia GO | 4.000% | 11/1/18 | 11,000 | 11,684 |
| Georgia GO | 5.000% | 12/1/18 | 7,800 | 8,465 |
| Georgia GO | 5.000% | 9/1/20 | 10,100 | 11,599 |
| Georgia Housing & Finance Authority Single Family Mortgage Revenue | 4.000% | 6/1/44 | 3,290 | 3,466 |
| Georgia Municipal Electric Power Authority Revenue | 5.000% | 1/1/17 | 1,400 | 1,410 |
| Georgia Municipal Electric Power Authority Revenue | 5.000% | 1/1/18 | 3,600 | 3,772 |
| Georgia Municipal Electric Power Authority Revenue | 5.000% | 1/1/19 | 1,000 | 1,085 |
| Georgia Municipal Electric Power Authority Revenue | 5.000% | 1/1/20 | 750 | 840 |
| Georgia Municipal Electric Power Authority Revenue | 5.000% | 1/1/22 | 10,000 | 11,788 |
| Georgia Municipal Gas Authority Revenue | 5.000% | 10/1/19 | 5,000 | 5,554 |
| Georgia Municipal Gas Authority Revenue | 5.000% | 10/1/20 | 3,600 | 4,113 |
| Georgia Municipal Gas Authority Revenue | 5.000% | 10/1/22 | 4,400 | 5,260 |
| Georgia Road & Tollway Authority GAN | 5.000% | 6/1/20 | 25,760 | 28,332 |
| Georgia Road & Tollway Authority Revenue | 5.000% | 10/1/18 | 18,240 | 19,676 |
| Glynn-Brunswick GA Memorial Hospital Authority Revenue | | | | |
| (Southeast Georgia Health System Obligated Group) | 5.000% | 8/1/21 | 2,500 | 2,891 |
| Glynn-Brunswick GA Memorial Hospital Authority Revenue | | | | |
| (Southeast Georgia Health System Obligated Group) | 5.000% | 8/1/22 | 2,500 | 2,953 |
| Gwinnett County GA School District GO | 5.000% | 2/1/19 | 1,500 | 1,636 |
| Gwinnett County GA School District GO | 5.000% | 2/1/20 | 1,000 | 1,128 |
| Gwinnett County GA School District GO | 5.000% | 2/1/22 | 25,000 | 29,839 |
| Gwinnett County GA School District GO | 5.000% | 8/1/22 | 13,000 | 15,720 |
| Gwinnett County GA Water & Sewer Authority Revenue | 5.000% | 8/1/17 | 1,675 | 1,729 |
| Gwinnett County GA Water & Sewer Authority Revenue | 5.000% | 8/1/18 | 4,335 | 4,648 |
| Main Street Natural Gas Inc. Georgia Gas Project Revenue | 5.000% | 3/15/17 | 7,140 | 7,236 |
| Main Street Natural Gas Inc. Georgia Gas Project Revenue | 5.000% | 3/15/17 | 5,350 | 5,415 |
| Main Street Natural Gas Inc. Georgia Gas Project Revenue | 5.000% | 3/15/18 | 7,125 | 7,428 |
| Main Street Natural Gas Inc. Georgia Gas Project Revenue | 5.000% | 3/15/18 | 1,885 | 1,972 |
| Main Street Natural Gas Inc. Georgia Gas Project Revenue | 5.000% | 3/15/19 | 1,160 | 1,237 |
| Main Street Natural Gas Inc. Georgia Gas Project Revenue | 5.000% | 3/15/21 | 2,330 | 2,603 |
| 3 Metropolitan Atlanta GA Rapid Transportation Authority Georgia Sales Tax Revenue PUT | 0.910% | 7/1/17 | 18,000 | 17,988 |
| 3 Metropolitan Atlanta GA Rapid Transportation Authority Georgia Sales Tax Revenue PUT | 0.930% | 7/1/17 | 17,500 | 17,493 |
| Monroe County GA Development Authority Pollution Control Revenue | | | | |
| (Georgia Power Co. Plant Scherer Project) PUT | 2.000% | 6/13/19 | 2,000 | 2,031 |
| Monroe County GA Development Authority Pollution Control Revenue | | | | |
| (Georgia Power Co. Plant Scherer Project) PUT | 2.350% | 12/11/20 | 9,500 | 9,787 |
| Municipal Electric Authority Georgia Revenue | 5.750% | 7/1/18 (Prere.) | 2,970 | 3,210 |
| Municipal Electric Authority Georgia Revenue | 5.750% | 1/1/19 | 1,045 | 1,126 |
| Municipal Electric Authority Georgia Revenue | 5.000% | 1/1/20 | 23,825 | 26,669 |
| Municipal Electric Authority Georgia Revenue | 5.000% | 1/1/20 | 2,000 | 2,239 |
| Municipal Electric Authority Georgia Revenue | 5.000% | 1/1/21 | 1,650 | 1,898 |
| Municipal Electric Authority Georgia Revenue | 5.000% | 1/1/22 | 5,465 | 6,439 |
| Municipal Electric Authority Georgia Revenue | 5.000% | 1/1/22 | 1,735 | 2,044 |
| Municipal Electric Authority Georgia Revenue | 5.000% | 1/1/23 | 1,510 | 1,816 |
| Municipal Electric Authority Georgia Revenue | 5.000% | 1/1/23 | 2,500 | 3,007 |
| Municipal Electric Authority Georgia Revenue | 5.000% | 1/1/23 | 3,840 | 4,619 |
| Municipal Electric Authority Georgia Revenue (Combined Cycle Project) | 5.000% | 11/1/17 | 1,500 | 1,562 |
| Municipal Electric Authority Georgia Revenue (Combined Cycle Project) | 5.000% | 11/1/18 | 1,250 | 1,349 |
| Municipal Electric Authority Georgia Revenue (Project One) | 5.000% | 1/1/17 | 8,165 | 8,224 |
| Municipal Gas Authority Georgia Revenue (Gas Portfolio III Project) | 5.000% | 10/1/18 | 2,000 | 2,151 |
| Municipal Gas Authority Georgia Revenue (Gas Portfolio III Project) | 5.000% | 10/1/19 | 1,500 | 1,666 |
| Municipal Gas Authority Georgia Revenue (Gas Portfolio III Project) | 5.000% | 10/1/20 | 1,000 | 1,142 |
| Municipal Gas Authority Georgia Revenue (Gas Portfolio III Project) | 5.000% | 10/1/21 | 1,500 | 1,755 |
| Municipal Gas Authority Georgia Revenue (Gas Portfolio III Project) | 5.000% | 10/1/22 | 1,000 | 1,196 |
| Richmond County GA Hospital Authority Revenue (University Health Services Inc. Project) | 5.000% | 1/1/21 | 1,000 | 1,148 |
67
Limited-Term Tax-Exempt Fund
| | | | |
| | | | Face | Market |
| | | Maturity | Amount | Value• |
| | Coupon | Date | ($000) | ($000) |
| Richmond County GA Hospital Authority Revenue (University Health Services Inc. Project) | 5.000% | 1/1/22 | 1,200 | 1,407 |
| Richmond County GA Hospital Authority Revenue (University Health Services Inc. Project) | 5.000% | 1/1/23 | 1,100 | 1,312 |
| Richmond County GA Hospital Authority Revenue (University Health Services Inc. Project) | 5.000% | 1/1/24 | 1,000 | 1,208 |
| 1 South Regional GA Joint Development Authority Revenue | | | | |
| (VSU Auxiliary Services Parking & Student Center Project) | 5.000% | 8/1/21 | 1,550 | 1,785 |
| 1 South Regional GA Joint Development Authority Revenue | | | | |
| (VSU Auxiliary Services Parking & Student Center Project) | 5.000% | 8/1/22 | 1,000 | 1,175 |
| 1 South Regional GA Joint Development Authority Revenue | | | | |
| (VSU Auxiliary Services Parking & Student Center Project) | 5.000% | 8/1/23 | 1,080 | 1,288 |
| 1 South Regional GA Joint Development Authority Revenue | | | | |
| (VSU Auxiliary Services Parking & Student Center Project) | 5.000% | 8/1/24 | 1,490 | 1,794 |
| | | | | 599,258 |
| Guam (0.0%) | | | | |
| Guam Government Business Privilege Tax Revenue | 5.000% | 11/15/20 | 750 | 840 |
| Guam Government Business Privilege Tax Revenue | 5.000% | 11/15/21 | 1,125 | 1,285 |
| Guam Government Business Privilege Tax Revenue | 5.000% | 11/15/22 | 1,500 | 1,745 |
| Guam Government Waterworks Authority Water & Waste Water System Revenue | 5.000% | 7/1/20 | 1,000 | 1,113 |
| Guam Government Waterworks Authority Water & Waste Water System Revenue | 5.250% | 7/1/20 | 600 | 673 |
| Guam Government Waterworks Authority Water & Waste Water System Revenue | 5.250% | 7/1/21 | 1,390 | 1,591 |
| Guam Power Authority Revenue | 5.000% | 10/1/18 | 475 | 508 |
| Guam Power Authority Revenue | 5.000% | 10/1/20 | 520 | 583 |
| | | | | 8,338 |
| Hawaii (1.0%) | | | | |
| Hawaii County HI GO | 5.000% | 9/1/22 | 1,330 | 1,602 |
| Hawaii County HI GO | 5.000% | 9/1/22 | 1,275 | 1,535 |
| Hawaii County HI GO | 5.000% | 9/1/23 | 1,200 | 1,473 |
| Hawaii County HI GO | 5.000% | 9/1/23 | 1,785 | 2,191 |
| Hawaii County HI GO | 5.000% | 9/1/23 | 1,395 | 1,712 |
| Hawaii Department of Budget & Finance Special Purpose Revenue (Queens Health System) PUT | 1.080% | 5/30/17 | 4,860 | 4,860 |
| Hawaii Department of Budget & Finance Special Purpose Revenue (Queens Health System) PUT | 1.080% | 5/30/17 | 2,510 | 2,510 |
| Hawaii GO | 5.000% | 12/1/18 | 17,250 | 18,699 |
| Hawaii GO | 5.000% | 6/1/19 | 6,960 | 7,671 |
| Hawaii GO | 5.000% | 6/1/19 | 2,370 | 2,610 |
| Hawaii GO | 5.000% | 8/1/19 | 3,735 | 4,137 |
| Hawaii GO | 5.000% | 8/1/19 | 3,500 | 3,876 |
| Hawaii GO | 5.000% | 11/1/19 | 11,960 | 13,355 |
| Hawaii GO | 5.000% | 11/1/19 | 40,725 | 45,476 |
| Hawaii GO | 5.000% | 12/1/19 | 5,000 | 5,598 |
| Hawaii GO | 5.000% | 8/1/20 | 10,985 | 12,541 |
| Hawaii GO | 5.000% | 8/1/20 | 13,905 | 15,874 |
| Hawaii GO | 5.000% | 8/1/21 | 7,610 | 8,933 |
| Hawaii GO | 5.000% | 8/1/21 | 7,000 | 8,210 |
| Hawaii GO | 5.000% | 8/1/22 | 6,000 | 7,211 |
| Hawaii GO | 5.000% | 8/1/22 | 2,500 | 3,005 |
| Hawaii GO | 5.000% | 10/1/22 | 9,000 | 10,860 |
| Hawaii GO | 5.000% | 10/1/22 | 7,000 | 8,447 |
| Hawaii GO | 5.000% | 10/1/22 | 5,500 | 6,637 |
| Hawaii GO | 5.000% | 10/1/23 | 1,075 | 1,322 |
| Hawaii GO | 5.000% | 10/1/23 | 5,000 | 6,148 |
| Hawaii Highway Revenue | 5.500% | 7/1/18 | 2,000 | 2,154 |
| Hawaii Highway Revenue | 5.000% | 1/1/20 | 1,000 | 1,123 |
| Honolulu HI City & County GO | 5.000% | 8/1/17 | 4,130 | 4,261 |
| Honolulu HI City & County GO | 5.000% | 8/1/18 | 2,715 | 2,906 |
| Honolulu HI City & County GO | 5.000% | 11/1/18 | 4,000 | 4,318 |
| Honolulu HI City & County GO | 5.000% | 11/1/19 | 6,000 | 6,689 |
| Honolulu HI City & County GO | 5.000% | 10/1/21 | 2,255 | 2,651 |
| Honolulu HI City & County GO | 5.000% | 10/1/21 | 3,620 | 4,255 |
| Honolulu HI City & County GO | 5.000% | 10/1/21 | 1,500 | 1,763 |
| 2 Honolulu HI City & County GO TOB PUT | 0.700% | 11/3/16 | 10,505 | 10,505 |
| | | | | 247,118 |
| Idaho (0.1%) | | | | |
| Idaho Health Facilities Authority Revenue (Trinity Health Group) | 5.000% | 12/1/20 | 5,000 | 5,736 |
| Idaho Health Facilities Authority Revenue (Trinity Health Group) | 5.000% | 12/1/21 | 2,000 | 2,355 |
| Idaho Health Facilities Authority Revenue (Trinity Health Group) | 5.000% | 12/1/22 | 2,000 | 2,405 |
| Idaho Health Facilities Authority Revenue (Trinity Health Group) | 5.000% | 12/1/23 | 4,400 | 5,387 |
| Idaho TAN | 2.000% | 6/30/17 | 7,500 | 7,567 |
68
Limited-Term Tax-Exempt Fund
| | | | |
| | | | Face | Market |
| | | Maturity | Amount | Value• |
| | Coupon | Date | ($000) | ($000) |
| Illinois (4.1%) | | | | |
| Chicago IL Board of Education GO | 5.000% | 12/1/16 | 2,500 | 2,498 |
| Chicago IL Board of Education GO | 5.000% | 12/1/18 (12) | 7,305 | 7,631 |
| Chicago IL Board of Education GO | 5.250% | 12/1/18 (14) | 4,970 | 5,217 |
| Chicago IL Board of Education GO | 5.000% | 12/1/19 (2) | 3,090 | 3,179 |
| Chicago IL Board of Education GO | 5.250% | 12/1/19 (14)(3) | 1,000 | 1,069 |
| Chicago IL Board of Education GO | 5.000% | 12/1/20 (2) | 2,000 | 2,056 |
| Chicago IL Board of Education GO | 5.250% | 12/1/20 (14)(3) | 1,250 | 1,358 |
| Chicago IL Board of Education GO | 7.000% | 12/1/26 | 10,000 | 10,620 |
| 3 Chicago IL Board of Education GO PUT | 4.630% | 3/1/17 | 10,000 | 9,990 |
| Chicago IL GO | 5.000% | 1/1/19 (4) | 4,645 | 4,683 |
| Chicago IL GO | 5.000% | 1/1/22 | 15,000 | 16,004 |
| Chicago IL GO | 5.000% | 1/1/23 | 18,500 | 19,762 |
| Chicago IL Metropolitan Water Reclamation District GO | 5.000% | 12/1/18 | 5,000 | 5,406 |
| Chicago IL Metropolitan Water Reclamation District GO | 5.000% | 12/1/21 | 4,470 | 5,245 |
| Chicago IL Metropolitan Water Reclamation District GO | 5.000% | 12/1/21 | 5,105 | 5,990 |
| 2 Chicago IL Metropolitan Water Reclamation District GO TOB VRDO | 0.750% | 11/7/16 | 17,600 | 17,600 |
| Chicago IL Midway Airport Revenue | 5.000% | 1/1/20 | 2,075 | 2,321 |
| Chicago IL O’Hare International Airport Revenue | 5.000% | 1/1/17 | 750 | 755 |
| Chicago IL O’Hare International Airport Revenue | 5.000% | 1/1/17 | 7,500 | 7,552 |
| Chicago IL O’Hare International Airport Revenue | 5.250% | 1/1/17 (14) | 4,540 | 4,573 |
| Chicago IL O’Hare International Airport Revenue | 5.000% | 1/1/18 | 1,250 | 1,308 |
| Chicago IL O’Hare International Airport Revenue | 5.000% | 1/1/18 | 2,050 | 2,138 |
| Chicago IL O’Hare International Airport Revenue | 5.000% | 1/1/19 | 1,000 | 1,082 |
| Chicago IL O’Hare International Airport Revenue | 5.000% | 1/1/19 | 1,420 | 1,525 |
| Chicago IL O’Hare International Airport Revenue | 5.000% | 1/1/21 | 500 | 573 |
| Chicago IL O’Hare International Airport Revenue | 5.000% | 1/1/21 | 4,175 | 4,783 |
| Chicago IL O’Hare International Airport Revenue | 5.000% | 1/1/22 | 1,125 | 1,319 |
| Chicago IL O’Hare International Airport Revenue | 5.000% | 1/1/22 | 9,700 | 11,371 |
| Chicago IL O’Hare International Airport Revenue | 5.000% | 1/1/23 | 7,000 | 8,374 |
| Chicago IL O’Hare International Airport Revenue | 5.000% | 1/1/23 | 1,100 | 1,316 |
| Chicago IL O’Hare International Airport Revenue | 5.000% | 1/1/24 | 10,445 | 12,683 |
| 2 Chicago IL O’Hare International Airport Revenue TOB VRDO | 0.780% | 11/7/16 (4) | 21,135 | 21,135 |
| 1 Chicago IL Park District GO | 5.000% | 1/1/22 | 400 | 456 |
| 1 Chicago IL Park District GO | 5.000% | 1/1/22 | 1,000 | 1,141 |
| 1 Chicago IL Park District GO | 5.000% | 1/1/23 | 400 | 463 |
| 1 Chicago IL Park District GO | 5.000% | 1/1/23 | 1,265 | 1,464 |
| 1 Chicago IL Park District GO | 5.000% | 1/1/24 | 550 | 643 |
| Chicago IL Park District Harbor Facilities GO | 5.000% | 1/1/20 | 1,195 | 1,311 |
| Chicago IL Park District Harbor Facilities GO | 5.000% | 1/1/21 | 2,920 | 3,276 |
| 2 Chicago IL Transit Authority Sales Tax Receipts Revenue TOB VRDO | 0.830% | 11/7/16 | 31,665 | 31,665 |
| 2 Chicago IL Transit Authority Sales Tax Receipts Revenue TOB VRDO | 0.830% | 11/7/16 | 22,895 | 22,895 |
| Chicago IL Wastewater Transmission Revenue | 5.000% | 1/1/21 | 1,000 | 1,116 |
| Chicago IL Wastewater Transmission Revenue | 5.000% | 1/1/22 | 2,000 | 2,270 |
| Chicago IL Wastewater Transmission Revenue | 5.000% | 1/1/23 | 2,000 | 2,300 |
| Chicago IL Water Revenue | 5.000% | 11/1/18 | 675 | 720 |
| Cook County IL Forest Preservation District GO | 5.000% | 12/15/17 | 1,000 | 1,042 |
| Cook County IL Forest Preservation District GO | 5.000% | 12/15/18 | 1,000 | 1,073 |
| Cook County IL Forest Preservation District GO | 5.000% | 12/15/19 | 1,580 | 1,740 |
| Cook County IL GO | 5.000% | 11/15/18 | 2,000 | 2,138 |
| Cook County IL GO | 5.000% | 11/15/19 | 1,500 | 1,645 |
| Cook County IL GO | 5.000% | 11/15/20 | 1,500 | 1,679 |
| Illinois Educational Facilities Authority Revenue (University of Chicago) PUT | 1.550% | 2/13/20 | 5,000 | 5,049 |
| Illinois Finance Authority Gas Supply Revenue (Peoples Gas Light & Coke) PUT | 1.875% | 8/1/20 | 8,000 | 8,105 |
| Illinois Finance Authority Revenue (Advocate Health Care Network) | 5.000% | 8/1/19 | 1,000 | 1,105 |
| Illinois Finance Authority Revenue (Advocate Health Care Network) | 5.000% | 8/1/21 | 2,000 | 2,333 |
| Illinois Finance Authority Revenue (Advocate Health Care Network) | 5.000% | 8/1/22 | 1,000 | 1,193 |
| Illinois Finance Authority Revenue (Advocate Health Care Network) | 1.375% | 11/15/22 | 3,030 | 3,005 |
| Illinois Finance Authority Revenue (Advocate Health Care Network) PUT | 0.930% | 5/30/17 | 5,750 | 5,750 |
| Illinois Finance Authority Revenue (Advocate Health Care Network) PUT | 5.000% | 5/1/19 | 26,795 | 29,335 |
| Illinois Finance Authority Revenue (Advocate Health Care Network) PUT | 5.000% | 1/15/20 | 5,850 | 6,536 |
| 2 Illinois Finance Authority Revenue (Advocate Health Care Network) TOB VRDO | 0.660% | 11/7/16 | 1,840 | 1,840 |
| Illinois Finance Authority Revenue (Ascension Health Credit Group) PUT | 5.000% | 5/1/17 | 3,275 | 3,343 |
| Illinois Finance Authority Revenue (Carle Foundation) | 5.000% | 8/15/17 | 1,500 | 1,547 |
| 1 Illinois Finance Authority Revenue (Carle Foundation) | 5.000% | 2/15/21 | 750 | 854 |
| 1 Illinois Finance Authority Revenue (Carle Foundation) | 5.000% | 2/15/23 | 1,000 | 1,178 |
| 2 Illinois Finance Authority Revenue (Carle Foundation) TOB VRDO | 0.750% | 11/7/16 (12) | 7,200 | 7,200 |
| Illinois Finance Authority Revenue (Centegra Health System) | 5.000% | 9/1/18 | 235 | 249 |
| Illinois Finance Authority Revenue (Centegra Health System) | 5.000% | 9/1/19 | 1,115 | 1,207 |
| Illinois Finance Authority Revenue (Centegra Health System) | 5.000% | 9/1/20 | 2,940 | 3,270 |
69
Limited-Term Tax-Exempt Fund
| | | | |
| | | | Face | Market |
| | | Maturity | Amount | Value• |
| | Coupon | Date | ($000) | ($000) |
| Illinois Finance Authority Revenue (Centegra Health System) | 5.000% | 9/1/20 | 500 | 556 |
| Illinois Finance Authority Revenue (Centegra Health System) | 5.000% | 9/1/21 | 975 | 1,104 |
| Illinois Finance Authority Revenue (DePaul University) | 5.000% | 10/1/21 | 380 | 442 |
| Illinois Finance Authority Revenue (DePaul University) | 5.000% | 10/1/24 | 250 | 306 |
| Illinois Finance Authority Revenue (Hospital Sister Services Inc.) | 5.000% | 8/15/18 | 4,000 | 4,277 |
| Illinois Finance Authority Revenue (Hospital Sister Services Inc.) | 5.000% | 8/15/19 | 4,205 | 4,641 |
| Illinois Finance Authority Revenue (Hospital Sister Services Inc.) | 5.000% | 8/15/20 | 4,210 | 4,752 |
| Illinois Finance Authority Revenue (Mercy Health System) | 5.000% | 12/1/22 | 5,000 | 5,873 |
| Illinois Finance Authority Revenue (Northwestern Community Hospital) | 5.000% | 7/1/20 | 1,035 | 1,165 |
| Illinois Finance Authority Revenue (Northwestern Community Hospital) | 5.000% | 7/1/22 | 2,380 | 2,793 |
| Illinois Finance Authority Revenue (OSF Healthcare System) | 5.000% | 11/15/20 | 2,560 | 2,913 |
| Illinois Finance Authority Revenue (OSF Healthcare System) | 5.000% | 11/15/21 | 1,100 | 1,282 |
| Illinois Finance Authority Revenue (OSF Healthcare System) | 5.000% | 5/15/22 | 1,925 | 2,259 |
| Illinois Finance Authority Revenue (OSF Healthcare System) | 5.000% | 11/15/22 | 1,535 | 1,821 |
| Illinois Finance Authority Revenue (Palos Community Hospital) | 5.000% | 5/15/17 | 2,500 | 2,554 |
| Illinois Finance Authority Revenue (Presbyterian Homes) | 5.000% | 5/1/21 | 1,200 | 1,374 |
| Illinois Finance Authority Revenue (Presbyterian Homes) | 5.000% | 5/1/22 | 1,600 | 1,867 |
| Illinois Finance Authority Revenue (Presbyterian Homes) | 5.000% | 5/1/23 | 1,400 | 1,661 |
| 3 Illinois Finance Authority Revenue (Presbyterian Homes) PUT | 1.719% | 5/1/21 | 2,500 | 2,510 |
| Illinois Finance Authority Revenue (Presence Health Network Obligated Group) | 5.000% | 2/15/21 | 3,055 | 3,390 |
| Illinois Finance Authority Revenue (Presence Health Network Obligated Group) | 5.000% | 2/15/22 | 4,000 | 4,503 |
| Illinois Finance Authority Revenue (Presence Health Network Obligated Group) | 5.000% | 2/15/23 | 5,000 | 5,691 |
| Illinois Finance Authority Revenue (Rush University Medical Center) | 5.000% | 11/15/19 | 500 | 555 |
| Illinois Finance Authority Revenue (Rush University Medical Center) | 5.000% | 11/15/20 | 1,000 | 1,140 |
| Illinois Finance Authority Revenue (Rush University Medical Center) | 5.000% | 11/15/21 | 1,000 | 1,168 |
| Illinois Finance Authority Revenue (Rush University Medical Center) | 5.000% | 11/15/22 | 1,000 | 1,194 |
| Illinois Finance Authority Revenue (Silver Cross & Medical Centers) | 5.000% | 8/15/22 | 1,000 | 1,154 |
| Illinois Finance Authority Revenue (Trinity Health Corp.) | 3.000% | 12/1/17 | 3,075 | 3,143 |
| 1 Illinois Finance Authority Revenue (University of Chicago Medical Center) | 5.000% | 8/15/22 | 1,200 | 1,421 |
| 1 Illinois Finance Authority Revenue (University of Chicago Medical Center) | 5.000% | 8/15/23 | 1,100 | 1,320 |
| Illinois Finance Authority Revenue (University of Chicago) | 5.000% | 10/1/19 | 1,745 | 1,940 |
| Illinois Finance Authority Revenue (University of Chicago) | 5.000% | 10/1/20 | 7,000 | 8,000 |
| 2 Illinois Finance Authority Revenue (University of Chicago) TOB VRDO | 0.680% | 11/7/16 | 15,825 | 15,825 |
| Illinois Finance Authority Solid Waste Disposal Revenue (Prairie Power Inc. Project) PUT | 1.300% | 5/8/17 | 2,340 | 2,340 |
| Illinois GO | 4.000% | 1/1/17 | 5,000 | 5,024 |
| Illinois GO | 5.000% | 8/1/17 | 5,000 | 5,127 |
| Illinois GO | 5.500% | 8/1/17 (14) | 1,425 | 1,468 |
| 1 Illinois GO | 5.000% | 2/1/18 | 15,000 | 15,541 |
| Illinois GO | 5.000% | 4/1/18 | 2,500 | 2,600 |
| Illinois GO | 5.000% | 5/1/18 | 8,000 | 8,334 |
| Illinois GO | 5.000% | 8/1/18 | 22,000 | 23,034 |
| Illinois GO | 5.250% | 1/1/19 | 8,060 | 8,535 |
| Illinois GO | 5.000% | 2/1/19 | 875 | 923 |
| 1 Illinois GO | 5.000% | 2/1/19 | 7,500 | 7,912 |
| Illinois GO | 5.000% | 8/1/19 | 26,625 | 28,290 |
| Illinois GO | 4.000% | 9/1/19 | 2,000 | 2,074 |
| Illinois GO | 5.000% | 2/1/20 | 3,000 | 3,207 |
| Illinois GO | 5.000% | 3/1/20 | 10,115 | 10,828 |
| Illinois GO | 5.000% | 4/1/20 | 2,000 | 2,144 |
| Illinois GO | 5.000% | 5/1/20 | 24,500 | 26,294 |
| Illinois GO | 5.000% | 7/1/20 | 12,500 | 13,447 |
| Illinois GO | 5.000% | 8/1/20 (4) | 6,500 | 7,089 |
| Illinois GO | 5.000% | 1/1/21 (4) | 8,425 | 9,030 |
| Illinois GO | 5.000% | 2/1/21 | 4,100 | 4,446 |
| 1 Illinois GO | 5.000% | 2/1/21 | 10,000 | 10,844 |
| Illinois GO | 5.000% | 4/1/21 | 8,500 | 9,235 |
| Illinois GO | 5.000% | 5/1/21 | 17,000 | 18,486 |
| Illinois GO | 5.000% | 1/1/23 | 19,200 | 21,063 |
| 1 Illinois GO | 5.000% | 2/1/23 | 7,000 | 7,684 |
| Illinois GO | 5.000% | 1/1/24 | 19,200 | 21,151 |
| Illinois Housing Development Authority Multi-Family Housing Revenue | | | | |
| (J. Michael Fitzgerald Apartments Project) PUT | 0.900% | 1/1/18 | 5,125 | 5,116 |
| Illinois Sales Tax Revenue | 5.000% | 6/15/19 | 14,220 | 15,623 |
| Illinois Sales Tax Revenue | 5.000% | 6/15/20 | 15,050 | 17,011 |
| Illinois Toll Highway Authority Revenue | 5.000% | 12/1/17 | 6,500 | 6,786 |
| Illinois Toll Highway Authority Revenue | 5.000% | 12/1/18 | 7,000 | 7,563 |
| Illinois Toll Highway Authority Revenue | 5.000% | 1/1/19 | 1,000 | 1,083 |
| Illinois Toll Highway Authority Revenue | 5.000% | 12/1/19 | 20,100 | 22,416 |
| Illinois Toll Highway Authority Revenue | 5.000% | 1/1/20 | 5,000 | 5,587 |
| Illinois Toll Highway Authority Revenue | 5.000% | 12/1/20 | 20,000 | 22,928 |
70
Limited-Term Tax-Exempt Fund
| | | | |
| | | | Face | Market |
| | | Maturity | Amount | Value• |
| | Coupon | Date | ($000) | ($000) |
| Illinois Toll Highway Authority Revenue | 5.000% | 1/1/21 | 5,000 | 5,739 |
| Illinois Toll Highway Authority Revenue | 5.000% | 12/1/21 | 15,000 | 17,619 |
| 2 Illinois Toll Highway Authority Revenue TOB VRDO | 0.670% | 11/7/16 | 10,435 | 10,435 |
| Illinois Unemployment Insurance Fund Building Receipts Revenue | 5.000% | 6/15/18 | 17,875 | 17,967 |
| Lake County IL Community High School District No. 117 GO | 0.000% | 12/1/17 (14) | 5,155 | 5,068 |
| McHenry County IL Conservation District GO | 5.000% | 2/1/19 | 2,500 | 2,713 |
| McHenry County IL Conservation District GO | 5.000% | 2/1/21 | 3,000 | 3,449 |
| Metropolitan Pier & Exposition Authority Illinois Dedicated Sales Tax Revenue | 0.000% | 6/15/21 (14) | 16,775 | 14,482 |
| Metropolitan Pier & Exposition Authority Illinois Dedicated Sales Tax Revenue | 0.000% | 12/15/21 (14) | 2,510 | 2,130 |
| Metropolitan Pier & Exposition Authority Illinois Dedicated Sales Tax Revenue | | | | |
| (McCormick Place Expansion Project) | 0.000% | 12/15/19 (14) | 1,235 | 1,132 |
| Metropolitan Pier & Exposition Authority Illinois Dedicated Sales Tax Revenue | | | | |
| (McCormick Place Expansion Project) | 5.000% | 12/15/22 | 2,500 | 2,551 |
| Northern Illinois Municipal Power Agency Project Revenue | 5.000% | 12/1/22 | 1,000 | 1,187 |
| Northern Illinois Municipal Power Agency Project Revenue | 5.000% | 12/1/23 | 2,210 | 2,657 |
| Northern Illinois Municipal Power Agency Project Revenue | 5.000% | 12/1/24 | 1,120 | 1,361 |
| Railsplitter Tobacco Settlement Authority Illinois Tobacco Settlement Revenue | 5.000% | 6/1/17 | 9,580 | 9,801 |
| Railsplitter Tobacco Settlement Authority Illinois Tobacco Settlement Revenue | 5.000% | 6/1/18 | 1,875 | 1,984 |
| Railsplitter Tobacco Settlement Authority Illinois Tobacco Settlement Revenue | 5.250% | 6/1/20 | 6,600 | 7,459 |
| Railsplitter Tobacco Settlement Authority Illinois Tobacco Settlement Revenue | 6.250% | 6/1/24 | 2,100 | 2,124 |
| Romeoville IL Revenue (Lewis University Project) | 5.000% | 10/1/21 | 615 | 698 |
| Romeoville IL Revenue (Lewis University Project) | 5.000% | 10/1/23 | 645 | 754 |
| Springfield IL Electric Revenue | 5.000% | 3/1/18 | 2,000 | 2,101 |
| Springfield IL Electric Revenue | 5.000% | 3/1/19 | 2,000 | 2,169 |
| Springfield IL Electric Revenue | 5.000% | 3/1/21 | 2,000 | 2,284 |
| Springfield IL Electric Revenue | 5.000% | 3/1/22 | 2,335 | 2,727 |
| Springfield IL Electric Revenue | 5.000% | 3/1/23 | 5,000 | 5,952 |
| Springfield IL Electric Revenue | 5.000% | 3/1/24 | 4,515 | 5,452 |
| University of Illinois COP | 5.000% | 8/15/20 | 5,000 | 5,627 |
| University of Illinois COP | 5.000% | 10/1/20 | 3,850 | 4,348 |
| University of Illinois COP | 5.000% | 8/15/21 | 5,000 | 5,749 |
| Will County IL Community High School District No. 210 (Lincoln-Way) GO | 4.000% | 1/1/22 | 450 | 451 |
| | | | | 986,279 |
| Indiana (1.3%) | | | | |
| Ball State University Housing & Dining System Indiana Revenue | 5.000% | 7/1/21 | 200 | 233 |
| Ball State University Housing & Dining System Indiana Revenue | 5.000% | 7/1/22 | 250 | 298 |
| Ball State University Housing & Dining System Indiana Revenue | 5.000% | 7/1/23 | 250 | 303 |
| Evansville IN Redevelopment Authority Revenue (Arena Project) | 5.000% | 2/1/21 (15) | 3,155 | 3,588 |
| Evansville IN Redevelopment Authority Revenue (Arena Project) | 5.000% | 2/1/22 (15) | 3,370 | 3,912 |
| Evansville IN Redevelopment Authority Revenue (Arena Project) | 5.000% | 2/1/23 (15) | 3,535 | 4,147 |
| Indiana Bond Bank Special Program Gas Revenue | 5.250% | 10/15/19 | 50 | 55 |
| Indiana Finance Authority Economic Development Revenue (Republic Services Inc. Project) PUT | 0.700% | 12/1/16 | 6,000 | 6,000 |
| Indiana Finance Authority Health System Revenue | | | | |
| (Sisters of St. Francis Health Services Inc. Obligated Group) | 5.000% | 11/1/16 | 3,000 | 3,000 |
| Indiana Finance Authority Health System Revenue | | | | |
| (Sisters of St. Francis Health Services Inc. Obligated Group) | 5.000% | 11/1/21 | 2,380 | 2,566 |
| Indiana Finance Authority Health System Revenue | | | | |
| (Sisters of St. Francis Health Services Inc. Obligated Group) | 5.000% | 11/1/22 | 1,500 | 1,789 |
| Indiana Finance Authority Hospital Revenue (Community Health Network) | 5.000% | 5/1/20 | 860 | 965 |
| Indiana Finance Authority Hospital Revenue (Indiana University Health Obligated Group) | 5.000% | 3/1/18 | 10,445 | 11,011 |
| Indiana Finance Authority Hospital Revenue (Indiana University Health Obligated Group) | 5.000% | 3/1/19 | 5,000 | 5,458 |
| Indiana Finance Authority Hospital Revenue (Indiana University Health Obligated Group) | 5.000% | 12/1/20 | 1,100 | 1,267 |
| Indiana Finance Authority Hospital Revenue (Indiana University Health Obligated Group) | 5.000% | 12/1/20 | 1,000 | 1,152 |
| Indiana Finance Authority Hospital Revenue (Indiana University Health Obligated Group) | 5.000% | 12/1/21 | 2,500 | 2,943 |
| Indiana Finance Authority Hospital Revenue (Indiana University Health Obligated Group) | 5.000% | 12/1/22 | 7,000 | 8,422 |
| Indiana Finance Authority Hospital Revenue (Indiana University Health Obligated Group) | 5.000% | 12/1/23 | 5,200 | 6,351 |
| Indiana Finance Authority Hospital Revenue (Parkview Health System) | 5.000% | 5/1/19 | 1,650 | 1,804 |
| Indiana Finance Authority Lease Revenue | 5.000% | 2/1/18 | 4,500 | 4,735 |
| Indiana Finance Authority Lease Revenue | 5.000% | 2/1/19 | 3,700 | 4,034 |
| Indiana Finance Authority Lease Revenue | 5.000% | 2/1/20 | 3,500 | 3,943 |
| Indiana Finance Authority Revenue (Community Foundation of Northwest Indiana Obligated Group) | 5.000% | 3/1/18 | 825 | 868 |
| Indiana Finance Authority Revenue (Community Foundation of Northwest Indiana Obligated Group) | 5.000% | 3/1/19 | 1,000 | 1,085 |
| Indiana Finance Authority Revenue (Community Foundation of Northwest Indiana Obligated Group) | 5.000% | 3/1/20 | 1,300 | 1,452 |
| Indiana Finance Authority Revenue (Community Foundation of Northwest Indiana Obligated Group) | 5.000% | 3/1/23 | 750 | 873 |
| Indiana Finance Authority Revenue (State Revolving Fund) | 5.000% | 2/1/17 | 7,625 | 7,709 |
| Indiana Finance Authority Wastewater Utility Revenue (CWA Authority Project) | 5.000% | 10/1/18 | 1,000 | 1,073 |
| Indiana Finance Authority Wastewater Utility Revenue (CWA Authority Project) | 5.000% | 10/1/19 | 335 | 373 |
| Indiana Finance Authority Wastewater Utility Revenue (CWA Authority Project) | 5.000% | 10/1/20 | 375 | 429 |
| Indiana Finance Authority Wastewater Utility Revenue (CWA Authority Project) | 5.000% | 10/1/20 | 840 | 961 |
71
Limited-Term Tax-Exempt Fund
| | | | |
| | | | Face | Market |
| | | Maturity | Amount | Value• |
| | Coupon | Date | ($000) | ($000) |
| Indiana Finance Authority Wastewater Utility Revenue (CWA Authority Project) | 5.000% | 10/1/21 | 380 | 446 |
| Indiana Finance Authority Wastewater Utility Revenue (CWA Authority Project) | 5.000% | 10/1/21 | 1,680 | 1,972 |
| Indiana Finance Authority Wastewater Utility Revenue (CWA Authority Project) | 5.000% | 10/1/22 | 1,000 | 1,199 |
| Indiana Health & Educational Facility Financing Authority Revenue | | | | |
| (Ascension Health Credit Group) PUT | 4.100% | 11/3/16 | 10,000 | 10,002 |
| 1 Indiana Health & Educational Facility Financing Authority Revenue | | | | |
| (Ascension Health Credit Group) PUT | 1.750% | 11/2/21 | 34,110 | 34,077 |
| Indiana Health Facility Financing Authority Revenue (Ascension Health Credit Group) PUT | 1.600% | 2/1/17 (Prere.) | 35 | 35 |
| Indiana Health Facility Financing Authority Revenue (Ascension Health Credit Group) PUT | 1.600% | 2/1/17 | 6,965 | 6,976 |
| Indiana Health Facility Financing Authority Revenue (Ascension Health Credit Group) PUT | 4.000% | 8/1/17 | 8,570 | 8,769 |
| Indiana Health Facility Financing Authority Revenue (Ascension Health Credit Group) PUT | 1.250% | 5/1/20 | 2,300 | 2,286 |
| Indiana Health Facility Financing Authority Revenue (Ascension Health Credit Group) PUT | 1.500% | 5/1/20 | 5,000 | 5,007 |
| Indiana Housing & Community Development Authority Revenue | | | | |
| (Edgewood Group Apartment Project) PUT | 1.150% | 3/1/18 | 5,425 | 5,428 |
| Indiana Municipal Power Agency Revenue | 5.000% | 1/1/18 | 1,500 | 1,571 |
| Indiana Transportation Finance Authority Revenue | 5.500% | 12/1/22 (14) | 16,640 | 20,513 |
| Indiana University Student Fee Revenue | 5.000% | 8/1/17 | 1,000 | 1,032 |
| Indiana University Student Fee Revenue | 5.000% | 6/1/18 | 1,000 | 1,065 |
| Indiana University Student Fee Revenue | 5.000% | 8/1/18 | 4,000 | 4,286 |
| Indiana University Student Fee Revenue | 5.000% | 6/1/19 | 1,500 | 1,653 |
| Indiana University Student Fee Revenue | 5.000% | 6/1/21 | 3,500 | 4,092 |
| Indiana University Student Fee Revenue | 5.000% | 6/1/22 | 3,000 | 3,594 |
| 2 Indianapolis IN Local Public Improvement Bond Bank Revenue TOB VRDO | 0.780% | 11/7/16 | 23,935 | 23,935 |
| Ivy IN Tech Community College Revenue | 5.000% | 7/1/19 | 850 | 936 |
| Ivy IN Tech Community College Revenue | 5.000% | 7/1/20 | 500 | 566 |
| Purdue University Indiana University COP | 5.000% | 7/1/21 | 2,290 | 2,680 |
| Purdue University Indiana University COP | 5.000% | 7/1/22 | 2,290 | 2,745 |
| Purdue University Indiana University Student Fee Revenue | 5.000% | 7/1/17 | 1,000 | 1,029 |
| Richmond IN Hospital Authority Revenue (Reid Hospital & Health Care Services Inc.) | 4.000% | 1/1/17 | 1,890 | 1,900 |
| Richmond IN Hospital Authority Revenue (Reid Hospital & Health Care Services Inc.) | 5.000% | 1/1/20 | 1,010 | 1,122 |
| Richmond IN Hospital Authority Revenue (Reid Hospital & Health Care Services Inc.) | 5.000% | 1/1/22 | 1,275 | 1,479 |
| Richmond IN Hospital Authority Revenue (Reid Hospital & Health Care Services Inc.) | 5.000% | 1/1/23 | 850 | 1,002 |
| Rockport IN Pollution Control Revenue (Indiana Michigan Power Co. Project) PUT | 1.750% | 6/1/18 | 5,500 | 5,525 |
| Terre Haute IN Sanitation District Special Tax Revenue | 4.000% | 1/1/17 | 3,455 | 3,469 |
| Terre Haute IN Sanitation District Special Tax Revenue | 4.000% | 7/1/17 | 3,520 | 3,577 |
| Terre Haute IN Sanitation District Special Tax Revenue | 4.000% | 1/1/18 | 3,590 | 3,688 |
| Terre Haute IN Sanitation District Special Tax Revenue | 4.000% | 7/1/18 | 3,665 | 3,804 |
| Terre Haute IN Sanitation District Special Tax Revenue | 4.000% | 1/1/19 | 3,740 | 3,916 |
| Whiting IN Environmental Facilities Revenue (BP Products North America Inc. Project) | 5.000% | 7/1/17 | 5,000 | 5,125 |
| Whiting IN Environmental Facilities Revenue (BP Products North America Inc. Project) PUT | 1.850% | 10/1/19 | 30,000 | 30,165 |
| 2 Zionsville IN Community Schools Building Corp. Revenue TOB VRDO | 0.760% | 11/7/16 LOC | 5,350 | 5,350 |
| | | | | 308,815 |
| Iowa (0.3%) | | | | |
| Iowa Board of Regents Hospital Revenue (University of Iowa Hospitals & Clinics) | 4.000% | 9/1/19 | 5,675 | 6,141 |
| Iowa Finance Authority Healthcare Revenue (Genesis Health System) | 5.000% | 7/1/19 | 4,075 | 4,487 |
| Iowa Finance Authority Midwestern Disaster Area Revenue (Iowa Fertilizer Co. Project) | 5.000% | 12/1/19 | 26,290 | 27,009 |
| Iowa Finance Authority Midwestern Disaster Area Revenue (Iowa Fertilizer Co. Project) | 5.500% | 12/1/22 | 7,500 | 7,603 |
| Iowa Finance Authority Revenue | 5.000% | 8/1/21 | 9,400 | 11,043 |
| Iowa Finance Authority Revenue | 5.000% | 8/1/22 | 10,000 | 12,049 |
| Iowa Higher Education Loan Authority Revenue Private College Facility (Grinnell College Project) | 4.000% | 12/1/17 | 1,300 | 1,346 |
| Iowa Special Obligation Revenue | 5.000% | 6/15/21 | 1,820 | 2,124 |
| Iowa Special Obligation Revenue | 5.000% | 6/15/22 | 3,740 | 4,467 |
| Iowa Special Obligation Revenue | 5.000% | 6/15/23 | 4,820 | 5,865 |
| Xenia IA Rural Water District Revenue | 5.000% | 12/1/21 | 320 | 367 |
| Xenia IA Rural Water District Revenue | 5.000% | 12/1/22 | 335 | 389 |
| | | | | 82,890 |
| Kansas (0.6%) | | | | |
| Johnson County KS Unified School District No. 233 GO | 5.000% | 9/1/21 | 750 | 880 |
| Johnson County KS Unified School District No. 233 GO | 5.000% | 9/1/21 | 1,565 | 1,836 |
| Johnson County KS Unified School District No. 233 GO | 5.000% | 9/1/22 | 1,000 | 1,200 |
| Johnson County KS Unified School District No. 233 GO | 5.000% | 9/1/23 | 750 | 915 |
| 3 Kansas Department of Transportation Highway Revenue | 0.593% | 9/1/17 | 4,000 | 3,995 |
| 3 Kansas Department of Transportation Highway Revenue | 0.673% | 9/1/18 | 3,500 | 3,477 |
| 3 Kansas Department of Transportation Highway Revenue | 0.753% | 9/1/19 | 3,000 | 2,972 |
| Kansas Development Finance Authority Health Facilities Revenue | | | | |
| (Kansas University Health System) | 5.000% | 3/1/17 | 1,000 | 1,014 |
| Kansas Development Finance Authority Health Facilities Revenue | | | | |
| (Kansas University Health System) | 5.000% | 3/1/18 | 1,035 | 1,089 |
72
Limited-Term Tax-Exempt Fund
| | | | |
| | | | Face | Market |
| | | Maturity | Amount | Value• |
| | Coupon | Date | ($000) | ($000) |
| Kansas Development Finance Authority Health Facilities Revenue | | | | |
| (Kansas University Health System) | 5.000% | 3/1/19 | 1,150 | 1,250 |
| Kansas Development Finance Authority Revenue | 5.000% | 5/1/21 | 17,635 | 20,428 |
| Kansas Development Finance Authority Revenue | 5.000% | 4/1/22 | 3,765 | 4,424 |
| Kansas Development Finance Authority Revenue | 5.000% | 5/1/22 | 17,565 | 20,745 |
| Kansas Development Finance Authority Revenue | 5.000% | 5/1/24 | 16,250 | 19,712 |
| Kansas Development Finance Authority Revenue | | | | |
| (Sisters of Charity of Leavenworth Health System) | 5.000% | 1/1/17 (ETM) | 4,920 | 4,955 |
| Kansas Development Finance Authority Revenue | | | | |
| (Sisters of Charity of Leavenworth Health System) | 5.000% | 1/1/17 | 750 | 755 |
| Kansas Development Finance Authority Revenue (Wichita State University Projects) | 5.000% | 6/1/18 | 2,420 | 2,570 |
| Wichita KS GO | 1.250% | 10/13/17 | 39,290 | 39,322 |
| Wichita KS Hospital Facilities Revenue (Via Christi Health System Inc.) | 5.000% | 11/15/17 (ETM) | 1,130 | 1,179 |
| Wichita KS Hospital Facilities Revenue (Via Christi Health System Inc.) | 5.000% | 11/15/18 (ETM) | 2,250 | 2,436 |
| Wichita KS Water & Sewer Utility Revenue | 5.000% | 10/1/22 | 1,040 | 1,248 |
| Wyandotte County/Kansas City KS Unified Government Utility System Revenue | 5.000% | 9/1/19 | 500 | 553 |
| Wyandotte County/Kansas City KS Unified Government Utility System Revenue | 5.000% | 9/1/20 | 1,565 | 1,780 |
| Wyandotte County/Kansas City KS Unified Government Utility System Revenue | 5.000% | 9/1/22 | 750 | 892 |
| | | | | 139,627 |
| Kentucky (0.9%) | | | | |
| Ashland KY Medical Center Revenue (King’s Daughters Medical Center Project) | 4.000% | 2/1/21 | 540 | 584 |
| Ashland KY Medical Center Revenue (King’s Daughters Medical Center Project) | 5.000% | 2/1/22 | 565 | 645 |
| Ashland KY Medical Center Revenue (King’s Daughters Medical Center Project) | 5.000% | 2/1/23 | 765 | 885 |
| Ashland KY Medical Center Revenue (King’s Daughters Medical Center Project) | 5.000% | 2/1/24 | 680 | 794 |
| Carroll County KY Pollution Control Revenue (Kentucky Utilities Co. Project) PUT | 1.050% | 9/1/19 | 6,875 | 6,800 |
| Kenton County KY Airport Revenue | 5.000% | 1/1/20 | 700 | 780 |
| Kenton County KY Airport Revenue | 5.000% | 1/1/21 | 700 | 800 |
| Kenton County KY Airport Revenue | 5.000% | 1/1/22 | 750 | 878 |
| Kenton County KY Airport Revenue | 5.000% | 1/1/23 | 500 | 594 |
| Kentucky Asset/Liability Commission Agency Fund Revenue (Federal Highway Trust) | 5.000% | 9/1/18 | 2,500 | 2,674 |
| Kentucky Bond Development Corp. Hospital Facilities Revenue (St. Elizabeth Medical Center, Inc.) | 5.000% | 5/1/21 | 1,000 | 1,160 |
| Kentucky Bond Development Corp. Hospital Facilities Revenue (St. Elizabeth Medical Center, Inc.) | 5.000% | 5/1/22 | 750 | 891 |
| 3 Kentucky Economic Development Finance Authority Revenue (Catholic Health Initiatives) PUT | 1.259% | 2/1/20 | 25,000 | 24,906 |
| Kentucky Economic Development Finance Authority Solid Waste Revenue | | | | |
| (Republic Services Inc. Project) PUT | 0.700% | 12/1/16 | 3,545 | 3,545 |
| Kentucky Municipal Power Agency Power System Revenue | 5.000% | 9/1/20 (14) | 6,000 | 6,734 |
| Kentucky Municipal Power Agency Power System Revenue | 5.000% | 9/1/21 (14) | 6,025 | 6,899 |
| Kentucky Municipal Power Agency Power System Revenue | 5.000% | 9/1/22 (14) | 2,500 | 2,907 |
| Kentucky Property & Building Commission Revenue | 5.000% | 11/1/16 | 5,340 | 5,340 |
| Kentucky Property & Building Commission Revenue | 5.000% | 8/1/21 | 15,840 | 18,313 |
| Kentucky Property & Building Commission Revenue | 5.000% | 8/1/22 | 4,510 | 5,316 |
| Kentucky Property & Building Commission Revenue | 5.000% | 8/1/22 | 15,060 | 17,751 |
| Kentucky Public Transportation Infrastructure Authority Toll Revenue | | | | |
| (Downtown Crossing Project) BAN | 5.000% | 7/1/17 | 27,800 | 28,529 |
| Kentucky Turnpike Authority Economic Development Road Revenue (Revitalization Project) | 5.000% | 7/1/18 | 2,500 | 2,667 |
| Louisville & Jefferson County KY Metropolitan Government Environmental Facilities Revenue | | | | |
| (Louisville Gas & Electric Co. Project) PUT | 1.150% | 6/1/17 | 5,000 | 5,003 |
| Louisville & Jefferson County KY Metropolitan Government Environmental Facilities Revenue | | | | |
| (Louisville Gas & Electric Co. Project) PUT | 1.600% | 6/1/17 | 9,500 | 9,531 |
| Louisville & Jefferson County KY Metropolitan Government Health System Revenue | | | | |
| (Norton Healthcare Obligated Group) | 5.000% | 10/1/20 | 600 | 681 |
| Louisville & Jefferson County KY Metropolitan Government Health System Revenue | | | | |
| (Norton Healthcare Obligated Group) | 3.000% | 10/1/21 | 1,000 | 1,067 |
| Louisville & Jefferson County KY Metropolitan Government Health System Revenue | | | | |
| (Norton Healthcare Obligated Group) | 5.000% | 10/1/22 | 1,750 | 2,074 |
| 1 Louisville & Jefferson County KY Metropolitan Sewer & Drain System BAN | 3.500% | 11/15/17 | 50,000 | 51,366 |
| Warren County KY Hospital Revenue | | | | |
| (Bowling Green-Warren County Community Hospital Corp. Project) | 5.000% | 4/1/18 | 1,100 | 1,160 |
| | | | | 211,274 |
| Louisiana (1.0%) | | | | |
| DeSoto Parish LA Pollution Control Revenue (Southwestern Electric Power Co. Project) | 1.600% | 1/1/19 | 13,500 | 13,522 |
| East Baton Rouge Parish LA Industrial Development Board Revenue (ExxonMobil Project) VRDO | 0.500% | 11/1/16 | 15,890 | 15,890 |
| 3 East Baton Rouge Parish LA Sewer Commission Revenue PUT | 0.870% | 8/1/18 | 24,005 | 23,889 |
| Ernest N. Morial - New Orleans LA Exhibition Hall Authority Special Tax Revenue | 4.000% | 7/15/18 | 1,040 | 1,090 |
| Ernest N. Morial - New Orleans LA Exhibition Hall Authority Special Tax Revenue | 5.000% | 7/15/19 | 1,190 | 1,309 |
| Lafayette LA Communications System Revenue | 5.000% | 11/1/20 (4) | 1,000 | 1,135 |
| Lafayette LA Communications System Revenue | 5.000% | 11/1/21 (4) | 1,000 | 1,156 |
| Lafayette LA Communications System Revenue | 5.000% | 11/1/22 (4) | 2,000 | 2,359 |
| Louisiana Citizens Property Insurance Corp. Assessment Revenue | 5.000% | 6/1/20 | 8,000 | 8,992 |
73
Limited-Term Tax-Exempt Fund
| | | | |
| | | | Face | Market |
| | | Maturity | Amount | Value• |
| | Coupon | Date | ($000) | ($000) |
| Louisiana Citizens Property Insurance Corp. Assessment Revenue | 5.000% | 6/1/21 (4) | 5,000 | 5,789 |
| Louisiana Citizens Property Insurance Corp. Assessment Revenue | 5.000% | 6/1/22 (4) | 4,000 | 4,737 |
| 3 Louisiana Gasoline & Fuel Tax Revenue PUT | 0.839% | 5/1/17 | 55,500 | 55,519 |
| 3 Louisiana Gasoline & Fuel Tax Revenue PUT | 0.840% | 5/1/18 | 12,500 | 12,463 |
| 3 Louisiana Gasoline & Fuel Tax Revenue PUT | 0.919% | 5/1/18 | 8,000 | 7,976 |
| Louisiana GO | 5.000% | 5/1/22 | 10,320 | 12,170 |
| Louisiana GO | 5.000% | 5/1/22 | 2,800 | 3,302 |
| Louisiana GO | 5.000% | 9/1/22 | 4,000 | 4,753 |
| Louisiana Highway Improvement Revenue | 5.000% | 6/15/18 | 1,325 | 1,411 |
| Louisiana Highway Improvement Revenue | 5.000% | 6/15/19 | 1,000 | 1,100 |
| Louisiana Highway Improvement Revenue | 5.000% | 6/15/20 | 1,325 | 1,500 |
| Louisiana Highway Improvement Revenue | 5.000% | 6/15/21 | 1,100 | 1,278 |
| Louisiana Housing Finance Agency Single Family Mortgage Revenue (Home Ownership Program) | 5.850% | 6/1/38 | 615 | 624 |
| Louisiana Offshore Terminal Authority Deep Water Port Revenue (LOOP LLC Project) PUT | 2.200% | 10/1/17 | 4,125 | 4,155 |
| Louisiana Public Facilities Authority Revenue (Ochsner Clinic Foundation Project) | 4.000% | 5/15/20 | 310 | 338 |
| Louisiana Public Facilities Authority Revenue (Ochsner Clinic Foundation Project) | 5.000% | 5/15/21 | 450 | 520 |
| Louisiana Public Facilities Authority Revenue (Ochsner Clinic Foundation Project) | 5.000% | 5/15/22 | 350 | 414 |
| Louisiana Stadium & Exposition District Revenue | 5.000% | 7/1/18 | 1,050 | 1,118 |
| Louisiana Stadium & Exposition District Revenue | 5.000% | 7/1/19 | 1,250 | 1,374 |
| Louisiana Stadium & Exposition District Revenue | 5.000% | 7/1/20 | 1,100 | 1,237 |
| New Orleans LA GO | 5.000% | 12/1/18 | 4,065 | 4,396 |
| New Orleans LA GO | 5.000% | 12/1/20 | 1,400 | 1,604 |
| New Orleans LA GO | 5.000% | 12/1/21 | 1,200 | 1,408 |
| New Orleans LA GO | 5.000% | 12/1/22 | 700 | 836 |
| New Orleans LA Sewage Service Revenue | 5.000% | 6/1/18 | 500 | 530 |
| New Orleans LA Sewage Service Revenue | 5.000% | 6/1/19 | 500 | 547 |
| New Orleans LA Sewage Service Revenue | 5.000% | 6/1/21 | 300 | 346 |
| New Orleans LA Sewage Service Revenue | 5.000% | 6/1/22 | 1,595 | 1,868 |
| New Orleans LA Sewage Service Revenue | 5.000% | 6/1/22 | 350 | 410 |
| New Orleans LA Sewage Service Revenue | 5.000% | 6/1/23 | 350 | 417 |
| New Orleans LA Water Revenue | 5.000% | 12/1/20 | 400 | 454 |
| New Orleans LA Water Revenue | 5.000% | 12/1/22 | 1,500 | 1,768 |
| St. Charles Parish LA Gulf Opportunity Zone Revenue (Valero Energy Corp.) PUT | 4.000% | 6/1/22 | 9,220 | 10,069 |
| Tobacco Settlement Financing Corp. Louisiana Revenue | 5.000% | 5/15/19 | 2,500 | 2,721 |
| Tobacco Settlement Financing Corp. Louisiana Revenue | 5.000% | 5/15/20 | 8,375 | 9,321 |
| Tobacco Settlement Financing Corp. Louisiana Revenue | 5.000% | 5/15/22 | 1,000 | 1,151 |
| | | | | 228,966 |
| Maine (0.1%) | | | | |
| Maine GO | 5.000% | 6/1/22 | 10,205 | 12,251 |
| Maine Health & Higher Educational Facilities Authority Revenue | 5.000% | 7/1/21 | 3,930 | 4,563 |
| Maine Health & Higher Educational Facilities Authority Revenue | 5.000% | 7/1/22 | 1,425 | 1,692 |
| Maine Health & Higher Educational Facilities Authority Revenue | 5.000% | 7/1/23 | 3,275 | 3,948 |
| | | | | 22,454 |
| Maryland (3.5%) | | | | |
| Anne Arundel County MD GO | 5.000% | 4/1/19 | 2,640 | 2,895 |
| Anne Arundel County MD GO | 5.000% | 4/1/19 | 6,960 | 7,631 |
| Anne Arundel County MD GO | 5.000% | 10/1/22 | 3,110 | 3,777 |
| Anne Arundel County MD GO | 5.000% | 10/1/22 | 1,455 | 1,767 |
| Anne Arundel County MD GO | 5.000% | 10/1/22 | 2,520 | 3,060 |
| Anne Arundel County MD GO | 5.000% | 10/1/22 | 4,690 | 5,695 |
| Anne Arundel County MD GO | 5.000% | 10/1/23 | 3,110 | 3,849 |
| Anne Arundel County MD GO | 5.000% | 10/1/23 | 1,455 | 1,801 |
| Anne Arundel County MD GO | 5.000% | 10/1/23 | 2,485 | 3,076 |
| Anne Arundel County MD GO | 5.000% | 10/1/23 | 3,880 | 4,802 |
| Baltimore County MD GO | 5.000% | 2/1/18 | 2,900 | 3,052 |
| Baltimore County MD GO | 5.000% | 2/1/18 | 9,000 | 9,470 |
| Baltimore County MD GO | 5.000% | 2/1/20 | 2,100 | 2,368 |
| Baltimore County MD GO | 5.000% | 10/15/21 | 10,400 | 12,257 |
| Baltimore County MD GO | 5.000% | 2/1/23 | 6,950 | 8,283 |
| Baltimore County MD GO | 5.000% | 8/1/23 | 3,700 | 4,561 |
| Baltimore County MD GO | 5.000% | 8/1/25 | 3,000 | 3,607 |
| Baltimore MD Consolidated Public Improvement GO | 5.000% | 10/15/17 | 500 | 520 |
| Baltimore MD Consolidated Public Improvement GO | 5.000% | 10/15/18 | 2,280 | 2,461 |
| Calvert County MD GO | 5.000% | 7/1/22 | 4,855 | 5,858 |
| Howard County MD GO | 5.000% | 2/15/17 | 3,450 | 3,494 |
| Howard County MD GO | 5.000% | 2/15/18 | 3,895 | 4,105 |
| Howard County MD GO | 5.000% | 2/15/19 | 3,830 | 4,184 |
| Howard County MD GO | 5.000% | 8/15/19 | 5,000 | 5,557 |
| Howard County MD GO | 5.000% | 2/15/20 | 4,475 | 5,053 |
74
Limited-Term Tax-Exempt Fund
| | | | |
| | | | Face | Market |
| | | Maturity | Amount | Value• |
| | Coupon | Date | ($000) | ($000) |
| Maryland Department of Transportation Revenue | 5.000% | 5/1/18 | 3,250 | 3,452 |
| Maryland Department of Transportation Revenue | 5.000% | 5/1/19 | 14,000 | 15,409 |
| 1 Maryland Department of Transportation Revenue | 4.000% | 9/1/20 | 18,475 | 20,511 |
| 1 Maryland Department of Transportation Revenue | 5.000% | 11/1/20 | 11,500 | 13,254 |
| Maryland Department of Transportation Revenue | 5.000% | 12/1/20 | 15,495 | 17,918 |
| 1 Maryland Department of Transportation Revenue | 5.000% | 11/1/21 | 12,375 | 14,663 |
| Maryland Department of Transportation Revenue | 5.000% | 12/15/21 | 7,920 | 9,424 |
| Maryland Department of Transportation Revenue | 5.000% | 2/15/22 | 38,965 | 46,511 |
| 1 Maryland Department of Transportation Revenue | 5.000% | 11/1/22 | 23,000 | 27,938 |
| Maryland Department of Transportation Revenue | 5.000% | 12/15/22 | 11,255 | 13,722 |
| Maryland Department of Transportation Revenue | 4.000% | 12/15/24 | 17,620 | 20,591 |
| Maryland Economic Development Corp. Revenue (Constellation Energy Group, Inc. Project) PUT | 2.550% | 6/1/20 | 8,900 | 9,007 |
| Maryland Economic Development Corp. Student Housing Revenue | | | | |
| (University of Maryland College Park) | 4.000% | 6/1/20 (4) | 620 | 681 |
| Maryland Economic Development Corp. Student Housing Revenue | | | | |
| (University of Maryland College Park) | 4.000% | 6/1/21 (4) | 700 | 784 |
| Maryland Economic Development Corp. Student Housing Revenue | | | | |
| (University of Maryland College Park) | 4.000% | 6/1/22 (4) | 1,200 | 1,367 |
| Maryland Economic Development Corp. Student Housing Revenue | | | | |
| (University of Maryland College Park) | 4.000% | 6/1/23 (4) | 1,350 | 1,560 |
| Maryland GO | 5.000% | 6/1/22 | 4,000 | 4,816 |
| Maryland GO | 5.000% | 8/1/17 | 8,495 | 8,769 |
| Maryland GO | 5.000% | 8/1/17 | 26,445 | 27,299 |
| Maryland GO | 5.000% | 8/1/17 | 5,070 | 5,234 |
| Maryland GO | 5.000% | 8/1/17 | 5,000 | 5,162 |
| Maryland GO | 5.000% | 8/15/17 (Prere.) | 2,795 | 2,889 |
| Maryland GO | 5.000% | 3/1/18 | 1,150 | 1,214 |
| Maryland GO | 5.250% | 3/1/18 | 2,400 | 2,541 |
| Maryland GO | 5.000% | 8/1/18 | 24,160 | 25,903 |
| Maryland GO | 5.000% | 8/1/18 | 28,795 | 30,873 |
| Maryland GO | 5.000% | 11/1/18 | 2,525 | 2,732 |
| 4 Maryland GO | 5.000% | 8/1/19 (Prere.) | 28,995 | 32,138 |
| Maryland GO | 5.000% | 11/1/19 | 4,265 | 4,774 |
| Maryland GO | 4.500% | 8/1/20 | 4,215 | 4,749 |
| Maryland GO | 5.000% | 3/1/21 (Prere.) | 3,745 | 4,353 |
| Maryland GO | 4.000% | 8/1/21 | 20,000 | 22,614 |
| Maryland GO | 5.000% | 8/1/21 | 30,000 | 35,349 |
| Maryland GO | 5.000% | 8/1/22 | 10,000 | 12,092 |
| Maryland GO | 5.000% | 8/1/22 | 4,430 | 5,357 |
| Maryland Health & Higher Educational Facilities Authority Revenue (Anne Arundel Health System) | 4.000% | 7/1/18 | 835 | 878 |
| Maryland Health & Higher Educational Facilities Authority Revenue (Anne Arundel Health System) | 4.000% | 7/1/19 | 850 | 916 |
| Maryland Health & Higher Educational Facilities Authority Revenue (Anne Arundel Health System) | 5.000% | 7/1/20 | 1,000 | 1,138 |
| 3 Maryland Health & Higher Educational Facilities Authority Revenue | | | | |
| (Johns Hopkins Health System Obligated Group) PUT | 1.183% | 11/15/17 | 5,895 | 5,891 |
| 3 Maryland Health & Higher Educational Facilities Authority Revenue | | | | |
| (Johns Hopkins Health System Obligated Group) PUT | 1.183% | 11/15/17 | 19,555 | 19,541 |
| 3 Maryland Health & Higher Educational Facilities Authority Revenue | | | | |
| (Johns Hopkins Health System Obligated Group) PUT | 0.933% | 5/15/18 | 4,900 | 4,890 |
| 3 Maryland Health & Higher Educational Facilities Authority Revenue | | | | |
| (Johns Hopkins Health System Obligated Group) PUT | 0.953% | 5/15/18 | 9,500 | 9,484 |
| Maryland Health & Higher Educational Facilities Authority Revenue (Loyola University) | 5.000% | 10/1/18 | 1,095 | 1,178 |
| Maryland Health & Higher Educational Facilities Authority Revenue (MedStar Health) | 5.000% | 8/15/17 | 1,500 | 1,549 |
| Maryland Health & Higher Educational Facilities Authority Revenue (MedStar Health) | 5.000% | 8/15/18 | 1,400 | 1,498 |
| Maryland Health & Higher Educational Facilities Authority Revenue (MedStar Health) | 5.000% | 8/15/19 | 1,400 | 1,549 |
| Maryland Health & Higher Educational Facilities Authority Revenue (MedStar Health) | 5.000% | 8/15/20 | 2,170 | 2,474 |
| Maryland Health & Higher Educational Facilities Authority Revenue (MedStar Health) | 5.000% | 8/15/21 | 1,785 | 2,090 |
| Maryland Health & Higher Educational Facilities Authority Revenue (MedStar Health) | 5.000% | 8/15/22 | 4,600 | 5,520 |
| Maryland Health & Higher Educational Facilities Authority Revenue (Meritus Medical Center, Inc.) | 4.000% | 7/1/20 | 1,000 | 1,094 |
| Maryland Health & Higher Educational Facilities Authority Revenue (Meritus Medical Center, Inc.) | 5.000% | 7/1/21 | 650 | 752 |
| Maryland Health & Higher Educational Facilities Authority Revenue (Meritus Medical Center, Inc.) | 5.000% | 7/1/22 | 500 | 588 |
| Maryland Health & Higher Educational Facilities Authority Revenue (Meritus Medical Center, Inc.) | 5.000% | 7/1/23 | 1,220 | 1,451 |
| Maryland Health & Higher Educational Facilities Authority Revenue | | | | |
| (Peninsula Regional Medical Center) | 5.000% | 7/1/21 | 2,220 | 2,597 |
| Maryland Health & Higher Educational Facilities Authority Revenue | | | | |
| (Western Maryland Health System) | 5.000% | 7/1/19 | 2,500 | 2,735 |
| Maryland Health & Higher Educational Facilities Authority Revenue | | | | |
| (Western Maryland Health System) | 5.000% | 7/1/20 | 3,150 | 3,543 |
| Maryland Health & Higher Educational Facilities Authority Revenue | | | | |
| (Western Maryland Health System) | 5.000% | 7/1/21 | 7,045 | 8,111 |
75
Limited-Term Tax-Exempt Fund
| | | | |
| | | | Face | Market |
| | | Maturity | Amount | Value• |
| | Coupon | Date | ($000) | ($000) |
| Maryland Health & Higher Educational Facilities Authority Revenue | | | | |
| (Western Maryland Health System) | 5.000% | 7/1/22 | 5,000 | 5,877 |
| Maryland Water Quality Financing Administration Bay Restoration Revolving Loan Fund Revenue | 5.000% | 3/1/22 | 12,350 | 14,717 |
| Montgomery County MD GO | 5.000% | 11/1/16 | 4,730 | 4,730 |
| Montgomery County MD GO | 5.000% | 8/1/17 | 12,100 | 12,491 |
| Montgomery County MD GO | 5.000% | 11/1/17 | 4,800 | 5,005 |
| Montgomery County MD GO | 5.000% | 7/1/18 | 32,050 | 34,257 |
| Montgomery County MD GO | 5.000% | 7/1/18 | 3,400 | 3,634 |
| Montgomery County MD GO | 5.000% | 8/1/18 | 2,000 | 2,144 |
| Montgomery County MD GO | 5.000% | 11/1/19 | 2,840 | 3,179 |
| Montgomery County MD GO | 5.000% | 11/1/21 | 22,680 | 26,895 |
| Montgomery County MD GO | 5.000% | 12/1/21 | 10,000 | 11,887 |
| Montgomery County MD GO | 5.000% | 12/1/22 | 8,650 | 10,536 |
| Washington MD Suburban Sanitary Commission GO | 4.000% | 6/1/21 | 14,705 | 16,592 |
| Washington MD Suburban Sanitary Commission GO | 4.000% | 6/1/22 | 15,290 | 17,587 |
| Washington Suburban Sanitation District Maryland GO | 5.000% | 6/1/17 | 4,000 | 4,101 |
| Washington Suburban Sanitation District Maryland GO | 5.000% | 6/1/18 | 2,735 | 2,914 |
| Washington Suburban Sanitation District Maryland GO | 5.000% | 6/1/20 | 5,000 | 5,698 |
| Washington Suburban Sanitation District Maryland GO | 5.000% | 6/1/21 | 4,695 | 5,507 |
| Westminster MD Educational Facilities Revenue (McDaniel College Inc.) | 5.000% | 11/1/21 | 1,840 | 2,111 |
| Westminster MD Educational Facilities Revenue (McDaniel College Inc.) | 5.000% | 11/1/22 | 1,950 | 2,274 |
| Westminster MD Educational Facilities Revenue (McDaniel College Inc.) | 5.000% | 11/1/23 | 2,060 | 2,430 |
| Westminster MD Revenue (Lutheran Village at Miller’s Grant) | 3.875% | 7/1/19 | 1,060 | 1,078 |
| Westminster MD Revenue (Lutheran Village at Miller’s Grant) | 4.375% | 7/1/21 | 5,675 | 5,840 |
| | | | | 849,784 |
| Massachusetts (4.8%) | | | | |
| Boston MA GO | 5.000% | 4/1/17 | 5,000 | 5,091 |
| Massachusetts Bay Transportation Authority Assessment Revenue | 5.000% | 7/1/18 | 1,250 | 1,337 |
| Massachusetts Bay Transportation Authority Sales Tax Revenue | 5.000% | 7/1/18 (Prere.) | 10,000 | 10,684 |
| Massachusetts Bay Transportation Authority Sales Tax Revenue | 5.250% | 7/1/18 (Prere.) | 5,215 | 5,594 |
| Massachusetts Bay Transportation Authority Sales Tax Revenue PUT | 0.930% | 5/30/17 | 29,190 | 29,190 |
| 2 Massachusetts Bay Transportation Authority Sales Tax Revenue TOB VRDO | 0.730% | 11/7/16 | 19,854 | 19,854 |
| Massachusetts College Building Authority Revenue | 5.000% | 5/1/20 | 3,000 | 3,401 |
| Massachusetts College Building Authority Revenue | 5.000% | 5/1/21 | 5,495 | 6,402 |
| Massachusetts Department of Transportation Metropolitan Highway System Revenue | 5.000% | 1/1/23 | 7,000 | 7,845 |
| Massachusetts Development Finance Agency Revenue (Berkshire Health System) | 5.000% | 10/1/18 | 1,245 | 1,334 |
| Massachusetts Development Finance Agency Revenue (Berkshire Health System) | 5.000% | 10/1/19 | 1,215 | 1,340 |
| Massachusetts Development Finance Agency Revenue (Boston Medical Center) | 5.000% | 7/1/17 (ETM) | 1,025 | 1,054 |
| Massachusetts Development Finance Agency Revenue (Boston Medical Center) | 5.000% | 7/1/17 | 1,035 | 1,062 |
| Massachusetts Development Finance Agency Revenue (Boston Medical Center) | 5.000% | 7/1/18 (ETM) | 435 | 465 |
| Massachusetts Development Finance Agency Revenue (Boston Medical Center) | 5.000% | 7/1/18 | 440 | 467 |
| Massachusetts Development Finance Agency Revenue (Boston Medical Center) | 5.000% | 7/1/21 | 750 | 858 |
| Massachusetts Development Finance Agency Revenue (Boston Medical Center) | 5.000% | 7/1/22 | 850 | 992 |
| 2 Massachusetts Development Finance Agency Revenue (Boston University) TOB VRDO | 0.750% | 11/7/16 LOC | 11,630 | 11,630 |
| Massachusetts Development Finance Agency Revenue (CareGroup Inc.) | 5.000% | 7/1/20 | 5,000 | 5,660 |
| Massachusetts Development Finance Agency Revenue (CareGroup Inc.) | 5.000% | 7/1/21 | 3,270 | 3,800 |
| Massachusetts Development Finance Agency Revenue (CareGroup Inc.) | 5.000% | 7/1/21 | 5,000 | 5,810 |
| Massachusetts Development Finance Agency Revenue (CareGroup Inc.) | 5.000% | 7/1/22 | 3,385 | 4,017 |
| Massachusetts Development Finance Agency Revenue (CareGroup Inc.) | 5.000% | 7/1/22 | 1,655 | 1,964 |
| Massachusetts Development Finance Agency Revenue (CareGroup Inc.) | 5.000% | 7/1/23 | 6,000 | 7,224 |
| Massachusetts Development Finance Agency Revenue (CareGroup Inc.) | 5.000% | 7/1/23 | 2,605 | 3,136 |
| Massachusetts Development Finance Agency Revenue (Emerson College) | 5.000% | 1/1/19 | 1,540 | 1,661 |
| Massachusetts Development Finance Agency Revenue (Emerson College) | 5.000% | 1/1/20 | 1,030 | 1,141 |
| Massachusetts Development Finance Agency Revenue (Emerson College) | 5.000% | 1/1/21 | 1,180 | 1,337 |
| Massachusetts Development Finance Agency Revenue (Emerson College) | 5.000% | 1/1/22 | 1,265 | 1,461 |
| Massachusetts Development Finance Agency Revenue (Emerson College) | 5.000% | 1/1/23 | 1,835 | 2,156 |
| Massachusetts Development Finance Agency Revenue (Harvard University) | 5.000% | 7/15/22 | 6,090 | 7,363 |
| Massachusetts Development Finance Agency Revenue (Harvard University) | 5.000% | 7/15/23 | 6,555 | 8,087 |
| Massachusetts Development Finance Agency Revenue (Partners Healthcare) | 5.000% | 7/1/20 | 800 | 912 |
| 3 Massachusetts Development Finance Agency Revenue (Partners Healthcare) PUT | 1.180% | 1/30/18 | 8,790 | 8,790 |
| 3 Massachusetts Development Finance Agency Revenue (Partners Healthcare) PUT | 1.110% | 1/29/20 | 5,500 | 5,397 |
| Massachusetts Development Finance Agency Revenue (Seven Hills Foundation Obligated Group) | 5.000% | 9/1/17 | 1,000 | 1,025 |
| Massachusetts Development Finance Agency Revenue (Seven Hills Foundation Obligated Group) | 5.000% | 9/1/18 | 1,025 | 1,067 |
| Massachusetts Development Finance Agency Revenue (Seven Hills Foundation Obligated Group) | 5.000% | 9/1/19 | 1,080 | 1,146 |
| Massachusetts Development Finance Agency Revenue (Seven Hills Foundation Obligated Group) | 5.000% | 9/1/20 | 1,105 | 1,191 |
| Massachusetts Development Finance Agency Revenue (Seven Hills Foundation Obligated Group) | 5.000% | 9/1/21 | 1,095 | 1,195 |
| Massachusetts Development Finance Agency Revenue (Seven Hills Foundation Obligated Group) | 5.000% | 9/1/22 | 1,165 | 1,284 |
| Massachusetts Development Finance Agency Revenue (South Shore Hospital Inc.) | 5.000% | 7/1/21 | 500 | 577 |
| Massachusetts Development Finance Agency Revenue (South Shore Hospital Inc.) | 5.000% | 7/1/22 | 600 | 706 |
76
Limited-Term Tax-Exempt Fund
| | | | |
| | | | Face | Market |
| | | Maturity | Amount | Value• |
| | Coupon | Date | ($000) | ($000) |
| Massachusetts Development Finance Agency Revenue (UMass Memorial Medical Center) | 5.000% | 7/1/17 | 2,265 | 2,323 |
| Massachusetts Development Finance Agency Revenue (UMass Memorial Medical Center) | 5.000% | 7/1/19 | 2,000 | 2,181 |
| Massachusetts Development Finance Agency Revenue (UMass Memorial Medical Center) | 5.000% | 7/1/21 | 3,200 | 3,647 |
| Massachusetts Development Finance Agency Revenue (UMass Memorial Medical Center) | 5.000% | 7/1/21 | 1,440 | 1,641 |
| Massachusetts Development Finance Agency Revenue (UMass Memorial Medical Center) | 5.000% | 7/1/22 | 750 | 869 |
| 3 Massachusetts Development Finance Agency Revenue (Williams College) PUT | 0.910% | 7/1/17 | 14,860 | 14,842 |
| Massachusetts Educational Financing Authority Education Loan Revenue | 5.500% | 1/1/22 | 1,000 | 1,111 |
| Massachusetts Federal Highway GAN (Accelerated Bridge Program) | 5.000% | 6/15/20 | 5,000 | 5,701 |
| 3 Massachusetts GO | 0.970% | 1/1/17 | 11,750 | 11,750 |
| 3 Massachusetts GO | 0.750% | 2/1/17 | 59,460 | 59,460 |
| 3 Massachusetts GO | 0.990% | 2/1/17 | 7,500 | 7,500 |
| Massachusetts GO | 2.000% | 4/24/17 | 31,805 | 32,002 |
| Massachusetts GO | 2.000% | 5/22/17 | 83,000 | 83,569 |
| Massachusetts GO | 2.000% | 6/26/17 | 40,000 | 40,358 |
| Massachusetts GO | 5.000% | 10/1/17 | 27,000 | 28,054 |
| Massachusetts GO | 5.500% | 11/1/17 | 2,100 | 2,199 |
| Massachusetts GO | 5.500% | 12/1/17 (14) | 3,255 | 3,421 |
| 3 Massachusetts GO | 1.060% | 1/1/18 | 10,000 | 10,004 |
| 4 Massachusetts GO | 5.000% | 8/1/18 (Prere.) | 4,500 | 4,821 |
| 4 Massachusetts GO | 5.000% | 8/1/18 (Prere.) | 4,535 | 4,853 |
| Massachusetts GO | 5.250% | 8/1/18 (4) | 5,060 | 5,444 |
| Massachusetts GO | 5.500% | 8/1/18 (14) | 2,000 | 2,160 |
| Massachusetts GO | 5.000% | 10/1/18 | 30,000 | 32,335 |
| Massachusetts GO | 5.500% | 10/1/18 | 4,955 | 5,388 |
| Massachusetts GO | 5.500% | 10/1/18 (4) | 10,200 | 11,090 |
| Massachusetts GO | 5.000% | 12/1/18 | 30,000 | 32,521 |
| Massachusetts GO | 5.500% | 12/1/19 (14) | 9,160 | 10,400 |
| Massachusetts GO | 5.000% | 4/1/20 | 45,000 | 50,917 |
| Massachusetts GO | 5.000% | 6/1/20 (Prere.) | 10,000 | 11,364 |
| Massachusetts GO | 5.000% | 8/1/20 | 33,155 | 37,905 |
| Massachusetts GO | 5.000% | 8/1/21 | 40,500 | 47,560 |
| Massachusetts GO | 5.000% | 10/1/21 (Prere.) | 7,860 | 9,280 |
| Massachusetts GO | 5.000% | 7/1/22 | 3,235 | 3,883 |
| Massachusetts GO | 5.000% | 11/1/23 | 10,000 | 12,094 |
| Massachusetts GO | 5.000% | 8/1/24 | 7,500 | 8,810 |
| Massachusetts GO | 5.000% | 11/1/24 | 3,500 | 4,225 |
| Massachusetts GO | 5.000% | 7/1/25 | 14,955 | 17,833 |
| Massachusetts GO | 5.000% | 7/1/26 | 7,020 | 8,358 |
| 3 Massachusetts GO PUT | 0.930% | 8/1/17 | 20,000 | 19,991 |
| Massachusetts GO PUT | 1.050% | 7/1/20 | 16,500 | 16,323 |
| Massachusetts Health & Educational Facilities Authority Revenue (Amherst College) PUT | 1.700% | 11/1/16 | 5,660 | 5,660 |
| Massachusetts Health & Educational Facilities Authority Revenue (Amherst College) PUT | 0.800% | 12/1/17 | 2,000 | 1,996 |
| Massachusetts Health & Educational Facilities Authority Revenue (Lahey Clinic Medical Center) | 5.250% | 8/15/17 (Prere.) | 6,650 | 6,889 |
| Massachusetts Health & Educational Facilities Authority Revenue | | | | |
| (Milford Regional Medical Center) | 5.000% | 7/15/22 | 500 | 513 |
| 4 Massachusetts Health & Educational Facilities Authority Revenue (MIT) | 5.000% | 7/1/17 (Prere.) | 3,500 | 3,601 |
| 4 Massachusetts Health & Educational Facilities Authority Revenue (MIT) | 5.500% | 7/1/18 (Prere.) | 3,875 | 4,168 |
| Massachusetts Health & Educational Facilities Authority Revenue (Museum of Fine Arts) VRDO | 0.500% | 11/1/16 | 23,410 | 23,410 |
| Massachusetts Health & Educational Facilities Authority Revenue (Northeastern University) | 5.000% | 10/1/17 | 5,000 | 5,187 |
| Massachusetts Health & Educational Facilities Authority Revenue (Partners Healthcare System) | 5.000% | 7/1/22 | 5,000 | 5,494 |
| Massachusetts Health & Educational Facilities Authority Revenue | | | | |
| (UMass Memorial Medical Center) | 5.000% | 7/1/20 | 960 | 1,072 |
| Massachusetts Health & Educational Facilities Authority Revenue | | | | |
| (UMass Memorial Medical Center) | 5.000% | 7/1/21 | 1,415 | 1,579 |
| Massachusetts Housing Finance Agency Single Family Housing Revenue | 3.500% | 6/1/42 | 8,465 | 8,969 |
| Massachusetts Housing Finance Agency Single Family Housing Revenue | 4.000% | 12/1/44 | 5,000 | 5,387 |
| Massachusetts Housing Finance Agency Single Family Housing Revenue | 4.000% | 6/1/45 | 4,855 | 5,156 |
| Massachusetts Municipal Wholesale Electric Co. Power System Revenue | 5.000% | 7/1/17 | 9,560 | 9,826 |
| Massachusetts Port Authority Revenue | 5.000% | 7/1/17 (4) | 6,600 | 6,789 |
| Massachusetts School Building Authority Dedicated Sales Tax Revenue | 5.000% | 8/15/17 (Prere.) | 4,715 | 4,875 |
| Massachusetts School Building Authority Dedicated Sales Tax Revenue | 5.000% | 5/15/19 | 2,250 | 2,477 |
| Massachusetts School Building Authority Dedicated Sales Tax Revenue | 5.000% | 8/15/19 | 15,000 | 16,652 |
| Massachusetts Transportation Fund Revenue (Accelerated Bridge Program) | 5.000% | 6/1/19 | 11,460 | 12,649 |
| Massachusetts Transportation Fund Revenue (Accelerated Bridge Program) | 5.000% | 6/1/21 | 5,000 | 5,852 |
| Massachusetts Transportation Fund Revenue (Accelerated Bridge Program) | 5.000% | 6/1/22 | 3,850 | 4,495 |
| Massachusetts Turnpike Authority Revenue (Metropolitan Highway System) | 0.000% | 1/1/18 (14) | 10,000 | 9,863 |
| Massachusetts Turnpike Authority Revenue (Metropolitan Highway System) | 0.000% | 1/1/20 (14) | 17,000 | 16,255 |
| Massachusetts Water Pollution Abatement Trust Revenue | 5.000% | 8/1/17 | 1,500 | 1,548 |
| Massachusetts Water Pollution Abatement Trust Revenue | 5.000% | 8/1/18 | 3,000 | 3,216 |
| Massachusetts Water Pollution Abatement Trust Revenue | 5.250% | 8/1/18 | 1,000 | 1,077 |
77
]
Limited-Term Tax-Exempt Fund
| | | | | |
| | | | | Face | Market |
| | | | Maturity | Amount | Value• |
| | | Coupon | Date | ($000) | ($000) |
| | Massachusetts Water Pollution Abatement Trust Revenue | 5.250% | 8/1/18 | 2,065 | 2,223 |
| | Massachusetts Water Pollution Abatement Trust Revenue | 5.000% | 8/1/19 | 4,500 | 4,995 |
| | Massachusetts Water Pollution Abatement Trust Revenue | 5.000% | 8/1/20 | 16,000 | 18,327 |
| | Massachusetts Water Pollution Abatement Trust Revenue | 5.000% | 8/1/21 | 4,580 | 5,401 |
| | Massachusetts Water Pollution Abatement Trust Revenue | 5.000% | 8/1/21 | 7,520 | 8,321 |
| | Massachusetts Water Pollution Abatement Trust Revenue | 5.000% | 8/1/21 | 6,000 | 6,871 |
| | Massachusetts Water Pollution Abatement Trust Revenue | 5.000% | 8/1/22 | 4,290 | 4,745 |
| | Massachusetts Water Pollution Abatement Trust Revenue | 5.000% | 8/1/23 | 5,000 | 5,526 |
| | Massachusetts Water Resources Authority Revenue | 5.000% | 8/1/19 (Prere.) | 930 | 1,031 |
| | Massachusetts Water Resources Authority Revenue | 5.000% | 8/1/19 (Prere.) | 3,210 | 3,560 |
| | Massachusetts Water Resources Authority Revenue | 5.000% | 8/1/20 | 1,370 | 1,521 |
| | Massachusetts Water Resources Authority Revenue | 5.000% | 8/1/21 | 3,900 | 4,582 |
| | Massachusetts Water Resources Authority Revenue | 5.000% | 8/1/23 | 6,000 | 7,039 |
| 2,3 | Massachusetts Water Resources Authority Revenue TOB PUT | 0.830% | 1/3/17 LOC | 4,750 | 4,750 |
| 2 | Massachusetts Water Resources Authority Revenue TOB VRDO | 0.750% | 11/7/16 LOC | 27,070 | 27,070 |
| | University of Massachusetts Building Authority Revenue | 5.000% | 11/1/16 | 7,555 | 7,555 |
| | University of Massachusetts Building Authority Revenue | 5.000% | 11/1/20 | 1,250 | 1,436 |
| | University of Massachusetts Building Authority Revenue PUT | 0.930% | 5/30/17 | 9,390 | 9,390 |
| | | | | | 1,153,892 |
| Michigan (2.7%) | | | | |
| | Chippewa Valley MI Schools GO | 5.000% | 5/1/19 | 1,025 | 1,123 |
| | Chippewa Valley MI Schools GO | 5.000% | 5/1/22 | 450 | 531 |
| | Chippewa Valley MI Schools GO | 5.000% | 5/1/23 | 575 | 690 |
| | Coopersville MI Area Public Schools GO | 5.000% | 5/1/20 | 1,235 | 1,392 |
| | Coopersville MI Area Public Schools GO | 5.000% | 5/1/21 | 2,325 | 2,687 |
| | Coopersville MI Area Public Schools GO | 5.000% | 5/1/22 | 1,900 | 2,242 |
| | Detroit MI Water Supply System Revenue | 5.000% | 11/14/16 (Prere.) | 5,845 | 5,854 |
| | Detroit MI Water Supply System Revenue | 5.000% | 7/1/20 | 1,755 | 1,962 |
| | East Lansing MI School District GO | 5.000% | 5/1/20 | 600 | 676 |
| | East Lansing MI School District GO | 5.000% | 5/1/22 | 2,095 | 2,472 |
| | Forest Hills MI Public Schools GO | 5.000% | 5/1/22 | 4,645 | 5,480 |
| | Forest Hills MI Public Schools GO | 5.000% | 5/1/23 | 4,405 | 5,286 |
| 2 | Great Lakes MI Water Authority Sewer Disposal System Revenue TOB VRDO | 0.830% | 11/7/16 (4) | 6,235 | 6,235 |
| | Great Lakes MI Water Authority Water Supply System Revenue | 5.000% | 7/1/22 | 1,840 | 2,154 |
| | Great Lakes MI Water Authority Water Supply System Revenue | 5.000% | 7/1/23 | 4,755 | 5,661 |
| | Kalamazoo MI Hospital Financing Authority Hospital Revenue (Bronson Healthcare Group) | 5.000% | 5/15/21 | 500 | 575 |
| | Kalamazoo MI Hospital Financing Authority Hospital Revenue (Bronson Healthcare Group) | 5.000% | 5/15/22 | 500 | 587 |
| | Kalamazoo MI Hospital Financing Authority Hospital Revenue (Bronson Healthcare Group) | 5.000% | 5/15/23 | 500 | 597 |
| | Kalamazoo MI Hospital Financing Authority Hospital Revenue (Bronson Healthcare Group) | 5.000% | 5/15/24 | 550 | 667 |
| | Kent Hospital Finance Authority Michigan Revenue (Spectrum Health System) PUT | 5.000% | 11/15/16 | 1,050 | 1,052 |
| | Kent Hospital Finance Authority Michigan Revenue (Spectrum Health System) PUT | 5.000% | 11/15/17 | 1,500 | 1,562 |
| | Kentwood MI Economic Development Corp. Revenue (Holland Home Obligated Group) | 4.000% | 11/15/24 | 3,120 | 3,368 |
| | L’Anse Creuse MI Public Schools GO | 5.000% | 5/1/18 | 720 | 763 |
| | L’Anse Creuse MI Public Schools GO | 5.000% | 5/1/19 | 1,030 | 1,128 |
| | L’Anse Creuse MI Public Schools GO | 5.000% | 5/1/20 | 1,670 | 1,882 |
| | L’Anse Creuse MI Public Schools GO | 5.000% | 5/1/21 | 250 | 289 |
| | Lincoln MI Consolidated School District GO | 5.000% | 5/1/21 (4) | 1,000 | 1,148 |
| | Lincoln MI Consolidated School District GO | 5.000% | 5/1/23 (4) | 1,310 | 1,563 |
| | Livonia MI Public Schools School District GO | 5.000% | 5/1/19 (15) | 1,000 | 1,095 |
| | Livonia MI Public Schools School District GO | 5.000% | 5/1/20 (15) | 3,365 | 3,793 |
| | Livonia MI Public Schools School District GO | 5.000% | 5/1/21 (15) | 2,000 | 2,311 |
| | Marquette MI Board of Light & Power Electric Utility System Revenue | 5.000% | 7/1/21 | 700 | 812 |
| | Marquette MI Board of Light & Power Electric Utility System Revenue | 5.000% | 7/1/22 | 900 | 1,068 |
| | Marquette MI Board of Light & Power Electric Utility System Revenue | 5.000% | 7/1/23 | 900 | 1,089 |
| | Michigan Building Authority Revenue | 5.000% | 10/15/17 | 1,250 | 1,300 |
| | Michigan Building Authority Revenue | 5.000% | 4/15/20 | 7,000 | 7,902 |
| | Michigan Building Authority Revenue | 5.000% | 10/15/20 | 2,250 | 2,577 |
| | Michigan Building Authority Revenue | 5.000% | 10/15/21 | 1,750 | 2,052 |
| | Michigan Building Authority Revenue | 5.000% | 4/15/22 | 4,350 | 5,149 |
| | Michigan Building Authority Revenue | 5.000% | 4/15/22 | 1,000 | 1,184 |
| | Michigan Building Authority Revenue | 5.000% | 4/15/23 | 1,350 | 1,627 |
| | Michigan Finance Authority Revenue | 5.000% | 10/1/19 | 850 | 936 |
| | Michigan Finance Authority Revenue | 5.000% | 4/1/20 | 3,800 | 4,218 |
| | Michigan Finance Authority Revenue | 5.000% | 10/1/20 | 1,200 | 1,320 |
| | Michigan Finance Authority Revenue | 5.000% | 4/1/21 | 4,350 | 4,935 |
| | Michigan Finance Authority Revenue | 5.000% | 4/15/21 | 6,240 | 7,224 |
| | Michigan Finance Authority Revenue | 5.000% | 10/1/21 | 1,275 | 1,440 |
| | Michigan Finance Authority Revenue | 5.000% | 4/1/22 | 7,185 | 8,299 |
| | Michigan Finance Authority Revenue | 5.000% | 10/1/22 | 525 | 605 |
78
Limited-Term Tax-Exempt Fund
| | | | |
| | | | Face | Market |
| | | Maturity | Amount | Value• |
| | Coupon | Date | ($000) | ($000) |
| Michigan Finance Authority Revenue | 5.000% | 4/1/23 | 5,500 | 6,449 |
| Michigan Finance Authority Revenue (Beaumont Health Obligated Group) | 4.000% | 8/1/17 | 1,000 | 1,022 |
| Michigan Finance Authority Revenue (Beaumont Health Obligated Group) | 4.000% | 8/1/20 | 1,250 | 1,368 |
| Michigan Finance Authority Revenue (Beaumont Health Obligated Group) | 5.000% | 8/1/21 | 3,500 | 4,059 |
| Michigan Finance Authority Revenue (Beaumont Health Obligated Group) | 5.000% | 8/1/22 | 2,500 | 2,967 |
| 2 Michigan Finance Authority Revenue (Beaumont Health Obligated Group) TOB VRDO | 0.830% | 11/7/16 | 6,060 | 6,060 |
| Michigan Finance Authority Revenue (Detroit Water & Sewer) | 3.000% | 7/1/17 | 200 | 203 |
| Michigan Finance Authority Revenue (Detroit Water & Sewer) | 3.000% | 7/1/17 | 500 | 506 |
| Michigan Finance Authority Revenue (Detroit Water & Sewer) | 5.000% | 7/1/17 | 1,100 | 1,127 |
| Michigan Finance Authority Revenue (Detroit Water & Sewer) | 5.000% | 7/1/17 (14) | 5,000 | 5,134 |
| Michigan Finance Authority Revenue (Detroit Water & Sewer) | 5.000% | 7/1/17 | 5,000 | 5,130 |
| Michigan Finance Authority Revenue (Detroit Water & Sewer) | 5.000% | 7/1/17 | 500 | 512 |
| Michigan Finance Authority Revenue (Detroit Water & Sewer) | 5.000% | 7/1/18 | 1,150 | 1,216 |
| Michigan Finance Authority Revenue (Detroit Water & Sewer) | 5.000% | 7/1/18 | 1,250 | 1,322 |
| Michigan Finance Authority Revenue (Detroit Water & Sewer) | 5.000% | 7/1/18 (14) | 6,000 | 6,372 |
| Michigan Finance Authority Revenue (Detroit Water & Sewer) | 5.000% | 7/1/18 (14) | 5,500 | 5,841 |
| Michigan Finance Authority Revenue (Detroit Water & Sewer) | 5.000% | 7/1/19 (14) | 2,000 | 2,189 |
| Michigan Finance Authority Revenue (Detroit Water & Sewer) | 5.000% | 7/1/19 (14) | 2,855 | 3,125 |
| Michigan Finance Authority Revenue (Detroit Water & Sewer) | 5.000% | 7/1/19 (14) | 3,500 | 3,831 |
| Michigan Finance Authority Revenue (Detroit Water & Sewer) | 5.000% | 7/1/19 (14) | 1,310 | 1,434 |
| Michigan Finance Authority Revenue (Detroit Water & Sewer) | 5.000% | 7/1/20 (14) | 8,000 | 8,986 |
| Michigan Finance Authority Revenue (Detroit Water & Sewer) | 5.000% | 7/1/20 (4) | 8,500 | 9,570 |
| Michigan Finance Authority Revenue (Detroit Water & Sewer) | 5.000% | 7/1/20 (14) | 2,310 | 2,595 |
| Michigan Finance Authority Revenue (Detroit Water & Sewer) | 5.000% | 7/1/20 (14) | 3,000 | 3,370 |
| Michigan Finance Authority Revenue (Detroit Water & Sewer) | 5.000% | 7/1/21 | 1,000 | 1,142 |
| Michigan Finance Authority Revenue (Detroit Water & Sewer) | 5.000% | 7/1/21 (4) | 16,260 | 18,744 |
| Michigan Finance Authority Revenue (Detroit Water & Sewer) | 5.000% | 7/1/21 (4) | 10,000 | 11,528 |
| Michigan Finance Authority Revenue (Detroit Water & Sewer) | 5.000% | 7/1/21 (14) | 3,000 | 3,452 |
| Michigan Finance Authority Revenue (Detroit Water & Sewer) | 5.000% | 7/1/22 | 1,000 | 1,161 |
| Michigan Finance Authority Revenue (Henry Ford Health System Obligated Group) | 5.000% | 11/15/21 | 1,800 | 2,098 |
| Michigan Finance Authority Revenue (Henry Ford Health System Obligated Group) | 5.000% | 11/15/22 | 2,000 | 2,372 |
| Michigan Finance Authority Revenue (Henry Ford Health System Obligated Group) | 5.000% | 11/15/23 | 3,000 | 3,606 |
| Michigan Finance Authority Revenue (McLaren Health Care Corp.) | 5.000% | 5/15/17 | 1,000 | 1,023 |
| Michigan Finance Authority Revenue (McLaren Health Care Corp.) | 5.000% | 5/15/18 | 805 | 856 |
| Michigan Finance Authority Revenue (McLaren Health Care Corp.) | 5.000% | 5/15/19 | 1,000 | 1,099 |
| Michigan Finance Authority Revenue (McLaren Health Care Corp.) | 5.000% | 5/15/20 | 600 | 679 |
| Michigan Finance Authority Revenue (McLaren Health Care Corp.) | 5.000% | 5/15/21 | 600 | 697 |
| Michigan Finance Authority Revenue (McLaren Health Care Corp.) | 5.000% | 5/15/22 | 800 | 946 |
| 2 Michigan Finance Authority Revenue (McLaren Health Care Corp.) TOB VRDO | 0.580% | 11/1/16 LOC | 25,000 | 25,000 |
| Michigan Finance Authority Revenue (MidMichigan Obligated Group) | 4.000% | 6/1/20 | 600 | 654 |
| Michigan Finance Authority Revenue (MidMichigan Obligated Group) | 5.000% | 6/1/21 | 750 | 866 |
| Michigan Finance Authority Revenue (MidMichigan Obligated Group) | 5.000% | 6/1/22 | 1,000 | 1,182 |
| Michigan Finance Authority Revenue (Sparrow Obligated Group) | 4.000% | 11/15/17 | 500 | 516 |
| Michigan Finance Authority Revenue (Sparrow Obligated Group) | 4.000% | 11/15/18 | 500 | 529 |
| Michigan Finance Authority Revenue (Sparrow Obligated Group) | 4.000% | 11/15/19 | 600 | 649 |
| Michigan Finance Authority Revenue (Sparrow Obligated Group) | 4.000% | 11/15/19 | 1,000 | 1,081 |
| Michigan Finance Authority Revenue (Sparrow Obligated Group) | 4.000% | 11/15/20 | 2,000 | 2,207 |
| Michigan Finance Authority Revenue (Sparrow Obligated Group) | 5.000% | 11/15/21 | 1,600 | 1,880 |
| Michigan Finance Authority Revenue (Sparrow Obligated Group) | 5.000% | 11/15/22 | 1,500 | 1,803 |
| Michigan Finance Authority Revenue (State Clean Water Revolving Fund) | 4.000% | 10/1/17 | 1,150 | 1,185 |
| Michigan Finance Authority Revenue (State Clean Water Revolving Fund) | 5.000% | 10/1/18 | 500 | 539 |
| Michigan Finance Authority Revenue (State Clean Water Revolving Fund) | 5.000% | 10/1/19 | 1,500 | 1,673 |
| 1 Michigan Finance Authority Revenue (State Clean Water Revolving Fund) | 5.000% | 10/1/21 | 4,575 | 5,387 |
| 1 Michigan Finance Authority Revenue (State Clean Water Revolving Fund) | 5.000% | 10/1/22 | 16,800 | 20,248 |
| 1 Michigan Finance Authority Revenue (State Clean Water Revolving Fund) | 5.000% | 10/1/23 | 7,230 | 8,880 |
| Michigan Finance Authority Revenue (Trinity Health Credit Group) | 5.000% | 12/1/20 | 9,235 | 10,595 |
| Michigan Finance Authority Revenue (Trinity Health Credit Group) | 5.000% | 12/1/21 | 5,000 | 5,870 |
| Michigan Finance Authority Revenue (Trinity Health Credit Group) | 5.000% | 12/1/22 | 5,500 | 6,585 |
| Michigan Finance Authority Revenue (Trinity Health Credit Group) | 5.000% | 12/1/23 | 6,000 | 7,301 |
| Michigan Finance Authority Revenue (Unemployment Obligation Assessment) | 5.000% | 1/1/17 | 1,225 | 1,234 |
| Michigan Finance Authority Revenue (Unemployment Obligation Assessment) | 5.000% | 7/1/18 | 50,500 | 53,978 |
| Michigan Finance Authority Revenue (Unemployment Obligation Assessment) | 5.000% | 7/1/19 | 20,000 | 22,122 |
| Michigan Finance Authority Revenue (Unemployment Obligation Assessment) | 5.000% | 7/1/22 | 7,445 | 7,594 |
| Michigan GAN | 5.000% | 3/15/20 | 6,000 | 6,741 |
| Michigan GAN | 5.000% | 3/15/21 | 3,750 | 4,324 |
| Michigan GAN | 5.000% | 3/15/22 | 2,500 | 2,949 |
| Michigan Hospital Finance Authority Revenue (Ascension Health Credit Group) | 5.000% | 11/15/17 | 5,000 | 5,215 |
| Michigan Hospital Finance Authority Revenue (Ascension Health Credit Group) | 5.000% | 11/15/23 | 7,330 | 8,145 |
| Michigan Hospital Finance Authority Revenue (Ascension Health Credit Group) PUT | 1.500% | 3/1/17 | 12,845 | 12,869 |
| Michigan Hospital Finance Authority Revenue (Ascension Health Credit Group) PUT | 1.400% | 6/29/18 | 11,750 | 11,804 |
79
Limited-Term Tax-Exempt Fund
| | | | |
| | | | Face | Market |
| | | Maturity | Amount | Value• |
| | Coupon | Date | ($000) | ($000) |
| Michigan Hospital Finance Authority Revenue (Ascension Health Credit Group) PUT | 1.500% | 5/1/20 | 2,785 | 2,794 |
| Michigan Hospital Finance Authority Revenue (Henry Ford Health System) | 5.000% | 11/15/16 (ETM) | 6,140 | 6,150 |
| Michigan Hospital Finance Authority Revenue (McLaren Health Care) | 5.000% | 6/1/18 | 6,375 | 6,779 |
| Michigan Hospital Finance Authority Revenue (McLaren Health Care) | 5.000% | 6/1/19 | 3,350 | 3,683 |
| Michigan Hospital Finance Authority Revenue (Trinity Health) PUT | 6.000% | 12/1/17 | 5,000 | 5,273 |
| Michigan Housing Development Authority Single Family Mortgage Revenue | 4.000% | 6/1/46 | 11,305 | 12,191 |
| Michigan Municipal Bond Authority Revenue (State Clean Water Revolving Fund) | 5.000% | 10/1/18 | 400 | 431 |
| Michigan State Hospital Finance Authority ( Ascension Health Senior Credit Group) OUT | 0.900% | 5/30/17 | 4,000 | 4,000 |
| Michigan State University Revenue | 5.000% | 2/15/17 | 6,135 | 6,212 |
| Michigan Strategic Fund Limited Obligation Revenue (Detroit Edison Co. Project) PUT | 1.450% | 9/1/21 | 8,000 | 7,898 |
| Michigan Strategic Fund Limited Obligation Revenue (Detroit Edison Co. Project) PUT | 1.450% | 9/1/21 | 2,000 | 1,975 |
| Michigan Strategic Fund Limited Obligation Revenue | | | | |
| (Facility for Rare Isotope Beams Project at Michigan State University) | 4.000% | 3/1/17 | 250 | 253 |
| Michigan Strategic Fund Limited Obligation Revenue | | | | |
| (Facility for Rare Isotope Beams Project at Michigan State University) | 4.000% | 3/1/18 | 500 | 520 |
| Michigan Strategic Fund Limited Obligation Revenue | | | | |
| (Facility for Rare Isotope Beams Project at Michigan State University) | 5.000% | 3/1/19 | 1,000 | 1,091 |
| Michigan Strategic Fund Limited Obligation Revenue | | | | |
| (Facility for Rare Isotope Beams Project at Michigan State University) | 5.000% | 3/1/20 | 800 | 900 |
| Michigan Strategic Fund Limited Obligation Revenue | | | | |
| (Facility for Rare Isotope Beams Project at Michigan State University) | 5.000% | 3/1/21 | 600 | 694 |
| Oakland University MI Revenue | 5.000% | 3/1/20 | 1,780 | 1,992 |
| Oakland University MI Revenue | 5.000% | 3/1/21 | 1,000 | 1,149 |
| Oakland University MI Revenue | 5.000% | 3/1/22 | 1,285 | 1,509 |
| Oakland University MI Revenue | 5.000% | 3/1/23 | 425 | 508 |
| Portage MI Public Schools GO | 5.000% | 11/1/20 | 750 | 857 |
| Portage MI Public Schools GO | 5.000% | 5/1/22 | 1,790 | 2,112 |
| Portage MI Public Schools GO | 5.000% | 11/1/22 | 1,380 | 1,648 |
| Rochester MI Community School District GO | 5.000% | 5/1/20 | 6,980 | 7,866 |
| Rochester MI Community School District GO | 5.000% | 5/1/21 | 4,075 | 4,710 |
| Rochester MI Community School District GO | 5.000% | 5/1/22 | 1,650 | 1,947 |
| Rochester MI Community School District GO | 5.000% | 5/1/23 | 1,225 | 1,470 |
| Romeo MI Community School District GO | 5.000% | 5/1/23 | 1,000 | 1,195 |
| Royal Oak MI City School District GO | 5.000% | 5/1/20 | 1,250 | 1,412 |
| Royal Oak MI City School District GO | 5.000% | 5/1/21 | 600 | 696 |
| Royal Oak MI Hospital Finance Authority Hospital Revenue (William Beaumont Hospital) | 5.000% | 9/1/17 | 1,400 | 1,447 |
| Royal Oak MI Hospital Finance Authority Hospital Revenue (William Beaumont Hospital) | 5.000% | 9/1/19 | 1,500 | 1,656 |
| Royal Oak MI Hospital Finance Authority Hospital Revenue (William Beaumont Hospital) | 5.000% | 9/1/20 | 1,200 | 1,360 |
| Saginaw MI Hospital Finance Authority Hospital Revenue (Covenant Medical Center Inc.) | 5.000% | 7/1/17 | 2,880 | 2,951 |
| University of Michigan Revenue | 4.000% | 4/1/17 | 11,385 | 11,546 |
| University of Michigan Revenue | 5.000% | 4/1/21 | 1,000 | 1,167 |
| University of Michigan Revenue | 5.000% | 4/1/22 | 600 | 718 |
| University of Michigan Revenue | 5.000% | 4/1/23 | 500 | 611 |
| 3 University of Michigan Revenue PUT | 1.060% | 4/2/18 | 22,000 | 21,901 |
| Walled Lake MI Consolidate School District GO | 5.000% | 5/1/22 | 3,135 | 3,699 |
| Warren MI Consolidated School District GO | 5.000% | 5/1/23 (15) | 2,755 | 3,291 |
| Wayne County MI Airport Authority Revenue | 5.000% | 12/1/23 | 2,345 | 2,749 |
| 2 Wayne State University Michigan Revenue TOB VRDO | 0.660% | 11/7/16 | 6,665 | 6,665 |
| 2 Wayne State University Michigan Revenue TOB VRDO | 0.780% | 11/7/16 | 2,500 | 2,500 |
| Western Michigan University Revenue | 5.000% | 11/15/21 | 1,000 | 1,173 |
| Woodhaven-Brownstone MI School District GO | 5.000% | 5/1/21 | 1,710 | 1,977 |
| Woodhaven-Brownstone MI School District GO | 5.000% | 5/1/22 | 1,730 | 2,041 |
| Woodhaven-Brownstone MI School District GO | 5.000% | 5/1/23 | 1,615 | 1,938 |
| | | | | 655,263 |
| Minnesota (0.9%) | | | | |
| Hennepin County MN GO | 5.000% | 12/1/20 | 3,000 | 3,472 |
| Hennepin County MN GO | 5.000% | 12/1/20 | 4,085 | 4,727 |
| Minneapolis & St. Paul MN Housing & Redevelopment Authority Health Care System Revenue | | | | |
| (Allina Health System) | 5.000% | 11/15/16 | 1,900 | 1,903 |
| Minneapolis & St. Paul MN Metropolitan Airports Commission Revenue | 5.000% | 1/1/20 | 3,500 | 3,920 |
| Minneapolis & St. Paul MN Metropolitan Airports Commission Revenue | 5.000% | 1/1/21 | 350 | 403 |
| Minneapolis & St. Paul MN Metropolitan Airports Commission Revenue | 5.000% | 1/1/21 | 2,700 | 3,112 |
| Minneapolis & St. Paul MN Metropolitan Airports Commission Revenue | 5.000% | 1/1/22 | 1,000 | 1,179 |
| Minneapolis & St. Paul MN Metropolitan Airports Commission Revenue | 5.000% | 1/1/22 | 3,000 | 3,536 |
| Minneapolis & St. Paul MN Metropolitan Airports Commission Revenue | 5.000% | 1/1/23 | 5,000 | 6,004 |
| Minneapolis & St. Paul MN Metropolitan Airports Commission Revenue | 5.000% | 1/1/24 | 7,180 | 8,772 |
| Minneapolis MN Health Care System Revenue (Fairview Health Services) | 5.000% | 11/15/21 | 550 | 641 |
| Minneapolis MN Health Care System Revenue (Fairview Health Services) | 5.000% | 11/15/22 | 200 | 237 |
| Minneapolis MN Special School District No. 1 COP | 5.000% | 2/1/19 | 6,830 | 7,432 |
80
Limited-Term Tax-Exempt Fund
| | | | |
| | | | Face | Market |
| | | Maturity | Amount | Value• |
| | Coupon | Date | ($000) | ($000) |
| Minneapolis MN Special School District No. 1 COP | 5.000% | 2/1/21 | 7,225 | 8,338 |
| Minnesota 911 Revenue | 5.000% | 6/1/18 (ETM) | 2,320 | 2,471 |
| Minnesota 911 Revenue | 5.000% | 6/1/21 | 9,390 | 11,011 |
| Minnesota General Fund Revenue | 5.000% | 3/1/19 | 6,410 | 7,000 |
| Minnesota GO | 5.000% | 12/1/16 | 8,150 | 8,180 |
| Minnesota GO | 5.000% | 10/1/17 (ETM) | 35 | 36 |
| Minnesota GO | 5.000% | 10/1/17 | 2,240 | 2,328 |
| Minnesota GO | 5.000% | 8/1/18 | 3,825 | 4,100 |
| Minnesota GO | 5.000% | 8/1/18 | 8,375 | 8,976 |
| Minnesota GO | 5.000% | 8/1/18 | 3,000 | 3,215 |
| Minnesota GO | 5.000% | 11/1/19 | 2,000 | 2,237 |
| Minnesota GO | 5.000% | 8/1/21 | 6,000 | 7,064 |
| Minnesota GO | 5.000% | 8/1/21 | 15,500 | 18,256 |
| Minnesota GO | 5.000% | 8/1/22 | 12,900 | 15,575 |
| Minnesota GO | 5.000% | 8/1/23 | 6,665 | 7,594 |
| Minnesota GO | 4.000% | 10/1/24 | 14,225 | 16,490 |
| Minnesota Higher Education Facilities Authority Revenue (University of St. Thomas) | 4.000% | 4/1/20 | 500 | 547 |
| Minnesota Higher Education Facilities Authority Revenue (University of St. Thomas) | 4.000% | 4/1/21 | 425 | 473 |
| Minnesota Higher Education Facilities Authority Revenue (University of St. Thomas) | 4.000% | 4/1/22 | 495 | 560 |
| Minnesota Municipal Power Agency Revenue | 5.000% | 1/1/20 | 2,000 | 2,243 |
| Minnesota Municipal Power Agency Revenue | 5.000% | 1/1/21 | 1,250 | 1,442 |
| Minnesota Public Facilities Authority Revenue (State Revolving Fund) | 5.000% | 3/1/18 | 8,500 | 8,973 |
| Shakopee MN Healthcare Facilities Revenue (St. Francis Regional Medical Center) | 5.000% | 9/1/20 | 1,340 | 1,518 |
| Shakopee MN Healthcare Facilities Revenue (St. Francis Regional Medical Center) | 5.000% | 9/1/21 | 1,195 | 1,388 |
| Shakopee MN Healthcare Facilities Revenue (St. Francis Regional Medical Center) | 5.000% | 9/1/22 | 1,580 | 1,875 |
| St. Cloud MN Health Care Revenue (CentraCare Health System) | 5.000% | 5/1/17 | 1,000 | 1,022 |
| St. Cloud MN Health Care Revenue (CentraCare Health System) | 5.000% | 5/1/22 | 2,800 | 3,320 |
| University of Minnesota Revenue | 5.000% | 8/1/17 | 3,215 | 3,318 |
| University of Minnesota Revenue | 5.000% | 12/1/17 | 10,000 | 10,458 |
| University of Minnesota Revenue | 5.000% | 8/1/22 | 1,575 | 1,887 |
| | | | | 207,233 |
| Mississippi (0.2%) | | | | |
| DeSoto County MS School District GO | 5.000% | 5/1/18 | 10,340 | 10,971 |
| DeSoto County MS School District GO | 5.000% | 5/1/19 | 8,000 | 8,801 |
| Gulfport MS Hospital Facilities Revenue (Memorial Hospital at Gulfport Project) | 5.000% | 7/1/21 | 1,050 | 1,188 |
| Gulfport MS Hospital Facilities Revenue (Memorial Hospital at Gulfport Project) | 5.000% | 7/1/22 | 2,000 | 2,303 |
| Gulfport MS Hospital Facilities Revenue (Memorial Hospital at Gulfport Project) | 5.000% | 7/1/23 | 1,500 | 1,751 |
| Jackson MS Public School District GO | 5.000% | 4/1/22 | 1,500 | 1,752 |
| Mississippi Business Finance Corp. Solid Waste Disposal Revenue | | | | |
| (Waste Management Inc. Project) PUT | 1.125% | 9/1/17 | 1,250 | 1,252 |
| 3 Mississippi GO | 1.160% | 9/1/17 | 4,635 | 4,640 |
| 2 Mississippi GO TOB VRDO | 0.670% | 11/7/16 | 3,680 | 3,680 |
| 3 Mississippi Hospital Equipment & Facilities Authority Revenue (Baptist Health System) PUT | 1.930% | 8/15/20 | 7,875 | 7,812 |
| Mississippi Hospital Equipment & Facilities Authority Revenue | | | | |
| (North Mississippi Health Services) | 5.000% | 10/1/17 | 2,500 | 2,591 |
| | | | | 46,741 |
| Missouri (1.0%) | | | | |
| Boone County MO Hospital Revenue | 5.000% | 8/1/22 | 1,370 | 1,595 |
| Boone County MO Hospital Revenue | 5.000% | 8/1/23 | 2,465 | 2,899 |
| Cape Girardeau County MO Industrial Development Authority of the Health Facilities Revenue | | | | |
| (St. Francis Medical Center) | 5.000% | 6/1/19 | 2,000 | 2,190 |
| Cape Girardeau County MO Industrial Development Authority of the Health Facilities Revenue | | | | |
| (St. Francis Medical Center) | 5.000% | 6/1/20 | 1,000 | 1,125 |
| Curators of the University of Missouri System Facilities Revenue | 5.000% | 11/1/17 | 3,270 | 3,410 |
| Curators of the University of Missouri System Facilities Revenue | 5.000% | 11/1/18 | 2,225 | 2,407 |
| Curators of the University of Missouri System Facilities Revenue | 5.000% | 11/1/18 | 1,445 | 1,563 |
| Curators of the University of Missouri System Facilities Revenue | 5.000% | 11/1/19 | 805 | 901 |
| Curators of the University of Missouri System Facilities Revenue | 5.000% | 11/1/20 | 2,000 | 2,305 |
| Joplin MO Industrial Development Authority Health Facilities Revenue (Freeman Health System) | 5.000% | 2/15/22 | 1,500 | 1,749 |
| Joplin MO Industrial Development Authority Health Facilities Revenue (Freeman Health System) | 5.000% | 2/15/23 | 1,420 | 1,688 |
| Kansas City MO Airport Revenue | 5.000% | 9/1/18 | 1,500 | 1,605 |
| Kansas City MO Airport Revenue | 5.000% | 9/1/19 | 2,715 | 2,998 |
| Kansas City MO GO | 4.000% | 2/1/18 | 5,660 | 5,880 |
| Kansas City MO Sanitary Sewer System Revenue | 4.000% | 1/1/21 | 1,025 | 1,143 |
| Kansas City MO Sanitary Sewer System Revenue | 4.000% | 1/1/22 | 1,250 | 1,419 |
| Kansas City MO Sanitary Sewer System Revenue | 4.000% | 1/1/23 | 1,500 | 1,724 |
| Kansas City MO Special Obligation Revenue | 5.000% | 10/1/21 | 1,305 | 1,515 |
| Kansas City MO Special Obligation Revenue | 5.000% | 10/1/21 | 1,275 | 1,480 |
| Kansas City MO Special Obligation Revenue | 5.000% | 10/1/22 | 1,410 | 1,672 |
81
Limited-Term Tax-Exempt Fund
| | | | |
| | | | Face | Market |
| | | Maturity | Amount | Value• |
| | Coupon | Date | ($000) | ($000) |
| Kansas City MO Special Obligation Revenue | 5.000% | 10/1/22 | 1,295 | 1,536 |
| Kansas City MO Special Obligation Revenue (Downtown Arena Project) | 5.000% | 4/1/21 | 3,000 | 3,444 |
| Kansas City MO Special Obligation Revenue (Downtown Arena Project) | 5.000% | 4/1/22 | 4,955 | 5,814 |
| Missouri Board of Public Buildings Special Obligation Revenue | 5.000% | 10/1/19 | 17,225 | 19,193 |
| Missouri Development Finance Board Infrastructure Facilities Revenue (Branson Landing Project) | 4.000% | 12/1/20 | 1,300 | 1,412 |
| Missouri Environmental Improvement & Energy Resources Authority Revenue | | | | |
| (Kansas City Power & Light) | 1.250% | 7/1/17 | 4,200 | 4,213 |
| Missouri Health & Educational Facilities Authority Educational Facilities Revenue | | | | |
| (St. Louis College of Pharmacy Project) | 5.000% | 5/1/19 | 750 | 811 |
| Missouri Health & Educational Facilities Authority Educational Facilities Revenue | | | | |
| (St. Louis College of Pharmacy Project) | 5.000% | 5/1/20 | 870 | 958 |
| Missouri Health & Educational Facilities Authority Educational Facilities Revenue | | | | |
| (St. Louis College of Pharmacy Project) | 5.000% | 5/1/21 | 1,420 | 1,591 |
| Missouri Health & Educational Facilities Authority Health Facilities Revenue (Cox Health) | 5.000% | 11/15/22 | 3,375 | 4,001 |
| Missouri Health & Educational Facilities Authority Health Facilities Revenue | | | | |
| (Freeman Health System) | 5.000% | 2/15/17 | 1,500 | 1,517 |
| Missouri Health & Educational Facilities Authority Health Facilities Revenue | | | | |
| (Freeman Health System) | 5.000% | 2/15/18 | 2,890 | 3,029 |
| Missouri Health & Educational Facilities Authority Health Facilities Revenue | | | | |
| (Freeman Health System) | 5.000% | 2/15/19 | 3,040 | 3,284 |
| Missouri Health & Educational Facilities Authority Health Facilities Revenue | | | | |
| (Freeman Health System) | 5.000% | 2/15/20 | 3,085 | 3,429 |
| 1 Missouri Health & Educational Facilities Authority Revenue | | | | |
| (Lutheran Senior Services Obligated Group) | 3.000% | 2/1/17 | 250 | 251 |
| 1 Missouri Health & Educational Facilities Authority Revenue | | | | |
| (Lutheran Senior Services Obligated Group) | 4.000% | 2/1/18 | 500 | 517 |
| 1 Missouri Health & Educational Facilities Authority Revenue | | | | |
| (Lutheran Senior Services Obligated Group) | 4.000% | 2/1/19 | 650 | 684 |
| 1 Missouri Health & Educational Facilities Authority Revenue | | | | |
| (Lutheran Senior Services Obligated Group) | 4.000% | 2/1/20 | 900 | 963 |
| 1 Missouri Health & Educational Facilities Authority Revenue | | | | |
| (Lutheran Senior Services Obligated Group) | 5.000% | 2/1/21 | 400 | 451 |
| 1 Missouri Health & Educational Facilities Authority Revenue | | | | |
| (Lutheran Senior Services Obligated Group) | 5.000% | 2/1/22 | 1,190 | 1,365 |
| 1 Missouri Health & Educational Facilities Authority Revenue | | | | |
| (Lutheran Senior Services Obligated Group) | 5.000% | 2/1/23 | 1,200 | 1,395 |
| 1 Missouri Health & Educational Facilities Authority Revenue | | | | |
| (Lutheran Senior Services Obligated Group) | 5.000% | 2/1/24 | 750 | 879 |
| Missouri Highways & Transportation Commission Road Revenue | 5.000% | 5/1/20 | 43,310 | 49,227 |
| Missouri Highways & Transportation Commission Road Revenue | 5.000% | 5/1/21 | 4,380 | 5,126 |
| Missouri Joint Municipal Electric Utility Commission Power Project Revenue | 5.000% | 1/1/19 | 2,200 | 2,379 |
| Missouri Joint Municipal Electric Utility Commission Power Project Revenue | 5.000% | 1/1/21 | 6,275 | 7,175 |
| Missouri Joint Municipal Electric Utility Commission Power Project Revenue | 5.000% | 1/1/22 | 4,365 | 5,086 |
| Missouri Joint Municipal Electric Utility Commission Power Project Revenue (Prairie Project) | 5.000% | 6/1/18 | 1,500 | 1,595 |
| Missouri Joint Municipal Electric Utility Commission Power Project Revenue (Prairie Project) | 5.000% | 12/1/18 | 1,250 | 1,353 |
| Missouri Joint Municipal Electric Utility Commission Power Project Revenue (Prairie Project) | 5.000% | 6/1/19 | 2,750 | 3,024 |
| Missouri Joint Municipal Electric Utility Commission Power Project Revenue (Prairie Project) | 5.000% | 12/1/19 | 2,500 | 2,794 |
| Missouri Joint Municipal Electric Utility Commission Power Project Revenue (Prairie Project) | 5.000% | 6/1/20 | 1,125 | 1,273 |
| Missouri Joint Municipal Electric Utility Commission Power Project Revenue (Prairie Project) | 5.000% | 12/1/20 | 1,000 | 1,149 |
| Missouri Joint Municipal Electric Utility Commission Power Project Revenue (Prairie Project) | 5.000% | 6/1/21 | 1,250 | 1,451 |
| Missouri Joint Municipal Electric Utility Commission Power Project Revenue (Prairie Project) | 5.000% | 12/1/21 | 1,860 | 2,187 |
| Missouri Joint Municipal Electric Utility Commission Power Project Revenue (Prairie Project) | 5.000% | 6/1/22 | 3,205 | 3,801 |
| Missouri Joint Municipal Electric Utility Commission Power Project Revenue (Prairie Project) | 5.000% | 12/1/22 | 1,500 | 1,799 |
| St. Joseph MO Industrial Development Authority Health Facilities Revenue | | | | |
| (Heartland Regional Medical Center) VRDO | 0.490% | 11/1/16 LOC | 27,170 | 27,170 |
| St. Louis County MO Industrial Development Authority Senior Living Facilities Revenue | | | | |
| (Friendship Village Sunset Hills) | 2.850% | 9/1/18 | 5,400 | 5,425 |
| St. Louis MO Airport Revenue (Lambert-St. Louis International Airport) | 5.000% | 7/1/18 | 1,295 | 1,378 |
| St. Louis MO Municipal Finance Corp. Lease Revenue (City Justice Center Project) | 5.000% | 2/15/17 | 2,000 | 2,024 |
| St. Louis MO Municipal Finance Corp. Lease Revenue (City Justice Center Project) | 5.000% | 2/15/18 | 4,000 | 4,199 |
| St. Louis MO Parking Revenue | 5.000% | 12/15/21 (4) | 535 | 622 |
| St. Louis MO Parking Revenue | 5.000% | 12/15/22 (4) | 1,000 | 1,188 |
| | | | | 233,430 |
| Montana (0.1%) | | | | |
| Forsyth MT Pollution Control Revenue (Northwestern Corporation Colstrip Project) | 2.000% | 8/1/23 | 20,000 | 19,834 |
| Montana Facility Finance Authority Revenue (Sisters of Charity of Leavenworth Health System) | 5.000% | 1/1/17 | 5,305 | 5,343 |
| | | | | 25,177 |
82
Limited-Term Tax-Exempt Fund
| | | | | |
| | | | | Face | Market |
| | | | Maturity | Amount | Value• |
| | | Coupon | Date | ($000) | ($000) |
| Multiple States (1.4%) | | | | |
| 2,3 | Eaton Vance Municipal Bond Fund II | 1.680% | 7/1/19 | 4,975 | 4,976 |
| 2 | Nuveen AMT-Free Municipal Income Fund VRDP VRDO | 0.770% | 11/7/16 LOC | 15,000 | 15,000 |
| 2 | Nuveen AMT-Free Quality Municipal Income Fund VRDP VRDO | 0.730% | 11/7/16 LOC | 62,500 | 62,500 |
| 2 | Nuveen AMT-Free Quality Municipal Income Fund VRDP VRDO | 0.760% | 11/7/16 LOC | 50,000 | 50,000 |
| 2 | Nuveen Enhanced AMT-Free Municipal Credit Opportunities Fund VRDP VRDO | 0.740% | 11/7/16 LOC | 154,200 | 154,200 |
| 2 | Nuveen Enhanced AMT-Free Municipal Credit Opportunities Fund VRDP VRDO | 0.730% | 11/7/16 LOC | 46,400 | 46,400 |
| | | | | | 333,076 |
| Nebraska (0.7%) | | | | |
| | Central Plains Energy Project Nebraska Gas Project Revenue (Project No. 1) | 5.250% | 12/1/20 | 5,000 | 5,712 |
| | Central Plains Energy Project Nebraska Gas Project Revenue (Project No. 1) | 5.250% | 12/1/21 | 3,000 | 3,502 |
| | Central Plains Energy Project Nebraska Gas Supply Revenue PUT | 5.000% | 6/1/19 | 11,175 | 12,159 |
| | Central Plains Energy Project Nebraska Gas Supply Revenue PUT | 5.000% | 12/1/19 | 50,000 | 55,149 |
| | Douglas County NE Hospital Authority No. 3 Health Facilities Revenue | | | | |
| | (Nebraska Methodist Health System) | 4.000% | 11/1/19 | 750 | 804 |
| | Douglas County NE Hospital Authority No. 3 Health Facilities Revenue | | | | |
| | (Nebraska Methodist Health System) | 5.000% | 11/1/20 | 1,400 | 1,581 |
| | Douglas County NE Hospital Authority No. 3 Health Facilities Revenue | | | | |
| | (Nebraska Methodist Health System) | 5.000% | 11/1/22 | 1,000 | 1,173 |
| | Lincoln County NE Hospital Authority No. 1 Hospital Revenue | | | | |
| | (Great Plains Regional Medical Center Project) | 5.000% | 11/1/18 | 500 | 535 |
| | Lincoln County NE Hospital Authority No. 1 Hospital Revenue | | | | |
| | (Great Plains Regional Medical Center Project) | 4.000% | 11/1/19 | 750 | 803 |
| | Lincoln County NE Hospital Authority No. 1 Hospital Revenue | | | | |
| | (Great Plains Regional Medical Center Project) | 4.000% | 11/1/20 | 600 | 652 |
| | Municipal Energy Agency of Nebraska Power Supply System Revenue | 5.000% | 4/1/19 | 1,500 | 1,638 |
| | Municipal Energy Agency of Nebraska Power Supply System Revenue | 5.000% | 4/1/20 | 1,350 | 1,519 |
| | Municipal Energy Agency of Nebraska Power Supply System Revenue | 5.000% | 4/1/23 | 1,030 | 1,236 |
| | Nebraska Investment Finance Authority Single Family Housing Revenue | 3.000% | 3/1/43 | 2,425 | 2,469 |
| | Nebraska Investment Finance Authority Single Family Housing Revenue | 3.000% | 9/1/43 | 2,750 | 2,791 |
| | Nebraska Investment Finance Authority Single Family Housing Revenue | 3.000% | 3/1/44 | 3,265 | 3,344 |
| | Nebraska Investment Finance Authority Single Family Housing Revenue | 4.000% | 9/1/44 | 4,865 | 5,147 |
| | Nebraska Investment Finance Authority Single Family Housing Revenue | 3.500% | 9/1/45 | 10,695 | 11,357 |
| | Nebraska Public Power District Revenue | 5.000% | 1/1/17 | 1,000 | 1,007 |
| | Nebraska Public Power District Revenue | 5.000% | 1/1/18 | 1,500 | 1,572 |
| | Nebraska Public Power District Revenue | 5.000% | 1/1/19 | 1,000 | 1,085 |
| | Nebraska Public Power District Revenue | 5.000% | 1/1/19 | 1,000 | 1,085 |
| | Nebraska Public Power District Revenue | 5.000% | 1/1/20 | 2,800 | 3,133 |
| | Nebraska Public Power District Revenue | 5.000% | 7/1/20 | 6,065 | 6,877 |
| | Nebraska Public Power District Revenue | 5.000% | 1/1/21 | 4,635 | 5,328 |
| | Nebraska Public Power District Revenue | 5.000% | 7/1/21 | 3,185 | 3,706 |
| | Omaha NE Public Power District Electric Revenue | 5.000% | 2/1/20 | 7,370 | 8,298 |
| | Omaha NE Public Power District Electric Revenue | 5.000% | 2/1/21 | 6,400 | 7,412 |
| | University of Nebraska Facilities Corp. Revenue (UNMC Eye Institute) | 5.000% | 3/1/18 | 8,850 | 9,333 |
| | University of Nebraska Student Fee Revenue | 5.000% | 7/1/18 | 1,500 | 1,601 |
| | University of Nebraska Student Fee Revenue | 5.000% | 7/1/20 | 3,015 | 3,428 |
| | University of Nebraska Student Fee Revenue | 5.000% | 7/1/21 | 1,335 | 1,559 |
| | University of Nebraska Student Fee Revenue | 5.000% | 7/1/21 | 1,000 | 1,167 |
| | University of Nebraska Student Fee Revenue | 5.000% | 7/1/22 | 1,400 | 1,672 |
| | University of Nebraska Student Fee Revenue | 5.000% | 7/1/22 | 1,500 | 1,792 |
| | University of Nebraska Student Health & Recreation Project Revenue | 5.000% | 5/15/20 | 1,255 | 1,422 |
| | University of Nebraska Student Health & Recreation Project Revenue | 5.000% | 5/15/22 | 1,135 | 1,352 |
| | | | | | 174,400 |
| Nevada (0.5%) | | | | |
| | Carson City NV Hospital Revenue (Carson Tahoe Regional Medical Center) | 5.000% | 9/1/17 | 1,915 | 1,971 |
| | Carson City NV Hospital Revenue (Carson Tahoe Regional Medical Center) | 5.000% | 9/1/19 | 1,030 | 1,121 |
| | Carson City NV Hospital Revenue (Carson Tahoe Regional Medical Center) | 5.000% | 9/1/20 | 1,165 | 1,298 |
| | Clark County NV Airport Improvement Revenue | 5.000% | 7/1/18 | 32,000 | 34,121 |
| | Clark County NV Highway Improvement Motor Vehicle Fuel Tax Revenue | 5.000% | 7/1/22 | 1,715 | 2,049 |
| | Clark County NV Passenger Facility Charge Revenue (Las Vegas McCarran International Airport) | 5.000% | 7/1/19 | 2,375 | 2,618 |
| | Clark County NV Passenger Facility Charge Revenue (Las Vegas McCarran International Airport) | 5.000% | 7/1/20 | 3,000 | 3,402 |
| | Clark County NV Passenger Facility Charge Revenue (Las Vegas McCarran International Airport) | 5.000% | 7/1/21 | 3,000 | 3,492 |
| | Clark County NV Passenger Facility Charge Revenue (Las Vegas McCarran International Airport) | 5.000% | 7/1/22 | 3,000 | 3,570 |
| | Clark County NV School District GO | 5.000% | 12/15/17 (Prere.) | 9,245 | 9,687 |
| | Clark County NV School District GO | 5.000% | 6/15/21 | 23,970 | 25,054 |
| | Las Vegas NV Convention & Visitors Authority Revenue | 5.000% | 7/1/21 | 1,000 | 1,160 |
| | Las Vegas NV Convention & Visitors Authority Revenue | 5.000% | 7/1/22 | 1,550 | 1,839 |
| | Las Vegas NV Convention & Visitors Authority Revenue | 5.000% | 7/1/23 | 1,180 | 1,422 |
| 2 | Nevada Capital Improvement & Cultural Affairs GO TOB VRDO | 0.660% | 11/7/16 | 9,510 | 9,510 |
83
Limited-Term Tax-Exempt Fund
| | | | | |
| | | | | Face | Market |
| | | | Maturity | Amount | Value• |
| | | Coupon | Date | ($000) | ($000) |
| | Nevada Unemployment Compensation Revenue | 5.000% | 12/1/17 | 6,000 | 6,274 |
| | Washoe County NV Gas & Water Facilities Revenue PUT | 3.000% | 6/1/22 | 7,500 | 8,016 |
| | | | | | 116,604 |
| New Hampshire (0.1%) | | | | |
| | Manchester NH General Airport Revenue | 5.000% | 1/1/22 | 6,820 | 7,773 |
| 1 | New Hampshire Health & Education Facilities Authority Revenue (Elliott Hospital Obligated Group) | 5.000% | 10/1/21 | 1,250 | 1,421 |
| 1 | New Hampshire Health & Education Facilities Authority Revenue (Elliott Hospital Obligated Group) | 5.000% | 10/1/22 | 900 | 1,040 |
| 1 | New Hampshire Health & Education Facilities Authority Revenue (Elliott Hospital Obligated Group) | 5.000% | 10/1/23 | 1,675 | 1,954 |
| 1 | New Hampshire Health & Education Facilities Authority Revenue | | | | |
| | (Southern New Hampshire Medical Center) | 4.000% | 10/1/22 | 2,070 | 2,307 |
| 1 | New Hampshire Health & Education Facilities Authority Revenue | | | | |
| | (Southern New Hampshire Medical Center) | 4.000% | 10/1/23 | 2,355 | 2,638 |
| | New Hampshire Municipal Bond Bank Revenue | 5.000% | 8/15/17 | 3,200 | 3,307 |
| 1 | New Hampshire Municipal Bond Bank Revenue | 4.000% | 8/15/21 | 505 | 568 |
| 1 | New Hampshire Municipal Bond Bank Revenue | 4.000% | 8/15/22 | 1,000 | 1,142 |
| | | | | | 22,150 |
| New Jersey (5.0%) | | | | |
| | Atlantic City NJ GO | 5.000% | 11/1/19 | 3,315 | 2,723 |
| | Atlantic City NJ GO | 5.000% | 12/1/19 | 6,995 | 5,744 |
| | Atlantic City NJ GO | 5.000% | 11/1/20 | 4,025 | 3,260 |
| | Atlantic City NJ GO | 5.000% | 12/1/20 | 7,185 | 5,817 |
| | Atlantic City NJ GO | 5.000% | 11/1/21 | 3,020 | 2,442 |
| | Atlantic City NJ GO | 5.000% | 12/1/21 | 1,970 | 1,592 |
| | Camden County NJ Improvement Authority Health Care Redevelopment Project Revenue | | | | |
| | (Cooper Health System Obligated Group) | 5.000% | 2/15/20 | 2,040 | 2,264 |
| | Camden County NJ Improvement Authority Health Care Redevelopment Project Revenue | | | | |
| | (Cooper Health System Obligated Group) | 5.000% | 2/15/21 | 2,460 | 2,797 |
| | Camden County NJ Improvement Authority Health Care Redevelopment Project Revenue | | | | |
| | (Cooper Health System Obligated Group) | 5.000% | 2/15/22 | 2,295 | 2,663 |
| | Camden County NJ Improvement Authority Lease Revenue | | | | |
| | (Rowan University School of Osteopathic Medicine Project) | 5.000% | 12/1/22 | 1,095 | 1,303 |
| 2 | Camden County NJ Improvement Authority Revenue VRDO | 0.670% | 11/7/16 LOC | 1,290 | 1,290 |
| 2,3 | Eaton Vance New Jersey Municipal Bond Fund II | 1.630% | 7/1/19 | 8,675 | 8,676 |
| | Gloucester County NJ Improvement Authority Revenue (Rowan University) | 5.000% | 7/1/18 | 1,600 | 1,703 |
| | Gloucester County NJ Improvement Authority Revenue (Rowan University) | 5.000% | 7/1/19 | 1,700 | 1,871 |
| | Gloucester County NJ Improvement Authority Revenue (Rowan University) | 5.000% | 7/1/20 | 1,800 | 2,038 |
| | Gloucester County NJ Improvement Authority Revenue (Rowan University) | 5.000% | 7/1/21 | 2,800 | 3,251 |
| | Gloucester County NJ Improvement Authority Revenue (Rowan University) | 5.000% | 7/1/22 | 1,200 | 1,423 |
| | Gloucester County NJ Improvement Authority Solid Waste Resource Revenue PUT | 2.125% | 12/1/17 | 3,280 | 3,318 |
| | Howell Township NJ BAN | 2.000% | 10/19/17 | 11,850 | 11,959 |
| | Long Branch NJ BAN | 1.750% | 2/10/17 | 10,596 | 10,616 |
| | Morris County NJ Improvement Authority Revenue | 4.000% | 5/1/21 | 2,000 | 2,241 |
| | Morris County NJ Improvement Authority Revenue | 4.000% | 5/1/22 | 1,000 | 1,142 |
| | New Jersey Economic Development Authority Revenue | 5.000% | 3/1/18 | 14,425 | 15,041 |
| | New Jersey Economic Development Authority Revenue | 5.000% | 3/1/19 (ETM) | 29,800 | 32,520 |
| | New Jersey Economic Development Authority Revenue | 5.000% | 6/15/22 | 62,735 | 69,745 |
| | New Jersey Economic Development Authority Revenue (Cigarette Tax) | 5.000% | 6/15/18 | 7,235 | 7,572 |
| | New Jersey Economic Development Authority Revenue (Cigarette Tax) | 5.000% | 6/15/19 | 8,000 | 8,568 |
| | New Jersey Economic Development Authority Revenue (Cigarette Tax) | 5.000% | 6/15/20 | 7,000 | 7,637 |
| | New Jersey Economic Development Authority Revenue (School Facilities Construction) | 5.000% | 12/15/16 (ETM) | 20,115 | 20,218 |
| | New Jersey Economic Development Authority Revenue (School Facilities Construction) | 5.000% | 12/15/16 | 12,310 | 12,366 |
| 3 | New Jersey Economic Development Authority Revenue (School Facilities Construction) | 1.530% | 2/1/17 | 14,000 | 13,999 |
| | New Jersey Economic Development Authority Revenue (School Facilities Construction) | 5.000% | 9/1/17 (ETM) | 7,500 | 7,764 |
| | New Jersey Economic Development Authority Revenue (School Facilities Construction) | 5.000% | 9/1/17 (ETM) | 6,450 | 6,677 |
| | New Jersey Economic Development Authority Revenue (School Facilities Construction) | 5.000% | 12/15/17 | 555 | 576 |
| | New Jersey Economic Development Authority Revenue (School Facilities Construction) | 5.000% | 12/15/17 (ETM) | 13,745 | 14,384 |
| | New Jersey Economic Development Authority Revenue (School Facilities Construction) | 5.500% | 9/1/18 (ETM) | 5,000 | 5,420 |
| | New Jersey Economic Development Authority Revenue (School Facilities Construction) | 5.000% | 3/1/19 (ETM) | 15,000 | 16,369 |
| | New Jersey Economic Development Authority Revenue (School Facilities Construction) | 5.000% | 12/15/19 | 16,780 | 18,223 |
| | New Jersey Economic Development Authority Revenue (School Facilities Construction) | 5.000% | 3/1/20 (ETM) | 910 | 1,024 |
| | New Jersey Economic Development Authority Revenue (School Facilities Construction) | 5.000% | 3/1/20 | 8,325 | 9,042 |
| | New Jersey Economic Development Authority Revenue (School Facilities Construction) | 5.000% | 9/1/20 (ETM) | 5,650 | 6,459 |
| | New Jersey Economic Development Authority Revenue (School Facilities Construction) | 5.000% | 9/1/20 | 2,095 | 2,294 |
| | New Jersey Economic Development Authority Revenue (School Facilities Construction) | 5.250% | 12/15/20 (2) | 9,670 | 10,725 |
| | New Jersey Economic Development Authority Revenue (School Facilities Construction) | 5.250% | 3/1/21 (Prere.) | 13,480 | 15,760 |
| | New Jersey Economic Development Authority Revenue (School Facilities Construction) | 5.250% | 9/1/22 | 4,990 | 5,484 |
| 2 | New Jersey Economic Development Authority Revenue (School Facilities Construction) | | | | |
| | TOB VRDO | 0.700% | 11/7/16 LOC | 9,805 | 9,805 |
| | New Jersey Economic Development Authority Revenue (School Facilities Construction) VRDO | 1.360% | 2/1/17 | 4,000 | 3,998 |
84
Limited-Term Tax-Exempt Fund
| | | | |
| | | | Face | Market |
| | | Maturity | Amount | Value• |
| | Coupon | Date | ($000) | ($000) |
| New Jersey Economic Development Authority Revenue | | | | |
| (Provident Group-Montclair Properties LLC - Montclair State University Student Housing Project) | 5.000% | 6/1/17 | 3,525 | 3,588 |
| New Jersey Economic Development Authority Sublease Revenue | | | | |
| (New Jersey Transit Corp. Light Rail Transit System Project) | 5.000% | 5/1/19 | 1,000 | 1,073 |
| New Jersey Educational Facilities Authority Revenue (College of New Jersey) | 4.000% | 7/1/20 | 405 | 444 |
| New Jersey Educational Facilities Authority Revenue (College of New Jersey) | 5.000% | 7/1/21 | 500 | 581 |
| New Jersey Educational Facilities Authority Revenue (College of New Jersey) | 5.000% | 7/1/22 | 720 | 854 |
| New Jersey Educational Facilities Authority Revenue (College of New Jersey) | 5.000% | 7/1/23 | 1,000 | 1,201 |
| New Jersey Educational Facilities Authority Revenue (Kean University) | 5.000% | 9/1/17 | 2,500 | 2,574 |
| New Jersey Educational Facilities Authority Revenue (Princeton University) | 5.000% | 7/1/17 | 5,095 | 5,242 |
| New Jersey Educational Facilities Authority Revenue (Princeton University) | 5.000% | 7/1/18 | 5,345 | 5,713 |
| New Jersey Equipment Lease Purchase COP | 5.000% | 6/15/17 | 2,625 | 2,688 |
| New Jersey Equipment Lease Purchase COP | 5.000% | 6/15/18 | 4,550 | 4,789 |
| New Jersey Equipment Lease Purchase COP | 5.000% | 6/15/19 | 10,255 | 10,752 |
| New Jersey Equipment Lease Purchase COP | 5.000% | 6/15/20 | 1,500 | 1,586 |
| New Jersey GO | 5.000% | 8/15/17 | 11,660 | 12,021 |
| New Jersey GO | 5.000% | 6/1/18 | 5,000 | 5,283 |
| New Jersey GO | 5.000% | 8/15/19 | 8,395 | 9,202 |
| New Jersey Health Care Facilities Financing Authority Revenue (AHS Hospital Corp.) | 5.000% | 7/1/18 (ETM) | 2,390 | 2,553 |
| New Jersey Health Care Facilities Financing Authority Revenue (AHS Hospital Corp.) | 5.000% | 7/1/18 | 110 | 117 |
| New Jersey Health Care Facilities Financing Authority Revenue (Barnabas Health) | 5.000% | 7/1/17 | 2,000 | 2,054 |
| New Jersey Health Care Facilities Financing Authority Revenue (Barnabas Health) | 5.000% | 7/1/18 | 1,000 | 1,064 |
| New Jersey Health Care Facilities Financing Authority Revenue (Barnabas Health) | 4.500% | 7/1/21 (Prere.) | 3,550 | 4,085 |
| New Jersey Health Care Facilities Financing Authority Revenue | | | | |
| (Hackensack University Medical Center) | 5.000% | 1/1/17 | 2,595 | 2,613 |
| New Jersey Health Care Facilities Financing Authority Revenue | | | | |
| (Hackensack University Medical Center) | 5.000% | 1/1/18 | 3,605 | 3,769 |
| New Jersey Health Care Facilities Financing Authority Revenue (Holy Name Medical Center) | 4.000% | 7/1/17 | 1,000 | 1,018 |
| New Jersey Health Care Facilities Financing Authority Revenue | | | | |
| (Meridian Health System Obligated Group) | 5.000% | 7/1/18 | 2,000 | 2,128 |
| New Jersey Health Care Facilities Financing Authority Revenue | | | | |
| (Meridian Health System Obligated Group) | 5.000% | 7/1/19 | 2,000 | 2,196 |
| New Jersey Health Care Facilities Financing Authority Revenue | | | | |
| (Meridian Health System Obligated Group) | 5.000% | 7/1/21 | 2,000 | 2,312 |
| 2 New Jersey Health Care Facilities Financing Authority Revenue | | | | |
| (Meridian Health System Obligated Group) TOB VRDO | 0.780% | 11/7/16 (12) | 9,045 | 9,045 |
| New Jersey Health Care Facilities Financing Authority Revenue (Princeton Healthcare System) | 5.000% | 7/1/21 | 1,000 | 1,154 |
| New Jersey Health Care Facilities Financing Authority Revenue (Princeton Healthcare System) | 5.000% | 7/1/22 | 1,500 | 1,769 |
| New Jersey Health Care Facilities Financing Authority Revenue (Princeton Healthcare System) | 5.000% | 7/1/23 | 2,000 | 2,400 |
| New Jersey Health Care Facilities Financing Authority Revenue (St. Joseph’s Healthcare System) | 4.000% | 7/1/20 | 1,000 | 1,085 |
| New Jersey Health Care Facilities Financing Authority Revenue (St. Joseph’s Healthcare System) | 5.000% | 7/1/21 | 1,000 | 1,146 |
| New Jersey Health Care Facilities Financing Authority Revenue (St. Joseph’s Healthcare System) | 5.000% | 7/1/22 | 1,500 | 1,754 |
| New Jersey Health Care Facilities Financing Authority Revenue (St. Joseph’s Healthcare System) | 5.000% | 7/1/23 | 3,000 | 3,556 |
| New Jersey Higher Education Assistance Authority Student Loan Revenue | 5.000% | 12/1/16 | 9,990 | 10,023 |
| New Jersey Higher Education Assistance Authority Student Loan Revenue | 5.000% | 12/1/16 | 3,810 | 3,823 |
| New Jersey Higher Education Assistance Authority Student Loan Revenue | 5.000% | 6/1/19 | 1,500 | 1,623 |
| 2 New Jersey Higher Education Assistance Authority Student Loan Revenue TOB VRDO | 0.850% | 11/7/16 | 5,000 | 5,000 |
| New Jersey Transportation Corp. GAN | 5.000% | 9/15/20 | 22,550 | 24,717 |
| 1 New Jersey Transportation Trust Fund Authority Federal Highway Reimbursement Revenue | 5.000% | 6/15/19 | 16,300 | 17,550 |
| 1 New Jersey Transportation Trust Fund Authority Federal Highway Reimbursement Revenue | 5.000% | 6/15/20 | 18,000 | 19,725 |
| 1 New Jersey Transportation Trust Fund Authority Federal Highway Reimbursement Revenue | 5.000% | 6/15/21 | 27,500 | 28,772 |
| 1 New Jersey Transportation Trust Fund Authority Federal Highway Reimbursement Revenue | 5.000% | 6/15/21 | 9,000 | 10,005 |
| 1 New Jersey Transportation Trust Fund Authority Federal Highway Reimbursement Revenue | 5.000% | 6/15/22 | 10,000 | 11,241 |
| 1 New Jersey Transportation Trust Fund Authority Federal Highway Reimbursement Revenue | 5.000% | 6/15/22 | 50,000 | 52,255 |
| 1 New Jersey Transportation Trust Fund Authority Federal Highway Reimbursement Revenue | 5.000% | 6/15/23 | 10,000 | 11,318 |
| 1 New Jersey Transportation Trust Fund Authority Federal Highway Reimbursement Revenue | 5.000% | 6/15/23 | 50,650 | 52,901 |
| New Jersey Transportation Trust Fund Authority Transportation Program Revenue | 5.000% | 6/15/20 | 11,000 | 12,037 |
| New Jersey Transportation Trust Fund Authority Transportation Program Revenue | 5.000% | 6/15/21 | 12,550 | 13,853 |
| New Jersey Transportation Trust Fund Authority Transportation Program Revenue | 5.000% | 6/15/21 | 1,295 | 1,429 |
| New Jersey Transportation Trust Fund Authority Transportation Program Revenue | 5.000% | 6/15/22 | 2,890 | 3,223 |
| New Jersey Transportation Trust Fund Authority Transportation Program Revenue | 5.000% | 6/15/23 | 2,500 | 2,808 |
| 3 New Jersey Transportation Trust Fund Authority Transportation Program Revenue PUT | 1.630% | 12/15/19 | 41,000 | 40,242 |
| 3 New Jersey Transportation Trust Fund Authority Transportation Program Revenue PUT | 1.830% | 12/15/21 | 24,000 | 23,081 |
| New Jersey Transportation Trust Fund Authority Transportation System Revenue | 5.000% | 12/15/17 | 10,000 | 10,405 |
| New Jersey Transportation Trust Fund Authority Transportation System Revenue | 5.000% | 12/15/17 | 7,500 | 7,804 |
| New Jersey Transportation Trust Fund Authority Transportation System Revenue | 5.000% | 12/15/17 | 30,000 | 31,215 |
| New Jersey Transportation Trust Fund Authority Transportation System Revenue | 5.000% | 6/15/18 | 2,500 | 2,631 |
| New Jersey Transportation Trust Fund Authority Transportation System Revenue | 5.000% | 12/15/18 | 15,810 | 16,858 |
| New Jersey Transportation Trust Fund Authority Transportation System Revenue | 5.000% | 6/15/19 | 2,815 | 3,033 |
| New Jersey Transportation Trust Fund Authority Transportation System Revenue | 5.000% | 12/15/19 | 31,245 | 34,043 |
85
Limited-Term Tax-Exempt Fund
| | | | | |
| | | | | Face | Market |
| | | | Maturity | Amount | Value• |
| | | Coupon | Date | ($000) | ($000) |
| | New Jersey Transportation Trust Fund Authority Transportation System Revenue | 5.000% | 6/15/20 | 14,635 | 16,014 |
| | New Jersey Transportation Trust Fund Authority Transportation System Revenue | 5.250% | 12/15/20 (4) | 5,000 | 5,659 |
| | New Jersey Transportation Trust Fund Authority Transportation System Revenue | 5.250% | 12/15/20 (4) | 5,800 | 6,565 |
| | New Jersey Transportation Trust Fund Authority Transportation System Revenue | 5.250% | 12/15/20 | 4,875 | 5,419 |
| 2 | New Jersey Transportation Trust Fund Authority Transportation System Revenue TOB VRDO | 0.700% | 11/7/16 LOC | 18,750 | 18,750 |
| 3 | New Jersey Turnpike Authority Revenue | 1.180% | 1/1/18 | 40,000 | 40,084 |
| | New Jersey Turnpike Authority Revenue | 5.000% | 1/1/20 | 750 | 839 |
| | New Jersey Turnpike Authority Revenue | 5.000% | 1/1/21 | 1,000 | 1,149 |
| 3 | New Jersey Turnpike Authority Revenue PUT | 1.250% | 1/1/17 | 12,500 | 12,500 |
| 3 | New Jersey Turnpike Authority Revenue PUT | 1.310% | 1/1/18 | 10,115 | 10,143 |
| 3 | New Jersey Turnpike Authority Revenue PUT | 1.310% | 1/1/18 | 15,000 | 15,041 |
| | Rutgers State University New Jersey Revenue | 5.000% | 5/1/19 | 1,000 | 1,097 |
| | Rutgers State University New Jersey Revenue | 5.000% | 5/1/19 | 1,000 | 1,097 |
| | Rutgers State University New Jersey Revenue | 5.000% | 5/1/20 | 2,000 | 2,257 |
| | Sparta Township NJ Board of Education GO | 5.000% | 2/15/21 | 1,030 | 1,188 |
| | Tobacco Settlement Financing Corp. New Jersey Revenue | 0.000% | 6/1/41 | 225,000 | 59,850 |
| | Union County NJ GO | 4.000% | 2/15/19 | 4,255 | 4,546 |
| | Union County NJ GO | 4.000% | 2/15/20 | 5,355 | 5,857 |
| | Union County NJ GO | 5.000% | 2/15/21 | 5,615 | 6,511 |
| | Union County NJ GO | 5.000% | 2/15/22 | 6,275 | 7,465 |
| | | | | | 1,188,858 |
| New Mexico (0.5%) | | | | |
| | Albuquerque Bernalillo County NM Water Utility Authority Revenue | 5.000% | 7/1/20 | 2,000 | 2,284 |
| | Albuquerque Bernalillo County NM Water Utility Authority Revenue | 5.000% | 7/1/20 | 3,225 | 3,683 |
| | Albuquerque NM Municipal School District No. 12 GO | 5.000% | 8/1/20 | 6,580 | 7,522 |
| | Albuquerque NM Municipal School District No. 12 GO | 5.000% | 8/1/20 | 1,800 | 2,058 |
| | Albuquerque NM Municipal School District No. 12 GO | 5.000% | 8/1/21 | 5,450 | 6,400 |
| | Albuquerque NM Municipal School District No. 12 GO | 5.000% | 8/1/21 | 1,130 | 1,327 |
| | Farmington NM Pollution Control Revenue (El Paso Electric Co. Four Corners Project) PUT | 1.875% | 9/1/17 | 4,500 | 4,517 |
| | Farmington NM Pollution Control Revenue | | | | |
| | (Southern California Edison Co. Four Corners Project) PUT | 1.875% | 4/1/20 | 19,000 | 19,281 |
| | New Mexico Educational Assistance Foundation Revenue | 4.000% | 12/1/16 | 7,000 | 7,020 |
| | New Mexico Educational Assistance Foundation Revenue | 4.000% | 12/1/17 | 5,000 | 5,157 |
| | New Mexico Finance Authority Transportation Revenue | 5.000% | 6/15/17 | 9,000 | 9,243 |
| | New Mexico Hospital Equipment Loan Council Hospital System Revenue | | | | |
| | (Presbyterian Healthcare Services) | 5.000% | 8/1/21 | 1,600 | 1,860 |
| 2 | New Mexico Hospital Equipment Loan Council Hospital System Revenue | | | | |
| | (Presbyterian Healthcare Services) TOB VRDO | 0.660% | 11/7/16 | 6,660 | 6,660 |
| 3 | New Mexico Municipal Energy Acquisition Authority Gas Supply Revenue | 0.923% | 2/1/18 | 5,000 | 4,989 |
| 3 | New Mexico Municipal Energy Acquisition Authority Gas Supply Revenue | 0.973% | 8/1/18 | 5,200 | 5,189 |
| 3 | New Mexico Municipal Energy Acquisition Authority Gas Supply Revenue PUT | 1.103% | 8/1/19 | 37,500 | 37,321 |
| | New Mexico Severance Tax Revenue | 5.000% | 7/1/17 | 6,015 | 6,188 |
| | | | | | 130,699 |
| New York (13.3%) | | | | |
| | Albany NY Industrial Development Agency Civic Facility Revenue | | | | |
| | (Albany Medical Center Hospital Project) VRDO | 0.800% | 11/7/16 LOC | 3,905 | 3,905 |
| | Brooklyn NY Local Development Corp. PILOT Revenue (Brooklyn Events Center) | 5.000% | 7/15/21 | 1,000 | 1,146 |
| | Brooklyn NY Local Development Corp. PILOT Revenue (Brooklyn Events Center) | 5.000% | 7/15/22 | 2,000 | 2,337 |
| | Brooklyn NY Local Development Corp. PILOT Revenue (Brooklyn Events Center) | 5.000% | 7/15/23 | 1,385 | 1,643 |
| | Buffalo & Erie County NY Industrial Land Development Corp. Revenue | 5.000% | 11/15/20 | 1,265 | 1,413 |
| | Buffalo & Erie County NY Industrial Land Development Corp. Revenue | 5.000% | 11/15/21 | 1,355 | 1,537 |
| | Central Islip NY Union Free School District BAN | 2.000% | 8/16/17 | 8,500 | 8,564 |
| | Clarence NY BAN | 2.000% | 7/21/17 | 6,281 | 6,328 |
| | Dobbs Ferry NY Union Free School District BAN | 2.000% | 7/28/17 | 3,700 | 3,725 |
| | Dutchess County NY Local Development Corp. Revenue (Culinary Institute of America Project) | 5.000% | 7/1/21 | 300 | 346 |
| | Dutchess County NY Local Development Corp. Revenue (Culinary Institute of America Project) | 5.000% | 7/1/22 | 300 | 352 |
| | Dutchess County NY Local Development Corp. Revenue (Culinary Institute of America Project) | 5.000% | 7/1/23 | 350 | 419 |
| | Dutchess County NY Local Development Corp. Revenue (Culinary Institute of America Project) | 5.000% | 7/1/24 | 350 | 424 |
| 2,3 | Eaton Vance New York Municipal Bond Fund II | 1.480% | 7/1/19 | 5,750 | 5,751 |
| | Erie County NY Industrial Development Agency School Facility Revenue | | | | |
| | (Buffalo City School District Project) | 5.000% | 5/1/17 | 3,000 | 3,067 |
| | Erie County NY Industrial Development Agency School Facility Revenue | | | | |
| | (Buffalo City School District Project) | 5.000% | 5/1/17 | 1,125 | 1,150 |
| | Johnson City Central School District BAN | 2.000% | 6/22/17 | 8,070 | 8,119 |
| | Lewiston-Porter Central School District BAN | 2.000% | 6/15/17 | 8,975 | 9,025 |
| | Long Island NY Power Authority Electric System Revenue | 5.000% | 9/1/17 | 9,955 | 10,294 |
| | Long Island NY Power Authority Electric System Revenue | 5.000% | 5/1/18 (ETM) | 2,000 | 2,123 |
| | Long Island NY Power Authority Electric System Revenue | 5.000% | 5/1/19 (ETM) | 1,500 | 1,647 |
| | Long Island NY Power Authority Electric System Revenue | 5.000% | 9/1/20 | 1,295 | 1,473 |
86
Limited-Term Tax-Exempt Fund
| | | | |
| | | | Face | Market |
| | | Maturity | Amount | Value• |
| | Coupon | Date | ($000) | ($000) |
| Long Island NY Power Authority Electric System Revenue | 5.000% | 9/1/21 | 1,295 | 1,507 |
| Long Island NY Power Authority Electric System Revenue | 5.000% | 9/1/22 | 750 | 893 |
| Long Island NY Power Authority Electric System Revenue | 5.000% | 9/1/22 | 2,000 | 2,380 |
| Long Island NY Power Authority Electric System Revenue | 5.000% | 9/1/23 | 1,000 | 1,208 |
| 3 Long Island NY Power Authority Electric System Revenue PUT | 1.019% | 11/1/18 | 16,850 | 16,870 |
| 3 Long Island NY Power Authority Electric System Revenue PUT | 1.249% | 11/1/18 | 30,000 | 30,172 |
| Monroe County NY Industrial Development Agency School Facility Revenue | | | | |
| (Rochester Schools Modernization Project) | 5.000% | 5/1/18 | 2,000 | 2,121 |
| Monroe County NY Industrial Development Agency School Facility Revenue | | | | |
| (Rochester Schools Modernization Project) | 5.000% | 5/1/18 | 1,000 | 1,060 |
| Monroe County NY Industrial Development Agency School Facility Revenue | | | | |
| (Rochester Schools Modernization Project) | 5.000% | 5/1/19 | 3,520 | 3,861 |
| Monroe County NY Industrial Development Agency School Facility Revenue | | | | |
| (Rochester Schools Modernization Project) | 5.000% | 5/1/19 | 2,000 | 2,194 |
| Mount Vernon City School District BAN | 2.000% | 8/18/17 | 8,500 | 8,556 |
| Nassau County NY GO | 5.000% | 4/1/20 | 14,340 | 16,131 |
| Nassau County NY GO | 5.000% | 4/1/21 | 11,075 | 12,751 |
| Nassau County NY GO | 5.000% | 1/1/22 | 9,685 | 11,322 |
| Nassau County NY Local Economic Assistance & Financing Corp. Revenue | | | | |
| (Catholic Health Services) | 5.000% | 7/1/20 | 4,640 | 5,208 |
| Nassau County NY Local Economic Assistance & Financing Corp. Revenue | | | | |
| (South Nassau Communities Hospital) | 5.000% | 7/1/18 | 2,550 | 2,706 |
| Nassau County NY Local Economic Assistance & Financing Corp. Revenue | | | | |
| (South Nassau Communities Hospital) | 5.000% | 7/1/20 | 1,660 | 1,863 |
| Nassau County NY Local Economic Assistance & Financing Corp. Revenue | | | | |
| (Winthrop University Hospital Association Project) | 5.000% | 7/1/18 | 2,000 | 2,117 |
| Nassau County NY Local Economic Assistance & Financing Corp. Revenue | | | | |
| (Winthrop University Hospital Association Project) | 5.000% | 7/1/19 | 1,565 | 1,705 |
| Nassau County NY Local Economic Assistance Corp. Revenue | | | | |
| (Catholic Health Services of Long Island Obligated Group Project) | 4.000% | 7/1/19 | 375 | 400 |
| Nassau County NY Local Economic Assistance Corp. Revenue | | | | |
| (Catholic Health Services of Long Island Obligated Group Project) | 5.000% | 7/1/21 | 1,340 | 1,542 |
| New Rochelle NY School District TAN | 2.000% | 6/29/17 | 6,000 | 6,041 |
| New York City NY Build NYC Resource Corp. Revenue (Ethical Culture Fieldston Project) | 4.000% | 6/1/19 | 850 | 910 |
| New York City NY Build NYC Resource Corp. Revenue (Ethical Culture Fieldston Project) | 5.000% | 6/1/20 | 600 | 675 |
| New York City NY Build NYC Resource Corp. Revenue (Ethical Culture Fieldston Project) | 5.000% | 6/1/21 | 1,000 | 1,153 |
| New York City NY Build NYC Resource Corp. Revenue (Ethical Culture Fieldston Project) | 5.000% | 6/1/22 | 650 | 767 |
| New York City NY GO | 5.000% | 8/1/17 | 13,590 | 14,028 |
| New York City NY GO | 5.000% | 8/1/17 | 9,750 | 10,065 |
| New York City NY GO | 5.000% | 8/1/17 | 6,000 | 6,194 |
| New York City NY GO | 5.000% | 8/1/17 | 3,800 | 3,923 |
| New York City NY GO | 5.000% | 8/1/17 | 8,185 | 8,449 |
| New York City NY GO | 5.000% | 10/1/17 | 2,500 | 2,598 |
| New York City NY GO | 5.000% | 10/1/17 | 5,150 | 5,351 |
| New York City NY GO | 5.000% | 8/1/18 | 6,000 | 6,422 |
| New York City NY GO | 5.000% | 8/1/18 | 5,000 | 5,352 |
| New York City NY GO | 5.000% | 8/1/18 | 7,500 | 8,028 |
| New York City NY GO | 5.000% | 8/1/18 | 3,250 | 3,479 |
| New York City NY GO | 5.000% | 8/1/18 | 6,000 | 6,422 |
| New York City NY GO | 5.000% | 8/1/18 | 4,650 | 4,977 |
| New York City NY GO | 5.000% | 8/1/18 | 25,315 | 27,096 |
| New York City NY GO | 5.000% | 8/1/18 | 13,030 | 13,947 |
| New York City NY GO | 5.000% | 10/1/18 | 7,650 | 8,237 |
| New York City NY GO | 4.000% | 8/1/19 | 12,165 | 13,129 |
| New York City NY GO | 5.000% | 8/1/19 | 15,000 | 16,595 |
| New York City NY GO | 5.000% | 8/1/19 | 8,000 | 8,850 |
| New York City NY GO | 5.000% | 8/1/19 | 15,000 | 16,595 |
| New York City NY GO | 5.000% | 8/1/19 | 20,155 | 22,297 |
| New York City NY GO | 5.000% | 8/1/19 | 7,225 | 7,993 |
| New York City NY GO | 5.000% | 8/1/19 | 5,830 | 6,450 |
| New York City NY GO | 5.000% | 8/1/19 | 5,000 | 5,532 |
| New York City NY GO | 5.000% | 8/1/19 | 5,000 | 5,532 |
| New York City NY GO | 5.000% | 8/1/20 | 20,000 | 22,776 |
| New York City NY GO | 5.000% | 8/1/20 | 1,880 | 2,141 |
| New York City NY GO | 5.000% | 8/1/20 | 33,525 | 38,178 |
| New York City NY GO | 5.000% | 8/1/20 | 4,500 | 5,125 |
| New York City NY GO | 5.000% | 10/1/20 | 4,375 | 5,007 |
| 3 New York City NY GO | 1.100% | 8/1/21 | 6,350 | 6,350 |
| New York City NY GO | 5.000% | 8/1/21 | 11,985 | 14,013 |
| New York City NY GO | 5.000% | 8/1/21 | 2,000 | 2,338 |
87
Limited-Term Tax-Exempt Fund
| | | | |
| | | | Face | Market |
| | | Maturity | Amount | Value• |
| | Coupon | Date | ($000) | ($000) |
| New York City NY GO | 5.000% | 8/1/21 | 4,000 | 4,677 |
| New York City NY GO | 5.000% | 8/1/21 | 6,100 | 7,132 |
| New York City NY GO | 5.000% | 8/1/21 | 5,890 | 6,887 |
| New York City NY GO | 5.000% | 8/1/21 | 17,280 | 20,204 |
| New York City NY GO | 5.000% | 8/1/21 | 10,000 | 11,692 |
| New York City NY GO | 5.000% | 8/1/22 | 14,640 | 17,532 |
| New York City NY GO | 5.000% | 8/1/22 | 4,275 | 5,119 |
| New York City NY GO | 5.000% | 8/1/22 | 1,470 | 1,760 |
| New York City NY GO | 5.000% | 8/1/22 | 4,000 | 4,790 |
| New York City NY GO | 5.000% | 8/1/22 | 40,930 | 49,015 |
| New York City NY GO | 5.000% | 8/1/23 | 10,000 | 12,215 |
| New York City NY GO | 5.000% | 8/1/23 | 14,790 | 18,066 |
| 3 New York City NY GO | 1.030% | 8/1/27 | 18,500 | 18,491 |
| New York City NY GO VRDO | 0.510% | 11/1/16 LOC | 7,000 | 7,000 |
| New York City NY Health & Hospital Corp. Revenue (Health System) | 5.000% | 2/15/17 | 8,150 | 8,248 |
| New York City NY Health & Hospital Corp. Revenue (Health System) | 5.000% | 2/15/21 | 3,000 | 3,470 |
| New York City NY Housing Development Corp. Multi-Family Housing Revenue | 0.750% | 11/1/16 | 2,555 | 2,555 |
| New York City NY Housing Development Corp. Multi-Family Housing Revenue | 1.100% | 11/1/16 | 2,115 | 2,115 |
| New York City NY Housing Development Corp. Multi-Family Housing Revenue | 1.200% | 11/1/17 | 24,965 | 24,971 |
| New York City NY Housing Development Corp. Multi-Family Housing Revenue | 1.250% | 5/1/18 | 2,390 | 2,392 |
| New York City NY Housing Development Corp. Multi-Family Housing Revenue | 1.250% | 5/1/18 | 10,010 | 10,012 |
| New York City NY Housing Development Corp. Multi-Family Housing Revenue | 5.000% | 7/1/18 | 3,500 | 3,731 |
| New York City NY Housing Development Corp. Multi-Family Housing Revenue | 1.500% | 11/1/18 | 13,095 | 13,119 |
| New York City NY Housing Development Corp. Multi-Family Housing Revenue | 1.500% | 11/1/18 | 17,105 | 17,136 |
| New York City NY Housing Development Corp. Multi-Family Housing Revenue | 1.650% | 5/1/19 | 20,000 | 20,042 |
| New York City NY Housing Development Corp. Multi-Family Housing Revenue | 5.000% | 7/1/19 | 4,300 | 4,737 |
| New York City NY Housing Development Corp. Multi-Family Housing Revenue | 5.000% | 7/1/20 | 4,760 | 5,396 |
| New York City NY Housing Development Corp. Sustainable Neighborhood Revenue | 1.300% | 11/1/19 | 13,500 | 13,474 |
| New York City NY Housing Development Corp. Sustainable Neighborhood Revenue | 1.375% | 5/1/20 | 5,750 | 5,762 |
| New York City NY Housing Development Corp. Sustainable Neighborhood Revenue PUT | 1.450% | 4/29/20 | 4,000 | 3,984 |
| New York City NY Municipal Water Finance Authority Water & Sewer System Revenue | 5.000% | 6/15/18 | 4,180 | 4,203 |
| New York City NY Municipal Water Finance Authority Water & Sewer System Revenue | 5.000% | 6/15/19 | 3,000 | 3,141 |
| New York City NY Municipal Water Finance Authority Water & Sewer System Revenue | 5.000% | 6/15/19 | 5,000 | 5,525 |
| 2 New York City NY Municipal Water Finance Authority Water & Sewer System Revenue | | | | |
| TOB VRDO | 0.660% | 11/7/16 | 7,700 | 7,700 |
| 2 New York City NY Municipal Water Finance Authority Water & Sewer System Revenue | | | | |
| TOB VRDO | 0.730% | 11/7/16 | 18,440 | 18,440 |
| 2 New York City NY Municipal Water Finance Authority Water & Sewer System Revenue | | | | |
| TOB VRDO | 0.730% | 11/7/16 | 23,405 | 23,405 |
| New York City NY Municipal Water Finance Authority Water & Sewer System Revenue VRDO | 0.500% | 11/1/16 | 38,740 | 38,740 |
| New York City NY Municipal Water Finance Authority Water & Sewer System Revenue VRDO | 0.530% | 11/1/16 | 26,700 | 26,700 |
| New York City NY Sales Tax Asset Receivable Corp. Revenue | 5.000% | 10/15/21 | 19,510 | 23,127 |
| New York City NY Transitional Finance Authority Building Aid Revenue | 5.000% | 7/15/19 | 1,000 | 1,106 |
| New York City NY Transitional Finance Authority Building Aid Revenue | 5.000% | 7/15/20 | 1,500 | 1,709 |
| New York City NY Transitional Finance Authority Building Aid Revenue | 5.000% | 7/15/21 | 1,520 | 1,778 |
| New York City NY Transitional Finance Authority Building Aid Revenue | 5.000% | 7/15/22 | 4,585 | 5,510 |
| New York City NY Transitional Finance Authority Future Tax Revenue | 5.000% | 11/1/16 | 8,010 | 8,010 |
| New York City NY Transitional Finance Authority Future Tax Revenue | 5.000% | 11/1/16 (ETM) | 2,105 | 2,105 |
| New York City NY Transitional Finance Authority Future Tax Revenue | 5.000% | 2/1/17 (ETM) | 295 | 298 |
| New York City NY Transitional Finance Authority Future Tax Revenue | 5.000% | 2/1/17 | 2,205 | 2,229 |
| New York City NY Transitional Finance Authority Future Tax Revenue | 5.000% | 11/1/17 (ETM) | 825 | 860 |
| New York City NY Transitional Finance Authority Future Tax Revenue | 5.000% | 11/1/17 | 6,175 | 6,437 |
| New York City NY Transitional Finance Authority Future Tax Revenue | 5.000% | 11/1/17 | 20,000 | 20,850 |
| New York City NY Transitional Finance Authority Future Tax Revenue | 5.000% | 11/1/17 | 20,000 | 20,850 |
| New York City NY Transitional Finance Authority Future Tax Revenue | 5.000% | 11/1/18 | 7,455 | 8,058 |
| New York City NY Transitional Finance Authority Future Tax Revenue | 5.000% | 11/15/18 | 11,950 | 12,935 |
| New York City NY Transitional Finance Authority Future Tax Revenue | 5.000% | 11/1/19 | 8,560 | 9,573 |
| New York City NY Transitional Finance Authority Future Tax Revenue | 5.000% | 11/1/19 | 25,115 | 28,087 |
| New York City NY Transitional Finance Authority Future Tax Revenue | 5.000% | 2/1/20 | 6,395 | 7,203 |
| New York City NY Transitional Finance Authority Future Tax Revenue | 5.000% | 2/1/20 | 8,925 | 10,052 |
| New York City NY Transitional Finance Authority Future Tax Revenue | 5.000% | 11/1/20 | 3,090 | 3,563 |
| New York City NY Transitional Finance Authority Future Tax Revenue | 5.000% | 11/1/21 | 9,000 | 10,658 |
| New York City NY Transitional Finance Authority Future Tax Revenue | 5.000% | 11/1/22 | 6,000 | 7,263 |
| 2 New York City NY Transitional Finance Authority Future Tax Revenue TOB VRDO | 0.620% | 11/1/16 | 3,525 | 3,525 |
| 2 New York City NY Transitional Finance Authority Future Tax Revenue TOB VRDO | 0.670% | 11/7/16 | 2,200 | 2,200 |
| New York City NY Trust for Cultural Resources Revenue (Museum of Modern Art) | 4.000% | 2/1/23 | 20,000 | 23,208 |
| New York City NY Trust for Cultural Resources Revenue (The Juilliard School) PUT | 1.350% | 8/1/17 | 7,300 | 7,325 |
| New York City NY Trust for Cultural Resources Revenue (Whitney Museum of American Art) | 5.000% | 7/1/17 | 6,250 | 6,421 |
| New York Convention Center Development Corp. Revenue | 5.000% | 11/15/21 | 2,000 | 2,352 |
| New York Convention Center Development Corp. Revenue | 5.000% | 11/15/22 | 1,000 | 1,202 |
88
Limited-Term Tax-Exempt Fund
| | | | |
| | | | Face | Market |
| | | Maturity | Amount | Value• |
| | Coupon | Date | ($000) | ($000) |
| 3 New York Metropolitan Transportation Authority Revenue | 1.043% | 11/1/16 | 3,495 | 3,495 |
| New York Metropolitan Transportation Authority Revenue | 5.000% | 11/15/16 | 6,000 | 6,010 |
| 3 New York Metropolitan Transportation Authority Revenue | 1.183% | 11/1/17 | 2,950 | 2,954 |
| New York Metropolitan Transportation Authority Revenue | 5.000% | 11/15/17 | 5,000 | 5,218 |
| New York Metropolitan Transportation Authority Revenue | 5.000% | 11/15/17 | 7,000 | 7,306 |
| New York Metropolitan Transportation Authority Revenue | 5.000% | 11/15/17 | 12,500 | 13,046 |
| New York Metropolitan Transportation Authority Revenue | 5.000% | 11/15/18 | 1,500 | 1,622 |
| New York Metropolitan Transportation Authority Revenue | 5.000% | 11/15/18 | 2,000 | 2,163 |
| New York Metropolitan Transportation Authority Revenue | 5.000% | 11/15/18 | 1,255 | 1,357 |
| New York Metropolitan Transportation Authority Revenue | 5.000% | 11/15/18 | 4,055 | 4,386 |
| New York Metropolitan Transportation Authority Revenue | 5.000% | 11/15/18 | 2,650 | 2,866 |
| New York Metropolitan Transportation Authority Revenue | 5.000% | 11/15/18 | 1,500 | 1,622 |
| New York Metropolitan Transportation Authority Revenue | 5.000% | 11/15/18 | 2,500 | 2,704 |
| New York Metropolitan Transportation Authority Revenue | 5.000% | 11/15/18 | 4,775 | 5,165 |
| New York Metropolitan Transportation Authority Revenue | 5.000% | 11/15/18 | 1,000 | 1,082 |
| New York Metropolitan Transportation Authority Revenue | 5.000% | 11/15/19 | 1,000 | 1,115 |
| New York Metropolitan Transportation Authority Revenue | 5.000% | 11/15/19 | 1,100 | 1,226 |
| New York Metropolitan Transportation Authority Revenue | 5.000% | 11/15/19 | 9,535 | 10,628 |
| New York Metropolitan Transportation Authority Revenue | 5.000% | 11/15/19 | 8,930 | 9,954 |
| New York Metropolitan Transportation Authority Revenue | 5.000% | 11/15/19 | 4,725 | 5,267 |
| New York Metropolitan Transportation Authority Revenue | 5.000% | 11/15/19 | 2,530 | 2,820 |
| New York Metropolitan Transportation Authority Revenue | 5.500% | 11/15/19 (14) | 5,000 | 5,648 |
| New York Metropolitan Transportation Authority Revenue | 5.000% | 11/15/20 | 1,560 | 1,785 |
| New York Metropolitan Transportation Authority Revenue | 5.000% | 11/15/20 | 5,000 | 5,720 |
| New York Metropolitan Transportation Authority Revenue | 5.000% | 11/15/20 | 2,400 | 2,746 |
| New York Metropolitan Transportation Authority Revenue | 5.000% | 11/15/21 | 1,230 | 1,440 |
| New York Metropolitan Transportation Authority Revenue | 5.000% | 11/15/21 | 5,000 | 5,856 |
| New York Metropolitan Transportation Authority Revenue | 5.000% | 11/15/21 | 1,750 | 2,049 |
| New York Metropolitan Transportation Authority Revenue | 5.000% | 11/15/21 | 1,500 | 1,757 |
| New York Metropolitan Transportation Authority Revenue | 5.000% | 11/15/22 | 2,250 | 2,693 |
| New York Metropolitan Transportation Authority Revenue | 5.000% | 11/15/22 | 16,145 | 19,322 |
| New York Metropolitan Transportation Authority Revenue | 5.000% | 11/15/22 | 1,000 | 1,197 |
| New York Metropolitan Transportation Authority Revenue | 5.000% | 11/15/23 | 1,000 | 1,219 |
| New York Metropolitan Transportation Authority Revenue | 5.000% | 11/15/24 | 2,775 | 3,340 |
| New York Metropolitan Transportation Authority Revenue (Dedicated Tax Fund) | 2.000% | 3/1/17 | 15,000 | 15,067 |
| New York Metropolitan Transportation Authority Revenue (Dedicated Tax Fund) | 2.000% | 6/1/17 | 5,000 | 5,035 |
| New York Metropolitan Transportation Authority Revenue (Dedicated Tax Fund) | 2.000% | 6/1/17 | 19,065 | 19,202 |
| New York Metropolitan Transportation Authority Revenue (Dedicated Tax Fund) | 4.000% | 6/1/17 | 67,725 | 69,006 |
| 3 New York Metropolitan Transportation Authority Revenue (Dedicated Tax Fund) | 1.580% | 11/1/19 | 9,300 | 9,388 |
| New York Metropolitan Transportation Authority Revenue (Dedicated Tax Fund) | 5.000% | 11/15/20 | 4,600 | 5,300 |
| 3 New York Metropolitan Transportation Authority Revenue (Dedicated Tax Fund) PUT | 1.010% | 6/1/17 | 19,850 | 19,823 |
| 3 New York Metropolitan Transportation Authority Revenue (Dedicated Tax Fund) PUT | 1.000% | 11/1/18 | 2,000 | 2,001 |
| 3 New York Metropolitan Transportation Authority Revenue (Dedicated Tax Fund) PUT | 1.080% | 11/1/19 | 2,750 | 2,750 |
| 3 New York Metropolitan Transportation Authority Revenue (Dedicated Tax Fund) PUT | 1.210% | 11/1/19 | 21,000 | 21,048 |
| New York Metropolitan Transportation Authority Revenue (Transit Revenue) | 5.000% | 11/15/17 | 2,500 | 2,609 |
| New York Metropolitan Transportation Authority Revenue (Transit Revenue) | 5.000% | 11/15/18 | 4,000 | 4,326 |
| New York Metropolitan Transportation Authority Revenue (Transit Revenue) | 5.000% | 11/15/19 | 3,500 | 3,901 |
| 2 New York Metropolitan Transportation Authority Revenue (Transit Revenue) TOB VRDO | 0.740% | 11/7/16 LOC | 13,955 | 13,955 |
| 3 New York Metropolitan Transportation Authority Revenue PUT | 1.053% | 11/1/16 | 12,500 | 12,500 |
| 3 New York Metropolitan Transportation Authority Revenue PUT | 1.203% | 11/1/16 | 15,000 | 15,000 |
| 3 New York Metropolitan Transportation Authority Revenue PUT | 0.834% | 5/15/17 (4) | 17,500 | 17,499 |
| 3 New York Metropolitan Transportation Authority Revenue PUT | 0.703% | 11/1/17 | 7,280 | 7,276 |
| 3 New York Metropolitan Transportation Authority Revenue PUT | 1.193% | 11/1/17 | 8,760 | 8,769 |
| 3 New York Metropolitan Transportation Authority Revenue PUT | 0.990% | 11/15/17 | 49,600 | 49,547 |
| 3 New York Metropolitan Transportation Authority Revenue PUT | 0.964% | 5/15/18 (4) | 20,750 | 20,764 |
| 3 New York Metropolitan Transportation Authority Revenue PUT | 0.653% | 11/1/19 | 5,215 | 5,178 |
| New York Metropolitan Transportation Authority Revenue PUT | 5.000% | 2/15/20 | 59,000 | 65,914 |
| 3 New York Metropolitan Transportation Authority Revenue PUT | 1.210% | 6/1/20 | 87,500 | 87,398 |
| New York Metropolitan Transportation Authority Revenue PUT | 4.000% | 11/15/20 | 11,000 | 12,126 |
| 2 New York Metropolitan Transportation Authority Revenue TOB VRDO | 0.780% | 11/7/16 | 12,970 | 12,970 |
| New York State Dormitory Authority Revenue (Brooklyn Law School) | 4.000% | 7/1/17 (ETM) | 2,360 | 2,411 |
| New York State Dormitory Authority Revenue (Brooklyn Law School) | 5.000% | 7/1/18 (ETM) | 2,105 | 2,249 |
| New York State Dormitory Authority Revenue (Brooklyn Law School) | 5.000% | 7/1/19 (ETM) | 2,180 | 2,408 |
| New York State Dormitory Authority Revenue (Columbia University) | 5.000% | 10/1/19 | 4,275 | 4,774 |
| New York State Dormitory Authority Revenue (Columbia University) | 5.000% | 10/1/20 | 1,125 | 1,296 |
| New York State Dormitory Authority Revenue (Columbia University) | 5.000% | 10/1/21 | 1,540 | 1,825 |
| New York State Dormitory Authority Revenue (Columbia University) | 5.000% | 10/1/22 | 1,500 | 1,824 |
| New York State Dormitory Authority Revenue (Department of Health) | 5.000% | 7/1/22 | 8,500 | 10,128 |
| New York State Dormitory Authority Revenue (Department of Health) | 5.000% | 7/1/23 | 6,555 | 7,952 |
| New York State Dormitory Authority Revenue (Icahn School of Medicine at Mount Sinai) | 4.000% | 7/1/20 | 5,000 | 5,452 |
89
Limited-Term Tax-Exempt Fund
| | | | |
| | | | Face | Market |
| | | Maturity | Amount | Value• |
| | Coupon | Date | ($000) | ($000) |
| New York State Dormitory Authority Revenue (Icahn School of Medicine at Mount Sinai) | 5.000% | 7/1/21 | 2,265 | 2,607 |
| New York State Dormitory Authority Revenue (Icahn School of Medicine at Mount Sinai) | 5.000% | 7/1/22 | 4,000 | 4,702 |
| New York State Dormitory Authority Revenue (Mental Health Services Facilities Improvement) | 5.000% | 8/15/17 | 6,185 | 6,392 |
| New York State Dormitory Authority Revenue (Mental Health Services Facilities Improvement) | 5.000% | 8/15/17 (ETM) | 55 | 57 |
| New York State Dormitory Authority Revenue | | | | |
| (Mount Sinai School of Medicine of New York University) | 5.000% | 7/1/17 | 1,750 | 1,798 |
| New York State Dormitory Authority Revenue | | | | |
| (Mount Sinai School of Medicine of New York University) | 5.000% | 7/1/18 | 2,500 | 2,663 |
| New York State Dormitory Authority Revenue (New York University Hospitals Center) | 5.000% | 7/1/21 | 2,400 | 2,794 |
| New York State Dormitory Authority Revenue (North Shore - Long Island Jewish Obligated Group) | 5.000% | 5/1/18 | 1,115 | 1,180 |
| New York State Dormitory Authority Revenue (North Shore - Long Island Jewish Obligated Group) | 5.000% | 5/1/21 | 2,555 | 2,955 |
| New York State Dormitory Authority Revenue (North Shore - Long Island Jewish Obligated Group) | 5.000% | 5/1/22 | 2,425 | 2,872 |
| New York State Dormitory Authority Revenue (Pace University) | 5.000% | 5/1/17 (ETM) | 25 | 26 |
| New York State Dormitory Authority Revenue (Pace University) | 5.000% | 5/1/17 | 975 | 992 |
| New York State Dormitory Authority Revenue (Pace University) | 4.000% | 5/1/20 (ETM) | 45 | 49 |
| New York State Dormitory Authority Revenue (Pace University) | 4.000% | 5/1/20 | 1,695 | 1,814 |
| New York State Dormitory Authority Revenue (Personal Income Tax) | 5.000% | 2/15/17 (ETM) | 5 | 5 |
| New York State Dormitory Authority Revenue (Personal Income Tax) | 5.000% | 2/15/17 | 16,840 | 17,054 |
| New York State Dormitory Authority Revenue (Personal Income Tax) | 5.000% | 2/15/17 (ETM) | 5 | 5 |
| New York State Dormitory Authority Revenue (Personal Income Tax) | 5.000% | 2/15/17 (ETM) | 5 | 5 |
| New York State Dormitory Authority Revenue (Personal Income Tax) | 5.000% | 2/15/17 | 9,600 | 9,722 |
| New York State Dormitory Authority Revenue (Personal Income Tax) | 5.000% | 2/15/18 | 27,490 | 28,941 |
| New York State Dormitory Authority Revenue (Personal Income Tax) | 5.000% | 2/15/18 (ETM) | 4,050 | 4,266 |
| New York State Dormitory Authority Revenue (Personal Income Tax) | 5.000% | 2/15/18 | 7,465 | 7,859 |
| New York State Dormitory Authority Revenue (Personal Income Tax) | 5.000% | 3/15/18 | 18,010 | 19,020 |
| New York State Dormitory Authority Revenue (Personal Income Tax) | 5.000% | 8/15/18 | 2,400 | 2,573 |
| New York State Dormitory Authority Revenue (Personal Income Tax) | 5.000% | 12/15/18 | 22,675 | 24,601 |
| New York State Dormitory Authority Revenue (Personal Income Tax) | 5.000% | 2/15/19 | 10,000 | 10,906 |
| New York State Dormitory Authority Revenue (Personal Income Tax) | 5.000% | 2/15/19 (ETM) | 5 | 5 |
| New York State Dormitory Authority Revenue (Personal Income Tax) | 5.000% | 2/15/19 | 4,145 | 4,520 |
| New York State Dormitory Authority Revenue (Personal Income Tax) | 5.250% | 2/15/19 (Prere.) | 5 | 5 |
| New York State Dormitory Authority Revenue (Personal Income Tax) | 5.250% | 2/15/19 (Prere.) | 15 | 16 |
| New York State Dormitory Authority Revenue (Personal Income Tax) | 5.000% | 8/15/19 | 11,665 | 12,938 |
| New York State Dormitory Authority Revenue (Personal Income Tax) | 5.000% | 2/15/20 | 4,000 | 4,493 |
| New York State Dormitory Authority Revenue (Personal Income Tax) | 5.000% | 8/15/20 | 9,550 | 10,888 |
| New York State Dormitory Authority Revenue (Personal Income Tax) | 5.000% | 3/15/21 | 33,395 | 38,654 |
| New York State Dormitory Authority Revenue (Personal Income Tax) | 5.000% | 3/15/21 | 12,620 | 14,607 |
| New York State Dormitory Authority Revenue (Personal Income Tax) | 5.000% | 6/15/21 | 7,710 | 8,980 |
| New York State Dormitory Authority Revenue (Personal Income Tax) | 5.250% | 2/15/22 | 4,980 | 5,450 |
| New York State Dormitory Authority Revenue (Personal Income Tax) | 5.000% | 2/15/23 | 41,000 | 49,468 |
| New York State Dormitory Authority Revenue (School Districts Financing Program) | 5.000% | 10/1/17 | 7,030 | 7,299 |
| New York State Dormitory Authority Revenue (School Districts Financing Program) | 5.000% | 10/1/17 (4) | 3,250 | 3,375 |
| New York State Dormitory Authority Revenue (School Districts Financing Program) | 5.000% | 10/1/17 | 2,000 | 2,077 |
| New York State Dormitory Authority Revenue (School Districts Financing Program) | 5.000% | 10/1/18 (4) | 1,350 | 1,454 |
| New York State Dormitory Authority Revenue (School Districts Financing Program) | 5.000% | 10/1/18 (4) | 2,500 | 2,693 |
| New York State Dormitory Authority Revenue (School Districts Financing Program) | 5.000% | 10/1/18 | 1,500 | 1,615 |
| New York State Dormitory Authority Revenue (School Districts Financing Program) | 5.000% | 10/1/18 (4) | 5,000 | 5,382 |
| New York State Dormitory Authority Revenue (School Districts Financing Program) | 5.000% | 10/1/18 | 2,155 | 2,319 |
| New York State Dormitory Authority Revenue (School Districts Financing Program) | 5.000% | 10/1/19 (15) | 1,000 | 1,114 |
| New York State Dormitory Authority Revenue (School Districts Financing Program) | 5.000% | 10/1/19 (4) | 3,200 | 3,564 |
| New York State Dormitory Authority Revenue (School Districts Financing Program) | 5.000% | 10/1/19 (4) | 6,010 | 6,690 |
| New York State Dormitory Authority Revenue (School Districts Financing Program) | 5.000% | 10/1/19 | 5,905 | 6,562 |
| New York State Dormitory Authority Revenue (School Districts Financing Program) | 5.000% | 10/1/20 (15) | 1,690 | 1,939 |
| New York State Dormitory Authority Revenue (School Districts Financing Program) | 5.000% | 10/1/20 (4) | 1,125 | 1,291 |
| New York State Dormitory Authority Revenue (School Districts Financing Program) | 5.000% | 10/1/21 (15) | 1,425 | 1,678 |
| New York State Dormitory Authority Revenue (Service Contract) | 5.000% | 7/1/17 | 10,510 | 10,803 |
| New York State Dormitory Authority Revenue (State University Educational Facilities) | 5.000% | 5/15/18 | 5,000 | 5,314 |
| New York State Dormitory Authority Revenue (State University Educational Facilities) | 5.000% | 5/15/19 | 3,500 | 3,851 |
| New York State Dormitory Authority Revenue (Yeshiva University) | 5.000% | 9/1/17 (ETM) | 385 | 398 |
| New York State Dormitory Authority Revenue (Yeshiva University) | 5.000% | 9/1/17 | 1,795 | 1,830 |
| New York State Dormitory Authority Revenue (Yeshiva University) | 5.000% | 9/1/19 (Prere.) | 230 | 254 |
| New York State Dormitory Authority Revenue (Yeshiva University) | 5.000% | 9/1/21 | 1,060 | 1,110 |
| New York State Dormitory Authority Sales Tax Revenue | 5.000% | 3/15/21 | 60,000 | 69,782 |
| New York State Dormitory Authority Sales Tax Revenue | 5.000% | 3/15/22 | 2,500 | 2,984 |
| New York State Environmental Facilities Corp. Revenue | | | | |
| (State Clean Water & Drinking Water Revolving Funds) | 5.000% | 6/15/18 | 4,900 | 5,232 |
| New York State Environmental Facilities Corp. Revenue | | | | |
| (State Clean Water & Drinking Water Revolving Funds) | 5.000% | 6/15/18 | 10,000 | 10,678 |
| New York State Environmental Facilities Corp. Revenue | | | | |
| (State Clean Water & Drinking Water Revolving Funds) | 5.000% | 6/15/19 | 3,700 | 4,094 |
90
Limited-Term Tax-Exempt Fund
| | | | | |
| | | | | Face | Market |
| | | | Maturity | Amount | Value• |
| | | Coupon | Date | ($000) | ($000) |
| | New York State Environmental Facilities Corp. Revenue | | | | |
| | (State Clean Water & Drinking Water Revolving Funds) | 5.000% | 6/15/20 | 3,000 | 3,427 |
| | New York State GO | 5.000% | 3/1/19 | 12,715 | 13,928 |
| | New York State Housing Finance Agency Affordable Housing Revenue | 1.150% | 5/1/18 | 4,150 | 4,152 |
| | New York State Housing Finance Agency Affordable Housing Revenue | 1.150% | 5/1/18 | 3,900 | 3,904 |
| | New York State Housing Finance Agency Affordable Housing Revenue | 1.150% | 5/1/18 | 1,250 | 1,251 |
| | New York State Housing Finance Agency Affordable Housing Revenue | 1.250% | 5/1/18 | 2,500 | 2,505 |
| | New York State Housing Finance Agency Affordable Housing Revenue | 1.250% | 5/1/18 | 4,750 | 4,759 |
| | New York State Housing Finance Agency Revenue | 1.050% | 5/1/19 | 850 | 847 |
| | New York State Housing Finance Agency Revenue | 1.100% | 11/1/19 | 1,000 | 994 |
| | New York State Housing Finance Agency Revenue | 1.250% | 5/1/20 | 7,500 | 7,465 |
| | New York State Local Government Assistance Corp. Revenue | 5.000% | 4/1/18 | 6,325 | 6,696 |
| | New York State Mortgage Agency Homeowner Mortgage Revenue | 2.625% | 4/1/41 | 585 | 596 |
| | New York State Thruway Authority Revenue | 5.000% | 1/1/19 | 3,700 | 4,015 |
| | New York State Thruway Authority Revenue | 5.000% | 5/1/19 | 83,125 | 91,228 |
| | New York State Thruway Authority Revenue | 5.000% | 1/1/20 | 1,500 | 1,681 |
| | New York State Thruway Authority Revenue | 5.000% | 1/1/21 | 2,450 | 2,828 |
| | New York State Thruway Authority Revenue | 5.000% | 1/1/22 | 1,500 | 1,776 |
| | New York State Thruway Authority Revenue (Highway & Bridge Trust Fund) | 5.000% | 4/1/17 | 18,145 | 18,477 |
| | New York State Thruway Authority Revenue (Highway & Bridge Trust Fund) | 5.000% | 4/1/18 | 3,500 | 3,706 |
| | New York State Thruway Authority Revenue (Personal Income Tax) | 5.000% | 3/15/18 | 625 | 660 |
| | New York State Thruway Authority Revenue (Personal Income Tax) | 5.000% | 3/15/18 | 8,440 | 8,913 |
| | New York State Thruway Authority Revenue (Personal Income Tax) | 5.000% | 3/15/19 | 500 | 547 |
| | New York State Urban Development Corp. Revenue | 5.250% | 1/1/17 | 10,095 | 10,172 |
| | New York State Urban Development Corp. Revenue (Personal Income Tax) | 5.000% | 12/15/16 | 20,000 | 20,108 |
| | New York State Urban Development Corp. Revenue (Personal Income Tax) | 5.000% | 3/15/18 | 20,000 | 21,121 |
| | New York State Urban Development Corp. Revenue (Personal Income Tax) | 5.000% | 3/15/19 | 8,030 | 8,783 |
| | New York State Urban Development Corp. Revenue (Personal Income Tax) | 5.000% | 3/15/20 | 10,145 | 11,424 |
| | New York State Urban Development Corp. Revenue (Personal Income Tax) | 5.000% | 3/15/20 | 8,525 | 9,600 |
| | New York State Urban Development Corp. Revenue (Personal Income Tax) | 5.000% | 3/15/20 | 23,430 | 26,383 |
| | New York State Urban Development Corp. Revenue (Personal Income Tax) | 5.000% | 3/15/21 | 24,900 | 28,821 |
| | New York State Urban Development Corp. Revenue (Personal Income Tax) | 5.000% | 3/15/21 | 10,625 | 12,298 |
| | New York State Urban Development Corp. Revenue (Personal Income Tax) | 5.000% | 3/15/21 | 50,035 | 57,915 |
| | New York State Urban Development Corp. Revenue (Personal Income Tax) | 5.000% | 3/15/22 | 45,795 | 54,261 |
| | New York State Urban Development Corp. Revenue (Personal Income Tax) | 5.000% | 3/15/22 | 25,000 | 29,622 |
| 2 | New York State Urban Development Corp. Revenue (Personal Income Tax) TOB VRDO | 0.730% | 11/7/16 | 10,115 | 10,115 |
| | Niagara NY Frontier Transportation Authority Airport Revenue | | | | |
| | (Buffalo Niagara International Airport) | 5.000% | 4/1/17 | 1,000 | 1,017 |
| | Niagara NY Frontier Transportation Authority Airport Revenue | | | | |
| | (Buffalo Niagara International Airport) | 4.000% | 4/1/18 | 500 | 521 |
| | Niagara NY Frontier Transportation Authority Airport Revenue | | | | |
| | (Buffalo Niagara International Airport) | 5.000% | 4/1/19 | 500 | 545 |
| | North Syracuse NY Central School District BAN | 2.000% | 8/11/17 | 4,448 | 4,479 |
| 2,3 | Nuveen New York AMT-Free Municipal Income Fund iMTP | 1.250% | 10/1/17 | 17,500 | 17,501 |
| 2 | Nuveen New York AMT-Free Municipal Income Fund VRDP VRDO | 0.720% | 11/7/16 LOC | 8,500 | 8,500 |
| 2 | Nuveen New York AMT-Free Municipal Income Fund VRDP VRDO | 0.780% | 11/7/16 LOC | 24,000 | 24,000 |
| | Onondaga County NY Civic Development Corp. Revenue (St. Joseph’s Hospital & Health Center) | 5.000% | 7/1/19 (ETM) | 500 | 539 |
| | Oyster Bay NY BAN | 2.750% | 2/3/17 | 15,000 | 15,030 |
| | Oyster Bay NY GO | 4.000% | 1/15/17 (15) | 1,500 | 1,509 |
| | Oyster Bay NY GO | 3.250% | 8/1/17 | 4,155 | 4,174 |
| | Oyster Bay NY GO | 4.000% | 8/15/17 (15) | 2,500 | 2,557 |
| | Oyster Bay NY GO | 4.000% | 1/15/18 (15) | 3,000 | 3,101 |
| | Oyster Bay NY GO | 3.250% | 8/1/18 | 8,560 | 8,617 |
| | Oyster Bay NY GO | 4.000% | 8/15/18 (15) | 2,000 | 2,097 |
| | Oyster Bay NY GO | 5.000% | 1/15/19 (15) | 5,140 | 5,551 |
| | Oyster Bay NY GO | 5.000% | 8/15/19 (15) | 3,125 | 3,436 |
| | Oyster Bay NY GO | 5.000% | 1/15/20 (15) | 3,105 | 3,448 |
| | Oyster Bay NY GO | 5.000% | 8/15/20 (15) | 4,350 | 4,901 |
| | Suffolk County NY Economic Development Corp. Revenue (Catholic Health Services) | 5.000% | 7/1/17 | 2,150 | 2,208 |
| | Suffolk County NY Economic Development Corp. Revenue (Catholic Health Services) | 5.000% | 7/1/18 | 4,000 | 4,256 |
| | Suffolk County NY Economic Development Corp. Revenue (Catholic Health Services) | 5.000% | 7/1/19 | 9,190 | 10,086 |
| | Suffolk County NY Economic Development Corp. Revenue (Catholic Health Services) | 5.000% | 7/1/20 | 835 | 941 |
| | Suffolk County NY GO | 5.000% | 2/1/18 (4) | 7,805 | 8,190 |
| | Suffolk County NY GO | 5.000% | 2/1/19 (4) | 3,915 | 4,246 |
| | Suffolk County NY GO | 5.000% | 2/1/20 (4) | 4,000 | 4,463 |
| | Suffolk County NY GO | 5.000% | 2/1/21 (4) | 4,580 | 5,247 |
| | Suffolk County NY GO | 5.000% | 5/15/22 (4) | 10,310 | 12,157 |
| | Suffolk County NY GO | 5.000% | 5/15/23 (4) | 10,845 | 13,048 |
| | Tobacco Settlement Financing Corp. New York Revenue | 5.000% | 6/1/17 | 1,225 | 1,255 |
| | Tobacco Settlement Financing Corp. New York Revenue | 5.000% | 6/1/17 | 6,500 | 6,660 |
91
Limited-Term Tax-Exempt Fund
| | | | |
| | | | Face | Market |
| | | Maturity | Amount | Value• |
| | Coupon | Date | ($000) | ($000) |
| Tobacco Settlement Financing Corp. New York Revenue | 5.000% | 6/1/21 | 540 | 542 |
| Tobacco Settlement Financing Corp. New York Revenue | 5.000% | 6/1/21 | 10,100 | 10,339 |
| Tobacco Settlement Financing Corp. New York Revenue | 5.000% | 6/1/22 | 5,000 | 5,118 |
| Triborough Bridge & Tunnel Authority New York Revenue | 5.000% | 11/15/17 | 3,815 | 3,982 |
| 3 Triborough Bridge & Tunnel Authority New York Revenue | 0.980% | 1/1/18 (4) | 5,000 | 4,999 |
| Triborough Bridge & Tunnel Authority New York Revenue | 5.000% | 1/1/18 | 13,435 | 14,079 |
| Triborough Bridge & Tunnel Authority New York Revenue | 5.000% | 11/15/18 | 7,000 | 7,573 |
| 3 Triborough Bridge & Tunnel Authority New York Revenue | 1.070% | 1/1/19 (4) | 1,700 | 1,699 |
| Triborough Bridge & Tunnel Authority New York Revenue | 5.000% | 11/15/20 | 500 | 576 |
| Triborough Bridge & Tunnel Authority New York Revenue | 5.000% | 11/15/21 | 1,000 | 1,184 |
| Triborough Bridge & Tunnel Authority New York Revenue | 5.000% | 11/15/22 | 850 | 1,031 |
| 3 Triborough Bridge & Tunnel Authority New York Revenue PUT | 0.873% | 1/3/17 | 7,500 | 7,499 |
| 3 Triborough Bridge & Tunnel Authority New York Revenue PUT | 0.753% | 2/1/19 | 11,350 | 11,243 |
| Troy NY Capital Resource Corp. Revenue (Rensselaer Polytechnic Institute Project) | 5.000% | 8/1/21 | 645 | 745 |
| Troy NY Capital Resource Corp. Revenue (Rensselaer Polytechnic Institute Project) | 5.000% | 8/1/22 | 1,000 | 1,181 |
| Utility Debt Securitization Authority New York Revenue | 5.000% | 12/15/18 | 500 | 503 |
| Westchester County NY Health Care Corp. Revenue | 5.000% | 11/1/16 | 8,170 | 8,170 |
| Westchester County NY Health Care Corp. Revenue | 5.000% | 11/1/17 | 8,600 | 8,938 |
| Westchester County NY Health Care Corp. Revenue | 5.000% | 11/1/21 | 4,700 | 5,479 |
| Windsor Central School District BAN | 1.500% | 8/18/17 | 7,255 | 7,274 |
| Yonkers NY GO | 4.000% | 10/1/17 | 505 | 519 |
| Yonkers NY GO | 3.000% | 7/1/18 | 500 | 515 |
| Yonkers NY GO | 3.000% | 8/15/18 | 1,000 | 1,033 |
| Yonkers NY GO | 4.000% | 3/15/19 (4) | 1,700 | 1,815 |
| Yonkers NY GO | 3.000% | 8/15/19 | 885 | 923 |
| Yonkers NY GO | 3.000% | 8/15/20 | 1,115 | 1,163 |
| | | | | 3,180,535 |
| North Carolina (1.4%) | | | | |
| Buncombe County NC Limited Obligation Revenue | 5.000% | 6/1/21 | 6,070 | 7,070 |
| Buncombe County NC Limited Obligation Revenue | 5.000% | 6/1/22 | 4,070 | 4,852 |
| Charlotte NC Water & Sewer System Revenue | 5.000% | 12/1/17 | 3,000 | 3,138 |
| Charlotte NC Water & Sewer System Revenue | 5.000% | 12/1/18 | 2,625 | 2,849 |
| 1 Charlotte-Mecklenburg NC Hospital Authority Health Care System Revenue | | | | |
| (Carolinas HealthCare System) | 5.000% | 1/15/22 | 4,250 | 5,004 |
| 1 Charlotte-Mecklenburg NC Hospital Authority Health Care System Revenue | | | | |
| (Carolinas HealthCare System) | 5.000% | 1/15/24 | 14,315 | 17,412 |
| Fayetteville NC Public Works Commission Revenue | 5.000% | 3/1/17 | 5,000 | 5,073 |
| Guilford County NC GO | 5.000% | 8/1/17 | 5,000 | 5,161 |
| Guilford County NC GO | 5.000% | 3/1/18 | 3,340 | 3,526 |
| Mecklenburg County NC COP | 5.000% | 10/1/21 | 4,000 | 4,689 |
| New Hanover County NC Hospital Revenue (New Hanover Regional Medical Center Project) | 5.000% | 10/1/19 | 1,000 | 1,106 |
| New Hanover County NC Hospital Revenue (New Hanover Regional Medical Center Project) | 5.000% | 10/1/21 | 3,200 | 3,716 |
| North Carolina Capital Facilities Finance Agency Solid Waste Disposal Revenue | | | | |
| (Republic Services, Inc. Project) PUT | 0.700% | 12/1/16 | 27,500 | 27,500 |
| North Carolina Capital Improvement Revenue | 5.000% | 5/1/17 | 9,600 | 9,808 |
| North Carolina Capital Improvement Revenue | 5.000% | 5/1/18 | 17,975 | 19,080 |
| 2 North Carolina Capital Improvement Revenue TOB VRDO | 0.670% | 11/7/16 | 4,000 | 4,000 |
| North Carolina Eastern Municipal Power Agency Power Systems Revenue | 5.000% | 1/1/17 (ETM) | 2,650 | 2,669 |
| North Carolina Eastern Municipal Power Agency Power Systems Revenue | 5.000% | 1/1/17 (ETM) | 7,175 | 7,226 |
| North Carolina Eastern Municipal Power Agency Power Systems Revenue | 5.000% | 1/1/18 (ETM) | 1,250 | 1,311 |
| North Carolina Eastern Municipal Power Agency Power Systems Revenue | 5.000% | 1/1/19 (ETM) | 3,515 | 3,819 |
| North Carolina Eastern Municipal Power Agency Power Systems Revenue | 5.000% | 1/1/19 (ETM) | 1,025 | 1,114 |
| North Carolina Eastern Municipal Power Agency Power Systems Revenue | 5.000% | 1/1/20 (ETM) | 13,050 | 14,651 |
| North Carolina Eastern Municipal Power Agency Power Systems Revenue | 5.000% | 1/1/20 (ETM) | 2,500 | 2,807 |
| North Carolina GAN | 5.000% | 3/1/22 | 2,250 | 2,654 |
| North Carolina GAN PUT | 4.000% | 3/1/18 | 21,000 | 21,503 |
| North Carolina GO | 5.000% | 3/1/18 | 16,770 | 17,664 |
| North Carolina GO | 5.000% | 6/1/19 | 2,000 | 2,208 |
| North Carolina Medical Care Commission Health Care Facilities Revenue | | | | |
| (Cape Fear Valley Health System) | 5.000% | 10/1/19 | 3,350 | 3,687 |
| North Carolina Medical Care Commission Health Care Facilities Revenue | | | | |
| (Cape Fear Valley Health System) | 5.000% | 10/1/20 | 7,885 | 8,899 |
| 2 North Carolina Medical Care Commission Health Care Facilities Revenue | | | | |
| (Vidant Health) TOB VRDO | 0.780% | 11/7/16 LOC | 15,375 | 15,375 |
| 3 North Carolina Medical Care Commission Health Care Facilities Revenue | | | | |
| (Wake Forest Baptist Obligated Group) PUT | 1.370% | 12/1/17 | 2,210 | 2,204 |
| North Carolina Medical Care Commission Health Care Facilities Revenue (WakeMed) | 5.000% | 10/1/17 | 2,000 | 2,073 |
| North Carolina Medical Care Commission Health Care Facilities Revenue (WakeMed) | 5.000% | 10/1/18 | 3,000 | 3,219 |
| 2 North Carolina Medical Care Commission Hospital Revenue (Baptist Hospital) TOB VRDO | 0.950% | 11/7/16 | 6,300 | 6,300 |
92
Limited-Term Tax-Exempt Fund
| | | | |
| | | | Face | Market |
| | | Maturity | Amount | Value• |
| | Coupon | Date | ($000) | ($000) |
| North Carolina Medical Care Commission Hospital Revenue (Moses Cone Health System) PUT | 0.980% | 5/30/17 | 12,740 | 12,740 |
| North Carolina Medical Care Commission Hospital Revenue (North Carolina Baptist Hospital) | 5.000% | 6/1/17 | 6,500 | 6,655 |
| North Carolina Medical Care Commission Hospital Revenue (North Carolina Baptist Hospital) | 5.000% | 6/1/19 | 3,910 | 4,281 |
| North Carolina Medical Care Commission Hospital Revenue | | | | |
| (Southeastern Regional Medical Center) | 4.000% | 6/1/19 | 1,450 | 1,547 |
| North Carolina Medical Care Commission Hospital Revenue | | | | |
| (Southeastern Regional Medical Center) | 4.000% | 6/1/20 | 500 | 543 |
| 1 North Carolina Medical Care Commission Retirement Facilities Revenue (Southminster Inc.) | 5.000% | 10/1/21 | 375 | 416 |
| 1 North Carolina Medical Care Commission Retirement Facilities Revenue (Southminster Inc.) | 5.000% | 10/1/22 | 1,105 | 1,242 |
| 1 North Carolina Medical Care Commission Retirement Facilities Revenue (Southminster Inc.) | 5.000% | 10/1/23 | 800 | 906 |
| 1 North Carolina Medical Care Commission Retirement Facilities Revenue (Southminster Inc.) | 5.000% | 10/1/24 | 920 | 1,046 |
| North Carolina Municipal Power Agency No. 1 Revenue (Catawba Electric) | 5.000% | 1/1/18 | 14,815 | 15,518 |
| North Carolina Municipal Power Agency No. 1 Revenue (Catawba Electric) | 5.000% | 1/1/18 (ETM) | 5,185 | 5,437 |
| North Carolina Municipal Power Agency No. 1 Revenue (Catawba Electric) | 5.000% | 1/1/19 (ETM) | 4,475 | 4,862 |
| North Carolina Municipal Power Agency No. 1 Revenue (Catawba Electric) | 5.000% | 1/1/19 | 12,025 | 13,042 |
| 1 Raleigh NC Combined Enterprise System Revenue | 5.000% | 3/1/22 | 600 | 716 |
| 1 Raleigh NC Combined Enterprise System Revenue | 5.000% | 3/1/22 | 670 | 799 |
| 1 Raleigh NC Combined Enterprise System Revenue | 5.000% | 3/1/23 | 1,110 | 1,355 |
| 1 Raleigh NC Combined Enterprise System Revenue | 5.000% | 3/1/23 | 1,000 | 1,220 |
| Raleigh NC GO | 5.000% | 12/1/16 | 2,470 | 2,479 |
| Raleigh NC GO | 5.000% | 12/1/16 | 2,605 | 2,615 |
| Raleigh NC GO | 5.000% | 4/1/20 | 4,700 | 5,328 |
| Wake County NC GO | 5.000% | 2/1/20 | 4,500 | 5,075 |
| Wake County NC GO | 5.000% | 2/1/22 | 3,100 | 3,700 |
| Wake County NC Public Improvement GO | 5.000% | 4/1/18 | 3,495 | 3,701 |
| | | | | 338,590 |
| North Dakota (0.0%) | | | | |
| Burleigh County ND Health Care Revenue (St. Alexis Medical Center Project) | 5.000% | 7/1/21 (ETM) | 650 | 757 |
| Burleigh County ND Health Care Revenue (St. Alexis Medical Center Project) | 5.000% | 7/1/21 (Prere.) | 1,200 | 1,405 |
| North Dakota Housing Finance Agency Revenue | 4.000% | 1/1/38 | 5,345 | 5,695 |
| | | | | 7,857 |
| Ohio (4.2%) | | | | |
| Akron OH Bath & Copley Joint Township Hospital District Revenue | | | | |
| (Children’s Hospital Medical Center of Akron) | 5.000% | 11/15/18 | 1,000 | 1,076 |
| Akron OH Bath & Copley Joint Township Hospital District Revenue | | | | |
| (Children’s Hospital Medical Center of Akron) | 5.000% | 11/15/25 | 3,450 | 4,003 |
| Akron OH Income Tax Revenue (Community Learning Centers) | 5.000% | 12/1/20 | 1,220 | 1,400 |
| Allen County OH Hospital Facilities Revenue (Catholic Healthcare Partners) | 5.000% | 5/1/23 | 2,450 | 2,874 |
| 2 Allen County OH Hospital Facilities Revenue (Catholic Healthcare Partners) TOB VRDO | 0.760% | 11/7/16 | 7,500 | 7,500 |
| American Municipal Power Ohio Inc. Revenue | 5.250% | 2/15/18 (Prere.) | 2,570 | 2,715 |
| American Municipal Power Ohio Inc. Revenue | 5.000% | 2/15/20 | 7,000 | 7,855 |
| American Municipal Power Ohio Inc. Revenue | 5.000% | 2/15/21 | 16,265 | 18,745 |
| American Municipal Power Ohio Inc. Revenue | 5.000% | 2/15/22 | 12,000 | 14,113 |
| American Municipal Power Ohio Inc. Revenue | 5.000% | 2/15/23 | 21,220 | 23,626 |
| American Municipal Power Ohio Inc. Revenue | 5.250% | 2/15/23 | 160 | 169 |
| American Municipal Power Ohio Inc. Revenue | 5.000% | 2/15/24 | 12,385 | 13,777 |
| American Municipal Power Ohio Inc. Revenue (Fremont Energy Center Project) | 5.000% | 2/15/18 | 1,480 | 1,556 |
| American Municipal Power Ohio Inc. Revenue (Fremont Energy Center Project) | 5.000% | 2/15/19 | 1,500 | 1,632 |
| American Municipal Power Ohio Inc. Revenue (Fremont Energy Center Project) | 5.000% | 2/15/20 | 2,145 | 2,407 |
| American Municipal Power Ohio Inc. Revenue (Hydroelectric Projects) | 5.000% | 2/15/17 | 6,000 | 6,073 |
| American Municipal Power Ohio Inc. Revenue (Hydroelectric Projects) | 5.000% | 2/15/21 | 300 | 346 |
| American Municipal Power Ohio Inc. Revenue (Hydroelectric Projects) | 5.000% | 2/15/22 | 400 | 470 |
| American Municipal Power Ohio Inc. Revenue (Hydroelectric Projects) | 5.000% | 2/15/23 | 500 | 600 |
| American Municipal Power Ohio Inc. Revenue (Meldahl Hydroelectric Project) | 5.000% | 2/15/22 | 470 | 553 |
| American Municipal Power Ohio Inc. Revenue (Meldahl Hydroelectric Project) | 5.000% | 2/15/23 | 375 | 450 |
| American Municipal Power Ohio Inc. Revenue (Meldahl Hydroelectric Project) | 5.000% | 2/15/24 | 370 | 450 |
| American Municipal Power Ohio Inc. Revenue (Prairie State Energy Campus Project) | 5.000% | 2/15/26 | 3,000 | 3,596 |
| American Municipal Power Ohio Inc. Revenue (Prairie State Energy Campus Project) PUT | 5.000% | 8/15/19 | 17,625 | 19,154 |
| American Municipal Power Ohio Inc. Revenue (Prairie State Energy Campus Project) PUT | 5.000% | 8/15/20 | 16,310 | 18,153 |
| 2 American Municipal Power Ohio Inc. Revenue (Prairie State Energy Campus Project) TOB VRDO | 0.780% | 11/7/16 (12) | 9,315 | 9,315 |
| Butler County OH Hospital Facilities Revenue (UC Health) | 5.500% | 11/1/22 | 3,415 | 3,944 |
| Butler County OH Transportation Improvement District Tax Allocation Revenue | 4.000% | 12/1/20 | 700 | 777 |
| Cleveland OH Airport System Revenue | 5.000% | 1/1/20 | 1,500 | 1,657 |
| Cleveland OH Airport System Revenue | 5.000% | 1/1/21 (4) | 455 | 519 |
| Cleveland OH Airport System Revenue | 5.000% | 1/1/22 (4) | 450 | 524 |
| Cleveland OH Airport System Revenue | 5.000% | 1/1/22 (4) | 1,635 | 1,902 |
| Cleveland OH Airport System Revenue | 5.000% | 1/1/23 (4) | 1,000 | 1,181 |
| Cleveland OH Airport System Revenue | 5.000% | 1/1/24 (4) | 3,150 | 3,776 |
| Cleveland OH GO | 5.000% | 12/1/20 | 1,800 | 2,066 |
93
Limited-Term Tax-Exempt Fund
| | | | |
| | | | Face | Market |
| | | Maturity | Amount | Value• |
| | Coupon | Date | ($000) | ($000) |
| Cleveland OH GO | 5.000% | 12/1/21 | 2,880 | 3,378 |
| Cleveland OH GO | 5.000% | 12/1/22 | 3,595 | 4,321 |
| Cleveland OH Income Tax Revenue | 5.000% | 5/15/17 (ETM) | 465 | 476 |
| Cleveland OH Income Tax Revenue | 5.000% | 5/15/17 | 725 | 741 |
| Cleveland OH Income Tax Revenue | 5.000% | 4/1/18 (Prere.) | 7,180 | 7,600 |
| Cleveland OH Income Tax Revenue | 5.000% | 5/15/22 | 1,500 | 1,766 |
| Cleveland OH Water Revenue | 5.000% | 1/1/18 | 1,780 | 1,866 |
| Cleveland OH Water Revenue | 5.000% | 1/1/19 | 3,100 | 3,366 |
| Cleveland OH Water Revenue | 5.000% | 1/1/20 | 1,500 | 1,682 |
| Cleveland OH Water Revenue | 5.000% | 1/1/21 | 1,000 | 1,155 |
| Cleveland OH Water Works Revenue | 5.000% | 1/1/18 | 1,000 | 1,046 |
| Cleveland State University Ohio General Receipts Revenue | 5.000% | 6/1/19 | 2,000 | 2,198 |
| Cleveland-Cuyahoga County OH Port Authority Revenue (Cleveland Museum of Art Project) | 5.000% | 10/1/19 | 6,000 | 6,651 |
| Cleveland-Cuyahoga County OH Port Authority Revenue | | | | |
| (Euclid Avenue Development Corp. Project) | 5.000% | 8/1/18 | 960 | 1,023 |
| Cleveland-Cuyahoga County OH Port Authority Revenue | | | | |
| (Euclid Avenue Development Corp. Project) | 5.000% | 8/1/19 | 1,390 | 1,530 |
| Cleveland-Cuyahoga County OH Port Authority Revenue | | | | |
| (Euclid Avenue Development Corp. Project) | 5.000% | 8/1/22 | 1,475 | 1,735 |
| Columbus OH GO | 5.000% | 6/1/17 | 7,510 | 7,700 |
| Columbus OH GO | 5.000% | 7/1/17 | 7,245 | 7,454 |
| Columbus OH GO | 5.000% | 7/1/17 | 5,740 | 5,905 |
| Columbus OH GO | 5.000% | 6/1/18 | 8,000 | 8,523 |
| Columbus OH GO | 5.000% | 7/1/18 | 7,280 | 7,780 |
| Columbus OH GO | 5.000% | 7/1/18 | 4,500 | 4,809 |
| Columbus OH GO | 5.000% | 2/15/19 | 1,910 | 2,086 |
| Columbus OH GO | 5.000% | 6/1/19 | 3,000 | 3,310 |
| Columbus OH GO | 5.000% | 7/1/19 | 6,690 | 7,402 |
| Columbus OH GO | 5.000% | 2/15/20 | 1,905 | 2,150 |
| Columbus OH GO | 5.000% | 7/1/22 | 1,000 | 1,205 |
| Columbus OH GO | 5.000% | 7/1/23 | 1,815 | 2,233 |
| Cuyahoga County OH (Convention Hotel Project) COP | 5.000% | 12/1/19 | 5,340 | 5,945 |
| Cuyahoga County OH (Convention Hotel Project) COP | 5.000% | 12/1/20 | 5,575 | 6,377 |
| Cuyahoga County OH (Convention Hotel Project) COP | 5.000% | 12/1/21 | 4,075 | 4,776 |
| Cuyahoga County OH Economic Development Revenue (Med Mart/Convention Center Project) | 5.000% | 12/1/19 | 7,000 | 7,800 |
| Cuyahoga County OH Excise Tax Revenue (Sports Facilities Improvement Project) | 5.000% | 12/1/21 | 1,045 | 1,220 |
| Cuyahoga County OH Excise Tax Revenue (Sports Facilities Improvement Project) | 5.000% | 12/1/22 | 1,000 | 1,191 |
| Cuyahoga County OH Excise Tax Revenue (Sports Facilities Improvement Project) | 5.000% | 12/1/24 | 500 | 606 |
| Cuyahoga County OH Sales Tax Revenue | 5.000% | 12/1/20 | 2,045 | 2,364 |
| Cuyahoga County OH Sales Tax Revenue | 5.000% | 12/1/21 | 1,000 | 1,183 |
| Dayton OH City School District GO | 5.000% | 11/1/19 | 3,500 | 3,897 |
| Dayton OH City School District GO | 5.000% | 11/1/20 | 5,000 | 5,726 |
| Fairfield County OH Hospital Facilities Revenue (Fairfield Medical Center) | 5.000% | 6/15/21 | 1,045 | 1,164 |
| Franklin County OH GO | 5.000% | 12/1/19 | 5,045 | 5,468 |
| Franklin County OH Hospital Facilities Revenue (OhioHealth Corp.) PUT | 5.000% | 7/12/17 | 7,500 | 7,713 |
| 2 Franklin County OH Hospital Facilities Revenue (OhioHealth Corp.) TOB VRDO | 0.750% | 11/7/16 | 6,830 | 6,830 |
| Greater Cleveland OH Regional Transit Authority Sales Tax Revenue | 5.000% | 12/1/19 | 1,185 | 1,327 |
| Greater Cleveland OH Regional Transit Authority Sales Tax Revenue | 5.000% | 12/1/21 | 1,355 | 1,602 |
| Greater Cleveland OH Regional Transit Authority Sales Tax Revenue | 5.000% | 12/1/22 | 1,590 | 1,924 |
| Hamilton County OH Healthcare Facilities Revenue (Christ Hospital Project) | 5.000% | 6/1/20 | 1,475 | 1,659 |
| Hamilton County OH Healthcare Facilities Revenue (Christ Hospital Project) | 5.000% | 6/1/22 | 4,665 | 5,506 |
| Hamilton County OH Healthcare Revenue (Life Enriching Communities) | 4.000% | 1/1/21 | 450 | 484 |
| Hamilton County OH Healthcare Revenue (Life Enriching Communities) | 5.000% | 1/1/22 | 470 | 532 |
| Hamilton County OH Healthcare Revenue (Life Enriching Communities) | 5.000% | 1/1/23 | 500 | 573 |
| Hamilton County OH Healthcare Revenue (Life Enriching Communities) | 5.000% | 1/1/24 | 680 | 786 |
| Hamilton County OH Hospital Facilities Revenue (Cincinnati Children’s Hospital Medical Center) | 4.000% | 5/15/17 | 785 | 799 |
| Hamilton County OH Hospital Facilities Revenue (Cincinnati Children’s Hospital Medical Center) | 5.000% | 5/15/18 | 750 | 795 |
| Hamilton County OH Hospital Facilities Revenue (Cincinnati Children’s Hospital Medical Center) | 5.000% | 5/15/19 | 1,000 | 1,096 |
| Hamilton County OH Hospital Facilities Revenue (Cincinnati Children’s Hospital Medical Center) | 5.000% | 5/15/20 | 1,000 | 1,131 |
| Hamilton County OH Hospital Facilities Revenue (Cincinnati Children’s Hospital Medical Center) | 5.000% | 5/15/21 | 1,000 | 1,164 |
| Hamilton County OH Hospital Facilities Revenue (Cincinnati Children’s Hospital Medical Center) | 5.000% | 5/15/22 | 500 | 593 |
| Hamilton County OH Hospital Facilities Revenue (UC Health) | 4.000% | 2/1/18 | 525 | 543 |
| Hamilton County OH Hospital Facilities Revenue (UC Health) | 5.000% | 2/1/19 | 750 | 809 |
| Hamilton County OH Hospital Facilities Revenue (UC Health) | 5.000% | 2/1/20 | 800 | 887 |
| Hamilton County OH Hospital Facilities Revenue (UC Health) | 5.000% | 2/1/22 | 500 | 579 |
| 2 Hamilton County OH Hospital Facilities Revenue (UC Health) TOB VRDO | 0.750% | 11/7/16 LOC | 11,395 | 11,395 |
| Hamilton County OH Sales Tax Revenue | 5.000% | 12/1/21 | 1,000 | 1,176 |
| Hamilton County OH Sales Tax Revenue | 5.000% | 12/1/22 | 2,250 | 2,703 |
| Hamilton County OH Sewer System Revenue | 5.000% | 12/1/20 | 3,605 | 4,153 |
| Hamilton County OH Sewer System Revenue | 5.000% | 12/1/21 | 2,085 | 2,465 |
94
Limited-Term Tax-Exempt Fund
| | | | |
| | | | Face | Market |
| | | Maturity | Amount | Value• |
| | Coupon | Date | ($000) | ($000) |
| Hamilton OH City School District GO | 5.000% | 12/1/21 | 3,475 | 4,085 |
| JobsOhio Beverage System Statewide Liquor Profits Revenue | 5.000% | 1/1/18 | 1,040 | 1,088 |
| JobsOhio Beverage System Statewide Liquor Profits Revenue | 5.000% | 1/1/20 | 14,225 | 15,909 |
| JobsOhio Beverage System Statewide Liquor Profits Revenue | 5.000% | 1/1/21 | 2,260 | 2,595 |
| JobsOhio Beverage System Statewide Liquor Profits Revenue | 5.000% | 1/1/23 | 1,725 | 2,064 |
| 2 JobsOhio Beverage System Statewide Liquor Profits Revenue TOB VRDO | 0.840% | 11/7/16 | 41,700 | 41,700 |
| Kent State University Ohio Revenue | 5.000% | 5/1/17 | 500 | 511 |
| Kent State University Ohio Revenue | 5.000% | 5/1/20 | 2,030 | 2,297 |
| Kent State University Ohio Revenue | 5.000% | 5/1/20 | 1,650 | 1,865 |
| Kent State University Ohio Revenue | 5.000% | 5/1/21 | 1,685 | 1,956 |
| Kent State University Ohio Revenue | 4.000% | 5/1/22 | 3,000 | 3,397 |
| Kent State University Ohio Revenue | 4.000% | 5/1/23 | 3,000 | 3,445 |
| Lake County OH Hospital Facilities Revenue (Lake Hospital System Inc.) | 5.000% | 8/15/20 | 1,230 | 1,386 |
| Lake County OH Hospital Facilities Revenue (Lake Hospital System Inc.) | 5.000% | 8/15/21 | 750 | 862 |
| Lake County OH Hospital Facilities Revenue (Lake Hospital System Inc.) | 5.000% | 8/15/22 | 1,575 | 1,847 |
| 2 Lorain County OH Hospital Facilities Revenue (Catholic Healthcare Partners) TOB VRDO | 0.870% | 11/7/16 | 10,500 | 10,500 |
| 2 Lorain County OH Hospital Facilities Revenue (Catholic Healthcare Partners) TOB VRDO | 0.880% | 11/7/16 (4) | 8,865 | 8,865 |
| 2 Lorain County OH Hospital Facilities Revenue (Catholic Healthcare Partners) TOB VRDO | 0.880% | 11/7/16 | 13,130 | 13,130 |
| Medina OH School District COP | 5.250% | 6/1/18 (Prere.) | 7,210 | 7,709 |
| 2 Montgomery County OH Revenue (Catholic Health Initiatives) TOB VRDO | 0.810% | 11/7/16 | 3,995 | 3,995 |
| Montgomery County OH Revenue (Miami Valley Hospital) | 5.750% | 11/15/21 | 3,750 | 4,387 |
| 2 Montgomery County OH Revenue (Miami Valley Hospital) TOB VRDO | 0.780% | 11/7/16 | 3,500 | 3,500 |
| 1 Newark OH BAN | 2.000% | 11/7/17 | 2,050 | 2,065 |
| Ohio Air Quality Development Authority Pollution Control Revenue | | | | |
| (FirstEnergy Generation Corp. Project) PUT | 3.100% | 3/1/19 | 3,000 | 2,744 |
| Ohio Building Authority Revenue (Administration Building Fund) | 5.000% | 10/1/18 | 1,750 | 1,883 |
| Ohio Building Authority Revenue (Highway Safety Building) | 5.000% | 10/1/17 | 1,040 | 1,080 |
| Ohio Building Authority Revenue (Highway Safety Building) | 5.000% | 10/1/17 | 2,670 | 2,773 |
| Ohio Building Authority Revenue (Highway Safety Building) | 5.000% | 10/1/20 | 1,265 | 1,450 |
| Ohio Capital Facilities Lease-Appropriation Revenue (Administrative Building Fund Projects) | 5.000% | 4/1/19 | 1,395 | 1,526 |
| Ohio Capital Facilities Lease-Appropriation Revenue (Adult Correctional Building Fund Projects) | 4.000% | 10/1/20 | 500 | 552 |
| Ohio Capital Facilities Lease-Appropriation Revenue (Adult Correctional Building Fund Projects) | 5.000% | 10/1/21 | 1,000 | 1,175 |
| Ohio Capital Facilities Lease-Appropriation Revenue (Adult Correctional Building Fund Projects) | 5.000% | 10/1/21 | 465 | 545 |
| Ohio Capital Facilities Lease-Appropriation Revenue (Adult Correctional Building Fund Projects) | 5.000% | 10/1/21 | 1,000 | 1,173 |
| Ohio Capital Facilities Lease-Appropriation Revenue (Adult Correctional Building Fund Projects) | 5.000% | 10/1/22 | 550 | 662 |
| Ohio Capital Facilities Lease-Appropriation Revenue (Adult Correctional Building Fund Projects) | 5.000% | 10/1/22 | 875 | 1,048 |
| Ohio Capital Facilities Lease-Appropriation Revenue (Adult Correctional Building Fund Projects) | 5.000% | 10/1/22 | 1,000 | 1,199 |
| Ohio Capital Facilities Lease-Appropriation Revenue (Adult Correctional Building Fund Projects) | 5.000% | 10/1/23 | 750 | 899 |
| Ohio Capital Facilities Lease-Appropriation Revenue | | | | |
| (Cultural & Sports Facilities Building Fund Projects) | 5.000% | 10/1/21 | 1,360 | 1,598 |
| Ohio Capital Facilities Lease-Appropriation Revenue | | | | |
| (Cultural & Sports Facilities Building Fund Projects) | 5.000% | 10/1/22 | 1,000 | 1,204 |
| Ohio Capital Facilities Lease-Appropriation Revenue | | | | |
| (Cultural & Sports Facilities Building Fund Projects) | 5.000% | 10/1/23 | 1,200 | 1,468 |
| Ohio Capital Facilities Lease-Appropriation Revenue | | | | |
| (Mental Health Facilities Improvement Fund Projects) | 5.000% | 6/1/21 | 1,000 | 1,165 |
| Ohio Capital Facilities Lease-Appropriation Revenue | | | | |
| (Mental Health Facilities Improvement Fund Projects) | 5.000% | 6/1/22 | 1,000 | 1,194 |
| Ohio Capital Facilities Lease-Appropriation Revenue | | | | |
| (Mental Health Facilities Improvement Fund Projects) | 5.000% | 6/1/23 | 1,000 | 1,214 |
| Ohio Capital Facilities Lease-Appropriation Revenue | | | | |
| (Parks & Recreation Improvement Fund Projects) | 5.000% | 8/1/23 | 1,000 | 1,219 |
| Ohio Common Schools GO | 5.000% | 9/15/19 | 3,910 | 4,355 |
| Ohio Common Schools GO | 5.000% | 9/15/21 (Prere.) | 4,410 | 5,205 |
| Ohio Common Schools GO | 5.000% | 9/15/21 | 5,920 | 6,982 |
| Ohio Common Schools GO | 5.000% | 9/15/23 | 11,315 | 13,934 |
| Ohio GO | 5.000% | 9/15/17 | 19,680 | 20,418 |
| Ohio GO | 5.000% | 5/1/18 | 10,960 | 11,642 |
| Ohio GO | 5.000% | 9/15/18 | 10,000 | 10,767 |
| Ohio GO | 5.000% | 9/15/18 | 5,000 | 5,384 |
| Ohio GO | 5.000% | 5/1/19 | 5,000 | 5,499 |
| Ohio GO | 5.000% | 5/1/19 | 6,680 | 7,347 |
| Ohio GO | 5.000% | 9/15/19 | 5,000 | 5,569 |
| Ohio GO | 5.000% | 5/1/20 | 7,000 | 7,949 |
| Ohio GO | 5.000% | 9/15/20 | 26,315 | 30,206 |
| Ohio GO | 5.000% | 5/1/21 | 2,645 | 3,089 |
| 1 Ohio Higher Educational Facility Commission Revenue | | | | |
| (Case Western Reserve University Project) | 5.000% | 12/1/22 | 4,540 | 5,433 |
| 1 Ohio Higher Educational Facility Commission Revenue | | | | |
| (Case Western Reserve University Project) | 5.000% | 12/1/23 | 2,500 | 3,036 |
95
Limited-Term Tax-Exempt Fund
| | | | |
| | | | Face | Market |
| | | Maturity | Amount | Value• |
| | Coupon | Date | ($000) | ($000) |
| Ohio Higher Educational Facility Commission Revenue | | | | |
| (Cleveland Clinic Health System Obligated Group) VRDO | 0.470% | 11/1/16 | 4,800 | 4,800 |
| Ohio Higher Educational Facility Commission Revenue (University of Dayton Project) | 5.000% | 12/1/16 (Prere.) | 4,500 | 4,516 |
| Ohio Higher Educational Facility Commission Revenue (Xavier University Project) | 5.000% | 5/1/19 | 625 | 683 |
| Ohio Higher Educational Facility Commission Revenue (Xavier University Project) | 5.000% | 5/1/20 | 1,350 | 1,512 |
| Ohio Higher Educational Facility Commission Revenue (Xavier University Project) | 5.000% | 5/1/22 | 500 | 580 |
| Ohio Highway Capital Improvements GO | 5.000% | 5/1/20 | 5,000 | 5,678 |
| Ohio Highway Capital Improvements GO | 5.000% | 5/1/21 | 2,500 | 2,920 |
| Ohio Highway Capital Improvements GO | 5.000% | 5/1/22 | 5,000 | 5,978 |
| 2 Ohio Hospital Revenue (Cleveland Clinic Health System Obligated Group) TOB VRDO | 0.660% | 11/7/16 | 10,995 | 10,995 |
| 2 Ohio Hospital Revenue (Cleveland Clinic Health System Obligated Group) TOB VRDO | 0.660% | 11/7/16 | 2,850 | 2,850 |
| Ohio Hospital Revenue (University Hospitals Health System Inc.) | 5.000% | 1/15/19 | 1,595 | 1,722 |
| Ohio Hospital Revenue (University Hospitals Health System Inc.) VRDO | 0.760% | 11/1/16 | 5,250 | 5,250 |
| Ohio Hospital Revenue (University Hospitals Health System Inc.) VRDO | 0.760% | 11/7/16 | 4,250 | 4,250 |
| Ohio Hospital Revenue (University Hospitals Health System Inc.) VRDO | 0.760% | 11/7/16 | 2,750 | 2,750 |
| Ohio Infrastructure Improvement GO | 5.000% | 8/1/18 | 3,450 | 3,695 |
| Ohio Major New State Infrastructure Project Revenue | 5.000% | 12/15/17 | 1,500 | 1,571 |
| Ohio Major New State Infrastructure Project Revenue | 5.000% | 12/15/17 | 8,635 | 9,041 |
| Ohio Major New State Infrastructure Project Revenue | 4.000% | 12/15/18 | 2,750 | 2,926 |
| Ohio Major New State Infrastructure Project Revenue | 4.000% | 12/15/19 | 2,450 | 2,667 |
| Ohio Major New State Infrastructure Project Revenue | 5.000% | 12/15/19 | 6,160 | 6,894 |
| Ohio Major New State Infrastructure Project Revenue | 5.000% | 12/15/19 | 2,500 | 2,798 |
| Ohio Major New State Infrastructure Project Revenue | 5.000% | 12/15/19 | 3,000 | 3,357 |
| Ohio Major New State Infrastructure Project Revenue | 5.000% | 12/15/20 | 2,750 | 3,160 |
| Ohio Major New State Infrastructure Project Revenue | 5.000% | 12/15/20 | 3,500 | 4,022 |
| Ohio Major New State Infrastructure Project Revenue | 5.000% | 12/15/21 | 4,000 | 4,711 |
| Ohio Major New State Infrastructure Project Revenue | 5.000% | 12/15/21 | 2,500 | 2,944 |
| Ohio Major New State Infrastructure Project Revenue | 5.000% | 12/15/22 | 5,000 | 6,024 |
| Ohio Public Facilities Commission GO | 5.000% | 2/1/21 | 1,390 | 1,612 |
| Ohio Public Facilities Commission GO | 5.000% | 4/1/21 | 2,280 | 2,656 |
| Ohio Public Facilities Commission GO | 5.000% | 2/1/22 | 1,460 | 1,734 |
| Ohio State University General Receipts Revenue | 5.000% | 12/1/16 (ETM) | 355 | 356 |
| Ohio State University General Receipts Revenue | 5.000% | 12/1/16 | 3,160 | 3,172 |
| Ohio State University General Receipts Revenue | 5.000% | 12/1/17 (ETM) | 280 | 293 |
| Ohio State University General Receipts Revenue | 5.000% | 12/1/17 | 4,720 | 4,935 |
| Ohio State University General Receipts Revenue | 5.000% | 12/1/19 | 1,440 | 1,562 |
| Ohio Turnpike Commission Turnpike Revenue | 5.500% | 2/15/18 (14) | 3,625 | 3,842 |
| Ohio Water Development Authority Drinking Water Assistance Fund Revenue | 5.000% | 6/1/17 | 4,500 | 4,615 |
| Ohio Water Development Authority Drinking Water Assistance Fund Revenue | 5.000% | 12/1/22 | 1,520 | 1,850 |
| 2 Ohio Water Development Authority Fresh Water Revenue TOB VRDO | 0.730% | 11/7/16 | 17,665 | 17,665 |
| Ohio Water Development Authority Pollution Control Revenue | | | | |
| (FirstEnergy Generation Corp. Project) | 3.000% | 5/15/19 | 24,000 | 21,596 |
| Ohio Water Development Authority Pollution Control Revenue (Water Quality) | 5.000% | 12/1/18 | 1,105 | 1,199 |
| Ohio Water Development Authority Pollution Control Revenue (Water Quality) | 5.000% | 12/1/19 | 1,925 | 2,159 |
| Ohio Water Development Authority Pollution Control Revenue (Water Quality) | 5.000% | 6/1/20 | 6,610 | 7,525 |
| Ohio Water Development Authority Pollution Control Revenue (Water Quality) | 5.000% | 6/1/20 | 10,205 | 11,618 |
| Ohio Water Development Authority Pollution Control Revenue (Water Quality) | 5.000% | 12/1/20 | 4,000 | 4,618 |
| Ohio Water Development Authority Pollution Control Revenue (Water Quality) | 5.000% | 12/1/20 | 7,500 | 8,659 |
| Ohio Water Development Authority Pollution Control Revenue (Water Quality) | 5.000% | 6/1/21 | 12,250 | 14,341 |
| Ohio Water Development Authority Pollution Control Revenue (Water Quality) | 5.000% | 12/1/21 | 4,050 | 4,800 |
| Ohio Water Development Authority Water Pollution Control Loan Fund Revenue | 5.000% | 12/1/17 | 1,000 | 1,046 |
| Ohio Water Development Authority Water Pollution Control Loan Fund Revenue | 5.000% | 6/1/19 | 1,695 | 1,870 |
| Ohio Water Development Authority Water Pollution Control Loan Fund Revenue | 5.000% | 12/1/19 | 5,490 | 6,165 |
| Ohio Water Development Authority Water Pollution Control Loan Fund Revenue | 5.000% | 6/1/20 | 2,225 | 2,533 |
| Ohio Water Development Authority Water Pollution Control Loan Fund Revenue | 5.000% | 12/1/20 | 1,750 | 2,020 |
| Ohio Water Development Authority Water Pollution Control Loan Fund Revenue | 5.000% | 6/1/21 | 1,350 | 1,580 |
| Ohio Water Development Authority Water Pollution Control Loan Fund Revenue | 5.000% | 12/1/21 | 1,300 | 1,541 |
| Ohio Water Development Authority Water Pollution Control Loan Fund Revenue | 5.000% | 6/1/22 | 3,000 | 3,600 |
| Ohio Water Development Authority Water Pollution Control Loan Fund Revenue | 5.500% | 6/1/22 | 1,505 | 1,846 |
| Ohio Water Development Authority Water Pollution Control Loan Fund Revenue | 5.000% | 12/1/22 | 2,850 | 3,462 |
| Ohio Water Development Authority Water Pollution Control Loan Fund Revenue | 5.000% | 6/1/23 | 6,000 | 7,342 |
| Penta Career Center Ohio COP | 5.000% | 4/1/19 | 2,470 | 2,679 |
| Penta Career Center Ohio COP | 5.000% | 4/1/20 | 1,095 | 1,218 |
| Princeton OH City School District GO | 4.000% | 12/1/21 | 1,200 | 1,352 |
| Princeton OH City School District GO | 5.000% | 12/1/22 | 700 | 844 |
| Princeton OH City School District GO | 5.000% | 12/1/23 | 1,350 | 1,651 |
| Princeton OH City School District GO | 5.000% | 12/1/25 | 795 | 979 |
| Ross County OH Hospital Facilities Revenue (Adena Health System) | 5.375% | 12/1/19 | 1,560 | 1,680 |
| Ross County OH Hospital Facilities Revenue (Adena Health System) | 5.750% | 12/1/22 | 4,750 | 5,180 |
| Sandusky OH BAN | 2.000% | 10/5/17 | 1,500 | 1,512 |
96
Limited-Term Tax-Exempt Fund
| | | | |
| | | | Face | Market |
| | | Maturity | Amount | Value• |
| | Coupon | Date | ($000) | ($000) |
| Scioto County OH Hospital Facilities Revenue (Southern Ohio Medical Center) | 5.000% | 2/15/19 | 630 | 683 |
| Scioto County OH Hospital Facilities Revenue (Southern Ohio Medical Center) | 5.000% | 2/15/20 | 1,135 | 1,266 |
| Scioto County OH Hospital Facilities Revenue (Southern Ohio Medical Center) | 5.000% | 2/15/21 | 650 | 743 |
| Scioto County OH Hospital Facilities Revenue (Southern Ohio Medical Center) | 5.000% | 2/15/22 | 1,100 | 1,286 |
| South-Western City OH School District GO | 5.000% | 12/1/21 | 1,000 | 1,180 |
| South-Western City OH School District GO | 5.000% | 12/1/23 | 1,000 | 1,229 |
| Southeastern Ohio Port Authority Hospital Facilities Revenue | | | | |
| (Marietta Area Health Care Inc. Obligated Group) | 5.000% | 12/1/22 | 735 | 814 |
| Toledo OH City School District GO | 5.000% | 12/1/18 | 3,055 | 3,306 |
| Toledo OH City School District GO | 5.000% | 12/1/19 | 2,220 | 2,481 |
| University of Cincinnati Ohio General Receipts Revenue | 5.000% | 6/1/18 | 1,585 | 1,687 |
| University of Toledo Ohio General Receipts Revenue | 5.000% | 6/1/17 | 1,855 | 1,899 |
| University of Toledo Ohio General Receipts Revenue | 5.000% | 6/1/19 | 2,805 | 3,064 |
| Warren County OH Health Care Facilities Improvement Revenue (Otterbein Homes Project) | 5.000% | 7/1/19 | 1,750 | 1,916 |
| Warren County OH Health Care Facilities Improvement Revenue (Otterbein Homes Project) | 5.000% | 7/1/20 | 2,550 | 2,871 |
| Warren County OH Health Care Facilities Improvement Revenue (Otterbein Homes Project) | 5.000% | 7/1/21 | 2,495 | 2,879 |
| | | | | 1,007,235 |
| Oklahoma (0.2%) | | | | |
| Cleveland County OK Educational Facilities Authority Lease Revenue | | | | |
| (Norman Public Schools Project) | 5.000% | 7/1/17 | 760 | 781 |
| Cleveland County OK Educational Facilities Authority Lease Revenue | | | | |
| (Norman Public Schools Project) | 5.000% | 7/1/18 | 1,325 | 1,410 |
| Cleveland County OK Educational Facilities Authority Lease Revenue | | | | |
| (Norman Public Schools Project) | 5.000% | 7/1/19 | 2,250 | 2,473 |
| Comanche County OK Hospital Authority Revenue | 5.000% | 7/1/19 | 3,145 | 3,339 |
| 1 Grand River Dam Authority Oklahoma Revenue | 5.000% | 6/1/21 | 5,000 | 5,808 |
| 1 Grand River Dam Authority Oklahoma Revenue | 5.000% | 6/1/22 | 1,500 | 1,783 |
| 1 Grand River Dam Authority Oklahoma Revenue | 5.000% | 6/1/23 | 3,385 | 4,098 |
| 1 Norman OK Regional Hospital Authority Revenue | 5.000% | 9/1/21 | 2,135 | 2,443 |
| 1 Norman OK Regional Hospital Authority Revenue | 5.000% | 9/1/22 | 2,375 | 2,763 |
| 1 Norman OK Regional Hospital Authority Revenue | 5.000% | 9/1/23 | 5,040 | 5,931 |
| Oklahoma Capitol Improvement Authority Facilities Revenue | 5.000% | 7/1/21 | 1,000 | 1,164 |
| Oklahoma City OK Water Utilities Trust Water & Sewer Revenue | 5.000% | 7/1/18 | 1,000 | 1,068 |
| Oklahoma Development Finance Authority Health System Revenue | | | | |
| (Integris Health Obligated Group) | 5.000% | 8/15/18 | 1,000 | 1,073 |
| Oklahoma Development Finance Authority Health System Revenue | | | | |
| (Integris Health Obligated Group) | 5.000% | 8/15/19 | 2,000 | 2,218 |
| Oklahoma Development Finance Authority Health System Revenue | | | | |
| (Integris Health Obligated Group) | 5.000% | 8/15/20 | 1,310 | 1,494 |
| Oklahoma Development Finance Authority Health System Revenue | | | | |
| (Integris Health Obligated Group) | 5.000% | 8/15/21 | 2,000 | 2,341 |
| Oklahoma Development Finance Authority Health System Revenue | | | | |
| (Integris Health Obligated Group) | 5.000% | 8/15/22 | 1,325 | 1,583 |
| Tulsa County OK Industrial Authority Educational Facilities Lease Revenue | 5.000% | 9/1/21 | 1,440 | 1,671 |
| Tulsa County OK Industrial Authority Educational Facilities Lease Revenue | 5.000% | 9/1/22 | 2,000 | 2,371 |
| | | | | 45,812 |
| Oregon (0.6%) | | | | |
| Forest Grove OR Campus Improvement Revenue (Pacific University Project) | 4.000% | 5/1/19 | 410 | 435 |
| Forest Grove OR Campus Improvement Revenue (Pacific University Project) | 4.000% | 5/1/20 | 500 | 540 |
| Forest Grove OR Campus Improvement Revenue (Pacific University Project) | 4.000% | 5/1/21 | 350 | 383 |
| Forest Grove OR Campus Improvement Revenue (Pacific University Project) | 5.000% | 5/1/22 | 350 | 407 |
| Gilliam County OR Solid Waste Disposal Revenue (Waste Management Inc. Project) PUT | 1.500% | 10/1/18 | 3,000 | 3,020 |
| Oregon Department of Administrative Services Lottery Revenue | 4.000% | 4/1/17 | 2,000 | 2,028 |
| Oregon Department of Administrative Services Lottery Revenue | 5.000% | 4/1/21 | 7,000 | 8,159 |
| Oregon Facilities Authority Revenue (Legacy Health Project) | 5.000% | 5/1/17 | 3,090 | 3,153 |
| Oregon Facilities Authority Revenue (Legacy Health Project) | 5.000% | 5/1/18 | 3,500 | 3,705 |
| 1 Oregon Facilities Authority Revenue (Legacy Health Project) | 5.000% | 6/1/22 | 750 | 885 |
| 1 Oregon Facilities Authority Revenue (Legacy Health Project) | 5.000% | 6/1/23 | 650 | 779 |
| Oregon Facilities Authority Revenue (PeaceHealth) | 5.000% | 11/1/16 | 2,000 | 2,000 |
| Oregon Facilities Authority Revenue (PeaceHealth) | 5.000% | 11/15/19 | 1,000 | 1,114 |
| Oregon Facilities Authority Revenue (PeaceHealth) | 5.000% | 11/15/20 | 1,275 | 1,462 |
| 3 Oregon Facilities Authority Revenue (Providence Health & Services) PUT | 1.510% | 10/1/17 | 8,750 | 8,750 |
| 3 Oregon Facilities Authority Revenue (Providence Health & Services) PUT | 1.630% | 9/15/18 | 10,000 | 10,002 |
| Oregon GO | 5.000% | 8/1/18 | 3,215 | 3,447 |
| Oregon Housing & Community Service Department Single Family Mortgage Revenue | 4.000% | 7/1/44 | 3,910 | 4,120 |
| Portland OR Sewer System Revenue | 5.000% | 6/15/22 | 59,960 | 72,052 |
| Tri-County Metropolitan Transportation District of Oregon Capital Grant Receipt Revenue | 4.000% | 11/1/17 | 7,380 | 7,503 |
| Tri-County Metropolitan Transportation District of Oregon Capital Grant Receipt Revenue | 5.000% | 10/1/18 | 3,000 | 3,219 |
97
Limited-Term Tax-Exempt Fund
| | | | | |
| | | | | Face | Market |
| | | | Maturity | Amount | Value• |
| | | Coupon | Date | ($000) | ($000) |
| | Tri-County Metropolitan Transportation District of Oregon Capital Grant Receipt Revenue | 3.000% | 11/1/18 | 4,250 | 4,295 |
| | Tri-County Metropolitan Transportation District of Oregon Capital Grant Receipt Revenue | 5.000% | 11/1/18 | 5,000 | 5,104 |
| | | | | | 146,562 |
| Pennsylvania (5.2%) | | | | |
| | Allegheny County PA GO | 4.000% | 12/1/16 | 17,830 | 17,880 |
| | Allegheny County PA GO | 5.000% | 12/1/18 | 7,000 | 7,572 |
| | Allegheny County PA GO | 5.000% | 12/1/19 | 5,250 | 5,862 |
| | Allegheny County PA Hospital Development Authority Revenue | | | | |
| | (University of Pittsburgh Medical Center) | 5.000% | 5/15/17 | 23,040 | 23,563 |
| | Allegheny County PA Hospital Development Authority Revenue | | | | |
| | (University of Pittsburgh Medical Center) | 5.000% | 10/15/17 | 1,000 | 1,039 |
| | Allegheny County PA Hospital Development Authority Revenue | | | | |
| | (University of Pittsburgh Medical Center) | 5.000% | 10/15/18 | 1,000 | 1,076 |
| | Allegheny County PA Hospital Development Authority Revenue | | | | |
| | (University of Pittsburgh Medical Center) | 1.227% | 2/1/21 | 7,190 | 7,182 |
| 2,3 | Allegheny County PA Hospital Development Authority Revenue | | | | |
| | (University of Pittsburgh Medical Center) TOB PUT | 0.830% | 12/1/16 LOC | 10,000 | 10,000 |
| 2,3 | Allegheny County PA Hospital Development Authority Revenue | | | | |
| | (University of Pittsburgh Medical Center) TOB PUT | 0.830% | 1/3/17 LOC | 10,250 | 10,250 |
| 2 | Allegheny County PA Hospital Development Authority Revenue | | | | |
| | (University of Pittsburgh Medical Center) TOB VRDO | 0.620% | 11/1/16 LOC | 32,100 | 32,100 |
| | Allegheny County PA Port Authority Revenue | 5.000% | 3/1/17 | 2,500 | 2,534 |
| | Allegheny County PA Sanitary Authority Sewer Revenue | 5.000% | 6/1/18 (4) | 3,000 | 3,187 |
| | Allegheny County PA Sanitary Authority Sewer Revenue | 5.000% | 12/1/18 (4) | 3,685 | 3,984 |
| | Allegheny County PA Sanitary Authority Sewer Revenue | 5.000% | 12/1/20 | 2,500 | 2,858 |
| | Allentown PA Neighborhood Improvement Zone Development Authority Tax Revenue | 5.000% | 5/1/25 | 2,500 | 2,802 |
| | Beaver County PA Hospital Authority Revenue (Heritage Valley Health System Inc.) | 5.000% | 5/15/18 | 1,010 | 1,070 |
| | Beaver County PA Industrial Development Authority Pollution Control Revenue | | | | |
| | (FirstEnergy Generation Project) PUT | 2.500% | 6/1/17 | 17,250 | 17,000 |
| | Beaver County PA Industrial Development Authority Pollution Control Revenue | | | | |
| | (FirstEnergy Generation Project) PUT | 2.700% | 4/2/18 | 8,250 | 7,801 |
| | Bethel Park PA School District GO | 5.000% | 8/1/22 | 500 | 596 |
| | Bethel Park PA School District GO | 5.000% | 8/1/23 | 700 | 851 |
| 3 | Bethlehem PA Area School District Authority Revenue PUT | 0.800% | 1/1/18 | 3,995 | 3,988 |
| | Bethlehem PA Water Authority Revenue | 5.000% | 11/15/17 (15) | 650 | 676 |
| | Bethlehem PA Water Authority Revenue | 5.000% | 11/15/18 (15) | 500 | 537 |
| | Bethlehem PA Water Authority Revenue | 5.000% | 11/15/19 (15) | 1,165 | 1,287 |
| | Bethlehem PA Water Authority Revenue | 5.000% | 11/15/20 (15) | 1,000 | 1,131 |
| | Bucks County PA GO | 5.000% | 5/1/20 | 2,175 | 2,467 |
| | Bucks County PA GO | 5.000% | 5/1/21 | 3,060 | 3,568 |
| | Bucks County PA GO | 5.000% | 5/1/22 | 1,255 | 1,498 |
| | Bucks County PA GO | 5.000% | 5/1/23 | 1,000 | 1,218 |
| | Bucks County PA Water & Sewer Authority Water System Revenue | 5.000% | 6/1/21 (15) | 4,500 | 5,192 |
| | Bucks County PA Water & Sewer Authority Water System Revenue | 4.000% | 6/1/22 (15) | 605 | 682 |
| | Bucks County PA Water & Sewer Authority Water System Revenue | 4.000% | 6/1/23 (15) | 500 | 570 |
| | Butler County PA Hospital Authority Revenue (Butler Health System Project) | 3.000% | 7/1/17 | 1,650 | 1,672 |
| | Butler County PA Hospital Authority Revenue (Butler Health System Project) | 3.000% | 7/1/18 | 300 | 309 |
| | Butler County PA Hospital Authority Revenue (Butler Health System Project) | 3.000% | 7/1/19 | 1,460 | 1,519 |
| | Butler County PA Hospital Authority Revenue (Butler Health System Project) | 4.000% | 7/1/20 | 525 | 570 |
| | Butler County PA Hospital Authority Revenue (Butler Health System Project) | 4.000% | 7/1/21 | 575 | 634 |
| | Butler County PA Hospital Authority Revenue (Butler Health System Project) | 5.000% | 7/1/22 | 1,150 | 1,340 |
| | Butler County PA Hospital Authority Revenue (Butler Health System Project) | 5.000% | 7/1/23 | 1,410 | 1,667 |
| | Clarion County PA Industrial Development Authority Revenue | | | | |
| | (Clarion University Foundation Inc. Student Housing Project) | 5.000% | 7/1/20 | 1,015 | 1,113 |
| | Clarion County PA Industrial Development Authority Revenue | | | | |
| | (Clarion University Foundation Inc. Student Housing Project) | 5.000% | 7/1/21 | 1,070 | 1,194 |
| | Clarion County PA Industrial Development Authority Revenue | | | | |
| | (Clarion University Foundation Inc. Student Housing Project) | 5.000% | 7/1/22 | 1,120 | 1,266 |
| | Clarion County PA Industrial Development Authority Revenue | | | | |
| | (Clarion University Foundation Inc. Student Housing Project) | 5.000% | 7/1/23 | 1,180 | 1,346 |
| | Commonwealth Financing Authority Pennsylvania Revenue | 5.000% | 6/1/18 | 670 | 709 |
| | Commonwealth Financing Authority Pennsylvania Revenue | 5.000% | 6/1/19 | 500 | 548 |
| | Delaware County PA Authority Hospital Revenue (Crozer-Keystone Obligated Group) | 5.000% | 12/15/16 (ETM) | 3,510 | 3,528 |
| | Delaware County PA Authority Hospital Revenue (Crozer-Keystone Obligated Group) | 5.000% | 12/15/16 (ETM) | 1,175 | 1,181 |
| | Delaware County PA Authority University Revenue (Villanova University) | 5.000% | 8/1/18 | 300 | 321 |
| | Delaware County PA Authority University Revenue (Villanova University) | 5.000% | 8/1/19 | 240 | 266 |
| | Delaware County PA Authority University Revenue (Villanova University) | 5.000% | 8/1/19 | 600 | 664 |
| | Delaware County PA Authority University Revenue (Villanova University) | 5.000% | 8/1/20 | 500 | 570 |
| | Delaware County PA Authority University Revenue (Villanova University) | 5.000% | 8/1/21 | 700 | 820 |
98
Limited-Term Tax-Exempt Fund
| | | | |
| | | | Face | Market |
| | | Maturity | Amount | Value• |
| | Coupon | Date | ($000) | ($000) |
| Delaware County PA Authority University Revenue (Villanova University) | 5.000% | 12/1/21 | 400 | 473 |
| Delaware County PA Authority University Revenue (Villanova University) | 5.000% | 8/1/22 | 400 | 480 |
| Delaware County PA Authority University Revenue (Villanova University) | 5.000% | 12/1/22 | 400 | 484 |
| Delaware County PA Authority University Revenue (Villanova University) | 5.000% | 12/1/23 | 750 | 925 |
| Delaware River Joint Toll Bridge Commission Pennsylvania & New Jersey Revenue | 5.500% | 7/1/19 (14) | 1,300 | 1,450 |
| Delaware River Joint Toll Bridge Commission Pennsylvania & New Jersey Revenue | 5.000% | 7/1/20 | 385 | 437 |
| Delaware River Joint Toll Bridge Commission Pennsylvania & New Jersey Revenue | 5.000% | 7/1/21 | 340 | 396 |
| Delaware River Joint Toll Bridge Commission Pennsylvania & New Jersey Revenue | 5.000% | 7/1/22 | 275 | 328 |
| Delaware River Port Authority Pennsylvania & New Jersey Revenue | 5.000% | 1/1/17 | 1,065 | 1,073 |
| Delaware River Port Authority Pennsylvania & New Jersey Revenue | 5.000% | 1/1/18 | 1,230 | 1,282 |
| Delaware River Port Authority Pennsylvania & New Jersey Revenue | 5.000% | 1/1/19 | 1,745 | 1,880 |
| Delaware River Port Authority Pennsylvania & New Jersey Revenue | 5.000% | 1/1/20 | 7,320 | 8,045 |
| Delaware River Port Authority Pennsylvania & New Jersey Revenue | 5.000% | 1/1/22 | 1,135 | 1,276 |
| 3 Hempfield PA School District GO PUT | 0.903% | 8/1/19 | 5,690 | 5,647 |
| Jackson PA Authority for Industrial Development Revenue (StoneRidge Retirement Living) VRDO | 0.650% | 11/7/16 LOC | 10,000 | 10,000 |
| Lancaster County PA Hospital Authority Health System Revenue | | | | |
| (University of Pennsylvania Health System) | 5.000% | 8/15/22 | 2,750 | 3,298 |
| Lancaster County PA Solid Waste Management Authority Solid Waste Disposal System Revenue | 5.000% | 12/15/18 | 1,625 | 1,760 |
| Lancaster County PA Solid Waste Management Authority Solid Waste Disposal System Revenue | 5.000% | 12/15/20 | 2,850 | 3,265 |
| 3 Manheim Township PA School District GO PUT | 0.759% | 5/1/18 | 6,850 | 6,777 |
| 1 Monroe County PA Hospital Authority Revenue (Pocono Medical Center) | 5.000% | 7/1/21 | 700 | 799 |
| Monroeville PA Finance Authority Revenue (UPMC Health System) | 4.000% | 2/15/17 | 750 | 757 |
| Monroeville PA Finance Authority Revenue (UPMC Health System) | 4.000% | 2/15/18 | 1,250 | 1,299 |
| Monroeville PA Finance Authority Revenue (UPMC Health System) | 5.000% | 2/15/19 | 1,000 | 1,088 |
| Montgomery County PA GO | 5.000% | 4/1/21 | 1,975 | 2,295 |
| Montgomery County PA GO | 5.000% | 4/1/23 | 2,395 | 2,906 |
| Montgomery County PA Higher Education & Health Authority Hospital Revenue | | | | |
| (Abington Memorial Hospital) | 5.000% | 6/1/18 | 1,000 | 1,060 |
| Montgomery County PA Higher Education & Health Authority Hospital Revenue | | | | |
| (Abington Memorial Hospital) | 5.000% | 6/1/19 | 3,300 | 3,609 |
| Montgomery County PA Higher Education & Health Authority Hospital Revenue | | | | |
| (Abington Memorial Hospital) | 5.000% | 6/1/20 | 6,410 | 7,210 |
| Montgomery County PA Higher Education & Health Authority Revenue (Arcadia University) | 5.000% | 4/1/17 | 1,395 | 1,416 |
| Montgomery County PA Higher Education & Health Authority Revenue (Arcadia University) | 5.000% | 4/1/18 | 1,460 | 1,527 |
| Montgomery County PA Higher Education & Health Authority Revenue (Arcadia University) | 5.000% | 4/1/19 | 1,535 | 1,645 |
| Montgomery County PA Higher Education & Health Authority Revenue (Arcadia University) | 5.000% | 4/1/20 | 1,515 | 1,658 |
| Montgomery County PA Higher Education & Health Authority Revenue (Arcadia University) | 5.000% | 4/1/21 | 1,550 | 1,728 |
| Montgomery County PA Higher Education & Health Authority Revenue | | | | |
| (Holy Redeemer Health System) | 4.000% | 10/1/19 | 500 | 533 |
| Montgomery County PA Higher Education & Health Authority Revenue | | | | |
| (Holy Redeemer Health System) | 5.000% | 10/1/20 | 1,265 | 1,417 |
| Montgomery County PA Higher Education & Health Authority Revenue | | | | |
| (Holy Redeemer Health System) | 5.000% | 10/1/21 | 1,320 | 1,510 |
| Montgomery County PA Higher Education & Health Authority Revenue | | | | |
| (Holy Redeemer Health System) | 5.000% | 10/1/22 | 1,380 | 1,607 |
| Montgomery County PA Industrial Development Authority Health Services Revenue | | | | |
| (Albert Einstein Healthcare Network) | 5.000% | 1/15/17 | 1,250 | 1,260 |
| Montgomery County PA Industrial Development Authority Health Services Revenue | | | | |
| (Albert Einstein Healthcare Network) | 5.000% | 1/15/20 | 1,200 | 1,313 |
| Montgomery County PA Industrial Development Authority Health Services Revenue | | | | |
| (Albert Einstein Healthcare Network) | 5.000% | 1/15/21 | 2,175 | 2,423 |
| Montgomery County PA Industrial Development Authority Health Services Revenue | | | | |
| (Albert Einstein Healthcare Network) | 5.000% | 1/15/22 | 4,000 | 4,528 |
| Montgomery County PA Industrial Development Authority Pollution Control Revenue | | | | |
| (Exelon Generation Co., LLC) PUT | 2.500% | 4/1/20 | 8,000 | 8,061 |
| Montgomery County PA Industrial Development Authority Pollution Control Revenue | | | | |
| (Exelon Generation Co., LLC) PUT | 2.500% | 4/1/20 | 5,000 | 5,038 |
| Moon Industrial Development Authority Pennsylvania Revenue | | | | |
| (Baptist Home Society Obligated Group) | 5.000% | 7/1/20 | 1,375 | 1,440 |
| 3 North Penn PA Water Authority Revenue | 0.763% | 11/1/19 | 1,000 | 991 |
| 3 North Penn PA Water Authority Revenue PUT | 0.853% | 11/1/19 | 2,500 | 2,485 |
| Northampton County PA General Purpose Authority Hospital Revenue | | | | |
| (St. Luke’s Hospital Project) | 5.000% | 8/15/21 | 1,500 | 1,729 |
| Northampton County PA General Purpose Authority Hospital Revenue | | | | |
| (St. Luke’s Hospital Project) | 5.000% | 8/15/22 | 3,885 | 4,546 |
| Northampton County PA General Purpose Authority Hospital Revenue | | | | |
| (St. Luke’s Hospital Project) | 5.000% | 8/15/23 | 2,185 | 2,595 |
| 3 Northampton County PA General Purpose Authority Hospital Revenue | | | | |
| (St. Luke’s Hospital Project) PUT | 2.030% | 8/15/20 | 8,125 | 8,133 |
| Northampton County PA General Purpose Authority University Revenue (Lafayette College) VRDO | 0.650% | 11/7/16 | 900 | 900 |
99
Limited-Term Tax-Exempt Fund
| | | | |
| | | | Face | Market |
| | | Maturity | Amount | Value• |
| | Coupon | Date | ($000) | ($000) |
| Northeastern Pennsylvania Hospital & Educational Authority Revenue (Wilkes University Project) | 5.000% | 3/1/22 | 925 | 1,060 |
| Northeastern Pennsylvania Hospital & Educational Authority Revenue (Wilkes University Project) | 5.000% | 3/1/23 | 985 | 1,148 |
| Pennsbury PA School District GO | 5.000% | 1/15/21 | 1,250 | 1,439 |
| Pennsbury PA School District GO | 5.000% | 1/15/22 | 1,000 | 1,179 |
| Pennsylvania Economic Development Financing Authority Health System Revenue | | | | |
| (Albert Einstein Healthcare Network) | 6.250% | 10/15/19 (Prere.) | 8,980 | 10,099 |
| Pennsylvania Economic Development Financing Authority Revenue (UPMC Obligated Group) | 4.000% | 2/1/20 | 1,650 | 1,798 |
| Pennsylvania Economic Development Financing Authority Revenue (UPMC Obligated Group) | 5.000% | 2/1/21 | 2,250 | 2,594 |
| Pennsylvania Economic Development Financing Authority Revenue (UPMC Obligated Group) | 5.000% | 2/1/22 | 2,775 | 3,276 |
| Pennsylvania Economic Development Financing Authority Solid Waste Disposal Revenue | | | | |
| (Republic Services Inc. Project) PUT | 1.000% | 1/3/17 | 2,360 | 2,360 |
| Pennsylvania Economic Development Financing Authority Solid Waste Disposal Revenue | | | | |
| (Waste Management Inc. Project) PUT | 1.500% | 5/1/18 | 3,000 | 3,011 |
| Pennsylvania Economic Development Financing Authority Unemployment Compensation Revenue | 5.000% | 7/1/18 | 27,000 | 28,836 |
| Pennsylvania Economic Development Financing Authority Unemployment Compensation Revenue | 5.000% | 7/1/21 | 19,775 | 20,728 |
| Pennsylvania GO | 5.000% | 11/1/16 | 4,700 | 4,700 |
| Pennsylvania GO | 5.000% | 6/1/17 | 3,060 | 3,137 |
| Pennsylvania GO | 5.000% | 7/1/17 | 4,155 | 4,273 |
| Pennsylvania GO | 5.000% | 7/15/17 | 15,005 | 15,456 |
| Pennsylvania GO | 5.000% | 10/15/17 | 8,500 | 8,833 |
| Pennsylvania GO | 5.000% | 10/15/18 | 10,000 | 10,758 |
| Pennsylvania GO | 5.000% | 4/1/19 | 30,390 | 33,113 |
| Pennsylvania GO | 5.000% | 5/1/19 | 5,000 | 5,463 |
| Pennsylvania GO | 5.000% | 6/1/19 | 15,000 | 16,431 |
| Pennsylvania GO | 5.000% | 7/1/19 | 10,000 | 10,983 |
| Pennsylvania GO | 5.000% | 7/1/19 | 9,900 | 10,873 |
| Pennsylvania GO | 5.000% | 3/15/20 | 5,380 | 6,020 |
| Pennsylvania GO | 5.000% | 4/1/20 | 7,450 | 8,347 |
| Pennsylvania GO | 5.000% | 6/15/20 | 21,120 | 23,799 |
| Pennsylvania GO | 5.000% | 7/1/20 | 20,925 | 23,608 |
| Pennsylvania GO | 5.000% | 10/15/20 | 22,345 | 25,290 |
| Pennsylvania GO | 5.000% | 8/1/22 | 7,500 | 8,783 |
| Pennsylvania GO | 5.000% | 6/1/23 | 3,000 | 3,534 |
| Pennsylvania GO | 4.000% | 7/1/23 | 13,000 | 14,594 |
| Pennsylvania GO | 5.000% | 9/15/23 | 4,830 | 5,808 |
| Pennsylvania GO | 5.000% | 9/15/25 (4) | 11,000 | 13,573 |
| Pennsylvania Higher Education Assistance Agency Revenue | 5.000% | 12/15/17 | 2,205 | 2,301 |
| Pennsylvania Higher Education Assistance Agency Revenue | 5.000% | 12/15/18 | 3,490 | 3,761 |
| Pennsylvania Higher Education Assistance Agency Revenue | 5.000% | 12/15/19 | 2,490 | 2,764 |
| Pennsylvania Higher Educational Facilities Authority Revenue | | | | |
| (AICUP Financing Program - Delaware Valley College Project) | 5.000% | 11/1/18 | 1,075 | 1,124 |
| Pennsylvania Higher Educational Facilities Authority Revenue (Higher Education System) | 5.000% | 6/15/17 | 4,655 | 4,777 |
| Pennsylvania Higher Educational Facilities Authority Revenue (Higher Education System) | 5.000% | 6/15/19 | 5,480 | 6,034 |
| Pennsylvania Higher Educational Facilities Authority Revenue (La Salle University) | 5.000% | 5/1/18 | 1,000 | 1,048 |
| Pennsylvania Higher Educational Facilities Authority Revenue (La Salle University) | 5.000% | 5/1/19 | 1,850 | 1,990 |
| Pennsylvania Higher Educational Facilities Authority Revenue (St. Joseph’s University) | 5.000% | 11/1/17 | 1,060 | 1,101 |
| Pennsylvania Higher Educational Facilities Authority Revenue (St. Joseph’s University) | 5.000% | 11/1/18 | 700 | 751 |
| Pennsylvania Higher Educational Facilities Authority Revenue | | | | |
| (Trustees of the University of Pennsylvania) | 5.000% | 10/1/20 | 2,745 | 3,151 |
| Pennsylvania Higher Educational Facilities Authority Revenue | | | | |
| (Trustees of the University of Pennsylvania) | 5.000% | 10/1/20 | 4,605 | 5,287 |
| Pennsylvania Higher Educational Facilities Authority Revenue | | | | |
| (Trustees of the University of Pennsylvania) | 5.000% | 10/1/21 | 2,120 | 2,498 |
| Pennsylvania Higher Educational Facilities Authority Revenue | | | | |
| (Trustees of the University of Pennsylvania) | 5.000% | 10/1/21 | 3,000 | 3,536 |
| Pennsylvania Higher Educational Facilities Authority Revenue | | | | |
| (Trustees of the University of Pennsylvania) | 5.000% | 10/1/22 | 5,000 | 6,030 |
| Pennsylvania Higher Educational Facilities Authority Revenue | | | | |
| (University of Pennsylvania Health System) | 5.000% | 8/15/19 | 5,655 | 6,257 |
| Pennsylvania Higher Educational Facilities Authority Revenue | | | | |
| (University of Pennsylvania Health System) | 5.000% | 5/15/20 | 8,000 | 9,030 |
| Pennsylvania Higher Educational Facilities Authority Revenue | | | | |
| (University of Pennsylvania Health System) | 5.000% | 8/15/20 | 1,925 | 2,188 |
| Pennsylvania Higher Educational Facilities Authority Revenue | | | | |
| (University of Pennsylvania Health System) | 5.000% | 8/15/21 | 3,000 | 3,501 |
| Pennsylvania Higher Educational Facilities Authority Revenue | | | | |
| (University of Pennsylvania Health System) | 5.000% | 8/15/22 | 750 | 895 |
| Pennsylvania Higher Educational Facilities Authority Revenue | | | | |
| (University of Pennsylvania Health System) | 5.000% | 8/15/23 | 3,000 | 3,648 |
100
Limited-Term Tax-Exempt Fund
| | | | |
| | | | Face | Market |
| | | Maturity | Amount | Value• |
| | Coupon | Date | ($000) | ($000) |
| Pennsylvania Higher Educational Facilities Authority Revenue | | | | |
| (University of Pittsburgh Medical Center) | 5.000% | 5/15/17 | 9,740 | 9,958 |
| Pennsylvania State University Revenue | 5.000% | 3/1/19 (Prere.) | 1,500 | 1,639 |
| Pennsylvania Turnpike Commission Motor License Fund Revenue | 5.000% | 12/1/19 | 1,020 | 1,135 |
| Pennsylvania Turnpike Commission Oil Franchise Tax Revenue | 5.000% | 12/1/22 | 3,485 | 4,151 |
| Pennsylvania Turnpike Commission Revenue | 5.000% | 12/1/17 | 3,515 | 3,669 |
| 3 Pennsylvania Turnpike Commission Revenue | 1.230% | 12/1/18 | 8,750 | 8,723 |
| 3 Pennsylvania Turnpike Commission Revenue | 1.310% | 12/1/18 | 10,000 | 9,990 |
| Pennsylvania Turnpike Commission Revenue | 5.000% | 12/1/18 | 1,150 | 1,241 |
| Pennsylvania Turnpike Commission Revenue | 5.000% | 12/1/18 | 3,240 | 3,499 |
| Pennsylvania Turnpike Commission Revenue | 5.000% | 6/1/19 (Prere.) | 5,000 | 5,512 |
| 3 Pennsylvania Turnpike Commission Revenue | 1.330% | 12/1/19 | 15,000 | 14,936 |
| 3 Pennsylvania Turnpike Commission Revenue | 1.780% | 12/1/19 | 20,000 | 20,141 |
| Pennsylvania Turnpike Commission Revenue | 5.000% | 12/1/19 | 1,015 | 1,129 |
| Pennsylvania Turnpike Commission Revenue | 5.000% | 12/1/19 | 1,175 | 1,306 |
| 3 Pennsylvania Turnpike Commission Revenue | 1.510% | 12/1/20 | 25,000 | 24,936 |
| Pennsylvania Turnpike Commission Revenue | 5.000% | 12/1/20 | 1,805 | 2,061 |
| Pennsylvania Turnpike Commission Revenue | 5.000% | 6/1/21 | 29,675 | 34,102 |
| Pennsylvania Turnpike Commission Revenue | 5.000% | 12/1/21 | 1,000 | 1,163 |
| Pennsylvania Turnpike Commission Revenue | 5.000% | 6/1/22 | 34,945 | 40,922 |
| Pennsylvania Turnpike Commission Revenue | 5.000% | 6/1/23 | 7,905 | 9,408 |
| Pennsylvania Turnpike Commission Revenue | 5.000% | 6/1/23 | 28,505 | 33,993 |
| 3 Pennsylvania Turnpike Commission Revenue PUT | 1.430% | 12/1/18 | 6,575 | 6,575 |
| Philadelphia PA Authority for Industrial Development Revenue (Cultural & Commercial Corridors) | 5.000% | 12/1/22 | 4,470 | 5,208 |
| Philadelphia PA Authority for Industrial Development Revenue (Cultural & Commercial Corridors) | 5.000% | 12/1/23 | 5,415 | 6,372 |
| Philadelphia PA Authority for Industrial Development Revenue (Temple University) | 5.000% | 4/1/17 | 700 | 712 |
| Philadelphia PA Authority for Industrial Development Revenue (Temple University) | 5.000% | 4/1/18 | 750 | 791 |
| Philadelphia PA Authority for Industrial Development Revenue (Temple University) | 5.000% | 4/1/18 | 1,615 | 1,704 |
| Philadelphia PA Authority for Industrial Development Revenue (Temple University) | 5.000% | 4/1/19 | 1,000 | 1,090 |
| Philadelphia PA Authority for Industrial Development Revenue (Temple University) | 5.000% | 4/1/19 | 1,650 | 1,799 |
| Philadelphia PA Authority for Industrial Development Revenue (Temple University) | 5.000% | 4/1/20 | 750 | 842 |
| Philadelphia PA Authority for Industrial Development Revenue (Temple University) | 5.000% | 4/1/20 | 3,500 | 3,929 |
| Philadelphia PA Authority for Industrial Development Revenue (Temple University) | 5.000% | 4/1/21 | 1,060 | 1,222 |
| Philadelphia PA Authority for Industrial Development Revenue (Temple University) | 5.000% | 4/1/21 | 3,605 | 4,156 |
| Philadelphia PA Authority for Industrial Development Revenue (Temple University) | 5.000% | 4/1/22 | 5,680 | 6,690 |
| Philadelphia PA Authority for Industrial Development Revenue (Temple University) | 5.000% | 4/1/22 | 750 | 883 |
| Philadelphia PA Authority for Industrial Development Revenue (Temple University) | 5.000% | 4/1/23 | 5,705 | 6,832 |
| Philadelphia PA Authority for Industrial Development Revenue (Temple University) | 5.000% | 4/1/23 | 650 | 778 |
| Philadelphia PA Gas Works Revenue | 5.375% | 7/1/18 (ETM) | 2,780 | 2,986 |
| Philadelphia PA GO | 5.000% | 7/15/17 | 1,000 | 1,029 |
| Philadelphia PA GO | 5.000% | 8/1/17 | 3,000 | 3,091 |
| Philadelphia PA GO | 5.000% | 12/15/17 (4) | 5,555 | 5,802 |
| Philadelphia PA GO | 5.000% | 7/15/18 | 2,000 | 2,131 |
| Philadelphia PA GO | 4.000% | 8/1/18 | 2,000 | 2,100 |
| Philadelphia PA GO | 5.000% | 7/15/19 | 1,410 | 1,548 |
| Philadelphia PA GO | 5.000% | 8/1/19 | 5,150 | 5,660 |
| Philadelphia PA GO | 5.000% | 8/1/20 | 3,625 | 4,077 |
| Philadelphia PA GO | 5.000% | 8/1/21 | 3,500 | 4,016 |
| Philadelphia PA GO | 5.000% | 8/1/22 | 4,500 | 5,270 |
| Philadelphia PA GO | 5.000% | 8/1/24 (12) | 2,000 | 2,199 |
| Philadelphia PA Hospitals & Higher Education Facilities Authority Hospital Revenue | | | | |
| (Temple University Health System Obligated Group) | 5.000% | 7/1/17 | 2,325 | 2,373 |
| Philadelphia PA Municipal Authority Revenue | 5.000% | 11/15/18 | 2,500 | 2,689 |
| Philadelphia PA School District GO | 5.000% | 9/1/18 | 2,780 | 2,932 |
| Philadelphia PA School District GO | 5.000% | 9/1/19 | 6,115 | 6,628 |
| Philadelphia PA School District GO | 5.000% | 9/1/20 | 6,000 | 6,637 |
| 1 Philadelphia PA School District GO | 5.000% | 9/1/21 | 2,745 | 3,088 |
| 1 Philadelphia PA School District GO | 5.000% | 9/1/21 | 4,500 | 5,062 |
| Philadelphia PA School District GO | 5.000% | 9/1/21 | 8,000 | 9,007 |
| 1 Philadelphia PA School District GO | 5.000% | 9/1/22 | 4,000 | 4,561 |
| 1 Philadelphia PA School District GO | 5.000% | 9/1/22 | 6,320 | 7,206 |
| 1 Philadelphia PA School District GO | 5.000% | 9/1/23 | 6,450 | 7,422 |
| 1 Philadelphia PA School District GO | 5.000% | 9/1/23 | 6,200 | 7,135 |
| Philadelphia PA School District GO | 5.125% | 9/1/23 (13) | 3,325 | 3,561 |
| Philadelphia PA TRAN | 2.000% | 6/30/17 | 19,275 | 19,421 |
| Philadelphia PA Water & Waste Water Revenue | 5.000% | 6/15/19 (4) | 2,500 | 2,754 |
| Philadelphia PA Water & Waste Water Revenue | 5.000% | 7/1/19 | 1,000 | 1,102 |
| Philadelphia PA Water & Waste Water Revenue | 5.000% | 1/1/20 | 7,165 | 8,018 |
| Philadelphia PA Water & Waste Water Revenue | 5.000% | 7/1/20 | 2,000 | 2,268 |
| Philadelphia PA Water & Waste Water Revenue | 5.000% | 7/1/21 | 1,250 | 1,455 |
101
Limited-Term Tax-Exempt Fund
| | | | |
| | | | Face | Market |
| | | Maturity | Amount | Value• |
| | Coupon | Date | ($000) | ($000) |
| Philadelphia PA Water & Waste Water Revenue | 5.000% | 7/1/21 | 1,000 | 1,164 |
| 1 Philadelphia PA Water & Waste Water Revenue | 5.000% | 10/1/23 | 5,000 | 6,033 |
| Pittsburgh PA GO | 5.000% | 9/1/18 | 11,000 | 11,784 |
| Pittsburgh PA Water & Sewer Authority Revenue | 5.000% | 9/1/19 (4) | 2,500 | 2,772 |
| Pittsburgh PA Water & Sewer Authority Revenue | 5.000% | 9/1/20 (4) | 3,385 | 3,863 |
| Reading PA School District GO | 5.000% | 4/1/19 | 6,230 | 6,664 |
| State Public School Building Authority Pennsylvania College Revenue | | | | |
| (Delaware County Community College Project) | 5.000% | 10/1/19 (15) | 1,725 | 1,910 |
| State Public School Building Authority Pennsylvania College Revenue | | | | |
| (Delaware County Community College Project) | 5.000% | 10/1/20 (15) | 1,035 | 1,176 |
| State Public School Building Authority Pennsylvania College Revenue | | | | |
| (Delaware County Community College Project) | 5.000% | 10/1/21 (15) | 2,670 | 3,106 |
| State Public School Building Authority Pennsylvania College Revenue | | | | |
| (Montgomery County Community College) | 5.000% | 5/1/20 | 2,995 | 3,341 |
| State Public School Building Authority Pennsylvania College Revenue | | | | |
| (Montgomery County Community College) | 5.000% | 5/1/21 | 1,000 | 1,143 |
| State Public School Building Authority Pennsylvania College Revenue | | | | |
| (Montgomery County Community College) | 5.000% | 5/1/22 | 1,000 | 1,163 |
| 3 University Area Joint Authority Pennsylvania Sewer Revenue PUT | 1.030% | 11/1/17 | 2,900 | 2,897 |
| University of Pittsburgh of the Commonwealth System of Higher Education | | | | |
| Pennsylvania Revenue (University Capital Project) | 5.500% | 9/15/20 | 1,030 | 1,140 |
| 2 University of Pittsburgh PA Revenue TOB VRDO | 0.660% | 11/7/16 | 7,500 | 7,500 |
| Washington County PA Hospital Authority Revenue (Washington Hospital Project) VRDO | 0.520% | 11/1/16 LOC | 6,535 | 6,535 |
| West Chester University Pennsylvania Student Housing Revenue BAN | 0.650% | 2/1/17 | 3,350 | 3,349 |
| Wilkes-Barre PA Finance Authority Revenue (University of Scranton Project) | 5.000% | 11/1/20 | 2,465 | 2,770 |
| York County PA GO | 4.000% | 12/1/16 (ETM) | 5,000 | 5,014 |
| 3 York County PA GO PUT | 0.659% | 6/1/17 | 7,085 | 7,078 |
| | | �� | | 1,245,443 |
| Rhode Island (0.4%) | | | | |
| Rhode Island & Providence Plantations GO | 5.000% | 11/15/16 (ETM) | 2,000 | 2,003 |
| Rhode Island Economic Development Corp. Airport Revenue | 5.000% | 7/1/19 | 700 | 756 |
| Rhode Island Economic Development Corp. Airport Revenue | 5.000% | 7/1/20 | 1,165 | 1,284 |
| Rhode Island Economic Development Corp. Airport Revenue | 5.000% | 7/1/21 | 1,355 | 1,522 |
| Rhode Island Health & Educational Building Corp. Higher Education Facilities Revenue | | | | |
| (University of Rhode Island) | 5.000% | 9/15/21 | 400 | 466 |
| Rhode Island Health & Educational Building Corp. Higher Education Facilities Revenue | | | | |
| (University of Rhode Island) | 5.000% | 9/15/21 | 405 | 470 |
| Rhode Island Health & Educational Building Corp. Higher Education Facilities Revenue | | | | |
| (University of Rhode Island) | 5.000% | 9/15/22 | 510 | 606 |
| Rhode Island Health & Educational Building Corp. Higher Education Facilities Revenue | | | | |
| (University of Rhode Island) | 5.000% | 9/15/22 | 450 | 533 |
| Rhode Island Health & Educational Building Corp. Higher Education Facilities Revenue | | | | |
| (University of Rhode Island) | 5.000% | 9/15/23 | 450 | 544 |
| Rhode Island Health & Educational Building Corp. Higher Education Facilities Revenue | | | | |
| (University of Rhode Island) | 5.000% | 9/15/23 | 640 | 768 |
| Rhode Island Health & Educational Building Corp. Higher Education Facilities Revenue | | | | |
| (University of Rhode Island) | 5.000% | 9/15/24 | 350 | 429 |
| Rhode Island Health & Educational Building Corp. Higher Education Facilities Revenue | | | | |
| (University of Rhode Island) | 5.000% | 9/15/24 | 670 | 814 |
| Rhode Island Health & Educational Building Corp. Hospital Financing Revenue | | | | |
| (Care New England Health System Obligated Group) | 5.000% | 9/1/18 (ETM) | 1,325 | 1,420 |
| Rhode Island Health & Educational Building Corp. Hospital Financing Revenue | | | | |
| (Care New England Health System Obligated Group) | 5.000% | 9/1/19 (ETM) | 1,650 | 1,823 |
| Rhode Island Health & Educational Building Corp. Hospital Financing Revenue | | | | |
| (Care New England Health System Obligated Group) | 5.000% | 9/1/20 (ETM) | 1,455 | 1,655 |
| Rhode Island Health & Educational Building Corp. Hospital Financing Revenue | | | | |
| (Care New England Health System Obligated Group) | 5.000% | 9/1/21 | 5,625 | 6,141 |
| Rhode Island Health & Educational Building Corp. Hospital Financing Revenue | | | | |
| (Care New England Health System Obligated Group) | 5.000% | 9/1/21 (ETM) | 1,650 | 1,926 |
| Rhode Island Health & Educational Building Corp. Hospital Financing Revenue | | | | |
| (Care New England Health System Obligated Group) | 5.000% | 9/1/22 | 2,500 | 2,752 |
| Rhode Island Health & Educational Building Corp. Hospital Financing Revenue | | | | |
| (Care New England Health System Obligated Group) | 5.000% | 9/1/23 | 2,700 | 2,979 |
| Rhode Island Health & Educational Building Corp. Hospital Financing Revenue | | | | |
| (Lifespan Obligated Group) | 5.000% | 5/15/21 | 2,330 | 2,660 |
| Rhode Island Health & Educational Building Corp. Hospital Financing Revenue | | | | |
| (Lifespan Obligated Group) | 5.000% | 5/15/22 | 2,510 | 2,916 |
| Rhode Island Health & Educational Building Corp. Hospital Financing Revenue | | | | |
| (Lifespan Obligated Group) | 5.000% | 5/15/23 | 2,200 | 2,584 |
102
Limited-Term Tax-Exempt Fund
| | | | |
| | | | Face | Market |
| | | Maturity | Amount | Value• |
| | Coupon | Date | ($000) | ($000) |
| Rhode Island Health & Educational Building Corp. Providence Public Schools Revenue | | | | |
| (Providence Public Buildings Authority) | 5.000% | 5/15/19 | 1,255 | 1,362 |
| Rhode Island Health & Educational Building Corp. Providence Public Schools Revenue | | | | |
| (Providence Public Buildings Authority) | 5.000% | 5/15/20 | 2,760 | 3,063 |
| Rhode Island Health & Educational Building Corp. Providence Public Schools Revenue | | | | |
| (Providence Public Buildings Authority) | 4.000% | 5/15/21 (4) | 10,470 | 11,450 |
| Rhode Island Health & Educational Building Corp. Providence Public Schools Revenue | | | | |
| (Providence Public Buildings Authority) | 5.000% | 5/15/21 | 2,000 | 2,269 |
| Rhode Island Health & Educational Building Corp. Providence Public Schools Revenue | | | | |
| (Providence Public Buildings Authority) | 4.000% | 5/15/22 (4) | 11,705 | 12,959 |
| Tobacco Settlement Financing Corp. Rhode Island Revenue | 5.000% | 6/1/19 | 10,580 | 11,477 |
| Tobacco Settlement Financing Corp. Rhode Island Revenue | 5.000% | 6/1/20 | 3,500 | 3,864 |
| Tobacco Settlement Financing Corp. Rhode Island Revenue | 5.000% | 6/1/21 | 2,755 | 3,084 |
| Tobacco Settlement Financing Corp. Rhode Island Revenue | 5.000% | 6/1/22 | 2,540 | 2,884 |
| | | | | 89,463 |
| South Carolina (1.3%) | | | | |
| Berkeley County SC School District Revenue | 5.000% | 12/1/17 | 600 | 625 |
| Berkeley County SC School District Revenue | 5.000% | 12/1/18 | 1,000 | 1,077 |
| Berkeley County SC School District Revenue | 5.000% | 12/1/20 | 1,000 | 1,134 |
| Charleston County SC GO | 5.000% | 11/1/17 | 1,045 | 1,090 |
| Charleston County SC GO | 5.000% | 11/1/17 | 6,485 | 6,762 |
| Charleston County SC GO | 5.000% | 11/1/18 | 7,085 | 7,666 |
| Charleston SC Educational Excellence Financing Corp. Revenue | | | | |
| (Charleston County School District, South Carolina Project) | 5.000% | 12/1/19 | 2,000 | 2,239 |
| 3 Charleston SC Waterworks & Sewer Capital Improvement Revenue PUT | 1.042% | 1/1/18 | 8,700 | 8,692 |
| Greenville County SC School District GO | 5.500% | 12/1/16 | 13,450 | 13,504 |
| 2 Greenville SC Health System Revenue TOB VRDO | 0.670% | 11/7/16 | 8,020 | 8,020 |
| 2 Greenwood SC Metropolitan Sewer System Revenue TOB VRDO | 0.700% | 11/7/16 (4) | 5,625 | 5,625 |
| Kershaw County SC Public Schools Foundation Installment Purchase Revenue | 5.000% | 12/1/20 | 600 | 680 |
| Kershaw County SC Public Schools Foundation Installment Purchase Revenue | 5.000% | 12/1/21 | 1,000 | 1,156 |
| Kershaw County SC Public Schools Foundation Installment Purchase Revenue | 5.000% | 12/1/22 | 1,000 | 1,178 |
| Lexington County SC Health Services District Inc. Hospital Revenue | 5.000% | 11/1/17 | 2,660 | 2,768 |
| Lexington County SC Health Services District Inc. Hospital Revenue | 5.000% | 11/1/18 | 1,345 | 1,449 |
| Myrtle Beach SC Hospitality Fee Revenue | 5.000% | 6/1/20 | 500 | 560 |
| Myrtle Beach SC Hospitality Fee Revenue | 5.000% | 6/1/21 | 1,000 | 1,147 |
| Myrtle Beach SC Tax Increase Revenue (Myrtle Beach Air Force Base Redevelopment Project) | 5.000% | 10/1/21 | 1,245 | 1,438 |
| Myrtle Beach SC Tax Increase Revenue (Myrtle Beach Air Force Base Redevelopment Project) | 5.000% | 10/1/22 | 1,240 | 1,459 |
| Newberry County SC School District Installment Purchase Revenue | 5.000% | 12/1/22 | 1,290 | 1,535 |
| Oconee County SC Pollution Control Facilities Revenue (Duke Energy Carolinas Project) | 3.600% | 2/1/17 | 15,100 | 15,200 |
| Piedmont SC Municipal Power Agency Revenue | 5.000% | 1/1/17 | 7,225 | 7,276 |
| Richland County SC School District No. 2 GO | 5.000% | 2/1/22 | 19,280 | 22,904 |
| Rock Hill SC Utility System Revenue | 5.000% | 1/1/22 | 780 | 913 |
| Rock Hill SC Utility System Revenue | 5.000% | 1/1/23 | 1,110 | 1,324 |
| Rock Hill SC Utility System Revenue | 5.000% | 1/1/24 | 1,000 | 1,207 |
| South Carolina Association of Governmental Organizations COP | 2.000% | 3/1/17 | 47,500 | 47,710 |
| South Carolina Association of Governmental Organizations Educational Facilities Corp. Revenue | | | | |
| (Pickens School District) | 5.000% | 12/1/19 | 1,250 | 1,389 |
| South Carolina Association of Governmental Organizations Educational Facilities Corp. Revenue | | | | |
| (Pickens School District) | 5.000% | 12/1/20 | 3,250 | 3,708 |
| South Carolina Association of Governmental Organizations Educational Facilities Corp. Revenue | | | | |
| (Pickens School District) | 5.000% | 12/1/21 | 2,635 | 3,078 |
| South Carolina Association of Governmental Organizations Educational Facilities Corp. Revenue | | | | |
| (Pickens School District) | 5.000% | 12/1/22 | 3,785 | 4,515 |
| South Carolina Jobs Economic Development Authority Hospital Revenue (AnMed Health Project) | 5.000% | 2/1/17 | 2,320 | 2,344 |
| South Carolina Jobs Economic Development Authority Hospital Revenue (Palmetto Health) | 5.000% | 8/1/17 | 300 | 309 |
| South Carolina Jobs Economic Development Authority Hospital Revenue (Palmetto Health) | 5.000% | 8/1/18 | 500 | 532 |
| South Carolina Jobs Economic Development Authority Hospital Revenue (Palmetto Health) | 5.000% | 8/1/19 | 1,000 | 1,094 |
| South Carolina Jobs Economic Development Authority Hospital Revenue (Palmetto Health) | 5.000% | 8/1/20 | 2,700 | 3,033 |
| South Carolina Jobs Economic Development Authority Hospital Revenue (Palmetto Health) | 5.000% | 8/1/21 | 1,000 | 1,149 |
| South Carolina Jobs Economic Development Authority Hospital Revenue (Palmetto Health) | 4.000% | 8/1/22 | 1,500 | 1,657 |
| South Carolina Jobs Economic Development Authority Revenue (Bon Secours Health System Inc.) | 4.500% | 11/1/17 | 1,000 | 1,036 |
| South Carolina Jobs Economic Development Authority Revenue (Bon Secours Health System Inc.) | 5.000% | 11/1/18 | 1,500 | 1,615 |
| South Carolina Jobs Economic Development Authority Revenue (Bon Secours Health System Inc.) | 5.000% | 11/1/19 | 1,000 | 1,111 |
| South Carolina Jobs Economic Development Authority Revenue (Bon Secours Health System Inc.) | 5.000% | 11/1/20 | 1,750 | 2,001 |
| South Carolina Ports Authority Revenue | 5.000% | 7/1/17 | 1,535 | 1,575 |
| South Carolina Public Service Authority Revenue | 5.000% | 1/1/17 (ETM) | 2,000 | 2,014 |
| South Carolina Public Service Authority Revenue | 5.000% | 12/1/17 | 6,035 | 6,308 |
| South Carolina Public Service Authority Revenue | 5.000% | 12/1/20 | 18,545 | 21,282 |
| South Carolina Public Service Authority Revenue | 5.000% | 12/1/21 | 2,500 | 2,938 |
103
Limited-Term Tax-Exempt Fund
| | | | |
| | | | Face | Market |
| | | Maturity | Amount | Value• |
| | Coupon | Date | ($000) | ($000) |
| South Carolina Public Service Authority Revenue | 5.000% | 12/1/21 | 290 | 341 |
| South Carolina Public Service Authority Revenue | 5.000% | 12/1/21 | 15,000 | 17,626 |
| South Carolina Public Service Authority Revenue | 5.000% | 12/1/22 | 1,500 | 1,802 |
| South Carolina Public Service Authority Revenue | 5.000% | 12/1/22 | 1,095 | 1,315 |
| South Carolina Public Service Authority Revenue | 5.000% | 12/1/22 | 500 | 601 |
| South Carolina Public Service Authority Revenue | 5.000% | 12/1/23 | 500 | 608 |
| 2 South Carolina Public Service Authority Revenue TOB VRDO | 0.720% | 11/7/16 | 6,520 | 6,520 |
| 2 South Carolina Public Service Authority Revenue TOB VRDO | 0.830% | 11/7/16 | 7,500 | 7,500 |
| South Carolina Transportation Infrastructure Revenue | 5.000% | 10/1/19 | 25,805 | 28,717 |
| South Carolina Transportation Infrastructure Revenue | 5.000% | 10/1/20 | 4,220 | 4,830 |
| South Carolina Transportation Infrastructure Revenue | 5.000% | 10/1/23 | 4,885 | 5,966 |
| | | | | 304,852 |
| South Dakota (0.0%) | | | | |
| South Dakota Building Authority Revenue | 5.000% | 6/1/20 | 500 | 567 |
| South Dakota Health & Educational Facilities Authority Revenue (Sanford Health) | 4.000% | 11/1/20 | 635 | 701 |
| South Dakota Health & Educational Facilities Authority Revenue (Sanford Health) | 5.000% | 11/1/20 | 645 | 736 |
| South Dakota Health & Educational Facilities Authority Revenue (Sanford Health) | 4.000% | 11/1/21 | 500 | 559 |
| South Dakota Health & Educational Facilities Authority Revenue (Sanford Health) | 5.000% | 11/1/21 | 550 | 643 |
| South Dakota Health & Educational Facilities Authority Revenue (Sanford Health) | 5.000% | 11/1/22 | 375 | 448 |
| South Dakota Health & Educational Facilities Authority Revenue (Sanford Health) | 5.000% | 11/1/22 | 535 | 639 |
| | | | | 4,293 |
| Tennessee (1.3%) | | | | |
| 2 Blount County TN Public Building Authority Revenue TOB VRDO | 0.640% | 11/7/16 LOC | 13,480 | 13,480 |
| Chattanooga TN Electric System Revenue | 5.000% | 9/1/20 | 3,820 | 4,376 |
| Chattanooga TN Electric System Revenue | 5.000% | 9/1/21 | 2,500 | 2,943 |
| Chattanooga TN Electric System Revenue | 5.000% | 9/1/22 | 2,000 | 2,411 |
| Jackson TN Hospital Improvement Revenue (Jackson-Madison County General Hospital Project) | 5.000% | 4/1/22 | 1,715 | 2,029 |
| Knox County TN Health Educational & Housing Facilities Board Hospital Facilities Revenue | | | | |
| (Covenant Healthcare) | 5.000% | 1/1/20 | 2,500 | 2,779 |
| 1 Knox County TN Health Educational & Housing Facilities Board Hospital Facilities Revenue | | | | |
| (University Health System Inc.) | 5.000% | 9/1/21 | 1,145 | 1,311 |
| 1 Knox County TN Health Educational & Housing Facilities Board Hospital Facilities Revenue | | | | |
| (University Health System Inc.) | 5.000% | 9/1/23 | 1,370 | 1,619 |
| Memphis TN Electric System Revenue | 5.000% | 12/1/16 | 44,095 | 44,255 |
| Memphis TN Electric System Revenue | 5.000% | 12/1/17 | 12,500 | 13,073 |
| Memphis TN GO | 5.000% | 10/1/17 | 2,500 | 2,598 |
| Memphis-Shelby County TN Airport Authority Revenue | 5.000% | 7/1/22 | 5,280 | 6,120 |
| Metropolitan Government of Nashville & Davidson County TN Electric Revenue | 5.500% | 5/15/17 (13) | 6,345 | 6,510 |
| Metropolitan Government of Nashville & Davidson County TN GO | 5.000% | 7/1/17 | 10,000 | 10,290 |
| Metropolitan Government of Nashville & Davidson County TN GO | 5.000% | 7/1/19 | 25,130 | 27,775 |
| Metropolitan Government of Nashville & Davidson County TN GO | 5.000% | 7/1/24 | 3,945 | 4,687 |
| 3 Metropolitan Government of Nashville & Davidson County TN Health & | | | | |
| Educational Facilities Board Revenue (Vanderbilt University) PUT | 1.230% | 4/1/17 (Prere.) | 4,760 | 4,760 |
| 3 Metropolitan Government of Nashville & Davidson County TN Health & | | | | |
| Educational Facilities Board Revenue (Vanderbilt University) PUT | 1.230% | 10/1/17 | 4,940 | 4,935 |
| Metropolitan Government of Nashville & Davidson County TN Water & Sewer Revenue | 5.000% | 7/1/18 | 5,000 | 5,337 |
| Metropolitan Government of Nashville & Davidson County TN Water & Sewer Revenue | 5.000% | 7/1/19 | 6,070 | 6,704 |
| Metropolitan Government of Nashville & Davidson County TN Water & Sewer Revenue | 5.000% | 7/1/20 | 1,000 | 1,138 |
| Murfreesboro TN GO | 5.000% | 6/1/20 | 3,950 | 4,492 |
| Shelby County TN GO | 5.000% | 3/1/19 | 10,275 | 11,233 |
| Shelby County TN GO | 5.000% | 4/1/23 | 1,000 | 1,218 |
| Shelby County TN Health Educational & Housing Facility Board Revenue | | | | |
| (Methodist Le Bonheur Healthcare) VRDO | 0.510% | 11/1/16 (4) | 5,190 | 5,190 |
| Tennessee Energy Acquisition Corp. Gas Revenue | 5.000% | 2/1/18 | 8,590 | 8,974 |
| Tennessee Energy Acquisition Corp. Gas Revenue | 5.000% | 2/1/19 | 12,825 | 13,802 |
| Tennessee Energy Acquisition Corp. Gas Revenue | 5.000% | 2/1/20 | 2,735 | 3,026 |
| Tennessee Energy Acquisition Corp. Gas Revenue | 5.250% | 9/1/20 | 19,005 | 21,551 |
| Tennessee Energy Acquisition Corp. Gas Revenue | 5.000% | 2/1/21 | 8,510 | 9,623 |
| Tennessee Energy Acquisition Corp. Gas Revenue | 5.250% | 9/1/21 | 13,125 | 15,218 |
| Tennessee Energy Acquisition Corp. Gas Revenue | 5.000% | 2/1/22 | 1,540 | 1,766 |
| Tennessee Energy Acquisition Corp. Gas Revenue | 5.250% | 9/1/22 | 1,280 | 1,505 |
| Tennessee Energy Acquisition Corp. Gas Revenue | 5.000% | 2/1/23 | 2,275 | 2,652 |
| Tennessee Energy Acquisition Corp. Gas Revenue | 5.250% | 9/1/23 | 2,780 | 3,325 |
| Tennessee GO | 5.000% | 8/1/18 | 5,185 | 5,560 |
| Tennessee GO | 5.000% | 8/1/18 | 16,000 | 17,157 |
| Tennessee GO | 5.000% | 10/1/18 | 3,730 | 4,024 |
| Tennessee Housing Development Agency Residential Finance Program Revenue | 4.000% | 7/1/39 | 2,790 | 2,988 |
| Tennessee Housing Development Agency Residential Finance Program Revenue | 4.000% | 1/1/45 | 4,190 | 4,456 |
| Washington County TN GO | 4.000% | 6/1/21 | 2,030 | 2,282 |
104
Limited-Term Tax-Exempt Fund
| | | | |
| | | | Face | Market |
| | | Maturity | Amount | Value• |
| | Coupon | Date | ($000) | ($000) |
| Washington County TN GO | 4.000% | 6/1/22 | 5,030 | 5,751 |
| Washington County TN GO | 4.000% | 6/1/23 | 5,260 | 6,089 |
| | | | | 321,012 |
| Texas (10.8%) | | | | |
| Alvin TX Independent School District GO | 5.000% | 2/15/22 | 1,780 | 2,111 |
| Austin TX Community College District Public Facilities Corp. Lease Revenue | 5.000% | 8/1/20 | 1,000 | 1,129 |
| Austin TX Community College District Public Facilities Corp. Lease Revenue | 5.000% | 8/1/21 | 1,000 | 1,155 |
| Austin TX Community College District Public Facilities Corp. Lease Revenue | 5.000% | 8/1/22 | 1,000 | 1,179 |
| Austin TX Electric Utility System Revenue | 5.000% | 11/15/18 | 500 | 542 |
| Austin TX Electric Utility System Revenue | 5.000% | 11/15/19 | 500 | 560 |
| Austin TX Electric Utility System Revenue | 5.000% | 11/15/20 | 1,000 | 1,154 |
| Austin TX GO | 5.000% | 9/1/17 | 3,250 | 3,367 |
| Austin TX GO | 5.000% | 9/1/22 | 11,720 | 14,114 |
| Austin TX Independent School District GO | 5.000% | 8/1/22 | 4,500 | 5,396 |
| Austin TX Water & Wastewater System Revenue | 5.000% | 11/15/19 | 1,000 | 1,117 |
| Austin TX Water & Wastewater System Revenue | 5.000% | 11/15/20 | 2,420 | 2,782 |
| Bexar County TX GO | 5.000% | 6/15/21 | 5,155 | 6,009 |
| Bexar County TX GO | 5.000% | 6/15/21 | 2,930 | 3,415 |
| Bexar County TX GO | 5.000% | 6/15/22 | 6,000 | 7,160 |
| Bexar County TX GO | 5.000% | 6/15/22 | 2,775 | 3,311 |
| Bexar County TX GO | 5.000% | 6/15/23 | 9,220 | 11,200 |
| Bexar County TX GO | 5.000% | 6/15/23 | 4,055 | 4,926 |
| Bexar County TX Hospital District GO | 5.000% | 2/15/21 | 1,875 | 2,165 |
| Bexar County TX Hospital District GO | 5.000% | 2/15/22 | 1,525 | 1,802 |
| Bexar County TX Hospital District GO | 5.000% | 2/15/23 | 1,465 | 1,767 |
| Bexar County TX Hospital District GO | 5.000% | 2/15/24 | 2,000 | 2,450 |
| Brownsville TX Independent School District GO | 5.000% | 2/15/22 | 2,770 | 3,284 |
| Brownsville TX Utility System Revenue | 5.000% | 9/1/20 | 1,250 | 1,424 |
| Brownsville TX Utility System Revenue | 5.000% | 9/1/21 | 1,000 | 1,165 |
| Central Texas Regional Mobility Authority Revenue | 5.750% | 1/1/17 (ETM) | 570 | 575 |
| Central Texas Regional Mobility Authority Revenue | 5.000% | 1/1/18 | 250 | 261 |
| Central Texas Regional Mobility Authority Revenue | 5.750% | 1/1/18 (ETM) | 1,450 | 1,532 |
| Central Texas Regional Mobility Authority Revenue | 5.000% | 1/1/19 | 530 | 572 |
| Central Texas Regional Mobility Authority Revenue | 5.000% | 1/1/20 | 610 | 676 |
| Central Texas Regional Mobility Authority Revenue | 5.000% | 1/1/20 | 625 | 693 |
| Central Texas Regional Mobility Authority Revenue | 5.750% | 1/1/20 | 1,000 | 1,132 |
| Central Texas Regional Mobility Authority Revenue | 5.000% | 1/1/21 | 1,295 | 1,468 |
| Central Texas Regional Mobility Authority Revenue | 5.000% | 1/1/22 | 2,375 | 2,752 |
| Central Texas Regional Mobility Authority Revenue | 5.000% | 1/1/23 | 4,500 | 5,294 |
| Central Texas Regional Mobility Authority Revenue PUT | 5.000% | 1/7/21 | 5,500 | 6,109 |
| Conroe TX Independent School District GO | 5.000% | 2/15/21 | 3,380 | 3,911 |
| Conroe TX Independent School District GO | 5.000% | 2/15/22 | 3,125 | 3,705 |
| Conroe TX Independent School District GO | 5.000% | 2/15/23 | 4,240 | 5,123 |
| Coppell TX Independent School District GO | 5.000% | 8/15/22 | 1,000 | 1,200 |
| Corpus Christi TX GO | 5.000% | 3/1/22 | 4,000 | 4,726 |
| Cypress-Fairbanks TX Independent School District GO | 5.000% | 2/15/22 | 9,835 | 11,661 |
| Cypress-Fairbanks TX Independent School District GO PUT | 0.900% | 8/15/18 | 7,590 | 7,544 |
| 1 Dallas County TX Utility & Reclamation District GO | 5.000% | 2/15/21 | 7,230 | 8,281 |
| 1 Dallas County TX Utility & Reclamation District GO | 5.000% | 2/15/22 | 5,365 | 6,271 |
| 1 Dallas County TX Utility & Reclamation District GO | 5.000% | 2/15/23 | 1,000 | 1,193 |
| Dallas TX Area Rapid Transit Sales Tax Revenue | 5.000% | 12/1/21 | 3,250 | 3,842 |
| Dallas TX GO | 5.000% | 2/15/17 (ETM) | 25 | 25 |
| Dallas TX GO | 5.000% | 2/15/17 | 8,855 | 8,967 |
| Dallas TX GO | 5.000% | 2/15/21 | 7,500 | 8,685 |
| Dallas TX GO | 5.000% | 2/15/21 | 3,240 | 3,752 |
| Dallas TX GO | 5.000% | 2/15/22 | 4,290 | 5,092 |
| Dallas TX GO | 5.000% | 2/15/23 | 3,500 | 4,237 |
| Dallas TX Independent School District GO | 5.000% | 8/15/23 | 7,265 | 8,933 |
| Dallas TX Independent School District GO PUT | 1.500% | 8/15/18 | 5,000 | 5,030 |
| Dallas TX Independent School District GO PUT | 5.000% | 2/15/22 | 20,000 | 23,570 |
| Dallas TX Waterworks & Sewer System Revenue | 5.000% | 10/1/17 | 3,105 | 3,226 |
| Dallas-Fort Worth TX International Airport Revenue | 5.000% | 11/1/16 | 4,000 | 4,000 |
| Dallas-Fort Worth TX International Airport Revenue | 5.000% | 11/1/17 | 1,200 | 1,249 |
| Dallas-Fort Worth TX International Airport Revenue | 5.000% | 11/1/18 | 500 | 539 |
| Dallas-Fort Worth TX International Airport Revenue | 5.000% | 11/1/19 | 2,500 | 2,780 |
| Dallas-Fort Worth TX International Airport Revenue | 5.000% | 11/1/19 | 2,500 | 2,780 |
| Dallas-Fort Worth TX International Airport Revenue | 5.000% | 11/1/19 | 1,000 | 1,112 |
| Dallas-Fort Worth TX International Airport Revenue | 5.000% | 11/1/20 | 2,500 | 2,858 |
| Dallas-Fort Worth TX International Airport Revenue | 5.000% | 11/1/20 | 1,000 | 1,143 |
105
Limited-Term Tax-Exempt Fund
| | | | |
| | | | Face | Market |
| | | Maturity | Amount | Value• |
| | Coupon | Date | ($000) | ($000) |
| Dallas-Fort Worth TX International Airport Revenue | 5.000% | 11/1/21 | 4,000 | 4,683 |
| Denton County TX GO | 5.000% | 7/15/22 | 2,000 | 2,400 |
| Denton County TX GO | 5.000% | 7/15/23 | 2,090 | 2,560 |
| Denton TX GO | 5.000% | 2/15/22 | 2,000 | 2,245 |
| Denton TX Independent School District GO | 0.000% | 8/15/20 | 1,195 | 1,139 |
| Denton TX Independent School District GO | 0.000% | 8/15/22 | 5,000 | 4,581 |
| Denton TX Independent School District GO PUT | 2.000% | 8/1/18 | 3,125 | 3,172 |
| Eagle Mountain & Saginaw TX Independent School District GO PUT | 2.000% | 8/1/19 | 9,000 | 9,194 |
| El Paso TX GO | 5.000% | 8/15/21 | 5,615 | 6,563 |
| El Paso TX GO | 5.000% | 8/15/21 | 1,935 | 2,262 |
| El Paso TX GO | 5.000% | 8/15/22 | 2,795 | 3,342 |
| El Paso TX Water & Sewer Revenue | 5.000% | 3/1/18 | 1,000 | 1,054 |
| El Paso TX Water & Sewer Revenue | 4.000% | 3/1/20 | 1,000 | 1,092 |
| El Paso TX Water & Sewer Revenue | 4.000% | 3/1/21 | 1,750 | 1,949 |
| El Paso TX Water & Sewer Revenue | 5.000% | 3/1/21 | 1,000 | 1,157 |
| El Paso TX Water & Sewer Revenue | 5.000% | 3/1/22 | 1,000 | 1,184 |
| Fort Bend County TX GO | 5.000% | 3/1/20 | 5,530 | 6,224 |
| Fort Bend County TX GO | 5.000% | 3/1/20 | 1,000 | 1,125 |
| Fort Bend County TX GO | 5.000% | 3/1/21 | 2,000 | 2,314 |
| Fort Bend County TX GO | 5.000% | 3/1/22 | 2,500 | 2,962 |
| Fort Bend County TX Toll Road Revenue | 5.000% | 3/1/22 | 200 | 236 |
| Fort Bend County TX Toll Road Revenue | 5.000% | 3/1/23 | 200 | 242 |
| Fort Bend TX Independent School District GO | 5.000% | 8/15/22 | 1,695 | 2,034 |
| Fort Worth TX GO | 5.000% | 3/1/18 | 4,375 | 4,614 |
| Fort Worth TX GO | 5.000% | 3/1/19 | 3,500 | 3,822 |
| Fort Worth TX GO | 5.000% | 3/1/20 | 10,075 | 11,339 |
| Fort Worth TX GO | 5.000% | 3/1/21 | 10,060 | 11,637 |
| Fort Worth TX GO | 5.000% | 3/1/23 | 9,985 | 12,054 |
| Fort Worth TX Water & Sewer Revenue | 5.000% | 2/15/18 | 4,100 | 4,317 |
| Frisco TX GO | 5.000% | 2/15/17 | 3,000 | 3,038 |
| Frisco TX GO | 5.000% | 2/15/18 | 3,325 | 3,501 |
| Frisco TX GO | 5.000% | 2/15/20 | 4,110 | 4,628 |
| Frisco TX GO | 5.000% | 2/15/21 | 4,295 | 4,970 |
| Frisco TX GO | 5.000% | 2/15/21 | 8,890 | 10,263 |
| Frisco TX GO | 5.000% | 2/15/22 | 7,730 | 9,140 |
| Frisco TX GO | 5.000% | 2/15/23 | 4,115 | 4,955 |
| Frisco TX Independent School District GO | 5.000% | 8/15/17 | 2,350 | 2,427 |
| Grand Parkway Transportation Corp. Texas System Toll Revenue BAN | 3.000% | 12/15/16 | 194,500 | 194,963 |
| Grand Prairie TX Independent School District GO | 5.000% | 2/15/21 | 1,500 | 1,735 |
| Grand Prairie TX Independent School District GO | 5.000% | 2/15/22 | 1,000 | 1,186 |
| Grand Prairie TX Independent School District GO | 5.000% | 2/15/23 | 675 | 816 |
| 2 Harris County TX Cultural Education Facilities Finance Corp. Hospital Revenue | | | | |
| (Children’s Hospital Project) TOB VRDO | 0.690% | 11/7/16 | 8,200 | 8,200 |
| 3 Harris County TX Cultural Education Facilities Finance Corp. Hospital Revenue | | | | |
| (Memorial Hermann Healthcare System) | 1.130% | 6/1/17 | 3,865 | 3,862 |
| 3 Harris County TX Cultural Education Facilities Finance Corp. Hospital Revenue | | | | |
| (Memorial Hermann Healthcare System) | 1.230% | 6/1/18 | 1,750 | 1,750 |
| 3 Harris County TX Cultural Education Facilities Finance Corp. Hospital Revenue | | | | |
| (Memorial Hermann Healthcare System) | 1.330% | 6/1/19 | 2,250 | 2,253 |
| 3 Harris County TX Cultural Education Facilities Finance Corp. Hospital Revenue | | | | |
| (Memorial Hermann Healthcare System) | 1.380% | 6/1/20 | 2,000 | 2,000 |
| 3 Harris County TX Cultural Education Facilities Finance Corp. Hospital Revenue | | | | |
| (Memorial Hermann Healthcare System) PUT | 1.210% | 12/1/19 | 9,000 | 8,980 |
| Harris County TX Cultural Education Facilities Finance Corp. Revenue (Baylor College of Medicine) | 5.000% | 11/15/20 | 2,500 | 2,856 |
| Harris County TX Cultural Education Facilities Finance Corp. Revenue (Baylor College of Medicine) | 5.000% | 11/15/21 | 1,600 | 1,873 |
| Harris County TX Cultural Education Facilities Finance Corp. Revenue (Baylor College of Medicine) | 5.000% | 11/15/22 | 1,800 | 2,149 |
| Harris County TX Cultural Education Facilities Finance Corp. Revenue | | | | |
| (Methodist Hospital System) VRDO | 0.540% | 11/1/16 | 13,300 | 13,300 |
| Harris County TX Cultural Education Facilities Finance Corp. Revenue (Texas Children’s Hospital) | 5.000% | 10/1/19 | 2,350 | 2,607 |
| Harris County TX Cultural Education Facilities Finance Corp. Revenue (Texas Children’s Hospital) | 5.000% | 10/1/21 | 4,000 | 4,684 |
| Harris County TX Cultural Education Facilities Finance Corp. Revenue (Texas Children’s Hospital) | 5.000% | 10/1/22 | 2,500 | 2,992 |
| Harris County TX Cultural Education Facilities Finance Corp. Revenue | | | | |
| (YMCA of the Greater Houston Area) | 5.000% | 6/1/18 | 425 | 446 |
| Harris County TX Cultural Education Facilities Finance Corp. Revenue | | | | |
| (YMCA of the Greater Houston Area) | 5.000% | 6/1/19 | 1,410 | 1,514 |
| Harris County TX Cultural Education Facilities Finance Corp. Thermal Utility Revenue | | | | |
| (TECO Project) | 5.000% | 11/15/16 | 1,000 | 1,002 |
| Harris County TX Flood Control District GO | 5.250% | 10/1/18 | 2,000 | 2,166 |
| Harris County TX GO | 5.000% | 10/1/17 | 6,775 | 7,039 |
| Harris County TX GO | 5.000% | 10/1/18 | 4,805 | 5,177 |
106
Limited-Term Tax-Exempt Fund
| | | | |
| | | | Face | Market |
| | | Maturity | Amount | Value• |
| | Coupon | Date | ($000) | ($000) |
| Harris County TX GO | 5.000% | 10/1/18 | 2,675 | 2,882 |
| Harris County TX GO | 5.000% | 10/1/22 | 1,100 | 1,327 |
| Harris County TX GO | 5.000% | 10/1/22 | 10,025 | 12,097 |
| Harris County TX Health Facilities Development Corp. Hospital Revenue | | | | |
| (Memorial Hermann Healthcare System) | 5.000% | 12/1/18 | 1,000 | 1,081 |
| Harris County TX Health Facilities Development Corp. Hospital Revenue | | | | |
| (Memorial Hermann Healthcare System) | 5.000% | 12/1/19 | 400 | 446 |
| Harris County TX Health Facilities Development Corp. Revenue | | | | |
| (Methodist Hospital System) VRDO | 0.540% | 11/1/16 | 5,700 | 5,700 |
| Harris County TX Health Facilities Development Corp. Revenue | | | | |
| (Methodist Hospital System) VRDO | 0.540% | 11/1/16 | 5,245 | 5,245 |
| Harris County TX Hospital District Revenue | 5.000% | 2/15/22 | 1,235 | 1,441 |
| Harris County TX Hospital District Revenue | 5.000% | 2/15/23 | 2,000 | 2,368 |
| Harris County TX Hospital District Revenue | 5.000% | 2/15/24 | 2,250 | 2,695 |
| Harris County TX Metropolitan Transit Authority Sales & Use Tax Revenue | 5.000% | 11/1/19 | 2,000 | 2,240 |
| Harris County TX Sports Authority Revenue | 5.000% | 11/15/20 | 575 | 649 |
| Harris County TX Sports Authority Revenue | 5.000% | 11/15/20 | 3,300 | 3,784 |
| Harris County TX Sports Authority Revenue | 5.000% | 11/15/21 | 8,115 | 9,530 |
| 3 Harris County TX Toll Road Revenue | 1.410% | 8/15/18 | 4,000 | 4,004 |
| 3 Harris County TX Toll Road Revenue PUT | 1.330% | 8/15/18 | 34,250 | 34,235 |
| Houston TX Airport System Revenue | 5.000% | 7/1/17 | 1,500 | 1,541 |
| Houston TX Airport System Revenue | 5.000% | 7/1/18 (14) | 6,070 | 6,237 |
| Houston TX Airport System Revenue | 5.000% | 7/1/18 | 1,720 | 1,828 |
| Houston TX Airport System Revenue | 5.000% | 7/1/19 (14) | 3,960 | 4,069 |
| 2 Houston TX Airport System Revenue TOB VRDO | 0.660% | 11/7/16 | 1,360 | 1,360 |
| Houston TX Community College System GO | 5.000% | 2/15/18 | 2,500 | 2,632 |
| Houston TX Community College System GO | 5.000% | 2/15/19 | 2,860 | 3,116 |
| Houston TX Community College System GO | 5.000% | 2/15/19 | 870 | 948 |
| Houston TX Community College System Revenue | 5.000% | 4/15/20 | 1,000 | 1,129 |
| Houston TX Community College System Revenue | 5.000% | 4/15/22 | 1,885 | 2,232 |
| Houston TX Community College System Revenue | 5.000% | 4/15/23 | 2,000 | 2,407 |
| Houston TX Community College System Revenue | 5.000% | 4/15/24 | 2,880 | 3,523 |
| Houston TX GO | 5.000% | 3/1/17 | 1,000 | 1,014 |
| Houston TX GO | 5.000% | 3/1/18 | 1,000 | 1,054 |
| Houston TX GO | 5.000% | 3/1/19 | 10,000 | 10,896 |
| Houston TX GO | 5.000% | 3/1/19 | 12,195 | 13,288 |
| Houston TX GO | 5.000% | 3/1/19 | 1,135 | 1,237 |
| Houston TX GO | 5.000% | 3/1/19 (Prere.) | 4,460 | 4,857 |
| Houston TX GO | 5.000% | 3/1/22 | 20,000 | 23,573 |
| Houston TX GO | 5.000% | 3/1/23 | 9,105 | 10,931 |
| Houston TX GO | 5.000% | 3/1/24 | 540 | 588 |
| Houston TX Hotel Occupancy Tax & Special Revenue (Convention & Entertainment Facilities) | 5.000% | 9/1/19 | 700 | 773 |
| Houston TX Hotel Occupancy Tax & Special Revenue (Convention & Entertainment Facilities) | 5.000% | 9/1/21 | 1,500 | 1,736 |
| Houston TX Independent School District GO | 5.000% | 2/15/17 | 2,375 | 2,405 |
| Houston TX Independent School District GO | 5.000% | 2/15/18 | 1,755 | 1,848 |
| Houston TX Independent School District GO | 5.000% | 2/15/19 | 2,890 | 3,152 |
| Houston TX Utility System Revenue | 5.000% | 11/15/16 | 1,855 | 1,858 |
| Houston TX Utility System Revenue | 5.000% | 11/15/17 | 13,500 | 14,090 |
| Houston TX Utility System Revenue | 5.250% | 11/15/17 (4) | 13,600 | 14,231 |
| Houston TX Utility System Revenue | 5.000% | 11/15/18 | 2,500 | 2,703 |
| Houston TX Utility System Revenue | 5.000% | 11/15/19 | 3,000 | 3,352 |
| Houston TX Utility System Revenue | 5.000% | 5/15/20 | 6,000 | 6,803 |
| Houston TX Utility System Revenue | 5.000% | 11/15/20 | 5,000 | 5,753 |
| Houston TX Utility System Revenue | 5.000% | 11/15/20 | 3,500 | 4,024 |
| Houston TX Utility System Revenue | 5.000% | 5/15/21 | 5,000 | 5,827 |
| Houston TX Utility System Revenue | 5.000% | 11/15/21 | 5,460 | 6,447 |
| Houston TX Utility System Revenue | 5.000% | 11/15/21 | 5,000 | 5,899 |
| Houston TX Utility System Revenue | 5.000% | 11/15/22 | 3,205 | 3,871 |
| Houston TX Utility System Revenue | 5.000% | 11/15/22 | 7,115 | 8,584 |
| Houston TX Utility System Revenue | 5.000% | 11/15/23 | 7,400 | 9,068 |
| 3 Houston TX Utility System Revenue PUT | 1.380% | 6/1/17 | 18,000 | 17,994 |
| 3 Houston TX Utility System Revenue PUT | 1.530% | 5/1/20 | 19,500 | 19,415 |
| Irving TX Independent School District GO | 5.000% | 2/15/22 | 3,750 | 4,446 |
| Irving TX Independent School District GO | 5.000% | 2/15/23 | 2,000 | 2,417 |
| Katy TX Independent School District GO | 5.000% | 2/15/21 | 2,185 | 2,533 |
| Katy TX Independent School District GO | 5.000% | 2/15/22 | 2,295 | 2,729 |
| Katy TX Independent School District GO | 5.000% | 2/15/23 | 1,510 | 1,834 |
| 3 Katy TX Independent School District GO PUT | 0.908% | 8/15/19 | 14,470 | 14,545 |
| Keller TX Independent School District GO | 5.000% | 8/15/20 | 2,650 | 3,027 |
| Keller TX Independent School District GO | 5.000% | 8/15/22 | 3,000 | 3,596 |
107
Limited-Term Tax-Exempt Fund
| | | | |
| | | | Face | Market |
| | | Maturity | Amount | Value• |
| | Coupon | Date | ($000) | ($000) |
| Kerrville TX Health Facilities Development Corp. Hospital Revenue | | | | |
| (Peterson Regional Medical Center Project) | 5.000% | 8/15/21 | 800 | 912 |
| Kerrville TX Health Facilities Development Corp. Hospital Revenue | | | | |
| (Peterson Regional Medical Center Project) | 5.000% | 8/15/22 | 1,000 | 1,158 |
| Klein TX Independent School District GO | 5.000% | 8/1/20 | 2,500 | 2,853 |
| Klein TX Independent School District GO | 5.000% | 8/1/21 | 8,550 | 10,026 |
| Klein TX Independent School District GO | 5.000% | 8/1/22 | 5,000 | 5,995 |
| Lamar TX Consolidated Independent School District GO | 5.000% | 2/15/19 | 2,705 | 2,949 |
| Lamar TX Consolidated Independent School District GO | 5.000% | 2/15/20 | 3,005 | 3,382 |
| Lamar TX Consolidated Independent School District GO | 5.000% | 2/15/21 | 2,320 | 2,684 |
| Lamar TX Consolidated Independent School District GO | 5.000% | 2/15/22 | 2,500 | 2,964 |
| Leander TX Independent School District GO | 0.000% | 8/16/20 | 2,675 | 2,549 |
| Leander TX Independent School District GO | 0.000% | 8/16/21 | 5,395 | 5,044 |
| Leander TX Independent School District GO | 0.000% | 8/16/22 | 9,615 | 8,808 |
| Leander TX Independent School District GO | 0.000% | 8/16/23 | 8,500 | 7,600 |
| Lewisville TX Independent School District GO | 4.000% | 8/15/20 | 1,000 | 1,104 |
| Lewisville TX Independent School District GO | 5.000% | 8/15/20 | 18,000 | 20,564 |
| Lewisville TX Independent School District GO | 4.000% | 8/15/21 | 2,240 | 2,521 |
| Lewisville TX Independent School District GO | 5.000% | 8/15/21 | 12,700 | 14,905 |
| Lewisville TX Independent School District GO | 5.000% | 8/15/22 | 7,500 | 9,001 |
| Lewisville TX Independent School District GO | 5.000% | 8/15/22 | 2,605 | 3,116 |
| Lone Star College System Texas GO | 5.000% | 2/15/22 | 6,000 | 7,094 |
| 2 Lone Star College System Texas GO TOB VRDO | 0.660% | 11/7/16 | 2,905 | 2,905 |
| Lower Colorado River Authority Texas Revenue | 5.000% | 5/15/17 | 1,710 | 1,748 |
| Lower Colorado River Authority Texas Revenue | 5.000% | 5/15/22 | 850 | 1,001 |
| Lower Colorado River Authority Texas Revenue | 5.000% | 5/15/23 | 1,200 | 1,439 |
| Lower Colorado River Authority Texas Transmission Contract Revenue | | | | |
| (LCRA Transmission Services Corp.) | 5.000% | 5/15/20 | 1,000 | 1,131 |
| Lower Colorado River Authority Texas Transmission Contract Revenue | | | | |
| (LCRA Transmission Services Corp.) | 5.000% | 5/15/21 | 800 | 928 |
| Lower Colorado River Authority Texas Transmission Contract Revenue | | | | |
| (LCRA Transmission Services Corp.) | 5.000% | 5/15/22 | 2,050 | 2,430 |
| Lubbock TX GO | 5.000% | 2/15/21 | 1,755 | 2,019 |
| Lubbock TX GO | 5.000% | 2/15/21 | 850 | 978 |
| Lubbock TX GO | 5.000% | 2/15/22 | 645 | 759 |
| Lubbock TX GO | 5.000% | 2/15/22 | 1,590 | 1,872 |
| Lubbock TX GO | 5.000% | 2/15/23 | 720 | 865 |
| Lubbock TX GO | 5.000% | 2/15/23 | 1,780 | 2,137 |
| Lubbock TX Health Facilities Development Corp. Revenue (St. Joseph Health System) | 5.000% | 7/1/17 | 4,210 | 4,326 |
| Lubbock TX Health Facilities Development Corp. Revenue (St. Joseph Health System) | 5.000% | 7/1/18 | 1,765 | 1,880 |
| Magnolia TX Independent School District GO | 5.000% | 8/15/21 | 1,505 | 1,766 |
| Magnolia TX Independent School District GO | 5.000% | 8/15/22 | 1,580 | 1,896 |
| Magnolia TX Independent School District GO | 5.000% | 8/15/23 | 510 | 623 |
| Marshall TX Independent School District GO | 5.000% | 2/15/23 | 2,185 | 2,640 |
| Mission TX Economic Development Corp. Solid Waste Disposal Revenue | | | | |
| (Allied Waste Inc. Project) PUT | 1.000% | 1/3/17 | 9,475 | 9,475 |
| New Hope TX Cultural Education Facilities FinanceCorp. Retirement Facilities Revenue | | | | |
| (Westminster Manor Project) | 5.000% | 11/1/23 | 500 | 587 |
| New Hope TX Cultural Education Facilities FinanceCorp. Retirement Facilities Revenue | | | | |
| (Westminster Manor Project) | 5.000% | 11/1/24 | 625 | 739 |
| New Hope TX Cultural Education Facilities FinanceCorp. Student Housing Revenue | | | | |
| (Tarleton State University Project) | 4.000% | 4/1/20 | 180 | 191 |
| New Hope TX Cultural Education Facilities FinanceCorp. Student Housing Revenue | | | | |
| (Tarleton State University Project) | 4.000% | 4/1/21 | 310 | 331 |
| New Hope TX Cultural Education Facilities FinanceCorp. Student Housing Revenue | | | | |
| (Tarleton State University Project) | 4.000% | 4/1/22 | 215 | 231 |
| New Hope TX Cultural Education Facilities FinanceCorp. Student Housing Revenue | | | | |
| (Texas A&M University Project) | 5.000% | 7/1/23 | 1,265 | 1,441 |
| Newark TX Cultural Education Facilities Finance Corp. Revenue | 5.000% | 11/15/22 | 1,000 | 1,186 |
| Newark TX Cultural Education Facilities Finance Corp. Revenue | 5.000% | 11/15/23 | 1,000 | 1,204 |
| North Central TX Health Facilities Development Corp. Hospital Revenue | | | | |
| (Children’s Medical Center of Dallas Project) | 5.000% | 8/15/17 | 1,000 | 1,033 |
| North Central TX Health Facilities Development Corp. Hospital Revenue | | | | |
| (Children’s Medical Center of Dallas Project) | 5.000% | 8/15/18 | 750 | 803 |
| North Central TX Health Facilities Development Corp. Hospital Revenue | | | | |
| (Children’s Medical Center of Dallas Project) | 5.000% | 8/15/19 | 1,900 | 2,100 |
| North East TX Independent School District GO | 5.000% | 2/1/22 | 6,985 | 8,274 |
| North East TX Independent School District GO PUT | 1.420% | 8/1/21 | 9,000 | 8,939 |
| North East TX Regional Mobility Authority Revenue | 5.000% | 1/1/23 | 900 | 1,052 |
| North East TX Regional Mobility Authority Revenue | 5.000% | 1/1/24 | 1,285 | 1,516 |
108
Limited-Term Tax-Exempt Fund
| | | | |
| | | | Face | Market |
| | | Maturity | Amount | Value• |
| | Coupon | Date | ($000) | ($000) |
| North Texas Tollway Authority System Revenue | 4.000% | 9/1/17 | 1,725 | 1,771 |
| North Texas Tollway Authority System Revenue | 5.000% | 9/1/17 | 1,480 | 1,532 |
| North Texas Tollway Authority System Revenue | 5.000% | 1/1/19 | 4,000 | 4,331 |
| North Texas Tollway Authority System Revenue | 5.000% | 1/1/20 | 5,000 | 5,584 |
| North Texas Tollway Authority System Revenue | 5.000% | 1/1/20 | 700 | 779 |
| North Texas Tollway Authority System Revenue | 5.000% | 1/1/20 | 4,000 | 4,467 |
| North Texas Tollway Authority System Revenue | 5.000% | 1/1/20 | 2,000 | 2,233 |
| North Texas Tollway Authority System Revenue | 5.000% | 1/1/21 | 1,000 | 1,139 |
| North Texas Tollway Authority System Revenue | 5.000% | 1/1/21 | 11,280 | 12,918 |
| North Texas Tollway Authority System Revenue | 5.000% | 1/1/21 | 3,600 | 4,123 |
| North Texas Tollway Authority System Revenue | 5.000% | 1/1/22 | 1,500 | 1,748 |
| North Texas Tollway Authority System Revenue | 5.000% | 1/1/22 | 5,250 | 6,152 |
| North Texas Tollway Authority System Revenue | 5.000% | 1/1/22 | 6,155 | 7,212 |
| North Texas Tollway Authority System Revenue | 5.000% | 1/1/23 | 9,500 | 11,365 |
| 3 North Texas Tollway Authority System Revenue PUT | 1.430% | 1/1/19 | 15,000 | 15,001 |
| 3 North Texas Tollway Authority System Revenue PUT | 1.300% | 1/1/20 | 29,690 | 29,771 |
| Northside Independent School District Texas GO PUT | 2.125% | 8/1/20 | 6,485 | 6,500 |
| Northside Independent School District Texas GO PUT | 1.750% | 6/1/22 | 12,500 | 12,488 |
| Olmos Park TX Higher Education Facilities Corp. Revenue | | | | |
| (University of the Incarnate Word Project) | 5.000% | 12/1/19 | 1,735 | 1,927 |
| Port Authority of Houston TX GO | 5.000% | 10/1/20 | 3,110 | 3,564 |
| Port Authority of Houston TX GO | 5.000% | 10/1/21 | 8,900 | 10,477 |
| Port Authority of Houston TX GO | 5.000% | 10/1/22 | 2,700 | 3,256 |
| Prosper TX Independent School District GO | 5.000% | 2/15/21 | 1,190 | 1,376 |
| Prosper TX Independent School District GO | 5.000% | 2/15/22 | 1,315 | 1,557 |
| Prosper TX Independent School District GO | 5.000% | 2/15/23 | 400 | 482 |
| Richardson TX Independent School District GO | 5.000% | 2/15/22 | 2,500 | 2,973 |
| Richardson TX Independent School District GO | 5.000% | 2/15/23 | 3,000 | 3,643 |
| Rockwall TX GO | 5.000% | 8/1/21 | 800 | 935 |
| Rockwall TX GO | 5.000% | 8/1/22 | 2,770 | 3,308 |
| Rockwall TX GO | 5.000% | 8/1/23 | 1,635 | 1,991 |
| Round Rock TX Independent School District GO | 5.000% | 8/1/21 | 3,095 | 3,629 |
| Round Rock TX Independent School District GO | 5.000% | 8/1/22 | 1,000 | 1,199 |
| Round Rock TX Independent School District GO | 5.000% | 8/1/23 | 2,000 | 2,443 |
| SA Energy Acquisition Public Facility Corp. Texas Gas Supply Revenue | 5.500% | 8/1/21 | 5,100 | 5,958 |
| Sam Rayburn TX Municipal Power Agency Revenue | 5.000% | 10/1/18 | 2,250 | 2,413 |
| Sam Rayburn TX Municipal Power Agency Revenue | 5.000% | 10/1/19 | 1,000 | 1,104 |
| San Antonio TX Electric & Gas Systems Revenue | 5.000% | 2/1/20 | 6,980 | 7,850 |
| San Antonio TX Electric & Gas Systems Revenue | 5.000% | 2/1/21 | 5,450 | 6,304 |
| San Antonio TX Electric & Gas Systems Revenue | 5.000% | 2/1/21 | 12,000 | 13,881 |
| San Antonio TX Electric & Gas Systems Revenue | 5.000% | 2/1/22 | 4,000 | 4,743 |
| San Antonio TX Electric & Gas Systems Revenue | 5.000% | 2/1/22 | 11,750 | 13,932 |
| San Antonio TX Electric & Gas Systems Revenue | 5.000% | 2/1/23 | 26,500 | 32,055 |
| San Antonio TX Electric & Gas Systems Revenue PUT | 2.000% | 12/1/16 | 3,500 | 3,503 |
| 3 San Antonio TX Electric & Gas Systems Revenue PUT | 0.910% | 2/1/17 | 25,000 | 24,995 |
| 3 San Antonio TX Electric & Gas Systems Revenue PUT | 1.010% | 2/1/18 | 27,250 | 27,175 |
| San Antonio TX Electric & Gas Systems Revenue PUT | 2.000% | 12/1/18 | 10,165 | 10,315 |
| San Antonio TX Electric & Gas Systems Revenue PUT | 3.000% | 12/1/20 | 20,000 | 21,260 |
| 2 San Antonio TX Electric and Gas Systems Revenue TOB VRDO | 0.660% | 11/7/16 | 9,020 | 9,020 |
| San Antonio TX GO | 5.000% | 2/1/17 | 4,135 | 4,180 |
| San Antonio TX GO | 5.000% | 2/1/17 | 1,300 | 1,314 |
| San Antonio TX GO | 5.000% | 8/1/17 | 1,070 | 1,105 |
| San Antonio TX GO | 5.000% | 2/1/18 | 3,500 | 3,681 |
| San Antonio TX GO | 5.000% | 8/1/18 | 1,000 | 1,072 |
| San Antonio TX GO | 5.000% | 2/1/20 | 2,500 | 2,814 |
| San Antonio TX GO | 5.000% | 2/1/21 | 3,500 | 4,052 |
| San Antonio TX GO | 5.000% | 2/1/22 | 3,000 | 3,560 |
| San Antonio TX Independent School District GO | 5.000% | 8/15/22 | 1,330 | 1,596 |
| San Antonio TX Independent School District GO PUT | 2.000% | 8/1/18 | 7,270 | 7,382 |
| San Antonio TX Water Revenue | 5.000% | 5/15/17 | 2,160 | 2,210 |
| San Antonio TX Water Revenue | 5.000% | 5/15/19 | 2,250 | 2,471 |
| San Antonio TX Water Revenue | 5.000% | 5/15/20 | 1,500 | 1,701 |
| San Antonio TX Water Revenue | 5.000% | 5/15/20 | 1,500 | 1,701 |
| San Antonio TX Water Revenue | 5.000% | 5/15/21 | 1,000 | 1,164 |
| San Antonio TX Water Revenue | 5.000% | 5/15/22 | 1,750 | 2,085 |
| 3 San Antonio TX Water Revenue PUT | 1.310% | 11/1/16 | 15,000 | 15,000 |
| 3 San Antonio TX Water Revenue PUT | 1.030% | 11/1/17 | 19,375 | 19,381 |
| 1 San Antonio TX Water Revenue PUT | 2.000% | 11/1/21 | 40,000 | 40,656 |
| Schertz-Cibolo-Universal City TX Independent School District GO | 5.000% | 2/1/23 | 3,830 | 4,616 |
109
Limited-Term Tax-Exempt Fund
| | | | |
| | | | Face | Market |
| | | Maturity | Amount | Value• |
| | Coupon | Date | ($000) | ($000) |
| Southwest Texas Higher Education Authority Inc. Revenue | | | | |
| (Southern Methodist University Project) | 5.000% | 10/1/20 | 3,000 | 3,433 |
| Southwest Texas Higher Education Authority Inc. Revenue | | | | |
| (Southern Methodist University Project) | 5.000% | 10/1/21 | 2,500 | 2,936 |
| Southwest Texas Higher Education Authority Inc. Revenue | | | | |
| (Southern Methodist University Project) | 5.000% | 10/1/22 | 3,900 | 4,687 |
| Spring Branch TX Independent School District GO | 5.000% | 2/1/22 | 5,000 | 5,923 |
| Stephen F Austin TX State University Revenue | 5.000% | 10/15/23 | 1,050 | 1,275 |
| Tarrant County TX Cultural Education Facilities Finance Corp. Hospital Revenue | | | | |
| (Hendrick Medical Center) | 5.000% | 9/1/21 | 1,200 | 1,384 |
| Tarrant County TX Cultural Education Facilities Finance Corp. Hospital Revenue | | | | |
| (Methodist Hospitals of Dallas) | 5.000% | 10/1/19 | 2,225 | 2,469 |
| Tarrant County TX Cultural Education Facilities Finance Corp. Hospital Revenue | | | | |
| (Methodist Hospitals of Dallas) | 5.000% | 10/1/20 | 1,845 | 2,105 |
| Tarrant County TX Cultural Education Facilities Finance Corp. Hospital Revenue | | | | |
| (Methodist Hospitals of Dallas) | 5.000% | 10/1/21 | 2,400 | 2,810 |
| Tarrant County TX Cultural Education Facilities Finance Corp. Hospital Revenue | | | | |
| (Scott & White Healthcare Project) | 5.000% | 8/15/17 (ETM) | 150 | 155 |
| Tarrant County TX Cultural Education Facilities Finance Corp. Hospital Revenue | | | | |
| (Scott & White Healthcare Project) | 5.000% | 8/15/17 (ETM) | 1,850 | 1,912 |
| Tarrant County TX Cultural Education Facilities Finance Corp. Hospital Revenue | | | | |
| (Scott & White Healthcare Project) | 5.000% | 8/15/20 | 1,520 | 1,720 |
| Tarrant County TX Cultural Education Facilities Finance Corp. Retirement Facilities Revenue | | | | |
| (Buckingham Senior Living Community Inc.) | 3.875% | 11/15/20 | 1,750 | 1,762 |
| Tarrant Regional Water District Texas Water Revenue | 5.000% | 3/1/21 | 1,000 | 1,160 |
| Tarrant Regional Water District Texas Water Revenue | 5.000% | 3/1/22 | 1,375 | 1,633 |
| Texas A&M University System Revenue Board of Regents Revenue | 5.000% | 5/15/21 | 4,425 | 5,163 |
| Texas A&M University System Revenue Board of Regents Revenue | 5.000% | 5/15/22 | 6,000 | 7,170 |
| Texas A&M University System Revenue Board of Regents Revenue | 5.000% | 5/15/23 | 13,235 | 16,159 |
| Texas GO | 5.000% | 10/1/17 | 7,500 | 7,795 |
| Texas GO | 5.000% | 10/1/18 | 4,650 | 5,015 |
| Texas GO | 5.000% | 10/1/18 | 7,500 | 8,091 |
| Texas GO | 5.000% | 10/1/19 | 8,000 | 8,924 |
| Texas GO | 5.000% | 10/1/20 | 10,000 | 11,493 |
| Texas GO | 5.000% | 4/1/21 | 3,490 | 4,061 |
| Texas GO | 5.000% | 10/1/21 | 19,000 | 22,402 |
| Texas GO | 5.000% | 10/1/21 | 5,950 | 7,015 |
| Texas Municipal Gas Acquisition & Supply Corp. Revenue | 5.000% | 12/15/16 | 170 | 171 |
| 3 Texas Municipal Gas Acquisition & Supply Corp. Revenue | 1.100% | 9/15/17 | 1,665 | 1,658 |
| Texas Municipal Gas Acquisition & Supply Corp. Revenue | 5.250% | 12/15/17 | 2,425 | 2,529 |
| Texas Municipal Gas Acquisition & Supply Corp. Revenue | 5.625% | 12/15/17 | 29,430 | 30,239 |
| Texas Municipal Gas Acquisition & Supply Corp. Revenue | 5.250% | 12/15/18 | 1,740 | 1,874 |
| Texas Municipal Gas Acquisition & Supply Corp. Revenue | 5.000% | 12/15/19 | 5,000 | 5,469 |
| Texas Municipal Gas Acquisition & Supply Corp. Revenue | 5.250% | 12/15/19 | 6,495 | 7,171 |
| Texas Municipal Gas Acquisition & Supply Corp. Revenue | 5.000% | 12/15/20 | 6,000 | 6,734 |
| Texas Municipal Gas Acquisition & Supply Corp. Revenue | 5.250% | 12/15/20 | 3,750 | 4,235 |
| Texas Municipal Gas Acquisition & Supply Corp. Revenue | 5.000% | 12/15/21 | 2,000 | 2,295 |
| Texas Municipal Gas Acquisition & Supply Corp. Revenue | 5.250% | 12/15/23 | 3,415 | 4,071 |
| Texas Public Finance Authority Revenue (Midwestern State University) | 5.000% | 12/1/20 | 1,000 | 1,143 |
| Texas Public Finance Authority Revenue (Midwestern State University) | 5.000% | 12/1/21 | 1,250 | 1,463 |
| Texas Public Finance Authority Revenue (Midwestern State University) | 5.000% | 12/1/22 | 675 | 807 |
| Texas Public Finance Authority Revenue (Midwestern State University) | 5.000% | 12/1/23 | 1,720 | 2,083 |
| Texas Public Finance Authority Revenue (Unemployment Compensation) | 4.000% | 1/1/18 | 8,030 | 8,053 |
| Texas Tech University System Financing System Revenue | 5.000% | 8/15/17 | 2,115 | 2,186 |
| Texas Tech University System Financing System Revenue | 5.000% | 8/15/18 | 3,065 | 3,285 |
| Texas Tech University System Financing System Revenue | 5.000% | 8/15/19 | 3,040 | 3,368 |
| Texas Tech University System Financing System Revenue | 5.000% | 8/15/20 | 5,000 | 5,706 |
| Texas Transportation Commission GO | 5.000% | 4/1/19 | 13,425 | 14,723 |
| Texas Transportation Commission GO | 5.000% | 4/1/20 | 11,465 | 12,985 |
| Texas Transportation Commission GO | 5.000% | 10/1/20 | 15,000 | 17,239 |
| Texas Transportation Commission GO | 5.000% | 10/1/21 | 15,000 | 17,686 |
| Texas Transportation Commission GO | 5.000% | 4/1/22 | 13,925 | 16,613 |
| Texas Transportation Commission GO | 5.000% | 10/1/24 | 9,295 | 11,614 |
| Texas Transportation Commission Mobility Fund GO | 5.000% | 10/1/22 | 16,855 | 20,360 |
| 3 Texas Transportation Commission Mobility Fund GO PUT | 1.010% | 10/1/18 | 50,000 | 49,736 |
| Texas Transportation Commission Revenue | 5.000% | 4/1/17 (Prere.) | 7,500 | 7,634 |
| Texas Transportation Commission Revenue | 5.000% | 4/1/17 | 1,845 | 1,878 |
| Texas Transportation Commission Revenue | 5.000% | 10/1/19 | 24,000 | 26,749 |
| Texas Transportation Commission Revenue | 5.000% | 10/1/20 | 35,000 | 40,182 |
| Texas Transportation Commission Revenue | 5.000% | 10/1/21 | 10,000 | 11,790 |
110
Limited-Term Tax-Exempt Fund
| | | | |
| | | | Face | Market |
| | | Maturity | Amount | Value• |
| | Coupon | Date | ($000) | ($000) |
| Texas Transportation Commission Revenue | 5.000% | 10/1/21 | 37,000 | 43,625 |
| Texas Transportation Commission Revenue | 5.000% | 10/1/22 | 5,000 | 6,040 |
| Texas Transportation Commission Revenue | 5.000% | 10/1/23 | 4,420 | 5,442 |
| 3 Texas Transportation Commission Revenue PUT | 0.980% | 4/1/17 | 69,000 | 68,972 |
| Texas Transportation Commission Turnpike System Revenue PUT | 5.000% | 4/1/20 | 19,200 | 21,498 |
| Texas Turnpike Authority Central Texas Turnpike System Revenue | 0.000% | 8/15/22 (ETM) | 1,920 | 1,754 |
| Texas Turnpike Authority Central Texas Turnpike System Revenue | 0.000% | 8/15/22 (2) | 8,365 | 7,472 |
| Texas Water Development Board Revenue | 5.000% | 4/15/22 | 5,250 | 6,270 |
| Texas Water Development Board Revenue | 5.000% | 4/15/22 | 4,810 | 5,744 |
| Texas Water Development Board Revenue | 5.000% | 10/15/22 | 3,480 | 4,208 |
| Tomball TX Independent School District GO PUT | 1.100% | 8/15/19 | 4,500 | 4,465 |
| University of Houston Texas Revenue | 5.000% | 2/15/20 | 6,100 | 6,860 |
| University of Houston Texas Revenue | 5.000% | 2/15/21 | 4,405 | 5,089 |
| University of Houston Texas Revenue | 5.000% | 2/15/23 | 6,880 | 8,297 |
| University of North Texas Revenue | 5.000% | 4/15/18 | 1,000 | 1,059 |
| University of North Texas Revenue | 5.000% | 4/15/20 (ETM) | 325 | 368 |
| University of North Texas Revenue | 5.000% | 4/15/20 | 2,180 | 2,462 |
| University of Texas Permanent University Fund Revenue | 5.000% | 7/1/20 | 4,020 | 4,579 |
| University of Texas Permanent University Fund Revenue | 5.000% | 7/1/21 | 1,250 | 1,464 |
| University of Texas Permanent University Fund Revenue | 5.000% | 7/1/21 | 4,175 | 4,889 |
| University of Texas Permanent University Fund Revenue | 5.000% | 7/1/22 | 1,500 | 1,801 |
| University of Texas Permanent University Fund Revenue | 5.000% | 7/1/22 | 2,820 | 3,386 |
| University of Texas Permanent University Fund Revenue | 5.000% | 7/1/22 | 2,000 | 2,401 |
| University of Texas Permanent University Fund Revenue | 5.000% | 7/1/23 | 1,250 | 1,530 |
| University of Texas Permanent University Fund Revenue | 5.000% | 7/1/23 | 2,650 | 3,244 |
| University of Texas System Revenue Financing System Revenue | 5.000% | 8/15/17 | 25,135 | 25,988 |
| University of Texas System Revenue Financing System Revenue | 5.000% | 8/15/18 | 6,505 | 6,980 |
| University of Texas System Revenue Financing System Revenue | 5.000% | 8/15/18 | 4,525 | 4,855 |
| University of Texas System Revenue Financing System Revenue | 5.000% | 8/15/19 | 9,255 | 10,265 |
| University of Texas System Revenue Financing System Revenue | 5.000% | 8/15/19 | 5,000 | 5,546 |
| University of Texas System Revenue Financing System Revenue | 5.000% | 8/15/20 | 3,660 | 4,189 |
| 1 University of Texas System Revenue Financing System Revenue | 5.000% | 8/15/21 | 11,860 | 13,901 |
| University of Texas System Revenue Financing System Revenue | 5.000% | 8/15/21 | 5,000 | 5,880 |
| University of Texas System Revenue Financing System Revenue | 5.000% | 8/15/21 | 2,000 | 2,352 |
| 1 University of Texas System Revenue Financing System Revenue | 5.000% | 8/15/22 | 5,735 | 6,887 |
| 1 University of Texas System Revenue Financing System Revenue | 5.000% | 8/15/22 | 26,500 | 31,807 |
| University of Texas System Revenue Financing System Revenue | 5.000% | 8/15/22 | 2,500 | 3,015 |
| University of Texas System Revenue Financing System Revenue | 5.000% | 8/15/22 | 5,260 | 6,337 |
| 1 University of Texas System Revenue Financing System Revenue | 5.000% | 8/15/23 | 3,350 | 4,106 |
| 1 University of Texas System Revenue Financing System Revenue | 5.000% | 8/15/23 | 17,465 | 21,372 |
| University of Texas System Revenue Financing System Revenue | 5.000% | 8/15/23 | 15,000 | 18,428 |
| Waller TX Independent School District GO | 5.000% | 2/15/22 | 1,095 | 1,297 |
| | | | | 2,586,598 |
| Utah (0.5%) | | | | |
| Alpine UT School District GO | 5.000% | 3/15/17 | 4,320 | 4,390 |
| Intermountain Power Agency Utah Power Supply Revenue | 5.000% | 7/1/17 | 1,300 | 1,337 |
| Intermountain Power Agency Utah Power Supply Revenue | 5.000% | 7/1/17 | 5,625 | 5,784 |
| Intermountain Power Agency Utah Power Supply Revenue | 5.000% | 7/1/18 | 2,425 | 2,587 |
| Intermountain Power Agency Utah Power Supply Revenue | 5.000% | 7/1/18 | 8,000 | 8,536 |
| Intermountain Power Agency Utah Power Supply Revenue | 5.000% | 7/1/19 | 2,360 | 2,603 |
| Intermountain Power Agency Utah Power Supply Revenue | 5.000% | 7/1/20 | 3,500 | 3,734 |
| University of Utah Revenue | 4.000% | 8/1/20 | 700 | 773 |
| University of Utah Revenue | 5.000% | 8/1/21 | 600 | 702 |
| University of Utah Revenue | 5.000% | 8/1/22 | 1,150 | 1,379 |
| University of Utah Revenue | 5.000% | 8/1/23 | 600 | 733 |
| Utah Associated Municipal Power Systems Revenue (Payson Power Project) | 4.000% | 4/1/18 | 3,550 | 3,684 |
| Utah Board of Regents Student Loan Revenue | 4.000% | 11/1/16 | 10,175 | 10,175 |
| Utah GO | 5.000% | 7/1/17 | 10,000 | 10,289 |
| Utah GO | 5.000% | 7/1/17 | 6,125 | 6,302 |
| Utah GO | 5.000% | 7/1/18 | 3,000 | 3,207 |
| Utah GO | 5.000% | 7/1/18 | 19,000 | 20,312 |
| Utah Transit Authority Sales Tax Revenue | 1.600% | 12/15/17 (Prere.) | 14,000 | 14,133 |
| Utah Transit Authority Sales Tax Revenue | 5.000% | 6/15/21 | 550 | 640 |
| Utah Transit Authority Sales Tax Revenue | 5.000% | 6/15/22 | 710 | 845 |
| Washington County UT School District GO | 5.000% | 3/1/22 | 5,165 | 6,173 |
| | | | | 108,318 |
| Vermont (0.0%) | | | | |
| Vermont Educational & Health Buildings Financing Agency Revenue | | | | |
| (University of Vermont Health Network) | 5.000% | 12/1/21 | 350 | 408 |
111
Limited-Term Tax-Exempt Fund
| | | | |
| | | | Face | Market |
| | | Maturity | Amount | Value• |
| | Coupon | Date | ($000) | ($000) |
| Vermont Educational & Health Buildings Financing Agency Revenue | | | | |
| (University of Vermont Health Network) | 5.000% | 12/1/22 | 650 | 773 |
| | | | | 1,181 |
| Virgin Islands (0.1%) | | | | |
| Virgin Islands Public Finance Authority Revenue | 5.000% | 10/1/18 | 5,510 | 5,608 |
| Virgin Islands Public Finance Authority Revenue | 5.000% | 10/1/19 | 5,790 | 5,908 |
| Virgin Islands Public Finance Authority Revenue | 5.000% | 9/1/20 | 1,000 | 1,095 |
| Virgin Islands Public Finance Authority Revenue | 5.000% | 9/1/21 | 2,000 | 2,222 |
| Virgin Islands Public Finance Authority Revenue | 5.000% | 9/1/22 | 2,000 | 2,253 |
| Virgin Islands Public Finance Authority Revenue | 5.000% | 10/1/22 | 5,950 | 5,870 |
| | | | | 22,956 |
| Virginia (2.3%) | | | | |
| Fairfax County VA Economic Development Authority Facilities Revenue (County Facilities Project) | 5.000% | 10/1/20 | 2,500 | 2,868 |
| Fairfax County VA Economic Development Authority Facilities Revenue (County Facilities Project) | 5.000% | 10/1/21 | 6,185 | 7,286 |
| Fairfax County VA Economic Development Authority Transportation District | | | | |
| Improvement Revenue (Silver Line Phase I Project) | 5.000% | 4/1/17 | 2,480 | 2,525 |
| Fairfax County VA Economic Development Authority Transportation District | | | | |
| Improvement Revenue (Silver Line Phase I Project) | 5.000% | 4/1/18 | 4,255 | 4,502 |
| Fairfax County VA GO | 4.000% | 10/1/21 | 6,510 | 7,391 |
| Fairfax County VA GO | 3.000% | 10/1/22 | 9,555 | 10,504 |
| Fairfax County VA Public Improvement GO | 5.000% | 4/1/18 | 10,885 | 11,527 |
| 3 Fredericksburg VA Economic Development Authority Hospital Facilities Revenue | | | | |
| (Mary Washington Healthcare Obligated Group) PUT | 2.530% | 2/1/17 | 6,500 | 6,512 |
| Halifax County VA Industrial Development Authority Revenue (Virginia Electric & Power Co.) PUT | 2.150% | 9/1/20 | 10,000 | 10,257 |
| Henrico County VA School District GO | 5.000% | 8/1/20 | 1,055 | 1,208 |
| Lexington VA Industrial Development Authority Residential Care Facility Revenue | | | | |
| (Kendall at Lexington Corp.) | 4.000% | 1/1/21 | 440 | 479 |
| Lexington VA Industrial Development Authority Residential Care Facility Revenue | | | | |
| (Kendall at Lexington Corp.) | 4.000% | 1/1/22 | 530 | 582 |
| Lexington VA Industrial Development Authority Residential Care Facility Revenue | | | | |
| (Kendall at Lexington Corp.) | 4.000% | 1/1/23 | 825 | 913 |
| Lexington VA Industrial Development Authority Residential Care Facility Revenue | | | | |
| (Kendall at Lexington Corp.) | 4.000% | 1/1/24 | 1,015 | 1,131 |
| Loudoun County VA GO | 5.000% | 12/1/18 | 3,435 | 3,728 |
| Louisa VA Industrial Development Authority Poll Control Revenue | | | | |
| (Virginia Electric & Power Co.) PUT | 1.750% | 5/16/19 | 10,000 | 10,131 |
| Newport News VA Economical Development Authority Residential Care Facilities Revenue | 4.000% | 12/1/21 | 2,800 | 2,983 |
| Newport News VA Economical Development Authority Residential Care Facilities Revenue | 4.000% | 12/1/22 | 2,900 | 3,096 |
| Newport News VA Economical Development Authority Residential Care Facilities Revenue | 4.000% | 12/1/23 | 3,070 | 3,272 |
| Norfolk VA GO | 5.000% | 10/1/22 | 2,535 | 3,061 |
| Norfolk VA GO | 5.000% | 10/1/23 | 360 | 443 |
| Peninsula VA Ports Authority Coal Terminal Revenue PUT | 1.550% | 10/1/19 | 1,875 | 1,869 |
| Roanoke VA Economic Development Authority Hospital Revenue (Carilion Clinic Obligated Group) | 5.000% | 7/1/19 | 5,015 | 5,512 |
| Roanoke VA Economic Development Authority Hospital Revenue (Carilion Clinic Obligated Group) | 5.000% | 7/1/20 | 1,460 | 1,652 |
| University of Virginia Revenue | 5.000% | 9/1/17 | 1,275 | 1,321 |
| University of Virginia Revenue | 5.000% | 6/1/20 | 500 | 570 |
| University of Virginia Revenue | 5.000% | 6/1/21 | 2,660 | 3,122 |
| University of Virginia Revenue | 5.000% | 8/1/21 | 33,000 | 38,917 |
| Virginia Beach VA GO | 5.000% | 4/1/18 | 3,250 | 3,443 |
| Virginia Beach VA GO | 5.000% | 7/15/18 | 2,995 | 3,207 |
| Virginia Beach VA GO | 5.000% | 5/1/20 | 4,300 | 4,891 |
| Virginia College Building Authority Educational Facilities Revenue | | | | |
| (21st Century College & Equipment Programs) | 5.000% | 2/1/18 | 9,585 | 10,083 |
| Virginia College Building Authority Educational Facilities Revenue | | | | |
| (21st Century College & Equipment Programs) | 5.000% | 2/1/22 | 19,465 | 23,113 |
| Virginia College Building Authority Educational Facilities Revenue (Marymount University Project) | 5.000% | 7/1/17 | 1,150 | 1,174 |
| Virginia College Building Authority Educational Facilities Revenue (Marymount University Project) | 5.000% | 7/1/18 | 425 | 446 |
| Virginia College Building Authority Educational Facilities Revenue (Marymount University Project) | 5.000% | 7/1/19 | 425 | 457 |
| Virginia College Building Authority Educational Facilities Revenue (Marymount University Project) | 5.000% | 7/1/20 | 275 | 302 |
| Virginia College Building Authority Educational Facilities Revenue (Marymount University Project) | 5.000% | 7/1/21 | 1,000 | 1,115 |
| Virginia College Building Authority Educational Facilities Revenue (Marymount University Project) | 5.000% | 7/1/21 | 1,140 | 1,272 |
| Virginia College Building Authority Educational Facilities Revenue (Marymount University Project) | 5.000% | 7/1/22 | 570 | 643 |
| Virginia College Building Authority Educational Facilities Revenue | | | | |
| (Public Higher Education Financing Program) | 5.000% | 9/1/20 | 7,685 | 8,790 |
| Virginia College Building Authority Educational Facilities Revenue | | | | |
| (Public Higher Education Financing Program) | 5.000% | 9/1/21 | 18,585 | 21,830 |
| Virginia College Building Authority Educational Facilities Revenue | | | | |
| (Public Higher Education Financing Program) | 5.000% | 9/1/21 | 10,990 | 12,909 |
112
Limited-Term Tax-Exempt Fund
| | | | |
| | | | Face | Market |
| | | Maturity | Amount | Value• |
| | Coupon | Date | ($000) | ($000) |
| Virginia College Building Authority Educational Facilities Revenue | | | | |
| (Public Higher Education Financing Program) | 5.000% | 9/1/22 | 11,870 | 14,280 |
| Virginia College Building Authority Educational Facilities Revenue | | | | |
| (Public Higher Education Financing Program) | 5.000% | 9/1/23 | 12,110 | 14,873 |
| Virginia Commonwealth Transportation Board GAN | 5.000% | 9/15/20 | 3,130 | 3,586 |
| Virginia Commonwealth Transportation Board Revenue | 5.000% | 3/15/17 | 3,015 | 3,064 |
| Virginia Commonwealth Transportation Board Revenue | 5.000% | 3/15/17 | 5,070 | 5,152 |
| Virginia Commonwealth Transportation Board Revenue | 5.000% | 9/15/17 | 2,970 | 3,080 |
| Virginia Commonwealth Transportation Board Revenue | 5.000% | 3/15/18 | 3,280 | 3,465 |
| Virginia Commonwealth Transportation Board Revenue | 5.000% | 5/15/18 | 8,115 | 8,634 |
| Virginia Commonwealth Transportation Board Revenue | 5.000% | 3/15/19 | 1,750 | 1,914 |
| Virginia Commonwealth Transportation Board Revenue | 5.000% | 5/15/19 | 8,525 | 9,391 |
| Virginia Commonwealth Transportation Board Revenue | 5.000% | 9/15/19 | 1,605 | 1,785 |
| 1 Virginia Commonwealth Transportation Board Revenue | 5.000% | 3/15/22 | 4,000 | 4,757 |
| 1 Virginia Commonwealth Transportation Board Revenue | 5.000% | 9/15/22 | 3,865 | 4,654 |
| 1 Virginia Commonwealth Transportation Board Revenue | 5.000% | 3/15/23 | 2,685 | 3,257 |
| 1 Virginia Commonwealth Transportation Board Revenue | 5.000% | 9/15/23 | 5,000 | 6,132 |
| Virginia Public Building Authority Public Facilities Revenue | 5.000% | 8/1/17 | 12,550 | 12,956 |
| Virginia Public Building Authority Public Facilities Revenue | 5.000% | 8/1/18 | 4,725 | 5,062 |
| Virginia Public Building Authority Public Facilities Revenue | 5.000% | 8/1/19 | 17,870 | 19,796 |
| Virginia Public Building Authority Public Facilities Revenue | 5.000% | 8/1/19 | 8,530 | 9,449 |
| Virginia Public Building Authority Public Facilities Revenue | 5.000% | 8/1/19 | 4,965 | 5,500 |
| Virginia Public Building Authority Public Facilities Revenue | 5.000% | 8/1/19 (Prere.) | 11,350 | 12,577 |
| Virginia Public Building Authority Public Facilities Revenue | 5.000% | 8/1/20 | 5,220 | 5,961 |
| Virginia Public Building Authority Public Facilities Revenue | 5.000% | 8/1/20 | 18,830 | 21,504 |
| Virginia Public School Authority Revenue | 5.000% | 8/1/18 | 16,665 | 17,851 |
| Virginia Public School Authority Revenue | 5.000% | 8/1/19 | 16,220 | 17,968 |
| Virginia Public School Authority Revenue | 5.000% | 8/1/20 | 20,425 | 23,326 |
| Virginia Public School Authority Revenue | 5.000% | 8/1/21 | 36,405 | 42,751 |
| Virginia Resources Authority Clean Water Revenue (State Revolving Fund) | 5.000% | 10/1/18 | 5,360 | 5,780 |
| Virginia Resources Authority Clean Water Revenue (State Revolving Fund) | 5.000% | 10/1/19 | 3,500 | 3,905 |
| Wise County VA Industrial Development Authority Solid Waste & Sewage Disposal Revenue | | | | |
| (Virginia Electric & Power Co.) PUT | 1.875% | 6/1/20 | 8,000 | 8,131 |
| York County VA Economic Development Authority Pollution Control Revenue | | | | |
| (VA Electric & Power Co. Project) PUT | 1.875% | 5/16/19 | 5,000 | 5,073 |
| | | | | 546,651 |
| Washington (2.6%) | | | | |
| 2 Central Puget Sound WA Regional Transit Authority Sales & Use Tax Revenue TOB VRDO | 0.580% | 11/1/16 | 26,975 | 26,975 |
| Central Washington University System Revenue | 5.000% | 5/1/17 | 1,860 | 1,898 |
| Central Washington University System Revenue | 5.000% | 5/1/18 | 1,960 | 2,072 |
| Central Washington University System Revenue | 5.000% | 5/1/19 | 2,050 | 2,239 |
| Central Washington University System Revenue | 5.000% | 5/1/20 | 2,150 | 2,415 |
| Energy Northwest Washington Electric Revenue (Columbia Generating Station) | 5.000% | 7/1/18 | 22,000 | 23,492 |
| Energy Northwest Washington Electric Revenue (Columbia Generating Station) | 5.000% | 7/1/20 | 1,160 | 1,321 |
| Energy Northwest Washington Electric Revenue (Project No. 1) | 5.000% | 7/1/17 | 14,000 | 14,402 |
| Energy Northwest Washington Electric Revenue (Project No. 3) | 5.000% | 7/1/17 | 20,000 | 20,574 |
| 3 Everett WA GO PUT | 1.030% | 12/1/19 | 3,725 | 3,672 |
| 3 Grant County WA Public Utility District No. 2 Electric System Revenue PUT | 0.950% | 12/1/17 | 10,000 | 9,969 |
| King County WA (Public Hospital District) GO | 5.000% | 12/1/19 | 2,500 | 2,790 |
| King County WA (Public Hospital District) GO | 5.000% | 12/1/20 | 2,500 | 2,879 |
| King County WA School District No. 216 GO | 4.000% | 12/1/18 | 1,250 | 1,327 |
| King County WA School District No. 216 GO | 4.000% | 12/1/19 | 1,360 | 1,479 |
| King County WA School District No. 216 GO | 5.000% | 12/1/20 | 2,085 | 2,395 |
| King County WA School District No. 216 GO | 5.000% | 12/1/21 | 2,265 | 2,668 |
| King County WA School District No. 414 GO | 5.000% | 12/1/22 | 4,000 | 4,836 |
| King County WA Sewer Revenue | 5.250% | 1/1/18 (Prere.) | 35,000 | 36,796 |
| King County WA Sewer Revenue | 5.000% | 1/1/19 | 12,835 | 13,944 |
| King County WA Sewer Revenue | 5.000% | 7/1/22 | 5,330 | 6,399 |
| Lewis County WA Public Utility District No. 1 Revenue (Cowlitz Falls Hydroelectric Project) | 5.000% | 10/1/18 | 1,400 | 1,505 |
| Lewis County WA Public Utility District No. 1 Revenue (Cowlitz Falls Hydroelectric Project) | 5.000% | 10/1/20 | 1,000 | 1,143 |
| Lewis County WA Public Utility District No. 1 Revenue (Cowlitz Falls Hydroelectric Project) | 5.000% | 10/1/21 | 1,000 | 1,172 |
| Port of Seattle WA Passenger Facility Charge Revenue | 5.000% | 12/1/17 | 4,000 | 4,171 |
| Port of Seattle WA Revenue | 5.000% | 3/1/20 | 4,000 | 4,508 |
| Port of Seattle WA Revenue | 5.000% | 3/1/22 | 1,250 | 1,480 |
| Seattle WA GO | 4.250% | 12/1/16 | 1,080 | 1,083 |
| Seattle WA GO | 5.000% | 5/1/18 | 7,935 | 8,431 |
| Seattle WA GO | 5.000% | 5/1/19 | 8,385 | 9,231 |
| Seattle WA GO | 5.000% | 6/1/22 | 15,755 | 18,942 |
| 3 Seattle WA Municipal Light & Power Revenue PUT | 1.310% | 11/1/18 | 6,750 | 6,751 |
113
Limited-Term Tax-Exempt Fund
| | | | |
| | | | Face | Market |
| | | Maturity | Amount | Value• |
| | Coupon | Date | ($000) | ($000) |
| 3 Seattle WA Municipal Light & Power Revenue PUT | 1.310% | 11/1/18 | 8,250 | 8,251 |
| 1 Skagit County WA Public Hospital District Revenue | 3.000% | 12/1/17 | 325 | 330 |
| 1 Skagit County WA Public Hospital District Revenue | 4.000% | 12/1/18 | 400 | 419 |
| 1 Skagit County WA Public Hospital District Revenue | 4.000% | 12/1/20 | 1,705 | 1,831 |
| 1 Skagit County WA Public Hospital District Revenue | 4.000% | 12/1/22 | 1,340 | 1,458 |
| 1 Skagit County WA Public Hospital District Revenue | 4.000% | 12/1/23 | 1,915 | 2,083 |
| Snohomish County WA School District No. 15 (Edmonds) GO | 5.000% | 12/1/20 | 1,000 | 1,148 |
| Snohomish County WA School District No. 4 (Lake Stevens) GO | 5.000% | 12/1/21 | 735 | 866 |
| Snohomish County WA School District No. 4 (Lake Stevens) GO | 5.000% | 12/1/22 | 700 | 844 |
| Tobacco Settlement Authority Washington Revenue | 5.000% | 6/1/25 | 3,885 | 3,898 |
| University of Washington Revenue | 5.000% | 4/1/17 | 6,880 | 7,005 |
| University of Washington Revenue | 5.000% | 4/1/18 | 7,225 | 7,647 |
| Washington (Motor Vehicle Fuel Tax) GO | 5.000% | 7/1/19 | 10,000 | 11,044 |
| Washington (Motor Vehicle Fuel Tax) GO | 5.000% | 7/1/20 | 41,360 | 47,109 |
| Washington (Motor Vehicle Fuel Tax) GO | 5.000% | 7/1/21 | 41,175 | 48,193 |
| Washington Economic Development Finance Authority Lease Revenue | | | | |
| (Washington Biomedical Research Properties 2) | 5.000% | 6/1/18 | 1,150 | 1,223 |
| Washington Economic Development Finance Authority Lease Revenue | | | | |
| (Washington Biomedical Research Properties 2) | 5.000% | 6/1/19 | 850 | 935 |
| Washington Economic Development Finance Authority Solid Waste Disposal Revenue | | | | |
| (Waste Management Inc. Project) PUT | 1.250% | 11/1/17 | 2,525 | 2,531 |
| Washington Federal Highway Grant Anticipation Revenue (520 Corridor Program) | 5.000% | 9/1/18 | 14,273 | 15,298 |
| Washington Federal Highway Grant Anticipation Revenue (520 Corridor Program) | 5.000% | 9/1/20 | 9,210 | 10,474 |
| Washington GO | 5.000% | 7/1/17 | 5,000 | 5,145 |
| Washington GO | 5.000% | 8/1/17 | 6,605 | 6,819 |
| Washington GO | 5.000% | 8/1/17 | 11,175 | 11,537 |
| Washington GO | 5.000% | 7/1/18 | 21,220 | 22,670 |
| Washington GO | 5.000% | 7/1/18 | 24,315 | 25,977 |
| Washington GO | 5.000% | 7/1/18 | 15,000 | 16,025 |
| Washington GO | 5.000% | 7/1/19 | 19,770 | 21,835 |
| Washington GO | 5.000% | 7/1/19 | 14,580 | 16,103 |
| Washington GO | 5.000% | 7/1/20 | 9,070 | 10,331 |
| Washington GO | 5.000% | 8/1/20 | 10,000 | 11,416 |
| Washington GO | 5.000% | 7/1/21 | 11,000 | 12,548 |
| Washington GO | 5.000% | 8/1/23 | 14,325 | 17,521 |
| Washington Health Care Facilities Authority Revenue | | | | |
| (Central Washington Health Services Association) | 5.000% | 7/1/20 | 875 | 974 |
| Washington Health Care Facilities Authority Revenue | | | | |
| (Central Washington Health Services Association) | 5.000% | 7/1/21 | 1,000 | 1,133 |
| Washington Health Care Facilities Authority Revenue | | | | |
| (Central Washington Health Services Association) | 5.000% | 7/1/22 | 1,965 | 2,263 |
| Washington Health Care Facilities Authority Revenue (MultiCare Health System) | 4.000% | 8/15/19 | 850 | 917 |
| Washington Health Care Facilities Authority Revenue (MultiCare Health System) | 5.000% | 8/15/19 | 1,000 | 1,106 |
| Washington Health Care Facilities Authority Revenue (MultiCare Health System) | 4.000% | 8/15/20 | 1,000 | 1,100 |
| Washington Health Care Facilities Authority Revenue (MultiCare Health System) | 5.000% | 8/15/20 | 1,380 | 1,569 |
| Washington Health Care Facilities Authority Revenue (MultiCare Health System) | 4.000% | 8/15/21 | 1,000 | 1,120 |
| Washington Health Care Facilities Authority Revenue (PeaceHealth) | 5.000% | 11/15/20 | 1,000 | 1,142 |
| Washington Health Care Facilities Authority Revenue (PeaceHealth) | 5.000% | 11/15/21 | 1,000 | 1,171 |
| Washington Health Care Facilities Authority Revenue (Providence Health & Services) | 5.000% | 10/1/17 | 1,360 | 1,412 |
| Washington Health Care Facilities Authority Revenue (Providence Health & Services) | 5.000% | 10/1/18 | 700 | 754 |
| Washington Health Care Facilities Authority Revenue (Providence Health & Services) | 5.000% | 10/1/19 | 1,000 | 1,112 |
| Washington Health Care Facilities Authority Revenue (Providence Health & Services) | 5.000% | 10/1/22 | 1,800 | 2,161 |
| Washington Health Care Facilities Authority Revenue (Providence Health & Services) PUT | 5.000% | 10/1/21 | 3,085 | 3,601 |
| Washington Health Care Facilities Authority Revenue (Seattle Cancer Care Alliance) | 5.000% | 3/1/19 | 600 | 649 |
| Washington Health Care Facilities Authority Revenue (Seattle Cancer Care Alliance) | 5.000% | 3/1/20 | 1,105 | 1,230 |
| Washington Health Care Facilities Authority Revenue (Seattle Cancer Care Alliance) | 4.000% | 3/1/21 | 800 | 874 |
| Washington Health Care Facilities Authority Revenue (Seattle Cancer Care Alliance) | 5.000% | 3/1/22 | 735 | 856 |
| Washington Housing Finance Commission Multi-Family Housing Revenue | | | | |
| (Heron’s Key Obligated Group) | 4.875% | 1/1/22 | 3,000 | 3,004 |
| Washington State University General Revenue | 5.000% | 4/1/20 | 1,100 | 1,243 |
| Washington State University General Revenue | 5.000% | 4/1/21 | 1,300 | 1,509 |
| Washington State University General Revenue | 5.000% | 4/1/22 | 1,400 | 1,661 |
| | | | | 626,034 |
| West Virginia (0.2%) | | | | |
| Mason County WV Pollution Control Revenue (Appalachian Power Co. Project) PUT | 1.625% | 10/1/18 | 6,000 | 6,028 |
| West Virginia Economic Development Authority Pollution Control Revenue | | | | |
| (American Electric Power Co. Inc.) | 3.250% | 5/1/19 | 10,000 | 10,336 |
| West Virginia Economic Development Authority Solid Waste Facilities Disposal Revenue | | | | |
| (Appalachian Power Co. - Amos Project) PUT | 1.900% | 4/1/19 | 5,000 | 5,018 |
114
Limited-Term Tax-Exempt Fund
| | | | |
| | | | Face | Market |
| | | Maturity | Amount | Value• |
| | Coupon | Date | ($000) | ($000) |
| West Virginia GO | 5.000% | 6/1/22 | 11,010 | 13,165 |
| West Virginia University Revenue | 5.000% | 10/1/18 | 1,300 | 1,399 |
| 3 West Virginia University Revenue PUT | 1.160% | 10/1/19 | 3,500 | 3,494 |
| West Virginia Water Development Authority Infrastructure Excess Lottery Revenue | | | | |
| (Chesapeake Bay/Greenbrier River Projects) | 5.000% | 7/1/21 | 750 | 876 |
| | | | | 40,316 |
| Wisconsin (1.2%) | | | | |
| Madison WI Community Development Authority Revenue (Wisconsin Alumni Research Project) | 5.000% | 10/1/17 | 3,370 | 3,498 |
| Milwaukee WI GO | 2.000% | 10/1/17 | 53,750 | 54,345 |
| Milwaukee WI GO | 5.000% | 5/1/18 | 11,655 | 12,370 |
| Milwaukee WI Sewerage System Revenue | 5.000% | 6/1/21 | 3,440 | 4,007 |
| Milwaukee WI Sewerage System Revenue | 5.000% | 6/1/22 | 3,615 | 4,310 |
| Milwaukee WI Sewerage System Revenue | 5.000% | 6/1/23 | 3,800 | 4,612 |
| University of Wisconsin Hospitals & Clinics Authority Revenue | 5.000% | 4/1/18 | 750 | 794 |
| University of Wisconsin Hospitals & Clinics Authority Revenue | 5.000% | 4/1/20 | 660 | 744 |
| Wisconsin Clean Water Revenue | 5.000% | 6/1/22 | 5,500 | 6,576 |
| Wisconsin GO | 5.000% | 5/1/17 | 7,000 | 7,153 |
| Wisconsin GO | 5.000% | 5/1/17 (ETM) | 4,700 | 4,801 |
| Wisconsin GO | 5.000% | 5/1/17 | 3,240 | 3,311 |
| Wisconsin GO | 5.000% | 5/1/17 (ETM) | 160 | 163 |
| Wisconsin GO | 5.000% | 11/1/17 | 4,500 | 4,692 |
| Wisconsin GO | 5.000% | 11/1/18 | 11,000 | 11,897 |
| Wisconsin GO | 5.000% | 5/1/19 | 5,000 | 5,499 |
| Wisconsin GO | 5.000% | 5/1/19 | 5,000 | 5,499 |
| Wisconsin GO | 5.000% | 11/1/19 | 3,100 | 3,467 |
| Wisconsin GO | 5.000% | 5/1/20 | 5,250 | 5,961 |
| Wisconsin GO | 5.000% | 11/1/20 | 7,400 | 8,524 |
| Wisconsin GO | 5.000% | 5/1/24 | 9,045 | 10,760 |
| Wisconsin Health & Educational Facilities Authority Health Facilities Revenue | | | | |
| (Iowa Health System Obligated Group) | 5.000% | 12/1/18 | 850 | 919 |
| Wisconsin Health & Educational Facilities Authority Health Facilities Revenue | | | | |
| (Iowa Health System Obligated Group) | 5.000% | 12/1/20 | 820 | 938 |
| Wisconsin Health & Educational Facilities Authority Revenue | | | | |
| (Ascension Health Alliance Credit Group) PUT | 5.000% | 6/1/20 | 34,460 | 38,972 |
| Wisconsin Health & Educational Facilities Authority Revenue (Aurora Health Care Inc.) | 5.000% | 7/15/17 | 5,025 | 5,158 |
| Wisconsin Health & Educational Facilities Authority Revenue (Aurora Health Care Inc.) | 5.000% | 7/15/17 | 1,000 | 1,026 |
| Wisconsin Health & Educational Facilities Authority Revenue (Aurora Health Care Inc.) | 5.000% | 7/15/19 | 1,160 | 1,269 |
| Wisconsin Health & Educational Facilities Authority Revenue | | | | |
| (Aurora Health Care Inc.) PUT | 1.250% | 8/15/17 | 6,250 | 6,264 |
| Wisconsin Health & Educational Facilities Authority Revenue | | | | |
| (Hospital Sisters Services Inc. Obligated Group) | 4.000% | 8/15/17 | 1,000 | 1,025 |
| Wisconsin Health & Educational Facilities Authority Revenue | | | | |
| (Hospital Sisters Services Inc. Obligated Group) | 5.000% | 8/15/18 | 1,000 | 1,070 |
| Wisconsin Health & Educational Facilities Authority Revenue | | | | |
| (Hospital Sisters Services Inc. Obligated Group) | 5.000% | 11/15/18 | 750 | 810 |
| Wisconsin Health & Educational Facilities Authority Revenue | | | | |
| (Hospital Sisters Services Inc. Obligated Group) | 4.000% | 8/15/19 | 1,500 | 1,618 |
| Wisconsin Health & Educational Facilities Authority Revenue | | | | |
| (Hospital Sisters Services Inc. Obligated Group) | 5.000% | 11/15/19 | 1,500 | 1,672 |
| Wisconsin Health & Educational Facilities Authority Revenue | | | | |
| (Hospital Sisters Services Inc. Obligated Group) | 5.000% | 8/15/20 | 5,335 | 6,064 |
| Wisconsin Health & Educational Facilities Authority Revenue | | | | |
| (Hospital Sisters Services Inc. Obligated Group) | 5.000% | 11/15/20 | 2,275 | 2,605 |
| Wisconsin Health & Educational Facilities Authority Revenue | | | | |
| (Hospital Sisters Services Inc. Obligated Group) | 5.000% | 11/15/21 | 2,485 | 2,919 |
| Wisconsin Health & Educational Facilities Authority Revenue (Marquette University) | 5.000% | 10/1/21 | 630 | 735 |
| Wisconsin Health & Educational Facilities Authority Revenue (Marquette University) | 5.000% | 10/1/22 | 350 | 417 |
| Wisconsin Health & Educational Facilities Authority Revenue (Marquette University) | 5.000% | 10/1/23 | 325 | 394 |
| Wisconsin Health & Educational Facilities Authority Revenue | | | | |
| (Marshfield Clinic Health System Obligated Group) | 5.000% | 2/15/20 | 1,840 | 2,039 |
| Wisconsin Health & Educational Facilities Authority Revenue | | | | |
| (Marshfield Clinic Health System Obligated Group) | 5.000% | 2/15/21 | 1,990 | 2,255 |
| Wisconsin Health & Educational Facilities Authority Revenue | | | | |
| (Marshfield Clinic Health System Obligated Group) | 5.000% | 2/15/22 | 2,100 | 2,422 |
| Wisconsin Health & Educational Facilities Authority Revenue | | | | |
| (Marshfield Clinic Health System Obligated Group) | 5.000% | 2/15/23 | 2,130 | 2,492 |
| Wisconsin Health & Educational Facilities Authority Revenue (Ministry Health Care Inc.) | 5.000% | 8/15/18 (Prere.) | 3,740 | 4,013 |
| Wisconsin Health & Educational Facilities Authority Revenue (Ministry Health Care Inc.) | 5.000% | 8/15/18 (ETM) | 730 | 783 |
| Wisconsin Health & Educational Facilities Authority Revenue (ThedaCare Inc. Obligated Group) | 4.000% | 12/15/16 | 525 | 527 |
115
Limited-Term Tax-Exempt Fund
| | | | |
| | | | Face | Market |
| | | Maturity | Amount | Value• |
| | Coupon | Date | ($000) | ($000) |
| Wisconsin Health & Educational Facilities Authority Revenue (ThedaCare Inc. Obligated Group) | 5.000% | 12/15/18 | 500 | 541 |
| Wisconsin Health & Educational Facilities Authority Revenue (ThedaCare Inc. Obligated Group) | 5.000% | 12/15/21 | 800 | 938 |
| Wisconsin Public Finance Authority Hospital Revenue (Renown Regional Medical Center) | 5.000% | 6/1/18 | 1,495 | 1,586 |
| Wisconsin Public Finance Authority Hospital Revenue (Renown Regional Medical Center) | 5.000% | 6/1/19 | 2,130 | 2,332 |
| Wisconsin Public Finance Authority Hospital Revenue (Renown Regional Medical Center) | 5.000% | 6/1/20 | 4,685 | 5,281 |
| Wisconsin Public Finance Authority Hospital Revenue (Renown Regional Medical Center) | 5.000% | 6/1/21 | 4,830 | 5,574 |
| Wisconsin Public Finance Authority Hospital Revenue (Renown Regional Medical Center) | 5.000% | 6/1/21 | 1,570 | 1,812 |
| Wisconsin Public Finance Authority Hospital Revenue (Renown Regional Medical Center) | 5.000% | 6/1/22 | 3,085 | 3,631 |
| Wisconsin Public Finance Authority Hospital Revenue (Renown Regional Medical Center) | 5.000% | 6/1/22 | 1,525 | 1,795 |
| Wisconsin Public Finance Authority Hospital Revenue (Renown Regional Medical Center) | 5.000% | 6/1/23 | 375 | 448 |
| Wisconsin Public Finance Authority Hospital Revenue (Renown Regional Medical Center) | 5.000% | 6/1/24 | 1,475 | 1,782 |
| Wisconsin Public Finance Authority Lease Development Revenue | | | | |
| (Central District Development Project) | 5.000% | 3/1/20 | 900 | 1,006 |
| Wisconsin Public Finance Authority Lease Development Revenue | | | | |
| (Central District Development Project) | 5.000% | 3/1/21 | 900 | 1,030 |
| Wisconsin Public Finance Authority Lease Development Revenue | | | | |
| (Central District Development Project) | 5.000% | 3/1/22 | 1,375 | 1,607 |
| Wisconsin Public Finance Authority Lease Development Revenue | | | | |
| (Central District Development Project) | 5.000% | 3/1/23 | 1,400 | 1,667 |
| Wisconsin Public Finance Authority Revenue (Church Home of Hartford Inc.) | 4.000% | 9/1/20 | 425 | 446 |
| | | | | 282,865 |
| Total Tax-Exempt Municipal Bonds (Cost $23,935,407) | | | | 24,167,220 |
| |
| | | | Shares | |
| Temporary Cash Investment (2.0%) | | | | |
| Money Market Fund (2.0%) | | | | |
| 5 Vanguard Municipal Cash Management Fund (Cost $477,373) | 0.614% | | 4,773,744 | 477,374 |
| Total Investments (102.9%) (Cost $24,412,780) | | | | 24,644,594 |
| |
| | | | | Amount |
| | | | | ($000) |
| Other Assets and Liabilities (-2.9%) | | | | |
| Other Assets | | | | |
| Investment in Vanguard | | | | 1,819 |
| Receivables for Investment Securities Sold | | | | 48,686 |
| Receivables for Accrued Income | | | | 234,651 |
| Receivables for Capital Shares Issued | | | | 20,967 |
| Other Assets4 | | | | 3,086 |
| Total Other Assets | | | | 309,209 |
| Liabilities | | | | |
| Payables for Investment Securities Purchased | | | | (950,322) |
| Payables for Capital Shares Redeemed | | | | (25,442) |
| Payables for Distributions | | | | (7,966) |
| Payables to Vanguard | | | | (12,882) |
| Other Liabilities | | | | (634) |
| Total Liabilities | | | | (997,246) |
| Net Assets (100%) | | | | 23,956,557 |
116
Limited-Term Tax-Exempt Fund
| |
| At October 31, 2016, net assets consisted of: | |
| | Amount |
| | ($000) |
| Paid-in Capital | 23,807,212 |
| Undistributed Net Investment Income | 32 |
| Accumulated Net Realized Losses | (82,649) |
| Unrealized Appreciation (Depreciation) | |
| Investment Securities | 231,814 |
| Futures Contracts | 148 |
| Net Assets | 23,956,557 |
| |
| Investor Shares—Net Assets | |
| Applicable to 181,318,761 outstanding $.001 par value shares of beneficial interest (unlimited authorization) | 1,997,768 |
| Net Asset Value Per Share—Investor Shares | $11.02 |
| |
| Admiral Shares—Net Assets | |
| Applicable to 1,992,995,112 outstanding $.001 par value shares of beneficial interest (unlimited authorization) | 21,958,789 |
| Net Asset Value Per Share—Admiral Shares | $11.02 |
• See Note A in Notes to Financial Statements.
1 Security purchased on a when-issued or delayed-delivery basis for which the fund has not taken delivery as of October 31, 2016.
2 Security exempt from registration under Rule 144A of the Securities Act of 1933. Such securities may be sold in transactions exempt from registration, normally to qualified institutional buyers. At October 31, 2016,
the aggregate value of these securities was $1,475,534,000, representing 6.2% of net assets.
3 Adjustable-rate security.
4 Securities with a value of $3,702,000 and cash of $1,844,000 have been segregated as initial margin for open futures contracts.
5 Affiliated money market fund available only to Vanguard funds and certain trusts and accounts managed by Vanguard. Rate shown is the 7-day yield.
A key to abbreviations and other references follows the Statement of Net Assets.
See accompanying Notes, which are an integral part of the Financial Statements.
117
Limited-Term Tax-Exempt Fund
Key to Abbreviations
ARS—Auction Rate Security.
BAN—Bond Anticipation Note.
COP—Certificate of Participation.
CP—Commercial Paper.
FR—Floating Rate.
GAN—Grant Anticipation Note.
GO—General Obligation Bond.
PILOT—Payments in Lieu of Taxes.
PUT—Put Option Obligation.
RAN—Revenue Anticipation Note.
TAN—Tax Anticipation Note.
TOB—Tender Option Bond.
TRAN—Tax Revenue Anticipation Note.
VRDO—Variable Rate Demand Obligation.
VRDP—Variable Rate Demand Preferred.
(ETM)—Escrowed to Maturity.
(Prere.)—Prerefunded.
Scheduled principal and interest payments are guaranteed by:
(1) MBIA (Municipal Bond Investors Assurance).
(2) AMBAC (Ambac Assurance Corporation).
(3) FGIC (Financial Guaranty Insurance Company).
(4) AGM (Assured Guaranty Municipal Corporation).
(5) BIGI (Bond Investors Guaranty Insurance).
(6) Connie Lee Inc.
(7) FHA (Federal Housing Authority).
(8) CapMAC (Capital Markets Assurance Corporation).
(9) American Capital Access Financial Guaranty Corporation.
(10) XL Capital Assurance Inc.
(11) CIFG (CDC IXIS Financial Guaranty).
(12) AGC (Assured Guaranty Corporation).
(13) BHAC (Berkshire Hathaway Assurance Corporation).
(14) NPFG (National Public Finance Guarantee Corporation).
(15) BAM (Build America Mutual Assurance Company).
(16) MAC (Municipal Assurance Corporation).
(17) RAA (Radian Asset Assurance Inc.).
(18) SBLF (Michigan School Bond Loan Fund).
The insurance does not guarantee the market value of the municipal bonds.
LOC—Scheduled principal and interest payments are guaranteed by bank letter of credit.
118
Limited-Term Tax-Exempt Fund
| |
| Statement of Operations |
| |
| | Year Ended |
| October 31, 2016 |
| | ($000) |
| Investment Income | |
| Income | |
| Interest1 | 376,143 |
| Total Income | 376,143 |
| Expenses | |
| The Vanguard Group—Note B | |
| Investment Advisory Services | 2,409 |
| Management and Administrative— | |
| Investor Shares | 2,923 |
| Management and Administrative— | |
| Admiral Shares | 13,455 |
| Marketing and Distribution— | |
| Investor Shares | 547 |
| Marketing and Distribution— | |
| Admiral Shares | 2,281 |
| Custodian Fees | 226 |
| Auditing Fees | 34 |
| Shareholders’ Reports—Investor Shares | 175 |
| Shareholders’ Reports—Admiral Shares | 235 |
| Trustees’ Fees and Expenses | 11 |
| Total Expenses | 22,296 |
| Net Investment Income | 353,847 |
| Realized Net Gain (Loss) | |
| Investment Securities Sold1 | 2,713 |
| Futures Contracts | 1,016 |
| Realized Net Gain (Loss) | 3,729 |
| Change in Unrealized Appreciation | |
| (Depreciation) | |
| Investment Securities | (58,658) |
| Futures Contracts | 152 |
| Change in Unrealized Appreciation | |
| (Depreciation) | (58,506) |
| Net Increase (Decrease) in Net Assets | |
| Resulting from Operations | 299,070 |
1 Interest income and realized net gain (loss) from an affiliated company of the fund were $1,890,000 and $1,000, respectively.
| | |
| Statement of Changes in Net Assets | | |
| |
| | Year Ended October 31, |
| | 2016 | 2015 |
| | ($000) | ($000) |
| Increase (Decrease) in Net Assets | | |
| Operations | | |
| Net Investment Income | 353,847 | 327,176 |
| Realized Net Gain (Loss) | 3,729 | 3,002 |
| Change in Unrealized Appreciation (Depreciation) | (58,506) | (74,576) |
| Net Increase (Decrease) in Net Assets Resulting from Operations | 299,070 | 255,602 |
| Distributions | | |
| Net Investment Income | | |
| Investor Shares | (30,355) | (32,569) |
| Admiral Shares | (323,387) | (294,569) |
| Realized Capital Gain | | |
| Investor Shares | — | — |
| Admiral Shares | — | — |
| Total Distributions | (353,742) | (327,138) |
| Capital Share Transactions | | |
| Investor Shares | (38,391) | (192,840) |
| Admiral Shares | 2,975,197 | 1,477,195 |
| Net Increase (Decrease) from Capital Share Transactions | 2,936,806 | 1,284,355 |
| Total Increase (Decrease) | 2,882,134 | 1,212,819 |
| Net Assets | | |
| Beginning of Period | 21,074,423 | 19,861,604 |
| End of Period1 | 23,956,557 | 21,074,423 |
1 Net Assets—End of Period includes undistributed (overdistributed) net investment income of $32,000 and $4,000.
See accompanying Notes, which are an integral part of the Financial Statements.
119
Limited-Term Tax-Exempt Fund
Financial Highlights
| | | | | |
| Investor Shares | | | | | |
| |
| For a Share Outstanding | | | Year Ended October 31, |
| Throughout Each Period | 2016 | 2015 | 2014 | 2013 | 2012 |
| Net Asset Value, Beginning of Period | $11.04 | $11.08 | $11.06 | $11.18 | $11.07 |
| Investment Operations | | | | | |
| Net Investment Income | .164 | .166 | .178 | .186 | .212 |
| Net Realized and Unrealized Gain (Loss) | | | | | |
| on Investments | (.020) | (. 040) | .020 | (.120) | .110 |
| Total from Investment Operations | .144 | .126 | .198 | .066 | . 322 |
| Distributions | | | | | |
| Dividends from Net Investment Income | (.164) | (.166) | (.178) | (.186) | (.212) |
| Distributions from Realized Capital Gains | — | — | — | — | — |
| Total Distributions | (.164) | (.166) | (.178) | (.186) | (.212) |
| Net Asset Value, End of Period | $11.02 | $11.04 | $11.08 | $11.06 | $11.18 |
| |
| Total Return1 | 1.31% | 1.15% | 1.81% | 0.60% | 2.93% |
| |
| Ratios/Supplemental Data | | | | | |
| Net Assets, End of Period (Millions) | $1,998 | $2,040 | $2,241 | $2,364 | $2,779 |
| Ratio of Total Expenses to Average Net Assets | 0.19% | 0.20% | 0.20% | 0.20% | 0.20% |
| Ratio of Net Investment Income to | | | | | |
| Average Net Assets | 1.48% | 1.51% | 1.61% | 1.67% | 1.90% |
| Portfolio Turnover Rate | 13% | 16% | 15% | 14% | 15% |
1 Total returns do not include account service fees that may have applied in the periods shown. Fund prospectuses provide information about
any applicable account service fees.
| | | | | |
| Admiral Shares | | | | | |
| |
| For a Share Outstanding | | | Year Ended October 31, |
| Throughout Each Period | 2016 | 2015 | 2014 | 2013 | 2012 |
| Net Asset Value, Beginning of Period | $11.04 | $11.08 | $11.06 | $11.18 | $11.07 |
| Investment Operations | | | | | |
| Net Investment Income | .175 | .175 | .187 | .195 | .221 |
| Net Realized and Unrealized Gain (Loss) | | | | | |
| on Investments | (.020) | (. 040) | .020 | (.120) | .110 |
| Total from Investment Operations | .155 | .135 | . 207 | . 075 | .331 |
| Distributions | | | | | |
| Dividends from Net Investment Income | (.175) | (.175) | (.187) | (.195) | (.221) |
| Distributions from Realized Capital Gains | — | — | — | — | — |
| Total Distributions | (.175) | (.175) | (.187) | (.195) | (.221) |
| Net Asset Value, End of Period | $11.02 | $11.04 | $11.08 | $11.06 | $11.18 |
| |
| Total Return1 | 1.41% | 1.23% | 1.89% | 0.68% | 3.01% |
| |
| Ratios/Supplemental Data | | | | | |
| Net Assets, End of Period (Millions) | $21,959 | $19,035 | $17,621 | $15,276 | $13,970 |
| Ratio of Total Expenses to Average Net Assets | 0.09% | 0.12% | 0.12% | 0.12% | 0.12% |
| Ratio of Net Investment Income to | | | | | |
| Average Net Assets | 1.58% | 1.59% | 1.69% | 1.75% | 1.98% |
| Portfolio Turnover Rate | 13% | 16% | 15% | 14% | 15% |
1 Total returns do not include account service fees that may have applied in the periods shown. Fund prospectuses provide information about
any applicable account service fees.
See accompanying Notes, which are an integral part of the Financial Statements.
120
Limited-Term Tax-Exempt Fund
Notes to Financial Statements
Vanguard Limited-Term Tax-Exempt Fund is registered under the Investment Company Act of 1940 as an open-end investment company, or mutual fund. The fund invests in debt instruments of many municipal issuers; the issuers’ abilities to meet their obligations may be affected by economic and political developments in a specific state or region. The fund offers two classes of shares: Investor Shares and Admiral Shares. Investor Shares are available to any investor who meets the fund’s minimum purchase requirements. Admiral Shares are designed for investors who meet certain administrative, service, and account-size criteria.
A. The following significant accounting policies conform to generally accepted accounting principles for U.S. investment companies. The fund consistently follows such policies in preparing its financial statements.
1. Security Valuation: Securities are valued as of the close of trading on the New York Stock Exchange (generally 4 p.m., Eastern time) on the valuation date. Bonds and temporary cash investments acquired over 60 days to maturity are valued using the latest bid prices or using valuations based on a matrix system (which considers such factors as security prices, yields, maturities, and ratings), both as furnished by independent pricing services. Investments in Vanguard Municipal Cash Management Fund are valued at that fund’s net asset value. Other temporary cash investments are valued at amortized cost, which approximates market value. Securities for which market quotations are not readily available, or whose values have been affected by events occurring before the fund’s pricing time but after the close of the securities’ primary markets, are valued by methods deemed by the board of trustees to represent fair value.
2. Futures Contracts: The fund uses futures contracts to invest in fixed income asset classes with greater efficiency and lower cost than is possible through direct investment, to add value when these instruments are attractively priced, or to adjust sensitivity to changes in interest rates. The primary risks associated with the use of futures contracts are imperfect correlation between changes in market values of bonds held by the fund and the prices of futures contracts, and the possibility of an illiquid market. Counterparty risk involving futures is mitigated because a regulated clearinghouse is the counterparty instead of the clearing broker. To further mitigate counterparty risk, the fund trades futures contracts on an exchange, monitors the financial strength of its clearing brokers and clearinghouse, and has entered into clearing agreements with its clearing brokers. The clearinghouse imposes initial margin requirements to secure the fund’s performance and requires daily settlement of variation margin representing changes in the market value of each contract.
Futures contracts are valued at their quoted daily settlement prices. The aggregate settlement values of the contracts are not recorded in the Statement of Net Assets. Fluctuations in the value of the contracts are recorded in the Statement of Net Assets as an asset (liability) and in the Statement of Operations as unrealized appreciation (depreciation) until the contracts are closed, when they are recorded as realized futures gains (losses).
During the year ended October 31, 2016, the fund’s average investments in long and short futures contracts each represented less than 1% and 0% of net assets, based on the average of aggregate settlement values at each quarter-end during the period.
3. Federal Income Taxes: The fund intends to continue to qualify as a regulated investment company and distribute all of its income. Management has analyzed the fund’s tax positions taken for all open federal income tax years (October 31, 2013–2016), and has concluded that no provision for federal income tax is required in the fund’s financial statements.
4. Distributions: Distributions from net investment income are declared daily and paid on the first business day of the following month. Annual distributions from realized capital gains, if any, are recorded on the ex-dividend date.
5. Credit Facility: The fund and certain other funds managed by The Vanguard Group (“Vanguard”) participate in a $3.1 billion committed credit facility provided by a syndicate of lenders pursuant to a credit agreement that may be renewed annually; each fund is individually liable for its borrowings, if any, under the credit facility. Borrowings may be utilized for temporary and emergency purposes, and are subject to the fund’s regulatory and contractual borrowing restrictions. The participating funds are charged administrative fees and an annual commitment fee of 0.10% of the undrawn amount of the facility; these fees are allocated to the funds based on a method approved by the fund’s board of trustees and included in Management and Administrative expenses on the fund’s Statement of Operations. Any borrowings under this facility bear interest at a rate based upon the higher of the one-month London Interbank Offered Rate, federal funds effective rate, or overnight bank funding rate plus an agreed-upon spread.
121
Limited-Term Tax-Exempt Fund
The fund had no borrowings outstanding at October 31, 2016, or at any time during the period then ended.
6. Other: Interest income includes income distributions received from Vanguard Municipal Cash Management Fund and is accrued daily. Premiums and discounts on debt securities purchased are amortized and accreted, respectively, to interest income over the lives of the respective securities. Security transactions are accounted for on the date securities are bought or sold. Costs used to determine realized gains (losses) on the sale of investment securities are those of the specific securities sold.
Each class of shares has equal rights as to assets and earnings, except that each class separately bears certain class-specific expenses related to maintenance of shareholder accounts (included in Management and Administrative expenses) and shareholder reporting. Marketing and distribution expenses are allocated to each class of shares based on a method approved by the board of trustees. Income, other non-class-specific expenses, and gains and losses on investments are allocated to each class of shares based on its relative net assets.
B. In accordance with the terms of a Funds’ Service Agreement (the “FSA”) between Vanguard and the fund, Vanguard furnishes to the fund investment advisory, corporate management, administrative, marketing, and distribution services at Vanguard’s cost of operations (as defined by the FSA). These costs of operations are allocated to the fund based on methods and guidelines approved by the board of trustees. Vanguard does not require reimbursement in the current period for certain costs of operations (such as deferred compensation/benefits and risk/insurance costs); the fund’s liability for these costs of operations is included in Payables to Vanguard on the Statement of Net Assets.
Upon the request of Vanguard, the fund may invest up to 0.40% of its net assets as capital in Vanguard. At October 31, 2016, the fund had contributed to Vanguard capital in the amount of $1,819,000, representing 0.01% of the fund’s net assets and 0.73% of Vanguard’s capitalization. The fund’s trustees and officers are also directors and employees, respectively, of Vanguard.
C. Various inputs may be used to determine the value of the fund’s investments. These inputs are summarized in three broad levels for financial statement purposes. The inputs or methodologies used to value securities are not necessarily an indication of the risk associated with investing in those securities.
Level 1—Quoted prices in active markets for identical securities.
Level 2—Other significant observable inputs (including quoted prices for similar securities, interest rates, prepayment speeds, credit risk, etc.).
Level 3—Significant unobservable inputs (including the fund’s own assumptions used to determine the fair value of investments).
The following table summarizes the market value of the fund’s investments as of October 31, 2016, based on the inputs used to value them:
| | | |
| | Level 1 | Level 2 | Level 3 |
| Investments | ($000) | ($000) | ($000) |
| Tax-Exempt Municipal Bonds | — | 24,167,220 | — |
| Temporary Cash Investments | 477,374 | — | — |
| Futures Contracts—Assets1 | 306 | — | — |
| Futures Contracts—Liabilities1 | (320) | — | — |
| Total | 477,360 | 24,167,220 | — |
| 1 Represents variation margin on the last day of the reporting period for recently closed futures contracts. | |
D. At October 31, 2016, the aggregate settlement value of open futures contracts and the related unrealized appreciation (depreciation) were:
| | | | |
| | | | | ($000) |
| | | | Aggregate | |
| | | Number of | Settlement | Unrealized |
| | | Long (Short) | Value | Appreciation |
| Futures Contracts | Expiration | Contracts | Long (Short) | (Depreciation) |
| 10-Year U.S. Treasury Note | December 2016 | 907 | 117,570 | 148 |
Unrealized appreciation (depreciation) on open futures contracts is required to be treated as realized gain (loss) for tax purposes.
Limited-Term Tax-Exempt Fund
E. Capital gain distributions are determined on a tax basis and may differ from realized capital gains for financial reporting purposes. Differences may be permanent or temporary. Permanent differences are reclassified among capital accounts in the financial statements to reflect their tax character. Temporary differences arise when gains or losses are recognized in different periods for financial statement and tax purposes. These differences will reverse at some time in the future.
The fund used capital loss carryforwards of 3,170,000 to offset taxable capital gains realized during the year ended October 31, 2016. At October 31, 2016, the fund had available capital losses totaling $81,990,000 to offset future net capital gains. Of this amount, $61,167,000 is subject to expiration dates; $29,710,000 may be used to offset future net capital gains through October 31, 2017, $4,375,000 through October 31, 2018, and $27,082,000 through October 31, 2019. Capital losses of $20,823,000 realized beginning in fiscal 2012 may be carried forward indefinitely under the Regulated Investment Company Modernization Act of 2010, but must be used before any expiring loss carryforwards. Capital loss carryforwards of $2,743,000 expired on October 31, 2016; accordingly, such losses have been reclassified from accumulated net realized losses to paid-in capital.
At October 31, 2016, the cost of investment securities for tax purposes was $24,413,291,000.
Net unrealized appreciation of investment securities for tax purposes was $231,303,000, consisting of unrealized gains of $271,120,000 on securities that had risen in value since their purchase and $39,817,000 in unrealized losses on securities that had fallen in value since their purchase.
F. During the year ended October 31, 2016, the fund purchased $5,183,119,000 of investment securities and sold $2,545,098,000 of investment securities, other than temporary cash investments.
The fund purchased securities from and sold securities to other Vanguard funds or accounts managed by Vanguard or its affiliates, in accordance with procedures adopted by the board of trustees in compliance with Rule 17a-7 of the Investment Company Act of 1940. For the year ended October 31, 2016, such purchases and sales were $1,279,902,000 and $754,616,000, respectively; these amounts are included in the purchases and sales of investment securities noted above.
G. Capital share transactions for each class of shares were:
| | | | |
| | | | Year Ended October 31, |
| | | 2016 | | 2015 |
| | Amount | Shares | Amount | Shares |
| | ($000) | (000) | ($000) | (000) |
| Investor Shares | | | | |
| Issued | 678,994 | 61,395 | 627,205 | 56,868 |
| Issued in Lieu of Cash Distributions | 24,711 | 2,234 | 26,273 | 2,382 |
| Redeemed | (742,096) | (67,088) | (846,318) | (76,753) |
| Net Increase (Decrease) —Investor Shares | (38,391) | (3,459) | (192,840) | (17,503) |
| Admiral Shares | | | | |
| Issued | 7,425,046 | 671,166 | 6,609,624 | 599,271 |
| Issued in Lieu of Cash Distributions | 241,195 | 21,804 | 218,176 | 19,781 |
| Redeemed | (4,691,044) | (424,141) | (5,350,605) | (485,455) |
| Net Increase (Decrease) —Admiral Shares | 2,975,197 | 268,829 | 1,477,195 | 133,597 |
H. Management has determined that no material events or transactions occurred subsequent to October 31, 2016, that would require recognition or disclosure in these financial statements.
123
Intermediate-Term Tax-Exempt Fund
Fund Profile
As of October 31, 2016
| | |
| Share-Class Characteristics | | |
| | Investor | Admiral |
| | Shares | Shares |
| Ticker Symbol | VWITX | VWIUX |
| Expense Ratio1 | 0.20% | 0.12% |
| 30-Day SEC Yield | 1.50% | 1.62% |
| | | |
| Financial Attributes | | |
| | | Bloomberg | |
| | | Barclays | Bloomberg |
| | | 1–15 Year | Barclays |
| | | Municipal | Municipal |
| | | Bond | Bond |
| | Fund | Index | Index |
| Number of Bonds | 6,292 | 40,240 | 49,796 |
| Yield to Maturity | | | |
| (before expenses) | 1.7% | 1.7% | 2.0% |
| Average Coupon | 4.6% | 4.8% | 4.8% |
| Average Duration | 5.0 years | 4.7 years | 5.9 years |
| Average Stated | | | |
| Maturity | 8.6 years | 7.9 years | 12.9 years |
| Short-Term Reserves | 4.0% | — | — |
| |
| Largest Area Concentrations2 | |
| New York | 15.5% |
| California | 11.6 |
| Texas | 10.3 |
| Illinois | 5.9 |
| Florida | 5.3 |
| Pennsylvania | 4.8 |
| Michigan | 3.6 |
| Maryland | 3.3 |
| New Jersey | 3.3 |
| Massachusetts | 3.1 |
| Top Ten | 66.7% |
| | |
| Volatility Measures | | |
| | Bloomberg | |
| | Barclays | Bloomberg |
| | 1–15 Year | Barclays |
| | Municipal | Municipal |
| | Bond Index | Bond Index |
| R-Squared | 0.98 | 0.98 |
| Beta | 1.08 | 0.89 |
These measures show the degree and timing of the fund’s fluctuations compared with the indexes over 36 months.
| |
| Distribution by Stated Maturity (% of portfolio) |
| Under 1 Year | 5.9% |
| 1–3 Years | 12.7 |
| 3–5 Years | 13.2 |
| 5–10 Years | 28.4 |
| 10–20 Years | 39.1 |
| 20–30 Years | 0.6 |
| Over 30 Years | 0.1 |
| |
| Distribution by Credit Quality (% of portfolio) |
| AAA | 21.3% |
| AA | 53.9 |
| A | 18.2 |
| BBB | 4.9 |
| BB | 0.1 |
| B or Lower | 0.4 |
| Not Rated | 1.2 |
Credit-quality ratings are obtained from Moody’s and S&P, and the higher rating for each issue is shown. “Not Rated” is used to classify securities for which a rating is not available. Not rated securities include a fund’s investment in Vanguard Market Liquidity Fund or Vanguard Municipal Cash Management Fund, each of which invests in high-quality money market instruments and may serve as a cash management vehicle for the Vanguard funds, trusts, and accounts. For more information about these ratings, see the Glossary entry for Credit Quality.
Investment Focus
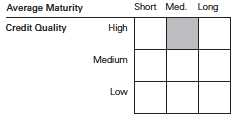
1 The expense ratios shown are from the prospectus dated February 26, 2016, and represent estimated costs for the current fiscal year. For the fiscal year ended October 31, 2016, the expense
Investor Shares and 0.09% for Admiral Shares.
2 Percentage of net assets, excluding any futures contracts.
124
Intermediate-Term Tax-Exempt Fund
Performance Summary
All of the returns in this report represent past performance, which is not a guarantee of future results that may be achieved by the fund. (Current performance may be lower or higher than the performance data cited. For performance data current to the most recent month-end, visit our website at vanguard.com/performance.) Note, too, that both investment returns and principal value can fluctuate widely, so an investor’s shares, when sold, could be worth more or less than their original cost. The returns shown do not reflect taxes that a shareholder would pay on fund distributions or on the sale of fund shares.
Cumulative Performance: October 31, 2006–October 31, 2016
Initial Investment of $10,000
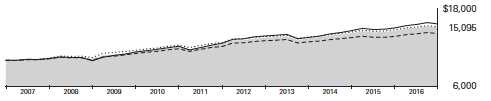
| | | | |
| | | Average Annual Total Returns | Final Value |
| | | Periods Ended October 31, 2016 | of a $10,000 |
| | One Year | Five Years | Ten Years | Investment |
| Intermediate-Term Tax-Exempt Fund | | | | |
| Investor Shares | 3.63% | 3.87% | 4.20% | $15,095 |
| Bloomberg Barclays 1–15 Year Municipal | | | | |
| Bond Index | 3.10 | 3.51 | 4.28 | 15,199 |
| Intermediate Municipal Funds Average1 | 3.32 | 3.13 | 3.55 | 14,170 |
| Bloomberg Barclays Municipal Bond Index | 4.06 | 4.34 | 4.57 | 15,637 |
| | | | |
| | | | | Final Value |
| | | | | of a $50,000 |
| | One Year | Five Years | Ten Years | Investment |
| Intermediate-Term Tax-Exempt Fund Admiral Shares | 3.73% | 3.95% | 4.29% | $76,081 |
| Bloomberg Barclays 1–15 Year Municipal Bond Index | 3.10 | 3.51 | 4.28 | 75,994 |
| Bloomberg Barclays Municipal Bond Index | 4.06 | 4.34 | 4.57 | 78,184 |
1 Derived from data provided by Lipper, a Thomson Reuters Company.
See Financial Highlights for dividend and capital gains information.
125
Intermediate-Term Tax-Exempt Fund
| | | | |
| Fiscal-Year Total Returns (%): October 31, 2006–October 31, 2016 | | | |
| | | | | Bloomberg |
| | | | | Barclays |
| | | | | 1–15 Year |
| | | | | Municipal |
| | | | Investor Shares | Bond Index |
| | Income | Capital | Total | Total |
| Fiscal Year | Returns | Returns | Returns | Returns |
| 2007 | 4.16% | -1.42% | 2.74% | 3.45% |
| 2008 | 3.99 | -4.48 | -0.49 | 0.88 |
| 2009 | 4.24 | 6.27 | 10.51 | 10.72 |
| 2010 | 3.81 | 3.14 | 6.95 | 6.81 |
| 2011 | 3.71 | -0.36 | 3.35 | 3.62 |
| 2012 | 3.35 | 4.80 | 8.15 | 7.02 |
| 2013 | 3.00 | -3.96 | -0.96 | -0.41 |
| 2014 | 3.28 | 3.03 | 6.31 | 5.56 |
| 2015 | 2.93 | -0.49 | 2.44 | 2.46 |
| 2016 | 2.78 | 0.85 | 3.63 | 3.10 |
Average Annual Total Returns: Periods Ended September 30, 2016
This table presents returns through the latest calendar quarter—rather than through the end of the fiscal period.
Securities and Exchange Commission rules require that we provide this information.
| | | | | | |
| | | | | | | Ten Years |
| | Inception Date | One Year | Five Years | Income | Capital | Total |
| Investor Shares | 9/1/1977 | 4.87% | 3.96% | 3.54% | 0.80% | 4.34% |
| Admiral Shares | 2/12/2001 | 4.97 | 4.05 | 3.62 | 0.80 | 4.42 |
126
Intermediate-Term Tax-Exempt Fund
Financial Statements
Statement of Net Assets
As of October 31, 2016
The fund reports a complete list of its holdings in regulatory filings four times in each fiscal year, at the quarter-ends. For the second and fourth fiscal quarters, the lists appear in the fund’s semiannual and annual reports to shareholders. For the first and third fiscal quarters, the fund files the lists with the Securities and Exchange Commission on Form N-Q. Shareholders can look up the fund’s Forms N-Q on the SEC’s website at sec.gov. Forms N-Q may also be reviewed and copied at the SEC’s Public Reference Room (see the back cover of this report for further information).
| | | | |
| | | | Face | Market |
| | | Maturity | Amount | Value• |
| | Coupon | Date | ($000) | ($000) |
| Tax-Exempt Municipal Bonds (99.1%) | | | | |
| Alabama (0.8%) | | | | |
| Alabama 21st Century Authority Tobacco Settlement Revenue | 5.000% | 6/1/20 | 1,000 | 1,123 |
| Alabama 21st Century Authority Tobacco Settlement Revenue | 5.000% | 6/1/21 | 1,500 | 1,722 |
| Alabama Federal Aid Highway Finance Authority Special Obligation Revenue | 5.000% | 9/1/30 | 7,950 | 9,537 |
| Alabama Incentives Financing Authority Special Obligation Revenue | 5.000% | 9/1/24 | 2,520 | 2,764 |
| Alabama Incentives Financing Authority Special Obligation Revenue | 5.000% | 9/1/24 | 3,695 | 4,059 |
| Alabama Incentives Financing Authority Special Obligation Revenue | 5.000% | 9/1/30 | 6,905 | 7,966 |
| Alabama Incentives Financing Authority Special Obligation Revenue | 5.000% | 9/1/31 | 7,245 | 8,328 |
| Alabama Incentives Financing Authority Special Obligation Revenue | 5.000% | 9/1/32 | 7,000 | 8,014 |
| Alabama Public School & College Authority Capital Improvement Revenue | 5.000% | 12/1/17 (Prere.) | 60,660 | 63,445 |
| Alabama Public School & College Authority Capital Improvement Revenue | 5.000% | 12/1/17 (Prere.) | 62,600 | 65,474 |
| Alabama Public School & College Authority Capital Improvement Revenue | 5.000% | 12/1/17 (Prere.) | 13,595 | 14,219 |
| Alabama Public School & College Authority Capital Improvement Revenue | 5.000% | 12/1/17 (Prere.) | 58,350 | 61,029 |
| Alabama Public School & College Authority Capital Improvement Revenue | 5.000% | 5/1/19 | 1,820 | 1,998 |
| Alabama Public School & College Authority Capital Improvement Revenue | 5.000% | 5/1/21 | 4,895 | 5,694 |
| Auburn University Alabama General Fee Revenue | 5.000% | 6/1/17 | 1,550 | 1,589 |
| Auburn University Alabama General Fee Revenue | 5.000% | 6/1/17 | 3,160 | 3,239 |
| Auburn University Alabama General Fee Revenue | 5.000% | 6/1/31 | 3,000 | 3,535 |
| Baldwin County AL Board of Education Revenue | 5.000% | 6/1/26 | 1,500 | 1,830 |
| Baldwin County AL Board of Education Revenue | 5.000% | 6/1/27 | 1,750 | 2,118 |
| Baldwin County AL Board of Education Revenue | 5.000% | 6/1/28 | 2,750 | 3,306 |
| Baldwin County AL Board of Education Revenue | 5.000% | 6/1/29 | 3,000 | 3,582 |
| Baldwin County AL Board of Education Revenue | 5.000% | 6/1/30 | 6,335 | 7,518 |
| Baldwin County AL Board of Education Revenue | 5.000% | 6/1/32 | 2,005 | 2,359 |
| Birmingham AL GO | 0.000% | 3/1/32 | 5,000 | 5,683 |
| Birmingham AL Water Works Board Water Revenue | 5.000% | 1/1/25 | 1,000 | 1,239 |
| Birmingham AL Water Works Board Water Revenue | 5.000% | 1/1/25 | 1,540 | 1,894 |
| Birmingham AL Water Works Board Water Revenue | 5.000% | 1/1/26 | 1,755 | 2,191 |
| Birmingham AL Water Works Board Water Revenue | 5.000% | 1/1/27 | 3,920 | 4,939 |
| Birmingham AL Water Works Board Water Revenue | 5.000% | 1/1/27 | 1,460 | 1,826 |
| Birmingham AL Water Works Board Water Revenue | 5.000% | 1/1/32 | 4,780 | 5,785 |
| Birmingham AL Water Works Board Water Revenue | 5.000% | 1/1/33 | 4,000 | 4,821 |
| Black Belt Energy Gas District Alabama Gas Supply Revenue PUT | 4.000% | 6/1/21 | 9,000 | 9,905 |
| Hoover AL GO | 4.000% | 7/1/24 | 3,900 | 4,568 |
| Hoover AL GO | 4.000% | 7/1/25 | 1,290 | 1,519 |
| Hoover AL GO | 4.000% | 7/1/26 | 1,345 | 1,595 |
| Hoover AL GO | 4.000% | 7/1/30 | 2,440 | 2,775 |
| Hoover AL GO | 4.000% | 7/1/31 | 5,135 | 5,797 |
| Hoover AL GO | 4.000% | 7/1/32 | 5,090 | 5,700 |
| Huntsville AL GO | 5.000% | 5/1/21 (Prere.) | 2,050 | 2,394 |
| Huntsville AL GO | 5.000% | 9/1/21 (Prere.) | 2,245 | 2,647 |
| Huntsville AL GO | 5.000% | 3/1/26 | 295 | 343 |
| Huntsville AL GO | 5.000% | 5/1/33 | 2,950 | 3,371 |
| Huntsville AL Water System Revenue | 5.000% | 11/1/25 | 1,500 | 1,879 |
| Huntsville AL Water System Revenue | 5.000% | 11/1/27 | 1,580 | 1,946 |
| Huntsville AL Water System Revenue | 5.000% | 11/1/28 | 1,500 | 1,838 |
| Infirmary Health System Special Care Facilities Financing Authority Mobile Alabama Revenue | | | | |
| (Infirmary Health System Inc.) | 5.000% | 2/1/18 | 2,830 | 2,942 |
| Infirmary Health System Special Care Facilities Financing Authority Mobile Alabama Revenue | | | | |
| (Infirmary Health System Inc.) | 5.250% | 2/1/19 | 2,415 | 2,593 |
| Infirmary Health System Special Care Facilities Financing Authority Mobile Alabama Revenue | | | | |
| (Infirmary Health System Inc.) | 5.250% | 2/1/20 | 2,845 | 3,135 |
| Infirmary Health System Special Care Facilities Financing Authority Mobile Alabama Revenue | | | | |
| (Infirmary Health System Inc.) | 5.250% | 2/3/20 (Prere.) | 3,630 | 4,115 |
| Infirmary Health System Special Care Facilities Financing Authority Mobile Alabama Revenue | | | | |
| (Infirmary Health System Inc.) | 5.250% | 2/3/20 (Prere.) | 5,450 | 6,178 |
127
Intermediate-Term Tax-Exempt Fund
| | | | |
| | | | Face | Market |
| | | Maturity | Amount | Value• |
| | Coupon | Date | ($000) | ($000) |
| Jefferson County AL Sewer Revenue | 5.000% | 10/1/22 | 1,730 | 1,903 |
| Jefferson County AL Sewer Revenue | 5.000% | 10/1/23 | 7,000 | 7,762 |
| Jefferson County AL Sewer Revenue | 0.000% | 10/1/26 (4) | 1,000 | 703 |
| Jefferson County AL Sewer Revenue | 0.000% | 10/1/27 (4) | 1,410 | 927 |
| Jefferson County AL Sewer Revenue | 0.000% | 10/1/28 (4) | 1,500 | 921 |
| Mobile AL Industrial Development Board Pollution Control Revenue (Alabama Power Co.) PUT | 1.650% | 3/20/17 | 8,700 | 8,726 |
| Mobile County AL Board of School Commissioners GO | 2.000% | 3/1/17 | 350 | 352 |
| Mobile County AL Board of School Commissioners GO | 2.000% | 3/1/18 | 500 | 507 |
| Mobile County AL Board of School Commissioners GO | 3.000% | 3/1/19 | 550 | 575 |
| Mobile County AL Board of School Commissioners GO | 5.000% | 3/1/29 | 3,565 | 4,323 |
| Mobile County AL Board of School Commissioners GO | 5.000% | 3/1/30 | 2,500 | 3,008 |
| Mobile County AL Board of School Commissioners GO | 5.000% | 3/1/31 | 3,000 | 3,590 |
| University of Alabama General Revenue | 5.000% | 7/1/21 | 10,530 | 12,325 |
| University of South Alabama University Facilities Revenue | 5.000% | 11/1/24 (4) | 1,535 | 1,872 |
| University of South Alabama University Facilities Revenue | 5.000% | 11/1/25 (4) | 1,700 | 2,091 |
| University of South Alabama University Facilities Revenue | 5.000% | 11/1/27 (4) | 2,010 | 2,477 |
| University of South Alabama University Facilities Revenue | 5.000% | 11/1/28 (4) | 2,110 | 2,575 |
| University of South Alabama University Facilities Revenue | 5.000% | 11/1/29 (4) | 1,110 | 1,346 |
| University of South Alabama University Facilities Revenue | 5.000% | 11/1/33 (4) | 5,110 | 6,065 |
| | | | | 440,114 |
| Alaska (0.1%) | | | | |
| Alaska GO | 4.000% | 8/1/18 | 1,200 | 1,265 |
| Alaska GO | 5.000% | 8/1/24 | 5,000 | 6,071 |
| Alaska Housing Finance Corp. General Housing Revenue | 5.000% | 12/1/25 | 3,075 | 3,639 |
| Alaska Housing Finance Corp. General Housing Revenue | 5.000% | 12/1/26 | 5,330 | 6,289 |
| Alaska Housing Finance Corp. General Housing Revenue | 5.000% | 12/1/29 | 2,000 | 2,306 |
| Alaska Municipal Bond Bank Authority Revenue | 5.000% | 2/1/32 | 4,845 | 5,587 |
| Anchorage AK Electric Utility Revenue | 5.000% | 12/1/26 | 2,350 | 2,852 |
| Anchorage AK Electric Utility Revenue | 5.000% | 12/1/34 | 4,500 | 5,254 |
| Anchorage AK GO | 5.000% | 9/1/20 | 3,900 | 4,442 |
| Matanuska-Susitna Borough AK GO | 5.000% | 3/1/17 | 3,595 | 3,647 |
| Matanuska-Susitna Borough AK Lease Revenue (Goose Creek Correctional Center) GO | 5.000% | 9/1/31 | 15,000 | 17,656 |
| Matanuska-Susitna Borough AK Lease Revenue (Goose Creek Correctional Center) GO | 5.000% | 9/1/32 | 5,000 | 5,860 |
| Northern Alaska Tobacco Securitization Corp. Revenue | 4.625% | 6/1/23 | 9,495 | 9,644 |
| | | | | 74,512 |
| Arizona (2.0%) | | | | |
| Arizona Board of Regents Arizona State University System Revenue | 5.000% | 7/1/31 | 725 | 872 |
| Arizona Board of Regents Arizona State University System Revenue | 5.000% | 7/1/32 | 875 | 1,048 |
| Arizona Board of Regents Arizona State University System Revenue | 5.000% | 7/1/33 | 700 | 834 |
| Arizona Board of Regents Arizona State University System Revenue | 5.000% | 7/1/34 | 1,000 | 1,188 |
| Arizona Board of Regents Arizona State University System Revenue | 5.000% | 7/1/34 | 4,300 | 5,124 |
| Arizona Board of Regents Arizona State University System Revenue | 5.000% | 7/1/35 | 600 | 711 |
| Arizona Board of Regents Arizona State University System Revenue | 5.000% | 7/1/36 | 3,125 | 3,704 |
| Arizona Board Regents Arizona State University System COP | 5.000% | 7/1/20 (14) | 5,120 | 5,257 |
| Arizona Board Regents Arizona State University System Revenue | 6.000% | 7/1/18 (Prere.) | 1,135 | 1,232 |
| Arizona Board Regents Arizona State University System Revenue | 5.000% | 6/1/19 (Prere.) | 2,545 | 2,804 |
| Arizona Board Regents Arizona State University System Revenue | 5.000% | 7/1/27 | 1,115 | 1,322 |
| Arizona Board Regents Arizona State University System Revenue | 5.000% | 7/1/28 | 3,510 | 4,303 |
| Arizona Board Regents Arizona State University System Revenue | 5.000% | 7/1/28 | 1,860 | 2,280 |
| Arizona Board Regents Arizona State University System Revenue | 5.000% | 7/1/28 | 1,000 | 1,183 |
| Arizona Board Regents Arizona State University System Revenue | 5.000% | 6/1/31 | 1,000 | 1,161 |
| Arizona Board Regents Arizona State University System Revenue | 5.000% | 6/1/32 | 1,290 | 1,495 |
| Arizona COP | 4.000% | 9/1/17 | 1,250 | 1,283 |
| Arizona COP | 5.000% | 3/1/18 (Prere.) | 10,000 | 10,550 |
| Arizona COP | 5.000% | 3/1/18 (Prere.) | 5,000 | 5,275 |
| Arizona COP | 5.000% | 9/1/18 | 1,275 | 1,368 |
| Arizona COP | 5.000% | 10/1/19 | 3,335 | 3,703 |
| Arizona COP | 5.000% | 9/1/20 | 1,700 | 1,937 |
| Arizona Health Facilities Authority Hospital System Revenue (Phoenix Children’s Hospital) | 5.000% | 2/1/21 | 3,480 | 3,969 |
| Arizona Health Facilities Authority Hospital System Revenue (Phoenix Children’s Hospital) | 5.000% | 2/1/22 | 3,100 | 3,612 |
| Arizona Health Facilities Authority Hospital System Revenue (Phoenix Children’s Hospital) | 5.000% | 2/1/23 | 5,000 | 5,763 |
| Arizona Health Facilities Authority Hospital System Revenue (Phoenix Children’s Hospital) | 5.000% | 2/1/27 | 6,500 | 7,317 |
| Arizona Health Facilities Authority Revenue (Banner Health) | 5.000% | 1/1/18 (Prere.) | 7,500 | 7,844 |
| Arizona Health Facilities Authority Revenue (Banner Health) | 5.000% | 1/1/18 (Prere.) | 10,000 | 10,459 |
| 1 Arizona Health Facilities Authority Revenue (Phoenix Children’s Hospital) PUT | 2.480% | 2/5/20 | 12,500 | 12,720 |
| Arizona Health Facilities Authority Revenue (Scottsdale Lincoln Hospitals Project) | 5.000% | 12/1/23 | 1,000 | 1,223 |
| Arizona Health Facilities Authority Revenue (Scottsdale Lincoln Hospitals Project) | 5.000% | 12/1/24 | 1,500 | 1,858 |
| Arizona Health Facilities Authority Revenue (Scottsdale Lincoln Hospitals Project) | 5.000% | 12/1/25 | 3,750 | 4,604 |
| Arizona Lottery Revenue | 5.000% | 7/1/22 (4) | 18,000 | 20,107 |
128
Intermediate-Term Tax-Exempt Fund
| | | | |
| | | | Face | Market |
| | | Maturity | Amount | Value• |
| | Coupon | Date | ($000) | ($000) |
| Arizona Lottery Revenue | 5.000% | 7/1/24 (4) | 15,000 | 16,706 |
| Arizona Lottery Revenue | 5.000% | 7/1/25 (4) | 15,000 | 16,682 |
| Arizona Lottery Revenue | 5.000% | 7/1/26 (4) | 13,975 | 15,519 |
| Arizona School Facilities Board COP | 5.000% | 9/1/17 | 21,000 | 21,721 |
| Arizona School Facilities Board COP | 5.000% | 9/1/18 | 13,000 | 13,922 |
| Arizona School Facilities Board COP | 5.125% | 9/1/18 (Prere.) | 5,000 | 5,387 |
| Arizona School Facilities Board COP | 5.000% | 9/1/19 | 2,650 | 2,932 |
| Arizona State University Revenue (McAllister Academic Village LLC) | 5.000% | 7/1/24 | 1,605 | 1,965 |
| Arizona State University Revenue (McAllister Academic Village LLC) | 5.000% | 7/1/34 | 2,900 | 3,451 |
| Arizona State University Revenue (McAllister Academic Village LLC) | 5.000% | 7/1/35 | 2,000 | 2,370 |
| Arizona State University Revenue (McAllister Academic Village LLC) | 5.000% | 7/1/36 | 2,500 | 2,956 |
| Arizona Transportation Board Excise Tax Revenue | 5.000% | 7/1/21 | 1,000 | 1,172 |
| Arizona Transportation Board Excise Tax Revenue | 5.000% | 7/1/22 | 10,000 | 11,994 |
| Arizona Transportation Board Excise Tax Revenue | 5.000% | 7/1/23 | 12,000 | 14,676 |
| Arizona Transportation Board Excise Tax Revenue | 5.000% | 7/1/24 | 27,590 | 34,299 |
| Arizona Transportation Board Excise Tax Revenue (Maricopa County Regional Area) | 5.000% | 7/1/17 (Prere.) | 10,085 | 10,373 |
| Arizona Transportation Board Excise Tax Revenue (Maricopa County Regional Area) | 5.000% | 7/1/17 (Prere.) | 11,500 | 11,828 |
| Arizona Transportation Board Excise Tax Revenue (Maricopa County Regional Area) | 5.000% | 7/1/17 (Prere.) | 16,300 | 16,765 |
| Arizona Transportation Board Excise Tax Revenue (Maricopa County Regional Area) | 5.000% | 7/1/17 (Prere.) | 10,000 | 10,285 |
| Arizona Transportation Board Excise Tax Revenue (Maricopa County Regional Area) | 5.000% | 7/1/17 (Prere.) | 7,540 | 7,755 |
| Arizona Transportation Board Excise Tax Revenue (Maricopa County Regional Area) | 5.000% | 7/1/17 (Prere.) | 10,000 | 10,285 |
| Arizona Transportation Board Excise Tax Revenue (Maricopa County Regional Area) | 5.000% | 7/1/20 (Prere.) | 9,940 | 11,325 |
| 2 Arizona Transportation Board Highway Revenue | 5.000% | 7/1/18 (Prere.) | 5,000 | 5,342 |
| Arizona Transportation Board Highway Revenue | 5.000% | 7/1/18 (Prere.) | 5,000 | 5,342 |
| Arizona Transportation Board Highway Revenue | 5.250% | 7/1/21 (Prere.) | 4,550 | 5,391 |
| Arizona Transportation Board Highway Revenue | 5.000% | 7/1/22 | 8,500 | 10,205 |
| Arizona Transportation Board Highway Revenue | 5.000% | 7/1/22 (Prere.) | 7,580 | 9,128 |
| Arizona Transportation Board Highway Revenue | 5.000% | 7/1/24 | 6,390 | 8,012 |
| Arizona Transportation Board Highway Revenue | 5.000% | 7/1/25 | 6,000 | 7,442 |
| Arizona Transportation Board Highway Revenue | 5.000% | 7/1/33 | 11,905 | 14,630 |
| Arizona Transportation Board Highway Revenue | 5.000% | 7/1/34 | 10,525 | 12,883 |
| Arizona Transportation Board Highway Revenue | 5.000% | 7/1/35 | 2,955 | 3,606 |
| Arizona Transportation Board Highway Revenue | 5.000% | 7/1/36 | 7,680 | 9,349 |
| Arizona Water Infrastructure Finance Authority Revenue | 5.000% | 10/1/20 | 3,500 | 4,018 |
| Arizona Water Infrastructure Finance Authority Revenue | 5.000% | 10/1/22 | 6,000 | 7,248 |
| Chandler AZ GO | 4.000% | 7/1/22 | 3,390 | 3,895 |
| Chandler AZ GO | 5.000% | 7/1/23 | 3,400 | 4,179 |
| Chandler AZ GO | 5.000% | 7/1/24 | 4,250 | 5,322 |
| Gilbert AZ Waterworks & Sewer System Revenue | 5.000% | 7/1/25 | 1,750 | 2,213 |
| Gilbert AZ Waterworks & Sewer System Revenue | 5.000% | 7/1/27 | 2,500 | 3,168 |
| Glendale AZ Industrial Development Authority Revenue (Midwestern University) | 5.000% | 5/15/18 | 3,325 | 3,504 |
| Glendale AZ Industrial Development Authority Revenue (Midwestern University) | 5.000% | 5/15/19 | 2,000 | 2,170 |
| Glendale AZ Industrial Development Authority Revenue (Midwestern University) | 5.000% | 5/15/20 | 1,500 | 1,667 |
| Glendale AZ Industrial Development Authority Revenue (Midwestern University) | 5.000% | 5/15/21 | 1,500 | 1,660 |
| Glendale AZ Industrial Development Authority Revenue (Midwestern University) | 5.000% | 5/15/22 | 3,500 | 3,876 |
| Glendale AZ Industrial Development Authority Revenue (Midwestern University) | 5.000% | 5/15/23 | 3,805 | 4,214 |
| Glendale AZ Industrial Development Authority Revenue (Midwestern University) | 5.000% | 5/15/25 | 3,750 | 4,139 |
| Glendale AZ Industrial Development Authority Revenue (Midwestern University) | 5.000% | 5/15/26 | 2,890 | 3,190 |
| Glendale AZ Industrial Development Authority Revenue (Midwestern University) | 5.000% | 5/15/27 | 5,000 | 5,501 |
| Glendale AZ Industrial Development Authority Revenue (Midwestern University) | 5.000% | 5/15/30 | 14,000 | 15,479 |
| Glendale AZ Senior Excise Tax Revenue | 5.000% | 7/1/19 | 4,185 | 4,613 |
| Glendale AZ Senior Excise Tax Revenue | 5.000% | 7/1/20 | 2,770 | 3,141 |
| Glendale AZ Senior Excise Tax Revenue | 5.000% | 7/1/21 | 2,990 | 3,476 |
| Glendale AZ Senior Excise Tax Revenue | 5.000% | 7/1/22 | 3,140 | 3,735 |
| Glendale AZ Senior Excise Tax Revenue | 5.000% | 7/1/30 | 8,745 | 10,401 |
| Glendale AZ Senior Excise Tax Revenue | 5.000% | 7/1/31 | 6,415 | 7,597 |
| Glendale AZ Transportation Excise Tax Revenue | 5.000% | 7/1/17 (Prere.) | 4,235 | 4,354 |
| Goodyear Public Improvement Corp. Municipal Facilities Revenue | 5.000% | 7/1/19 | 1,455 | 1,604 |
| Goodyear Public Improvement Corp. Municipal Facilities Revenue | 5.000% | 7/1/20 | 1,695 | 1,922 |
| Goodyear Public Improvement Corp. Municipal Facilities Revenue | 4.000% | 7/1/30 | 1,775 | 1,970 |
| Goodyear Public Improvement Corp. Municipal Facilities Revenue | 4.000% | 7/1/31 | 1,500 | 1,653 |
| Goodyear Public Improvement Corp. Municipal Facilities Revenue | 4.000% | 7/1/31 | 1,400 | 1,543 |
| Maricopa County AZ Community College District GO | 5.000% | 7/1/21 | 9,495 | 11,128 |
| 3 Maricopa County AZ Industrial Development Authority Health Facilities Revenue | | | | |
| (Banner Health Obligated Group) | 5.000% | 1/1/27 | 8,000 | 9,957 |
| 3 Maricopa County AZ Industrial Development Authority Health Facilities Revenue | | | | |
| (Banner Health Obligated Group) | 5.000% | 1/1/28 | 31,605 | 39,304 |
| 3 Maricopa County AZ Industrial Development Authority Health Facilities Revenue | | | | |
| (Banner Health Obligated Group) | 4.000% | 1/1/32 | 12,000 | 12,856 |
129
Intermediate-Term Tax-Exempt Fund
| | | | |
| | | | Face | Market |
| | | Maturity | Amount | Value• |
| | Coupon | Date | ($000) | ($000) |
| Maricopa County AZ Industrial Development Authority Health Facilities Revenue | | | | |
| (Catholic Healthcare West) | 5.000% | 7/1/17 | 10,000 | 10,268 |
| Maricopa County AZ Industrial Development Authority Health Facilities Revenue | | | | |
| (Catholic Healthcare West) | 5.000% | 7/1/18 | 6,000 | 6,157 |
| Maricopa County AZ Regional Public Transportation Authority Excise Tax Revenue | 5.000% | 7/1/19 (Prere.) | 6,220 | 6,873 |
| Maricopa County AZ School District No. 28 (Kyrene Elementary) GO | 4.000% | 7/1/20 | 1,355 | 1,492 |
| Maricopa County AZ School District No. 28 (Kyrene Elementary) GO | 5.250% | 7/1/28 | 690 | 846 |
| Maricopa County AZ School District No. 28 (Kyrene Elementary) GO | 5.500% | 7/1/29 | 480 | 597 |
| Maricopa County AZ School District No. 28 (Kyrene Elementary) GO | 5.500% | 7/1/30 | 375 | 463 |
| Maricopa County AZ Unified School District GO | 5.000% | 7/1/22 | 8,450 | 10,135 |
| Mesa AZ Excise Tax Revenue | 5.000% | 7/1/27 | 4,000 | 4,106 |
| Mesa AZ Utility System Revenue | 5.000% | 7/1/19 (14) | 10,000 | 11,058 |
| Mesa AZ Utility System Revenue | 5.000% | 7/1/21 (14) | 11,900 | 13,911 |
| Mesa AZ Utility System Revenue | 4.000% | 7/1/32 | 6,700 | 7,418 |
| Mesa AZ Utility System Revenue TOB VRDO | 0.670% | 11/7/16 | 595 | 595 |
| Phoenix AZ Civic Improvement Corp. Airport Revenue | 5.000% | 7/1/23 | 5,000 | 5,329 |
| Phoenix AZ Civic Improvement Corp. Airport Revenue | 5.000% | 7/1/24 | 2,235 | 2,382 |
| Phoenix AZ Civic Improvement Corp. Airport Revenue | 5.000% | 7/1/27 | 9,530 | 10,150 |
| Phoenix AZ Civic Improvement Corp. Airport Revenue | 5.000% | 7/1/28 | 9,555 | 10,749 |
| Phoenix AZ Civic Improvement Corp. Airport Revenue | 5.000% | 7/1/30 | 13,330 | 14,885 |
| Phoenix AZ Civic Improvement Corp. Excise Tax Revenue | 5.000% | 7/1/20 | 5,165 | 5,308 |
| Phoenix AZ Civic Improvement Corp. Excise Tax Revenue | 4.750% | 7/1/24 | 7,805 | 8,003 |
| Phoenix AZ Civic Improvement Corp. Wastewater System Revenue | 5.500% | 7/1/24 | 2,500 | 2,688 |
| Phoenix AZ Civic Improvement Corp. Water System Revenue | 5.000% | 7/1/20 | 3,010 | 3,435 |
| Phoenix AZ Civic Improvement Corp. Water System Revenue | 5.000% | 7/1/22 | 11,000 | 13,193 |
| Phoenix AZ Civic Improvement Corp. Water System Revenue | 5.000% | 7/1/23 | 7,000 | 8,561 |
| Phoenix AZ Civic Improvement Corp. Water System Revenue | 5.000% | 7/1/24 | 7,770 | 9,659 |
| Phoenix AZ Civic Improvement Corp. Water System Revenue | 5.000% | 7/1/25 | 9,000 | 11,097 |
| Phoenix AZ Civic Improvement Corp. Water System Revenue | 5.000% | 7/1/26 | 7,000 | 8,572 |
| Phoenix AZ Civic Improvement Corp. Water System Revenue | 5.000% | 7/1/27 | 2,500 | 3,045 |
| Phoenix AZ GO | 5.000% | 7/1/17 (Prere.) | 950 | 977 |
| Phoenix AZ GO | 5.000% | 7/1/20 | 4,200 | 4,317 |
| Phoenix AZ GO | 5.000% | 7/1/23 | 1,400 | 1,714 |
| Phoenix AZ GO | 5.000% | 7/1/24 | 3,000 | 3,734 |
| Phoenix AZ GO | 5.000% | 7/1/25 | 5,000 | 6,297 |
| Phoenix AZ GO | 5.000% | 7/1/26 | 4,000 | 5,105 |
| Pima County AZ GO | 2.000% | 7/1/18 | 3,000 | 3,052 |
| Pima County AZ GO | 4.000% | 7/1/21 | 6,000 | 6,714 |
| Pima County AZ Industrial Development Authority Revenue (Tucson Electric Power Co. Project) | 4.000% | 9/1/29 | 12,000 | 13,011 |
| Pima County AZ Regional Transportation Authority Excise Tax Revenue | 5.000% | 6/1/22 | 3,000 | 3,587 |
| Pima County AZ Regional Transportation Authority Excise Tax Revenue | 5.000% | 6/1/23 | 3,500 | 4,248 |
| Pima County AZ Regional Transportation Authority Excise Tax Revenue | 5.000% | 6/1/26 | 3,590 | 4,350 |
| Pima County AZ Sewer Revenue | 5.000% | 7/1/21 | 4,400 | 5,154 |
| Pima County AZ Sewer Revenue | 5.000% | 7/1/24 | 5,800 | 7,210 |
| Pima County AZ Sewer Revenue | 5.000% | 7/1/25 | 5,000 | 6,288 |
| Pima County AZ Tucson Unified School District No. 1 GO | 5.000% | 7/1/24 (15) | 1,040 | 1,282 |
| Pima County AZ Tucson Unified School District No. 1 GO | 5.000% | 7/1/25 (15) | 1,200 | 1,498 |
| Pima County AZ Tucson Unified School District No. 1 GO | 5.000% | 7/1/26 (15) | 1,500 | 1,892 |
| Regional Public Transportation Authority Arizona Excise Tax Revenue | | | | |
| (Maricopa County Public Transportation) | 5.250% | 7/1/22 | 2,000 | 2,424 |
| Regional Public Transportation Authority Arizona Excise Tax Revenue | | | | |
| (Maricopa County Public Transportation) | 5.250% | 7/1/23 | 1,000 | 1,235 |
| Regional Public Transportation Authority Arizona Excise Tax Revenue | | | | |
| (Maricopa County Public Transportation) | 5.250% | 7/1/25 | 1,000 | 1,240 |
| Salt River Project Arizona Agricultural Improvement & Power District Revenue | 4.000% | 1/1/18 | 3,775 | 3,913 |
| Salt River Project Arizona Agricultural Improvement & Power District Revenue | 5.000% | 1/1/22 | 4,350 | 4,722 |
| Salt River Project Arizona Agricultural Improvement & Power District Revenue | 5.000% | 1/1/27 | 10,000 | 10,466 |
| Salt River Project Arizona Agricultural Improvement & Power District Revenue | 5.000% | 1/1/28 | 2,750 | 2,878 |
| Salt Verde AZ Financial Corp. Gas Revenue | 5.250% | 12/1/19 | 25 | 28 |
| Salt Verde AZ Financial Corp. Gas Revenue | 5.250% | 12/1/21 | 3,770 | 4,363 |
| Salt Verde AZ Financial Corp. Gas Revenue | 5.250% | 12/1/22 | 3,965 | 4,670 |
| Salt Verde AZ Financial Corp. Gas Revenue | 5.250% | 12/1/23 | 8,370 | 10,060 |
| Salt Verde AZ Financial Corp. Gas Revenue | 5.250% | 12/1/24 | 4,510 | 5,475 |
| Salt Verde AZ Financial Corp. Gas Revenue | 5.250% | 12/1/25 | 19,125 | 23,444 |
| Salt Verde AZ Financial Corp. Gas Revenue | 5.250% | 12/1/26 | 2,725 | 3,354 |
| Salt Verde AZ Financial Corp. Gas Revenue | 5.250% | 12/1/28 | 270 | 337 |
| Scottsdale AZ GO | 5.000% | 7/1/22 | 3,000 | 3,616 |
| Scottsdale AZ GO | 4.000% | 7/1/24 | 3,000 | 3,523 |
| Scottsdale AZ Municipal Property Corp. Excise Tax Revenue | 5.000% | 7/1/22 | 12,415 | 14,905 |
| Tucson AZ GO | 5.000% | 7/1/19 (Prere.) | 1,000 | 1,104 |
130
Intermediate-Term Tax-Exempt Fund
| | | | |
| | | | Face | Market |
| | | Maturity | Amount | Value• |
| | Coupon | Date | ($000) | ($000) |
| Tucson AZ GO | 5.000% | 7/1/19 (Prere.) | 1,000 | 1,104 |
| Tucson AZ Water System Revenue | 5.000% | 7/1/23 | 3,500 | 4,291 |
| University Medical Center Corp. Arizona Hospital Revenue | 6.250% | 7/1/19 (Prere.) | 1,500 | 1,703 |
| Yavapai County AZ Industrial Development Authority Solid Waste Disposal Revenue | | | | |
| (Republic Services Inc.) PUT | 0.700% | 12/1/16 | 25,000 | 25,000 |
| Yuma AZ Industrial Development Authority Hospital Revenue (Yuma Regional Medical Center) | 5.000% | 8/1/24 | 1,200 | 1,439 |
| Yuma AZ Industrial Development Authority Hospital Revenue (Yuma Regional Medical Center) | 5.000% | 8/1/25 | 1,250 | 1,486 |
| Yuma AZ Industrial Development Authority Hospital Revenue (Yuma Regional Medical Center) | 5.000% | 8/1/32 | 1,000 | 1,148 |
| Yuma AZ Industrial Development Authority Hospital Revenue (Yuma Regional Medical Center) | 5.250% | 8/1/32 | 1,500 | 1,751 |
| | | | | 1,079,589 |
| Arkansas (0.1%) | | | | |
| Arkansas Development Finance Authority Hospital Revenue | | | | |
| (Washington Regional Medical Center) | 5.000% | 2/1/22 | 380 | 442 |
| Arkansas Federal Highway Grant Anticipation & Tax Revenue GO | 5.000% | 10/1/24 | 10,105 | 12,665 |
| Pulaski County AR Hospital Revenue (Arkansas Children’s Hospital) | 5.000% | 3/1/30 | 1,290 | 1,551 |
| Pulaski County AR Hospital Revenue (Arkansas Children’s Hospital) | 5.000% | 3/1/31 | 2,390 | 2,855 |
| Pulaski County AR Hospital Revenue (Arkansas Children’s Hospital) | 5.000% | 3/1/32 | 3,000 | 3,564 |
| Pulaski County AR Hospital Revenue (Arkansas Children’s Hospital) | 5.000% | 3/1/33 | 3,305 | 3,907 |
| Pulaski County AR Hospital Revenue (Arkansas Children’s Hospital) | 5.000% | 3/1/34 | 2,815 | 3,315 |
| Rogers AR Sales & Use Tax Revenue | 2.125% | 11/1/29 | 3,135 | 3,157 |
| University of Arkansas Revenue | 4.000% | 11/1/18 | 600 | 636 |
| University of Arkansas Revenue | 5.000% | 11/1/19 | 600 | 669 |
| University of Arkansas Revenue | 5.000% | 11/1/20 | 855 | 981 |
| University of Arkansas Revenue | 5.000% | 11/1/25 | 500 | 630 |
| University of Arkansas Revenue | 5.000% | 11/1/26 | 600 | 763 |
| University of Arkansas Revenue | 5.000% | 11/1/29 | 700 | 863 |
| University of Arkansas Revenue | 5.000% | 11/1/31 | 800 | 981 |
| University of Arkansas Revenue | 5.000% | 11/1/33 | 1,000 | 1,213 |
| University of Arkansas Revenue | 5.000% | 11/1/34 | 1,000 | 1,208 |
| University of Arkansas Revenue | 5.000% | 11/1/36 | 1,200 | 1,445 |
| University of Arkansas Revenue (Fayetteville Campus) | 5.000% | 11/1/22 | 2,000 | 2,407 |
| University of Arkansas Revenue (Fayetteville Campus) | 5.000% | 11/1/23 | 1,280 | 1,568 |
| University of Arkansas Revenue (Fayetteville Campus) | 5.000% | 11/1/25 | 1,815 | 2,112 |
| University of Arkansas Revenue (Fayetteville Campus) | 5.000% | 11/1/25 | 2,000 | 2,438 |
| University of Arkansas Revenue (Fayetteville Campus) | 5.000% | 11/1/26 | 1,075 | 1,249 |
| University of Arkansas Revenue (Fayetteville Campus) | 5.000% | 11/1/26 | 2,190 | 2,651 |
| University of Arkansas Revenue (Fayetteville Campus) | 5.000% | 11/1/27 | 1,695 | 1,954 |
| University of Arkansas Revenue (Fayetteville Campus) | 5.000% | 11/1/28 | 3,210 | 3,830 |
| University of Arkansas Revenue (Fayetteville Campus) | 5.000% | 11/1/29 | 3,355 | 3,983 |
| University of Arkansas Revenue (Fayetteville Campus) | 5.000% | 11/1/30 | 2,555 | 3,018 |
| University of Arkansas Revenue (UAMS Campus) | 5.000% | 11/1/27 | 1,000 | 1,209 |
| University of Arkansas Revenue (UAMS Campus) | 5.000% | 11/1/28 | 3,000 | 3,606 |
| University of Arkansas Revenue (UAMS Campus) | 5.000% | 11/1/29 | 1,970 | 2,358 |
| University of Arkansas Revenue (UAMS Campus) | 5.000% | 11/1/30 | 2,000 | 2,384 |
| | | | | 75,612 |
| California (11.6%) | | | | |
| ABAG Finance Authority for Nonprofit Corps. California Revenue (Jackson Laboratory) | 5.000% | 7/1/27 | 1,375 | 1,587 |
| ABAG Finance Authority for Nonprofit Corps. California Revenue (Jackson Laboratory) | 5.000% | 7/1/29 | 2,795 | 3,191 |
| Alameda CA Corridor Transportation Authority Revenue | 5.000% | 3/1/21 | 3,250 | 3,795 |
| Alameda County CA Joint Powers Authority Lease Revenue | 5.250% | 12/1/27 | 3,000 | 3,662 |
| Alameda County CA Joint Powers Authority Lease Revenue | 5.000% | 12/1/30 | 12,395 | 14,848 |
| Anaheim CA Housing & Public Improvements Authority Revenue | | | | |
| (Electric Utility Distribution System) | 5.000% | 10/1/29 | 5,170 | 6,035 |
| Anaheim CA Public Financing Authority Revenue (Electric System) | 5.250% | 10/1/28 | 5,030 | 5,841 |
| Anaheim CA Public Financing Authority Revenue (Electric System) | 5.250% | 10/1/29 | 5,300 | 6,113 |
| Antelope Valley-East Kern CA Water Agency Revenue | 4.000% | 6/1/20 | 1,000 | 1,102 |
| Bay Area Toll Authority California Toll Bridge Revenue (San Francisco Bay Area) | 5.000% | 4/1/17 (Prere.) | 7,000 | 7,123 |
| Bay Area Toll Authority California Toll Bridge Revenue (San Francisco Bay Area) PUT | 1.000% | 4/3/17 | 7,635 | 7,637 |
| Bay Area Toll Authority California Toll Bridge Revenue (San Francisco Bay Area) PUT | 1.875% | 4/1/19 | 2,410 | 2,443 |
| 1 Bay Area Toll Authority California Toll Bridge Revenue (San Francisco Bay Area) PUT | 1.230% | 4/1/20 | 18,615 | 18,544 |
| Bay Area Toll Authority California Toll Bridge Revenue (San Francisco Bay Area) PUT | 1.875% | 4/1/20 | 38,860 | 39,453 |
| 1 Bay Area Toll Authority California Toll Bridge Revenue (San Francisco Bay Area) PUT | 1.330% | 4/1/21 | 14,500 | 14,437 |
| Bay Area Toll Authority California Toll Bridge Revenue (San Francisco Bay Area) PUT | 2.000% | 4/1/21 | 15,375 | 15,731 |
| 1 Bay Area Toll Authority California Toll Bridge Revenue (San Francisco Bay Area) PUT | 1.530% | 5/1/23 | 13,500 | 13,490 |
| Beverly Hills CA Unified School District GO | 0.000% | 8/1/28 | 5,000 | 3,718 |
| Beverly Hills CA Unified School District GO | 0.000% | 8/1/29 | 7,950 | 5,648 |
| California Department of Water Resources Power Supply Revenue | 5.000% | 5/1/18 (Prere.) | 19,250 | 20,447 |
| California Department of Water Resources Power Supply Revenue | 5.000% | 5/1/18 (Prere.) | 20,000 | 21,244 |
| California Department of Water Resources Power Supply Revenue | 5.000% | 5/1/20 (Prere.) | 12,410 | 14,090 |
131
Intermediate-Term Tax-Exempt Fund
| | | | |
| | | | Face | Market |
| | | Maturity | Amount | Value• |
| | Coupon | Date | ($000) | ($000) |
| California Department of Water Resources Power Supply Revenue | 5.000% | 5/1/20 (Prere.) | 6,200 | 7,039 |
| California Department of Water Resources Power Supply Revenue | 5.000% | 5/1/20 | 168,065 | 191,006 |
| California Department of Water Resources Power Supply Revenue | 5.000% | 5/1/20 | 20,000 | 22,730 |
| California Department of Water Resources Power Supply Revenue | 5.000% | 5/1/21 | 7,590 | 8,602 |
| California Department of Water Resources Power Supply Revenue | 5.000% | 5/1/22 | 3,800 | 4,301 |
| California Department of Water Resources Water System Revenue (Central Valley Project) | 5.000% | 12/1/16 (ETM) | 10 | 10 |
| California Department of Water Resources Water System Revenue (Central Valley Project) | 5.000% | 12/1/16 | 2,685 | 2,695 |
| California Department of Water Resources Water System Revenue (Central Valley Project) | 5.000% | 12/1/16 | 5,000 | 5,019 |
| California Department of Water Resources Water System Revenue (Central Valley Project) | 5.000% | 12/1/23 (ETM) | 80 | 100 |
| California Department of Water Resources Water System Revenue (Central Valley Project) | 5.000% | 12/1/23 | 14,920 | 18,539 |
| California Department of Water Resources Water System Revenue (Central Valley Project) | 5.000% | 12/1/24 (ETM) | 35 | 44 |
| California Department of Water Resources Water System Revenue (Central Valley Project) | 5.000% | 12/1/24 (Prere.) | 55 | 70 |
| California Department of Water Resources Water System Revenue (Central Valley Project) | 5.000% | 12/1/24 (Prere.) | 10 | 13 |
| California Department of Water Resources Water System Revenue (Central Valley Project) | 5.000% | 12/1/24 | 9,965 | 12,575 |
| California Department of Water Resources Water System Revenue (Central Valley Project) | 5.000% | 12/1/28 | 14,945 | 18,538 |
| California Department of Water Resources Water System Revenue (Central Valley Project) | 5.000% | 12/1/29 | 2,490 | 3,081 |
| California Economic Recovery GO | 5.000% | 7/1/19 (Prere.) | 20,000 | 22,139 |
| California Economic Recovery GO | 5.250% | 7/1/19 (Prere.) | 31,780 | 35,387 |
| California Economic Recovery GO | 5.250% | 7/1/19 (Prere.) | 18,220 | 20,288 |
| California Education Notes Program TRAN | 2.000% | 6/30/17 | 22,015 | 22,189 |
| California Educational Facilities Authority Revenue (University of the Pacific) | 5.000% | 11/1/29 | 3,000 | 3,674 |
| California Educational Facilities Authority Revenue (University of the Pacific) | 5.000% | 11/1/32 | 1,595 | 1,912 |
| California Educational Facilities Authority Revenue (University of the Pacific) | 5.000% | 11/1/33 | 1,500 | 1,782 |
| California GO | 5.000% | 3/1/17 | 3,000 | 3,044 |
| California GO | 5.000% | 4/1/17 | 13,050 | 13,288 |
| 1 California GO | 1.380% | 5/1/17 | 3,500 | 3,500 |
| California GO | 5.000% | 12/1/17 (Prere.) | 14,250 | 14,907 |
| California GO | 5.500% | 4/1/18 | 30,000 | 31,993 |
| California GO | 6.000% | 4/1/18 | 11,480 | 12,327 |
| California GO | 5.000% | 9/1/18 | 8,500 | 9,146 |
| California GO | 5.000% | 9/1/18 | 7,000 | 7,532 |
| California GO | 5.000% | 12/1/18 | 85 | 85 |
| California GO | 5.000% | 8/1/19 | 29,650 | 32,914 |
| 3 California GO | 5.000% | 8/1/19 | 37,500 | 41,620 |
| California GO | 3.000% | 9/1/19 | 7,000 | 7,402 |
| California GO | 5.000% | 4/1/20 | 18,000 | 19,752 |
| California GO | 5.000% | 8/1/20 | 18,970 | 19,171 |
| California GO | 5.000% | 9/1/20 | 30,930 | 35,462 |
| California GO | 5.000% | 10/1/20 | 3,000 | 3,449 |
| California GO | 5.000% | 11/1/20 (14) | 5,000 | 5,211 |
| California GO | 5.000% | 9/1/21 | 30,155 | 35,494 |
| California GO | 5.000% | 12/1/21 | 16,365 | 17,110 |
| California GO | 5.000% | 3/1/22 | 26,540 | 31,564 |
| California GO | 5.250% | 10/1/22 | 15,000 | 16,827 |
| California GO | 5.000% | 12/1/22 | 11,000 | 13,320 |
| California GO | 5.000% | 9/1/23 | 9,770 | 11,969 |
| California GO | 5.000% | 11/1/23 | 17,200 | 21,148 |
| California GO | 5.000% | 12/1/23 | 34,000 | 41,878 |
| California GO | 5.000% | 3/1/24 | 30,000 | 36,985 |
| California GO | 5.000% | 5/1/24 | 35,000 | 43,268 |
| California GO | 5.000% | 10/1/24 | 19,500 | 20,634 |
| California GO | 5.000% | 10/1/24 | 10,500 | 13,065 |
| California GO | 5.000% | 12/1/24 | 5,730 | 7,029 |
| California GO | 5.000% | 3/1/25 | 15,000 | 18,724 |
| California GO | 5.000% | 9/1/25 | 4,000 | 5,024 |
| California GO | 5.000% | 10/1/25 | 20,000 | 24,060 |
| California GO | 5.000% | 11/1/25 | 33,000 | 40,646 |
| California GO | 5.000% | 12/1/25 | 5,490 | 6,712 |
| California GO | 5.500% | 8/1/26 | 23,665 | 25,545 |
| California GO | 5.000% | 10/1/26 | 31,140 | 37,440 |
| California GO | 5.000% | 10/1/27 | 11,250 | 13,500 |
| California GO | 5.250% | 10/1/27 | 26,440 | 31,551 |
| California GO | 5.000% | 11/1/27 | 17,380 | 21,152 |
| California GO | 5.000% | 2/1/28 | 12,500 | 14,938 |
| California GO | 5.000% | 11/1/28 | 9,175 | 11,127 |
| California GO | 5.000% | 12/1/28 | 3,575 | 4,342 |
| California GO | 5.750% | 4/1/29 | 2,395 | 2,659 |
| California GO | 5.000% | 9/1/29 | 13,500 | 16,673 |
| California GO | 5.250% | 9/1/29 | 10,460 | 12,813 |
| California GO | 5.000% | 10/1/29 | 10,000 | 12,188 |
132
Intermediate-Term Tax-Exempt Fund
| | | | |
| | | | Face | Market |
| | | Maturity | Amount | Value• |
| | Coupon | Date | ($000) | ($000) |
| California GO | 5.000% | 10/1/29 | 4,445 | 4,697 |
| California GO | 5.000% | 10/1/29 | 27,000 | 29,930 |
| California GO | 5.250% | 3/1/30 | 29,500 | 33,239 |
| California GO | 5.000% | 5/1/30 | 30,000 | 36,193 |
| California GO | 5.000% | 9/1/30 | 4,500 | 5,261 |
| California GO | 5.250% | 9/1/30 | 25,480 | 31,126 |
| California GO | 5.750% | 4/1/31 | 79,190 | 87,933 |
| California GO | 4.000% | 9/1/31 | 7,660 | 8,522 |
| California GO | 5.000% | 10/1/31 | 24,000 | 29,071 |
| California GO | 5.000% | 2/1/32 | 50,640 | 59,425 |
| California GO | 4.000% | 9/1/32 | 5,000 | 5,526 |
| California GO | 4.000% | 9/1/32 | 5,000 | 5,526 |
| California GO | 5.000% | 10/1/32 | 11,000 | 13,271 |
| California GO | 5.000% | 2/1/33 | 60,000 | 70,331 |
| California GO | 6.500% | 4/1/33 | 54,500 | 61,555 |
| California GO | 4.000% | 9/1/33 | 26,000 | 28,595 |
| California GO | 5.000% | 10/1/33 | 6,000 | 7,219 |
| California GO | 5.000% | 10/1/34 | 10,000 | 11,992 |
| California GO | 4.000% | 9/1/35 | 10,000 | 10,899 |
| California GO PUT | 3.000% | 12/1/19 | 6,000 | 6,282 |
| California GO PUT | 4.000% | 12/1/21 | 13,300 | 14,907 |
| California Health Facilities Financing Authority Revenue (Catholic Healthcare West) | 5.250% | 3/1/27 | 19,000 | 22,015 |
| California Health Facilities Financing Authority Revenue (Catholic Healthcare West) | 5.250% | 3/1/28 | 9,160 | 10,518 |
| California Health Facilities Financing Authority Revenue (Children’s Hospital of Los Angeles) | 5.000% | 11/15/25 | 5,000 | 5,707 |
| California Health Facilities Financing Authority Revenue (Children’s Hospital of Los Angeles) | 5.000% | 11/15/26 | 5,000 | 5,682 |
| California Health Facilities Financing Authority Revenue (Children’s Hospital of Los Angeles) | 5.000% | 11/15/27 | 3,845 | 4,350 |
| California Health Facilities Financing Authority Revenue | | | | |
| (City of Hope Medical Center) | 5.000% | 11/15/26 | 2,430 | 2,895 |
| California Health Facilities Financing Authority Revenue | | | | |
| (Lucile Salter Packard Children’s Hospital at Stanford) PUT | 1.450% | 3/15/17 (Prere.) | 4,020 | 4,031 |
| California Health Facilities Financing Authority Revenue | | | | |
| (Lucile Salter Packard Children’s Hospital at Stanford) PUT | 1.450% | 3/15/17 (Prere.) | 4,000 | 4,010 |
| 4 California Health Facilities Financing Authority Revenue | | | | |
| (Lucile Salter Packard Children’s Hospital at Stanford) TOB VRDO | 0.750% | 11/7/16 | 650 | 650 |
| California Health Facilities Financing Authority Revenue | | | | |
| (Providence St. Joseph Health Obligated Group) PUT | 4.000% | 10/1/24 | 41,500 | 48,067 |
| California Health Facilities Financing Authority Revenue (Scripps Health) | 5.000% | 10/1/19 | 8,080 | 8,727 |
| California Health Facilities Financing Authority Revenue (Scripps Health) | 5.500% | 10/1/20 | 4,000 | 4,357 |
| California Health Facilities Financing Authority Revenue (Scripps Health) | 5.000% | 10/1/21 | 7,110 | 7,671 |
| California Health Facilities Financing Authority Revenue (St. Joseph Health System) | 5.250% | 7/1/21 | 25,980 | 28,944 |
| California Health Facilities Financing Authority Revenue (St. Joseph Health System) | 5.500% | 7/1/29 | 15,000 | 16,660 |
| California Health Facilities Financing Authority Revenue (St. Joseph Health System) PUT | 5.000% | 10/15/20 | 12,500 | 14,285 |
| California Health Facilities Financing Authority Revenue (Sutter Health) | 5.500% | 8/15/17 | 5,100 | 5,296 |
| California Health Facilities Financing Authority Revenue (Sutter Health) | 5.500% | 8/15/26 | 4,500 | 5,205 |
| California Health Facilities Financing Authority Revenue (Sutter Health) | 5.875% | 8/15/31 | 10,000 | 11,670 |
| California Health Facilities Financing Authority Revenue (Sutter Health) PUT | 1.000% | 8/15/19 | 5,925 | 5,897 |
| 1 California Infrastructure & Economic Development Bank Revenue (The Colburn School) PUT | 1.630% | 6/1/20 | 10,000 | 10,065 |
| California Municipal Finance Authority | | | | |
| (Community Hospitals of Central California Obligated Group) COP | 5.000% | 2/1/20 | 1,575 | 1,701 |
| California Municipal Finance Authority | | | | |
| (Community Hospitals of Central California Obligated Group) COP | 5.000% | 2/1/21 | 1,740 | 1,874 |
| California Municipal Finance Authority | | | | |
| (Community Hospitals of Central California Obligated Group) COP | 5.250% | 2/1/24 | 5,050 | 5,510 |
| California Municipal Finance Authority Revenue (Anaheim Electric Utility Distribution System) | 5.000% | 10/1/29 | 1,000 | 1,228 |
| California Municipal Finance Authority Revenue (Anaheim Electric Utility Distribution System) | 5.000% | 10/1/32 | 2,190 | 2,641 |
| California Municipal Finance Authority Revenue (Anaheim Electric Utility Distribution System) | 5.000% | 10/1/35 | 1,755 | 2,093 |
| California Municipal Finance Authority Revenue (University of La Verne) | 5.750% | 6/1/25 | 8,525 | 9,814 |
| California Municipal Finance Authority Revenue (University of La Verne) | 6.125% | 6/1/30 | 3,000 | 3,454 |
| California Pollution Control Financing Authority Revenue (Pacific Gas & Electric Co.) VRDO | 0.500% | 11/1/16 LOC | 9,000 | 9,000 |
| California Public Works Board Lease Revenue (Department of Corrections) | 5.000% | 6/1/27 | 7,420 | 8,783 |
| California Public Works Board Lease Revenue (Department of Corrections) | 5.250% | 10/1/27 | 1,325 | 1,643 |
| California Public Works Board Lease Revenue (Department of General Services) | 6.125% | 4/1/19 (Prere.) | 5,000 | 5,620 |
| California Public Works Board Lease Revenue (Department of General Services) | 6.125% | 4/1/19 (Prere.) | 2,000 | 2,248 |
| California Public Works Board Lease Revenue (Department of State Hospitals) | 5.000% | 6/1/27 | 5,000 | 5,987 |
| California Public Works Board Lease Revenue (Judicial Council Projects) | 5.000% | 10/1/23 | 750 | 912 |
| California Public Works Board Lease Revenue (Judicial Council Projects) | 5.000% | 10/1/24 | 900 | 1,108 |
| California Public Works Board Lease Revenue (Judicial Council Projects) | 5.000% | 12/1/24 | 10,000 | 11,759 |
| California Public Works Board Lease Revenue (Judicial Council Projects) | 5.250% | 12/1/25 | 7,000 | 8,276 |
| California Public Works Board Lease Revenue (Judicial Council Projects) | 5.250% | 12/1/26 | 5,000 | 5,907 |
| California Public Works Board Lease Revenue (Judicial Council Projects) | 5.000% | 3/1/27 | 3,120 | 3,716 |
133
Intermediate-Term Tax-Exempt Fund
| | | | |
| | | | Face | Market |
| | | Maturity | Amount | Value• |
| | Coupon | Date | ($000) | ($000) |
| California Public Works Board Lease Revenue (Judicial Council Projects) | 5.000% | 12/1/27 | 13,000 | 15,206 |
| California Public Works Board Lease Revenue (Judicial Council Projects) | 5.000% | 12/1/28 | 8,000 | 9,329 |
| California Public Works Board Lease Revenue (Judicial Council Projects) | 5.000% | 3/1/29 | 4,250 | 5,024 |
| California Public Works Board Lease Revenue (Judicial Council Projects) | 5.000% | 12/1/29 | 10,705 | 12,464 |
| California Public Works Board Lease Revenue (Judicial Council Projects) | 5.000% | 3/1/30 | 3,930 | 4,625 |
| California Public Works Board Lease Revenue (Judicial Council Projects) | 5.000% | 3/1/31 | 5,000 | 5,878 |
| California Public Works Board Lease Revenue (Judicial Council Projects) | 5.000% | 3/1/33 | 3,350 | 3,915 |
| 2 California Public Works Board Lease Revenue (Regents of The University of California) | 5.000% | 12/1/21 (Prere.) | 8,145 | 9,689 |
| California Public Works Board Lease Revenue (Various Capital Projects) | 3.000% | 4/1/18 | 4,605 | 4,741 |
| California Public Works Board Lease Revenue (Various Capital Projects) | 3.000% | 4/1/19 | 4,740 | 4,963 |
| California Public Works Board Lease Revenue (Various Capital Projects) | 5.000% | 5/1/19 | 11,290 | 12,393 |
| California Public Works Board Lease Revenue (Various Capital Projects) | 5.000% | 5/1/19 | 8,130 | 8,925 |
| California Public Works Board Lease Revenue (Various Capital Projects) | 6.250% | 11/1/19 (Prere.) | 13,665 | 15,792 |
| California Public Works Board Lease Revenue (Various Capital Projects) | 4.000% | 4/1/20 | 9,265 | 10,149 |
| California Public Works Board Lease Revenue (Various Capital Projects) | 5.000% | 4/1/20 | 2,700 | 3,048 |
| California Public Works Board Lease Revenue (Various Capital Projects) | 5.000% | 5/1/20 | 8,975 | 10,156 |
| California Public Works Board Lease Revenue (Various Capital Projects) | 5.000% | 11/1/20 | 7,460 | 8,567 |
| California Public Works Board Lease Revenue (Various Capital Projects) | 4.000% | 4/1/21 | 5,000 | 5,582 |
| California Public Works Board Lease Revenue (Various Capital Projects) | 5.000% | 5/1/21 | 4,500 | 5,228 |
| California Public Works Board Lease Revenue (Various Capital Projects) | 5.000% | 5/1/21 | 3,000 | 3,485 |
| 2 California Public Works Board Lease Revenue (Various Capital Projects) | 5.000% | 12/1/21 (Prere.) | 10,000 | 11,896 |
| California Public Works Board Lease Revenue (Various Capital Projects) | 5.000% | 5/1/22 | 6,050 | 7,200 |
| California Public Works Board Lease Revenue (Various Capital Projects) | 5.000% | 5/1/23 | 3,000 | 3,617 |
| California Public Works Board Lease Revenue (Various Capital Projects) | 5.000% | 5/1/23 | 4,460 | 5,377 |
| California Public Works Board Lease Revenue (Various Capital Projects) | 5.000% | 4/1/27 | 3,075 | 3,625 |
| California Public Works Board Lease Revenue (Various Capital Projects) | 4.000% | 11/1/30 | 8,245 | 9,133 |
| California Public Works Board Lease Revenue (Various Capital Projects) | 5.500% | 11/1/30 | 2,495 | 3,054 |
| California Public Works Board Lease Revenue (Various Capital Projects) | 5.125% | 10/1/31 | 4,250 | 4,936 |
| California Public Works Board Lease Revenue (Various Capital Projects) | 4.000% | 11/1/31 | 20,000 | 22,026 |
| California Public Works Board Lease Revenue (Various Capital Projects) | 5.000% | 4/1/32 | 9,650 | 11,145 |
| California Public Works Board Lease Revenue (Various Capital Projects) | 4.000% | 4/1/33 | 8,125 | 8,861 |
| California State University Systemwide Revenue | 5.000% | 5/1/19 (Prere.) | 14,775 | 16,262 |
| California State University Systemwide Revenue | 5.750% | 5/1/19 (Prere.) | 5,000 | 5,596 |
| California State University Systemwide Revenue | 5.000% | 11/1/19 | 2,095 | 2,347 |
| California State University Systemwide Revenue | 5.000% | 11/1/20 | 2,000 | 2,311 |
| California State University Systemwide Revenue | 5.000% | 11/1/21 | 1,445 | 1,716 |
| California State University Systemwide Revenue | 5.000% | 11/1/24 | 2,000 | 2,521 |
| California State University Systemwide Revenue | 5.000% | 11/1/28 | 3,540 | 4,460 |
| California State University Systemwide Revenue | 5.250% | 11/1/28 | 7,395 | 8,718 |
| California State University Systemwide Revenue | 5.250% | 11/1/29 | 7,790 | 9,179 |
| California State University Systemwide Revenue | 5.000% | 11/1/30 | 3,350 | 4,150 |
| California State University Systemwide Revenue | 5.000% | 11/1/30 | 24,850 | 30,316 |
| California State University Systemwide Revenue | 5.250% | 11/1/30 | 7,960 | 9,446 |
| California State University Systemwide Revenue | 5.000% | 11/1/31 | 4,600 | 5,668 |
| California State University Systemwide Revenue | 5.000% | 11/1/31 | 21,630 | 26,263 |
| California State University Systemwide Revenue | 5.250% | 11/1/31 | 4,000 | 4,747 |
| California State University Systemwide Revenue | 5.000% | 11/1/32 | 10,000 | 12,235 |
| California State University Systemwide Revenue | 5.000% | 11/1/32 | 10,000 | 12,076 |
| California State University Systemwide Revenue | 5.000% | 11/1/33 | 20,000 | 24,055 |
| California State University Systemwide Revenue | 5.000% | 11/1/34 | 24,190 | 28,996 |
| California State University Systemwide Revenue | 5.000% | 11/1/35 | 4,355 | 5,203 |
| California State University Systemwide Revenue PUT | 3.000% | 11/1/19 | 6,700 | 7,010 |
| California Statewide Communities Development Authority Revenue | | | | |
| (Daughters of Charity Health System) | 5.750% | 7/1/24 | 3,855 | 3,819 |
| California Statewide Communities Development Authority Revenue | | | | |
| (Loma Linda University Medical Center) | 5.000% | 12/1/28 | 4,000 | 4,656 |
| California Statewide Communities Development Authority Revenue | | | | |
| (Loma Linda University Medical Center) | 5.000% | 12/1/30 | 3,500 | 4,010 |
| Capistrano CA Unified School District Special Tax Revenue | 4.000% | 9/1/23 (15) | 6,435 | 6,891 |
| Cerritos CA Community College District GO | 5.250% | 8/1/19 (Prere.) | 3,540 | 3,953 |
| Cerritos CA Community College District GO | 5.250% | 8/1/19 (Prere.) | 3,160 | 3,529 |
| Cerritos CA Community College District GO | 5.250% | 8/1/19 (Prere.) | 4,235 | 4,729 |
| Cerritos CA Community College District GO | 0.000% | 8/1/28 | 1,000 | 717 |
| Cerritos CA Community College District GO | 0.000% | 8/1/30 | 1,850 | 1,202 |
| Cerritos CA Community College District GO | 0.000% | 8/1/31 | 1,000 | 626 |
| Chabot-Las Positas CA Community College District GO | 5.000% | 8/1/27 | 7,000 | 8,353 |
| Chabot-Las Positas CA Community College District GO | 5.000% | 8/1/30 | 15,000 | 17,559 |
| Chabot-Las Positas CA Community College District GO | 5.000% | 8/1/31 | 5,000 | 5,828 |
| Chabot-Las Positas CA Community College District GO | 5.000% | 8/1/32 | 17,000 | 19,727 |
| Chaffey CA Community College District GO | 5.000% | 6/1/24 | 1,120 | 1,395 |
134
Intermediate-Term Tax-Exempt Fund
| | | | |
| | | | Face | Market |
| | | Maturity | Amount | Value• |
| | Coupon | Date | ($000) | ($000) |
| Chaffey CA Community College District GO | 5.000% | 6/1/29 | 1,250 | 1,519 |
| Chaffey CA Community College District GO | 5.000% | 6/1/30 | 2,000 | 2,420 |
| Chino CA Public Financing Authority Special Tax Revenue | 5.000% | 9/1/26 (4) | 800 | 987 |
| Chino CA Public Financing Authority Special Tax Revenue | 5.000% | 9/1/27 (4) | 2,340 | 2,864 |
| Chino CA Public Financing Authority Special Tax Revenue | 5.000% | 9/1/29 (4) | 1,300 | 1,560 |
| Chula Vista CA Municipal Financing Authority Special Tax Revenue | 5.000% | 9/1/23 | 1,080 | 1,279 |
| Chula Vista CA Municipal Financing Authority Special Tax Revenue | 5.000% | 9/1/24 | 1,130 | 1,349 |
| Chula Vista CA Municipal Financing Authority Special Tax Revenue | 5.000% | 9/1/25 | 1,145 | 1,380 |
| Chula Vista CA Municipal Financing Authority Special Tax Revenue | 5.000% | 9/1/26 | 1,255 | 1,498 |
| Chula Vista CA Municipal Financing Authority Special Tax Revenue | 5.000% | 9/1/27 | 1,320 | 1,566 |
| Chula Vista CA Municipal Financing Authority Special Tax Revenue | 5.000% | 9/1/28 | 1,380 | 1,621 |
| Chula Vista CA Municipal Financing Authority Special Tax Revenue | 5.000% | 9/1/29 | 1,445 | 1,688 |
| Chula Vista CA Municipal Financing Authority Special Tax Revenue | 5.000% | 9/1/30 | 1,400 | 1,626 |
| Chula Vista CA Municipal Financing Authority Special Tax Revenue | 5.000% | 9/1/31 | 1,600 | 1,844 |
| Coast CA Community College District GO | 5.000% | 8/1/18 (Prere.) | 6,250 | 6,701 |
| Contra Costa CA Community College District GO | 5.000% | 8/1/29 | 2,000 | 2,416 |
| Contra Costa CA Community College District GO | 5.000% | 8/1/30 | 3,000 | 3,608 |
| Contra Costa CA Community College District GO | 5.000% | 8/1/34 | 4,000 | 4,737 |
| Contra Costa CA Transportation Authority Sales Tax Revenue | 5.000% | 3/1/20 (Prere.) | 2,000 | 2,260 |
| Cupertino CA Union School District GO | 5.000% | 8/1/35 | 1,000 | 1,187 |
| East Side CA Union High School District Santa Clara County GO | 5.000% | 8/1/26 | 2,500 | 3,037 |
| East Side CA Union High School District Santa Clara County GO | 5.000% | 8/1/27 | 2,000 | 2,425 |
| East Side CA Union High School District Santa Clara County GO | 5.000% | 8/1/28 | 2,655 | 3,143 |
| East Side CA Union High School District Santa Clara County GO | 5.000% | 8/1/28 | 3,000 | 3,624 |
| El Dorado CA Irrigation District Revenue | 5.000% | 3/1/22 (4) | 1,035 | 1,232 |
| El Dorado CA Irrigation District Revenue | 5.000% | 3/1/23 (4) | 1,750 | 2,076 |
| El Dorado CA Irrigation District Revenue | 5.000% | 3/1/24 (4) | 1,000 | 1,188 |
| El Dorado CA Irrigation District Revenue | 5.000% | 3/1/25 (4) | 1,000 | 1,181 |
| El Dorado CA Irrigation District Revenue | 5.000% | 3/1/26 (4) | 2,485 | 2,922 |
| El Dorado CA Irrigation District Revenue | 5.000% | 3/1/27 (4) | 2,110 | 2,407 |
| El Dorado CA Irrigation District Revenue | 5.000% | 3/1/28 (4) | 2,000 | 2,334 |
| El Dorado CA Irrigation District Revenue | 5.000% | 3/1/34 (4) | 3,060 | 3,576 |
| El Monte CA High School District GO | 5.500% | 6/1/19 (Prere.) | 2,355 | 2,627 |
| El Monte CA High School District GO | 5.500% | 6/1/19 (Prere.) | 2,630 | 2,934 |
| El Segundo CA Unified School District GO | 0.000% | 8/1/28 | 2,705 | 1,905 |
| El Segundo CA Unified School District GO | 0.000% | 8/1/29 | 8,655 | 5,848 |
| El Segundo CA Unified School District GO | 0.000% | 8/1/30 | 9,160 | 5,912 |
| Elk Grove CA Finance Authority Special Tax Revenue | 5.000% | 9/1/23 | 775 | 943 |
| Elk Grove CA Finance Authority Special Tax Revenue | 5.000% | 9/1/24 | 1,000 | 1,233 |
| Elk Grove CA Finance Authority Special Tax Revenue | 5.000% | 9/1/25 | 750 | 928 |
| Elk Grove CA Finance Authority Special Tax Revenue | 5.000% | 9/1/26 | 1,155 | 1,420 |
| Elk Grove CA Finance Authority Special Tax Revenue | 5.000% | 9/1/30 (15) | 1,130 | 1,355 |
| Elk Grove CA Finance Authority Special Tax Revenue | 5.000% | 9/1/31 (15) | 1,750 | 2,084 |
| Elk Grove CA Finance Authority Special Tax Revenue | 5.000% | 9/1/32 (15) | 1,365 | 1,616 |
| Folsom Cordova CA Unified School District School Facilities Improvement District No. 3 GO | 0.000% | 10/1/23 (14) | 2,875 | 2,434 |
| Folsom Cordova CA Unified School District School Facilities Improvement District No. 3 GO | 0.000% | 10/1/24 (14) | 1,700 | 1,388 |
| Folsom Cordova CA Unified School District School Facilities Improvement District No. 3 GO | 0.000% | 10/1/25 (14) | 2,055 | 1,614 |
| Folsom Cordova CA Unified School District School Facilities Improvement District No. 3 GO | 0.000% | 10/1/26 (14) | 2,985 | 2,248 |
| Folsom Cordova CA Unified School District School Facilities Improvement District No. 3 GO | 0.000% | 10/1/28 (14) | 2,875 | 1,999 |
| Foothill/Eastern Transportation Corridor Agency California Toll Road Revenue | 0.000% | 1/15/28 | 20,090 | 16,996 |
| Foothill/Eastern Transportation Corridor Agency California Toll Road Revenue | 0.000% | 1/15/29 | 2,000 | 1,707 |
| Foothill/Eastern Transportation Corridor Agency California Toll Road Revenue | 6.250% | 1/15/33 | 2,000 | 2,370 |
| Foothill/Eastern Transportation Corridor Agency California Toll Road Revenue PUT | 5.500% | 1/15/23 | 40,500 | 47,624 |
| Fresno CA Sewer Revenue | 5.000% | 9/1/25 (12) | 2,275 | 2,440 |
| Fresno CA Sewer Revenue | 5.000% | 9/1/26 (12) | 7,425 | 7,947 |
| Fresno CA Sewer Revenue | 5.000% | 9/1/27 (12) | 7,835 | 8,377 |
| Gavilan CA Joint Community College District GO | 5.000% | 8/1/30 | 5,000 | 6,118 |
| Gavilan CA Joint Community College District GO | 5.000% | 8/1/31 | 6,000 | 7,298 |
| Gilroy CA Unified School District GO | 0.000% | 8/1/30 (ETM) | 255 | 185 |
| Gilroy CA Unified School District GO | 0.000% | 8/1/30 (12) | 5,245 | 3,431 |
| Golden State Tobacco Securitization Corp. California Revenue | 5.000% | 6/1/33 | 17,000 | 20,034 |
| Golden State Tobacco Securitization Corp. California Revenue | 5.000% | 6/1/33 | 4,595 | 4,522 |
| Golden State Tobacco Securitization Corp. California Revenue | 5.000% | 6/1/34 | 6,000 | 7,036 |
| Hacienda La Puente CA Unified School District GO | 5.000% | 8/1/25 (4) | 7,000 | 8,748 |
| Hayward CA Unified School District GO | 5.000% | 8/1/28 (4) | 2,720 | 3,257 |
| Hayward CA Unified School District GO | 5.000% | 8/1/28 (4) | 3,795 | 4,544 |
| Hayward CA Unified School District GO | 5.000% | 8/1/29 (4) | 2,575 | 3,062 |
| Hayward CA Unified School District GO | 5.000% | 8/1/29 (4) | 4,315 | 5,131 |
| Imperial CA Irrigation District Electric Revenue | 5.000% | 11/1/20 (Prere.) | 5,200 | 6,005 |
| Jurupa CA Public Financing Authority Special Tax Revenue | 5.000% | 9/1/28 | 1,025 | 1,238 |
135
Intermediate-Term Tax-Exempt Fund
| | | | |
| | | | Face | Market |
| | | Maturity | Amount | Value• |
| | Coupon | Date | ($000) | ($000) |
| Jurupa CA Public Financing Authority Special Tax Revenue | 5.000% | 9/1/29 | 1,000 | 1,200 |
| Jurupa CA Public Financing Authority Special Tax Revenue | 5.000% | 9/1/31 | 1,190 | 1,411 |
| La Mesa-Spring Valley CA School District GO | 0.000% | 8/1/23 (14) | 2,090 | 1,785 |
| La Mesa-Spring Valley CA School District GO | 0.000% | 8/1/25 (14) | 3,635 | 2,885 |
| La Mesa-Spring Valley CA School District GO | 0.000% | 8/1/27 (14) | 1,500 | 1,080 |
| La Mesa-Spring Valley CA School District GO | 0.000% | 8/1/28 (14) | 3,170 | 2,181 |
| Long Beach CA Finance Authority Natural Gas Purchase Revenue | 5.250% | 11/15/20 | 50 | 56 |
| Long Beach CA Finance Authority Natural Gas Purchase Revenue | 5.250% | 11/15/23 | 255 | 302 |
| Long Beach CA Finance Authority Natural Gas Purchase Revenue | 5.000% | 11/15/24 | 90 | 105 |
| Long Beach CA Finance Authority Natural Gas Purchase Revenue | 5.500% | 11/15/28 | 125 | 158 |
| Long Beach CA Finance Authority Tax Revenue | 5.500% | 11/1/18 (2) | 5,495 | 5,983 |
| Long Beach CA Finance Authority Tax Revenue | 5.500% | 11/1/19 (2) | 3,970 | 4,479 |
| Long Beach CA Finance Authority Tax Revenue | 5.500% | 11/1/20 (2) | 3,250 | 3,784 |
| Long Beach CA Finance Authority Tax Revenue | 5.500% | 11/1/21 (2) | 7,645 | 9,164 |
| Long Beach CA Finance Authority Tax Revenue | 5.500% | 11/1/22 (2) | 3,535 | 4,348 |
| Long Beach CA Unified School District GO | 0.000% | 8/1/23 (12) | 1,995 | 1,754 |
| Long Beach CA Unified School District GO | 0.000% | 8/1/26 (12) | 1,475 | 1,154 |
| 2 Los Angeles CA Community College District GO | 5.000% | 8/1/19 (Prere.) | 7,210 | 7,995 |
| 2 Los Angeles CA Community College District GO | 5.250% | 8/1/19 (Prere.) | 4,145 | 4,624 |
| Los Angeles CA Community College District GO | 5.000% | 8/1/22 | 6,000 | 7,255 |
| Los Angeles CA Community College District GO | 5.000% | 8/1/23 | 10,000 | 12,353 |
| Los Angeles CA Community College District GO | 4.000% | 8/1/24 | 900 | 1,064 |
| Los Angeles CA Community College District GO | 5.000% | 8/1/24 | 7,500 | 9,424 |
| Los Angeles CA Community College District GO | 4.000% | 8/1/25 | 1,575 | 1,876 |
| Los Angeles CA Community College District GO | 4.000% | 8/1/26 | 1,200 | 1,439 |
| Los Angeles CA Community College District GO | 5.000% | 8/1/27 | 24,845 | 30,720 |
| Los Angeles CA Community College District GO | 5.000% | 8/1/28 | 3,000 | 3,699 |
| Los Angeles CA Community College District GO | 5.000% | 8/1/30 | 30,500 | 37,283 |
| Los Angeles CA Community College District GO | 3.000% | 7/1/31 | 44,445 | 44,518 |
| Los Angeles CA Community College District GO | 3.000% | 7/1/32 | 15,895 | 15,875 |
| Los Angeles CA Community College District GO | 4.000% | 8/1/32 | 21,000 | 23,347 |
| Los Angeles CA Community College District GO | 4.000% | 8/1/33 | 4,805 | 5,321 |
| Los Angeles CA Community College District GO | 4.000% | 8/1/33 | 20,000 | 22,146 |
| Los Angeles CA Department of Airports International Airport Revenue | 5.000% | 5/15/18 (Prere.) | 3,960 | 4,212 |
| Los Angeles CA Department of Airports International Airport Revenue | 5.000% | 5/15/18 (Prere.) | 3,115 | 3,313 |
| Los Angeles CA Department of Airports International Airport Revenue | 5.000% | 5/15/18 (Prere.) | 3,250 | 3,457 |
| Los Angeles CA Department of Airports International Airport Revenue | 5.000% | 5/15/18 (Prere.) | 3,250 | 3,457 |
| Los Angeles CA Department of Airports International Airport Revenue | 5.250% | 5/15/28 | 12,750 | 14,544 |
| Los Angeles CA Department of Airports International Airport Revenue | 5.250% | 5/15/29 | 5,000 | 5,694 |
| Los Angeles CA Department of Water & Power Revenue | 5.000% | 12/1/18 | 55,995 | 60,589 |
| Los Angeles CA Department of Water & Power Revenue | 5.000% | 7/1/27 | 7,985 | 9,936 |
| Los Angeles CA Department of Water & Power Revenue | 5.000% | 7/1/31 | 22,715 | 27,151 |
| Los Angeles CA Department of Water & Power Revenue | 5.000% | 7/1/32 | 2,565 | 3,120 |
| Los Angeles CA Department of Water & Power Revenue | 5.000% | 7/1/33 | 11,185 | 13,269 |
| Los Angeles CA Department of Water & Power Revenue | 5.000% | 7/1/36 | 2,750 | 3,300 |
| Los Angeles CA Harbor Department Revenue | 4.000% | 8/1/18 | 1,225 | 1,293 |
| Los Angeles CA Harbor Department Revenue | 5.000% | 8/1/19 | 1,000 | 1,111 |
| Los Angeles CA Harbor Department Revenue | 5.000% | 8/1/22 | 1,000 | 1,211 |
| Los Angeles CA Harbor Department Revenue | 5.000% | 8/1/23 | 1,000 | 1,236 |
| Los Angeles CA Harbor Department Revenue | 5.000% | 8/1/28 | 6,930 | 7,649 |
| Los Angeles CA Municipal Improvement Corp. Lease Revenue | 5.000% | 11/1/29 | 7,000 | 8,580 |
| Los Angeles CA Municipal Improvement Corp. Lease Revenue | 5.000% | 11/1/30 | 10,000 | 12,182 |
| Los Angeles CA Municipal Improvement Corp. Lease Revenue | 4.000% | 11/1/34 | 10,875 | 11,838 |
| Los Angeles CA Municipal Improvement Corp. Lease Revenue (Police Headquarters Facility) | 4.750% | 1/1/17 (Prere.) | 9,000 | 9,061 |
| Los Angeles CA Municipal Improvement Corp. Lease Revenue (Police Headquarters Facility) | 5.000% | 1/1/17 (Prere.) | 15,435 | 15,546 |
| Los Angeles CA Unified School District GO | 4.500% | 7/1/17 (Prere.) | 4,000 | 4,102 |
| Los Angeles CA Unified School District GO | 5.000% | 7/1/17 (Prere.) | 4,000 | 4,115 |
| Los Angeles CA Unified School District GO | 5.000% | 7/1/17 (Prere.) | 6,425 | 6,610 |
| Los Angeles CA Unified School District GO | 5.000% | 7/1/17 (Prere.) | 7,330 | 7,541 |
| Los Angeles CA Unified School District GO | 5.000% | 7/1/17 (Prere.) | 10,000 | 10,287 |
| Los Angeles CA Unified School District GO | 5.000% | 7/1/17 (Prere.) | 22,410 | 23,054 |
| Los Angeles CA Unified School District GO | 5.000% | 7/1/18 | 2,000 | 2,138 |
| Los Angeles CA Unified School District GO | 5.000% | 7/1/18 | 2,575 | 2,753 |
| Los Angeles CA Unified School District GO | 5.000% | 7/1/19 | 20,000 | 22,144 |
| Los Angeles CA Unified School District GO | 5.000% | 7/1/19 | 20,625 | 22,836 |
| Los Angeles CA Unified School District GO | 5.000% | 7/1/20 | 33,000 | 37,702 |
| Los Angeles CA Unified School District GO | 5.000% | 7/1/22 | 20,000 | 24,133 |
| Los Angeles CA Unified School District GO | 5.250% | 7/1/23 | 8,835 | 9,837 |
| Los Angeles CA Unified School District GO | 5.000% | 7/1/26 | 20,000 | 24,806 |
| Los Angeles CA Unified School District GO | 5.000% | 7/1/26 | 7,500 | 8,295 |
136
Intermediate-Term Tax-Exempt Fund
| | | | |
| | | | Face | Market |
| | | Maturity | Amount | Value• |
| | Coupon | Date | ($000) | ($000) |
| Los Angeles CA Unified School District GO | 5.250% | 7/1/28 | 8,000 | 9,173 |
| Los Angeles CA Unified School District GO | 5.000% | 7/1/29 | 1,400 | 1,706 |
| Los Angeles CA Unified School District GO | 5.200% | 7/1/29 | 6,295 | 6,990 |
| Los Angeles CA Wastewater System Revenue | 5.000% | 6/1/29 | 6,520 | 7,146 |
| Los Angeles County CA Metropolitan Transportation Authority Sales Tax Revenue | 5.000% | 7/1/27 | 4,000 | 5,102 |
| Los Angeles County CA Public Works Financing Authority Lease Revenue | 5.000% | 8/1/17 | 5,000 | 5,161 |
| Los Angeles County CA Public Works Financing Authority Lease Revenue | 5.000% | 8/1/27 | 1,475 | 1,733 |
| Los Angeles County CA Public Works Financing Authority Lease Revenue | 5.000% | 8/1/28 | 2,000 | 2,341 |
| Los Angeles County CA Public Works Financing Authority Lease Revenue | 5.000% | 8/1/29 | 2,365 | 2,768 |
| Los Angeles County CA Public Works Financing Authority Lease Revenue | 5.000% | 8/1/32 | 3,000 | 3,533 |
| Los Angeles County CA Unified School District GO | 5.000% | 7/1/25 | 20,000 | 25,399 |
| Los Angeles County CA Unified School District GO | 5.000% | 7/1/26 | 20,000 | 25,737 |
| Los Angeles County CA Unified School District GO | 5.000% | 7/1/27 | 72,330 | 92,046 |
| Los Angeles County CA Unified School District GO | 5.000% | 7/1/28 | 35,940 | 45,248 |
| M-S-R California Energy Authority Revenue | 7.000% | 11/1/34 | 6,000 | 8,746 |
| 1 Metropolitan Water District of Southern California Revenue PUT | 1.010% | 3/27/18 | 3,000 | 3,001 |
| 1 Metropolitan Water District of Southern California Revenue PUT | 1.010% | 3/27/18 | 31,000 | 31,009 |
| Mount Diablo CA Unified School District GO | 5.000% | 8/1/29 | 6,415 | 7,536 |
| Mount Diablo CA Unified School District GO | 5.000% | 8/1/30 | 5,510 | 6,523 |
| Mount Diablo CA Unified School District GO | 5.000% | 8/1/32 | 12,910 | 15,244 |
| Mount San Antonio CA Community College District GO | 0.000% | 8/1/28 | 3,000 | 2,866 |
| Oakland CA Redevelopment Agency Tax Allocation Revenue (Central District Project) | 5.000% | 9/1/21 | 4,500 | 5,219 |
| Oakland CA Redevelopment Agency Tax Allocation Revenue (Central District Project) | 5.000% | 9/1/22 | 1,500 | 1,776 |
| Oakland CA Unified School District GO | 6.250% | 8/1/18 | 1,000 | 1,093 |
| Oakland CA Unified School District GO | 6.250% | 8/1/19 | 1,150 | 1,314 |
| Oakland CA Unified School District GO | 5.000% | 8/1/23 (4) | 2,000 | 2,457 |
| Oakland CA Unified School District GO | 5.000% | 8/1/24 (4) | 2,000 | 2,495 |
| Oakland CA Unified School District GO | 5.000% | 8/1/25 (4) | 2,295 | 2,899 |
| Oakland CA Unified School District GO | 5.000% | 8/1/26 (4) | 2,820 | 3,551 |
| Orange County CA Airport Revenue | 5.250% | 7/1/25 | 6,480 | 7,146 |
| 2 Orange County CA Sanitation District COP | 5.000% | 2/1/17 (Prere.) | 2,500 | 2,527 |
| 2 Orange County CA Sanitation District COP | 5.000% | 2/1/19 (Prere.) | 4,510 | 4,920 |
| 2 Orange County CA Sanitation District COP | 5.000% | 2/1/19 (Prere.) | 7,250 | 7,910 |
| Palo Alto CA Unified School District GO | 0.000% | 8/1/23 | 13,900 | 12,254 |
| Palo Alto CA Unified School District GO | 0.000% | 8/1/28 | 20,320 | 14,964 |
| Palo Alto CA Unified School District GO | 0.000% | 8/1/29 | 19,530 | 13,875 |
| Palo Alto CA Unified School District GO | 0.000% | 8/1/31 | 12,305 | 8,165 |
| Palomar Pomerado Health California GO | 0.000% | 8/1/32 (12) | 9,300 | 5,410 |
| Paramount CA Redevelopment Agency Successor Agency Tax Allocation Revenue | | | | |
| (Redevelopment Project Area No. 1) | 0.000% | 8/1/26 (14) | 5,000 | 3,619 |
| Peralta CA Community College District Revenue | 5.000% | 8/1/28 | 3,000 | 3,674 |
| Perris CA Public Financing Authority Tax Allocation Revenue | 5.000% | 10/1/20 | 1,035 | 1,182 |
| Perris CA Public Financing Authority Tax Allocation Revenue | 5.000% | 10/1/22 | 1,135 | 1,357 |
| Perris CA Public Financing Authority Tax Allocation Revenue | 5.000% | 10/1/23 | 1,200 | 1,462 |
| Perris CA Public Financing Authority Tax Allocation Revenue | 5.000% | 10/1/24 | 1,260 | 1,555 |
| Perris CA Public Financing Authority Tax Allocation Revenue | 5.000% | 10/1/25 | 1,315 | 1,642 |
| Perris CA Public Financing Authority Tax Allocation Revenue | 5.000% | 10/1/31 | 3,220 | 3,851 |
| Poway CA Redevelopment Agency Successor Agency Tax Allocation Revenue | 5.000% | 12/15/24 | 3,550 | 4,440 |
| Poway CA Redevelopment Agency Successor Agency Tax Allocation Revenue | 5.000% | 12/15/25 | 5,580 | 7,062 |
| Poway CA Redevelopment Agency Successor Agency Tax Allocation Revenue | 5.000% | 6/15/28 | 2,190 | 2,712 |
| Poway CA Redevelopment Agency Successor Agency Tax Allocation Revenue | 5.000% | 12/15/28 | 2,190 | 2,705 |
| Poway CA Redevelopment Agency Successor Agency Tax Allocation Revenue | 5.000% | 12/15/29 | 4,830 | 5,916 |
| Poway CA Unified School District GO | 0.000% | 8/1/29 | 5,000 | 3,421 |
| Poway CA Unified School District Public Financing Authority Special Tax Revenue | 5.000% | 9/1/27 (15) | 2,750 | 3,366 |
| Poway CA Unified School District Public Financing Authority Special Tax Revenue | 5.000% | 9/1/29 (15) | 2,235 | 2,683 |
| Poway CA Unified School District Public Financing Authority Special Tax Revenue | 5.000% | 9/1/30 (15) | 1,745 | 2,083 |
| Rancho Santiago CA Community College District GO | 5.000% | 9/1/25 | 6,690 | 8,179 |
| Rancho Santiago CA Community College District GO | 5.000% | 9/1/26 | 16,145 | 19,669 |
| Redding CA Electric System COP | 5.000% | 6/1/23 (4) | 6,875 | 7,316 |
| Redding CA Electric System COP | 5.000% | 6/1/25 (4) | 7,860 | 8,357 |
| Redding CA Electric System COP | 5.000% | 6/1/27 (4) | 4,660 | 4,951 |
| Rialto CA Redevelopment Agency Successor Agency Tax Allocation Revenue | 5.000% | 9/1/30 (15) | 2,885 | 3,444 |
| Rialto CA Redevelopment Agency Successor Agency Tax Allocation Revenue | 5.000% | 9/1/31 (15) | 3,050 | 3,616 |
| Rialto CA Redevelopment Agency Successor Agency Tax Allocation Revenue | 5.000% | 9/1/32 (15) | 3,125 | 3,678 |
| Riverside County CA Public Financing Authority Lease Revenue | 5.000% | 11/1/31 | 9,575 | 11,468 |
| Riverside County CA Public Financing Authority Lease Revenue | 5.000% | 11/1/33 | 3,495 | 4,146 |
| Riverside County CA Public Financing Authority Lease Revenue | 5.000% | 11/1/34 | 12,070 | 14,243 |
| Riverside County CA Transportation Commission Sales Tax Revenue | 5.000% | 6/1/23 | 3,000 | 3,683 |
| Riverside County CA Transportation Commission Sales Tax Revenue | 5.250% | 6/1/27 | 4,980 | 6,153 |
| Riverside County CA Transportation Commission Sales Tax Revenue | 5.250% | 6/1/29 | 7,805 | 9,585 |
137
Intermediate-Term Tax-Exempt Fund
| | | | |
| | | | Face | Market |
| | | Maturity | Amount | Value• |
| | Coupon | Date | ($000) | ($000) |
| Riverside County CA Transportation Commission Toll Revenue | 0.000% | 6/1/25 | 8,790 | 6,395 |
| Riverside County CA Transportation Commission Toll Revenue | 0.000% | 6/1/26 | 3,375 | 2,346 |
| Riverside County CA Transportation Commission Toll Revenue | 0.000% | 6/1/27 | 5,480 | 3,641 |
| Riverside County CA Transportation Commission Toll Revenue | 0.000% | 6/1/28 | 9,395 | 5,956 |
| Riverside County CA Transportation Commission Toll Revenue | 0.000% | 6/1/29 | 11,075 | 6,665 |
| Rocklin CA Unified School District GO | 0.000% | 8/1/22 (14) | 5,450 | 4,908 |
| Roseville CA Natural Gas Financing Authority Gas Revenue | 5.000% | 2/15/20 | 4,735 | 5,160 |
| Roseville CA Natural Gas Financing Authority Gas Revenue | 5.000% | 2/15/23 | 115 | 132 |
| Roseville CA Natural Gas Financing Authority Gas Revenue | 5.000% | 2/15/25 | 235 | 275 |
| Roseville CA Natural Gas Financing Authority Gas Revenue | 5.000% | 2/15/26 | 145 | 171 |
| Roseville CA Natural Gas Financing Authority Gas Revenue | 5.000% | 2/15/28 | 110 | 132 |
| Sacramento CA City Financing Authority Revenue | 5.000% | 12/1/21 (15) | 1,810 | 2,137 |
| Sacramento CA City Financing Authority Revenue | 5.000% | 12/1/23 (15) | 750 | 921 |
| Sacramento CA City Financing Authority Revenue | 5.000% | 12/1/24 (15) | 1,500 | 1,863 |
| Sacramento CA City Financing Authority Tax Allocation Revenue | 0.000% | 12/1/25 (14) | 13,125 | 10,347 |
| 4 Sacramento CA Municipal Utility District Revenue TOB VRDO | 0.730% | 11/7/16 | 7,500 | 7,500 |
| Sacramento CA Regional Transit District Farebox Revenue | 5.000% | 3/1/24 | 720 | 811 |
| Sacramento CA Regional Transit District Farebox Revenue | 5.000% | 3/1/26 | 1,200 | 1,350 |
| Sacramento County CA Airport Revenue | 5.500% | 7/1/27 | 7,870 | 8,435 |
| Sacramento County CA Airport Revenue | 5.500% | 7/1/28 | 5,000 | 5,356 |
| Sacramento County CA Airport Revenue | 5.625% | 7/1/29 | 5,485 | 5,887 |
| Sacramento County CA GO | 5.000% | 2/1/17 | 4,650 | 4,689 |
| Sacramento County CA GO | 5.250% | 2/1/18 | 6,140 | 6,432 |
| Sacramento County CA GO | 5.250% | 2/1/19 | 4,940 | 5,303 |
| Sacramento County CA GO | 5.500% | 2/1/20 | 4,700 | 5,209 |
| Sacramento County CA Sanitation Districts Financing Authority Revenue | 5.000% | 8/1/26 | 1,000 | 1,255 |
| Sacramento County CA Sanitation Districts Financing Authority Revenue | 5.000% | 8/1/28 | 1,100 | 1,359 |
| Sacramento County CA Sanitation Districts Financing Authority Revenue | 5.000% | 12/1/30 | 2,000 | 2,411 |
| Sacramento County CA Sanitation Districts Financing Authority Revenue | 5.000% | 8/1/31 | 1,000 | 1,210 |
| Sacramento County CA Sanitation Districts Financing Authority Revenue | 5.000% | 12/1/31 | 3,000 | 3,598 |
| Sacramento County CA Sanitation Districts Financing Authority Revenue | 5.000% | 8/1/35 | 1,000 | 1,188 |
| San Bernardino CA City Unified School District GO | 5.000% | 8/1/29 (4) | 1,960 | 2,300 |
| San Bernardino CA City Unified School District GO | 5.000% | 8/1/30 (4) | 1,180 | 1,376 |
| San Bernardino CA City Unified School District GO | 5.000% | 8/1/31 (4) | 1,320 | 1,529 |
| San Bernardino CA City Unified School District GO | 5.000% | 8/1/32 (4) | 1,400 | 1,614 |
| San Bernardino CA Community College District GO | 5.000% | 8/1/24 | 12,065 | 14,806 |
| San Bernardino CA Community College District GO | 5.000% | 8/1/25 | 13,965 | 17,017 |
| San Bernardino CA Community College District GO | 5.000% | 8/1/26 | 14,080 | 17,064 |
| San Bernardino County CA Medical Center (Arrowhead Project) COP | 5.000% | 8/1/17 | 2,500 | 2,578 |
| San Bernardino County CA Medical Center (Arrowhead Project) COP | 5.000% | 8/1/18 | 8,995 | 9,620 |
| San Bernardino County CA Medical Center (Arrowhead Project) COP | 5.000% | 8/1/19 | 8,500 | 9,395 |
| San Diego CA Community College District GO | 5.000% | 8/1/17 (Prere.) | 19,015 | 19,631 |
| San Diego CA Community College District GO | 5.250% | 8/1/19 (Prere.) | 3,325 | 3,712 |
| San Diego CA Community College District GO | 5.000% | 8/1/21 (Prere.) | 7,400 | 8,728 |
| San Diego CA Community College District GO | 5.000% | 8/1/21 (Prere.) | 3,895 | 4,594 |
| San Diego CA Community College District GO | 5.000% | 8/1/21 (Prere.) | 8,350 | 9,849 |
| San Diego CA Community College District GO | 5.000% | 8/1/21 (Prere.) | 4,000 | 4,718 |
| San Diego CA Community College District GO | 5.000% | 8/1/21 (Prere.) | 4,315 | 5,089 |
| San Diego CA Community College District GO | 5.000% | 8/1/30 | 5,000 | 6,013 |
| 3 San Diego CA Community College District GO | 4.000% | 8/1/32 | 24,700 | 27,457 |
| 2 San Diego CA Public Facilities Financing Authority Sewer Revenue | 5.000% | 5/15/19 (Prere.) | 2,000 | 2,204 |
| San Diego CA Public Facilities Financing Authority Sewer Revenue | 5.250% | 5/15/20 (Prere.) | 10,000 | 11,467 |
| San Diego CA Public Facilities Financing Authority Sewer Revenue | 5.000% | 5/15/23 | 10,000 | 12,282 |
| San Diego CA Public Facilities Financing Authority Sewer Revenue | 5.000% | 5/15/24 | 23,615 | 29,523 |
| San Diego CA Public Facilities Financing Authority Sewer Revenue | 5.000% | 5/15/25 | 25,000 | 31,712 |
| San Diego CA Public Facilities Financing Authority Water Revenue | 5.000% | 8/1/20 | 7,690 | 8,809 |
| San Diego CA Public Facilities Financing Authority Water Revenue | 5.000% | 8/1/28 | 6,000 | 7,514 |
| San Diego CA Public Facilities Financing Authority Water Revenue | 5.000% | 8/1/31 | 5,160 | 6,376 |
| San Diego CA Public Facilities Financing Authority Water Revenue | 5.000% | 8/1/32 | 4,790 | 5,885 |
| San Diego CA Public Facilities Financing Authority Water Revenue | 5.000% | 8/1/33 | 15,835 | 19,379 |
| San Diego CA Public Facilities Financing Authority Water Revenue | 5.000% | 8/1/34 | 12,645 | 15,414 |
| San Diego CA Public Facilities Financing Authority Water Revenue | 5.000% | 8/1/35 | 12,100 | 14,679 |
| San Diego CA Public Facilities Financing Authority Water Revenue | 5.000% | 8/1/36 | 9,255 | 11,174 |
| San Diego CA Unified School District GO | 5.500% | 7/1/27 (4) | 17,020 | 22,563 |
| San Diego CA Unified School District GO | 0.000% | 7/1/30 | 17,310 | 11,353 |
| San Diego County CA Regional Airport Authority Revenue | 5.000% | 7/1/28 | 2,500 | 2,814 |
| San Diego County CA Water Authority Revenue | 5.000% | 5/1/30 | 5,275 | 6,545 |
| San Diego County CA Water Authority Revenue | 5.000% | 5/1/34 | 10,500 | 12,767 |
| San Francisco CA Bay Area Rapid Transit District GO | 5.000% | 8/1/30 | 5,000 | 6,153 |
| San Francisco CA Bay Area Rapid Transit District Sales Tax Revenue | 5.000% | 7/1/24 | 1,055 | 1,326 |
138
Intermediate-Term Tax-Exempt Fund
| | | | |
| | | | Face | Market |
| | | Maturity | Amount | Value• |
| | Coupon | Date | ($000) | ($000) |
| San Francisco CA Bay Area Rapid Transit District Sales Tax Revenue | 5.000% | 7/1/25 | 2,100 | 2,674 |
| San Francisco CA Bay Area Rapid Transit District Sales Tax Revenue | 5.000% | 7/1/26 | 1,430 | 1,812 |
| San Francisco CA City & County GO | 5.000% | 6/15/27 | 10,000 | 12,161 |
| San Francisco CA City & County GO | 4.000% | 6/15/28 | 25,000 | 28,205 |
| San Francisco CA City & County GO | 4.000% | 6/15/29 | 15,000 | 16,824 |
| San Francisco CA City & County International Airport Revenue | 5.000% | 5/1/20 (Prere.) | 2,135 | 2,426 |
| San Francisco CA City & County International Airport Revenue | 5.000% | 5/1/20 (Prere.) | 3,900 | 4,432 |
| San Francisco CA City & County International Airport Revenue | 5.000% | 5/1/21 | 2,865 | 3,250 |
| San Francisco CA City & County International Airport Revenue | 5.000% | 5/1/22 | 5,235 | 5,935 |
| San Francisco CA City & County International Airport Revenue | 5.250% | 5/1/22 | 5,500 | 6,074 |
| San Francisco CA City & County International Airport Revenue | 5.500% | 5/1/26 | 3,370 | 3,736 |
| San Francisco CA City & County Public Utilities Commission Wastewater Revenue | 5.000% | 10/1/33 | 9,030 | 10,929 |
| San Francisco CA City & County Public Utilities Commission Wastewater Revenue | 5.000% | 10/1/33 | 2,545 | 3,080 |
| San Francisco CA City & County Public Utilities Commission Water Revenue | 4.000% | 11/1/30 | 15,000 | 16,797 |
| San Francisco CA City & County Public Utilities Commission Water Revenue | 5.000% | 10/1/32 | 10,000 | 11,912 |
| San Francisco CA City & County Public Utilities Commission Water Revenue | 5.000% | 11/1/32 | 2,000 | 2,405 |
| San Francisco CA City & County Public Utilities Commission Water Revenue | 5.000% | 11/1/34 | 14,000 | 16,524 |
| San Francisco CA City & County Unified School District GO | 4.000% | 6/15/31 | 13,670 | 14,799 |
| San Francisco CA City & County Unified School District GO | 4.000% | 6/15/32 | 3,950 | 4,255 |
| San Joaquin Hills CA Transportation Corridor Agency Toll Road Revenue | 0.000% | 1/15/21 (14) | 12,385 | 11,170 |
| San Jose CA Airport Revenue | 5.000% | 3/1/27 | 2,255 | 2,719 |
| San Jose CA Airport Revenue | 5.000% | 3/1/28 | 2,185 | 2,625 |
| San Jose CA Redevelopment Agency Tax Allocation Revenue | 5.000% | 8/1/20 (2) | 20,000 | 20,590 |
| San Jose CA Redevelopment Agency Tax Allocation Revenue | 5.000% | 8/1/23 (2) | 24,900 | 25,605 |
| San Jose CA Redevelopment Agency Tax Allocation Revenue | 5.000% | 8/1/24 (14) | 29,885 | 30,807 |
| San Jose CA Redevelopment Agency Tax Allocation Revenue | 5.250% | 8/1/27 | 2,400 | 2,683 |
| San Jose CA Redevelopment Agency Tax Allocation Revenue | 5.375% | 8/1/28 | 1,175 | 1,317 |
| San Jose CA Redevelopment Agency Tax Allocation Revenue | 6.500% | 8/1/28 | 25,385 | 27,701 |
| San Jose-Evergreen CA Community College District GO | 5.000% | 9/1/29 | 1,510 | 1,843 |
| San Jose-Evergreen CA Community College District GO | 5.000% | 9/1/30 | 2,745 | 3,339 |
| San Jose-Evergreen CA Community College District GO | 5.000% | 9/1/30 | 3,445 | 4,191 |
| San Jose-Evergreen CA Community College District GO | 5.000% | 9/1/31 | 3,010 | 3,645 |
| San Jose-Evergreen CA Community College District GO | 5.000% | 9/1/31 | 3,840 | 4,650 |
| San Jose-Evergreen CA Community College District GO | 5.000% | 9/1/32 | 3,095 | 3,730 |
| San Mateo County CA Joint Powers Financing Authority Lease Revenue | | | | |
| (Maple Street Correctional Center) | 5.000% | 6/15/27 | 2,000 | 2,458 |
| San Mateo County CA Joint Powers Financing Authority Lease Revenue | | | | |
| (Maple Street Correctional Center) | 5.000% | 6/15/28 | 2,500 | 3,052 |
| San Mateo County CA Joint Powers Financing Authority Lease Revenue | | | | |
| (Maple Street Correctional Center) | 5.000% | 6/15/29 | 1,675 | 2,031 |
| San Mateo County CA Joint Powers Financing Authority Lease Revenue (Youth Services Campus) | 4.625% | 7/15/18 (Prere.) | 1,000 | 1,064 |
| 2 San Mateo County CA Joint Powers Financing Authority Lease Revenue (Youth Services Campus) | 5.250% | 7/15/18 (Prere.) | 2,000 | 2,150 |
| San Ramon Valley CA Unified School District GO | 5.000% | 8/1/26 | 3,385 | 4,122 |
| San Ramon Valley CA Unified School District GO | 5.000% | 8/1/27 | 1,080 | 1,310 |
| Santa Ana CA Unified School District GO | 0.000% | 8/1/29 (14) | 3,315 | 2,226 |
| Santa Ana CA Unified School District GO | 0.000% | 8/1/30 (14) | 2,150 | 1,376 |
| Santa Clara County CA Financing Authority Lease Revenue (Multiple Facilities Projects) | 5.000% | 11/15/19 | 13,825 | 14,960 |
| Santa Clara County CA Financing Authority Revenue | 5.000% | 5/15/27 | 2,110 | 2,625 |
| Santa Clara Valley CA Transportation Authority Sales Tax Revenue | 5.000% | 4/1/26 | 700 | 880 |
| Santa Clara Valley CA Transportation Authority Sales Tax Revenue | 5.000% | 4/1/28 | 1,000 | 1,237 |
| Santa Clara Valley CA Transportation Authority Sales Tax Revenue | 5.000% | 4/1/29 | 1,000 | 1,226 |
| Santa Clara Valley CA Transportation Authority Sales Tax Revenue | 5.000% | 4/1/30 | 1,000 | 1,216 |
| Santa Clara Valley CA Transportation Authority Sales Tax Revenue | 5.000% | 4/1/31 | 1,000 | 1,210 |
| Santa Clara Valley CA Transportation Authority Sales Tax Revenue | 5.000% | 4/1/32 | 1,500 | 1,804 |
| Santa Clara Valley CA Transportation Authority Sales Tax Revenue | 5.000% | 4/1/33 | 1,500 | 1,797 |
| Santa Clara Valley CA Transportation Authority Sales Tax Revenue | 5.000% | 4/1/35 | 2,650 | 3,154 |
| Santa Clara Valley CA Transportation Authority Sales Tax Revenue | 5.000% | 4/1/36 | 1,750 | 2,079 |
| Santa Clara Valley CA Water District Revenue | 5.000% | 6/1/32 | 2,000 | 2,439 |
| Santa Clara Valley CA Water District Revenue | 5.000% | 6/1/33 | 2,000 | 2,428 |
| Santa Monica CA Community College District GO | 0.000% | 8/1/23 | 9,045 | 7,993 |
| Santa Monica CA Community College District GO | 5.000% | 8/1/24 | 4,210 | 5,166 |
| Santa Monica CA Community College District GO | 5.000% | 8/1/25 | 5,000 | 6,104 |
| Santa Monica CA Community College District GO | 5.000% | 8/1/26 | 8,650 | 10,520 |
| Santa Monica CA Community College District GO | 0.000% | 8/1/27 | 6,565 | 5,091 |
| Santa Monica CA Community College District GO | 5.000% | 8/1/27 | 5,145 | 6,239 |
| Santa Monica CA Community College District GO | 0.000% | 8/1/28 | 7,105 | 5,232 |
| Santa Monica CA Community College District GO | 0.000% | 8/1/29 | 12,640 | 8,980 |
| Santa Rosa CA Wastewater Revenue | 0.000% | 9/1/27 (2) | 11,125 | 8,320 |
| Southern California Public Power Authority Revenue | 5.000% | 7/1/22 | 10,000 | 11,407 |
| Southern California Public Power Authority Revenue | 5.000% | 7/1/27 | 10,000 | 11,384 |
139
Intermediate-Term Tax-Exempt Fund
| | | | |
| | | | Face | Market |
| | | Maturity | Amount | Value• |
| | Coupon | Date | ($000) | ($000) |
| Southern California Public Power Authority Revenue | 5.000% | 7/1/28 | 10,000 | 11,376 |
| Southern California Public Power Authority Revenue | 5.000% | 7/1/29 | 2,500 | 2,841 |
| Southern California Public Power Authority Revenue (Canyon Power Project) | 5.000% | 7/1/22 | 5,000 | 5,862 |
| Southern California Public Power Authority Revenue (Milford Wind Corridor Phase I Project) | 5.000% | 7/1/26 | 9,000 | 10,092 |
| Southern California Public Power Authority Revenue (Natural Gas Project) | 5.250% | 11/1/27 | 375 | 463 |
| State Center California Community College District GO | 5.000% | 8/1/29 | 6,005 | 7,388 |
| State Center California Community College District GO | 5.000% | 8/1/30 | 3,335 | 4,080 |
| State Center California Community College District GO | 5.000% | 8/1/31 | 5,070 | 6,167 |
| Sweetwater CA Unified School District GO | 5.000% | 8/1/29 (15) | 3,300 | 3,981 |
| Tulare County CA Transportation Authority Sales Tax Revenue | 4.000% | 2/1/34 | 3,000 | 3,204 |
| Tulare County CA Transportation Authority Sales Tax Revenue | 4.000% | 2/1/35 | 2,000 | 2,165 |
| Tuolumne CA Wind Project Authority Revenue | 5.000% | 1/1/19 (Prere.) | 13,465 | 14,635 |
| Tuolumne CA Wind Project Authority Revenue | 5.000% | 1/1/19 (Prere.) | 13,130 | 14,270 |
| Tuolumne CA Wind Project Authority Revenue | 5.000% | 1/1/19 | 3,000 | 3,262 |
| Tuolumne CA Wind Project Authority Revenue | 5.625% | 1/1/19 (Prere.) | 9,000 | 9,902 |
| Turlock CA Irrigation District Revenue | 5.000% | 1/1/20 (Prere.) | 3,935 | 4,418 |
| Turlock CA Irrigation District Revenue | 5.000% | 1/1/20 (Prere.) | 4,160 | 4,670 |
| Turlock CA Irrigation District Revenue | 5.000% | 1/1/20 (Prere.) | 4,335 | 4,867 |
| Turlock CA Irrigation District Revenue | 5.000% | 1/1/20 (Prere.) | 2,250 | 2,526 |
| University of California Revenue | 5.250% | 5/15/19 (Prere.) | 11,000 | 12,192 |
| University of California Revenue | 5.250% | 5/15/19 (Prere.) | 4,245 | 4,705 |
| University of California Revenue | 5.500% | 5/15/19 (Prere.) | 14,675 | 16,341 |
| University of California Revenue | 5.750% | 5/15/19 (Prere.) | 5,000 | 5,599 |
| University of California Revenue | 5.000% | 5/15/23 | 2,000 | 2,460 |
| University of California Revenue | 5.000% | 5/15/23 | 3,000 | 3,680 |
| University of California Revenue | 5.000% | 5/15/23 | 1,500 | 1,753 |
| University of California Revenue | 5.000% | 5/15/26 | 12,915 | 15,027 |
| University of California Revenue | 5.000% | 5/15/27 | 6,010 | 7,530 |
| University of California Revenue | 5.000% | 5/15/27 | 5,000 | 5,813 |
| University of California Revenue | 5.000% | 5/15/28 | 12,500 | 15,569 |
| University of California Revenue | 5.000% | 5/15/28 | 5,500 | 6,850 |
| University of California Revenue | 5.000% | 5/15/28 | 25,995 | 31,507 |
| University of California Revenue | 5.000% | 5/15/29 | 19,000 | 23,463 |
| University of California Revenue | 5.000% | 5/15/30 | 2,830 | 3,253 |
| University of California Revenue | 5.000% | 5/15/31 | 11,000 | 13,405 |
| University of California Revenue | 5.000% | 5/15/32 | 4,000 | 4,847 |
| University of California Revenue | 5.000% | 5/15/32 | 21,800 | 25,863 |
| University of California Revenue | 5.000% | 5/15/33 | 31,200 | 36,910 |
| University of California Revenue | 5.000% | 5/15/34 | 38,420 | 45,348 |
| University of California Revenue | 5.000% | 5/15/36 | 7,175 | 8,662 |
| University of California Revenue PUT | 5.000% | 5/15/23 | 127,165 | 155,852 |
| Ventura County CA Community College District GO | 0.000% | 8/1/23 | 6,155 | 5,355 |
| Ventura County CA Community College District GO | 0.000% | 8/1/24 | 8,050 | 6,790 |
| Ventura County CA Community College District GO | 0.000% | 8/1/25 | 8,000 | 6,500 |
| Ventura County CA Community College District GO | 0.000% | 8/1/26 | 8,500 | 6,649 |
| Ventura County CA Community College District GO | 0.000% | 8/1/27 | 8,500 | 6,347 |
| Ventura County CA Community College District GO | 5.000% | 8/1/27 | 1,000 | 1,230 |
| Ventura County CA Community College District GO | 5.000% | 8/1/28 | 1,000 | 1,226 |
| Ventura County CA Community College District GO | 5.000% | 8/1/29 | 1,000 | 1,206 |
| Ventura County CA Public Financing Authority COP | 5.625% | 8/15/19 (Prere.) | 1,000 | 1,127 |
| Ventura County CA Public Financing Authority COP | 5.750% | 8/15/19 (Prere.) | 1,750 | 1,979 |
| Ventura County CA Public Financing Authority COP | 5.750% | 8/15/19 (Prere.) | 1,750 | 1,979 |
| Victor Valley CA Community College District GO | 5.375% | 8/1/19 (Prere.) | 4,250 | 4,756 |
| Vista CA Joint Powers Financing Authority Revenue | 5.250% | 5/1/32 | 6,155 | 7,560 |
| Vista CA Joint Powers Financing Authority Revenue | 5.250% | 5/1/33 | 6,815 | 8,330 |
| Vista CA Joint Powers Financing Authority Revenue | 5.250% | 5/1/34 | 7,355 | 8,946 |
| Walnut CA Energy Center Authority Revenue | 5.000% | 1/1/29 | 2,510 | 2,768 |
| Walnut CA Energy Center Authority Revenue | 5.000% | 1/1/30 | 3,775 | 4,170 |
| West Basin CA Municipal Water District COP | 5.000% | 8/1/18 (Prere.) | 5,365 | 5,752 |
| West Basin CA Municipal Water District COP | 5.000% | 8/1/18 (Prere.) | 5,000 | 5,360 |
| West Contra Costa CA Unified School District GO | 0.000% | 8/1/17 (12) | 1,565 | 1,552 |
| West Contra Costa CA Unified School District GO | 0.000% | 8/1/18 (ETM) | 3,000 | 2,944 |
| West Contra Costa CA Unified School District GO | 0.000% | 8/1/19 (12) | 4,190 | 4,033 |
| West Contra Costa CA Unified School District GO | 0.000% | 8/1/20 (12) | 6,000 | 5,657 |
| West Contra Costa CA Unified School District GO | 5.000% | 8/1/27 | 2,405 | 2,952 |
| West Contra Costa CA Unified School District GO | 0.000% | 8/1/28 (14) | 5,230 | 3,748 |
| West Contra Costa CA Unified School District GO | 5.000% | 8/1/29 | 3,500 | 4,227 |
| West Contra Costa CA Unified School District GO | 0.000% | 8/1/32 (12) | 5,000 | 3,081 |
| West Contra Costa CA Unified School District GO | 5.000% | 8/1/32 (4) | 6,270 | 7,305 |
140
Intermediate-Term Tax-Exempt Fund
| | | | |
| | | | Face | Market |
| | | Maturity | Amount | Value• |
| | Coupon | Date | ($000) | ($000) |
| West Contra Costa CA Unified School District GO | 0.000% | 8/1/33 (12) | 2,810 | 1,649 |
| Westlands CA Water District Revenue | 5.000% | 9/1/26 (4) | 1,000 | 1,182 |
| | | | | 6,162,112 |
| Colorado (1.3%) | | | | |
| Adams County CO COP | 5.000% | 12/1/30 | 600 | 719 |
| Adams County CO COP | 5.000% | 12/1/33 | 1,000 | 1,180 |
| Adams County CO COP | 5.000% | 12/1/34 | 725 | 850 |
| Aurora CO COP | 5.000% | 12/1/19 | 1,050 | 1,168 |
| Aurora CO COP | 5.000% | 12/1/20 | 2,000 | 2,241 |
| Aurora CO COP | 5.000% | 12/1/21 | 3,505 | 3,922 |
| Aurora CO COP | 5.000% | 12/1/22 | 4,730 | 5,290 |
| Aurora CO COP | 5.000% | 12/1/23 | 4,465 | 4,990 |
| Aurora CO COP | 5.000% | 12/1/24 | 4,215 | 4,708 |
| Aurora CO COP | 5.000% | 12/1/25 | 5,475 | 6,109 |
| Broomfield CO City & County COP | 5.000% | 12/1/24 | 2,685 | 3,036 |
| Broomfield CO City & County COP | 5.000% | 12/1/25 | 2,820 | 3,181 |
| Broomfield CO City & County COP | 5.000% | 12/1/26 | 2,965 | 3,345 |
| Broomfield CO City & County COP | 5.000% | 12/1/29 | 7,470 | 8,418 |
| Colorado (UCDHSC Fitzsimons Academic Projects) COP | 5.250% | 11/1/23 | 5,000 | 6,128 |
| Colorado Education Loan Program Revenue | 2.000% | 6/29/17 | 13,200 | 13,307 |
| Colorado Education Loan Program Revenue | 5.000% | 6/29/17 | 11,800 | 12,126 |
| Colorado General Fund Revenue | 2.000% | 6/27/17 | 34,000 | 34,272 |
| Colorado Health Facilities Authority Revenue | | | | |
| (Adventist Health System/Sunbelt Obligated Group) PUT | 5.000% | 11/15/23 | 7,000 | 8,475 |
| Colorado Health Facilities Authority Revenue | | | | |
| (Adventist Health System/Sunbelt Obligated Group) PUT | 5.000% | 11/15/26 | 25,000 | 31,198 |
| Colorado Health Facilities Authority Revenue (Catholic Health Initiatives) | 6.125% | 10/1/28 | 10,000 | 10,866 |
| Colorado Health Facilities Authority Revenue (Catholic Health Initiatives) | 5.500% | 7/1/29 | 50,000 | 55,104 |
| Colorado Health Facilities Authority Revenue (Catholic Health Initiatives) | 5.250% | 2/1/31 | 17,000 | 18,902 |
| Colorado Health Facilities Authority Revenue (Catholic Health Initiatives) | 5.000% | 1/1/33 | 8,385 | 9,393 |
| 4 Colorado Health Facilities Authority Revenue (Catholic Health Initiatives) TOB VRDO | 0.780% | 11/7/16 | 5,305 | 5,305 |
| Colorado Health Facilities Authority Revenue (Christian Living Communities) | 5.000% | 1/1/25 | 600 | 694 |
| Colorado Health Facilities Authority Revenue (Christian Living Communities) | 5.000% | 1/1/26 | 750 | 862 |
| Colorado Health Facilities Authority Revenue (Covenant Retirement Community Inc.) | 5.000% | 12/1/23 | 2,000 | 2,335 |
| Colorado Health Facilities Authority Revenue (Covenant Retirement Community Inc.) | 5.000% | 12/1/24 | 2,500 | 2,943 |
| Colorado Health Facilities Authority Revenue (Covenant Retirement Community Inc.) | 5.000% | 12/1/25 | 2,540 | 2,987 |
| Colorado Health Facilities Authority Revenue (Covenant Retirement Community Inc.) | 5.000% | 12/1/26 | 1,865 | 2,179 |
| Colorado Health Facilities Authority Revenue (Covenant Retirement Community Inc.) | 5.000% | 12/1/27 | 2,025 | 2,272 |
| Colorado Health Facilities Authority Revenue (Covenant Retirement Community Inc.) | 5.000% | 12/1/27 | 1,375 | 1,595 |
| Colorado Health Facilities Authority Revenue (Covenant Retirement Community Inc.) | 5.000% | 12/1/28 | 1,030 | 1,185 |
| Colorado Health Facilities Authority Revenue (Covenant Retirement Community Inc.) | 5.000% | 12/1/30 | 1,405 | 1,604 |
| Colorado Health Facilities Authority Revenue (Covenant Retirement Community Inc.) | 5.000% | 12/1/33 | 6,750 | 7,401 |
| Colorado Health Facilities Authority Revenue (NCMC Inc.) | 4.000% | 5/15/29 | 5,000 | 5,540 |
| Colorado Health Facilities Authority Revenue (NCMC Inc.) | 4.000% | 5/15/30 | 8,500 | 9,349 |
| Colorado Health Facilities Authority Revenue (NCMC Inc.) | 4.000% | 5/15/31 | 5,390 | 5,895 |
| Colorado Health Facilities Authority Revenue (NCMC Inc.) | 4.000% | 5/15/32 | 5,500 | 5,982 |
| Colorado Health Facilities Authority Revenue (Sisters of Charity of Leavenworth Health System) | 5.000% | 1/1/22 | 6,100 | 6,832 |
| Colorado Health Facilities Authority Revenue (Sisters of Charity of Leavenworth Health System) | 5.000% | 1/1/22 | 13,175 | 14,756 |
| Colorado Health Facilities Authority Revenue (Sisters of Charity of Leavenworth Health System) | 5.250% | 1/1/30 | 20,955 | 23,314 |
| Commerce City CO Sales & Use Tax Revenue | 5.000% | 8/1/31 (4) | 2,415 | 2,843 |
| Commerce City CO Sales & Use Tax Revenue | 5.000% | 8/1/33 (4) | 2,410 | 2,815 |
| Denver CO City & County Airport Revenue | 5.000% | 11/15/25 | 15,000 | 17,948 |
| Denver CO City & County Airport Revenue | 5.000% | 11/15/26 | 5,750 | 6,858 |
| Denver CO City & County Airport Revenue | 5.250% | 11/15/28 | 3,210 | 3,600 |
| Denver CO City & County Airport Revenue | 5.250% | 11/15/28 | 3,000 | 3,613 |
| Denver CO City & County Airport Revenue | 5.250% | 11/15/29 | 5,000 | 5,986 |
| Denver CO City & County Airport Revenue | 5.250% | 11/15/30 | 14,400 | 17,282 |
| E-470 Public Highway Authority Colorado Revenue | 0.000% | 9/1/17 (14) | 24,490 | 24,228 |
| E-470 Public Highway Authority Colorado Revenue | 5.250% | 9/1/18 (14) | 7,850 | 8,219 |
| E-470 Public Highway Authority Colorado Revenue | 5.250% | 9/1/18 (14) | 6,355 | 6,784 |
| E-470 Public Highway Authority Colorado Revenue | 0.000% | 9/1/19 (14) | 15,100 | 14,367 |
| E-470 Public Highway Authority Colorado Revenue | 0.000% | 9/1/21 | 27,500 | 25,030 |
| E-470 Public Highway Authority Colorado Revenue | 0.000% | 9/1/22 (14) | 11,315 | 10,077 |
| E-470 Public Highway Authority Colorado Revenue | 0.000% | 9/1/23 (14) | 15,435 | 13,122 |
| E-470 Public Highway Authority Colorado Revenue | 0.000% | 9/1/24 (14) | 20,000 | 16,374 |
| E-470 Public Highway Authority Colorado Revenue | 5.250% | 9/1/25 | 1,500 | 1,673 |
| E-470 Public Highway Authority Colorado Revenue | 5.375% | 9/1/26 | 2,500 | 2,789 |
| Garfield, Pitkin, & Eagle County CO School District GO | 1.000% | 12/15/16 | 500 | 500 |
| Garfield, Pitkin, & Eagle County CO School District GO | 2.000% | 12/15/17 | 500 | 507 |
141
Intermediate-Term Tax-Exempt Fund
| | | | |
| | | | Face | Market |
| | | Maturity | Amount | Value• |
| | Coupon | Date | ($000) | ($000) |
| Garfield, Pitkin, & Eagle County CO School District GO | 4.000% | 12/15/32 | 4,010 | 4,453 |
| Garfield, Pitkin, & Eagle County CO School District GO | 4.000% | 12/15/33 | 7,535 | 8,329 |
| Garfield, Pitkin, & Eagle County CO School District GO | 4.000% | 12/15/34 | 7,075 | 7,778 |
| Garfield, Pitkin, & Eagle County CO School District GO | 4.000% | 12/15/35 | 7,440 | 8,154 |
| Park Creek CO Metropolitan District Limited Property Tax Revenue | 5.000% | 12/1/23 | 1,520 | 1,798 |
| Park Creek CO Metropolitan District Limited Property Tax Revenue | 5.000% | 12/1/26 | 1,000 | 1,189 |
| Park Creek CO Metropolitan District Limited Property Tax Revenue | 5.000% | 12/1/29 | 2,000 | 2,336 |
| Park Creek CO Metropolitan District Limited Property Tax Revenue | 5.000% | 12/1/31 | 1,500 | 1,734 |
| Park Creek CO Metropolitan District Limited Property Tax Revenue | 5.000% | 12/1/33 | 1,080 | 1,236 |
| Park Creek CO Metropolitan District Limited Property Tax Revenue | 5.000% | 12/1/34 | 1,250 | 1,425 |
| Park Creek CO Metropolitan District Limited Property Tax Revenue | 5.000% | 12/1/35 | 1,125 | 1,281 |
| Regional Transportation District of Colorado COP | 5.000% | 6/1/23 | 2,000 | 2,259 |
| Regional Transportation District of Colorado COP | 5.000% | 6/1/24 | 1,000 | 1,126 |
| Regional Transportation District of Colorado COP | 5.000% | 6/1/25 | 1,000 | 1,120 |
| Regional Transportation District of Colorado Sales Tax Revenue (FasTracks Project) | 5.000% | 11/1/24 | 5,000 | 6,007 |
| Regional Transportation District of Colorado Sales Tax Revenue (FasTracks Project) | 5.000% | 11/1/25 | 5,875 | 7,058 |
| University of Colorado Enterprise System Revenue | 5.000% | 6/1/17 (Prere.) | 5,785 | 5,930 |
| University of Colorado Enterprise System Revenue | 5.500% | 6/1/19 (Prere.) | 2,750 | 3,066 |
| University of Colorado Enterprise System Revenue | 5.500% | 6/1/19 (Prere.) | 2,000 | 2,230 |
| University of Colorado Enterprise System Revenue | 5.000% | 6/1/26 | 1,250 | 1,483 |
| University of Colorado Enterprise System Revenue | 5.000% | 6/1/26 | 1,500 | 1,839 |
| University of Colorado Enterprise System Revenue | 5.000% | 6/1/27 | 2,085 | 2,470 |
| University of Colorado Enterprise System Revenue | 4.000% | 6/1/28 | 5,600 | 6,310 |
| University of Colorado Enterprise System Revenue | 5.000% | 6/1/28 | 2,480 | 2,935 |
| University of Colorado Enterprise System Revenue | 5.000% | 6/1/28 | 2,000 | 2,419 |
| University of Colorado Enterprise System Revenue | 5.000% | 6/1/29 | 2,445 | 2,889 |
| University of Colorado Enterprise System Revenue | 5.000% | 6/1/29 | 2,250 | 2,704 |
| University of Colorado Enterprise System Revenue | 5.000% | 6/1/30 | 2,720 | 3,229 |
| University of Colorado Enterprise System Revenue | 5.000% | 6/1/31 | 1,850 | 2,191 |
| University of Colorado Enterprise System Revenue | 4.000% | 6/1/32 | 2,250 | 2,497 |
| University of Colorado Enterprise System Revenue | 5.000% | 6/1/32 | 1,950 | 2,304 |
| University of Colorado Enterprise System Revenue | 4.000% | 6/1/33 | 3,700 | 4,087 |
| University of Colorado Enterprise System Revenue | 5.000% | 6/1/33 | 3,155 | 3,718 |
| University of Colorado Hospital Authority Revenue | 5.000% | 11/15/27 | 6,000 | 7,057 |
| University of Colorado Hospital Authority Revenue | 6.000% | 11/15/29 | 9,850 | 11,101 |
| | | | | 664,315 |
| Connecticut (1.4%) | | | | |
| 1 Connecticut GO | 1.400% | 5/15/17 | 5,000 | 5,008 |
| Connecticut GO | 5.000% | 11/1/17 | 7,750 | 8,070 |
| Connecticut GO | 4.000% | 11/15/17 | 6,885 | 7,108 |
| 1 Connecticut GO | 1.550% | 5/15/18 | 14,100 | 14,126 |
| Connecticut GO | 5.000% | 11/15/18 | 8,500 | 9,175 |
| Connecticut GO | 5.000% | 12/15/18 | 11,100 | 11,160 |
| Connecticut GO | 5.000% | 3/15/20 | 7,770 | 8,692 |
| 1 Connecticut GO | 1.880% | 4/15/20 | 17,000 | 17,158 |
| Connecticut GO | 5.000% | 11/1/20 | 4,970 | 5,653 |
| 1 Connecticut GO | 1.380% | 3/1/21 | 4,305 | 4,319 |
| Connecticut GO | 5.000% | 11/1/21 | 5,000 | 5,824 |
| Connecticut GO | 4.000% | 3/15/22 | 14,405 | 16,099 |
| Connecticut GO | 5.000% | 4/15/22 | 6,005 | 7,030 |
| Connecticut GO | 5.000% | 5/15/22 | 11,310 | 13,092 |
| Connecticut GO | 5.000% | 6/1/22 | 8,010 | 9,402 |
| Connecticut GO | 5.000% | 6/15/22 | 9,355 | 10,990 |
| Connecticut GO | 5.000% | 9/15/22 | 6,830 | 8,063 |
| Connecticut GO | 5.000% | 11/15/22 | 5,000 | 5,922 |
| Connecticut GO | 5.000% | 11/15/22 | 17,120 | 20,277 |
| Connecticut GO | 5.000% | 3/15/23 | 18,315 | 21,726 |
| Connecticut GO | 5.000% | 11/1/23 | 10,000 | 11,674 |
| Connecticut GO | 5.000% | 11/15/23 | 7,715 | 9,266 |
| Connecticut GO | 5.000% | 11/15/23 | 14,275 | 17,145 |
| Connecticut GO | 5.000% | 3/15/24 | 10,000 | 11,999 |
| Connecticut GO | 5.000% | 6/1/24 | 10,000 | 11,770 |
| Connecticut GO | 5.000% | 9/1/24 | 20,000 | 24,147 |
| Connecticut GO | 5.000% | 10/15/24 | 10,805 | 12,812 |
| Connecticut GO | 5.000% | 11/15/24 | 6,440 | 7,796 |
| Connecticut GO | 5.000% | 11/15/24 | 10,025 | 12,135 |
| Connecticut GO | 5.000% | 3/1/25 | 19,440 | 22,933 |
| Connecticut GO | 5.000% | 9/1/25 | 19,395 | 23,479 |
| Connecticut GO | 5.000% | 11/15/25 | 15,795 | 19,317 |
142
Intermediate-Term Tax-Exempt Fund
| | | | |
| | | | Face | Market |
| | | Maturity | Amount | Value• |
| | Coupon | Date | ($000) | ($000) |
| Connecticut GO | 5.000% | 11/15/25 | 3,250 | 3,975 |
| Connecticut GO | 5.000% | 9/1/26 | 13,170 | 15,838 |
| Connecticut GO | 5.000% | 11/1/26 | 9,250 | 10,764 |
| Connecticut GO | 5.000% | 3/15/27 | 10,000 | 11,990 |
| Connecticut GO | 5.000% | 3/1/30 | 8,900 | 10,382 |
| Connecticut GO | 5.000% | 3/1/31 | 10,500 | 12,187 |
| Connecticut GO | 5.000% | 4/15/32 | 4,000 | 4,557 |
| Connecticut GO | 5.000% | 8/15/32 | 20,000 | 23,158 |
| Connecticut Health & Educational Facilities Authority Revenue (Hartford Healthcare) | 5.000% | 7/1/32 | 4,000 | 4,408 |
| Connecticut Health & Educational Facilities Authority Revenue (Quinnipiac University) | 5.000% | 7/1/24 | 5,475 | 6,628 |
| Connecticut Health & Educational Facilities Authority Revenue (Quinnipiac University) | 5.000% | 7/1/25 | 5,190 | 6,326 |
| Connecticut Health & Educational Facilities Authority Revenue (Stamford Hospital) | 5.000% | 7/1/32 | 15,000 | 16,626 |
| 4 Connecticut Health & Educational Facilities Authority Revenue (Trinity Health Corp.) TOB VRDO | 0.660% | 11/7/16 | 4,000 | 4,000 |
| Connecticut Health & Educational Facilities Authority Revenue (Wesleyan University) | 5.000% | 7/1/20 (Prere.) | 8,550 | 9,762 |
| Connecticut Health & Educational Facilities Authority Revenue (Yale University) PUT | 1.200% | 2/1/19 | 14,920 | 14,964 |
| Connecticut Health & Educational Facilities Authority Revenue (Yale University) PUT | 1.000% | 2/6/19 | 40,000 | 39,925 |
| Connecticut Health & Educational Facilities Authority Revenue (Yale University) PUT | 2.000% | 7/1/26 | 8,000 | 7,972 |
| Connecticut Special Tax Revenue (Transportation Infrastructure) | 5.000% | 11/1/17 | 7,090 | 7,385 |
| Connecticut Special Tax Revenue (Transportation Infrastructure) | 5.000% | 9/1/22 | 5,000 | 5,963 |
| Connecticut Special Tax Revenue (Transportation Infrastructure) | 5.000% | 11/1/23 | 12,085 | 13,017 |
| Connecticut Special Tax Revenue (Transportation Infrastructure) | 5.000% | 11/1/24 | 10,880 | 11,712 |
| Connecticut Special Tax Revenue (Transportation Infrastructure) | 5.000% | 1/1/25 | 19,445 | 23,325 |
| Connecticut Special Tax Revenue (Transportation Infrastructure) | 5.000% | 11/1/25 | 12,515 | 13,467 |
| Connecticut Special Tax Revenue (Transportation Infrastructure) | 5.000% | 1/1/26 | 8,225 | 9,850 |
| Connecticut Special Tax Revenue (Transportation Infrastructure) | 5.000% | 1/1/27 | 15,000 | 17,925 |
| Connecticut Special Tax Revenue (Transportation Infrastructure) | 5.000% | 9/1/31 | 10,000 | 11,901 |
| Connecticut Special Tax Revenue (Transportation Infrastructure) | 5.000% | 9/1/32 | 6,000 | 7,108 |
| Connecticut Special Tax Revenue (Transportation Infrastructure) | 5.000% | 9/1/34 | 3,745 | 4,404 |
| Hartford CT GO | 5.000% | 4/1/28 | 2,055 | 2,198 |
| South Central CT Regional Water Authority Water System Revenue | 5.000% | 8/1/24 | 750 | 925 |
| South Central CT Regional Water Authority Water System Revenue | 5.000% | 8/1/29 | 1,000 | 1,226 |
| University of Connecticut GO | 5.000% | 2/15/26 | 3,140 | 3,840 |
| University of Connecticut GO | 5.000% | 2/15/27 | 8,000 | 9,677 |
| | | | | 740,752 |
| Delaware (0.0%) | | | | |
| Delaware GO | 5.000% | 8/1/24 | 6,040 | 7,463 |
| 2 Delaware Transportation Authority Transportation System Revenue | 5.000% | 7/1/19 (Prere.) | 10,000 | 11,053 |
| University of Delaware Revenue | 5.000% | 11/1/22 | 1,000 | 1,113 |
| | | | | 19,629 |
| District of Columbia (0.3%) | | | | |
| District of Columbia GO | 5.000% | 6/1/19 | 5,000 | 5,508 |
| District of Columbia GO | 5.000% | 6/1/19 (4) | 5,325 | 5,564 |
| District of Columbia GO | 5.000% | 6/1/20 (4) | 11,840 | 12,369 |
| District of Columbia GO | 5.000% | 6/1/21 | 5,000 | 5,841 |
| District of Columbia GO | 5.000% | 6/1/21 (4) | 10,380 | 10,844 |
| District of Columbia Hospital Revenue (Children’s Hospital Obligated Group) | 5.000% | 7/15/24 | 2,025 | 2,504 |
| District of Columbia Hospital Revenue (Children’s Hospital Obligated Group) | 5.000% | 7/15/25 | 2,200 | 2,757 |
| District of Columbia Income Tax Revenue | 5.000% | 12/1/22 | 3,500 | 4,243 |
| District of Columbia Income Tax Revenue | 5.000% | 12/1/32 | 5,210 | 6,245 |
| District of Columbia Revenue (Georgetown University) | 5.000% | 4/1/21 (2) | 5,610 | 5,698 |
| District of Columbia Revenue (Georgetown University) | 5.000% | 4/1/22 (2) | 5,800 | 5,889 |
| District of Columbia Revenue (Georgetown University) | 5.000% | 4/1/23 (2) | 6,600 | 6,701 |
| District of Columbia Revenue (Georgetown University) | 5.000% | 4/1/24 (2) | 6,190 | 6,285 |
| District of Columbia Revenue (Georgetown University) PUT | 4.700% | 4/1/18 | 23,500 | 24,633 |
| District of Columbia Revenue (Methodist Home of the District of Columbia) | 4.500% | 1/1/25 | 1,815 | 1,865 |
| District of Columbia Revenue (National Public Radio, Inc.) | 5.000% | 4/1/25 | 4,170 | 5,107 |
| District of Columbia Revenue (National Public Radio, Inc.) | 5.000% | 4/1/26 | 3,985 | 4,919 |
| District of Columbia Revenue (National Public Radio, Inc.) | 5.000% | 4/1/28 | 2,000 | 2,430 |
| District of Columbia Water & Sewer Authority Public Utility Revenue | 5.000% | 10/1/31 | 9,595 | 11,299 |
| District of Columbia Water & Sewer Authority Public Utility Revenue | 5.000% | 10/1/31 | 5,115 | 6,023 |
| District of Columbia Water & Sewer Authority Public Utility Revenue | 5.000% | 10/1/32 | 5,000 | 5,879 |
| District of Columbia Water & Sewer Authority Public Utility Revenue | 5.000% | 10/1/32 | 5,000 | 5,879 |
| Metropolitan Washington DC/VA Airports Authority Airport System Revenue VRDO | 0.530% | 11/1/16 LOC | 3,490 | 3,490 |
| | | | | 151,972 |
| Florida (5.3%) | | | | |
| Alachua County FL Health Facilities Authority Revenue | | | | |
| (Shands Teaching Hospital & Clinics, Inc. Project) | 5.000% | 12/1/25 | 1,000 | 1,193 |
| Alachua County FL Health Facilities Authority Revenue | | | | |
| (Shands Teaching Hospital & Clinics, Inc. Project) | 5.000% | 12/1/26 | 1,250 | 1,481 |
143
Intermediate-Term Tax-Exempt Fund
| | | | |
| | | | Face | Market |
| | | Maturity | Amount | Value• |
| | Coupon | Date | ($000) | ($000) |
| Alachua County FL Health Facilities Authority Revenue | | | | |
| (Shands Teaching Hospital & Clinics, Inc. Project) | 5.000% | 12/1/27 | 1,300 | 1,532 |
| Alachua County FL Health Facilities Authority Revenue | | | | |
| (Shands Teaching Hospital & Clinics, Inc. Project) | 5.000% | 12/1/34 | 22,000 | 25,103 |
| Brevard County FL Health Facilities Authority Revenue (Health First Inc. Project) | 5.000% | 4/1/22 | 5,050 | 5,892 |
| Brevard County FL Health Facilities Authority Revenue (Health First Inc. Project) | 5.000% | 4/1/23 | 1,100 | 1,314 |
| Brevard County FL Health Facilities Authority Revenue (Health First Inc. Project) | 5.000% | 4/1/23 | 5,065 | 6,015 |
| Brevard County FL Health Facilities Authority Revenue (Health First Inc. Project) | 5.000% | 4/1/24 | 2,370 | 2,875 |
| Brevard County FL Health Facilities Authority Revenue (Health First Inc. Project) | 5.000% | 4/1/24 | 5,595 | 6,598 |
| Brevard County FL Health Facilities Authority Revenue (Health First Inc. Project) | 5.000% | 4/1/25 | 2,440 | 2,937 |
| Brevard County FL Health Facilities Authority Revenue (Health First Inc. Project) | 5.000% | 4/1/25 | 5,890 | 6,896 |
| Brevard County FL Health Facilities Authority Revenue (Health First Inc. Project) | 5.000% | 4/1/26 | 6,200 | 7,209 |
| Brevard County FL Health Facilities Authority Revenue (Health First Inc. Project) | 5.000% | 4/1/27 | 2,620 | 3,112 |
| Brevard County FL Health Facilities Authority Revenue (Health First Inc. Project) | 5.000% | 4/1/27 | 6,280 | 7,267 |
| Brevard County FL Health Facilities Authority Revenue (Health First Inc. Project) | 5.000% | 4/1/28 | 5,795 | 6,841 |
| Brevard County FL Health Facilities Authority Revenue (Health First Inc. Project) | 5.000% | 4/1/29 | 4,355 | 5,103 |
| Brevard County FL Health Facilities Authority Revenue (Health First Inc. Project) | 5.000% | 4/1/30 | 3,290 | 3,834 |
| Brevard County FL Health Facilities Authority Revenue (Health First Inc. Project) | 5.000% | 4/1/31 | 4,500 | 5,211 |
| Brevard County FL Health Facilities Authority Revenue (Health First Inc. Project) | 5.000% | 4/1/31 | 7,000 | 7,921 |
| Brevard County FL Health Facilities Authority Revenue (Health First Inc. Project) | 5.000% | 4/1/32 | 9,000 | 10,383 |
| Brevard County FL Health Facilities Authority Revenue (Health First Inc. Project) | 5.000% | 4/1/33 | 6,750 | 7,763 |
| Brevard County FL School Board COP | 5.000% | 7/1/17 (Prere.) | 4,615 | 4,746 |
| Brevard County FL School Board COP | 5.000% | 7/1/17 (Prere.) | 4,850 | 4,988 |
| Brevard County FL School Board COP | 5.000% | 7/1/17 (Prere.) | 5,090 | 5,235 |
| Brevard County FL School Board COP | 5.000% | 7/1/25 | 1,000 | 1,186 |
| Broward County FL Airport System Revenue | 5.000% | 10/1/25 | 2,000 | 2,341 |
| Broward County FL Airport System Revenue | 5.000% | 10/1/26 | 2,730 | 3,179 |
| Broward County FL Airport System Revenue | 5.000% | 10/1/27 | 5,785 | 6,695 |
| Broward County FL Airport System Revenue | 5.000% | 10/1/28 | 5,000 | 5,758 |
| Broward County FL Airport System Revenue | 5.500% | 10/1/31 | 7,210 | 8,744 |
| Broward County FL Airport System Revenue | 5.500% | 10/1/32 | 7,610 | 9,197 |
| Broward County FL Airport System Revenue | 5.500% | 10/1/33 | 8,025 | 9,670 |
| Broward County FL GO | 5.000% | 1/1/20 | 9,185 | 10,312 |
| Broward County FL Port Facilities Revenue | 5.500% | 9/1/29 | 5,500 | 6,063 |
| Broward County FL School Board COP | 5.250% | 7/1/18 (Prere.) | 12,480 | 13,380 |
| Broward County FL Water & Sewer Utility Revenue | 5.000% | 10/1/18 (Prere.) | 2,000 | 2,155 |
| Central Florida Expressway Authority BAN | 1.625% | 1/1/19 | 25,000 | 25,149 |
| 3 Central Florida Expressway Authority Revenue | 5.000% | 7/1/25 | 2,500 | 3,092 |
| 3 Central Florida Expressway Authority Revenue | 5.000% | 7/1/26 | 4,000 | 4,986 |
| 3 Central Florida Expressway Authority Revenue | 5.000% | 7/1/27 | 5,000 | 6,176 |
| 3 Central Florida Expressway Authority Revenue | 5.000% | 7/1/28 | 4,000 | 4,892 |
| 3 Central Florida Expressway Authority Revenue | 4.000% | 7/1/32 | 6,500 | 7,059 |
| 3 Central Florida Expressway Authority Revenue | 4.000% | 7/1/33 | 9,500 | 10,267 |
| 3 Central Florida Expressway Authority Revenue | 5.000% | 7/1/33 | 4,715 | 5,614 |
| 3 Central Florida Expressway Authority Revenue | 5.000% | 7/1/34 | 7,000 | 8,289 |
| Citizens Property Insurance Corp. Florida Revenue (Coastal Account) | 5.250% | 6/1/17 | 60,990 | 62,588 |
| Citizens Property Insurance Corp. Florida Revenue (Coastal Account) | 5.000% | 6/1/20 | 19,000 | 21,152 |
| Citizens Property Insurance Corp. Florida Revenue (Coastal Account) | 5.000% | 6/1/22 | 30,000 | 35,174 |
| Citizens Property Insurance Corp. Florida Revenue (Coastal Account) | 5.000% | 6/1/25 | 20,000 | 24,422 |
| Citizens Property Insurance Corp. Florida Revenue | | | | |
| (Personal Lines Account/Commercial Lines Account) | 5.000% | 6/1/19 | 19,150 | 21,043 |
| Citizens Property Insurance Corp. Florida Revenue | | | | |
| (Personal Lines Account/Commercial Lines Account) | 5.000% | 6/1/20 | 21,100 | 23,830 |
| Duval County FL School Board COP | 5.000% | 7/1/27 | 4,000 | 4,839 |
| Duval County FL School Board COP | 5.000% | 7/1/33 | 14,415 | 16,864 |
| Florida Board of Education Lottery Revenue | 5.000% | 7/1/17 (Prere.) | 14,690 | 15,248 |
| Florida Board of Education Lottery Revenue | 5.000% | 7/1/17 (Prere.) | 13,700 | 14,221 |
| Florida Board of Education Lottery Revenue | 5.000% | 7/1/17 (Prere.) | 14,385 | 14,932 |
| Florida Board of Education Lottery Revenue | 5.000% | 7/1/17 (Prere.) | 15,855 | 16,458 |
| Florida Board of Education Lottery Revenue | 5.000% | 7/1/18 | 4,000 | 4,271 |
| Florida Board of Education Lottery Revenue | 5.000% | 7/1/19 | 2,775 | 3,065 |
| Florida Board of Education Lottery Revenue | 5.000% | 7/1/19 | 4,550 | 4,903 |
| Florida Board of Education Lottery Revenue | 5.000% | 7/1/24 | 11,385 | 12,250 |
| Florida Board of Education Lottery Revenue | 5.000% | 7/1/24 | 14,020 | 17,395 |
| Florida Board of Education Lottery Revenue | 5.000% | 7/1/25 | 13,215 | 14,214 |
| Florida Board of Education Lottery Revenue | 5.000% | 7/1/26 | 13,875 | 14,919 |
| Florida Board of Education Public Education Capital Outlay GO | 5.000% | 6/1/17 (Prere.) | 3,500 | 3,621 |
| Florida Board of Education Public Education Capital Outlay GO | 5.000% | 6/1/18 | 10,170 | 10,837 |
| Florida Board of Education Public Education Capital Outlay GO | 5.000% | 6/1/18 | 8,180 | 8,716 |
| Florida Board of Education Public Education Capital Outlay GO | 5.000% | 6/1/19 | 7,000 | 7,721 |
144
Intermediate-Term Tax-Exempt Fund
| | | | |
| | | | Face | Market |
| | | Maturity | Amount | Value• |
| | Coupon | Date | ($000) | ($000) |
| Florida Board of Education Public Education Capital Outlay GO | 5.000% | 6/1/19 | 2,905 | 3,204 |
| Florida Board of Education Public Education Capital Outlay GO | 5.000% | 6/1/20 | 9,020 | 10,269 |
| Florida Board of Education Public Education Capital Outlay GO | 5.000% | 6/1/20 | 10,000 | 11,384 |
| Florida Board of Education Public Education Capital Outlay GO | 5.000% | 6/1/20 | 22,000 | 25,045 |
| Florida Board of Education Public Education Capital Outlay GO | 5.000% | 6/1/20 | 5,585 | 6,215 |
| Florida Board of Education Public Education Capital Outlay GO | 5.000% | 6/1/21 | 8,200 | 9,599 |
| Florida Board of Education Public Education Capital Outlay GO | 5.000% | 6/1/21 | 35,250 | 41,266 |
| Florida Board of Education Public Education Capital Outlay GO | 5.000% | 6/1/21 | 7,945 | 9,301 |
| Florida Board of Education Public Education Capital Outlay GO | 5.000% | 6/1/22 | 8,700 | 10,439 |
| Florida Board of Education Public Education Capital Outlay GO | 5.000% | 6/1/22 | 10,000 | 11,999 |
| Florida Board of Education Public Education Capital Outlay GO | 5.000% | 6/1/22 | 7,050 | 8,459 |
| Florida Board of Education Public Education Capital Outlay GO | 5.000% | 6/1/22 | 3,040 | 3,648 |
| Florida Board of Education Public Education Capital Outlay GO | 5.000% | 6/1/23 | 10,440 | 12,774 |
| Florida Board of Education Public Education Capital Outlay GO | 5.000% | 6/1/23 | 2,125 | 2,357 |
| Florida Board of Education Public Education Capital Outlay GO | 6.000% | 6/1/23 | 7,000 | 9,014 |
| Florida Board of Education Public Education Capital Outlay GO | 5.000% | 6/1/25 | 20,515 | 25,324 |
| Florida Board of Education Public Education Capital Outlay GO | 5.000% | 6/1/31 | 5,000 | 5,817 |
| Florida Department of Environmental Protection & Preservation Revenue | 5.000% | 7/1/17 | 8,175 | 8,405 |
| Florida Department of Environmental Protection & Preservation Revenue | 5.000% | 7/1/17 (Prere.) | 6,700 | 6,956 |
| Florida Department of Environmental Protection & Preservation Revenue | 5.000% | 7/1/17 (Prere.) | 10,045 | 10,429 |
| Florida Department of Environmental Protection & Preservation Revenue | 5.000% | 7/1/17 (Prere.) | 9,025 | 9,370 |
| Florida Department of Environmental Protection & Preservation Revenue | 5.000% | 7/1/17 (Prere.) | 9,475 | 9,837 |
| Florida Department of Environmental Protection & Preservation Revenue | 5.000% | 7/1/17 (Prere.) | 9,950 | 10,330 |
| Florida Department of Environmental Protection & Preservation Revenue | 5.000% | 7/1/17 (Prere.) | 5,445 | 5,653 |
| Florida Department of Environmental Protection & Preservation Revenue | 5.000% | 7/1/17 (Prere.) | 10,970 | 11,389 |
| Florida Department of Environmental Protection & Preservation Revenue | 5.000% | 7/1/19 | 5,855 | 6,305 |
| Florida Department of Environmental Protection & Preservation Revenue | 5.000% | 7/1/20 | 4,025 | 4,572 |
| Florida Department of Environmental Protection & Preservation Revenue | 5.000% | 7/1/24 | 10,025 | 10,762 |
| Florida Department of Environmental Protection & Preservation Revenue | 5.000% | 7/1/25 | 10,525 | 11,286 |
| Florida Department of Environmental Protection & Preservation Revenue | 5.000% | 7/1/26 | 11,055 | 11,854 |
| Florida Department of Environmental Protection & Preservation Revenue | 5.000% | 7/1/27 | 11,605 | 12,422 |
| Florida Department of Transportation GO | 5.000% | 7/1/19 | 7,895 | 8,733 |
| Florida Department of Transportation GO | 5.000% | 7/1/19 | 5,000 | 5,531 |
| Florida Department of Transportation GO | 5.000% | 7/1/20 | 6,620 | 7,555 |
| Florida Department of Transportation GO | 5.000% | 7/1/21 | 4,120 | 4,835 |
| Florida Department of Transportation GO | 5.000% | 7/1/21 | 7,540 | 8,848 |
| Florida Department of Transportation GO | 5.000% | 7/1/22 | 22,060 | 26,525 |
| Florida Department of Transportation GO | 5.000% | 7/1/22 | 6,055 | 6,747 |
| Florida Higher Educational Facilities Financing Authority Revenue (Nova Southeastern University) | 5.000% | 4/1/33 | 1,800 | 2,109 |
| Florida Higher Educational Facilities Financing Authority Revenue (Nova Southeastern University) | 5.000% | 4/1/34 | 1,500 | 1,751 |
| Florida Higher Educational Facilities Financing Authority Revenue (University of Tampa Project) | 5.000% | 4/1/32 | 1,000 | 1,114 |
| Florida Mid-Bay Bridge Authority Revenue | 5.000% | 10/1/23 | 2,000 | 2,368 |
| Florida Mid-Bay Bridge Authority Revenue | 5.000% | 10/1/24 | 1,750 | 2,095 |
| Florida Mid-Bay Bridge Authority Revenue | 5.000% | 10/1/25 | 1,250 | 1,511 |
| Florida Mid-Bay Bridge Authority Revenue | 5.000% | 10/1/30 | 2,750 | 3,175 |
| Florida Municipal Power Agency Revenue | 5.000% | 10/1/18 (Prere.) | 10,625 | 11,457 |
| Florida Municipal Power Agency Revenue | 5.250% | 10/1/19 (4) | 10,000 | 11,147 |
| Florida Municipal Power Agency Revenue | 5.750% | 10/1/19 (Prere.) | 3,000 | 3,409 |
| Florida Municipal Power Agency Revenue | 5.000% | 10/1/21 | 5,000 | 5,832 |
| Florida Municipal Power Agency Revenue | 5.000% | 10/1/23 | 1,750 | 2,121 |
| Florida Municipal Power Agency Revenue | 5.000% | 10/1/24 | 1,000 | 1,228 |
| Florida Municipal Power Agency Revenue | 5.000% | 10/1/25 | 1,705 | 2,111 |
| Florida Municipal Power Agency Revenue | 5.000% | 10/1/26 | 1,000 | 1,228 |
| Florida Municipal Power Agency Revenue | 5.000% | 10/1/27 | 1,875 | 2,012 |
| Florida Municipal Power Agency Revenue | 5.000% | 10/1/27 | 1,100 | 1,342 |
| Florida Municipal Power Agency Revenue | 5.000% | 10/1/28 | 1,370 | 1,656 |
| Florida Municipal Power Agency Revenue | 5.000% | 10/1/29 | 5,000 | 6,108 |
| Florida Municipal Power Agency Revenue | 5.000% | 10/1/29 | 3,475 | 4,175 |
| Florida Municipal Power Agency Revenue | 5.000% | 10/1/30 | 9,995 | 12,138 |
| Florida Municipal Power Agency Revenue | 5.000% | 10/1/31 | 8,500 | 10,265 |
| Florida Ports Financing Commission Revenue | 5.000% | 10/1/24 | 2,075 | 2,410 |
| Florida Ports Financing Commission Revenue | 5.000% | 10/1/26 | 1,420 | 1,646 |
| Florida Ports Financing Commission Revenue | 5.000% | 10/1/28 | 2,000 | 2,319 |
| Florida Turnpike Authority Revenue | 5.000% | 7/1/17 | 1,420 | 1,461 |
| Florida Turnpike Authority Revenue | 5.000% | 7/1/19 | 1,365 | 1,416 |
| Florida Turnpike Authority Revenue | 5.000% | 7/1/19 | 9,230 | 10,202 |
| Florida Turnpike Authority Revenue | 5.000% | 7/1/20 | 3,000 | 3,113 |
| Florida Turnpike Authority Revenue | 5.000% | 7/1/24 | 8,760 | 10,840 |
| Florida Turnpike Authority Revenue | 5.000% | 7/1/25 | 9,275 | 11,605 |
| Florida Turnpike Authority Revenue | 4.000% | 7/1/34 | 12,355 | 13,252 |
145
Intermediate-Term Tax-Exempt Fund
| | | | |
| | | | Face | Market |
| | | Maturity | Amount | Value• |
| | Coupon | Date | ($000) | ($000) |
| Florida Water Pollution Control Financing Corp. Revenue | 5.000% | 1/15/20 | 2,000 | 2,166 |
| Fort Myers FL Improvement Revenue | 5.000% | 12/1/16 (Prere.) | 6,330 | 6,353 |
| Fort Myers FL Improvement Revenue | 5.000% | 12/1/25 (14) | 1,010 | 1,014 |
| Greater Orlando Aviation Authority Florida Airport Facilities Revenue | 5.000% | 10/1/25 | 1,690 | 1,899 |
| Halifax Hospital Medical Center Florida Hospital Revenue | 5.000% | 6/1/23 | 1,320 | 1,572 |
| Halifax Hospital Medical Center Florida Hospital Revenue | 5.000% | 6/1/24 | 1,110 | 1,341 |
| Halifax Hospital Medical Center Florida Hospital Revenue | 5.000% | 6/1/25 | 1,350 | 1,649 |
| Halifax Hospital Medical Center Florida Hospital Revenue | 5.000% | 6/1/27 | 1,445 | 1,757 |
| Halifax Hospital Medical Center Florida Hospital Revenue | 5.000% | 6/1/28 | 2,000 | 2,403 |
| Halifax Hospital Medical Center Florida Hospital Revenue | 5.000% | 6/1/29 | 2,000 | 2,384 |
| Halifax Hospital Medical Center Florida Hospital Revenue | 5.000% | 6/1/30 | 2,000 | 2,362 |
| Hernando County FL School District COP | 5.000% | 7/1/31 (4) | 5,925 | 7,033 |
| Highlands County FL Health Facilities Authority Hospital Revenue | | | | |
| (Adventist Health System/Sunbelt Obligated Group) | 5.000% | 11/15/17 | 3,000 | 3,129 |
| Highlands County FL Health Facilities Authority Hospital Revenue | | | | |
| (Adventist Health System/Sunbelt Obligated Group) | 5.000% | 11/15/18 | 2,000 | 2,160 |
| Highlands County FL Health Facilities Authority Hospital Revenue | | | | |
| (Adventist Health System/Sunbelt Obligated Group) | 5.000% | 11/15/18 | 3,000 | 3,240 |
| Highlands County FL Health Facilities Authority Hospital Revenue | | | | |
| (Adventist Health System/Sunbelt Obligated Group) | 5.000% | 11/15/20 | 2,155 | 2,406 |
| Highlands County FL Health Facilities Authority Hospital Revenue | | | | |
| (Adventist Health System/Sunbelt Obligated Group) | 5.000% | 11/15/20 | 7,000 | 7,806 |
| Highlands County FL Health Facilities Authority Hospital Revenue | | | | |
| (Adventist Health System/Sunbelt Obligated Group) | 4.500% | 11/15/21 | 2,250 | 2,442 |
| Highlands County FL Health Facilities Authority Hospital Revenue | | | | |
| (Adventist Health System/Sunbelt Obligated Group) | 5.250% | 11/15/21 | 2,000 | 2,241 |
| Hillsborough County FL Aviation Authority Revenue (Tampa International Airport) | 5.000% | 10/1/17 | 2,750 | 2,848 |
| Hillsborough County FL Aviation Authority Revenue (Tampa International Airport) | 5.000% | 10/1/18 | 3,400 | 3,637 |
| Hillsborough County FL Community Investment Tax Revenue | 5.000% | 11/1/18 | 12,320 | 13,297 |
| Hillsborough County FL Community Investment Tax Revenue | 5.000% | 11/1/19 | 14,680 | 16,374 |
| Hillsborough County FL Industrial Development Authority Health Facilities Revenue | | | | |
| (University Community Hospital) | 5.500% | 8/15/17 (ETM) | 1,260 | 1,307 |
| Hillsborough County FL Industrial Development Authority Hospital Revenue | | | | |
| (Tampa General Hospital Project) | 5.000% | 10/1/28 | 12,300 | 14,374 |
| Hillsborough County FL Industrial Development Authority Hospital Revenue | | | | |
| (Tampa General Hospital Project) | 5.000% | 10/1/31 | 26,400 | 30,315 |
| Hillsborough County FL Industrial Development Authority Hospital Revenue | | | | |
| (Tampa General Hospital Project) | 5.000% | 10/1/34 | 3,000 | 3,392 |
| Hillsborough County FL Industrial Development Authority Revenue | | | | |
| (University Community Hospital) | 6.500% | 8/15/19 (ETM) | 2,230 | 2,441 |
| Hillsborough County FL School Board (Master Lease Program) COP | 5.000% | 7/1/27 | 13,575 | 15,822 |
| Hillsborough County FL School Board (Master Lease Program) COP | 5.000% | 7/1/28 | 14,000 | 16,239 |
| Hillsborough County FL School Board (Master Lease Program) COP | 5.000% | 7/1/29 | 15,070 | 17,397 |
| Hillsborough County FL School Board COP | 5.000% | 7/1/24 | 16,305 | 18,237 |
| Hillsborough County FL School Board COP | 5.000% | 7/1/25 | 6,000 | 6,697 |
| Jacksonville FL Electric Authority Electric System Revenue | 5.000% | 10/1/22 | 600 | 720 |
| Jacksonville FL Electric Authority Electric System Revenue | 5.000% | 10/1/22 | 2,500 | 2,793 |
| Jacksonville FL Electric Authority Electric System Revenue | 5.000% | 10/1/23 | 750 | 895 |
| Jacksonville FL Electric Authority Electric System Revenue | 5.000% | 10/1/24 | 7,025 | 8,355 |
| Jacksonville FL Electric Authority Electric System Revenue | 5.000% | 10/1/25 | 2,000 | 2,369 |
| Jacksonville FL Electric Authority Electric System Revenue | 5.000% | 10/1/27 | 4,490 | 5,311 |
| Jacksonville FL Electric Authority Electric System Revenue | 5.000% | 10/1/28 | 3,900 | 4,325 |
| Jacksonville FL Electric Authority Electric System Revenue | 5.000% | 10/1/29 | 2,075 | 2,303 |
| Jacksonville FL Electric Authority Revenue (St. John’s River Power Park) | 5.000% | 10/1/19 | 15,265 | 17,009 |
| Jacksonville FL Electric Authority Revenue (St. John’s River Power Park) | 5.000% | 10/1/20 | 22,255 | 25,527 |
| Jacksonville FL Electric Authority Water & Sewer Revenue | 5.000% | 10/1/29 | 6,160 | 7,104 |
| Jacksonville FL Electric Authority Water & Sewer Revenue | 5.000% | 10/1/29 | 2,000 | 2,382 |
| Jacksonville FL Electric Authority Water & Sewer Revenue | 4.000% | 10/1/30 | 3,000 | 3,286 |
| Jacksonville FL Sales Taxes Revenue | 4.750% | 10/1/18 (Prere.) | 13,280 | 14,252 |
| Jacksonville FL Sales Taxes Revenue | 5.000% | 10/1/18 (Prere.) | 5,415 | 5,837 |
| Jacksonville FL Sales Taxes Revenue | 5.000% | 10/1/18 (Prere.) | 5,685 | 6,128 |
| Jacksonville FL Sales Taxes Revenue | 5.000% | 10/1/18 (Prere.) | 5,970 | 6,435 |
| Jacksonville FL Special Revenue | 5.000% | 10/1/19 (Prere.) | 4,800 | 5,349 |
| Jacksonville FL Special Revenue | 5.000% | 10/1/20 | 15,420 | 17,604 |
| Jacksonville FL Special Revenue | 5.000% | 10/1/25 | 4,500 | 5,323 |
| Jacksonville FL Special Revenue | 5.000% | 10/1/26 | 7,710 | 9,426 |
| Jacksonville FL Special Revenue | 5.000% | 10/1/28 | 6,385 | 7,675 |
| Jacksonville FL Special Revenue | 5.000% | 10/1/29 | 7,750 | 9,252 |
| Jacksonville FL Special Revenue | 5.000% | 10/1/30 | 3,145 | 3,726 |
| Jacksonville FL Special Revenue | 5.000% | 10/1/32 | 1,750 | 2,077 |
146
Intermediate-Term Tax-Exempt Fund
| | | | |
| | | | Face | Market |
| | | Maturity | Amount | Value• |
| | Coupon | Date | ($000) | ($000) |
| Jacksonville FL Special Revenue | 5.000% | 10/1/33 | 3,105 | 3,633 |
| Jacksonville FL Special Revenue | 5.000% | 10/1/34 | 1,765 | 2,058 |
| Lake County FL School Board COP | 5.000% | 6/1/28 (4) | 1,500 | 1,775 |
| Lake County FL School Board COP | 5.000% | 6/1/29 (4) | 1,750 | 2,057 |
| Lake County FL School Board COP | 5.000% | 6/1/30 (4) | 3,000 | 3,505 |
| Lake County FL School Board COP | 5.000% | 6/1/31 (4) | 5,000 | 5,892 |
| Lakeland FL Educational Facilities Revenue (Florida Southern College Project) | 5.000% | 9/1/31 | 500 | 563 |
| Lakeland FL Energy System Revenue | 5.000% | 10/1/17 | 1,000 | 1,039 |
| Lakeland FL Hospital Revenue (Lakeland Regional Health Systems) | 5.000% | 11/15/25 | 2,000 | 2,446 |
| Lakeland FL Hospital Revenue (Lakeland Regional Health Systems) | 5.000% | 11/15/26 | 2,200 | 2,716 |
| Lakeland FL Hospital Revenue (Lakeland Regional Health Systems) | 5.000% | 11/15/27 | 5,000 | 6,108 |
| Lakeland FL Hospital Revenue (Lakeland Regional Health Systems) | 5.000% | 11/15/35 | 3,000 | 3,407 |
| Lee County FL Non-Ad Valorem Revenue | 5.000% | 10/1/22 | 1,750 | 2,097 |
| Lee County FL Non-Ad Valorem Revenue | 5.000% | 10/1/23 | 2,750 | 3,354 |
| Lee County FL Non-Ad Valorem Revenue | 5.000% | 10/1/24 | 3,000 | 3,713 |
| Lee County FL School Board COP | 5.000% | 8/1/22 | 1,600 | 1,905 |
| Lee County FL School Board COP | 5.000% | 8/1/23 | 1,130 | 1,367 |
| Lee County FL School Board COP | 5.000% | 8/1/24 | 2,310 | 2,818 |
| Lee County FL School Board COP | 5.000% | 8/1/27 | 5,000 | 6,029 |
| Lee County FL School Board COP | 5.000% | 8/1/28 | 4,000 | 4,791 |
| Lee County FL School Board COP | 5.000% | 8/1/34 | 3,500 | 4,130 |
| Lee County FL School Board COP | 5.000% | 8/1/35 | 4,270 | 5,027 |
| Lee County FL Transportation Facilities Revenue | 5.000% | 10/1/26 (4) | 1,000 | 1,210 |
| Lee County FL Transportation Facilities Revenue | 5.000% | 10/1/28 (4) | 3,055 | 3,648 |
| Lee County FL Transportation Facilities Revenue | 5.000% | 10/1/30 (4) | 3,300 | 3,902 |
| Lee County FL Transportation Facilities Revenue | 5.000% | 10/1/32 (4) | 1,820 | 2,134 |
| Lee County FL Transportation Facilities Revenue | 5.000% | 10/1/33 (4) | 1,000 | 1,168 |
| Lee County FL Transportation Facilities Revenue | 5.000% | 10/1/34 (4) | 1,000 | 1,164 |
| Lee County FL Transportation Facilities Revenue | 5.000% | 10/1/35 (4) | 1,000 | 1,161 |
| Lee County FL Water & Sewer Revenue | 5.250% | 10/1/25 | 5,950 | 6,981 |
| Manatee County FL Revenue | 5.000% | 10/1/22 | 1,255 | 1,507 |
| Manatee County FL Revenue | 5.000% | 10/1/23 | 1,300 | 1,586 |
| Manatee County FL Revenue | 5.000% | 10/1/25 | 1,325 | 1,608 |
| Manatee County FL Revenue | 5.000% | 10/1/26 | 1,520 | 1,840 |
| Manatee County FL Revenue | 5.000% | 10/1/27 | 1,580 | 1,907 |
| Marco Island FL Utility System Revenue | 5.250% | 10/1/32 | 3,300 | 3,887 |
| Marco Island FL Utility System Revenue | 5.250% | 10/1/33 | 2,000 | 2,347 |
| Miami Beach FL Health Facilities Authority Revenue (Mount Sinai Medical Center) | 5.000% | 11/15/20 | 2,825 | 3,209 |
| Miami Beach FL Health Facilities Authority Revenue (Mount Sinai Medical Center) | 5.000% | 11/15/21 | 3,415 | 3,969 |
| Miami Beach FL Health Facilities Authority Revenue (Mount Sinai Medical Center) | 5.000% | 11/15/22 | 3,000 | 3,556 |
| Miami Beach FL Health Facilities Authority Revenue (Mount Sinai Medical Center) | 5.000% | 11/15/23 | 2,525 | 2,973 |
| Miami Beach FL Health Facilities Authority Revenue (Mount Sinai Medical Center) | 5.000% | 11/15/29 | 1,325 | 1,503 |
| Miami Beach FL Health Facilities Authority Revenue (Mount Sinai Medical Center) | 5.000% | 11/15/30 | 1,000 | 1,158 |
| Miami Beach FL Redevelopment Agency Tax Allocation Revenue | 5.000% | 2/1/34 | 4,000 | 4,605 |
| Miami Beach FL Redevelopment Agency Tax Allocation Revenue | 5.000% | 2/1/35 | 5,000 | 5,738 |
| Miami Beach FL Resort Tax Revenue | 5.000% | 9/1/25 | 840 | 1,043 |
| Miami Beach FL Resort Tax Revenue | 5.000% | 9/1/26 | 1,000 | 1,229 |
| Miami Beach FL Resort Tax Revenue | 5.000% | 9/1/28 | 1,300 | 1,579 |
| Miami Beach FL Resort Tax Revenue | 5.000% | 9/1/29 | 1,000 | 1,206 |
| Miami Beach FL Resort Tax Revenue | 5.000% | 9/1/30 | 1,500 | 1,799 |
| Miami Beach FL Resort Tax Revenue | 5.000% | 9/1/35 | 1,500 | 1,764 |
| Miami-Dade County FL Aviation Revenue (Miami International Airport) | 5.000% | 10/1/18 (Prere.) | 1,800 | 1,940 |
| Miami-Dade County FL Aviation Revenue (Miami International Airport) | 5.000% | 10/1/20 (Prere.) | 555 | 636 |
| Miami-Dade County FL Aviation Revenue (Miami International Airport) | 5.000% | 10/1/23 | 1,460 | 1,663 |
| Miami-Dade County FL Aviation Revenue (Miami International Airport) | 5.000% | 10/1/24 | 2,630 | 2,994 |
| Miami-Dade County FL Aviation Revenue (Miami International Airport) | 5.000% | 10/1/25 | 2,750 | 3,362 |
| Miami-Dade County FL Aviation Revenue (Miami International Airport) | 5.750% | 10/1/25 | 5,000 | 5,650 |
| Miami-Dade County FL Aviation Revenue (Miami International Airport) | 5.000% | 10/1/26 | 6,500 | 7,387 |
| Miami-Dade County FL Aviation Revenue (Miami International Airport) | 5.000% | 10/1/29 | 6,645 | 7,530 |
| Miami-Dade County FL Aviation Revenue (Miami International Airport) | 5.000% | 10/1/29 (12) | 4,000 | 4,398 |
| Miami-Dade County FL Aviation Revenue (Miami International Airport) | 5.000% | 10/1/30 | 4,460 | 5,373 |
| Miami-Dade County FL Aviation Revenue (Miami International Airport) | 5.000% | 10/1/30 | 5,500 | 6,199 |
| Miami-Dade County FL Aviation Revenue (Miami International Airport) | 5.000% | 10/1/31 | 2,055 | 2,419 |
| Miami-Dade County FL Aviation Revenue (Miami International Airport) | 5.000% | 10/1/31 | 4,765 | 5,708 |
| Miami-Dade County FL Aviation Revenue (Miami International Airport) | 5.000% | 10/1/34 | 2,000 | 2,365 |
| Miami-Dade County FL Aviation Revenue (Miami International Airport) | 5.000% | 10/1/35 | 2,450 | 2,891 |
| Miami-Dade County FL Building Better Communities GO | 5.000% | 7/1/24 | 5,000 | 6,200 |
| Miami-Dade County FL Building Better Communities GO | 5.000% | 7/1/27 | 3,600 | 4,489 |
| Miami-Dade County FL Building Better Communities GO | 5.000% | 7/1/35 | 8,210 | 9,784 |
| Miami-Dade County FL Building Better Communities GO | 5.000% | 7/1/35 | 15,390 | 18,340 |
147
Intermediate-Term Tax-Exempt Fund
| | | | |
| | | | Face | Market |
| | | Maturity | Amount | Value• |
| | Coupon | Date | ($000) | ($000) |
| Miami-Dade County FL Building Better Communities GO | 5.000% | 7/1/36 | 8,620 | 10,240 |
| Miami-Dade County FL Building Better Communities GO | 5.000% | 7/1/36 | 14,000 | 16,631 |
| Miami-Dade County FL Educational Facilities Authority Revenue (University of Miami) | 5.000% | 4/1/17 (Prere.) | 5,275 | 5,368 |
| Miami-Dade County FL Educational Facilities Authority Revenue (University of Miami) | 5.000% | 4/1/17 (Prere.) | 2,040 | 2,076 |
| Miami-Dade County FL Expressway Authority Toll System Revenue | 5.000% | 7/1/23 | 4,000 | 4,824 |
| Miami-Dade County FL Expressway Authority Toll System Revenue | 5.000% | 7/1/24 | 4,250 | 5,203 |
| Miami-Dade County FL Expressway Authority Toll System Revenue | 5.000% | 7/1/25 | 3,750 | 4,546 |
| Miami-Dade County FL Expressway Authority Toll System Revenue | 5.000% | 7/1/26 | 3,250 | 3,919 |
| Miami-Dade County FL Expressway Authority Toll System Revenue | 5.000% | 7/1/27 | 2,250 | 2,697 |
| Miami-Dade County FL Expressway Authority Toll System Revenue | 5.000% | 7/1/31 | 2,000 | 2,336 |
| Miami-Dade County FL Expressway Authority Toll System Revenue | 5.000% | 7/1/32 | 2,550 | 2,965 |
| Miami-Dade County FL Expressway Authority Toll System Revenue | 5.000% | 7/1/33 | 5,000 | 5,799 |
| Miami-Dade County FL Industrial Development Authority Revenue (Biscayne Properties LLC) | 5.000% | 6/1/30 | 2,350 | 2,546 |
| Miami-Dade County FL Industrial Development Authority Revenue (Biscayne Properties LLC) | 5.000% | 6/1/35 | 2,750 | 2,927 |
| Miami-Dade County FL School Board COP | 5.000% | 11/1/16 (Prere.) | 5,005 | 5,005 |
| Miami-Dade County FL School Board COP | 5.000% | 11/1/16 (Prere.) | 2,500 | 2,500 |
| Miami-Dade County FL School Board COP | 5.000% | 11/1/16 (Prere.) | 2,655 | 2,655 |
| Miami-Dade County FL School Board COP | 5.000% | 11/1/16 (Prere.) | 3,280 | 3,280 |
| Miami-Dade County FL School Board COP | 5.000% | 11/1/16 (Prere.) | 3,500 | 3,500 |
| Miami-Dade County FL School Board COP | 5.000% | 5/1/17 (Prere.) | 5,685 | 5,806 |
| Miami-Dade County FL School Board COP | 5.250% | 5/1/18 (Prere.) | 25,200 | 26,849 |
| Miami-Dade County FL School Board COP | 5.250% | 5/1/18 (Prere.) | 27,650 | 29,460 |
| Miami-Dade County FL School Board COP | 5.250% | 5/1/18 (Prere.) | 14,225 | 15,156 |
| Miami-Dade County FL School Board COP | 5.250% | 5/1/18 (Prere.) | 12,980 | 13,830 |
| 2 Miami-Dade County FL School Board COP | 5.250% | 5/1/18 (Prere.) | 15,530 | 16,546 |
| Miami-Dade County FL School Board COP | 5.000% | 8/1/19 (2) | 5,265 | 5,617 |
| Miami-Dade County FL School Board COP | 5.000% | 11/1/26 | 7,935 | 9,571 |
| Miami-Dade County FL School Board COP | 5.000% | 11/1/27 | 10,000 | 11,988 |
| Miami-Dade County FL School Board COP | 5.000% | 11/1/28 | 10,000 | 11,889 |
| Miami-Dade County FL School Board COP | 5.000% | 11/1/29 | 10,000 | 11,825 |
| Miami-Dade County FL Seaport Revenue | 5.750% | 10/1/30 | 2,300 | 2,726 |
| Miami-Dade County FL Seaport Revenue | 5.750% | 10/1/32 | 2,600 | 3,083 |
| Miami-Dade County FL Special Obligation Revenue | 5.000% | 10/1/24 | 2,000 | 2,378 |
| Miami-Dade County FL Special Obligation Revenue | 5.000% | 10/1/25 | 2,750 | 3,267 |
| Miami-Dade County FL Special Obligation Revenue | 5.000% | 10/1/26 | 11,340 | 13,382 |
| Miami-Dade County FL Special Obligation Revenue | 5.000% | 10/1/27 | 2,500 | 2,942 |
| Miami-Dade County FL Special Obligation Revenue | 5.000% | 10/1/28 | 8,840 | 10,353 |
| Miami-Dade County FL Special Obligation Revenue | 0.000% | 10/1/29 | 5,000 | 3,187 |
| Miami-Dade County FL Special Obligation Revenue | 5.000% | 10/1/29 | 10,000 | 11,667 |
| Miami-Dade County FL Special Obligation Revenue | 4.000% | 4/1/30 | 12,555 | 13,772 |
| Miami-Dade County FL Special Obligation Revenue | 5.000% | 10/1/30 | 12,000 | 13,948 |
| Miami-Dade County FL Special Obligation Revenue | 5.000% | 10/1/30 | 4,000 | 4,649 |
| Miami-Dade County FL Special Obligation Revenue | 4.000% | 4/1/31 | 11,270 | 12,278 |
| Miami-Dade County FL Special Obligation Revenue | 0.000% | 10/1/31 | 2,155 | 1,258 |
| Miami-Dade County FL Special Obligation Revenue | 5.000% | 10/1/31 | 13,500 | 15,586 |
| Miami-Dade County FL Special Obligation Revenue | 0.000% | 10/1/32 | 2,890 | 1,615 |
| Miami-Dade County FL Special Obligation Revenue | 5.000% | 10/1/32 | 11,550 | 13,245 |
| Miami-Dade County FL Transit Sales Surtax Revenue | 5.000% | 7/1/27 | 4,000 | 4,669 |
| Miami-Dade County FL Transit Sales Surtax Revenue | 5.000% | 7/1/28 | 2,060 | 2,396 |
| Miami-Dade County FL Transit Sales Surtax Revenue | 5.000% | 7/1/30 | 8,000 | 9,331 |
| Miami-Dade County FL Transit Sales Surtax Revenue | 5.000% | 7/1/31 | 6,250 | 7,290 |
| Miami-Dade County FL Transit Sales Surtax Revenue | 5.000% | 7/1/32 | 1,650 | 1,922 |
| Miami-Dade County FL Water & Sewer Revenue | 5.000% | 10/1/17 (Prere.) | 7,400 | 7,689 |
| Miami-Dade County FL Water & Sewer Revenue | 5.250% | 10/1/21 | 20,000 | 23,615 |
| 4 Miami-Dade County FL Water & Sewer Revenue TOB VRDO | 0.780% | 11/7/16 (4) | 14,000 | 14,000 |
| North Brevard County FL Hospital District Revenue (Parrish Medical Center Project) | 5.500% | 10/1/18 (Prere.) | 3,560 | 3,873 |
| North Brevard County FL Hospital District Revenue (Parrish Medical Center Project) | 5.500% | 10/1/28 | 1,440 | 1,548 |
| Orange County FL Health Facilities Authority Hospital Revenue (Orlando Health Inc.) | 5.250% | 10/1/21 | 8,000 | 8,931 |
| Orange County FL Health Facilities Authority Hospital Revenue (Orlando Health Inc.) | 5.000% | 10/1/29 | 3,000 | 3,650 |
| Orange County FL Health Facilities Authority Hospital Revenue (Orlando Health Inc.) | 5.000% | 10/1/30 | 1,500 | 1,807 |
| Orange County FL Health Facilities Authority Hospital Revenue (Orlando Health Inc.) | 5.000% | 10/1/33 | 5,000 | 5,899 |
| Orange County FL Health Facilities Authority Hospital Revenue (Orlando Health Inc.) | 5.000% | 10/1/35 | 6,415 | 7,484 |
| Orange County FL Health Facilities Authority Hospital Revenue (Orlando Health Inc.) | 5.000% | 10/1/36 | 5,000 | 5,810 |
| Orange County FL School Board COP | 4.500% | 8/1/18 (Prere.) | 8,400 | 8,928 |
| Orange County FL School Board COP | 4.500% | 8/1/18 (Prere.) | 7,000 | 7,440 |
| Orange County FL Tourist Development Revenue | 5.000% | 10/1/17 | 5,955 | 6,182 |
| Orange County FL Tourist Development Revenue | 5.000% | 10/1/18 (14) | 18,980 | 19,693 |
| Orange County FL Tourist Development Revenue | 5.000% | 10/1/19 | 8,680 | 9,650 |
| Orange County FL Tourist Development Revenue | 5.000% | 10/1/20 (14) | 15,345 | 15,918 |
| Orange County FL Tourist Development Revenue | 5.000% | 10/1/21 (14) | 16,605 | 17,224 |
148
Intermediate-Term Tax-Exempt Fund
| | | | |
| | | | Face | Market |
| | | Maturity | Amount | Value• |
| | Coupon | Date | ($000) | ($000) |
| Orlando & Orange County FL Expressway Authority Revenue | 5.000% | 7/1/20 (Prere.) | 3,500 | 3,988 |
| Orlando & Orange County FL Expressway Authority Revenue | 5.000% | 7/1/20 (Prere.) | 7,780 | 8,864 |
| Orlando & Orange County FL Expressway Authority Revenue | 5.000% | 7/1/20 (Prere.) | 5,000 | 5,697 |
| Orlando & Orange County FL Expressway Authority Revenue | 5.000% | 7/1/31 | 13,030 | 15,236 |
| Orlando FL Capital Improvement Revenue | 5.000% | 10/1/21 | 1,000 | 1,176 |
| Orlando FL Capital Improvement Revenue | 5.000% | 10/1/24 | 825 | 1,020 |
| Orlando FL Capital Improvement Revenue | 5.000% | 10/1/24 | 1,145 | 1,416 |
| Orlando FL Capital Improvement Revenue | 5.000% | 10/1/25 | 875 | 1,095 |
| Orlando FL Capital Improvement Revenue | 5.000% | 10/1/26 | 1,200 | 1,517 |
| Orlando FL Capital Improvement Revenue | 5.000% | 10/1/26 | 1,265 | 1,599 |
| Orlando FL Utility Commission Utility System Revenue | 5.250% | 10/1/22 | 3,245 | 3,958 |
| Orlando FL Utility Commission Utility System Revenue | 5.000% | 10/1/23 | 4,000 | 4,910 |
| Osceola County FL Expressway System Revenue (Poinciana Parkway Project) | 0.000% | 10/1/29 | 1,000 | 771 |
| Osceola County FL Expressway System Revenue (Poinciana Parkway Project) | 0.000% | 10/1/30 | 1,400 | 1,088 |
| Osceola County FL Expressway System Revenue (Poinciana Parkway Project) | 0.000% | 10/1/31 | 1,600 | 1,247 |
| Osceola County FL Expressway System Revenue (Poinciana Parkway Project) | 0.000% | 10/1/32 | 2,060 | 1,599 |
| Osceola County FL Expressway System Revenue (Poinciana Parkway Project) | 0.000% | 10/1/33 | 3,000 | 2,310 |
| Palm Beach County FL Health Facilities Authority Hospital Revenue (BRRH Corp. Obligated Group) | 5.000% | 12/1/22 | 850 | 996 |
| Palm Beach County FL Health Facilities Authority Hospital Revenue (BRRH Corp. Obligated Group) | 5.000% | 12/1/23 | 1,250 | 1,484 |
| Palm Beach County FL Health Facilities Authority Hospital Revenue (BRRH Corp. Obligated Group) | 5.000% | 12/1/24 | 1,000 | 1,197 |
| Palm Beach County FL School Board COP | 5.000% | 8/1/28 | 6,115 | 7,102 |
| Palm Beach County FL School Board COP | 5.000% | 8/1/29 | 3,595 | 4,313 |
| Palm Beach County FL School Board COP | 5.000% | 8/1/29 | 5,970 | 6,923 |
| Palm Beach County FL School Board COP | 5.000% | 8/1/31 | 10,660 | 12,659 |
| Palm Beach County FL School Board COP | 5.000% | 8/1/32 | 12,000 | 14,189 |
| Palm Beach County FL Solid Waste Authority Revenue | 5.000% | 10/1/17 | 6,000 | 6,229 |
| Palm Beach County FL Solid Waste Authority Revenue | 5.000% | 10/1/18 | 6,000 | 6,459 |
| 2 Palm Beach County FL Solid Waste Authority Revenue | 5.500% | 10/1/18 (Prere.) | 15,000 | 16,299 |
| Pasco County FL School Board COP | 5.000% | 8/1/24 | 2,315 | 2,784 |
| Port St. Lucie FL Utility Revenue | 5.000% | 9/1/18 (Prere.) | 3,790 | 4,074 |
| Port St. Lucie FL Utility Revenue | 5.000% | 9/1/24 | 780 | 958 |
| Port St. Lucie FL Utility Revenue | 5.000% | 9/1/25 | 860 | 1,067 |
| Port St. Lucie FL Utility Revenue | 5.000% | 9/1/27 | 860 | 1,067 |
| Port St. Lucie FL Utility Revenue | 5.000% | 9/1/28 | 2,500 | 3,073 |
| Port St. Lucie FL Utility Revenue | 5.000% | 9/1/29 | 2,000 | 2,441 |
| Port St. Lucie FL Utility Revenue | 5.000% | 9/1/29 (12) | 390 | 415 |
| Port St. Lucie FL Utility Revenue | 4.000% | 9/1/30 | 2,200 | 2,436 |
| Port St. Lucie FL Utility Revenue | 5.000% | 9/1/30 | 2,000 | 2,302 |
| Port St. Lucie FL Utility Revenue | 4.000% | 9/1/31 | 2,500 | 2,747 |
| Port St. Lucie FL Utility Revenue | 5.000% | 9/1/31 | 2,100 | 2,405 |
| Reedy Creek FL Improvement District GO | 5.250% | 6/1/32 | 9,600 | 11,340 |
| Reedy Creek FL Improvement District GO | 5.250% | 6/1/33 | 10,000 | 11,772 |
| Reedy Creek FL Improvement District Utilities Revenue | 5.000% | 10/1/23 | 2,505 | 2,994 |
| Sarasota County FL Infrastructure Sales Surtax Revenue | 5.000% | 10/1/23 | 1,000 | 1,227 |
| Sarasota County FL Infrastructure Sales Surtax Revenue | 5.000% | 10/1/24 | 1,550 | 1,932 |
| Sarasota County FL School Board COP | 5.000% | 7/1/18 | 2,185 | 2,324 |
| Sarasota County FL School Board COP | 5.000% | 7/1/20 | 2,855 | 3,211 |
| Sarasota County FL School Board COP | 5.000% | 7/1/20 (Prere.) | 5,380 | 6,134 |
| Sarasota County FL School Board COP | 5.000% | 7/1/20 (Prere.) | 5,050 | 5,758 |
| St. Johns County FL Development Authority Revenue | | | | |
| (Presbyterian Retirement Communities Project) | 5.750% | 8/1/30 | 1,500 | 1,681 |
| St. Lucie County FL School Board COP | 5.000% | 7/1/24 | 1,595 | 1,915 |
| Sumter County FL Industrial Development Authority Hospital Revenue | | | | |
| (Central Florida Health Alliance Project) | 5.000% | 7/1/24 | 500 | 597 |
| Sumter County FL Industrial Development Authority Hospital Revenue | | | | |
| (Central Florida Health Alliance Project) | 5.000% | 7/1/28 | 500 | 579 |
| Sumter County FL Industrial Development Authority Hospital Revenue | | | | |
| (Central Florida Health Alliance Project) | 5.000% | 7/1/29 | 500 | 576 |
| Sumter County FL Industrial Development Authority Hospital Revenue | | | | |
| (Central Florida Health Alliance Project) | 5.125% | 7/1/34 | 1,135 | 1,286 |
| Sunshine State Governmental Financing Commission Florida Revenue | | | | |
| (Miami Dade County Program) | 5.000% | 9/1/23 | 5,985 | 6,901 |
| Sunshine State Governmental Financing Commission Florida Revenue | | | | |
| (Miami Dade County Program) | 5.125% | 9/1/24 | 4,625 | 5,340 |
| Sunshine State Governmental Financing Commission Florida Revenue | | | | |
| (Miami Dade County Program) | 5.000% | 9/1/27 | 4,250 | 5,085 |
| Sunshine State Governmental Financing Commission Florida Revenue | | | | |
| (Miami Dade County Program) | 5.000% | 9/1/28 | 4,450 | 5,293 |
| Tallahassee FL Health Facilities Revenue (Tallahassee Memorial HealthCare Inc. Project) | 5.000% | 12/1/24 | 925 | 1,117 |
| Tallahassee FL Health Facilities Revenue (Tallahassee Memorial HealthCare Inc. Project) | 5.000% | 12/1/25 | 650 | 792 |
149
Intermediate-Term Tax-Exempt Fund
| | | | |
| | | | Face | Market |
| | | Maturity | Amount | Value• |
| | Coupon | Date | ($000) | ($000) |
| Tallahassee FL Health Facilities Revenue (Tallahassee Memorial HealthCare Inc. Project) | 5.000% | 12/1/27 | 1,100 | 1,323 |
| Tallahassee FL Health Facilities Revenue (Tallahassee Memorial HealthCare Inc. Project) | 5.000% | 12/1/28 | 1,450 | 1,728 |
| Tampa Bay FL Water Utility System Revenue | 6.000% | 10/1/29 (14) | 10,000 | 13,740 |
| Tampa Bay FL Water Utility System Revenue | 5.000% | 10/1/32 | 2,305 | 2,743 |
| Tampa FL Cigarette Tax Allocation Revenue (H. Lee Moffitt Cancer Center Project) | 5.000% | 9/1/21 | 1,220 | 1,409 |
| Tampa FL Cigarette Tax Allocation Revenue (H. Lee Moffitt Cancer Center Project) | 5.000% | 9/1/23 | 1,400 | 1,633 |
| Tampa FL Health System Revenue (BayCare Health System) | 5.000% | 11/15/19 | 3,580 | 3,988 |
| Tampa FL Health System Revenue (BayCare Health System) | 5.000% | 11/15/21 | 18,420 | 20,725 |
| Tampa FL Health System Revenue (BayCare Health System) | 5.000% | 11/15/22 | 13,395 | 15,168 |
| Tampa FL Health System Revenue (BayCare Health System) | 5.000% | 11/15/33 | 14,686 | 16,702 |
| Tampa FL Hospital Revenue | 5.000% | 7/1/21 | 1,000 | 1,145 |
| Tampa FL Hospital Revenue | 5.000% | 7/1/22 | 1,075 | 1,255 |
| Tampa FL Hospital Revenue | 5.000% | 7/1/24 | 1,000 | 1,152 |
| Tampa FL Hospital Revenue | 5.000% | 7/1/25 | 1,935 | 2,215 |
| Tampa FL Hospital Revenue | 5.000% | 7/1/26 | 1,500 | 1,707 |
| Tampa FL Hospital Revenue | 5.000% | 7/1/27 | 1,000 | 1,133 |
| Tampa FL Revenue (University of Tampa Project) | 5.000% | 4/1/26 | 1,400 | 1,684 |
| Tampa FL Revenue (University of Tampa Project) | 5.000% | 4/1/30 | 1,650 | 1,926 |
| Tampa FL Revenue (University of Tampa Project) | 5.000% | 4/1/32 | 1,880 | 2,173 |
| Tampa FL Revenue (University of Tampa Project) | 5.000% | 4/1/33 | 2,340 | 2,693 |
| Tampa FL Revenue (University of Tampa Project) | 5.000% | 4/1/34 | 2,505 | 2,873 |
| Tampa FL Revenue (University of Tampa Project) | 5.000% | 4/1/35 | 1,680 | 1,922 |
| Tohopekaliga FL Water Authority Utility System Revenue | 5.750% | 10/1/21 (Prere.) | 2,300 | 2,793 |
| University of South Florida Financing Corp. COP | 5.000% | 7/1/30 | 6,085 | 7,155 |
| Volusia County FL Educational Facilities Authority Revenue | | | | |
| (Embry-Riddle Aeronautical University Inc.) | 5.000% | 10/15/27 | 1,125 | 1,338 |
| Volusia County FL Educational Facilities Authority Revenue | | | | |
| (Embry-Riddle Aeronautical University Inc.) | 5.000% | 10/15/28 | 1,000 | 1,177 |
| Volusia County FL Educational Facilities Authority Revenue | | | | |
| (Embry-Riddle Aeronautical University Inc.) | 5.000% | 10/15/29 | 1,100 | 1,287 |
| Volusia County FL Educational Facilities Authority Revenue | | | | |
| (Embry-Riddle Aeronautical University Inc.) | 5.000% | 10/15/30 | 1,750 | 2,040 |
| Volusia County FL School Board COP | 5.000% | 8/1/23 | 1,000 | 1,217 |
| Volusia County FL School Board COP | 5.000% | 8/1/24 | 500 | 615 |
| Volusia County FL School Board COP | 5.000% | 8/1/25 | 1,675 | 2,043 |
| Volusia County FL School Board COP | 5.000% | 8/1/27 | 1,800 | 2,160 |
| Volusia County FL School Board COP | 5.000% | 8/1/28 | 1,650 | 1,967 |
| Volusia County FL School Board COP | 5.000% | 8/1/29 | 2,350 | 2,783 |
| Volusia County FL School Board COP | 5.000% | 8/1/30 | 3,880 | 4,574 |
| Volusia County FL School Board COP | 5.000% | 8/1/31 | 2,350 | 2,758 |
| Winter Park FL Water & Sewer Revenue | 5.000% | 12/1/29 | 1,975 | 2,191 |
| | | | | 2,803,684 |
| Georgia (2.8%) | | | | |
| Athens-Clarke County GA Unified Government Water & Sewerage Revenue | 5.000% | 1/1/27 | 2,315 | 2,838 |
| Athens-Clarke County GA Unified Government Water & Sewerage Revenue | 5.000% | 1/1/28 | 2,500 | 3,046 |
| Athens-Clarke County GA Unified Government Water & Sewerage Revenue | 4.000% | 1/1/32 | 2,000 | 2,186 |
| Atlanta GA Airport Passenger Facility Charge Revenue | 5.000% | 1/1/21 | 4,000 | 4,483 |
| Atlanta GA Airport Passenger Facility Charge Revenue | 5.000% | 1/1/22 | 10,000 | 11,187 |
| Atlanta GA Airport Passenger Facility Charge Revenue | 5.000% | 1/1/24 | 1,600 | 1,967 |
| Atlanta GA Airport Passenger Facility Charge Revenue | 5.000% | 1/1/28 | 3,000 | 3,631 |
| Atlanta GA Airport Passenger Facility Charge Revenue | 5.000% | 1/1/29 | 3,000 | 3,569 |
| Atlanta GA Airport Passenger Facility Charge Revenue | 5.000% | 1/1/30 | 5,000 | 5,884 |
| Atlanta GA Airport Passenger Facility Charge Revenue | 5.000% | 1/1/31 | 5,000 | 5,862 |
| Atlanta GA Airport Passenger Facility Charge Revenue | 5.000% | 1/1/32 | 5,500 | 6,424 |
| Atlanta GA Airport Passenger Facility Charge Revenue | 5.000% | 1/1/33 | 2,000 | 2,328 |
| Atlanta GA Airport Passenger Facility Charge Revenue | 5.000% | 1/1/34 | 2,000 | 2,320 |
| Atlanta GA Airport Revenue | 5.000% | 1/1/21 | 2,000 | 2,235 |
| Atlanta GA Airport Revenue | 5.000% | 1/1/22 | 2,300 | 2,573 |
| Atlanta GA Airport Revenue | 5.000% | 1/1/24 | 1,000 | 1,219 |
| Atlanta GA Airport Revenue | 5.875% | 1/1/24 | 3,145 | 3,721 |
| Atlanta GA Airport Revenue | 5.000% | 1/1/26 | 1,600 | 1,866 |
| Atlanta GA Airport Revenue | 5.000% | 1/1/27 | 1,390 | 1,613 |
| Atlanta GA Airport Revenue | 5.000% | 1/1/31 | 2,525 | 3,004 |
| Atlanta GA Development Authority Revenue | 5.000% | 7/1/25 | 2,480 | 3,094 |
| Atlanta GA Development Authority Revenue | 5.000% | 7/1/27 | 1,000 | 1,222 |
| Atlanta GA Development Authority Revenue | 5.000% | 7/1/28 | 1,355 | 1,640 |
| Atlanta GA Development Authority Revenue | 5.000% | 7/1/30 | 1,250 | 1,490 |
| Atlanta GA GO | 5.250% | 12/1/19 (12) | 4,925 | 5,552 |
| Atlanta GA GO | 5.250% | 12/1/20 (12) | 3,280 | 3,700 |
150
Intermediate-Term Tax-Exempt Fund
| | | | |
| | | | Face | Market |
| | | Maturity | Amount | Value• |
| | Coupon | Date | ($000) | ($000) |
| Atlanta GA Water & Wastewater Revenue | 5.000% | 11/1/16 | 4,950 | 4,950 |
| Atlanta GA Water & Wastewater Revenue | 5.500% | 11/1/16 (4) | 7,000 | 7,000 |
| Atlanta GA Water & Wastewater Revenue | 5.500% | 11/1/17 (3) | 5,400 | 5,651 |
| Atlanta GA Water & Wastewater Revenue | 5.500% | 11/1/17 (4) | 8,000 | 8,372 |
| Atlanta GA Water & Wastewater Revenue | 6.000% | 11/1/19 (Prere.) | 1,000 | 1,146 |
| Atlanta GA Water & Wastewater Revenue | 5.500% | 11/1/22 (4) | 9,800 | 11,851 |
| Atlanta GA Water & Wastewater Revenue | 5.000% | 11/1/23 | 3,000 | 3,683 |
| Atlanta GA Water & Wastewater Revenue | 5.000% | 11/1/24 | 3,000 | 3,740 |
| Atlanta GA Water & Wastewater Revenue | 5.000% | 11/1/25 | 2,500 | 3,133 |
| Atlanta GA Water & Wastewater Revenue | 5.750% | 11/1/25 (4) | 6,500 | 8,573 |
| Atlanta GA Water & Wastewater Revenue | 5.750% | 11/1/26 (4) | 15,220 | 20,470 |
| Atlanta GA Water & Wastewater Revenue | 5.750% | 11/1/27 (4) | 5,585 | 7,605 |
| 1 Atlanta GA Water & Wastewater Revenue PUT | 1.858% | 11/1/18 | 21,685 | 21,914 |
| 4 Atlanta GA Water & Wastewater Revenue TOB VRDO | 0.750% | 11/7/16 | 10,000 | 10,000 |
| Burke County GA Development Authority Pollution Control Revenue | | | | |
| (Georgia Power Co. Plant Vogtle Project) PUT | 1.750% | 6/1/17 | 15,500 | 15,560 |
| Burke County GA Development Authority Pollution Control Revenue | | | | |
| (Oglethorpe Power Corp. Vogtle Project) | 0.920% | 1/1/24 (4) | 2,350 | 2,324 |
| 3 Clarke County GA Hospital Authority Revenue (Piedmont Healthcare Inc.) | 5.000% | 7/1/20 | 750 | 847 |
| 3 Clarke County GA Hospital Authority Revenue (Piedmont Healthcare Inc.) | 5.000% | 7/1/30 | 3,285 | 3,879 |
| 3 Clarke County GA Hospital Authority Revenue (Piedmont Healthcare Inc.) | 5.000% | 7/1/31 | 3,225 | 3,790 |
| Cobb County GA Kennestone Hospital Authority Revenue | 6.250% | 4/1/34 (2) | 1,000 | 1,144 |
| Cobb County GA Kennestone Hospital Authority Revenue | 5.500% | 4/1/37 (2) | 7,500 | 8,400 |
| Dalton GA Development Authority Revenue (Hamilton Health Care System) | 5.000% | 8/15/22 | 1,675 | 1,975 |
| Dalton GA Development Authority Revenue (Hamilton Health Care System) | 5.000% | 8/15/23 | 1,975 | 2,314 |
| Dalton GA Development Authority Revenue (Hamilton Health Care System) | 5.000% | 8/15/24 | 1,000 | 1,164 |
| Dalton GA Development Authority Revenue (Hamilton Health Care System) | 5.000% | 8/15/27 | 6,880 | 7,876 |
| DeKalb County GA Private Hospital Authority (Children’s Healthcare of Atlanta Inc. Project) RAN | 5.000% | 11/15/17 | 1,250 | 1,302 |
| DeKalb County GA Private Hospital Authority (Children’s Healthcare of Atlanta Inc. Project) RAN | 5.000% | 11/15/20 | 1,400 | 1,568 |
| DeKalb County GA Water & Sewer Revenue | 5.250% | 10/1/23 | 1,410 | 1,675 |
| DeKalb County GA Water & Sewer Revenue | 5.250% | 10/1/24 | 1,500 | 1,782 |
| DeKalb County GA Water & Sewer Revenue | 5.250% | 10/1/31 | 2,225 | 2,619 |
| DeKalb County GA Water & Sewer Revenue | 5.250% | 10/1/32 | 4,000 | 4,698 |
| Fayette County GA Hospital Authority (Fayette Community Hospital Project) RAN | 5.250% | 6/15/23 | 11,395 | 12,513 |
| Forsyth County GA GO | 5.000% | 3/1/20 | 2,145 | 2,425 |
| 3 Fulton County GA Development Authority Revenue (Piedmont Healthcare Inc. Project) | 5.000% | 7/1/20 | 760 | 860 |
| Fulton County GA Development Authority Revenue (Piedmont Healthcare Inc. Project) | 5.250% | 6/15/23 | 6,110 | 6,710 |
| 3 Fulton County GA Development Authority Revenue (Piedmont Healthcare Inc. Project) | 5.000% | 7/1/30 | 3,010 | 3,576 |
| 3 Fulton County GA Development Authority Revenue (Piedmont Healthcare Inc. Project) | 5.000% | 7/1/32 | 2,640 | 3,088 |
| Fulton County GA Residential Care Facilities for the Elderly Authority Revenue (Lenbrook Square) | 4.000% | 7/1/25 | 1,000 | 1,101 |
| Fulton County GA Residential Care Facilities for the Elderly Authority Revenue (Lenbrook Square) | 4.000% | 7/1/26 | 1,000 | 1,095 |
| Fulton County GA Residential Care Facilities for the Elderly Authority Revenue (Lenbrook Square) | 5.000% | 7/1/31 | 7,000 | 7,884 |
| Fulton County GA Water & Sewer Revenue | 5.000% | 1/1/33 | 10,000 | 11,638 |
| Georgia GO | 5.000% | 7/1/17 | 36,235 | 37,279 |
| Georgia GO | 5.000% | 2/1/19 | 33,695 | 36,761 |
| 3 Georgia GO | 5.000% | 7/1/19 | 18,000 | 19,893 |
| Georgia GO | 5.000% | 7/1/19 | 5,000 | 5,535 |
| Georgia GO | 4.000% | 11/1/19 | 2,500 | 2,724 |
| 3 Georgia GO | 5.000% | 12/1/19 | 12,995 | 14,562 |
| 3 Georgia GO | 5.000% | 1/1/20 | 22,000 | 24,706 |
| Georgia GO | 5.000% | 2/1/20 | 34,000 | 38,341 |
| Georgia GO | 5.000% | 7/1/20 | 3,000 | 3,427 |
| Georgia GO | 5.000% | 7/1/20 | 10,000 | 11,425 |
| Georgia GO | 5.000% | 7/1/20 | 18,460 | 21,090 |
| 3 Georgia GO | 5.000% | 7/1/20 | 21,065 | 24,031 |
| Georgia GO | 5.000% | 11/1/20 | 9,240 | 10,666 |
| 3 Georgia GO | 5.000% | 12/1/20 | 13,660 | 15,785 |
| Georgia GO | 5.000% | 2/1/21 | 46,000 | 53,469 |
| Georgia GO | 5.000% | 10/1/21 | 8,000 | 9,472 |
| Georgia GO | 5.000% | 1/1/22 | 9,415 | 11,212 |
| 3 Georgia GO | 5.000% | 1/1/22 | 14,000 | 16,650 |
| Georgia GO | 5.000% | 2/1/22 | 6,590 | 7,866 |
| Georgia GO | 5.000% | 2/1/22 | 13,425 | 16,024 |
| 3 Georgia GO | 5.000% | 7/1/22 | 22,000 | 26,512 |
| Georgia GO | 4.000% | 10/1/22 | 2,150 | 2,488 |
| 3 Georgia GO | 5.000% | 12/1/22 | 46,000 | 56,021 |
| Georgia GO | 5.000% | 2/1/23 | 18,395 | 22,469 |
| Georgia GO | 5.000% | 7/1/23 | 20,160 | 24,308 |
| Georgia GO | 5.000% | 2/1/25 | 3,000 | 3,707 |
| Georgia GO | 4.000% | 7/1/25 | 22,000 | 26,208 |
151
Intermediate-Term Tax-Exempt Fund
| | | | |
| | | | Face | Market |
| | | Maturity | Amount | Value• |
| | Coupon | Date | ($000) | ($000) |
| Georgia GO | 5.000% | 2/1/27 | 10,000 | 12,253 |
| Georgia Municipal Electric Power Authority Revenue | 5.000% | 1/1/22 | 12,000 | 14,093 |
| Georgia Municipal Electric Power Authority Revenue | 5.000% | 1/1/24 | 4,000 | 4,806 |
| Georgia Municipal Electric Power Authority Revenue | 5.000% | 1/1/25 | 1,300 | 1,551 |
| Georgia Road & Tollway Authority Revenue | 5.000% | 3/1/19 | 15,500 | 16,960 |
| Georgia Road & Tollway Authority Revenue | 5.000% | 10/1/21 | 2,420 | 2,865 |
| Glynn-Brunswick GA Memorial Hospital Authority Revenue | | | | |
| (Southeast Georgia Health System Obligated Group) | 5.000% | 8/1/30 | 4,365 | 5,165 |
| Glynn-Brunswick GA Memorial Hospital Authority Revenue | | | | |
| (Southeast Georgia Health System Obligated Group) | 5.000% | 8/1/34 | 7,000 | 8,108 |
| Gwinnett County GA School District GO | 5.000% | 2/1/17 | 2,100 | 2,123 |
| Gwinnett County GA School District GO | 5.000% | 8/1/20 | 20,000 | 22,909 |
| Gwinnett County GA School District GO | 5.000% | 2/1/21 | 10,000 | 11,624 |
| Gwinnett County GA School District GO | 5.000% | 8/1/21 | 23,000 | 27,101 |
| Henry County GA Hospital Authority Revenue (Piedmont Fayette Hospital Project) | 5.000% | 7/1/30 | 5,375 | 6,202 |
| Henry County GA Hospital Authority Revenue (Piedmont Fayette Hospital Project) | 5.000% | 7/1/34 | 10,000 | 11,360 |
| Macon-Bibb County GA Hospital Authority Revenue (Medical Center of Central Georgia) | 5.000% | 8/1/22 | 1,430 | 1,571 |
| Macon-Bibb County GA Hospital Authority Revenue (Medical Center of Central Georgia) | 5.000% | 8/1/24 | 1,250 | 1,368 |
| Main Street Natural Gas Inc. Georgia Gas Project Revenue | 5.000% | 3/15/17 | 2,340 | 2,371 |
| Main Street Natural Gas Inc. Georgia Gas Project Revenue | 5.250% | 9/15/19 | 30 | 33 |
| Main Street Natural Gas Inc. Georgia Gas Project Revenue | 5.000% | 3/15/20 | 23,970 | 26,394 |
| Main Street Natural Gas Inc. Georgia Gas Project Revenue | 5.000% | 3/15/20 | 2,270 | 2,479 |
| Main Street Natural Gas Inc. Georgia Gas Project Revenue | 5.000% | 3/15/21 | 6,765 | 7,556 |
| Main Street Natural Gas Inc. Georgia Gas Project Revenue | 5.000% | 3/15/21 | 37,000 | 41,690 |
| Main Street Natural Gas Inc. Georgia Gas Project Revenue | 5.000% | 3/15/22 | 10,720 | 12,123 |
| Metropolitan Atlanta GA Rapid Transportation Authority Georgia Sales Tax Revenue | 5.250% | 7/1/26 (14) | 4,800 | 6,102 |
| Metropolitan Atlanta Rapid Transportation Authority Georgia Sales Tax Revenue | 5.000% | 7/1/33 | 29,440 | 35,809 |
| Metropolitan Atlanta Rapid Transportation Authority Georgia Sales Tax Revenue | 5.000% | 7/1/34 | 30,915 | 37,426 |
| Metropolitan Atlanta Rapid Transportation Authority Georgia Sales Tax Revenue | 5.000% | 7/1/35 | 31,365 | 37,851 |
| Metropolitan Atlanta Rapid Transportation Authority Georgia Sales Tax Revenue | 5.000% | 7/1/36 | 22,080 | 26,520 |
| Municipal Electric Authority Georgia Revenue | 5.000% | 4/1/17 | 3,980 | 4,051 |
| Municipal Electric Authority Georgia Revenue | 5.750% | 7/1/18 (Prere.) | 38,065 | 41,138 |
| Municipal Electric Authority Georgia Revenue | 5.000% | 1/1/19 | 3,580 | 3,882 |
| Municipal Electric Authority Georgia Revenue | 5.750% | 1/1/19 | 13,375 | 14,406 |
| Municipal Electric Authority Georgia Revenue | 5.000% | 4/1/19 | 3,160 | 3,456 |
| Municipal Electric Authority Georgia Revenue | 5.000% | 1/1/20 | 15,000 | 16,791 |
| Municipal Electric Authority Georgia Revenue | 4.000% | 1/1/21 | 7,725 | 8,565 |
| Municipal Electric Authority Georgia Revenue | 5.000% | 1/1/21 | 2,810 | 3,233 |
| Municipal Electric Authority Georgia Revenue | 5.000% | 11/1/23 | 14,605 | 16,612 |
| Municipal Electric Authority Georgia Revenue | 5.000% | 11/1/24 | 11,650 | 13,231 |
| Municipal Electric Authority Georgia Revenue | 5.000% | 1/1/25 | 2,125 | 2,623 |
| Municipal Electric Authority Georgia Revenue | 5.000% | 1/1/28 | 29,195 | 36,163 |
| Municipal Electric Authority Georgia Revenue | 5.000% | 1/1/28 | 16,215 | 20,085 |
| Municipal Electric Authority Georgia Revenue | 5.000% | 1/1/30 | 1,050 | 1,244 |
| Municipal Electric Authority Georgia Revenue | 5.000% | 1/1/33 | 2,115 | 2,476 |
| Municipal Electric Authority Georgia Revenue | 5.000% | 1/1/34 | 2,000 | 2,333 |
| Municipal Electric Authority Georgia Revenue | 5.000% | 1/1/35 | 5,000 | 5,814 |
| Municipal Electric Authority Georgia Revenue (Project One) | 5.000% | 1/1/21 | 7,600 | 8,743 |
| Private Colleges & University Authority of Georgia Revenue (Emory University) | 5.000% | 10/1/20 | 1,220 | 1,401 |
| Private Colleges & University Authority of Georgia Revenue (Emory University) | 5.000% | 10/1/21 | 775 | 913 |
| Private Colleges & University Authority of Georgia Revenue (Emory University) | 5.000% | 10/1/23 | 510 | 628 |
| Private Colleges & University Authority of Georgia Revenue (Emory University) | 5.000% | 9/1/29 | 3,340 | 3,704 |
| Richmond County GA Hospital Authority (University Health Services Inc. Project) RAN | 5.500% | 1/1/19 (Prere.) | 17,500 | 19,188 |
| Savannah GA Hospital Authority Revenue (St. Joseph’s/Candler Health System, Inc.) | 5.500% | 7/1/30 | 4,000 | 4,765 |
| Savannah GA Hospital Authority Revenue (St. Joseph’s/Candler Health System, Inc.) | 5.500% | 7/1/31 | 4,000 | 4,749 |
| | | | | 1,489,787 |
| Guam (0.0%) | | | | |
| Guam Government Business Privilege Tax Revenue | 5.000% | 11/15/23 | 6,280 | 7,373 |
| Guam Government Business Privilege Tax Revenue | 5.000% | 11/15/24 | 4,790 | 5,678 |
| Guam Government Business Privilege Tax Revenue | 5.000% | 11/15/25 | 4,200 | 5,019 |
| Guam Government Waterworks Authority Water & Waste Water System Revenue | 5.000% | 7/1/36 | 300 | 343 |
| Guam International Airport Authority Revenue | 5.000% | 10/1/23 | 2,310 | 2,715 |
| | | | | 21,128 |
| Hawaii (1.0%) | | | | |
| Hawaii Airports System Revenue | 5.250% | 7/1/30 | 13,975 | 15,792 |
| Hawaii County HI GO | 5.000% | 9/1/28 | 1,000 | 1,241 |
| Hawaii County HI GO | 5.000% | 9/1/29 | 2,065 | 2,543 |
| Hawaii County HI GO | 5.000% | 9/1/30 | 1,000 | 1,223 |
| Hawaii GO | 4.000% | 11/1/17 | 4,100 | 4,233 |
152
Intermediate-Term Tax-Exempt Fund
| | | | |
| | | | Face | Market |
| | | Maturity | Amount | Value• |
| | Coupon | Date | ($000) | ($000) |
| Hawaii GO | 5.000% | 12/1/18 | 9,250 | 10,027 |
| Hawaii GO | 5.000% | 10/1/20 | 5,500 | 6,307 |
| Hawaii GO | 5.000% | 10/1/20 | 9,910 | 11,365 |
| Hawaii GO | 5.000% | 12/1/20 | 4,480 | 5,161 |
| Hawaii GO | 5.000% | 10/1/21 | 3,055 | 3,600 |
| Hawaii GO | 5.000% | 10/1/21 | 5,000 | 5,893 |
| Hawaii GO | 5.000% | 11/1/22 | 11,155 | 13,488 |
| Hawaii GO | 5.000% | 12/1/22 | 10,000 | 11,795 |
| Hawaii GO | 5.000% | 8/1/24 | 14,970 | 18,634 |
| Hawaii GO | 5.000% | 8/1/24 | 8,970 | 11,165 |
| Hawaii GO | 5.000% | 10/1/24 | 10,000 | 12,479 |
| Hawaii GO | 5.000% | 10/1/24 | 9,000 | 11,231 |
| Hawaii GO | 5.000% | 11/1/24 | 22,305 | 26,705 |
| Hawaii GO | 5.000% | 4/1/25 | 19,785 | 24,780 |
| Hawaii GO | 5.000% | 8/1/25 | 4,105 | 5,099 |
| Hawaii GO | 5.000% | 8/1/25 | 2,500 | 3,106 |
| Hawaii GO | 5.000% | 10/1/25 | 12,000 | 15,150 |
| Hawaii GO | 5.000% | 10/1/25 | 6,680 | 8,434 |
| Hawaii GO | 5.000% | 10/1/25 | 9,000 | 11,363 |
| Hawaii GO | 4.000% | 4/1/26 | 26,025 | 30,662 |
| Hawaii GO | 5.000% | 10/1/28 | 7,760 | 9,757 |
| Hawaii GO | 5.000% | 8/1/29 | 8,500 | 10,313 |
| Hawaii GO | 4.000% | 4/1/30 | 21,685 | 24,321 |
| Hawaii GO | 4.000% | 10/1/30 | 17,750 | 20,009 |
| Hawaii GO | 4.000% | 4/1/31 | 21,410 | 23,842 |
| Hawaii GO | 4.000% | 10/1/31 | 8,000 | 8,951 |
| Hawaii GO | 5.000% | 8/1/33 | 2,865 | 3,409 |
| Hawaii Highway Revenue | 4.000% | 1/1/22 | 1,000 | 1,137 |
| Hawaii Highway Revenue | 5.000% | 1/1/24 | 2,500 | 3,077 |
| Hawaii Highway Revenue | 5.000% | 1/1/25 | 4,000 | 4,978 |
| Hawaii Highway Revenue | 5.000% | 1/1/26 | 2,500 | 3,156 |
| Hawaii Highway Revenue | 5.000% | 1/1/32 | 2,180 | 2,593 |
| Hawaii Pacific Health Revenue | 5.625% | 7/1/30 | 2,345 | 2,639 |
| Honolulu HI City & County GO | 5.000% | 7/1/17 (Prere.) | 3,000 | 3,084 |
| Honolulu HI City & County GO | 5.000% | 7/1/17 (Prere.) | 2,705 | 2,781 |
| Honolulu HI City & County GO | 4.000% | 10/1/18 | 1,920 | 2,030 |
| Honolulu HI City & County GO | 5.250% | 7/1/19 (4) | 4,755 | 5,275 |
| Honolulu HI City & County GO | 4.000% | 10/1/19 | 2,515 | 2,724 |
| Honolulu HI City & County GO | 5.000% | 10/1/19 | 2,055 | 2,285 |
| Honolulu HI City & County GO | 5.000% | 10/1/19 | 3,365 | 3,741 |
| Honolulu HI City & County GO | 5.000% | 10/1/20 | 3,675 | 4,208 |
| Honolulu HI City & County GO | 5.000% | 10/1/20 | 5,015 | 5,743 |
| Honolulu HI City & County GO | 5.000% | 8/1/21 (Prere.) | 5,000 | 5,881 |
| Honolulu HI City & County GO | 5.000% | 10/1/22 | 4,205 | 5,058 |
| Honolulu HI City & County GO | 5.000% | 10/1/22 | 1,000 | 1,203 |
| Honolulu HI City & County GO | 5.000% | 10/1/22 | 4,000 | 4,812 |
| Honolulu HI City & County GO | 5.000% | 11/1/22 | 3,000 | 3,616 |
| Honolulu HI City & County GO | 5.000% | 11/1/23 | 3,500 | 4,207 |
| Honolulu HI City & County GO | 5.000% | 8/1/24 | 4,535 | 5,327 |
| Honolulu HI City & County GO | 5.000% | 10/1/26 | 7,500 | 9,407 |
| Honolulu HI City & County GO | 5.000% | 10/1/26 | 5,000 | 6,272 |
| Honolulu HI City & County GO | 5.000% | 10/1/27 | 4,000 | 4,970 |
| Honolulu HI City & County GO | 5.000% | 10/1/28 | 4,000 | 4,987 |
| Honolulu HI City & County GO | 5.000% | 10/1/31 | 12,690 | 15,404 |
| Honolulu HI City & County Wastewater System Revenue | 5.000% | 7/1/25 | 1,340 | 1,681 |
| Honolulu HI City & County Wastewater System Revenue | 5.000% | 7/1/26 | 3,000 | 3,744 |
| Honolulu HI City & County Wastewater System Revenue | 5.000% | 7/1/27 | 1,075 | 1,352 |
| Honolulu HI City & County Wastewater System Revenue | 4.000% | 7/1/28 | 6,175 | 7,074 |
| Honolulu HI City & County Wastewater System Revenue | 4.000% | 7/1/29 | 10,000 | 11,346 |
| Honolulu HI City & County Wastewater System Revenue | 5.000% | 7/1/30 | 8,220 | 9,955 |
| Honolulu HI City & County Wastewater System Revenue | 5.000% | 7/1/34 | 6,765 | 8,040 |
| Honolulu HI City & County Wastewater System Revenue | 5.000% | 7/1/35 | 6,835 | 8,100 |
| | | | | 543,965 |
| Idaho (0.1%) | | | | |
| Idaho Bond Bank Authority Revenue | 5.250% | 3/15/19 (Prere.) | 715 | 786 |
| Idaho Bond Bank Authority Revenue | 5.250% | 3/15/19 (Prere.) | 755 | 831 |
| Idaho Bond Bank Authority Revenue | 5.250% | 3/15/19 (Prere.) | 285 | 313 |
| Idaho Bond Bank Authority Revenue | 5.250% | 3/15/19 (Prere.) | 1,245 | 1,370 |
| 2 Idaho Health Facilities Authority Revenue (Trinity Health Group) | 6.125% | 12/1/18 (Prere.) | 12,050 | 13,331 |
153
Intermediate-Term Tax-Exempt Fund
| | | | |
| | | | Face | Market |
| | | Maturity | Amount | Value• |
| | Coupon | Date | ($000) | ($000) |
| Idaho Health Facilities Authority Revenue (Trinity Health Group) | 5.000% | 12/1/24 | 1,500 | 1,858 |
| Idaho Health Facilities Authority Revenue (Trinity Health Group) | 5.000% | 12/1/25 | 2,750 | 3,407 |
| Idaho Health Facilities Authority Revenue (Trinity Health Group) | 5.000% | 12/1/30 | 3,250 | 3,759 |
| Idaho Housing & Finance Association RAN | 4.750% | 7/15/19 | 5,000 | 5,457 |
| | | | | 31,112 |
| Illinois (5.9%) | | | | |
| Berwyn IL GO | 5.000% | 12/1/25 (4) | 5,000 | 5,203 |
| Chicago IL Board of Education GO | 5.000% | 12/1/16 (ETM) | 3,085 | 3,096 |
| Chicago IL Board of Education GO | 0.000% | 12/1/18 (14) | 4,520 | 4,235 |
| Chicago IL Board of Education GO | 5.000% | 12/1/18 (4) | 2,500 | 2,577 |
| Chicago IL Board of Education GO | 0.000% | 12/1/19 (14) | 5,610 | 5,079 |
| Chicago IL Board of Education GO | 5.000% | 12/1/19 (12) | 1,015 | 1,071 |
| Chicago IL Board of Education GO | 5.000% | 12/1/19 (4) | 6,130 | 6,319 |
| Chicago IL Board of Education GO | 6.000% | 1/1/20 (14) | 6,300 | 6,619 |
| Chicago IL Board of Education GO | 5.000% | 12/1/20 (4) | 1,500 | 1,546 |
| Chicago IL Board of Education GO | 5.500% | 12/1/21 (4)(2) | 4,090 | 4,558 |
| Chicago IL Board of Education GO | 5.000% | 12/1/22 | 18,500 | 17,393 |
| Chicago IL Board of Education GO | 5.500% | 12/1/22 (4) | 9,625 | 10,811 |
| Chicago IL Board of Education GO | 5.000% | 12/1/23 (4) | 1,105 | 1,137 |
| Chicago IL Board of Education GO | 5.250% | 12/1/24 (4) | 1,840 | 1,945 |
| Chicago IL Board of Education GO | 5.250% | 12/1/25 | 8,000 | 7,451 |
| Chicago IL Board of Education GO | 5.000% | 12/1/26 (4) | 12,640 | 12,937 |
| Chicago IL Board of Education GO | 5.250% | 12/1/26 (12) | 3,360 | 3,550 |
| Chicago IL Board of Education GO | 7.000% | 12/1/26 | 19,500 | 20,709 |
| Chicago IL Board of Education GO | 5.000% | 12/1/33 | 20,500 | 18,571 |
| Chicago IL Board of Education GO | 5.250% | 12/1/35 | 11,985 | 11,086 |
| 1 Chicago IL Board of Education GO PUT | 4.630% | 3/1/17 | 11,700 | 11,689 |
| Chicago IL GO | 5.250% | 1/1/17 (14) | 2,300 | 2,310 |
| Chicago IL GO | 5.500% | 1/1/17 (ETM) | 7,065 | 7,120 |
| Chicago IL GO | 5.500% | 1/1/17 (4) | 11,365 | 11,424 |
| Chicago IL GO | 5.000% | 1/1/18 (4) | 17,530 | 17,591 |
| Chicago IL GO | 5.000% | 1/1/21 (4) | 18,155 | 18,303 |
| Chicago IL GO | 5.000% | 1/1/21 (14) | 5,490 | 5,707 |
| Chicago IL GO | 5.000% | 1/1/25 | 20,465 | 21,922 |
| Chicago IL GO | 5.000% | 1/1/26 | 11,500 | 12,275 |
| Chicago IL GO | 5.000% | 1/1/26 (4) | 1,160 | 1,166 |
| Chicago IL GO | 5.000% | 1/1/27 (14) | 5,000 | 5,194 |
| Chicago IL GO | 5.000% | 1/1/28 (14) | 5,000 | 5,194 |
| Chicago IL Metropolitan Water Reclamation District GO | 5.000% | 12/1/30 | 35,000 | 40,056 |
| Chicago IL Midway Airport Revenue | 5.000% | 1/1/23 | 2,500 | 3,005 |
| Chicago IL Midway Airport Revenue | 5.000% | 1/1/24 | 3,400 | 4,060 |
| Chicago IL Midway Airport Revenue | 5.000% | 1/1/26 | 6,040 | 6,984 |
| Chicago IL Midway Airport Revenue | 5.000% | 1/1/32 | 10,000 | 11,391 |
| Chicago IL Midway Airport Revenue | 5.000% | 1/1/33 | 10,000 | 11,364 |
| Chicago IL Midway Airport Revenue | 5.000% | 1/1/34 | 6,700 | 7,600 |
| Chicago IL Midway Airport Revenue | 5.000% | 1/1/35 | 2,200 | 2,489 |
| Chicago IL Motor Fuel Tax Revenue | 5.000% | 1/1/23 | 1,200 | 1,294 |
| Chicago IL Motor Fuel Tax Revenue | 5.000% | 1/1/24 | 1,110 | 1,201 |
| Chicago IL Motor Fuel Tax Revenue | 5.000% | 1/1/28 | 1,000 | 1,051 |
| Chicago IL Motor Fuel Tax Revenue | 5.000% | 1/1/29 | 1,000 | 1,044 |
| Chicago IL O’Hare International Airport Revenue | 5.000% | 1/1/18 | 4,000 | 4,184 |
| Chicago IL O’Hare International Airport Revenue | 5.000% | 1/1/18 (4) | 7,025 | 7,074 |
| Chicago IL O’Hare International Airport Revenue | 5.000% | 1/1/19 (4) | 8,920 | 9,325 |
| Chicago IL O’Hare International Airport Revenue | 5.000% | 1/1/19 (4) | 22,920 | 23,076 |
| Chicago IL O’Hare International Airport Revenue | 5.000% | 1/1/22 (4) | 18,295 | 19,093 |
| Chicago IL O’Hare International Airport Revenue | 5.000% | 1/1/23 (4) | 15,275 | 15,936 |
| Chicago IL O’Hare International Airport Revenue | 5.000% | 1/1/24 (4) | 18,250 | 19,040 |
| Chicago IL O’Hare International Airport Revenue | 5.000% | 1/1/24 | 3,000 | 3,478 |
| Chicago IL O’Hare International Airport Revenue | 5.250% | 1/1/24 | 1,250 | 1,473 |
| Chicago IL O’Hare International Airport Revenue | 5.000% | 1/1/25 | 7,410 | 8,531 |
| Chicago IL O’Hare International Airport Revenue | 5.000% | 1/1/25 | 5,500 | 6,747 |
| Chicago IL O’Hare International Airport Revenue | 5.500% | 1/1/25 | 1,500 | 1,786 |
| Chicago IL O’Hare International Airport Revenue | 5.000% | 1/1/26 | 4,000 | 4,582 |
| Chicago IL O’Hare International Airport Revenue | 5.500% | 1/1/26 | 1,000 | 1,190 |
| Chicago IL O’Hare International Airport Revenue | 5.000% | 1/1/27 | 3,560 | 4,057 |
| Chicago IL O’Hare International Airport Revenue | 5.500% | 1/1/27 | 2,435 | 2,888 |
| Chicago IL O’Hare International Airport Revenue | 5.000% | 1/1/28 | 3,000 | 3,405 |
| Chicago IL O’Hare International Airport Revenue | 5.000% | 1/1/28 | 10,750 | 12,899 |
| Chicago IL O’Hare International Airport Revenue | 5.000% | 1/1/29 (4) | 2,300 | 2,694 |
154
Intermediate-Term Tax-Exempt Fund
| | | | |
| | | | Face | Market |
| | | Maturity | Amount | Value• |
| | Coupon | Date | ($000) | ($000) |
| Chicago IL O’Hare International Airport Revenue | 5.000% | 1/1/29 | 3,000 | 3,388 |
| Chicago IL O’Hare International Airport Revenue | 5.000% | 1/1/29 | 10,300 | 12,258 |
| Chicago IL O’Hare International Airport Revenue | 5.000% | 1/1/30 | 3,220 | 3,618 |
| Chicago IL O’Hare International Airport Revenue | 5.000% | 1/1/31 | 2,900 | 3,249 |
| Chicago IL O’Hare International Airport Revenue | 5.000% | 1/1/31 | 22,500 | 26,449 |
| Chicago IL O’Hare International Airport Revenue | 5.500% | 1/1/31 | 13,495 | 15,432 |
| Chicago IL O’Hare International Airport Revenue | 5.500% | 1/1/31 | 10,000 | 11,435 |
| Chicago IL O’Hare International Airport Revenue | 5.000% | 1/1/32 | 10,000 | 11,699 |
| Chicago IL O’Hare International Airport Revenue | 5.000% | 1/1/33 (4) | 74,685 | 77,696 |
| Chicago IL O’Hare International Airport Revenue | 5.000% | 1/1/33 | 20,040 | 23,429 |
| Chicago IL O’Hare International Airport Revenue | 5.250% | 1/1/33 (4) | 1,000 | 1,163 |
| Chicago IL Park District GO | 5.000% | 1/1/21 | 2,000 | 2,244 |
| Chicago IL Park District GO | 5.000% | 1/1/25 | 4,425 | 4,933 |
| 3 Chicago IL Park District GO | 5.000% | 1/1/25 | 625 | 734 |
| 3 Chicago IL Park District GO | 5.000% | 1/1/26 | 500 | 591 |
| 3 Chicago IL Park District GO | 5.000% | 1/1/27 | 1,000 | 1,172 |
| 3 Chicago IL Park District GO | 5.000% | 1/1/28 | 1,000 | 1,164 |
| 3 Chicago IL Park District GO | 5.000% | 1/1/29 | 785 | 906 |
| 3 Chicago IL Park District GO | 5.000% | 1/1/30 | 1,000 | 1,144 |
| 3 Chicago IL Park District GO | 5.000% | 1/1/31 | 1,000 | 1,138 |
| 3 Chicago IL Park District GO | 5.000% | 1/1/31 | 2,000 | 2,277 |
| 3 Chicago IL Park District GO | 5.000% | 1/1/33 | 2,000 | 2,255 |
| 3 Chicago IL Park District GO | 5.000% | 1/1/34 | 2,000 | 2,246 |
| Chicago IL Park District Harbor Facilities GO | 5.000% | 1/1/28 | 4,835 | 5,337 |
| Chicago IL Park District Harbor Facilities GO | 5.000% | 1/1/29 | 5,170 | 5,685 |
| Chicago IL Park District Harbor Facilities GO | 5.000% | 1/1/30 | 2,770 | 3,035 |
| Chicago IL Transit Authority Capital Grant Receipts Revenue | 5.000% | 12/1/16 (Prere.) | 2,455 | 2,464 |
| Chicago IL Transit Authority Capital Grant Receipts Revenue | 5.000% | 12/1/16 (Prere.) | 7,545 | 7,572 |
| Chicago IL Transit Authority Capital Grant Receipts Revenue | 5.500% | 6/1/18 | 7,435 | 7,888 |
| Chicago IL Transit Authority Capital Grant Receipts Revenue | 5.000% | 6/1/20 | 4,900 | 5,206 |
| Chicago IL Transit Authority Capital Grant Receipts Revenue | 5.000% | 6/1/20 (12) | 3,185 | 3,389 |
| Chicago IL Transit Authority Capital Grant Receipts Revenue | 5.250% | 6/1/24 (12) | 5,000 | 5,228 |
| Chicago IL Transit Authority Capital Grant Receipts Revenue | 5.250% | 6/1/25 (12) | 11,000 | 11,488 |
| Chicago IL Transit Authority Capital Grant Receipts Revenue | 5.250% | 6/1/26 (12) | 8,260 | 8,620 |
| Chicago IL Transit Authority Capital Grant Receipts Revenue | 5.000% | 6/1/27 | 31,170 | 33,438 |
| Chicago IL Transit Authority Capital Grant Receipts Revenue | 5.000% | 6/1/27 | 13,085 | 14,037 |
| Chicago IL Transit Authority Capital Grant Receipts Revenue | 5.000% | 6/1/28 | 30,225 | 32,221 |
| Chicago IL Transit Authority Sales Tax Receipts Revenue | 5.000% | 12/1/19 | 9,915 | 10,809 |
| Chicago IL Transit Authority Sales Tax Receipts Revenue | 5.250% | 12/1/30 | 10,000 | 11,209 |
| 4 Chicago IL Transit Authority Sales Tax Receipts Revenue TOB VRDO | 0.830% | 11/7/16 | 15,380 | 15,380 |
| Chicago IL Wastewater Transmission Revenue | 5.000% | 1/1/23 | 2,435 | 2,800 |
| Chicago IL Wastewater Transmission Revenue | 5.000% | 1/1/28 | 1,550 | 1,760 |
| Chicago IL Wastewater Transmission Revenue | 5.000% | 1/1/30 | 1,450 | 1,623 |
| Chicago IL Wastewater Transmission Revenue | 5.000% | 1/1/31 | 2,000 | 2,225 |
| Chicago IL Wastewater Transmission Revenue | 5.000% | 1/1/32 | 1,875 | 2,077 |
| Chicago IL Wastewater Transmission Revenue | 5.000% | 1/1/33 | 2,100 | 2,318 |
| Chicago IL Water Revenue | 5.000% | 11/1/19 (4) | 17,565 | 18,727 |
| Chicago IL Water Revenue | 5.000% | 11/1/23 | 1,670 | 1,920 |
| Chicago IL Water Revenue | 5.000% | 11/1/24 | 1,500 | 1,719 |
| Chicago IL Water Revenue | 5.000% | 11/1/25 | 2,000 | 2,275 |
| Chicago IL Water Revenue | 5.000% | 11/1/26 | 2,000 | 2,271 |
| Chicago IL Water Revenue | 5.000% | 11/1/28 | 5,000 | 5,606 |
| Chicago IL Water Revenue | 5.000% | 11/1/30 | 3,590 | 3,996 |
| Chicago IL Water Revenue | 5.000% | 11/1/31 | 3,000 | 3,336 |
| Chicago IL Water Revenue | 5.000% | 11/1/32 | 3,000 | 3,324 |
| Chicago IL Waterworks Revenue | 5.000% | 11/1/22 | 1,000 | 1,155 |
| Chicago IL Waterworks Revenue | 5.000% | 11/1/29 | 1,000 | 1,152 |
| Chicago IL Waterworks Revenue | 5.000% | 11/1/31 | 2,000 | 2,273 |
| Chicago IL Waterworks Revenue | 5.000% | 11/1/33 | 2,000 | 2,251 |
| Chicago IL Waterworks Revenue | 5.000% | 11/1/36 (2) | 7,580 | 7,604 |
| Cook County IL Community College District GO | 5.000% | 3/1/19 (Prere.) | 1,100 | 1,149 |
| Cook County IL Community College District GO | 5.000% | 12/1/24 | 2,000 | 2,297 |
| Cook County IL Community College District GO | 5.250% | 12/1/26 | 2,000 | 2,310 |
| Cook County IL Community College District GO | 5.250% | 12/1/27 | 2,000 | 2,297 |
| Cook County IL Community College District GO | 5.250% | 12/1/28 | 2,000 | 2,276 |
| Cook County IL Forest Preservation District GO | 5.000% | 12/15/24 | 1,020 | 1,142 |
| Cook County IL Forest Preservation District GO | 5.000% | 12/15/25 | 1,000 | 1,113 |
| Cook County IL Forest Preservation District GO | 5.000% | 12/15/26 | 2,225 | 2,468 |
| Cook County IL Forest Preservation District GO | 5.000% | 12/15/26 | 2,485 | 2,757 |
| Cook County IL Forest Preservation District GO | 5.000% | 12/15/27 | 2,335 | 2,655 |
155
Intermediate-Term Tax-Exempt Fund
| | | | |
| | | | Face | Market |
| | | Maturity | Amount | Value• |
| | Coupon | Date | ($000) | ($000) |
| Cook County IL Forest Preservation District GO | 5.000% | 12/15/27 | 2,605 | 2,876 |
| Cook County IL Forest Preservation District GO | 5.000% | 12/15/28 | 2,455 | 2,693 |
| Cook County IL Forest Preservation District GO | 5.000% | 12/15/28 | 2,240 | 2,457 |
| Cook County IL Forest Preservation District GO | 5.000% | 12/15/32 | 5,000 | 5,489 |
| Cook County IL GO | 5.000% | 11/15/18 | 8,000 | 8,551 |
| Cook County IL GO | 5.000% | 11/15/20 | 7,500 | 8,201 |
| Cook County IL GO | 5.000% | 11/15/21 | 5,410 | 5,897 |
| Cook County IL GO | 5.250% | 11/15/28 | 35,500 | 39,585 |
| Cook County IL High School District No. 205 (Thornton Township) GO | 5.500% | 12/1/17 (12) | 2,000 | 2,095 |
| Du Page & Cook Counties IL Community Consolidated School District GO | 4.500% | 1/1/21 (14) | 4,900 | 4,931 |
| Du Page & Cook Counties IL Community Consolidated School District GO | 5.000% | 6/1/24 | 1,750 | 2,116 |
| Du Page & Cook Counties IL Community Consolidated School District GO | 5.000% | 6/1/25 | 1,820 | 2,182 |
| Du Page & Cook Counties IL Community Consolidated School District GO | 5.000% | 6/1/26 | 2,290 | 2,739 |
| Du Page & Cook Counties IL Community Consolidated School District GO | 5.000% | 6/1/27 | 2,000 | 2,386 |
| Grundy & Will Counties IL Community Unified School District GO | 5.875% | 2/1/23 | 2,315 | 2,500 |
| Grundy & Will Counties IL Community Unified School District GO | 5.875% | 2/1/25 | 2,720 | 2,936 |
| Grundy & Will Counties IL Community Unified School District GO | 5.875% | 2/1/26 | 3,060 | 3,302 |
| Grundy & Will Counties IL Community Unified School District GO | 5.875% | 8/1/28 | 6,520 | 7,033 |
| Illinois Finance Authority Revenue (Advocate Health Care Network) | 6.125% | 11/1/18 (Prere.) | 3,000 | 3,309 |
| Illinois Finance Authority Revenue (Advocate Health Care Network) | 5.000% | 4/1/19 (Prere.) | 4,715 | 5,165 |
| Illinois Finance Authority Revenue (Advocate Health Care Network) | 5.000% | 4/1/19 | 1,500 | 1,638 |
| Illinois Finance Authority Revenue (Advocate Health Care Network) | 5.000% | 4/1/20 | 2,000 | 2,188 |
| Illinois Finance Authority Revenue (Advocate Health Care Network) | 5.000% | 4/1/21 | 6,535 | 7,133 |
| Illinois Finance Authority Revenue (Advocate Health Care Network) | 5.000% | 4/1/22 | 5,285 | 5,749 |
| Illinois Finance Authority Revenue (Advocate Health Care Network) | 5.000% | 8/1/23 | 1,000 | 1,208 |
| Illinois Finance Authority Revenue (Advocate Health Care Network) | 5.000% | 8/1/24 | 1,200 | 1,472 |
| Illinois Finance Authority Revenue (Advocate Health Care Network) | 5.000% | 8/1/28 | 3,885 | 4,617 |
| Illinois Finance Authority Revenue (Advocate Health Care Network) | 5.000% | 8/1/29 | 5,000 | 5,903 |
| Illinois Finance Authority Revenue (Advocate Health Care Network) PUT | 5.000% | 2/12/20 | 6,595 | 7,385 |
| Illinois Finance Authority Revenue (Art Institute of Chicago) | 5.000% | 3/1/30 | 3,000 | 3,412 |
| Illinois Finance Authority Revenue (Carle Foundation) | 5.625% | 8/15/31 | 10,000 | 11,573 |
| Illinois Finance Authority Revenue (Centegra Health System) | 5.000% | 9/1/27 | 15,000 | 16,676 |
| Illinois Finance Authority Revenue (Centegra Health System) | 5.000% | 9/1/28 | 1,290 | 1,467 |
| Illinois Finance Authority Revenue (Centegra Health System) | 5.000% | 9/1/32 | 7,575 | 8,253 |
| Illinois Finance Authority Revenue (Centegra Health System) | 5.000% | 9/1/34 | 5,000 | 5,550 |
| Illinois Finance Authority Revenue (Central DuPage Health) | 5.000% | 11/1/27 | 17,390 | 19,148 |
| Illinois Finance Authority Revenue (Central DuPage Health) | 5.125% | 11/1/29 | 15,000 | 16,553 |
| Illinois Finance Authority Revenue (Children’s Memorial Hospital) | 5.500% | 8/15/28 | 21,760 | 23,385 |
| Illinois Finance Authority Revenue (Christian Homes Inc.) | 5.000% | 5/15/26 | 1,000 | 1,178 |
| Illinois Finance Authority Revenue (Christian Homes Inc.) | 5.000% | 5/15/31 | 1,875 | 2,093 |
| Illinois Finance Authority Revenue (DePaul University) | 5.000% | 10/1/28 | 2,000 | 2,431 |
| Illinois Finance Authority Revenue (DePaul University) | 5.000% | 10/1/29 | 2,000 | 2,412 |
| Illinois Finance Authority Revenue (DePaul University) | 5.000% | 10/1/30 | 1,000 | 1,197 |
| Illinois Finance Authority Revenue (DePaul University) | 5.000% | 10/1/33 | 2,000 | 2,356 |
| Illinois Finance Authority Revenue (Franciscan Communities Inc.) | 4.000% | 5/15/23 | 1,000 | 1,041 |
| Illinois Finance Authority Revenue (Franciscan Communities Inc.) | 4.750% | 5/15/33 | 8,225 | 8,606 |
| Illinois Finance Authority Revenue (Illinois Wesleyan University) | 5.000% | 9/1/36 | 1,000 | 1,126 |
| Illinois Finance Authority Revenue (Loyola University) | 5.000% | 7/1/25 | 8,750 | 10,104 |
| Illinois Finance Authority Revenue (Loyola University) | 5.000% | 7/1/26 | 3,595 | 4,132 |
| Illinois Finance Authority Revenue (Loyola University) | 5.000% | 7/1/27 | 1,495 | 1,710 |
| Illinois Finance Authority Revenue (Loyola University) | 5.000% | 7/1/28 | 1,570 | 1,786 |
| Illinois Finance Authority Revenue (Loyola University) | 5.000% | 7/1/29 | 1,650 | 1,868 |
| Illinois Finance Authority Revenue (Loyola University) | 5.000% | 7/1/30 | 1,730 | 1,950 |
| Illinois Finance Authority Revenue (Loyola University) | 5.000% | 7/1/31 | 1,815 | 2,038 |
| Illinois Finance Authority Revenue (Loyola University) | 5.000% | 7/1/32 | 1,905 | 2,132 |
| Illinois Finance Authority Revenue (Memorial Health System) | 5.250% | 4/1/29 | 12,670 | 13,686 |
| Illinois Finance Authority Revenue (Mercy Health System) | 5.000% | 12/1/23 | 1,215 | 1,443 |
| Illinois Finance Authority Revenue (Mercy Health System) | 5.000% | 12/1/24 | 5,125 | 6,136 |
| Illinois Finance Authority Revenue (Mercy Health System) | 4.000% | 12/1/28 | 7,885 | 8,564 |
| Illinois Finance Authority Revenue (Mercy Health System) | 4.000% | 12/1/31 | 6,500 | 6,904 |
| Illinois Finance Authority Revenue (Mercy Health System) | 4.000% | 12/1/32 | 10,000 | 10,563 |
| Illinois Finance Authority Revenue (Mercy Health System) | 5.000% | 12/1/33 | 3,840 | 4,393 |
| Illinois Finance Authority Revenue (Mercy Health System) | 5.000% | 12/1/34 | 3,500 | 3,995 |
| Illinois Finance Authority Revenue (Northwestern Community Hospital) | 5.250% | 7/1/18 (Prere.) | 8,500 | 9,113 |
| Illinois Finance Authority Revenue (Northwestern Community Hospital) | 5.750% | 8/15/30 | 9,000 | 10,133 |
| Illinois Finance Authority Revenue (Northwestern Community Hospital) | 5.000% | 7/1/33 | 5,000 | 5,861 |
| Illinois Finance Authority Revenue (Northwestern Community Hospital) | 5.000% | 7/1/35 | 5,500 | 6,412 |
| Illinois Finance Authority Revenue (Northwestern Community Hospital) | 5.000% | 7/1/36 | 2,500 | 2,910 |
| Illinois Finance Authority Revenue (OSF Healthcare System) | 7.000% | 5/15/19 (Prere.) | 10,000 | 11,503 |
| Illinois Finance Authority Revenue (OSF Healthcare System) | 5.000% | 5/15/22 | 2,000 | 2,347 |
156
Intermediate-Term Tax-Exempt Fund
| | | | |
| | | | Face | Market |
| | | Maturity | Amount | Value• |
| | Coupon | Date | ($000) | ($000) |
| Illinois Finance Authority Revenue (OSF Healthcare System) | 5.000% | 5/15/23 | 3,750 | 4,386 |
| Illinois Finance Authority Revenue (OSF Healthcare System) | 5.000% | 11/15/23 | 1,000 | 1,202 |
| Illinois Finance Authority Revenue (OSF Healthcare System) | 4.500% | 5/15/24 | 5,000 | 5,583 |
| Illinois Finance Authority Revenue (OSF Healthcare System) | 5.000% | 11/15/24 | 1,600 | 1,947 |
| Illinois Finance Authority Revenue (OSF Healthcare System) | 5.000% | 11/15/25 | 1,950 | 2,387 |
| Illinois Finance Authority Revenue (OSF Healthcare System) | 5.000% | 5/15/26 | 1,000 | 1,224 |
| Illinois Finance Authority Revenue (OSF Healthcare System) | 5.000% | 11/15/28 | 1,250 | 1,491 |
| Illinois Finance Authority Revenue (OSF Healthcare System) | 5.000% | 11/15/29 | 2,000 | 2,371 |
| Illinois Finance Authority Revenue (OSF Healthcare System) | 5.000% | 5/15/30 | 2,300 | 2,715 |
| Illinois Finance Authority Revenue (OSF Healthcare System) | 4.000% | 5/15/31 | 2,150 | 2,292 |
| Illinois Finance Authority Revenue (Palos Community Hospital) | 5.375% | 5/15/30 | 24,070 | 26,554 |
| Illinois Finance Authority Revenue (Presence Health Network Obligated Group) | 5.000% | 2/15/24 | 5,000 | 5,719 |
| Illinois Finance Authority Revenue (Presence Health Network Obligated Group) | 5.000% | 2/15/25 | 8,000 | 9,176 |
| Illinois Finance Authority Revenue (Presence Health Network Obligated Group) | 5.000% | 2/15/26 | 8,000 | 9,198 |
| Illinois Finance Authority Revenue (Presence Health Network Obligated Group) | 5.000% | 2/15/27 | 10,000 | 11,578 |
| Illinois Finance Authority Revenue (Presence Health Network Obligated Group) | 5.000% | 2/15/28 | 13,750 | 15,707 |
| Illinois Finance Authority Revenue (Presence Health Network Obligated Group) | 5.000% | 2/15/32 | 10,000 | 11,131 |
| Illinois Finance Authority Revenue (Riverside Health System) | 4.000% | 11/15/30 | 2,500 | 2,664 |
| Illinois Finance Authority Revenue (Riverside Health System) | 4.000% | 11/15/31 | 2,000 | 2,114 |
| Illinois Finance Authority Revenue (Riverside Health System) | 4.000% | 11/15/32 | 2,000 | 2,096 |
| Illinois Finance Authority Revenue (Rush University Medical Center) | 5.000% | 11/1/18 (Prere.) | 5,000 | 5,403 |
| Illinois Finance Authority Revenue (Rush University Medical Center) | 5.750% | 11/1/18 (Prere.) | 3,000 | 3,286 |
| Illinois Finance Authority Revenue (Rush University Medical Center) | 6.375% | 5/1/19 (Prere.) | 7,000 | 7,929 |
| Illinois Finance Authority Revenue (Rush University Medical Center) | 5.000% | 11/15/25 | 2,870 | 3,534 |
| Illinois Finance Authority Revenue (Rush University Medical Center) | 5.000% | 11/15/26 | 4,000 | 4,868 |
| Illinois Finance Authority Revenue (Rush University Medical Center) | 5.000% | 11/15/27 | 4,000 | 4,839 |
| Illinois Finance Authority Revenue (Rush University Medical Center) | 5.000% | 11/15/28 | 4,000 | 4,786 |
| Illinois Finance Authority Revenue (Silver Cross & Medical Centers) | 5.000% | 8/15/25 | 1,000 | 1,192 |
| Illinois Finance Authority Revenue (Silver Cross & Medical Centers) | 5.500% | 8/15/30 | 8,000 | 8,398 |
| Illinois Finance Authority Revenue (Silver Cross & Medical Centers) | 5.000% | 8/15/35 | 2,700 | 3,050 |
| Illinois Finance Authority Revenue (Southern Illinois Healthcare) | 5.250% | 3/1/30 (4) | 7,000 | 7,708 |
| Illinois Finance Authority Revenue (University of Chicago Medical Center) | 5.000% | 8/15/19 | 11,605 | 12,851 |
| Illinois Finance Authority Revenue (University of Chicago Medical Center) | 5.000% | 8/15/20 | 3,185 | 3,631 |
| Illinois Finance Authority Revenue (University of Chicago Medical Center) | 5.000% | 8/15/22 | 10,000 | 11,354 |
| 3 Illinois Finance Authority Revenue (University of Chicago Medical Center) | 5.000% | 8/15/24 | 1,100 | 1,338 |
| 3 Illinois Finance Authority Revenue (University of Chicago Medical Center) | 5.000% | 8/15/25 | 1,200 | 1,467 |
| 3 Illinois Finance Authority Revenue (University of Chicago Medical Center) | 5.000% | 8/15/26 | 1,700 | 2,088 |
| Illinois Finance Authority Revenue (University of Chicago) | 5.000% | 10/1/22 | 2,000 | 2,346 |
| Illinois Finance Authority Revenue (University of Chicago) | 5.000% | 10/1/22 | 2,000 | 2,393 |
| Illinois Finance Authority Revenue (University of Chicago) | 5.000% | 10/1/23 | 4,000 | 4,666 |
| Illinois Finance Authority Revenue (University of Chicago) | 5.000% | 10/1/23 | 5,265 | 6,405 |
| Illinois Finance Authority Revenue (University of Chicago) | 5.000% | 10/1/24 | 5,195 | 6,048 |
| Illinois Finance Authority Revenue (University of Chicago) | 5.000% | 10/1/25 | 2,990 | 3,464 |
| Illinois Finance Authority Revenue (University of Chicago) | 5.000% | 10/1/26 | 3,500 | 4,067 |
| Illinois Finance Authority Revenue (University of Chicago) | 5.000% | 10/1/28 | 4,400 | 5,081 |
| Illinois Finance Authority Revenue (University of Chicago) | 5.000% | 10/1/28 | 15,000 | 17,940 |
| Illinois Finance Authority Revenue (University of Chicago) | 5.000% | 10/1/29 | 4,250 | 4,904 |
| Illinois Finance Authority Revenue (University of Chicago) | 5.000% | 10/1/29 | 12,250 | 14,563 |
| Illinois Finance Authority Revenue (University of Chicago) | 5.000% | 10/1/30 | 5,250 | 6,085 |
| Illinois Finance Authority Revenue (University of Chicago) | 5.000% | 10/1/31 | 15,000 | 17,654 |
| Illinois Finance Authority Revenue (University of Chicago) | 5.000% | 10/1/31 | 5,300 | 6,130 |
| Illinois Finance Authority Revenue (University of Chicago) | 5.000% | 10/1/32 | 15,000 | 17,584 |
| Illinois Finance Authority Revenue (University of Chicago) | 5.000% | 10/1/32 | 1,050 | 1,212 |
| Illinois Finance Authority Revenue (University of Chicago) | 5.000% | 10/1/35 | 28,975 | 33,696 |
| Illinois GO | 5.000% | 1/1/17 | 22,985 | 23,131 |
| Illinois GO | 5.000% | 3/1/17 | 1,550 | 1,569 |
| Illinois GO | 5.000% | 8/1/17 | 8,760 | 8,982 |
| Illinois GO | 5.000% | 1/1/20 (4) | 8,635 | 9,329 |
| Illinois GO | 5.000% | 8/1/20 | 2,000 | 2,155 |
| Illinois GO | 5.000% | 1/1/21 (4) | 21,470 | 23,012 |
| Illinois GO | 5.250% | 1/1/21 | 7,525 | 8,226 |
| Illinois GO | 5.000% | 8/1/21 | 25,000 | 27,261 |
| Illinois GO | 5.000% | 1/1/22 | 2,740 | 2,897 |
| Illinois GO | 5.000% | 2/1/22 | 6,000 | 6,552 |
| Illinois GO | 5.000% | 7/1/22 | 7,000 | 7,677 |
| Illinois GO | 5.000% | 8/1/22 (4) | 11,720 | 13,034 |
| Illinois GO | 5.000% | 2/1/23 | 7,000 | 7,684 |
| 3 Illinois GO | 5.000% | 2/1/23 | 5,000 | 5,489 |
| Illinois GO | 5.000% | 7/1/23 | 6,000 | 6,608 |
| Illinois GO | 5.000% | 8/1/23 | 17,000 | 18,732 |
157
Intermediate-Term Tax-Exempt Fund
| | | | |
| | | | Face | Market |
| | | Maturity | Amount | Value• |
| | Coupon | Date | ($000) | ($000) |
| Illinois GO | 4.000% | 1/1/24 | 14,000 | 14,334 |
| Illinois GO | 5.000% | 2/1/24 | 6,270 | 6,910 |
| Illinois GO | 5.000% | 6/1/24 | 7,000 | 7,725 |
| Illinois GO | 5.500% | 7/1/24 | 19,000 | 21,397 |
| Illinois GO | 5.000% | 8/1/24 | 25,335 | 27,360 |
| Illinois GO | 5.000% | 11/1/24 (2) | 5,000 | 5,017 |
| Illinois GO | 5.000% | 1/1/25 | 17,000 | 18,772 |
| Illinois GO | 5.000% | 2/1/26 | 11,125 | 12,061 |
| 3 Illinois GO | 5.000% | 2/1/26 | 20,000 | 22,074 |
| Illinois GO | 5.000% | 4/1/26 (2) | 12,600 | 12,643 |
| Illinois GO | 5.000% | 4/1/26 (4) | 16,175 | 17,724 |
| Illinois GO | 5.000% | 6/1/26 | 5,100 | 5,117 |
| Illinois GO | 5.000% | 6/1/26 | 120 | 120 |
| Illinois GO | 5.500% | 7/1/26 | 7,000 | 7,839 |
| 3 Illinois GO | 5.000% | 2/1/27 | 33,500 | 36,956 |
| Illinois GO | 5.000% | 4/1/27 | 3,840 | 4,139 |
| Illinois GO | 5.500% | 7/1/27 | 8,000 | 8,928 |
| Illinois GO | 5.000% | 1/1/28 | 5,000 | 5,436 |
| 3 Illinois GO | 5.000% | 2/1/28 | 10,305 | 11,283 |
| Illinois GO | 5.000% | 4/1/28 (4) | 4,515 | 4,886 |
| Illinois GO | 5.250% | 7/1/28 | 7,500 | 8,237 |
| Illinois GO | 5.000% | 1/1/29 | 19,200 | 20,706 |
| Illinois GO | 5.250% | 2/1/29 | 8,750 | 9,553 |
| Illinois GO | 5.000% | 3/1/29 | 23,000 | 24,118 |
| Illinois GO | 5.250% | 2/1/30 | 13,000 | 14,158 |
| Illinois GO | 5.000% | 1/1/31 | 11,000 | 11,435 |
| Illinois GO | 5.250% | 2/1/31 | 9,000 | 9,772 |
| Illinois GO | 5.000% | 3/1/31 | 7,985 | 8,310 |
| Illinois GO | 5.250% | 7/1/31 | 6,000 | 6,504 |
| Illinois GO | 5.000% | 9/1/31 | 6,500 | 6,694 |
| Illinois GO | 4.000% | 6/1/33 | 20,880 | 19,998 |
| Illinois GO | 5.500% | 7/1/33 (4) | 3,300 | 3,712 |
| Illinois Regional Transportation Authority Revenue | 6.250% | 7/1/22 (4) | 5,000 | 6,255 |
| Illinois Regional Transportation Authority Revenue | 6.000% | 7/1/23 (14) | 5,000 | 6,326 |
| Illinois Regional Transportation Authority Revenue | 6.250% | 7/1/23 (4) | 11,475 | 14,694 |
| Illinois Sales Tax Revenue | 0.000% | 12/15/16 (2) | 5,000 | 4,991 |
| Illinois Sales Tax Revenue | 5.000% | 6/15/18 | 12,000 | 12,755 |
| Illinois Sales Tax Revenue | 5.375% | 6/15/18 | 9,860 | 10,525 |
| Illinois Sales Tax Revenue | 5.000% | 6/15/19 (Prere.) | 1,345 | 1,484 |
| Illinois Sales Tax Revenue | 5.000% | 6/15/19 | 6,000 | 6,592 |
| Illinois Sales Tax Revenue | 5.000% | 6/15/20 | 3,880 | 4,265 |
| Illinois Sales Tax Revenue | 5.375% | 6/15/20 | 9,635 | 10,985 |
| Illinois Sales Tax Revenue | 5.000% | 6/15/21 | 15,000 | 17,334 |
| Illinois Sales Tax Revenue | 5.000% | 6/15/22 | 22,720 | 26,829 |
| Illinois Toll Highway Authority Revenue | 5.000% | 1/1/22 | 4,100 | 4,815 |
| Illinois Toll Highway Authority Revenue | 5.000% | 12/1/22 | 12,700 | 15,231 |
| Illinois Toll Highway Authority Revenue | 5.000% | 1/1/27 | 1,250 | 1,475 |
| Illinois Toll Highway Authority Revenue | 5.000% | 1/1/28 | 1,250 | 1,469 |
| Illinois Toll Highway Authority Revenue | 5.000% | 1/1/28 | 2,500 | 2,760 |
| Illinois Toll Highway Authority Revenue | 5.000% | 1/1/29 | 3,500 | 4,086 |
| Illinois Toll Highway Authority Revenue | 5.000% | 1/1/30 | 3,745 | 4,347 |
| Illinois Toll Highway Authority Revenue | 5.000% | 1/1/31 | 8,000 | 9,250 |
| Illinois Toll Highway Authority Revenue | 5.000% | 1/1/31 | 1,410 | 1,646 |
| Illinois Toll Highway Authority Revenue | 5.000% | 1/1/31 | 6,100 | 7,151 |
| Illinois Toll Highway Authority Revenue | 5.000% | 12/1/31 | 12,000 | 14,271 |
| Illinois Toll Highway Authority Revenue | 5.000% | 1/1/32 | 9,000 | 10,367 |
| Illinois Toll Highway Authority Revenue | 5.000% | 1/1/32 | 1,650 | 1,925 |
| Illinois Toll Highway Authority Revenue | 5.000% | 12/1/32 | 7,000 | 8,287 |
| Illinois Toll Highway Authority Revenue | 5.000% | 1/1/33 | 9,000 | 10,334 |
| Illinois Toll Highway Authority Revenue | 5.000% | 1/1/33 | 2,500 | 2,906 |
| Illinois Toll Highway Authority Revenue | 5.000% | 1/1/33 | 11,100 | 12,898 |
| Illinois Toll Highway Authority Revenue | 5.000% | 1/1/34 | 2,000 | 2,345 |
| Illinois Toll Highway Authority Revenue | 5.000% | 1/1/34 | 3,850 | 4,461 |
| Illinois Toll Highway Authority Revenue | 5.000% | 1/1/34 | 11,700 | 13,558 |
| Illinois Toll Highway Authority Revenue | 5.000% | 1/1/35 | 2,060 | 2,404 |
| Illinois Unemployment Insurance Fund Building Receipts Revenue | 4.000% | 12/15/16 | 2,650 | 2,661 |
| Illinois Unemployment Insurance Fund Building Receipts Revenue | 5.000% | 12/15/16 | 5,490 | 5,519 |
| Illinois Unemployment Insurance Fund Building Receipts Revenue | 5.000% | 6/15/18 | 7,500 | 7,538 |
| Kane McHenry Cook & DeKalb County IL Unit School District GO | 5.000% | 1/1/21 | 1,715 | 1,952 |
| Lake County IL Community High School District No. 127 GO | 0.000% | 2/1/19 | 5,000 | 4,813 |
158
Intermediate-Term Tax-Exempt Fund
| | | | |
| | | | Face | Market |
| | | Maturity | Amount | Value• |
| | Coupon | Date | ($000) | ($000) |
| Lake County IL Community High School District No. 127 GO | 0.000% | 2/1/20 | 5,000 | 4,699 |
| Lake County IL Community High School District No. 127 GO | 0.000% | 2/1/22 | 5,690 | 5,105 |
| McHenry & Kane Counties IL Community Consolidated School District No. 158 GO | 5.625% | 1/15/31 | 3,500 | 4,080 |
| McHenry & Kane Counties IL Community Consolidated School District No. 158 GO | 5.625% | 1/15/32 | 4,000 | 4,647 |
| McHenry County IL Conservation District GO | 5.000% | 2/1/22 | 3,000 | 3,527 |
| Metropolitan Pier & Exposition Authority Illinois Dedicated Sales Tax Revenue | 0.000% | 12/15/16 (14) | 11,330 | 11,309 |
| Metropolitan Pier & Exposition Authority Illinois Dedicated Sales Tax Revenue | 0.000% | 6/15/19 (14) | 38,440 | 35,834 |
| Metropolitan Pier & Exposition Authority Illinois Dedicated Sales Tax Revenue | 0.000% | 12/15/21 (14) | 6,000 | 5,092 |
| Metropolitan Pier & Exposition Authority Illinois Dedicated Sales Tax Revenue | 0.000% | 12/15/23 (14) | 32,515 | 25,385 |
| Metropolitan Pier & Exposition Authority Illinois Dedicated Sales Tax Revenue | 0.000% | 12/15/23 (14) | 21,000 | 16,395 |
| Metropolitan Pier & Exposition Authority Illinois Dedicated Sales Tax Revenue | 0.000% | 12/15/24 (14) | 23,795 | 17,717 |
| Metropolitan Pier & Exposition Authority Illinois Dedicated Sales Tax Revenue | 0.000% | 12/15/25 (14) | 29,785 | 21,081 |
| Metropolitan Pier & Exposition Authority Illinois Dedicated Sales Tax Revenue | 0.000% | 6/15/26 (4) | 10,725 | 7,401 |
| Metropolitan Pier & Exposition Authority Illinois Dedicated Sales Tax Revenue | 0.000% | 6/15/27 (4) | 9,400 | 6,164 |
| Metropolitan Pier & Exposition Authority Illinois Dedicated Sales Tax Revenue | 0.000% | 12/15/29 (14) | 40,000 | 22,865 |
| Metropolitan Pier & Exposition Authority Illinois Dedicated Sales Tax Revenue | 0.000% | 6/15/30 (4) | 115 | 64 |
| Metropolitan Pier & Exposition Authority Illinois Dedicated Sales Tax Revenue | 0.000% | 12/15/31 (14) | 72,685 | 37,636 |
| Metropolitan Pier & Exposition Authority Illinois Dedicated Sales Tax Revenue | 0.000% | 6/15/33 (14) | 41,400 | 19,952 |
| Metropolitan Pier & Exposition Authority Illinois Dedicated Sales Tax Revenue | | | | |
| (McCormick Place Expansion Project) | 0.000% | 6/15/31 (14) | 44,205 | 23,393 |
| Metropolitan Pier & Exposition Authority Illinois Dedicated Sales Tax Revenue | | | | |
| (McCormick Place Expansion Project) | 0.000% | 6/15/32 (14) | 25,135 | 12,696 |
| Northern Illinois Municipal Power Agency Project Revenue | 5.000% | 12/1/24 | 1,125 | 1,367 |
| Northern Illinois Municipal Power Agency Project Revenue | 5.000% | 12/1/25 | 3,000 | 3,674 |
| Northern Illinois Municipal Power Agency Project Revenue | 5.000% | 12/1/26 | 2,200 | 2,717 |
| Northern Illinois Municipal Power Agency Project Revenue | 5.000% | 12/1/27 | 1,985 | 2,424 |
| Northern Illinois Municipal Power Agency Project Revenue | 4.000% | 12/1/31 | 1,750 | 1,890 |
| Northern Illinois Municipal Power Agency Project Revenue | 4.000% | 12/1/32 | 2,000 | 2,153 |
| Peoria IL Public Building Community School District Revenue | 0.000% | 12/1/16 (12) | 2,900 | 2,897 |
| Railsplitter Tobacco Settlement Authority Illinois Tobacco Settlement Revenue | 5.000% | 6/1/17 | 6,000 | 6,138 |
| Railsplitter Tobacco Settlement Authority Illinois Tobacco Settlement Revenue | 5.000% | 6/1/18 | 5,000 | 5,290 |
| Railsplitter Tobacco Settlement Authority Illinois Tobacco Settlement Revenue | 5.500% | 6/1/23 | 37,000 | 42,895 |
| Railsplitter Tobacco Settlement Authority Illinois Tobacco Settlement Revenue | 6.000% | 6/1/28 | 10,000 | 11,743 |
| Southwestern Illinois Development Authority Revenue (Local Government Program) | 5.000% | 4/15/30 | 10,000 | 11,073 |
| Springfield IL Water Revenue | 5.000% | 3/1/29 | 2,525 | 2,929 |
| Springfield IL Water Revenue | 5.000% | 3/1/30 | 2,000 | 2,320 |
| Springfield IL Water Revenue | 5.000% | 3/1/31 | 2,785 | 3,227 |
| Springfield IL Water Revenue | 5.000% | 3/1/32 | 3,035 | 3,516 |
| University of Illinois Auxiliary Facilities System Revenue | 5.000% | 4/1/21 | 3,430 | 3,842 |
| University of Illinois Auxiliary Facilities System Revenue | 5.000% | 4/1/22 | 6,015 | 6,702 |
| University of Illinois Auxiliary Facilities System Revenue | 5.000% | 4/1/29 | 2,075 | 2,395 |
| University of Illinois Auxiliary Facilities System Revenue | 5.000% | 4/1/30 | 2,000 | 2,297 |
| University of Illinois Auxiliary Facilities System Revenue | 5.250% | 4/1/30 | 5,000 | 5,579 |
| University of Illinois Auxiliary Facilities System Revenue | 5.000% | 4/1/31 | 2,420 | 2,754 |
| University of Illinois Auxiliary Facilities System Revenue | 5.000% | 4/1/33 | 2,000 | 2,258 |
| University of Illinois Auxiliary Facilities System Revenue | 5.000% | 4/1/34 | 2,000 | 2,253 |
| University of Illinois COP | 4.000% | 8/15/19 | 10,000 | 10,709 |
| University of Illinois COP | 4.000% | 10/1/19 | 5,115 | 5,492 |
| Waubonsee IL Community College District No. 516 GO | 5.000% | 12/15/23 | 1,715 | 2,004 |
| Waubonsee IL Community College District No. 516 GO | 5.000% | 12/15/24 | 7,950 | 9,196 |
| Waubonsee IL Community College District No. 516 GO | 5.000% | 12/15/25 | 3,405 | 3,908 |
| Will County IL Community High School District No. 210 (Lincoln-Way) GO | 5.000% | 1/1/28 | 8,800 | 8,996 |
| Will County IL Community High School District No. 210 (Lincoln-Way) GO | 0.000% | 1/1/29 | 5,920 | 3,231 |
| Will County IL Community High School District No. 210 (Lincoln-Way) GO | 0.000% | 1/1/30 | 5,680 | 2,908 |
| Will County IL Community High School District No. 210 (Lincoln-Way) GO | 5.000% | 1/1/30 | 5,500 | 5,561 |
| Will County IL Community High School District No. 210 (Lincoln-Way) GO | 5.000% | 1/1/31 | 8,150 | 8,210 |
| Winnebago & Boone Counties IL Rockford School District No. 205 GO | 0.000% | 2/1/24 | 7,980 | 6,718 |
| Winnebago & Boone Counties IL Rockford School District No. 205 GO | 0.000% | 2/1/25 | 4,065 | 3,307 |
| Winnebago & Boone Counties IL Rockford School District No. 205 GO | 0.000% | 2/1/26 | 3,645 | 2,838 |
| Winnebago & Boone Counties IL Rockford School District No. 205 GO | 0.000% | 2/1/27 | 2,000 | 1,500 |
| | | | | 3,110,371 |
| Indiana (1.3%) | | | | |
| Carmel IN Local Public Improvement Bond Bank Revenue | 5.000% | 7/15/31 | 5,000 | 6,047 |
| Carmel IN Local Public Improvement Bond Bank Revenue | 5.000% | 7/15/32 | 8,105 | 9,748 |
| Carmel IN Local Public Improvement Bond Bank Revenue | 5.000% | 7/15/33 | 9,110 | 10,905 |
| Carmel IN Local Public Improvement Bond Bank Revenue | 5.000% | 7/15/34 | 9,630 | 11,482 |
| Carmel IN Local Public Improvement Bond Bank Revenue | 5.000% | 1/15/36 | 13,470 | 15,985 |
| Decatur Township IN Multi-School Buildings Corp. Revenue | 5.000% | 1/15/17 (Prere.) | 5,695 | 5,744 |
| Franklin IN Community Multi-School Building Corp. Revenue | 5.000% | 7/15/23 (4) | 2,480 | 2,964 |
159
Intermediate-Term Tax-Exempt Fund
| | | | |
| | | | Face | Market |
| | | Maturity | Amount | Value• |
| | Coupon | Date | ($000) | ($000) |
| Indiana Bond Bank Special Program Gas Revenue | 5.250% | 10/15/21 | 145 | 167 |
| Indiana Finance Authority Facilities Revenue (Miami Correctional Facility - Phase II) | 5.000% | 7/1/17 (ETM) | 3,315 | 3,409 |
| Indiana Finance Authority Facilities Revenue (Miami Correctional Facility - Phase II) | 5.000% | 7/1/18 (ETM) | 4,085 | 4,364 |
| Indiana Finance Authority Health System Revenue | | | | |
| (Sisters of St. Francis Health Services Inc. Obligated Group) | 5.000% | 11/1/18 | 5,000 | 5,379 |
| Indiana Finance Authority Health System Revenue | | | | |
| (Sisters of St. Francis Health Services Inc. Obligated Group) | 5.000% | 11/1/20 | 4,370 | 4,713 |
| Indiana Finance Authority Health System Revenue | | | | |
| (Sisters of St. Francis Health Services Inc. Obligated Group) | 5.000% | 11/1/23 | 3,570 | 3,845 |
| Indiana Finance Authority Health System Revenue | | | | |
| (Sisters of St. Francis Health Services Inc. Obligated Group) | 5.250% | 11/1/24 | 10,855 | 11,738 |
| Indiana Finance Authority Health System Revenue | | | | |
| (Sisters of St. Francis Health Services Inc. Obligated Group) | 5.250% | 11/1/25 | 13,895 | 15,020 |
| Indiana Finance Authority Health System Revenue | | | | |
| (Sisters of St. Francis Health Services Inc. Obligated Group) | 5.250% | 11/1/26 | 14,425 | 15,584 |
| Indiana Finance Authority Health System Revenue | | | | |
| (Sisters of St. Francis Health Services Inc. Obligated Group) | 5.250% | 11/1/27 | 8,615 | 9,300 |
| Indiana Finance Authority Highway Revenue | 4.500% | 12/1/23 (14) | 29,010 | 29,097 |
| Indiana Finance Authority Highway Revenue | 5.000% | 12/1/23 | 15,110 | 18,646 |
| Indiana Finance Authority Highway Revenue | 5.000% | 12/1/25 | 17,000 | 21,518 |
| Indiana Finance Authority Hospital Revenue (Community Health Network) | 5.000% | 5/1/22 | 1,295 | 1,526 |
| Indiana Finance Authority Hospital Revenue (Community Health Network) | 5.000% | 5/1/24 | 2,500 | 2,969 |
| Indiana Finance Authority Hospital Revenue (Community Health Network) | 5.000% | 5/1/25 | 2,500 | 2,941 |
| Indiana Finance Authority Hospital Revenue (Community Health Network) | 5.000% | 5/1/26 | 2,500 | 2,903 |
| Indiana Finance Authority Hospital Revenue (Community Health Network) | 5.000% | 5/1/27 | 2,500 | 2,889 |
| Indiana Finance Authority Hospital Revenue (Indiana University Health Obligated Group) | 5.000% | 12/1/17 | 1,520 | 1,588 |
| Indiana Finance Authority Hospital Revenue (Indiana University Health Obligated Group) | 5.000% | 12/1/18 | 1,125 | 1,218 |
| Indiana Finance Authority Hospital Revenue (Indiana University Health Obligated Group) | 5.000% | 12/1/24 | 5,000 | 6,177 |
| Indiana Finance Authority Hospital Revenue (Indiana University Health Obligated Group) | 5.000% | 12/1/24 | 1,400 | 1,742 |
| Indiana Finance Authority Hospital Revenue (Indiana University Health Obligated Group) | 5.000% | 12/1/25 | 4,100 | 5,117 |
| Indiana Finance Authority Hospital Revenue (Indiana University Health Obligated Group) | 5.000% | 12/1/26 | 1,030 | 1,251 |
| Indiana Finance Authority Hospital Revenue (Indiana University Health Obligated Group) | 5.000% | 12/1/27 | 1,000 | 1,208 |
| Indiana Finance Authority Hospital Revenue (Indiana University Health Obligated Group) | 5.000% | 12/1/28 | 2,600 | 3,115 |
| Indiana Finance Authority Hospital Revenue (Indiana University Health Obligated Group) | 5.000% | 12/1/30 | 1,000 | 1,184 |
| Indiana Finance Authority Hospital Revenue (Indiana University Health Obligated Group) | 5.000% | 12/1/33 | 3,000 | 3,541 |
| Indiana Finance Authority Hospital Revenue (Indiana University Health Obligated Group) | 5.000% | 12/1/34 | 18,515 | 21,773 |
| Indiana Finance Authority Hospital Revenue (Indiana University Health Obligated Group) | 5.000% | 12/1/35 | 19,220 | 22,538 |
| Indiana Finance Authority Hospital Revenue (Parkview Health System) | 5.000% | 5/1/29 | 3,000 | 3,420 |
| Indiana Finance Authority Lease Revenue | 5.000% | 11/1/17 | 7,500 | 7,802 |
| Indiana Finance Authority Revenue | 5.000% | 2/1/23 | 11,000 | 13,357 |
| Indiana Finance Authority Revenue | 5.000% | 2/1/24 | 10,000 | 12,379 |
| Indiana Finance Authority Revenue | 5.000% | 2/1/26 | 2,045 | 2,599 |
| Indiana Finance Authority Revenue | 5.000% | 8/1/26 | 2,100 | 2,687 |
| Indiana Finance Authority Revenue | 5.000% | 2/1/27 | 4,140 | 5,254 |
| Indiana Finance Authority Revenue | 5.000% | 2/1/27 | 7,815 | 9,918 |
| Indiana Finance Authority Revenue | 5.000% | 8/1/27 | 1,705 | 2,159 |
| Indiana Finance Authority Revenue | | | | |
| (Community Foundation of Northwest Indiana Obligated Group) | 5.000% | 3/1/21 | 1,225 | 1,405 |
| Indiana Finance Authority Revenue | | | | |
| (Community Foundation of Northwest Indiana Obligated Group) | 5.000% | 3/1/22 | 1,000 | 1,174 |
| Indiana Finance Authority Revenue | | | | |
| (Community Foundation of Northwest Indiana Obligated Group) | 5.000% | 3/1/24 | 2,000 | 2,309 |
| Indiana Finance Authority Revenue | | | | |
| (Community Foundation of Northwest Indiana Obligated Group) | 5.000% | 3/1/25 | 1,000 | 1,144 |
| Indiana Finance Authority Revenue | | | | |
| (Community Foundation of Northwest Indiana Obligated Group) | 5.000% | 3/1/30 | 3,250 | 3,602 |
| Indiana Finance Authority Revenue (Stadium Project) | 5.250% | 2/1/27 | 3,000 | 3,747 |
| Indiana Finance Authority Revenue (Stadium Project) | 5.250% | 2/1/29 | 5,000 | 6,117 |
| Indiana Finance Authority Revenue (Stadium Project) | 5.250% | 2/1/30 | 6,000 | 7,289 |
| Indiana Finance Authority Revenue (Stadium Project) | 5.250% | 2/1/31 | 10,130 | 12,262 |
| Indiana Finance Authority Revenue (State Revolving Fund) | 5.000% | 2/1/32 | 9,150 | 10,679 |
| Indiana Finance Authority Revenue (Trinity Health) | 5.000% | 12/1/28 | 6,295 | 7,163 |
| Indiana Finance Authority Wastewater Utility Revenue (CWA Authority Project) | 5.000% | 10/1/24 | 1,000 | 1,235 |
| Indiana Finance Authority Wastewater Utility Revenue (CWA Authority Project) | 5.000% | 10/1/27 | 1,000 | 1,207 |
| Indiana Finance Authority Wastewater Utility Revenue (CWA Authority Project) | 5.000% | 10/1/28 | 2,180 | 2,613 |
| Indiana Finance Authority Wastewater Utility Revenue (CWA Authority Project) | 5.000% | 10/1/29 | 5,000 | 5,834 |
| Indiana Finance Authority Wastewater Utility Revenue (CWA Authority Project) | 5.000% | 10/1/29 | 2,295 | 2,736 |
| Indiana Finance Authority Wastewater Utility Revenue (CWA Authority Project) | 5.000% | 10/1/30 | 5,490 | 6,375 |
| Indiana Finance Authority Wastewater Utility Revenue (CWA Authority Project) | 5.000% | 10/1/31 | 3,325 | 3,863 |
| Indiana Finance Authority Wastewater Utility Revenue (CWA Authority Project) | 5.250% | 10/1/31 | 10,000 | 11,745 |
160
Intermediate-Term Tax-Exempt Fund
| | | | |
| | | | Face | Market |
| | | Maturity | Amount | Value• |
| | Coupon | Date | ($000) | ($000) |
| Indiana Health Facility Financing Authority Revenue (Ascension Health Credit Group) PUT | 1.600% | 2/1/17 (Prere.) | 45 | 45 |
| Indiana Health Facility Financing Authority Revenue (Ascension Health Credit Group) PUT | 1.600% | 2/1/17 | 8,955 | 8,970 |
| Indiana Health Facility Financing Authority Revenue (Parkview Health System Obligated Group) | 0.613% | 5/1/31 (2) | 3,200 | 2,972 |
| Indiana Municipal Power Agency Revenue | 5.625% | 1/1/19 (Prere.) | 4,640 | 5,100 |
| Indiana Municipal Power Agency Revenue | 5.750% | 1/1/19 (Prere.) | 2,000 | 2,204 |
| Indiana Municipal Power Agency Revenue | 5.000% | 1/1/33 | 7,245 | 8,580 |
| Indiana Municipal Power Agency Revenue | 5.000% | 1/1/34 | 19,000 | 22,395 |
| Indiana Municipal Power Agency Revenue | 5.000% | 1/1/35 | 20,000 | 23,499 |
| Indiana Municipal Power Agency Revenue | 5.000% | 1/1/36 | 12,500 | 14,630 |
| Indiana Office Building Commission Facilities Revenue (New Castle Correctional Facility) | 5.250% | 7/1/19 (14) | 2,515 | 2,783 |
| Indiana University Student Fee Revenue | 5.000% | 8/1/21 (Prere.) | 1,000 | 1,177 |
| Indiana University Student Fee Revenue | 5.000% | 8/1/21 (Prere.) | 1,000 | 1,177 |
| Indiana University Student Fee Revenue | 5.000% | 8/1/21 (Prere.) | 1,560 | 1,836 |
| Indiana University Student Fee Revenue | 5.000% | 8/1/21 | 4,500 | 5,284 |
| Indiana University Student Fee Revenue | 5.000% | 8/1/22 | 6,370 | 7,663 |
| Indiana University Student Fee Revenue | 5.000% | 8/1/23 | 3,510 | 4,239 |
| Indiana University Student Fee Revenue | 5.000% | 8/1/24 | 2,175 | 2,617 |
| Indiana University Student Fee Revenue | 5.000% | 8/1/25 | 2,040 | 2,452 |
| Indianapolis IN Gas Utility Revenue | 5.000% | 8/15/21 (4) | 3,530 | 4,021 |
| Indianapolis IN Gas Utility Revenue | 5.000% | 8/15/22 (4) | 15,655 | 17,789 |
| Indianapolis IN Local Public Improvement Bond Bank Revenue | 5.000% | 8/1/18 (Prere.) | 1,425 | 1,527 |
| Indianapolis IN Local Public Improvement Bond Bank Revenue | 5.000% | 8/1/18 (Prere.) | 1,895 | 2,031 |
| Indianapolis IN Local Public Improvement Bond Bank Revenue | 5.000% | 8/1/18 (Prere.) | 2,085 | 2,235 |
| Indianapolis IN Local Public Improvement Bond Bank Revenue | 5.000% | 8/1/18 (Prere.) | 1,985 | 2,128 |
| Indianapolis IN Local Public Improvement Bond Bank Revenue | 5.000% | 1/15/19 | 3,000 | 3,248 |
| Indianapolis IN Local Public Improvement Bond Bank Revenue | 5.000% | 1/15/20 | 1,545 | 1,723 |
| Indianapolis IN Local Public Improvement Bond Bank Revenue | 5.000% | 2/1/20 | 5,000 | 5,419 |
| Indianapolis IN Local Public Improvement Bond Bank Revenue | 5.000% | 1/15/21 | 8,590 | 9,667 |
| Indianapolis IN Local Public Improvement Bond Bank Revenue | 5.000% | 1/15/22 | 7,000 | 7,857 |
| Indianapolis IN Local Public Improvement Bond Bank Revenue (Bank-Waterworks Project) | 5.500% | 1/1/29 | 10,000 | 10,930 |
| Indianapolis IN Local Public Improvement Bond Bank Revenue (PILOT Infrastructure Project) | 5.000% | 1/1/23 (4) | 4,285 | 4,801 |
| Indianapolis IN Local Public Improvement Bond Bank Revenue (PILOT Infrastructure Project) | 5.000% | 1/1/25 (4) | 3,535 | 3,953 |
| Indianapolis IN Local Public Improvement Bond Bank Revenue | | | | |
| (Qualified Midwestern Disaster Area) | 5.500% | 2/1/28 | 4,065 | 4,727 |
| Indianapolis IN Local Public Improvement Bond Bank Revenue | | | | |
| (Qualified Midwestern Disaster Area) | 5.500% | 2/1/29 | 4,370 | 5,079 |
| Lake Central IN Multi-District School Building Corp. Revenue | 5.000% | 7/15/25 | 4,330 | 5,157 |
| Lake Central IN Multi-District School Building Corp. Revenue | 5.000% | 7/15/26 | 4,835 | 5,722 |
| Purdue University Indiana University COP | 5.000% | 7/1/20 | 2,000 | 2,276 |
| Purdue University Indiana University COP | 5.000% | 7/1/25 | 4,815 | 6,062 |
| Purdue University Indiana University COP | 5.000% | 7/1/26 | 5,055 | 6,435 |
| Purdue University Indiana University COP | 5.000% | 7/1/30 | 5,995 | 7,408 |
| Purdue University Indiana University COP | 5.000% | 7/1/31 | 5,980 | 7,346 |
| Purdue University Indiana University COP | 5.000% | 7/1/34 | 3,485 | 4,232 |
| Purdue University Indiana University COP | 5.000% | 7/1/36 | 1,655 | 1,996 |
| Purdue University Indiana University Student Facilities System Revenue | 4.000% | 7/1/19 | 1,110 | 1,199 |
| Purdue University Indiana University Student Facilities System Revenue | 4.000% | 7/1/20 | 2,170 | 2,399 |
| Purdue University Indiana University Student Facilities System Revenue | 5.000% | 7/1/32 | 1,850 | 2,263 |
| Purdue University Indiana University Student Facilities System Revenue | 5.000% | 7/1/33 | 2,505 | 3,049 |
| Purdue University Indiana University Student Facilities System Revenue | 5.000% | 7/1/34 | 1,590 | 1,928 |
| Purdue University Indiana University Student Facilities System Revenue | 5.000% | 7/1/36 | 1,255 | 1,513 |
| Whiting IN Environmental Facilities Revenue (BP Products North America Inc. Project) | 5.000% | 7/1/17 | 5,000 | 5,125 |
| | | | | 710,277 |
| Iowa (0.3%) | | | | |
| Ames IA Hospital Revenue (Mary Greeley Medical Center) | 5.500% | 6/15/20 (Prere.) | 2,000 | 2,306 |
| Ames IA Hospital Revenue (Mary Greeley Medical Center) | 5.625% | 6/15/20 (Prere.) | 2,000 | 2,315 |
| Iowa Finance Authority Health Facilities Revenue (Iowa Health System) | 5.250% | 8/15/19 (Prere.) | 5,500 | 6,134 |
| Iowa Finance Authority Health Facilities Revenue (Iowa Health System) | 5.250% | 2/15/29 (12) | 13,500 | 14,579 |
| Iowa Finance Authority Midwestern Disaster Area Revenue (Iowa Fertilizer Co. Project) | 5.000% | 12/1/19 | 6,390 | 6,565 |
| Iowa Finance Authority Midwestern Disaster Area Revenue (Iowa Fertilizer Co. Project) | 5.500% | 12/1/22 | 58,100 | 58,899 |
| Iowa Finance Authority Midwestern Disaster Area Revenue (Iowa Fertilizer Co. Project) | 5.250% | 12/1/25 | 500 | 522 |
| Iowa Finance Authority Revenue | 5.000% | 8/1/20 | 3,000 | 3,429 |
| Iowa Special Obligation Revenue | 5.000% | 6/1/24 | 4,000 | 4,944 |
| Iowa Special Obligation Revenue | 5.000% | 6/15/24 | 5,260 | 6,505 |
| Iowa Special Obligation Revenue | 5.000% | 6/1/25 | 4,640 | 5,798 |
| Iowa Special Obligation Revenue | 5.000% | 6/15/25 | 4,690 | 5,864 |
| Iowa Special Obligation Revenue | 5.000% | 6/15/26 | 3,560 | 4,497 |
| Iowa Special Obligation Revenue | 5.000% | 6/1/27 | 5,450 | 6,807 |
| Iowa Special Obligation Revenue (Ijobs Program) | 5.000% | 6/1/27 | 5,985 | 6,740 |
161
Intermediate-Term Tax-Exempt Fund
| | | | |
| | | | Face | Market |
| | | Maturity | Amount | Value• |
| | Coupon | Date | ($000) | ($000) |
| Iowa Special Obligation Revenue (Ijobs Program) | 5.000% | 6/1/28 | 6,280 | 7,067 |
| Iowa Special Obligation Revenue (Prison Infrastructure) | 5.000% | 6/15/20 (Prere.) | 4,000 | 4,553 |
| Iowa Special Obligation Revenue (Prison Infrastructure) | 5.000% | 6/15/20 (Prere.) | 1,150 | 1,309 |
| Iowa Special Obligation Revenue (Prison Infrastructure) | 5.000% | 6/15/20 (Prere.) | 2,100 | 2,390 |
| Iowa Student Loan Liquidity Corp. Revenue | 5.000% | 12/1/16 | 8,545 | 8,573 |
| Iowa Student Loan Liquidity Corp. Revenue | 5.250% | 12/1/17 | 5,655 | 5,883 |
| | | | | 165,679 |
| Kansas (0.7%) | | | | |
| Cowley County KS Unified School District GO | 4.750% | 9/1/18 (Prere.) | 380 | 405 |
| Cowley County KS Unified School District GO | 4.750% | 9/1/18 (Prere.) | 3,500 | 3,735 |
| Cowley County KS Unified School District GO | 4.750% | 9/1/26 (4) | 3,300 | 3,521 |
| Johnson County KS Unified School District No. 233 GO | 5.000% | 9/1/23 | 1,000 | 1,220 |
| Johnson County KS Unified School District No. 233 GO | 5.000% | 9/1/24 | 1,450 | 1,795 |
| Johnson County KS Unified School District No. 233 GO | 5.000% | 9/1/24 | 1,000 | 1,238 |
| Johnson County KS Unified School District No. 233 GO | 5.000% | 9/1/24 | 1,500 | 1,857 |
| Johnson County KS Unified School District No. 233 GO | 5.000% | 9/1/25 | 1,650 | 2,062 |
| Johnson County KS Unified School District No. 233 GO | 5.000% | 9/1/25 | 2,250 | 2,812 |
| Johnson County KS Unified School District No. 233 GO | 5.000% | 9/1/26 | 2,150 | 2,719 |
| Johnson County KS Unified School District No. 233 GO | 4.000% | 9/1/29 | 1,000 | 1,118 |
| Kansas Department of Transportation Highway Revenue | 5.000% | 9/1/20 | 24,000 | 27,562 |
| Kansas Department of Transportation Highway Revenue | 5.000% | 9/1/20 | 5,000 | 5,738 |
| Kansas Department of Transportation Highway Revenue | 5.000% | 9/1/21 | 10,000 | 11,812 |
| Kansas Department of Transportation Highway Revenue | 5.000% | 9/1/22 | 7,425 | 8,988 |
| Kansas Department of Transportation Highway Revenue | 5.000% | 9/1/25 | 10,000 | 12,424 |
| Kansas Department of Transportation Highway Revenue | 5.000% | 9/1/26 | 13,300 | 16,580 |
| Kansas Department of Transportation Highway Revenue | 5.000% | 9/1/27 | 14,000 | 17,344 |
| Kansas Department of Transportation Highway Revenue | 5.000% | 9/1/28 | 11,400 | 14,019 |
| Kansas Department of Transportation Highway Revenue | 5.000% | 9/1/29 | 15,525 | 18,983 |
| Kansas Development Finance Authority Health Facilities Revenue | | | | |
| (Kansas University Health System) | 5.375% | 3/1/30 | 1,000 | 1,108 |
| Kansas Development Finance Authority Health Facilities Revenue | | | | |
| (Kansas University Health System) | 5.000% | 3/1/31 | 1,000 | 1,092 |
| Kansas Development Finance Authority Health Facilities Revenue | | | | |
| (Kansas University Health System) | 5.000% | 3/1/34 | 2,000 | 2,179 |
| Kansas Development Finance Authority Hospital Revenue | | | | |
| (Adventist Health System/Sunbelt Obligated Group) | 5.000% | 11/15/17 (Prere.) | 2,800 | 2,922 |
| Kansas Development Finance Authority Hospital Revenue | | | | |
| (Adventist Health System/Sunbelt Obligated Group) | 5.000% | 11/15/17 (Prere.) | 6,000 | 6,262 |
| Kansas Development Finance Authority Hospital Revenue | | | | |
| (Adventist Health System/Sunbelt Obligated Group) | 5.000% | 11/15/17 (Prere.) | 1,500 | 1,565 |
| Kansas Development Finance Authority Hospital Revenue | | | | |
| (Adventist Health System/Sunbelt Obligated Group) | 5.500% | 11/15/29 | 10,435 | 11,725 |
| 4 Kansas Development Finance Authority Hospital Revenue | | | | |
| (Adventist Health System/Sunbelt Obligated Group) TOB VRDO | 0.750% | 11/7/16 | 8,000 | 8,000 |
| Kansas Development Finance Authority Revenue | 5.000% | 5/1/20 | 11,400 | 12,865 |
| Kansas Development Finance Authority Revenue | 5.000% | 5/1/23 | 10,000 | 12,000 |
| Kansas Development Finance Authority Revenue | 5.000% | 5/1/25 | 10,000 | 12,027 |
| Kansas Development Finance Authority Revenue | 5.000% | 5/1/26 | 13,290 | 15,942 |
| Kansas Development Finance Authority Revenue | 5.000% | 5/1/27 | 23,500 | 28,110 |
| Kansas Development Finance Authority Revenue | 5.000% | 5/1/28 | 7,000 | 8,367 |
| Kansas Development Finance Authority Revenue | 5.000% | 4/1/29 | 7,025 | 8,168 |
| Kansas Development Finance Authority Revenue | 5.000% | 4/1/32 | 13,000 | 14,915 |
| Kansas Development Finance Authority Revenue | 5.000% | 4/1/33 | 15,045 | 17,204 |
| Kansas Development Finance Authority Revenue | 5.000% | 4/1/34 | 5,795 | 6,608 |
| Kansas Development Finance Authority Revenue | | | | |
| (Kansas Department of Commerce Impact Program) | 5.000% | 6/1/19 | 6,730 | 7,323 |
| Kansas Development Finance Authority Revenue | | | | |
| (Kansas Department of Commerce Impact Program) | 5.000% | 6/1/20 | 7,070 | 7,890 |
| Kansas Development Finance Authority Revenue | | | | |
| (Sisters of Charity of Leavenworth Health System) | 5.250% | 1/1/20 (Prere.) | 6,510 | 7,346 |
| Kansas Development Finance Authority Revenue | | | | |
| (Sisters of Charity of Leavenworth Health System) | 5.250% | 1/1/25 | 990 | 1,108 |
| Lawrence KS Water & Sewage System Revenue | 5.000% | 11/1/28 | 3,575 | 4,387 |
| Leavenworth County KS Unified School District GO | 4.500% | 3/1/18 (12) | 1,030 | 1,079 |
| Leavenworth County KS Unified School District GO | 4.500% | 3/1/19 (12) | 1,000 | 1,079 |
| Leavenworth County KS Unified School District GO | 4.500% | 9/1/19 (12) | 600 | 657 |
| Leavenworth County KS Unified School District GO | 4.750% | 9/1/19 (Prere.) | 1,265 | 1,395 |
| Leavenworth County KS Unified School District GO | 4.750% | 9/1/19 (Prere.) | 1,165 | 1,285 |
| Leavenworth County KS Unified School District GO | 5.000% | 9/1/19 (Prere.) | 1,360 | 1,510 |
162
Intermediate-Term Tax-Exempt Fund
| | | | |
| | | | Face | Market |
| | | Maturity | Amount | Value• |
| | Coupon | Date | ($000) | ($000) |
| Leavenworth County KS Unified School District GO | 5.000% | 9/1/19 (Prere.) | 1,060 | 1,177 |
| Leavenworth County KS Unified School District GO | 4.500% | 3/1/20 (12) | 1,115 | 1,214 |
| Wichita KS Hospital Facilities Revenue (Via Christi Health System Inc.) | 5.000% | 11/15/16 (ETM) | 1,000 | 1,002 |
| Wyandotte County/Kansas City KS Unified Government Utility System Revenue | 5.000% | 9/1/22 | 750 | 892 |
| Wyandotte County/Kansas City KS Unified Government Utility System Revenue | 5.000% | 9/1/23 | 1,500 | 1,816 |
| | | | | 368,151 |
| Kentucky (0.6%) | | | | |
| Ashland KY Medical Center Revenue (King’s Daughters Medical Center Project) | 5.000% | 2/1/25 | 720 | 845 |
| Ashland KY Medical Center Revenue (King’s Daughters Medical Center Project) | 5.000% | 2/1/26 | 570 | 670 |
| Ashland KY Medical Center Revenue (King’s Daughters Medical Center Project) | 5.000% | 2/1/27 | 615 | 718 |
| Ashland KY Medical Center Revenue (King’s Daughters Medical Center Project) | 5.000% | 2/1/28 | 630 | 731 |
| Kentucky Asset/Liability Commission Agency Fund Revenue (Federal Highway Trust) | 5.250% | 9/1/18 (14) | 5,000 | 5,371 |
| Kentucky Asset/Liability Commission Agency Fund Revenue (Federal Highway Trust) | 5.000% | 9/1/21 | 14,000 | 15,893 |
| Kentucky Asset/Liability Commission Agency Fund Revenue (Federal Highway Trust) | 5.000% | 9/1/22 | 7,000 | 7,892 |
| Kentucky Bond Development Corp. Hospital Facilities Revenue (St. Elizabeth Medical Center, Inc.) | 4.000% | 5/1/32 | 1,750 | 1,888 |
| Kentucky Bond Development Corp. Hospital Facilities Revenue (St. Elizabeth Medical Center, Inc.) | 4.000% | 5/1/35 | 1,425 | 1,518 |
| Kentucky Bond Development Corp. Hospital Facilities Revenue (St. Elizabeth Medical Center, Inc.) | 4.000% | 5/1/36 | 1,200 | 1,274 |
| Kentucky Economic Development Finance Authority Health System Revenue | | | | |
| (Norton Healthcare Inc. & Affiliates) | 0.000% | 10/1/25 (14) | 12,000 | 9,234 |
| Kentucky Economic Development Finance Authority Medical Center Revenue | | | | |
| (King’s Daughters Medical Center Project) | 5.000% | 2/1/18 | 1,840 | 1,917 |
| Kentucky Economic Development Finance Authority Medical Center Revenue | | | | |
| (King’s Daughters Medical Center Project) | 5.000% | 2/1/19 | 1,475 | 1,580 |
| Kentucky Economic Development Finance Authority Medical Center Revenue | | | | |
| (King’s Daughters Medical Center Project) | 5.000% | 2/1/20 | 2,985 | 3,278 |
| Kentucky Economic Development Finance Authority Medical Center Revenue | | | | |
| (King’s Daughters Medical Center Project) | 5.000% | 2/1/21 | 2,000 | 2,188 |
| 1 Kentucky Economic Development Finance Authority Revenue (Catholic Health Initiatives) PUT | 1.259% | 2/1/20 | 40,000 | 39,849 |
| Kentucky Municipal Power Agency Power System Revenue | 5.000% | 9/1/25 (14) | 4,500 | 5,420 |
| Kentucky Municipal Power Agency Power System Revenue | 5.000% | 9/1/27 (14) | 4,425 | 5,265 |
| Kentucky Municipal Power Agency Power System Revenue | 5.000% | 9/1/28 (14) | 3,500 | 4,116 |
| Kentucky Municipal Power Agency Power System Revenue | 5.000% | 9/1/29 (14) | 4,000 | 4,676 |
| Kentucky Municipal Power Agency Power System Revenue | 5.000% | 9/1/30 (14) | 2,370 | 2,755 |
| Kentucky Property & Building Commission Revenue | 5.000% | 8/1/17 | 1,600 | 1,650 |
| Kentucky Property & Building Commission Revenue | 5.000% | 10/1/17 | 1,170 | 1,215 |
| Kentucky Property & Building Commission Revenue | 5.000% | 11/1/17 | 8,570 | 8,922 |
| Kentucky Property & Building Commission Revenue | 5.000% | 11/1/18 (Prere.) | 5,000 | 5,406 |
| Kentucky Property & Building Commission Revenue | 5.000% | 11/1/18 (Prere.) | 5,120 | 5,536 |
| Kentucky Property & Building Commission Revenue | 5.250% | 2/1/19 (Prere.) | 5,510 | 6,026 |
| Kentucky Property & Building Commission Revenue | 5.250% | 2/1/19 (Prere.) | 4,425 | 4,840 |
| Kentucky Property & Building Commission Revenue | 5.500% | 8/1/19 (2) | 6,870 | 7,659 |
| Kentucky Property & Building Commission Revenue | 5.000% | 10/1/19 (2) | 5,000 | 5,535 |
| Kentucky Property & Building Commission Revenue | 5.500% | 8/1/20 (2) | 4,320 | 4,967 |
| Kentucky Property & Building Commission Revenue | 5.000% | 11/1/20 | 4,500 | 4,854 |
| Kentucky Property & Building Commission Revenue | 5.000% | 8/1/21 | 35,000 | 39,608 |
| Kentucky Property & Building Commission Revenue | 5.250% | 2/1/23 (12) | 705 | 768 |
| Kentucky Property & Building Commission Revenue | 5.000% | 8/1/23 | 5,000 | 5,970 |
| Kentucky Property & Building Commission Revenue | 5.250% | 2/1/25 (12) | 570 | 620 |
| Kentucky Public Transportation Infrastructure Authority Toll Revenue | | | | |
| (Downtown Crossing Project) BAN | 0.000% | 7/1/20 | 1,700 | 1,530 |
| Kentucky Public Transportation Infrastructure Authority Toll Revenue | | | | |
| (Downtown Crossing Project) BAN | 0.000% | 7/1/23 | 1,720 | 1,381 |
| Kentucky Turnpike Authority Economic Development Road Revenue (Revitalization Project) | 5.000% | 7/1/18 (Prere.) | 9,890 | 10,563 |
| Kentucky Turnpike Authority Economic Development Road Revenue (Revitalization Project) | 5.000% | 7/1/18 (Prere.) | 7,065 | 7,545 |
| Kentucky Turnpike Authority Economic Development Road Revenue (Revitalization Project) | 5.000% | 7/1/18 (Prere.) | 7,000 | 7,476 |
| Kentucky Turnpike Authority Economic Development Road Revenue (Revitalization Project) | 5.000% | 7/1/22 | 1,000 | 1,184 |
| Kentucky Turnpike Authority Economic Development Road Revenue (Revitalization Project) | 5.000% | 7/1/24 | 1,450 | 1,766 |
| Kentucky Turnpike Authority Economic Development Road Revenue (Revitalization Project) | 5.000% | 7/1/29 | 3,905 | 4,617 |
| Kentucky Turnpike Authority Economic Development Road Revenue (Revitalization Project) | 5.000% | 7/1/31 | 5,210 | 6,117 |
| Louisville & Jefferson County KY Metropolitan Government Health System Revenue | | | | |
| (Norton Healthcare Obligated Group) | 5.000% | 10/1/24 | 1,000 | 1,214 |
| Louisville & Jefferson County KY Metropolitan Government Health System Revenue | | | | |
| (Norton Healthcare Obligated Group) | 5.000% | 10/1/25 | 1,250 | 1,527 |
| Louisville & Jefferson County KY Metropolitan Government Health System Revenue | | | | |
| (Norton Healthcare Obligated Group) | 5.000% | 10/1/26 | 5,370 | 6,622 |
| Louisville & Jefferson County KY Metropolitan Government Health System Revenue | | | | |
| (Norton Healthcare Obligated Group) | 5.000% | 10/1/27 | 2,000 | 2,450 |
| Louisville & Jefferson County KY Metropolitan Government Revenue (Catholic Health Initiatives) | 5.000% | 12/1/25 | 8,900 | 10,102 |
| Louisville & Jefferson County KY Metropolitan Government Revenue (Catholic Health Initiatives) | 5.000% | 12/1/30 | 14,775 | 16,420 |
163
Intermediate-Term Tax-Exempt Fund
| | | | |
| | | | Face | Market |
| | | Maturity | Amount | Value• |
| | Coupon | Date | ($000) | ($000) |
| Louisville & Jefferson County KY Metropolitan Government Revenue (Catholic Health Initiatives) | 5.000% | 12/1/31 | 9,000 | 9,972 |
| Paducah KY Electric Plant Board Revenue | 5.000% | 10/1/25 (4) | 1,665 | 2,020 |
| Paducah KY Electric Plant Board Revenue | 5.000% | 10/1/26 (4) | 1,110 | 1,361 |
| Warren County KY Hospital Revenue | | | | |
| (Bowling Green-Warren County Community Hospital Corp. Project) | 5.000% | 4/1/20 | 1,180 | 1,320 |
| Warren County KY Hospital Revenue | | | | |
| (Bowling Green-Warren County Community Hospital Corp. Project) | 5.000% | 4/1/28 | 4,000 | 4,603 |
| | | | | 320,444 |
| Louisiana (0.8%) | | | | |
| Bossier City LA Utilities Revenue | 5.000% | 10/1/29 | 1,000 | 1,203 |
| Bossier City LA Utilities Revenue | 5.000% | 10/1/31 | 1,000 | 1,187 |
| Bossier City LA Utilities Revenue | 5.000% | 10/1/32 | 1,000 | 1,182 |
| Bossier City LA Utilities Revenue | 5.000% | 10/1/33 | 3,000 | 3,531 |
| East Baton Rouge Parish LA Sales Tax Revenue | 5.000% | 8/1/19 (Prere.) | 5,165 | 5,720 |
| Ernest N. Morial - New Orleans LA Exhibition Hall Authority Special Tax Revenue | 5.000% | 7/15/27 | 2,800 | 3,254 |
| Jefferson Parish LA Environmental Facilities & Community Development Authority Revenue | 5.000% | 4/1/17 | 1,000 | 1,017 |
| Jefferson Parish LA Environmental Facilities & Community Development Authority Revenue | 5.000% | 4/1/18 | 1,000 | 1,054 |
| Jefferson Parish LA Environmental Facilities & Community Development Authority Revenue | 5.000% | 4/1/19 (Prere.) | 1,000 | 1,096 |
| Jefferson Parish LA Environmental Facilities & Community Development Authority Revenue | 5.000% | 4/1/19 (Prere.) | 1,000 | 1,096 |
| Jefferson Parish LA Environmental Facilities & Community Development Authority Revenue | 5.000% | 4/1/19 | 1,030 | 1,122 |
| Lafayette LA Communications System Revenue | 5.000% | 11/1/23 (4) | 2,000 | 2,397 |
| Lafayette LA Communications System Revenue | 5.000% | 11/1/24 (4) | 5,310 | 6,441 |
| Lafayette LA Communications System Revenue | 5.000% | 11/1/25 (4) | 1,500 | 1,822 |
| Louisiana Gasoline & Fuel Tax Revenue | 5.000% | 5/1/31 | 20,665 | 24,442 |
| Louisiana Gasoline & Fuel Tax Revenue | 5.000% | 5/1/32 | 10,000 | 11,775 |
| Louisiana Gasoline & Fuel Tax Revenue | 5.000% | 5/1/33 | 5,905 | 6,927 |
| Louisiana Gasoline & Fuel Tax Revenue | 5.000% | 5/1/34 | 4,000 | 4,677 |
| Louisiana Gasoline & Fuel Tax Revenue | 5.000% | 5/1/35 | 7,095 | 8,275 |
| 1 Louisiana Gasoline & Fuel Tax Revenue PUT | 0.839% | 5/1/17 | 10,000 | 10,003 |
| 1 Louisiana Gasoline & Fuel Tax Revenue PUT | 0.919% | 5/1/18 | 34,500 | 34,397 |
| Louisiana GO | 5.000% | 11/15/17 | 10,000 | 10,437 |
| Louisiana GO | 5.000% | 11/15/17 | 17,040 | 17,785 |
| Louisiana GO | 5.000% | 8/1/25 | 2,375 | 2,896 |
| Louisiana GO | 5.000% | 12/1/26 | 7,870 | 9,557 |
| Louisiana GO | 5.000% | 5/1/29 | 14,815 | 17,656 |
| Louisiana Local Government Environmental Facilities & Community Development | | | | |
| Authority Revenue (East Baton Rouge Sewerage Commission Projects) | 5.000% | 2/1/29 | 1,525 | 1,792 |
| Louisiana Local Government Environmental Facilities & Community Development | | | | |
| Authority Revenue (East Baton Rouge Sewerage Commission Projects) | 5.000% | 2/1/31 | 3,140 | 3,653 |
| Louisiana Local Government Environmental Facilities & Community Development | | | | |
| Authority Revenue (East Baton Rouge Sewerage Commission Projects) | 5.000% | 2/1/33 | 3,500 | 4,044 |
| Louisiana Local Government Environmental Facilities & Community Development | | | | |
| Authority Revenue (East Baton Rouge Sewerage Commission Projects) | 5.000% | 2/1/34 | 2,550 | 2,937 |
| Louisiana Local Government Environmental Facilities & Community Development | | | | |
| Authority Revenue (LCTCS Facilities Corp. Project) | 5.000% | 10/1/22 | 2,790 | 3,160 |
| Louisiana Local Government Environmental Facilities & Community Development | | | | |
| Authority Revenue (LCTCS Facilities Corp. Project) | 5.000% | 10/1/24 | 11,000 | 12,384 |
| Louisiana Local Government Environmental Facilities & Community Development | | | | |
| Authority Revenue (LCTCS Facilities Corp. Project) | 5.000% | 10/1/25 | 2,000 | 2,247 |
| Louisiana Local Government Environmental Facilities & Community Development | | | | |
| Authority Revenue (Plaquemines Project) | 5.000% | 9/1/26 (4) | 1,700 | 1,992 |
| Louisiana Local Government Environmental Facilities & Community Development | | | | |
| Authority Revenue (Plaquemines Project) | 5.000% | 9/1/28 (4) | 1,875 | 2,175 |
| Louisiana Local Government Environmental Facilities & Community Development | | | | |
| Authority Revenue (Plaquemines Project) | 5.000% | 9/1/31 (4) | 1,420 | 1,632 |
| Louisiana Local Government Environmental Facilities & Community Development | | | | |
| Authority Revenue (Women’s Hospital Foundation Project) | 5.625% | 10/1/30 | 15,905 | 18,221 |
| Louisiana Office Facilities Corp. Lease Revenue (Capitol Complex Project) | 5.000% | 5/1/17 | 5,300 | 5,409 |
| Louisiana Office Facilities Corp. Lease Revenue (Capitol Complex Project) | 5.000% | 5/1/19 | 4,495 | 4,918 |
| Louisiana Public Facilities Authority Hospital Revenue | | | | |
| (Franciscan Missionaries of Our Lady Health System Project) | 5.000% | 7/1/31 | 7,055 | 8,242 |
| Louisiana Public Facilities Authority Hospital Revenue | | | | |
| (Franciscan Missionaries of Our Lady Health System Project) | 5.000% | 7/1/32 | 8,440 | 9,817 |
| Louisiana Public Facilities Authority Revenue (Loyola University) | 5.250% | 10/1/29 | 4,000 | 4,520 |
| Louisiana Public Facilities Authority Revenue (Nineteenth Judicial District Court Building Project) | 5.000% | 6/1/36 (4) | 2,200 | 2,497 |
| Louisiana Public Facilities Authority Revenue (Ochsner Clinic Foundation Project) | 5.000% | 5/15/17 (ETM) | 415 | 425 |
| Louisiana Public Facilities Authority Revenue (Ochsner Clinic Foundation Project) | 5.000% | 5/15/17 | 1,105 | 1,129 |
| Louisiana Public Facilities Authority Revenue (Ochsner Clinic Foundation Project) | 5.250% | 5/15/17 (Prere.) | 4,170 | 4,272 |
| Louisiana Public Facilities Authority Revenue (Ochsner Clinic Foundation Project) | 5.000% | 5/15/23 | 400 | 482 |
164
Intermediate-Term Tax-Exempt Fund
| | | | |
| | | | Face | Market |
| | | Maturity | Amount | Value• |
| | Coupon | Date | ($000) | ($000) |
| Louisiana Public Facilities Authority Revenue (Ochsner Clinic Foundation Project) | 5.000% | 5/15/24 | 510 | 624 |
| Louisiana Public Facilities Authority Revenue (Ochsner Clinic Foundation Project) | 5.000% | 5/15/25 | 850 | 1,046 |
| Louisiana Public Facilities Authority Revenue (Ochsner Clinic Foundation Project) | 5.000% | 5/15/27 | 1,000 | 1,209 |
| Louisiana Public Facilities Authority Revenue (Ochsner Clinic Foundation Project) | 5.250% | 5/15/27 | 10,995 | 11,221 |
| Louisiana Stadium & Exposition District Revenue | 5.000% | 7/1/24 | 2,125 | 2,503 |
| Louisiana Stadium & Exposition District Revenue | 5.000% | 7/1/25 | 5,445 | 6,367 |
| Louisiana Stadium & Exposition District Revenue | 5.000% | 7/1/26 | 5,000 | 5,813 |
| Louisiana Stadium & Exposition District Revenue | 5.000% | 7/1/27 | 3,770 | 4,363 |
| Louisiana Stadium & Exposition District Revenue | 5.000% | 7/1/28 | 3,650 | 4,197 |
| Louisiana State University Revenue | 5.000% | 7/1/29 | 3,180 | 3,694 |
| Louisiana State University Revenue | 5.000% | 7/1/30 | 1,000 | 1,156 |
| Louisiana State University Revenue | 5.000% | 7/1/32 | 2,765 | 3,172 |
| New Orleans LA Aviation Board Revenue | 4.500% | 1/1/17 (12) | 1,955 | 1,967 |
| New Orleans LA Aviation Board Revenue | 4.500% | 1/1/17 (12) | 1,540 | 1,549 |
| New Orleans LA Aviation Board Revenue | 5.000% | 1/1/18 (12) | 2,440 | 2,552 |
| New Orleans LA Aviation Board Revenue | 5.000% | 1/1/18 (12) | 2,200 | 2,301 |
| New Orleans LA GO | 5.125% | 12/1/17 (Prere.) | 10,000 | 10,475 |
| New Orleans LA GO | 5.000% | 12/1/23 | 2,250 | 2,725 |
| New Orleans LA GO | 5.000% | 12/1/24 | 2,500 | 2,993 |
| New Orleans LA GO | 5.000% | 12/1/25 | 2,500 | 2,973 |
| New Orleans LA GO | 5.000% | 12/1/26 (4) | 3,770 | 4,461 |
| New Orleans LA GO | 5.000% | 12/1/27 (4) | 2,260 | 2,656 |
| New Orleans LA GO | 5.000% | 12/1/28 (4) | 2,310 | 2,700 |
| New Orleans LA Sewage Service Revenue | 5.000% | 6/1/26 | 500 | 603 |
| New Orleans LA Sewage Service Revenue | 5.000% | 6/1/29 | 1,100 | 1,295 |
| New Orleans LA Sewage Service Revenue | 5.000% | 6/1/34 | 1,385 | 1,592 |
| New Orleans LA Sewage Service Revenue | 5.000% | 6/1/35 | 950 | 1,089 |
| New Orleans LA Water Revenue | 5.000% | 12/1/23 | 655 | 784 |
| New Orleans LA Water Revenue | 5.000% | 12/1/23 | 1,000 | 1,197 |
| New Orleans LA Water Revenue | 5.000% | 12/1/24 | 1,000 | 1,206 |
| New Orleans LA Water Revenue | 5.000% | 12/1/24 | 550 | 663 |
| New Orleans LA Water Revenue | 5.000% | 12/1/25 | 500 | 608 |
| New Orleans LA Water Revenue | 5.000% | 12/1/26 | 1,000 | 1,208 |
| New Orleans LA Water Revenue | 5.000% | 12/1/27 | 865 | 1,036 |
| New Orleans LA Water Revenue | 5.000% | 12/1/28 | 550 | 651 |
| New Orleans LA Water Revenue | 5.000% | 12/1/28 | 1,200 | 1,406 |
| New Orleans LA Water Revenue | 5.000% | 12/1/29 | 650 | 765 |
| New Orleans LA Water Revenue | 5.000% | 12/1/29 | 1,000 | 1,166 |
| New Orleans LA Water Revenue | 5.000% | 12/1/30 | 500 | 586 |
| New Orleans LA Water Revenue | 5.000% | 12/1/31 | 1,430 | 1,666 |
| New Orleans LA Water Revenue | 5.000% | 12/1/32 | 1,345 | 1,559 |
| New Orleans LA Water Revenue | 5.000% | 12/1/33 | 760 | 877 |
| New Orleans LA Water Revenue | 5.000% | 12/1/34 | 1,430 | 1,645 |
| New Orleans LA Water Revenue | 5.000% | 12/1/34 | 2,600 | 2,969 |
| New Orleans LA Water Revenue | 5.000% | 12/1/35 | 700 | 803 |
| St. Charles Parish LA Gulf Opportunity Zone Revenue (Valero Energy Corp.) PUT | 4.000% | 6/1/22 | 18,135 | 19,804 |
| Tobacco Settlement Financing Corp. Louisiana Revenue | 5.250% | 5/15/31 | 10,000 | 11,194 |
| Tobacco Settlement Financing Corp. Louisiana Revenue | 5.250% | 5/15/32 | 12,365 | 14,052 |
| Tobacco Settlement Financing Corp. Louisiana Revenue | 5.250% | 5/15/33 | 5,000 | 5,644 |
| | | | | 445,682 |
| Maine (0.1%) | | | | |
| Maine GO | 5.000% | 6/1/19 | 5,000 | 5,516 |
| Maine Municipal Bond Bank Revenue | 5.000% | 11/1/25 | 2,000 | 2,452 |
| Maine Municipal Bond Bank Revenue | 5.000% | 11/1/26 | 2,000 | 2,457 |
| Maine Municipal Bond Bank Revenue | 5.000% | 11/1/27 | 2,215 | 2,699 |
| Portland ME Airport Revenue | 5.000% | 1/1/21 (4) | 1,000 | 1,106 |
| Portland ME Airport Revenue | 5.000% | 1/1/22 (4) | 1,000 | 1,102 |
| Portland ME Airport Revenue | 5.000% | 1/1/23 (4) | 1,000 | 1,109 |
| Portland ME Airport Revenue | 5.000% | 1/1/24 (4) | 1,610 | 1,778 |
| Portland ME Airport Revenue | 5.000% | 1/1/25 (4) | 1,000 | 1,100 |
| Portland ME Airport Revenue | 5.000% | 1/1/26 (4) | 1,720 | 1,885 |
| Portland ME Airport Revenue | 5.000% | 1/1/28 (4) | 1,200 | 1,307 |
| Portland ME Airport Revenue | 5.000% | 1/1/29 (4) | 1,265 | 1,372 |
| | | | | 23,883 |
| Maryland (3.3%) | | | | |
| Anne Arundel County MD GO | 5.000% | 4/1/19 | 1,885 | 2,067 |
| Anne Arundel County MD GO | 5.000% | 4/1/19 | 1,030 | 1,129 |
| Anne Arundel County MD GO | 5.000% | 10/1/19 | 3,110 | 3,468 |
| Anne Arundel County MD GO | 5.000% | 10/1/19 | 8,240 | 9,188 |
165
Intermediate-Term Tax-Exempt Fund
| | | | |
| | | | Face | Market |
| | | Maturity | Amount | Value• |
| | Coupon | Date | ($000) | ($000) |
| Anne Arundel County MD GO | 5.000% | 10/1/19 | 4,830 | 5,385 |
| Anne Arundel County MD GO | 5.000% | 4/1/20 | 1,855 | 2,103 |
| Anne Arundel County MD GO | 5.000% | 4/1/20 | 830 | 941 |
| Anne Arundel County MD GO | 5.000% | 4/1/20 | 2,255 | 2,556 |
| Anne Arundel County MD GO | 5.000% | 10/1/20 | 3,110 | 3,581 |
| Anne Arundel County MD GO | 5.000% | 10/1/20 | 6,210 | 7,150 |
| Anne Arundel County MD GO | 5.000% | 10/1/20 | 4,735 | 5,452 |
| Anne Arundel County MD GO | 5.000% | 4/1/21 | 6,395 | 7,467 |
| Anne Arundel County MD GO | 5.000% | 4/1/21 | 1,880 | 2,195 |
| Anne Arundel County MD GO | 5.000% | 4/1/21 | 1,135 | 1,325 |
| Anne Arundel County MD GO | 5.000% | 4/1/21 | 2,590 | 3,024 |
| Anne Arundel County MD GO | 5.000% | 10/1/21 | 3,110 | 3,682 |
| Anne Arundel County MD GO | 5.000% | 10/1/21 | 1,455 | 1,723 |
| Anne Arundel County MD GO | 5.000% | 10/1/21 | 6,185 | 7,323 |
| Anne Arundel County MD GO | 5.000% | 10/1/21 | 4,715 | 5,583 |
| Anne Arundel County MD GO | 5.000% | 10/1/24 | 3,110 | 3,914 |
| Anne Arundel County MD GO | 5.000% | 10/1/24 | 1,455 | 1,831 |
| Anne Arundel County MD GO | 5.000% | 10/1/24 | 2,445 | 3,077 |
| Anne Arundel County MD GO | 5.000% | 10/1/24 | 3,850 | 4,845 |
| Anne Arundel County MD GO | 5.000% | 10/1/25 | 3,110 | 3,970 |
| Anne Arundel County MD GO | 5.000% | 10/1/25 | 1,455 | 1,857 |
| Anne Arundel County MD GO | 5.000% | 10/1/25 | 2,400 | 3,064 |
| Anne Arundel County MD GO | 5.000% | 10/1/25 | 4,605 | 5,878 |
| Anne Arundel County MD GO | 5.000% | 10/1/26 | 3,110 | 3,932 |
| Anne Arundel County MD GO | 5.000% | 10/1/26 | 1,455 | 1,840 |
| Anne Arundel County MD GO | 5.000% | 10/1/26 | 4,160 | 5,260 |
| Anne Arundel County MD GO | 5.000% | 10/1/27 | 3,110 | 3,905 |
| Baltimore County MD GO | 5.000% | 8/1/19 | 3,000 | 3,330 |
| Baltimore County MD GO | 5.000% | 2/1/20 | 1,000 | 1,128 |
| Baltimore County MD GO | 5.000% | 8/1/21 | 5,000 | 5,884 |
| Baltimore County MD GO | 5.000% | 8/1/21 | 6,705 | 7,890 |
| Baltimore County MD GO | 5.000% | 8/1/21 | 2,600 | 3,060 |
| Baltimore County MD GO | 5.000% | 2/1/22 | 3,000 | 3,576 |
| Baltimore MD Consolidated Public Improvement GO | 5.000% | 8/1/20 | 4,050 | 4,639 |
| Baltimore MD Consolidated Public Improvement GO | 5.000% | 8/1/21 | 5,800 | 6,825 |
| Baltimore MD Project Revenue | 5.000% | 7/1/26 | 1,585 | 1,838 |
| Baltimore MD Project Revenue | 5.000% | 7/1/26 | 1,250 | 1,449 |
| Baltimore MD Project Revenue | 5.000% | 7/1/27 | 1,745 | 2,019 |
| Baltimore MD Project Revenue | 5.000% | 7/1/28 | 1,570 | 1,816 |
| Baltimore MD Project Revenue | 5.000% | 7/1/28 | 1,905 | 2,204 |
| Baltimore MD Project Revenue | 5.000% | 7/1/29 | 2,075 | 2,401 |
| Baltimore MD Project Revenue | 5.000% | 7/1/30 | 1,905 | 2,190 |
| Baltimore MD Project Revenue | 5.000% | 7/1/30 | 3,255 | 3,741 |
| Baltimore MD Project Revenue | 5.000% | 7/1/31 | 2,000 | 2,299 |
| Calvert County MD GO | 5.000% | 7/1/23 | 3,300 | 4,068 |
| Howard County MD GO | 5.000% | 8/15/20 | 14,125 | 16,199 |
| Howard County MD GO | 5.000% | 8/15/21 | 14,440 | 17,019 |
| Howard County MD GO | 5.000% | 2/15/22 | 13,605 | 16,255 |
| Howard County MD GO | 5.000% | 8/15/24 | 4,500 | 5,289 |
| Maryland Department of Transportation Revenue | 5.000% | 2/15/19 | 34,000 | 37,145 |
| Maryland Department of Transportation Revenue | 5.000% | 6/1/19 | 8,155 | 9,001 |
| 3 Maryland Department of Transportation Revenue | 5.000% | 11/1/19 | 19,000 | 21,248 |
| Maryland Department of Transportation Revenue | 5.000% | 2/15/20 | 41,400 | 46,715 |
| Maryland Department of Transportation Revenue | 5.000% | 6/1/20 | 8,850 | 10,078 |
| 3 Maryland Department of Transportation Revenue | 4.000% | 9/1/20 | 18,480 | 20,517 |
| 3 Maryland Department of Transportation Revenue | 5.000% | 11/1/20 | 11,585 | 13,352 |
| Maryland Department of Transportation Revenue | 5.000% | 2/15/21 | 46,790 | 54,403 |
| 3 Maryland Department of Transportation Revenue | 5.000% | 11/1/21 | 12,000 | 14,219 |
| 3 Maryland Department of Transportation Revenue | 5.000% | 11/1/23 | 25,000 | 30,954 |
| Maryland Department of Transportation Revenue | 4.000% | 12/15/28 | 17,390 | 19,705 |
| Maryland Department of Transportation Revenue | 4.000% | 12/15/29 | 27,000 | 30,438 |
| Maryland Economic Development Corp. Pollution Control Revenue (Potomac Electric Power Co.) | 6.200% | 9/1/22 | 6,000 | 6,685 |
| Maryland Economic Development Corp. Revenue (Constellation Energy Group, Inc. Project) PUT | 2.550% | 6/1/20 | 5,150 | 5,212 |
| Maryland GO | 5.000% | 3/1/17 | 3,440 | 3,490 |
| Maryland GO | 5.000% | 8/1/17 | 20,000 | 20,646 |
| Maryland GO | 5.000% | 3/15/18 | 20,000 | 21,144 |
| Maryland GO | 4.500% | 8/1/18 | 35,465 | 37,717 |
| Maryland GO | 5.000% | 8/1/18 | 2,175 | 2,332 |
| Maryland GO | 5.000% | 8/1/18 | 3,000 | 3,216 |
| Maryland GO | 5.000% | 3/1/19 | 5,000 | 5,471 |
166
Intermediate-Term Tax-Exempt Fund
| | | | |
| | | | Face | Market |
| | | Maturity | Amount | Value• |
| | Coupon | Date | ($000) | ($000) |
| Maryland GO | 5.000% | 3/1/19 | 10,395 | 11,374 |
| Maryland GO | 5.000% | 8/1/19 | 5,100 | 5,661 |
| Maryland GO | 5.000% | 8/1/19 | 5,000 | 5,550 |
| Maryland GO | 5.000% | 8/1/19 | 5,015 | 5,567 |
| Maryland GO | 5.000% | 3/1/20 | 12,450 | 14,077 |
| Maryland GO | 5.000% | 3/1/20 | 14,640 | 16,553 |
| Maryland GO | 5.000% | 3/15/20 | 16,615 | 18,810 |
| Maryland GO | 4.500% | 8/1/20 | 13,550 | 15,267 |
| Maryland GO | 5.000% | 8/1/20 | 5,145 | 5,893 |
| Maryland GO | 5.000% | 8/1/20 | 15,000 | 17,182 |
| Maryland GO | 5.250% | 8/1/20 | 4,000 | 4,619 |
| Maryland GO | 5.000% | 3/1/21 | 13,965 | 16,270 |
| Maryland GO | 5.000% | 3/1/21 | 7,580 | 8,831 |
| Maryland GO | 5.000% | 3/1/21 | 31,755 | 36,997 |
| Maryland GO | 4.000% | 8/1/21 | 43,490 | 49,174 |
| Maryland GO | 5.000% | 8/1/21 | 16,350 | 19,265 |
| Maryland GO | 5.000% | 8/1/21 | 2,230 | 2,628 |
| Maryland GO | 5.000% | 3/1/22 | 32,550 | 38,937 |
| Maryland GO | 5.000% | 3/1/22 (Prere.) | 7,150 | 8,539 |
| Maryland GO | 5.000% | 8/1/22 | 29,215 | 35,327 |
| Maryland GO | 5.000% | 8/1/22 | 4,500 | 5,442 |
| Maryland GO | 5.000% | 8/1/22 | 71,720 | 86,725 |
| Maryland GO | 5.000% | 3/1/23 | 37,360 | 44,535 |
| Maryland GO | 4.000% | 8/1/23 | 37,875 | 44,254 |
| Maryland GO | 5.000% | 8/1/23 | 71,995 | 88,902 |
| Maryland GO | 5.000% | 8/1/23 | 14,805 | 18,282 |
| Maryland GO | 5.000% | 8/1/24 | 3,000 | 3,772 |
| Maryland GO | 4.000% | 8/1/26 | 28,000 | 32,270 |
| Maryland GO | 4.000% | 6/1/29 | 68,270 | 77,622 |
| Maryland GO | 4.000% | 6/1/30 | 73,035 | 82,606 |
| Maryland Health & Higher Educational Facilities Authority Revenue (Anne Arundel Health System) | 5.000% | 7/1/21 | 800 | 936 |
| Maryland Health & Higher Educational Facilities Authority Revenue (Anne Arundel Health System) | 5.000% | 7/1/23 | 900 | 1,073 |
| 1 Maryland Health & Higher Educational Facilities Authority Revenue | | | | |
| (Johns Hopkins Health System Obligated Group) PUT | 0.903% | 5/15/18 | 10,000 | 9,976 |
| Maryland Health & Higher Educational Facilities Authority Revenue | | | | |
| (Maryland Institute College of Art) | 5.000% | 6/1/29 | 1,000 | 1,129 |
| Maryland Health & Higher Educational Facilities Authority Revenue (MedStar Health, Inc.) | 5.000% | 8/15/31 | 5,580 | 6,465 |
| Maryland Health & Higher Educational Facilities Authority Revenue (MedStar Health, Inc.) | 5.000% | 8/15/32 | 6,630 | 7,632 |
| Maryland Health & Higher Educational Facilities Authority Revenue (MedStar Health, Inc.) | 5.000% | 8/15/33 | 5,000 | 5,726 |
| Maryland Health & Higher Educational Facilities Authority Revenue (Meritus Medical Center, Inc.) | 5.000% | 7/1/34 | 2,600 | 2,941 |
| Maryland Health & Higher Educational Facilities Authority Revenue | | | | |
| (University of Maryland Medical System) | 5.000% | 7/1/17 | 3,000 | 3,083 |
| Maryland Health & Higher Educational Facilities Authority Revenue | | | | |
| (University of Maryland Medical System) | 5.000% | 7/1/18 | 2,500 | 2,663 |
| Maryland Health & Higher Educational Facilities Authority Revenue | | | | |
| (University of Maryland Medical System) | 5.250% | 7/1/19 | 1,700 | 1,816 |
| Maryland Health & Higher Educational Facilities Authority Revenue | | | | |
| (University of Maryland Medical System) | 4.500% | 7/1/20 | 1,500 | 1,576 |
| Maryland Health & Higher Educational Facilities Authority Revenue | | | | |
| (University of Maryland Medical System) | 5.250% | 7/1/21 | 2,000 | 2,134 |
| Maryland Health & Higher Educational Facilities Authority Revenue | | | | |
| (University of Maryland Medical System) | 4.750% | 7/1/23 | 900 | 944 |
| Maryland Health & Higher Educational Facilities Authority Revenue | | | | |
| (University of Maryland Medical System) | 5.500% | 7/1/24 (2) | 3,800 | 4,041 |
| Maryland Health & Higher Educational Facilities Authority Revenue | | | | |
| (University of Maryland Medical System) | 5.250% | 7/1/28 (2) | 9,000 | 9,534 |
| Maryland Transportation Authority GAN | 5.250% | 3/1/20 | 8,085 | 8,864 |
| Maryland Water Quality Financing Administration Bay Restoration Revolving Loan Fund Revenue | 5.000% | 3/1/23 | 12,970 | 15,780 |
| Maryland Water Quality Financing Administration Bay Restoration Revolving Loan Fund Revenue | 5.000% | 3/1/24 | 12,000 | 14,877 |
| Maryland Water Quality Financing Administration Bay Restoration Revolving Loan Fund Revenue | 5.000% | 3/1/25 | 14,000 | 17,180 |
| Montgomery County MD GO | 5.000% | 7/1/17 | 3,460 | 3,560 |
| Montgomery County MD GO | 5.000% | 7/1/19 | 8,790 | 9,730 |
| Montgomery County MD GO | 5.000% | 11/1/20 | 11,370 | 13,125 |
| Montgomery County MD GO | 5.000% | 7/1/21 | 2,380 | 2,795 |
| Montgomery County MD GO | 5.000% | 7/1/21 | 2,500 | 2,936 |
| Montgomery County MD GO | 5.000% | 11/1/22 | 39,265 | 47,729 |
| Montgomery County MD GO | 5.000% | 11/1/23 | 18,000 | 22,315 |
| Montgomery County MD GO | 5.000% | 11/1/26 | 8,300 | 10,378 |
| Prince Georges County MD GO | 5.000% | 8/1/21 | 13,745 | 16,175 |
| Prince Georges County MD GO | 5.000% | 9/15/21 | 4,975 | 5,875 |
167
Intermediate-Term Tax-Exempt Fund
| | | | |
| | | | Face | Market |
| | | Maturity | Amount | Value• |
| | Coupon | Date | ($000) | ($000) |
| Prince Georges County MD GO | 5.000% | 9/1/23 | 10,865 | 13,416 |
| Prince Georges County MD GO | 4.000% | 9/1/26 | 2,000 | 2,324 |
| University of Maryland Auxiliary Facility & Tuition Revenue | 5.000% | 4/1/19 | 4,995 | 5,477 |
| Washington MD Suburban Sanitary Commission GO | 5.000% | 6/1/20 | 4,415 | 5,031 |
| Washington MD Suburban Sanitary Commission GO | 4.000% | 6/1/31 | 8,185 | 9,136 |
| Washington MD Suburban Sanitary Commission GO | 4.000% | 6/1/32 | 8,515 | 9,454 |
| Westminster MD Revenue (Lutheran Village at Miller’s Grant) | 4.875% | 7/1/23 | 4,720 | 4,896 |
| | | | | 1,771,175 |
| Massachusetts (3.1%) | | | | |
| Boston MA GO | 5.000% | 8/1/17 | 5,035 | 5,199 |
| Boston MA GO | 5.000% | 4/1/20 | 6,000 | 6,802 |
| Boston MA GO | 5.000% | 2/1/23 | 4,760 | 5,651 |
| Massachusetts Bay Transportation Authority Assessment Revenue | 5.000% | 7/1/19 | 15,000 | 16,613 |
| 4 Massachusetts Bay Transportation Authority Sales Tax Revenue TOB VRDO | 0.730% | 11/7/16 | 40,807 | 40,807 |
| 2 Massachusetts College Building Authority Revenue | 5.125% | 5/1/19 (Prere.) | 1,420 | 1,565 |
| 2 Massachusetts College Building Authority Revenue | 5.250% | 5/1/19 (Prere.) | 2,250 | 2,486 |
| Massachusetts College Building Authority Revenue | 5.000% | 5/1/28 | 1,290 | 1,454 |
| Massachusetts College Building Authority Revenue | 5.000% | 5/1/29 | 2,905 | 3,411 |
| Massachusetts College Building Authority Revenue | 5.000% | 5/1/30 | 4,820 | 5,633 |
| Massachusetts College Building Authority Revenue | 5.000% | 5/1/31 | 6,040 | 7,041 |
| Massachusetts Department of Transportation Metropolitan Highway System Revenue | 5.000% | 1/1/20 | 2,610 | 2,923 |
| Massachusetts Department of Transportation Metropolitan Highway System Revenue | 5.000% | 1/1/23 | 14,750 | 16,491 |
| Massachusetts Department of Transportation Metropolitan Highway System Revenue | 5.000% | 1/1/26 | 13,625 | 15,202 |
| Massachusetts Development Finance Agency Revenue (Berklee College of Music) | 5.000% | 10/1/29 | 3,110 | 3,533 |
| Massachusetts Development Finance Agency Revenue (Berklee College of Music) | 5.000% | 10/1/31 | 1,200 | 1,373 |
| Massachusetts Development Finance Agency Revenue (Berkshire Health System) | 5.000% | 10/1/20 | 1,205 | 1,364 |
| Massachusetts Development Finance Agency Revenue (Berkshire Health System) | 5.000% | 10/1/21 | 1,760 | 2,039 |
| Massachusetts Development Finance Agency Revenue (Berkshire Health System) | 5.000% | 10/1/22 | 2,125 | 2,450 |
| Massachusetts Development Finance Agency Revenue (Berkshire Health System) | 5.000% | 10/1/23 | 2,235 | 2,562 |
| Massachusetts Development Finance Agency Revenue (Berkshire Health System) | 5.000% | 10/1/24 | 1,500 | 1,710 |
| Massachusetts Development Finance Agency Revenue (Berkshire Health System) | 5.000% | 10/1/25 | 1,600 | 1,813 |
| Massachusetts Development Finance Agency Revenue (Berkshire Health System) | 5.000% | 10/1/26 | 1,100 | 1,241 |
| Massachusetts Development Finance Agency Revenue (Berkshire Health System) | 5.000% | 10/1/27 | 1,165 | 1,312 |
| Massachusetts Development Finance Agency Revenue (Boston College) | 5.000% | 7/1/29 | 9,500 | 10,808 |
| Massachusetts Development Finance Agency Revenue (Boston Medical Center) | 5.000% | 7/1/24 | 1,000 | 1,192 |
| Massachusetts Development Finance Agency Revenue (Boston Medical Center) | 5.000% | 7/1/25 | 1,000 | 1,199 |
| Massachusetts Development Finance Agency Revenue (Boston Medical Center) | 5.000% | 7/1/26 | 1,000 | 1,203 |
| Massachusetts Development Finance Agency Revenue (Boston Medical Center) | 5.000% | 7/1/32 | 3,760 | 4,285 |
| Massachusetts Development Finance Agency Revenue (Boston Medical Center) | 5.000% | 7/1/34 | 3,490 | 3,962 |
| Massachusetts Development Finance Agency Revenue (Dana-Farber Cancer Institute) | 5.000% | 12/1/35 | 5,240 | 6,181 |
| Massachusetts Development Finance Agency Revenue (Dana-Farber Cancer Institute) | 5.000% | 12/1/36 | 2,000 | 2,353 |
| Massachusetts Development Finance Agency Revenue (Draper Laboratory) | 5.750% | 9/1/18 (Prere.) | 6,765 | 7,354 |
| Massachusetts Development Finance Agency Revenue (Emerson College) | 5.500% | 1/1/30 | 15,000 | 16,559 |
| Massachusetts Development Finance Agency Revenue (Harvard University) | 5.000% | 7/15/19 | 4,000 | 4,434 |
| Massachusetts Development Finance Agency Revenue (Harvard University) | 4.000% | 7/15/20 | 2,500 | 2,769 |
| Massachusetts Development Finance Agency Revenue (Harvard University) | 5.000% | 7/15/20 | 6,500 | 7,435 |
| Massachusetts Development Finance Agency Revenue (Harvard University) | 5.000% | 7/15/21 | 3,000 | 3,533 |
| Massachusetts Development Finance Agency Revenue (Harvard University) | 5.000% | 7/15/28 | 7,000 | 8,905 |
| Massachusetts Development Finance Agency Revenue (Harvard University) | 5.000% | 7/15/34 | 10,800 | 13,292 |
| Massachusetts Development Finance Agency Revenue (Seven Hills Foundation Obligated Group) | 5.000% | 9/1/23 | 1,230 | 1,370 |
| Massachusetts Development Finance Agency Revenue (Seven Hills Foundation Obligated Group) | 5.000% | 9/1/24 | 1,310 | 1,465 |
| Massachusetts Development Finance Agency Revenue (Seven Hills Foundation Obligated Group) | 5.000% | 9/1/25 | 2,770 | 3,114 |
| Massachusetts Development Finance Agency Revenue (Seven Hills Foundation Obligated Group) | 5.000% | 9/1/32 | 17,575 | 19,191 |
| Massachusetts Development Finance Agency Revenue (Simmons College) | 5.000% | 10/1/23 | 835 | 994 |
| Massachusetts Development Finance Agency Revenue (Simmons College) | 5.000% | 10/1/24 | 700 | 844 |
| Massachusetts Development Finance Agency Revenue (Simmons College) | 5.000% | 10/1/25 | 800 | 974 |
| Massachusetts Development Finance Agency Revenue (Tufts Medical Center) | 7.250% | 1/1/32 | 10,000 | 11,947 |
| Massachusetts Development Finance Agency Revenue (UMass Memorial Medical Center) | 5.125% | 7/1/26 | 2,690 | 3,042 |
| Massachusetts Educational Financing Authority Education Loan Revenue | 5.500% | 1/1/22 | 3,500 | 3,888 |
| Massachusetts Federal Highway GAN (Accelerated Bridge Program) | 5.000% | 6/15/20 | 10,205 | 11,237 |
| Massachusetts Federal Highway GAN (Accelerated Bridge Program) | 5.000% | 6/15/24 | 20,000 | 24,895 |
| Massachusetts Federal Highway Revenue | 5.000% | 6/15/22 | 10,000 | 12,017 |
| Massachusetts GO | 0.525% | 12/1/30 (14) | 6,050 | 5,490 |
| Massachusetts GO | 0.525% | 12/1/30 (14) | 625 | 567 |
| Massachusetts GO | 0.570% | 12/1/30 (14) | 8,375 | 7,600 |
| Massachusetts GO | 0.525% | 12/1/30 (14) | 17,550 | 15,927 |
| Massachusetts GO | 2.000% | 5/22/17 | 53,000 | 53,363 |
| Massachusetts GO | 5.000% | 6/1/17 | 1,200 | 1,230 |
| Massachusetts GO | 2.000% | 6/26/17 | 40,000 | 40,358 |
168
Intermediate-Term Tax-Exempt Fund
| | | | |
| | | | Face | Market |
| | | Maturity | Amount | Value• |
| | Coupon | Date | ($000) | ($000) |
| Massachusetts GO | 5.000% | 8/1/17 | 24,060 | 24,835 |
| Massachusetts GO | 5.500% | 11/1/17 (14) | 20,100 | 21,052 |
| Massachusetts GO | 5.500% | 11/1/17 (4) | 7,000 | 7,332 |
| Massachusetts GO | 5.500% | 11/1/17 | 10,000 | 10,474 |
| Massachusetts GO | 5.500% | 8/1/18 (14) | 5,000 | 5,401 |
| Massachusetts GO | 5.500% | 10/1/18 | 9,500 | 10,329 |
| Massachusetts GO | 5.000% | 3/1/19 (Prere.) | 10,000 | 10,925 |
| Massachusetts GO | 5.000% | 7/1/19 | 3,645 | 4,026 |
| Massachusetts GO | 5.000% | 5/1/20 | 8,355 | 9,479 |
| Massachusetts GO | 5.000% | 7/1/20 | 3,920 | 4,471 |
| Massachusetts GO | 5.500% | 10/1/20 (14) | 11,065 | 12,922 |
| Massachusetts GO | 5.000% | 4/1/21 (Prere.) | 18,000 | 21,005 |
| Massachusetts GO | 5.000% | 4/1/21 (Prere.) | 26,675 | 31,129 |
| Massachusetts GO | 5.000% | 7/1/21 | 10,170 | 11,919 |
| Massachusetts GO | 5.000% | 8/1/21 (Prere.) | 20,000 | 23,561 |
| Massachusetts GO | 5.250% | 8/1/21 | 20,870 | 24,748 |
| Massachusetts GO | 5.250% | 8/1/21 (2) | 4,445 | 5,271 |
| Massachusetts GO | 5.000% | 8/1/22 | 14,000 | 16,841 |
| Massachusetts GO | 5.000% | 7/1/24 | 9,575 | 11,899 |
| Massachusetts GO | 5.000% | 7/1/24 | 3,705 | 4,604 |
| Massachusetts GO | 5.000% | 8/1/24 | 65,150 | 81,081 |
| Massachusetts GO | 5.000% | 7/1/25 | 5,710 | 7,178 |
| Massachusetts GO | 1.057% | 11/1/25 | 22,000 | 21,920 |
| Massachusetts GO | 5.000% | 4/1/26 | 42,115 | 53,480 |
| Massachusetts GO | 5.000% | 7/1/27 | 41,660 | 52,491 |
| Massachusetts GO | 5.000% | 7/1/28 | 16,000 | 20,040 |
| Massachusetts GO | 5.000% | 7/1/29 | 10,425 | 12,744 |
| Massachusetts GO | 5.000% | 7/1/30 | 12,000 | 14,553 |
| Massachusetts GO | 4.000% | 11/1/30 | 45,000 | 49,238 |
| Massachusetts GO | 5.000% | 9/1/31 | 5,770 | 6,854 |
| Massachusetts GO | 4.000% | 9/1/33 | 23,500 | 25,760 |
| 1 Massachusetts GO PUT | 0.930% | 8/1/17 | 49,000 | 48,979 |
| Massachusetts Health & Educational Facilities Authority Revenue (Boston College) | 5.500% | 6/1/30 | 5,000 | 6,664 |
| Massachusetts Health & Educational Facilities Authority Revenue (Boston Medical Center) | 5.000% | 7/1/18 (Prere.) | 1,890 | 2,014 |
| Massachusetts Health & Educational Facilities Authority Revenue (Boston Medical Center) | 5.000% | 7/1/18 (Prere.) | 15,450 | 16,463 |
| Massachusetts Health & Educational Facilities Authority Revenue (CareGroup) | 5.375% | 7/1/18 (Prere.) | 3,380 | 3,631 |
| Massachusetts Health & Educational Facilities Authority Revenue (CareGroup) | 5.375% | 7/1/18 (Prere.) | 5,500 | 5,909 |
| Massachusetts Health & Educational Facilities Authority Revenue (CareGroup) | 5.375% | 7/1/18 (Prere.) | 3,500 | 3,760 |
| Massachusetts Health & Educational Facilities Authority Revenue (Harvard University) | 6.250% | 4/1/20 | 1,685 | 1,980 |
| 2 Massachusetts Health & Educational Facilities Authority Revenue (MIT) | 6.000% | 7/1/18 (Prere.) | 5,000 | 5,419 |
| Massachusetts Health & Educational Facilities Authority Revenue (Northeastern University) | 5.000% | 10/1/20 | 3,740 | 4,257 |
| Massachusetts Health & Educational Facilities Authority Revenue (Northeastern University) | 5.000% | 10/1/25 | 1,460 | 1,565 |
| Massachusetts Health & Educational Facilities Authority Revenue (Northeastern University) | 5.000% | 10/1/26 | 2,000 | 2,142 |
| Massachusetts Health & Educational Facilities Authority Revenue (Northeastern University) | 5.000% | 10/1/28 | 1,155 | 1,233 |
| Massachusetts Health & Educational Facilities Authority Revenue (Suffolk University) | 6.250% | 7/1/30 | 5,000 | 5,598 |
| Massachusetts Port Authority Revenue | 5.000% | 7/1/29 | 8,345 | 9,871 |
| Massachusetts Port Authority Revenue | 5.000% | 7/1/31 | 3,000 | 3,620 |
| Massachusetts Port Authority Revenue | 5.000% | 7/1/32 | 3,500 | 4,202 |
| Massachusetts Port Authority Revenue | 5.000% | 7/1/33 | 4,005 | 4,789 |
| Massachusetts Port Authority Revenue | 5.000% | 7/1/34 | 1,470 | 1,752 |
| Massachusetts Port Authority Revenue | 5.000% | 7/1/35 | 2,500 | 2,974 |
| Massachusetts School Building Authority Dedicated Sales Tax Revenue | 5.000% | 8/15/21 | 2,500 | 2,940 |
| Massachusetts School Building Authority Dedicated Sales Tax Revenue | 5.000% | 8/15/24 | 20,000 | 24,010 |
| Massachusetts School Building Authority Dedicated Sales Tax Revenue | 5.000% | 8/15/25 | 2,000 | 2,516 |
| Massachusetts School Building Authority Dedicated Sales Tax Revenue | 5.000% | 8/15/26 | 6,745 | 8,451 |
| Massachusetts School Building Authority Dedicated Sales Tax Revenue | 5.000% | 8/15/27 | 5,000 | 5,991 |
| Massachusetts School Building Authority Dedicated Sales Tax Revenue | 5.000% | 8/15/27 | 9,000 | 11,185 |
| Massachusetts School Building Authority Dedicated Sales Tax Revenue | 5.000% | 8/15/28 | 32,750 | 39,223 |
| Massachusetts School Building Authority Dedicated Sales Tax Revenue | 5.000% | 8/15/29 | 4,000 | 4,907 |
| Massachusetts School Building Authority Dedicated Sales Tax Revenue | 5.000% | 8/15/31 | 18,500 | 22,404 |
| Massachusetts School Building Authority Dedicated Sales Tax Revenue | 5.000% | 5/15/32 | 6,400 | 7,554 |
| Massachusetts School Building Authority Dedicated Sales Tax Revenue | 4.000% | 8/15/32 | 10,600 | 11,628 |
| Massachusetts School Building Authority Dedicated Sales Tax Revenue | 5.000% | 10/15/32 | 8,010 | 9,335 |
| Massachusetts School Building Authority Dedicated Sales Tax Revenue | 5.000% | 5/15/33 | 7,610 | 8,957 |
| Massachusetts School Building Authority Dedicated Sales Tax Revenue | 5.000% | 8/15/34 | 5,000 | 5,976 |
| Massachusetts School Building Authority Dedicated Sales Tax Revenue | 5.000% | 8/15/35 | 4,000 | 4,767 |
| Massachusetts Special Obligation Dedicated Tax Revenue | 5.250% | 1/1/19 (14) | 5,125 | 5,580 |
| Massachusetts Special Obligation Dedicated Tax Revenue | 5.500% | 1/1/26 (14) | 29,860 | 38,113 |
| Massachusetts Special Obligation Dedicated Tax Revenue | 5.500% | 1/1/28 (14) | 11,075 | 14,445 |
| Massachusetts Water Pollution Abatement Trust Revenue | 5.250% | 2/1/21 | 5,955 | 6,979 |
169
Intermediate-Term Tax-Exempt Fund
| | | | |
| | | | Face | Market |
| | | Maturity | Amount | Value• |
| | Coupon | Date | ($000) | ($000) |
| Massachusetts Water Pollution Abatement Trust Revenue | 5.000% | 8/1/23 | 6,430 | 7,926 |
| Massachusetts Water Pollution Abatement Trust Revenue | 5.000% | 8/1/24 | 7,665 | 9,618 |
| Massachusetts Water Resources Authority Revenue | 6.500% | 7/15/19 (ETM) | 15,665 | 16,797 |
| Massachusetts Water Resources Authority Revenue | 5.000% | 8/1/19 | 21,580 | 23,943 |
| 2 Massachusetts Water Resources Authority Revenue | 5.000% | 8/1/21 (Prere.) | 2,350 | 2,766 |
| 2 Massachusetts Water Resources Authority Revenue | 5.000% | 8/1/21 (Prere.) | 3,500 | 4,120 |
| 2 Massachusetts Water Resources Authority Revenue | 5.000% | 8/1/21 (Prere.) | 2,000 | 2,354 |
| Massachusetts Water Resources Authority Revenue | 5.000% | 8/1/30 | 5,000 | 5,808 |
| Massachusetts Water Resources Authority Revenue | 5.000% | 8/1/31 | 5,000 | 5,808 |
| Massachusetts Water Resources Authority Revenue | 5.000% | 8/1/33 | 10,000 | 12,141 |
| Massachusetts Water Resources Authority Revenue | 5.000% | 8/1/34 | 10,000 | 12,093 |
| Massachusetts Water Resources Authority Revenue | 5.000% | 8/1/35 | 6,800 | 8,197 |
| 4 Massachusetts Water Resources Authority Revenue TOB VRDO | 0.750% | 11/7/16 LOC | 37,675 | 37,675 |
| Metropolitan Boston MA Transit Parking Corp. Revenue | 5.000% | 7/1/26 | 3,000 | 3,461 |
| Metropolitan Boston MA Transit Parking Corp. Revenue | 5.000% | 7/1/27 | 3,440 | 3,956 |
| Metropolitan Boston MA Transit Parking Corp. Revenue | 5.000% | 7/1/28 | 5,100 | 5,866 |
| Metropolitan Boston MA Transit Parking Corp. Revenue | 5.000% | 7/1/29 | 11,580 | 13,262 |
| Metropolitan Boston MA Transit Parking Corp. Revenue | 5.000% | 7/1/30 | 11,000 | 12,569 |
| Metropolitan Boston MA Transit Parking Corp. Revenue | 5.000% | 7/1/31 | 11,575 | 13,226 |
| | | | | 1,656,583 |
| Michigan (3.6%) | | | | |
| Battle Creek MI School District GO | 5.000% | 5/1/24 | 1,000 | 1,207 |
| Battle Creek MI School District GO | 5.000% | 5/1/32 | 2,920 | 3,415 |
| Battle Creek MI School District GO | 5.000% | 5/1/33 | 1,500 | 1,748 |
| Battle Creek MI School District GO | 5.000% | 5/1/34 | 3,065 | 3,560 |
| Birmingham MI City School District GO | 4.000% | 5/1/24 | 1,000 | 1,153 |
| Birmingham MI City School District GO | 4.000% | 5/1/25 | 1,465 | 1,673 |
| Chippewa Valley MI Schools GO | 5.000% | 5/1/25 | 700 | 861 |
| Chippewa Valley MI Schools GO | 5.000% | 5/1/32 | 1,000 | 1,176 |
| Chippewa Valley MI Schools GO | 5.000% | 5/1/34 | 1,080 | 1,261 |
| Chippewa Valley MI Schools GO | 5.000% | 5/1/35 | 800 | 931 |
| Dearborn MI School District GO | 5.000% | 5/1/26 | 3,755 | 4,444 |
| Dearborn MI School District GO | 5.000% | 5/1/27 | 3,650 | 4,343 |
| Dearborn MI School District GO | 5.000% | 5/1/28 | 3,635 | 4,302 |
| Dearborn MI School District GO | 5.000% | 5/1/30 | 4,000 | 4,681 |
| Dearborn MI School District GO | 5.000% | 5/1/32 | 3,150 | 3,657 |
| Detroit MI GO | 5.000% | 4/1/17 (ETM) | 555 | 563 |
| Detroit MI GO | 5.000% | 4/1/17 (12)(ETM) | 3,025 | 3,079 |
| Detroit MI Sewage Disposal System Revenue | 7.000% | 7/1/27 (4) | 3,865 | 4,401 |
| Detroit MI Water & Sewerage Department Sewage Disposal System Revenue | 5.000% | 7/1/23 | 7,000 | 8,077 |
| Detroit MI Water & Sewerage Department Sewage Disposal System Revenue | 5.000% | 7/1/32 | 14,000 | 15,456 |
| Detroit/Wayne County MI Stadium Authority Revenue | 5.000% | 10/1/19 (4) | 1,300 | 1,415 |
| Detroit/Wayne County MI Stadium Authority Revenue | 5.000% | 10/1/20 (4) | 1,500 | 1,662 |
| Detroit/Wayne County MI Stadium Authority Revenue | 5.000% | 10/1/21 (4) | 1,100 | 1,237 |
| Detroit/Wayne County MI Stadium Authority Revenue | 5.000% | 10/1/22 (4) | 1,000 | 1,143 |
| Forest Hills MI Public Schools GO | 5.000% | 5/1/19 | 3,350 | 3,669 |
| Forest Hills MI Public Schools GO | 5.000% | 5/1/20 | 3,760 | 4,237 |
| Forest Hills MI Public Schools GO | 5.000% | 5/1/21 | 3,365 | 3,889 |
| Great Lakes MI Water Authority Sewer Disposal System Revenue | 5.000% | 7/1/25 | 4,800 | 5,834 |
| Great Lakes MI Water Authority Sewer Disposal System Revenue | 5.000% | 7/1/30 | 17,025 | 19,863 |
| Great Lakes MI Water Authority Sewer Disposal System Revenue | 5.000% | 7/1/31 | 4,750 | 5,555 |
| Great Lakes MI Water Authority Sewer Disposal System Revenue | 4.000% | 12/1/16 (4) | 4,750 | 5,003 |
| Great Lakes MI Water Authority Sewer Disposal System Revenue | 5.000% | 7/1/35 | 34,080 | 38,840 |
| Great Lakes MI Water Authority Sewer Disposal System Revenue | 5.000% | 7/1/36 | 64,000 | 72,826 |
| Great Lakes MI Water Authority Water Supply System Revenue | 5.000% | 7/1/25 | 10,240 | 12,464 |
| Great Lakes MI Water Authority Water Supply System Revenue | 5.000% | 7/1/28 | 14,000 | 16,736 |
| Great Lakes MI Water Authority Water Supply System Revenue | 5.000% | 7/1/30 | 5,400 | 6,300 |
| Great Lakes MI Water Authority Water Supply System Revenue | 5.000% | 7/1/31 | 9,210 | 10,678 |
| Great Lakes MI Water Authority Water Supply System Revenue | 4.000% | 7/1/33 (4) | 13,380 | 14,093 |
| Jackson County MI Hospital Finance Authority Hospital Revenue (Allegiance Health) | 5.000% | 6/1/17 (ETM) | 2,420 | 2,480 |
| Kalamazoo MI Hospital Financing Authority Hospital Revenue (Bronson Methodist Hospital) | 5.000% | 5/15/30 | 18,370 | 20,217 |
| Karegnondi Water Authority Michigan Water Supply System Revenue (Karegnondi Water Pipeline) | 5.000% | 11/1/22 | 1,000 | 1,176 |
| Karegnondi Water Authority Michigan Water Supply System Revenue (Karegnondi Water Pipeline) | 5.000% | 11/1/23 | 1,000 | 1,194 |
| Karegnondi Water Authority Michigan Water Supply System Revenue (Karegnondi Water Pipeline) | 5.000% | 11/1/25 | 3,250 | 3,786 |
| Karegnondi Water Authority Michigan Water Supply System Revenue (Karegnondi Water Pipeline) | 5.250% | 11/1/29 | 5,325 | 6,195 |
| Karegnondi Water Authority Michigan Water Supply System Revenue (Karegnondi Water Pipeline) | 5.250% | 11/1/30 | 1,750 | 2,032 |
| Karegnondi Water Authority Michigan Water Supply System Revenue (Karegnondi Water Pipeline) | 5.250% | 11/1/31 | 4,750 | 5,495 |
| Karegnondi Water Authority Michigan Water Supply System Revenue (Karegnondi Water Pipeline) | 5.250% | 11/1/32 | 5,000 | 5,764 |
| Karegnondi Water Authority Michigan Water Supply System Revenue (Karegnondi Water Pipeline) | 5.250% | 11/1/34 | 1,500 | 1,714 |
170
Intermediate-Term Tax-Exempt Fund
| | | | |
| | | | Face | Market |
| | | Maturity | Amount | Value• |
| | Coupon | Date | ($000) | ($000) |
| Karegnondi Water Authority Michigan Water Supply System Revenue (Karegnondi Water Pipeline) | 5.250% | 11/1/35 | 8,730 | 9,950 |
| Lincoln MI Consolidated School District GO | 5.000% | 5/1/25 (4) | 1,000 | 1,216 |
| Lincoln MI Consolidated School District GO | 5.000% | 5/1/26 (4) | 1,250 | 1,529 |
| Marquette MI Board of Light & Power Electric Utility System Revenue | 5.000% | 7/1/32 | 1,145 | 1,364 |
| Marquette MI Board of Light & Power Electric Utility System Revenue | 5.000% | 7/1/33 | 1,000 | 1,189 |
| Marysville MI Public Schools District GO | 5.000% | 5/1/29 | 2,255 | 2,721 |
| Marysville MI Public Schools District GO | 5.000% | 5/1/32 | 3,010 | 3,565 |
| Marysville MI Public Schools District GO | 5.000% | 5/1/33 | 3,285 | 3,872 |
| Michigan Building Authority Revenue | 5.000% | 10/15/18 | 12,575 | 13,537 |
| Michigan Building Authority Revenue | 5.000% | 10/15/19 | 8,315 | 9,243 |
| Michigan Building Authority Revenue | 5.000% | 10/15/24 | 2,500 | 2,883 |
| Michigan Building Authority Revenue | 5.000% | 10/15/24 | 3,000 | 3,460 |
| Michigan Building Authority Revenue | 5.000% | 4/15/25 | 2,500 | 3,089 |
| Michigan Building Authority Revenue | 5.000% | 4/15/25 | 5,250 | 6,487 |
| Michigan Building Authority Revenue | 5.000% | 10/15/25 | 5,920 | 6,797 |
| Michigan Building Authority Revenue | 5.000% | 4/15/26 | 6,500 | 8,036 |
| Michigan Building Authority Revenue | 5.000% | 4/15/26 | 1,570 | 1,955 |
| Michigan Building Authority Revenue | 5.000% | 4/15/27 | 1,500 | 1,863 |
| Michigan Building Authority Revenue | 5.000% | 4/15/28 | 8,000 | 9,690 |
| Michigan Building Authority Revenue | 5.000% | 10/15/28 | 2,000 | 2,450 |
| Michigan Building Authority Revenue | 5.000% | 4/15/29 | 26,550 | 31,907 |
| Michigan Building Authority Revenue | 5.000% | 10/15/29 | 9,625 | 11,471 |
| Michigan Building Authority Revenue | 5.000% | 4/15/30 | 15,000 | 17,899 |
| Michigan Building Authority Revenue | 5.000% | 4/15/31 | 4,040 | 4,796 |
| Michigan Building Authority Revenue | 5.000% | 10/15/31 | 10,415 | 12,364 |
| Michigan Building Authority Revenue | 5.000% | 4/15/32 | 27,185 | 32,153 |
| Michigan Building Authority Revenue | 5.000% | 10/15/32 | 4,660 | 5,512 |
| Michigan Building Authority Revenue | 5.000% | 4/15/35 | 13,405 | 15,692 |
| Michigan Finance Authority Revenue | 5.000% | 4/1/18 | 13,000 | 13,669 |
| Michigan Finance Authority Revenue | 5.000% | 10/1/23 | 2,000 | 2,349 |
| Michigan Finance Authority Revenue | 5.000% | 4/1/24 | 4,000 | 4,736 |
| Michigan Finance Authority Revenue | 5.000% | 10/1/24 | 2,010 | 2,383 |
| Michigan Finance Authority Revenue | 5.000% | 4/1/25 | 2,160 | 2,577 |
| Michigan Finance Authority Revenue | 5.000% | 10/1/26 | 3,300 | 3,924 |
| Michigan Finance Authority Revenue | 5.000% | 10/1/27 | 3,375 | 3,991 |
| Michigan Finance Authority Revenue | 5.000% | 10/1/29 | 4,350 | 5,073 |
| Michigan Finance Authority Revenue | 5.000% | 10/1/30 | 5,240 | 6,082 |
| Michigan Finance Authority Revenue | 5.000% | 10/1/32 | 2,500 | 2,869 |
| Michigan Finance Authority Revenue (Beaumont Health Obligated Group) | 5.000% | 8/1/24 | 7,000 | 8,571 |
| Michigan Finance Authority Revenue (Beaumont Health Obligated Group) | 5.000% | 8/1/25 | 3,000 | 3,642 |
| Michigan Finance Authority Revenue (Beaumont Health Obligated Group) | 5.000% | 8/1/28 | 6,500 | 7,704 |
| Michigan Finance Authority Revenue (Beaumont Health Obligated Group) | 5.000% | 8/1/30 | 11,000 | 12,909 |
| Michigan Finance Authority Revenue (Beaumont Health Obligated Group) | 5.000% | 8/1/32 | 13,570 | 15,749 |
| Michigan Finance Authority Revenue (Detroit Water & Sewer) | 5.000% | 7/1/22 (4) | 20,000 | 23,498 |
| Michigan Finance Authority Revenue (Detroit Water & Sewer) | 5.000% | 7/1/22 (14) | 1,210 | 1,416 |
| Michigan Finance Authority Revenue (Detroit Water & Sewer) | 5.000% | 7/1/23 (4) | 19,000 | 22,731 |
| Michigan Finance Authority Revenue (Detroit Water & Sewer) | 5.000% | 7/1/24 (14) | 1,840 | 2,212 |
| Michigan Finance Authority Revenue (Detroit Water & Sewer) | 5.000% | 7/1/24 (4) | 15,000 | 18,201 |
| Michigan Finance Authority Revenue (Detroit Water & Sewer) | 5.000% | 7/1/25 (4) | 2,950 | 3,545 |
| Michigan Finance Authority Revenue (Detroit Water & Sewer) | 5.000% | 7/1/26 | 1,500 | 1,785 |
| Michigan Finance Authority Revenue (Detroit Water & Sewer) | 5.000% | 7/1/26 (4) | 5,000 | 5,963 |
| Michigan Finance Authority Revenue (Detroit Water & Sewer) | 5.000% | 7/1/26 (4) | 12,225 | 14,580 |
| Michigan Finance Authority Revenue (Detroit Water & Sewer) | 5.000% | 7/1/27 | 1,350 | 1,591 |
| Michigan Finance Authority Revenue (Detroit Water & Sewer) | 5.000% | 7/1/27 (4) | 10,000 | 11,857 |
| Michigan Finance Authority Revenue (Detroit Water & Sewer) | 5.000% | 7/1/28 | 1,000 | 1,168 |
| Michigan Finance Authority Revenue (Detroit Water & Sewer) | 5.000% | 7/1/28 (4) | 7,000 | 8,238 |
| Michigan Finance Authority Revenue (Detroit Water & Sewer) | 5.000% | 7/1/29 | 16,500 | 19,044 |
| Michigan Finance Authority Revenue (Detroit Water & Sewer) | 5.000% | 7/1/30 | 700 | 815 |
| Michigan Finance Authority Revenue (Detroit Water & Sewer) | 5.000% | 7/1/30 | 15,000 | 17,206 |
| Michigan Finance Authority Revenue (Detroit Water & Sewer) | 5.000% | 7/1/31 | 1,200 | 1,390 |
| Michigan Finance Authority Revenue (Detroit Water & Sewer) | 5.000% | 7/1/31 | 10,000 | 11,419 |
| Michigan Finance Authority Revenue (Detroit Water & Sewer) | 5.000% | 7/1/32 | 3,100 | 3,534 |
| Michigan Finance Authority Revenue (Detroit Water & Sewer) | 5.000% | 7/1/32 | 1,000 | 1,152 |
| Michigan Finance Authority Revenue (Detroit Water & Sewer) | 5.000% | 7/1/32 | 7,500 | 8,526 |
| Michigan Finance Authority Revenue (Detroit Water & Sewer) | 5.000% | 7/1/33 | 850 | 975 |
| Michigan Finance Authority Revenue (Detroit Water & Sewer) | 5.000% | 7/1/33 | 3,500 | 3,973 |
| Michigan Finance Authority Revenue (Detroit Water & Sewer) | 5.000% | 7/1/33 | 20,250 | 22,931 |
| Michigan Finance Authority Revenue (Detroit Water & Sewer) | 5.000% | 7/1/34 | 2,000 | 2,287 |
| Michigan Finance Authority Revenue (Detroit Water & Sewer) | 5.000% | 7/1/34 | 5,450 | 6,165 |
| Michigan Finance Authority Revenue (Detroit Water & Sewer) | 5.000% | 7/1/34 | 1,000 | 1,129 |
171
Intermediate-Term Tax-Exempt Fund
| | | | |
| | | | Face | Market |
| | | Maturity | Amount | Value• |
| | Coupon | Date | ($000) | ($000) |
| Michigan Finance Authority Revenue (Detroit Water & Sewer) | 5.000% | 7/1/35 (4) | 3,500 | 4,022 |
| Michigan Finance Authority Revenue (Detroit Water & Sewer) | 5.000% | 7/1/35 | 1,350 | 1,539 |
| Michigan Finance Authority Revenue (Henry Ford Health System Obligated Group) | 5.000% | 11/15/24 | 2,300 | 2,799 |
| Michigan Finance Authority Revenue (Henry Ford Health System Obligated Group) | 5.000% | 11/15/26 | 4,000 | 4,923 |
| Michigan Finance Authority Revenue (Henry Ford Health System Obligated Group) | 5.000% | 11/15/32 | 3,655 | 4,257 |
| Michigan Finance Authority Revenue (Henry Ford Health System Obligated Group) | 5.000% | 11/15/34 | 7,000 | 8,061 |
| Michigan Finance Authority Revenue (Henry Ford Health System Obligated Group) | 5.000% | 11/15/37 | 12,000 | 13,676 |
| Michigan Finance Authority Revenue (McLaren Health Care Corp.) | 5.000% | 5/15/23 | 1,000 | 1,196 |
| Michigan Finance Authority Revenue (McLaren Health Care Corp.) | 5.000% | 5/15/24 | 1,000 | 1,214 |
| Michigan Finance Authority Revenue (McLaren Health Care Corp.) | 5.000% | 5/15/25 | 1,500 | 1,833 |
| Michigan Finance Authority Revenue (McLaren Health Care Corp.) | 5.000% | 5/15/26 | 1,000 | 1,212 |
| Michigan Finance Authority Revenue (McLaren Health Care Corp.) | 5.000% | 5/15/27 | 800 | 960 |
| Michigan Finance Authority Revenue (McLaren Health Care Corp.) | 5.000% | 5/15/28 | 1,000 | 1,189 |
| Michigan Finance Authority Revenue (McLaren Health Care Corp.) | 5.000% | 5/15/29 | 1,000 | 1,181 |
| Michigan Finance Authority Revenue (McLaren Health Care Corp.) | 5.000% | 5/15/30 | 2,580 | 3,028 |
| Michigan Finance Authority Revenue (McLaren Health Care Corp.) | 5.000% | 5/15/31 | 2,655 | 3,096 |
| 1 Michigan Finance Authority Revenue (McLaren Health Care Corp.) PUT | 0.964% | 10/15/18 | 48,255 | 48,148 |
| 1 Michigan Finance Authority Revenue (McLaren Health Care Corp.) PUT | 1.114% | 10/15/20 | 25,000 | 24,892 |
| 4 Michigan Finance Authority Revenue (McLaren Health Care Corp.) TOB VRDO | 0.580% | 11/1/16 LOC | 20,000 | 20,000 |
| Michigan Finance Authority Revenue (MidMichigan Obligated Group) | 5.000% | 6/1/28 | 1,310 | 1,550 |
| Michigan Finance Authority Revenue (MidMichigan Obligated Group) | 5.000% | 6/1/29 | 2,000 | 2,351 |
| Michigan Finance Authority Revenue (MidMichigan Obligated Group) | 5.000% | 6/1/30 | 3,000 | 3,511 |
| Michigan Finance Authority Revenue (MidMichigan Obligated Group) | 5.000% | 6/1/31 | 5,000 | 5,828 |
| Michigan Finance Authority Revenue (MidMichigan Obligated Group) | 5.000% | 6/1/32 | 5,000 | 5,806 |
| Michigan Finance Authority Revenue (Sparrow Obligated Group) | 5.000% | 11/15/23 | 830 | 984 |
| Michigan Finance Authority Revenue (Sparrow Obligated Group) | 5.000% | 11/15/24 | 1,300 | 1,612 |
| Michigan Finance Authority Revenue (Sparrow Obligated Group) | 5.000% | 11/15/24 | 425 | 500 |
| Michigan Finance Authority Revenue (Sparrow Obligated Group) | 5.000% | 11/15/25 | 1,190 | 1,389 |
| Michigan Finance Authority Revenue (Sparrow Obligated Group) | 5.000% | 11/15/26 | 400 | 465 |
| Michigan Finance Authority Revenue (State Clean Water Revolving Fund) | 5.000% | 10/1/17 | 2,000 | 2,079 |
| 3 Michigan Finance Authority Revenue (State Clean Water Revolving Fund) | 2.000% | 10/1/19 | 1,800 | 1,852 |
| 3 Michigan Finance Authority Revenue (State Clean Water Revolving Fund) | 4.000% | 10/1/20 | 8,360 | 9,278 |
| 3 Michigan Finance Authority Revenue (State Clean Water Revolving Fund) | 4.000% | 10/1/30 | 7,500 | 8,465 |
| Michigan Finance Authority Revenue (State Clean Water Revolving Fund) | 5.000% | 10/1/32 | 1,500 | 1,763 |
| Michigan Finance Authority Revenue (Trinity Health Credit Group) | 5.000% | 12/1/20 (Prere.) | 70 | 81 |
| Michigan Finance Authority Revenue (Trinity Health Credit Group) | 5.000% | 12/1/24 | 4,750 | 5,844 |
| Michigan Finance Authority Revenue (Trinity Health Credit Group) | 5.000% | 12/1/25 | 3,500 | 4,309 |
| Michigan Finance Authority Revenue (Trinity Health Credit Group) | 5.000% | 12/1/27 | 7,930 | 8,935 |
| Michigan Finance Authority Revenue (Trinity Health Credit Group) | 5.000% | 12/1/30 | 12,500 | 14,457 |
| Michigan Finance Authority Revenue (Trinity Health Credit Group) | 5.000% | 12/1/33 | 5,000 | 5,924 |
| Michigan Finance Authority Revenue (Trinity Health Credit Group) | 5.000% | 12/1/34 | 7,870 | 9,287 |
| Michigan Finance Authority Revenue (Unemployment Obligation Assessment) | 5.000% | 7/1/17 | 65,000 | 66,882 |
| Michigan Finance Authority Revenue (Unemployment Obligation Assessment) | 5.000% | 7/1/18 | 50,500 | 53,978 |
| Michigan Finance Authority Revenue (Unemployment Obligation Assessment) | 5.000% | 7/1/19 | 44,000 | 48,668 |
| Michigan Finance Authority Revenue (Unemployment Obligation Assessment) | 5.000% | 1/1/22 | 7,735 | 8,101 |
| Michigan GAN | 5.000% | 3/15/23 | 5,000 | 5,984 |
| Michigan GAN | 5.000% | 3/15/26 | 6,000 | 7,440 |
| Michigan GAN | 5.000% | 3/15/27 | 3,750 | 4,677 |
| Michigan GO | 5.000% | 5/1/17 | 33,880 | 34,613 |
| Michigan GO | 5.250% | 9/15/17 (Prere.) | 12,805 | 13,302 |
| Michigan GO | 5.250% | 9/15/17 (Prere.) | 10,810 | 11,229 |
| Michigan GO | 5.000% | 12/1/25 | 7,835 | 9,895 |
| Michigan GO | 5.000% | 12/1/26 | 2,285 | 2,862 |
| Michigan Hospital Finance Authority Revenue (Ascension Health Credit Group) | 5.000% | 11/15/32 | 18,470 | 21,798 |
| Michigan Hospital Finance Authority Revenue (Ascension Health Credit Group) | 5.000% | 11/15/33 | 16,910 | 19,858 |
| Michigan Hospital Finance Authority Revenue (Ascension Health Credit Group) PUT | 1.500% | 3/15/17 | 45,000 | 45,095 |
| Michigan Hospital Finance Authority Revenue (Henry Ford Health System) | 5.250% | 11/15/19 (Prere.) | 5,000 | 5,624 |
| Michigan Hospital Finance Authority Revenue (Henry Ford Health System) | 5.625% | 11/15/19 (Prere.) | 15,775 | 17,920 |
| Michigan Hospital Finance Authority Revenue (McLaren Health Care) | 5.000% | 6/1/27 | 2,000 | 2,297 |
| Michigan Hospital Finance Authority Revenue (McLaren Health Care) | 5.000% | 6/1/28 | 2,600 | 2,971 |
| Michigan Hospital Finance Authority Revenue (MidMichigan Obligated Group) | 5.125% | 6/1/19 (ETM) | 1,900 | 2,011 |
| Michigan Hospital Finance Authority Revenue (MidMichigan Obligated Group) | 5.625% | 6/1/19 (Prere.) | 5,000 | 5,582 |
| Michigan Hospital Finance Authority Revenue (MidMichigan Obligated Group) | 6.000% | 6/1/19 (Prere.) | 4,000 | 4,504 |
| Michigan Hospital Finance Authority Revenue (Trinity Health) PUT | 6.000% | 12/1/17 | 3,950 | 4,166 |
| Michigan Housing Development Authority Revenue | 3.500% | 6/1/47 | 13,000 | 13,761 |
| Michigan Municipal Bond Authority Revenue (State Clean Water Revolving Fund) | 5.000% | 10/1/22 | 4,000 | 4,574 |
| Michigan Strategic Fund Limited Obligation Revenue | | | | |
| (Facility for Rare Isotope Beams Project at Michigan State University) | 5.000% | 3/1/23 | 1,250 | 1,511 |
| Michigan Strategic Fund Limited Obligation Revenue | | | | |
| (Facility for Rare Isotope Beams Project at Michigan State University) | 5.000% | 3/1/24 | 1,500 | 1,841 |
172
Intermediate-Term Tax-Exempt Fund
| | | | |
| | | | Face | Market |
| | | Maturity | Amount | Value• |
| | Coupon | Date | ($000) | ($000) |
| Michigan Strategic Fund Limited Obligation Revenue | | | | |
| (Facility for Rare Isotope Beams Project at Michigan State University) | 5.000% | 3/1/25 | 1,250 | 1,518 |
| Michigan Strategic Fund Limited Obligation Revenue | | | | |
| (Facility for Rare Isotope Beams Project at Michigan State University) | 5.000% | 3/1/26 | 2,000 | 2,402 |
| Michigan Strategic Fund Limited Obligation Revenue | | | | |
| (Facility for Rare Isotope Beams Project at Michigan State University) | 5.000% | 3/1/27 | 1,700 | 2,024 |
| Michigan Strategic Fund Limited Obligation Revenue | | | | |
| (Facility for Rare Isotope Beams Project at Michigan State University) | 5.000% | 3/1/28 | 1,250 | 1,480 |
| Michigan Strategic Fund Limited Obligation Revenue | | | | |
| (Facility for Rare Isotope Beams Project at Michigan State University) | 5.000% | 3/1/29 | 2,500 | 2,939 |
| Michigan Strategic Fund Limited Obligation Revenue (Senate Offices Project) | 5.000% | 10/15/30 | 1,480 | 1,730 |
| Michigan Strategic Fund Limited Obligation Revenue (Senate Offices Project) | 5.000% | 10/15/34 | 2,170 | 2,492 |
| Michigan Strategic Fund Limited Obligation Revenue (Senate Offices Project) | 5.000% | 10/15/35 | 1,370 | 1,565 |
| Michigan Trunk Line Revenue | 5.000% | 11/15/22 | 7,000 | 8,458 |
| Monroe County MI Economic Development Corp. Revenue (Detroit Edison Co. Project) | 6.950% | 9/1/22 (14) | 27,000 | 34,810 |
| Oakland University MI Revenue | 5.000% | 3/1/24 | 500 | 607 |
| Oakland University MI Revenue | 5.000% | 3/1/25 | 500 | 614 |
| Oakland University MI Revenue | 5.000% | 3/1/26 | 500 | 618 |
| Oakland University MI Revenue | 5.000% | 3/1/27 | 750 | 918 |
| Oakland University MI Revenue | 5.000% | 3/1/28 | 1,215 | 1,473 |
| Oakland University MI Revenue | 5.000% | 3/1/29 | 1,735 | 2,086 |
| Oakland University MI Revenue | 5.000% | 3/1/31 | 2,225 | 2,637 |
| Oakland University MI Revenue | 5.000% | 3/1/32 | 3,140 | 3,701 |
| Oakland University MI Revenue | 5.000% | 3/1/33 | 1,775 | 2,083 |
| Oakland University MI Revenue | 5.000% | 3/1/34 | 3,745 | 4,377 |
| Oakland University MI Revenue | 5.000% | 3/1/35 | 2,205 | 2,571 |
| Oakland University MI Revenue | 5.000% | 3/1/36 | 2,025 | 2,354 |
| Portage MI Public Schools GO | 5.000% | 11/1/33 | 2,130 | 2,511 |
| Portage MI Public Schools GO | 5.000% | 11/1/35 | 1,300 | 1,523 |
| Portage MI Public Schools GO | 5.000% | 11/1/36 | 1,500 | 1,755 |
| Rochester MI Community School District GO | 5.000% | 5/1/19 | 4,180 | 4,578 |
| Rockford MI Public Schools GO | 5.000% | 5/1/32 | 2,000 | 2,368 |
| Rockford MI Public Schools GO | 5.000% | 5/1/33 | 2,470 | 2,912 |
| Romeo MI Community School District GO | 5.000% | 5/1/32 | 1,290 | 1,521 |
| Romeo MI Community School District GO | 5.000% | 5/1/33 | 1,350 | 1,584 |
| Romeo MI Community School District GO | 5.000% | 5/1/34 | 1,425 | 1,668 |
| Romeo MI Community School District GO | 5.000% | 5/1/35 | 1,000 | 1,166 |
| Royal Oak MI Hospital Finance Authority Hospital Revenue (William Beaumont Hospital) | 8.000% | 9/1/18 (Prere.) | 13,900 | 15,699 |
| Royal Oak MI Hospital Finance Authority Hospital Revenue (William Beaumont Hospital) | 5.500% | 8/1/19 (ETM) | 20,000 | 22,421 |
| Royal Oak MI Hospital Finance Authority Hospital Revenue (William Beaumont Hospital) | 6.375% | 8/1/19 (Prere.) | 25,000 | 28,648 |
| Royal Oak MI Hospital Finance Authority Hospital Revenue (William Beaumont Hospital) | 5.000% | 9/1/22 | 2,500 | 2,972 |
| Royal Oak MI Hospital Finance Authority Hospital Revenue (William Beaumont Hospital) | 5.000% | 9/1/23 | 2,000 | 2,420 |
| Royal Oak MI Hospital Finance Authority Hospital Revenue (William Beaumont Hospital) | 5.000% | 9/1/26 | 2,225 | 2,658 |
| Saginaw MI Hospital Finance Authority Hospital Revenue (Covenant Medical Center Inc.) | 5.000% | 7/1/18 | 2,195 | 2,322 |
| Saginaw MI Hospital Finance Authority Hospital Revenue (Covenant Medical Center Inc.) | 5.000% | 7/1/19 | 2,300 | 2,503 |
| Saginaw MI Hospital Finance Authority Hospital Revenue (Covenant Medical Center Inc.) | 5.000% | 7/1/30 | 10,000 | 11,040 |
| University of Michigan Revenue | 5.000% | 4/1/17 | 30,000 | 30,548 |
| 1 University of Michigan Revenue PUT | 1.060% | 4/2/18 | 25,100 | 24,987 |
| Wayne County MI Airport Authority Revenue | 5.000% | 12/1/29 | 1,525 | 1,819 |
| Wayne County MI Airport Authority Revenue | 5.000% | 12/1/31 | 2,300 | 2,713 |
| Wayne County MI Airport Authority Revenue | 5.000% | 12/1/32 | 2,870 | 3,371 |
| Wayne County MI Airport Authority Revenue | 5.000% | 12/1/33 | 10,165 | 11,903 |
| Wayne County MI Airport Authority Revenue | 5.000% | 12/1/34 | 3,390 | 3,961 |
| Wayne County MI Airport Authority Revenue | 5.000% | 12/1/34 | 2,600 | 3,038 |
| Wayne County MI Airport Authority Revenue | 5.000% | 12/1/35 | 3,870 | 4,508 |
| Wayne County MI Airport Authority Revenue (Detroit Metropolitan Wayne County Airport) | 5.000% | 12/1/16 | 5,000 | 5,018 |
| Wayne County MI Airport Authority Revenue (Detroit Metropolitan Wayne County Airport) | 4.500% | 12/1/25 (14) | 8,050 | 8,342 |
| Wayne County MI Airport Authority Revenue (Detroit Metropolitan Wayne County Airport) | 5.000% | 12/1/27 | 5,655 | 6,461 |
| Wayne County MI Airport Authority Revenue (Detroit Metropolitan Wayne County Airport) | 5.000% | 12/1/28 | 5,935 | 6,724 |
| Wayne County MI Airport Authority Revenue (Detroit Metropolitan Wayne County Airport) | 5.000% | 12/1/29 | 3,895 | 4,425 |
| Wayne County MI Airport Authority Revenue (Detroit Metropolitan Wayne County Airport) | 5.000% | 12/1/30 | 6,540 | 7,379 |
| Wayne County MI Airport Authority Revenue (Detroit Metropolitan Wayne County Airport) | 5.000% | 12/1/31 | 6,370 | 7,153 |
| Wayne County MI Airport Authority Revenue (Detroit Metropolitan Wayne County Airport) | 5.000% | 12/1/32 | 4,300 | 4,823 |
| 4 Wayne State University Michigan Revenue TOB VRDO | 0.700% | 11/7/16 | 5,000 | 5,000 |
| Woodhaven-Brownstone MI School District GO | 5.000% | 5/1/29 | 3,800 | 4,586 |
| Woodhaven-Brownstone MI School District GO | 5.000% | 5/1/30 | 3,850 | 4,611 |
| Woodhaven-Brownstone MI School District GO | 5.000% | 5/1/31 | 3,905 | 4,653 |
| | | | | 1,902,123 |
173
Intermediate-Term Tax-Exempt Fund
| | | | |
| | | | Face | Market |
| | | Maturity | Amount | Value• |
| | Coupon | Date | ($000) | ($000) |
| Minnesota (1.6%) | | | | |
| Duluth MN Independent School District No. 709 COP | 5.000% | 2/1/22 | 2,150 | 2,509 |
| Hennepin County MN GO | 5.000% | 12/1/19 | 5,050 | 5,668 |
| Hennepin County MN GO | 5.000% | 12/1/23 | 2,600 | 3,233 |
| Hennepin County MN GO | 5.000% | 12/1/24 | 3,055 | 3,863 |
| Hennepin County MN GO | 5.000% | 12/1/25 | 1,295 | 1,661 |
| Hennepin County MN GO | 5.000% | 12/1/26 | 3,635 | 4,725 |
| Metropolitan Council (Minneapolis-St. Paul Metropolitan Area) Minnesota GO | 5.000% | 3/1/18 | 4,500 | 4,750 |
| Metropolitan Council (Minneapolis-St. Paul Metropolitan Area) Minnesota GO | 5.000% | 3/1/19 | 4,200 | 4,595 |
| Metropolitan Council (Minneapolis-St. Paul Metropolitan Area) Minnesota GO | 5.000% | 3/1/19 | 1,500 | 1,641 |
| Metropolitan Council (Minneapolis-St. Paul Metropolitan Area) Minnesota GO | 5.000% | 3/1/20 | 4,500 | 5,086 |
| Minneapolis & St. Paul MN Housing & Redevelopment Authority Health Care System Revenue | | | | |
| (Allina Health System) | 5.000% | 11/15/17 | 1,785 | 1,861 |
| Minneapolis & St. Paul MN Housing & Redevelopment Authority Health Care System Revenue | | | | |
| (Allina Health System) | 5.000% | 11/15/18 | 2,190 | 2,365 |
| Minneapolis & St. Paul MN Housing & Redevelopment Authority Health Care System Revenue | | | | |
| (Allina Health System) | 5.000% | 11/15/20 | 1,585 | 1,763 |
| Minneapolis & St. Paul MN Housing & Redevelopment Authority Health Care System Revenue | | | | |
| (Allina Health System) | 5.000% | 11/15/20 | 1,805 | 2,008 |
| Minneapolis & St. Paul MN Housing & Redevelopment Authority Health Care System Revenue | | | | |
| (Allina Health System) | 5.000% | 11/15/21 | 2,205 | 2,452 |
| Minneapolis & St. Paul MN Housing & Redevelopment Authority Health Care System Revenue | | | | |
| (Allina Health System) | 5.000% | 11/15/21 | 3,925 | 4,365 |
| Minneapolis & St. Paul MN Housing & Redevelopment Authority Health Care System Revenue | | | | |
| (Allina Health System) | 5.000% | 11/15/22 | 2,425 | 2,697 |
| Minneapolis & St. Paul MN Housing & Redevelopment Authority Health Care System Revenue | | | | |
| (Allina Health System) | 5.250% | 11/15/29 | 7,000 | 7,829 |
| Minneapolis & St. Paul MN Metropolitan Airports Commission Revenue | 5.000% | 1/1/26 | 12,000 | 15,081 |
| Minneapolis & St. Paul MN Metropolitan Airports Commission Revenue | 5.000% | 1/1/28 | 4,000 | 4,777 |
| Minneapolis & St. Paul MN Metropolitan Airports Commission Revenue | 5.000% | 1/1/28 | 20,500 | 25,724 |
| Minneapolis & St. Paul MN Metropolitan Airports Commission Revenue | 5.000% | 1/1/29 | 2,280 | 2,701 |
| Minneapolis & St. Paul MN Metropolitan Airports Commission Revenue | 5.000% | 1/1/30 | 2,500 | 2,940 |
| Minneapolis & St. Paul MN Metropolitan Airports Commission Revenue | 5.000% | 1/1/31 | 2,500 | 2,927 |
| Minneapolis & St. Paul MN Metropolitan Council Wastewater GO | 5.000% | 3/1/20 | 4,485 | 5,070 |
| Minneapolis & St. Paul MN Metropolitan Council Wastewater GO | 5.000% | 3/1/21 | 5,000 | 5,823 |
| Minneapolis & St. Paul MN Metropolitan Council Wastewater GO | 5.000% | 3/1/25 | 7,000 | 8,863 |
| Minneapolis & St. Paul MN Metropolitan Council Wastewater GO | 5.000% | 3/1/26 | 7,395 | 9,483 |
| Minneapolis MN GO | 2.000% | 12/1/19 | 8,000 | 8,232 |
| Minneapolis MN Health Care System Revenue (Fairview Health Services) | 6.000% | 11/15/18 (ETM) | 8,530 | 9,014 |
| Minneapolis MN Health Care System Revenue (Fairview Health Services) | 6.625% | 11/15/18 (Prere.) | 15,500 | 17,277 |
| Minneapolis MN Special School District No. 1 COP | 5.000% | 2/1/22 | 6,805 | 8,046 |
| Minneapolis MN Special School District No. 1 COP | 5.000% | 2/1/23 | 7,550 | 9,098 |
| Minneapolis MN Special School District No. 1 COP | 5.000% | 2/1/24 | 8,215 | 9,918 |
| Minneapolis MN Special School District No. 1 COP | 5.000% | 2/1/25 | 5,050 | 6,039 |
| Minneapolis MN Special School District No. 1 COP | 5.000% | 2/1/26 | 7,000 | 8,349 |
| Minneapolis MN Special School District No. 1 COP | 5.000% | 2/1/27 | 10,085 | 11,996 |
| Minneapolis MN Special School District No. 1 COP | 5.000% | 2/1/28 | 10,590 | 12,589 |
| 3 Minnesota 911 Revenue | 5.000% | 6/1/18 | 18,000 | 19,171 |
| 3 Minnesota 911 Revenue | 5.000% | 6/1/19 | 20,400 | 22,484 |
| 3 Minnesota 911 Revenue | 5.000% | 6/1/20 | 21,420 | 24,360 |
| Minnesota COP | 5.000% | 6/1/17 | 7,745 | 7,773 |
| Minnesota COP | 5.000% | 6/1/18 | 7,135 | 7,161 |
| Minnesota COP | 5.000% | 6/1/19 | 8,540 | 8,571 |
| Minnesota COP | 5.000% | 6/1/28 | 3,225 | 3,883 |
| Minnesota COP | 5.000% | 6/1/29 | 3,385 | 4,050 |
| Minnesota COP | 5.000% | 6/1/30 | 3,405 | 4,052 |
| Minnesota COP | 5.000% | 6/1/32 | 3,670 | 4,328 |
| Minnesota COP | 5.000% | 6/1/33 | 3,615 | 4,247 |
| Minnesota COP | 5.000% | 6/1/34 | 4,005 | 4,690 |
| Minnesota General Fund Revenue | 5.000% | 3/1/24 | 7,500 | 8,850 |
| Minnesota General Fund Revenue | 5.000% | 3/1/25 | 6,000 | 7,074 |
| Minnesota GO | 5.000% | 12/1/16 | 5,145 | 5,164 |
| Minnesota GO | 5.000% | 8/1/17 | 1,000 | 1,032 |
| Minnesota GO | 5.000% | 8/1/18 | 3,895 | 4,175 |
| Minnesota GO | 5.000% | 8/1/21 | 5,445 | 6,410 |
| Minnesota GO | 5.000% | 8/1/21 | 6,000 | 7,064 |
| Minnesota GO | 5.000% | 8/1/21 | 6,500 | 7,652 |
| Minnesota GO | 5.000% | 8/1/21 | 31,000 | 36,496 |
| Minnesota GO | 5.000% | 10/1/21 (Prere.) | 155 | 182 |
| Minnesota GO | 5.000% | 8/1/22 | 20,500 | 24,764 |
174
Intermediate-Term Tax-Exempt Fund
| | | | |
| | | | Face | Market |
| | | Maturity | Amount | Value• |
| | Coupon | Date | ($000) | ($000) |
| Minnesota GO | 5.000% | 8/1/23 | 32,540 | 40,111 |
| Minnesota GO | 5.000% | 8/1/23 | 12,000 | 14,792 |
| Minnesota GO | 5.000% | 8/1/24 | 12,355 | 15,503 |
| Minnesota GO | 5.000% | 8/1/24 | 15,500 | 19,424 |
| Minnesota GO | 5.000% | 8/1/24 | 1,350 | 1,692 |
| Minnesota GO | 5.000% | 10/1/24 | 9,845 | 11,572 |
| Minnesota GO | 5.000% | 8/1/25 | 17,005 | 21,622 |
| Minnesota GO | 5.000% | 8/1/25 | 13,500 | 17,165 |
| Minnesota GO | 5.000% | 8/1/25 | 9,590 | 12,212 |
| Minnesota GO | 5.000% | 8/1/25 | 31,390 | 39,971 |
| Minnesota GO | 4.000% | 8/1/26 | 8,015 | 9,612 |
| Minnesota GO | 5.000% | 8/1/26 | 35,060 | 44,342 |
| Minnesota GO | 5.000% | 8/1/27 | 4,000 | 5,028 |
| Minnesota Higher Education Facilities Authority Revenue (University of St. Thomas) | 4.000% | 4/1/17 | 820 | 831 |
| Minnesota Higher Education Facilities Authority Revenue (University of St. Thomas) | 4.000% | 4/1/18 | 455 | 474 |
| Minnesota Higher Education Facilities Authority Revenue (University of St. Thomas) | 4.000% | 4/1/19 | 425 | 455 |
| Minnesota Office of Higher Education Revenue (Supplemental Student Loan Program) | 5.000% | 11/1/16 | 1,120 | 1,120 |
| Minnesota Office of Higher Education Revenue (Supplemental Student Loan Program) | 5.000% | 11/1/18 | 4,305 | 4,605 |
| Minnesota Public Facilities Authority Revenue (State Revolving Fund) | 5.000% | 3/1/20 (Prere.) | 5,000 | 5,642 |
| Osseo MN Independent School District No. 279 GO | 5.000% | 2/1/20 | 7,410 | 8,336 |
| Rochester MN Health Care Facilities Revenue (Mayo Clinic) | 5.000% | 11/15/29 | 7,000 | 9,042 |
| Rochester MN Health Care Facilities Revenue (Mayo Clinic) | 5.000% | 11/15/31 | 8,000 | 10,342 |
| Rochester MN Health Care Facilities Revenue (Mayo Clinic) PUT | 4.000% | 11/15/18 | 11,500 | 12,195 |
| South Washington County MN Independent School District No. 833 GO | 5.000% | 2/1/25 | 4,215 | 5,279 |
| Southern Minnesota Municipal Power Agency Power Supply System Revenue | 5.250% | 1/1/19 (Prere.) | 2,000 | 2,182 |
| St. Cloud MN Health Care Revenue (CentraCare Health System) | 5.000% | 5/1/23 | 2,000 | 2,418 |
| St. Cloud MN Health Care Revenue (CentraCare Health System) | 5.000% | 5/1/24 | 1,500 | 1,842 |
| St. Louis Park MN Health Care Facilities Revenue (Park Nicollet Health Services) | 5.500% | 7/1/18 (Prere.) | 21,700 | 23,366 |
| St. Louis Park MN Health Care Facilities Revenue (Park Nicollet Health Services) | 5.625% | 7/1/18 (Prere.) | 6,000 | 6,473 |
| University of Minnesota Revenue | 5.000% | 12/1/18 | 1,000 | 1,084 |
| University of Minnesota Revenue | 5.000% | 8/1/19 | 1,150 | 1,274 |
| University of Minnesota Revenue | 5.000% | 4/1/20 | 2,895 | 3,276 |
| University of Minnesota Revenue | 5.000% | 4/1/21 | 3,140 | 3,656 |
| University of Minnesota Revenue | 5.000% | 4/1/22 | 500 | 546 |
| University of Minnesota Revenue | 5.000% | 8/1/22 | 1,585 | 1,813 |
| University of Minnesota Revenue | 5.000% | 8/1/23 | 2,500 | 2,858 |
| University of Minnesota Revenue | 5.000% | 8/1/24 | 4,515 | 5,158 |
| | | | | 837,964 |
| Mississippi (0.3%) | | | | |
| Gulfport MS Hospital Facilities Revenue (Memorial Hospital at Gulfport Project) | 5.000% | 7/1/28 | 3,620 | 4,263 |
| Jackson MS Public School District GO | 5.000% | 4/1/23 | 1,500 | 1,776 |
| Jackson MS Public School District GO | 5.000% | 4/1/24 | 3,000 | 3,578 |
| Jackson MS Public School District GO | 5.000% | 4/1/25 | 5,285 | 6,369 |
| Jackson MS Public School District GO | 5.000% | 4/1/26 | 5,000 | 6,084 |
| Jackson MS Public School District GO | 5.000% | 4/1/27 | 4,500 | 5,516 |
| Mississippi Development Bank Special Obligation Revenue (Harrison County Highway Project) | 5.000% | 1/1/24 | 2,500 | 3,047 |
| Mississippi Development Bank Special Obligation Revenue (Madison County Highway Project) | 5.000% | 1/1/24 | 2,500 | 3,047 |
| Mississippi GO | 5.500% | 12/1/16 | 3,435 | 3,449 |
| Mississippi GO | 5.000% | 12/1/17 (Prere.) | 16,890 | 17,671 |
| Mississippi GO | 5.000% | 12/1/17 (Prere.) | 10,000 | 10,463 |
| Mississippi GO | 5.000% | 10/1/19 | 2,330 | 2,599 |
| Mississippi GO | 5.000% | 10/1/30 | 12,035 | 14,068 |
| Mississippi GO | 5.000% | 11/1/30 | 4,000 | 4,874 |
| Mississippi GO | 5.000% | 10/1/31 | 11,735 | 13,693 |
| Mississippi GO | 5.000% | 12/1/31 | 11,250 | 13,493 |
| Mississippi GO | 5.000% | 12/1/32 | 7,000 | 8,360 |
| Mississippi Hospital Equipment & Facilities Authority Revenue (North Mississippi Health Services) | 5.000% | 10/1/17 | 2,500 | 2,591 |
| University of Southern Mississippi S.M. Educational Building Corp. Revenue | | | | |
| (Athletics Facilities Improvements Project) | 5.000% | 3/1/17 (Prere.) | 10,000 | 10,132 |
| | | | | 135,073 |
| Missouri (0.9%) | | | | |
| Bi-State Development Agency of the Missouri-Illinois Metropolitan District | | | | |
| Mass Transit Sales Tax Revenue | 5.000% | 10/1/33 | 7,500 | 8,681 |
| Cape Girardeau County MO Industrial Development Authority of the Health Facilities Revenue | | | | |
| (St. Francis Medical Center) | 5.000% | 6/1/26 | 1,000 | 1,151 |
| Cape Girardeau County MO Industrial Development Authority of the Health Facilities Revenue | | | | |
| (St. Francis Medical Center) | 5.000% | 6/1/27 | 1,850 | 2,118 |
| Curators of the University of Missouri System Facilities Revenue | 5.000% | 11/1/26 | 1,830 | 2,138 |
| Curators of the University of Missouri System Facilities Revenue | 5.000% | 11/1/27 | 1,000 | 1,166 |
175
Intermediate-Term Tax-Exempt Fund
| | | | |
| | | | Face | Market |
| | | Maturity | Amount | Value• |
| | Coupon | Date | ($000) | ($000) |
| Curators of the University of Missouri System Facilities Revenue | 4.000% | 11/1/30 | 3,000 | 3,345 |
| Curators of the University of Missouri System Facilities Revenue | 4.000% | 11/1/31 | 6,415 | 7,109 |
| Jackson County MO Special Obligation Revenue (Truman Sports Complex Project) | 5.000% | 12/1/20 | 5,000 | 5,749 |
| Jackson County MO Special Obligation Revenue (Truman Sports Complex Project) | 5.000% | 12/1/25 | 6,000 | 7,352 |
| Jackson County MO Special Obligation Revenue (Truman Sports Complex Project) | 5.000% | 12/1/26 | 5,000 | 6,072 |
| Jackson County MO Special Obligation Revenue (Truman Sports Complex Project) | 5.000% | 12/1/27 | 12,745 | 15,380 |
| Jackson County MO Special Obligation Revenue (Truman Sports Complex Project) | 5.000% | 12/1/29 | 13,625 | 16,229 |
| Jackson County MO Special Obligation Revenue (Truman Sports Complex Project) | 5.000% | 12/1/30 | 13,675 | 16,218 |
| Jackson County MO Special Obligation Revenue (Truman Sports Complex Project) | 5.000% | 12/1/31 | 5,535 | 6,533 |
| Kansas City MO Sanitary Sewer System Revenue | 4.000% | 1/1/30 | 1,190 | 1,322 |
| Kansas City MO Sanitary Sewer System Revenue | 4.000% | 1/1/31 | 1,700 | 1,877 |
| Kansas City MO Special Obligation Revenue (Downtown Arena Project) | 5.000% | 4/1/32 | 7,225 | 8,403 |
| Kansas City MO Special Obligation Revenue (Downtown Arena Project) | 4.000% | 4/1/35 | 2,000 | 2,129 |
| Kansas City MO Special Obligation Revenue (Downtown Arena Project) | 4.000% | 4/1/36 | 1,850 | 1,964 |
| Kansas City MO Special Obligation Revenue (Performing Arts Center Garage Project) | 0.000% | 2/1/18 | 3,000 | 2,936 |
| Kansas City MO Special Obligation Revenue (Performing Arts Center Garage Project) | 0.000% | 2/1/19 | 7,615 | 7,301 |
| Missouri Board of Public Buildings Special Obligation Revenue | 4.000% | 4/1/20 | 5,160 | 5,662 |
| Missouri Environmental Improvement & Energy Resources Authority Revenue | 1.453% | 12/1/22 (14) | 6,385 | 5,978 |
| Missouri Environmental Improvement & Energy Resources Authority Revenue | 5.000% | 1/1/24 | 2,000 | 2,471 |
| Missouri Environmental Improvement & Energy Resources Authority Revenue | 5.000% | 1/1/25 | 2,900 | 3,637 |
| Missouri Environmental Improvement & Energy Resources Authority Revenue | 5.000% | 7/1/26 | 4,250 | 5,352 |
| Missouri Environmental Improvement & Energy Resources Authority Revenue | 5.000% | 1/1/27 | 2,000 | 2,510 |
| Missouri Health & Educational Facilities Authority Health Facilities Revenue (Cox Health) | 5.000% | 11/15/26 | 2,045 | 2,417 |
| Missouri Health & Educational Facilities Authority Health Facilities Revenue (Cox Health) | 5.000% | 11/15/28 | 1,000 | 1,164 |
| Missouri Health & Educational Facilities Authority Health Facilities Revenue | | | | |
| (Freeman Health System) | 5.000% | 2/15/21 | 2,845 | 3,241 |
| Missouri Health & Educational Facilities Authority Health Facilities Revenue | | | | |
| (Freeman Health System) | 5.000% | 2/15/22 | 3,490 | 4,061 |
| Missouri Health & Educational Facilities Authority Health Facilities Revenue | | | | |
| (Freeman Health System) | 5.000% | 2/15/23 | 3,690 | 4,281 |
| Missouri Health & Educational Facilities Authority Health Facilities Revenue | | | | |
| (Freeman Health System) | 5.000% | 2/15/24 | 3,320 | 3,829 |
| Missouri Health & Educational Facilities Authority Health Facilities Revenue (SSM Health System) | 5.000% | 6/1/19 | 2,420 | 2,654 |
| Missouri Health & Educational Facilities Authority Health Facilities Revenue (SSM Health System) | 5.000% | 6/1/22 | 5,270 | 5,957 |
| Missouri Health & Educational Facilities Authority Health Facilities Revenue (SSM Health System) | 5.000% | 6/1/26 | 3,000 | 3,630 |
| Missouri Health & Educational Facilities Authority Health Facilities Revenue (SSM Health System) | 5.000% | 6/1/27 | 4,000 | 4,794 |
| Missouri Health & Educational Facilities Authority Health Facilities Revenue (SSM Health System) | 5.000% | 6/1/28 | 3,500 | 4,167 |
| Missouri Health & Educational Facilities Authority Health Facilities Revenue (SSM Health System) | 5.000% | 6/1/29 | 4,000 | 4,732 |
| Missouri Health & Educational Facilities Authority Health Facilities Revenue (SSM Health System) | 5.000% | 6/1/30 | 4,000 | 4,708 |
| Missouri Health & Educational Facilities Authority Health Facilities Revenue (SSM Health System) | 5.000% | 6/1/31 | 3,000 | 3,517 |
| Missouri Health & Educational Facilities Authority Health Facilities Revenue | | | | |
| (St. Luke’s Health System) | 5.000% | 11/15/20 | 3,975 | 4,559 |
| Missouri Health & Educational Facilities Authority Health Facilities Revenue | | | | |
| (St. Luke’s Health System) | 5.250% | 11/15/25 | 8,000 | 9,102 |
| Missouri Health & Educational Facilities Authority Health Facilities Revenue | | | | |
| (St. Luke’s Health System) | 5.000% | 11/15/30 | 5,000 | 5,546 |
| Missouri Health & Educational Facilities Authority Health Facilities Revenue | | | | |
| (St. Luke’s Health System) | 4.000% | 11/15/33 | 5,450 | 5,880 |
| Missouri Health & Educational Facilities Authority Revenue (Children’s Mercy Hospital) | 5.250% | 5/15/29 | 19,230 | 20,945 |
| Missouri Health & Educational Facilities Authority Revenue (Children’s Mercy Hospital) | 4.000% | 5/15/33 | 3,530 | 3,719 |
| Missouri Health & Educational Facilities Authority Revenue (Children’s Mercy Hospital) | 5.000% | 5/15/36 | 2,615 | 3,034 |
| 3 Missouri Health & Educational Facilities Authority Revenue | | | | |
| (Lutheran Senior Services Obligated Group) | 5.000% | 2/1/25 | 850 | 1,003 |
| 3 Missouri Health & Educational Facilities Authority Revenue | | | | |
| (Lutheran Senior Services Obligated Group) | 5.000% | 2/1/26 | 750 | 891 |
| 3 Missouri Health & Educational Facilities Authority Revenue | | | | |
| (Lutheran Senior Services Obligated Group) | 5.000% | 2/1/28 | 1,000 | 1,165 |
| 3 Missouri Health & Educational Facilities Authority Revenue | | | | |
| (Lutheran Senior Services Obligated Group) | 5.000% | 2/1/29 | 1,150 | 1,328 |
| 3 Missouri Health & Educational Facilities Authority Revenue | | | | |
| (Lutheran Senior Services Obligated Group) | 5.000% | 2/1/30 | 400 | 458 |
| 3 Missouri Health & Educational Facilities Authority Revenue | | | | |
| (Lutheran Senior Services Obligated Group) | 5.000% | 2/1/31 | 1,350 | 1,535 |
| 3 Missouri Health & Educational Facilities Authority Revenue | | | | |
| (Lutheran Senior Services Obligated Group) | 5.000% | 2/1/32 | 500 | 566 |
| 3 Missouri Health & Educational Facilities Authority Revenue | | | | |
| (Lutheran Senior Services Obligated Group) | 5.000% | 2/1/33 | 550 | 622 |
| Missouri Health & Educational Facilities Authority Revenue (Mercy Health) | 5.000% | 11/15/34 | 30,000 | 34,838 |
| Missouri Health & Educational Facilities Authority Revenue (Mercy Health) VRDO | 0.788% | 6/1/31 (2) | 1,000 | 911 |
| Missouri Health & Educational Facilities Authority Revenue (Mercy Health) VRDO | 0.783% | 6/1/31 (2) | 7,800 | 7,108 |
176
Intermediate-Term Tax-Exempt Fund
| | | | |
| | | | Face | Market |
| | | Maturity | Amount | Value• |
| | Coupon | Date | ($000) | ($000) |
| Missouri Health & Educational Facilities Authority Revenue (Washington University) | 5.000% | 11/15/30 | 15,000 | 17,519 |
| Missouri Highways & Transportation Commission Road Revenue | 5.000% | 2/1/19 | 2,000 | 2,182 |
| Missouri Highways & Transportation Commission Road Revenue | 5.000% | 5/1/22 | 5,000 | 6,007 |
| Missouri Highways & Transportation Commission Road Revenue | 5.000% | 5/1/24 | 15,000 | 18,739 |
| Missouri Joint Municipal Electric Utility Commission Power Project Revenue | 5.000% | 1/1/24 | 2,800 | 3,371 |
| Missouri Joint Municipal Electric Utility Commission Power Project Revenue | 5.000% | 1/1/26 | 4,570 | 5,518 |
| Missouri Joint Municipal Electric Utility Commission Power Project Revenue | 5.000% | 1/1/27 | 3,250 | 3,897 |
| Missouri Joint Municipal Electric Utility Commission Power Project Revenue | 5.000% | 1/1/28 | 2,250 | 2,680 |
| Missouri Joint Municipal Electric Utility Commission Power Project Revenue | 5.000% | 1/1/29 | 5,000 | 5,910 |
| Missouri Joint Municipal Electric Utility Commission Power Project Revenue | 5.000% | 1/1/30 | 6,455 | 7,562 |
| Missouri Joint Municipal Electric Utility Commission Power Project Revenue | 5.000% | 1/1/31 | 10,000 | 11,659 |
| Missouri Joint Municipal Electric Utility Commission Power Project Revenue | 5.000% | 12/1/36 | 10,000 | 11,691 |
| Missouri Joint Municipal Electric Utility Commission Power Project Revenue (Iatan 2 Project) | 5.000% | 12/1/34 | 10,500 | 12,225 |
| Missouri Joint Municipal Electric Utility Commission Power Project Revenue (Iatan 2 Project) | 5.000% | 12/1/35 | 8,000 | 9,288 |
| Missouri Joint Municipal Electric Utility Commission Power Project Revenue (Prairie Project) | 5.000% | 1/1/17 (Prere.) | 12,225 | 12,314 |
| Missouri Joint Municipal Electric Utility Commission Power Project Revenue (Prairie Project) | 5.000% | 1/1/17 (Prere.) | 15,730 | 15,844 |
| Missouri Joint Municipal Electric Utility Commission Power Project Revenue (Prairie Project) | 5.000% | 6/1/24 | 3,000 | 3,648 |
| Missouri Joint Municipal Electric Utility Commission Power Project Revenue (Prairie Project) | 5.000% | 12/1/24 | 2,785 | 3,410 |
| Missouri Joint Municipal Electric Utility Commission Power Project Revenue (Prairie Project) | 5.000% | 6/1/25 | 1,600 | 1,969 |
| Missouri Joint Municipal Electric Utility Commission Power Project Revenue (Prairie Project) | 5.000% | 12/1/25 | 2,270 | 2,782 |
| Missouri Joint Municipal Electric Utility Commission Power Project Revenue (Prairie Project) | 5.000% | 12/1/29 | 3,500 | 4,164 |
| St. Louis County MO Parkway C-2 School District GO | 5.000% | 3/1/24 | 2,500 | 3,114 |
| St. Louis MO Airport Revenue (Lambert-St. Louis International Airport) | 6.125% | 7/1/24 | 6,000 | 6,717 |
| St. Louis MO Parking Revenue | 5.000% | 12/15/24 (4) | 1,000 | 1,216 |
| St. Louis MO Parking Revenue | 5.000% | 12/15/25 (4) | 1,000 | 1,232 |
| St. Louis MO Parking Revenue | 5.000% | 12/15/26 (4) | 1,000 | 1,219 |
| St. Louis MO Sewer & Wastewater Revenue | 5.000% | 5/1/34 | 3,050 | 3,664 |
| St. Louis MO Sewer & Wastewater Revenue | 5.000% | 5/1/35 | 2,000 | 2,396 |
| St. Louis MO Sewer & Wastewater Revenue | 5.000% | 5/1/36 | 3,000 | 3,586 |
| | | | | 492,668 |
| Montana (0.1%) | | | | |
| Forsyth MT Pollution Control Revenue (Northwestern Corporation Colstrip Project) | 2.000% | 8/1/23 | 20,000 | 19,834 |
| Forsyth MT Pollution Control Revenue (Puget Sound Energy Project) | 3.900% | 3/1/31 | 2,925 | 3,088 |
| | | | | 22,922 |
| Multiple States (0.3%) | | | | |
| 4 Nuveen Enhanced AMT-Free Municipal Credit Opportunities Fund VRDP VRDO | 0.730% | 11/3/16 LOC | 91,300 | 91,300 |
| 4 Nuveen Enhanced AMT-Free Municipal Credit Opportunities Fund VRDP VRDO | 0.740% | 11/3/16 LOC | 84,400 | 84,400 |
| | | | | 175,700 |
| Nebraska (0.5%) | | | | |
| Central Plains Energy Project Nebraska Gas Project Revenue (Project No. 3) | 5.000% | 9/1/27 | 9,330 | 10,637 |
| Central Plains Energy Project Nebraska Gas Supply Revenue PUT | 5.000% | 12/1/19 | 150,000 | 165,448 |
| Douglas County NE Hospital Authority No. 3 Health Facilities Revenue | | | | |
| (Nebraska Methodist Health System) | 5.000% | 11/1/23 | 1,910 | 2,271 |
| Douglas County NE Hospital Authority No. 3 Health Facilities Revenue | | | | |
| (Nebraska Methodist Health System) | 5.000% | 11/1/24 | 1,400 | 1,679 |
| Douglas County NE Hospital Authority No. 3 Health Facilities Revenue | | | | |
| (Nebraska Methodist Health System) | 5.000% | 11/1/25 | 2,005 | 2,419 |
| Douglas County NE Hospital Authority No. 3 Health Facilities Revenue | | | | |
| (Nebraska Methodist Health System) | 5.000% | 11/1/26 | 1,160 | 1,385 |
| Douglas County NE Hospital Authority No. 3 Health Facilities Revenue | | | | |
| (Nebraska Methodist Health System) | 5.000% | 11/1/27 | 1,760 | 2,088 |
| Douglas County NE Hospital Authority No. 3 Health Facilities Revenue | | | | |
| (Nebraska Methodist Health System) | 5.000% | 11/1/28 | 1,250 | 1,470 |
| Douglas County NE Hospital Authority No. 3 Health Facilities Revenue | | | | |
| (Nebraska Methodist Health System) | 5.000% | 11/1/29 | 1,895 | 2,216 |
| Lincoln County NE Hospital Authority No. 1 Hospital Revenue | | | | |
| (Great Plains Regional Medical Center Project) | 4.000% | 11/1/21 | 1,000 | 1,104 |
| Lincoln County NE Hospital Authority No. 1 Hospital Revenue | | | | |
| (Great Plains Regional Medical Center Project) | 4.000% | 11/1/22 | 860 | 944 |
| Lincoln County NE Hospital Authority No. 1 Hospital Revenue | | | | |
| (Great Plains Regional Medical Center Project) | 5.000% | 11/1/24 | 1,320 | 1,513 |
| Lincoln County NE Hospital Authority No. 1 Hospital Revenue | | | | |
| (Great Plains Regional Medical Center Project) | 5.000% | 11/1/25 | 1,000 | 1,139 |
| Lincoln County NE Hospital Authority No. 1 Hospital Revenue | | | | |
| (Great Plains Regional Medical Center Project) | 5.000% | 11/1/32 | 5,000 | 5,557 |
| Lincoln NE Electric System Revenue | 5.000% | 9/1/22 (Prere.) | 1,010 | 1,221 |
| Lincoln NE Electric System Revenue | 5.000% | 9/1/25 | 1,990 | 2,381 |
| Municipal Energy Agency of Nebraska Power Supply System Revenue | 5.000% | 4/1/26 | 3,065 | 3,563 |
| Municipal Energy Agency of Nebraska Power Supply System Revenue | 5.000% | 4/1/29 | 2,125 | 2,435 |
177
Intermediate-Term Tax-Exempt Fund
| | | | |
| | | | Face | Market |
| | | Maturity | Amount | Value• |
| | Coupon | Date | ($000) | ($000) |
| Municipal Energy Agency of Nebraska Power Supply System Revenue | 5.000% | 4/1/31 | 2,500 | 2,851 |
| Municipal Energy Agency of Nebraska Power Supply System Revenue | 5.000% | 4/1/32 | 2,800 | 3,181 |
| Nebraska Public Power District Revenue | 5.000% | 1/1/18 (Prere.) | 8,000 | 8,388 |
| Nebraska Public Power District Revenue | 5.000% | 1/1/30 | 1,000 | 1,168 |
| Nebraska Public Power District Revenue | 5.000% | 1/1/30 | 2,000 | 2,336 |
| Nebraska Public Power District Revenue | 5.000% | 1/1/31 | 1,250 | 1,453 |
| Nebraska Public Power District Revenue | 5.000% | 1/1/31 | 1,920 | 2,232 |
| Nebraska Public Power District Revenue | 5.000% | 1/1/31 | 2,000 | 2,325 |
| Nebraska Public Power District Revenue | 5.000% | 1/1/32 | 1,470 | 1,705 |
| Nebraska Public Power District Revenue | 5.000% | 1/1/32 | 2,095 | 2,430 |
| Nebraska Public Power District Revenue | 5.000% | 1/1/33 | 1,250 | 1,448 |
| Nebraska Public Power District Revenue | 5.000% | 1/1/33 | 2,325 | 2,693 |
| Nebraska Public Power District Revenue | 5.000% | 1/1/33 | 5,000 | 5,791 |
| Nebraska Public Power District Revenue | 5.000% | 1/1/34 | 1,500 | 1,733 |
| Omaha NE Public Power District Electric Revenue | 5.000% | 2/1/25 | 14,000 | 17,509 |
| Omaha NE Public Power District Electric Revenue | 5.000% | 2/1/27 | 2,375 | 2,980 |
| University of Nebraska Student Fee Revenue | 5.000% | 7/1/22 | 4,000 | 4,778 |
| University of Nebraska Student Fee Revenue | 5.000% | 7/1/24 | 1,645 | 1,967 |
| | | | | 276,438 |
| Nevada (1.0%) | | | | |
| Carson City NV Hospital Revenue (Carson Tahoe Regional Medical Center) | 5.000% | 9/1/21 | 2,330 | 2,649 |
| Carson City NV Hospital Revenue (Carson Tahoe Regional Medical Center) | 5.000% | 9/1/27 | 3,500 | 3,936 |
| Clark County NV Airport Improvement Revenue | 5.000% | 7/1/21 | 2,000 | 2,239 |
| Clark County NV Airport Improvement Revenue | 5.000% | 7/1/30 | 15,000 | 16,505 |
| Clark County NV GO | 5.000% | 7/1/19 | 9,000 | 9,932 |
| Clark County NV GO | 5.000% | 11/1/20 | 5,000 | 5,734 |
| Clark County NV GO | 5.000% | 7/1/21 | 6,075 | 7,092 |
| Clark County NV GO | 5.000% | 7/1/33 | 16,290 | 18,947 |
| Clark County NV Highway Improvement Motor Vehicle Fuel Tax Revenue | 5.000% | 7/1/18 | 885 | 945 |
| Clark County NV Highway Improvement Motor Vehicle Fuel Tax Revenue | 5.000% | 7/1/19 | 1,000 | 1,105 |
| Clark County NV Highway Improvement Motor Vehicle Fuel Tax Revenue | 5.000% | 7/1/20 | 1,500 | 1,707 |
| Clark County NV Highway Improvement Motor Vehicle Fuel Tax Revenue | 5.000% | 7/1/21 | 2,810 | 3,278 |
| Clark County NV Passenger Facility Charge Revenue (Las Vegas McCarran International Airport) | 5.000% | 7/1/30 | 15,000 | 16,524 |
| Clark County NV School District GO | 5.000% | 12/15/17 (Prere.) | 16,360 | 17,141 |
| Clark County NV School District GO | 5.000% | 12/15/17 (Prere.) | 10,000 | 10,478 |
| Clark County NV School District GO | 5.000% | 12/15/17 (Prere.) | 15,000 | 15,716 |
| Clark County NV School District GO | 5.000% | 6/15/18 (Prere.) | 12,445 | 13,274 |
| Clark County NV School District GO | 5.000% | 6/15/18 (Prere.) | 29,900 | 31,892 |
| Clark County NV School District GO | 5.000% | 6/15/20 | 14,335 | 14,985 |
| Clark County NV School District GO | 5.000% | 6/15/21 | 8,980 | 9,386 |
| Clark County NV School District GO | 5.000% | 6/15/22 | 14,655 | 15,316 |
| Clark County NV Water Reclamation District GO | 5.375% | 7/1/18 (Prere.) | 2,985 | 3,207 |
| Clark County NV Water Reclamation District GO | 5.000% | 7/1/20 | 3,695 | 4,209 |
| Clark County NV Water Reclamation District GO | 5.000% | 7/1/21 | 3,880 | 4,541 |
| Las Vegas NV Convention & Visitors Authority Revenue | 5.000% | 7/1/25 | 2,080 | 2,563 |
| Las Vegas NV Convention & Visitors Authority Revenue | 5.000% | 7/1/26 | 1,440 | 1,792 |
| Las Vegas NV Convention & Visitors Authority Revenue | 5.000% | 7/1/27 | 1,815 | 2,242 |
| Las Vegas NV GO | 4.000% | 6/1/18 | 3,110 | 3,259 |
| Las Vegas NV GO | 4.000% | 6/1/19 | 3,235 | 3,476 |
| Las Vegas NV GO | 4.000% | 6/1/20 | 3,360 | 3,690 |
| Las Vegas NV GO | 4.000% | 6/1/21 | 3,500 | 3,914 |
| Las Vegas NV GO | 5.000% | 6/1/21 | 1,400 | 1,627 |
| Las Vegas NV GO | 5.000% | 9/1/24 | 5,690 | 7,033 |
| Las Vegas NV GO | 5.000% | 9/1/25 | 6,070 | 7,599 |
| Las Vegas NV GO | 4.000% | 6/1/30 | 4,610 | 5,146 |
| Las Vegas NV GO | 4.000% | 6/1/31 | 4,795 | 5,314 |
| Las Vegas NV GO | 4.000% | 6/1/32 | 4,990 | 5,486 |
| Las Vegas Valley Water District Nevada GO | 4.000% | 6/1/17 | 2,060 | 2,099 |
| Las Vegas Valley Water District Nevada GO | 5.000% | 6/1/17 | 5,000 | 5,125 |
| Las Vegas Valley Water District Nevada GO | 5.000% | 6/1/18 | 7,370 | 7,844 |
| Las Vegas Valley Water District Nevada GO | 5.000% | 6/1/19 | 5,000 | 5,504 |
| Las Vegas Valley Water District Nevada GO | 5.000% | 12/1/19 | 5,000 | 5,595 |
| Las Vegas Valley Water District Nevada GO | 5.000% | 6/1/24 | 2,665 | 3,283 |
| Las Vegas Valley Water District Nevada GO | 5.000% | 6/1/24 | 4,000 | 4,928 |
| Las Vegas Valley Water District Nevada GO | 5.000% | 6/1/25 | 2,050 | 2,552 |
| Las Vegas Valley Water District Nevada GO | 5.000% | 6/1/25 | 2,000 | 2,490 |
| Las Vegas Valley Water District Nevada GO | 5.000% | 6/1/26 | 2,000 | 2,521 |
| Las Vegas Valley Water District Nevada GO | 5.250% | 6/1/27 | 10,460 | 12,193 |
| Las Vegas Valley Water District Nevada GO | 5.000% | 6/1/31 | 4,000 | 4,847 |
178
Intermediate-Term Tax-Exempt Fund
| | | | |
| | | | Face | Market |
| | | Maturity | Amount | Value• |
| | Coupon | Date | ($000) | ($000) |
| Las Vegas Valley Water District Nevada GO | 5.000% | 6/1/31 | 3,500 | 4,242 |
| Las Vegas Valley Water District Nevada GO | 5.000% | 6/1/31 | 4,500 | 5,256 |
| Las Vegas Valley Water District Nevada GO | 5.000% | 6/1/32 | 3,295 | 3,968 |
| Las Vegas Valley Water District Nevada GO | 5.000% | 6/1/32 | 6,040 | 7,045 |
| Las Vegas Valley Water District Nevada GO | 5.000% | 6/1/32 | 2,000 | 2,333 |
| Las Vegas Valley Water District Nevada GO | 5.000% | 2/1/35 | 8,000 | 8,375 |
| Las Vegas Valley Water District Nevada GO | 5.000% | 6/1/35 | 4,150 | 4,940 |
| Las Vegas Valley Water District Nevada GO | 5.000% | 6/1/35 | 6,000 | 7,142 |
| Las Vegas Valley Water District Nevada GO | 5.000% | 2/1/36 | 5,000 | 5,228 |
| Nevada GO | 5.000% | 4/1/22 | 17,000 | 20,194 |
| Nevada GO | 5.000% | 11/1/23 | 28,500 | 34,917 |
| Nevada GO | 5.000% | 4/1/24 | 17,595 | 21,663 |
| Nevada GO | 5.000% | 11/1/25 | 34,000 | 42,337 |
| Nevada Highway Improvement Revenue (Motor Vehicle Fuel Tax) | 5.000% | 12/1/19 | 7,000 | 7,851 |
| Reno NV Health Facility Revenue (Dignity Health Obligated Group) | 5.250% | 7/1/31 | 4,000 | 4,084 |
| Reno NV Hospital Revenue (Renown Regional Medical Center) | 5.500% | 6/1/18 (Prere.) | 1,585 | 1,700 |
| Reno NV Hospital Revenue (Renown Regional Medical Center) | 5.500% | 6/1/28 (2) | 165 | 175 |
| Truckee Meadows NV Water Authority Water Revenue | 5.000% | 7/1/32 | 4,435 | 5,352 |
| Truckee Meadows NV Water Authority Water Revenue | 5.000% | 7/1/34 | 7,750 | 9,272 |
| Truckee Meadows NV Water Authority Water Revenue | 5.000% | 7/1/35 | 1,750 | 2,086 |
| | | | | 541,020 |
| New Hampshire (0.1%) | | | | |
| Manchester NH General Airport Revenue | 5.000% | 1/1/24 | 6,000 | 6,794 |
| New Hampshire Health & Education Facilities Authority Revenue (Concord Hospital) | 5.000% | 10/1/25 | 2,140 | 2,486 |
| New Hampshire Health & Education Facilities Authority Revenue (Concord Hospital) | 5.000% | 10/1/26 | 1,070 | 1,236 |
| New Hampshire Health & Education Facilities Authority Revenue (Concord Hospital) | 5.000% | 10/1/27 | 1,185 | 1,363 |
| New Hampshire Health & Education Facilities Authority Revenue | | | | |
| (Southern New Hampshire Medical Center) | 5.000% | 10/1/32 | 6,000 | 6,189 |
| New Hampshire Health & Education Facilities Authority Revenue | | | | |
| (Southern New Hampshire University) | 5.000% | 1/1/27 | 2,500 | 2,839 |
| New Hampshire Health & Education Facilities Authority Revenue | | | | |
| (University System of New Hampshire) | 5.500% | 7/1/20 | 10,000 | 11,105 |
| New Hampshire Health & Education Facilities Authority Revenue (Wentworth Douglas Hospital) | 6.000% | 1/1/31 | 10,000 | 11,513 |
| New Hampshire Municipal Bond Bank Revenue | 5.000% | 2/15/18 | 1,010 | 1,064 |
| New Hampshire Municipal Bond Bank Revenue | 5.000% | 2/15/19 | 1,010 | 1,101 |
| New Hampshire Municipal Bond Bank Revenue | 5.000% | 8/15/19 | 1,500 | 1,664 |
| 3 New Hampshire Municipal Bond Bank Revenue | 4.000% | 8/15/28 | 1,500 | 1,713 |
| | | | | 49,067 |
| New Jersey (3.3%) | | | | |
| Atlantic County NJ Improvement Authority Revenue | 5.000% | 9/1/25 (4) | 4,955 | 5,985 |
| Atlantic County NJ Improvement Authority Revenue | 5.000% | 9/1/26 (4) | 4,685 | 5,713 |
| Atlantic County NJ Improvement Authority Revenue | 5.000% | 9/1/27 (4) | 3,000 | 3,626 |
| Bergen County NJ GO | 5.000% | 10/15/21 | 2,500 | 2,963 |
| Essex County NJ Improvement Authority Revenue | 5.500% | 10/1/23 (14) | 10,000 | 12,464 |
| Essex County NJ Improvement Authority Revenue | 5.250% | 12/15/23 (2) | 3,635 | 4,495 |
| Essex County NJ Improvement Authority Revenue | 5.250% | 12/15/24 (2) | 3,720 | 4,668 |
| Jersey City NJ GO | 5.000% | 3/1/20 | 1,610 | 1,781 |
| Jersey City NJ GO | 5.000% | 3/1/21 | 1,200 | 1,359 |
| New Jersey Casino Reinvestment Development Authority Revenue (Hotel Room Fee) | 5.250% | 1/1/23 (2) | 3,900 | 3,923 |
| New Jersey Casino Reinvestment Development Authority Revenue (Luxury Tax) | 5.000% | 11/1/24 (4) | 1,000 | 1,156 |
| New Jersey Casino Reinvestment Development Authority Revenue (Luxury Tax) | 5.000% | 11/1/26 (4) | 2,205 | 2,511 |
| New Jersey Casino Reinvestment Development Authority Revenue (Luxury Tax) | 5.000% | 11/1/27 (4) | 2,500 | 2,827 |
| New Jersey COP | 5.000% | 6/15/17 | 4,840 | 4,956 |
| New Jersey COP | 5.250% | 6/15/28 | 4,675 | 5,044 |
| New Jersey COP | 5.250% | 6/15/29 | 1,000 | 1,076 |
| New Jersey Economic Development Authority Revenue | 5.000% | 6/15/21 | 16,500 | 18,148 |
| New Jersey Economic Development Authority Revenue | 5.000% | 6/15/22 | 25,000 | 27,793 |
| New Jersey Economic Development Authority Revenue | 5.000% | 6/15/23 | 4,930 | 5,513 |
| New Jersey Economic Development Authority Revenue | 5.250% | 6/15/32 | 5,000 | 5,634 |
| New Jersey Economic Development Authority Revenue | 5.250% | 6/15/33 | 8,495 | 9,546 |
| New Jersey Economic Development Authority Revenue (Cigarette Tax) | 5.000% | 6/15/23 | 12,000 | 13,453 |
| New Jersey Economic Development Authority Revenue (Cigarette Tax) | 5.000% | 6/15/24 | 7,500 | 8,348 |
| New Jersey Economic Development Authority Revenue (School Facilities Construction) | 5.000% | 12/15/16 (ETM) | 23,815 | 23,937 |
| New Jersey Economic Development Authority Revenue (School Facilities Construction) | 5.000% | 12/15/16 | 14,570 | 14,637 |
| New Jersey Economic Development Authority Revenue (School Facilities Construction) | 5.000% | 12/15/18 | 22,500 | 23,958 |
| New Jersey Economic Development Authority Revenue (School Facilities Construction) | 5.250% | 9/1/19 (Prere.) | 10,500 | 11,726 |
| New Jersey Economic Development Authority Revenue (School Facilities Construction) | 5.000% | 12/15/19 | 17,410 | 18,907 |
| New Jersey Economic Development Authority Revenue (School Facilities Construction) | 5.250% | 12/15/21 (12) | 5,000 | 5,780 |
| New Jersey Economic Development Authority Revenue (School Facilities Construction) | 5.250% | 12/15/21 (14) | 7,975 | 9,185 |
179
Intermediate-Term Tax-Exempt Fund
| | | | |
| | | | Face | Market |
| | | Maturity | Amount | Value• |
| | Coupon | Date | ($000) | ($000) |
| New Jersey Economic Development Authority Revenue (School Facilities Construction) | 5.000% | 9/1/23 | 8,690 | 9,436 |
| New Jersey Economic Development Authority Revenue (School Facilities Construction) | 5.500% | 9/1/23 (14) | 51,630 | 61,588 |
| New Jersey Economic Development Authority Revenue (School Facilities Construction) | 5.250% | 9/1/24 | 1,000 | 1,117 |
| New Jersey Economic Development Authority Revenue (School Facilities Construction) | 5.000% | 3/1/25 | 2,985 | 3,300 |
| New Jersey Economic Development Authority Revenue (School Facilities Construction) | 5.500% | 9/1/25 (4) | 18,130 | 22,084 |
| New Jersey Economic Development Authority Revenue (School Facilities Construction) | 5.000% | 3/1/27 | 4,205 | 4,635 |
| New Jersey Economic Development Authority Revenue (School Facilities Construction) | 5.500% | 9/1/27 (14) | 8,000 | 9,841 |
| New Jersey Economic Development Authority Revenue (School Facilities Construction) | 5.000% | 3/1/28 | 5,515 | 6,068 |
| New Jersey Economic Development Authority Revenue (School Facilities Construction) | 5.500% | 12/15/29 | 5,000 | 5,429 |
| 4 New Jersey Economic Development Authority Revenue (School Facilities Construction) | | | | |
| TOB VRDO | 0.750% | 11/7/16 (12) | 3,065 | 3,065 |
| New Jersey Economic Development Authority Revenue | | | | |
| (Provident Group-Montclair Properties LLC - Montclair State University Student Housing Project) | 5.000% | 6/1/18 | 2,000 | 2,088 |
| New Jersey Economic Development Authority Revenue | | | | |
| (Provident Group-Montclair Properties LLC - Montclair State University Student Housing Project) | 5.250% | 6/1/19 | 2,000 | 2,178 |
| New Jersey Economic Development Authority Revenue | | | | |
| (Provident Group-Montclair Properties LLC - Montclair State University Student Housing Project) | 5.250% | 6/1/20 | 2,000 | 2,196 |
| New Jersey Economic Development Authority Revenue | | | | |
| (Provident Group-Montclair Properties LLC - Montclair State University Student Housing Project) | 5.375% | 6/1/25 | 5,000 | 5,546 |
| New Jersey Educational Facilities Authority Revenue (Kean University) | 5.000% | 7/1/24 (4) | 2,000 | 2,432 |
| New Jersey Educational Facilities Authority Revenue (Kean University) | 5.000% | 7/1/25 (4) | 3,000 | 3,679 |
| New Jersey Educational Facilities Authority Revenue (Kean University) | 5.000% | 7/1/26 (4) | 3,075 | 3,725 |
| New Jersey Educational Facilities Authority Revenue (Kean University) | 5.000% | 7/1/28 (4) | 2,495 | 2,968 |
| New Jersey Educational Facilities Authority Revenue (Kean University) | 5.250% | 9/1/29 | 25,170 | 27,584 |
| New Jersey Educational Facilities Authority Revenue (Princeton University) | 5.000% | 7/1/19 | 7,280 | 8,065 |
| New Jersey Educational Facilities Authority Revenue (Princeton University) | 5.000% | 7/1/20 | 8,300 | 9,489 |
| New Jersey Educational Facilities Authority Revenue (Princeton University) | 5.000% | 7/1/21 | 6,785 | 7,982 |
| New Jersey Educational Facilities Authority Revenue (Princeton University) | 5.000% | 7/1/27 | 2,965 | 3,473 |
| New Jersey Educational Facilities Authority Revenue (University Medical & Dentistry) | 7.125% | 6/1/19 (Prere.) | 6,000 | 6,921 |
| New Jersey Equipment Lease Purchase COP | 5.250% | 6/15/20 | 6,180 | 6,647 |
| New Jersey Equipment Lease Purchase COP | 5.250% | 6/15/21 | 5,820 | 6,304 |
| New Jersey Equipment Lease Purchase COP | 5.375% | 6/15/29 | 11,000 | 11,867 |
| New Jersey GO | 5.000% | 8/15/20 | 30,000 | 33,694 |
| New Jersey Health Care Facilities Financing Authority Lease Revenue | | | | |
| (Greystone Park Psychiatric Hospital Project) | 5.000% | 9/15/21 | 8,140 | 8,981 |
| New Jersey Health Care Facilities Financing Authority Lease Revenue | | | | |
| (Greystone Park Psychiatric Hospital Project) | 5.000% | 9/15/24 | 3,415 | 3,824 |
| New Jersey Health Care Facilities Financing Authority Lease Revenue | | | | |
| (Greystone Park Psychiatric Hospital Project) | 5.000% | 9/15/25 | 12,965 | 14,543 |
| New Jersey Health Care Facilities Financing Authority Lease Revenue | | | | |
| (Greystone Park Psychiatric Hospital Project) | 5.000% | 9/15/26 | 12,505 | 13,980 |
| New Jersey Health Care Facilities Financing Authority Lease Revenue | | | | |
| (Greystone Park Psychiatric Hospital Project) | 5.000% | 9/15/28 | 13,835 | 15,350 |
| New Jersey Health Care Facilities Financing Authority Lease Revenue | | | | |
| (Marlboro Psychiatric Hospital Project) | 5.000% | 9/15/29 | 2,735 | 3,023 |
| New Jersey Health Care Facilities Financing Authority Lease Revenue | | | | |
| (Marlboro Psychiatric Hospital Project) | 5.000% | 9/15/33 | 5,000 | 5,458 |
| New Jersey Health Care Facilities Financing Authority Revenue (AHS Hospital Corp.) | 5.000% | 7/1/17 (ETM) | 8,485 | 8,727 |
| New Jersey Health Care Facilities Financing Authority Revenue (AHS Hospital Corp.) | 5.000% | 7/1/17 | 390 | 401 |
| New Jersey Health Care Facilities Financing Authority Revenue | | | | |
| (Barnabas Health) | 4.625% | 7/1/21 (Prere.) | 3,700 | 4,279 |
| New Jersey Health Care Facilities Financing Authority Revenue | | | | |
| (Hackensack University Medical Center) | 5.000% | 1/1/19 | 2,610 | 2,820 |
| New Jersey Health Care Facilities Financing Authority Revenue | | | | |
| (Hackensack University Medical Center) | 5.000% | 1/1/20 | 2,120 | 2,361 |
| New Jersey Health Care Facilities Financing Authority Revenue | | | | |
| (Hackensack University Medical Center) | 5.000% | 1/1/22 | 1,500 | 1,655 |
| New Jersey Health Care Facilities Financing Authority Revenue | | | | |
| (Hospital Asset Transformation Program) | 5.500% | 10/1/18 (Prere.) | 2,870 | 3,122 |
| New Jersey Health Care Facilities Financing Authority Revenue | | | | |
| (Hospital Asset Transformation Program) | 5.500% | 10/1/23 | 9,990 | 10,695 |
| New Jersey Health Care Facilities Financing Authority Revenue | | | | |
| (Meridian Health System Obligated Group) | 5.000% | 7/1/20 | 3,000 | 3,389 |
| New Jersey Health Care Facilities Financing Authority Revenue | | | | |
| (Meridian Health System Obligated Group) | 5.000% | 7/1/21 | 2,000 | 2,312 |
| New Jersey Health Care Facilities Financing Authority Revenue | | | | |
| (Meridian Health System Obligated Group) | 5.000% | 7/1/22 | 2,000 | 2,365 |
| New Jersey Health Care Facilities Financing Authority Revenue | | | | |
| (Meridian Health System Obligated Group) | 5.000% | 7/1/26 | 1,000 | 1,159 |
180
Intermediate-Term Tax-Exempt Fund
| | | | |
| | | | Face | Market |
| | | Maturity | Amount | Value• |
| | Coupon | Date | ($000) | ($000) |
| New Jersey Health Care Facilities Financing Authority Revenue | | | | |
| (Palisades Medical Center Obligated Group) | 5.000% | 7/1/26 | 5,000 | 5,747 |
| New Jersey Health Care Facilities Financing Authority Revenue (Princeton Healthcare System) | 5.000% | 7/1/24 | 2,000 | 2,428 |
| New Jersey Health Care Facilities Financing Authority Revenue (Princeton Healthcare System) | 5.000% | 7/1/25 | 1,345 | 1,652 |
| New Jersey Health Care Facilities Financing Authority Revenue (Princeton Healthcare System) | 5.000% | 7/1/26 | 1,800 | 2,233 |
| New Jersey Health Care Facilities Financing Authority Revenue | | | | |
| (St. Barnabas Health Care System) | 5.000% | 7/1/29 | 3,350 | 3,400 |
| New Jersey Health Care Facilities Financing Authority Revenue (St. Joseph’s Healthcare System) | 5.000% | 7/1/24 | 2,415 | 2,885 |
| New Jersey Health Care Facilities Financing Authority Revenue (St. Joseph’s Healthcare System) | 5.000% | 7/1/25 | 1,535 | 1,846 |
| New Jersey Health Care Facilities Financing Authority Revenue (St. Joseph’s Healthcare System) | 5.000% | 7/1/27 | 2,420 | 2,857 |
| New Jersey Health Care Facilities Financing Authority Revenue (Virtua Health) | 5.750% | 7/1/33 | 20,000 | 22,114 |
| New Jersey Higher Education Assistance Authority Student Loan Revenue | 4.500% | 12/1/20 | 4,195 | 4,413 |
| New Jersey Sports & Exposition Authority Revenue | 5.000% | 9/1/17 | 9,900 | 10,194 |
| New Jersey Sports & Exposition Authority Revenue | 5.000% | 9/1/17 (ETM) | 100 | 104 |
| New Jersey Sports & Exposition Authority Revenue | 4.500% | 9/1/18 (Prere.) | 20 | 21 |
| New Jersey Sports & Exposition Authority Revenue | 4.500% | 9/1/24 | 2,035 | 2,105 |
| 3 New Jersey Transportation Trust Fund Authority Federal Highway Reimbursement Revenue | 5.000% | 6/15/24 | 30,000 | 31,319 |
| 3 New Jersey Transportation Trust Fund Authority Federal Highway Reimbursement Revenue | 5.000% | 6/15/24 | 10,000 | 11,338 |
| 3 New Jersey Transportation Trust Fund Authority Federal Highway Reimbursement Revenue | 5.000% | 6/15/27 | 24,475 | 27,664 |
| 3 New Jersey Transportation Trust Fund Authority Federal Highway Reimbursement Revenue | 5.000% | 6/15/28 | 8,530 | 9,549 |
| 3 New Jersey Transportation Trust Fund Authority Federal Highway Reimbursement Revenue | 5.000% | 6/15/28 | 25,600 | 26,675 |
| 3 New Jersey Transportation Trust Fund Authority Federal Highway Reimbursement Revenue | 5.000% | 6/15/29 | 50,610 | 52,695 |
| New Jersey Transportation Trust Fund Authority Transportation Program Revenue | 5.000% | 6/15/20 | 7,105 | 7,775 |
| New Jersey Transportation Trust Fund Authority Transportation Program Revenue | 5.000% | 6/15/22 | 2,025 | 2,258 |
| New Jersey Transportation Trust Fund Authority Transportation Program Revenue | 5.000% | 6/15/23 | 2,500 | 2,808 |
| New Jersey Transportation Trust Fund Authority Transportation Program Revenue | 5.000% | 6/15/24 | 3,265 | 3,702 |
| New Jersey Transportation Trust Fund Authority Transportation Program Revenue | 5.000% | 6/15/25 | 6,000 | 6,858 |
| New Jersey Transportation Trust Fund Authority Transportation Program Revenue | 5.250% | 6/15/27 | 5,000 | 5,774 |
| New Jersey Transportation Trust Fund Authority Transportation Program Revenue | 5.250% | 6/15/28 | 5,025 | 5,757 |
| New Jersey Transportation Trust Fund Authority Transportation Program Revenue | 5.250% | 6/15/29 | 5,000 | 5,691 |
| New Jersey Transportation Trust Fund Authority Transportation Program Revenue | 5.250% | 6/15/33 | 2,500 | 2,801 |
| New Jersey Transportation Trust Fund Authority Transportation Program Revenue | 5.250% | 6/15/34 | 5,000 | 5,591 |
| New Jersey Transportation Trust Fund Authority Transportation System Revenue | 5.750% | 6/15/17 | 1,250 | 1,286 |
| New Jersey Transportation Trust Fund Authority Transportation System Revenue | 5.000% | 12/15/17 | 15,000 | 15,608 |
| New Jersey Transportation Trust Fund Authority Transportation System Revenue | 5.000% | 12/15/18 | 1,530 | 1,631 |
| New Jersey Transportation Trust Fund Authority Transportation System Revenue | 5.000% | 12/15/19 | 7,545 | 8,221 |
| New Jersey Transportation Trust Fund Authority Transportation System Revenue | 5.250% | 12/15/19 | 5,000 | 5,485 |
| New Jersey Transportation Trust Fund Authority Transportation System Revenue | 5.250% | 12/15/19 (14) | 25,000 | 27,642 |
| New Jersey Transportation Trust Fund Authority Transportation System Revenue | 5.250% | 12/15/19 | 1,610 | 1,766 |
| New Jersey Transportation Trust Fund Authority Transportation System Revenue | 5.250% | 12/15/19 | 1,540 | 1,689 |
| New Jersey Transportation Trust Fund Authority Transportation System Revenue | 5.000% | 6/15/20 | 3,825 | 4,185 |
| New Jersey Transportation Trust Fund Authority Transportation System Revenue | 5.750% | 6/15/20 | 9,350 | 10,381 |
| New Jersey Transportation Trust Fund Authority Transportation System Revenue | 5.250% | 12/15/20 | 29,395 | 32,676 |
| New Jersey Transportation Trust Fund Authority Transportation System Revenue | 5.250% | 12/15/20 (4) | 9,000 | 10,187 |
| New Jersey Transportation Trust Fund Authority Transportation System Revenue | 5.500% | 12/15/20 (14) | 30,000 | 34,163 |
| New Jersey Transportation Trust Fund Authority Transportation System Revenue | 5.250% | 12/15/21 | 12,100 | 13,611 |
| New Jersey Transportation Trust Fund Authority Transportation System Revenue | 5.500% | 12/15/21 (14) | 25,000 | 29,096 |
| New Jersey Transportation Trust Fund Authority Transportation System Revenue | 5.500% | 12/15/21 (12) | 3,745 | 4,374 |
| New Jersey Transportation Trust Fund Authority Transportation System Revenue | 5.500% | 12/15/21 | 14,375 | 16,341 |
| New Jersey Transportation Trust Fund Authority Transportation System Revenue | 5.250% | 12/15/22 (2) | 30,900 | 35,118 |
| New Jersey Transportation Trust Fund Authority Transportation System Revenue | 5.250% | 12/15/22 | 3,770 | 4,283 |
| New Jersey Transportation Trust Fund Authority Transportation System Revenue | 5.500% | 12/15/22 | 29,000 | 33,348 |
| New Jersey Transportation Trust Fund Authority Transportation System Revenue | 5.250% | 12/15/23 | 2,500 | 2,861 |
| New Jersey Transportation Trust Fund Authority Transportation System Revenue | 5.750% | 6/15/24 (14) | 25,000 | 30,557 |
| New Jersey Transportation Trust Fund Authority Transportation System Revenue | 5.000% | 12/15/24 | 18,240 | 20,772 |
| New Jersey Transportation Trust Fund Authority Transportation System Revenue | 0.000% | 12/15/25 | 72,680 | 51,996 |
| New Jersey Transportation Trust Fund Authority Transportation System Revenue | 0.000% | 12/15/25 | 1,000 | 715 |
| New Jersey Transportation Trust Fund Authority Transportation System Revenue | 0.000% | 12/15/27 | 48,285 | 31,364 |
| New Jersey Transportation Trust Fund Authority Transportation System Revenue | 5.125% | 6/15/28 | 3,500 | 3,813 |
| New Jersey Transportation Trust Fund Authority Transportation System Revenue | 5.500% | 6/15/31 | 17,500 | 19,631 |
| New Jersey Transportation Trust Fund Authority Transportation System Revenue | 5.250% | 6/15/32 | 14,250 | 15,946 |
| New Jersey Turnpike Authority Revenue | 5.000% | 1/1/21 | 19,705 | 21,297 |
| New Jersey Turnpike Authority Revenue | 5.000% | 1/1/22 | 4,500 | 4,860 |
| New Jersey Turnpike Authority Revenue | 5.500% | 1/1/25 (2) | 13,000 | 16,268 |
| New Jersey Turnpike Authority Revenue | 5.000% | 1/1/32 | 20,460 | 23,626 |
| New Jersey Turnpike Authority Revenue | 5.000% | 1/1/32 | 3,000 | 3,459 |
| New Jersey Turnpike Authority Revenue | 5.000% | 1/1/33 | 23,540 | 27,114 |
| South Jersey Transportation Authority New Jersey Transportation System Revenue | 5.000% | 11/1/16 (ETM) | 2,400 | 2,400 |
| South Jersey Transportation Authority New Jersey Transportation System Revenue | 5.000% | 11/1/16 | 5,190 | 5,190 |
| South Jersey Transportation Authority New Jersey Transportation System Revenue | 5.000% | 11/1/23 | 1,320 | 1,549 |
181
Intermediate-Term Tax-Exempt Fund
| | | | |
| | | | Face | Market |
| | | Maturity | Amount | Value• |
| | Coupon | Date | ($000) | ($000) |
| South Jersey Transportation Authority New Jersey Transportation System Revenue | 5.000% | 11/1/23 | 2,430 | 2,795 |
| South Jersey Transportation Authority New Jersey Transportation System Revenue | 5.000% | 11/1/24 | 2,800 | 3,198 |
| South Jersey Transportation Authority New Jersey Transportation System Revenue | 5.000% | 11/1/28 | 2,000 | 2,241 |
| South Jersey Transportation Authority New Jersey Transportation System Revenue | 5.000% | 11/1/28 | 1,205 | 1,394 |
| South Jersey Transportation Authority New Jersey Transportation System Revenue | 5.000% | 11/1/29 | 1,500 | 1,728 |
| South Jersey Transportation Authority New Jersey Transportation System Revenue | 5.000% | 11/1/30 | 1,000 | 1,145 |
| South Jersey Transportation Authority New Jersey Transportation System Revenue | 5.000% | 11/1/31 | 1,170 | 1,333 |
| South Jersey Transportation Authority New Jersey Transportation System Revenue | 5.000% | 11/1/32 | 1,000 | 1,134 |
| South Jersey Transportation Authority New Jersey Transportation System Revenue | 5.000% | 11/1/34 | 1,000 | 1,127 |
| Sussex County NJ GO | 5.000% | 2/15/23 | 5,485 | 6,655 |
| Sussex County NJ GO | 5.000% | 2/15/24 | 4,356 | 5,383 |
| Tobacco Settlement Financing Corp. New Jersey Revenue | 5.000% | 6/1/17 | 15,925 | 16,321 |
| Tobacco Settlement Financing Corp. New Jersey Revenue | 5.000% | 6/1/18 | 16,975 | 17,388 |
| Tobacco Settlement Financing Corp. New Jersey Revenue | 5.000% | 6/1/19 | 30,805 | 31,511 |
| Tobacco Settlement Financing Corp. New Jersey Revenue | 4.500% | 6/1/23 | 50,587 | 51,294 |
| Tobacco Settlement Financing Corp. New Jersey Revenue | 4.625% | 6/1/26 | 28,410 | 28,537 |
| Tobacco Settlement Financing Corp. New Jersey Revenue | 0.000% | 6/1/41 | 243,000 | 64,638 |
| West Deptford Township NJ GO | 5.000% | 7/1/24 (4) | 1,210 | 1,242 |
| West Deptford Township NJ GO | 5.000% | 7/1/25 (4) | 1,260 | 1,293 |
| West Deptford Township NJ GO | 5.000% | 7/1/26 (4) | 1,000 | 1,026 |
| | | | | 1,729,103 |
| New Mexico (0.3%) | | | | |
| Albuquerque NM GO | 5.000% | 7/1/24 | 4,615 | 5,737 |
| Farmington NM Pollution Control Revenue | | | | |
| (Southern California Edison Co. Four Corners Project) PUT | 1.875% | 4/1/20 | 16,000 | 16,236 |
| Farmington NM Pollution Control Revenue | | | | |
| (Southern California Edison Co. Four Corners Project) PUT | 1.875% | 4/1/20 | 35,000 | 35,470 |
| New Mexico Educational Assistance Foundation Revenue | 4.000% | 9/1/18 | 16,440 | 17,348 |
| New Mexico Educational Assistance Foundation Revenue | 4.000% | 9/1/19 | 5,990 | 6,476 |
| New Mexico Educational Assistance Foundation Revenue | 5.000% | 12/1/19 | 1,500 | 1,677 |
| New Mexico Educational Assistance Foundation Revenue | 4.000% | 12/1/20 | 1,500 | 1,663 |
| New Mexico Finance Authority Transportation Revenue | 5.000% | 12/15/16 | 7,260 | 7,299 |
| New Mexico GO | 5.000% | 3/1/23 | 15,925 | 19,381 |
| New Mexico Hospital Equipment Loan Council Hospital System Revenue | | | | |
| (Presbyterian Healthcare Services) | 5.000% | 8/1/24 | 900 | 1,107 |
| New Mexico Hospital Equipment Loan Council Hospital System Revenue | | | | |
| (Presbyterian Healthcare Services) | 5.000% | 8/1/25 | 1,000 | 1,245 |
| New Mexico Hospital Equipment Loan Council Hospital System Revenue | | | | |
| (Presbyterian Healthcare Services) | 5.000% | 8/1/26 | 1,025 | 1,264 |
| New Mexico Hospital Equipment Loan Council Hospital System Revenue | | | | |
| (Presbyterian Healthcare Services) | 5.000% | 8/1/27 | 1,435 | 1,756 |
| New Mexico Hospital Equipment Loan Council Hospital System Revenue | | | | |
| (Presbyterian Healthcare Services) | 5.000% | 8/1/29 | 3,000 | 3,609 |
| New Mexico Hospital Equipment Loan Council Hospital System Revenue | | | | |
| (Presbyterian Healthcare Services) | 5.000% | 8/1/30 | 3,000 | 3,591 |
| New Mexico Hospital Equipment Loan Council Hospital System Revenue | | | | |
| (Presbyterian Healthcare Services) | 5.000% | 8/1/31 | 3,685 | 4,386 |
| New Mexico Hospital Equipment Loan Council Hospital System Revenue | | | | |
| (Presbyterian Healthcare Services) | 5.000% | 8/1/32 | 2,500 | 2,960 |
| | | | | 131,205 |
| New York (15.5%) | | | | |
| Amherst NY Development Corp. Student Housing Facility Revenue | 3.500% | 10/1/19 | 1,185 | 1,256 |
| Amherst NY Development Corp. Student Housing Facility Revenue | 4.000% | 10/1/21 | 2,575 | 2,800 |
| Amherst NY Development Corp. Student Housing Facility Revenue | 4.000% | 10/1/22 | 2,680 | 2,903 |
| Brooklyn NY Local Development Corp. PILOT Revenue (Barclays Center Project) | 6.000% | 1/15/20 (Prere.) | 6,735 | 7,773 |
| Dutchess County NY Local Development Corp. Revenue (Health Quest Systems Inc. Project) | 5.000% | 7/1/24 | 1,240 | 1,514 |
| Dutchess County NY Local Development Corp. Revenue (Health Quest Systems Inc. Project) | 5.000% | 7/1/24 | 1,850 | 2,258 |
| Dutchess County NY Local Development Corp. Revenue (Health Quest Systems Inc. Project) | 5.000% | 7/1/25 | 1,310 | 1,620 |
| Dutchess County NY Local Development Corp. Revenue (Health Quest Systems Inc. Project) | 5.000% | 7/1/25 | 4,190 | 5,180 |
| Dutchess County NY Local Development Corp. Revenue (Health Quest Systems Inc. Project) | 5.000% | 7/1/26 | 1,395 | 1,736 |
| Dutchess County NY Local Development Corp. Revenue (Health Quest Systems Inc. Project) | 5.000% | 7/1/26 | 4,695 | 5,843 |
| Dutchess County NY Local Development Corp. Revenue (Health Quest Systems Inc. Project) | 5.000% | 7/1/28 | 5,470 | 6,675 |
| Erie County NY Industrial Development Agency School Facility Revenue | | | | |
| (Buffalo City School District Project) | 5.250% | 5/1/26 | 6,775 | 7,946 |
| Erie County NY Industrial Development Agency School Facility Revenue | | | | |
| (Buffalo City School District Project) | 5.250% | 5/1/27 | 8,560 | 10,022 |
| Erie County NY Industrial Development Agency School Facility Revenue | | | | |
| (Buffalo City School District Project) | 5.250% | 5/1/29 | 6,315 | 7,379 |
182
Intermediate-Term Tax-Exempt Fund
| | | | |
| | | | Face | Market |
| | | Maturity | Amount | Value• |
| | Coupon | Date | ($000) | ($000) |
| Erie County NY Industrial Development Agency School Facility Revenue | | | | |
| (Buffalo City School District Project) | 5.250% | 5/1/31 | 2,500 | 2,887 |
| Freeport NY GO | 5.000% | 1/15/20 | 2,070 | 2,314 |
| Long Island NY Power Authority Electric System Revenue | 5.000% | 12/1/16 (Prere.) | 1,265 | 1,270 |
| Long Island NY Power Authority Electric System Revenue | 5.000% | 12/1/16 (Prere.) | 2,510 | 2,519 |
| Long Island NY Power Authority Electric System Revenue | 5.000% | 12/1/16 (Prere.) | 70 | 70 |
| Long Island NY Power Authority Electric System Revenue | 5.000% | 12/1/18 (Prere.) | 390 | 391 |
| Long Island NY Power Authority Electric System Revenue | 5.750% | 4/1/19 (Prere.) | 20,000 | 22,260 |
| Long Island NY Power Authority Electric System Revenue | 5.500% | 5/1/19 (Prere.) | 28,235 | 31,357 |
| Long Island NY Power Authority Electric System Revenue | 5.000% | 4/1/23 | 5,800 | 6,219 |
| Long Island NY Power Authority Electric System Revenue | 5.000% | 9/1/29 | 10,000 | 11,666 |
| 1 Long Island NY Power Authority Electric System Revenue PUT | 1.019% | 11/1/18 | 18,650 | 18,672 |
| Monroe County NY Industrial Development Agency School Facility Revenue | | | | |
| (Rochester Schools Modernization Project) | 5.000% | 5/1/20 | 3,500 | 3,955 |
| Monroe County NY Industrial Development Corp. Mortgage Revenue | | | | |
| (Unity Hospital Rochester Project) | 5.500% | 8/15/23 | 2,335 | 2,345 |
| Nassau County NY GO | 5.000% | 4/1/22 | 14,850 | 17,462 |
| Nassau County NY GO | 4.000% | 10/1/22 | 8,755 | 9,580 |
| Nassau County NY GO | 5.000% | 4/1/23 | 15,665 | 18,771 |
| Nassau County NY GO | 4.000% | 10/1/23 | 5,245 | 5,717 |
| Nassau County NY Local Economic Assistance & Financing Corp. Revenue | | | | |
| (Winthrop University Hospital Association Project) | 5.000% | 7/1/21 | 2,605 | 2,974 |
| Nassau County NY Local Economic Assistance Corp. Revenue | | | | |
| (Catholic Health Services of Long Island Obligated Group Project) | 5.000% | 7/1/25 | 1,350 | 1,607 |
| Nassau County NY Local Economic Assistance Corp. Revenue | | | | |
| (Catholic Health Services of Long Island Obligated Group Project) | 5.000% | 7/1/27 | 3,090 | 3,613 |
| New York City NY Build NYC Resource Corp. Revenue (New York Law School Project) | 5.000% | 7/1/24 | 3,245 | 3,860 |
| New York City NY Build NYC Resource Corp. Revenue (New York Law School Project) | 5.000% | 7/1/25 | 3,485 | 4,181 |
| New York City NY Build NYC Resource Corp. Revenue (New York Law School Project) | 5.000% | 7/1/26 | 3,660 | 4,442 |
| New York City NY Build NYC Resource Corp. Revenue (The Chapin School Project) | 5.000% | 11/1/19 | 4,000 | 4,462 |
| New York City NY Build NYC Resource Corp. Revenue (The Chapin School Project) | 4.000% | 11/1/26 | 4,000 | 4,735 |
| New York City NY Build NYC Resource Corp. Revenue (The Chapin School Project) | 5.000% | 11/1/26 | 3,500 | 4,463 |
| New York City NY GO | 5.000% | 2/1/17 (Prere.) | 8,425 | 8,514 |
| New York City NY GO | 4.000% | 8/1/17 | 1,000 | 1,025 |
| New York City NY GO | 5.000% | 8/1/17 | 8,950 | 9,239 |
| New York City NY GO | 5.000% | 8/1/17 (Prere.) | 1,095 | 1,130 |
| New York City NY GO | 5.000% | 8/1/17 (Prere.) | 115 | 119 |
| New York City NY GO | 5.000% | 8/1/17 (Prere.) | 1,555 | 1,604 |
| New York City NY GO | 5.000% | 8/1/17 | 7,610 | 7,855 |
| New York City NY GO | 5.000% | 10/1/17 (Prere.) | 590 | 613 |
| New York City NY GO | 5.000% | 8/1/18 | 5,000 | 5,352 |
| New York City NY GO | 5.250% | 8/15/18 (Prere.) | 2,130 | 2,296 |
| New York City NY GO | 5.450% | 4/1/19 (Prere.) | 6,310 | 6,986 |
| New York City NY GO | 5.000% | 6/1/19 | 8,675 | 9,545 |
| New York City NY GO | 5.000% | 8/1/19 | 12,130 | 12,505 |
| New York City NY GO | 5.000% | 8/1/19 | 17,870 | 19,770 |
| New York City NY GO | 5.000% | 8/1/19 | 5,000 | 5,532 |
| New York City NY GO | 5.000% | 8/1/19 | 32,000 | 35,402 |
| New York City NY GO | 5.000% | 8/1/19 | 4,500 | 4,978 |
| New York City NY GO | 5.000% | 8/1/19 | 3,100 | 3,430 |
| New York City NY GO | 5.000% | 8/1/20 | 32,355 | 35,784 |
| New York City NY GO | 5.000% | 8/1/20 | 6,060 | 6,901 |
| New York City NY GO | 5.000% | 8/1/20 | 5,000 | 5,694 |
| New York City NY GO | 5.000% | 8/1/20 | 14,000 | 15,943 |
| New York City NY GO | 5.000% | 8/1/20 | 3,895 | 4,015 |
| New York City NY GO | 5.000% | 8/1/20 | 8,445 | 8,704 |
| New York City NY GO | 5.250% | 9/1/20 | 8,815 | 9,521 |
| New York City NY GO | 5.000% | 10/1/20 | 855 | 887 |
| New York City NY GO | 5.000% | 2/1/21 | 3,875 | 3,915 |
| New York City NY GO | 5.250% | 3/1/21 | 4,255 | 4,662 |
| New York City NY GO | 5.000% | 8/1/21 | 5 | 5 |
| New York City NY GO | 5.000% | 8/1/21 | 9,600 | 9,903 |
| New York City NY GO | 5.000% | 8/1/21 | 5,000 | 5,846 |
| New York City NY GO | 5.000% | 8/1/21 | 10,000 | 11,692 |
| New York City NY GO | 5.000% | 8/1/21 | 59,135 | 65,368 |
| New York City NY GO | 5.000% | 8/1/21 | 4,000 | 4,677 |
| New York City NY GO | 5.000% | 8/1/21 | 15,750 | 17,951 |
| New York City NY GO | 5.250% | 9/1/21 | 14,250 | 15,389 |
| New York City NY GO | 5.000% | 10/1/21 | 7,545 | 8,863 |
| New York City NY GO | 5.000% | 8/1/22 | 2,500 | 2,994 |
183
Intermediate-Term Tax-Exempt Fund
| | | | |
| | | | Face | Market |
| | | Maturity | Amount | Value• |
| | Coupon | Date | ($000) | ($000) |
| New York City NY GO | 5.000% | 8/1/22 | 32,000 | 35,355 |
| New York City NY GO | 5.000% | 8/1/22 | 6,400 | 7,664 |
| New York City NY GO | 5.000% | 8/1/22 | 7,415 | 8,880 |
| New York City NY GO | 5.000% | 8/1/22 | 5,955 | 6,142 |
| New York City NY GO | 5.000% | 8/1/22 | 6,740 | 8,071 |
| New York City NY GO | 5.000% | 8/1/22 | 18,475 | 21,064 |
| New York City NY GO | 5.000% | 8/1/22 | 6,020 | 6,856 |
| New York City NY GO | 5.250% | 8/15/22 | 25,250 | 27,211 |
| New York City NY GO | 5.000% | 8/1/23 | 5,650 | 6,902 |
| New York City NY GO | 5.000% | 8/1/23 | 2,000 | 2,209 |
| New York City NY GO | 5.000% | 8/1/23 | 3,690 | 4,516 |
| New York City NY GO | 5.000% | 8/1/23 | 7,740 | 9,473 |
| New York City NY GO | 5.000% | 8/1/23 | 3,905 | 4,770 |
| New York City NY GO | 5.000% | 8/1/23 | 11,000 | 13,176 |
| New York City NY GO | 5.250% | 8/15/23 | 21,820 | 23,506 |
| New York City NY GO | 5.000% | 10/1/23 | 4,430 | 5,327 |
| New York City NY GO | 5.000% | 4/1/24 | 17,335 | 20,565 |
| New York City NY GO | 5.000% | 8/1/24 | 20,000 | 24,630 |
| New York City NY GO | 5.000% | 8/1/24 | 8,085 | 9,215 |
| New York City NY GO | 5.000% | 8/1/24 | 16,990 | 21,094 |
| New York City NY GO | 5.000% | 8/1/24 | 4,000 | 4,784 |
| New York City NY GO | 5.000% | 8/1/24 | 5,310 | 6,206 |
| New York City NY GO | 5.250% | 8/15/24 | 23,815 | 25,647 |
| New York City NY GO | 5.000% | 10/1/24 | 5,000 | 5,867 |
| New York City NY GO | 5.000% | 10/1/24 | 4,500 | 5,404 |
| New York City NY GO | 5.000% | 8/1/25 | 3,300 | 3,888 |
| New York City NY GO | 5.000% | 8/1/25 | 10,000 | 12,576 |
| New York City NY GO | 5.000% | 8/1/25 | 3,630 | 4,565 |
| New York City NY GO | 5.000% | 8/1/25 | 15,500 | 19,493 |
| New York City NY GO | 5.000% | 8/1/25 | 5,000 | 5,966 |
| New York City NY GO | 5.000% | 10/1/25 | 10,985 | 13,161 |
| New York City NY GO | 5.000% | 4/1/26 | 10,000 | 11,816 |
| New York City NY GO | 5.000% | 4/1/26 | 3,590 | 3,917 |
| New York City NY GO | 5.000% | 8/1/26 | 9,735 | 11,833 |
| New York City NY GO | 5.000% | 8/1/26 | 14,215 | 17,278 |
| New York City NY GO | 5.000% | 8/1/26 | 5,000 | 5,958 |
| New York City NY GO | 5.000% | 10/1/26 | 23,890 | 28,588 |
| New York City NY GO | 5.000% | 4/1/27 | 14,780 | 17,445 |
| 1 New York City NY GO | 1.030% | 8/1/27 | 16,500 | 16,492 |
| New York City NY GO | 5.000% | 8/1/27 | 6,585 | 7,974 |
| New York City NY GO | 5.000% | 8/1/27 | 4,705 | 5,530 |
| New York City NY GO | 5.000% | 8/1/27 | 20,000 | 25,168 |
| New York City NY GO | 5.000% | 10/1/27 | 15,000 | 17,924 |
| New York City NY GO | 5.000% | 8/1/28 | 18,500 | 23,026 |
| New York City NY GO | 5.000% | 8/1/28 | 18,000 | 21,126 |
| New York City NY GO | 5.000% | 8/1/28 | 9,300 | 11,243 |
| New York City NY GO | 5.000% | 3/1/29 | 27,590 | 32,902 |
| New York City NY GO | 5.000% | 5/15/29 | 7,900 | 8,638 |
| New York City NY GO | 5.000% | 8/1/29 | 9,715 | 11,642 |
| New York City NY GO | 5.000% | 3/1/30 | 16,230 | 19,267 |
| New York City NY GO | 5.000% | 8/1/30 | 10,655 | 12,686 |
| New York City NY GO | 5.000% | 8/1/30 | 23,000 | 26,708 |
| New York City NY GO | 5.000% | 8/1/30 | 5,380 | 6,439 |
| New York City NY GO | 5.000% | 8/1/30 | 6,845 | 8,150 |
| New York City NY GO | 5.000% | 3/1/31 | 33,315 | 39,180 |
| New York City NY GO | 5.450% | 4/1/31 | 250 | 275 |
| New York City NY GO | 4.000% | 8/1/31 | 30,000 | 33,459 |
| New York City NY GO | 5.000% | 10/1/31 | 34,050 | 39,713 |
| New York City NY GO | 4.000% | 8/1/32 | 5,000 | 5,536 |
| New York City NY GO | 5.000% | 8/1/32 | 1,475 | 1,713 |
| New York City NY GO | 5.000% | 8/1/33 | 5,000 | 5,869 |
| New York City NY GO | 4.000% | 8/1/35 | 15,000 | 16,326 |
| New York City NY GO VRDO | 0.500% | 11/1/16 | 9,930 | 9,930 |
| New York City NY GO VRDO | 0.500% | 11/1/16 | 22,700 | 22,700 |
| New York City NY GO VRDO | 0.500% | 11/1/16 LOC | 22,500 | 22,500 |
| New York City NY GO VRDO | 0.500% | 11/1/16 | 30,000 | 30,000 |
| New York City NY GO VRDO | 0.520% | 11/1/16 LOC | 6,400 | 6,400 |
| New York City NY GO VRDO | 0.520% | 11/1/16 LOC | 4,100 | 4,100 |
| New York City NY GO VRDO | 0.520% | 11/1/16 | 10,300 | 10,300 |
| New York City NY GO VRDO | 0.530% | 11/1/16 | 3,230 | 3,230 |
184
Intermediate-Term Tax-Exempt Fund
| | | | |
| | | | Face | Market |
| | | Maturity | Amount | Value• |
| | Coupon | Date | ($000) | ($000) |
| New York City NY Health & Hospital Corp. Revenue (Health System) | 5.000% | 2/15/24 | 3,500 | 3,921 |
| New York City NY Health & Hospital Corp. Revenue (Health System) | 5.000% | 2/15/30 | 19,200 | 21,127 |
| New York City NY Housing Development Corp. Multi-Family Housing Revenue | 5.000% | 7/1/26 | 12,940 | 15,414 |
| New York City NY Housing Development Corp. Multi-Family Housing Revenue | 5.250% | 7/1/28 | 17,300 | 20,626 |
| New York City NY Housing Development Corp. Multi-Family Housing Revenue | 5.250% | 7/1/29 | 22,000 | 26,147 |
| New York City NY Housing Development Corp. Multi-Family Housing Revenue | 5.250% | 7/1/30 | 12,500 | 14,784 |
| New York City NY Housing Development Corp. Multi-Family Housing Revenue PUT | 2.950% | 2/1/26 | 34,510 | 35,862 |
| New York City NY Housing Development Corp. Multi-Family Mortgage Revenue (8 Spruce Street) | 3.000% | 2/15/48 | 9,000 | 9,198 |
| New York City NY Industrial Development Agency Civic Facility Revenue | | | | |
| (Civil Liberties Union) VRDO | 0.520% | 11/1/16 LOC | 6,990 | 6,990 |
| New York City NY Municipal Water Finance Authority Water & Sewer System Revenue | 5.000% | 6/15/18 (Prere.) | 500 | 533 |
| New York City NY Municipal Water Finance Authority Water & Sewer System Revenue | 5.000% | 6/15/26 | 35,000 | 40,963 |
| New York City NY Municipal Water Finance Authority Water & Sewer System Revenue | 5.000% | 6/15/26 | 25,880 | 30,289 |
| New York City NY Municipal Water Finance Authority Water & Sewer System Revenue | 5.000% | 6/15/29 | 4,500 | 5,094 |
| New York City NY Municipal Water Finance Authority Water & Sewer System Revenue | 5.000% | 6/15/29 | 41,500 | 48,509 |
| New York City NY Municipal Water Finance Authority Water & Sewer System Revenue | 5.000% | 6/15/29 | 3,080 | 3,282 |
| New York City NY Municipal Water Finance Authority Water & Sewer System Revenue | 5.000% | 6/15/29 | 5,000 | 6,098 |
| New York City NY Municipal Water Finance Authority Water & Sewer System Revenue | 5.000% | 6/15/30 | 10,000 | 11,277 |
| New York City NY Municipal Water Finance Authority Water & Sewer System Revenue | 5.000% | 6/15/31 | 24,500 | 28,580 |
| New York City NY Municipal Water Finance Authority Water & Sewer System Revenue | 5.000% | 6/15/31 | 9,000 | 10,150 |
| New York City NY Municipal Water Finance Authority Water & Sewer System Revenue | 5.000% | 6/15/31 | 30,000 | 35,058 |
| New York City NY Municipal Water Finance Authority Water & Sewer System Revenue | 5.000% | 6/15/32 | 17,500 | 20,295 |
| New York City NY Municipal Water Finance Authority Water & Sewer System Revenue | 5.000% | 6/15/32 | 5,545 | 6,430 |
| New York City NY Municipal Water Finance Authority Water & Sewer System Revenue | 5.000% | 6/15/34 | 50,000 | 59,361 |
| New York City NY Municipal Water Finance Authority Water & Sewer System Revenue | 5.000% | 6/15/35 | 10,415 | 12,395 |
| New York City NY Municipal Water Finance Authority Water & Sewer System Revenue VRDO | 0.500% | 11/1/16 | 15,450 | 15,450 |
| New York City NY Municipal Water Finance Authority Water & Sewer System Revenue VRDO | 0.500% | 11/1/16 | 15,100 | 15,100 |
| New York City NY Municipal Water Finance Authority Water & Sewer System Revenue VRDO | 0.500% | 11/1/16 | 10,100 | 10,100 |
| New York City NY Municipal Water Finance Authority Water & Sewer System Revenue VRDO | 0.500% | 11/1/16 | 45,855 | 45,855 |
| New York City NY Municipal Water Finance Authority Water & Sewer System Revenue VRDO | 0.520% | 11/1/16 | 4,500 | 4,500 |
| New York City NY Municipal Water Finance Authority Water & Sewer System Revenue VRDO | 0.520% | 11/1/16 | 4,650 | 4,650 |
| New York City NY Municipal Water Finance Authority Water & Sewer System Revenue VRDO | 0.520% | 11/1/16 | 15,210 | 15,210 |
| New York City NY Municipal Water Finance Authority Water & Sewer System Revenue VRDO | 0.530% | 11/1/16 | 5,300 | 5,300 |
| New York City NY Sales Tax Asset Receivable Corp. Revenue | 5.000% | 10/15/24 | 15,830 | 19,961 |
| New York City NY Sales Tax Asset Receivable Corp. Revenue | 5.000% | 10/15/28 | 6,000 | 7,482 |
| New York City NY Transitional Finance Authority Building Aid Revenue | 5.000% | 1/15/17 | 5,150 | 5,196 |
| New York City NY Transitional Finance Authority Building Aid Revenue | 5.000% | 7/15/17 | 6,335 | 6,525 |
| New York City NY Transitional Finance Authority Building Aid Revenue | 5.000% | 1/15/19 | 3,875 | 4,212 |
| New York City NY Transitional Finance Authority Building Aid Revenue | 5.000% | 1/15/23 | 4,440 | 4,831 |
| New York City NY Transitional Finance Authority Building Aid Revenue | 5.000% | 1/15/24 | 7,040 | 7,659 |
| New York City NY Transitional Finance Authority Building Aid Revenue | 5.000% | 1/15/25 (14) | 10,170 | 10,257 |
| New York City NY Transitional Finance Authority Building Aid Revenue | 5.250% | 1/15/25 | 13,090 | 14,309 |
| New York City NY Transitional Finance Authority Building Aid Revenue | 5.000% | 7/15/25 | 10,085 | 12,722 |
| New York City NY Transitional Finance Authority Building Aid Revenue | 5.000% | 1/15/26 (14) | 7,620 | 7,685 |
| New York City NY Transitional Finance Authority Building Aid Revenue | 5.250% | 1/15/26 | 10,520 | 11,497 |
| New York City NY Transitional Finance Authority Building Aid Revenue | 5.250% | 1/15/26 | 8,185 | 8,945 |
| New York City NY Transitional Finance Authority Building Aid Revenue | 5.250% | 1/15/27 | 4,615 | 5,043 |
| New York City NY Transitional Finance Authority Building Aid Revenue | 5.125% | 1/15/28 | 3,465 | 3,776 |
| New York City NY Transitional Finance Authority Building Aid Revenue | 5.000% | 7/15/28 | 11,000 | 13,551 |
| New York City NY Transitional Finance Authority Building Aid Revenue | 5.000% | 1/15/29 | 3,550 | 3,722 |
| New York City NY Transitional Finance Authority Building Aid Revenue | 5.000% | 7/15/29 | 5,000 | 6,109 |
| New York City NY Transitional Finance Authority Building Aid Revenue | 5.000% | 1/15/30 | 9,500 | 10,298 |
| New York City NY Transitional Finance Authority Building Aid Revenue | 5.000% | 7/15/30 | 5,000 | 6,073 |
| New York City NY Transitional Finance Authority Building Aid Revenue | 5.000% | 7/15/30 | 9,000 | 10,947 |
| New York City NY Transitional Finance Authority Building Aid Revenue | 5.000% | 7/15/31 | 18,000 | 20,744 |
| New York City NY Transitional Finance Authority Building Aid Revenue | 5.000% | 7/15/31 | 6,000 | 7,015 |
| New York City NY Transitional Finance Authority Building Aid Revenue | 5.000% | 7/15/31 | 5,270 | 6,350 |
| New York City NY Transitional Finance Authority Building Aid Revenue | 5.000% | 7/15/32 | 5,000 | 5,994 |
| New York City NY Transitional Finance Authority Building Aid Revenue | 5.000% | 7/15/32 | 3,950 | 4,611 |
| New York City NY Transitional Finance Authority Building Aid Revenue | 5.000% | 7/15/33 | 10,000 | 11,936 |
| New York City NY Transitional Finance Authority Building Aid Revenue | 5.000% | 7/15/34 | 10,000 | 11,867 |
| New York City NY Transitional Finance Authority Building Aid Revenue | 5.000% | 7/15/34 | 10,000 | 11,890 |
| New York City NY Transitional Finance Authority Building Aid Revenue | 5.000% | 7/15/35 | 10,000 | 11,845 |
| New York City NY Transitional Finance Authority Future Tax Revenue | 5.000% | 11/1/17 | 8,965 | 9,346 |
| New York City NY Transitional Finance Authority Future Tax Revenue | 5.000% | 11/1/17 | 12,000 | 12,510 |
| New York City NY Transitional Finance Authority Future Tax Revenue | 5.000% | 11/1/17 | 4,580 | 4,679 |
| New York City NY Transitional Finance Authority Future Tax Revenue | 5.000% | 11/1/18 | 6,500 | 7,026 |
| New York City NY Transitional Finance Authority Future Tax Revenue | 5.000% | 11/1/18 | 15,000 | 16,214 |
| New York City NY Transitional Finance Authority Future Tax Revenue | 5.000% | 11/1/18 | 5,000 | 5,405 |
| New York City NY Transitional Finance Authority Future Tax Revenue | 5.000% | 5/1/19 (Prere.) | 2,695 | 2,963 |
185
Intermediate-Term Tax-Exempt Fund
| | | | |
| | | | Face | Market |
| | | Maturity | Amount | Value• |
| | Coupon | Date | ($000) | ($000) |
| New York City NY Transitional Finance Authority Future Tax Revenue | 5.000% | 11/1/19 | 3,570 | 3,992 |
| New York City NY Transitional Finance Authority Future Tax Revenue | 5.000% | 11/1/19 | 9,835 | 10,999 |
| New York City NY Transitional Finance Authority Future Tax Revenue | 5.000% | 11/1/19 | 2,535 | 2,835 |
| New York City NY Transitional Finance Authority Future Tax Revenue | 5.000% | 11/1/20 | 6,000 | 6,917 |
| New York City NY Transitional Finance Authority Future Tax Revenue | 5.000% | 11/1/20 | 13,500 | 15,564 |
| New York City NY Transitional Finance Authority Future Tax Revenue | 5.000% | 11/1/21 | 30,000 | 33,571 |
| New York City NY Transitional Finance Authority Future Tax Revenue | 5.000% | 11/1/21 | 16,030 | 18,983 |
| New York City NY Transitional Finance Authority Future Tax Revenue | 5.000% | 5/1/22 | 8,395 | 9,233 |
| New York City NY Transitional Finance Authority Future Tax Revenue | 5.000% | 5/1/23 | 16,740 | 20,365 |
| New York City NY Transitional Finance Authority Future Tax Revenue | 5.000% | 11/1/23 | 14,000 | 17,218 |
| New York City NY Transitional Finance Authority Future Tax Revenue | 5.000% | 2/1/24 | 6,000 | 6,934 |
| New York City NY Transitional Finance Authority Future Tax Revenue | 5.000% | 11/1/24 | 20,000 | 24,982 |
| New York City NY Transitional Finance Authority Future Tax Revenue | 5.000% | 11/1/24 | 1,985 | 2,479 |
| New York City NY Transitional Finance Authority Future Tax Revenue | 5.000% | 11/1/24 | 12,220 | 15,264 |
| New York City NY Transitional Finance Authority Future Tax Revenue | 5.000% | 11/1/24 | 6,000 | 7,068 |
| New York City NY Transitional Finance Authority Future Tax Revenue | 5.000% | 11/1/24 | 15,550 | 18,317 |
| New York City NY Transitional Finance Authority Future Tax Revenue | 5.000% | 11/1/24 | 1,000 | 1,178 |
| New York City NY Transitional Finance Authority Future Tax Revenue | 5.000% | 11/1/24 | 14,245 | 17,433 |
| New York City NY Transitional Finance Authority Future Tax Revenue | 5.000% | 11/1/24 | 13,770 | 17,286 |
| New York City NY Transitional Finance Authority Future Tax Revenue | 5.000% | 11/1/24 | 10,030 | 12,591 |
| New York City NY Transitional Finance Authority Future Tax Revenue | 5.000% | 2/1/25 | 4,285 | 4,944 |
| New York City NY Transitional Finance Authority Future Tax Revenue | 5.000% | 11/1/25 | 5,000 | 5,879 |
| New York City NY Transitional Finance Authority Future Tax Revenue | 5.000% | 11/1/25 | 5,000 | 5,879 |
| New York City NY Transitional Finance Authority Future Tax Revenue | 5.000% | 11/1/25 | 5,500 | 6,467 |
| New York City NY Transitional Finance Authority Future Tax Revenue | 5.000% | 2/1/26 | 10,290 | 11,855 |
| New York City NY Transitional Finance Authority Future Tax Revenue | 5.000% | 2/1/26 | 10,795 | 12,436 |
| New York City NY Transitional Finance Authority Future Tax Revenue | 5.000% | 11/1/26 | 2,635 | 3,093 |
| New York City NY Transitional Finance Authority Future Tax Revenue | 5.000% | 11/1/26 | 8,620 | 10,117 |
| New York City NY Transitional Finance Authority Future Tax Revenue | 5.250% | 11/1/26 | 8,255 | 9,567 |
| New York City NY Transitional Finance Authority Future Tax Revenue | 5.000% | 11/1/27 | 1,435 | 1,683 |
| New York City NY Transitional Finance Authority Future Tax Revenue | 5.000% | 11/1/27 | 4,000 | 4,691 |
| New York City NY Transitional Finance Authority Future Tax Revenue | 5.000% | 2/1/28 | 25,675 | 29,522 |
| New York City NY Transitional Finance Authority Future Tax Revenue | 5.000% | 2/1/28 | 10,000 | 11,772 |
| New York City NY Transitional Finance Authority Future Tax Revenue | 5.000% | 8/1/28 | 5,000 | 6,137 |
| New York City NY Transitional Finance Authority Future Tax Revenue | 5.000% | 11/1/28 | 7,000 | 8,700 |
| New York City NY Transitional Finance Authority Future Tax Revenue | 5.000% | 5/1/29 | 12,000 | 14,348 |
| New York City NY Transitional Finance Authority Future Tax Revenue | 4.000% | 5/1/30 | 10,000 | 11,207 |
| New York City NY Transitional Finance Authority Future Tax Revenue | 5.000% | 2/1/31 | 8,000 | 9,165 |
| New York City NY Transitional Finance Authority Future Tax Revenue | 5.000% | 5/1/31 | 19,000 | 22,290 |
| New York City NY Transitional Finance Authority Future Tax Revenue | 5.000% | 11/1/31 | 8,000 | 9,754 |
| New York City NY Transitional Finance Authority Future Tax Revenue | 5.000% | 11/1/31 | 24,475 | 28,608 |
| New York City NY Transitional Finance Authority Future Tax Revenue | 5.000% | 2/1/32 | 12,700 | 14,911 |
| New York City NY Transitional Finance Authority Future Tax Revenue | 5.000% | 8/1/32 | 13,750 | 16,675 |
| New York City NY Transitional Finance Authority Future Tax Revenue | 5.000% | 11/1/32 | 4,270 | 5,068 |
| New York City NY Transitional Finance Authority Future Tax Revenue | 5.000% | 11/1/32 | 16,500 | 19,286 |
| New York City NY Transitional Finance Authority Future Tax Revenue | 5.000% | 2/1/33 | 17,500 | 20,536 |
| New York City NY Transitional Finance Authority Future Tax Revenue | 5.000% | 8/1/33 | 12,150 | 14,725 |
| New York City NY Transitional Finance Authority Future Tax Revenue | 5.000% | 11/1/33 | 13,700 | 16,445 |
| New York City NY Transitional Finance Authority Future Tax Revenue | 5.000% | 8/1/34 | 15,910 | 19,219 |
| New York City NY Transitional Finance Authority Future Tax Revenue | 5.000% | 11/1/34 | 11,150 | 13,295 |
| New York City NY Transitional Finance Authority Future Tax Revenue | 5.000% | 11/1/34 | 27,325 | 32,498 |
| New York City NY Transitional Finance Authority Future Tax Revenue | 5.000% | 8/1/35 | 22,020 | 26,582 |
| New York City NY Transitional Finance Authority Future Tax Revenue | 5.000% | 11/1/35 | 13,290 | 15,835 |
| New York City NY Transitional Finance Authority Future Tax Revenue | 5.000% | 8/1/36 | 3,000 | 3,558 |
| New York City NY Transitional Finance Authority Future Tax Revenue | 5.000% | 11/1/36 | 4,000 | 4,762 |
| 4 New York City NY Transitional Finance Authority Future Tax Revenue TOB VRDO | 0.620% | 11/1/16 | 10,030 | 10,030 |
| New York City NY Transitional Finance Authority Future Tax Revenue VRDO | 0.500% | 11/1/16 | 52,100 | 52,100 |
| New York City NY Transitional Finance Authority Future Tax Revenue VRDO | 0.520% | 11/1/16 | 13,800 | 13,800 |
| New York City NY Trust for Cultural Resources Revenue | | | | |
| (Lincoln Center for the Performing Arts Inc.) | 5.250% | 12/1/18 | 7,600 | 8,247 |
| New York City NY Trust for Cultural Resources Revenue (Museum of Modern Art) | 4.000% | 4/1/26 | 9,500 | 11,276 |
| New York City NY Trust for Cultural Resources Revenue (Wildlife Conservation Society) | 5.000% | 8/1/33 | 5,270 | 6,274 |
| New York Liberty Development Corp. Revenue | 5.000% | 11/15/31 | 13,200 | 15,137 |
| New York Liberty Development Corp. Revenue (7 World Trade Center Project) | 5.000% | 9/15/31 | 14,000 | 16,378 |
| New York Liberty Development Corp. Revenue (Goldman Sachs Headquarters) | 5.250% | 10/1/35 | 19,640 | 24,837 |
| New York Metropolitan Transportation Authority Revenue | 5.000% | 11/15/17 (Prere.) | 10,000 | 10,436 |
| New York Metropolitan Transportation Authority Revenue | 5.000% | 11/15/17 (Prere.) | 2,685 | 2,802 |
| New York Metropolitan Transportation Authority Revenue | 5.750% | 7/1/18 | 1,975 | 2,133 |
| New York Metropolitan Transportation Authority Revenue | 5.000% | 11/15/19 | 23,500 | 26,194 |
| New York Metropolitan Transportation Authority Revenue | 5.000% | 11/15/20 | 34,225 | 39,155 |
186
Intermediate-Term Tax-Exempt Fund
| | | | |
| | | | Face | Market |
| | | Maturity | Amount | Value• |
| | Coupon | Date | ($000) | ($000) |
| New York Metropolitan Transportation Authority Revenue | 5.000% | 11/15/21 | 19,000 | 22,251 |
| New York Metropolitan Transportation Authority Revenue | 5.500% | 11/15/21 (4) | 15,900 | 19,186 |
| New York Metropolitan Transportation Authority Revenue | 5.000% | 11/15/22 | 8,385 | 10,035 |
| New York Metropolitan Transportation Authority Revenue | 5.000% | 11/15/23 | 6,800 | 7,091 |
| New York Metropolitan Transportation Authority Revenue | 5.000% | 11/15/23 | 5,000 | 6,094 |
| New York Metropolitan Transportation Authority Revenue | 5.000% | 11/15/23 | 6,550 | 7,898 |
| New York Metropolitan Transportation Authority Revenue | 5.000% | 11/15/24 | 2,250 | 2,387 |
| New York Metropolitan Transportation Authority Revenue | 5.000% | 11/15/24 | 2,525 | 2,633 |
| New York Metropolitan Transportation Authority Revenue | 5.000% | 11/15/24 | 10,000 | 12,288 |
| New York Metropolitan Transportation Authority Revenue | 5.000% | 11/15/24 | 6,505 | 7,829 |
| New York Metropolitan Transportation Authority Revenue | 5.000% | 11/15/25 | 1,500 | 1,753 |
| New York Metropolitan Transportation Authority Revenue | 5.000% | 11/15/25 | 10,000 | 11,689 |
| New York Metropolitan Transportation Authority Revenue | 5.000% | 11/15/25 | 1,330 | 1,596 |
| New York Metropolitan Transportation Authority Revenue | 5.000% | 11/15/25 | 31,000 | 37,229 |
| New York Metropolitan Transportation Authority Revenue | 5.000% | 11/15/26 | 3,000 | 3,183 |
| New York Metropolitan Transportation Authority Revenue | 5.000% | 11/15/26 | 15,000 | 17,534 |
| New York Metropolitan Transportation Authority Revenue | 5.000% | 11/15/26 | 2,300 | 2,750 |
| New York Metropolitan Transportation Authority Revenue | 5.000% | 11/15/26 | 5,355 | 6,411 |
| New York Metropolitan Transportation Authority Revenue | 5.000% | 11/15/27 | 3,885 | 4,121 |
| New York Metropolitan Transportation Authority Revenue | 5.000% | 11/15/27 | 1,500 | 1,620 |
| New York Metropolitan Transportation Authority Revenue | 5.000% | 11/15/27 | 3,850 | 4,500 |
| New York Metropolitan Transportation Authority Revenue | 5.000% | 11/15/27 | 1,695 | 2,020 |
| New York Metropolitan Transportation Authority Revenue | 5.250% | 11/15/27 | 22,625 | 26,243 |
| New York Metropolitan Transportation Authority Revenue | 5.000% | 11/15/28 | 15,000 | 17,882 |
| New York Metropolitan Transportation Authority Revenue | 5.000% | 11/15/28 | 20,500 | 25,048 |
| New York Metropolitan Transportation Authority Revenue | 5.250% | 11/15/28 | 9,000 | 10,439 |
| New York Metropolitan Transportation Authority Revenue | 5.000% | 11/15/29 | 13,635 | 16,229 |
| New York Metropolitan Transportation Authority Revenue | 5.250% | 11/15/29 | 20,730 | 24,045 |
| New York Metropolitan Transportation Authority Revenue | 5.000% | 11/15/30 | 10,260 | 12,163 |
| New York Metropolitan Transportation Authority Revenue | 5.000% | 11/15/30 | 12,125 | 14,148 |
| New York Metropolitan Transportation Authority Revenue | 5.000% | 11/15/30 | 12,735 | 15,097 |
| New York Metropolitan Transportation Authority Revenue | 5.250% | 11/15/30 | 24,500 | 28,386 |
| New York Metropolitan Transportation Authority Revenue | 5.250% | 11/15/30 | 5,500 | 6,762 |
| New York Metropolitan Transportation Authority Revenue | 4.750% | 11/15/31 | 8,000 | 8,883 |
| New York Metropolitan Transportation Authority Revenue | 5.000% | 11/15/31 | 8,500 | 10,077 |
| New York Metropolitan Transportation Authority Revenue | 5.000% | 11/15/31 | 5,500 | 6,415 |
| New York Metropolitan Transportation Authority Revenue | 5.000% | 11/15/31 | 7,000 | 8,328 |
| New York Metropolitan Transportation Authority Revenue | 5.000% | 11/15/32 | 5,480 | 6,384 |
| New York Metropolitan Transportation Authority Revenue | 5.000% | 11/15/32 | 12,705 | 14,802 |
| New York Metropolitan Transportation Authority Revenue | 5.000% | 11/15/33 | 13,055 | 15,218 |
| New York Metropolitan Transportation Authority Revenue | 5.000% | 11/15/33 | 5,000 | 5,897 |
| New York Metropolitan Transportation Authority Revenue | 5.000% | 11/15/34 | 19,605 | 22,788 |
| New York Metropolitan Transportation Authority Revenue (Dedicated Petroleum Tax) | 6.000% | 4/1/20 (ETM) | 20,300 | 22,263 |
| 1 New York Metropolitan Transportation Authority Revenue (Dedicated Tax Fund) | 1.380% | 11/1/17 | 18,000 | 18,042 |
| 1 New York Metropolitan Transportation Authority Revenue (Dedicated Tax Fund) | 1.580% | 11/1/19 | 8,000 | 8,076 |
| New York Metropolitan Transportation Authority Revenue (Dedicated Tax Fund) | 5.000% | 11/15/25 | 6,125 | 7,212 |
| New York Metropolitan Transportation Authority Revenue (Dedicated Tax Fund) | 5.000% | 11/15/25 | 10,360 | 12,198 |
| New York Metropolitan Transportation Authority Revenue (Dedicated Tax Fund) | 5.000% | 11/15/26 | 7,245 | 8,507 |
| New York Metropolitan Transportation Authority Revenue (Dedicated Tax Fund) | 5.000% | 11/15/26 | 10,910 | 12,811 |
| New York Metropolitan Transportation Authority Revenue (Dedicated Tax Fund) | 5.000% | 11/15/27 | 11,530 | 13,508 |
| New York Metropolitan Transportation Authority Revenue (Dedicated Tax Fund) | 5.000% | 11/15/27 | 11,415 | 13,373 |
| New York Metropolitan Transportation Authority Revenue (Dedicated Tax Fund) | 5.125% | 11/15/28 | 2,000 | 2,346 |
| New York Metropolitan Transportation Authority Revenue (Dedicated Tax Fund) | 5.125% | 11/15/28 | 10,500 | 12,315 |
| New York Metropolitan Transportation Authority Revenue (Dedicated Tax Fund) | 5.250% | 11/15/29 | 11,500 | 14,568 |
| New York Metropolitan Transportation Authority Revenue (Dedicated Tax Fund) | 5.250% | 11/15/30 | 15,000 | 18,900 |
| New York Metropolitan Transportation Authority Revenue (Dedicated Tax Fund) | 5.000% | 11/15/32 | 6,500 | 7,877 |
| New York Metropolitan Transportation Authority Revenue (Dedicated Tax Fund) | 5.000% | 11/15/33 | 10,900 | 13,155 |
| New York Metropolitan Transportation Authority Revenue (Dedicated Tax Fund) | 5.000% | 11/15/34 | 11,445 | 13,757 |
| New York Metropolitan Transportation Authority Revenue (Dedicated Tax Fund) | 5.000% | 11/15/35 | 10,020 | 11,996 |
| New York Metropolitan Transportation Authority Revenue (Dedicated Tax Fund) | 5.000% | 11/15/36 | 59,700 | 71,529 |
| New York Metropolitan Transportation Authority Revenue (Dedicated Tax Fund) | 5.000% | 11/15/36 | 12,610 | 15,109 |
| New York Metropolitan Transportation Authority Revenue (Hudson Yards Development) | 5.000% | 11/15/46 | 4,600 | 5,013 |
| New York Metropolitan Transportation Authority Revenue (Hudson Yards Development) | 5.000% | 11/15/51 | 4,600 | 5,124 |
| New York Metropolitan Transportation Authority Revenue (Service Contract) | 5.750% | 1/1/17 (14) | 1,615 | 1,629 |
| New York Metropolitan Transportation Authority Revenue (Transit Revenue) | 5.000% | 11/15/17 (Prere.) | 5,000 | 5,218 |
| New York Metropolitan Transportation Authority Revenue (Transit Revenue) | 5.500% | 11/15/18 | 13,245 | 13,862 |
| New York Metropolitan Transportation Authority Revenue (Transit Revenue) | 5.000% | 11/15/21 | 5,000 | 5,008 |
| New York Metropolitan Transportation Authority Revenue (Transit Revenue) | 5.000% | 11/15/26 | 2,500 | 2,993 |
| New York Metropolitan Transportation Authority Revenue (Transit Revenue) | 5.000% | 11/15/28 | 2,000 | 2,384 |
| New York Metropolitan Transportation Authority Revenue (Transit Revenue) PUT | 5.000% | 11/15/19 | 8,040 | 8,938 |
187
Intermediate-Term Tax-Exempt Fund
| | | | |
| | | | Face | Market |
| | | Maturity | Amount | Value• |
| | Coupon | Date | ($000) | ($000) |
| 1 New York Metropolitan Transportation Authority Revenue PUT | 1.053% | 11/1/16 | 12,500 | 12,500 |
| 1 New York Metropolitan Transportation Authority Revenue PUT | 1.193% | 11/1/17 | 8,765 | 8,774 |
| 1 New York Metropolitan Transportation Authority Revenue PUT | 0.990% | 11/15/17 | 31,200 | 31,167 |
| New York Metropolitan Transportation Authority Revenue PUT | 5.000% | 2/15/20 | 18,000 | 20,109 |
| 4 New York Metropolitan Transportation Authority Revenue TOB VRDO | 0.780% | 11/7/16 | 26,885 | 26,885 |
| New York Metropolitan Transportation Authority Revenue VRDO | 0.490% | 11/1/16 LOC | 33,505 | 33,505 |
| New York State Dormitory Authority Lease Revenue (Mental Health Services Facilities) | 5.000% | 8/15/21 | 10,000 | 11,432 |
| New York State Dormitory Authority Lease Revenue (Mental Health Services Facilities) | 5.000% | 8/15/22 | 2,000 | 2,272 |
| New York State Dormitory Authority Lease Revenue (State University Dormitory Facilities) | 5.000% | 7/1/24 | 2,000 | 2,328 |
| New York State Dormitory Authority Lease Revenue (State University Dormitory Facilities) | 5.000% | 7/1/28 | 3,925 | 4,427 |
| New York State Dormitory Authority Lease Revenue (State University Dormitory Facilities) | 5.000% | 7/1/29 | 2,320 | 2,684 |
| New York State Dormitory Authority Lease Revenue (State University Dormitory Facilities) | 5.000% | 7/1/29 | 2,125 | 2,401 |
| New York State Dormitory Authority Lease Revenue (State University Dormitory Facilities) | 5.000% | 7/1/30 | 4,330 | 4,893 |
| New York State Dormitory Authority Revenue (City University System) | 5.000% | 7/1/18 (Prere.) | 2,570 | 2,746 |
| New York State Dormitory Authority Revenue (City University System) | 5.000% | 7/1/19 | 430 | 459 |
| New York State Dormitory Authority Revenue (City University System) | 5.000% | 7/1/20 (Prere.) | 215 | 245 |
| New York State Dormitory Authority Revenue (City University System) | 5.000% | 7/1/21 | 4,785 | 5,435 |
| New York State Dormitory Authority Revenue (City University System) | 5.000% | 7/1/22 | 5,340 | 6,044 |
| New York State Dormitory Authority Revenue (City University System) | 5.000% | 7/1/25 | 6,100 | 6,893 |
| New York State Dormitory Authority Revenue (Columbia University) | 5.000% | 10/1/21 | 19,375 | 22,961 |
| New York State Dormitory Authority Revenue (Department of Health) | 5.000% | 7/1/18 | 4,885 | 5,210 |
| New York State Dormitory Authority Revenue (Department of Health) | 5.000% | 7/1/19 | 4,000 | 4,411 |
| New York State Dormitory Authority Revenue (Department of Health) | 5.000% | 7/1/20 | 6,485 | 7,361 |
| New York State Dormitory Authority Revenue (Department of Health) | 5.000% | 7/1/21 | 3,500 | 4,076 |
| New York State Dormitory Authority Revenue (Fordham University) | 5.000% | 7/1/28 | 1,070 | 1,245 |
| New York State Dormitory Authority Revenue (Fordham University) | 5.125% | 7/1/29 | 1,625 | 1,896 |
| New York State Dormitory Authority Revenue (Fordham University) | 5.200% | 7/1/30 | 1,200 | 1,400 |
| New York State Dormitory Authority Revenue (Icahn School of Medicine at Mount Sinai) | 5.000% | 7/1/24 | 9,345 | 11,332 |
| New York State Dormitory Authority Revenue (Icahn School of Medicine at Mount Sinai) | 5.000% | 7/1/28 | 6,500 | 7,770 |
| New York State Dormitory Authority Revenue (Icahn School of Medicine at Mount Sinai) | 5.000% | 7/1/29 | 10,000 | 11,822 |
| New York State Dormitory Authority Revenue (Icahn School of Medicine at Mount Sinai) | 5.000% | 7/1/30 | 4,500 | 5,289 |
| New York State Dormitory Authority Revenue (Icahn School of Medicine at Mount Sinai) | 5.000% | 7/1/32 | 12,000 | 13,978 |
| New York State Dormitory Authority Revenue (Memorial Sloan-Kettering Cancer Center) | 5.000% | 7/1/26 | 1,500 | 1,757 |
| New York State Dormitory Authority Revenue (Memorial Sloan-Kettering Cancer Center) | 5.000% | 7/1/29 | 1,000 | 1,158 |
| New York State Dormitory Authority Revenue (Memorial Sloan-Kettering Cancer Center) | 5.000% | 7/1/30 | 1,000 | 1,153 |
| New York State Dormitory Authority Revenue (Mental Health Services Facilities Improvement) | 5.000% | 2/15/17 (Prere.) | 5 | 5 |
| New York State Dormitory Authority Revenue (Mental Health Services Facilities Improvement) | 5.000% | 8/15/18 (Prere.) | 2,520 | 2,705 |
| New York State Dormitory Authority Revenue (Mental Health Services Facilities Improvement) | 5.000% | 8/15/18 (Prere.) | 2,865 | 3,075 |
| New York State Dormitory Authority Revenue (Mental Health Services Facilities Improvement) | 5.000% | 2/15/19 (4) | 5,030 | 5,396 |
| New York State Dormitory Authority Revenue (Mental Health Services Facilities Improvement) | 5.000% | 2/15/19 (4) | 3,195 | 3,232 |
| New York State Dormitory Authority Revenue (Mental Health Services Facilities Improvement) | 5.000% | 2/15/19 | 135 | 145 |
| New York State Dormitory Authority Revenue (Mental Health Services Facilities Improvement) | 5.000% | 8/15/20 (ETM) | 10 | 11 |
| New York State Dormitory Authority Revenue (Mental Health Services Facilities Improvement) | 5.000% | 8/15/20 | 13,280 | 15,146 |
| New York State Dormitory Authority Revenue (Mental Health Services Facilities Improvement) | 5.000% | 2/15/25 | 215 | 230 |
| New York State Dormitory Authority Revenue (Mount Sinai Hospital Obligated Group) | 5.000% | 7/1/26 | 3,500 | 3,927 |
| New York State Dormitory Authority Revenue | | | | |
| (Mount Sinai School of Medicine of New York University) | 5.000% | 7/1/17 (Prere.) | 8,000 | 8,228 |
| New York State Dormitory Authority Revenue | | | | |
| (Mount Sinai School of Medicine of New York University) | 5.000% | 7/1/17 (Prere.) | 3,300 | 3,394 |
| New York State Dormitory Authority Revenue | | | | |
| (Mount Sinai School of Medicine of New York University) | 5.000% | 7/1/17 (Prere.) | 4,000 | 4,114 |
| New York State Dormitory Authority Revenue | | | | |
| (Mount Sinai School of Medicine of New York University) | 5.000% | 7/1/21 | 1,500 | 1,692 |
| New York State Dormitory Authority Revenue (New York University Hospitals Center) | 5.000% | 7/1/25 | 3,000 | 3,736 |
| 2 New York State Dormitory Authority Revenue (New York University) | 5.000% | 7/1/18 (Prere.) | 2,000 | 2,137 |
| New York State Dormitory Authority Revenue (New York University) | 6.000% | 7/1/19 (14) | 1,700 | 1,915 |
| New York State Dormitory Authority Revenue (New York University) | 5.000% | 7/1/22 | 3,445 | 3,803 |
| New York State Dormitory Authority Revenue (New York University) | 5.000% | 7/1/25 | 5,130 | 6,496 |
| New York State Dormitory Authority Revenue (New York University) | 5.000% | 7/1/26 | 4,000 | 5,127 |
| New York State Dormitory Authority Revenue (New York University) | 5.000% | 7/1/35 | 10,000 | 12,087 |
| New York State Dormitory Authority Revenue (New York University) | 5.000% | 7/1/36 | 9,000 | 10,870 |
| New York State Dormitory Authority Revenue (Personal Income Tax) | 5.000% | 12/15/16 (Prere.) | 5,000 | 5,026 |
| 2 New York State Dormitory Authority Revenue (Personal Income Tax) | 5.000% | 3/15/17 (Prere.) | 2,565 | 2,606 |
| New York State Dormitory Authority Revenue (Personal Income Tax) | 5.000% | 3/15/18 (Prere.) | 33,000 | 34,881 |
| New York State Dormitory Authority Revenue (Personal Income Tax) | 5.000% | 3/15/18 (Prere.) | 34,650 | 36,625 |
| New York State Dormitory Authority Revenue (Personal Income Tax) | 5.000% | 3/15/18 (Prere.) | 5,790 | 6,120 |
| New York State Dormitory Authority Revenue (Personal Income Tax) | 5.000% | 12/15/18 | 36,270 | 39,351 |
| New York State Dormitory Authority Revenue (Personal Income Tax) | 5.000% | 2/15/19 | 12,145 | 13,245 |
| New York State Dormitory Authority Revenue (Personal Income Tax) | 5.000% | 3/15/19 | 3,075 | 3,363 |
| New York State Dormitory Authority Revenue (Personal Income Tax) | 5.000% | 12/15/19 | 15,000 | 16,817 |
188
Intermediate-Term Tax-Exempt Fund
| | | | |
| | | | Face | Market |
| | | Maturity | Amount | Value• |
| | Coupon | Date | ($000) | ($000) |
| New York State Dormitory Authority Revenue (Personal Income Tax) | 5.000% | 2/15/20 (Prere.) | 20 | 23 |
| New York State Dormitory Authority Revenue (Personal Income Tax) | 5.000% | 2/15/20 | 37,000 | 41,558 |
| New York State Dormitory Authority Revenue (Personal Income Tax) | 5.000% | 12/15/20 | 8,000 | 9,213 |
| New York State Dormitory Authority Revenue (Personal Income Tax) | 5.000% | 2/15/21 | 12,060 | 13,590 |
| New York State Dormitory Authority Revenue (Personal Income Tax) | 5.000% | 2/15/21 | 36,430 | 42,076 |
| New York State Dormitory Authority Revenue (Personal Income Tax) | 5.000% | 2/15/22 (Prere.) | 920 | 1,099 |
| New York State Dormitory Authority Revenue (Personal Income Tax) | 5.000% | 2/15/22 (Prere.) | 3,835 | 4,581 |
| New York State Dormitory Authority Revenue (Personal Income Tax) | 5.000% | 2/15/22 (Prere.) | 1,340 | 1,601 |
| New York State Dormitory Authority Revenue (Personal Income Tax) | 5.000% | 2/15/22 | 33,415 | 39,510 |
| New York State Dormitory Authority Revenue (Personal Income Tax) | 5.500% | 3/15/22 (2) | 7,000 | 8,491 |
| New York State Dormitory Authority Revenue (Personal Income Tax) | 5.000% | 3/15/23 | 8,500 | 10,274 |
| New York State Dormitory Authority Revenue (Personal Income Tax) | 5.000% | 2/15/24 | 4,695 | 5,559 |
| New York State Dormitory Authority Revenue (Personal Income Tax) | 5.000% | 2/15/24 | 35,885 | 44,015 |
| New York State Dormitory Authority Revenue (Personal Income Tax) | 5.000% | 2/15/25 | 8,500 | 10,577 |
| New York State Dormitory Authority Revenue (Personal Income Tax) | 5.000% | 3/15/25 | 20,000 | 24,914 |
| New York State Dormitory Authority Revenue (Personal Income Tax) | 5.000% | 2/15/26 | 19,540 | 23,022 |
| New York State Dormitory Authority Revenue (Personal Income Tax) | 5.000% | 2/15/26 | 30,480 | 38,065 |
| New York State Dormitory Authority Revenue (Personal Income Tax) | 5.000% | 2/15/26 | 39,000 | 49,061 |
| New York State Dormitory Authority Revenue (Personal Income Tax) | 5.000% | 2/15/26 | 10,000 | 12,338 |
| New York State Dormitory Authority Revenue (Personal Income Tax) | 5.000% | 3/15/26 | 17,630 | 20,467 |
| New York State Dormitory Authority Revenue (Personal Income Tax) | 5.000% | 3/15/26 | 2,585 | 3,001 |
| New York State Dormitory Authority Revenue (Personal Income Tax) | 5.000% | 12/15/26 | 10,300 | 12,395 |
| New York State Dormitory Authority Revenue (Personal Income Tax) | 5.000% | 2/15/27 | 20,000 | 24,770 |
| New York State Dormitory Authority Revenue (Personal Income Tax) | 5.000% | 2/15/27 | 10,035 | 12,289 |
| New York State Dormitory Authority Revenue (Personal Income Tax) | 5.000% | 3/15/27 | 15,000 | 18,604 |
| New York State Dormitory Authority Revenue (Personal Income Tax) | 5.000% | 3/15/27 | 30,650 | 35,565 |
| New York State Dormitory Authority Revenue (Personal Income Tax) | 5.000% | 3/15/28 | 11,580 | 14,255 |
| New York State Dormitory Authority Revenue (Personal Income Tax) | 5.000% | 3/15/28 | 2,875 | 3,131 |
| New York State Dormitory Authority Revenue (Personal Income Tax) | 5.000% | 3/15/28 | 20,000 | 21,779 |
| New York State Dormitory Authority Revenue (Personal Income Tax) | 5.000% | 3/15/28 | 25,000 | 28,997 |
| New York State Dormitory Authority Revenue (Personal Income Tax) | 5.000% | 2/15/29 | 10,000 | 12,073 |
| New York State Dormitory Authority Revenue (Personal Income Tax) | 5.000% | 3/15/29 | 25,000 | 28,974 |
| New York State Dormitory Authority Revenue (Personal Income Tax) | 5.000% | 2/15/30 | 18,905 | 22,089 |
| New York State Dormitory Authority Revenue (Personal Income Tax) | 5.000% | 2/15/30 | 10,000 | 12,010 |
| New York State Dormitory Authority Revenue (Personal Income Tax) | 5.000% | 2/15/30 | 1,000 | 1,117 |
| New York State Dormitory Authority Revenue (Personal Income Tax) | 5.000% | 3/15/30 | 32,000 | 36,975 |
| New York State Dormitory Authority Revenue (Personal Income Tax) | 5.000% | 3/15/30 | 20,740 | 24,953 |
| New York State Dormitory Authority Revenue (Personal Income Tax) | 5.000% | 3/15/31 | 17,240 | 20,149 |
| New York State Dormitory Authority Revenue (Personal Income Tax) | 5.000% | 2/15/32 | 7,500 | 8,738 |
| New York State Dormitory Authority Revenue (Personal Income Tax) | 5.000% | 2/15/33 | 1,070 | 1,244 |
| New York State Dormitory Authority Revenue (Personal Income Tax) | 5.000% | 3/15/33 | 10,135 | 11,811 |
| New York State Dormitory Authority Revenue (Personal Income Tax) | 5.000% | 3/15/34 | 36,795 | 44,102 |
| New York State Dormitory Authority Revenue (School Districts Financing Program) | 5.000% | 10/1/19 | 10,000 | 11,132 |
| New York State Dormitory Authority Revenue (School Districts Financing Program) | 5.000% | 10/1/19 (12) | 2,500 | 2,779 |
| New York State Dormitory Authority Revenue (School Districts Financing Program) | 5.000% | 10/1/19 | 3,475 | 3,868 |
| New York State Dormitory Authority Revenue (School Districts Financing Program) | 5.000% | 10/1/20 | 10,000 | 11,470 |
| New York State Dormitory Authority Revenue (School Districts Financing Program) | 5.000% | 10/1/21 (4) | 1,250 | 1,472 |
| New York State Dormitory Authority Revenue (School Districts Financing Program) | 5.000% | 10/1/21 | 750 | 878 |
| New York State Dormitory Authority Revenue (School Districts Financing Program) | 5.000% | 10/1/22 | 16,355 | 19,296 |
| New York State Dormitory Authority Revenue (School Districts Financing Program) | 5.000% | 10/1/22 | 7,000 | 7,981 |
| New York State Dormitory Authority Revenue (School Districts Financing Program) | 5.000% | 10/1/22 | 500 | 602 |
| New York State Dormitory Authority Revenue (School Districts Financing Program) | 5.000% | 10/1/23 | 19,435 | 22,811 |
| New York State Dormitory Authority Revenue (School Districts Financing Program) | 5.000% | 10/1/23 (4) | 1,000 | 1,208 |
| New York State Dormitory Authority Revenue (School Districts Financing Program) | 5.000% | 10/1/23 | 1,250 | 1,499 |
| New York State Dormitory Authority Revenue (School Districts Financing Program) | 5.000% | 10/1/24 | 6,290 | 7,465 |
| New York State Dormitory Authority Revenue (School Districts Financing Program) | 5.000% | 10/1/24 (4) | 1,500 | 1,799 |
| New York State Dormitory Authority Revenue (School Districts Financing Program) | 5.000% | 10/1/24 | 1,000 | 1,191 |
| New York State Dormitory Authority Revenue (School Districts Financing Program) | 5.000% | 10/1/25 | 7,595 | 8,952 |
| New York State Dormitory Authority Revenue (School Districts Financing Program) | 5.000% | 10/1/25 (4) | 1,000 | 1,188 |
| New York State Dormitory Authority Revenue (School Districts Financing Program) | 5.000% | 10/1/25 | 1,000 | 1,182 |
| New York State Dormitory Authority Revenue (School Districts Financing Program) | 5.000% | 10/1/26 | 4,500 | 5,174 |
| New York State Dormitory Authority Revenue (School Districts Financing Program) | 5.000% | 10/1/26 (4) | 1,500 | 1,839 |
| New York State Dormitory Authority Revenue (School Districts Financing Program) | 5.000% | 10/1/26 | 750 | 881 |
| New York State Dormitory Authority Revenue (School Districts Financing Program) | 5.000% | 10/1/27 (4) | 400 | 467 |
| New York State Dormitory Authority Revenue (School Districts Financing Program) | 5.000% | 10/1/27 | 500 | 584 |
| New York State Dormitory Authority Revenue (School Districts Financing Program) | 5.000% | 10/1/28 (4) | 200 | 231 |
| New York State Dormitory Authority Revenue (School Districts Financing Program) | 5.000% | 10/1/28 | 425 | 493 |
| New York State Dormitory Authority Revenue (School Districts Financing Program) | 5.000% | 10/1/29 | 500 | 578 |
| New York State Dormitory Authority Revenue (Service Contract) | 5.000% | 7/1/18 | 11,570 | 12,327 |
| New York State Dormitory Authority Revenue (Service Contract) | 5.000% | 7/1/20 | 6,815 | 7,518 |
189
Intermediate-Term Tax-Exempt Fund
| | | | |
| | | | Face | Market |
| | | Maturity | Amount | Value• |
| | Coupon | Date | ($000) | ($000) |
| New York State Dormitory Authority Revenue (Service Contract) | 5.000% | 7/1/21 | 17,750 | 19,576 |
| New York State Dormitory Authority Revenue (Service Contract) | 5.000% | 7/1/22 | 3,050 | 3,362 |
| New York State Dormitory Authority Revenue (State University Educational Facilities) | 5.000% | 5/15/19 | 3,000 | 3,301 |
| New York State Dormitory Authority Revenue (State University Educational Facilities) | 5.000% | 5/15/22 | 9,200 | 10,987 |
| New York State Dormitory Authority Revenue (State University Educational Facilities) | 5.000% | 5/15/28 | 10,865 | 12,770 |
| New York State Dormitory Authority Revenue (State University Educational Facilities) | 5.000% | 5/15/29 | 3,000 | 3,534 |
| New York State Dormitory Authority Revenue (State University Educational Facilities) | 5.000% | 5/15/30 | 1,000 | 1,179 |
| New York State Dormitory Authority Sales Tax Revenue | 5.000% | 3/15/18 | 4,465 | 4,716 |
| New York State Dormitory Authority Sales Tax Revenue | 5.000% | 3/15/19 | 4,800 | 5,251 |
| New York State Dormitory Authority Sales Tax Revenue | 5.000% | 3/15/20 | 15,275 | 17,254 |
| New York State Dormitory Authority Sales Tax Revenue | 5.000% | 3/15/21 | 16,000 | 18,609 |
| New York State Dormitory Authority Sales Tax Revenue | 5.000% | 3/15/22 | 19,505 | 23,278 |
| New York State Dormitory Authority Sales Tax Revenue | 5.000% | 3/15/22 | 43,155 | 51,503 |
| New York State Dormitory Authority Sales Tax Revenue | 5.000% | 3/15/23 | 2,650 | 3,230 |
| New York State Dormitory Authority Sales Tax Revenue | 5.000% | 3/15/24 | 20,500 | 25,453 |
| New York State Dormitory Authority Sales Tax Revenue | 5.000% | 3/15/25 | 35,000 | 44,158 |
| New York State Dormitory Authority Sales Tax Revenue | 5.000% | 3/15/34 | 27,610 | 33,291 |
| New York State Dormitory Authority Sales Tax Revenue | 5.000% | 3/15/35 | 32,000 | 38,442 |
| New York State Energy Research & Development Authority Pollution Control Revenue | | | | |
| (Consolidated Edison Co. of New York Inc. Project) | 1.365% | 5/1/32 (10) | 21,325 | 19,406 |
| New York State Energy Research & Development Authority Pollution Control Revenue | | | | |
| (Consolidated Edison Co. of New York Inc. Project) | 1.365% | 5/1/32 (10) | 3,050 | 2,776 |
| New York State Energy Research & Development Authority Pollution Control Revenue | | | | |
| (Consolidated Edison Co. of New York Inc. Project) | 1.365% | 5/1/32 (10) | 12,025 | 10,943 |
| New York State Energy Research & Development Authority Pollution Control Revenue | | | | |
| (Niagara Mohawk Corp.) | 1.336% | 7/1/29 (10) | 1,590 | 1,534 |
| New York State Energy Research & Development Authority Pollution Control Revenue | | | | |
| (Niagara Mohawk Corp.) | 1.328% | 3/1/27 (2) | 1,320 | 1,274 |
| New York State Energy Research & Development Authority Pollution Control Revenue | | | | |
| (Niagara Mohawk Corp.) | 1.335% | 12/1/25 (2) | 7,900 | 7,624 |
| New York State Environmental Facilities Corp. Revenue (Personal Income Tax) | 5.250% | 12/15/18 (Prere.) | 7,170 | 7,829 |
| New York State Environmental Facilities Corp. Revenue (Personal Income Tax) | 5.250% | 12/15/18 (Prere.) | 15,795 | 17,247 |
| New York State Environmental Facilities Corp. Revenue (Personal Income Tax) | 5.250% | 12/15/24 | 70 | 76 |
| New York State Environmental Facilities Corp. Revenue (Personal Income Tax) | 5.250% | 12/15/25 | 155 | 169 |
| New York State Environmental Facilities Corp. Revenue | | | | |
| (State Clean Water & Drinking Water Revolving Funds) | 5.000% | 6/15/19 | 4,000 | 4,425 |
| New York State Environmental Facilities Corp. Revenue | | | | |
| (State Clean Water & Drinking Water Revolving Funds) | 5.000% | 6/15/27 | 10,000 | 11,679 |
| New York State Environmental Facilities Corp. Revenue | | | | |
| (State Clean Water & Drinking Water Revolving Funds) | 5.000% | 6/15/27 | 5,000 | 6,113 |
| New York State Environmental Facilities Corp. Revenue | | | | |
| (State Clean Water & Drinking Water Revolving Funds) | 5.000% | 6/15/28 | 11,460 | 13,384 |
| New York State Environmental Facilities Corp. Revenue | | | | |
| (State Clean Water & Drinking Water Revolving Funds) | 5.000% | 6/15/29 | 17,830 | 20,824 |
| New York State Environmental Facilities Corp. Revenue | | | | |
| (State Clean Water & Drinking Water Revolving Funds) | 5.000% | 6/15/30 | 26,230 | 30,521 |
| New York State Environmental Facilities Corp. Revenue | | | | |
| (State Clean Water & Drinking Water Revolving Funds) | 5.000% | 6/15/31 | 3,670 | 4,270 |
| New York State Environmental Facilities Corp. Revenue | | | | |
| (State Clean Water & Drinking Water Revolving Funds) | 5.000% | 6/15/33 | 12,515 | 15,284 |
| New York State Environmental Facilities Corp. Revenue (State Revolving Funds) | 5.000% | 5/15/21 (Prere.) | 5 | 6 |
| New York State Environmental Facilities Corp. Revenue (State Revolving Funds) | 5.000% | 5/15/21 (Prere.) | 5 | 6 |
| New York State Environmental Facilities Corp. Revenue (State Revolving Funds) | 5.000% | 5/15/21 (Prere.) | 5 | 6 |
| New York State Environmental Facilities Corp. Revenue (State Revolving Funds) | 5.000% | 5/15/21 (Prere.) | 5 | 6 |
| New York State Environmental Facilities Corp. Revenue (State Revolving Funds) | 5.000% | 5/15/21 (Prere.) | 10 | 12 |
| New York State Environmental Facilities Corp. Revenue (State Revolving Funds) | 5.000% | 5/15/21 (Prere.) | 5 | 6 |
| New York State Environmental Facilities Corp. Revenue (State Revolving Funds) | 5.000% | 5/15/21 (Prere.) | 5 | 6 |
| New York State Environmental Facilities Corp. Revenue (State Revolving Funds) | 5.000% | 11/15/23 | 3,785 | 4,420 |
| New York State Environmental Facilities Corp. Revenue (State Revolving Funds) | 5.000% | 11/15/24 | 3,470 | 4,051 |
| New York State Environmental Facilities Corp. Revenue (State Revolving Funds) | 5.000% | 11/15/25 | 6,030 | 7,036 |
| New York State Environmental Facilities Corp. Revenue (State Revolving Funds) | 5.000% | 11/15/27 | 3,345 | 3,901 |
| New York State Environmental Facilities Corp. Revenue (State Revolving Funds) | 5.000% | 11/15/28 | 6,150 | 7,167 |
| New York State Environmental Facilities Corp. Revenue (State Revolving Funds) | 5.000% | 11/15/29 | 5,315 | 6,181 |
| New York State Environmental Facilities Corp. Revenue (State Revolving Funds) | 5.000% | 11/15/30 | 1,835 | 2,130 |
| New York State GO | 4.500% | 2/1/17 | 14,125 | 14,265 |
| New York State GO | 4.500% | 2/1/18 | 24,735 | 25,890 |
| New York State GO | 4.500% | 2/1/19 | 10,670 | 11,535 |
| New York State GO | 5.000% | 2/1/30 | 3,000 | 3,353 |
| New York State GO | 5.000% | 2/15/30 | 20,000 | 23,154 |
| New York State Local Government Assistance Corp. Revenue | 5.500% | 4/1/17 (4) | 2,410 | 2,455 |
190
Intermediate-Term Tax-Exempt Fund
| | | | |
| | | | Face | Market |
| | | Maturity | Amount | Value• |
| | Coupon | Date | ($000) | ($000) |
| New York State Local Government Assistance Corp. Revenue | 5.500% | 4/1/17 | 600 | 612 |
| New York State Local Government Assistance Corp. Revenue | 5.000% | 4/1/19 | 6,640 | 7,283 |
| New York State Thruway Authority Revenue | 5.000% | 5/1/19 | 12,270 | 13,466 |
| New York State Thruway Authority Revenue | 5.000% | 1/1/20 (14) | 8,940 | 9,369 |
| New York State Thruway Authority Revenue | 5.000% | 1/1/21 (14) | 8,000 | 8,383 |
| New York State Thruway Authority Revenue | 5.000% | 1/1/22 (14) | 10,000 | 10,477 |
| New York State Thruway Authority Revenue | 5.000% | 1/1/29 | 21,195 | 24,617 |
| New York State Thruway Authority Revenue | 5.000% | 1/1/31 | 7,000 | 8,089 |
| New York State Thruway Authority Revenue | 5.000% | 1/1/34 | 4,000 | 4,732 |
| New York State Thruway Authority Revenue | 5.000% | 1/1/35 | 3,000 | 3,536 |
| New York State Thruway Authority Revenue | 5.000% | 1/1/36 | 4,000 | 4,696 |
| New York State Thruway Authority Revenue (Highway & Bridge Trust Fund) | 5.000% | 4/1/17 (Prere.) | 6,650 | 6,768 |
| New York State Thruway Authority Revenue (Highway & Bridge Trust Fund) | 5.000% | 4/1/17 (Prere.) | 5,650 | 5,751 |
| New York State Thruway Authority Revenue (Highway & Bridge Trust Fund) | 5.000% | 10/1/17 (Prere.) | 11,395 | 11,842 |
| New York State Thruway Authority Revenue (Highway & Bridge Trust Fund) | 5.000% | 4/1/18 | 13,260 | 14,042 |
| New York State Thruway Authority Revenue (Highway & Bridge Trust Fund) | 5.000% | 10/1/18 (Prere.) | 4,745 | 5,116 |
| New York State Thruway Authority Revenue (Highway & Bridge Trust Fund) | 5.000% | 4/1/20 | 9,890 | 11,100 |
| New York State Thruway Authority Revenue (Highway & Bridge Trust Fund) | 5.000% | 4/1/20 | 5,655 | 6,095 |
| New York State Thruway Authority Revenue (Highway & Bridge Trust Fund) | 5.000% | 4/1/23 | 8,515 | 9,342 |
| New York State Thruway Authority Revenue (Highway & Bridge Trust Fund) | 5.000% | 4/1/25 | 4,500 | 4,937 |
| New York State Thruway Authority Revenue (Highway & Bridge Trust Fund) | 5.000% | 4/1/27 | 21,600 | 24,932 |
| New York State Thruway Authority Revenue (Highway & Bridge Trust Fund) | 5.000% | 4/1/27 | 7,000 | 7,680 |
| New York State Thruway Authority Revenue (Highway & Bridge Trust Fund) | 5.000% | 4/1/28 | 13,505 | 15,576 |
| New York State Thruway Authority Revenue (Highway & Bridge Trust Fund) | 5.000% | 4/1/30 | 27,175 | 31,200 |
| New York State Thruway Authority Revenue (Personal Income Tax) | 5.250% | 9/15/17 (Prere.) | 7,115 | 7,397 |
| New York State Thruway Authority Revenue (Personal Income Tax) | 5.000% | 9/15/18 (Prere.) | 19,395 | 20,891 |
| New York State Thruway Authority Revenue (Personal Income Tax) | 5.000% | 3/15/21 | 5,495 | 5,921 |
| New York State Thruway Authority Revenue (Personal Income Tax) | 5.000% | 3/15/29 | 7,000 | 7,619 |
| New York State Thruway Authority Revenue (Second Generation Highway & Bridge Trust Fund) | 5.000% | 4/1/22 | 22,710 | 25,637 |
| New York State Urban Development Corp. Revenue | 5.250% | 1/1/17 | 12,000 | 12,091 |
| New York State Urban Development Corp. Revenue | 5.250% | 1/1/18 | 36,140 | 37,977 |
| New York State Urban Development Corp. Revenue | 5.250% | 1/1/22 | 7,500 | 8,041 |
| New York State Urban Development Corp. Revenue | 4.375% | 3/15/22 | 9,020 | 9,722 |
| New York State Urban Development Corp. Revenue | 5.000% | 12/15/22 | 2,000 | 2,175 |
| New York State Urban Development Corp. Revenue | 5.000% | 12/15/23 | 2,615 | 2,844 |
| New York State Urban Development Corp. Revenue | 5.000% | 1/1/26 | 7,910 | 8,443 |
| New York State Urban Development Corp. Revenue (Personal Income Tax) | 5.000% | 12/15/17 (Prere.) | 4,955 | 5,193 |
| New York State Urban Development Corp. Revenue (Personal Income Tax) | 5.000% | 3/15/18 | 1,775 | 1,875 |
| New York State Urban Development Corp. Revenue (Personal Income Tax) | 5.000% | 3/15/18 | 27,000 | 28,514 |
| New York State Urban Development Corp. Revenue (Personal Income Tax) | 5.000% | 12/15/18 | 20,000 | 21,699 |
| New York State Urban Development Corp. Revenue (Personal Income Tax) | 5.000% | 3/15/19 | 4,185 | 4,577 |
| New York State Urban Development Corp. Revenue (Personal Income Tax) | 5.000% | 12/15/19 | 40,760 | 45,697 |
| New York State Urban Development Corp. Revenue (Personal Income Tax) | 5.000% | 3/15/20 | 10,000 | 11,260 |
| New York State Urban Development Corp. Revenue (Personal Income Tax) | 5.000% | 12/15/20 | 36,240 | 40,603 |
| New York State Urban Development Corp. Revenue (Personal Income Tax) | 5.500% | 3/15/21 (14) | 10,000 | 11,805 |
| New York State Urban Development Corp. Revenue (Personal Income Tax) | 5.000% | 12/15/21 | 18,310 | 20,508 |
| New York State Urban Development Corp. Revenue (Personal Income Tax) | 5.000% | 3/15/22 | 18,695 | 22,151 |
| New York State Urban Development Corp. Revenue (Personal Income Tax) | 5.500% | 3/15/22 (14) | 21,000 | 25,472 |
| New York State Urban Development Corp. Revenue (Personal Income Tax) | 5.000% | 3/15/23 | 11,150 | 13,477 |
| New York State Urban Development Corp. Revenue (Personal Income Tax) | 5.000% | 12/15/23 | 2,225 | 2,327 |
| New York State Urban Development Corp. Revenue (Personal Income Tax) | 5.000% | 3/15/24 | 35,500 | 43,606 |
| New York State Urban Development Corp. Revenue (Personal Income Tax) | 5.000% | 3/15/25 | 52,210 | 65,074 |
| New York State Urban Development Corp. Revenue (Personal Income Tax) | 5.000% | 3/15/26 | 40,000 | 49,434 |
| New York State Urban Development Corp. Revenue (Personal Income Tax) | 5.000% | 3/15/26 | 18,425 | 23,298 |
| New York State Urban Development Corp. Revenue (Personal Income Tax) | 5.000% | 3/15/26 | 18,425 | 21,390 |
| New York State Urban Development Corp. Revenue (Personal Income Tax) | 5.000% | 3/15/28 | 6,950 | 7,568 |
| New York State Urban Development Corp. Revenue (Personal Income Tax) | 5.000% | 3/15/30 | 14,910 | 17,262 |
| New York State Urban Development Corp. Revenue (Personal Income Tax) | 5.000% | 3/15/31 | 28,030 | 33,351 |
| New York State Urban Development Corp. Revenue (Personal Income Tax) | 5.000% | 3/15/31 | 30,000 | 36,439 |
| New York State Urban Development Corp. Revenue (Personal Income Tax) | 5.000% | 3/15/31 | 10,000 | 11,555 |
| New York State Urban Development Corp. Revenue (Personal Income Tax) | 5.000% | 3/15/31 | 16,000 | 19,037 |
| New York State Urban Development Corp. Revenue (Personal Income Tax) | 5.000% | 3/15/33 | 28,000 | 33,149 |
| New York State Urban Development Corp. Revenue (Personal Income Tax) | 5.000% | 3/15/33 | 30,890 | 36,570 |
| New York State Urban Development Corp. Revenue (Personal Income Tax) | 5.000% | 3/15/34 | 30,000 | 35,960 |
| New York State Urban Development Corp. Revenue (Personal Income Tax) | 5.000% | 3/15/35 | 21,620 | 25,839 |
| New York State Urban Development Corp. Revenue (Service Contract) | 5.000% | 1/1/18 | 8,000 | 8,384 |
| New York State Urban Development Corp. Revenue (Service Contract) | 5.000% | 1/1/18 | 24,275 | 25,439 |
| New York State Urban Development Corp. Revenue (Service Contract) | 5.000% | 1/1/19 | 3,625 | 3,936 |
| New York State Urban Development Corp. Revenue (Service Contract) | 5.250% | 1/1/19 (4) | 7,050 | 7,411 |
| New York State Urban Development Corp. Revenue (Service Contract) | 5.000% | 1/1/20 | 8,165 | 9,156 |
191
Intermediate-Term Tax-Exempt Fund
| | | | |
| | | | Face | Market |
| | | Maturity | Amount | Value• |
| | Coupon | Date | ($000) | ($000) |
| New York State Urban Development Corp. Revenue (Service Contract) | 5.000% | 1/1/21 | 11,345 | 12,745 |
| New York State Urban Development Corp. Revenue (Service Contract) | 5.000% | 1/1/22 | 5,120 | 5,746 |
| New York State Urban Development Corp. Revenue (Service Contract) | 5.250% | 1/1/25 | 15,000 | 16,074 |
| Niagara NY Area Development Corp. Revenue (Niagara University Project) | 5.000% | 5/1/17 | 250 | 255 |
| Niagara NY Area Development Corp. Revenue (Niagara University Project) | 5.000% | 5/1/18 | 280 | 294 |
| Niagara NY Area Development Corp. Revenue (Niagara University Project) | 5.000% | 5/1/19 | 350 | 379 |
| Port Authority of New York & New Jersey Revenue | 5.000% | 9/1/27 | 1,250 | 1,543 |
| Port Authority of New York & New Jersey Revenue | 5.250% | 7/15/30 | 18,635 | 21,761 |
| Port Authority of New York & New Jersey Revenue | 5.000% | 10/15/31 | 27,175 | 33,156 |
| Port Authority of New York & New Jersey Revenue | 5.000% | 9/1/33 | 1,000 | 1,196 |
| Port Authority of New York & New Jersey Revenue | 5.000% | 10/15/35 | 7,000 | 8,390 |
| 4 Port Authority of New York & New Jersey Revenue TOB VRDO | 0.670% | 11/7/16 | 1,220 | 1,220 |
| Port Authority of New York & New Jersey Special Obligation Revenue | | | | |
| (John F. Kennedy International Air Terminal LLC) | 6.500% | 12/1/28 | 25,000 | 25,742 |
| Suffolk County NY GO | 5.000% | 5/15/21 (4) | 9,280 | 10,697 |
| Syracuse NY Industrial Development Agency Civic Facility Revenue | | | | |
| (Syracuse University Project) VRDO | 0.595% | 12/1/29 (2) | 4,375 | 3,927 |
| Tobacco Settlement Financing Corp. New York Revenue | 5.000% | 6/1/22 | 1,645 | 1,651 |
| Tobacco Settlement Financing Corp. New York Revenue | 5.000% | 6/1/22 | 5,000 | 5,118 |
| Triborough Bridge & Tunnel Authority New York Revenue | 5.000% | 11/15/16 | 2,000 | 2,003 |
| Triborough Bridge & Tunnel Authority New York Revenue | 5.000% | 5/15/18 (Prere.) | 4,550 | 4,841 |
| Triborough Bridge & Tunnel Authority New York Revenue | 5.000% | 11/15/23 | 11,000 | 13,597 |
| Triborough Bridge & Tunnel Authority New York Revenue | 5.000% | 11/15/24 | 15,000 | 18,838 |
| Triborough Bridge & Tunnel Authority New York Revenue | 5.000% | 11/15/25 | 24,975 | 26,947 |
| Triborough Bridge & Tunnel Authority New York Revenue | 5.000% | 1/1/26 | 15,000 | 17,617 |
| Triborough Bridge & Tunnel Authority New York Revenue | 5.000% | 1/1/28 | 15,000 | 17,576 |
| Triborough Bridge & Tunnel Authority New York Revenue | 5.000% | 11/15/30 | 7,415 | 8,010 |
| Triborough Bridge & Tunnel Authority New York Revenue | 5.000% | 11/15/33 | 14,900 | 18,171 |
| Triborough Bridge & Tunnel Authority New York Revenue | 5.000% | 11/15/34 | 8,350 | 10,143 |
| Triborough Bridge & Tunnel Authority New York Revenue | 5.000% | 11/15/35 | 2,045 | 2,449 |
| Triborough Bridge & Tunnel Authority New York Revenue | 5.000% | 11/15/35 | 3,460 | 4,144 |
| Triborough Bridge & Tunnel Authority New York Revenue | 5.000% | 11/15/35 | 6,065 | 7,339 |
| Triborough Bridge & Tunnel Authority New York Revenue | 5.000% | 11/15/36 | 8,215 | 9,823 |
| United Nations Development Corp. New York Revenue | 5.000% | 7/1/21 | 7,200 | 7,901 |
| Utility Debt Securitization Authority New York Revenue | 5.000% | 12/15/29 | 33,000 | 40,229 |
| Utility Debt Securitization Authority New York Revenue | 5.000% | 12/15/31 | 5,140 | 6,208 |
| Utility Debt Securitization Authority New York Revenue | 5.000% | 12/15/32 | 20,825 | 25,408 |
| Utility Debt Securitization Authority New York Revenue | 5.000% | 12/15/33 | 24,860 | 30,336 |
| Utility Debt Securitization Authority New York Revenue | 5.000% | 12/15/34 | 15,000 | 18,232 |
| Utility Debt Securitization Authority New York Revenue | 5.000% | 12/15/34 | 38,500 | 46,516 |
| Utility Debt Securitization Authority New York Revenue | 5.000% | 12/15/35 | 50,905 | 61,365 |
| Utility Debt Securitization Authority New York Revenue | 5.000% | 12/15/36 | 30,000 | 36,083 |
| Westchester County NY GO | 5.000% | 7/1/21 (ETM) | 240 | 282 |
| Westchester County NY GO | 5.000% | 7/1/21 | 11,740 | 13,799 |
| Westchester County NY GO | 5.000% | 7/1/21 (ETM) | 335 | 394 |
| Westchester County NY Health Care Corp. Revenue | 6.000% | 11/1/20 (Prere.) | 870 | 1,035 |
| Westchester County NY Health Care Corp. Revenue | 5.000% | 11/1/30 | 1,935 | 2,164 |
| Westchester County NY Health Care Corp. Revenue | 6.000% | 11/1/30 | 130 | 148 |
| Westchester County NY Local Development Corp. Revenue (Westchester Medical Center) | 5.000% | 11/1/31 | 2,600 | 2,988 |
| Westchester County NY Local Development Corp. Revenue (Westchester Medical Center) | 5.000% | 11/1/32 | 2,375 | 2,719 |
| Westchester County NY Local Development Corp. Revenue (Westchester Medical Center) | 5.000% | 11/1/33 | 2,965 | 3,384 |
| | | | | 8,185,072 |
| North Carolina (1.3%) | | | | |
| Buncombe County NC Limited Obligation Revenue | 5.000% | 6/1/19 | 2,515 | 2,769 |
| Buncombe County NC Limited Obligation Revenue | 5.000% | 6/1/20 | 5,280 | 5,991 |
| Cabarrus County NC Installment Financing Contract Revenue | 4.000% | 4/1/18 | 650 | 678 |
| Cabarrus County NC Installment Financing Contract Revenue | 5.000% | 4/1/19 | 500 | 547 |
| Cabarrus County NC Installment Financing Contract Revenue | 5.000% | 4/1/20 | 1,810 | 2,045 |
| Cabarrus County NC Installment Financing Contract Revenue | 5.000% | 4/1/21 | 1,310 | 1,521 |
| Cape Fear NC Public Utility Authority Water & Sewer System Revenue | 5.000% | 8/1/18 | 2,400 | 2,572 |
| Cape Fear NC Public Utility Authority Water & Sewer System Revenue | 5.000% | 8/1/20 | 3,350 | 3,828 |
| Cape Fear NC Public Utility Authority Water & Sewer System Revenue | 5.000% | 8/1/25 | 2,500 | 3,155 |
| Cape Fear NC Public Utility Authority Water & Sewer System Revenue | 4.000% | 8/1/26 | 2,765 | 3,290 |
| Cape Fear NC Public Utility Authority Water & Sewer System Revenue | 5.000% | 8/1/28 | 1,800 | 2,261 |
| Cape Fear NC Public Utility Authority Water & Sewer System Revenue | 5.000% | 8/1/29 | 1,750 | 2,181 |
| Charlotte NC GO | 5.000% | 8/1/18 | 4,270 | 4,578 |
| Charlotte NC GO | 5.000% | 12/1/19 | 7,780 | 8,727 |
| Charlotte NC GO | 5.000% | 7/1/22 | 3,280 | 3,948 |
| Charlotte NC GO | 5.000% | 7/1/23 | 3,355 | 4,020 |
192
Intermediate-Term Tax-Exempt Fund
| | | | |
| | | | Face | Market |
| | | Maturity | Amount | Value• |
| | Coupon | Date | ($000) | ($000) |
| Durham Capital Financing Corp. North Carolina Limited Obligation Revenue | 5.000% | 6/1/33 | 3,210 | 3,782 |
| Durham County NC GO | 5.000% | 10/1/22 | 5,020 | 6,086 |
| Durham County NC GO | 5.000% | 10/1/23 | 5,105 | 6,314 |
| Durham County NC GO | 5.000% | 10/1/27 | 8,160 | 10,460 |
| Durham County NC GO | 5.000% | 10/1/28 | 1,945 | 2,466 |
| Greensboro NC GO | 5.000% | 2/1/23 | 2,420 | 2,951 |
| Guilford County NC GO | 5.000% | 2/1/21 | 5,000 | 5,812 |
| Guilford County NC GO | 5.000% | 3/1/22 | 3,220 | 3,848 |
| Mecklenburg County NC COP | 4.750% | 2/1/19 (Prere.) | 2,500 | 2,711 |
| Mecklenburg County NC COP | 5.000% | 2/1/19 (Prere.) | 3,390 | 3,695 |
| Mecklenburg County NC COP | 5.000% | 2/1/19 (Prere.) | 1,200 | 1,308 |
| Mecklenburg County NC COP | 5.000% | 2/1/19 (Prere.) | 1,000 | 1,090 |
| Mecklenburg County NC GO | 5.000% | 2/1/17 | 3,635 | 3,675 |
| Mecklenburg County NC GO | 5.000% | 3/1/17 | 1,000 | 1,015 |
| Mecklenburg County NC GO | 5.000% | 3/1/19 (Prere.) | 3,715 | 4,058 |
| Mecklenburg County NC GO | 5.000% | 2/1/21 | 1,120 | 1,302 |
| New Hanover County NC Hospital Revenue (New Hanover Regional Medical Center Project) | 5.000% | 10/1/27 (4) | 9,900 | 10,904 |
| North Carolina Capital Facilities Financial Solid Waste Disposal Revenue (Duke Energy) | 4.375% | 10/1/31 | 4,250 | 4,640 |
| North Carolina Capital Improvement Revenue | 5.000% | 5/1/17 | 11,115 | 11,355 |
| North Carolina Capital Improvement Revenue | 5.000% | 5/1/19 | 15,500 | 17,027 |
| North Carolina Capital Improvement Revenue | 5.000% | 5/1/20 | 15,385 | 17,442 |
| North Carolina Capital Improvement Revenue | 5.000% | 5/1/21 | 13,495 | 15,722 |
| North Carolina Capital Improvement Revenue | 5.000% | 5/1/27 | 30,510 | 34,208 |
| North Carolina Capital Improvement Revenue | 5.000% | 5/1/29 | 28,585 | 32,071 |
| North Carolina Eastern Municipal Power Agency Power Systems Revenue | 5.000% | 1/1/19 (Prere.) | 22,510 | 24,409 |
| North Carolina Eastern Municipal Power Agency Power Systems Revenue | 5.500% | 1/1/19 (Prere.) | 3,000 | 3,291 |
| North Carolina GAN | 5.000% | 3/1/21 | 2,060 | 2,374 |
| North Carolina GAN | 5.000% | 3/1/24 | 13,000 | 15,894 |
| North Carolina GAN | 5.000% | 3/1/25 | 19,100 | 23,572 |
| North Carolina GAN | 5.000% | 3/1/27 | 5,955 | 7,203 |
| North Carolina GAN | 5.000% | 3/1/29 | 15,000 | 17,884 |
| North Carolina GAN PUT | 4.000% | 3/1/18 | 11,000 | 11,263 |
| North Carolina GO | 5.000% | 3/1/17 (Prere.) | 700 | 710 |
| North Carolina GO | 5.000% | 3/1/17 (Prere.) | 9,300 | 9,432 |
| North Carolina GO | 5.000% | 3/1/17 | 1,925 | 1,953 |
| North Carolina GO | 5.000% | 5/1/18 | 11,900 | 12,641 |
| North Carolina GO | 5.000% | 6/1/19 | 14,515 | 16,021 |
| North Carolina GO | 5.000% | 6/1/19 | 5,000 | 5,519 |
| North Carolina GO | 4.000% | 5/1/23 | 39,470 | 45,844 |
| North Carolina GO | 5.000% | 6/1/24 | 9,260 | 11,608 |
| North Carolina GO | 5.000% | 6/1/25 | 9,640 | 12,272 |
| North Carolina GO | 5.000% | 6/1/26 | 9,875 | 12,742 |
| North Carolina Infrastructure Financial Corp. Capital Improvements COP | 5.000% | 2/1/17 (Prere.) | 10,000 | 10,105 |
| North Carolina Infrastructure Financial Corp. Capital Improvements COP | 5.000% | 2/1/18 (4) | 9,675 | 9,777 |
| North Carolina Medical Care Commission Health Care Facilities Revenue | | | | |
| (Cape Fear Valley Health System) | 5.000% | 10/1/21 | 8,610 | 9,892 |
| North Carolina Medical Care Commission Health Care Facilities Revenue | | | | |
| (Cape Fear Valley Health System) | 5.000% | 10/1/22 | 9,155 | 10,690 |
| North Carolina Medical Care Commission Health Care Facilities Revenue | | | | |
| (Novant Health Obligated Group) | 5.000% | 11/1/30 | 2,435 | 2,704 |
| North Carolina Medical Care Commission Health Care Facilities Revenue (Vidant Health) | 5.000% | 6/1/28 | 1,250 | 1,501 |
| North Carolina Medical Care Commission Health Care Facilities Revenue (Vidant Health) | 5.000% | 6/1/29 | 2,000 | 2,384 |
| North Carolina Medical Care Commission Health Care Facilities Revenue (WakeMed) | 5.000% | 10/1/31 | 12,500 | 14,273 |
| 3 North Carolina Medical Care Commission Health System Revenue (Mission Health System Inc.) | 5.000% | 10/1/28 | 1,050 | 1,263 |
| 3 North Carolina Medical Care Commission Health System Revenue (Mission Health System Inc.) | 5.000% | 10/1/29 | 1,000 | 1,195 |
| 3 North Carolina Medical Care Commission Health System Revenue (Mission Health System Inc.) | 5.000% | 10/1/31 | 1,000 | 1,181 |
| 3 North Carolina Medical Care Commission Health System Revenue (Mission Health System Inc.) | 5.000% | 10/1/32 | 1,800 | 2,113 |
| North Carolina Medical Care Commission Hospital Revenue (North Carolina Baptist Hospital) | 5.000% | 6/1/20 | 1,375 | 1,550 |
| North Carolina Medical Care Commission Hospital Revenue (North Carolina Baptist Hospital) | 5.000% | 6/1/21 | 5,000 | 5,629 |
| North Carolina Medical Care Commission Hospital Revenue (North Carolina Baptist Hospital) | 5.000% | 6/1/22 | 5,000 | 5,623 |
| North Carolina Medical Care Commission Hospital Revenue | | | | |
| (Southeastern Regional Medical Center) | 5.000% | 6/1/23 | 1,825 | 2,108 |
| North Carolina Medical Care Commission Hospital Revenue | | | | |
| (Southeastern Regional Medical Center) | 5.000% | 6/1/25 | 1,035 | 1,180 |
| North Carolina Municipal Power Agency No. 1 Revenue (Catawba Electric) | 5.250% | 1/1/18 (ETM) | 5,000 | 5,257 |
| North Carolina Municipal Power Agency No. 1 Revenue (Catawba Electric) | 5.250% | 1/1/18 (Prere.) | 3,085 | 3,242 |
| North Carolina Municipal Power Agency No. 1 Revenue (Catawba Electric) | 5.250% | 1/1/18 (Prere.) | 2,000 | 2,102 |
| North Carolina Municipal Power Agency No. 1 Revenue (Catawba Electric) | 5.000% | 1/1/19 (Prere.) | 3,205 | 3,475 |
| North Carolina Municipal Power Agency No. 1 Revenue (Catawba Electric) | 5.000% | 1/1/30 | 1,295 | 1,396 |
| North Carolina Revenue | 5.000% | 11/1/19 | 5,000 | 5,585 |
193
Intermediate-Term Tax-Exempt Fund
| | | | |
| | | | Face | Market |
| | | Maturity | Amount | Value• |
| | Coupon | Date | ($000) | ($000) |
| North Carolina State University at Raleigh General Revenue | 5.000% | 10/1/25 | 2,655 | 3,242 |
| University of North Carolina University System Revenue | 5.250% | 10/1/19 (Prere.) | 1,590 | 1,785 |
| University of North Carolina University System Revenue | 5.250% | 10/1/19 (Prere.) | 1,720 | 1,931 |
| 3 Wake County NC GO | 5.000% | 3/1/18 | 3,455 | 3,647 |
| 3 Wake County NC GO | 5.000% | 3/1/19 | 4,500 | 4,924 |
| Wake County NC GO | 5.000% | 2/1/20 | 7,500 | 8,458 |
| 3 Wake County NC GO | 5.000% | 3/1/20 | 9,340 | 10,561 |
| Wake County NC GO | 5.000% | 3/1/21 | 5,125 | 5,971 |
| 3 Wake County NC GO | 5.000% | 3/1/22 | 18,150 | 21,712 |
| 3 Wake County NC GO | 5.000% | 3/1/23 | 18,730 | 22,896 |
| Wake County NC Limited Obligation Revenue | 5.000% | 6/1/19 (Prere.) | 3,000 | 3,306 |
| Wake County NC Limited Obligation Revenue | 5.000% | 12/1/20 | 6,380 | 7,357 |
| Wake County NC Public Improvement GO | 5.000% | 9/1/21 | 2,400 | 2,835 |
| | | | | 693,535 |
| North Dakota (0.0%) | | | | |
| Burleigh County ND Health Care Revenue (St. Alexis Medical Center Project) | 5.000% | 7/1/21 (Prere.) | 1,500 | 1,756 |
| Burleigh County ND Health Care Revenue (St. Alexis Medical Center Project) | 5.000% | 7/1/21 (Prere.) | 1,000 | 1,170 |
| Burleigh County ND Health Care Revenue (St. Alexis Medical Center Project) | 5.000% | 7/1/21 (Prere.) | 1,300 | 1,522 |
| | | | | 4,448 |
| Ohio (2.2%) | | | | |
| Akron OH Bath & Copley Joint Township Hospital District Revenue | | | | |
| (Children’s Hospital Medical Center of Akron) | 5.000% | 11/15/32 | 7,500 | 8,419 |
| Akron OH Income Tax Revenue (Community Learning Centers) | 5.000% | 12/1/27 | 5,830 | 6,896 |
| Allen County OH Hospital Facilities Revenue (Catholic Healthcare Partners) | 5.000% | 9/1/17 | 14,645 | 15,127 |
| Allen County OH Hospital Facilities Revenue (Catholic Healthcare Partners) | 5.250% | 9/1/27 | 30,000 | 34,035 |
| 4 Allen County OH Hospital Facilities Revenue (Catholic Healthcare Partners) TOB VRDO | 0.720% | 11/7/16 | 5,160 | 5,160 |
| American Municipal Power Ohio Inc. Revenue | 5.000% | 2/15/17 (ETM) | 3,885 | 3,933 |
| American Municipal Power Ohio Inc. Revenue | 5.000% | 2/15/17 | 2,885 | 2,920 |
| American Municipal Power Ohio Inc. Revenue | 5.250% | 2/15/18 (Prere.) | 1,500 | 1,584 |
| American Municipal Power Ohio Inc. Revenue | 5.250% | 2/15/18 (Prere.) | 16,520 | 17,451 |
| American Municipal Power Ohio Inc. Revenue | 5.000% | 2/15/24 | 11,430 | 12,714 |
| American Municipal Power Ohio Inc. Revenue | 5.000% | 2/15/25 | 10,000 | 11,106 |
| American Municipal Power Ohio Inc. Revenue | 5.250% | 2/15/28 | 1,035 | 1,086 |
| American Municipal Power Ohio Inc. Revenue (Fremont Energy Center Project) | 5.000% | 2/15/23 | 2,375 | 2,795 |
| American Municipal Power Ohio Inc. Revenue (Fremont Energy Center Project) | 5.250% | 2/15/29 | 6,120 | 7,199 |
| American Municipal Power Ohio Inc. Revenue (Fremont Energy Center Project) | 5.000% | 2/15/31 | 9,145 | 10,520 |
| American Municipal Power Ohio Inc. Revenue (Fremont Energy Center Project) | 5.000% | 2/15/32 | 13,480 | 15,456 |
| American Municipal Power Ohio Inc. Revenue (Hydroelectric Projects) | 5.250% | 2/15/18 | 16,000 | 16,876 |
| American Municipal Power Ohio Inc. Revenue (Hydroelectric Projects) | 5.250% | 2/15/19 | 13,050 | 14,271 |
| American Municipal Power Ohio Inc. Revenue (Hydroelectric Projects) | 5.000% | 2/15/20 | 10,310 | 11,570 |
| American Municipal Power Ohio Inc. Revenue (Hydroelectric Projects) | 4.000% | 2/15/30 | 1,825 | 1,995 |
| American Municipal Power Ohio Inc. Revenue (Hydroelectric Projects) | 4.000% | 2/15/31 | 1,565 | 1,699 |
| American Municipal Power Ohio Inc. Revenue (Hydroelectric Projects) | 4.000% | 2/15/32 | 1,850 | 1,997 |
| American Municipal Power Ohio Inc. Revenue (Prairie State Energy Campus Project) | 5.250% | 2/15/18 (Prere.) | 2,100 | 2,218 |
| American Municipal Power Ohio Inc. Revenue (Prairie State Energy Campus Project) | 5.000% | 2/15/19 (Prere.) | 5,000 | 5,448 |
| American Municipal Power Ohio Inc. Revenue (Prairie State Energy Campus Project) PUT | 5.000% | 8/15/19 | 7,000 | 7,607 |
| Cincinnati OH City School District GO | 5.250% | 12/1/20 (14) | 7,000 | 8,118 |
| Cincinnati OH City School District GO | 5.250% | 6/1/21 | 3,810 | 4,340 |
| Cincinnati OH City School District GO | 5.250% | 12/1/21 (14) | 5,710 | 6,801 |
| Cincinnati OH City School District GO | 5.250% | 6/1/22 | 3,180 | 3,613 |
| Cincinnati OH City School District GO | 5.250% | 12/1/22 (14) | 10,000 | 12,189 |
| Cleveland OH Airport System Revenue | 5.000% | 1/1/23 (4) | 1,510 | 1,784 |
| Cleveland OH Airport System Revenue | 5.000% | 1/1/24 (4) | 1,075 | 1,288 |
| Cleveland OH GO | 5.000% | 12/1/18 | 1,000 | 1,082 |
| Cleveland OH GO | 5.000% | 12/1/19 | 1,780 | 1,988 |
| Cleveland OH Income Tax Revenue | 5.000% | 10/1/28 | 5,005 | 6,039 |
| Cleveland OH Income Tax Revenue | 5.000% | 10/1/29 | 4,800 | 5,760 |
| Cleveland OH Income Tax Revenue | 5.000% | 10/1/30 | 10,020 | 11,953 |
| Cleveland OH Municipal School District GO | 5.000% | 12/1/26 | 1,660 | 1,979 |
| Cleveland OH Municipal School District GO | 5.000% | 12/1/27 | 1,000 | 1,187 |
| Cleveland OH Public Power System Revenue | 5.000% | 11/15/16 (Prere.) | 3,780 | 3,786 |
| Cleveland OH Public Power System Revenue | 5.000% | 11/15/16 (Prere.) | 2,365 | 2,369 |
| Cleveland OH Public Power System Revenue | 5.000% | 11/15/16 (Prere.) | 3,900 | 3,907 |
| Cleveland OH Public Power System Revenue | 5.000% | 11/15/16 (Prere.) | 7,300 | 7,312 |
| Cleveland OH Public Power System Revenue | 5.000% | 11/15/16 (Prere.) | 3,875 | 3,881 |
| Cleveland OH Public Power System Revenue | 5.000% | 11/15/20 (14) | 2,135 | 2,143 |
| Cleveland OH Public Power System Revenue | 5.000% | 11/15/21 (14) | 3,555 | 3,568 |
| Cleveland OH Public Power System Revenue | 5.000% | 11/15/22 (14) | 6,765 | 6,789 |
| Cleveland OH Public Power System Revenue | 5.000% | 11/15/23 (14) | 3,630 | 3,643 |
194
Intermediate-Term Tax-Exempt Fund
| | | | |
| | | | Face | Market |
| | | Maturity | Amount | Value• |
| | Coupon | Date | ($000) | ($000) |
| Cleveland OH Public Power System Revenue | 5.000% | 11/15/24 (14) | 3,570 | 3,583 |
| Cleveland OH Water Revenue | 5.000% | 1/1/23 | 2,400 | 2,825 |
| Cleveland OH Water Revenue | 5.000% | 1/1/25 | 2,500 | 2,928 |
| Cleveland OH Water Revenue | 5.000% | 1/1/26 | 2,250 | 2,622 |
| Cleveland State University Ohio General Receipts Revenue | 5.000% | 6/1/29 | 5,000 | 5,721 |
| Cleveland State University Ohio General Receipts Revenue | 5.000% | 6/1/30 | 5,225 | 6,015 |
| Cleveland State University Ohio General Receipts Revenue | 5.000% | 6/1/31 | 8,640 | 9,947 |
| Cleveland State University Ohio General Receipts Revenue | 5.000% | 6/1/32 | 9,060 | 10,369 |
| Cleveland-Cuyahoga County OH Port Authority Revenue | | | | |
| (Euclid Avenue Development Corp. Project) | 5.000% | 8/1/31 | 3,175 | 3,667 |
| Cleveland-Cuyahoga County OH Port Authority Revenue | | | | |
| (Euclid Avenue Development Corp. Project) | 5.000% | 8/1/32 | 3,340 | 3,841 |
| Columbus OH City School District GO | 4.000% | 12/1/17 | 1,000 | 1,033 |
| Columbus OH City School District GO | 0.000% | 12/1/27 (4) | 14,060 | 10,555 |
| Columbus OH City School District GO | 0.000% | 12/1/29 (4) | 11,170 | 7,778 |
| Columbus OH City School District School Facilities Construction & Improvement GO | 5.000% | 12/1/16 (4) | 6,000 | 6,021 |
| Columbus OH City School District School Facilities Construction & Improvement GO | 4.000% | 12/1/19 | 2,000 | 2,143 |
| Columbus OH GO | 5.000% | 2/15/21 | 7,190 | 8,360 |
| Columbus OH GO | 5.000% | 2/15/22 | 3,000 | 3,572 |
| Columbus OH GO | 5.000% | 7/1/24 | 5,655 | 7,076 |
| Columbus OH GO | 5.000% | 8/15/24 | 10,295 | 12,910 |
| Columbus OH GO | 5.000% | 7/1/25 | 15,095 | 19,142 |
| Columbus OH GO | 5.000% | 7/1/26 | 19,795 | 25,433 |
| 3 Columbus OH GO | 5.000% | 2/15/28 | 7,435 | 9,474 |
| Columbus OH Metropolitan Library Special Obligation Revenue | 5.000% | 12/1/20 (Prere.) | 1,325 | 1,530 |
| Columbus OH Sewer Revenue | 5.000% | 6/1/29 | 12,000 | 14,928 |
| Columbus OH Sewer Revenue | 5.000% | 6/1/30 | 10,250 | 12,618 |
| Columbus OH Sewer Revenue | 5.000% | 6/1/32 | 3,400 | 4,153 |
| Cuyahoga County OH Economic Development Revenue (Med Mart/Convention Center Project) | 5.000% | 12/1/20 | 7,000 | 8,022 |
| Cuyahoga County OH Economic Development Revenue (Med Mart/Convention Center Project) | 5.000% | 12/1/21 | 7,300 | 8,328 |
| Cuyahoga County OH Excise Tax Revenue (Sports Facilities Improvement Project) | 5.000% | 12/1/26 | 1,500 | 1,796 |
| Cuyahoga County OH GO | 5.000% | 12/1/19 | 2,120 | 2,374 |
| Cuyahoga County OH Sales Tax Revenue | 5.000% | 12/1/26 | 1,500 | 1,848 |
| Cuyahoga County OH Sales Tax Revenue | 5.000% | 12/1/28 | 2,000 | 2,435 |
| Cuyahoga County OH Sales Tax Revenue | 5.000% | 12/1/29 | 3,715 | 4,492 |
| Cuyahoga OH Community College District Revenue | 5.000% | 2/1/20 (Prere.) | 2,500 | 2,811 |
| Cuyahoga OH Community College District Revenue | 5.000% | 2/1/20 (Prere.) | 3,470 | 3,902 |
| Cuyahoga OH Community College District Revenue | 5.000% | 2/1/20 (Prere.) | 6,610 | 7,432 |
| Dayton OH City School District GO | 5.000% | 11/1/21 | 9,210 | 10,817 |
| Dayton OH City School District GO | 5.000% | 11/1/22 | 5,500 | 6,598 |
| Fairfield County OH Hospital Facilities Revenue (Fairfield Medical Center) | 5.125% | 6/15/33 | 11,000 | 12,171 |
| Franklin County OH Convention Facilities Authority Revenue | 5.000% | 12/1/20 | 6,000 | 6,875 |
| Franklin County OH Convention Facilities Authority Revenue | 5.000% | 12/1/28 | 7,000 | 8,510 |
| Franklin County OH Convention Facilities Authority Revenue | 5.000% | 12/1/29 | 5,000 | 6,037 |
| Franklin County OH Convention Facilities Authority Revenue | 5.000% | 12/1/30 | 8,640 | 10,415 |
| Franklin County OH Convention Facilities Authority Revenue | 5.000% | 12/1/31 | 10,000 | 11,997 |
| Franklin County OH Convention Facilities Authority Revenue | 5.000% | 12/1/32 | 10,000 | 11,940 |
| Franklin County OH Convention Facilities Authority Revenue | 5.000% | 12/1/33 | 10,000 | 11,892 |
| 4 Franklin County OH Hospital Facilities Revenue (OhioHealth Corp.) TOB VRDO | 0.750% | 11/7/16 | 4,500 | 4,500 |
| Hamilton County OH Healthcare Revenue (Life Enriching Communities) | 5.000% | 1/1/25 | 1,125 | 1,305 |
| Hamilton County OH Healthcare Revenue (Life Enriching Communities) | 5.000% | 1/1/26 | 700 | 811 |
| Hamilton County OH Healthcare Revenue (Life Enriching Communities) | 5.000% | 1/1/31 | 1,500 | 1,674 |
| Hamilton County OH Sales Tax Revenue | 5.000% | 12/1/18 (2) | 7,950 | 7,978 |
| Hamilton County OH Sales Tax Revenue | 5.000% | 12/1/19 (2) | 22,380 | 22,458 |
| Hamilton County OH Sales Tax Revenue | 5.000% | 12/1/23 (2) | 18,515 | 18,580 |
| Hamilton County OH Sales Tax Revenue | 5.000% | 12/1/23 | 3,250 | 3,974 |
| Hamilton County OH Sales Tax Revenue | 5.000% | 12/1/24 | 3,300 | 4,085 |
| Hamilton County OH Sales Tax Revenue | 5.000% | 12/1/25 | 3,000 | 3,736 |
| Hamilton County OH Sales Tax Revenue | 5.000% | 12/1/26 | 3,000 | 3,761 |
| Hamilton County OH Sales Tax Revenue | 4.000% | 12/1/31 | 1,500 | 1,657 |
| Huber Heights OH City School District GO | 4.750% | 12/1/19 (Prere.) | 890 | 991 |
| Huber Heights OH City School District GO | 4.875% | 12/1/19 (Prere.) | 150 | 168 |
| Huber Heights OH City School District GO | 5.000% | 12/1/19 (Prere.) | 1,000 | 1,121 |
| Huber Heights OH City School District GO | 5.000% | 12/1/19 (Prere.) | 1,000 | 1,121 |
| Kent State University Ohio Revenue | 5.000% | 5/1/29 | 1,000 | 1,146 |
| Kent State University Ohio Revenue | 5.000% | 5/1/30 | 1,750 | 2,004 |
| Kent State University Ohio Revenue | 5.000% | 5/1/31 | 4,000 | 4,566 |
| Lake County OH Hospital Facilities Revenue (Lake Hospital System Inc.) | 5.000% | 8/15/25 | 2,675 | 3,240 |
| Lake County OH Hospital Facilities Revenue (Lake Hospital System Inc.) | 5.000% | 8/15/26 | 1,170 | 1,406 |
| Lake County OH Hospital Facilities Revenue (Lake Hospital System Inc.) | 5.000% | 8/15/28 | 2,255 | 2,664 |
195
Intermediate-Term Tax-Exempt Fund
| | | | |
| | | | Face | Market |
| | | Maturity | Amount | Value• |
| | Coupon | Date | ($000) | ($000) |
| Lake County OH Hospital Facilities Revenue (Lake Hospital System Inc.) | 5.000% | 8/15/29 | 1,745 | 2,042 |
| Lorain County OH Hospital Facilities Revenue (Catholic Healthcare Partners) | 5.000% | 4/1/17 (4) | 6,600 | 6,712 |
| Lorain County OH Hospital Facilities Revenue (Catholic Healthcare Partners) | 5.000% | 4/1/17 (4) | 6,600 | 6,712 |
| Lorain County OH Hospital Facilities Revenue (Catholic Healthcare Partners) | 5.000% | 4/1/18 (4) | 7,300 | 7,682 |
| Lorain County OH Hospital Facilities Revenue (Catholic Healthcare Partners) | 5.000% | 4/1/18 (4) | 7,300 | 7,682 |
| Lucas County OH Hospital Revenue (ProMedica Healthcare Obligated Group) | 5.000% | 11/15/26 | 11,920 | 13,737 |
| Lucas County OH Hospital Revenue (ProMedica Healthcare Obligated Group) | 5.750% | 11/15/31 | 6,000 | 7,111 |
| Miami University of Ohio General Receipts Revenue | 5.000% | 9/1/31 | 2,000 | 2,308 |
| Ohio Building Authority Revenue (Administration Building Fund) | 5.000% | 4/1/19 (Prere.) | 1,975 | 2,164 |
| Ohio Building Authority Revenue (Administration Building Fund) | 5.000% | 10/1/19 | 5,000 | 5,568 |
| Ohio Building Authority Revenue (Adult Correctional Building) | 5.250% | 4/1/17 | 5,565 | 5,671 |
| Ohio Building Authority Revenue (Adult Correctional Building) | 5.125% | 4/1/30 | 1,475 | 1,688 |
| Ohio Capital Facilities Lease-Appropriation Revenue | | | | |
| (Mental Health Facilities Improvement Fund Projects) | 5.000% | 2/1/23 | 2,075 | 2,496 |
| Ohio Common Schools GO | 5.000% | 9/15/19 | 9,655 | 10,739 |
| Ohio Common Schools GO | 5.000% | 6/15/20 | 7,730 | 8,810 |
| Ohio GO | 5.000% | 9/15/19 | 9,025 | 10,052 |
| Ohio GO | 5.000% | 4/1/21 | 4,440 | 5,142 |
| Ohio GO | 5.000% | 9/15/24 | 12,500 | 15,609 |
| Ohio Higher Educational Facility Commission Revenue | | | | |
| (Cleveland Clinic Health System Obligated Group) | 5.000% | 1/1/29 | 4,500 | 5,210 |
| Ohio Higher Educational Facility Commission Revenue | | | | |
| (Cleveland Clinic Health System Obligated Group) VRDO | 0.470% | 11/1/16 | 4,635 | 4,635 |
| Ohio Higher Educational Facility Commission Revenue (Denison University Project) | 5.000% | 11/1/17 (Prere.) | 980 | 1,022 |
| Ohio Higher Educational Facility Commission Revenue (Denison University Project) | 5.000% | 11/1/17 (Prere.) | 1,880 | 1,960 |
| Ohio Higher Educational Facility Commission Revenue (Denison University Project) | 5.000% | 11/1/26 | 3,020 | 3,141 |
| Ohio Higher Educational Facility Commission Revenue (Oberlin College Project) | 5.000% | 10/1/19 | 24,015 | 26,725 |
| Ohio Higher Educational Facility Commission Revenue (University of Dayton Project) | 5.000% | 12/1/16 (Prere.) | 2,500 | 2,509 |
| Ohio Highway Capital Improvements GO | 5.000% | 5/1/19 | 5,000 | 5,504 |
| Ohio Highway Capital Improvements GO | 5.000% | 5/1/27 | 10,220 | 12,076 |
| Ohio Hospital Revenue (Cleveland Clinic Health System Obligated Group) | 5.000% | 1/1/27 | 9,330 | 10,084 |
| Ohio Hospital Revenue (Cleveland Clinic Health System Obligated Group) | 5.125% | 1/1/28 | 11,670 | 12,636 |
| Ohio Housing Finance Agency Residential Mortgage Revenue | 6.125% | 9/1/28 | 1,130 | 1,175 |
| Ohio Major New State Infrastructure Project Revenue | 5.500% | 6/15/18 (Prere.) | 4,000 | 4,299 |
| Ohio Major New State Infrastructure Project Revenue | 5.000% | 12/15/22 | 5,235 | 6,307 |
| Ohio Major New State Infrastructure Project Revenue | 5.000% | 12/15/23 | 3,250 | 3,869 |
| Ohio Major New State Infrastructure Project Revenue | 5.000% | 12/15/23 | 4,000 | 4,901 |
| Ohio Major New State Infrastructure Project Revenue | 5.000% | 12/15/24 | 4,000 | 4,958 |
| Ohio Parks & Recreation Capital Facilities Revenue | 5.000% | 2/1/27 | 3,150 | 3,829 |
| Ohio Parks & Recreation Capital Facilities Revenue | 5.000% | 2/1/28 | 3,310 | 4,000 |
| Ohio Parks & Recreation Capital Facilities Revenue | 5.000% | 2/1/29 | 3,475 | 4,163 |
| Ohio State University General Receipts Revenue | 5.000% | 12/1/18 (Prere.) | 250 | 271 |
| Ohio State University General Receipts Revenue | 5.000% | 12/1/19 (Prere.) | 215 | 241 |
| Ohio State University General Receipts Revenue | 5.000% | 12/1/20 | 3,535 | 3,950 |
| Ohio State University General Receipts Revenue | 5.000% | 12/1/26 | 2,250 | 2,438 |
| Ohio Turnpike Commission Turnpike Revenue | 5.500% | 2/15/20 (14) | 9,000 | 10,271 |
| Ohio Turnpike Commission Turnpike Revenue | 5.000% | 2/15/22 | 1,750 | 1,966 |
| Ohio Turnpike Commission Turnpike Revenue | 5.000% | 2/15/28 | 2,000 | 2,371 |
| Ohio Turnpike Commission Turnpike Revenue | 5.250% | 2/15/29 | 3,000 | 3,584 |
| Ohio Turnpike Commission Turnpike Revenue | 5.000% | 2/15/31 | 7,195 | 7,989 |
| Ohio Water Development Authority Drinking Water Assistance Fund Revenue | 5.000% | 6/1/18 (Prere.) | 3,585 | 3,819 |
| Ohio Water Development Authority Drinking Water Assistance Fund Revenue | 5.250% | 12/1/19 | 5,775 | 6,529 |
| Ohio Water Development Authority Drinking Water Assistance Fund Revenue | 5.250% | 12/1/20 | 5,570 | 6,496 |
| Ohio Water Development Authority Fresh Water Revenue | 5.000% | 12/1/18 | 3,000 | 3,255 |
| 4 Ohio Water Development Authority Fresh Water Revenue TOB VRDO | 0.730% | 11/7/16 | 5,870 | 5,870 |
| Ohio Water Development Authority Pollution Control Revenue (Water Quality) | 5.000% | 6/1/24 | 3,325 | 4,139 |
| Ohio Water Development Authority Water Pollution Control Loan Fund Revenue | 5.250% | 6/1/18 | 5,635 | 6,027 |
| Ohio Water Development Authority Water Pollution Control Loan Fund Revenue | 5.000% | 12/1/19 | 5,000 | 5,615 |
| Ohio Water Development Authority Water Pollution Control Loan Fund Revenue | 5.000% | 6/1/21 | 9,160 | 10,741 |
| Penta Career Center Ohio COP | 5.250% | 4/1/23 | 2,480 | 2,901 |
| Scioto County OH Hospital Facilities Revenue (Southern Ohio Medical Center) | 5.000% | 2/15/17 (ETM) | 3,350 | 3,391 |
| Scioto County OH Hospital Facilities Revenue (Southern Ohio Medical Center) | 5.000% | 2/15/18 (ETM) | 3,520 | 3,708 |
| Scioto County OH Hospital Facilities Revenue (Southern Ohio Medical Center) | 5.000% | 2/15/18 (Prere.) | 3,195 | 3,365 |
| Scioto County OH Hospital Facilities Revenue (Southern Ohio Medical Center) | 5.000% | 2/15/18 (Prere.) | 3,680 | 3,876 |
| Scioto County OH Hospital Facilities Revenue (Southern Ohio Medical Center) | 5.500% | 2/15/18 (Prere.) | 17,000 | 18,014 |
| University of Akron Ohio General Receipts Revenue | 5.000% | 1/1/23 (4) | 8,010 | 8,926 |
| University of Akron Ohio General Receipts Revenue | 5.000% | 1/1/24 (4) | 3,335 | 3,714 |
| University of Akron Ohio General Receipts Revenue | 5.000% | 1/1/25 (4) | 2,500 | 2,783 |
| University of Akron Ohio General Receipts Revenue | 5.000% | 1/1/26 (4) | 2,000 | 2,224 |
| University of Akron Ohio General Receipts Revenue | 5.000% | 1/1/27 (4) | 2,000 | 2,222 |
196
Intermediate-Term Tax-Exempt Fund
| | | | |
| | | | Face | Market |
| | | Maturity | Amount | Value• |
| | Coupon | Date | ($000) | ($000) |
| University of Akron Ohio General Receipts Revenue | 5.000% | 1/1/28 (4) | 2,500 | 2,776 |
| University of Akron Ohio General Receipts Revenue | 5.000% | 1/1/31 | 2,175 | 2,527 |
| University of Cincinnati Ohio General Receipts Revenue | 5.000% | 6/1/22 | 2,455 | 2,930 |
| University of Cincinnati Ohio General Receipts Revenue | 5.000% | 6/1/29 | 6,385 | 7,493 |
| University of Cincinnati Ohio General Receipts Revenue | 5.000% | 6/1/30 | 1,000 | 1,165 |
| | | | | 1,159,998 |
| Oklahoma (0.3%) | | | | |
| 3 Grand River Dam Authority Oklahoma Revenue | 5.000% | 6/1/20 | 4,000 | 4,527 |
| 3 Grand River Dam Authority Oklahoma Revenue | 5.000% | 6/1/28 | 7,500 | 9,256 |
| Norman OK Regional Hospital Authority Revenue | 0.719% | 9/1/22 (14) | 10,350 | 9,664 |
| 3 Norman OK Regional Hospital Authority Revenue | 5.000% | 9/1/17 | 1,055 | 1,062 |
| 3 Norman OK Regional Hospital Authority Revenue | 5.000% | 9/1/18 | 755 | 781 |
| 3 Norman OK Regional Hospital Authority Revenue | 5.000% | 9/1/19 | 795 | 842 |
| 3 Norman OK Regional Hospital Authority Revenue | 5.000% | 9/1/20 | 835 | 902 |
| 3 Norman OK Regional Hospital Authority Revenue | 5.000% | 9/1/21 | 880 | 967 |
| 3 Norman OK Regional Hospital Authority Revenue | 5.000% | 9/1/22 | 925 | 1,030 |
| 3 Norman OK Regional Hospital Authority Revenue | 5.000% | 9/1/23 | 970 | 1,089 |
| 3 Norman OK Regional Hospital Authority Revenue | 5.000% | 9/1/24 | 1,020 | 1,151 |
| 3 Norman OK Regional Hospital Authority Revenue | 5.000% | 9/1/24 | 5,000 | 5,939 |
| 3 Norman OK Regional Hospital Authority Revenue | 5.000% | 9/1/25 | 3,500 | 4,159 |
| 3 Norman OK Regional Hospital Authority Revenue | 5.000% | 9/1/25 | 1,075 | 1,212 |
| 3 Norman OK Regional Hospital Authority Revenue | 5.000% | 9/1/26 | 3,555 | 4,233 |
| 3 Norman OK Regional Hospital Authority Revenue | 5.000% | 9/1/26 | 1,130 | 1,274 |
| 3 Norman OK Regional Hospital Authority Revenue | 5.000% | 9/1/27 | 1,185 | 1,334 |
| 3 Norman OK Regional Hospital Authority Revenue | 5.000% | 9/1/27 | 2,100 | 2,481 |
| 3 Norman OK Regional Hospital Authority Revenue | 5.000% | 9/1/28 | 2,000 | 2,342 |
| 3 Norman OK Regional Hospital Authority Revenue | 5.000% | 9/1/29 | 1,310 | 1,452 |
| 3 Norman OK Regional Hospital Authority Revenue | 5.000% | 9/1/30 | 1,380 | 1,521 |
| 3 Norman OK Regional Hospital Authority Revenue | 5.000% | 9/1/31 | 1,450 | 1,589 |
| Oklahoma Capitol Improvement Authority Facilities Revenue | 5.000% | 7/1/23 | 2,500 | 3,035 |
| Oklahoma Capitol Improvement Authority Facilities Revenue | 5.000% | 7/1/24 | 1,500 | 1,848 |
| Oklahoma Capitol Improvement Authority Facilities Revenue | 5.000% | 7/1/25 | 3,000 | 3,675 |
| Oklahoma Capitol Improvement Authority Facilities Revenue | 5.000% | 7/1/26 | 2,500 | 3,055 |
| Oklahoma Capitol Improvement Authority Facilities Revenue | 5.000% | 7/1/27 | 3,000 | 3,634 |
| Oklahoma Capitol Improvement Authority Facilities Revenue | 5.000% | 7/1/28 | 2,000 | 2,413 |
| Oklahoma Capitol Improvement Authority Facilities Revenue | 5.000% | 7/1/29 | 2,500 | 2,997 |
| Oklahoma Capitol Improvement Authority Facilities Revenue | 5.000% | 7/1/30 | 2,500 | 2,982 |
| Oklahoma City OK GO | 5.000% | 3/1/17 | 7,335 | 7,442 |
| Oklahoma City OK Water Utilities Trust Water & Sewer Revenue | 5.000% | 7/1/23 | 1,500 | 1,841 |
| Oklahoma City OK Water Utilities Trust Water & Sewer Revenue | 5.000% | 7/1/31 | 4,255 | 5,086 |
| Oklahoma City OK Water Utilities Trust Water & Sewer Revenue | 5.000% | 7/1/32 | 5,000 | 5,963 |
| Oklahoma Development Finance Authority Health System Revenue | | | | |
| (Integris Health Obligated Group) | 5.000% | 8/15/18 (Prere.) | 12,100 | 12,979 |
| Oklahoma Development Finance Authority Health System Revenue | | | | |
| (Integris Health Obligated Group) | 5.000% | 8/15/25 | 2,000 | 2,485 |
| Oklahoma Development Finance Authority Health System Revenue | | | | |
| (Integris Health Obligated Group) | 5.000% | 8/15/26 | 1,000 | 1,233 |
| Oklahoma Development Finance Authority Health System Revenue | | | | |
| (Integris Health Obligated Group) | 5.000% | 8/15/27 | 1,750 | 2,141 |
| Oklahoma Development Finance Authority Health System Revenue | | | | |
| (Integris Health Obligated Group) | 5.000% | 8/15/28 | 1,750 | 2,124 |
| Oklahoma Development Finance Authority Health System Revenue | | | | |
| (Integris Health Obligated Group) | 5.000% | 8/15/29 | 1,750 | 2,111 |
| Oklahoma Municipal Power Authority Power Supply System Revenue | 5.875% | 1/1/18 (Prere.) | 1,045 | 1,106 |
| Oklahoma Municipal Power Authority Power Supply System Revenue | 5.000% | 1/1/29 | 350 | 421 |
| Oklahoma Municipal Power Authority Power Supply System Revenue | 5.000% | 1/1/32 | 3,770 | 4,447 |
| Oklahoma Municipal Power Authority Power Supply System Revenue | 5.000% | 1/1/33 | 6,055 | 7,113 |
| Oklahoma Municipal Power Authority Power Supply System Revenue | 5.000% | 1/1/33 | 1,500 | 1,764 |
| Oklahoma Turnpike Authority Revenue | 5.000% | 1/1/17 | 7,000 | 7,051 |
| Oklahoma Turnpike Authority Revenue | 5.000% | 1/1/27 | 1,160 | 1,331 |
| Tulsa County OK Industrial Authority Educational Facilities Lease Revenue | 5.000% | 9/1/24 | 3,500 | 4,274 |
| Tulsa County OK Industrial Authority Educational Facilities Lease Revenue | 5.000% | 9/1/25 | 6,175 | 7,627 |
| University of Oklahoma Revenue | 5.000% | 7/1/29 | 1,895 | 2,192 |
| University of Oklahoma Revenue | 5.000% | 7/1/30 | 2,230 | 2,559 |
| University of Oklahoma Revenue | 5.000% | 7/1/31 | 2,000 | 2,295 |
| University of Oklahoma Revenue | 5.000% | 7/1/32 | 670 | 769 |
| | | | | 168,800 |
197
Intermediate-Term Tax-Exempt Fund
| | | | |
| | | | Face | Market |
| | | Maturity | Amount | Value• |
| | Coupon | Date | ($000) | ($000) |
| Oregon (0.8%) | | | | |
| Eugene OR Electric Utility System Revenue | 5.000% | 8/1/25 | 1,440 | 1,817 |
| Forest Grove OR Campus Improvement Revenue (Pacific University Project) | 5.000% | 5/1/30 | 550 | 642 |
| Forest Grove OR Campus Improvement Revenue (Pacific University Project) | 5.000% | 5/1/36 | 2,500 | 2,853 |
| Multnomah County OR School District GO | 5.000% | 6/15/19 | 18,000 | 19,870 |
| Multnomah County OR School District GO | 5.000% | 6/15/20 | 21,515 | 24,506 |
| Multnomah County OR School District GO | 5.000% | 6/15/21 | 36,255 | 42,454 |
| Oregon Department of Administrative Services COP | 5.000% | 5/1/19 (Prere.) | 3,130 | 3,436 |
| Oregon Department of Administrative Services COP | 5.000% | 5/1/19 (Prere.) | 1,750 | 1,921 |
| Oregon Department of Administrative Services COP | 5.000% | 5/1/19 (Prere.) | 2,220 | 2,437 |
| Oregon Department of Administrative Services COP | 5.000% | 5/1/19 (Prere.) | 3,520 | 3,864 |
| Oregon Department of Administrative Services COP | 5.000% | 11/1/19 | 2,000 | 2,231 |
| Oregon Department of Administrative Services COP | 5.000% | 11/1/19 (Prere.) | 4,310 | 4,818 |
| Oregon Department of Administrative Services COP | 5.000% | 11/1/20 | 5,350 | 5,969 |
| Oregon Department of Administrative Services Lottery Revenue | 5.000% | 4/1/17 (Prere.) | 5,675 | 5,776 |
| Oregon Department of Administrative Services Lottery Revenue | 5.000% | 4/1/23 | 3,500 | 4,269 |
| Oregon Department of Administrative Services Lottery Revenue | 5.000% | 4/1/23 | 2,110 | 2,574 |
| Oregon Department of Administrative Services Lottery Revenue | 5.000% | 4/1/23 | 1,430 | 1,744 |
| Oregon Department of Administrative Services Lottery Revenue | 5.000% | 4/1/23 | 6,355 | 7,751 |
| Oregon Department of Administrative Services Lottery Revenue | 5.000% | 4/1/24 | 7,000 | 8,695 |
| Oregon Department of Administrative Services Lottery Revenue | 5.000% | 4/1/25 | 5,440 | 6,837 |
| Oregon Department of Administrative Services Lottery Revenue | 5.000% | 4/1/25 | 2,130 | 2,610 |
| Oregon Department of Administrative Services Lottery Revenue | 5.000% | 4/1/25 | 8,015 | 9,819 |
| Oregon Department of Administrative Services Lottery Revenue | 5.000% | 4/1/29 | 8,000 | 9,788 |
| Oregon Department of Administrative Services Lottery Revenue | 5.000% | 4/1/31 | 11,010 | 12,961 |
| Oregon Department of Administrative Services Lottery Revenue | 5.250% | 4/1/31 | 6,200 | 7,170 |
| Oregon Department of Administrative Services Lottery Revenue | 5.000% | 4/1/32 | 5,560 | 6,512 |
| Oregon Department of Administrative Services Lottery Revenue | 5.000% | 4/1/33 | 5,545 | 6,484 |
| Oregon Department of Transportation Highway User Tax Revenue | 5.000% | 11/15/24 | 3,000 | 3,773 |
| Oregon Department of Transportation Highway User Tax Revenue | 5.000% | 11/15/27 | 2,000 | 2,482 |
| Oregon Department of Transportation Highway User Tax Revenue | 5.000% | 11/15/28 | 5,500 | 6,771 |
| Oregon Department of Transportation Highway User Tax Revenue | 5.000% | 11/15/29 | 9,500 | 11,635 |
| Oregon Department of Transportation Highway User Tax Revenue | 5.000% | 11/15/30 | 2,500 | 3,052 |
| Oregon Facilities Authority Revenue (Legacy Health Project) | 5.250% | 5/1/20 | 7,610 | 8,643 |
| Oregon Facilities Authority Revenue (Legacy Health Project) | 5.250% | 5/1/21 | 7,500 | 8,755 |
| 3 Oregon Facilities Authority Revenue (Legacy Health Project) | 5.000% | 6/1/32 | 4,000 | 4,697 |
| 3 Oregon Facilities Authority Revenue (Legacy Health Project) | 5.000% | 6/1/33 | 4,000 | 4,675 |
| Oregon Facilities Authority Revenue (PeaceHealth) | 5.000% | 11/15/22 | 1,000 | 1,204 |
| Oregon Facilities Authority Revenue (PeaceHealth) | 5.000% | 11/15/23 | 1,250 | 1,534 |
| Oregon Facilities Authority Revenue (PeaceHealth) | 5.000% | 11/15/26 | 1,810 | 2,190 |
| Oregon Facilities Authority Revenue (PeaceHealth) | 5.000% | 11/15/27 | 2,000 | 2,407 |
| Oregon Facilities Authority Revenue (PeaceHealth) | 5.000% | 11/15/28 | 2,500 | 2,986 |
| Oregon Facilities Authority Revenue (PeaceHealth) | 5.000% | 11/15/29 | 1,420 | 1,688 |
| 3 Oregon Facilities Authority Revenue (Samaritan Health Services Project) | 5.000% | 10/1/27 | 2,725 | 3,221 |
| 3 Oregon Facilities Authority Revenue (Samaritan Health Services Project) | 5.000% | 10/1/28 | 3,965 | 4,644 |
| Oregon Facilities Authority Revenue (University of Portland) | 5.000% | 4/1/27 | 595 | 718 |
| Oregon Facilities Authority Revenue (University of Portland) | 5.000% | 4/1/29 | 750 | 889 |
| Oregon Facilities Authority Revenue (University of Portland) | 5.000% | 4/1/30 | 700 | 824 |
| Oregon Facilities Authority Revenue (University of Portland) | 5.000% | 4/1/31 | 700 | 819 |
| Oregon Facilities Authority Revenue (University of Portland) | 5.000% | 4/1/32 | 1,000 | 1,165 |
| Oregon Facilities Authority Revenue (University of Portland) | 5.000% | 4/1/33 | 1,100 | 1,278 |
| Oregon Facilities Authority Revenue (University of Portland) | 5.000% | 4/1/34 | 1,280 | 1,484 |
| Oregon Facilities Authority Revenue (University of Portland) | 5.000% | 4/1/35 | 1,200 | 1,387 |
| Oregon GO | 5.000% | 5/1/18 | 1,500 | 1,593 |
| Oregon GO | 5.000% | 11/1/18 | 3,750 | 4,057 |
| Oregon GO | 5.000% | 5/1/19 | 2,770 | 3,049 |
| Oregon GO | 5.000% | 5/1/21 (Prere.) | 1,570 | 1,834 |
| Oregon GO | 5.000% | 5/1/21 (Prere.) | 2,415 | 2,822 |
| Oregon GO | 5.000% | 5/1/21 (Prere.) | 5,165 | 6,035 |
| Oregon GO | 5.000% | 5/1/21 (Prere.) | 5,685 | 6,642 |
| Oregon GO | 5.000% | 5/1/21 (Prere.) | 3,370 | 3,937 |
| Oregon GO | 5.000% | 5/1/21 (Prere.) | 1,490 | 1,741 |
| Oregon GO | 5.000% | 5/1/21 (Prere.) | 2,460 | 2,874 |
| Oregon GO | 5.000% | 5/1/21 (Prere.) | 2,755 | 3,219 |
| Oregon GO | 5.000% | 5/1/21 (Prere.) | 2,890 | 3,377 |
| Oregon GO | 5.000% | 5/1/21 (Prere.) | 1,760 | 2,056 |
| Oregon GO | 5.000% | 5/1/31 | 2,915 | 3,473 |
| Oregon GO | 5.000% | 5/1/32 | 2,060 | 2,449 |
| Oregon GO | 5.000% | 11/1/32 | 1,440 | 1,731 |
| Oregon GO (Oregon University System Projects) | 5.250% | 8/1/28 | 1,650 | 1,950 |
198
Intermediate-Term Tax-Exempt Fund
| | | | |
| | | | Face | Market |
| | | Maturity | Amount | Value• |
| | Coupon | Date | ($000) | ($000) |
| Oregon GO (Oregon University System Projects) | 5.250% | 8/1/28 | 2,585 | 3,055 |
| Oregon GO (Oregon University System Projects) | 5.250% | 8/1/29 | 2,725 | 3,179 |
| Oregon GO (Oregon University System Projects) | 5.250% | 8/1/30 | 2,050 | 2,407 |
| Oregon GO (Oregon University System Projects) | 5.250% | 8/1/30 | 2,865 | 3,364 |
| Oregon GO (Oregon University System Projects) | 5.250% | 8/1/31 | 3,015 | 3,532 |
| Port of Portland OR International Airport Revenue | 5.000% | 7/1/29 | 1,650 | 2,011 |
| Port of Portland OR International Airport Revenue | 5.000% | 7/1/30 | 1,000 | 1,209 |
| Port of Portland OR International Airport Revenue | 5.000% | 7/1/32 | 1,065 | 1,271 |
| Port of Portland OR International Airport Revenue | 5.000% | 7/1/34 | 3,000 | 3,543 |
| Portland OR Sewer System Revenue | 5.000% | 6/1/20 | 43,210 | 49,208 |
| | | | | 418,347 |
| Pennsylvania (4.8%) | | | | |
| Allegheny County PA GO | 5.000% | 11/1/19 (Prere.) | 15,000 | 16,767 |
| Allegheny County PA GO | 5.000% | 11/1/25 | 7,445 | 9,253 |
| Allegheny County PA GO | 5.000% | 11/1/26 | 3,075 | 3,851 |
| Allegheny County PA GO | 5.000% | 11/1/29 | 12,000 | 14,673 |
| Allegheny County PA GO VRDO | 0.630% | 11/7/16 LOC | 8,100 | 8,100 |
| Allegheny County PA Higher Education Building Authority University Revenue | | | | |
| (Duquesne University) | 5.500% | 3/1/21 (Prere.) | 1,290 | 1,523 |
| Allegheny County PA Higher Education Building Authority University Revenue | | | | |
| (Duquesne University) | 5.500% | 3/1/21 (Prere.) | 2,720 | 3,211 |
| Allegheny County PA Hospital Development Authority Revenue | | | | |
| (University of Pittsburgh Medical Center) | 1.227% | 2/1/21 | 14,115 | 14,099 |
| Allegheny County PA Port Authority Revenue | 5.750% | 3/1/29 | 17,000 | 19,967 |
| Allegheny County PA Sanitary Authority Sewer Revenue | 5.000% | 12/1/23 | 3,400 | 4,132 |
| Allegheny County PA Sanitary Authority Sewer Revenue | 5.000% | 12/1/24 | 2,500 | 3,078 |
| Allegheny County PA Sanitary Authority Sewer Revenue | 4.000% | 12/1/34 (4) | 2,000 | 2,167 |
| Allentown PA Neighborhood Improvement Zone Development Authority Tax Revenue | 5.000% | 5/1/24 | 2,795 | 3,161 |
| Allentown PA Neighborhood Improvement Zone Development Authority Tax Revenue | 5.000% | 5/1/25 | 2,500 | 2,802 |
| Allentown PA Neighborhood Improvement Zone Development Authority Tax Revenue | 5.000% | 5/1/26 | 2,000 | 2,228 |
| Allentown PA Neighborhood Improvement Zone Development Authority Tax Revenue | 5.000% | 5/1/28 | 2,310 | 2,549 |
| Allentown PA Neighborhood Improvement Zone Development Authority Tax Revenue | 5.000% | 5/1/29 | 3,740 | 4,105 |
| Allentown PA Neighborhood Improvement Zone Development Authority Tax Revenue | 5.000% | 5/1/31 | 3,000 | 3,267 |
| Beaver County PA Industrial Development Authority Pollution Control Revenue | | | | |
| (FirstEnergy Generation Project) PUT | 2.500% | 6/1/17 | 4,500 | 4,435 |
| Beaver County PA Industrial Development Authority Pollution Control Revenue | | | | |
| (FirstEnergy Generation Project) PUT | 2.700% | 4/2/18 | 16,100 | 15,224 |
| Bucks County PA Water & Sewer Authority Water System Revenue | 5.000% | 6/1/19 (15) | 2,000 | 2,188 |
| Canonsburg-Houston PA Joint Authority Sewer Revenue | 5.000% | 12/1/31 | 1,825 | 2,132 |
| Canonsburg-Houston PA Joint Authority Sewer Revenue | 5.000% | 12/1/32 | 1,915 | 2,226 |
| Central Bradford PA Progress Authority Revenue (Guthrie Healthcare System) | 5.500% | 12/1/31 | 12,500 | 14,506 |
| Central Bucks County PA School District GO | 5.000% | 5/15/20 (ETM) | 625 | 710 |
| Central Bucks County PA School District GO | 5.000% | 5/15/20 | 1,645 | 1,866 |
| Commonwealth Financing Authority Pennsylvania Revenue | 5.000% | 6/1/21 (4) | 3,940 | 4,436 |
| Commonwealth Financing Authority Pennsylvania Revenue | 5.000% | 6/1/25 | 875 | 1,025 |
| Commonwealth Financing Authority Pennsylvania Revenue | 5.000% | 6/1/32 | 7,000 | 7,930 |
| Cumberland County PA Municipal Authority Revenue (Diakon Lutheran Social Ministries Project) | 5.250% | 1/1/17 (ETM) | 2,135 | 2,151 |
| Cumberland County PA Municipal Authority Revenue (Diakon Lutheran Social Ministries Project) | 5.250% | 1/1/17 | 240 | 242 |
| Cumberland County PA Municipal Authority Revenue (Diakon Lutheran Social Ministries Project) | 5.500% | 1/1/18 (ETM) | 2,460 | 2,593 |
| Cumberland County PA Municipal Authority Revenue (Diakon Lutheran Social Ministries Project) | 5.500% | 1/1/18 | 275 | 289 |
| Cumberland County PA Municipal Authority Revenue (Diakon Lutheran Social Ministries Project) | 5.750% | 1/1/19 (Prere.) | 3,075 | 3,386 |
| Cumberland County PA Municipal Authority Revenue (Diakon Lutheran Social Ministries Project) | 6.000% | 1/1/19 (Prere.) | 3,770 | 4,171 |
| Cumberland County PA Municipal Authority Revenue (Diakon Lutheran Social Ministries Project) | 5.750% | 1/1/20 | 340 | 371 |
| Cumberland County PA Municipal Authority Revenue (Diakon Lutheran Social Ministries Project) | 6.000% | 1/1/21 | 420 | 460 |
| Dauphin County PA General Authority Health System Revenue (Pinnacle Health System Project) | 6.000% | 6/1/19 (Prere.) | 7,060 | 7,955 |
| Dauphin County PA General Authority Health System Revenue (Pinnacle Health System Project) | 6.000% | 6/1/29 | 7,740 | 8,676 |
| Delaware County PA Authority Hospital Revenue (Crozer-Keystone Obligated Group) | 5.000% | 12/15/16 (Prere.) | 2,070 | 2,081 |
| Delaware County PA Authority Hospital Revenue (Crozer-Keystone Obligated Group) | 5.000% | 12/15/16 (Prere.) | 3,790 | 3,809 |
| Delaware County PA Authority Hospital Revenue (Crozer-Keystone Obligated Group) | 5.000% | 12/15/16 (Prere.) | 6,000 | 6,030 |
| Delaware County PA Authority Hospital Revenue (Crozer-Keystone Obligated Group) | 5.000% | 12/15/16 (Prere.) | 4,175 | 4,196 |
| Delaware County PA Authority Hospital Revenue (Crozer-Keystone Obligated Group) | 5.000% | 12/15/16 (Prere.) | 3,985 | 4,005 |
| Delaware County PA GO | 5.000% | 10/1/17 | 2,250 | 2,338 |
| Delaware County PA GO | 5.000% | 10/1/18 | 2,360 | 2,545 |
| Delaware County PA GO | 5.000% | 10/1/21 | 1,645 | 1,938 |
| Delaware River Port Authority Pennsylvania & New Jersey Revenue | 5.000% | 1/1/23 | 4,850 | 5,527 |
| Lancaster County PA Hospital Authority Health System Revenue | | | | |
| (University of Pennsylvania Health System) | 5.000% | 8/15/26 | 6,540 | 8,125 |
| Lancaster County PA Hospital Authority Revenue (University of Pennsylvania Health System) | 5.000% | 8/15/28 | 1,420 | 1,730 |
| Lancaster County PA Hospital Authority Revenue (University of Pennsylvania Health System) | 5.000% | 8/15/29 | 1,385 | 1,677 |
199
Intermediate-Term Tax-Exempt Fund
| | | | |
| | | | Face | Market |
| | | Maturity | Amount | Value• |
| | Coupon | Date | ($000) | ($000) |
| Lancaster County PA Hospital Authority Revenue (University of Pennsylvania Health System) | 5.000% | 8/15/33 | 3,000 | 3,553 |
| Lancaster County PA Hospital Authority Revenue (University of Pennsylvania Health System) | 5.000% | 8/15/34 | 3,000 | 3,539 |
| Lancaster County PA Solid Waste Management Authority Solid Waste Disposal System Revenue | 5.000% | 12/15/33 | 5,750 | 6,646 |
| Lycoming County PA Authority College Revenue (Pennsylvania College of Technology) | 5.000% | 10/1/21 | 1,000 | 1,159 |
| Lycoming County PA Authority College Revenue (Pennsylvania College of Technology) | 5.000% | 10/1/22 | 1,000 | 1,183 |
| Lycoming County PA Authority College Revenue (Pennsylvania College of Technology) | 5.000% | 10/1/24 | 525 | 636 |
| Lycoming County PA Authority College Revenue (Pennsylvania College of Technology) | 5.000% | 10/1/25 | 1,085 | 1,322 |
| Lycoming County PA Authority College Revenue (Pennsylvania College of Technology) | 5.000% | 10/1/26 | 600 | 735 |
| Middletown PA School District GO | 5.000% | 3/1/31 | 3,030 | 3,446 |
| Middletown PA School District GO | 5.000% | 3/1/32 | 3,375 | 3,824 |
| Monroeville PA Finance Authority Revenue (UPMC Health System) | 5.000% | 2/15/29 | 6,995 | 8,015 |
| Montgomery County PA Higher Education & Health Authority Hospital Revenue | | | | |
| (Abington Memorial Hospital) | 5.000% | 6/1/25 | 7,000 | 8,126 |
| Montgomery County PA Higher Education & Health Authority Hospital Revenue | | | | |
| (Abington Memorial Hospital) | 5.000% | 6/1/25 | 5,765 | 6,261 |
| Montgomery County PA Higher Education & Health Authority Hospital Revenue | | | | |
| (Abington Memorial Hospital) | 5.000% | 6/1/27 | 6,000 | 6,895 |
| Montgomery County PA Higher Education & Health Authority Hospital Revenue | | | | |
| (Abington Memorial Hospital) | 5.000% | 6/1/31 | 8,500 | 9,577 |
| Montgomery County PA Industrial Development Authority Health Services Revenue | | | | |
| (Albert Einstein Healthcare Network) | 5.000% | 1/15/23 | 8,000 | 9,136 |
| Montgomery County PA Industrial Development Authority Health Services Revenue | | | | |
| (Albert Einstein Healthcare Network) | 5.000% | 1/15/24 | 4,365 | 5,039 |
| Montgomery County PA Industrial Development Authority Health Services Revenue | | | | |
| (Albert Einstein Healthcare Network) | 5.000% | 1/15/25 | 3,800 | 4,384 |
| Montgomery County PA Industrial Development Authority Health Services Revenue | | | | |
| (Albert Einstein Healthcare Network) | 5.250% | 1/15/26 | 3,250 | 3,772 |
| Montgomery County PA Industrial Development Authority Health Services Revenue | | | | |
| (Albert Einstein Healthcare Network) | 5.250% | 1/15/27 | 3,000 | 3,445 |
| Montgomery County PA Industrial Development Authority Health Services Revenue | | | | |
| (Albert Einstein Healthcare Network) | 5.250% | 1/15/29 | 3,850 | 4,350 |
| Montgomery County PA Industrial Development Authority Health Services Revenue | | | | |
| (Albert Einstein Healthcare Network) | 5.250% | 1/15/31 | 8,350 | 9,352 |
| Montgomery County PA Industrial Development Authority Health Services Revenue | | | | |
| (Albert Einstein Healthcare Network) | 5.250% | 1/15/32 | 9,055 | 10,108 |
| Montgomery County PA Industrial Development Authority Pollution Control Revenue | | | | |
| (Exelon Generation Co., LLC) PUT | 2.500% | 4/1/20 | 4,000 | 4,031 |
| Montgomery County PA Industrial Development Authority Pollution Control Revenue | | | | |
| (Exelon Generation Co., LLC) PUT | 2.500% | 4/1/20 | 3,250 | 3,275 |
| Montour PA School District GO | 5.000% | 4/1/32 (4) | 3,245 | 3,802 |
| Moon Industrial Development Authority Pennsylvania Revenue | | | | |
| (Baptist Home Society Obligated Group) | 5.625% | 7/1/30 | 3,750 | 4,206 |
| Moon Industrial Development Authority Pennsylvania Revenue | | | | |
| (Baptist Home Society Obligated Group) | 5.750% | 7/1/35 | 6,925 | 7,735 |
| Northampton County PA General Purpose Authority Hospital Revenue | | | | |
| (St. Luke’s Hospital Project) | 5.000% | 8/15/18 (Prere.) | 1,000 | 1,072 |
| Northampton County PA General Purpose Authority Hospital Revenue | | | | |
| (St. Luke’s Hospital Project) | 5.125% | 8/15/18 (Prere.) | 1,000 | 1,074 |
| Northampton County PA General Purpose Authority Hospital Revenue | | | | |
| (St. Luke’s Hospital Project) | 5.250% | 8/15/18 (Prere.) | 1,000 | 1,076 |
| Northampton County PA General Purpose Authority Hospital Revenue | | | | |
| (St. Luke’s Hospital Project) | 5.250% | 8/15/18 (Prere.) | 1,500 | 1,614 |
| Northampton County PA General Purpose Authority Hospital Revenue | | | | |
| (St. Luke’s Hospital Project) | 5.250% | 8/15/18 (Prere.) | 3,000 | 3,229 |
| Northampton County PA General Purpose Authority Hospital Revenue | | | | |
| (St. Luke’s Hospital Project) | 5.000% | 8/15/24 | 2,815 | 3,388 |
| Northampton County PA General Purpose Authority Hospital Revenue | | | | |
| (St. Luke’s Hospital Project) | 5.000% | 8/15/25 | 2,025 | 2,453 |
| Northampton County PA General Purpose Authority Hospital Revenue | | | | |
| (St. Luke’s Hospital Project) | 5.000% | 8/15/26 | 2,270 | 2,764 |
| Northampton County PA General Purpose Authority Hospital Revenue | | | | |
| (St. Luke’s Hospital Project) | 5.000% | 8/15/27 | 2,835 | 3,430 |
| Northampton County PA General Purpose Authority Hospital Revenue | | | | |
| (St. Luke’s Hospital Project) | 5.000% | 8/15/29 | 5,205 | 6,159 |
| Northampton County PA General Purpose Authority Hospital Revenue | | | | |
| (St. Luke’s Hospital Project) | 5.000% | 8/15/30 | 7,720 | 9,071 |
| Northampton County PA General Purpose Authority Hospital Revenue | | | | |
| (St. Luke’s Hospital Project) | 5.000% | 8/15/31 | 8,130 | 9,508 |
| Northampton County PA General Purpose Authority Hospital Revenue | | | | |
| (St. Luke’s Hospital Project) | 5.000% | 8/15/36 | 6,790 | 7,828 |
200
Intermediate-Term Tax-Exempt Fund
| | | | |
| | | | Face | Market |
| | | Maturity | Amount | Value• |
| | Coupon | Date | ($000) | ($000) |
| Pennsylvania Economic Development Financing Authority Health System Revenue | | | | |
| (Albert Einstein Healthcare Network) | 6.250% | 10/15/19 (Prere.) | 2,795 | 3,143 |
| Pennsylvania Economic Development Financing Authority Pollution Control Revenue | | | | |
| (PPL Electric Utilities Corp. Project) | 4.000% | 10/1/23 | 17,500 | 19,216 |
| Pennsylvania Economic Development Financing Authority Revenue (UPMC Obligated Group) | 5.000% | 2/1/23 | 1,250 | 1,494 |
| Pennsylvania Economic Development Financing Authority Revenue (UPMC Obligated Group) | 5.000% | 2/1/24 | 3,000 | 3,638 |
| Pennsylvania Economic Development Financing Authority Revenue (UPMC Obligated Group) | 5.000% | 2/1/25 | 2,180 | 2,649 |
| Pennsylvania Economic Development Financing Authority Revenue (UPMC Obligated Group) | 5.000% | 2/1/26 | 3,000 | 3,620 |
| Pennsylvania Economic Development Financing Authority Revenue (UPMC Obligated Group) | 5.000% | 2/1/27 | 4,705 | 5,637 |
| Pennsylvania Economic Development Financing Authority Revenue (UPMC Obligated Group) | 5.000% | 2/1/29 | 6,000 | 7,063 |
| Pennsylvania Economic Development Financing Authority Revenue (UPMC Obligated Group) | 5.000% | 2/1/31 | 12,965 | 15,086 |
| Pennsylvania Economic Development Financing Authority Revenue (UPMC Obligated Group) | 5.000% | 2/1/32 | 6,865 | 7,952 |
| Pennsylvania Economic Development Financing Authority Revenue (UPMC Obligated Group) | 5.000% | 2/1/33 | 10,000 | 11,538 |
| Pennsylvania Economic Development Financing Authority Revenue (UPMC Obligated Group) | 5.000% | 7/1/33 | 10,000 | 11,401 |
| Pennsylvania Economic Development Financing Authority Unemployment Compensation Revenue | 4.000% | 1/1/17 | 1,000 | 1,006 |
| Pennsylvania Economic Development Financing Authority Unemployment Compensation Revenue | 5.000% | 7/1/18 | 1,950 | 2,083 |
| Pennsylvania Economic Development Financing Authority Unemployment Compensation Revenue | 5.000% | 7/1/19 | 4,700 | 5,192 |
| Pennsylvania Economic Development Financing Authority Unemployment Compensation Revenue | 5.000% | 7/1/20 | 20,000 | 22,119 |
| Pennsylvania Economic Development Financing Authority Unemployment Compensation Revenue | 5.000% | 1/1/21 | 10,000 | 10,853 |
| Pennsylvania Economic Development Financing Authority Unemployment Compensation Revenue | 5.000% | 7/1/22 | 10,945 | 11,058 |
| Pennsylvania GO | 5.000% | 5/1/19 | 15,000 | 16,388 |
| Pennsylvania GO | 5.000% | 7/1/19 | 14,925 | 16,392 |
| Pennsylvania GO | 5.000% | 6/1/21 | 20,000 | 23,075 |
| Pennsylvania GO | 5.000% | 7/1/21 | 32,365 | 37,420 |
| Pennsylvania GO | 5.375% | 7/1/21 | 4,950 | 5,806 |
| Pennsylvania GO | 5.000% | 6/1/22 | 19,450 | 22,879 |
| Pennsylvania GO | 4.000% | 7/1/23 | 13,000 | 14,594 |
| Pennsylvania GO | 5.000% | 11/15/23 | 4,705 | 5,485 |
| Pennsylvania GO | 5.000% | 8/15/24 | 44,000 | 53,543 |
| Pennsylvania GO | 5.000% | 3/15/25 | 7,000 | 8,541 |
| Pennsylvania GO | 5.000% | 4/1/25 | 7,500 | 8,893 |
| Pennsylvania GO | 5.000% | 9/15/26 | 34,500 | 42,809 |
| Pennsylvania GO | 5.000% | 9/15/27 | 25,375 | 31,087 |
| Pennsylvania GO | 5.000% | 3/15/28 | 21,000 | 25,087 |
| Pennsylvania GO | 4.000% | 10/15/28 | 11,550 | 12,742 |
| Pennsylvania GO | 4.000% | 8/15/29 (4) | 17,000 | 18,768 |
| Pennsylvania GO | 4.000% | 6/15/30 | 24,400 | 26,432 |
| Pennsylvania GO | 4.000% | 8/15/30 (4) | 19,000 | 20,796 |
| Pennsylvania Higher Education Assistance Agency Revenue | 5.000% | 12/15/20 | 2,560 | 2,914 |
| Pennsylvania Higher Education Assistance Agency Revenue | 5.000% | 12/15/21 | 1,830 | 2,074 |
| Pennsylvania Higher Educational Facilities Authority Revenue | 4.000% | 6/15/32 | 8,500 | 9,147 |
| Pennsylvania Higher Educational Facilities Authority Revenue | 4.000% | 6/15/33 | 10,000 | 10,709 |
| Pennsylvania Higher Educational Facilities Authority Revenue (Drexel University) VRDO | 0.480% | 11/1/16 LOC | 2,805 | 2,805 |
| Pennsylvania Higher Educational Facilities Authority Revenue | | | | |
| (Foundation for Indiana University of Pennsylvania Student Housing) | 5.000% | 7/1/27 | 1,745 | 1,987 |
| Pennsylvania Higher Educational Facilities Authority Revenue (Higher Education System) | 5.000% | 6/15/29 | 4,125 | 4,641 |
| Pennsylvania Higher Educational Facilities Authority Revenue (Higher Education System) | 5.000% | 6/15/29 | 1,300 | 1,482 |
| Pennsylvania Higher Educational Facilities Authority Revenue (La Salle University) | 5.000% | 5/1/24 | 1,435 | 1,670 |
| Pennsylvania Higher Educational Facilities Authority Revenue (La Salle University) | 5.000% | 5/1/25 | 1,670 | 1,931 |
| Pennsylvania Higher Educational Facilities Authority Revenue (La Salle University) | 5.000% | 5/1/26 | 1,690 | 1,945 |
| 4 Pennsylvania Higher Educational Facilities Authority Revenue | | | | |
| (Presbyterian Medical Center) TOB VRDO | 0.660% | 11/7/16 | 7,200 | 7,200 |
| Pennsylvania Higher Educational Facilities Authority Revenue (Temple University) | 5.000% | 4/1/25 | 2,065 | 2,427 |
| Pennsylvania Higher Educational Facilities Authority Revenue (Temple University) | 5.000% | 4/1/26 | 1,140 | 1,334 |
| Pennsylvania Higher Educational Facilities Authority Revenue (Temple University) | 5.000% | 4/1/27 | 1,120 | 1,304 |
| Pennsylvania Higher Educational Facilities Authority Revenue (Temple University) | 5.000% | 4/1/28 | 3,085 | 3,579 |
| Pennsylvania Higher Educational Facilities Authority Revenue (Temple University) | 5.000% | 4/1/30 | 2,985 | 3,431 |
| Pennsylvania Higher Educational Facilities Authority Revenue (Temple University) | 5.000% | 4/1/31 | 3,500 | 4,011 |
| Pennsylvania Higher Educational Facilities Authority Revenue (Thomas Jefferson University) | 5.250% | 9/1/19 (2) | 2,935 | 3,258 |
| Pennsylvania Higher Educational Facilities Authority Revenue (Thomas Jefferson University) | 5.000% | 3/1/27 | 700 | 817 |
| Pennsylvania Higher Educational Facilities Authority Revenue (Thomas Jefferson University) | 5.000% | 3/1/28 | 1,650 | 1,919 |
| Pennsylvania Higher Educational Facilities Authority Revenue (Thomas Jefferson University) | 5.000% | 3/1/30 | 500 | 577 |
| Pennsylvania Higher Educational Facilities Authority Revenue (Thomas Jefferson University) | 5.000% | 3/1/32 | 1,000 | 1,145 |
| 2 Pennsylvania Higher Educational Facilities Authority Revenue | | | | |
| (Trustees of the University of Pennsylvania) | 5.000% | 3/1/21 (Prere.) | 2,405 | 2,798 |
| Pennsylvania Higher Educational Facilities Authority Revenue | | | | |
| (Trustees of the University of Pennsylvania) | 5.000% | 10/1/23 | 8,220 | 10,102 |
| Pennsylvania Higher Educational Facilities Authority Revenue | | | | |
| (Trustees of the University of Pennsylvania) | 5.000% | 10/1/24 | 7,000 | 8,729 |
201
Intermediate-Term Tax-Exempt Fund
| | | | |
| | | | Face | Market |
| | | Maturity | Amount | Value• |
| | Coupon | Date | ($000) | ($000) |
| Pennsylvania Higher Educational Facilities Authority Revenue | | | | |
| (Trustees of the University of Pennsylvania) | 5.000% | 10/1/25 | 5,000 | 6,313 |
| Pennsylvania Higher Educational Facilities Authority Revenue | | | | |
| (Trustees of the University of Pennsylvania) | 5.000% | 10/1/26 | 4,625 | 5,801 |
| Pennsylvania Higher Educational Facilities Authority Revenue | | | | |
| (Trustees of the University of Pennsylvania) | 5.000% | 10/1/26 | 9,550 | 11,979 |
| Pennsylvania Higher Educational Facilities Authority Revenue | | | | |
| (University of Pennsylvania Health System) | 5.000% | 8/15/24 | 6,310 | 7,772 |
| Pennsylvania Higher Educational Facilities Authority Revenue | | | | |
| (University of Pennsylvania Health System) | 5.000% | 8/15/25 | 5,500 | 6,850 |
| Pennsylvania Higher Educational Facilities Authority Revenue | | | | |
| (University of Pittsburgh Medical Center) | 5.000% | 5/15/31 | 500 | 550 |
| Pennsylvania Higher Educational Facilities Authority Revenue (University of the Sciences) | 5.000% | 11/1/33 | 5,805 | 6,670 |
| Pennsylvania Housing Finance Agency Single Family Mortgage Revenue | 4.000% | 10/1/18 | 2,000 | 2,113 |
| Pennsylvania Housing Finance Agency Single Family Mortgage Revenue | 5.000% | 10/1/19 | 2,000 | 2,204 |
| Pennsylvania Housing Finance Agency Single Family Mortgage Revenue | 5.000% | 10/1/20 | 1,500 | 1,711 |
| Pennsylvania Industrial Development Authority Economic Development Revenue | 5.500% | 7/1/18 (Prere.) | 17,530 | 18,870 |
| Pennsylvania Industrial Development Authority Economic Development Revenue | 5.500% | 7/1/18 (Prere.) | 12,180 | 13,111 |
| Pennsylvania Public School Building Authority Lease Revenue (School District of Philadelphia) | 5.000% | 12/1/16 (Prere.) | 3,430 | 3,442 |
| Pennsylvania Public School Building Authority Lease Revenue (School District of Philadelphia) | 5.000% | 12/1/16 (Prere.) | 10,600 | 10,638 |
| Pennsylvania Public School Building Authority Lease Revenue (School District of Philadelphia) | 5.000% | 12/1/16 (Prere.) | 11,130 | 11,170 |
| Pennsylvania Public School Building Authority Lease Revenue (School District of Philadelphia) | 5.000% | 12/1/16 (Prere.) | 11,585 | 11,626 |
| Pennsylvania Public School Building Authority Lease Revenue (School District of Philadelphia) | 5.000% | 6/1/23 (4) | 6,080 | 6,102 |
| Pennsylvania Public School Building Authority Lease Revenue (School District of Philadelphia) | 5.000% | 6/1/24 (4) | 6,620 | 6,644 |
| Pennsylvania Public School Building Authority Lease Revenue (School District of Philadelphia) | 5.000% | 6/1/26 (4) | 6,640 | 6,664 |
| Pennsylvania State University Revenue | 5.000% | 9/1/21 | 620 | 728 |
| Pennsylvania State University Revenue | 5.000% | 9/1/21 | 1,400 | 1,644 |
| Pennsylvania State University Revenue | 5.000% | 9/1/26 | 1,250 | 1,588 |
| Pennsylvania State University Revenue | 5.000% | 9/1/26 | 3,000 | 3,812 |
| Pennsylvania State University Revenue | 4.000% | 9/1/27 | 4,800 | 5,579 |
| Pennsylvania State University Revenue | 5.000% | 9/1/28 | 5,000 | 6,223 |
| Pennsylvania State University Revenue | 5.000% | 9/1/29 | 5,000 | 6,179 |
| Pennsylvania State University Revenue | 5.000% | 9/1/29 | 1,150 | 1,421 |
| Pennsylvania State University Revenue | 5.000% | 9/1/30 | 1,650 | 2,024 |
| Pennsylvania State University Revenue | 5.000% | 9/1/30 | 1,750 | 2,146 |
| Pennsylvania State University Revenue | 4.000% | 9/1/35 | 1,650 | 1,812 |
| Pennsylvania State University Revenue | 5.000% | 9/1/35 | 1,350 | 1,618 |
| Pennsylvania State University Revenue | 4.000% | 9/1/36 | 1,730 | 1,895 |
| Pennsylvania State University Revenue | 5.000% | 9/1/36 | 1,325 | 1,584 |
| Pennsylvania Turnpike Commission Motor License Fund Revenue | 5.000% | 12/1/23 | 1,770 | 2,116 |
| Pennsylvania Turnpike Commission Motor License Fund Revenue | 5.000% | 12/1/24 | 1,825 | 2,174 |
| Pennsylvania Turnpike Commission Motor License Fund Revenue | 5.000% | 12/1/25 | 2,190 | 2,592 |
| Pennsylvania Turnpike Commission Motor License Fund Revenue | 5.000% | 12/1/26 | 2,165 | 2,550 |
| Pennsylvania Turnpike Commission Oil Franchise Tax Revenue | 5.000% | 12/1/17 (2) | 5,155 | 5,173 |
| Pennsylvania Turnpike Commission Oil Franchise Tax Revenue | 5.000% | 12/1/23 | 2,895 | 3,504 |
| Pennsylvania Turnpike Commission Oil Franchise Tax Revenue | 5.000% | 12/1/26 | 1,460 | 1,809 |
| Pennsylvania Turnpike Commission Oil Franchise Tax Revenue | 5.000% | 12/1/27 | 1,600 | 1,959 |
| Pennsylvania Turnpike Commission Revenue | 5.000% | 6/1/18 (Prere.) | 2,500 | 2,663 |
| Pennsylvania Turnpike Commission Revenue | 5.250% | 6/1/18 (Prere.) | 12,345 | 13,199 |
| Pennsylvania Turnpike Commission Revenue | 5.000% | 6/1/19 (Prere.) | 4,520 | 4,983 |
| Pennsylvania Turnpike Commission Revenue | 5.000% | 6/1/19 (Prere.) | 9,020 | 9,939 |
| Pennsylvania Turnpike Commission Revenue | 5.000% | 6/1/19 (Prere.) | 40,980 | 45,155 |
| Pennsylvania Turnpike Commission Revenue | 5.000% | 6/1/19 (Prere.) | 8,585 | 9,464 |
| Pennsylvania Turnpike Commission Revenue | 5.000% | 6/1/19 (Prere.) | 3,535 | 3,897 |
| Pennsylvania Turnpike Commission Revenue | 5.250% | 6/1/19 (Prere.) | 4,715 | 5,228 |
| Pennsylvania Turnpike Commission Revenue | 5.000% | 12/1/19 (Prere.) | 7,280 | 8,158 |
| 1 Pennsylvania Turnpike Commission Revenue | 1.900% | 12/1/20 | 22,700 | 22,929 |
| Pennsylvania Turnpike Commission Revenue | 5.250% | 12/1/20 (Prere.) | 1,710 | 1,990 |
| 1 Pennsylvania Turnpike Commission Revenue | 1.610% | 12/1/21 | 37,500 | 37,370 |
| Pennsylvania Turnpike Commission Revenue | 5.000% | 12/1/21 | 6,930 | 7,701 |
| Pennsylvania Turnpike Commission Revenue | 5.000% | 12/1/21 | 16,660 | 18,588 |
| Pennsylvania Turnpike Commission Revenue | 5.000% | 6/1/24 | 27,855 | 33,517 |
| Pennsylvania Turnpike Commission Revenue | 5.000% | 6/1/24 (4) | 8,395 | 10,082 |
| Pennsylvania Turnpike Commission Revenue | 5.000% | 6/1/25 | 11,910 | 14,431 |
| Pennsylvania Turnpike Commission Revenue | 5.000% | 6/1/25 | 37,630 | 45,595 |
| Pennsylvania Turnpike Commission Revenue | 5.000% | 12/1/25 | 1,250 | 1,406 |
| Pennsylvania Turnpike Commission Revenue | 5.000% | 6/1/26 | 9,845 | 11,918 |
| Pennsylvania Turnpike Commission Revenue | 5.000% | 6/1/26 (4) | 35,000 | 42,833 |
| Pennsylvania Turnpike Commission Revenue | 5.000% | 6/1/26 | 35,000 | 42,565 |
| Pennsylvania Turnpike Commission Revenue | 5.000% | 12/1/26 | 2,320 | 2,792 |
202
Intermediate-Term Tax-Exempt Fund
| | | | |
| | | | Face | Market |
| | | Maturity | Amount | Value• |
| | Coupon | Date | ($000) | ($000) |
| Pennsylvania Turnpike Commission Revenue | 5.000% | 12/1/26 | 1,500 | 1,687 |
| Pennsylvania Turnpike Commission Revenue | 5.000% | 6/1/27 | 5,275 | 6,331 |
| Pennsylvania Turnpike Commission Revenue | 5.000% | 12/1/27 | 1,335 | 1,502 |
| Pennsylvania Turnpike Commission Revenue | 5.000% | 6/1/28 | 5,140 | 6,108 |
| Pennsylvania Turnpike Commission Revenue | 0.000% | 12/1/28 | 3,500 | 3,829 |
| Pennsylvania Turnpike Commission Revenue | 5.000% | 12/1/28 | 1,000 | 1,205 |
| Pennsylvania Turnpike Commission Revenue | 5.000% | 12/1/28 | 1,000 | 1,121 |
| Pennsylvania Turnpike Commission Revenue | 5.250% | 12/1/28 | 4,015 | 4,525 |
| Pennsylvania Turnpike Commission Revenue | 5.000% | 6/1/29 | 3,030 | 3,558 |
| Pennsylvania Turnpike Commission Revenue | 5.000% | 6/1/29 | 7,635 | 9,009 |
| Pennsylvania Turnpike Commission Revenue | 5.000% | 12/1/29 | 2,000 | 2,397 |
| Pennsylvania Turnpike Commission Revenue | 5.000% | 6/1/30 | 5,000 | 5,850 |
| Pennsylvania Turnpike Commission Revenue | 5.000% | 12/1/30 | 4,000 | 4,770 |
| Pennsylvania Turnpike Commission Revenue | 5.000% | 6/1/31 | 6,890 | 8,012 |
| Pennsylvania Turnpike Commission Revenue | 5.000% | 12/1/31 | 25,500 | 30,281 |
| Pennsylvania Turnpike Commission Revenue | 5.000% | 12/1/31 | 3,785 | 4,495 |
| Pennsylvania Turnpike Commission Revenue | 5.000% | 12/1/31 | 1,500 | 1,675 |
| Pennsylvania Turnpike Commission Revenue | 5.500% | 12/1/31 | 6,185 | 7,065 |
| Pennsylvania Turnpike Commission Revenue | 5.625% | 12/1/31 | 10,000 | 11,471 |
| Pennsylvania Turnpike Commission Revenue | 5.000% | 6/1/32 | 14,615 | 16,836 |
| Pennsylvania Turnpike Commission Revenue | 5.000% | 12/1/32 | 31,195 | 36,870 |
| Pennsylvania Turnpike Commission Revenue | 5.000% | 12/1/32 | 3,250 | 3,841 |
| Pennsylvania Turnpike Commission Revenue | 5.000% | 6/1/33 | 9,950 | 11,436 |
| Pennsylvania Turnpike Commission Revenue | 0.000% | 12/1/33 | 4,500 | 4,906 |
| Pennsylvania Turnpike Commission Revenue | 5.000% | 12/1/33 | 4,940 | 5,683 |
| Pennsylvania Turnpike Commission Revenue | 5.000% | 12/1/33 | 23,000 | 27,074 |
| Pennsylvania Turnpike Commission Revenue | 5.000% | 12/1/34 | 2,620 | 3,004 |
| Pennsylvania Turnpike Commission Revenue | 5.000% | 12/1/34 | 4,000 | 4,557 |
| Pennsylvania Turnpike Commission Revenue | 5.000% | 6/1/35 | 22,500 | 25,620 |
| Pennsylvania Turnpike Commission Revenue | 5.000% | 12/1/35 | 30,410 | 34,813 |
| Pennsylvania Turnpike Commission Revenue | 5.000% | 12/1/35 | 4,000 | 4,530 |
| Pennsylvania Turnpike Commission Revenue | 5.000% | 6/1/36 | 20,000 | 22,738 |
| Pennsylvania Turnpike Commission Revenue | 5.000% | 12/1/36 | 4,000 | 4,523 |
| 4 Pennsylvania Turnpike Commission Revenue TOB VRDO | 0.750% | 11/7/16 (12) | 3,245 | 3,245 |
| Philadelphia PA Airport Revenue | 5.000% | 6/15/23 | 2,000 | 2,218 |
| Philadelphia PA Authority for Industrial Development Revenue (Cultural & Commercial Corridors) | 5.000% | 12/1/26 | 5,000 | 5,967 |
| Philadelphia PA Authority for Industrial Development Revenue (Temple University) | 5.000% | 4/1/24 | 6,500 | 7,908 |
| Philadelphia PA Authority for Industrial Development Revenue (Temple University) | 5.000% | 4/1/25 | 7,820 | 9,629 |
| Philadelphia PA Authority for Industrial Development Revenue (Temple University) | 5.000% | 4/1/26 | 12,860 | 15,668 |
| Philadelphia PA Authority for Industrial Development Revenue (Temple University) | 5.000% | 4/1/27 | 6,750 | 8,155 |
| Philadelphia PA Authority for Industrial Development Revenue (Temple University) | 5.000% | 4/1/28 | 3,500 | 4,194 |
| Philadelphia PA Authority for Industrial Development Revenue (Temple University) | 5.000% | 4/1/29 | 2,500 | 2,973 |
| Philadelphia PA Authority for Industrial Development Revenue (Temple University) | 5.000% | 4/1/34 | 3,250 | 3,780 |
| Philadelphia PA Authority for Industrial Development Revenue (Temple University) | 5.000% | 4/1/35 | 7,135 | 8,270 |
| Philadelphia PA Gas Works Revenue | 5.000% | 10/1/17 (Prere.) | 4,065 | 4,224 |
| Philadelphia PA Gas Works Revenue | 5.000% | 10/1/21 | 7,170 | 8,285 |
| Philadelphia PA Gas Works Revenue | 5.000% | 10/1/23 | 5,550 | 6,642 |
| Philadelphia PA Gas Works Revenue | 5.000% | 8/1/24 | 6,400 | 7,757 |
| Philadelphia PA Gas Works Revenue | 5.000% | 10/1/24 | 1,800 | 2,181 |
| Philadelphia PA Gas Works Revenue | 5.000% | 10/1/25 | 2,500 | 3,058 |
| Philadelphia PA Gas Works Revenue | 5.000% | 10/1/29 | 3,275 | 3,930 |
| Philadelphia PA GO | 5.000% | 8/1/23 | 7,310 | 8,704 |
| Philadelphia PA GO | 5.000% | 8/1/26 | 9,000 | 10,872 |
| Philadelphia PA GO | 5.000% | 8/1/29 | 5,000 | 5,866 |
| Philadelphia PA Hospitals & Higher Education Facilities Authority Health System Revenue | | | | |
| (Jefferson Health System) | 5.250% | 5/15/20 (Prere.) | 24,000 | 27,416 |
| Philadelphia PA Hospitals & Higher Education Facilities Authority Hospital Revenue | | | | |
| (Temple University Health System Obligated Group) | 6.250% | 7/1/23 | 9,100 | 9,336 |
| Philadelphia PA Hospitals & Higher Education Facilities Authority Hospital Revenue | | | | |
| (Temple University Health System Obligated Group) | 5.500% | 7/1/26 | 4,275 | 4,340 |
| Philadelphia PA Hospitals & Higher Education Facilities Authority Hospital Revenue | | | | |
| (Temple University Health System Obligated Group) | 5.500% | 7/1/30 | 6,040 | 6,126 |
| Philadelphia PA Municipal Authority Revenue | 6.375% | 4/1/29 | 3,500 | 3,852 |
| Philadelphia PA School District GO | 5.000% | 9/1/21 | 5,000 | 5,505 |
| Philadelphia PA School District GO | 5.000% | 6/1/24 (4)(3) | 2,000 | 2,324 |
| 3 Philadelphia PA School District GO | 5.000% | 9/1/25 (15) | 34,410 | 40,566 |
| Philadelphia PA School District GO | 5.000% | 9/1/26 | 2,295 | 2,618 |
| Philadelphia PA School District GO | 5.000% | 9/1/32 | 2,100 | 2,322 |
| Philadelphia PA Water & Waste Water Revenue | 5.000% | 7/1/20 | 1,300 | 1,474 |
| Philadelphia PA Water & Waste Water Revenue | 5.000% | 8/1/22 (4) | 3,000 | 3,372 |
203
Intermediate-Term Tax-Exempt Fund
| | | | |
| | | | Face | Market |
| | | Maturity | Amount | Value• |
| | Coupon | Date | ($000) | ($000) |
| Philadelphia PA Water & Waste Water Revenue | 5.000% | 1/1/23 | 2,300 | 2,763 |
| Philadelphia PA Water & Waste Water Revenue | 5.000% | 7/1/23 | 2,000 | 2,428 |
| Philadelphia PA Water & Waste Water Revenue | 5.000% | 7/1/24 | 3,800 | 4,623 |
| Philadelphia PA Water & Waste Water Revenue | 5.000% | 7/1/26 | 5,500 | 6,626 |
| 3 Philadelphia PA Water & Waste Water Revenue | 5.000% | 10/1/26 | 6,000 | 7,437 |
| 3 Philadelphia PA Water & Waste Water Revenue | 5.000% | 10/1/27 | 3,810 | 4,706 |
| Philadelphia PA Water & Waste Water Revenue | 4.000% | 7/1/34 | 6,380 | 6,808 |
| Philadelphia PA Water & Waste Water Revenue | 4.000% | 7/1/35 | 11,000 | 11,713 |
| Pittsburgh & Allegheny County PA Sports & Exhibition Authority Lease Revenue VRDO | 0.750% | 11/7/16 (4) | 22,945 | 22,945 |
| Plum Borough PA School District GO | 5.000% | 9/15/23 (15) | 1,000 | 1,194 |
| Southcentral Pennsylvania General Authority Revenue (WellSpan Health Obligated Group) | 6.000% | 6/1/18 (Prere.) | 17,165 | 18,530 |
| Southcentral Pennsylvania General Authority Revenue (WellSpan Health Obligated Group) | 6.000% | 6/1/25 | 12,835 | 13,611 |
| Southeastern Pennsylvania Transportation Authority Revenue | 5.000% | 3/1/27 | 6,100 | 6,779 |
| Southeastern Pennsylvania Transportation Authority Revenue | 5.000% | 3/1/28 | 5,000 | 5,529 |
| St. Mary Hospital Authority Pennsylvania Health System Revenue (Catholic Health Initiatives) | 5.000% | 5/15/20 (Prere.) | 2,440 | 2,769 |
| St. Mary Hospital Authority Pennsylvania Health System Revenue (Catholic Health Initiatives) | 5.000% | 11/15/25 | 15,385 | 17,288 |
| St. Mary Hospital Authority Pennsylvania Health System Revenue (Catholic Health Initiatives) | 5.000% | 11/15/27 | 2,465 | 2,760 |
| State Public School Building Authority Pennsylvania College Revenue | | | | |
| (Delaware County Community College Project) | 5.000% | 10/1/24 (15) | 2,635 | 3,202 |
| State Public School Building Authority Pennsylvania College Revenue | | | | |
| (Delaware County Community College Project) | 5.000% | 10/1/25 (15) | 2,880 | 3,505 |
| State Public School Building Authority Pennsylvania College Revenue | | | | |
| (Delaware County Community College Project) | 5.000% | 10/1/26 (15) | 3,445 | 4,149 |
| State Public School Building Authority Pennsylvania College Revenue | | | | |
| (Delaware County Community College Project) | 5.000% | 10/1/27 (15) | 3,130 | 3,736 |
| State Public School Building Authority Pennsylvania College Revenue | | | | |
| (Montgomery County Community College) | 5.000% | 5/1/24 | 3,290 | 3,929 |
| 3 State Public School Building Authority Pennsylvania Lease Revenue | | | | |
| (School District of Philadelphia) | 5.000% | 6/1/24 | 21,000 | 24,279 |
| 3 State Public School Building Authority Pennsylvania Lease Revenue | | | | |
| (School District of Philadelphia) | 5.000% | 6/1/25 (4) | 9,505 | 11,135 |
| 3 State Public School Building Authority Pennsylvania Lease Revenue | | | | |
| (School District of Philadelphia) | 5.000% | 6/1/26 (4) | 31,500 | 37,116 |
| Unionville-Chadds Ford PA School District GO | 5.000% | 6/1/24 | 1,255 | 1,547 |
| Unionville-Chadds Ford PA School District GO | 5.000% | 6/1/25 | 1,750 | 2,182 |
| Unionville-Chadds Ford PA School District GO | 5.000% | 6/1/26 | 1,000 | 1,263 |
| University of Pittsburgh of the Commonwealth System of Higher Education | | | | |
| Pennsylvania Revenue | 5.000% | 9/15/17 | 3,990 | 4,136 |
| University of Pittsburgh of the Commonwealth System of Higher Education | | | | |
| Pennsylvania Revenue (University Capital Project) | 5.000% | 9/15/19 | 2,650 | 2,906 |
| University of Pittsburgh of the Commonwealth System of Higher Education | | | | |
| Pennsylvania Revenue (University Capital Project) | 5.500% | 9/15/23 | 9,000 | 9,941 |
| University of Pittsburgh of the Commonwealth System of Higher Education | | | | |
| Pennsylvania Revenue (University Capital Project) | 5.250% | 9/15/27 | 12,500 | 13,958 |
| University of Pittsburgh of the Commonwealth System of Higher Education | | | | |
| Pennsylvania Revenue (University Capital Project) | 5.250% | 9/15/28 | 2,375 | 2,650 |
| University of Pittsburgh of the Commonwealth System of Higher Education | | | | |
| Pennsylvania Revenue (University Capital Project) | 5.250% | 9/15/29 | 11,250 | 12,539 |
| Upper Merion PA Area School District GO | 4.000% | 1/15/26 | 1,000 | 1,155 |
| Westmoreland County PA Industrial Development Authority Revenue (Excela Health Project) | 5.000% | 7/1/19 | 1,235 | 1,328 |
| Westmoreland County PA Industrial Development Authority Revenue (Excela Health Project) | 5.250% | 7/1/20 | 1,330 | 1,473 |
| Westmoreland County PA Industrial Development Authority Revenue (Excela Health Project) | 5.000% | 7/1/25 | 4,500 | 4,966 |
| Westmoreland County PA Municipal Authority Revenue | 5.000% | 8/15/32 | 15,000 | 17,297 |
| Wilkes-Barre PA Finance Authority Revenue (University of Scranton Project) | 5.000% | 11/1/21 | 1,015 | 1,145 |
| Wilkes-Barre PA Finance Authority Revenue (University of Scranton Project) | 5.000% | 11/1/22 | 1,160 | 1,305 |
| Wilkes-Barre PA Finance Authority Revenue (University of Scranton Project) | 5.000% | 11/1/23 | 1,350 | 1,515 |
| Wilkes-Barre PA Finance Authority Revenue (University of Scranton Project) | 5.000% | 11/1/24 | 1,420 | 1,589 |
| Wilkes-Barre PA Finance Authority Revenue (University of Scranton Project) | 5.000% | 11/1/25 | 1,465 | 1,640 |
| Wilkes-Barre PA Finance Authority Revenue (University of Scranton Project) | 5.000% | 11/1/30 | 6,185 | 6,925 |
| | | | | 2,551,427 |
| Puerto Rico (0.2%) | | | | |
| Puerto Rico Electric Power Authority Revenue | 5.000% | 7/1/19 (14) | 10,430 | 10,562 |
| Puerto Rico Electric Power Authority Revenue | 5.000% | 7/1/20 (14) | 18,245 | 18,416 |
| Puerto Rico Electric Power Authority Revenue | 5.000% | 7/1/21 (14) | 24,290 | 24,598 |
| Puerto Rico Electric Power Authority Revenue | 5.250% | 7/1/21 (14) | 5,000 | 5,487 |
| Puerto Rico Electric Power Authority Revenue | 5.250% | 7/1/22 (14) | 10,000 | 11,057 |
| Puerto Rico Highway & Transportation Authority Revenue | 5.250% | 7/1/21 (13)(3) | 5,300 | 6,023 |
| Puerto Rico Sales Tax Financing Corp. Revenue | 5.500% | 8/1/19 (Prere.) | 255 | 286 |
| | | | | 76,429 |
204
Intermediate-Term Tax-Exempt Fund
| | | | |
| | | | Face | Market |
| | | Maturity | Amount | Value• |
| | Coupon | Date | ($000) | ($000) |
| Rhode Island (0.2%) | | | | |
| Rhode Island & Providence Plantations GO | 5.500% | 8/1/28 | 9,805 | 11,570 |
| Rhode Island & Providence Plantations GO | 5.500% | 8/1/30 | 3,610 | 4,233 |
| Rhode Island Commerce Corp. Airport Revenue | 5.000% | 7/1/28 | 500 | 595 |
| Rhode Island Commerce Corp. Airport Revenue | 5.000% | 7/1/32 | 650 | 755 |
| Rhode Island Commerce Corp. Airport Revenue | 5.000% | 7/1/35 | 1,575 | 1,810 |
| Rhode Island Commerce Corp. Airport Revenue | 5.000% | 7/1/37 | 500 | 573 |
| Rhode Island Economic Development Corp. Revenue (Department of Transportation) | 5.250% | 6/15/19 (Prere.) | 20,000 | 22,185 |
| Rhode Island Economic Development Corp. Revenue (Department of Transportation) | 5.250% | 6/15/19 (Prere.) | 25,000 | 27,731 |
| Rhode Island Health & Educational Building Corp. Higher Education Facilities Revenue | | | | |
| (University of Rhode Island) | 5.000% | 9/15/26 | 1,260 | 1,559 |
| Rhode Island Health & Educational Building Corp. Higher Education Facilities Revenue | | | | |
| (University of Rhode Island) | 5.000% | 9/15/27 | 2,000 | 2,444 |
| Rhode Island Health & Educational Building Corp. Hospital Financing Revenue | | | | |
| (Care New England Health System Obligated Group) | 5.500% | 9/1/23 (Prere.) | 6,000 | 7,493 |
| Rhode Island Health & Educational Building Corp. Hospital Financing Revenue | | | | |
| (Care New England Health System Obligated Group) | 6.000% | 9/1/23 (Prere.) | 5,500 | 7,045 |
| Rhode Island Health & Educational Building Corp. Hospital Financing Revenue | | | | |
| (Care New England Health System Obligated Group) | 5.000% | 9/1/25 | 5,000 | 5,545 |
| Rhode Island Health & Educational Building Corp. Hospital Financing Revenue | | | | |
| (Care New England Health System Obligated Group) | 5.000% | 9/1/26 | 5,000 | 5,558 |
| Rhode Island Health & Educational Building Corp. Hospital Financing Revenue | | | | |
| (Care New England Health System Obligated Group) | 5.000% | 9/1/31 | 3,000 | 3,249 |
| Rhode Island Health & Educational Building Corp. Hospital Financing Revenue | | | | |
| (Lifespan Obligated Group) | 5.000% | 5/15/24 | 2,350 | 2,789 |
| Rhode Island Health & Educational Building Corp. Public Schools Revenue (Pooled Issue) | 4.500% | 5/15/18 (Prere.) | 2,880 | 3,040 |
| Rhode Island Health & Educational Building Corp. Public Schools Revenue (Pooled Issue) | 4.625% | 5/15/18 (Prere.) | 3,210 | 3,394 |
| Rhode Island Health & Educational Building Corp. Public Schools Revenue (Pooled Issue) | 4.750% | 5/15/18 (Prere.) | 3,500 | 3,707 |
| Tobacco Settlement Financing Corp. Rhode Island Revenue | 2.250% | 6/1/41 | 6,015 | 6,038 |
| | | | | 121,313 |
| South Carolina (1.1%) | | | | |
| Aiken County SC Consolidated School District | 5.000% | 3/1/24 | 7,980 | 9,880 |
| Beaufort County SC School District GO | 5.000% | 3/1/18 | 3,800 | 4,011 |
| Beaufort County SC School District GO | 5.000% | 3/1/21 | 3,245 | 3,767 |
| Berkeley County SC School District Revenue | 5.000% | 3/1/18 | 3,670 | 3,871 |
| Berkeley County SC Utility Revenue | 5.000% | 6/1/30 | 8,170 | 9,675 |
| Charleston County SC GO | 5.000% | 11/1/21 | 2,765 | 3,282 |
| Charleston SC Educational Excellence Financing Corp. Revenue | | | | |
| (Charleston County School District, South Carolina Project) | 5.000% | 12/1/16 (Prere.) | 3,105 | 3,116 |
| Charleston SC Educational Excellence Financing Corp. Revenue | | | | |
| (Charleston County School District, South Carolina Project) | 5.000% | 12/1/27 | 10,000 | 12,086 |
| Charleston SC Waterworks & Sewer Capital Improvement Revenue | 5.000% | 1/1/20 | 3,075 | 3,458 |
| Dorchester County SC School District No. 2 Installment Purchase Revenue | 4.000% | 12/1/25 | 8,805 | 9,894 |
| Dorchester County SC School District No. 2 Installment Purchase Revenue | 4.000% | 12/1/26 | 9,760 | 10,890 |
| Florence County SC School District GO | 5.000% | 3/1/18 | 2,730 | 2,879 |
| Greenville County SC Hospital Revenue (Greenville Hospital System) | 4.125% | 5/1/17 | 5,315 | 5,398 |
| Greenville County SC Hospital Revenue (Greenville Hospital System) | 5.000% | 5/1/18 | 2,655 | 2,805 |
| Greenville County SC School District Installment Revenue | 5.500% | 12/1/19 | 32,480 | 36,765 |
| Greenville County SC School District Installment Revenue | 5.000% | 12/1/26 | 28,255 | 28,355 |
| Kershaw County SC Public Schools Foundation Installment Purchase Revenue | 5.000% | 12/1/24 | 1,000 | 1,204 |
| Kershaw County SC Public Schools Foundation Installment Purchase Revenue | 5.000% | 12/1/25 | 1,080 | 1,311 |
| Lexington County SC Health Services District Inc. Hospital Revenue | 5.000% | 11/1/26 | 6,220 | 7,095 |
| Lexington County SC Health Services District Inc. Hospital Revenue | 5.000% | 11/1/35 | 3,000 | 3,487 |
| Lexington County SC Health Services District Inc. Hospital Revenue | 5.000% | 11/1/36 | 5,040 | 5,841 |
| Lexington County SC Health Services District Inc. Hospital Revenue | 5.000% | 11/1/37 | 11,305 | 13,081 |
| Myrtle Beach SC Hospitality Fee Revenue | 5.000% | 6/1/26 | 1,000 | 1,191 |
| Myrtle Beach SC Hospitality Fee Revenue | 5.000% | 6/1/27 | 2,075 | 2,458 |
| Myrtle Beach SC Hospitality Fee Revenue | 5.000% | 6/1/30 | 1,000 | 1,162 |
| Myrtle Beach SC Hospitality Fee Revenue | 5.000% | 6/1/31 | 2,500 | 2,888 |
| Myrtle Beach SC Hospitality Fee Revenue | 5.000% | 6/1/33 | 2,750 | 3,155 |
| Newberry County SC School District Installment Purchase Revenue | 5.000% | 12/1/26 | 4,000 | 4,854 |
| Newberry County SC School District Installment Purchase Revenue | 5.000% | 12/1/29 | 3,390 | 4,035 |
| Newberry County SC School District Installment Purchase Revenue | 5.000% | 12/1/30 | 5,210 | 6,179 |
| Piedmont SC Municipal Power Agency Revenue | 5.000% | 1/1/20 | 14,100 | 15,736 |
| Piedmont SC Municipal Power Agency Revenue | 0.000% | 1/1/22 (14) | 9,950 | 8,987 |
| Piedmont SC Municipal Power Agency Revenue | 0.000% | 1/1/23 (14) | 8,780 | 7,705 |
| Piedmont SC Municipal Power Agency Revenue | 5.000% | 1/1/23 | 1,335 | 1,593 |
| Piedmont SC Municipal Power Agency Revenue | 0.000% | 1/1/24 (14) | 2,400 | 2,055 |
| Piedmont SC Municipal Power Agency Revenue | 5.000% | 1/1/24 | 3,535 | 4,021 |
205
Intermediate-Term Tax-Exempt Fund
| | | | |
| | | | Face | Market |
| | | Maturity | Amount | Value• |
| | Coupon | Date | ($000) | ($000) |
| Piedmont SC Municipal Power Agency Revenue | 5.000% | 1/1/24 | 2,000 | 2,421 |
| Piedmont SC Municipal Power Agency Revenue | 5.000% | 1/1/24 | 13,620 | 14,203 |
| Piedmont SC Municipal Power Agency Revenue | 5.000% | 1/1/25 | 8,020 | 9,080 |
| Piedmont SC Municipal Power Agency Revenue | 5.000% | 1/1/25 | 3,000 | 3,672 |
| Piedmont SC Municipal Power Agency Revenue | 5.000% | 1/1/29 (4) | 8,600 | 9,658 |
| Piedmont SC Municipal Power Agency Revenue | 5.000% | 1/1/29 (4) | 2,800 | 3,145 |
| South Carolina Association of Governmental Organizations Educational Facilities Corp. Revenue | | | | |
| (Pickens School District) | 5.000% | 12/1/23 | 2,000 | 2,428 |
| South Carolina Association of Governmental Organizations Educational Facilities Corp. Revenue | | | | |
| (Pickens School District) | 5.000% | 12/1/24 | 2,300 | 2,824 |
| South Carolina Association of Governmental Organizations Educational Facilities Corp. Revenue | | | | |
| (Pickens School District) | 5.000% | 12/1/26 | 2,000 | 2,418 |
| South Carolina Association of Governmental Organizations Educational Facilities Corp. Revenue | | | | |
| (Pickens School District) | 5.000% | 12/1/27 | 2,500 | 3,005 |
| South Carolina GO | 5.000% | 4/1/18 | 2,400 | 2,542 |
| South Carolina GO | 5.000% | 4/1/19 | 7,825 | 8,587 |
| South Carolina GO | 5.000% | 4/1/19 | 2,495 | 2,738 |
| South Carolina GO | 5.000% | 8/1/19 | 10,465 | 11,617 |
| South Carolina GO | 5.000% | 10/1/19 | 4,530 | 5,056 |
| South Carolina GO | 5.000% | 4/1/25 | 2,150 | 2,724 |
| South Carolina Higher Education Revenue (Clemson University) | 5.000% | 5/1/20 | 4,410 | 5,014 |
| South Carolina Higher Education Revenue (Clemson University) | 5.000% | 5/1/21 | 2,380 | 2,784 |
| South Carolina Higher Education Revenue (Clemson University) | 5.000% | 5/1/22 | 4,860 | 5,831 |
| South Carolina Jobs Economic Development Authority Hospital Revenue (AnMed Health Project) | 5.000% | 2/1/18 | 2,000 | 2,096 |
| South Carolina Jobs Economic Development Authority Hospital Revenue (Palmetto Health) | 5.250% | 8/1/23 (4) | 6,275 | 6,672 |
| South Carolina Jobs Economic Development Authority Hospital Revenue (Palmetto Health) | 5.250% | 8/1/24 (4) | 6,200 | 6,578 |
| South Carolina Jobs Economic Development Authority Hospital Revenue (Palmetto Health) | 5.250% | 8/1/25 (4) | 6,925 | 7,332 |
| South Carolina Jobs Economic Development Authority Hospital Revenue (Palmetto Health) | 5.000% | 8/1/27 | 11,740 | 13,575 |
| South Carolina Jobs Economic Development Authority Hospital Revenue (Palmetto Health) | 5.250% | 8/1/27 (4) | 13,550 | 14,302 |
| South Carolina Jobs Economic Development Authority Hospital Revenue (Palmetto Health) | 5.000% | 8/1/28 | 7,850 | 9,021 |
| South Carolina Public Service Authority Revenue | 5.000% | 12/1/16 | 7,225 | 7,251 |
| South Carolina Public Service Authority Revenue | 5.000% | 12/1/23 | 10,000 | 12,160 |
| South Carolina Public Service Authority Revenue | 5.000% | 12/1/24 | 13,900 | 17,104 |
| South Carolina Public Service Authority Revenue | 5.000% | 12/1/25 | 5,615 | 6,907 |
| South Carolina Public Service Authority Revenue | 5.000% | 12/1/27 | 4,295 | 5,225 |
| South Carolina Public Service Authority Revenue | 5.000% | 12/1/28 | 15,130 | 18,355 |
| South Carolina Public Service Authority Revenue | 5.000% | 12/1/29 | 6,065 | 7,308 |
| South Carolina Public Service Authority Revenue | 5.000% | 12/1/30 | 5,000 | 6,045 |
| South Carolina Public Service Authority Revenue | 5.000% | 12/1/30 | 10,510 | 12,592 |
| South Carolina Public Service Authority Revenue | 5.000% | 12/1/31 | 13,980 | 16,625 |
| South Carolina Public Service Authority Revenue | 5.000% | 12/1/32 | 8,535 | 10,101 |
| South Carolina Public Service Authority Revenue | 5.000% | 12/1/33 | 10,465 | 12,302 |
| South Carolina Public Service Authority Revenue | 5.000% | 12/1/34 | 20,000 | 23,712 |
| South Carolina Public Service Authority Revenue | 5.000% | 12/1/35 | 9,310 | 11,004 |
| South Carolina Public Service Authority Revenue | 5.000% | 12/1/35 | 3,000 | 3,570 |
| South Carolina Transportation Infrastructure Revenue | 5.000% | 10/1/18 | 5,185 | 5,583 |
| Sumter Two School Facilities Inc. South Carolina Installment Purchase Revenue | 5.000% | 12/1/24 (15) | 1,000 | 1,206 |
| Sumter Two School Facilities Inc. South Carolina Installment Purchase Revenue | 5.000% | 12/1/25 (15) | 1,440 | 1,753 |
| | | | | 586,296 |
| South Dakota (0.1%) | | | | |
| Educational Enhancement Funding Corp. South Dakota Tobacco Settlement Revenue | 5.000% | 6/1/23 | 1,000 | 1,170 |
| South Dakota Building Authority Revenue | 5.000% | 6/1/33 | 4,000 | 4,667 |
| South Dakota Health & Educational Facilities Authority Revenue (Sanford Health) | 5.000% | 11/1/23 | 650 | 790 |
| South Dakota Health & Educational Facilities Authority Revenue (Sanford Health) | 5.000% | 11/1/24 | 650 | 798 |
| South Dakota Health & Educational Facilities Authority Revenue (Sanford Health) | 5.000% | 11/1/25 | 600 | 728 |
| South Dakota Health & Educational Facilities Authority Revenue (Sanford Health) | 5.000% | 11/1/26 | 675 | 810 |
| South Dakota Health & Educational Facilities Authority Revenue (Sanford Health) | 5.000% | 11/1/27 | 1,025 | 1,219 |
| South Dakota Health & Educational Facilities Authority Revenue (Sanford Health) | 5.000% | 11/1/28 | 825 | 970 |
| South Dakota Health & Educational Facilities Authority Revenue (Sanford Health) | 5.000% | 11/1/29 | 1,415 | 1,650 |
| South Dakota Health & Educational Facilities Authority Revenue (Sanford Health) | 5.250% | 11/1/29 | 2,000 | 2,199 |
| South Dakota Health & Educational Facilities Authority Revenue (Sanford Health) | 5.000% | 11/1/34 | 8,250 | 9,428 |
| | | | | 24,429 |
| Tennessee (1.0%) | | | | |
| Chattanooga TN Electric System Revenue | 5.000% | 9/1/28 | 2,315 | 2,850 |
| Chattanooga TN Electric System Revenue | 5.000% | 9/1/31 | 2,250 | 2,717 |
| Chattanooga-Hamilton County TN Hospital Authority Hospital Revenue | 5.000% | 10/1/23 | 650 | 774 |
| Chattanooga-Hamilton County TN Hospital Authority Hospital Revenue | 5.000% | 10/1/24 | 745 | 898 |
| Chattanooga-Hamilton County TN Hospital Authority Hospital Revenue | 5.000% | 10/1/26 | 1,485 | 1,762 |
| Chattanooga-Hamilton County TN Hospital Authority Hospital Revenue | 5.000% | 10/1/28 | 2,400 | 2,768 |
206
Intermediate-Term Tax-Exempt Fund
| | | | |
| | | | Face | Market |
| | | Maturity | Amount | Value• |
| | Coupon | Date | ($000) | ($000) |
| Chattanooga-Hamilton County TN Hospital Authority Hospital Revenue | 5.000% | 10/1/29 | 5,325 | 6,108 |
| Chattanooga-Hamilton County TN Hospital Authority Hospital Revenue | 5.000% | 10/1/30 | 5,615 | 6,414 |
| Chattanooga-Hamilton County TN Hospital Authority Hospital Revenue | 5.000% | 10/1/32 | 6,520 | 7,374 |
| Chattanooga-Hamilton County TN Hospital Authority Hospital Revenue | 5.000% | 10/1/33 | 6,340 | 7,151 |
| Chattanooga-Hamilton County TN Hospital Authority Hospital Revenue | 5.000% | 10/1/34 | 2,590 | 2,916 |
| Clarksville TN Public Building Authority Revenue (Pooled Financing) VRDO | 0.590% | 11/1/16 LOC | 4,000 | 4,000 |
| Clarksville TN Public Building Authority Revenue (Pooled Financing) VRDO | 0.590% | 11/1/16 LOC | 6,885 | 6,885 |
| Jackson TN Hospital Improvement Revenue (Jackson-Madison County General Hospital Project) | 5.250% | 4/1/18 (Prere.) | 6,045 | 6,419 |
| Jackson TN Hospital Improvement Revenue (Jackson-Madison County General Hospital Project) | 5.375% | 4/1/18 (Prere.) | 5,835 | 6,206 |
| Jackson TN Hospital Improvement Revenue (Jackson-Madison County General Hospital Project) | 5.000% | 4/1/19 | 1,145 | 1,249 |
| Jackson TN Hospital Improvement Revenue (Jackson-Madison County General Hospital Project) | 5.000% | 4/1/20 | 3,480 | 3,911 |
| Jackson TN Hospital Improvement Revenue (Jackson-Madison County General Hospital Project) | 5.250% | 4/1/23 | 2,235 | 2,365 |
| Jackson TN Hospital Improvement Revenue (Jackson-Madison County General Hospital Project) | 5.375% | 4/1/28 | 2,165 | 2,281 |
| Jackson TN Hospital Improvement Revenue (Jackson-Madison County General Hospital Project) | 5.250% | 4/1/31 | 5,880 | 6,992 |
| Jackson TN Hospital Improvement Revenue (Jackson-Madison County General Hospital Project) | 5.250% | 4/1/32 | 8,780 | 10,361 |
| Jackson TN Hospital Improvement Revenue (Jackson-Madison County General Hospital Project) | 5.250% | 4/1/33 | 9,240 | 10,881 |
| Jackson TN Hospital Improvement Revenue (Jackson-Madison County General Hospital Project) | 5.250% | 4/1/34 | 7,725 | 9,077 |
| Knox County TN GO | 5.000% | 4/1/18 | 2,105 | 2,229 |
| Knox County TN Health Educational & Housing Facilities Board Hospital Facilities Revenue | | | | |
| (Covenant Healthcare) | 5.000% | 1/1/21 | 2,500 | 2,851 |
| Knox County TN Health Educational & Housing Facilities Board Hospital Facilities Revenue | | | | |
| (Covenant Healthcare) | 5.000% | 1/1/22 | 1,100 | 1,282 |
| Knox County TN Health Educational & Housing Facilities Board Hospital Facilities Revenue | | | | |
| (Covenant Healthcare) | 5.000% | 1/1/23 | 4,860 | 5,776 |
| Memphis TN GO | 5.000% | 11/1/16 (Prere.) | 4,000 | 4,000 |
| Memphis TN GO | 5.000% | 5/1/28 | 3,145 | 3,633 |
| Memphis TN GO | 5.000% | 5/1/30 | 1,715 | 1,971 |
| Metropolitan Government of Nashville & Davidson County TN GO | 5.000% | 1/1/18 (Prere.) | 5,000 | 5,243 |
| Metropolitan Government of Nashville & Davidson County TN GO | 5.000% | 7/1/19 | 13,085 | 14,462 |
| Metropolitan Government of Nashville & Davidson County TN GO | 5.000% | 1/1/28 | 7,755 | 9,721 |
| Metropolitan Government of Nashville & Davidson County TN GO | 5.000% | 1/1/30 | 5,000 | 6,159 |
| Metropolitan Government of Nashville & Davidson County TN GO | 5.000% | 1/1/31 | 5,000 | 6,125 |
| Metropolitan Government of Nashville & Davidson County TN GO | 5.000% | 1/1/32 | 10,000 | 12,183 |
| 3 Metropolitan Government of Nashville & Davidson County TN Health & | | | | |
| Educational Facilities Board Revenue (Ascension Health Credit Group) PUT | 1.550% | 11/3/20 | 8,500 | 8,514 |
| Metropolitan Government of Nashville & Davidson County TN Health & | | | | |
| Educational Facilities Board Revenue (Blakeford at Green Hills) | 5.000% | 7/1/27 | 1,000 | 1,110 |
| Metropolitan Government of Nashville & Davidson County TN Health & | | | | |
| Educational Facilities Board Revenue (Vanderbilt University) | 5.000% | 7/1/35 | 5,000 | 5,866 |
| 1 Metropolitan Government of Nashville & Davidson County TN Health & | | | | |
| Educational Facilities Board Revenue (Vanderbilt University) PUT | 1.230% | 4/1/17 (Prere.) | 5,640 | 5,640 |
| 1 Metropolitan Government of Nashville & Davidson County TN Health & | | | | |
| Educational Facilities Board Revenue (Vanderbilt University) PUT | 1.230% | 10/1/17 | 5,860 | 5,854 |
| Montgomery County TN Public Building Authority Pooled Financial Revenue | | | | |
| (Tennessee County Loan Pool) VRDO | 0.590% | 11/1/16 LOC | 3,300 | 3,300 |
| Shelby County TN GO | 4.750% | 3/1/18 | 5,525 | 5,813 |
| Shelby County TN GO | 5.000% | 4/1/19 (ETM) | 100 | 110 |
| Shelby County TN GO | 5.000% | 4/1/19 | 400 | 439 |
| Shelby County TN GO | 5.000% | 4/1/24 | 2,000 | 2,480 |
| Shelby County TN GO | 5.000% | 4/1/25 | 8,000 | 10,034 |
| Shelby County TN GO | 5.000% | 4/1/26 | 4,000 | 5,096 |
| Shelby County TN Health Educational & Housing Facility Board Revenue | | | | |
| (Baptist Memorial Health Care) | 5.000% | 9/1/18 | 7,180 | 7,670 |
| Shelby County TN Health Educational & Housing Facility Board Revenue | | | | |
| (Baptist Memorial Health Care) | 5.000% | 9/1/19 | 2,000 | 2,198 |
| Shelby County TN Health Educational & Housing Facility Board Revenue | | | | |
| (Methodist Le Bonheur Healthcare) VRDO | 0.510% | 11/1/16 (4) | 30,010 | 30,010 |
| Shelby County TN Health Educational & Housing Facility Board Revenue | | | | |
| (Methodist Le Bonheur Healthcare) VRDO | 0.520% | 11/1/16 (4) | 13,545 | 13,545 |
| Tennessee Energy Acquisition Corp. Gas Revenue | 5.250% | 9/1/17 | 39,340 | 40,616 |
| Tennessee Energy Acquisition Corp. Gas Revenue | 5.250% | 9/1/18 | 57,705 | 61,657 |
| Tennessee Energy Acquisition Corp. Gas Revenue | 5.250% | 9/1/21 | 50 | 58 |
| Tennessee Energy Acquisition Corp. Gas Revenue | 5.000% | 2/1/22 | 10,135 | 11,621 |
| Tennessee Energy Acquisition Corp. Gas Revenue | 5.000% | 2/1/24 | 10,960 | 12,806 |
| Tennessee Energy Acquisition Corp. Gas Revenue | 5.000% | 2/1/25 | 5,815 | 6,836 |
| Tennessee Energy Acquisition Corp. Gas Revenue | 5.250% | 9/1/26 | 1,550 | 1,900 |
| Tennessee Energy Acquisition Corp. Gas Revenue | 5.000% | 2/1/27 | 18,000 | 21,595 |
| Tennessee GO | 5.000% | 5/1/17 (Prere.) | 2,075 | 2,120 |
| Tennessee GO | 5.000% | 8/1/17 | 3,165 | 3,268 |
| Tennessee GO | 5.000% | 10/1/17 | 6,000 | 6,236 |
207
Intermediate-Term Tax-Exempt Fund
| | | | |
| | | | Face | Market |
| | | Maturity | Amount | Value• |
| | Coupon | Date | ($000) | ($000) |
| Tennessee GO | 4.000% | 8/1/18 | 2,500 | 2,637 |
| Tennessee GO | 5.000% | 8/1/18 | 2,565 | 2,751 |
| Tennessee GO | 5.000% | 8/1/19 | 4,000 | 4,441 |
| Tennessee GO | 5.000% | 8/1/19 | 2,165 | 2,404 |
| Tennessee GO | 5.000% | 8/1/20 | 2,500 | 2,864 |
| Tennessee GO | 5.000% | 8/1/20 | 2,200 | 2,520 |
| Tennessee GO | 5.000% | 8/1/21 | 3,420 | 4,030 |
| Tennessee GO | 5.000% | 8/1/21 | 2,000 | 2,357 |
| Tennessee GO | 5.000% | 8/1/22 | 2,000 | 2,418 |
| Tennessee GO | 5.000% | 8/1/22 | 3,000 | 3,628 |
| Tennessee GO | 5.000% | 8/1/23 | 3,525 | 4,353 |
| Tennessee GO | 5.000% | 9/1/27 | 2,000 | 2,484 |
| Tennessee GO | 5.000% | 9/1/27 | 4,300 | 5,341 |
| Tennessee GO | 5.000% | 9/1/28 | 1,850 | 2,281 |
| Tennessee Housing Development Agency Homeownership Program Revenue | 4.500% | 7/1/37 | 2,100 | 2,235 |
| Tennessee School Bond Authority Higher Educational Facilities Revenue (2nd Program) | 5.000% | 11/1/22 | 3,000 | 3,627 |
| Tennessee School Bond Authority Higher Educational Facilities Revenue (2nd Program) | 5.000% | 11/1/23 | 3,520 | 4,334 |
| Tennessee School Bond Authority Higher Educational Facilities Revenue (2nd Program) | 5.000% | 11/1/24 | 2,500 | 3,121 |
| Tennessee School Bond Authority Higher Educational Facilities Revenue (2nd Program) | 5.000% | 11/1/25 | 5,000 | 6,273 |
| Tennessee School Bond Authority Higher Educational Facilities Revenue (2nd Program) | 5.000% | 11/1/26 | 2,055 | 2,564 |
| Tennessee School Bond Authority Higher Educational Facilities Revenue (2nd Program) | 5.000% | 11/1/27 | 2,305 | 2,849 |
| Tennessee School Bond Authority Higher Educational Facilities Revenue (2nd Program) | 5.000% | 11/1/28 | 1,555 | 1,911 |
| Tennessee School Bond Authority Higher Educational Facilities Revenue (2nd Program) | 5.000% | 11/1/29 | 1,400 | 1,709 |
| Tennessee School Bond Authority Higher Educational Facilities Revenue (2nd Program) | 5.000% | 11/1/31 | 1,500 | 1,811 |
| Tennessee School Bond Authority Higher Educational Facilities Revenue (2nd Program) | 5.000% | 11/1/34 | 1,150 | 1,372 |
| | | | | 540,701 |
| Texas (10.3%) | | | | |
| Alamo TX Regional Mobility Authority Revenue | 5.000% | 6/15/26 | 2,670 | 3,289 |
| Alamo TX Regional Mobility Authority Revenue | 5.000% | 6/15/27 | 1,500 | 1,834 |
| Alamo TX Regional Mobility Authority Revenue | 5.000% | 6/15/29 | 3,090 | 3,729 |
| Alamo TX Regional Mobility Authority Revenue | 5.000% | 6/15/31 | 3,055 | 3,641 |
| Alamo TX Regional Mobility Authority Revenue | 5.000% | 6/15/33 | 3,755 | 4,434 |
| Alamo TX Regional Mobility Authority Revenue | 5.000% | 6/15/34 | 3,945 | 4,642 |
| Alamo TX Regional Mobility Authority Revenue | 5.000% | 6/15/35 | 4,140 | 4,858 |
| Alamo TX Regional Mobility Authority Revenue | 5.000% | 6/15/36 | 4,350 | 5,093 |
| Aldine TX Independent School District GO | 5.000% | 2/15/20 | 5,000 | 5,628 |
| Aldine TX Independent School District GO | 4.000% | 2/15/31 | 12,120 | 13,406 |
| Aldine TX Independent School District GO | 4.000% | 2/15/32 | 12,660 | 13,914 |
| Alief TX Independent School District GO | 5.000% | 2/15/26 | 2,635 | 3,335 |
| Allen TX Independent School District GO | 5.000% | 2/15/31 | 1,000 | 1,216 |
| Allen TX Independent School District GO | 5.000% | 2/15/32 | 1,000 | 1,210 |
| Arlington TX Independent School District GO | 5.000% | 2/15/20 | 1,705 | 1,919 |
| Arlington TX Independent School District GO | 5.000% | 2/15/24 | 4,500 | 5,540 |
| Austin TX Combined Utility System Revenue | 0.000% | 5/15/18 (14) | 24,215 | 23,783 |
| Austin TX Community College District Public Facilities Corp. Lease Revenue | 5.000% | 8/1/23 | 1,250 | 1,499 |
| Austin TX Community College District Public Facilities Corp. Lease Revenue | 5.000% | 8/1/24 | 1,000 | 1,216 |
| Austin TX Community College District Public Facilities Corp. Lease Revenue | 5.000% | 8/1/25 | 1,500 | 1,845 |
| Austin TX Community College District Public Facilities Corp. Lease Revenue | 5.000% | 8/1/26 | 1,000 | 1,224 |
| Austin TX Community College District Public Facilities Corp. Lease Revenue | 5.000% | 8/1/28 | 1,750 | 2,107 |
| Austin TX Electric Utility System Revenue | 5.000% | 11/15/25 | 4,750 | 5,653 |
| Austin TX GO | 5.000% | 9/1/29 | 2,855 | 3,469 |
| Austin TX GO | 5.000% | 9/1/30 | 1,240 | 1,497 |
| Austin TX GO | 5.000% | 9/1/31 | 2,140 | 2,572 |
| Austin TX GO | 5.000% | 9/1/33 | 4,315 | 5,142 |
| Austin TX Independent School District GO | 5.000% | 8/1/24 | 3,500 | 4,343 |
| Austin TX Independent School District GO | 5.000% | 8/1/25 | 3,000 | 3,772 |
| Austin TX Independent School District GO | 5.000% | 8/1/26 | 3,000 | 3,820 |
| Austin TX Independent School District GO | 5.000% | 8/1/27 | 6,185 | 7,793 |
| Austin TX Independent School District GO | 5.000% | 8/1/30 | 1,225 | 1,469 |
| Austin TX Water & Wastewater System Revenue | 5.000% | 11/15/21 | 2,500 | 2,798 |
| Austin TX Water & Wastewater System Revenue | 5.000% | 11/15/21 | 350 | 413 |
| Austin TX Water & Wastewater System Revenue | 5.000% | 11/15/30 | 5,000 | 5,921 |
| Austin TX Water & Wastewater System Revenue | 5.000% | 11/15/31 | 4,000 | 4,724 |
| Austin TX Water & Wastewater System Revenue | 5.000% | 11/15/32 | 10,000 | 12,187 |
| Austin TX Water & Wastewater System Revenue | 5.000% | 11/15/32 | 10,705 | 12,614 |
| Austin TX Water & Wastewater System Revenue | 5.000% | 11/15/33 | 5,000 | 6,064 |
| Austin TX Water & Wastewater System Revenue | 5.000% | 11/15/33 | 11,410 | 13,393 |
| Austin TX Water & Wastewater System Revenue | 5.000% | 11/15/34 | 5,545 | 6,698 |
| Austin TX Water & Wastewater System Revenue | 5.000% | 11/15/34 | 12,075 | 14,128 |
208
Intermediate-Term Tax-Exempt Fund
| | | | |
| | | | Face | Market |
| | | Maturity | Amount | Value• |
| | Coupon | Date | ($000) | ($000) |
| Bexar County TX GO | 5.000% | 6/15/20 | 3,400 | 3,860 |
| Camino Real Texas Mobility Authority Revenue | 5.250% | 2/15/18 | 11,960 | 12,607 |
| Camino Real Texas Mobility Authority Revenue | 5.250% | 8/15/18 | 11,770 | 12,399 |
| Camino Real Texas Mobility Authority Revenue | 5.250% | 2/15/19 | 12,595 | 13,259 |
| Camino Real Texas Mobility Authority Revenue | 5.250% | 8/15/19 | 12,925 | 13,601 |
| Camino Real Texas Mobility Authority Revenue | 5.250% | 2/15/20 | 13,265 | 13,947 |
| Camino Real Texas Mobility Authority Revenue | 5.250% | 8/15/20 | 13,580 | 14,268 |
| Camino Real Texas Mobility Authority Revenue | 5.000% | 2/15/21 | 1,780 | 1,787 |
| 3 Carrollton-Farmers Branch TX Independent School District GO | 4.000% | 2/15/20 | 5,060 | 5,526 |
| Central Texas Regional Mobility Authority Revenue | 5.000% | 1/1/17 | 250 | 252 |
| Central Texas Regional Mobility Authority Revenue | 5.000% | 1/1/18 | 250 | 261 |
| Central Texas Regional Mobility Authority Revenue | 5.000% | 1/1/19 | 735 | 792 |
| Central Texas Regional Mobility Authority Revenue | 5.000% | 1/1/20 | 1,550 | 1,715 |
| Central Texas Regional Mobility Authority Revenue | 5.750% | 1/1/20 | 1,150 | 1,301 |
| Central Texas Regional Mobility Authority Revenue | 5.750% | 1/1/20 (Prere.) | 2,925 | 3,341 |
| Central Texas Regional Mobility Authority Revenue | 5.000% | 1/1/21 | 1,170 | 1,323 |
| Central Texas Regional Mobility Authority Revenue | 5.750% | 1/1/21 (Prere.) | 4,000 | 4,729 |
| Central Texas Regional Mobility Authority Revenue | 5.000% | 1/1/22 | 750 | 865 |
| Central Texas Regional Mobility Authority Revenue | 5.000% | 1/1/23 | 725 | 849 |
| Central Texas Regional Mobility Authority Revenue | 5.000% | 1/1/24 | 2,375 | 2,822 |
| Central Texas Regional Mobility Authority Revenue | 5.000% | 1/1/24 | 1,180 | 1,395 |
| Central Texas Regional Mobility Authority Revenue | 0.000% | 1/1/25 | 4,650 | 3,551 |
| Central Texas Regional Mobility Authority Revenue | 5.000% | 1/1/25 | 1,350 | 1,609 |
| Central Texas Regional Mobility Authority Revenue | 0.000% | 1/1/26 | 6,490 | 4,760 |
| Central Texas Regional Mobility Authority Revenue | 0.000% | 1/1/27 | 7,850 | 5,539 |
| Central Texas Regional Mobility Authority Revenue | 5.000% | 1/1/27 | 1,035 | 1,237 |
| Central Texas Regional Mobility Authority Revenue | 0.000% | 1/1/28 | 5,500 | 3,721 |
| Central Texas Regional Mobility Authority Revenue | 0.000% | 1/1/29 | 5,220 | 3,370 |
| Central Texas Regional Mobility Authority Revenue | 0.000% | 1/1/30 | 4,355 | 2,691 |
| Central Texas Regional Mobility Authority Revenue | 5.000% | 1/1/30 | 2,750 | 3,219 |
| Central Texas Regional Mobility Authority Revenue | 5.000% | 1/1/30 | 1,000 | 1,164 |
| Central Texas Regional Mobility Authority Revenue | 0.000% | 1/1/31 | 4,880 | 2,883 |
| Central Texas Regional Mobility Authority Revenue | 5.000% | 1/1/31 | 1,275 | 1,475 |
| Central Texas Regional Mobility Authority Revenue | 5.000% | 1/1/32 | 1,860 | 2,140 |
| Central Texas Regional Mobility Authority Revenue | 0.000% | 1/1/33 | 4,000 | 2,162 |
| Central Texas Regional Mobility Authority Revenue | 5.000% | 1/1/33 | 1,440 | 1,648 |
| Central Texas Regional Mobility Authority Revenue | 5.000% | 1/1/33 | 2,000 | 2,303 |
| Central Texas Regional Mobility Authority Revenue | 5.000% | 1/1/33 | 1,310 | 1,503 |
| Central Texas Regional Mobility Authority Revenue | 5.000% | 1/1/33 | 3,500 | 3,918 |
| Central Texas Regional Mobility Authority Revenue | 0.000% | 1/1/34 | 4,000 | 2,040 |
| Central Texas Regional Mobility Authority Revenue | 5.000% | 1/1/34 | 1,245 | 1,420 |
| Central Texas Regional Mobility Authority Revenue | 5.000% | 1/1/34 | 1,700 | 1,952 |
| Central Texas Regional Mobility Authority Revenue | 5.000% | 1/1/34 | 1,355 | 1,549 |
| Central Texas Regional Mobility Authority Revenue | 0.000% | 1/1/35 | 4,950 | 2,427 |
| Central Texas Regional Mobility Authority Revenue | 5.000% | 1/1/35 | 1,500 | 1,708 |
| Central Texas Regional Mobility Authority Revenue | 5.000% | 1/1/35 | 1,700 | 1,947 |
| Central Texas Regional Mobility Authority Revenue | 5.000% | 1/1/35 | 2,000 | 2,279 |
| Central Texas Regional Mobility Authority Revenue | 5.000% | 1/1/36 | 1,625 | 1,857 |
| Central Texas Regional Mobility Authority Revenue | 0.000% | 1/1/37 | 5,525 | 2,510 |
| Central Texas Regional Mobility Authority Revenue | 0.000% | 1/1/38 | 3,500 | 1,529 |
| Central Texas Regional Mobility Authority Revenue | 0.000% | 1/1/39 | 4,500 | 1,866 |
| Central Texas Regional Mobility Authority Revenue | 0.000% | 1/1/40 | 5,700 | 2,266 |
| Clifton TX Higher Education Finance Corp. Revenue (Baylor University) | 5.250% | 3/1/25 | 5,080 | 5,884 |
| Clifton TX Higher Education Finance Corp. Revenue (Baylor University) | 5.250% | 3/1/26 | 4,305 | 4,978 |
| Clifton TX Higher Education Finance Corp. Revenue (Baylor University) | 5.250% | 3/1/27 | 5,995 | 6,922 |
| Clifton TX Higher Education Finance Corp. Revenue (Baylor University) | 5.250% | 3/1/28 | 6,180 | 7,135 |
| Clifton TX Higher Education Finance Corp. Revenue (Baylor University) | 5.250% | 3/1/29 | 3,190 | 3,683 |
| Clifton TX Higher Education Finance Corp. Revenue (Baylor University) | 5.250% | 3/1/30 | 6,535 | 7,540 |
| Conroe TX Independent School District GO | 5.000% | 2/15/26 | 8,190 | 9,471 |
| Corpus Christi TX GO | 4.000% | 3/1/21 | 3,000 | 3,339 |
| Corpus Christi TX GO | 5.000% | 3/1/24 | 6,180 | 7,570 |
| Corpus Christi TX GO | 5.000% | 3/1/25 | 2,000 | 2,475 |
| Corpus Christi TX GO | 5.000% | 3/1/29 | 5,235 | 6,204 |
| Corpus Christi TX GO | 5.000% | 3/1/30 | 5,495 | 6,471 |
| Corpus Christi TX GO | 5.000% | 3/1/31 | 5,770 | 6,780 |
| Cypress-Fairbanks TX Independent School District GO | 5.000% | 2/15/20 | 2,720 | 3,062 |
| Cypress-Fairbanks TX Independent School District GO | 5.000% | 2/15/23 | 9,695 | 11,714 |
| Dallas County TX Community College GO | 5.000% | 2/15/20 | 6,950 | 7,833 |
| Dallas County TX GO | 5.000% | 8/15/22 | 3,700 | 4,449 |
| Dallas County TX GO | 5.000% | 8/15/23 | 3,170 | 3,890 |
209
Intermediate-Term Tax-Exempt Fund
| | | | |
| | | | Face | Market |
| | | Maturity | Amount | Value• |
| | Coupon | Date | ($000) | ($000) |
| Dallas County TX GO | 5.000% | 8/15/24 | 4,175 | 5,197 |
| Dallas County TX GO | 5.000% | 8/15/25 | 6,500 | 8,203 |
| Dallas County TX Utility & Reclamation District GO | 5.000% | 2/15/24 | 8,000 | 9,666 |
| 3 Dallas County TX Utility & Reclamation District GO | 5.000% | 2/15/25 | 8,360 | 10,163 |
| Dallas County TX Utility & Reclamation District GO | 5.250% | 2/15/25 (2) | 11,245 | 11,392 |
| Dallas County TX Utility & Reclamation District GO | 5.250% | 2/15/25 (2) | 11,245 | 11,392 |
| 3 Dallas County TX Utility & Reclamation District GO | 5.000% | 2/15/26 | 8,000 | 9,791 |
| 3 Dallas County TX Utility & Reclamation District GO | 5.000% | 2/15/27 | 8,160 | 10,002 |
| Dallas TX Area Rapid Transit Sales Tax Revenue | 4.500% | 12/1/18 (Prere.) | 11,385 | 12,232 |
| Dallas TX Area Rapid Transit Sales Tax Revenue | 4.500% | 12/1/18 (Prere.) | 14,130 | 15,182 |
| Dallas TX Area Rapid Transit Sales Tax Revenue | 5.000% | 12/1/27 | 2,295 | 2,742 |
| Dallas TX Area Rapid Transit Sales Tax Revenue | 5.000% | 12/1/29 | 1,195 | 1,418 |
| Dallas TX Area Rapid Transit Sales Tax Revenue | 5.000% | 12/1/30 | 2,160 | 2,547 |
| Dallas TX Area Rapid Transit Sales Tax Revenue | 5.000% | 12/1/35 | 1,300 | 1,543 |
| Dallas TX Civic Center Improvement Revenue | 5.000% | 8/15/23 (12) | 9,880 | 10,799 |
| Dallas TX Civic Center Improvement Revenue | 5.000% | 8/15/24 (12) | 8,345 | 9,097 |
| Dallas TX Civic Center Improvement Revenue | 5.000% | 8/15/25 (12) | 5,050 | 5,505 |
| Dallas TX Civic Center Improvement Revenue | 5.000% | 8/15/26 (12) | 1,650 | 1,794 |
| Dallas TX GO | 5.000% | 2/15/22 | 22,840 | 27,109 |
| Dallas TX GO | 5.000% | 2/15/22 (ETM) | 45 | 54 |
| Dallas TX GO | 5.000% | 2/15/23 | 11,000 | 13,318 |
| Dallas TX GO | 5.000% | 2/15/24 | 8,500 | 10,483 |
| Dallas TX GO | 5.000% | 2/15/25 | 3,000 | 3,741 |
| Dallas TX GO | 5.000% | 2/15/28 | 5,635 | 6,865 |
| Dallas TX GO | 5.000% | 2/15/34 | 3,000 | 3,539 |
| Dallas TX Independent School District GO | 5.000% | 2/15/24 | 17,450 | 20,180 |
| Dallas TX Independent School District GO PUT | 4.000% | 2/15/18 | 15,000 | 15,583 |
| Dallas TX Waterworks & Sewer System Revenue | 5.000% | 10/1/18 | 2,000 | 2,156 |
| Dallas TX Waterworks & Sewer System Revenue | 5.000% | 10/1/21 | 10,000 | 11,790 |
| Dallas-Fort Worth TX International Airport Revenue | 5.000% | 11/1/20 | 2,740 | 2,740 |
| Dallas-Fort Worth TX International Airport Revenue | 5.000% | 11/1/28 | 7,335 | 8,401 |
| Dallas-Fort Worth TX International Airport Revenue | 5.250% | 11/1/28 | 2,235 | 2,703 |
| Dallas-Fort Worth TX International Airport Revenue | 5.000% | 11/1/29 | 6,360 | 7,285 |
| Dallas-Fort Worth TX International Airport Revenue | 5.250% | 11/1/29 | 14,950 | 18,064 |
| Dallas-Fort Worth TX International Airport Revenue | 5.000% | 11/1/30 | 14,195 | 16,741 |
| Dallas-Fort Worth TX International Airport Revenue | 5.000% | 11/1/30 | 6,680 | 7,617 |
| Dallas-Fort Worth TX International Airport Revenue | 5.250% | 11/1/30 | 12,500 | 15,060 |
| Dallas-Fort Worth TX International Airport Revenue | 5.000% | 11/1/31 | 7,750 | 9,106 |
| Dallas-Fort Worth TX International Airport Revenue | 5.000% | 11/1/32 | 5,775 | 6,761 |
| Dallas-Fort Worth TX International Airport Revenue | 5.000% | 11/1/33 | 9,000 | 10,503 |
| Denton County TX GO | 5.000% | 7/15/21 | 1,500 | 1,758 |
| Denton County TX GO | 5.000% | 7/15/24 | 1,500 | 1,870 |
| Denton County TX GO | 5.000% | 7/15/25 | 1,555 | 1,966 |
| Denton County TX GO | 4.000% | 7/15/32 | 3,000 | 3,313 |
| Denton County TX GO | 4.000% | 7/15/33 | 2,000 | 2,197 |
| Duncanville TX Independent School District GO | 5.000% | 2/15/30 | 10,785 | 12,953 |
| Duncanville TX Independent School District GO | 5.000% | 2/15/31 | 11,120 | 13,290 |
| El Paso TX GO | 4.000% | 8/15/30 | 3,400 | 3,769 |
| El Paso TX GO | 5.000% | 8/15/31 | 4,000 | 4,813 |
| El Paso TX GO | 5.000% | 8/15/31 | 2,985 | 3,592 |
| El Paso TX GO | 5.000% | 8/15/32 | 3,625 | 4,338 |
| El Paso TX GO | 5.000% | 8/15/34 | 4,570 | 5,413 |
| El Paso TX GO | 5.000% | 8/15/35 | 4,795 | 5,661 |
| El Paso TX GO | 5.000% | 8/15/36 | 4,000 | 4,708 |
| El Paso TX GO | 5.000% | 8/15/36 | 5,035 | 5,926 |
| El Paso TX Water & Sewer Revenue | 5.000% | 3/1/25 | 1,050 | 1,299 |
| Fort Bend County TX GO | 5.000% | 3/1/19 | 4,970 | 5,421 |
| Fort Bend County TX GO | 5.000% | 3/1/20 | 2,500 | 2,814 |
| Fort Bend County TX GO | 5.000% | 3/1/21 | 2,750 | 3,181 |
| Fort Worth TX GO | 4.000% | 3/1/18 | 1,490 | 1,552 |
| Fort Worth TX GO | 5.000% | 3/1/24 | 9,070 | 11,145 |
| Fort Worth TX GO | 5.000% | 3/1/25 | 10,155 | 12,612 |
| Fort Worth TX GO | 5.000% | 3/1/26 | 10,235 | 12,882 |
| Fort Worth TX Water & Sewer Revenue | 5.000% | 2/15/21 | 5,000 | 5,790 |
| Fort Worth TX Water & Sewer Revenue | 5.000% | 2/15/29 | 6,155 | 7,034 |
| Fort Worth TX Water & Sewer Revenue | 5.000% | 2/15/30 | 6,430 | 7,274 |
| Fort Worth TX Water & Sewer Revenue | 5.000% | 2/15/31 | 6,255 | 7,076 |
| Frisco TX GO | 5.000% | 2/15/19 | 2,010 | 2,194 |
| Frisco TX Independent School District GO | 5.000% | 8/15/24 | 4,000 | 4,966 |
| Frisco TX Independent School District GO | 5.000% | 8/15/25 | 3,235 | 4,070 |
210
Intermediate-Term Tax-Exempt Fund
| | | | |
| | | | Face | Market |
| | | Maturity | Amount | Value• |
| | Coupon | Date | ($000) | ($000) |
| Frisco TX Independent School District GO | 5.000% | 8/15/26 | 3,000 | 3,784 |
| Garland TX Independent School District GO | 5.000% | 2/15/22 | 3,000 | 3,552 |
| Grand Parkway Transportation Corp. Texas System Toll Revenue | 0.000% | 10/1/31 | 2,875 | 2,648 |
| Grand Parkway Transportation Corp. Texas System Toll Revenue | 0.000% | 10/1/32 | 5,320 | 4,881 |
| Grand Parkway Transportation Corp. Texas System Toll Revenue | 0.000% | 10/1/33 | 18,100 | 16,565 |
| Grapevine-Colleyville TX Independent School District GO | 5.000% | 8/15/23 | 1,000 | 1,223 |
| Grapevine-Colleyville TX Independent School District GO | 5.000% | 8/15/24 | 1,715 | 2,129 |
| Grapevine-Colleyville TX Independent School District GO | 5.000% | 8/15/25 | 2,390 | 3,007 |
| Grapevine-Colleyville TX Independent School District GO | 5.000% | 8/15/26 | 1,000 | 1,248 |
| Grapevine-Colleyville TX Independent School District GO | 5.000% | 8/15/28 | 3,000 | 3,688 |
| Harris County TX Cultural Education Facilities Finance Corp. Revenue (Methodist Hospital System) | 5.250% | 12/1/16 | 12,000 | 12,045 |
| Harris County TX Cultural Education Facilities Finance Corp. Revenue (Methodist Hospital System) | 5.250% | 12/1/17 | 17,000 | 17,782 |
| Harris County TX Cultural Education Facilities Finance Corp. Revenue (Methodist Hospital System) | | | | |
| VRDO | 0.540% | 11/1/16 | 30,820 | 30,820 |
| Harris County TX Cultural Education Facilities Finance Corp. Revenue | | | | |
| (St. Luke’s Episcopal Health System) | 5.000% | 2/15/19 (Prere.) | 10,225 | 11,158 |
| Harris County TX Cultural Education Facilities Finance Corp. Revenue | | | | |
| (St. Luke’s Episcopal Health System) | 5.000% | 2/15/19 (ETM) | 4,000 | 4,365 |
| Harris County TX Cultural Education Facilities Finance Corp. Revenue | | | | |
| (St. Luke’s Episcopal Health System) | 5.625% | 2/15/19 (Prere.) | 40,730 | 45,023 |
| Harris County TX Cultural Education Facilities Finance Corp. Revenue (Texas Children’s Hospital) | 5.000% | 10/1/23 | 2,000 | 2,423 |
| Harris County TX Cultural Education Facilities Finance Corp. Revenue (Texas Children’s Hospital) | 5.000% | 10/1/24 | 3,000 | 3,687 |
| Harris County TX Cultural Education Facilities Finance Corp. Revenue (Texas Children’s Hospital) | 5.000% | 10/1/28 | 3,110 | 3,774 |
| Harris County TX Cultural Education Facilities Finance Corp. Revenue (Texas Children’s Hospital) | 5.000% | 10/1/29 | 7,340 | 8,859 |
| Harris County TX Cultural Education Facilities Finance Corp. Revenue (Texas Children’s Hospital) | 5.000% | 10/1/30 | 2,185 | 2,615 |
| 4 Harris County TX Cultural Education Facilities Finance Corp. Revenue (Texas Children’s Hospital) | | | | |
| TOB VRDO | 0.580% | 11/1/16 | 35,330 | 35,330 |
| Harris County TX Flood Control District GO | 5.000% | 10/1/26 | 6,000 | 7,377 |
| Harris County TX Flood Control District GO | 5.000% | 10/1/27 | 5,000 | 6,087 |
| Harris County TX Flood Control District GO | 5.000% | 10/1/28 | 3,000 | 3,634 |
| Harris County TX Flood Control District GO | 5.000% | 10/1/29 | 10,000 | 12,247 |
| Harris County TX Flood Control District GO | 5.000% | 10/1/29 | 2,000 | 2,406 |
| Harris County TX GO | 5.000% | 10/1/17 | 4,000 | 4,156 |
| Harris County TX GO | 5.000% | 10/1/17 | 4,705 | 4,888 |
| Harris County TX GO | 5.000% | 10/1/18 | 4,090 | 4,407 |
| Harris County TX GO | 5.000% | 10/1/20 | 1,020 | 1,170 |
| Harris County TX GO | 5.000% | 10/1/21 | 8,000 | 9,169 |
| Harris County TX GO | 5.000% | 8/15/25 | 4,000 | 5,014 |
| Harris County TX GO | 5.000% | 10/1/25 | 8,000 | 10,055 |
| Harris County TX GO | 5.000% | 10/1/25 | 5,755 | 7,233 |
| Harris County TX GO | 5.000% | 8/15/26 | 2,500 | 3,165 |
| Harris County TX GO | 5.000% | 10/1/27 | 6,335 | 7,871 |
| Harris County TX GO | 5.000% | 10/1/28 | 6,660 | 8,229 |
| Harris County TX GO | 5.000% | 10/1/29 | 6,490 | 7,960 |
| Harris County TX GO | 5.000% | 10/1/30 | 5,405 | 6,585 |
| Harris County TX GO | 5.000% | 8/15/34 | 3,120 | 3,697 |
| Harris County TX GO | 5.000% | 10/1/35 | 4,215 | 5,026 |
| Harris County TX GO | 5.000% | 10/1/36 | 6,545 | 7,788 |
| Harris County TX Health Facilities Development Corp. Hospital Revenue | | | | |
| (Memorial Hermann Healthcare System) | 7.000% | 12/1/18 (Prere.) | 5,000 | 5,627 |
| Harris County TX Health Facilities Development Corp. Hospital Revenue | | | | |
| (Texas Children’s Hospital) | 5.000% | 10/1/24 | 8,500 | 9,417 |
| Harris County TX Health Facilities Development Corp. Revenue | | | | |
| (Methodist Hospital System) VRDO | 0.540% | 11/1/16 | 15,605 | 15,605 |
| Harris County TX Health Facilities Development Corp. Revenue | | | | |
| (Methodist Hospital System) VRDO | 0.540% | 11/1/16 | 11,810 | 11,810 |
| 2 Harris County TX Metropolitan Transit Authority Revenue | 5.000% | 11/1/19 (Prere.) | 5,665 | 6,322 |
| Harris County TX Metropolitan Transit Authority Revenue | 5.000% | 11/1/19 (Prere.) | 6,475 | 7,226 |
| Harris County TX Metropolitan Transit Authority Revenue | 5.000% | 11/1/19 (Prere.) | 3,000 | 3,348 |
| 4 Harris County TX Metropolitan Transit Authority Revenue TOB VRDO | 0.750% | 11/7/16 | 7,745 | 7,745 |
| Harris County TX Metropolitan Transportation Authority Lease Revenue | 5.625% | 11/1/19 | 4,535 | 4,959 |
| Harris County TX Metropolitan Transportation Authority Lease Revenue | 5.875% | 11/1/20 | 3,640 | 3,999 |
| Harris County TX Metropolitan Transportation Authority Lease Revenue | 6.000% | 11/1/21 | 4,295 | 4,729 |
| Harris County TX Sports Authority Revenue | 0.000% | 11/15/23 (14) | 7,000 | 5,548 |
| Harris County TX Sports Authority Revenue | 5.000% | 11/15/24 | 1,480 | 1,780 |
| Harris County TX Sports Authority Revenue | 5.000% | 11/15/25 | 1,000 | 1,193 |
| Harris County TX Sports Authority Revenue | 5.000% | 11/15/26 | 1,000 | 1,189 |
| Harris County TX Sports Authority Revenue | 5.000% | 11/15/27 | 1,530 | 1,806 |
| Harris County TX Sports Authority Revenue | 5.000% | 11/15/28 | 5,100 | 6,053 |
| Harris County TX Sports Authority Revenue | 5.000% | 11/15/29 | 12,000 | 14,169 |
211
Intermediate-Term Tax-Exempt Fund
| | | | |
| | | | Face | Market |
| | | Maturity | Amount | Value• |
| | Coupon | Date | ($000) | ($000) |
| Harris County TX Sports Authority Revenue | 5.000% | 11/15/30 | 5,000 | 5,874 |
| Harris County TX Toll Road Revenue | 5.000% | 8/15/20 | 2,000 | 2,219 |
| Harris County TX Toll Road Revenue | 5.000% | 8/15/25 | 3,375 | 3,994 |
| Harris County TX Toll Road Revenue | 5.000% | 8/15/27 | 22,160 | 26,182 |
| Houston TX Airport System Revenue | 5.000% | 7/1/18 | 1,750 | 1,863 |
| Houston TX Airport System Revenue | 5.000% | 7/1/19 | 1,750 | 1,867 |
| Houston TX Airport System Revenue | 5.000% | 7/1/20 | 2,130 | 2,272 |
| Houston TX Airport System Revenue | 5.000% | 7/1/25 | 1,000 | 1,155 |
| Houston TX Airport System Revenue | 5.000% | 7/1/26 | 3,000 | 3,465 |
| Houston TX Airport System Revenue | 5.000% | 7/1/26 (14) | 17,030 | 17,488 |
| Houston TX Community College System GO | 5.000% | 2/15/17 | 1,000 | 1,013 |
| Houston TX Community College System Revenue | 5.000% | 4/15/21 (10) | 3,145 | 3,157 |
| Houston TX GO | 5.000% | 3/1/21 | 2,000 | 2,305 |
| Houston TX GO | 5.000% | 3/1/22 | 12,250 | 14,439 |
| Houston TX GO | 5.000% | 3/1/22 | 5,000 | 5,893 |
| Houston TX GO | 5.000% | 3/1/23 | 16,680 | 19,571 |
| Houston TX GO | 5.000% | 3/1/23 | 4,000 | 4,802 |
| Houston TX GO | 5.000% | 3/1/24 | 1,860 | 2,271 |
| Houston TX GO | 5.000% | 3/1/25 | 1,600 | 1,973 |
| Houston TX GO | 5.000% | 3/1/26 | 10,000 | 12,480 |
| Houston TX GO | 5.000% | 3/1/26 | 10,000 | 12,147 |
| Houston TX GO | 5.000% | 3/1/27 | 9,750 | 12,005 |
| Houston TX GO | 5.000% | 3/1/30 | 4,000 | 4,737 |
| Houston TX GO | 5.000% | 3/1/31 | 5,180 | 6,190 |
| Houston TX GO | 5.000% | 3/1/32 | 3,840 | 4,564 |
| Houston TX Hotel Occupancy Tax & Special Revenue (Convention & Entertainment Facilities) | 0.000% | 9/1/17 (2) | 13,760 | 13,625 |
| Houston TX Hotel Occupancy Tax & Special Revenue (Convention & Entertainment Facilities) | 0.000% | 9/1/18 (2) | 16,285 | 15,841 |
| Houston TX Hotel Occupancy Tax & Special Revenue (Convention & Entertainment Facilities) | 0.000% | 9/1/21 (2) | 22,720 | 20,275 |
| Houston TX Hotel Occupancy Tax & Special Revenue (Convention & Entertainment Facilities) | 5.000% | 9/1/26 | 1,650 | 1,984 |
| Houston TX Hotel Occupancy Tax & Special Revenue (Convention & Entertainment Facilities) | 5.000% | 9/1/28 | 2,090 | 2,476 |
| Houston TX Hotel Occupancy Tax & Special Revenue (Convention & Entertainment Facilities) | 5.000% | 9/1/29 | 1,500 | 1,767 |
| Houston TX Independent School District GO | 5.000% | 2/15/19 | 2,000 | 2,182 |
| Houston TX Independent School District GO | 5.000% | 2/15/20 | 4,500 | 5,065 |
| Houston TX Independent School District GO | 5.000% | 2/15/20 | 6,000 | 6,759 |
| Houston TX Independent School District GO | 5.000% | 2/15/21 | 15,895 | 18,391 |
| Houston TX Independent School District GO | 5.000% | 2/15/24 | 8,000 | 9,850 |
| Houston TX Independent School District GO | 5.000% | 2/15/25 | 5,000 | 6,240 |
| Houston TX Independent School District GO | 5.000% | 2/15/26 | 7,595 | 9,612 |
| Houston TX Independent School District GO | 5.000% | 2/15/27 | 10,375 | 12,984 |
| Houston TX Independent School District GO PUT | 3.000% | 6/1/18 | 60,420 | 62,265 |
| Houston TX Independent School District GO PUT | 1.375% | 6/1/19 | 10,000 | 10,030 |
| Houston TX Utility System Revenue | 5.000% | 11/15/16 | 3,730 | 3,736 |
| Houston TX Utility System Revenue | 5.250% | 11/15/17 (4) | 13,500 | 14,127 |
| Houston TX Utility System Revenue | 5.000% | 5/15/23 | 7,000 | 8,508 |
| Houston TX Utility System Revenue | 5.000% | 11/15/23 | 3,000 | 3,685 |
| Houston TX Utility System Revenue | 5.000% | 5/15/24 | 9,000 | 11,123 |
| Houston TX Utility System Revenue | 5.000% | 5/15/25 | 5,000 | 6,112 |
| Houston TX Utility System Revenue | 5.000% | 11/15/27 | 6,000 | 7,309 |
| Houston TX Utility System Revenue | 5.250% | 11/15/29 | 13,250 | 15,335 |
| Houston TX Utility System Revenue | 5.000% | 11/15/30 | 15,000 | 18,446 |
| Houston TX Utility System Revenue | 5.000% | 11/15/30 | 14,670 | 17,133 |
| Houston TX Utility System Revenue | 5.000% | 11/15/30 | 8,020 | 9,367 |
| Houston TX Utility System Revenue | 4.000% | 11/15/31 | 17,535 | 19,365 |
| Houston TX Utility System Revenue | 5.000% | 11/15/31 | 10,335 | 12,070 |
| Houston TX Utility System Revenue | 5.000% | 11/15/31 | 10,000 | 11,679 |
| Houston TX Utility System Revenue | 5.000% | 11/15/32 | 8,190 | 9,565 |
| Houston TX Utility System Revenue | 5.000% | 11/15/32 | 10,000 | 11,679 |
| Houston TX Utility System Revenue | 5.000% | 11/15/34 | 3,800 | 4,485 |
| Houston TX Utility System Revenue | 5.000% | 11/15/35 | 30,000 | 35,973 |
| Houston TX Utility System Revenue | 5.000% | 11/15/36 | 20,040 | 23,952 |
| 1 Houston TX Utility System Revenue PUT | 1.530% | 5/1/20 | 10,000 | 9,956 |
| Humble TX Independent School District GO | 5.000% | 2/15/21 | 5,125 | 5,930 |
| Humble TX Independent School District GO | 5.500% | 2/15/24 | 14,235 | 18,047 |
| Judson TX Independent School District | 5.000% | 2/1/23 | 2,000 | 2,414 |
| Judson TX Independent School District | 5.000% | 2/1/24 | 2,000 | 2,461 |
| Judson TX Independent School District | 5.000% | 2/1/25 | 1,500 | 1,871 |
| Katy TX Independent School District GO | 5.000% | 2/15/18 | 1,450 | 1,528 |
| Lake Travis TX Independent School District GO | 5.000% | 2/15/33 | 2,665 | 3,046 |
| Lamar TX Consolidated Independent School District GO | 5.000% | 2/15/25 | 5,000 | 6,240 |
| Laredo TX Community College District GO | 5.000% | 8/1/22 | 1,500 | 1,778 |
212
Intermediate-Term Tax-Exempt Fund
| | | | |
| | | | Face | Market |
| | | Maturity | Amount | Value• |
| | Coupon | Date | ($000) | ($000) |
| Laredo TX Community College District GO | 5.000% | 8/1/30 | 2,000 | 2,358 |
| Laredo TX Community College District GO | 5.000% | 8/1/32 | 1,250 | 1,461 |
| Laredo TX Community College District GO | 5.000% | 8/1/34 | 1,500 | 1,742 |
| Laredo TX Independent School District GO | 5.000% | 8/1/24 | 4,340 | 5,374 |
| Leander TX Independent School District GO | 0.000% | 8/16/24 | 8,500 | 7,357 |
| Leander TX Independent School District GO | 0.000% | 8/16/25 | 10,000 | 8,385 |
| Lone Star College System Texas GO | 5.000% | 2/15/21 | 3,650 | 4,219 |
| Lone Star College System Texas GO | 5.000% | 2/15/21 | 1,140 | 1,318 |
| Lone Star College System Texas GO | 5.000% | 2/15/27 | 1,790 | 2,231 |
| 4 Lone Star College System Texas GO TOB VRDO | 0.660% | 11/7/16 | 4,960 | 4,960 |
| Lower Colorado River Authority Texas Revenue | 5.250% | 5/15/19 (Prere.) | 105 | 116 |
| Lower Colorado River Authority Texas Revenue | 5.250% | 5/15/19 (Prere.) | 5 | 6 |
| Lower Colorado River Authority Texas Revenue | 5.250% | 5/15/19 (Prere.) | 5 | 6 |
| Lower Colorado River Authority Texas Revenue | 5.250% | 5/15/19 (Prere.) | 5 | 6 |
| Lower Colorado River Authority Texas Revenue | 5.000% | 5/15/29 | 10,000 | 11,305 |
| Lower Colorado River Authority Texas Revenue | 5.250% | 5/15/29 | 9,070 | 9,935 |
| Lower Colorado River Authority Texas Revenue | 5.250% | 5/15/29 | 2,380 | 2,612 |
| Lower Colorado River Authority Texas Revenue | 5.000% | 5/15/30 | 4,000 | 4,505 |
| Lower Colorado River Authority Texas Revenue | 5.000% | 5/15/30 | 10,000 | 11,071 |
| Lower Colorado River Authority Texas Revenue | 5.000% | 5/15/32 | 13,955 | 16,047 |
| Lower Colorado River Authority Texas Revenue | 5.000% | 5/15/33 | 8,500 | 9,741 |
| Lower Colorado River Authority Texas Transmission Contract Revenue | | | | |
| (LCRA Transmission Services Corp.) | 5.000% | 5/15/24 | 1,025 | 1,255 |
| Lower Colorado River Authority Texas Transmission Contract Revenue | | | | |
| (LCRA Transmission Services Corp.) | 5.000% | 5/15/24 | 2,220 | 2,718 |
| Lower Colorado River Authority Texas Transmission Contract Revenue | | | | |
| (LCRA Transmission Services Corp.) | 5.000% | 5/15/25 | 1,350 | 1,671 |
| Lower Colorado River Authority Texas Transmission Contract Revenue | | | | |
| (LCRA Transmission Services Corp.) | 5.000% | 5/15/25 | 1,100 | 1,361 |
| Lower Colorado River Authority Texas Transmission Contract Revenue | | | | |
| (LCRA Transmission Services Corp.) | 5.000% | 5/15/31 | 1,635 | 1,932 |
| Lower Colorado River Authority Texas Transmission Contract Revenue | | | | |
| (LCRA Transmission Services Corp.) | 5.000% | 5/15/31 | 1,350 | 1,618 |
| Lower Colorado River Authority Texas Transmission Contract Revenue | | | | |
| (LCRA Transmission Services Corp.) | 5.000% | 5/15/32 | 1,400 | 1,649 |
| Lubbock TX GO | 5.000% | 2/15/23 | 700 | 833 |
| Lubbock TX GO | 5.000% | 2/15/27 | 5,735 | 6,575 |
| Lubbock TX GO | 5.000% | 2/15/29 | 4,335 | 4,970 |
| Lubbock TX GO | 5.000% | 2/15/30 | 6,660 | 7,570 |
| Lubbock TX GO | 4.000% | 2/15/31 | 1,500 | 1,661 |
| Lubbock TX GO | 5.000% | 2/15/31 | 4,120 | 4,683 |
| Lubbock TX GO | 4.000% | 2/15/32 | 1,425 | 1,566 |
| Lubbock TX GO | 4.000% | 2/15/33 | 1,000 | 1,094 |
| Mesquite TX Health Facilities Development Corp. Retirement Facility Revenue | | | | |
| (Christian Care CentersInc. Project) | 5.125% | 2/15/30 | 1,000 | 1,106 |
| Montgomery County TX GO | 5.000% | 3/1/28 | 20,225 | 24,966 |
| Montgomery County TX GO | 5.000% | 3/1/31 | 16,450 | 19,839 |
| Montgomery County TX GO | 5.000% | 3/1/32 | 16,910 | 20,269 |
| New Hope TX Cultural Education Facilities FinanceCorp. Retirement Facilities Revenue | | | | |
| (MRC Crestview Project) | 4.000% | 11/15/26 | 2,000 | 2,163 |
| New Hope TX Cultural Education Facilities FinanceCorp. Retirement Facilities Revenue | | | | |
| (Wesleyan Homes Inc. Project) | 5.000% | 1/1/24 | 1,300 | 1,414 |
| New Hope TX Cultural Education Facilities FinanceCorp. Retirement Facilities Revenue | | | | |
| (Wesleyan Homes Inc. Project) | 5.250% | 1/1/29 | 1,500 | 1,616 |
| New Hope TX Cultural Education Facilities FinanceCorp. Retirement Facilities Revenue | | | | |
| (Wesleyan Homes Inc. Project) | 5.500% | 1/1/35 | 1,400 | 1,506 |
| New Hope TX Cultural Education Facilities FinanceCorp. Student Housing Revenue | | | | |
| (Tarleton State University Project) | 5.000% | 4/1/29 | 725 | 803 |
| New Hope TX Cultural Education Facilities FinanceCorp. Student Housing Revenue | | | | |
| (Tarleton State University Project) | 5.000% | 4/1/30 | 845 | 935 |
| New Hope TX Cultural Education Facilities FinanceCorp. Student Housing Revenue | | | | |
| (Tarleton State University Project) | 5.000% | 4/1/35 | 1,000 | 1,088 |
| New Hope TX Cultural Education Facilities FinanceCorp. Student Housing Revenue | | | | |
| (Texas A&M University Project) | 5.000% | 7/1/25 | 2,250 | 2,586 |
| New Hope TX Cultural Education Facilities FinanceCorp. Student Housing Revenue | | | | |
| (Texas A&M University Project) | 5.000% | 7/1/30 | 12,500 | 13,910 |
| New Hope TX Cultural Education Facilities FinanceCorp. Student Housing Revenue | | | | |
| (Texas A&M University Project) | 5.000% | 7/1/35 | 8,300 | 9,074 |
| North East TX Independent School District GO | 5.000% | 8/1/19 | 11,455 | 12,697 |
| North East TX Regional Mobility Authority Revenue | 5.000% | 1/1/25 | 1,350 | 1,604 |
213
Intermediate-Term Tax-Exempt Fund
| | | | |
| | | | Face | Market |
| | | Maturity | Amount | Value• |
| | Coupon | Date | ($000) | ($000) |
| North East TX Regional Mobility Authority Revenue | 5.000% | 1/1/26 | 1,415 | 1,688 |
| North East TX Regional Mobility Authority Revenue | 5.000% | 1/1/27 | 1,485 | 1,763 |
| North East TX Regional Mobility Authority Revenue | 5.000% | 1/1/28 | 1,560 | 1,838 |
| North East TX Regional Mobility Authority Revenue | 5.000% | 1/1/29 | 1,640 | 1,914 |
| North East TX Regional Mobility Authority Revenue | 5.000% | 1/1/30 | 1,470 | 1,703 |
| North East TX Regional Mobility Authority Revenue | 5.000% | 1/1/36 | 9,000 | 10,309 |
| North Harris County TX Regional Water Authority Revenue | 5.125% | 12/15/18 (Prere.) | 7,410 | 8,072 |
| North Harris County TX Regional Water Authority Revenue | 5.125% | 12/15/18 (Prere.) | 5,895 | 6,421 |
| North Harris County TX Regional Water Authority Revenue | 5.125% | 12/15/18 (Prere.) | 5,250 | 5,719 |
| North Harris County TX Regional Water Authority Revenue | 5.125% | 12/15/18 (Prere.) | 6,225 | 6,781 |
| North Harris County TX Regional Water Authority Revenue | 5.125% | 12/15/18 (Prere.) | 8,920 | 9,717 |
| North Harris County TX Regional Water Authority Revenue | 5.125% | 12/15/18 (Prere.) | 8,040 | 8,758 |
| 3 North Texas Municipal Water District Water System Revenue | 5.000% | 9/1/18 | 3,925 | 4,201 |
| 3 North Texas Municipal Water District Water System Revenue | 5.000% | 9/1/20 | 6,935 | 7,904 |
| 3 North Texas Municipal Water District Water System Revenue | 5.000% | 9/1/21 | 7,275 | 8,514 |
| 3 North Texas Municipal Water District Water System Revenue | 5.000% | 9/1/22 | 6,000 | 7,187 |
| 3 North Texas Municipal Water District Water System Revenue | 5.000% | 9/1/23 | 7,000 | 8,539 |
| North Texas Tollway Authority System Revenue | 5.500% | 1/1/17 | 4,750 | 4,788 |
| North Texas Tollway Authority System Revenue | 5.500% | 1/1/18 | 4,000 | 4,211 |
| North Texas Tollway Authority System Revenue | 6.000% | 1/1/18 (Prere.) | 19,380 | 20,538 |
| North Texas Tollway Authority System Revenue | 6.000% | 1/1/18 (Prere.) | 36,270 | 38,438 |
| North Texas Tollway Authority System Revenue | 6.000% | 1/1/18 (Prere.) | 22,840 | 24,205 |
| North Texas Tollway Authority System Revenue | 6.000% | 1/1/18 (Prere.) | 17,275 | 18,308 |
| North Texas Tollway Authority System Revenue | 6.000% | 1/1/18 (Prere.) | 9,680 | 10,259 |
| North Texas Tollway Authority System Revenue | 6.000% | 1/1/18 (Prere.) | 4,450 | 4,716 |
| North Texas Tollway Authority System Revenue | 6.000% | 1/1/18 (Prere.) | 3,855 | 4,085 |
| North Texas Tollway Authority System Revenue | 6.000% | 1/1/18 (Prere.) | 3,460 | 3,667 |
| North Texas Tollway Authority System Revenue | 6.000% | 1/1/19 | 15,000 | 15,860 |
| North Texas Tollway Authority System Revenue | 6.000% | 1/1/19 (Prere.) | 2,620 | 2,902 |
| North Texas Tollway Authority System Revenue | 6.000% | 1/1/20 | 2,720 | 2,870 |
| North Texas Tollway Authority System Revenue | 6.000% | 1/1/21 | 5,085 | 5,356 |
| North Texas Tollway Authority System Revenue | 6.000% | 1/1/22 | 3,205 | 3,379 |
| North Texas Tollway Authority System Revenue | 5.000% | 1/1/23 | 1,865 | 2,217 |
| North Texas Tollway Authority System Revenue | 5.000% | 1/1/23 | 7,750 | 9,271 |
| North Texas Tollway Authority System Revenue | 6.250% | 2/1/23 | 46,470 | 52,756 |
| North Texas Tollway Authority System Revenue | 5.000% | 1/1/24 | 1,400 | 1,692 |
| North Texas Tollway Authority System Revenue | 5.000% | 1/1/24 | 9,000 | 10,935 |
| North Texas Tollway Authority System Revenue | 6.000% | 1/1/24 | 2,425 | 2,547 |
| North Texas Tollway Authority System Revenue | 5.000% | 1/1/25 | 3,300 | 4,068 |
| North Texas Tollway Authority System Revenue | 5.000% | 1/1/25 | 2,000 | 2,448 |
| North Texas Tollway Authority System Revenue | 5.000% | 1/1/25 | 8,000 | 9,672 |
| North Texas Tollway Authority System Revenue | 6.000% | 1/1/25 | 625 | 658 |
| North Texas Tollway Authority System Revenue | 6.000% | 1/1/25 | 1,360 | 1,438 |
| North Texas Tollway Authority System Revenue | 5.000% | 1/1/26 | 10,000 | 12,038 |
| North Texas Tollway Authority System Revenue | 6.000% | 1/1/26 | 540 | 568 |
| North Texas Tollway Authority System Revenue | 5.000% | 1/1/27 | 2,000 | 2,411 |
| North Texas Tollway Authority System Revenue | 5.000% | 1/1/27 | 4,100 | 4,917 |
| North Texas Tollway Authority System Revenue | 6.000% | 1/1/27 | 490 | 516 |
| North Texas Tollway Authority System Revenue | 6.000% | 1/1/28 | 600 | 662 |
| North Texas Tollway Authority System Revenue | 5.500% | 9/1/28 | 1,250 | 1,484 |
| North Texas Tollway Authority System Revenue | 5.000% | 1/1/29 | 5,000 | 6,000 |
| North Texas Tollway Authority System Revenue | 5.250% | 9/1/29 | 4,130 | 4,844 |
| North Texas Tollway Authority System Revenue | 5.000% | 1/1/30 | 5,250 | 6,178 |
| North Texas Tollway Authority System Revenue | 5.000% | 9/1/30 | 9,000 | 10,433 |
| North Texas Tollway Authority System Revenue | 5.000% | 9/1/30 | 3,150 | 3,651 |
| North Texas Tollway Authority System Revenue | 5.000% | 1/1/31 | 15,180 | 17,832 |
| North Texas Tollway Authority System Revenue | 5.000% | 1/1/31 | 12,400 | 14,126 |
| North Texas Tollway Authority System Revenue | 5.000% | 1/1/31 | 11,040 | 12,951 |
| North Texas Tollway Authority System Revenue | 5.000% | 9/1/31 | 28,500 | 32,965 |
| North Texas Tollway Authority System Revenue | 5.000% | 9/1/31 | 4,000 | 4,627 |
| North Texas Tollway Authority System Revenue | 5.000% | 1/1/32 | 48,000 | 56,079 |
| North Texas Tollway Authority System Revenue | 5.000% | 1/1/32 | 3,595 | 4,275 |
| North Texas Tollway Authority System Revenue | 5.000% | 1/1/33 | 43,500 | 50,614 |
| North Texas Tollway Authority System Revenue | 5.000% | 1/1/34 | 33,000 | 38,266 |
| North Texas Tollway Authority System Revenue | 5.000% | 1/1/34 | 1,500 | 1,768 |
| North Texas Tollway Authority System Revenue | 5.000% | 1/1/35 | 1,000 | 1,174 |
| North Texas Tollway Authority System Revenue | 5.000% | 1/1/36 | 1,800 | 2,107 |
| Northside Independent School District Texas GO | 4.000% | 2/15/18 | 1,000 | 1,039 |
| Northside Independent School District Texas GO | 5.000% | 2/15/23 | 3,110 | 3,752 |
| Northside Independent School District Texas GO | 5.000% | 6/15/23 | 3,015 | 3,665 |
214
Intermediate-Term Tax-Exempt Fund
| | | | |
| | | | Face | Market |
| | | Maturity | Amount | Value• |
| | Coupon | Date | ($000) | ($000) |
| Northside Independent School District Texas GO | 5.000% | 2/15/24 | 5,000 | 6,147 |
| Northwest Independent School District Texas GO | 5.000% | 2/15/25 | 10,000 | 12,480 |
| Northwest Independent School District Texas GO | 5.000% | 2/15/26 | 6,380 | 7,906 |
| Northwest TX Independent School District GO | 4.000% | 2/15/20 | 3,240 | 3,543 |
| Pasadena TX GO | 4.000% | 2/15/29 | 1,000 | 1,119 |
| Pasadena TX GO | 4.000% | 2/15/30 | 1,750 | 1,940 |
| Plano TX Independent School District GO | 5.000% | 2/15/19 | 7,500 | 8,176 |
| Plano TX Independent School District GO | 5.000% | 2/15/20 | 21,580 | 24,291 |
| Plano TX Independent School District GO | 5.000% | 2/15/21 | 7,000 | 8,099 |
| Plano TX Independent School District GO | 5.000% | 2/15/25 | 15,365 | 19,175 |
| Plano TX Independent School District GO | 5.000% | 2/15/26 | 8,215 | 10,397 |
| Red River TX Education Finance Corp. Revenue (Edwards University Project) | 5.000% | 6/1/25 | 1,000 | 1,201 |
| Red River TX Education Finance Corp. Revenue (Edwards University Project) | 5.000% | 6/1/26 | 700 | 849 |
| Red River TX Education Finance Corp. Revenue (Edwards University Project) | 5.000% | 6/1/27 | 900 | 1,085 |
| Red River TX Education Finance Corp. Revenue (Edwards University Project) | 5.000% | 6/1/28 | 705 | 840 |
| Red River TX Education Finance Corp. Revenue (Edwards University Project) | 5.000% | 6/1/29 | 1,420 | 1,680 |
| Red River TX Education Finance Corp. Revenue (Edwards University Project) | 4.000% | 6/1/36 | 1,000 | 1,062 |
| Richardson TX Independent School District GO | 5.000% | 2/15/21 | 3,000 | 3,478 |
| 3 Round Rock TX Independent School District GO | 5.000% | 8/1/19 | 5,360 | 5,934 |
| SA Energy Acquisition Public Facility Corp. Texas Gas Supply Revenue | 5.250% | 8/1/17 | 16,100 | 16,568 |
| SA Energy Acquisition Public Facility Corp. Texas Gas Supply Revenue | 5.250% | 8/1/18 | 18,985 | 20,227 |
| SA Energy Acquisition Public Facility Corp. Texas Gas Supply Revenue | 5.500% | 8/1/19 | 22,010 | 24,347 |
| SA Energy Acquisition Public Facility Corp. Texas Gas Supply Revenue | 5.500% | 8/1/20 | 9,465 | 10,792 |
| SA Energy Acquisition Public Facility Corp. Texas Gas Supply Revenue | 5.500% | 8/1/21 | 3,010 | 3,516 |
| SA Energy Acquisition Public Facility Corp. Texas Gas Supply Revenue | 5.500% | 8/1/23 | 200 | 242 |
| SA Energy Acquisition Public Facility Corp. Texas Gas Supply Revenue | 5.500% | 8/1/25 | 4,105 | 5,024 |
| SA Energy Acquisition Public Facility Corp. Texas Gas Supply Revenue | 5.500% | 8/1/27 | 910 | 1,141 |
| Sabine River Authority TX Pollution Control Revenue (Southwestern Electric Power Co. Project) | 4.950% | 3/1/18 (14) | 16,000 | 16,707 |
| Sam Rayburn TX Municipal Power Agency Revenue | 5.000% | 10/1/20 | 1,000 | 1,129 |
| San Antonio TX Electric & Gas Systems Revenue | 5.000% | 2/1/20 | 5,860 | 6,590 |
| San Antonio TX Electric & Gas Systems Revenue | 5.000% | 2/1/22 | 20,000 | 23,714 |
| San Antonio TX Electric & Gas Systems Revenue | 5.000% | 2/1/23 | 5,890 | 7,125 |
| San Antonio TX Electric & Gas Systems Revenue | 5.000% | 2/1/23 | 52,060 | 62,974 |
| San Antonio TX Electric & Gas Systems Revenue | 5.000% | 2/1/24 | 15,515 | 19,123 |
| San Antonio TX Electric & Gas Systems Revenue | 5.000% | 2/1/25 | 14,750 | 18,383 |
| San Antonio TX Electric & Gas Systems Revenue | 5.000% | 2/1/26 | 9,275 | 11,723 |
| San Antonio TX Electric & Gas Systems Revenue | 5.000% | 2/1/30 | 2,710 | 3,204 |
| San Antonio TX Electric & Gas Systems Revenue | 5.000% | 2/1/31 | 3,000 | 3,531 |
| San Antonio TX Electric & Gas Systems Revenue | 4.000% | 2/1/32 | 16,950 | 18,812 |
| San Antonio TX GO | 4.000% | 2/1/17 | 16,075 | 16,211 |
| San Antonio TX GO | 5.000% | 8/1/17 (Prere.) | 5,685 | 5,868 |
| San Antonio TX GO | 5.000% | 8/1/17 (Prere.) | 6,030 | 6,224 |
| San Antonio TX GO | 5.000% | 2/1/23 | 12,630 | 15,303 |
| San Antonio TX GO | 5.000% | 2/1/25 | 10,000 | 12,489 |
| San Antonio TX GO | 5.000% | 2/1/26 | 5,800 | 7,193 |
| San Antonio TX GO | 5.000% | 2/1/26 | 2,500 | 3,040 |
| San Antonio TX GO | 5.000% | 2/1/27 | 4,915 | 6,050 |
| San Antonio TX GO | 5.000% | 2/1/27 | 4,045 | 5,117 |
| San Antonio TX GO | 5.000% | 2/1/27 | 1,750 | 2,115 |
| San Antonio TX GO | 5.000% | 2/1/28 | 1,000 | 1,202 |
| San Antonio TX GO | 5.000% | 2/1/29 | 1,250 | 1,502 |
| San Antonio TX Independent School District GO | 5.000% | 8/15/26 | 7,370 | 9,390 |
| San Antonio TX Independent School District GO | 5.000% | 8/15/27 | 5,840 | 7,362 |
| San Antonio TX Independent School District GO | 5.000% | 8/15/29 | 8,475 | 10,525 |
| San Antonio TX Independent School District GO | 5.000% | 8/15/31 | 6,345 | 7,783 |
| San Antonio TX Independent School District GO | 5.000% | 8/15/32 | 2,800 | 3,415 |
| 3 San Antonio TX Water Revenue | 5.000% | 5/15/33 | 6,210 | 7,501 |
| 3 San Antonio TX Water Revenue | 5.000% | 5/15/34 | 7,000 | 8,421 |
| 3 San Antonio TX Water Revenue | 5.000% | 5/15/35 | 6,500 | 7,794 |
| 3 San Antonio TX Water Revenue | 5.000% | 5/15/36 | 6,565 | 7,847 |
| Schertz-Cibolo-Universal City TX Independent School District GO | 3.000% | 2/1/18 | 2,060 | 2,113 |
| Southwest Texas Higher Education Authority Inc. Revenue | | | | |
| (Southern Methodist University Project) | 5.000% | 10/1/19 (Prere.) | 9,100 | 10,135 |
| Southwest Texas Higher Education Authority Inc. Revenue | | | | |
| (Southern Methodist University Project) | 5.000% | 10/1/19 (Prere.) | 4,375 | 4,873 |
| Southwest Texas Higher Education Authority Inc. Revenue | | | | |
| (Southern Methodist University Project) | 5.000% | 10/1/19 (Prere.) | 2,250 | 2,506 |
| Spring Branch TX Independent School District GO | 5.000% | 2/1/20 | 7,000 | 7,870 |
| Spring Branch TX Independent School District GO | 5.000% | 2/1/20 | 3,830 | 4,306 |
| Spring Branch TX Independent School District GO | 5.000% | 2/1/21 | 2,500 | 2,889 |
215
Intermediate-Term Tax-Exempt Fund
| | | | |
| | | | Face | Market |
| | | Maturity | Amount | Value• |
| | Coupon | Date | ($000) | ($000) |
| Spring TX Independent School District GO | 5.000% | 8/15/24 | 5,080 | 6,307 |
| Spring TX Independent School District GO | 5.000% | 8/15/25 | 3,655 | 4,598 |
| Spring TX Independent School District GO | 5.000% | 8/15/28 | 7,850 | 9,650 |
| Spring TX Independent School District GO | 5.000% | 8/15/29 | 4,315 | 5,262 |
| Spring TX Independent School District GO | 5.000% | 8/15/32 | 6,165 | 7,396 |
| Stephen F Austin TX State University Revenue | 5.000% | 10/15/24 | 650 | 798 |
| Stephen F Austin TX State University Revenue | 5.000% | 10/15/25 | 600 | 743 |
| Stephen F Austin TX State University Revenue | 5.000% | 10/15/26 | 1,400 | 1,747 |
| Stephen F Austin TX State University Revenue | 5.000% | 10/15/29 | 1,000 | 1,216 |
| Sugar Land TX GO | 5.000% | 2/15/30 | 3,445 | 3,853 |
| Tarrant County TX Cultural Education Facilities Finance Corp. Hospital Revenue | | | | |
| (Baylor Scott & White Healthcare Project) | 5.000% | 11/15/28 | 3,750 | 4,553 |
| Tarrant County TX Cultural Education Facilities Finance Corp. Hospital Revenue | | | | |
| (Baylor Scott & White Healthcare Project) | 5.000% | 11/15/29 | 5,500 | 6,648 |
| Tarrant County TX Cultural Education Facilities Finance Corp. Hospital Revenue | | | | |
| (Baylor Scott & White Healthcare Project) | 5.000% | 11/15/30 | 3,000 | 3,613 |
| Tarrant County TX Cultural Education Facilities Finance Corp. Hospital Revenue | | | | |
| (Baylor Scott & White Healthcare Project) | 5.000% | 11/15/31 | 1,500 | 1,795 |
| Tarrant County TX Cultural Education Facilities Finance Corp. Hospital Revenue | | | | |
| (Baylor Scott & White Healthcare Project) | 5.000% | 11/15/32 | 2,750 | 3,276 |
| Tarrant County TX Cultural Education Facilities Finance Corp. Hospital Revenue | | | | |
| (Baylor Scott & White Healthcare Project) | 4.000% | 11/15/34 | 3,000 | 3,229 |
| Tarrant County TX Cultural Education Facilities Finance Corp. Hospital Revenue | | | | |
| (Baylor Scott & White Healthcare Project) | 4.000% | 11/15/35 | 3,500 | 3,755 |
| Tarrant County TX Cultural Education Facilities Finance Corp. Hospital Revenue | | | | |
| (Baylor Scott & White Healthcare Project) | 4.000% | 11/15/36 | 2,000 | 2,139 |
| Tarrant County TX Cultural Education Facilities Finance Corp. Hospital Revenue | | | | |
| (Methodist Hospitals of Dallas) | 5.250% | 10/1/31 | 21,880 | 25,832 |
| Tarrant County TX Cultural Education Facilities Finance Corp. Hospital Revenue | | | | |
| (Scott & White Healthcare Project) | 5.000% | 8/15/20 (Prere.) | 2,985 | 3,414 |
| Tarrant County TX Cultural Education Facilities Finance Corp. Hospital Revenue | | | | |
| (Scott & White Healthcare Project) | 5.000% | 8/15/20 (Prere.) | 13,495 | 15,433 |
| 2 Tarrant County TX Cultural Education Facilities Finance Corp. Hospital Revenue | | | | |
| (Scott & White Healthcare Project) | 5.000% | 8/15/20 (Prere.) | 23,855 | 27,281 |
| Tarrant County TX Cultural Education Facilities Finance Corp. Revenue (CHRISTUS Health) | 5.000% | 7/1/17 | 8,570 | 8,798 |
| Tarrant County TX Cultural Education Facilities Finance Corp. Revenue (CHRISTUS Health) | 5.000% | 7/1/18 | 9,000 | 9,570 |
| Tarrant County TX Cultural Education Facilities Finance Corp. Revenue (CHRISTUS Health) | 5.000% | 7/1/19 | 9,455 | 10,366 |
| Tarrant County TX Cultural Education Facilities Finance Corp. Revenue (CHRISTUS Health) | 6.250% | 7/1/28 (12) | 16,500 | 18,142 |
| Temple TX GO | 5.250% | 8/1/17 (Prere.) | 1,665 | 1,721 |
| Temple TX GO | 5.250% | 8/1/17 (Prere.) | 1,525 | 1,577 |
| Texas A&M University System Permanent University Fund Revenue | 5.000% | 7/1/19 | 3,335 | 3,689 |
| Texas A&M University System Revenue Board of Regents Revenue | 5.000% | 5/15/21 | 9,425 | 10,996 |
| Texas A&M University System Revenue Board of Regents Revenue | 5.000% | 5/15/22 | 10,935 | 13,067 |
| Texas A&M University System Revenue Board of Regents Revenue | 5.000% | 5/15/23 | 11,355 | 13,864 |
| Texas A&M University System Revenue Financing System Revenue | 5.000% | 7/1/30 | 3,940 | 4,548 |
| Texas GO | 5.000% | 8/1/17 | 3,165 | 3,268 |
| Texas GO | 5.000% | 10/1/19 | 6,335 | 7,066 |
| Texas GO | 5.000% | 10/1/20 | 3,845 | 4,419 |
| Texas GO | 5.000% | 10/1/20 | 3,000 | 3,448 |
| Texas GO | 5.000% | 4/1/21 | 5,150 | 5,993 |
| Texas GO | 5.000% | 10/1/22 | 19,055 | 23,018 |
| Texas GO | 5.000% | 10/1/24 | 4,000 | 4,998 |
| Texas GO | 5.000% | 10/1/25 | 5,420 | 6,853 |
| Texas GO | 5.000% | 10/1/26 | 8,000 | 9,909 |
| Texas GO | 5.000% | 4/1/27 | 10,000 | 12,162 |
| Texas GO | 5.000% | 10/1/27 | 33,600 | 40,786 |
| Texas GO | 5.000% | 10/1/27 | 5,295 | 6,498 |
| Texas GO | 5.000% | 10/1/28 | 31,975 | 38,629 |
| Texas Municipal Gas Acquisition & Supply Corp. Revenue | 5.625% | 12/15/17 | 32,125 | 33,008 |
| Texas Municipal Gas Acquisition & Supply Corp. Revenue | 5.000% | 12/15/20 | 5,000 | 5,612 |
| Texas Municipal Gas Acquisition & Supply Corp. Revenue | 5.000% | 12/15/21 | 6,000 | 6,885 |
| Texas Municipal Gas Acquisition & Supply Corp. Revenue | 5.250% | 12/15/21 | 10,510 | 12,176 |
| Texas Municipal Gas Acquisition & Supply Corp. Revenue | 5.250% | 12/15/22 | 3,645 | 4,251 |
| Texas Municipal Gas Acquisition & Supply Corp. Revenue | 5.000% | 12/15/23 | 8,000 | 9,331 |
| Texas Municipal Gas Acquisition & Supply Corp. Revenue | 5.250% | 12/15/23 | 1,650 | 1,967 |
| Texas Municipal Gas Acquisition & Supply Corp. Revenue | 5.000% | 12/15/25 | 5,000 | 5,730 |
| Texas Municipal Gas Acquisition & Supply Corp. Revenue | 6.250% | 12/15/26 | 32,710 | 40,163 |
| Texas Municipal Gas Acquisition & Supply Corp. Revenue | 5.000% | 12/15/27 | 12,000 | 13,664 |
| Texas Municipal Gas Acquisition & Supply Corp. Revenue | 5.000% | 12/15/29 | 10,000 | 11,253 |
| Texas Municipal Gas Acquisition & Supply Corp. Revenue | 5.000% | 12/15/31 | 12,125 | 13,587 |
216
Intermediate-Term Tax-Exempt Fund
| | | | |
| | | | Face | Market |
| | | Maturity | Amount | Value• |
| | Coupon | Date | ($000) | ($000) |
| Texas Municipal Gas Acquisition & Supply Corp. Revenue | 5.000% | 12/15/32 | 2,500 | 2,787 |
| Texas Municipal Power Agency Revenue | 0.000% | 9/1/17 (ETM) | 445 | 442 |
| Texas Municipal Power Agency Revenue | 0.000% | 9/1/17 (14)(ETM) | 7,675 | 7,611 |
| Texas Municipal Power Agency Revenue | 0.000% | 9/1/17 (14)(ETM) | 23,590 | 23,377 |
| Texas Private Activity Surface Transportation Corp. Revenue | 7.500% | 12/31/31 | 32,000 | 37,784 |
| Texas Private Activity Surface Transportation Corp. Revenue | 7.500% | 6/30/32 | 47,510 | 56,945 |
| Texas Public Finance Authority Revenue (Unemployment Compensation) | 4.000% | 1/1/18 | 5,890 | 5,907 |
| Texas State University System Financing System Revenue | 5.000% | 3/15/25 | 750 | 899 |
| Texas State University System Financing System Revenue | 5.000% | 3/15/27 | 1,200 | 1,431 |
| Texas State University System Financing System Revenue | 5.000% | 3/15/28 | 3,870 | 4,402 |
| Texas State University System Financing System Revenue | 5.000% | 3/15/30 | 3,255 | 3,699 |
| Texas State University System Financing System Revenue | 5.000% | 3/15/31 | 4,480 | 5,085 |
| 3 Texas Transportation Commission GO | 5.000% | 4/1/20 | 9,500 | 10,748 |
| Texas Transportation Commission GO | 5.000% | 4/1/21 | 4,800 | 5,586 |
| 3 Texas Transportation Commission GO | 5.000% | 4/1/21 | 5,500 | 6,400 |
| Texas Transportation Commission GO | 5.000% | 4/1/22 | 14,000 | 16,703 |
| Texas Transportation Commission GO | 5.000% | 4/1/22 | 10,245 | 12,264 |
| 3 Texas Transportation Commission GO | 5.000% | 4/1/22 | 5,000 | 5,965 |
| Texas Transportation Commission GO | 5.000% | 10/1/22 | 7,000 | 8,456 |
| Texas Transportation Commission GO | 5.000% | 10/1/23 | 13,000 | 16,005 |
| Texas Transportation Commission GO | 5.000% | 4/1/24 | 6,000 | 7,439 |
| Texas Transportation Commission GO | 5.000% | 10/1/24 | 20,670 | 25,828 |
| Texas Transportation Commission GO | 5.000% | 4/1/25 | 10,050 | 12,407 |
| Texas Transportation Commission GO | 5.000% | 10/1/25 | 33,700 | 41,989 |
| Texas Transportation Commission GO | 5.000% | 4/1/26 | 13,550 | 16,640 |
| Texas Transportation Commission GO | 5.000% | 4/1/27 | 3,635 | 4,572 |
| Texas Transportation Commission GO | 5.000% | 4/1/33 | 20,300 | 24,572 |
| Texas Transportation Commission GO | 5.000% | 4/1/34 | 15,000 | 18,087 |
| Texas Transportation Commission Mobility Fund GO | 5.000% | 10/1/20 | 14,910 | 17,136 |
| Texas Transportation Commission Mobility Fund GO | 5.000% | 10/1/21 | 3,500 | 4,127 |
| Texas Transportation Commission Mobility Fund GO | 5.000% | 10/1/25 | 16,250 | 20,546 |
| 1 Texas Transportation Commission Mobility Fund GO PUT | 1.010% | 10/1/18 | 75,000 | 74,604 |
| Texas Transportation Commission Revenue | 5.000% | 4/1/17 (Prere.) | 20,000 | 20,358 |
| Texas Transportation Commission Revenue | 5.000% | 4/1/17 (Prere.) | 5,000 | 5,089 |
| Texas Transportation Commission Revenue | 5.000% | 4/1/17 (Prere.) | 23,405 | 23,824 |
| Texas Transportation Commission Revenue | 5.000% | 10/1/19 | 10,000 | 11,145 |
| Texas Transportation Commission Revenue | 5.000% | 10/1/19 | 6,000 | 6,687 |
| Texas Transportation Commission Revenue | 5.000% | 4/1/20 | 5,000 | 5,658 |
| Texas Transportation Commission Revenue | 5.000% | 10/1/20 | 41,500 | 47,644 |
| Texas Transportation Commission Revenue | 5.000% | 4/1/21 | 17,500 | 20,364 |
| Texas Transportation Commission Revenue | 5.000% | 4/1/22 | 13,490 | 16,094 |
| Texas Transportation Commission Revenue | 5.000% | 10/1/24 | 35,000 | 43,734 |
| Texas Transportation Commission Revenue | 5.000% | 10/1/25 | 25,355 | 32,059 |
| 1 Texas Transportation Commission Revenue PUT | 0.980% | 4/1/17 | 12,000 | 11,995 |
| Texas Transportation Commission Revenue PUT | 4.000% | 10/1/21 | 11,500 | 12,892 |
| Texas Transportation Commission Turnpike System Revenue | 5.000% | 8/15/29 | 4,000 | 4,672 |
| Texas Transportation Commission Turnpike System Revenue | 5.000% | 8/15/30 | 10,375 | 12,059 |
| Texas Transportation Commission Turnpike System Revenue | 5.000% | 8/15/31 | 36,155 | 41,795 |
| Texas Transportation Commission Turnpike System Revenue | 5.000% | 8/15/32 | 15,000 | 17,420 |
| Texas Transportation Commission Turnpike System Revenue | 5.000% | 8/15/32 | 40,730 | 46,929 |
| Texas Transportation Commission Turnpike System Revenue | 5.000% | 8/15/33 | 53,165 | 61,097 |
| Texas Transportation Commission Turnpike System Revenue | 5.000% | 8/15/34 | 9,485 | 10,879 |
| Texas Turnpike Authority Central Texas Turnpike System Revenue | 0.000% | 8/15/20 (ETM) | 3,515 | 3,338 |
| Texas Turnpike Authority Central Texas Turnpike System Revenue | 0.000% | 8/15/20 (2) | 6,485 | 6,088 |
| Texas Water Development Board Revenue | 4.000% | 4/15/20 | 2,300 | 2,525 |
| Texas Water Development Board Revenue | 5.000% | 4/15/20 | 3,185 | 3,605 |
| Texas Water Development Board Revenue | 5.000% | 7/15/20 | 3,800 | 4,207 |
| Texas Water Development Board Revenue | 5.000% | 10/15/20 | 1,000 | 1,148 |
| Texas Water Development Board Revenue | 5.000% | 4/15/21 | 4,950 | 5,760 |
| Texas Water Development Board Revenue | 5.000% | 4/15/21 | 3,000 | 3,491 |
| Texas Water Development Board Revenue | 5.000% | 10/15/21 | 3,300 | 3,889 |
| Texas Water Development Board Revenue | 5.000% | 10/15/31 | 8,000 | 9,754 |
| Texas Water Financial Assistance GO | 5.000% | 8/1/20 | 2,000 | 2,218 |
| 3 Tomball TX Independent School District GO | 5.000% | 2/15/19 | 3,210 | 3,499 |
| Tomball TX Independent School District GO | 5.000% | 2/15/23 | 5,000 | 6,041 |
| Tomball TX Independent School District GO | 5.000% | 2/15/24 | 10,000 | 12,372 |
| 2 University of Houston Texas Revenue | 4.750% | 2/15/18 (Prere.) | 6,430 | 6,753 |
| University of Houston Texas Revenue | 5.000% | 2/15/21 (Prere.) | 255 | 296 |
| University of Houston Texas Revenue | 4.750% | 2/15/28 (4) | 2,185 | 2,278 |
| University of Houston Texas Revenue | 4.000% | 2/15/29 | 4,340 | 4,806 |
217
Intermediate-Term Tax-Exempt Fund
| | | | |
| | | | Face | Market |
| | | Maturity | Amount | Value• |
| | Coupon | Date | ($000) | ($000) |
| University of Houston Texas Revenue | 5.000% | 2/15/29 | 4,745 | 5,446 |
| University of Houston Texas Revenue | 4.000% | 2/15/31 | 4,865 | 5,294 |
| University of Houston Texas Revenue | 4.000% | 2/15/32 | 4,875 | 5,271 |
| University of Texas Permanent University Fund Revenue | 5.000% | 7/1/19 | 24,000 | 26,546 |
| University of Texas Permanent University Fund Revenue | 5.000% | 7/1/24 | 3,920 | 4,883 |
| University of Texas Permanent University Fund Revenue | 5.000% | 7/1/25 | 8,095 | 10,198 |
| University of Texas Permanent University Fund Revenue | 5.000% | 7/1/25 | 3,000 | 3,780 |
| University of Texas Permanent University Fund Revenue | 5.000% | 7/1/26 | 6,250 | 7,843 |
| University of Texas Permanent University Fund Revenue | 5.000% | 7/1/26 | 5,500 | 7,016 |
| University of Texas Permanent University Fund Revenue | 5.000% | 7/1/27 | 5,000 | 6,335 |
| University of Texas System Revenue Financing System Revenue | 4.750% | 2/15/17 (Prere.) | 4,585 | 4,638 |
| 3 University of Texas System Revenue Financing System Revenue | 5.000% | 8/15/18 | 1,540 | 1,648 |
| 3 University of Texas System Revenue Financing System Revenue | 5.000% | 8/15/19 | 2,725 | 3,016 |
| University of Texas System Revenue Financing System Revenue | 5.000% | 8/15/20 | 9,785 | 9,906 |
| University of Texas System Revenue Financing System Revenue | 5.000% | 8/15/20 | 2,700 | 3,087 |
| 3 University of Texas System Revenue Financing System Revenue | 5.000% | 8/15/20 | 6,300 | 7,192 |
| 3 University of Texas System Revenue Financing System Revenue | 5.000% | 8/15/20 | 4,370 | 4,986 |
| University of Texas System Revenue Financing System Revenue | 5.000% | 8/15/21 | 4,110 | 4,834 |
| 3 University of Texas System Revenue Financing System Revenue | 5.000% | 8/15/21 | 4,500 | 5,278 |
| University of Texas System Revenue Financing System Revenue | 5.000% | 8/15/25 | 6,000 | 7,605 |
| University of Texas System Revenue Financing System Revenue | 5.000% | 8/15/26 | 4,000 | 5,128 |
| University of Texas System Revenue Financing System Revenue | 4.750% | 8/15/30 | 6,610 | 6,687 |
| University of Texas System Revenue Financing System Revenue | 5.000% | 8/15/31 | 9,835 | 11,599 |
| University of Texas System Revenue Financing System Revenue | 5.000% | 8/15/32 | 4,180 | 4,925 |
| Williamson County TX GO | 5.000% | 2/15/23 | 6,000 | 7,130 |
| | | | | 5,449,987 |
| Utah (0.4%) | | | | |
| Alpine UT School District GO | 5.000% | 3/15/20 | 12,135 | 13,729 |
| Central Utah Water Conservancy District GO | 5.000% | 4/1/26 | 6,155 | 7,124 |
| Central Utah Water Conservancy District GO | 5.000% | 4/1/27 | 4,000 | 4,634 |
| Central Utah Water Conservancy District GO | 5.000% | 4/1/28 | 3,000 | 3,473 |
| Central Utah Water Conservancy District GO | 5.000% | 4/1/28 | 765 | 883 |
| Central Utah Water Conservancy District GO | 5.000% | 4/1/29 | 7,000 | 8,089 |
| Central Utah Water Conservancy District GO | 5.000% | 10/1/32 | 5,640 | 6,631 |
| Intermountain Power Agency Utah Power Supply Revenue | 5.000% | 7/1/22 | 2,000 | 2,133 |
| Intermountain Power Agency Utah Power Supply Revenue | 5.000% | 7/1/23 | 1,045 | 1,114 |
| Riverton UT Hospital Revenue (IHC Health Services Inc.) | 5.000% | 8/15/19 | 2,100 | 2,323 |
| Salt Lake & Sandy UT Metropolitan Water District Revenue | 5.000% | 7/1/32 | 2,000 | 2,337 |
| Utah Associated Municipal Power Systems Revenue (Horse Butte Wind Project) | 5.000% | 9/1/27 | 4,060 | 4,731 |
| Utah Associated Municipal Power Systems Revenue (Horse Butte Wind Project) | 5.000% | 9/1/28 | 4,260 | 4,941 |
| Utah Board of Regents Student Loan Revenue | 5.000% | 11/1/22 | 10,800 | 12,230 |
| Utah Board of Regents Student Loan Revenue | 5.000% | 11/1/23 | 4,200 | 4,739 |
| Utah GO | 4.500% | 7/1/19 | 11,200 | 12,254 |
| Utah GO | 5.000% | 7/1/19 | 19,000 | 21,037 |
| Utah Transit Authority Sales Tax Revenue | 5.000% | 6/15/26 | 1,350 | 1,652 |
| Utah Transit Authority Sales Tax Revenue | 5.000% | 6/15/27 | 2,230 | 2,710 |
| Utah Transit Authority Sales Tax Revenue | 5.000% | 6/15/28 | 2,250 | 2,708 |
| Utah Transit Authority Sales Tax Revenue | 5.000% | 6/15/29 | 9,005 | 10,762 |
| Utah Transit Authority Sales Tax Revenue | 4.000% | 12/15/29 | 3,100 | 3,448 |
| Utah Transit Authority Sales Tax Revenue | 5.000% | 6/15/30 | 6,680 | 7,934 |
| Utah Transit Authority Sales Tax Revenue | 5.000% | 6/15/31 | 4,515 | 5,336 |
| Utah Transit Authority Sales Tax Revenue | 5.000% | 6/15/32 | 10,330 | 12,129 |
| Utah Transit Authority Sales Tax Revenue | 5.000% | 6/15/33 | 10,510 | 12,296 |
| Utah Transit Authority Sales Tax Revenue | 5.000% | 6/15/34 | 7,105 | 8,295 |
| Washington County UT School District GO | 5.000% | 3/1/21 | 6,150 | 7,159 |
| | | | | 186,831 |
| Vermont (0.0%) | | | | |
| Vermont Educational & Health Buildings Financing Agency Hospital Revenue | | | | |
| (Fletcher Allen Health Care Project) | 5.000% | 6/1/18 (Prere.) | 8,000 | 8,513 |
| Vermont Educational & Health Buildings Financing Agency Revenue (Middlebury College Project) | 5.000% | 11/1/31 | 4,130 | 4,916 |
| | | | | 13,429 |
| Virgin Islands (0.0%) | | | | |
| Virgin Islands Public Finance Authority Revenue | 5.000% | 10/1/18 | 4,500 | 4,552 |
| Virgin Islands Public Finance Authority Revenue | 5.000% | 10/1/24 | 1,025 | 1,011 |
| | | | | 5,563 |
| Virginia (1.8%) | | | | |
| Arlington County VA GO | 5.000% | 8/15/19 | 1,000 | 1,111 |
| Chesapeake VA Toll Road Revenue | 5.000% | 7/15/23 | 1,600 | 1,848 |
218
Intermediate-Term Tax-Exempt Fund
| | | | |
| | | | Face | Market |
| | | Maturity | Amount | Value• |
| | Coupon | Date | ($000) | ($000) |
| Chesterfield County VA Water & Sewer Revenue | 5.000% | 11/1/21 | 3,860 | 4,581 |
| Chesterfield County VA Water & Sewer Revenue | 5.000% | 11/1/22 | 6,000 | 7,301 |
| Chesterfield County VA Water & Sewer Revenue | 5.000% | 11/1/23 | 5,315 | 6,597 |
| Chesterfield County VA Water & Sewer Revenue | 5.000% | 11/1/24 | 5,365 | 6,775 |
| Chesterfield County VA Water & Sewer Revenue | 5.000% | 11/1/25 | 3,285 | 4,201 |
| Chesterfield County VA Water & Sewer Revenue | 5.000% | 11/1/26 | 2,005 | 2,599 |
| Fairfax County VA Economic Development Authority Facilities Revenue (County Facilities Project) | 5.000% | 10/1/22 | 7,945 | 9,582 |
| Fairfax County VA Economic Development Authority Facilities Revenue (County Facilities Project) | 5.000% | 10/1/24 | 5,195 | 6,474 |
| Fairfax County VA Economic Development Authority Facilities Revenue (County Facilities Project) | 5.000% | 10/1/33 | 2,000 | 2,371 |
| Fairfax County VA Economic Development Authority Transportation District | | | | |
| Improvement Revenue (Silver Line Phase I Project) | 5.000% | 4/1/20 (Prere.) | 9,730 | 11,020 |
| Fairfax County VA Economic Development Authority Transportation District | | | | |
| Improvement Revenue (Silver Line Phase I Project) | 5.000% | 4/1/20 (Prere.) | 5,000 | 5,663 |
| Fairfax County VA Economic Development Authority Transportation District | | | | |
| Improvement Revenue (Silver Line Phase I Project) | 5.000% | 4/1/20 (Prere.) | 4,890 | 5,538 |
| Fairfax County VA GO | 4.000% | 10/1/19 | 5,800 | 6,308 |
| Fairfax County VA GO | 5.000% | 10/1/20 | 1,000 | 1,151 |
| Fairfax County VA GO | 5.000% | 10/1/21 | 1,000 | 1,184 |
| Fairfax County VA GO | 5.000% | 10/1/23 | 10,000 | 12,391 |
| Fairfax County VA GO | 5.000% | 10/1/24 | 10,000 | 12,610 |
| Fairfax County VA GO | 4.000% | 10/1/25 | 4,000 | 4,756 |
| Fairfax County VA GO | 5.000% | 10/1/25 | 5,000 | 6,367 |
| Fairfax County VA GO | 4.000% | 10/1/27 | 18,275 | 21,514 |
| Fairfax County VA Industrial Development Authority Health Care Revenue | | | | |
| (Inova Health System Obligated Group) | 5.000% | 5/15/25 | 2,000 | 2,189 |
| Fairfax County VA Public Improvement GO | 5.000% | 4/1/18 (Prere.) | 2,050 | 2,170 |
| Fairfax County VA Public Improvement GO | 5.000% | 4/1/20 | 10,940 | 12,402 |
| Fairfax County VA Public Improvement GO | 5.000% | 10/1/21 | 4,315 | 5,109 |
| Fairfax County VA Public Improvement GO | 5.000% | 10/1/21 (Prere.) | 7,315 | 8,654 |
| Fairfax County VA Public Improvement GO | 5.000% | 10/1/21 (Prere.) | 10,315 | 12,203 |
| Fairfax County VA Public Improvement GO | 5.000% | 4/1/23 | 10,465 | 12,831 |
| Fairfax County VA Water Authority Revenue | 5.000% | 4/1/25 | 2,500 | 2,969 |
| Fredericksburg VA Economic Development Authority Hospital Facilities Revenue | | | | |
| (MediCorp Health System Obligated Group) | 5.250% | 6/15/23 | 2,500 | 2,899 |
| Hampton VA GO | 5.000% | 1/15/20 | 3,000 | 3,264 |
| Henrico County VA GO | 5.000% | 7/15/21 | 4,900 | 5,766 |
| Henrico County VA Water & Sewer Revenue | 5.000% | 5/1/28 | 3,175 | 4,020 |
| Newport News VA Economical Development Authority Residential Care Facilities Revenue | 5.000% | 12/1/24 | 1,720 | 1,950 |
| Newport News VA Economical Development Authority Residential Care Facilities Revenue | 5.000% | 12/1/25 | 1,750 | 1,989 |
| Norfolk VA Water Revenue | 5.000% | 11/1/19 | 2,615 | 2,921 |
| Roanoke VA Economic Development Authority Hospital Revenue (Carilion Clinic Obligated Group) | 5.000% | 7/1/21 | 2,500 | 2,904 |
| Roanoke VA Economic Development Authority Hospital Revenue (Carilion Clinic Obligated Group) | 5.000% | 7/1/22 | 3,040 | 3,617 |
| Roanoke VA Economic Development Authority Hospital Revenue (Carilion Clinic Obligated Group) | 5.000% | 7/1/25 | 1,400 | 1,627 |
| Roanoke VA Economic Development Authority Hospital Revenue (Carilion Clinic Obligated Group) | 5.000% | 7/1/25 | 10,375 | 11,668 |
| Roanoke VA Economic Development Authority Hospital Revenue (Carilion Clinic Obligated Group) | 5.000% | 7/1/26 | 1,475 | 1,704 |
| Stafford County VA Economic Development Authority Hospital Facilities Revenue | | | | |
| (Mary Washington Healthcare Obligated Group) | 5.000% | 6/15/25 | 1,000 | 1,222 |
| Stafford County VA Economic Development Authority Hospital Facilities Revenue | | | | |
| (Mary Washington Healthcare Obligated Group) | 5.000% | 6/15/26 | 1,700 | 2,090 |
| Stafford County VA Economic Development Authority Hospital Facilities Revenue | | | | |
| (Mary Washington Healthcare Obligated Group) | 5.000% | 6/15/27 | 1,500 | 1,824 |
| Stafford County VA Economic Development Authority Hospital Facilities Revenue | | | | |
| (Mary Washington Healthcare Obligated Group) | 5.000% | 6/15/28 | 1,550 | 1,852 |
| Stafford County VA Economic Development Authority Hospital Facilities Revenue | | | | |
| (Mary Washington Healthcare Obligated Group) | 5.000% | 6/15/33 | 1,000 | 1,159 |
| Stafford County VA Economic Development Authority Hospital Facilities Revenue | | | | |
| (Mary Washington Healthcare Obligated Group) | 5.000% | 6/15/34 | 2,500 | 2,884 |
| Stafford County VA Economic Development Authority Hospital Facilities Revenue | | | | |
| (Mary Washington Healthcare Obligated Group) | 5.000% | 6/15/35 | 2,500 | 2,879 |
| Suffolk VA GO | 5.000% | 2/1/23 | 5,000 | 6,101 |
| Virginia Beach VA Development Authority Public Facility Revenue | 5.000% | 7/15/17 (Prere.) | 5,665 | 5,837 |
| Virginia Beach VA Development Authority Public Facility Revenue | 5.000% | 7/15/17 (Prere.) | 5,335 | 5,497 |
| Virginia Beach VA Development Authority Public Facility Revenue | 5.000% | 7/15/17 (Prere.) | 5,125 | 5,281 |
| Virginia Beach VA Development Authority Public Facility Revenue | 5.000% | 7/15/17 (Prere.) | 5,955 | 6,136 |
| Virginia Beach VA GO | 4.000% | 9/15/20 | 6,195 | 6,893 |
| Virginia Beach VA GO | 5.000% | 5/1/22 | 4,300 | 5,166 |
| Virginia Beach VA GO | 5.000% | 5/1/23 | 4,300 | 5,276 |
| Virginia Beach VA GO | 5.000% | 5/1/24 | 4,300 | 5,372 |
| Virginia College Building Authority Educational Facilities Revenue | | | | |
| (21st Century College & Equipment Programs) | 5.000% | 2/1/17 | 1,000 | 1,011 |
219
Intermediate-Term Tax-Exempt Fund
| | | | |
| | | | Face | Market |
| | | Maturity | Amount | Value• |
| | Coupon | Date | ($000) | ($000) |
| Virginia College Building Authority Educational Facilities Revenue | | | | |
| (21st Century College & Equipment Programs) | 5.000% | 2/1/18 | 10,595 | 10,705 |
| Virginia College Building Authority Educational Facilities Revenue | | | | |
| (21st Century College & Equipment Programs) | 5.000% | 2/1/19 | 18,575 | 20,234 |
| Virginia College Building Authority Educational Facilities Revenue | | | | |
| (21st Century College & Equipment Programs) | 5.000% | 2/1/19 | 10,415 | 11,345 |
| Virginia College Building Authority Educational Facilities Revenue | | | | |
| (21st Century College & Equipment Programs) | 5.000% | 2/1/20 | 17,655 | 19,867 |
| Virginia College Building Authority Educational Facilities Revenue | | | | |
| (21st Century College & Equipment Programs) | 5.000% | 2/1/21 | 17,540 | 20,313 |
| Virginia College Building Authority Educational Facilities Revenue | | | | |
| (21st Century College & Equipment Programs) | 5.000% | 2/1/22 | 1,000 | 1,187 |
| Virginia College Building Authority Educational Facilities Revenue | | | | |
| (21st Century College & Equipment Programs) | 5.000% | 2/1/28 | 5,840 | 6,744 |
| Virginia College Building Authority Educational Facilities Revenue | | | | |
| (21st Century College & Equipment Programs) | 4.000% | 2/1/31 | 18,000 | 20,028 |
| Virginia College Building Authority Educational Facilities Revenue | | | | |
| (21st Century College & Equipment Programs) | 4.000% | 2/1/32 | 20,225 | 22,329 |
| Virginia College Building Authority Educational Facilities Revenue | | | | |
| (21st Century College & Equipment Programs) | 4.000% | 2/1/33 | 21,035 | 23,115 |
| Virginia College Building Authority Educational Facilities Revenue | | | | |
| (Public Higher Education Financing Program) | 5.000% | 9/1/19 | 2,000 | 2,222 |
| Virginia College Building Authority Educational Facilities Revenue | | | | |
| (Public Higher Education Financing Program) | 5.000% | 9/1/20 | 3,715 | 4,249 |
| Virginia College Building Authority Educational Facilities Revenue | | | | |
| (Public Higher Education Financing Program) | 5.000% | 9/1/22 | 18,000 | 21,655 |
| Virginia College Building Authority Educational Facilities Revenue | | | | |
| (Public Higher Education Financing Program) | 4.000% | 9/1/30 | 4,515 | 5,064 |
| Virginia College Building Authority Educational Facilities Revenue | | | | |
| (Public Higher Education Financing Program) | 4.000% | 9/1/31 | 3,710 | 4,134 |
| Virginia College Building Authority Educational Facilities Revenue | | | | |
| (Public Higher Education Financing Program) | 4.000% | 9/1/32 | 4,900 | 5,424 |
| 3 Virginia Commonwealth Transportation Board Revenue | 4.000% | 3/15/18 | 2,360 | 2,460 |
| 3 Virginia Commonwealth Transportation Board Revenue | 5.000% | 9/15/19 | 7,475 | 8,308 |
| 3 Virginia Commonwealth Transportation Board Revenue | 5.000% | 3/15/20 | 2,500 | 2,821 |
| 3 Virginia Commonwealth Transportation Board Revenue | 5.000% | 9/15/20 | 5,000 | 5,725 |
| 3 Virginia Commonwealth Transportation Board Revenue | 5.000% | 3/15/21 | 4,400 | 5,106 |
| 3 Virginia Commonwealth Transportation Board Revenue | 5.000% | 9/15/21 | 2,000 | 2,352 |
| Virginia Commonwealth Transportation Board Revenue | 5.000% | 3/15/22 | 2,000 | 2,375 |
| Virginia Commonwealth Transportation Board Revenue | 5.000% | 5/15/23 | 7,960 | 9,736 |
| Virginia Commonwealth Transportation Board Revenue | 5.000% | 3/15/24 | 2,790 | 3,360 |
| Virginia Commonwealth Transportation Board Revenue | 5.000% | 5/15/24 | 21,000 | 25,041 |
| Virginia Commonwealth Transportation Board Revenue | 5.000% | 9/15/24 | 1,800 | 2,163 |
| Virginia Commonwealth Transportation Board Revenue | 5.000% | 9/15/25 | 5,035 | 6,026 |
| 3 Virginia Commonwealth Transportation Board Revenue | 5.000% | 3/15/26 | 9,155 | 11,559 |
| Virginia Commonwealth Transportation Board Revenue | 5.000% | 3/15/26 | 5,040 | 6,032 |
| 3 Virginia Commonwealth Transportation Board Revenue | 5.000% | 9/15/26 | 10,325 | 13,120 |
| Virginia Commonwealth Transportation Board Revenue | 5.000% | 9/15/26 | 2,000 | 2,392 |
| Virginia Commonwealth Transportation Board Revenue | 5.000% | 3/15/27 | 2,100 | 2,507 |
| Virginia Commonwealth Transportation Board Revenue | 5.000% | 5/15/27 | 13,765 | 15,976 |
| Virginia Commonwealth Transportation Board Revenue | 5.000% | 5/15/27 | 12,560 | 14,700 |
| Virginia Commonwealth Transportation Board Revenue | 5.000% | 9/15/27 | 5,260 | 6,272 |
| Virginia Commonwealth Transportation Board Revenue | 5.000% | 5/15/30 | 30,140 | 34,874 |
| Virginia Commonwealth Transportation Board Revenue | 5.000% | 5/15/31 | 31,550 | 36,506 |
| Virginia Commonwealth Transportation Board Revenue | 5.000% | 5/15/31 | 10,000 | 11,674 |
| Virginia GO | 4.000% | 6/1/19 | 14,380 | 15,506 |
| Virginia GO | 4.000% | 6/1/20 | 14,530 | 16,048 |
| Virginia Public Building Authority Public Facilities Revenue | 5.000% | 8/1/17 | 7,815 | 8,068 |
| Virginia Public Building Authority Public Facilities Revenue | 5.000% | 8/1/19 | 8,290 | 9,184 |
| Virginia Public Building Authority Public Facilities Revenue | 5.000% | 8/1/19 | 11,000 | 12,186 |
| Virginia Public Building Authority Public Facilities Revenue | 5.000% | 8/1/20 | 8,715 | 9,953 |
| Virginia Public Building Authority Public Facilities Revenue | 5.000% | 8/1/20 | 7,660 | 8,748 |
| Virginia Public Building Authority Public Facilities Revenue | 5.000% | 8/1/21 | 9,165 | 10,753 |
| Virginia Public Building Authority Public Facilities Revenue | 5.000% | 8/1/21 | 8,055 | 9,451 |
| Virginia Public Building Authority Public Facilities Revenue | 5.000% | 8/1/21 (Prere.) | 11,540 | 13,590 |
| Virginia Public School Authority Revenue | 4.000% | 8/1/18 | 4,815 | 5,074 |
| Virginia Public School Authority Revenue | 4.000% | 8/1/20 | 8,000 | 8,846 |
| Virginia Public School Authority Revenue | 5.000% | 8/1/20 | 2,500 | 2,771 |
| Virginia Public School Authority School Technology & Security Notes Revenue | 5.000% | 4/15/20 | 13,570 | 15,368 |
| Virginia Public School Authority School Technology & Security Notes Revenue | 5.000% | 4/15/20 | 5,000 | 5,662 |
220
Intermediate-Term Tax-Exempt Fund
| | | | |
| | | | Face | Market |
| | | Maturity | Amount | Value• |
| | Coupon | Date | ($000) | ($000) |
| Virginia Public School Authority School Technology & Security Notes Revenue | 5.000% | 4/15/21 | 11,000 | 12,815 |
| Virginia Resources Authority Clean Water Revenue (State Revolving Fund) | 5.000% | 10/1/22 | 7,760 | 9,413 |
| Virginia Resources Authority Clean Water Revenue (State Revolving Fund) | 5.000% | 10/1/22 | 8,500 | 10,306 |
| Virginia Resources Authority Clean Water Revenue (State Revolving Fund) | 5.000% | 10/1/23 | 9,985 | 12,350 |
| Virginia Resources Authority Clean Water Revenue (State Revolving Fund) | 5.000% | 10/1/23 | 5,845 | 7,212 |
| Virginia Resources Authority Infrastructure Revenue | 5.000% | 11/1/20 | 3,625 | 4,173 |
| Winchester VA Economic Development Authority Hospital Revenue | | | | |
| (Valley Health Obligated Group) | 5.000% | 1/1/31 | 3,000 | 3,586 |
| Winchester VA Economic Development Authority Hospital Revenue | | | | |
| (Valley Health Obligated Group) | 5.000% | 1/1/32 | 2,115 | 2,506 |
| Winchester VA Economic Development Authority Hospital Revenue | | | | |
| (Valley Health Obligated Group) | 5.000% | 1/1/33 | 2,500 | 2,940 |
| Winchester VA Economic Development Authority Hospital Revenue | | | | |
| (Valley Health Obligated Group) | 5.000% | 1/1/34 | 3,000 | 3,517 |
| | | | | 961,004 |
| Washington (2.8%) | | | | |
| 4 Central Puget Sound WA Regional Transit Authority Sales & Use Tax Revenue TOB VRDO | 0.580% | 11/1/16 | 6,900 | 6,900 |
| Energy Northwest Washington Electric Revenue (Columbia Generating Station) | 5.000% | 7/1/19 | 25,500 | 28,163 |
| Energy Northwest Washington Electric Revenue (Columbia Generating Station) | 5.000% | 7/1/20 | 20,000 | 22,780 |
| Energy Northwest Washington Electric Revenue (Columbia Generating Station) | 5.000% | 7/1/22 | 3,250 | 3,894 |
| Energy Northwest Washington Electric Revenue (Columbia Generating Station) | 5.000% | 7/1/23 | 3,500 | 4,273 |
| Energy Northwest Washington Electric Revenue (Columbia Generating Station) | 5.000% | 7/1/24 | 1,250 | 1,551 |
| Energy Northwest Washington Electric Revenue (Columbia Generating Station) | 5.000% | 7/1/30 | 6,000 | 7,217 |
| Energy Northwest Washington Electric Revenue (Columbia Generating Station) | 5.000% | 7/1/30 | 3,250 | 3,922 |
| Energy Northwest Washington Electric Revenue (Columbia Generating Station) | 5.000% | 7/1/31 | 1,000 | 1,200 |
| Energy Northwest Washington Electric Revenue (Columbia Generating Station) | 5.000% | 7/1/31 | 10,000 | 11,965 |
| Energy Northwest Washington Electric Revenue (Columbia Generating Station) | 5.000% | 7/1/32 | 5,000 | 5,955 |
| Energy Northwest Washington Electric Revenue (Project No. 1) | 5.000% | 7/1/24 | 1,615 | 2,004 |
| Energy Northwest Washington Electric Revenue (Project No. 1) | 5.000% | 7/1/25 | 5,385 | 6,757 |
| Energy Northwest Washington Electric Revenue (Project No. 1) | 5.000% | 7/1/25 | 12,500 | 15,685 |
| Energy Northwest Washington Electric Revenue (Project No. 1) | 5.000% | 7/1/26 | 13,000 | 15,117 |
| Energy Northwest Washington Electric Revenue (Project No. 1) | 5.000% | 7/1/27 | 19,000 | 23,320 |
| Energy Northwest Washington Electric Revenue (Project No. 3) | 5.000% | 7/1/26 | 24,500 | 31,141 |
| Energy Northwest Washington Electric Revenue (Project No. 3) | 5.000% | 7/1/27 | 19,750 | 24,835 |
| Energy Northwest Washington Electric Revenue (Project No. 3) | 5.000% | 7/1/28 | 13,000 | 15,847 |
| Grays Harbor County WA Public Utility District No. 1 Revenue | 5.000% | 1/1/27 | 1,000 | 1,205 |
| Grays Harbor County WA Public Utility District No. 1 Revenue | 5.000% | 1/1/28 | 1,000 | 1,196 |
| Grays Harbor County WA Public Utility District No. 1 Revenue | 5.000% | 1/1/29 | 1,200 | 1,423 |
| Grays Harbor County WA Public Utility District No. 1 Revenue | 5.000% | 1/1/30 | 1,575 | 1,853 |
| Grays Harbor County WA Public Utility District No. 1 Revenue | 5.000% | 1/1/31 | 1,625 | 1,902 |
| King County WA (Bellevue School District) GO | 5.000% | 12/1/27 | 16,505 | 19,058 |
| King County WA (Bellevue School District) GO | 5.000% | 12/1/28 | 17,335 | 20,016 |
| King County WA (Bellevue School District) GO | 5.000% | 12/1/29 | 18,200 | 21,015 |
| King County WA GO | 5.000% | 7/1/20 | 5,075 | 5,786 |
| King County WA GO | 4.750% | 1/1/34 | 3,075 | 3,199 |
| King County WA School District No. 414 GO | 5.000% | 6/1/19 | 1,620 | 1,783 |
| King County WA School District No. 414 GO | 5.000% | 12/1/19 | 4,815 | 5,387 |
| King County WA School District No. 414 GO | 5.000% | 12/1/20 | 5,615 | 6,458 |
| King County WA School District No. 414 GO | 5.000% | 12/1/21 | 7,910 | 9,320 |
| 2 King County WA Sewer Revenue | 5.750% | 1/1/18 (Prere.) | 2,500 | 2,643 |
| King County WA Sewer Revenue | 5.000% | 1/1/20 | 4,000 | 4,491 |
| Pierce County WA School District No. 10 (Tacoma) GO | 3.000% | 6/1/17 | 2,000 | 2,027 |
| Pierce County WA School District No. 10 (Tacoma) GO | 5.000% | 12/1/17 | 3,000 | 3,137 |
| Pierce County WA School District No. 10 (Tacoma) GO | 4.000% | 6/1/20 | 2,000 | 2,202 |
| Pierce County WA School District No. 10 (Tacoma) GO | 5.000% | 12/1/20 | 3,600 | 4,147 |
| Port of Seattle WA Passenger Facility Charge Revenue | 5.000% | 12/1/17 | 1,000 | 1,043 |
| Port of Seattle WA Passenger Facility Charge Revenue | 5.000% | 12/1/20 | 3,000 | 3,419 |
| Port of Seattle WA Passenger Facility Charge Revenue | 5.000% | 12/1/22 | 5,525 | 6,287 |
| Port of Seattle WA Revenue | 5.000% | 6/1/22 | 2,000 | 2,266 |
| Port of Seattle WA Revenue | 5.000% | 2/1/25 | 1,605 | 1,982 |
| Port of Seattle WA Revenue | 5.000% | 3/1/25 | 1,500 | 1,849 |
| Port of Seattle WA Revenue | 5.000% | 2/1/26 | 2,500 | 3,114 |
| Port of Seattle WA Revenue | 5.000% | 3/1/26 | 1,000 | 1,221 |
| Port of Seattle WA Revenue | 5.000% | 2/1/27 | 3,000 | 3,701 |
| Port of Seattle WA Revenue | 5.000% | 3/1/27 | 1,000 | 1,213 |
| Port of Seattle WA Revenue | 5.000% | 8/1/27 | 8,635 | 10,103 |
| Port of Seattle WA Revenue | 5.000% | 3/1/28 | 1,750 | 2,108 |
| Port of Seattle WA Revenue | 5.000% | 8/1/28 | 7,485 | 8,726 |
| Port of Seattle WA Revenue | 5.000% | 3/1/29 | 2,000 | 2,392 |
221
Intermediate-Term Tax-Exempt Fund
| | | | |
| | | | Face | Market |
| | | Maturity | Amount | Value• |
| | Coupon | Date | ($000) | ($000) |
| Port of Seattle WA Revenue | 5.000% | 3/1/30 | 2,000 | 2,369 |
| Port of Seattle WA Revenue | 5.000% | 6/1/30 | 6,000 | 6,703 |
| Port of Seattle WA Revenue | 5.000% | 8/1/30 | 8,000 | 9,389 |
| Port of Seattle WA Revenue | 5.000% | 8/1/31 | 5,500 | 6,445 |
| Seattle WA GO | 5.000% | 6/1/21 | 16,395 | 19,225 |
| Seattle WA Municipal Light & Power Revenue | 5.000% | 2/1/20 | 7,945 | 8,935 |
| Seattle WA Water System Revenue | 5.000% | 5/1/19 | 12,000 | 13,188 |
| Seattle WA Water System Revenue | 5.000% | 5/1/24 | 12,610 | 15,606 |
| 3 Skagit County WA Public Hospital District Revenue | 4.000% | 12/1/24 | 2,295 | 2,484 |
| 3 Skagit County WA Public Hospital District Revenue | 4.000% | 12/1/25 | 3,760 | 4,044 |
| Snohomish County WA School District No. 15 (Edmonds) GO | 5.000% | 12/1/29 | 3,700 | 4,421 |
| Snohomish County WA School District No. 15 (Edmonds) GO | 5.000% | 12/1/30 | 3,000 | 3,558 |
| Snohomish County WA School District No. 15 (Edmonds) GO | 5.000% | 12/1/31 | 3,650 | 4,307 |
| Snohomish County WA School District No. 201 GO | 5.250% | 12/1/18 (Prere.) | 5,500 | 5,994 |
| Tobacco Settlement Authority Washington Revenue | 5.000% | 6/1/27 | 10,000 | 10,185 |
| Tobacco Settlement Authority Washington Revenue | 5.250% | 6/1/28 | 17,670 | 18,732 |
| University of Washington Revenue | 5.000% | 7/1/27 | 6,925 | 8,150 |
| University of Washington Revenue | 5.000% | 4/1/28 | 10,195 | 11,820 |
| University of Washington Revenue | 5.000% | 7/1/28 | 11,490 | 13,479 |
| University of Washington Revenue | 5.000% | 7/1/29 | 7,500 | 8,759 |
| University of Washington Revenue | 5.000% | 4/1/30 | 9,315 | 10,660 |
| University of Washington Revenue | 5.000% | 7/1/30 | 10,495 | 12,421 |
| University of Washington Revenue | 5.000% | 4/1/31 | 10,500 | 11,992 |
| University of Washington Revenue | 5.000% | 4/1/32 | 11,375 | 12,971 |
| University of Washington Revenue | 5.000% | 7/1/32 | 5,000 | 5,917 |
| Washington (Motor Vehicle Fuel Tax) GO | 5.000% | 8/1/17 | 2,070 | 2,137 |
| Washington (Motor Vehicle Fuel Tax) GO | 5.000% | 1/1/18 | 1,940 | 2,034 |
| Washington (Motor Vehicle Fuel Tax) GO | 5.000% | 8/1/19 (Prere.) | 3,185 | 3,530 |
| Washington (Motor Vehicle Fuel Tax) GO | 5.000% | 7/1/20 | 5,780 | 6,583 |
| Washington (Motor Vehicle Fuel Tax) GO | 5.000% | 8/1/23 | 5,435 | 6,515 |
| Washington (Motor Vehicle Fuel Tax) GO | 5.000% | 8/1/25 | 5,260 | 6,297 |
| Washington (Motor Vehicle Fuel Tax) GO | 5.000% | 8/1/26 | 6,175 | 7,389 |
| Washington (Motor Vehicle Fuel Tax) GO | 5.000% | 7/1/27 | 14,900 | 18,190 |
| Washington (Motor Vehicle Fuel Tax) GO | 5.000% | 7/1/27 | 5,000 | 6,104 |
| Washington (Motor Vehicle Fuel Tax) GO | 5.000% | 7/1/28 | 19,710 | 23,929 |
| Washington (Motor Vehicle Fuel Tax) GO | 5.000% | 6/1/29 | 10,545 | 12,298 |
| Washington (Motor Vehicle Fuel Tax) GO | 5.000% | 6/1/30 | 7,525 | 8,703 |
| Washington (Motor Vehicle Fuel Tax) GO | 5.000% | 7/1/30 | 8,000 | 9,724 |
| Washington (Motor Vehicle Fuel Tax) GO | 4.000% | 7/1/31 | 23,685 | 25,801 |
| Washington (Motor Vehicle Fuel Tax) GO | 5.000% | 7/1/31 | 9,520 | 11,502 |
| Washington (Motor Vehicle Fuel Tax) GO | 5.000% | 8/1/33 | 6,800 | 8,025 |
| Washington (Motor Vehicle Fuel Tax) GO | 5.000% | 8/1/34 | 11,640 | 13,706 |
| Washington Economic Development Finance Authority Lease Revenue | | | | |
| (Washington Biomedical Research Properties 2) | 5.000% | 6/1/27 | 1,410 | 1,720 |
| Washington Economic Development Finance Authority Lease Revenue | | | | |
| (Washington Biomedical Research Properties 2) | 5.000% | 6/1/29 | 1,435 | 1,725 |
| Washington Economic Development Finance Authority Lease Revenue | | | | |
| (Washington Biomedical Research Properties 2) | 5.000% | 6/1/31 | 2,165 | 2,574 |
| Washington Economic Development Finance Authority Lease Revenue | | | | |
| (Washington Biomedical Research Properties 2) | 5.000% | 6/1/32 | 1,460 | 1,728 |
| Washington GO | 5.000% | 7/1/17 (Prere.) | 7,295 | 7,503 |
| Washington GO | 5.000% | 7/1/17 | 32,460 | 33,400 |
| 2 Washington GO | 5.000% | 7/1/18 (Prere.) | 5,000 | 5,340 |
| 2 Washington GO | 5.000% | 2/1/19 (Prere.) | 6,790 | 7,398 |
| Washington GO | 5.000% | 7/1/19 | 6,940 | 7,665 |
| Washington GO | 5.000% | 8/1/19 (Prere.) | 4,845 | 5,370 |
| Washington GO | 0.000% | 6/1/20 (14) | 5,500 | 5,241 |
| Washington GO | 5.000% | 7/1/20 | 2,705 | 2,781 |
| Washington GO | 5.000% | 7/1/20 | 13,035 | 14,847 |
| Washington GO | 5.000% | 8/1/20 | 4,730 | 5,400 |
| Washington GO | 5.000% | 7/1/22 | 9,845 | 11,796 |
| Washington GO | 5.000% | 7/1/22 | 23,500 | 28,157 |
| Washington GO | 5.000% | 7/1/22 | 20,000 | 23,963 |
| Washington GO | 5.000% | 7/1/23 | 10,000 | 11,964 |
| Washington GO | 5.000% | 7/1/24 | 2,875 | 3,560 |
| Washington GO | 5.000% | 7/1/24 | 5,000 | 5,982 |
| Washington GO | 5.000% | 1/1/25 | 1,750 | 2,023 |
| Washington GO | 5.000% | 7/1/25 | 50,585 | 62,291 |
| Washington GO | 5.000% | 7/1/27 | 8,550 | 10,438 |
| Washington GO | 5.000% | 8/1/27 | 7,495 | 9,254 |
222
Intermediate-Term Tax-Exempt Fund
| | | | |
| | | | Face | Market |
| | | Maturity | Amount | Value• |
| | Coupon | Date | ($000) | ($000) |
| Washington GO | 5.000% | 2/1/28 | 10,000 | 11,565 |
| Washington GO | 5.000% | 8/1/28 | 20,210 | 24,866 |
| Washington GO | 5.000% | 2/1/29 | 9,650 | 11,156 |
| Washington GO | 5.000% | 2/1/30 | 13,740 | 16,501 |
| Washington GO | 5.000% | 2/1/30 | 8,545 | 10,159 |
| Washington GO | 5.000% | 7/1/30 | 20,730 | 25,198 |
| Washington GO | 5.000% | 8/1/30 | 20,980 | 24,372 |
| Washington GO | 5.000% | 6/1/31 | 5,250 | 6,072 |
| Washington GO | 5.000% | 7/1/31 | 20,300 | 24,526 |
| Washington GO | 5.000% | 8/1/31 | 13,860 | 16,567 |
| Washington GO | 5.000% | 8/1/31 | 10,145 | 12,376 |
| Washington GO | 5.000% | 2/1/32 | 6,170 | 7,131 |
| Washington GO | 5.000% | 6/1/32 | 5,500 | 6,361 |
| Washington GO | 5.000% | 8/1/32 | 29,775 | 35,264 |
| Washington Health Care Facilities Authority Revenue | | | | |
| (Central Washington Health Services Association) | 5.000% | 7/1/27 | 2,675 | 3,124 |
| Washington Health Care Facilities Authority Revenue | | | | |
| (Central Washington Health Services Association) | 5.000% | 7/1/28 | 2,160 | 2,504 |
| Washington Health Care Facilities Authority Revenue | | | | |
| (Central Washington Health Services Association) | 5.000% | 7/1/29 | 1,755 | 2,020 |
| Washington Health Care Facilities Authority Revenue (MultiCare Health System) | 5.000% | 8/15/18 | 2,000 | 2,144 |
| Washington Health Care Facilities Authority Revenue (MultiCare Health System) | 5.250% | 8/15/18 (Prere.) | 3,675 | 3,960 |
| Washington Health Care Facilities Authority Revenue (MultiCare Health System) | 5.250% | 8/15/18 (Prere.) | 3,550 | 3,825 |
| Washington Health Care Facilities Authority Revenue (MultiCare Health System) | 5.250% | 8/15/18 (Prere.) | 3,925 | 4,229 |
| Washington Health Care Facilities Authority Revenue (MultiCare Health System) | 5.250% | 8/15/18 (Prere.) | 3,425 | 3,690 |
| Washington Health Care Facilities Authority Revenue (MultiCare Health System) | 5.250% | 8/15/18 (Prere.) | 3,550 | 3,825 |
| Washington Health Care Facilities Authority Revenue (MultiCare Health System) | 5.250% | 8/15/18 (Prere.) | 3,625 | 3,906 |
| Washington Health Care Facilities Authority Revenue (MultiCare Health System) | 5.250% | 8/15/18 (Prere.) | 3,800 | 4,094 |
| Washington Health Care Facilities Authority Revenue (MultiCare Health System) | 5.250% | 8/15/19 | 3,800 | 4,227 |
| Washington Health Care Facilities Authority Revenue (MultiCare Health System) | 5.250% | 8/15/20 | 4,250 | 4,726 |
| Washington Health Care Facilities Authority Revenue (MultiCare Health System) | 5.250% | 8/15/21 | 6,525 | 7,243 |
| Washington Health Care Facilities Authority Revenue (MultiCare Health System) | 5.250% | 8/15/22 | 5,500 | 6,092 |
| Washington Health Care Facilities Authority Revenue (PeaceHealth) | 5.000% | 11/1/18 | 23,000 | 24,746 |
| Washington Health Care Facilities Authority Revenue (PeaceHealth) | 5.000% | 11/15/23 | 1,500 | 1,826 |
| Washington Health Care Facilities Authority Revenue (PeaceHealth) | 5.000% | 11/1/24 | 19,830 | 21,833 |
| Washington Health Care Facilities Authority Revenue (PeaceHealth) | 5.000% | 11/15/25 | 1,710 | 2,081 |
| Washington Health Care Facilities Authority Revenue (PeaceHealth) | 5.000% | 11/15/27 | 1,035 | 1,229 |
| Washington Health Care Facilities Authority Revenue (Providence Health & Services) | 5.000% | 10/1/32 | 3,785 | 4,352 |
| Washington Health Care Facilities Authority Revenue (Providence Health & Services) PUT | 4.000% | 10/1/21 | 2,700 | 3,024 |
| Washington Health Care Facilities Authority Revenue (Seattle Cancer Care Alliance) | 5.000% | 3/1/32 | 2,800 | 3,287 |
| Washington Higher Education Facilities Authority Revenue (Gonzaga University Project) | 5.000% | 4/1/19 (Prere.) | 2,580 | 2,827 |
| Washington Higher Education Facilities Authority Revenue (Gonzaga University Project) | 5.000% | 4/1/19 (Prere.) | 3,005 | 3,293 |
| Washington Higher Education Facilities Authority Revenue (Gonzaga University Project) | 5.000% | 4/1/19 (Prere.) | 4,470 | 4,899 |
| Washington Higher Education Facilities Authority Revenue (Gonzaga University Project) | 5.000% | 4/1/19 (Prere.) | 2,000 | 2,192 |
| Washington Housing Finance Commission Multi-Family Housing Revenue | | | | |
| (Emerald Heights Project) | 5.000% | 7/1/28 | 1,675 | 1,886 |
| Washington Housing Finance Commission Multi-Family Housing Revenue | | | | |
| (Emerald Heights Project) | 5.000% | 7/1/33 | 2,840 | 3,137 |
| Washington State University General Revenue | 5.000% | 10/1/28 | 3,070 | 3,588 |
| Washington State University General Revenue | 5.000% | 10/1/29 | 3,070 | 3,572 |
| Washington State University General Revenue | 5.000% | 10/1/30 | 3,140 | 3,656 |
| Washington State University General Revenue | 5.000% | 10/1/31 | 3,170 | 3,682 |
| | | | | 1,463,372 |
| West Virginia (0.3%) | | | | |
| West Virginia Economic Development Authority Lottery Revenue | 5.000% | 6/15/19 | 1,395 | 1,535 |
| West Virginia Economic Development Authority Lottery Revenue | 5.000% | 6/15/21 | 3,500 | 3,969 |
| West Virginia Economic Development Authority Lottery Revenue | 5.000% | 6/15/22 | 2,055 | 2,324 |
| West Virginia Economic Development Authority Lottery Revenue | 5.000% | 6/15/23 | 1,745 | 1,970 |
| West Virginia Economic Development Authority Lottery Revenue | 5.000% | 6/15/25 | 2,445 | 2,747 |
| West Virginia Economic Development Authority Lottery Revenue | 5.000% | 6/15/27 | 5,085 | 5,681 |
| West Virginia Higher Education Policy Commission Revenue | 5.000% | 4/1/25 | 2,000 | 2,348 |
| West Virginia Higher Education Policy Commission Revenue | 5.000% | 4/1/27 | 1,500 | 1,749 |
| West Virginia Higher Education Policy Commission Revenue | 5.000% | 4/1/28 | 2,000 | 2,315 |
| West Virginia Higher Education Policy Commission Revenue | 5.000% | 4/1/29 | 2,000 | 2,303 |
| West Virginia Hospital Finance Authority Hospital Revenue (Charleston Area Medical Center Inc.) | 5.000% | 9/1/17 | 6,335 | 6,534 |
| West Virginia Hospital Finance Authority Hospital Revenue (Charleston Area Medical Center Inc.) | 5.000% | 9/1/18 | 4,985 | 5,310 |
| West Virginia Hospital Finance Authority Hospital Revenue (Charleston Area Medical Center Inc.) | 5.000% | 9/1/19 | 2,990 | 3,275 |
| West Virginia Hospital Finance Authority Hospital Revenue (Charleston Area Medical Center Inc.) | 5.000% | 9/1/20 | 3,560 | 3,908 |
| West Virginia Hospital Finance Authority Hospital Revenue (Charleston Area Medical Center Inc.) | 5.125% | 9/1/21 | 3,265 | 3,585 |
223
Intermediate-Term Tax-Exempt Fund
| | | | |
| | | | Face | Market |
| | | Maturity | Amount | Value• |
| | Coupon | Date | ($000) | ($000) |
| West Virginia Hospital Finance Authority Hospital Revenue (Charleston Area Medical Center Inc.) | 5.000% | 9/1/24 | 2,840 | 3,420 |
| West Virginia Hospital Finance Authority Hospital Revenue (Charleston Area Medical Center Inc.) | 5.000% | 9/1/25 | 2,880 | 3,438 |
| West Virginia Hospital Finance Authority Hospital Revenue (Charleston Area Medical Center Inc.) | 5.000% | 9/1/26 | 2,280 | 2,702 |
| West Virginia Hospital Finance Authority Hospital Revenue (Charleston Area Medical Center Inc.) | 5.000% | 9/1/27 | 2,840 | 3,336 |
| West Virginia Hospital Finance Authority Hospital Revenue (Charleston Area Medical Center Inc.) | 5.000% | 9/1/28 | 3,095 | 3,610 |
| West Virginia Hospital Finance Authority Hospital Revenue | | | | |
| (United Health System Obligated Group) | 5.000% | 6/1/18 (ETM) | 1,920 | 2,044 |
| West Virginia Hospital Finance Authority Hospital Revenue | | | | |
| (United Health System Obligated Group) | 5.000% | 6/1/19 (Prere.) | 12,620 | 13,899 |
| West Virginia Hospital Finance Authority Hospital Revenue | | | | |
| (United Health System Obligated Group) | 4.000% | 6/1/29 | 5,490 | 6,084 |
| West Virginia Hospital Finance Authority Hospital Revenue | | | | |
| (United Health System Obligated Group) | 4.000% | 6/1/30 | 5,500 | 6,051 |
| West Virginia Hospital Finance Authority Hospital Revenue | | | | |
| (United Health System Obligated Group) | 4.000% | 6/1/31 | 3,250 | 3,556 |
| West Virginia Hospital Finance Authority Hospital Revenue | | | | |
| (United Health System Obligated Group) | 4.000% | 6/1/32 | 8,700 | 9,465 |
| West Virginia Hospital Finance Authority Hospital Revenue | | | | |
| (United Health System Obligated Group) | 4.000% | 6/1/34 | 9,500 | 10,245 |
| West Virginia Hospital Finance Authority Hospital Revenue | | | | |
| (United Health System Obligated Group) | 4.000% | 6/1/35 | 4,500 | 4,833 |
| West Virginia School Building Authority Excess Lottery Revenue | 5.250% | 7/1/18 (Prere.) | 2,500 | 2,681 |
| West Virginia School Building Authority Excess Lottery Revenue | 5.250% | 7/1/18 (Prere.) | 5,810 | 6,231 |
| West Virginia University Revenue | 5.000% | 10/1/17 | 1,500 | 1,557 |
| West Virginia University Revenue | 5.000% | 10/1/30 | 3,000 | 3,464 |
| West Virginia Water Development Authority Infrastructure Excess Lottery Revenue | | | | |
| (Chesapeake Bay/Greenbrier River Projects) | 5.000% | 7/1/27 | 2,710 | 3,285 |
| West Virginia Water Development Authority Infrastructure Excess Lottery Revenue | | | | |
| (Chesapeake Bay/Greenbrier River Projects) | 5.000% | 7/1/31 | 3,435 | 4,105 |
| West Virginia Water Development Authority Infrastructure Excess Lottery Revenue | | | | |
| (Chesapeake Bay/Greenbrier River Projects) | 5.000% | 7/1/33 | 3,690 | 4,372 |
| | | | | 147,931 |
| Wisconsin (1.1%) | | | | |
| Central Brown County WI Water Authority Water System Revenue | 5.000% | 11/1/30 | 1,890 | 2,238 |
| Central Brown County WI Water Authority Water System Revenue | 5.000% | 11/1/31 | 2,000 | 2,357 |
| Central Brown County WI Water Authority Water System Revenue | 5.000% | 11/1/32 | 2,000 | 2,348 |
| Central Brown County WI Water Authority Water System Revenue | 5.000% | 11/1/33 | 1,500 | 1,755 |
| Central Brown County WI Water Authority Water System Revenue | 5.000% | 11/1/34 | 1,500 | 1,749 |
| Central Brown County WI Water Authority Water System Revenue | 5.000% | 11/1/35 | 1,500 | 1,743 |
| Madison WI Community Development Authority Revenue (Wisconsin Alumni Research Project) | 5.000% | 10/1/18 | 1,640 | 1,765 |
| Madison WI Community Development Authority Revenue (Wisconsin Alumni Research Project) | 5.000% | 10/1/19 | 3,705 | 4,121 |
| Milwaukee WI GO | 5.000% | 2/1/19 | 3,000 | 3,266 |
| Milwaukee WI GO | 4.000% | 3/15/19 | 8,490 | 9,083 |
| Milwaukee WI GO | 4.000% | 3/15/20 | 9,930 | 10,885 |
| Milwaukee WI Metropolitan Sewer District GO | 5.250% | 10/1/22 | 2,690 | 3,279 |
| Milwaukee WI Sewerage System Revenue | 5.000% | 6/1/24 | 3,995 | 4,928 |
| Milwaukee WI Sewerage System Revenue | 5.000% | 6/1/25 | 4,200 | 5,241 |
| Wisconsin Clean Water Revenue | 4.000% | 6/1/17 | 1,000 | 1,019 |
| Wisconsin GO | 5.000% | 11/1/17 | 4,500 | 4,692 |
| 2 Wisconsin GO | 5.000% | 5/1/18 (Prere.) | 7,135 | 7,578 |
| Wisconsin GO | 5.000% | 5/1/18 (2) | 4,050 | 4,302 |
| Wisconsin GO | 5.000% | 5/1/18 | 3,800 | 4,037 |
| Wisconsin GO | 5.000% | 5/1/18 (ETM) | 7,485 | 7,948 |
| Wisconsin GO | 5.000% | 5/1/18 | 7,770 | 8,254 |
| Wisconsin GO | 5.000% | 5/1/19 | 4,700 | 5,169 |
| Wisconsin GO | 5.000% | 5/1/19 | 12,000 | 13,198 |
| Wisconsin GO | 5.000% | 5/1/19 | 3,885 | 4,273 |
| Wisconsin GO | 5.000% | 5/1/20 (Prere.) | 2,305 | 2,615 |
| Wisconsin GO | 5.000% | 5/1/20 | 1,000 | 1,136 |
| Wisconsin GO | 5.000% | 5/1/20 | 2,915 | 3,310 |
| Wisconsin GO | 5.000% | 11/1/20 | 7,000 | 8,063 |
| Wisconsin GO | 5.000% | 5/1/21 | 9,335 | 10,889 |
| Wisconsin GO | 5.000% | 5/1/22 | 1,195 | 1,350 |
| Wisconsin GO | 5.000% | 5/1/22 | 10,425 | 12,106 |
| Wisconsin GO | 5.000% | 5/1/25 | 7,500 | 8,910 |
| Wisconsin GO | 5.000% | 5/1/27 | 2,750 | 3,252 |
| Wisconsin GO | 5.000% | 5/1/27 | 1,400 | 1,655 |
| Wisconsin GO | 6.000% | 5/1/27 | 10,000 | 11,181 |
| Wisconsin GO | 5.000% | 5/1/28 | 2,060 | 2,429 |
224
Intermediate-Term Tax-Exempt Fund
| | | | |
| | | | Face | Market |
| | | Maturity | Amount | Value• |
| | Coupon | Date | ($000) | ($000) |
| Wisconsin GO | 5.000% | 5/1/29 | 1,715 | 2,020 |
| Wisconsin Health & Educational Facilities Authority Health Facilities Revenue (SSM Health Care) | 5.000% | 6/1/19 | 4,110 | 4,500 |
| Wisconsin Health & Educational Facilities Authority Health Facilities Revenue (SSM Health Care) | 5.000% | 6/1/20 | 3,240 | 3,652 |
| Wisconsin Health & Educational Facilities Authority Health Facilities Revenue (SSM Health Care) | 5.000% | 6/1/21 | 5,230 | 5,913 |
| Wisconsin Health & Educational Facilities Authority Health Facilities Revenue (SSM Health Care) | 5.000% | 6/1/22 | 3,295 | 3,712 |
| Wisconsin Health & Educational Facilities Authority Revenue | | | | |
| (Ascension Health Alliance Credit Group) | 4.000% | 11/15/32 | 8,000 | 8,708 |
| Wisconsin Health & Educational Facilities Authority Revenue | | | | |
| (Ascension Health Alliance Credit Group) | 4.000% | 11/15/33 | 50,545 | 54,754 |
| Wisconsin Health & Educational Facilities Authority Revenue | | | | |
| (Ascension Health Alliance Credit Group) | 4.000% | 11/15/34 | 33,500 | 36,145 |
| Wisconsin Health & Educational Facilities Authority Revenue | | | | |
| (Ascension Health Alliance Credit Group) | 4.000% | 11/15/35 | 25,000 | 26,867 |
| Wisconsin Health & Educational Facilities Authority Revenue | | | | |
| (Ascension Health Alliance Credit Group) | 5.000% | 11/15/36 | 13,950 | 16,503 |
| Wisconsin Health & Educational Facilities Authority Revenue | | | | |
| (Ascension Health Alliance Credit Group) PUT | 5.000% | 6/1/21 | 34,215 | 39,664 |
| Wisconsin Health & Educational Facilities Authority Revenue (Aurora Health Care Inc.) | 5.000% | 7/15/28 | 8,500 | 9,575 |
| Wisconsin Health & Educational Facilities Authority Revenue (Aurora Health Care Inc.) | 5.500% | 4/15/29 | 11,700 | 13,030 |
| Wisconsin Health & Educational Facilities Authority Revenue (Beloit College) | 5.000% | 7/1/28 | 765 | 895 |
| Wisconsin Health & Educational Facilities Authority Revenue (Beloit College) | 5.000% | 7/1/29 | 685 | 795 |
| Wisconsin Health & Educational Facilities Authority Revenue (Beloit College) | 5.000% | 7/1/30 | 940 | 1,084 |
| Wisconsin Health & Educational Facilities Authority Revenue (Beloit College) | 5.000% | 7/1/31 | 990 | 1,135 |
| Wisconsin Health & Educational Facilities Authority Revenue (Beloit College) | 5.000% | 7/1/32 | 1,045 | 1,192 |
| Wisconsin Health & Educational Facilities Authority Revenue | | | | |
| (Children’s Hospital of Wisconsin Inc.) | 5.375% | 8/15/24 | 5,900 | 6,618 |
| Wisconsin Health & Educational Facilities Authority Revenue | | | | |
| (Hospital Sisters Services Inc. Obligated Group) | 5.000% | 11/15/28 | 12,110 | 14,528 |
| Wisconsin Health & Educational Facilities Authority Revenue | | | | |
| (Hospital Sisters Services Inc. Obligated Group) | 5.000% | 11/15/29 | 12,000 | 14,343 |
| Wisconsin Health & Educational Facilities Authority Revenue (Marquette University) | 5.000% | 10/1/24 | 700 | 831 |
| Wisconsin Health & Educational Facilities Authority Revenue (Marquette University) | 5.000% | 10/1/28 | 1,865 | 2,166 |
| Wisconsin Health & Educational Facilities Authority Revenue (Marquette University) | 5.000% | 10/1/29 | 1,500 | 1,735 |
| Wisconsin Health & Educational Facilities Authority Revenue (Marquette University) | 5.000% | 10/1/30 | 1,660 | 1,919 |
| Wisconsin Health & Educational Facilities Authority Revenue | | | | |
| (Marshfield Clinic Health System Obligated Group) | 5.000% | 2/15/24 | 2,310 | 2,727 |
| Wisconsin Health & Educational Facilities Authority Revenue | | | | |
| (Marshfield Clinic Health System Obligated Group) | 5.000% | 2/15/25 | 2,435 | 2,897 |
| Wisconsin Health & Educational Facilities Authority Revenue | | | | |
| (Marshfield Clinic Health System Obligated Group) | 5.000% | 2/15/26 | 940 | 1,123 |
| Wisconsin Health & Educational Facilities Authority Revenue | | | | |
| (Marshfield Clinic Health System Obligated Group) | 5.000% | 2/15/27 | 1,685 | 1,994 |
| Wisconsin Health & Educational Facilities Authority Revenue (Medical College Wisconsin) | 5.000% | 12/1/34 | 7,000 | 8,369 |
| Wisconsin Health & Educational Facilities Authority Revenue (Medical College Wisconsin) | 5.000% | 12/1/35 | 6,340 | 7,543 |
| 2 Wisconsin Health & Educational Facilities Authority Revenue (Ministry Health Care Inc.) | 5.000% | 8/15/22 (Prere.) | 11,800 | 14,245 |
| Wisconsin Health & Educational Facilities Authority Revenue (ProHealth Care Obligated Group) | 5.000% | 8/15/30 | 2,000 | 2,330 |
| Wisconsin Health & Educational Facilities Authority Revenue (ProHealth Care Obligated Group) | 5.000% | 8/15/31 | 1,650 | 1,915 |
| Wisconsin Health & Educational Facilities Authority Revenue (ProHealth Care Obligated Group) | 5.000% | 8/15/33 | 1,250 | 1,440 |
| Wisconsin Health & Educational Facilities Authority Revenue (ProHealth Care Obligated Group) | 5.000% | 8/15/34 | 1,250 | 1,437 |
| Wisconsin Petroleum Inspection Fee Revenue | 4.000% | 7/1/19 | 8,710 | 9,393 |
| Wisconsin Public Finance Authority Hospital Revenue (Renown Regional Medical Center) | 5.000% | 6/1/25 | 2,130 | 2,593 |
| Wisconsin Public Finance Authority Hospital Revenue (Renown Regional Medical Center) | 5.000% | 6/1/26 | 3,680 | 4,504 |
| Wisconsin Public Finance Authority Hospital Revenue (Renown Regional Medical Center) | 5.000% | 6/1/26 | 6,285 | 7,614 |
| Wisconsin Public Finance Authority Hospital Revenue (Renown Regional Medical Center) | 5.000% | 6/1/27 | 4,625 | 5,569 |
| Wisconsin Public Finance Authority Hospital Revenue (Renown Regional Medical Center) | 5.000% | 6/1/28 | 6,955 | 8,313 |
| Wisconsin Public Finance Authority Hospital Revenue (Renown Regional Medical Center) | 5.000% | 6/1/29 | 4,295 | 5,098 |
| Wisconsin Public Finance Authority Hospital Revenue (Renown Regional Medical Center) | 5.000% | 6/1/30 | 7,675 | 9,058 |
| Wisconsin Public Finance Authority Hospital Revenue (Renown Regional Medical Center) | 5.000% | 6/1/33 | 5,895 | 6,897 |
| Wisconsin Public Power System Power Supply System Revenue | 5.000% | 7/1/32 | 4,000 | 4,642 |
| Wisconsin Public Power System Power Supply System Revenue | 5.000% | 7/1/33 | 3,500 | 4,048 |
| Wisconsin Transportation Revenue | 5.000% | 7/1/17 | 3,000 | 3,087 |
| Wisconsin Transportation Revenue | 5.000% | 7/1/18 (Prere.) | 5,100 | 5,446 |
| Wisconsin Transportation Revenue | 5.000% | 7/1/30 | 5,000 | 5,867 |
| | | | | 582,557 |
| Total Tax-Exempt Municipal Bonds (Cost $50,134,172) | | | | 52,505,280 |
225
| | | |
| Intermediate-Term Tax-Exempt Fund | | | |
| |
| |
| |
| |
| | | | Market |
| | | | Value• |
| | Coupon | Shares | ($000) |
| Temporary Cash Investment (2.2%) | | | |
| Money Market Fund (2.2%) | | | |
| 5 Vanguard Municipal Cash Management Fund (Cost $1,146,605) | 0.614% | 11,466,017 | 1,146,601 |
| Total Investments (101.3%) (Cost $51,280,777) | | | 53,651,881 |
| |
| | | | Amount |
| | | | ($000) |
| Other Assets and Liabilities (-1.3%) | | | |
| Other Assets | | | |
| Investment in Vanguard | | | 4,051 |
| Receivables for Investment Securities Sold | | | 128,825 |
| Receivables for Accrued Income | | | 617,686 |
| Receivables for Capital Shares Issued | | | 47,276 |
| Other Assets | | | 2,724 |
| Total Other Assets | | | 800,562 |
| Liabilities | | | |
| Payables for Investment Securities Purchased | | | (1,352,936) |
| Payables for Capital Shares Redeemed | | | (43,334) |
| Payables for Distributions | | | (35,321) |
| Payables to Vanguard | | | (34,342) |
| Other Liabilities | | | (815) |
| Total Liabilities | | | (1,466,748) |
| Net Assets (100%) | | | 52,985,695 |
| |
| |
| At October 31, 2016, net assets consisted of: | | | |
| | | | Amount |
| | | | ($000) |
| Paid-in Capital | | | 50,648,395 |
| Undistributed Net Investment Income | | | 222 |
| Accumulated Net Realized Losses | | | (34,548) |
| Unrealized Appreciation (Depreciation) | | | |
| Investment Securities | | | 2,371,104 |
| Futures Contracts | | | 522 |
| Net Assets | | | 52,985,695 |
| |
| |
| Investor Shares—Net Assets | | | |
| Applicable to 315,345,813 outstanding $.001 par value shares of beneficial interest (unlimited authorization) | | | 4,513,040 |
| Net Asset Value Per Share—Investor Shares | | | $14.31 |
| |
| |
| Admiral Shares—Net Assets | | | |
| Applicable to 3,386,995,716 outstanding $.001 par value shares of beneficial interest (unlimited authorization) | | | 48,472,655 |
| Net Asset Value Per Share—Admiral Shares | | | $14.31 |
• See Note A in Notes to Financial Statements.
1 Adjustable-rate security.
2 Securities with a value of $17,779,000 have been segregated as initial margin for open futures contracts.
3 Security purchased on a when-issued or delayed-delivery basis for which the fund has not taken delivery as of October 31, 2016.
4 Security exempt from registration under Rule 144A of the Securities Act of 1933. Such securities may be sold in transactions exempt from registration, normally to qualified institutional buyers. At October 31, 2016,
the aggregate value of these securities was $466,722,000, representing 0.9% of net assets.
5 Affiliated money market fund available only to Vanguard funds and certain trusts and accounts managed by Vanguard. Rate shown is the 7-day yield.
A key to abbreviations and other references follows the Statement of Net Assets.
See accompanying Notes, which are an integral part of the Financial Statements.
226
Intermediate-Term Tax-Exempt Fund
Key to Abbreviations
ARS—Auction Rate Security.
BAN—Bond Anticipation Note.
COP—Certificate of Participation.
CP—Commercial Paper.
FR—Floating Rate.
GAN—Grant Anticipation Note.
GO—General Obligation Bond.
PILOT—Payments in Lieu of Taxes.
PUT—Put Option Obligation.
RAN—Revenue Anticipation Note.
TAN—Tax Anticipation Note.
TOB—Tender Option Bond.
TRAN—Tax Revenue Anticipation Note.
VRDO—Variable Rate Demand Obligation.
VRDP—Variable Rate Demand Preferred.
(ETM)—Escrowed to Maturity.
(Prere.)—Prerefunded.
Scheduled principal and interest payments are guaranteed by:
(1) MBIA (Municipal Bond Investors Assurance).
(2) AMBAC (Ambac Assurance Corporation).
(3) FGIC (Financial Guaranty Insurance Company).
(4) AGM (Assured Guaranty Municipal Corporation).
(5) BIGI (Bond Investors Guaranty Insurance).
(6) Connie Lee Inc.
(7) FHA (Federal Housing Authority).
(8) CapMAC (Capital Markets Assurance Corporation).
(9) American Capital Access Financial Guaranty Corporation.
(10) XL Capital Assurance Inc.
(11) CIFG (CDC IXIS Financial Guaranty).
(12) AGC (Assured Guaranty Corporation).
(13) BHAC (Berkshire Hathaway Assurance Corporation).
(14) NPFG (National Public Finance Guarantee Corporation).
(15) BAM (Build America Mutual Assurance Company).
(16) MAC (Municipal Assurance Corporation).
(17) RAA (Radian Asset Assurance Inc.).
(18) SBLF (Michigan School Bond Loan Fund).
The insurance does not guarantee the market value of the municipal bonds.
LOC—Scheduled principal and interest payments are guaranteed by bank letter of credit.
227
Intermediate-Term Tax-Exempt Fund
| |
| Statement of Operations |
| |
| | Year Ended |
| October 31, 2016 |
| | ($000) |
| Investment Income | |
| Income | |
| Interest1 | 1,442,643 |
| Total Income | 1,442,643 |
| Expenses | |
| The Vanguard Group—Note B | |
| Investment Advisory Services | 5,325 |
| Management and Administrative— | |
| Investor Shares | 6,792 |
| Management and Administrative— | |
| Admiral Shares | 30,361 |
| Marketing and Distribution— | |
| Investor Shares | 1,099 |
| Marketing and Distribution— | |
| Admiral Shares | 4,283 |
| Custodian Fees | 497 |
| Auditing Fees | 36 |
| Shareholders’ Reports—Investor Shares | 244 |
| Shareholders’ Reports—Admiral Shares | 434 |
| Trustees’ Fees and Expenses | 24 |
| Total Expenses | 49,095 |
| Net Investment Income | 1,393,548 |
| Realized Net Gain (Loss) | |
| Investment Securities Sold1 | 32,650 |
| Futures Contracts | (1,012) |
| Realized Net Gain (Loss) | 31,638 |
| Change in Unrealized Appreciation | |
| (Depreciation) | |
| Investment Securities | 296,118 |
| Futures Contracts | 640 |
| Change in Unrealized Appreciation | |
| (Depreciation) | 296,758 |
| Net Increase (Decrease) in Net Assets | |
| Resulting from Operations | 1,721,944 |
1 Interest income and realized net gain (loss) from affiliated companies of the fund were $3,417,000 and ($1,000), respectively.
| | |
| Statement of Changes in Net Assets | | |
| |
| | Year Ended October 31, |
| | 2016 | 2015 |
| | ($000) | ($000) |
| Increase (Decrease) in Net Assets | | |
| Operations | | |
| Net Investment Income | 1,393,548 | 1,265,531 |
| Realized Net Gain (Loss) | 31,638 | 16,815 |
| Change in Unrealized Appreciation (Depreciation) | 296,758 | (226,382) |
| Net Increase (Decrease) in Net Assets Resulting from Operations | 1,721,944 | 1,055,964 |
| Distributions | | |
| Net Investment Income | | |
| Investor Shares | (124,432) | (134,008) |
| Admiral Shares | (1,268,748) | (1,130,815) |
| Realized Capital Gain | | |
| Investor Shares | — | — |
| Admiral Shares | — | — |
| Total Distributions | (1,393,180) | (1,264,823) |
| Capital Share Transactions | | |
| Investor Shares | 59,375 | (195,148) |
| Admiral Shares | 7,880,106 | 5,557,644 |
| Net Increase (Decrease) from Capital Share Transactions | 7,939,481 | 5,362,496 |
| Total Increase (Decrease) | 8,268,245 | 5,153,637 |
| Net Assets | | |
| Beginning of Period | 44,717,450 | 39,563,813 |
| End of Period1 | 52,985,695 | 44,717,450 |
| 1 Net Assets—End of Period includes undistributed (overdistributed) net investment income of $222,000 and $257,000. |
See accompanying Notes, which are an integral part of the Financial Statements.
228
| | | | | |
| Intermediate-Term Tax-Exempt Fund | | | | | |
| |
| |
| Financial Highlights | | | | | |
| |
| Investor Shares | | | | | |
| |
| For a Share Outstanding | | | Year Ended October 31, |
| Throughout Each Period | 2016 | 2015 | 2014 | 2013 | 2012 |
| Net Asset Value, Beginning of Period | $14.19 | $14.26 | $13.84 | $14.41 | $13.75 |
| Investment Operations | | | | | |
| Net Investment Income | .393 | .413 | .440 | .433 | .449 |
| Net Realized and Unrealized Gain (Loss) | | | | | |
| on Investments | .120 | (. 070) | . 420 | (. 570) | .660 |
| Total from Investment Operations | .513 | .343 | .860 | (.137) | 1.109 |
| Distributions | | | | | |
| Dividends from Net Investment Income | (. 393) | (.413) | (. 440) | (. 433) | (. 449) |
| Distributions from Realized Capital Gains | — | — | — | — | — |
| Total Distributions | (. 393) | (.413) | (. 440) | (. 433) | (. 449) |
| Net Asset Value, End of Period | $14.31 | $14.19 | $14.26 | $13.84 | $14.41 |
| |
| Total Return1 | 3.63% | 2.44% | 6.31% | -0.96% | 8.15% |
| |
| Ratios/Supplemental Data | | | | | |
| Net Assets, End of Period (Millions) | $4,513 | $4,416 | $4,637 | $4,878 | $6,976 |
| Ratio of Total Expenses to Average Net Assets | 0.19% | 0.20% | 0.20% | 0.20% | 0.20% |
| Ratio of Net Investment Income to | | | | | |
| Average Net Assets | 2.72% | 2.91% | 3.13% | 3.06% | 3.15% |
| Portfolio Turnover Rate | 9% | 12% | 12% | 16% | 11% |
1 Total returns do not include account service fees that may have applied in the periods shown. Fund prospectuses provide information about any applicable account service fees.
| | | | | |
| Admiral Shares | | | | | |
| |
| For a Share Outstanding | | | Year Ended October 31, |
| Throughout Each Period | 2016 | 2015 | 2014 | 2013 | 2012 |
| Net Asset Value, Beginning of Period | $14.19 | $14.26 | $13.84 | $14.41 | $13.75 |
| Investment Operations | | | | | |
| Net Investment Income | . 407 | . 425 | .451 | .445 | .460 |
| Net Realized and Unrealized Gain (Loss) | | | | | |
| on Investments | .120 | (. 070) | . 420 | (. 570) | .660 |
| Total from Investment Operations | . 527 | . 355 | .871 | (.125) | 1.120 |
| Distributions | | | | | |
| Dividends from Net Investment Income | (. 407) | (. 425) | (.451) | (. 445) | (.460) |
| Distributions from Realized Capital Gains | — | — | — | — | — |
| Total Distributions | (. 407) | (. 425) | (.451) | (. 445) | (.460) |
| Net Asset Value, End of Period | $14.31 | $14.19 | $14.26 | $13.84 | $14.41 |
| |
| Total Return1 | 3.73% | 2.53% | 6.39% | -0.88% | 8.24% |
| |
| Ratios/Supplemental Data | | | | | |
| Net Assets, End of Period (Millions) | $48,473 | $40,302 | $34,927 | $29,278 | $30,729 |
| Ratio of Total Expenses to Average Net Assets | 0.09% | 0.12% | 0.12% | 0.12% | 0.12% |
| Ratio of Net Investment Income to | | | | | |
| Average Net Assets | 2.82% | 2.99% | 3.21% | 3.14% | 3.23% |
| Portfolio Turnover Rate | 9% | 12% | 12% | 16% | 11% |
1 Total returns do not include account service fees that may have applied in the periods shown. Fund prospectuses provide information about any applicable account service fees.
See accompanying Notes, which are an integral part of the Financial Statements.
229
Intermediate-Term Tax-Exempt Fund
Notes to Financial Statements
Vanguard Intermediate-Term Tax-Exempt Fund is registered under the Investment Company Act of 1940 as an open-end investment company, or mutual fund. The fund invests in debt instruments of many municipal issuers; the issuers’ abilities to meet their obligations may be affected by economic and political developments in a specific state or region. The fund offers two classes of shares: Investor Shares and Admiral Shares. Investor Shares are available to any investor who meets the fund’s minimum purchase requirements. Admiral Shares are designed for investors who meet certain administrative, service, and account-size criteria.
A. The following significant accounting policies conform to generally accepted accounting principles for U.S. investment companies. The fund consistently follows such policies in preparing its financial statements.
1. Security Valuation: Securities are valued as of the close of trading on the New York Stock Exchange (generally 4 p.m., Eastern time) on the valuation date. Bonds and temporary cash investments acquired over 60 days to maturity are valued using the latest bid prices or using valuations based on a matrix system (which considers such factors as security prices, yields, maturities, and ratings), both as furnished by independent pricing services. Investments in Vanguard Municipal Cash Management Fund are valued at that fund’s net asset value. Other temporary cash investments are valued at amortized cost, which approximates market value. Securities for which market quotations are not readily available, or whose values have been affected by events occurring before the fund’s pricing time but after the close of the securities’ primary markets, are valued by methods deemed by the board of trustees to represent fair value.
2. Futures Contracts: The fund uses futures contracts to invest in fixed income asset classes with greater efficiency and lower cost than is possible through direct investment, to add value when these instruments are attractively priced, or to adjust sensitivity to changes in interest rates. The primary risks associated with the use of futures contracts are imperfect correlation between changes in market values of bonds held by the fund and the prices of futures contracts, and the possibility of an illiquid market. Counterparty risk involving futures is mitigated because a regulated clearinghouse is the counterparty instead of the clearing broker. To further mitigate counterparty risk, the fund trades futures contracts on an exchange, monitors the financial strength of its clearing brokers and clearinghouse, and has entered into clearing agreements with its clearing brokers. The clearinghouse imposes initial margin requirements to secure the fund’s performance and requires daily settlement of variation margin representing changes in the market value of each contract.
Futures contracts are valued at their quoted daily settlement prices. The aggregate settlement values of the contracts are not recorded in the Statement of Net Assets. Fluctuations in the value of the contracts are recorded in the Statement of Net Assets as an asset (liability) and in the Statement of Operations as unrealized appreciation (depreciation) until the contracts are closed, when they are recorded as realized futures gains (losses).
During the year ended October 31, 2016, the fund’s average investments in long and short futures contracts represented 2% and less than 1% of net assets, respectively, based on the average of aggregate settlement values at each quarter-end during the period.
3. Federal Income Taxes: The fund intends to continue to qualify as a regulated investment company and distribute all of its income. Management has analyzed the fund’s tax positions taken for all open federal income tax years (October 31, 2013–2016), and has concluded that no provision for federal income tax is required in the fund’s financial statements.
4. Distributions: Distributions from net investment income are declared daily and paid on the first business day of the following month. Annual distributions from realized capital gains, if any, are recorded on the ex-dividend date.
5. Credit Facility: The fund and certain other funds managed by The Vanguard Group (“Vanguard”) participate in a $3.1 billion committed credit facility provided by a syndicate of lenders pursuant to a credit agreement that may be renewed annually; each fund is individually liable for its borrowings, if any, under the credit facility. Borrowings may be utilized for temporary and emergency purposes, and are subject to the fund’s regulatory and contractual borrowing restrictions. The participating funds are charged administrative fees and an annual commitment fee of 0.10% of the undrawn amount of the facility; these fees are allocated to the funds based on a method approved by the fund’s board of trustees and included in Management and Administrative expenses on the fund’s Statement of Operations. Any borrowings under this facility bear interest at a rate based upon the higher of the one-month London Interbank Offered Rate, federal funds effective rate, or overnight bank funding rate plus an agreed-upon spread.
230
Intermediate-Term Tax-Exempt Fund
The fund had no borrowings outstanding at October 31, 2016, or at any time during the period then ended.
6. Other: Interest income includes income distributions received from Vanguard Municipal Cash Management Fund and is accrued daily. Premiums and discounts on debt securities purchased are amortized and accreted, respectively, to interest income over the lives of the respective securities. Security transactions are accounted for on the date securities are bought or sold. Costs used to determine realized gains (losses) on the sale of investment securities are those of the specific securities sold.
Each class of shares has equal rights as to assets and earnings, except that each class separately bears certain class-specific expenses related to maintenance of shareholder accounts (included in Management and Administrative expenses) and shareholder reporting. Marketing and distribution expenses are allocated to each class of shares based on a method approved by the board of trustees. Income, other non-class-specific expenses, and gains and losses on investments are allocated to each class of shares based on its relative net assets.
B. In accordance with the terms of a Funds’ Service Agreement (the “FSA”) between Vanguard and the fund, Vanguard furnishes to the fund investment advisory, corporate management, administrative, marketing, and distribution services at Vanguard’s cost of operations (as defined by the FSA). These costs of operations are allocated to the fund based on methods and guidelines approved by the board of trustees. Vanguard does not require reimbursement in the current period for certain costs of operations (such as deferred compensation/benefits and risk/insurance costs); the fund’s liability for these costs of operations is included in Payables to Vanguard on the Statement of Net Assets.
Upon the request of Vanguard, the fund may invest up to 0.40% of its net assets as capital in Vanguard. At October 31, 2016, the fund had contributed to Vanguard capital in the amount of $4,051,000, representing 0.01% of the fund’s net assets and 1.62% of Vanguard’s capitalization. The fund’s trustees and officers are also directors and employees, respectively, of Vanguard.
C. Various inputs may be used to determine the value of the fund’s investments. These inputs are summarized in three broad levels for financial statement purposes. The inputs or methodologies used to value securities are not necessarily an indication of the risk associated with investing in those securities.
Level 1—Quoted prices in active markets for identical securities.
Level 2—Other significant observable inputs (including quoted prices for similar securities, interest rates, prepayment speeds, credit risk, etc.).
Level 3—Significant unobservable inputs (including the fund’s own assumptions used to determine the fair value of investments).
The following table summarizes the market value of the fund’s investments as of October 31, 2016, based on the inputs used to value them:
| | | |
| | Level 1 | Level 2 | Level 3 |
| Investments | ($000) | ($000) | ($000) |
| Tax-Exempt Municipal Bonds | — | 52,505,280 | — |
| Temporary Cash Investments | 1,146,601 | — | — |
| Futures Contracts—Assets1 | 922 | — | — |
| Futures Contracts—Liabilities1 | (56) | — | — |
| Total | 1,147,467 | 52,505,280 | — |
| 1 Represents variation margin on the last day of the reporting period. | | | |
D. At October 31, 2016, the aggregate settlement value of open futures contracts and the related unrealized appreciation (depreciation) were:
| | | | |
| | | | | ($000) |
| | | | Aggregate | |
| | | Number of | Settlement | Unrealized |
| | | Long (Short) | Value | Appreciation |
| Futures Contracts | Expiration | Contracts | Long (Short) | (Depreciation) |
| 5-Year U.S. Treasury Note | December 2016 | 7,183 | 867,684 | 194 |
| 10-Year U.S. Treasury Note | December 2016 | 2,009 | 260,417 | 328 |
| | | | | 522 |
Unrealized appreciation (depreciation) on open futures contracts is required to be treated as realized gain (loss) for tax purposes.
231
Intermediate-Term Tax-Exempt Fund
E. Capital gain distributions are determined on a tax basis and may differ from realized capital gains for financial reporting purposes. Differences may be permanent or temporary. Permanent differences are reclassified among capital accounts in the financial statements to reflect their tax character. Temporary differences arise when gains or losses are recognized in different periods for financial statement and tax purposes. These differences will reverse at some time in the future.
The fund used capital loss carryforwards of $17,375,000 to offset taxable capital gains realized during the year ended October 31, 2016. At October 31, 2016, the fund had available capital losses totaling $18,686,000 to offset future net capital gains through October 31, 2019.
At October 31, 2016, the cost of investment securities for tax purposes was $51,296,117,000.
Net unrealized appreciation of investment securities for tax purposes was $2,355,764,000, consisting of unrealized gains of $2,450,137,000 on securities that had risen in value since their purchase and $94,373,000 in unrealized losses on securities that had fallen in value since their purchase.
F. During the year ended October 31, 2016, the fund purchased $13,113,694,000 of investment securities and sold $4,394,114,000 of investment securities, other than temporary cash investments.
The fund purchased securities from and sold securities to other Vanguard funds or accounts managed by Vanguard or its affiliates, in accordance with procedures adopted by the board of trustees in compliance with Rule 17a-7 of the Investment Company Act of 1940. For the year ended October 31, 2016, such purchases and sales were $2,134,576,000 and $1,141,431,000 respectively; these amounts are included in the purchases and sales of investment securities noted above.
| | | | |
| G. Capital share transactions for each class of shares were: | | | |
| | | | Year Ended October 31, |
| | | 2016 | | 2015 |
| | Amount | Shares | Amount | Shares |
| | ($000) | (000) | ($000) | (000) |
| Investor Shares | | | | |
| Issued | 1,384,586 | 96,067 | 1,130,585 | 79,643 |
| Issued in Lieu of Cash Distributions | 100,014 | 6,938 | 106,294 | 7,484 |
| Redeemed | (1,425,225) | (98,861) | (1,432,027) | (101,123) |
| Net Increase (Decrease) —Investor Shares | 59,375 | 4,144 | (195,148) | (13,996) |
| Admiral Shares | | | | |
| Issued | 12,256,425 | 850,439 | 9,658,491 | 680,355 |
| Issued in Lieu of Cash Distributions | 891,655 | 61,843 | 800,114 | 56,351 |
| Redeemed | (5,267,974) | (365,660) | (4,900,961) | (345,664) |
| Net Increase (Decrease) —Admiral Shares | 7,880,106 | 546,622 | 5,557,644 | 391,042 |
H. Management has determined that no material events or transactions occurred subsequent to October 31, 2016, that would require recognition or disclosure in these financial statements.
232
Long-Term Tax-Exempt Fund
Fund Profile
As of October 31, 2016
| | |
| Share-Class Characteristics | | |
| | Investor | Admiral |
| | Shares | Shares |
| Ticker Symbol | VWLTX | VWLUX |
| Expense Ratio1 | 0.20% | 0.12% |
| 30-Day SEC Yield | 1.99% | 2.11% |
| |
| |
| Financial Attributes | | |
| | | Bloomberg |
| | | Barclays |
| | | Municipal |
| | | Bond |
| | Fund | Index |
| Number of Bonds | 1,488 | 49,796 |
| Yield to Maturity | | |
| (before expenses) | 2.2% | 2.0% |
| Average Coupon | 4.8% | 4.8% |
| Average Duration | 6.6 years | 5.9 years |
| Average Stated Maturity | 16.1 years | 12.9 years |
| Short-Term Reserves | 2.5% | — |
| |
| Largest Area Concentrations2 | |
| California | 16.5% |
| New York | 14.9 |
| Texas | 9.4 |
| Illinois | 7.2 |
| Florida | 6.8 |
| Pennsylvania | 4.9 |
| New Jersey | 3.3 |
| Michigan | 2.8 |
| Georgia | 2.3 |
| Massachusetts | 2.1 |
| Top Ten | 70.2% |
| |
| |
| Volatility Measures | |
| | Bloomberg |
| | Barclays |
| | Municipal |
| | Bond Index |
| R-Squared | 0.97 |
| Beta | 1.17 |
These measures show the degree and timing of the fund’s fluctuations compared with the indexes over 36 months.
| |
| Distribution by Stated Maturity (% of portfolio) |
| Under 1 Year | 4.4% |
| 1–3 Years | 6.6 |
| 3–5 Years | 2.6 |
| 5–10 Years | 9.4 |
| 10–20 Years | 42.4 |
| 20–30 Years | 31.0 |
| Over 30 Years | 3.6 |
Distribution by Credit Quality (% of portfolio)
| |
| AAA | 13.6% |
| AA | 55.4 |
| A | 21.6 |
| BBB | 6.8 |
| BB | 0.2 |
| B or Lower | 0.8 |
| Not Rated | 1.6 |
Credit-quality ratings are obtained from Moody’s and S&P, and the higher rating for each issue is shown. “Not Rated” is used to classify securities for which a rating is not available. Not rated securities include a fund’s investment in Vanguard Market Liquidity Fund or Vanguard Municipal Cash Management Fund, each of which invests in high-quality money market instruments and may serve as a cash management vehicle for the Vanguard funds, trusts, and accounts. For more information about these ratings, see the Glossary entry for Credit Quality.
Investment Focus
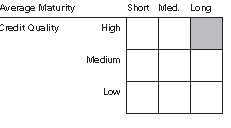
1 The expense ratios shown are from the prospectus dated February 26, 2016, and represent estimated costs for the current fiscal year. For the fiscal year ended October 31, 2016, the expense ratios were 0.19% for Investor Shares and 0.09% for Admiral Shares.
2 Percentage of net assets, excluding any futures contracts.
233
Long-Term Tax-Exempt Fund
Performance Summary
All of the returns in this report represent past performance, which is not a guarantee of future results that may be achieved by the fund. (Current performance may be lower or higher than the performance data cited. For performance data current to the most recent month-end, visit our website at vanguard.com/performance.) Note, too, that both investment returns and principal value can fluctuate widely, so an investor’s shares, when sold, could be worth more or less than their original cost. The returns shown do not reflect taxes that a shareholder would pay on fund distributions or on the sale of fund shares.
Cumulative Performance: October 31, 2006–October 31, 2016
Initial Investment of $10,000
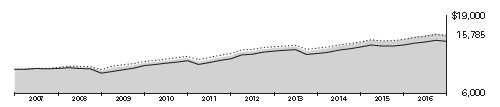
| | | | |
| | | Average Annual Total Returns | Final Value |
| | | Periods Ended October 31, 2016 | of a $10,000 |
| | One Year | Five Years | Ten Years | Investment |
| Long-Term Tax-Exempt Fund | | | | |
| Investor Shares | 5.39% | 5.16% | 4.67% | $15,785 |
| Bloomberg Barclays Municipal Bond Index | 4.06 | 4.34 | 4.57 | 15,637 |
| General & Insured Municipal Debt | | | | |
| Funds Average1 | 4.34 | 4.55 | 3.92 | 14,696 |
| | | | |
| | | | | Final Value |
| | | | | of a $50,000 |
| | One Year | Five Years | Ten Years | Investment |
| Long-Term Tax-Exempt Fund Admiral Shares | 5.50% | 5.25% | 4.75% | $79,554 |
| Bloomberg Barclays Municipal Bond Index | 4.06 | 4.34 | 4.57 | 78,184 |
1 Derived from data provided by Lipper, a Thomson Reuters Company.
See Financial Highlights for dividend and capital gains information.
234
| | | | |
| Long-Term Tax-Exempt Fund | | | | |
| |
| |
| |
| |
| Fiscal-Year Total Returns (%): October 31, 2006–October 31, 2016 | | | |
| | | | | Bloomberg |
| | | | | Barclays |
| | | | | Municipal |
| | | | Investor Shares | Bond Index |
| | Income | Capital | Total | Total |
| Fiscal Year | Returns | Returns | Returns | Returns |
| 2007 | 4.57% | -2.20% | 2.37% | 2.91% |
| 2008 | 4.28 | -9.02 | -4.74 | -3.30 |
| 2009 | 5.09 | 8.23 | 13.32 | 13.60 |
| 2010 | 4.50 | 3.02 | 7.52 | 7.78 |
| 2011 | 4.36 | -1.07 | 3.29 | 3.78 |
| 2012 | 4.07 | 6.20 | 10.27 | 9.03 |
| 2013 | 3.68 | -5.75 | -2.07 | -1.72 |
| 2014 | 4.22 | 5.30 | 9.52 | 7.82 |
| 2015 | 3.73 | -0.54 | 3.19 | 2.87 |
| 2016 | 3.62 | 1.77 | 5.39 | 4.06 |
Average Annual Total Returns: Periods Ended September 30, 2016
This table presents returns through the latest calendar quarter—rather than through the end of the fiscal period.
Securities and Exchange Commission rules require that we provide this information.
| | | | | | |
| | | | | | | Ten Years |
| | Inception Date | One Year | Five Years | Income | Capital | Total |
| Investor Shares | 9/1/1977 | 7.01% | 5.32% | 4.23% | 0.63% | 4.86% |
| Admiral Shares | 2/12/2001 | 7.11 | 5.41 | 4.31 | 0.63 | 4.94 |
235
Long-Term Tax-Exempt Fund
Financial Statements
Statement of Net Assets
As of October 31, 2016
The fund reports a complete list of its holdings in regulatory filings four times in each fiscal year, at the quarter-ends. For the second and fourth fiscal quarters, the lists appear in the fund’s semiannual and annual reports to shareholders. For the first and third fiscal quarters, the fund files the lists with the Securities and Exchange Commission on Form N-Q. Shareholders can look up the fund’s Forms N-Q on the SEC’s website at sec.gov. Forms N-Q may also be reviewed and copied at the SEC’s Public Reference Room (see the back cover of this report for further information).
| | | | |
| | | | Face | Market |
| | | Maturity | Amount | Value• |
| | Coupon | Date | ($000) | ($000) |
| Tax-Exempt Municipal Bonds (98.7%) | | | | |
| Alabama (1.3%) | | | | |
| Alabama GO | 4.000% | 11/1/29 | 5,950 | 6,782 |
| Alabama GO | 4.000% | 11/1/30 | 6,195 | 6,920 |
| Alabama GO | 4.000% | 11/1/31 | 6,445 | 7,149 |
| Alabama Incentives Financing Authority Special Obligation Revenue | 5.000% | 9/1/37 | 10,945 | 12,415 |
| Alabama Incentives Financing Authority Special Obligation Revenue | 5.000% | 9/1/42 | 3,325 | 3,754 |
| Alabama Port Authority Docks Facilities Revenue | 6.000% | 10/1/40 | 5,000 | 5,840 |
| Auburn University Alabama General Fee Revenue | 5.000% | 6/1/42 | 8,455 | 9,860 |
| Birmingham AL GO | 0.000% | 3/1/27 | 2,500 | 2,912 |
| Birmingham AL GO | 0.000% | 3/1/37 | 2,500 | 2,808 |
| Birmingham AL Water Works Board Water Revenue | 5.000% | 1/1/32 | 7,145 | 8,583 |
| Birmingham AL Water Works Board Water Revenue | 5.000% | 1/1/33 | 5,775 | 6,892 |
| Huntsville AL GO | 5.000% | 5/1/21 (Prere.) | 2,535 | 2,961 |
| Huntsville AL GO | 5.000% | 5/1/26 | 325 | 375 |
| Jefferson County AL Sewer Revenue | 0.000% | 10/1/42 (4) | 12,500 | 10,367 |
| Jefferson County AL Sewer Revenue | 6.000% | 10/1/42 | 8,780 | 10,436 |
| Jefferson County AL Sewer Revenue | 7.000% | 10/1/51 | 10,000 | 12,541 |
| Jefferson County AL Sewer Revenue | 6.500% | 10/1/53 | 15,525 | 18,996 |
| Selma AL Industrial Development Board Revenue (International Paper Co. Project) | 5.375% | 12/1/35 | 2,000 | 2,293 |
| | | | | 131,884 |
| Alaska (0.2%) | | | | |
| Alaska Housing Finance Corp. General Housing Revenue | 5.000% | 12/1/26 | 6,620 | 8,066 |
| Alaska Housing Finance Corp. General Housing Revenue | 5.000% | 12/1/28 | 3,995 | 4,775 |
| Alaska Industrial Development & Export Authority Revenue (Providence Health & Services) | 5.500% | 10/1/41 | 6,000 | 6,831 |
| | | | | 19,672 |
| Arizona (1.0%) | | | | |
| Arizona Board Regents Arizona State University System Revenue | 5.000% | 6/1/37 | 3,750 | 4,314 |
| Arizona COP | 5.000% | 3/1/18 (Prere.) | 12,140 | 12,808 |
| Arizona Transportation Board Excise Tax Revenue | 5.000% | 7/1/25 | 8,925 | 10,990 |
| Arizona Transportation Board Highway Revenue | 5.000% | 7/1/22 (Prere.) | 11,175 | 13,457 |
| Buckeye AZ Excise Tax Revenue | 5.000% | 7/1/35 | 4,480 | 5,174 |
| Buckeye AZ Excise Tax Revenue | 5.000% | 7/1/43 | 11,690 | 13,347 |
| Maricopa County AZ Industrial Development Authority Hospital System Revenue | | | | |
| (Samaritan Health Services) | 7.000% | 12/1/16 (ETM) | 1,200 | 1,206 |
| Maricopa County AZ Pollution Control Corp. Revenue (Southern California Edison Co.) | 5.000% | 6/1/35 | 5,500 | 6,107 |
| Mesa AZ Utility System Revenue | 4.000% | 7/1/31 | 7,250 | 8,073 |
| Phoenix AZ Civic Improvement Corp. Airport Revenue | 5.000% | 7/1/21 | 4,000 | 4,545 |
| Phoenix AZ Civic Improvement Corp. Airport Revenue | 5.000% | 7/1/22 | 6,375 | 7,230 |
| Phoenix AZ Civic Improvement Corp. Water System Revenue | 5.000% | 7/1/34 | 10,000 | 10,947 |
| Pima County AZ Sewer Revenue | 5.000% | 7/1/26 | 2,000 | 2,372 |
| Pima County AZ Sewer Revenue | 5.000% | 7/1/27 | 1,000 | 1,184 |
| 1 Pinal County AZ Electric District Revenue | 4.000% | 7/1/32 | 1,000 | 1,063 |
| Salt Verde AZ Financial Corp. Gas Revenue | 5.250% | 12/1/20 | 515 | 583 |
| Salt Verde AZ Financial Corp. Gas Revenue | 5.250% | 12/1/24 | 2,220 | 2,695 |
| Salt Verde AZ Financial Corp. Gas Revenue | 5.250% | 12/1/27 | 785 | 973 |
| | | | | 107,068 |
| Arkansas (0.1%) | | | | |
| Springdale AR Public Facilities Board Hospital Revenue (Arkansas Children’s Northwest Inc.) | 5.000% | 3/1/40 | 5,265 | 6,190 |
| University of Arkansas Revenue (Fayetteville Campus) | 5.000% | 11/1/31 | 2,170 | 2,553 |
| University of Arkansas Revenue (Fayetteville Campus) | 5.000% | 11/1/32 | 2,845 | 3,333 |
| | | | | 12,076 |
| California (16.5%) | | | | |
| Alameda CA Corridor Transportation Authority Revenue | 0.000% | 10/1/30 (2) | 5,000 | 2,938 |
| Alameda CA Corridor Transportation Authority Revenue | 0.000% | 10/1/31 (14) | 8,450 | 5,163 |
| Alameda CA Corridor Transportation Authority Revenue | 0.000% | 10/1/33 (14) | 12,000 | 6,762 |
236
Long-Term Tax-Exempt Fund
| | | | |
| | | | Face | Market |
| | | Maturity | Amount | Value• |
| | Coupon | Date | ($000) | ($000) |
| Alameda County CA Joint Powers Authority Lease Revenue | 5.250% | 12/1/29 | 8,300 | 10,131 |
| Alameda County CA Unified School District GO | 5.000% | 8/1/39 | 11,455 | 13,613 |
| Bay Area Toll Authority California Toll Bridge Revenue (San Francisco Bay Area) | 5.000% | 4/1/17 (Prere.) | 8,000 | 8,141 |
| Bay Area Toll Authority California Toll Bridge Revenue (San Francisco Bay Area) | 5.000% | 4/1/32 | 2,060 | 2,437 |
| California Department of Water Resources Power Supply Revenue | 5.000% | 5/1/18 (Prere.) | 5,375 | 5,709 |
| California Department of Water Resources Power Supply Revenue | 5.000% | 5/1/18 (Prere.) | 7,650 | 8,126 |
| California Department of Water Resources Power Supply Revenue | 5.000% | 5/1/20 (Prere.) | 3,100 | 3,520 |
| California Department of Water Resources Power Supply Revenue | 5.000% | 5/1/22 | 1,900 | 2,150 |
| California Department of Water Resources Water System Revenue (Central Valley Project) | 5.000% | 6/1/18 (Prere.) | 7,275 | 7,754 |
| California Department of Water Resources Water System Revenue (Central Valley Project) | 5.000% | 12/1/24 (Prere.) | 30 | 38 |
| California Department of Water Resources Water System Revenue (Central Valley Project) | 5.000% | 12/1/27 | 9,970 | 12,467 |
| California Educational Facilities Authority Revenue (Claremont McKenna College) | 4.000% | 1/1/39 | 10,000 | 10,863 |
| California Educational Facilities Authority Revenue (Pepperdine College) | 5.000% | 9/1/40 | 5,000 | 5,928 |
| California Educational Facilities Authority Revenue (Pepperdine College) | 5.000% | 10/1/49 | 5,000 | 5,945 |
| California Educational Facilities Authority Revenue (Santa Clara University) | 5.000% | 4/1/36 | 3,000 | 3,559 |
| California Educational Facilities Authority Revenue (Santa Clara University) | 5.000% | 4/1/45 | 14,000 | 16,444 |
| California GO | 5.250% | 9/1/24 | 12,500 | 14,961 |
| California GO | 5.250% | 10/1/24 | 3,000 | 3,601 |
| California GO | 5.625% | 4/1/26 | 21,900 | 24,319 |
| California GO | 5.000% | 3/1/28 | 10,000 | 12,184 |
| California GO | 4.000% | 9/1/28 | 7,000 | 8,031 |
| California GO | 5.000% | 9/1/29 | 10,000 | 11,712 |
| California GO | 5.000% | 10/1/29 | 5,000 | 6,094 |
| California GO | 5.000% | 10/1/30 | 12,600 | 15,334 |
| California GO | 4.000% | 9/1/31 | 8,500 | 9,456 |
| California GO | 4.000% | 9/1/32 | 2,250 | 2,487 |
| California GO | 6.000% | 3/1/33 | 4,000 | 4,643 |
| California GO | 6.500% | 4/1/33 | 41,500 | 46,872 |
| California GO | 5.000% | 8/1/34 | 5,000 | 5,946 |
| California GO | 5.000% | 9/1/35 | 13,220 | 15,830 |
| California GO | 6.000% | 11/1/35 | 10,000 | 11,414 |
| California GO | 5.000% | 9/1/36 | 3,250 | 3,829 |
| California GO | 6.000% | 4/1/38 | 10,340 | 11,534 |
| California GO | 6.000% | 11/1/39 | 6,500 | 7,419 |
| California GO | 5.000% | 9/1/41 | 5,000 | 5,756 |
| California GO | 5.000% | 9/1/42 | 11,360 | 13,227 |
| California GO | 5.000% | 2/1/43 | 5,500 | 6,360 |
| California GO | 5.000% | 4/1/43 | 1,000 | 1,160 |
| California GO | 5.000% | 11/1/43 | 5,000 | 5,868 |
| California GO | 5.000% | 12/1/43 | 8,250 | 9,698 |
| California GO | 5.000% | 8/1/45 | 7,280 | 8,658 |
| California GO | 5.000% | 9/1/45 | 5,000 | 5,978 |
| California Health Facilities Financing Authority Revenue (Adventist Health System/West) | 5.750% | 9/1/19 (Prere.) | 5,500 | 6,233 |
| California Health Facilities Financing Authority Revenue (Catholic Healthcare West) | 5.625% | 7/1/35 | 5,000 | 5,315 |
| California Health Facilities Financing Authority Revenue (Catholic Healthcare West) | 6.000% | 7/1/39 | 4,500 | 5,030 |
| 1 California Health Facilities Financing Authority Revenue (El Camino Hospital) | 4.000% | 2/1/41 | 5,000 | 5,152 |
| California Health Facilities Financing Authority Revenue | | | | |
| (Providence St. Joseph Health Obligated Group) | 4.000% | 10/1/36 | 5,000 | 5,342 |
| California Health Facilities Financing Authority Revenue (St. Joseph Health System) | 5.000% | 7/1/33 | 2,000 | 2,312 |
| California Health Facilities Financing Authority Revenue (St. Joseph Health System) | 5.750% | 7/1/39 | 8,000 | 8,894 |
| California Health Facilities Financing Authority Revenue (Sutter Health) | 5.875% | 8/15/31 | 6,000 | 7,002 |
| California Health Facilities Financing Authority Revenue (Sutter Health) | 6.000% | 8/15/42 | 15,000 | 17,501 |
| California Infrastructure & Economic Development Bank Revenue | 5.000% | 10/1/41 | 8,000 | 9,700 |
| California Infrastructure & Economic Development Bank Revenue | | | | |
| (Independent System Operator Corp. Project) | 5.000% | 2/1/34 | 13,800 | 15,966 |
| California Infrastructure & Economic Development Bank Revenue | | | | |
| (Pacific Gas & Electric Co.) VRDO | 0.500% | 11/1/16 LOC | 7,200 | 7,200 |
| California Municipal Finance Authority Recovery Zone Revenue (Chevron USA Inc. Project) VRDO | 0.450% | 11/1/16 | 12,350 | 12,350 |
| California Municipal Finance Authority Revenue (Anaheim Electric Utility Distribution System) | 5.000% | 10/1/31 | 2,075 | 2,515 |
| California Municipal Finance Authority Revenue (University of La Verne) | 6.250% | 6/1/40 | 5,000 | 5,769 |
| California Public Works Board Lease Revenue (Department of General Services) | 6.250% | 4/1/19 (Prere.) | 10,000 | 11,270 |
| California Public Works Board Lease Revenue (Various Capital Projects) | 5.000% | 10/1/28 | 4,000 | 4,646 |
| California Public Works Board Lease Revenue (Various Capital Projects) | 5.000% | 11/1/30 | 4,205 | 4,951 |
| California Public Works Board Lease Revenue (Various Capital Projects) | 5.500% | 11/1/30 | 1,320 | 1,616 |
| California Public Works Board Lease Revenue (Various Capital Projects) | 5.250% | 11/1/32 | 7,280 | 8,813 |
| California Public Works Board Lease Revenue (Various Capital Projects) | 5.000% | 4/1/37 | 14,705 | 16,869 |
| California Public Works Board Lease Revenue (Various Capital Projects) | 5.000% | 11/1/37 | 5,000 | 5,810 |
| California State University Systemwide Revenue | 5.000% | 5/1/17 (Prere.) | 3,505 | 3,581 |
| California State University Systemwide Revenue | 5.000% | 5/1/17 (Prere.) | 3,810 | 3,892 |
| California State University Systemwide Revenue | 5.250% | 5/1/19 (Prere.) | 8,600 | 9,518 |
237
Long-Term Tax-Exempt Fund
| | | | |
| | | | Face | Market |
| | | Maturity | Amount | Value• |
| | Coupon | Date | ($000) | ($000) |
| California State University Systemwide Revenue | 5.000% | 11/1/29 | 3,750 | 4,668 |
| California State University Systemwide Revenue | 5.000% | 11/1/41 | 15,950 | 19,080 |
| California State University Systemwide Revenue | 5.000% | 11/1/43 | 3,190 | 3,826 |
| California Statewide Communities Development Authority Revenue | | | | |
| (Adventist Health System/West) | 5.000% | 3/1/28 | 5,575 | 6,903 |
| California Statewide Communities Development Authority Revenue | | | | |
| (Buck Institute for Age Research) | 5.000% | 11/15/49 (4) | 6,200 | 7,205 |
| California Statewide Communities Development Authority Revenue (Kaiser Permanente) | 5.000% | 4/1/42 | 24,250 | 27,580 |
| California Statewide Communities Development Authority Revenue | | | | |
| (Loma Linda University Medical Center) | 5.000% | 12/1/41 | 10,000 | 11,126 |
| California Statewide Communities Development Authority Revenue (Trinity Health) | 5.000% | 12/1/41 | 13,975 | 15,992 |
| California Statewide Communities Development Authority Senior Living Revenue | | | | |
| (Southern California Presbyterian Homes) | 7.250% | 11/15/41 | 3,000 | 3,423 |
| California Statewide Communities Development Authority Student Housing Revenue | | | | |
| (CHF-Irvine LLC - UCI East Campus Apartments Phase II) | 5.750% | 5/15/18 (Prere.) | 4,000 | 4,302 |
| Chabot-Las Positas CA Community College District GO | 5.000% | 8/1/27 | 4,175 | 4,982 |
| Charter Oak CA Unified School District GO | 5.000% | 8/1/40 (4) | 5,270 | 6,115 |
| Chino CA Public Financing Authority Special Tax Revenue | 5.000% | 9/1/31 (4) | 1,050 | 1,245 |
| Chino CA Public Financing Authority Special Tax Revenue | 5.000% | 9/1/33 (4) | 3,130 | 3,649 |
| Chino CA Public Financing Authority Special Tax Revenue | 5.000% | 9/1/34 (4) | 1,100 | 1,255 |
| Chino CA Public Financing Authority Special Tax Revenue | 5.000% | 9/1/35 (4) | 865 | 998 |
| Chula Vista CA Industrial Development Revenue (San Diego Gas & Electric Co.) | 5.875% | 2/15/34 | 10,000 | 11,125 |
| Chula Vista CA Municipal Financing Authority Special Tax Revenue | 5.000% | 9/1/34 | 2,840 | 3,230 |
| Clovis CA Unified School District GO | 5.000% | 8/1/38 | 3,850 | 4,538 |
| Coast CA Community College District GO | 4.000% | 8/1/32 | 7,205 | 8,067 |
| Contra Costa CA Community College District GO | 4.000% | 8/1/29 | 5,725 | 6,310 |
| Corona-Norco CA Unified School District GO | 5.000% | 8/1/44 | 6,625 | 7,833 |
| Corona-Norco CA Unified School District Special Tax Revenue | | | | |
| (Community Facilities District No. 98-1) | 5.000% | 9/1/29 | 1,705 | 1,988 |
| Corona-Norco CA Unified School District Special Tax Revenue | | | | |
| (Community Facilities District No. 98-1) | 5.000% | 9/1/32 | 1,500 | 1,723 |
| Eastern California Municipal Water District Water & Wastewater Revenue VRDO | 0.460% | 11/1/16 | 1,000 | 1,000 |
| El Camino CA Community College District GO | 4.000% | 8/1/41 | 7,000 | 7,625 |
| El Dorado CA Irrigation District Revenue | 5.000% | 3/1/34 (4) | 1,480 | 1,730 |
| Escondido CA GO | 5.000% | 9/1/32 | 3,855 | 4,659 |
| Foothill-De Anza CA Community College District GO | 4.000% | 8/1/34 | 2,185 | 2,427 |
| Foothill-De Anza CA Community College District GO | 4.000% | 8/1/35 | 2,000 | 2,214 |
| Foothill-De Anza CA Community College District GO | 5.000% | 8/1/36 | 1,645 | 1,959 |
| Foothill/Eastern Transportation Corridor Agency California Toll Road Revenue | 5.750% | 1/15/46 | 10,000 | 11,692 |
| Gilroy CA School Facilities Finance Authority Revenue | 5.000% | 8/1/46 | 3,000 | 3,471 |
| Golden State Tobacco Securitization Corp. California Revenue | 5.000% | 6/1/40 | 19,250 | 22,270 |
| Golden State Tobacco Securitization Corp. California Revenue | 5.750% | 6/1/47 | 7,580 | 7,463 |
| Grossmont CA Healthcare District GO | 5.000% | 7/15/17 (Prere.) | 15,770 | 16,250 |
| 2 Grossmont CA Healthcare District GO | 6.125% | 7/15/21 (Prere.) | 5,000 | 6,153 |
| Grossmont CA Union High School District GO | 4.000% | 8/1/29 | 1,775 | 2,032 |
| Grossmont CA Union High School District GO | 4.000% | 8/1/30 | 1,750 | 1,987 |
| Imperial CA Irrigation District Electric Revenue | 6.250% | 11/1/20 (Prere.) | 2,225 | 2,678 |
| Irvine CA Reassessment District No. 85-7A Improvement Revenue VRDO | 0.500% | 11/1/16 LOC | 2,500 | 2,500 |
| Irvine CA Unified School District Community Facilities District No. 09-1 | | | | |
| Special Tax Revenue VRDO | 0.460% | 11/1/16 LOC | 12,050 | 12,050 |
| Jefferson CA Union High School District GO | 5.000% | 8/1/29 (15) | 2,210 | 2,661 |
| Jefferson CA Union High School District GO | 5.000% | 8/1/31 (15) | 3,265 | 3,883 |
| Kern County CA GO | 6.000% | 8/1/35 (12) | 2,500 | 2,774 |
| Long Beach CA Harbor Revenue | 5.000% | 5/15/37 | 4,365 | 5,174 |
| Long Beach CA Harbor Revenue | 5.000% | 5/15/42 | 1,500 | 1,773 |
| Los Angeles CA Community College District GO | 5.000% | 8/1/18 (Prere.) | 6,600 | 7,074 |
| Los Angeles CA Community College District GO | 6.000% | 8/1/19 (Prere.) | 10,000 | 11,359 |
| Los Angeles CA Community College District GO | 5.250% | 8/1/20 (Prere.) | 3,000 | 3,461 |
| Los Angeles CA Community College District GO | 3.000% | 7/1/31 | 6,995 | 7,006 |
| Los Angeles CA Community College District GO | 4.000% | 8/1/32 | 10,000 | 11,118 |
| Los Angeles CA Department of Airports International Airport Revenue | 5.000% | 5/15/35 | 2,000 | 2,357 |
| Los Angeles CA Department of Water & Power Revenue | 5.000% | 7/1/33 | 1,555 | 1,870 |
| Los Angeles CA Department of Water & Power Revenue | 5.000% | 7/1/35 | 2,500 | 2,991 |
| Los Angeles CA Department of Water & Power Revenue | 5.000% | 7/1/35 | 11,770 | 14,083 |
| Los Angeles CA Department of Water & Power Revenue | 5.375% | 7/1/38 | 4,000 | 4,362 |
| Los Angeles CA Department of Water & Power Revenue | 5.000% | 7/1/41 | 2,500 | 2,980 |
| Los Angeles CA Department of Water & Power Revenue | 5.000% | 7/1/43 | 5,000 | 5,847 |
| Los Angeles CA Department of Water & Power Revenue | 5.000% | 7/1/43 | 3,500 | 4,093 |
| Los Angeles CA Department of Water & Power Revenue | 5.000% | 7/1/43 | 9,000 | 10,555 |
| Los Angeles CA Department of Water & Power Revenue | 5.000% | 7/1/46 | 5,200 | 6,184 |
238
Long-Term Tax-Exempt Fund
| | | | |
| | | | Face | Market |
| | | Maturity | Amount | Value• |
| | Coupon | Date | ($000) | ($000) |
| Los Angeles CA Unified School District GO | 5.000% | 7/1/17 (Prere.) | 27,240 | 28,023 |
| Los Angeles CA Unified School District GO | 5.000% | 7/1/17 (Prere.) | 7,435 | 7,649 |
| Los Angeles CA Unified School District GO | 5.000% | 7/1/17 (Prere.) | 6,980 | 7,181 |
| Los Angeles CA Unified School District GO | 5.000% | 7/1/26 | 6,950 | 7,686 |
| Los Angeles CA Unified School District GO | 4.000% | 7/1/33 | 6,000 | 6,702 |
| Los Angeles CA Unified School District GO | 4.000% | 7/1/34 | 6,000 | 6,677 |
| Los Angeles CA Wastewater System Revenue | 5.750% | 6/1/19 (Prere.) | 6,145 | 6,888 |
| Los Angeles CA Wastewater System Revenue | 5.000% | 6/1/28 | 1,500 | 1,869 |
| Los Angeles CA Wastewater System Revenue | 5.000% | 6/1/28 | 2,000 | 2,493 |
| Los Angeles CA Wastewater System Revenue | 5.750% | 6/1/28 | 4,935 | 5,511 |
| Los Angeles CA Wastewater System Revenue | 5.000% | 6/1/29 | 2,085 | 2,577 |
| Los Angeles CA Wastewater System Revenue | 5.000% | 6/1/30 | 2,000 | 2,457 |
| Los Angeles CA Wastewater System Revenue | 5.000% | 6/1/30 | 1,700 | 2,088 |
| Los Angeles CA Wastewater System Revenue | 5.000% | 6/1/31 | 4,090 | 4,996 |
| Los Angeles CA Wastewater System Revenue | 5.000% | 6/1/32 | 4,815 | 5,852 |
| Los Angeles County CA Public Works Financing Authority Lease Revenue | 5.000% | 8/1/31 | 2,790 | 3,294 |
| Los Angeles County CA Redevelopment Authority Tax Allocation Revenue | | | | |
| (Long Beach Project Area) | 5.000% | 8/1/29 | 4,140 | 5,011 |
| Los Angeles County CA Redevelopment Authority Tax Allocation Revenue | | | | |
| (Long Beach Project Area) | 5.000% | 8/1/30 | 4,685 | 5,633 |
| Los Angeles County CA Redevelopment Authority Tax Allocation Revenue | | | | |
| (Long Beach Project Area) | 5.000% | 8/1/31 | 7,180 | 8,583 |
| Los Angeles County CA Redevelopment Authority Tax Allocation Revenue | | | | |
| (Long Beach Project Area) | 5.000% | 8/1/32 | 6,465 | 7,689 |
| M-S-R California Public Power Agency Revenue (San Juan Project) | 6.750% | 7/1/20 (ETM) | 4,385 | 4,907 |
| Marin CA Healthcare District GO | 4.000% | 8/1/40 | 7,825 | 8,467 |
| Metropolitan Water District of Southern California Revenue | 5.000% | 7/1/35 | 5,000 | 5,540 |
| Modesto CA Irrigation District COP | 5.500% | 7/1/18 (Prere.) | 5,700 | 6,138 |
| Modesto CA Irrigation District Financing Authority Revenue (Woodland Project) | 6.500% | 10/1/22 (ETM) | 12,735 | 14,838 |
| Mount Diablo CA Unified School District GO | 5.000% | 8/1/32 | 2,675 | 3,159 |
| Newport Beach CA Revenue (Hoag Memorial Hospital Presbyterian) | 6.000% | 12/1/21 (Prere.) | 3,500 | 4,324 |
| Oakland CA GO | 5.000% | 1/15/28 | 1,230 | 1,511 |
| Oakland CA GO | 5.000% | 1/15/35 | 4,025 | 4,722 |
| Oakland CA Unified School District GO | 5.000% | 8/1/29 (4) | 1,500 | 1,843 |
| Oakland CA Unified School District GO | 5.000% | 8/1/30 (4) | 1,000 | 1,222 |
| Palmdale CA Community Redevelopment Agency Tax Allocation Revenue | 5.000% | 9/1/27 (14) | 1,500 | 1,885 |
| Palomar Pomerado Health California GO | 0.000% | 8/1/37 | 5,000 | 2,227 |
| Palomar Pomerado Health California GO | 0.000% | 8/1/38 (12) | 10,000 | 11,828 |
| Poway CA Unified School District GO | 0.000% | 8/1/46 | 9,600 | 3,179 |
| Poway CA Unified School District GO | 0.000% | 8/1/51 | 20,000 | 5,290 |
| Riverside CA Community College District GO | 5.000% | 8/1/29 | 5,820 | 7,176 |
| Riverside CA Community College District GO | 5.000% | 8/1/30 | 5,555 | 6,811 |
| Riverside County CA Public Financing Authority Lease Revenue | 5.000% | 11/1/29 | 9,420 | 11,424 |
| Riverside County CA Public Financing Authority Lease Revenue | 5.250% | 11/1/40 | 8,330 | 9,973 |
| Riverside County CA Public Financing Authority Lease Revenue | 5.250% | 11/1/45 | 10,000 | 11,928 |
| Riverside County CA Transportation Commission Toll Revenue | 5.750% | 6/1/44 | 3,000 | 3,474 |
| Riverside County CA Transportation Commission Toll Revenue | 5.750% | 6/1/48 | 1,000 | 1,157 |
| Sacramento CA City Financing Authority Tax Allocation Revenue | 0.000% | 12/1/28 (14) | 15,815 | 11,057 |
| Sacramento CA Municipal Utility District Revenue | 5.000% | 8/15/26 | 5,750 | 6,905 |
| Sacramento CA Municipal Utility District Revenue | 5.000% | 8/15/27 | 3,250 | 4,232 |
| Sacramento CA Municipal Utility District Revenue | 5.000% | 8/15/27 | 1,385 | 1,646 |
| Sacramento CA Regional Transit District Farebox Revenue | 5.000% | 3/1/42 | 3,250 | 3,620 |
| Sacramento CA Unified School District GO | 5.000% | 8/1/27 (4) | 1,310 | 1,613 |
| Sacramento CA Unified School District GO | 5.000% | 8/1/28 (4) | 2,000 | 2,443 |
| Sacramento CA Unified School District GO | 5.000% | 8/1/29 (4) | 1,240 | 1,503 |
| Sacramento County CA Airport Revenue | 6.000% | 7/1/41 | 10,500 | 11,331 |
| San Bernardino CA Community College District GO | 4.000% | 8/1/27 | 10,000 | 11,273 |
| San Bernardino CA Community College District GO | 5.000% | 8/1/48 | 3,750 | 4,415 |
| San Bernardino County CA Medical Center COP | 6.875% | 8/1/24 (ETM) | 13,000 | 16,888 |
| San Diego CA Public Facilities Financing Authority Water Revenue | 5.000% | 8/1/29 | 5,770 | 6,849 |
| San Diego CA Public Facilities Financing Authority Water Revenue | 5.000% | 8/1/37 | 4,740 | 5,709 |
| San Diego CA Public Facilities Financing Authority Water Revenue | 5.000% | 8/1/38 | 3,000 | 3,608 |
| San Diego CA Unified School District GO | 5.500% | 7/1/22 (14) | 9,160 | 11,314 |
| San Diego CA Unified School District GO | 4.000% | 7/1/31 | 13,000 | 14,653 |
| San Diego CA Unified School District GO | 4.000% | 7/1/35 | 1,435 | 1,574 |
| San Diego CA Unified School District GO | 0.000% | 7/1/37 | 14,000 | 6,766 |
| San Diego CA Unified School District GO | 4.000% | 7/1/45 | 24,000 | 25,781 |
| San Diego County CA Regional Airport Authority Revenue | 5.000% | 7/1/43 | 5,450 | 6,167 |
| San Dieguito CA Union High School District GO | 4.000% | 8/1/32 | 4,960 | 5,566 |
| San Dieguito CA Union High School District GO | 4.000% | 8/1/33 | 1,820 | 2,032 |
239
Long-Term Tax-Exempt Fund
| | | | |
| | | | Face | Market |
| | | Maturity | Amount | Value• |
| | Coupon | Date | ($000) | ($000) |
| San Francisco CA Bay Area Rapid Transit District GO | 5.000% | 8/1/37 | 1,125 | 1,345 |
| San Francisco CA City & County COP | 4.000% | 9/1/34 | 5,085 | 5,501 |
| San Francisco CA City & County International Airport Revenue | 5.000% | 5/3/21 (Prere.) | 390 | 457 |
| San Francisco CA City & County International Airport Revenue | 5.000% | 5/1/26 | 1,610 | 1,876 |
| San Francisco CA City & County International Airport Revenue | 6.000% | 5/1/39 | 10,000 | 11,211 |
| San Francisco CA City & County Public Utilities Commission Water Revenue | 5.000% | 11/1/30 | 7,660 | 9,314 |
| San Francisco CA City & County Public Utilities Commission Water Revenue | 5.000% | 11/1/35 | 5,255 | 6,187 |
| San Francisco CA City & County Public Utilities Commission Water Revenue | 5.000% | 11/1/36 | 8,585 | 10,190 |
| San Joaquin Hills CA Transportation Corridor Agency Toll Road Revenue | 0.000% | 1/15/25 (14) | 9,250 | 7,204 |
| San Jose CA Redevelopment Agency Tax Allocation Revenue | 5.000% | 8/1/27 (14) | 5,000 | 5,018 |
| San Luis & Delta Mendota CA Water Authority Revenue | 5.000% | 3/1/43 (15) | 5,140 | 5,763 |
| San Mateo CA Union High School District GO | 4.000% | 9/1/31 | 6,240 | 6,993 |
| San Mateo County CA Joint Powers Financing Authority Lease Revenue | | | | |
| (Youth Services Campus) | 5.000% | 7/15/18 (Prere.) | 5,000 | 5,353 |
| San Ramon Valley CA Unified School District GO | 4.000% | 8/1/28 | 1,225 | 1,379 |
| San Ramon Valley CA Unified School District GO | 4.000% | 8/1/28 | 1,225 | 1,379 |
| San Ramon Valley CA Unified School District GO | 4.000% | 8/1/29 | 3,495 | 3,901 |
| San Ramon Valley CA Unified School District GO | 4.000% | 8/1/31 | 1,855 | 2,074 |
| San Ramon Valley CA Unified School District GO | 4.000% | 8/1/33 | 2,200 | 2,434 |
| Santa Clara Valley CA Joint Powers Authority Revenue | 5.000% | 8/1/41 | 1,750 | 2,106 |
| Santa Clara Valley CA Joint Powers Authority Revenue | 5.000% | 8/1/46 | 2,000 | 2,400 |
| Southern California Public Power Authority Revenue | 5.000% | 7/1/29 | 2,670 | 3,034 |
| Southwestern California Community College District GO | 5.000% | 8/1/44 | 7,800 | 9,203 |
| State Center California Community College District GO | 5.000% | 8/1/17 (Prere.) | 16,100 | 16,623 |
| Stockton CA Unified School District GO | 5.000% | 8/1/42 (4) | 4,650 | 5,344 |
| Twin Rivers CA Unified School District GO | 5.000% | 8/1/40 (15) | 5,000 | 5,714 |
| Ukiah CA Electric Revenue | 6.250% | 6/1/18 (14) | 1,610 | 1,684 |
| University of California Regents Medical Center Pooled Revenue | 4.000% | 5/15/37 | 9,700 | 10,558 |
| University of California Revenue | 4.000% | 5/15/35 | 5,000 | 5,465 |
| University of California Revenue | 5.250% | 5/15/37 | 3,000 | 3,607 |
| University of California Revenue | 5.000% | 5/15/38 | 20,000 | 23,433 |
| University of California Revenue | 5.250% | 5/15/38 | 10,000 | 11,993 |
| University of California Revenue | 5.000% | 5/15/44 | 4,000 | 4,641 |
| University of California Revenue | 5.000% | 5/15/46 | 4,000 | 4,758 |
| Ventura County CA Community College District GO | 5.500% | 8/1/18 (Prere.) | 12,000 | 12,973 |
| Victor Valley CA Community College District GO | 6.000% | 8/1/19 (Prere.) | 12,000 | 13,631 |
| Vista CA Joint Powers Financing Authority Revenue | 5.250% | 5/1/31 | 5,110 | 6,312 |
| Walnut CA Energy Center Authority Revenue | 5.000% | 1/1/35 | 8,985 | 9,907 |
| Walnut Valley CA Unified School District GO | 4.000% | 8/1/29 | 1,000 | 1,144 |
| Walnut Valley CA Unified School District GO | 4.000% | 8/1/30 | 2,000 | 2,269 |
| Walnut Valley CA Unified School District GO | 4.000% | 8/1/31 | 2,000 | 2,251 |
| Washington Township CA Health Care District GO | 5.500% | 8/1/38 | 5,125 | 6,138 |
| West Contra Costa CA Unified School District GO | 5.000% | 8/1/45 | 8,000 | 9,310 |
| West Contra Costa CA Unified School District GO | 5.000% | 8/1/45 | 4,250 | 4,946 |
| Western Placer CA Unified School District COP | 4.000% | 8/1/41 (4) | 5,365 | 5,782 |
| Whittier CA Health Facilities Revenue (Presbyterian Intercommunity Hospital Obligated Group) | 5.000% | 6/1/44 | 8,200 | 9,287 |
| | | | | 1,691,153 |
| Colorado (1.2%) | | | | |
| Adams & Weld County CO School District No. 27J GO | 4.000% | 12/1/30 | 1,000 | 1,113 |
| Adams & Weld County CO School District No. 27J GO | 4.000% | 12/1/31 | 1,515 | 1,675 |
| Colorado Health Facilities Authority Revenue (Catholic Health Initiatives) | 5.250% | 2/1/31 | 4,000 | 4,448 |
| Colorado Health Facilities Authority Revenue (Catholic Health Initiatives) | 5.500% | 7/1/34 | 5,000 | 5,510 |
| Colorado Health Facilities Authority Revenue (Covenant Retirement Community Inc.) | 5.000% | 12/1/33 | 5,000 | 5,482 |
| Commerce City CO Sales & Use Tax Revenue | 5.000% | 8/1/44 (4) | 4,000 | 4,615 |
| Denver CO City & County Airport Revenue | 5.000% | 11/15/43 | 8,000 | 9,101 |
| E-470 Public Highway Authority Colorado Revenue | 0.000% | 9/1/19 (14) | 13,000 | 12,369 |
| E-470 Public Highway Authority Colorado Revenue | 0.000% | 9/1/23 (14) | 20,775 | 17,662 |
| E-470 Public Highway Authority Colorado Revenue | 0.000% | 9/1/25 (14) | 9,700 | 7,690 |
| E-470 Public Highway Authority Colorado Revenue | 0.000% | 9/1/30 (14) | 16,500 | 10,583 |
| Garfield, Pitkin, & Eagle County CO School District GO | 4.000% | 12/15/31 | 4,470 | 4,998 |
| Regional Transportation District of Colorado Sales Tax Revenue | | | | |
| (Denver Transit Partners Eagle P3 Project) | 6.000% | 1/15/34 | 5,000 | 5,691 |
| Regional Transportation District of Colorado Sales Tax Revenue | | | | |
| (Denver Transit Partners Eagle P3 Project) | 6.000% | 1/15/41 | 14,765 | 16,779 |
| University of Colorado COP | 4.000% | 11/1/30 | 12,675 | 13,906 |
| University of Colorado Enterprise System Revenue | 5.750% | 6/1/19 (Prere.) | 1,000 | 1,120 |
| University of Colorado Enterprise System Revenue | 5.000% | 6/1/37 | 975 | 1,121 |
| | | | | 123,863 |
240
Long-Term Tax-Exempt Fund
| | | | |
| | | | Face | Market |
| | | Maturity | Amount | Value• |
| | Coupon | Date | ($000) | ($000) |
| Connecticut (0.7%) | | | | |
| Connecticut GO | 5.000% | 4/15/25 | 10,000 | 11,666 |
| Connecticut GO | 5.000% | 4/15/26 | 5,000 | 5,802 |
| Connecticut GO | 5.000% | 10/15/26 | 4,140 | 4,851 |
| Connecticut GO | 5.000% | 11/1/26 | 3,000 | 3,491 |
| Connecticut GO | 5.000% | 10/15/31 | 1,850 | 2,138 |
| Connecticut GO | 5.000% | 6/15/32 | 8,905 | 10,334 |
| Connecticut GO | 5.000% | 6/15/33 | 6,255 | 7,226 |
| Connecticut Housing Finance Authority Revenue Housing Mortgage Finance Program | 4.000% | 11/15/32 | 3,820 | 4,090 |
| Connecticut Housing Finance Authority Revenue Housing Mortgage Finance Program | 4.000% | 11/15/44 | 2,455 | 2,611 |
| Connecticut Special Tax Revenue (Transportation Infrastructure) | 5.000% | 10/1/31 | 7,500 | 8,963 |
| Connecticut Special Tax Revenue (Transportation Infrastructure) | 5.000% | 9/1/33 | 7,000 | 8,259 |
| Hartford CT GO | 5.000% | 4/1/24 | 1,215 | 1,336 |
| Hartford CT GO | 5.000% | 4/1/27 | 1,650 | 1,772 |
| Hartford CT GO | 5.000% | 4/1/28 | 3,565 | 3,813 |
| | | | | 76,352 |
| Delaware (0.0%) | | | | |
| University of Delaware Revenue | 5.000% | 11/1/32 | 1,990 | 2,336 |
| University of Delaware Revenue | 5.000% | 11/1/33 | 1,000 | 1,172 |
| | | | | 3,508 |
| District of Columbia (1.0%) | | | | |
| District of Columbia GO | 5.000% | 6/1/26 | 7,395 | 9,218 |
| District of Columbia GO | 5.000% | 6/1/27 | 3,000 | 3,783 |
| District of Columbia GO | 5.000% | 6/1/27 | 2,000 | 2,475 |
| District of Columbia GO | 5.000% | 6/1/28 | 2,750 | 3,384 |
| District of Columbia GO | 5.000% | 6/1/38 | 10,000 | 11,755 |
| District of Columbia GO | 5.000% | 6/1/41 | 6,800 | 8,094 |
| District of Columbia Hospital Revenue (Children’s Hospital Obligated Group) | 5.000% | 7/15/33 | 9,235 | 10,947 |
| District of Columbia Revenue (Georgetown University) | 5.500% | 4/1/36 | 5,000 | 5,344 |
| District of Columbia Revenue (National Public Radio, Inc.) | 5.000% | 4/1/29 | 3,560 | 4,292 |
| District of Columbia Revenue (National Public Radio, Inc.) | 5.000% | 4/1/30 | 3,025 | 3,614 |
| 2 District of Columbia Water & Sewer Authority Public Utility Revenue | 5.500% | 10/1/18 (Prere.) | 13,000 | 14,139 |
| District of Columbia Water & Sewer Authority Public Utility Revenue | 5.000% | 10/1/34 | 5,750 | 6,885 |
| District of Columbia Water & Sewer Authority Public Utility Revenue | 5.000% | 10/1/37 | 10,000 | 11,654 |
| Metropolitan Washington DC/VA Airports Authority Dulles Toll Road Revenue | | | | |
| (Dulles Metrorail & Capital Improvement Projects) | 5.000% | 10/1/53 | 7,500 | 8,331 |
| | | | | 103,915 |
| Florida (6.8%) | | | | |
| Alachua County FL Health Facilities Authority Revenue (East Ridge Retirement Village) | 6.250% | 11/15/44 | 4,250 | 4,799 |
| Alachua County FL Health Facilities Authority Revenue | | | | |
| (Shands Teaching Hospital & Clinics, Inc. Project) | 6.250% | 12/1/16 (14) | 1,955 | 1,963 |
| Alachua County FL Health Facilities Authority Revenue | | | | |
| (Shands Teaching Hospital & Clinics, Inc. Project) | 5.000% | 12/1/44 | 10,075 | 11,365 |
| Brevard County FL Health Facilities Authority Revenue (Health First Inc. Project) | 7.000% | 4/1/19 (Prere.) | 7,000 | 8,005 |
| Broward County FL Airport System Revenue | 5.375% | 10/1/29 | 1,500 | 1,670 |
| Broward County FL Airport System Revenue | 5.250% | 10/1/38 | 14,000 | 16,509 |
| Broward County FL Port Facilities Revenue | 6.000% | 9/1/25 | 2,000 | 2,252 |
| Broward County FL Sales Tax Revenue (Main Courthouse Project) | 5.250% | 10/1/36 | 17,500 | 19,821 |
| Clearwater FL Water & Sewer Revenue | 5.250% | 12/1/39 | 5,000 | 5,537 |
| Collier County FL Special Obligation Revenue | 5.000% | 7/1/34 | 3,000 | 3,319 |
| Florida Board of Education Lottery Revenue | 5.000% | 7/1/17 (Prere.) | 12,995 | 13,489 |
| Florida Board of Education Lottery Revenue | 5.000% | 7/1/23 | 17,380 | 21,219 |
| Florida Board of Education Lottery Revenue | 5.000% | 7/1/27 | 16,780 | 21,000 |
| Florida Board of Education Public Education Capital Outlay GO | 4.000% | 6/1/33 | 15,995 | 17,682 |
| Florida Board of Education Public Education Capital Outlay GO | 5.000% | 6/1/33 | 3,000 | 3,372 |
| Florida Board of Education Public Education Capital Outlay GO | 5.000% | 6/1/34 | 2,695 | 2,893 |
| Florida Board of Education Public Education Capital Outlay GO | 5.000% | 6/1/35 | 7,000 | 7,515 |
| Florida Department of Environmental Protection & Preservation Revenue | 5.000% | 7/1/20 | 8,175 | 8,785 |
| Florida Department of Environmental Protection & Preservation Revenue | 5.000% | 7/1/21 | 8,610 | 9,246 |
| Florida Municipal Power Agency Revenue | 5.000% | 10/1/18 (Prere.) | 5,165 | 5,570 |
| Florida Municipal Power Agency Revenue | 6.250% | 10/1/19 (Prere.) | 2,000 | 2,301 |
| Florida Municipal Power Agency Revenue | 5.000% | 10/1/31 | 910 | 969 |
| Florida Water Pollution Control Financing Corp. Revenue | 5.000% | 1/15/25 | 3,000 | 3,240 |
| Halifax Hospital Medical Center Florida Hospital Revenue | 5.500% | 6/1/18 (Prere.) | 3,000 | 3,215 |
| Highlands County FL Health Facilities Authority Hospital Revenue | | | | |
| (Adventist Health System/Sunbelt Obligated Group) | 5.250% | 11/15/16 (Prere.) | 245 | 245 |
| Highlands County FL Health Facilities Authority Hospital Revenue | | | | |
| (Adventist Health System/Sunbelt Obligated Group) | 5.625% | 11/15/37 | 5,000 | 5,601 |
241
Long-Term Tax-Exempt Fund
| | | | |
| | | | Face | Market |
| | | Maturity | Amount | Value• |
| | Coupon | Date | ($000) | ($000) |
| Hillsborough County FL Industrial Development Authority Hospital Revenue | | | | |
| (H. Lee Moffitt Cancer Center Project) | 5.250% | 7/1/17 (Prere.) | 7,085 | 7,298 |
| Hillsborough County FL Industrial Development Authority Hospital Revenue | | | | |
| (Tampa General Hospital Project) | 5.000% | 10/1/34 | 12,750 | 14,417 |
| Hillsborough County FL Industrial Development Authority Revenue | | | | |
| (University Community Hospital) | 6.500% | 8/15/19 (ETM) | 5,415 | 5,928 |
| Hillsborough County FL School Board COP | 5.000% | 7/1/25 | 2,500 | 2,791 |
| Jacksonville FL Electric Authority Revenue (St. John’s River Power Park) | 5.000% | 10/1/37 | 4,500 | 4,659 |
| Jacksonville FL Electric Authority Water & Sewer Revenue | 5.000% | 10/1/33 | 3,500 | 4,022 |
| Jacksonville FL Health Facilities Authority Hospital Revenue (Baptist Medical Center Project) | 5.000% | 8/15/27 | 2,500 | 2,568 |
| Jacksonville FL Health Facilities Authority Hospital Revenue (Baptist Medical Center Project) | 5.000% | 8/15/37 | 3,800 | 3,890 |
| Jacksonville FL Sales Taxes Revenue | 5.000% | 10/1/18 (Prere.) | 5,000 | 5,390 |
| Jacksonville FL Transportation Revenue | 5.000% | 10/1/31 | 2,000 | 2,351 |
| Lakeland FL Hospital Revenue (Lakeland Regional Health Systems) | 5.000% | 11/15/40 | 2,500 | 2,802 |
| Marion County FL Hospital District Health System Improvement Revenue | | | | |
| (Munroe Regional Health System) | 5.000% | 10/1/17 (Prere.) | 14,290 | 14,846 |
| Martin County FL Health Facilities Authority Revenue (Martin Memorial Medical Center) | 5.000% | 11/15/45 | 6,940 | 7,690 |
| Miami Beach FL Health Facilities Authority Revenue (Mount Sinai Medical Center) | 5.000% | 11/15/44 | 5,000 | 5,607 |
| Miami Beach FL Parking Revenue | 5.000% | 9/1/31 (15) | 1,635 | 1,932 |
| Miami Beach FL Parking Revenue | 5.000% | 9/1/40 (15) | 1,850 | 2,135 |
| Miami Beach FL Resort Tax Revenue | 5.000% | 9/1/31 | 1,000 | 1,194 |
| Miami FL Special Obligation Revenue (Marlins Stadium Project) | 5.250% | 7/1/35 (4) | 2,000 | 2,209 |
| Miami FL Special Obligation Revenue (Street & Sidewalk Improvement Program) | 5.625% | 1/1/39 | 2,000 | 2,173 |
| Miami-Dade County FL Aviation Revenue (Miami International Airport) | 5.500% | 10/1/19 (Prere.) | 1,775 | 2,001 |
| Miami-Dade County FL Aviation Revenue (Miami International Airport) | 5.000% | 10/1/23 | 3,000 | 3,418 |
| Miami-Dade County FL Aviation Revenue (Miami International Airport) | 5.000% | 10/1/24 | 3,000 | 3,415 |
| Miami-Dade County FL Aviation Revenue (Miami International Airport) | 5.750% | 10/1/25 | 4,720 | 5,333 |
| Miami-Dade County FL Aviation Revenue (Miami International Airport) | 5.000% | 10/1/28 | 2,000 | 2,269 |
| Miami-Dade County FL Aviation Revenue (Miami International Airport) | 5.000% | 10/1/29 | 14,165 | 16,051 |
| Miami-Dade County FL Aviation Revenue (Miami International Airport) | 5.000% | 10/1/30 | 4,270 | 4,813 |
| Miami-Dade County FL Aviation Revenue (Miami International Airport) | 5.375% | 10/1/35 | 5,200 | 5,893 |
| Miami-Dade County FL Aviation Revenue (Miami International Airport) | 5.500% | 10/1/41 | 9,000 | 10,059 |
| Miami-Dade County FL Building Better Communities GO | 5.000% | 7/1/41 | 20,480 | 24,177 |
| Miami-Dade County FL Industrial Development Authority Revenue (Biscayne Properties LLC) | 5.000% | 6/1/48 | 10,000 | 10,512 |
| Miami-Dade County FL School Board COP | 5.250% | 5/1/18 (Prere.) | 10,000 | 10,653 |
| Miami-Dade County FL School Board COP | 5.250% | 5/1/18 (Prere.) | 5,850 | 6,232 |
| Miami-Dade County FL School Board COP | 5.250% | 5/1/18 (Prere.) | 5,000 | 5,326 |
| Miami-Dade County FL School Board COP | 5.250% | 5/1/18 (Prere.) | 8,165 | 8,698 |
| Miami-Dade County FL Seaport Revenue | 5.750% | 10/1/32 | 5,150 | 6,106 |
| Miami-Dade County FL Seaport Revenue | 5.500% | 10/1/42 | 5,000 | 5,850 |
| Miami-Dade County FL Special Obligation Revenue | 5.000% | 10/1/31 | 10,000 | 11,545 |
| Miami-Dade County FL Special Obligation Revenue | 5.000% | 10/1/37 | 2,500 | 2,834 |
| Miami-Dade County FL Transit Sales Surtax Revenue | 5.000% | 7/1/37 | 7,000 | 8,107 |
| Miami-Dade County FL Water & Sewer Revenue | 5.000% | 10/1/17 (Prere.) | 7,000 | 7,273 |
| North Brevard County FL Hospital District Revenue (Parrish Medical Center Project) | 5.750% | 10/1/18 (Prere.) | 1,425 | 1,557 |
| North Brevard County FL Hospital District Revenue (Parrish Medical Center Project) | 5.750% | 10/1/38 | 575 | 617 |
| Orange County FL Health Facilities Authority Hospital Revenue (Orlando Health Inc.) | 5.000% | 10/1/42 | 6,940 | 7,618 |
| Orange County FL Health Facilities Authority Hospital Revenue (Orlando Health Inc.) | 5.000% | 10/1/42 | 2,000 | 2,146 |
| Orange County FL Health Facilities Authority Revenue (Nemours Foundation Project) | 5.000% | 1/1/39 | 6,500 | 6,936 |
| Orange County FL School Board COP | 5.000% | 8/1/17 (Prere.) | 5,000 | 5,158 |
| Orlando & Orange County FL Expressway Authority Revenue | 5.000% | 7/1/17 (Prere.) | 5,340 | 5,492 |
| Orlando & Orange County FL Expressway Authority Revenue | 5.000% | 7/1/20 (Prere.) | 2,000 | 2,279 |
| Orlando & Orange County FL Expressway Authority Revenue | 5.000% | 7/1/20 (Prere.) | 5,000 | 5,697 |
| Orlando & Orange County FL Expressway Authority Revenue | 5.000% | 7/1/20 (Prere.) | 1,000 | 1,139 |
| Orlando & Orange County FL Expressway Authority Revenue | 5.000% | 7/1/32 | 1,500 | 1,746 |
| Orlando FL Utility Commission Utility System Revenue | 5.000% | 4/1/19 (Prere.) | 1,575 | 1,725 |
| Orlando FL Utility Commission Utility System Revenue | 5.000% | 4/1/19 (Prere.) | 1,525 | 1,670 |
| Orlando FL Utility Commission Utility System Revenue | 5.250% | 4/1/19 (Prere.) | 2,500 | 2,753 |
| Orlando FL Utility Commission Utility System Revenue | 5.000% | 10/1/29 | 2,100 | 2,279 |
| Orlando FL Utility Commission Utility System Revenue | 5.000% | 10/1/33 | 2,030 | 2,216 |
| Osceola County FL Expressway System Revenue (Poinciana Parkway Project) | 0.000% | 10/1/39 | 6,000 | 4,546 |
| Osceola County FL Expressway System Revenue (Poinciana Parkway Project) | 0.000% | 10/1/42 | 7,540 | 5,698 |
| Osceola County FL Expressway System Revenue (Poinciana Parkway Project) | 5.375% | 10/1/47 | 2,000 | 2,208 |
| Palm Beach County FL Public Improvement Revenue | 5.000% | 5/1/18 (Prere.) | 8,000 | 8,494 |
| Palm Beach County FL Public Improvement Revenue | 5.000% | 5/1/18 (Prere.) | 1,700 | 1,805 |
| Palm Beach County FL School Board COP | 5.000% | 8/1/17 (Prere.) | 2,000 | 2,064 |
| Palm Beach County FL School Board COP | 5.000% | 8/1/17 (Prere.) | 7,135 | 7,364 |
| Palm Beach County FL Solid Waste Authority Revenue | 5.500% | 10/1/18 (Prere.) | 25,000 | 27,165 |
| Port St. Lucie FL Revenue | 6.250% | 9/1/18 (Prere.) | 10,000 | 10,973 |
| Port St. Lucie FL Utility Revenue | 5.000% | 9/1/18 (Prere.) | 1,810 | 1,946 |
242
Long-Term Tax-Exempt Fund
| | | | |
| | | | Face | Market |
| | | Maturity | Amount | Value• |
| | Coupon | Date | ($000) | ($000) |
| Port St. Lucie FL Utility Revenue | 5.000% | 9/1/35 (12) | 190 | 203 |
| Sarasota County FL Public Hospital District Hospital Revenue | | | | |
| (Sarasota Memorial Hospital Project) | 5.625% | 7/1/39 | 10,000 | 10,928 |
| Sarasota County FL School Board COP | 5.375% | 7/1/19 (Prere.) | 3,000 | 3,344 |
| Sarasota County FL School Board COP | 5.500% | 7/1/19 (Prere.) | 2,775 | 3,103 |
| St. Johns County FL Development Authority Revenue | | | | |
| (Presbyterian Retirement Communities Project) | 6.000% | 8/1/45 | 5,000 | 5,628 |
| St. Johns County FL Industrial Development Authority Health Care Revenue | | | | |
| (Vicars Landing Project) | 5.000% | 2/15/17 | 245 | 247 |
| St. Johns County FL Ponte Vedra Utility Systems Revenue | 5.000% | 10/1/30 (4) | 3,650 | 3,663 |
| St. Petersburg FL Health Facilities Authority Revenue | | | | |
| (All Children’s Hospital Inc. Obligated Group) | 6.500% | 11/15/19 (Prere.) | 2,000 | 2,324 |
| St. Petersburg FL Public Utility Revenue | 5.500% | 10/1/19 (Prere.) | 1,000 | 1,129 |
| Sumter County FL Industrial Development Authority Hospital Revenue | | | | |
| (Central Florida Health Alliance Project) | 5.250% | 7/1/44 | 3,000 | 3,385 |
| Sunrise FL Utility System Revenue | 5.500% | 10/1/18 (ETM) | 6,795 | 7,200 |
| Sunrise FL Utility System Revenue | 5.200% | 10/1/22 (2) | 9,550 | 10,277 |
| Tallahassee FL Energy System Revenue | 5.000% | 10/1/37 (14) | 2,500 | 2,589 |
| Tallahassee FL Health Facilities Revenue (Tallahassee Memorial HealthCare Inc. Project) | 5.000% | 12/1/44 | 6,860 | 7,649 |
| Tampa Bay FL Water Utility System Revenue | 5.000% | 10/1/18 (Prere.) | 7,000 | 7,546 |
| Tampa FL Cigarette Tax Allocation Revenue (H. Lee Moffitt Cancer Center Project) | 5.000% | 9/1/26 | 1,000 | 1,172 |
| Tampa FL Cigarette Tax Allocation Revenue (H. Lee Moffitt Cancer Center Project) | 5.000% | 9/1/28 | 1,700 | 1,972 |
| Tampa FL Cigarette Tax Allocation Revenue (H. Lee Moffitt Cancer Center Project) | 5.000% | 9/1/29 | 1,950 | 2,252 |
| Tampa FL Health System Revenue (BayCare Health System) | 5.000% | 11/15/33 | 7,407 | 8,424 |
| Tohopekaliga FL Water Authority Utility System Revenue | 5.750% | 10/1/21 (Prere.) | 1,525 | 1,852 |
| Tohopekaliga FL Water Authority Utility System Revenue | 5.750% | 10/1/21 (Prere.) | 1,600 | 1,943 |
| Tohopekaliga FL Water Authority Utility System Revenue | 5.750% | 10/1/21 (Prere.) | 1,750 | 2,125 |
| West Palm Beach FL Revenue | 5.000% | 10/1/37 | 10,655 | 12,682 |
| West Palm Beach FL Revenue | 5.000% | 10/1/40 | 11,000 | 13,030 |
| | | | | 694,007 |
| Georgia (2.3%) | | | | |
| Atlanta GA Airport Revenue | 5.000% | 1/1/33 | 2,615 | 2,986 |
| Atlanta GA Airport Revenue | 5.000% | 1/1/33 | 5,000 | 5,709 |
| Atlanta GA Airport Revenue | 5.000% | 1/1/34 | 2,750 | 3,133 |
| Atlanta GA Airport Revenue | 5.000% | 1/1/34 | 5,000 | 5,696 |
| Atlanta GA Airport Revenue | 5.000% | 1/1/37 | 6,010 | 6,837 |
| Atlanta GA Development Authority Revenue | 5.250% | 7/1/40 | 2,500 | 2,973 |
| Atlanta GA Development Authority Revenue | 5.250% | 7/1/44 | 5,500 | 6,521 |
| Atlanta GA Water & Wastewater Revenue | 5.000% | 11/1/35 | 5,000 | 5,889 |
| Burke County GA Development Authority Pollution Control Revenue | | | | |
| (Oglethorpe Power Corp. Vogtle Project) | 5.500% | 1/1/33 | 3,000 | 3,138 |
| 1 Clarke County GA Hospital Authority Revenue (Piedmont Healthcare Inc.) | 4.000% | 7/1/32 | 3,275 | 3,438 |
| Dalton GA Development Authority Revenue (Hamilton Health Care System) | 5.500% | 8/15/26 (14) | 12,000 | 14,234 |
| DeKalb County GA Water & Sewer Revenue | 5.250% | 10/1/36 | 3,000 | 3,517 |
| 1 Fayette County GA Hospital Authority Revenue (Piedmont Healthcare Inc.) | 5.000% | 7/1/46 | 5,000 | 5,714 |
| 1 Fulton County GA Development Authority Revenue (Piedmont Healthcare Inc. Project) | 4.000% | 7/1/31 | 1,865 | 1,980 |
| Gainesville & Hall County GA Hospital Authority Revenue | | | | |
| (Northeast Georgia Health System Inc. Project) | 5.500% | 8/15/54 | 10,000 | 12,025 |
| Georgia GO | 5.000% | 2/1/27 | 10,000 | 12,739 |
| Georgia GO | 5.000% | 7/1/29 | 2,000 | 2,307 |
| Georgia Municipal Electric Power Authority Revenue | 5.000% | 1/1/30 | 4,265 | 4,931 |
| Georgia Municipal Electric Power Authority Revenue | 5.000% | 1/1/39 | 7,000 | 7,938 |
| Gwinnett County GA School District GO | 5.000% | 2/1/36 | 5,000 | 5,912 |
| Henry County GA School District GO | 4.000% | 8/1/29 | 5,000 | 5,765 |
| Henry County GA School District GO | 4.000% | 8/1/30 | 5,000 | 5,710 |
| Macon-Bibb County GA Hospital Authority Revenue (Medical Center of Central Georgia) | 5.000% | 8/1/32 | 4,500 | 4,877 |
| Macon-Bibb County GA Hospital Authority Revenue (Medical Center of Central Georgia) | 5.000% | 8/1/35 | 3,405 | 3,681 |
| Main Street Natural Gas Inc. Georgia Gas Project Revenue | 5.000% | 3/15/17 | 310 | 314 |
| Main Street Natural Gas Inc. Georgia Gas Project Revenue | 5.000% | 3/15/21 | 10,305 | 11,611 |
| Main Street Natural Gas Inc. Georgia Gas Project Revenue | 5.500% | 9/15/25 | 15,000 | 18,241 |
| Metropolitan Atlanta GA Rapid Transportation Authority Georgia Sales Tax Revenue | 6.250% | 7/1/18 | 3,640 | 3,848 |
| Metropolitan Atlanta Rapid Transportation Authority Georgia Sales Tax Revenue | 5.000% | 7/1/36 | 12,000 | 14,413 |
| Metropolitan Atlanta Rapid Transportation Authority Georgia Sales Tax Revenue | 5.000% | 7/1/37 | 20,785 | 24,906 |
| Municipal Electric Authority Georgia Revenue | 5.500% | 7/1/18 (Prere.) | 5,180 | 5,577 |
| Municipal Electric Authority Georgia Revenue | 5.500% | 1/1/26 | 1,820 | 1,951 |
| Municipal Electric Authority Georgia Revenue (Plant Voltage Units 3 & 4 Project J) | 5.500% | 7/1/60 | 5,000 | 5,966 |
| Municipal Electric Authority Georgia Revenue (Project One) | 5.000% | 1/1/21 | 3,000 | 3,451 |
| Private Colleges & University Authority of Georgia Revenue (Emory University) | 5.000% | 9/1/32 | 1,500 | 1,662 |
| Richmond County GA Hospital Authority Revenue (University Health Services Inc. Project) | 4.000% | 1/1/34 | 5,000 | 5,382 |
| | | | | 234,972 |
243
Long-Term Tax-Exempt Fund
| | | | |
| | | | Face | Market |
| | | Maturity | Amount | Value• |
| | Coupon | Date | ($000) | ($000) |
| Hawaii (1.4%) | | | | |
| Hawaii Department of Budget & Finance Special Purpose Revenue | | | | |
| (Hawaii Pacific Health Obligated Group) | 5.500% | 7/1/38 | 4,360 | 5,123 |
| Hawaii GO | 4.000% | 10/1/27 | 3,705 | 4,273 |
| Hawaii GO | 4.000% | 4/1/30 | 7,500 | 8,412 |
| Hawaii GO | 4.000% | 10/1/30 | 15,460 | 17,427 |
| Hawaii GO | 4.000% | 4/1/31 | 7,500 | 8,352 |
| Hawaii GO | 4.000% | 10/1/31 | 6,640 | 7,429 |
| Hawaii GO | 4.000% | 10/1/33 | 3,750 | 4,122 |
| Hawaii Harbor System Revenue | 5.500% | 7/1/35 | 5,000 | 5,635 |
| Hawaii Harbor System Revenue | 5.625% | 7/1/40 | 5,000 | 5,661 |
| Hawaii Highway Revenue | 4.000% | 1/1/32 | 1,000 | 1,112 |
| Honolulu HI City & County GO | 5.250% | 4/1/19 (Prere.) | 8,000 | 8,817 |
| Honolulu HI City & County GO | 5.250% | 4/1/19 (Prere.) | 8,000 | 8,817 |
| Honolulu HI City & County GO | 5.250% | 8/1/21 (Prere.) | 2,000 | 2,375 |
| Honolulu HI City & County GO | 5.250% | 8/1/21 (Prere.) | 3,025 | 3,593 |
| Honolulu HI City & County GO | 5.000% | 10/1/32 | 6,840 | 8,260 |
| Honolulu HI City & County Wastewater System Revenue | 5.250% | 7/1/21 (Prere.) | 5,000 | 5,924 |
| Honolulu HI City & County Wastewater System Revenue | 5.000% | 7/1/28 | 3,250 | 4,061 |
| Honolulu HI City & County Wastewater System Revenue | 4.000% | 7/1/29 | 9,610 | 10,903 |
| Honolulu HI City & County Wastewater System Revenue | 5.000% | 7/1/29 | 2,500 | 3,099 |
| Honolulu HI City & County Wastewater System Revenue | 5.000% | 7/1/30 | 4,250 | 5,227 |
| Honolulu HI City & County Wastewater System Revenue | 5.000% | 7/1/40 | 10,000 | 11,750 |
| University of Hawaii Revenue | 6.000% | 10/1/38 | 2,500 | 2,834 |
| | | | | 143,206 |
| Idaho (0.1%) | | | | |
| Idaho Health Facilities Authority Revenue (Trinity Health Group) | 6.250% | 12/1/18 (Prere.) | 6,000 | 6,654 |
| Idaho Housing & Finance Association RAN | 5.000% | 7/15/22 | 6,465 | 7,081 |
| | | | | 13,735 |
| Illinois (7.2%) | | | | |
| Chicago IL Board of Education GO | 5.500% | 12/1/26 (14) | 5,225 | 6,006 |
| Chicago IL Board of Education GO | 5.500% | 12/1/30 (2) | 3,490 | 3,665 |
| Chicago IL Board of Education GO | 5.000% | 12/1/41 | 6,920 | 6,143 |
| Chicago IL Board of Education GO | 5.250% | 12/1/41 | 3,000 | 2,750 |
| Chicago IL Board of Education GO | 5.000% | 12/1/42 | 15,500 | 13,700 |
| Chicago IL Board of Education GO | 7.000% | 12/1/44 | 5,000 | 5,310 |
| Chicago IL GO | 5.530% | 1/1/20 (14) | 5,000 | 5,038 |
| Chicago IL GO | 5.000% | 1/1/21 (4) | 3,000 | 3,057 |
| Chicago IL GO | 5.580% | 1/1/22 (14) | 5,000 | 5,038 |
| Chicago IL GO | 5.600% | 1/1/24 (14) | 2,480 | 2,499 |
| Chicago IL GO | 5.610% | 1/1/25 (14) | 1,305 | 1,315 |
| Chicago IL GO | 5.650% | 1/1/28 (14) | 2,820 | 2,842 |
| Chicago IL GO | 5.000% | 1/1/34 | 8,000 | 8,139 |
| Chicago IL GO | 5.000% | 1/1/38 | 2,000 | 2,008 |
| Chicago IL Metropolitan Water Reclamation District GO | 5.000% | 12/1/31 | 7,500 | 8,568 |
| Chicago IL Midway Airport Revenue | 5.000% | 1/1/35 | 7,800 | 8,826 |
| Chicago IL Midway Airport Revenue | 5.000% | 1/1/36 | 2,000 | 2,259 |
| Chicago IL O’Hare International Airport Revenue | 5.000% | 1/1/30 | 26,870 | 31,738 |
| Chicago IL O’Hare International Airport Revenue | 5.000% | 1/1/33 | 5,615 | 6,565 |
| Chicago IL O’Hare International Airport Revenue | 6.500% | 1/1/41 | 3,000 | 3,589 |
| Chicago IL O’Hare International Airport Revenue | 5.750% | 1/1/43 | 9,000 | 10,460 |
| Chicago IL Park District GO | 5.000% | 1/1/36 | 4,000 | 4,283 |
| 1 Chicago IL Park District GO | 5.000% | 1/1/40 | 3,250 | 3,607 |
| Chicago IL Public Building Commission GO | 7.000% | 1/1/20 (ETM) | 27,500 | 31,509 |
| Chicago IL Sales Tax Revenue | 5.000% | 1/1/29 | 4,265 | 4,510 |
| Chicago IL Sales Tax Revenue | 5.250% | 1/1/38 | 2,055 | 2,166 |
| Chicago IL Transit Authority Sales Tax Receipts Revenue | 5.250% | 12/1/36 | 6,400 | 7,084 |
| Chicago IL Wastewater Transmission Revenue | 5.000% | 1/1/39 | 1,500 | 1,642 |
| 3 Chicago IL Water Revenue TOB VRDO | 0.830% | 11/7/16 | 6,470 | 6,470 |
| Chicago IL Waterworks Revenue | 5.000% | 11/1/44 | 7,500 | 8,329 |
| Cook County IL Community College District GO | 5.125% | 12/1/38 | 4,250 | 4,702 |
| Cook County IL Forest Preservation District GO | 5.000% | 12/15/32 | 1,000 | 1,098 |
| Cook County IL Forest Preservation District GO | 5.000% | 12/15/37 | 2,500 | 2,732 |
| Illinois Finance Authority Revenue (Advocate Health Care Network) | 5.000% | 6/1/42 | 16,580 | 18,417 |
| Illinois Finance Authority Revenue (Art Institute of Chicago) | 5.000% | 3/1/34 | 7,750 | 8,707 |
| Illinois Finance Authority Revenue (Ascension Health Credit Group) | 5.000% | 11/15/37 | 5,000 | 5,641 |
| Illinois Finance Authority Revenue (Ascension Health Credit Group) | 5.000% | 11/15/42 | 17,895 | 20,118 |
| Illinois Finance Authority Revenue (Carle Foundation) | 6.000% | 8/15/41 | 5,000 | 5,847 |
| Illinois Finance Authority Revenue (Carle Foundation) | 6.000% | 8/15/41 (4) | 1,500 | 1,758 |
244
Long-Term Tax-Exempt Fund
| | | | |
| | | | Face | Market |
| | | Maturity | Amount | Value• |
| | Coupon | Date | ($000) | ($000) |
| 1 Illinois Finance Authority Revenue (Carle Foundation) | 5.000% | 2/15/45 | 20,000 | 22,271 |
| Illinois Finance Authority Revenue (Central DuPage Health) | 5.250% | 11/1/39 | 4,000 | 4,382 |
| Illinois Finance Authority Revenue (Chicago University) | 5.500% | 8/15/19 (Prere.) | 15,000 | 16,845 |
| Illinois Finance Authority Revenue (Children’s Memorial Hospital) | 5.375% | 8/15/39 | 10,000 | 10,617 |
| Illinois Finance Authority Revenue (Franciscan Communities Inc.) | 5.125% | 5/15/43 | 2,500 | 2,647 |
| Illinois Finance Authority Revenue (Franciscan Communities Inc.) | 5.250% | 5/15/47 | 9,730 | 10,314 |
| Illinois Finance Authority Revenue (Illinois Wesleyan University) | 5.000% | 9/1/36 | 1,000 | 1,126 |
| Illinois Finance Authority Revenue (Loyola University) | 5.000% | 7/1/42 | 2,000 | 2,217 |
| Illinois Finance Authority Revenue (Mercy Health System) | 5.000% | 12/1/46 | 12,250 | 13,767 |
| Illinois Finance Authority Revenue (Northwestern Community Hospital) | 5.375% | 7/1/18 (Prere.) | 3,000 | 3,223 |
| Illinois Finance Authority Revenue (OSF Healthcare System) | 7.000% | 5/15/19 (Prere.) | 15,000 | 17,254 |
| Illinois Finance Authority Revenue (OSF Healthcare System) | 6.000% | 5/15/20 (Prere.) | 4,085 | 4,772 |
| Illinois Finance Authority Revenue (OSF Healthcare System) | 4.000% | 5/15/32 | 3,080 | 3,266 |
| Illinois Finance Authority Revenue (OSF Healthcare System) | 4.000% | 5/15/33 | 1,110 | 1,169 |
| Illinois Finance Authority Revenue (OSF Healthcare System) | 4.000% | 5/15/34 | 2,800 | 2,936 |
| Illinois Finance Authority Revenue (OSF Healthcare System) | 6.000% | 5/15/39 | 2,275 | 2,586 |
| Illinois Finance Authority Revenue (OSF Healthcare System) | 5.000% | 5/15/41 | 6,000 | 6,608 |
| Illinois Finance Authority Revenue (OSF Healthcare System) | 5.000% | 11/15/45 | 5,000 | 5,668 |
| Illinois Finance Authority Revenue (Presence Health Network Obligated Group) | 4.000% | 2/15/41 | 4,000 | 3,820 |
| Illinois Finance Authority Revenue (Presence Health Network Obligated Group) | 5.000% | 2/15/41 | 2,000 | 2,180 |
| Illinois Finance Authority Revenue (Riverside Health System) | 6.250% | 11/15/19 (Prere.) | 2,775 | 3,203 |
| Illinois Finance Authority Revenue (Riverside Health System) | 6.250% | 11/15/35 | 1,825 | 2,064 |
| Illinois Finance Authority Revenue (Rush University Medical Center) | 5.000% | 11/15/33 | 5,000 | 5,834 |
| Illinois Finance Authority Revenue (Silver Cross & Medical Centers) | 7.000% | 8/15/19 (Prere.) | 16,000 | 18,631 |
| Illinois Finance Authority Revenue (Southern Illinois Healthcare) | 5.375% | 3/1/35 (4) | 5,120 | 5,622 |
| Illinois Finance Authority Revenue (Trinity Health Corp.) | 5.000% | 12/1/30 | 3,000 | 3,377 |
| Illinois Finance Authority Revenue (University of Chicago) | 5.750% | 7/1/18 (Prere.) | 7,750 | 8,373 |
| Illinois Finance Authority Revenue (University of Chicago) | 5.000% | 10/1/32 | 790 | 912 |
| Illinois Finance Authority Revenue (University of Chicago) | 5.000% | 10/1/33 | 10,000 | 11,668 |
| Illinois GO | 5.000% | 3/1/21 | 4,000 | 4,342 |
| Illinois GO | 5.000% | 8/1/21 | 7,000 | 7,633 |
| Illinois GO | 5.000% | 8/1/24 | 9,000 | 9,719 |
| Illinois GO | 5.000% | 2/1/25 | 1,630 | 1,782 |
| Illinois GO | 5.500% | 7/1/25 | 2,800 | 3,143 |
| Illinois GO | 5.000% | 8/1/25 | 5,110 | 5,483 |
| Illinois GO | 5.000% | 1/1/28 | 9,125 | 9,921 |
| Illinois GO | 5.250% | 2/1/32 | 8,075 | 8,736 |
| Illinois GO | 5.250% | 2/1/33 (4) | 5,200 | 5,615 |
| Illinois GO | 5.500% | 7/1/33 (4) | 3,350 | 3,768 |
| Illinois GO | 5.250% | 2/1/34 (4) | 3,125 | 3,369 |
| Illinois GO | 5.000% | 5/1/34 | 2,000 | 2,092 |
| Illinois GO | 5.500% | 7/1/38 | 7,500 | 8,198 |
| Illinois Regional Transportation Authority Revenue | 7.200% | 11/1/20 (2) | 10,905 | 12,201 |
| Illinois Sports Facility Authority Revenue | 5.500% | 6/15/30 (2) | 7,085 | 7,111 |
| Illinois Toll Highway Authority Revenue | 5.500% | 1/1/18 (Prere.) | 20,000 | 21,087 |
| Illinois Toll Highway Authority Revenue | 5.000% | 12/1/22 | 2,400 | 2,878 |
| Illinois Toll Highway Authority Revenue | 5.000% | 1/1/36 | 10,000 | 11,546 |
| Illinois Toll Highway Authority Revenue | 5.000% | 1/1/38 | 10,000 | 11,414 |
| Illinois Toll Highway Authority Revenue | 5.000% | 1/1/40 | 15,400 | 17,719 |
| Metropolitan Pier & Exposition Authority Illinois Dedicated Sales Tax Revenue | 0.000% | 6/15/25 (14) | 10,000 | 7,247 |
| Metropolitan Pier & Exposition Authority Illinois Dedicated Sales Tax Revenue | 0.000% | 12/15/31 (14) | 17,500 | 9,061 |
| Metropolitan Pier & Exposition Authority Illinois Dedicated Sales Tax Revenue | 0.000% | 6/15/33 (14) | 7,500 | 3,614 |
| Metropolitan Pier & Exposition Authority Illinois Dedicated Sales Tax Revenue | 0.000% | 12/15/34 (14) | 4,870 | 2,197 |
| Metropolitan Pier & Exposition Authority Illinois Dedicated Sales Tax Revenue | 0.000% | 6/15/44 (4) | 10,000 | 2,894 |
| Metropolitan Pier & Exposition Authority Illinois Dedicated Sales Tax Revenue | 5.250% | 6/15/50 | 9,210 | 9,721 |
| Metropolitan Pier & Exposition Authority Illinois Dedicated Sales Tax Revenue | | | | |
| (McCormick Place Expansion Project) | 0.000% | 12/15/24 (14) | 2,715 | 2,022 |
| Metropolitan Pier & Exposition Authority Illinois Dedicated Sales Tax Revenue | | | | |
| (McCormick Place Expansion Project) | 0.000% | 6/15/31 (14) | 17,500 | 9,261 |
| Metropolitan Pier & Exposition Authority Illinois Dedicated Sales Tax Revenue | | | | |
| (McCormick Place Expansion Project) | 0.000% | 6/15/32 (14) | 7,500 | 3,788 |
| Metropolitan Pier & Exposition Authority Illinois Dedicated Sales Tax Revenue | | | | |
| (McCormick Place Expansion Project) | 5.000% | 6/15/42 | 3,965 | 4,206 |
| Metropolitan Pier & Exposition Authority Illinois Dedicated Sales Tax Revenue | | | | |
| (McCormick Place Expansion Project) | 5.500% | 6/15/53 | 1,000 | 1,136 |
| Railsplitter Tobacco Settlement Authority Illinois Tobacco Settlement Revenue | 6.000% | 6/1/28 | 15,000 | 17,614 |
| Springfield IL Water Revenue | 5.000% | 3/1/37 | 8,000 | 9,255 |
| University of Illinois Auxiliary Facilities System Revenue | 5.500% | 4/1/31 | 3,000 | 3,460 |
| Will County IL Community High School District No. 210 (Lincoln-Way) GO | 5.000% | 1/1/27 | 115 | 119 |
245
Long-Term Tax-Exempt Fund
| | | | |
| | | | Face | Market |
| | | Maturity | Amount | Value• |
| | Coupon | Date | ($000) | ($000) |
| Will County IL Community High School District No. 210 (Lincoln-Way) GO | 5.000% | 1/1/29 | 9,100 | 9,249 |
| Will County IL Community High School District No. 210 (Lincoln-Way) GO | 0.000% | 1/1/32 | 16,500 | 7,485 |
| | | | | 735,573 |
| Indiana (1.9%) | | | | |
| Indiana Finance Authority Facilities Revenue (Wabash Valley Correctional Facility) | 5.250% | 7/1/19 | 2,500 | 2,768 |
| Indiana Finance Authority Health System Revenue | | | | |
| (Sisters of St. Francis Health Services Inc. Obligated Group) | 5.250% | 11/1/39 | 3,000 | 3,306 |
| Indiana Finance Authority Health System Revenue | | | | |
| (Sisters of St. Francis Health Services Inc. Obligated Group) | 5.000% | 11/1/41 | 12,815 | 14,693 |
| Indiana Finance Authority Revenue (BHI Senior Living) | 6.000% | 11/15/41 | 10,000 | 11,554 |
| Indiana Finance Authority Revenue | | | | |
| (Community Foundation of Northwest Indiana Obligated Group) | 5.000% | 3/1/41 | 6,500 | 7,096 |
| Indiana Finance Authority Revenue (Marquette Project) | 5.000% | 3/1/30 | 1,100 | 1,224 |
| Indiana Finance Authority Revenue (Marquette Project) | 5.000% | 3/1/39 | 2,770 | 3,001 |
| Indiana Finance Authority Revenue (Stadium Project) | 5.250% | 2/1/32 | 6,130 | 7,383 |
| Indiana Finance Authority Revenue (Stadium Project) | 5.250% | 2/1/33 | 12,610 | 15,111 |
| Indiana Finance Authority Revenue (Stadium Project) | 5.250% | 2/1/34 | 8,760 | 10,430 |
| Indiana Finance Authority Revenue (Stadium Project) | 5.250% | 2/1/35 | 2,500 | 2,964 |
| Indiana Finance Authority Wastewater Utility Revenue (CWA Authority Project) | 5.000% | 10/1/37 | 7,000 | 8,057 |
| Indiana Finance Authority Wastewater Utility Revenue (CWA Authority Project) | 5.000% | 10/1/39 | 7,000 | 8,092 |
| Indiana Finance Authority Wastewater Utility Revenue (CWA Authority Project) | 5.000% | 10/1/46 | 15,000 | 17,361 |
| Indiana Finance Authority Water Utilities Revenue | 5.000% | 10/1/41 | 11,335 | 13,352 |
| Indiana Finance Authority Water Utilities Revenue | 5.000% | 10/1/46 | 7,140 | 8,377 |
| Indianapolis IN Local Public Improvement Bond Bank Revenue (Bank-Waterworks Project) | 5.750% | 1/1/38 | 10,000 | 11,013 |
| Indianapolis IN Local Public Improvement Bond Bank Revenue (PILOT Infrastructure Project) | 5.000% | 1/1/29 (4) | 5,245 | 5,833 |
| Indianapolis IN Local Public Improvement Bond Bank Revenue | | | | |
| (Qualified Midwestern Disaster Area) | 5.750% | 2/1/36 | 8,800 | 10,230 |
| Northern Indiana Commuter Transportation District Revenue | 5.000% | 7/1/32 | 1,000 | 1,183 |
| Purdue University Indiana University COP | 5.000% | 7/1/27 | 5,305 | 6,690 |
| Purdue University Indiana University Student Fee Revenue | 5.000% | 7/1/32 | 6,945 | 8,277 |
| Purdue University Indiana University Student Fee Revenue | 5.000% | 7/1/33 | 5,575 | 6,617 |
| Purdue University Indiana University Student Fee Revenue | 5.000% | 7/1/34 | 4,810 | 5,689 |
| | | | | 190,301 |
| Iowa (0.3%) | | | | |
| Iowa Finance Authority Midwestern Disaster Area Revenue (Iowa Fertilizer Co. Project) | 5.500% | 12/1/22 | 11,675 | 11,835 |
| Iowa Finance Authority Midwestern Disaster Area Revenue (Iowa Fertilizer Co. Project) | 5.250% | 12/1/25 | 15,000 | 15,645 |
| | | | | 27,480 |
| Kansas (0.6%) | | | | |
| Johnson County KS Unified School District No. 233 GO | 4.000% | 9/1/30 | 5,000 | 5,646 |
| Johnson County KS Unified School District No. 233 GO | 4.000% | 9/1/31 | 4,000 | 4,483 |
| Kansas Development Finance Authority Revenue | 5.000% | 5/1/29 | 2,275 | 2,705 |
| Kansas Development Finance Authority Revenue | 5.000% | 5/1/30 | 4,230 | 5,000 |
| Kansas Development Finance Authority Revenue | 5.000% | 5/1/31 | 4,975 | 5,867 |
| Kansas Development Finance Authority Revenue | 5.000% | 5/1/32 | 5,225 | 6,131 |
| Kansas Development Finance Authority Revenue | 5.000% | 5/1/33 | 1,610 | 1,886 |
| Kansas Development Finance Authority Revenue | 5.000% | 5/1/34 | 1,590 | 1,858 |
| Kansas Development Finance Authority Revenue | 5.000% | 4/1/35 | 16,585 | 18,871 |
| Kansas Development Finance Authority Revenue | 5.000% | 5/1/35 | 1,665 | 1,940 |
| Wyandotte County/Kansas City KS Unified Government Utility System Revenue | 5.000% | 9/1/44 | 2,750 | 3,177 |
| | | | | 57,564 |
| Kentucky (0.6%) | | | | |
| Kentucky Economic Development Finance Authority Hospital Revenue | | | | |
| (Baptist Healthcare System Obligated Group) | 5.375% | 8/15/24 | 5,000 | 5,339 |
| Kentucky Economic Development Finance Authority Hospital Revenue | | | | |
| (Baptist Healthcare System Obligated Group) | 5.000% | 8/15/42 | 6,225 | 6,679 |
| Kentucky Public Transportation Infrastructure Authority Toll Revenue | | | | |
| (Downtown Crossing Project) BAN | 0.000% | 7/1/34 | 2,000 | 1,737 |
| Kentucky Public Transportation Infrastructure Authority Toll Revenue | | | | |
| (Downtown Crossing Project) BAN | 0.000% | 7/1/43 | 10,000 | 8,513 |
| Kentucky Public Transportation Infrastructure Authority Toll Revenue | | | | |
| (Downtown Crossing Project) BAN | 5.750% | 7/1/49 | 10,100 | 11,694 |
| Kentucky Public Transportation Infrastructure Authority Toll Revenue | | | | |
| (Downtown Crossing Project) BAN | 6.000% | 7/1/53 | 5,000 | 5,877 |
| Louisville & Jefferson County KY Metropolitan Government Health System Revenue | | | | |
| (Norton Healthcare Obligated Group) | 5.750% | 10/1/42 | 13,000 | 15,414 |
| Louisville & Jefferson County KY Metropolitan Government Revenue (Catholic Health Initiatives) | 5.000% | 6/1/22 (Prere.) | 3,435 | 4,120 |
| Louisville & Jefferson County KY Metropolitan Government Revenue (Catholic Health Initiatives) | 5.000% | 12/1/35 | 1,065 | 1,171 |
246
Long-Term Tax-Exempt Fund
| | | | |
| | | | Face | Market |
| | | Maturity | Amount | Value• |
| | Coupon | Date | ($000) | ($000) |
| Warren County KY Hospital Revenue | | | | |
| (Bowling Green-Warren County Community Hospital Corp. Project) | 5.000% | 4/1/35 | 1,600 | 1,788 |
| | | | | 62,332 |
| Louisiana (0.6%) | | | | |
| East Baton Rouge Parish LA Sewer Commission Revenue | 5.000% | 2/1/33 | 5,405 | 6,349 |
| East Baton Rouge Parish LA Sewer Commission Revenue | 5.000% | 2/1/34 | 5,290 | 6,193 |
| Lafayette LA Communications System Revenue | 5.000% | 11/1/26 (4) | 3,185 | 3,843 |
| Lafayette LA Communications System Revenue | 5.000% | 11/1/28 (4) | 1,250 | 1,478 |
| Louisiana Local Government Environmental Facilities & Community Development | | | | |
| Authority Revenue (East Baton Rouge Sewerage Commission Projects) | 5.000% | 2/1/39 | 4,250 | 4,857 |
| Louisiana Local Government Environmental Facilities & Community Development | | | | |
| Authority Revenue (LCTCS Facilities Corp. Project) | 5.000% | 10/1/35 | 5,180 | 6,012 |
| Louisiana Local Government Environmental Facilities & Community Development | | | | |
| Authority Revenue (Women’s Hospital Foundation Project) | 5.875% | 10/1/40 | 14,000 | 16,177 |
| Louisiana Stadium & Exposition District Revenue | 5.000% | 7/1/28 | 4,000 | 4,600 |
| Louisiana Stadium & Exposition District Revenue | 5.000% | 7/1/29 | 3,000 | 3,433 |
| Louisiana State University Revenue | 5.000% | 7/1/24 | 1,000 | 1,202 |
| Louisiana State University Revenue | 5.000% | 7/1/25 | 505 | 602 |
| St. Charles Parish LA Gulf Opportunity Zone Revenue (Valero Energy Corp.) PUT | 4.000% | 6/1/22 | 4,000 | 4,368 |
| | | | | 59,114 |
| Maine (0.1%) | | | | |
| Maine Health & Higher Educational Facilities Authority Revenue (Bates College) | 5.000% | 7/1/38 | 4,000 | 4,600 |
| Maine Health & Higher Educational Facilities Authority Revenue | | | | |
| (Stephens Memorial Hospital Association) | 5.000% | 7/1/39 | 5,100 | 5,760 |
| | | | | 10,360 |
| Maryland (1.5%) | | | | |
| Baltimore County MD GO | 5.000% | 2/1/26 | 2,800 | 3,313 |
| Baltimore MD Consolidated Public Improvement GO | 5.000% | 8/1/30 | 5,000 | 6,092 |
| Baltimore MD Project Revenue | 5.000% | 7/1/38 | 5,000 | 5,766 |
| Maryland Department of Transportation Revenue | 4.000% | 12/15/28 | 10,000 | 11,331 |
| Maryland Economic Development Corp. Pollution Control Revenue (Potomac Electric Power Co.) | 6.200% | 9/1/22 | 4,000 | 4,456 |
| Maryland GO | 5.000% | 3/1/26 | 17,910 | 21,708 |
| Maryland GO | 4.000% | 3/1/27 | 5,000 | 5,690 |
| Maryland GO | 4.000% | 6/1/29 | 25,000 | 28,425 |
| Maryland Health & Higher Educational Facilities Authority Revenue (MedStar Health, Inc.) | 5.000% | 8/15/38 | 10,000 | 11,292 |
| Maryland Health & Higher Educational Facilities Authority Revenue (Meritus Medical Center, Inc.) | 5.000% | 7/1/40 | 6,500 | 7,290 |
| Maryland Health & Higher Educational Facilities Authority Revenue | | | | |
| (University of Maryland Medical System) | 7.000% | 7/1/22 (14) | 8,910 | 10,578 |
| Montgomery County MD GO | 4.000% | 12/1/30 | 1,000 | 1,123 |
| Montgomery County MD GO | 4.000% | 12/1/34 | 15,000 | 16,555 |
| Prince Georges County MD GO | 4.000% | 7/1/27 | 8,655 | 10,132 |
| Washington Suburban Sanitation District Maryland GO | 4.000% | 6/1/34 | 7,315 | 8,053 |
| | | | | 151,804 |
| Massachusetts (2.1%) | | | | |
| Massachusetts Bay Transportation Authority General Transportation Revenue | 7.000% | 3/1/21 (ETM) | 2,680 | 2,732 |
| Massachusetts Bay Transportation Authority General Transportation Revenue | 7.000% | 3/1/21 | 6,070 | 7,013 |
| Massachusetts Bay Transportation Authority Sales Tax Revenue | 5.250% | 7/1/18 (Prere.) | 725 | 778 |
| Massachusetts Bay Transportation Authority Sales Tax Revenue | 5.250% | 7/1/18 (Prere.) | 1,775 | 1,904 |
| Massachusetts Bay Transportation Authority Sales Tax Revenue | 4.000% | 7/1/33 | 2,390 | 2,619 |
| 3 Massachusetts Bay Transportation Authority Sales Tax Revenue TOB VRDO | 0.730% | 11/7/16 | 10,277 | 10,277 |
| Massachusetts College Building Authority Revenue | 0.000% | 5/1/17 (ETM) | 7,460 | 7,427 |
| Massachusetts College Building Authority Revenue | 5.000% | 5/1/35 | 2,500 | 2,797 |
| Massachusetts Department of Transportation Metropolitan Highway System Revenue | 5.000% | 1/1/26 | 8,000 | 8,926 |
| Massachusetts Department of Transportation Metropolitan Highway System Revenue | 5.000% | 1/1/27 | 8,000 | 8,918 |
| Massachusetts Department of Transportation Metropolitan Highway System Revenue | 5.000% | 1/1/35 | 5,000 | 5,579 |
| Massachusetts Development Finance Agency Revenue (Baystate Medical Obligated Group) | 5.000% | 7/1/44 | 5,000 | 5,662 |
| Massachusetts Development Finance Agency Revenue (Boston Medical Center) | 5.000% | 7/1/33 | 3,205 | 3,650 |
| Massachusetts Development Finance Agency Revenue (Commonwealth Contract Assistance) | 5.500% | 2/1/40 | 10,000 | 11,254 |
| Massachusetts Development Finance Agency Revenue (Partners Healthcare) | 5.000% | 7/1/47 | 6,695 | 7,830 |
| Massachusetts Development Finance Agency Revenue (Wellesley College) | 5.000% | 7/1/42 | 5,000 | 5,861 |
| Massachusetts Development Finance Agency Revenue (Williams College) | 5.000% | 7/1/34 | 2,390 | 2,887 |
| Massachusetts GO | 4.000% | 9/1/31 | 12,500 | 13,872 |
| Massachusetts GO | 4.000% | 9/1/32 | 12,500 | 13,770 |
| Massachusetts GO | 5.000% | 8/1/36 | 9,855 | 11,448 |
| Massachusetts GO | 4.000% | 6/1/43 | 1,000 | 1,055 |
| Massachusetts Health & Educational Facilities Authority Revenue (Boston Medical Center) | 5.750% | 7/1/18 (Prere.) | 890 | 959 |
| Massachusetts Health & Educational Facilities Authority Revenue (Boston Medical Center) | 5.750% | 7/1/18 (Prere.) | 7,300 | 7,869 |
| Massachusetts School Building Authority Dedicated Sales Tax Revenue | 5.000% | 8/15/30 | 10,100 | 12,078 |
247
Long-Term Tax-Exempt Fund
| | | | |
| | | | Face | Market |
| | | Maturity | Amount | Value• |
| | Coupon | Date | ($000) | ($000) |
| Massachusetts School Building Authority Dedicated Sales Tax Revenue | 4.000% | 8/15/32 | 8,800 | 9,653 |
| Massachusetts School Building Authority Dedicated Sales Tax Revenue | 5.250% | 10/15/35 | 3,000 | 3,543 |
| Massachusetts Special Obligation Dedicated Tax Revenue | 5.500% | 1/1/27 (14) | 7,190 | 9,303 |
| Massachusetts Water Resources Authority Revenue | 5.000% | 8/1/17 (Prere.) | 755 | 779 |
| Massachusetts Water Resources Authority Revenue | 6.500% | 7/15/19 (ETM) | 8,355 | 8,959 |
| Massachusetts Water Resources Authority Revenue | 5.000% | 8/1/20 (Prere.) | 5,000 | 5,717 |
| Massachusetts Water Resources Authority Revenue | 5.000% | 8/1/21 (Prere.) | 180 | 212 |
| Massachusetts Water Resources Authority Revenue | 5.000% | 8/1/21 (Prere.) | 820 | 965 |
| Massachusetts Water Resources Authority Revenue | 5.000% | 8/1/27 | 3,000 | 3,514 |
| Metropolitan Boston MA Transit Parking Corp. Revenue | 5.250% | 7/1/36 | 4,500 | 5,218 |
| University of Massachusetts Building Authority Revenue | 5.000% | 11/1/39 | 10,795 | 12,733 |
| | | | | 217,761 |
| Michigan (2.8%) | | | | |
| Detroit MI GO | 5.000% | 4/1/17 (ETM) | 491 | 500 |
| Detroit MI GO | 5.000% | 4/1/17 (12)(ETM) | 2,679 | 2,726 |
| Detroit MI Water & Sewerage Department Sewage Disposal System Revenue | 5.250% | 7/1/39 | 1,000 | 1,117 |
| Detroit/Wayne County MI Stadium Authority Revenue | 5.000% | 10/1/26 (4) | 2,500 | 2,787 |
| Great Lakes MI Water Authority Water Supply System Revenue | 4.000% | 7/1/33 (4) | 10,000 | 10,533 |
| Great Lakes MI Water Authority Water Supply System Revenue | 5.000% | 7/1/46 | 20,000 | 22,424 |
| Karegnondi Water Authority Michigan Water Supply System Revenue (Karegnondi Water Pipeline) | 5.250% | 11/1/40 | 17,330 | 19,450 |
| Kent Hospital Finance Authority Michigan Revenue (Spectrum Health System) PUT | 5.000% | 1/15/42 | 10,805 | 11,833 |
| Kentwood MI Economic Development Corp. Revenue (Holland Home Obligated Group) | 5.000% | 11/15/37 | 8,875 | 9,679 |
| Michigan Building Authority Revenue | 5.000% | 4/15/29 | 2,925 | 3,515 |
| Michigan Building Authority Revenue | 5.000% | 10/15/29 | 1,375 | 1,639 |
| Michigan Building Authority Revenue | 5.000% | 4/15/31 | 12,000 | 14,245 |
| Michigan Building Authority Revenue | 5.000% | 4/15/38 | 2,000 | 2,331 |
| Michigan Building Authority Revenue | 5.000% | 10/15/45 | 3,900 | 4,499 |
| Michigan Building Authority Revenue | 5.250% | 10/15/47 | 2,000 | 2,349 |
| Michigan Finance Authority Revenue | 5.000% | 10/1/39 | 13,195 | 14,854 |
| Michigan Finance Authority Revenue (Detroit Water & Sewer) | 5.000% | 7/1/27 | 500 | 595 |
| Michigan Finance Authority Revenue (Detroit Water & Sewer) | 5.000% | 7/1/28 (4) | 3,000 | 3,593 |
| Michigan Finance Authority Revenue (Detroit Water & Sewer) | 5.000% | 7/1/29 | 1,000 | 1,172 |
| Michigan Finance Authority Revenue (Detroit Water & Sewer) | 5.000% | 7/1/32 (14) | 2,210 | 2,527 |
| Michigan Finance Authority Revenue (Detroit Water & Sewer) | 5.000% | 7/1/32 | 5,000 | 5,684 |
| Michigan Finance Authority Revenue (Detroit Water & Sewer) | 5.000% | 7/1/34 (14) | 1,165 | 1,326 |
| Michigan Finance Authority Revenue (Detroit Water & Sewer) | 5.000% | 7/1/34 | 7,500 | 8,465 |
| Michigan Finance Authority Revenue (Detroit Water & Sewer) | 5.000% | 7/1/44 | 3,670 | 4,032 |
| Michigan Finance Authority Revenue (Henry Ford Health System Obligated Group) | 5.000% | 11/15/41 | 10,000 | 11,296 |
| Michigan Finance Authority Revenue (McLaren Health Care Corp.) | 5.000% | 5/15/33 | 4,000 | 4,621 |
| Michigan Finance Authority Revenue (McLaren Health Care Corp.) | 5.000% | 5/15/38 | 13,500 | 15,389 |
| Michigan Finance Authority Revenue (MidMichigan Obligated Group) | 5.000% | 6/1/39 | 6,000 | 6,835 |
| Michigan Finance Authority Revenue (State Clean Water Revolving Fund) | 5.000% | 10/1/25 | 1,500 | 1,796 |
| Michigan Finance Authority Revenue (State Clean Water Revolving Fund) | 5.000% | 10/1/26 | 3,100 | 3,710 |
| Michigan GO | 5.250% | 9/15/17 (Prere.) | 14,000 | 14,543 |
| Michigan Hospital Finance Authority Revenue (Henry Ford Health System) | 5.750% | 11/15/19 (Prere.) | 5,000 | 5,699 |
| Michigan Hospital Finance Authority Revenue (MidMichigan Obligated Group) | 6.125% | 6/1/19 (Prere.) | 9,000 | 10,162 |
| Michigan Hospital Finance Authority Revenue (Trinity Health) | 5.000% | 12/1/48 | 2,300 | 2,526 |
| Michigan Municipal Bond Authority Revenue (State Clean Water Revolving Fund) | 5.000% | 10/1/17 (Prere.) | 8,870 | 9,214 |
| Michigan State University Revenue | 5.000% | 8/15/26 | 1,165 | 1,406 |
| Michigan State University Revenue | 5.000% | 8/15/27 | 1,000 | 1,204 |
| Michigan Strategic Fund Limited Obligation Revenue (Holland Home Obligated Group) | 5.000% | 11/15/42 | 4,765 | 5,160 |
| Michigan Strategic Fund Limited Obligation Revenue (Senate Offices Project) | 5.250% | 10/15/40 | 5,500 | 6,363 |
| Royal Oak MI Hospital Finance Authority Hospital Revenue (William Beaumont Hospital) | 6.000% | 8/1/19 (Prere.) | 8,000 | 9,086 |
| Royal Oak MI Hospital Finance Authority Hospital Revenue (William Beaumont Hospital) | 5.000% | 9/1/39 | 8,245 | 9,306 |
| Wayne County MI Airport Authority Revenue | 5.000% | 12/1/45 | 5,000 | 5,755 |
| Wayne County MI Airport Authority Revenue (Detroit Metropolitan Wayne County Airport) | 5.000% | 12/1/39 (15) | 3,000 | 3,467 |
| Woodhaven-Brownstone MI School District GO | 5.000% | 5/1/27 | 3,675 | 4,521 |
| Woodhaven-Brownstone MI School District GO | 5.000% | 5/1/28 | 3,705 | 4,511 |
| | | | | 288,445 |
| Minnesota (1.4%) | | | | |
| Duluth MN Independent School District No. 709 COP | 5.000% | 2/1/26 | 2,000 | 2,465 |
| Duluth MN Independent School District No. 709 COP | 4.000% | 2/1/27 | 1,200 | 1,359 |
| Minneapolis MN Health Care System Revenue (Fairview Health Services) | 6.750% | 11/15/18 (Prere.) | 4,250 | 4,748 |
| Minneapolis MN Special School District No. 1 COP | 4.000% | 2/1/29 | 11,120 | 12,090 |
| Minneapolis MN Special School District No. 1 COP | 4.000% | 2/1/30 | 11,505 | 12,408 |
| Minnesota COP | 5.000% | 6/1/31 | 3,730 | 4,418 |
| Minnesota GO | 5.000% | 8/1/22 | 22,640 | 27,335 |
| Minnesota GO | 5.000% | 8/1/24 | 13,070 | 16,400 |
| Minnesota GO | 5.000% | 8/1/34 | 18,000 | 21,879 |
248
Long-Term Tax-Exempt Fund
| | | | |
| | | | Face | Market |
| | | Maturity | Amount | Value• |
| | Coupon | Date | ($000) | ($000) |
| Rochester MN Health Care Facilities Revenue (Mayo Clinic) | 5.000% | 11/15/33 | 5,000 | 6,498 |
| Rochester MN Health Care Facilities Revenue (Mayo Clinic) | 5.000% | 11/15/34 | 10,000 | 13,049 |
| Rochester MN Health Care Facilities Revenue (Mayo Clinic) | 5.000% | 11/15/35 | 2,500 | 3,273 |
| University of Minnesota Revenue | 5.125% | 4/1/34 | 1,250 | 1,370 |
| University of Minnesota Revenue | 5.000% | 8/1/35 | 10,300 | 11,560 |
| University of Minnesota Revenue | 5.000% | 4/1/36 | 1,800 | 2,177 |
| | | | | 141,029 |
| Mississippi (0.4%) | | | | |
| Jackson MS Public School District GO | 5.000% | 4/1/28 | 1,645 | 2,000 |
| Mississippi Hospital Equipment & Facilities Authority Revenue (Baptist Health System) | 5.000% | 9/1/41 | 5,000 | 5,593 |
| Mississippi State University Educational Building Corp. Revenue | 5.250% | 8/1/38 | 2,500 | 2,965 |
| S.M. Educational Building Corp. Mississippi Revenue | | | | |
| (Residence Hall Construction & Refunding Project) | 5.000% | 3/1/43 | 14,490 | 16,283 |
| Warren County MS Gulf Opportunity Zone Revenue (International Paper Co. Projects) | 6.500% | 9/1/32 | 10,000 | 10,872 |
| Warren County MS Gulf Opportunity Zone Revenue (International Paper Co. Projects) | 5.375% | 12/1/35 | 4,750 | 5,388 |
| | | | | 43,101 |
| Missouri (1.2%) | | | | |
| Bi-State Development Agency of the Missouri-Illinois Metropolitan District | | | | |
| Mass Transit Sales Tax Revenue | 5.000% | 10/1/44 | 4,670 | 5,341 |
| Curators of the University of Missouri System Facilities Revenue | 5.000% | 11/1/24 | 1,500 | 1,757 |
| Curators of the University of Missouri System Facilities Revenue | 4.000% | 11/1/33 | 5,000 | 5,491 |
| Jackson County MO Special Obligation Revenue (Truman Sports Complex Project) | 5.000% | 12/1/30 | 5,190 | 6,155 |
| Jackson County MO Special Obligation Revenue (Truman Sports Complex Project) | 5.000% | 12/1/31 | 10,000 | 11,803 |
| Kansas City MO Special Obligation Revenue (Downtown Arena Project) | 5.000% | 4/1/29 | 2,755 | 3,270 |
| Kansas City MO Special Obligation Revenue (Downtown Arena Project) | 5.000% | 4/1/30 | 6,905 | 8,128 |
| Kansas City MO Special Obligation Revenue (Downtown Arena Project) | 5.000% | 4/1/40 | 6,750 | 7,731 |
| Kansas City MO Special Obligation Revenue (Kansas City Downtown Redevelopment District) | 5.000% | 9/1/39 | 3,150 | 3,650 |
| Missouri Health & Educational Facilities Authority Health Facilities Revenue (Cox Health) | 5.500% | 11/15/18 (Prere.) | 2,800 | 3,061 |
| Missouri Health & Educational Facilities Authority Health Facilities Revenue (Cox Health) | 5.500% | 11/15/33 | 700 | 752 |
| Missouri Health & Educational Facilities Authority Revenue (Children’s Mercy Hospital) | 4.000% | 5/15/34 | 5,000 | 5,234 |
| Missouri Health & Educational Facilities Authority Revenue (Children’s Mercy Hospital) | 4.000% | 5/15/39 | 8,000 | 8,276 |
| Missouri Health & Educational Facilities Authority Revenue (Washington University) | 5.375% | 3/15/18 (Prere.) | 8,000 | 8,496 |
| Missouri Health & Educational Facilities Authority Revenue (Washington University) | 5.000% | 11/15/37 | 14,950 | 17,264 |
| Missouri Highways & Transportation Commission Road Revenue | 5.000% | 5/1/25 | 10,000 | 12,397 |
| St. Louis MO Sewer & Wastewater Revenue | 5.000% | 5/1/30 | 3,380 | 4,134 |
| St. Louis MO Sewer & Wastewater Revenue | 5.000% | 5/1/31 | 2,000 | 2,432 |
| St. Louis MO Sewer & Wastewater Revenue | 5.000% | 5/1/45 | 10,000 | 11,837 |
| | | | | 127,209 |
| Montana (0.0%) | | | | |
| Forsyth MT Pollution Control Revenue (Puget Sound Energy Project) | 3.900% | 3/1/31 | 3,575 | 3,774 |
| |
| Nebraska (0.2%) | | | | |
| Central Plains Energy Project Nebraska Gas Project Revenue (Project No. 1) | 5.250% | 12/1/20 | 5,000 | 5,712 |
| Douglas County NE Hospital Authority No. 3 Health Facilities Revenue | | | | |
| (Nebraska Methodist Health System) | 5.000% | 11/1/45 | 2,500 | 2,825 |
| Municipal Energy Agency of Nebraska Power Supply System Revenue | 5.375% | 4/1/19 (Prere.) | 3,000 | 3,312 |
| Municipal Energy Agency of Nebraska Power Supply System Revenue | 5.000% | 4/1/29 | 2,000 | 2,292 |
| 2 Omaha NE Public Power District Electric Revenue | 5.500% | 2/1/18 (Prere.) | 5,000 | 5,289 |
| University of Nebraska Student Fee Revenue | 5.000% | 7/1/37 | 5,000 | 5,727 |
| | | | | 25,157 |
| Nevada (0.6%) | | | | |
| Clark County NV GO | 6.500% | 6/1/17 (2) | 5,000 | 5,166 |
| Las Vegas NV GO | 4.000% | 9/1/32 | 8,860 | 9,712 |
| Las Vegas NV GO | 4.000% | 9/1/33 | 9,220 | 10,060 |
| Las Vegas Valley Water District Nevada GO | 5.000% | 6/1/27 | 1,050 | 1,243 |
| Las Vegas Valley Water District Nevada GO | 5.000% | 6/1/29 | 7,470 | 8,783 |
| Las Vegas Valley Water District Nevada GO | 5.000% | 6/1/30 | 7,845 | 9,186 |
| Las Vegas Valley Water District Nevada GO | 5.000% | 2/1/31 | 2,125 | 2,228 |
| Las Vegas Valley Water District Nevada GO | 5.000% | 6/1/32 | 2,800 | 3,372 |
| Nevada Highway Improvement Revenue (Motor Vehicle Fuel Tax) | 5.000% | 6/1/18 (Prere.) | 10,255 | 10,921 |
| Nevada Highway Improvement Revenue (Motor Vehicle Fuel Tax) | 5.000% | 6/1/18 (Prere.) | 5,000 | 5,325 |
| | | | | 65,996 |
| New Hampshire (0.3%) | | | | |
| New Hampshire Health & Education Facilities Authority Revenue (Dartmouth College) | 6.000% | 8/1/38 | 2,400 | 2,695 |
| New Hampshire Health & Education Facilities Authority Revenue | | | | |
| (Southern New Hampshire University) | 5.000% | 1/1/34 | 1,375 | 1,527 |
| New Hampshire Health & Education Facilities Authority Revenue | | | | |
| (Southern New Hampshire University) | 5.000% | 1/1/42 | 7,955 | 8,811 |
249
Long-Term Tax-Exempt Fund
| | | | |
| | | | Face | Market |
| | | Maturity | Amount | Value• |
| | Coupon | Date | ($000) | ($000) |
| New Hampshire Health & Education Facilities Authority Revenue (Wentworth Douglas Hospital) | 7.000% | 1/1/38 | 8,000 | 9,521 |
| 1 New Hampshire Municipal Bond Bank Revenue | 4.000% | 8/15/30 | 1,000 | 1,118 |
| 1 New Hampshire Municipal Bond Bank Revenue | 4.000% | 8/15/31 | 640 | 710 |
| 1 New Hampshire Municipal Bond Bank Revenue | 4.000% | 8/15/32 | 1,000 | 1,104 |
| | | | | 25,486 |
| New Jersey (3.3%) | | | | |
| Camden County NJ Improvement Authority Health Care Redevelopment Project Revenue | | | | |
| (Cooper Health System Obligated Group) | 5.750% | 2/15/42 | 5,000 | 5,773 |
| New Jersey Economic Development Authority Revenue (School Facilities Construction) | 5.500% | 12/15/19 (2) | 10,000 | 11,010 |
| New Jersey Economic Development Authority Revenue (School Facilities Construction) | 5.000% | 3/1/26 | 3,000 | 3,332 |
| New Jersey Economic Development Authority Revenue (School Facilities Construction) | 5.500% | 9/1/26 (2) | 10,000 | 11,852 |
| New Jersey Economic Development Authority Revenue (School Facilities Construction) | 5.500% | 9/1/27 (14) | 9,000 | 11,071 |
| New Jersey Economic Development Authority Revenue (School Facilities Construction) | 5.000% | 3/1/28 | 20,000 | 22,101 |
| New Jersey Educational Facilities Authority Revenue (College of New Jersey) | 4.000% | 7/1/34 | 1,000 | 1,076 |
| New Jersey Educational Facilities Authority Revenue (College of New Jersey) | 4.000% | 7/1/35 | 1,750 | 1,878 |
| New Jersey Educational Facilities Authority Revenue (University Medical & Dentistry) | 7.500% | 6/1/19 (Prere.) | 7,250 | 8,431 |
| New Jersey Health Care Facilities Financing Authority Lease Revenue | | | | |
| (Greystone Park Psychiatric Hospital Project) | 5.000% | 9/15/29 | 7,335 | 8,108 |
| New Jersey Health Care Facilities Financing Authority Revenue | | | | |
| (Inspira Health System Obligated Group) | 5.000% | 7/1/27 | 5,755 | 7,031 |
| New Jersey Health Care Facilities Financing Authority Revenue | | | | |
| (Inspira Health System Obligated Group) | 5.000% | 7/1/29 | 2,670 | 3,211 |
| New Jersey Health Care Facilities Financing Authority Revenue (Virtua Health) | 5.750% | 7/1/33 | 8,190 | 9,055 |
| New Jersey Housing & Mortgage Finance Agency Single Family Housing Revenue | 4.250% | 10/1/32 | 1,290 | 1,349 |
| New Jersey Housing & Mortgage Finance Agency Single Family Housing Revenue | 6.500% | 10/1/38 | 100 | 103 |
| New Jersey Transportation Trust Fund Authority Federal Highway Reimbursement Revenue | 5.000% | 6/15/27 | 1,000 | 1,130 |
| New Jersey Transportation Trust Fund Authority Federal Highway Reimbursement Revenue | 5.000% | 6/15/28 | 2,500 | 2,799 |
| 1 New Jersey Transportation Trust Fund Authority Federal Highway Reimbursement Revenue | 5.000% | 6/15/30 | 2,550 | 2,829 |
| 1 New Jersey Transportation Trust Fund Authority Federal Highway Reimbursement Revenue | 5.000% | 6/15/30 | 10,885 | 11,326 |
| 1 New Jersey Transportation Trust Fund Authority Federal Highway Reimbursement Revenue | 5.000% | 6/15/31 | 7,000 | 7,271 |
| New Jersey Transportation Trust Fund Authority Transportation Program Revenue | 5.000% | 6/15/28 | 12,000 | 13,313 |
| New Jersey Transportation Trust Fund Authority Transportation Program Revenue | 5.000% | 6/15/29 | 1,925 | 2,104 |
| New Jersey Transportation Trust Fund Authority Transportation Program Revenue | 5.250% | 6/15/32 | 3,000 | 3,376 |
| New Jersey Transportation Trust Fund Authority Transportation Program Revenue | 5.500% | 6/15/39 | 5,300 | 5,948 |
| New Jersey Transportation Trust Fund Authority Transportation Program Revenue | 5.250% | 6/15/41 | 7,300 | 8,134 |
| New Jersey Transportation Trust Fund Authority Transportation Program Revenue | 5.000% | 6/15/44 | 10,000 | 10,806 |
| New Jersey Transportation Trust Fund Authority Transportation System Revenue | 5.500% | 12/15/21 | 5,180 | 5,888 |
| New Jersey Transportation Trust Fund Authority Transportation System Revenue | 5.500% | 12/15/21 (14) | 30,000 | 34,915 |
| New Jersey Transportation Trust Fund Authority Transportation System Revenue | 5.250% | 6/15/22 | 5,000 | 5,539 |
| New Jersey Transportation Trust Fund Authority Transportation System Revenue | 5.250% | 12/15/22 (2) | 8,500 | 9,660 |
| New Jersey Transportation Trust Fund Authority Transportation System Revenue | 0.000% | 12/15/25 (2) | 15,000 | 10,982 |
| New Jersey Transportation Trust Fund Authority Transportation System Revenue | 5.250% | 6/15/26 | 2,000 | 2,226 |
| New Jersey Transportation Trust Fund Authority Transportation System Revenue | 0.000% | 12/15/27 | 15,000 | 9,743 |
| New Jersey Transportation Trust Fund Authority Transportation System Revenue | 5.000% | 6/15/32 | 7,400 | 8,135 |
| New Jersey Transportation Trust Fund Authority Transportation System Revenue | 0.000% | 12/15/32 (4) | 17,000 | 8,963 |
| New Jersey Transportation Trust Fund Authority Transportation System Revenue | 5.500% | 12/15/38 (12) | 8,000 | 8,566 |
| New Jersey Turnpike Authority Revenue | 5.150% | 1/1/17 (Prere.) | 34,500 | 34,757 |
| New Jersey Turnpike Authority Revenue | 5.000% | 1/1/29 | 8,000 | 9,449 |
| New Jersey Turnpike Authority Revenue | 5.000% | 1/1/30 | 10,795 | 12,522 |
| South Jersey Transportation Authority New Jersey Transportation System Revenue | 5.000% | 11/1/27 | 2,000 | 2,258 |
| | | | | 338,020 |
| New Mexico (0.4%) | | | | |
| New Mexico Hospital Equipment Loan Council Hospital System Revenue | | | | |
| (Presbyterian Healthcare Services) | 5.000% | 8/1/39 | 6,500 | 7,028 |
| New Mexico Hospital Equipment Loan Council Hospital System Revenue | | | | |
| (Presbyterian Healthcare Services) | 5.000% | 8/1/42 | 15,025 | 16,982 |
| New Mexico Hospital Equipment Loan Council Hospital System Revenue | | | | |
| (Presbyterian Healthcare Services) | 5.000% | 8/1/44 | 10,100 | 11,703 |
| | | | | 35,713 |
| New York (14.9%) | | | | |
| Brooklyn NY Local Development Corp. PILOT Revenue (Barclays Center Project) | 6.375% | 1/15/20 (Prere.) | 6,000 | 6,996 |
| Erie County NY Industrial Development Agency School Facility Revenue | | | | |
| (Buffalo City School District Project) | 5.000% | 5/1/24 | 8,120 | 9,665 |
| Erie County NY Industrial Development Agency School Facility Revenue | | | | |
| (Buffalo City School District Project) | 5.000% | 5/1/25 | 6,710 | 7,981 |
| Hudson Yards Infrastructure Corp. New York Revenue | 5.750% | 2/15/47 | 28,730 | 33,568 |
| Long Island NY Power Authority Electric System Revenue | 6.250% | 4/1/19 (Prere.) | 3,000 | 3,375 |
| Long Island NY Power Authority Electric System Revenue | 5.000% | 9/1/39 | 2,000 | 2,306 |
| Long Island NY Power Authority Electric System Revenue | 5.000% | 9/1/41 | 3,250 | 3,782 |
250
Long-Term Tax-Exempt Fund
| | | | |
| | | | Face | Market |
| | | Maturity | Amount | Value• |
| | Coupon | Date | ($000) | ($000) |
| Long Island NY Power Authority Electric System Revenue | 5.000% | 9/1/44 | 14,000 | 16,121 |
| Long Island NY Power Authority Electric System Revenue | 5.000% | 9/1/46 | 1,735 | 2,009 |
| Nassau County NY Local Economic Assistance & Financing Corp. Revenue | | | | |
| (Winthrop University Hospital Association Project) | 5.000% | 7/1/32 | 3,000 | 3,370 |
| New York City NY GO | 5.000% | 8/1/17 (Prere.) | 780 | 805 |
| New York City NY GO | 5.000% | 8/1/23 | 8,000 | 9,772 |
| New York City NY GO | 5.000% | 8/1/23 | 9,550 | 11,439 |
| New York City NY GO | 5.000% | 8/1/24 | 10,195 | 12,388 |
| New York City NY GO | 5.000% | 8/1/24 | 4,665 | 5,580 |
| New York City NY GO | 5.000% | 8/1/25 | 5,000 | 5,516 |
| New York City NY GO | 5.000% | 8/1/25 | 9,160 | 11,045 |
| New York City NY GO | 5.000% | 8/1/25 | 5,000 | 6,029 |
| New York City NY GO | 5.000% | 8/1/26 | 2,765 | 3,295 |
| New York City NY GO | 5.000% | 8/1/26 | 8,065 | 10,096 |
| New York City NY GO | 5.000% | 8/1/27 | 7,000 | 7,714 |
| New York City NY GO | 5.000% | 8/1/31 | 5,000 | 5,806 |
| New York City NY GO | 5.000% | 3/1/32 | 5,000 | 5,849 |
| New York City NY GO | 4.000% | 8/1/32 | 5,000 | 5,536 |
| New York City NY GO | 5.000% | 8/1/32 | 5,000 | 5,806 |
| New York City NY GO | 5.000% | 10/1/32 | 5,260 | 6,223 |
| New York City NY GO | 5.000% | 8/1/35 | 1,500 | 1,738 |
| New York City NY GO | 4.000% | 8/1/36 | 7,500 | 8,136 |
| New York City NY GO | 5.000% | 8/1/37 | 7,690 | 9,124 |
| New York City NY GO VRDO | 0.500% | 11/1/16 | 3,450 | 3,450 |
| New York City NY GO VRDO | 0.500% | 11/1/16 | 1,300 | 1,300 |
| New York City NY GO VRDO | 0.510% | 11/1/16 LOC | 1,700 | 1,700 |
| New York City NY GO VRDO | 0.520% | 11/1/16 LOC | 9,700 | 9,700 |
| New York City NY Health & Hospital Corp. Revenue (Health System) | 5.000% | 2/15/30 | 6,000 | 6,602 |
| New York City NY Industrial Development Agency PILOT Revenue (Yankee Stadium Project) | 0.000% | 3/1/20 (12) | 8,400 | 7,925 |
| New York City NY Industrial Development Agency PILOT Revenue (Yankee Stadium Project) | 0.000% | 3/1/22 (12) | 4,585 | 4,139 |
| New York City NY Industrial Development Agency PILOT Revenue (Yankee Stadium Project) | 0.000% | 3/1/24 (12) | 9,670 | 8,211 |
| New York City NY Municipal Water Finance Authority Water & Sewer System Revenue | 5.000% | 6/15/28 | 2,000 | 2,369 |
| New York City NY Municipal Water Finance Authority Water & Sewer System Revenue | 5.000% | 6/15/31 | 10,000 | 11,277 |
| New York City NY Municipal Water Finance Authority Water & Sewer System Revenue | 5.000% | 6/15/32 | 6,580 | 7,631 |
| New York City NY Municipal Water Finance Authority Water & Sewer System Revenue | 5.000% | 6/15/34 | 3,500 | 4,078 |
| New York City NY Municipal Water Finance Authority Water & Sewer System Revenue | 5.000% | 6/15/34 | 9,000 | 10,685 |
| New York City NY Municipal Water Finance Authority Water & Sewer System Revenue | 5.000% | 6/15/35 | 7,500 | 8,261 |
| New York City NY Municipal Water Finance Authority Water & Sewer System Revenue | 5.000% | 6/15/35 | 4,150 | 4,939 |
| New York City NY Municipal Water Finance Authority Water & Sewer System Revenue | 5.000% | 6/15/36 | 5,000 | 5,931 |
| New York City NY Municipal Water Finance Authority Water & Sewer System Revenue | 5.000% | 6/15/39 | 20,000 | 23,601 |
| New York City NY Municipal Water Finance Authority Water & Sewer System Revenue | 5.000% | 6/15/43 | 10,000 | 11,481 |
| New York City NY Municipal Water Finance Authority Water & Sewer System Revenue | 5.375% | 6/15/43 | 21,000 | 24,336 |
| New York City NY Municipal Water Finance Authority Water & Sewer System Revenue | 5.500% | 6/15/43 | 1,500 | 1,747 |
| New York City NY Municipal Water Finance Authority Water & Sewer System Revenue | 5.000% | 6/15/44 | 13,775 | 15,815 |
| New York City NY Municipal Water Finance Authority Water & Sewer System Revenue | 5.000% | 6/15/44 | 5,000 | 5,812 |
| New York City NY Municipal Water Finance Authority Water & Sewer System Revenue | 5.000% | 6/15/45 | 1,000 | 1,159 |
| New York City NY Municipal Water Finance Authority Water & Sewer System Revenue | 5.000% | 6/15/45 | 6,320 | 7,276 |
| New York City NY Municipal Water Finance Authority Water & Sewer System Revenue | 5.000% | 6/15/46 | 5,000 | 5,850 |
| New York City NY Municipal Water Finance Authority Water & Sewer System Revenue VRDO | 0.500% | 11/1/16 | 3,000 | 3,000 |
| New York City NY Municipal Water Finance Authority Water & Sewer System Revenue VRDO | 0.500% | 11/1/16 | 4,100 | 4,100 |
| New York City NY Municipal Water Finance Authority Water & Sewer System Revenue VRDO | 0.500% | 11/1/16 | 5,420 | 5,420 |
| New York City NY Municipal Water Finance Authority Water & Sewer System Revenue VRDO | 0.500% | 11/1/16 | 1,600 | 1,600 |
| New York City NY Transitional Finance Authority Building Aid Revenue | 5.000% | 1/15/28 | 12,000 | 12,584 |
| New York City NY Transitional Finance Authority Building Aid Revenue | 5.000% | 7/15/31 | 5,000 | 5,846 |
| New York City NY Transitional Finance Authority Building Aid Revenue | 5.000% | 7/15/32 | 16,000 | 18,439 |
| New York City NY Transitional Finance Authority Building Aid Revenue | 5.000% | 7/15/32 | 800 | 934 |
| New York City NY Transitional Finance Authority Building Aid Revenue | 5.000% | 7/15/33 | 5,000 | 5,762 |
| New York City NY Transitional Finance Authority Building Aid Revenue | 5.000% | 7/15/37 | 10,000 | 11,674 |
| New York City NY Transitional Finance Authority Building Aid Revenue | 5.250% | 7/15/37 | 2,750 | 3,199 |
| New York City NY Transitional Finance Authority Building Aid Revenue | 5.000% | 7/15/40 | 8,000 | 9,419 |
| New York City NY Transitional Finance Authority Future Tax Revenue | 5.000% | 5/1/17 (Prere.) | 7,795 | 7,962 |
| New York City NY Transitional Finance Authority Future Tax Revenue | 5.000% | 5/1/19 (Prere.) | 870 | 956 |
| New York City NY Transitional Finance Authority Future Tax Revenue | 5.000% | 11/1/29 | 15,000 | 17,884 |
| New York City NY Transitional Finance Authority Future Tax Revenue | 5.000% | 2/1/30 | 5,000 | 6,051 |
| New York City NY Transitional Finance Authority Future Tax Revenue | 5.000% | 2/1/32 | 10,000 | 11,935 |
| New York City NY Transitional Finance Authority Future Tax Revenue | 5.000% | 2/1/33 | 2,500 | 2,934 |
| New York City NY Transitional Finance Authority Future Tax Revenue | 5.000% | 11/1/33 | 5,000 | 5,844 |
| New York City NY Transitional Finance Authority Future Tax Revenue | 5.000% | 5/1/34 | 6,130 | 6,720 |
| New York City NY Transitional Finance Authority Future Tax Revenue | 5.000% | 11/1/34 | 7,000 | 8,347 |
| New York City NY Transitional Finance Authority Future Tax Revenue | 5.000% | 2/1/35 | 8,940 | 10,242 |
251
Long-Term Tax-Exempt Fund
| | | | |
| | | | Face | Market |
| | | Maturity | Amount | Value• |
| | Coupon | Date | ($000) | ($000) |
| New York City NY Transitional Finance Authority Future Tax Revenue | 5.000% | 11/1/35 | 10,000 | 11,886 |
| New York City NY Transitional Finance Authority Future Tax Revenue | 4.000% | 2/1/36 | 10,000 | 10,861 |
| New York City NY Transitional Finance Authority Future Tax Revenue | 5.000% | 2/1/37 | 9,000 | 10,726 |
| New York City NY Transitional Finance Authority Future Tax Revenue | 5.000% | 8/1/37 | 7,135 | 8,591 |
| New York City NY Transitional Finance Authority Future Tax Revenue | 5.000% | 11/1/39 | 15,875 | 18,063 |
| New York City NY Transitional Finance Authority Future Tax Revenue | 5.000% | 2/1/41 | 23,000 | 26,722 |
| New York City NY Transitional Finance Authority Future Tax Revenue | 5.000% | 2/1/42 | 4,500 | 5,179 |
| 3 New York City NY Transitional Finance Authority Future Tax Revenue TOB VRDO | 0.620% | 11/1/16 | 5,880 | 5,880 |
| New York City NY Transitional Finance Authority Future Tax Revenue VRDO | 0.500% | 11/1/16 | 7,900 | 7,900 |
| 3 New York City NY Trust for Cultural Resources Revenue | | | | |
| (Wildlife Conservation Society) TOB VRDO | 0.680% | 11/7/16 | 5,335 | 5,335 |
| New York Convention Center Development Corp. Revenue | 5.000% | 11/15/45 | 5,130 | 5,972 |
| 3 New York Counties Tobacco Trust Revenue | 6.250% | 6/1/41 | 7,950 | 8,343 |
| New York Liberty Development Corp. Revenue | 5.000% | 11/15/31 | 3,000 | 3,440 |
| New York Liberty Development Corp. Revenue | 5.000% | 12/15/41 | 12,100 | 13,884 |
| New York Liberty Development Corp. Revenue | 5.125% | 1/15/44 | 5,000 | 5,535 |
| New York Liberty Development Corp. Revenue | 5.000% | 11/15/44 | 7,550 | 8,561 |
| New York Liberty Development Corp. Revenue | 5.750% | 11/15/51 | 18,500 | 21,703 |
| New York Liberty Development Corp. Revenue (Goldman Sachs Headquarters) | 5.250% | 10/1/35 | 100 | 126 |
| New York Metropolitan Transportation Authority Revenue | 5.000% | 11/15/29 | 5,000 | 5,921 |
| New York Metropolitan Transportation Authority Revenue | 5.000% | 11/15/30 | 4,750 | 5,631 |
| New York Metropolitan Transportation Authority Revenue | 5.000% | 11/15/30 | 6,000 | 7,178 |
| New York Metropolitan Transportation Authority Revenue | 5.000% | 11/15/31 | 11,935 | 13,920 |
| New York Metropolitan Transportation Authority Revenue | 5.000% | 11/15/31 | 6,000 | 7,138 |
| New York Metropolitan Transportation Authority Revenue | 5.250% | 11/15/31 | 10,000 | 12,249 |
| New York Metropolitan Transportation Authority Revenue | 5.000% | 11/15/32 | 4,500 | 5,335 |
| New York Metropolitan Transportation Authority Revenue | 5.000% | 11/15/33 | 5,400 | 6,295 |
| New York Metropolitan Transportation Authority Revenue | 5.250% | 11/15/37 | 11,105 | 13,284 |
| New York Metropolitan Transportation Authority Revenue | 5.000% | 11/15/38 | 5,000 | 5,769 |
| New York Metropolitan Transportation Authority Revenue | 5.000% | 11/15/38 | 8,550 | 9,865 |
| New York Metropolitan Transportation Authority Revenue | 5.250% | 11/15/40 | 7,500 | 8,568 |
| New York Metropolitan Transportation Authority Revenue | 5.000% | 11/15/45 | 7,000 | 8,122 |
| New York Metropolitan Transportation Authority Revenue | 5.250% | 11/15/56 | 4,625 | 5,520 |
| New York Metropolitan Transportation Authority Revenue | 5.250% | 11/15/56 | 5,500 | 6,613 |
| New York Metropolitan Transportation Authority Revenue (Dedicated Petroleum Tax) | 5.000% | 11/15/34 | 3,750 | 4,181 |
| New York Metropolitan Transportation Authority Revenue (Dedicated Tax Fund) | 5.000% | 11/15/24 | 5,000 | 5,898 |
| New York Metropolitan Transportation Authority Revenue (Dedicated Tax Fund) | 5.000% | 11/15/24 | 3,000 | 3,539 |
| New York Metropolitan Transportation Authority Revenue (Dedicated Tax Fund) | 5.000% | 11/15/28 | 10,250 | 12,352 |
| New York Metropolitan Transportation Authority Revenue (Dedicated Tax Fund) | 5.125% | 11/15/28 | 2,000 | 2,346 |
| New York Metropolitan Transportation Authority Revenue (Dedicated Tax Fund) | 5.250% | 11/15/29 | 11,500 | 14,568 |
| New York Metropolitan Transportation Authority Revenue (Dedicated Tax Fund) | 5.250% | 11/15/32 | 18,220 | 22,589 |
| New York Metropolitan Transportation Authority Revenue (Transit Revenue) | 5.000% | 11/1/25 | 5,575 | 6,689 |
| New York Metropolitan Transportation Authority Revenue (Transit Revenue) | 5.000% | 11/15/25 | 7,000 | 8,407 |
| New York Metropolitan Transportation Authority Revenue (Transit Revenue) | 5.000% | 11/15/26 | 9,885 | 11,834 |
| New York Metropolitan Transportation Authority Revenue (Transit Revenue) | 5.000% | 11/15/31 | 3,000 | 3,493 |
| New York Metropolitan Transportation Authority Revenue (Transit Revenue) | 5.000% | 11/15/38 | 10,000 | 11,646 |
| New York Metropolitan Transportation Authority Revenue (Transit Revenue) | 5.250% | 11/15/41 | 6,000 | 7,048 |
| New York State Dormitory Authority Lease Revenue (State University Dormitory Facilities) | 5.000% | 7/1/40 | 8,700 | 9,774 |
| New York State Dormitory Authority Revenue (Mental Health Services Facilities Improvement) | 5.000% | 8/15/19 (ETM) | 10 | 11 |
| New York State Dormitory Authority Revenue (New York University) | 5.000% | 7/1/27 | 6,185 | 7,855 |
| New York State Dormitory Authority Revenue (New York University) | 5.750% | 7/1/27 (14) | 10,000 | 12,699 |
| New York State Dormitory Authority Revenue (New York University) | 5.000% | 7/1/37 | 2,300 | 2,684 |
| New York State Dormitory Authority Revenue (Personal Income Tax) | 5.000% | 12/15/16 (Prere.) | 5,000 | 5,026 |
| New York State Dormitory Authority Revenue (Personal Income Tax) | 5.000% | 12/15/21 (ETM) | 5 | 6 |
| New York State Dormitory Authority Revenue (Personal Income Tax) | 5.000% | 2/15/22 (Prere.) | 610 | 729 |
| New York State Dormitory Authority Revenue (Personal Income Tax) | 5.000% | 3/15/27 | 5,650 | 6,655 |
| New York State Dormitory Authority Revenue (Personal Income Tax) | 5.000% | 3/15/28 | 4,750 | 5,172 |
| New York State Dormitory Authority Revenue (Personal Income Tax) | 5.000% | 12/15/30 | 26,300 | 31,141 |
| New York State Dormitory Authority Revenue (Personal Income Tax) | 5.000% | 2/15/31 | 9,120 | 10,636 |
| New York State Dormitory Authority Revenue (Personal Income Tax) | 5.000% | 3/15/33 | 10,000 | 11,654 |
| New York State Dormitory Authority Revenue (Personal Income Tax) | 5.000% | 3/15/34 | 22,000 | 25,370 |
| New York State Dormitory Authority Revenue (Personal Income Tax) | 5.000% | 2/15/37 | 2,250 | 2,612 |
| New York State Dormitory Authority Revenue (Personal Income Tax) | 5.000% | 3/15/38 | 7,500 | 8,810 |
| New York State Dormitory Authority Revenue (Personal Income Tax) | 5.000% | 2/15/39 | 20,000 | 23,330 |
| New York State Dormitory Authority Revenue (Personal Income Tax) | 5.000% | 3/15/42 | 25,000 | 28,642 |
| New York State Dormitory Authority Revenue (School Districts Financing Program) | 5.000% | 10/1/22 (4) | 7,240 | 8,542 |
| New York State Dormitory Authority Revenue (State University Educational Facilities) | 5.000% | 5/15/26 | 2,000 | 2,369 |
| New York State Dormitory Authority Revenue (The New School) | 6.000% | 7/1/20 (Prere.) | 5,000 | 5,886 |
| New York State Environmental Facilities Corp. Revenue | | | | |
| (State Clean Water & Drinking Water Revolving Funds) | 5.000% | 6/15/29 | 5,860 | 7,090 |
252
Long-Term Tax-Exempt Fund
| | | | |
| | | | Face | Market |
| | | Maturity | Amount | Value• |
| | Coupon | Date | ($000) | ($000) |
| New York State Environmental Facilities Corp. Revenue | | | | |
| (State Clean Water & Drinking Water Revolving Funds) | 5.000% | 6/15/36 | 3,500 | 4,057 |
| New York State Environmental Facilities Corp. Revenue | | | | |
| (State Clean Water & Drinking Water Revolving Funds) | 5.000% | 6/15/41 | 16,750 | 20,137 |
| New York State Environmental Facilities Corp. Revenue (State Revolving Funds) | 5.000% | 5/15/43 | 5,000 | 5,730 |
| New York State GO | 5.000% | 2/1/30 | 3,385 | 3,783 |
| New York State GO | 5.000% | 2/15/30 | 4,000 | 4,631 |
| New York State Thruway Authority Revenue | 5.000% | 1/1/26 | 10,000 | 12,165 |
| New York State Thruway Authority Revenue (Highway & Bridge Trust Fund) | 5.000% | 10/1/18 (Prere.) | 5,000 | 5,391 |
| New York State Thruway Authority Revenue (Highway & Bridge Trust Fund) | 5.000% | 4/1/30 | 5,000 | 5,828 |
| New York State Thruway Authority Revenue (Highway & Bridge Trust Fund) | 5.000% | 4/1/31 | 6,265 | 7,295 |
| New York State Thruway Authority Revenue (Personal Income Tax) | 5.000% | 3/15/30 | 8,000 | 9,067 |
| New York State Urban Development Corp. Revenue | 5.000% | 1/1/23 | 7,785 | 8,313 |
| New York State Urban Development Corp. Revenue | 5.625% | 1/1/28 | 7,385 | 8,107 |
| New York State Urban Development Corp. Revenue (Personal Income Tax) | 5.000% | 12/15/21 | 10,000 | 11,201 |
| New York State Urban Development Corp. Revenue (Personal Income Tax) | 5.000% | 3/15/28 | 15,000 | 18,567 |
| New York State Urban Development Corp. Revenue (Personal Income Tax) | 5.000% | 3/15/29 | 5,000 | 6,127 |
| New York State Urban Development Corp. Revenue (Personal Income Tax) | 5.000% | 3/15/31 | 10,000 | 11,898 |
| New York State Urban Development Corp. Revenue (Personal Income Tax) | 5.000% | 3/15/32 | 11,170 | 13,261 |
| New York State Urban Development Corp. Revenue (Personal Income Tax) | 5.000% | 3/15/32 | 5,835 | 7,007 |
| New York State Urban Development Corp. Revenue (Personal Income Tax) | 5.000% | 3/15/33 | 10,000 | 11,839 |
| Port Authority of New York & New Jersey Revenue | 5.000% | 10/15/28 | 4,000 | 4,965 |
| Port Authority of New York & New Jersey Revenue | 5.000% | 10/15/31 | 2,000 | 2,440 |
| Port Authority of New York & New Jersey Revenue | 5.000% | 9/1/33 | 3,905 | 4,672 |
| Port Authority of New York & New Jersey Revenue | 5.000% | 5/1/36 | 3,425 | 3,846 |
| Port Authority of New York & New Jersey Revenue | 5.000% | 5/1/38 | 4,180 | 4,679 |
| Port Authority of New York & New Jersey Special Obligation Revenue | | | | |
| (John F. Kennedy International Air Terminal LLC) | 6.000% | 12/1/42 | 10,000 | 11,584 |
| Tompkins County NY Industrial Development Agency Civic Facility Revenue (Cornell University) | 5.000% | 7/1/37 | 10,000 | 11,303 |
| Triborough Bridge & Tunnel Authority New York Revenue | 6.125% | 1/1/21 (ETM) | 6,565 | 7,449 |
| Triborough Bridge & Tunnel Authority New York Revenue | 5.000% | 11/15/29 | 6,710 | 8,369 |
| Triborough Bridge & Tunnel Authority New York Revenue | 5.250% | 11/15/38 | 12,500 | 13,278 |
| Utility Debt Securitization Authority New York Revenue | 5.000% | 12/15/27 | 5,000 | 6,283 |
| Utility Debt Securitization Authority New York Revenue | 5.000% | 12/15/28 | 10,000 | 12,574 |
| Utility Debt Securitization Authority New York Revenue | 5.000% | 12/15/32 | 14,480 | 17,753 |
| Utility Debt Securitization Authority New York Revenue | 4.000% | 12/15/37 | 7,500 | 8,271 |
| Utility Debt Securitization Authority New York Revenue | 5.000% | 12/15/37 | 19,000 | 22,818 |
| | | | | 1,523,283 |
| North Carolina (1.0%) | | | | |
| Buncombe County NC Limited Obligation Revenue | 5.000% | 6/1/27 | 2,860 | 3,507 |
| Buncombe County NC Limited Obligation Revenue | 5.000% | 6/1/28 | 1,500 | 1,829 |
| Cabarrus County NC Installment Financing Contract Revenue | 5.000% | 4/1/28 | 1,000 | 1,242 |
| Cabarrus County NC Installment Financing Contract Revenue | 5.000% | 4/1/30 | 1,000 | 1,222 |
| Cabarrus County NC Installment Financing Contract Revenue | 5.000% | 4/1/32 | 1,825 | 2,202 |
| Cape Fear NC Public Utility Authority Water & Sewer System Revenue | 5.000% | 8/1/27 | 2,600 | 3,289 |
| Charlotte NC Airport Revenue | 5.000% | 7/1/26 | 2,205 | 2,508 |
| Charlotte NC Airport Revenue | 5.000% | 7/1/36 | 2,000 | 2,271 |
| Charlotte NC Water & Sewer System Revenue | 5.000% | 7/1/33 | 5,000 | 5,652 |
| North Carolina Capital Facilities Finance Agency Revenue (Duke University Project) | 5.000% | 10/1/55 | 6,000 | 7,035 |
| North Carolina Eastern Municipal Power Agency Power Systems Revenue | 5.000% | 1/1/18 (Prere.) | 5,010 | 5,244 |
| North Carolina Eastern Municipal Power Agency Power Systems Revenue | 5.000% | 1/1/19 (Prere.) | 5,000 | 5,422 |
| North Carolina Eastern Municipal Power Agency Power Systems Revenue | 5.500% | 1/1/19 (Prere.) | 3,000 | 3,291 |
| North Carolina GAN | 5.000% | 3/1/28 | 20,000 | 24,012 |
| North Carolina Medical Care Commission Health Care Facilities Revenue (Vidant Health) | 5.000% | 6/1/36 | 500 | 563 |
| North Carolina Medical Care Commission Hospital Revenue (North Carolina Baptist Hospital) | 5.250% | 6/1/29 | 3,000 | 3,361 |
| North Carolina Medical Care Commission Retirement Facilities Mortgage Revenue | | | | |
| (Salemtowne Project) | 5.375% | 10/1/45 | 10,000 | 10,924 |
| North Carolina Municipal Power Agency No. 1 Revenue (Catawba Electric) | 5.000% | 1/1/31 | 12,000 | 14,411 |
| Winston-Salem NC Water & Sewer System Revenue | 4.000% | 6/1/30 | 1,610 | 1,840 |
| Winston-Salem NC Water & Sewer System Revenue | 4.000% | 6/1/31 | 1,500 | 1,701 |
| Winston-Salem NC Water & Sewer System Revenue | 4.000% | 6/1/32 | 2,000 | 2,254 |
| | | | | 103,780 |
| Ohio (1.4%) | | | | |
| Allen County OH Hospital Facilities Revenue (Catholic Healthcare Partners) | 5.250% | 9/1/27 | 10,000 | 11,345 |
| Allen County OH Hospital Facilities Revenue (Catholic Healthcare Partners) | 5.000% | 5/1/42 | 1,300 | 1,451 |
| American Municipal Power Ohio Inc. Revenue (Fremont Energy Center Project) | 5.000% | 2/15/25 | 4,000 | 4,687 |
| American Municipal Power Ohio Inc. Revenue (Hydroelectric Projects) | 5.000% | 2/15/41 | 8,315 | 9,618 |
| Buckeye Tobacco Settlement Financing Authority Ohio Revenue | 5.875% | 6/1/47 | 5,000 | 4,700 |
| Butler County OH Hospital Facilities Revenue (Kettering Health Network) | 6.375% | 4/1/36 | 5,465 | 6,343 |
253
Long-Term Tax-Exempt Fund
| | | | |
| | | | Face | Market |
| | | Maturity | Amount | Value• |
| | Coupon | Date | ($000) | ($000) |
| Butler County OH Hospital Facilities Revenue (Kettering Health Network) | 5.625% | 4/1/41 | 5,000 | 5,632 |
| 1 Butler County OH Hospital Facilities Revenue (UC Health) | 5.000% | 11/15/45 | 8,810 | 9,987 |
| Cleveland OH Water Revenue | 4.000% | 1/1/31 | 1,355 | 1,460 |
| Cleveland OH Water Revenue | 4.000% | 1/1/32 | 1,500 | 1,607 |
| Cleveland-Cuyahoga County OH Port Authority Revenue | | | | |
| (Euclid Avenue Development Corp. Project) | 5.000% | 8/1/33 | 3,510 | 4,023 |
| Cleveland-Cuyahoga County OH Port Authority Revenue | | | | |
| (Euclid Avenue Development Corp. Project) | 5.000% | 8/1/34 | 3,690 | 4,210 |
| Franklin County OH Health Care Facilities Improvement Revenue (OPRS Communities) | 5.000% | 7/1/29 | 2,235 | 2,534 |
| Franklin County OH Health Care Facilities Improvement Revenue (OPRS Communities) | 5.000% | 7/1/38 | 11,975 | 13,097 |
| Lucas County OH Hospital Revenue (ProMedica Healthcare Obligated Group) | 5.250% | 11/15/27 | 3,250 | 3,773 |
| Lucas County OH Hospital Revenue (ProMedica Healthcare Obligated Group) | 5.250% | 11/15/28 | 6,000 | 6,940 |
| Lucas County OH Hospital Revenue (ProMedica Healthcare Obligated Group) | 5.000% | 11/15/29 | 5,270 | 6,010 |
| Lucas County OH Hospital Revenue (ProMedica Healthcare Obligated Group) | 6.000% | 11/15/41 | 3,220 | 3,836 |
| Middletown OH City School District GO | 5.000% | 6/1/17 (Prere.) | 4,715 | 4,833 |
| Ohio GO | 5.000% | 2/1/29 | 3,000 | 3,492 |
| Ohio Hospital Revenue (Cleveland Clinic Health System Obligated Group) | 5.500% | 1/1/39 | 10,000 | 10,892 |
| Ohio Hospital Revenue (University Hospitals Health System Inc.) | 5.000% | 1/15/41 | 7,750 | 8,511 |
| Ohio State University General Receipts Revenue | 5.000% | 6/1/38 | 7,000 | 8,135 |
| Scioto County OH Hospital Facilities Revenue (Southern Ohio Medical Center) | 5.750% | 2/15/18 (Prere.) | 3,500 | 3,720 |
| | | | | 140,836 |
| Oklahoma (0.1%) | | | | |
| Oklahoma Capitol Improvement Authority Highway Improvement Revenue | 4.000% | 7/1/33 | 5,000 | 5,404 |
| Oklahoma Capitol Improvement Authority Highway Improvement Revenue | 4.000% | 7/1/34 | 2,000 | 2,154 |
| Oklahoma Turnpike Authority Revenue | 5.000% | 1/1/28 | 775 | 888 |
| | | | | 8,446 |
| Oregon (0.5%) | | | | |
| Deschutes County OR Hospital Facilities Authority Revenue (St. Charles Memorial Hospital Inc.) | 4.000% | 1/1/33 | 1,000 | 1,080 |
| Deschutes County OR Hospital Facilities Authority Revenue (St. Charles Memorial Hospital Inc.) | 4.000% | 1/1/34 | 500 | 538 |
| Deschutes County OR Hospital Facilities Authority Revenue (St. Charles Memorial Hospital Inc.) | 4.000% | 1/1/35 | 1,000 | 1,071 |
| Eugene OR Electric Utility System Revenue | 4.000% | 8/1/31 | 700 | 788 |
| Eugene OR Electric Utility System Revenue | 4.000% | 8/1/32 | 1,250 | 1,396 |
| Eugene OR Electric Utility System Revenue | 4.000% | 8/1/33 | 1,000 | 1,111 |
| Oregon Department of Administrative Services COP | 5.000% | 5/1/19 (Prere.) | 6,755 | 7,415 |
| Oregon Department of Administrative Services Lottery Revenue | 5.250% | 4/1/30 | 4,000 | 4,626 |
| Oregon Department of Transportation Highway User Tax Revenue | 5.000% | 11/15/30 | 4,345 | 5,305 |
| Oregon GO | 5.000% | 5/1/27 | 3,110 | 3,956 |
| Oregon GO | 5.000% | 6/1/27 | 1,990 | 2,534 |
| Oregon GO | 5.000% | 5/1/28 | 770 | 973 |
| Oregon GO | 5.000% | 6/1/28 | 2,090 | 2,642 |
| Oregon GO | 5.000% | 5/1/29 | 2,000 | 2,506 |
| Oregon GO | 5.000% | 6/1/29 | 2,195 | 2,753 |
| Oregon GO (Oregon University System Projects) | 5.000% | 8/1/36 | 2,000 | 2,308 |
| Oregon Health & Science University Revenue | 5.000% | 7/1/27 | 2,150 | 2,529 |
| Umatilla County OR Hospital Facility Authority Revenue (Catholic Health Initiatives) | 5.000% | 5/1/22 | 10,860 | 10,899 |
| | | | | 54,430 |
| Pennsylvania (4.9%) | | | | |
| Allegheny County PA GO | 5.000% | 11/1/28 | 5,000 | 6,154 |
| 3 Allegheny County PA Hospital Development Authority Revenue | | | | |
| (University of Pittsburgh Medical Center) TOB VRDO | 0.620% | 11/1/16 LOC | 25,590 | 25,590 |
| Allegheny County PA Port Authority Revenue | 5.750% | 3/1/29 | 8,000 | 9,396 |
| Centre County PA Hospital Authority Revenue (Mount Nittany Medical Center Project) | 5.000% | 11/15/32 | 3,000 | 3,420 |
| Delaware County PA Authority Hospital Revenue (Crozer-Keystone Obligated Group) | 5.000% | 12/15/16 (Prere.) | 4,920 | 4,945 |
| Delaware County PA Authority University Revenue (Villanova University) | 4.000% | 12/1/30 | 1,855 | 2,082 |
| Delaware County PA Authority University Revenue (Villanova University) | 5.000% | 8/1/31 | 800 | 951 |
| Delaware County PA Authority University Revenue (Villanova University) | 5.000% | 8/1/32 | 920 | 1,089 |
| Delaware County PA Authority University Revenue (Villanova University) | 5.000% | 8/1/33 | 2,625 | 3,095 |
| Delaware County PA Authority University Revenue (Villanova University) | 5.000% | 8/1/34 | 2,000 | 2,351 |
| Delaware County PA Authority University Revenue (Villanova University) | 5.000% | 8/1/35 | 2,160 | 2,530 |
| Franklin County PA Industrial Development Authority Revenue (Chambersburg Hospital Project) | 5.375% | 7/1/42 | 4,325 | 4,834 |
| 1 Monroe County PA Hospital Authority Revenue (Pocono Medical Center) | 5.000% | 7/1/36 | 2,000 | 2,263 |
| Monroeville PA Finance Authority Revenue (UPMC Health System) | 5.000% | 2/15/27 | 3,095 | 3,856 |
| Montgomery County PA Industrial Development Authority Health Services Revenue | | | | |
| (Albert Einstein Healthcare Network) | 5.250% | 1/15/45 | 5,000 | 5,529 |
| Montgomery County PA Industrial Development Authority Revenue | | | | |
| (Philadelphia Presbyterian Homes Inc. Project) | 7.000% | 12/1/35 | 3,000 | 3,459 |
| Montgomery County PA Industrial Development Authority Revenue | | | | |
| (Philadelphia Presbyterian Homes Inc. Project) | 7.000% | 12/1/40 | 2,390 | 2,737 |
254
Long-Term Tax-Exempt Fund
| | | | |
| | | | Face | Market |
| | | Maturity | Amount | Value• |
| | Coupon | Date | ($000) | ($000) |
| Moon Industrial Development Authority Pennsylvania Revenue | | | | |
| (Baptist Home Society Obligated Group) | 6.000% | 7/1/45 | 6,140 | 6,888 |
| Moon Industrial Development Authority Pennsylvania Revenue | | | | |
| (Baptist Home Society Obligated Group) | 6.125% | 7/1/50 | 5,015 | 5,650 |
| Northampton County PA General Purpose Authority Hospital Revenue | | | | |
| (St. Luke’s Hospital Project) | 5.500% | 8/15/18 (Prere.) | 3,500 | 3,782 |
| Northampton County PA General Purpose Authority Hospital Revenue | | | | |
| (St. Luke’s Hospital Project) | 5.500% | 8/15/18 (Prere.) | 2,500 | 2,702 |
| Pennsylvania Economic Development Financing Authority Revenue (UPMC Obligated Group) | 5.000% | 2/1/30 | 13,955 | 16,324 |
| Pennsylvania Economic Development Financing Authority Revenue (UPMC Obligated Group) | 5.000% | 2/1/34 | 3,000 | 3,450 |
| Pennsylvania Economic Development Financing Authority Revenue (UPMC Obligated Group) | 5.000% | 7/1/38 | 12,000 | 13,540 |
| Pennsylvania GO | 4.000% | 8/15/28 (4) | 15,000 | 16,671 |
| Pennsylvania Higher Educational Facilities Authority Revenue (Bryn Mawr College) | 5.000% | 12/1/38 | 4,500 | 5,268 |
| Pennsylvania Higher Educational Facilities Authority Revenue (Higher Education System) | 5.000% | 6/15/29 | 1,000 | 1,140 |
| Pennsylvania Higher Educational Facilities Authority Revenue (St. Joseph’s University) | 5.000% | 11/1/40 | 5,160 | 5,773 |
| Pennsylvania Higher Educational Facilities Authority Revenue (Temple University) | 5.000% | 4/1/27 | 1,120 | 1,304 |
| Pennsylvania Higher Educational Facilities Authority Revenue (Temple University) | 5.000% | 4/1/28 | 3,100 | 3,597 |
| Pennsylvania Higher Educational Facilities Authority Revenue (Temple University) | 5.000% | 4/1/30 | 3,000 | 3,448 |
| Pennsylvania Higher Educational Facilities Authority Revenue (Temple University) | 5.000% | 4/1/31 | 1,500 | 1,719 |
| Pennsylvania Higher Educational Facilities Authority Revenue (Temple University) | 5.000% | 4/1/32 | 1,500 | 1,713 |
| Pennsylvania Higher Educational Facilities Authority Revenue (Thomas Jefferson University) | 5.000% | 9/1/45 | 2,000 | 2,277 |
| Pennsylvania Higher Educational Facilities Authority Revenue (Thomas Jefferson University) | 5.250% | 9/1/50 | 18,000 | 20,794 |
| Pennsylvania Higher Educational Facilities Authority Revenue | | | | |
| (Trustees of the University of Pennsylvania) | 4.000% | 8/15/32 | 2,750 | 3,038 |
| Pennsylvania Higher Educational Facilities Authority Revenue | | | | |
| (Trustees of the University of Pennsylvania) | 4.000% | 8/15/33 | 1,555 | 1,708 |
| Pennsylvania Higher Educational Facilities Authority Revenue | | | | |
| (University of Pennsylvania Health System) | 5.000% | 8/15/40 | 8,000 | 9,268 |
| Pennsylvania Higher Educational Facilities Authority Student Housing Revenue | | | | |
| (University Properties Inc.) | 5.000% | 7/1/42 | 4,790 | 5,033 |
| Pennsylvania State University Revenue | 5.000% | 9/1/27 | 830 | 1,040 |
| Pennsylvania State University Revenue | 5.000% | 9/1/28 | 1,000 | 1,224 |
| Pennsylvania State University Revenue | 5.000% | 9/1/28 | 3,000 | 3,672 |
| Pennsylvania Turnpike Commission Motor License Fund Revenue | 5.500% | 12/1/28 | 9,015 | 10,883 |
| Pennsylvania Turnpike Commission Motor License Fund Revenue | 5.500% | 12/1/31 | 7,255 | 8,711 |
| Pennsylvania Turnpike Commission Motor License Fund Revenue | 5.000% | 12/1/42 | 1,000 | 1,134 |
| Pennsylvania Turnpike Commission Motor License Fund Revenue | 5.000% | 12/1/43 | 5,000 | 5,665 |
| Pennsylvania Turnpike Commission Oil Franchise Tax Revenue | 5.000% | 12/1/22 | 1,000 | 1,203 |
| Pennsylvania Turnpike Commission Revenue | 5.250% | 6/1/18 (Prere.) | 4,000 | 4,277 |
| Pennsylvania Turnpike Commission Revenue | 5.500% | 6/1/18 (Prere.) | 5,000 | 5,366 |
| Pennsylvania Turnpike Commission Revenue | 5.000% | 6/1/19 (Prere.) | 1,085 | 1,196 |
| Pennsylvania Turnpike Commission Revenue | 5.000% | 6/1/19 (Prere.) | 4,915 | 5,416 |
| Pennsylvania Turnpike Commission Revenue | 6.500% | 12/1/20 (Prere.) | 6,000 | 7,294 |
| Pennsylvania Turnpike Commission Revenue | 5.000% | 6/1/27 | 11,325 | 13,593 |
| Pennsylvania Turnpike Commission Revenue | 5.000% | 6/1/28 | 7,555 | 8,978 |
| Pennsylvania Turnpike Commission Revenue | 5.000% | 6/1/28 | 1,750 | 2,080 |
| Pennsylvania Turnpike Commission Revenue | 5.000% | 6/1/29 | 3,750 | 4,425 |
| Pennsylvania Turnpike Commission Revenue | 5.000% | 6/1/29 (4) | 13,000 | 15,606 |
| Pennsylvania Turnpike Commission Revenue | 5.000% | 12/1/30 | 1,400 | 1,563 |
| Pennsylvania Turnpike Commission Revenue | 5.000% | 12/1/33 | 9,200 | 10,830 |
| Pennsylvania Turnpike Commission Revenue | 0.000% | 12/1/34 | 3,500 | 3,159 |
| Pennsylvania Turnpike Commission Revenue | 4.000% | 12/1/34 | 11,670 | 12,182 |
| Pennsylvania Turnpike Commission Revenue | 0.000% | 12/1/37 | 6,000 | 5,321 |
| Pennsylvania Turnpike Commission Revenue | 5.000% | 12/1/38 | 15,990 | 17,577 |
| Pennsylvania Turnpike Commission Revenue | 5.000% | 12/1/39 | 5,000 | 5,771 |
| Pennsylvania Turnpike Commission Revenue | 5.000% | 12/1/40 | 16,400 | 18,449 |
| Pennsylvania Turnpike Commission Revenue | 5.000% | 12/1/40 | 6,400 | 7,289 |
| Pennsylvania Turnpike Commission Revenue | 5.250% | 12/1/44 | 12,000 | 13,786 |
| Pennsylvania Turnpike Commission Revenue | 5.250% | 12/1/45 | 3,500 | 4,077 |
| Philadelphia PA Authority for Industrial Development Revenue (Temple University) | 5.000% | 4/1/45 | 6,035 | 6,907 |
| Philadelphia PA GO | 5.000% | 8/1/29 | 5,735 | 6,728 |
| Philadelphia PA Hospitals & Higher Education Facilities Authority Hospital Revenue | | | | |
| (Temple University Health System Obligated Group) | 5.500% | 7/1/26 | 3,000 | 3,046 |
| Philadelphia PA Hospitals & Higher Education Facilities Authority Hospital Revenue | | | | |
| (Temple University Health System Obligated Group) | 5.500% | 7/1/30 | 5,000 | 5,071 |
| Philadelphia PA Hospitals & Higher Education Facilities Authority Hospital Revenue | | | | |
| (Temple University Health System Obligated Group) | 5.625% | 7/1/42 | 3,000 | 3,314 |
| Philadelphia PA School District GO | 6.000% | 9/1/18 (Prere.) | 5 | 5 |
| Philadelphia PA School District GO | 6.000% | 9/1/18 (Prere.) | 5 | 5 |
| Philadelphia PA School District GO | 6.000% | 9/1/18 (Prere.) | 5 | 5 |
255
Long-Term Tax-Exempt Fund
| | | | |
| | | | Face | Market |
| | | Maturity | Amount | Value• |
| | Coupon | Date | ($000) | ($000) |
| Philadelphia PA School District GO | 6.000% | 9/1/18 (Prere.) | 100 | 109 |
| Philadelphia PA School District GO | 6.000% | 9/1/18 (Prere.) | 5 | 5 |
| 1 Philadelphia PA School District GO | 5.000% | 9/1/25 (15) | 10,000 | 11,789 |
| Philadelphia PA School District GO | 6.000% | 9/1/38 | 6,880 | 7,210 |
| Philadelphia PA Water & Waste Water Revenue | 5.000% | 7/1/45 | 15,000 | 17,195 |
| 1 State Public School Building Authority Pennsylvania Lease Revenue | | | | |
| (School District of Philadelphia) | 5.000% | 6/1/25 (4) | 10,000 | 11,715 |
| Westmoreland County PA Municipal Authority Revenue | 5.000% | 8/15/31 | 3,000 | 3,473 |
| Westmoreland County PA Municipal Authority Revenue | 5.000% | 8/15/37 | 4,210 | 4,790 |
| Wilkes-Barre PA Finance Authority Revenue (University of Scranton Project) | 5.000% | 11/1/40 | 3,500 | 3,909 |
| | | | | 506,411 |
| Puerto Rico (0.1%) | | | | |
| Puerto Rico Electric Power Authority Revenue | 5.250% | 7/1/30 (14) | 5,000 | 5,452 |
| |
| Rhode Island (0.3%) | | | | |
| Rhode Island & Providence Plantations GO | 5.500% | 8/1/29 | 7,355 | 8,664 |
| Rhode Island & Providence Plantations GO | 5.500% | 8/1/31 | 2,520 | 2,951 |
| Rhode Island Health & Educational Building Corp. Public Schools Revenue (Pooled Issue) | 4.500% | 5/15/18 (Prere.) | 2,575 | 2,718 |
| Rhode Island Health & Educational Building Corp. Public Schools Revenue (Pooled Issue) | 4.500% | 5/15/18 (Prere.) | 1,665 | 1,757 |
| Rhode Island Housing & Mortgage Finance Corp. Revenue | 4.000% | 10/1/40 | 830 | 862 |
| Tobacco Settlement Financing Corp. Rhode Island Revenue | 5.000% | 6/1/35 | 10,000 | 10,834 |
| | | | | 27,786 |
| South Carolina (1.5%) | | | | |
| Charleston County SC Airport District System Revenue | 5.000% | 7/1/43 | 5,000 | 5,555 |
| Charleston SC Educational Excellence Financing Corp. Revenue | | | | |
| (Charleston County School District, South Carolina Project) | 5.000% | 12/1/16 (Prere.) | 7,000 | 7,025 |
| Charleston SC Educational Excellence Financing Corp. Revenue | | | | |
| (Charleston County School District, South Carolina Project) | 5.000% | 12/1/16 (Prere.) | 10,580 | 10,618 |
| Charleston SC Educational Excellence Financing Corp. Revenue | | | | |
| (Charleston County School District, South Carolina Project) | 5.000% | 12/1/26 | 10,000 | 12,154 |
| Charleston SC Educational Excellence Financing Corp. Revenue | | | | |
| (Charleston County School District, South Carolina Project) | 5.000% | 12/1/29 | 2,500 | 3,021 |
| Florence County SC Hospital Revenue (McLeod Regional Medical Center Project) | 5.000% | 11/1/37 | 4,200 | 4,629 |
| Piedmont SC Municipal Power Agency Revenue | 5.750% | 1/1/34 (4) | 10,000 | 11,721 |
| South Carolina Association of Governmental Organizations Educational Facilities Corp. Revenue | | | | |
| (Pickens School District) | 5.000% | 12/1/30 | 1,500 | 1,768 |
| South Carolina Public Service Authority Revenue | 5.250% | 1/1/19 (Prere.) | 6,000 | 6,549 |
| South Carolina Public Service Authority Revenue | 5.500% | 1/1/19 (Prere.) | 795 | 870 |
| South Carolina Public Service Authority Revenue | 5.500% | 1/1/19 (Prere.) | 9,205 | 10,078 |
| South Carolina Public Service Authority Revenue | 5.000% | 12/1/33 | 20,000 | 23,805 |
| South Carolina Public Service Authority Revenue | 5.000% | 12/1/38 | 10,000 | 11,550 |
| South Carolina Public Service Authority Revenue | 5.125% | 12/1/43 | 1,500 | 1,741 |
| South Carolina Public Service Authority Revenue | 5.000% | 12/1/50 | 5,935 | 6,679 |
| South Carolina Public Service Authority Revenue | 5.500% | 12/1/54 | 10,000 | 11,781 |
| South Carolina Public Service Authority Revenue | 5.250% | 12/1/55 | 10,500 | 12,375 |
| South Carolina Public Service Authority Revenue | 5.000% | 12/1/56 | 7,500 | 8,545 |
| University of South Carolina Higher Education Revenue | 5.250% | 6/1/18 (Prere.) | 5,610 | 5,996 |
| | | | | 156,460 |
| South Dakota (0.2%) | | | | |
| South Dakota Health & Educational Facilities Authority Revenue (Sanford Health) | 5.000% | 11/1/35 | 3,000 | 3,478 |
| South Dakota Health & Educational Facilities Authority Revenue (Sanford Health) | 5.000% | 11/1/37 | 10,045 | 11,269 |
| South Dakota Health & Educational Facilities Authority Revenue (Sanford Health) | 5.000% | 11/1/45 | 1,000 | 1,141 |
| | | | | 15,888 |
| Tennessee (1.2%) | | | | |
| Chattanooga TN Health Educational & Housing Facility Board Revenue (Catholic Health Initiatives) | 5.250% | 1/1/45 | 14,005 | 15,608 |
| Clarksville TN Public Building Authority Revenue (Morristown) VRDO | 0.590% | 11/1/16 LOC | 4,680 | 4,680 |
| 1 Knox County TN Health Educational & Housing Facilities Board Hospital Facilities Revenue | | | | |
| (University Health System Inc.) | 5.000% | 9/1/36 | 2,500 | 2,828 |
| 1 Knox County TN Health Educational & Housing Facilities Board Hospital Facilities Revenue | | | | |
| (University Health System Inc.) | 5.000% | 9/1/47 | 11,315 | 12,590 |
| Metropolitan Government of Nashville & Davidson County TN GO | 5.000% | 1/1/27 | 5,000 | 6,313 |
| Shelby County TN GO | 5.000% | 4/1/27 | 2,855 | 3,679 |
| Shelby County TN Health Educational & Housing Facility Board Revenue (Methodist Healthcare) | 5.250% | 3/1/18 (Prere.) | 350 | 370 |
| Shelby County TN Health Educational & Housing Facility Board Revenue | | | | |
| (Methodist Le Bonheur Healthcare) VRDO | 0.520% | 11/1/16 (4) | 4,400 | 4,400 |
| Tennessee Energy Acquisition Corp. Gas Revenue | 5.000% | 2/1/19 | 600 | 646 |
| Tennessee Energy Acquisition Corp. Gas Revenue | 5.000% | 2/1/20 | 360 | 398 |
| Tennessee Energy Acquisition Corp. Gas Revenue | 5.250% | 9/1/20 | 740 | 839 |
256
Long-Term Tax-Exempt Fund
| | | | |
| | | | Face | Market |
| | | Maturity | Amount | Value• |
| | Coupon | Date | ($000) | ($000) |
| Tennessee Energy Acquisition Corp. Gas Revenue | 5.250% | 9/1/22 | 990 | 1,164 |
| Tennessee Energy Acquisition Corp. Gas Revenue | 5.000% | 2/1/23 | 9,645 | 11,244 |
| Tennessee Energy Acquisition Corp. Gas Revenue | 5.250% | 9/1/23 | 3,710 | 4,437 |
| Tennessee Energy Acquisition Corp. Gas Revenue | 5.250% | 9/1/24 | 6,175 | 7,400 |
| Tennessee Energy Acquisition Corp. Gas Revenue | 5.250% | 9/1/26 | 2,160 | 2,648 |
| Tennessee Energy Acquisition Corp. Gas Revenue | 5.000% | 2/1/27 | 19,950 | 23,935 |
| Tennessee GO | 5.000% | 9/1/28 | 5,750 | 7,090 |
| Tennessee GO | 5.000% | 9/1/29 | 2,500 | 3,067 |
| Tennessee GO | 5.000% | 8/1/30 | 1,345 | 1,661 |
| Tennessee GO | 5.000% | 9/1/34 | 700 | 842 |
| Tennessee Housing Development Agency Homeownership Program Revenue | 4.500% | 7/1/37 | 1,105 | 1,176 |
| Tennessee Housing Development Agency Homeownership Program Revenue | 4.000% | 7/1/38 | 2,695 | 2,843 |
| Washington County TN GO | 4.000% | 6/1/29 | 3,260 | 3,729 |
| | | | | 123,587 |
| Texas (9.4%) | | | | |
| Allen TX Independent School District GO | 5.000% | 2/15/38 | 11,965 | 14,212 |
| Allen TX Independent School District GO | 5.000% | 2/15/39 | 12,600 | 14,944 |
| Arlington TX Independent School District GO | 4.000% | 2/15/30 | 2,000 | 2,226 |
| Austin TX Combined Utility System Revenue | 0.000% | 5/15/17 (14) | 4,900 | 4,876 |
| Austin TX Community College District Public Facilities Corp. Lease Revenue | 5.000% | 8/1/29 | 3,270 | 3,903 |
| Austin TX Community College District Public Facilities Corp. Lease Revenue | 5.000% | 8/1/31 | 7,140 | 8,406 |
| Austin TX GO | 5.000% | 9/1/32 | 1,300 | 1,555 |
| Austin TX Independent School District GO | 5.000% | 8/1/26 | 1,425 | 1,777 |
| Austin TX Water & Wastewater System Revenue | 5.000% | 11/15/25 | 3,000 | 3,516 |
| Austin TX Water & Wastewater System Revenue | 5.000% | 11/15/25 | 5,000 | 5,986 |
| Austin TX Water & Wastewater System Revenue | 5.000% | 11/15/27 | 2,500 | 3,142 |
| Central Texas Regional Mobility Authority Revenue | 5.750% | 1/1/21 (Prere.) | 4,260 | 5,036 |
| Central Texas Regional Mobility Authority Revenue | 6.250% | 1/1/21 (Prere.) | 1,000 | 1,202 |
| Central Texas Regional Mobility Authority Revenue | 6.750% | 1/1/21 (Prere.) | 2,000 | 2,445 |
| Central Texas Regional Mobility Authority Revenue | 5.000% | 1/1/45 | 6,000 | 6,744 |
| Clear Creek TX Independent School District GO | 5.000% | 2/15/30 | 10,000 | 12,010 |
| Clifton TX Higher Education Finance Corp. Revenue (Baylor University) | 5.250% | 3/1/29 | 3,000 | 3,464 |
| Crowley TX Independent School District GO | 5.000% | 8/1/37 | 6,000 | 7,110 |
| Crowley TX Independent School District GO | 5.000% | 8/1/38 | 7,030 | 8,312 |
| Crowley TX Independent School District GO | 5.000% | 8/1/39 | 5,250 | 6,199 |
| 1 Dallas County TX Utility & Reclamation District GO | 5.000% | 2/15/28 | 5,000 | 6,118 |
| 2 Dallas TX Area Rapid Transit Sales Tax Revenue | 5.250% | 12/1/18 (Prere.) | 1,760 | 1,918 |
| Dallas TX Area Rapid Transit Sales Tax Revenue | 5.000% | 12/1/41 | 8,810 | 10,347 |
| Dallas TX Area Rapid Transit Sales Tax Revenue | 5.000% | 12/1/46 | 2,585 | 3,025 |
| Dallas TX Civic Center Improvement Revenue | 5.000% | 8/15/27 (12) | 5,000 | 5,365 |
| Dallas TX Civic Center Improvement Revenue | 5.000% | 8/15/28 (12) | 2,125 | 2,310 |
| Dallas TX GO | 5.000% | 2/15/25 | 10,000 | 12,192 |
| Dallas TX GO | 5.000% | 2/15/29 | 2,335 | 2,825 |
| Dallas TX GO | 5.000% | 2/15/30 | 3,585 | 4,303 |
| Dallas TX GO | 5.000% | 2/15/31 | 2,485 | 2,968 |
| Dallas-Fort Worth TX International Airport Revenue | 5.250% | 11/1/31 | 5,800 | 6,967 |
| Dallas-Fort Worth TX International Airport Revenue | 5.000% | 11/1/37 | 5,000 | 5,792 |
| Dallas-Fort Worth TX International Airport Revenue | 5.000% | 11/1/38 | 6,410 | 7,418 |
| Denton TX Independent School District GO | 5.000% | 8/15/45 | 12,000 | 14,054 |
| 1 El Paso County TX Community College District Revenue | 5.000% | 4/1/42 (4) | 5,000 | 5,721 |
| El Paso TX GO | 5.000% | 8/15/27 | 3,625 | 4,490 |
| Fort Bend County TX GO | 5.000% | 3/1/27 | 4,255 | 5,259 |
| Fort Bend TX Grand Parkway Toll Road Authority Revenue | 5.000% | 3/1/23 | 1,000 | 1,194 |
| Friendswood TX Independent School District GO | 4.000% | 2/15/32 | 3,630 | 4,018 |
| Grand Parkway Transportation Corp. Texas System Toll Revenue | 0.000% | 10/1/35 | 21,495 | 19,555 |
| Grand Parkway Transportation Corp. Texas System Toll Revenue | 0.000% | 10/1/36 | 8,475 | 7,684 |
| Grand Parkway Transportation Corp. Texas System Toll Revenue | 5.250% | 10/1/51 | 12,000 | 14,159 |
| Harris County TX Cultural Education Facilities Finance Corp. Hospital Revenue | | | | |
| (Memorial Hermann Healthcare System) | 5.000% | 12/1/35 | 8,000 | 9,108 |
| 3 Harris County TX Cultural Education Facilities Finance Corp. Revenue | | | | |
| (Texas Children’s Hospital) TOB VRDO | 0.580% | 11/1/16 | 2,800 | 2,800 |
| Harris County TX GO | 5.000% | 10/1/26 | 3,000 | 3,757 |
| Harris County TX Health Facilities Development Corp. Hospital Revenue | | | | |
| (Memorial Hermann Healthcare System) | 7.125% | 12/1/18 (Prere.) | 3,250 | 3,666 |
| Harris County TX Sports Authority Revenue | 5.000% | 11/15/27 (4) | 2,150 | 2,583 |
| Harris County TX Sports Authority Revenue | 5.000% | 11/15/28 | 1,465 | 1,711 |
| Harris County TX Sports Authority Revenue | 5.000% | 11/15/30 | 2,790 | 3,231 |
| Harris County TX Toll Road Revenue | 5.000% | 8/15/18 (Prere.) | 2,000 | 2,147 |
| Hays County TX GO | 4.000% | 2/15/31 | 2,265 | 2,496 |
257
Long-Term Tax-Exempt Fund
| | | | |
| | | | Face | Market |
| | | Maturity | Amount | Value• |
| | Coupon | Date | ($000) | ($000) |
| Hays County TX GO | 4.000% | 2/15/32 | 3,820 | 4,179 |
| Highland Park TX Independent School District GO | 5.000% | 2/15/27 | 7,680 | 9,420 |
| Houston TX Airport System Revenue | 5.000% | 7/1/32 | 3,000 | 3,445 |
| Houston TX Airport System Revenue | 5.500% | 7/1/39 | 5,000 | 5,358 |
| Houston TX Community College System GO | 5.000% | 2/15/36 | 10,000 | 11,141 |
| Houston TX GO | 5.000% | 3/1/25 | 3,335 | 4,051 |
| Houston TX GO | 5.000% | 3/1/27 | 20,000 | 24,626 |
| Houston TX GO | 5.000% | 3/1/30 | 5,395 | 6,250 |
| Houston TX Utility System Revenue | 5.000% | 5/15/28 | 3,000 | 3,609 |
| Houston TX Utility System Revenue | 4.000% | 11/15/31 | 17,535 | 19,365 |
| Houston TX Utility System Revenue | 5.250% | 11/15/31 | 5,000 | 5,765 |
| Houston TX Utility System Revenue | 5.000% | 11/15/32 | 28,395 | 34,522 |
| Humble TX Independent School District GO | 4.000% | 2/15/28 | 10,290 | 11,665 |
| Lamar TX Consolidated Independent School District GO | 4.000% | 2/15/30 | 10,000 | 11,132 |
| Lamar TX Consolidated Independent School District GO | 4.000% | 2/15/31 | 5,000 | 5,531 |
| Lamar TX Consolidated Independent School District GO | 4.000% | 2/15/32 | 6,835 | 7,512 |
| Laredo TX Community College District GO | 5.000% | 8/1/30 | 2,000 | 2,358 |
| Laredo TX Community College District GO | 5.000% | 8/1/32 | 1,250 | 1,461 |
| Laredo TX Community College District GO | 5.000% | 8/1/34 | 1,500 | 1,742 |
| Lone Star College System Texas GO | 4.000% | 2/15/29 | 1,150 | 1,290 |
| Lower Colorado River Authority Texas Revenue | 5.625% | 5/15/19 (Prere.) | 20 | 22 |
| Lower Colorado River Authority Texas Revenue | 5.625% | 5/15/19 (Prere.) | 205 | 228 |
| Lower Colorado River Authority Texas Revenue | 5.625% | 5/15/19 (Prere.) | 10 | 11 |
| Lower Colorado River Authority Texas Revenue | 5.625% | 5/15/19 (Prere.) | 5 | 6 |
| Lower Colorado River Authority Texas Revenue | 5.000% | 5/15/26 | 3,000 | 3,560 |
| Lower Colorado River Authority Texas Revenue | 5.500% | 5/15/36 | 5,000 | 5,503 |
| Lower Colorado River Authority Texas Revenue | 5.625% | 5/15/39 | 4,760 | 5,223 |
| Lower Colorado River Authority Texas Revenue | 5.000% | 5/15/40 | 5,000 | 5,537 |
| Lower Colorado River Authority Texas Transmission Contract Revenue | | | | |
| (LCRA Transmission Services Corp.) | 5.000% | 5/15/40 | 3,500 | 4,001 |
| Lubbock TX GO | 4.000% | 2/15/30 | 1,250 | 1,374 |
| Mansfield TX Independent School District GO | 5.000% | 2/15/45 | 5,000 | 5,812 |
| Matagorda County TX Navigation District No. 1 Pollution Control Revenue | | | | |
| (Central Power & Light Co. Project) | 6.300% | 11/1/29 | 7,500 | 8,385 |
| Missouri City TX GO | 4.000% | 6/15/32 | 1,000 | 1,085 |
| Montgomery County TX GO | 5.125% | 3/1/19 (Prere.) | 4,000 | 4,377 |
| Montgomery County TX GO | 5.250% | 3/1/19 (Prere.) | 5,000 | 5,485 |
| New Hope TX Cultural Education Facilities FinanceCorp. First Mortgage Revenue | | | | |
| (Morningside Ministries Project) | 6.500% | 1/1/48 | 10,350 | 11,910 |
| New Hope TX Cultural Education Facilities FinanceCorp. Retirement Facilities Revenue | | | | |
| (Wesleyan Homes Inc. Project) | 5.500% | 1/1/43 | 1,600 | 1,708 |
| New Hope TX Cultural Education Facilities FinanceCorp. Retirement Facilities Revenue | | | | |
| (Wesleyan Homes Inc. Project) | 5.500% | 1/1/49 | 1,600 | 1,700 |
| New Hope TX Cultural Education Facilities FinanceCorp. Student Housing Revenue | | | | |
| (Texas A&M University Project) | 5.000% | 7/1/47 | 6,900 | 7,459 |
| North Texas Tollway Authority System Revenue | 6.250% | 1/1/19 (Prere.) | 4,880 | 5,431 |
| North Texas Tollway Authority System Revenue | 6.250% | 2/1/23 | 10,000 | 11,353 |
| North Texas Tollway Authority System Revenue | 5.000% | 1/1/28 | 2,000 | 2,397 |
| North Texas Tollway Authority System Revenue | 5.000% | 1/1/30 | 10,000 | 11,991 |
| North Texas Tollway Authority System Revenue | 5.000% | 9/1/30 | 9,000 | 10,433 |
| North Texas Tollway Authority System Revenue | 5.000% | 9/1/31 | 2,000 | 2,313 |
| North Texas Tollway Authority System Revenue | 5.000% | 1/1/32 | 3,000 | 3,505 |
| North Texas Tollway Authority System Revenue | 5.000% | 1/1/33 | 13,675 | 15,485 |
| North Texas Tollway Authority System Revenue | 5.000% | 1/1/34 | 14,355 | 16,225 |
| North Texas Tollway Authority System Revenue | 6.000% | 1/1/38 | 12,500 | 14,653 |
| North Texas Tollway Authority System Revenue | 6.250% | 1/1/39 | 1,120 | 1,232 |
| North Texas Tollway Authority System Revenue | 6.000% | 9/1/41 | 2,500 | 3,017 |
| Olmos Park TX Higher Education Facilities Corp. Revenue | | | | |
| (University of the Incarnate Word Project) | 5.000% | 12/1/23 | 1,000 | 1,176 |
| Olmos Park TX Higher Education Facilities Corp. Revenue | | | | |
| (University of the Incarnate Word Project) | 5.000% | 12/1/24 | 4,325 | 5,152 |
| Olmos Park TX Higher Education Facilities Corp. Revenue | | | | |
| (University of the Incarnate Word Project) | 5.000% | 12/1/25 | 4,520 | 5,350 |
| Olmos Park TX Higher Education Facilities Corp. Revenue | | | | |
| (University of the Incarnate Word Project) | 5.000% | 12/1/26 | 2,250 | 2,650 |
| Olmos Park TX Higher Education Facilities Corp. Revenue | | | | |
| (University of the Incarnate Word Project) | 5.000% | 12/1/27 | 1,845 | 2,160 |
| Pasadena TX GO | 4.000% | 2/15/32 | 1,500 | 1,642 |
| Round Rock TX Independent School District GO | 4.000% | 8/1/30 | 3,130 | 3,518 |
| SA Energy Acquisition Public Facility Corp. Texas Gas Supply Revenue | 5.500% | 8/1/22 | 5,480 | 6,504 |
258
Long-Term Tax-Exempt Fund
| | | | |
| | | | Face | Market |
| | | Maturity | Amount | Value• |
| | Coupon | Date | ($000) | ($000) |
| SA Energy Acquisition Public Facility Corp. Texas Gas Supply Revenue | 5.500% | 8/1/23 | 6,155 | 7,444 |
| San Antonio TX Electric & Gas Systems Revenue | 5.000% | 2/1/27 | 3,600 | 4,543 |
| San Antonio TX Electric & Gas Systems Revenue | 5.000% | 2/1/38 | 6,500 | 7,537 |
| San Antonio TX Water Revenue | 5.000% | 5/15/26 | 2,000 | 2,353 |
| San Jacinto TX Community College District GO | 5.000% | 2/15/29 | 3,860 | 4,696 |
| San Jacinto TX Community College District GO | 5.000% | 2/15/30 | 4,055 | 4,891 |
| San Jacinto TX Community College District GO | 5.000% | 2/15/31 | 2,250 | 2,699 |
| San Jacinto TX Community College District GO | 5.000% | 2/15/32 | 2,000 | 2,386 |
| Tarrant County TX Cultural Education Facilities Finance Corp. Hospital Revenue | | | | |
| (Baylor Scott & White Healthcare Project) | 5.000% | 11/15/37 | 4,500 | 5,295 |
| Tarrant County TX Cultural Education Facilities Finance Corp. Hospital Revenue | | | | |
| (Baylor Scott & White Healthcare Project) | 5.000% | 11/15/45 | 7,265 | 8,482 |
| Tarrant Regional Water District Texas Water Revenue | 5.000% | 3/1/19 (Prere.) | 3,000 | 3,278 |
| Texas GO | 4.000% | 5/15/32 | 2,250 | 2,477 |
| Texas GO | 5.000% | 5/15/40 | 7,000 | 8,238 |
| Texas GO | 5.000% | 10/1/44 | 20,195 | 23,690 |
| Texas Municipal Gas Acquisition & Supply Corp. Revenue | 5.250% | 12/15/19 | 600 | 662 |
| Texas Municipal Gas Acquisition & Supply Corp. Revenue | 5.250% | 12/15/20 | 550 | 621 |
| Texas Municipal Gas Acquisition & Supply Corp. Revenue | 5.250% | 12/15/23 | 1,390 | 1,657 |
| Texas Municipal Gas Acquisition & Supply Corp. Revenue | 5.250% | 12/15/24 | 6,630 | 7,930 |
| Texas Municipal Gas Acquisition & Supply Corp. Revenue | 5.250% | 12/15/25 | 2,470 | 2,978 |
| Texas Municipal Gas Acquisition & Supply Corp. Revenue | 5.000% | 12/15/26 | 2,700 | 3,086 |
| Texas Municipal Gas Acquisition & Supply Corp. Revenue | 5.250% | 12/15/26 | 1,155 | 1,404 |
| Texas Private Activity Surface Transportation Corp. Revenue | 7.500% | 12/31/31 | 4,000 | 4,723 |
| Texas Private Activity Surface Transportation Corp. Revenue | 6.875% | 12/31/39 | 9,000 | 10,457 |
| Texas Private Activity Surface Transportation Corp. Revenue | 7.000% | 6/30/40 | 29,880 | 35,252 |
| Texas State University System Financing System Revenue | 5.000% | 3/15/38 | 3,300 | 3,819 |
| Texas State University System Financing System Revenue | 5.000% | 3/15/42 | 2,000 | 2,260 |
| Texas Transportation Commission GO | 5.000% | 4/1/27 | 7,000 | 8,805 |
| Texas Transportation Commission GO | 5.000% | 4/1/28 | 10,000 | 12,096 |
| Texas Transportation Commission Mobility Fund GO | 5.000% | 10/1/36 | 10,000 | 11,960 |
| Texas Transportation Commission Revenue | 5.000% | 8/15/41 | 3,815 | 4,319 |
| Texas Transportation Commission Turnpike System Revenue | 5.000% | 8/15/34 | 6,000 | 6,882 |
| Texas Transportation Commission Turnpike System Revenue | 5.000% | 8/15/37 | 6,440 | 7,401 |
| Texas Turnpike Authority Central Texas Turnpike System Revenue | 0.000% | 8/15/26 (ETM) | 555 | 455 |
| Texas Turnpike Authority Central Texas Turnpike System Revenue | 0.000% | 8/15/26 (2) | 9,445 | 7,216 |
| Texas Turnpike Authority Central Texas Turnpike System Revenue | 0.000% | 8/15/28 (ETM) | 50 | 38 |
| Texas Turnpike Authority Central Texas Turnpike System Revenue | 0.000% | 8/15/28 (2) | 29,955 | 21,005 |
| Texas Water Development Board Revenue | 5.000% | 10/15/30 | 10,000 | 12,255 |
| United TX Independent School District GO | 5.000% | 8/15/26 | 2,195 | 2,724 |
| United TX Independent School District GO | 5.000% | 8/15/27 | 2,300 | 2,829 |
| United TX Independent School District GO | 5.000% | 8/15/28 | 2,355 | 2,880 |
| United TX Independent School District GO | 5.000% | 8/15/29 | 2,535 | 3,080 |
| University of Houston Texas Revenue | 4.000% | 2/15/30 | 4,610 | 5,056 |
| University of North Texas Revenue | 5.000% | 4/15/33 | 3,200 | 3,756 |
| University of North Texas Revenue | 5.000% | 4/15/34 | 3,000 | 3,509 |
| University of North Texas Revenue | 5.000% | 4/15/36 | 3,000 | 3,491 |
| Ysleta TX Independent School District GO | 5.000% | 8/15/41 | 7,065 | 8,298 |
| | | | | 961,154 |
| Utah (0.4%) | | | | |
| Central Utah Water Conservancy District GO | 5.000% | 4/1/30 | 4,500 | 5,189 |
| Utah Transit Authority Sales Tax Revenue | 5.000% | 6/15/29 | 2,500 | 2,953 |
| Utah Transit Authority Sales Tax Revenue | 5.000% | 6/15/30 | 4,180 | 4,917 |
| Utah Transit Authority Sales Tax Revenue | 5.000% | 6/15/31 | 3,110 | 3,659 |
| Utah Transit Authority Sales Tax Revenue | 5.000% | 6/15/32 | 1,855 | 2,177 |
| Utah Transit Authority Sales Tax Revenue | 5.000% | 6/15/38 | 15,825 | 18,835 |
| | | | | 37,730 |
| Virginia (1.5%) | | | | |
| Fairfax County VA Economic Development Authority Facilities Revenue (County Facilities Project) | 5.000% | 10/1/32 | 1,800 | 2,143 |
| Fairfax County VA Economic Development Authority Facilities Revenue (County Facilities Project) | 5.000% | 10/1/34 | 1,145 | 1,353 |
| Fairfax County VA Economic Development Authority Transportation District | | | | |
| Improvement Revenue (Silver Line Phase I Project) | 5.000% | 4/1/20 (Prere.) | 1,000 | 1,133 |
| Fairfax County VA Economic Development Authority Transportation District | | | | |
| Improvement Revenue (Silver Line Phase I Project) | 4.000% | 4/1/31 | 3,810 | 4,246 |
| Fairfax County VA Economic Development Authority Transportation District | | | | |
| Improvement Revenue (Silver Line Phase I Project) | 4.000% | 4/1/32 | 11,190 | 12,373 |
| Fairfax County VA Industrial Development Authority Health Care Revenue | | | | |
| (Inova Health System Obligated Group) | 5.500% | 5/15/19 (Prere.) | 3,530 | 3,928 |
259
Long-Term Tax-Exempt Fund
| | | | |
| | | | Face | Market |
| | | Maturity | Amount | Value• |
| | Coupon | Date | ($000) | ($000) |
| Fairfax County VA Industrial Development Authority Health Care Revenue | | | | |
| (Inova Health System Obligated Group) | 5.500% | 5/15/35 | 6,470 | 7,152 |
| Fairfax County VA Sewer Revenue | 4.000% | 7/15/32 | 2,515 | 2,827 |
| Henrico County VA Economic Development Authority Revenue (Bon Secours Health System) | 5.250% | 11/1/42 (12) | 3,500 | 3,882 |
| Henrico County VA Water & Sewer Revenue | 5.000% | 5/1/27 | 2,585 | 3,298 |
| Roanoke VA Economic Development Authority Hospital Revenue (Carilion Clinic Obligated Group) | 5.000% | 7/1/28 | 1,640 | 1,877 |
| University of Virginia Revenue | 5.000% | 6/1/37 | 8,000 | 9,528 |
| University of Virginia Revenue | 5.000% | 4/1/45 | 5,000 | 5,927 |
| Virginia Commonwealth Transportation Board Revenue | 4.000% | 3/15/26 | 12,455 | 13,833 |
| Virginia Commonwealth Transportation Board Revenue | 5.000% | 5/15/30 | 28,875 | 33,775 |
| Virginia Commonwealth Transportation Board Revenue | 5.000% | 5/15/32 | 17,375 | 20,104 |
| Virginia Commonwealth Transportation Board Revenue | 5.000% | 5/15/33 | 4,000 | 4,628 |
| Virginia Public Building Authority Public Facilities Revenue | 4.000% | 8/1/27 | 8,335 | 9,290 |
| Virginia Public Building Authority Public Facilities Revenue | 4.000% | 8/1/28 | 8,675 | 9,601 |
| | | | | 150,898 |
| Washington (1.6%) | | | | |
| 3 Central Puget Sound WA Regional Transit Authority Sales & Use Tax Revenue TOB VRDO | 0.580% | 11/1/16 | 6,600 | 6,600 |
| Chelan County WA Public Utility District No. 1 Hydro-Electric System Revenue | | | | |
| (Columbia River-Rock Island Hydro) | 0.000% | 6/1/18 (14) | 10,000 | 9,806 |
| 2 King County WA Sewer Revenue | 5.750% | 1/1/18 (Prere.) | 7,170 | 7,580 |
| Port of Seattle WA Revenue | 5.000% | 8/1/29 | 10,500 | 12,201 |
| Port of Seattle WA Revenue | 5.000% | 6/1/30 | 2,000 | 2,234 |
| Port of Seattle WA Revenue | 5.000% | 4/1/31 | 3,260 | 3,850 |
| Port of Seattle WA Revenue | 5.000% | 4/1/32 | 3,425 | 4,028 |
| Port of Seattle WA Revenue | 5.000% | 3/1/33 | 4,380 | 5,124 |
| Port of Seattle WA Revenue | 5.000% | 4/1/34 | 3,665 | 4,279 |
| Port of Seattle WA Revenue | 5.000% | 3/1/35 | 3,240 | 3,768 |
| Seattle WA Municipal Light & Power Revenue | 4.000% | 4/1/29 | 3,825 | 4,355 |
| Seattle WA Municipal Light & Power Revenue | 5.250% | 2/1/33 | 2,000 | 2,302 |
| Snohomish County WA Public Utility District No. 1 Revenue | 5.000% | 12/1/40 | 5,000 | 5,868 |
| Tobacco Settlement Authority Washington Revenue | 5.250% | 6/1/29 | 10,125 | 10,726 |
| Tobacco Settlement Authority Washington Revenue | 5.250% | 6/1/30 | 9,065 | 9,853 |
| University of Washington Revenue | 5.000% | 7/1/34 | 2,000 | 2,367 |
| Washington Economic Development Finance Authority Lease Revenue | | | | |
| (Washington Biomedical Research Properties 2) | 5.000% | 6/1/23 | 1,800 | 2,181 |
| Washington GO | 5.000% | 2/1/35 | 10,000 | 11,482 |
| Washington GO | 5.000% | 8/1/35 | 2,000 | 2,313 |
| Washington Health Care Facilities Authority Revenue (MultiCare Health System) | 5.250% | 8/15/18 (Prere.) | 6,000 | 6,465 |
| Washington Health Care Facilities Authority Revenue (MultiCare Health System) | 5.500% | 8/15/18 (Prere.) | 5,490 | 5,940 |
| Washington Health Care Facilities Authority Revenue (MultiCare Health System) | 5.250% | 8/15/31 (4) | 5,000 | 5,288 |
| Washington Health Care Facilities Authority Revenue (MultiCare Health System) | 5.000% | 8/15/44 | 5,000 | 5,522 |
| Washington Health Care Facilities Authority Revenue (Providence Health & Services) | 5.000% | 10/1/33 | 7,500 | 8,598 |
| 2 Washington Health Care Facilities Authority Revenue (Seattle Children’s Hospital) | 5.625% | 10/1/19 (Prere.) | 12,000 | 13,593 |
| Washington Health Care Facilities Authority Revenue (Seattle Children’s Hospital) | 5.000% | 10/1/40 | 2,215 | 2,444 |
| 2 Washington Health Care Facilities Authority Revenue (Swedish Health Services) | 6.250% | 5/15/21 (Prere.) | 6,500 | 7,948 |
| | | | | 166,715 |
| West Virginia (0.4%) | | | | |
| West Virginia Economic Development Authority Solid Waste Facilities Disposal Revenue | | | | |
| (Appalachian Power Co. - Amos Project) | 5.375% | 12/1/38 | 2,500 | 2,799 |
| West Virginia Hospital Finance Authority Hospital Revenue (Charleston Area Medical Center Inc.) | 5.625% | 9/1/32 | 6,500 | 7,101 |
| West Virginia Hospital Finance Authority Hospital Revenue | | | | |
| (United Health System Obligated Group) | 5.500% | 6/1/44 | 20,000 | 23,147 |
| West Virginia University Revenue | 5.000% | 10/1/36 | 5,985 | 6,900 |
| West Virginia Water Development Authority Infrastructure Excess Lottery Revenue | | | | |
| (Chesapeake Bay/Greenbrier River Projects) | 5.000% | 7/1/30 | 3,000 | 3,587 |
| | | | | 43,534 |
| Wisconsin (1.2%) | | | | |
| Wisconsin GO | 6.000% | 5/1/36 | 10,000 | 11,151 |
| Wisconsin Health & Educational Facilities Authority Health Care Facilities Revenue | | | | |
| (Luther Hospital) | 5.750% | 11/15/30 | 7,500 | 8,303 |
| Wisconsin Health & Educational Facilities Authority Health Facilities Revenue (SSM Health Care) | 5.250% | 6/1/34 | 6,785 | 7,541 |
| Wisconsin Health & Educational Facilities Authority Revenue (Agnesian HealthCare Inc.) | 5.750% | 7/1/30 | 6,150 | 6,964 |
| Wisconsin Health & Educational Facilities Authority Revenue | | | | |
| (Ascension Health Alliance Credit Group) | 4.000% | 11/15/36 | 15,000 | 16,069 |
| Wisconsin Health & Educational Facilities Authority Revenue | | | | |
| (Ascension Health Alliance Credit Group) | 4.000% | 11/15/39 | 5,000 | 5,297 |
| Wisconsin Health & Educational Facilities Authority Revenue (Aurora Health Care Inc.) | 5.625% | 4/15/39 | 12,110 | 13,393 |
| Wisconsin Health & Educational Facilities Authority Revenue (Froedtert & Community Health Inc.) | 5.000% | 4/1/42 | 20,690 | 22,989 |
| Wisconsin Health & Educational Facilities Authority Revenue (Marquette University) | 5.000% | 10/1/29 | 1,700 | 1,966 |
260
| | | | |
| Long-Term Tax-Exempt Fund | | | | |
| |
| |
| |
| |
| | | | Face | Market |
| | | Maturity | Amount | Value• |
| | Coupon | Date | ($000) | ($000) |
| Wisconsin Health & Educational Facilities Authority Revenue (Marquette University) | 5.000% | 10/1/30 | 3,260 | 3,768 |
| Wisconsin Health & Educational Facilities Authority Revenue (Marquette University) | 4.000% | 10/1/31 | 1,000 | 1,091 |
| Wisconsin Health & Educational Facilities Authority Revenue (Marquette University) | 4.000% | 10/1/32 | 1,080 | 1,171 |
| Wisconsin Health & Educational Facilities Authority Revenue (Marquette University) | 4.000% | 10/1/33 | 1,385 | 1,491 |
| Wisconsin Health & Educational Facilities Authority Revenue (Marquette University) | 4.000% | 10/1/34 | 1,570 | 1,681 |
| Wisconsin Health & Educational Facilities Authority Revenue (Medical College Wisconsin) | 5.000% | 12/1/41 | 15,000 | 17,547 |
| Wisconsin Health & Educational Facilities Authority Revenue (Ministry Health Care Inc.) | 5.000% | 8/15/22 (Prere.) | 2,950 | 3,561 |
| Wisconsin Transportation Revenue | 5.000% | 7/1/31 | 2,815 | 3,295 |
| | | | | 127,278 |
| Total Tax-Exempt Municipal Bonds (Cost $9,430,361) | | | | 10,115,298 |
| |
| | | | Shares | |
| Temporary Cash Investment (1.1%) | | | | |
| Money Market Fund (1.1%) | | | | |
| 4 Vanguard Municipal Cash Management Fund (Cost $112,210) | 0.614% | | 1,122,095 | 112,209 |
| Total Investments (99.8%) (Cost $9,542,571) | | | | 10,227,507 |
| |
| | | | | Amount |
| | | | | ($000) |
| Other Assets and Liabilities (0.2%) | | | | |
| Other Assets | | | | |
| Investment in Vanguard | | | | 791 |
| Receivables for Investment Securities Sold | | | | 48,577 |
| Receivables for Accrued Income | | | | 127,990 |
| Receivables for Capital Shares Issued | | | | 4,781 |
| Other Assets | | | | 1,460 |
| Total Other Assets | | | | 183,599 |
| Liabilities | | | | |
| Payables for Investment Securities Purchased | | | | (134,250) |
| Payables for Capital Shares Redeemed | | | | (9,028) |
| Payables for Distributions | | | | (10,209) |
| Payables to Vanguard | | | | (9,937) |
| Other Liabilities | | | | (2,350) |
| Total Liabilities | | | | (165,774) |
| Net Assets (100%) | | | | 10,245,332 |
261
| |
| Long-Term Tax-Exempt Fund | |
| |
| |
| |
| |
| At October 31, 2016, net assets consisted of: | |
| | Amount |
| | ($000) |
| Paid-in Capital | 9,538,257 |
| Undistributed Net Investment Income | 32 |
| Accumulated Net Realized Gains | 22,437 |
| Unrealized Appreciation (Depreciation) | |
| Investment Securities | 684,936 |
| Futures Contracts | (330) |
| Net Assets | 10,245,332 |
| |
| Investor Shares—Net Assets | |
| Applicable to 85,115,778 outstanding $.001 par value shares of beneficial interest (unlimited authorization) | 1,006,850 |
| Net Asset Value Per Share—Investor Shares | $11.83 |
| |
| Admiral Shares—Net Assets | |
| Applicable to 780,988,952 outstanding $.001 par value shares of beneficial interest (unlimited authorization) | 9,238,482 |
| Net Asset Value Per Share—Admiral Shares | $11.83 |
• See Note A in Notes to Financial Statements.
1 Security purchased on a when-issued or delayed-delivery basis for which the fund has not taken delivery as of October 31, 2016.
2 Securities with a value of $3,801,000 have been segregated as initial margin for open futures contracts.
3 Security exempt from registration under Rule 144A of the Securities Act of 1933. Such securities may be sold in transactions exempt from registration, normally to qualified institutional buyers. At October 31, 2016,
the aggregate value of these securities was $71,295,000, representing 0.7% of net assets.
4 Affiliated money market fund available only to Vanguard funds and certain trusts and accounts managed by Vanguard. Rate shown is the 7-day yield.
A key to abbreviations and other references follows the Statement of Net Assets.
See accompanying Notes, which are an integral part of the Financial Statements.
262
Long-Term Tax-Exempt Fund
Key to Abbreviations
ARS—Auction Rate Security.
BAN—Bond Anticipation Note.
COP—Certificate of Participation.
CP—Commercial Paper.
FR—Floating Rate.
GAN—Grant Anticipation Note.
GO—General Obligation Bond.
PILOT—Payments in Lieu of Taxes.
PUT—Put Option Obligation.
RAN—Revenue Anticipation Note.
TAN—Tax Anticipation Note.
TOB—Tender Option Bond.
TRAN—Tax Revenue Anticipation Note.
VRDO—Variable Rate Demand Obligation.
VRDP—Variable Rate Demand Preferred.
(ETM)—Escrowed to Maturity.
(Prere.)—Prerefunded.
Scheduled principal and interest payments are guaranteed by:
(1) MBIA (Municipal Bond Investors Assurance).
(2) AMBAC (Ambac Assurance Corporation).
(3) FGIC (Financial Guaranty Insurance Company).
(4) AGM (Assured Guaranty Municipal Corporation).
(5) BIGI (Bond Investors Guaranty Insurance).
(6) Connie Lee Inc.
(7) FHA (Federal Housing Authority).
(8) CapMAC (Capital Markets Assurance Corporation).
(9) American Capital Access Financial Guaranty Corporation.
(10) XL Capital Assurance Inc.
(11) CIFG (CDC IXIS Financial Guaranty).
(12) AGC (Assured Guaranty Corporation).
(13) BHAC (Berkshire Hathaway Assurance Corporation).
(14) NPFG (National Public Finance Guarantee Corporation).
(15) BAM (Build America Mutual Assurance Company).
(16) MAC (Municipal Assurance Corporation).
(17) RAA (Radian Asset Assurance Inc.).
(18) SBLF (Michigan School Bond Loan Fund).
The insurance does not guarantee the market value of the municipal bonds.
LOC—Scheduled principal and interest payments are guaranteed by bank letter of credit.
263
Long-Term Tax-Exempt Fund
| |
| Statement of Operations |
| |
| | Year Ended |
| October 31, 2016 |
| | ($000) |
| Investment Income | |
| Income | |
| Interest1 | 364,139 |
| Total Income | 364,139 |
| Expenses | |
| The Vanguard Group—Note B | |
| Investment Advisory Services | 1,055 |
| Management and Administrative— | |
| Investor Shares | 1,461 |
| Management and Administrative— | |
| Admiral Shares | 6,055 |
| Marketing and Distribution— | |
| Investor Shares | 226 |
| Marketing and Distribution— | |
| Admiral Shares | 723 |
| Custodian Fees | 102 |
| Auditing Fees | 36 |
| Shareholders’ Reports—Investor Shares | 79 |
| Shareholders’ Reports—Admiral Shares | 104 |
| Trustees’ Fees and Expenses | 5 |
| Total Expenses | 9,846 |
| Net Investment Income | 354,293 |
| Realized Net Gain (Loss) | |
| Investment Securities Sold1 | 40,675 |
| Futures Contracts | 1,405 |
| Realized Net Gain (Loss) | 42,080 |
| Change in Unrealized Appreciation | |
| (Depreciation) | |
| Investment Securities | 105,631 |
| Futures Contracts | (307) |
| Change in Unrealized Appreciation | |
| (Depreciation) | 105,324 |
| Net Increase (Decrease) in Net Assets | |
| Resulting from Operations | 501,697 |
1 Interest income and realized net gain (loss) from an affiliated company of the fund were $385,000 and $1,000, respectively.
| | |
| Statement of Changes in Net Assets | | |
| |
| | Year Ended October 31, |
| | 2016 | 2015 |
| | ($000) | ($000) |
| Increase (Decrease) in Net Assets | | |
| Operations | | |
| Net Investment Income | 354,293 | 327,539 |
| Realized Net Gain (Loss) | 42,080 | 20,394 |
| Change in Unrealized Appreciation (Depreciation) | 105,324 | (64,857) |
| Net Increase (Decrease) in Net Assets Resulting from Operations | 501,697 | 283,076 |
| Distributions | | |
| Net Investment Income | | |
| Investor Shares | (34,846) | (34,634) |
| Admiral Shares | (318,057) | (292,289) |
| Realized Capital Gain1 | | |
| Investor Shares | (1,272) | (2,184) |
| Admiral Shares | (11,042) | (17,592) |
| Total Distributions | (365,217) | (346,699) |
| Capital Share Transactions | | |
| Investor Shares | 64,359 | (22,477) |
| Admiral Shares | 1,028,954 | 664,563 |
| Net Increase (Decrease) from Capital Share Transactions | 1,093,313 | 642,086 |
| Total Increase (Decrease) | 1,229,793 | 578,463 |
| Net Assets | | |
| Beginning of Period | 9,015,539 | 8,437,076 |
| End of Period2 | 10,245,332 | 9,015,539 |
1 Includes fiscal 2016 and 2015 short-term gain distributions totaling $549,000 and $8,716,000, respectively. Short-term gain distributions are treated as ordinary income dividends for tax purposes.
2 Net Assets—End of Period includes undistributed (overdistributed) net investment income of $32,000 and $36,000.
See accompanying Notes, which are an integral part of the Financial Statements.
264
| | | | | |
| Long-Term Tax-Exempt Fund | | | | | |
| |
| |
| Financial Highlights | | | | | |
| |
| Investor Shares | | | | | |
| |
| For a Share Outstanding | | | Year Ended October 31, |
| Throughout Each Period | 2016 | 2015 | 2014 | 2013 | 2012 |
| Net Asset Value, Beginning of Period | $11.64 | $11.73 | $11.14 | $11.82 | $11.13 |
| Investment Operations | | | | | |
| Net Investment Income | .418 | .430 | .450 | .441 | . 437 |
| Net Realized and Unrealized Gain (Loss) | | | | | |
| on Investments | . 206 | (. 063) | .590 | (. 680) | .690 |
| Total from Investment Operations | . 624 | . 367 | 1.040 | (. 239) | 1.127 |
| Distributions | | | | | |
| Dividends from Net Investment Income | (.418) | (. 430) | (. 450) | (.441) | (. 437) |
| Distributions from Realized Capital Gains | (.016) | (.027) | — | — | — |
| Total Distributions | (. 434) | (. 457) | (. 450) | (.441) | (. 437) |
| Net Asset Value, End of Period | $11.83 | $11.64 | $11.73 | $11.14 | $11.82 |
| |
| Total Return1 | 5.39% | 3.19% | 9.52% | -2.07% | 10.27% |
| |
| Ratios/Supplemental Data | | | | | |
| Net Assets, End of Period (Millions) | $1,007 | $928 | $958 | $988 | $1,130 |
| Ratio of Total Expenses to Average Net Assets | 0.19% | 0.20% | 0.20% | 0.20% | 0.20% |
| Ratio of Net Investment Income to | | | | | |
| Average Net Assets | 3.52% | 3.69% | 3.95% | 3.84% | 3.78% |
| Portfolio Turnover Rate | 13% | 18% | 21% | 35% | 15% |
1 Total returns do not include account service fees that may have applied in the periods shown. Fund prospectuses provide information about any applicable account service fees.
| | | | | |
| Admiral Shares | | | | | |
| |
| For a Share Outstanding | | | Year Ended October 31, |
| Throughout Each Period | 2016 | 2015 | 2014 | 2013 | 2012 |
| Net Asset Value, Beginning of Period | $11.64 | $11.73 | $11.14 | $11.82 | $11.13 |
| Investment Operations | | | | | |
| Net Investment Income | .430 | .439 | .459 | .450 | .446 |
| Net Realized and Unrealized Gain (Loss) | | | | | |
| on Investments | . 206 | (. 063) | .590 | (. 680) | .690 |
| Total from Investment Operations | .636 | . 376 | 1.049 | (. 230) | 1.136 |
| Distributions | | | | | |
| Dividends from Net Investment Income | (. 430) | (. 439) | (. 459) | (. 450) | (. 446) |
| Distributions from Realized Capital Gains | (.016) | (.027) | — | — | — |
| Total Distributions | (. 446) | (. 466) | (. 459) | (. 450) | (. 446) |
| Net Asset Value, End of Period | $11.83 | $11.64 | $11.73 | $11.14 | $11.82 |
| |
| Total Return1 | 5.50% | 3.27% | 9.60% | -1.99% | 10.36% |
| |
| Ratios/Supplemental Data | | | | | |
| Net Assets, End of Period (Millions) | $9,238 | $8,088 | $7,480 | $6,827 | $7,039 |
| Ratio of Total Expenses to Average Net Assets | 0.09% | 0.12% | 0.12% | 0.12% | 0.12% |
| Ratio of Net Investment Income to | | | | | |
| Average Net Assets | 3.62% | 3.77% | 4.03% | 3.92% | 3.86% |
| Portfolio Turnover Rate | 13% | 18% | 21% | 35% | 15% |
1 Total returns do not include account service fees that may have applied in the periods shown. Fund prospectuses provide information about any applicable account service fees.
See accompanying Notes, which are an integral part of the Financial Statements.
265
Long-Term Tax-Exempt Fund
Notes to Financial Statements
Vanguard Long-Term Tax-Exempt Fund is registered under the Investment Company Act of 1940 as an open-end investment company, or mutual fund. The fund invests in debt instruments of many municipal issuers; the issuers’ abilities to meet their obligations may be affected by economic and political developments in a specific state or region. The fund offers two classes of shares: Investor Shares and Admiral Shares. Investor Shares are available to any investor who meets the fund’s minimum purchase requirements. Admiral Shares are designed for investors who meet certain administrative, service, and account-size criteria.
A. The following significant accounting policies conform to generally accepted accounting principles for U.S. investment companies. The fund consistently follows such policies in preparing its financial statements.
1. Security Valuation: Securities are valued as of the close of trading on the New York Stock Exchange (generally 4 p.m., Eastern time) on the valuation date. Bonds and temporary cash investments acquired over 60 days to maturity are valued using the latest bid prices or using valuations based on a matrix system (which considers such factors as security prices, yields, maturities, and ratings), both as furnished by independent pricing services. Investments in Vanguard Municipal Cash Management Fund are valued at that fund’s net asset value. Other temporary cash investments are valued at amortized cost, which approximates market value. Securities for which market quotations are not readily available, or whose values have been affected by events occurring before the fund’s pricing time but after the close of the securities’ primary markets, are valued by methods deemed by the board of trustees to represent fair value.
2. Futures Contracts: The fund uses futures contracts to invest in fixed income asset classes with greater efficiency and lower cost than is possible through direct investment, to add value when these instruments are attractively priced, or to adjust sensitivity to changes in interest rates. The primary risks associated with the use of futures contracts are imperfect correlation between changes in market values of bonds held by the fund and the prices of futures contracts, and the possibility of an illiquid market. Counterparty risk involving futures is mitigated because a regulated clearinghouse is the counterparty instead of the clearing broker. To further mitigate counterparty risk, the fund trades futures contracts on an exchange, monitors the financial strength of its clearing brokers and clearinghouse, and has entered into clearing agreements with its clearing brokers. The clearinghouse imposes initial margin requirements to secure the fund’s performance and requires daily settlement of variation margin representing changes in the market value of each contract.
Futures contracts are valued at their quoted daily settlement prices. The aggregate settlement values of the contracts are not recorded in the Statement of Net Assets. Fluctuations in the value of the contracts are recorded in the Statement of Net Assets as an asset (liability) and in the Statement of Operations as unrealized appreciation (depreciation) until the contracts are closed, when they are recorded as realized futures gains (losses).
During the year ended October 31, 2016, the fund’s average investments in long and short futures contracts each represented less than 1% of net assets, based on the average of aggregate settlement values at each quarter-end during the period.
3. Federal Income Taxes: The fund intends to continue to qualify as a regulated investment company and distribute all of its income. Management has analyzed the fund’s tax positions taken for all open federal income tax years (October 31, 2013–2016), and has concluded that no provision for federal income tax is required in the fund’s financial statements.
4. Distributions: Distributions from net investment income are declared daily and paid on the first business day of the following month. Annual distributions from realized capital gains, if any, are recorded on the ex-dividend date.
5. Credit Facility: The fund and certain other funds managed by The Vanguard Group (“Vanguard”) participate in a $3.1 billion committed credit facility provided by a syndicate of lenders pursuant to a credit agreement that may be renewed annually; each fund is individually liable for its borrowings, if any, under the credit facility. Borrowings may be utilized for temporary and emergency purposes, and are subject to the fund’s regulatory and contractual borrowing restrictions. The participating funds are charged administrative fees and an annual commitment fee of 0.10% of the undrawn amount of the facility; these fees are allocated to the funds based on a method approved by the fund’s board of trustees and included in Management and Administrative expenses on the fund’s Statement of Operations. Any borrowings under this facility bear interest at a rate based upon the higher of the one-month London Interbank Offered Rate, federal funds effective rate, or overnight bank funding rate plus an agreed-upon spread.
The fund had no borrowings outstanding at October 31, 2016, or at any time during the period then ended.
266
Long-Term Tax-Exempt Fund
6. Other: Interest income includes income distributions received from Vanguard Municipal Cash Management Fund and is accrued daily. Premiums and discounts on debt securities purchased are amortized and accreted, respectively, to interest income over the lives of the respective securities. Security transactions are accounted for on the date securities are bought or sold. Costs used to determine realized gains (losses) on the sale of investment securities are those of the specific securities sold.
Each class of shares has equal rights as to assets and earnings, except that each class separately bears certain class-specific expenses related to maintenance of shareholder accounts (included in Management and Administrative expenses) and shareholder reporting. Marketing and distribution expenses are allocated to each class of shares based on a method approved by the board of trustees. Income, other non-class-specific expenses, and gains and losses on investments are allocated to each class of shares based on its relative net assets.
B. In accordance with the terms of a Funds’ Service Agreement (the “FSA”) between Vanguard and the fund, Vanguard furnishes to the fund investment advisory, corporate management, administrative, marketing, and distribution services at Vanguard’s cost of operations (as defined by the FSA). These costs of operations are allocated to the fund based on methods and guidelines approved by the board of trustees. Vanguard does not require reimbursement in the current period for certain costs of operations (such as deferred compensation/benefits and risk/insurance costs); the fund’s liability for these costs of operations is included in Payables to Vanguard on the Statement of Net Assets.
Upon the request of Vanguard, the fund may invest up to 0.40% of its net assets as capital in Vanguard. At October 31, 2016, the fund had contributed to Vanguard capital in the amount of $791,000, representing 0.01% of the fund’s net assets and 0.32% of Vanguard’s capitalization. The fund’s trustees and officers are also directors and employees, respectively, of Vanguard.
C. Various inputs may be used to determine the value of the fund’s investments. These inputs are summarized in three broad levels for financial statement purposes. The inputs or methodologies used to value securities are not necessarily an indication of the risk associated with investing in those securities.
Level 1—Quoted prices in active markets for identical securities.
Level 2—Other significant observable inputs (including quoted prices for similar securities, interest rates, prepayment speeds, credit risk, etc.).
Level 3—Significant unobservable inputs (including the fund’s own assumptions used to determine the fair value of investments).
The following table summarizes the market value of the fund’s investments as of October 31, 2016, based on the inputs used to value them:
| | | |
| | Level 1 | Level 2 | Level 3 |
| Investments | ($000) | ($000) | ($000) |
| Tax-Exempt Municipal Bonds | — | 10,115,298 | — |
| Temporary Cash Investments | 112,209 | — | — |
| Futures Contracts—Assets1 | 279 | — | — |
| Futures Contracts—Liabilities1 | (11) | — | — |
| Total | 112,477 | 10,115,298 | — |
| 1 Represents variation margin on the last day of the reporting period. | | | |
D. At October 31, 2016, the aggregate settlement value of open futures contracts and the related unrealized appreciation (depreciation) were:
| | | | |
| | | | | ($000) |
| | | | Aggregate | |
| | | Number of | Settlement | Unrealized |
| | | Long (Short) | Value | Appreciation |
| Futures Contracts | Expiration | Contracts | Long (Short) | (Depreciation) |
| 10-Year U.S. Treasury Note | December 2016 | 390 | 50,554 | 63 |
| 5-Year U.S. Treasury Note | December 2016 | 397 | 47,957 | 11 |
| Ultra Long U.S. Treasury Bond | December 2016 | 124 | 21,816 | (425) |
| 30-Year U.S. Treasury Bond | December 2016 | 134 | 21,804 | 21 |
| | | | | (330) |
Unrealized appreciation (depreciation) on open futures contracts is required to be treated as realized gain (loss) for tax purposes.
267
Long-Term Tax-Exempt Fund
E. Capital gain distributions are determined on a tax basis and may differ from realized capital gains for financial reporting purposes. Differences may be permanent or temporary. Permanent differences are reclassified among capital accounts in the financial statements to reflect their tax character. Temporary differences arise when gains or losses are recognized in different periods for financial statement and tax purposes. These differences will reverse at some time in the future.
The fund used a tax accounting practice to treat a portion of the price of capital shares redeemed during the year as distributions from realized capital gains. Accordingly, the fund has reclassified $3,831,000 from accumulated net realized gains to paid-in capital.
For tax purposes, at October 31, 2016, the fund had short-term and long-term capital gains of $7,971,000 and $24,236,000, respectively, available for distribution. Short-term gain distributions are treated as ordinary income dividends for tax purposes.
At October 31, 2016, the cost of investment securities for tax purposes was $9,552,653,000.
Net unrealized appreciation of investment securities for tax purposes was $674,854,000, consisting of unrealized gains of $692,077,000 on securities that had risen in value since their purchase and $17,223,000 in unrealized losses on securities that had fallen in value since their purchase.
F. During the year ended October 31, 2016, the fund purchased $2,444,842,000 of investment securities and sold $1,263,536,000 of investment securities, other than temporary cash investments.
The fund purchased securities from and sold securities to other Vanguard funds or accounts managed by Vanguard or its affiliates, in accordance with procedures adopted by the board of trustees in compliance with Rule 17a-7 of the Investment Company Act of 1940. For the year ended October 31, 2016, such purchases and sales were $373,045,000 and $323,290,000 respectively; these amounts are included in the purchases and sales of investment securities noted above.
| | | | |
| G. Capital share transactions for each class of shares were: | | | |
| | | | Year Ended October 31, |
| | | 2016 | | 2015 |
| | Amount | Shares | Amount | Shares |
| | ($000) | (000) | ($000) | (000) |
| Investor Shares | | | | |
| Issued | 309,232 | 25,947 | 193,377 | 16,549 |
| Issued in Lieu of Cash Distributions | 29,134 | 2,445 | 29,539 | 2,530 |
| Redeemed | (274,007) | (22,961) | (245,393) | (21,045) |
| Net Increase (Decrease) —Investor Shares | 64,359 | 5,431 | (22,477) | (1,966) |
| Admiral Shares | | | | |
| Issued | 1,878,669 | 157,575 | 1,465,794 | 125,693 |
| Issued in Lieu of Cash Distributions | 212,274 | 17,810 | 199,970 | 17,129 |
| Redeemed | (1,061,989) | (89,087) | (1,001,201) | (85,910) |
| Net Increase (Decrease) —Admiral Shares | 1,028,954 | 86,298 | 664,563 | 56,912 |
H. Management has determined that no material events or transactions occurred subsequent to October 31, 2016, that would require recognition or disclosure in these financial statements.
268
High-Yield Tax-Exempt Fund
Fund Profile
As of October 31, 2016
| | |
| Share-Class Characteristics | | |
| | Investor | Admiral |
| | Shares | Shares |
| Ticker Symbol | VWAHX | VWALX |
| Expense Ratio1 | 0.20% | 0.12% |
| 30-Day SEC Yield | 2.49% | 2.61% |
| |
| |
| Financial Attributes | | |
| | | Bloomberg |
| | | Barclays |
| | | Municipal |
| | | Bond |
| | Fund | Index |
| Number of Bonds | 1,672 | 49,796 |
| Yield to Maturity | | |
| (before expenses) | 3.1% | 2.0% |
| Average Coupon | 4.8% | 4.8% |
| Average Duration | 6.7 years | 5.9 years |
| Average Stated Maturity | 17.2 years | 12.9 years |
| Short-Term Reserves | 5.2% | — |
| |
| Largest Area Concentrations2 | |
| California | 13.2.% |
| New York | 11.2 |
| Illinois | 9.5 |
| Texas | 8.7 |
| New Jersey | 7.9 |
| Pennsylvania | 6.1 |
| Florida | 6.0 |
| Michigan | 3.8 |
| Wisconsin | 2.5 |
| Indiana | 2.2 |
| Top Ten | 71.1% |
| |
| |
| Volatility Measures | |
| | Bloomberg |
| | Barclays |
| | Municipal |
| | Bond Index |
| R-Squared | 0.96 |
| Beta | 1.18 |
These measures show the degree and timing of the fund’s fluctuations compared with the indexes over 36 months.
Distribution by Stated Maturity (% of portfolio)
| |
| Under 1 Year | 5.3% |
| 1–3 Years | 5.8 |
| 3–5 Years | 3.7 |
| 5–10 Years | 9.7 |
| 10–20 Years | 33.0 |
| 20–30 Years | 34.9 |
| Over 30 Years | 7.6 |
Distribution by Credit Quality (% of portfolio)
| |
| AAA | 2.5% |
| AA | 26.7 |
| A | 37.4 |
| BBB | 19.0 |
| BB | 3.8 |
| B or Lower | 3.8 |
| Not Rated | 6.8 |
Credit-quality ratings are obtained from Moody’s and S&P, and the higher rating for each issue is shown. “Not Rated” is used to classify securities for which a rating is not available. Not rated securities include a fund’s investment in Vanguard Market Liquidity Fund or Vanguard Municipal Cash Management Fund, each of which invests in high-quality money market instruments and may serve as a cash management vehicle for the Vanguard funds, trusts, and accounts. For more information about these ratings, see the Glossary entry for Credit Quality.
Investment Focus
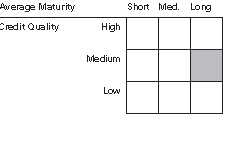
1 The expense ratios shown are from the prospectus dated February 26, 2016, and represent estimated costs for the current fiscal year. For the fiscal year ended October 31, 2016, the expense ratios were 0.19% for Investor Shares and 0.09% for Admiral Shares.
2 Percentage of net assets, excluding any futures contracts.
269
High-Yield Tax-Exempt Fund
Performance Summary
All of the returns in this report represent past performance, which is not a guarantee of future results that may be achieved by the fund. (Current performance may be lower or higher than the performance data cited. For performance data current to the most recent month-end, visit our website at vanguard.com/performance.) Note, too, that both investment returns and principal value can fluctuate widely, so an investor’s shares, when sold, could be worth more or less than their original cost. The returns shown do not reflect taxes that a shareholder would pay on fund distributions or on the sale of fund shares.
Cumulative Performance: October 31, 2006–October 31, 2016
Initial Investment of $10,000
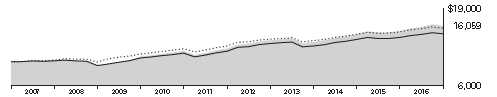
| | | | |
| | | Average Annual Total Returns | Final Value |
| | | Periods Ended October 31, 2016 | of a $10,000 |
| | One Year | Five Years | Ten Years | Investment |
| High-Yield Tax-Exempt Fund Investor Shares | 6.15% | 5.65% | 4.85% | $16,059 |
| Bloomberg Barclays Municipal Bond Index | 4.06 | 4.34 | 4.57 | 15,637 |
| General & Insured Municipal Debt | | | | |
| Funds Average1 | 4.34 | 4.55 | 3.92 | 14,696 |
| | | | |
| | | | | Final Value |
| | | | | of a $50,000 |
| | One Year | Five Years | Ten Years | Investment |
| High-Yield Tax-Exempt Fund Admiral Shares | 6.26% | 5.74% | 4.93% | $80,936 |
| Bloomberg Barclays Municipal Bond Index | 4.06 | 4.34 | 4.57 | 78,184 |
1 Derived from data provided by Lipper, a Thomson Reuters Company.
See Financial Highlights for dividend and capital gains information.
270
| | | | |
| High-Yield Tax-Exempt Fund | | | | |
| |
| |
| |
| |
| Fiscal-Year Total Returns (%): October 31, 2006–October 31, 2016 | | | |
| | | | | Bloomberg |
| | | | | Barclays |
| | | | | Municipal |
| | | | Investor Shares | Bond Index |
| | Income | Capital | Total | Total |
| Fiscal Year | Returns | Returns | Returns | Returns |
| 2007 | 4.60% | -2.66% | 1.94% | 2.91% |
| 2008 | 4.32 | -12.52 | -8.20 | -3.30 |
| 2009 | 5.65 | 10.44 | 16.09 | 13.60 |
| 2010 | 4.76 | 4.00 | 8.76 | 7.78 |
| 2011 | 4.57 | -1.31 | 3.26 | 3.78 |
| 2012 | 4.21 | 7.22 | 11.43 | 9.03 |
| 2013 | 3.74 | -5.85 | -2.11 | -1.72 |
| 2014 | 4.23 | 5.64 | 9.87 | 7.82 |
| 2015 | 3.74 | -0.27 | 3.47 | 2.87 |
| 2016 | 3.74 | 2.41 | 6.15 | 4.06 |
Average Annual Total Returns: Periods Ended September 30, 2016
This table presents returns through the latest calendar quarter—rather than through the end of the fiscal period.
Securities and Exchange Commission rules require that we provide this information.
| | | | | | |
| | | | | | | Ten Years |
| | Inception Date | One Year | Five Years | Income | Capital | Total |
| Investor Shares | 12/27/1978 | 7.92% | 5.83% | 4.36% | 0.68% | 5.04% |
| Admiral Shares | 11/12/2001 | 8.03 | 5.92 | 4.45 | 0.68 | 5.13 |
271
High-Yield Tax-Exempt Fund
Financial Statements
Statement of Net Assets
As of October 31, 2016
The fund reports a complete list of its holdings in regulatory filings four times in each fiscal year, at the quarter-ends. For the second and fourth fiscal quarters, the lists appear in the fund’s semiannual and annual reports to shareholders. For the first and third fiscal quarters, the fund files the lists with the Securities and Exchange Commission on Form N-Q. Shareholders can look up the fund’s Forms N-Q on the SEC’s website at sec.gov. Forms N-Q may also be reviewed and copied at the SEC’s Public Reference Room (see the back cover of this report for further information).
| | | | |
| | | | Face | Market |
| | | Maturity | Amount | Value• |
| | Coupon | Date | ($000) | ($000) |
| Tax-Exempt Municipal Bonds (99.4%) | | | | |
| Alabama (1.1%) | | | | |
| Alabama Port Authority Docks Facilities Revenue | 6.000% | 10/1/40 | 3,000 | 3,504 |
| 1 Birmingham AL GO | 0.000% | 3/1/37 | 2,500 | 2,809 |
| 2 Birmingham AL GO | 0.000% | 3/1/40 | 3,000 | 3,212 |
| 2 Birmingham AL GO | 0.000% | 3/1/45 | 4,000 | 4,266 |
| Birmingham AL Special Care Facilities Financing Authority Revenue | | | | |
| (Methodist Home for the Aging) | 5.750% | 6/1/45 | 2,500 | 2,770 |
| Houston County AL Health Care Authority Revenue | 5.000% | 10/1/30 | 6,785 | 7,730 |
| Jefferson County AL Sewer Revenue | 0.000% | 10/1/38 (4) | 7,500 | 6,245 |
| Jefferson County AL Sewer Revenue | 6.000% | 10/1/42 | 3,000 | 3,566 |
| Jefferson County AL Sewer Revenue | 7.000% | 10/1/51 | 34,230 | 42,927 |
| Jefferson County AL Sewer Revenue | 6.500% | 10/1/53 | 24,250 | 29,672 |
| Mobile AL Industrial Development Board Pollution Control Revenue (Alabama Power Co.) PUT | 1.650% | 3/20/17 | 6,300 | 6,319 |
| Montgomery AL Higher Education Building Authority Revenue (Faulkner University) | 5.000% | 10/1/36 | 2,820 | 3,098 |
| Montgomery AL Higher Education Building Authority Revenue (Faulkner University) | 5.000% | 10/1/43 | 5,080 | 5,542 |
| Selma AL Industrial Development Board Revenue (International Paper Co. Project) | 5.375% | 12/1/35 | 4,000 | 4,585 |
| | | | | 126,245 |
| Alaska (0.2%) | | | | |
| Alaska Industrial Development & Export Authority Revenue (Providence Health & Services) | 5.500% | 10/1/41 | 6,105 | 6,950 |
| Anchorage AK Electric Utility Revenue | 5.000% | 12/1/35 | 5,000 | 5,818 |
| Anchorage AK Electric Utility Revenue | 5.000% | 12/1/36 | 5,000 | 5,803 |
| Northern Alaska Tobacco Securitization Corp. Revenue | 4.625% | 6/1/23 | 2,530 | 2,570 |
| | | | | 21,141 |
| American Samoa (0.0%) | | | | |
| American Samoa Economic Development Authority Revenue | 6.625% | 9/1/35 | 5,000 | 5,018 |
| |
| Arizona (0.9%) | | | | |
| Arizona Health Facilities Authority Health Care Facilities Revenue (Beatitudes Campus Project) | 5.200% | 10/1/37 | 7,000 | 7,002 |
| Arizona Health Facilities Authority Hospital System Revenue (Phoenix Children’s Hospital) | 5.000% | 2/1/30 | 3,250 | 3,598 |
| Arizona Health Facilities Authority Hospital System Revenue (Phoenix Children’s Hospital) | 5.000% | 2/1/33 | 1,700 | 1,883 |
| Arizona Health Facilities Authority Hospital System Revenue (Phoenix Children’s Hospital) | 5.000% | 2/1/34 | 8,250 | 9,054 |
| Arizona State University Revenue (McAllister Academic Village LLC) | 5.000% | 7/1/27 | 1,830 | 2,266 |
| Arizona State University Revenue (McAllister Academic Village LLC) | 5.000% | 7/1/37 | 2,310 | 2,727 |
| Maricopa County AZ Pollution Control Corp. Revenue (Southern California Edison Co.) | 5.000% | 6/1/35 | 12,500 | 13,879 |
| Phoenix AZ Civic Improvement Corp. Excise Tax Revenue | 5.000% | 7/1/28 | 2,250 | 2,747 |
| Phoenix AZ Civic Improvement Corp. Excise Tax Revenue | 5.000% | 7/1/29 | 6,670 | 8,057 |
| Phoenix AZ Civic Improvement Corp. Water System Revenue | 5.000% | 7/1/33 | 5,925 | 6,998 |
| Phoenix AZ Civic Improvement Corp. Water System Revenue | 5.000% | 7/1/34 | 5,520 | 6,498 |
| Pima County AZ Industrial Development Authority Revenue (Tucson Electric Power Co. Project) | 4.000% | 9/1/29 | 3,000 | 3,253 |
| Salt Verde AZ Financial Corp. Gas Revenue | 5.250% | 12/1/26 | 8,545 | 10,516 |
| Salt Verde AZ Financial Corp. Gas Revenue | 5.250% | 12/1/27 | 17,105 | 21,203 |
| University Medical Center Corp. Arizona Hospital Revenue | 6.500% | 7/1/19 (Prere.) | 2,500 | 2,855 |
| | | | | 102,536 |
| Arkansas (0.2%) | | | | |
| Arkansas Development Finance Authority Hospital Revenue | | | | |
| (Washington Regional Medical Center) | 5.000% | 2/1/24 | 1,600 | 1,918 |
| Arkansas Development Finance Authority Hospital Revenue | | | | |
| (Washington Regional Medical Center) | 5.000% | 2/1/27 | 2,970 | 3,536 |
| Arkansas Development Finance Authority Hospital Revenue | | | | |
| (Washington Regional Medical Center) | 5.000% | 2/1/28 | 3,845 | 4,548 |
| Arkansas Development Finance Authority Hospital Revenue | | | | |
| (Washington Regional Medical Center) | 5.000% | 2/1/30 | 5,045 | 5,882 |
| Arkansas Development Finance Authority Hospital Revenue | | | | |
| (Washington Regional Medical Center) | 5.000% | 2/1/33 | 1,425 | 1,637 |
272
High-Yield Tax-Exempt Fund
| | | | |
| | | | Face | Market |
| | | Maturity | Amount | Value• |
| | Coupon | Date | ($000) | ($000) |
| Arkansas Development Finance Authority Hospital Revenue | | | | |
| (Washington Regional Medical Center) | 5.000% | 2/1/33 | 1,645 | 1,890 |
| | | | | 19,411 |
| California (13.2%) | | | | |
| Alameda CA Corridor Transportation Authority Revenue | 5.400% | 10/1/17 (Prere.) | 5,250 | 5,474 |
| Alameda CA Corridor Transportation Authority Revenue | 0.000% | 10/1/30 (2) | 1,000 | 588 |
| Alameda CA Corridor Transportation Authority Revenue | 5.000% | 10/1/34 | 3,750 | 4,393 |
| Alameda CA Corridor Transportation Authority Revenue | 4.000% | 10/1/35 (4) | 3,750 | 4,093 |
| Alameda CA Corridor Transportation Authority Revenue | 5.000% | 10/1/35 | 3,200 | 3,739 |
| Alameda CA Corridor Transportation Authority Revenue | 5.000% | 10/1/35 (4) | 3,850 | 4,568 |
| Alameda CA Corridor Transportation Authority Revenue | 5.000% | 10/1/36 | 2,000 | 2,330 |
| Alameda CA Corridor Transportation Authority Revenue | 5.000% | 10/1/36 (4) | 2,210 | 2,614 |
| Alameda CA Corridor Transportation Authority Revenue | 4.000% | 10/1/37 (4) | 1,500 | 1,629 |
| Alameda CA Corridor Transportation Authority Revenue | 5.000% | 10/1/37 | 6,000 | 6,978 |
| 3 Bay Area Toll Authority California Toll Bridge Revenue (San Francisco Bay Area) PUT | 1.230% | 4/1/20 | 5,000 | 4,981 |
| 3 Bay Area Toll Authority California Toll Bridge Revenue (San Francisco Bay Area) PUT | 1.530% | 5/1/23 | 10,000 | 9,993 |
| California Department of Water Resources Water System Revenue (Central Valley Project) | 5.000% | 6/1/18 (Prere.) | 5,175 | 5,515 |
| California Department of Water Resources Water System Revenue (Central Valley Project) | 5.000% | 6/1/18 (Prere.) | 5 | 5 |
| California Department of Water Resources Water System Revenue (Central Valley Project) | 5.000% | 12/1/28 | 195 | 208 |
| California Educational Facilities Authority Revenue (Stanford University) | 5.250% | 4/1/40 | 5,940 | 8,338 |
| California GO | 5.000% | 11/1/21 | 13,845 | 14,427 |
| California GO | 5.250% | 9/1/24 | 6,500 | 7,780 |
| California GO | 5.000% | 9/1/28 | 8,230 | 9,656 |
| California GO | 5.000% | 9/1/29 | 4,565 | 5,347 |
| 4 California GO | 5.000% | 8/1/30 | 14,500 | 17,758 |
| California GO | 5.000% | 10/1/30 | 12,600 | 15,334 |
| California GO | 4.000% | 9/1/31 | 10,000 | 11,125 |
| California GO | 6.000% | 3/1/33 | 3,000 | 3,482 |
| California GO | 5.125% | 4/1/33 | 15,000 | 15,819 |
| California GO | 6.500% | 4/1/33 | 34,000 | 38,401 |
| California GO | 5.000% | 9/1/36 | 3,250 | 3,829 |
| California GO | 5.000% | 2/1/38 | 6,375 | 7,400 |
| California GO | 5.250% | 3/1/38 | 5,000 | 5,264 |
| California GO | 5.500% | 11/1/39 | 10,000 | 11,239 |
| California GO | 6.000% | 11/1/39 | 5,000 | 5,707 |
| California GO | 5.000% | 2/1/43 | 2,750 | 3,180 |
| California GO | 5.000% | 11/1/43 | 12,500 | 14,671 |
| California GO | 4.000% | 9/1/45 | 3,000 | 3,243 |
| California Health Facilities Financing Authority Revenue (Adventist Health System/West) | 5.750% | 9/1/19 (Prere.) | 4,500 | 5,100 |
| California Health Facilities Financing Authority Revenue (Adventist Health System/West) | 4.000% | 3/1/28 | 5,000 | 5,515 |
| California Health Facilities Financing Authority Revenue (Adventist Health System/West) | 4.000% | 3/1/33 | 10,000 | 10,644 |
| California Health Facilities Financing Authority Revenue (Adventist Health System/West) | 4.000% | 3/1/39 | 10,000 | 10,371 |
| California Health Facilities Financing Authority Revenue (Catholic Healthcare West) | 6.000% | 7/1/39 | 7,500 | 8,383 |
| California Health Facilities Financing Authority Revenue (Children’s Hospital of Los Angeles) | 5.000% | 11/15/29 | 5,650 | 6,338 |
| 4 California Health Facilities Financing Authority Revenue (El Camino Hospital) | 5.000% | 2/1/41 | 10,000 | 11,557 |
| California Health Facilities Financing Authority Revenue | | | | |
| (Lucile Salter Packard Children’s Hospital at Stanford) | 5.000% | 8/15/55 | 3,000 | 3,464 |
| California Health Facilities Financing Authority Revenue (St. Joseph Health System) | 5.750% | 7/1/39 | 7,000 | 7,782 |
| California Health Facilities Financing Authority Revenue (Sutter Health) | 4.000% | 8/15/40 | 10,000 | 10,545 |
| California Health Facilities Financing Authority Revenue (Sutter Health) | 6.000% | 8/15/42 | 12,000 | 14,001 |
| California Infrastructure & Economic Development Bank Revenue | | | | |
| (Independent System Operator Corp. Project) | 5.000% | 2/1/34 | 13,770 | 15,931 |
| California Infrastructure & Economic Development Bank Revenue | | | | |
| (Pacific Gas & Electric Co.) VRDO | 0.500% | 11/1/16 LOC | 2,070 | 2,070 |
| California Municipal Finance Authority Revenue (Azusa Pacific University) | 5.000% | 4/1/35 | 2,000 | 2,278 |
| California Municipal Finance Authority Revenue (University of La Verne) | 6.250% | 6/1/40 | 3,585 | 4,137 |
| California Pollution Control Financing Authority Solid Waste Disposal Revenue | | | | |
| (Republic Services Inc. Project) PUT | 0.750% | 2/1/17 | 20,000 | 20,000 |
| California Pollution Control Financing Authority Solid Waste Disposal Revenue | | | | |
| (Republic Services Inc. Project) PUT | 5.250% | 12/1/17 | 12,155 | 12,652 |
| California Public Works Board Lease Revenue (Department of Corrections) | 4.500% | 9/1/35 | 10,000 | 11,136 |
| California Public Works Board Lease Revenue (Judicial Council Projects) | 5.000% | 12/1/28 | 3,600 | 4,198 |
| California Public Works Board Lease Revenue (Judicial Council Projects) | 5.000% | 3/1/34 | 7,380 | 8,628 |
| California Public Works Board Lease Revenue (Various Capital Projects) | 5.000% | 12/1/21 (Prere.) | 10,000 | 11,895 |
| California Public Works Board Lease Revenue (Various Capital Projects) | 4.000% | 4/1/31 | 15,305 | 16,844 |
| California Public Works Board Lease Revenue (Various Capital Projects) | 5.000% | 11/1/37 | 9,035 | 10,499 |
| 5 California State University Systemwide Revenue | 5.250% | 5/1/19 (Prere.) | 9,275 | 10,265 |
| California State University Systemwide Revenue | 4.000% | 11/1/38 | 5,560 | 6,089 |
| California State University Systemwide Revenue | 4.000% | 11/1/45 | 2,750 | 2,985 |
273
High-Yield Tax-Exempt Fund
| | | | | |
| | | | | Face | Market |
| | | | Maturity | Amount | Value• |
| | | Coupon | Date | ($000) | ($000) |
| | California State University Systemwide Revenue | 5.000% | 11/1/45 | 6,400 | 7,638 |
| | California Statewide Communities Development Authority Revenue (899 Charleston Project) | 5.250% | 11/1/44 | 2,000 | 2,209 |
| | California Statewide Communities Development Authority Revenue (899 Charleston Project) | 5.375% | 11/1/49 | 4,700 | 5,200 |
| | California Statewide Communities Development Authority Revenue | | | | |
| | (Adventist Health System/West) | 5.000% | 3/1/30 | 6,380 | 7,748 |
| | California Statewide Communities Development Authority Revenue | | | | |
| | (Adventist Health System/West) | 5.000% | 3/1/35 | 4,500 | 5,349 |
| | California Statewide Communities Development Authority Revenue (John Muir Health) | 4.000% | 8/15/46 | 3,200 | 3,321 |
| | California Statewide Communities Development Authority Revenue (John Muir Health) | 4.000% | 8/15/51 | 4,000 | 4,133 |
| | California Statewide Communities Development Authority Revenue (Kaiser Permanente) | 5.000% | 4/1/42 | 18,930 | 21,529 |
| | California Statewide Communities Development Authority Revenue | | | | |
| | (Loma Linda University Medical Center) | 5.000% | 12/1/36 | 9,000 | 10,083 |
| | California Statewide Communities Development Authority Revenue | | | | |
| | (Loma Linda University Medical Center) | 5.000% | 12/1/41 | 10,000 | 11,126 |
| | California Statewide Communities Development Authority Revenue | | | | |
| | (Loma Linda University Medical Center) | 5.500% | 12/1/54 | 12,000 | 13,377 |
| | California Statewide Communities Development Authority Revenue | | | | |
| | (Loma Linda University Medical Center) | 5.250% | 12/1/56 | 40,750 | 45,461 |
| 5 | California Statewide Communities Development Authority Student Housing Revenue | | | | |
| | (CHF-Irvine LLC - UCI East Campus Apartments Phase II) | 5.750% | 5/15/18 (Prere.) | 8,000 | 8,604 |
| | Corona-Norco CA School District Public Financing Authority Special Tax Revenue | 5.000% | 9/1/32 | 1,125 | 1,321 |
| | Corona-Norco CA School District Public Financing Authority Special Tax Revenue | 5.000% | 9/1/35 | 585 | 678 |
| 3,6 | Eaton Vance California Municipal Income Trust | 2.130% | 9/1/19 | 15,000 | 15,001 |
| | Elk Grove CA Finance Authority Special Tax Revenue | 5.000% | 9/1/38 (15) | 1,465 | 1,703 |
| | Foothill/Eastern Transportation Corridor Agency California Toll Road Revenue | 0.000% | 1/15/42 | 6,000 | 5,097 |
| | Foothill/Eastern Transportation Corridor Agency California Toll Road Revenue | 6.500% | 1/15/43 | 8,730 | 10,422 |
| | Foothill/Eastern Transportation Corridor Agency California Toll Road Revenue | 5.750% | 1/15/46 | 18,000 | 21,045 |
| | Golden State Tobacco Securitization Corp. California Revenue | 4.500% | 6/1/27 | 4,000 | 4,009 |
| | Golden State Tobacco Securitization Corp. California Revenue | 5.000% | 6/1/32 | 4,500 | 5,337 |
| | Golden State Tobacco Securitization Corp. California Revenue | 5.000% | 6/1/35 | 15,000 | 17,452 |
| | Golden State Tobacco Securitization Corp. California Revenue | 5.300% | 6/1/37 | 7,000 | 6,952 |
| | Golden State Tobacco Securitization Corp. California Revenue | 5.000% | 6/1/40 | 38,175 | 44,164 |
| | Golden State Tobacco Securitization Corp. California Revenue | 5.000% | 6/1/45 | 3,650 | 4,223 |
| | Golden State Tobacco Securitization Corp. California Revenue | 5.750% | 6/1/47 | 31,245 | 30,761 |
| | Grossmont CA Healthcare District GO | 5.000% | 7/15/17 (Prere.) | 4,000 | 4,122 |
| | Grossmont CA Healthcare District GO | 6.125% | 7/15/21 (Prere.) | 5,000 | 6,153 |
| | Imperial CA Irrigation District Electric Revenue | 5.000% | 11/1/37 | 3,000 | 3,580 |
| | Kern County CA GO | 5.750% | 8/1/35 (12) | 4,500 | 4,931 |
| | Lee Lake CA Public Financing Authority Revenue | 5.000% | 9/1/28 | 2,805 | 3,266 |
| | Lee Lake CA Public Financing Authority Revenue | 5.000% | 9/1/29 | 2,825 | 3,279 |
| | Lee Lake CA Public Financing Authority Revenue | 5.000% | 9/1/32 | 3,500 | 4,011 |
| | Lee Lake CA Public Financing Authority Revenue | 5.125% | 9/1/35 | 2,350 | 2,684 |
| | Long Beach CA Harbor Revenue | 5.000% | 5/15/28 | 4,855 | 5,842 |
| | Long Beach CA Harbor Revenue | 5.000% | 5/15/30 | 2,000 | 2,379 |
| | Los Angeles CA Department of Airports International Airport Revenue | 5.375% | 5/15/30 | 15,000 | 15,902 |
| | Los Angeles CA Department of Airports International Airport Revenue | 5.000% | 5/15/32 | 2,000 | 2,345 |
| | Los Angeles CA Department of Airports International Airport Revenue | 4.000% | 5/15/34 | 2,500 | 2,704 |
| | Los Angeles CA Department of Airports International Airport Revenue | 5.000% | 5/15/35 | 1,750 | 2,039 |
| | Los Angeles CA Department of Airports International Airport Revenue | 4.000% | 5/15/36 | 1,500 | 1,618 |
| | Los Angeles CA Department of Airports International Airport Revenue | 5.000% | 5/15/41 | 11,000 | 12,673 |
| | Los Angeles CA Department of Water & Power Revenue | 5.000% | 7/1/41 | 2,500 | 2,980 |
| | Los Angeles CA Regional Airports Improvement Corp. Lease Revenue (LAXFuel Corp.) | 5.000% | 1/1/32 | 4,000 | 4,420 |
| | Los Angeles CA Unified School District GO | 4.000% | 7/1/34 | 6,000 | 6,677 |
| | Los Angeles CA Unified School District GO | 4.000% | 7/1/35 | 7,000 | 7,756 |
| | Los Angeles CA Wastewater System Revenue | 5.750% | 6/1/19 (Prere.) | 4,315 | 4,837 |
| | Los Angeles CA Wastewater System Revenue | 5.750% | 6/1/27 | 3,465 | 3,873 |
| | Los Angeles County CA Public Works Financing Authority Lease Revenue | 5.000% | 8/1/33 | 2,500 | 2,937 |
| | Los Angeles County CA Public Works Financing Authority Lease Revenue | 4.000% | 12/1/34 | 1,500 | 1,633 |
| | Los Angeles County CA Public Works Financing Authority Lease Revenue | 4.000% | 12/1/36 | 750 | 811 |
| | Los Angeles County CA Public Works Financing Authority Lease Revenue | 4.000% | 12/1/40 | 2,000 | 2,150 |
| | Marin CA Healthcare District GO | 4.000% | 8/1/40 | 8,000 | 8,656 |
| | Modesto CA Irrigation District COP | 5.500% | 7/1/18 (Prere.) | 11,300 | 12,168 |
| | Northstar Community Services District California Community Facilities District No. 1 | | | | |
| | Special Tax Revenue | 5.000% | 9/1/37 | 10,000 | 10,057 |
| | Oakland CA Unified School District GO | 6.125% | 8/1/19 (Prere.) | 4,000 | 4,562 |
| | Oakland CA Unified School District GO | 5.000% | 8/1/30 | 1,250 | 1,509 |
| | Oakland CA Unified School District GO | 5.000% | 8/1/32 | 1,000 | 1,194 |
| | Oakland CA Unified School District GO | 5.500% | 8/1/32 | 3,000 | 3,595 |
| | Oakland CA Unified School District GO | 6.625% | 8/1/38 | 4,000 | 4,963 |
| | Oakland CA Unified School District GO | 5.000% | 8/1/40 | 4,000 | 4,685 |
274
High-Yield Tax-Exempt Fund
| | | | |
| | | | Face | Market |
| | | Maturity | Amount | Value• |
| | Coupon | Date | ($000) | ($000) |
| Palomar Pomerado Health California GO | 4.000% | 8/1/31 | 4,000 | 4,389 |
| Palomar Pomerado Health California GO | 0.000% | 8/1/33 (12) | 8,805 | 4,812 |
| Palomar Pomerado Health California GO | 0.000% | 8/1/38 (12) | 10,740 | 12,703 |
| Palomar Pomerado Health California Revenue | 5.000% | 11/1/28 | 3,500 | 4,052 |
| Palomar Pomerado Health California Revenue | 5.000% | 11/1/29 | 4,605 | 5,297 |
| Palomar Pomerado Health California Revenue | 5.000% | 11/1/30 | 3,335 | 3,818 |
| Palomar Pomerado Health California Revenue | 5.000% | 11/1/31 | 2,485 | 2,836 |
| Peralta CA Community College District Revenue | 4.000% | 8/1/39 | 7,000 | 7,563 |
| Peralta CA Community College District Revenue | 4.000% | 8/1/39 | 5,000 | 5,376 |
| Port of Oakland CA Revenue | 5.000% | 5/1/28 | 10,000 | 11,739 |
| Port of Oakland CA Revenue | 5.000% | 5/1/29 | 10,000 | 11,682 |
| Port of Oakland CA Revenue | 5.000% | 5/1/29 | 2,250 | 2,542 |
| Port of Oakland CA Revenue | 5.125% | 5/1/30 | 2,000 | 2,259 |
| Port of Oakland CA Revenue | 5.125% | 5/1/31 | 2,000 | 2,249 |
| Poway CA Unified School District GO | 0.000% | 8/1/46 | 2,500 | 828 |
| Poway CA Unified School District Public Financing Authority Special Tax Revenue | 5.000% | 9/1/28 (15) | 1,330 | 1,610 |
| Poway CA Unified School District Public Financing Authority Special Tax Revenue | 5.000% | 9/1/31 (15) | 3,740 | 4,434 |
| Poway CA Unified School District Public Financing Authority Special Tax Revenue | 5.000% | 9/1/32 (15) | 2,490 | 2,931 |
| Poway CA Unified School District Public Financing Authority Special Tax Revenue | 5.000% | 9/1/34 (15) | 2,990 | 3,479 |
| Rancho Cucamonga CA Redevelopment Agency Successor Agency Tax Allocation Revenue | | | | |
| (Rancho Redevelopment Project) | 4.000% | 9/1/31 (14) | 2,000 | 2,209 |
| Rancho Cucamonga CA Redevelopment Agency Successor Agency Tax Allocation Revenue | | | | |
| (Rancho Redevelopment Project) | 4.000% | 9/1/32 (14) | 3,205 | 3,510 |
| Rancho Cucamonga CA Redevelopment Agency Successor Agency Tax Allocation Revenue | | | | |
| (Rancho Redevelopment Project) | 4.000% | 9/1/34 (14) | 2,140 | 2,319 |
| Rancho Mirage CA Joint Powers Financing Authority Revenue (Eisenhower Medical Center) | 5.000% | 7/1/27 | 1,000 | 1,023 |
| Rancho Santiago CA Community College District GO | 5.125% | 9/1/28 (4) | 12,000 | 15,484 |
| Rancho Santiago CA Community College District GO | 5.125% | 9/1/29 (4) | 6,000 | 7,763 |
| Riverside CA Community College District GO | 5.000% | 8/1/28 | 5,000 | 6,221 |
| Riverside County CA Transportation Commission Toll Revenue | 0.000% | 6/1/42 | 7,000 | 2,317 |
| Roseville CA Financing Authority Electric System Revenue | 5.000% | 2/1/37 | 11,000 | 12,258 |
| Roseville CA Natural Gas Financing Authority Gas Revenue | 5.000% | 2/15/21 | 425 | 474 |
| Sacramento County CA Airport Revenue | 6.000% | 7/1/41 | 9,500 | 10,252 |
| San Bernardino CA City Unified School District GO | 5.000% | 8/1/26 (4) | 1,310 | 1,569 |
| San Bernardino CA City Unified School District GO | 5.000% | 8/1/28 (4) | 1,500 | 1,772 |
| San Bernardino County CA Medical Center COP | 7.000% | 8/1/20 | 12,180 | 14,194 |
| San Bernardino County CA Medical Center COP | 6.875% | 8/1/24 (ETM) | 25,220 | 32,763 |
| San Diego CA Community College District GO | 5.250% | 8/1/19 (Prere.) | 5,500 | 6,141 |
| San Diego CA Unified School District GO | 0.000% | 7/1/30 | 15,000 | 9,838 |
| San Francisco CA City & County International Airport Revenue | 5.750% | 5/1/19 | 20,565 | 22,053 |
| San Francisco CA City & County International Airport Revenue | 5.750% | 5/1/20 | 26,405 | 28,316 |
| San Francisco CA City & County International Airport Revenue | 5.000% | 5/1/30 | 5,000 | 5,696 |
| San Francisco CA City & County International Airport Revenue | 5.000% | 5/1/31 | 2,095 | 2,373 |
| San Francisco CA City & County International Airport Revenue | 5.250% | 5/1/33 | 10,000 | 11,556 |
| San Francisco CA City & County International Airport Revenue | 5.000% | 5/1/39 | 2,500 | 2,846 |
| San Francisco CA City & County International Airport Revenue | 6.000% | 5/1/39 | 2,130 | 2,388 |
| San Francisco CA City & County International Airport Revenue | 5.000% | 5/1/40 | 5,000 | 5,689 |
| San Francisco CA City & County International Airport Revenue | 5.000% | 5/1/41 | 15,875 | 18,228 |
| San Francisco CA City & County International Airport Revenue | 5.000% | 5/1/46 | 15,000 | 17,131 |
| San Francisco CA City & County Redevelopment Agency Community Facilities District No. 7 | | | | |
| Special Tax Revenue (Hunters Point Shipyard Improvements) | 5.000% | 8/1/39 | 2,240 | 2,492 |
| San Francisco CA City & County Redevelopment Agency Community Facilities District No. 7 | | | | |
| Special Tax Revenue (Hunters Point Shipyard Improvements) | 5.000% | 8/1/44 | 2,500 | 2,772 |
| San Francisco CA City & County Redevelopment Financing Authority Tax Allocation Revenue | | | | |
| (Mission Bay North) | 6.625% | 8/1/19 (Prere.) | 2,000 | 2,304 |
| San Francisco CA City & County Redevelopment Financing Authority Tax Allocation Revenue | | | | |
| (Mission Bay South) | 7.000% | 2/1/21 (Prere.) | 1,500 | 1,867 |
| 6 San Francisco CA City & County Redevelopment Financing Authority Tax Allocation Revenue | | | | |
| (Mission Bays Redevelopment Project) | 3.000% | 8/1/21 | 6,000 | 6,159 |
| 6 San Francisco CA City & County Redevelopment Financing Authority Tax Allocation Revenue | | | | |
| (Mission Bays Redevelopment Project) | 0.000% | 8/1/23 | 2,000 | 1,455 |
| 6 San Francisco CA City & County Redevelopment Financing Authority Tax Allocation Revenue | | | | |
| (Mission Bays Redevelopment Project) | 0.000% | 8/1/26 | 3,000 | 1,842 |
| 6 San Francisco CA City & County Redevelopment Financing Authority Tax Allocation Revenue | | | | |
| (Mission Bays Redevelopment Project) | 0.000% | 8/1/31 | 6,000 | 2,787 |
| 6 San Francisco CA City & County Redevelopment Financing Authority Tax Allocation Revenue | | | | |
| (Mission Bays Redevelopment Project) | 0.000% | 8/1/43 | 9,000 | 2,138 |
| San Francisco Office of Community Investment & Infrastructure Special Tax Revenue | | | | |
| (Mission Bay) | 5.000% | 8/1/25 | 1,600 | 1,838 |
275
High-Yield Tax-Exempt Fund
| | | | |
| | | | Face | Market |
| | | Maturity | Amount | Value• |
| | Coupon | Date | ($000) | ($000) |
| San Francisco Office of Community Investment & Infrastructure Special Tax Revenue | | | | |
| (Mission Bay) | 5.000% | 8/1/26 | 1,250 | 1,428 |
| San Francisco Office of Community Investment & Infrastructure Special Tax Revenue | | | | |
| (Mission Bay) | 5.000% | 8/1/28 | 1,510 | 1,704 |
| San Francisco Office of Community Investment & Infrastructure Special Tax Revenue | | | | |
| (Mission Bay) | 5.000% | 8/1/30 | 1,000 | 1,119 |
| San Francisco Office of Community Investment & Infrastructure Special Tax Revenue | | | | |
| (Mission Bay) | 5.000% | 8/1/33 | 1,335 | 1,478 |
| San Joaquin Hills CA Transportation Corridor Agency Toll Road Revenue | 0.000% | 1/15/24 (14) | 2,000 | 1,629 |
| San Joaquin Hills CA Transportation Corridor Agency Toll Road Revenue | 0.000% | 1/15/25 (14) | 15,900 | 12,383 |
| San Jose CA Redevelopment Agency Tax Allocation Revenue | 4.440% | 8/1/17 (14) | 2,420 | 2,428 |
| San Jose CA Redevelopment Agency Tax Allocation Revenue | 4.540% | 8/1/18 (14) | 780 | 783 |
| San Jose CA Redevelopment Agency Tax Allocation Revenue | 5.000% | 8/1/19 (2) | 1,700 | 1,751 |
| San Mateo CA Community Facilities District No. 2008-1 Special Tax Revenue (Bay Meadows) | 5.000% | 9/1/42 | 2,000 | 2,171 |
| Simi Valley CA School Financing Authority Revenue | 5.000% | 8/1/27 (4) | 10,000 | 10,503 |
| Southern California Public Power Authority Revenue (Natural Gas Project) | 5.250% | 11/1/20 | 1,700 | 1,937 |
| Stockton CA Public Financing Authority Revenue | 4.000% | 9/2/27 (15) | 1,170 | 1,342 |
| Stockton CA Public Financing Authority Revenue | 4.000% | 9/2/29 (15) | 1,355 | 1,517 |
| Stockton CA Public Financing Authority Revenue | 4.000% | 9/2/31 (15) | 1,000 | 1,102 |
| Stockton CA Public Financing Authority Water Revenue (Delta Water Supply Project) | 6.250% | 10/1/40 | 6,200 | 7,705 |
| Sweetwater CA Unified School District GO | 5.000% | 8/1/26 (15) | 6,465 | 7,981 |
| Sweetwater CA Unified School District GO | 4.000% | 8/1/42 | 2,000 | 2,149 |
| Turlock CA Irrigation District Revenue | 5.000% | 1/1/20 (Prere.) | 6,385 | 7,168 |
| Ukiah CA Unified School District GO | 0.000% | 8/1/31 (10) | 9,245 | 5,391 |
| University of California Regents Medical Center Pooled Revenue | 4.000% | 5/15/44 | 12,500 | 13,487 |
| University of California Revenue | 5.000% | 5/15/46 | 3,000 | 3,568 |
| Victor Valley CA Community College District GO | 6.000% | 8/1/19 (Prere.) | 8,000 | 9,087 |
| Walnut CA Energy Center Authority Revenue | 5.000% | 1/1/35 | 10,000 | 11,026 |
| West Contra Costa CA Unified School District GO | 6.000% | 8/1/27 | 3,000 | 4,150 |
| Whittier CA Health Facilities Revenue (Presbyterian Intercommunity Hospital Obligated Group) | 5.000% | 6/1/44 | 18,865 | 21,366 |
| | | | | 1,476,338 |
| Colorado (1.6%) | | | | |
| Colorado Educational & Cultural Facilities Authority Revenue (Regis University) | 5.000% | 10/1/26 | 2,390 | 2,820 |
| Colorado Educational & Cultural Facilities Authority Revenue (Regis University) | 5.000% | 10/1/27 | 2,515 | 2,948 |
| Colorado Educational & Cultural Facilities Authority Revenue (Regis University) | 5.000% | 10/1/28 | 2,300 | 2,683 |
| Colorado Educational & Cultural Facilities Authority Revenue (Regis University) | 5.000% | 10/1/30 | 1,615 | 1,865 |
| Colorado Health Facilities Authority Revenue (Catholic Health Initiatives) | 5.000% | 7/1/31 | 4,580 | 5,148 |
| Colorado Health Facilities Authority Revenue (Christian Living Communities) | 5.000% | 1/1/31 | 1,400 | 1,566 |
| Colorado Health Facilities Authority Revenue (Christian Living Communities) | 5.000% | 1/1/37 | 1,800 | 1,980 |
| Colorado Health Facilities Authority Revenue (Covenant Retirement Community Inc.) | 5.000% | 12/1/33 | 3,250 | 3,563 |
| Colorado Health Facilities Authority Revenue (Covenant Retirement Community Inc.) | 5.000% | 12/1/35 | 7,250 | 8,119 |
| Colorado Health Facilities Authority Revenue (Sunny Vista Living Center) | 6.125% | 12/1/45 | 1,000 | 1,089 |
| Colorado Health Facilities Authority Revenue (Sunny Vista Living Center) | 6.250% | 12/1/50 | 2,000 | 2,180 |
| Denver CO City & County Airport Revenue | 5.250% | 11/15/36 | 7,500 | 8,413 |
| Denver CO City & County Airport Revenue | 5.250% | 11/15/43 | 8,000 | 9,005 |
| Denver CO City & County Dedicated Tax Revenue | 4.000% | 8/1/46 | 4,850 | 5,160 |
| E-470 Public Highway Authority Colorado Revenue | 0.000% | 9/1/18 (14) | 5,000 | 4,850 |
| E-470 Public Highway Authority Colorado Revenue | 0.000% | 9/1/24 (14) | 29,225 | 23,926 |
| E-470 Public Highway Authority Colorado Revenue | 0.000% | 9/1/25 (14) | 14,900 | 11,812 |
| E-470 Public Highway Authority Colorado Revenue | 0.000% | 9/1/29 (14) | 21,600 | 14,457 |
| E-470 Public Highway Authority Colorado Revenue | 0.000% | 9/1/30 (14) | 10,025 | 6,430 |
| Plaza CO Metropolitan District No. 1 Tax Allocation Revenue | 5.000% | 12/1/17 | 1,000 | 1,027 |
| Plaza CO Metropolitan District No. 1 Tax Allocation Revenue | 5.000% | 12/1/18 | 1,375 | 1,440 |
| Plaza CO Metropolitan District No. 1 Tax Allocation Revenue | 5.000% | 12/1/20 | 1,000 | 1,084 |
| Plaza CO Metropolitan District No. 1 Tax Allocation Revenue | 5.000% | 12/1/21 | 1,000 | 1,094 |
| Plaza CO Metropolitan District No. 1 Tax Allocation Revenue | 5.000% | 12/1/22 | 500 | 551 |
| Regional Transportation District of Colorado Sales Tax Revenue | | | | |
| (Denver Transit Partners Eagle P3 Project) | 6.000% | 1/15/34 | 6,000 | 6,830 |
| Regional Transportation District of Colorado Sales Tax Revenue | | | | |
| (Denver Transit Partners Eagle P3 Project) | 6.000% | 1/15/41 | 14,765 | 16,779 |
| Solaris CO Metropolitan District GO | 3.750% | 12/1/26 | 650 | 644 |
| Solaris CO Metropolitan District GO | 5.000% | 12/1/36 | 850 | 885 |
| Solaris CO Metropolitan District GO | 5.000% | 12/1/46 | 1,880 | 1,941 |
| Southglenn CO Metropolitan District Revenue | 3.000% | 12/1/21 | 1,960 | 1,931 |
| Southglenn CO Metropolitan District Revenue | 3.500% | 12/1/26 | 6,000 | 5,813 |
| Southglenn CO Metropolitan District Revenue | 5.000% | 12/1/30 | 1,535 | 1,627 |
| University of Colorado Hospital Authority Revenue | 5.000% | 11/15/36 | 8,000 | 9,202 |
| University of Colorado Hospital Authority Revenue | 5.000% | 11/15/42 | 12,500 | 14,287 |
| | | | | 183,149 |
276
High-Yield Tax-Exempt Fund
| | | | |
| | | | Face | Market |
| | | Maturity | Amount | Value• |
| | Coupon | Date | ($000) | ($000) |
| Connecticut (0.2%) | | | | |
| Connecticut Health & Educational Facilities Authority Revenue (Church Home of Hartford Inc.) | 2.875% | 9/1/20 | 700 | 699 |
| Connecticut Health & Educational Facilities Authority Revenue (Church Home of Hartford Inc.) | 5.000% | 9/1/53 | 2,600 | 2,794 |
| Connecticut Health & Educational Facilities Authority Revenue (Hartford Healthcare) | 5.000% | 7/1/32 | 3,250 | 3,582 |
| Connecticut Health & Educational Facilities Authority Revenue (Quinnipiac University) | 5.000% | 7/1/34 | 2,345 | 2,734 |
| Connecticut Health & Educational Facilities Authority Revenue (Quinnipiac University) | 5.000% | 7/1/35 | 1,650 | 1,918 |
| Connecticut Health & Educational Facilities Authority Revenue (Quinnipiac University) | 5.000% | 7/1/36 | 1,500 | 1,739 |
| Connecticut Health & Educational Facilities Authority Revenue (Stamford Hospital) | 5.000% | 7/1/37 | 6,500 | 7,158 |
| Connecticut Health & Educational Facilities Authority Revenue (Stamford Hospital) | 4.000% | 7/1/46 | 3,000 | 3,100 |
| South Central CT Regional Water Authority Water System Revenue | 5.000% | 8/1/27 | 1,000 | 1,248 |
| | | | | 24,972 |
| Delaware (0.0%) | | | | |
| Delaware Economic Development Authority Revenue (Delaware State University Project) | 5.000% | 10/1/36 | 3,890 | 4,422 |
| |
| District of Columbia (0.6%) | | | | |
| District of Columbia Hospital Revenue (Children’s Hospital Obligated Group) | 5.000% | 7/15/31 | 5,925 | 7,109 |
| District of Columbia Hospital Revenue (Children’s Hospital Obligated Group) | 5.000% | 7/15/32 | 3,445 | 4,115 |
| District of Columbia Hospital Revenue (Children’s Hospital Obligated Group) | 5.000% | 7/15/34 | 1,000 | 1,178 |
| District of Columbia Revenue (Methodist Home of the District of Columbia) | 5.125% | 1/1/35 | 1,560 | 1,593 |
| District of Columbia Revenue (Methodist Home of the District of Columbia) | 5.250% | 1/1/39 | 1,015 | 1,038 |
| District of Columbia Student Dormitory Revenue (Provident Group - Howard Properties LLC) | 5.000% | 10/1/30 | 5,500 | 5,607 |
| District of Columbia Student Dormitory Revenue (Provident Group - Howard Properties LLC) | 5.000% | 10/1/45 | 7,390 | 7,424 |
| 5 District of Columbia Water & Sewer Authority Public Utility Revenue | 5.500% | 10/1/18 (Prere.) | 10,000 | 10,876 |
| Metropolitan Washington DC/VA Airports Authority Airport System Revenue | 5.250% | 10/1/25 | 10,000 | 11,123 |
| Metropolitan Washington DC/VA Airports Authority Airport System Revenue | 5.000% | 10/1/30 | 4,000 | 4,686 |
| Metropolitan Washington DC/VA Airports Authority Airport System Revenue | 5.000% | 10/1/44 | 2,500 | 2,827 |
| Metropolitan Washington DC/VA Airports Authority Dulles Toll Road Revenue | | | | |
| (Dulles Metrorail & Capital Improvement Projects) | 5.000% | 10/1/53 | 7,500 | 8,331 |
| | | | | 65,907 |
| Florida (6.0%) | | | | |
| Alachua County FL Health Facilities Authority Revenue | | | | |
| (Shands Teaching Hospital & Clinics, Inc. Project) | 5.000% | 12/1/44 | 25,000 | 28,201 |
| Brevard County FL Health Facilities Authority Revenue (Health First Inc. Project) | 5.000% | 4/1/39 | 20,000 | 22,627 |
| Broward County FL Airport System Revenue | 5.000% | 10/1/37 | 7,755 | 8,585 |
| Broward County FL Airport System Revenue | 5.000% | 10/1/40 | 2,000 | 2,276 |
| Broward County FL Airport System Revenue | 5.000% | 10/1/45 | 12,455 | 14,120 |
| Cape Coral FL Health Facilities Authority Senior Housing Revenue (Gulf Care Inc. Project) | 5.875% | 7/1/40 | 4,000 | 4,376 |
| Cape Coral FL Health Facilities Authority Senior Housing Revenue (Gulf Care Inc. Project) | 6.000% | 7/1/50 | 6,250 | 6,799 |
| Capital Trust Agency Florida Revenue (Tallahassee Tapestry Senior Housing Project) | 7.000% | 12/1/45 | 3,000 | 3,099 |
| Capital Trust Agency Florida Revenue (Tallahassee Tapestry Senior Housing Project) | 7.125% | 12/1/50 | 2,000 | 2,068 |
| 4 Central Florida Expressway Authority Revenue | 4.000% | 7/1/33 | 9,500 | 10,267 |
| 4 Central Florida Expressway Authority Revenue | 4.000% | 7/1/35 | 5,000 | 5,364 |
| Citizens Property Insurance Corp. Florida Revenue (Coastal Account) | 5.250% | 6/1/17 | 5,000 | 5,131 |
| Citizens Property Insurance Corp. Florida Revenue | | | | |
| (Personal Lines Account/Commercial Lines Account) | 5.000% | 6/1/20 | 8,450 | 9,543 |
| East Homestead Community Development District Florida Special Assessment Revenue | 7.250% | 5/1/21 | 1,005 | 1,073 |
| Florida Board of Education Lottery Revenue | 5.000% | 7/1/17 (Prere.) | 14,455 | 15,004 |
| Florida Higher Educational Facilities Financing Authority Revenue (Nova Southeastern University) | 5.000% | 4/1/28 | 1,335 | 1,612 |
| Florida Higher Educational Facilities Financing Authority Revenue (Nova Southeastern University) | 5.000% | 4/1/29 | 1,250 | 1,498 |
| Florida Higher Educational Facilities Financing Authority Revenue (Nova Southeastern University) | 5.000% | 4/1/30 | 1,325 | 1,576 |
| Florida Housing Finance Corp. Homeowner Mortgage Revenue | 5.000% | 7/1/41 | 1,585 | 1,652 |
| Florida Housing Finance Corp. Homeowner Mortgage Revenue | 5.500% | 7/1/48 | 460 | 464 |
| Florida Mid-Bay Bridge Authority Revenue | 5.000% | 10/1/35 | 1,780 | 2,012 |
| Florida Mid-Bay Bridge Authority Revenue | 5.000% | 10/1/40 | 1,000 | 1,123 |
| Florida Municipal Power Agency Revenue | 6.250% | 10/1/19 (Prere.) | 3,250 | 3,739 |
| Halifax Hospital Medical Center Florida Hospital Revenue | 5.000% | 6/1/35 | 1,000 | 1,153 |
| Halifax Hospital Medical Center Florida Hospital Revenue | 5.000% | 6/1/46 | 3,850 | 4,354 |
| Hernando County FL School District COP | 5.000% | 7/1/27 (4) | 6,000 | 7,356 |
| Hernando County FL School District COP | 5.000% | 7/1/28 (4) | 5,825 | 7,069 |
| Hernando County FL School District COP | 5.000% | 7/1/29 (4) | 6,645 | 7,985 |
| Hernando County FL School District COP | 5.000% | 7/1/30 (4) | 6,975 | 8,325 |
| Highlands County FL Health Facilities Authority Hospital Revenue | | | | |
| (Adventist Health System/Sunbelt Obligated Group) | 5.250% | 11/15/16 (Prere.) | 365 | 366 |
| Highlands County FL Health Facilities Authority Hospital Revenue | | | | |
| (Adventist Health System/Sunbelt Obligated Group) | 6.000% | 11/15/37 | 5,000 | 5,653 |
| Hillsborough County FL Aviation Authority Revenue (Tampa International Airport) | 5.000% | 10/1/44 | 10,000 | 11,514 |
| Hillsborough County FL Industrial Development Authority Health Facilities Revenue | | | | |
| (University Community Hospital) | 5.625% | 8/15/18 (Prere.) | 6,000 | 6,502 |
| Jacksonville FL Transportation Revenue | 5.000% | 10/1/28 | 8,425 | 9,994 |
277
High-Yield Tax-Exempt Fund
| | | | |
| | | | Face | Market |
| | | Maturity | Amount | Value• |
| | Coupon | Date | ($000) | ($000) |
| Lakeland FL Educational Facilities Revenue (Florida Southern College Project) | 5.000% | 9/1/37 | 750 | 834 |
| Lakeland FL Educational Facilities Revenue (Florida Southern College Project) | 5.000% | 9/1/42 | 1,500 | 1,665 |
| Lakeland FL Hospital Revenue (Lakeland Regional Health Systems) | 5.000% | 11/15/40 | 6,250 | 7,004 |
| Lakeland FL Hospital Revenue (Lakeland Regional Health Systems) | 5.000% | 11/15/45 | 8,980 | 10,010 |
| Lee County FL Solid Waste System Revenue | 5.000% | 10/1/22 (14) | 2,000 | 2,334 |
| Lee County FL Solid Waste System Revenue | 5.000% | 10/1/23 (14) | 2,815 | 3,326 |
| Lee County FL Solid Waste System Revenue | 5.000% | 10/1/24 (14) | 3,175 | 3,781 |
| Lee County FL Solid Waste System Revenue | 5.000% | 10/1/25 (14) | 2,545 | 3,047 |
| Lee County FL Solid Waste System Revenue | 5.000% | 10/1/26 (14) | 1,465 | 1,759 |
| Lee Memorial Health System Florida Hospital Revenue | 5.250% | 4/1/35 (14) | 13,350 | 13,557 |
| Martin County FL Health Facilities Authority Revenue (Martin Memorial Medical Center) | 5.000% | 11/15/28 | 8,360 | 9,249 |
| Martin County FL Industrial Development Authority Revenue | | | | |
| (Indiantown Cogeneration, LP Project) | 3.950% | 12/15/21 | 14,900 | 15,551 |
| Martin County FL Industrial Development Authority Revenue | | | | |
| (Indiantown Cogeneration, LP Project) | 4.200% | 12/15/25 | 9,000 | 9,390 |
| Miami Beach FL Health Facilities Authority Revenue (Mount Sinai Medical Center) | 5.000% | 11/15/29 | 2,175 | 2,467 |
| Miami Beach FL Parking Revenue | 5.000% | 9/1/45 | 5,000 | 5,725 |
| 6 Miami Beach FL Resort Tax Revenue TOB VRDO | 0.680% | 11/7/16 | 4,620 | 4,620 |
| Miami-Dade County FL Aviation Revenue (Miami International Airport) | 5.125% | 4/1/18 (Prere.) | 6,875 | 7,282 |
| Miami-Dade County FL Aviation Revenue (Miami International Airport) | 5.125% | 10/1/24 (14) | 11,700 | 12,311 |
| Miami-Dade County FL Aviation Revenue (Miami International Airport) | 5.000% | 10/1/25 | 5,000 | 5,805 |
| Miami-Dade County FL Aviation Revenue (Miami International Airport) | 5.000% | 10/1/26 | 5,000 | 5,775 |
| Miami-Dade County FL Aviation Revenue (Miami International Airport) | 5.000% | 10/1/27 | 7,215 | 8,290 |
| Miami-Dade County FL Aviation Revenue (Miami International Airport) | 5.000% | 10/1/28 | 6,150 | 7,030 |
| Miami-Dade County FL Aviation Revenue (Miami International Airport) | 5.000% | 10/1/29 | 17,000 | 19,331 |
| Miami-Dade County FL Aviation Revenue (Miami International Airport) | 5.000% | 10/1/31 | 4,705 | 5,424 |
| Miami-Dade County FL Aviation Revenue (Miami International Airport) | 5.000% | 10/1/33 | 29,000 | 33,125 |
| Miami-Dade County FL Aviation Revenue (Miami International Airport) | 5.000% | 10/1/38 | 5,000 | 5,681 |
| Miami-Dade County FL Aviation Revenue (Miami International Airport) | 5.000% | 10/1/41 | 15,750 | 18,375 |
| Miami-Dade County FL Aviation Revenue (Miami International Airport) | 5.500% | 10/1/41 | 4,000 | 4,471 |
| Miami-Dade County FL Health Facilities Authority Hospital Revenue (Miami Children’s Hospital) | 6.125% | 8/1/42 | 3,500 | 4,008 |
| Miami-Dade County FL Industrial Development Authority Revenue (Biscayne Properties LLC) | 5.000% | 6/1/40 | 5,805 | 6,137 |
| Miami-Dade County FL Industrial Development Authority Revenue (Biscayne Properties LLC) | 5.000% | 6/1/48 | 5,975 | 6,281 |
| Miami-Dade County FL Public Facilities Revenue (Jackson Memorial Hospital) | 5.750% | 6/1/39 (12) | 5,250 | 5,806 |
| Miami-Dade County FL Seaport Revenue | 6.000% | 10/1/24 | 1,590 | 1,976 |
| Miami-Dade County FL Seaport Revenue | 6.000% | 10/1/25 | 1,680 | 2,086 |
| Miami-Dade County FL Seaport Revenue | 6.250% | 10/1/38 | 5,000 | 6,170 |
| Miami-Dade County FL Special Obligation Revenue | 0.000% | 10/1/31 | 5,000 | 2,919 |
| Miami-Dade County FL Special Obligation Revenue | 5.000% | 10/1/31 | 4,170 | 4,814 |
| Miami-Dade County FL Special Obligation Revenue | 5.000% | 10/1/32 | 2,460 | 2,821 |
| Miami-Dade County FL Special Obligation Revenue | 5.000% | 10/1/35 | 6,500 | 7,385 |
| North Brevard County FL Hospital District Revenue (Parrish Medical Center Project) | 5.750% | 10/1/18 (Prere.) | 2,845 | 3,109 |
| North Brevard County FL Hospital District Revenue (Parrish Medical Center Project) | 5.750% | 10/1/38 | 1,155 | 1,240 |
| Orange County FL Health Facilities Authority Hospital Revenue (Orlando Health Inc.) | 5.000% | 10/1/42 | 7,500 | 8,047 |
| Orlando & Orange County FL Expressway Authority Revenue | 5.000% | 7/1/21 (4) | 20,000 | 22,764 |
| Orlando & Orange County FL Expressway Authority Revenue | 5.000% | 7/1/35 | 10,000 | 11,546 |
| Orlando FL Utility Commission Water & Electric Revenue | 6.750% | 10/1/17 (ETM) | 380 | 399 |
| Osceola County FL Expressway System Revenue (Poinciana Parkway Project) | 0.000% | 10/1/39 | 6,000 | 4,546 |
| Osceola County FL Expressway System Revenue (Poinciana Parkway Project) | 0.000% | 10/1/42 | 7,540 | 5,698 |
| Osceola County FL Expressway System Revenue (Poinciana Parkway Project) | 5.375% | 10/1/47 | 2,000 | 2,208 |
| Palm Beach County FL Health Facilities Authority Retirement Communities Revenue | | | | |
| (ACTS Retirement - Life Communities Inc. Obligated Group) | 5.500% | 11/15/20 (Prere.) | 2,005 | 2,347 |
| Palm Beach County FL Health Facilities Authority Revenue (Jupiter Medical Center Inc. Project) | 5.000% | 11/1/43 | 3,250 | 3,512 |
| Palm Beach County FL Health Facilities Authority Revenue (Sinai Residences Boca Raton Project) | 7.500% | 6/1/49 | 3,000 | 3,658 |
| Port St. Lucie FL Utility Revenue | 4.000% | 9/1/32 | 5,000 | 5,463 |
| Port St. Lucie FL Utility Revenue | 4.000% | 9/1/33 | 4,000 | 4,356 |
| Port St. Lucie FL Utility Revenue | 4.000% | 9/1/34 | 3,000 | 3,259 |
| Port St. Lucie FL Utility Revenue | 4.000% | 9/1/36 | 5,000 | 5,410 |
| 4 Sarasota County FL Health Facilities Authority Revenue (Village of Isle Project) | 5.000% | 1/1/25 | 1,145 | 1,351 |
| 4 Sarasota County FL Health Facilities Authority Revenue (Village of Isle Project) | 5.000% | 1/1/26 | 2,100 | 2,489 |
| 4 Sarasota County FL Health Facilities Authority Revenue (Village of Isle Project) | 5.000% | 1/1/27 | 2,000 | 2,349 |
| 4 Sarasota County FL Health Facilities Authority Revenue (Village of Isle Project) | 5.000% | 1/1/28 | 2,310 | 2,695 |
| 4 Sarasota County FL Health Facilities Authority Revenue (Village of Isle Project) | 5.000% | 1/1/29 | 1,100 | 1,270 |
| 4 Sarasota County FL Health Facilities Authority Revenue (Village of Isle Project) | 5.000% | 1/1/30 | 1,000 | 1,148 |
| 4 Sarasota County FL Health Facilities Authority Revenue (Village of Isle Project) | 5.000% | 1/1/32 | 1,100 | 1,253 |
| Sarasota County FL Public Hospital District Hospital Revenue (Sarasota Memorial Hospital Project) | 5.500% | 7/1/34 | 3,500 | 3,824 |
| St. Petersburg FL Health Facilities Authority Revenue (All Children’s Hospital Inc. Obligated Group) | 6.500% | 11/15/19 (Prere.) | 8,000 | 9,297 |
| Tallahassee FL Health Facilities Revenue (Tallahassee Memorial HealthCare Inc. Project) | 5.000% | 12/1/40 | 7,155 | 8,018 |
| Tallahassee FL Health Facilities Revenue (Tallahassee Memorial HealthCare Inc. Project) | 5.000% | 12/1/44 | 5,000 | 5,575 |
| Tampa FL Health System Revenue (BayCare Health System) | 5.000% | 11/15/33 | 7,407 | 8,424 |
278
High-Yield Tax-Exempt Fund
| | | | |
| | | | Face | Market |
| | | Maturity | Amount | Value• |
| | Coupon | Date | ($000) | ($000) |
| Tampa FL Health System Revenue (BayCare Health System) | 5.000% | 11/15/46 | 8,500 | 9,909 |
| Tampa FL Revenue (University of Tampa Project) | 5.000% | 4/1/40 | 2,500 | 2,830 |
| Tampa FL Revenue (University of Tampa Project) | 5.000% | 4/1/45 | 6,050 | 6,824 |
| University of South Florida Financing Corp. COP | 5.000% | 7/1/29 | 5,710 | 6,755 |
| University of South Florida Financing Corp. COP | 5.000% | 7/1/33 | 7,140 | 8,281 |
| Volusia County FL Educational Facilities Authority Revenue | | | | |
| (Embry-Riddle Aeronautical University Inc.) | 5.000% | 10/15/45 | 2,655 | 2,988 |
| | | | | 672,944 |
| Georgia (1.7%) | | | | |
| Americus & Sumter County GA Hospital Authority Revenue (Magnolia Manor Obligated Group) | 6.375% | 5/15/43 | 5,615 | 6,377 |
| Atlanta GA Water & Wastewater Revenue | 6.250% | 11/1/19 (Prere.) | 15,000 | 17,306 |
| 5 Atlanta GA Water & Wastewater Revenue | 6.250% | 11/1/19 (Prere.) | 2,500 | 2,884 |
| Burke County GA Development Authority Pollution Control Revenue | | | | |
| (Oglethorpe Power Corp. Vogtle Project) | 5.500% | 1/1/33 | 5,000 | 5,230 |
| Cedartown Polk County GA Hospital Authority Revenue (Polk Medical Center Project) | 5.000% | 7/1/34 | 5,770 | 6,669 |
| Cedartown Polk County GA Hospital Authority Revenue (Polk Medical Center Project) | 5.000% | 7/1/39 | 5,000 | 5,690 |
| 4 Clarke County GA Hospital Authority Revenue (Piedmont Healthcare Inc.) | 5.000% | 7/1/46 | 7,910 | 9,039 |
| Dalton GA Development Authority Revenue (Hamilton Health Care System) | 5.500% | 8/15/17 (14) | 730 | 755 |
| Dalton GA Development Authority Revenue (Hamilton Health Care System) | 5.000% | 8/15/28 | 6,685 | 7,610 |
| Fulton County GA Residential Care Facilities for the Elderly Authority Revenue (Lenbrook Square) | 5.000% | 7/1/36 | 4,050 | 4,497 |
| Fulton County GA Residential Care Facilities for the Elderly Authority Revenue (Lenbrook Square) | 5.000% | 7/1/42 | 8,800 | 9,683 |
| Georgia GO | 5.000% | 11/1/16 | 8,055 | 8,055 |
| Georgia Municipal Electric Power Authority Revenue | 6.600% | 1/1/18 (14) | 1,085 | 1,120 |
| Glynn-Brunswick GA Memorial Hospital Authority Revenue | | | | |
| (Southeast Georgia Health System Obligated Group) | 5.000% | 8/1/29 | 5,775 | 6,869 |
| Main Street Natural Gas Inc. Georgia Gas Project Revenue | 5.000% | 3/15/18 | 5,385 | 5,632 |
| Main Street Natural Gas Inc. Georgia Gas Project Revenue | 5.000% | 3/15/20 | 1,270 | 1,387 |
| Main Street Natural Gas Inc. Georgia Gas Project Revenue | 5.250% | 9/15/20 | 5,240 | 5,836 |
| Main Street Natural Gas Inc. Georgia Gas Project Revenue | 5.500% | 9/15/22 | 2,330 | 2,722 |
| Main Street Natural Gas Inc. Georgia Gas Project Revenue | 5.500% | 9/15/23 | 2,380 | 2,845 |
| Main Street Natural Gas Inc. Georgia Gas Project Revenue | 5.500% | 9/15/26 | 5,630 | 6,928 |
| Main Street Natural Gas Inc. Georgia Gas Project Revenue | 5.500% | 9/15/27 | 530 | 660 |
| Marietta GA Development Authority Revenue | 7.000% | 6/15/30 | 4,000 | 4,179 |
| Marietta GA Development Authority Revenue | 7.000% | 6/15/39 | 7,500 | 7,811 |
| Municipal Electric Authority Georgia Revenue | 5.500% | 7/1/18 (Prere.) | 5,180 | 5,577 |
| Municipal Electric Authority Georgia Revenue | 5.500% | 1/1/26 | 1,820 | 1,951 |
| Municipal Electric Authority Georgia Revenue | 5.000% | 1/1/28 | 12,000 | 14,864 |
| Municipal Electric Authority Georgia Revenue | 5.500% | 7/1/60 | 5,000 | 5,874 |
| Municipal Electric Authority Georgia Revenue (Plant Voltage Units 3 & 4 Project J) | 5.500% | 7/1/60 | 5,000 | 5,966 |
| Private Colleges & University Authority of Georgia Revenue (Mercer University) | 5.000% | 10/1/45 | 20,000 | 22,199 |
| | | | | 186,215 |
| Guam (0.1%) | | | | |
| Guam Government Waterworks Authority Water & Waste Water System Revenue | 5.000% | 1/1/46 | 5,500 | 6,254 |
| Guam International Airport Authority Revenue | 6.250% | 10/1/34 | 5,500 | 6,586 |
| Guam International Airport Authority Revenue | 6.375% | 10/1/43 | 3,000 | 3,578 |
| | | | | 16,418 |
| Hawaii (0.6%) | | | | |
| Hawaii Airports System Revenue | 5.000% | 7/1/45 | 21,455 | 24,409 |
| Hawaii Department of Budget & Finance Special Purpose Revenue | | | | |
| (Chaminade University of Honolulu) | 5.000% | 1/1/35 | 1,230 | 1,278 |
| Hawaii Department of Budget & Finance Special Purpose Revenue | | | | |
| (Chaminade University of Honolulu) | 5.000% | 1/1/45 | 1,500 | 1,541 |
| Hawaii Department of Transportation - Airports Division Lease Revenue COP | 5.250% | 8/1/25 | 2,250 | 2,672 |
| Hawaii Department of Transportation - Airports Division Lease Revenue COP | 5.250% | 8/1/26 | 3,500 | 4,142 |
| Hawaii Harbor System Revenue | 5.500% | 7/1/35 | 5,000 | 5,635 |
| Hawaii Harbor System Revenue | 5.625% | 7/1/40 | 5,000 | 5,661 |
| Hawaii Pacific Health Revenue | 5.500% | 7/1/40 | 7,000 | 7,739 |
| Hawaii Pacific Health Revenue | 5.750% | 7/1/40 | 2,365 | 2,641 |
| Honolulu HI City & County Wastewater System Revenue | 0.000% | 7/1/17 (14) | 6,000 | 5,948 |
| Honolulu HI City & County Wastewater System Revenue | 0.000% | 7/1/18 (14) | 2,000 | 1,947 |
| | | | | 63,613 |
| Idaho (0.1%) | | | | |
| Idaho Housing & Finance Association RAN | 5.000% | 7/15/23 | 8,430 | 9,224 |
| Idaho Housing & Finance Association RAN | 5.000% | 7/15/27 | 7,000 | 7,594 |
| | | | | 16,818 |
| Illinois (9.5%) | | | | |
| Chicago IL Board of Education GO | 5.000% | 12/1/31 | 1,250 | 1,139 |
| Chicago IL Board of Education GO | 5.125% | 12/1/32 | 6,225 | 5,698 |
279
High-Yield Tax-Exempt Fund
| | | | |
| | | | Face | Market |
| | | Maturity | Amount | Value• |
| | Coupon | Date | ($000) | ($000) |
| Chicago IL Board of Education GO | 5.000% | 12/1/33 | 8,750 | 7,927 |
| Chicago IL Board of Education GO | 5.000% | 12/1/34 | 5,410 | 4,884 |
| Chicago IL Board of Education GO | 5.250% | 12/1/35 | 4,965 | 4,593 |
| Chicago IL Board of Education GO | 5.250% | 12/1/39 | 19,475 | 17,889 |
| Chicago IL Board of Education GO | 5.000% | 12/1/41 | 9,355 | 8,304 |
| Chicago IL Board of Education GO | 5.000% | 12/1/42 | 25,740 | 22,752 |
| Chicago IL Board of Education GO | 7.000% | 12/1/44 | 42,500 | 45,135 |
| Chicago IL Board of Education GO | 6.500% | 12/1/46 | 14,500 | 14,874 |
| Chicago IL GO | 5.000% | 1/1/24 | 6,645 | 7,032 |
| Chicago IL GO | 5.620% | 1/1/26 (14) | 2,755 | 2,776 |
| Chicago IL GO | 5.650% | 1/1/27 (14) | 2,630 | 2,650 |
| Chicago IL GO | 0.000% | 1/1/31 | 4,915 | 2,087 |
| Chicago IL GO | 5.500% | 1/1/31 | 500 | 533 |
| Chicago IL GO | 5.000% | 1/1/34 | 6,660 | 6,762 |
| Chicago IL GO | 5.000% | 1/1/34 | 2,000 | 2,035 |
| Chicago IL GO | 5.000% | 1/1/35 | 4,370 | 4,437 |
| Chicago IL GO | 5.000% | 1/1/38 | 13,000 | 13,055 |
| Chicago IL GO | 5.500% | 1/1/39 | 3,700 | 3,899 |
| Chicago IL GO | 5.500% | 1/1/42 | 2,000 | 2,091 |
| Chicago IL Midway Airport Revenue | 5.000% | 1/1/27 | 2,000 | 2,395 |
| Chicago IL Midway Airport Revenue | 5.000% | 1/1/28 | 1,765 | 2,099 |
| Chicago IL Midway Airport Revenue | 5.000% | 1/1/29 | 16,180 | 18,555 |
| Chicago IL Midway Airport Revenue | 5.000% | 1/1/29 | 2,220 | 2,608 |
| Chicago IL Midway Airport Revenue | 5.000% | 1/1/31 | 6,945 | 7,882 |
| Chicago IL Midway Airport Revenue | 5.000% | 1/1/33 | 7,200 | 8,097 |
| Chicago IL Midway Airport Revenue | 5.375% | 1/1/33 | 4,000 | 4,578 |
| Chicago IL Midway Airport Revenue | 5.000% | 1/1/34 | 7,105 | 7,966 |
| Chicago IL Midway Airport Revenue | 5.000% | 1/1/41 | 11,700 | 12,991 |
| Chicago IL O’Hare International Airport Revenue | 5.000% | 1/1/30 | 8,500 | 9,749 |
| Chicago IL O’Hare International Airport Revenue | 5.000% | 1/1/30 | 11,000 | 12,212 |
| Chicago IL O’Hare International Airport Revenue | 5.250% | 1/1/30 | 3,655 | 4,031 |
| Chicago IL O’Hare International Airport Revenue | 5.000% | 1/1/31 | 11,000 | 12,540 |
| Chicago IL O’Hare International Airport Revenue | 5.000% | 1/1/31 | 15,595 | 17,242 |
| Chicago IL O’Hare International Airport Revenue | 5.000% | 1/1/34 | 5,600 | 6,298 |
| Chicago IL O’Hare International Airport Revenue | 5.625% | 1/1/35 | 7,000 | 8,040 |
| Chicago IL O’Hare International Airport Revenue | 5.750% | 1/1/38 | 12,000 | 13,977 |
| Chicago IL O’Hare International Airport Revenue | 5.750% | 1/1/39 | 3,000 | 3,460 |
| Chicago IL O’Hare International Airport Revenue | 5.000% | 1/1/46 | 3,565 | 3,955 |
| Chicago IL Park District GO | 5.000% | 1/1/40 | 7,500 | 8,168 |
| Chicago IL Public Building Commission GO | 7.000% | 1/1/20 (ETM) | 10,000 | 11,458 |
| Chicago IL Sales Tax Revenue | 5.250% | 1/1/38 | 7,300 | 7,694 |
| Chicago IL Transit Authority Sales Tax Receipts Revenue | 5.250% | 12/1/30 | 2,950 | 3,307 |
| Chicago IL Transit Authority Sales Tax Receipts Revenue | 5.250% | 12/1/36 | 5,400 | 5,977 |
| Chicago IL Wastewater Transmission Revenue | 5.000% | 1/1/34 | 2,500 | 2,785 |
| Chicago IL Wastewater Transmission Revenue | 5.000% | 1/1/34 | 2,525 | 2,782 |
| Chicago IL Wastewater Transmission Revenue | 5.000% | 1/1/35 | 2,000 | 2,223 |
| Chicago IL Wastewater Transmission Revenue | 5.000% | 1/1/39 | 9,000 | 9,855 |
| Chicago IL Water Revenue | 5.250% | 11/1/38 | 16,315 | 17,123 |
| Chicago IL Waterworks Revenue | 5.000% | 11/1/39 | 1,000 | 1,113 |
| Chicago IL Waterworks Revenue | 5.000% | 11/1/44 | 7,000 | 7,774 |
| Illinois Finance Authority Revenue (Advocate Health Care Network) | 5.000% | 6/1/42 | 1,500 | 1,666 |
| 6 Illinois Finance Authority Revenue (Advocate Health Care Network) TOB VRDO | 0.660% | 11/7/16 | 7,000 | 7,000 |
| Illinois Finance Authority Revenue (Carle Foundation) | 6.000% | 8/15/41 | 2,000 | 2,339 |
| Illinois Finance Authority Revenue (Carle Foundation) | 6.000% | 8/15/41 (4) | 1,500 | 1,758 |
| 4 Illinois Finance Authority Revenue (Carle Foundation) | 5.000% | 2/15/45 | 20,000 | 22,271 |
| Illinois Finance Authority Revenue (Centegra Health System) | 5.000% | 9/1/38 | 7,500 | 8,097 |
| Illinois Finance Authority Revenue (Centegra Health System) | 5.000% | 9/1/39 | 8,150 | 8,946 |
| Illinois Finance Authority Revenue (Centegra Health System) | 5.000% | 9/1/42 | 2,000 | 2,191 |
| Illinois Finance Authority Revenue (Children’s Memorial Hospital) | 5.375% | 8/15/39 | 22,500 | 23,889 |
| Illinois Finance Authority Revenue (Christian Homes Inc.) | 5.000% | 5/15/36 | 1,400 | 1,530 |
| Illinois Finance Authority Revenue (Christian Homes Inc.) | 5.000% | 5/15/40 | 1,275 | 1,385 |
| Illinois Finance Authority Revenue (Columbia College) | 5.000% | 12/1/17 (Prere.) | 8,230 | 8,600 |
| Illinois Finance Authority Revenue (Columbia College) | 5.000% | 12/1/37 | 10,000 | 10,676 |
| Illinois Finance Authority Revenue (DePaul University) | 4.000% | 10/1/32 | 2,735 | 2,941 |
| Illinois Finance Authority Revenue (DePaul University) | 5.000% | 10/1/32 | 500 | 591 |
| Illinois Finance Authority Revenue (DePaul University) | 4.000% | 10/1/34 | 1,620 | 1,721 |
| Illinois Finance Authority Revenue (DePaul University) | 5.000% | 10/1/36 | 1,360 | 1,579 |
| Illinois Finance Authority Revenue (DePaul University) | 5.000% | 10/1/41 | 7,875 | 9,078 |
| Illinois Finance Authority Revenue (Franciscan Communities Inc.) | 5.125% | 5/15/43 | 9,235 | 9,778 |
| Illinois Finance Authority Revenue (Illinois Wesleyan University) | 5.000% | 9/1/46 | 2,200 | 2,457 |
280
High-Yield Tax-Exempt Fund
| | | | |
| | | | Face | Market |
| | | Maturity | Amount | Value• |
| | Coupon | Date | ($000) | ($000) |
| Illinois Finance Authority Revenue (Lutheran Home & Services) | 5.625% | 5/15/42 | 5,500 | 5,888 |
| Illinois Finance Authority Revenue (Lutheran Home & Services) | 5.750% | 5/15/46 | 5,750 | 6,183 |
| Illinois Finance Authority Revenue (Mercy Health System) | 5.000% | 12/1/40 | 2,950 | 3,338 |
| Illinois Finance Authority Revenue (Mercy Health System) | 5.000% | 12/1/46 | 9,500 | 10,676 |
| Illinois Finance Authority Revenue (Northwestern Community Hospital) | 5.375% | 7/1/18 (Prere.) | 6,000 | 6,445 |
| Illinois Finance Authority Revenue (Northwestern Memorial Hospital) PUT | 5.000% | 8/15/37 | 6,250 | 6,980 |
| Illinois Finance Authority Revenue (OSF Healthcare System) | 7.000% | 5/15/19 (Prere.) | 10,000 | 11,502 |
| Illinois Finance Authority Revenue (OSF Healthcare System) | 6.000% | 5/15/20 (Prere.) | 4,020 | 4,697 |
| Illinois Finance Authority Revenue (OSF Healthcare System) | 5.000% | 11/15/34 | 1,915 | 2,206 |
| Illinois Finance Authority Revenue (OSF Healthcare System) | 5.000% | 11/15/35 | 1,875 | 2,157 |
| Illinois Finance Authority Revenue (OSF Healthcare System) | 6.000% | 5/15/39 | 2,245 | 2,552 |
| Illinois Finance Authority Revenue (OSF Healthcare System) | 5.000% | 5/15/41 | 6,000 | 6,608 |
| Illinois Finance Authority Revenue (OSF Healthcare System) | 5.000% | 11/15/45 | 19,750 | 22,388 |
| Illinois Finance Authority Revenue (Plymouth Place Inc.) | 5.000% | 5/15/37 | 1,750 | 1,868 |
| Illinois Finance Authority Revenue (Plymouth Place Inc.) | 5.250% | 5/15/45 | 1,000 | 1,081 |
| Illinois Finance Authority Revenue (Plymouth Place Inc.) | 5.250% | 5/15/50 | 2,845 | 2,986 |
| Illinois Finance Authority Revenue (Presence Health Network Obligated Group) | 5.000% | 2/15/33 | 5,000 | 5,538 |
| Illinois Finance Authority Revenue (Presence Health Network Obligated Group) | 5.000% | 2/15/34 | 4,580 | 5,056 |
| Illinois Finance Authority Revenue (Presence Health Network Obligated Group) | 5.000% | 2/15/36 | 5,000 | 5,493 |
| Illinois Finance Authority Revenue (Presence Health Network Obligated Group) | 4.000% | 2/15/41 | 4,000 | 3,820 |
| Illinois Finance Authority Revenue (Presence Health Network Obligated Group) | 5.000% | 2/15/41 | 2,000 | 2,180 |
| Illinois Finance Authority Revenue (Rehabilitation Institute of Chicago) | 6.000% | 7/1/43 | 10,000 | 11,886 |
| Illinois Finance Authority Revenue (Riverside Health System) | 6.250% | 11/15/19 (Prere.) | 2,775 | 3,203 |
| Illinois Finance Authority Revenue (Riverside Health System) | 4.000% | 11/15/33 | 4,555 | 4,750 |
| Illinois Finance Authority Revenue (Riverside Health System) | 4.000% | 11/15/34 | 2,425 | 2,519 |
| Illinois Finance Authority Revenue (Riverside Health System) | 6.250% | 11/15/35 | 1,825 | 2,064 |
| Illinois Finance Authority Revenue (Rush University Medical Center) | 6.625% | 5/1/19 (Prere.) | 10,000 | 11,388 |
| Illinois Finance Authority Revenue (Rush University Medical Center) | 5.000% | 11/15/38 | 8,900 | 10,246 |
| Illinois Finance Authority Revenue (Silver Cross & Medical Centers) | 6.875% | 8/15/19 (Prere.) | 500 | 580 |
| Illinois Finance Authority Revenue (Silver Cross & Medical Centers) | 7.000% | 8/15/19 (Prere.) | 14,000 | 16,302 |
| Illinois Finance Authority Revenue (Silver Cross & Medical Centers) | 5.000% | 8/15/35 | 7,300 | 8,246 |
| Illinois Finance Authority Revenue (Silver Cross & Medical Centers) | 5.000% | 8/15/44 | 1,750 | 1,944 |
| Illinois GO | 5.000% | 1/1/19 (4) | 4,000 | 4,241 |
| Illinois GO | 5.000% | 1/1/20 (4) | 2,930 | 3,166 |
| 4 Illinois GO | 5.000% | 2/1/20 | 19,750 | 21,114 |
| Illinois GO | 5.000% | 8/1/21 | 8,000 | 8,723 |
| Illinois GO | 5.000% | 3/1/22 | 5,000 | 5,465 |
| Illinois GO | 5.000% | 5/1/22 | 1,150 | 1,259 |
| Illinois GO | 5.000% | 8/1/22 | 14,225 | 15,612 |
| 4 Illinois GO | 5.000% | 2/1/23 | 5,000 | 5,489 |
| Illinois GO | 5.000% | 3/1/23 | 6,165 | 6,685 |
| Illinois GO | 5.000% | 8/1/23 | 13,800 | 15,206 |
| Illinois GO | 5.000% | 3/1/24 | 5,000 | 5,385 |
| Illinois GO | 5.000% | 8/1/24 | 13,660 | 14,752 |
| Illinois GO | 5.000% | 2/1/25 | 2,270 | 2,482 |
| Illinois GO | 5.000% | 8/1/25 | 3,000 | 3,219 |
| Illinois GO | 5.000% | 1/1/28 | 5,000 | 5,436 |
| 4 Illinois GO | 5.000% | 2/1/28 | 10,000 | 10,949 |
| Illinois GO | 5.000% | 5/1/29 | 6,125 | 6,524 |
| Illinois GO | 5.000% | 6/1/30 | 4,725 | 4,741 |
| Illinois GO | 5.250% | 2/1/32 | 9,575 | 10,359 |
| Illinois GO | 5.250% | 2/1/33 (4) | 6,200 | 6,695 |
| Illinois GO | 5.500% | 7/1/33 (4) | 3,350 | 3,768 |
| Illinois GO | 5.000% | 1/1/34 | 6,805 | 7,030 |
| Illinois GO | 5.250% | 2/1/34 (4) | 3,125 | 3,369 |
| Illinois GO | 5.000% | 5/1/34 | 2,500 | 2,614 |
| Illinois GO | 5.500% | 7/1/38 | 7,500 | 8,198 |
| Illinois Sales Tax Revenue | 5.000% | 6/15/17 | 7,000 | 7,179 |
| Illinois Sports Facility Authority Revenue | 5.500% | 6/15/30 (2) | 6,120 | 6,143 |
| Illinois Toll Highway Authority Revenue | 5.000% | 1/1/31 | 6,000 | 6,594 |
| Illinois Toll Highway Authority Revenue | 5.000% | 1/1/37 | 6,000 | 6,950 |
| Illinois Toll Highway Authority Revenue | 5.000% | 1/1/37 | 5,000 | 5,755 |
| Illinois Toll Highway Authority Revenue | 5.000% | 1/1/40 | 9,400 | 10,815 |
| 6 Illinois Toll Highway Authority Revenue TOB VRDO | 0.680% | 11/7/16 | 3,100 | 3,100 |
| Metropolitan Pier & Exposition Authority Illinois Dedicated Sales Tax Revenue | 0.000% | 12/15/31 (14) | 10,000 | 5,178 |
| Metropolitan Pier & Exposition Authority Illinois Dedicated Sales Tax Revenue | 0.000% | 6/15/44 (4) | 10,000 | 2,894 |
| Metropolitan Pier & Exposition Authority Illinois Dedicated Sales Tax Revenue | | | | |
| (McCormick Place Expansion Project) | 0.000% | 12/15/30 (14) | 13,555 | 7,341 |
| Metropolitan Pier & Exposition Authority Illinois Dedicated Sales Tax Revenue | | | | |
| (McCormick Place Expansion Project) | 0.000% | 6/15/31 (14) | 10,000 | 5,292 |
281
High-Yield Tax-Exempt Fund
| | | | |
| | | | Face | Market |
| | | Maturity | Amount | Value• |
| | Coupon | Date | ($000) | ($000) |
| Metropolitan Pier & Exposition Authority Illinois Dedicated Sales Tax Revenue | | | | |
| (McCormick Place Expansion Project) | 0.000% | 6/15/32 (14) | 10,000 | 5,051 |
| Metropolitan Pier & Exposition Authority Illinois Dedicated Sales Tax Revenue | | | | |
| (McCormick Place Expansion Project) | 5.000% | 6/15/42 | 5,000 | 5,304 |
| Metropolitan Pier & Exposition Authority Illinois Dedicated Sales Tax Revenue | | | | |
| (McCormick Place Expansion Project) | 5.000% | 6/15/53 | 7,500 | 8,170 |
| Metropolitan Pier & Exposition Authority Illinois Dedicated Sales Tax Revenue | | | | |
| (McCormick Place Expansion Project) | 5.500% | 6/15/53 | 9,000 | 10,221 |
| Northern Illinois Municipal Power Agency Project Revenue | 4.000% | 12/1/33 | 4,000 | 4,285 |
| Northern Illinois Municipal Power Agency Project Revenue | 4.000% | 12/1/35 | 5,000 | 5,298 |
| Northern Illinois Municipal Power Agency Project Revenue | 4.000% | 12/1/36 | 4,500 | 4,752 |
| Northern Illinois Municipal Power Agency Project Revenue | 5.000% | 12/1/41 | 10,125 | 11,638 |
| Railsplitter Tobacco Settlement Authority Illinois Tobacco Settlement Revenue | 6.000% | 6/1/28 | 1,200 | 1,409 |
| Romeoville IL Revenue (Lewis University Project) | 5.000% | 10/1/35 | 3,190 | 3,588 |
| Romeoville IL Revenue (Lewis University Project) | 5.000% | 10/1/42 | 5,000 | 5,585 |
| Will County IL Community High School District No. 210 (Lincoln-Way) GO | 0.000% | 1/1/31 | 13,330 | 6,433 |
| Will County IL Community High School District No. 210 (Lincoln-Way) GO | 5.000% | 1/1/31 | 8,150 | 8,210 |
| | | | | 1,070,415 |
| Indiana (2.2%) | | | | |
| Ball State University Housing & Dining System Indiana Revenue | 5.000% | 7/1/35 | 1,695 | 1,974 |
| 4 Chesterton IN Economical Development Revenue (Storypoint Chesterton Project) | 6.375% | 1/15/51 | 5,000 | 5,003 |
| Gary/Chicago IL International Airport Authority Industrial Development Zone Revenue | 5.000% | 2/1/29 | 2,000 | 2,163 |
| Gary/Chicago IL International Airport Authority Industrial Development Zone Revenue | 5.250% | 2/1/34 | 2,650 | 2,856 |
| Gary/Chicago IL International Airport Authority Industrial Development Zone Revenue | 5.000% | 2/1/39 | 3,300 | 3,474 |
| Indiana Finance Authority Economic Development Revenue (Republic Services Inc. Project) PUT | 0.850% | 12/1/16 | 8,000 | 8,000 |
| Indiana Finance Authority Health System Revenue | | | | |
| (Sisters of St. Francis Health Services Inc. Obligated Group) | 5.000% | 11/1/51 | 10,000 | 11,398 |
| Indiana Finance Authority Hospital Revenue (Deaconess Health System Obligated Group) | 5.000% | 3/1/32 | 5,000 | 5,656 |
| Indiana Finance Authority Hospital Revenue (Deaconess Health System Obligated Group) | 5.000% | 3/1/35 | 6,000 | 6,724 |
| Indiana Finance Authority Revenue | | | | |
| (Community Foundation of Northwest Indiana Obligated Group) | 5.000% | 3/1/41 | 5,500 | 6,004 |
| Indiana Finance Authority Revenue (Deaconess Health System Obligated Group) | 5.000% | 3/1/39 | 7,205 | 8,272 |
| Indiana Finance Authority Revenue (I-69 Development Partners LLC) | 5.250% | 9/1/34 | 5,000 | 5,386 |
| Indiana Finance Authority Revenue (I-69 Development Partners LLC) | 5.250% | 9/1/40 | 9,000 | 9,630 |
| Indiana Finance Authority Revenue (Ohio River Bridges East End Crossing Project) | 5.000% | 7/1/40 | 2,500 | 2,773 |
| Indiana Finance Authority Revenue (Ohio River Bridges East End Crossing Project) | 5.000% | 7/1/44 | 25,550 | 28,097 |
| Indiana Finance Authority Revenue (Ohio River Bridges East End Crossing Project) | 5.000% | 7/1/48 | 28,025 | 30,643 |
| Indiana Health Facility Financing Authority Hospital Revenue (Ancilla System Inc.) | 7.375% | 7/1/23 (ETM) | 19,400 | 25,493 |
| Indiana Municipal Power Agency Revenue | 6.000% | 1/1/19 (Prere.) | 13,275 | 14,697 |
| Indianapolis IN Airport Authority Special Facilities Revenue (Federal Express Corp. Project) | 5.100% | 1/15/17 (ETM) | 14,500 | 14,628 |
| Indianapolis IN Local Public Improvement Bond Bank Revenue | | | | |
| (Indianapolis Airport Authority Project) | 5.000% | 1/1/31 | 5,000 | 5,723 |
| Indianapolis IN Local Public Improvement Bond Bank Revenue | | | | |
| (Indianapolis Airport Authority Project) | 5.000% | 1/1/32 | 4,500 | 5,120 |
| Indianapolis IN Local Public Improvement Bond Bank Revenue | | | | |
| (Indianapolis Airport Authority Project) | 5.000% | 1/1/33 | 3,150 | 3,571 |
| Indianapolis IN Local Public Improvement Bond Bank Revenue | | | | |
| (Qualified Midwestern Disaster Area) | 5.750% | 2/1/36 | 5,000 | 5,813 |
| 3 Whiting IN Environmental Facilities Revenue (BP Products North America Inc. Project) PUT | 1.380% | 12/2/19 | 35,000 | 34,617 |
| | | | | 247,715 |
| Iowa (0.9%) | | | | |
| Iowa Finance Authority Midwestern Disaster Area Revenue (Iowa Fertilizer Co. Project) | 5.000% | 12/1/19 | 12,965 | 13,320 |
| Iowa Finance Authority Midwestern Disaster Area Revenue (Iowa Fertilizer Co. Project) | 5.500% | 12/1/22 | 43,385 | 43,982 |
| Iowa Finance Authority Midwestern Disaster Area Revenue (Iowa Fertilizer Co. Project) | 5.250% | 12/1/25 | 18,400 | 19,191 |
| Iowa Higher Education Loan Authority Revenue Private College Facility (Wartburg College Project) | 5.000% | 10/1/32 | 5,000 | 5,295 |
| Iowa Higher Education Loan Authority Revenue Private College Facility (Wartburg College Project) | 5.000% | 10/1/37 | 8,950 | 9,376 |
| Xenia IA Rural Water District Revenue | 5.000% | 12/1/31 | 1,600 | 1,854 |
| Xenia IA Rural Water District Revenue | 5.000% | 12/1/36 | 2,000 | 2,276 |
| Xenia IA Rural Water District Revenue | 5.000% | 12/1/41 | 2,000 | 2,262 |
| | | | | 97,556 |
| Kansas (0.5%) | | | | |
| Coffeyville KS Electric System Revenue | 5.000% | 6/1/38 (14) | 6,000 | 6,468 |
| Coffeyville KS Electric System Revenue | 5.000% | 6/1/42 (14) | 3,500 | 3,762 |
| Ford County KS Unified School District No. 443 GO | 4.000% | 3/1/28 (15) | 1,000 | 1,142 |
| Johnson County KS Unified School District No. 233 GO | 4.000% | 9/1/30 | 1,000 | 1,109 |
| Johnson County KS Unified School District No. 233 GO | 4.000% | 9/1/31 | 1,000 | 1,102 |
| Kansas Development Finance Authority Health Facilities Revenue | | | | |
| (Kansas University Health System) | 5.375% | 3/1/29 | 3,000 | 3,332 |
| Wichita KS GO | 5.000% | 12/1/34 | 2,280 | 2,646 |
282
High-Yield Tax-Exempt Fund
| | | | |
| | | | Face | Market |
| | | Maturity | Amount | Value• |
| | Coupon | Date | ($000) | ($000) |
| Wichita KS GO | 5.000% | 12/1/35 | 2,365 | 2,743 |
| Wichita KS GO | 5.000% | 12/1/39 | 11,305 | 12,946 |
| Wichita KS Health Care Facilities Revenue | 5.000% | 12/1/31 | 500 | 508 |
| Wichita KS Health Care Facilities Revenue | 5.250% | 12/1/36 | 500 | 511 |
| Wichita KS Health Care Facilities Revenue | 6.375% | 5/15/43 | 7,000 | 7,730 |
| Wichita KS Health Care Facilities Revenue | 5.375% | 12/1/46 | 1,250 | 1,271 |
| Wichita KS Health Care Facilities Revenue | 6.500% | 5/15/48 | 8,000 | 8,881 |
| Wichita KS Health Care Facilities Revenue (Larksfield Place Obligated Group) | 7.375% | 12/15/43 | 5,000 | 5,661 |
| | | | | 59,812 |
| Kentucky (0.6%) | | | | |
| Ashland KY Medical Center Revenue (King’s Daughters Medical Center Project) | 5.000% | 2/1/40 | 3,125 | 3,477 |
| Kentucky Economic Development Finance Authority Hospital Revenue | | | | |
| (Baptist Healthcare System Obligated Group) | 5.250% | 8/15/46 | 11,555 | 12,529 |
| Kentucky Housing Corp. Housing Revenue | 5.250% | 7/1/32 | 175 | 177 |
| Kentucky Public Transportation Infrastructure Authority Toll Revenue | | | | |
| (Downtown Crossing Project) BAN | 0.000% | 7/1/33 | 3,065 | 2,671 |
| Kentucky Public Transportation Infrastructure Authority Toll Revenue | | | | |
| (Downtown Crossing Project) BAN | 0.000% | 7/1/39 | 3,000 | 2,545 |
| Kentucky Public Transportation Infrastructure Authority Toll Revenue | | | | |
| (Downtown Crossing Project) BAN | 6.000% | 7/1/53 | 12,025 | 14,133 |
| Louisville & Jefferson County KY Metropolitan Government Health Facilities Revenue | | | | |
| (Jewish Hospital& St. Mary’s Healthcare Inc. Project) | 5.750% | 2/1/18 (Prere.) | 9,400 | 9,974 |
| Louisville & Jefferson County KY Metropolitan Government Health System Revenue | | | | |
| (Norton Healthcare Obligated Group) | 5.750% | 10/1/42 | 9,500 | 11,264 |
| Louisville & Jefferson County KY Metropolitan Government Revenue (Catholic Health Initiatives) | 5.000% | 6/1/22 (Prere.) | 4,775 | 5,727 |
| Louisville & Jefferson County KY Metropolitan Government Revenue (Catholic Health Initiatives) | 5.000% | 12/1/35 | 1,475 | 1,622 |
| | | | | 64,119 |
| Louisiana (1.3%) | | | | |
| 6 Juban Crossing LA Economic Development District Revenue | 7.000% | 9/15/44 | 6,250 | 6,620 |
| Louisiana Citizens Property Insurance Corp. Assessment Revenue | 6.750% | 6/1/18 (Prere.) | 6,000 | 6,557 |
| Louisiana Housing Finance Agency Single Family Mortgage Revenue (Home Ownership Program) | 5.950% | 6/1/38 | 875 | 887 |
| Louisiana Local Government Environmental Facilities & Community Development | | | | |
| Authority Revenue (East Baton Rouge Sewerage Commission Projects) | 5.000% | 2/1/39 | 4,250 | 4,856 |
| Louisiana Local Government Environmental Facilities & Community Development | | | | |
| Authority Revenue (Women’s Hospital Foundation Project) | 5.875% | 10/1/40 | 9,990 | 11,543 |
| Louisiana Local Government Environmental Facilities & Community Development | | | | |
| Authority Revenue (Women’s Hospital Foundation Project) | 6.000% | 10/1/44 | 8,095 | 9,388 |
| 6 Louisiana Public Facilities Authority Dock & Wharf Revenue (Impala Warehousing LLC Project) | 6.500% | 7/1/36 | 28,700 | 31,873 |
| Louisiana Public Facilities Authority Hospital Revenue | | | | |
| (Franciscan Missionaries of Our Lady Health System Project) | 5.000% | 7/1/39 | 17,500 | 20,024 |
| Louisiana Public Facilities Authority Hospital Revenue | | | | |
| (Franciscan Missionaries of Our Lady Health System Project) | 5.000% | 7/1/42 | 8,000 | 8,771 |
| Louisiana Public Facilities Authority Revenue (Nineteenth Judicial District Court Building Project) | 5.000% | 6/1/42 (4) | 3,500 | 3,950 |
| New Orleans LA Aviation Board Revenue | 6.000% | 1/1/23 (12) | 5,000 | 5,491 |
| New Orleans LA Aviation Board Revenue | 5.000% | 1/1/34 | 2,725 | 3,088 |
| New Orleans LA Aviation Board Revenue | 5.000% | 1/1/35 | 2,000 | 2,258 |
| New Orleans LA Sewage Service Revenue | 5.000% | 6/1/44 | 3,000 | 3,422 |
| New Orleans LA Water Revenue | 5.000% | 12/1/44 | 7,000 | 7,896 |
| Port of New Orleans LA Board of Commissioners Port Facility Revenue | 5.000% | 4/1/30 | 1,210 | 1,347 |
| Port of New Orleans LA Board of Commissioners Port Facility Revenue | 5.000% | 4/1/32 | 2,720 | 2,997 |
| St. Charles Parish LA Gulf Opportunity Zone Revenue (Valero Energy Corp.) PUT | 4.000% | 6/1/22 | 12,515 | 13,667 |
| | | | | 144,635 |
| Maine (0.1%) | | | | |
| Maine Health & Higher Educational Facilities Authority Revenue (Eastern Maine Medical Center) | 5.000% | 7/1/41 | 3,500 | 3,861 |
| Maine Health & Higher Educational Facilities Authority Revenue (Eastern Maine Medical Center) | 5.000% | 7/1/46 | 7,750 | 8,509 |
| Maine Housing Authority Mortgage Revenue | 4.500% | 11/15/28 | 1,770 | 1,874 |
| | | | | 14,244 |
| Maryland (1.0%) | | | | |
| Anne Arundel County MD Special Tax Revenue (Villages at 2 Rivers Project) | 5.125% | 7/1/36 | 1,030 | 1,067 |
| Anne Arundel County MD Special Tax Revenue (Villages at 2 Rivers Project) | 5.250% | 7/1/44 | 2,150 | 2,223 |
| Baltimore MD Special Obligation Revenue | 7.000% | 9/1/38 | 8,000 | 8,401 |
| Frederick County MD Special Tax Revenue (Jefferson Technology Park) | 7.125% | 7/1/43 | 5,000 | 5,643 |
| Howard County MD Retirement Community Revenue (Columbia Vantage House Corp.) | 5.000% | 4/1/36 | 1,730 | 1,776 |
| Howard County MD Retirement Community Revenue (Columbia Vantage House Corp.) | 5.000% | 4/1/46 | 7,205 | 7,310 |
| Maryland Economic Development Corp. Revenue (Purple Line Light Rail Project) | 5.000% | 3/31/24 | 8,000 | 9,229 |
| Maryland GO | 4.000% | 6/1/30 | 7,500 | 8,483 |
| Maryland Health & Higher Educational Facilities Authority Revenue | | | | |
| (Life Bridge Health Obligated Group) | 5.000% | 7/1/40 | 2,000 | 2,325 |
283
High-Yield Tax-Exempt Fund
| | | | |
| | | | Face | Market |
| | | Maturity | Amount | Value• |
| | Coupon | Date | ($000) | ($000) |
| Maryland Health & Higher Educational Facilities Authority Revenue | | | | |
| (Life Bridge Health Obligated Group) | 5.000% | 7/1/47 | 15,000 | 17,346 |
| 4 Maryland Health & Higher Educational Facilities Authority Revenue | | | | |
| (Life Bridge Health Obligated Group) | 5.000% | 7/1/47 | 3,500 | 4,006 |
| Maryland Health & Higher Educational Facilities Authority Revenue | | | | |
| (Maryland Institute College of Art) | 4.000% | 6/1/42 | 2,500 | 2,614 |
| Maryland Health & Higher Educational Facilities Authority Revenue (MedStar Health, Inc.) | 5.000% | 8/15/26 | 4,000 | 4,722 |
| Maryland Health & Higher Educational Facilities Authority Revenue (MedStar Health, Inc.) | 5.000% | 8/15/27 | 7,005 | 8,229 |
| Maryland Health & Higher Educational Facilities Authority Revenue (Meritus Medical Center, Inc.) | 5.000% | 7/1/45 | 7,750 | 8,649 |
| Maryland Health & Higher Educational Facilities Authority Revenue | | | | |
| (University of Maryland Medical System) | 5.000% | 7/1/33 | 6,750 | 7,686 |
| Montgomery County MD GO CP | 0.920% | 12/1/16 | 9,800 | 9,800 |
| Westminster MD Revenue (Lutheran Village at Miller’s Grant) | 6.125% | 7/1/39 | 750 | 842 |
| Westminster MD Revenue (Lutheran Village at Miller’s Grant) | 6.250% | 7/1/44 | 2,000 | 2,248 |
| | | | | 112,599 |
| Massachusetts (1.2%) | | | | |
| Massachusetts Development Finance Agency Revenue (Boston Medical Center) | 5.000% | 7/1/22 (Prere.) | 120 | 144 |
| Massachusetts Development Finance Agency Revenue (Boston Medical Center) | 5.000% | 7/1/22 (Prere.) | 745 | 894 |
| Massachusetts Development Finance Agency Revenue (Boston Medical Center) | 5.000% | 7/1/29 | 635 | 709 |
| Massachusetts Development Finance Agency Revenue (Boston Medical Center) | 5.000% | 7/1/35 | 4,065 | 4,604 |
| Massachusetts Development Finance Agency Revenue (Boston Medical Center) | 5.000% | 7/1/36 | 1,750 | 1,982 |
| Massachusetts Development Finance Agency Revenue (Boston Medical Center) | 5.000% | 7/1/37 | 2,000 | 2,258 |
| Massachusetts Development Finance Agency Revenue (Boston Medical Center) | 4.000% | 7/1/38 | 2,500 | 2,556 |
| 4 Massachusetts Development Finance Agency Revenue (Boston University) | 5.000% | 10/1/28 | 3,560 | 4,515 |
| 4 Massachusetts Development Finance Agency Revenue (Boston University) | 4.000% | 10/1/34 | 1,000 | 1,075 |
| 4 Massachusetts Development Finance Agency Revenue (Boston University) | 4.000% | 10/1/46 | 9,500 | 10,033 |
| Massachusetts Development Finance Agency Revenue (Emerson College) | 5.000% | 1/1/41 | 5,000 | 5,612 |
| Massachusetts Development Finance Agency Revenue (Harvard University) | 5.500% | 11/15/18 (Prere.) | 1,095 | 1,197 |
| Massachusetts Development Finance Agency Revenue (Harvard University) | 5.500% | 11/15/18 (Prere.) | 3,380 | 3,696 |
| Massachusetts Development Finance Agency Revenue (Lowell General Hospital) | 5.000% | 7/1/44 | 7,165 | 7,826 |
| Massachusetts Development Finance Agency Revenue (Merrimack College) | 5.125% | 7/1/44 | 5,950 | 6,646 |
| Massachusetts Development Finance Agency Revenue (Milford Regional Medical Center) | 5.750% | 7/15/43 | 3,750 | 4,318 |
| Massachusetts Development Finance Agency Revenue (Suffolk University) | 5.125% | 7/1/40 | 9,000 | 9,653 |
| Massachusetts Development Finance Agency Revenue (Tufts Medical Center) | 7.250% | 1/1/32 | 3,500 | 4,182 |
| Massachusetts Development Finance Agency Revenue (Tufts Medical Center) | 6.875% | 1/1/41 | 1,500 | 1,759 |
| Massachusetts Development Finance Agency Revenue (WGBH Educational Foundation) | 4.000% | 1/1/32 | 1,645 | 1,802 |
| Massachusetts Development Finance Agency Revenue (WGBH Educational Foundation) | 4.000% | 1/1/33 | 1,000 | 1,092 |
| Massachusetts Educational Financing Authority Education Loan Revenue | 5.000% | 7/1/20 | 5,000 | 5,515 |
| Massachusetts Educational Financing Authority Education Loan Revenue | 5.000% | 7/1/21 | 5,000 | 5,582 |
| Massachusetts Educational Financing Authority Education Loan Revenue | 5.000% | 1/1/24 | 7,000 | 8,082 |
| 3 Massachusetts GO PUT | 0.930% | 8/1/17 | 5,000 | 4,998 |
| Massachusetts GO VRDO | 0.460% | 11/1/16 | 2,650 | 2,650 |
| Massachusetts Health & Educational Facilities Authority Revenue | | | | |
| (Baystate Medical Center) VRDO | 0.520% | 11/1/16 LOC | 4,900 | 4,900 |
| Massachusetts Health & Educational Facilities Authority Revenue (Suffolk University) | 6.250% | 7/1/30 | 5,000 | 5,598 |
| Massachusetts Port Authority Revenue | 5.000% | 7/1/40 | 2,000 | 2,295 |
| Massachusetts Port Authority Revenue | 5.000% | 7/1/43 | 10,000 | 11,558 |
| Massachusetts Port Authority Revenue | 5.000% | 7/1/45 | 3,500 | 3,996 |
| Massachusetts Port Authority Revenue | 4.000% | 7/1/46 | 8,000 | 8,312 |
| | | | | 140,039 |
| Michigan (3.8%) | | | | |
| Chippewa Valley MI Schools GO | 5.000% | 5/1/28 | 1,500 | 1,811 |
| Chippewa Valley MI Schools GO | 5.000% | 5/1/29 | 1,000 | 1,197 |
| Chippewa Valley MI Schools GO | 5.000% | 5/1/30 | 1,000 | 1,189 |
| Chippewa Valley MI Schools GO | 5.000% | 5/1/31 | 1,000 | 1,183 |
| Detroit MI Water & Sewerage Department Sewage Disposal System Revenue | 5.500% | 7/1/24 | 10,000 | 10,258 |
| Detroit MI Water & Sewerage Department Sewage Disposal System Revenue | 5.250% | 7/1/39 | 4,735 | 5,289 |
| Detroit MI Water Supply System Revenue | 5.000% | 11/14/16 (Prere.) | 4,415 | 4,422 |
| Detroit MI Water Supply System Revenue | 5.000% | 7/1/31 | 5,000 | 5,487 |
| Detroit MI Water Supply System Revenue | 5.250% | 7/1/41 | 1,270 | 1,394 |
| Genesee County MI GO | 5.250% | 2/1/40 (15) | 12,330 | 14,188 |
| Grand Traverse County MI Hospital Finance Authority Revenue | 5.000% | 7/1/44 | 1,730 | 1,948 |
| Grand Traverse County MI Hospital Finance Authority Revenue | 5.000% | 7/1/47 | 3,550 | 3,991 |
| Great Lakes MI Water Authority Sewer Disposal System Revenue | 5.000% | 7/1/31 | 4,000 | 4,678 |
| Great Lakes MI Water Authority Sewer Disposal System Revenue | 5.000% | 7/1/36 | 5,000 | 5,690 |
| Great Lakes MI Water Authority Water Supply System Revenue | 5.000% | 7/1/28 | 5,000 | 5,977 |
| Great Lakes MI Water Authority Water Supply System Revenue | 5.000% | 7/1/31 | 6,000 | 6,957 |
| Jackson County MI Hospital Finance Authority Hospital Revenue (Allegiance Health) | 5.250% | 6/1/20 (Prere.) | 10,000 | 11,440 |
| Kalamazoo MI Hospital Financing Authority Hospital Revenue (Bronson Healthcare Group) | 4.000% | 5/15/31 | 3,000 | 3,188 |
284
High-Yield Tax-Exempt Fund
| | | | |
| | | | Face | Market |
| | | Maturity | Amount | Value• |
| | Coupon | Date | ($000) | ($000) |
| Kalamazoo MI Hospital Financing Authority Hospital Revenue (Bronson Healthcare Group) | 4.000% | 5/15/32 | 3,350 | 3,541 |
| Kalamazoo MI Hospital Financing Authority Hospital Revenue (Bronson Healthcare Group) | 4.000% | 5/15/33 | 4,750 | 5,000 |
| Kalamazoo MI Hospital Financing Authority Hospital Revenue (Bronson Methodist Hospital) | 5.000% | 5/15/30 | 10,000 | 11,006 |
| Karegnondi Water Authority Michigan Water Supply System Revenue (Karegnondi Water Pipeline) | 5.250% | 11/1/40 | 7,500 | 8,417 |
| Karegnondi Water Authority Michigan Water Supply System Revenue (Karegnondi Water Pipeline) | 5.000% | 11/1/43 | 16,110 | 17,809 |
| Lincoln MI Consolidated School District GO | 5.000% | 5/1/40 (4) | 1,250 | 1,435 |
| Livonia MI Public Schools School District GO | 5.000% | 5/1/45 (4) | 4,500 | 5,163 |
| Marquette MI Board of Light & Power Electric Utility System Revenue | 5.000% | 7/1/27 | 850 | 1,050 |
| Marquette MI Board of Light & Power Electric Utility System Revenue | 5.000% | 7/1/28 | 1,000 | 1,225 |
| Marquette MI Board of Light & Power Electric Utility System Revenue | 5.000% | 7/1/29 | 1,000 | 1,216 |
| Marquette MI Board of Light & Power Electric Utility System Revenue | 5.000% | 7/1/30 | 1,000 | 1,207 |
| Marquette MI Board of Light & Power Electric Utility System Revenue | 5.000% | 7/1/31 | 1,000 | 1,197 |
| Marysville MI Public Schools District GO | 5.000% | 5/1/37 | 2,135 | 2,497 |
| Michigan Building Authority Revenue | 5.000% | 11/15/36 (4) | 6,500 | 7,367 |
| Michigan Building Authority Revenue | 5.000% | 4/15/38 | 5,000 | 5,827 |
| Michigan Building Authority Revenue | 5.000% | 10/15/50 | 6,000 | 6,855 |
| Michigan Finance Authority Revenue | 4.500% | 10/1/29 | 5,000 | 5,464 |
| Michigan Finance Authority Revenue | 5.000% | 10/1/33 | 3,000 | 3,429 |
| Michigan Finance Authority Revenue | 5.000% | 10/1/34 | 3,670 | 4,181 |
| Michigan Finance Authority Revenue (Beaumont Health Obligated Group) | 5.000% | 8/1/28 | 3,250 | 3,852 |
| Michigan Finance Authority Revenue (Beaumont Health Obligated Group) | 5.000% | 8/1/33 | 5,500 | 6,362 |
| Michigan Finance Authority Revenue (Beaumont Health Obligated Group) | 5.000% | 11/1/44 | 8,630 | 9,679 |
| Michigan Finance Authority Revenue (Detroit Water & Sewer) | 5.000% | 7/1/29 | 2,500 | 2,885 |
| Michigan Finance Authority Revenue (Detroit Water & Sewer) | 5.000% | 7/1/30 | 2,805 | 3,218 |
| Michigan Finance Authority Revenue (Detroit Water & Sewer) | 5.000% | 7/1/32 (4) | 4,400 | 5,070 |
| Michigan Finance Authority Revenue (Detroit Water & Sewer) | 5.000% | 7/1/33 | 2,000 | 2,265 |
| Michigan Finance Authority Revenue (Detroit Water & Sewer) | 5.000% | 7/1/34 | 1,500 | 1,693 |
| Michigan Finance Authority Revenue (Detroit Water & Sewer) | 5.000% | 7/1/34 | 5,500 | 6,222 |
| Michigan Finance Authority Revenue (Detroit Water & Sewer) | 5.000% | 7/1/35 | 4,500 | 5,076 |
| Michigan Finance Authority Revenue (Detroit Water & Sewer) | 5.000% | 7/1/44 | 17,830 | 19,587 |
| Michigan Finance Authority Revenue (Detroit Water & Sewer) | 5.000% | 7/1/44 | 7,510 | 8,076 |
| Michigan Finance Authority Revenue (Henry Ford Health System Obligated Group) | 5.000% | 11/15/41 | 10,000 | 11,297 |
| Michigan Finance Authority Revenue (McLaren Health Care Corp.) | 5.000% | 5/15/32 | 2,340 | 2,715 |
| Michigan Finance Authority Revenue (McLaren Health Care Corp.) | 5.000% | 5/15/32 | 4,670 | 5,419 |
| Michigan Finance Authority Revenue (McLaren Health Care Corp.) | 5.000% | 5/15/33 | 4,025 | 4,650 |
| Michigan Finance Authority Revenue (McLaren Health Care Corp.) | 5.000% | 5/15/34 | 2,200 | 2,533 |
| Michigan Finance Authority Revenue (McLaren Health Care Corp.) | 5.000% | 5/15/35 | 2,515 | 2,885 |
| Michigan Finance Authority Revenue (MidMichigan Obligated Group) | 5.000% | 6/1/33 | 2,750 | 3,183 |
| Michigan Finance Authority Revenue (MidMichigan Obligated Group) | 5.000% | 6/1/34 | 3,000 | 3,464 |
| Michigan Finance Authority Revenue (Sparrow Obligated Group) | 5.000% | 11/15/27 | 3,500 | 4,286 |
| Michigan Finance Authority Revenue (Sparrow Obligated Group) | 5.000% | 11/15/28 | 2,000 | 2,420 |
| Michigan Finance Authority Revenue (Sparrow Obligated Group) | 5.000% | 11/15/36 | 2,500 | 2,814 |
| 6 Michigan Finance Authority Revenue (Trinity Health Credit Group) TOB VRDO | 0.660% | 11/7/16 | 3,335 | 3,335 |
| Michigan Finance Authority Revenue (Unemployment Obligation Assessment) | 5.000% | 7/1/22 | 2,665 | 2,718 |
| Michigan Finance Authority Student Loan Revenue | 5.000% | 11/1/16 | 3,670 | 3,670 |
| Michigan Finance Authority Student Loan Revenue | 5.000% | 11/1/17 | 2,625 | 2,707 |
| Michigan GO | 5.250% | 9/15/17 (Prere.) | 12,000 | 12,466 |
| Michigan Hospital Finance Authority Revenue (McLaren Health Care) | 5.000% | 6/1/35 | 2,115 | 2,355 |
| Michigan Hospital Finance Authority Revenue (MidMichigan Obligated Group) | 6.125% | 6/1/19 (Prere.) | 4,315 | 4,872 |
| Michigan Tobacco Settlement Financing Authority Revenue | 5.250% | 6/1/22 | 3,735 | 3,688 |
| Michigan Tobacco Settlement Financing Authority Revenue | 6.875% | 6/1/42 | 15,830 | 16,225 |
| Oakland University MI Revenue | 5.000% | 3/1/41 | 5,000 | 5,773 |
| Oakland University MI Revenue | 5.000% | 3/1/47 | 9,000 | 10,344 |
| Rockford MI Public Schools GO | 5.000% | 5/1/37 | 1,240 | 1,446 |
| Rockford MI Public Schools GO | 5.000% | 5/1/38 | 1,025 | 1,192 |
| Rockford MI Public Schools GO | 5.000% | 5/1/39 | 1,025 | 1,191 |
| Rockford MI Public Schools GO | 5.000% | 5/1/40 | 1,025 | 1,189 |
| Rockford MI Public Schools GO | 5.000% | 5/1/41 | 1,025 | 1,187 |
| Rockford MI Public Schools GO | 5.000% | 5/1/44 | 2,250 | 2,601 |
| Romeo MI Community School District GO | 5.000% | 5/1/37 | 1,825 | 2,122 |
| Romeo MI Community School District GO | 5.000% | 5/1/41 | 2,000 | 2,311 |
| Royal Oak MI Hospital Finance Authority Hospital Revenue (William Beaumont Hospital) | 6.000% | 8/1/19 (Prere.) | 7,000 | 7,950 |
| Saginaw MI Hospital Finance Authority Hospital Revenue (Covenant Medical Center Inc.) | 5.000% | 7/1/30 | 10,000 | 11,040 |
| Wayne County MI Airport Authority Revenue | 5.000% | 12/1/34 | 5,000 | 5,696 |
| Wayne County MI Airport Authority Revenue | 5.000% | 12/1/38 | 4,000 | 4,520 |
| Wayne County MI Airport Authority Revenue (Detroit Metropolitan Wayne County Airport) | 5.000% | 12/1/28 | 6,125 | 6,891 |
| Wayne County MI Airport Authority Revenue (Detroit Metropolitan Wayne County Airport) | 5.000% | 12/1/32 | 2,065 | 2,292 |
| Wayne County MI Airport Authority Revenue (Detroit Metropolitan Wayne County Airport) | 5.000% | 12/1/37 | 2,000 | 2,192 |
| Wayne County MI Airport Authority Revenue (Detroit Metropolitan Wayne County Airport) | 5.000% | 12/1/39 | 1,700 | 1,898 |
| Wayne County MI Airport Authority Revenue (Detroit Metropolitan Wayne County Airport) | 5.000% | 12/1/44 | 2,000 | 2,227 |
| | | | | 429,922 |
285
High-Yield Tax-Exempt Fund
| | | | | |
| | | | | Face | Market |
| | | | Maturity | Amount | Value• |
| | | Coupon | Date | ($000) | ($000) |
| Minnesota (0.4%) | | | | |
| | Anoka MN Healthcare & Housing Facilities Revenue (Homestead at Anoka Inc.) | 5.375% | 11/1/34 | 1,135 | 1,220 |
| | Anoka MN Healthcare & Housing Facilities Revenue (Homestead at Anoka Inc.) | 5.125% | 11/1/49 | 4,050 | 4,234 |
| | Dakota County MN Community Development Agency Multifamily Housing Revenue | | | | |
| | (Highview Hills Senior Housing Project) | 7.000% | 8/1/18 (Prere.) | 8,000 | 8,827 |
| | Minneapolis MN Health Care System Revenue (Fairview Health Services) | 6.750% | 11/15/18 (Prere.) | 8,250 | 9,217 |
| | Minnesota Housing Finance Agency Residential Housing Revenue | 4.000% | 7/1/40 | 440 | 457 |
| | Minnesota Municipal Power Agency Revenue | 5.000% | 10/1/33 | 1,380 | 1,645 |
| | Minnesota Municipal Power Agency Revenue | 5.000% | 10/1/36 | 880 | 1,038 |
| | Minnesota Municipal Power Agency Revenue | 5.000% | 10/1/47 | 2,500 | 2,921 |
| 5 | Minnesota Public Facilities Authority Revenue (State Revolving Fund) | 5.000% | 3/1/20 (Prere.) | 5,000 | 5,642 |
| | Rochester MN Health Care & Housing Facility Revenue (Homestead At Rochester, Inc. Project) | 6.875% | 12/1/48 | 10,000 | 11,538 |
| | St. Paul MN Housing & Redevelopment Authority Hospital Revenue (HealthEast Obligated Group) | 5.250% | 11/15/28 | 1,650 | 1,825 |
| | | | | | 48,564 |
| Mississippi (0.5%) | | | | |
| | Gulfport MS Hospital Facilities Revenue (Memorial Hospital at Gulfport Project) | 5.000% | 7/1/29 | 4,150 | 4,851 |
| | Gulfport MS Hospital Facilities Revenue (Memorial Hospital at Gulfport Project) | 5.000% | 7/1/30 | 2,450 | 2,847 |
| | Gulfport MS Hospital Facilities Revenue (Memorial Hospital at Gulfport Project) | 5.000% | 7/1/31 | 2,000 | 2,314 |
| | Jackson County MS Pollution Control Revenue (Chevron USA Inc.) VRDO | 0.500% | 11/1/16 | 12,800 | 12,800 |
| | Mississippi Business Finance Corp. Gulf Opportunity Zone Industrial Development Revenue | | | | |
| | (Chevron USA Inc. Project) VRDO | 0.500% | 11/1/16 | 900 | 900 |
| | Mississippi Business Finance Corp. Gulf Opportunity Zone Industrial Development Revenue | | | | |
| | (Chevron USA Inc. Project) VRDO | 0.500% | 11/1/16 | 7,100 | 7,100 |
| | Mississippi Hospital Equipment & Facilities Authority Revenue (Baptist Health System) | 5.000% | 9/1/46 | 17,500 | 19,482 |
| | Warren County MS Gulf Opportunity Zone Revenue (International Paper Co. Projects) | 5.375% | 12/1/35 | 5,500 | 6,239 |
| | | | | | 56,533 |
| Missouri (0.9%) | | | | |
| | Cape Girardeau County MO Industrial Development Authority of the Health Facilities Revenue | | | | |
| | (St. Francis Medical Center) | 5.000% | 6/1/33 | 10,000 | 11,108 |
| | Joplin MO Industrial Development Authority Health Facilities Revenue (Freeman Health System) | 5.000% | 2/15/29 | 1,105 | 1,289 |
| | Kirkwood MO Industrial Development Authority Retirement Community Revenue | | | | |
| | (Aberdeen Heights Project) | 8.250% | 5/15/39 | 5,000 | 5,697 |
| | Kirkwood MO Industrial Development Authority Retirement Community Revenue | | | | |
| | (Aberdeen Heights Project) | 8.250% | 5/15/45 | 5,000 | 5,685 |
| | Missouri Health & Educational Facilities Authority Educational Facilities Revenue | | | | |
| | (St. Louis College of Pharmacy Project) | 5.000% | 5/1/40 | 1,410 | 1,515 |
| | Missouri Health & Educational Facilities Authority Educational Facilities Revenue | | | | |
| | (St. Louis College of Pharmacy Project) | 5.500% | 5/1/43 | 8,500 | 9,460 |
| | Missouri Health & Educational Facilities Authority Educational Facilities Revenue | | | | |
| | (St. Louis College of Pharmacy Project) | 5.000% | 5/1/45 | 2,000 | 2,140 |
| | Missouri Health & Educational Facilities Authority Health Facilities Revenue (Cox Health) | 5.500% | 11/15/18 (Prere.) | 5,200 | 5,685 |
| | Missouri Health & Educational Facilities Authority Health Facilities Revenue (Cox Health) | 5.500% | 11/15/33 | 1,300 | 1,397 |
| | Missouri Health & Educational Facilities Authority Health Facilities Revenue (Cox Health) | 5.000% | 11/15/48 | 2,475 | 2,768 |
| 4 | Missouri Health & Educational Facilities Authority Revenue | | | | |
| | (Lutheran Senior Services Obligated Group) | 5.000% | 2/1/35 | 1,065 | 1,198 |
| 4 | Missouri Health & Educational Facilities Authority Revenue | | | | |
| | (Lutheran Senior Services Obligated Group) | 5.000% | 2/1/46 | 4,000 | 4,440 |
| | Missouri Health & Educational Facilities Authority Revenue (Mercy Health) | 5.000% | 11/15/45 | 5,000 | 5,713 |
| | Missouri Housing Development Corp. Single Family Mortgage Revenue | 6.000% | 3/1/38 | 380 | 384 |
| | Missouri Housing Development Corp. Single Family Mortgage Revenue | 5.600% | 9/1/38 | 1,800 | 1,815 |
| | Missouri Joint Municipal Electric Utility Commission Power Project Revenue | 4.000% | 12/1/32 | 9,000 | 9,815 |
| | Missouri Joint Municipal Electric Utility Commission Power Project Revenue | 4.000% | 12/1/33 | 10,000 | 10,827 |
| | Missouri Joint Municipal Electric Utility Commission Power Project Revenue (Prairie Project) | 5.000% | 12/1/27 | 1,750 | 2,113 |
| | Missouri Joint Municipal Electric Utility Commission Power Project Revenue (Prairie Project) | 5.000% | 6/1/28 | 2,690 | 3,229 |
| | St. Louis County MO Industrial Development Authority Revenue | | | | |
| | (Ranken-Jordan Pediatric Specialty Hospital) | 4.000% | 11/15/36 | 1,400 | 1,342 |
| | St. Louis County MO Industrial Development Authority Revenue | | | | |
| | (Ranken-Jordan Pediatric Specialty Hospital) | 5.000% | 11/15/41 | 1,000 | 1,068 |
| | St. Louis County MO Industrial Development Authority Revenue | | | | |
| | (Ranken-Jordan Pediatric Specialty Hospital) | 5.000% | 11/15/46 | 1,750 | 1,862 |
| | St. Louis County MO Industrial Development Authority Senior Living Facilities Revenue | | | | |
| | (St. Andrew’s Resources for Seniors Obligated Group) | 5.000% | 12/1/35 | 2,000 | 2,087 |
| | St. Louis County MO Industrial Development Authority Senior Living Facilities Revenue | | | | |
| | (St. Andrew’s Resources for Seniors Obligated Group) | 5.125% | 12/1/45 | 4,250 | 4,419 |
| | | | | | 97,056 |
| Multiple States (1.1%) | | | | |
| 3,6 | Eaton Vance Municipal Income Trust | 2.130% | 9/1/19 | 10,000 | 10,001 |
| 6 | Nuveen Quality Municipal Income Fund VRDP VRDO | 0.810% | 11/7/16 LOC | 55,000 | 55,000 |
| 6 | Nuveen Quality Municipal Income Fund VRDP VRDO | 0.810% | 11/7/16 LOC | 55,000 | 55,000 |
| | | | | | 120,001 |
286
High-Yield Tax-Exempt Fund
| | | | | |
| | | | | Face | Market |
| | | | Maturity | Amount | Value• |
| | | Coupon | Date | ($000) | ($000) |
| Nebraska (0.3%) | | | | |
| | Central Plains Energy Project Nebraska Gas Project Revenue (Project No. 3) | 5.000% | 9/1/32 | 2,500 | 2,827 |
| | Central Plains Energy Project Nebraska Gas Project Revenue (Project No. 3) | 5.000% | 9/1/42 | 14,420 | 16,132 |
| | Municipal Energy Agency of Nebraska Power Supply System Revenue | 4.000% | 4/1/32 | 2,010 | 2,178 |
| | Municipal Energy Agency of Nebraska Power Supply System Revenue | 4.000% | 4/1/33 | 1,785 | 1,924 |
| | Nebraska Public Power District Revenue | 5.000% | 1/1/35 | 3,200 | 3,686 |
| | Omaha NE Public Power District Electric Revenue | 5.000% | 2/1/41 | 3,680 | 4,274 |
| | | | | | 31,021 |
| Nevada (0.4%) | | | | |
| | Carson City NV Hospital Revenue (Carson Tahoe Regional Medical Center) | 5.000% | 9/1/33 | 9,500 | 10,382 |
| | Clark County NV School District GO | 5.000% | 6/15/18 (Prere.) | 10,000 | 10,666 |
| | Las Vegas NV Convention & Visitors Authority Revenue | 5.000% | 7/1/28 | 2,000 | 2,449 |
| | Las Vegas NV Convention & Visitors Authority Revenue | 5.000% | 7/1/29 | 2,000 | 2,430 |
| | Las Vegas Valley Water District Nevada GO | 5.000% | 6/1/41 | 6,000 | 7,086 |
| | Nevada Capital Improvement & Cultural Affairs GO | 5.000% | 12/1/17 (Prere.) | 2,550 | 2,667 |
| | Sparks NV Local Improvement District Revenue | 6.500% | 9/1/20 | 1,065 | 1,129 |
| | Sparks NV Local Improvement District Revenue | 6.750% | 9/1/27 | 2,640 | 2,755 |
| | Truckee Meadows NV Water Authority Water Revenue | 5.000% | 7/1/37 | 2,000 | 2,374 |
| | | | | | 41,938 |
| New Hampshire (0.2%) | | | | |
| 4 | New Hampshire Health & Education Facilities Authority Revenue (Elliott Hospital Obligated Group) | 5.000% | 10/1/38 | 4,000 | 4,469 |
| | New Hampshire Health & Education Facilities Authority Revenue | | | | |
| | (Southern New Hampshire University) | 5.000% | 1/1/34 | 1,375 | 1,527 |
| | New Hampshire Health & Education Facilities Authority Revenue | | | | |
| | (Southern New Hampshire University) | 5.000% | 1/1/42 | 4,450 | 4,929 |
| | New Hampshire Health & Education Facilities Authority Revenue (Wentworth Douglas Hospital) | 7.000% | 1/1/38 | 7,000 | 8,331 |
| | | | | | 19,256 |
| New Jersey (7.9%) | | | | |
| | Atlantic City NJ GO | 4.000% | 11/1/24 (4) | 4,805 | 4,981 |
| | Atlantic City NJ GO | 4.000% | 11/1/25 (4) | 2,405 | 2,477 |
| | Camden County NJ Improvement Authority Health Care Redevelopment Project Revenue | | | | |
| | (Cooper Health System Obligated Group) | 5.750% | 2/15/42 | 5,000 | 5,773 |
| | Camden County NJ Improvement Authority Lease Revenue | | | | |
| | (Rowan University School of Osteopathic Medicine Project) | 5.000% | 12/1/25 | 1,195 | 1,425 |
| | Camden County NJ Improvement Authority Lease Revenue | | | | |
| | (Rowan University School of Osteopathic Medicine Project) | 5.000% | 12/1/26 | 1,630 | 1,933 |
| | Camden County NJ Improvement Authority Lease Revenue | | | | |
| | (Rowan University School of Osteopathic Medicine Project) | 5.000% | 12/1/27 | 1,610 | 1,900 |
| 3,6 | Eaton Vance New Jersey Municipal Income Trust | 2.130% | 9/1/19 | 7,500 | 7,501 |
| | Gloucester County NJ Pollution Control Financing Authority Revenue (Logan Project) | 5.000% | 12/1/24 | 12,875 | 14,501 |
| | New Jersey Building Authority Revenue | 5.000% | 6/15/19 | 13,670 | 14,727 |
| | New Jersey Casino Reinvestment Development Authority Revenue (Hotel Room Fee) | 5.250% | 1/1/23 (2) | 1,450 | 1,458 |
| | New Jersey COP | 5.250% | 6/15/27 | 5,000 | 5,412 |
| | New Jersey Economic Development Authority Retirement Community Revenue | | | | |
| | (Seabrook Village Inc.) | 5.250% | 11/15/16 (Prere.) | 2,000 | 2,003 |
| | New Jersey Economic Development Authority Retirement Community Revenue | | | | |
| | (Seabrook Village Inc.) | 5.250% | 11/15/16 (Prere.) | 1,500 | 1,503 |
| | New Jersey Economic Development Authority Revenue | 5.000% | 6/15/23 | 10,000 | 11,183 |
| | New Jersey Economic Development Authority Revenue | 5.250% | 6/15/40 | 2,500 | 2,780 |
| | New Jersey Economic Development Authority Revenue (Bancroft NeuroHealth Project) | 5.000% | 6/1/36 | 3,800 | 3,890 |
| | New Jersey Economic Development Authority Revenue (Goethals Bridge Replacement Project) | 5.375% | 1/1/43 | 750 | 852 |
| | New Jersey Economic Development Authority Revenue (Motor Vehicle Surcharges) | 5.250% | 7/1/24 (14) | 18,055 | 21,458 |
| | New Jersey Economic Development Authority Revenue (School Facilities Construction) | 5.250% | 9/1/19 (Prere.) | 10,200 | 11,391 |
| | New Jersey Economic Development Authority Revenue (School Facilities Construction) | 5.250% | 3/1/21 (Prere.) | 3,455 | 4,039 |
| | New Jersey Economic Development Authority Revenue (School Facilities Construction) | 5.500% | 3/1/21 (Prere.) | 2,055 | 2,424 |
| | New Jersey Economic Development Authority Revenue (School Facilities Construction) | 5.750% | 3/1/21 (Prere.) | 6,300 | 7,498 |
| | New Jersey Economic Development Authority Revenue (School Facilities Construction) | 5.000% | 9/1/21 | 6,745 | 7,370 |
| | New Jersey Economic Development Authority Revenue (School Facilities Construction) | 5.500% | 9/1/21 | 755 | 841 |
| | New Jersey Economic Development Authority Revenue (School Facilities Construction) | 5.250% | 12/15/21 (14) | 4,500 | 5,183 |
| | New Jersey Economic Development Authority Revenue (School Facilities Construction) | 5.000% | 3/1/22 | 4,750 | 5,263 |
| | New Jersey Economic Development Authority Revenue (School Facilities Construction) | 5.000% | 3/1/22 | 8,000 | 8,863 |
| | New Jersey Economic Development Authority Revenue (School Facilities Construction) | 5.000% | 9/1/22 | 7,150 | 7,776 |
| | New Jersey Economic Development Authority Revenue (School Facilities Construction) | 5.250% | 9/1/23 | 6,545 | 7,317 |
| | New Jersey Economic Development Authority Revenue (School Facilities Construction) | 5.750% | 9/1/23 | 700 | 800 |
| | New Jersey Economic Development Authority Revenue (School Facilities Construction) | 5.500% | 9/1/24 (2) | 6,300 | 7,328 |
| | New Jersey Economic Development Authority Revenue (School Facilities Construction) | 5.000% | 3/1/27 | 1,650 | 1,805 |
| | New Jersey Economic Development Authority Revenue (School Facilities Construction) | 5.250% | 9/1/27 | 2,385 | 2,631 |
| | New Jersey Economic Development Authority Revenue (School Facilities Construction) | 5.000% | 3/1/32 | 3,000 | 3,247 |
| | New Jersey Economic Development Authority Revenue (School Facilities Construction) | 5.000% | 6/15/40 | 19,485 | 21,032 |
287
High-Yield Tax-Exempt Fund
| | | | |
| | | | Face | Market |
| | | Maturity | Amount | Value• |
| | Coupon | Date | ($000) | ($000) |
| New Jersey Economic Development Authority Revenue (West Campus Housing LLC) | 5.000% | 7/1/35 | 1,150 | 1,234 |
| New Jersey Economic Development Authority Revenue (West Campus Housing LLC) | 4.500% | 7/1/41 | 2,750 | 2,811 |
| New Jersey Economic Development Authority Revenue | | | | |
| (Provident Group-Montclair Properties LLC - Montclair State University Student Housing Project) | 5.750% | 6/1/31 | 4,000 | 4,441 |
| New Jersey Economic Development Authority Special Facility Revenue | | | | |
| (Continental Airlines Inc. Project) | 5.125% | 9/15/23 | 12,730 | 14,163 |
| New Jersey Economic Development Authority Special Facility Revenue | | | | |
| (Continental Airlines Inc. Project) | 5.250% | 9/15/29 | 9,750 | 10,841 |
| New Jersey Educational Facilities Authority Revenue (College of St. Elizabeth) | 5.000% | 7/1/46 | 4,000 | 4,178 |
| New Jersey Educational Facilities Authority Revenue (Stockton University) | 5.000% | 7/1/32 | 3,000 | 3,478 |
| New Jersey Educational Facilities Authority Revenue (Stockton University) | 5.000% | 7/1/33 | 3,000 | 3,462 |
| New Jersey Educational Facilities Authority Revenue (University Medical & Dentistry) | 7.500% | 6/1/19 (Prere.) | 6,500 | 7,559 |
| New Jersey Equipment Lease Purchase COP | 5.000% | 6/15/23 | 4,100 | 4,319 |
| New Jersey Health Care Facilities Financing Authority Lease Revenue | | | | |
| (Marlboro Psychiatric Hospital Project) | 5.000% | 9/15/29 | 5,000 | 5,527 |
| New Jersey Health Care Facilities Financing Authority Revenue (St. Joseph’s Healthcare System) | 4.000% | 7/1/48 | 13,540 | 13,615 |
| New Jersey Health Care Facilities Financing Authority Revenue (University Hospital) | 4.125% | 7/1/38 (4) | 8,000 | 8,484 |
| New Jersey Health Care Facilities Financing Authority Revenue (Virtua Health) | 5.750% | 7/1/33 | 6,700 | 7,408 |
| New Jersey Higher Education Assistance Authority Student Loan Revenue | 5.000% | 12/1/18 | 15,000 | 15,868 |
| New Jersey Higher Education Assistance Authority Student Loan Revenue | 5.000% | 12/1/20 | 5,000 | 5,537 |
| New Jersey Higher Education Assistance Authority Student Loan Revenue | 5.000% | 12/1/20 | 10,205 | 11,234 |
| New Jersey Higher Education Assistance Authority Student Loan Revenue | 5.000% | 12/1/21 | 5,000 | 5,629 |
| New Jersey Higher Education Assistance Authority Student Loan Revenue | 5.000% | 12/1/21 | 2,835 | 3,192 |
| New Jersey Higher Education Assistance Authority Student Loan Revenue | 5.000% | 12/1/22 | 2,500 | 2,853 |
| New Jersey Higher Education Assistance Authority Student Loan Revenue | 3.250% | 12/1/28 | 4,500 | 4,400 |
| New Jersey Higher Education Assistance Authority Student Loan Revenue | 5.750% | 12/1/28 | 1,815 | 2,028 |
| New Jersey Higher Education Assistance Authority Student Loan Revenue | 3.250% | 12/1/29 | 5,000 | 4,855 |
| New Jersey Higher Education Assistance Authority Student Loan Revenue | 3.500% | 12/1/29 | 10,000 | 10,010 |
| New Jersey Higher Education Assistance Authority Student Loan Revenue | 3.250% | 12/1/30 | 5,000 | 4,797 |
| New Jersey Higher Education Assistance Authority Student Loan Revenue | 3.625% | 12/1/30 | 2,650 | 2,762 |
| New Jersey Higher Education Assistance Authority Student Loan Revenue | 3.500% | 12/1/31 | 9,500 | 9,243 |
| New Jersey Higher Education Assistance Authority Student Loan Revenue | 4.000% | 12/1/39 | 1,750 | 1,757 |
| 4 New Jersey Transportation Trust Fund Authority Federal Highway Reimbursement Revenue | 5.000% | 6/15/27 | 7,575 | 8,562 |
| New Jersey Transportation Trust Fund Authority Federal Highway Reimbursement Revenue | 5.000% | 6/15/28 | 7,500 | 8,396 |
| 4 New Jersey Transportation Trust Fund Authority Federal Highway Reimbursement Revenue | 5.000% | 6/15/30 | 3,775 | 4,188 |
| 4 New Jersey Transportation Trust Fund Authority Federal Highway Reimbursement Revenue | 5.000% | 6/15/30 | 18,550 | 19,302 |
| 4 New Jersey Transportation Trust Fund Authority Federal Highway Reimbursement Revenue | 5.000% | 6/15/31 | 11,500 | 11,946 |
| New Jersey Transportation Trust Fund Authority Transportation Program Revenue | 5.000% | 6/15/19 | 1,950 | 2,101 |
| New Jersey Transportation Trust Fund Authority Transportation Program Revenue | 5.000% | 6/15/22 | 1,500 | 1,673 |
| New Jersey Transportation Trust Fund Authority Transportation Program Revenue | 5.250% | 6/15/23 | 2,740 | 3,084 |
| New Jersey Transportation Trust Fund Authority Transportation Program Revenue | 5.000% | 6/15/26 | 21,615 | 24,167 |
| New Jersey Transportation Trust Fund Authority Transportation Program Revenue | 5.250% | 6/15/33 | 5,000 | 5,551 |
| New Jersey Transportation Trust Fund Authority Transportation Program Revenue | 5.000% | 6/15/36 | 5,000 | 5,418 |
| New Jersey Transportation Trust Fund Authority Transportation Program Revenue | 5.000% | 6/15/38 | 18,000 | 19,454 |
| New Jersey Transportation Trust Fund Authority Transportation Program Revenue | 5.500% | 6/15/39 | 5,300 | 5,948 |
| New Jersey Transportation Trust Fund Authority Transportation Program Revenue | 5.000% | 6/15/44 | 19,665 | 21,249 |
| New Jersey Transportation Trust Fund Authority Transportation System Revenue | 5.000% | 12/15/18 | 1,360 | 1,450 |
| New Jersey Transportation Trust Fund Authority Transportation System Revenue | 5.000% | 12/15/19 | 9,000 | 9,806 |
| New Jersey Transportation Trust Fund Authority Transportation System Revenue | 5.250% | 12/15/19 | 5,240 | 5,749 |
| New Jersey Transportation Trust Fund Authority Transportation System Revenue | 5.250% | 12/15/19 | 1,205 | 1,322 |
| New Jersey Transportation Trust Fund Authority Transportation System Revenue | 5.000% | 6/15/20 | 2,570 | 2,812 |
| New Jersey Transportation Trust Fund Authority Transportation System Revenue | 5.250% | 12/15/20 (4) | 6,000 | 6,791 |
| New Jersey Transportation Trust Fund Authority Transportation System Revenue | 5.500% | 12/15/21 (12) | 5,855 | 6,839 |
| New Jersey Transportation Trust Fund Authority Transportation System Revenue | 5.500% | 12/15/21 | 2,140 | 2,433 |
| New Jersey Transportation Trust Fund Authority Transportation System Revenue | 5.500% | 12/15/21 (14) | 15,250 | 17,749 |
| New Jersey Transportation Trust Fund Authority Transportation System Revenue | 5.250% | 12/15/22 (2) | 6,565 | 7,461 |
| New Jersey Transportation Trust Fund Authority Transportation System Revenue | 5.500% | 12/15/22 (4) | 8,175 | 9,714 |
| New Jersey Transportation Trust Fund Authority Transportation System Revenue | 5.500% | 12/15/22 | 2,105 | 2,421 |
| New Jersey Transportation Trust Fund Authority Transportation System Revenue | 5.750% | 6/15/23 (14) | 10,000 | 12,039 |
| New Jersey Transportation Trust Fund Authority Transportation System Revenue | 5.250% | 12/15/23 | 2,500 | 2,861 |
| New Jersey Transportation Trust Fund Authority Transportation System Revenue | 0.000% | 12/15/25 (2) | 30,000 | 21,964 |
| New Jersey Transportation Trust Fund Authority Transportation System Revenue | 0.000% | 12/15/27 | 15,000 | 9,744 |
| New Jersey Transportation Trust Fund Authority Transportation System Revenue | 5.625% | 12/15/28 | 20,000 | 21,568 |
| New Jersey Transportation Trust Fund Authority Transportation System Revenue | 5.500% | 6/15/31 | 26,940 | 30,221 |
| New Jersey Transportation Trust Fund Authority Transportation System Revenue | 0.000% | 12/15/31 | 4,275 | 2,184 |
| New Jersey Transportation Trust Fund Authority Transportation System Revenue | 5.000% | 6/15/32 | 10,000 | 10,993 |
| New Jersey Transportation Trust Fund Authority Transportation System Revenue | 5.250% | 6/15/32 | 7,000 | 7,833 |
| New Jersey Transportation Trust Fund Authority Transportation System Revenue | 5.250% | 6/15/36 | 22,000 | 24,111 |
| New Jersey Transportation Trust Fund Authority Transportation System Revenue | 5.500% | 12/15/38 (12) | 8,000 | 8,566 |
| New Jersey Transportation Trust Fund Authority Transportation System Revenue | 5.500% | 6/15/41 | 3,000 | 3,306 |
288
High-Yield Tax-Exempt Fund
| | | | |
| | | | Face | Market |
| | | Maturity | Amount | Value• |
| | Coupon | Date | ($000) | ($000) |
| New Jersey Turnpike Authority Revenue | 5.150% | 1/1/17 (Prere.) | 21,495 | 21,655 |
| New Jersey Turnpike Authority Revenue | 5.000% | 1/1/30 | 8,295 | 9,622 |
| New Jersey Turnpike Authority Revenue | 5.000% | 1/1/31 | 6,785 | 7,862 |
| New Jersey Turnpike Authority Revenue | 5.000% | 1/1/38 | 15,000 | 17,148 |
| New Jersey Turnpike Authority Revenue | 5.000% | 1/1/43 | 5,000 | 5,696 |
| Salem County NJ Pollution Control Financing Authority Revenue (Chambers Project) | 5.000% | 12/1/23 | 26,750 | 30,271 |
| Tobacco Settlement Financing Corp. New Jersey Revenue | 4.500% | 6/1/23 | 4,000 | 4,056 |
| Tobacco Settlement Financing Corp. New Jersey Revenue | 4.625% | 6/1/26 | 8,645 | 8,684 |
| Tobacco Settlement Financing Corp. New Jersey Revenue | 5.000% | 6/1/29 | 8,640 | 8,618 |
| Tobacco Settlement Financing Corp. New Jersey Revenue | 4.750% | 6/1/34 | 11,180 | 10,709 |
| Tobacco Settlement Financing Corp. New Jersey Revenue | 5.000% | 6/1/41 | 2,500 | 2,339 |
| | | | | 883,886 |
| New Mexico (0.1%) | | | | |
| New Mexico Finance Authority Revenue | 4.000% | 6/1/30 | 2,950 | 3,322 |
| New Mexico Hospital Equipment Loan Council Hospital System Revenue | | | | |
| (Gerald Champion Regional Medical Center) | 5.500% | 7/1/42 | 5,000 | 5,472 |
| New Mexico Mortgage Finance Authority Single Family Mortgage Revenue | 5.300% | 1/1/39 | 765 | 784 |
| New Mexico State Finance Authority Revenue | 4.000% | 6/1/31 | 3,350 | 3,746 |
| | | | | 13,324 |
| New York (11.2%) | | | | |
| Brooklyn NY Local Development Corp. PILOT Revenue (Barclays Center Project) | 6.375% | 1/15/20 (Prere.) | 5,000 | 5,830 |
| Brooklyn NY Local Development Corp. PILOT Revenue (Brooklyn Events Center) | 5.000% | 7/15/28 | 3,750 | 4,532 |
| Brooklyn NY Local Development Corp. PILOT Revenue (Brooklyn Events Center) | 5.000% | 7/15/42 | 5,900 | 6,757 |
| Dutchess County NY Local Development Corp. Revenue (Health Quest Systems Inc. Project) | 4.000% | 7/1/41 | 2,000 | 2,105 |
| Hempstead NY Local Development Corp. Revenue (Molloy College) | 5.000% | 7/1/39 | 1,500 | 1,681 |
| Hudson Yards Infrastructure Corp. New York Revenue | 5.750% | 2/15/47 | 25,400 | 29,677 |
| Jefferson County NY Industrial Development Agency Solid Waste Disposal Revenue | 4.750% | 1/1/20 | 1,900 | 1,876 |
| Jefferson County NY Industrial Development Agency Solid Waste Disposal Revenue | 5.250% | 1/1/24 | 3,345 | 3,251 |
| Long Island NY Power Authority Electric System Revenue | 5.500% | 4/1/22 | 10,010 | 10,900 |
| Long Island NY Power Authority Electric System Revenue | 5.000% | 9/1/29 | 1,000 | 1,195 |
| Long Island NY Power Authority Electric System Revenue | 5.000% | 9/1/29 | 4,500 | 5,426 |
| Long Island NY Power Authority Electric System Revenue | 5.000% | 9/1/30 | 1,500 | 1,798 |
| Long Island NY Power Authority Electric System Revenue | 5.000% | 9/1/31 | 1,000 | 1,181 |
| Long Island NY Power Authority Electric System Revenue | 5.000% | 9/1/31 | 5,000 | 5,959 |
| Long Island NY Power Authority Electric System Revenue | 5.000% | 9/1/32 | 1,000 | 1,175 |
| Long Island NY Power Authority Electric System Revenue | 5.000% | 9/1/33 | 1,600 | 1,875 |
| Long Island NY Power Authority Electric System Revenue | 5.000% | 9/1/34 | 1,500 | 1,754 |
| Long Island NY Power Authority Electric System Revenue | 5.000% | 9/1/36 | 1,000 | 1,163 |
| Long Island NY Power Authority Electric System Revenue | 5.000% | 9/1/38 | 1,000 | 1,161 |
| Long Island NY Power Authority Electric System Revenue | 5.000% | 9/1/39 | 1,000 | 1,153 |
| Long Island NY Power Authority Electric System Revenue | 5.000% | 9/1/44 | 12,000 | 13,818 |
| Nassau County NY GO | 5.000% | 1/1/28 | 13,000 | 15,826 |
| Nassau County NY Local Economic Assistance Corp. Revenue | | | | |
| (Catholic Health Services of Long Island Obligated Group Project) | 5.000% | 7/1/30 | 1,500 | 1,714 |
| New York City NY Build NYC Resource Corp. Revenue (New York Law School Project) | 5.000% | 7/1/41 | 5,655 | 6,429 |
| New York City NY Build NYC Resource Corp. Revenue (New York Law School Project) | 4.000% | 7/1/45 | 4,000 | 4,152 |
| New York City NY GO | 5.000% | 1/1/17 (Prere.) | 3,935 | 3,963 |
| New York City NY GO | 5.000% | 1/1/25 | 1,815 | 1,828 |
| New York City NY GO | 5.000% | 8/1/25 | 6,465 | 8,130 |
| New York City NY GO | 5.000% | 8/1/32 | 8,000 | 9,290 |
| New York City NY GO | 5.000% | 8/1/36 | 15,000 | 17,477 |
| New York City NY GO VRDO | 0.500% | 11/1/16 | 13,000 | 13,000 |
| New York City NY GO VRDO | 0.500% | 11/1/16 | 6,600 | 6,600 |
| New York City NY GO VRDO | 0.510% | 11/1/16 LOC | 2,100 | 2,100 |
| New York City NY GO VRDO | 0.530% | 11/1/16 LOC | 7,000 | 7,000 |
| New York City NY Health & Hospital Corp. Revenue (Health System) | 5.000% | 2/15/30 | 6,000 | 6,602 |
| New York City NY Housing Development Corp. Multi-Family Mortgage Revenue (8 Spruce Street) | 4.500% | 2/15/48 | 5,000 | 5,260 |
| New York City NY Industrial Development Agency Airport Facilities Revenue | | | | |
| (TRIPS Obligated Group) | 5.000% | 7/1/28 | 4,000 | 4,380 |
| New York City NY Industrial Development Agency PILOT Revenue (Yankee Stadium Project) | 0.000% | 3/1/26 (12) | 5,000 | 3,920 |
| New York City NY Industrial Development Agency PILOT Revenue (Yankee Stadium Project) | 7.000% | 3/1/49 (12) | 10,000 | 11,330 |
| New York City NY Municipal Water Finance Authority Water & Sewer System Revenue | 5.000% | 6/15/35 | 7,500 | 8,261 |
| New York City NY Municipal Water Finance Authority Water & Sewer System Revenue | 5.000% | 6/15/35 | 10,000 | 11,838 |
| New York City NY Municipal Water Finance Authority Water & Sewer System Revenue | 5.375% | 6/15/43 | 10,000 | 11,589 |
| New York City NY Municipal Water Finance Authority Water & Sewer System Revenue | 5.000% | 6/15/44 | 5,000 | 5,812 |
| New York City NY Municipal Water Finance Authority Water & Sewer System Revenue | 5.000% | 6/15/45 | 8,000 | 9,273 |
| New York City NY Municipal Water Finance Authority Water & Sewer System Revenue | 5.000% | 6/15/46 | 16,235 | 18,994 |
| New York City NY Municipal Water Finance Authority Water & Sewer System Revenue VRDO | 0.490% | 11/1/16 | 11,050 | 11,050 |
| New York City NY Municipal Water Finance Authority Water & Sewer System Revenue VRDO | 0.500% | 11/1/16 | 7,540 | 7,540 |
289
High-Yield Tax-Exempt Fund
| | | | |
| | | | Face | Market |
| | | Maturity | Amount | Value• |
| | Coupon | Date | ($000) | ($000) |
| New York City NY Municipal Water Finance Authority Water & Sewer System Revenue VRDO | 0.500% | 11/1/16 | 1,100 | 1,100 |
| New York City NY Municipal Water Finance Authority Water & Sewer System Revenue VRDO | 0.500% | 11/1/16 | 15,200 | 15,200 |
| New York City NY Municipal Water Finance Authority Water & Sewer System Revenue VRDO | 0.520% | 11/1/16 | 2,800 | 2,800 |
| New York City NY Transitional Finance Authority Building Aid Revenue | 5.125% | 1/15/33 | 5,000 | 5,416 |
| New York City NY Transitional Finance Authority Building Aid Revenue | 5.000% | 1/15/34 | 8,650 | 9,062 |
| New York City NY Transitional Finance Authority Building Aid Revenue | 5.000% | 7/15/37 | 20,000 | 23,349 |
| New York City NY Transitional Finance Authority Building Aid Revenue | 5.000% | 7/15/40 | 12,000 | 13,753 |
| New York City NY Transitional Finance Authority Building Aid Revenue | 5.000% | 7/15/41 | 8,000 | 9,398 |
| New York City NY Transitional Finance Authority Future Tax Revenue | 5.000% | 11/1/16 (ETM) | 130 | 130 |
| New York City NY Transitional Finance Authority Future Tax Revenue | 5.000% | 11/1/16 | 7,870 | 7,870 |
| New York City NY Transitional Finance Authority Future Tax Revenue | 5.000% | 8/1/32 | 2,765 | 3,353 |
| New York City NY Transitional Finance Authority Future Tax Revenue | 5.000% | 11/1/33 | 4,300 | 5,162 |
| New York City NY Transitional Finance Authority Future Tax Revenue | 5.000% | 2/1/36 | 15,000 | 17,866 |
| New York City NY Transitional Finance Authority Future Tax Revenue | 5.000% | 11/1/37 | 11,250 | 13,365 |
| New York City NY Transitional Finance Authority Future Tax Revenue | 5.000% | 11/1/38 | 7,865 | 9,309 |
| New York City NY Transitional Finance Authority Future Tax Revenue | 4.000% | 5/1/42 | 8,250 | 8,878 |
| New York City NY Transitional Finance Authority Future Tax Revenue VRDO | 0.500% | 11/1/16 | 6,775 | 6,775 |
| New York City NY Transitional Finance Authority Future Tax Revenue VRDO | 0.520% | 11/1/16 | 2,600 | 2,600 |
| New York City NY Transitional Finance Authority Recovery Revenue VRDO | 0.510% | 11/1/16 | 6,300 | 6,300 |
| New York Convention Center Development Corp. Revenue | 5.000% | 11/15/40 | 7,465 | 8,723 |
| 6 New York Counties Tobacco Trust Revenue | 6.250% | 6/1/41 | 9,915 | 10,405 |
| New York Counties Tobacco Trust Revenue | 5.000% | 6/1/45 | 3,750 | 4,137 |
| New York Counties Tobacco Trust Revenue | 5.000% | 6/1/51 | 7,500 | 8,145 |
| New York Liberty Development Corp. Revenue | 5.000% | 11/15/31 | 2,000 | 2,293 |
| New York Liberty Development Corp. Revenue | 5.125% | 1/15/44 | 5,000 | 5,535 |
| New York Liberty Development Corp. Revenue | 5.000% | 11/15/44 | 5,080 | 5,760 |
| New York Liberty Development Corp. Revenue | 6.375% | 7/15/49 | 10,870 | 12,141 |
| New York Liberty Development Corp. Revenue | 5.750% | 11/15/51 | 11,000 | 12,904 |
| New York Liberty Development Corp. Revenue (Goldman Sachs Headquarters) | 5.250% | 10/1/35 | 3,905 | 4,938 |
| New York Liberty Development Corp. Revenue (Goldman Sachs Headquarters) | 5.500% | 10/1/37 | 5,005 | 6,560 |
| New York Metropolitan Transportation Authority Revenue | 5.000% | 11/15/29 | 3,515 | 3,730 |
| New York Metropolitan Transportation Authority Revenue | 5.000% | 11/15/31 | 2,000 | 2,333 |
| New York Metropolitan Transportation Authority Revenue | 5.000% | 11/15/32 | 2,000 | 2,330 |
| New York Metropolitan Transportation Authority Revenue | 5.250% | 11/15/32 | 2,250 | 2,684 |
| New York Metropolitan Transportation Authority Revenue | 5.250% | 11/15/33 | 2,500 | 2,995 |
| New York Metropolitan Transportation Authority Revenue | 5.000% | 11/15/36 | 9,000 | 10,454 |
| New York Metropolitan Transportation Authority Revenue | 5.250% | 11/15/36 | 9,225 | 11,042 |
| New York Metropolitan Transportation Authority Revenue | 5.000% | 11/15/37 | 6,875 | 8,098 |
| New York Metropolitan Transportation Authority Revenue | 5.000% | 11/15/38 | 8,575 | 9,894 |
| New York Metropolitan Transportation Authority Revenue | 5.000% | 11/15/40 | 3,000 | 3,493 |
| New York Metropolitan Transportation Authority Revenue | 5.250% | 11/15/40 | 13,000 | 14,851 |
| New York Metropolitan Transportation Authority Revenue | 5.250% | 11/15/56 | 7,000 | 8,355 |
| New York Metropolitan Transportation Authority Revenue | 5.250% | 11/15/56 | 5,500 | 6,613 |
| New York Metropolitan Transportation Authority Revenue (Dedicated Petroleum Tax) | 6.000% | 4/1/20 (ETM) | 9,000 | 9,870 |
| New York Metropolitan Transportation Authority Revenue (Dedicated Petroleum Tax) | 5.000% | 11/15/34 | 3,250 | 3,624 |
| New York Metropolitan Transportation Authority Revenue (Dedicated Tax Fund) | 5.000% | 11/15/35 | 2,910 | 3,487 |
| New York Metropolitan Transportation Authority Revenue (Hudson Yards Development) | 5.000% | 11/15/46 | 20,000 | 21,797 |
| New York Metropolitan Transportation Authority Revenue (Hudson Yards Development) | 5.000% | 11/15/51 | 10,000 | 11,138 |
| New York Metropolitan Transportation Authority Revenue (Hudson Yards Development) | 5.000% | 11/15/56 | 9,800 | 11,073 |
| New York Metropolitan Transportation Authority Revenue (Transit Revenue) | 5.000% | 11/1/25 | 5,575 | 6,689 |
| New York Metropolitan Transportation Authority Revenue (Transit Revenue) | 5.250% | 11/15/41 | 8,500 | 9,985 |
| New York Metropolitan Transportation Authority Revenue VRDO | 0.490% | 11/1/16 LOC | 2,200 | 2,200 |
| 6 New York State Dormitory Authority Lease Revenue | | | | |
| (State University Dormitory Facilities) TOB VRDO | 0.660% | 11/7/16 | 8,995 | 8,995 |
| New York State Dormitory Authority Revenue (Fordham University) | 5.000% | 7/1/41 | 3,750 | 4,413 |
| New York State Dormitory Authority Revenue (Icahn School of Medicine at Mount Sinai) | 5.000% | 7/1/34 | 18,370 | 21,215 |
| New York State Dormitory Authority Revenue (Icahn School of Medicine at Mount Sinai) | 4.000% | 7/1/40 | 1,000 | 1,055 |
| New York State Dormitory Authority Revenue (New York University Hospitals Center) | 5.625% | 7/1/17 (Prere.) | 8,750 | 9,037 |
| New York State Dormitory Authority Revenue (New York University Hospitals Center) | 4.000% | 7/1/40 | 1,500 | 1,599 |
| New York State Dormitory Authority Revenue (New York University) | 4.000% | 7/1/39 | 6,000 | 6,526 |
| New York State Dormitory Authority Revenue (New York University) | 4.000% | 7/1/43 | 6,500 | 7,036 |
| New York State Dormitory Authority Revenue (North Shore - Long Island Jewish Obligated Group) | 1.237% | 5/1/18 | 10,075 | 10,060 |
| New York State Dormitory Authority Revenue (Pace University) | 5.000% | 5/1/21 | 910 | 1,026 |
| New York State Dormitory Authority Revenue (Personal Income Tax) | 5.000% | 2/15/26 | 12,000 | 14,986 |
| New York State Dormitory Authority Revenue (Personal Income Tax) | 5.000% | 3/15/31 | 4,285 | 5,158 |
| New York State Dormitory Authority Revenue (Personal Income Tax) | 5.000% | 3/15/32 | 8,910 | 10,767 |
| New York State Dormitory Authority Revenue (Personal Income Tax) | 5.000% | 2/15/39 | 3,000 | 3,500 |
| New York State Dormitory Authority Revenue (St. John’s University) | 5.000% | 7/1/33 | 3,000 | 3,525 |
| New York State Dormitory Authority Revenue (St. John’s University) | 5.000% | 7/1/34 | 1,000 | 1,169 |
| New York State Dormitory Authority Revenue (The New School) | 5.500% | 7/1/40 | 5,000 | 5,710 |
290
High-Yield Tax-Exempt Fund
| | | | | |
| | | | | Face | Market |
| | | | Maturity | Amount | Value• |
| | | Coupon | Date | ($000) | ($000) |
| | New York State Liberty Development Corp. Liberty Revenue (3 World Trade Center Project) | 5.000% | 11/15/44 | 47,545 | 53,482 |
| | New York State Thruway Authority Revenue | 5.000% | 1/1/30 | 8,180 | 9,755 |
| | New York State Thruway Authority Revenue | 4.000% | 1/1/37 | 3,250 | 3,544 |
| | New York State Thruway Authority Revenue | 5.000% | 1/1/37 | 15,000 | 17,143 |
| | New York State Thruway Authority Revenue | 5.000% | 1/1/41 | 8,500 | 9,972 |
| | New York State Thruway Authority Revenue | 5.000% | 1/1/51 | 6,800 | 7,783 |
| | New York State Thruway Authority Revenue | 5.250% | 1/1/56 | 5,000 | 5,921 |
| | New York State Urban Development Corp. Revenue (Personal Income Tax) | 5.000% | 3/15/30 | 6,250 | 7,520 |
| | New York Transportation Development Corp. Special Facility Revenue | | | | |
| | (JFK International Airport Project) | 5.000% | 8/1/26 | 7,500 | 8,195 |
| | New York Transportation Development Corp. Special Facility Revenue | | | | |
| | (JFK International Airport Project) | 5.000% | 8/1/31 | 17,000 | 18,147 |
| | New York Transportation Development Corp. Special Facility Revenue (La Guardia Airport) | 4.000% | 7/1/35 (4) | 5,000 | 5,208 |
| | New York Transportation Development Corp. Special Facility Revenue (La Guardia Airport) | 4.000% | 7/1/36 (4) | 5,500 | 5,710 |
| | New York Transportation Development Corp. Special Facility Revenue (La Guardia Airport) | 4.000% | 7/1/37 (4) | 8,650 | 8,986 |
| | New York Transportation Development Corp. Special Facility Revenue (La Guardia Airport) | 5.000% | 7/1/41 | 5,000 | 5,460 |
| | New York Transportation Development Corp. Special Facility Revenue (La Guardia Airport) | 5.250% | 1/1/50 | 15,000 | 16,593 |
| 6 | New York Transportation Development Corp. Special Facility Revenue (La Guardia Airport) | | | | |
| | TOB VRDO | 0.930% | 11/7/16 | 10,000 | 10,000 |
| | Niagara NY Frontier Transportation Authority Airport Revenue | | | | |
| | (Buffalo Niagara International Airport) | 5.000% | 4/1/25 | 2,000 | 2,340 |
| | Niagara NY Frontier Transportation Authority Airport Revenue | | | | |
| | (Buffalo Niagara International Airport) | 5.000% | 4/1/26 | 3,750 | 4,364 |
| 3,6 | Nuveen Dividend Advantage Municipal Fund 3 iMTP | 1.380% | 10/1/17 | 10,000 | 10,001 |
| | Port Authority of New York & New Jersey Revenue | 5.000% | 9/15/25 | 3,835 | 4,372 |
| | Port Authority of New York & New Jersey Revenue | 5.000% | 9/1/27 | 1,695 | 2,028 |
| | Port Authority of New York & New Jersey Revenue | 5.000% | 10/15/28 | 5,625 | 6,783 |
| | Port Authority of New York & New Jersey Revenue | 5.000% | 10/15/29 | 10,000 | 12,013 |
| | Port Authority of New York & New Jersey Revenue | 5.000% | 9/1/32 | 4,500 | 5,240 |
| | Port Authority of New York & New Jersey Revenue | 5.000% | 10/15/32 | 9,900 | 11,047 |
| | Port Authority of New York & New Jersey Revenue | 5.000% | 12/1/33 | 5,000 | 5,733 |
| | Port Authority of New York & New Jersey Revenue | 5.750% | 3/15/35 | 25,000 | 26,437 |
| | Port Authority of New York & New Jersey Revenue | 5.000% | 10/15/36 | 2,665 | 3,087 |
| | Port Authority of New York & New Jersey Revenue | 5.000% | 10/15/37 | 4,665 | 5,396 |
| | Port Authority of New York & New Jersey Revenue | 5.000% | 10/15/44 | 10,000 | 11,475 |
| | Port Authority of New York & New Jersey Revenue | 5.000% | 5/1/45 | 5,000 | 5,852 |
| | Port Authority of New York & New Jersey Special Obligation Revenue | | | | |
| | (John F. Kennedy International Air Terminal LLC) | 5.500% | 12/1/31 | 4,000 | 4,550 |
| | Port Authority of New York & New Jersey Special Obligation Revenue | | | | |
| | (John F. Kennedy International Air Terminal LLC) | 6.000% | 12/1/42 | 13,000 | 15,059 |
| | Suffolk County NY Economic Development Corp. Revenue (Catholic Health Services) | 5.000% | 7/1/30 | 2,315 | 2,639 |
| | Suffolk County NY Economic Development Corp. Revenue (Catholic Health Services) | 5.000% | 7/1/31 | 2,000 | 2,271 |
| | Syracuse NY Industrial Development Agency Revenue (Carousel Center Project) | 5.000% | 1/1/30 | 2,750 | 3,173 |
| | Syracuse NY Industrial Development Agency Revenue (Carousel Center Project) | 5.000% | 1/1/31 | 1,000 | 1,146 |
| | Syracuse NY Industrial Development Agency Revenue (Carousel Center Project) | 5.000% | 1/1/32 | 2,370 | 2,711 |
| | Syracuse NY Industrial Development Agency Revenue (Carousel Center Project) | 5.000% | 1/1/33 | 2,600 | 2,958 |
| | Syracuse NY Industrial Development Agency Revenue (Carousel Center Project) | 5.000% | 1/1/34 | 2,000 | 2,267 |
| | Syracuse NY Industrial Development Agency Revenue (Carousel Center Project) | 5.000% | 1/1/35 | 1,405 | 1,587 |
| | Syracuse NY Industrial Development Agency Revenue (Carousel Center Project) | 5.000% | 1/1/36 | 1,750 | 1,969 |
| | Tompkins County NY Development Corp. Revenue (Tompkins Cortland Community College) | 5.000% | 7/1/27 | 3,485 | 3,740 |
| | Tompkins County NY Development Corp. Revenue (Tompkins Cortland Community College) | 5.000% | 7/1/32 | 3,000 | 3,156 |
| | Tompkins County NY Development Corp. Revenue (Tompkins Cortland Community College) | 5.000% | 7/1/38 | 4,000 | 4,161 |
| | Triborough Bridge & Tunnel Authority New York Revenue | 5.000% | 11/15/28 | 4,000 | 4,757 |
| | Triborough Bridge & Tunnel Authority New York Revenue | 5.000% | 11/15/29 | 2,000 | 2,366 |
| | Triborough Bridge & Tunnel Authority New York Revenue | 5.000% | 11/15/46 | 10,000 | 11,840 |
| | Troy NY Capital Resource Corp. Revenue (Rensselaer Polytechnic Institute Project) | 5.000% | 8/1/32 | 1,000 | 1,176 |
| | Westchester County NY Health Care Corp. Revenue | 6.125% | 11/1/20 (Prere.) | 2,665 | 3,184 |
| | Westchester County NY Health Care Corp. Revenue | 6.125% | 11/1/37 | 335 | 380 |
| | Westchester County NY Local Development Corp. Revenue (Pace University) | 5.000% | 5/1/34 | 2,050 | 2,300 |
| | Westchester County NY Local Development Corp. Revenue (Westchester Medical Center) | 5.000% | 11/1/46 | 27,500 | 30,887 |
| | | | | | 1,261,228 |
| North Carolina (0.7%) | | | | |
| | North Carolina Medical Care Commission Health Care Facilities Revenue | | | | |
| | (Cape Fear Valley Health System) | 5.000% | 10/1/23 | 9,785 | 11,345 |
| | North Carolina Medical Care Commission Health Care Facilities Revenue (Maryfield Inc.) | 5.000% | 10/1/25 | 2,000 | 2,294 |
| | North Carolina Medical Care Commission Health Care Facilities Revenue (Maryfield Inc.) | 5.000% | 10/1/30 | 2,000 | 2,219 |
| | North Carolina Medical Care Commission Health Care Facilities Revenue (Maryfield Inc.) | 5.000% | 10/1/35 | 2,250 | 2,465 |
| | North Carolina Medical Care Commission Health Care Facilities Revenue (Vidant Health) | 5.000% | 6/1/30 | 4,000 | 4,741 |
| | North Carolina Medical Care Commission Health Care Facilities Revenue (Vidant Health) | 5.000% | 6/1/32 | 5,000 | 5,876 |
291
High-Yield Tax-Exempt Fund
| | | | |
| | | | Face | Market |
| | | Maturity | Amount | Value• |
| | Coupon | Date | ($000) | ($000) |
| North Carolina Medical Care Commission Health Care Facilities Revenue (Vidant Health) | 5.000% | 6/1/36 | 2,000 | 2,251 |
| North Carolina Medical Care Commission Health Care Facilities Revenue (Vidant Health) | 5.000% | 6/1/40 | 10,000 | 11,487 |
| 4 North Carolina Medical Care Commission Health System Revenue (Mission Health System Inc.) | 5.000% | 10/1/34 | 1,500 | 1,746 |
| 4 North Carolina Medical Care Commission Health System Revenue (Mission Health System Inc.) | 5.000% | 10/1/35 | 1,620 | 1,879 |
| 4 North Carolina Medical Care Commission Health System Revenue (Mission Health System Inc.) | 5.000% | 10/1/36 | 1,655 | 1,914 |
| North Carolina Medical Care Commission Hospital Revenue (North Carolina Baptist Hospital) | 5.000% | 6/1/34 | 5,050 | 5,544 |
| North Carolina Medical Care Commission Retirement Facilities Mortgage Revenue (Aldersgate) | 6.250% | 7/1/35 | 4,500 | 5,163 |
| North Carolina Medical Care Commission Retirement Facilities Mortgage Revenue | | | | |
| (Givens Estates Project) | 5.000% | 7/1/27 | 2,750 | 2,841 |
| North Carolina Medical Care Commission Retirement Facilities Mortgage Revenue | | | | |
| (Salemtowne Project) | 5.000% | 10/1/20 | 2,380 | 2,604 |
| North Carolina Medical Care Commission Retirement Facilities Mortgage Revenue | | | | |
| (Salemtowne Project) | 5.000% | 10/1/26 | 5,000 | 5,648 |
| North Carolina Medical Care Commission Retirement Facilities Mortgage Revenue | | | | |
| (Salemtowne Project) | 5.000% | 10/1/30 | 2,000 | 2,220 |
| 4 North Carolina Medical Care Commission Retirement Facilities Revenue (Southminster Inc.) | 5.000% | 10/1/31 | 1,750 | 1,943 |
| 4 North Carolina Medical Care Commission Retirement Facilities Revenue (Southminster Inc.) | 5.000% | 10/1/37 | 1,800 | 1,966 |
| | | | | 76,146 |
| Ohio (1.5%) | | | | |
| Allen County OH Hospital Facilities Revenue (Catholic Healthcare Partners) | 5.250% | 9/1/27 | 10,000 | 11,345 |
| American Municipal Power Ohio Inc. Revenue (Hydroelectric Projects) | 4.000% | 2/15/33 | 2,530 | 2,719 |
| American Municipal Power Ohio Inc. Revenue (Hydroelectric Projects) | 5.000% | 2/15/41 | 3,065 | 3,553 |
| American Municipal Power Ohio Inc. Revenue (Hydroelectric Projects) | 5.000% | 2/15/41 | 5,000 | 5,783 |
| American Municipal Power Ohio Inc. Revenue (Meldahl Hydroelectric Project) | 4.000% | 2/15/41 | 2,575 | 2,712 |
| Bowling Green State University Ohio Student Housing Revenue | | | | |
| (CFP I LLC - State University Project) | 5.750% | 6/1/31 | 5,000 | 5,418 |
| Buckeye Tobacco Settlement Financing Authority Ohio Revenue | 5.750% | 6/1/34 | 10,195 | 9,505 |
| Buckeye Tobacco Settlement Financing Authority Ohio Revenue | 6.250% | 6/1/37 | 5,000 | 4,857 |
| Buckeye Tobacco Settlement Financing Authority Ohio Revenue | 6.000% | 6/1/42 | 12,005 | 11,444 |
| Buckeye Tobacco Settlement Financing Authority Ohio Revenue | 5.875% | 6/1/47 | 5,730 | 5,386 |
| Buckeye Tobacco Settlement Financing Authority Ohio Revenue | 6.500% | 6/1/47 | 10,545 | 10,372 |
| Butler County OH Hospital Facilities Revenue (Kettering Health Network) | 6.375% | 4/1/36 | 3,750 | 4,352 |
| Butler County OH Hospital Facilities Revenue (Kettering Health Network) | 5.625% | 4/1/41 | 5,000 | 5,632 |
| Butler County OH Hospital Facilities Revenue (UC Health) | 5.250% | 11/1/29 | 3,380 | 3,867 |
| 4 Butler County OH Hospital Facilities Revenue (UC Health) | 5.000% | 11/15/45 | 8,810 | 9,987 |
| Dayton-Montgomery County OH Port Authority Revenue (StoryPoint Troy Project) | 7.125% | 1/15/50 | 10,000 | 10,207 |
| Hamilton County OH Healthcare Revenue (Life Enriching Communities) | 5.000% | 1/1/36 | 1,500 | 1,650 |
| Hamilton County OH Healthcare Revenue (Life Enriching Communities) | 5.000% | 1/1/46 | 2,100 | 2,281 |
| Hamilton County OH Healthcare Revenue (Life Enriching Communities) | 5.000% | 1/1/51 | 5,400 | 5,854 |
| Hamilton County OH Hospital Facilities Revenue (UC Health) | 5.000% | 2/1/44 | 440 | 489 |
| JobsOhio Beverage System Statewide Liquor Profits Revenue | 5.000% | 1/1/38 | 7,280 | 8,323 |
| Lucas County OH Hospital Revenue (ProMedica Healthcare Obligated Group) | 5.250% | 11/15/27 | 7,500 | 8,706 |
| Lucas County OH Hospital Revenue (ProMedica Healthcare Obligated Group) | 6.000% | 11/15/41 | 3,000 | 3,574 |
| Ohio Hospital Revenue (University Hospitals Health System Inc.) | 5.000% | 1/15/41 | 3,590 | 4,145 |
| Ohio Hospital Revenue (University Hospitals Health System Inc.) | 5.000% | 1/15/41 | 10,250 | 11,257 |
| Ohio Private Activity Revenue (Portsmouth Gateway Group LLC) | 5.000% | 12/31/39 | 3,540 | 3,937 |
| Ohio Private Activity Revenue (Portsmouth Gateway Group LLC) | 5.000% | 6/30/53 | 4,000 | 4,382 |
| Penta Career Center Ohio COP | 5.250% | 4/1/26 | 3,505 | 4,030 |
| Penta Career Center Ohio COP | 5.250% | 4/1/27 | 3,490 | 3,998 |
| Wood County OH Hospital Facilities Revenue (Wood County Hospital) | 5.000% | 12/1/32 | 3,000 | 3,228 |
| | | | | 172,993 |
| Oklahoma (0.3%) | | | | |
| Cleveland County OK Educational Facilities Authority Lease Revenue | | | | |
| (Moore Public Schools Project) | 5.000% | 6/1/23 | 6,445 | 7,779 |
| 4 Norman OK Regional Hospital Authority Revenue | 5.000% | 9/1/37 | 7,390 | 7,955 |
| Oklahoma County OK Finance Authority Revenue (Epworth Villa Project) | 5.125% | 4/1/42 | 6,260 | 6,482 |
| Oklahoma Housing Finance Agency Single Family Mortgage Revenue | | | | |
| (Homeownership Loan Program) | 5.950% | 9/1/37 | 780 | 793 |
| Oklahoma Municipal Power Authority Power Supply System Revenue | 6.000% | 1/1/18 (Prere.) | 4,500 | 4,770 |
| Oklahoma Municipal Power Authority Power Supply System Revenue | 5.000% | 1/1/30 | 965 | 1,150 |
| Oklahoma Municipal Power Authority Power Supply System Revenue | 4.000% | 1/1/35 | 580 | 620 |
| Oklahoma Municipal Power Authority Power Supply System Revenue | 4.000% | 1/1/36 | 295 | 314 |
| Oklahoma Municipal Power Authority Power Supply System Revenue | 5.000% | 1/1/38 | 3,500 | 4,064 |
| | | | | 33,927 |
| Oregon (0.3%) | | | | |
| 4 Oregon Facilities Authority Revenue (Samaritan Health Services Project) | 5.000% | 10/1/32 | 1,800 | 2,063 |
| 5 Oregon Health & Science University Revenue | 5.750% | 7/1/19 (Prere.) | 6,750 | 7,584 |
| Oregon Housing & Community Service Department Single Family Mortgage Revenue | 4.000% | 7/1/44 | 2,340 | 2,462 |
| Port of Portland OR International Airport Revenue | 5.000% | 7/1/34 | 3,160 | 3,646 |
292
High-Yield Tax-Exempt Fund
| | | | |
| | | | Face | Market |
| | | Maturity | Amount | Value• |
| | Coupon | Date | ($000) | ($000) |
| 4 Salem OR Hospital Facilities Authority Revenue (Salem Health Project) | 5.000% | 5/15/46 | 8,000 | 9,098 |
| Yamhill County OR Hospital Authority Revenue (Friendsview Manor) | 5.000% | 11/15/46 | 2,250 | 2,429 |
| Yamhill County OR School District No. 40 (McMinnville) GO | 4.000% | 6/15/31 | 1,000 | 1,125 |
| Yamhill County OR School District No. 40 (McMinnville) GO | 4.000% | 6/15/32 | 1,000 | 1,117 |
| | | | | 29,524 |
| Pennsylvania (6.1%) | | | | |
| Allegheny County PA GO | 5.000% | 11/1/19 (Prere.) | 3,265 | 3,650 |
| Allegheny County PA GO VRDO | 0.630% | 11/7/16 LOC | 1,500 | 1,500 |
| Allegheny County PA Higher Education Building Authority University Revenue | | | | |
| (Chatham University) | 5.000% | 9/1/30 | 500 | 565 |
| Allegheny County PA Higher Education Building Authority University Revenue | | | | |
| (Chatham University) | 5.000% | 9/1/35 | 2,165 | 2,415 |
| Allegheny County PA Higher Education Building Authority University Revenue | | | | |
| (Duquesne University) | 5.000% | 3/1/27 | 1,635 | 1,999 |
| 6 Allegheny County PA Hospital Development Authority Revenue | | | | |
| (University of Pittsburgh Medical Center) TOB VRDO | 0.620% | 11/1/16 LOC | 14,100 | 14,100 |
| Allegheny County PA Sanitary Authority Sewer Revenue | 4.000% | 12/1/31 (4) | 1,000 | 1,101 |
| Allegheny County PA Sanitary Authority Sewer Revenue | 4.000% | 12/1/32 (4) | 1,385 | 1,515 |
| Allegheny County PA Sanitary Authority Sewer Revenue | 4.000% | 12/1/33 (4) | 2,000 | 2,180 |
| Allentown PA Neighborhood Improvement Zone Development Authority Tax Revenue | 5.000% | 5/1/30 | 2,650 | 2,896 |
| Allentown PA Neighborhood Improvement Zone Development Authority Tax Revenue | 5.000% | 5/1/42 | 14,500 | 15,460 |
| Beaver County PA Industrial Development Authority Pollution Control Revenue | | | | |
| (FirstEnergy Generation Project) PUT | 2.700% | 4/2/18 | 5,000 | 4,728 |
| Cumberland County PA Municipal Authority Revenue | | | | |
| (Asbury Pennsylvania CCRC Obligated Group) | 5.250% | 1/1/41 | 4,000 | 4,229 |
| Doylestown PA Hospital Authority Revenue | 5.000% | 7/1/41 | 3,500 | 3,879 |
| East Hempfield Township PA Industrial Development Authority Revenue | | | | |
| (Millersville University Student Housing Project) | 5.000% | 7/1/35 | 1,060 | 1,164 |
| East Hempfield Township PA Industrial Development Authority Revenue | | | | |
| (Millersville University Student Housing Project) | 5.000% | 7/1/39 | 1,625 | 1,764 |
| East Hempfield Township PA Industrial Development Authority Revenue | | | | |
| (Millersville University Student Housing Project) | 5.000% | 7/1/46 | 3,175 | 3,431 |
| 3 Geisinger Authority Health System Pennsylvania Revenue (Geisinger Health System) PUT | 1.428% | 6/1/24 | 18,500 | 18,516 |
| 6 Lancaster County PA Hospital Authority Health System Revenue | | | | |
| (Lancaster General Hospital Project) TOB VRDO | 0.660% | 11/7/16 | 3,300 | 3,300 |
| Lancaster County PA Hospital Authority Health System Revenue | | | | |
| (University of Pennsylvania Health System) | 4.000% | 8/15/45 | 5,240 | 5,500 |
| Lancaster County PA Hospital Authority Health System Revenue | | | | |
| (University of Pennsylvania Health System) | 5.000% | 8/15/46 | 7,000 | 8,141 |
| Lancaster County PA Hospital Authority Revenue (University of Pennsylvania Health System) | 5.000% | 8/15/36 | 1,000 | 1,171 |
| Lehigh County PA Authority Water & Sewer Revenue | 5.000% | 12/1/43 | 4,285 | 4,857 |
| Lehigh County PA General Purpose Authority Revenue | | | | |
| (Bible Fellowship Church Homes Inc. Project) | 5.125% | 7/1/32 | 2,710 | 2,922 |
| Lehigh County PA General Purpose Authority Revenue | | | | |
| (Bible Fellowship Church Homes Inc. Project) | 5.250% | 7/1/42 | 4,000 | 4,297 |
| Lehigh County PA General Purpose Hospital Authority Revenue (Lehigh Valley Health Network) | 4.000% | 7/1/33 | 2,940 | 3,142 |
| Lehigh County PA General Purpose Hospital Authority Revenue (Lehigh Valley Health Network) | 4.000% | 7/1/35 | 10,000 | 10,617 |
| Monroeville PA Finance Authority Revenue (UPMC Health System) | 5.000% | 2/15/30 | 4,000 | 4,561 |
| Montgomery County PA Higher Education & Health Authority Revenue (Arcadia University) | 5.750% | 4/1/40 | 3,530 | 3,947 |
| Montgomery County PA Industrial Development Authority Health Services Revenue | | | | |
| (Albert Einstein Healthcare Network) | 5.250% | 1/15/36 | 11,250 | 12,507 |
| Montgomery County PA Industrial Development Authority Health Services Revenue | | | | |
| (Albert Einstein Healthcare Network) | 5.250% | 1/15/45 | 10,000 | 11,058 |
| Montgomery County PA Industrial Development Authority Health Services Revenue | | | | |
| (Albert Einstein Healthcare Network) | 5.250% | 1/15/46 | 1,700 | 1,880 |
| Montgomery County PA Industrial Development Authority Revenue | | | | |
| (Philadelphia Presbyterian Homes Inc. Project) | 7.000% | 12/1/35 | 2,670 | 3,079 |
| Montgomery County PA Industrial Development Authority Revenue | | | | |
| (Philadelphia Presbyterian Homes Inc. Project) | 7.000% | 12/1/40 | 2,500 | 2,863 |
| Montgomery County PA Industrial Development Authority Revenue | | | | |
| (Whitemarsh Continuing Care Retirement Community Inc.) | 5.250% | 1/1/40 | 5,000 | 5,140 |
| Montgomery County PA Industrial Development Authority Revenue | | | | |
| (Whitemarsh Continuing Care Retirement Community Inc.) | 5.375% | 1/1/50 | 10,000 | 10,326 |
| Moon Industrial Development Authority Pennsylvania Revenue | | | | |
| (Baptist Home Society Obligated Group) | 6.125% | 7/1/50 | 15,000 | 16,899 |
| Northampton County PA General Purpose Authority Hospital Revenue | | | | |
| (St. Luke’s Hospital Project) | 5.500% | 8/15/18 (Prere.) | 6,500 | 7,024 |
| Northampton County PA General Purpose Authority Hospital Revenue | | | | |
| (St. Luke’s Hospital Project) | 5.500% | 8/15/18 (Prere.) | 5,000 | 5,403 |
293
High-Yield Tax-Exempt Fund
| | | | |
| | | | Face | Market |
| | | Maturity | Amount | Value• |
| | Coupon | Date | ($000) | ($000) |
| Northeastern Pennsylvania Hospital & Educational Authority Revenue (Wilkes University Project) | 5.000% | 3/1/37 | 765 | 863 |
| Pennsylvania Economic Development Financing Authority Exempt Facilities Revenue | | | | |
| (National Gypsum Co.) | 5.500% | 11/1/44 | 5,000 | 5,495 |
| Pennsylvania Economic Development Financing Authority Resource Recovery Revenue | | | | |
| (Colver Project) | 4.625% | 12/1/18 (2) | 17,500 | 17,555 |
| Pennsylvania Economic Development Financing Authority Revenue (PA Bridges Financing Corp.) | 5.000% | 12/31/38 | 4,000 | 4,464 |
| Pennsylvania Economic Development Financing Authority Revenue (PA Bridges Financing Corp.) | 5.000% | 6/30/42 | 6,060 | 6,705 |
| Pennsylvania Economic Development Financing Authority Revenue | | | | |
| (Rapid Bridge Replacement Project) | 5.000% | 12/31/29 | 10,000 | 11,594 |
| Pennsylvania GO | 5.000% | 9/15/27 | 10,000 | 12,251 |
| Pennsylvania GO | 5.000% | 8/1/32 | 8,235 | 9,501 |
| Pennsylvania GO | 5.000% | 8/1/33 | 6,440 | 7,398 |
| Pennsylvania Higher Educational Facilities Authority Revenue (Drexel University) | 4.000% | 5/1/36 | 4,000 | 4,267 |
| Pennsylvania Higher Educational Facilities Authority Revenue | | | | |
| (Foundation for Indiana University of Pennsylvania Student Housing) | 5.000% | 7/1/41 | 2,275 | 2,520 |
| 6 Pennsylvania Higher Educational Facilities Authority Revenue | | | | |
| (Higher Education System) TOB VRDO | 0.690% | 11/7/16 | 7,560 | 7,560 |
| Pennsylvania Higher Educational Facilities Authority Revenue (Thomas Jefferson University) | 5.250% | 9/1/50 | 15,120 | 17,467 |
| Pennsylvania Turnpike Commission Revenue | 5.000% | 6/1/19 (Prere.) | 6,865 | 7,568 |
| Pennsylvania Turnpike Commission Revenue | 5.000% | 6/1/19 (Prere.) | 10,040 | 11,068 |
| Pennsylvania Turnpike Commission Revenue | 5.000% | 6/1/19 (Prere.) | 720 | 793 |
| Pennsylvania Turnpike Commission Revenue | 5.000% | 6/1/19 (Prere.) | 3,270 | 3,603 |
| Pennsylvania Turnpike Commission Revenue | 6.500% | 12/1/20 (Prere.) | 4,000 | 4,863 |
| Pennsylvania Turnpike Commission Revenue | 5.000% | 6/1/27 | 30,000 | 36,007 |
| Pennsylvania Turnpike Commission Revenue | 5.000% | 12/1/30 | 10,000 | 11,776 |
| Pennsylvania Turnpike Commission Revenue | 5.000% | 12/1/31 | 10,000 | 11,700 |
| Pennsylvania Turnpike Commission Revenue | 5.000% | 12/1/33 | 9,200 | 10,829 |
| Pennsylvania Turnpike Commission Revenue | 5.000% | 12/1/33 | 5,000 | 5,886 |
| Pennsylvania Turnpike Commission Revenue | 5.500% | 12/1/33 | 4,000 | 4,809 |
| Pennsylvania Turnpike Commission Revenue | 5.000% | 6/1/37 | 6,245 | 7,051 |
| Pennsylvania Turnpike Commission Revenue | 5.000% | 6/1/39 | 12,000 | 13,590 |
| Pennsylvania Turnpike Commission Revenue | 0.000% | 12/1/39 | 8,000 | 6,573 |
| Pennsylvania Turnpike Commission Revenue | 5.250% | 12/1/39 | 13,000 | 15,025 |
| Pennsylvania Turnpike Commission Revenue | 5.000% | 12/1/40 | 16,415 | 18,466 |
| Pennsylvania Turnpike Commission Revenue | 5.000% | 12/1/40 | 6,400 | 7,289 |
| Pennsylvania Turnpike Commission Revenue | 5.000% | 12/1/40 | 11,225 | 12,864 |
| Pennsylvania Turnpike Commission Revenue | 5.000% | 12/1/41 | 17,000 | 19,110 |
| Pennsylvania Turnpike Commission Revenue | 5.000% | 12/1/41 | 5,000 | 5,747 |
| Pennsylvania Turnpike Commission Revenue | 5.250% | 12/1/45 | 3,500 | 4,077 |
| Pennsylvania Turnpike Commission Revenue | 5.000% | 12/1/46 | 10,530 | 11,784 |
| Philadelphia PA Authority for Industrial Development Revenue (Cultural & Commercial Corridors) | 5.000% | 12/1/27 | 5,000 | 5,928 |
| Philadelphia PA Gas Works Revenue | 5.000% | 8/1/26 | 3,455 | 4,183 |
| Philadelphia PA Gas Works Revenue | 5.000% | 8/1/27 | 2,000 | 2,402 |
| Philadelphia PA Gas Works Revenue | 5.000% | 8/1/28 | 2,000 | 2,375 |
| Philadelphia PA Gas Works Revenue | 5.000% | 10/1/30 | 4,200 | 5,011 |
| Philadelphia PA Gas Works Revenue | 5.000% | 10/1/32 | 3,335 | 3,935 |
| Philadelphia PA Gas Works Revenue | 5.000% | 8/1/33 | 1,000 | 1,153 |
| Philadelphia PA Gas Works Revenue | 5.000% | 8/1/34 | 1,000 | 1,149 |
| Philadelphia PA Gas Works Revenue | 4.000% | 10/1/35 | 1,845 | 1,981 |
| Philadelphia PA Gas Works Revenue | 4.000% | 10/1/36 | 1,750 | 1,876 |
| Philadelphia PA Hospitals & Higher Education Facilities Authority Hospital Revenue | | | | |
| (Children’s Hospital of Philadelphia Project) VRDO | 0.520% | 11/1/16 | 3,400 | 3,400 |
| Philadelphia PA Hospitals & Higher Education Facilities Authority Hospital Revenue | | | | |
| (Temple University Health System Obligated Group) | 5.625% | 7/1/36 | 5,850 | 6,484 |
| Philadelphia PA Hospitals & Higher Education Facilities Authority Hospital Revenue | | | | |
| (Temple University Health System Obligated Group) | 5.625% | 7/1/42 | 7,930 | 8,759 |
| Philadelphia PA School District GO | 6.000% | 9/1/18 (Prere.) | 15 | 16 |
| Philadelphia PA School District GO | 6.000% | 9/1/18 (Prere.) | 5 | 5 |
| Philadelphia PA School District GO | 6.000% | 9/1/18 (Prere.) | 10 | 11 |
| Philadelphia PA School District GO | 6.000% | 9/1/18 (Prere.) | 190 | 208 |
| Philadelphia PA School District GO | 6.000% | 9/1/18 (Prere.) | 10 | 11 |
| Philadelphia PA School District GO | 6.000% | 9/1/18 (Prere.) | 5 | 5 |
| 4 Philadelphia PA School District GO | 5.000% | 9/1/27 (15) | 12,000 | 14,097 |
| Philadelphia PA School District GO | 6.000% | 9/1/38 | 12,765 | 13,377 |
| Philadelphia PA Water & Waste Water Revenue | 5.000% | 7/1/40 | 3,500 | 4,025 |
| Philadelphia PA Water & Waste Water Revenue | 5.000% | 7/1/45 | 7,000 | 8,024 |
| Pocono Mountains Industrial Park Authority Pennsylvania Hospital Revenue | | | | |
| (St. Luke’s Hospital Obligated Group) | 5.000% | 8/15/40 | 8,125 | 9,113 |
| Sayre PA Health Care Facilities Authority Revenue (Guthrie Health Care System) | 1.214% | 12/1/17 | 10,120 | 10,121 |
| Scranton-Lackawanna PA Health & Welfare Authority Revenue (Marywood University Project) | 5.000% | 6/1/36 | 4,000 | 4,250 |
294
High-Yield Tax-Exempt Fund
| | | | |
| | | | Face | Market |
| | | Maturity | Amount | Value• |
| | Coupon | Date | ($000) | ($000) |
| Scranton-Lackawanna PA Health & Welfare Authority Revenue (Marywood University Project) | 5.000% | 6/1/46 | 5,250 | 5,537 |
| 6 Westmoreland County PA Industrial Development Authority Revenue | 4.720% | 7/1/35 | 12,000 | 12,732 |
| | | | | 682,012 |
| Puerto Rico (0.6%) | | | | |
| Puerto Rico Aqueduct & Sewer Authority Revenue | 5.125% | 7/1/37 | 4,905 | 3,699 |
| Puerto Rico Aqueduct & Sewer Authority Revenue | 5.250% | 7/1/42 | 14,200 | 10,711 |
| 7 Puerto Rico GO | 5.000% | 7/1/28 | 1,845 | 1,168 |
| 7 Puerto Rico GO | 5.125% | 7/1/28 | 3,245 | 2,054 |
| 7 Puerto Rico GO | 5.375% | 7/1/30 | 3,665 | 2,320 |
| 7 Puerto Rico GO | 5.125% | 7/1/31 | 3,125 | 1,973 |
| 7 Puerto Rico GO | 5.750% | 7/1/38 | 4,320 | 2,759 |
| 7 Puerto Rico GO | 5.000% | 7/1/41 | 6,795 | 4,255 |
| Puerto Rico Sales Tax Financing Corp. Revenue | 5.000% | 8/1/40 | 19,575 | 14,094 |
| Puerto Rico Sales Tax Financing Corp. Revenue | 5.250% | 8/1/40 | 19,080 | 13,738 |
| Puerto Rico Sales Tax Financing Corp. Revenue | 5.000% | 8/1/46 | 5,725 | 4,122 |
| Puerto Rico Sales Tax Financing Corp. Revenue | 5.750% | 8/1/57 | 8,530 | 6,133 |
| | | | | 67,026 |
| Rhode Island (0.6%) | | | | |
| Rhode Island Commerce Corp. Airport Revenue | 5.000% | 7/1/41 | 1,000 | 1,146 |
| Rhode Island Commerce Corp. Airport Revenue | 5.000% | 7/1/46 | 1,750 | 1,996 |
| Rhode Island Health & Educational Building Corp. Higher Education Facilities Revenue | | | | |
| (University of Rhode Island) | 5.000% | 9/15/28 | 2,505 | 3,032 |
| Rhode Island Health & Educational Building Corp. Higher Education Facilities Revenue | | | | |
| (University of Rhode Island) | 5.000% | 9/15/29 | 5,170 | 6,211 |
| Rhode Island Health & Educational Building Corp. Higher Education Facilities Revenue | | | | |
| (University of Rhode Island) | 5.000% | 9/15/30 | 2,105 | 2,520 |
| Rhode Island Health & Educational Building Corp. Higher Education Facilities Revenue | | | | |
| (University of Rhode Island) | 4.000% | 9/15/31 | 1,000 | 1,098 |
| Rhode Island Health & Educational Building Corp. Higher Education Facilities Revenue | | | | |
| (University of Rhode Island) | 4.000% | 9/15/32 | 1,250 | 1,364 |
| Rhode Island Health & Educational Building Corp. Higher Education Facilities Revenue | | | | |
| (University of Rhode Island) | 4.000% | 9/15/33 | 1,350 | 1,467 |
| Rhode Island Health & Educational Building Corp. Higher Education Facilities Revenue | | | | |
| (University of Rhode Island) | 4.000% | 9/15/34 | 1,325 | 1,432 |
| Rhode Island Health & Educational Building Corp. Hospital Financing Revenue | | | | |
| (Care New England Health System Obligated Group) | 5.000% | 9/1/31 | 4,500 | 4,874 |
| Rhode Island Health & Educational Building Corp. Hospital Financing Revenue | | | | |
| (Care New England Health System Obligated Group) | 5.000% | 9/1/36 | 8,500 | 9,050 |
| Rhode Island Health & Educational Building Corp. Providence Public Schools Revenue | | | | |
| (Providence Public Buildings Authority) | 5.000% | 5/15/27 (4) | 10,040 | 12,036 |
| Tobacco Settlement Financing Corp. Rhode Island Revenue | 5.000% | 6/1/29 | 4,530 | 5,069 |
| Tobacco Settlement Financing Corp. Rhode Island Revenue | 5.000% | 6/1/30 | 4,000 | 4,446 |
| Tobacco Settlement Financing Corp. Rhode Island Revenue | 2.250% | 6/1/41 | 10,580 | 10,621 |
| | | | | 66,362 |
| South Carolina (1.6%) | | | | |
| Charleston SC Educational Excellence Financing Corp. Revenue | | | | |
| (Charleston County School District, South Carolina Project) | 5.000% | 12/1/16 (Prere.) | 10,120 | 10,156 |
| 6 Charleston SC Educational Excellence Financing Corp. Revenue | | | | |
| (Charleston County School District, South Carolina Project) TOB VRDO | 0.680% | 11/7/16 | 7,250 | 7,250 |
| Lancaster County SC Assessment Revenue | 5.450% | 12/1/37 | 1,170 | 1,171 |
| Lexington County SC Health Services District Inc. Hospital Revenue | 5.000% | 11/1/41 | 10,000 | 11,518 |
| Piedmont SC Municipal Power Agency Revenue | 5.250% | 1/1/19 | 11,770 | 12,329 |
| Piedmont SC Municipal Power Agency Revenue | 5.750% | 1/1/34 (4) | 10,000 | 11,721 |
| South Carolina Jobs Economic Development Authority Health Care Facilities Revenue | | | | |
| (Lutheran Homes of South Carolina Inc.) | 5.375% | 5/1/21 | 1,500 | 1,503 |
| South Carolina Jobs Economic Development Authority Revenue (Care Alliance Health Services) | 5.250% | 8/15/46 | 15,000 | 17,307 |
| South Carolina Ports Authority Revenue | 5.250% | 7/1/55 | 10,245 | 11,572 |
| South Carolina Public Service Authority Revenue | 5.500% | 1/1/19 (Prere.) | 1,190 | 1,303 |
| South Carolina Public Service Authority Revenue | 5.500% | 1/1/19 (Prere.) | 13,810 | 15,120 |
| South Carolina Public Service Authority Revenue | 5.000% | 12/1/33 | 5,000 | 5,951 |
| South Carolina Public Service Authority Revenue | 5.000% | 12/1/34 | 7,430 | 8,693 |
| South Carolina Public Service Authority Revenue | 5.000% | 12/1/35 | 7,940 | 9,264 |
| South Carolina Public Service Authority Revenue | 5.000% | 12/1/38 | 15,335 | 17,712 |
| South Carolina Public Service Authority Revenue | 5.000% | 12/1/39 | 5,000 | 5,791 |
| South Carolina Public Service Authority Revenue | 5.000% | 12/1/50 | 10,000 | 11,254 |
| South Carolina Public Service Authority Revenue | 5.000% | 12/1/56 | 7,500 | 8,545 |
| University of South Carolina Higher Education Revenue | 5.000% | 5/1/27 | 1,430 | 1,788 |
| University of South Carolina Higher Education Revenue | 5.000% | 5/1/28 | 700 | 868 |
295
High-Yield Tax-Exempt Fund
| | | | |
| | | | Face | Market |
| | | Maturity | Amount | Value• |
| | Coupon | Date | ($000) | ($000) |
| University of South Carolina Higher Education Revenue | 5.000% | 5/1/30 | 2,500 | 3,042 |
| University of South Carolina Higher Education Revenue | 5.000% | 5/1/31 | 1,200 | 1,452 |
| | | | | 175,310 |
| South Dakota (0.2%) | | | | |
| South Dakota Building Authority Revenue | 5.000% | 6/1/38 | 4,000 | 4,662 |
| South Dakota Health & Educational Facilities Authority Revenue (Sanford Health) | 5.000% | 11/1/37 | 10,000 | 11,219 |
| South Dakota Health & Educational Facilities Authority Revenue (Sanford Health) | 5.000% | 11/1/44 | 5,000 | 5,612 |
| | | | | 21,493 |
| Tennessee (1.8%) | | | | |
| Blount County TN Health & Educational Facilities Board Revenue (Asbury Inc.) | 5.000% | 1/1/31 | 1,700 | 1,861 |
| Blount County TN Health & Educational Facilities Board Revenue (Asbury Inc.) | 5.000% | 1/1/37 | 375 | 403 |
| Blount County TN Health & Educational Facilities Board Revenue (Asbury Inc.) | 5.000% | 1/1/47 | 2,125 | 2,257 |
| Chattanooga TN Health Educational & Housing Facility Board Revenue (Catholic Health Initiatives) | 5.250% | 1/1/45 | 6,500 | 7,244 |
| Chattanooga-Hamilton County TN Hospital Authority Hospital Revenue | 5.000% | 10/1/39 | 7,600 | 8,499 |
| Chattanooga-Hamilton County TN Hospital Authority Hospital Revenue | 5.000% | 10/1/44 | 10,280 | 11,481 |
| Clarksville TN Public Building Authority Revenue (Morristown) VRDO | 0.590% | 11/1/16 LOC | 4,000 | 4,000 |
| Clarksville TN Public Building Authority Revenue (Pooled Financing) VRDO | 0.590% | 11/1/16 LOC | 10,700 | 10,700 |
| Knox County TN Health Educational & Housing Facilities Board Hospital Facilities Revenue | | | | |
| (Covenant Healthcare) | 0.000% | 1/1/42 | 3,215 | 910 |
| Metropolitan Government of Nashville & Davidson County TN Health & | | | | |
| Educational Facilities Board Revenue (Vanderbilt University) | 5.000% | 7/1/40 | 5,000 | 5,811 |
| Metropolitan Government of Nashville & Davidson County TN Health & | | | | |
| Educational Facilities Board Revenue (Vanderbilt University) | 5.000% | 7/1/46 | 5,000 | 5,770 |
| Metropolitan Government of Nashville & Davidson County TN Industrial Development | | | | |
| Board Revenue (Waste Management Inc. Tennessee Project) PUT | 1.500% | 8/1/17 | 7,500 | 7,521 |
| Montgomery County TN Public Building Authority Pooled Financial Revenue | | | | |
| (Tennessee County Loan Pool) VRDO | 0.590% | 11/1/16 LOC | 19,300 | 19,300 |
| Shelby County TN Health Educational & Housing Facility Board Revenue | | | | |
| (Methodist Le Bonheur Healthcare) VRDO | 0.520% | 11/1/16 (4) | 7,400 | 7,400 |
| Tennessee Energy Acquisition Corp. Gas Revenue | 5.000% | 2/1/19 | 22,820 | 24,559 |
| Tennessee Energy Acquisition Corp. Gas Revenue | 5.250% | 9/1/19 | 7,280 | 8,026 |
| Tennessee Energy Acquisition Corp. Gas Revenue | 5.000% | 2/1/20 | 3,460 | 3,828 |
| Tennessee Energy Acquisition Corp. Gas Revenue | 5.250% | 9/1/21 | 2,320 | 2,690 |
| Tennessee Energy Acquisition Corp. Gas Revenue | 5.000% | 2/1/22 | 1,010 | 1,158 |
| Tennessee Energy Acquisition Corp. Gas Revenue | 5.250% | 9/1/22 | 6,285 | 7,389 |
| Tennessee Energy Acquisition Corp. Gas Revenue | 5.000% | 2/1/23 | 2,190 | 2,553 |
| Tennessee Energy Acquisition Corp. Gas Revenue | 5.250% | 9/1/23 | 1,665 | 1,991 |
| Tennessee Energy Acquisition Corp. Gas Revenue | 5.000% | 2/1/24 | 5,790 | 6,765 |
| Tennessee Energy Acquisition Corp. Gas Revenue | 5.250% | 9/1/24 | 8,060 | 9,659 |
| Tennessee Energy Acquisition Corp. Gas Revenue | 5.250% | 9/1/26 | 3,535 | 4,333 |
| Tennessee Energy Acquisition Corp. Gas Revenue | 5.000% | 2/1/27 | 16,325 | 19,586 |
| Tennessee Housing Development Agency Homeownership Program Revenue | 4.500% | 1/1/38 | 1,070 | 1,131 |
| Tennessee Housing Development Agency Residential Finance Program Revenue | 4.000% | 7/1/39 | 3,590 | 3,833 |
| Washington County TN GO | 4.000% | 6/1/28 | 6,405 | 7,398 |
| | | | | 198,056 |
| Texas (8.7%) | | | | |
| Austin TX Airport System Revenue | 5.000% | 11/15/26 | 1,000 | 1,192 |
| Austin TX Airport System Revenue | 5.000% | 11/15/39 | 4,370 | 4,937 |
| Central Texas Regional Mobility Authority Revenue | 6.250% | 1/1/21 (Prere.) | 1,500 | 1,803 |
| Central Texas Regional Mobility Authority Revenue | 0.000% | 1/1/32 | 4,090 | 2,307 |
| Central Texas Regional Mobility Authority Revenue | 0.000% | 1/1/33 | 3,000 | 1,621 |
| Central Texas Regional Mobility Authority Revenue | 5.000% | 1/1/33 | 6,590 | 7,307 |
| Central Texas Regional Mobility Authority Revenue | 4.000% | 1/1/41 | 6,000 | 6,219 |
| Central Texas Regional Mobility Authority Revenue | 5.000% | 1/1/46 | 7,000 | 7,905 |
| Dallas TX Area Rapid Transit Sales Tax Revenue | 5.000% | 12/1/41 | 8,000 | 9,396 |
| Dallas-Fort Worth TX International Airport Revenue | 5.000% | 11/1/26 | 10,000 | 11,270 |
| Dallas-Fort Worth TX International Airport Revenue | 5.250% | 11/1/26 | 1,530 | 1,822 |
| Dallas-Fort Worth TX International Airport Revenue | 5.000% | 11/1/32 | 7,200 | 8,023 |
| Dallas-Fort Worth TX International Airport Revenue | 5.000% | 11/1/35 | 7,000 | 7,771 |
| Dallas-Fort Worth TX International Airport Revenue | 5.000% | 11/1/35 | 3,760 | 4,174 |
| Dallas-Fort Worth TX International Airport Revenue | 5.000% | 11/1/38 | 21,275 | 23,697 |
| Dallas-Fort Worth TX International Airport Revenue | 5.000% | 11/1/38 | 7,085 | 7,793 |
| Dallas-Fort Worth TX International Airport Revenue | 5.000% | 11/1/42 | 16,785 | 18,654 |
| Dallas-Fort Worth TX International Airport Revenue | 5.000% | 11/1/42 | 10,000 | 11,188 |
| Dallas-Fort Worth TX International Airport Revenue | 5.000% | 11/1/43 | 11,000 | 12,041 |
| Grand Parkway Transportation Corp. Texas System Toll Revenue | 0.000% | 10/1/34 | 19,500 | 17,783 |
| Grand Parkway Transportation Corp. Texas System Toll Revenue | 5.250% | 10/1/51 | 8,000 | 9,439 |
| Harris County TX Cultural Education Facilities Finance Corp. Hospital Revenue | | | | |
| (Memorial Hermann Healthcare System) | 5.000% | 12/1/31 | 8,000 | 9,180 |
296
High-Yield Tax-Exempt Fund
| | | | |
| | | | Face | Market |
| | | Maturity | Amount | Value• |
| | Coupon | Date | ($000) | ($000) |
| Harris County TX Cultural Education Facilities Finance Corp. Revenue | | | | |
| (YMCA of the Greater Houston Area) | 5.000% | 6/1/38 | 2,500 | 2,720 |
| Harris County TX Sports Authority Revenue | 5.000% | 11/15/31 | 500 | 576 |
| Harris County TX Sports Authority Revenue | 5.000% | 11/15/32 | 500 | 573 |
| Harris County TX Sports Authority Revenue | 5.000% | 11/15/34 | 1,100 | 1,252 |
| Hays County TX Special Assessment Revenue | 7.000% | 9/15/45 | 4,500 | 4,636 |
| Houston TX Airport System Revenue | 5.000% | 7/15/30 | 11,605 | 13,088 |
| Houston TX Airport System Revenue | 5.000% | 7/1/32 | 5,000 | 5,539 |
| Houston TX Airport System Revenue | 5.000% | 7/15/35 | 5,000 | 5,521 |
| Houston TX Airport System Revenue | 5.500% | 7/1/39 | 5,010 | 5,369 |
| Houston TX Airport System Special Facilities Revenue | | | | |
| (Continental Airlines Inc. Terminal Improvement Projects) | 4.750% | 7/1/24 | 7,500 | 8,464 |
| Houston TX Airport System Special Facilities Revenue | | | | |
| (Continental Airlines Inc. Terminal Improvement Projects) | 5.000% | 7/1/29 | 23,150 | 25,870 |
| Houston TX Airport System Special Facilities Revenue | | | | |
| (Continental Airlines Inc. Terminal Improvement Projects) | 6.500% | 7/15/30 | 4,000 | 4,615 |
| 6 Lone Star College System Texas GO TOB VRDO | 0.660% | 11/7/16 | 9,535 | 9,535 |
| Love Field Airport Modernization Corp. Texas Special Facilities Revenue | | | | |
| (Southwest Airlines Co. Project) | 5.000% | 11/1/22 | 2,250 | 2,618 |
| Lower Colorado River Authority Texas Revenue | 5.625% | 5/15/19 (Prere.) | 15 | 17 |
| Lower Colorado River Authority Texas Revenue | 5.625% | 5/15/19 (Prere.) | 10 | 11 |
| Lower Colorado River Authority Texas Revenue | 5.625% | 5/15/19 (Prere.) | 205 | 228 |
| Lower Colorado River Authority Texas Revenue | 5.625% | 5/15/19 (Prere.) | 5 | 6 |
| Lower Colorado River Authority Texas Revenue | 5.000% | 5/15/30 | 5,000 | 5,536 |
| Lower Colorado River Authority Texas Revenue | 5.500% | 5/15/36 | 10,000 | 11,006 |
| Lower Colorado River Authority Texas Revenue | 5.625% | 5/15/39 | 4,765 | 5,228 |
| Lower Colorado River Authority Texas Transmission Contract Revenue | | | | |
| (LCRA Transmission Services Corp.) | 5.000% | 5/15/28 | 1,400 | 1,713 |
| Lower Colorado River Authority Texas Transmission Contract Revenue | | | | |
| (LCRA Transmission Services Corp.) | 5.000% | 5/15/29 | 1,035 | 1,256 |
| Lower Colorado River Authority Texas Transmission Contract Revenue | | | | |
| (LCRA Transmission Services Corp.) | 5.000% | 5/15/30 | 1,375 | 1,657 |
| Lower Colorado River Authority Texas Transmission Contract Revenue | | | | |
| (LCRA Transmission Services Corp.) | 5.000% | 5/15/45 | 9,500 | 10,937 |
| Lubbock TX Independent School District GO | 5.750% | 2/15/19 (Prere.) | 4,500 | 4,983 |
| Mesquite TX Health Facilities Development Corp. Retirement Facility Revenue | | | | |
| (Christian Care CentersInc. Project) | 5.125% | 2/15/42 | 2,750 | 2,969 |
| Mission TX Economic Development Corp. Revenue (Natgasoline Project) | 5.750% | 10/1/31 | 15,000 | 15,846 |
| New Hope TX Cultural Education Facilities FinanceCorp. First Mortgage Revenue | | | | |
| (Morningside Ministries Project) | 6.500% | 1/1/43 | 4,370 | 5,039 |
| New Hope TX Cultural Education Facilities FinanceCorp. Retirement Facilities Revenue | | | | |
| (Carillon Life Care Community Project) | 5.000% | 7/1/36 | 1,950 | 2,034 |
| New Hope TX Cultural Education Facilities FinanceCorp. Retirement Facilities Revenue | | | | |
| (Carillon Life Care Community Project) | 5.000% | 7/1/46 | 2,250 | 2,305 |
| New Hope TX Cultural Education Facilities FinanceCorp. Retirement Facilities Revenue | | | | |
| (Legacy at Willow Bend Retirement Community Project) | 5.000% | 11/1/36 | 4,605 | 5,147 |
| New Hope TX Cultural Education Facilities FinanceCorp. Retirement Facilities Revenue | | | | |
| (Legacy at Willow Bend Retirement Community Project) | 5.000% | 11/1/46 | 3,000 | 3,333 |
| New Hope TX Cultural Education Facilities FinanceCorp. Retirement Facilities Revenue | | | | |
| (Legacy at Willow Bend Retirement Community Project) | 5.000% | 11/1/51 | 4,750 | 5,254 |
| 4 New Hope TX Cultural Education Facilities FinanceCorp. Retirement Facilities Revenue | | | | |
| (MRC Crestview Project) | 3.000% | 11/15/21 | 800 | 799 |
| New Hope TX Cultural Education Facilities FinanceCorp. Retirement Facilities Revenue | | | | |
| (MRC Crestview Project) | 5.000% | 11/15/31 | 850 | 953 |
| New Hope TX Cultural Education Facilities FinanceCorp. Retirement Facilities Revenue | | | | |
| (MRC Crestview Project) | 5.000% | 11/15/36 | 550 | 610 |
| New Hope TX Cultural Education Facilities FinanceCorp. Retirement Facilities Revenue | | | | |
| (MRC Crestview Project) | 5.000% | 11/15/46 | 1,600 | 1,758 |
| 4 New Hope TX Cultural Education Facilities FinanceCorp. Retirement Facilities Revenue | | | | |
| (MRC Crestview Project) | 5.500% | 11/15/46 | 1,500 | 1,505 |
| 4 New Hope TX Cultural Education Facilities FinanceCorp. Retirement Facilities Revenue | | | | |
| (MRC Crestview Project) | 5.500% | 11/15/52 | 1,150 | 1,139 |
| New Hope TX Cultural Education Facilities FinanceCorp. Retirement Facilities Revenue | | | | |
| (Westminster Manor Project) | 5.000% | 11/1/31 | 1,000 | 1,126 |
| New Hope TX Cultural Education Facilities FinanceCorp. Retirement Facilities Revenue | | | | |
| (Westminster Manor Project) | 5.000% | 11/1/40 | 1,000 | 1,105 |
| New Hope TX Cultural Education Facilities FinanceCorp. Student Housing Revenue | | | | |
| (Tarleton State University Project) | 5.000% | 4/1/35 | 1,500 | 1,632 |
| New Hope TX Cultural Education Facilities FinanceCorp. Student Housing Revenue | | | | |
| (Tarleton State University Project) | 5.000% | 4/1/39 | 2,250 | 2,429 |
297
High-Yield Tax-Exempt Fund
| | | | |
| | | | Face | Market |
| | | Maturity | Amount | Value• |
| | Coupon | Date | ($000) | ($000) |
| New Hope TX Cultural Education Facilities FinanceCorp. Student Housing Revenue | | | | |
| (Tarleton State University Project) | 5.000% | 4/1/46 | 3,765 | 4,047 |
| New Hope TX Cultural Education Facilities FinanceCorp. Student Housing Revenue | | | | |
| (Tarleton State University Project) | 5.000% | 4/1/47 | 4,000 | 4,304 |
| New Hope TX Cultural Education Facilities FinanceCorp. Student Housing Revenue | | | | |
| (Texas A&M University Project) | 5.000% | 7/1/35 | 4,200 | 4,592 |
| New Hope TX Cultural Education Facilities FinanceCorp. Student Housing Revenue | | | | |
| (Texas A&M University Project) | 5.000% | 7/1/47 | 14,000 | 15,133 |
| New Hope TX Cultural Education Facilities FinanceCorp. Student Housing Revenue | | | | |
| (Texas A&M University Project) | 5.000% | 4/1/48 | 1,250 | 1,353 |
| North East TX Regional Mobility Authority Revenue | 5.000% | 1/1/41 | 5,860 | 6,657 |
| North East TX Regional Mobility Authority Revenue | 5.000% | 1/1/41 | 990 | 1,116 |
| North East TX Regional Mobility Authority Revenue | 5.000% | 1/1/46 | 7,700 | 8,708 |
| North East TX Regional Mobility Authority Revenue | 5.000% | 1/1/46 | 4,150 | 4,659 |
| North Texas Tollway Authority System Revenue | 5.625% | 1/1/18 (Prere.) | 5,640 | 5,953 |
| North Texas Tollway Authority System Revenue | 5.625% | 1/1/18 (Prere.) | 1,505 | 1,588 |
| North Texas Tollway Authority System Revenue | 5.750% | 1/1/18 (Prere.) | 29,000 | 30,649 |
| North Texas Tollway Authority System Revenue | 6.000% | 1/1/19 (Prere.) | 7,350 | 8,141 |
| North Texas Tollway Authority System Revenue | 6.250% | 1/1/19 (Prere.) | 12,585 | 14,006 |
| North Texas Tollway Authority System Revenue | 6.250% | 2/1/23 | 20,000 | 22,705 |
| North Texas Tollway Authority System Revenue | 6.000% | 1/1/28 | 1,690 | 1,864 |
| North Texas Tollway Authority System Revenue | 5.000% | 1/1/30 | 6,250 | 7,354 |
| North Texas Tollway Authority System Revenue | 5.000% | 1/1/30 | 10,000 | 11,991 |
| North Texas Tollway Authority System Revenue | 5.000% | 9/1/30 | 7,000 | 8,114 |
| North Texas Tollway Authority System Revenue | 5.000% | 1/1/32 | 13,020 | 14,784 |
| North Texas Tollway Authority System Revenue | 5.625% | 1/1/33 | 1,000 | 1,049 |
| North Texas Tollway Authority System Revenue | 6.250% | 1/1/39 | 2,895 | 3,184 |
| North Texas Tollway Authority System Revenue | 6.000% | 9/1/41 | 5,000 | 6,033 |
| 6 Port Arthur TX Independent School District GO TOB VRDO | 0.670% | 11/7/16 (12) | 9,125 | 9,125 |
| Red River TX Education Finance Corp. Revenue (Edwards University Project) | 5.000% | 6/1/46 | 2,250 | 2,562 |
| SA Energy Acquisition Public Facility Corp. Texas Gas Supply Revenue | 5.500% | 8/1/20 | 1,180 | 1,345 |
| SA Energy Acquisition Public Facility Corp. Texas Gas Supply Revenue | 5.500% | 8/1/24 | 7,675 | 9,318 |
| SA Energy Acquisition Public Facility Corp. Texas Gas Supply Revenue | 5.500% | 8/1/25 | 1,000 | 1,224 |
| Tarrant County TX Cultural Education Facilities Finance Corp. Hospital Revenue | | | | |
| (Air Force Villages Project) | 5.000% | 5/15/37 | 6,000 | 6,526 |
| Tarrant County TX Cultural Education Facilities Finance Corp. Hospital Revenue | | | | |
| (Air Force Villages Project) | 5.000% | 5/15/45 | 10,000 | 10,804 |
| Tarrant County TX Cultural Education Facilities Finance Corp. Retirement Facilities Revenue | | | | |
| (SQLC Senior Living Center Mirador Project) | 7.250% | 11/15/16 | 3,825 | 3,250 |
| Tarrant County TX Cultural Education Facilities Finance Corp. Retirement Facilities Revenue | | | | |
| (Stayton at Museum Way Project) | 8.250% | 11/15/44 | 4,000 | 4,293 |
| Texas Municipal Gas Acquisition & Supply Corp. Revenue | 1.270% | 9/15/17 | 5,775 | 5,773 |
| Texas Municipal Gas Acquisition & Supply Corp. Revenue | 5.250% | 12/15/19 | 10,000 | 11,040 |
| Texas Municipal Gas Acquisition & Supply Corp. Revenue | 5.250% | 12/15/20 | 15,400 | 17,390 |
| Texas Municipal Gas Acquisition & Supply Corp. Revenue | 5.000% | 12/15/21 | 1,120 | 1,285 |
| Texas Municipal Gas Acquisition & Supply Corp. Revenue | 5.000% | 12/15/23 | 1,120 | 1,306 |
| Texas Municipal Gas Acquisition & Supply Corp. Revenue | 5.250% | 12/15/24 | 7,500 | 8,971 |
| Texas Municipal Gas Acquisition & Supply Corp. Revenue | 5.000% | 12/15/25 | 16,500 | 18,908 |
| Texas Municipal Gas Acquisition & Supply Corp. Revenue | 5.000% | 12/15/26 | 3,050 | 3,486 |
| Texas Municipal Gas Acquisition & Supply Corp. Revenue | 5.250% | 12/15/26 | 6,995 | 8,503 |
| Texas Municipal Gas Acquisition & Supply Corp. Revenue | 6.250% | 12/15/26 | 14,935 | 18,338 |
| Texas Municipal Gas Acquisition & Supply Corp. Revenue | 5.000% | 12/15/27 | 3,650 | 4,156 |
| Texas Municipal Gas Acquisition & Supply Corp. Revenue | 5.000% | 12/15/28 | 1,920 | 2,168 |
| Texas Municipal Gas Acquisition & Supply Corp. Revenue | 5.000% | 12/15/29 | 4,355 | 4,901 |
| Texas Municipal Gas Acquisition & Supply Corp. Revenue | 5.000% | 12/15/32 | 6,480 | 7,223 |
| Texas Municipal Power Agency Revenue | 0.000% | 9/1/17 (ETM) | 50 | 50 |
| Texas Municipal Power Agency Revenue | 0.000% | 9/1/17 (14)(ETM) | 14,385 | 14,264 |
| Texas Municipal Power Agency Revenue | 0.000% | 9/1/17 (14)(ETM) | 44,225 | 43,825 |
| Texas Private Activity Surface Transportation Corp. Revenue | 7.500% | 12/31/31 | 3,705 | 4,375 |
| Texas Private Activity Surface Transportation Corp. Revenue | 7.500% | 6/30/32 | 20,000 | 23,972 |
| Texas Private Activity Surface Transportation Corp. Revenue | 7.500% | 6/30/33 | 10,000 | 11,980 |
| Texas Private Activity Surface Transportation Corp. Revenue | 7.000% | 12/31/38 | 12,500 | 15,463 |
| Texas Private Activity Surface Transportation Corp. Revenue | 6.875% | 12/31/39 | 23,525 | 27,333 |
| Texas Private Activity Surface Transportation Corp. Revenue | 7.000% | 6/30/40 | 2,640 | 3,115 |
| Texas Private Activity Surface Transportation Corp. Revenue | 6.750% | 6/30/43 | 24,790 | 30,254 |
| Texas Private Activity Surface Transportation Corp. Revenue (Blueridge Transportation Group) | 5.000% | 12/31/40 | 3,000 | 3,356 |
| Texas Private Activity Surface Transportation Corp. Revenue (Blueridge Transportation Group) | 5.000% | 12/31/45 | 5,000 | 5,548 |
| Texas Private Activity Surface Transportation Corp. Revenue (Blueridge Transportation Group) | 5.000% | 12/31/50 | 6,000 | 6,614 |
| Texas Transportation Commission Turnpike System Revenue | 5.000% | 8/15/34 | 31,900 | 36,587 |
| Texas Transportation Commission Turnpike System Revenue | 5.000% | 8/15/37 | 12,925 | 14,747 |
298
High-Yield Tax-Exempt Fund
| | | | |
| | | | Face | Market |
| | | Maturity | Amount | Value• |
| | Coupon | Date | ($000) | ($000) |
| Westlake TX Special Assessment Revenue | 6.250% | 9/1/40 | 2,500 | 2,543 |
| Westlake TX Special Assessment Revenue | 6.375% | 9/1/45 | 2,500 | 2,547 |
| | | | | 969,911 |
| Utah (0.5%) | | | | |
| Utah Associated Municipal Power Systems Revenue (Horse Butte Wind Project) | 5.000% | 9/1/29 | 4,475 | 5,167 |
| Utah Associated Municipal Power Systems Revenue (Horse Butte Wind Project) | 5.000% | 9/1/30 | 3,700 | 4,269 |
| Utah Associated Municipal Power Systems Revenue (Horse Butte Wind Project) | 5.000% | 9/1/31 | 4,685 | 5,385 |
| Utah Associated Municipal Power Systems Revenue (Horse Butte Wind Project) | 5.000% | 9/1/32 | 3,500 | 4,007 |
| Utah Transit Authority Sales Tax Revenue | 4.000% | 12/15/29 | 1,265 | 1,407 |
| Utah Transit Authority Sales Tax Revenue | 4.000% | 12/15/30 | 4,500 | 4,977 |
| Utah Transit Authority Sales Tax Revenue | 4.000% | 12/15/31 | 4,000 | 4,392 |
| Utah Transit Authority Sales Tax Revenue | 5.000% | 6/15/35 | 10,460 | 12,168 |
| Utah Transit Authority Sales Tax Revenue | 5.000% | 6/15/42 | 11,840 | 13,350 |
| | | | | 55,122 |
| Vermont (0.2%) | | | | |
| Vermont Educational & Health Buildings Financing Agency Revenue | | | | |
| (University of Vermont Health Network) | 5.000% | 12/1/37 | 1,500 | 1,740 |
| Vermont Educational & Health Buildings Financing Agency Revenue | | | | |
| (University of Vermont Health Network) | 5.000% | 12/1/38 | 1,750 | 2,021 |
| Vermont Educational & Health Buildings Financing Agency Revenue | | | | |
| (University of Vermont Health Network) | 5.000% | 12/1/39 | 1,130 | 1,304 |
| Vermont Educational & Health Buildings Financing Agency Revenue | | | | |
| (University of Vermont Health Network) | 4.000% | 12/1/42 | 5,000 | 5,185 |
| Vermont Housing Finance Agency Revenue | 4.125% | 11/1/42 | 1,850 | 1,917 |
| 3 Vermont Student Assistance Corp. Education Loan Revenue | 3.858% | 12/3/35 | 10,000 | 10,411 |
| | | | | 22,578 |
| Virgin Islands (0.2%) | | | | |
| Virgin Islands Port Authority Marine Revenue | 5.000% | 9/1/29 | 3,500 | 3,999 |
| Virgin Islands Port Authority Marine Revenue | 5.000% | 9/1/33 | 2,250 | 2,537 |
| Virgin Islands Public Finance Authority Revenue | 5.000% | 9/1/30 | 5,000 | 5,623 |
| Virgin Islands Public Finance Authority Revenue | 5.000% | 9/1/33 | 3,000 | 3,318 |
| Virgin Islands Public Finance Authority Revenue | 5.000% | 10/1/39 | 2,000 | 1,910 |
| | | | | 17,387 |
| Virginia (1.5%) | | | | |
| 6 Alexandria VA Redevelopment & Housing Authority Multi-Family Housing Mortgage Revenue | | | | |
| (Portals West Apartment) | 8.250% | 4/1/32 (ETM) | 415 | 551 |
| Chesapeake VA Toll Road Revenue | 0.000% | 7/15/40 | 7,800 | 6,257 |
| Chesterfield County VA Economic Development Authority Retirement Facilities Revenue | | | | |
| (Brandermill Woods Project) | 5.125% | 1/1/43 | 4,750 | 4,996 |
| Fredericksburg VA Economic Development Authority Hospital Facilities Revenue | | | | |
| (Mary Washington Healthcare Obligated Group) | 5.000% | 6/15/29 | 1,425 | 1,653 |
| Fredericksburg VA Economic Development Authority Hospital Facilities Revenue | | | | |
| (Mary Washington Healthcare Obligated Group) | 5.000% | 6/15/30 | 2,000 | 2,303 |
| Fredericksburg VA Economic Development Authority Hospital Facilities Revenue | | | | |
| (Mary Washington Healthcare Obligated Group) | 5.000% | 6/15/31 | 1,155 | 1,325 |
| Fredericksburg VA Economic Development Authority Hospital Facilities Revenue | | | | |
| (Mary Washington Healthcare Obligated Group) | 5.000% | 6/15/33 | 1,000 | 1,137 |
| Gloucester County NJ Industrial Development Authority Solid Waste Disposal Revenue | | | | |
| (Waste Management, Inc. Project) PUT | 1.600% | 5/1/17 | 4,000 | 4,012 |
| Hanover County VA Economic Development Authority Residential Care Facility Revenue | | | | |
| (Covenant Woods) | 5.000% | 7/1/42 | 5,550 | 5,863 |
| Lexington VA Industrial Development Authority Residential Care Facility Revenue | | | | |
| (Kendall at Lexington Corp.) | 4.000% | 1/1/31 | 750 | 797 |
| Newport News VA Economical Development Authority Residential Care Facilities Revenue | 5.000% | 12/1/31 | 5,000 | 5,496 |
| Newport News VA Economical Development Authority Residential Care Facilities Revenue | 5.000% | 12/1/38 | 10,000 | 10,774 |
| 6 Newport News VA Industrial Development Authority Health System Revenue | 5.330% | 7/1/45 | 17,000 | 17,914 |
| 4 Prince William County VA Industrial Development Agency Revenue | | | | |
| (Westminster Presbyterian Retirement Community Inc.) | 5.000% | 1/1/31 | 1,700 | 1,873 |
| 4 Prince William County VA Industrial Development Agency Revenue | | | | |
| (Westminster Presbyterian Retirement Community Inc.) | 5.000% | 1/1/37 | 1,000 | 1,084 |
| 4 Prince William County VA Industrial Development Agency Revenue | | | | |
| (Westminster Presbyterian Retirement Community Inc.) | 5.000% | 1/1/46 | 2,200 | 2,362 |
| Tobacco Settlement Financing Corp. Virginia Revenue | 5.200% | 6/1/46 | 3,000 | 2,874 |
| Virginia College Building Authority Educational Facilities Revenue (Marymount University Project) | 5.250% | 7/1/30 | 1,000 | 1,129 |
| Virginia College Building Authority Educational Facilities Revenue (Marymount University Project) | 5.000% | 7/1/35 | 1,295 | 1,412 |
| Virginia College Building Authority Educational Facilities Revenue (Marymount University Project) | 5.250% | 7/1/35 | 2,000 | 2,217 |
| Virginia College Building Authority Educational Facilities Revenue (Marymount University Project) | 5.000% | 7/1/45 | 10,000 | 10,825 |
| Virginia College Building Authority Educational Facilities Revenue (Marymount University Project) | 5.000% | 7/1/45 | 4,755 | 5,147 |
299
High-Yield Tax-Exempt Fund
| | | | |
| | | | Face | Market |
| | | Maturity | Amount | Value• |
| | Coupon | Date | ($000) | ($000) |
| Virginia Port Authority Port Facilities Revenue | 5.000% | 7/1/33 | 2,835 | 3,279 |
| Virginia Port Authority Port Facilities Revenue | 5.000% | 7/1/34 | 3,380 | 3,898 |
| Virginia Port Authority Port Facilities Revenue | 5.000% | 7/1/36 | 7,045 | 8,096 |
| Virginia Small Business Financing Authority Revenue (Elizabeth River Crossings Project) | 5.250% | 1/1/32 | 12,670 | 14,236 |
| Virginia Small Business Financing Authority Revenue (Elizabeth River Crossings Project) | 6.000% | 1/1/37 | 15,000 | 17,462 |
| Virginia Small Business Financing Authority Revenue (Elizabeth River Crossings Project) | 5.500% | 1/1/42 | 13,350 | 14,978 |
| Virginia Small Business Financing Authority Revenue (Express Lanes LLC) | 5.000% | 7/1/34 | 11,500 | 12,379 |
| | | | | 166,329 |
| Washington (1.2%) | | | | |
| 6 Central Puget Sound WA Regional Transit Authority Sales & Use Tax Revenue TOB VRDO | 0.580% | 11/1/16 | 3,900 | 3,900 |
| Chelan County WA Public Utility District No. 1 Consolidated System Revenue (Chelan Hydro) | 5.500% | 7/1/25 | 2,500 | 2,915 |
| Chelan County WA Public Utility District No. 1 Consolidated System Revenue (Chelan Hydro) | 5.500% | 7/1/26 | 4,000 | 4,642 |
| Port of Seattle WA Revenue | 5.000% | 9/1/25 | 3,000 | 3,450 |
| Port of Seattle WA Revenue | 5.000% | 6/1/30 | 9,000 | 10,054 |
| Port of Seattle WA Revenue | 5.000% | 4/1/33 | 2,500 | 2,865 |
| Port of Seattle WA Revenue | 5.000% | 4/1/35 | 6,150 | 7,025 |
| Port of Seattle WA Revenue | 5.000% | 4/1/40 | 5,000 | 5,673 |
| Port of Tacoma WA Revenue | 5.000% | 12/1/37 | 8,835 | 10,271 |
| Port of Tacoma WA Revenue | 5.000% | 12/1/38 | 9,275 | 10,756 |
| Snohomish County WA School District No. 4 (Lake Stevens) GO | 4.000% | 12/1/29 | 1,785 | 2,012 |
| Tobacco Settlement Authority Washington Revenue | 5.250% | 6/1/30 | 9,060 | 9,848 |
| Tobacco Settlement Authority Washington Revenue | 5.250% | 6/1/31 | 5,000 | 5,524 |
| Washington Health Care Facilities Authority Revenue | | | | |
| (Central Washington Health Services Association) | 5.000% | 7/1/39 | 4,500 | 5,043 |
| Washington Health Care Facilities Authority Revenue (MultiCare Health System) | 5.500% | 8/15/18 (Prere.) | 10,000 | 10,819 |
| Washington Health Care Facilities Authority Revenue (Seattle Cancer Care Alliance) | 5.000% | 3/1/38 | 10,000 | 11,449 |
| Washington Higher Education Facilities Authority Revenue (Seattle University Project) | 5.250% | 5/1/34 | 5,000 | 5,438 |
| Washington Housing Finance Commission Multi-Family Housing Revenue | | | | |
| (Heron’s Key Obligated Group) | 6.750% | 7/1/35 | 820 | 868 |
| Washington Housing Finance Commission Multi-Family Housing Revenue | | | | |
| (Heron’s Key Obligated Group) | 7.000% | 7/1/45 | 2,000 | 2,135 |
| Washington Housing Finance Commission Multi-Family Housing Revenue | | | | |
| (Heron’s Key Obligated Group) | 7.000% | 7/1/50 | 2,000 | 2,122 |
| Washington Housing Finance Commission Multi-Family Housing Revenue | | | | |
| (Presbyterian Retirement Communities Northwest Obligated Group) | 5.000% | 1/1/36 | 2,125 | 2,373 |
| Washington Housing Finance Commission Multi-Family Housing Revenue | | | | |
| (Presbyterian Retirement Communities Northwest Obligated Group) | 5.000% | 1/1/46 | 3,250 | 3,604 |
| Washington Housing Finance Commission Multi-Family Housing Revenue | | | | |
| (Presbyterian Retirement Communities Northwest Obligated Group) | 5.000% | 1/1/51 | 3,650 | 4,026 |
| Washington Housing Finance Commission Revenue (Wesley Homes Lea Hill Project) | 5.000% | 7/1/31 | 1,910 | 2,031 |
| Washington Housing Finance Commission Revenue (Wesley Homes Lea Hill Project) | 5.000% | 7/1/36 | 1,000 | 1,057 |
| Washington Housing Finance Commission Revenue (Wesley Homes Lea Hill Project) | 5.000% | 7/1/41 | 1,100 | 1,158 |
| Washington Housing Finance Commission Revenue (Wesley Homes Lea Hill Project) | 5.000% | 7/1/46 | 2,500 | 2,622 |
| Washington Housing Finance Commission Revenue (Wesley Homes Lea Hill Project) | 5.000% | 7/1/51 | 3,800 | 3,955 |
| | | | | 137,635 |
| West Virginia (0.3%) | | | | |
| West Virginia Economic Development Authority Energy Revenue | | | | |
| (Morgantown Energy Associates Project) | 2.875% | 12/15/26 | 6,055 | 5,944 |
| West Virginia Economic Development Authority Solid Waste Facilities Disposal Revenue | | | | |
| (Appalachian Power Co. - Amos Project) | 5.375% | 12/1/38 | 2,500 | 2,799 |
| West Virginia Hospital Finance Authority Hospital Revenue | | | | |
| (Charleston Area Medical Center Inc.) | 5.625% | 9/1/32 | 6,000 | 6,554 |
| West Virginia Hospital Finance Authority Hospital Revenue | | | | |
| (United Health System Obligated Group) | 5.500% | 6/1/19 (Prere.) | 400 | 445 |
| West Virginia Hospital Finance Authority Hospital Revenue | | | | |
| (United Health System Obligated Group) | 5.375% | 6/1/38 | 5,000 | 5,782 |
| West Virginia Hospital Finance Authority Hospital Revenue | | | | |
| (United Health System Obligated Group) | 5.500% | 6/1/44 | 5,000 | 5,787 |
| West Virginia Hospital Finance Authority Hospital Revenue | | | | |
| (Valley Health System Obligated Group) | 5.000% | 1/1/44 | 2,000 | 2,265 |
| West Virginia Hospital Finance Authority Hospital Revenue | | | | |
| (Valley Health System Obligated Group) | 5.000% | 1/1/44 | 2,250 | 2,520 |
| | | | | 32,096 |
| Wisconsin (2.5%) | | | | |
| Platteville WI Redevelopment Authority Revenue (Platteville Real Estate) | 5.000% | 7/1/42 | 3,000 | 3,199 |
| Public Finance Authority Wisconsin Revenue (Bancroft Neurohealth Obligated Group) | 5.000% | 6/1/22 | 1,425 | 1,529 |
| Public Finance Authority Wisconsin Revenue (Bancroft Neurohealth Obligated Group) | 5.000% | 6/1/23 | 1,000 | 1,072 |
| Public Finance Authority Wisconsin Revenue (Bancroft Neurohealth Obligated Group) | 5.000% | 6/1/36 | 1,500 | 1,512 |
| Public Finance Authority Wisconsin Revenue (Bancroft Neurohealth Obligated Group) | 5.125% | 6/1/48 | 4,500 | 4,546 |
300
| | | | | |
| High-Yield Tax-Exempt Fund | | | | |
| |
| |
| |
| |
| | | | | Face | Market |
| | | | Maturity | Amount | Value• |
| | | Coupon | Date | ($000) | ($000) |
| | University of Wisconsin Hospitals & Clinics Authority Revenue | 5.000% | 4/1/26 | 2,410 | 2,856 |
| | Wisconsin GO | 6.250% | 5/1/19 (Prere.) | 20,200 | 22,817 |
| | Wisconsin GO | 6.000% | 5/1/27 | 17,000 | 19,008 |
| | Wisconsin Health & Educational Facilities Authority Revenue (Agnesian HealthCare Inc.) | 5.500% | 7/1/40 | 5,675 | 6,348 |
| | Wisconsin Health & Educational Facilities Authority Revenue (Aurora Health Care Inc.) | 5.625% | 4/15/39 | 10,810 | 11,956 |
| | Wisconsin Health & Educational Facilities Authority Revenue (Beloit College) | 5.000% | 7/1/33 | 1,105 | 1,255 |
| | Wisconsin Health & Educational Facilities Authority Revenue (Beloit College) | 5.000% | 7/1/36 | 625 | 703 |
| | Wisconsin Health & Educational Facilities Authority Revenue (Beloit College) | 5.000% | 7/1/39 | 1,550 | 1,734 |
| | Wisconsin Health & Educational Facilities Authority Revenue (Children’s Hospital of Wisconsin Inc.) | 5.375% | 8/15/37 | 5,000 | 5,508 |
| | Wisconsin Health & Educational Facilities Authority Revenue (Gundersen Lutheran) | 5.250% | 10/15/39 | 6,765 | 7,614 |
| | Wisconsin Health & Educational Facilities Authority Revenue (Marquette University) | 5.000% | 10/1/46 | 20,425 | 23,697 |
| 5 | Wisconsin Health & Educational Facilities Authority Revenue (Ministry Health Care Inc.) | 5.000% | 8/15/22 (Prere.) | 5,500 | 6,639 |
| | Wisconsin Health & Educational Facilities Authority Revenue (ProHealth Care Obligated Group) | 5.000% | 8/15/39 | 20,000 | 22,744 |
| | Wisconsin Health & Educational Facilities Authority Revenue (ThedaCare Inc. Obligated Group) | 5.000% | 12/15/34 | 9,300 | 10,814 |
| | Wisconsin Health & Educational Facilities Authority Revenue (ThedaCare Inc. Obligated Group) | 5.000% | 12/15/44 | 3,155 | 3,595 |
| | Wisconsin Public Finance Authority Airport Facilities Revenue (AFCO Investors II Portfolio) | 5.000% | 10/1/23 | 7,500 | 7,607 |
| | Wisconsin Public Finance Authority Airport Facilities Revenue (TRIPS Obligated Group) | 5.000% | 7/1/17 | 6,100 | 6,259 |
| | Wisconsin Public Finance Authority Airport Facilities Revenue (TRIPS Obligated Group) | 5.000% | 7/1/22 | 9,835 | 10,823 |
| | Wisconsin Public Finance Authority Airport Facilities Revenue (TRIPS Obligated Group) | 5.250% | 7/1/28 | 12,000 | 13,262 |
| 6 | Wisconsin Public Finance Authority Airport Facilities Revenue (TRIPS Obligated Group) | 5.250% | 7/1/28 | 3,050 | 3,394 |
| | Wisconsin Public Finance Authority Airport Facilities Revenue (TRIPS Obligated Group) | 5.000% | 7/1/42 | 5,000 | 5,289 |
| 6 | Wisconsin Public Finance Authority Airport Facilities Revenue (TRIPS Obligated Group) | 5.000% | 7/1/42 | 4,500 | 4,808 |
| | Wisconsin Public Finance Authority CCRC Revenue (Glenridge on Palmer Ranch Inc. Project) | 8.250% | 6/1/46 | 14,500 | 17,843 |
| | Wisconsin Public Finance Authority Exempt Facilities Revenue (National Gypsum Co.) | 5.250% | 4/1/30 | 10,000 | 10,949 |
| | Wisconsin Public Finance Authority Exempt Facilities Revenue (National Gypsum Co.) | 4.000% | 8/1/35 | 7,000 | 7,022 |
| | Wisconsin Public Finance Authority Hospital Revenue (Renown Regional Medical Center) | 5.000% | 6/1/31 | 3,000 | 3,513 |
| | Wisconsin Public Finance Authority Hospital Revenue (Renown Regional Medical Center) | 5.000% | 6/1/32 | 4,745 | 5,532 |
| | Wisconsin Public Finance Authority Revenue (Celanese Corp.) | 5.000% | 12/1/25 | 5,000 | 5,753 |
| | Wisconsin Public Finance Authority Revenue (Celanese Corp.) | 4.300% | 11/1/30 | 7,210 | 7,423 |
| | Wisconsin Public Finance Authority Revenue (Church Home of Hartford Inc.) | 5.000% | 9/1/30 | 800 | 864 |
| | Wisconsin Public Finance Authority Revenue (Church Home of Hartford Inc.) | 5.000% | 9/1/38 | 4,050 | 4,289 |
| | Wisconsin Public Finance Authority Student Housing Revenue | | | | |
| | (Western Carolina University Project) | 5.250% | 7/1/47 | 3,250 | 3,598 |
| | | | | | 277,374 |
| Total Tax-Exempt Municipal Bonds (Cost $10,537,482) | | | | 11,140,291 |
| |
| | | | | Shares | |
| Temporary Cash Investment (2.0%) | | | | |
| Money Market Fund (2.0%) | | | | |
| 8 | Vanguard Municipal Cash Management Fund (Cost $231,907) | 0.614% | | 2,319,072 | 231,907 |
| Total Investments (101.4%) (Cost $10,769,389) | | | | 11,372,198 |
| |
| | | | | | Amount |
| | | | | | ($000) |
| Other Assets and Liabilities (-1.4%) | | | | |
| Other Assets | | | | |
| Investment in Vanguard | | | | 862 |
| Receivables for Investment Securities Sold | | | | 21,195 |
| Receivables for Accrued Income | | | | 144,388 |
| Receivables for Capital Shares Issued | | | | 10,285 |
| Other Assets | | | | 1,758 |
| Total Other Assets | | | | 178,488 |
| Liabilities | | | | |
| Payables for Investment Securities Purchased | | | | (313,232) |
| Payables for Capital Shares Redeemed | | | | (7,786) |
| Payables for Distributions | | | | (10,214) |
| Payables to Vanguard | | | | (7,965) |
| Other Liabilities | | | | (105) |
| Total Liabilities | | | | (339,302) |
| Net Assets (100%) | | | | 11,211,384 |
301
| |
| High-Yield Tax-Exempt Fund | |
| |
| |
| |
| |
| At October 31, 2016, net assets consisted of: | |
| | Amount |
| | ($000) |
| Paid-in Capital | 10,659,742 |
| Undistributed Net Investment Income | 232 |
| Accumulated Net Realized Losses | (51,486) |
| Unrealized Appreciation (Depreciation) | |
| Investment Securities | 602,809 |
| Futures Contracts | 87 |
| Net Assets | 11,211,384 |
| |
| Investor Shares—Net Assets | |
| Applicable to 172,642,442 outstanding $.001 par value shares of beneficial interest (unlimited authorization) | 1,980,390 |
| Net Asset Value Per Share—Investor Shares | $11.47 |
| |
| Admiral Shares—Net Assets | |
| Applicable to 804,720,834 outstanding $.001 par value shares of beneficial interest (unlimited authorization) | 9,230,994 |
| Net Asset Value Per Share—Admiral Shares | $11.47 |
• See Note A in Notes to Financial Statements.
1 5.000% coupon rate will be effective March 2017.
2 5.000% coupon rate will be effective March 2019.
3 Adjustable-rate security.
4 Security purchased on a when-issued or delayed-delivery basis for which the fund has not taken delivery as of October 31, 2016.
5 Securities with a value of $3,374,000 have been segregated as initial margin for open futures contracts.
6 Security exempt from registration under Rule 144A of the Securities Act of 1933. Such securities may be sold in transactions exempt from registration, normally to qualified institutional buyers. At October 31, 2016,
the aggregate value of these securities was $347,002,000, representing 3.1% of net assets.
7 Non-income-producing security--security in default.
8 Affiliated money market fund available only to Vanguard funds and certain trusts and accounts managed by Vanguard. Rate shown is the 7-day yield.
A key to abbreviations and other references follows the Statement of Net Assets.
See accompanying Notes, which are an integral part of the Financial Statements.
302
High-Yield Tax-Exempt Fund
Key to Abbreviations
ARS—Auction Rate Security.
BAN—Bond Anticipation Note.
COP—Certificate of Participation.
CP—Commercial Paper.
FR—Floating Rate.
GAN—Grant Anticipation Note.
GO—General Obligation Bond.
PILOT—Payments in Lieu of Taxes.
PUT—Put Option Obligation.
RAN—Revenue Anticipation Note.
TAN—Tax Anticipation Note.
TOB—Tender Option Bond.
TRAN—Tax Revenue Anticipation Note.
VRDO—Variable Rate Demand Obligation.
VRDP—Variable Rate Demand Preferred.
(ETM)—Escrowed to Maturity.
(Prere.)—Prerefunded.
Scheduled principal and interest payments are guaranteed by:
(1) MBIA (Municipal Bond Investors Assurance).
(2) AMBAC (Ambac Assurance Corporation).
(3) FGIC (Financial Guaranty Insurance Company).
(4) AGM (Assured Guaranty Municipal Corporation).
(5) BIGI (Bond Investors Guaranty Insurance).
(6) Connie Lee Inc.
(7) FHA (Federal Housing Authority).
(8) CapMAC (Capital Markets Assurance Corporation).
(9) American Capital Access Financial Guaranty Corporation.
(10) XL Capital Assurance Inc.
(11) CIFG (CDC IXIS Financial Guaranty).
(12) AGC (Assured Guaranty Corporation).
(13) BHAC (Berkshire Hathaway Assurance Corporation).
(14) NPFG (National Public Finance Guarantee Corporation).
(15) BAM (Build America Mutual Assurance Company).
(16) MAC (Municipal Assurance Corporation).
(17) RAA (Radian Asset Assurance Inc.).
(18) SBLF (Michigan School Bond Loan Fund).
The insurance does not guarantee the market value of the municipal bonds.
LOC—Scheduled principal and interest payments are guaranteed by bank letter of credit.
303
High-Yield Tax-Exempt Fund
| |
| Statement of Operations |
| |
| | Year Ended |
| October 31, 2016 |
| | ($000) |
| Investment Income | |
| Income | |
| Interest1 | 388,178 |
| Total Income | 388,178 |
| Expenses | |
| The Vanguard Group—Note B | |
| Investment Advisory Services | 1,105 |
| Management and Administrative— | |
| Investor Shares | 2,648 |
| Management and Administrative— | |
| Admiral Shares | 5,536 |
| Marketing and Distribution— | |
| Investor Shares | 461 |
| Marketing and Distribution— | |
| Admiral Shares | 841 |
| Custodian Fees | 107 |
| Auditing Fees | 36 |
| Shareholders’ Reports—Investor Shares | 138 |
| Shareholders’ Reports—Admiral Shares | 120 |
| Trustees’ Fees and Expenses | 5 |
| Total Expenses | 10,997 |
| Net Investment Income | 377,181 |
| Realized Net Gain (Loss) | |
| Investment Securities Sold1 | 45,888 |
| Futures Contracts | 1,446 |
| Realized Net Gain (Loss) | 47,334 |
| Change in Unrealized Appreciation | |
| (Depreciation) | |
| Investment Securities | 157,798 |
| Futures Contracts | 232 |
| Change in Unrealized Appreciation | |
| (Depreciation) | 158,030 |
| Net Increase (Decrease) in Net Assets | |
| Resulting from Operations | 582,545 |
1 Interest income and realized net gain (loss) from an affiliated company of the fund were $718,000 and ($5,000), respectively.
| | |
| Statement of Changes in Net Assets | | |
| |
| | Year Ended October 31, |
| | 2016 | 2015 |
| | ($000) | ($000) |
| Increase (Decrease) in Net Assets | | |
| Operations | | |
| Net Investment Income | 377,181 | 322,674 |
| Realized Net Gain (Loss) | 47,334 | 16,631 |
| Change in Unrealized Appreciation (Depreciation) | 158,030 | (42,914) |
| Net Increase (Decrease) in Net Assets Resulting from Operations | 582,545 | 296,391 |
| Distributions | | |
| Net Investment Income | | |
| Investor Shares | (65,480) | (57,478) |
| Admiral Shares | (311,221) | (264,622) |
| Realized Capital Gain | | |
| Investor Shares | — | — |
| Admiral Shares | — | — |
| Total Distributions | (376,701) | (322,100) |
| Capital Share Transactions | | |
| Investor Shares | 329,721 | 134,686 |
| Admiral Shares | 1,664,700 | 810,104 |
| Net Increase (Decrease) from Capital Share Transactions | 1,994,421 | 944,790 |
| Total Increase (Decrease) | 2,200,265 | 919,081 |
| Net Assets | | |
| Beginning of Period | 9,011,119 | 8,092,038 |
| End of Period1 | 11,211,384 | 9,011,119 |
| 1 Net Assets—End of Period includes undistributed (overdistributed) net investment income of $232,000 and $188,000. | |
See accompanying Notes, which are an integral part of the Financial Statements.
304
| | | | | |
| High-Yield Tax-Exempt Fund | | | | | |
| |
| |
| Financial Highlights | | | | | |
| |
| Investor Shares | | | | | |
| |
| For a Share Outstanding | | | Year Ended October 31, |
| Throughout Each Period | 2016 | 2015 | 2014 | 2013 | 2012 |
| Net Asset Value, Beginning of Period | $11.20 | $11.23 | $10.63 | $11.29 | $10.53 |
| Investment Operations | | | | | |
| Net Investment Income | .413 | .414 | .430 | . 428 | . 425 |
| Net Realized and Unrealized Gain (Loss) | | | | | |
| on Investments | . 270 | (. 030) | .600 | (. 660) | .760 |
| Total from Investment Operations | .683 | .384 | 1.030 | (. 232) | 1.185 |
| Distributions | | | | | |
| Dividends from Net Investment Income | (.413) | (.414) | (. 430) | (. 428) | (. 425) |
| Distributions from Realized Capital Gains | — | — | — | — | — |
| Total Distributions | (.413) | (.414) | (. 430) | (. 428) | (. 425) |
| Net Asset Value, End of Period | $11.47 | $11.20 | $11.23 | $10.63 | $11.29 |
| |
| Total Return1 | 6.15% | 3.47% | 9.87% | -2.11% | 11.43% |
| |
| Ratios/Supplemental Data | | | | | |
| Net Assets, End of Period (Millions) | $1,980 | $1,614 | $1,484 | $1,307 | $1,609 |
| Ratio of Total Expenses to Average Net Assets | 0.19% | 0.20% | 0.20% | 0.20% | 0.20% |
| Ratio of Net Investment Income to | | | | | |
| Average Net Assets | 3.59% | 3.69% | 3.94% | 3.88% | 3.86% |
| Portfolio Turnover Rate | 19% | 21% | 28% | 29% | 20% |
1 Total returns do not include account service fees that may have applied in the periods shown. Fund prospectuses provide information about any applicable account service fees.
| | | | | |
| Admiral Shares | | | | | |
| |
| For a Share Outstanding | | | Year Ended October 31, |
| Throughout Each Period | 2016 | 2015 | 2014 | 2013 | 2012 |
| Net Asset Value, Beginning of Period | $11.20 | $11.23 | $10.63 | $11.29 | $10.53 |
| Investment Operations | | | | | |
| Net Investment Income | . 425 | . 423 | .438 | .436 | .434 |
| Net Realized and Unrealized Gain (Loss) | | | | | |
| on Investments | . 270 | (. 030) | .600 | (. 660) | .760 |
| Total from Investment Operations | .695 | .393 | 1.038 | (. 224) | 1.194 |
| Distributions | | | | | |
| Dividends from Net Investment Income | (. 425) | (. 423) | (. 438) | (. 436) | (. 434) |
| Distributions from Realized Capital Gains | — | — | — | — | — |
| Total Distributions | (. 425) | (. 423) | (. 438) | (. 436) | (. 434) |
| Net Asset Value, End of Period | $11.47 | $11.20 | $11.23 | $10.63 | $11.29 |
| |
| Total Return1 | 6.26% | 3.56% | 9.96% | -2.04% | 11.52% |
| |
| Ratios/Supplemental Data | | | | | |
| Net Assets, End of Period (Millions) | $9,231 | $7,398 | $6,608 | $5,621 | $6,340 |
| Ratio of Total Expenses to Average Net Assets | 0.09% | 0.12% | 0.12% | 0.12% | 0.12% |
| Ratio of Net Investment Income to | | | | | |
| Average Net Assets | 3.69% | 3.77% | 4.02% | 3.96% | 3.94% |
| Portfolio Turnover Rate | 19% | 21% | 28% | 29% | 20% |
1 Total returns do not include account service fees that may have applied in the periods shown. Fund prospectuses provide information about any applicable account service fees.
See accompanying Notes, which are an integral part of the Financial Statements.
305
High-Yield Tax-Exempt Fund
Notes to Financial Statements
Vanguard High-Yield Tax-Exempt Fund is registered under the Investment Company Act of 1940 as an open-end investment company, or mutual fund. The fund invests in debt instruments of many municipal issuers; the issuers’ abilities to meet their obligations may be affected by economic and political developments in a specific state or region. The fund offers two classes of shares: Investor Shares and Admiral Shares. Investor Shares are available to any investor who meets the fund’s minimum purchase requirements. Admiral Shares are designed for investors who meet certain administrative, service, and account-size criteria.
A. The following significant accounting policies conform to generally accepted accounting principles for U.S. investment companies. The fund consistently follows such policies in preparing its financial statements.
1. Security Valuation: Securities are valued as of the close of trading on the New York Stock Exchange (generally 4 p.m., Eastern time) on the valuation date. Bonds and temporary cash investments acquired over 60 days to maturity are valued using the latest bid prices or using valuations based on a matrix system (which considers such factors as security prices, yields, maturities, and ratings), both as furnished by independent pricing services. Investments in Vanguard Municipal Cash Management Fund are valued at that fund’s net asset value. Other temporary cash investments are valued at amortized cost, which approximates market value. Securities for which market quotations are not readily available, or whose values have been affected by events occurring before the fund’s pricing time but after the close of the securities’ primary markets, are valued by methods deemed by the board of trustees to represent fair value.
2. Futures Contracts: The fund uses futures contracts to invest in fixed income asset classes with greater efficiency and lower cost than is possible through direct investment, to add value when these instruments are attractively priced, or to adjust sensitivity to changes in interest rates. The primary risks associated with the use of futures contracts are imperfect correlation between changes in market values of bonds held by the fund and the prices of futures contracts, and the possibility of an illiquid market. Counterparty risk involving futures is mitigated because a regulated clearinghouse is the counterparty instead of the clearing broker. To further mitigate counterparty risk, the fund trades futures contracts on an exchange, monitors the financial strength of its clearing brokers and clearinghouse, and has entered into clearing agreements with its clearing brokers. The clearinghouse imposes initial margin requirements to secure the fund’s performance and requires daily settlement of variation margin representing changes in the market value of each contract.
Futures contracts are valued at their quoted daily settlement prices. The aggregate settlement values of the contracts are not recorded in the Statement of Net Assets. Fluctuations in the value of the contracts are recorded in the Statement of Net Assets as an asset (liability) and in the Statement of Operations as unrealized appreciation (depreciation) until the contracts are closed, when they are recorded as realized futures gains (losses).
During the year ended October 31, 2016, the fund’s average investments in long and short futures contracts represented 1% and less than 1% of net assets respectively, based on the average of aggregate settlement values at each quarter-end during the period.
3. Federal Income Taxes: The fund intends to continue to qualify as a regulated investment company and distribute all of its income. Management has analyzed the fund’s tax positions taken for all open federal income tax years (October 31, 2013–2016), and has concluded that no provision for federal income tax is required in the fund’s financial statements.
4. Distributions: Distributions from net investment income are declared daily and paid on the first business day of the following month. Annual distributions from realized capital gains, if any, are recorded on the ex-dividend date.
5. Credit Facility: The fund and certain other funds managed by The Vanguard Group (“Vanguard”) participate in a $3.1 billion committed credit facility provided by a syndicate of lenders pursuant to a credit agreement that may be renewed annually; each fund is individually liable for its borrowings, if any, under the credit facility. Borrowings may be utilized for temporary and emergency purposes, and are subject to the fund’s regulatory and contractual borrowing restrictions. The participating funds are charged administrative fees and an annual commitment fee of 0.10% of the undrawn amount of the facility; these fees are allocated to the funds based on a method approved by the fund’s board of trustees and included in Management and Administrative expenses on the fund’s Statement of Operations. Any borrowings under this facility bear interest at a rate based upon the higher of the one-month London Interbank Offered Rate, federal funds effective rate, or overnight bank funding rate plus an agreed-upon spread.
The fund had no borrowings outstanding at October 31, 2016, or at any time during the period then ended.
306
High-Yield Tax-Exempt Fund
6. Other: Interest income includes income distributions received from Vanguard Municipal Cash Management Fund and is accrued daily. Premiums and discounts on debt securities purchased are amortized and accreted, respectively, to interest income over the lives of the respective securities. Security transactions are accounted for on the date securities are bought or sold. Costs used to determine realized gains (losses) on the sale of investment securities are those of the specific securities sold.
Each class of shares has equal rights as to assets and earnings, except that each class separately bears certain class-specific expenses related to maintenance of shareholder accounts (included in Management and Administrative expenses) and shareholder reporting. Marketing and distribution expenses are allocated to each class of shares based on a method approved by the board of trustees. Income, other non-class-specific expenses, and gains and losses on investments are allocated to each class of shares based on its relative net assets.
B. In accordance with the terms of a Funds’ Service Agreement (the “FSA”) between Vanguard and the fund, Vanguard furnishes to the fund investment advisory, corporate management, administrative, marketing, and distribution services at Vanguard’s cost of operations (as defined by the FSA). These costs of operations are allocated to the fund based on methods and guidelines approved by the board of trustees. Vanguard does not require reimbursement in the current period for certain costs of operations (such as deferred compensation/benefits and risk/insurance costs); the fund’s liability for these costs of operations is included in Payables to Vanguard on the Statement of Net Assets.
Upon the request of Vanguard, the fund may invest up to 0.40% of its net assets as capital in Vanguard. At October 31, 2016, the fund had contributed to Vanguard capital in the amount of $862,000, representing 0.01% of the fund’s net assets and 0.34% of Vanguard’s capitalization. The fund’s trustees and officers are also directors and employees, respectively, of Vanguard.
C. Various inputs may be used to determine the value of the fund’s investments. These inputs are summarized in three broad levels for financial statement purposes. The inputs or methodologies used to value securities are not necessarily an indication of the risk associated with investing in those securities.
Level 1—Quoted prices in active markets for identical securities.
Level 2—Other significant observable inputs (including quoted prices for similar securities, interest rates, prepayment speeds, credit risk, etc.).
Level 3—Significant unobservable inputs (including the fund’s own assumptions used to determine the fair value of investments).
The following table summarizes the market value of the fund’s investments as of October 31, 2016, based on the inputs used to value them:
| | | |
| | Level 1 | Level 2 | Level 3 |
| Investments | ($000) | ($000) | ($000) |
| Tax-Exempt Municipal Bonds | — | 11,140,291 | — |
| Temporary Cash Investments | 231,907 | — | — |
| Futures Contracts—Assets1 | 192 | — | — |
| Futures Contracts—Liabilities1 | (43) | — | — |
| Total | 232,056 | 11,140,291 | — |
| 1 Represents variation margin on the last day of the reporting period. | | | |
At October 31, 2016, the aggregate settlement value of open futures contracts and the related unrealized appreciation (depreciation) were:
| | | | |
| | | | | ($000) |
| | | | Aggregate | |
| | | Number of | Settlement | Unrealized |
| | | Long (Short) | Value | Appreciation |
| Futures Contracts | Expiration | Contracts | Long (Short) | (Depreciation) |
| 10-Year U.S. Treasury Note | December 2016 | 425 | 55,091 | 69 |
| 5-Year U.S. Treasury Note | December 2016 | 434 | 52,426 | 12 |
| 30-Year U.S. Treasury Bond | December 2016 | 244 | 39,703 | 38 |
| Ultra Long U.S. Treasury Bond | December 2016 | (105) | (18,473) | (32) |
| | | | | 87 |
Unrealized appreciation (depreciation) on open futures contracts is required to be treated as realized gain (loss) for tax purposes.
307
High-Yield Tax-Exempt Fund
D. Capital gain distributions are determined on a tax basis and may differ from realized capital gains for financial reporting purposes. Differences may be permanent or temporary. Permanent differences are reclassified among capital accounts in the financial statements to reflect their tax character. Temporary differences arise when gains or losses are recognized in different periods for financial statement and tax purposes. These differences will reverse at some time in the future.
The fund used capital loss carryforwards of $45,456,000 to offset taxable capital gains realized during the year ended October 31, 2016. At October 31, 2016, the fund had available capital losses totaling $45,766,000 to offset future net capital gains of $944,000 through October 31, 2017, $2,545,000 through October 31, 2018, and $42,277,000 through October 31, 2019.
The fund had realized losses totaling $5,633,000 through October 31, 2016, which are deferred for tax purposes and reduce the amount of tax basis unrealized appreciation on investment securities.
At October 31, 2016, the cost of investment securities for tax purposes was $10,775,022,000. Net unrealized appreciation of investment securities for tax purposes was $597,176,000, consisting of unrealized gains of $637,296,000 on securities that had risen in value since their purchase and $40,120,000 in unrealized losses on securities that had fallen in value since their purchase.
E. During the year ended October 31, 2016, the fund purchased $3,967,205,000 of investment securities and sold $1,858,462,000 of investment securities, other than temporary cash investments.
The fund purchased securities from and sold securities to other Vanguard funds or accounts managed by Vanguard or its affiliates, in accordance with procedures adopted by the board of trustees in compliance with Rule 17a-7 of the Investment Company Act of 1940. For the year ended October 31, 2016, such purchases and sales were $711,435,000 and $553,010,000, respectively; these amounts are included in the purchases and sales of investment securities noted above.
| | | | |
| F. Capital share transactions for each class of shares were: | | | |
| | | | Year Ended October 31, |
| | | 2016 | | 2015 |
| | Amount | Shares | Amount | Shares |
| | ($000) | (000) | ($000) | (000) |
| Investor Shares | | | | |
| Issued | 803,288 | 69,735 | 521,949 | 46,456 |
| Issued in Lieu of Cash Distributions | 53,930 | 4,682 | 47,102 | 4,195 |
| Redeemed | (527,497) | (45,792) | (434,365) | (38,765) |
| Net Increase (Decrease) —Investor Shares | 329,721 | 28,625 | 134,686 | 11,886 |
| Admiral Shares | | | | |
| Issued | 2,482,615 | 215,571 | 1,750,263 | 155,866 |
| Issued in Lieu of Cash Distributions | 206,486 | 17,924 | 174,394 | 15,535 |
| Redeemed | (1,024,401) | (89,035) | (1,114,553) | (99,338) |
| Net Increase (Decrease) —Admiral Shares | 1,664,700 | 144,460 | 810,104 | 72,063 |
G. Management has determined that no material events or transactions occurred subsequent to October 31, 2016, that would require recognition or disclosure in these financial statements.
308
Report of Independent Registered Public Accounting Firm
To the Board of Trustees of Vanguard Municipal Bond Funds and the Shareholders of Vanguard Short-Term Tax-Exempt Fund, Vanguard Limited-Term Tax-Exempt Fund, Vanguard Intermediate-Term Tax-Exempt Fund, Vanguard Long-Term Tax-Exempt Fund and Vanguard High-Yield Tax-Exempt Fund: In our opinion, the accompanying statements of net assets and the related statements of operations and of changes in net assets and the financial highlights present fairly, in all material respects, the financial position of Vanguard Short-Term Tax-Exempt Fund, Vanguard Limited-Term Tax-Exempt Fund, Vanguard Intermediate-Term Tax-Exempt Fund, Vanguard Long-Term Tax-Exempt Fund and Vanguard High-Yield Tax-Exempt Fund (constituting separate portfolios of Vanguard Municipal Bond Funds, hereafter referred to as the “Funds”) at October 31, 2016, the results of each of their operations for the year then ended, the changes in each of their net assets for each of the two years in the period then ended, and the financial highlights for each of the five years in the period then ended, in conformity with accounting principles generally accepted in the United States of America. These financial statements and financial highlights (hereafter referred to as “financial statements”) are the responsibility of the Funds’ management. Our responsibility is to express an opinion on these financial statements based on our audits. We conducted our audits of these financial statements in accordance with the standards of the Public Company Accounting Oversight Board (United States). Those standards require that we plan and perform the audit to obtain reasonable assurance about whether the financial statements are free of material misstatement. An audit includes examining, on a test basis, evidence supporting the amounts and disclosures in the financial statements, assessing the accounting principles used and significant estimates made by management, and evaluating the overall financial statement presentation. We believe that our audits, which included confirmation of securities at October 31, 2016 by correspondence with the custodian and brokers and by agreement to the underlying ownership records of the transfer agent, provide a reasonable basis for our opinion.
/s/PricewaterhouseCoopers LLP
Philadelphia, Pennsylvania
December 15, 2016
309
Special 2016 tax information (unaudited) for Vanguard Short-Term Tax-Exempt Fund
This information for the fiscal year ended October 31, 2016, is included pursuant to provisions of the Internal Revenue Code.
The fund designates 100% of its income dividends as exempt-interest dividends.
Special 2016 tax information (unaudited) for Vanguard Limited-Term Tax-Exempt Fund
This information for the fiscal year ended October 31, 2016, is included pursuant to provisions of the Internal Revenue Code.
The fund designates 100% of its income dividends as exempt-interest dividends.
Special 2016 tax information (unaudited) for Vanguard Intermediate-Term Tax-Exempt Fund
This information for the fiscal year ended October 31, 2016, is included pursuant to provisions of the Internal Revenue Code.
The fund designates 100% of its income dividends as exempt-interest dividends.
Special 2016 tax information (unaudited) for Vanguard Long-Term Tax-Exempt Fund
This information for the fiscal year ended October 31, 2016, is included pursuant to provisions of the Internal Revenue Code.
The fund distributed $14,776,000 as capital gain dividends (20% rate gain distributions) to shareholders during the fiscal year.
The fund designates 100% of its income dividends as exempt-interest dividends.
Special 2016 tax information (unaudited) for Vanguard High-Yield Tax-Exempt Fund
This information for the fiscal year ended October 31, 2016, is included pursuant to provisions of the Internal Revenue Code.
The fund designates 100% of its income dividends as exempt-interest dividends.
310
About Your Fund’s Expenses
As a shareholder of the fund, you incur ongoing costs, which include costs for portfolio management, administrative services, and shareholder reports (like this one), among others. Operating expenses, which are deducted from a fund’s gross income, directly reduce the investment return of the fund.
A fund’s expenses are expressed as a percentage of its average net assets. This figure is known as the expense ratio. The following examples are intended to help you understand the ongoing costs (in dollars) of investing in your fund and to compare these costs with those of other mutual funds. The examples are based on an investment of $1,000 made at the beginning of the period shown and held for the entire period.
The accompanying table illustrates your fund’s costs in two ways:
• Based on actual fund return. This section helps you to estimate the actual expenses that you paid over the period. The “Ending Account Value” shown is derived from the fund’s actual return, and the third column shows the dollar amount that would have been paid by an investor who started with $1,000 in the fund. You may use the information in this table, together with the amount you invested, to estimate the expenses that you paid over the period.
To do so, simply divide your account value by $1,000 (for example, an $8,600 account value divided by $1,000 = 8.6), then multiply the result by the number given for your fund under the heading “Expenses Paid During Period.”
• Based on hypothetical 5% yearly return. This section is intended to help you compare your fund’s costs with those of other mutual funds. It assumes that the fund had a yearly return of 5% before expenses, but that the expense ratio is unchanged. In this case—because the return used is not the fund’s actual return—the results do not apply to your investment. The example is useful in making comparisons because the Securities and Exchange Commission requires all mutual funds to calculate expenses based on a 5% return. You can assess your fund’s costs by comparing this hypothetical example with the hypothetical examples that appear in shareholder reports of other funds.
Note that the expenses shown in the table are meant to highlight and help you compare ongoing costs only and do not reflect transaction costs incurred by the fund for buying and selling securities. Further, the expenses do not include any purchase, redemption, or account service fees described in the fund prospectus. If such fees were applied to your account, your costs would be higher. Your fund does not carry a “sales load.” The calculations assume no shares were bought or sold during the period. Your actual costs may have been higher or lower, depending on the amount of your investment and the timing of any purchases or redemptions.
You can find more information about the fund’s expenses, including annual expense ratios, in the Financial Statements section of this report. For additional information on operating expenses and other shareholder costs, please refer to your fund’s current prospectus.
311
| | | |
| Six Months Ended October 31, 2016 | | | |
| | Beginning | Ending | Expenses |
| | Account Value | Account Value | Paid During |
| Tax-Exempt Fund | 4/30/2016 | 10/31/2016 | Period1 |
| Based on Actual Fund Return | | | |
| Short-Term | | | |
| Investor Shares | $1,000.00 | $1,002.64 | $0.91 |
| Admiral Shares | 1,000.00 | 1,003.22 | 0.30 |
| Limited-Term | | | |
| Investor Shares | $1,000.00 | $1,002.93 | $0.91 |
| Admiral Shares | 1,000.00 | 1,003.52 | 0.30 |
| Intermediate-Term | | | |
| Investor Shares | $1,000.00 | $1,003.66 | $0.91 |
| Admiral Shares | 1,000.00 | 1,004.25 | 0.30 |
| Long-Term | | | |
| Investor Shares | $1,000.00 | $1,008.06 | $0.91 |
| Admiral Shares | 1,000.00 | 1,008.65 | 0.30 |
| High-Yield | | | |
| Investor Shares | $1,000.00 | $1,015.21 | $0.91 |
| Admiral Shares | 1,000.00 | 1,015.81 | 0.30 |
| Based on Hypothetical 5% Yearly Return | | | |
| Short-Term | | | |
| Investor Shares | $1,000.00 | $1,024.23 | $0.92 |
| Admiral Shares | 1,000.00 | 1,024.84 | 0.31 |
| Limited-Term | | | |
| Investor Shares | $1,000.00 | $1,024.23 | $0.92 |
| Admiral Shares | 1,000.00 | 1,024.84 | 0.31 |
| Intermediate-Term | | | |
| Investor Shares | $1,000.00 | $1,024.23 | $0.92 |
| Admiral Shares | 1,000.00 | 1,024.84 | 0.31 |
| Long-Term | | | |
| Investor Shares | $1,000.00 | $1,024.23 | $0.92 |
| Admiral Shares | 1,000.00 | 1,024.84 | 0.31 |
| High-Yield | | | |
| Investor Shares | $1,000.00 | $1,024.23 | $0.92 |
| Admiral Shares | 1,000.00 | 1,024.84 | 0.31 |
1 The calculations are based on expenses incurred in the most recent six-month period. The funds’ annualized six-month expense ratios for that period are: for the Short-Term Tax-Exempt Fund, 0.18% for Investor Shares and 0.06% for Admiral Shares; for the Limited-Term Tax-Exempt Fund, 0.18% for Investor Shares and 0.06% for Admiral Shares; for the Intermediate-Term Tax-Exempt Fund, 0.18% for Investor Shares and 0.06% for Admiral Shares; for the Long-Term Tax-Exempt Fund, 0.18% for Investor Shares and 0.06% for Admiral Shares; and for the High-Yield Tax-Exempt Fund, 0.18% for Investor Shares and 0.06% for Admiral Shares. The dollar amounts shown as “Expenses Paid” are equal to the annualized expense ratio multiplied by the average account value over the period, multiplied by the number of days in the most recent six-month period, then divided by the number of days in the most recent 12-month period (184/366).
312
Glossary
30-Day SEC Yield. A fund’s 30-day SEC yield is derived using a formula specified by the U.S. Securities and Exchange Commission. Under the formula, data related to the fund’s security holdings in the previous 30 days are used to calculate the fund’s hypothetical net income for that period, which is then annualized and divided by the fund’s estimated average net assets over the calculation period. For the purposes of this calculation, a security’s income is based on its current market yield to maturity (for bonds), its actual income (for asset-backed securities), or its projected dividend yield (for stocks). Because the SEC yield represents hypothetical annualized income, it will differ—at times significantly—from the fund’s actual experience. As a result, the fund’s income distributions may be higher or lower than implied by the SEC yield.
Average Coupon. The average interest rate paid on the fixed income securities held by a fund. It is expressed as a percentage of face value.
Average Duration. An estimate of how much the value of the bonds held by a fund will fluctuate in response to a change in interest rates. To see how the value could change, multiply the average duration by the change in rates. If interest rates rise by 1 percentage point, the value of the bonds in a fund with an average duration of five years would decline by about 5%. If rates decrease by a percentage point, the value would rise by 5%.
Average Stated Maturity. The average length of time until fixed income securities held by a fund reach maturity and are repaid using the maturity date of the security. The figure reflects the proportion of fund assets represented by each security; it also reflects any futures contracts held. In general, the longer the average stated maturity, the more a fund’s share price will fluctuate in response to changes in market interest rates.
Beta. A measure of the magnitude of a fund’s past share-price fluctuations in relation to the ups and downs of a given market index. The index is assigned a beta of 1.00. Compared with a given index, a fund with a beta of 1.20 typically would have seen its share price rise or fall by 12% when the index rose or fell by 10%. For this report, beta is based on returns over the past 36 months for both the fund and the index. Note that a fund’s beta should be reviewed in conjunction with its R-squared (see definition). The lower the R-squared, the less correlation there is between the fund and the index, and the less reliable beta is as an indicator of volatility.
Credit Quality. Credit-quality ratings are measured on a scale that generally ranges from AAA (highest) to D (lowest). Credit-quality ratings are obtained from Moody’s and S&P, and the higher rating for each issue is used. “Not Rated” is used to classify securities for which a rating is not available. Not rated securities include a fund’s investment in Vanguard Market Liquidity Fund or Vanguard Municipal Cash Management Fund, each of which invests in high-quality money market instruments and may serve as a cash management vehicle for the Vanguard funds, trusts, and accounts.
Expense Ratio. A fund’s total annual operating expenses expressed as a percentage of the fund’s average net assets. The expense ratio includes management and administrative expenses, but does not include the transaction costs of buying and selling portfolio securities.
Inception Date. The date on which the assets of a fund (or one of its share classes) are first invested in accordance with the fund’s investment objective. For funds with a subscription period, the inception date is the day after that period ends. Investment performance is measured from the inception date.
R-Squared. A measure of how much of a fund’s past returns can be explained by the returns from the market in general, as measured by a given index. If a fund’s total returns were precisely synchronized with an index’s returns, its R-squared would be 1.00. If the fund’s returns bore no relationship to the index’s returns, its R-squared would be 0. For this report, R-squared is based on returns over the past 36 months for both the fund and the index.
Short-Term Reserves. The percentage of a fund invested in highly liquid, short-term securities that can be readily converted to cash.
Yield to Maturity. The rate of return an investor would receive if the fixed income securities held by a fund were held to their maturity dates.
313
The Vanguard Municipal Bond Funds are not sponsored, endorsed, issued, sold, or promoted by Barclays Risk Analytics and Index Solutions Limited or any of its affiliates (“Barclays”). Barclays makes no representation or warranty, express or implied, to the owners or purchasers of the Vanguard Municipal Bond Funds or any member of the public regarding the advisability of investing in securities generally or in the Vanguard Municipal Bond Funds particularly or the ability of the Barclays Indexes to track general bond market performance. Barclays has not passed on the legality or suitability of the Vanguard Municipal Bond Funds with respect to any person or entity. Barclays’ only relationship to Vanguard and the Vanguard Municipal Bond Funds is the licensing of the Barclays Indexes, which are determined, composed, and calculated by Barclays without regard to Vanguard or the Vanguard Municipal Bond Funds or any owners or purchasers of the Vanguard Municipal Bond Funds. Barclays has no obligation to take the needs of Vanguard, the Vanguard Municipal Bond Funds, or the owners of the Vanguard Municipal Bond Funds into consideration in determining, composing, or calculating the Barclays Indexes. Barclays is not responsible for and has not participated in the determination of the timing of, prices at, or quantities of the Vanguard Municipal Bond Funds to be issued. Barclays has no obligation or liability in connection with the administration, marketing, or trading of the Vanguard Municipal Bond Funds.
BARCLAYS SHALL HAVE NO LIABILITY TO THIRD PARTIES FOR THE QUALITY, ACCURACY AND/OR COMPLETENESS OF THE INDEX OR ANY DATA INCLUDED THEREIN OR FOR INTERRUPTIONS IN THE DELIVERY OF THE INDEX. BARCLAYS MAKES NO WARRANTY, EXPRESS OR IMPLIED, AS TO RESULTS TO BE OBTAINED BY OWNERS OF THE VANGUARD MUNICIPAL BOND FUNDS OR ANY OTHER PERSON OR ENTITY FROM THE USE OF THE INDEX OR ANY DATA INCLUDED THEREIN IN CONNECTION WITH THE RIGHTS LICENSED HEREUNDER OR FOR ANY OTHER USE. BARCLAYS RESERVES THE RIGHT TO CHANGE THE METHODS OF CALCULATION OR PUBLICATION, OR TO CEASE THE CALCULATION OR PUBLICATION OF THE BARCLAYS INDICES, AND BARCLAYS SHALL NOT BE LIABLE FOR ANY MISCALCULATION OF OR ANY INCORRECT, DELAYED OR INTERRUPTED PUBLICATION WITH RESPECT TO ANY OF THE BARCLAYS INDICES. BARCLAYS MAKES NO EXPRESS OR IMPLIED WARRANTIES, AND HEREBY EXPRESSLY DISCLAIMS ALL WARRANTIES OF MERCHANTABILITY OR FITNESS FOR A PARTICULAR PURPOSE OR USE WITH RESPECT TO THE INDEX OR ANY DATA INCLUDED THEREIN. BARCLAYS SHALL NOT BE LIABLE FOR ANY DAMAGES, INCLUDING, WITHOUT LIMITATION, ANY INDIRECT OR CONSEQUENTIAL DAMAGES RESULTING FROM THE USE OF THE INDEX OR ANY DATA INCLUDED THEREIN.
© 2016 Barclays. Used with Permission.
Source: Barclays Global Family of Indices. Copyright 2016, Barclays. All rights reserved.
This page intentionally left blank.
This page intentionally left blank.
This page intentionally left blank.
This page intentionally left blank.
This page intentionally left blank.
This page intentionally left blank.
The People Who Govern Your Fund
The trustees of your mutual fund are there to see that the fund is operated and managed in your best interests since, as a shareholder, you are a part owner of the fund. Your fund’s trustees also serve on the board of directors of The Vanguard Group, Inc., which is owned by the Vanguard funds and provides services to them on an at-cost basis.
A majority of Vanguard’s board members are independent, meaning that they have no affiliation with Vanguard or the funds they oversee, apart from the sizable personal investments they have made as private individuals.
The independent board members have distinguished backgrounds in business, academia, and public service. Each of the trustees and executive officers oversees 198 Vanguard funds.
The following table provides information for each trustee and executive officer of the fund. The mailing address of the trustees and officers is P.O. Box 876, Valley Forge, PA 19482. More information about the trustees is in the Statement of Additional Information, which can be obtained, without charge, by contacting Vanguard at 800-662-7447, or online at vanguard.com.
Interested Trustee1 F. William McNabb III
Born 1957. Trustee Since July 2009. Chairman of the Board. Principal Occupation(s) During the Past Five Years and Other Experience: Chairman of the Board of The Vanguard Group, Inc., and of each of the investment companies served by The Vanguard Group, since January 2010; Director of The Vanguard Group since 2008; Chief Executive Officer and President of The Vanguard Group, and of each of the investment companies served by The Vanguard Group, since 2008; Director of Vanguard Marketing Corporation; Managing Director of The Vanguard Group (1995–2008).
Independent Trustees Emerson U. Fullwood
Born 1948. Trustee Since January 2008. Principal Occupation(s) During the Past Five Years and Other Experience: Executive Chief Staff and Marketing Officer for North America and Corporate Vice President (retired 2008) of Xerox Corporation (document management products and services); Executive in Residence and 2009–2010 Distinguished Minett Professor at the Rochester Institute of Technology; Lead Director of SPX FLOW, Inc. (multi-industry manufacturing); Director of the United Way of Rochester, the University of Rochester Medical Center, Monroe Community College Foundation, North Carolina A&T University, and Roberts Wesleyan College.
Rajiv L. Gupta
Born 1945. Trustee Since December 2001.2 Principal Occupation(s) During the Past Five Years and Other Experience: Chairman and Chief Executive Officer (retired 2009) and President (2006–2008) of Rohm and Haas Co. (chemicals); Director of Tyco International plc (diversified manufacturing and services), HP Inc. (printer and personal computer manufacturing), and Delphi Automotive plc (automotive components); Senior Advisor at New Mountain Capital.
Amy Gutmann
Born 1949. Trustee Since June 2006. Principal Occupation(s) During the Past Five Years and Other Experience: President of the University of Pennsylvania; Christopher H. Browne Distinguished Professor of Political Science, School of Arts and Sciences, and Professor of Communication, Annenberg School for Communication, with secondary faculty appointments in the Department of Philosophy, School of Arts and Sciences, and at the Graduate School of Education, University of Pennsylvania; Trustee of the National Constitution Center; Chair of the Presidential Commission for the Study of Bioethical Issues.
JoAnn Heffernan Heisen
Born 1950. Trustee Since July 1998. Principal Occupation(s) During the Past Five Years and Other Experience: Corporate Vice President and Chief Global Diversity Officer (retired 2008) and
Member of the Executive Committee (1997–2008) of Johnson & Johnson (pharmaceuticals/medical devices/consumer products); Director of Skytop Lodge Corporation (hotels) and the Robert Wood Johnson Foundation; Member of the Advisory Board of the Institute for Women’s Leadership at Rutgers University.
F. Joseph Loughrey
Born 1949. Trustee Since October 2009. Principal Occupation(s) During the Past Five Years and Other Experience: President and Chief Operating Officer (retired 2009) of Cummins Inc. (industrial machinery); Chairman of the Board of Hillenbrand, Inc. (specialized consumer services), and of Oxfam America; Director of SKF AB (industrial machinery), Hyster-Yale Materials Handling, Inc. (forklift trucks), the Lumina Foundation for Education, and the V Foundation for Cancer Research; Member of the Advisory Council for the College of Arts and Letters and of the Advisory Board to the Kellogg Institute for International Studies, both at the University of Notre Dame.
Mark Loughridge
Born 1953. Trustee Since March 2012. Principal Occupation(s) During the Past Five Years and Other Experience: Senior Vice President and Chief Financial Officer (retired 2013) at IBM (information technology services); Fiduciary Member of IBM’s Retirement Plan Committee (2004–2013); Director of the Dow Chemical Company; Member of the Council on Chicago Booth.
Scott C. Malpass
Born 1962. Trustee Since March 2012. Principal Occupation(s) During the Past Five Years and Other Experience: Chief Investment Officer and Vice President at the University of Notre Dame; Assistant Professor of Finance at the Mendoza College of Business at Notre Dame; Member of the Notre Dame 403(b) Investment Committee, the Board of Advisors for Spruceview Capital Partners, and the Investment Advisory Committee of Major League Baseball; Board Member of TIFF Advisory Services, Inc., and Catholic Investment Services, Inc. (investment advisors).
André F. Perold
Born 1952. Trustee Since December 2004. Principal Occupation(s) During the Past Five Years and Other Experience: George Gund Professor of Finance and Banking, Emeritus at the Harvard Business School (retired 2011); Chief Investment Officer and Managing Partner of HighVista Strategies LLC (private investment firm); Director of Rand Merchant Bank; Overseer of the Museum of Fine Arts Boston.
Peter F. Volanakis
Born 1955. Trustee Since July 2009. Principal Occupation(s) During the Past Five Years and Other Experience: President and Chief Operating Officer (retired 2010) of Corning Incorporated (communications equipment); Chairman of the Board of Trustees of Colby-Sawyer College; Member of the Advisory Board of the Norris Cotton Cancer Center.
Executive Officers Glenn Booraem
Born 1967. Treasurer Since May 2015. Principal Occupation(s) During the Past Five Years and Other Experience: Principal of The Vanguard Group, Inc.; Treasurer of each of the investment companies served by The Vanguard Group; Controller of each of the investment companies served by The Vanguard Group (2010–2015); Assistant Controller of each of the investment companies served by The Vanguard Group (2001–2010).
Thomas J. Higgins
Born 1957. Chief Financial Officer Since September 2008. Principal Occupation(s) During the Past Five Years and Other Experience: Principal of The Vanguard Group, Inc.; Chief Financial Officer of each of the investment companies served by The Vanguard Group; Treasurer of each of the investment companies served by The Vanguard Group (1998–2008).
Peter Mahoney
Born 1974. Controller Since May 2015. Principal Occupation(s) During the Past Five Years and Other Experience: Head of Global Fund Accounting at The Vanguard Group, Inc.; Controller of each of the investment companies served by The Vanguard Group; Head of International Fund Services at The Vanguard Group (2008–2014).
Anne E. Robinson
Born 1970. Secretary Since September 2016. Principal Occupation(s) During the Past Five Years and Other Experience: Managing Director of The Vanguard Group, Inc.; General Counsel of The Vanguard Group; Secretary of The Vanguard Group and of each of the investment companies served by The Vanguard Group; Director and Senior Vice President of Vanguard Marketing Corporation; Managing Director and General Counsel of Global Cards and Consumer Services at Citigroup (2014–2016); Counsel at American Express (2003–2014).
Vanguard Senior Management Team
| |
| Mortimer J. Buckley | James M. Norris |
| Kathleen C. Gubanich | Thomas M. Rampulla |
| Martha G. King | Glenn W. Reed |
| John T. Marcante | Karin A. Risi |
| Chris D. McIsaac | Michael Rollings |
Chairman Emeritus and Senior Advisor
John J. Brennan
Chairman, 1996–2009
Chief Executive Officer and President, 1996–2008
Founder
John C. Bogle
Chairman and Chief Executive Officer, 1974–1996
1 Mr. McNabb is considered an “interested person,” as defined in the Investment Company Act of 1940, because he is an officer of the Vanguard funds.
2 December 2002 for Vanguard Equity Income Fund, the Vanguard Municipal Bond Funds, and the Vanguard State Tax-Exempt Funds.
| |
|  |
| P.O. Box 2600 |
| Valley Forge, PA 19482-2600 |
| |
Connect with Vanguard® > vanguard.com | |
| |
| Fund Information > 800-662-7447 | All comparative mutual fund data are from Lipper, |
| | a Thomson Reuters Company, or Morningstar, Inc., |
| Direct Investor Account Services > 800-662-2739 | unless otherwise noted. |
| | |
| Institutional Investor Services > 800-523-1036 |
| You can obtain a free copy of Vanguard’s proxy voting |
| Text Telephone for People | guidelines by visiting vanguard.com/proxyreporting or |
| Who Are Deaf or Hard of Hearing > 800-749-7273 | by calling Vanguard at 800-662-2739. The guidelines |
| | are also available from the SEC’s website, sec.gov. |
| | In addition, you may obtain a free report on how your |
| |
| This material may be used in conjunction | fund voted the proxies for securities it owned during |
| | the 12 months ended June 30. To get the report, visit |
| with the offering of shares of any Vanguard | either vanguard.com/proxyreporting or sec.gov. |
| fund only if preceded or accompanied by the | |
| fund’s current prospectus. | You can review and copy information about your fund |
| | at the SEC’s Public Reference Room in Washington, D.C. |
| CFA® is a registered trademark owned by CFA Institute. | To find out more about this public service, call the SEC |
| | at 202-551-8090. Information about your fund is also |
| | available on the SEC’s website, and you can receive |
| | copies of this information, for a fee, by sending a |
| | request in either of two ways: via email addressed to |
| | publicinfo@sec.gov or via regular mail addressed to the |
| | Public Reference Section, Securities and Exchange |
| | Commission, Washington, DC 20549-1520. |
| |
| |
| |
| |
| | © 2016 The Vanguard Group, Inc. |
| | All rights reserved. |
| | Vanguard Marketing Corporation, Distributor. |
| | Q950 122016 |
|
 |
|
| Annual Report | October 31, 2016 |
| Vanguard Tax-Exempt Bond Index Fund |
A new format, unwavering commitment
As you begin reading this report, you’ll notice that we’ve made some improvements to the opening sections—based on feedback from you, our clients.
Page 1 starts with a new ”Your Fund’s Performance at a Glance,” a concise, handy summary of how your fund performed during the period.
In the renamed ”Chairman’s Perspective,” Bill McNabb will focus on enduring principles and investment insights.
We’ve modified some tables, and eliminated some redundancy, but we haven’t removed any information.
At Vanguard, we’re always looking for better ways to communicate and to help you make sound investment decisions. Thank you for entrusting your assets to us.
| |
| Contents | |
| Your Fund’s Performance at a Glance. | 1 |
| Chairman’s Perspective. | 3 |
| Fund Profile. | 7 |
| Performance Summary. | 8 |
| Financial Statements. | 10 |
| About Your Fund’s Expenses. | 81 |
| Glossary. | 83 |
Please note: The opinions expressed in this report are just that—informed opinions. They should not be considered promises or advice. Also, please keep in mind that the information and opinions cover the period through the date on the front of this report. Of course, the risks of investing in your fund are spelled out in the prospectus.
See the Glossary for definitions of investment terms used in this report.
About the cover: No matter what language you speak, Vanguard has one consistent message and set of principles. Our primary focus is on you, our clients. We conduct our business with integrity as a faithful steward of your assets. This message is shown translated into seven languages, reflecting our expanding global presence.
Your Fund’s Performance at a Glance
• For the 12 months ended October 31, 2016, Vanguard Tax-Exempt Bond Index Fund returned 4.28% for Investor Shares, 4.29% for ETF Shares, and 4.36% for Admiral Shares. Its benchmark index returned 4.32%, and the average return of peer funds was 4.34%.
• Municipal bond issuance picked up in the second half of the fiscal year. At the same time, demand was solid, helped by concerns about global growth and Britain’s vote to leave the European Union.
• Toward the end of the period, the fund posted negative monthly returns. Demand cooled while supply accelerated as the prospect of a Federal Reserve rate hike seemed increasingly likely.
• By maturity, lower-quality investment-grade bonds generally returned more than their higher-quality counterparts. And with the muni bond yield curve flattening, longer-dated bonds outstripped shorter-dated ones, although returns were positive across the maturity spectrum.
| | | | | |
| Total Returns: Fiscal Year Ended October 31, 2016 | | | | |
| | | Taxable- | | | |
| | 30-Day SEC | Equivalent | Income | Capital | Total |
| | Yield | Yield | Returns | Returns | Returns |
| Vanguard Tax-Exempt Bond Index Fund | | | | | |
| Investor Shares | 1.61% | 2.84% | 1.49% | 2.79% | 4.28% |
| ETF Shares | 1.70 | 3.00 | | | |
| Market Price | | | | | 4.19 |
| Net Asset Value | | | | | 4.29 |
| Admiral™ Shares | 1.70 | 3.00 | 1.62 | 2.74 | 4.36 |
| S&P National AMT-Free Municipal Bond Index | | | | | 4.32 |
| General Municipal Funds Average | | | | | 4.34 |
The calculation of taxable-equivalent yield assumes a typical itemized tax return and is based on the maximum federal tax rate of 43.4%. State and local taxes were not considered. Please see the prospectus for a detailed explanation of the calculation.
General Municipal Funds Average: Derived from data provided by Lipper, a Thomson Reuters Company.
Admiral Shares carry lower expenses and are available to investors who meet certain account-balance requirements. The Vanguard ETF® Shares shown are traded on the NYSE Arca exchange and are available only through brokers. The table provides ETF returns based on both the NYSE Arca market price and the net asset value for a share. U.S. Pat. Nos. 6,879,964; 7,337,138; 7,720,749; 7,925,573; 8,090,646; and 8,417,623.
For the ETF Shares, the market price is determined by the midpoint of the bid-offer spread as of the closing time of the New York Stock Exchange (generally 4 p.m., Eastern time). The net asset value is also determined as of the NYSE closing time. For more information about how the ETF Shares' market prices have compared with their net asset value, visit vanguard.com, select your ETF, and then select the Price and Performance tab. The ETF premium/discount analysis there shows the percentages of days on which the ETF Shares' market price was above or below the NAV.
1
| | | | |
| Expense Ratios | | | | |
| Your Fund Compared With Its Peer Group | | | | |
| | Investor | ETF | Admiral | Peer Group |
| | Shares | Shares | Shares | Average |
| Tax-Exempt Bond Index Fund | 0.20% | 0.12% | 0.12% | 0.94% |
The fund expense ratios shown are from the prospectus dated February 26, 2016, and represent estimated costs for the current fiscal year. For the fiscal year ended October 31, 2016, the fund’s expense ratios were 0.19% for Investor Shares, 0.09% for ETF Shares, and 0.09% for Admiral Shares. The peer-group expense ratio is derived from data provided by Lipper, a Thomson Reuters Company, and captures information through year-end 2015.
Peer group: General Municipal Funds Average.
2
Chairman’s Perspective

Bill McNabb
Chairman and Chief Executive Officer
Dear Shareholder,
Over the three years ended August 31, 2016, investors poured more than $1 trillion into index funds. Indexing now accounts for nearly a third of all mutual fund assets—more than double what it did a decade ago and eight times its share two decades ago.1
By contrast, active management’s commercial struggles have reflected its disappointing investment performance. Over the decade ended December 31, 2015, 82% of actively managed stock funds and 81% of active bond funds have either underperformed their benchmarks or shut down.
This subpar performance has fueled the explosion of asset growth in indexing among individual, retirement, and nonprofit investors. So what might the trend mean for the future of actively managed funds?
Our research and experience indicate that active management can survive—and even succeed—but only if it’s offered at much lower expense.
High costs, which limit a manager’s ability to deliver benchmark-beating returns to clients, are the biggest reason why active has lagged. Industrywide as of December 31, 2015, the average expense ratio for all active stock funds is 1.14%, compared with 0.76% for stock index
1 Sources: Wall Street Journal; Morningstar, Inc.; and Investment Company Institute, 2016.
3
funds. And the expense advantage is even wider for bonds; the average expense ratio for an active bond fund is 0.93%, compared with 0.43% for bond index funds.
But even these big differences understate the real gap. These days, it’s not hard to find an index fund that charges maybe 0.05% or 0.10%. So even if you have identified active managers who are skilled at selecting stocks and bonds, to match the return of a comparable (much cheaper) index fund would require significant outperformance. Think about it. Any fund that charges 1.00% in expenses—not even the high end of the range—will find it extraordinarily difficult to overcome the index fund’s head start.
Active management also has taken a hit from a regulatory environment that has been favorable to low-cost strategies. The U.S. Department of Labor several years ago mandated greater disclosure of retirement plan fees. And its new fiduciary rule, which is set to take effect in April, requires financial advisors to demonstrate that their recommendations are aligned with their clients’ best interest. Both changes encourage the use of lower-cost investments, including index funds.
The future of active management
In light of all this, people have been asking me whether active management is “dead.” My response is both yes and no. High-cost active management is dead, and rightly so. It has never been a winning proposition
| | | |
| Market Barometer | | | |
| | | Average Annual Total Returns |
| | | Periods Ended October 31, 2016 |
| | One | Three | Five |
| | Year | Years | Years |
| Stocks | | | |
| Russell 1000 Index (Large-caps) | 4.26% | 8.48% | 13.51% |
| Russell 2000 Index (Small-caps) | 4.11 | 4.12 | 11.51 |
| Russell 3000 Index (Broad U.S. market) | 4.24 | 8.13 | 13.35 |
| FTSE All-World ex US Index (International) | 0.64 | -0.94 | 4.09 |
| |
| Bonds | | | |
| Bloomberg Barclays U.S. Aggregate Bond Index | | | |
| (Broad taxable market) | 4.37% | 3.48% | 2.90% |
| Bloomberg Barclays Municipal Bond Index | | | |
| (Broad tax-exempt market) | 4.06 | 4.89 | 4.34 |
| Citigroup Three-Month U.S. Treasury Bill Index | 0.22 | 0.07 | 0.07 |
| |
| CPI | | | |
| Consumer Price Index | 1.64% | 1.15% | 1.32% |
4
for investors. Low-cost active funds, though, can potentially play an important role for investors who seek to outperform the market.
Paying less for your funds is the only sure-fire way to improve your odds of achieving success in active management. But even if you have found an active manager with low costs, the odds of outperforming the market are still long. You have to be able to identify talented stock and bond portfolio managers with long time horizons and clear investment strategies. Look for managers with consistent track records and the discipline to stick closely to their investment strategy.
Know what you own and why
Despite the well-deserved reputation of indexing and the challenges for active managers, there’s still a place for traditional active strategies that are low-cost, diversified, and highly disciplined, and are run by talented managers who focus on the long term.
Vanguard has always applied these principles to our active strategies, and investors have benefited as a majority of our active funds outperformed their benchmarks and bested their peers’ average annual return over the ten years ended September 30, 2016.
Worried about the election’s impact on your portfolio?
The 2016 presidential election season was one of the most intense and unpredictable in U.S. history. In its aftermath, investors may be left with lingering questions about what the outcome will mean for their portfolios. The answer, based on Vanguard research into decades of historical data, is that presidential elections typically have no long-term effect on market performance.
These findings hold true regardless of the market’s initial reaction. Whether there’s a swoon or bounce immediately after an election, investors shouldn’t extrapolate that performance to the long term.
As you can see in the accompanying chart, data going back to 1853 show that stock market returns are virtually identical no matter which party controls the White House. Although headlines out of Washington at any given time may still cause concern, investors shouldn’t overreact to short-term events. Instead, it’s best to maintain a balanced and diversified portfolio and stay focused on your long-term goals.
Average annual stock market returns based on party control of the White House (1853–2015)
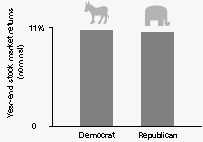
Sources: Global Financial Data, 1853–1926; Morningstar, Inc., and Ibbotson Associates thereafter through 2015.
5
But it’s crucial for investors to be patient. Even active managers with the best track records frequently underperform their benchmarks when their investment styles are out of favor. Such periods, though temporary, can persist. So it’s important when entrusting your assets to an active strategy to be in it for the long haul.
Make sure you know what you’re buying and what the risks are. Active strategies are becoming more complex, so it’s important to clearly understand what the investments in your portfolio are designed to accomplish and why you want to hold them. Otherwise, you run the risk of selecting strategies that don’t fit your needs or objectives.
Keeping these considerations in mind can potentially boost your chances of success in identifying active strategies that may be able to help you reach your goals.
As always, thank you for investing with Vanguard.
Sincerely,

F. William McNabb III
Chairman and Chief Executive Officer
November 9, 2016
6
Tax-Exempt Bond Index Fund
Fund Profile
As of October 31, 2016
Share-Class Characteristics
| | | |
| | Investor | ETF Admiral |
| | Shares | Shares | Shares |
| Ticker Symbol | VTEBX | VTEB | VTEAX |
| Expense Ratio1 | 0.20% | 0.12% | 0.12% |
| 30-Day SEC Yield | 1.61% | 1.70% | 1.70% |
| |
| Financial Attributes | | |
| |
| | | | S&P |
| | | | National |
| | | | AMT-Free |
| | | Fund | Muni Bond Idx |
| Number of Bonds | | 2,118 | 11,032 |
| Yield to Maturity | | | |
| (before expenses) | | 1.8% | 1.7% |
| Average Coupon | | 4.7% | 4.6% |
| Average Duration | 5.6 years | 5.5 years |
| Average Stated | | | |
| Maturity | 13.2 years | 13.0 years |
| Short-Term Reserves | | 1.6% | — |
| |
| |
| Largest Area Concentrations | |
| New York | | | 20.8% |
| California | | | 14.9 |
| Texas | | | 10.1 |
| New Jersey | | | 5.7 |
| Pennsylvania | | | 4.9 |
| Massachusetts | | | 4.5 |
| Illinois | | | 4.3 |
| Florida | | | 3.6 |
| Maryland | | | 2.5 |
| Georgia | | | 2.3 |
| Top Ten | | | 73.6% |
Percentage of net assets, excluding any futures contracts.
| |
| Distribution by Stated Maturity (% of portfolio) | |
| Under 1 Year | 4.9% |
| 1 - 3 Years | 13.5 |
| 3 - 5 Years | 8.9 |
| 5 - 10 Years | 16.6 |
| 10 - 20 Years | 28.3 |
| 20 - 30 Years | 24.0 |
| Over 30 Years | 3.8 |
Distribution by Credit Quality (% of portfolio)
| |
| AAA | 23.8% |
| AA | 57.1 |
| A | 15.3 |
| BBB | 2.9 |
| Not Rated | 0.9 |
Credit-quality ratings are from Moody's and S&P. The higher rating for each issue is shown. "Not Rated" is used to classify securities for which a rating is not available. For more information about these ratings, see the Glossary entry for Credit Quality.
Investment Focus

1 The expense ratios shown are from the prospectus dated February 26, 2016, and represent estimated costs for the current fiscal year. For the fiscal year ended October 31, 2016, the expense ratios were 0.19% for Investor Shares, 0.09% for ETF Shares, and 0.09% for Admiral Shares.
7
Tax-Exempt Bond Index Fund
Performance Summary
All of the returns in this report represent past performance, which is not a guarantee of future results that may be achieved by the fund. (Current performance may be lower or higher than the performance data cited. For performance data current to the most recent month-end, visit our website at vanguard.com/performance.) Note, too, that both investment returns and principal value can fluctuate widely, so an investor’s shares, when sold, could be worth more or less than their original cost. The returns shown do not reflect taxes that a shareholder would pay on fund distributions or on the sale of fund shares.
Cumulative Performance: August 21, 2015, Through October 31, 2016
Initial Investment of $10,000
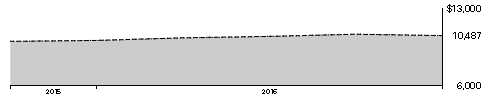
| | | |
| | Average Annual Total Returns | |
| | Periods Ended October 31, 2016 | |
| | | Since | Final Value |
| | One | Inception | of a $10,000 |
| | Year | (8/21/2015) | Investment |
| Tax-Exempt Bond Index FundInvestor | | | |
| Shares | 4.02% | 4.06% | $10,487 |
| S&P National AMT-Free Municipal Bond | | | |
| Index | 4.32 | 4.32 | 10,519 |
| |
| General Municipal Funds Average | 4.34 | 4.37 | 10,525 |
General Municipal Funds Average: Derived from data provided by Lipper, a Thomson Reuters Company.
"Since Inception" performance is calculated from the Investor Shares’ inception date for both the fund and its comparative standards.
| | | |
| | | Since | Final Value |
| | One | Inception | of a $10,000 |
| | Year | (8/21/2015) | Investment |
| Tax-Exempt Bond Index Fund | | | |
| ETF Shares Net Asset Value | 4.29% | 4.32% | $10,518 |
| Tax-Exempt Bond Index Fund | | | |
| ETF Shares Market Price | 4.19 | 4.36 | 10,523 |
| S&P National AMT-Free Municipal Bond | | | |
| Index | 4.32 | 4.32 | 10,519 |
| "Since Inception" performance is calculated from the ETF Shares’ inception date for both the fund and its comparative standards. |
Vanguard fund returns are adjusted to reflect the 0.25% fee on purchases of fund shares. The fee does not apply to the ETF Shares. The Fiscal-Year Total Returns table is not adjusted for fees.
See Financial Highlights for dividend and capital gains information.
8
| | | |
| Tax-Exempt Bond Index Fund | | | |
| |
| |
| |
| |
| | Average Annual Total Returns | |
| | Periods Ended October 31, 2016 | |
| | | Since | Final Value |
| | One | Inception | of a $10,000 |
| | Year | (8/25/2015) | Investment |
| Tax-Exempt Bond Index Fund Admiral Shares | 4.10% | 4.26% | $10,507 |
| S&P National AMT-Free Municipal Bond | | | |
| Index | 4.32 | 4.45 | 10,528 |
"Since Inception" performance is calculated from the Admiral Shares’ inception date for both the fund and its comparative standards.
| | |
| Cumulative Returns of ETF Shares: August 21, 2015, Through October 31, 2016 | |
| |
| | | Since |
| | One | Inception |
| | Year | (8/21/2015) |
| Tax-Exempt Bond Index Fund ETF Shares Market | | |
| Price | 4.19% | 5.23% |
| Tax-Exempt Bond Index Fund ETF Shares Net | | |
| Asset Value | 4.29 | 5.18 |
| S&P National AMT-Free Municipal Bond Index | 4.32 | 5.19 |
"Since Inception" performance is calculated from the ETF Shares’ inception date for both the fund and its comparative standards.
| | | | |
| Fiscal-Year Total Returns (%): August 21, 2015, Through October 31, 2016 | |
| | | | | S&P |
| | | | | National |
| | | | | AMT-Free |
| | | | Investor Shares | Muni Bond Idx |
| Fiscal Year | Income Returns | Capital Returns | Total Returns | Total Returns |
| 2015 | 0.32% | 0.50% | 0.82% | 0.83% |
| 2016 | 1.49 | 2.79 | 4.28 | 4.32 |
Average Annual Total Returns: Periods Ended September 30, 2016
This table presents returns through the latest calendar quarter—rather than through the end of the fiscal period.
Securities and Exchange Commission rules require that we provide this information.
| | | | | |
| | | | | | Since Inception |
| | Inception Date | One Year | Income | Capital | Total |
| Investor Shares | 8/21/2015 | 5.72% | 1.55% | 3.95% | 5.50% |
| Fee-Adjusted Returns | | 5.45 | | | 5.27 |
| ETF Shares | 8/21/2015 | | | | |
| Market Price | | 5.58 | | | 5.47 |
| Net Asset Value | | 5.71 | | | 5.54 |
| Admiral Shares | 8/25/2015 | 5.74 | 1.69 | 4.04 | 5.73 |
| Fee-Adjusted Returns | | 5.48 | | | 5.49 |
Vanguard fund returns are adjusted to reflect the 0.25% fee on purchases of fund shares. The fee does not apply to the ETF Shares. The Fiscal-Year Total Returns table is not adjusted for fees.
9
Tax-Exempt Bond Index Fund
Financial Statements
Statement of Net Assets
As of October 31, 2016
The fund reports a complete list of its holdings in regulatory filings four times in each fiscal year, at the quarter-ends. For the second and fourth fiscal quarters, the lists appear in the fund’s semiannual and annual reports to shareholders. For the first and third fiscal quarters, the fund files the lists with the Securities and Exchange Commission on Form N-Q. Shareholders can look up the fund’s Forms N-Q on the SEC’s website at sec.gov. Forms N-Q may also be reviewed and copied at the SEC’s Public Reference Room (see the back cover of this report for further information).
| | | | |
| | | | Face | Market |
| | | Maturity | Amount | Value• |
| | Coupon | Date | ($000) | ($000) |
| Tax-Exempt Municipal Bonds (98.1%) | | | | |
| Alabama (0.9%) | | | | |
| Alabama Federal Aid Highway Finance | | | | |
| Authority GAN | 5.000% | 9/1/18 | 100 | 107 |
| Alabama Federal Aid Highway Finance | | | | |
| Authority GAN | 5.000% | 9/1/27 | 260 | 317 |
| Alabama Federal Aid Highway Finance | | | | |
| Authority Special | 5.000% | 9/1/19 | 200 | 221 |
| Alabama Federal Aid Highway Finance | | | | |
| Authority Special Obligation Revenue | 5.000% | 9/1/28 | 250 | 304 |
| Alabama Incentives Financing Authority Special | | | | |
| Obligation Revenue | 5.000% | 9/1/37 | 380 | 431 |
| Alabama Public School & College Authority | 5.000% | 1/1/24 | 225 | 275 |
| Alabama Public School & College Authority | 5.000% | 1/1/26 | 290 | 359 |
| Alabama Public School & College Authority | 5.000% | 1/1/27 | 325 | 398 |
| Alabama Public School & College Authority | | | | |
| Capital Improvement Revenue | 5.000% | 12/1/17 (Prere.) | 150 | 157 |
| Alabama Public School & College Authority | | | | |
| Capital Improvement Revenue | 5.000% | 5/1/18 | 55 | 58 |
| Alabama Public School & College Authority | | | | |
| Capital Improvement Revenue | 5.000% | 1/1/23 | 160 | 192 |
| Auburn University Alabama General Fee Revenue | 5.000% | 6/1/28 | 300 | 372 |
| Baldwin County AL Board of Education Revenue | 4.500% | 7/1/37 (2) | 505 | 516 |
| Birmingham AL Airport Authority Revenue | 5.250% | 7/1/30 (4) | 150 | 169 |
| Birmingham AL Airport Authority Revenue | 5.500% | 7/1/40 (4) | 140 | 158 |
| Birmingham AL Water Works & Sewer Board | | | | |
| Water Revenue | 4.500% | 1/1/43 (2) | 100 | 101 |
| Birmingham AL Water Works Board Water | | | | |
| Revenue | 5.000% | 1/1/21 (Prere.) | 575 | 665 |
| Birmingham AL Water Works Board Water | | | | |
| Revenue | 5.000% | 1/1/43 | 650 | 758 |
| | | | | 5,558 |
| Alaska (0.3%) | | | | |
| Alaska Municipal Bond Bank Authority Revenue | 5.000% | 2/1/27 | 515 | 607 |
| Alaska Municipal Bond Bank Authority Revenue | 5.000% | 3/1/27 | 245 | 296 |
| Anchorage AK Electric Utility Revenue | 5.000% | 12/1/41 | 270 | 312 |
| Anchorage AK GO | 5.000% | 9/1/19 | 700 | 776 |
| Anchorage AK Water Revenue | 5.000% | 5/1/37 (14) | 100 | 102 |
| | | | | 2,093 |
10
| | | | |
| Tax-Exempt Bond Index Fund | | | | |
| |
| |
| |
| | | | Face | Market |
| | | Maturity | Amount | Value• |
| | Coupon | Date | ($000) | ($000) |
| Arizona (1.4%) | | | | |
| Arizona Board Regents Arizona State University | | | | |
| System Revenue | 5.000% | 7/1/37 | 380 | 441 |
| Arizona COP | 5.000% | 10/1/18 (4) | 50 | 54 |
| Arizona COP | 5.000% | 10/1/29 (4) | 110 | 121 |
| Arizona School Facilities Board COP | 5.250% | 9/1/18 (Prere.) | 200 | 216 |
| Arizona School Facilities Board COP | 5.750% | 9/1/18 (Prere.) | 420 | 457 |
| Arizona School Facilities Board COP | 5.000% | 9/1/23 | 500 | 606 |
| Arizona Transportation Board Excise Tax Revenue | 5.250% | 7/1/19 (Prere.) | 135 | 150 |
| Arizona Transportation Board Excise Tax Revenue | 5.000% | 7/1/23 | 60 | 73 |
| Arizona Transportation Board Excise Tax Revenue | | | | |
| (Maricopa County Regional Area) | 5.000% | 7/1/18 | 80 | 85 |
| Arizona Transportation Board Excise Tax Revenue | | | | |
| (Maricopa County Regional Area) | 5.000% | 7/1/19 (Prere.) | 300 | 331 |
| Arizona Transportation Board Highway Revenue | 5.000% | 7/1/24 | 145 | 182 |
| Arizona Transportation Board Highway Revenue | 5.000% | 7/1/25 | 520 | 622 |
| Arizona Transportation Board Highway Revenue | 5.000% | 7/1/26 | 50 | 60 |
| Arizona Transportation Board Highway Revenue | 5.000% | 7/1/31 | 55 | 66 |
| Arizona Transportation Board Highway Revenue | 5.000% | 7/1/32 | 60 | 72 |
| Arizona Water Infrastructure Finance Authority | | | | |
| Revenue | 5.000% | 10/1/20 (Prere.) | 150 | 172 |
| Arizona Water Infrastructure Finance Authority | | | | |
| Revenue | 5.000% | 10/1/23 | 125 | 154 |
| Phoenix AZ Civic Improvement Corp. Transit | | | | |
| Excise Tax Revenue (Light Rail Project) | 5.000% | 7/1/20 | 200 | 228 |
| Phoenix AZ Civic Improvement Corp. Water | | | | |
| System Revenue | 5.000% | 7/1/20 | 700 | 799 |
| Phoenix AZ Civic Improvement Corp. Water | | | | |
| System Revenue | 5.000% | 7/1/21 | 275 | 322 |
| Phoenix AZ GO | 4.000% | 7/1/24 | 65 | 76 |
| Phoenix AZ GO | 5.000% | 7/1/26 | 500 | 638 |
| Pima County AZ Industrial Development Authority | | | | |
| Lease Revenue (Clark County Detention | | | | |
| Facilities Project) | 5.000% | 9/1/39 | 270 | 282 |
| Pima County AZ Sewer Revenue | 5.000% | 7/1/24 | 200 | 249 |
| Pinal County AZ Electric District Revenue | 5.250% | 7/1/21 (Prere.) | 70 | 83 |
| Salt River Project Arizona Agricultural | | | | |
| Improvement & Power District Revenue | 5.000% | 12/1/19 | 100 | 112 |
| Salt River Project Arizona Agricultural | | | | |
| Improvement & Power District Revenue | 5.000% | 1/1/27 | 100 | 105 |
| Salt River Project Arizona Agricultural | | | | |
| Improvement & Power District Revenue | 5.000% | 12/1/27 | 300 | 352 |
| Salt River Project Arizona Agricultural | | | | |
| Improvement & Power District Revenue | 5.000% | 1/1/28 | 50 | 54 |
| Salt River Project Arizona Agricultural | | | | |
| Improvement & Power District Revenue | 5.000% | 12/1/28 | 125 | 147 |
| Salt River Project Arizona Agricultural | | | | |
| Improvement & Power District Revenue | 5.000% | 12/1/31 | 120 | 141 |
| Salt River Project Arizona Agricultural | | | | |
| Improvement & Power District Revenue | 5.000% | 1/1/32 | 55 | 60 |
| Salt River Project Arizona Agricultural | | | | |
| Improvement & Power District Revenue | 5.000% | 1/1/33 | 75 | 81 |
| Salt River Project Arizona Agricultural | | | | |
| Improvement & Power District Revenue | 5.000% | 1/1/38 | 195 | 204 |
11
| | | | |
| Tax-Exempt Bond Index Fund | | | | |
| |
| |
| |
| | | | Face | Market |
| | | Maturity | Amount | Value• |
| | Coupon | Date | ($000) | ($000) |
| Salt River Project Arizona Agricultural | | | | |
| Improvement & Power District Revenue | 5.000% | 1/1/39 | 525 | 566 |
| Salt River Project Arizona Agricultural | | | | |
| Improvement & Power District Revenue | 5.000% | 12/1/45 | 125 | 147 |
| | | | | 8,508 |
| Arkansas (0.1%) | | | | |
| Arkansas GO | 5.000% | 6/15/21 | 225 | 263 |
| Fort Smith AR Water & Sewer Revenue | 5.000% | 10/1/32 (4) | 100 | 107 |
| | | | | 370 |
| California (14.9%) | | | | |
| Alameda CA Corridor Transportation Authority | | | | |
| Revenue | 5.450% | 10/1/17 (Prere.) | 200 | 209 |
| Alameda CA Corridor Transportation Authority | | | | |
| Revenue | 0.000% | 10/1/19 (ETM) | 235 | 227 |
| Alameda CA Corridor Transportation Authority | | | | |
| Revenue | 0.000% | 10/1/19 (2) | 15 | 14 |
| Alameda CA Corridor Transportation Authority | | | | |
| Revenue | 0.000% | 10/1/20 (ETM) | 140 | 133 |
| Alameda CA Corridor Transportation Authority | | | | |
| Revenue | 0.000% | 10/1/20 (2) | 5 | 5 |
| Alameda CA Corridor Transportation Authority | | | | |
| Revenue | 5.000% | 10/1/34 | 250 | 293 |
| Alameda CA Corridor Transportation Authority | | | | |
| Revenue | 0.000% | 10/1/35 (14) | 315 | 160 |
| Alvord CA Unified School District GO | 0.000% | 8/1/41 (4) | 150 | 57 |
| Anaheim CA Housing & Public Improvements | | | | |
| Authority Revenue (Electric Utility Distribution | | | | |
| System) | 5.000% | 10/1/34 | 500 | 574 |
| Anaheim CA Public Financing Authority Lease | | | | |
| Revenue | 0.000% | 9/1/36 (4) | 140 | 69 |
| Anaheim CA Redevelopment Agency Tax | | | | |
| Allocation Revenue (Merged Redevelopment | | | | |
| Project Area) | 5.000% | 2/1/31 (4) | 100 | 104 |
| Baldwin Park CA Unified School District GO | 0.000% | 8/1/42 (15) | 100 | 23 |
| Bay Area Toll Authority California Toll Bridge | | | | |
| Revenue (San Francisco Bay Area) | 5.000% | 4/1/18 (Prere.) | 150 | 159 |
| Bay Area Toll Authority California Toll Bridge | | | | |
| Revenue (San Francisco Bay Area) | 5.250% | 4/1/19 (Prere.) | 125 | 138 |
| Bay Area Toll Authority California Toll Bridge | | | | |
| Revenue (San Francisco Bay Area) | 5.000% | 4/1/28 | 355 | 425 |
| Bay Area Toll Authority California Toll Bridge | | | | |
| Revenue (San Francisco Bay Area) | 5.000% | 4/1/43 | 145 | 169 |
| Bay Area Toll Authority California Toll Bridge | | | | |
| Revenue (San Francisco Bay Area) | 5.000% | 10/1/54 | 760 | 879 |
| Bay Area Toll Authority California Toll Bridge | | | | |
| Revenue (San Francisco Bay Area) PUT | 1.500% | 4/2/18 | 935 | 940 |
| Bay Area Toll Authority California Toll Bridge | | | | |
| Revenue (San Francisco Bay Area) PUT | 2.000% | 4/1/21 | 250 | 256 |
| California Department of Water Resources | | | | |
| Power Supply Revenue | 5.000% | 5/1/17 (4) | 270 | 276 |
| California Department of Water Resources | | | | |
| Power Supply Revenue | 5.000% | 5/1/17 | 125 | 128 |
| California Department of Water Resources | | | | |
| Power Supply Revenue | 4.000% | 5/1/18 | 150 | 157 |
12
| | | | |
| Tax-Exempt Bond Index Fund | | | | |
| |
| |
| |
| | | | Face | Market |
| | | Maturity | Amount | Value• |
| | Coupon | Date | ($000) | ($000) |
| California Department of Water Resources | | | | |
| Power Supply Revenue | 5.000% | 5/1/18 (Prere.) | 250 | 266 |
| California Department of Water Resources | | | | |
| Power Supply Revenue | 5.000% | 5/1/18 (Prere.) | 250 | 266 |
| California Department of Water Resources | | | | |
| Power Supply Revenue | 5.000% | 5/1/19 | 305 | 336 |
| California Department of Water Resources | | | | |
| Power Supply Revenue | 5.000% | 5/1/20 | 225 | 256 |
| California Department of Water Resources | | | | |
| Power Supply Revenue | 5.000% | 5/1/21 | 500 | 585 |
| California Department of Water Resources Water | | | | |
| System Revenue (Central Valley Project) | 5.000% | 12/1/19 (Prere.) | 100 | 112 |
| California Department of Water Resources Water | | | | |
| System Revenue (Central Valley Project) | 5.000% | 12/1/26 | 100 | 125 |
| California Department of Water Resources Water | | | | |
| System Revenue (Central Valley Project) | 5.000% | 12/1/29 | 150 | 186 |
| California Economic Recovery GO | 5.000% | 7/1/19 (Prere.) | 100 | 111 |
| California Educational Facilities Authority Revenue | | | | |
| (Stanford University) | 5.000% | 3/15/39 | 400 | 541 |
| California Educational Facilities Authority Revenue | | | | |
| (Stanford University) | 5.000% | 6/1/43 | 150 | 207 |
| California Educational Facilities Authority Revenue | | | | |
| (Stanford University) | 5.000% | 5/1/45 | 300 | 418 |
| California Educational Facilities Authority Revenue | | | | |
| (University of Southern California) | 5.000% | 10/1/18 (Prere.) | 325 | 351 |
| California Educational Facilities Authority Revenue | | | | |
| (University of Southern California) | 5.250% | 10/1/18 (Prere.) | 580 | 629 |
| California GO | 5.000% | 2/1/17 | 370 | 374 |
| California GO | 5.000% | 2/1/17 | 125 | 126 |
| California GO | 5.000% | 6/1/17 (Prere.) | 335 | 343 |
| California GO | 5.000% | 6/1/17 (Prere.) | 340 | 348 |
| California GO | 5.000% | 9/1/17 | 1,200 | 1,243 |
| California GO | 3.500% | 10/1/17 | 140 | 144 |
| California GO | 5.000% | 11/1/17 | 400 | 417 |
| California GO | 5.000% | 11/1/17 (Prere.) | 595 | 620 |
| California GO | 5.000% | 12/1/17 (Prere.) | 230 | 241 |
| California GO | 5.000% | 12/1/17 (Prere.) | 200 | 209 |
| California GO | 6.000% | 2/1/18 (2) | 100 | 107 |
| California GO | 5.500% | 4/1/18 | 165 | 176 |
| California GO | 5.000% | 8/1/18 | 1,200 | 1,287 |
| California GO | 5.000% | 2/1/19 | 300 | 327 |
| California GO | 5.500% | 4/1/19 | 100 | 111 |
| California GO | 6.000% | 4/1/19 | 165 | 185 |
| California GO | 5.000% | 8/1/19 | 100 | 111 |
| California GO | 5.000% | 9/1/19 | 100 | 100 |
| California GO | 5.000% | 2/1/20 | 225 | 254 |
| California GO | 5.000% | 10/1/20 | 210 | 241 |
| California GO | 5.000% | 10/1/20 | 500 | 575 |
| California GO | 5.250% | 10/1/20 | 500 | 562 |
| California GO | 5.000% | 2/1/21 | 505 | 585 |
| California GO | 5.500% | 4/1/21 | 400 | 444 |
| California GO | 5.000% | 9/1/21 | 260 | 306 |
| California GO | 5.000% | 10/1/21 | 125 | 147 |
| California GO | 5.000% | 11/1/21 | 670 | 792 |
| California GO | 5.000% | 12/1/21 | 265 | 314 |
13
| | | | |
| Tax-Exempt Bond Index Fund | | | | |
| |
| |
| |
| | | | Face | Market |
| | | Maturity | Amount | Value• |
| | Coupon | Date | ($000) | ($000) |
| California GO | 5.000% | 2/1/22 | 100 | 119 |
| California GO | 5.000% | 2/1/22 | 175 | 208 |
| California GO | 5.000% | 9/1/22 | 350 | 421 |
| California GO | 5.000% | 10/1/22 | 110 | 133 |
| California GO | 5.250% | 10/1/22 | 150 | 183 |
| California GO | 5.000% | 2/1/23 | 250 | 298 |
| California GO | 5.000% | 8/1/23 | 170 | 172 |
| California GO | 5.000% | 9/1/23 | 100 | 121 |
| California GO | 5.250% | 9/1/23 | 100 | 120 |
| California GO | 5.000% | 11/1/23 | 1,025 | 1,260 |
| California GO | 5.000% | 12/1/23 | 250 | 308 |
| California GO | 5.000% | 12/1/23 | 75 | 92 |
| California GO | 5.000% | 3/1/24 | 500 | 616 |
| California GO | 5.000% | 8/1/24 | 600 | 745 |
| California GO | 5.500% | 2/1/25 | 500 | 643 |
| California GO | 5.625% | 4/1/25 | 310 | 344 |
| California GO | 5.000% | 10/1/25 | 500 | 615 |
| California GO | 5.000% | 10/1/25 | 70 | 86 |
| California GO | 5.000% | 3/1/26 | 200 | 248 |
| California GO | 5.000% | 3/1/26 | 565 | 699 |
| California GO | 5.000% | 4/1/26 | 100 | 106 |
| California GO | 5.000% | 8/1/26 | 500 | 623 |
| California GO | 5.000% | 9/1/26 | 145 | 156 |
| California GO | 5.000% | 10/1/26 | 100 | 123 |
| California GO | 5.000% | 11/1/26 | 100 | 104 |
| California GO | 5.000% | 3/1/27 | 390 | 478 |
| California GO | 4.500% | 8/1/27 | 155 | 156 |
| California GO | 5.000% | 9/1/27 | 315 | 382 |
| California GO | 5.000% | 10/1/27 | 100 | 120 |
| California GO | 5.000% | 10/1/27 | 170 | 209 |
| California GO | 5.000% | 11/1/27 | 500 | 609 |
| California GO | 5.750% | 4/1/28 | 295 | 328 |
| California GO | 4.500% | 8/1/28 (12) | 100 | 101 |
| California GO | 5.000% | 9/1/28 | 100 | 121 |
| California GO | 5.000% | 10/1/28 | 200 | 245 |
| California GO | 5.000% | 8/1/29 | 200 | 243 |
| California GO | 3.000% | 9/1/29 | 105 | 109 |
| California GO | 5.000% | 10/1/29 | 250 | 305 |
| California GO | 5.000% | 10/1/29 | 750 | 793 |
| California GO | 5.000% | 10/1/29 | 90 | 100 |
| California GO | 5.250% | 10/1/29 | 105 | 117 |
| California GO | 5.000% | 12/1/29 | 75 | 91 |
| California GO | 5.000% | 3/1/30 | 160 | 192 |
| California GO | 5.250% | 3/1/30 | 300 | 338 |
| California GO | 4.500% | 8/1/30 | 420 | 424 |
| California GO | 5.000% | 8/1/30 | 50 | 60 |
| California GO | 5.000% | 8/1/30 | 300 | 362 |
| California GO | 5.000% | 10/1/30 | 340 | 414 |
| California GO | 5.000% | 2/1/31 | 50 | 59 |
| California GO | 5.750% | 4/1/31 | 335 | 372 |
| California GO | 5.000% | 8/1/31 | 150 | 181 |
| California GO | 3.250% | 9/1/31 | 115 | 119 |
| California GO | 5.000% | 9/1/31 | 200 | 233 |
| California GO | 5.000% | 10/1/31 | 215 | 260 |
| California GO | 5.000% | 11/1/31 | 145 | 174 |
14
| | | | |
| Tax-Exempt Bond Index Fund | | | | |
| |
| |
| |
| | | | Face | Market |
| | | Maturity | Amount | Value• |
| | Coupon | Date | ($000) | ($000) |
| California GO | 5.000% | 5/1/32 | 50 | 60 |
| California GO | 5.000% | 8/1/32 | 250 | 296 |
| California GO | 5.250% | 8/1/32 (4) | 505 | 670 |
| California GO | 3.000% | 9/1/32 | 330 | 332 |
| California GO | 5.000% | 2/1/33 | 510 | 598 |
| California GO | 6.500% | 4/1/33 | 655 | 740 |
| California GO | 4.250% | 8/1/33 (14) | 740 | 746 |
| California GO | 5.000% | 8/1/33 | 300 | 360 |
| California GO | 5.000% | 8/1/33 | 275 | 325 |
| California GO | 3.000% | 9/1/33 | 310 | 309 |
| California GO | 3.375% | 9/1/33 | 210 | 216 |
| California GO | 4.000% | 9/1/33 | 250 | 275 |
| California GO | 4.000% | 8/1/34 | 275 | 297 |
| California GO | 4.000% | 9/1/34 | 250 | 274 |
| California GO | 5.000% | 9/1/34 | 750 | 901 |
| California GO | 5.500% | 11/1/34 | 145 | 163 |
| California GO | 4.500% | 12/1/34 | 130 | 130 |
| California GO | 6.000% | 4/1/35 | 270 | 301 |
| California GO | 5.000% | 8/1/35 | 330 | 393 |
| California GO | 4.000% | 9/1/35 | 250 | 272 |
| California GO | 3.750% | 12/1/35 | 500 | 524 |
| California GO | 5.250% | 3/1/36 | 100 | 105 |
| California GO | 5.125% | 8/1/36 | 100 | 107 |
| California GO | 4.000% | 9/1/36 | 250 | 272 |
| California GO | 4.500% | 12/1/36 (12) | 90 | 90 |
| California GO | 4.000% | 9/1/37 | 250 | 272 |
| California GO | 5.000% | 11/1/37 | 110 | 114 |
| California GO | 5.000% | 12/1/37 | 90 | 94 |
| California GO | 5.250% | 3/1/38 | 260 | 274 |
| California GO | 5.000% | 4/1/38 | 55 | 58 |
| California GO | 6.000% | 4/1/38 | 605 | 675 |
| California GO | 5.000% | 10/1/39 | 120 | 142 |
| California GO | 6.000% | 11/1/39 | 250 | 285 |
| California GO | 5.500% | 3/1/40 | 145 | 165 |
| California GO | 5.250% | 11/1/40 | 100 | 115 |
| California GO | 5.000% | 9/1/41 | 640 | 737 |
| California GO | 5.000% | 10/1/41 | 100 | 115 |
| California GO | 5.000% | 4/1/42 | 200 | 231 |
| California GO | 5.000% | 9/1/42 | 100 | 116 |
| California GO | 5.000% | 2/1/43 | 110 | 127 |
| California GO | 5.000% | 4/1/43 | 200 | 232 |
| California GO | 4.875% | 11/1/43 | 165 | 192 |
| California GO | 5.000% | 11/1/43 | 605 | 710 |
| California GO | 4.500% | 12/1/43 | 405 | 460 |
| California GO | 4.000% | 11/1/44 | 200 | 214 |
| California GO | 5.000% | 8/1/45 | 500 | 595 |
| California GO PUT | 3.000% | 12/1/19 | 125 | 131 |
| California Public Works Board Lease Revenue | | | | |
| (Department of Corrections) | 5.000% | 9/1/20 | 100 | 114 |
| California Public Works Board Lease Revenue | | | | |
| (Department of Corrections) | 4.000% | 6/1/28 | 60 | 67 |
| California Public Works Board Lease Revenue | | | | |
| (Department of Corrections) | 5.000% | 9/1/39 | 300 | 350 |
| California Public Works Board Lease Revenue | | | | |
| (Department of General Services) | 5.000% | 5/1/18 | 150 | 159 |
15
| | | | |
| Tax-Exempt Bond Index Fund | | | | |
| |
| |
| |
| | | | Face | Market |
| | | Maturity | Amount | Value• |
| | Coupon | Date | ($000) | ($000) |
| California Public Works Board Lease Revenue | | | | |
| (Judicial Council Projects) | 5.000% | 12/1/24 | 150 | 176 |
| California Public Works Board Lease Revenue | | | | |
| (Judicial Council Projects) | 5.250% | 12/1/25 | 250 | 296 |
| California Public Works Board Lease Revenue | | | | |
| (Regents of The University of California) | 5.000% | 12/1/21 (Prere.) | 205 | 244 |
| California Public Works Board Lease Revenue | | | | |
| (Various Capital Projects) | 5.000% | 4/1/21 | 125 | 145 |
| California Public Works Board Lease Revenue | | | | |
| (Various Capital Projects) | 5.250% | 11/1/28 | 300 | 367 |
| California Public Works Board Lease Revenue | | | | |
| (Various Capital Projects) | 5.000% | 11/1/29 | 100 | 120 |
| California Public Works Board Lease Revenue | | | | |
| (Various Capital Projects) | 5.750% | 10/1/30 | 200 | 225 |
| California Public Works Board Lease Revenue | | | | |
| (Various Capital Projects) | 5.000% | 4/1/37 | 205 | 235 |
| California St For Previous Issues See 13062T | | | | |
| Forfuture Issues See 13063B Rfdg | 5.500% | 8/1/30 | 100 | 108 |
| California State University Systemwide Revenue | 5.250% | 5/1/19 (Prere.) | 255 | 282 |
| California State University Systemwide Revenue | 5.250% | 5/1/19 (Prere.) | 90 | 100 |
| California State University Systemwide Revenue | 5.000% | 11/1/29 | 255 | 312 |
| California State University Systemwide Revenue | 5.000% | 11/1/31 | 150 | 182 |
| California State University Systemwide Revenue | 5.000% | 11/1/31 | 510 | 627 |
| California State University Systemwide Revenue | 5.000% | 11/1/32 | 50 | 61 |
| California State University Systemwide Revenue | 4.000% | 11/1/34 | 125 | 138 |
| California State University Systemwide Revenue | 4.000% | 11/1/35 | 235 | 259 |
| California State University Systemwide Revenue | 4.000% | 11/1/37 | 375 | 410 |
| California State University Systemwide Revenue | 5.000% | 11/1/37 | 250 | 291 |
| California State University Systemwide Revenue | 5.000% | 11/1/37 | 350 | 414 |
| California State University Systemwide Revenue | 4.000% | 11/1/38 | 125 | 137 |
| California State University Systemwide Revenue | 5.000% | 11/1/41 | 490 | 586 |
| California State University Systemwide Revenue | 4.000% | 11/1/43 | 200 | 217 |
| California State University Systemwide Revenue | 5.000% | 11/1/47 | 105 | 125 |
| Chino Basin Regional Financing Authority California | | | | |
| Revenue (Inland Empire Utilities Agency) | 5.000% | 11/1/33 (2) | 100 | 104 |
| Chino Basin Regional Financing Authority California | | | | |
| Revenue (Inland Empire Utilities Agency) | 5.000% | 11/1/38 (2) | 200 | 208 |
| Clovis CA Unified School District GO | 4.000% | 8/1/40 | 150 | 162 |
| Coast CA Community College District GO | 5.000% | 8/1/38 | 680 | 802 |
| Corona-Norco CA Unified School District GO | 0.000% | 8/1/39 (4) | 400 | 171 |
| Cypress CA Elementary School District GO | 0.000% | 8/1/40 | 250 | 109 |
| East Bay CA Municipal Utility District Water | | | | |
| System Revenue | 5.000% | 6/1/19 | 150 | 166 |
| East Bay CA Municipal Utility District Water | | | | |
| System Revenue | 5.000% | 6/1/32 | 145 | 176 |
| East Bay CA Municipal Utility District Water | | | | |
| System Revenue | 5.000% | 6/1/35 | 250 | 300 |
| Eastern California Municipal Water District Water | | | | |
| & Sewer COP | 5.000% | 7/1/18 (Prere.) | 200 | 214 |
| Gilroy CA School Facilities Finance Authority | | | | |
| Revenue | 4.000% | 8/1/42 | 320 | 348 |
| Imperial CA Irrigation District Electric Revenue | 5.000% | 11/1/18 (Prere.) | 105 | 114 |
| Los Angeles CA Community College District GO | 5.000% | 8/1/28 | 570 | 703 |
| Los Angeles CA Community College District GO | 5.000% | 8/1/29 | 250 | 307 |
| Los Angeles CA Community College District GO | 5.000% | 8/1/30 | 130 | 159 |
16
| | | | |
| Tax-Exempt Bond Index Fund | | | | |
| |
| |
| |
| | | | Face | Market |
| | | Maturity | Amount | Value• |
| | Coupon | Date | ($000) | ($000) |
| Los Angeles CA Community College District GO | 5.000% | 8/1/31 | 305 | 371 |
| Los Angeles CA Community College District GO | 4.000% | 8/1/39 | 325 | 354 |
| Los Angeles CA Department of Airports | | | | |
| International Airport Revenue | 5.000% | 5/15/29 | 100 | 109 |
| Los Angeles CA Department of Airports | | | | |
| International Airport Revenue | 5.250% | 5/15/29 | 250 | 276 |
| Los Angeles CA Department of Airports | | | | |
| International Airport Revenue | 5.000% | 5/15/35 | 690 | 780 |
| Los Angeles CA Department of Airports | | | | |
| International Airport Revenue | 5.000% | 5/15/35 | 160 | 189 |
| Los Angeles CA Department of Water & Power | | | | |
| Revenue | 5.000% | 7/1/18 | 140 | 150 |
| Los Angeles CA Department of Water & Power | | | | |
| Revenue | 5.000% | 7/1/20 | 290 | 332 |
| Los Angeles CA Department of Water & Power | | | | |
| Revenue | 5.000% | 7/1/24 | 125 | 152 |
| Los Angeles CA Department of Water & Power | | | | |
| Revenue | 5.000% | 7/1/29 | 245 | 296 |
| Los Angeles CA Department of Water & Power | | | | |
| Revenue | 5.000% | 7/1/29 | 140 | 167 |
| Los Angeles CA Department of Water & Power | | | | |
| Revenue | 5.000% | 7/1/32 | 130 | 155 |
| Los Angeles CA Department of Water & Power | | | | |
| Revenue | 5.000% | 7/1/35 | 300 | 359 |
| Los Angeles CA Department of Water & Power | | | | |
| Revenue | 5.000% | 7/1/39 (2) | 200 | 205 |
| Los Angeles CA Department of Water & Power | | | | |
| Revenue | 5.000% | 7/1/43 | 180 | 210 |
| Los Angeles CA Department of Water & Power | | | | |
| Revenue | 5.000% | 7/1/43 | 240 | 281 |
| Los Angeles CA Department of Water & Power | | | | |
| Revenue | 5.000% | 7/1/44 (2) | 500 | 513 |
| Los Angeles CA Department of Water & Power | | | | |
| Revenue | 5.000% | 7/1/44 | 150 | 176 |
| Los Angeles CA Department of Water & Power | | | | |
| Revenue | 5.000% | 7/1/46 | 750 | 890 |
| Los Angeles CA GO | 4.500% | 9/1/28 | 200 | 213 |
| Los Angeles CA Municipal Improvement Corp. | | | | |
| Lease Revenue | 4.000% | 11/1/33 | 480 | 526 |
| Los Angeles CA Unified School District GO | 4.500% | 7/1/17 (Prere.) | 100 | 103 |
| Los Angeles CA Unified School District GO | 5.000% | 7/1/17 (Prere.) | 100 | 103 |
| Los Angeles CA Unified School District GO | 5.000% | 7/1/17 (Prere.) | 100 | 103 |
| Los Angeles CA Unified School District GO | 5.500% | 7/1/17 (3) | 100 | 103 |
| Los Angeles CA Unified School District GO | 5.000% | 7/1/19 | 70 | 78 |
| Los Angeles CA Unified School District GO | 4.500% | 7/1/22 (4) | 530 | 543 |
| Los Angeles CA Unified School District GO | 5.000% | 7/1/22 | 200 | 241 |
| Los Angeles CA Unified School District GO | 5.000% | 7/1/24 | 500 | 627 |
| Los Angeles CA Unified School District GO | 5.000% | 7/1/27 | 120 | 148 |
| Los Angeles CA Unified School District GO | 4.250% | 1/1/28 (3) | 100 | 102 |
| Los Angeles CA Unified School District GO | 4.500% | 1/1/28 (14) | 455 | 466 |
| Los Angeles CA Unified School District GO | 5.000% | 7/1/28 | 230 | 282 |
| Los Angeles CA Unified School District GO | 5.000% | 7/1/29 | 295 | 363 |
| Los Angeles CA Unified School District GO | 5.200% | 7/1/29 | 200 | 222 |
| Los Angeles CA Unified School District GO | 5.000% | 7/1/32 | 300 | 348 |
| Los Angeles CA Unified School District GO | 5.000% | 1/1/34 | 140 | 155 |
17
| | | | |
| Tax-Exempt Bond Index Fund | | | | |
| |
| |
| |
| | | | Face | Market |
| | | Maturity | Amount | Value• |
| | Coupon | Date | ($000) | ($000) |
| Los Angeles CA Unified School District GO | 4.000% | 7/1/40 | 735 | 804 |
| Los Angeles CA Wastewater System Revenue | 5.000% | 6/1/35 | 500 | 590 |
| Los Angeles CA Wastewater System Revenue | 5.000% | 6/1/45 | 250 | 295 |
| Los Angeles County CA Public Works Financing | | | | |
| Authority Lease Revenue | 5.000% | 8/15/18 (Prere.) | 100 | 107 |
| Los Angeles County CA Public Works Financing | | | | |
| Authority Lease Revenue | 4.000% | 12/1/40 | 580 | 623 |
| Los Angeles County CA Sanitation Districts | | | | |
| Financing Authority Revenue | 5.000% | 10/1/20 | 55 | 63 |
| Metropolitan Water District of Southern California | | | | |
| Revenue | 5.000% | 7/1/35 | 100 | 111 |
| Metropolitan Water District of Southern California | | | | |
| Revenue | 5.000% | 7/1/37 | 100 | 103 |
| Mount San Antonio CA Community College | | | | |
| District GO | 0.000% | 8/1/43 | 150 | 124 |
| New Haven CA Unified School District GO | 0.000% | 8/1/34 (12) | 120 | 67 |
| Orange County CA Sanitation District Wastewater | | | | |
| Revenue | 3.000% | 2/1/31 | 150 | 154 |
| Orange County CA Water District Revenue | 5.000% | 8/15/39 | 125 | 138 |
| Pittsburg CA Unified School District Financing | | | | |
| Authority Revenue | 5.500% | 9/1/21 (Prere.) | 350 | 422 |
| Poway CA Unified School District GO | 0.000% | 8/1/33 | 300 | 171 |
| Riverside County CA Transportation Commission | | | | |
| Sales Tax Revenue | 5.250% | 6/1/39 | 515 | 614 |
| Sacramento CA Municipal Utility District Revenue | 5.000% | 8/15/18 (Prere.) | 40 | 43 |
| Sacramento CA Municipal Utility District Revenue | 5.000% | 8/15/20 | 195 | 224 |
| Sacramento CA Municipal Utility District Revenue | 5.000% | 8/15/27 (4) | 60 | 64 |
| Sacramento CA Municipal Utility District Revenue | 5.000% | 8/15/37 | 75 | 89 |
| Sacramento CA Water Revenue | 5.000% | 9/1/38 | 425 | 499 |
| Sacramento County CA Airport Revenue | 6.000% | 7/1/41 | 170 | 183 |
| San Diego CA Community College District GO | 5.000% | 8/1/30 | 95 | 114 |
| San Diego CA Public Facilities Financing Authority | | | | |
| Lease Revenue | 5.000% | 9/1/28 | 125 | 141 |
| San Diego CA Public Facilities Financing Authority | | | | |
| Sewer Revenue | 5.000% | 5/15/17 | 115 | 118 |
| San Diego CA Public Facilities Financing Authority | | | | |
| Sewer Revenue | 5.000% | 5/15/19 (Prere.) | 80 | 88 |
| San Diego CA Public Facilities Financing Authority | | | | |
| Sewer Revenue | 5.250% | 5/15/19 (Prere.) | 250 | 277 |
| San Diego CA Public Facilities Financing Authority | | | | |
| Sewer Revenue | 5.250% | 5/15/20 (Prere.) | 100 | 115 |
| San Diego CA Unified School District GO | 0.000% | 7/1/35 | 400 | 211 |
| San Diego CA Unified School District GO | 5.000% | 7/1/35 | 100 | 118 |
| San Diego CA Unified School District GO | 0.000% | 7/1/36 | 100 | 50 |
| San Diego CA Unified School District GO | 0.000% | 7/1/37 | 200 | 97 |
| San Diego CA Unified School District GO | 0.000% | 7/1/38 | 170 | 79 |
| San Diego CA Unified School District GO | 5.000% | 7/1/40 | 200 | 237 |
| San Diego CA Unified School District GO | 0.000% | 7/1/42 | 150 | 99 |
| San Diego CA Unified School District GO | 4.000% | 7/1/45 | 225 | 242 |
| San Diego CA Unified School District GO | 0.000% | 7/1/47 | 250 | 82 |
| San Diego CA Unified School District GO | 0.000% | 7/1/47 | 100 | 68 |
| San Diego County CA Regional Transportation | | | | |
| Commission Sales Tax Revenue | 5.000% | 4/1/42 | 350 | 407 |
| San Diego County CA Regional Transportation | | | | |
| Commission Sales Tax Revenue | 4.750% | 4/1/48 | 465 | 527 |
18
| | | | |
| Tax-Exempt Bond Index Fund | | | | |
| |
| |
| |
| | | | Face | Market |
| | | Maturity | Amount | Value• |
| | Coupon | Date | ($000) | ($000) |
| San Diego County CA Water Authority Revenue | 5.000% | 5/1/18 (Prere.) | 30 | 32 |
| San Diego County CA Water Authority Revenue | 5.000% | 5/1/18 (Prere.) | 140 | 149 |
| San Francisco CA City & County (War Memorial | | | | |
| Veterans Building Seismic Upgrade & | | | | |
| Improvements) COP | 4.000% | 4/1/45 | 150 | 160 |
| San Francisco CA City & County COP | 5.000% | 9/1/18 | 700 | 752 |
| San Francisco CA City & County GO | 5.000% | 6/15/26 | 100 | 122 |
| San Francisco CA City & County GO | 5.000% | 10/1/28 | 100 | 114 |
| San Francisco CA City & County International | | | | |
| Airport Revenue | 4.900% | 5/1/29 | 100 | 111 |
| San Francisco CA City & County International | | | | |
| Airport Revenue | 6.000% | 5/1/39 | 125 | 140 |
| San Francisco CA City & County International | | | | |
| Airport Revenue | 5.000% | 5/1/43 | 130 | 149 |
| San Francisco CA City & County Public Utilities | | | | |
| Commission Water Revenue | 5.000% | 11/1/32 | 540 | 649 |
| San Joaquin Hills CA Transportation Corridor | | | | |
| Agency Toll Road Revenue | 5.000% | 1/15/50 | 100 | 113 |
| San Jose CA Finance Authority Revenue | | | | |
| (Civic Center Project) | 5.000% | 6/1/39 | 100 | 115 |
| San Jose CA Unified School District Santa Clara | | | | |
| County GO | 5.000% | 8/1/18 (Prere.) | 100 | 107 |
| San Marcos CA Unified School District GO | 0.000% | 8/1/51 | 100 | 25 |
| San Mateo CA Union High School District GO | 5.000% | 9/1/21 (Prere.) | 10 | 12 |
| San Mateo CA Union High School District GO | 0.000% | 9/1/41 | 100 | 84 |
| San Mateo CA Union High School District GO | 5.000% | 9/1/42 | 90 | 104 |
| Santa Clara County CA GO | 5.000% | 8/1/34 | 250 | 278 |
| Santa Clara Valley CA Water District Revenue | 5.000% | 6/1/46 | 325 | 386 |
| Southern California Public Power Authority | | | | |
| Revenue (Windy Point/Windy Flats Project) | 5.000% | 7/1/25 | 120 | 137 |
| Southern California Water Replenishment District | | | | |
| Financing Authority Revenue | 5.000% | 8/1/41 | 680 | 810 |
| State of California | 5.000% | 9/1/22 | 185 | 223 |
| Turlock CA Irrigation District Revenue | 5.000% | 1/1/20 (Prere.) | 210 | 236 |
| University of California Regents Medical Center | | | | |
| Pooled Revenue | 4.000% | 5/15/37 | 300 | 327 |
| University of California Revenue | 5.000% | 5/15/22 | 100 | 120 |
| University of California Revenue | 5.000% | 5/15/23 | 500 | 615 |
| University of California Revenue | 5.000% | 5/15/27 | 75 | 94 |
| University of California Revenue | 5.000% | 5/15/29 | 195 | 241 |
| University of California Revenue | 5.000% | 5/15/31 | 55 | 67 |
| University of California Revenue | 5.000% | 5/15/32 | 1,050 | 1,272 |
| University of California Revenue | 5.000% | 5/15/33 | 700 | 828 |
| University of California Revenue | 4.000% | 5/15/36 | 350 | 383 |
| University of California Revenue | 5.000% | 5/15/37 | 100 | 117 |
| University of California Revenue | 5.000% | 5/15/42 | 640 | 745 |
| University of California Revenue | 5.000% | 5/15/46 | 500 | 595 |
| University of California Revenue PUT | 5.000% | 5/15/23 | 100 | 123 |
| Ventura County CA Public Financing Authority | | | | |
| Lease Revenue | 5.000% | 11/1/38 | 170 | 198 |
| Ventura County CA Public Financing Authority | | | | |
| Lease Revenue | 4.000% | 11/1/43 | 115 | 122 |
| Ventura County CA Public Financing Authority | | | | |
| Lease Revenue | 5.000% | 11/1/43 | 30 | 35 |
19
| | | | |
| Tax-Exempt Bond Index Fund | | | | |
| |
| |
| |
| | | | Face | Market |
| | | Maturity | Amount | Value• |
| | Coupon | Date | ($000) | ($000) |
| William S. Hart Union High School District | | | | |
| California GO | 4.000% | 8/1/38 | 100 | 107 |
| Yosemite CA Community College District GO | 5.000% | 8/1/18 (Prere.) | 100 | 107 |
| Yosemite CA Community College District GO | 5.000% | 8/1/32 | 100 | 121 |
| Yosemite CA Community College District GO | 0.000% | 8/1/42 | 75 | 54 |
| | | | | 92,839 |
| Colorado (0.5%) | | | | |
| Board of Governors of the Colorado State | | | | |
| University System Enterprise Revenue | 5.000% | 3/1/47 | 125 | 144 |
| Boulder Larimer & Weld Counties CO St. Vrain | | | | |
| Valley School District GO | 5.000% | 12/15/18 (Prere.) | 100 | 109 |
| Colorado Higher Education Capital Construction | | | | |
| Lease Purchase Financing Program COP | 5.250% | 11/1/18 (Prere.) | 155 | 168 |
| Colorado Higher Education Capital Construction | | | | |
| Lease Purchase Financing Program COP | 5.500% | 11/1/18 (Prere.) | 400 | 436 |
| Colorado Public Highway Authority Capital | | | | |
| Appreciation Revenue | 0.000% | 9/1/35 | 235 | 120 |
| Colorado Springs CO Utility System Revenue | 5.000% | 11/15/43 | 50 | 59 |
| Denver CO City & County Airport Revenue | 5.000% | 11/15/33 | 200 | 235 |
| Denver CO City & County Airport Revenue | 4.000% | 11/15/43 | 170 | 180 |
| Denver CO City & County Dedicated Tax Revenue | 4.000% | 8/1/46 | 150 | 160 |
| E-470 Public Highway Authority Colorado Revenue | 0.000% | 9/1/29 (14) | 200 | 134 |
| E-470 Public Highway Authority Colorado Revenue | 0.000% | 9/1/30 (14) | 230 | 148 |
| E-470 Public Highway Authority Colorado Revenue | 0.000% | 9/1/32 (14) | 155 | 92 |
| E-470 Public Highway Authority Colorado Revenue | 0.000% | 9/1/37 (14) | 350 | 138 |
| Regional Transportation District of Colorado COP | 5.000% | 6/1/39 | 245 | 278 |
| Regional Transportation District of Colorado Sales | | | | |
| Tax Revenue (FasTracks Project) | 5.000% | 11/1/16 (Prere.) | 50 | 50 |
| Regional Transportation District of Colorado Sales | | | | |
| Tax Revenue (FasTracks Project) | 5.000% | 11/1/29 | 350 | 418 |
| Regional Transportation District of Colorado Sales | | | | |
| Tax Revenue (FasTracks Project) | 4.500% | 11/1/34 (4) | 80 | 83 |
| University of Colorado Enterprise System Revenue | 5.000% | 6/1/37 | 125 | 146 |
| University of Colorado Enterprise System Revenue | 5.000% | 6/1/43 | 250 | 291 |
| | | | | 3,389 |
| Connecticut (1.4%) | | | | |
| Connecticut GO | 5.000% | 11/1/16 (Prere.) | 345 | 345 |
| Connecticut GO | 5.000% | 6/15/17 | 500 | 513 |
| Connecticut GO | 5.000% | 10/15/20 | 150 | 170 |
| Connecticut GO | 5.000% | 12/15/20 | 280 | 282 |
| Connecticut GO | 5.000% | 12/1/21 | 400 | 446 |
| Connecticut GO | 5.000% | 10/15/22 | 180 | 213 |
| Connecticut GO | 5.000% | 12/1/22 | 100 | 104 |
| Connecticut GO | 5.000% | 3/15/24 | 275 | 330 |
| Connecticut GO | 5.000% | 10/15/25 | 100 | 119 |
| Connecticut GO | 5.000% | 11/1/26 | 310 | 334 |
| Connecticut GO | 5.000% | 8/15/27 | 500 | 608 |
| Connecticut GO | 5.000% | 11/15/27 | 500 | 606 |
| Connecticut GO | 5.000% | 11/15/28 | 300 | 360 |
| Connecticut Health & Educational Facilities | | | | |
| Authority Revenue (Yale University) | 4.700% | 7/1/29 | 100 | 103 |
| Connecticut Health & Educational Facilities | | | | |
| Authority Revenue (Yale University) | 4.850% | 7/1/37 | 290 | 297 |
20
| | | | |
| Tax-Exempt Bond Index Fund | | | | |
| |
| |
| |
| | | | Face | Market |
| | | Maturity | Amount | Value• |
| | Coupon | Date | ($000) | ($000) |
| Connecticut Health & Educational Facilities | | | | |
| Authority Revenue (Yale University) | 5.000% | 7/1/40 | 445 | 473 |
| Connecticut Health & Educational Facilities | | | | |
| Authority Revenue (Yale University) | 5.050% | 7/1/42 | 200 | 205 |
| Connecticut Health & Educational Facilities | | | | |
| Authority Revenue (Yale University) PUT | 1.375% | 7/11/18 | 100 | 101 |
| Connecticut Special Tax Revenue | | | | |
| (Transportation Infrastructure) | 5.000% | 2/1/19 | 175 | 190 |
| Connecticut Special Tax Revenue | | | | |
| (Transportation Infrastructure) | 5.000% | 8/1/23 | 315 | 381 |
| Connecticut Special Tax Revenue | | | | |
| (Transportation Infrastructure) | 5.000% | 9/1/26 | 150 | 184 |
| Connecticut Special Tax Revenue | | | | |
| (Transportation Infrastructure) | 5.000% | 9/1/26 | 950 | 1,196 |
| Connecticut Special Tax Revenue | | | | |
| (Transportation Infrastructure) | 5.000% | 8/1/27 | 100 | 122 |
| Connecticut Special Tax Revenue | | | | |
| (Transportation Infrastructure) | 5.000% | 8/1/30 | 300 | 360 |
| Connecticut Special Tax Revenue | | | | |
| (Transportation Infrastructure) | 5.000% | 10/1/30 | 225 | 270 |
| Connecticut Special Tax Revenue | | | | |
| (Transportation Infrastructure) | 5.000% | 10/1/33 | 100 | 119 |
| | | | | 8,431 |
| Delaware (0.2%) | | | | |
| Delaware GO | 5.000% | 7/1/23 | 400 | 493 |
| Delaware Transportation Authority Transportation | | | | |
| System Revenue | 5.000% | 6/1/55 | 450 | 510 |
| | | | | 1,003 |
| District of Columbia (1.0%) | | | | |
| District of Columbia GO | 5.000% | 6/1/24 | 75 | 91 |
| District of Columbia GO | 4.750% | 6/1/33 (14) | 520 | 531 |
| District of Columbia GO | 5.000% | 6/1/33 (4) | 430 | 449 |
| District of Columbia GO | 5.000% | 6/1/33 | 155 | 184 |
| District of Columbia GO | 5.000% | 6/1/33 (13) | 105 | 111 |
| District of Columbia GO | 5.000% | 6/1/34 | 500 | 593 |
| District of Columbia GO | 4.750% | 6/1/36 (14) | 240 | 245 |
| District of Columbia GO | 4.500% | 6/1/37 (14) | 100 | 102 |
| District of Columbia GO | 5.000% | 6/1/37 | 180 | 213 |
| District of Columbia GO | 4.000% | 6/1/41 | 170 | 185 |
| District of Columbia GO | 5.000% | 6/1/41 | 200 | 238 |
| District of Columbia Income Tax Revenue | 5.000% | 12/1/23 | 150 | 181 |
| District of Columbia Income Tax Revenue | 5.250% | 12/1/26 | 420 | 472 |
| District of Columbia Income Tax Revenue | 5.000% | 12/1/28 | 230 | 260 |
| District of Columbia Water & Sewer Authority | | | | |
| Public Utility Revenue | 5.250% | 10/1/40 | 100 | 121 |
| District of Columbia Water & Sewer Authority | | | | |
| Public Utility Revenue | 5.000% | 10/1/44 | 285 | 333 |
| District of Columbia Water & Sewer Authority | | | | |
| Public Utility Revenue | 5.000% | 10/1/45 | 930 | 1,088 |
| Metropolitan Washington DC/VA Airports | | | | |
| Authority Airport System Revenue | 5.000% | 10/1/35 | 125 | 141 |
| Metropolitan Washington DC/VA Airports | | | | |
| Authority Airport System Revenue | 5.000% | 10/1/39 | 145 | 163 |
| Metropolitan Washington DC/VA Airports | | | | |
| Authority Dulles Toll Road Revenue | 5.000% | 10/1/39 | 20 | 22 |
21
| | | | |
| Tax-Exempt Bond Index Fund | | | | |
| |
| |
| |
| | | | Face | Market |
| | | Maturity | Amount | Value• |
| | Coupon | Date | ($000) | ($000) |
| Metropolitan Washington DC/VA Airports | | | | |
| Authority Dulles Toll Road Revenue (Dulles | | | | |
| Metrorail & Capital Improvement Projects) | 0.000% | 10/1/37 | 130 | 55 |
| Metropolitan Washington DC/VA Airports | | | | |
| Authority Dulles Toll Road Revenue (Dulles | | | | |
| Metrorail & Capital Improvement Projects) | 0.000% | 10/1/39 | 90 | 35 |
| Metropolitan Washington DC/VA Airports | | | | |
| Authority Dulles Toll Road Revenue (Dulles | | | | |
| Metrorail & Capital Improvement Projects) | 0.000% | 10/1/40 (12) | 1,000 | 388 |
| Metropolitan Washington DC/VA Airports | | | | |
| Authority Dulles Toll Road Revenue (Dulles | | | | |
| Metrorail & Capital Improvement Projects) | 5.250% | 10/1/44 | 20 | 22 |
| Metropolitan Washington DC/VA Airports | | | | |
| Authority Dulles Toll Road Revenue (Dulles | | | | |
| Metrorail & Capital Improvement Projects) | 5.000% | 10/1/53 | 270 | 300 |
| | | | | 6,523 |
| Florida (3.6%) | | | | |
| Broward County FL Airport System Revenue | 5.000% | 10/1/42 | 420 | 482 |
| Broward County FL School Board COP | 5.250% | 7/1/18 (Prere.) | 60 | 64 |
| Broward County FL School Board COP | 5.000% | 7/1/24 | 125 | 153 |
| Broward County FL Water & Sewer Utility | | | | |
| Revenue | 5.250% | 10/1/18 (Prere.) | 500 | 541 |
| Cape Coral FL Water & Sewer System Revenue | 5.000% | 10/1/41 (4) | 280 | 322 |
| Duval County FL School Board COP | 5.000% | 7/1/17 (Prere.) | 300 | 309 |
| Florida Board of Education Lottery Revenue | 5.000% | 7/1/24 | 220 | 273 |
| Florida Board of Education Public Education | | | | |
| Capital Outlay GO | 5.000% | 6/1/17 | 100 | 103 |
| Florida Board of Education Public Education | | | | |
| Capital Outlay GO | 5.000% | 6/1/18 | 205 | 218 |
| Florida Board of Education Public Education | | | | |
| Capital Outlay GO | 5.000% | 6/1/21 | 110 | 125 |
| Florida Board of Education Public Education | | | | |
| Capital Outlay GO | 5.000% | 6/1/25 | 250 | 291 |
| Florida Board of Education Public Education | | | | |
| Capital Outlay GO | 5.000% | 6/1/25 | 225 | 269 |
| Florida Board of Education Public Education | | | | |
| Capital Outlay GO | 5.000% | 6/1/33 | 715 | 804 |
| Florida Board of Education Public Education | | | | |
| Capital Outlay GO | 4.750% | 6/1/37 (14) | 145 | 149 |
| Florida Municipal Power Agency Revenue | 5.250% | 10/1/18 (Prere.) | 105 | 114 |
| Florida Municipal Power Agency Revenue | 5.250% | 10/1/18 (Prere.) | 125 | 135 |
| Florida Municipal Power Agency Revenue | 5.250% | 10/1/19 | 135 | 150 |
| Florida Municipal Power Agency Revenue | 5.000% | 10/1/22 | 290 | 345 |
| Florida Water Pollution Control Financing | | | | |
| Corp. Revenue | 5.000% | 1/15/20 | 200 | 217 |
| Fort Lauderdale FL Water & Sewer Revenue | 4.750% | 9/1/17 (Prere.) | 100 | 103 |
| Greater Orlando Aviation Authority Florida | | | | |
| Airport Facilities Revenue | 5.000% | 10/1/39 | 400 | 451 |
| Hillsborough County FL School Board | | | | |
| (Master Lease Program) COP | 5.000% | 7/1/26 | 55 | 68 |
| Hillsborough County FL School Board | | | | |
| (Master Lease Program) COP | 5.000% | 7/1/29 | 200 | 231 |
| Jacksonville FL Electric Authority Electric | | | | |
| System Revenue | 5.000% | 10/1/39 | 40 | 46 |
22
| | | | |
| Tax-Exempt Bond Index Fund | | | | |
| |
| |
| |
| | | | Face | Market |
| | | Maturity | Amount | Value• |
| | Coupon | Date | ($000) | ($000) |
| Miami-Dade County FL Aviation Revenue | | | | |
| (Miami International Airport) | 4.500% | 10/1/17 (Prere.) | 105 | 108 |
| Miami-Dade County FL Aviation Revenue | | | | |
| (Miami International Airport) | 5.250% | 10/1/17 (Prere.) | 325 | 338 |
| Miami-Dade County FL Aviation Revenue | | | | |
| (Miami International Airport) | 5.000% | 10/1/18 (Prere.) | 375 | 404 |
| Miami-Dade County FL Aviation Revenue | | | | |
| (Miami International Airport) | 5.000% | 10/1/30 | 250 | 301 |
| Miami-Dade County FL Aviation Revenue | | | | |
| (Miami International Airport) | 5.375% | 10/1/35 | 100 | 113 |
| Miami-Dade County FL Aviation Revenue | | | | |
| (Miami International Airport) | 5.500% | 10/1/36 | 305 | 342 |
| Miami-Dade County FL Aviation Revenue | | | | |
| (Miami International Airport) | 5.000% | 10/1/41 | 250 | 292 |
| Miami-Dade County FL Aviation Revenue | | | | |
| (Miami International Airport) | 5.500% | 10/1/41 | 100 | 112 |
| Miami-Dade County FL Building Better | | | | |
| Communities GO | 5.625% | 7/1/18 (Prere.) | 165 | 178 |
| Miami-Dade County FL Building Better | | | | |
| Communities GO | 5.625% | 7/1/18 (Prere.) | 110 | 119 |
| Miami-Dade County FL Building Better | | | | |
| Communities GO | 5.000% | 7/1/38 | 500 | 592 |
| Miami-Dade County FL Educational Facilities | | | | |
| Authority Revenue (University of Miami) | 4.000% | 4/1/45 | 100 | 107 |
| Miami-Dade County FL Educational Facilities | | | | |
| Authority Revenue (University of Miami) | 5.000% | 4/1/45 | 180 | 207 |
| Miami-Dade County FL Expressway Authority | | | | |
| Toll System Revenue | 5.000% | 7/1/24 | 200 | 245 |
| Miami-Dade County FL Expressway Authority | | | | |
| Toll System Revenue | 5.000% | 7/1/40 | 370 | 414 |
| Miami-Dade County FL Industrial Development | | | | |
| Authority Revenue (Biscayne Properties LLC) | 5.000% | 6/1/48 | 255 | 268 |
| Miami-Dade County FL Professional Sports | | | | |
| Franchise Facilities Tax Revenue | 0.000% | 10/1/48 (12) | 200 | 55 |
| Miami-Dade County FL Professional Sports | | | | |
| Franchise Facilities Tax Revenue | 0.000% | 4/1/49 (12) | 475 | 127 |
| Miami-Dade County FL School Board COP | 5.000% | 5/1/17 (Prere.) | 100 | 102 |
| Miami-Dade County FL School Board COP | 5.250% | 5/1/18 (Prere.) | 150 | 160 |
| Miami-Dade County FL School Board COP | 5.250% | 5/1/18 (Prere.) | 100 | 107 |
| Miami-Dade County FL School Board COP | 5.250% | 5/1/18 (Prere.) | 120 | 128 |
| Miami-Dade County FL School Board COP | 5.250% | 5/1/18 (Prere.) | 100 | 107 |
| Miami-Dade County FL School Board COP | 5.250% | 5/1/18 (Prere.) | 250 | 266 |
| Miami-Dade County FL School Board COP | 5.375% | 2/1/19 (Prere.) | 195 | 214 |
| Miami-Dade County FL School Board COP | 5.625% | 5/1/31 | 65 | 75 |
| Miami-Dade County FL School Board COP | 3.250% | 2/1/33 | 695 | 697 |
| Miami-Dade County FL School District GO | 5.000% | 3/15/46 | 750 | 866 |
| Miami-Dade County FL Special Obligation | | | | |
| Revenue | 5.000% | 10/1/17 (Prere.) | 175 | 182 |
| Miami-Dade County FL Special Obligation | | | | |
| Revenue | 5.000% | 10/1/35 | 560 | 636 |
| Miami-Dade County FL Special Obligation | | | | |
| Revenue | 5.000% | 10/1/35 | 300 | 353 |
| Miami-Dade County FL Transit Sales Surtax | | | | |
| Revenue | 4.000% | 7/1/42 | 190 | 200 |
23
| | | | |
| Tax-Exempt Bond Index Fund | | | | |
| |
| |
| |
| | | | Face | Market |
| | | Maturity | Amount | Value• |
| | Coupon | Date | ($000) | ($000) |
| Miami-Dade County FL Transit Sales Surtax | | | | |
| Revenue | 5.000% | 7/1/42 | 195 | 224 |
| Miami-Dade County FL Water & Sewer Revenue | 5.125% | 10/1/18 (Prere.) | 440 | 475 |
| Miami-Dade County FL Water & Sewer Revenue | 5.250% | 10/1/18 (4) | 300 | 325 |
| Miami-Dade County FL Water & Sewer Revenue | 6.000% | 10/1/18 (Prere.) | 110 | 121 |
| Miami-Dade County FL Water & Sewer Revenue | 5.000% | 10/1/23 | 100 | 122 |
| Miami-Dade County FL Water & Sewer Revenue | 5.000% | 10/1/24 | 250 | 311 |
| Miami-Dade County FL Water & Sewer Revenue | 5.000% | 10/1/34 | 65 | 73 |
| Miami-Dade County FL Water & Sewer Revenue | 5.000% | 10/1/39 (12) | 100 | 112 |
| Miami-Dade County FL Water & Sewer Revenue | 5.000% | 10/1/42 | 600 | 688 |
| Orange County FL School Board COP | 5.000% | 8/1/17 (Prere.) | 135 | 139 |
| Orange County FL School Board COP | 5.500% | 8/1/19 (Prere.) | 310 | 348 |
| Orlando & Orange County FL Expressway | | | | |
| Authority Revenue | 5.000% | 7/1/20 (Prere.) | 240 | 273 |
| Orlando FL Contract Tourist Development | | | | |
| Tax Payments Revenue | 5.250% | 11/1/31 | 200 | 240 |
| Orlando FL Contract Tourist Development | | | | |
| Tax Payments Revenue | 5.000% | 11/1/44 | 400 | 459 |
| Orlando FL Utility Commission Utility System | | | | |
| Revenue | 5.000% | 10/1/18 | 400 | 431 |
| Orlando FL Utility Commission Utility System | | | | |
| Revenue | 5.000% | 4/1/19 (Prere.) | 1,000 | 1,095 |
| Orlando FL Utility Commission Utility System | | | | |
| Revenue | 5.000% | 10/1/23 | 125 | 153 |
| Orlando FL Utility Commission Utility System | | | | |
| Revenue | 5.000% | 10/1/25 | 125 | 157 |
| Osceola County FL Expressway System Revenue | | | | |
| (Poinciana Parkway Project) | 0.000% | 10/1/22 | 50 | 39 |
| Osceola County FL Expressway System Revenue | | | | |
| (Poinciana Parkway Project) | 0.000% | 10/1/32 | 45 | 35 |
| Osceola County FL Expressway System Revenue | | | | |
| (Poinciana Parkway Project) | 0.000% | 10/1/39 | 590 | 447 |
| Osceola County FL Expressway System Revenue | | | | |
| (Poinciana Parkway Project) | 5.375% | 10/1/47 | 140 | 155 |
| Palm Beach County FL Public Improvement | | | | |
| Revenue | 5.000% | 5/1/18 (Prere.) | 210 | 223 |
| Palm Beach County FL Public Improvement | | | | |
| Revenue | 5.000% | 5/1/18 (Prere.) | 105 | 111 |
| Palm Beach County FL Solid Waste Authority | | | | |
| Revenue | 5.500% | 10/1/18 (Prere.) | 65 | 71 |
| Palm Beach County FL Solid Waste Authority | | | | |
| Revenue | 5.000% | 10/1/21 (Prere.) | 5 | 6 |
| Palm Beach County FL Solid Waste Authority | | | | |
| Revenue | 5.000% | 10/1/31 | 95 | 110 |
| Port St. Lucie FL Utility Revenue | 5.000% | 9/1/18 (Prere.) | 100 | 108 |
| Port St. Lucie FL Utility Revenue | 5.000% | 9/1/35 (12) | 10 | 11 |
| South Florida Water Management District COP | 5.000% | 10/1/33 | 275 | 328 |
| Tallahassee FL Utility System Revenue | 5.000% | 10/1/32 | 105 | 109 |
| Tallahassee FL Utility System Revenue | 5.000% | 10/1/37 | 150 | 155 |
| Tampa Bay FL Water Utility System Revenue | 5.000% | 10/1/18 (Prere.) | 85 | 92 |
| Tampa Bay FL Water Utility System Revenue | 5.000% | 10/1/18 (ETM) | 120 | 129 |
| Tampa Bay FL Water Utility System Revenue | 5.000% | 10/1/19 (ETM) | 130 | 145 |
| | | | | 22,398 |
24
| | | | |
| Tax-Exempt Bond Index Fund | | | | |
| |
| |
| |
| | | | Face | Market |
| | | Maturity | Amount | Value• |
| | Coupon | Date | ($000) | ($000) |
| Georgia (2.3%) | | | | |
| Atlanta GA Metropolitan Rapid Transit Authority | | | | |
| Revenue | 5.000% | 7/1/39 | 215 | 236 |
| Atlanta GA Water & Wastewater Revenue | 6.000% | 11/1/19 (Prere.) | 245 | 281 |
| Atlanta GA Water & Wastewater Revenue | 6.000% | 11/1/19 (Prere.) | 50 | 57 |
| Atlanta GA Water & Wastewater Revenue | 6.250% | 11/1/19 (Prere.) | 1,120 | 1,292 |
| Atlanta GA Water & Wastewater Revenue | 6.250% | 11/1/19 (Prere.) | 135 | 156 |
| Atlanta GA Water & Wastewater Revenue | 5.250% | 11/1/27 (4) | 150 | 197 |
| Atlanta GA Water & Wastewater Revenue | 5.000% | 11/1/33 | 550 | 652 |
| Atlanta GA Water & Wastewater Revenue | 5.000% | 11/1/40 | 100 | 117 |
| Atlanta GA Water & Wastewater Revenue | 5.000% | 11/1/43 | 475 | 554 |
| DeKalb County GA Water & Sewer Revenue | 5.250% | 10/1/41 | 215 | 251 |
| Georgia GO | 5.000% | 7/1/17 | 250 | 257 |
| Georgia GO | 5.000% | 7/1/17 | 1,000 | 1,029 |
| Georgia GO | 4.000% | 9/1/17 | 215 | 221 |
| Georgia GO | 5.000% | 7/1/18 (Prere.) | 150 | 160 |
| Georgia GO | 5.000% | 1/1/19 (Prere.) | 350 | 380 |
| Georgia GO | 5.000% | 7/1/19 | 665 | 736 |
| Georgia GO | 5.000% | 7/1/19 | 100 | 111 |
| Georgia GO | 5.000% | 10/1/21 | 250 | 296 |
| Georgia GO | 5.000% | 2/1/22 | 100 | 119 |
| Georgia GO | 4.500% | 11/1/22 | 135 | 156 |
| Georgia GO | 5.000% | 7/1/24 | 130 | 139 |
| Georgia GO | 5.000% | 7/1/27 | 100 | 120 |
| Georgia Road & Tollway Authority GAN | 5.000% | 6/1/17 | 200 | 205 |
| Georgia Road & Tollway Authority Revenue | 5.000% | 3/1/21 | 1,000 | 1,165 |
| Gwinnett County GA School District GO | 4.500% | 10/1/17 | 200 | 207 |
| Gwinnett County GA School District GO | 5.000% | 8/1/22 | 1,000 | 1,209 |
| Metropolitan Atlanta GA Rapid Transportation | | | | |
| Authority Georgia Sales Tax Revenue | 4.500% | 7/1/17 (Prere.) | 185 | 190 |
| Metropolitan Atlanta GA Rapid Transportation | | | | |
| Authority Georgia Sales Tax Revenue | 5.000% | 7/1/20 (14) | 570 | 649 |
| Metropolitan Atlanta GA Rapid Transportation | | | | |
| Authority Georgia Sales Tax Revenue | 5.250% | 7/1/36 | 180 | 198 |
| Municipal Electric Authority Georgia Revenue | 5.000% | 1/1/20 | 400 | 448 |
| Municipal Electric Authority Georgia Revenue | 5.000% | 7/1/60 | 100 | 115 |
| Municipal Electric Authority Georgia Revenue | | | | |
| (Project One) | 5.250% | 1/1/17 | 200 | 202 |
| Private Colleges & University Authority of Georgia | | | | |
| Revenue (Emory University) | 5.000% | 9/1/18 (Prere.) | 555 | 596 |
| Private Colleges & University Authority of Georgia | | | | |
| Revenue (Emory University) | 5.000% | 10/1/38 | 500 | 599 |
| Private Colleges & University Authority of Georgia | | | | |
| Revenue (Savannah College of Art & Design) | 5.000% | 4/1/44 | 500 | 561 |
| Sandy Springs GA Public Facilities Authority | | | | |
| (City Center Project) | 5.000% | 5/1/41 | 500 | 598 |
| | | | | 14,459 |
| Hawaii (0.7%) | | | | |
| Hawaii GO | 5.000% | 5/1/18 (Prere.) | 95 | 101 |
| Hawaii GO | 5.000% | 5/1/18 (Prere.) | 5 | 5 |
| Hawaii GO | 5.000% | 12/1/18 | 500 | 542 |
| Hawaii GO | 5.000% | 12/1/21 (Prere.) | 90 | 107 |
| Hawaii GO | 5.000% | 12/1/21 (Prere.) | 135 | 161 |
| Hawaii GO | 5.000% | 12/1/21 (Prere.) | 125 | 149 |
| Hawaii GO | 5.000% | 12/1/21 (Prere.) | 65 | 77 |
25
| | | | |
| Tax-Exempt Bond Index Fund | | | | |
| |
| |
| |
| | | | Face | Market |
| | | Maturity | Amount | Value• |
| | Coupon | Date | ($000) | ($000) |
| Hawaii GO | 5.000% | 8/1/23 | 115 | 141 |
| Hawaii GO | 5.000% | 8/1/23 (Prere.) | 40 | 49 |
| Hawaii GO | 5.000% | 8/1/25 | 245 | 304 |
| Hawaii GO | 5.000% | 12/1/26 | 260 | 304 |
| Hawaii GO | 5.000% | 10/1/27 | 500 | 621 |
| Hawaii GO | 5.000% | 12/1/27 | 195 | 228 |
| Hawaii GO | 5.000% | 8/1/28 | 50 | 61 |
| Hawaii GO | 5.000% | 12/1/28 | 100 | 117 |
| Hawaii GO | 5.000% | 8/1/29 | 50 | 61 |
| Hawaii GO | 5.000% | 8/1/30 | 125 | 149 |
| Hawaii GO | 5.000% | 8/1/30 | 300 | 362 |
| Hawaii GO | 3.000% | 4/1/36 | 470 | 470 |
| Honolulu HI City & County Wastewater System | | | | |
| Revenue | 5.000% | 7/1/37 | 175 | 205 |
| | | | | 4,214 |
| Idaho (0.0%) | | | | |
| Idaho Housing & Finance Association RAN | 5.250% | 7/15/18 (Prere.) | 65 | 70 |
| Idaho Housing & Finance Association RAN | 5.000% | 7/15/26 | 75 | 92 |
| | | | | 162 |
| Illinois (4.3%) | | | | |
| Chicago IL GO | 5.000% | 1/1/23 | 35 | 37 |
| Chicago IL GO | 5.000% | 12/1/23 (2) | 100 | 100 |
| Chicago IL GO | 4.300% | 1/1/24 (2) | 100 | 100 |
| Chicago IL GO | 5.000% | 1/1/27 (4) | 200 | 213 |
| Chicago IL GO | 4.750% | 1/1/28 (14) | 75 | 75 |
| Chicago IL GO | 4.750% | 1/1/32 (4) | 170 | 171 |
| Chicago IL GO | 5.500% | 1/1/33 | 100 | 106 |
| Chicago IL GO | 5.500% | 1/1/34 | 150 | 159 |
| Chicago IL GO | 4.750% | 1/1/36 (4) | 395 | 396 |
| Chicago IL Metropolitan Water Reclamation | | | | |
| District GO | 5.000% | 12/1/16 (Prere.) | 145 | 146 |
| Chicago IL Metropolitan Water Reclamation | | | | |
| District GO | 5.000% | 12/1/18 | 100 | 108 |
| Chicago IL Metropolitan Water Reclamation | | | | |
| District GO | 5.000% | 12/1/24 | 275 | 337 |
| Chicago IL Metropolitan Water Reclamation | | | | |
| District GO | 5.000% | 12/1/26 | 60 | 75 |
| Chicago IL Midway Airport Revenue | 5.000% | 1/1/25 | 75 | 88 |
| Chicago IL Midway Airport Revenue | 5.000% | 1/1/27 | 60 | 70 |
| Chicago IL O’Hare International Airport Revenue | 5.000% | 1/1/17 | 480 | 483 |
| Chicago IL O’Hare International Airport Revenue | 5.000% | 1/1/24 | 185 | 225 |
| Chicago IL O’Hare International Airport Revenue | 5.000% | 1/1/26 | 100 | 121 |
| Chicago IL O’Hare International Airport Revenue | 5.000% | 1/1/28 | 85 | 102 |
| Chicago IL O’Hare International Airport Revenue | 5.000% | 1/1/30 | 200 | 236 |
| Chicago IL O’Hare International Airport Revenue | 5.000% | 1/1/32 | 140 | 156 |
| Chicago IL O’Hare International Airport Revenue | 5.000% | 1/1/35 | 50 | 54 |
| Chicago IL O’Hare International Airport Revenue | 4.500% | 1/1/38 (4) | 610 | 630 |
| Chicago IL O’Hare International Airport Revenue | 5.000% | 1/1/39 | 525 | 597 |
| Chicago IL O’Hare International Airport Revenue | 5.750% | 1/1/39 | 435 | 502 |
| Chicago IL O’Hare International Airport Revenue | 6.500% | 1/1/41 | 25 | 30 |
| Chicago IL O’Hare International Airport Revenue | 5.000% | 1/1/44 | 125 | 142 |
| Chicago IL Transit Authority Sales Tax Receipts | | | | |
| Revenue | 5.250% | 12/1/49 | 250 | 284 |
| Chicago IL Wastewater Transmission Revenue | 5.000% | 1/1/20 | 500 | 547 |
| Chicago IL Wastewater Transmission Revenue | 0.000% | 1/1/28 (14) | 275 | 189 |
26
| | | | |
| Tax-Exempt Bond Index Fund | | | | |
| |
| |
| |
| | | | Face | Market |
| | | Maturity | Amount | Value• |
| | Coupon | Date | ($000) | ($000) |
| Chicago IL Wastewater Transmission Revenue | 5.000% | 1/1/39 | 150 | 166 |
| Chicago IL Water Revenue | 5.000% | 11/1/29 | 50 | 56 |
| Chicago IL Water Revenue | 5.000% | 11/1/32 (2) | 250 | 251 |
| Chicago IL Water Revenue | 5.250% | 11/1/38 | 350 | 367 |
| Chicago IL Waterworks Revenue | 5.000% | 11/1/30 | 250 | 291 |
| Chicago IL Waterworks Revenue | 5.000% | 11/1/36 (2) | 175 | 176 |
| Cook County IL GO | 5.000% | 11/15/17 (14) | 300 | 312 |
| Cook County IL GO | 5.000% | 11/15/18 | 25 | 27 |
| Cook County IL GO | 5.000% | 11/15/21 | 25 | 27 |
| Cook County IL GO | 5.250% | 11/15/22 | 100 | 113 |
| Cook County IL GO | 5.000% | 11/15/23 | 250 | 293 |
| Cook County IL GO | 5.250% | 11/15/24 | 200 | 227 |
| Cook County IL GO | 5.250% | 11/15/25 | 100 | 113 |
| Cook County IL GO | 5.000% | 11/15/28 | 85 | 92 |
| Cook County IL Sales Tax Revenue | 5.000% | 11/15/37 | 250 | 280 |
| Illinois Finance Authority Revenue | | | | |
| (DePaul University) | 6.125% | 4/1/21 (Prere.) | 205 | 249 |
| Illinois Finance Authority Revenue | | | | |
| (Illinois Wesleyan University) | 5.000% | 9/1/46 | 140 | 156 |
| Illinois Finance Authority Revenue | | | | |
| (University of Chicago) | 4.000% | 10/1/32 | 90 | 96 |
| Illinois Finance Authority Revenue | | | | |
| (University of Chicago) | 4.000% | 10/1/33 | 50 | 53 |
| Illinois Finance Authority Revenue | | | | |
| (University of Chicago) | 4.000% | 10/1/49 | 90 | 93 |
| Illinois Finance Authority Revenue | | | | |
| (University of Chicago) | 5.000% | 10/1/51 | 75 | 83 |
| Illinois GO | 5.000% | 7/1/20 | 125 | 134 |
| Illinois GO | 4.000% | 9/1/20 | 135 | 140 |
| Illinois GO | 5.000% | 7/1/21 | 125 | 136 |
| Illinois GO | 5.000% | 8/1/21 | 535 | 583 |
| Illinois GO | 5.000% | 5/1/22 | 55 | 60 |
| Illinois GO | 5.000% | 8/1/22 (4) | 200 | 222 |
| Illinois GO | 4.000% | 9/1/22 | 200 | 208 |
| Illinois GO | 5.000% | 7/1/23 | 50 | 55 |
| Illinois GO | 5.000% | 8/1/23 | 480 | 529 |
| Illinois GO | 5.000% | 1/1/24 | 50 | 52 |
| Illinois GO | 5.000% | 3/1/25 | 390 | 417 |
| Illinois GO | 5.500% | 7/1/25 | 210 | 236 |
| Illinois GO | 4.000% | 8/1/25 | 170 | 173 |
| Illinois GO | 5.000% | 8/1/25 | 60 | 64 |
| Illinois GO | 5.500% | 7/1/26 | 160 | 179 |
| Illinois GO | 5.000% | 2/1/27 | 50 | 54 |
| Illinois GO | 5.000% | 2/1/27 | 500 | 552 |
| Illinois GO | 5.000% | 3/1/28 | 150 | 151 |
| Illinois GO | 5.000% | 9/1/28 (4) | 50 | 50 |
| Illinois GO | 5.000% | 11/1/28 (2) | 100 | 100 |
| Illinois GO | 5.000% | 5/1/29 | 75 | 80 |
| Illinois GO | 5.250% | 7/1/29 | 130 | 142 |
| Illinois GO | 4.000% | 2/1/31 (4) | 250 | 250 |
| Illinois GO | 5.000% | 3/1/34 | 1,370 | 1,375 |
| Illinois GO | 5.000% | 5/1/35 | 150 | 156 |
| Illinois GO | 5.000% | 5/1/36 | 50 | 52 |
| Illinois Municipal Electric Agency Power Supply | | | | |
| System Revenue | 5.000% | 2/1/22 | 100 | 117 |
27
| | | | |
| Tax-Exempt Bond Index Fund | | | | |
| |
| |
| |
| | | | Face | Market |
| | | Maturity | Amount | Value• |
| | Coupon | Date | ($000) | ($000) |
| Illinois Municipal Electric Agency Power Supply | | | | |
| System Revenue | 5.000% | 2/1/23 | 175 | 208 |
| Illinois Municipal Electric Agency Power Supply | | | | |
| System Revenue | 4.000% | 2/1/33 | 250 | 267 |
| Illinois Regional Transportation Authority Revenue | 6.500% | 7/1/26 (14) | 65 | 87 |
| Illinois Sales Tax Revenue | 4.750% | 6/15/19 (Prere.) | 75 | 82 |
| Illinois Sales Tax Revenue | 5.250% | 6/15/19 (Prere.) | 160 | 178 |
| Illinois Sales Tax Revenue | 5.000% | 6/15/20 | 100 | 113 |
| Illinois Sales Tax Revenue | 5.000% | 6/15/20 | 220 | 249 |
| Illinois Sales Tax Revenue | 5.000% | 6/15/23 | 400 | 480 |
| Illinois Sales Tax Revenue | 5.000% | 6/15/24 | 315 | 376 |
| Illinois Sports Facility Authority Revenue | 0.000% | 6/15/26 (2) | 90 | 63 |
| Illinois Sports Facility Authority Revenue | 5.000% | 6/15/27 (4) | 330 | 378 |
| Illinois Toll Highway Authority Revenue | 5.500% | 1/1/18 (Prere.) | 50 | 53 |
| Illinois Toll Highway Authority Revenue | 4.000% | 12/1/31 | 185 | 201 |
| Illinois Toll Highway Authority Revenue | 5.000% | 12/1/32 | 90 | 107 |
| Illinois Toll Highway Authority Revenue | 5.000% | 1/1/36 | 750 | 864 |
| Illinois Toll Highway Authority Revenue | 5.000% | 1/1/37 | 375 | 432 |
| Illinois Toll Highway Authority Revenue | 5.000% | 1/1/38 | 375 | 428 |
| Illinois Toll Highway Authority Revenue | 5.000% | 1/1/40 | 150 | 173 |
| Illinois Toll Highway Authority Revenue | 5.000% | 1/1/40 | 200 | 230 |
| Illinois Unemployment Insurance Fund Building | | | | |
| Receipts Revenue | 5.000% | 12/15/16 | 500 | 503 |
| Metropolitan Pier & Exposition Authority Illinois | | | | |
| Dedicated Sales Tax Revenue | 0.000% | 12/15/23 (14) | 105 | 82 |
| Metropolitan Pier & Exposition Authority Illinois | | | | |
| Dedicated Sales Tax Revenue | 0.000% | 6/15/27 (4) | 180 | 118 |
| Metropolitan Pier & Exposition Authority Illinois | | | | |
| Dedicated Sales Tax Revenue | 0.000% | 12/15/29 (14) | 70 | 40 |
| Metropolitan Pier & Exposition Authority Illinois | | | | |
| Dedicated Sales Tax Revenue | 0.000% | 12/15/34 (14) | 255 | 115 |
| Metropolitan Pier & Exposition Authority Illinois | | | | |
| Dedicated Sales Tax Revenue | 0.000% | 6/15/44 (4) | 520 | 151 |
| Metropolitan Pier & Exposition Authority Illinois | | | | |
| Dedicated Sales Tax Revenue | 0.000% | 6/15/46 (4) | 615 | 162 |
| Metropolitan Pier & Exposition Authority Illinois | | | | |
| Dedicated Sales Tax Revenue | 5.250% | 6/15/50 | 50 | 53 |
| Metropolitan Pier & Exposition Authority Illinois | | | | |
| Dedicated Sales Tax Revenue | 5.500% | 6/15/50 | 235 | 250 |
| Metropolitan Pier & Exposition Authority Illinois | | | | |
| Dedicated Sales Tax Revenue (McCormick | | | | |
| Place Expansion Project) | 0.000% | 6/15/20 (14) | 215 | 193 |
| Metropolitan Pier & Exposition Authority Illinois | | | | |
| Dedicated Sales Tax Revenue (McCormick | | | | |
| Place Expansion Project) | 5.000% | 12/15/20 | 70 | 78 |
| Metropolitan Pier & Exposition Authority Illinois | | | | |
| Dedicated Sales Tax Revenue (McCormick | | | | |
| Place Expansion Project) | 5.000% | 12/15/22 | 100 | 115 |
| Metropolitan Pier & Exposition Authority Illinois | | | | |
| Dedicated Sales Tax Revenue (McCormick | | | | |
| Place Expansion Project) | 5.000% | 12/15/26 | 65 | 72 |
| Metropolitan Pier & Exposition Authority Illinois | | | | |
| Dedicated Sales Tax Revenue (McCormick | | | | |
| Place Expansion Project) | 0.000% | 6/15/31 (14) | 365 | 193 |
28
| | | | |
| Tax-Exempt Bond Index Fund | | | | |
| |
| |
| |
| | | | Face | Market |
| | | Maturity | Amount | Value• |
| | Coupon | Date | ($000) | ($000) |
| Metropolitan Pier & Exposition Authority Illinois | | | | |
| Dedicated Sales Tax Revenue (McCormick | | | | |
| Place Expansion Project) | 0.000% | 6/15/32 (14) | 130 | 66 |
| Metropolitan Pier & Exposition Authority Illinois | | | | |
| Dedicated Sales Tax Revenue (McCormick | | | | |
| Place Expansion Project) | 0.000% | 6/15/37 (14) | 200 | 79 |
| Metropolitan Pier & Exposition Authority Illinois | | | | |
| Dedicated Sales Tax Revenue (McCormick | | | | |
| Place Expansion Project) | 0.000% | 12/15/41 | 200 | 59 |
| Metropolitan Pier & Exposition Authority Illinois | | | | |
| Dedicated Sales Tax Revenue (McCormick | | | | |
| Place Expansion Project) | 4.250% | 6/15/42 | 315 | 319 |
| Metropolitan Pier & Exposition Authority Illinois | | | | |
| Dedicated Sales Tax Revenue (McCormick | | | | |
| Place Expansion Project) | 0.000% | 6/15/43 (4) | 320 | 97 |
| Metropolitan Pier & Exposition Authority Illinois | | | | |
| Dedicated Sales Tax Revenue (McCormick | | | | |
| Place Expansion Project) | 0.000% | 6/15/45 (4) | 340 | 94 |
| Metropolitan Pier & Exposition Authority Illinois | | | | |
| Dedicated Sales Tax Revenue (McCormick | | | | |
| Place Expansion Project) | 5.000% | 6/15/50 | 340 | 355 |
| Metropolitan Pier & Exposition Authority Illinois | | | | |
| Dedicated Sales Tax Revenue (McCormick | | | | |
| Place Expansion Project) | 5.200% | 6/15/50 | 350 | 369 |
| Metropolitan Pier & Exposition Authority Illinois | | | | |
| Dedicated Sales Tax Revenue (McCormick | | | | |
| Place Expansion Project) | 0.000% | 12/15/50 | 570 | 103 |
| Metropolitan Pier & Exposition Authority Illinois | | | | |
| Dedicated Sales Tax Revenue (McCormick | | | | |
| Place Expansion Project) | 0.000% | 12/15/51 (4) | 570 | 114 |
| Metropolitan Pier & Exposition Authority Illinois | | | | |
| Dedicated Sales Tax Revenue (McCormick | | | | |
| Place Expansion Project) | 0.000% | 12/15/51 | 185 | 32 |
| Northern Illinois Municipal Power Agency | | | | |
| Project Revenue | 4.000% | 12/1/32 | 175 | 188 |
| Northern Illinois Municipal Power Agency | | | | |
| Project Revenue | 4.000% | 12/1/35 | 185 | 196 |
| Northern Illinois Municipal Power Agency | | | | |
| Project Revenue (Prairie State Project) | 5.000% | 1/1/18 (Prere.) | 225 | 236 |
| Northern Illinois Municipal Power Agency | | | | |
| Project Revenue (Prairie State Project) | 5.000% | 1/1/18 (Prere.) | 130 | 136 |
| Springfield IL Electric Revenue | 5.000% | 3/1/18 (Prere.) | 365 | 385 |
| Will County IL Community High School District | | | | |
| No. 210 (Lincoln-Way) GO | 0.000% | 1/1/31 | 190 | 92 |
| Will County IL Community High School District | | | | |
| No. 210 (Lincoln-Way) GO | 0.000% | 1/1/32 | 90 | 41 |
| Will County IL Community High School District | | | | |
| No. 210 (Lincoln-Way) GO | 0.000% | 1/1/33 | 300 | 128 |
| | | | | 26,450 |
| Indiana (0.4%) | | | | |
| Indiana Finance Authority Highway Revenue | 5.000% | 12/1/25 | 220 | 278 |
| Indiana Finance Authority Highway Revenue | 5.000% | 6/1/27 | 300 | 381 |
| Indiana Finance Authority Revenue | 5.000% | 2/1/25 | 50 | 63 |
| Indiana Finance Authority Revenue | | | | |
| (State Revolving Fund) | 5.000% | 2/1/21 (Prere.) | 235 | 273 |
29
| | | | |
| Tax-Exempt Bond Index Fund | | | | |
| |
| |
| |
| | | | Face | Market |
| | | Maturity | Amount | Value• |
| | Coupon | Date | ($000) | ($000) |
| Indiana Finance Authority Wastewater Utility | | | | |
| Revenue (CWA Authority Project) | 5.000% | 10/1/41 | 145 | 166 |
| Indiana Municipal Power Agency Revenue | 6.000% | 1/1/19 (Prere.) | 100 | 111 |
| Indiana Municipal Power Agency Revenue | 5.000% | 1/1/42 | 500 | 579 |
| Indianapolis IN Local Public Improvement Bond | | | | |
| Bank Revenue (Bank-Waterworks Project) | 5.500% | 1/1/29 | 150 | 164 |
| Indianapolis IN Local Public Improvement Bond | | | | |
| Bank Revenue (Bank-Waterworks Project) | 5.750% | 1/1/38 | 100 | 110 |
| Indianapolis IN Local Public Improvement Bond | | | | |
| Bank Revenue (Waterworks Project) | 5.250% | 1/1/29 (12) | 60 | 65 |
| | | | | 2,190 |
| Iowa (0.2%) | | | | |
| Iowa Finance Authority Revenue | 5.000% | 8/1/20 | 285 | 326 |
| Iowa Special Obligation Revenue | 5.000% | 6/1/28 | 250 | 310 |
| Iowa Special Obligation Revenue (Ijobs Program) | 5.000% | 6/1/19 (Prere.) | 555 | 611 |
| | | | | 1,247 |
| Kansas (0.3%) | | | | |
| Kansas Department of Transportation Highway | | | | |
| Revenue | 5.500% | 3/1/19 (4) | 205 | 227 |
| Kansas Department of Transportation Highway | | | | |
| Revenue | 5.000% | 9/1/20 | 30 | 34 |
| Kansas Department of Transportation Highway | | | | |
| Revenue | 5.000% | 9/1/30 | 750 | 924 |
| Kansas Department of Transportation Highway | | | | |
| Revenue | 5.000% | 9/1/34 | 195 | 236 |
| Seward County KS Unified School District | | | | |
| No. 480 GO | 5.000% | 9/1/39 | 500 | 568 |
| Wyandotte County/Kansas City KS Unified | | | | |
| Government Utility System Revenue | 5.000% | 9/1/40 | 75 | 86 |
| | | | | 2,075 |
| Kentucky (0.5%) | | | | |
| Kentucky Municipal Power Agency Power | | | | |
| System Revenue | 4.000% | 9/1/39 (14) | 110 | 116 |
| Kentucky Municipal Power Agency Power | | | | |
| System Revenue | 5.000% | 9/1/42 (14) | 150 | 170 |
| Kentucky Property & Building Commission | | | | |
| Revenue | 5.250% | 2/1/18 | 110 | 116 |
| Kentucky Property & Building Commission | | | | |
| Revenue | 5.000% | 8/1/18 | 345 | 368 |
| Kentucky Property & Building Commission | | | | |
| Revenue | 5.375% | 11/1/18 (Prere.) | 160 | 174 |
| Kentucky Property & Building Commission | | | | |
| Revenue | 5.500% | 11/1/18 (Prere.) | 320 | 348 |
| Kentucky Property & Building Commission | | | | |
| Revenue | 5.250% | 2/1/19 (Prere.) | 230 | 252 |
| Kentucky Property & Building Commission | | | | |
| Revenue | 5.000% | 11/1/20 | 120 | 129 |
| Kentucky Property & Building Commission | | | | |
| Revenue | 5.000% | 8/1/23 | 105 | 125 |
| Kentucky Property & Building Commission | | | | |
| Revenue | 5.250% | 2/1/24 (12) | 15 | 16 |
| Kentucky Property & Building Commission | | | | |
| Revenue | 5.000% | 11/1/26 | 500 | 613 |
30
| | | | |
| Tax-Exempt Bond Index Fund | | | | |
| |
| |
| |
| | | | Face | Market |
| | | Maturity | Amount | Value• |
| | Coupon | Date | ($000) | ($000) |
| Kentucky Property & Building Commission | | | | |
| Revenue | 5.500% | 11/1/28 | 30 | 33 |
| Kentucky Public Transportation Infrastructure | | | | |
| Authority Toll Revenue (Downtown Crossing | | | | |
| Project) BAN | 6.000% | 7/1/53 | 200 | 235 |
| Louisville & Jefferson County KY Metropolitan | | | | |
| Sewer & Drain System | 3.000% | 5/15/46 | 500 | 467 |
| Louisville & Jefferson County KY Metropolitan | | | | |
| Sewer & Drain System Revenue | 5.000% | 5/15/34 | 100 | 116 |
| Louisville & Jefferson County KY Metropolitan | | | | |
| Sewer & Drain System Revenue | 4.250% | 5/15/38 (12) | 65 | 68 |
| | | | | 3,346 |
| Louisiana (0.8%) | | | | |
| East Baton Rouge Parish LA Sewer Commission | | | | |
| Revenue | 5.250% | 2/1/19 (Prere.) | 55 | 60 |
| Lafayette LA Communications System Revenue | 5.250% | 11/1/17 (Prere.) | 275 | 287 |
| Louisiana Citizens Property Insurance Corp. | | | | |
| Assessment Revenue | 5.000% | 6/1/23 | 500 | 600 |
| Louisiana Gasoline & Fuel Tax Revenue | 5.000% | 5/1/23 | 145 | 172 |
| Louisiana Gasoline & Fuel Tax Revenue | 5.000% | 5/1/36 | 150 | 175 |
| Louisiana Gasoline & Fuel Tax Revenue | 5.000% | 5/1/41 | 110 | 128 |
| Louisiana Gasoline & Fuel Tax Revenue | 5.000% | 5/1/45 | 290 | 322 |
| Louisiana GO | 5.000% | 8/1/25 | 100 | 122 |
| Louisiana GO | 5.000% | 9/1/34 | 1,000 | 1,181 |
| Louisiana Local Government Environmental | | | | |
| Facilities & Community Development Authority | | | | |
| Revenue (East Baton Rouge Sewerage | | | | |
| Commission Projects) | 5.000% | 2/1/43 | 100 | 112 |
| Louisiana Local Government Environmental | | | | |
| Facilities & Community Development Authority | | | | |
| Revenue (East Baton Rouge Sewerage | | | | |
| Commission Projects) | 4.000% | 2/1/48 | 130 | 135 |
| Louisiana Local Government Environmental | | | | |
| Facilities & Community Development Authority | | | | |
| Revenue (LCTCS Facilities Corp. Project) | 5.000% | 10/1/37 | 495 | 573 |
| Louisiana Local Government Environmental | | | | |
| Facilities & Community Development Authority | | | | |
| Revenue (LCTCS Facilities Corp. Project) | 5.000% | 10/1/39 | 100 | 116 |
| Louisiana Public Facilities Authority Lease Revenue | 5.000% | 7/1/51 | 150 | 169 |
| Louisiana Public Facilities Authority Lease Revenue | 5.000% | 7/1/56 | 150 | 166 |
| Louisiana Public Facilities Authority Revenue | | | | |
| (Loyola University) | 5.000% | 10/1/41 | 215 | 235 |
| New Orleans LA Sewage Service Revenue | 5.000% | 6/1/44 | 160 | 183 |
| | | | | 4,736 |
| Maryland (2.5%) | | | | |
| Baltimore County MD GO | 3.000% | 2/1/34 | 295 | 299 |
| Baltimore MD Project Revenue | 4.500% | 7/1/32 (2) | 300 | 307 |
| Baltimore MD Project Revenue | 5.000% | 7/1/38 | 60 | 69 |
| Baltimore MD Project Revenue | 5.000% | 7/1/41 | 660 | 756 |
| Baltimore MD Project Revenue | 5.000% | 7/1/43 | 105 | 121 |
| Howard County MD GO | 3.000% | 2/15/30 | 100 | 103 |
| Maryland Department of Transportation Revenue | 5.000% | 9/1/18 (Prere.) | 205 | 220 |
| Maryland Department of Transportation Revenue | 5.000% | 2/15/23 | 500 | 610 |
| Maryland Department of Transportation Revenue | 3.000% | 12/15/30 | 755 | 776 |
| Maryland GO | 5.000% | 3/1/18 | 100 | 105 |
31
| | | | |
| Tax-Exempt Bond Index Fund | | | | |
| |
| |
| |
| | | | Face | Market |
| | | Maturity | Amount | Value• |
| | Coupon | Date | ($000) | ($000) |
| Maryland GO | 5.000% | 7/15/18 (Prere.) | 115 | 123 |
| Maryland GO | 5.000% | 3/1/19 | 110 | 120 |
| Maryland GO | 5.000% | 3/1/19 (Prere.) | 60 | 66 |
| Maryland GO | 5.000% | 3/15/19 | 125 | 137 |
| Maryland GO | 5.000% | 3/15/19 (Prere.) | 240 | 263 |
| Maryland GO | 5.000% | 8/1/19 (Prere.) | 200 | 222 |
| Maryland GO | 5.000% | 8/1/20 | 500 | 573 |
| Maryland GO | 5.000% | 8/1/21 | 125 | 143 |
| Maryland GO | 5.000% | 8/1/21 | 1,200 | 1,414 |
| Maryland GO | 5.000% | 3/1/22 (Prere.) | 250 | 299 |
| Maryland GO | 5.000% | 3/1/22 | 250 | 290 |
| Maryland GO | 5.000% | 8/1/23 | 250 | 309 |
| Maryland GO | 5.000% | 3/1/24 | 430 | 526 |
| Maryland GO | 5.000% | 6/1/24 | 940 | 1,178 |
| Maryland GO | 4.000% | 8/1/24 | 700 | 825 |
| Maryland GO | 5.000% | 8/1/24 | 200 | 251 |
| Maryland GO | 5.000% | 8/1/24 | 115 | 142 |
| Maryland GO | 5.000% | 3/1/26 | 75 | 91 |
| Maryland GO | 5.000% | 6/1/26 | 1,000 | 1,241 |
| Maryland GO | 3.000% | 3/1/27 | 350 | 366 |
| Maryland GO | 4.000% | 8/1/27 | 140 | 160 |
| Maryland GO | 3.000% | 3/1/28 | 295 | 307 |
| Maryland GO | 3.000% | 3/1/30 | 200 | 208 |
| Maryland GO | 3.000% | 6/1/31 | 500 | 511 |
| Maryland Transportation Authority Facilities | | | | |
| Projects Revenue | 5.000% | 7/1/38 (4) | 100 | 106 |
| Maryland Transportation Authority Facilities | | | | |
| Projects Revenue | 4.500% | 7/1/41 (4) | 670 | 685 |
| Montgomery County MD GO | 5.000% | 7/1/21 | 200 | 235 |
| Montgomery County MD GO | 5.000% | 11/1/23 | 750 | 930 |
| Montgomery County MD GO | 5.000% | 11/1/25 | 500 | 627 |
| Montgomery County MD GO | 5.000% | 11/1/26 | 50 | 62 |
| | | | | 15,776 |
| Massachusetts (4.5%) | | | | |
| Massachusetts Bay Transportation Authority | | | | |
| Assessment Revenue | 4.050% | 7/1/41 | 50 | 53 |
| Massachusetts Bay Transportation Authority | | | | |
| Assessment Revenue | 5.000% | 7/1/41 | 150 | 175 |
| Massachusetts Bay Transportation Authority | | | | |
| Sales Tax Revenue | 5.500% | 7/1/17 | 115 | 119 |
| Massachusetts Bay Transportation Authority | | | | |
| Sales Tax Revenue | 5.250% | 7/1/18 (Prere.) | 130 | 139 |
| Massachusetts Bay Transportation Authority | | | | |
| Sales Tax Revenue | 5.500% | 7/1/18 | 425 | 457 |
| Massachusetts Bay Transportation Authority | | | | |
| Sales Tax Revenue | 5.000% | 7/1/31 | 90 | 117 |
| Massachusetts Bay Transportation Authority | | | | |
| Sales Tax Revenue | 5.000% | 7/1/45 | 535 | 626 |
| Massachusetts Department of Transportation | | | | |
| Metropolitan Highway System Revenue | 5.000% | 1/1/32 | 560 | 622 |
| Massachusetts Department of Transportation | | | | |
| Metropolitan Highway System Revenue | 5.000% | 1/1/35 | 40 | 45 |
| Massachusetts Department of Transportation | | | | |
| Metropolitan Highway System Revenue | 5.000% | 1/1/37 | 25 | 28 |
32
| | | | |
| Tax-Exempt Bond Index Fund | | | | |
| |
| |
| |
| | | | Face | Market |
| | | Maturity | Amount | Value• |
| | Coupon | Date | ($000) | ($000) |
| Massachusetts Development Finance Agency | | | | |
| Revenue (Boston University) | 5.000% | 7/1/42 | 145 | 149 |
| Massachusetts Development Finance Agency | | | | |
| Revenue (Brandeis University) | 5.000% | 10/1/35 | 165 | 183 |
| Massachusetts Development Finance Agency | | | | |
| Revenue (Harvard University) | 5.000% | 10/15/20 (Prere.) | 1,015 | 1,167 |
| Massachusetts Development Finance Agency | | | | |
| Revenue (Williams College) | 5.000% | 7/1/43 | 380 | 450 |
| Massachusetts Federal Highway GAN | | | | |
| (Accelerated Bridge Program) | 5.000% | 6/15/24 | 60 | 75 |
| Massachusetts Federal Highway GAN | | | | |
| (Accelerated Bridge Program) | 5.000% | 6/15/26 | 320 | 395 |
| Massachusetts GO | 5.000% | 8/1/17 (Prere.) | 500 | 516 |
| Massachusetts GO | 5.000% | 8/1/17 (Prere.) | 360 | 372 |
| Massachusetts GO | 5.000% | 8/1/18 (Prere.) | 125 | 134 |
| Massachusetts GO | 5.500% | 8/1/18 | 145 | 157 |
| Massachusetts GO | 5.000% | 3/1/19 (Prere.) | 100 | 109 |
| Massachusetts GO | 5.000% | 7/1/19 (Prere.) | 50 | 55 |
| Massachusetts GO | 5.000% | 4/1/21 (Prere.) | 100 | 117 |
| Massachusetts GO | 5.000% | 8/1/21 (Prere.) | 100 | 118 |
| Massachusetts GO | 5.250% | 8/1/21 | 75 | 89 |
| Massachusetts GO | 5.250% | 9/1/21 (4) | 500 | 594 |
| Massachusetts GO | 5.250% | 8/1/22 | 250 | 304 |
| Massachusetts GO | 5.000% | 3/1/23 | 1,000 | 1,215 |
| Massachusetts GO | 5.250% | 8/1/23 | 75 | 93 |
| Massachusetts GO | 5.000% | 10/1/23 | 150 | 177 |
| Massachusetts GO | 5.000% | 7/1/24 | 335 | 416 |
| Massachusetts GO | 5.250% | 9/1/25 (4) | 150 | 192 |
| Massachusetts GO | 5.000% | 7/1/26 | 500 | 637 |
| Massachusetts GO | 5.000% | 7/1/27 | 775 | 922 |
| Massachusetts GO | 4.000% | 10/1/27 | 225 | 247 |
| Massachusetts GO | 4.000% | 11/1/29 | 100 | 110 |
| Massachusetts GO | 5.000% | 7/1/30 | 505 | 612 |
| Massachusetts GO | 5.000% | 7/1/33 | 100 | 120 |
| Massachusetts GO | 5.000% | 8/1/35 | 100 | 116 |
| Massachusetts GO | 3.375% | 10/1/35 | 200 | 203 |
| Massachusetts GO | 4.000% | 9/1/37 | 200 | 216 |
| Massachusetts GO | 3.250% | 9/1/38 | 200 | 200 |
| Massachusetts GO | 3.600% | 10/1/38 | 160 | 163 |
| Massachusetts GO | 4.000% | 5/1/39 | 255 | 272 |
| Massachusetts GO | 3.625% | 10/1/39 | 100 | 102 |
| Massachusetts GO | 4.000% | 5/1/40 | 100 | 106 |
| Massachusetts GO | 3.625% | 10/1/41 | 800 | 811 |
| Massachusetts GO | 4.000% | 4/1/42 | 955 | 1,005 |
| Massachusetts GO | 4.500% | 12/1/43 | 1,200 | 1,332 |
| Massachusetts GO | 5.000% | 7/1/45 | 400 | 470 |
| Massachusetts GO | 5.000% | 3/1/46 | 585 | 679 |
| Massachusetts GO | 4.000% | 4/1/46 | 770 | 819 |
| Massachusetts Health & Educational Facilities | | | | |
| Authority Revenue (Harvard University) | 5.000% | 10/1/17 (Prere.) | 685 | 712 |
| Massachusetts Health & Educational Facilities | | | | |
| Authority Revenue (Harvard University) | 5.000% | 12/15/19 (Prere.) | 335 | 376 |
| Massachusetts Health & Educational Facilities | | | | |
| Authority Revenue (MIT) | 5.250% | 7/1/33 | 100 | 137 |
| Massachusetts Port Authority Revenue | 5.000% | 7/1/45 | 160 | 187 |
33
| | | | |
| Tax-Exempt Bond Index Fund | | | | |
| |
| |
| |
| | | | Face | Market |
| | | Maturity | Amount | Value• |
| | Coupon | Date | ($000) | ($000) |
| Massachusetts School Building Authority | | | | |
| Dedicated Sales Tax Revenue | 4.500% | 8/15/17 (Prere.) | 240 | 247 |
| Massachusetts School Building Authority | | | | |
| Dedicated Sales Tax Revenue | 4.500% | 8/15/17 (Prere.) | 90 | 93 |
| Massachusetts School Building Authority | | | | |
| Dedicated Sales Tax Revenue | 4.750% | 8/15/17 (Prere.) | 725 | 748 |
| Massachusetts School Building Authority | | | | |
| Dedicated Sales Tax Revenue | 5.000% | 8/15/19 | 75 | 83 |
| Massachusetts School Building Authority | | | | |
| Dedicated Sales Tax Revenue | 5.000% | 10/15/19 | 595 | 664 |
| Massachusetts School Building Authority | | | | |
| Dedicated Sales Tax Revenue | 5.000% | 8/15/29 | 750 | 898 |
| Massachusetts School Building Authority | | | | |
| Dedicated Sales Tax Revenue | 5.000% | 10/15/32 | 275 | 320 |
| Massachusetts School Building Authority | | | | |
| Dedicated Sales Tax Revenue | 5.250% | 10/15/35 | 55 | 65 |
| Massachusetts School Building Authority | | | | |
| Dedicated Sales Tax Revenue | 5.000% | 10/15/41 | 360 | 419 |
| Massachusetts School Building Authority | | | | |
| Dedicated Sales Tax Revenue | 4.000% | 11/15/46 | 300 | 321 |
| Massachusetts Special Obligation Dedicated | | | | |
| Tax Revenue | 5.500% | 1/1/30 (14) | 125 | 165 |
| Massachusetts State Health & Educational | | | | |
| Facilities Authority Revenue Prerefunded-Berklee | | | | |
| CLG Music | 5.000% | 10/1/17 (Prere.) | 170 | 177 |
| Massachusetts State Health & Educational | | | | |
| Facilities Authority Revenue Unrefunded-Berklee | | | | |
| CLG Music | 5.000% | 10/1/37 | 10 | 10 |
| Massachusetts Transportation Fund Revenue | | | | |
| (Accelerated Bridge Program) | 4.375% | 6/1/43 | 85 | 93 |
| Massachusetts Transportation Fund Revenue | | | | |
| (Accelerated Bridge Program) | 5.000% | 6/1/44 | 750 | 884 |
| Massachusetts Transportation Fund Revenue | | | | |
| (Rail Enhancement Program) | 4.000% | 6/1/45 | 150 | 163 |
| Massachusetts Water Pollution Abatement | | | | |
| Trust Revenue | 5.250% | 8/1/18 | 120 | 129 |
| Massachusetts Water Pollution Abatement | | | | |
| Trust Revenue | 5.250% | 8/1/19 | 100 | 112 |
| Massachusetts Water Pollution Abatement | | | | |
| Trust Revenue | 5.000% | 8/1/22 | 400 | 484 |
| Massachusetts Water Resources Authority | | | | |
| Revenue | 4.500% | 2/1/17 (Prere.) | 100 | 101 |
| Massachusetts Water Resources Authority | | | | |
| Revenue | 5.000% | 8/1/19 (Prere.) | 210 | 233 |
| Massachusetts Water Resources Authority | | | | |
| Revenue | 5.000% | 8/1/19 (Prere.) | 170 | 188 |
| Massachusetts Water Resources Authority | | | | |
| Revenue | 5.250% | 8/1/31 (4) | 80 | 106 |
| Massachusetts Water Resources Authority | | | | |
| Revenue | 5.000% | 8/1/37 | 125 | 145 |
| Massachusetts Water Resources Authority | | | | |
| Revenue | 4.000% | 8/1/40 | 500 | 544 |
| Massachusetts Water Resources Authority | | | | |
| Revenue | 5.000% | 8/1/40 | 250 | 298 |
34
| | | | |
| Tax-Exempt Bond Index Fund | | | | |
| |
| |
| |
| | | | Face | Market |
| | | Maturity | Amount | Value• |
| | Coupon | Date | ($000) | ($000) |
| University of Massachusetts Building Authority | | | | |
| Revenue | 5.000% | 11/1/44 | 85 | 99 |
| University of Massachusetts Building Authority | | | | |
| Revenue | 4.000% | 11/1/45 | 150 | 159 |
| | | | | 27,960 |
| Michigan (1.8%) | | | | |
| Detroit MI City School District GO | 5.250% | 5/1/27 (4) | 110 | 135 |
| Detroit MI City School District GO | 5.250% | 5/1/32 (4) | 125 | 152 |
| Detroit MI GO | 5.250% | 3/1/17 (Prere.) | 100 | 104 |
| Detroit MI Sewage Disposal System Revenue | 5.250% | 7/1/29 (13) | 100 | 106 |
| Detroit MI Sewage Disposal System Revenue | 5.000% | 7/1/36 (14) | 110 | 110 |
| Detroit MI Water Supply System Revenue | 5.750% | 7/1/23 (13) | 250 | 269 |
| Holland MI Electric Utility System Revenue | 5.000% | 7/1/27 | 250 | 288 |
| Karegnondi Water Authority Michigan Water Supply | | | | |
| System Revenue (Karegnondi Water Pipeline) | 5.250% | 11/1/28 | 500 | 584 |
| Kent County MI Airport Revenue (Gerald R. Ford | | | | |
| International Airport) | 5.000% | 1/1/17 (Prere.) | 100 | 101 |
| Lansing MI Board of Water & Light Utility System | | | | |
| Revenue | 5.000% | 7/1/37 | 50 | 57 |
| Lansing MI Board of Water & Light Utility System | | | | |
| Revenue | 5.500% | 7/1/41 | 250 | 293 |
| Michigan Building Authority Revenue | 5.000% | 4/15/19 | 215 | 235 |
| Michigan Building Authority Revenue | 5.000% | 4/15/22 | 100 | 118 |
| Michigan Building Authority Revenue | 5.000% | 4/15/23 | 115 | 139 |
| Michigan Building Authority Revenue | 5.000% | 10/15/32 | 250 | 299 |
| Michigan Building Authority Revenue | 5.000% | 10/15/33 | 125 | 149 |
| Michigan Building Authority Revenue | 5.000% | 4/15/38 | 130 | 151 |
| Michigan Building Authority Revenue | 5.000% | 4/15/41 | 500 | 585 |
| Michigan Building Authority Revenue | 5.000% | 10/15/50 | 110 | 126 |
| Michigan Finance Authority Revenue | 5.000% | 4/1/19 | 250 | 271 |
| Michigan Finance Authority Revenue | 5.000% | 4/1/21 | 250 | 284 |
| Michigan Finance Authority Revenue | 5.000% | 7/1/44 | 500 | 552 |
| Michigan Finance Authority Revenue | | | | |
| (Detroit School District) | 5.000% | 5/1/18 | 600 | 633 |
| Michigan Finance Authority Revenue | | | | |
| (Detroit Water & Sewer) | 5.000% | 7/1/25 (4) | 250 | 300 |
| Michigan Finance Authority Revenue | | | | |
| (Detroit Water & Sewer) | 5.000% | 7/1/25 (4) | 400 | 481 |
| Michigan Finance Authority Revenue | | | | |
| (Detroit Water & Sewer) | 5.000% | 7/1/26 (4) | 280 | 334 |
| Michigan Finance Authority Revenue | | | | |
| (Detroit Water & Sewer) | 5.000% | 7/1/32 (4) | 115 | 132 |
| Michigan Finance Authority Revenue | | | | |
| (Detroit Water & Sewer) | 5.000% | 7/1/34 | 485 | 549 |
| Michigan Finance Authority Revenue | | | | |
| (Unemployment Obligation Assessment) | 5.000% | 1/1/18 | 200 | 210 |
| Michigan Finance Authority Revenue | | | | |
| (Unemployment Obligation Assessment) | 5.000% | 7/1/19 | 200 | 221 |
| Michigan Finance Authority Revenue | | | | |
| (Unemployment Obligation Assessment) | 5.000% | 7/1/20 | 110 | 122 |
| Michigan GAN | 5.000% | 3/15/22 | 300 | 354 |
| Michigan GAN | 5.000% | 3/15/27 | 250 | 312 |
| Michigan GO | 5.250% | 9/15/17 (Prere.) | 245 | 254 |
| Michigan GO | 5.000% | 11/1/18 (Prere.) | 50 | 54 |
| Michigan GO | 5.000% | 5/1/19 | 65 | 69 |
35
| | | | |
| Tax-Exempt Bond Index Fund | | | | |
| |
| |
| |
| | | | Face | Market |
| | | Maturity | Amount | Value• |
| | Coupon | Date | ($000) | ($000) |
| Michigan Grant Anticipation Revenue | 5.250% | 9/15/17 (Prere.) | 400 | 416 |
| Michigan Trunk Line Revenue | 5.500% | 11/1/18 | 65 | 71 |
| Michigan Trunk Line Revenue | 5.000% | 11/1/19 | 50 | 56 |
| University of Michigan Revenue | 5.000% | 4/1/40 | 500 | 599 |
| Wayne County MI Airport Authority Revenue | | | | |
| (Detroit Metropolitan Wayne County Airport) | 5.000% | 12/1/42 (4) | 230 | 260 |
| Wayne State University Michigan Revenue | 5.000% | 11/15/18 (Prere.) | 155 | 168 |
| Wayne State University Michigan Revenue | 5.000% | 11/15/24 (4) | 200 | 216 |
| Western Michigan University Revenue | 5.000% | 5/15/18 (Prere.) | 50 | 53 |
| | | | | 10,972 |
| Minnesota (0.8%) | | | | |
| Hennepin County MN Sales Tax Revenue | 4.750% | 12/15/33 | 250 | 261 |
| Minnesota General Fund Revenue | 5.000% | 3/1/29 | 760 | 888 |
| Minnesota GO | 5.000% | 8/1/17 | 125 | 129 |
| Minnesota GO | 5.000% | 8/1/17 (Prere.) | 545 | 562 |
| Minnesota GO | 5.000% | 8/1/17 (Prere.) | 145 | 150 |
| Minnesota GO | 5.000% | 8/1/19 | 200 | 222 |
| Minnesota GO | 5.000% | 11/1/19 | 75 | 84 |
| Minnesota GO | 5.000% | 8/1/20 | 500 | 573 |
| Minnesota GO | 5.000% | 8/1/21 | 485 | 553 |
| Minnesota GO | 5.000% | 8/1/22 | 160 | 182 |
| Minnesota GO | 5.000% | 8/1/23 | 200 | 228 |
| Minnesota GO | 5.000% | 8/1/23 | 540 | 666 |
| Minnesota GO | 5.000% | 8/1/25 | 500 | 636 |
| Minnesota Municipal Power Agency Revenue | 5.000% | 1/1/40 | 60 | 69 |
| | | | | 5,203 |
| Mississippi (0.3%) | | | | |
| Mississippi Development Bank Special Obligation | | | | |
| Revenue | 5.250% | 8/1/20 (Prere.) | 500 | 576 |
| Mississippi GO | 5.000% | 10/1/20 | 75 | 86 |
| Mississippi GO | 5.000% | 11/1/21 | 150 | 178 |
| Mississippi GO | 5.000% | 10/1/36 | 855 | 993 |
| | | | | 1,833 |
| Missouri (0.3%) | | | | |
| Bi-State Development Agency of the | | | | |
| Missouri-Illinois Metropolitan District | | | | |
| Mass Transit Sales Tax Revenue | 5.000% | 10/1/28 | 100 | 107 |
| Jackson County MO Special Obligation | | | | |
| Revenue (Truman Sports Complex Project) | 5.000% | 12/1/31 | 150 | 177 |
| Kansas City MO Special Obligation Revenue | | | | |
| (Downtown Arena Project) | 5.125% | 4/1/18 (Prere.) | 300 | 318 |
| Kansas City MO Special Obligation Revenue | | | | |
| (Downtown Arena Project) | 5.000% | 4/1/40 | 500 | 573 |
| Metropolitan St. Louis MO Sewer District | | | | |
| Wastewater System Revenue | 5.000% | 5/1/27 | 50 | 61 |
| Missouri Joint Municipal Electric Utility | | | | |
| Commission Power Project Revenue | 5.000% | 1/1/17 (Prere.) | 140 | 141 |
| Missouri Joint Municipal Electric Utility Commission | | | | |
| Power Project Revenue (Iatan 2 Project) | 6.000% | 1/1/19 (Prere.) | 115 | 127 |
| Springfield MO Public Utility Revenue | 4.000% | 8/1/31 | 130 | 143 |
| St. Louis MO Airport Revenue (Lambert-St. Louis | | | | |
| International Airport) | 5.500% | 7/1/30 (14) | 50 | 64 |
| St. Louis MO Sewer & Wastewater Revenue | 5.000% | 5/1/42 | 250 | 292 |
| | | | | 2,003 |
36
| | | | |
| Tax-Exempt Bond Index Fund | | | | |
| |
| |
| |
| | | | Face | Market |
| | | Maturity | Amount | Value• |
| | Coupon | Date | ($000) | ($000) |
| Nebraska (0.3%) | | | | |
| Nebraska GO (Lincoln-West Haymarket Joint | | | | |
| Public Agency) | 5.000% | 12/15/42 | 50 | 58 |
| Nebraska Public Power District Revenue | 5.000% | 1/1/40 | 880 | 1,014 |
| Omaha NE Public Power District Electric Revenue | 5.000% | 2/1/21 | 150 | 174 |
| Omaha NE Public Power District Electric Revenue | 5.000% | 2/1/28 | 250 | 311 |
| Omaha NE Public Power District Electric Revenue | 4.000% | 2/1/38 | 175 | 189 |
| Omaha NE Public Power District Electric Revenue | 4.000% | 2/1/42 | 150 | 158 |
| Omaha NE Public Power District Electric Revenue | 5.250% | 2/1/42 | 135 | 160 |
| | | | | 2,064 |
| Nevada (1.9%) | | | | |
| Clark County NV GO | 5.000% | 11/1/16 (Prere.) | 90 | 90 |
| Clark County NV GO | 5.000% | 11/1/24 (2) | 135 | 135 |
| Clark County NV GO | 5.000% | 11/1/27 | 600 | 754 |
| Clark County NV GO | 5.000% | 6/1/33 | 55 | 58 |
| Clark County NV GO | 5.000% | 6/1/38 | 295 | 312 |
| Clark County NV Highway Improvement Motor | | | | |
| Vehicle Fuel Tax Revenue | 5.000% | 7/1/19 (Prere.) | 500 | 552 |
| Clark County NV Passenger Facility Charge Revenue | | | | |
| (Las Vegas McCarran International Airport) | 5.000% | 7/1/17 (Prere.) | 200 | 206 |
| Clark County NV Passenger Facility Charge Revenue | | | | |
| (Las Vegas McCarran International Airport) | 5.000% | 7/1/17 (Prere.) | 100 | 103 |
| Clark County NV Passenger Facility Charge Revenue | | | | |
| (Las Vegas McCarran International Airport) | 5.000% | 7/1/30 | 100 | 110 |
| Clark County NV Passenger Facility Charge Revenue | | | | |
| (Las Vegas McCarran International Airport) | 5.250% | 7/1/39 (4) | 115 | 127 |
| Clark County NV Passenger Facility Charge Revenue | | | | |
| (Las Vegas McCarran International Airport) | 5.250% | 7/1/42 | 110 | 122 |
| Clark County NV School District GO | 4.500% | 6/15/17 (14) | 55 | 56 |
| Clark County NV School District GO | 5.500% | 6/15/17 | 100 | 103 |
| Clark County NV School District GO | 5.000% | 12/15/17 (Prere.) | 245 | 257 |
| Clark County NV School District GO | 5.000% | 6/15/18 | 720 | 767 |
| Clark County NV School District GO | 5.000% | 6/15/18 (Prere.) | 1,125 | 1,200 |
| Clark County NV School District GO | 5.000% | 6/15/18 (Prere.) | 400 | 427 |
| Clark County NV School District GO | 5.000% | 6/15/18 (Prere.) | 155 | 165 |
| Clark County NV School District GO | 5.000% | 6/15/18 (Prere.) | 320 | 341 |
| Clark County NV School District GO | 5.000% | 6/15/20 | 250 | 266 |
| Clark County NV School District GO | 5.000% | 6/15/21 (14) | 125 | 132 |
| Clark County NV School District GO | 5.000% | 6/15/22 (14) | 75 | 79 |
| Clark County NV School District GO | 5.000% | 6/15/22 | 50 | 53 |
| Clark County NV School District GO | 5.000% | 6/15/23 (14) | 325 | 343 |
| Clark County NV School District GO | 3.500% | 6/15/24 (14) | 125 | 127 |
| Las Vegas NV Convention & Visitors Authority | | | | |
| Revenue | 5.000% | 7/1/28 | 155 | 190 |
| Las Vegas NV Convention & Visitors Authority | | | | |
| Revenue | 5.000% | 7/1/29 | 160 | 194 |
| Las Vegas NV GO | 6.000% | 4/1/19 (Prere.) | 100 | 112 |
| Las Vegas Valley Water District Nevada GO | 5.000% | 2/1/30 | 220 | 231 |
| Las Vegas Valley Water District Nevada GO | 5.000% | 2/1/35 | 150 | 157 |
| Las Vegas Valley Water District Nevada GO | 5.000% | 2/1/36 | 105 | 110 |
| Las Vegas Valley Water District Nevada GO | 5.000% | 6/1/38 | 60 | 68 |
| Las Vegas Valley Water District Nevada GO | 5.000% | 6/1/39 | 865 | 1,021 |
| Las Vegas Valley Water District Nevada GO | 4.000% | 6/1/42 | 200 | 213 |
| Las Vegas Valley Water District Nevada GO | 5.000% | 6/1/42 | 285 | 328 |
| Nevada Capital Improvement & Cultural Affairs GO | 5.000% | 12/1/17 (Prere.) | 125 | 131 |
37
| | | | |
| Tax-Exempt Bond Index Fund | | | | |
| |
| |
| |
| | | | Face | Market |
| | | Maturity | Amount | Value• |
| | Coupon | Date | ($000) | ($000) |
| Nevada Capital Improvement & Cultural Affairs GO | 5.000% | 3/1/22 | 50 | 59 |
| Nevada GO | 5.000% | 12/1/17 (Prere.) | 100 | 105 |
| Nevada GO | 5.000% | 4/1/24 | 110 | 135 |
| Nevada GO | 5.000% | 11/1/24 | 115 | 143 |
| Nevada GO | 5.000% | 11/1/26 | 250 | 309 |
| Nevada Unemployment Compensation Revenue | 5.000% | 12/1/17 | 100 | 105 |
| Truckee Meadows NV Water Authority Water | | | | |
| Revenue | 4.500% | 7/1/30 (4) | 200 | 205 |
| Washoe County NV Highway Fuel Tax Revenue | 5.000% | 2/1/29 | 885 | 957 |
| | | | | 11,658 |
| New Hampshire (0.1%) | | | | |
| New Hampshire Health & Education Facilities | | | | |
| Authority Revenue (Dartmouth College) | 5.250% | 6/1/19 (Prere.) | 365 | 405 |
| |
| New Jersey (5.7%) | | | | |
| Garden State Preservation Trust New Jersey | | | | |
| Revenue (Open Space & Farmland Preservation) | 5.125% | 11/1/16 (4) | 150 | 150 |
| Garden State Preservation Trust New Jersey | | | | |
| Revenue (Open Space & Farmland Preservation) | 5.125% | 11/1/17 (4) | 90 | 94 |
| Garden State Preservation Trust New Jersey | | | | |
| Revenue (Open Space & Farmland Preservation) | 5.000% | 11/1/20 | 145 | 164 |
| New Jersey COP | 5.250% | 6/15/30 | 250 | 269 |
| New Jersey Economic Development Authority | | | | |
| Lease Revenue (Rutgers State University) | 5.000% | 6/15/46 | 495 | 571 |
| New Jersey Economic Development Authority | | | | |
| Revenue | 5.000% | 6/15/23 | 155 | 173 |
| New Jersey Economic Development Authority | | | | |
| Revenue | 4.000% | 6/15/24 | 100 | 106 |
| New Jersey Economic Development Authority | | | | |
| Revenue (Cigarette Tax) | 5.000% | 6/15/17 | 100 | 102 |
| New Jersey Economic Development Authority | | | | |
| Revenue (Cigarette Tax) | 5.000% | 6/15/24 | 130 | 145 |
| New Jersey Economic Development Authority | | | | |
| Revenue (Cigarette Tax) | 4.250% | 6/15/27 | 320 | 333 |
| New Jersey Economic Development Authority | | | | |
| Revenue (School Facilities Construction) | 5.000% | 3/1/17 (ETM) | 15 | 15 |
| New Jersey Economic Development Authority | | | | |
| Revenue (School Facilities Construction) | 5.000% | 9/1/17 (Prere.) | 120 | 124 |
| New Jersey Economic Development Authority | | | | |
| Revenue (School Facilities Construction) | 5.000% | 9/1/17 (ETM) | 590 | 611 |
| New Jersey Economic Development Authority | | | | |
| Revenue (School Facilities Construction) | 5.000% | 3/1/19 (ETM) | 1,000 | 1,091 |
| New Jersey Economic Development Authority | | | | |
| Revenue (School Facilities Construction) | 5.000% | 6/15/19 | 400 | 430 |
| New Jersey Economic Development Authority | | | | |
| Revenue (School Facilities Construction) | 5.000% | 3/1/20 | 220 | 239 |
| New Jersey Economic Development Authority | | | | |
| Revenue (School Facilities Construction) | 5.000% | 3/1/21 | 250 | 274 |
| New Jersey Economic Development Authority | | | | |
| Revenue (School Facilities Construction) | 5.250% | 12/15/21 (14) | 100 | 115 |
| New Jersey Economic Development Authority | | | | |
| Revenue (School Facilities Construction) | 5.000% | 3/1/22 | 350 | 388 |
| New Jersey Economic Development Authority | | | | |
| Revenue (School Facilities Construction) | 5.000% | 3/1/23 | 575 | 641 |
38
| | | | |
| Tax-Exempt Bond Index Fund | | | | |
| |
| |
| |
| | | | Face | Market |
| | | Maturity | Amount | Value• |
| | Coupon | Date | ($000) | ($000) |
| New Jersey Economic Development Authority | | | | |
| Revenue (School Facilities Construction) | 5.000% | 3/1/24 | 750 | 836 |
| New Jersey Economic Development Authority | | | | |
| Revenue (School Facilities Construction) | 5.000% | 3/1/25 | 1,515 | 1,687 |
| New Jersey Economic Development Authority | | | | |
| Revenue (School Facilities Construction) | 5.250% | 9/1/25 | 250 | 277 |
| New Jersey Economic Development Authority | | | | |
| Revenue (School Facilities Construction) | 5.000% | 3/1/26 | 155 | 172 |
| New Jersey Economic Development Authority | | | | |
| Revenue (School Facilities Construction) | 4.375% | 6/15/27 | 110 | 118 |
| New Jersey Economic Development Authority | | | | |
| Revenue (School Facilities Construction) | 5.000% | 6/15/27 | 165 | 186 |
| New Jersey Economic Development Authority | | | | |
| Revenue (School Facilities Construction) | 5.000% | 3/1/28 | 455 | 503 |
| New Jersey Economic Development Authority | | | | |
| Revenue (School Facilities Construction) | 5.000% | 3/1/29 | 180 | 198 |
| New Jersey Economic Development Authority | | | | |
| Revenue (School Facilities Construction) | 5.000% | 3/1/38 | 150 | 161 |
| New Jersey Economic Development Authority | | | | |
| Revenue (School Facilities Construction) | 5.000% | 6/15/40 | 100 | 108 |
| New Jersey Economic Development Authority | | | | |
| Revenue(Provident Group-Rowan Properties | | | | |
| LLC - Rowan University Housing Project) | 5.000% | 1/1/48 | 100 | 111 |
| New Jersey Economic Development Authority | | | | |
| Sublease Revenue (New Jersey Transit Corp. | | | | |
| Light Rail Transit System Project) | 5.000% | 5/1/19 | 215 | 231 |
| New Jersey Educational Facilities Authority | | | | |
| Revenue (College of New Jersey) | 5.000% | 7/1/18 (Prere.) | 140 | 150 |
| New Jersey Educational Facilities Authority | | | | |
| Revenue (Kean University) | 5.000% | 7/1/17 (Prere.) | 100 | 103 |
| New Jersey Educational Facilities Authority | | | | |
| Revenue (Princeton University) | 5.000% | 7/1/33 | 160 | 165 |
| New Jersey Educational Facilities Authority | | | | |
| Revenue (Princeton University) | 4.500% | 7/1/35 | 1,000 | 1,056 |
| New Jersey Educational Facilities Authority | | | | |
| Revenue (Princeton University) | 4.500% | 7/1/37 | 300 | 307 |
| New Jersey Educational Facilities Authority | | | | |
| Revenue (Princeton University) | 4.000% | 7/1/45 | 140 | 155 |
| New Jersey Equipment Lease Purchase COP | 5.000% | 6/15/21 | 100 | 106 |
| New Jersey GO | 5.000% | 6/1/20 | 300 | 335 |
| New Jersey GO | 5.000% | 6/1/22 | 500 | 583 |
| New Jersey GO | 5.000% | 6/1/28 | 125 | 149 |
| New Jersey Health Care Facilities Financing | | | | |
| Authority Revenue (Hospital Asset | | | | |
| Transformation Program) | 5.250% | 10/1/18 (Prere.) | 15 | 16 |
| New Jersey Health Care Facilities Financing | | | | |
| Authority Revenue (Hospital Asset | | | | |
| Transformation Program) | 5.250% | 10/1/38 | 40 | 42 |
| New Jersey Higher Education Assistance | | | | |
| Authority Student Loan Revenue | 5.625% | 6/1/30 | 100 | 110 |
| New Jersey Transportation Trust Fund Authority | | | | |
| Federal Highway Reimbursement Revenue | 5.000% | 6/15/19 | 150 | 162 |
| New Jersey Transportation Trust Fund Authority | | | | |
| Federal Highway Reimbursement Revenue | 5.000% | 6/15/20 | 200 | 219 |
39
| | | | |
| Tax-Exempt Bond Index Fund | | | | |
| |
| |
| |
| | | | Face | Market |
| | | Maturity | Amount | Value• |
| | Coupon | Date | ($000) | ($000) |
| New Jersey Transportation Trust Fund Authority | | | | |
| Federal Highway Reimbursement Revenue | 5.000% | 6/15/21 | 150 | 157 |
| New Jersey Transportation Trust Fund Authority | | | | |
| Federal Highway Reimbursement Revenue | 5.000% | 6/15/22 | 150 | 157 |
| New Jersey Transportation Trust Fund Authority | | | | |
| Federal Highway Reimbursement Revenue | 5.000% | 6/15/23 | 150 | 157 |
| New Jersey Transportation Trust Fund Authority | | | | |
| Federal Highway Reimbursement Revenue | 5.000% | 6/15/23 | 100 | 113 |
| New Jersey Transportation Trust Fund Authority | | | | |
| Federal Highway Reimbursement Revenue | 5.000% | 6/15/24 | 160 | 167 |
| New Jersey Transportation Trust Fund Authority | | | | |
| Federal Highway Reimbursement Revenue | 5.000% | 6/15/25 | 200 | 227 |
| New Jersey Transportation Trust Fund Authority | | | | |
| Federal Highway Reimbursement Revenue | 5.000% | 6/15/27 | 300 | 339 |
| New Jersey Transportation Trust Fund Authority | | | | |
| Federal Highway Reimbursement Revenue | 5.000% | 6/15/28 | 300 | 336 |
| New Jersey Transportation Trust Fund Authority | | | | |
| Federal Highway Reimbursement Revenue | 5.000% | 6/15/29 | 200 | 208 |
| New Jersey Transportation Trust Fund Authority | | | | |
| Federal Highway Reimbursement Revenue | 5.000% | 6/15/30 | 150 | 166 |
| New Jersey Transportation Trust Fund Authority | | | | |
| Federal Highway Reimbursement Revenue | 5.000% | 6/15/30 | 225 | 234 |
| New Jersey Transportation Trust Fund Authority | | | | |
| Federal Highway Reimbursement Revenue | 5.000% | 6/15/31 | 250 | 260 |
| New Jersey Transportation Trust Fund Authority | | | | |
| Transportation Program Revenue | 5.000% | 6/15/25 | 580 | 641 |
| New Jersey Transportation Trust Fund Authority | | | | |
| Transportation Program Revenue | 5.000% | 12/15/25 (2) | 245 | 254 |
| New Jersey Transportation Trust Fund Authority | | | | |
| Transportation Program Revenue | 5.000% | 6/15/28 | 100 | 110 |
| New Jersey Transportation Trust Fund Authority | | | | |
| Transportation Program Revenue | 5.750% | 12/15/31 | 200 | 216 |
| New Jersey Transportation Trust Fund Authority | | | | |
| Transportation Program Revenue | 5.000% | 6/15/32 | 250 | 271 |
| New Jersey Transportation Trust Fund Authority | | | | |
| Transportation Program Revenue | 0.000% | 12/15/36 | 170 | 67 |
| New Jersey Transportation Trust Fund Authority | | | | |
| Transportation Program Revenue | 4.750% | 6/15/38 | 150 | 160 |
| New Jersey Transportation Trust Fund Authority | | | | |
| Transportation Program Revenue | 5.000% | 6/15/38 | 460 | 495 |
| New Jersey Transportation Trust Fund Authority | | | | |
| Transportation Program Revenue | 5.000% | 6/15/44 | 400 | 431 |
| New Jersey Transportation Trust Fund Authority | | | | |
| Transportation Program Revenue | 5.000% | 6/15/46 | 50 | 54 |
| New Jersey Transportation Trust Fund Authority | | | | |
| Transportation System Revenue | 5.000% | 12/15/16 | 400 | 402 |
| New Jersey Transportation Trust Fund Authority | | | | |
| Transportation System Revenue | 5.000% | 12/15/16 | 160 | 161 |
| New Jersey Transportation Trust Fund Authority | | | | |
| Transportation System Revenue | 5.500% | 12/15/16 (14) | 440 | 443 |
| New Jersey Transportation Trust Fund Authority | | | | |
| Transportation System Revenue | 5.500% | 12/15/16 (4) | 110 | 111 |
| New Jersey Transportation Trust Fund Authority | | | | |
| Transportation System Revenue | 5.000% | 12/15/19 | 200 | 218 |
40
| | | | |
| Tax-Exempt Bond Index Fund | | | | |
| |
| |
| |
| | | | Face | Market |
| | | Maturity | Amount | Value• |
| | Coupon | Date | ($000) | ($000) |
| New Jersey Transportation Trust Fund Authority | | | | |
| Transportation System Revenue | 5.250% | 12/15/19 | 500 | 549 |
| New Jersey Transportation Trust Fund Authority | | | | |
| Transportation System Revenue | 5.250% | 12/15/19 | 325 | 357 |
| New Jersey Transportation Trust Fund Authority | | | | |
| Transportation System Revenue | 5.500% | 12/15/21 | 635 | 722 |
| New Jersey Transportation Trust Fund Authority | | | | |
| Transportation System Revenue | 5.000% | 6/15/22 | 125 | 139 |
| New Jersey Transportation Trust Fund Authority | | | | |
| Transportation System Revenue | 5.250% | 6/15/22 | 65 | 72 |
| New Jersey Transportation Trust Fund Authority | | | | |
| Transportation System Revenue | 5.500% | 12/15/22 | 170 | 195 |
| New Jersey Transportation Trust Fund Authority | | | | |
| Transportation System Revenue | 5.000% | 12/15/23 | 430 | 485 |
| New Jersey Transportation Trust Fund Authority | | | | |
| Transportation System Revenue | 5.250% | 12/15/23 (2) | 255 | 292 |
| New Jersey Transportation Trust Fund Authority | | | | |
| Transportation System Revenue | 5.000% | 6/15/24 | 140 | 159 |
| New Jersey Transportation Trust Fund Authority | | | | |
| Transportation System Revenue | 5.000% | 12/15/24 | 250 | 285 |
| New Jersey Transportation Trust Fund Authority | | | | |
| Transportation System Revenue | 0.000% | 12/15/26 (2) | 150 | 105 |
| New Jersey Transportation Trust Fund Authority | | | | |
| Transportation System Revenue | 5.000% | 12/15/26 (2) | 100 | 104 |
| New Jersey Transportation Trust Fund Authority | | | | |
| Transportation System Revenue | 5.000% | 12/15/27 (2) | 130 | 135 |
| New Jersey Transportation Trust Fund Authority | | | | |
| Transportation System Revenue | 0.000% | 12/15/28 (2) | 745 | 472 |
| New Jersey Transportation Trust Fund Authority | | | | |
| Transportation System Revenue | 0.000% | 12/15/28 | 220 | 135 |
| New Jersey Transportation Trust Fund Authority | | | | |
| Transportation System Revenue | 0.000% | 12/15/29 | 100 | 58 |
| New Jersey Transportation Trust Fund Authority | | | | |
| Transportation System Revenue | 0.000% | 12/15/30 | 280 | 156 |
| New Jersey Transportation Trust Fund Authority | | | | |
| Transportation System Revenue | 0.000% | 12/15/31 | 495 | 253 |
| New Jersey Transportation Trust Fund Authority | | | | |
| Transportation System Revenue | 5.000% | 6/15/32 | 700 | 769 |
| New Jersey Transportation Trust Fund Authority | | | | |
| Transportation System Revenue | 5.250% | 6/15/32 | 500 | 559 |
| New Jersey Transportation Trust Fund Authority | | | | |
| Transportation System Revenue | 0.000% | 12/15/32 (4) | 865 | 456 |
| New Jersey Transportation Trust Fund Authority | | | | |
| Transportation System Revenue | 0.000% | 12/15/32 | 60 | 29 |
| New Jersey Transportation Trust Fund Authority | | | | |
| Transportation System Revenue | 5.000% | 12/15/32 (2) | 100 | 103 |
| New Jersey Transportation Trust Fund Authority | | | | |
| Transportation System Revenue | 0.000% | 12/15/34 | 305 | 133 |
| New Jersey Transportation Trust Fund Authority | | | | |
| Transportation System Revenue | 5.250% | 6/15/36 | 250 | 274 |
| New Jersey Transportation Trust Fund Authority | | | | |
| Transportation System Revenue | 0.000% | 12/15/37 | 415 | 157 |
| New Jersey Transportation Trust Fund Authority | | | | |
| Transportation System Revenue | 0.000% | 12/15/38 | 720 | 258 |
41
| | | | |
| Tax-Exempt Bond Index Fund | | | | |
| |
| |
| |
| | | | Face | Market |
| | | Maturity | Amount | Value• |
| | Coupon | Date | ($000) | ($000) |
| New Jersey Transportation Trust Fund Authority | | | | |
| Transportation System Revenue | 0.000% | 12/15/38 | 150 | 54 |
| New Jersey Transportation Trust Fund Authority | | | | |
| Transportation System Revenue | 5.875% | 12/15/38 | 200 | 217 |
| New Jersey Transportation Trust Fund Authority | | | | |
| Transportation System Revenue | 6.000% | 12/15/38 | 250 | 272 |
| New Jersey Transportation Trust Fund Authority | | | | |
| Transportation System Revenue | 0.000% | 12/15/39 | 155 | 53 |
| New Jersey Transportation Trust Fund Authority | | | | |
| Transportation System Revenue | 0.000% | 12/15/40 | 380 | 123 |
| New Jersey Transportation Trust Fund Authority | | | | |
| Transportation System Revenue | 5.000% | 6/15/42 | 370 | 393 |
| New Jersey Transportation Trust Fund Authority | | | | |
| Transportation System Revenue | 5.000% | 6/15/42 | 315 | 339 |
| New Jersey Turnpike Authority Revenue | 5.000% | 1/1/19 | 80 | 87 |
| New Jersey Turnpike Authority Revenue | 5.000% | 1/1/20 | 150 | 168 |
| New Jersey Turnpike Authority Revenue | 5.000% | 1/1/25 | 200 | 238 |
| New Jersey Turnpike Authority Revenue | 5.250% | 1/1/26 (4) | 240 | 305 |
| New Jersey Turnpike Authority Revenue | 5.000% | 1/1/27 | 170 | 201 |
| New Jersey Turnpike Authority Revenue | 5.250% | 1/1/27 (4) | 50 | 64 |
| New Jersey Turnpike Authority Revenue | 5.000% | 1/1/29 | 100 | 118 |
| New Jersey Turnpike Authority Revenue | 5.000% | 1/1/30 | 100 | 120 |
| New Jersey Turnpike Authority Revenue | 5.000% | 1/1/32 | 100 | 119 |
| New Jersey Turnpike Authority Revenue | 5.000% | 1/1/33 | 400 | 469 |
| New Jersey Turnpike Authority Revenue | 5.000% | 1/1/33 | 170 | 201 |
| New Jersey Turnpike Authority Revenue | 5.000% | 1/1/34 | 255 | 301 |
| New Jersey Turnpike Authority Revenue | 5.000% | 1/1/38 | 790 | 903 |
| New Jersey Turnpike Authority Revenue | 4.000% | 1/1/43 | 100 | 105 |
| New Jersey Turnpike Authority Revenue | 5.000% | 1/1/43 | 435 | 496 |
| New Jersey Turnpike Authority Revenue | 5.000% | 1/1/45 | 850 | 981 |
| Newark NJ Housing Authority Port Authority-Port | | | | |
| Newark Marine Terminal Revenue (City of Newark | | | | |
| Redevelopment Projects) | 4.375% | 1/1/37 (14) | 105 | 105 |
| Rutgers State University New Jersey Revenue | 5.000% | 5/1/19 (Prere.) | 315 | 346 |
| South Jersey Transportation Authority New Jersey | | | | |
| Transportation System Revenue | 5.000% | 11/1/20 | 130 | 145 |
| | | | | 35,170 |
| New Mexico (0.1%) | | | | |
| New Mexico Finance Authority Transportation | | | | |
| Revenue | 5.000% | 6/15/17 | 350 | 360 |
| New Mexico Finance Authority Transportation | | | | |
| Revenue | 5.000% | 6/15/18 | 125 | 133 |
| | | | | 493 |
| New York (20.8%) | | | | |
| Brooklyn NY Local Development Corp. PILOT | | | | |
| Revenue (Barclays Center Project) | 6.375% | 1/15/20 (Prere.) | 625 | 729 |
| Brooklyn NY Local Development Corp. PILOT | | | | |
| Revenue (Barclays Center Project) | 6.500% | 1/15/20 (Prere.) | 255 | 298 |
| Brooklyn NY Local Development Corp. PILOT | | | | |
| Revenue (Barclays Center Project) | 0.000% | 7/15/46 | 175 | 47 |
| Brooklyn NY Local Development Corp. PILOT | | | | |
| Revenue (Barclays Center Project) | 0.000% | 7/15/47 | 240 | 62 |
| Brooklyn NY Local Development Corp. PILOT | | | | |
| Revenue (Brooklyn Events Center) | 5.000% | 7/15/42 | 200 | 229 |
42
| | | | |
| Tax-Exempt Bond Index Fund | | | | |
| |
| |
| |
| | | | Face | Market |
| | | Maturity | Amount | Value• |
| | Coupon | Date | ($000) | ($000) |
| Hudson Yards Infrastructure Corp. New York | | | | |
| Revenue | 4.500% | 2/15/47 (14) | 905 | 915 |
| Hudson Yards Infrastructure Corp. New York | | | | |
| Revenue | 5.000% | 2/15/47 | 1,425 | 1,442 |
| Hudson Yards Infrastructure Corp. New York | | | | |
| Revenue | 5.000% | 2/15/47 (3) | 1,015 | 1,027 |
| Long Island NY Power Authority Electric System | | | | |
| Revenue | 5.000% | 12/1/16 (Prere.) | 190 | 191 |
| Long Island NY Power Authority Electric System | | | | |
| Revenue | 5.000% | 12/1/16 (Prere.) | 10 | 10 |
| Long Island NY Power Authority Electric System | | | | |
| Revenue | 5.500% | 4/1/19 (Prere.) | 400 | 443 |
| Long Island NY Power Authority Electric System | | | | |
| Revenue | 5.750% | 4/1/19 (Prere.) | 135 | 150 |
| Long Island NY Power Authority Electric System | | | | |
| Revenue | 5.750% | 4/1/19 (Prere.) | 150 | 167 |
| Long Island NY Power Authority Electric System | | | | |
| Revenue | 6.250% | 4/1/19 (Prere.) | 335 | 377 |
| Long Island NY Power Authority Electric System | | | | |
| Revenue | 5.500% | 5/1/19 (Prere.) | 300 | 333 |
| Long Island NY Power Authority Electric System | | | | |
| Revenue | 6.000% | 5/1/19 (Prere.) | 550 | 618 |
| Long Island NY Power Authority Electric System | | | | |
| Revenue | 0.000% | 6/1/22 (4) | 100 | 91 |
| Long Island NY Power Authority Electric System | | | | |
| Revenue | 0.000% | 6/1/26 (4) | 110 | 89 |
| Long Island NY Power Authority Electric System | | | | |
| Revenue | 5.000% | 9/1/26 | 100 | 117 |
| Long Island NY Power Authority Electric System | | | | |
| Revenue | 0.000% | 6/1/28 (4) | 270 | 203 |
| Long Island NY Power Authority Electric System | | | | |
| Revenue | 5.000% | 9/1/37 | 500 | 574 |
| Long Island NY Power Authority Electric System | | | | |
| Revenue | 5.000% | 9/1/41 | 495 | 576 |
| Long Island NY Power Authority Electric System | | | | |
| Revenue | 5.000% | 9/1/42 | 105 | 120 |
| Long Island NY Power Authority Electric System | | | | |
| Revenue | 5.000% | 9/1/45 | 200 | 230 |
| Nassau County NY GO | 5.000% | 4/1/39 | 250 | 287 |
| Nassau County NY GO | 5.000% | 4/1/43 | 300 | 343 |
| New York City NY GO | 5.000% | 8/1/17 | 285 | 294 |
| New York City NY GO | 5.000% | 8/1/17 | 100 | 103 |
| New York City NY GO | 5.000% | 8/1/17 | 550 | 568 |
| New York City NY GO | 5.000% | 8/1/18 | 405 | 433 |
| New York City NY GO | 5.000% | 8/1/18 | 500 | 535 |
| New York City NY GO | 5.000% | 8/1/18 | 240 | 257 |
| New York City NY GO | 5.000% | 8/1/18 | 500 | 535 |
| New York City NY GO | 5.000% | 5/15/19 (Prere.) | 15 | 17 |
| New York City NY GO | 5.000% | 8/1/19 | 120 | 133 |
| New York City NY GO | 5.000% | 8/1/19 | 195 | 216 |
| New York City NY GO | 5.000% | 8/1/19 | 175 | 194 |
| New York City NY GO | 4.000% | 9/1/19 | 255 | 270 |
| New York City NY GO | 5.000% | 8/1/20 | 310 | 353 |
| New York City NY GO | 5.000% | 8/1/20 | 500 | 569 |
| New York City NY GO | 5.000% | 8/1/20 | 1,300 | 1,480 |
43
| | | | |
| Tax-Exempt Bond Index Fund | | | | |
| |
| |
| |
| | | | Face | Market |
| | | Maturity | Amount | Value• |
| | Coupon | Date | ($000) | ($000) |
| New York City NY GO | 5.000% | 8/1/20 | 210 | 232 |
| New York City NY GO | 5.000% | 4/1/21 | 705 | 817 |
| New York City NY GO | 5.000% | 8/1/21 | 125 | 138 |
| New York City NY GO | 5.000% | 8/1/21 | 300 | 351 |
| New York City NY GO | 5.000% | 8/1/22 | 120 | 144 |
| New York City NY GO | 5.000% | 8/1/22 | 300 | 359 |
| New York City NY GO | 5.000% | 8/1/22 | 60 | 72 |
| New York City NY GO | 5.000% | 8/1/22 | 60 | 72 |
| New York City NY GO | 5.000% | 4/1/23 | 700 | 832 |
| New York City NY GO | 5.000% | 8/1/23 | 125 | 138 |
| New York City NY GO | 5.000% | 8/1/23 | 250 | 293 |
| New York City NY GO | 5.000% | 4/1/24 | 150 | 159 |
| New York City NY GO | 5.000% | 8/1/24 | 435 | 540 |
| New York City NY GO | 5.000% | 8/1/24 | 550 | 683 |
| New York City NY GO | 5.000% | 8/1/24 | 575 | 714 |
| New York City NY GO | 5.000% | 2/1/25 | 120 | 126 |
| New York City NY GO | 5.000% | 8/1/25 | 200 | 241 |
| New York City NY GO | 5.000% | 8/1/25 | 170 | 208 |
| New York City NY GO | 5.000% | 8/1/25 | 140 | 174 |
| New York City NY GO | 5.000% | 8/1/25 | 350 | 440 |
| New York City NY GO | 5.000% | 4/1/26 | 100 | 106 |
| New York City NY GO | 5.000% | 8/1/26 | 500 | 596 |
| New York City NY GO | 5.500% | 11/15/26 | 100 | 109 |
| New York City NY GO | 5.125% | 12/1/26 | 100 | 105 |
| New York City NY GO | 5.000% | 8/1/27 | 200 | 248 |
| New York City NY GO | 5.000% | 8/1/28 | 300 | 365 |
| New York City NY GO | 5.000% | 8/1/28 | 55 | 68 |
| New York City NY GO | 5.000% | 10/1/28 | 225 | 268 |
| New York City NY GO | 5.000% | 8/1/29 | 315 | 379 |
| New York City NY GO | 5.000% | 8/1/29 | 240 | 288 |
| New York City NY GO | 5.000% | 3/1/30 | 100 | 118 |
| New York City NY GO | 5.000% | 10/1/30 | 200 | 233 |
| New York City NY GO | 5.000% | 5/15/31 | 230 | 251 |
| New York City NY GO | 5.000% | 8/1/32 | 110 | 130 |
| New York City NY GO | 5.000% | 10/1/32 | 185 | 216 |
| New York City NY GO | 5.000% | 8/1/35 | 50 | 58 |
| New York City NY IDA (Yankee Stadium) | 5.000% | 3/1/31 (3) | 20 | 20 |
| New York City NY Industrial Development | | | | |
| Agency PILOT Revenue (Yankee Stadium Project) | 5.000% | 3/1/36 (14) | 100 | 100 |
| New York City NY Industrial Development | | | | |
| Agency PILOT Revenue (Yankee Stadium Project) | 4.500% | 3/1/39 (3) | 50 | 50 |
| New York City NY Industrial Development | | | | |
| Agency PILOT Revenue (Yankee Stadium Project) | 4.750% | 3/1/46 (14) | 100 | 100 |
| New York City NY Industrial Development Agency | | | | |
| PILOT Revenue (Yankee Stadium Project) | 5.000% | 3/1/46 (3) | 565 | 568 |
| New York City NY Municipal Water Finance | | | | |
| Authority Water & Sewer System Revenue | 4.500% | 6/15/17 (Prere.) | 55 | 56 |
| New York City NY Municipal Water Finance | | | | |
| Authority Water & Sewer System Revenue | 4.750% | 6/15/17 (Prere.) | 85 | 87 |
| New York City NY Municipal Water Finance | | | | |
| Authority Water & Sewer System Revenue | 5.000% | 6/15/18 (Prere.) | 15 | 16 |
| New York City NY Municipal Water Finance | | | | |
| Authority Water & Sewer System Revenue | 5.000% | 6/15/26 | 240 | 281 |
| New York City NY Municipal Water Finance | | | | |
| Authority Water & Sewer System Revenue | 5.000% | 6/15/29 | 170 | 191 |
44
| | | | |
| Tax-Exempt Bond Index Fund | | | | |
| |
| |
| |
| | | | Face | Market |
| | | Maturity | Amount | Value• |
| | Coupon | Date | ($000) | ($000) |
| New York City NY Municipal Water Finance | | | | |
| Authority Water & Sewer System Revenue | 5.250% | 6/15/30 | 120 | 143 |
| New York City NY Municipal Water Finance | | | | |
| Authority Water & Sewer System Revenue | 4.750% | 6/15/33 (14) | 50 | 51 |
| New York City NY Municipal Water Finance | | | | |
| Authority Water & Sewer System Revenue | 4.000% | 6/15/34 | 150 | 165 |
| New York City NY Municipal Water Finance | | | | |
| Authority Water & Sewer System Revenue | 5.000% | 6/15/34 | 460 | 546 |
| New York City NY Municipal Water Finance | | | | |
| Authority Water & Sewer System Revenue | 4.750% | 6/15/35 | 15 | 15 |
| New York City NY Municipal Water Finance | | | | |
| Authority Water & Sewer System Revenue | 5.000% | 6/15/35 | 625 | 688 |
| New York City NY Municipal Water Finance | | | | |
| Authority Water & Sewer System Revenue | 4.750% | 6/15/36 (4) | 150 | 154 |
| New York City NY Municipal Water Finance | | | | |
| Authority Water & Sewer System Revenue | 5.000% | 6/15/36 | 485 | 575 |
| New York City NY Municipal Water Finance | | | | |
| Authority Water & Sewer System Revenue | 5.000% | 6/15/37 | 170 | 181 |
| New York City NY Municipal Water Finance | | | | |
| Authority Water & Sewer System Revenue | 4.500% | 6/15/38 | 500 | 526 |
| New York City NY Municipal Water Finance | | | | |
| Authority Water & Sewer System Revenue | 5.000% | 6/15/38 | 790 | 810 |
| New York City NY Municipal Water Finance | | | | |
| Authority Water & Sewer System Revenue | 5.000% | 6/15/38 | 350 | 411 |
| New York City NY Municipal Water Finance | | | | |
| Authority Water & Sewer System Revenue | 4.500% | 6/15/39 (14) | 205 | 209 |
| New York City NY Municipal Water Finance | | | | |
| Authority Water & Sewer System Revenue | 5.000% | 6/15/39 | 100 | 118 |
| New York City NY Municipal Water Finance | | | | |
| Authority Water & Sewer System Revenue | 5.000% | 6/15/39 | 300 | 354 |
| New York City NY Municipal Water Finance | | | | |
| Authority Water & Sewer System Revenue | 5.000% | 6/15/39 | 700 | 769 |
| New York City NY Municipal Water Finance | | | | |
| Authority Water & Sewer System Revenue | 5.000% | 6/15/39 | 195 | 231 |
| New York City NY Municipal Water Finance | | | | |
| Authority Water & Sewer System Revenue | 5.000% | 6/15/40 | 1,220 | 1,340 |
| New York City NY Municipal Water Finance | | | | |
| Authority Water & Sewer System Revenue | 5.250% | 6/15/40 | 260 | 287 |
| New York City NY Municipal Water Finance | | | | |
| Authority Water & Sewer System Revenue | 5.500% | 6/15/40 | 120 | 133 |
| New York City NY Municipal Water Finance | | | | |
| Authority Water & Sewer System Revenue | 5.750% | 6/15/40 | 180 | 194 |
| New York City NY Municipal Water Finance | | | | |
| Authority Water & Sewer System Revenue | 5.000% | 6/15/43 | 115 | 132 |
| New York City NY Municipal Water Finance | | | | |
| Authority Water & Sewer System Revenue | 5.375% | 6/15/43 | 740 | 858 |
| New York City NY Municipal Water Finance | | | | |
| Authority Water & Sewer System Revenue | 5.500% | 6/15/43 | 65 | 76 |
| New York City NY Municipal Water Finance | | | | |
| Authority Water & Sewer System Revenue | 5.000% | 6/15/44 | 555 | 637 |
| New York City NY Municipal Water Finance | | | | |
| Authority Water & Sewer System Revenue | 5.250% | 6/15/44 | 400 | 472 |
| New York City NY Municipal Water Finance | | | | |
| Authority Water & Sewer System Revenue | 4.000% | 6/15/45 | 100 | 107 |
45
| | | | |
| Tax-Exempt Bond Index Fund | | | | |
| |
| |
| |
| | | | Face | Market |
| | | Maturity | Amount | Value• |
| | Coupon | Date | ($000) | ($000) |
| New York City NY Municipal Water Finance | | | | |
| Authority Water & Sewer System Revenue | 5.000% | 6/15/45 | 655 | 759 |
| New York City NY Municipal Water Finance | | | | |
| Authority Water & Sewer System Revenue | 5.000% | 6/15/46 | 775 | 899 |
| New York City NY Municipal Water Finance | | | | |
| Authority Water & Sewer System Revenue | 5.000% | 6/15/47 | 300 | 347 |
| New York City NY Municipal Water Finance | | | | |
| Authority Water & Sewer System Revenue | 5.000% | 6/15/47 | 250 | 290 |
| New York City NY Municipal Water Finance | | | | |
| Authority Water & Sewer System Revenue | 5.000% | 6/15/47 | 1,190 | 1,386 |
| New York City NY Municipal Water Finance | | | | |
| Authority Water & Sewer System Revenue | 5.000% | 6/15/47 | 355 | 413 |
| New York City NY Sales Tax Asset Receivable | | | | |
| Corp. Revenue | 5.000% | 10/15/21 | 750 | 889 |
| New York City NY Sales Tax Asset Receivable | | | | |
| Corp. Revenue | 5.000% | 10/15/22 | 200 | 243 |
| New York City NY Sales Tax Asset Receivable | | | | |
| Corp. Revenue | 5.000% | 10/15/28 | 295 | 368 |
| New York City NY Sales Tax Asset Receivable | | | | |
| Corp. Revenue | 5.000% | 10/15/30 | 165 | 204 |
| New York City NY Sales Tax Asset Receivable | | | | |
| Corp. Revenue | 5.000% | 10/15/31 | 215 | 264 |
| New York City NY Transitional Finance Authority | | | | |
| Building Aid Revenue | 5.000% | 7/15/25 | 160 | 187 |
| New York City NY Transitional Finance Authority | | | | |
| Building Aid Revenue | 3.250% | 7/15/27 | 100 | 106 |
| New York City NY Transitional Finance Authority | | | | |
| Building Aid Revenue | 5.250% | 1/15/30 | 60 | 65 |
| New York City NY Transitional Finance Authority | | | | |
| Building Aid Revenue | 4.500% | 1/15/31 (14) | 350 | 352 |
| New York City NY Transitional Finance Authority | | | | |
| Building Aid Revenue | 5.000% | 7/15/31 | 80 | 97 |
| New York City NY Transitional Finance Authority | | | | |
| Building Aid Revenue | 5.500% | 1/15/33 | 315 | 346 |
| New York City NY Transitional Finance Authority | | | | |
| Building Aid Revenue | 6.000% | 7/15/33 | 280 | 304 |
| New York City NY Transitional Finance Authority | | | | |
| Building Aid Revenue | 4.250% | 1/15/34 | 245 | 246 |
| New York City NY Transitional Finance Authority | | | | |
| Building Aid Revenue | 5.000% | 1/15/34 | 700 | 733 |
| New York City NY Transitional Finance Authority | | | | |
| Building Aid Revenue | 5.375% | 1/15/34 | 140 | 153 |
| New York City NY Transitional Finance Authority | | | | |
| Building Aid Revenue | 5.000% | 7/15/35 | 750 | 888 |
| New York City NY Transitional Finance Authority | | | | |
| Building Aid Revenue | 5.000% | 7/15/36 | 100 | 115 |
| New York City NY Transitional Finance Authority | | | | |
| Building Aid Revenue | 5.000% | 7/15/36 (12) | 100 | 101 |
| New York City NY Transitional Finance Authority | | | | |
| Building Aid Revenue | 5.500% | 1/15/39 | 245 | 269 |
| New York City NY Transitional Finance Authority | | | | |
| Building Aid Revenue | 5.000% | 7/15/43 | 300 | 349 |
| New York City NY Transitional Finance Authority | | | | |
| Future Tax Revenue | 5.000% | 11/1/17 | 350 | 365 |
46
| | | | |
| Tax-Exempt Bond Index Fund | | | | |
| |
| |
| |
| | | | Face | Market |
| | | Maturity | Amount | Value• |
| | Coupon | Date | ($000) | ($000) |
| New York City NY Transitional Finance Authority | | | | |
| Future Tax Revenue | 5.000% | 11/1/20 | 200 | 224 |
| New York City NY Transitional Finance Authority | | | | |
| Future Tax Revenue | 5.000% | 11/1/21 | 125 | 148 |
| New York City NY Transitional Finance Authority | | | | |
| Future Tax Revenue | 5.000% | 11/1/21 | 100 | 118 |
| New York City NY Transitional Finance Authority | | | | |
| Future Tax Revenue | 5.250% | 2/1/22 | 450 | 526 |
| New York City NY Transitional Finance Authority | | | | |
| Future Tax Revenue | 5.000% | 11/1/22 | 215 | 254 |
| New York City NY Transitional Finance Authority | | | | |
| Future Tax Revenue | 5.000% | 11/1/24 | 595 | 701 |
| New York City NY Transitional Finance Authority | | | | |
| Future Tax Revenue | 5.000% | 11/1/25 | 150 | 190 |
| New York City NY Transitional Finance Authority | | | | |
| Future Tax Revenue | 5.000% | 11/1/25 | 150 | 189 |
| New York City NY Transitional Finance Authority | | | | |
| Future Tax Revenue | 5.000% | 11/1/26 | 200 | 250 |
| New York City NY Transitional Finance Authority | | | | |
| Future Tax Revenue | 5.000% | 11/1/26 | 125 | 151 |
| New York City NY Transitional Finance Authority | | | | |
| Future Tax Revenue | 5.000% | 11/1/27 | 100 | 124 |
| New York City NY Transitional Finance Authority | | | | |
| Future Tax Revenue | 5.000% | 5/1/30 | 210 | 250 |
| New York City NY Transitional Finance Authority | | | | |
| Future Tax Revenue | 5.000% | 5/1/31 | 50 | 59 |
| New York City NY Transitional Finance Authority | | | | |
| Future Tax Revenue | 5.000% | 8/1/31 | 200 | 242 |
| New York City NY Transitional Finance Authority | | | | |
| Future Tax Revenue | 5.000% | 11/1/31 | 185 | 226 |
| New York City NY Transitional Finance Authority | | | | |
| Future Tax Revenue | 5.000% | 11/1/31 | 100 | 119 |
| New York City NY Transitional Finance Authority | | | | |
| Future Tax Revenue | 5.000% | 5/1/32 | 750 | 906 |
| New York City NY Transitional Finance Authority | | | | |
| Future Tax Revenue | 5.000% | 8/1/32 | 150 | 182 |
| New York City NY Transitional Finance Authority | | | | |
| Future Tax Revenue | 5.000% | 11/1/32 | 100 | 119 |
| New York City NY Transitional Finance Authority | | | | |
| Future Tax Revenue | 5.000% | 8/1/33 | 475 | 576 |
| New York City NY Transitional Finance Authority | | | | |
| Future Tax Revenue | 5.000% | 11/1/33 | 400 | 455 |
| New York City NY Transitional Finance Authority | | | | |
| Future Tax Revenue | 5.000% | 5/1/34 | 320 | 377 |
| New York City NY Transitional Finance Authority | | | | |
| Future Tax Revenue | 5.000% | 8/1/34 | 100 | 119 |
| New York City NY Transitional Finance Authority | | | | |
| Future Tax Revenue | 3.000% | 2/1/35 | 300 | 300 |
| New York City NY Transitional Finance Authority | | | | |
| Future Tax Revenue | 5.000% | 2/1/35 | 305 | 349 |
| New York City NY Transitional Finance Authority | | | | |
| Future Tax Revenue | 5.000% | 5/1/35 | 500 | 598 |
| New York City NY Transitional Finance Authority | | | | |
| Future Tax Revenue | 5.000% | 11/1/35 | 450 | 536 |
47
| | | | |
| Tax-Exempt Bond Index Fund | | | | |
| |
| |
| |
| | | | Face | Market |
| | | Maturity | Amount | Value• |
| | Coupon | Date | ($000) | ($000) |
| New York City NY Transitional Finance Authority | | | | |
| Future Tax Revenue | 5.000% | 5/1/37 | 625 | 740 |
| New York City NY Transitional Finance Authority | | | | |
| Future Tax Revenue | 5.000% | 2/1/38 | 200 | 236 |
| New York City NY Transitional Finance Authority | | | | |
| Future Tax Revenue | 5.000% | 5/1/38 | 85 | 100 |
| New York City NY Transitional Finance Authority | | | | |
| Future Tax Revenue | 5.000% | 11/1/38 | 60 | 70 |
| New York City NY Transitional Finance Authority | | | | |
| Future Tax Revenue | 5.000% | 11/1/38 | 165 | 195 |
| New York City NY Transitional Finance Authority | | | | |
| Future Tax Revenue | 5.000% | 8/1/39 | 500 | 599 |
| New York City NY Transitional Finance Authority | | | | |
| Future Tax Revenue | 5.000% | 11/1/39 | 480 | 546 |
| New York City NY Transitional Finance Authority | | | | |
| Future Tax Revenue | 5.000% | 2/1/40 | 750 | 881 |
| New York City NY Transitional Finance Authority | | | | |
| Future Tax Revenue | 5.000% | 2/1/41 | 440 | 511 |
| New York City NY Transitional Finance Authority | | | | |
| Future Tax Revenue | 5.000% | 5/1/42 | 600 | 696 |
| New York City NY Transitional Finance Authority | | | | |
| Future Tax Revenue | 5.000% | 8/1/42 | 500 | 588 |
| New York Convention Center Development Corp. | | | | |
| Revenue | 5.000% | 11/15/40 | 100 | 117 |
| New York Metropolitan Transportation Authority | | | | |
| Revenue | 4.500% | 11/15/17 (Prere.) | 120 | 125 |
| New York Metropolitan Transportation Authority | | | | |
| Revenue | 4.500% | 11/15/17 (Prere.) | 80 | 83 |
| New York Metropolitan Transportation Authority | | | | |
| Revenue | 5.000% | 11/15/17 | 100 | 104 |
| New York Metropolitan Transportation Authority | | | | |
| Revenue | 5.000% | 11/15/18 | 145 | 157 |
| New York Metropolitan Transportation Authority | | | | |
| Revenue | 5.000% | 11/15/18 | 70 | 76 |
| New York Metropolitan Transportation Authority | | | | |
| Revenue | 5.000% | 11/15/19 | 300 | 334 |
| New York Metropolitan Transportation Authority | | | | |
| Revenue | 5.000% | 11/15/19 | 150 | 167 |
| New York Metropolitan Transportation Authority | | | | |
| Revenue | 5.000% | 11/15/19 | 50 | 56 |
| New York Metropolitan Transportation Authority | | | | |
| Revenue | 5.000% | 11/15/19 | 250 | 250 |
| New York Metropolitan Transportation Authority | | | | |
| Revenue | 5.000% | 11/15/20 | 115 | 132 |
| New York Metropolitan Transportation Authority | | | | |
| Revenue | 5.000% | 11/15/21 | 120 | 141 |
| New York Metropolitan Transportation Authority | | | | |
| Revenue | 5.000% | 11/15/24 | 275 | 331 |
| New York Metropolitan Transportation Authority | | | | |
| Revenue | 5.000% | 11/15/25 | 275 | 330 |
| New York Metropolitan Transportation Authority | | | | |
| Revenue | 5.000% | 11/15/25 | 100 | 121 |
| New York Metropolitan Transportation Authority | | | | |
| Revenue | 5.000% | 11/15/27 | 500 | 555 |
48
| | | | |
| Tax-Exempt Bond Index Fund | | | | |
| |
| |
| |
| | | | Face | Market |
| | | Maturity | Amount | Value• |
| | Coupon | Date | ($000) | ($000) |
| New York Metropolitan Transportation Authority | | | | |
| Revenue | 5.000% | 11/15/27 | 250 | 308 |
| New York Metropolitan Transportation Authority | | | | |
| Revenue | 5.000% | 11/15/28 | 475 | 566 |
| New York Metropolitan Transportation Authority | | | | |
| Revenue | 5.000% | 11/15/28 | 100 | 108 |
| New York Metropolitan Transportation Authority | | | | |
| Revenue | 5.000% | 11/15/29 | 150 | 179 |
| New York Metropolitan Transportation Authority | | | | |
| Revenue | 5.000% | 11/15/31 | 315 | 316 |
| New York Metropolitan Transportation Authority | | | | |
| Revenue | 5.000% | 11/15/36 (4) | 220 | 256 |
| New York Metropolitan Transportation Authority | | | | |
| Revenue | 5.000% | 11/15/36 | 240 | 279 |
| New York Metropolitan Transportation Authority | | | | |
| Revenue | 5.000% | 11/15/37 | 350 | 406 |
| New York Metropolitan Transportation Authority | | | | |
| Revenue | 5.000% | 11/15/38 | 150 | 175 |
| New York Metropolitan Transportation Authority | | | | |
| Revenue | 5.000% | 11/15/38 | 50 | 58 |
| New York Metropolitan Transportation Authority | | | | |
| Revenue | 5.250% | 11/15/38 | 175 | 206 |
| New York Metropolitan Transportation Authority | | | | |
| Revenue | 4.250% | 11/15/39 | 100 | 107 |
| New York Metropolitan Transportation Authority | | | | |
| Revenue | 5.000% | 11/15/42 | 50 | 58 |
| New York Metropolitan Transportation Authority | | | | |
| Revenue | 5.000% | 11/15/42 | 550 | 636 |
| New York Metropolitan Transportation Authority | | | | |
| Revenue | 5.000% | 11/15/43 | 100 | 115 |
| New York Metropolitan Transportation Authority | | | | |
| Revenue | 5.000% | 11/15/43 | 345 | 400 |
| New York Metropolitan Transportation Authority | | | | |
| Revenue | 5.000% | 11/15/44 | 660 | 765 |
| New York Metropolitan Transportation Authority | | | | |
| Revenue | 5.000% | 11/15/45 | 250 | 290 |
| New York Metropolitan Transportation Authority | | | | |
| Revenue | 5.250% | 11/15/55 | 55 | 65 |
| New York Metropolitan Transportation Authority | | | | |
| Revenue | 5.000% | 11/15/56 | 800 | 932 |
| New York Metropolitan Transportation Authority | | | | |
| Revenue (Dedicated Petroleum Tax) | 5.000% | 11/15/34 | 1,210 | 1,349 |
| New York Metropolitan Transportation Authority | | | | |
| Revenue (Dedicated Tax Fund) | 0.000% | 11/15/30 | 500 | 335 |
| New York Metropolitan Transportation Authority | | | | |
| Revenue (Dedicated Tax Fund) | 5.250% | 11/15/30 | 55 | 69 |
| New York Metropolitan Transportation Authority | | | | |
| Revenue (Dedicated Tax Fund) | 5.000% | 11/15/36 | 300 | 359 |
| New York Metropolitan Transportation Authority | | | | |
| Revenue (Hudson Yards Development) | 5.000% | 11/15/46 | 400 | 436 |
| New York Metropolitan Transportation Authority | | | | |
| Revenue (Hudson Yards Development) | 5.000% | 11/15/51 | 400 | 446 |
| New York Metropolitan Transportation Authority | | | | |
| Revenue (Hudson Yards Development) | 5.000% | 11/15/56 | 200 | 226 |
49
| | | | |
| Tax-Exempt Bond Index Fund | | | | |
| |
| |
| |
| | | | Face | Market |
| | | Maturity | Amount | Value• |
| | Coupon | Date | ($000) | ($000) |
| New York Metropolitan Transportation Authority | | | | |
| Revenue (Transit Revenue) | 5.000% | 11/15/25 | 100 | 124 |
| New York Metropolitan Transportation Authority | | | | |
| Revenue (Transit Revenue) | 6.500% | 11/15/28 | 205 | 228 |
| New York Metropolitan Transportation Authority | | | | |
| Revenue (Transit Revenue) | 5.000% | 11/15/41 | 410 | 474 |
| New York State Dormitory Authority Lease | | | | |
| Revenue (State University Dormitory Facilities) | 5.000% | 7/1/35 | 250 | 289 |
| New York State Dormitory Authority Lease | | | | |
| Revenue (State University Dormitory Facilities) | 5.000% | 7/1/45 | 250 | 294 |
| New York State Dormitory Authority Revenue | 5.250% | 5/15/19 (2) | 50 | 55 |
| New York State Dormitory Authority Revenue | | | | |
| (Columbia University) | 5.000% | 7/1/38 | 410 | 437 |
| New York State Dormitory Authority Revenue | | | | |
| (Columbia University) | 5.000% | 10/1/41 | 400 | 462 |
| New York State Dormitory Authority Revenue | | | | |
| (Columbia University) | 5.000% | 10/1/46 | 265 | 319 |
| New York State Dormitory Authority Revenue | | | | |
| (Cornell University) | 5.000% | 7/1/39 | 170 | 187 |
| New York State Dormitory Authority Revenue | | | | |
| (Mount Sinai School of Medicine of New York | | | | |
| University) | 5.125% | 7/1/19 (Prere.) | 250 | 277 |
| New York State Dormitory Authority Revenue | | | | |
| (New York University) | 5.000% | 7/1/36 | 170 | 205 |
| New York State Dormitory Authority Revenue | | | | |
| (New York University) | 5.000% | 7/1/48 | 190 | 220 |
| New York State Dormitory Authority Revenue | | | | |
| (Personal Income Tax) | 5.000% | 12/15/16 (Prere.) | 100 | 101 |
| New York State Dormitory Authority Revenue | | | | |
| (Personal Income Tax) | 5.000% | 3/15/17 | 100 | 102 |
| New York State Dormitory Authority Revenue | | | | |
| (Personal Income Tax) | 5.000% | 3/15/17 (Prere.) | 200 | 203 |
| New York State Dormitory Authority Revenue | | | | |
| (Personal Income Tax) | 5.000% | 2/15/18 | 260 | 274 |
| New York State Dormitory Authority Revenue | | | | |
| (Personal Income Tax) | 5.000% | 2/15/18 | 50 | 53 |
| New York State Dormitory Authority Revenue | | | | |
| (Personal Income Tax) | 5.000% | 3/15/18 | 100 | 106 |
| New York State Dormitory Authority Revenue | | | | |
| (Personal Income Tax) | 5.000% | 3/15/20 | 500 | 563 |
| New York State Dormitory Authority Revenue | | | | |
| (Personal Income Tax) | 5.000% | 3/15/20 | 60 | 68 |
| New York State Dormitory Authority Revenue | | | | |
| (Personal Income Tax) | 5.000% | 12/15/20 | 180 | 207 |
| New York State Dormitory Authority Revenue | | | | |
| (Personal Income Tax) | 5.000% | 3/15/21 | 145 | 168 |
| New York State Dormitory Authority Revenue | | | | |
| (Personal Income Tax) | 5.000% | 3/15/21 | 125 | 145 |
| New York State Dormitory Authority Revenue | | | | |
| (Personal Income Tax) | 5.000% | 3/15/21 | 400 | 463 |
| New York State Dormitory Authority Revenue | | | | |
| (Personal Income Tax) | 5.000% | 8/15/21 | 265 | 310 |
| New York State Dormitory Authority Revenue | | | | |
| (Personal Income Tax) | 5.000% | 3/15/22 | 350 | 415 |
50
| | | | |
| Tax-Exempt Bond Index Fund | | | | |
| |
| |
| |
| | | | Face | Market |
| | | Maturity | Amount | Value• |
| | Coupon | Date | ($000) | ($000) |
| New York State Dormitory Authority Revenue | | | | |
| (Personal Income Tax) | 5.000% | 2/15/23 | 100 | 121 |
| New York State Dormitory Authority Revenue | | | | |
| (Personal Income Tax) | 5.000% | 3/15/24 | 250 | 297 |
| New York State Dormitory Authority Revenue | | | | |
| (Personal Income Tax) | 5.000% | 3/15/25 | 140 | 174 |
| New York State Dormitory Authority Revenue | | | | |
| (Personal Income Tax) | 5.000% | 3/15/25 | 250 | 311 |
| New York State Dormitory Authority Revenue | | | | |
| (Personal Income Tax) | 5.000% | 2/15/26 | 180 | 222 |
| New York State Dormitory Authority Revenue | | | | |
| (Personal Income Tax) | 5.000% | 3/15/27 | 75 | 93 |
| New York State Dormitory Authority Revenue | | | | |
| (Personal Income Tax) | 5.000% | 2/15/29 | 80 | 97 |
| New York State Dormitory Authority Revenue | | | | |
| (Personal Income Tax) | 5.000% | 3/15/29 | 350 | 412 |
| New York State Dormitory Authority Revenue | | | | |
| (Personal Income Tax) | 5.000% | 3/15/29 | 65 | 79 |
| New York State Dormitory Authority Revenue | | | | |
| (Personal Income Tax) | 5.000% | 12/15/29 | 100 | 120 |
| New York State Dormitory Authority Revenue | | | | |
| (Personal Income Tax) | 5.000% | 3/15/30 | 400 | 468 |
| New York State Dormitory Authority Revenue | | | | |
| (Personal Income Tax) | 5.000% | 3/15/30 | 520 | 626 |
| New York State Dormitory Authority Revenue | | | | |
| (Personal Income Tax) | 5.000% | 2/15/32 | 150 | 179 |
| New York State Dormitory Authority Revenue | | | | |
| (Personal Income Tax) | 5.000% | 3/15/34 | 235 | 282 |
| New York State Dormitory Authority Revenue | | | | |
| (Personal Income Tax) | 5.000% | 3/15/34 | 155 | 179 |
| New York State Dormitory Authority Revenue | | | | |
| (Personal Income Tax) | 5.000% | 3/15/35 | 750 | 889 |
| New York State Dormitory Authority Revenue | | | | |
| (Personal Income Tax) | 5.000% | 3/15/36 | 500 | 589 |
| New York State Dormitory Authority Revenue | | | | |
| (Personal Income Tax) | 5.000% | 2/15/37 | 290 | 340 |
| New York State Dormitory Authority Revenue | | | | |
| (Personal Income Tax) | 5.000% | 2/15/38 | 105 | 123 |
| New York State Dormitory Authority Revenue | | | | |
| (Personal Income Tax) | 5.000% | 3/15/38 | 55 | 65 |
| New York State Dormitory Authority Revenue | | | | |
| (Personal Income Tax) | 5.000% | 2/15/39 | 1,190 | 1,388 |
| New York State Dormitory Authority Revenue | | | | |
| (Personal Income Tax) | 5.000% | 3/15/41 | 585 | 663 |
| New York State Dormitory Authority Revenue | | | | |
| (School Districts Financing Program) | 5.000% | 3/15/17 | 500 | 508 |
| New York State Dormitory Authority Revenue | | | | |
| (Service Contract) | 5.000% | 7/1/20 | 600 | 662 |
| New York State Dormitory Authority Revenue | | | | |
| (State University Educational Facilities) | 4.000% | 5/15/17 | 100 | 102 |
| New York State Dormitory Authority Revenue | | | | |
| (State University Educational Facilities) | 4.000% | 5/15/19 | 225 | 242 |
| New York State Dormitory Authority Revenue | | | | |
| (State University Educational Facilities) | 5.000% | 5/15/20 | 75 | 85 |
51
| | | | |
| Tax-Exempt Bond Index Fund | | | | |
| |
| |
| |
| | | | Face | Market |
| | | Maturity | Amount | Value• |
| | Coupon | Date | ($000) | ($000) |
| New York State Dormitory Authority Revenue | | | | |
| (State University Educational Facilities) | 5.000% | 5/15/23 | 50 | 60 |
| New York State Dormitory Authority Revenue | | | | |
| (State University Educational Facilities) | 5.000% | 5/15/29 | 500 | 589 |
| New York State Dormitory Authority Sales Tax | | | | |
| Revenue | 5.000% | 3/15/17 | 460 | 467 |
| New York State Dormitory Authority Sales Tax | | | | |
| Revenue | 5.000% | 3/15/18 | 1,250 | 1,320 |
| New York State Dormitory Authority Sales Tax | | | | |
| Revenue | 5.000% | 3/15/23 | 500 | 609 |
| New York State Dormitory Authority Sales Tax | | | | |
| Revenue | 5.000% | 3/15/25 | 105 | 132 |
| New York State Dormitory Authority Sales Tax | | | | |
| Revenue | 5.000% | 3/15/26 | 250 | 311 |
| New York State Dormitory Authority Sales Tax | | | | |
| Revenue | 5.000% | 3/15/26 | 250 | 315 |
| New York State Dormitory Authority Sales Tax | | | | |
| Revenue | 5.000% | 3/15/27 | 120 | 148 |
| New York State Dormitory Authority Sales Tax | | | | |
| Revenue | 5.000% | 3/15/28 | 1,000 | 1,204 |
| New York State Dormitory Authority Sales Tax | | | | |
| Revenue | 5.000% | 3/15/30 | 100 | 123 |
| New York State Dormitory Authority Sales Tax | | | | |
| Revenue | 5.000% | 3/15/33 | 500 | 611 |
| New York State Environmental Fac. Corp. Rev. | | | | |
| (Clean Water & Drinking Revolving Funds) | 5.000% | 6/15/37 | 85 | 91 |
| New York State Environmental Facilities Corp. | | | | |
| Revenue (State Clean Water & Drinking Water | | | | |
| Revolving Funds) | 5.000% | 6/15/18 | 100 | 107 |
| New York State Environmental Facilities Corp. | | | | |
| Revenue (State Clean Water & Drinking Water | | | | |
| Revolving Funds) | 5.000% | 6/15/21 | 250 | 267 |
| New York State Environmental Facilities Corp. | | | | |
| Revenue (State Clean Water & Drinking Water | | | | |
| Revolving Funds) | 4.750% | 6/15/32 | 100 | 102 |
| New York State Environmental Facilities Corp. | | | | |
| Revenue (State Clean Water & Drinking Water | | | | |
| Revolving Funds) | 4.500% | 6/15/36 | 100 | 102 |
| New York State Environmental Facilities Corp. | | | | |
| Revenue (State Clean Water & Drinking Water | | | | |
| Revolving Funds) | 5.000% | 6/15/41 | 250 | 301 |
| New York State Environmental Facilities Corp. | | | | |
| Revenue (State Clean Water & Drinking Water | | | | |
| Revolving Funds) | 4.000% | 6/15/46 | 100 | 108 |
| New York State GO | 3.500% | 3/1/43 | 350 | 365 |
| New York State Local Government Assistance | | | | |
| Corp. Revenue | 5.000% | 4/1/20 | 100 | 106 |
| New York State Thruway Authority Revenue | 5.000% | 5/1/19 (4) | 985 | 1,081 |
| New York State Thruway Authority Revenue | 5.000% | 5/1/19 | 1,290 | 1,416 |
| New York State Thruway Authority Revenue | 5.000% | 1/1/20 (14) | 130 | 136 |
| New York State Thruway Authority Revenue | 5.000% | 1/1/26 | 350 | 411 |
| New York State Thruway Authority Revenue | 5.000% | 1/1/31 | 330 | 381 |
| New York State Thruway Authority Revenue | 5.000% | 1/1/31 | 125 | 148 |
| New York State Thruway Authority Revenue | 4.000% | 1/1/56 | 100 | 104 |
| New York State Thruway Authority Revenue | 5.250% | 1/1/56 | 100 | 118 |
52
| | | | |
| Tax-Exempt Bond Index Fund | | | | |
| |
| |
| |
| | | | Face | Market |
| | | Maturity | Amount | Value• |
| | Coupon | Date | ($000) | ($000) |
| New York State Thruway Authority Revenue | | | | |
| (Highway & Bridge Trust Fund) | 5.000% | 4/1/20 | 175 | 198 |
| New York State Thruway Authority Revenue | | | | |
| (Highway & Bridge Trust Fund) | 5.000% | 4/1/31 | 500 | 574 |
| New York State Thruway Authority Revenue | | | | |
| (Personal Income Tax) | 5.500% | 3/15/19 (2) | 285 | 315 |
| New York State Thruway Authority Revenue | | | | |
| (Personal Income Tax) | 5.000% | 3/15/20 | 250 | 282 |
| New York State Thruway Authority Revenue | | | | |
| (Personal Income Tax) | 5.000% | 3/15/23 | 200 | 232 |
| New York State Thruway Authority Revenue | | | | |
| (Personal Income Tax) | 5.000% | 3/15/29 | 340 | 389 |
| New York State Thruway Authority Revenue | | | | |
| (Personal Income Tax) | 5.000% | 3/15/30 | 60 | 70 |
| New York State Thruway Authority Revenue | | | | |
| (Second Generation Highway & Bridge | | | | |
| Trust Fund) | 5.000% | 4/1/18 (Prere.) | 105 | 111 |
| New York State Urban Development Corp. | | | | |
| Revenue | 5.000% | 1/1/18 | 150 | 157 |
| New York State Urban Development Corp. | | | | |
| Revenue | 5.500% | 1/1/19 | 100 | 110 |
| New York State Urban Development Corp. | | | | |
| Revenue | 5.000% | 3/15/20 | 240 | 270 |
| New York State Urban Development Corp. | | | | |
| Revenue | 5.250% | 1/1/22 | 200 | 214 |
| New York State Urban Development Corp. | | | | |
| Revenue (Personal Income Tax) | 5.000% | 3/15/17 | 400 | 407 |
| New York State Urban Development Corp. | | | | |
| Revenue (Personal Income Tax) | 4.500% | 3/15/18 (Prere.) | 50 | 53 |
| New York State Urban Development Corp. | | | | |
| Revenue (Personal Income Tax) | 4.500% | 3/15/18 (Prere.) | 55 | 58 |
| New York State Urban Development Corp. | | | | |
| Revenue (Personal Income Tax) | 5.000% | 12/15/18 | 145 | 157 |
| New York State Urban Development Corp. | | | | |
| Revenue (Personal Income Tax) | 5.000% | 12/15/19 | 170 | 191 |
| New York State Urban Development Corp. | | | | |
| Revenue (Personal Income Tax) | 5.000% | 3/15/22 | 300 | 355 |
| New York State Urban Development Corp. | | | | |
| Revenue (Personal Income Tax) | 5.000% | 3/15/23 | 300 | 363 |
| New York State Urban Development Corp. | | | | |
| Revenue (Personal Income Tax) | 5.000% | 3/15/24 | 260 | 320 |
| New York State Urban Development Corp. | | | | |
| Revenue (Personal Income Tax) | 5.000% | 3/15/25 | 270 | 329 |
| New York State Urban Development Corp. | | | | |
| Revenue (Personal Income Tax) | 5.000% | 3/15/26 | 300 | 378 |
| New York State Urban Development Corp. | | | | |
| Revenue (Personal Income Tax) | 5.000% | 3/15/27 | 1,000 | 1,248 |
| New York State Urban Development Corp. | | | | |
| Revenue (Personal Income Tax) | 5.000% | 3/15/28 | 160 | 199 |
| New York State Urban Development Corp. | | | | |
| Revenue (Personal Income Tax) | 5.000% | 3/15/29 | 200 | 239 |
| New York State Urban Development Corp. | | | | |
| Revenue (Personal Income Tax) | 5.000% | 3/15/30 | 400 | 481 |
| New York State Urban Development Corp. | | | | |
| Revenue (Personal Income Tax) | 5.000% | 3/15/30 | 65 | 77 |
53
| | | | |
| Tax-Exempt Bond Index Fund | | | | |
| |
| |
| |
| | | | Face | Market |
| | | Maturity | Amount | Value• |
| | Coupon | Date | ($000) | ($000) |
| New York State Urban Development Corp. | | | | |
| Revenue (Personal Income Tax) | 5.000% | 3/15/30 | 55 | 66 |
| New York State Urban Development Corp. | | | | |
| Revenue (Personal Income Tax) | 5.000% | 3/15/30 | 500 | 608 |
| New York State Urban Development Corp. | | | | |
| Revenue (Personal Income Tax) | 5.000% | 3/15/31 | 115 | 133 |
| New York State Urban Development Corp. | | | | |
| Revenue (Personal Income Tax) | 5.000% | 3/15/32 | 185 | 220 |
| New York State Urban Development Corp. | | | | |
| Revenue (Personal Income Tax) | 5.000% | 3/15/33 | 250 | 296 |
| New York State Urban Development Corp. | | | | |
| Revenue (Personal Income Tax) | 5.000% | 3/15/33 | 300 | 361 |
| New York State Urban Development Corp. | | | | |
| Revenue (Personal Income Tax) | 5.000% | 3/15/35 | 250 | 296 |
| New York State Urban Development Corp. | | | | |
| Revenue (Personal Income Tax) | 5.250% | 3/15/38 | 250 | 272 |
| New York State Urban Development Corp. | | | | |
| Revenue (Service Contract) | 5.000% | 1/1/18 (4) | 100 | 105 |
| New York State Urban Development Corp. | | | | |
| Revenue (Service Contract) | 5.250% | 1/1/20 | 310 | 338 |
| New York State Urban Development Corp. | | | | |
| Revenue (Service Contract) | 5.000% | 1/1/21 | 460 | 517 |
| Port Authority of New York & New Jersey Revenue | 5.000% | 12/1/20 | 75 | 87 |
| Port Authority of New York & New Jersey Revenue | 5.000% | 12/1/21 | 60 | 71 |
| Port Authority of New York & New Jersey Revenue | 5.000% | 5/1/26 | 100 | 125 |
| Port Authority of New York & New Jersey Revenue | 5.000% | 12/1/30 | 70 | 85 |
| Port Authority of New York & New Jersey Revenue | 4.750% | 7/15/31 | 100 | 106 |
| Port Authority of New York & New Jersey Revenue | 5.000% | 11/15/31 | 250 | 261 |
| Port Authority of New York & New Jersey Revenue | 5.000% | 10/15/32 | 250 | 303 |
| Port Authority of New York & New Jersey Revenue | 5.000% | 10/15/32 | 500 | 555 |
| Port Authority of New York & New Jersey Revenue | 5.000% | 6/1/33 | 255 | 304 |
| Port Authority of New York & New Jersey Revenue | 4.750% | 7/15/33 | 620 | 659 |
| Port Authority of New York & New Jersey Revenue | 5.000% | 9/1/34 | 50 | 60 |
| Port Authority of New York & New Jersey Revenue | 4.500% | 11/15/34 (2) | 85 | 88 |
| Port Authority of New York & New Jersey Revenue | 5.000% | 9/1/36 | 60 | 71 |
| Port Authority of New York & New Jersey Revenue | 4.750% | 11/1/36 | 140 | 152 |
| Port Authority of New York & New Jersey Revenue | 5.000% | 8/15/37 (4) | 125 | 129 |
| Port Authority of New York & New Jersey Revenue | 4.500% | 10/15/37 | 385 | 420 |
| Port Authority of New York & New Jersey Revenue | 5.000% | 11/15/37 | 400 | 418 |
| Port Authority of New York & New Jersey Revenue | 5.000% | 12/1/38 | 565 | 668 |
| Port Authority of New York & New Jersey Revenue | 4.500% | 9/15/39 | 300 | 327 |
| Port Authority of New York & New Jersey Revenue | 5.000% | 10/15/41 | 550 | 650 |
| Port Authority of New York & New Jersey Revenue | 5.000% | 5/1/45 | 300 | 351 |
| Port Authority of New York & New Jersey Revenue | 4.000% | 10/15/45 | 360 | 391 |
| Port Authority of New York & New Jersey Revenue | 5.250% | 10/15/55 | 250 | 299 |
| Port Authority of New York & New Jersey Revenue | 6.125% | 6/1/94 | 200 | 254 |
| Suffolk County NY Water Authority Water System | | | | |
| Revenue | 3.000% | 6/1/32 | 200 | 203 |
| Triborough Bridge & Tunnel Authority New York | | | | |
| Revenue | 5.000% | 11/15/18 | 110 | 119 |
| Triborough Bridge & Tunnel Authority New York | | | | |
| Revenue | 5.500% | 11/15/20 (14) | 185 | 217 |
| Triborough Bridge & Tunnel Authority New York | | | | |
| Revenue | 5.000% | 11/15/21 | 80 | 95 |
54
| | | | |
| Tax-Exempt Bond Index Fund | | | | |
| |
| |
| |
| | | | Face | Market |
| | | Maturity | Amount | Value• |
| | Coupon | Date | ($000) | ($000) |
| Triborough Bridge & Tunnel Authority New York | | | | |
| Revenue | 5.000% | 11/15/21 | 590 | 699 |
| Triborough Bridge & Tunnel Authority New York | | | | |
| Revenue | 5.000% | 11/15/22 | 495 | 600 |
| Triborough Bridge & Tunnel Authority New York | | | | |
| Revenue | 5.000% | 11/15/23 | 80 | 99 |
| Triborough Bridge & Tunnel Authority New York | | | | |
| Revenue | 5.000% | 11/15/24 | 75 | 94 |
| Triborough Bridge & Tunnel Authority New York | | | | |
| Revenue | 5.000% | 1/1/25 | 125 | 147 |
| Triborough Bridge & Tunnel Authority New York | | | | |
| Revenue | 5.000% | 11/15/25 | 105 | 127 |
| Triborough Bridge & Tunnel Authority New York | | | | |
| Revenue | 5.000% | 1/1/28 | 175 | 205 |
| Triborough Bridge & Tunnel Authority New York | | | | |
| Revenue | 0.000% | 11/15/29 | 200 | 136 |
| Triborough Bridge & Tunnel Authority New York | | | | |
| Revenue | 0.000% | 11/15/30 | 160 | 105 |
| Triborough Bridge & Tunnel Authority New York | | | | |
| Revenue | 4.750% | 11/15/30 | 540 | 570 |
| Triborough Bridge & Tunnel Authority New York | | | | |
| Revenue | 0.000% | 11/15/31 | 140 | 89 |
| Triborough Bridge & Tunnel Authority New York | | | | |
| Revenue | 5.000% | 11/15/33 | 50 | 53 |
| Triborough Bridge & Tunnel Authority New York | | | | |
| Revenue | 3.000% | 11/15/34 | 240 | 244 |
| Triborough Bridge & Tunnel Authority New York | | | | |
| Revenue | 5.000% | 11/15/37 | 50 | 53 |
| Triborough Bridge & Tunnel Authority New York | | | | |
| Revenue | 5.000% | 11/15/38 | 805 | 866 |
| Triborough Bridge & Tunnel Authority New York | | | | |
| Revenue | 5.000% | 11/15/46 | 70 | 83 |
| Utility Debt Securitization Authority New York | | | | |
| Revenue | 5.000% | 12/15/23 | 600 | 712 |
| Utility Debt Securitization Authority New York | | | | |
| Revenue | 5.000% | 12/15/24 | 500 | 606 |
| Utility Debt Securitization Authority New York | | | | |
| Revenue | 5.000% | 12/15/26 | 750 | 931 |
| Utility Debt Securitization Authority New York | | | | |
| Revenue | 5.000% | 12/15/30 | 245 | 297 |
| Utility Debt Securitization Authority New York | | | | |
| Revenue | 3.000% | 12/15/32 | 100 | 103 |
| Utility Debt Securitization Authority New York | | | | |
| Revenue | 5.000% | 12/15/32 | 50 | 61 |
| Utility Debt Securitization Authority New York | | | | |
| Revenue | 5.000% | 12/15/34 | 155 | 185 |
| Utility Debt Securitization Authority New York | | | | |
| Revenue | 5.000% | 12/15/35 | 250 | 301 |
| Utility Debt Securitization Authority New York | | | | |
| Revenue | 4.000% | 12/15/37 | 200 | 221 |
| Utility Debt Securitization Authority New York | | | | |
| Revenue | 5.000% | 12/15/37 | 805 | 967 |
| Utility Debt Securitization Authority New York | | | | |
| Revenue | 5.000% | 12/15/41 | 400 | 474 |
| | | | | 129,042 |
55
| | | | |
| Tax-Exempt Bond Index Fund | | | | |
| |
| |
| |
| | | | Face | Market |
| | | Maturity | Amount | Value• |
| | Coupon | Date | ($000) | ($000) |
| North Carolina (1.6%) | | | | |
| Cape Fear NC Public Utility Authority Water & | | | | |
| Sewer System Revenue | 5.000% | 8/1/18 (Prere.) | 115 | 123 |
| Cape Fear NC Public Utility Authority Water & | | | | |
| Sewer System Revenue | 5.000% | 8/1/29 | 250 | 312 |
| Charlotte NC COP | 3.000% | 6/1/22 | 200 | 202 |
| Charlotte NC Water & Sewer System Revenue | 5.000% | 7/1/21 | 300 | 352 |
| Charlotte NC Water & Sewer System Revenue | 4.750% | 7/1/33 | 255 | 271 |
| North Carolina Capital Facilities Finance Agency | | | | |
| Revenue (Duke University Project) | 5.000% | 4/1/19 (Prere.) | 520 | 570 |
| North Carolina Capital Facilities Finance Agency | | | | |
| Revenue (Duke University Project) | 5.000% | 10/1/41 | 250 | 297 |
| North Carolina Capital Facilities Finance Agency | | | | |
| Revenue (Duke University Project) | 4.250% | 7/1/42 | 255 | 255 |
| North Carolina Capital Facilities Finance Agency | | | | |
| Revenue (Duke University Project) | 5.000% | 10/1/55 | 500 | 586 |
| North Carolina Capital Improvement Revenue | 4.500% | 5/1/28 | 475 | 526 |
| North Carolina Eastern Municipal Power Agency | | | | |
| Power Systems Revenue | 5.000% | 1/1/19 (Prere.) | 545 | 591 |
| North Carolina Eastern Municipal Power Agency | | | | |
| Power Systems Revenue | 6.000% | 1/1/22 (ETM) | 370 | 457 |
| North Carolina GAN | 5.250% | 3/1/20 | 215 | 236 |
| North Carolina GAN PUT | 4.000% | 3/1/18 | 125 | 128 |
| North Carolina GO | 5.000% | 5/1/19 | 120 | 132 |
| North Carolina GO | 5.000% | 5/1/20 | 200 | 227 |
| North Carolina GO | 5.000% | 5/1/20 (Prere.) | 90 | 102 |
| North Carolina GO | 5.000% | 5/1/22 | 500 | 601 |
| North Carolina GO | 5.000% | 5/1/22 | 30 | 34 |
| North Carolina Municipal Power Agency No. 1 | | | | |
| Revenue (Catawba Electric) | 4.000% | 1/1/18 | 70 | 73 |
| North Carolina Municipal Power Agency No. 1 | | | | |
| Revenue (Catawba Electric) | 5.000% | 1/1/19 (Prere.) | 230 | 250 |
| North Carolina Municipal Power Agency No. 1 | | | | |
| Revenue (Catawba Electric) | 5.000% | 1/1/30 | 55 | 59 |
| North Carolina Revenue | 5.000% | 11/1/19 | 250 | 279 |
| North Carolina Revenue | 5.000% | 5/1/22 | 475 | 567 |
| North Carolina Revenue | 5.000% | 6/1/25 | 75 | 94 |
| Raleigh NC Combined Enterprise System Revenue | 5.000% | 3/1/40 | 265 | 303 |
| University of North Carolina University System | | | | |
| Revenue | 5.000% | 12/1/17 (Prere.) | 2,120 | 2,218 |
| Wake County NC GO | 5.000% | 3/1/22 | 200 | 239 |
| | | | | 10,084 |
| Ohio (1.7%) | | | | |
| American Municipal Power Ohio Inc. Revenue | 4.375% | 2/15/44 | 105 | 111 |
| American Municipal Power Ohio Inc. Revenue | | | | |
| (Fremont Energy Center Project) | 5.000% | 2/15/42 | 325 | 368 |
| American Municipal Power Ohio Inc. Revenue | | | | |
| (Prairie State Energy Campus Project) | 5.250% | 2/15/18 (Prere.) | 50 | 53 |
| American Municipal Power Ohio Inc. Revenue | | | | |
| (Prairie State Energy Campus Project) | 5.000% | 2/15/26 | 50 | 60 |
| American Municipal Power Ohio Inc. Revenue | | | | |
| (Prairie State Energy Campus Project) PUT | 5.000% | 8/15/19 | 150 | 163 |
| American Municipal Power Ohio Inc. Revenue | | | | |
| (Prairie State Energy Campus Project) PUT | 5.000% | 8/15/20 | 210 | 234 |
| Cleveland Heights OH City School District GO | 4.500% | 12/1/47 | 165 | 180 |
56
| | | | |
| Tax-Exempt Bond Index Fund | | | | |
| |
| |
| |
| | | | Face | Market |
| | | Maturity | Amount | Value• |
| | Coupon | Date | ($000) | ($000) |
| Cleveland OH Airport System Revenue | 5.000% | 1/1/29 | 200 | 227 |
| Cleveland State University Ohio General Receipts | | | | |
| Revenue | 5.000% | 6/1/37 | 95 | 109 |
| Columbus OH GO | 5.000% | 7/1/25 | 100 | 127 |
| Columbus OH GO | 5.000% | 7/1/26 | 405 | 520 |
| Columbus OH Sewer Revenue | 5.000% | 6/1/27 | 50 | 62 |
| Columbus OH Sewer Revenue | 5.000% | 6/1/28 | 500 | 618 |
| Franklin County OH GO | 5.000% | 12/1/17 (Prere.) | 100 | 105 |
| Hamilton County OH Sales Tax Revenue | 4.000% | 12/1/31 | 300 | 331 |
| Hamilton County OH Sewer System Revenue | 5.000% | 12/1/38 | 110 | 129 |
| Northeast Ohio Regional Sewer District | | | | |
| Wastewater Revenue | 5.000% | 11/15/39 | 250 | 294 |
| Northeast Ohio Regional Sewer District | | | | |
| Wastewater Revenue | 5.000% | 11/15/44 | 335 | 392 |
| Northeast Ohio Regional Sewer District | | | | |
| Wastewater Revenue | 4.000% | 11/15/49 | 255 | 270 |
| Ohio GO | 5.000% | 9/15/21 | 200 | 236 |
| Ohio GO | 5.000% | 9/15/24 | 535 | 668 |
| Ohio GO | 5.000% | 9/15/25 | 250 | 316 |
| Ohio State University General Receipts Revenue | 5.000% | 12/1/39 | 60 | 70 |
| Ohio State University General Receipts Revenue | 4.000% | 6/1/43 | 145 | 155 |
| Ohio Turnpike Commission Turnpike Revenue | 0.000% | 2/15/36 | 100 | 49 |
| Ohio Turnpike Commission Turnpike Revenue | 0.000% | 2/15/38 | 930 | 423 |
| Ohio Turnpike Commission Turnpike Revenue | 5.250% | 2/15/39 | 105 | 122 |
| Ohio Turnpike Commission Turnpike Revenue | 0.000% | 2/15/42 | 215 | 83 |
| Ohio Turnpike Commission Turnpike Revenue | 0.000% | 2/15/43 | 465 | 173 |
| Ohio Water Development Authority Water | | | | |
| Pollution Control Loan Fund Revenue | 5.000% | 12/1/19 (Prere.) | 1,060 | 1,188 |
| Sandusky OH BAN | 2.000% | 10/5/17 | 450 | 454 |
| Springboro OH BAN | 1.500% | 1/26/17 | 500 | 501 |
| Springboro OH BAN | 1.500% | 3/30/17 | 1,000 | 1,002 |
| Willoughby-Eastlake City OH School District GO | 5.000% | 12/1/46 | 295 | 342 |
| Willoughby-Eastlake City OH School District GO | 4.000% | 12/1/50 | 520 | 543 |
| | | | | 10,678 |
| Oklahoma (0.1%) | | | | |
| Oklahoma Municipal Power Authority Power | | | | |
| Supply System Revenue | 5.000% | 1/1/47 | 200 | 230 |
| Oklahoma Turnpike Authority Revenue | 5.000% | 1/1/17 | 100 | 101 |
| | | | | 331 |
| Oregon (0.5%) | | | | |
| North Clackamas County OR School District | | | | |
| No. 12 GO | 4.500% | 6/15/17 (Prere.) | 50 | 51 |
| Oregon Department of Administrative Services | | | | |
| Lottery Revenue | 5.000% | 4/1/19 (Prere.) | 700 | 766 |
| Oregon Department of Transportation Highway | | | | |
| User Tax Revenue | 5.000% | 11/15/30 | 500 | 611 |
| Oregon Department of Transportation Highway | | | | |
| User Tax Revenue | 5.000% | 11/15/31 | 400 | 486 |
| Oregon GO | 4.500% | 8/1/32 | 65 | 67 |
| Oregon GO (Veterans Welfare) | 4.700% | 6/1/41 | 175 | 194 |
| Port of Portland OR International Airport Revenue | 5.500% | 7/1/18 (Prere.) | 50 | 54 |
| Portland OR Sewer System Revenue | 5.000% | 3/1/35 | 120 | 134 |
| Tri-County Metropolitan Transportation District of | | | | |
| Oregon Capital Grant Receipt Revenue | 5.000% | 11/1/18 | 500 | 510 |
| | | | | 2,873 |
57
| | | | |
| Tax-Exempt Bond Index Fund | | | | |
| |
| |
| |
| | | | Face | Market |
| | | Maturity | Amount | Value• |
| | Coupon | Date | ($000) | ($000) |
| Pennsylvania (4.9%) | | | | |
| Allegheny County PA Airport Authority Revenue | | | | |
| (Pittsburgh International Airport) | 5.000% | 1/1/17 (4) | 145 | 146 |
| Allegheny County PA Airport Authority Revenue | | | | |
| (Pittsburgh International Airport) | 5.000% | 1/1/18 (4) | 80 | 84 |
| Allegheny County PA GO | 5.000% | 11/1/19 (Prere.) | 545 | 609 |
| Allegheny County PA GO | 5.000% | 11/1/28 | 500 | 615 |
| Allegheny County PA GO | 5.000% | 12/1/37 | 150 | 176 |
| Allentown PA Neighborhood Improvement Zone | | | | |
| Development Authority Tax Revenue | 5.000% | 5/1/25 | 335 | 375 |
| Allentown PA Neighborhood Improvement Zone | | | | |
| Development Authority Tax Revenue | 5.000% | 5/1/30 | 150 | 164 |
| Chester County PA GO | 5.000% | 7/15/19 (Prere.) | 75 | 83 |
| Chester County PA GO | 5.000% | 7/15/28 | 25 | 28 |
| Commonwealth Financing Authority Pennsylvania | | | | |
| Revenue | 5.000% | 6/1/36 | 100 | 112 |
| Delaware River Port Authority Pennsylvania & | | | | |
| New Jersey Revenue | 4.500% | 7/1/17 (Prere.) | 125 | 128 |
| Delaware River Port Authority Pennsylvania & | | | | |
| New Jersey Revenue | 4.500% | 1/1/32 | 200 | 224 |
| Delaware River Port Authority Pennsylvania & | | | | |
| New Jersey Revenue | 5.000% | 1/1/35 | 100 | 111 |
| Delaware River Port Authority Pennsylvania & | | | | |
| New Jersey Revenue | 5.000% | 1/1/40 | 125 | 138 |
| Delaware Valley PA Regional Finance Authority | | | | |
| Revenue | 5.600% | 7/1/17 (2) | 50 | 52 |
| Delaware Valley PA Regional Finance Authority | | | | |
| Revenue | 5.750% | 7/1/17 | 250 | 258 |
| Delaware Valley PA Regional Finance Authority | | | | |
| Revenue | 5.500% | 8/1/28 (2) | 60 | 75 |
| Delaware Valley PA Regional Finance Authority | | | | |
| Revenue | 5.750% | 7/1/32 | 705 | 905 |
| Lehigh County PA Authority Water & Sewer | | | | |
| Revenue | 5.000% | 12/1/43 | 115 | 130 |
| Pennsylvania Economic Development Financing | | | | |
| Authority Unemployment Compensation Revenue | 5.000% | 7/1/17 | 600 | 617 |
| Pennsylvania Economic Development Financing | | | | |
| Authority Unemployment Compensation Revenue | 5.000% | 1/1/19 | 390 | 424 |
| Pennsylvania Economic Development Financing | | | | |
| Authority Unemployment Compensation Revenue | 5.000% | 1/1/20 | 360 | 398 |
| Pennsylvania GO | 5.000% | 3/1/17 | 100 | 101 |
| Pennsylvania GO | 5.000% | 5/1/17 | 100 | 102 |
| Pennsylvania GO | 4.500% | 11/1/17 (Prere.) | 1,250 | 1,296 |
| Pennsylvania GO | 5.000% | 6/1/18 | 500 | 531 |
| Pennsylvania GO | 5.000% | 7/1/18 | 100 | 107 |
| Pennsylvania GO | 5.000% | 7/1/18 | 125 | 133 |
| Pennsylvania GO | 5.000% | 2/15/19 | 75 | 81 |
| Pennsylvania GO | 5.000% | 7/1/19 | 70 | 77 |
| Pennsylvania GO | 5.000% | 7/1/20 | 275 | 310 |
| Pennsylvania GO | 5.000% | 7/1/22 | 100 | 118 |
| Pennsylvania GO | 5.000% | 4/15/24 | 200 | 218 |
| Pennsylvania GO | 5.000% | 11/15/24 | 190 | 221 |
| Pennsylvania GO | 5.000% | 6/1/25 | 500 | 585 |
| Pennsylvania GO | 5.000% | 4/1/26 | 635 | 749 |
| Pennsylvania GO | 5.000% | 6/15/26 | 100 | 120 |
58
| | | | |
| Tax-Exempt Bond Index Fund | | | | |
| |
| |
| |
| | | | Face | Market |
| | | Maturity | Amount | Value• |
| | Coupon | Date | ($000) | ($000) |
| Pennsylvania GO | 5.000% | 9/15/26 | 1,150 | 1,427 |
| Pennsylvania GO | 5.000% | 3/15/27 | 750 | 903 |
| Pennsylvania GO | 4.000% | 10/15/28 | 100 | 110 |
| Pennsylvania GO | 5.000% | 9/15/29 | 750 | 903 |
| Pennsylvania GO | 5.000% | 3/15/31 | 200 | 234 |
| Pennsylvania GO | 4.000% | 6/15/32 | 395 | 422 |
| Pennsylvania GO | 5.000% | 10/15/32 | 430 | 496 |
| Pennsylvania GO | 4.000% | 3/15/34 | 200 | 212 |
| Pennsylvania GO | 4.000% | 9/15/34 | 500 | 539 |
| Pennsylvania GO | 3.000% | 9/15/35 | 500 | 477 |
| Pennsylvania Higher Educational Facilities | | | | |
| Authority Revenue (Drexel University) | 5.000% | 11/1/17 (Prere.) | 125 | 130 |
| Pennsylvania Higher Educational Facilities | | | | |
| Authority Revenue (Temple University) | 5.000% | 4/1/42 | 100 | 113 |
| Pennsylvania Public School Building Authority | | | | |
| Lease Revenue (School District of Philadelphia) | 5.000% | 6/1/29 (4) | 100 | 117 |
| Pennsylvania Public School Building Authority | | | | |
| Lease Revenue (School District of Philadelphia) | 4.500% | 6/1/32 (4) | 700 | 702 |
| Pennsylvania Public School Building Authority | | | | |
| Lease Revenue (School District of Philadelphia) | 5.000% | 6/1/33 (4) | 135 | 135 |
| Pennsylvania Public School Building Authority | | | | |
| Revenue (Harrisburg School District) | 4.750% | 5/15/19 (Prere.) | 370 | 405 |
| Pennsylvania State University Revenue | 5.000% | 9/1/41 | 200 | 237 |
| Pennsylvania Turnpike Commission Motor | | | | |
| License Fund Revenue | 5.250% | 12/1/43 | 50 | 58 |
| Pennsylvania Turnpike Commission Oil Franchise | | | | |
| Tax Revenue | 5.000% | 12/1/18 (Prere.) | 150 | 163 |
| Pennsylvania Turnpike Commission Revenue | 5.250% | 6/1/18 (Prere.) | 30 | 32 |
| Pennsylvania Turnpike Commission Revenue | 6.250% | 6/1/18 (Prere.) | 110 | 119 |
| Pennsylvania Turnpike Commission Revenue | 5.000% | 6/1/19 (Prere.) | 20 | 22 |
| Pennsylvania Turnpike Commission Revenue | 5.000% | 6/1/19 (Prere.) | 130 | 143 |
| Pennsylvania Turnpike Commission Revenue | 5.000% | 6/1/19 (Prere.) | 55 | 61 |
| Pennsylvania Turnpike Commission Revenue | 5.250% | 6/1/19 (Prere.) | 10 | 11 |
| Pennsylvania Turnpike Commission Revenue | 5.250% | 6/1/19 (Prere.) | 120 | 133 |
| Pennsylvania Turnpike Commission Revenue | 5.750% | 6/1/19 (Prere.) | 100 | 112 |
| Pennsylvania Turnpike Commission Revenue | 5.000% | 12/1/19 (Prere.) | 5 | 6 |
| Pennsylvania Turnpike Commission Revenue | 5.000% | 12/1/19 (Prere.) | 65 | 73 |
| Pennsylvania Turnpike Commission Revenue | 5.350% | 12/1/20 (Prere.) | 310 | 363 |
| Pennsylvania Turnpike Commission Revenue | 5.350% | 12/1/20 (Prere.) | 20 | 23 |
| Pennsylvania Turnpike Commission Revenue | 5.750% | 12/1/20 (Prere.) | 110 | 130 |
| Pennsylvania Turnpike Commission Revenue | 6.000% | 12/1/20 (Prere.) | 90 | 108 |
| Pennsylvania Turnpike Commission Revenue | 6.500% | 12/1/20 (Prere.) | 60 | 73 |
| Pennsylvania Turnpike Commission Revenue | 5.000% | 12/1/21 | 60 | 67 |
| Pennsylvania Turnpike Commission Revenue | 5.000% | 6/1/26 | 300 | 365 |
| Pennsylvania Turnpike Commission Revenue | 5.750% | 12/1/28 | 120 | 138 |
| Pennsylvania Turnpike Commission Revenue | 0.000% | 12/1/30 | 200 | 248 |
| Pennsylvania Turnpike Commission Revenue | 5.350% | 12/1/30 | 35 | 40 |
| Pennsylvania Turnpike Commission Revenue | 6.250% | 6/1/33 (4) | 200 | 259 |
| Pennsylvania Turnpike Commission Revenue | 6.000% | 12/1/34 | 630 | 737 |
| Pennsylvania Turnpike Commission Revenue | 5.450% | 12/1/35 | 165 | 188 |
| Pennsylvania Turnpike Commission Revenue | 5.000% | 12/1/37 | 595 | 654 |
| Pennsylvania Turnpike Commission Revenue | 0.000% | 12/1/38 | 510 | 630 |
| Pennsylvania Turnpike Commission Revenue | 4.500% | 12/1/38 | 100 | 104 |
| Pennsylvania Turnpike Commission Revenue | 5.000% | 12/1/38 | 695 | 764 |
| Pennsylvania Turnpike Commission Revenue | 5.000% | 6/1/39 (12) | 150 | 163 |
59
| | | | |
| Tax-Exempt Bond Index Fund | | | | |
| |
| |
| |
| | | | Face | Market |
| | | Maturity | Amount | Value• |
| | Coupon | Date | ($000) | ($000) |
| Pennsylvania Turnpike Commission Revenue | 5.250% | 6/1/39 | 360 | 393 |
| Pennsylvania Turnpike Commission Revenue | 5.000% | 12/1/39 | 85 | 98 |
| Pennsylvania Turnpike Commission Revenue | 5.125% | 12/1/40 | 155 | 170 |
| Pennsylvania Turnpike Commission Revenue | 5.300% | 12/1/41 | 140 | 154 |
| Pennsylvania Turnpike Commission Revenue | 5.000% | 12/1/44 | 715 | 821 |
| Pennsylvania Turnpike Commission Revenue | 5.000% | 12/1/44 | 250 | 287 |
| Pennsylvania Turnpike Commission Revenue | 5.250% | 12/1/44 (15) | 240 | 282 |
| Pennsylvania Turnpike Commission Revenue | 5.000% | 12/1/45 | 150 | 168 |
| Philadelphia PA Airport Revenue | 5.000% | 6/15/40 | 50 | 56 |
| Philadelphia PA Gas Works Revenue | 5.000% | 10/1/17 (Prere.) | 285 | 296 |
| Philadelphia PA Gas Works Revenue | 5.250% | 8/1/20 (Prere.) | 145 | 167 |
| Philadelphia PA Gas Works Revenue | 4.000% | 10/1/35 | 250 | 268 |
| Philadelphia PA Gas Works Revenue | 5.250% | 8/1/40 | 230 | 258 |
| Philadelphia PA GO | 5.000% | 7/15/38 | 495 | 561 |
| Philadelphia PA Water & Waste Water Revenue | 5.000% | 8/1/17 (4) | 115 | 119 |
| Philadelphia PA Water & Waste Water Revenue | 4.250% | 11/1/31 (2) | 70 | 72 |
| Philadelphia PA Water & Waste Water Revenue | 5.000% | 7/1/40 | 230 | 265 |
| Philadelphia PA Water & Waste Water Revenue | 5.000% | 1/1/41 | 135 | 152 |
| Philadelphia PA Water & Waste Water Revenue | 5.125% | 1/1/43 | 50 | 56 |
| Philadelphia PA Water & Waste Water Revenue | 5.000% | 7/1/43 | 740 | 849 |
| University of Pittsburgh of the Commonwealth | | | | |
| System of Higher Education Pennsylvania | | | | |
| Revenue (University Capital Project) | 5.000% | 9/15/28 | 470 | 513 |
| Westmoreland County PA Municipal Authority | | | | |
| Revenue | 5.000% | 8/15/42 (15) | 250 | 286 |
| | | | | 30,441 |
| Rhode Island (0.0%) | | | | |
| Rhode Island Turnpike & Bridge Authority Revenue | 5.000% | 10/1/40 | 100 | 116 |
| |
| South Carolina (1.4%) | | | | |
| Charleston SC Educational Excellence Financing | | | | |
| Corp. Revenue (Charleston County School District, | | | | |
| South Carolina Project) | 5.000% | 12/1/24 | 125 | 154 |
| Charleston SC Educational Excellence Financing | | | | |
| Corp. Revenue (Charleston County School District, | | | | |
| South Carolina Project) | 5.000% | 12/1/27 | 350 | 423 |
| Charleston SC Educational Excellence Financing | | | | |
| Corp. Revenue (Charleston County School District, | | | | |
| South Carolina Project) | 5.000% | 12/1/30 | 780 | 930 |
| Charleston SC Waterworks & Sewer Capital | | | | |
| Improvement Revenue | 5.000% | 1/1/21 (Prere.) | 110 | 127 |
| Columbia SC Waterworks & Sewer System | | | | |
| Revenue | 5.000% | 2/1/40 | 50 | 56 |
| Greenville County SC School District GO | 5.000% | 12/1/27 | 110 | 110 |
| Greenville County SC School District Installment | | | | |
| Revenue | 5.000% | 12/1/25 (12) | 150 | 151 |
| Piedmont SC Municipal Power Agency Revenue | 5.000% | 1/1/22 | 275 | 313 |
| South Carolina Public Service Authority Revenue | 3.000% | 12/1/46 | 600 | 575 |
| South Carolina Public Service Authority Revenue | 5.250% | 1/1/19 (Prere.) | 100 | 109 |
| South Carolina Public Service Authority Revenue | 5.250% | 1/1/19 (Prere.) | 480 | 524 |
| South Carolina Public Service Authority Revenue | 5.500% | 1/1/19 (Prere.) | 90 | 99 |
| South Carolina Public Service Authority Revenue | 5.000% | 1/1/20 (Prere.) | 315 | 353 |
| South Carolina Public Service Authority Revenue | 5.000% | 12/1/21 | 75 | 88 |
| South Carolina Public Service Authority Revenue | 4.000% | 1/1/32 | 105 | 109 |
| South Carolina Public Service Authority Revenue | 5.000% | 12/1/33 | 350 | 417 |
60
| | | | |
| Tax-Exempt Bond Index Fund | | | | |
| |
| |
| |
| | | | Face | Market |
| | | Maturity | Amount | Value• |
| | Coupon | Date | ($000) | ($000) |
| South Carolina Public Service Authority Revenue | 5.000% | 12/1/36 | 100 | 113 |
| South Carolina Public Service Authority Revenue | 5.000% | 12/1/36 | 290 | 340 |
| South Carolina Public Service Authority Revenue | 5.125% | 12/1/43 | 50 | 58 |
| South Carolina Public Service Authority Revenue | 5.000% | 12/1/46 | 1,415 | 1,619 |
| South Carolina Public Service Authority Revenue | 5.000% | 12/1/48 | 520 | 596 |
| South Carolina Public Service Authority Revenue | 5.000% | 12/1/49 | 130 | 147 |
| South Carolina Public Service Authority Revenue | 5.000% | 12/1/50 | 385 | 433 |
| South Carolina Public Service Authority Revenue | 5.500% | 12/1/54 | 150 | 177 |
| South Carolina Public Service Authority Revenue | 5.000% | 12/1/55 | 250 | 281 |
| South Carolina Public Service Authority Revenue | 5.250% | 12/1/55 | 250 | 295 |
| South Carolina Transportation Infrastructure | | | | |
| Revenue | 5.000% | 10/1/20 | 230 | 263 |
| South Carolina Transportation Infrastructure | | | | |
| Revenue | 3.375% | 10/1/32 | 155 | 159 |
| | | | | 9,019 |
| Tennessee (0.4%) | | | | |
| Memphis-Shelby County TN Sports Authority | | | | |
| Revenue (Memphis Arena) | 5.375% | 11/1/29 | 110 | 123 |
| Metropolitan Government of Nashville & Davidson | | | | |
| County TN Electric Revenue | 5.000% | 5/15/27 | 450 | 539 |
| Metropolitan Government of Nashville & Davidson | | | | |
| County TN GO | 5.000% | 1/1/18 (Prere.) | 485 | 509 |
| Metropolitan Government of Nashville & Davidson | | | | |
| County TN GO | 5.000% | 1/1/18 (Prere.) | 100 | 105 |
| Metropolitan Government of Nashville & Davidson | | | | |
| County TN GO | 5.000% | 7/1/18 | 100 | 107 |
| Metropolitan Government of Nashville & Davidson | | | | |
| County TN GO | 5.000% | 1/1/28 | 250 | 313 |
| Tennessee GO | 5.000% | 8/1/18 | 490 | 525 |
| Tennessee GO | 5.000% | 8/1/21 | 205 | 242 |
| | | | | 2,463 |
| Texas (10.1%) | | | | |
| Alamo TX Community College District GO | 4.500% | 8/15/33 (14) | 100 | 103 |
| Alamo TX Regional Mobility Authority Revenue | 5.000% | 6/15/46 | 310 | 359 |
| Austin TX Water & Wastewater System Revenue | 5.000% | 11/15/41 | 200 | 231 |
| Central Texas Regional Mobility Authority Revenue | 6.000% | 1/1/21 (Prere.) | 100 | 119 |
| Central Texas Regional Mobility Authority Revenue | 6.250% | 1/1/21 (Prere.) | 275 | 331 |
| Central Texas Regional Mobility Authority Revenue | 5.000% | 1/1/40 | 300 | 340 |
| Central Texas Regional Mobility Authority Revenue | 5.000% | 1/1/45 | 100 | 112 |
| Cypress-Fairbanks TX Independent School | | | | |
| District GO | 5.000% | 2/15/27 | 185 | 224 |
| Cypress-Fairbanks TX Independent School | | | | |
| District GO | 4.500% | 2/15/28 | 250 | 253 |
| Cypress-Fairbanks TX Independent School | | | | |
| District GO | 5.000% | 2/15/44 | 1,000 | 1,160 |
| Dallas TX Area Rapid Transit Sales Tax Revenue | 5.000% | 12/1/16 (Prere.) | 145 | 145 |
| Dallas TX Area Rapid Transit Sales Tax Revenue | 4.750% | 12/1/18 (Prere.) | 55 | 59 |
| Dallas TX Area Rapid Transit Sales Tax Revenue | 5.000% | 12/1/18 (Prere.) | 190 | 206 |
| Dallas TX Area Rapid Transit Sales Tax Revenue | 5.250% | 12/1/18 (Prere.) | 125 | 136 |
| Dallas TX Area Rapid Transit Sales Tax Revenue | 5.250% | 12/1/18 (Prere.) | 325 | 354 |
| Dallas TX Area Rapid Transit Sales Tax Revenue | 5.250% | 12/1/18 (Prere.) | 90 | 98 |
| Dallas TX Area Rapid Transit Sales Tax Revenue | 5.250% | 12/1/18 (Prere.) | 60 | 65 |
| Dallas TX Area Rapid Transit Sales Tax Revenue | 5.250% | 12/1/29 (2) | 170 | 222 |
| Dallas TX Area Rapid Transit Sales Tax Revenue | 5.250% | 12/1/30 (2) | 100 | 131 |
| Dallas TX Area Rapid Transit Sales Tax Revenue | 5.000% | 12/1/32 (2) | 5 | 5 |
61
| | | | |
| Tax-Exempt Bond Index Fund | | | | |
| |
| |
| |
| | | | Face | Market |
| | | Maturity | Amount | Value• |
| | Coupon | Date | ($000) | ($000) |
| Dallas TX Area Rapid Transit Sales Tax Revenue | 5.000% | 12/1/46 | 350 | 410 |
| Dallas TX GO | 5.000% | 2/15/18 | 100 | 105 |
| Dallas TX GO | 5.000% | 2/15/23 | 75 | 91 |
| Dallas TX GO | 5.000% | 2/15/24 | 100 | 118 |
| Dallas TX GO | 5.000% | 2/15/25 | 300 | 366 |
| Dallas TX GO | 5.000% | 2/15/26 | 375 | 455 |
| Dallas TX Independent School District GO | 5.500% | 2/15/18 (Prere.) | 155 | 164 |
| Dallas TX Independent School District GO | 6.375% | 2/15/18 (Prere.) | 1,000 | 1,071 |
| Dallas TX Independent School District GO | 5.000% | 8/15/24 | 250 | 312 |
| Dallas TX Independent School District GO | 5.000% | 8/15/28 | 130 | 158 |
| Dallas TX Waterworks & Sewer System Revenue | 5.000% | 10/1/37 | 500 | 595 |
| Dallas TX Waterworks & Sewer System Revenue | 5.000% | 10/1/41 | 50 | 59 |
| Dallas-Fort Worth TX International Airport Revenue | 5.250% | 11/1/33 | 100 | 119 |
| Dallas-Fort Worth TX International Airport Revenue | 5.000% | 11/1/35 | 80 | 90 |
| Dallas-Fort Worth TX International Airport Revenue | 5.000% | 11/1/35 | 50 | 57 |
| Dallas-Fort Worth TX International Airport Revenue | 5.000% | 11/1/43 | 150 | 173 |
| Dallas-Fort Worth TX International Airport Revenue | 5.000% | 11/1/44 | 165 | 190 |
| Dallas-Fort Worth TX International Airport Revenue | 4.000% | 11/1/45 | 140 | 148 |
| Dallas-Fort Worth TX International Airport Revenue | 5.000% | 11/1/45 | 385 | 431 |
| Dallas-Fort Worth TX International Airport Revenue | 5.000% | 11/1/45 | 100 | 114 |
| Fort Bend TX Grand Parkway Toll Road Authority | | | | |
| Revenue | 5.000% | 3/1/32 | 50 | 59 |
| Fort Bend TX Grand Parkway Toll Road Authority | | | | |
| Revenue | 5.000% | 3/1/37 | 300 | 350 |
| Fort Bend TX Grand Parkway Toll Road Authority | | | | |
| Revenue | 4.000% | 3/1/46 | 300 | 315 |
| Fort Bend TX Independent School District GO | 5.000% | 8/15/19 | 175 | 194 |
| Fort Bend TX Independent School District GO | 4.750% | 8/15/34 | 50 | 53 |
| Fort Worth TX Independent School District GO | 5.000% | 2/15/34 | 300 | 333 |
| Fort Worth TX Water & Sewer Revenue | 5.000% | 2/15/23 | 700 | 847 |
| Grand Parkway Transportation Corp. Texas | | | | |
| System Toll Revenue | 5.250% | 10/1/51 | 325 | 383 |
| Grand Parkway Transportation Corp. Texas | | | | |
| System Toll Revenue | 5.000% | 4/1/53 | 450 | 521 |
| Harris County TX Flood Control District Revenue | 5.000% | 10/1/34 | 865 | 979 |
| Harris County TX Flood Control District Revenue | 5.000% | 10/1/39 | 100 | 113 |
| Harris County TX GO | 5.750% | 10/1/18 (Prere.) | 350 | 382 |
| Harris County TX GO | 5.000% | 8/15/22 | 50 | 60 |
| Harris County TX GO | 5.000% | 10/1/23 | 205 | 235 |
| Harris County TX GO | 5.000% | 8/15/28 | 250 | 310 |
| Harris County TX GO | 5.000% | 10/1/28 | 500 | 618 |
| Harris County TX Metropolitan Transit Authority | | | | |
| Sales & Use Tax Revenue | 5.000% | 11/1/36 | 350 | 405 |
| Harris County TX Sports Authority Revenue | 5.000% | 11/15/30 | 190 | 223 |
| Harris County TX Sports Authority Revenue | 0.000% | 11/15/34 (4) | 175 | 86 |
| Harris County TX Sports Authority Revenue | 0.000% | 11/15/43 (4) | 200 | 64 |
| Harris County TX Toll Road Revenue | 5.000% | 8/15/18 (Prere.) | 575 | 617 |
| Harris County TX Toll Road Revenue | 5.000% | 8/15/19 (Prere.) | 150 | 166 |
| Harris County TX Toll Road Revenue | 5.000% | 8/15/29 | 265 | 312 |
| Houston TX Airport System Revenue | 5.000% | 7/1/27 (14) | 730 | 749 |
| Houston TX Community College GO | 5.000% | 2/15/34 | 130 | 152 |
| Houston TX Community College System GO | 5.000% | 2/15/33 | 415 | 486 |
| Houston TX Community College System GO | 5.000% | 2/15/36 | 400 | 446 |
| Houston TX GO | 5.000% | 3/1/18 | 300 | 316 |
| Houston TX GO | 5.000% | 3/1/18 (Prere.) | 100 | 105 |
62
| | | | |
| Tax-Exempt Bond Index Fund | | | | |
| |
| |
| |
| | | | Face | Market |
| | | Maturity | Amount | Value• |
| | Coupon | Date | ($000) | ($000) |
| Houston TX GO | 5.250% | 3/1/18 (Prere.) | 310 | 328 |
| Houston TX GO | 5.000% | 3/1/19 (Prere.) | 90 | 98 |
| Houston TX GO | 5.000% | 3/1/24 | 10 | 11 |
| Houston TX GO | 5.000% | 3/1/24 | 500 | 586 |
| Houston TX GO | 5.000% | 3/1/27 | 250 | 308 |
| Houston TX GO | 5.000% | 3/1/28 | 500 | 611 |
| Houston TX Higher Education Finance Corp. | | | | |
| Revenue (Rice University Project) | 4.750% | 11/15/17 (Prere.) | 150 | 156 |
| Houston TX Independent School District GO | 5.000% | 2/15/17 (Prere.) | 200 | 202 |
| Houston TX Independent School District GO PUT | 4.000% | 6/1/17 | 500 | 509 |
| Houston TX Utility System Revenue | 5.250% | 11/15/17 (4) | 160 | 167 |
| Houston TX Utility System Revenue | 5.375% | 5/15/19 (Prere.) | 110 | 122 |
| Houston TX Utility System Revenue | 5.000% | 5/15/22 | 130 | 155 |
| Houston TX Utility System Revenue | 5.000% | 5/15/24 | 250 | 309 |
| Houston TX Utility System Revenue | 5.000% | 11/15/24 | 80 | 100 |
| Houston TX Utility System Revenue | 5.250% | 11/15/28 | 215 | 249 |
| Houston TX Utility System Revenue | 5.250% | 11/15/29 | 160 | 185 |
| Houston TX Utility System Revenue | 5.000% | 11/15/34 | 200 | 236 |
| Houston TX Utility System Revenue | 5.000% | 11/15/36 | 125 | 145 |
| Houston TX Utility System Revenue | 5.000% | 11/15/44 | 75 | 87 |
| Irving TX Combination Tax & Hotel Occupancy | | | | |
| Revenue GO | 5.000% | 8/15/39 | 375 | 407 |
| Judson TX Independent School District GO | 4.500% | 2/1/17 (Prere.) | 135 | 136 |
| Judson TX Independent School District GO | 4.500% | 2/1/35 | 65 | 66 |
| Keller TX Independent School District GO | 5.250% | 2/15/19 (Prere.) | 180 | 197 |
| Keller TX Independent School District GO | 5.500% | 2/15/19 (Prere.) | 735 | 809 |
| Klein TX Independent School District GO | 5.000% | 8/1/18 (Prere.) | 75 | 80 |
| Lake Travis TX Independent School District GO | 5.000% | 2/15/42 | 510 | 581 |
| Lamar TX Consolidated Independent School | | | | |
| District GO | 5.000% | 2/15/17 (Prere.) | 100 | 101 |
| Leander TX Independent School District GO | 5.000% | 8/15/26 | 400 | 485 |
| Leander TX Independent School District GO | 5.000% | 8/15/40 | 380 | 447 |
| Lewisville TX Independent School District GO | 5.000% | 2/15/19 (Prere.) | 100 | 109 |
| Lewisville TX Independent School District GO | 5.000% | 2/15/19 (Prere.) | 325 | 354 |
| Lewisville TX Independent School District GO | 5.000% | 2/15/19 (Prere.) | 125 | 136 |
| Lewisville TX Independent School District GO | 5.000% | 8/15/20 | 400 | 457 |
| Lewisville TX Independent School District GO | 4.000% | 8/15/26 | 400 | 464 |
| Lone Star College System Texas GO | 5.000% | 8/15/18 (Prere.) | 150 | 161 |
| Lone Star College System Texas GO | 5.000% | 8/15/18 (Prere.) | 35 | 38 |
| Lone Star College System Texas GO | 5.000% | 8/15/38 | 35 | 37 |
| Lower Colorado River Authority Texas Revenue | 6.250% | 5/15/18 (Prere.) | 250 | 271 |
| Lower Colorado River Authority Texas Revenue | 5.000% | 5/15/21 | 125 | 142 |
| Lower Colorado River Authority Texas Revenue | 5.250% | 5/15/29 | 150 | 164 |
| Lower Colorado River Authority Texas Revenue | 5.500% | 5/15/33 | 195 | 214 |
| Lower Colorado River Authority Texas Revenue | 5.000% | 5/15/39 | 200 | 228 |
| Lower Colorado River Authority Texas Revenue | 5.625% | 5/15/39 | 125 | 137 |
| Lower Colorado River Authority Texas Revenue | 5.000% | 5/15/40 | 540 | 600 |
| Lower Colorado River Authority Texas | | | | |
| Transmission Contract Revenue | | | | |
| (LCRA Transmission Services Corp.) | 5.000% | 5/15/35 (13) | 300 | 318 |
| Lower Colorado River Authority Texas | | | | |
| Transmission Contract Revenue | | | | |
| (LCRA Transmission Services Corp.) | 4.000% | 5/15/39 | 220 | 231 |
| Lower Colorado River Authority Texas | | | | |
| Transmission Contract Revenue | | | | |
| (LCRA Transmission Services Corp.) | 5.000% | 5/15/40 (4) | 100 | 111 |
63
| | | | |
| Tax-Exempt Bond Index Fund | | | | |
| |
| |
| |
| | | | Face | Market |
| | | Maturity | Amount | Value• |
| | Coupon | Date | ($000) | ($000) |
| Lower Colorado River Authority Texas | | | | |
| Transmission Contract Revenue | | | | |
| (LCRA Transmission Services Corp.) | 5.000% | 5/15/41 | 275 | 305 |
| North East TX Regional Mobility Authority Revenue | 5.000% | 1/1/22 | 600 | 690 |
| North East TX Regional Mobility Authority Revenue | 5.000% | 1/1/46 | 130 | 147 |
| North Harris County TX Regional Water Authority | | | | |
| Revenue | 5.250% | 12/15/18 (Prere.) | 485 | 530 |
| North Harris County TX Regional Water Authority | | | | |
| Revenue | 5.375% | 12/15/18 (Prere.) | 375 | 410 |
| North Texas Tollway Authority System Revenue | 5.125% | 1/1/18 (Prere.) | 275 | 289 |
| North Texas Tollway Authority System Revenue | 5.500% | 1/1/18 | 170 | 179 |
| North Texas Tollway Authority System Revenue | 5.625% | 1/1/18 (Prere.) | 50 | 53 |
| North Texas Tollway Authority System Revenue | 5.750% | 1/1/19 (Prere.) | 950 | 1,047 |
| North Texas Tollway Authority System Revenue | 6.000% | 1/1/19 (Prere.) | 100 | 111 |
| North Texas Tollway Authority System Revenue | 5.000% | 1/1/21 | 105 | 120 |
| North Texas Tollway Authority System Revenue | 6.000% | 1/1/23 | 50 | 55 |
| North Texas Tollway Authority System Revenue | 5.000% | 1/1/27 | 180 | 216 |
| North Texas Tollway Authority System Revenue | 5.125% | 1/1/28 (14) | 10 | 10 |
| North Texas Tollway Authority System Revenue | 5.000% | 1/1/30 | 200 | 235 |
| North Texas Tollway Authority System Revenue | 5.000% | 1/1/30 | 230 | 276 |
| North Texas Tollway Authority System Revenue | 5.000% | 9/1/31 | 185 | 214 |
| North Texas Tollway Authority System Revenue | 0.000% | 1/1/32 (12) | 155 | 91 |
| North Texas Tollway Authority System Revenue | 5.000% | 9/1/32 | 270 | 312 |
| North Texas Tollway Authority System Revenue | 5.625% | 1/1/33 | 5 | 5 |
| North Texas Tollway Authority System Revenue | 5.625% | 1/1/33 | 10 | 10 |
| North Texas Tollway Authority System Revenue | 0.000% | 1/1/35 (12) | 200 | 103 |
| North Texas Tollway Authority System Revenue | 5.500% | 9/1/36 | 70 | 83 |
| North Texas Tollway Authority System Revenue | 0.000% | 1/1/38 (12) | 600 | 272 |
| North Texas Tollway Authority System Revenue | 5.000% | 1/1/38 | 500 | 575 |
| North Texas Tollway Authority System Revenue | 4.000% | 1/1/39 | 535 | 570 |
| North Texas Tollway Authority System Revenue | 5.000% | 1/1/40 | 895 | 1,024 |
| North Texas Tollway Authority System Revenue | 5.500% | 9/1/41 | 270 | 318 |
| North Texas Tollway Authority System Revenue | 6.000% | 1/1/43 | 160 | 188 |
| North Texas Tollway Authority System Revenue | 5.250% | 1/1/44 | 25 | 27 |
| North Texas Tollway Authority System Revenue | | | | |
| PUT | 1.950% | 1/1/19 | 500 | 505 |
| Plano TX Independent School District GO | 5.250% | 2/15/18 (Prere.) | 170 | 180 |
| Port of Houston Authority of Harris County Texas | | | | |
| Tax Revenue | 5.000% | 10/1/35 | 100 | 114 |
| Red River TX Education Finance Corp. Revenue | | | | |
| (Texas Christian University Project) | 5.000% | 3/15/43 | 85 | 98 |
| Round Rock TX Independent School District GO | 5.000% | 8/1/33 | 200 | 214 |
| San Antonio TX Electric & Gas Systems Revenue | 5.000% | 2/1/18 | 60 | 63 |
| San Antonio TX Electric & Gas Systems Revenue | 5.000% | 2/1/19 | 200 | 218 |
| San Antonio TX Electric & Gas Systems Revenue | 5.000% | 2/1/19 | 110 | 120 |
| San Antonio TX Electric & Gas Systems Revenue | 5.000% | 2/1/20 | 1,350 | 1,518 |
| San Antonio TX Electric & Gas Systems Revenue | 5.000% | 2/1/22 | 70 | 83 |
| San Antonio TX Electric & Gas Systems Revenue | 5.000% | 2/1/23 | 140 | 169 |
| San Antonio TX Electric & Gas Systems Revenue | 5.250% | 2/1/24 | 110 | 138 |
| San Antonio TX Electric & Gas Systems Revenue | 5.000% | 2/1/32 | 150 | 181 |
| San Antonio TX GO | 5.000% | 2/1/20 | 200 | 225 |
| San Antonio TX Independent School District GO | 5.000% | 2/15/24 | 100 | 124 |
| San Antonio TX Public Facilities Corp. Lease | | | | |
| Revenue | 4.000% | 9/15/33 | 140 | 150 |
64
| | | | |
| Tax-Exempt Bond Index Fund | | | | |
| |
| |
| |
| | | | Face | Market |
| | | Maturity | Amount | Value• |
| | Coupon | Date | ($000) | ($000) |
| San Antonio TX Public Facilities Corp. Lease | | | | |
| Revenue | 4.000% | 9/15/34 | 70 | 75 |
| San Antonio TX Public Facilities Corp. Lease | | | | |
| Revenue | 4.000% | 9/15/42 | 615 | 647 |
| San Antonio TX Water Revenue | 4.500% | 5/15/32 (14) | 330 | 336 |
| San Antonio TX Water Revenue | 4.500% | 5/15/37 (14) | 280 | 285 |
| San Jacinto TX Community College District GO | 5.000% | 2/15/19 (Prere.) | 895 | 976 |
| Spring Branch TX Independent School District GO | 5.250% | 2/1/17 (Prere.) | 200 | 202 |
| Tarrant Regional Water District Texas Water | | | | |
| Revenue | 5.000% | 3/1/37 | 115 | 134 |
| Texas GO | 5.000% | 4/1/18 (Prere.) | 190 | 201 |
| Texas GO | 5.000% | 4/1/20 | 100 | 113 |
| Texas GO | 5.000% | 10/1/20 | 500 | 575 |
| Texas GO | 5.000% | 10/1/22 | 545 | 658 |
| Texas GO | 5.000% | 10/1/27 | 145 | 178 |
| Texas GO | 5.000% | 10/1/27 | 55 | 69 |
| Texas GO | 5.000% | 10/1/28 | 100 | 121 |
| Texas GO | 5.000% | 4/1/30 | 100 | 106 |
| Texas GO | 5.000% | 4/1/44 | 200 | 233 |
| Texas GO | 5.000% | 10/1/44 | 820 | 962 |
| Texas Municipal Power Agency Revenue | 5.000% | 9/1/40 | 170 | 191 |
| Texas Transportation Commission GO | 5.000% | 10/1/18 | 200 | 216 |
| Texas Transportation Commission GO | 5.000% | 10/1/21 | 300 | 354 |
| Texas Transportation Commission GO | 5.000% | 4/1/23 | 100 | 122 |
| Texas Transportation Commission GO | 5.000% | 4/1/24 | 365 | 453 |
| Texas Transportation Commission GO | 5.000% | 10/1/25 | 720 | 897 |
| Texas Transportation Commission GO | 5.000% | 4/1/26 | 100 | 118 |
| Texas Transportation Commission GO | 5.000% | 4/1/31 | 300 | 357 |
| Texas Transportation Commission Mobility | | | | |
| Fund GO | 5.000% | 4/1/17 (Prere.) | 105 | 107 |
| Texas Transportation Commission Mobility | | | | |
| Fund GO | 5.000% | 10/1/28 | 55 | 68 |
| Texas Transportation Commission Mobility | | | | |
| Fund GO | 5.000% | 10/1/29 | 50 | 62 |
| Texas Transportation Commission Mobility | | | | |
| Fund GO | 4.500% | 4/1/35 (14) | 200 | 203 |
| Texas Transportation Commission Mobility | | | | |
| Fund GO | 4.750% | 4/1/37 | 530 | 556 |
| Texas Transportation Commission Revenue | 5.000% | 4/1/17 (Prere.) | 300 | 305 |
| Texas Transportation Commission Revenue | 4.000% | 10/1/18 | 190 | 201 |
| Texas Transportation Commission Revenue | 5.000% | 4/1/19 | 140 | 153 |
| Texas Transportation Commission Revenue | 5.000% | 4/1/20 | 540 | 611 |
| Texas Transportation Commission Revenue | 5.000% | 10/1/20 | 500 | 574 |
| Texas Transportation Commission Revenue | 5.000% | 4/1/21 | 380 | 442 |
| Texas Transportation Commission Revenue | 5.000% | 10/1/22 | 150 | 181 |
| Texas Transportation Commission Revenue | 5.000% | 4/1/24 | 70 | 87 |
| Texas Transportation Commission Revenue | 5.000% | 10/1/24 | 90 | 112 |
| Texas Transportation Commission Revenue | 5.000% | 10/1/25 | 235 | 297 |
| Texas Transportation Commission Revenue | 5.000% | 10/1/26 | 100 | 128 |
| Texas Transportation Commission Revenue | 5.000% | 4/1/34 | 100 | 118 |
| Texas Transportation Commission Revenue | 5.000% | 8/15/41 | 100 | 113 |
| Texas Transportation Commission Turnpike | | | | |
| System Revenue | 5.000% | 8/15/34 | 800 | 918 |
| Texas Transportation Commission Turnpike | | | | |
| System Revenue | 5.000% | 8/15/37 | 260 | 299 |
65
| | | | |
| Tax-Exempt Bond Index Fund | | | | |
| |
| |
| |
| | | | Face | Market |
| | | Maturity | Amount | Value• |
| | Coupon | Date | ($000) | ($000) |
| Texas Transportation Commission Turnpike | | | | |
| System Revenue | 5.000% | 8/15/42 | 400 | 453 |
| Texas Turnpike Authority Central Texas Turnpike | | | | |
| System Revenue | 0.000% | 8/15/22 (2) | 95 | 85 |
| Texas Water Development Board Revenue | 5.000% | 7/15/26 | 100 | 103 |
| Texas Water Development Board Revenue | 5.000% | 10/15/30 | 100 | 123 |
| Texas Water Development Board Revenue | 5.000% | 10/15/31 | 525 | 640 |
| Texas Water Development Board Revenue | 5.000% | 10/15/45 | 400 | 476 |
| Texas Water Financial Assistance GO | 4.000% | 8/1/41 | 100 | 108 |
| University of Texas Permanent University Fund | | | | |
| Revenue | 5.250% | 7/1/30 | 55 | 72 |
| University of Texas Permanent University Fund | | | | |
| Revenue | 4.000% | 7/1/34 | 300 | 330 |
| University of Texas Permanent University Fund | | | | |
| Revenue | 5.000% | 7/1/41 | 300 | 357 |
| University of Texas System Revenue Financing | | | | |
| System Revenue | 5.000% | 8/15/20 | 50 | 57 |
| University of Texas System Revenue Financing | | | | |
| System Revenue | 5.375% | 8/15/23 | 110 | 138 |
| University of Texas System Revenue Financing | | | | |
| System Revenue | 5.000% | 8/15/25 | 100 | 127 |
| University of Texas System Revenue Financing | | | | |
| System Revenue | 5.000% | 8/15/26 | 400 | 513 |
| University of Texas System Revenue Financing | | | | |
| System Revenue | 4.250% | 8/15/36 | 100 | 101 |
| University of Texas System Revenue Financing | | | | |
| System Revenue | 5.000% | 8/15/43 | 450 | 530 |
| | | | | 62,695 |
| Utah (0.6%) | | | | |
| Intermountain Power Agency Utah Power Supply | | | | |
| Revenue | 5.000% | 7/1/21 | 210 | 224 |
| Intermountain Power Agency Utah Power Supply | | | | |
| Revenue | 5.000% | 7/1/22 | 480 | 512 |
| University of Utah Revenue | 5.000% | 8/1/32 | 135 | 159 |
| Utah GO | 5.000% | 7/1/18 (Prere.) | 200 | 214 |
| Utah GO | 5.000% | 7/1/21 (Prere.) | 250 | 294 |
| Utah GO | 5.000% | 7/1/25 | 395 | 498 |
| Utah Transit Authority Sales Tax Revenue | 4.750% | 6/15/18 (Prere.) | 240 | 255 |
| Utah Transit Authority Sales Tax Revenue | 5.000% | 6/15/18 (Prere.) | 75 | 80 |
| Utah Transit Authority Sales Tax Revenue | 5.000% | 6/15/18 (Prere.) | 195 | 208 |
| Utah Transit Authority Sales Tax Revenue | 5.000% | 6/15/27 | 340 | 424 |
| Utah Transit Authority Sales Tax Revenue | 5.000% | 6/15/28 | 60 | 74 |
| Utah Transit Authority Sales Tax Revenue | 5.000% | 6/15/30 | 80 | 98 |
| Utah Transit Authority Sales Tax Revenue | 4.000% | 12/15/30 | 500 | 553 |
| Utah Transit Authority Sales Tax Revenue | 5.000% | 6/15/38 | 200 | 238 |
| | | | | 3,831 |
| Virginia (1.0%) | | | | |
| Arlington County VA GO | 5.000% | 8/1/22 | 240 | 290 |
| Fairfax County VA Public Improvement GO | 5.000% | 4/1/21 | 350 | 409 |
| Fairfax County VA Public Improvement GO | 5.000% | 4/1/23 | 110 | 135 |
| Fairfax VA GO | 4.000% | 1/15/31 | 120 | 131 |
| Hampton Roads VA Sanitation & Wastewater | | | | |
| District Revenue | 5.000% | 4/1/18 (Prere.) | 85 | 90 |
| Richmond VA Public Utility Revenue | 4.500% | 1/15/33 (4) | 50 | 50 |
| Richmond VA Public Utility Revenue | 5.000% | 1/15/40 | 120 | 130 |
66
| | | | |
| Tax-Exempt Bond Index Fund | | | | |
| |
| |
| |
| | | | Face | Market |
| | | Maturity | Amount | Value• |
| | Coupon | Date | ($000) | ($000) |
| University of Virginia Revenue | 5.000% | 6/1/40 | 475 | 505 |
| Virginia College Building Authority Educational | | | | |
| Facilities Revenue (21st Century College & | | | | |
| Equipment Programs) | 5.000% | 2/1/31 | 1,000 | 1,200 |
| Virginia Commonwealth Transportation Board | | | | |
| Revenue | 5.000% | 5/15/23 | 315 | 385 |
| Virginia Commonwealth Transportation Board | | | | |
| Revenue | 4.500% | 5/15/36 | 50 | 56 |
| Virginia GO | 5.000% | 6/1/19 | 200 | 221 |
| Virginia GO | 5.000% | 6/1/26 | 250 | 316 |
| Virginia GO | 5.000% | 6/1/27 | 85 | 107 |
| Virginia Public Building Authority Public Facilities | | | | |
| Revenue | 5.000% | 8/1/18 | 150 | 161 |
| Virginia Public Building Authority Public Facilities | | | | |
| Revenue | 5.000% | 8/1/25 | 250 | 314 |
| Virginia Public School Authority Revenue | 5.000% | 8/1/19 | 130 | 144 |
| Virginia Public School Authority Revenue | 5.000% | 8/1/22 | 50 | 60 |
| Virginia Public School Authority Revenue | 5.000% | 8/1/22 | 240 | 288 |
| Virginia Public School Authority Revenue | 5.000% | 8/1/23 | 205 | 247 |
| Virginia Public School Authority Revenue | 5.000% | 8/1/25 | 550 | 693 |
| | | | | 5,932 |
| Washington (2.1%) | | | | |
| Central Puget Sound WA Regional Transit | | | | |
| Authority Sales & Use Tax Revenue | 5.000% | 11/1/31 | 200 | 243 |
| Central Puget Sound WA Regional Transit | | | | |
| Authority Sales & Use Tax Revenue | 5.000% | 11/1/32 | 100 | 121 |
| Central Puget Sound WA Regional Transit | | | | |
| Authority Sales & Use Tax Revenue | 5.000% | 11/1/35 | 350 | 416 |
| Central Puget Sound WA Regional Transit | | | | |
| Authority Sales & Use Tax Revenue | 5.000% | 11/1/45 | 950 | 1,114 |
| Energy Northwest Washington Electric Revenue | | | | |
| (Columbia Generating Station) | 5.000% | 7/1/18 | 650 | 694 |
| Energy Northwest Washington Electric Revenue | | | | |
| (Columbia Generating Station) | 5.000% | 7/1/19 | 260 | 287 |
| Energy Northwest Washington Electric Revenue | | | | |
| (Columbia Generating Station) | 5.000% | 7/1/21 | 75 | 88 |
| Energy Northwest Washington Electric Revenue | | | | |
| (Columbia Generating Station) | 5.000% | 7/1/30 | 200 | 241 |
| Energy Northwest Washington Electric Revenue | | | | |
| (Project No. 1) | 5.000% | 7/1/25 | 50 | 62 |
| Energy Northwest Washington Electric Revenue | | | | |
| (Project No. 1) | 5.000% | 7/1/28 | 50 | 57 |
| Energy Northwest Washington Electric Revenue | | | | |
| (Project No. 3) | 5.000% | 7/1/18 | 300 | 320 |
| Energy Northwest Washington Electric Revenue | | | | |
| (Project No. 3) | 5.000% | 7/1/27 | 250 | 314 |
| King County WA Sewer Revenue Unrefunded-REF | 5.000% | 1/1/45 | 30 | 33 |
| King County WA Sewer Revenue | 5.000% | 1/1/19 (Prere.) | 550 | 598 |
| King County WA Sewer Revenue | 5.000% | 7/1/20 (Prere.) | 95 | 108 |
| King County WA Sewer Revenue | 5.125% | 1/1/21 (Prere.) | 35 | 41 |
| King County WA Sewer Revenue | 5.125% | 1/1/37 | 30 | 34 |
| Northwest Energy Washington Electric Revenue | | | | |
| (Columbia Generating Station) | 5.250% | 7/1/18 | 125 | 134 |
| Port of Seattle WA Revenue | 5.000% | 2/1/30 | 250 | 301 |
| Port of Seattle WA Revenue | 5.000% | 8/1/31 | 100 | 117 |
67
| | | | |
| Tax-Exempt Bond Index Fund | | | | |
| |
| |
| |
| | | | Face | Market |
| | | Maturity | Amount | Value• |
| | Coupon | Date | ($000) | ($000) |
| Port of Tacoma WA GO | 5.000% | 6/1/18 (Prere.) | 115 | 122 |
| Seattle WA Municipal Light & Power Revenue | 5.000% | 2/1/20 (Prere.) | 15 | 17 |
| Seattle WA Municipal Light & Power Revenue | 5.000% | 2/1/23 | 60 | 67 |
| University of Washington Revenue | 3.125% | 7/1/42 | 465 | 460 |
| Washington (Motor Vehicle Fuel Tax) GO | 4.500% | 1/1/17 (Prere.) | 100 | 101 |
| Washington (Motor Vehicle Fuel Tax) GO | 4.000% | 7/1/18 | 60 | 63 |
| Washington (Motor Vehicle Fuel Tax) GO | 5.000% | 7/1/23 | 235 | 287 |
| Washington (Motor Vehicle Fuel Tax) GO | 4.000% | 7/1/25 | 100 | 110 |
| Washington (Motor Vehicle Fuel Tax) GO | 5.000% | 7/1/29 | 200 | 242 |
| Washington (Motor Vehicle Fuel Tax) GO | 5.000% | 8/1/33 | 500 | 590 |
| Washington (Motor Vehicle Fuel Tax) GO | 5.000% | 6/1/41 | 200 | 230 |
| Washington Federal Highway Grant Anticipation | | | | |
| Revenue (520 Corridor Program) | 5.000% | 9/1/21 | 100 | 117 |
| Washington Federal Highway Grant Anticipation | | | | |
| Revenue (520 Corridor Program) | 5.000% | 9/1/22 | 90 | 107 |
| Washington Federal Highway Grant Anticipation | | | | |
| Revenue (520 Corridor Program) | 5.000% | 9/1/24 | 70 | 83 |
| Washington GO | 5.000% | 7/1/17 | 200 | 206 |
| Washington GO | 5.000% | 1/1/18 | 530 | 556 |
| Washington GO | 5.000% | 1/1/18 (Prere.) | 195 | 204 |
| Washington GO | 5.000% | 1/1/18 (Prere.) | 100 | 105 |
| Washington GO | 5.000% | 1/1/18 (Prere.) | 65 | 68 |
| Washington GO | 5.000% | 7/1/18 (Prere.) | 170 | 182 |
| Washington GO | 5.000% | 7/1/18 | 150 | 160 |
| Washington GO | 5.000% | 7/1/18 | 210 | 224 |
| Washington GO | 5.000% | 7/1/18 (Prere.) | 60 | 64 |
| Washington GO | 5.000% | 7/1/18 (Prere.) | 100 | 107 |
| Washington GO | 5.000% | 7/1/18 (Prere.) | 80 | 85 |
| Washington GO | 5.000% | 1/1/19 (Prere.) | 85 | 92 |
| Washington GO | 5.000% | 2/1/19 (Prere.) | 60 | 65 |
| Washington GO | 5.000% | 1/1/20 | 175 | 196 |
| Washington GO | 5.000% | 1/1/21 | 150 | 173 |
| Washington GO | 4.000% | 7/1/26 | 350 | 384 |
| Washington GO | 5.000% | 7/1/26 | 150 | 188 |
| Washington GO | 3.000% | 7/1/29 | 275 | 277 |
| Washington GO | 5.000% | 8/1/30 | 75 | 90 |
| Washington GO | 5.000% | 7/1/32 | 100 | 119 |
| Washington GO | 5.000% | 7/1/32 | 100 | 120 |
| Washington GO | 5.000% | 7/1/33 | 275 | 325 |
| Washington GO | 5.000% | 7/1/33 | 500 | 598 |
| Washington GO | 5.000% | 8/1/34 | 250 | 282 |
| Washington GO | 5.000% | 8/1/39 | 500 | 593 |
| | | | | 13,382 |
| West Virginia (0.0%) | | | | |
| West Virginia Economic Development Authority | | | | |
| Lottery Revenue | 5.000% | 6/15/40 | 50 | 56 |
| |
| Wisconsin (0.8%) | | | | |
| Wisconsin Annual Appropriation Revenue | 5.750% | 5/1/29 | 100 | 111 |
| Wisconsin GO | 5.000% | 5/1/19 (2) | 175 | 192 |
| Wisconsin GO | 5.000% | 11/1/20 | 60 | 69 |
| Wisconsin GO | 5.000% | 11/1/20 | 500 | 576 |
| Wisconsin GO | 5.000% | 11/1/22 | 250 | 294 |
| Wisconsin GO | 5.000% | 11/1/23 | 205 | 253 |
| Wisconsin GO | 5.000% | 5/1/25 | 90 | 107 |
68
| | | | |
| Tax-Exempt Bond Index Fund | | | | |
| |
| |
| |
| | | | Face | Market |
| | | Maturity | Amount | Value• |
| | Coupon | Date | ($000) | ($000) |
| Wisconsin GO | 5.000% | 11/1/29 | 500 | 617 |
| Wisconsin GO | 5.000% | 5/1/35 | 520 | 609 |
| Wisconsin GO | 6.000% | 5/1/36 | 450 | 502 |
| Wisconsin GO | 5.000% | 5/1/37 | 750 | 882 |
| Wisconsin Health & Educational Facilities Authority | | | | |
| Revenue (Medical College Wisconsin) | 4.000% | 12/1/46 | 300 | 316 |
| Wisconsin Public Finance Authority Lease | | | | |
| Development Revenue (Central District | | | | |
| Development Project) | 5.000% | 3/1/41 | 245 | 283 |
| Wisconsin Public Power System Power Supply | | | | |
| System Revenue | 5.000% | 7/1/37 | 290 | 334 |
| Wisconsin Transportation Revenue | 5.000% | 7/1/19 (14) | 90 | 100 |
| | | | | 5,245 |
| Wyoming (0.0%) | | | | |
| Campbell County WY Solid Waste Facilities | | | | |
| Revenue(Basin Electric Power Cooperative - | | | | |
| Dry Fork Station Facilities) | 5.750% | 7/15/39 | 225 | 249 |
| Total Tax-Exempt Municipal Bonds (Cost $608,888) | | | | 609,965 |
| |
| | | | Shares | |
| Temporary Cash Investment (1.6%) | | | | |
| Money Market Fund (1.6%) | | | | |
| 1 Vanguard Municipal Cash Management Fund | | | | |
| (Cost $9,699) | 0.614% | | 96,989 | 9,699 |
| Total Investments (99.7%) (Cost $618,587) | | | | 619,664 |
| |
| | | | | Amount |
| | | | | ($000) |
| Other Assets and Liabilities (0.3%) | | | | |
| Other Assets | | | | |
| Investment in Vanguard | | | | 45 |
| Receivables for Accrued Income | | | | 7,469 |
| Receivables for Capital Shares Issued | | | | 1,053 |
| Total Other Assets | | | | 8,567 |
| Liabilities | | | | |
| Payables for Investment Securities Purchased | | | | (6,247) |
| Payables for Capital Shares Redeemed | | | | (16) |
| Payables for Distributions | | | | (13) |
| Payables to Vanguard | | | | (49) |
| Other Liabilities | | | | (92) |
| Total Liabilities | | | | (6,417) |
| Net Assets (100%) | | | | 621,814 |
69
| |
| Tax-Exempt Bond Index Fund | |
| |
| |
| At October 31, 2016, net assets consisted of: | |
| | Amount |
| | ($000) |
| Paid-in Capital | 619,992 |
| Undistributed Net Investment Income | 781 |
| Accumulated Net Realized Losses | (36) |
| Unrealized Appreciation (Depreciation) | 1,077 |
| Net Assets | 621,814 |
| |
| Investor Shares—Net Assets | |
| Applicable to 224,620 outstanding $.001 par value shares of | |
| beneficial interest (unlimited authorization) | 2,319 |
| Net Asset Value Per Share—Investor Shares | $10.33 |
| |
| ETF Shares—Net Assets | |
| Applicable to 10,650,709 outstanding $.001 par value shares of | |
| beneficial interest (unlimited authorization) | 550,354 |
| Net Asset Value Per Share—ETF Shares | $51.67 |
| |
| Admiral Shares—Net Assets | |
| Applicable to 3,348,831 outstanding $.001 par value shares of | |
| beneficial interest (unlimited authorization) | 69,141 |
| Net Asset Value Per Share—Admiral Shares | $20.65 |
• See Note A in Notes to Financial Statements.
1 Affiliated money market fund available only to Vanguard funds and certain trusts and accounts managed by Vanguard. Rate shown is
the 7-day yield.
A Key to abbreviations and other references follows the Statement of Net Assets.
See accompanying Notes, which are an integral part of the Financial Statements.
70
Tax-Exempt Bond Index Fund
Key to Abbreviations
ARS—Auction Rate Security.
BAN—Bond Anticipation Note.
COP—Certificate of Participation.
CP—Commercial Paper.
FR—Floating Rate.
GAN—Grant Anticipation Note.
GO—General Obligation Bond.
PILOT—Payments in Lieu of Taxes.
PUT—Put Option Obligation.
RAN—Revenue Anticipation Note.
TAN—Tax Anticipation Note.
TOB—Tender Option Bond.
TRAN—Tax Revenue Anticipation Note.
VRDO—Variable Rate Demand Obligation.
VRDP—Variable Rate Demand Preferred.
(ETM)—Escrowed to Maturity.
(Prere.)—Prerefunded.
Scheduled principal and interest payments are guaranteed by:
(1) MBIA (Municipal Bond Investors Assurance).
(2) AMBAC (Ambac Assurance Corporation).
(3) FGIC (Financial Guaranty Insurance Company).
(4) AGM (Assured Guaranty Municipal Corporation).
(5) BIGI (Bond Investors Guaranty Insurance).
(6) Connie Lee Inc.
(7) FHA (Federal Housing Authority).
(8) CapMAC (Capital Markets Assurance Corporation).
(9) American Capital Access Financial Guaranty Corporation.
(10) XL Capital Assurance Inc.
(11) CIFG (CDC IXIS Financial Guaranty).
(12) AGC (Assured Guaranty Corporation).
(13) BHAC (Berkshire Hathaway Assurance Corporation).
(14) NPFG (National Public Finance Guarantee Corporation).
(15) BAM (Build America Mutual Assurance Company).
(16) MAC (Municipal Assurance Corporation).
(17) RAA (Radian Asset Assurance Inc.).
(18) SBLF (Michigan School Bond Loan Fund).
The insurance does not guarantee the market value of the municipal bonds.
LOC—Scheduled principal and interest payments are guaranteed by bank letter of credit.
71
| |
| Tax-Exempt Bond Index Fund | |
| |
| |
| Statement of Operations | |
| |
| | Year Ended |
| | October 31, 2016 |
| | ($000) |
| Investment Income | |
| Income | |
| Interest1 | 6,074 |
| Total Income | 6,074 |
| Expenses | |
| The Vanguard Group—Note B | |
| Investment Advisory Services | 37 |
| Management and Administrative—Investor Shares | 5 |
| Management and Administrative—ETF Shares | 169 |
| Management and Administrative—Admiral Shares | 21 |
| Marketing and Distribution—Investor Shares | — |
| Marketing and Distribution—ETF Shares | 24 |
| Marketing and Distribution—Admiral Shares | 4 |
| Custodian Fees | 1 |
| Auditing Fees | 37 |
| Shareholders’ Reports—Investor Shares | — |
| Shareholders’ Reports—ETF Shares | 4 |
| Shareholders’ Reports—Admiral Shares | 1 |
| Total Expenses | 303 |
| Net Investment Income | 5,771 |
| Realized Net Gain (Loss) on Investment Securities Sold1 | (32) |
| Change in Unrealized Appreciation (Depreciation) of Investment Securities | 744 |
| Net Increase (Decrease) in Net Assets Resulting from Operations | 6,483 |
1 Interest income and realized net gain (loss) from an affiliated company of the fund were $34,000 and $0, respectively.
See accompanying Notes, which are an integral part of the Financial Statements.
72
| | |
| Tax-Exempt Bond Index Fund | | |
| |
| |
| Statement of Changes in Net Assets | | |
| |
| | | August 21, |
| | Year Ended | 20151 to |
| | October 31, | October 31, |
| | 2016 | 2015 |
| | ($000) | ($000) |
| Increase (Decrease) in Net Assets | | |
| Operations | | |
| Net Investment Income | 5,771 | 223 |
| Realized Net Gain (Loss) | (32) | (4) |
| Change in Unrealized Appreciation (Depreciation) | 744 | 333 |
| Net Increase (Decrease) in Net Assets Resulting from Operations | 6,483 | 552 |
| Distributions | | |
| Net Investment Income | | |
| Investor Shares | (24) | (7) |
| ETF Shares | (4,401) | (107) |
| Admiral Shares | (657) | (17) |
| Realized Capital Gain | | |
| Investor Shares | — | — |
| ETF Shares | — | — |
| Admiral Shares | — | — |
| Total Distributions | (5,082) | (131) |
| Capital Share Transactions | | |
| Investor Shares | (3,074) | 5,377 |
| ETF Shares | 488,632 | 60,013 |
| Admiral Shares | 61,896 | 7,148 |
| Net Increase (Decrease) from Capital Share Transactions | 547,454 | 72,538 |
| Total Increase (Decrease) | 548,855 | 72,959 |
| Net Assets | | |
| Beginning of Period | 72,959 | — |
| End of Period2 | 621,814 | 72,959 |
1 Inception.
2 Net Assets—End of Period includes undistributed (overdistributed) net investment income of $781,000 and $92,000.
See accompanying Notes, which are an integral part of the Financial Statements.
73
| | |
| Tax-Exempt Bond Index Fund | | |
| |
| |
| Financial Highlights | | |
| |
| |
| Investor Shares | | |
| | Year | Aug. 21, |
| | Ended | 20151 to |
| | October 31, | Oct. 31, |
| For a Share Outstanding Throughout Each Period | 2016 | 2015 |
| Net Asset Value, Beginning of Period | $10.05 | $10.00 |
| Investment Operations | | |
| Net Investment Income | .149 | . 034 |
| Net Realized and Unrealized Gain (Loss) on Investments2 | .280 | .048 |
| Total from Investment Operations | .429 | .082 |
| Distributions | | |
| Dividends from Net Investment Income | (.149) | (.032) |
| Distributions from Realized Capital Gains | — | — |
| Total Distributions | (.149) | (.032) |
| Net Asset Value, End of Period | $10.33 | $10.05 |
| |
| Total Return3 | 4.28% | 0.82% |
| |
| Ratios/Supplemental Data | | |
| Net Assets, End of Period (Millions) | $2 | $5 |
| Ratio of Total Expenses to Average Net Assets | 0.19% | 0.20%4 |
| Ratio of Net Investment Income to Average Net Assets | 1.61% | 1.88%4 |
| Portfolio Turnover Rate 5 | 8% | 1% |
1 Inception.
2 Includes increases from purchase fees of $0.00 and $0.06.
3 Total returns do not include transaction or account service fees that may have applied in the periods shown. Fund prospectuses provide
information about any applicable transaction and account service fees.
4 Annualized.
5 Excludes the value of portfolio securities received or delivered as a result of in-kind purchases or redemptions of the fund’s capital shares,
including ETF Creation Units.
See accompanying Notes, which are an integral part of the Financial Statements.
74
| | |
| Tax-Exempt Bond Index Fund | | |
| |
| |
| Financial Highlights | | |
| |
| |
| ETF Shares | | |
| | Year | Aug. 21, |
| | Ended | 20151 to |
| | October 31, | Oct. 31, |
| For a Share Outstanding Throughout Each Period | 2016 | 2015 |
| Net Asset Value, Beginning of Period | $50.33 | $50.00 |
| Investment Operations | | |
| Net Investment Income | . 810 | .170 |
| Net Realized and Unrealized Gain (Loss) on Investments2 | 1.343 | .255 |
| Total from Investment Operations | 2.153 | .425 |
| Distributions | | |
| Dividends from Net Investment Income | (.813) | (.095) |
| Distributions from Realized Capital Gains | — | — |
| Total Distributions | (.813) | (.095) |
| Net Asset Value, End of Period | $51.67 | $50.33 |
| |
| Total Return | 4.29% | 0.85% |
| |
| Ratios/Supplemental Data | | |
| Net Assets, End of Period (Millions) | $550 | $60 |
| Ratio of Total Expenses to Average Net Assets | 0.09% | 0.12%3 |
| Ratio of Net Investment Income to Average Net Assets | 1.71% | 1.96%3 |
| Portfolio Turnover Rate | 8% | 1% |
1 Inception.
2 Includes increases from purchase fees of $0.02 and $0.00.
3 Annualized.
See accompanying Notes, which are an integral part of the Financial Statements.
75
| | |
| Tax-Exempt Bond Index Fund | | |
| |
| |
| Financial Highlights | | |
| |
| |
| Admiral Shares | | |
| | Year | Aug. 25, |
| | Ended | 20151 to |
| | October 31, | Oct. 31, |
| For a Share Outstanding Throughout Each Period | 2016 | 2015 |
| Net Asset Value, Beginning of Period | $20.10 | $19.98 |
| Investment Operations | | |
| Net Investment Income | . 324 | . 066 |
| Net Realized and Unrealized Gain (Loss) on Investments | .550 | .120 |
| Total from Investment Operations | .874 | .186 |
| Distributions | | |
| Dividends from Net Investment Income | (.324) | (.066) |
| Distributions from Realized Capital Gains | — | — |
| Total Distributions | (.324) | (.066) |
| Net Asset Value, End of Period | $20.65 | $20.10 |
| |
| Total Return2 | 4.36% | 0.93% |
| |
| Ratios/Supplemental Data | | |
| Net Assets, End of Period (Millions) | $69 | $7 |
| Ratio of Total Expenses to Average Net Assets | 0.09% | 0.12%3 |
| Ratio of Net Investment Income to Average Net Assets | 1.71% | 1.96%3 |
| Portfolio Turnover Rate 4 | 8% | 1% |
1 Inception.
2 Total returns do not include transaction or account service fees that may have applied in the periods shown. Fund prospectuses provide
information about any applicable transaction and account service fees.
3 Annualized.
4 Excludes the value of portfolio securities received or delivered as a result of in-kind purchases or redemptions of the fund’s capital shares,
including ETF Creation Units.
See accompanying Notes, which are an integral part of the Financial Statements.
76
Tax-Exempt Bond Index Fund
Notes to Financial Statements
Vanguard Tax-Exempt Bond Index Fund is registered under the Investment Company Act of 1940 as an open-end investment company, or mutual fund. The fund invests in debt instruments of many municipal issuers; the issuers’ abilities to meet their obligations may be affected by economic and political developments in a specific state or region. The fund offers three classes of shares: Investor Shares, ETF Shares, and Admiral Shares. Investor Shares are available to any investor who meets the fund’s minimum purchase requirements. ETF Shares are listed for trading on NYSE Arca; they can be purchased and sold through a broker. Admiral Shares are designed for investors who meet certain administrative, service, and account-size criteria.
A. The following significant accounting policies conform to generally accepted accounting principles for U.S. investment companies. The fund consistently follows such policies in preparing its financial statements.
1. Security Valuation: Securities are valued as of the close of trading on the New York Stock Exchange (generally 4 p.m., Eastern time) on the valuation date. Bonds and temporary cash investments acquired over 60 days to maturity are valued using the latest bid prices or using valuations based on a matrix system (which considers such factors as security prices, yields, maturities, and ratings), both as furnished by independent pricing services. Investments in Vanguard Municipal Cash Management Fund are valued at that fund’s net asset value. Other temporary cash investments are valued at amortized cost, which approximates market value. Securities for which market quotations are not readily available, or whose values have been affected by events occurring before the fund’s pricing time but after the close of the securities’ primary markets, are valued by methods deemed by the board of trustees to represent fair value.
2. Federal Income Taxes: The fund intends to continue to qualify as a regulated investment company and distribute all of its income. Management has analyzed the fund’s tax positions taken for all open federal income tax years (October 31, 2015–2016), and has concluded that no provision for federal income tax is required in the fund’s financial statements.
3. Distributions: Distributions to shareholders are recorded on the ex-dividend date.
4. Credit Facility: The fund and certain other funds managed by The Vanguard Group (“Vanguard”) participate in a $3.1 billion committed credit facility provided by a syndicate of lenders pursuant to a credit agreement that may be renewed annually; each fund is individually liable for its borrowings, if any, under the credit facility. Borrowings may be utilized for temporary and emergency purposes, and are subject to the fund’s regulatory and contractual borrowing restrictions. The participating funds are charged administrative fees and an annual commitment fee of 0.10% of the undrawn amount of the facility; these fees are allocated to the funds based on a method approved by the fund’s board of trustees and included in Management and Administrative expenses on the fund’s Statement of Operations. Any borrowings under this facility bear interest at a rate based upon the higher of the one-month London Interbank Offered Rate, federal funds effective rate, or overnight bank funding rate plus an agreed-upon spread.
The fund had no borrowings outstanding at October 31, 2016, or at any time during the period then ended.
5. Other: Interest income includes income distributions received from Vanguard Municipal Cash Management Fund and is accrued daily. Premiums and discounts on debt securities purchased are amortized and accreted, respectively, to interest income over the lives of the respective securities. Security transactions are accounted for on the date securities are bought or sold. Costs used to determine realized gains (losses) on the sale of investment securities are those of the specific securities sold. Fees assessed on capital share transactions are credited to paid-in capital.
77
Tax-Exempt Bond Index Fund
Each class of shares has equal rights as to assets and earnings, except that each class separately bears certain class-specific expenses related to maintenance of shareholder accounts (included in Management and Administrative expenses) and shareholder reporting. Marketing and distribution expenses are allocated to each class of shares based on a method approved by the board of trustees. Income, other non-class-specific expenses, and gains and losses on investments are allocated to each class of shares based on its relative net assets.
B. In accordance with the terms of a Funds’ Service Agreement (the “FSA”) between Vanguard and the fund, Vanguard furnishes to the fund investment advisory, corporate management, administrative, marketing, and distribution services at Vanguard’s cost of operations (as defined by the FSA). These costs of operations are allocated to the fund based on methods and guidelines approved by the board of trustees. Vanguard does not require reimbursement in the current period for certain costs of operations (such as deferred compensation/benefits and risk/insurance costs); the fund’s liability for these costs of operations is included in Payables to Vanguard on the Statement of Net Assets.
Upon the request of Vanguard, the fund may invest up to 0.40% of its net assets as capital in Vanguard. At October 31, 2016, the fund had contributed to Vanguard capital in the amount of $45,000, representing 0.01% of the fund’s net assets and 0.02% of Vanguard’s capitalization. The fund’s trustees and officers are also directors and employees, respectively, of Vanguard.
C. Various inputs may be used to determine the value of the fund’s investments. These inputs are summarized in three broad levels for financial statement purposes. The inputs or methodologies used to value securities are not necessarily an indication of the risk associated with investing in those securities.
Level 1—Quoted prices in active markets for identical securities.
Level 2—Other significant observable inputs (including quoted prices for similar securities, interest rates, prepayment speeds, credit risk, etc.).
Level 3—Significant unobservable inputs (including the fund’s own assumptions used to determine the fair value of investments).
The following table summarizes the market value of the fund’s investments as of October 31, 2016, based on the inputs used to value them:
| | | |
| | Level 1 | Level 2 | Level 3 |
| Investments | ($000) | ($000) | ($000) |
| Tax-Exempt Municipal Bonds | — | 609,965 | — |
| Temporary Cash Investments | 9,699 | — | — |
| Total | 9,699 | 609,965 | — |
D. Distributions are determined on a tax basis and may differ from net investment income and realized capital gains for financial reporting purposes. Differences may be permanent or temporary. Permanent differences are reclassified among capital accounts in the financial statements to reflect their tax character. Temporary differences arise when certain items of income, expense, gain, or loss are recognized in different periods for financial statement and tax purposes. These differences will reverse at some time in the future. Differences in classification may also result from the treatment of short-term gains as ordinary income for tax purposes.
For tax purposes, at October 31, 2016, the fund had $809,000 of ordinary income available for distribution. The fund had available capital losses totaling $36,000 that may be carried forward indefinitely to offset future net capital gains.
78
Tax-Exempt Bond Index Fund
At October 31, 2016, the cost of investment securities for tax purposes was $618,587,000. Net unrealized appreciation of investment securities for tax purposes was $1,077,000, consisting of unrealized gains of $4,577,000 on securities that had risen in value since their purchase and $3,500,000 in unrealized losses on securities that had fallen in value since their purchase.
E. During the year ended October 31, 2016, the fund purchased $549,370,000 of investment securities and sold $23,969,000 of investment securities, other than temporary cash investments. Purchases include $352,036,000 in connection with in-kind purchases of the fund’s capital shares.
| | | | |
| F. Capital share transactions for each class of shares were: | | | |
| | | Year Ended | August 21, 20151 to |
| | October 31, 2016 | October 31, 2015 |
| | Amount | Shares | Amount | Shares |
| | ($000) | (000) | ($000) | (000) |
| Investor Shares | | | | |
| Issued 2 | 3,124 | 303 | 5,438 | 542 |
| Issued in Lieu of Cash Distributions | 19 | 2 | 7 | 1 |
| Redeemed | (6,217) | (616) | (68) | (7) |
| Net Increase (Decrease)—Investor Shares | (3,074) | (311) | 5,377 | 536 |
| ETF Shares | | | | |
| Issued 2 | 488,632 | 9,451 | 60,013 | 1,200 |
| Issued in Lieu of Cash Distributions | — | — | — | — |
| Redeemed | — | — | — | — |
| Net Increase (Decrease)—ETF Shares | 488,632 | 9,451 | 60,013 | 1,200 |
| Admiral Shares | | | | |
| Issued 2 | 75,733 | 3,667 | 7,277 | 363 |
| Issued in Lieu of Cash Distributions | 579 | 28 | 14 | 1 |
| Redeemed | (14,416) | (703) | (143) | (7) |
| Net Increase (Decrease)—Admiral Shares | 61,896 | 2,992 | 7,148 | 357 |
1 Inception.
2 Includes purchase fees for fiscal 2016 and 2015 of $182,000 and $32,000, respectively (fund totals).
At October 31, 2016, one shareholder was the record or beneficial owner of 26% of the fund’s net assets. If the shareholder were to redeem its investment in the fund, the redemption might result in an increase in the fund’s expense ratio.
G. Management has determined that no material events or transactions occurred subsequent to October 31, 2016, that would require recognition or disclosure in these financial statements.
79
Report of Independent Registered Public Accounting Firm
To the Board of Trustees of Vanguard Municipal Bond Funds and the Shareholders of Vanguard Tax-Exempt Bond Index Fund: In our opinion, the accompanying statement of net assets and the related statements of operations and of changes in net assets and the financial highlights present fairly, in all material respects, the financial position of Vanguard Tax-Exempt Bond Index Fund (constituting a separate portfolio of Vanguard Municipal Bond Funds, hereafter referred to as the “Fund”) at October 31, 2016, and the results of its operations for the year then ended, and the changes in its net assets and financial highlights for the periods indicated, in conformity with accounting principles generally accepted in the United States of America. These financial statements and financial highlights (hereafter referred to as “financial statements”) are the responsibility of the Fund’s management. Our responsibility is to express an opinion on these financial statements based on our audits. We conducted our audits of these financial statements in accordance with the standards of the Public Company Accounting Oversight Board (United States). Those standards require that we plan and perform the audit to obtain reasonable assurance about whether the financial statements are free of material misstatement. An audit includes examining, on a test basis, evidence supporting the amounts and disclosures in the financial statements, assessing the accounting principles used and significant estimates made by management, and evaluating the overall financial statement presentation. We believe that our audits, which included confirmation of securities at October 31, 2016 by correspondence with the custodian and brokers and by agreement to the underlying ownership records of the transfer agent, provide a reasonable basis for our opinion.
/s/PricewaterhouseCoopers LLP
Philadelphia, Pennsylvania
December 15, 2016
Special 2016 tax information (unaudited) for Vanguard Tax-Exempt Bond Index Fund
This information for the fiscal year ended October 31, 2016, is included pursuant to provisions of the Internal Revenue Code.
The fund designates 100% of its income dividends as exempt-interest dividends.
80
About Your Fund’s Expenses
As a shareholder of the fund, you incur ongoing costs, which include costs for portfolio management, administrative services, and shareholder reports (like this one), among others. Operating expenses, which are deducted from a fund’s gross income, directly reduce the investment return of the fund.
A fund’s expenses are expressed as a percentage of its average net assets. This figure is known as the expense ratio. The following examples are intended to help you understand the ongoing costs (in dollars) of investing in your fund and to compare these costs with those of other mutual funds. The examples are based on an investment of $1,000 made at the beginning of the period shown and held for the entire period.
The accompanying table illustrates your fund’s costs in two ways:
• Based on actual fund return. This section helps you to estimate the actual expenses that you paid over the period. The ”Ending Account Value“ shown is derived from the fund‘s actual return, and the third column shows the dollar amount that would have been paid by an investor who started with $1,000 in the fund. You may use the information here, together with the amount you invested, to estimate the expenses that you paid over the period.
To do so, simply divide your account value by $1,000 (for example, an $8,600 account value divided by $1,000 = 8.6), then multiply the result by the number given for your fund under the heading ”Expenses Paid During Period.“
• Based on hypothetical 5% yearly return. This section is intended to help you compare your fund‘s costs with those of other mutual funds. It assumes that the fund had a yearly return of 5% before expenses, but that the expense ratio is unchanged. In this case—because the return used is not the fund’s actual return—the results do not apply to your investment. The example is useful in making comparisons because the Securities and Exchange Commission requires all mutual funds to calculate expenses based on a 5% return. You can assess your fund’s costs by comparing this hypothetical example with the hypothetical examples that appear in shareholder reports of other funds.
Note that the expenses shown in the table are meant to highlight and help you compare ongoing costs only and do not reflect transaction costs incurred by the fund for buying and selling securities. Further, the expenses do not include any purchase, redemption, or account service fees described in the fund prospectus. If such fees were applied to your account, your costs would be higher. Your fund does not carry a “sales load.”
The calculations assume no shares were bought or sold during the period. Your actual costs may have been higher or lower, depending on the amount of your investment and the timing of any purchases or redemptions.
You can find more information about the fund’s expenses, including annual expense ratios, in the Financial Statements section of this report. For additional information on operating expenses and other shareholder costs, please refer to your fund’s current prospectus.
81
| | | |
| Six Months Ended October 31, 2016 | | | |
| | Beginning | Ending | Expenses |
| | Account Value | Account Value | Paid During |
| Tax-Exempt Bond Index Fund | 4/30/2016 | 10/31/2016 | Period |
| Based on Actual Fund Return | | | |
| Investor Shares | $1,000.00 | $1,006.23 | $0.91 |
| ETF Shares | 1,000.00 | 1,006.50 | 0.35 |
| Admiral Shares | 1,000.00 | 1,006.71 | 0.35 |
| Based on Hypothetical 5% Yearly Return | | | |
| Investor Shares | $1,000.00 | $1,024.23 | $0.92 |
| ETF Shares | 1,000.00 | 1,024.78 | 0.36 |
| Admiral Shares | 1,000.00 | 1,024.78 | 0.36 |
The calculations are based on expenses incurred in the most recent six-month period. The fund’s annualized six-month expense ratios for that period are 0.18% for Investor Shares, 0.07% for ETF Shares, and 0.07% for Admiral Shares. The dollar amounts shown as “Expenses Paid” are equal to the annualized expense ratio multiplied by the average account value over the period, multiplied by the number of days in the most recent six-month period, then divided by the number of days in the most recent 12-month period (184/366).
82
Glossary
30-Day SEC Yield. A fund’s 30-day SEC yield is derived using a formula specified by the U.S. Securities and Exchange Commission. Under the formula, data related to the fund’s security holdings in the previous 30 days are used to calculate the fund’s hypothetical net income for that period, which is then annualized and divided by the fund’s estimated average net assets over the calculation period. For the purposes of this calculation, a security’s income is based on its current market yield to maturity (for bonds), its actual income (for asset-backed securities), or its projected dividend yield (for stocks). Because the SEC yield represents hypothetical annualized income, it will differ—at times significantly—from the fund’s actual experience. As a result, the fund’s income distributions may be higher or lower than implied by the SEC yield.
Average Coupon. The average interest rate paid on the fixed income securities held by a fund. It is expressed as a percentage of face value.
Average Duration. An estimate of how much the value of the bonds held by a fund will fluctuate in response to a change in interest rates. To see how the value could change, multiply the average duration by the change in rates. If interest rates rise by 1 percentage point, the value of the bonds in a fund with an average duration of five years would decline by about 5%. If rates decrease by a percentage point, the value would rise by 5%.
Average Stated Maturity. The average length of time until fixed income securities held by a fund reach maturity and are repaid using the maturity date of the security. The figure reflects the proportion of fund assets represented by each security; it also reflects any futures contracts held. In general, the longer the average stated maturity, the more a fund’s share price will fluctuate in response to changes in market interest rates.
Credit Quality. Credit-quality ratings are measured on a scale that generally ranges from AAA (highest) to D (lowest). Credit-quality ratings are obtained from Moody’s and S&P, and the higher rating for each issue is used. ”Not Rated” is used to classify securities for which a rating is not available.
Expense Ratio. A fund’s total annual operating expenses expressed as a percentage of the fund’s average net assets. The expense ratio includes management and administrative expenses, but does not include the transaction costs of buying and selling portfolio securities.
Inception Date. The date on which the assets of a fund (or one of its share classes) are first invested in accordance with the fund’s investment objective. For funds with a subscription period, the inception date is the day after that period ends. Investment performance is measured from the inception date.
Short-Term Reserves. The percentage of a fund invested in highly liquid, short-term securities that can be readily converted to cash.
Yield to Maturity. The rate of return an investor would receive if the fixed income securities held by a fund were held to their maturity dates.
83
The People Who Govern Your Fund
The trustees of your mutual fund are there to see that the fund is operated and managed in your best interests since, as a shareholder, you are a part owner of the fund. Your fund’s trustees also serve on the board of directors of The Vanguard Group, Inc., which is owned by the Vanguard funds and provides services to them on an at-cost basis.
A majority of Vanguard’s board members are independent, meaning that they have no affiliation with Vanguard or the funds they oversee, apart from the sizable personal investments they have made as private individuals. The independent board members have distinguished backgrounds in business, academia, and public service. Each of the trustees and executive officers oversees 198 Vanguard funds.
The following table provides information for each trustee and executive officer of the fund. The mailing address of the trustees and officers is P.O. Box 876, Valley Forge, PA 19482. More information about the trustees is in the Statement of Additional Information, which can be obtained, without charge, by contacting Vanguard at 800-662-7447, or online at vanguard.com.
InterestedTrustee1
F. William McNabb III
Born 1957. Trustee Since July 2009. Chairman of the Board. Principal Occupation(s) During the Past Five Years and Other Experience: Chairman of the Board of The Vanguard Group, Inc., and of each of the investment companies served by The Vanguard Group, since January 2010; Director of The Vanguard Group since 2008; Chief Executive Officer and President of The Vanguard Group, and of each of the investment companies served by The Vanguard Group, since 2008; Director of Vanguard Marketing Corporation; Managing Director of The Vanguard Group (1995–2008).
Independent Trustees
Emerson U. Fullwood
Born 1948. Trustee Since January 2008. Principal Occupation(s) During the Past Five Years and Other Experience: Executive Chief Staff and Marketing Officer for North America and Corporate Vice President (retired 2008) of Xerox Corporation (document management products and services); Executive in Residence and 2009–2010 Distinguished Minett Professor at the Rochester Institute of Technology; Lead Director of SPX FLOW, Inc. (multi-industry manufacturing); Director of the United Way of Rochester, the University of Rochester Medical Center, Monroe Community College Foundation, North Carolina A&T University, and Roberts Wesleyan College.
Rajiv L. Gupta
Born 1945. Trustee Since December 2001.2 Principal Occupation(s) During the Past Five Years and Other Experience: Chairman and Chief Executive Officer (retired 2009) and President (2006–2008) of Rohm and Haas Co. (chemicals); Director of Tyco International plc (diversified manufacturing and services), HP Inc. (printer and personal computer manufacturing), and Delphi Automotive plc (automotive components); Senior Advisor at New Mountain Capital.
Amy Gutmann
Born 1949. Trustee Since June 2006. Principal Occupation(s) During the Past Five Years and Other Experience: President of the University of Pennsylvania; Christopher H. Browne Distinguished Professor of Political Science, School of Arts and Sciences, and Professor of Communication, Annenberg School for Communication, with secondary faculty appointments in the Department of Philosophy, School of Arts and Sciences, and at the Graduate School of Education, University of Pennsylvania; Trustee of the National Constitution Center; Chair of the Presidential Commission for the Study of Bioethical Issues.
JoAnn Heffernan Heisen
Born 1950. Trustee Since July 1998. Principal Occupation(s) During the Past Five Years and Other Experience: Corporate Vice President and Chief Global Diversity Officer (retired 2008) and Member of the Executive Committee (1997–2008) of Johnson & Johnson (pharmaceuticals/medical devices/consumer products); Director of Skytop Lodge Corporation (hotels) and the Robert Wood Johnson Foundation; Member of the Advisory Board of the Institute for Women’s Leadership at Rutgers University.
F. Joseph Loughrey
Born 1949. Trustee Since October 2009. Principal Occupation(s) During the Past Five Years and Other Experience: President and Chief Operating Officer (retired 2009) of Cummins Inc. (industrial machinery); Chairman of the Board of Hillenbrand, Inc. (specialized consumer services), and of Oxfam America; Director of SKF AB (industrial machinery), Hyster-Yale Materials Handling, Inc. (forklift trucks), the Lumina Foundation for Education, and the V Foundation for Cancer Research; Member of the Advisory Council for the College of Arts and Letters and of the Advisory Board to the Kellogg Institute for International Studies, both at the University of Notre Dame.
Mark Loughridge
Born 1953. Trustee Since March 2012. Principal Occupation(s) During the Past Five Years and Other Experience: Senior Vice President and Chief Financial Officer (retired 2013) at IBM (information technology services); Fiduciary Member of IBM’s Retirement Plan Committee (2004–2013); Director of the Dow Chemical Company; Member of the Council on Chicago Booth.
Scott C. Malpass
Born 1962. Trustee Since March 2012. Principal Occupation(s) During the Past Five Years and Other Experience: Chief Investment Officer and Vice President at the University of Notre Dame; Assistant Professor of Finance at the Mendoza College of Business at Notre Dame; Member of the Notre Dame 403(b) Investment Committee, the Board of Advisors for Spruceview Capital Partners, and the Investment Advisory Committee of Major League Baseball; Board Member of TIFF Advisory Services, Inc., and Catholic Investment Services, Inc. (investment advisors).
André F. Perold
Born 1952. Trustee Since December 2004. Principal Occupation(s) During the Past Five Years and Other Experience: George Gund Professor of Finance and Banking, Emeritus at the Harvard Business School (retired 2011); Chief Investment Officer and Managing Partner of HighVista Strategies LLC (private investment firm); Director of Rand Merchant Bank; Overseer of the Museum of Fine Arts Boston.
Peter F. Volanakis
Born 1955. Trustee Since July 2009. Principal Occupation(s) During the Past Five Years and Other Experience: President and Chief Operating Officer (retired 2010) of Corning Incorporated (communications equipment); Chairman of the Board of Trustees of Colby-Sawyer College; Member of the Advisory Board of the Norris Cotton Cancer Center.
Executive Officers
Glenn Booraem
Born 1967. Treasurer Since May 2015. Principal Occupation(s) During the Past Five Years and Other Experience: Principal of The Vanguard Group, Inc.; Treasurer of each of the investment companies served by The Vanguard Group; Controller of each of the investment companies served by The Vanguard Group (2010–2015); Assistant Controller of each of the investment companies served by The Vanguard Group (2001–2010).
Thomas J. Higgins
Born 1957. Chief Financial Officer Since September 2008. Principal Occupation(s) During the Past Five Years and Other Experience: Principal of The Vanguard Group, Inc.; Chief Financial Officer of each of the investment companies served by The Vanguard Group; Treasurer of each of the investment companies served by The Vanguard Group (1998–2008).
Peter Mahoney
Born 1974. Controller Since May 2015. Principal Occupation(s) During the Past Five Years and Other Experience: Head of Global Fund Accounting at The Vanguard Group, Inc.; Controller of each of the investment companies served by The Vanguard Group; Head of International Fund Services at The Vanguard Group (2008–2014).
Anne E. Robinson
Born 1970. Secretary Since September 2016. Principal Occupation(s) During the Past Five Years and Other Experience: Managing Director of The Vanguard Group, Inc.; General Counsel of The Vanguard Group; Secretary of The Vanguard Group and of each of the investment companies served by The Vanguard Group; Director and Senior Vice President of Vanguard Marketing Corporation; Managing Director and General Counsel of Global Cards and Consumer Services at Citigroup (2014–2016); Counsel at American Express (2003–2014).
Vanguard Senior Management Team
| |
| Mortimer J. Buckley | James M. Norris |
| Kathleen C. Gubanich | Thomas M. Rampulla |
| Martha G. King | Glenn W. Reed |
| John T. Marcante | Karin A. Risi |
| Chris D. McIsaac | Michael Rollings |
Chairman Emeritus and Senior Advisor
John J. Brennan
Chairman, 1996–2009
Chief Executive Officer and President, 1996–2008
Founder
John C. Bogle
Chairman and Chief Executive Officer, 1974–1996
1 Mr. McNabb is considered an “interested person,” as defined in the Investment Company Act of 1940, because he is an officer of the Vanguard funds.
2 December 2002 for Vanguard Equity Income Fund, the Vanguard Municipal Bond Funds, and the Vanguard State Tax-Exempt Funds.
| |
|  |
| P.O. Box 2600
Valley Forge, PA 19482-2600 |
| |
Connect with Vanguard® > vanguard.com | |
| | |
| Fund Information > 800-662-7447 | |
| |
| Direct Investor Account Services > 800-662-2739 | The index is a product of S&P Dow Jones Indices LLC |
| (“SPDJI”), and has been licensed for use by Vanguard. |
| Institutional Investor Services > 800-523-1036 | Standard & Poor’s® and S&P® are registered |
| trademarks of Standard & Poor’s Financial Services LLC |
| Text Telephone for People | (“S&P”); Dow Jones® is a registered trademark of Dow |
| Who Are Deaf or Hard of Hearing> 800-749-7273 | Jones Trademark Holdings LLC (“Dow Jones”); S&P® |
| | and S&P 500® are trademarks of S&P; and these |
| This material may be used in conjunction | trademarks have been licensed for use by SPDJI and |
| with the offering of shares of any Vanguard | sublicensed for certain purposes by Vanguard. |
| fund only if preceded or accompanied by | Vanguard product(s) are not sponsored, endorsed, sold |
| | or promoted by SPDJI, Dow Jones, S&P, or their |
| the fund’s current prospectus. | respective affiliates and none of such parties make any |
| All comparative mutual fund data are from Lipper, a | representation regarding the advisability of investing in |
| Thomson Reuters Company, or Morningstar, Inc., unless | such product(s) nor do they have any liability for any |
| otherwise noted. | errors, omissions, or interruptions of the index. |
| |
| You can obtain a free copy of Vanguard’s proxy voting | |
| guidelines by visiting vanguard.com/proxyreporting or by | |
| calling Vanguard at 800-662-2739. The guidelines are | |
| also available from the SEC’s website, sec.gov. In | |
| addition, you may obtain a free report on how your fund | |
| voted the proxies for securities it owned during the 12 | |
| months ended June 30. To get the report, visit either | |
| vanguard.com/proxyreporting or sec.gov. | |
| |
| You can review and copy information about your fund at | |
| the SEC’s Public Reference Room in Washington, D.C. To | |
| find out more about this public service, call the SEC at | |
| 202-551-8090. Information about your fund is also | |
| available on the SEC’s website, and you can receive | |
| copies of this information, for a fee, by sending a | |
| request in either of two ways: via email addressed to | |
| publicinfo@sec.gov or via regular mail addressed to the | |
| Public Reference Section, Securities and Exchange | |
| Commission, Washington, DC 20549-1520. | |
| |
| | © 2016 The Vanguard Group, Inc. |
| | All rights reserved. |
| | Vanguard Marketing Corporation, Distributor. |
| |
| | Q14910 122016 |
 |
| Annual Report | October 31, 2016 |
| Vanguard Tax-Exempt Money Market Fund |
A new format, unwavering commitment
As you begin reading this report, you’ll notice that we’ve made some improvements to the opening sections—based on feedback from you, our clients.
Page 1 starts with a new “Your Fund’s Performance at a Glance,” a concise, handy summary of how your fund performed during the period.
In the renamed “Chairman’s Perspective,” Bill McNabb will focus on enduring principles and investment insights.
We’ve modified some tables, and eliminated some redundancy, but we haven’t removed any information.
At Vanguard, we’re always looking for better ways to communicate and to help you make sound investment decisions. Thank you for entrusting your assets to us.
| |
| Contents | |
| Your Fund’s Performance at a Glance | 1 |
| Chairman’s Perspective | 3 |
| Advisor’s Report | 7 |
| Fund Profile | 11 |
| Performance Summary | 12 |
| Financial Statements | 14 |
| About Your Fund’s Expenses | 54 |
| Glossary | 56 |
Please note: The opinions expressed in this report are just that—informed opinions. They should not be considered promises or advice. Also, please keep in mind that the information and opinions cover the period through the date on the front of this report. Of course, the risks of investing in your fund are spelled out in the prospectus.
See the Glossary for definitions of investment terms used in this report.
About the cover: No matter what language you speak, Vanguard has one consistent message and set of principles. Our primary focus is on you, our clients. We conduct our business with integrity as a faithful steward of your assets. This message is shown translated into seven languages, reflecting our expanding global presence.
Your Fund’s Performance at a Glance
• For the 12 months ended October 31, 2016, Vanguard Tax Exempt Money Market Fund returned 0.25%, exceeding the 0.07% average return of its peer funds.
• During the period, we saw the final implementation of new money market regulations, which allow liquidity fees and redemption “gates” in institutional and retail funds. Institutional funds will also now have variable net asset values. (Classified as retail, your fund continues to seek to maintain a stable net asset value.)
• The new regulations led to a shift in asset flows that caused yields on some eligible money market securities to climb.
• The fund’s positioning in preparation for money market reform, and its low expense ratio compared to peers, helped it outperform.
• For the ten years ended October 31, 2016, your fund had an average annual return of 0.74%. The average return of peer funds was 0.53%.
| | | | | |
| Total Returns: Fiscal Year Ended October 31, 2016 | | | | |
| Taxable- | | | |
| 7-Day | Equivalent | Income | Capital | Total |
| SEC Yield | Yield1 | Return | Return | Return |
| Vanguard Tax-Exempt Money Market Fund | 0.56% | 0.99% | 0.25% | 0.00% | 0.25% |
| Tax-Exempt Money Market Funds Average2 | 0.07 |
1 This calculation, which assumes a typical itemized tax return, is based on the maximum federal income tax rate of 43.4%. State and local
taxes were not considered. Please see the prospectus for a detailed explanation of the calculation.
2 Derived from data provided by Lipper, a Thomson Reuters Company.
| |
| Total Returns: Ten Years Ended October 31, 2016 | |
| Average Annual |
| Return |
| Tax-Exempt Money Market Fund | 0.74% |
| Tax-Exempt Money Market Funds Average1 | 0.53 |
| 1 Derived from data provided by Lipper, a Thomson Reuters Company. | |
The figures shown represent past performance, which is not a guarantee of future results. (Current performance may be lower or higher than the performance data cited. For performance data current to the most recent month-end, visit our website at vanguard.com/performance.) Note, too, that both investment returns and principal value can fluctuate widely, so an investor’s shares, when sold, could be worth more or less than their original cost.
1
| | |
| Expense Ratios1 | | |
| Your Fund Compared With Its Peer Group | | |
|
| | Peer Group |
| Fund | Average2 |
| Tax-Exempt Money Market Fund | 0.15% | 0.09% |
1 The fund expense ratio shown is from the prospectus dated February 26, 2016, and represents estimated costs for the current fiscal year.
For the fiscal year ended October 31, 2016, the fund’s expense ratio was 0.12%, reflecting a temporary change in operating expenses
(described in Note B of the Notes to Financial Statements). Before this reduction, the expense ratio was 0.15%. The peer-group expense
ratio is derived from data provided by Lipper, a Thomson Reuters Company, and captures information through year-end 2015.
2 Peer Group: Tax-Exempt Money Market Funds.
2
Chairman’s Perspective

Bill McNabb
Chairman and Chief Executive Officer
Dear Shareholder,
Over the three years ended August 31, 2016, investors poured more than $1 trillion into index funds. Indexing now accounts for nearly a third of all mutual fund assets—more than double what it did a decade ago and eight times its share two decades ago.1
By contrast, active management’s commercial struggles have reflected its disappointing investment performance. Over the decade ended December 31, 2015, 82% of actively managed stock funds and 81% of active bond funds have either underperformed their benchmarks or shut down.
This subpar performance has fueled the explosion of asset growth in indexing among individual, retirement, and nonprofit investors. So what might the trend mean for the future of actively managed funds?
Our research and experience indicate that active management can survive—and even succeed—but only if it’s offered at much lower expense.
High costs, which limit a manager’s ability to deliver benchmark-beating returns to clients, are the biggest reason why active has lagged. Industrywide as of December 31, 2015, the average expense ratio for all active stock funds is 1.14%, compared with 0.76% for stock index
1 Sources: Wall Street Journal; Morningstar, Inc.; and Investment Company Institute, 2016.
3
funds. And the expense advantage is even wider for bonds; the average expense ratio for an active bond fund is 0.93%, compared with 0.43% for bond index funds.
But even these big differences understate the real gap. These days, it’s not hard to find an index fund that charges maybe 0.05% or 0.10%. So even if you have identified active managers who are skilled at selecting stocks and bonds, to match the return of a comparable (much cheaper) index fund would require significant outperformance. Think about it. Any fund that charges 1.00% in expenses—not even the high end of the range—will find it extraordinarily difficult to overcome the index fund’s head start.
Active management also has taken a hit from a regulatory environment that has been favorable to low-cost strategies. The U.S. Department of Labor several years ago mandated greater disclosure of retirement plan fees. And its new fiduciary rule, which is set to take effect in April, requires financial advisors to demonstrate that their recommendations are aligned with their clients’ best interest. Both changes encourage the use of lower-cost investments, including index funds.
The future of active management
In light of all this, people have been asking me whether active management is “dead.” My response is both yes and no. High-cost active management is dead, and rightly so. It has never been a winning proposition
| | | |
| Market Barometer | | | |
| | Average Annual Total Returns |
| | Periods Ended October 31, 2016 |
| One | Three | Five |
| Year | Years | Years |
| Stocks | | | |
| Russell 1000 Index (Large-caps) | 4.26% | 8.48% | 13.51% |
| Russell 2000 Index (Small-caps) | 4.11 | 4.12 | 11.51 |
| Russell 3000 Index (Broad U.S. market) | 4.24 | 8.13 | 13.35 |
| FTSE All-World ex US Index (International) | 0.64 | -0.94 | 4.09 |
| |
| Bonds | | | |
| Bloomberg Barclays U.S. Aggregate Bond Index | | | |
| (Broad taxable market) | 4.37% | 3.48% | 2.90% |
| Bloomberg Barclays Municipal Bond Index | | | |
| (Broad tax-exempt market) | 4.06 | 4.89 | 4.34 |
| Citigroup Three-Month U.S. Treasury Bill Index | 0.22 | 0.07 | 0.07 |
| |
| CPI | | | |
| Consumer Price Index | 1.64% | 1.15% | 1.32% |
4
for investors. Low-cost active funds, though, can potentially play an important role for investors who seek to outperform the market.
Paying less for your funds is the only sure-fire way to improve your odds of achieving success in active management. But even if you have found an active manager with low costs, the odds of outperforming the market are still long. You have to be able to identify talented stock and bond portfolio managers with long time horizons and clear investment strategies. Look for managers with consistent track records and the discipline to stick closely to their investment strategy.
Know what you own and why
Despite the well-deserved reputation of indexing and the challenges for active managers, there’s still a place for traditional active strategies that are low-cost, diversified, and highly disciplined, and are run by talented managers who focus on the long term.
Vanguard has always applied these principles to our active strategies, and investors have benefited as a majority of our active funds outperformed their benchmarks and bested their peers’ average annual return over the ten years ended September 30, 2016.
Worried about the election’s impact on your portfolio?
The 2016 presidential election season was one of the most intense and unpredictable in U.S. history. In its aftermath, investors may be left with lingering questions about what the outcome will mean for their portfolios. The answer, based on Vanguard research into decades of historical data, is that presidential elections typically have no long-term effect on market performance.
These findings hold true regardless of the market’s initial reaction. Whether there’s a swoon or bounce immediately after an election, investors shouldn’t extrapolate that performance to the long term.
As you can see in the accompanying chart, data going back to 1853 show that stock market returns are virtually identical no matter which party controls the White House. Although headlines out of Washington at any given time may still cause concern, investors
shouldn’t overreact to short-term events. Instead, it’s best to maintain a balanced and diversified portfolio and stay focused on your long-term goals.
Average annual stock market returns based on party control of the White House (1853–2015)
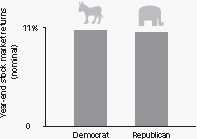
Sources: Global Financial Data, 1853–1926; Morningstar, Inc., and Ibbotson Associates thereafter through 2015.
5
But it’s crucial for investors to be patient. Even active managers with the best track records frequently underperform their benchmarks when their investment styles are out of favor. Such periods, though temporary, can persist. So it’s important when entrusting your assets to an active strategy to be in it for the long haul.
Make sure you know what you’re buying and what the risks are. Active strategies are becoming more complex, so it’s important to clearly understand what the investments in your portfolio are designed to accomplish and why you want to hold them. Otherwise, you run the risk of selecting strategies that don’t fit your needs or objectives.
Keeping these considerations in mind can potentially boost your chances of success in identifying active strategies that may be able to help you reach your goals.
As always, thank you for investing with Vanguard.
Sincerely,

F. William McNabb III
Chairman and Chief Executive Officer
November 9, 2016
6
Advisor’s Report
For the 12 months ended October 31, 2016, Vanguard Tax-Exempt Money Market Fund returned 0.25%. Its performance exceeded the average 0.07% return for tax-exempt money market peers.
The investment environment
The period began and ended with investors wondering when, and by how much, the Federal Reserve would raise short-term interest rates.
In December, the Fed increased the target range for the federal funds rate for the first time in a decade, bumping it to 0.25%–0.50% from the near-zero level and citing as reasons for the move an improving labor market and reasonable confidence that inflation would rise to its 2% objective. Investors interpreted the increase as a
signal the U.S. economy was on sturdy footing and that monetary policy was normalizing, although rates remained below historical standards. Market expectations were for future hikes to be gradual, with four likely coming the next year.
Those expectations were dampened in early 2016 as steep declines in commodity prices and unanticipated sluggish economic growth around the world, especially in China, triggered a move toward less risky assets. In subsequent meetings, the Fed seemed less inclined to raise rates as it became unclear whether inflation and employment targets would be realized—and the United Kingdom’s June vote to leave the European Union further clouded the
| | |
| Yields of Municipal Bonds | | |
| (AAA-Rated General-Obligation Issues) | | |
| October 31, | October 31, |
| Maturity | 2015 | 2016 |
| 2 years | 0.54% | 0.85% |
| 5 years | 1.17 | 1.14 |
| 10 years | 2.04 | 1.74 |
| 30 years | 3.07 | 2.56 |
| Source: Vanguard. | | |
7
outlook. The voting results sparked uncertainty in global financial markets, but by the end of the summer the initial impact was mostly offset as better economic data led to shifting sentiments at key central banks. Investors were soon anticipating that the next hike would likely come at the Fed’s December meeting.
That anticipation was partly bolstered by third-quarter GDP. The U.S. economy posted weak results in the early part of your fund’s fiscal year. A strong dollar and soft global economic and financial
conditions were likely behind the slow growth. The economy showed a little more steam in the third quarter of 2016, growing 2.9% thanks to a surge in exports, an uptick in inventory investment, and more government spending. We expect growth to moderate around 2% over the near term.
Employment gains were a bright spot during the period, with payrolls increasing by an average of around 203,000 per month over the trailing 12 months. With more workers drawn into the labor market,
Money market reform: What’s changed and what hasn’t
The final phase of money market reform took effect on October 14, 2016, the compliance date for the Securities and Exchange Commission’s new rules designed to enhance the stability and resilience of all money market funds.
Vanguard Tax-Exempt Money Market Fund’s goal remains to provide the stability that shareholders have come to expect. The fund qualifies as a retail fund, which means it will seek to maintain a stable net asset value of $1 per share. (Institutional money market funds, which have floating share prices, are not offered by Vanguard.)
Under the new rules, we report the fund’s weekly liquid assets, daily market value to four decimal places, and daily net shareholder cash flow. (See your fund’s Portfolio & Management tab on vanguard.com.)
Two other changes involve liquidity fees and redemption “gates,” tools to help keep funds stable during times of extreme market duress.
A fee of up to 2% may be imposed by the fund’s board on the sale of shares if the fund’s weekly liquid assets fall below specified thresholds of its total assets. (The SEC has strict definitions for “liquid” assets; generally this refers to assets that can be sold in the normal course of business with little impact on their price.) The fee would reduce the dollar amount you receive for your redemption.
A gate is a temporary suspension of redemptions. The board may impose either fees or gates or both. You can learn more in the prospectus, available at vanguard.com.
8
the unemployment rate dipped as low as 4.7%; at the end of the period it stood at 4.9%. However, the participation rate, which reflects the percentage of the population working or seeking work, was little changed over the period. Strong employment gains were coupled with a slight increase in wages. Those gains, along with a rebound in commodity prices, could be spurring a rise in inflation, which is nearing the Fed’s 2% target.
The U.S. Treasury bond market gained 4.48% over the last 12 months despite some volatility. Yields initially edged higher as investors factored in future Fed hikes, then retreated as prospects for global growth and inflation deteriorated. In the days after the Brexit vote, the yield on the 10-year Treasury note hit a record low of 1.36%. As the possibility of a rate hike strengthened in the fall, yields inched up again. The 10-year Treasury note shed 34 basis points over the fiscal year, finishing at 1.83%.
Management of the fund
This fiscal year saw the final implementation of new money market regulations, which allow liquidity fees and redemption “gates” in institutional and retail funds. Institutional funds will also now have variable net asset values. These tools are designed to protect funds during times of stress.
As a retail fund, your fund will continue to seek to maintain a stable net asset value of $1 per share, but under certain conditions
its board can now impose a liquidity fee and restrict redemptions. (See the insight box on page 8 for more information.) Institutional money fund investors and those who no longer qualified to invest in a retail fund largely transitioned to U.S. government funds, as these funds are also able to continue to maintain a stable net asset value. We estimate that around half of the assets in the municipal money market fund industry transitioned to U.S. government money funds. Vanguard municipal money market funds experienced outflows, but at a much lower rate.
The money market regulations made for a challenging environment. The shift in asset flows caused the yields on eligible money market securities such as variable-rate demand notes to climb and the yield curve to slightly invert. We maintained high levels of liquidity and a short weighted average maturity in preparation for money market reform. This positioning allowed us to add value for the fund by taking advantage of shorter-term conditions caused by the reform. Your fund’s ability to take advantage of the increase in yields on money market-eligible securities, along with its low expense ratio compared to peers, helped it outperform for the period.
Please note that your fund is allowed to invest in securities whose income is subject to the alternative minimum tax (AMT). As of October 31, 2016, your fund owned securities that would generate income distributions subject to the AMT.
9
A look ahead
We expect the Fed to raise rates gradually, compared with prior periods of economic recovery. The pace of future hikes will likely depend on future economic growth and inflation; we expect the former to be modest and the latter to remain tame. The dollar will likely remain strong as long as central banks such as the Bank of Japan and the European Central Bank maintain the accommodative monetary stances that have produced negative interest rates in those regions.
Of course, market conditions could change, especially given the results of the U.S. presidential election. Job growth and inflation that exceed expectations could also affect market conditions. We remain confident, however, that our team of experienced managers, analysts, and traders can handle whatever the market brings and find opportunities that will produce competitive returns.
Please note that in the first quarter of 2017, Vanguard Tax-Exempt Money Market Fund will change its name to Vanguard Municipal Money Market Fund. The fund’s board decided to change the name to provide additional cash management flexibility. The investment objective and limitations of the fund will remain the same, including the 20% limitation on investments in securities that are subject to the alternative minimum tax.
Christopher W. Alwine, CFA, Principal,
Head of Municipal Group
Justin A. Schwartz, CFA, Portfolio Manager,
Head of Municipal Money Market Funds
Vanguard Fixed Income Group
November 4, 2016
10
Tax-Exempt Money Market Fund
Fund Profile
As of October 31, 2016
| |
| Financial Attributes | |
| Ticker Symbol | VMSXX |
| Expense Ratio1 | 0.15% |
| 7-Day SEC Yield | 0.56% |
| Average Weighted Maturity | 31 days |
| |
| Largest Area Concentrations | |
| New York | 11.3% |
| Multiple States | 11.2 |
| Texas | 7.7 |
| Illinois | 5.3 |
| New Jersey | 3.8 |
| Wisconsin | 3.8 |
| Florida | 3.7 |
| California | 3.4 |
| Michigan | 3.0 |
| Missouri | 2.9 |
| Top Ten | 56.1% |
1 The expense ratio shown is from the prospectus dated February 26, 2016, and represents estimated costs for the current fiscal year. For the fiscal year ended October 31, 2016, the expense ratio was 0.12%, reflecting a temporary change in operating expenses (described in Note B of the Notes to Financial Statements). Before this reduction, the expense ratio was 0.15%.
11
Tax-Exempt Money Market Fund
Performance Summary
Investment returns will fluctuate. All of the returns in this report represent past performance, which is not a guarantee of future results that may be achieved by the fund. (Current performance may be lower or higher than the performance data cited. For performance data current to the most recent month-end, visit our website at vanguard.com/performance.) The returns shown do not reflect taxes that a shareholder would pay on fund distributions. The fund is only available to retail investors (natural persons). You could lose money by investing in the fund. Although the fund seeks to preserve the value of your investment at $1.00 per share, it cannot guarantee it will do so. The fund may impose a fee upon the sale of your shares or may temporarily suspend your ability to sell shares if the fund’s liquidity falls below required minimums because of market conditions or other factors. An investment in the fund is not insured or guaranteed by the Federal Deposit Insurance Corporation or any other government agency. The fund’s sponsor has no legal obligation to provide financial support to the fund, and you should not expect that the sponsor will provide financial support to the fund at any time. The fund’s 7-day SEC yield reflects its current earnings more closely than do the average annual returns.
Cumulative Performance: October 31, 2006–October 31, 2016
Initial Investment of $10,000
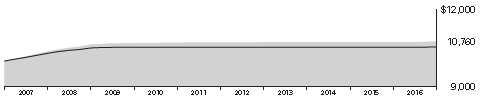
| | | | |
| | | Average Annual Total Returns | Final Value |
| | | Periods Ended October 31, 2016 | of a $10,000 |
| | One Year | Five Years | Ten Years | Investment |
| Tax-Exempt Money Market Fund | 0.25% | 0.07% | 0.74% | $10,760 |
| Tax-Exempt Money Market Funds Average1 | 0.07 | 0.02 | 0.53 | 10,546 |
1 Derived from data provided by Lipper, a Thomson Reuters Company.
See Financial Highlights for dividend information.
12
Tax-Exempt Money Market Fund
| | |
| Fiscal-Year Total Returns (%): October 31, 2006–October 31, 2016 | | |
| |
| Tax-Exempt |
| Money Market |
| Funds Average |
| Fiscal Year | Total Returns | Total Returns1 |
| 2007 | 3.65% | 2.99% |
| 2008 | 2.63 | 2.03 |
| 2009 | 0.60 | 0.27 |
| 2010 | 0.14 | 0.00 |
| 2011 | 0.09 | 0.00 |
| 2012 | 0.04 | 0.00 |
| 2013 | 0.02 | 0.00 |
| 2014 | 0.01 | 0.01 |
| 2015 | 0.01 | 0.01 |
| 2016 | 0.25 | 0.07 |
| 7-day SEC yield (10/31/2016): 0.56% | | |
| 1 Derived from data provided by Lipper, a Thomson Reuters Company. | | |
Average Annual Total Returns: Periods Ended September 30, 2016
This table presents returns through the latest calendar quarter—rather than through the end of the fiscal period.
Securities and Exchange Commission rules require that we provide this information.
| | | | |
| Inception Date | One Year | Five Years | Ten Years |
| Tax-Exempt Money Market | 6/10/1980 | 0.19% | 0.05% | 0.76% |
13
Tax-Exempt Money Market Fund
Financial Statements
Statement of Net Assets
As of October 31, 2016
The fund reports a complete list of its holdings in various monthly and quarterly regulatory filings. The fund publishes its holdings on a monthly basis at vanguard.com and files them with the Securities and Exchange Commission on Form N-MFP. The fund’s Form N-MFP filings may be viewed at sec.gov or via a link on the “Portfolio Holdings” page on vanguard.com. For the second and fourth fiscal quarters, the lists appear in the fund’s semiannual and annual reports to shareholders. For the first and third fiscal quarters, the fund files the lists with the SEC on Form N-Q. Shareholders can look up the fund’s Forms N-Q on the SEC’s website at sec.gov. Forms N-Q may also be reviewed and copied at the SEC’s Public Reference Room (see the back cover of this report for further information).
| | | | | |
| Face | Market |
| Maturity | Amount | Value• |
| | Coupon | Date | ($000) | ($000) |
| Tax-Exempt Municipal Bonds (95.0%) | | | | |
| Alabama (0.5%) | | | | |
| 1 | Alabama Special Care Facilities Financing | | | | |
| | Authority Birmingham Revenue (Ascension | | | | |
| | Health Credit Group) TOB VRDO | 0.660% | 11/7/16 | 6,370 | 6,370 |
| 1 | Auburn University Alabama General Fee Revenue | | | | |
| | TOB VRDO | 0.660% | 11/7/16 | 16,125 | 16,125 |
| Tuscaloosa County AL Industrial Development | | | | |
| | Authority Gulf Opportunity Zone Revenue | | | | |
| | (Hunt Refining Project) VRDO | 0.670% | 11/7/16 LOC | 14,000 | 14,000 |
| Tuscaloosa County AL Industrial Development | | | | |
| | Authority Gulf Opportunity Zone Revenue | | | | |
| | (Hunt Refining Project) VRDO | 0.680% | 11/7/16 LOC | 6,000 | 6,000 |
| University of Alabama at Birmingham Hospital | | | | |
| | Revenue VRDO | 0.650% | 11/7/16 LOC | 34,650 | 34,650 |
| 77,145 |
| Alaska (0.4%) | | | | |
| Alaska Housing Finance Corp. Home Mortgage | | | | |
| | Revenue VRDO | 0.650% | 11/7/16 | 44,275 | 44,275 |
| Alaska Student Loan Corp. Education Loan | | | | |
| | Revenue VRDO | 0.650% | 11/7/16 LOC | 17,655 | 17,655 |
| 61,930 |
| Arizona (1.3%) | | | | |
| 1 | Arizona Health Facilities Authority Revenue | | | | |
| | (Banner Health) TOB VRDO | 0.660% | 11/7/16 | 21,000 | 21,000 |
| Arizona Health Facilities Authority Revenue | | | | |
| | (Banner Health) VRDO | 0.630% | 11/7/16 LOC | 63,550 | 63,550 |
| Arizona Health Facilities Authority Revenue | | | | |
| | (Banner Health) VRDO | 0.640% | 11/7/16 LOC | 15,525 | 15,525 |
| Arizona Health Facilities Authority Revenue | | | | |
| | (Banner Health) VRDO | 0.650% | 11/7/16 LOC | 9,625 | 9,625 |
| Arizona Health Facilities Authority Revenue | | | | |
| | (Banner Health) VRDO | 0.650% | 11/7/16 LOC | 9,130 | 9,130 |
| Arizona Health Facilities Authority Revenue | | | | |
| | (Banner Health) VRDO | 0.650% | 11/7/16 LOC | 14,000 | 14,000 |
14
| | | | | |
| Tax-Exempt Money Market Fund | | | | |
| |
| |
| |
| Face | Market |
| Maturity | Amount | Value• |
| | Coupon | Date | ($000) | ($000) |
| 1 | Arizona Transportation Board Highway Revenue | | | | |
| | TOB VRDO | 0.660% | 11/7/16 | 7,260 | 7,260 |
| 1 | Mesa AZ Utility System Revenue TOB VRDO | 0.670% | 11/7/16 | 8,250 | 8,250 |
| 1 | Mesa AZ Utility System Revenue TOB VRDO | 0.670% | 11/7/16 | 7,500 | 7,500 |
| 1 | Phoenix AZ Civic Improvement Corp. Airport | | | | |
| | Revenue TOB VRDO | 0.750% | 11/7/16 | 1,000 | 1,000 |
| 1 | Phoenix AZ Civic Improvement Corp. | | | | |
| | Wastewater System Revenue TOB VRDO | 0.630% | 11/7/16 LOC | 20,085 | 20,085 |
| 1 | Phoenix AZ Civic Improvement Corp. Water | | | | |
| | System Revenue TOB VRDO | 0.660% | 11/7/16 | 5,000 | 5,000 |
| Phoenix AZ Industrial Development Authority | | | | |
| | Revenue (Mayo Clinic) VRDO | 0.470% | 11/1/16 | 4,300 | 4,300 |
| 1 | Salt River Project Arizona Agricultural | | | | |
| | Improvement & Power District Revenue TOB | | | | |
| | VRDO | 0.660% | 11/7/16 | 5,650 | 5,650 |
| 1 | Salt River Project Arizona Agricultural | | | | |
| | Improvement & Power District Revenue TOB | | | | |
| | VRDO | 0.670% | 11/7/16 | 4,000 | 4,000 |
| 1 | Tempe AZ Union High School District No. 213 | | | | |
| | GO TOB VRDO | 0.660% | 11/7/16 | 6,840 | 6,840 |
| 1 | University of Arizona Revenue TOB VRDO | 0.660% | 11/7/16 | 6,715 | 6,715 |
| 209,430 |
| California (3.4%) | | | | |
| 1 | Bay Area Toll Authority California Toll Bridge | | | | |
| | Revenue (San Francisco Bay Area) TOB VRDO | 0.670% | 11/7/16 | 5,570 | 5,570 |
| 1 | California Educational Facilities Authority | | | | |
| | Revenue (University of Southern California) | | | | |
| | TOB VRDO | 0.660% | 11/7/16 | 5,050 | 5,050 |
| 1 | California Educational Facilities Authority | | | | |
| | Revenue (University of Southern California) | | | | |
| | TOB VRDO | 0.690% | 11/7/16 | 20,000 | 20,000 |
| California GO CP | 0.930% | 12/6/16 LOC | 25,000 | 25,000 |
| California Health Facilities Financing Authority | | | | |
| | Revenue (Children’s Hospital of Orange County) | | | | |
| | VRDO | 0.630% | 11/7/16 LOC | 3,960 | 3,960 |
| California Health Facilities Financing Authority | | | | |
| | Revenue (Memorial Health Services) VRDO | 0.630% | 11/7/16 | 1,000 | 1,000 |
| 1 | California Health Facilities Financing Authority | | | | |
| | Revenue (Sutter Health) TOB VRDO | 0.660% | 11/7/16 | 3,660 | 3,660 |
| 1 | California Health Facilities Financing Authority | | | | |
| | Revenue (Sutter Health) TOB VRDO | 0.660% | 11/7/16 | 5,000 | 5,000 |
| 1 | California Health Facilities Financing Authority | | | | |
| | Revenue (Sutter Health) TOB VRDO | 0.660% | 11/7/16 | 10,000 | 10,000 |
| 1 | California Health Facilities Financing Authority | | | | |
| | Revenue (Sutter Health) TOB VRDO | 0.660% | 11/7/16 | 18,980 | 18,980 |
| 1 | California Health Facilities Financing Authority | | | | |
| | Revenue (Sutter Health) TOB VRDO | 0.770% | 11/7/16 | 3,625 | 3,625 |
| California Housing Finance Agency Home | | | | |
| | Mortgage Revenue VRDO | 0.640% | 11/1/16 LOC | 650 | 650 |
| California Pollution Control Financing Authority | | | | |
| | Revenue (Pacific Gas & Electric Co.) VRDO | 0.500% | 11/1/16 LOC | 72,700 | 72,700 |
| California State University Institute CP | 0.520% | 11/2/16 LOC | 10,000 | 10,000 |
| California State University Institute CP | 0.520% | 11/2/16 | 9,800 | 9,800 |
15
| | | | | |
| Tax-Exempt Money Market Fund | | | | |
| |
| |
| |
| Face | Market |
| Maturity | Amount | Value• |
| | Coupon | Date | ($000) | ($000) |
| California Statewide Communities Development | | | | |
| | Authority Revenue (Community Hospital of the | | | | |
| | Monterey Peninsula) VRDO | 0.630% | 11/7/16 LOC | 15,000 | 15,000 |
| 1 | California Statewide Communities Development | | | | |
| | Authority Revenue (Sutter Health) TOB VRDO | 0.660% | 11/7/16 | 5,545 | 5,545 |
| 1 | Foothill-De Anza CA Community College District | | | | |
| | GO TOB VRDO | 0.660% | 11/7/16 | 7,500 | 7,500 |
| 1 | Los Angeles CA Department of Airports | | | | |
| | International Airport Revenue TOB VRDO | 0.690% | 11/7/16 | 6,695 | 6,695 |
| Los Angeles CA TRAN | 3.000% | 6/29/17 | 117,500 | 119,282 |
| Los Angeles County CA TRAN | 3.000% | 6/30/17 | 77,550 | 78,736 |
| 1 | Nuveen California Dividend Advantage Municipal | | | | |
| | Fund VRDP VRDO | 0.750% | 11/7/16 LOC | 31,000 | 31,000 |
| 1 | Nuveen California Dividend Advantage Municipal | | | | |
| | Fund VRDP VRDO | 0.780% | 11/7/16 LOC | 20,000 | 20,000 |
| 1 | Nuveen California Dividend Advantage Municipal | | | | |
| | Fund VRDP VRDO | 0.780% | 11/7/16 LOC | 10,000 | 10,000 |
| Otay CA Water District (Capital Project) COP | | | | |
| | VRDO | 0.660% | 11/7/16 LOC | 3,810 | 3,810 |
| 1 | Regents of the University of California Revenue | | | | |
| | TOB VRDO | 0.660% | 11/7/16 | 7,600 | 7,600 |
| 1 | Regents of the University of California Revenue | | | | |
| | TOB VRDO | 0.660% | 11/7/16 | 14,270 | 14,270 |
| San Francisco CA City & County International | | | | |
| | Airport Revenue VRDO | 0.620% | 11/7/16 LOC | 1,900 | 1,900 |
| 1 | San Mateo County CA Community College | | | | |
| | District GO TOB VRDO | 0.660% | 11/7/16 | 8,810 | 8,810 |
| Southern California Public Power Authority | | | | |
| | Revenue VRDO | 0.600% | 11/7/16 LOC | 7,400 | 7,400 |
| 1 | Sweetwater CA Unified School District GO TOB | | | | |
| | VRDO | 0.670% | 11/7/16 (13) | 13,600 | 13,600 |
| 1 | West Valley-Mission CA Community College | | | | |
| | District GO TOB VRDO | 0.660% | 11/7/16 | 8,500 | 8,500 |
| 554,643 |
| Colorado (2.2%) | | | | |
| 1 | Adams County CO COP TOB VRDO | 0.680% | 11/7/16 | 6,825 | 6,825 |
| 1 | Board of Governors of the Colorado State | | | | |
| | University System Enterprise Revenue TOB | | | | |
| | VRDO | 0.680% | 11/7/16 | 8,665 | 8,665 |
| 1 | Colorado Health Facilities Authority Revenue | | | | |
| | (Adventist Health System/Sunbelt Obligated | | | | |
| | Group) TOB VRDO | 0.660% | 11/7/16 | 8,000 | 8,000 |
| Colorado Health Facilities Authority Revenue | | | | |
| | (Evangelical Lutheran Good Samaritan Society | | | | |
| | Project) VRDO | 0.630% | 11/7/16 LOC | 11,280 | 11,280 |
| 1 | Colorado Health Facilities Authority Revenue | | | | |
| | (Sisters of Charity of Leavenworth Health | | | | |
| | System) TOB VRDO | 0.660% | 11/7/16 | 20,295 | 20,295 |
| Colorado Health Facilities Authority Revenue | | | | |
| | (Sisters of Charity of Leavenworth Health | | | | |
| | System) TOB VRDO | 0.660% | 11/7/16 | 13,635 | 13,635 |
| Colorado Health Facilities Authority Revenue | | | | |
| | (Sisters of Charity of Leavenworth Health | | | | |
| | System) TOB VRDO | 0.660% | 11/7/16 | 6,000 | 6,000 |
16
| | | | | |
| Tax-Exempt Money Market Fund | | | | |
| |
| |
| |
| Face | Market |
| Maturity | Amount | Value• |
| | Coupon | Date | ($000) | ($000) |
| 1 | Colorado Health Facilities Authority Revenue | | | | |
| | (Sisters of Charity of Leavenworth Health | | | | |
| | System) TOB VRDO | 0.670% | 11/7/16 | 7,175 | 7,175 |
| Colorado Health Facilities Authority Revenue | | | | |
| | (Sisters of Charity of Leavenworth Health | | | | |
| | System) VRDO | 0.650% | 11/7/16 | 33,495 | 33,495 |
| Colorado Health Facilities Authority Revenue | | | | |
| | (Sisters of Charity of Leavenworth Health | | | | |
| | System) VRDO | 0.660% | 11/7/16 | 25,490 | 25,490 |
| Colorado Housing & Finance Authority | | | | |
| | Multi-Family Mortgage Revenue VRDO | 0.640% | 11/7/16 | 7,635 | 7,635 |
| Colorado Housing & Finance Authority | | | | |
| | Multi-Family Mortgage Revenue VRDO | 0.660% | 11/7/16 | 19,530 | 19,530 |
| Colorado Housing & Finance Authority | | | | |
| | Multi-Family Mortgage Revenue VRDO | 0.660% | 11/7/16 | 7,455 | 7,455 |
| Colorado Housing & Finance Authority | | | | |
| | Multi-Family Mortgage Revenue VRDO | 0.670% | 11/7/16 | 1,610 | 1,610 |
| Colorado Housing & Finance Authority | | | | |
| | Multi-Family Mortgage Revenue VRDO | 0.670% | 11/7/16 | 12,450 | 12,450 |
| Colorado Housing & Finance Authority | | | | |
| | Single Family Mortgage Revenue VRDO | 0.620% | 11/7/16 | 14,605 | 14,605 |
| Colorado Housing & Finance Authority | | | | |
| | Single Family Mortgage Revenue VRDO | 0.640% | 11/7/16 | 6,230 | 6,230 |
| Colorado Housing & Finance Authority | | | | |
| | Single Family Mortgage Revenue VRDO | 0.650% | 11/7/16 | 9,100 | 9,100 |
| Colorado Housing & Finance Authority | | | | |
| | Single Family Mortgage Revenue VRDO | 0.650% | 11/7/16 | 5,825 | 5,825 |
| Colorado Housing & Finance Authority | | | | |
| | Single Family Mortgage Revenue VRDO | 0.680% | 11/7/16 | 13,900 | 13,900 |
| Colorado Housing & Finance Authority | | | | |
| | Single Family Mortgage Revenue VRDO | 0.680% | 11/7/16 | 8,900 | 8,900 |
| Colorado Housing & Finance Authority | | | | |
| | Single Family Mortgage Revenue VRDO | 0.700% | 11/7/16 | 24,115 | 24,115 |
| Colorado Housing & Finance Authority | | | | |
| | Single Family Mortgage Revenue VRDO | 0.700% | 11/7/16 | 5,525 | 5,525 |
| 1 | Colorado Springs CO Utility System Revenue | | | | |
| | TOB VRDO | 0.660% | 11/7/16 | 9,810 | 9,810 |
| Colorado Springs CO Utility System Revenue | | | | |
| | VRDO | 0.620% | 11/7/16 | 12,300 | 12,300 |
| Colorado Springs CO Utility System Revenue | | | | |
| | VRDO | 0.630% | 11/7/16 | 8,850 | 8,850 |
| 1 | Denver CO City & County Airport Revenue TOB | | | | |
| | VRDO | 0.710% | 11/7/16 LOC | 25,000 | 25,000 |
| 1 | Denver CO City & County Dedicated Tax | | | | |
| | Revenue TOB VRDO | 0.660% | 11/7/16 | 6,665 | 6,665 |
| 1 | Denver CO City & County Justice System | | | | |
| | Facilities GO TOB VRDO | 0.750% | 11/7/16 | 7,500 | 7,500 |
| University of Colorado Hospital Authority | | | | |
| | Revenue PUT | 0.880% | 5/29/17 | 13,000 | 13,000 |
| 360,865 |
| Connecticut (0.7%) | | | | |
| 1 | Connecticut GO TOB VRDO | 0.670% | 11/7/16 | 2,000 | 2,000 |
| Connecticut Health & Educational Facilities | | | | |
| | Authority Revenue (Hotchkiss School) VRDO | 0.620% | 11/7/16 | 8,000 | 8,000 |
17
| | | | | |
| Tax-Exempt Money Market Fund | | | | |
| |
| |
| |
| Face | Market |
| Maturity | Amount | Value• |
| | Coupon | Date | ($000) | ($000) |
| 1 | Connecticut Health & Educational Facilities | | | | |
| | Authority Revenue (Trinity Health Corp.) | | | | |
| | TOB VRDO | 0.660% | 11/7/16 | 8,000 | 8,000 |
| 1 | Connecticut Health & Educational Facilities | | | | |
| | Authority Revenue (Trinity Health Corp.) | | | | |
| | TOB VRDO | 0.660% | 11/7/16 | 4,445 | 4,445 |
| Connecticut Health & Educational Facilities | | | | |
| | Authority Revenue (Yale University) VRDO | 0.680% | 11/7/16 LOC | 43,745 | 43,745 |
| Connecticut Housing Finance Authority Revenue | | | | |
| | Housing Mortgage Finance Program VRDO | 0.620% | 11/7/16 | 6,875 | 6,875 |
| Connecticut Housing Finance Authority Revenue | | | | |
| | Housing Mortgage Finance Program VRDO | 0.630% | 11/7/16 | 5,500 | 5,500 |
| Connecticut Housing Finance Authority Revenue | | | | |
| | Housing Mortgage Finance Program VRDO | 0.650% | 11/7/16 | 27,695 | 27,695 |
| 106,260 |
| Delaware (0.1%) | | | | |
| New Castle County DE Student Housing | | | | |
| | Revenue (University Courtyard Apartments) | | | | |
| | VRDO | 0.660% | 11/7/16 LOC | 14,395 | 14,395 |
| | | | |
| District of Columbia (1.4%) | | | | |
| 1 | District of Columbia GO TOB VRDO | 0.640% | 11/7/16 LOC | 22,670 | 22,670 |
| District of Columbia Housing Finance Agency | | | | |
| | Multifamily Housing Revenue (Edgewood | | | | |
| | Terrace I) PUT | 0.650% | 12/1/16 | 7,000 | 7,000 |
| District of Columbia Housing Finance Agency | | | | |
| | Multifamily Housing Revenue (Park 7 at | | | | |
| | Minnesota Benning Project) VRDO | 0.650% | 11/7/16 LOC | 7,000 | 7,000 |
| 1 | District of Columbia Income Tax Revenue TOB | | | | |
| | VRDO | 0.660% | 11/7/16 | 9,995 | 9,995 |
| 1 | District of Columbia Income Tax Revenue TOB | | | | |
| | VRDO | 0.690% | 11/7/16 | 7,855 | 7,855 |
| District of Columbia Revenue (American | | | | |
| | University) VRDO | 0.620% | 11/7/16 LOC | 10,000 | 10,000 |
| District of Columbia Revenue (Georgetown | | | | |
| | University) VRDO | 0.610% | 11/7/16 LOC | 33,050 | 33,050 |
| District of Columbia Revenue (MedStar Health, | | | | |
| | Inc.) VRDO | 0.530% | 11/1/16 LOC | 3,200 | 3,200 |
| District of Columbia Revenue (MedStar Health, | | | | |
| | Inc.) VRDO | 0.590% | 11/7/16 LOC | 11,250 | 11,250 |
| 1 | District of Columbia Water & Sewer Authority | | | | |
| | Public Utility Revenue TOB VRDO | 0.630% | 11/7/16 LOC | 33,490 | 33,490 |
| 1 | District of Columbia Water & Sewer Authority | | | | |
| | Public Utility Revenue TOB VRDO | 0.660% | 11/7/16 | 11,870 | 11,870 |
| 1 | District of Columbia Water & Sewer Authority | | | | |
| | Public Utility Revenue TOB VRDO | 0.670% | 11/7/16 | 6,190 | 6,190 |
| District of Columbia Water & Sewer Authority | | | | |
| | Public Utility Revenue VRDO | 0.610% | 11/7/16 | 21,125 | 21,125 |
| District of Columbia Water & Sewer Authority | | | | |
| | Public Utility Revenue VRDO | 0.620% | 11/7/16 | 10,000 | 10,000 |
| Metropolitan Washington DC/VA Airports | | | | |
| | Authority Airport System Revenue VRDO | 0.640% | 11/7/16 LOC | 20,910 | 20,910 |
| Metropolitan Washington DC/VA Airports | | | | |
| | Authority Dulles Toll Road Revenue CP | 0.900% | 1/5/17 LOC | 15,000 | 15,000 |
| 230,605 |
18
| | | | | |
| Tax-Exempt Money Market Fund | | | | |
| |
| |
| |
| Face | Market |
| Maturity | Amount | Value• |
| | Coupon | Date | ($000) | ($000) |
| Florida (3.7%) | | | | |
| 1 | Broward County FL School Board COP TOB | | | | |
| | VRDO | 0.670% | 11/7/16 LOC | 34,100 | 34,100 |
| 1 | Broward County FL Water & Sewer Utility | | | | |
| | Revenue TOB VRDO | 0.660% | 11/7/16 | 11,330 | 11,330 |
| 1 | Florida Board of Education Public Education GO | | | | |
| | TOB VRDO | 0.660% | 11/7/16 | 15,135 | 15,135 |
| 1 | Florida Department of Management Services | | | | |
| | COP TOB VRDO | 0.660% | 11/7/16 | 6,960 | 6,960 |
| Florida Keys Aqueduct Authority Water Revenue | | | | |
| | VRDO | 0.560% | 11/7/16 LOC | 35,975 | 35,975 |
| 1 | Greater Orlando Aviation Authority Florida Airport | | | | |
| | Facilities Revenue TOB VRDO | 0.660% | 11/7/16 | 12,000 | 12,000 |
| Jacksonville FL Electric Authority Electric System | | | | |
| | Revenue CP | 0.780% | 11/16/16 | 30,965 | 30,965 |
| Jacksonville FL Electric Authority Water & Sewer | | | | |
| | Revenue VRDO | 0.500% | 11/1/16 | 15,000 | 15,000 |
| Jacksonville FL Electric Authority Water & Sewer | | | | |
| | Revenue VRDO | 0.580% | 11/7/16 | 4,840 | 4,840 |
| Jacksonville FL Electric Authority Water & Sewer | | | | |
| | Revenue VRDO | 0.650% | 11/7/16 | 8,000 | 8,000 |
| 1 | Jacksonville FL Special Revenue TOB VRDO | 0.660% | 11/7/16 | 3,900 | 3,900 |
| 1 | Miami Beach FL Resort Tax Revenue TOB VRDO | 0.670% | 11/7/16 | 10,000 | 10,000 |
| 1 | Miami Beach FL Resort Tax Revenue TOB VRDO | 0.680% | 11/7/16 | 3,750 | 3,750 |
| 1 | Miami-County FL Transit Sales Surtax Revenue | | | | |
| | TOB VRDO | 0.670% | 11/7/16 | 7,600 | 7,600 |
| 1 | Miami-Dade County FL Building Better | | | | |
| | Communities GO TOB VRDO | 0.660% | 11/7/16 | 25,940 | 25,940 |
| 1 | Miami-Dade County FL School Board COP TOB | | | | |
| | VRDO | 0.630% | 11/7/16 LOC | 20,300 | 20,300 |
| Miami-Dade County FL Seaport Revenue VRDO | 0.640% | 11/7/16 LOC | 106,820 | 106,820 |
| North Broward FL Hospital District Revenue | | | | |
| | VRDO | 0.560% | 11/7/16 LOC | 78,240 | 78,240 |
| Orange County FL Health Facilities Authority | | | | |
| | Hospital Revenue (Orlando Regional Healthcare | | | | |
| | System) VRDO | 0.680% | 11/7/16 LOC | 4,240 | 4,240 |
| Orange County FL Health Facilities Authority | | | | |
| | Revenue (Nemours Foundation Project) VRDO | 0.630% | 11/7/16 LOC | 18,700 | 18,700 |
| Orange County FL Health Facilities Authority | | | | |
| | Revenue (Nemours Foundation Project) VRDO | 0.630% | 11/7/16 LOC | 15,940 | 15,940 |
| 1 | Orange County FL Housing Finance Authority | | | | |
| | Homeowner Revenue (Multi-County Program) | | | | |
| | TOB VRDO | 0.680% | 11/7/16 | 765 | 765 |
| 1 | Orange County FL Sales Tax Revenue TOB VRDO | 0.660% | 11/7/16 | 10,230 | 10,230 |
| 1 | Orange County FL School Board COP TOB VRDO | 0.660% | 11/7/16 | 19,070 | 19,070 |
| Palm Beach County FL Revenue (Children’s | | | | |
| | Home Society Project) VRDO | 0.680% | 11/7/16 LOC | 10,535 | 10,535 |
| Palm Beach County FL Revenue (Community | | | | |
| | Foundation Palm Beach Project) VRDO | 0.900% | 11/7/16 LOC | 6,600 | 6,600 |
| Pinellas County FL School District TAN | 2.000% | 6/30/17 | 59,100 | 59,555 |
| 1 | Tampa Bay FL Water Utility System Revenue | | | | |
| | TOB VRDO | 0.680% | 11/7/16 | 8,960 | 8,960 |
| Tampa FL Health System Revenue (BayCare | | | | |
| | Health System) | 0.930% | 5/29/17 | 13,500 | 13,500 |
| 1 | Tampa Health System Revenue TOB VRDO | 0.670% | 11/7/16 | 4,800 | 4,800 |
| 603,750 |
19
| | | | | |
| Tax-Exempt Money Market Fund | | | | |
| |
| |
| |
| Face | Market |
| Maturity | Amount | Value• |
| | Coupon | Date | ($000) | ($000) |
| Georgia (1.3%) | | | | |
| 1 | Atlanta GA Water & Wastewater Revenue TOB | | | | |
| | VRDO | 0.660% | 11/7/16 | 23,865 | 23,865 |
| Burke County GA Development Authority | | | | |
| | Pollution Control Revenue (Oglethorpe Power | | | | |
| | Corp. Vogtle Project) VRDO | 0.650% | 11/7/16 LOC | 30,300 | 30,300 |
| Cobb County GA Hospital Authority Revenue | | | | |
| | (Equipment Pool Project) VRDO | 0.640% | 11/7/16 LOC | 25,000 | 25,000 |
| Cobb County GA Hospital Authority Revenue | | | | |
| | (Equipment Pool Project) VRDO | 0.640% | 11/7/16 LOC | 6,600 | 6,600 |
| 1 | DeKalb County GA Water & Sewer Revenue | | | | |
| | TOB VRDO | 0.660% | 11/7/16 | 11,990 | 11,990 |
| 1 | Fulton County GA Development Authority | | | | |
| | Revenue (Piedmont Healthcare Inc. Project) | | | | |
| | TOB VRDO | 0.660% | 11/7/16 | 22,835 | 22,835 |
| Fulton County GA Development Authority | | | | |
| | Revenue (Shepherd Center Inc. Project) VRDO | 0.740% | 11/7/16 LOC | 51,200 | 51,200 |
| 1 | Private Colleges & University Authority of | | | | |
| | Georgia Revenue (Emory University) TOB VRDO | 0.660% | 11/7/16 | 5,635 | 5,635 |
| Private Colleges & University Authority of | | | | |
| | Georgia Revenue (Emory University) VRDO | 0.620% | 11/7/16 | 28,400 | 28,400 |
| 205,825 |
| Hawaii (0.4%) | | | | |
| Hawaii Department of Budget & Finance Special | | | | |
| | Purpose Revenue (Queens Health System) PUT | 1.080% | 5/29/17 | 19,225 | 19,225 |
| Hawaii Department of Budget & Finance Special | | | | |
| | Purpose Revenue (Queens Health System) PUT | 1.080% | 5/29/17 | 41,480 | 41,480 |
| 60,705 |
| Idaho (0.5%) | | | | |
| Idaho Building Authority Revenue (Prison | | | | |
| | Facilities Project) VRDO | 0.640% | 11/7/16 | 29,245 | 29,245 |
| Idaho TAN | 2.000% | 6/30/17 | 50,000 | 50,420 |
| 79,665 |
| Illinois (5.3%) | | | | |
| Channahon IL Revenue (Morris Hospital) VRDO | 0.640% | 11/7/16 LOC | 3,970 | 3,970 |
| Channahon IL Revenue (Morris Hospital) VRDO | 0.640% | 11/7/16 LOC | 4,880 | 4,880 |
| Channahon IL Revenue (Morris Hospital) VRDO | 0.640% | 11/7/16 LOC | 4,960 | 4,960 |
| Channahon IL Revenue (Morris Hospital) VRDO | 0.640% | 11/7/16 LOC | 4,515 | 4,515 |
| Channahon IL Revenue (Morris Hospital) VRDO | 0.640% | 11/7/16 LOC | 6,430 | 6,430 |
| 1 | Chicago IL Metropolitan Water Reclamation | | | | |
| | District GO TOB VRDO | 0.710% | 11/7/16 | 12,000 | 12,000 |
| Illinois Development Finance Authority Revenue | | | | |
| | (American College of Surgeons) VRDO | 0.630% | 11/7/16 LOC | 22,382 | 22,382 |
| Illinois Development Finance Authority Revenue | | | | |
| | (Chicago Horticultural Society) VRDO | 0.900% | 11/7/16 LOC | 16,000 | 16,000 |
| Illinois Development Finance Authority Revenue | | | | |
| | (McCormick Theological Seminary) VRDO | 0.620% | 11/7/16 LOC | 22,435 | 22,435 |
| Illinois Educational Facilities Authority (Pooled | | | | |
| | Financing Program) CP | 0.750% | 11/9/16 LOC | 5,000 | 5,000 |
| Illinois Educational Facilities Authority (Pooled | | | | |
| | Financing Program) CP | 0.950% | 1/9/17 LOC | 20,655 | 20,655 |
| Illinois Educational Facilities Authority (Pooled | | | | |
| | Financing Program) CP | 0.950% | 1/10/17 LOC | 34,065 | 34,065 |
20
| | | | | |
| Tax-Exempt Money Market Fund | | | | |
| |
| |
| |
| Face | Market |
| Maturity | Amount | Value• |
| | Coupon | Date | ($000) | ($000) |
| Illinois Educational Facilities Authority (Pooled | | | | |
| | Financing Program) CP | 0.940% | 2/7/17 LOC | 21,143 | 21,143 |
| Illinois Educational Facilities Authority Revenue | | | | |
| | (Columbia College Chicago) VRDO | 0.550% | 11/7/16 LOC | 15,750 | 15,750 |
| 1 | Illinois Educational Facilities Authority Revenue | | | | |
| | (University of Chicago) TOB VRDO | 0.660% | 11/7/16 | 5,200 | 5,200 |
| Illinois Educational Facilities Authority Revenue | | | | |
| | (University of Chicago) VRDO | 0.640% | 11/7/16 | 2,893 | 2,893 |
| Illinois Finance Authority Revenue (Advocate | | | | |
| | Health Care Network) PUT | 0.930% | 5/29/17 | 6,500 | 6,500 |
| Illinois Finance Authority Revenue (Advocate | | | | |
| | Health Care Network) PUT | 0.700% | 7/25/17 | 3,000 | 3,000 |
| 1 | Illinois Finance Authority Revenue (Advocate | | | | |
| | Health Care Network) TOB VRDO | 0.660% | 11/7/16 | 45,290 | 45,290 |
| 1 | Illinois Finance Authority Revenue (Advocate | | | | |
| | Health Care Network) TOB VRDO | 0.660% | 11/7/16 | 2,250 | 2,250 |
| Illinois Finance Authority Revenue (Advocate | | | | |
| | Health Care Network) VRDO | 0.550% | 11/7/16 | 46,640 | 46,640 |
| Illinois Finance Authority Revenue (Bradley | | | | |
| | University) VRDO | 0.630% | 11/7/16 LOC | 28,385 | 28,385 |
| 1 | Illinois Finance Authority Revenue (Central | | | | |
| | DuPage Health) TOB VRDO | 0.660% | 11/7/16 | 13,125 | 13,125 |
| Illinois Finance Authority Revenue (Chicago | | | | |
| | Horticulture Project) VRDO | 0.900% | 11/7/16 LOC | 21,000 | 21,000 |
| Illinois Finance Authority Revenue (Edward | | | | |
| | Hospital) VRDO | 0.650% | 11/7/16 LOC | 26,560 | 26,560 |
| Illinois Finance Authority Revenue (Evangelical | | | | |
| | Project) VRDO | 0.670% | 11/7/16 LOC | 8,215 | 8,215 |
| Illinois Finance Authority Revenue (Illinois College) | | | | |
| | VRDO | 0.630% | 11/7/16 LOC | 5,690 | 5,690 |
| 1 | Illinois Finance Authority Revenue (NorthShore | | | | |
| | University Health System) TOB VRDO | 0.660% | 11/7/16 | 4,375 | 4,375 |
| 1 | Illinois Finance Authority Revenue (Northwestern | | | | |
| | Memorial Hospital) TOB VRDO | 0.660% | 11/7/16 | 6,000 | 6,000 |
| Illinois Finance Authority Revenue (Northwestern | | | | |
| | Memorial Hospital) VRDO | 0.630% | 11/7/16 | 20,755 | 20,755 |
| Illinois Finance Authority Revenue (Swedish | | | | |
| | Covenant Hospital) VRDO | 0.600% | 11/7/16 LOC | 21,425 | 21,425 |
| Illinois Finance Authority Revenue (Trinity | | | | |
| | International University) VRDO | 0.640% | 11/7/16 LOC | 10,840 | 10,840 |
| 1 | Illinois Finance Authority Revenue (University of | | | | |
| | Chicago Medical Center) TOB VRDO | 0.670% | 11/7/16 | 10,200 | 10,200 |
| Illinois Finance Authority Revenue (University of | | | | |
| | Chicago) VRDO | 0.640% | 11/7/16 | 15,900 | 15,900 |
| Illinois Finance Authority Revenue (University of | | | | |
| | Chicago) VRDO | 0.640% | 11/7/16 | 14,334 | 14,334 |
| Illinois GO VRDO | 0.600% | 11/7/16 LOC | 36,300 | 36,300 |
| Illinois GO VRDO | 0.670% | 11/7/16 LOC | 5,100 | 5,100 |
| Illinois GO VRDO | 0.670% | 11/7/16 LOC | 17,000 | 17,000 |
| Illinois Health Facilities Authority Revenue | | | | |
| | (Elmhurst Memorial Hospital) VRDO | 0.550% | 11/7/16 LOC | 33,400 | 33,400 |
| Illinois Health Facilities Authority Revenue | | | | |
| | (Evanston Hospital Corp.) VRDO | 0.630% | 11/7/16 | 2,970 | 2,970 |
21
| | | | | |
| Tax-Exempt Money Market Fund | | | | |
| |
| |
| |
| Face | Market |
| Maturity | Amount | Value• |
| | Coupon | Date | ($000) | ($000) |
| Illinois Housing Development Authority Revenue | | | | |
| | (Lakeshore Plaza) VRDO | 0.630% | 11/7/16 | 23,070 | 23,070 |
| Illinois Housing Development Authority Revenue | | | | |
| | (Larkin Village) VRDO | 0.660% | 11/7/16 | 11,650 | 11,650 |
| Illinois Toll Highway Authority Revenue VRDO | 0.630% | 11/7/16 LOC | 30,300 | 30,300 |
| Illinois Toll Highway Authority Revenue VRDO | 0.640% | 11/7/16 | 19,825 | 19,825 |
| Illinois Toll Highway Authority Revenue VRDO | 0.640% | 11/7/16 | 59,305 | 59,305 |
| 1 | Illinois Toll Highway Authority Toll Highway | | | | |
| | Revenue TOB VRDO | 0.660% | 11/7/16 | 21,000 | 21,000 |
| 1 | Illinois Toll Highway Authority Toll Highway | | | | |
| | Revenue TOB VRDO | 0.660% | 11/7/16 | 8,995 | 8,995 |
| 1 | Illinois Toll Highway Authority Toll Highway | | | | |
| | Revenue TOB VRDO | 0.730% | 11/7/16 | 14,900 | 14,900 |
| Illinois Toll Highway Authority Toll Highway | | | | |
| | Revenue VRDO | 0.630% | 11/7/16 LOC | 55,000 | 55,000 |
| 851,577 |
| Indiana (1.5%) | | | | |
| DeKalb County IN Economic Development | | | | |
| | Revenue (New Process Steel, LP Project) VRDO | 0.700% | 11/7/16 LOC | 5,000 | 5,000 |
| Indiana Bond Bank Revenue | 2.000% | 1/4/17 | 20,420 | 20,458 |
| Indiana Finance Authority Environmental | | | | |
| | Improvement Revenue (Ispat Inland Inc. Project) | | | | |
| | VRDO | 0.690% | 11/7/16 LOC | 26,000 | 26,000 |
| 1 | Indiana Finance Authority Health System Revenue | | | | |
| | (Sisters of St. Francis Health Services Inc. | | | | |
| | Obligated Group) TOB VRDO | 0.670% | 11/7/16 | 2,500 | 2,500 |
| 1 | Indiana Finance Authority Hospital Revenue | | | | |
| | (Indiana University Health Obligated Group) | | | | |
| | TOB VRDO | 0.680% | 11/7/16 | 12,000 | 12,000 |
| Indiana Finance Authority Hospital Revenue | | | | |
| | (Indiana University) VRDO | 0.650% | 11/7/16 LOC | 18,005 | 18,005 |
| Indiana Finance Authority Hospital Revenue | | | | |
| | (Indiana University) VRDO | 0.700% | 11/7/16 LOC | 7,315 | 7,315 |
| Indiana Finance Authority Midwestern Disaster | | | | |
| | Relief Revenue (Ohio Valley Electric Corp. | | | | |
| | Project) VRDO | 0.630% | 11/7/16 LOC | 20,100 | 20,100 |
| Indiana Finance Authority Revenue (Ascension | | | | |
| | Health Credit Group) VRDO | 0.640% | 11/7/16 | 26,825 | 26,825 |
| Indiana Finance Authority Revenue (Ascension | | | | |
| | Health Credit Group) VRDO | 0.640% | 11/7/16 | 40,900 | 40,900 |
| Indiana Health & Educational Facility Financing | | | | |
| | Authority Hospital Revenue (Indiana University | | | | |
| | Health Obligated Group) VRDO | 0.590% | 11/7/16 LOC | 9,075 | 9,075 |
| Indiana Health & Educational Facility Financing | | | | |
| | Authority Hospital Revenue (Indiana University | | | | |
| | Health Obligated Group) VRDO | 0.610% | 11/7/16 LOC | 4,000 | 4,000 |
| Indiana Municipal Power Agency Revenue VRDO | 0.560% | 11/7/16 LOC | 855 | 855 |
| 1 | Indianapolis IN Local Public Improvement Bond | | | | |
| | Bank Revenue TOB VRDO | 0.830% | 11/7/16 | 13,360 | 13,360 |
| Lawrenceburg IN Pollution Control Revenue | | | | |
| | VRDO | 0.650% | 11/7/16 LOC | 5,500 | 5,500 |
| 1 | Wayne Township Marion County IN School | | | | |
| | Building Corp. Mortgage Revenue TOB VRDO | 0.640% | 11/7/16 LOC | 30,255 | 30,255 |
| 242,148 |
22
| | | | | |
| Tax-Exempt Money Market Fund | | | | |
| |
| |
| |
| Face | Market |
| Maturity | Amount | Value• |
| | Coupon | Date | ($000) | ($000) |
| Iowa (0.2%) | | | | |
| Iowa Finance Authority Single Family Mortgage | | | | |
| | Revenue VRDO | 0.630% | 11/7/16 | 20,000 | 20,000 |
| 1 | Iowa Special Obligation Revenue (Ijobs Program) | | | | |
| | TOB VRDO | 0.710% | 11/7/16 | 8,500 | 8,500 |
| 28,500 |
| Kansas (0.4%) | | | | |
| 1 | Kansas Department of Transportation Highway | | | | |
| | Revenue TOB VRDO | 0.670% | 11/7/16 | 1,600 | 1,600 |
| 1 | Kansas Development Finance Authority Hospital | | | | |
| | Revenue (Adventist Health System/Sunbelt | | | | |
| | Obligated Group) TOB VRDO | 0.660% | 11/7/16 | 9,225 | 9,225 |
| Wyandotte County/Kansas City KS Unified | | | | |
| | Government GO | 1.000% | 3/1/17 | 60,470 | 60,470 |
| 71,295 |
| Kentucky (1.1%) | | | | |
| Kentucky Economic Development Finance | | | | |
| | Authority Hospital Facilities Revenue (St. | | | | |
| | Elizabeth Medical Center Inc.) VRDO | 0.670% | 11/7/16 | 4,300 | 4,300 |
| 1 | Kentucky Infrastructure Authority Wastewater & | | | | |
| | Drinking Water Revenue TOB VRDO | 0.690% | 11/7/16 | 7,190 | 7,190 |
| Louisville & Jefferson County KY Metropolitan | | | | |
| | Government Health System Revenue (Norton | | | | |
| | Healthcare Obligated Group) VRDO | 0.520% | 11/1/16 LOC | 5,500 | 5,500 |
| 1 | Louisville & Jefferson County KY Metropolitan | | | | |
| | Government Parking Revenue TOB VRDO | 0.660% | 11/7/16 | 6,130 | 6,130 |
| Louisville & Jefferson County KY Metropolitan | | | | |
| | Sewer & Drain System BAN | 5.000% | 11/22/16 | 148,850 | 149,215 |
| 172,335 |
| Louisiana (0.8%) | | | | |
| East Baton Rouge Parish LA Industrial | | | | |
| | Development Board Revenue (ExxonMobil | | | | |
| | Project) VRDO | 0.500% | 11/1/16 | 25,000 | 25,000 |
| Louisiana Public Facilities Authority Revenue | | | | |
| | (CHRISTUS Health) VRDO | 0.720% | 11/7/16 LOC | 13,905 | 13,905 |
| St. James Parish LA Revenue (NuStar Logistics | | | | |
| | LP Project) VRDO | 0.670% | 11/7/16 LOC | 55,440 | 55,440 |
| St. James Parish LA Revenue (Nustar Logistics | | | | |
| | LP Project) VRDO | 0.700% | 11/7/16 LOC | 34,300 | 34,300 |
| 128,645 |
| Maryland (2.0%) | | | | |
| 1 | Baltimore MD GO TOB VRDO | 0.660% | 11/7/16 | 7,500 | 7,500 |
| 1 | Baltimore MD Project Revenue TOB VRDO | 0.660% | 11/7/16 | 6,665 | 6,665 |
| 1 | BlackRock Maryland Municipal Bond Trust VRDO | 0.720% | 11/7/16 LOC | 9,800 | 9,800 |
| 1 | Maryland Department of Housing & Community | | | | |
| | Development Revenue TOB VRDO | 0.710% | 11/7/16 | 2,880 | 2,880 |
| 1 | Maryland Health & Higher Educational Facilities | | | | |
| | Authority Revenue (Johns Hopkins Health | | | | |
| | System) TOB VRDO | 0.660% | 11/7/16 | 6,665 | 6,665 |
| 1 | Maryland Health & Higher Educational Facilities | | | | |
| | Authority Revenue (Johns Hopkins University) | | | | |
| | TOB VRDO | 0.660% | 11/7/16 | 10,465 | 10,465 |
23
| | | | | |
| Tax-Exempt Money Market Fund | | | | |
| |
| |
| |
| Face | Market |
| Maturity | Amount | Value• |
| | Coupon | Date | ($000) | ($000) |
| Maryland Health & Higher Educational Facilities | | | | |
| | Authority Revenue (University of Maryland | | | | |
| | Medical System) VRDO | 0.630% | 11/7/16 LOC | 58,865 | 58,865 |
| 1 | Maryland Transportation Authority Facilities | | | | |
| | Projects Revenue TOB VRDO | 0.700% | 11/7/16 | 5,000 | 5,000 |
| Montgomery County MD GO CP | 0.770% | 11/8/16 | 7,100 | 7,100 |
| Montgomery County MD GO CP | 0.770% | 11/16/16 | 27,100 | 27,100 |
| Montgomery County MD GO CP | 0.920% | 12/1/16 | 50,000 | 50,000 |
| Montgomery County MD GO CP | 0.930% | 12/2/16 | 36,700 | 36,700 |
| Montgomery County MD GO CP | 0.930% | 12/2/16 | 25,000 | 25,000 |
| Montgomery County MD GO CP | 0.880% | 12/15/16 | 16,000 | 16,000 |
| Montgomery County MD Revenue (CHE Trinity | | | | |
| | Health Credit Group) PUT | 0.700% | 12/1/16 | 24,500 | 24,500 |
| Washington MD Suburban Sanitary Commission | | | | |
| | BAN VRDO | 0.660% | 11/7/16 | 21,000 | 21,000 |
| 315,240 |
| Massachusetts (2.8%) | | | | |
| Massachusetts Bay Transportation Authority | | | | |
| | General Transportation Revenue VRDO | 0.610% | 11/7/16 | 21,915 | 21,915 |
| Massachusetts Bay Transportation Authority | | | | |
| | Sales Tax Revenue PUT | 0.930% | 5/29/17 | 8,220 | 8,220 |
| Massachusetts Development Finance Agency | | | | |
| | Revenue (Cushing Academy Issue) VRDO | 0.680% | 11/7/16 LOC | 18,265 | 18,265 |
| 1 | Massachusetts Development Finance Agency | | | | |
| | Revenue (Partners Healthcare) TOB VRDO | 0.670% | 11/7/16 | 2,000 | 2,000 |
| Massachusetts GO | 2.000% | 5/22/17 | 93,000 | 93,676 |
| Massachusetts GO | 2.000% | 6/26/17 | 67,000 | 67,571 |
| 1 | Massachusetts GO TOB VRDO | 0.580% | 11/1/16 LOC | 25,000 | 25,000 |
| 1 | Massachusetts GO TOB VRDO | 0.580% | 11/1/16 LOC | 14,400 | 14,400 |
| 1 | Massachusetts GO TOB VRDO | 0.660% | 11/7/16 | 3,750 | 3,750 |
| 1 | Massachusetts GO TOB VRDO | 0.670% | 11/7/16 | 3,750 | 3,750 |
| 1 | Massachusetts GO TOB VRDO | 0.670% | 11/7/16 | 1,325 | 1,325 |
| Massachusetts Health & Educational Facilities | | | | |
| | Authority Revenue (Baystate Medical Center) | | | | |
| | VRDO | 0.480% | 11/1/16 LOC | 8,880 | 8,880 |
| Massachusetts Health & Educational Facilities | | | | |
| | Authority Revenue (MIT) VRDO | 0.620% | 11/7/16 | 42,730 | 42,730 |
| Massachusetts Health & Educational Facilities | | | | |
| | Authority Revenue (Partners Healthcare System) | | | | |
| | VRDO | 0.600% | 11/7/16 | 3,800 | 3,800 |
| Massachusetts Health & Educational Facilities | | | | |
| | Authority Revenue (Pool Loan Program) VRDO | 0.620% | 11/7/16 LOC | 8,700 | 8,700 |
| 1 | Massachusetts School Building Authority | | | | |
| | Dedicated Sales Tax Revenue TOB VRDO | 0.660% | 11/7/16 | 5,000 | 5,000 |
| 1 | Massachusetts School Building Authority | | | | |
| | Dedicated Sales Tax Revenue TOB VRDO | 0.670% | 11/7/16 | 2,300 | 2,300 |
| 1 | Massachusetts School Building Authority | | | | |
| | Dedicated Sales Tax Revenue TOB VRDO | 0.670% | 11/7/16 | 4,125 | 4,125 |
| 1 | Massachusetts Water Resources Authority | | | | |
| | Revenue TOB VRDO | 0.660% | 11/7/16 | 7,500 | 7,500 |
| 1 | Massachusetts Water Resources Authority | | | | |
| | Revenue TOB VRDO | 0.660% | 11/7/16 | 5,000 | 5,000 |
| Massachusetts Water Resources Authority | | | | |
| | Revenue VRDO | 0.570% | 11/7/16 | 8,300 | 8,300 |
24
| | | | | |
| Tax-Exempt Money Market Fund | | | | |
| |
| |
| |
| Face | Market |
| Maturity | Amount | Value• |
| | Coupon | Date | ($000) | ($000) |
| Massachusetts Water Resources Authority | | | | |
| | Revenue VRDO | 0.670% | 11/7/16 | 30,745 | 30,745 |
| University of Massachusetts Building Authority | | | | |
| | Revenue PUT | 0.930% | 5/29/17 | 61,935 | 61,935 |
| 448,887 |
| Michigan (3.0%) | | | | |
| Kent Hospital Finance Authority Michigan Revenue | | | | |
| | (Spectrum Health System) PUT | 0.880% | 5/29/17 | 26,255 | 26,255 |
| 1 | Michigan Building Authority Revenue TOB VRDO | 0.730% | 11/7/16 | 8,500 | 8,500 |
| 1 | Michigan Finance Authority Hospital Revenue | | | | |
| | Bonds (Trinity Health Credit Group) TOB VRDO | 0.660% | 11/7/16 LOC | 15,000 | 15,000 |
| Michigan Finance Authority Revenue (Trinity | | | | |
| | Health Credit Group) PUT | 0.700% | 12/1/16 | 7,730 | 7,730 |
| Michigan Higher Education Facilities Authority | | | | |
| | Revenue (Albion College Project) VRDO | 0.630% | 11/7/16 LOC | 4,765 | 4,765 |
| Michigan Hospital Finance Authority Revenue | | | | |
| | (Ascension Health Credit Group) VRDO | 0.630% | 11/7/16 | 10,000 | 10,000 |
| Michigan Housing Development Authority Rental | | | | |
| | Housing Revenue VRDO | 0.660% | 11/7/16 | 55,220 | 55,220 |
| Michigan Housing Development Authority Single | | | | |
| | Family Mortgage Revenue VRDO | 0.640% | 11/7/16 | 74,850 | 74,850 |
| Michigan Housing Development Authority Single | | | | |
| | Family Mortgage Revenue VRDO | 0.660% | 11/7/16 | 71,450 | 71,450 |
| Michigan Housing Development Authority Single | | | | |
| | Family Mortgage Revenue VRDO | 0.680% | 11/7/16 | 114,140 | 114,140 |
| Michigan State University Board of Trustees | | | | |
| | General Revenue VRDO | 0.630% | 11/7/16 | 35,800 | 35,800 |
| Michigan State University Board of Trustees | | | | |
| | General Revenue VRDO | 0.630% | 11/7/16 | 32,200 | 32,200 |
| Michigan State University Board of Trustees | | | | |
| | General Revenue VRDO | 0.630% | 11/7/16 | 13,095 | 13,095 |
| Michigan State University Revenue CP | 0.950% | 1/10/17 | 5,405 | 5,405 |
| Oakland University of Michigan Revenue VRDO | 0.640% | 11/7/16 LOC | 6,800 | 6,800 |
| 1 | University of Michigan Revenue TOB VRDO | 0.660% | 11/7/16 | 6,190 | 6,190 |
| 1 | University of Michigan Revenue TOB VRDO | 0.670% | 11/7/16 | 1,400 | 1,400 |
| 488,800 |
| Minnesota (0.7%) | | | | |
| 1 | Minneapolis MN Health Care System Revenue | | | | |
| | (Fairview Health Services) TOB VRDO | 0.660% | 11/7/16 LOC | 60,000 | 60,000 |
| 1 | Minnesota GO TOB VRDO | 0.660% | 11/7/16 | 3,510 | 3,510 |
| Minnesota Housing Finance Agency Residential | | | | |
| | Housing Revenue VRDO | 0.630% | 11/7/16 | 4,500 | 4,500 |
| Minnesota Housing Finance Agency Residential | | | | |
| | Housing Revenue VRDO | 0.660% | 11/7/16 | 27,900 | 27,900 |
| Minnesota Housing Finance Agency Residential | | | | |
| | Housing Revenue VRDO | 0.660% | 11/7/16 | 1,015 | 1,015 |
| Minnesota Housing Finance Agency Residential | | | | |
| | Housing Revenue VRDO | 0.660% | 11/7/16 | 10,600 | 10,600 |
| St. Paul MN Housing & Redevelopment Authority | | | | |
| | Revenue (Highland Ridge Project) VRDO | 0.640% | 11/7/16 LOC | 5,250 | 5,250 |
| 1 | Western Minnesota Municipal Power Agency | | | | |
| | Revenue TOB VRDO | 0.660% | 11/7/16 | 6,665 | 6,665 |
| 119,440 |
25
| | | | | |
| Tax-Exempt Money Market Fund | | | | |
| |
| |
| |
| Face | Market |
| Maturity | Amount | Value• |
| | Coupon | Date | ($000) | ($000) |
| Mississippi (0.7%) | | | | |
| Mississippi Business Finance Corp. Gulf | | | | |
| | Opportunity Zone Industrial Development | | | | |
| | Revenue (Chevron USA Inc. Project) VRDO | 0.500% | 11/1/16 | 4,600 | 4,600 |
| Mississippi Business Finance Corp. Gulf | | | | |
| | Opportunity Zone Industrial Development | | | | |
| | Revenue (Chevron USA Inc. Project) VRDO | 0.500% | 11/1/16 | 7,000 | 7,000 |
| Mississippi Business Finance Corp. Gulf | | | | |
| | Opportunity Zone Industrial Development | | | | |
| | Revenue (Chevron USA Inc. Project) VRDO | 0.620% | 11/7/16 | 50,000 | 50,000 |
| Mississippi Business Finance Corp. Gulf | | | | |
| | Opportunity Zone Industrial Development | | | | |
| | Revenue (Chevron USA Inc. Project) VRDO | 0.620% | 11/7/16 | 13,000 | 13,000 |
| Mississippi Development Bank Special Obligation | | | | |
| | Revenue (Harrison County Coliseum) VRDO | 0.630% | 11/7/16 LOC | 1,000 | 1,000 |
| Mississippi Hospital Equipment & Facilities | | | | |
| | Authority Revenue (North Mississippi Health | | | | |
| | Services) VRDO | 0.580% | 11/7/16 | 21,800 | 21,800 |
| Mississippi Hospital Equipment & Facilities | | | | |
| | Authority Revenue (North Mississippi Health | | | | |
| | Services) VRDO | 0.580% | 11/7/16 | 16,450 | 16,450 |
| 113,850 |
| Missouri (2.9%) | | | | |
| Missouri Health & Education Facilities Authority | | | | |
| | Health Facilities CP | 0.950% | 12/5/16 | 25,000 | 25,000 |
| Missouri Health & Educational Facilities Authority | | | | |
| | Health Facilities CP | 0.950% | 12/5/16 | 30,000 | 30,000 |
| 1 | Missouri Health & Educational Facilities Authority | | | | |
| | Health Facilities Revenue (BJC Health System) | | | | |
| | TOB VRDO | 0.660% | 11/7/16 | 7,500 | 7,500 |
| 1 | Missouri Health & Educational Facilities Authority | | | | |
| | Health Facilities Revenue (BJC Health System) | | | | |
| | TOB VRDO | 0.660% | 11/7/16 | 6,000 | 6,000 |
| Missouri Health & Educational Facilities Authority | | | | |
| | Health Facilities Revenue (BJC Health System) | | | | |
| | VRDO | 0.600% | 11/7/16 | 66,625 | 66,625 |
| Missouri Health & Educational Facilities Authority | | | | |
| | Health Facilities Revenue (BJC Health System) | | | | |
| | VRDO | 0.600% | 11/7/16 | 79,800 | 79,800 |
| Missouri Health & Educational Facilities Authority | | | | |
| | Health Facilities Revenue (BJC Health System) | | | | |
| | VRDO | 0.600% | 11/7/16 | 77,900 | 77,900 |
| Missouri Health & Educational Facilities Authority | | | | |
| | Health Facilities Revenue (BJC Health System) | | | | |
| | VRDO | 0.620% | 11/7/16 | 55,000 | 55,000 |
| Missouri Health & Educational Facilities Authority | | | | |
| | Health Facilities Revenue (BJC Health System) | | | | |
| | VRDO | 0.620% | 11/7/16 | 39,925 | 39,925 |
| Missouri Health & Educational Facilities Authority | | | | |
| | Health Facilities Revenue (St. Louis University) | | | | |
| | VRDO | 0.480% | 11/1/16 LOC | 2,915 | 2,915 |
| 1 | Missouri Health & Educational Facilities Authority | | | | |
| | Revenue (Washington University) TOB VRDO | 0.660% | 11/7/16 | 22,695 | 22,695 |
26
| | | | | |
| Tax-Exempt Money Market Fund | | | | |
| |
| |
| |
| Face | Market |
| Maturity | Amount | Value• |
| | Coupon | Date | ($000) | ($000) |
| 1 | Missouri Health and Educational Facilities | | | | |
| | Authority Revenue (Washington University) | | | | |
| | TOB VRDO | 0.660% | 11/7/16 | 5,570 | 5,570 |
| St. Louis County MO TAN | 2.000% | 4/1/17 | 31,740 | 31,919 |
| St. Louis MO General Fund Revenue | 2.000% | 6/1/17 | 9,500 | 9,566 |
| 1 | St. Louis MO Sewer & Wastewater Revenue | | | | |
| | TOB VRDO | 0.660% | 11/7/16 | 1,670 | 1,670 |
| 1 | St. Louis MO Sewer & Wastewater Revenue | | | | |
| | TOB VRDO | 0.670% | 11/7/16 | 2,670 | 2,670 |
| 464,755 |
| Multiple States (11.2%) | | | | |
| 1,2 Federal Home Loan Mortgage Corp. Multifamily | | | | |
| | Housing Revenue TOB VRDO | 0.660% | 11/7/16 LOC | 144,046 | 144,046 |
| 2 | Federal Home Loan Mortgage Corp. Multifamily | | | | |
| | Housing Revenue TOB VRDO | 0.660% | 11/7/16 LOC | 56,585 | 56,585 |
| 2 | Federal Home Loan Mortgage Corp. Multifamily | | | | |
| | Housing Revenue TOB VRDO | 0.660% | 11/7/16 LOC | 10,490 | 10,490 |
| 2 | Federal Home Loan Mortgage Corp. Multifamily | | | | |
| | Housing Revenue TOB VRDO | 0.660% | 11/7/16 LOC | 11,330 | 11,330 |
| 1,2 Federal Home Loan Mortgage Corp. Multifamily | | | | |
| | Housing Revenue TOB VRDO | 0.670% | 11/7/16 LOC | 340,545 | 340,545 |
| 2 | Federal Home Loan Mortgage Corp. Multifamily | | | | |
| | Housing Revenue TOB VRDO | 0.680% | 11/7/16 LOC | 14,520 | 14,520 |
| 1,2 Federal Home Loan Mortgage Corp. Multifamily | | | | |
| | Housing Revenue TOB VRDO | 0.680% | 11/7/16 LOC | 32,080 | 32,080 |
| 1 | Nuveen AMT-Free Quality Municipal Income | | | | |
| | Fund VRDP VRDO | 0.730% | 11/7/16 LOC | 72,300 | 72,300 |
| 1 | Nuveen AMT-Free Quality Municipal Income | | | | |
| | Fund VRDP VRDO | 0.760% | 11/7/16 LOC | 94,000 | 94,000 |
| 1 | Nuveen Enhanced AMT-Free Municipal Credit | | | | |
| | Opportunities Fund VRDP VRDO | 0.730% | 11/7/16 LOC | 124,800 | 124,800 |
| 1 | Nuveen Enhanced AMT-Free Municipal Credit | | | | |
| | Opportunities Fund VRDP VRDO | 0.740% | 11/7/16 LOC | 85,300 | 85,300 |
| 1 | Nuveen Enhanced Municipal Credit Opportunities | | | | |
| | Fund VRDP VRDO | 0.780% | 11/7/16 LOC | 94,700 | 94,700 |
| 1 | Nuveen Enhanced Municipal Credit Opportunities | | | | |
| | Fund VRDP VRDO | 0.780% | 11/7/16 LOC | 180,000 | 180,000 |
| 1 | Nuveen Enhanced Municipal Credit Opportunities | | | | |
| | Fund VRDP VRDO | 0.780% | 11/7/16 LOC | 176,400 | 176,400 |
| 1 | Nuveen Quality Municipal Income Fund VRDP | | | | |
| | VRDO | 0.810% | 11/7/16 LOC | 118,000 | 118,000 |
| 1 | Nuveen Quality Municipal Income Fund VRDP | | | | |
| | VRDO | 0.810% | 11/7/16 LOC | 92,400 | 92,400 |
| 1 | Nuveen Quality Municipal Income Fund VRDP | | | | |
| | VRDO | 0.810% | 11/7/16 LOC | 100,000 | 100,000 |
| 1 | Western Asset Managed Municipals Fund Inc. | | | | |
| | VRDP VRDO | 0.780% | 11/7/16 LOC | 39,575 | 39,575 |
| 1 | Western Asset Municipal Partners Fund Inc. | | | | |
| | VRDP VRDO | 0.780% | 11/7/16 LOC | 25,100 | 25,100 |
| 1,812,171 |
27
| | | | | |
| Tax-Exempt Money Market Fund | | | | |
| |
| |
| |
| Face | Market |
| Maturity | Amount | Value• |
| | Coupon | Date | ($000) | ($000) |
| Nebraska (1.8%) | | | | |
| Douglas County NE GO | 4.000% | 12/15/16 | 2,385 | 2,395 |
| 1 | Douglas County NE Hospital Authority No. 3 | | | | |
| | Health Facilities Revenue (Nebraska Methodist | | | | |
| | Health System) TOB VRDO | 0.670% | 11/7/16 (13) | 10,060 | 10,060 |
| Lincoln NE Electric System Revenue CP | 0.920% | 1/4/17 | 22,750 | 22,750 |
| 1 | Nebraska Investment Finance Authority | | | | |
| | Multifamily Housing Revenue (Riverbend | | | | |
| | Apartments Project) VRDO | 0.610% | 11/7/16 LOC | 5,520 | 5,520 |
| Nebraska Investment Finance Authority Single | | | | |
| | Family Housing Revenue VRDO | 0.630% | 11/7/16 | 101,350 | 101,350 |
| 1 | Nebraska Public Power Agency Revenue TOB | | | | |
| | VRDO | 0.690% | 11/7/16 (13) | 27,500 | 27,500 |
| 1 | Nebraska Public Power Generation Agency | | | | |
| | Revenue (Whelan Energy Center Unit 2) TOB | | | | |
| | VRDO | 0.690% | 11/7/16 (13) | 76,870 | 76,870 |
| 1 | Omaha NE Public Power District Separate | | | | |
| | Electric Revenue TOB VRDO | 0.670% | 11/7/16 (13) | 34,610 | 34,610 |
| 1 | University of Nebraska Student Fee Revenue | | | | |
| | TOB VRDO | 0.690% | 11/7/16 | 4,100 | 4,100 |
| 285,155 |
| Nevada (1.9%) | | | | |
| Clark County NV Airport Improvement Revenue | | | | |
| | VRDO | 0.600% | 11/7/16 LOC | 4,050 | 4,050 |
| Clark County NV Economic Development | | | | |
| | Revenue (Opportunity Village Foundation | | | | |
| | Project) VRDO | 0.630% | 11/7/16 LOC | 16,400 | 16,400 |
| 1 | Clark County NV Water Reclamation District GO | | | | |
| | TOB VRDO | 0.660% | 11/7/16 | 14,805 | 14,805 |
| 1 | Las Vegas NV GO TOB VRDO | 0.660% | 11/7/16 | 8,330 | 8,330 |
| 1 | Las Vegas NV GO TOB VRDO | 0.690% | 11/7/16 | 10,850 | 10,850 |
| Las Vegas Valley Water District Nevada GO CP | 0.760% | 11/7/16 | 22,000 | 22,000 |
| Las Vegas Valley Water District Nevada GO CP | 0.780% | 12/1/16 | 22,540 | 22,540 |
| Las Vegas Valley Water District Nevada GO CP | 0.780% | 12/8/16 | 22,000 | 22,000 |
| Las Vegas Valley Water District Nevada GO CP | 0.800% | 2/1/17 | 25,760 | 25,760 |
| Las Vegas Valley Water District Nevada GO CP | 0.780% | 2/6/17 | 35,500 | 35,500 |
| Las Vegas Valley Water District Nevada GO CP | 0.850% | 2/7/17 | 38,000 | 38,000 |
| Las Vegas Valley Water District Nevada GO CP | 0.950% | 2/8/17 | 17,800 | 17,800 |
| 1 | Las Vegas Valley Water District Nevada GO TOB | | | | |
| | VRDO | 0.660% | 11/7/16 | 16,500 | 16,500 |
| 1 | Las Vegas Valley Water District Nevada GO TOB | | | | |
| | VRDO | 0.670% | 11/7/16 | 22,475 | 22,475 |
| 1 | Las Vegas Valley Water District Nevada GO TOB | | | | |
| | VRDO | 0.670% | 11/7/16 | 7,185 | 7,185 |
| 1 | Nevada GO TOB VRDO | 0.670% | 11/7/16 | 10,800 | 10,800 |
| Nevada Housing Division Multi-Unit Housing | | | | |
| | Revenue (City Center Project) VRDO | 0.780% | 11/7/16 LOC | 7,440 | 7,440 |
| 302,435 |
| New Hampshire (0.2%) | | | | |
| 1 | New Hampshire Health & Education Facilities | | | | |
| | Authority Revenue (Dartmouth College) TOB | | | | |
| | VRDO | 0.660% | 11/7/16 | 10,000 | 10,000 |
28
| | | | | |
| Tax-Exempt Money Market Fund | | | | |
| |
| |
| |
| Face | Market |
| Maturity | Amount | Value• |
| | Coupon | Date | ($000) | ($000) |
| 1 | New Hampshire Health & Education Facilities | | | | |
| | Authority Revenue (Dartmouth College) TOB | | | | |
| | VRDO | 0.660% | 11/7/16 | 8,000 | 8,000 |
| 1 | New Hampshire Health & Education Facilities | | | | |
| | Authority Revenue (Dartmouth College) TOB | | | | |
| | VRDO | 0.690% | 11/7/16 | 13,225 | 13,225 |
| 31,225 |
| New Jersey (3.8%) | | | | |
| Burlington County NJ Bridge Commission | | | | |
| | Revenue | 2.000% | 12/1/16 | 12,850 | 12,863 |
| Burlington Township NJ GO | 2.000% | 10/5/17 | 6,574 | 6,625 |
| Cherry Hill Township NJ BAN | 2.000% | 10/18/17 | 21,253 | 21,445 |
| Cliffside Park NJ BAN | 2.000% | 7/21/17 | 4,870 | 4,915 |
| Clifton NJ BAN | 2.000% | 10/10/17 | 17,983 | 18,157 |
| Cranford NJ BAN | 2.000% | 1/27/17 | 4,850 | 4,866 |
| East Hanover Township NJ BAN | 2.000% | 8/18/17 | 8,443 | 8,524 |
| Freehold Township NJ BAN | 2.000% | 11/18/16 | 4,135 | 4,138 |
| Hudson County NJ Improvement Authority | | | | |
| | Essential Purpose Pooled Governmental Loan | | | | |
| | Revenue VRDO | 0.640% | 11/7/16 LOC | 4,000 | 4,000 |
| Hudson County NJ Improvement Authority | | | | |
| | Pooled Revenue | 1.750% | 11/11/16 | 40,000 | 40,014 |
| Hudson County NJ Improvement Authority | | | | |
| | Pooled Revenue | 2.250% | 4/19/17 | 5,550 | 5,589 |
| 3 | Hudson County NJ Improvement Authority | | | | |
| | Pooled Revenue | 2.000% | 11/1/17 | 5,340 | 5,398 |
| Monroe Township NJ BAN | 2.000% | 8/3/17 | 17,528 | 17,691 |
| Moorestown Township NJ BAN | 2.000% | 8/31/17 | 4,950 | 4,999 |
| Mount Laurel Township NJ BAN | 1.500% | 3/8/17 | 4,355 | 4,367 |
| Mount Laurel Township NJ BAN | 2.000% | 3/8/17 | 4,880 | 4,902 |
| New Jersey Economic Development Authority | | | | |
| | Industrial Development Revenue (Ocean Spray | | | | |
| | Cranberries Inc. Project) VRDO | 0.750% | 11/7/16 LOC | 8,000 | 8,000 |
| New Jersey Educational Facilities Authority | | | | |
| | Revenue (Centenary College) VRDO | 0.600% | 11/7/16 LOC | 1,715 | 1,715 |
| New Jersey Health Care Facilities Financing | | | | |
| | Authority Revenue (Hospital Capital Asset | | | | |
| | Pooled Program) VRDO | 0.630% | 11/7/16 LOC | 8,500 | 8,500 |
| New Jersey Health Care Facilities Financing | | | | |
| | Authority Revenue (Virtua Health) VRDO | 0.620% | 11/7/16 LOC | 9,300 | 9,300 |
| 1 | New Jersey Higher Education Assistance | | | | |
| | Authority Student Loan Revenue TOB VRDO | 0.700% | 11/7/16 LOC | 13,000 | 13,000 |
| 1 | New Jersey Higher Education Assistance | | | | |
| | Authority Student Loan Revenue TOB VRDO | 0.700% | 11/7/16 LOC | 4,700 | 4,700 |
| New Jersey Housing & Mortgage Finance | | | | |
| | Agency Multi-Family Housing Revenue VRDO | 0.650% | 11/7/16 LOC | 3,700 | 3,700 |
| New Jersey Housing & Mortgage Finance | | | | |
| | Agency Multi-Family Housing Revenue VRDO | 0.650% | 11/7/16 LOC | 2,415 | 2,415 |
| New Jersey Housing & Mortgage Finance | | | | |
| | Agency Single Family Housing Revenue VRDO | 0.630% | 11/7/16 | 16,500 | 16,500 |
| New Jersey Housing & Mortgage Finance | | | | |
| | Agency Single Family Housing Revenue VRDO | 0.630% | 11/7/16 | 61,540 | 61,540 |
| New Jersey Housing & Mortgage Finance | | | | |
| | Agency Single Family Housing Revenue VRDO | 0.650% | 11/7/16 | 72,325 | 72,325 |
29
| | | | | |
| Tax-Exempt Money Market Fund | | | | |
| |
| |
| |
| Face | Market |
| Maturity | Amount | Value• |
| | Coupon | Date | ($000) | ($000) |
| New Jersey Housing & Mortgage Finance | | | | |
| | Agency Single Family Housing Revenue VRDO | 0.660% | 11/7/16 | 3,500 | 3,500 |
| North Bergen Township NJ BAN | 2.000% | 3/31/17 | 22,435 | 22,545 |
| 1 | Nuveen New Jersey Dividend Advantage | | | | |
| | Municipal Fund VRDP VRDO | 0.760% | 11/7/16 LOC | 30,000 | 30,000 |
| 1 | Nuveen New Jersey Dividend Advantage | | | | |
| | Municipal Fund VRDP VRDO | 0.760% | 11/7/16 LOC | 48,000 | 48,000 |
| 1 | Nuveen New Jersey Dividend Advantage | | | | |
| | Municipal Fund VRDP VRDO | 0.780% | 11/7/16 LOC | 26,700 | 26,700 |
| Paramus Borough NJ BAN | 2.000% | 2/17/17 | 13,988 | 14,044 |
| Parsippany-Troy Hills Township NJ BAN | 2.000% | 9/21/17 | 45,255 | 45,722 |
| Pequannock Township NJ BAN | 2.000% | 4/28/17 | 3,900 | 3,919 |
| Rockaway NJ BAN | 2.000% | 11/18/16 | 5,005 | 5,008 |
| Secaucus NJ BAN | 2.000% | 1/6/17 | 2,215 | 2,220 |
| Secaucus NJ BAN | 2.000% | 8/10/17 | 4,615 | 4,658 |
| Somerset County NJ BAN | 2.000% | 9/20/17 | 7,252 | 7,326 |
| Sussex County NJ BAN | 2.250% | 6/28/17 | 4,295 | 4,338 |
| 1 | Union County NJ Utilities Authority Revenue | | | | |
| | TOB VRDO | 0.700% | 11/7/16 | 6,400 | 6,400 |
| West Milford NJ Township BAN | 2.000% | 9/22/17 | 10,189 | 10,286 |
| 604,854 |
| New Mexico (0.8%) | | | | |
| 1 | New Mexico Educational Assistance Foundation | | | | |
| | Revenue TOB VRDO | 0.710% | 11/7/16 | 39,395 | 39,395 |
| New Mexico Finance Authority Transportation | | | | |
| | Revenue VRDO | 0.600% | 11/7/16 LOC | 3,850 | 3,850 |
| New Mexico Hospital Equipment Loan Council | | | | |
| | Hospital System Revenue (Presbyterian | | | | |
| | Healthcare Services) VRDO | 0.610% | 11/7/16 | 62,005 | 62,005 |
| New Mexico Hospital Equipment Loan Council | | | | |
| | Hospital System Revenue (Presbyterian | | | | |
| | Healthcare Services) VRDO | 0.610% | 11/7/16 | 27,000 | 27,000 |
| 132,250 |
| New York (11.3%) | | | | |
| Commack NY Union Free School District TAN | 2.000% | 6/27/17 | 12,500 | 12,583 |
| Connetquot NY Central School District BAN | 2.000% | 9/1/17 | 10,486 | 10,595 |
| Connetquot NY Central School District TAN | 2.000% | 6/27/17 | 13,500 | 13,617 |
| 1 | Erie County NY Industrial Development Agency | | | | |
| | School Facility Revenue (Buffalo City School | | | | |
| | District Project) TOB VRDO | 0.660% | 11/7/16 | 20,250 | 20,250 |
| Grand Island NY BAN | 2.000% | 10/12/17 | 8,306 | 8,381 |
| Half Hollow Hills NY Central School District TAN | 2.000% | 6/27/17 | 20,000 | 20,143 |
| Hauppauge NY Union Free School District TAN | 1.500% | 6/23/17 | 7,250 | 7,282 |
| Huntington NY Union Free School District TAN | 2.000% | 6/23/17 | 9,000 | 9,063 |
| Lindenhurst NY Union Free School District TAN | 2.000% | 6/22/17 | 9,500 | 9,559 |
| 1 | New York City NY GO TOB VRDO | 0.660% | 11/7/16 | 8,250 | 8,250 |
| 1 | New York City NY GO TOB VRDO | 0.670% | 11/7/16 | 23,090 | 23,090 |
| New York City NY GO VRDO | 0.500% | 11/1/16 LOC | 9,800 | 9,800 |
| New York City NY GO VRDO | 0.510% | 11/1/16 LOC | 13,250 | 13,250 |
| New York City NY GO VRDO | 0.510% | 11/1/16 LOC | 8,800 | 8,800 |
| New York City NY GO VRDO | 0.530% | 11/1/16 | 1,600 | 1,600 |
| New York City NY GO VRDO | 0.610% | 11/7/16 LOC | 14,465 | 14,465 |
| New York City NY GO VRDO | 0.620% | 11/7/16 LOC | 8,170 | 8,170 |
| New York City NY GO VRDO | 0.620% | 11/7/16 LOC | 29,910 | 29,910 |
30
| | | | | |
| Tax-Exempt Money Market Fund | | | | |
| |
| |
| |
| Face | Market |
| Maturity | Amount | Value• |
| | Coupon | Date | ($000) | ($000) |
| New York City NY GO VRDO | 0.630% | 11/7/16 LOC | 11,700 | 11,700 |
| New York City NY GO VRDO | 0.640% | 11/7/16 LOC | 37,500 | 37,500 |
| New York City NY Housing Development Corp. | | | | |
| | Multi-Family Housing Revenue (201 Pearl Street) | | | | |
| | VRDO | 0.650% | 11/7/16 LOC | 18,000 | 18,000 |
| New York City NY Housing Development Corp. | | | | |
| | Multi-Family Housing Revenue VRDO | 0.630% | 11/7/16 | 35,840 | 35,840 |
| New York City NY Housing Development Corp. | | | | |
| | Multi-Family Mortgage Revenue (Bruckner by | | | | |
| | the Bridge) VRDO | 0.640% | 11/7/16 LOC | 11,900 | 11,900 |
| New York City NY Housing Development Corp. | | | | |
| | Multi-Family Mortgage Revenue (Elliot Chelsea | | | | |
| | Development) VRDO | 0.630% | 11/7/16 LOC | 12,925 | 12,925 |
| New York City NY Housing Development Corp. | | | | |
| | Multi-Family Mortgage Revenue (Markham | | | | |
| | Gardens Apartments) VRDO | 0.570% | 11/7/16 LOC | 3,600 | 3,600 |
| New York City NY Housing Development Corp. | | | | |
| | Multi-Family Mortgage Revenue (West 26th | | | | |
| | Street Development) VRDO | 0.680% | 11/7/16 LOC | 10,000 | 10,000 |
| New York City NY Housing Development Corp. | | | | |
| | Multi-Family Rental Housing Revenue (2 Gold | | | | |
| | Street) VRDO | 0.650% | 11/7/16 | 103,200 | 103,200 |
| New York City NY Housing Development Corp. | | | | |
| | Multi-Family Rental Housing Revenue (90 West | | | | |
| | Street) VRDO | 0.650% | 11/7/16 LOC | 25,200 | 25,200 |
| New York City NY Housing Development Corp. | | | | |
| | Multi-Family Rental Housing Revenue (Atlantic | | | | |
| | Court Apartments) VRDO | 0.570% | 11/7/16 LOC | 15,000 | 15,000 |
| New York City NY Housing Development Corp. | | | | |
| | Multi-Family Rental Housing Revenue | | | | |
| | (Lexington Courts) VRDO | 0.610% | 11/7/16 LOC | 8,200 | 8,200 |
| New York City NY Housing Development Corp. | | | | |
| | Multi-Family Rental Housing Revenue | | | | |
| | (The Balton) VRDO | 0.690% | 11/7/16 LOC | 8,300 | 8,300 |
| New York City NY Housing Finance Agency | | | | |
| | Revenue (211 North End Avenue) VRDO | 0.650% | 11/7/16 LOC | 21,400 | 21,400 |
| New York City NY Housing Finance Agency | | | | |
| | Revenue (900 Eighth Avenue) VRDO | 0.650% | 11/7/16 LOC | 34,000 | 34,000 |
| New York City NY Industrial Development | | | | |
| | Agency Special Facility Revenue (New York | | | | |
| | Stock Exchange Project) VRDO | 0.620% | 11/7/16 LOC | 5,000 | 5,000 |
| 1 | New York City NY Municipal Water Finance | | | | |
| | Authority Water & Sewer System Revenue | | | | |
| | TOB VRDO | 0.660% | 11/7/16 | 5,000 | 5,000 |
| 1 | New York City NY Municipal Water Finance | | | | |
| | Authority Water & Sewer System Revenue | | | | |
| | TOB VRDO | 0.660% | 11/7/16 | 1,505 | 1,505 |
| 1 | New York City NY Municipal Water Finance | | | | |
| | Authority Water & Sewer System Revenue | | | | |
| | TOB VRDO | 0.690% | 11/7/16 | 16,800 | 16,800 |
| New York City NY Municipal Water Finance | | | | |
| | Authority Water & Sewer System Revenue | | | | |
| | VRDO | 0.500% | 11/1/16 | 11,460 | 11,460 |
31
| | | | | |
| Tax-Exempt Money Market Fund | | | | |
| |
| |
| |
| Face | Market |
| Maturity | Amount | Value• |
| | Coupon | Date | ($000) | ($000) |
| New York City NY Municipal Water Finance | | | | |
| | Authority Water & Sewer System Revenue | | | | |
| | VRDO | 0.500% | 11/1/16 | 1,700 | 1,700 |
| New York City NY Municipal Water Finance | | | | |
| | Authority Water & Sewer System Revenue | | | | |
| | VRDO | 0.500% | 11/1/16 | 9,300 | 9,300 |
| New York City NY Municipal Water Finance | | | | |
| | Authority Water & Sewer System Revenue | | | | |
| | VRDO | 0.500% | 11/1/16 | 10,800 | 10,800 |
| New York City NY Municipal Water Finance | | | | |
| | Authority Water & Sewer System Revenue | | | | |
| | VRDO | 0.500% | 11/1/16 | 5,300 | 5,300 |
| New York City NY Municipal Water Finance | | | | |
| | Authority Water & Sewer System Revenue | | | | |
| | VRDO | 0.510% | 11/1/16 | 5,800 | 5,800 |
| New York City NY Municipal Water Finance | | | | |
| | Authority Water & Sewer System Revenue | | | | |
| | VRDO | 0.520% | 11/1/16 | 1,400 | 1,400 |
| New York City NY Municipal Water Finance | | | | |
| | Authority Water & Sewer System Revenue | | | | |
| | VRDO | 0.610% | 11/7/16 | 19,800 | 19,800 |
| New York City NY Municipal Water Finance | | | | |
| | Authority Water & Sewer System Revenue | | | | |
| | VRDO | 0.620% | 11/7/16 | 6,000 | 6,000 |
| New York City NY Municipal Water Finance | | | | |
| | Authority Water & Sewer System Revenue | | | | |
| | VRDO | 0.620% | 11/7/16 | 7,000 | 7,000 |
| New York City NY Municipal Water Finance | | | | |
| | Authority Water & Sewer System Revenue | | | | |
| | VRDO | 0.640% | 11/7/16 | 48,000 | 48,000 |
| 1 | New York City NY Municipal Water Finance | | | | |
| | Authority Water and Sewer System Revenue | | | | |
| | TOB VRDO | 0.680% | 11/7/16 | 6,800 | 6,800 |
| 1 | New York City NY Transitional Finance Authority | | | | |
| | Building Aid Revenue TOB VRDO | 0.670% | 11/7/16 | 31,500 | 31,500 |
| 1 | New York City NY Transitional Finance Authority | | | | |
| | Building Aid Revenue TOB VRDO | 0.670% | 11/7/16 | 10,535 | 10,535 |
| 1 | New York City NY Transitional Finance Authority | | | | |
| | Future Tax Revenue TOB VRDO | 0.660% | 11/7/16 | 1,500 | 1,500 |
| 1 | New York City NY Transitional Finance Authority | | | | |
| | Future Tax Revenue TOB VRDO | 0.670% | 11/7/16 | 6,200 | 6,200 |
| New York City NY Transitional Finance Authority | | | | |
| | Future Tax Revenue VRDO | 0.500% | 11/1/16 | 5,200 | 5,200 |
| New York City NY Transitional Finance Authority | | | | |
| | Future Tax Revenue VRDO | 0.610% | 11/7/16 | 102,700 | 102,700 |
| New York City NY Transitional Finance Authority | | | | |
| | Future Tax Revenue VRDO | 0.650% | 11/7/16 | 2,600 | 2,600 |
| New York City NY Trust for Cultural Resources | | | | |
| | Revenue (The Metropolitan Museum of Art) | | | | |
| | VRDO | 0.630% | 11/7/16 | 8,000 | 8,000 |
| 1 | New York Liberty Development Corp. Revenue | | | | |
| | (Bank of America Tower at One Bryant Park | | | | |
| | Project) TOB VRDO | 0.660% | 11/7/16 | 9,000 | 9,000 |
32
Tax-Exempt Money Market Fund
| | | | | |
| Face | Market |
| Maturity | Amount | Value• |
| | Coupon | Date | ($000) | ($000) |
| 1 | New York Liberty Development Corp. Revenue | | | | |
| | (Port Authority Consolidated Bonds) TOB VRDO | 0.680% | 11/7/16 | 16,300 | 16,300 |
| 1 | New York Metropolitan Transportation Authority | | | | |
| | Revenue (Dedicated Petroleum Tax) TOB VRDO | 0.670% | 11/7/16 (13) | 42,605 | 42,605 |
| New York Metropolitan Transportation Authority | | | | |
| | Revenue (Dedicated Tax Fund) VRDO | 0.610% | 11/7/16 LOC | 21,500 | 21,500 |
| New York Metropolitan Transportation Authority | | | | |
| | Revenue VRDO | 0.490% | 11/1/16 LOC | 19,430 | 19,430 |
| New York Metropolitan Transportation Authority | | | | |
| | Revenue VRDO | 0.500% | 11/1/16 LOC | 3,765 | 3,765 |
| 1 | New York State Dormitory Authority Lease | | | | |
| | Revenue (State University Dormitory Facilities) | | | | |
| | TOB VRDO | 0.670% | 11/7/16 | 5,820 | 5,820 |
| New York State Dormitory Authority Revenue | | | | |
| | (Blythedale Children’s Hospital) VRDO | 0.630% | 11/7/16 LOC | 23,115 | 23,115 |
| New York State Dormitory Authority Revenue | | | | |
| | (Fordham University) VRDO | 0.620% | 11/7/16 LOC | 25,240 | 25,240 |
| New York State Dormitory Authority Revenue | | | | |
| | (Le Moyne College) VRDO | 0.640% | 11/7/16 LOC | 4,950 | 4,950 |
| 1 | New York State Dormitory Authority Revenue | | | | |
| | (Personal Income Tax) TOB VRDO | 0.660% | 11/7/16 | 1,875 | 1,875 |
| 1 | New York State Dormitory Authority Revenue | | | | |
| | (Personal Income Tax) TOB VRDO | 0.660% | 11/7/16 | 6,425 | 6,425 |
| 1 | New York State Dormitory Authority Revenue | | | | |
| | (Personal Income Tax) TOB VRDO | 0.660% | 11/7/16 | 13,000 | 13,000 |
| 1 | New York State Dormitory Authority Revenue | | | | |
| | (Personal Income Tax) TOB VRDO | 0.670% | 11/7/16 | 5,000 | 5,000 |
| New York State Dormitory Authority Revenue | | | | |
| | (Rockefeller University) VRDO | 0.630% | 11/7/16 | 2,275 | 2,275 |
| New York State Dormitory Authority Revenue | | | | |
| | (St. John’s University) VRDO | 0.610% | 11/7/16 LOC | 17,655 | 17,655 |
| 1 | New York State Environmental Facilities Corp. | | | | |
| | Revenue (State Clean Water & Drinking Water | | | | |
| | Revolving Funds) TOB VRDO | 0.660% | 11/7/16 | 3,640 | 3,640 |
| New York State Housing Finance Agency Housing | | | | |
| | Revenue (20 River Terrace Housing) VRDO | 0.650% | 11/7/16 LOC | 71,400 | 71,400 |
| New York State Housing Finance Agency Housing | | | | |
| | Revenue (316 11th Avenue) VRDO | 0.670% | 11/7/16 LOC | 20,000 | 20,000 |
| New York State Housing Finance Agency Housing | | | | |
| | Revenue (625 W 57th St) VRDO | 0.690% | 11/7/16 LOC | 1,200 | 1,200 |
| New York State Housing Finance Agency Housing | | | | |
| | Revenue (855 6th Avenue) VRDO | 0.650% | 11/7/16 LOC | 18,500 | 18,500 |
| New York State Housing Finance Agency Housing | | | | |
| | Revenue (Chelsea Apartments) VRDO | 0.650% | 11/7/16 LOC | 35,000 | 35,000 |
| New York State Housing Finance Agency Housing | | | | |
| | Revenue (Clinton Park Phase II) VRDO | 0.650% | 11/7/16 LOC | 37,000 | 37,000 |
| New York State Housing Finance Agency Housing | | | | |
| | Revenue (Dock Street) VRDO | 0.640% | 11/7/16 LOC | 1,700 | 1,700 |
| New York State Housing Finance Agency Housing | | | | |
| | Revenue (East 84th Street) VRDO | 0.570% | 11/7/16 LOC | 16,800 | 16,800 |
| New York State Housing Finance Agency Housing | | | | |
| | Revenue (East 92nd Street) VRDO | 0.630% | 11/7/16 LOC | 11,000 | 11,000 |
| New York State Housing Finance Agency Housing | | | | |
| | Revenue (Riverside Center 2) VRDO | 0.650% | 11/7/16 LOC | 8,300 | 8,300 |
33
| | | | | |
| Tax-Exempt Money Market Fund | | | | |
| |
| |
| |
| Face | Market |
| Maturity | Amount | Value• |
| | Coupon | Date | ($000) | ($000) |
| New York State Housing Finance Agency | | | | |
| | Revenue (Clinton Park) VRDO | 0.630% | 11/7/16 LOC | 6,700 | 6,700 |
| New York State Housing Finance Agency | | | | |
| | Revenue (Maestro West Chelsea Housing) | | | | |
| | VRDO | 0.650% | 11/7/16 LOC | 13,000 | 13,000 |
| New York State Housing Finance Agency | | | | |
| | Revenue (Service Contract) VRDO | 0.700% | 11/7/16 LOC | 3,870 | 3,870 |
| New York State Local Government Assistance | | | | |
| | Corp. Revenue VRDO | 0.650% | 11/7/16 | 63,005 | 63,005 |
| New York State Mortgage Agency Homeowner | | | | |
| | Mortgage Revenue VRDO | 0.550% | 11/7/16 | 25,000 | 25,000 |
| New York State Mortgage Agency Homeowner | | | | |
| | Mortgage Revenue VRDO | 0.670% | 11/7/16 | 17,250 | 17,250 |
| New York State Mortgage Agency Homeowner | | | | |
| | Mortgage Revenue VRDO | 0.700% | 11/7/16 | 35,000 | 35,000 |
| New York State Urban Development Corp. | | | | |
| | Revenue (Service Contract) VRDO | 0.610% | 11/7/16 | 1,600 | 1,600 |
| New York State Urban Development Corp. | | | | |
| | Revenue (Service Contract) VRDO | 0.610% | 11/7/16 | 25,195 | 25,195 |
| New York State Urban Development Corp. | | | | |
| | Revenue (Service Contract) VRDO | 0.630% | 11/7/16 LOC | 7,700 | 7,700 |
| North Hempstead NY BAN | 2.250% | 4/4/17 | 7,500 | 7,545 |
| 1 | Nuveen New York AMT-Free Municipal Income | | | | |
| | Fund VRDP VRDO | 0.730% | 11/7/16 LOC | 27,500 | 27,500 |
| 1 | Nuveen New York Dividend Advantage Municipal | | | | |
| | Fund VRDP VRDO | 0.780% | 11/7/16 LOC | 33,500 | 33,500 |
| Pittsford NY Central School District BAN | 2.000% | 2/10/17 | 2,000 | 2,007 |
| Port Authority of New York & New Jersey | | | | |
| | Revenue CP | 0.880% | 12/20/16 | 19,295 | 19,295 |
| 1 | Port Authority of New York & New Jersey | | | | |
| | Revenue TOB VRDO | 0.700% | 11/7/16 | 2,100 | 2,100 |
| Rensselaer County NY GO | 2.000% | 8/11/17 | 9,600 | 9,692 |
| Saratoga County NY Capital Resource Corp. | | | | |
| | Revenue (Saratoga Hospital Project) VRDO | 0.680% | 11/7/16 LOC | 4,825 | 4,825 |
| Smithtown NY Central School District TAN | 1.500% | 6/30/17 | 9,600 | 9,638 |
| South Country NY Central School District TAN | 2.000% | 6/27/17 | 11,500 | 11,588 |
| South Huntington NY Union Free School District | | | | |
| | TAN | 2.000% | 6/27/17 | 6,000 | 6,043 |
| Syosset NY Central School District TAN | 1.500% | 6/27/17 | 4,500 | 4,520 |
| Triborough Bridge & Tunnel Authority New York | | | | |
| | Revenue VRDO | 0.600% | 11/7/16 LOC | 1,920 | 1,920 |
| Triborough Bridge & Tunnel Authority New York | | | | |
| | Revenue VRDO | 0.680% | 11/7/16 LOC | 70,695 | 70,695 |
| Ulster County NY BAN | 2.000% | 11/23/16 | 8,810 | 8,818 |
| 3 | Ulster County NY BAN | 2.000% | 11/22/17 | 6,955 | 7,030 |
| 1 | Utility Debt Securitization Authority New York | | | | |
| | Revenue TOB VRDO | 0.660% | 11/7/16 | 37,500 | 37,500 |
| 1,820,504 |
| North Carolina (1.5%) | | | | |
| Board of Governors of the University of North | | | | |
| | Carolina Revenue (University of North Carolina | | | | |
| | Hospitals at Chapel Hill) VRDO | 0.620% | 11/7/16 | 40,155 | 40,155 |
| Charlotte NC Airport Revenue VRDO | 0.640% | 11/7/16 LOC | 2,900 | 2,900 |
34
| | | | | |
| Tax-Exempt Money Market Fund | | | | |
| |
| |
| |
| Face | Market |
| Maturity | Amount | Value• |
| | Coupon | Date | ($000) | ($000) |
| 1 | Charlotte NC Water & Sewer System Revenue | | | | |
| | TOB VRDO | 0.670% | 11/7/16 | 7,465 | 7,465 |
| 1 | Charlotte-Mecklenburg NC Hospital Authority | | | | |
| | Health Care System Revenue (Carolinas | | | | |
| | HealthCare System) TOB VRDO | 0.710% | 11/7/16 | 14,000 | 14,000 |
| North Carolina Capital Facilities Finance Agency | | | | |
| | (Duke University Project) CP | 0.760% | 11/3/16 | 5,865 | 5,865 |
| North Carolina Capital Facilities Finance Agency | | | | |
| | (Duke University Project) CP | 0.820% | 11/16/16 | 4,662 | 4,662 |
| North Carolina Capital Facilities Finance Agency | | | | |
| | (Duke University Project) CP | 0.950% | 12/8/16 | 11,737 | 11,737 |
| 1 | North Carolina Capital Facilities Finance Agency | | | | |
| | Revenue (Duke University Project) TOB VRDO | 0.660% | 11/7/16 | 2,285 | 2,285 |
| 1 | North Carolina Capital Facilities Finance Agency | | | | |
| | Revenue (Duke University Project) TOB VRDO | 0.660% | 11/7/16 | 2,495 | 2,495 |
| 1 | North Carolina Capital Facilities Finance Agency | | | | |
| | Revenue (Duke University Project) TOB VRDO | 0.660% | 11/7/16 | 3,395 | 3,395 |
| North Carolina Capital Facilities Finance Agency | | | | |
| | Revenue (YMCA of the Triangle) VRDO | 0.700% | 11/7/16 LOC | 10,910 | 10,910 |
| North Carolina Capital Facilities Finance Agency | | | | |
| | Revenue (YMCA of the Triangle) VRDO | 0.710% | 11/7/16 LOC | 9,050 | 9,050 |
| North Carolina Medical Care Commission Health | | | | |
| | Care Facilities Revenue (Lenoir Memorial | | | | |
| | Hospital Project) VRDO | 0.620% | 11/7/16 LOC | 15,200 | 15,200 |
| North Carolina Medical Care Commission Hospital | | | | |
| | Revenue (Baptist Hospital) VRDO | 0.630% | 11/7/16 LOC | 6,095 | 6,095 |
| North Carolina Medical Care Commission Hospital | | | | |
| | Revenue (Moses Cone Health System) PUT | 0.980% | 5/29/17 | 21,555 | 21,555 |
| 1 | North Carolina Revenue TOB VRDO | 0.670% | 11/7/16 | 2,900 | 2,900 |
| Raleigh Durham NC Airport Authority Revenue | | | | |
| | VRDO | 0.630% | 11/7/16 LOC | 12,930 | 12,930 |
| Raleigh NC Combined Enterprise System | | | | |
| | Revenue VRDO | 0.640% | 11/7/16 | 21,490 | 21,490 |
| Raleigh NC Combined Enterprise System | | | | |
| | Revenue VRDO | 0.640% | 11/7/16 | 49,085 | 49,085 |
| 244,174 |
| North Dakota (0.1%) | | | | |
| North Dakota Housing Finance Agency Home | | | | |
| | Mortgage Revenue VRDO | 0.590% | 11/7/16 | 19,950 | 19,950 |
| | | | |
| Ohio (2.6%) | | | | |
| Akron OH Income Tax Revenue | 1.250% | 12/15/16 | 7,000 | 7,005 |
| Athens County OH Port Authority Housing | | | | |
| | Revenue VRDO | 0.640% | 11/7/16 LOC | 1,600 | 1,600 |
| Avon Lake OH BAN | 2.000% | 7/12/17 | 25,496 | 25,717 |
| Avon OH BAN | 1.500% | 1/26/17 | 1,310 | 1,312 |
| Avon OH BAN | 2.000% | 9/7/17 | 6,500 | 6,563 |
| Avon OH GO | 1.250% | 1/26/17 | 2,000 | 2,003 |
| Butler County OH Capital Funding Revenue VRDO | 0.630% | 11/7/16 LOC | 6,170 | 6,170 |
| Cleveland-Cuyahoga County OH Port Authority | | | | |
| | Revenue (Carnegie/89th Garage & Service | | | | |
| | Center LLC Project) VRDO | 0.610% | 11/7/16 LOC | 9,180 | 9,180 |
35
| | | | | |
| Tax-Exempt Money Market Fund | | | | |
| |
| |
| |
| Face | Market |
| Maturity | Amount | Value• |
| | Coupon | Date | ($000) | ($000) |
| Cleveland-Cuyahoga County OH Port Authority | | | | |
| | Revenue (Cleveland Museum of Art Project) | | | | |
| | VRDO | 0.630% | 11/7/16 | 15,900 | 15,900 |
| Cleveland-Cuyahoga County OH Port Authority | | | | |
| | Revenue (Cleveland Museum of Art Project) | | | | |
| | VRDO | 0.630% | 11/7/16 | 18,350 | 18,350 |
| Cleveland-Cuyahoga County OH Port Authority | | | | |
| | Revenue (Cleveland Museum of Art Project) | | | | |
| | VRDO | 0.640% | 11/7/16 | 3,250 | 3,250 |
| Columbus OH Regional Airport Authority Airport | | | | |
| | Revenue (Oasbo Expanded Asset Program) | | | | |
| | VRDO | 0.630% | 11/7/16 LOC | 13,405 | 13,405 |
| Columbus OH Regional Airport Authority Airport | | | | |
| | Revenue (Oasbo Expanded Asset Program) | | | | |
| | VRDO | 0.630% | 11/7/16 LOC | 16,570 | 16,570 |
| Columbus OH Regional Airport Authority Airport | | | | |
| | Revenue (Oasbo Expanded Asset Program) | | | | |
| | VRDO | 0.630% | 11/7/16 LOC | 3,890 | 3,890 |
| Columbus OH Regional Airport Authority | | | | |
| | Revenue (Pooled Financing Program) VRDO | 0.630% | 11/7/16 LOC | 7,265 | 7,265 |
| Deerfield Township OH BAN | 1.200% | 10/26/17 | 1,600 | 1,600 |
| Fairborn OH BAN | 1.250% | 3/23/17 | 2,000 | 2,004 |
| Franklin County OH Hospital Facilities Revenue | | | | |
| | (US Health Corp. of Columbus) VRDO | 0.620% | 11/7/16 LOC | 4,925 | 4,925 |
| Franklin County OH Hospital Revenue | | | | |
| | (Nationwide Children’s Hospital Project) VRDO | 0.600% | 11/7/16 | 17,840 | 17,840 |
| Franklin County OH Hospital Revenue | | | | |
| | (Nationwide Children’s Hospital Project) VRDO | 0.630% | 11/7/16 | 6,875 | 6,875 |
| Highland Heights OH BAN | 2.000% | 6/15/17 | 2,750 | 2,770 |
| Huber Heights OH BAN | 2.000% | 6/1/17 | 9,063 | 9,122 |
| Independence OH BAN | 2.000% | 4/13/17 | 3,000 | 3,016 |
| Lakewood OH BAN | 1.250% | 4/4/17 | 1,600 | 1,604 |
| 3 | Lorain County OH BAN | 1.250% | 11/9/17 | 2,500 | 2,509 |
| Middleburg Heights OH BAN | 2.000% | 7/25/17 | 1,240 | 1,250 |
| Middletown OH Hospital Facilities Revenue | | | | |
| | (Atrium Medical Center) VRDO | 0.630% | 11/7/16 LOC | 9,400 | 9,400 |
| 1 | Nuveen Ohio Quality Income Municipal Fund | | | | |
| | VRDP VRDO | 0.780% | 11/7/16 LOC | 43,000 | 43,000 |
| Ohio Common Schools GO VRDO | 0.600% | 11/7/16 | 25,470 | 25,470 |
| Ohio GO VRDO | 0.650% | 11/7/16 | 5,130 | 5,130 |
| Ohio GO VRDO | 0.650% | 11/7/16 | 8,375 | 8,375 |
| Ohio GO VRDO | 0.650% | 11/7/16 | 2,885 | 2,885 |
| Ohio Higher Educational Facility Commission | | | | |
| | Revenue (Case Western Reserve University | | | | |
| | Project) CP | 0.770% | 11/3/16 | 11,000 | 11,000 |
| Ohio Higher Educational Facility Commission | | | | |
| | Revenue (Case Western Reserve University | | | | |
| | Project) CP | 0.870% | 12/1/16 | 22,500 | 22,500 |
| Ohio Higher Educational Facility Commission | | | | |
| | Revenue (Case Western Reserve University | | | | |
| | Project) CP | 0.900% | 12/1/16 | 3,000 | 3,000 |
| Ohio Higher Educational Facility Commission | | | | |
| | Revenue (Case Western Reserve University | | | | |
| | Project) CP | 0.800% | 12/8/16 | 3,500 | 3,500 |
36
| | | | | |
| Tax-Exempt Money Market Fund | | | | |
| |
| |
| |
| Face | Market |
| Maturity | Amount | Value• |
| | Coupon | Date | ($000) | ($000) |
| Ohio Higher Educational Facility Commission | | | | |
| | Revenue (Case Western Reserve University | | | | |
| | Project) CP | 0.870% | 12/8/16 | 6,500 | 6,500 |
| Ohio Higher Educational Facility Commission | | | | |
| | Revenue (Cleveland Clinic Health System | | | | |
| | Obligated Group) VRDO | 0.470% | 11/1/16 | 4,650 | 4,650 |
| Ohio Higher Educational Facility Commission | | | | |
| | Revenue (Cleveland Clinic Health System | | | | |
| | Obligated Group) VRDO | 0.470% | 11/1/16 | 5,000 | 5,000 |
| 1 | Ohio Higher Educational Facility Commission | | | | |
| | Revenue (University Hospitals Health System | | | | |
| | Inc.) TOB VRDO | 0.700% | 11/7/16 (13) | 1,665 | 1,665 |
| Ohio Housing Finance Agency Residential | | | | |
| | Mortgage Revenue VRDO | 0.570% | 11/7/16 | 3,725 | 3,725 |
| Ohio Housing Finance Agency Residential | | | | |
| | Mortgage Revenue VRDO | 0.580% | 11/7/16 | 9,400 | 9,400 |
| Ohio Housing Finance Agency Residential | | | | |
| | Mortgage Revenue VRDO | 0.660% | 11/7/16 | 1,830 | 1,830 |
| Ohio Infrastructure Improvement GO VRDO | 0.650% | 11/7/16 | 4,415 | 4,415 |
| Ohio State University General Receipts Revenue | | | | |
| | CP | 0.890% | 12/7/16 | 8,630 | 8,630 |
| 1 | Ohio State University General Receipts Revenue | | | | |
| | TOB VRDO | 0.690% | 11/7/16 | 5,750 | 5,750 |
| 1 | Ohio State University General Receipts Revenue | | | | |
| | TOB VRDO | 0.690% | 11/7/16 | 5,750 | 5,750 |
| Ohio State University General Receipts Revenue | | | | |
| | VRDO | 0.600% | 11/7/16 | 12,625 | 12,625 |
| Springboro OH BAN | 1.500% | 1/26/17 | 3,900 | 3,905 |
| Toledo-Lucas County OH Port Authority Airport | | | | |
| | Development Revenue (Flight Safety | | | | |
| | International Inc.) VRDO | 0.630% | 11/7/16 (13) | 2,000 | 2,000 |
| Union County OH BAN | 1.250% | 3/29/17 | 1,900 | 1,904 |
| Union Township OH BAN | 1.250% | 9/7/17 | 14,625 | 14,681 |
| 418,385 |
| Oklahoma (0.3%) | | | | |
| 1 | Grand River Dam Authority Oklahoma Revenue | | | | |
| | TOB VRDO | 0.670% | 11/7/16 (13) | 26,100 | 26,100 |
| 1 | Oklahoma Turnpike Authority Revenue TOB VRDO 0.690% | 11/7/16 | 8,000 | 8,000 |
| 1 | Tulsa County OK Industrial Authority Health Care | | | | |
| | Revenue (St. Francis Health System Inc.) TOB | | | | |
| | VRDO | 0.670% | 11/7/16 | 15,131 | 15,131 |
| 49,231 |
| Oregon (0.7%) | | | | |
| Oregon Facilities Authority Revenue (PeaceHealth) | | | | |
| | VRDO | 0.610% | 11/7/16 LOC | 14,000 | 14,000 |
| Oregon Facilities Authority Revenue (Reed | | | | |
| | College Projects) VRDO | 0.650% | 11/7/16 | 38,535 | 38,535 |
| Oregon GO (Veterans Welfare) VRDO | 0.660% | 11/7/16 | 11,740 | 11,740 |
| 1 | Oregon Housing & Community Service | | | | |
| | Department Single Family Mortgage Revenue | | | | |
| | TOB VRDO | 0.710% | 11/7/16 | 7,615 | 7,615 |
| Oregon Housing & Community Service | | | | |
| | Department Single Family Mortgage Revenue | | | | |
| | VRDO | 0.600% | 11/7/16 | 6,640 | 6,640 |
37
| | | | | |
| Tax-Exempt Money Market Fund | | | | |
| |
| |
| |
| Face | Market |
| Maturity | Amount | Value• |
| | Coupon | Date | ($000) | ($000) |
| Oregon Housing & Community Service | | | | |
| | Department Single Family Mortgage Revenue | | | | |
| | VRDO | 0.640% | 11/7/16 | 13,140 | 13,140 |
| Oregon Housing & Community Service | | | | |
| | Department Single Family Mortgage Revenue | | | | |
| | VRDO | 0.650% | 11/7/16 | 15,000 | 15,000 |
| 106,670 |
| Pennsylvania (1.7%) | | | | |
| Allegheny County PA GO VRDO | 0.630% | 11/7/16 LOC | 2,900 | 2,900 |
| Allegheny County PA Higher Education Building | | | | |
| | Authority University Revenue (Carnegie Mellon | | | | |
| | University) VRDO | 0.520% | 11/1/16 | 6,000 | 6,000 |
| Bucks County PA Industrial Development | | | | |
| | Authority Hospital Revenue (Grand View | | | | |
| | Hospital) VRDO | 0.600% | 11/7/16 LOC | 3,900 | 3,900 |
| Delaware County PA Industrial Development | | | | |
| | Authority Airport Facilities Revenue (United | | | | |
| | Parcel Service Inc.) VRDO | 0.550% | 11/1/16 | 18,100 | 18,100 |
| Delaware County PA Industrial Development | | | | |
| | Authority Solid Waste Revenue (Scott Paper Co.) | | | | |
| | VRDO | 0.670% | 11/7/16 | 14,900 | 14,900 |
| Delaware County PA Industrial Development | | | | |
| | Authority Solid Waste Revenue (Scott Paper Co.) | | | | |
| | VRDO | 0.670% | 11/7/16 | 11,500 | 11,500 |
| Emmaus PA General Authority Revenue VRDO | 0.600% | 11/7/16 LOC | 7,000 | 7,000 |
| Emmaus PA General Authority Revenue VRDO | 0.600% | 11/7/16 LOC | 7,100 | 7,100 |
| Emmaus PA General Authority Revenue VRDO | 0.600% | 11/7/16 LOC | 7,000 | 7,000 |
| Emmaus PA General Authority Revenue VRDO | 0.630% | 11/7/16 LOC | 24,150 | 24,150 |
| 1 | Nuveen Pennsylvania Investment Quality | | | | |
| | Municipal Fund VRDP VRDO | 0.780% | 11/7/16 LOC | 17,000 | 17,000 |
| 1 | Nuveen Pennsylvania Investment Quality | | | | |
| | Municipal Fund VRDP VRDO | 0.780% | 11/7/16 LOC | 34,800 | 34,800 |
| Pennsylvania Higher Educational Facilities | | | | |
| | Authority Revenue (Gwynedd Mercy College) | | | | |
| | VRDO | 0.600% | 11/7/16 LOC | 3,850 | 3,850 |
| 1 | Pennsylvania Housing Finance Agency Single | | | | |
| | Family Mortgage Revenue TOB VRDO | 0.660% | 11/7/16 | 1,250 | 1,250 |
| 1 | Pennsylvania Housing Finance Agency Single | | | | |
| | Family Mortgage Revenue TOB VRDO | 0.750% | 11/7/16 | 3,875 | 3,875 |
| Pennsylvania Housing Finance Agency Single | | | | |
| | Family Mortgage Revenue VRDO | 0.640% | 11/7/16 | 13,145 | 13,145 |
| Pennsylvania Housing Finance Agency Single | | | | |
| | Family Mortgage Revenue VRDO | 0.640% | 11/7/16 | 17,280 | 17,280 |
| Pennsylvania Housing Finance Agency Single | | | | |
| | Family Mortgage Revenue VRDO | 0.650% | 11/7/16 | 2,625 | 2,625 |
| Pennsylvania Housing Finance Agency Single | | | | |
| | Family Mortgage Revenue VRDO | 0.650% | 11/7/16 | 20,800 | 20,800 |
| Pennsylvania Housing Finance Agency Single | | | | |
| | Family Mortgage Revenue VRDO | 0.650% | 11/7/16 | 6,535 | 6,535 |
| Pennsylvania Housing Finance Agency Single | | | | |
| | Family Mortgage Revenue VRDO | 0.650% | 11/7/16 | 900 | 900 |
| Pennsylvania Housing Finance Agency Single | | | | |
| | Family Mortgage Revenue VRDO | 0.700% | 11/7/16 | 13,910 | 13,910 |
38
| | | | | |
| Tax-Exempt Money Market Fund | | | | |
| |
| |
| |
| Face | Market |
| Maturity | Amount | Value• |
| | Coupon | Date | ($000) | ($000) |
| Pennsylvania Housing Finance Agency Single | | | | |
| | Family Mortgage Revenue VRDO | 0.700% | 11/7/16 | 12,210 | 12,210 |
| Philadelphia PA School District GO VRDO | 0.600% | 11/7/16 LOC | 19,045 | 19,045 |
| 269,775 |
| Rhode Island (0.2%) | | | | |
| Rhode Island Health & Educational Building Corp. | | | | |
| | Higher Education Facilities Revenue (Brown | | | | |
| | University) VRDO | 0.580% | 11/7/16 | 26,280 | 26,280 |
| | | | |
| South Carolina (1.2%) | | | | |
| 1 | Charleston SC Waterworks & Sewer Capital | | | | |
| | Improvement Revenue TOB VRDO | 0.670% | 11/7/16 | 3,000 | 3,000 |
| Columbia SC Waterworks & Sewer System | | | | |
| | Revenue VRDO | 0.640% | 11/7/16 LOC | 13,160 | 13,160 |
| Greenville County SC Hospital System Revenue | | | | |
| | VRDO | 0.620% | 11/7/16 LOC | 5,295 | 5,295 |
| Greenville County SC School District GO | 2.000% | 6/1/17 | 84,800 | 85,399 |
| Lancaster County SC School District BAN | 1.500% | 3/15/17 | 25,000 | 25,075 |
| South Carolina Association of Governmental | | | | |
| | Organizations COP | 2.000% | 3/1/17 | 47,618 | 47,814 |
| South Carolina Educational Facilities Authority | | | | |
| | Revenue (Columbia College) VRDO | 0.650% | 11/7/16 LOC | 4,600 | 4,600 |
| South Carolina Jobs Economic Development | | | | |
| | Authority Revenue (Heathwood Hall Episcopal | | | | |
| | School) VRDO | 0.600% | 11/7/16 LOC | 1,700 | 1,700 |
| University of South Carolina School of Medicine | | | | |
| | Educational Trust Healthcare Facilities Revenue | | | | |
| | VRDO | 0.600% | 11/7/16 LOC | 3,345 | 3,345 |
| 189,388 |
| South Dakota (0.2%) | | | | |
| South Dakota Health & Educational Facilities | | | | |
| | Authority Revenue (Sioux Valley Hospital & | | | | |
| | Health System) VRDO | 0.620% | 11/7/16 LOC | 8,335 | 8,335 |
| South Dakota Housing Development Authority | | | | |
| | Homeownership Mortgage Revenue VRDO | 0.570% | 11/7/16 | 625 | 625 |
| South Dakota Housing Development Authority | | | | |
| | Homeownership Mortgage Revenue VRDO | 0.630% | 11/7/16 | 22,000 | 22,000 |
| 30,960 |
| Tennessee (2.9%) | | | | |
| Blount County & Alcoa & Maryville TN Industrial | | | | |
| | Development Board Revenue (Local | | | | |
| | Government Public Improvement) VRDO | 0.620% | 11/7/16 LOC | 7,875 | 7,875 |
| Blount County TN Public Building Authority | | | | |
| | Revenue (Local Government Public | | | | |
| | Improvement) VRDO | 0.620% | 11/7/16 | 16,600 | 16,600 |
| Blount County TN Public Building Authority | | | | |
| | Revenue (Local Government Public | | | | |
| | Improvement) VRDO | 0.620% | 11/7/16 LOC | 9,825 | 9,825 |
| Metropolitan Government of Nashville & | | | | |
| | Davidson County TN GO (Extendible) CP | 0.950% | 12/13/16 LOC | 25,000 | 25,000 |
| Metropolitan Government of Nashville & | | | | |
| | Davidson County TN GO (Extendible) CP | 0.830% | 5/29/17 | 37,500 | 37,500 |
39
| | | | | |
| Tax-Exempt Money Market Fund | | | | |
| |
| |
| |
| Face | Market |
| Maturity | Amount | Value• |
| | Coupon | Date | ($000) | ($000) |
| Metropolitan Government of Nashville & | | | | |
| | Davidson County TN GO (Extendible) CP | 0.990% | 7/1/17 | 12,500 | 12,500 |
| 1 | Metropolitan Government of Nashville & | | | | |
| | Davidson County TN GO TOB VRDO | 0.660% | 11/7/16 | 7,500 | 7,500 |
| 1 | Metropolitan Government of Nashville & | | | | |
| | Davidson County TN Health & Educational | | | | |
| | Facilities Board Revenue (Vanderbilt University) | | | | |
| | TOB VRDO | 0.660% | 11/7/16 | 8,250 | 8,250 |
| Montgomery County TN Public Building Authority | | | | |
| | Pooled Financial Revenue (Tennessee County | | | | |
| | Loan Pool) VRDO | 0.590% | 11/1/16 LOC | 6,235 | 6,235 |
| 1 | Rutherford County TN Health & Educational | | | | |
| | Facilities Board Revenue (Ascension Health | | | | |
| | Credit Group) TOB VRDO | 0.660% | 11/7/16 | 6,250 | 6,250 |
| Sevier County TN Public Building Authority Local | | | | |
| | Government Public Improvement Revenue | | | | |
| | VRDO | 0.620% | 11/7/16 LOC | 12,500 | 12,500 |
| Sevier County TN Public Building Authority Local | | | | |
| | Government Public Improvement Revenue | | | | |
| | VRDO | 0.620% | 11/7/16 | 45,400 | 45,400 |
| Sevier County TN Public Building Authority Local | | | | |
| | Government Public Improvement Revenue | | | | |
| | VRDO | 0.740% | 11/7/16 LOC | 34,080 | 34,080 |
| Shelby County TN GO VRDO | 0.610% | 11/7/16 | 159,490 | 159,490 |
| Tennessee GO CP | 0.770% | 11/3/16 | 27,843 | 27,843 |
| Tennessee GO CP | 0.920% | 12/2/16 | 15,600 | 15,600 |
| Tennessee GO CP | 0.900% | 12/19/16 | 23,354 | 23,354 |
| 1 | Tennessee School Bond Authority Higher | | | | |
| | Educational Facilities Revenue (2nd Program) | | | | |
| | TOB VRDO | 0.660% | 11/7/16 | 19,040 | 19,040 |
| 474,842 |
| Texas (7.7%) | | | | |
| Austin TX Electric Utility System Revenue | 5.000% | 11/15/16 (Prere.) | 4,610 | 4,618 |
| Austin TX GO | 2.000% | 5/1/17 | 1,460 | 1,469 |
| Austin TX GO | 2.000% | 9/1/17 | 1,555 | 1,570 |
| Austin TX Hotel Occupancy Tax Revenue VRDO | 0.630% | 11/7/16 LOC | 7,490 | 7,490 |
| Austin TX Water & Wastewater System Revenue | | | | |
| | VRDO | 0.610% | 11/7/16 LOC | 4,570 | 4,570 |
| Board of Regents of the Texas A&M University | | | | |
| | System Revenue Financing System Revenue | | | | |
| | CP | 0.910% | 12/6/16 | 16,678 | 16,678 |
| Dallas Area Rapid Transit Sales Tax Revenue CP | 0.930% | 1/5/17 | 10,500 | 10,500 |
| 1 | Dallas TX Area Rapid Transit Sales Tax Revenue | | | | |
| | TOB VRDO | 0.660% | 11/7/16 | 5,500 | 5,500 |
| Denton TX Independent School District GO VRDO | 0.640% | 11/7/16 | 23,940 | 23,940 |
| 1 | Grand Parkway Transportation Corp. Texas | | | | |
| | System Toll Revenue TOB VRDO | 0.670% | 11/7/16 | 23,145 | 23,145 |
| Harris County TX Cultural Education Facilities | | | | |
| | Finance Corp. Revenue (Methodist Hospital | | | | |
| | System) CP | 0.750% | 11/18/16 | 78,000 | 78,000 |
| Harris County TX Cultural Education Facilities | | | | |
| | Finance Corp. Revenue (Methodist Hospital | | | | |
| | System) CP | 0.640% | 11/29/16 | 35,000 | 35,000 |
40
| | | | | |
| Tax-Exempt Money Market Fund | | | | |
| |
| |
| |
| Face | Market |
| Maturity | Amount | Value• |
| | Coupon | Date | ($000) | ($000) |
| Harris County TX Cultural Education Facilities | | | | |
| | Finance Corp. Revenue (Methodist Hospital | | | | |
| | System) CP | 0.640% | 11/29/16 | 5,105 | 5,105 |
| Harris County TX Cultural Education Facilities | | | | |
| | Finance Corp. Revenue (Methodist Hospital | | | | |
| | System) VRDO | 0.540% | 11/1/16 | 1,100 | 1,100 |
| Harris County TX Cultural Education Facilities | | | | |
| | Finance Corp. Revenue (Methodist Hospital | | | | |
| | System) VRDO | 0.540% | 11/1/16 | 4,400 | 4,400 |
| 1 | Harris County TX Cultural Education Facilities | | | | |
| | Finance Corp. Revenue (Texas Children’s | | | | |
| | Hospital) TOB VRDO | 0.580% | 11/1/16 | 4,200 | 4,200 |
| 1 | Harris County TX Cultural Education Facilities | | | | |
| | Finance Corp. Revenue (Texas Children’s | | | | |
| | Hospital) TOB VRDO | 0.730% | 11/7/16 | 4,800 | 4,800 |
| 1 | Harris County TX GO TOB VRDO | 0.660% | 11/7/16 | 8,070 | 8,070 |
| 1 | Harris County TX GO TOB VRDO | 0.660% | 11/7/16 | 8,160 | 8,160 |
| 1 | Harris County TX GO TOB VRDO | 0.670% | 11/7/16 | 39,600 | 39,600 |
| Harris County TX Health Facilities Development | | | | |
| | Corp. Revenue (Methodist Hospital System) | | | | |
| | VRDO | 0.540% | 11/1/16 | 4,000 | 4,000 |
| 1 | Harris County TX Toll Road Revenue TOB VRDO | 0.670% | 11/7/16 (13) | 5,200 | 5,200 |
| 1 | Houston TX Airport System Revenue TOB VRDO | 0.670% | 11/7/16 | 12,000 | 12,000 |
| Houston TX Combined Utility System CP | 0.770% | 11/17/16 | 22,000 | 22,000 |
| Houston TX Combined Utility System CP | 0.820% | 11/17/16 | 8,000 | 8,000 |
| Houston TX Combined Utility System CP | 0.880% | 1/4/17 | 20,000 | 20,000 |
| 1 | Houston TX Higher Education Finance Corp. | | | | |
| | Revenue (Rice University Project) TOB VRDO | 0.660% | 11/7/16 | 6,665 | 6,665 |
| Houston TX Higher Education Finance Corp. | | | | |
| | Revenue (Rice University Project) VRDO | 0.660% | 11/7/16 | 15,665 | 15,665 |
| 1 | Houston TX Utility System Revenue TOB VRDO | 0.640% | 11/7/16 LOC | 15,085 | 15,085 |
| 1 | Houston TX Utility System Revenue TOB VRDO | 0.670% | 11/7/16 | 23,380 | 23,380 |
| 1 | Houston TX Utility System Revenue TOB VRDO | 0.670% | 11/7/16 | 12,240 | 12,240 |
| Houston TX Utility System Revenue VRDO | 0.610% | 11/7/16 LOC | 6,250 | 6,250 |
| Houston TX Utility System Revenue VRDO | 0.610% | 11/7/16 LOC | 77,325 | 77,325 |
| Lubbock TX Independent School District GO | | | | |
| | VRDO | 0.660% | 11/7/16 | 16,000 | 16,000 |
| Mesquite TX Independent School District School | | | | |
| | Building VRDO | 0.660% | 11/7/16 | 5,500 | 5,500 |
| North East TX Independent School District CP | 0.850% | 12/8/16 | 30,000 | 30,000 |
| 1 | North East TX Independent School District GO | | | | |
| | TOB VRDO | 0.670% | 11/7/16 | 31,305 | 31,305 |
| 3 | North Texas Municipal Water District Water | | | | |
| | System Revenue | 5.000% | 9/1/17 | 7,185 | 7,408 |
| 1 | North Texas Tollway Authority System Revenue | | | | |
| | TOB VRDO | 0.660% | 11/7/16 (13) | 6,000 | 6,000 |
| 1 | North Texas Tollway Authority System Revenue | | | | |
| | TOB VRDO | 0.680% | 11/7/16 (13) | 22,360 | 22,360 |
| North Texas Tollway Authority System Revenue | | | | |
| | VRDO | 0.610% | 11/7/16 LOC | 28,950 | 28,950 |
| Northwest Independent School District Texas GO | | | | |
| | VRDO | 0.660% | 11/7/16 | 8,170 | 8,170 |
| 1 | Pearland TX Independent School District GO TOB | | | | |
| | VRDO | 0.700% | 11/7/16 | 9,000 | 9,000 |
41
| | | | | |
| Tax-Exempt Money Market Fund | | | | |
| |
| |
| |
| Face | Market |
| Maturity | Amount | Value• |
| | Coupon | Date | ($000) | ($000) |
| Red River TX Education Finance Corp. Revenue | | | | |
| | (Texas Christian University Project) VRDO | 0.640% | 11/7/16 | 16,000 | 16,000 |
| 1 | San Antonio TX Electric & Gas Systems Revenue | | | | |
| | TOB VRDO | 0.660% | 11/7/16 | 5,900 | 5,900 |
| 1 | San Antonio TX Electric & Gas Systems Revenue | | | | |
| | TOB VRDO | 0.690% | 11/7/16 | 14,465 | 14,465 |
| San Antonio TX Water Revenue CP | 0.770% | 11/9/16 | 37,700 | 37,700 |
| 1 | Tarrant County TX Cultural Education Facilities | | | | |
| | Finance Corp. Hospital Revenue (Baylor Health | | | | |
| | Care System Project) TOB VRDO | 0.680% | 11/7/16 | 5,555 | 5,555 |
| Tarrant County TX Cultural Education Facilities | | | | |
| | Finance Corp. Hospital Revenue (Baylor Health | | | | |
| | Care System Project) VRDO | 0.640% | 11/7/16 LOC | 21,550 | 21,550 |
| 1 | Tarrant County TX Cultural Education Facilities | | | | |
| | Finance Corp. Hospital Revenue (Baylor Scott & | | | | |
| | White Healthcare Project) TOB VRDO | 0.660% | 11/7/16 | 39,605 | 39,605 |
| 1 | Tarrant County TX Cultural Education Facilities | | | | |
| | Finance Corp. Hospital Revenue (Baylor Scott & | | | | |
| | White Healthcare Project) TOB VRDO | 0.680% | 11/7/16 | 4,620 | 4,620 |
| Tarrant County TX Cultural Education Facilities | | | | |
| | Finance Corp. Revenue (CHRISTUS Health) | | | | |
| | VRDO | 0.640% | 11/7/16 LOC | 43,900 | 43,900 |
| Texas (Veterans Housing Assistance Program) | | | | |
| | GO VRDO | 0.630% | 11/7/16 | 61,535 | 61,535 |
| Texas Department of Housing & Community | | | | |
| | Affairs Single Mortgage Revenue VRDO | 0.670% | 11/7/16 | 25,030 | 25,030 |
| 1 | Texas GO TOB VRDO | 0.670% | 11/7/16 | 34,740 | 34,740 |
| 1 | Texas GO TOB VRDO | 0.670% | 11/7/16 | 10,735 | 10,735 |
| 1 | Texas GO TOB VRDO | 0.750% | 11/7/16 | 19,735 | 19,735 |
| Texas State University System Financing System | | | | |
| | Revenue (Extendible) CP | 0.990% | 7/9/17 | 2,519 | 2,519 |
| 1 | Texas Transportation Commission Mobility Fund | | | | |
| | GO TOB VRDO | 0.660% | 11/7/16 | 20,410 | 20,410 |
| Texas Transportation Commission Mobility Fund | | | | |
| | GO VRDO | 0.600% | 11/7/16 | 27,800 | 27,800 |
| 1 | Texas Water Development Board Revenue TOB | | | | |
| | VRDO | 0.670% | 11/7/16 | 10,940 | 10,940 |
| 1 | Texas Water Development Board Revenue TOB | | | | |
| | VRDO | 0.670% | 11/7/16 | 5,900 | 5,900 |
| Trinity River Authority of Texas Central Regional | | | | |
| | Wastewater System Revenue (Extendible) CP | 1.000% | 6/30/17 | 45,000 | 45,000 |
| University of Texas System Revenue Financing | | | | |
| | System Revenue CP | 0.930% | 1/9/17 | 21,454 | 21,454 |
| University of Texas System Revenue Financing | | | | |
| | System Revenue CP | 0.930% | 1/10/17 | 16,592 | 16,592 |
| University of Texas System Revenue Financing | | | | |
| | System Revenue VRDO | 0.600% | 11/7/16 | 72,925 | 72,925 |
| 1,245,028 |
| Utah (0.4%) | | | | |
| Emery County UT Pollution Control Revenue | | | | |
| | (PacifiCorp Projects) VRDO | 0.600% | 11/7/16 LOC | 29,500 | 29,500 |
| Murray UT Hospital Revenue (IHC Health | | | | |
| | Services) VRDO | 0.520% | 11/1/16 | 12,500 | 12,500 |
42
| | | | | |
| Tax-Exempt Money Market Fund | | | | |
| |
| |
| |
| Face | Market |
| Maturity | Amount | Value• |
| | Coupon | Date | ($000) | ($000) |
| Murray UT Hospital Revenue (IHC Health | | | | |
| | Services) VRDO | 0.580% | 11/7/16 | 11,300 | 11,300 |
| Utah Housing Finance Agency Single Family | | | | |
| | Mortgage Revenue VRDO | 0.690% | 11/7/16 | 3,595 | 3,595 |
| 1 | Utah Transit Authority Sales Tax Revenue TOB | | | | |
| | VRDO | 0.660% | 11/7/16 | 3,300 | 3,300 |
| 1 | Utah Transit Authority Sales Tax Revenue TOB | | | | |
| | VRDO | 0.700% | 11/7/16 | 9,720 | 9,720 |
| 69,915 |
| Virginia (1.2%) | | | | |
| Chesapeake Redevelopment & Housing Authority | | | | |
| | Revenue (Alta Great Bridge Apartments Project) | | | | |
| | VRDO | 0.710% | 11/7/16 LOC | 9,625 | 9,625 |
| Fairfax County VA Industrial Development | | | | |
| | Authority Health Care Revenue (Inova Health | | | | |
| | System Obligated Group) VRDO | 0.630% | 11/7/16 | 38,885 | 38,885 |
| Fairfax County VA Industrial Development | | | | |
| | Authority Health Care Revenue (Inova Health | | | | |
| | System Obligated Group) VRDO | 0.680% | 11/7/16 | 24,150 | 24,150 |
| Loudoun County VA Industrial Development | | | | |
| | Authority Revenue (Howard Hughes Medical | | | | |
| | Institute) VRDO | 0.620% | 11/7/16 | 7,845 | 7,845 |
| Loudoun County VA Industrial Development | | | | |
| | Authority Revenue (Howard Hughes Medical | | | | |
| | Institute) VRDO | 0.620% | 11/7/16 | 8,185 | 8,185 |
| Norfolk VA Economic Development Authority | | | | |
| | Hospital Facilities Revenue (Sentara Healthcare) | | | | |
| | VRDO | 0.620% | 11/7/16 | 16,015 | 16,015 |
| Stafford County VA Industrial Development | | | | |
| | Authority Revenue (VML/VACo Commonwealth | | | | |
| | Loan Program) VRDO | 0.650% | 11/7/16 LOC | 2,120 | 2,120 |
| 1 | University of Virginia Revenue TOB VRDO | 0.660% | 11/7/16 | 14,300 | 14,300 |
| 1 | Virginia Commonwealth Transportation Board | | | | |
| | Revenue TOB VRDO | 0.660% | 11/7/16 | 3,000 | 3,000 |
| 1 | Virginia Housing Development Authority | | | | |
| | Commonwealth Mortgage Revenue TOB VRDO | 0.670% | 11/7/16 | 5,000 | 5,000 |
| Virginia Public Building Authority Public Facilities | | | | |
| | Revenue VRDO | 0.610% | 11/7/16 | 49,900 | 49,900 |
| Virginia Public School Authority Revenue | 5.000% | 8/1/17 | 3,780 | 3,897 |
| 1 | Virginia Resources Authority Clean Water | | | | |
| | Revenue (State Revolving Fund) TOB VRDO | 0.660% | 11/7/16 | 9,490 | 9,490 |
| 192,412 |
| Washington (1.6%) | | | | |
| 1 | Central Puget Sound WA Regional Transit | | | | |
| | Authority Sales & Use Tax Revenue TOB VRDO | 0.670% | 11/7/16 | 2,885 | 2,885 |
| Chelan County WA Public Utility District No. 1 | | | | |
| | Consolidated System Revenue VRDO | 0.640% | 11/7/16 | 20,450 | 20,450 |
| 1 | King County WA Sewer Revenue TOB VRDO | 0.670% | 11/7/16 | 2,100 | 2,100 |
| 1 | Northwest Energy Washington Electric Revenue | | | | |
| | (Columbia Generating Station) TOB VRDO | 0.660% | 11/7/16 | 5,500 | 5,500 |
| 1 | Pierce County WA School District No. 10 | | | | |
| | (Tacoma) GO TOB VRDO | 0.670% | 11/7/16 | 2,650 | 2,650 |
| Tacoma WA Housing Authority Revenue (Sunset | | | | |
| | Apartment Projects) VRDO | 0.710% | 11/7/16 LOC | 13,250 | 13,250 |
43
| | | | | |
| Tax-Exempt Money Market Fund | | | | |
| |
| |
| |
| Face | Market |
| Maturity | Amount | Value• |
| | Coupon | Date | ($000) | ($000) |
| 1 | Washington GO TOB VRDO | 0.660% | 11/7/16 | 2,250 | 2,250 |
| 1 | Washington GO TOB VRDO | 0.660% | 11/7/16 | 5,100 | 5,100 |
| 1 | Washington GO TOB VRDO | 0.660% | 11/7/16 | 8,325 | 8,325 |
| 1 | Washington GO TOB VRDO | 0.670% | 11/7/16 | 4,700 | 4,700 |
| 1 | Washington Health Care Facilities Authority | | | | |
| | Revenue (Children’s Hospital & Regional | | | | |
| | Medical Center) TOB VRDO | 0.670% | 11/7/16 | 21,280 | 21,280 |
| 1 | Washington Health Care Facilities Authority | | | | |
| | Revenue (Providence Health & Services) TOB | | | | |
| | VRDO | 0.670% | 11/7/16 | 8,610 | 8,610 |
| 1 | Washington Health Care Facilities Authority | | | | |
| | Revenue (Providence Health & Services) TOB | | | | |
| | VRDO | 0.670% | 11/7/16 | 12,475 | 12,475 |
| Washington Health Care Facilities Authority | | | | |
| | Revenue (Providence Health & Services) VRDO | 0.640% | 11/7/16 | 73,250 | 73,250 |
| Washington Health Care Facilities Authority | | | | |
| | Revenue (Providence Health & Services) VRDO | 0.640% | 11/7/16 | 11,675 | 11,675 |
| Washington Higher Education Facilities Authority | | | | |
| | Revenue (Seattle University) VRDO | 0.640% | 11/7/16 LOC | 13,865 | 13,865 |
| Washington Higher Education Facilities Authority | | | | |
| | Revenue (Whitman College Project) VRDO | 0.640% | 11/7/16 | 23,300 | 23,300 |
| Washington Housing Finance Commission | | | | |
| | Multi-Family Housing Revenue (New Haven | | | | |
| | Apartments Project) VRDO | 0.570% | 11/7/16 LOC | 4,000 | 4,000 |
| Washington Housing Finance Commission | | | | |
| | Multi-Family Housing Revenue (Vintage at | | | | |
| | Silverdale Senior Living Project) VRDO | 0.600% | 11/7/16 LOC | 14,880 | 14,880 |
| Washington Housing Finance Commission | | | | |
| | Nonprofit Revenue (The Overlake School | | | | |
| | Project) VRDO | 0.600% | 11/7/16 LOC | 4,400 | 4,400 |
| Washington Housing Finance Commission | | | | |
| | Nonprofit Revenue (The Overlake School | | | | |
| | Project) VRDO | 0.600% | 11/7/16 LOC | 4,560 | 4,560 |
| 259,505 |
| West Virginia (0.5%) | | | | |
| West Virginia Hospital Finance Authority Hospital | | | | |
| | Revenue (Cabell Huntington Hospital Inc.) VRDO | 0.620% | 11/7/16 LOC | 8,500 | 8,500 |
| West Virginia Hospital Finance Authority Hospital | | | | |
| | Revenue (Charleston Area Medical Center Inc.) | | | | |
| | VRDO | 0.650% | 11/7/16 LOC | 76,645 | 76,645 |
| 85,145 |
| Wisconsin (3.8%) | | | | |
| Madison WI Metropolitan School District Revenue | 2.000% | 9/7/17 | 64,000 | 64,608 |
| Milwaukee WI (Extendible) CP | 0.660% | 5/15/17 | 10,000 | 10,000 |
| Milwaukee WI GO | 2.000% | 10/1/17 | 53,775 | 54,327 |
| Milwaukee WI Redevelopment Authority | | | | |
| | Redevelopment Lease Revenue (University | | | | |
| | Wisconsin Kenilworth Project) VRDO | 0.670% | 11/7/16 LOC | 4,960 | 4,960 |
| 1 | Public Finance Authority Wisconsin Lease | | | | |
| | Development Revenue (KU Campus | | | | |
| | Development Corp. - Central District | | | | |
| | Development Project) TOB VRDO | 0.750% | 11/7/16 | 25,335 | 25,335 |
| University of Wisconsin Hospitals & Clinics | | | | |
| | Authority Revenue VRDO | 0.610% | 11/7/16 LOC | 30,770 | 30,770 |
44
| | | | | |
| Tax-Exempt Money Market Fund | | | | |
| |
| |
| |
| Face | Market |
| Maturity | Amount | Value• |
| | Coupon | Date | ($000) | ($000) |
| 1 | Wisconsin Annual Appropriation Revenue TOB | | | | |
| | VRDO | 0.660% | 11/7/16 | 11,085 | 11,085 |
| Wisconsin Department of Transportation | | | | |
| | Revenue CP | 1.000% | 1/6/17 | 10,000 | 10,000 |
| Wisconsin GO (Extendible) CP | 1.000% | 6/30/17 | 4,694 | 4,694 |
| Wisconsin GO (Extendible) CP | 1.010% | 7/2/17 | 90,295 | 90,295 |
| Wisconsin GO (Extendible) CP | 0.870% | 7/14/17 | 26,708 | 26,708 |
| Wisconsin GO (Extendible) CP | 0.810% | 7/16/17 | 15,866 | 15,866 |
| Wisconsin GO CP | 0.900% | 12/8/16 | 36,025 | 36,025 |
| 1 | Wisconsin Health & Educational Facilities | | | | |
| | Authority Revenue (Ascension Health Credit | | | | |
| | Group) TOB VRDO | 0.660% | 11/7/16 | 750 | 750 |
| 1 | Wisconsin Health & Educational Facilities | | | | |
| | Authority Revenue (Ascension Health Credit | | | | |
| | Group) TOB VRDO | 0.660% | 11/7/16 | 15,000 | 15,000 |
| Wisconsin Health & Educational Facilities | | | | |
| | Authority Revenue (Aurora Health Care Inc.) | | | | |
| | VRDO | 0.530% | 11/1/16 LOC | 9,290 | 9,290 |
| Wisconsin Health & Educational Facilities | | | | |
| | Authority Revenue (Goodwill Industries of | | | | |
| | North Central Wisconsin Inc.) VRDO | 0.600% | 11/7/16 LOC | 5,700 | 5,700 |
| Wisconsin Health & Educational Facilities | | | | |
| | Authority Revenue (Medical College Wisconsin) | | | | |
| | VRDO | 0.610% | 11/7/16 LOC | 64,900 | 64,900 |
| Wisconsin Health & Educational Facilities | | | | |
| | Authority Revenue (Upland Hills Health Inc.) | | | | |
| | VRDO | 0.640% | 11/7/16 LOC | 8,950 | 8,950 |
| Wisconsin Health and Educational Facilities | | | | |
| | Authority (Aurora Health Care, Inc) CP | 0.800% | 11/22/16 LOC | 39,470 | 39,470 |
| Wisconsin Health and Educational Facilities | | | | |
| | Authority (Aurora Health Care, Inc.) CP | 0.680% | 11/17/16 LOC | 40,000 | 40,000 |
| Wisconsin Housing & Economic Development | | | | |
| | Authority Home Ownership Revenue VRDO | 0.630% | 11/7/16 | 26,000 | 26,000 |
| Wisconsin Housing & Economic Development | | | | |
| | Authority Multi-Family Revenue VRDO | 0.620% | 11/7/16 | 23,850 | 23,850 |
| 618,583 |
| Wyoming (0.1%) | | | | |
| Converse County WY Pollution Control Revenue | | | | |
| | (PacifiCorp Projects) VRDO | 0.630% | 11/7/16 LOC | 16,000 | 16,000 |
| Sweetwater County WY Pollution Control | | | | |
| | Revenue (PacifiCorp Projects) VRDO | 0.630% | 11/7/16 LOC | 7,000 | 7,000 |
| 23,000 |
| Total Tax-Exempt Municipal Bonds (Cost $15,322,527) | 15,322,527 |
| | | | |
| Shares |
| Temporary Cash Investment (4.7%) | | | | |
| Money Market Fund (4.7%) | | | | |
| 4 | Vanguard Municipal Cash Management Fund | | | | |
| | (Cost $747,463) | 0.614% | | 7,474,644 | 747,464 |
| Total Investments (99.7%) (Cost $16,069,990) | 16,069,991 |
45
Tax-Exempt Money Market Fund
| |
| Amount |
| ($000) |
| Other Assets and Liabilities (0.3%) | |
| Other Assets | 195,944 |
| Liabilities | (142,171) |
| 53,773 |
| Net Assets (100%) | |
| Applicable to 16,121,795,348 outstanding $.001 par value shares of | |
| beneficial interest (unlimited authorization) | 16,123,764 |
| Net Asset Value Per Share | $1.00 |
| |
| |
| Statement of Assets and Liabilities | |
| Assets | |
| Investments in Securities, at Value |
| Unaffiliated Issuers | 15,322,527 |
| Affiliated Vanguard Funds | 747,464 |
| Total Investments in Securities | 16,069,991 |
| Investment in Vanguard | 1,205 |
| Receivables for Investment Securities Sold | 85,665 |
| Receivables for Accrued Income | 28,357 |
| Receivables for Capital Shares Issued | 55,898 |
| Other Assets | 24,819 |
| Total Assets | 16,265,935 |
| Liabilities | |
| Payables for Investment Securities Purchased | 82,097 |
| Payables for Capital Shares Redeemed | 38,396 |
| Payables for Distributions | 586 |
| Payables to Vanguard | 21,039 |
| Other Liabilities | 53 |
| Total Liabilities | 142,171 |
| Net Assets | 16,123,764 |
| |
| At October 31, 2016, net assets consisted of: | |
| Amount |
| ($000) |
| Paid-in Capital | 16,123,756 |
| Undistributed Net Investment Income | 7 |
| Accumulated Net Realized Gains | — |
| Unrealized Appreciation (Depreciation) | 1 |
| Net Assets | 16,123,764 |
• See Note A in Notes to Financial Statements.
1 Security exempt from registration under Rule 144A of the Securities Act of 1933. Such securities may be sold in transactions exempt from
registration, normally to qualified institutional buyers. At October 31, 2016, the aggregate value of these securities was $4,624,057,000,
representing 28.7% of net assets.
2 The issuer was placed under federal conservatorship in September 2008; since that time, its daily operations have been managed by the
Federal Housing Finance Agency and it receives capital from the U.S. Treasury, as needed to maintain a positive net worth, in exchange
for senior preferred stock.
3 Security purchased on a when-issued or delayed-delivery basis for which the fund has not taken delivery as of October 31, 2016.
4 Affiliated money market fund available only to Vanguard funds and certain trusts and accounts managed by Vanguard. Rate shown
is the 7-day yield.
A key to abbreviations and other references follows the Statement of Net Assets.
See accompanying Notes, which are an integral part of the Financial Statements.
46
Tax-Exempt Money Market Fund
Key to Abbreviations
ARS—Auction Rate Security.
BAN—Bond Anticipation Note.
COP—Certificate of Participation.
CP—Commercial Paper.
FR—Floating Rate.
GAN—Grant Anticipation Note.
GO—General Obligation Bond.
PILOT—Payments in Lieu of Taxes.
PUT—Put Option Obligation.
RAN—Revenue Anticipation Note.
TAN—Tax Anticipation Note.
TOB—Tender Option Bond.
TRAN—Tax Revenue Anticipation Note.
VRDO—Variable Rate Demand Obligation.
VRDP—Variable Rate Demand Preferred.
(ETM)—Escrowed to Maturity.
(Prere.)—Prerefunded.
Scheduled principal and interest payments are guaranteed by:
(1) MBIA (Municipal Bond Investors Assurance).
(2) AMBAC (Ambac Assurance Corporation).
(3) FGIC (Financial Guaranty Insurance Company).
(4) AGM (Assured Guaranty Municipal Corporation).
(5) BIGI (Bond Investors Guaranty Insurance).
(6) Connie Lee Inc.
(7) FHA (Federal Housing Authority).
(8) CapMAC (Capital Markets Assurance Corporation).
(9) American Capital Access Financial Guaranty Corporation.
(10) XL Capital Assurance Inc.
(11) CIFG (CDC IXIS Financial Guaranty).
(12) AGC (Assured Guaranty Corporation).
(13) BHAC (Berkshire Hathaway Assurance Corporation).
(14) NPFG (National Public Finance Guarantee Corporation).
(15) BAM (Build America Mutual Assurance Company).
(16) MAC (Municipal Assurance Corporation).
(17) RAA (Radian Asset Assurance Inc.).
(18) SBLF (Michigan School Bond Loan Fund).
The insurance does not guarantee the market value of the municipal bonds.
LOC—Scheduled principal and interest payments are guaranteed by bank letter of credit.
47
| | |
| Tax-Exempt Money Market Fund | |
| |
| |
| Statement of Operations | |
| |
| Year Ended |
| October 31, 2016 |
| ($000) |
| Investment Income | |
| Income | |
| Interest1 | 60,230 |
| Total Income | 60,230 |
| Expenses | |
| The Vanguard Group—Note B | |
| Investment Advisory Services | 3,566 |
| Management and Administrative | 16,510 |
| Marketing and Distribution | 4,638 |
| Custodian Fees | 174 |
| Auditing Fees | 30 |
| Shareholders’ Reports | 124 |
| Trustees’ Fees and Expenses | 9 |
| Total Expenses | 25,051 |
| Expense Reduction—Note B | (5,178) |
| Net Expenses | 19,873 |
| Net Investment Income | 40,357 |
| Realized Net Gain (Loss) on Investment Securities Sold1 | 11 |
| Change in Unrealized Appreciation (Depreciation) of Investment Securities | 1 |
| Net Increase (Decrease) in Net Assets Resulting from Operations | 40,369 |
1 Interest income and realized net gain (loss) from an affiliated company of the fund were $2,277,000 and $4,000, respectively.
See accompanying Notes, which are an integral part of the Financial Statements.
48
| | |
| Tax-Exempt Money Market Fund | | |
| |
| |
| Statement of Changes in Net Assets | | |
| |
| Year Ended October 31, |
| 2016 | 2015 |
| ($000) | ($000) |
| Increase (Decrease) in Net Assets | | |
| Operations | | |
| Net Investment Income | 40,357 | 1,772 |
| Realized Net Gain (Loss) | 11 | 27 |
| Change in Unrealized Appreciation (Depreciation) | 1 | — |
| Net Increase (Decrease) in Net Assets Resulting from Operations | 40,369 | 1,799 |
| Distributions | | |
| Net Investment Income | (40,371) | (1,751) |
| Realized Capital Gain | — | — |
| Total Distributions | (40,371) | (1,751) |
| Capital Share Transactions (at $1.00 per share) | | |
| Issued | 15,910,832 | 16,617,253 |
| Issued in Lieu of Cash Distributions | 38,248 | 1,697 |
| Redeemed | (17,046,907) | (16,790,319) |
| Net Increase (Decrease) from Capital Share Transactions | (1,097,827) | (171,369) |
| Total Increase (Decrease) | (1,097,829) | (171,321) |
| Net Assets |
| Beginning of Period | 17,221,593 | 17,392,914 |
| End of Period1 | 16,123,764 | 17,221,593 |
| 1 Net Assets—End of Period includes undistributed (overdistributed) net investment income of $7,000 and $21,000. |
See accompanying Notes, which are an integral part of the Financial Statements.
49
| | | | | |
| Tax-Exempt Money Market Fund | | | | | |
| |
| |
| Financial Highlights | | | | | |
| |
| |
| For a Share Outstanding | | | Year Ended October 31, |
| Throughout Each Period | 2016 | 2015 | 2014 | 2013 | 2012 |
| Net Asset Value, Beginning of Period | $1.00 | $1.00 | $1.00 | $1.00 | $1.00 |
| Investment Operations | |
| Net Investment Income | .0025 | .0001 | .0001 | .0002 | .0004 |
| Net Realized and Unrealized Gain (Loss) | | | | | |
| on Investments | — | — | — | — | — |
| Total from Investment Operations | .0025 | .0001 | .0001 | .0002 | .0004 |
| Distributions | | |
| Dividends from Net Investment Income | (.0025) | (.0001) | (.0001) | (.0002) | (.0004) |
| Distributions from Realized Capital Gains | — | — | — | — | — |
| Total Distributions | (.0025) | (.0001) | (.0001) | (.0002) | (.0004) |
| Net Asset Value, End of Period | $1.00 | $1.00 | $1.00 | $1.00 | $1.00 |
| |
| Total Return1 | 0.25% | 0.01% | 0.01% | 0.02% | 0.04% |
| |
| Ratios/Supplemental Data | | |
| Net Assets, End of Period (Millions) | $16,124 | $17,222 | $17,393 | $18,119 | $17,004 |
| Ratio of Expenses to Average Net Assets | 0.12%2 | 0.07%2 | 0.09%2 | 0.13%2 | 0.16% |
| Ratio of Net Investment Income to | | | | | |
| Average Net Assets | 0.24% | 0.01% | 0.01% | 0.02% | 0.04% |
1 Total returns do not include account service fees that may have applied in the periods shown. Fund prospectuses provide information
about any applicable account service fees.
2 The ratio of total expenses to average net assets before an expense reduction was 0.15% in 2016, 0.15% in 2015, 0.16% in 2014, and
0.16% in 2013. See Note B in the Notes to Financial Statements.
See accompanying Notes, which are an integral part of the Financial Statements.
50
Tax-Exempt Money Market Fund
Notes to Financial Statements
Vanguard Tax-Exempt Money Market Fund is registered under the Investment Company Act of 1940 as an open-end investment company, or mutual fund. The fund invests in debt instruments of many municipal issuers; the issuers’ abilities to meet their obligations may be affected by economic and political developments in a specific state or region.
A. The following significant accounting policies conform to generally accepted accounting principles for U.S. investment companies. The fund consistently follows such policies in preparing its financial statements.
1. Security Valuation: Securities are valued as of the close of trading on the New York Stock Exchange (generally 4 p.m., Eastern time) on the valuation date. Securities are valued at amortized cost, which approximates market value. Investments in Vanguard Municipal Cash Management Fund are valued at the fund’s net asset value.
2. Federal Income Taxes: The fund intends to continue to qualify as a regulated investment company and distribute all of its income. Management has analyzed the fund’s tax positions taken for all open federal income tax years (October 31, 2013–2016), and has concluded that no provision for federal income tax is required in the fund’s financial statements.
3. Distributions: Distributions from net investment income are declared daily and paid on the first business day of the following month.
4. Credit Facility: The fund and certain other funds managed by The Vanguard Group (“Vanguard”) participate in a $3.1 billion committed credit facility provided by a syndicate of lenders pursuant to a credit agreement that may be renewed annually; each fund is individually liable for its borrowings, if any, under the credit facility. Borrowings may be utilized for temporary and emergency purposes, and are subject to the fund’s regulatory and contractual borrowing restrictions. The participating funds are charged administrative fees and an annual commitment fee of 0.10% of the undrawn amount of the facility; these fees are allocated to the funds based on a method approved by the fund’s board of trustees and included in Management and Administrative expenses on the fund’s Statement of Operations. Any borrowings under this facility bear interest at a rate based upon the higher of the one-month London Interbank Offered Rate, federal funds effective rate, or overnight bank funding rate plus an agreed-upon spread.
The fund had no borrowings outstanding at October 31, 2016, or at any time during the period then ended.
5. Other: Interest income includes income distributions received from Vanguard Municipal Cash Management Fund and is accrued daily. Premiums and discounts on debt securities purchased are amortized and accreted, respectively, to interest income over the lives of the respective securities. Security transactions are accounted for on the date securities are bought or sold. Costs used to determine realized gains (losses) on the sale of investment securities are those of the specific securities sold.
B. In accordance with the terms of a Funds’ Service Agreement (the “FSA”) between Vanguard and the fund, Vanguard furnishes to the fund investment advisory, corporate management, administrative, marketing, and distribution services at Vanguard’s cost of operations (as defined by the FSA). These costs of operations are allocated to the fund based on methods and guidelines approved by the board of trustees. Vanguard does not require reimbursement in the current period for certain costs of operations (such as deferred compensation/benefits and risk/insurance costs); the fund’s liability for these costs of operations is included in Payables to Vanguard on the Statement of Assets and Liabilities.
51
Tax-Exempt Money Market Fund
Upon the request of Vanguard, the fund may invest up to 0.40% of its net assets as capital in Vanguard. At October 31, 2016, the fund had contributed to Vanguard capital in the amount of $1,205,000 representing 0.01% of the fund’s net assets and 0.48% of Vanguard’s capitalization. The fund’s trustees and officers are also directors and employees, respectively, of Vanguard.
Vanguard and the board of trustees have agreed to temporarily limit certain net operating expenses in excess of the fund’s daily yield in order to maintain a zero or positive yield for the fund. Vanguard and the board of trustees may terminate the temporary expense limitation at any time. For the year ended October 31, 2016, Vanguard’s expenses were reduced by $5,178,000 (an effective annual rate of 0.03% of the fund’s average net assets); the fund is not obligated to repay this amount to Vanguard.
C. Various inputs may be used to determine the value of the fund’s investments. These inputs are summarized in three broad levels for financial statement purposes. The inputs or methodologies used to value securities are not necessarily an indication of the risk associated with investing in those securities.
Level 1—Quoted prices in active markets for identical securities.
Level 2—Other significant observable inputs (including quoted prices for similar securities, interest rates, prepayment speeds, credit risk, etc.).
Level 3—Significant unobservable inputs (including the fund’s own assumptions used to determine the fair value of investments).
The fund’s investment in Vanguard Municipal Cash Management Fund is valued based on Level 1 inputs. All of the fund’s other investments were valued using amortized cost, in accordance with rules under the Investment Company Act of 1940. Amortized cost approximates the current fair value of a security, but since the value is not obtained from a quoted price in an active market, securities valued at amortized cost are considered to be valued using Level 2 inputs.
D. Capital gain distributions are determined on a tax basis and may differ from realized capital gains for financial reporting purposes. Differences may be permanent or temporary. Permanent differences are reclassified among capital accounts in the financial statements to reflect their tax character. Temporary differences arise when gains or losses are recognized in different periods for financial statement and tax purposes. These differences will reverse at some time in the future.
At October 31, 2016, the cost of investment securities for tax purposes was $16,069,990,000. Net unrealized appreciation of investment securities for tax purposes was $1,000, consisting entirely of unrealized gains on securities that had risen in value since their purchase.
E. The fund purchased securities from and sold securities to other Vanguard funds or accounts managed by Vanguard or its affiliates, in accordance with procedures adopted by the board of trustees in compliance with Rule 17a-7 of the Investment Company Act of 1940. For the year ended October 31, 2016, such purchases and sales were $1,775,561,000 and $2,553,600,000, respectively.
F. Management has determined that no material events or transactions occurred subsequent to October 31, 2016, that would require recognition or disclosure in these financial statements.
52
Report of Independent Registered Public Accounting Firm
To the Board of Trustees of Vanguard Municipal Bond Funds and the Shareholders of Vanguard Tax-Exempt Money Market Fund: In our opinion, the accompanying statement of net assets, statement of assets and liabilities and the related statements of operations and of changes in net assets and the financial highlights present fairly, in all material respects, the financial position of Vanguard Tax-Exempt Money Market Fund (constituting a separate portfolio of Vanguard Municipal Bond Funds, hereafter referred to as the “Fund”) at October 31, 2016, the results of its operations for the year then ended, the changes in its net assets for each of the two years in the period then ended, and the financial highlights for each of the five years in the period then ended, in conformity with accounting principles generally accepted in the United States of America. These financial statements and financial highlights (hereafter referred to as “financial statements”) are the responsibility of the Fund’s management. Our responsibility is to express an opinion on these financial statements based on our audits. We conducted our audits of these financial statements in accordance with the standards of the Public Company Accounting Oversight Board (United States). Those standards require that we plan and perform the audit to obtain reasonable assurance about whether the financial statements are free of material misstatement. An audit includes examining, on a test basis, evidence supporting the amounts and disclosures in the financial statements, assessing the accounting principles used and significant estimates made by management, and evaluating the overall financial statement presentation. We believe that our audits, which included confirmation of securities at October 31, 2016 by correspondence with the custodian and brokers and by agreement to the underlying ownership records of the transfer agent, provide a reasonable basis for our opinion.
/s/PricewaterhouseCoopers LLP
Philadelphia, Pennsylvania
December 15, 2016
Special 2016 tax information (unaudited) for Vanguard Tax-Exempt Money Market Fund
This information for the fiscal year ended October 31, 2016, is included pursuant to provisions of the Internal Revenue Code.
The fund designates 100% of its income dividends as exempt-interest dividends.
53
About Your Fund’s Expenses
As a shareholder of the fund, you incur ongoing costs, which include costs for portfolio management, administrative services, and shareholder reports (like this one), among others. Operating expenses, which are deducted from a fund’s gross income, directly reduce the investment return of the fund.
A fund’s expenses are expressed as a percentage of its average net assets. This figure is known as the expense ratio. The following examples are intended to help you understand the ongoing costs (in dollars) of investing in your fund and to compare these costs with those of other mutual funds. The examples are based on an investment of $1,000 made at the beginning of the period shown and held for the entire period.
The accompanying table illustrates your fund’s costs in two ways:
• Based on actual fund return. This section helps you to estimate the actual expenses that you paid over the period. The ”Ending Account Value“ shown is derived from the fund‘s actual return, and the third column shows the dollar amount that would have been paid by an investor who started with $1,000 in the fund. You may use the information here, together with the amount you invested, to estimate the expenses that you paid over the period.
To do so, simply divide your account value by $1,000 (for example, an $8,600 account value divided by $1,000 = 8.6), then multiply the result by the number given for your fund under the heading ”Expenses Paid During Period.“
• Based on hypothetical 5% yearly return. This section is intended to help you compare your fund‘s costs with those of other mutual funds. It assumes that the fund had a yearly return of 5% before expenses, but that the expense ratio is unchanged. In this case—because the return used is not the fund’s actual return—the results do not apply to your investment. The example is useful in making comparisons because the Securities and Exchange Commission requires all mutual funds to calculate expenses based on a 5% return. You can assess your fund’s costs by comparing this hypothetical example with the hypothetical examples that appear in shareholder reports of other funds.
Note that the expenses shown in the table are meant to highlight and help you compare ongoing costs only and do not reflect transaction costs incurred by the fund for buying and selling securities. Further, the expenses do not include any purchase, redemption, or account service fees described in the fund prospectus. If such fees were applied to your account, your costs would be higher. Your fund does not carry a “sales load.” The calculations assume no shares were bought or sold during the period. Your actual costs may have been higher or lower, depending on the amount of your investment and the timing of any purchases or redemptions.
You can find more information about the fund’s expenses, including annual expense ratios, in the Financial Statements section of this report. For additional information on operating expenses and other shareholder costs, please refer to your fund’s current prospectus.
54
| | | |
| Six Months Ended October 31, 2016 | | | |
| Beginning | Ending | Expenses |
| Account Value | Account Value | Paid During |
| Tax-Exempt Money Market Fund | 4/30/2016 | 10/31/2016 | Period1 |
| Based on Actual Fund Return | $1,000.00 | $1,002.16 | $0.70 |
| Based on Hypothetical 5% Yearly Return | 1,000.00 | 1,024.43 | 0.71 |
| | | |
1 The calculations are based on expenses incurred in the most recent six-month period. The fund’s annualized six-month expense ratio for that period is 0.14%. The dollar amounts shown as “Expenses Paid” are equal to the annualized expense ratio multiplied by the average account value over the period, multiplied by the number of days in the most recent six-month period, then divided by the number of days in the most recent 12-month period (184/366).
55
Glossary
Average Weighted Maturity. The average length of time until fixed income securities held by a fund reach maturity and are repaid. The figure reflects the proportion of fund assets represented by each security.
Expense Ratio. A fund’s total annual operating expenses expressed as a percentage of the fund’s average net assets. The expense ratio includes management and administrative expenses, but does not include the transaction costs of buying and selling portfolio securities.
Inception Date. The date on which the assets of a fund (or one of its share classes) are first invested in accordance with the fund’s investment objective. For funds with a subscription period, the inception date is the day after that period ends. Investment performance is measured from the inception date.
Yield. A money market fund’s 7-day SEC yield is calculated by annualizing its income distributions for the previous seven days, as required by the U.S. Securities and Exchange Commission.
56
This page intentionally left blank.
This page intentionally left blank.
This page intentionally left blank.
The People Who Govern Your Fund
The trustees of your mutual fund are there to see that the fund is operated and managed in your best interests since, as a shareholder, you are a part owner of the fund. Your fund’s trustees also serve on the board of directors of The Vanguard Group, Inc., which is owned by the Vanguard funds and provides services to them on an at-cost basis.
A majority of Vanguard’s board members are independent, meaning that they have no affiliation with Vanguard or the funds they oversee, apart from the sizable personal investments they have made as private individuals. The independent board members have distinguished backgrounds in business, academia, and public service. Each of the trustees and executive officers oversees 198 Vanguard funds.
The following table provides information for each trustee and executive officer of the fund. The mailing address of the trustees and officers is P.O. Box 876, Valley Forge, PA 19482. More information about the trustees is in the Statement of Additional Information, which can be obtained, without charge, by contacting Vanguard at 800-662-7447, or online at vanguard.com.
InterestedTrustee1 F. William McNabb III
Born 1957. Trustee Since July 2009. Chairman of the Board. Principal Occupation(s) During the Past Five Years and Other Experience: Chairman of the Board of The Vanguard Group, Inc., and of each of the investment companies served by The Vanguard Group, since January 2010; Director of The Vanguard Group since 2008; Chief Executive Officer and President of The Vanguard Group, and of each of the investment companies served by The Vanguard Group, since 2008; Director of Vanguard Marketing Corporation; Managing Director of The Vanguard Group (1995–2008).
IndependentTrustees Emerson U. Fullwood
Born 1948. Trustee Since January 2008. Principal Occupation(s) During the Past Five Years and Other Experience: Executive Chief Staff and Marketing Officer for North America and Corporate Vice President (retired 2008) of Xerox Corporation (document management products and services); Executive in Residence and 2009–2010 Distinguished Minett Professor at the Rochester Institute of Technology; Lead Director of SPX FLOW, Inc. (multi-industry manufacturing); Director of the United Way of Rochester, the University of Rochester Medical Center, Monroe Community College Foundation, North Carolina A&T University, and Roberts Wesleyan College.
Rajiv L. Gupta
Born 1945. Trustee Since December 2001.2 Principal Occupation(s) During the Past Five Years and Other Experience: Chairman and Chief Executive Officer (retired 2009) and President (2006–2008) of Rohm and Haas Co. (chemicals); Director of Tyco International plc (diversified manufacturing and services), HP Inc. (printer and personal computer manufacturing), and Delphi Automotive plc (automotive components); Senior Advisor at New Mountain Capital.
Amy Gutmann
Born 1949. Trustee Since June 2006. Principal Occupation(s) During the Past Five Years and Other Experience: President of the University of Pennsylvania; Christopher H. Browne Distinguished Professor of Political Science, School of Arts and Sciences, and Professor of Communication, Annenberg School for Communication, with secondary faculty appointments in the Department of Philosophy, School of Arts and Sciences, and at the Graduate School of Education, University of Pennsylvania; Trustee of the National Constitution Center; Chair of the Presidential Commission for the Study of Bioethical Issues.
JoAnn Heffernan Heisen
Born 1950. Trustee Since July 1998. Principal Occupation(s) During the Past Five Years and Other Experience: Corporate Vice President and Chief Global Diversity Officer (retired 2008) and Member of the Executive Committee (1997–2008) of Johnson & Johnson (pharmaceuticals/medical devices/consumer products); Director of Skytop Lodge Corporation (hotels) and the Robert Wood Johnson Foundation; Member of the Advisory Board of the Institute for Women’s Leadership at Rutgers University.
F. Joseph Loughrey
Born 1949. Trustee Since October 2009. Principal Occupation(s) During the Past Five Years and Other Experience: President and Chief Operating Officer (retired 2009) of Cummins Inc. (industrial machinery); Chairman of the Board of Hillenbrand, Inc. (specialized consumer services), and of Oxfam America; Director of SKF AB (industrial machinery), Hyster-Yale Materials Handling, Inc. (forklift trucks), the Lumina Foundation for Education, and the V Foundation for Cancer Research; Member of the Advisory Council for the College of Arts and Letters and of the Advisory Board to the Kellogg Institute for International Studies, both at the University of Notre Dame.
Mark Loughridge
Born 1953. Trustee Since March 2012. Principal Occupation(s) During the Past Five Years and Other Experience: Senior Vice President and Chief Financial Officer (retired 2013) at IBM (information technology services); Fiduciary Member of IBM’s Retirement Plan Committee (2004–2013); Director of the Dow Chemical Company; Member of the Council on Chicago Booth.
Scott C. Malpass
Born 1962. Trustee Since March 2012. Principal Occupation(s) During the Past Five Years and Other Experience: Chief Investment Officer and Vice President at the University of Notre Dame; Assistant Professor of Finance at the Mendoza College of Business at Notre Dame; Member of the Notre Dame 403(b) Investment Committee, the Board of Advisors for Spruceview Capital Partners, and the Investment Advisory Committee of Major League Baseball; Board Member of TIFF Advisory Services, Inc., and Catholic Investment Services, Inc. (investment advisors).
André F. Perold
Born 1952. Trustee Since December 2004. Principal Occupation(s) During the Past Five Years and Other Experience: George Gund Professor of Finance and Banking, Emeritus at the Harvard Business School (retired 2011); Chief Investment Officer and Managing Partner of HighVista Strategies LLC (private investment firm); Director of Rand Merchant Bank; Overseer of the Museum of Fine Arts Boston.
Peter F. Volanakis
Born 1955. Trustee Since July 2009. Principal Occupation(s) During the Past Five Years and Other Experience: President and Chief Operating Officer (retired 2010) of Corning Incorporated (communications equipment); Chairman of the Board of Trustees of Colby-Sawyer College; Member of the Advisory Board of the Norris Cotton Cancer Center.
Executive Officers Glenn Booraem
Born 1967. Treasurer Since May 2015. Principal Occupation(s) During the Past Five Years and Other Experience: Principal of The Vanguard Group, Inc.; Treasurer of each of the investment companies served by The Vanguard Group; Controller of each of the investment companies served by The Vanguard Group (2010–2015); Assistant Controller of each of the investment companies served by The Vanguard Group (2001–2010).
Thomas J. Higgins
Born 1957. Chief Financial Officer Since September 2008. Principal Occupation(s) During the Past Five Years and Other Experience: Principal of The Vanguard Group, Inc.; Chief Financial Officer of each of the investment companies served by The Vanguard Group; Treasurer of each of the investment companies served by The Vanguard Group (1998–2008).
Peter Mahoney
Born 1974. Controller Since May 2015. Principal Occupation(s) During the Past Five Years and Other Experience: Head of Global Fund Accounting at The Vanguard Group, Inc.; Controller of each of the investment companies served by The Vanguard Group; Head of International Fund Services at The Vanguard Group (2008–2014).
Anne E. Robinson
Born 1970. Secretary Since September 2016. Principal Occupation(s) During the Past Five Years and Other Experience: Managing Director of The Vanguard Group, Inc.; General Counsel of The Vanguard Group; Secretary of The Vanguard Group and of each of the investment companies served by The Vanguard Group; Director and Senior Vice President of Vanguard Marketing Corporation; Managing Director and General Counsel of Global Cards and Consumer Services at Citigroup (2014–2016); Counsel at American Express (2003–2014).
Vanguard Senior Management Team
| |
| Mortimer J. Buckley | James M. Norris |
| Kathleen C. Gubanich | Thomas M. Rampulla |
| Martha G. King | Glenn W. Reed |
| John T. Marcante | Karin A. Risi |
| Chris D. McIsaac | Michael Rollings |
Chairman Emeritus and Senior Advisor
John J. Brennan
Chairman, 1996–2009
Chief Executive Officer and President, 1996–2008
Founder
John C. Bogle
Chairman and Chief Executive Officer, 1974–1996
1 Mr. McNabb is considered an “interested person,” as defined in the Investment Company Act of 1940, because he is an officer of the Vanguard funds.
2 December 2002 for Vanguard Equity Income Fund, the Vanguard Municipal Bond Funds, and the Vanguard State Tax-Exempt Funds.
| |
|  |
| P.O. Box 2600 |
| Valley Forge, PA 19482-2600 |
Connect with Vanguard® > vanguard.com | |
| |
| Fund Information > 800-662-7447 | |
| | CFA® is a registered trademark owned by CFA Institute. |
| Direct Investor Account Services > 800-662-2739 | |
| |
| Institutional Investor Services > 800-523-1036 | |
| |
| Text Telephone for People | |
| Who Are Deaf or Hard of Hearing > 800-749-7273 | |
| |
| This material may be used in conjunction | |
| with the offering of shares of any Vanguard | |
| fund only if preceded or accompanied by | |
| the fund’s current prospectus. | |
| |
| All comparative mutual fund data are from Lipper, | |
| a Thomson Reuters Company, or Morningstar, Inc., | |
| unless otherwise noted. | |
| |
| You can obtain a free copy of Vanguard’s proxy voting | |
| guidelines by visiting vanguard.com/proxyreporting or | |
| by calling Vanguard at 800-662-2739. The guidelines | |
| are also available from the SEC’s website, sec.gov. | |
| In addition, you may obtain a free report on how your | |
| fund voted the proxies for securities it owned during | |
| the 12 months ended June 30. To get the report, visit | |
| either vanguard.com/proxyreporting or sec.gov. | |
| |
| You can review and copy information about your fund | |
| at the SEC’s Public Reference Room in Washington, D.C. | |
| To find out more about this public service, call the SEC | |
| at 202-551-8090. Information about your fund is also | |
| available on the SEC’s website, and you can receive | |
| copies of this information, for a fee, by sending a | |
| request in either of two ways: via email addressed | |
| to publicinfo@sec.gov or via regular mail addressed | |
| to the Public Reference Section, Securities and | |
| Exchange Commission, Washington, DC 20549-1520. | |
| | © 2016 The Vanguard Group, Inc. |
| | All rights reserved. |
| | Vanguard Marketing Corporation, Distributor. |
| | Q450 122016 |
Item 2: Code of Ethics. The Registrant has adopted a code of ethics that applies to the Registrant’s principal executive officer, principal financial officer, principal accounting officer or controller or persons performing similar functions. The Code of Ethics was amended during the reporting period covered by this report to make certain technical, non-material changes.
Item 3: Audit Committee Financial Expert. All members of the Audit Committee have been determined by the Registrant’s Board of Trustees to be Audit Committee Financial Experts and to be independent: Rajiv L. Gupta, JoAnn Heffernan Heisen, F. Joseph Loughrey, Mark Loughridge, and Peter F. Volanakis.
Item 4: Principal Accountant Fees and Services.
(a) Audit Fees.
Audit Fees of the Registrant
Fiscal Year Ended October 31, 2016: $243,000
Fiscal Year Ended October 31, 2015: $207,000
Aggregate Audit Fees of Registered Investment Companies in the Vanguard Group.
Fiscal Year Ended October 31, 2016: $9,629,849
Fiscal Year Ended October 31, 2015: $7,000,200
Includes fees billed in connection with audits of the Registrant, other registered investment companies in the Vanguard complex, The Vanguard Group, Inc. and Vanguard Marketing Corporation.
(b) Audit-Related Fees.
Fiscal Year Ended October 31, 2016: $2,717,627
Fiscal Year Ended October 31, 2015: $2,899,096
Includes fees billed in connection with assurance and related services provided to the Registrant, other registered investment companies in the Vanguard complex, The Vanguard Group, Inc., and Vanguard Marketing Corporation.
(c) Tax Fees.
Fiscal Year Ended October 31, 2016: $254,050
Fiscal Year Ended October 31, 2015: $353,389
Includes fees billed in connection with tax compliance, planning, and advice services provided to the Registrant, other registered investment companies in the Vanguard complex, The Vanguard Group, Inc., and Vanguard Marketing Corporation.
(d) All Other Fees.
Fiscal Year Ended October 31, 2016: $214,225
Fiscal Year Ended October 31, 2015: $202,313
Includes fees billed for services related to tax reported information provided to the Registrant, other registered investment companies in the Vanguard complex, The Vanguard Group, Inc., and Vanguard Marketing Corporation.
(e) (1) Pre-Approval Policies. The policy of the Registrant’s Audit Committee is to consider and, if appropriate, approve before the principal accountant is engaged for such services, all specific audit and non-audit services provided to: the Registrant, other registered investment companies in the Vanguard complex, The Vanguard Group, Inc., and entities controlled by The Vanguard Group, Inc. that provide ongoing services to the Registrant. In making a determination, the Audit Committee considers whether the services are consistent with maintaining the principal accountant’s independence.
In the event of a contingency situation in which the principal accountant is needed to provide services in between scheduled Audit Committee meetings, the Chairman of the Audit Committee would be called on to consider and, if appropriate, pre-approve audit or permitted non-audit services in an amount sufficient to complete services through the next Audit Committee meeting, and to determine if such services would be consistent with maintaining the accountant’s independence. At the next scheduled Audit Committee meeting, services and fees would be presented to the Audit Committee for formal consideration, and, if appropriate, approval by the entire Audit Committee. The Audit Committee would again consider whether such services and fees are consistent with maintaining the principal accountant’s independence.
The Registrant’s Audit Committee is informed at least annually of all audit and non-audit services provided by the principal accountant to the Vanguard complex, whether such services are provided to: the Registrant, other registered investment companies in the Vanguard complex, The Vanguard Group, Inc., or other entities controlled by The Vanguard Group, Inc. that provide ongoing services to the Registrant.
(2) No percentage of the principal accountant’s fees or services were approved pursuant to the waiver provision of paragraph (c)(7)(i)(C) of Rule 2-01 of Regulation S-X.
(f) For the most recent fiscal year, over 50% of the hours worked under the principal accountant’s engagement were not performed by persons other than full-time, permanent employees of the principal accountant.
(g) Aggregate Non-Audit Fees.
Fiscal Year Ended October 31, 2016: $468,275
Fiscal Year Ended October 31, 2015: $555,702
Includes fees billed for non-audit services provided to the Registrant, other registered investment companies in the Vanguard complex, The Vanguard Group, Inc., and Vanguard Marketing Corporation.
(h) For the most recent fiscal year, the Audit Committee has determined that the provision of all non-audit services was consistent with maintaining the principal accountant’s independence.
Item 5: Audit Committee of Listed Registrants.
The Registrant is a listed issuer as defined in rule 10A-3 under the Securities Exchange Act of 1934 (“Exchange Act”). The Registrant has a separately-designated standing audit committee established in accordance with Section 3(a)(58)(A) of the Exchange Act. The Registrant’s audit committee members are: Emerson U. Fullwood, Rajiv L. Gupta, Amy Gutmann, JoAnn Heffernan Heisen, F. Joseph Loughrey, Mark Loughridge, Scott C. Malpass, André F. Perold, and Peter F. Volanakis.
Item 6: Investments. Not Applicable.
Item 7: Disclosure of Proxy Voting Policies and Procedures for Closed-End Management Investment Companies.
Not Applicable.
Item 8: Portfolio Managers of Closed-End Management Investment Companies.
Not Applicable.
Item 9: Purchase of Equity Securities by Closed-End Management Investment Company and Affiliated Purchasers.
Not Applicable.
Item 10: Submission of Matters to a Vote of Security Holders. Not Applicable.
Item 11: Controls and Procedures.
(a) Disclosure Controls and Procedures. The Principal Executive and Financial Officers concluded that the Registrant’s Disclosure Controls and Procedures are effective based on their evaluation of the Disclosure Controls and Procedures as of a date within 90 days of the filing date of this report.
(b) Internal Control Over Financial Reporting. There were no significant changes in Registrant’s Internal Control Over Financial Reporting or in other factors that could significantly affect this control subsequent to the date of the evaluation, including any corrective actions with regard to significant deficiencies and material weaknesses.
Item 12: Exhibits.
(a) Code of Ethics. (b) Certifications.
Pursuant to the requirements of the Securities Exchange Act of 1934 and the Investment Company Act of 1940, the registrant has duly caused this report to be signed on its behalf by the undersigned, thereunto duly authorized.
| |
| | VANGUARD MUNICIPAL BOND FUNDS |
| |
| |
| BY: | /s/ F. WILLIAM MCNABB III* |
| F. WILLIAM MCNABB III |
| | CHIEF EXECUTIVE OFFICER |
| |
| Date: December 19, 2016 |
Pursuant to the requirements of the Securities Exchange Act of 1934 and the Investment Company Act of 1940, this report has been signed below by the following persons on behalf of the registrant and in the capacities and on the dates indicated.
| |
| | VANGUARD MUNICIPAL BOND FUNDS |
BY: | /s/ F. WILLIAM MCNABB III* |
| F. WILLIAM MCNABB III |
| | CHIEF EXECUTIVE OFFICER |
Date: December 19, 2016 |
| VANGUARD MUNICIPAL BOND FUNDS |
BY: | /s/ THOMAS J. HIGGINS* |
| | THOMAS J. HIGGINS |
| | CHIEF FINANCIAL OFFICER |
Date: December 19, 2016 |
* By: /s/ Anne E. Robinson
Anne E. Robinson, pursuant to a Power of Attorney filed on October 4, 2016 see file Number
33-32548, Incorporated by Reference.