UNITED STATES
SECURITIES AND EXCHANGE COMMISSION
Washington, D.C. 20549
FORM N-CSR
CERTIFIED SHAREHOLDER REPORT
OF
REGISTERED MANAGEMENT INVESTMENT COMPANIES
Investment Company Act file number: 811-02687
Name of Registrant: Vanguard Municipal Bond Funds
Address of Registrant:
P.O. Box 2600
Valley Forge, PA 19482
Name and address of agent for service:
Heidi Stam, Esquire
P.O. Box 876
Valley Forge, PA 19482
Registrant’s telephone number, including area code: (610) 669-1000
Date of fiscal year end: October 31
Date of reporting period: November 1, 2013 – October 31, 2014
Item 1: Reports to Shareholders
Vanguard Municipal Bond Funds
Vanguard Tax-Exempt Money Market Fund
Vanguard Short-Term Tax-Exempt Fund
Vanguard Limited-Term Tax-Exempt Fund
Vanguard Intermediate-Term Tax-Exempt Fund
Vanguard Long-Term Tax-Exempt Fund
Vanguard High-Yield Tax-Exempt Fund
The mission continues
On May 1, 1975, Vanguard began operations, a fledgling company based on the simple but revolutionary idea that a mutual fund company should be managed solely in the interest of its investors.
Four decades later, that revolutionary spirit continues to animate the enterprise. Vanguard remains on a mission to give investors the best chance of investment success.
As we mark our 40th anniversary, we thank you for entrusting your assets to Vanguard and giving us the opportunity to help you reach your financial goals in the decades to come.
| |
| Contents | |
| |
| Your Fund’s Total Returns | 1 |
| Chairman’s Letter | 2 |
| Advisor’s Report | 7 |
| Tax-Exempt Money Market Fund | 9 |
| Short-Term Tax-Exempt Fund | 33 |
| Limited-Term Tax-Exempt Fund | 41 |
| Intermediate-Term Tax-Exempt Fund | 49 |
| Long-Term Tax-Exempt Fund | 57 |
| High-Yield Tax-Exempt Fund | 65 |
| About Your Fund’s Expenses | 75 |
| Glossary | 77 |
Please note: The opinions expressed in this report are just that—informed opinions. They should not be considered promises or advice. Also, please keep in mind that the information andopinions cover the period through the date on the front of this report. Of course, the risks of investing in your fund are spelled out in the prospectus.See the Glossary for definitions of investment terms used in this report.About the cover: Since our founding, Vanguard has drawn inspiration from the enterprise and valor demonstrated by British naval hero Horatio Nelson and his command
at the Battle of the Nile in 1798. The photograph displays a replica of a merchant ship from the same era as Nelson’s flagship, the HMS Vanguard.
Your Fund’s Total Returns
| | | | | |
| Fiscal Year Ended October 31, 2014 | | | | | |
| | | Taxable- | | | |
| | SEC | Equivalent | Income | Capital | Total |
| | Yields1 | Yields2 | Returns | Returns | Returns |
| Vanguard Tax-Exempt Money Market Fund | 0.01% | 0.02% | 0.01% | 0.00% | 0.01% |
| Tax-Exempt Money Market Funds Average3 | | | | | 0.01 |
| |
| Vanguard Short-Term Tax-Exempt Fund | | | | | |
| Investor Shares | 0.28% | 0.65% | 0.72% | –0.06% | 0.66% |
| Admiral ™ Shares4 | 0.36 | 0.83 | 0.80 | –0.06 | 0.74 |
| Barclays 1 Year Municipal Bond Index | | | | | 0.72 |
| 1–2 Year Municipal Funds Average3 | | | | | 0.43 |
| |
| Vanguard Limited-Term Tax-Exempt Fund | | | | | |
| Investor Shares | 0.70% | 1.61% | 1.63% | 0.18% | 1.81% |
| Admiral Shares 4 | 0.78 | 1.80 | 1.71 | 0.18 | 1.89 |
| Barclays 1–5 Year Municipal Bond Index | | | | | 1.98 |
| 1–5 Year Municipal Funds Average3 | | | | | 1.50 |
| |
| Vanguard Intermediate-Term Tax-Exempt Fund | | | | | |
| Investor Shares | 1.54% | 3.55% | 3.28% | 3.03% | 6.31% |
| Admiral Shares 4 | 1.62 | 3.73 | 3.36 | 3.03 | 6.39 |
| Barclays 1–15 Year Municipal Bond Index | | | | | 5.56 |
| Intermediate Municipal Funds Average3 | | | | | 5.11 |
| |
| Vanguard Long-Term Tax-Exempt Fund | | | | | |
| Investor Shares | 2.22% | 5.12% | 4.22% | 5.30% | 9.52% |
| Admiral Shares 4 | 2.30 | 5.30 | 4.30 | 5.30 | 9.60 |
| Barclays Municipal Bond Index | | | | | 7.82 |
| General & Insured Municipal Debt Funds Average3 | | | | 8.63 |
| |
| Vanguard High-Yield Tax-Exempt Fund | | | | | |
| Investor Shares | 2.56% | 5.90% | 4.23% | 5.64% | 9.87% |
| Admiral Shares 4 | 2.64 | 6.08 | 4.32 | 5.64 | 9.96 |
| Barclays Municipal Bond Index | | | | | 7.82 |
| General & Insured Municipal Debt Funds Average3 | | | | 8.63 |
1 7-day SEC yield for the Tax-Exempt Money Market Fund; 30-day SEC yield for the other funds.
2 This calculation, which assumes a typical itemized tax return, is based on the maximum federal income tax rate of 43.4%. State and local taxes were not considered. Please see the prospectus for a detailed
explanation of the calculation.
3 Derived from data provided by Lipper, a Thomson Reuters Company.
4 Admiral Shares carry lower expenses and are available to investors who meet certain account-balance requirements.
1

Chairman’s Letter
Dear Shareholder,
After getting off to a rough start, the broad U.S. municipal bond market posted ten consecutive months of positive returns to finish the fiscal year ended October 31, 2014, with a return of almost 8%.
Demand was strongest for longer-dated and lower-rated munis, a trend that helped Vanguard High-Yield Tax-Exempt Fund and Vanguard Long-Term Tax-Exempt Fund return about 10% and Vanguard Intermediate-Term Tax-Exempt Fund return about 6%. Price appreciation accounted for a healthy portion of the funds’ returns, unlike in the previous fiscal year when price depreciation was a significant detractor.
The returns of our two shorter-maturity muni bond funds were more modest, with earned income playing a central role in their performances. Vanguard Limited-Term Tax-Exempt Fund produced a result of about 2% and Vanguard Short-Term Tax-Exempt Fund returned less than 1%.
For a look at the relative contributions of price changes and income to the long-term performance of muni bonds, please see the box on page 5.
All five bond funds fared better than their peers: The outperformance ranged from 23 basis points for Investor Shares of the Short-Term Fund to 133 basis points for Admiral Shares of the High-Yield Fund. (A basis point is one-hundredth of a percentage point.) The bond funds’ returns were roughly in line with or slightly ahead of those of their benchmark indexes.
The rise in muni bond prices drove the 30-day SEC yields for the Vanguard funds lower. Over the 12 months, the yield of Investor Shares dropped from 0.38% to 0.28% for the Short-Term Fund and from 3.68% to 2.56% for the High-Yield Fund.
With Federal Reserve policy pinning short-term interest rates near zero, Vanguard Tax-Exempt Money Market Fund, which invests in securities maturing in less than one year, performed in line with its peer group with a return of 0.01%.
U.S. taxable bonds made gains as their low yields fell further
The broad U.S. taxable bond market returned 4.14%. Bond prices, which backtracked at times over the summer, climbed in October as investors sought sanctuary from stock market volatility.
| | | |
| Market Barometer | | | |
| | | Average Annual Total Returns |
| | Periods Ended October 31, 2014 |
| | One Year | Three Years | Five Years |
| Bonds | | | |
| Barclays U.S. Aggregate Bond Index (Broad taxable market) | 4.14% | 2.73% | 4.22% |
| Barclays Municipal Bond Index (Broad tax-exempt market) | 7.82 | 4.93 | 5.26 |
| Citigroup Three-Month U.S. Treasury Bill Index | 0.04 | 0.04 | 0.06 |
| |
| Stocks | | | |
| Russell 1000 Index (Large-caps) | 16.78% | 19.90% | 16.98% |
| Russell 2000 Index (Small-caps) | 8.06 | 18.18 | 17.39 |
| Russell 3000 Index (Broad U.S. market) | 16.07 | 19.77 | 17.01 |
| FTSE All-World ex US Index (International) | 0.45 | 8.07 | 6.38 |
| |
| CPI | | | |
| Consumer Price Index | 1.66% | 1.60% | 1.89% |
2
Although there was some upward pressure on shorter-term Treasury yields as the Fed gradually brought its stimulative bond-buying program to an end in October, yields of longer-term Treasuries fell. Over the 12 months, the yield of the 5-year Treasury note moved up from 1.32% to 1.57%, while the 10-year note slipped from 2.54% to 2.31%, and the 30-year dropped from 3.64% to 3.05%.
Overall, Treasuries gained close to 3%, while their riskier investment-grade counterparts climbed by more than double that figure.
International bond markets (as measured by the Barclays Global Aggregate Index ex USD) slid in September and October en route to a –2.53% return for the 12 months.
Their smooth ride turned jagged, but U.S. stocks ended higher
The broad U.S. stock market returned about 16% for the 12 months ended October 31, after taking investors on a roller-coaster ride in the period’s final month.
Impressive corporate earnings and various global stimulus measures generally supported stocks against a bleaker backdrop that included tensions in the Middle East and Ukraine and other international economic concerns. But over the first two weeks of October, stocks declined sharply as investors reacted to weakness in the global economy, especially the slowdown in China and the threat of deflation in Europe. Reflecting confidence in the U.S. economy, however, the Federal Reserve announced October 29 that it was ending its stimulative bond-buying program as anticipated.
U.S. stocks staged an impressive rebound in the period’s final two weeks, and several major indexes finished at record highs. International stocks didn’t fare as well. Emerging markets posted a modest advance, while stocks from the developed markets of Europe and the Pacific region slipped.
Both supply and demand worked in munis’ favor
Municipal bonds were under pressure through much of 2013 amid the prospect that the Federal Reserve would scale back its bond purchases and unsettling news headlines about distressed issuers such as Puerto Rico and Detroit. Other considerations took center stage in the new year, however, including a domestic economic recovery marked by stops and starts, instability in Eastern Europe and the Middle East, and muni yields that were attractive on their own and relative to those of Treasuries and corporate bonds.
Those factors contributed to a resurgence in demand for munis in 2014 among the usual clients for these securities—people in high income tax brackets looking for tax-exempt income. Munis’ compelling yields also elicited demand from nontraditional buyers, including foreign investors and U.S. banks, insurance companies, and hedge funds.
At the same time, supply remained light. Despite a blip in the second quarter of 2014, tax collection remained solid at state and local levels, broadly speaking. Generally improving finances made those entities reluctant to take on more debt despite the low cost of borrowing. New issuance was down about 10% over the previous 12-month period. That number reflects a drop in the refunding of outstanding debt (which may have run its course now that rates have been so low for so long) and the financing of new capital projects.
The funds were well positioned for this environment thanks to the skill of their advisor, Vanguard Fixed Income Group. Their outsized allocation to longer-dated maturities relative to their benchmarks
Expense Ratios1
Your Fund Compared With Its Peer Group
| | | |
| | Investor | Admiral | Peer Group |
| | Shares | Shares | Average2 |
| Tax-Exempt Money Market Fund | 0.16% | — | 0.20% |
| Short-Term Tax-Exempt Fund | 0.20 | 0.12% | 0.62 |
| Limited-Term Tax-Exempt Fund | 0.20 | 0.12 | 0.70 |
| Intermediate-Term Tax-Exempt Fund | 0.20 | 0.12 | 0.81 |
| Long-Term Tax-Exempt Fund | 0.20 | 0.12 | 0.97 |
| High-Yield Tax-Exempt Fund | 0.20 | 0.12 | 0.97 |
1 The fund expense ratios shown are from the prospectus dated February 26, 2014, and represent estimated costs for the current fiscalyear. For the fiscal year ended October 31, 2014, expense ratios were: for the Tax-Exempt Money Market Fund, 0.09%; for the Short-TermTax-Exempt Fund, 0.20% for Investor Shares and 0.12% for Admiral Shares; for the Limited-Term Tax-Exempt Fund, 0.20% for InvestorShares and 0.12% for Admiral Shares; for the Intermediate-Term Tax-Exempt Fund, 0.20% for Investor Shares and 0.12% for AdmiralShares; for the Long-Term Tax-Exempt Fund, 0.20% for Investor Shares and 0.12% for Admiral Shares; for the High-Yield Tax-Exempt Fund,0.20% for Investor Shares and 0.12% for Admiral Shares. The expense ratio for the Tax-Exempt Money Market Fund reflects a temporaryreduction in operating expenses (described in Note B of the Notes to Financial Statements). Before the reduction, the expense ratiowas 0.16%.2 Peer groups are: for the Tax-Exempt Money Market Fund, Tax-Exempt Money Market Funds; for the Short-Term Tax-Exempt Fund, 1–2Year Municipal Funds; for the Limited-Term Tax-Exempt Fund, 1–5 Year Municipal Funds; for the Intermediate-Term Tax-Exempt Fund,Intermediate Municipal Funds; for the Long-Term Tax-Exempt Fund and High-Yield Tax-Exempt Fund, General & Insured Municipal DebtFunds. Peer-group values are derived from data provided by Lipper, a Thomson Reuters Company, and capture information throughyear-end 2013.3
provided an advantage. Another significant contributor to relative performance for the longer-maturity funds in particular was their holdings in premium callable bonds—these bonds may be redeemed prior to maturity, so they tend to pay slightly higher coupons as compensation for that risk.
The funds also had a much smaller allocation than their benchmarks did to Puerto Rico’s beleaguered muni bond issuers. Despite their high coupons and the allure of their exemption from federal, state, and local taxes, these securities underperformed because of the economic and fiscal challenges facing the commonwealth.
A more modest contribution to relative performance came from good calls by the advisor on individual securities. A tilt toward lower-rated investment-grade bonds helped as well, although the advisor began to pare back its allocations over the period as credit spreads tightened, meaning investors were being paid less for taking on the credit risk of these securities.
Although it was a very strong year for munis, keep in mind that given how low yields have fallen, it’s unlikely that the funds, the longer-maturity funds especially, will produce similar returns next year.
For more information about the advisor’s approach and the funds’ positioning during the year, please see the Advisor’s Report that follows this letter.
Strong credit analysis helped steer the funds through rough waters
Over the ten years ended October 31, media scares about the creditworthiness of municipal issuers and a small number of widely publicized municipal bankruptcies rattled the muni market at times. Here at Vanguard, however, our in-house analysis has always been one of the main pillars of our investment process, helping us to identify opportunities among muni bonds and to sidestep potential problems. And that process is ongoing, even for the bonds already held in our portfolios.
Our credit analysts, along with the competitive advantage of having low costs, have been instrumental in enabling the Vanguard tax-exempt municipal bond funds to outperform their peer groups over the last decade by between 57 and 129 basis points a year, on average. The funds’ annual returns for Investor Shares ranged from 2.06% for the Short-Term Fund to 4.87% for the High-Yield Fund.
| |
| Total Returns | |
| Ten Years Ended October 31, 2014 | |
| | Average Annual |
| | Return |
| Tax-Exempt Money Market Fund | 1.25% |
| Tax-Exempt Money Market Funds Average1 | 0.93 |
| |
| Short-Term Tax-Exempt Fund Investor Shares | 2.06% |
| Barclays 1 Year Municipal Bond Index | 2.20 |
| 1–2 Year Municipal Funds Average1 | 0.77 |
| |
| Limited-Term Tax-Exempt Fund Investor Shares | 2.71% |
| Barclays 1–5 Year Municipal Bond Index | 3.17 |
| 1–5 Year Municipal Funds Average1 | 2.14 |
| |
| Intermediate-Term Tax-Exempt Fund Investor Shares | 4.21% |
| Barclays 1–15 Year Municipal Bond Index | 4.32 |
| Intermediate Municipal Funds Average1 | 3.57 |
| |
| Long-Term Tax-Exempt Fund Investor Shares | 4.59% |
| Barclays Municipal Bond Index | 4.71 |
| General & Insured Municipal Debt Funds Average1 | 3.98 |
| |
| High-Yield Tax-Exempt Fund Investor Shares | 4.87% |
| Barclays Municipal Bond Index | 4.71 |
| General & Insured Municipal Debt Funds Average1 | 3.98 |
| 1 Derived from data provided by Lipper, a Thomson Reuters Company. |
The figures shown represent past performance, which is not a guarantee of future results. (Current performance
may be lower or higher than the performance data cited. For performance data current to the most recent month-
end, visit our website at vanguard.com/performance.) Note, too, that both investment returns and principal value
can fluctuate widely, so an investor’s shares, when sold, could be worth more or less than their original cost.4
Relative to their benchmark indexes, the bond funds produced roughly comparable results, the Limited-Term Fund being an exception.
High costs don’t equal strong fund performance
The adage “You get what you pay for” doesn’t apply to mutual funds. In fact, the reverse is true: Research suggests that higher costs are consistent with weaker returns. (See, for example, Shopping for Alpha: You Get What You Don’t Pay For, at vanguard.com/research.)
Wouldn’t paying the highest fees allow you to purchase the services of the greatest talents, and therefore get you the best returns? As it turns out, the data don’t support that argument. The explanation is simple: Every dollar paid for management fees is a dollar less earning potential return. Keeping expenses down can help narrow the gap between what the markets return and what investors actually earn.
That’s why Vanguard always seeks to minimize costs. It’s a strategy that reflects decades of experience and research, boiled down to one tenet: The less you pay, the more you keep.
As always, thank you for investing with Vanguard.
Sincerely,

F. William McNabb III
Chairman and Chief Executive Officer
November 13, 2014
|
| Income remains the main source of long-term muni returns |
| |
| Once considered a staid investment vehicle, municipal bonds have thrown investors a few |
| curve balls in recent years with some dramatic price fluctuations. The volatility included sharp |
| declines in the first six months of 2013, followed by large price gains in the first six months |
| of 2014. |
| |
| For patient muni investors who resist the urge to jump in and out of the market, however, |
| prices play a limited role in long-term returns. In the chart below, which shows the annualized |
| returns for Vanguard’s five muni bond funds over the past decade, income has contributed far |
| more to total returns—about 90% or more—than price changes have. So price swings may |
| make headlines, but for long-term muni investors, income is still the real story. |
| |
| Income and price contributions to muni returns |
| Annualized ten-year total returns for Vanguard municipal bond funds’ Investor Shares, |
| as of October 31, 2014 |
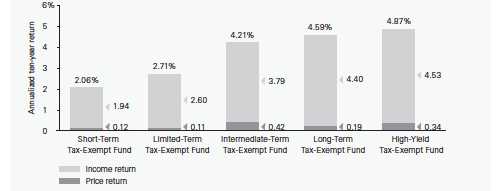
Source: Vanguard.
5
| | | | |
| Your Fund’s Performance at a Glance | | | | |
| October 31, 2013–October 31, 2014 | | | | |
| | | | Distributions Per Share |
| | Starting | Ending | Income | Capital |
| | Share Price | Share Price | Dividends | Gains |
| Vanguard Tax-Exempt Money Market Fund | $1.00 | $1.00 | $0.000 | $0.000 |
| Vanguard Short-Term Tax-Exempt Fund | | | | |
| Investor Shares | $15.87 | $15.86 | $0.115 | $0.000 |
| Admiral Shares | 15.87 | 15.86 | 0.128 | 0.000 |
| Vanguard Limited-Term Tax-Exempt Fund | | | | |
| Investor Shares | $11.06 | $11.08 | $0.178 | $0.000 |
| Admiral Shares | 11.06 | 11.08 | 0.187 | 0.000 |
| Vanguard Intermediate-Term Tax-Exempt Fund | | | |
| Investor Shares | $13.84 | $14.26 | $0.440 | $0.000 |
| Admiral Shares | 13.84 | 14.26 | 0.451 | 0.000 |
| Vanguard Long-Term Tax-Exempt Fund | | | | |
| Investor Shares | $11.14 | $11.73 | $0.450 | $0.000 |
| Admiral Shares | 11.14 | 11.73 | 0.459 | 0.000 |
| Vanguard High-Yield Tax-Exempt Fund | | | | |
| Investor Shares | $10.63 | $11.23 | $0.430 | $0.000 |
| Admiral Shares | 10.63 | 11.23 | 0.438 | 0.000 |
6
Advisor’s Report
For the 12 months ended October 31, 2014, the Vanguard Municipal Bond Funds posted returns that ranged from 0.66% for the Investor Shares of the Short-Term Tax-Exempt Fund to 9.96% for the Admiral Shares of the High-Yield Tax-Exempt Fund. All of the bond funds performed in line with their benchmark indexes or outpaced them, and all surpassed the average returns of peer-group funds. The Tax-Exempt Money Market Fund returned 0.01%, matching the average return of its peer group.
The investment environment
It was a remarkable year for municipal bonds. While the macroeconomic environment helped the overall bond market produce solid returns, light supply and a surge in demand helped munis perform even better.
The bond market was shaken last year when the Federal Reserve signaled its intention to wind down its unprecedented bond-buying program. The Fed eventually succeeded in reassuring investors that the tapering would take place gradually, that it would proceed only if it saw sufficient underlying strength in the economy, and that interest rates were likely to remain low for a considerable period even after the program ended.
The economy provided the signals the Fed was looking for to end its program. Gross domestic product increased at a rate of about 2.4% over the 12 months despite a sharp contraction in the first quarter of 2014 resulting in part from severe winter weather. The labor market also improved, with the unemployment rate falling from 7.2% to 5.8%, and inflation remained well below the Fed’s target of 2%.
This benign environment for bonds—moderate economic growth, low inflation, and continuing easy monetary policy—helped revive demand. Heightened tensions in Eastern Europe and the Middle East were factors as well, with more risk-averse investors turning to bonds as a safe harbor for their assets.
Over the period, the Treasury yield curve flattened, as securities with longer maturities strongly outperformed those with shorter maturities. And corporate bonds as a whole fared even better as investors were lured by their higher yields, drawing credit spreads tighter.
A lack of supply helped the muni market outperform both Treasuries and corporates. Muni issuers remained focused on austerity, despite continued improvement in tax collections overall. That translated into a drop in new issuance of roughly 10% for this 12-month period.
At the same time, demand for these securities rebounded. After munis fell out of favor with investors last year, their valuations reached very attractive levels compared with Treasuries and corporate bonds. Those valuations drew back individual investors looking for tax-free income, but also many buyers who would not otherwise have been interested, including insurance companies, pension funds, and foreign investors.
Management of the funds
Our outsized allocation to longer-dated bonds worked out well. While many investors were of the view that rates were headed significantly higher and wanted to limit their exposure to the longer end of the curve, we thought that rates would remain relatively stable and that holding bonds with maturities of 10 years or more would help us maximize yield.
In terms of credit exposure in the funds, we saw relative value in A-rated bonds in particular at the beginning of the period. The prices of these bonds rose significantly as investors intensified their search for yield, and so, as with longer-dated bonds, we gradually reduced our exposure.
Other good calls included our allocation to premium callable bonds; these bonds carry a reinvestment risk as the issuers may redeem them before they mature, and for that they offer a higher yield than non-callable bonds.
We were significantly underweighted in Puerto Rico bonds, as we have been for some time. While the yields of those bonds are high, so is the level of credit risk associated with them because of the territory’s debt load, unbalanced budget, and poor economic prospects. That choice boosted the relative performance of the funds as well.
| | |
| Yields of Municipal Bonds | | |
| (AAA-Rated General-Obligation Issues) | | |
| | October 31, | October 31, |
| Maturity | 2013 | 2014 |
| 2 years | 0.34% | 0.14% |
| 5 years | 1.06 | 0.86 |
| 10 years | 2.44 | 1.96 |
| 30 years | 4.04 | 3.00 |
| Source: Vanguard. |
7
A look ahead
The strong performance of municipal bonds has put their valuations at much fuller levels than where they were 12 months ago. And with yields having fallen so low, the economy continuing to improve, and a potential rise in interest rates in the offing, we expect muni returns over the next year to be more or less in line with the coupons they pay out.
Our outlook is for the U.S. economy to grow at a moderate pace in 2015. The Fed is likely to begin raising the federal funds target rate in the second half of next year. Although market volatility will probably pick up as we approach that point, we believe that the pace of tightening in monetary policy will be slow and that the target rate will end up at a level below its historical average. For muni bonds, that’s likely to mean their interest rates will remain lower than the levels we’ve seen over the past 10 to 15 years.
As we enter the new fiscal year, the funds have durations that are modestly shorter than their benchmarks’ (because of the prospect of rising interest rates) and allocations favoring longer maturities, but we’ve taken a more neutral stance regarding quality. In terms of sectors, the funds still have a tilt toward health care, project finance, and corporate-backed munis that we believe provide attractive compensation for the level of risk being taken. As for Puerto Rico, we are likely to remain largely on the sidelines until we see sustained economic growth and budget discipline.
Since, as we mentioned, an eventual tightening of monetary policy is likely to be accompanied by an increase in market volatility, we will continue to hold above-average levels of liquidity that will give us the “dry powder” to take advantage of any dislocations in pricing that may arise.
As always, our experienced team of portfolio managers, traders, and credit analysts will continue to seek out opportunities to add to the funds’ performance by identifying bonds that are mispriced by the market.
Christopher W. Alwine, CFA, Principal,
Head of Municipal Bond Group
Pamela Wisehaupt Tynan, Principal,
Head of Municipal Money Market Funds
Mathew M. Kiselak, Principal,
Portfolio Manager
Marlin G. Brown, Portfolio Manager
James D’Arcy, CFA, Portfolio Manager
Vanguard Fixed Income Group
November 18, 2014
8
Tax-Exempt Money Market Fund
Fund Profile
As of October 31, 2014
| |
| Financial Attributes | |
| |
| Ticker Symbol | VMSXX |
| Expense Ratio1 | 0.16% |
| 7-Day SEC Yield | 0.01% |
| Average Weighted Maturity | 42 days |
| |
| Largest Area Concentrations | |
| |
| Texas | 10.6% |
| New York | 8.3 |
| Illinois | 5.0 |
| Florida | 4.3 |
| Indiana | 4.0 |
| California | 3.7 |
| Georgia | 3.5 |
| Maryland | 3.3 |
| New Jersey | 3.0 |
| Colorado | 2.7 |
| Top Ten | 48.4% |
| |
| Distribution by Credit Quality (% of portfolio) |
| First Tier | 100.0% |
A First Tier security is one that is eligible for money marketfunds and has been rated in the highest short-term rating categoryfor debt obligations by nationally recognized statistical ratingorganizations. Credit-quality ratings are obtained from Moody’s,Fitch, and S&P. For securities rated by all three agencies, wheretwo of them are in agreement and assign the highest ratingcategory, the highest rating applies. If a security is only ratedby two agencies, and their ratings are in different categories,the lower of the ratings applies. An unrated security is First Tierif it represents quality comparable to that of a rated security,as determined in accordance with SEC Rule 2a-7. For moreinformation about these ratings, see the Glossary entry forCredit Quality.1 The expense ratio shown is from the prospectus dated February 26, 2014, and represents estimated costs for the current fiscal year. For the fiscal year ended October 31, 2014, the expense ratio was 0.09%,
reflecting a temporary reduction in operating expenses (described in Note B of the Notes to Financial Statements). Before this reduction, the expense ratio was 0.16%.
9
Tax-Exempt Money Market Fund
Performance Summary
Investment returns will fluctuate. All of the returns in this report represent past performance, which is not a guarantee of future results that may be achieved by the fund. (Current performance may be lower or higher than the performance data cited. For performance data current to the most recent month-end, visit our website at vanguard.com/performance.) The returns shown do not reflect taxes that a shareholder would pay on fund distributions. An investment in a money market fund is not insured or guaranteed by the Federal Deposit Insurance Corporation or any other government agency. Although the fund seeks to preserve the value of your investment at $1 per share, it is possible to lose money by investing in the fund. The fund’s 7-day SEC yield reflects its current earnings more closely than do the average annual returns.
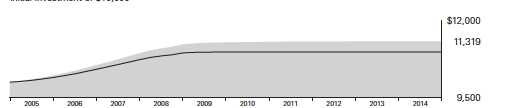
Cumulative Performance: October 31, 2004–October 31, 2014
Initial Investment of $10,000
| | | | |
| | | Average Annual Total Returns | Final Value |
| | Periods Ended October 31, 2014 | of a $10,000 |
| | One Year | Five Years | Ten Years | Investment |
| Tax-Exempt Money Market Fund | 0.01% | 0.06% | 1.25% | $11,319 |
| Tax-Exempt Money Market Funds Average1 | 0.01 | 0.00 | 0.93 | 10,975 |
| | |
| Fiscal-Year Total Returns (%): October 31, 2004–October 31, 2014 | | |
| |
| | | Tax-Exempt |
| | | Money Market |
| | | Funds Average |
| Fiscal Year | Total Returns | Total Returns1 |
| 2005 | 2.13% | 1.48% |
| 2006 | 3.26 | 2.63 |
| 2007 | 3.65 | 2.99 |
| 2008 | 2.63 | 2.03 |
| 2009 | 0.60 | 0.27 |
| 2010 | 0.14 | 0.00 |
| 2011 | 0.09 | 0.00 |
| 2012 | 0.04 | 0.00 |
| 2013 | 0.02 | 0.00 |
| 2014 | 0.01 | 0.01 |
| 7-day SEC yield (10/31/2014): 0.01% |
Average Annual Total Returns: Periods Ended September 30, 2014
This table presents returns through the latest calendar quarter—rather than through the end of the fiscal period.
Securities and Exchange Commission rules require that we provide this information.
| | | | | | |
| | | | | | | Ten Years |
| | Inception Date | One Year | Five Years | Capital | Income | Total |
| Tax-Exempt Money Market | 6/10/1980 | 0.01% | 0.06% | 0.00% | 1.26% | 1.26% |
1 Derived from data provided by Lipper, a Thomson Reuters Company.
See Financial Highlights for dividend information.
10
Tax-Exempt Money Market Fund
Financial Statements
Statement of Net Assets
As of October 31, 2014
The fund reports a complete list of its holdings in various monthly and quarterly regulatory filings. The fund publishes its holdings on a monthly basis at vanguard.com and files them with the Securities and Exchange Commission on Form N-MFP. The fund’s Form N-MFP filings become public 60 days after the relevant month-end, and may be viewed at sec.gov or via a link on the “Portfolio Holdings” page on vanguard.com. For the second and fourth fiscal quarters, the lists appear in the fund’s semiannual and annual reports to shareholders. For the first and third fiscal quarters, the fund files the lists with the SEC on Form N-Q. Shareholders can look up the fund’s Forms N-Q on the SEC’s website at sec.gov. Forms N-Q may also be reviewed and copied at the SEC’s Public Reference Room (see the back cover of this report for further information).
| | | | | |
| | | | | Face | Market |
| | | Maturity | | Amount | Value• |
| | Coupon | Date | | ($000) | ($000) |
| Tax-Exempt Municipal Bonds (96.4%) | | | | | |
| Alabama (0.1%) | | | | | |
| 1 Alabama Public School & College Authority Capital Improvement Revenue TOB VRDO | 0.050% | 11/7/14 | | 16,100 | 16,100 |
| 1 Alabama Public School & College Authority Capital Improvement Revenue TOB VRDO | 0.090% | 11/7/14 | | 1,055 | 1,055 |
| | | | | | 17,155 |
| Alaska (0.9%) | | | | | |
| Alaska GO BAN | 1.000% | 3/23/15 | | 100,000 | 100,338 |
| 1 Alaska Housing Finance Corp. General Housing Revenue TOB VRDO | 0.060% | 11/7/14 | | 10,365 | 10,365 |
| Alaska Housing Finance Corp. Home Mortgage Revenue VRDO | 0.040% | 11/7/14 | | 13,400 | 13,400 |
| Alaska Student Loan Corp. Education Loan Revenue VRDO | 0.060% | 11/7/14 | LOC | 18,800 | 18,800 |
| North Slope Borough AK | 2.000% | 6/30/15 | | 10,000 | 10,124 |
| | | | | | 153,027 |
| Arizona (1.2%) | | | | | |
| 1 Arizona Health Facilities Authority Revenue (Banner Health) TOB VRDO | 0.060% | 11/7/14 | | 21,000 | 21,000 |
| 1 Arizona Health Facilities Authority Revenue (Banner Health) TOB VRDO | 0.080% | 11/7/14 | | 9,995 | 9,995 |
| Arizona Health Facilities Authority Revenue (Banner Health) VRDO | 0.050% | 11/7/14 | LOC | 9,910 | 9,910 |
| Arizona Health Facilities Authority Revenue (Banner Health) VRDO | 0.050% | 11/7/14 | LOC | 67,905 | 67,905 |
| 1 Arizona Transportation Board Highway Revenue TOB VRDO | 0.060% | 11/7/14 | | 7,260 | 7,260 |
| Coconino County AZ Pollution Control Corp. Revenue (Tucson Electric Power Navajo Project) | | | | | |
| VRDO | 0.110% | 11/7/14 | LOC | 18,300 | 18,300 |
| 1 Maricopa County AZ Public Finance Corp. Lease Revenue TOB VRDO | 0.070% | 11/7/14 | | 11,995 | 11,995 |
| 1 Phoenix AZ Civic Improvement Corp. Airport Revenue TOB VRDO | 0.150% | 11/7/14 | | 1,000 | 1,000 |
| 1 Phoenix AZ Civic Improvement Corp. Wastewater System Revenue TOB VRDO | 0.050% | 11/7/14 | LOC | 20,260 | 20,260 |
| 1 Phoenix AZ Civic Improvement Corp. Water System Revenue TOB VRDO | 0.050% | 11/7/14 | | 8,240 | 8,240 |
| 1 Phoenix AZ Civic Improvement Corp. Water System Revenue TOB VRDO | 0.060% | 11/7/14 | | 4,995 | 4,995 |
| 1 Salt River Project Arizona Agricultural Improvement & Power District Revenue TOB VRDO | 0.050% | 11/7/14 | | 4,000 | 4,000 |
| 1 Salt River Project Arizona Agricultural Improvement & Power District Revenue TOB VRDO | 0.050% | 11/7/14 | | 16,000 | 16,000 |
| 1 Salt River Project Arizona Agricultural Improvement & Power District Revenue TOB VRDO | 0.060% | 11/7/14 | | 3,320 | 3,320 |
| 1 Tempe AZ Union High School District No. 213 GO TOB VRDO | 0.050% | 11/7/14 | | 6,840 | 6,840 |
| | | | | | 211,020 |
| California (3.7%) | | | | | |
| ABAG Finance Authority for Nonprofit Corps. California Revenue (Computer History Museum) | | | | | |
| VRDO | 0.050% | 11/7/14 | LOC | 7,000 | 7,000 |
| California Community College Financing Authority TRAN | 2.000% | 6/30/15 | | 5,000 | 5,062 |
| California Educational Facilities Authority Revenue (Stanford University) CP | 0.100% | 1/30/15 | | 40,000 | 40,000 |
| 1 California Educational Facilities Authority Revenue (University of Southern California) | | | | | |
| TOB VRDO | 0.050% | 11/7/14 | | 20,000 | 20,000 |
| 1 California Educational Facilities Authority Revenue (University of Southern California) | | | | | |
| TOB VRDO | 0.060% | 11/7/14 | | 5,050 | 5,050 |
| 1 California Health Facilities Financing Authority Revenue (Providence Health Services) | | | | | |
| TOB VRDO | 0.090% | 11/7/14 | | 9,480 | 9,480 |
| California Statewide Communities Development Authority Gas Supply Revenue VRDO | 0.050% | 11/7/14 | | 78,710 | 78,710 |
| 1 California Statewide Communities Development Authority Revenue (Sutter Health) TOB VRDO | 0.060% | 11/7/14 | | 5,545 | 5,545 |
| East Bay CA Municipal Utility District Water System Revenue (Extendible) CP | 0.100% | 4/20/15 | | 15,000 | 15,000 |
| 2 Eastern Municipal Water District CA Water & Sewer Revenue PUT | 0.070% | 2/27/15 | | 24,575 | 24,575 |
| 2 Eastern Municipal Water District CA Water & Sewer Revenue PUT | 0.060% | 5/22/15 | | 10,000 | 10,000 |
| 1 Golden State Tobacco Securitization Corp. California TOB VRDO | 0.090% | 11/7/14 | (13)(3) | 9,900 | 9,900 |
| 2 Irvine CA Ranch Water District Revenue PUT | 0.060% | 3/12/15 | | 8,550 | 8,550 |
| 2 Irvine CA Ranch Water District Revenue PUT | 0.060% | 3/12/15 | | 5,695 | 5,695 |
| 1 Los Angeles CA Department of Water & Power Revenue TOB VRDO | 0.060% | 11/7/14 | | 17,500 | 17,500 |
| Los Angeles County CA Schools Pooled Financing Program TRAN | 2.000% | 12/31/14 | | 4,200 | 4,213 |
| Los Angeles County CA Schools Pooled Financing Program TRAN | 2.000% | 1/30/15 | | 3,000 | 3,013 |
| Los Angeles County CA TRAN | 1.500% | 6/30/15 | | 120,000 | 121,092 |
| Los Angeles International Airport Revenue CP | 0.100% | 2/10/15 | LOC | 6,000 | 6,000 |
| 2 Metropolitan Water District of Southern California Revenue PUT | 0.070% | 6/5/15 | | 22,910 | 22,910 |
| 1 Nuveen California Dividend Advantage Municipal Fund VRDP VRDO | 0.120% | 11/7/14 | LOC | 26,000 | 26,000 |
11
Tax-Exempt Money Market Fund
| | | | | |
| | | | | Face | Market |
| | | Maturity | | Amount | Value• |
| | Coupon | Date | | ($000) | ($000) |
| 1 Nuveen California Dividend Advantage Municipal Fund VRDP VRDO | 0.140% | 11/7/14 | LOC | 20,000 | 20,000 |
| 2 Riverside CA Water Revenue PUT | 0.070% | 4/1/15 | | 14,085 | 14,085 |
| Riverside County CA TRAN | 1.500% | 6/30/15 | | 65,000 | 65,594 |
| Sacramento CA Municipal Utility District Revenue VRDO | 0.040% | 11/7/14 | LOC | 10,000 | 10,000 |
| San Francisco CA City & County (Earthquake Safety & Emergency Response) GO | 2.000% | 6/15/15 | | 3,630 | 3,672 |
| San Francisco CA City & County (Earthquake Safety & Emergency Response) GO | 2.000% | 6/15/15 | | 6,655 | 6,732 |
| 1 University of California Revenue TOB VRDO | 0.060% | 11/7/14 | | 7,600 | 7,600 |
| University of California Revenue VRDO | 0.040% | 11/7/14 | | 26,800 | 26,800 |
| Ventura County CA TRAN | 1.500% | 7/1/15 | | 36,610 | 36,943 |
| | | | | | 636,721 |
| Colorado (2.7%) | | | | | |
| 1 Board of Governors of the Colorado State University System Enterprise Revenue TOB VRDO | 0.050% | 11/7/14 | LOC | 21,995 | 21,995 |
| Castle Rock CO COP VRDO | 0.070% | 11/7/14 | LOC | 9,765 | 9,765 |
| Colorado (UCDHSC Fitzsimons Academic Projects) COP | 5.250% | 11/1/15 | (Prere.) | 2,600 | 2,731 |
| 1 Colorado Board of Governors University Enterprise System Revenue TOB VRDO | 0.080% | 11/7/14 | | 14,995 | 14,995 |
| Colorado General Fund TRAN | 2.000% | 6/26/15 | | 45,000 | 45,548 |
| Colorado Health Facilities Authority Revenue (Evangelical Lutheran Good Samaritan | | | | | |
| Society Project) VRDO | 0.040% | 11/7/14 | LOC | 400 | 400 |
| 1 Colorado Health Facilities Authority Revenue (Sisters of Charity of Leavenworth | | | | | |
| Health System) TOB VRDO | 0.050% | 11/7/14 | | 7,000 | 7,000 |
| 1 Colorado Health Facilities Authority Revenue (Sisters of Charity of Leavenworth | | | | | |
| Health System) TOB VRDO | 0.060% | 11/7/14 | | 12,700 | 12,700 |
| Colorado Health Facilities Authority Revenue (Sisters of Charity of Leavenworth | | | | | |
| Health System) TOB VRDO | 0.060% | 11/7/14 | | 4,000 | 4,000 |
| Colorado Health Facilities Authority Revenue (Sisters of Charity of Leavenworth | | | | | |
| Health System) TOB VRDO | 0.060% | 11/7/14 | | 6,000 | 6,000 |
| 1 Colorado Health Facilities Authority Revenue (Sisters of Charity of Leavenworth | | | | | |
| Health System) TOB VRDO | 0.060% | 11/7/14 | | 7,175 | 7,175 |
| Colorado Health Facilities Authority Revenue (Sisters of Charity of Leavenworth | | | | | |
| Health System) VRDO | 0.050% | 11/7/14 | | 13,780 | 13,780 |
| Colorado Housing & Finance Authority Multi-Family Mortgage Revenue VRDO | 0.060% | 11/7/14 | | 16,200 | 16,200 |
| Colorado Housing & Finance Authority Multi-Family Mortgage Revenue VRDO | 0.060% | 11/7/14 | | 45,545 | 45,545 |
| Colorado Housing & Finance Authority Multi-Family Mortgage Revenue VRDO | 0.060% | 11/7/14 | | 25,320 | 25,320 |
| Colorado Housing & Finance Authority Multi-Family Mortgage Revenue VRDO | 0.060% | 11/7/14 | | 14,905 | 14,905 |
| Colorado Housing & Finance Authority Single Family Mortgage Revenue VRDO | 0.040% | 11/7/14 | | 22,990 | 22,990 |
| Colorado Housing & Finance Authority Single Family Mortgage Revenue VRDO | 0.040% | 11/7/14 | | 6,100 | 6,100 |
| Colorado Housing & Finance Authority Single Family Mortgage Revenue VRDO | 0.050% | 11/7/14 | | 44,225 | 44,225 |
| Colorado Housing & Finance Authority Single Family Mortgage Revenue VRDO | 0.050% | 11/7/14 | | 26,710 | 26,710 |
| Colorado Housing & Finance Authority Single Family Mortgage Revenue VRDO | 0.050% | 11/7/14 | | 9,435 | 9,435 |
| Colorado Housing & Finance Authority Single Family Mortgage Revenue VRDO | 0.070% | 11/7/14 | | 11,000 | 11,000 |
| Colorado Housing & Finance Authority Single Family Mortgage Revenue VRDO | 0.080% | 11/7/14 | | 15,700 | 15,700 |
| 1 Colorado Regional Transportation District Sales Tax Revenue TOB VRDO | 0.060% | 11/7/14 | | 11,210 | 11,210 |
| Colorado Springs CO Utility System Revenue VRDO | 0.040% | 11/7/14 | | 12,500 | 12,500 |
| Colorado Springs CO Utility System Revenue VRDO | 0.060% | 11/7/14 | | 32,240 | 32,240 |
| 1 Denver CO City & County Airport Revenue TOB VRDO | 0.070% | 11/7/14 | LOC | 25,000 | 25,000 |
| | | | | | 465,169 |
| Connecticut (1.0%) | | | | | |
| Connecticut GO | 1.000% | 12/15/14 | | 40,160 | 40,204 |
| 1 Connecticut Health & Educational Facilities Authority Revenue (Yale University) TOB VRDO | 0.090% | 11/7/14 | | 10,335 | 10,335 |
| Connecticut Health & Educational Facilities Authority Revenue (Yale University) VRDO | 0.030% | 11/7/14 | | 20,665 | 20,665 |
| Connecticut Health & Educational Facilities Authority Revenue (Yale University) VRDO | 0.040% | 11/7/14 | | 10,445 | 10,445 |
| Connecticut Housing Finance Authority Revenue Housing Mortgage Finance Program VRDO | 0.050% | 11/7/14 | | 40,205 | 40,205 |
| Connecticut Housing Finance Authority Revenue Housing Mortgage Finance Program VRDO | 0.060% | 11/7/14 | | 29,050 | 29,050 |
| Greenwich CT BAN | 1.000% | 1/22/15 | | 20,000 | 20,039 |
| Hartford CT GO | 5.000% | 8/1/15 | (Prere.) | 1,970 | 2,041 |
| | | | | | 172,984 |
| Delaware (0.0%) | | | | | |
| 1 Delaware Housing Authority Single Family Mortgage Revenue TOB VRDO | 0.310% | 11/7/14 | | 1,245 | 1,245 |
| |
| District of Columbia (1.2%) | | | | | |
| 1 District of Columbia GO TOB VRDO | 0.050% | 11/7/14 | LOC | 22,725 | 22,725 |
| 2 District of Columbia Income Tax Revenue | 0.090% | 12/1/14 | | 30,000 | 30,000 |
| 1 District of Columbia Income Tax Revenue TOB VRDO | 0.050% | 11/7/14 | | 7,855 | 7,855 |
| 1 District of Columbia Income Tax Revenue TOB VRDO | 0.060% | 11/7/14 | | 9,995 | 9,995 |
| 1 District of Columbia Income Tax Revenue TOB VRDO | 0.070% | 11/7/14 | | 4,200 | 4,200 |
| District of Columbia Revenue (Georgetown University) VRDO | 0.040% | 11/7/14 | LOC | 32,000 | 32,000 |
| District of Columbia Revenue (Henry J. Kaiser Family Foundation) VRDO | 0.090% | 11/7/14 | | 26,000 | 26,000 |
| 1 District of Columbia Water & Sewer Authority Public Utility Revenue TOB VRDO | 0.050% | 11/7/14 | LOC | 12,790 | 12,790 |
| 1 District of Columbia Water & Sewer Authority Public Utility Revenue TOB VRDO | 0.060% | 11/7/14 | | 6,190 | 6,190 |
12
Tax-Exempt Money Market Fund
| | | | | |
| | | | | Face | Market |
| | | Maturity | | Amount | Value• |
| | Coupon | Date | | ($000) | ($000) |
| 1 District of Columbia Water & Sewer Authority Public Utility Revenue TOB VRDO | 0.070% | 11/7/14 | | 9,500 | 9,500 |
| 1 District of Columbia Water & Sewer Authority Public Utility Revenue TOB VRDO | 0.070% | 11/7/14 | | 11,865 | 11,865 |
| District of Columbia Water & Sewer Authority Public Utility Revenue VRDO | 0.030% | 11/7/14 | | 12,125 | 12,125 |
| District of Columbia Water & Sewer Authority Public Utility Revenue VRDO | 0.050% | 11/7/14 | | 10,000 | 10,000 |
| 1 Metropolitan Washington DC/VA Airports Authority Airport System Revenue TOB VRDO | 0.080% | 11/7/14 | | 9,750 | 9,750 |
| | | | | | 204,995 |
| Florida (4.3%) | | | | | |
| 1 Broward County FL GO TOB VRDO | 0.050% | 11/7/14 | | 10,775 | 10,775 |
| 1 Broward County FL School Board COP TOB VRDO | 0.050% | 11/7/14 | LOC | 34,295 | 34,295 |
| 1 Broward County FL Water & Sewer Utility Revenue TOB VRDO | 0.060% | 11/7/14 | | 5,660 | 5,660 |
| 1 Florida Board of Education Public Education Capital Outlay GO TOB VRDO | 0.050% | 11/7/14 | | 12,715 | 12,715 |
| 1 Florida Board of Education Public Education Capital Outlay GO TOB VRDO | 0.050% | 11/7/14 | | 6,265 | 6,265 |
| 1 Florida Board of Education Public Education Capital Outlay GO TOB VRDO | 0.050% | 11/7/14 | | 12,000 | 12,000 |
| 1 Florida Board of Education Public Education Capital Outlay GO TOB VRDO | 0.060% | 11/7/14 | | 9,000 | 9,000 |
| 1 Florida Board of Education Public Education Capital Outlay GO TOB VRDO | 0.060% | 11/7/14 | | 10,110 | 10,110 |
| 1 Florida Department of Management Services COP TOB VRDO | 0.060% | 11/7/14 | | 6,955 | 6,955 |
| 1 Florida Housing Finance Corp. Homeowner Mortgage Revenue TOB VRDO | 0.110% | 11/7/14 | | 1,420 | 1,420 |
| Florida Hurricane Catastrophe Fund Finance Corp. Revenue | 5.000% | 7/1/15 | (ETM) | 12,065 | 12,454 |
| Florida Keys Aqueduct Authority Water Revenue VRDO | 0.040% | 11/7/14 | LOC | 28,350 | 28,350 |
| 1 Florida Ports Financing Commission Revenue TOB PUT | 0.600% | 7/8/15 | | 3,930 | 3,930 |
| 1 Florida Turnpike Authority Revenue TOB VRDO | 0.080% | 11/7/14 | | 56,335 | 56,335 |
| Gainesville FL Utility System Revenue VRDO | 0.070% | 11/3/14 | | 4,600 | 4,600 |
| Gainesville FL Utility System Revenue VRDO | 0.070% | 11/3/14 | | 2,140 | 2,140 |
| 1 Greater Orlando Aviation Authority Florida Airport Facilities Revenue TOB VRDO | 0.060% | 11/7/14 | | 12,000 | 12,000 |
| Jacksonville FL Electric Authority Electric System Revenue CP | 0.060% | 11/4/14 | | 7,300 | 7,300 |
| Jacksonville FL Electric Authority Electric System Revenue VRDO | 0.060% | 11/3/14 | | 1,700 | 1,700 |
| 1 Jacksonville FL Special Revenue TOB VRDO | 0.060% | 11/7/14 | | 3,900 | 3,900 |
| 1 Jacksonville FL Special Revenue TOB VRDO | 0.080% | 11/7/14 | | 11,995 | 11,995 |
| 1 Miami-Dade County FL Aviation Revenue (Miami International Airport) TOB VRDO | 0.080% | 11/7/14 | (13)(12) | 11,500 | 11,500 |
| 1 Miami-Dade County FL Building Better Communities GO TOB VRDO | 0.050% | 11/7/14 | LOC | 23,260 | 23,260 |
| 1 Miami-Dade County FL Building Better Communities GO TOB VRDO | 0.050% | 11/7/14 | LOC | 53,625 | 53,625 |
| 1 Miami-Dade County FL School Board COP TOB VRDO | 0.050% | 11/7/14 | LOC | 15,880 | 15,880 |
| Miami-Dade County FL Seaport Revenue VRDO | 0.050% | 11/7/14 | LOC | 57,800 | 57,800 |
| Miami-Dade County FL Seaport Revenue VRDO | 0.060% | 11/7/14 | LOC | 6,000 | 6,000 |
| 1 Miami-Dade County FL Transit Sales Surtax Revenue TOB VRDO | 0.080% | 11/7/14 | | 21,620 | 21,620 |
| North Broward FL Hospital District Revenue VRDO | 0.050% | 11/7/14 | LOC | 79,050 | 79,050 |
| Orange County FL Health Facilities Authority Hospital Revenue (Orlando Regional | | | | | |
| Healthcare System) VRDO | 0.040% | 11/7/14 | LOC | 4,630 | 4,630 |
| Orange County FL Health Facilities Authority Revenue (Nemours Foundation Project) VRDO | 0.050% | 11/7/14 | | 20,000 | 20,000 |
| 1 Orange County FL Housing Finance Authority Homeowner Revenue (Multi-County Program) | | | | | |
| TOB VRDO | 0.110% | 11/7/14 | | 1,300 | 1,300 |
| 1 Orange County FL School Board COP TOB VRDO | 0.050% | 11/7/14 | LOC | 34,555 | 34,555 |
| 1 Orange County FL School Board COP TOB VRDO | 0.060% | 11/7/14 | | 8,000 | 8,000 |
| 1 Orange County FL School Board COP TOB VRDO | 0.060% | 11/7/14 | | 19,070 | 19,070 |
| Orlando & Orange County FL Expressway Authority Revenue VRDO | 0.040% | 11/7/14 | LOC | 19,900 | 19,900 |
| 1 Palm Beach County FL Public Improvement Revenue TOB VRDO | 0.050% | 11/7/14 | | 8,295 | 8,295 |
| Palm Beach County FL Revenue (Children’s Home Society Project) VRDO | 0.110% | 11/7/14 | LOC | 11,065 | 11,065 |
| Palm Beach County FL Revenue (Community Foundation Palm Beach Project) VRDO | 0.070% | 11/7/14 | LOC | 5,700 | 5,700 |
| 1 Palm Beach County FL School Board COP TOB VRDO | 0.090% | 11/7/14 | | 2,935 | 2,935 |
| 1 South Florida Water Management District COP TOB VRDO | 0.090% | 11/3/14 | | 11,405 | 11,405 |
| 1 South Florida Water Management District COP TOB VRDO | 0.070% | 11/7/14 | | 7,225 | 7,225 |
| 1 South Miami FL Health Facilities Authority Hospital Revenue (Baptist Health South Florida | | | | | |
| Obligated Group) TOB VRDO | 0.080% | 11/7/14 | | 9,360 | 9,360 |
| 1 South Miami FL Health Facilities Authority Hospital Revenue (Baptist Health South Florida | | | | | |
| Obligated Group) TOB VRDO | 0.080% | 11/7/14 | | 37,995 | 37,995 |
| Sunshine State Governmental Financing Commission Florida Revenue | | | | | |
| (Miami Dade County Program) VRDO | 0.050% | 11/7/14 | LOC | 15,180 | 15,180 |
| 1 Tampa Bay FL Water Utility System Revenue TOB VRDO | 0.070% | 11/7/14 | | 6,730 | 6,730 |
| University of Central Florida Athletic Association Inc. COP | 5.000% | 10/1/15 | (Prere.) | 1,805 | 1,885 |
| University of Central Florida Athletic Association Inc. COP | 5.000% | 10/1/15 | (Prere.) | 3,275 | 3,419 |
| | | | | | 751,283 |
| Georgia (3.5%) | | | | | |
| Atlanta GA Development Authority Revenue (Georgia Aquarium Inc. Project) VRDO | 0.050% | 11/7/14 | LOC | 22,280 | 22,280 |
| Cobb County GA Hospital Authority Revenue (Equipment Pool Project) VRDO | 0.050% | 11/7/14 | LOC | 6,600 | 6,600 |
| Cobb County GA Hospital Authority Revenue (Equipment Pool Project) VRDO | 0.050% | 11/7/14 | LOC | 25,000 | 25,000 |
| 1 DeKalb County GA Water & Sewer Revenue TOB VRDO | 0.050% | 11/7/14 | LOC | 26,260 | 26,260 |
| 1 DeKalb County GA Water & Sewer Revenue TOB VRDO | 0.060% | 11/7/14 | | 11,990 | 11,990 |
13
Tax-Exempt Money Market Fund
| | | | | |
| | | | | Face | Market |
| | | Maturity | | Amount | Value• |
| | Coupon | Date | | ($000) | ($000) |
| 1 Fulton County GA Development Authority Revenue (Piedmont Healthcare Inc. Project) | | | | | |
| TOB VRDO | 0.060% | 11/7/14 | | 22,835 | 22,835 |
| Fulton County GA Development Authority Revenue (Piedmont Healthcare Inc. Project) VRDO | 0.050% | 11/7/14 | LOC | 64,095 | 64,095 |
| Fulton County GA Development Authority Revenue (Robert A. Woodruff Arts Center) VRDO | 0.050% | 11/7/14 | LOC | 36,170 | 36,170 |
| Fulton County GA Development Authority Revenue (Shepherd Center Inc. Project) VRDO | 0.050% | 11/7/14 | LOC | 48,075 | 48,075 |
| Fulton County GA TAN | 1.000% | 12/31/14 | | 100,000 | 100,149 |
| Georgia GO | 3.350% | 12/1/14 | | 12,335 | 12,368 |
| Georgia GO | 5.000% | 7/1/15 | | 1,000 | 1,032 |
| 1 Georgia GO TOB VRDO | 0.080% | 11/7/14 | | 10,620 | 10,620 |
| 1 Gwinnett County GA School District GO TOB VRDO | 0.050% | 11/7/14 | | 12,105 | 12,105 |
| Macon-Bibb County GA Hospital Authority Revenue (Medical Center of Central Georgia) VRDO | 0.050% | 11/7/14 | LOC | 39,650 | 39,650 |
| Macon-Bibb County GA Hospital Authority Revenue (Medical Center of Central Georgia) VRDO | 0.050% | 11/7/14 | LOC | 11,860 | 11,860 |
| Main Street Natural Gas Inc. Georgia Gas Project Revenue VRDO | 0.050% | 11/7/14 | | 89,300 | 89,300 |
| 1 Private Colleges & University Authority of Georgia Revenue (Emory University) TOB VRDO | 0.050% | 11/7/14 | | 15,145 | 15,145 |
| 1 Private Colleges & University Authority of Georgia Revenue (Emory University) TOB VRDO | 0.060% | 11/7/14 | | 5,630 | 5,630 |
| 1 Private Colleges & University Authority of Georgia Revenue (Emory University) TOB VRDO | 0.070% | 11/7/14 | | 4,000 | 4,000 |
| Private Colleges & University Authority of Georgia Revenue (Emory University) VRDO | 0.040% | 11/7/14 | | 22,100 | 22,100 |
| Private Colleges & University Authority of Georgia Revenue (Emory University) VRDO | 0.050% | 11/7/14 | | 28,400 | 28,400 |
| | | | | | 615,664 |
| Hawaii (0.3%) | | | | | |
| Honolulu HI City & County GO CP | 0.080% | 2/4/15 | | 7,500 | 7,500 |
| 1 Honolulu HI City & County Wastewater System Revenue TOB VRDO | 0.050% | 11/7/14 | LOC | 16,125 | 16,125 |
| 1 University of Hawaii Revenue TOB VRDO | 0.060% | 11/7/14 | (13)(1) | 19,800 | 19,800 |
| | | | | | 43,425 |
| Idaho (1.0%) | | | | | |
| Idaho Building Authority Revenue (Prison Facilities Project) VRDO | 0.050% | 11/7/14 | | 7,385 | 7,385 |
| 2 Idaho Health Facilities Authority Hospital Revenue (Trinity Health Group) PUT | 0.120% | 5/29/15 | | 10,915 | 10,915 |
| Idaho Housing & Finance Association Single Family Mortgage Revenue VRDO | 0.100% | 11/7/14 | | 7,515 | 7,515 |
| Idaho Housing & Finance Association Single Family Mortgage Revenue VRDO | 0.100% | 11/7/14 | | 6,950 | 6,950 |
| Idaho Housing & Finance Association Single Family Mortgage Revenue VRDO | 0.100% | 11/7/14 | | 8,330 | 8,330 |
| Idaho Housing & Finance Association Single Family Mortgage Revenue VRDO | 0.100% | 11/7/14 | | 4,485 | 4,485 |
| Idaho Housing & Finance Association Single Family Mortgage Revenue VRDO | 0.100% | 11/7/14 | | 6,590 | 6,590 |
| Idaho Housing & Finance Association Single Family Mortgage Revenue VRDO | 0.100% | 11/7/14 | | 5,375 | 5,375 |
| Idaho Housing & Finance Association Single Family Mortgage Revenue VRDO | 0.100% | 11/7/14 | | 6,620 | 6,620 |
| Idaho Housing & Finance Association Single Family Mortgage Revenue VRDO | 0.100% | 11/7/14 | | 7,150 | 7,150 |
| Idaho Housing & Finance Association Single Family Mortgage Revenue VRDO | 0.100% | 11/7/14 | | 10,170 | 10,170 |
| Idaho Housing & Finance Association Single Family Mortgage Revenue VRDO | 0.100% | 11/7/14 | | 10,250 | 10,250 |
| Idaho Housing & Finance Association Single Family Mortgage Revenue VRDO | 0.100% | 11/7/14 | | 9,865 | 9,865 |
| Idaho Housing & Finance Association Single Family Mortgage Revenue VRDO | 0.100% | 11/7/14 | | 8,835 | 8,835 |
| Idaho Housing & Finance Association Unemployment Compensation Revenue | 5.000% | 8/15/15 | | 5,000 | 5,187 |
| Idaho TAN | 2.000% | 6/30/15 | | 60,000 | 60,748 |
| | | | | | 176,370 |
| Illinois (5.0%) | | | | | |
| Channahon IL Revenue (Morris Hospital) VRDO | 0.050% | 11/7/14 | LOC | 3,760 | 3,760 |
| Channahon IL Revenue (Morris Hospital) VRDO | 0.050% | 11/7/14 | LOC | 4,825 | 4,825 |
| Chicago IL Board of Education GO VRDO | 0.050% | 11/7/14 | LOC | 14,220 | 14,220 |
| 1 Chicago IL Metropolitan Water Reclamation District GO TOB VRDO | 0.050% | 11/7/14 | | 9,385 | 9,385 |
| 1 Chicago IL Metropolitan Water Reclamation District GO TOB VRDO | 0.100% | 11/7/14 | | 12,000 | 12,000 |
| Chicago IL Midway Airport Revenue VRDO | 0.060% | 11/7/14 | LOC | 41,570 | 41,570 |
| Chicago IL Water Revenue VRDO | 0.070% | 11/7/14 | LOC | 6,440 | 6,440 |
| Chicago IL Water Revenue VRDO | 0.080% | 11/7/14 | LOC | 18,015 | 18,015 |
| Chicago IL Water Revenue VRDO | 0.080% | 11/7/14 | LOC | 4,860 | 4,860 |
| Illinois Educational Facilities Authority (Pooled Financing Program) CP | 0.080% | 11/4/14 | LOC | 20,655 | 20,655 |
| Illinois Educational Facilities Authority (Pooled Financing Program) CP | 0.060% | 11/6/14 | LOC | 25,223 | 25,223 |
| Illinois Educational Facilities Authority (Pooled Financing Program) CP | 0.070% | 12/3/14 | LOC | 35,000 | 35,000 |
| Illinois Educational Facilities Authority Revenue (Columbia College Chicago) VRDO | 0.050% | 11/7/14 | LOC | 14,900 | 14,900 |
| Illinois Educational Facilities Authority Revenue (University of Chicago) PUT | 0.160% | 3/12/15 | | 10,000 | 10,000 |
| 1 Illinois Educational Facilities Authority Revenue (University of Chicago) TOB VRDO | 0.050% | 11/7/14 | | 5,200 | 5,200 |
| 1 Illinois Educational Facilities Authority Revenue (University of Chicago) TOB VRDO | 0.070% | 11/7/14 | | 9,185 | 9,185 |
| 2 Illinois Finance Authority Revenue (Advocate Health Care Network) PUT | 0.170% | 5/29/15 | | 11,500 | 11,500 |
| 1 Illinois Finance Authority Revenue (Advocate Health Care Network) TOB VRDO | 0.060% | 11/7/14 | | 25,000 | 25,000 |
| 1 Illinois Finance Authority Revenue (Advocate Health Care Network) TOB VRDO | 0.080% | 11/7/14 | | 33,140 | 33,140 |
| Illinois Finance Authority Revenue (Advocate Health Care Network) VRDO | 0.050% | 11/7/14 | | 61,640 | 61,640 |
| Illinois Finance Authority Revenue (Bradley University) VRDO | 0.050% | 11/7/14 | LOC | 28,385 | 28,385 |
| 1 Illinois Finance Authority Revenue (Central DuPage Health) TOB VRDO | 0.060% | 11/7/14 | | 13,125 | 13,125 |
| Illinois Finance Authority Revenue (Chicago Horticulture Project) VRDO | 0.060% | 11/7/14 | LOC | 21,000 | 21,000 |
| 1 Illinois Finance Authority Revenue (Chicago University) TOB VRDO | 0.080% | 11/7/14 | | 9,990 | 9,990 |
| Illinois Finance Authority Revenue (Evangelical Project) VRDO | 0.050% | 11/7/14 | LOC | 4,670 | 4,670 |
| Illinois Finance Authority Revenue (Hospital Sister Services Inc.) CP | 0.090% | 11/5/14 | | 25,000 | 25,000 |
14
Tax-Exempt Money Market Fund
| | | | | |
| | | | | Face | Market |
| | | Maturity | | Amount | Value• |
| | Coupon | Date | | ($000) | ($000) |
| Illinois Finance Authority Revenue (Methodist Medical Center) VRDO | 0.060% | 11/7/14 | LOC | 11,500 | 11,500 |
| 1 Illinois Finance Authority Revenue (Northshore University Health System) TOB VRDO | 0.060% | 11/7/14 | | 4,375 | 4,375 |
| 1 Illinois Finance Authority Revenue (Northwestern Memorial Hospital) TOB VRDO | 0.060% | 11/7/14 | | 6,000 | 6,000 |
| 1 Illinois Finance Authority Revenue (Northwestern University) TOB VRDO | 0.050% | 11/7/14 | | 8,165 | 8,165 |
| Illinois Finance Authority Revenue (Northwestern University) VRDO | 0.030% | 11/7/14 | | 14,000 | 14,000 |
| Illinois Finance Authority Revenue (Rush University Medical Center) VRDO | 0.040% | 11/7/14 | LOC | 12,000 | 12,000 |
| Illinois Finance Authority Revenue (Trinity International University) VRDO | 0.050% | 11/7/14 | LOC | 11,490 | 11,490 |
| 1 Illinois Finance Authority Revenue (University of Chicago Medical Center) TOB VRDO | 0.080% | 11/7/14 | | 10,200 | 10,200 |
| 1 Illinois Finance Authority Revenue (University of Chicago) TOB VRDO | 0.050% | 11/7/14 | | 20,500 | 20,500 |
| Illinois Finance Authority Revenue (University of Chicago) VRDO | 0.060% | 11/7/14 | | 14,999 | 14,999 |
| Illinois Finance Authority Revenue (University of Chicago) VRDO | 0.060% | 11/7/14 | | 16,000 | 16,000 |
| Illinois GO VRDO | 0.040% | 11/7/14 | LOC | 18,000 | 18,000 |
| Illinois GO VRDO | 0.050% | 11/7/14 | LOC | 17,000 | 17,000 |
| Illinois Health Facilities Authority Revenue (Elmhurst Memorial Hospital) VRDO | 0.050% | 11/7/14 | LOC | 16,100 | 16,100 |
| Illinois Health Facilities Authority Revenue (Northwestern Memorial Hospital) VRDO | 0.070% | 11/3/14 | | 2,500 | 2,500 |
| Illinois Housing Development Authority (Lakeshore Plaza) VRDO | 0.050% | 11/7/14 | LOC | 9,875 | 9,875 |
| Illinois Housing Development Authority (Larkin Village) VRDO | 0.060% | 11/7/14 | LOC | 5,370 | 5,370 |
| Illinois Toll Highway Authority Revenue | 5.000% | 7/1/15 | (Prere.) | 9,715 | 10,029 |
| 1 Illinois Toll Highway Authority Toll Highway Revenue TOB VRDO | 0.060% | 11/7/14 | | 14,900 | 14,900 |
| 1 Illinois Toll Highway Authority Toll Highway Revenue TOB VRDO | 0.060% | 11/7/14 | | 8,995 | 8,995 |
| 1 Metropolitan Pier & Exposition Authority Illinois Dedicated Sales Tax Revenue TOB VRDO | 0.050% | 11/7/14 | | 41,760 | 41,760 |
| 1 Metropolitan Pier & Exposition Authority Illinois Dedicated Sales Tax Revenue TOB VRDO | 0.050% | 11/7/14 | | 28,685 | 28,685 |
| 1 Metropolitan Pier & Exposition Authority Illinois Dedicated Sales Tax Revenue TOB VRDO | 0.050% | 11/7/14 | | 11,750 | 11,750 |
| 1 Metropolitan Pier & Exposition Authority Illinois Dedicated Sales Tax Revenue TOB VRDO | 0.050% | 11/7/14 | | 8,125 | 8,125 |
| 1 Metropolitan Pier & Exposition Authority Illinois Dedicated Sales Tax Revenue TOB VRDO | 0.060% | 11/7/14 | | 12,640 | 12,640 |
| 1 Metropolitan Pier & Exposition Authority Illinois Dedicated Sales Tax Revenue TOB VRDO | 0.070% | 11/7/14 | | 13,400 | 13,400 |
| 1 Metropolitan Pier & Exposition Authority Illinois Dedicated Sales Tax Revenue TOB VRDO | 0.080% | 11/7/14 | | 28,500 | 28,500 |
| 1 University of Illinois Auxiliary Facilities System Revenue TOB VRDO | 0.090% | 11/7/14 | | 19,300 | 19,300 |
| | | | | | 864,846 |
| Indiana (4.0%) | | | | | |
| Indiana Bond Bank Revenue Interim Advance Funding Program TAN | 1.250% | 1/6/15 | | 12,700 | 12,723 |
| Indiana Finance Authority Environmental Improvement Revenue (Ispat Inland Inc. Project) | | | | | |
| VRDO | 0.040% | 11/7/14 | LOC | 26,000 | 26,000 |
| 1 Indiana Finance Authority Hospital Revenue (Indiana University) TOB VRDO | 0.050% | 11/7/14 | LOC | 10,000 | 10,000 |
| Indiana Finance Authority Hospital Revenue (Indiana University) VRDO | 0.040% | 11/7/14 | LOC | 16,215 | 16,215 |
| Indiana Finance Authority Hospital Revenue (Indiana University) VRDO | 0.050% | 11/7/14 | LOC | 42,600 | 42,600 |
| Indiana Finance Authority Midwestern Disaster Relief Revenue (Ohio Valley Electric | | | | | |
| Corp. Project) VRDO | 0.050% | 11/7/14 | LOC | 10,000 | 10,000 |
| Indiana Finance Authority Revenue (Ascension Health Credit Group) VRDO | 0.050% | 11/7/14 | | 26,825 | 26,825 |
| Indiana Finance Authority Revenue (Ascension Health Credit Group) VRDO | 0.050% | 11/7/14 | | 17,000 | 17,000 |
| Indiana Finance Authority Revenue (Columbus Regional Hospital) VRDO | 0.060% | 11/7/14 | LOC | 6,200 | 6,200 |
| 1 Indiana Finance Authority Revenue (State Revolving Fund) TOB VRDO | 0.050% | 11/7/14 | | 40 | 40 |
| 1 Indiana Health Facility Financing Authority Revenue (Ascension Health Credit Group) | | | | | |
| TOB VRDO | 0.060% | 11/7/14 | | 12,750 | 12,750 |
| 1 Indiana Housing & Community Development Authority Single Family Mortgage Revenue | | | | | |
| TOB VRDO | 0.050% | 11/7/14 | | 54,475 | 54,475 |
| 1 Indiana Housing & Community Development Authority Single Family Mortgage Revenue | | | | | |
| TOB VRDO | 0.110% | 11/7/14 | | 485 | 485 |
| 1 Indianapolis IN Local Public Improvement Bond Bank Revenue TOB VRDO | 0.240% | 11/7/14 | | 13,360 | 13,360 |
| Lawrenceburg IN Pollution Control Revenue VRDO | 0.040% | 11/7/14 | LOC | 5,500 | 5,500 |
| Posey County IN Economic Development Revenue (Midwest Fertilizer Corp. Project) PUT | 0.300% | 11/18/14 | | 415,000 | 415,000 |
| 1 Wayne Township Marion County IN School Building Corp. Mortgage Revenue TOB VRDO | 0.050% | 11/7/14 | LOC | 30,575 | 30,575 |
| | | | | | 699,748 |
| Iowa (0.3%) | | | | | |
| 1 Iowa Finance Authority Health Facilities Revenue (UnityPoint Health) TOB VRDO | 0.080% | 11/7/14 | | 10,500 | 10,500 |
| Iowa Finance Authority Single Family Mortgage Revenue VRDO | 0.080% | 11/7/14 | | 8,830 | 8,830 |
| Iowa Finance Authority Single Family Mortgage Revenue VRDO | 0.080% | 11/7/14 | | 9,205 | 9,205 |
| Iowa Finance Authority Single Family Mortgage Revenue VRDO | 0.080% | 11/7/14 | | 9,020 | 9,020 |
| 1 Iowa Special Obligation Revenue (Ijobs Program) TOB VRDO | 0.100% | 11/7/14 | | 8,500 | 8,500 |
| 1 Iowa Special Obligation Revenue TOB VRDO | 0.100% | 11/7/14 | | 11,200 | 11,200 |
| | | | | | 57,255 |
| Kansas (0.8%) | | | | | |
| 1 Kansas Department of Transportation Highway Revenue TOB VRDO | 0.050% | 11/7/14 | | 5,990 | 5,990 |
| 2 Kansas Department of Transportation Revenue | 0.092% | 9/1/15 | | 7,400 | 7,400 |
| 1 Kansas Development Finance Authority Hospital Revenue (Adventist Health System/ | | | | | |
| Sunbelt Obligated Group) TOB VRDO | 0.060% | 11/7/14 | | 9,225 | 9,225 |
15
Tax-Exempt Money Market Fund
| | | | | |
| | | | | Face | Market |
| | | Maturity | | Amount | Value• |
| | Coupon | Date | | ($000) | ($000) |
| 1 Kansas Development Finance Authority Hospital Revenue (Adventist Health System/ | | | | | |
| Sunbelt Obligated Group) TOB VRDO | 0.070% | 11/7/14 | | 8,000 | 8,000 |
| Leawood KS GO | 1.000% | 9/1/15 | | 22,060 | 22,212 |
| Sedgwick County KS Airport Facility Revenue (FlightSafety International Inc. Project) VRDO | 0.110% | 11/7/14 | | 34,000 | 34,000 |
| Wichita KS BAN | 0.250% | 10/15/15 | | 24,550 | 24,556 |
| Wichita KS BAN | 0.300% | 10/15/15 | | 24,435 | 24,440 |
| | | | | | 135,823 |
| Kentucky (0.7%) | | | | | |
| Kentucky Economic Development Finance Authority Hospital Facilities Revenue | | | | | |
| (St. Elizabeth Medical Center Inc.) VRDO | 0.050% | 11/7/14 | | 32,500 | 32,500 |
| Kentucky Economic Development Finance Authority Hospital Revenue (Baptist Healthcare | | | | | |
| System Obligated Group) VRDO | 0.040% | 11/7/14 | LOC | 12,000 | 12,000 |
| Kentucky Higher Education Student Loan Corp. Student Loan Revenue VRDO | 0.060% | 11/7/14 | LOC | 26,000 | 26,000 |
| Kentucky Housing Corp. Housing Revenue VRDO | 0.060% | 11/7/14 | | 17,540 | 17,540 |
| Kentucky Housing Corp. Housing Revenue VRDO | 0.060% | 11/7/14 | | 9,750 | 9,750 |
| 1 Kentucky Turnpike Authority Economic Development Road Revenue (Revitalization Project) | | | | | |
| TOB VRDO | 0.050% | 11/7/14 | | 10,220 | 10,220 |
| 1 Louisville & Jefferson County KY Metropolitan Government Parking Revenue TOB VRDO | 0.060% | 11/7/14 | | 6,125 | 6,125 |
| Richmond KY League of Cities Funding Lease Program Revenue VRDO | 0.060% | 11/7/14 | LOC | 5,900 | 5,900 |
| Williamstown KY League of Cities Funding Trust Lease Revenue VRDO | 0.060% | 11/7/14 | LOC | 2,700 | 2,700 |
| Williamstown KY League of Cities Funding Trust Lease Revenue VRDO | 0.060% | 11/7/14 | LOC | 3,500 | 3,500 |
| | | | | | 126,235 |
| Louisiana (1.6%) | | | | | |
| Ascension Parish LA Industrial Development Board Revenue (IMTT-Geismar Project) VRDO | 0.050% | 11/7/14 | LOC | 85,000 | 85,000 |
| East Baton Rouge Parish LA Sales Tax Revenue | 5.000% | 2/1/15 | (Prere.) | 1,300 | 1,316 |
| Louisiana Public Facilities Authority Revenue (CHRISTUS Health) VRDO | 0.050% | 11/7/14 | LOC | 13,905 | 13,905 |
| Louisiana Public Facilities Authority Revenue (International-Matex Tank Terminals Project) | | | | | |
| VRDO | 0.050% | 11/7/14 | LOC | 55,000 | 55,000 |
| Louisiana Public Facilities Authority Revenue (International-Matex Tank Terminals Project) | | | | | |
| VRDO | 0.050% | 11/7/14 | LOC | 50,000 | 50,000 |
| Louisiana Public Facilities Authority Revenue (Tiger Athletic Foundation Project) VRDO | 0.050% | 11/7/14 | LOC | 18,675 | 18,675 |
| St. James Parish LA Revenue (Nustar Logistics LP Project) VRDO | 0.050% | 11/7/14 | LOC | 45,740 | 45,740 |
| | | | | | 269,636 |
| Maine (0.3%) | | | | | |
| Maine Health & Higher Educational Facilities Authority Revenue VRDO | 0.060% | 11/7/14 | LOC | 13,650 | 13,650 |
| 1 Maine Housing Authority Mortgage Revenue TOB VRDO | 0.110% | 11/7/14 | | 5,510 | 5,510 |
| Maine Housing Authority Mortgage Revenue VRDO | 0.050% | 11/7/14 | | 20,000 | 20,000 |
| Maine Housing Authority Mortgage Revenue VRDO | 0.050% | 11/7/14 | | 9,000 | 9,000 |
| | | | | | 48,160 |
| Maryland (3.3%) | | | | | |
| Baltimore County MD BAN | 1.000% | 2/25/15 | | 84,000 | 84,231 |
| Baltimore County MD BAN | 1.000% | 2/25/15 | | 114,000 | 114,314 |
| Baltimore County MD GO | 5.000% | 2/1/15 | | 9,000 | 9,110 |
| 1 Baltimore MD GO TOB VRDO | 0.060% | 11/7/14 | | 7,500 | 7,500 |
| 1 Maryland Department of Housing & Community Development Revenue TOB VRDO | 0.080% | 11/7/14 | | 7,440 | 7,440 |
| 1 Maryland Department of Housing & Community Development Revenue TOB VRDO | 0.090% | 11/7/14 | | 7,520 | 7,520 |
| 1 Maryland Department of Housing & Community Development Revenue TOB VRDO | 0.090% | 11/7/14 | | 3,340 | 3,340 |
| 1 Maryland Department of Housing & Community Development Revenue TOB VRDO | 0.090% | 11/7/14 | | 4,430 | 4,430 |
| Maryland Department of Housing & Community Development Revenue VRDO | 0.070% | 11/7/14 | | 37,200 | 37,200 |
| Maryland GO | 5.250% | 2/15/15 | | 1,325 | 1,344 |
| 1 Maryland Health & Higher Educational Facilities Authority Revenue (Johns Hopkins | | | | | |
| Health System) TOB VRDO | 0.060% | 11/7/14 | | 5,000 | 5,000 |
| Maryland Health & Higher Educational Facilities Authority Revenue (Johns Hopkins University) | | | | | |
| CP | 0.060% | 11/5/14 | | 20,000 | 20,000 |
| 1 Maryland Health & Higher Educational Facilities Authority Revenue (Johns Hopkins University) | | | | | |
| TOB VRDO | 0.050% | 11/7/14 | | 7,585 | 7,585 |
| 1 Maryland Health & Higher Educational Facilities Authority Revenue (Johns Hopkins University) | | | | | |
| TOB VRDO | 0.050% | 11/7/14 | | 8,265 | 8,265 |
| Maryland Health & Higher Educational Facilities Authority Revenue (University of Maryland | | | | | |
| Medical System) VRDO | 0.050% | 11/7/14 | LOC | 40,340 | 40,340 |
| 1 Maryland Transportation Authority Facilities Projects Revenue TOB VRDO | 0.050% | 11/7/14 | | 15,265 | 15,265 |
| 1 Maryland Transportation Authority Facilities Projects Revenue TOB VRDO | 0.060% | 11/7/14 | | 13,860 | 13,860 |
| Montgomery County MD GO | 5.000% | 11/1/14 | | 9,675 | 9,675 |
| Montgomery County MD GO CP | 0.100% | 11/5/14 | | 30,895 | 30,895 |
| Montgomery County MD GO CP | 0.090% | 11/6/14 | | 37,000 | 37,000 |
| Montgomery County MD GO CP | 0.100% | 11/6/14 | | 39,105 | 39,105 |
| Montgomery County MD GO CP | 0.070% | 12/3/14 | | 9,105 | 9,105 |
| Montgomery County MD Housing Opportunities Commission Multifamily Housing Revenue | | | | | |
| (Canterbury Apartments) VRDO | 0.050% | 11/7/14 | LOC | 8,030 | 8,030 |
| Prince Georges County MD | 2.000% | 9/1/15 | | 5,435 | 5,518 |
16
Tax-Exempt Money Market Fund
| | | | | |
| | | | | Face | Market |
| | | Maturity | | Amount | Value• |
| | Coupon | Date | | ($000) | ($000) |
| Washington Suburban Sanitation District Maryland GO VRDO | 0.040% | 11/7/14 | | 16,700 | 16,700 |
| Washington Suburban Sanitation District Maryland GO VRDO | 0.050% | 11/7/14 | | 15,400 | 15,400 |
| Washington Suburban Sanitation District Maryland GO VRDO | 0.050% | 11/7/14 | | 12,500 | 12,500 |
| | | | | | 570,672 |
| Massachusetts (2.4%) | | | | | |
| Massachusetts Bay Transportation Authority Sales Tax Revenue CP | 0.090% | 12/9/14 | | 27,575 | 27,575 |
| 2 Massachusetts Bay Transportation Authority Sales Tax Revenue PUT | 0.140% | 5/29/15 | | 3,210 | 3,210 |
| Massachusetts Department of Transportation Metropolitan Highway System Revenue VRDO | 0.050% | 11/7/14 | | 43,625 | 43,625 |
| Massachusetts Department of Transportation Metropolitan Highway System Revenue VRDO | 0.050% | 11/7/14 | | 50,400 | 50,400 |
| Massachusetts Department of Transportation Metropolitan Highway System Revenue VRDO | 0.060% | 11/7/14 | | 12,085 | 12,085 |
| Massachusetts Development Finance Agency Revenue (Cushing Academy Issue) VRDO | 0.050% | 11/7/14 | LOC | 8,365 | 8,365 |
| 2 Massachusetts GO | 0.220% | 1/1/15 | | 7,500 | 7,500 |
| Massachusetts GO | 5.000% | 3/1/15 | (Prere.) | 6,500 | 6,604 |
| 1 Massachusetts GO TOB VRDO | 0.050% | 11/7/14 | | 15,195 | 15,195 |
| 1 Massachusetts GO TOB VRDO | 0.060% | 11/7/14 | | 3,750 | 3,750 |
| 1 Massachusetts GO TOB VRDO | 0.060% | 11/7/14 | | 1,850 | 1,850 |
| 1 Massachusetts Health & Educational Facilities Authority Revenue (Harvard University) | | | | | |
| TOB VRDO | 0.080% | 11/3/14 | | 13,500 | 13,500 |
| Massachusetts Health & Educational Facilities Authority Revenue (MIT) VRDO | 0.050% | 11/7/14 | | 42,630 | 42,630 |
| Massachusetts Health & Educational Facilities Authority Revenue (Museum of Fine Arts) VRDO | 0.060% | 11/3/14 | | 4,500 | 4,500 |
| Massachusetts Health & Educational Facilities Authority Revenue (Pool Loan Program) VRDO | 0.060% | 11/7/14 | LOC | 18,100 | 18,100 |
| 1 Massachusetts Housing Finance Agency Multifamily Housing Revenue TOB VRDO | 0.100% | 11/7/14 | | 5,515 | 5,515 |
| Massachusetts RAN | 1.500% | 5/28/15 | | 54,000 | 54,427 |
| Massachusetts School Building Authority Dedicated Sales Tax Revenue | 5.000% | 8/15/15 | (Prere.) | 845 | 877 |
| Massachusetts School Building Authority Dedicated Sales Tax Revenue BAN | 1.500% | 7/16/15 | | 15,000 | 15,145 |
| 1 Massachusetts School Building Authority Dedicated Sales Tax Revenue TOB VRDO | 0.060% | 11/7/14 | | 5,000 | 5,000 |
| 1 Massachusetts School Building Authority Dedicated Sales Tax Revenue TOB VRDO | 0.060% | 11/7/14 | | 4,125 | 4,125 |
| Massachusetts Water Pollution Abatement Trust Revenue | 5.000% | 8/1/15 | | 5,000 | 5,182 |
| 1 Massachusetts Water Resources Authority Revenue TOB VRDO | 0.050% | 11/7/14 | | 7,300 | 7,300 |
| 1 Massachusetts Water Resources Authority Revenue TOB VRDO | 0.050% | 11/7/14 | | 7,500 | 7,500 |
| 1 Massachusetts Water Resources Authority Revenue TOB VRDO | 0.060% | 11/7/14 | | 5,000 | 5,000 |
| Massachusetts Water Resources Authority Revenue VRDO | 0.040% | 11/7/14 | | 24,800 | 24,800 |
| Methuen MA GO BAN | 2.000% | 8/7/15 | | 15,415 | 15,609 |
| 2 University of Massachusetts Building Authority Revenue PUT | 0.140% | 5/29/15 | | 16,155 | 16,155 |
| | | | | | 425,524 |
| Michigan (2.4%) | | | | | |
| 1 Michigan Finance Authority Hospital Revenue Bonds (Trinity Health Credit Group) TOB VRDO | 0.050% | 11/7/14 | LOC | 15,000 | 15,000 |
| Michigan Hospital Finance Authority Revenue (Trinity Health) VRDO | 0.030% | 11/7/14 | | 22,825 | 22,825 |
| Michigan Housing Development Authority Single Family Mortgage Revenue VRDO | 0.050% | 11/7/14 | | 57,850 | 57,850 |
| Michigan Housing Development Authority Single Family Mortgage Revenue VRDO | 0.060% | 11/7/14 | | 31,220 | 31,220 |
| Michigan Housing Development Authority Single Family Mortgage Revenue VRDO | 0.060% | 11/7/14 | | 107,040 | 107,040 |
| Michigan State University Board of Trustees General Revenue VRDO | 0.040% | 11/7/14 | | 42,140 | 42,140 |
| Michigan State University Board of Trustees General Revenue VRDO | 0.040% | 11/7/14 | | 33,400 | 33,400 |
| Michigan State University Revenue CP | 0.080% | 11/5/14 | | 13,690 | 13,690 |
| Michigan State University Revenue CP | 0.080% | 1/14/15 | | 9,160 | 9,160 |
| Michigan State University Revenue CP | 0.080% | 1/15/15 | | 8,220 | 8,220 |
| Regents of the University of Michigan CP | 0.060% | 12/11/14 | | 51,000 | 51,000 |
| University of Michigan Revenue VRDO | 0.040% | 11/7/14 | | 25,145 | 25,145 |
| 1 Wayne State University Michigan Revenue TOB VRDO | 0.100% | 11/7/14 | | 5,000 | 5,000 |
| | | | | | 421,690 |
| Minnesota (1.8%) | | | | | |
| 1 Minneapolis MN Health Care System Revenue (Fairview Health Services) TOB VRDO | 0.050% | 11/7/14 | LOC | 20,000 | 20,000 |
| Minnesota GO | 5.000% | 11/1/14 | (Prere.) | 4,865 | 4,865 |
| 1 Minnesota GO TOB VRDO | 0.060% | 11/7/14 | | 3,510 | 3,510 |
| Minnesota Housing Finance Agency Residential Housing Revenue VRDO | 0.070% | 11/7/14 | | 25,000 | 25,000 |
| Minnesota Housing Finance Agency Residential Housing Revenue VRDO | 0.070% | 11/7/14 | | 6,025 | 6,025 |
| Minnesota Office of Higher Education Revenue (Supplemental Student Loan Program) VRDO | 0.060% | 11/7/14 | LOC | 99,700 | 99,700 |
| Minnesota School District TRAN | 2.000% | 9/15/15 | | 9,420 | 9,572 |
| Rochester MN Healthcare Facilities Revenue (Mayo Foundation) CP | 0.120% | 11/13/14 | | 8,400 | 8,400 |
| Rochester MN Healthcare Facilities Revenue (Mayo Foundation) CP | 0.150% | 11/20/14 | | 105,000 | 105,000 |
| University of Minnesota Revenue CP | 0.090% | 12/4/14 | | 8,700 | 8,700 |
| University of Minnesota Revenue CP | 0.060% | 12/8/14 | | 17,260 | 17,260 |
| | | | | | 308,032 |
| Mississippi (0.4%) | | | | | |
| Jackson County MS Pollution Control Revenue (Chevron USA Inc. Project) VRDO | 0.070% | 11/3/14 | | 15,950 | 15,950 |
| Mississippi Business Finance Corp. Gulf Opportunity Zone Industrial Development Revenue | | | | | |
| (Chevron USA Inc. Project) VRDO | 0.080% | 11/3/14 | | 5,700 | 5,700 |
17
Tax-Exempt Money Market Fund
| | | | | |
| | | | | Face | Market |
| | | Maturity | | Amount | Value• |
| | Coupon | Date | | ($000) | ($000) |
| Mississippi Business Finance Corp. Gulf Opportunity Zone Industrial Development Revenue | | | | | |
| (Chevron USA Inc. Project) VRDO | 0.050% | 11/7/14 | | 28,400 | 28,400 |
| Mississippi GO | 5.500% | 9/1/15 | | 4,035 | 4,213 |
| Mississippi Hospital Equipment & Facilities Authority Revenue (North Mississippi | | | | | |
| Health Services) VRDO | 0.060% | 11/7/14 | | 14,890 | 14,890 |
| | | | | | 69,153 |
| Missouri (2.4%) | | | | | |
| Kansas City MO GO | 2.000% | 2/1/15 | | 5,000 | 5,024 |
| 2 Missouri Health & Education Facilities Authority Revenue (BJC Health System) PUT | 0.120% | 5/29/15 | | 20,000 | 20,000 |
| 1 Missouri Health & Education Facilities Authority Revenue (St. Luke’s Health System)TOB VRDO | 0.050% | 11/7/14 | LOC | 41,995 | 41,995 |
| Missouri Health & Educational Facilities Authority Health Facilities Revenue | | | | | |
| (BJC Health System) VRDO | 0.030% | 11/7/14 | | 17,175 | 17,175 |
| Missouri Health & Educational Facilities Authority Health Facilities Revenue | | | | | |
| (BJC Health System) VRDO | 0.030% | 11/7/14 | | 28,000 | 28,000 |
| Missouri Health & Educational Facilities Authority Health Facilities Revenue | | | | | |
| (BJC Health System) VRDO | 0.040% | 11/7/14 | | 45,800 | 45,800 |
| Missouri Health & Educational Facilities Authority Health Facilities Revenue | | | | | |
| (BJC Health System) VRDO | 0.040% | 11/7/14 | | 34,700 | 34,700 |
| Missouri Health & Educational Facilities Authority Health Facilities Revenue | | | | | |
| (BJC Health System) VRDO | 0.060% | 11/7/14 | | 40,645 | 40,645 |
| Missouri Health & Educational Facilities Authority Revenue (Ascension Health Credit Group) | | | | | |
| VRDO | 0.040% | 11/7/14 | | 23,810 | 23,810 |
| Missouri Health & Educational Facilities Authority Revenue (Ascension Health Credit Group) | | | | | |
| VRDO | 0.040% | 11/7/14 | | 22,000 | 22,000 |
| 1 Missouri Health & Educational Facilities Authority Revenue (BJC Health System) TOB VRDO | 0.080% | 11/7/14 | | 64,995 | 64,995 |
| 1 Missouri Health & Educational Facilities Authority Revenue (Washington University) TOB VRDO | 0.050% | 11/7/14 | | 15,800 | 15,800 |
| 1 Missouri Health & Educational Facilities Authority Revenue (Washington University) TOB VRDO | 0.060% | 11/7/14 | | 5,570 | 5,570 |
| Missouri Highways & Transportation Commission Road Revenue VRDO | 0.050% | 11/7/14 | LOC | 8,950 | 8,950 |
| St. Joseph MO Industrial Development Authority Health Facilities Revenue | | | | | |
| (Heartland Regional Medical Center) VRDO | 0.050% | 11/7/14 | LOC | 17,500 | 17,500 |
| St. Louis MO General Fund TRAN | 2.000% | 5/29/15 | | 32,500 | 32,844 |
| | | | | | 424,808 |
| Multiple States (8.0%) | | | | | |
| 1 BlackRock Municipal Bond Investment Trust VRDP VRDO | 0.140% | 11/7/14 | LOC | 8,500 | 8,500 |
| 1 BlackRock MuniYield Quality Fund, Inc. VRDP VRDO | 0.140% | 11/7/14 | LOC | 27,000 | 27,000 |
| Federal Home Loan Mortgage Corp. Multifamily Housing Revenue TOB VRDO | 0.060% | 11/7/14 | LOC | 26,105 | 26,105 |
| Federal Home Loan Mortgage Corp. Multifamily Housing Revenue TOB VRDO | 0.060% | 11/7/14 | LOC | 11,495 | 11,495 |
| Federal Home Loan Mortgage Corp. Multifamily Housing Revenue TOB VRDO | 0.070% | 11/7/14 | LOC | 14,855 | 14,855 |
| 1 Federal Home Loan Mortgage Corp. Multifamily Housing Revenue TOB VRDO | 0.080% | 11/7/14 | LOC | 15,330 | 15,330 |
| 1 Federal Home Loan Mortgage Corp. Multifamily Housing Revenue TOB VRDO | 0.090% | 11/7/14 | LOC | 340,775 | 340,775 |
| 1 Federal Home Loan Mortgage Corp. Multifamily Housing Revenue TOB VRDO | 0.090% | 11/7/14 | LOC | 34,687 | 34,687 |
| 1 Nuveen AMT-Free Municipal Income Fund VRDP VRDO | 0.130% | 11/7/14 | LOC | 24,000 | 24,000 |
| 1 Nuveen Dividend Advantage Municipal Fund 2, Inc. VRDP VRDO | 0.150% | 11/7/14 | LOC | 39,300 | 39,300 |
| 1 Nuveen Insured Municipal Opportunity Fund VRDP VRDO | 0.140% | 11/7/14 | LOC | 203,500 | 203,500 |
| 1 Nuveen Municipal Advantage Fund VRDP VRDO | 0.130% | 11/7/14 | LOC | 166,700 | 166,700 |
| 1 Nuveen Municipal Market Opportunity Fund VRDP VRDO | 0.170% | 11/7/14 | LOC | 29,900 | 29,900 |
| 1 Nuveen Premium Income Municipal Fund 2, Inc. VRDP VRDO | 0.140% | 11/7/14 | LOC | 42,000 | 42,000 |
| 1 Nuveen Premium Income Municipal Fund 4, Inc. VRDP VRDO | 0.130% | 11/7/14 | LOC | 170,000 | 170,000 |
| 1 Nuveen Quality Income Municipal Fund, Inc. VRDP VRDO | 0.130% | 11/7/14 | LOC | 212,800 | 212,800 |
| 1 Nuveen Select Quality Municipal Fund, Inc. VRDP VRDO | 0.140% | 11/7/14 | LOC | 25,000 | 25,000 |
| | | | | | 1,391,947 |
| Nebraska (1.4%) | | | | | |
| Central Plains Energy Project Nebraska Gas Project Revenue (Project No. 2) VRDO | 0.050% | 11/7/14 | | 102,565 | 102,565 |
| Lincoln NE Electric System Revenue CP | 0.090% | 12/4/14 | | 15,500 | 15,500 |
| 1 Nebraska Investment Finance Authority Multifamily Housing Revenue | | | | | |
| (Riverbend Apartments Project) VRDO | 0.080% | 11/7/14 | LOC | 5,740 | 5,740 |
| Nebraska Investment Finance Authority Single Family Housing Revenue VRDO | 0.040% | 11/7/14 | | 61,425 | 61,425 |
| 1 Omaha NE Public Power District Electric Revenue TOB VRDO | 0.050% | 11/7/14 | | 10,060 | 10,060 |
| 1 Omaha NE Public Power District Separate Electric Revenue TOB VRDO | 0.060% | 11/7/14 | (13) | 34,610 | 34,610 |
| 1 Omaha NE Public Power District Separate Electric Revenue TOB VRDO | 0.090% | 11/7/14 | | 9,510 | 9,510 |
| | | | | | 239,410 |
| Nevada (1.7%) | | | | | |
| Clark County NV Economic Development Revenue (Opportunity Village Foundation Project) | | | | | |
| VRDO | 0.050% | 11/7/14 | LOC | 17,000 | 17,000 |
| 1 Clark County NV GO TOB VRDO | 0.050% | 11/7/14 | LOC | 50,850 | 50,850 |
| 1 Clark County NV GO TOB VRDO | 0.080% | 11/7/14 | | 7,615 | 7,615 |
| 1 Las Vegas NV GO TOB VRDO | 0.050% | 11/7/14 | | 10,850 | 10,850 |
| 1 Las Vegas NV GO TOB VRDO | 0.060% | 11/7/14 | | 8,330 | 8,330 |
| Las Vegas Valley Water District Nevada GO CP | 0.090% | 11/5/14 | | 11,600 | 11,600 |
18
Tax-Exempt Money Market Fund
| | | | | |
| | | | | Face | Market |
| | | Maturity | | Amount | Value• |
| | Coupon | Date | | ($000) | ($000) |
| Las Vegas Valley Water District Nevada GO CP | 0.090% | 11/5/14 | | 16,000 | 16,000 |
| Las Vegas Valley Water District Nevada GO CP | 0.090% | 11/6/14 | | 37,945 | 37,945 |
| Las Vegas Valley Water District Nevada GO CP | 0.090% | 11/6/14 | | 38,995 | 38,995 |
| Las Vegas Valley Water District Nevada GO CP | 0.100% | 1/8/15 | | 53,000 | 53,000 |
| 1 Las Vegas Valley Water District Nevada GO TOB VRDO | 0.080% | 11/7/14 | | 4,685 | 4,685 |
| Nevada GO | 5.000% | 2/1/15 | (Prere.) | 2,000 | 2,024 |
| Nevada GO | 5.000% | 2/1/15 | (Prere.) | 5,000 | 5,060 |
| 1 Nevada GO TOB VRDO | 0.100% | 11/7/14 | | 9,400 | 9,400 |
| 1 Nevada Higher Education Revenue TOB VRDO | 0.050% | 11/7/14 | LOC | 12,935 | 12,935 |
| Nevada Housing Division Multi-Unit Housing Revenue (City Center Project) VRDO | 0.200% | 11/7/14 | LOC | 7,440 | 7,440 |
| 1 Truckee Meadows NV Water Authority Water Revenue TOB VRDO | 0.050% | 11/7/14 | LOC | 9,990 | 9,990 |
| | | | | | 303,719 |
| New Hampshire (0.1%) | | | | | |
| 1 New Hampshire Health & Education Facilities Authority Revenue (Dartmouth College) | | | | | |
| TOB VRDO | 0.050% | 11/7/14 | | 8,000 | 8,000 |
| 1 New Hampshire Health & Education Facilities Authority Revenue (Dartmouth College) | | | | | |
| TOB VRDO | 0.050% | 11/7/14 | | 6,945 | 6,945 |
| 1 New Hampshire Health & Education Facilities Authority Revenue (Dartmouth College) | | | | | |
| TOB VRDO | 0.060% | 11/7/14 | | 10,000 | 10,000 |
| | | | | | 24,945 |
| New Jersey (3.0%) | | | | | |
| Burlington County NJ BAN | 0.750% | 5/19/15 | | 24,834 | 24,918 |
| Cherry Hill Township NJ BAN | 1.000% | 10/22/15 | | 5,600 | 5,645 |
| Clifton NJ BANS | 1.000% | 10/14/15 | | 5,100 | 5,135 |
| Essex County NJ Improvement Authority Revenue | 1.500% | 10/1/15 | | 3,600 | 3,641 |
| Fair Lawn NJ BAN | 1.000% | 9/18/15 | | 5,500 | 5,538 |
| Garden State Preservation Trust New Jersey Revenue (Open Space & Farmland Preservation) | 5.800% | 11/1/15 | (Prere.) | 6,000 | 6,337 |
| Hudson County NJ BAN | 2.000% | 12/5/14 | | 25,535 | 25,575 |
| Mahwah Township NJ BAN | 1.000% | 8/7/15 | | 5,000 | 5,033 |
| Mahwah Township NJ BAN | 1.000% | 10/9/15 | | 2,750 | 2,772 |
| Mercer County NJ BAN | 1.000% | 12/2/14 | | 25,000 | 25,017 |
| Mercer County NJ BAN | 5.000% | 2/13/15 | | 24,800 | 25,143 |
| Middlesex County NJ BAN | 0.750% | 6/5/15 | | 10,000 | 10,037 |
| Monmouth County NJ Improvement Authority Revenue (Pooled Government Loan) | 2.000% | 12/4/14 | | 6,000 | 6,010 |
| New Jersey Economic Development Authority Industrial Development Revenue | | | | | |
| (Ocean Spray Cranberries Inc. Project) VRDO | 0.160% | 11/7/14 | LOC | 8,000 | 8,000 |
| New Jersey Economic Development Authority Revenue (School Facilities Construction) | 5.000% | 3/1/15 | (Prere.) | 2,500 | 2,540 |
| New Jersey Economic Development Authority Revenue (School Facilities Construction) | 5.000% | 3/1/15 | (Prere.) | 2,700 | 2,744 |
| New Jersey Economic Development Authority Revenue (School Facilities Construction) | 5.125% | 3/1/15 | (Prere.) | 21,455 | 21,812 |
| New Jersey Economic Development Authority Revenue (School Facilities Construction) | 5.125% | 3/1/15 | (Prere.) | 2,175 | 2,211 |
| New Jersey Economic Development Authority Revenue (School Facilities Construction) | 5.250% | 3/1/15 | (Prere.) | 3,300 | 3,356 |
| New Jersey Economic Development Authority Revenue (School Facilities Construction) | 5.250% | 3/1/15 | (Prere.) | 6,000 | 6,102 |
| 1 New Jersey GO TOB VRDO | 0.070% | 11/3/14 | LOC | 94,000 | 94,000 |
| 1 New Jersey GO TOB VRDO | 0.070% | 11/3/14 | LOC | 59,995 | 59,995 |
| New Jersey Higher Education Assistance Authority Student Loan Revenue | 5.000% | 6/1/15 | | 3,750 | 3,851 |
| New Jersey Housing & Mortgage Finance Agency Multi-Family Housing Revenue VRDO | 0.080% | 11/7/14 | LOC | 34,900 | 34,900 |
| New Jersey Housing & Mortgage Finance Agency Single Family Housing Revenue VRDO | 0.050% | 11/7/14 | | 2,200 | 2,200 |
| New Jersey Housing & Mortgage Finance Agency Single Family Housing Revenue VRDO | 0.060% | 11/7/14 | | 3,500 | 3,500 |
| New Jersey Transportation Trust Fund Authority Transportation System Revenue | 5.000% | 6/15/15 | (Prere.) | 6,120 | 6,304 |
| North Bergen Township NJ BAN | 1.000% | 4/1/15 | | 10,645 | 10,680 |
| 1 Nuveen New Jersey Dividend Advantage Municipal Fund VRDP VRDO | 0.150% | 11/7/14 | LOC | 16,000 | 16,000 |
| 1 Nuveen New Jersey Investment Quality Municipal Fund VRDP VRDO | 0.130% | 11/7/14 | LOC | 15,000 | 15,000 |
| 1 Nuveen New Jersey Premium Income Municipal Fund VRDP VRDO | 0.130% | 11/7/14 | LOC | 24,000 | 24,000 |
| Paramus Borough NJ BAN | 1.000% | 2/20/15 | | 10,100 | 10,121 |
| Secaucus NJ BAN | 1.000% | 6/12/15 | | 4,800 | 4,820 |
| Wayne Township NJ BAN | 0.750% | 7/20/15 | | 4,300 | 4,316 |
| West Orange Township NJ BAN | 1.000% | 10/20/15 | | 3,680 | 3,706 |
| Woodbridge Township NJ BAN | 1.000% | 8/21/15 | | 35,000 | 35,224 |
| | | | | | 526,183 |
| New Mexico (0.3%) | | | | | |
| 1 New Mexico Educational Assistance Foundation Revenue TOB VRDO | 0.080% | 11/7/14 | | 39,395 | 39,395 |
| New Mexico Hospital Equipment Loan Council Hospital System Revenue | | | | | |
| (Presbyterian Healthcare Services) VRDO | 0.070% | 11/7/14 | | 12,165 | 12,165 |
| | | | | | 51,560 |
| New York (8.3%) | | | | | |
| Albany NY GO BAN | 1.000% | 7/2/15 | | 14,500 | 14,581 |
| Connetquot NY Central School District BAN | 1.000% | 9/4/15 | | 6,150 | 6,193 |
| Erie County NY Fiscal Stability Authority BAN | 1.250% | 7/31/15 | | 20,500 | 20,667 |
19
Tax-Exempt Money Market Fund
| | | | | |
| | | | | Face | Market |
| | | Maturity | | Amount | Value• |
| | Coupon | Date | | ($000) | ($000) |
| Huntington NY Union Free School District TAN | 1.000% | 6/26/15 | | 10,000 | 10,056 |
| Islip NY BAN | 0.500% | 12/11/14 | | 4,960 | 4,962 |
| New York City NY GO | 4.000% | 8/1/15 | | 1,000 | 1,029 |
| New York City NY GO | 5.000% | 8/1/15 | | 24,690 | 25,587 |
| New York City NY GO | 5.000% | 8/1/15 | | 8,000 | 8,290 |
| 1 New York City NY GO TOB VRDO | 0.050% | 11/7/14 | | 15,000 | 15,000 |
| 1 New York City NY GO TOB VRDO | 0.060% | 11/7/14 | | 8,250 | 8,250 |
| 1 New York City NY GO TOB VRDO | 0.070% | 11/7/14 | | 17,320 | 17,320 |
| New York City NY GO VRDO | 0.070% | 11/3/14 | | 2,400 | 2,400 |
| New York City NY GO VRDO | 0.040% | 11/7/14 | LOC | 53,580 | 53,580 |
| New York City NY Housing Development Corp. Multi-Family Housing Revenue | | | | | |
| (201 Pearl Street) VRDO | 0.050% | 11/7/14 | LOC | 18,000 | 18,000 |
| 1 New York City NY Housing Development Corp. Multi-Family Housing Revenue TOB VRDO | 0.080% | 11/7/14 | | 21,650 | 21,650 |
| New York City NY Housing Development Corp. Multi-Family Mortgage Revenue | | | | | |
| (Bruckner by the Bridge) VRDO | 0.050% | 11/7/14 | LOC | 10,000 | 10,000 |
| New York City NY Housing Development Corp. Multi-Family Mortgage Revenue | | | | | |
| (Elliot Chelsea Development) VRDO | 0.050% | 11/7/14 | LOC | 12,925 | 12,925 |
| New York City NY Housing Development Corp. Multi-Family Mortgage Revenue | | | | | |
| (Markham Gardens Apartments) VRDO | 0.060% | 11/7/14 | LOC | 3,600 | 3,600 |
| New York City NY Housing Development Corp. Multi-Family Mortgage Revenue | | | | | |
| (West 26th Street Development) VRDO | 0.060% | 11/7/14 | LOC | 10,000 | 10,000 |
| New York City NY Housing Development Corp. Multi-Family Rental Housing Revenue | | | | | |
| (2 Gold Street) VRDO | 0.050% | 11/7/14 | | 100,200 | 100,200 |
| New York City NY Housing Development Corp. Multi-Family Rental Housing Revenue | | | | | |
| (90 West Street) VRDO | 0.050% | 11/7/14 | LOC | 11,300 | 11,300 |
| New York City NY Housing Development Corp. Multi-Family Rental Housing Revenue | | | | | |
| (Atlantic Court Apartments) VRDO | 0.060% | 11/7/14 | LOC | 15,000 | 15,000 |
| New York City NY Housing Development Corp. Multi-Family Rental Housing Revenue | | | | | |
| (The Balton) VRDO | 0.050% | 11/7/14 | LOC | 7,500 | 7,500 |
| New York City NY Industrial Development Agency Civic Facility Revenue | | | | | |
| (New York Law School) VRDO | 0.040% | 11/7/14 | LOC | 18,055 | 18,055 |
| 1 New York City NY Municipal Water Finance Authority Water & Sewer System Revenue | | | | | |
| TOB VRDO | 0.060% | 11/7/14 | | 12,300 | 12,300 |
| 1 New York City NY Municipal Water Finance Authority Water & Sewer System Revenue | | | | | |
| TOB VRDO | 0.060% | 11/7/14 | | 21,055 | 21,055 |
| 1 New York City NY Municipal Water Finance Authority Water & Sewer System Revenue | | | | | |
| TOB VRDO | 0.060% | 11/7/14 | | 5,000 | 5,000 |
| 1 New York City NY Municipal Water Finance Authority Water & Sewer System Revenue | | | | | |
| TOB VRDO | 0.060% | 11/7/14 | | 7,300 | 7,300 |
| 1 New York City NY Municipal Water Finance Authority Water & Sewer System Revenue | | | | | |
| TOB VRDO | 0.080% | 11/7/14 | | 23,405 | 23,405 |
| 1 New York City NY Municipal Water Finance Authority Water & Sewer System Revenue | | | | | |
| TOB VRDO | 0.080% | 11/7/14 | | 49,995 | 49,995 |
| New York City NY Municipal Water Finance Authority Water & Sewer System Revenue VRDO | 0.060% | 11/3/14 | | 13,300 | 13,300 |
| New York City NY Municipal Water Finance Authority Water & Sewer System Revenue VRDO | 0.070% | 11/3/14 | | 9,500 | 9,500 |
| New York City NY Municipal Water Finance Authority Water & Sewer System Revenue VRDO | 0.070% | 11/3/14 | | 5,400 | 5,400 |
| New York City NY Municipal Water Finance Authority Water & Sewer System Revenue VRDO | 0.050% | 11/7/14 | | 50,000 | 50,000 |
| 1 New York City NY Transitional Finance Authority Building Aid Revenue TOB VRDO | 0.070% | 11/7/14 | | 10,000 | 10,000 |
| New York City NY Transitional Finance Authority Future Tax Revenue VRDO | 0.040% | 11/7/14 | | 90,700 | 90,700 |
| New York Liberty Development Corp. Revenue PUT | 0.150% | 3/19/15 | | 87,500 | 87,500 |
| New York Liberty Development Corp. Revenue PUT | 0.150% | 3/19/15 | | 141,000 | 141,000 |
| New York Liberty Development Corp. Revenue PUT | 0.150% | 3/19/15 | | 11,500 | 11,500 |
| 1 New York Metropolitan Transportation Authority Revenue (Dedicated Petroleum Tax) | | | | | |
| TOB VRDO | 0.050% | 11/7/14 | (13) | 7,800 | 7,800 |
| 1 New York Metropolitan Transportation Authority Revenue (Dedicated Tax Fund) TOB VRDO | 0.070% | 11/7/14 | (13) | 15,935 | 15,935 |
| New York Metropolitan Transportation Authority Revenue (Dedicated Tax Fund) VRDO | 0.040% | 11/7/14 | LOC | 14,800 | 14,800 |
| New York State Dormitory Authority Revenue (Le Moyne College) VRDO | 0.050% | 11/7/14 | LOC | 4,130 | 4,130 |
| 1 New York State Dormitory Authority Revenue (Mental Health Services Facilities Improvement) | | | | | |
| TOB VRDO | 0.160% | 11/7/14 | | 3,835 | 3,835 |
| New York State Dormitory Authority Revenue (New York Law School) VRDO | 0.040% | 11/7/14 | LOC | 6,895 | 6,895 |
| New York State Dormitory Authority Revenue (New York Public Library) VRDO | 0.040% | 11/7/14 | LOC | 4,660 | 4,660 |
| 1 New York State Dormitory Authority Revenue (Personal Income Tax) TOB VRDO | 0.050% | 11/7/14 | | 5,000 | 5,000 |
| 1 New York State Dormitory Authority Revenue (Personal Income Tax) TOB VRDO | 0.060% | 11/7/14 | | 13,000 | 13,000 |
| 1 New York State Dormitory Authority Revenue (Personal Income Tax) TOB VRDO | 0.060% | 11/7/14 | | 6,420 | 6,420 |
| 1 New York State Dormitory Authority Revenue (Personal Income Tax) TOB VRDO | 0.080% | 11/7/14 | | 23,485 | 23,485 |
| 1 New York State Dormitory Authority Revenue (Vassar College) TOB VRDO | 0.050% | 11/7/14 | | 1,000 | 1,000 |
| 1 New York State Environmental Facilities Corp. Revenue (State Clean Water & Drinking Water | | | | | |
| Revolving Funds) TOB VRDO | 0.060% | 11/7/14 | | 3,640 | 3,640 |
| New York State Housing Finance Agency Housing Revenue (10 Liberty Street) VRDO | 0.060% | 11/7/14 | LOC | 16,100 | 16,100 |
| New York State Housing Finance Agency Housing Revenue (100 Maiden Lane) VRDO | 0.050% | 11/7/14 | LOC | 16,500 | 16,500 |
| New York State Housing Finance Agency Housing Revenue (8 East 102nd Street) VRDO | 0.040% | 11/7/14 | LOC | 12,000 | 12,000 |
20
Tax-Exempt Money Market Fund
| | | | | |
| | | | | Face | Market |
| | | Maturity | | Amount | Value• |
| | Coupon | Date | | ($000) | ($000) |
| New York State Housing Finance Agency Housing Revenue (Chelsea Apartments) VRDO | 0.060% | 11/7/14 | LOC | 10,000 | 10,000 |
| New York State Housing Finance Agency Housing Revenue (West 23rd Street) VRDO | 0.050% | 11/7/14 | LOC | 10,400 | 10,400 |
| New York State Housing Finance Agency Revenue (250 West 50th Street Project) VRDO | 0.060% | 11/7/14 | LOC | 50,000 | 50,000 |
| New York State Housing Finance Agency Revenue (Maestro West Chelsea Housing) VRDO | 0.050% | 11/7/14 | LOC | 13,000 | 13,000 |
| New York State Mortgage Agency Homeowner Mortgage Revenue VRDO | 0.080% | 11/3/14 | | 12,520 | 12,520 |
| New York State Mortgage Agency Homeowner Mortgage Revenue VRDO | 0.090% | 11/3/14 | | 1,350 | 1,350 |
| New York State Mortgage Agency Homeowner Mortgage Revenue VRDO | 0.060% | 11/7/14 | | 25,605 | 25,605 |
| New York State Mortgage Agency Homeowner Mortgage Revenue VRDO | 0.060% | 11/7/14 | | 25,000 | 25,000 |
| 1 New York State Urban Development Corp. Revenue (Personal Income Tax) TOB VRDO | 0.080% | 11/7/14 | | 10,115 | 10,115 |
| New York State Urban Development Corp. Revenue (Service Contract) VRDO | 0.030% | 11/7/14 | LOC | 36,945 | 36,945 |
| North Hempstead NY BAN | 0.500% | 4/8/15 | | 14,263 | 14,278 |
| 1 Nuveen AMT-Free Municipal Income Fund VRDP VRDO | 0.140% | 11/7/14 | LOC | 2,200 | 2,200 |
| 1 Nuveen New York AMT-Free Municipal Income Fund VRDP VRDO | 0.110% | 11/7/14 | LOC | 31,000 | 31,000 |
| 1 Nuveen New York AMT-Free Municipal Income Fund VRDP VRDO | 0.110% | 11/7/14 | LOC | 20,000 | 20,000 |
| 1 Nuveen New York AMT-Free Municipal Income Fund VRDP VRDO | 0.110% | 11/7/14 | LOC | 25,500 | 25,500 |
| 1 Nuveen New York Performance Plus Municipal Fund VRDP VRDO | 0.140% | 11/7/14 | LOC | 11,200 | 11,200 |
| 1 Port Authority of New York & New Jersey Revenue TOB VRDO | 0.080% | 11/7/14 | | 3,335 | 3,335 |
| 1 Port Authority of New York & New Jersey Revenue TOB VRDO | 0.080% | 11/7/14 | | 5,555 | 5,555 |
| Port Washington NY Union Free School District BAN | 1.000% | 8/7/15 | | 3,475 | 3,497 |
| Tompkins County NY BAN | 1.000% | 7/14/15 | | 4,790 | 4,818 |
| Triborough Bridge & Tunnel Authority New York Revenue VRDO | 0.040% | 11/7/14 | LOC | 18,090 | 18,090 |
| Triborough Bridge & Tunnel Authority New York Revenue VRDO | 0.050% | 11/7/14 | LOC | 1,685 | 1,685 |
| | | | | | 1,445,393 |
| North Carolina (1.7%) | | | | | |
| Board of Governors of the University of North Carolina Revenue (University of North Carolina | | | | | |
| Hospitals at Chapel Hill) VRDO | 0.050% | 11/7/14 | | 43,110 | 43,110 |
| 1 Charlotte NC Water & Sewer System Revenue TOB VRDO | 0.050% | 11/7/14 | | 7,520 | 7,520 |
| Mecklenburg County NC GO | 4.000% | 12/1/14 | | 1,740 | 1,746 |
| North Carolina Capital Facilities Finance Agency (Duke University Project) CP | 0.100% | 12/2/14 | | 8,237 | 8,237 |
| North Carolina Capital Facilities Finance Agency (Duke University Project) CP | 0.110% | 12/4/14 | | 14,051 | 14,051 |
| North Carolina Capital Facilities Finance Agency (Duke University Project) CP | 0.100% | 12/10/14 | | 17,928 | 17,928 |
| North Carolina Capital Facilities Finance Agency (Duke University Project) CP | 0.110% | 12/16/14 | | 14,289 | 14,289 |
| North Carolina Capital Facilities Finance Agency (Duke University Project) CP | 0.080% | 2/4/15 | | 14,133 | 14,133 |
| North Carolina Capital Facilities Finance Agency (Duke University Project) CP | 0.080% | 2/5/15 | | 14,051 | 14,051 |
| 1 North Carolina Capital Facilities Finance Agency Revenue (Duke University Project) TOB VRDO | 0.050% | 11/7/14 | | 9,200 | 9,200 |
| 1 North Carolina Capital Facilities Finance Agency Revenue (Duke University Project) TOB VRDO | 0.060% | 11/7/14 | | 2,495 | 2,495 |
| North Carolina Capital Facilities Finance Agency Revenue (YMCA of the Triangle) VRDO | 0.070% | 11/7/14 | LOC | 11,510 | 11,510 |
| North Carolina Capital Facilities Finance Agency Revenue (YMCA of the Triangle) VRDO | 0.070% | 11/7/14 | LOC | 10,135 | 10,135 |
| 1 North Carolina Capital Improvement Revenue TOB VRDO | 0.050% | 11/7/14 | | 10,610 | 10,610 |
| North Carolina Educational Facilities Finance Agency Revenue (Duke University) VRDO | 0.040% | 11/7/14 | | 19,685 | 19,685 |
| North Carolina GO | 5.000% | 3/1/15 | | 8,000 | 8,129 |
| North Carolina Limited Obligation Revenue | 4.000% | 11/1/14 | | 2,000 | 2,000 |
| North Carolina Medical Care Commission Health Care Facilities Revenue (Lenoir Memorial | | | | | |
| Hospital Project) VRDO | 0.040% | 11/7/14 | LOC | 12,575 | 12,575 |
| North Carolina Medical Care Commission Hospital Revenue (Baptist Hospital) VRDO | 0.050% | 11/7/14 | LOC | 6,095 | 6,095 |
| 2 North Carolina Medical Care Commission Hospital Revenue (Moses Cone Health System) PUT | 0.170% | 5/29/15 | | 11,905 | 11,905 |
| Raleigh Durham NC Airport Authority Revenue VRDO | 0.040% | 11/7/14 | LOC | 13,700 | 13,700 |
| 1 University of North Carolina University Revenue TOB VRDO | 0.050% | 11/7/14 | | 25,345 | 25,345 |
| 1 University of North Carolina University Revenue TOB VRDO | 0.060% | 11/7/14 | | 6,710 | 6,710 |
| Wake County NC GO | 5.000% | 2/1/15 | | 1,100 | 1,113 |
| Winston-Salem NC Water & Sewer System Revenue VRDO | 0.040% | 11/7/14 | | 13,660 | 13,660 |
| | | | | | 299,932 |
| North Dakota (0.2%) | | | | | |
| North Dakota Housing Finance Agency Home Mortgage Revenue VRDO | 0.050% | 11/7/14 | | 19,950 | 19,950 |
| North Dakota Housing Finance Agency Home Mortgage Revenue VRDO | 0.050% | 11/7/14 | | 9,600 | 9,600 |
| | | | | | 29,550 |
| Ohio (2.2%) | | | | | |
| Akron OH Bath & Copley Joint Township Hospital District Revenue (Akron General | | | | | |
| Health System) VRDO | 0.070% | 11/7/14 | LOC | 600 | 600 |
| Akron OH Income Tax Revenue BAN | 1.000% | 11/12/14 | | 3,095 | 3,095 |
| 1 Allen County OH Hospital Facilities Revenue (Catholic Healthcare Partners) TOB VRDO | 0.080% | 11/7/14 | | 16,010 | 16,010 |
| Butler County OH BAN | 0.300% | 7/30/15 | | 2,400 | 2,400 |
| Columbus OH BAN | 1.000% | 8/28/15 | | 4,500 | 4,532 |
| 1 Columbus OH GO TOB VRDO | 0.050% | 11/7/14 | | 10,040 | 10,040 |
| Columbus OH Regional Airport Authority Airport Revenue (Oasbo Expanded Asset Program) | | | | | |
| VRDO | 0.050% | 11/7/14 | LOC | 16,565 | 16,565 |
| Columbus OH Regional Airport Authority Airport Revenue (Oasbo Expanded Asset Program) | | | | | |
| VRDO | 0.050% | 11/7/14 | LOC | 15,265 | 15,265 |
21
Tax-Exempt Money Market Fund
| | | | | |
| | | | | Face | Market |
| | | Maturity | | Amount | Value• |
| | Coupon | Date | | ($000) | ($000) |
| Columbus OH Regional Airport Authority Revenue (Pooled Financing Program) VRDO | 0.050% | 11/7/14 | LOC | 5,245 | 5,245 |
| 2 Franklin County OH Hospital Facilities Revenue (OhioHealth Corp.) PUT | 0.080% | 6/3/15 | | 10,000 | 10,000 |
| 1 Franklin County OH Hospital Facilities Revenue (OhioHealth Corp.) TOB VRDO | 0.090% | 11/7/14 | | 4,330 | 4,330 |
| Franklin County OH Hospital Facilities Revenue (OhioHealth Corp.) VRDO | 0.040% | 11/7/14 | | 13,150 | 13,150 |
| Franklin County OH Hospital Facilities Revenue (OhioHealth Corp.) VRDO | 0.040% | 11/7/14 | | 24,400 | 24,400 |
| Franklin County OH Hospital Facilities Revenue (US Health Corp. of Columbus) VRDO | 0.050% | 11/7/14 | LOC | 6,380 | 6,380 |
| Franklin County OH Hospital Revenue (Nationwide Hospital) VRDO | 0.030% | 11/7/14 | | 10,165 | 10,165 |
| 2 Franklin County OH Revenue (Trinity Health Credit Group) PUT | 0.120% | 5/29/15 | | 9,685 | 9,685 |
| Huber Heights OH BAN | 1.000% | 11/7/14 | | 6,500 | 6,501 |
| 3 Huber Heights OH BAN | 1.000% | 6/3/15 | | 13,583 | 13,637 |
| Kent OH BAN | 1.000% | 9/2/15 | | 2,355 | 2,369 |
| 1 Nuveen Ohio Quality Income Municipal Fund VRDP VRDO | 0.140% | 11/7/14 | LOC | 11,000 | 11,000 |
| Ohio Air Quality Development Authority Revenue (Ohio Valley Electric Corp. Project) VRDO | 0.040% | 11/7/14 | LOC | 4,000 | 4,000 |
| Ohio Common Schools GO VRDO | 0.030% | 11/7/14 | | 15,475 | 15,475 |
| Ohio GO VRDO | 0.030% | 11/7/14 | | 2,100 | 2,100 |
| Ohio GO VRDO | 0.040% | 11/7/14 | | 8,375 | 8,375 |
| Ohio Housing Finance Agency Residential Mortgage Revenue VRDO | 0.060% | 11/7/14 | | 2,710 | 2,710 |
| Ohio Housing Finance Agency Residential Mortgage Revenue VRDO | 0.060% | 11/7/14 | | 32,360 | 32,360 |
| Ohio Housing Finance Agency Residential Mortgage Revenue VRDO | 0.070% | 11/7/14 | | 20,565 | 20,565 |
| Ohio Housing Finance Agency Residential Mortgage Revenue VRDO | 0.070% | 11/7/14 | | 28,565 | 28,565 |
| Ohio Housing Finance Agency Residential Mortgage Revenue VRDO | 0.070% | 11/7/14 | | 17,380 | 17,380 |
| Ohio State University General Receipts Revenue VRDO | 0.030% | 11/7/14 | | 39,160 | 39,160 |
| Ohio State University General Receipts Revenue VRDO | 0.030% | 11/7/14 | | 13,495 | 13,495 |
| 1 South-Western City OH School District GO TOB VRDO | 0.050% | 11/7/14 | | 4,980 | 4,980 |
| | | | | | 374,534 |
| Oklahoma (0.0%) | | | | | |
| 1 Oklahoma Housing Finance Agency Single Family Mortgage Revenue | | | | | |
| (Homeownership Loan Program) TOB VRDO | 0.110% | 11/7/14 | | 1,395 | 1,395 |
| |
| Oregon (1.2%) | | | | | |
| Oregon Facilities Authority Revenue (Reed College Projects) VRDO | 0.070% | 11/7/14 | | 34,775 | 34,775 |
| Oregon Health & Science University Revenue VRDO | 0.050% | 11/7/14 | LOC | 15,925 | 15,925 |
| 1 Oregon Housing & Community Service Department Single Family Mortgage Revenue | | | | | |
| TOB VRDO | 0.090% | 11/7/14 | | 8,665 | 8,665 |
| Oregon Housing & Community Service Department Single Family Mortgage Revenue VRDO | 0.050% | 11/7/14 | | 6,640 | 6,640 |
| Oregon Housing & Community Service Department Single Family Mortgage Revenue VRDO | 0.070% | 11/7/14 | | 15,000 | 15,000 |
| Oregon TAN | 2.000% | 6/15/15 | | 117,000 | 118,360 |
| Portland OR TAN | 1.750% | 6/24/15 | | 12,735 | 12,868 |
| | | | | | 212,233 |
| Pennsylvania (0.8%) | | | | | |
| 1 Allegheny County PA Hospital Development Authority Revenue (University of Pittsburgh | | | | | |
| Medical Center) TOB VRDO | 0.050% | 11/7/14 | LOC | 11,300 | 11,300 |
| 1 Central Bradford PA Progress Authority Revenue (Robert Packer Hospital) TOB VRDO | 0.050% | 11/7/14 | LOC | 4,935 | 4,935 |
| Delaware County PA Industrial Development Authority Solid Waste Revenue (Scott Paper Co.) | | | | | |
| VRDO | 0.060% | 11/7/14 | | 11,300 | 11,300 |
| Emmaus PA General Authority Revenue VRDO | 0.050% | 11/7/14 | LOC | 5,285 | 5,285 |
| Northampton County PA General Purpose Authority University Revenue (Lafayette College) | | | | | |
| VRDO | 0.060% | 11/7/14 | | 14,290 | 14,290 |
| Nuveen PA Investment Quality Municipal Fund VRDP VRDO | 0.150% | 11/7/14 | LOC | 22,000 | 22,000 |
| Pennsylvania Economic Development Financing Authority Unemployment Compensation | | | | | |
| Revenue VRDO | 0.050% | 11/7/14 | LOC | 13,875 | 13,875 |
| 1 Pennsylvania Housing Finance Agency Single Family Mortgage Revenue TOB VRDO | 0.150% | 11/7/14 | | 3,875 | 3,875 |
| Pennsylvania Housing Finance Agency Single Family Mortgage Revenue VRDO | 0.050% | 11/7/14 | | 11,130 | 11,130 |
| Pennsylvania Housing Finance Agency Single Family Mortgage Revenue VRDO | 0.050% | 11/7/14 | | 20,000 | 20,000 |
| 1 Philadelphia PA Authority for Industrial Development Revenue (Girard Estate Aramark Project) | | | | | |
| VRDO | 0.090% | 11/7/14 | LOC | 15,350 | 15,350 |
| | | | | | 133,340 |
| Rhode Island (0.1%) | | | | | |
| 1 Narragansett RI Commission Wastewater System Revenue TOB VRDO | 0.050% | 11/7/14 | LOC | 11,750 | 11,750 |
| Rhode Island Health & Educational Building Corp. Health Facilities Revenue (St. Antoine) VRDO | 0.060% | 11/7/14 | LOC | 7,065 | 7,065 |
| Rhode Island Health & Educational Building Corp. Health Facilities Revenue (St. Antoine) VRDO | 0.060% | 11/7/14 | LOC | 4,420 | 4,420 |
| | | | | | 23,235 |
| South Carolina (1.3%) | | | | | |
| 1 Charleston SC Educational Excellence Financing Corp. Revenue (Charleston County | | | | | |
| School District, South Carolina Project) TOB VRDO | 0.050% | 11/7/14 | | 1,550 | 1,550 |
| Greenville County SC School District BAN | 1.000% | 6/1/15 | | 58,370 | 58,668 |
| Richland County SC BAN | 1.000% | 11/6/14 | | 50,000 | 50,006 |
| Richland County SC BAN | 1.500% | 10/30/15 | | 50,000 | 50,677 |
22
Tax-Exempt Money Market Fund
| | | | | |
| | | | | Face | Market |
| | | Maturity | | Amount | Value• |
| | Coupon | Date | | ($000) | ($000) |
| South Carolina GO | 4.000% | 4/1/15 | | 590 | 599 |
| South Carolina GO | 4.000% | 4/1/15 | | 1,285 | 1,306 |
| South Carolina GO | 4.000% | 6/1/15 | | 3,500 | 3,578 |
| 1 South Carolina Housing Finance & Development Authority Revenue TOB VRDO | 0.060% | 11/7/14 | | 5,880 | 5,880 |
| South Carolina Jobs Economic Development Authority Industrial Revenue (South Carolina | | | | | |
| Electric & Gas Co. Project) VRDO | 0.080% | 11/7/14 | LOC | 6,900 | 6,900 |
| 1 South Carolina Public Service Authority Revenue TOB VRDO | 0.050% | 11/7/14 | LOC | 20,195 | 20,195 |
| 1 South Carolina Public Service Authority Revenue TOB VRDO | 0.050% | 11/7/14 | LOC | 30,185 | 30,185 |
| | | | | | 229,544 |
| South Dakota (0.2%) | | | | | |
| South Dakota Housing Development Authority Homeownership Mortgage Revenue VRDO | 0.040% | 11/7/14 | | 17,000 | 17,000 |
| South Dakota Housing Development Authority Homeownership Mortgage Revenue VRDO | 0.050% | 11/7/14 | | 20,085 | 20,085 |
| | | | | | 37,085 |
| Tennessee (2.1%) | | | | | |
| Blount County & Alcoa & Maryville TN Industrial Development Board Revenue | | | | | |
| (Local Government Public Improvement) VRDO | 0.040% | 11/7/14 | LOC | 4,600 | 4,600 |
| Blount County TN Public Building Authority Revenue (Local Government Public Improvement) | | | | | |
| VRDO | 0.040% | 11/7/14 | LOC | 10,685 | 10,685 |
| Blount County TN Public Building Authority Revenue (Local Government Public Improvement) | | | | | |
| VRDO | 0.040% | 11/7/14 | LOC | 14,170 | 14,170 |
| Blount County TN Public Building Authority Revenue (Local Government Public Improvement) | | | | | |
| VRDO | 0.040% | 11/7/14 | | 18,300 | 18,300 |
| 1 Knoxville TN Waste Water System Revenue TOB VRDO | 0.060% | 11/7/14 | | 15,945 | 15,945 |
| Metropolitan Government of Nashville & Davidson County TN GO CP | 0.110% | 7/4/15 | | 12,500 | 12,500 |
| 1 Metropolitan Government of Nashville & Davidson County TN Health & Educational Facilities | | | | | |
| Board Revenue (Vanderbilt University) TOB VRDO | 0.060% | 11/7/14 | | 8,250 | 8,250 |
| 1 Rutherford County TN Health & Educational Facilities Board Revenue (Ascension Health | | | | | |
| Credit Group) TOB VRDO | 0.060% | 11/7/14 | | 6,250 | 6,250 |
| Sevier County TN Public Building Authority Local Government Public Improvement Revenue | | | | | |
| VRDO | 0.040% | 11/7/14 | LOC | 4,500 | 4,500 |
| Sevier County TN Public Building Authority Local Government Public Improvement Revenue | | | | | |
| VRDO | 0.040% | 11/7/14 | | 23,600 | 23,600 |
| Sevier County TN Public Building Authority Local Government Public Improvement Revenue | | | | | |
| VRDO | 0.100% | 11/7/14 | LOC | 11,100 | 11,100 |
| Shelby County TN GO VRDO | 0.050% | 11/7/14 | | 70,000 | 70,000 |
| Tennessee GO CP | 0.070% | 11/4/14 | | 16,500 | 16,500 |
| Tennessee GO CP | 0.070% | 12/4/14 | | 20,620 | 20,620 |
| Tennessee GO CP | 0.070% | 12/4/14 | | 61,527 | 61,527 |
| Tennessee GO CP | 0.090% | 2/3/15 | | 25,000 | 25,000 |
| Tennessee GO CP | 0.100% | 2/11/15 | | 28,000 | 28,000 |
| 1 Tennessee Housing Development Agency Homeownership Program Revenue TOB VRDO | 0.100% | 11/7/14 | | 8,000 | 8,000 |
| | | | | | 359,547 |
| Texas (10.6%) | | | | | |
| Arlington TX Independent School District GO | 5.000% | 2/15/15 | (Prere.) | 7,225 | 7,325 |
| Austin TX Combined Utility System Revenue CP | 0.080% | 12/3/14 | LOC | 68,305 | 68,305 |
| 1 Austin TX Water & Wastewater System Revenue TOB VRDO | 0.050% | 11/7/14 | (13) | 5,635 | 5,635 |
| 1 Austin TX Water & Wastewater System Revenue TOB VRDO | 0.050% | 11/7/14 | LOC | 16,795 | 16,795 |
| 1 Beaumont TX Independent School District School Building GO TOB VRDO | 0.110% | 11/7/14 | | 10,010 | 10,010 |
| City of Austin TX Water Wastewater System Revenue BOND | 5.000% | 5/15/15 | (Prere.) | 3,120 | 3,201 |
| 1 Comal TX Independent School District GO TOB VRDO | 0.050% | 11/7/14 | LOC | 10,095 | 10,095 |
| 1 Conroe TX Independent School District GO TOB VRDO | 0.060% | 11/7/14 | | 6,010 | 6,010 |
| Dallas Area Rapid Transit Sales Tax Revenue CP | 0.080% | 11/5/14 | | 20,000 | 20,000 |
| Dallas Area Rapid Transit Sales Tax Revenue CP | 0.090% | 12/5/14 | | 10,000 | 10,000 |
| Dallas Area Rapid Transit Sales Tax Revenue CP | 0.100% | 1/7/15 | | 12,500 | 12,500 |
| Dallas Area Rapid Transit Sales Tax Revenue CP | 0.100% | 1/8/15 | | 12,500 | 12,500 |
| Dallas Area Rapid Transit Sales Tax Revenue CP | 0.100% | 2/20/15 | | 10,000 | 10,000 |
| 1 Dallas TX Area Rapid Transit Sales Tax Revenue TOB VRDO | 0.050% | 11/7/14 | LOC | 19,305 | 19,305 |
| 1 Dallas TX Area Rapid Transit Sales Tax Revenue TOB VRDO | 0.050% | 11/7/14 | | 5,500 | 5,500 |
| 1 Dallas TX Area Rapid Transit Sales Tax Revenue TOB VRDO | 0.050% | 11/7/14 | | 18,145 | 18,145 |
| 1 Dallas TX Area Rapid Transit Sales Tax Revenue TOB VRDO | 0.070% | 11/7/14 | | 12,465 | 12,465 |
| Dallas TX Waterworks & Sewer System Revenue CP | 0.060% | 11/3/14 | | 20,000 | 20,000 |
| Dallas TX Waterworks & Sewer System Revenue CP | 0.070% | 12/5/14 | | 31,385 | 31,385 |
| Dallas TX Waterworks & Sewer System Revenue CP | 0.070% | 12/5/14 | | 9,065 | 9,065 |
| Frisco TX GO | 4.000% | 2/15/15 | | 1,250 | 1,264 |
| Garland TX Electric Utility System Revenue CP | 0.090% | 3/3/15 | LOC | 5,000 | 5,000 |
| 1 Harris County TX Cultural Education Facilities Finance Corp. Hospital Revenue | | | | | |
| (Memorial Hermann Healthcare System) TOB VRDO | 0.050% | 11/7/14 | LOC | 37,395 | 37,395 |
| Harris County TX Cultural Education Facilities Finance Corp. Revenue | | | | | |
| (Methodist Hospital System) VRDO | 0.070% | 11/3/14 | | 8,470 | 8,470 |
23
Tax-Exempt Money Market Fund
| | | | | |
| | | | | Face | Market |
| | | Maturity | | Amount | Value• |
| | Coupon | Date | | ($000) | ($000) |
| Harris County TX GO | 5.000% | 10/1/15 | | 1,500 | 1,566 |
| Harris County TX GO CP | 0.050% | 11/4/14 | | 30,188 | 30,188 |
| 1 Harris County TX GO TOB VRDO | 0.060% | 11/7/14 | | 8,070 | 8,070 |
| 1 Harris County TX Health Facilities Development Corp. Hospital Revenue (Memorial Hermann | | | | | |
| Healthcare System) TOB VRDO | 0.050% | 11/7/14 | LOC | 34,795 | 34,795 |
| Harris County TX Health Facilities Development Corp. Revenue (Methodist Hospital System) | | | | | |
| VRDO | 0.070% | 11/3/14 | | 3,400 | 3,400 |
| Harris County TX TAN | 1.000% | 2/27/15 | | 43,500 | 43,629 |
| Harris County TX TAN | 2.000% | 2/27/15 | | 12,500 | 12,577 |
| 1 Harris County TX Toll Road Revenue TOB VRDO | 0.060% | 11/7/14 | (13) | 5,200 | 5,200 |
| 1 Houston TX Airport System Revenue TOB VRDO | 0.050% | 11/7/14 | | 12,000 | 12,000 |
| Houston TX Higher Education Finance Corp. Revenue (Rice University Project) CP | 0.110% | 11/13/14 | | 9,535 | 9,535 |
| 1 Houston TX Higher Education Finance Corp. Revenue (Rice University Project) TOB VRDO | 0.060% | 11/7/14 | | 6,665 | 6,665 |
| Houston TX TRAN | 1.000% | 6/30/15 | | 37,500 | 37,720 |
| 1 Houston TX Utility System Revenue TOB VRDO | 0.050% | 11/7/14 | LOC | 15,195 | 15,195 |
| 1 Houston TX Utility System Revenue TOB VRDO | 0.050% | 11/7/14 | | 12,240 | 12,240 |
| Houston TX Utility System Revenue VRDO | 0.050% | 11/7/14 | LOC | 20,000 | 20,000 |
| 1 Hutto TX Independent School District GO TOB VRDO | 0.060% | 11/7/14 | | 21,130 | 21,130 |
| 1 Lone Star College System Texas Revenue TOB VRDO | 0.080% | 11/7/14 | | 11,740 | 11,740 |
| 1 McKinney TX Independent School District GO TOB VRDO | 0.050% | 11/7/14 | LOC | 10,095 | 10,095 |
| Mesquite TX Independent School District GO PUT | 0.120% | 11/20/14 | | 18,255 | 18,255 |
| 1 North East TX Independent School District GO TOB VRDO | 0.050% | 11/7/14 | LOC | 5,000 | 5,000 |
| 1 North East TX Independent School District GO TOB VRDO | 0.050% | 11/7/14 | | 31,305 | 31,305 |
| 1 North East TX Independent School District GO TOB VRDO | 0.060% | 11/7/14 | | 3,355 | 3,355 |
| 1 North Texas Health Facilities Development Corp. Hospital Revenue (United Regional | | | | | |
| Health Care System) TOB VRDO | 0.050% | 11/7/14 | LOC | 13,035 | 13,035 |
| 1 North Texas Tollway Authority System Revenue TOB VRDO | 0.060% | 11/7/14 | (13) | 10,000 | 10,000 |
| 1 North Texas Tollway Authority System Revenue TOB VRDO | 0.060% | 11/7/14 | (13) | 6,000 | 6,000 |
| 1 North Texas Tollway Authority System Revenue TOB VRDO | 0.110% | 11/7/14 | (13) | 22,360 | 22,360 |
| 1 Northside TX Independent School District GO TOB VRDO | 0.050% | 11/7/14 | | 4,500 | 4,500 |
| 1 Northside TX Independent School District GO TOB VRDO | 0.060% | 11/7/14 | | 17,315 | 17,315 |
| Northwest Texas Independent School District GO VRDO | 0.060% | 11/7/14 | | 8,170 | 8,170 |
| 1 Pearland TX GO TOB VRDO | 0.050% | 11/7/14 | LOC | 10,075 | 10,075 |
| 1 Pearland TX Independent School District GO TOB VRDO | 0.100% | 11/7/14 | | 9,000 | 9,000 |
| San Antonio TX Electric & Gas Systems Revenue | 5.375% | 2/1/15 | | 1,480 | 1,499 |
| 1 San Antonio TX Electric & Gas Systems Revenue TOB VRDO | 0.050% | 11/7/14 | | 15,800 | 15,800 |
| 1 San Antonio TX Electric & Gas Systems Revenue TOB VRDO | 0.050% | 11/7/14 | | 14,465 | 14,465 |
| 1 San Antonio TX Electric & Gas Systems Revenue TOB VRDO | 0.060% | 11/7/14 | | 4,700 | 4,700 |
| San Antonio TX Electric & Gas Systems Revenue VRDO | 0.050% | 11/7/14 | | 96,400 | 96,400 |
| San Antonio TX Electric and Gas Systems Rev | 5.000% | 2/1/15 | (Prere.) | 2,185 | 2,211 |
| 1 San Antonio TX Public Facilities Corp. Lease Revenue TOB VRDO | 0.050% | 11/7/14 | LOC | 11,610 | 11,610 |
| 1 San Antonio TX Water Revenue TOB VRDO | 0.050% | 11/7/14 | | 21,550 | 21,550 |
| Southwest Texas Higher Education Authority Inc. Revenue (Southern Methodist | | | | | |
| University Project) VRDO | 0.040% | 11/7/14 | | 16,600 | 16,600 |
| Tarrant County TX Cultural Education Facilities Finance Corp. Hospital Revenue | | | | | |
| (Baylor Health Care System Project) VRDO | 0.050% | 11/7/14 | LOC | 21,100 | 21,100 |
| Tarrant County TX Cultural Education Facilities Finance Corp. Hospital Revenue | | | | | |
| (Scott & White Healthcare Project) VRDO | 0.050% | 11/7/14 | LOC | 55,000 | 55,000 |
| Tarrant County TX Cultural Education Facilities Finance Corp. Revenue | | | | | |
| (CHRISTUS Health) VRDO | 0.040% | 11/7/14 | LOC | 38,305 | 38,305 |
| Tarrant County TX Cultural Education Facilities Finance Corp. Revenue | | | | | |
| (CHRISTUS Health) VRDO | 0.050% | 11/7/14 | LOC | 43,900 | 43,900 |
| Texas (Veterans Housing Assistance Program) GO VRDO | 0.060% | 11/7/14 | | 37,870 | 37,870 |
| 1 Texas Department of Housing & Community Affairs Single Family Revenue TOB VRDO | 0.110% | 11/7/14 | | 480 | 480 |
| 1 Texas GO TOB VRDO | 0.080% | 11/7/14 | | 5,360 | 5,360 |
| 1 Texas GO TOB VRDO | 0.130% | 11/7/14 | | 8,750 | 8,750 |
| Texas Public Finance Authority GO CP | 0.090% | 12/9/14 | | 10,000 | 10,000 |
| Texas Public Finance Authority GO CP | 0.090% | 12/9/14 | | 5,000 | 5,000 |
| Texas Tech University CP | 0.060% | 11/5/14 | | 18,500 | 18,500 |
| Texas Tech University CP | 0.070% | 11/6/14 | | 7,825 | 7,825 |
| Texas TRAN | 1.500% | 8/31/15 | | 483,000 | 488,473 |
| 1 Texas Transportation Commission Revenue TOB VRDO | 0.050% | 11/7/14 | | 20,300 | 20,300 |
| 1 Texas Transportation Commission Revenue TOB VRDO | 0.060% | 11/7/14 | | 13,740 | 13,740 |
| 1 Texas Water Development Board Revenue TOB VRDO | 0.100% | 11/7/14 | | 7,500 | 7,500 |
| Travis County TX GO | 1.500% | 3/1/15 | | 4,725 | 4,746 |
| 1 University of Texas Permanent University Fund Revenue TOB VRDO | 0.050% | 11/7/14 | | 12,560 | 12,560 |
| University of Texas System Revenue Financing System Revenue CP | 0.080% | 12/4/14 | | 20,384 | 20,384 |
| University of Texas System Revenue Financing System Revenue CP | 0.080% | 1/15/15 | | 25,000 | 25,000 |
| University of Texas System Revenue Financing System Revenue VRDO | 0.050% | 11/7/14 | | 7,000 | 7,000 |
| | | | | | 1,851,113 |
24
Tax-Exempt Money Market Fund
| | | | | |
| | | | | Face | Market |
| | | Maturity | | Amount | Value• |
| | Coupon | Date | | ($000) | ($000) |
| Utah (0.6%) | | | | | |
| Murray UT Hospital Revenue (IHC Health Services) VRDO | 0.030% | 11/7/14 | | 34,600 | 34,600 |
| 2 Utah County UT Hospital Revenue (IHC Health Services) PUT | 0.110% | 5/29/15 | | 8,100 | 8,100 |
| 2 Utah County UT Hospital Revenue (IHC Health Services) PUT | 0.110% | 5/29/15 | | 8,000 | 8,000 |
| 1 Utah Housing Corp. Single Family Mortgage Revenue TOB VRDO | 0.560% | 11/7/14 | | 880 | 880 |
| Utah Housing Finance Agency Single Family Mortgage Revenue VRDO | 0.100% | 11/7/14 | | 4,900 | 4,900 |
| Utah Housing Finance Agency Single Family Mortgage Revenue VRDO | 0.100% | 11/7/14 | | 2,700 | 2,700 |
| 1 Utah Transit Authority Sales Tax Revenue TOB VRDO | 0.050% | 11/7/14 | | 16,850 | 16,850 |
| 1 Utah Transit Authority Sales Tax Revenue TOB VRDO | 0.050% | 11/7/14 | | 10,690 | 10,690 |
| 1 Utah Transit Authority Sales Tax Revenue TOB VRDO | 0.100% | 11/7/14 | | 9,720 | 9,720 |
| | | | | | 96,440 |
| Vermont (0.1%) | | | | | |
| Vermont Educational & Health Buildings Financing Agency Hospital Revenue (Fletcher Allen | | | | | |
| Health Care Project) VRDO | 0.040% | 11/7/14 | LOC | 14,370 | 14,370 |
| 1 Vermont Housing Finance Agency Revenue TOB VRDO | 0.110% | 11/7/14 | | 40 | 40 |
| | | | | | 14,410 |
| Virginia (1.7%) | | | | | |
| Alexandria VA Industrial Development Authority Revenue (Institute for Defense | | | | | |
| Analyses Project) VRDO | 0.050% | 11/7/14 | LOC | 6,955 | 6,955 |
| Capital Region Airport Commission Virginia Passenger Facility Charge Revenue VRDO | 0.110% | 11/7/14 | LOC | 13,395 | 13,395 |
| Chesterfield County VA GO | 4.000% | 1/1/15 | | 5,995 | 6,033 |
| Fairfax County VA Industrial Development Authority Hospital Revenue (Inova Health System | | | | | |
| Hospital Project) VRDO | 0.040% | 11/7/14 | | 24,150 | 24,150 |
| 1 Hampton VA Roads Sanitation District Wastewater Revenue TOB VRDO | 0.050% | 11/7/14 | | 18,900 | 18,900 |
| Hanover County VA Economic Development Authority Revenue (Bon Secours | | | | | |
| Health System Inc.) VRDO | 0.040% | 11/7/14 | LOC | 14,700 | 14,700 |
| Harrisonburg VA Industrial Development Authority Revenue (Mennonite Retirement) VRDO | 0.040% | 11/7/14 | LOC | 4,500 | 4,500 |
| Loudoun County VA GO | 3.000% | 12/1/14 | | 3,725 | 3,734 |
| 1 Newport News VA GO TOB VRDO | 0.060% | 11/7/14 | | 10,635 | 10,635 |
| Norfolk VA GO VRDO | 0.030% | 11/7/14 | | 22,910 | 22,910 |
| Richmond VA GO | 5.000% | 7/15/15 | | 4,880 | 5,047 |
| Stafford County VA Industrial Development Authority Revenue (VML/VACo Commonwealth | | | | | |
| Loan Program) VRDO | 0.060% | 11/7/14 | LOC | 2,300 | 2,300 |
| Tobacco Settlement Financing Corp. Virginia Revenue | 5.625% | 6/1/15 | (Prere.) | 9,400 | 9,697 |
| 1 University of Virginia Revenue TOB VRDO | 0.050% | 11/7/14 | | 22,325 | 22,325 |
| 1 University of Virginia Revenue TOB VRDO | 0.060% | 11/7/14 | | 12,195 | 12,195 |
| Virginia College Building Authority Educational Facilities Revenue (21St Century College | | | | | |
| & Equipment Programs) | 5.000% | 2/1/15 | | 9,445 | 9,559 |
| Virginia College Building Authority Educational Facilities Revenue (21St Century College | | | | | |
| & Equipment Programs) | 5.000% | 2/1/15 | | 3,060 | 3,097 |
| 1 Virginia College Building Authority Educational Facilities Revenue (Public Higher Education | | | | | |
| Financing Program) TOB VRDO | 0.050% | 11/7/14 | | 12,070 | 12,070 |
| 1 Virginia Commonwealth Transportation Revenue TOB VRDO | 0.060% | 11/7/14 | | 8,700 | 8,700 |
| Virginia GO | 5.000% | 6/1/15 | | 2,000 | 2,057 |
| 1 Virginia Housing Development Authority Commonwealth Mortgage Revenue TOB VRDO | 0.070% | 11/7/14 | | 5,000 | 5,000 |
| Virginia Public Building Authority Public Facilities Revenue VRDO | 0.050% | 11/7/14 | | 49,800 | 49,800 |
| Virginia Public School Authority Revenue | 5.000% | 8/1/15 | | 2,405 | 2,493 |
| 1 Virginia Resources Authority Clean Water Revenue (State Revolving Fund) TOB VRDO | 0.050% | 11/7/14 | | 9,490 | 9,490 |
| 1 Virginia Resources Authority Clean Water Revenue (State Revolving Fund) TOB VRDO | 0.050% | 11/7/14 | | 8,900 | 8,900 |
| | | | | | 288,642 |
| Washington (2.2%) | | | | | |
| 1 Central Puget Sound WA Regional Transit Authority Sales & Use Tax Revenue TOB VRDO | 0.050% | 11/7/14 | | 12,215 | 12,215 |
| Chelan County WA Public Utility District No. 1 Consolidated System Revenue VRDO | 0.050% | 11/7/14 | | 30,350 | 30,350 |
| 1 King County WA GO TOB VRDO | 0.110% | 11/7/14 | | 13,760 | 13,760 |
| 1 King County WA Sewer Revenue TOB VRDO | 0.050% | 11/7/14 | | 2,100 | 2,100 |
| 1 King County WA Sewer Revenue TOB VRDO | 0.060% | 11/7/14 | | 14,850 | 14,850 |
| 1 Seattle WA Drain & Wastewater Revenue TOB VRDO | 0.050% | 11/7/14 | | 9,815 | 9,815 |
| 1 Seattle WA Drain & Wastewater Revenue TOB VRDO | 0.050% | 11/7/14 | | 11,200 | 11,200 |
| Tacoma WA Electric System Revenue | 4.125% | 7/1/15 | (Prere.) | 7,500 | 7,696 |
| Tacoma WA Housing Authority Revenue (Sunset Apartment Projects) VRDO | 0.080% | 11/7/14 | LOC | 13,100 | 13,100 |
| 3 Tacoma WA School District No. 10 (Pierce County) BAN | 2.000% | 12/1/14 | | 9,000 | 9,012 |
| 1 University of Washington Revenue TOB VRDO | 0.050% | 11/7/14 | LOC | 38,200 | 38,200 |
| Washington GO | 5.000% | 7/1/15 | | 12,000 | 12,388 |
| 1 Washington GO TOB VRDO | 0.050% | 11/7/14 | | 10,420 | 10,420 |
| 1 Washington GO TOB VRDO | 0.050% | 11/7/14 | | 15,020 | 15,020 |
| 1 Washington GO TOB VRDO | 0.060% | 11/7/14 | | 5,100 | 5,100 |
| 1 Washington GO TOB VRDO | 0.060% | 11/7/14 | | 2,000 | 2,000 |
| 1 Washington GO TOB VRDO | 0.080% | 11/7/14 | | 21,120 | 21,120 |
25
Tax-Exempt Money Market Fund
| | | | | |
| | | | | Face | Market |
| | | Maturity | | Amount | Value• |
| | Coupon | Date | | ($000) | ($000) |
| 1 Washington Health Care Facilities Authority Revenue (Providence Health & Services) | | | | | |
| TOB VRDO | 0.050% | 11/7/14 | | 12,475 | 12,475 |
| 1 Washington Health Care Facilities Authority Revenue (Providence Health & Services) | | | | | |
| TOB VRDO | 0.050% | 11/7/14 | | 8,610 | 8,610 |
| Washington Health Care Facilities Authority Revenue (Providence Health & Services) VRDO | 0.070% | 11/7/14 | | 73,250 | 73,250 |
| 1 Washington Health Care Facilities Authority Revenue (Seattle Children’s Hospital) TOB VRDO | 0.060% | 11/7/14 | | 10,800 | 10,800 |
| 1 Washington Health Care Facilities Authority Revenue (Seattle Children’s Hospital) TOB VRDO | 0.060% | 11/7/14 | | 9,995 | 9,995 |
| Washington Higher Education Facilities Authority Revenue (Seattle University) VRDO | 0.060% | 11/7/14 | LOC | 15,630 | 15,630 |
| Washington Higher Education Facilities Authority Revenue (Whitman College Project) VRDO | 0.060% | 11/7/14 | | 14,000 | 14,000 |
| Washington Housing Finance Commission Multi-Family Housing Revenue | | | | | |
| (New Haven Apartments Project) VRDO | 0.050% | 11/7/14 | LOC | 4,000 | 4,000 |
| Washington Housing Finance Commission Multi-Family Housing Revenue | | | | | |
| (Vintage at Silverdale Senior Living Project) VRDO | 0.080% | 11/7/14 | LOC | 11,880 | 11,880 |
| | | | | | 388,986 |
| West Virginia (0.5%) | | | | | |
| West Virginia Hospital Finance Authority Hospital Revenue (Cabell Huntington Hospital Inc.) | | | | | |
| VRDO | 0.040% | 11/7/14 | LOC | 9,200 | 9,200 |
| West Virginia Hospital Finance Authority Hospital Revenue (Charleston Area Medical | | | | | |
| Center Inc.) VRDO | 0.060% | 11/7/14 | LOC | 78,515 | 78,515 |
| | | | | | 87,715 |
| Wisconsin (2.6%) | | | | | |
| Milwaukee WI (Extendible) CP | 0.090% | 6/27/15 | | 12,000 | 12,000 |
| Milwaukee WI (Extendible) CP | 0.080% | 7/4/15 | | 17,500 | 17,500 |
| Milwaukee WI RAN | 1.500% | 6/30/15 | | 100,000 | 100,914 |
| Milwaukee WI Redevelopment Authority Redevelopment Lease Revenue | | | | | |
| (University Wisconsin Kenilworth Project) VRDO | 0.050% | 11/7/14 | LOC | 5,490 | 5,490 |
| Oak Creek WI GO | 2.000% | 4/1/15 | | 4,050 | 4,080 |
| Racine WI BAN | 2.000% | 8/12/15 | | 1,500 | 1,504 |
| Racine WI Unified School District BAN | 1.700% | 7/15/15 | | 9,200 | 9,237 |
| 1 Wisconsin Annual Appropriation Revenue TOB VRDO | 0.060% | 11/7/14 | | 11,085 | 11,085 |
| Wisconsin Department of Transportation Revenue CP | 0.120% | 12/4/14 | | 17,500 | 17,500 |
| Wisconsin GO | 5.000% | 5/1/15 | (Prere.) | 1,250 | 1,280 |
| Wisconsin GO | 5.000% | 5/1/15 | | 2,000 | 2,048 |
| Wisconsin GO CP | 0.110% | 5/4/15 | | 27,200 | 27,200 |
| Wisconsin GO CP | 0.110% | 5/31/15 | | 17,456 | 17,456 |
| Wisconsin GO CP | 0.110% | 6/1/15 | | 76,682 | 76,682 |
| 1 Wisconsin GO TOB VRDO | 0.050% | 11/7/14 | | 18,890 | 18,890 |
| 1 Wisconsin Health & Educational Facilities Authority Revenue (Ascension Health Credit Group) | | | | | |
| TOB VRDO | 0.060% | 11/7/14 | | 750 | 750 |
| Wisconsin Health & Educational Facilities Authority Revenue (Gundersen Lutheran) VRDO | 0.080% | 11/7/14 | LOC | 22,000 | 22,000 |
| Wisconsin Health & Educational Facilities Authority Revenue (Hospital Sisters Services Inc.) | | | | | |
| VRDO | 0.050% | 11/7/14 | LOC | 17,050 | 17,050 |
| 1 Wisconsin Housing & Economic Development Authority Home Ownership Revenue | | | | | |
| TOB VRDO | 0.110% | 11/7/14 | | 2,130 | 2,130 |
| Wisconsin Housing & Economic Development Authority Home Ownership Revenue VRDO | 0.050% | 11/7/14 | | 21,650 | 21,650 |
| Wisconsin Housing & Economic Development Authority Home Ownership Revenue VRDO | 0.060% | 11/7/14 | | 44,470 | 44,470 |
| Wisconsin Housing & Economic Development Authority Multi-Family Revenue VRDO | 0.050% | 11/7/14 | | 22,000 | 22,000 |
| | | | | | 452,916 |
| Wyoming (0.2%) | | | | | |
| Converse County WY Pollution Control Revenue (PacifiCorp Projects) VRDO | 0.050% | 11/7/14 | LOC | 16,000 | 16,000 |
| Lincoln County WY Pollution Control Revenue (Exxonmobil Project) VRDO | 0.060% | 11/3/14 | | 10,000 | 10,000 |
| Sweetwater County WY Pollution Control Revenue (PacifiCorp Projects) VRDO | 0.070% | 11/3/14 | LOC | 8,100 | 8,100 |
| | | | | | 34,100 |
| Total Tax-Exempt Municipal Bonds (Cost $16,768,514) | | | | | 16,768,514 |
26
| | | |
| Tax-Exempt Money Market Fund | | | |
| |
| |
| |
| |
| | | | Market |
| | | | Value• |
| | Coupon | Shares | ($000) |
| Temporary Cash Investment (3.4%) | | | |
| Money Market Fund (3.4%) | | | |
| 4 Vanguard Municipal Cash Management Fund (Cost $585,256) | 0.047% | 585,256,426 | 585,256 |
| Total Investments (99.8%) (Cost $17,353,770) | | | 17,353,770 |
| Other Assets and Liabilities (0.2%) | | | |
| Other Assets | | | 154,178 |
| Liabilities | | | (115,034) |
| | | | 39,144 |
| Net Assets (100%) | | | |
| Applicable to 17,390,992,094 outstanding $.001 par value shares of | | | |
| beneficial interest (unlimited authorization) | | | 17,392,914 |
| Net Asset Value Per Share | | | $1.00 |
| |
| |
| At October 31, 2014, net assets consisted of: | | | |
| | | | Amount |
| | | | ($000) |
| Paid-in Capital | | | 17,392,896 |
| Undistributed Net Investment Income | | | — |
| Accumulated Net Realized Gains | | | 18 |
| Net Assets | | | 17,392,914 |
• See Note A in Notes to Financial Statements.
1 Security exempt from registration under Rule 144A of the Securities Act of 1933. Such securities may be sold in transactions exempt from registration, normally to qualified institutional buyers. At October 31, 2014,
the aggregate value of these securities was $5,310,367,000, representing 30.5% of net assets.
2 Adjustable-rate security.
3 Security purchased on a when-issued or delayed-delivery basis for which the fund has not taken delivery as of October 31, 2014.
4 Affiliated money market fund available only to Vanguard funds and certain trusts and accounts managed by Vanguard. Rate shown is the 7-day yield.
A key to abbreviations and other references follows the Statement of Net Assets.
See accompanying Notes, which are an integral part of the Financial Statements.
27
Tax-Exempt Money Market Fund
Key to Abbreviations
ARS—Auction Rate Security.
BAN—Bond Anticipation Note.
COP—Certificate of Participation.
CP—Commercial Paper.
FR—Floating Rate.
GAN—Grant Anticipation Note.
GO—General Obligation Bond.
PILOT—Payments in Lieu of Taxes.
PUT—Put Option Obligation.
RAN—Revenue Anticipation Note.
TAN—Tax Anticipation Note.
TOB—Tender Option Bond.
TRAN—Tax Revenue Anticipation Note.
VRDO—Variable Rate Demand Obligation.
VRDP—Variable Rate Demand Preferred.
(ETM)—Escrowed to Maturity.
(Prere.)—Prerefunded.
Scheduled principal and interest payments are guaranteed by:
(1) MBIA (Municipal Bond Investors Assurance).
(2) AMBAC (Ambac Assurance Corporation).
(3) FGIC (Financial Guaranty Insurance Company).
(4) AGM (Assured Guaranty Municipal Corporation).
(5) BIGI (Bond Investors Guaranty Insurance).
(6) Connie Lee Inc.
(7) FHA (Federal Housing Authority).
(8) CapMAC (Capital Markets Assurance Corporation).
(9) American Capital Access Financial Guaranty Corporation.
(10) XL Capital Assurance Inc.
(11) CIFG (CDC IXIS Financial Guaranty).
(12) AGC (Assured Guaranty Corporation).
(13) BHAC (Berkshire Hathaway Assurance Corporation).
(14) NPFG (National Public Finance Guarantee Corporation).
(15) BAM (Build America Mutual Assurance Company).
(16) MAC (Municipal Assurance Corporation).
(17) RAA (Radian Asset Assurance Inc.).
The insurance does not guarantee the market value of the municipal bonds.
LOC—Scheduled principal and interest payments are guaranteed by bank letter of credit.
28
Tax-Exempt Money Market Fund
Statement of Operations
Statement of Changes in Net Assets
| |
| | Year Ended |
| October 31, 2014 |
| | ($000) |
| Investment Income | |
| Income | |
| Interest1 | 17,517 |
| Total Income | 17,517 |
| Expenses | |
| The Vanguard Group—Note B | |
| Investment Advisory Services | 3,533 |
| Management and Administrative | 20,163 |
| Marketing and Distribution | 4,490 |
| Custodian Fees | 183 |
| Auditing Fees | 27 |
| Shareholders’ Reports | 257 |
| Trustees’ Fees and Expenses | 13 |
| Total Expenses | 28,666 |
| Expense Reduction—Note B | (12,940) |
| Net Expenses | 15,726 |
| Net Investment Income | 1,791 |
| Realized Net Gain (Loss) on | |
| Investment Securities Sold | (10) |
| Net Increase (Decrease) in Net Assets | |
| Resulting from Operations | 1,781 |
| | |
| | Year Ended October 31, |
| | 2014 | 2013 |
| | ($000) | ($000) |
| Increase (Decrease) in Net Assets | | |
| Operations | | |
| Net Investment Income | 1,791 | 3,307 |
| Realized Net Gain (Loss) | (10) | 146 |
| Net Increase (Decrease) in Net Assets Resulting from Operations | 1,781 | 3,453 |
| Distributions | | |
| Net Investment Income | (1,791) | (3,307) |
| Realized Capital Gain | — | — |
| Total Distributions | (1,791) | (3,307) |
| Capital Share Transactions (at $1.00 per share) | | |
| Issued | 16,146,472 | 19,181,910 |
| Issued in Lieu of Cash Distributions | 1,737 | 3,200 |
| Redeemed | (16,874,230) | (18,070,175) |
| Net Increase (Decrease) from Capital Share Transactions | (726,021) | 1,114,935 |
| Total Increase (Decrease) | (726,031) | 1,115,081 |
| Net Assets | | |
| Beginning of Period | 18,118,945 | 17,003,864 |
| End of Period | 17,392,914 | 18,118,945 |
1 Interest income from an affiliated company of the fund was $460,000.See accompanying Notes, which are an integral part of the Financial Statements.29
Tax-Exempt Money Market Fund
Financial Highlights
| | | | | |
| For a Share Outstanding | | | Year Ended October 31, |
| Throughout Each Period | 2014 | 2013 | 2012 | 2011 | 2010 |
| Net Asset Value, Beginning of Period | $1.00 | $1.00 | $1.00 | $1.00 | $1.00 |
| Investment Operations | | | | | |
| Net Investment Income | .0001 | .0002 | .0004 | .001 | .001 |
| Net Realized and Unrealized Gain (Loss) | | | | | |
| on Investments | — | — | — | — | — |
| Total from Investment Operations | .0001 | .0002 | .0004 | .001 | .001 |
| Distributions | | | | | |
| Dividends from Net Investment Income | (.0001) | (.0002) | (.0004) | (.001) | (.001) |
| Distributions from Realized Capital Gains | — | — | — | — | — |
| Total Distributions | (.0001) | (.0002) | (.0004) | (.001) | (.001) |
| Net Asset Value, End of Period | $1.00 | $1.00 | $1.00 | $1.00 | $1.00 |
| |
| Total Return1 | 0.01% | 0.02% | 0.04% | 0.09% | 0.14% |
| |
| Ratios/Supplemental Data | | | | | |
| Net Assets, End of Period (Millions) | $17,393 | $18,119 | $17,004 | $17,593 | $18,405 |
| Ratio of Total Expenses to Average Net Assets | 0.09%2 | 0.13%2 | 0.16% | 0.17% | 0.17% |
| Ratio of Net Investment Income to | | | | | |
| Average Net Assets | 0.01% | 0.02% | 0.04% | 0.09% | 0.14% |
1 Total returns do not include account service fees that may have applied in the periods shown. Fund prospectuses provide information aboutany applicable account service fees.2 The ratio of total expenses to average net assets before an expense reduction was 0.16% in 2014 and 0.16% in 2013. See Note B in theNotes to Financial Statements.See accompanying Notes, which are an integral part of the Financial Statements.
30
Tax-Exempt Money Market Fund
Notes to Financial Statements
Vanguard Tax-Exempt Money Market Fund is registered under the Investment Company Act of 1940 as an open-end investment company, or mutual fund. The fund invests in debt instruments of many municipal issuers; the issuers’ abilities to meet their obligations may be affected by economic and political developments in a specific state or region.
A. The following significant accounting policies conform to generally accepted accounting principles for U.S. investment companies. The fund consistently follows such policies in preparing its financial statements.
1. Security Valuation: Securities are valued as of the close of trading on the New York Stock Exchange (generally 4 p.m., Eastern time) on the valuation date. Securities are valued at amortized cost, which approximates market value. Investments in Vanguard Municipal Cash Management Fund are valued at that fund’s net asset value 2. Federal Income Taxes: The fund intends to continue to qualify as a regulated investment company and distribute all of its income. Management has analyzed the fund’s tax positions taken for all open federal income tax years (October 31, 2011–2014), and has concluded that no provision for federal income tax is required in the fund’s financial statements.
3. Distributions: Distributions from net investment income are declared daily and paid on the first business day of the following month.
4. Credit Facility: The fund and certain other funds managed by The Vanguard Group participate in a $2.89 billion committed credit facility provided by a syndicate of lenders pursuant to a credit agreement that may be renewed annually; each fund is individually liable for its borrowings, if any, under the credit facility. Borrowings may be utilized for temporary and emergency purposes, and are subject to the fund’s regulatory and contractual borrowing restrictions. The participating funds are charged administrative fees and an annual commitment fee of 0.06% of the undrawn amount of the facility; these fees are allocated to the funds based on a method approved by the fund’s board of trustees and included in Management and Administrative expenses on the fund’s Statement of Operations. Any borrowings under this facility bear interest at a rate equal to the higher of the federal funds rate or LIBOR reference rate plus an agreed-upon spread.
The fund had no borrowings outstanding at October 31, 2014, or at any time during the period then ended.
5. Other: Interest income includes income distributions received from Vanguard Municipal Cash Management Fund and is accrued daily. Premiums and discounts on debt securities purchased are amortized and accreted, respectively, to interest income over the lives of the respective securities. Security transactions are accounted for on the date securities are bought or sold. Costs used to determine realized gains (losses) on the sale of investment securities are those of the specific securities sold.
B. The Vanguard Group furnishes at cost investment advisory, corporate management, administrative, marketing, and distribution services. The costs of such services are allocated to the fund based on methods approved by the board of trustees. The fund has committed to invest up to 0.40% of its net assets in Vanguard. At October 31, 2014, the fund had contributed capital of $1,749,000 to Vanguard (included in Other Assets), representing 0.01% of the fund’s net assets and 0.70% of Vanguard’s capitalization. The fund’s trustees and officers are also directors and officers of Vanguard. Vanguard and the board of trustees have agreed to temporarily limit certain net operating expenses in excess of the fund’s daily yield so as to maintain a zero or positive yield for the fund. Vanguard and the board of trustees may terminate the temporary expense limitation at any time. For the year ended October 31, 2014, Vanguard’s expenses were reduced by $12,940,000 (an effective annual rate of 0.07% of the fund’s average net assets).
C. Various inputs may be used to determine the value of the fund’s investments. These inputs are summarized in three broad levels for financial statement purposes. The inputs or methodologies used to value securities are not necessarily an indication of the risk associated with investing in those securities.
Level 1—Quoted prices in active markets for identical securities.
Level 2—Other significant observable inputs (including quoted prices for similar securities, interest rates, prepayment speeds, credit risk, etc.).
Level 3—Significant unobservable inputs (including the fund’s own assumptions used to determine the fair value of investments).
31
Tax-Exempt Money Market Fund
The fund’s investment in Vanguard Municipal Cash Management Fund is valued based on Level 1 inputs. All of the fund’s other investments were valued using amortized cost, in accordance with rules under the Investment Company Act of 1940. Amortized cost approximates the current fair value of a security, but since the value is not obtained from a quoted price in an active market, securities valued at amortized cost are considered to be valued using Level 2 inputs.
D. Management has determined that no material events or transactions occurred subsequent to October 31, 2014, that would require recognition or disclosure in these financial statements.
32
Short-Term Tax-Exempt Fund
Fund Profile
As of October 31, 2014
| | |
| Share-Class Characteristics | | |
| | Investor | Admiral |
| | Shares | Shares |
| Ticker Symbol | VWSTX | VWSUX |
| Expense Ratio1 | 0.20% | 0.12% |
| 30-Day SEC Yield | 0.28% | 0.36% |
| | | |
| Financial Attributes | | |
| | | Barclays | |
| | | 1 Year | Barclays |
| | | Municipal Municipal |
| | | Bond | Bond |
| | Fund | Index | Index |
| Number of Bonds | 1,626 | 3,577 | 45,888 |
| Yield to Maturity | | | |
| (before expenses) | 0.4% | 0.5% | 2.1% |
| Average Coupon | 2.4% | 4.8% | 4.8% |
| Average Duration | 1.0 years | 1.4 years | 6.6 years |
| Average Stated | | | |
| Maturity | 1.4 years | 1.5 years 13.4 years |
| Short-Term Reserves | 26.7% | — | — |
| |
| Largest Area Concentrations2 | |
| |
| New York | 18.9% |
| Texas | 10.5 |
| California | 9.8 |
| Florida | 6.1 |
| Pennsylvania | 6.0 |
| Illinois | 6.0 |
| New Jersey | 3.9 |
| Michigan | 3.6 |
| Connecticut | 3.6 |
| Massachusetts | 3.4 |
| Top Ten | 71.8% |
| | |
| Volatility Measures | | |
| | Barclays | |
| | 1 Year | Barclays |
| | Municipal | Municipal |
| | Bond Index | Bond Index |
| R-Squared | 0.54 | 0.67 |
| Beta | 1.86 | 0.09 |
| These measures show the degree and timing of the fund’s |
| fluctuations compared with the indexes over 36 months. |
| |
| Distribution by Stated Maturity (% of portfolio) |
| |
| Under 6 Months | 40.1% |
| 6 Months–1 Year | 8.9 |
| 1–2 Years | 18.2 |
| 2–3 Years | 16.8 |
| 3–4 Years | 10.2 |
| 4–5 Years | 4.7 |
| Over 5 Years | 1.1 |
| |
| Distribution by Credit Quality (% of portfolio) |
| |
| AAA | 17.5% |
| AA | 62.0 |
| A | 15.2 |
| BBB | 3.6 |
| BB | 0.3 |
| Not Rated | 1.4 |
Credit-quality ratings are from Moody’s and S&P. The higher ratingfor each issue is shown. “Not Rated” is used to classify securitiesfor which a rating is not available. For information about theseratings, see the Glossary entry for Credit Quality.Investment Focus
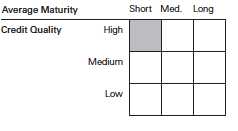
1 The expense ratios shown are from the prospectus dated February 26, 2014, and represent estimated costs for the current fiscal year. For the fiscal year ended October 31, 2014, the expense ratios were 0.20% for
the Investor Shares and 0.12% for the Admiral Shares.
2 Percentage of net assets, excluding any futures contracts.
33
Short-Term Tax-Exempt Fund
Performance Summary
All of the returns in this report represent past performance, which is not a guarantee of future results that may be achieved by the fund. (Current performance may be lower or higher than the performance data cited. For performance data current to the most recent month-end, visit our website at vanguard.com/performance.) Note, too, that both investment returns and principal value can fluctuate widely, so an investor’s shares, when sold, could be worth more or less than their original cost. The returns shown do not reflect taxes that a shareholder would pay on fund distributions or on the sale of fund shares.
Cumulative Performance: October 31, 2004–October 31, 2014
Initial Investment of $10,000
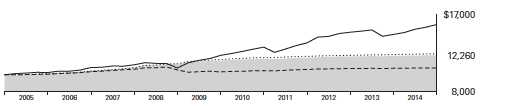
| | | | |
| | | Average Annual Total Returns | Final Value |
| | Periods Ended October 31, 2014 | of a $10,000 |
| | One Year | Five Years | Ten Years | Investment |
| Short-Term Tax-Exempt Fund Investor Shares | 0.66% | 1.04% | 2.06% | $12,260 |
| Barclays 1 Year Municipal Bond Index | 0.72 | 1.09 | 2.20 | 12,432 |
| 1–2 Year Municipal Funds Average1 | 0.43 | 0.88 | 0.77 | 10,792 |
| Barclays Municipal Bond Index | 7.82 | 5.26 | 4.71 | 15,839 |
| | | | |
| | | | | Final Value |
| | | | | of a $50,000 |
| | One Year | Five Years | Ten Years | Investment |
| Short-Term Tax-Exempt Fund Admiral Shares | 0.74% | 1.12% | 2.14% | $61,772 |
| Barclays 1 Year Municipal Bond Index | 0.72 | 1.09 | 2.20 | 62,161 |
| Barclays Municipal Bond Index | 7.82 | 5.26 | 4.71 | 79,197 |
1 Derived from data provided by Lipper, a Thomson Reuters Company.
See Financial Highlights for dividend and capital gains information.
34
Short-Term Tax-Exempt Fund
Fiscal-Year Total Returns (%): October 31, 2004–October 31, 2014
| | | | |
| | | | | Barclays |
| | | | | 1 Year |
| | | | | Municipal |
| | | | Investor Shares | Bond Index |
| | Capital | Income | Total | Total |
| Fiscal Year | Returns | Returns | Returns | Returns |
| 2005 | –0.89% | 2.18% | 1.29% | 1.18% |
| 2006 | 0.32 | 2.90 | 3.22 | 3.05 |
| 2007 | 0.26 | 3.44 | 3.70 | 3.82 |
| 2008 | 0.38 | 3.30 | 3.68 | 4.22 |
| 2009 | 1.28 | 2.31 | 3.59 | 4.40 |
| 2010 | 0.44 | 1.38 | 1.82 | 1.81 |
| 2011 | –0.31 | 1.23 | 0.92 | 1.18 |
| 2012 | 0.19 | 1.08 | 1.27 | 1.01 |
| 2013 | –0.38 | 0.89 | 0.51 | 0.74 |
| 2014 | –0.06 | 0.72 | 0.66 | 0.72 |
Average Annual Total Returns: Periods Ended September 30, 2014
This table presents returns through the latest calendar quarter—rather than through the end of the fiscal period.
Securities and Exchange Commission rules require that we provide this information.
| | | | | | |
| | | | | Ten Years |
| | Inception Date | One Year | Five Years | Capital | Income | Total |
| Investor Shares | 9/1/1977 | 0.87% | 1.00% | 0.11% | 1.95% | 2.06% |
| Admiral Shares | 2/12/2001 | 0.95 | 1.08 | 0.11 | 2.03 | 2.14 |
35
Short-Term Tax-Exempt Fund
Financial Statements
The Statement of Net Assets—an integral part of the Financial Statements for Vanguard Short-Term Tax-Exempt Fund—is included as an insert to this report.
Statement of Operations
| |
| | Year Ended |
| October 31, 2014 |
| | ($000) |
| Investment Income | |
| Income | |
| Interest1 | 116,779 |
| Total Income | 116,779 |
| Expenses | |
| The Vanguard Group—Note B | |
| Investment Advisory Services | 1,232 |
| Management and Administrative— | |
| Investor Shares | 2,820 |
| Management and Administrative— | |
| Admiral Shares | 9,087 |
| Marketing and Distribution— | |
| Investor Shares | 450 |
| Marketing and Distribution— | |
| Admiral Shares | 2,643 |
| Custodian Fees | 135 |
| Auditing Fees | 32 |
| Shareholders’ Reports—Investor Shares | 80 |
| Shareholders’ Reports—Admiral Shares | 88 |
| Trustees’ Fees and Expenses | 9 |
| Total Expenses | 16,576 |
| Net Investment Income | 100,203 |
| Realized Net Gain (Loss) | |
| Investment Securities Sold | 3,281 |
| Futures Contracts | (729) |
| Realized Net Gain (Loss) | 2,552 |
| Change in Unrealized Appreciation | |
| (Depreciation) of Investment Securities | (5,023) |
| Net Increase (Decrease) in Net Assets | |
| Resulting from Operations | 97,732 |
Statement of Changes in Net Assets
| | |
| | Year Ended October 31, |
| | 2014 | 2013 |
| | ($000) | ($000) |
| Increase (Decrease) in Net Assets | | |
| Operations | | |
| Net Investment Income | 100,203 | 110,026 |
| Realized Net Gain (Loss) | 2,552 | 534 |
| Change in Unrealized Appreciation (Depreciation) | (5,023) | (46,963) |
| Net Increase (Decrease) in Net Assets Resulting from Operations | 97,732 | 63,597 |
| Distributions | | |
| Net Investment Income | | |
| Investor Shares | (12,900) | (17,873) |
| Admiral Shares | (87,303) | (92,153) |
| Realized Capital Gain | | |
| Investor Shares | — | — |
| Admiral Shares | — | — |
| Total Distributions | (100,203) | (110,026) |
| Capital Share Transactions | | |
| Investor Shares | (109,064) | (272,790) |
| Admiral Shares | 861,870 | 926,168 |
| Net Increase (Decrease) from Capital Share Transactions | 752,806 | 653,378 |
| Total Increase (Decrease) | 750,335 | 606,949 |
| Net Assets | | |
| Beginning of Period | 12,061,773 | 11,454,824 |
| End of Period | 12,812,108 | 12,061,773 |
1 Interest income from an affiliated company of the fund was $141,000.
See accompanying Notes, which are an integral part of the Financial Statements.
36
Short-Term Tax-Exempt Fund
Financial Highlights
| | | | | |
| Investor Shares | | | | | |
| |
| For a Share Outstanding | Year Ended October 31, |
| Throughout Each Period | 2014 | 2013 | 2012 | 2011 | 2010 |
| Net Asset Value, Beginning of Period | $15.87 | $15.93 | $15.90 | $15.95 | $15.88 |
| Investment Operations | | | | | |
| Net Investment Income | .115 | .141 | .171 | .196 | .217 |
| Net Realized and Unrealized Gain (Loss) | | | | | |
| on Investments | (.010) | (. 060) | .030 | (. 050) | . 070 |
| Total from Investment Operations | .105 | . 081 | .201 | .146 | . 287 |
| Distributions | | | | | |
| Dividends from Net Investment Income | (.115) | (.141) | (.171) | (.196) | (.217) |
| Distributions from Realized Capital Gains | — | — | — | — | — |
| Total Distributions | (.115) | (.141) | (.171) | (.196) | (.217) |
| Net Asset Value, End of Period | $15.86 | $15.87 | $15.93 | $15.90 | $15.95 |
| |
| Total Return1 | 0.66% | 0.51% | 1.27% | 0.92% | 1.82% |
| |
| Ratios/Supplemental Data | | | | | |
| Net Assets, End of Period (Millions) | $1,713 | $1,822 | $2,103 | $2,668 | $3,126 |
| Ratio of Total Expenses to Average Net Assets | 0.20% | 0.20% | 0.20% | 0.20% | 0.20% |
| Ratio of Net Investment Income to | | | | | |
| Average Net Assets | 0.72% | 0.89% | 1.07% | 1.23% | 1.36% |
| Portfolio Turnover Rate | 27% | 30% | 29% | 28% | 29% |
1 Total returns do not include account service fees that may have applied in the periods shown. Fund prospectuses provide information about
any applicable account service fees.
| | | | | |
| Admiral Shares | | | | | |
| |
| For a Share Outstanding | Year Ended October 31, |
| Throughout Each Period | 2014 | 2013 | 2012 | 2011 | 2010 |
| Net Asset Value, Beginning of Period | $15.87 | $15.93 | $15.90 | $15.95 | $15.88 |
| Investment Operations | | | | | |
| Net Investment Income | .128 | .154 | .183 | . 209 | . 230 |
| Net Realized and Unrealized Gain (Loss) | | | | | |
| on Investments | (.010) | (. 060) | .030 | (. 050) | . 070 |
| Total from Investment Operations | .118 | .094 | .213 | .159 | .300 |
| Distributions | | | | | |
| Dividends from Net Investment Income | (.128) | (.154) | (.183) | (. 209) | (. 230) |
| Distributions from Realized Capital Gains | — | — | — | — | — |
| Total Distributions | (.128) | (.154) | (.183) | (. 209) | (. 230) |
| Net Asset Value, End of Period | $15.86 | $15.87 | $15.93 | $15.90 | $15.95 |
| |
| Total Return | 0.74% | 0.59% | 1.35% | 1.00% | 1.90% |
| |
| Ratios/Supplemental Data | | | | | |
| Net Assets, End of Period (Millions) | $11,100 | $10,240 | $9,351 | $8,561 | $8,863 |
| Ratio of Total Expenses to Average Net Assets | 0.12% | 0.12% | 0.12% | 0.12% | 0.12% |
| Ratio of Net Investment Income to | | | | | |
| Average Net Assets | 0.80% | 0.97% | 1.15% | 1.31% | 1.44% |
| Portfolio Turnover Rate | 27% | 30% | 29% | 28% | 29% |
See accompanying Notes, which are an integral part of the Financial Statements.
37
Short-Term Tax-Exempt Fund
Notes to Financial Statements
Vanguard Short-Term Tax-Exempt Fund is registered under the Investment Company Act of 1940 as an open-end investment company, or mutual fund. The fund invests in debt instruments of many municipal issuers; the issuers’ abilities to meet their obligations may be affected by economic and political developments in a specific state or region. The fund offers two classes of shares: Investor Shares and Admiral Shares. Investor Shares are available to any investor who meets the fund’s minimum purchase requirements. Admiral Shares are designed for investors who meet certain administrative, service, and account-size criteria.
A. The following significant accounting policies conform to generally accepted accounting principles for U.S. investment companies. The fund consistently follows such policies in preparing its financial statements.
1. Security Valuation: Securities are valued as of the close of trading on the New York Stock Exchange (generally 4 p.m., Eastern time) on the valuation date. Bonds, and temporary cash investments acquired over 60 days to maturity, are valued using the latest bid prices or using valuations based on a matrix system (which considers such factors as security prices, yields, maturities, and ratings), both as furnished by independent pricing services. Investments in Vanguard Municipal Cash Management Fund are valued at that fund’s net asset value. Other temporary cash investments are valued at amortized cost, which approximates market value. Securities for which market quotations are not readily available, or whose values have been affected by events occurring before the fund’s pricing time but after the close of the securities’ primary markets, are valued by methods deemed by the board of trustees to represent fair value.
2. Futures Contracts: The fund uses futures contracts to invest in fixed income asset classes with greater efficiency and lower cost than is possible through direct investment, to add value when these instruments are attractively priced, or to adjust sensitivity to changes in interest rates. The primary risks associated with the use of futures contracts are imperfect correlation between changes in market values of bonds held by the fund and the prices of futures contracts, and the possibility of an illiquid market. Counterparty risk involving futures is mitigated because a regulated clearinghouse is the counterparty instead of the clearing broker. To further mitigate counterparty risk, the fund trades futures contracts on an exchange, monitors the financial strength of its clearing brokers and clearinghouse, and has entered into clearing agreements with its clearing brokers. The clearinghouse imposes initial margin requirements to secure the fund’s performance and requires daily settlement of variation margin representing changes in the market value of each contract.
Futures contracts are valued at their quoted daily settlement prices. The aggregate settlement values of the contracts are not recorded in the Statement of Net Assets. Fluctuations in the value of the contracts are recorded in the Statement of Net Assets as an asset (liability) and in the Statement of Operations as unrealized appreciation (depreciation) until the contracts are closed, when they are recorded as realized futures gains (losses).
During the year ended October 31, 2014, the fund’s average investments in long and short futures contracts each represented less than 1% of net assets, based on the average of aggregate settlement values at each quarter-end during the period. The fund had no open futures contracts at October 31, 2014.
3. Federal Income Taxes: The fund intends to continue to qualify as a regulated investment company and distribute all of its income. Management has analyzed the fund’s tax positions taken for all open federal income tax years (October 31, 2011–2014), and has concluded that no provision for federal income tax is required in the fund’s financial statements.
4. Distributions: Distributions from net investment income are declared daily and paid on the first business day of the following month. Annual distributions from realized capital gains, if any, are recorded on the ex-dividend date.
5. Credit Facility: The fund and certain other funds managed by The Vanguard Group participate in a $2.89 billion committed credit facility provided by a syndicate of lenders pursuant to a credit agreement that may be renewed annually; each fund is individually liable for its borrowings, if any, under the credit facility. Borrowings may be utilized for temporary and emergency purposes, and are subject to the fund’s regulatory and contractual borrowing restrictions. The participating funds are charged administrative fees and an annual commitment fee of 0.06% of the undrawn amount of the facility; these fees are allocated to the funds based on a method approved by the fund’s board of trustees and included in Management and Administrative expenses on the fund’s Statement of Operations. Any borrowings under this facility bear interest at a rate equal to the higher of the federal funds rate or LIBOR reference rate plus an agreed-upon spread.
The fund had no borrowings outstanding at October 31, 2014, or at any time during the period then ended.
38
Short-Term Tax-Exempt Fund
6. Other: Interest income includes income distributions received from Vanguard Municipal Cash Management Fund and is accrued daily. Premiums and discounts on debt securities purchased are amortized and accreted, respectively, to interest income over the lives of the respective securities. Security transactions are accounted for on the date securities are bought or sold. Costs used to determine realized gains (losses) on the sale of investment securities are those of the specific securities sold.
Each class of shares has equal rights as to assets and earnings, except that each class separately bears certain class-specific expenses related to maintenance of shareholder accounts (included in Management and Administrative expenses) and shareholder reporting. Marketing and distribution expenses are allocated to each class of shares based on a method approved by the board of trustees. Income, other non-class-specific expenses, and gains and losses on investments are allocated to each class of shares based on its relative net assets.
B. The Vanguard Group furnishes at cost investment advisory, corporate management, administrative, marketing, and distribution services. The costs of such services are allocated to the fund based on methods approved by the board of trustees. The fund has committed to invest up to 0.40% of its net assets in Vanguard. At October 31, 2014, the fund had contributed capital of $1,273,000 to Vanguard (included in Other Assets), representing 0.01% of the fund’s net assets and 0.51% of Vanguard’s capitalization. The fund’s trustees and officers are also directors and officers of Vanguard.
C. Various inputs may be used to determine the value of the fund’s investments. These inputs are summarized in three broad levels for financial statement purposes. The inputs or methodologies used to value securities are not necessarily an indication of the risk associated with investing in those securities.
Level 1—Quoted prices in active markets for identical securities.
Level 2—Other significant observable inputs (including quoted prices for similar securities, interest rates, prepayment speeds, credit risk, etc.).
Level 3—Significant unobservable inputs (including the fund’s own assumptions used to determine the fair value of investments).
The following table summarizes the market value of the fund’s investments as of October 31, 2014, based on the inputs used to value them:
| | | |
| | Level 1 | Level 2 | Level 3 |
| Investments | ($000) | ($000) | ($000) |
| Tax-Exempt Municipal Bonds | — | 12,909,610 | — |
| Temporary Cash Investments | 225,345 | — | — |
| Total | 225,345 | 12,909,610 | — |
D. Capital gain distributions are determined on a tax basis and may differ from realized capital gains for financial reporting purposes. Differences may be permanent or temporary. Permanent differences are reclassified among capital accounts in the financial statements to reflect their tax character. Temporary differences arise when gains or losses are recognized in different periods for financial statement and tax purposes. These differences will reverse at some time in the future.
The fund used capital loss carryforwards of $2,708,000 to offset taxable capital gains realized during the year ended October 31, 2014. At October 31, 2014, the fund had available capital losses totaling $15,828,000 to offset future net capital gains of $2,752,000 through October 31, 2015, $2,331,000 through October 31, 2018, and $10,745,000 through October 31, 2019.
At October 31, 2014, the cost of investment securities for tax purposes was $13,058,274,000. Net unrealized appreciation of investment securities for tax purposes was $76,681,000, consisting of unrealized gains of $77,584,000 on securities that had risen in value since their purchase and $903,000 in unrealized losses on securities that had fallen in value since their purchase.
E. During the year ended October 31, 2014, the fund purchased $3,541,066,000 of investment securities and sold $2,248,894,000 of investment securities, other than temporary cash investments.
39
Short-Term Tax-Exempt Fund
F. Capital share transactions for each class of shares were:
| | | | |
| | | | Year Ended October 31, |
| | 2014 | 2013 |
| | Amount | Shares | Amount | Shares |
| | ($000) | (000) | ($000) | (000) |
| Investor Shares | | | | |
| Issued | 688,453 | 43,385 | 968,303 | 60,932 |
| Issued in Lieu of Cash Distributions | 10,133 | 639 | 14,603 | 919 |
| Redeemed | (807,650) | (50,899) | (1,255,696) | (79,046) |
| Net Increase (Decrease) —Investor Shares | (109,064) | (6,875) | (272,790) | (17,195) |
| Admiral Shares | | | | |
| Issued | 4,877,636 | 307,406 | 5,674,600 | 357,264 |
| Issued in Lieu of Cash Distributions | 65,029 | 4,099 | 71,117 | 4,477 |
| Redeemed | (4,080,795) | (257,182) | (4,819,549) | (303,300) |
| Net Increase (Decrease) —Admiral Shares | 861,870 | 54,323 | 926,168 | 58,441 |
G. Management has determined that no material events or transactions occurred subsequent to October 31, 2014, that would require recognition or disclosure in these financial statements.
40
Limited-Term Tax-Exempt Fund
Fund Profile
As of October 31, 2014
| | |
| Share-Class Characteristics | | |
| | Investor | Admiral |
| | Shares | Shares |
| Ticker Symbol | VMLTX | VMLUX |
| Expense Ratio1 | 0.20% | 0.12% |
| 30-Day SEC Yield | 0.70% | 0.78% |
| | | |
| Financial Attributes | | |
| | | Barclays | |
| | | 1–5 Year | Barclays |
| | | Municipal Municipal |
| | | Bond | Bond |
| | Fund | Index | Index |
| Number of Bonds | 2,652 | 14,626 | 45,888 |
| Yield to Maturity | | | |
| (before expenses) | 0.9% | 0.9% | 2.1% |
| Average Coupon | 3.6% | 4.8% | 4.8% |
| Average Duration | 2.5 years | 2.8 years | 6.6 years |
| Average Stated | | | |
| Maturity | 3.3 years | 3.4 years 13.4 years |
| Short-Term Reserves | 12.5% | — | — |
| |
| Largest Area Concentrations2 | |
| |
| New York | 14.7% |
| California | 12.6 |
| Texas | 7.5 |
| Pennsylvania | 5.8 |
| Illinois | 5.2 |
| New Jersey | 4.6 |
| Florida | 4.5 |
| Massachusetts | 4.5 |
| Ohio | 3.5 |
| Washington | 3.0 |
| Top Ten | 65.9% |
| | |
| Volatility Measures | | |
| | Barclays | |
| | 1–5 Year | Barclays |
| | Municipal | Municipal |
| | Bond Index | Bond Index |
| R-Squared | 0.96 | 0.75 |
| Beta | 1.05 | 0.28 |
| These measures show the degree and timing of the fund’s fluctuations compared with the indexes over 36 months. |
|
| |
| Distribution by Stated Maturity (% of portfolio) |
| |
| Under 6 Months | 17.2% |
| 6 Months–1 Year | 4.3 |
| 1–2 Years | 11.1 |
| 2–3 Years | 14.9 |
| 3–4 Years | 16.6 |
| 4–5 Years | 14.4 |
| Over 5 Years | 21.5 |
| |
| Distribution by Credit Quality (% of portfolio) |
| |
| AAA | 19.9% |
| AA | 55.4 |
| A | 20.3 |
| BBB | 3.5 |
| BB | 0.5 |
| Not Rated | 0.4 |
Credit-quality ratings are from Moody’s and S&P. The higher ratingfor each issue is shown. “Not Rated” is used to classify securitiesfor which a rating is not available. For information about theseratings, see the Glossary entry for Credit Quality.Investment Focus

1 The expense ratios shown are from the prospectus dated February 26, 2014, and represent estimated costs for the current fiscal year. For the fiscal year ended October 31, 2014, the expense ratios were 0.20% for
the Investor Shares and 0.12% for the Admiral Shares.
2 Percentage of net assets, excluding any futures contracts.
41
Limited-Term Tax-Exempt Fund
Performance Summary
All of the returns in this report represent past performance, which is not a guarantee of future results that may be achieved by the fund. (Current performance may be lower or higher than the performance data cited. For performance data current to the most recent month-end, visit our website at vanguard.com/performance.) Note, too, that both investment returns and principal value can fluctuate widely, so an investor’s shares, when sold, could be worth more or less than their original cost. The returns shown do not reflect taxes that a shareholder would pay on fund distributions or on the sale of fund shares.
Cumulative Performance: October 31, 2004–October 31, 2014
Initial Investment of $10,000
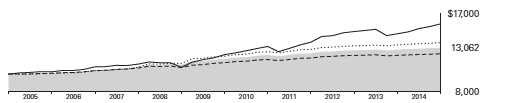
| | | | |
| | | Average Annual Total Returns | Final Value |
| | Periods Ended October 31, 2014 | of a $10,000 |
| | One Year | Five Years | Ten Years | Investment |
| Limited-Term Tax-Exempt Fund | | | | |
| Investor Shares | 1.81% | 2.17% | 2.71% | $13,062 |
| Barclays 1–5 Year Municipal Bond Index | 1.98 | 2.50 | 3.17 | 13,662 |
| 1–5 Year Municipal Funds Average1 | 1.50 | 1.76 | 2.14 | 12,359 |
| Barclays Municipal Bond Index | 7.82 | 5.26 | 4.71 | 15,839 |
| | | | |
| | | | | Final Value |
| | | | | of a $50,000 |
| | One Year | Five Years | Ten Years | Investment |
| Limited-Term Tax-Exempt Fund Admiral Shares | 1.89% | 2.25% | 2.79% | $65,814 |
| Barclays 1–5 Year Municipal Bond Index | 1.98 | 2.50 | 3.17 | 68,308 |
| Barclays Municipal Bond Index | 7.82 | 5.26 | 4.71 | 79,197 |
1 Derived from data provided by Lipper, a Thomson Reuters Company.
See Financial Highlights for dividend and capital gains information.
42
Limited-Term Tax-Exempt Fund
| | | | |
| Fiscal-Year Total Returns (%): October 31, 2004–October 31, 2014 | | | |
| | | | | Barclays |
| | | | | 1–5 Year |
| | | | | Municipal |
| | Investor Shares | Bond Index |
| | Capital | Income | Total | Total |
| Fiscal Year | Returns | Returns | Returns | Returns |
| 2005 | –2.28% | 2.99% | 0.71% | 0.56% |
| 2006 | 0.09 | 3.28 | 3.37 | 3.43 |
| 2007 | 0.09 | 3.53 | 3.62 | 3.90 |
| 2008 | –0.75 | 3.43 | 2.68 | 3.92 |
| 2009 | 3.00 | 2.92 | 5.92 | 7.51 |
| 2010 | 1.64 | 2.40 | 4.04 | 4.32 |
| 2011 | –0.72 | 2.25 | 1.53 | 2.15 |
| 2012 | 0.99 | 1.94 | 2.93 | 3.17 |
| 2013 | –1.07 | 1.67 | 0.60 | 0.93 |
| 2014 | 0.18 | 1.63 | 1.81 | 1.98 |
Average Annual Total Returns: Periods Ended September 30, 2014
This table presents returns through the latest calendar quarter—rather than through the end of the fiscal period.
Securities and Exchange Commission rules require that we provide this information.
| | | | | | |
| | | | | | | Ten Years |
| | Inception Date | One Year Five Years | Capital | Income | Total |
| Investor Shares | 8/31/1987 | 2.19% | 2.01% | 0.10% | 2.61% | 2.71% |
| Admiral Shares | 2/12/2001 | 2.27 | 2.09 | 0.10 | 2.69 | 2.79 |
43
Limited-Term Tax-Exempt Fund
Financial Statements
The Statement of Net Assets—an integral part of the Financial Statements for Vanguard Limited-Term Tax-Exempt Fund—is included as an insert to this report.
Statement of Operations
| |
| | Year Ended |
| October 31, 2014 |
| | ($000) |
| Investment Income | |
| Income | |
| Interest1 | 337,588 |
| Total Income | 337,588 |
| Expenses | |
| The Vanguard Group—Note B | |
| Investment Advisory Services | 1,808 |
| Management and Administrative— | |
| Investor Shares | 3,536 |
| Management and Administrative— | |
| Admiral Shares | 13,976 |
| Marketing and Distribution— | |
| Investor Shares | 578 |
| Marketing and Distribution— | |
| Admiral Shares | 3,717 |
| Custodian Fees | 194 |
| Auditing Fees | 32 |
| Shareholders’ Reports—Investor Shares | 234 |
| Shareholders’ Reports—Admiral Shares | 147 |
| Trustees’ Fees and Expenses | 13 |
| Total Expenses | 24,235 |
| Net Investment Income | 313,353 |
| Realized Net Gain (Loss) | |
| Investment Securities Sold | (7,642) |
| Futures Contracts | (4,290) |
| Realized Net Gain (Loss) | (11,932) |
| Change in Unrealized Appreciation | |
| (Depreciation) of Investment Securities | 39,883 |
| Net Increase (Decrease) in Net Assets | |
| Resulting from Operations | 341,304 |
Statement of Changes in Net Assets
| | |
| | Year Ended October 31, |
| | 2014 | 2013 |
| | ($000) | ($000) |
| Increase (Decrease) in Net Assets | | |
| Operations | | |
| Net Investment Income | 313,353 | 301,483 |
| Realized Net Gain (Loss) | (11,932) | (5,242) |
| Change in Unrealized Appreciation (Depreciation) | 39,883 | (188,570) |
| Net Increase (Decrease) in Net Assets Resulting from Operations | 341,304 | 107,671 |
| Distributions | | |
| Net Investment Income | | |
| Investor Shares | (37,104) | (42,849) |
| Admiral Shares | (276,249) | (258,634) |
| Realized Capital Gain | | |
| Investor Shares | — | — |
| Admiral Shares | — | — |
| Total Distributions | (313,353) | (301,483) |
| Capital Share Transactions | | |
| Investor Shares | (127,025) | (385,733) |
| Admiral Shares | 2,319,999 | 1,470,493 |
| Net Increase (Decrease) from Capital Share Transactions | 2,192,974 | 1,084,760 |
| Total Increase (Decrease) | 2,220,925 | 890,948 |
| Net Assets | | |
| Beginning of Period | 17,640,679 | 16,749,731 |
| End of Period | 19,861,604 | 17,640,679 |
1 Interest income from an affiliated company of the fund was $154,000.
See accompanying Notes, which are an integral part of the Financial Statements.
44
| | | | | |
| Limited-Term Tax-Exempt Fund | | | | | |
| |
| |
| Financial Highlights | | | | | |
| |
| Investor Shares | | | | | |
| |
| For a Share Outstanding | Year Ended October 31, |
| Throughout Each Period | 2014 | 2013 | 2012 | 2011 | 2010 |
| Net Asset Value, Beginning of Period | $11.06 | $11.18 | $11.07 | $11.15 | $10.97 |
| Investment Operations | | | | | |
| Net Investment Income | .178 | .186 | .212 | .247 | . 259 |
| Net Realized and Unrealized Gain (Loss) | | | | | |
| on Investments | .020 | (.120) | .110 | (.080) | .180 |
| Total from Investment Operations | .198 | .066 | . 322 | .167 | .439 |
| Distributions | | | | | |
| Dividends from Net Investment Income | (.178) | (.186) | (.212) | (.247) | (. 259) |
| Distributions from Realized Capital Gains | — | — | — | — | — |
| Total Distributions | (.178) | (.186) | (.212) | (.247) | (. 259) |
| Net Asset Value, End of Period | $11.08 | $11.06 | $11.18 | $11.07 | $11.15 |
| |
| Total Return1 | 1.81% | 0.60% | 2.93% | 1.53% | 4.04% |
| |
| Ratios/Supplemental Data | | | | | |
| Net Assets, End of Period (Millions) | $2,241 | $2,364 | $2,779 | $3,123 | $3,484 |
| Ratio of Total Expenses to Average Net Assets | 0.20% | 0.20% | 0.20% | 0.20% | 0.20% |
| Ratio of Net Investment Income to | | | | | |
| Average Net Assets | 1.61% | 1.67% | 1.90% | 2.24% | 2.33% |
| Portfolio Turnover Rate | 15% | 14% | 15% | 14% | 14% |
1 Total returns do not include account service fees that may have applied in the periods shown. Fund prospectuses provide information about
any applicable account service fees.
| | | | | |
| Admiral Shares | | | | | |
| |
| For a Share Outstanding | Year Ended October 31, |
| Throughout Each Period | 2014 | 2013 | 2012 | 2011 | 2010 |
| Net Asset Value, Beginning of Period | $11.06 | $11.18 | $11.07 | $11.15 | $10.97 |
| Investment Operations | | | | | |
| Net Investment Income | .187 | .195 | .221 | . 256 | . 268 |
| Net Realized and Unrealized Gain (Loss) | | | | | |
| on Investments | .020 | (.120) | .110 | (.080) | .180 |
| Total from Investment Operations | . 207 | . 075 | .331 | .176 | .448 |
| Distributions | | | | | |
| Dividends from Net Investment Income | (.187) | (.195) | (.221) | (. 256) | (. 268) |
| Distributions from Realized Capital Gains | — | — | — | — | — |
| Total Distributions | (.187) | (.195) | (.221) | (. 256) | (. 268) |
| Net Asset Value, End of Period | $11.08 | $11.06 | $11.18 | $11.07 | $11.15 |
| |
| Total Return | 1.89% | 0.68% | 3.01% | 1.61% | 4.12% |
| |
| Ratios/Supplemental Data | | | | | |
| Net Assets, End of Period (Millions) | $17,621 | $15,276 | $13,970 | $11,463 | $10,524 |
| Ratio of Total Expenses to Average Net Assets | 0.12% | 0.12% | 0.12% | 0.12% | 0.12% |
| Ratio of Net Investment Income to | | | | | |
| Average Net Assets | 1.69% | 1.75% | 1.98% | 2.32% | 2.41% |
| Portfolio Turnover Rate | 15% | 14% | 15% | 14% | 14% |
See accompanying Notes, which are an integral part of the Financial Statements.
45
Limited-Term Tax-Exempt Fund
Notes to Financial Statements
Vanguard Limited-Term Tax-Exempt Fund is registered under the Investment Company Act of 1940 as an open-end investment company, or mutual fund. The fund invests in debt instruments of many municipal issuers; the issuers’ abilities to meet their obligations may be affected by economic and political developments in a specific state or region. The fund offers two classes of shares: Investor Shares and Admiral Shares. Investor Shares are available to any investor who meets the fund’s minimum purchase requirements. Admiral Shares are designed for investors who meet certain administrative, service, and account-size criteria.
A. The following significant accounting policies conform to generally accepted accounting principles for U.S. investment companies. The fund consistently follows such policies in preparing its financial statements.
1. Security Valuation: Securities are valued as of the close of trading on the New York Stock Exchange (generally 4 p.m., Eastern time) on the valuation date. Bonds, and temporary cash investments acquired over 60 days to maturity, are valued using the latest bid prices or using valuations based on a matrix system (which considers such factors as security prices, yields, maturities, and ratings), both as furnished by independent pricing services. Investments in Vanguard Municipal Cash Management Fund are valued at that fund’s net asset value. Other temporary cash investments are valued at amortized cost, which approximates market value. Securities for which market quotations are not readily available, or whose values have been affected by events occurring before the fund’s pricing time but after the close of the securities’ primary markets, are valued by methods deemed by the board of trustees to represent fair value.
2. Futures Contracts: The fund uses futures contracts to invest in fixed income asset classes with greater efficiency and lower cost than is possible through direct investment, to add value when these instruments are attractively priced, or to adjust sensitivity to changes in interest rates. The primary risks associated with the use of futures contracts are imperfect correlation between changes in market values of bonds held by the fund and the prices of futures contracts, and the possibility of an illiquid market. Counterparty risk involving futures is mitigated because a regulated clearinghouse is the counterparty instead of the clearing broker. To further mitigate counterparty risk, the fund trades futures contracts on an exchange, monitors the financial strength of its clearing brokers and clearing-house, and has entered into clearing agreements with its clearing brokers. The clearinghouse imposes initial margin requirements to secure the fund’s performance and requires daily settlement of variation margin representing changes in the market value of each contract.
Futures contracts are valued at their quoted daily settlement prices. The aggregate settlement values of the contracts are not recorded in the Statement of Net Assets. Fluctuations in the value of the contracts are recorded in the Statement of Net Assets as an asset (liability) and in the Statement of Operations as unrealized appreciation (depreciation) until the contracts are closed, when they are recorded as realized futures gains (losses).
During the year ended October 31, 2014, the fund’s average investments in long and short futures contracts represented 0% and 1% of net assets, respectively, based on the average of aggregate settlement values at each quarter-end during the period. The fund had no open futures contracts at October 31, 2014.
3. Federal Income Taxes: The fund intends to continue to qualify as a regulated investment company and distribute all of its income. Management has analyzed the fund’s tax positions taken for all open federal income tax years (October 31, 2011–2014), and has concluded that no provision for federal income tax is required in the fund’s financial statements.
4. Distributions: Distributions from net investment income are declared daily and paid on the first business day of the following month. Annual distributions from realized capital gains, if any, are recorded on the ex-dividend date.
5. Credit Facility: The fund and certain other funds managed by The Vanguard Group participate in a $2.89 billion committed credit facility provided by a syndicate of lenders pursuant to a credit agreement that may be renewed annually; each fund is individually liable for its borrowings, if any, under the credit facility. Borrowings may be utilized for temporary and emergency purposes, and are subject to the fund’s regulatory and contractual borrowing restrictions. The participating funds are charged administrative fees and an annual commitment fee of 0.06% of the undrawn amount of the facility; these fees are allocated to the funds based on a method approved by the fund’s board of trustees and included in Management and Administrative expenses on the fund’s Statement of Operations. Any borrowings under this facility bear interest at a rate equal to the higher of the federal funds rate or LIBOR reference rate plus an agreed-upon spread.
The fund had no borrowings outstanding at October 31, 2014, or at any time during the period then ended.
46
Limited-Term Tax-Exempt Fund
6. Other: Interest income includes income distributions received from Vanguard Municipal Cash Management Fund and is accrued daily. Premiums and discounts on debt securities purchased are amortized and accreted, respectively, to interest income over the lives of the respective securities. Security transactions are accounted for on the date securities are bought or sold. Costs used to determine realized gains (losses) on the sale of investment securities are those of the specific securities sold.
Each class of shares has equal rights as to assets and earnings, except that each class separately bears certain class-specific expenses related to maintenance of shareholder accounts (included in Management and Administrative expenses) and shareholder reporting. Marketing and distribution expenses are allocated to each class of shares based on a method approved by the board of trustees. Income, other non-class-specific expenses, and gains and losses on investments are allocated to each class of shares based on its relative net assets.
B. The Vanguard Group furnishes at cost investment advisory, corporate management, administrative, marketing, and distribution services. The costs of such services are allocated to the fund based on methods approved by the board of trustees. The fund has committed to invest up to 0.40% of its net assets in Vanguard. At October 31, 2014, the fund had contributed capital of $1,966,000 to Vanguard (included in Other Assets), representing 0.01% of the fund’s net assets and 0.79% of Vanguard’s capitalization. The fund’s trustees and officers are also directors and officers of Vanguard.
C. Various inputs may be used to determine the value of the fund’s investments. These inputs are summarized in three broad levels for financial statement purposes. The inputs or methodologies used to value securities are not necessarily an indication of the risk associated with investing in those securities.
Level 1—Quoted prices in active markets for identical securities.
Level 2—Other significant observable inputs (including quoted prices for similar securities, interest rates, prepayment speeds, credit risk, etc.).
Level 3—Significant unobservable inputs (including the fund’s own assumptions used to determine the fair value of investments).
The following table summarizes the market value of the fund’s investments as of October 31, 2014, based on the inputs used to value them:
| | | |
| | Level 1 | Level 2 | Level 3 |
| Investments | ($000) | ($000) | ($000) |
| Tax-Exempt Municipal Bonds | — | 19,624,555 | — |
| Temporary Cash Investments | 314,510 | — | — |
| Total | 314,510 | 19,624,555 | — |
D. Capital gain distributions are determined on a tax basis and may differ from realized capital gains for financial reporting purposes. Differences may be permanent or temporary. Permanent differences are reclassified among capital accounts in the financial statements to reflect their tax character. Temporary differences arise when gains or losses are recognized in different periods for financial statement and tax purposes. These differences will reverse at some time in the future.
At October 31, 2014, the fund had available capital losses totaling $102,697,000 to offset future net capital gains. Of this amount, $76,395,000 is subject to expiration dates; $12,485,000 may be used to offset future net capital gains through October 31, 2015, $2,743,000 through October 31, 2016, $29,710,000 through October 31, 2017, $4,375,000 through October 31, 2018, and $27,082,000 through October 31, 2019. Capital losses of $26,302,000 realized beginning in fiscal 2012 may be carried forward indefinitely under the Regulated Investment Company Modernization Act of 2010, but must be used before any expiring loss carryforwards. Capital loss carryforwards of $16,166,000 expired on October 31, 2014; accordingly, such losses have been reclassified from accumulated net realized losses to paid-in capital.
At October 31, 2014, the cost of investment securities for tax purposes was $19,575,932,000.
Net unrealized appreciation of investment securities for tax purposes was $363,133,000, consisting of unrealized gains of $370,502,000 on securities that had risen in value since their purchase and $7,369,000 in unrealized losses on securities that had fallen in value since their purchase.
E. During the year ended October 31, 2014, the fund purchased $5,325,572,000 of investment securities and sold $2,428,563,000 of investment securities, other than temporary cash investments.
47
Limited-Term Tax-Exempt Fund
F. Capital share transactions for each class of shares were:
| | | | |
| | Year Ended October 31, |
| | 2014 | 2013 |
| | Amount | Shares | Amount | Shares |
| | ($000) | (000) | ($000) | (000) |
| Investor Shares | | | | |
| Issued | 784,589 | 70,888 | 955,275 | 86,010 |
| Issued in Lieu of Cash Distributions | 30,097 | 2,720 | 34,682 | 3,125 |
| Redeemed | (941,711) | (85,092) | (1,375,690) | (123,891) |
| Net Increase (Decrease) —Investor Shares | (127,025) | (11,484) | (385,733) | (34,756) |
| Admiral Shares | | | | |
| Issued | 6,227,111 | 562,633 | 6,769,862 | 609,929 |
| Issued in Lieu of Cash Distributions | 206,336 | 18,643 | 196,106 | 17,678 |
| Redeemed | (4,113,448) | (371,810) | (5,495,475) | (495,714) |
| Net Increase (Decrease) —Admiral Shares | 2,319,999 | 209,466 | 1,470,493 | 131,893 |
G. Management has determined that no material events or transactions occurred subsequent to October 31, 2014, that would require recognition or disclosure in these financial statements.
48
Intermediate-Term Tax-Exempt Fund
Fund Profile
As of October 31, 2014
| | |
| Share-Class Characteristics | | |
| | Investor | Admiral |
| | Shares | Shares |
| Ticker Symbol | VWITX | VWIUX |
| Expense Ratio1 | 0.20% | 0.12% |
| 30-Day SEC Yield | 1.54% | 1.62% |
| | | |
| Financial Attributes | | |
| | | Barclays | |
| | | 1–15 Year | Barclays |
| | | Municipal Municipal |
| | | Bond | Bond |
| | Fund | Index | Index |
| Number of Bonds | 4,341 | 37,228 | 45,888 |
| Yield to Maturity | | | |
| (before expenses) | 1.8% | 1.7% | 2.1% |
| Average Coupon | 4.3% | 4.8% | 4.8% |
| Average Duration | 4.7 years | 4.8 years | 6.6 years |
| Average Stated | | | |
| Maturity | 8.8 years | 8.1 years 13.4 years |
| Short-Term Reserves | 8.5% | — | — |
| |
| Largest Area Concentrations2 | |
| |
| New York | 16.7% |
| California | 12.1 |
| Texas | 8.5 |
| Illinois | 7.7 |
| Florida | 6.5 |
| New Jersey | 4.3 |
| Massachusetts | 3.8 |
| Pennsylvania | 3.7 |
| Ohio | 2.9 |
| Michigan | 2.7 |
| Top Ten | 68.9% |
| | |
| Volatility Measures | | |
| | Barclays | |
| | 1–15 Year | Barclays |
| | Municipal | Municipal |
| | Bond Index | Bond Index |
| R-Squared | 0.99 | 0.98 |
| Beta | 1.19 | 0.91 |
These measures show the degree and timing of the fund’s
fluctuations compared with the indexes over 36 months.
| |
| Distribution by Stated Maturity (% of portfolio) |
| |
| Under 1 Year | 12.9% |
| 1–3 Years | 9.4 |
| 3–5 Years | 8.7 |
| 5–10 Years | 26.4 |
| 10–20 Years | 41.6 |
| 20–30 Years | 1.0 |
| |
| Distribution by Credit Quality (% of portfolio) |
| |
| AAA | 18.8% |
| AA | 57.0 |
| A | 20.4 |
| BBB | 2.7 |
| BB | 0.4 |
| B or Lower | 0.1 |
| Not Rated | 0.6 |
Credit-quality ratings are from Moody’s and S&P. The higher ratingfor each issue is shown. “Not Rated” is used to classify securitiesfor which a rating is not available. For information about theseratings, see the Glossary entry for Credit Quality.Investment Focus
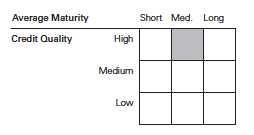
1 The expense ratios shown are from the prospectus dated February 26, 2014, and represent estimated costs for the current fiscal year. For the fiscal year ended October 31, 2014, the expense ratios were 0.20% for the Investor Shares and 0.12% for the Admiral Shares.
2 Percentage of net assets, excluding any futures contracts.
49
Intermediate-Term Tax-Exempt Fund
Performance Summary
All of the returns in this report represent past performance, which is not a guarantee of future results that may be achieved by the fund. (Current performance may be lower or higher than the performance data cited. For performance data current to the most recent month-end, visit our website at vanguard.com/performance.) Note, too, that both investment returns and principal value can fluctuate widely, so an investor’s shares, when sold, could be worth more or less than their original cost. The returns shown do not reflect taxes that a shareholder would pay on fund distributions or on the sale of fund shares.
Cumulative Performance: October 31, 2004–October 31, 2014
Initial Investment of $10,000
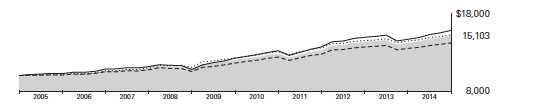
| | | | |
| | | Average Annual Total Returns | Final Value |
| | Periods Ended October 31, 2014 | of a $10,000 |
| | One Year | Five Years | Ten Years | Investment |
| Intermediate-Term Tax-Exempt Fund | | | | |
| Investor Shares | 6.31% | 4.71% | 4.21% | $15,103 |
| Barclays 1–15 Year Municipal Bond Index | 5.56 | 4.48 | 4.32 | 15,269 |
| Intermediate Municipal Funds Average1 | 5.11 | 4.11 | 3.57 | 14,207 |
| Barclays Municipal Bond Index | 7.82 | 5.26 | 4.71 | 15,839 |
| | | | |
| | | | | Final Value |
| | | | | of a $50,000 |
| | One Year | Five Years | Ten Years | Investment |
| Intermediate-Term Tax-Exempt Fund Admiral Shares | 6.39% | 4.79% | 4.29% | $76,094 |
| Barclays 1–15 Year Municipal Bond Index | 5.56 | 4.48 | 4.32 | 76,345 |
| Barclays Municipal Bond Index | 7.82 | 5.26 | 4.71 | 79,197 |
1 Derived from data provided by Lipper, a Thomson Reuters Company.
See Financial Highlights for dividend and capital gains information.
50
| | | | |
| Intermediate-Term Tax-Exempt Fund | | | | |
| |
| |
| |
| |
| Fiscal-Year Total Returns (%): October 31, 2004–October 31, 2014 | | | |
| | | | | Barclays |
| | | | | 1–15 Year |
| | | | | Municipal |
| | Investor Shares | Bond Index |
| | Capital | Income | Total | Total |
| Fiscal Year | Returns | Returns | Returns | Returns |
| 2005 | –3.00% | 4.02% | 1.02% | 1.15% |
| 2006 | 0.83 | 4.31 | 5.14 | 4.91 |
| 2007 | –1.42 | 4.16 | 2.74 | 3.45 |
| 2008 | –4.48 | 3.99 | –0.49 | 0.88 |
| 2009 | 6.27 | 4.24 | 10.51 | 10.72 |
| 2010 | 3.14 | 3.81 | 6.95 | 6.81 |
| 2011 | –0.36 | 3.71 | 3.35 | 3.62 |
| 2012 | 4.80 | 3.35 | 8.15 | 7.02 |
| 2013 | –3.96 | 3.00 | –0.96 | –0.41 |
| 2014 | 3.03 | 3.28 | 6.31 | 5.56 |
Average Annual Total Returns: Periods Ended September 30, 2014
This table presents returns through the latest calendar quarter—rather than through the end of the fiscal period.
Securities and Exchange Commission rules require that we provide this information.
| | | | | | |
| | | | | | | Ten Years |
| | Inception Date | One Year | Five Years | Capital | Income | Total |
| Investor Shares | 9/1/1977 | 6.58% | 4.14% | 0.42% | 3.80% | 4.22% |
| Admiral Shares | 2/12/2001 | 6.67 | 4.22 | 0.42 | 3.88 | 4.30 |
51
Intermediate-Term Tax-Exempt Fund
Financial Statements
The Statement of Net Assets—an integral part of the Financial Statements for Vanguard Intermediate-Term Tax-Exempt Fund—is included as an insert to this report.
Statement of Operations
| |
| | Year Ended |
| October 31, 2014 |
| | ($000) |
| Investment Income | |
| Income | |
| Interest1 | 1,205,161 |
| Total Income | 1,205,161 |
| Expenses | |
| The Vanguard Group—Note B | |
| Investment Advisory Services | 3,506 |
| Management and Administrative— | |
| Investor Shares | 7,207 |
| Management and Administrative— | |
| Admiral Shares | 28,522 |
| Marketing and Distribution— | |
| Investor Shares | 1,163 |
| Marketing and Distribution— | |
| Admiral Shares | 5,726 |
| Custodian Fees | 366 |
| Auditing Fees | 33 |
| Shareholders’ Reports—Investor Shares | 293 |
| Shareholders’ Reports—Admiral Shares | 267 |
| Trustees’ Fees and Expenses | 25 |
| Total Expenses | 47,108 |
| Net Investment Income | 1,158,053 |
| Realized Net Gain (Loss) | |
| Investment Securities Sold | 24,323 |
| Futures Contracts | (12,429) |
| Realized Net Gain (Loss) | 11,894 |
| Change in Unrealized Appreciation | |
| (Depreciation) of Investment Securities | 1,052,444 |
| Net Increase (Decrease) in Net Assets | |
| Resulting from Operations | 2,222,391 |
Statement of Changes in Net Assets
| | |
| | Year Ended October 31, |
| | 2014 | 2013 |
| | ($000) | ($000) |
| Increase (Decrease) in Net Assets | | |
| Operations | | |
| Net Investment Income | 1,158,053 | 1,165,653 |
| Realized Net Gain (Loss) | 11,894 | (20,482) |
| Change in Unrealized Appreciation (Depreciation) | 1,052,444 | (1,542,747) |
| Net Increase (Decrease) in Net Assets Resulting from Operations | 2,222,391 | (397,576) |
| Distributions | | |
| Net Investment Income | | |
| Investor Shares | (143,934) | (185,983) |
| Admiral Shares | (1,014,119) | (979,670) |
| Realized Capital Gain | | |
| Investor Shares | — | — |
| Admiral Shares | — | — |
| Total Distributions | (1,158,053) | (1,165,653) |
| Capital Share Transactions | | |
| Investor Shares | (372,441) | (1,848,146) |
| Admiral Shares | 4,715,641 | (137,058) |
| Net Increase (Decrease) from Capital Share Transactions | 4,343,200 | (1,985,204) |
| Total Increase (Decrease) | 5,407,538 | (3,548,433) |
| Net Assets | | |
| Beginning of Period | 34,156,275 | 37,704,708 |
| End of Period | 39,563,813 | 34,156,275 |
1 Interest income from an affiliated company of the fund was $240,000.
See accompanying Notes, which are an integral part of the Financial Statements.
52
Intermediate-Term Tax-Exempt Fund
Financial Highlights
| | | | | |
| Investor Shares | | | | | |
| |
| For a Share Outstanding | Year Ended October 31, |
| Throughout Each Period | 2014 | 2013 | 2012 | 2011 | 2010 |
| Net Asset Value, Beginning of Period | $13.84 | $14.41 | $13.75 | $13.80 | $13.38 |
| Investment Operations | | | | | |
| Net Investment Income | .440 | .433 | .449 | .494 | .495 |
| Net Realized and Unrealized Gain (Loss) | | | | | |
| on Investments | . 420 | (. 570) | .660 | (. 050) | . 420 |
| Total from Investment Operations | .860 | (.137) | 1.109 | .444 | .915 |
| Distributions | | | | | |
| Dividends from Net Investment Income | (. 440) | (. 433) | (. 449) | (. 494) | (. 495) |
| Distributions from Realized Capital Gains | — | — | — | — | — |
| Total Distributions | (. 440) | (. 433) | (. 449) | (. 494) | (. 495) |
| Net Asset Value, End of Period | $14.26 | $13.84 | $14.41 | $13.75 | $13.80 |
| |
| Total Return1 | 6.31% | –0.96% | 8.15% | 3.35% | 6.95% |
| |
| Ratios/Supplemental Data | | | | | |
| Net Assets, End of Period (Millions) | $4,637 | $4,878 | $6,976 | $6,783 | $8,122 |
| Ratio of Total Expenses to Average Net Assets | 0.20% | 0.20% | 0.20% | 0.20% | 0.20% |
| Ratio of Net Investment Income to | | | | | |
| Average Net Assets | 3.13% | 3.06% | 3.15% | 3.66% | 3.63% |
| Portfolio Turnover Rate | 12% | 16% | 11% | 15% | 20% |
1 Total returns do not include account service fees that may have applied in the periods shown. Fund prospectuses provide information about
any applicable transaction fees.
| | | | | |
| Admiral Shares | | | | | |
| |
| For a Share Outstanding | Year Ended October 31, |
| Throughout Each Period | 2014 | 2013 | 2012 | 2011 | 2010 |
| Net Asset Value, Beginning of Period | $13.84 | $14.41 | $13.75 | $13.80 | $13.38 |
| Investment Operations | | | | | |
| Net Investment Income | .451 | .445 | .460 | .505 | .506 |
| Net Realized and Unrealized Gain (Loss) | | | | | |
| on Investments | . 420 | (. 570) | .660 | (. 050) | . 420 |
| Total from Investment Operations | .871 | (.125) | 1.120 | .455 | . 926 |
| Distributions | | | | | |
| Dividends from Net Investment Income | (.451) | (. 445) | (.460) | (. 505) | (. 506) |
| Distributions from Realized Capital Gains | — | — | — | — | — |
| Total Distributions | (.451) | (. 445) | (.460) | (. 505) | (. 506) |
| Net Asset Value, End of Period | $14.26 | $13.84 | $14.41 | $13.75 | $13.80 |
| |
| Total Return | 6.39% | –0.88% | 8.24% | 3.43% | 7.03% |
| |
| Ratios/Supplemental Data | | | | | |
| Net Assets, End of Period (Millions) | $34,927 | $29,278 | $30,729 | $24,140 | $22,701 |
| Ratio of Total Expenses to Average Net Assets | 0.12% | 0.12% | 0.12% | 0.12% | 0.12% |
| Ratio of Net Investment Income to | | | | | |
| Average Net Assets | 3.21% | 3.14% | 3.23% | 3.74% | 3.71% |
| Portfolio Turnover Rate | 12% | 16% | 11% | 15% | 20% |
See accompanying Notes, which are an integral part of the Financial Statements.
53
Intermediate-Term Tax-Exempt Fund
Notes to Financial Statements
Vanguard Intermediate-Term Tax-Exempt Fund is registered under the Investment Company Act of 1940 as an open-end investment company, or mutual fund. The fund invests in debt instruments of many municipal issuers; the issuers’ abilities to meet their obligations may be affected by economic and political developments in a specific state or region. The fund offers two classes of shares: Investor Shares and Admiral Shares. Investor Shares are available to any investor who meets the fund’s minimum purchase requirements. Admiral Shares are designed for investors who meet certain administrative, service, and account-size criteria.
A. The following significant accounting policies conform to generally accepted accounting principles for U.S. investment companies. The fund consistently follows such policies in preparing its financial statements.
1. Security Valuation: Securities are valued as of the close of trading on the New York Stock Exchange (generally 4 p.m., Eastern time) on the valuation date. Bonds, and temporary cash investments acquired over 60 days to maturity, are valued using the latest bid prices or using valuations based on a matrix system (which considers such factors as security prices, yields, maturities, and ratings), both as furnished by independent pricing services. Investments in Vanguard Municipal Cash Management Fund are valued at that fund’s net asset value. Other temporary cash investments are valued at amortized cost, which approximates market value. Securities for which market quotations are not readily available, or whose values have been affected by events occurring before the fund’s pricing time but after the close of the securities’ primary markets, are valued by methods deemed by the board of trustees to represent fair value.
2. Futures Contracts: The fund uses futures contracts to invest in fixed income asset classes with greater efficiency and lower cost than is possible through direct investment, to add value when these instruments are attractively priced, or to adjust sensitivity to changes in interest rates. The primary risks associated with the use of futures contracts are imperfect correlation between changes in market values of bonds held by the fund and the prices of futures contracts, and the possibility of an illiquid market. Counterparty risk involving futures is mitigated because a regulated clearinghouse is the counterparty instead of the clearing broker. To further mitigate counterparty risk, the fund trades futures contracts on an exchange, monitors the financial strength of its clearing brokers and clearing-house, and has entered into clearing agreements with its clearing brokers. The clearinghouse imposes initial margin requirements to secure the fund’s performance and requires daily settlement of variation margin representing changes in the market value of each contract.
Futures contracts are valued at their quoted daily settlement prices. The aggregate settlement values of the contracts are not recorded in the Statement of Net Assets. Fluctuations in the value of the contracts are recorded in the Statement of Net Assets as an asset (liability) and in the Statement of Operations as unrealized appreciation (depreciation) until the contracts are closed, when they are recorded as realized futures gains (losses).
During the year ended October 31, 2014, the fund’s average investments in long and short futures contracts represented 0% and less than 1% of net assets, respectively, based on the average of aggregate settlement values at each quarter-end during the period. The fund had no open futures contracts at October 31, 2014.
3. Federal Income Taxes: The fund intends to continue to qualify as a regulated investment company and distribute all of its income. Management has analyzed the fund’s tax positions taken for all open federal income tax years (October 31, 2011–2014), and has concluded that no provision for federal income tax is required in the fund’s financial statements.
4. Distributions: Distributions from net investment income are declared daily and paid on the first business day of the following month. Annual distributions from realized capital gains, if any, are recorded on the ex-dividend date.
5. Credit Facility: The fund and certain other funds managed by The Vanguard Group participate in a $2.89 billion committed credit facility provided by a syndicate of lenders pursuant to a credit agreement that may be renewed annually; each fund is individually liable for its borrowings, if any, under the credit facility. Borrowings may be utilized for temporary and emergency purposes, and are subject to the fund’s regulatory and contractual borrowing restrictions. The participating funds are charged administrative fees and an annual commitment fee of 0.06% of the undrawn amount of the facility; these fees are allocated to the funds based on a method approved by the fund’s board of trustees and included in Management and Administrative expenses on the fund’s Statement of Operations. Any borrowings under this facility bear interest at a rate equal to the higher of the federal funds rate or LIBOR reference rate plus an agreed-upon spread.
The fund had no borrowings outstanding at October 31, 2014, or at any time during the period then ended.
54
Intermediate-Term Tax-Exempt Fund
6. Other: Interest income includes income distributions received from Vanguard Municipal Cash Management Fund and is accrued daily. Premiums and discounts on debt securities purchased are amortized and accreted, respectively, to interest income over the lives of the respective securities. Security transactions are accounted for on the date securities are bought or sold. Costs used to determine realized gains (losses) on the sale of investment securities are those of the specific securities sold.
Each class of shares has equal rights as to assets and earnings, except that each class separately bears certain class-specific expenses related to maintenance of shareholder accounts (included in Management and Administrative expenses) and shareholder reporting. Marketing and distribution expenses are allocated to each class of shares based on a method approved by the board of trustees. Income, other non-class-specific expenses, and gains and losses on investments are allocated to each class of shares based on its relative net assets.
B. The Vanguard Group furnishes at cost investment advisory, corporate management, administrative, marketing, and distribution services. The costs of such services are allocated to the fund based on methods approved by the board of trustees. The fund has committed to invest up to 0.40% of its net assets in Vanguard. At October 31, 2014, the fund had contributed capital of $3,892,000 to Vanguard (included in Other Assets), representing 0.01% of the fund’s net assets and 1.56% of Vanguard’s capitalization. The fund’s trustees and officers are also directors and officers of Vanguard.
C. Various inputs may be used to determine the value of the fund’s investments. These inputs are summarized in three broad levels for financial statement purposes. The inputs or methodologies used to value securities are not necessarily an indication of the risk associated with investing in those securities.
Level 1—Quoted prices in active markets for identical securities.
Level 2—Other significant observable inputs (including quoted prices for similar securities, interest
rates, prepayment speeds, credit risk, etc.).
Level 3—Significant unobservable inputs (including the fund’s own assumptions used to determine
the fair value of investments).
The following table summarizes the market value of the fund’s investments as of October 31, 2014, based on the inputs used to value them:
| | | |
| | Level 1 | Level 2 | Level 3 |
| Investments | ($000) | ($000) | ($000) |
| Tax-Exempt Municipal Bonds | — | 38,926,860 | — |
| Temporary Cash Investments | 671,354 | — | — |
| Total | 671,354 | 38,926,860 | — |
D. Capital gain distributions are determined on a tax basis and may differ from realized capital gains for financial reporting purposes. Differences may be permanent or temporary. Permanent differences are reclassified among capital accounts in the financial statements to reflect their tax character. Temporary differences arise when gains or losses are recognized in different periods for financial statement and tax purposes. These differences will reverse at some time in the future.
The fund used capital loss carryforwards of $16,979,000 to offset taxable capital gains realized during the year ended October 31, 2014. At October 31, 2014, the fund had available capital losses totaling $42,526,000 to offset future net capital gains. Of this amount, $30,029,000 is subject to expiration on October 31, 2019. Capital losses of $12,497,000 realized beginning in fiscal 2012 may be carried forward indefinitely under the Regulated Investment Company Modernization Act of 2010, but must be used before any expiring loss carryforwards.
At October 31, 2014, the cost of investment securities for tax purposes was $37,337,439,000. Net unrealized appreciation of investment securities for tax purposes was $2,260,775,000, consisting of unrealized gains of $2,282,843,000 on securities that had risen in value since their purchase and $22,068,000 in unrealized losses on securities that had fallen in value since their purchase.
55
Intermediate-Term Tax-Exempt Fund
E. During the year ended October 31, 2014, the fund purchased $6,370,780,000 of investment securities and sold $3,932,311,000 of investment securities, other than temporary cash investments.
| | | | |
| F. Capital share transactions for each class of shares were: | | | |
| | Year Ended October 31, |
| | 2014 | 2013 |
| | Amount | Shares | Amount | Shares |
| | ($000) | (000) | ($000) | (000) |
| Investor Shares | | | | |
| Issued | 1,173,942 | 83,460 | 1,354,423 | 94,710 |
| Issued in Lieu of Cash Distributions | 113,146 | 8,055 | 138,262 | 9,788 |
| Redeemed | (1,659,529) | (118,679) | (3,340,831) | (236,255) |
| Net Increase (Decrease) —Investor Shares | (372,441) | (27,164) | (1,848,146) | (131,757) |
| Admiral Shares | | | | |
| Issued | 8,657,035 | 616,998 | 7,576,177 | 532,566 |
| Issued in Lieu of Cash Distributions | 717,116 | 51,012 | 699,066 | 49,553 |
| Redeemed | (4,658,510) | (333,588) | (8,412,301) | (599,727) |
| Net Increase (Decrease) —Admiral Shares | 4,715,641 | 334,422 | (137,058) | (17,608) |
G. Management has determined that no material events or transactions occurred subsequent to October 31, 2014, that would require recognition or disclosure in these financial statements.
56
Long-Term Tax-Exempt Fund
Fund Profile
As of October 31, 2014
| | |
| Share-Class Characteristics | | |
| | Investor | Admiral |
| | Shares | Shares |
| Ticker Symbol | VWLTX | VWLUX |
| Expense Ratio1 | 0.20% | 0.12% |
| 30-Day SEC Yield | 2.22% | 2.30% |
| | |
| Financial Attributes | | |
| | | Barclays |
| | | Municipal |
| | | Bond |
| | Fund | Index |
| Number of Bonds | 1,195 | 45,888 |
| Yield to Maturity | | |
| (before expenses) | 2.4% | 2.1% |
| Average Coupon | 4.6% | 4.8% |
| Average Duration | 6.1 years | 6.6 years |
| Average Stated Maturity | 16.1 years 13.4 years |
| Short-Term Reserves | 5.3% | — |
| |
| Largest Area Concentrations2 | |
| |
| New York | 15.6% |
| California | 14.1 |
| Florida | 8.7 |
| Illinois | 8.5 |
| Texas | 7.5 |
| Pennsylvania | 4.1 |
| New Jersey | 4.1 |
| Massachusetts | 3.8 |
| Colorado | 2.2 |
| Washington | 2.2 |
| Top Ten | 70.8% |
| |
| Volatility Measures | |
| | Barclays |
| | Municipal |
| | Bond Index |
| R-Squared | 0.99 |
| Beta | 1.15 |
| These measures show the degree and timing of the fund’s fluctuations compared with the indexes over 36 months. |
|
| |
| Distribution by Stated Maturity (% of portfolio) |
| |
| Under 1 Year | 8.0% |
| 1–3 Years | 4.1 |
| 3–5 Years | 1.9 |
| 5–10 Years | 12.7 |
| 10–20 Years | 36.9 |
| 20–30 Years | 32.8 |
| Over 30 Years | 3.6 |
| |
| Distribution by Credit Quality (% of portfolio) |
| |
| AAA | 11.9% |
| AA | 56.7 |
| A | 24.0 |
| BBB | 5.6 |
| BB | 0.5 |
| B or Lower | 0.1 |
| Not Rated | 1.2 |
Credit-quality ratings are from Moody’s and S&P. The higher ratingfor each issue is shown. “Not Rated” is used to classify securitiesfor which a rating is not available. For information about theseratings, see the Glossary entry for Credit Quality.Investment Focus

1 The expense ratios shown are from the prospectus dated February 26, 2014, and represent estimated costs for the current fiscal year. For the fiscal year ended October 31, 2014, the expense ratios were 0.20% for
the Investor Shares and 0.12% for the Admiral Shares.
2 Percentage of net assets, excluding any futures contracts.
57
Long-Term Tax-Exempt Fund
Performance Summary
All of the returns in this report represent past performance, which is not a guarantee of future results that may be achieved by the fund. (Current performance may be lower or higher than the performance data cited. For performance data current to the most recent month-end, visit our website at vanguard.com/performance.) Note, too, that both investment returns and principal value can fluctuate widely, so an investor’s shares, when sold, could be worth more or less than their original cost. The returns shown do not reflect taxes that a shareholder would pay on fund distributions or on the sale of fund shares.
Cumulative Performance: October 31, 2004–October 31, 2014
Initial Investment of $10,000
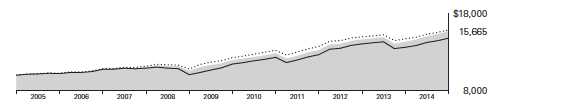
| | | | |
| | | Average Annual Total Returns | Final Value |
| | Periods Ended October 31, 2014 | of a $10,000 |
| | One Year | Five Years | Ten Years | Investment |
| Long-Term Tax-Exempt Fund | | | | |
| Investor Shares | 9.52% | 5.61% | 4.59% | $15,665 |
| Barclays Municipal Bond Index | 7.82 | 5.26 | 4.71 | 15,839 |
| General & Insured Municipal Debt | | | | |
| Funds Average1 | 8.63 | 5.26 | 3.98 | 14,775 |
| | | | |
| | | | | Final Value |
| | | | | of a $50,000 |
| | One Year | Five Years | Ten Years | Investment |
| Long-Term Tax-Exempt Fund Admiral Shares | 9.60% | 5.69% | 4.67% | $78,924 |
| Barclays Municipal Bond Index | 7.82 | 5.26 | 4.71 | 79,197 |
1 Derived from data provided by Lipper, a Thomson Reuters Company.
See Financial Highlights for dividend and capital gains information.
58
| | | | |
| Long-Term Tax-Exempt Fund | | | | |
| |
| |
| |
| |
| Fiscal-Year Total Returns (%): October 31, 2004–October 31, 2014 | | | |
| | | | | Barclays |
| | | | | Municipal |
| | Investor Shares | Bond Index |
| | Capital | Income | Total | Total |
| Fiscal Year | Returns | Returns | Returns | Returns |
| 2005 | –2.77% | 4.46% | 1.69% | 2.54% |
| 2006 | 1.37 | 4.77 | 6.14 | 5.75 |
| 2007 | –2.20 | 4.57 | 2.37 | 2.91 |
| 2008 | –9.02 | 4.28 | –4.74 | –3.30 |
| 2009 | 8.23 | 5.09 | 13.32 | 13.60 |
| 2010 | 3.02 | 4.50 | 7.52 | 7.78 |
| 2011 | –1.07 | 4.36 | 3.29 | 3.78 |
| 2012 | 6.20 | 4.07 | 10.27 | 9.03 |
| 2013 | –5.75 | 3.68 | –2.07 | –1.72 |
| 2014 | 5.30 | 4.22 | 9.52 | 7.82 |
Average Annual Total Returns: Periods Ended September 30, 2014
This table presents returns through the latest calendar quarter—rather than through the end of the fiscal period.
Securities and Exchange Commission rules require that we provide this information.
| | | | | | |
| | | | | Ten Years |
| | Inception Date | One Year | Five Years | Capital | Income | Total |
| Investor Shares | 9/1/1977 | 9.68% | 4.90% | 0.19% | 4.41% | 4.60% |
| Admiral Shares | 2/12/2001 | 9.76 | 4.99 | 0.19 | 4.49 | 4.68 |
59
Long-Term Tax-Exempt Fund
Financial Statements
The Statement of Net Assets—an integral part of the Financial Statements for Vanguard Long-Term Tax-Exempt Fund—is included as an insert to this report.
Statement of Operations
| |
| | Year Ended |
| October 31, 2014 |
| | ($000) |
| Investment Income | |
| Income | |
| Interest1 | 332,448 |
| Total Income | 332,448 |
| Expenses | |
| The Vanguard Group—Note B | |
| Investment Advisory Services | 782 |
| Management and Administrative— | |
| Investor Shares | 1,495 |
| Management and Administrative— | |
| Admiral Shares | 6,443 |
| Marketing and Distribution— | |
| Investor Shares | 234 |
| Marketing and Distribution— | |
| Admiral Shares | 1,176 |
| Custodian Fees | 90 |
| Auditing Fees | 33 |
| Shareholders’ Reports—Investor Shares | 78 |
| Shareholders’ Reports—Admiral Shares | 62 |
| Trustees’ Fees and Expenses | 6 |
| Total Expenses | 10,399 |
| Net Investment Income | 322,049 |
| Realized Net Gain (Loss) | |
| Investment Securities Sold | 29,433 |
| Futures Contracts | (2,733) |
| Realized Net Gain (Loss) | 26,700 |
| Change in Unrealized Appreciation | |
| (Depreciation) of Investment Securities | 386,287 |
| Net Increase (Decrease) in Net Assets | |
| Resulting from Operations | 735,036 |
Statement of Changes in Net Assets
| | |
| | Year Ended October 31, |
| | 2014 | 2013 |
| | ($000) | ($000) |
| Increase (Decrease) in Net Assets | | |
| Operations | | |
| Net Investment Income | 322,049 | 308,788 |
| Realized Net Gain (Loss) | 26,700 | 32,275 |
| Change in Unrealized Appreciation (Depreciation) | 386,287 | (489,695) |
| Net Increase (Decrease) in Net Assets Resulting from Operations | 735,036 | (148,632) |
| Distributions | | |
| Net Investment Income | | |
| Investor Shares | (37,837) | (40,551) |
| Admiral Shares | (284,212) | (268,237) |
| Realized Capital Gain | | |
| Investor Shares | — | — |
| Admiral Shares | — | — |
| Total Distributions | (322,049) | (308,788) |
| Capital Share Transactions | | |
| Investor Shares | (79,730) | (79,967) |
| Admiral Shares | 288,915 | 183,283 |
| Net Increase (Decrease) from Capital Share Transactions | 209,185 | 103,316 |
| Total Increase (Decrease) | 622,172 | (354,104) |
| Net Assets | | |
| Beginning of Period | 7,814,904 | 8,169,008 |
| End of Period | 8,437,076 | 7,814,904 |
1 Interest income from an affiliated company of the fund was $52,000.
See accompanying Notes, which are an integral part of the Financial Statements.
60
Long-Term Tax-Exempt Fund
Financial Highlights
| | | | | |
| Investor Shares | | | | | |
| |
| For a Share Outstanding | Year Ended October 31, |
| Throughout Each Period | 2014 | 2013 | 2012 | 2011 | 2010 |
| Net Asset Value, Beginning of Period | $11.14 | $11.82 | $11.13 | $11.25 | $10.92 |
| Investment Operations | | | | | |
| Net Investment Income | .450 | .441 | . 437 | .468 | .475 |
| Net Realized and Unrealized Gain (Loss) | | | | | |
| on Investments | .590 | (. 680) | .690 | (.120) | .330 |
| Total from Investment Operations | 1.040 | (. 239) | 1.127 | .348 | .805 |
| Distributions | | | | | |
| Dividends from Net Investment Income | (. 450) | (.441) | (. 437) | (. 468) | (.475) |
| Distributions from Realized Capital Gains | — | — | — | — | — |
| Total Distributions | (. 450) | (.441) | (. 437) | (. 468) | (.475) |
| Net Asset Value, End of Period | $11.73 | $11.14 | $11.82 | $11.13 | $11.25 |
| |
| Total Return1 | 9.52% | –2.07% | 10.27% | 3.29% | 7.52% |
| |
| Ratios/Supplemental Data | | | | | |
| Net Assets, End of Period (Millions) | $958 | $988 | $1,130 | $1,100 | $1,615 |
| Ratio of Total Expenses to Average Net Assets | 0.20% | 0.20% | 0.20% | 0.20% | 0.20% |
| Ratio of Net Investment Income to | | | | | |
| Average Net Assets | 3.95% | 3.84% | 3.78% | 4.33% | 4.28% |
| Portfolio Turnover Rate | 21% | 35% | 15% | 19% | 23% |
1 Total returns do not include account service fees that may have applied in the periods shown. Fund prospectuses provide information about
any applicable account service fees.
| | | | | |
| Admiral Shares | | | | | |
| |
| For a Share Outstanding | Year Ended October 31, |
| Throughout Each Period | 2014 | 2013 | 2012 | 2011 | 2010 |
| Net Asset Value, Beginning of Period | $11.14 | $11.82 | $11.13 | $11.25 | $10.92 |
| Investment Operations | | | | | |
| Net Investment Income | .459 | .450 | .446 | .477 | .484 |
| Net Realized and Unrealized Gain (Loss) | | | | | |
| on Investments | .590 | (. 680) | .690 | (.120) | .330 |
| Total from Investment Operations | 1.049 | (. 230) | 1.136 | . 357 | .814 |
| Distributions | | | | | |
| Dividends from Net Investment Income | (. 459) | (. 450) | (. 446) | (.477) | (. 484) |
| Distributions from Realized Capital Gains | — | — | — | — | — |
| Total Distributions | (. 459) | (. 450) | (. 446) | (.477) | (. 484) |
| Net Asset Value, End of Period | $11.73 | $11.14 | $11.82 | $11.13 | $11.25 |
| |
| Total Return | 9.60% | –1.99% | 10.36% | 3.37% | 7.61% |
| |
| Ratios/Supplemental Data | | | | | |
| Net Assets, End of Period (Millions) | $7,480 | $6,827 | $7,039 | $6,150 | $6,361 |
| Ratio of Total Expenses to Average Net Assets | 0.12% | 0.12% | 0.12% | 0.12% | 0.12% |
| Ratio of Net Investment Income to | | | | | |
| Average Net Assets | 4.03% | 3.92% | 3.86% | 4.41% | 4.36% |
| Portfolio Turnover Rate | 21% | 35% | 15% | 19% | 23% |
See accompanying Notes, which are an integral part of the Financial Statements.
61
Long-Term Tax-Exempt Fund
Notes to Financial Statements
Vanguard Long-Term Tax-Exempt Fund is registered under the Investment Company Act of 1940 as an open-end investment company, or mutual fund. The fund invests in debt instruments of many municipal issuers; the issuers’ abilities to meet their obligations may be affected by economic and political developments in a specific state or region. The fund offers two classes of shares: Investor Shares and Admiral Shares. Investor Shares are available to any investor who meets the fund’s minimum purchase requirements. Admiral Shares are designed for investors who meet certain administrative, service, and account-size criteria.
A. The following significant accounting policies conform to generally accepted accounting principles for U.S. investment companies. The fund consistently follows such policies in preparing its financial statements.
1. Security Valuation: Securities are valued as of the close of trading on the New York Stock Exchange (generally 4 p.m., Eastern time) on the valuation date. Bonds, and temporary cash investments acquired over 60 days to maturity, are valued using the latest bid prices or using valuations based on a matrix system (which considers such factors as security prices, yields, maturities, and ratings), both as furnished by independent pricing services. Investments in Vanguard Municipal Cash Management Fund are valued at that fund’s net asset value. Other temporary cash investments are valued at amortized cost, which approximates market value. Securities for which market quotations are not readily available, or whose values have been affected by events occurring before the fund’s pricing time but after the close of the securities’ primary markets, are valued by methods deemed by the board of trustees to represent fair value.
2. Futures Contracts: The fund uses futures contracts to invest in fixed income asset classes with greater efficiency and lower cost than is possible through direct investment, to add value when these instruments are attractively priced, or to adjust sensitivity to changes in interest rates. The primary risks associated with the use of futures contracts are imperfect correlation between changes in market values of bonds held by the fund and the prices of futures contracts, and the possibility of an illiquid market. Counterparty risk involving futures is mitigated because a regulated clearinghouse is the counterparty instead of the clearing broker. To further mitigate counterparty risk, the fund trades futures contracts on an exchange, monitors the financial strength of its clearing brokers and clearinghouse, and has entered into clearing agreements with its clearing brokers. The clearinghouse imposes initial margin requirements to secure the fund’s performance and requires daily settlement of variation margin representing changes in the market value of each contract.
Futures contracts are valued at their quoted daily settlement prices. The aggregate settlement values of the contracts are not recorded in the Statement of Net Assets. Fluctuations in the value of the contracts are recorded in the Statement of Net Assets as an asset (liability) and in the Statement of Operations as unrealized appreciation (depreciation) until the contracts are closed, when they are recorded as realized futures gains (losses).
During the year ended October 31, 2014, the fund’s average investments in long and short futures contracts represented 0% and less than 1% of net assets, respectively, based on the average of aggregate settlement values at each quarter-end during the period. The fund had no open futures contracts at October 31, 2014.
3. Federal Income Taxes: The fund intends to continue to qualify as a regulated investment company and distribute all of its income. Management has analyzed the fund’s tax positions taken for all open federal income tax years (October 31, 2011–2014), and has concluded that no provision for federal income tax is required in the fund’s financial statements.
4. Distributions: Distributions from net investment income are declared daily and paid on the first business day of the following month. Annual distributions from realized capital gains, if any, are recorded on the ex-dividend date.
5. Credit Facility: The fund and certain other funds managed by The Vanguard Group participate in a $2.89 billion committed credit facility provided by a syndicate of lenders pursuant to a credit agreement that may be renewed annually; each fund is individually liable for its borrowings, if any, under the credit facility. Borrowings may be utilized for temporary and emergency purposes, and are subject to the fund’s regulatory and contractual borrowing restrictions. The participating funds are charged administrative fees and an annual commitment fee of 0.06% of the undrawn amount of the facility; these fees are allocated to the funds based on a method approved by the fund’s board of trustees and included in Management and Administrative expenses on the fund’s Statement of Operations. Any borrowings under this facility bear interest at a rate equal to the higher of the federal funds rate or LIBOR reference rate plus an agreed-upon spread.
The fund had no borrowings outstanding at October 31, 2014, or at any time during the period then ended.
62
Long-Term Tax-Exempt Fund
6. Other: Interest income includes income distributions received from Vanguard Municipal Cash Management Fund and is accrued daily. Premiums and discounts on debt securities purchased are amortized and accreted, respectively, to interest income over the lives of the respective securities. Security transactions are accounted for on the date securities are bought or sold. Costs used to determine realized gains (losses) on the sale of investment securities are those of the specific securities sold.
Each class of shares has equal rights as to assets and earnings, except that each class separately bears certain class-specific expenses related to maintenance of shareholder accounts (included in Management and Administrative expenses) and shareholder reporting. Marketing and distribution expenses are allocated to each class of shares based on a method approved by the board of trustees. Income, other non-class-specific expenses, and gains and losses on investments are allocated to each class of shares based on its relative net assets.
B. The Vanguard Group furnishes at cost investment advisory, corporate management, administrative, marketing, and distribution services. The costs of such services are allocated to the fund based on methods approved by the board of trustees. The fund has committed to invest up to 0.40% of its net assets in Vanguard. At October 31, 2014, the fund had contributed capital of $836,000 to Vanguard (included in Other Assets), representing 0.01% of the fund’s net assets and 0.33% of Vanguard’s capitalization. The fund’s trustees and officers are also directors and officers of Vanguard.
C. Various inputs may be used to determine the value of the fund’s investments. These inputs are summarized in three broad levels for financial statement purposes. The inputs or methodologies used to value securities are not necessarily an indication of the risk associated with investing in those securities.
Level 1—Quoted prices in active markets for identical securities.
Level 2—Other significant observable inputs (including quoted prices for similar securities, interest rates, prepayment speeds, credit risk, etc.).
Level 3—Significant unobservable inputs (including the fund’s own assumptions used to determine the fair value of investments).
The following table summarizes the market value of the fund’s investments as of October 31, 2014, based on the inputs used to value them:
| | | |
| | Level 1 | Level 2 | Level 3 |
| Investments | ($000) | ($000) | ($000) |
| Tax-Exempt Municipal Bonds | — | 8,311,621 | — |
| Temporary Cash Investments | 96,514 | — | — |
| Total | 96,514 | 8,311,621 | — |
D. Capital gain distributions are determined on a tax basis and may differ from realized capital gains for financial reporting purposes. Differences may be permanent or temporary. Permanent differences are reclassified among capital accounts in the financial statements to reflect their tax character. Temporary differences arise when gains or losses are recognized in different periods for financial statement and tax purposes. These differences will reverse at some time in the future.
The fund used a tax accounting practice to treat a portion of the price of capital shares redeemed during the year as distributions from realized capital gains. Accordingly, the fund has reclassified $3,177,000 from accumulated net realized gains to paid-in capital.
For tax purposes, at October 31, 2014, the fund had short-term and long-term capital gains of $8,668,000 and $11,081,000, respectively, available for distribution. Short-term gain distributions are treated as ordinary income dividends for tax purposes.
At October 31, 2014, the cost of investment securities for tax purposes was $7,786,849,000. Net unrealized appreciation of investment securities for tax purposes was $621,286,000, consisting of unrealized gains of $627,993,000 on securities that had risen in value since their purchase and $6,707,000 in unrealized losses on securities that had fallen in value since their purchase.
E. During the year ended October 31, 2014, the fund purchased $1,576,084,000 of investment securities and sold $1,577,820,000 of investment securities, other than temporary cash investments.
63
Long-Term Tax-Exempt Fund
| | | | |
| F. Capital share transactions for each class of shares were: | | | |
| | Year Ended October 31, |
| | 2014 | 2013 |
| | Amount | Shares | Amount | Shares |
| | ($000) | (000) | ($000) | (000) |
| Investor Shares | | | | |
| Issued | 207,505 | 18,159 | 266,723 | 22,904 |
| Issued in Connection with Acquisition of | | | | |
| Florida Focused Long-Term Tax-Exempt Fund | — | — | 105,678 | 9,572 |
| Issued in Lieu of Cash Distributions | 29,949 | 2,621 | 31,420 | 2,735 |
| Redeemed | (317,184) | (27,863) | (483,788) | (42,140) |
| Net Increase (Decrease) —Investor Shares | (79,730) | (7,083) | (79,967) | (6,929) |
| Admiral Shares | | | | |
| Issued | 1,098,246 | 96,354 | 1,263,259 | 109,409 |
| Issued in Connection with Acquisition of | | | | |
| Florida Focused Long-Term Tax-Exempt Fund | — | — | 717,427 | 64,984 |
| Issued in Lieu of Cash Distributions | 182,196 | 15,931 | 170,637 | 14,866 |
| Redeemed | (991,527) | (87,520) | (1,968,040) | (171,909) |
| Net Increase (Decrease) —Admiral Shares | 288,915 | 24,765 | 183,283 | 17,350 |
G. On July 26, 2013, the fund acquired all the net assets of Vanguard Florida Focused Long-Term Tax-Exempt Fund pursuant to a plan of reorganization approved by the funds’ board of trustees on March 22, 2013, and by the shareholders of Vanguard Florida Focused Long-Term Tax-Exempt Fund on July 22, 2013. The purpose of the transaction was to combine two funds with comparable investment objectives. The acquisition was accomplished by a tax-free exchange of 74,556,000 of the Long-Term Tax-Exempt Fund’s capital shares for the 72,777,000 shares of Florida Focused Long-Term Tax-Exempt Fund outstanding on July 26, 2013. Each class of shares of Florida Focused Long-Term Tax-Exempt Fund was exchanged for the like class of shares of Long-Term Tax-Exempt Fund. The Florida Focused Long-Term Tax-Exempt Fund’s net assets of $823,105,000, including $11,895,000 of unrealized appreciation, were combined with Long-Term Tax-Exempt Fund’s net assets of $7,135,448,000, resulting in combined net assets of $7,958,553,000 on July 26, 2013.
H. Management has determined that no material events or transactions occurred subsequent to October 31, 2014, that would require recognition or disclosure in these financial statements.
64
High-Yield Tax-Exempt Fund
Fund Profile
As of October 31, 2014
| | |
| Share-Class Characteristics | | |
| | Investor | Admiral |
| | Shares | Shares |
| Ticker Symbol | VWAHX | VWALX |
| Expense Ratio1 | 0.20% | 0.12% |
| 30-Day SEC Yield | 2.56% | 2.64% |
| | |
| Financial Attributes | | |
| | | Barclays |
| | | Municipal |
| | | Bond |
| | Fund | Index |
| Number of Bonds | 1,066 | 45,888 |
| Yield to Maturity | | |
| (before expenses) | 2.8% | 2.1% |
| Average Coupon | 4.5% | 4.8% |
| Average Duration | 6.1 years | 6.6 years |
| Average Stated Maturity | 15.8 years 13.4 years |
| Short-Term Reserves | 7.0% | — |
| |
| Largest Area Concentrations2 | |
| |
| California | 14.4% |
| New York | 12.9 |
| Texas | 8.7 |
| Illinois | 8.4 |
| New Jersey | 8.2 |
| Florida | 5.5 |
| Pennsylvania | 3.6 |
| Michigan | 2.6 |
| Indiana | 2.2 |
| Georgia | 2.2 |
| Top Ten | 68.7% |
| |
| Volatility Measures | |
| | Barclays |
| | Municipal |
| | Bond Index |
| R-Squared | 0.98 |
| Beta | 1.16 |
| These measures show the degree and timing of the fund’s fluctuations compared with the indexes over 36 months. |
|
| |
| Distribution by Stated Maturity (% of portfolio) |
| |
| Under 1 Year | 10.9% |
| 1–3 Years | 5.0 |
| 3–5 Years | 3.3 |
| 5–10 Years | 13.6 |
| 10–20 Years | 28.6 |
| 20–30 Years | 32.6 |
| Over 30 Years | 6.0 |
| |
| Distribution by Credit Quality (% of portfolio) |
| |
| AAA | 8.6% |
| AA | 31.6 |
| A | 35.9 |
| BBB | 13.1 |
| BB | 2.3 |
| B or Lower | 3.2 |
| Not Rated | 5.3 |
Credit-quality ratings are from Moody’s and S&P. The higher ratingfor each issue is shown. “Not Rated” is used to classify securitiesfor which a rating is notavailable. For information about theseratings, see the Glossary entry for Credit Quality.Investment Focus
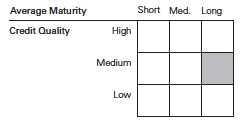
1 The expense ratios shown are from the prospectus dated February 26, 2014, and represent estimated costs for the current fiscal year. For the fiscal year ended October 31, 2014, the expense ratios were 0.20% for
the Investor Shares and 0.12% for the Admiral Shares.
2 Percentage of net assets, excluding any futures contracts.
65
High-Yield Tax-Exempt Fund
Performance Summary
All of the returns in this report represent past performance, which is not a guarantee of future results that may be achieved by the fund. (Current performance may be lower or higher than the performance data cited. For performance data current to the most recent month-end, visit our website at vanguard.com/performance.) Note, too, that both investment returns and principal value can fluctuate widely, so an investor’s shares, when sold, could be worth more or less than their original cost. The returns shown do not reflect taxes that a shareholder would pay on fund distributions or on the sale of fund shares.
Cumulative Performance: October 31, 2004–October 31, 2014
Initial Investment of $10,000
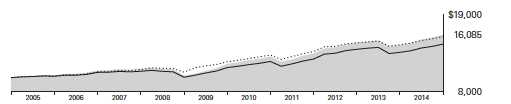
| | | | |
| | | Average Annual Total Returns | Final Value |
| | Periods Ended October 31, 2014 | of a $10,000 |
| | One Year | Five Years | Ten Years | Investment |
| High-Yield Tax-Exempt Fund Investor Shares | 9.87% | 6.12% | 4.87% | $16,085 |
| Barclays Municipal Bond Index | 7.82 | 5.26 | 4.71 | 15,839 |
| General & Insured Municipal Debt | | | | |
| Funds Average1 | 8.63 | 5.26 | 3.98 | 14,775 |
| | | | |
| | | | | Final Value |
| | | | | of a $50,000 |
| | One Year | Five Years | Ten Years | Investment |
| High-Yield Tax-Exempt Fund Admiral Shares | 9.96% | 6.21% | 4.95% | $81,043 |
| Barclays Municipal Bond Index | 7.82 | 5.26 | 4.71 | 79,197 |
1 Derived from data provided by Lipper, a Thomson Reuters Company.
See Financial Highlights for dividend and capital gains information.
66
| | | | |
| High-Yield Tax-Exempt Fund | | | | |
| |
| |
| |
| |
| Fiscal-Year Total Returns (%): October 31, 2004–October 31, 2014 | | | |
| | | | | Barclays |
| | | | | Municipal |
| | | | Investor Shares | Bond Index |
| | Capital | Income | Total | Total |
| Fiscal Year | Returns | Returns | Returns | Returns |
| 2005 | –1.38% | 4.58% | 3.20% | 2.54% |
| 2006 | 1.87 | 4.74 | 6.61 | 5.75 |
| 2007 | –2.66 | 4.60 | 1.94 | 2.91 |
| 2008 | –12.52 | 4.32 | –8.20 | –3.30 |
| 2009 | 10.44 | 5.65 | 16.09 | 13.60 |
| 2010 | 4.00 | 4.76 | 8.76 | 7.78 |
| 2011 | –1.31 | 4.57 | 3.26 | 3.78 |
| 2012 | 7.22 | 4.21 | 11.43 | 9.03 |
| 2013 | –5.85 | 3.74 | –2.11 | –1.72 |
| 2014 | 5.64 | 4.23 | 9.87 | 7.82 |
Average Annual Total Returns: Periods Ended September 30, 2014
This table presents returns through the latest calendar quarter—rather than through the end of the fiscal period.
Securities and Exchange Commission rules require that we provide this information.
| | | | | | |
| | | | | Ten Years |
| | Inception Date | One Year | Five Years | Capital | Income | Total |
| Investor Shares | 12/27/1978 | 9.95% | 5.45% | 0.34% | 4.54% | 4.88% |
| Admiral Shares | 11/12/2001 | 10.04 | 5.54 | 0.34 | 4.62 | 4.96 |
67
High-Yield Tax-Exempt Fund
Financial Statements
The Statement of Net Assets—an integral part of the Financial Statements for Vanguard High-Yield Tax-Exempt Fund—is included as an insert to this report.
Statement of Operations
| |
| | Year Ended |
| October 31, 2014 |
| | ($000) |
| Investment Income | |
| Income | |
| Interest1 | 303,177 |
| Total Income | 303,177 |
| Expenses | |
| The Vanguard Group—Note B | |
| Investment Advisory Services | 710 |
| Management and Administrative— | |
| Investor Shares | 2,144 |
| Management and Administrative— | |
| Admiral Shares | 5,240 |
| Marketing and Distribution— | |
| Investor Shares | 335 |
| Marketing and Distribution— | |
| Admiral Shares | 1,176 |
| Custodian Fees | 81 |
| Auditing Fees | 33 |
| Shareholders’ Reports—Investor Shares | 118 |
| Shareholders’ Reports—Admiral Shares | 70 |
| Trustees’ Fees and Expenses | 5 |
| Total Expenses | 9,912 |
| Net Investment Income | 293,265 |
| Realized Net Gain (Loss) | |
| Investment Securities Sold | 12,089 |
| Futures Contracts | (2,996) |
| Realized Net Gain (Loss) | 9,093 |
| Change in Unrealized Appreciation | |
| (Depreciation) of Investment Securities | 390,147 |
| Net Increase (Decrease) in Net Assets | |
| Resulting from Operations | 692,505 |
Statement of Changes in Net Assets
| | |
| | Year Ended October 31, |
| | 2014 | 2013 |
| | ($000) | ($000) |
| Increase (Decrease) in Net Assets | | |
| Operations | | |
| Net Investment Income | 293,265 | 303,352 |
| Realized Net Gain (Loss) | 9,093 | 31,323 |
| Change in Unrealized Appreciation (Depreciation) | 390,147 | (499,601) |
| Net Increase (Decrease) in Net Assets Resulting from Operations | 692,505 | (164,926) |
| Distributions | | |
| Net Investment Income | | |
| Investor Shares | (54,083) | (59,323) |
| Admiral Shares | (239,182) | (244,029) |
| Realized Capital Gain | | |
| Investor Shares | — | — |
| Admiral Shares | — | — |
| Total Distributions | (293,265) | (303,352) |
| Capital Share Transactions | | |
| Investor Shares | 102,733 | (206,915) |
| Admiral Shares | 661,795 | (345,536) |
| Net Increase (Decrease) from Capital Share Transactions | 764,528 | (552,451) |
| Total Increase (Decrease) | 1,163,768 | (1,020,729) |
| Net Assets | | |
| Beginning of Period | 6,928,270 | 7,948,999 |
| End of Period | 8,092,038 | 6,928,270 |
1 Interest income from an affiliated company of the fund was $72,000.
See accompanying Notes, which are an integral part of the Financial Statements.
68
| | | | | |
| High-Yield Tax-Exempt Fund | | | | | |
| |
| |
| Financial Highlights | | | | | |
| |
| Investor Shares | | | | | |
| |
| For a Share Outstanding | Year Ended October 31, |
| Throughout Each Period | 2014 | 2013 | 2012 | 2011 | 2010 |
| Net Asset Value, Beginning of Period | $10.63 | $11.29 | $10.53 | $10.67 | $10.26 |
| Investment Operations | | | | | |
| Net Investment Income | .430 | . 428 | . 425 | .465 | .470 |
| Net Realized and Unrealized Gain (Loss) | | | | | |
| on Investments | .600 | (. 660) | .760 | (.140) | .410 |
| Total from Investment Operations | 1.030 | (. 232) | 1.185 | . 325 | .880 |
| Distributions | | | | | |
| Dividends from Net Investment Income | (. 430) | (. 428) | (. 425) | (. 465) | (.470) |
| Distributions from Realized Capital Gains | — | — | — | — | — |
| Total Distributions | (. 430) | (. 428) | (. 425) | (. 465) | (.470) |
| Net Asset Value, End of Period | $11.23 | $10.63 | $11.29 | $10.53 | $10.67 |
| |
| Total Return1 | 9.87% | –2.11% | 11.43% | 3.26% | 8.76% |
| |
| Ratios/Supplemental Data | | | | | |
| Net Assets, End of Period (Millions) | $1,484 | $1,307 | $1,609 | $1,339 | $1,861 |
| Ratio of Total Expenses to Average Net Assets | 0.20% | 0.20% | 0.20% | 0.20% | 0.20% |
| Ratio of Net Investment Income to | | | | | |
| Average Net Assets | 3.94% | 3.88% | 3.86% | 4.54% | 4.49% |
| Portfolio Turnover Rate | 28% | 29% | 20% | 19% | 19% |
1 Total returns do not include account service fees that may have applied in the periods shown. Fund prospectuses provide information about
any applicable account service fees.
| | | | | |
| Admiral Shares | | | | | |
| |
| For a Share Outstanding | Year Ended October 31, |
| Throughout Each Period | 2014 | 2013 | 2012 | 2011 | 2010 |
| Net Asset Value, Beginning of Period | $10.63 | $11.29 | $10.53 | $10.67 | $10.26 |
| Investment Operations | | | | | |
| Net Investment Income | .438 | .436 | .434 | .473 | .479 |
| Net Realized and Unrealized Gain (Loss) | | | | | |
| on Investments | .600 | (. 660) | .760 | (.140) | .410 |
| Total from Investment Operations | 1.038 | (. 224) | 1.194 | .333 | .889 |
| Distributions | | | | | |
| Dividends from Net Investment Income | (. 438) | (. 436) | (. 434) | (.473) | (.479) |
| Distributions from Realized Capital Gains | — | — | — | — | — |
| Total Distributions | (. 438) | (. 436) | (. 434) | (.473) | (.479) |
| Net Asset Value, End of Period | $11.23 | $10.63 | $11.29 | $10.53 | $10.67 |
| |
| Total Return | 9.96% | –2.04% | 11.52% | 3.34% | 8.85% |
| |
| Ratios/Supplemental Data | | | | | |
| Net Assets, End of Period (Millions) | $6,608 | $5,621 | $6,340 | $4,813 | $5,230 |
| Ratio of Total Expenses to Average Net Assets | 0.12% | 0.12% | 0.12% | 0.12% | 0.12% |
| Ratio of Net Investment Income to | | | | | |
| Average Net Assets | 4.02% | 3.96% | 3.94% | 4.62% | 4.57% |
| Portfolio Turnover Rate | 28% | 29% | 20% | 19% | 19% |
See accompanying Notes, which are an integral part of the Financial Statements.
69
High-Yield Tax-Exempt Fund
Notes to Financial Statements
Vanguard High-Yield Tax-Exempt Fund is registered under the Investment Company Act of 1940 as an open-end investment company, or mutual fund. The fund invests in debt instruments of many municipal issuers; the issuers’ abilities to meet their obligations may be affected by economic and political developments in a specific state or region. The fund offers two classes of shares: Investor Shares and Admiral Shares. Investor Shares are available to any investor who meets the fund’s minimum purchase requirements. Admiral Shares are designed for investors who meet certain administrative, service, and account-size criteria.
A. The following significant accounting policies conform to generally accepted accounting principles for U.S. investment companies. The fund consistently follows such policies in preparing its financial statements.
1. Security Valuation: Securities are valued as of the close of trading on the New York Stock Exchange (generally 4 p.m., Eastern time) on the valuation date. Bonds, and temporary cash investments acquired over 60 days to maturity, are valued using the latest bid prices or using valuations based on a matrix system (which considers such factors as security prices, yields, maturities, and ratings), both as furnished by independent pricing services. Investments in Vanguard Municipal Cash Management Fund are valued at that fund’s net asset value. Other temporary cash investments are valued at amortized cost, which approximates market value. Securities for which market quotations are not readily available, or whose values have been affected by events occurring before the fund’s pricing time but after the close of the securities’ primary markets, are valued by methods deemed by the board of trustees to represent fair value.
2. Futures Contracts: The fund uses futures contracts to invest in fixed income asset classes with greater efficiency and lower cost than is possible through direct investment, to add value when these instruments are attractively priced, or to adjust sensitivity to changes in interest rates. The primary risks associated with the use of futures contracts are imperfect correlation between changes in market values of bonds held by the fund and the prices of futures contracts, and the possibility of an illiquid market. Counterparty risk involving futures is mitigated because a regulated clearinghouse is the counterparty instead of the clearing broker. To further mitigate counterparty risk, the fund trades futures contracts on an exchange, monitors the financial strength of its clearing brokers and clearing-house, and has entered into clearing agreements with its clearing brokers. The clearinghouse imposes initial margin requirements to secure the fund’s performance and requires daily settlement of variation margin representing changes in the market value of each contract.
Futures contracts are valued at their quoted daily settlement prices. The aggregate settlement values of the contracts are not recorded in the Statement of Net Assets. Fluctuations in the value of the contracts are recorded in the Statement of Net Assets as an asset (liability) and in the Statement of Operations as unrealized appreciation (depreciation) until the contracts are closed, when they are recorded as realized futures gains (losses).
During the year ended October 31, 2014, the fund’s average investments in long and short futures contracts represented 0% and less than 1% of net assets, respectively, based on the average of aggregate settlement values at each quarter-end during the period. The fund had no open futures contracts at October 31, 2014.
3. Federal Income Taxes: The fund intends to continue to qualify as a regulated investment company and distribute all of its income. Management has analyzed the fund’s tax positions taken for all open federal income tax years (October 31, 2011–2014), and has concluded that no provision for federal income tax is required in the fund’s financial statements.
4. Distributions: Distributions from net investment income are declared daily and paid on the first business day of the following month. Annual distributions from realized capital gains, if any, are recorded on the ex-dividend date.
5. Credit Facility: The fund and certain other funds managed by The Vanguard Group participate in a $2.89 billion committed credit facility provided by a syndicate of lenders pursuant to a credit agreement that may be renewed annually; each fund is individually liable for its borrowings, if any, under the credit facility. Borrowings may be utilized for temporary and emergency purposes, and are subject to the fund’s regulatory and contractual borrowing restrictions. The participating funds are charged administrative fees and an annual commitment fee of 0.06% of the undrawn amount of the facility; these fees are allocated to the funds based on a method approved by the fund’s board of trustees and included in Management and Administrative expenses on the fund’s Statement of Operations. Any borrowings under this facility bear interest at a rate equal to the higher of the federal funds rate or LIBOR reference rate plus an agreed-upon spread.
The fund had no borrowings outstanding at October 31, 2014, or at any time during the period then ended.
70
High-Yield Tax-Exempt Fund
6. Other: Interest income includes income distributions received from Vanguard Municipal Cash Management Fund and is accrued daily. Premiums and discounts on debt securities purchased are amortized and accreted, respectively, to interest income over the lives of the respective securities. Security transactions are accounted for on the date securities are bought or sold. Costs used to determine realized gains (losses) on the sale of investment securities are those of the specific securities sold.
Each class of shares has equal rights as to assets and earnings, except that each class separately bears certain class-specific expenses related to maintenance of shareholder accounts (included in Management and Administrative expenses) and shareholder reporting. Marketing and distribution expenses are allocated to each class of shares based on a method approved by the board of trustees. Income, other non-class-specific expenses, and gains and losses on investments are allocated to each class of shares based on its relative net assets.
B. The Vanguard Group furnishes at cost investment advisory, corporate management, administrative, marketing, and distribution services. The costs of such services are allocated to the fund based on methods approved by the board of trustees. The fund has committed to invest up to 0.40% of its net assets in Vanguard. At October 31, 2014, the fund had contributed capital of $795,000 to Vanguard (included in Other Assets), representing 0.01% of the fund’s net assets and 0.32% of Vanguard’s capitalization. The fund’s trustees and officers are also directors and officers of Vanguard.
C. Various inputs may be used to determine the value of the fund’s investments. These inputs are summarized in three broad levels for financial statement purposes. The inputs or methodologies used to value securities are not necessarily an indication of the risk associated with investing in those securities.
Level 1—Quoted prices in active markets for identical securities.
Level 2—Other significant observable inputs (including quoted prices for similar securities, interest rates, prepayment speeds, credit risk, etc.).
Level 3—Significant unobservable inputs (including the fund’s own assumptions used to determine the fair value of investments).
The following table summarizes the market value of the fund’s investments as of October 31, 2014, based on the inputs used to value them:
| | | |
| | Level 1 | Level 2 | Level 3 |
| Investments | ($000) | ($000) | ($000) |
| Tax-Exempt Municipal Bonds | — | 7,899,033 | — |
| Temporary Cash Investments | 122,358 | — | — |
| Total | 122,358 | 7,899,033 | — |
D. Capital gain distributions are determined on a tax basis and may differ from realized capital gains for financial reporting purposes. Differences may be permanent or temporary. Permanent differences are reclassified among capital accounts in the financial statements to reflect their tax character. Temporary differences arise when gains or losses are recognized in different periods for financial statement and tax purposes. These differences will reverse at some time in the future.
The fund used capital loss carryforwards of $9,077,000 to offset taxable capital gains realized during the year ended October 31, 2014. At October 31, 2014, the fund had available capital losses totaling $107,611,000 to offset future net capital gains of $62,789,000 through October 31, 2017, $2,545,000 through October 31, 2018, and $42,277,000 through October 31, 2019.
At October 31, 2014, the cost of investment securities for tax purposes was $7,541,451,000. Net unrealized appreciation of investment securities for tax purposes was $479,940,000, consisting of unrealized gains of $508,094,000 on securities that had risen in value since their purchase and $28,154,000 in unrealized losses on securities that had fallen in value since their purchase.
E. During the year ended October 31, 2014, the fund purchased $2,311,457,000 of investment securities and sold $1,896,991,000 of investment securities, other than temporary cash investments.
71
High-Yield Tax-Exempt Fund
| | | | |
| F. Capital share transactions for each class of shares were: | | | |
| | Year Ended October 31, |
| | 2014 | 2013 |
| | Amount | Shares | Amount | Shares |
| | ($000) | (000) | ($000) | (000) |
| Investor Shares | | | | |
| Issued | 477,380 | 43,698 | 489,396 | 43,791 |
| Issued in Lieu of Cash Distributions | 43,835 | 4,007 | 47,720 | 4,336 |
| Redeemed | (418,482) | (38,466) | (744,031) | (67,813) |
| Net Increase (Decrease) —Investor Shares | 102,733 | 9,239 | (206,915) | (19,686) |
| Admiral Shares | | | | |
| Issued | 1,571,428 | 143,680 | 1,588,643 | 143,071 |
| Issued in Lieu of Cash Distributions | 157,956 | 14,438 | 163,489 | 14,861 |
| Redeemed | (1,067,589) | (98,508) | (2,097,668) | (191,076) |
| Net Increase (Decrease) —Admiral Shares | 661,795 | 59,610 | (345,536) | (33,144) |
G. Management has determined that no material events or transactions occurred subsequent to October 31, 2014, that would require recognition or disclosure in these financial statements.
72
Report of Independent Registered Public Accounting Firm
To the Board of Trustees of Vanguard Municipal Bond Funds and the Shareholders of Vanguard Tax-Exempt Money Market Fund, Vanguard Short-Term Tax-Exempt Fund, Vanguard Limited-Term Tax-Exempt Fund, Vanguard Intermediate-Term Tax-Exempt Fund, Vanguard Long-Term Tax-Exempt Fund and Vanguard High-Yield Tax-Exempt Fund: In our opinion, the statement of net assets appearing herein and the accompanying statements of net assets appearing in the insert to this annual report and the related statements of operations and of changes in net assets and the financial highlights present fairly, in all material respects, the financial position of Vanguard Tax-Exempt Money Market Fund, Vanguard Short-Term Tax-Exempt Fund, Vanguard Limited-Term Tax-Exempt Fund, Vanguard Intermediate-Term Tax-Exempt Fund, Vanguard Long-Term Tax-Exempt Fund and Vanguard High-Yield Tax-Exempt Fund (constituting separate portfolios of Vanguard Municipal Bond Funds, hereafter referred to as the “Funds”) at October 31, 2014, the results of each of their operations for the year then ended, the changes in each of their net assets for each of the two years in the period then ended, and the financial highlights for each of the five years in the period then ended, in conformity with accounting principles generally accepted in the United States of America. These financial statements and financial highlights (hereafter referred to as “financial statements”) are the responsibility of the Funds’ management. Our responsibility is to express an opinion on these financial statements based on our audits. We conducted our audits of these financial statements in accordance with the standards of the Public Company Accounting Oversight Board (United States). Those standards require that we plan and perform the audit to obtain reasonable assurance about whether the financial statements are free of material misstatement. An audit includes examining, on a test basis, evidence supporting the amounts and disclosures in the financial statements, assessing the accounting principles used and significant estimates made by management, and evaluating the overall financial statement presentation. We believe that our audits, which included confirmation of securities at October 31, 2014 by correspondence with the custodian, by agreement to the underlying ownership records of the transfer agent and the application of alternative auditing procedures where securities purchased had not been received, provide a reasonable basis for our opinion.
/s/PricewaterhouseCoopers LLP
Philadelphia, Pennsylvania
December 11, 2014
73

Special 2014 tax information (unaudited) for Vanguard Tax-Exempt Money Market Fund
This information for the fiscal year ended October 31, 2014, is included pursuant to provisions
of the Internal Revenue Code.
The fund designates 100% of its income dividends as exempt-interest dividends.

Special 2014 tax information (unaudited) for Vanguard Short-Term Tax-Exempt Fund
This information for the fiscal year ended October 31, 2014, is included pursuant to provisions
of the Internal Revenue Code.
The fund designates 100% of its income dividends as exempt-interest dividends.

Special 2014 tax information (unaudited) for Vanguard Limited-Term Tax-Exempt Fund
This information for the fiscal year ended October 31, 2014, is included pursuant to provisions
of the Internal Revenue Code.
The fund designates 100% of its income dividends as exempt-interest dividends.

Special 2014 tax information (unaudited) for Vanguard Intermediate-Term Tax-Exempt Fund
This information for the fiscal year ended October 31, 2014, is included pursuant to provisions
of the Internal Revenue Code.
The fund designates 100% of its income dividends as exempt-interest dividends.

Special 2014 tax information (unaudited) for Vanguard Long-Term Tax-Exempt Fund
This information for the fiscal year ended October 31, 2014, is included pursuant to provisions
of the Internal Revenue Code.
The fund distributed $2,503,000 as capital gain dividends (from net long-term capital gains)
to shareholders during the fiscal year.
The fund designates 100% of its income dividends as exempt-interest dividends.

Special 2014 tax information (unaudited) for Vanguard High-Yield Tax-Exempt Fund
This information for the fiscal year ended October 31, 2014, is included pursuant to provisions
of the Internal Revenue Code.
The fund designates 100% of its income dividends as exempt-interest dividends.
74
About Your Fund’s Expenses
As a shareholder of the fund, you incur ongoing costs, which include costs for portfolio management, administrative services, and shareholder reports (like this one), among others. Operating expenses, which are deducted from a fund’s gross income, directly reduce the investment return of the fund.
A fund’s expenses are expressed as a percentage of its average net assets. This figure is known as the expense ratio. The following examples are intended to help you understand the ongoing costs (in dollars) of investing in your fund and to compare these costs with those of other mutual funds. The examples are based on an investment of $1,000 made at the beginning of the period shown and held for the entire period.
The accompanying table illustrates your fund’s costs in two ways:
• Based on actual fund return. This section helps you to estimate the actual expenses that you paid over the period. The “Ending Account Value” shown is derived from the fund’s actual return, and the third column shows the dollar amount that would have been paid by an investor who started with $1,000 in the fund. You may use the information in this table, together with the amount you invested, to estimate the expenses that you paid over the period.
To do so, simply divide your account value by $1,000 (for example, an $8,600 account value divided by $1,000 = 8.6), then multiply the result by the number given for your fund under the heading “Expenses Paid During Period.”
• Based on hypothetical 5% yearly return. This section is intended to help you compare your fund’s costs with those of other mutual funds. It assumes that the fund had a yearly return of 5% before expenses, but that the expense ratio is unchanged. In this case—because the return used is not the fund’s actual return—the results do not apply to your investment. The example is useful in making comparisons because the Securities and Exchange Commission requires all mutual funds to calculate expenses based on a 5% return. You can assess your fund’s costs by comparing this hypothetical example with the hypothetical examples that appear in shareholder reports of other funds.
Note that the expenses shown in the table are meant to highlight and help you compare ongoing costs only and do not reflect transaction costs incurred by the fund for buying and selling securities. Further, the expenses do not include any purchase, redemption, or account service fees described in the fund prospectus. If such fees were applied to your account, your costs would be higher. Your fund does not carry a “sales load.” The calculations assume no shares were bought or sold during the period. Your actual costs may have been higher or lower, depending on the amount of your investment and the timing of any purchases or redemptions.
You can find more information about the fund’s expenses, including annual expense ratios, in the Financial Statements section of this report. For additional information on operating expenses and other shareholder costs, please refer to your fund’s current prospectus.
75
| | | |
| Six Months Ended October 31, 2014 | | | |
| | Beginning | Ending | Expenses |
| | Account Value | Account Value | Paid During |
| Tax-Exempt Fund | 4/30/2014 | 10/31/2014 | Period1 |
| Based on Actual Fund Return | | | |
| Money Market | $1,000.00 | $1,000.05 | $0.40 |
| Short-Term | | | |
| Investor Shares | $1,000.00 | $1,002.86 | $1.01 |
| Admiral Shares | 1,000.00 | 1,003.26 | 0.61 |
| Limited-Term | | | |
| Investor Shares | $1,000.00 | $1,009.78 | $1.01 |
| Admiral Shares | 1,000.00 | 1,010.18 | 0.61 |
| Intermediate-Term | | | |
| Investor Shares | $1,000.00 | $1,028.20 | $1.02 |
| Admiral Shares | 1,000.00 | 1,028.61 | 0.61 |
| Long-Term | | | |
| Investor Shares | $1,000.00 | $1,042.22 | $1.03 |
| Admiral Shares | 1,000.00 | 1,042.64 | 0.62 |
| High-Yield | | | |
| Investor Shares | $1,000.00 | $1,043.16 | $1.03 |
| Admiral Shares | 1,000.00 | 1,043.58 | 0.62 |
| Based on Hypothetical 5% Yearly Return | | | |
| Money Market | $1,000.00 | $1,024.80 | $0.41 |
| Short-Term | | | |
| Investor Shares | $1,000.00 | $1,024.20 | $1.02 |
| Admiral Shares | 1,000.00 | 1,024.60 | 0.61 |
| Limited-Term | | | |
| Investor Shares | $1,000.00 | $1,024.20 | $1.02 |
| Admiral Shares | 1,000.00 | 1,024.60 | 0.61 |
| Intermediate-Term | | | |
| Investor Shares | $1,000.00 | $1,024.20 | $1.02 |
| Admiral Shares | 1,000.00 | 1,024.60 | 0.61 |
| Long-Term | | | |
| Investor Shares | $1,000.00 | $1,024.20 | $1.02 |
| Admiral Shares | 1,000.00 | 1,024.60 | 0.61 |
| High-Yield | | | |
| Investor Shares | $1,000.00 | $1,024.20 | $1.02 |
| Admiral Shares | 1,000.00 | 1,024.60 | 0.61 |
1 The calculations are based on expenses incurred in the most recent six-month period. The funds’ annualized six-month expense ratios for that period are: for the Tax-Exempt Money Market Fund, 0.08%; for the
Short-Term Tax-Exempt Fund, 0.20% for Investor Shares and 0.12% for Admiral Shares; for the Limited-Term Tax-Exempt Fund, 0.20% for Investor Shares and 0.12% for Admiral Shares; for the Intermediate-Term
Tax-Exempt Fund, 0.20% for Investor Shares and 0.12% for Admiral Shares; for the Long-Term Tax-Exempt Fund, 0.20% for Investor Shares and 0.12% for Admiral Shares; and for the High-Yield Tax-Exempt Fund,
0.20% for Investor Shares and 0.12% for Admiral Shares. The dollar amounts shown as “Expenses Paid” are equal to the annualized expense ratio multiplied by the average account value over the period, multiplied
by the number of days in the most recent six-month period, then divided by the number of days in the most recent 12-month period.
76
Glossary
Average Coupon. The average interest rate paid on the fixed income securities held by a fund. It is expressed as a percentage of face value.
Average Duration. An estimate of how much the value of the bonds held by a fund will fluctuate in response to a change in interest rates. To see how the value could change, multiply the average duration by the change in rates. If interest rates rise by 1 percentage point, the value of the bonds in a fund with an average duration of five years would decline by about 5%. If rates decrease by a percentage point, the value would rise by 5%.
Average Stated Maturity. The average length of time until fixed income securities held by a fund reach maturity and are repaid using the maturity date of the security. The figure reflects the proportion of fund assets represented by each security; it also reflects any futures contracts held. In general, the longer the average stated maturity, the more a fund’s share price will fluctuate in response to changes in market interest rates.
Average Weighted Maturity. The average length of time until fixed income securities held by a fund reach maturity and are repaid. The figure reflects the proportion of fund assets represented by each security.
Beta. A measure of the magnitude of a fund’s past share-price fluctuations in relation to the ups and downs of a given market index. The index is assigned a beta of 1.00. Compared with a given index, a fund with a beta of 1.20 typically would have seen its share price rise or fall by 12% when the index rose or fell by 10%. For this report, beta is based on returns over the past 36 months for both the fund and the index. Note that a fund’s beta should be reviewed in conjunction with its R-squared (see definition). The lower the R-squared, the less correlation there is between the fund and the index, and the less reliable beta is as an indicator of volatility.
Credit Quality. For the Tax-Exempt Money Market Fund, the Distribution by Credit Quality table includes tier ratings for consistency with SEC Rule 2a-7 under the Investment Company Act of 1940, which governs money market funds. A First Tier security is one that is eligible for money market funds and has been rated in the highest short-term rating category for debt obligations by the requisite nationally recognized statistical rating organizations. Credit-quality ratings are from Moody’s, Fitch, and S&P. For securities rated by all three agencies, where two of them are in agreement and assign the highest rating category, the highest rating applies. If a security is only rated by two agencies, and their ratings are in different categories, the lower of the ratings applies. An unrated security is First Tier if it represents quality comparable to that of a rated security, as determined in accordance with SEC Rule 2a-7. A Second Tier security is one that is eligible for money market funds and is not a First Tier security. For the tax-exempt bond funds, credit-quality ratings are measured on a scale that generally ranges from AAA (highest) to D (lowest). “Not Rated” is used to classify securities for which a rating is not available. Credit-quality ratings for each issue are obtained from Moody’s and S&P, and the higher rating for each issue is used.
Expense Ratio. A fund’s total annual operating expenses expressed as a percentage of the fund’s average net assets. The expense ratio includes management and administrative expenses, but does not include the transaction costs of buying and selling portfolio securities.
Inception Date. The date on which the assets of a fund (or one of its share classes) are first invested in accordance with the fund’s investment objective. For funds with a subscription period, the inception date is the day after that period ends. Investment performance is measured from the inception date.
R-Squared. A measure of how much of a fund’s past returns can be explained by the returns from the market in general, as measured by a given index. If a fund’s total returns were precisely synchronized with an index’s returns, its R-squared would be 1.00. If the fund’s returns bore no relationship to the index’s returns, its R-squared would be 0. For this report, R-squared is based on returns over the past 36 months for both the fund and the index.
Short-Term Reserves. The percentage of a fund invested in highly liquid, short-term securities that can be readily converted to cash.
77
Yield. A money market fund’s 7-day SEC yield is calculated by annualizing its income distributions for the previous seven days, as required by the U.S. Securities and Exchange Commission. For other funds, 30-day SEC yield is derived using a formula specified by the commission. Under the formula, data related to the fund’s security holdings in the previous 30 days are used to calculate the fund’s hypothetical net income for that period, which is then annualized and divided by the fund’s estimated average net assets over the calculation period. For the purposes of this calculation, a security’s income is based on its current market yield to maturity (in the case of bonds) or its projected dividend yield (for stocks). Because the SEC yield represents hypothetical annualized income, it will differ—at times significantly—from the fund’s actual experience. As a result, the fund’s income distributions may be higher or lower than implied by the SEC yield.
Yield to Maturity. The rate of return an investor would receive if the fixed income securities held by a fund were held to their maturity dates.
78
This page intentionally left blank.
This page intentionally left blank.
The People Who Govern Your Fund
The trustees of your mutual fund are there to see that the fund is operated and managed in your best interests since, as a shareholder, you are a part owner of the fund. Your fund’s trustees also serve on the board of directors of The Vanguard Group, Inc., which is owned by the Vanguard funds and provides services to them on an at-cost basis.
A majority of Vanguard’s board members are independent, meaning that they have no affiliation with Vanguard or the funds they oversee, apart from the sizable personal investments they have made as private individuals.
The independent board members have distinguished backgrounds in business, academia, and public service. Each of the trustees and executive officers oversees 177 Vanguard funds.
The following table provides information for each trustee and executive officer of the fund. More information about the trustees is in the Statement of Additional Information, which can be obtained, without charge, by contacting Vanguard at 800-662-7447, or online at vanguard.com.
| | | |
| Interested Trustee1 | products); Director of Skytop Lodge Corporation | Peter F. Volanakis | |
| | (hotels), the University Medical Center at Princeton, | Born 1955. Trustee Since July 2009. Principal |
| F. William McNabb III | the Robert Wood Johnson Foundation, and the Center | Occupation(s) During the Past Five Years: President |
| Born 1957. Trustee Since July 2009. Chairman of the | for Talent Innovation; Member of the Advisory Board | and Chief Operating Officer (retired 2010) of Corning |
| Board. Principal Occupation(s) During the Past Five | of the Maxwell School of Citizenship and Public | Incorporated (communications equipment); Trustee of |
| Years: Chairman of the Board of The Vanguard Group, | Affairs at Syracuse University. | Colby-Sawyer College; Member of the Advisory Board |
| Inc., and of each of the investment companies served | | of the Norris Cotton Cancer Center and of the Advisory |
| by The Vanguard Group, since January 2010; Director | F. Joseph Loughrey | Board of the Parthenon Group (strategy consulting). |
| of The Vanguard Group since 2008; Chief Executive | Born 1949. Trustee Since October 2009. Principal | | |
| Officer and President of The Vanguard Group, and of | Occupation(s) During the Past Five Years: President | Executive Officers | |
| each of the investment companies served by The | and Chief Operating Officer (retired 2009) of Cummins | | |
| Vanguard Group, since 2008; Director of Vanguard | Inc. (industrial machinery); Chairman of the Board of | Glenn Booraem | |
| Marketing Corporation; Managing Director of The | Hillenbrand, Inc. (specialized consumer services), and | Born 1967. Controller Since July 2010. Principal |
| Vanguard Group (1995–2008). | of Oxfam America; Director of SKF AB (industrial | Occupation(s) During the Past Five Years: Principal |
| | machinery), Hyster-Yale Materials Handling, Inc. | of The Vanguard Group, Inc.; Controller of each of |
| Independent Trustees | (forklift trucks), the Lumina Foundation for Education, | the investment companies served by The Vanguard |
| | and the V Foundation for Cancer Research; Member | Group; Assistant Controller of each of the investment |
| Emerson U. Fullwood | of the Advisory Council for the College of Arts and | companies served by The Vanguard Group |
| Born 1948. Trustee Since January 2008. Principal | Letters and of the Advisory Board to the Kellogg | (2001–2010). | |
| Occupation(s) During the Past Five Years: Executive | Institute for International Studies, both at the | | |
| Chief Staff and Marketing Officer for North America | University of Notre Dame. | Thomas J. Higgins | |
| and Corporate Vice President (retired 2008) of Xerox | | Born 1957. Chief Financial Officer Since September |
| Corporation (document management products and | Mark Loughridge | 2008. Principal Occupation(s) During the Past Five |
| services); Executive in Residence and 2009–2010 | Born 1953. Trustee Since March 2012. Principal | Years: Principal of The Vanguard Group, Inc.; Chief |
| Distinguished Minett Professor at the Rochester | Occupation(s) During the Past Five Years: Senior | Financial Officer of each of the investment companies |
| Institute of Technology; Director of SPX Corporation | Vice President and Chief Financial Officer (retired | served by The Vanguard Group; Treasurer of each of |
| (multi-industry manufacturing), the United Way of | 2013) at IBM (information technology services); | the investment companies served by The Vanguard |
| Rochester, Amerigroup Corporation (managed health | Fiduciary Member of IBM’s Retirement Plan | Group (1998–2008). | |
| care), the University of Rochester Medical Center, | Committee (2004–2013); Member of the Council | | |
| Monroe Community College Foundation, and North | on Chicago Booth. | Kathryn J. Hyatt |
| Carolina A&T University. | | Born 1955. Treasurer Since November 2008. |
| | Scott C. Malpass | Principal Occupation(s) During the Past Five Years: |
| Rajiv L. Gupta | Born 1962. Trustee Since March 2012. Principal | Principal of The Vanguard Group, Inc.; Treasurer of |
| Born 1945. Trustee Since December 2001.2 | Occupation(s) During the Past Five Years: Chief | each of the investment companies served by The |
| Principal Occupation(s) During the Past Five Years: | Investment Officer and Vice President at the | Vanguard Group; Assistant Treasurer of each of |
| Chairman and Chief Executive Officer (retired 2009) | University of Notre Dame; Assistant Professor | the investment companies served by The Vanguard |
| and President (2006–2008) of Rohm and Haas Co. | of Finance at the Mendoza College of Business at | Group (1988–2008). | |
| (chemicals); Director of Tyco International, Ltd. | Notre Dame; Member of the Notre Dame 403(b) | | |
| (diversified manufacturing and services), Hewlett- | Investment Committee; Board Member of TIFF | Heidi Stam |
| Packard Co. (electronic computer manufacturing), | Advisory Services, Inc. (investment advisor); | Born 1956. Secretary Since July 2005. Principal |
| and Delphi Automotive LLP (automotive components); | Member of the Investment Advisory Committees | Occupation(s) During the Past Five Years: Managing |
| Senior Advisor at New Mountain Capital. | of the Financial Industry Regulatory Authority | Director of The Vanguard Group, Inc.; General Counsel |
| | (FINRA) and of Major League Baseball. | of The Vanguard Group; Secretary of The Vanguard |
| Amy Gutmann | | Group and of each of the investment companies |
| Born 1949. Trustee Since June 2006. Principal | André F. Perold | served by The Vanguard Group; Director and Senior |
| Occupation(s) During the Past Five Years: President of | Born 1952. Trustee Since December 2004. Principal | Vice President of Vanguard Marketing Corporation. |
| the University of Pennsylvania; Christopher H. Browne | Occupation(s) During the Past Five Years: George | | |
| Distinguished Professor of Political Science, School of | Gund Professor of Finance and Banking, Emeritus | Vanguard Senior Management Team |
| Arts and Sciences, and Professor of Communication, | at the Harvard Business School (retired 2011); | Mortimer J. Buckley | Chris D. McIsaac |
| Annenberg School for Communication, with secondary | Chief Investment Officer and Managing Partner of | Kathleen C. Gubanich | Michael S. Miller |
| faculty appointments in the Department of Philosophy, | HighVista Strategies LLC (private investment firm); | Paul A. Heller | James M. Norris |
| School of Arts and Sciences, and at the Graduate | Director of Rand Merchant Bank; Overseer of the | Martha G. King | Glenn W. Reed |
| School of Education, University of Pennsylvania; | Museum of Fine Arts Boston. | John T. Marcante | |
| Trustee of the National Constitution Center; Chair | | | |
| of the Presidential Commission for the Study of | Alfred M. Rankin, Jr. | Chairman Emeritus and Senior Advisor |
| Bioethical Issues. | Born 1941. Trustee Since January 1993. Principal | | |
| | Occupation(s) During the Past Five Years: Chairman, | John J. Brennan | |
| JoAnn Heffernan Heisen | President, and Chief Executive Officer of NACCO | Chairman, 1996–2009 | |
| Born 1950. Trustee Since July 1998. Principal | Industries, Inc. (housewares/lignite), and of Hyster- | Chief Executive Officer and President, 1996–2008 |
| Occupation(s) During the Past Five Years: Corporate | Yale Materials Handling, Inc. (forklift trucks); Chairman | | |
| Vice President and Chief Global Diversity Officer | of the Board of University Hospitals of Cleveland. | Founder | |
| (retired 2008) and Member of the Executive | | John C. Bogle | |
| Committee (1997–2008) of Johnson & Johnson | | Chairman and Chief Executive Officer, 1974–1996 |
| (pharmaceuticals/medical devices/consumer | | | |
1 Mr. McNabb is considered an “interested person,” as defined in the Investment Company Act of 1940, because he is an officer of the Vanguard funds.
2 December 2002 for Vanguard Equity Income Fund, the Vanguard Municipal Bond Funds, and the Vanguard State Tax-Exempt Funds.
| 
|
| | P.O. Box 2600 |
| | Valley Forge, PA 19482-2600 |
| |
| |
| |
| |
| Connect with Vanguard® > vanguard.com | |
| |
| |
| |
| |
| Fund Information > 800-662-7447 | All comparative mutual fund data are from Lipper, |
| | a Thomson Reuters Company, or Morningstar, Inc., |
| Direct Investor Account Services > 800-662-2739 | unless otherwise noted. |
| |
| Institutional Investor Services > 800-523-1036 | You can obtain a free copy of Vanguard’s proxy voting |
| Text Telephone for People | guidelines by visiting vanguard.com/proxyreporting or |
| Who Are Deaf or Hard of Hearing > 800-749-7273 | by calling Vanguard at 800-662-2739. The guidelines |
| | are also available from the SEC’s website, sec.gov. |
| | In addition, you may obtain a free report on how your |
| | fund voted the proxies for securities it owned during |
| This material may be used in conjunction | the 12 months ended June 30. To get the report, visit |
| with the offering of shares of any Vanguard | either vanguard.com/proxyreporting or sec.gov. |
| fund only if preceded or accompanied by the | |
| fund’s current prospectus. | You can review and copy information about your fund |
| | at the SEC’s Public Reference Room in Washington, D.C. |
| CFA® is a registered trademark owned by CFA Institute. | To find out more about this public service, call the SEC |
| | at 202-551-8090. Information about your fund is also |
| | available on the SEC’s website, and you can receive |
| | copies of this information, for a fee, by sending a |
| | request in either of two ways: via e-mail addressed to |
| | publicinfo@sec.gov or via regular mail addressed to the |
| | Public Reference Section, Securities and Exchange |
| | Commission, Washington, DC 20549-1520. |
| |
| |
| |
| |
| | © 2014 The Vanguard Group, Inc. |
| | All rights reserved. |
| | Vanguard Marketing Corporation, Distributor. |
| | Q950 122014 |
Vanguard® Municipal Bond Funds
Statement of Net Assets
As of October 31, 2014
The Statement of Net Assets should be read in conjunction with each fund’s Statement of Operations,
Statement of Changes in Net Assets, Financial Highlights, and Notes to Financial Statements, all of which appear in the accompanying report.
Each fund reports a complete list of its holdings in regulatory filings four times in each fiscal year, at the quarter-ends. For the second and fourth fiscal quarters, the lists appear in the fund’s semiannual and annual reports to shareholders. For the first and third fiscal quarters, the fund files the lists with the Securities and Exchange Commission on Form N-Q. Shareholders can look up the fund’s Forms N-Q on the SEC’s website at sec.gov. Forms N-Q may also be reviewed and copied at the SEC’s Public Reference Room (see the back cover of the accompanying report for further information).
| |
| Contents | |
| |
| Short-Term Tax-Exempt Fund | 1 |
| Limited-Term Tax-Exempt Fund | 30 |
| Intermediate-Term Tax-Exempt Fund | 74 |
| Long-Term Tax-Exempt Fund | 143 |
| High-Yield Tax-Exempt Fund | 164 |
| Key to Abbreviations | Back cover |
Short-Term Tax-Exempt Fund
| | | | | |
| | | | | Face | Market |
| | | Maturity | | Amount | Value• |
| | Coupon | Date | | ($000) | ($000) |
| Tax-Exempt Municipal Bonds (100.8%) | | | | | |
| Alabama (0.7%) | | | | | |
| 1 Alabama Public School & College Authority Capital Improvement Revenue TOB VRDO | 0.090% | 11/7/14 | | 12,360 | 12,360 |
| Alabama Special Care Facilities Financing Authority Birmingham Revenue | | | | | |
| (Ascension Health Credit Group) PUT | 1.500% | 6/1/16 | | 4,560 | 4,630 |
| 1 Alabama Special Care Facilities Financing Authority Birmingham Revenue | | | | | |
| (Ascension Health Credit Group) TOB VRDO | 0.060% | 11/7/14 | | 12,750 | 12,750 |
| Chatom AL Industrial Development Board Gulf Opportunity Zone Revenue | | | | | |
| (Powersouth Energy Cooperative Projects) PUT | 0.500% | 11/15/14 | | 27,940 | 27,940 |
| Chatom AL Industrial Development Board Gulf Opportunity Zone Revenue | | | | | |
| (Powersouth Energy Cooperative Projects) PUT | 0.450% | 12/1/14 | | 9,200 | 9,200 |
| Chatom AL Industrial Development Board Gulf Opportunity Zone Revenue | | | | | |
| (Powersouth Energy Cooperative Projects) PUT | 0.450% | 2/1/15 | | 11,000 | 11,000 |
| Jefferson County AL Sewer Revenue | 5.000% | 10/1/15 | | 600 | 621 |
| Jefferson County AL Sewer Revenue | 5.000% | 10/1/16 | | 1,000 | 1,069 |
| Jefferson County AL Sewer Revenue | 5.000% | 10/1/17 | | 1,625 | 1,774 |
| Jefferson County AL Sewer Revenue | 5.000% | 10/1/18 | | 1,500 | 1,666 |
| Mobile AL Infirmary Health System Special Care Facilities Financing Authority Revenue | | | | | |
| (Infirmary Health System Inc.) | 5.000% | 2/1/15 | | 1,715 | 1,732 |
| | | | | | 84,742 |
| Alaska (0.6%) | | | | | |
| Alaska Housing Finance Corp. Home Mortgage Revenue VRDO | 0.040% | 11/7/14 | | 46,755 | 46,755 |
| Alaska Industrial Development & Export Authority Revenue | 5.000% | 4/1/15 | | 3,000 | 3,061 |
| Matanuska-Susitna Borough AK GO | 4.000% | 3/1/15 | | 1,000 | 1,013 |
| Matanuska-Susitna Borough AK GO | 5.000% | 3/1/18 | | 3,775 | 4,291 |
| North Slope Borough AK | 4.000% | 6/30/17 | | 9,000 | 9,818 |
| Valdez AK Marine Terminal Revenue (BP Pipelines) | 5.000% | 1/1/16 | | 10,000 | 10,543 |
| Valdez AK Marine Terminal Revenue (BP Pipelines) | 5.000% | 1/1/16 | | 2,000 | 2,109 |
| | | | | | 77,590 |
| Arizona (0.9%) | | | | | |
| Arizona COP | 2.000% | 10/1/15 | | 400 | 406 |
| Arizona COP | 4.000% | 10/1/15 | | 1,700 | 1,756 |
| Arizona COP | 3.000% | 10/1/16 | | 315 | 328 |
| Arizona COP | 5.000% | 10/1/16 | | 750 | 811 |
| Arizona Health Facilities Authority Hospital System Revenue (Phoenix Children’s Hospital) | 3.000% | 2/1/16 | | 1,200 | 1,235 |
| Arizona Health Facilities Authority Hospital System Revenue (Phoenix Children’s Hospital) | 4.000% | 2/1/17 | | 2,000 | 2,137 |
| Arizona Health Facilities Authority Hospital System Revenue (Phoenix Children’s Hospital) | 5.000% | 2/1/18 | | 1,000 | 1,121 |
| Arizona Health Facilities Authority Revenue (Banner Health) | 5.000% | 1/1/16 | | 5,000 | 5,270 |
| Arizona Health Facilities Authority Revenue (Banner Health) VRDO | 0.050% | 11/7/14 | LOC | 3,885 | 3,885 |
| 2 Arizona Health Facilities Authority Revenue (Phoenix Children’s Hospital) PUT | 1.900% | 2/5/20 | | 12,500 | 12,700 |
| Arizona School Facilities Board COP | 4.000% | 9/1/15 | | 3,750 | 3,869 |
| Arizona School Facilities Board COP | 4.000% | 9/1/16 | | 3,125 | 3,325 |
| Arizona School Facilities Board COP | 5.000% | 9/1/17 | | 1,800 | 2,014 |
1
Short-Term Tax-Exempt Fund
| | | | | | |
| | | | | | Face | Market |
| | | | Maturity | | Amount | Value• |
| | | Coupon | Date | | ($000) | ($000) |
| | Arizona School Facilities Board COP | 5.000% | 9/1/18 | | 1,500 | 1,715 |
| | Maricopa County AZ Unified School District GO | 2.000% | 7/1/15 | | 6,250 | 6,328 |
| | Maricopa County AZ Unified School District No. 4 (Mesa) GO | 4.000% | 7/1/19 | | 3,750 | 4,229 |
| 1 | Mesa AZ Utility System Revenue TOB VRDO | 0.060% | 11/7/14 | (4) | 8,250 | 8,250 |
| 1 | Mesa AZ Utility System Revenue TOB VRDO | 0.060% | 11/7/14 | (4) | 7,500 | 7,500 |
| 1 | Phoenix AZ Civic Improvement Corp. Airport Revenue TOB VRDO | 0.100% | 11/7/14 | | 8,990 | 8,990 |
| 1 | Phoenix AZ Civic Improvement Corp. Airport Revenue TOB VRDO | 0.150% | 11/7/14 | | 4,000 | 4,000 |
| | Phoenix AZ Civic Improvement Corp. Excise Tax Revenue | 5.000% | 7/1/15 | | 4,250 | 4,387 |
| | Phoenix AZ Civic Improvement Corp. Excise Tax Revenue | 5.000% | 7/1/16 | | 2,325 | 2,503 |
| | Phoenix AZ Civic Improvement Corp. Excise Tax Revenue | 5.000% | 7/1/17 | | 4,250 | 4,749 |
| | Phoenix AZ GO | 4.000% | 7/1/16 | | 5,360 | 5,686 |
| | Pima County AZ Sewer Revenue | 5.000% | 7/1/15 | | 1,250 | 1,290 |
| | Pima County AZ Sewer Revenue | 5.000% | 7/1/16 | | 2,000 | 2,153 |
| | Pima County AZ Sewer Revenue | 4.000% | 7/1/17 | | 2,000 | 2,182 |
| 1 | Salt River Project Arizona Agricultural Improvement & Power District Revenue TOB VRDO | 0.060% | 11/7/14 | | 13,940 | 13,940 |
| | Yavapai County AZ Industrial Development Authority Hospital Facility Revenue | | | | | |
| | (Northern Arizona Healthcare System) | 5.000% | 10/1/15 | | 1,750 | 1,825 |
| | Yavapai County AZ Industrial Development Authority Hospital Facility Revenue | | | | | |
| | (Northern Arizona Healthcare System) | 5.000% | 10/1/16 | | 2,120 | 2,303 |
| | Yuma AZ Industrial Development Authority Hospital Revenue (Yuma Regional Medical Center) | 5.000% | 8/1/19 | | 1,000 | 1,144 |
| | | | | | | 122,031 |
| California (9.8%) | | | | | |
| | Bay Area Toll Authority California Toll Bridge Revenue (San Francisco Bay Area) PUT | 0.958% | 8/1/17 | | 29,500 | 29,839 |
| | Bay Area Toll Authority California Toll Bridge Revenue (San Francisco Bay Area) PUT | 1.450% | 8/1/17 | | 7,000 | 7,091 |
| | Bay Area Toll Authority California Toll Bridge Revenue (San Francisco Bay Area) PUT | 1.450% | 8/1/17 | | 10,040 | 10,170 |
| | Bay Area Toll Authority California Toll Bridge Revenue PUT | 1.500% | 4/2/18 | | 13,500 | 13,680 |
| | Bay Area Toll Authority California Toll Bridge Revenue PUT | 1.875% | 4/1/19 | | 7,550 | 7,742 |
| | Brea CA Redevelopment Agency Successor Agency Tax Allocation Revenue | | | | | |
| | (Redevelopment Project AB) | 4.000% | 8/1/15 | | 2,825 | 2,906 |
| | Brea CA Redevelopment Agency Successor Agency Tax Allocation Revenue | | | | | |
| | (Redevelopment Project AB) | 4.000% | 8/1/16 | | 1,200 | 1,275 |
| | Brea CA Redevelopment Agency Successor Agency Tax Allocation Revenue | | | | | |
| | (Redevelopment Project AB) | 5.000% | 8/1/17 | | 1,150 | 1,285 |
| | California County CA Tobacco Securitization Agency Revenue | 4.000% | 6/1/15 | | 500 | 510 |
| | California County CA Tobacco Securitization Agency Revenue | 4.000% | 6/1/16 | | 500 | 525 |
| | California County CA Tobacco Securitization Agency Revenue | 4.000% | 6/1/17 | | 575 | 616 |
| | California County CA Tobacco Securitization Agency Revenue | 4.000% | 6/1/18 | | 1,000 | 1,088 |
| | California Department of Water Resources Power Supply Revenue | 5.000% | 5/1/15 | | 13,750 | 14,085 |
| | California Department of Water Resources Power Supply Revenue | 5.000% | 5/1/16 | | 14,560 | 15,587 |
| 2,3 | California Department of Water Resources Water System Revenue (Central Valley Project) PUT | 0.000% | 12/1/17 | | 29,750 | 29,755 |
| | California GO | 4.000% | 11/1/14 | | 2,650 | 2,650 |
| | California GO | 5.000% | 11/1/15 | | 1,600 | 1,677 |
| | California GO | 5.000% | 9/1/16 | | 8,000 | 8,681 |
| | California GO | 5.000% | 9/1/16 | | 1,465 | 1,590 |
| | California GO | 5.000% | 10/1/16 | | 12,070 | 13,142 |
| | California GO | 5.000% | 9/1/17 | | 4,250 | 4,769 |
| | California GO | 5.000% | 10/1/17 | | 35,000 | 39,380 |
| | California GO | 5.000% | 4/1/18 | | 20,385 | 23,239 |
| 2 | California GO PUT | 0.730% | 5/1/15 | | 25,855 | 25,903 |
| 2 | California GO PUT | 0.600% | 12/1/16 | | 39,650 | 39,838 |
| | California GO PUT | 4.000% | 12/1/16 | | 27,465 | 29,020 |
| 2 | California GO PUT | 0.810% | 12/1/17 | | 14,250 | 14,382 |
| 2 | California GO PUT | 0.939% | 12/3/18 | | 6,500 | 6,601 |
| 1 | California GO TOB VRDO | 0.140% | 11/7/14 | LOC | 31,610 | 31,610 |
| 1 | California GO TOB VRDO | 0.190% | 11/7/14 | (4) | 10,000 | 10,000 |
| 1 | California GO TOB VRDO | 0.250% | 11/7/14 | (4) | 15,925 | 15,925 |
| | California GO VRDO | 0.040% | 11/7/14 | LOC | 13,700 | 13,700 |
| | California GO VRDO | 0.050% | 11/7/14 | LOC | 8,900 | 8,900 |
| | California Health Facilities Financing Authority Revenue (Cedars-Sinai Medical Center) | 5.000% | 8/15/15 | | 2,000 | 2,077 |
| | California Health Facilities Financing Authority Revenue (Cedars-Sinai Medical Center) | 5.000% | 8/15/16 | | 3,000 | 3,249 |
| 2 | California Health Facilities Financing Authority Revenue (Children’s Hospital of Los Angeles) PUT | 1.850% | 7/1/17 | | 8,825 | 8,891 |
| | California Health Facilities Financing Authority Revenue (City of Hope Medical Center) | 5.000% | 11/15/16 | | 1,005 | 1,099 |
| | California Health Facilities Financing Authority Revenue (Memorial Health Services) | 5.000% | 10/1/15 | | 940 | 982 |
| | California Health Facilities Financing Authority Revenue (Memorial Health Services) | 5.000% | 10/1/16 | | 1,500 | 1,634 |
| | California Health Facilities Financing Authority Revenue (Memorial Health Services) | 5.000% | 10/1/17 | | 1,000 | 1,128 |
| | California Health Facilities Financing Authority Revenue (St. Joseph Health System) PUT | 5.000% | 10/17/17 | | 9,000 | 10,172 |
| | California Health Facilities Financing Authority Revenue (Stanford Hospital) | 5.000% | 8/15/15 | | 1,000 | 1,039 |
| 1 | California Health Facilities Financing Authority Revenue (Sutter Health) TOB VRDO | 0.060% | 11/7/14 | | 15,495 | 15,495 |
| 1 | California Health Facilities Financing Authority Revenue (Sutter Health) TOB VRDO | 0.060% | 11/7/14 | | 20,885 | 20,885 |
| | California Housing Finance Agency Multifamily Housing Revenue | 0.850% | 8/1/16 | | 750 | 751 |
| 2 | California Infrastructure & Economic Development Bank Revenue (Index-Museum Art Project) PUT | 1.858% | 8/1/18 | | 20,000 | 20,626 |
2
Short-Term Tax-Exempt Fund
| | | | | |
| | | | | Face | Market |
| | | Maturity | | Amount | Value• |
| | Coupon | Date | | ($000) | ($000) |
| 2 California Infrastructure & Economic Development Bank Revenue (J. Paul Getty Trust) PUT | 0.350% | 4/1/15 | | 6,400 | 6,401 |
| 2 California Infrastructure & Economic Development Bank Revenue (J. Paul Getty Trust) PUT | 0.330% | 4/3/17 | | 2,900 | 2,900 |
| 2 California Infrastructure & Economic Development Bank Revenue (J. Paul Getty Trust) PUT | 0.330% | 4/3/17 | | 22,500 | 22,502 |
| California Municipal Finance Authority | | | | | |
| (Community Hospitals of Central California Obligated Group) COP | 5.000% | 2/1/16 | | 1,000 | 1,052 |
| California Municipal Finance Authority | | | | | |
| (Community Hospitals of Central California Obligated Group) COP | 5.000% | 2/1/17 | | 1,100 | 1,189 |
| California Municipal Finance Authority Revenue (NorthBay Healthcare Group) | 5.000% | 11/1/14 | | 1,480 | 1,480 |
| California Municipal Finance Authority Revenue (NorthBay Healthcare Group) | 5.000% | 11/1/15 | | 1,450 | 1,504 |
| California Municipal Finance Authority Revenue (NorthBay Healthcare Group) | 5.000% | 11/1/16 | | 1,610 | 1,714 |
| 2 California Municipal Finance Authority Revenue (NorthBay Healthcare Group) PUT | 2.150% | 11/1/16 | | 5,000 | 5,013 |
| California Municipal Finance Authority Revenue (University of La Verne) | 5.000% | 6/1/15 | | 2,120 | 2,169 |
| California Municipal Finance Authority Solid Waste Revenue (Republic Services Inc. Project) PUT | 0.300% | 1/2/15 | | 11,500 | 11,500 |
| California Public Works Board Lease Revenue (Department of Corrections) | 5.000% | 1/1/15 | (2) | 3,900 | 3,931 |
| California Public Works Board Lease Revenue (Department of Corrections) | 5.000% | 6/1/15 | | 1,250 | 1,285 |
| California Public Works Board Lease Revenue (Department of Corrections) | 5.000% | 6/1/16 | | 7,160 | 7,688 |
| California Public Works Board Lease Revenue (Department of Corrections) | 5.000% | 6/1/17 | | 8,205 | 9,120 |
| California Public Works Board Lease Revenue (Department of Corrections) | 5.000% | 6/1/17 | | 5,000 | 5,558 |
| California Public Works Board Lease Revenue (Department of Corrections) | 5.000% | 6/1/18 | | 2,500 | 2,857 |
| California Public Works Board Lease Revenue (Department of Corrections) | 5.000% | 6/1/18 | | 10,650 | 12,171 |
| California Public Works Board Lease Revenue (Department of Public Health) | 3.000% | 11/1/14 | | 2,000 | 2,000 |
| California Public Works Board Lease Revenue (Department of Public Health) | 4.000% | 11/1/15 | | 2,500 | 2,595 |
| California Public Works Board Lease Revenue (Department of State Hospitals) | 4.000% | 6/1/17 | | 5,000 | 5,431 |
| California Public Works Board Lease Revenue (Department of State Hospitals) | 4.000% | 6/1/18 | | 5,000 | 5,540 |
| California Public Works Board Lease Revenue (Judicial Council Projects) | 5.000% | 12/1/16 | | 1,500 | 1,644 |
| California Public Works Board Lease Revenue (Various Capital Projects) | 5.000% | 11/1/14 | | 4,000 | 4,000 |
| California Public Works Board Lease Revenue (Various Capital Projects) | 4.000% | 10/1/15 | | 3,000 | 3,105 |
| California Public Works Board Lease Revenue (Various Capital Projects) | 5.000% | 4/1/16 | | 3,415 | 3,642 |
| California Public Works Board Lease Revenue (Various Capital Projects) | 4.000% | 10/1/16 | | 3,070 | 3,284 |
| California Public Works Board Lease Revenue (Various Capital Projects) | 5.000% | 4/1/17 | | 2,710 | 2,996 |
| California Public Works Board Lease Revenue (Various Capital Projects) | 5.000% | 4/1/18 | | 1,000 | 1,137 |
| California Statewide Communities Development Authority Health Facility Revenue | | | | | |
| (Catholic Healthcare West) | 0.350% | 11/7/14 | (4) | 20,650 | 20,650 |
| California Statewide Communities Development Authority Health Facility Revenue | | | | | |
| (Catholic Healthcare West) | 0.390% | 11/7/14 | (4) | 8,900 | 8,900 |
| 1 California Statewide Communities Development Authority Revenue | | | | | |
| (Huntington Memorial Hospital) TOB VRDO | 0.280% | 11/7/14 | LOC | 25,000 | 25,000 |
| California Statewide Communities Development Authority Revenue (Kaiser Permanente) PUT | 5.000% | 5/1/17 | | 5,000 | 5,564 |
| California Statewide Communities Development Authority Revenue (Kaiser Permanente) PUT | 5.000% | 5/1/17 | | 5,285 | 5,881 |
| 1 California Statewide Communities Development Authority Revenue | | | | | |
| (Kaiser Permanente) TOB VRDO | 0.200% | 11/7/14 | | 6,050 | 6,050 |
| California Statewide Communities Development Authority Revenue (Kaiser Permanente) VRDO | 0.030% | 11/7/14 | | 29,770 | 29,770 |
| 1 California Statewide Communities Development Authority Revenue | | | | | |
| (St. Joseph Health System) TOB VRDO | 0.220% | 11/7/14 | (4) | 17,832 | 17,832 |
| California Statewide Communities Development Authority Senior Living Health Facility Revenue | | | | | |
| (Los Angeles Jewish Home for the Aging) | 2.500% | 8/1/20 | | 1,165 | 1,195 |
| Chula Vista CA Industrial Development Revenue (San Diego Gas & Electric Co.) | 1.650% | 7/1/18 | | 4,700 | 4,731 |
| Chula Vista CA Municipal Financing Authority Special Tax Revenue | 5.000% | 9/1/16 | | 1,220 | 1,312 |
| Chula Vista CA Municipal Financing Authority Special Tax Revenue | 5.000% | 9/1/17 | | 585 | 647 |
| 2 Contra Costa CA Transportation Authority Sales Tax Revenue PUT | 0.472% | 12/15/15 | | 23,750 | 23,792 |
| 1 Desert CA Community College District GO TOB VRDO | 0.070% | 11/7/14 | | 14,340 | 14,340 |
| 2 East Bay CA Municipal Utility District Waste Water System Revenue PUT | 0.370% | 7/8/15 | | 1,415 | 1,414 |
| El Dorado CA Irrigation District Revenue | 4.000% | 3/1/17 | (4) | 1,500 | 1,619 |
| Foothill/Eastern Transportation Corridor Agency California Toll Road Revenue PUT | 5.000% | 1/15/18 | | 17,765 | 19,438 |
| Glendale CA Redevelopment Agency Successor Agency Tax Allocation Revenue | | | | | |
| (Central Glendale Redevelopment Project) | 3.000% | 12/1/15 | (4) | 2,350 | 2,419 |
| 1 Golden State Tobacco Securitization Corp. California TOB VRDO | 0.220% | 11/7/14 | (12)LOC | 14,500 | 14,500 |
| Irvine CA Reassessment District No. 13-1 Improvement Revenue | 2.000% | 9/2/15 | | 1,560 | 1,575 |
| Irvine CA Reassessment District No. 13-1 Improvement Revenue | 4.000% | 9/2/16 | | 1,065 | 1,122 |
| Jurupa CA Public Financing Authority Special Tax Revenue | 4.000% | 9/1/16 | | 425 | 450 |
| Jurupa CA Public Financing Authority Special Tax Revenue | 3.500% | 9/1/17 | | 425 | 454 |
| Jurupa CA Public Financing Authority Special Tax Revenue | 4.000% | 9/1/18 | | 380 | 417 |
| Jurupa CA Public Financing Authority Special Tax Revenue | 5.000% | 9/1/19 | | 460 | 529 |
| La Quinta CA Redevelopment Agency Tax Allocation Revenue | 3.000% | 9/1/15 | | 1,705 | 1,744 |
| La Quinta CA Redevelopment Agency Tax Allocation Revenue | 4.000% | 9/1/16 | | 1,600 | 1,699 |
| La Verne CA (Brethren Hillcrest Homes) COP | 2.000% | 5/15/15 | | 465 | 468 |
| La Verne CA (Brethren Hillcrest Homes) COP | 3.000% | 5/15/17 | | 575 | 596 |
| La Verne CA (Brethren Hillcrest Homes) COP | 4.000% | 5/15/18 | | 235 | 253 |
| Long Beach CA Finance Authority Natural Gas Purchase Revenue | 5.250% | 11/15/18 | | 1,185 | 1,333 |
| Long Beach CA Harbor Revenue | 5.000% | 11/15/18 | | 32,500 | 37,784 |
| Los Angeles CA Department of Water & Power Revenue | 4.000% | 1/1/16 | | 9,100 | 9,419 |
3
Short-Term Tax-Exempt Fund
| | | | | |
| | | | | Face | Market |
| | | Maturity | | Amount | Value• |
| | Coupon | Date | | ($000) | ($000) |
| Los Angeles CA Department of Water & Power Revenue | 5.000% | 1/1/16 | | 9,800 | 10,233 |
| Los Angeles CA GO | 5.000% | 9/1/18 | | 12,900 | 14,948 |
| Los Angeles CA Unified School District GO | 5.000% | 7/1/18 | | 23,335 | 26,842 |
| Los Angeles CA Unified School District GO | 5.000% | 7/1/18 | | 73,395 | 84,425 |
| Los Angeles CA Unified School District GO | 5.000% | 7/1/18 | | 9,830 | 11,307 |
| 1 Los Angeles CA Unified School District GO TOB VRDO | 0.060% | 11/7/14 | | 6,700 | 6,700 |
| Los Angeles County CA Metropolitan Transportation Authority Sales Tax Revenue | 5.000% | 7/1/18 | | 12,750 | 14,721 |
| Los Angeles County CA Public Works Financing Authority Lease Revenue | 5.000% | 8/1/15 | | 10,850 | 11,242 |
| Los Angeles County CA Public Works Financing Authority Lease Revenue | 5.000% | 8/1/16 | | 3,450 | 3,730 |
| Los Angeles County CA Redevelopment Authority Tax Allocation Revenue (Various Project Areas) | 4.000% | 9/1/15 | | 1,000 | 1,030 |
| Los Angeles County CA Redevelopment Authority Tax Allocation Revenue (Various Project Areas) | 5.000% | 9/1/17 | | 3,815 | 4,242 |
| Los Angeles County CA Redevelopment Authority Tax Allocation Revenue (Various Project Areas) | 5.000% | 9/1/18 | | 1,000 | 1,137 |
| Los Angeles County CA Regional Financing Authority Revenue (Montecedro Inc. Project) | 2.500% | 11/15/20 | | 1,665 | 1,693 |
| Los Angeles County CA Regional Financing Authority Revenue (Montecedro Inc. Project) | 3.000% | 11/15/20 | | 925 | 944 |
| 1 Metropolitan Water District of Southern California Revenue TOB VRDO | 0.060% | 11/7/14 | | 24,125 | 24,125 |
| Modesto CA Irrigation District Electric Revenue | 5.000% | 7/1/15 | | 1,000 | 1,033 |
| Modesto CA Irrigation District Electric Revenue | 5.000% | 7/1/16 | | 3,100 | 3,347 |
| Modesto CA Irrigation District Electric Revenue | 5.000% | 7/1/17 | | 1,055 | 1,181 |
| Monterey Peninsula CA Unified School District BAN | 2.500% | 11/1/15 | | 4,250 | 4,346 |
| Northern California Gas Authority No. 1 Revenue | 0.788% | 7/1/19 | | 12,800 | 12,600 |
| Oakland CA Redevelopment Agency Tax Allocation Revenue (Central District Project) | 5.000% | 9/1/16 | | 2,100 | 2,267 |
| Oakland CA Redevelopment Agency Tax Allocation Revenue (Central District Project) | 5.000% | 9/1/17 | | 3,500 | 3,897 |
| Oakland CA Redevelopment Agency Tax Allocation Revenue (Central District Project) | 5.000% | 9/1/18 | | 1,550 | 1,766 |
| Oakland CA Redevelopment Agency Tax Allocation Revenue (Central District Project) | 5.000% | 9/1/19 | | 1,500 | 1,742 |
| Pittsburg CA Redevelopment Agency Tax Allocation Revenue | | | | | |
| (Los Medanos Community Development Project) | 4.000% | 8/1/16 | | 1,325 | 1,403 |
| Riverside County CA Asset Leasing Corp. Leasehold Revenue (Riverside County Hospital Project) | 4.000% | 6/1/16 | | 2,500 | 2,637 |
| Riverside County CA Asset Leasing Corp. Leasehold Revenue (Riverside County Hospital Project) | 5.000% | 6/1/16 | | 3,400 | 3,640 |
| Riverside County CA Asset Leasing Corp. Leasehold Revenue (Riverside County Hospital Project) | 4.000% | 6/1/17 | | 2,000 | 2,166 |
| Riverside County CA Asset Leasing Corp. Leasehold Revenue (Riverside County Hospital Project) | 5.000% | 6/1/17 | | 3,705 | 4,106 |
| Riverside County CA Transportation Commission Sales Tax Revenue | 5.000% | 6/1/18 | | 500 | 575 |
| Roseville CA Natural Gas Financing Authority Gas Revenue | 5.000% | 2/15/15 | | 1,500 | 1,518 |
| Sacramento CA Municipal Utility District Revenue | 5.000% | 8/15/15 | | 2,635 | 2,736 |
| San Bernardino CA City Unified School District GO | 4.000% | 8/1/16 | | 1,250 | 1,328 |
| San Bernardino County CA Medical Center (Arrowhead Project) COP | 5.000% | 8/1/15 | | 2,965 | 3,066 |
| San Diego CA Unified School District GO | 0.500% | 7/1/15 | | 13,100 | 13,127 |
| San Diego CA Unified School District GO | 0.500% | 7/1/15 | | 3,500 | 3,507 |
| 1 San Diego County CA Water Authority Revenue COP TOB VRDO | 0.050% | 11/7/14 | | 4,000 | 4,000 |
| San Francisco CA City & County International Airport Revenue | 5.000% | 5/1/15 | (4) | 5,000 | 5,123 |
| San Francisco CA City & County International Airport Revenue | 5.000% | 5/1/15 | | 4,535 | 4,646 |
| San Francisco CA City & County International Airport Revenue | 5.000% | 5/1/16 | | 21,100 | 22,607 |
| 3 San Joaquin Hills CA Transportation Corridor Agency Toll Road Revenue | 5.000% | 1/15/16 | | 6,000 | 6,320 |
| 3 San Joaquin Hills CA Transportation Corridor Agency Toll Road Revenue | 5.000% | 1/15/17 | | 1,500 | 1,636 |
| 1 San Jose CA Unified School District Santa Clara County GO TOB VRDO | 0.100% | 11/7/14 | | 1,400 | 1,400 |
| 1 San Mateo County CA Joint Powers Financing Authority Lease Revenue | | | | | |
| (Maple Street Correctional Center) TOB VRDO | 0.120% | 11/7/14 | | 6,275 | 6,275 |
| | | | | | 1,254,808 |
| Colorado (1.9%) | | | | | |
| Broomfield CO City & County COP | 5.000% | 12/1/15 | | 5,790 | 6,080 |
| Colorado Educational & Cultural Facilities Authority Revenue (Johnson & Wales University) | 4.000% | 4/1/15 | | 1,100 | 1,117 |
| Colorado Educational & Cultural Facilities Authority Revenue (Johnson & Wales University) | 5.000% | 4/1/16 | | 1,000 | 1,060 |
| Colorado Health Facilities Authority Revenue (Catholic Health Initiatives) PUT | 5.000% | 11/11/14 | | 1,400 | 1,402 |
| Colorado Health Facilities Authority Revenue (Catholic Health Initiatives) PUT | 4.000% | 11/12/15 | | 3,400 | 3,528 |
| 1 Colorado Health Facilities Authority Revenue (Catholic Health Initiatives) TOB VRDO | 0.250% | 11/7/14 | | 10,000 | 10,000 |
| Colorado Health Facilities Authority Revenue (Covenant Retirement Community Inc.) | 5.000% | 12/1/14 | | 1,320 | 1,324 |
| Colorado Health Facilities Authority Revenue (Covenant Retirement Community Inc.) | 5.000% | 12/1/15 | | 1,050 | 1,090 |
| Colorado Health Facilities Authority Revenue (Covenant Retirement Community Inc.) | 4.000% | 12/1/16 | | 1,000 | 1,046 |
| Colorado Health Facilities Authority Revenue (Covenant Retirement Community Inc.) | 5.000% | 12/1/17 | | 1,580 | 1,717 |
| Colorado Health Facilities Authority Revenue (Covenant Retirement Community Inc.) | 3.150% | 12/1/18 | | 8,460 | 8,530 |
| Colorado Health Facilities Authority Revenue (Sisters of Charity of Leavenworth Health System) | 5.000% | 1/1/15 | | 1,945 | 1,961 |
| Colorado Health Facilities Authority Revenue (Sisters of Charity of Leavenworth Health System) | 5.000% | 1/1/15 | | 3,500 | 3,528 |
| 1 Colorado Health Facilities Authority Revenue (Sisters of Charity of Leavenworth Health System) | | | | | |
| TOB VRDO | 0.060% | 11/7/14 | | 7,595 | 7,595 |
| Colorado Health Facilities Authority Revenue (Sisters of Charity of Leavenworth Health System) | | | | | |
| VRDO | 0.050% | 11/7/14 | | 30,900 | 30,900 |
| Colorado Springs CO Utility System Revenue VRDO | 0.050% | 11/7/14 | | 11,190 | 11,190 |
| Denver CO City & County Airport Revenue | 0.460% | 11/4/14 | (12) | 21,675 | 21,675 |
| Denver CO City & County Airport Revenue | 0.600% | 11/5/14 | (12) | 26,600 | 26,600 |
| Denver CO City & County Airport Revenue | 0.600% | 11/6/14 | (12) | 26,925 | 26,925 |
| Denver CO City & County Airport Revenue | 0.340% | 11/7/14 | (12) | 21,050 | 21,050 |
| 2 E-470 Public Highway Authority Colorado Revenue PUT | 1.230% | 8/31/17 | | 7,500 | 7,508 |
4
Short-Term Tax-Exempt Fund
| | | | | |
| | | | | Face | Market |
| | | Maturity | | Amount | Value• |
| | Coupon | Date | | ($000) | ($000) |
| 2 E-470 Public Highway Authority Colorado Revenue PUT | 1.800% | 9/1/17 | (14) | 7,000 | 7,051 |
| Regional Transportation District of Colorado COP | 5.000% | 6/1/15 | | 2,330 | 2,396 |
| Regional Transportation District of Colorado Sales Tax Revenue | 5.000% | 11/1/14 | | 5,250 | 5,250 |
| Regional Transportation District of Colorado Sales Tax Revenue (FasTracks Project) | 5.000% | 11/1/16 | (Prere.) | 14,230 | 15,533 |
| Regional Transportation District of Colorado Sales Tax Revenue (FasTracks Project) | 5.000% | 11/1/16 | (Prere.) | 11,280 | 12,313 |
| 1 University of Colorado Enterprise System Revenue TOB VRDO | 0.180% | 11/7/14 | LOC | 7,820 | 7,820 |
| | | | | | 246,189 |
| Connecticut (3.6%) | | | | | |
| Connecticut GO | 5.000% | 1/1/15 | | 3,400 | 3,428 |
| 2 Connecticut GO | 0.450% | 4/15/15 | | 6,395 | 6,405 |
| 2 Connecticut GO | 0.550% | 5/15/15 | | 36,400 | 36,472 |
| Connecticut GO | 4.000% | 8/15/15 | | 2,000 | 2,061 |
| Connecticut GO | 3.000% | 12/15/15 | | 8,375 | 8,639 |
| Connecticut GO | 5.000% | 12/15/15 | | 39,310 | 41,431 |
| 2 Connecticut GO | 0.580% | 4/15/16 | | 5,000 | 5,024 |
| 2 Connecticut GO | 0.700% | 5/15/16 | | 22,350 | 22,502 |
| 2 Connecticut GO | 0.700% | 5/15/16 | | 8,300 | 8,357 |
| Connecticut GO | 4.000% | 6/15/16 | | 46,570 | 49,308 |
| Connecticut GO | 0.290% | 7/1/16 | | 7,000 | 7,000 |
| Connecticut GO | 5.000% | 7/15/16 | | 10,000 | 10,785 |
| 2 Connecticut GO | 0.480% | 9/15/16 | | 3,000 | 3,015 |
| Connecticut GO | 5.000% | 11/1/16 | | 7,000 | 7,635 |
| Connecticut GO | 5.000% | 12/1/16 | | 5,000 | 5,471 |
| Connecticut GO | 5.000% | 12/15/16 | | 37,470 | 41,057 |
| Connecticut GO | 0.330% | 1/1/17 | | 12,740 | 12,740 |
| 2 Connecticut GO | 0.360% | 3/1/17 | | 3,000 | 2,999 |
| 2 Connecticut GO | 0.390% | 3/1/17 | | 7,415 | 7,423 |
| 2 Connecticut GO | 0.730% | 4/15/17 | | 4,000 | 4,033 |
| 2 Connecticut GO | 0.820% | 5/15/17 | | 3,120 | 3,155 |
| Connecticut GO | 0.330% | 7/1/17 | | 15,825 | 15,825 |
| Connecticut GO | 5.000% | 7/15/17 | | 5,000 | 5,589 |
| 2 Connecticut GO | 0.570% | 9/15/17 | | 1,750 | 1,761 |
| Connecticut GO | 0.330% | 10/31/17 | | 13,310 | 13,310 |
| 2 Connecticut GO | 0.930% | 4/15/18 | | 2,250 | 2,281 |
| 2 Connecticut GO | 0.820% | 9/15/18 | | 4,000 | 4,052 |
| 2 Connecticut GO | 1.150% | 5/15/19 | | 5,000 | 5,112 |
| 2 Connecticut GO | 0.970% | 9/15/19 | | 1,000 | 1,020 |
| 2 Connecticut GO PUT | 0.700% | 9/15/17 | | 10,215 | 10,313 |
| 2 Connecticut GO PUT | 1.400% | 3/1/18 | | 17,500 | 17,571 |
| Connecticut Health & Educational Facilities Authority Revenue (Yale University) PUT | 5.000% | 2/12/15 | | 20,810 | 21,091 |
| Connecticut Health & Educational Facilities Authority Revenue (Yale University) PUT | 0.800% | 7/26/17 | | 40,000 | 40,217 |
| Connecticut Special Tax Revenue (Transportation Infrastructure) | 5.000% | 11/1/15 | | 1,000 | 1,049 |
| Connecticut Special Tax Revenue (Transportation Infrastructure) | 5.000% | 2/1/16 | | 2,000 | 2,118 |
| Connecticut Special Tax Revenue (Transportation Infrastructure) | 5.000% | 10/1/16 | | 4,150 | 4,517 |
| New Britain CT BAN | 2.000% | 3/26/15 | | 11,000 | 11,055 |
| University of Connecticut GO | 5.000% | 2/15/16 | | 1,855 | 1,967 |
| University of Connecticut GO | 5.000% | 2/15/16 | | 7,865 | 8,338 |
| | | | | | 456,126 |
| Delaware (0.1%) | | | | | |
| Delaware Transportation Authority Transportation System Revenue | 5.000% | 7/1/16 | | 2,300 | 2,480 |
| University of Delaware Revenue PUT | 0.700% | 5/1/16 | | 8,750 | 8,787 |
| | | | | | 11,267 |
| District of Columbia (0.2%) | | | | | |
| District of Columbia Revenue (Washington Drama Society) VRDO | 0.060% | 11/7/14 | LOC | 13,140 | 13,140 |
| 2 District of Columbia Water & Sewer Authority Public Utility Revenue PUT | 0.530% | 12/1/14 | (Prere.) | 7,390 | 7,390 |
| 2 District of Columbia Water & Sewer Authority Public Utility Revenue PUT | 0.630% | 6/1/16 | | 6,000 | 6,014 |
| | | | | | 26,544 |
| Florida (6.1%) | | | | | |
| Broward County FL Airport System Revenue | 5.000% | 10/1/17 | | 1,050 | 1,178 |
| Broward County FL Airport System Revenue | 5.000% | 10/1/18 | | 700 | 804 |
| Broward County FL School Board COP | 4.000% | 7/1/15 | | 1,000 | 1,025 |
| Broward County FL School Board COP | 5.000% | 7/1/16 | | 2,000 | 2,148 |
| Broward County FL School Board COP | 5.000% | 7/1/17 | | 5,000 | 5,557 |
| Broward County FL School Board COP | 5.000% | 7/1/18 | | 4,415 | 5,010 |
| Citizens Property Insurance Corp. Florida Revenue (Coastal Account) | 5.000% | 6/1/15 | | 30,000 | 30,838 |
| Citizens Property Insurance Corp. Florida Revenue (Coastal Account) | 5.000% | 6/1/15 | | 15,000 | 15,419 |
| Citizens Property Insurance Corp. Florida Revenue (Coastal Account) | 5.000% | 6/1/16 | | 16,545 | 17,718 |
| 2 Citizens Property Insurance Corp. Florida Revenue | | | | | |
| (Personal Lines Account/Commercial Lines Account) | 1.300% | 6/1/15 | | 4,100 | 4,121 |
5
Short-Term Tax-Exempt Fund
| | | | | | |
| | | | | | Face | Market |
| | | | Maturity | | Amount | Value• |
| | | Coupon | Date | | ($000) | ($000) |
| | Citizens Property Insurance Corp. Florida Revenue | | | | | |
| | (Personal Lines Account/Commercial Lines Account) | 5.000% | 6/1/18 | | 36,700 | 41,567 |
| | Citizens Property Insurance Corp. Florida Revenue | | | | | |
| | (Personal Lines Account/Commercial Lines Account) | 5.000% | 6/1/19 | | 6,700 | 7,738 |
| | Escambia County FL Pollution Control Revenue (Gulf Power Co. Project) PUT | 1.550% | 6/15/16 | | 3,000 | 3,052 |
| | Escambia County FL Solid Waste Disposal System Revenue (Gulf Power Co. Project) PUT | 1.350% | 6/2/15 | | 5,835 | 5,860 |
| 3 | Florida Board of Education GO | 5.000% | 1/1/16 | | 57,340 | 60,518 |
| 3 | Florida Board of Education GO | 5.000% | 1/1/17 | | 38,245 | 42,001 |
| | Florida Board of Education Lottery Revenue | 5.000% | 7/1/15 | | 12,045 | 12,435 |
| | Florida Board of Education Lottery Revenue | 5.000% | 7/1/16 | | 16,710 | 17,991 |
| | Florida Board of Education Lottery Revenue | 5.000% | 7/1/16 | | 11,655 | 12,549 |
| | Florida Board of Education Public Education Capital Outlay GO | 5.000% | 6/1/15 | | 5,540 | 5,698 |
| | Florida Department of Transportation GO | 5.000% | 7/1/16 | | 9,405 | 10,136 |
| 1 | Florida Education System University System Improvement Revenue TOB VRDO | 0.070% | 11/7/14 | | 9,980 | 9,980 |
| | Florida GO | 4.000% | 7/1/15 | | 1,000 | 1,026 |
| | Florida Hurricane Catastrophe Fund Finance Corp. Revenue | 5.000% | 7/1/15 | (ETM) | 21,695 | 22,396 |
| | Florida Municipal Power Agency Revenue (Stanton II Project) | 5.000% | 10/1/16 | | 1,350 | 1,462 |
| | Florida Municipal Power Agency Revenue (Stanton II Project) | 4.000% | 10/1/17 | | 1,650 | 1,798 |
| 1 | Greater Orlando Aviation Authority Florida Airport Facilities Revenue TOB VRDO | 0.080% | 11/7/14 | | 5,000 | 5,000 |
| | Halifax Hospital Medical Center Florida Hospital Revenue | 5.250% | 6/1/19 | | 2,375 | 2,499 |
| | Highlands County FL Health Facilities Authority Hospital Revenue | | | | | |
| | (Adventist Health System/Sunbelt Obligated Group) | 5.000% | 11/15/14 | | 2,000 | 2,004 |
| | Highlands County FL Health Facilities Authority Hospital Revenue | | | | | |
| | (Adventist Health System/Sunbelt Obligated Group) | 5.125% | 11/15/17 | | 2,075 | 2,266 |
| 1 | Highlands County FL Health Facilities Authority Hospital Revenue | | | | | |
| | (Adventist Health System/Sunbelt Obligated Group) TOB VRDO | 0.060% | 11/7/14 | | 15,730 | 15,730 |
| | Hillsborough County FL Aviation Authority Revenue (Tampa International Airport) | 5.500% | 10/1/15 | (4) | 2,000 | 2,096 |
| | Hillsborough County FL Industrial Development Authority Hospital Revenue | | | | | |
| | (Tampa General Hospital Project) | 4.000% | 10/1/15 | | 375 | 388 |
| | Hillsborough County FL School Board COP | 5.000% | 7/1/15 | | 1,170 | 1,207 |
| | Jacksonville FL Capital Project Revenue VRDO | 0.070% | 11/7/14 | LOC | 28,900 | 28,900 |
| | Jacksonville FL Electric Authority Electric System Revenue VRDO | 0.050% | 11/7/14 | | 8,100 | 8,100 |
| | Jacksonville FL Electric Authority Electric System Revenue VRDO | 0.050% | 11/7/14 | | 7,115 | 7,115 |
| | Jacksonville FL Electric Authority Water & Sewer Revenue | 4.000% | 10/1/17 | | 1,500 | 1,644 |
| | Jacksonville FL Electric Authority Water & Sewer Revenue VRDO | 0.050% | 11/7/14 | | 41,390 | 41,390 |
| | Jacksonville FL Electric Authority Water & Sewer Revenue VRDO | 0.060% | 11/7/14 | | 12,300 | 12,300 |
| | Kissimmee FL Utility Authority Electric System Revenue | 4.000% | 10/1/15 | | 2,000 | 2,065 |
| 2 | Lakeland FL Energy System Revenue | 0.800% | 10/1/17 | | 10,000 | 10,046 |
| | Lee County FL Non-Ad Valorem Revenue | 4.000% | 10/1/15 | | 850 | 878 |
| | Lee County FL Non-Ad Valorem Revenue | 4.000% | 10/1/16 | | 1,000 | 1,062 |
| | Lee County FL Non-Ad Valorem Revenue | 5.000% | 10/1/17 | | 1,220 | 1,361 |
| | Lee County FL School Board COP | 5.000% | 8/1/17 | | 4,000 | 4,467 |
| | Lee County FL School Board COP | 5.000% | 8/1/18 | | 3,530 | 4,045 |
| | Miami Beach FL Health Facilities Authority Revenue (Mount Sinai Medical Center) | 3.000% | 11/15/14 | | 600 | 601 |
| 1 | Miami Beach FL Health Facilities Authority Revenue (Mount Sinai Medical Center) | 6.750% | 11/15/14 | (Prere.) | 1,500 | 1,503 |
| | Miami Beach FL Health Facilities Authority Revenue (Mount Sinai Medical Center) | 4.000% | 11/15/17 | | 1,965 | 2,099 |
| | Miami Beach FL Health Facilities Authority Revenue (Mount Sinai Medical Center) | 4.000% | 11/15/18 | | 1,125 | 1,208 |
| 1 | Miami-Dade County FL Building Better Communities GO TOB VRDO | 0.060% | 11/7/14 | | 9,995 | 9,995 |
| 1 | Miami-Dade County FL Educational Facilities Authority Revenue (University of Miami) TOB VRDO | 0.150% | 11/7/14 | | 10,140 | 10,140 |
| | Miami-Dade County FL Health Facilities Authority Hospital Revenue (Miami Children’s Hospital) | 5.000% | 8/1/17 | | 400 | 440 |
| | Miami-Dade County FL Health Facilities Authority Hospital Revenue (Miami Children’s Hospital) | 4.000% | 8/1/18 | | 505 | 549 |
| | Miami-Dade County FL Industrial Development Authority Solid Waste Disposal Revenue | | | | | |
| | (Waste Management Inc. of Florida Project) PUT | 2.250% | 11/3/14 | | 6,250 | 6,250 |
| 1,2 | Miami-Dade County FL School Board COP TOB PUT | 0.490% | 11/6/14 | LOC | 15,760 | 15,760 |
| 1,2 | Miami-Dade County FL School Board COP TOB PUT | 0.490% | 11/6/14 | LOC | 15,760 | 15,760 |
| 1,2 | Miami-Dade County FL School Board COP TOB PUT | 0.530% | 11/6/14 | LOC | 12,690 | 12,690 |
| 1,2 | Miami-Dade County FL School Board COP TOB PUT | 0.510% | 12/11/14 | LOC | 27,245 | 27,245 |
| 1 | Miami-Dade County FL School Board COP TOB VRDO | 0.150% | 11/7/14 | (12) | 26,000 | 26,000 |
| | Miami-Dade County FL Seaport Revenue VRDO | 0.050% | 11/7/14 | LOC | 3,900 | 3,900 |
| 1 | Miami-Dade County FL Transit Sales Surtax Revenue TOB VRDO | 0.070% | 11/7/14 | (12) | 7,450 | 7,450 |
| 1 | Miami-Dade County FL Transit Sales Surtax Revenue TOB VRDO | 0.070% | 11/7/14 | (4) | 32,570 | 32,570 |
| 1 | Miami-Dade County FL Water & Sewer Revenue TOB VRDO | 0.090% | 11/7/14 | (4) | 7,935 | 7,935 |
| 1 | Miami-Dade County FL Water & Sewer Revenue TOB VRDO | 0.150% | 11/7/14 | (4) | 14,000 | 14,000 |
| 1 | Miami-Dade County FL Water & Sewer Revenue TOB VRDO | 0.240% | 11/7/14 | | 17,990 | 17,990 |
| | Okeechobee County FL Solid Waste Disposal Revenue | | | | | |
| | (Waste Management Inc./Okeechobee Landfill Project) PUT | 2.250% | 7/1/16 | | 2,520 | 2,598 |
| | Orange County FL Health Facilities Authority Revenue (Nemours Foundation Project) | 4.000% | 1/1/15 | | 500 | 503 |
| | Orange County FL School Board COP | 5.000% | 8/1/15 | | 2,700 | 2,797 |
| | Palm Beach County FL Health Facilities Authority Hospital Revenue (BRRH Corp. Obligated Group) | 2.000% | 12/1/14 | | 5,185 | 5,192 |
| | Palm Beach County FL Health Facilities Authority Hospital Revenue (BRRH Corp. Obligated Group) | 3.000% | 12/1/15 | | 2,180 | 2,236 |
| | Palm Beach County FL Health Facilities Authority Hospital Revenue (BRRH Corp. Obligated Group) | 3.000% | 12/1/16 | | 1,000 | 1,043 |
6
Short-Term Tax-Exempt Fund
| | | | | |
| | | | | Face | Market |
| | | Maturity | | Amount | Value• |
| | Coupon | Date | | ($000) | ($000) |
| Palm Beach County FL Health Facilities Authority Hospital Revenue (BRRH Corp. Obligated Group) | 3.000% | 12/1/17 | | 1,000 | 1,052 |
| Palm Beach County FL Health Facilities Authority Hospital Revenue (BRRH Corp. Obligated Group) | 4.000% | 12/1/18 | | 750 | 819 |
| Palm Beach County FL Health Facilities Authority Revenue (Jupiter Medical Center Inc. Project) | 4.000% | 11/1/17 | | 2,095 | 2,231 |
| Palm Beach County FL School Board COP PUT | 5.000% | 8/1/16 | | 8,000 | 8,623 |
| 1 Palm Beach County FL School Board COP TOB VRDO | 0.090% | 11/7/14 | | 2,200 | 2,200 |
| 1 Palm Beach County FL Water & Sewer Revenue TOB VRDO | 0.060% | 11/7/14 | | 2,215 | 2,215 |
| Reedy Creek FL Improvement District Utilities Revenue | 5.000% | 10/1/17 | | 785 | 877 |
| 1 South Miami FL Health Facilities Authority Hospital Revenue | | | | | |
| (Baptist Health South Florida Obligated Group) TOB VRDO | 0.060% | 11/7/14 | | 7,500 | 7,500 |
| 1 South Miami FL Health Facilities Authority Hospital Revenue | | | | | |
| (Baptist Health South Florida Obligated Group) TOB VRDO | 0.100% | 11/7/14 | | 6,350 | 6,350 |
| Tallahassee FL Energy System Revenue | 5.250% | 10/1/15 | (4) | 5,240 | 5,474 |
| 1 Tallahassee FL Energy System Revenue TOB VRDO | 0.090% | 11/7/14 | | 11,250 | 11,250 |
| Tampa Bay FL Water Utility System Revenue | 5.000% | 10/1/16 | | 5,500 | 5,982 |
| Tampa FL Cigarette Tax Allocation Revenue (H. Lee Moffitt Cancer Center Project) | 3.000% | 9/1/15 | | 850 | 868 |
| Tampa FL Cigarette Tax Allocation Revenue (H. Lee Moffitt Cancer Center Project) | 3.000% | 9/1/16 | | 1,000 | 1,042 |
| Tampa FL Hospital Revenue | 4.000% | 7/1/15 | | 400 | 408 |
| Tampa FL Hospital Revenue | 5.000% | 7/1/16 | | 700 | 747 |
| Tampa FL Hospital Revenue | 4.000% | 7/1/17 | | 1,525 | 1,634 |
| | | | | | 782,314 |
| Georgia (2.3%) | | | | | |
| Atlanta GA Airport Passenger Facility Charge Revenue | 5.000% | 1/1/15 | | 2,440 | 2,460 |
| Atlanta GA Airport Revenue | 4.000% | 1/1/15 | | 500 | 503 |
| Atlanta GA Airport Revenue | 5.000% | 1/1/16 | | 1,000 | 1,055 |
| Atlanta GA Airport Revenue | 5.000% | 1/1/16 | | 6,500 | 6,856 |
| Atlanta GA Airport Revenue | 5.000% | 1/1/18 | | 500 | 565 |
| 1 Atlanta GA Airport Revenue TOB VRDO | 0.250% | 11/7/14 | (4) | 10,000 | 10,000 |
| 2 Atlanta GA Water & Wastewater Revenue PUT | 1.603% | 11/1/18 | | 56,750 | 58,299 |
| 1 Atlanta GA Water & Wastewater Revenue TOB VRDO | 0.150% | 11/7/14 | | 10,000 | 10,000 |
| Bartow County GA Development Authority Pollution Control Revenue | | | | | |
| (Georgia Power Co. Plant Bowen Project) PUT | 2.375% | 8/10/17 | | 8,000 | 8,220 |
| Burke County GA Development Authority Pollution Control Revenue | | | | | |
| (Georgia Power Co. Plant Vogtle Project) PUT | 1.400% | 4/1/15 | | 5,500 | 5,522 |
| Burke County GA Development Authority Pollution Control Revenue | | | | | |
| (Georgia Power Co. Plant Vogtle Project) PUT | 1.250% | 5/1/15 | | 8,500 | 8,534 |
| Burke County GA Development Authority Pollution Control Revenue | | | | | |
| (Georgia Power Co. Plant Vogtle Project) PUT | 1.550% | 6/21/16 | | 10,000 | 10,109 |
| Burke County GA Development Authority Pollution Control Revenue | | | | | |
| (Georgia Power Co. Plant Vogtle Project) PUT | 1.375% | 4/4/17 | | 2,275 | 2,288 |
| Burke County GA Development Authority Pollution Control Revenue | | | | | |
| (Georgia Power Co. Plant Vogtle Project) PUT | 1.750% | 6/1/17 | | 10,000 | 10,186 |
| Burke County GA Development Authority Pollution Control Revenue | | | | | |
| (Georgia Power Co. Plant Vogtle Project) PUT | 1.800% | 4/3/18 | | 5,250 | 5,324 |
| Carroll County GA School District GO | 4.000% | 4/1/15 | | 3,000 | 3,048 |
| Cobb County GA Kennestone Hospital Authority Revenue | 3.000% | 4/1/15 | | 350 | 354 |
| Cobb County GA Kennestone Hospital Authority Revenue | 4.000% | 4/1/16 | | 1,050 | 1,103 |
| Dalton GA Development Authority Revenue (Hamilton Health Care System) | 4.000% | 8/15/15 | | 750 | 772 |
| Dalton GA Development Authority Revenue (Hamilton Health Care System) | 4.000% | 8/15/16 | | 1,370 | 1,456 |
| Dalton GA Development Authority Revenue (Hamilton Health Care System) | 5.000% | 8/15/17 | | 1,500 | 1,675 |
| DeKalb County GA Water & Sewer Revenue | 4.000% | 10/1/15 | | 1,000 | 1,035 |
| DeKalb County GA Water & Sewer Revenue | 5.000% | 10/1/17 | | 500 | 562 |
| DeKalb County GA Water & Sewer Revenue | 5.000% | 10/1/17 | | 1,000 | 1,124 |
| DeKalb County GA Water & Sewer Revenue | 5.000% | 10/1/18 | | 800 | 922 |
| Floyd County GA Development Authority Revenue | | | | | |
| (Georgia Power Co. Plant Hammond Project) PUT | 0.850% | 11/19/15 | | 5,000 | 5,018 |
| Georgia GO | 4.750% | 11/1/15 | | 8,035 | 8,403 |
| Georgia GO | 5.000% | 2/1/16 | | 21,995 | 23,297 |
| Georgia GO | 5.000% | 4/1/16 | | 8,155 | 8,698 |
| Georgia GO | 5.000% | 7/1/16 | | 1,195 | 1,233 |
| Georgia Municipal Electric Power Authority Revenue | 5.000% | 1/1/15 | | 1,500 | 1,512 |
| Georgia Municipal Electric Power Authority Revenue | 5.000% | 1/1/16 | | 1,250 | 1,319 |
| Georgia Municipal Electric Power Authority Revenue | 5.000% | 1/1/17 | | 1,825 | 2,001 |
| Georgia Municipal Electric Power Authority Revenue | 5.000% | 1/1/18 | | 1,825 | 2,065 |
| Georgia Municipal Electric Power Authority Revenue | 5.000% | 1/1/18 | | 1,400 | 1,584 |
| Georgia Road & Tollway Authority Revenue | 5.000% | 3/1/16 | | 6,700 | 7,122 |
| Henry County GA School District GO | 4.000% | 12/1/14 | | 2,500 | 2,508 |
| Henry County GA School District GO | 4.000% | 12/1/15 | | 4,000 | 4,165 |
| Main Street Natural Gas Inc. Georgia Gas Project Revenue | 5.000% | 3/15/15 | | 6,745 | 6,847 |
| Main Street Natural Gas Inc. Georgia Gas Project Revenue | 5.000% | 3/15/15 | | 14,550 | 14,771 |
| Main Street Natural Gas Inc. Georgia Gas Project Revenue | 5.000% | 3/15/16 | | 5,220 | 5,497 |
| Main Street Natural Gas Inc. Georgia Gas Project Revenue | 5.000% | 3/15/17 | | 250 | 269 |
7
Short-Term Tax-Exempt Fund
| | | | | | |
| | | | | | Face | Market |
| | | | Maturity | | Amount | Value• |
| | | Coupon | Date | | ($000) | ($000) |
| 2 | Metropolitan Atlanta GA Rapid Transportation Authority Georgia Sales Tax Revenue | 0.220% | 7/1/16 | | 1,800 | 1,800 |
| 2 | Metropolitan Atlanta GA Rapid Transportation Authority Georgia Sales Tax Revenue PUT | 0.330% | 7/1/17 | | 14,000 | 14,001 |
| 2 | Metropolitan Atlanta GA Rapid Transportation Authority Georgia Sales Tax Revenue PUT | 0.350% | 7/1/17 | | 17,500 | 17,502 |
| | Monroe County GA Development Authority Pollution Control Revenue | | | | | |
| | (Georgia Power Co. Plant Scherer Project) PUT | 2.000% | 6/13/19 | | 2,000 | 2,057 |
| | Municipal Electric Authority Georgia Revenue | 5.000% | 4/1/18 | | 3,565 | 4,063 |
| | Municipal Electric Authority Georgia Revenue (Combined Cycle Project) | 5.000% | 11/1/16 | | 1,325 | 1,447 |
| | Municipal Electric Authority Georgia Revenue (Combined Cycle Project) | 5.000% | 11/1/17 | | 1,700 | 1,918 |
| | Municipal Electric Authority Georgia Revenue (Project One) | 5.000% | 1/1/15 | | 2,000 | 2,016 |
| | Municipal Electric Authority Georgia Revenue (Project One) | 5.000% | 1/1/16 | | 3,000 | 3,167 |
| | | | | | | 296,252 |
| Hawaii (0.5%) | | | | | |
| | Hawaii GO | 5.000% | 2/1/15 | | 3,600 | 3,644 |
| | Hawaii GO | 5.000% | 8/1/15 | | 10,000 | 10,365 |
| | Hawaii GO | 5.000% | 2/1/16 | | 4,000 | 4,237 |
| | Hawaii GO | 5.000% | 7/1/16 | (2) | 23,095 | 23,829 |
| | Hawaii Housing Finance & Development Corp. Multifamily Housing Revenue (Halekauwila Place) | 0.700% | 12/1/15 | | 6,000 | 6,002 |
| | Honolulu HI City & County GO | 5.000% | 7/1/15 | (14) | 4,000 | 4,130 |
| | Honolulu HI City & County GO | 5.000% | 11/1/16 | | 7,165 | 7,825 |
| | | | | | | 60,032 |
| Idaho (0.3%) | | | | | |
| | Idaho Building Authority Revenue (Prison Facilities Project) VRDO | 0.050% | 11/7/14 | | 4,735 | 4,735 |
| | Idaho Housing & Finance Association Unemployment Compensation Revenue | 5.000% | 8/15/15 | | 31,375 | 32,565 |
| | | | | | | 37,300 |
| Illinois (6.0%) | | | | | |
| | Chicago IL Board of Education GO | 5.000% | 12/1/15 | (14) | 6,375 | 6,400 |
| | Chicago IL Board of Education GO | 5.000% | 12/1/15 | | 2,000 | 2,095 |
| | Chicago IL Board of Education GO | 5.000% | 12/1/16 | | 2,855 | 3,074 |
| | Chicago IL Board of Education GO | 5.000% | 12/1/17 | (4) | 3,000 | 3,310 |
| 2 | Chicago IL Board of Education GO PUT | 1.000% | 3/1/16 | | 10,000 | 9,977 |
| 2 | Chicago IL Board of Education GO PUT | 0.686% | 6/2/16 | | 25,750 | 25,424 |
| 1,2 | Chicago IL Board of Education GO TOB PUT | 0.580% | 11/20/14 | LOC | 76,500 | 76,500 |
| 1 | Chicago IL Board of Education GO TOB VRDO | 0.310% | 11/7/14 | (4) | 6,520 | 6,520 |
| | Chicago IL GO | 5.000% | 1/1/15 | (ETM) | 2,715 | 2,737 |
| | Chicago IL GO | 6.250% | 1/1/15 | (ETM) | 2,500 | 2,525 |
| 1 | Chicago IL GO TOB VRDO | 0.310% | 11/7/14 | | 15,180 | 15,180 |
| | Chicago IL Midway Airport Revenue PUT | 5.000% | 1/1/15 | (Prere.) | 10,925 | 11,013 |
| | Chicago IL O’Hare International Airport Revenue | 4.000% | 1/1/15 | | 1,000 | 1,006 |
| | Chicago IL O’Hare International Airport Revenue | 5.000% | 1/1/16 | | 3,000 | 3,163 |
| | Chicago IL O’Hare International Airport Revenue | 5.250% | 1/1/17 | (14) | 4,540 | 4,992 |
| 1 | Chicago IL O’Hare International Airport Revenue TOB VRDO | 0.140% | 11/7/14 | LOC | 16,360 | 16,360 |
| 1 | Chicago IL O’Hare International Airport Revenue TOB VRDO | 0.170% | 11/7/14 | (4) | 2,500 | 2,500 |
| 1 | Chicago IL O’Hare International Airport Revenue TOB VRDO | 0.200% | 11/7/14 | (4) | 21,645 | 21,645 |
| 1 | Chicago IL O’Hare International Airport Revenue TOB VRDO | 0.200% | 11/7/14 | (12) | 27,185 | 27,185 |
| 1 | Chicago IL Transit Authority Sales Tax Receipts Revenue TOB VRDO | 0.160% | 11/7/14 | | 25,500 | 25,500 |
| | Chicago IL Water Revenue | 5.000% | 11/1/18 | | 675 | 768 |
| 1 | Chicago IL Water Revenue TOB VRDO | 0.220% | 11/7/14 | | 7,495 | 7,495 |
| 1 | Chicago IL Water Revenue TOB VRDO | 0.220% | 11/7/14 | | 5,245 | 5,245 |
| | Illinois Educational Facilities Authority Revenue (Field Museum of Natural History) VRDO | 0.050% | 11/7/14 | LOC | 8,100 | 8,100 |
| | Illinois Educational Facilities Authority Revenue (University of Chicago) PUT | 1.875% | 2/12/15 | | 3,925 | 3,943 |
| | Illinois Finance Authority Gas Supply Revenue (Peoples Gas Light & Coke) PUT | 2.625% | 8/1/15 | | 2,675 | 2,719 |
| | Illinois Finance Authority Revenue (Advocate Health Care Network) PUT | 5.000% | 5/1/19 | | 5,000 | 5,795 |
| 1 | Illinois Finance Authority Revenue (Advocate Health Care Network) TOB VRDO | 0.060% | 11/7/14 | | 9,000 | 9,000 |
| | Illinois Finance Authority Revenue (Advocate Health Care Network) VRDO | 0.050% | 11/7/14 | | 14,030 | 14,030 |
| | Illinois Finance Authority Revenue (Art Institute of Chicago) | 5.000% | 3/1/15 | | 3,000 | 3,048 |
| | Illinois Finance Authority Revenue (Art Institute of Chicago) | 5.000% | 3/1/15 | | 900 | 914 |
| | Illinois Finance Authority Revenue (Ascension Health Credit Group) PUT | 5.000% | 5/1/15 | | 7,050 | 7,217 |
| | Illinois Finance Authority Revenue (Ascension Health Credit Group) PUT | 5.000% | 5/1/17 | | 4,500 | 4,986 |
| | Illinois Finance Authority Revenue (Carle Foundation) | 5.000% | 8/15/16 | | 2,220 | 2,393 |
| 1 | Illinois Finance Authority Revenue (Carle Foundation) TOB VRDO | 0.170% | 11/7/14 | (12) | 12,680 | 12,680 |
| | Illinois Finance Authority Revenue (Carle Foundation) VRDO | 0.040% | 11/7/14 | LOC | 7,700 | 7,700 |
| | Illinois Finance Authority Revenue (Carle Foundation) VRDO | 0.050% | 11/7/14 | LOC | 38,900 | 38,900 |
| | Illinois Finance Authority Revenue (Centegra Health System) | 5.000% | 9/1/18 | | 235 | 261 |
| | Illinois Finance Authority Revenue (Hospital Sister Services Inc.) | 5.000% | 8/15/15 | | 1,000 | 1,037 |
| | Illinois Finance Authority Revenue (Hospital Sister Services Inc.) | 5.000% | 8/15/16 | | 1,150 | 1,242 |
| | Illinois Finance Authority Revenue (Hospital Sister Services Inc.) | 5.000% | 8/15/17 | | 2,000 | 2,233 |
| | Illinois Finance Authority Revenue (Northwest Community Hospital) VRDO | 0.050% | 11/7/14 | LOC | 33,800 | 33,800 |
| | Illinois Finance Authority Revenue (Provena Health) | 5.250% | 5/1/15 | | 2,555 | 2,606 |
| | Illinois Finance Authority Revenue (Trinity Health Corp.) | 3.000% | 12/1/16 | | 1,865 | 1,960 |
| | Illinois Finance Authority Revenue (University of Chicago Medical Center) | 5.000% | 8/15/15 | | 1,500 | 1,556 |
| | Illinois Finance Authority Revenue (University of Chicago) | 5.000% | 10/1/15 | | 500 | 522 |
8
Short-Term Tax-Exempt Fund
| | | | | |
| | | | | Face | Market |
| | | Maturity | | Amount | Value• |
| | Coupon | Date | | ($000) | ($000) |
| Illinois Finance Authority Revenue (University of Chicago) | 5.000% | 10/1/16 | | 690 | 749 |
| 1 Illinois Finance Authority Revenue (University of Chicago) TOB VRDO | 0.060% | 11/7/14 | | 2,960 | 2,960 |
| Illinois Finance Authority Solid Waste Disposal Revenue (Prairie Power Inc. Project) PUT | 1.300% | 5/8/17 | | 2,445 | 2,469 |
| Illinois GO | 5.000% | 9/1/15 | | 2,860 | 2,871 |
| Illinois GO | 5.000% | 1/1/16 | | 25,945 | 27,217 |
| Illinois GO | 5.000% | 5/1/16 | | 6,500 | 6,899 |
| Illinois GO | 4.000% | 2/1/18 | | 4,000 | 4,305 |
| Illinois GO | 5.000% | 4/1/18 | | 2,500 | 2,778 |
| Illinois GO | 5.000% | 5/1/18 | | 8,000 | 8,900 |
| Illinois GO | 5.000% | 8/1/18 | | 22,160 | 24,742 |
| Illinois GO | 4.000% | 2/1/19 | | 7,500 | 8,053 |
| Illinois GO | 5.000% | 2/1/19 | | 875 | 975 |
| Illinois GO | 5.000% | 5/1/19 | | 12,000 | 13,396 |
| Illinois GO | 5.000% | 7/1/19 | | 4,725 | 5,280 |
| Illinois GO | 5.000% | 8/1/19 | | 15,000 | 16,773 |
| Illinois Regional Transportation Authority Revenue PUT | 0.400% | 9/1/15 | | 25,000 | 25,000 |
| Illinois Sales Tax Revenue | 5.500% | 6/15/15 | (3) | 1,500 | 1,550 |
| Illinois Sales Tax Revenue | 5.000% | 6/15/16 | | 10,000 | 10,746 |
| Illinois Sales Tax Revenue | 5.500% | 6/15/16 | (3) | 1,140 | 1,233 |
| Illinois Toll Highway Authority Revenue | 5.000% | 12/1/17 | | 6,500 | 7,355 |
| 1 Illinois Toll Highway Authority Toll Highway Revenue TOB VRDO | 0.060% | 11/7/14 | | 15,995 | 15,995 |
| 1 Illinois Toll Highway Authority Toll Highway Revenue TOB VRDO | 0.060% | 11/7/14 | | 14,305 | 14,305 |
| 1 Illinois Toll Highway Authority Toll Highway Revenue TOB VRDO | 0.060% | 11/7/14 | | 7,750 | 7,750 |
| Illinois Unemployment Insurance Fund Building Receipts Revenue | 4.000% | 12/15/14 | | 1,500 | 1,507 |
| Illinois Unemployment Insurance Fund Building Receipts Revenue | 5.000% | 12/15/14 | | 7,250 | 7,294 |
| Illinois Unemployment Insurance Fund Building Receipts Revenue | 5.000% | 6/15/15 | | 7,265 | 7,485 |
| Illinois Unemployment Insurance Fund Building Receipts Revenue | 4.000% | 12/15/15 | | 2,750 | 2,868 |
| Illinois Unemployment Insurance Fund Building Receipts Revenue | 5.000% | 12/15/15 | | 3,000 | 3,162 |
| Illinois Unemployment Insurance Fund Building Receipts Revenue | 5.000% | 6/15/16 | | 8,190 | 8,807 |
| Illinois Unemployment Insurance Fund Building Receipts Revenue | 5.000% | 6/15/17 | | 18,250 | 19,980 |
| Illinois Unemployment Insurance Fund Building Receipts Revenue | 5.000% | 12/15/17 | | 7,500 | 8,203 |
| Illinois Unemployment Insurance Fund Building Receipts Revenue | 5.000% | 6/15/18 | | 10,475 | 11,446 |
| 1 Lake, Cook, Kane, & McHenry Counties IL Community Unified School District GO TOB VRDO | 0.060% | 11/7/14 | | 10,355 | 10,355 |
| 1 Metropolitan Pier & Exposition Authority Illinois Dedicated Sales Tax Revenue TOB VRDO | 0.160% | 11/7/14 | LOC | 5,515 | 5,515 |
| 1 Metropolitan Pier & Exposition Authority Illinois Dedicated Sales Tax Revenue TOB VRDO | 0.160% | 11/7/14 | (14)LOC | 9,715 | 9,715 |
| Railsplitter Tobacco Settlement Authority Illinois Tobacco Settlement Revenue | 5.000% | 6/1/15 | | 7,000 | 7,182 |
| Railsplitter Tobacco Settlement Authority Illinois Tobacco Settlement Revenue | 5.000% | 6/1/17 | | 2,500 | 2,747 |
| Railsplitter Tobacco Settlement Authority Illinois Tobacco Settlement Revenue | 5.000% | 6/1/18 | | 1,875 | 2,112 |
| | | | | | 767,935 |
| Indiana (0.7%) | | | | | |
| Indiana Bond Bank Special Program Gas Revenue | 5.250% | 10/15/16 | | 1,000 | 1,080 |
| Indiana Finance Authority Health System Revenue | | | | | |
| (Sisters of St. Francis Health Services Inc. Obligated Group) | 5.000% | 11/1/14 | | 1,415 | 1,415 |
| Indiana Finance Authority Hospital Revenue (Community Health Network) | 5.000% | 5/1/17 | | 520 | 573 |
| Indiana Finance Authority Hospital Revenue (Indiana University Health Obligated Group) | 4.000% | 3/1/15 | | 1,500 | 1,519 |
| Indiana Finance Authority Hospital Revenue (Indiana University Health Obligated Group) | 5.000% | 3/1/16 | | 4,560 | 4,843 |
| Indiana Finance Authority Hospital Revenue (Indiana University Health Obligated Group) | 3.000% | 12/1/16 | | 1,400 | 1,475 |
| Indiana Finance Authority Hospital Revenue (Indiana University Health Obligated Group) | 5.000% | 3/1/17 | | 4,350 | 4,800 |
| Indiana Finance Authority Hospital Revenue (Indiana University Health Obligated Group) | 4.000% | 12/1/18 | | 1,500 | 1,679 |
| Indiana Finance Authority Hospital Revenue (Parkview Health System) | 4.000% | 5/1/17 | | 500 | 537 |
| Indiana Finance Authority Revenue (Community Foundation of Northwest Indiana Obligated Group) | 4.000% | 3/1/15 | | 250 | 253 |
| Indiana Finance Authority Revenue (Community Foundation of Northwest Indiana Obligated Group) | 5.000% | 3/1/16 | | 500 | 526 |
| Indiana Finance Authority Revenue (Community Foundation of Northwest Indiana Obligated Group) | 5.000% | 3/1/17 | | 1,000 | 1,085 |
| Indiana Finance Authority Revenue (State Revolving Fund) | 5.000% | 2/1/16 | | 7,630 | 8,082 |
| Indiana Finance Authority Wastewater Utility Revenue (CWA Authority Project) | 4.000% | 10/1/16 | | 375 | 400 |
| Indiana Finance Authority Wastewater Utility Revenue (CWA Authority Project) | 5.000% | 10/1/17 | | 350 | 393 |
| Indiana Finance Authority Wastewater Utility Revenue (CWA Authority Project) | 5.000% | 10/1/18 | | 410 | 471 |
| Indiana Health & Educational Facility Financing Authority Revenue | | | | | |
| (Ascension Health Credit Group) PUT | 4.100% | 11/3/16 | | 2,080 | 2,231 |
| Indiana Health Facility Financing Authority Revenue (Ascension Health Credit Group) PUT | 5.000% | 6/1/15 | | 15,305 | 15,732 |
| Indiana Health Facility Financing Authority Revenue (Ascension Health Credit Group) PUT | 1.500% | 6/1/16 | | 4,560 | 4,634 |
| Indiana Health Facility Financing Authority Revenue (Ascension Health Credit Group) PUT | 5.000% | 7/28/16 | | 2,700 | 2,914 |
| Indiana Health Facility Financing Authority Revenue (Ascension Health Credit Group) PUT | 1.600% | 2/1/17 | | 10,000 | 10,213 |
| Indiana Municipal Power Agency Revenue | 5.000% | 1/1/16 | | 800 | 844 |
| Indiana Municipal Power Agency Revenue | 5.000% | 1/1/17 | | 1,250 | 1,371 |
| Rockport IN Pollution Control Revenue (Indiana Michigan Power Co. Project) PUT | 1.750% | 6/1/18 | | 5,500 | 5,533 |
| Terre Haute IN Sanitation District Special Tax Revenue | 4.000% | 1/1/15 | | 3,190 | 3,207 |
| Terre Haute IN Sanitation District Special Tax Revenue | 4.000% | 7/1/15 | | 3,255 | 3,322 |
| Terre Haute IN Sanitation District Special Tax Revenue | 4.000% | 1/1/16 | | 3,320 | 3,430 |
| Terre Haute IN Sanitation District Special Tax Revenue | 4.000% | 7/1/16 | | 3,385 | 3,537 |
| | | | | | 86,099 |
9
Short-Term Tax-Exempt Fund
| | | | | |
| | | | | Face | Market |
| | | Maturity | | Amount | Value• |
| | Coupon | Date | | ($000) | ($000) |
| Iowa (0.0%) | | | | | |
| Iowa Board of Regents Hospital Revenue (University of Iowa Hospitals & Clinics) | 4.000% | 9/1/18 | | 3,525 | 3,940 |
| Iowa Higher Education Loan Authority Revenue Private College Facility (Grinnell College Project) | 5.000% | 12/1/15 | | 1,400 | 1,472 |
| | | | | | 5,412 |
| Kansas (0.4%) | | | | | |
| Burlington KS Environmental Improvement Revenue | | | | | |
| (Kansas City Power & Light Co. Project) VRDO | 0.050% | 11/7/14 | LOC | 11,000 | 11,000 |
| 2 Kansas Department of Transportation Highway Revenue | 0.292% | 9/1/16 | | 15,000 | 15,000 |
| 2 Kansas Department of Transportation Highway Revenue | 0.342% | 9/1/17 | | 4,100 | 4,100 |
| 2 Kansas Department of Transportation Highway Revenue | 0.422% | 9/1/18 | | 3,500 | 3,502 |
| 2 Kansas Department of Transportation Highway Revenue | 0.502% | 9/1/19 | | 3,000 | 3,003 |
| Kansas Development Finance Authority Hospital Revenue | | | | | |
| (Adventist Health System/Sunbelt Obligated Group) | 4.500% | 11/15/14 | | 2,500 | 2,504 |
| Wichita KS Hospital Facilities Revenue (Via Christi Health System Inc.) | 4.000% | 11/15/14 | (ETM) | 200 | 200 |
| Wichita KS Hospital Facilities Revenue (Via Christi Health System Inc.) | 5.000% | 11/15/14 | (ETM) | 2,000 | 2,004 |
| Wichita KS Hospital Facilities Revenue (Via Christi Health System Inc.) | 5.000% | 11/15/14 | (ETM) | 2,060 | 2,064 |
| Wichita KS Hospital Facilities Revenue (Via Christi Health System Inc.) | 4.500% | 11/15/15 | (ETM) | 355 | 371 |
| Wichita KS Hospital Facilities Revenue (Via Christi Health System Inc.) | 5.000% | 11/15/16 | (ETM) | 750 | 820 |
| Wyandotte County/Kansas City KS Unified Government Utility System Revenue | 4.000% | 9/1/17 | | 1,000 | 1,089 |
| Wyandotte County/Kansas City KS Unified Government Utility System Revenue | 5.000% | 9/1/19 | | 500 | 584 |
| | | | | | 46,241 |
| Kentucky (0.6%) | | | | | |
| 2 Ashland KY Medical Center Revenue (King’s Daughters Medical Center Project) PUT | 1.800% | 2/1/17 | | 11,675 | 11,733 |
| Kentucky Asset/Liability Commission Agency Fund Revenue (Federal Highway Trust) | 5.000% | 9/1/17 | | 1,500 | 1,679 |
| Kentucky Economic Development Finance Authority Medical Center Revenue | | | | | |
| (King’s Daughters Medical Center Project) | 5.000% | 2/1/16 | | 950 | 1,000 |
| Kentucky Economic Development Finance Authority Medical Center Revenue | | | | | |
| (King’s Daughters Medical Center Project) | 5.000% | 2/1/17 | | 510 | 552 |
| Kentucky Economic Development Finance Authority Revenue (Catholic Health Initiatives) PUT | 5.000% | 11/11/14 | | 1,000 | 1,001 |
| Kentucky Property & Building Commission Revenue | 5.000% | 8/1/15 | | 3,675 | 3,808 |
| Kentucky Property & Building Commission Revenue | 5.000% | 11/1/15 | | 4,000 | 4,192 |
| Kentucky Property & Building Commission Revenue | 5.000% | 8/1/16 | (4) | 5,000 | 5,172 |
| Kentucky Property & Building Commission Revenue | 5.000% | 10/1/16 | (2) | 3,950 | 4,293 |
| Kentucky Public Transportation Infrastructure Authority Toll Revenue | | | | | |
| (Downtown Crossing Project) BAN | 3.000% | 7/1/17 | | 250 | 263 |
| Kentucky Public Transportation Infrastructure Authority Toll Revenue | | | | | |
| (Downtown Crossing Project) BAN | 5.000% | 7/1/17 | | 27,795 | 30,667 |
| Louisville & Jefferson County KY Metropolitan Government Revenue (Catholic Health Initiatives) | 5.000% | 12/1/17 | | 2,500 | 2,818 |
| Louisville & Jefferson County KY Metropolitan Government Revenue (Catholic Health Initiatives) | 5.000% | 12/1/18 | | 1,750 | 2,020 |
| Russell KY Revenue (Bon Secours Health System) | 4.000% | 11/1/15 | | 300 | 310 |
| Warren County KY Hospital Revenue | | | | | |
| (Bowling Green-Warren County Community Hospital Corp. Project) | 4.000% | 4/1/15 | | 1,000 | 1,014 |
| Warren County KY Hospital Revenue | | | | | |
| (Bowling Green-Warren County Community Hospital Corp. Project) | 4.000% | 4/1/16 | | 1,100 | 1,151 |
| Warren County KY Hospital Revenue | | | | | |
| (Bowling Green-Warren County Community Hospital Corp. Project) | 4.000% | 4/1/17 | | 200 | 214 |
| | | | | | 71,887 |
| Louisiana (1.0%) | | | | | |
| 2 East Baton Rouge Parish LA Sewer Commission Revenue PUT | 0.606% | 8/1/18 | | 25,000 | 25,018 |
| 2 Louisiana Gasoline & Fuel Tax Revenue PUT | 0.577% | 5/1/17 | | 44,500 | 44,608 |
| 2 Louisiana Gasoline & Fuel Tax Revenue PUT | 0.577% | 5/1/18 | | 12,500 | 12,517 |
| 2 Louisiana Gasoline & Fuel Tax Revenue PUT | 0.657% | 5/1/18 | | 5,100 | 5,130 |
| Louisiana GO | 5.000% | 8/1/16 | | 5,000 | 5,408 |
| Louisiana Office Facilities Corp. Lease Revenue (Capitol Complex Project) | 5.000% | 5/1/15 | | 1,500 | 1,536 |
| Louisiana Offshore Terminal Authority Deep Water Port Revenue (LOOP LLC Project) PUT | 2.125% | 10/1/15 | | 5,000 | 5,057 |
| Louisiana Offshore Terminal Authority Deep Water Port Revenue (LOOP LLC Project) PUT | 2.200% | 10/1/17 | | 4,125 | 4,158 |
| 1 Louisiana Public Facilities Authority Hospital Revenue | | | | | |
| (Franciscan Missionaries of Our Lady Health System Project) TOB VRDO | 0.170% | 11/7/14 | (4) | 4,995 | 4,995 |
| Louisiana Public Facilities Authority Revenue (Entergy Gulf States Project) | 2.875% | 11/1/15 | | 2,250 | 2,291 |
| New Orleans LA Sewage Service Revenue | 4.000% | 6/1/16 | | 880 | 926 |
| New Orleans LA Sewage Service Revenue | 5.000% | 6/1/17 | | 1,000 | 1,102 |
| New Orleans LA Water Revenue | 5.000% | 12/1/17 | | 290 | 323 |
| New Orleans LA Water Revenue | 5.000% | 12/1/18 | | 500 | 568 |
| Tobacco Settlement Financing Corp. Louisiana Revenue | 5.000% | 5/15/17 | | 1,730 | 1,883 |
| Tobacco Settlement Financing Corp. Louisiana Revenue | 5.000% | 5/15/18 | | 9,000 | 10,045 |
| Tobacco Settlement Financing Corp. Louisiana Revenue | 5.000% | 5/15/19 | | 2,500 | 2,840 |
| | | | | | 128,405 |
10
Short-Term Tax-Exempt Fund
| | | | | |
| | | | | Face | Market |
| | | Maturity | | Amount | Value• |
| | Coupon | Date | | ($000) | ($000) |
| Maine (0.0%) | | | | | |
| Maine Health & Higher Educational Facilities Authority Revenue VRDO | 0.060% | 11/7/14 | LOC | 4,975 | 4,975 |
| |
| Maryland (1.3%) | | | | | |
| Anne Arundel County MD GO | 5.000% | 4/1/17 | | 6,960 | 7,709 |
| Anne Arundel County MD GO | 5.000% | 4/1/18 | | 6,960 | 7,952 |
| Baltimore County MD GO | 4.000% | 2/1/15 | | 2,900 | 2,928 |
| Maryland Department of Transportation Revenue | 5.000% | 6/1/16 | | 2,010 | 2,159 |
| Maryland GO | 5.000% | 3/15/15 | | 1,430 | 1,456 |
| Maryland GO | 5.000% | 8/1/15 | | 1,455 | 1,508 |
| Maryland GO | 5.250% | 8/15/15 | | 4,250 | 4,421 |
| Maryland GO | 5.000% | 8/1/16 | | 27,680 | 29,928 |
| Maryland GO | 5.000% | 8/1/16 | | 5,000 | 5,406 |
| Maryland GO | 5.000% | 8/1/16 | | 4,500 | 4,865 |
| Maryland GO | 4.000% | 8/15/16 | | 9,570 | 10,193 |
| Maryland GO | 5.000% | 8/1/18 | | 15,285 | 17,639 |
| Maryland Health & Higher Educational Facilities Authority Revenue (Anne Arundel Health System) | 3.000% | 7/1/15 | | 1,045 | 1,065 |
| Maryland Health & Higher Educational Facilities Authority Revenue (Anne Arundel Health System) | 3.000% | 7/1/16 | | 425 | 443 |
| Maryland Health & Higher Educational Facilities Authority Revenue (Anne Arundel Health System) | 4.000% | 7/1/17 | | 500 | 543 |
| Maryland Health & Higher Educational Facilities Authority Revenue | | | | | |
| (Johns Hopkins Health System Obligated Group) | 5.000% | 7/1/18 | | 1,000 | 1,154 |
| Maryland Health & Higher Educational Facilities Authority Revenue | | | | | |
| (Johns Hopkins Health System Obligated Group) PUT | 5.000% | 5/15/15 | | 2,000 | 2,053 |
| 2 Maryland Health & Higher Educational Facilities Authority Revenue | | | | | |
| (Johns Hopkins Health System Obligated Group) PUT | 1.252% | 11/15/16 | | 2,000 | 2,020 |
| 2 Maryland Health & Higher Educational Facilities Authority Revenue | | | | | |
| (Johns Hopkins Health System Obligated Group) PUT | 0.932% | 11/15/17 | | 12,020 | 12,076 |
| 2 Maryland Health & Higher Educational Facilities Authority Revenue | | | | | |
| (Johns Hopkins Health System Obligated Group) PUT | 0.682% | 5/15/18 | | 5,300 | 5,297 |
| 2 Maryland Health & Higher Educational Facilities Authority Revenue | | | | | |
| (Johns Hopkins Health System Obligated Group) PUT | 0.702% | 5/15/18 | | 9,625 | 9,625 |
| 3 Maryland Health & Higher Educational Facilities Authority Revenue | | | | | |
| (Western Maryland Health System) | 4.000% | 7/1/15 | | 1,000 | 1,023 |
| 3 Maryland Health & Higher Educational Facilities Authority Revenue | | | | | |
| (Western Maryland Health System) | 5.000% | 7/1/16 | | 5,000 | 5,345 |
| 3 Maryland Health & Higher Educational Facilities Authority Revenue | | | | | |
| (Western Maryland Health System) | 5.000% | 7/1/17 | | 5,000 | 5,511 |
| Maryland Transportation Authority GAN | 5.250% | 3/1/16 | | 1,100 | 1,173 |
| Montgomery County MD GO | 5.000% | 11/1/15 | | 2,725 | 2,857 |
| Prince Georges County MD | 5.000% | 9/1/17 | | 8,015 | 9,010 |
| Prince Georges County MD GO | 5.000% | 9/15/15 | | 1,100 | 1,146 |
| Prince Georges County MD GO | 5.000% | 3/1/18 | | 5,280 | 6,022 |
| University System of Maryland Auxiliary Facility & Tuition Revenue | 5.000% | 4/1/16 | | 4,405 | 4,698 |
| Westminster MD Revenue (Lutheran Village at Miller’s Grant) | 3.875% | 7/1/19 | | 1,065 | 1,078 |
| | | | | | 168,303 |
| Massachusetts (3.4%) | | | | | |
| Boston MA GO | 5.000% | 2/1/18 | | 7,965 | 9,061 |
| Boston MA GO | 5.000% | 8/1/18 | | 4,045 | 4,668 |
| 1 Massachusetts Bay Transportation Authority Sales Tax Revenue TOB VRDO | 0.150% | 11/3/14 | | 25,495 | 25,495 |
| 1 Massachusetts Bay Transportation Authority Sales Tax Revenue TOB VRDO | 0.170% | 11/7/14 | | 30,043 | 30,043 |
| Massachusetts Department of Transportation Metropolitan Highway System Revenue | 5.000% | 1/1/15 | | 7,500 | 7,561 |
| Massachusetts Development Finance Agency Revenue (Berkshire Health System) | 4.000% | 10/1/15 | | 500 | 515 |
| Massachusetts Development Finance Agency Revenue (Berkshire Health System) | 5.000% | 10/1/16 | | 1,205 | 1,297 |
| 2 Massachusetts Development Finance Agency Revenue (Boston University) PUT | 0.600% | 9/30/16 | | 11,000 | 11,039 |
| Massachusetts Development Finance Agency Revenue (Dominion Energy Brayton Project) PUT | 2.250% | 9/1/16 | (Prere.) | 23,980 | 24,785 |
| Massachusetts Development Finance Agency Revenue (Partners Healthcare) PUT | 5.000% | 1/14/16 | | 11,600 | 12,246 |
| 2 Massachusetts Development Finance Agency Revenue (Partners Healthcare) PUT | 0.600% | 1/30/18 | | 8,935 | 8,932 |
| Massachusetts Development Finance Agency Revenue (Tufts Medical Center) | 5.000% | 1/1/15 | | 1,245 | 1,253 |
| Massachusetts Development Finance Agency Revenue (UMass Memorial Medical Center) | 5.000% | 7/1/15 | | 400 | 410 |
| Massachusetts Development Finance Agency Revenue (UMass Memorial Medical Center) | 5.000% | 7/1/17 | | 2,260 | 2,433 |
| 2 Massachusetts Development Finance Agency Revenue (Williams College) PUT | 0.330% | 7/1/17 | | 14,860 | 14,835 |
| Massachusetts GO | 5.000% | 1/1/15 | | 4,000 | 4,033 |
| 2 Massachusetts GO | 0.450% | 2/1/15 | | 7,500 | 7,504 |
| 2 Massachusetts GO | 0.710% | 2/1/15 | | 8,300 | 8,307 |
| 2 Massachusetts GO | 0.500% | 9/1/15 | | 32,350 | 32,411 |
| Massachusetts GO | 5.000% | 10/1/15 | | 2,980 | 3,113 |
| 2 Massachusetts GO | 0.170% | 2/1/16 | | 42,150 | 42,154 |
| Massachusetts GO | 5.000% | 8/1/16 | | 3,375 | 3,646 |
| 2 Massachusetts GO | 0.390% | 1/1/17 | | 12,100 | 12,114 |
| 2 Massachusetts GO | 0.410% | 2/1/17 | | 14,335 | 14,366 |
| 2 Massachusetts GO | 0.480% | 1/1/18 | | 7,000 | 7,032 |
11
Short-Term Tax-Exempt Fund
| | | | | |
| | | | | Face | Market |
| | | Maturity | | Amount | Value• |
| | Coupon | Date | | ($000) | ($000) |
| Massachusetts Health & Educational Facilities Authority Revenue (Amherst College) PUT | 1.000% | 11/3/14 | | 10,028 | 10,028 |
| Massachusetts Health & Educational Facilities Authority Revenue (Amherst College) PUT | 1.700% | 11/1/16 | | 9,115 | 9,294 |
| Massachusetts Health & Educational Facilities Authority Revenue (Amherst College) PUT | 0.800% | 12/1/17 | | 2,000 | 2,001 |
| Massachusetts Health & Educational Facilities Authority Revenue (Lahey Clinic Medical Center) | 5.000% | 8/15/19 | (14) | 500 | 518 |
| Massachusetts Health & Educational Facilities Authority Revenue (Partners Healthcare System) | 0.250% | 11/5/14 | (4) | 13,800 | 13,800 |
| Massachusetts Health & Educational Facilities Authority Revenue (Partners Healthcare System) | 0.450% | 11/7/14 | (4) | 12,000 | 12,000 |
| 1 Massachusetts Health & Educational Facilities Authority Revenue (Partners Healthcare System) | | | | | |
| TOB VRDO | 0.060% | 11/7/14 | | 13,100 | 13,100 |
| Massachusetts Health & Educational Facilities Authority Revenue | | | | | |
| (UMass Memorial Medical Center) | 5.000% | 7/1/15 | | 1,425 | 1,462 |
| Massachusetts School Building Authority Dedicated Sales Tax Revenue | 5.000% | 8/15/15 | (4) | 1,000 | 1,038 |
| Massachusetts School Building Authority Dedicated Sales Tax Revenue | 5.000% | 8/15/15 | (Prere.) | 3,665 | 3,805 |
| Massachusetts School Building Authority Dedicated Sales Tax Revenue | 5.000% | 8/15/15 | (Prere.) | 2,000 | 2,076 |
| Massachusetts School Building Authority Dedicated Sales Tax Revenue | 5.000% | 8/15/15 | (Prere.) | 7,370 | 7,651 |
| Massachusetts Water Resources Authority Revenue | 5.250% | 8/1/15 | (14) | 6,000 | 6,230 |
| 1 Massachusetts Water Resources Authority Revenue TOB VRDO | 0.050% | 11/7/14 | LOC | 22,000 | 22,000 |
| 1 Massachusetts Water Resources Authority Revenue TOB VRDO | 0.060% | 11/7/14 | | 3,605 | 3,605 |
| 1 Massachusetts Water Resources Authority Revenue TOB VRDO | 0.190% | 11/7/14 | LOC | 14,765 | 14,765 |
| 1 Massachusetts Water Resources Authority Revenue TOB VRDO | 0.190% | 11/7/14 | (4)LOC | 19,540 | 19,540 |
| | | | | | 432,166 |
| Michigan (3.6%) | | | | | |
| 1 Detroit MI City School District GO TOB VRDO | 0.570% | 11/7/14 | | 10,240 | 10,240 |
| 1 Detroit MI City School District GO TOB VRDO | 0.570% | 11/7/14 | | 8,000 | 8,000 |
| 1 Detroit MI City School District GO TOB VRDO | 0.890% | 11/7/14 | | 14,115 | 14,115 |
| 1 Detroit MI City School District GO TOB VRDO | 0.890% | 11/7/14 | | 17,845 | 17,845 |
| Detroit/Wayne County MI Stadium Authority Revenue | 5.000% | 10/1/15 | | 1,255 | 1,297 |
| Detroit/Wayne County MI Stadium Authority Revenue | 5.000% | 10/1/16 | | 1,285 | 1,366 |
| Detroit/Wayne County MI Stadium Authority Revenue | 5.000% | 10/1/17 | | 620 | 671 |
| Kent Hospital MI Finance Authority Revenue (Spectrum Health) | 5.000% | 11/15/14 | | 1,000 | 1,002 |
| Kent Hospital MI Finance Authority Revenue (Spectrum Health) PUT | 5.500% | 1/15/15 | | 5,425 | 5,483 |
| Livonia MI Public Schools School District GO | 2.000% | 5/1/15 | (15) | 285 | 287 |
| Livonia MI Public Schools School District GO | 4.000% | 5/1/16 | (15) | 500 | 524 |
| Livonia MI Public Schools School District GO | 4.000% | 5/1/17 | (15) | 1,000 | 1,073 |
| Livonia MI Public Schools School District GO | 5.000% | 5/1/18 | (15) | 850 | 965 |
| Michigan Building Authority Revenue | 5.000% | 10/15/15 | | 10,000 | 10,451 |
| Michigan Building Authority Revenue | 5.000% | 10/15/16 | | 12,250 | 13,301 |
| Michigan Finance Authority Revenue | 4.000% | 10/1/17 | | 1,155 | 1,259 |
| Michigan Finance Authority Revenue | 5.000% | 10/1/18 | | 1,135 | 1,299 |
| Michigan Finance Authority Revenue (Detroit School District) | 2.850% | 8/20/15 | | 2,550 | 2,559 |
| Michigan Finance Authority Revenue (Detroit Water & Sewer) | 2.000% | 7/1/15 | | 6,310 | 6,356 |
| Michigan Finance Authority Revenue (Detroit Water & Sewer) | 2.000% | 7/1/15 | | 31,960 | 32,246 |
| Michigan Finance Authority Revenue (Detroit Water & Sewer) | 2.000% | 7/1/15 | | 3,160 | 3,183 |
| Michigan Finance Authority Revenue (Detroit Water & Sewer) | 2.000% | 7/1/15 | | 22,140 | 22,338 |
| Michigan Finance Authority Revenue (Detroit Water & Sewer) | 5.000% | 7/1/16 | | 890 | 942 |
| Michigan Finance Authority Revenue (Detroit Water & Sewer) | 5.000% | 7/1/16 | | 5,115 | 5,445 |
| Michigan Finance Authority Revenue (Detroit Water & Sewer) | 5.000% | 7/1/16 | | 4,000 | 4,258 |
| Michigan Finance Authority Revenue (Detroit Water & Sewer) | 5.000% | 7/1/17 | | 1,105 | 1,201 |
| Michigan Finance Authority Revenue (Detroit Water & Sewer) | 5.000% | 7/1/17 | (14) | 5,000 | 5,501 |
| Michigan Finance Authority Revenue (Detroit Water & Sewer) | 5.000% | 7/1/17 | | 5,000 | 5,468 |
| Michigan Finance Authority Revenue (Detroit Water & Sewer) | 5.000% | 7/1/17 | | 500 | 543 |
| Michigan Finance Authority Revenue (Detroit Water & Sewer) | 5.000% | 7/1/18 | | 1,000 | 1,107 |
| Michigan Finance Authority Revenue (Detroit Water & Sewer) | 5.000% | 7/1/18 | (14) | 6,000 | 6,740 |
| Michigan Finance Authority Revenue (Detroit Water & Sewer) | 5.000% | 7/1/18 | (14) | 5,500 | 6,178 |
| Michigan Finance Authority Revenue (Detroit Water & Sewer) | 5.000% | 7/1/18 | | 1,150 | 1,273 |
| Michigan Finance Authority Revenue (Detroit Water & Sewer) | 5.000% | 7/1/19 | (14) | 2,855 | 3,247 |
| Michigan Finance Authority Revenue (Detroit Water & Sewer) | 5.000% | 7/1/19 | (14) | 3,500 | 3,981 |
| Michigan Finance Authority Revenue (Unemployment Obligation Assessment) | 5.000% | 7/1/15 | | 13,050 | 13,474 |
| Michigan Finance Authority Revenue (Unemployment Obligation Assessment) | 5.000% | 1/1/18 | | 6,425 | 7,280 |
| Michigan Finance Authority Revenue (Unemployment Obligation Assessment) | 5.000% | 7/1/18 | | 10,275 | 11,791 |
| Michigan Finance Authority Revenue (Unemployment Obligation Assessment) | 5.000% | 1/1/19 | | 22,000 | 25,514 |
| Michigan Hospital Finance Authority Revenue (Ascension Health Credit Group) | 5.000% | 11/15/15 | | 3,000 | 3,145 |
| Michigan Hospital Finance Authority Revenue (Ascension Health Credit Group) PUT | 0.900% | 3/16/15 | | 16,000 | 16,035 |
| Michigan Hospital Finance Authority Revenue (Ascension Health Credit Group) PUT | 1.500% | 3/15/17 | | 7,875 | 8,027 |
| Michigan Hospital Finance Authority Revenue (Ascension Health Credit Group) PUT | 2.000% | 5/30/18 | | 14,000 | 14,479 |
| Michigan Hospital Finance Authority Revenue (Ascension Health Credit Group) PUT | 1.400% | 6/29/18 | | 11,750 | 11,898 |
| Michigan Hospital Finance Authority Revenue (Henry Ford Health System) | 4.000% | 11/15/14 | | 1,500 | 1,502 |
| Michigan Hospital Finance Authority Revenue (McLaren Health Care) | 5.000% | 6/1/15 | | 1,395 | 1,434 |
| Michigan Hospital Finance Authority Revenue (McLaren Health Care) | 5.000% | 6/1/16 | | 1,500 | 1,608 |
| Michigan Hospital Finance Authority Revenue (McLaren Health Care) | 5.000% | 6/1/17 | | 2,100 | 2,332 |
| Michigan Hospital Finance Authority Revenue (McLaren Health Care) VRDO | 0.060% | 11/7/14 | LOC | 6,620 | 6,620 |
| Michigan Municipal Bond Authority Revenue (State Clean Water Revolving Fund) | 5.000% | 10/1/15 | | 1,835 | 1,916 |
12
Short-Term Tax-Exempt Fund
| | | | | |
| | | | | Face | Market |
| | | Maturity | | Amount | Value• |
| | Coupon | Date | | ($000) | ($000) |
| Michigan Municipal Bond Authority Revenue (State Clean Water Revolving Fund) | 5.000% | 10/1/15 | | 3,185 | 3,326 |
| Michigan Strategic Fund Limited Obligation Revenue (Detroit Edison Co. Project) PUT | 2.125% | 9/1/16 | | 10,000 | 10,185 |
| Michigan Strategic Fund Limited Obligation Revenue | | | | | |
| (Facility for Rare Isotope Beams Project at Michigan State University) | 4.000% | 3/1/16 | | 500 | 524 |
| Michigan Strategic Fund Limited Obligation Revenue | | | | | |
| (Facility for Rare Isotope Beams Project at Michigan State University) | 4.000% | 3/1/17 | | 250 | 270 |
| Michigan Strategic Fund Limited Obligation Revenue | | | | | |
| (Facility for Rare Isotope Beams Project at Michigan State University) | 4.000% | 3/1/18 | | 500 | 551 |
| Michigan Trunk Line Revenue | 5.250% | 11/1/15 | (14) | 5,000 | 5,254 |
| Michigan Trunk Line Revenue | 5.000% | 11/15/16 | | 5,000 | 5,467 |
| Michigan Trunk Line Revenue | 5.000% | 11/15/17 | | 13,500 | 15,259 |
| Oakland University of Michigan Revenue VRDO | 0.050% | 11/7/14 | LOC | 19,260 | 19,260 |
| 3 Royal Oak City MI School District GO | 5.000% | 5/1/17 | | 1,300 | 1,437 |
| 3 Royal Oak City MI School District GO | 5.000% | 5/1/18 | | 1,000 | 1,136 |
| Royal Oak MI Hospital Finance Authority Hospital Revenue (William Beaumont Hospital) | 5.000% | 8/1/15 | | 2,500 | 2,587 |
| Saginaw MI Hospital Finance Authority Hospital Revenue (Covenant Medical Center Inc.) | 5.000% | 7/1/15 | | 2,215 | 2,272 |
| 1 Saginaw Valley State University Michigan Revenue TOB VRDO | 0.200% | 11/7/14 | (4) | 5,000 | 5,000 |
| 2 Saline MI Area Schools GO PUT | 0.600% | 11/2/15 | | 9,285 | 9,279 |
| St. Johns MI Public Schools School District GO | 5.000% | 5/1/19 | | 7,250 | 8,369 |
| University of Michigan Revenue | 4.000% | 4/1/15 | | 9,600 | 9,756 |
| 2 University of Michigan Revenue PUT | 0.250% | 4/1/15 | | 1,060 | 1,060 |
| University of Michigan Revenue VRDO | 0.070% | 11/7/14 | | 31,095 | 31,095 |
| | | | | | 460,886 |
| Minnesota (0.7%) | | | | | |
| 3 Hennepin County MN GO | 5.000% | 12/1/16 | | 1,180 | 1,293 |
| 3 Hennepin County MN GO | 5.000% | 12/1/16 | | 4,035 | 4,421 |
| Maple Grove MN Health Care Facilities Revenue (Maple Grove Hospital Corp.) | 5.000% | 5/1/16 | | 1,500 | 1,578 |
| Minneapolis & St. Paul MN Housing & Redevelopment Authority Health Care System Revenue | | | | | |
| (Children’s Hospital Clinics) VRDO | 0.100% | 11/3/14 | (4) | 24,325 | 24,325 |
| Minnesota General Fund Revenue | 5.000% | 3/1/17 | | 2,000 | 2,208 |
| Minnesota GO | 5.000% | 10/1/15 | (ETM) | 95 | 99 |
| Minnesota GO | 5.000% | 10/1/15 | | 8,155 | 8,517 |
| Minnesota GO | 5.000% | 11/1/15 | | 2,150 | 2,254 |
| Minnesota GO | 5.000% | 8/1/16 | | 6,045 | 6,536 |
| Minnesota GO | 5.000% | 8/1/16 | (ETM) | 70 | 76 |
| Minnesota GO | 5.000% | 8/1/16 | | 4,480 | 4,844 |
| Minnesota GO | 5.000% | 10/1/17 | | 3,545 | 3,996 |
| Minnesota Higher Education Facilities Authority Revenue (Carleton College) VRDO | 0.110% | 11/7/14 | | 7,555 | 7,555 |
| Minnesota Public Facilities Authority Revenue (State Revolving Fund) | 5.000% | 3/1/15 | | 11,180 | 11,362 |
| Minnesota Public Facilities Authority Revenue (State Revolving Fund) | 5.000% | 3/1/16 | | 11,535 | 12,257 |
| Shakopee MN Healthcare Facilities Revenue (St. Francis Regional Medical Center) | 4.000% | 9/1/16 | | 295 | 312 |
| Shakopee MN Healthcare Facilities Revenue (St. Francis Regional Medical Center) | 5.000% | 9/1/17 | | 465 | 519 |
| Shakopee MN Healthcare Facilities Revenue (St. Francis Regional Medical Center) | 5.000% | 9/1/18 | | 885 | 1,007 |
| Shakopee MN Healthcare Facilities Revenue (St. Francis Regional Medical Center) | 5.000% | 9/1/19 | | 555 | 643 |
| | | | | | 93,802 |
| Mississippi (0.4%) | | | | | |
| Jackson County MS Pollution Control Revenue (Chevron USA Inc. Project) VRDO | 0.070% | 11/3/14 | | 6,400 | 6,400 |
| Mississippi Business Finance Corp. Gulf Opportunity Zone Industrial Development Revenue | | | | | |
| (Chevron USA Inc. Project) VRDO | 0.050% | 11/7/14 | | 30,000 | 30,000 |
| Mississippi Business Finance Corp. Solid Waste Disposal Revenue | | | | | |
| (Waste Management Inc. Project) PUT | 2.250% | 11/3/14 | | 5,750 | 5,750 |
| Mississippi GO | 5.250% | 11/1/16 | (14) | 2,550 | 2,797 |
| 2 Mississippi GO | 0.580% | 9/1/17 | | 6,215 | 6,219 |
| 1 Mississippi GO TOB VRDO | 0.050% | 11/7/14 | | 3,680 | 3,680 |
| Missouri Development Bank Special Obligation Revenue | | | | | |
| (Marshall County Industrial Development Authority) | 4.000% | 1/1/15 | | 1,250 | 1,258 |
| | | | | | 56,104 |
| Missouri (0.8%) | | | | | |
| Curators of the University of Missouri System Facilities Revenue VRDO | 0.030% | 11/7/14 | | 49,835 | 49,835 |
| 3 Jackson County MO Special Obligation Revenue (Truman Sports Complex Project) | 5.000% | 12/1/17 | | 2,000 | 2,257 |
| Kansas City MO Airport Revenue | 4.000% | 9/1/15 | | 1,500 | 1,548 |
| Kansas City MO Airport Revenue | 5.000% | 9/1/16 | | 900 | 975 |
| Kansas City MO Airport Revenue | 5.000% | 9/1/17 | | 1,250 | 1,396 |
| Missouri Board of Public Buildings Special Obligation Revenue | 3.000% | 10/1/16 | | 2,795 | 2,935 |
| Missouri Environmental Improvement & Energy Resources Authority Revenue | | | | | |
| (Kansas City Power & Light) | 1.250% | 7/1/17 | | 4,000 | 4,058 |
| Missouri GO | 5.000% | 10/1/15 | | 2,500 | 2,611 |
| Missouri Health & Educational Facilities Authority Educational Facilities Revenue | | | | | |
| (St. Louis College of Pharmacy Project) | 3.000% | 5/1/15 | | 1,905 | 1,929 |
| 1 Missouri Health & Educational Facilities Authority Revenue (Washington University) TOB VRDO | 0.060% | 11/7/14 | | 11,300 | 11,300 |
13
Short-Term Tax-Exempt Fund
| | | | | |
| | | | | Face | Market |
| | | Maturity | | Amount | Value• |
| | Coupon | Date | | ($000) | ($000) |
| Missouri Highways & Transportation Commission Road Revenue | 5.250% | 5/1/17 | (Prere.) | 11,000 | 12,286 |
| St. Louis MO Airport Revenue (Lambert-St. Louis International Airport) | 4.000% | 7/1/15 | | 900 | 922 |
| St. Louis MO Airport Revenue (Lambert-St. Louis International Airport) | 5.000% | 7/1/16 | | 1,000 | 1,072 |
| St. Louis MO Municipal Finance Corp. Lease Revenue (City Justice Center Project) | 5.000% | 2/15/15 | | 1,870 | 1,894 |
| St. Louis MO Municipal Finance Corp. Lease Revenue (City Justice Center Project) | 5.000% | 2/15/16 | | 2,250 | 2,369 |
| | | | | | 97,387 |
| Nebraska (0.1%) | | | | | |
| 1 Douglas County NE Hospital Authority No. 3 Health Facilities Revenue | | | | | |
| (Nebraska Methodist Health System) TOB VRDO | 0.100% | 11/7/14 | (13) | 10,060 | 10,060 |
| Lincoln County NE Hospital Authority No. 1 Hospital Revenue | | | | | |
| (Great Plains Regional Medical Center Project) | 4.000% | 11/1/16 | | 500 | 530 |
| Lincoln County NE Hospital Authority No. 1 Hospital Revenue | | | | | |
| (Great Plains Regional Medical Center Project) | 4.000% | 11/1/17 | | 500 | 540 |
| Municipal Energy Agency of Nebraska Power Supply System Revenue | 3.000% | 4/1/15 | | 550 | 557 |
| Municipal Energy Agency of Nebraska Power Supply System Revenue | 4.000% | 4/1/16 | | 1,000 | 1,051 |
| University of Nebraska Student Fee Revenue | 5.000% | 7/1/16 | | 1,380 | 1,487 |
| University of Nebraska Student Fee Revenue | 5.000% | 7/1/17 | | 1,105 | 1,235 |
| | | | | | 15,460 |
| Nevada (0.7%) | | | | | |
| 1 Clark County NV GO TOB VRDO | 0.060% | 11/7/14 | | 14,720 | 14,720 |
| 1 Clark County NV Water Reclamation District GO TOB VRDO | 0.060% | 11/7/14 | | 14,800 | 14,800 |
| 1 Clark County NV Water Reclamation District GO TOB VRDO | 0.060% | 11/7/14 | | 6,000 | 6,000 |
| Las Vegas Valley Water District Nevada GO | 5.000% | 6/1/15 | | 500 | 514 |
| 1 Las Vegas Valley Water District Nevada GO TOB VRDO | 0.080% | 11/7/14 | | 4,690 | 4,690 |
| Nevada Unemployment Compensation Revenue | 2.000% | 12/1/14 | | 27,310 | 27,354 |
| Nevada Unemployment Compensation Revenue | 4.000% | 6/1/15 | | 5,500 | 5,624 |
| Nevada Unemployment Compensation Revenue | 4.000% | 12/1/15 | | 6,250 | 6,509 |
| Nevada Unemployment Compensation Revenue | 5.000% | 6/1/17 | | 10,000 | 11,149 |
| | | | | | 91,360 |
| New Hampshire (0.2%) | | | | | |
| New Hampshire GO | 5.000% | 2/15/15 | | 1,285 | 1,303 |
| New Hampshire GO | 5.000% | 8/15/15 | | 5,000 | 5,192 |
| 1 New Hampshire Health & Education Facilities Authority Revenue (LRGHealthcare) TOB VRDO | 0.110% | 11/7/14 | | 15,645 | 15,645 |
| | | | | | 22,140 |
| New Jersey (3.9%) | | | | | |
| Bergen County NJ GO | 3.000% | 9/1/15 | | 2,165 | 2,215 |
| Bergen County NJ GO | 4.000% | 9/1/16 | | 1,875 | 1,996 |
| 3 Camden County NJ Improvement Authority Health Care Redevelopment Project Revenue | | | | | |
| (Cooper Health System Obligated Group) | 5.000% | 2/15/18 | | 2,775 | 3,099 |
| 3 Camden County NJ Improvement Authority Health Care Redevelopment Project Revenue | | | | | |
| (Cooper Health System Obligated Group) | 5.000% | 2/15/19 | | 3,050 | 3,462 |
| Essex County NJ Improvement Authority Revenue | 2.000% | 10/1/16 | | 7,910 | 8,151 |
| 3 Essex County NJ Utilities Authority Revenue | 3.000% | 11/4/16 | | 5,625 | 5,892 |
| Garden State Preservation Trust New Jersey Revenue (Open Space & Farmland Preservation) | 5.500% | 11/1/14 | (4) | 6,725 | 6,725 |
| Jersey City NJ BAN | 2.000% | 12/12/14 | | 23,692 | 23,724 |
| Middlesex County NJ COP | 5.500% | 10/15/15 | | 1,305 | 1,367 |
| Monroe Township NJ Board of Education GO | 4.000% | 8/1/17 | | 1,085 | 1,176 |
| Monroe Township NJ Board of Education GO | 4.000% | 8/1/18 | | 2,070 | 2,282 |
| New Brunswick NJ BAN | 1.500% | 6/18/15 | | 25,132 | 25,307 |
| New Jersey Building Authority BAN | 3.000% | 6/15/16 | | 12,000 | 12,192 |
| New Jersey Economic Development Authority Revenue | 5.000% | 3/1/18 | | 14,425 | 16,061 |
| New Jersey Economic Development Authority Revenue (Cigarette Tax) | 5.000% | 6/15/15 | | 2,840 | 2,920 |
| New Jersey Economic Development Authority Revenue (Cigarette Tax) | 5.000% | 6/15/16 | | 20,000 | 21,354 |
| New Jersey Economic Development Authority Revenue (Cigarette Tax) | 5.000% | 6/15/17 | | 5,000 | 5,502 |
| New Jersey Economic Development Authority Revenue (Cigarette Tax) | 5.000% | 6/15/18 | | 3,235 | 3,634 |
| 2 New Jersey Economic Development Authority Revenue (School Facilities Construction) | 0.630% | 2/1/15 | | 10,700 | 10,700 |
| New Jersey Economic Development Authority Revenue (School Facilities Construction) | 5.250% | 3/1/15 | (Prere.) | 8,820 | 8,970 |
| New Jersey Economic Development Authority Revenue (School Facilities Construction) | 5.000% | 9/1/15 | (ETM) | 12,000 | 12,483 |
| New Jersey Economic Development Authority Revenue (School Facilities Construction) | 5.000% | 9/1/15 | (ETM) | 5,000 | 5,201 |
| 2 New Jersey Economic Development Authority Revenue (School Facilities Construction) | 1.750% | 2/1/16 | | 11,880 | 11,989 |
| New Jersey Economic Development Authority Revenue (School Facilities Construction) | 5.000% | 9/1/16 | | 5,000 | 5,381 |
| New Jersey Economic Development Authority Revenue (School Facilities Construction) | 5.000% | 12/15/16 | | 5,415 | 5,883 |
| 2 New Jersey Economic Development Authority Revenue (School Facilities Construction) | 0.950% | 2/1/17 | | 14,580 | 14,618 |
| 2 New Jersey Economic Development Authority Revenue (School Facilities Construction) VRDO | 0.780% | 2/1/17 | | 25,000 | 25,075 |
| New Jersey Educational Facilities Authority Revenue (Higher Education Trust Fund) | 5.000% | 6/1/15 | | 5,100 | 5,236 |
| New Jersey Educational Facilities Authority Revenue (Higher Education Trust Fund) | 5.000% | 9/1/15 | (4) | 1,030 | 1,070 |
| New Jersey Educational Facilities Authority Revenue (Princeton University) | 5.000% | 7/1/18 | | 2,500 | 2,579 |
| New Jersey Equipment Lease Purchase COP | 5.000% | 6/15/18 | | 4,550 | 5,104 |
| New Jersey GO | 5.250% | 7/15/16 | (2) | 1,010 | 1,091 |
14
Short-Term Tax-Exempt Fund
| | | | | |
| | | | | Face | Market |
| | | Maturity | | Amount | Value• |
| | Coupon | Date | | ($000) | ($000) |
| New Jersey Health Care Facilities Financing Authority Department of Human Services | | | | | |
| Lease Revenue (Greystone Park Psychiatric Hospital Project) | 5.000% | 9/15/15 | | 7,880 | 8,186 |
| New Jersey Health Care Facilities Financing Authority Revenue (AHS Hospital Corp.) | 5.000% | 7/1/18 | | 2,500 | 2,828 |
| New Jersey Health Care Facilities Financing Authority Revenue | | | | | |
| (Atlanticare Regional Medical Center) | 5.000% | 7/1/16 | | 250 | 268 |
| New Jersey Health Care Facilities Financing Authority Revenue (Holy Name Medical Center) | 4.000% | 7/1/17 | | 1,000 | 1,069 |
| New Jersey Health Care Facilities Financing Authority Revenue | | | | | |
| (Meridian Health System Obligated Group) | 5.000% | 7/1/15 | | 2,000 | 2,062 |
| New Jersey Health Care Facilities Financing Authority Revenue | | | | | |
| (Meridian Health System Obligated Group) | 5.000% | 7/1/16 | | 2,000 | 2,147 |
| New Jersey Health Care Facilities Financing Authority Revenue | | | | | |
| (Meridian Health System Obligated Group) | 5.000% | 7/1/17 | | 2,000 | 2,218 |
| New Jersey Health Care Facilities Financing Authority Revenue | | | | | |
| (Palisades Medical Center Obligated Group) | 5.000% | 7/1/17 | | 1,305 | 1,405 |
| New Jersey Health Care Facilities Financing Authority Revenue | | | | | |
| (Robert Wood Johnson University) VRDO | 0.030% | 11/7/14 | LOC | 4,100 | 4,100 |
| New Jersey Health Care Facilities Financing Authority Revenue (Virtua Health) | 4.000% | 7/1/18 | | 750 | 824 |
| New Jersey Health Care Facilities Financing Authority Revenue (Virtua Health) | 4.000% | 7/1/19 | | 2,000 | 2,213 |
| New Jersey Health Care Facilities Financing Authority Revenue (Virtua Health) | 5.000% | 7/1/19 | | 1,000 | 1,162 |
| New Jersey Higher Education Assistance Authority Student Loan Revenue | 5.000% | 12/1/15 | | 2,500 | 2,628 |
| New Jersey Housing & Mortgage Finance Agency Multi-Family Housing Revenue | | | | | |
| (Broadway Townhouses Project) | 0.600% | 12/1/16 | | 6,000 | 5,991 |
| New Jersey Housing & Mortgage Finance Agency Multi-Family Housing Revenue | | | | | |
| (Sycamore Ridge Apartments) | 0.500% | 11/1/15 | | 4,000 | 4,001 |
| New Jersey Transportation Corp. GAN | 5.000% | 9/15/17 | | 14,500 | 16,020 |
| New Jersey Transportation Corp. GAN | 5.000% | 9/15/18 | | 16,345 | 18,507 |
| New Jersey Transportation Trust Fund Authority Transportation System Revenue | 5.000% | 6/15/16 | | 2,000 | 2,134 |
| New Jersey Transportation Trust Fund Authority Transportation System Revenue | 5.000% | 6/15/17 | | 3,000 | 3,292 |
| 1 New Jersey Transportation Trust Fund Authority Transportation System Revenue TOB VRDO | 0.140% | 11/7/14 | LOC | 7,630 | 7,630 |
| 1 New Jersey Transportation Trust Fund Authority Transportation System Revenue TOB VRDO | 0.300% | 11/7/14 | | 10,700 | 10,700 |
| New Jersey Turnpike Authority Revenue | 5.000% | 1/1/15 | (Prere.) | 13,500 | 13,609 |
| 2 New Jersey Turnpike Authority Revenue | 0.530% | 1/1/17 | | 30,000 | 30,020 |
| 2 New Jersey Turnpike Authority Revenue PUT | 0.372% | 1/1/16 | | 10,000 | 10,003 |
| 2 New Jersey Turnpike Authority Revenue PUT | 0.580% | 1/1/16 | | 20,000 | 20,050 |
| 2 New Jersey Turnpike Authority Revenue PUT | 0.670% | 1/1/17 | | 30,000 | 30,110 |
| 2 New Jersey Turnpike Authority Revenue PUT | 0.730% | 1/1/18 | | 5,000 | 5,018 |
| 1 New Jersey Turnpike Authority Revenue TOB VRDO | 0.250% | 11/7/14 | (4) | 6,500 | 6,500 |
| 1 Rutgers State University New Jersey Revenue TOB VRDO | 0.060% | 11/7/14 | | 14,800 | 14,800 |
| Rutgers State University New Jersey Revenue VRDO | 0.060% | 11/3/14 | | 2,900 | 2,900 |
| | | | | | 494,834 |
| New Mexico (1.1%) | | | | | |
| Farmington NM Pollution Control Revenue (El Paso Electric Co. Four Corners Project) PUT | 1.875% | 9/1/17 | | 4,500 | 4,559 |
| New Mexico Educational Assistance Foundation Revenue | 4.000% | 9/1/15 | | 4,400 | 4,540 |
| New Mexico Educational Assistance Foundation Revenue | 4.000% | 12/1/15 | | 3,800 | 3,955 |
| New Mexico Hospital Equipment Loan Council Hospital System Revenue | | | | | |
| (Presbyterian Healthcare Services) VRDO | 0.050% | 11/7/14 | | 37,100 | 37,100 |
| 2 New Mexico Municipal Energy Acquisition Authority Gas Supply Revenue | 0.672% | 2/1/18 | | 5,010 | 5,032 |
| 2 New Mexico Municipal Energy Acquisition Authority Gas Supply Revenue | 0.722% | 8/1/18 | | 5,200 | 5,227 |
| 2 New Mexico Municipal Energy Acquisition Authority Gas Supply Revenue PUT | 0.852% | 8/1/19 | | 37,500 | 37,761 |
| New Mexico Severance Tax Revenue | 5.000% | 7/1/15 | | 5,915 | 6,107 |
| New Mexico Severance Tax Revenue | 5.000% | 7/1/15 | | 9,150 | 9,445 |
| New Mexico Severance Tax Revenue | 5.000% | 7/1/16 | | 7,545 | 8,124 |
| New Mexico Severance Tax Revenue | 4.000% | 7/1/19 | | 16,245 | 17,929 |
| | | | | | 139,779 |
| New York (18.9%) | | | | | |
| Erie County NY Industrial Development Agency School Facility Revenue | | | | | |
| (Buffalo City School District Project) | 5.000% | 5/1/15 | | 1,000 | 1,024 |
| Erie County NY Industrial Development Agency School Facility Revenue | | | | | |
| (Buffalo City School District Project) | 5.000% | 5/1/16 | | 1,000 | 1,070 |
| Erie County NY Industrial Development Agency School Facility Revenue | | | | | |
| (Buffalo City School District Project) | 5.000% | 5/1/17 | | 3,435 | 3,812 |
| 1 Erie County NY Industrial Development Agency School Facility Revenue | | | | | |
| (Buffalo City School District Project) TOB VRDO | 0.060% | 11/7/14 | | 2,900 | 2,900 |
| Geneva NY Industrial Development Agency Civic Facility Revenue | | | | | |
| (Colleges of the Seneca Project) VRDO | 0.050% | 11/7/14 | LOC | 9,865 | 9,865 |
| Long Beach NY City School District RAN | 1.500% | 8/14/15 | | 18,000 | 18,117 |
| Long Beach NY RAN | 1.500% | 9/18/15 | | 2,075 | 2,081 |
| Long Beach NY RAN | 1.500% | 9/18/15 | | 1,735 | 1,743 |
| Long Island NY Power Authority Electric System Revenue | 5.000% | 5/1/15 | (ETM) | 9,320 | 9,546 |
| Long Island NY Power Authority Electric System Revenue | 5.000% | 5/1/16 | | 4,315 | 4,596 |
| Long Island NY Power Authority Electric System Revenue | 5.000% | 6/1/16 | (Prere.) | 7,525 | 8,084 |
15
Short-Term Tax-Exempt Fund
| | | | | |
| | | | | Face | Market |
| | | Maturity | | Amount | Value• |
| | Coupon | Date | | ($000) | ($000) |
| Long Island NY Power Authority Electric System Revenue | 5.000% | 5/1/17 | | 1,000 | 1,101 |
| Long Island Power Authority Electric System Revenue | 5.000% | 5/1/15 | (ETM) | 140 | 143 |
| Long Island Power Authority Electric System Revenue | 5.000% | 5/1/15 | (14) | 860 | 880 |
| Monroe County NY Industrial Development Agency School Facility Revenue | | | | | |
| (Rochester Schools Modernization Project) | 3.000% | 5/1/15 | | 1,180 | 1,197 |
| Monroe County NY Industrial Development Agency School Facility Revenue | | | | | |
| (Rochester Schools Modernization Project) | 5.000% | 5/1/17 | | 3,730 | 4,137 |
| Monroe County NY Industrial Development Agency School Facility Revenue | | | | | |
| (Rochester Schools Modernization Project) | 5.000% | 5/1/17 | | 1,450 | 1,608 |
| Monroe County NY Industrial Development Agency School Facility Revenue | | | | | |
| (Rochester Schools Modernization Project) | 5.000% | 5/1/18 | | 2,000 | 2,282 |
| Monroe County NY Industrial Development Corp. Revenue (Rochester General Hospital) | 3.000% | 12/1/14 | | 600 | 601 |
| Monroe County NY Industrial Development Corp. Revenue (Rochester General Hospital) | 3.000% | 12/1/15 | | 875 | 898 |
| Nassau County NY Health Care Corp. RAN | 2.250% | 1/15/15 | | 7,825 | 7,833 |
| Nassau County NY Interim Finance Authority Sales Tax Revenue VRDO | 0.050% | 11/7/14 | | 42,550 | 42,550 |
| Nassau County NY Interim Finance Authority Sales Tax Revenue VRDO | 0.060% | 11/7/14 | | 18,295 | 18,295 |
| Nassau County NY Local Economic Assistance & Financing Corp. Revenue | | | | | |
| (Catholic Health Services) | 5.000% | 7/1/15 | | 750 | 772 |
| Nassau County NY Local Economic Assistance & Financing Corp. Revenue | | | | | |
| (Catholic Health Services) | 5.000% | 7/1/19 | | 1,305 | 1,496 |
| Nassau County NY Local Economic Assistance & Financing Corp. Revenue | | | | | |
| (South Nassau Communities Hospital) | 4.000% | 7/1/15 | | 960 | 981 |
| Nassau County NY Local Economic Assistance & Financing Corp. Revenue | | | | | |
| (South Nassau Communities Hospital) | 5.000% | 7/1/17 | | 1,320 | 1,446 |
| Nassau County NY Local Economic Assistance & Financing Corp. Revenue | | | | | |
| (Winthrop University Hospital Association Project) | 4.000% | 7/1/17 | | 1,500 | 1,605 |
| Nassau County NY Local Economic Assistance Corp. Revenue | | | | | |
| (Catholic Health Services of Long Island Obligated Group Project) | 3.000% | 7/1/17 | | 900 | 947 |
| Nassau County NY Local Economic Assistance Corp. Revenue | | | | | |
| (Catholic Health Services of Long Island Obligated Group Project) | 4.000% | 7/1/18 | | 800 | 875 |
| Nassau County NY Local Economic Assistance Corp. Revenue | | | | | |
| (Catholic Health Services of Long Island Obligated Group Project) | 4.000% | 7/1/19 | | 375 | 411 |
| New York City NY GO | 0.150% | 11/3/14 | (4) | 25,900 | 25,900 |
| New York City NY GO | 0.500% | 11/3/14 | (12) | 20,100 | 20,100 |
| New York City NY GO | 0.400% | 11/5/14 | (4) | 28,300 | 28,300 |
| New York City NY GO | 0.450% | 11/6/14 | (4) | 4,100 | 4,100 |
| New York City NY GO | 0.390% | 11/7/14 | (4) | 15,800 | 15,800 |
| New York City NY GO | 0.500% | 11/7/14 | (4) | 1,700 | 1,700 |
| New York City NY GO | 3.000% | 3/1/15 | | 5,135 | 5,183 |
| New York City NY GO | 2.000% | 8/1/15 | | 8,285 | 8,398 |
| New York City NY GO | 2.000% | 8/1/15 | | 63,430 | 64,293 |
| New York City NY GO | 2.000% | 8/1/15 | | 2,690 | 2,727 |
| New York City NY GO | 4.000% | 8/1/15 | | 5,985 | 6,156 |
| New York City NY GO | 5.000% | 8/1/15 | | 5,200 | 5,388 |
| New York City NY GO | 5.000% | 8/1/15 | | 7,075 | 7,330 |
| New York City NY GO | 5.000% | 8/1/15 | | 18,500 | 19,167 |
| New York City NY GO | 5.000% | 8/1/15 | | 1,500 | 1,554 |
| New York City NY GO | 5.000% | 8/1/15 | | 8,000 | 8,289 |
| New York City NY GO | 5.250% | 8/1/15 | | 35 | 35 |
| New York City NY GO | 5.250% | 8/1/15 | | 5 | 5 |
| New York City NY GO | 2.000% | 3/1/16 | | 14,975 | 15,316 |
| New York City NY GO | 5.000% | 8/1/16 | | 2,325 | 2,512 |
| New York City NY GO | 5.000% | 8/1/16 | | 6,000 | 6,481 |
| New York City NY GO | 5.000% | 8/1/16 | | 23,810 | 25,720 |
| New York City NY GO | 5.000% | 8/1/16 | | 5,000 | 5,401 |
| New York City NY GO | 5.000% | 8/1/16 | | 5,000 | 5,401 |
| New York City NY GO | 5.000% | 4/1/17 | | 3,000 | 3,196 |
| New York City NY GO | 4.000% | 8/1/17 | | 5,705 | 6,214 |
| New York City NY GO | 5.000% | 8/1/17 | | 34,730 | 38,769 |
| New York City NY GO | 5.000% | 8/1/17 | | 7,280 | 8,127 |
| New York City NY GO | 5.000% | 8/1/17 | | 44,560 | 49,743 |
| New York City NY GO | 5.000% | 8/1/17 | | 4,305 | 4,806 |
| New York City NY GO | 5.000% | 8/1/17 | | 10,000 | 11,163 |
| New York City NY GO | 5.000% | 8/1/17 | | 33,680 | 37,597 |
| New York City NY GO | 5.000% | 8/1/17 | | 30,990 | 34,594 |
| New York City NY GO | 5.000% | 8/1/17 | | 3,715 | 4,147 |
| New York City NY GO | 5.000% | 8/1/18 | | 3,250 | 3,730 |
| New York City NY GO | 5.000% | 8/1/18 | | 8,790 | 10,089 |
| New York City NY GO | 5.000% | 8/1/19 | | 15,000 | 17,509 |
| 2 New York City NY GO | 0.430% | 8/1/21 | | 4,700 | 4,701 |
| 2 New York City NY GO | 0.520% | 8/1/21 | | 6,325 | 6,327 |
16
Short-Term Tax-Exempt Fund
| | | | | | |
| | | | | | Face | Market |
| | | | Maturity | | Amount | Value• |
| | | Coupon | Date | | ($000) | ($000) |
| 1 | New York City NY GO TOB VRDO | 0.060% | 11/7/14 | | 5,090 | 5,090 |
| | New York City NY Health & Hospital Corp. Revenue (Health System) | 5.000% | 2/15/15 | | 4,000 | 4,055 |
| | New York City NY Housing Development Corp. Multi-Family Housing Revenue | 1.150% | 11/1/15 | | 17,000 | 17,101 |
| | New York City NY Housing Development Corp. Multi-Family Housing Revenue | 0.950% | 5/1/16 | | 30,000 | 30,013 |
| | New York City NY Housing Development Corp. Multi-Family Housing Revenue | 0.400% | 11/1/16 | | 9,500 | 9,489 |
| | New York City NY Housing Development Corp. Multi-Family Housing Revenue | 1.100% | 11/1/16 | | 8,865 | 8,868 |
| | New York City NY Housing Development Corp. Multi-Family Housing Revenue | 0.850% | 11/1/17 | | 6,215 | 6,227 |
| | New York City NY Housing Development Corp. Multi-Family Housing Revenue | 1.250% | 5/1/18 | | 2,390 | 2,396 |
| | New York City NY Housing Development Corp. Multi-Family Housing Revenue | 1.250% | 5/1/18 | | 10,010 | 10,031 |
| | New York City NY Housing Development Corp. Multi-Family Housing Revenue PUT | 1.000% | 10/26/17 | | 4,705 | 4,706 |
| 1 | New York City NY Housing Development Corp. Multi-Family Housing Revenue TOB VRDO | 0.200% | 11/7/14 | | 9,485 | 9,485 |
| | New York City NY Municipal Water Finance Authority Water & Sewer System Revenue | 5.000% | 6/15/16 | (ETM) | 2,500 | 2,690 |
| | New York City NY Municipal Water Finance Authority Water & Sewer System Revenue | 5.000% | 6/15/18 | | 4,180 | 4,582 |
| | New York City NY Municipal Water Finance Authority Water & Sewer System Revenue | 5.000% | 6/15/19 | | 3,100 | 3,515 |
| 1 | New York City NY Municipal Water Finance Authority Water & Sewer System Revenue TOB VRDO | 0.050% | 11/7/14 | | 5,840 | 5,840 |
| | New York City NY Municipal Water Finance Authority Water & Sewer System Revenue VRDO | 0.060% | 11/3/14 | | 14,850 | 14,850 |
| | New York City NY Municipal Water Finance Authority Water & Sewer System Revenue VRDO | 0.070% | 11/3/14 | | 13,400 | 13,400 |
| | New York City NY Municipal Water Finance Authority Water & Sewer System Revenue VRDO | 0.070% | 11/3/14 | | 9,800 | 9,800 |
| | New York City NY Municipal Water Finance Authority Water & Sewer System Revenue VRDO | 0.070% | 11/3/14 | | 5,300 | 5,300 |
| | New York City NY Municipal Water Finance Authority Water & Sewer System Revenue VRDO | 0.040% | 11/7/14 | | 28,975 | 28,975 |
| 1 | New York City NY Transitional Finance Authority Building Aid Revenue TOB VRDO | 0.060% | 11/6/14 | | 5,000 | 5,000 |
| 1 | New York City NY Transitional Finance Authority Building Aid Revenue TOB VRDO | 0.070% | 11/7/14 | | 25,650 | 25,650 |
| | New York City NY Transitional Finance Authority Future Tax Revenue | 5.000% | 11/1/14 | (ETM) | 9,460 | 9,460 |
| | New York City NY Transitional Finance Authority Future Tax Revenue | 5.000% | 11/1/14 | | 16,290 | 16,290 |
| | New York City NY Transitional Finance Authority Future Tax Revenue | 0.260% | 11/6/14 | (4) | 21,600 | 21,600 |
| | New York City NY Transitional Finance Authority Future Tax Revenue | 0.390% | 11/7/14 | (4) | 55,025 | 55,025 |
| | New York City NY Transitional Finance Authority Future Tax Revenue | 5.000% | 11/1/15 | (ETM) | 1,070 | 1,121 |
| | New York City NY Transitional Finance Authority Future Tax Revenue | 5.000% | 11/1/15 | | 9,125 | 9,568 |
| | New York City NY Transitional Finance Authority Future Tax Revenue | 5.000% | 2/1/16 | (ETM) | 1,000 | 1,059 |
| | New York City NY Transitional Finance Authority Future Tax Revenue | 3.000% | 11/1/16 | | 2,560 | 2,695 |
| | New York City NY Transitional Finance Authority Future Tax Revenue | 5.000% | 11/1/16 | | 3,500 | 3,584 |
| | New York City NY Transitional Finance Authority Future Tax Revenue | 5.000% | 11/1/16 | | 10,000 | 10,924 |
| | New York City NY Transitional Finance Authority Future Tax Revenue | 5.000% | 11/1/16 | (ETM) | 115 | 126 |
| | New York City NY Transitional Finance Authority Future Tax Revenue | 5.000% | 11/1/16 | | 3,885 | 4,244 |
| | New York City NY Transitional Finance Authority Future Tax Revenue | 5.000% | 11/1/16 | | 5,495 | 6,003 |
| 1 | New York City NY Transitional Finance Authority Future Tax Revenue TOB VRDO | 0.060% | 11/7/14 | | 2,200 | 2,200 |
| | New York City NY Transitional Finance Authority Future Tax Revenue VRDO | 0.060% | 11/3/14 | | 8,505 | 8,505 |
| | New York City NY Transitional Finance Authority Future Tax Revenue VRDO | 0.060% | 11/3/14 | | 4,000 | 4,000 |
| | New York City NY Trust for Cultural Resources Revenue (Museum of Modern Art) | 4.000% | 8/1/17 | | 6,250 | 6,818 |
| | New York City NY Trust for Cultural Resources Revenue (The Juilliard School) PUT | 2.100% | 7/1/15 | | 14,000 | 14,179 |
| 1 | New York Liberty Development Corp. Revenue (Port Authority Consolidated Bonds) TOB VRDO | 0.070% | 11/7/14 | | 26,835 | 26,835 |
| | New York Metropolitan Transportation Authority Revenue | 3.000% | 11/15/14 | | 1,225 | 1,226 |
| | New York Metropolitan Transportation Authority Revenue | 4.000% | 11/15/14 | | 3,000 | 3,005 |
| | New York Metropolitan Transportation Authority Revenue | 5.000% | 11/15/14 | | 3,500 | 3,507 |
| | New York Metropolitan Transportation Authority Revenue | 5.000% | 11/15/14 | | 2,675 | 2,680 |
| | New York Metropolitan Transportation Authority Revenue | 4.000% | 11/15/15 | | 8,000 | 8,311 |
| | New York Metropolitan Transportation Authority Revenue | 4.000% | 11/15/15 | | 3,030 | 3,148 |
| | New York Metropolitan Transportation Authority Revenue | 4.000% | 11/15/15 | | 3,895 | 4,046 |
| | New York Metropolitan Transportation Authority Revenue | 5.000% | 11/15/15 | | 2,355 | 2,472 |
| | New York Metropolitan Transportation Authority Revenue | 5.000% | 11/15/15 | | 5,130 | 5,384 |
| | New York Metropolitan Transportation Authority Revenue | 5.000% | 11/15/15 | | 5,435 | 5,704 |
| 2 | New York Metropolitan Transportation Authority Revenue | 0.792% | 11/1/16 | | 3,500 | 3,526 |
| | New York Metropolitan Transportation Authority Revenue | 5.000% | 11/15/16 | | 2,650 | 2,894 |
| 2 | New York Metropolitan Transportation Authority Revenue | 0.932% | 11/1/17 | | 2,950 | 2,985 |
| | New York Metropolitan Transportation Authority Revenue | 5.000% | 11/15/17 | | 1,190 | 1,343 |
| | New York Metropolitan Transportation Authority Revenue | 5.000% | 11/15/17 | | 12,500 | 14,111 |
| | New York Metropolitan Transportation Authority Revenue | 5.000% | 11/15/18 | | 4,055 | 4,687 |
| | New York Metropolitan Transportation Authority Revenue | 5.000% | 11/15/18 | | 3,500 | 4,046 |
| 1 | New York Metropolitan Transportation Authority Revenue (Dedicated Petroleum Tax) TOB VRDO | 0.050% | 11/7/14 | (13) | 24,900 | 24,900 |
| 2 | New York Metropolitan Transportation Authority Revenue (Dedicated Tax Fund) PUT | 0.430% | 6/1/17 | | 20,455 | 20,457 |
| 2,3 | New York Metropolitan Transportation Authority Revenue (Dedicated Tax Fund) PUT | 0.280% | 11/1/18 | | 2,000 | 2,000 |
| 2 | New York Metropolitan Transportation Authority Revenue (Dedicated Tax Fund) PUT | 0.630% | 11/1/19 | | 21,000 | 20,997 |
| 2,3 | New York Metropolitan Transportation Authority Revenue (Dedicated Tax Fund) PUT | 0.730% | 11/1/19 | | 9,070 | 9,069 |
| | New York Metropolitan Transportation Authority Revenue (Transit Revenue) | 4.000% | 11/15/14 | | 1,135 | 1,137 |
| | New York Metropolitan Transportation Authority Revenue (Transit Revenue) | 5.000% | 11/15/15 | | 2,000 | 2,099 |
| | New York Metropolitan Transportation Authority Revenue (Transit Revenue) | 5.000% | 11/15/15 | | 1,625 | 1,705 |
| | New York Metropolitan Transportation Authority Revenue (Transit Revenue) | 4.000% | 11/15/16 | | 1,000 | 1,072 |
| | New York Metropolitan Transportation Authority Revenue (Transit Revenue) | 5.000% | 11/15/16 | | 2,250 | 2,457 |
| | New York Metropolitan Transportation Authority Revenue (Transit Revenue) | 5.000% | 11/15/17 | | 1,200 | 1,355 |
| | New York Metropolitan Transportation Authority Revenue (Transit Revenue) PUT | 5.000% | 11/15/14 | | 7,985 | 8,000 |
| 2 | New York Metropolitan Transportation Authority Revenue PUT | 0.632% | 11/1/15 | | 36,300 | 36,364 |
17
Short-Term Tax-Exempt Fund
| | | | | | |
| | | | | | Face | Market |
| | | | Maturity | | Amount | Value• |
| | | Coupon | Date | | ($000) | ($000) |
| 2 | New York Metropolitan Transportation Authority Revenue PUT | 0.752% | 11/1/15 | | 11,700 | 11,741 |
| 2 | New York Metropolitan Transportation Authority Revenue PUT | 0.320% | 5/15/16 | | 15,000 | 15,002 |
| 2 | New York Metropolitan Transportation Authority Revenue PUT | 0.952% | 11/1/16 | | 15,510 | 15,674 |
| 2 | New York Metropolitan Transportation Authority Revenue PUT | 0.575% | 5/15/17 | (4) | 17,500 | 17,513 |
| 2 | New York Metropolitan Transportation Authority Revenue PUT | 0.452% | 11/1/17 | | 2,280 | 2,286 |
| 2,3 | New York Metropolitan Transportation Authority Revenue PUT | 0.000% | 11/15/17 | | 44,600 | 44,564 |
| 2 | New York Metropolitan Transportation Authority Revenue PUT | 0.705% | 5/15/18 | (4) | 3,500 | 3,508 |
| 1 | New York Metropolitan Transportation Authority Revenue TOB VRDO | 0.060% | 11/7/14 | (13) | 19,780 | 19,780 |
| 1 | New York State Dormitory Authority Lease Revenue | | | | | |
| | (State University Dormitory Facilities) TOB VRDO | 0.060% | 11/7/14 | | 8,995 | 8,995 |
| | New York State Dormitory Authority Revenue (Brooklyn Law School) | 4.000% | 7/1/15 | (ETM) | 1,760 | 1,805 |
| | New York State Dormitory Authority Revenue (Brooklyn Law School) | 5.000% | 7/1/16 | (ETM) | 1,750 | 1,885 |
| | New York State Dormitory Authority Revenue (City University System) | 5.000% | 7/1/15 | | 11,410 | 11,780 |
| | New York State Dormitory Authority Revenue (City University System) | 5.000% | 7/1/16 | (14) | 5,000 | 5,157 |
| 1 | New York State Dormitory Authority Revenue (Columbia University) TOB VRDO | 0.060% | 11/7/14 | | 8,535 | 8,535 |
| | New York State Dormitory Authority Revenue (Mental Health Services Facilities Improvement) | 5.000% | 2/15/15 | (ETM) | 10 | 10 |
| | New York State Dormitory Authority Revenue (Mental Health Services Facilities Improvement) | 5.000% | 2/15/15 | | 2,435 | 2,470 |
| | New York State Dormitory Authority Revenue (Mental Health Services Facilities Improvement) | 5.000% | 8/15/15 | (ETM) | 15 | 16 |
| | New York State Dormitory Authority Revenue (Mental Health Services Facilities Improvement) | 5.000% | 8/15/15 | | 5,110 | 5,306 |
| | New York State Dormitory Authority Revenue | | | | | |
| | (Mount Sinai School of Medicine of New York University) | 5.000% | 7/1/15 | | 2,095 | 2,161 |
| | New York State Dormitory Authority Revenue (North Shore–Long Island Jewish Obligated Group) | 5.000% | 5/1/15 | | 2,450 | 2,507 |
| | New York State Dormitory Authority Revenue (North Shore–Long Island Jewish Obligated Group) | 5.000% | 5/1/16 | | 1,725 | 1,840 |
| | New York State Dormitory Authority Revenue (North Shore–Long Island Jewish Obligated Group) | 5.000% | 5/1/17 | | 2,000 | 2,201 |
| | New York State Dormitory Authority Revenue (North Shore–Long Island Jewish Obligated Group) | 5.000% | 5/1/18 | | 2,500 | 2,819 |
| | New York State Dormitory Authority Revenue (Personal Income Tax) | 5.000% | 2/15/15 | (ETM) | 10 | 10 |
| | New York State Dormitory Authority Revenue (Personal Income Tax) | 5.000% | 2/15/15 | | 14,115 | 14,314 |
| | New York State Dormitory Authority Revenue (Personal Income Tax) | 5.000% | 2/15/15 | | 9,880 | 10,019 |
| | New York State Dormitory Authority Revenue (Personal Income Tax) | 5.000% | 3/15/15 | | 2,625 | 2,673 |
| | New York State Dormitory Authority Revenue (Personal Income Tax) | 5.000% | 3/15/15 | | 1,000 | 1,018 |
| | New York State Dormitory Authority Revenue (Personal Income Tax) | 5.000% | 2/15/16 | (ETM) | 5 | 5 |
| | New York State Dormitory Authority Revenue (Personal Income Tax) | 5.000% | 2/15/16 | | 10,235 | 10,860 |
| | New York State Dormitory Authority Revenue (Personal Income Tax) | 5.000% | 3/15/16 | | 1,000 | 1,065 |
| | New York State Dormitory Authority Revenue (Personal Income Tax) | 5.000% | 3/15/16 | | 3,380 | 3,599 |
| 1 | New York State Dormitory Authority Revenue (Personal Income Tax) TOB VRDO | 0.060% | 11/7/14 | | 5,000 | 5,000 |
| 1 | New York State Dormitory Authority Revenue (Personal Income Tax) TOB VRDO | 0.060% | 11/7/14 | | 9,210 | 9,210 |
| 1 | New York State Dormitory Authority Revenue (Personal Income Tax) TOB VRDO | 0.060% | 11/7/14 | | 3,060 | 3,060 |
| | New York State Dormitory Authority Revenue (Rockefeller University) VRDO | 0.050% | 11/7/14 | | 46,415 | 46,415 |
| | New York State Dormitory Authority Revenue (School Districts Financing Program) | 4.000% | 10/1/15 | (15) | 400 | 414 |
| | New York State Dormitory Authority Revenue (School Districts Financing Program) | 5.000% | 10/1/15 | (4) | 4,600 | 4,803 |
| | New York State Dormitory Authority Revenue (School Districts Financing Program) | 5.000% | 10/1/15 | | 3,000 | 3,128 |
| | New York State Dormitory Authority Revenue (School Districts Financing Program) | 4.000% | 10/1/16 | (4) | 4,000 | 4,268 |
| | New York State Dormitory Authority Revenue (School Districts Financing Program) | 5.000% | 10/1/16 | (4) | 2,500 | 2,719 |
| | New York State Dormitory Authority Revenue (School Districts Financing Program) | 5.000% | 10/1/16 | (15) | 375 | 408 |
| | New York State Dormitory Authority Revenue (School Districts Financing Program) | 5.000% | 10/1/16 | | 10,205 | 11,091 |
| | New York State Dormitory Authority Revenue (School Districts Financing Program) | 5.000% | 10/1/16 | (4) | 5,000 | 5,438 |
| | New York State Dormitory Authority Revenue (School Districts Financing Program) | 5.000% | 10/1/17 | (4) | 3,300 | 3,713 |
| | New York State Dormitory Authority Revenue (School Districts Financing Program) | 5.000% | 10/1/17 | | 3,445 | 3,847 |
| | New York State Dormitory Authority Revenue (School Districts Financing Program) | 5.000% | 10/1/17 | (15) | 500 | 563 |
| | New York State Dormitory Authority Revenue (School Districts Financing Program) | 5.000% | 10/1/18 | (15) | 1,000 | 1,154 |
| | New York State Dormitory Authority Revenue (School Districts Financing Program) | 5.000% | 10/1/18 | | 2,160 | 2,471 |
| | New York State Energy Research & Development Authority Pollution Control Revenue | | | | | |
| | (New York State Electric & Gas Corp. Project) | 2.125% | 3/15/15 | | 7,000 | 7,037 |
| | New York State Energy Research & Development Authority Pollution Control Revenue | | | | | |
| | (New York State Electric & Gas Corp. Project) | 2.250% | 12/1/15 | | 7,000 | 7,108 |
| | New York State Environmental Facilities Corp. Revenue | | | | | |
| | (State Clean Water & Drinking Water Revolving Funds) | 5.000% | 6/15/15 | | 535 | 537 |
| | New York State Housing Finance Agency Affordable Housing Revenue | 0.800% | 11/1/16 | | 2,750 | 2,763 |
| | New York State Housing Finance Agency Affordable Housing Revenue | 0.800% | 11/1/16 | | 2,500 | 2,513 |
| | New York State Housing Finance Agency Affordable Housing Revenue | 0.750% | 5/1/17 | | 4,850 | 4,842 |
| | New York State Housing Finance Agency Affordable Housing Revenue | 0.750% | 5/1/17 | | 2,505 | 2,501 |
| | New York State Housing Finance Agency Affordable Housing Revenue | 0.750% | 5/1/17 | | 6,705 | 6,694 |
| | New York State Housing Finance Agency Affordable Housing Revenue | 0.850% | 11/1/17 | | 6,890 | 6,895 |
| | New York State Housing Finance Agency Affordable Housing Revenue | 0.850% | 11/1/17 | | 6,000 | 6,007 |
| | New York State Housing Finance Agency Affordable Housing Revenue | 1.250% | 5/1/18 | | 2,500 | 2,502 |
| | New York State Housing Finance Agency Affordable Housing Revenue | 1.250% | 5/1/18 | | 4,750 | 4,756 |
| | New York State Housing Finance Agency Housing Revenue | 1.150% | 11/1/16 | | 7,000 | 7,087 |
| 3 | New York State Housing Finance Agency Housing Revenue | 0.900% | 11/1/17 | | 5,000 | 4,993 |
| 3 | New York State Housing Finance Agency Housing Revenue | 0.900% | 11/1/17 | | 6,000 | 5,992 |
| | New York State Housing Finance Agency Housing Revenue (20 River Terrace Housing) VRDO | 0.050% | 11/7/14 | LOC | 41,500 | 41,500 |
| | New York State Housing Finance Agency Housing Revenue (West 17th Street) VRDO | 0.050% | 11/7/14 | LOC | 4,600 | 4,600 |
18
Short-Term Tax-Exempt Fund
| | | | | | |
| | | | | | Face | Market |
| | | | Maturity | | Amount | Value• |
| | | Coupon | Date | | ($000) | ($000) |
| | New York State Housing Finance Agency Revenue (Personal Income Tax) VRDO | 0.050% | 11/7/14 | | 13,300 | 13,300 |
| | New York State Local Government Assistance Corp. Revenue VRDO | 0.050% | 11/7/14 | | 8,900 | 8,900 |
| | New York State Local Government Assistance Corp. Revenue VRDO | 0.050% | 11/7/14 | | 22,700 | 22,700 |
| | New York State Thruway Authority Revenue | 4.000% | 1/1/15 | | 2,000 | 2,013 |
| | New York State Thruway Authority Revenue | 5.000% | 1/1/17 | | 2,000 | 2,189 |
| | New York State Thruway Authority Revenue | 5.000% | 1/1/18 | | 1,500 | 1,689 |
| | New York State Thruway Authority Revenue | 5.000% | 5/1/19 | | 41,875 | 48,448 |
| | New York State Thruway Authority Revenue (Highway & Bridge Trust Fund) | 4.000% | 4/1/15 | | 8,500 | 8,636 |
| | New York State Thruway Authority Revenue (Highway & Bridge Trust Fund) | 4.000% | 4/1/15 | | 2,840 | 2,886 |
| | New York State Thruway Authority Revenue (Highway & Bridge Trust Fund) | 5.000% | 4/1/15 | | 15,000 | 15,303 |
| | New York State Thruway Authority Revenue (Highway & Bridge Trust Fund) | 5.000% | 4/1/15 | (4) | 1,115 | 1,138 |
| | New York State Thruway Authority Revenue (Highway & Bridge Trust Fund) | 5.000% | 4/1/15 | | 1,450 | 1,479 |
| | New York State Thruway Authority Revenue (Highway & Bridge Trust Fund) | 5.000% | 4/1/16 | (14) | 2,875 | 2,999 |
| | New York State Thruway Authority Revenue (Highway & Bridge Trust Fund) | 5.000% | 4/1/17 | (14) | 1,735 | 1,810 |
| | New York State Thruway Authority Revenue (Second Generation Highway & Bridge Trust Fund) | 5.000% | 4/1/15 | | 7,000 | 7,142 |
| | New York State Urban Development Corp. Revenue | 5.000% | 1/1/16 | | 10,000 | 10,557 |
| | New York State Urban Development Corp. Revenue (Personal Income Tax) | 5.000% | 12/15/14 | | 27,460 | 27,624 |
| | New York State Urban Development Corp. Revenue (Personal Income Tax) | 5.000% | 3/15/16 | | 23,880 | 25,427 |
| | New York State Urban Development Corp. Revenue (Personal Income Tax) | 5.000% | 3/15/17 | | 10,090 | 11,149 |
| | New York State Urban Development Corp. Revenue (Service Contract) | 5.000% | 1/1/15 | | 27,900 | 28,129 |
| | New York State Urban Development Corp. Revenue (Service Contract) | 5.000% | 1/1/16 | | 25,000 | 26,391 |
| | New York State Urban Development Corp. Revenue (Service Contract) VRDO | 0.050% | 11/7/14 | | 17,300 | 17,300 |
| | New York State Urban Development Corp. Revenue (Service Contract) VRDO | 0.060% | 11/7/14 | | 45,980 | 45,980 |
| | New York State Urban Development Corp. Revenue (Service Contract) VRDO | 0.070% | 11/7/14 | | 22,625 | 22,625 |
| 1,2 | Nuveen New York AMT-Free Municipal Income Fund iMTP | 0.670% | 10/1/17 | | 17,500 | 17,505 |
| | Onondaga County NY Civic Development Corp. Revenue (St. Joseph’s Hospital & Health Center) | 5.000% | 7/1/19 | | 500 | 538 |
| | Oyster Bay NY BAN | 1.500% | 2/6/15 | | 51,120 | 51,226 |
| | Oyster Bay NY GO | 3.250% | 8/1/15 | | 7,835 | 7,995 |
| | Oyster Bay NY GO | 3.250% | 8/1/16 | | 8,070 | 8,389 |
| | Oyster Bay NY GO | 3.250% | 8/1/17 | | 4,155 | 4,370 |
| | Port Authority of New York & New Jersey Revenue | 5.000% | 8/15/18 | (4) | 2,855 | 3,178 |
| | Suffolk County NY Economic Development Corp. Revenue (Catholic Health Services) | 5.000% | 7/1/16 | | 1,250 | 1,338 |
| | Suffolk County NY GO | 3.000% | 2/1/15 | | 2,460 | 2,476 |
| | Suffolk County NY GO | 5.000% | 2/1/16 | (4) | 4,250 | 4,493 |
| | Suffolk County NY GO | 5.000% | 2/1/17 | (4) | 3,415 | 3,744 |
| | Suffolk County NY RAN | 1.500% | 3/26/15 | | 12,250 | 12,293 |
| | Tobacco Settlement Financing Corp. New York Revenue | 5.000% | 6/1/15 | | 15,000 | 15,427 |
| | Tobacco Settlement Financing Corp. New York Revenue | 5.000% | 6/1/19 | | 12,500 | 12,842 |
| | Tobacco Settlement Financing Corp. New York Revenue | 5.000% | 6/1/20 | | 10,000 | 10,718 |
| | Tobacco Settlement Financing Corp. New York Revenue | 5.000% | 6/1/20 | | 1,500 | 1,541 |
| | Tobacco Settlement Financing Corp. New York Revenue | 5.000% | 6/1/20 | | 6,250 | 6,697 |
| | Triborough Bridge & Tunnel Authority New York BAN | 5.000% | 5/15/15 | | 37,500 | 38,480 |
| | Triborough Bridge & Tunnel Authority New York Revenue | 5.250% | 11/15/15 | | 6,500 | 6,844 |
| | Triborough Bridge & Tunnel Authority New York Revenue | 5.000% | 11/15/16 | | 8,570 | 9,372 |
| 2 | Triborough Bridge & Tunnel Authority New York Revenue | 0.300% | 1/1/17 | (4) | 10,700 | 10,716 |
| 2 | Triborough Bridge & Tunnel Authority New York Revenue | 0.400% | 1/1/18 | (4) | 5,000 | 5,009 |
| 2 | Triborough Bridge & Tunnel Authority New York Revenue | 0.490% | 1/1/19 | (4) | 1,450 | 1,452 |
| | Triborough Bridge & Tunnel Authority New York Revenue PUT | 5.000% | 11/15/14 | | 8,445 | 8,461 |
| 2 | Triborough Bridge & Tunnel Authority New York Revenue PUT | 0.472% | 1/1/15 | | 5,500 | 5,501 |
| 2 | Triborough Bridge & Tunnel Authority New York Revenue PUT | 0.482% | 1/4/16 | | 8,000 | 8,002 |
| 2 | Triborough Bridge & Tunnel Authority New York Revenue PUT | 0.622% | 1/3/17 | | 5,000 | 5,012 |
| | Utility Debt Securitization Authority New York Revenue | 5.000% | 12/15/16 | | 18,135 | 18,242 |
| | Utility Debt Securitization Authority New York Revenue | 5.000% | 12/15/17 | | 875 | 921 |
| | Utility Debt Securitization Authority New York Revenue | 5.000% | 6/15/18 | | 875 | 942 |
| | Utility Debt Securitization Authority New York Revenue | 5.000% | 12/15/18 | | 635 | 698 |
| | Yonkers NY GO | 3.000% | 7/1/16 | | 1,300 | 1,350 |
| | Yonkers NY GO | 3.000% | 8/15/16 | | 675 | 703 |
| | Yonkers NY GO | 3.000% | 7/1/17 | | 1,005 | 1,056 |
| | Yonkers NY GO | 3.000% | 8/15/17 | | 510 | 537 |
| | | | | | | 2,415,879 |
| North Carolina (1.6%) | | | | | |
| | Cabarrus NC COP | 4.000% | 1/1/15 | | 2,975 | 2,994 |
| | Charlotte NC GO | 5.000% | 7/1/15 | | 850 | 878 |
| | Charlotte NC GO | 5.000% | 7/1/18 | | 5,000 | 5,757 |
| | Charlotte NC Water & Sewer System Revenue | 4.000% | 12/1/15 | | 2,140 | 2,227 |
| | Charlotte NC Water & Sewer System Revenue | 5.000% | 12/1/16 | | 1,390 | 1,522 |
| | Charlotte-Mecklenburg NC Hospital Authority Health Care System Revenue | | | | | |
| | (Carolinas HealthCare System) | 5.000% | 1/15/16 | | 530 | 559 |
| 1 | Charlotte-Mecklenburg NC Hospital Authority Health Care System Revenue | | | | | |
| | (Carolinas HealthCare System) TOB VRDO | 0.070% | 11/7/14 | | 3,350 | 3,350 |
19
Short-Term Tax-Exempt Fund
| | | | | |
| | | | | Face | Market |
| | | Maturity | | Amount | Value• |
| | Coupon | Date | | ($000) | ($000) |
| Charlotte-Mecklenburg NC Hospital Authority Health Care System Revenue | | | | | |
| (Carolinas HealthCare System) VRDO | 0.050% | 11/7/14 | | 44,100 | 44,100 |
| 1 Johnston NC Memorial Hospital Authority Revenue TOB VRDO | 0.100% | 11/7/14 | (4) | 4,920 | 4,920 |
| 1 Johnston NC Memorial Hospital Authority Revenue TOB VRDO | 0.100% | 11/7/14 | (4) | 6,427 | 6,427 |
| New Hanover County NC Hospital Revenue (New Hanover Regional Medical Center Project) | 4.000% | 10/1/17 | | 2,585 | 2,814 |
| New Hanover County NC Hospital Revenue (New Hanover Regional Medical Center Project) | 4.000% | 10/1/18 | | 1,480 | 1,636 |
| North Carolina Capital Facilities Finance Agency Solid Waste Disposal Revenue | | | | | |
| (Republic Services, Inc. Project) PUT | 0.300% | 12/1/14 | | 24,750 | 24,739 |
| North Carolina Eastern Municipal Power Agency Power Systems Revenue | 5.000% | 1/1/15 | | 5,000 | 5,041 |
| North Carolina Eastern Municipal Power Agency Power Systems Revenue | 5.000% | 1/1/15 | | 2,300 | 2,319 |
| North Carolina Eastern Municipal Power Agency Power Systems Revenue | 5.000% | 1/1/16 | | 1,200 | 1,265 |
| North Carolina Eastern Municipal Power Agency Power Systems Revenue | 5.000% | 1/1/17 | | 5,000 | 5,465 |
| North Carolina Eastern Municipal Power Agency Power Systems Revenue | 5.000% | 1/1/17 | | 10,555 | 11,536 |
| North Carolina GO | 5.000% | 3/1/15 | (Prere.) | 4,710 | 4,786 |
| North Carolina GO | 5.000% | 3/1/15 | (Prere.) | 290 | 295 |
| North Carolina GO | 5.000% | 4/1/16 | | 2,200 | 2,347 |
| North Carolina GO | 5.000% | 3/1/18 | | 4,770 | 5,410 |
| North Carolina Medical Care Commission Health Care Facilities Revenue | | | | | |
| (Cape Fear Valley Health System) | 4.000% | 10/1/17 | | 3,725 | 4,063 |
| North Carolina Medical Care Commission Health Care Facilities Revenue | | | | | |
| (Cape Fear Valley Health System) | 5.000% | 10/1/18 | | 3,780 | 4,300 |
| 2 North Carolina Medical Care Commission Health Care Facilities Revenue | | | | | |
| (Wake Forest Baptist Obligated Group) PUT | 0.790% | 12/1/17 | | 8,570 | 8,548 |
| North Carolina Medical Care Commission Hospital Revenue (North Carolina Baptist Hospital) | 5.000% | 6/1/15 | | 1,500 | 1,542 |
| North Carolina Medical Care Commission Hospital Revenue | | | | | |
| (Southeastern Regional Medical Center) | 4.000% | 6/1/17 | | 620 | 669 |
| North Carolina Medical Care Commission Hospital Revenue | | | | | |
| (Southeastern Regional Medical Center) | 4.000% | 6/1/18 | | 500 | 547 |
| North Carolina Municipal Power Agency Revenue | 5.000% | 1/1/15 | | 5,650 | 5,696 |
| North Carolina Municipal Power Agency Revenue | 5.000% | 1/1/16 | | 5,000 | 5,273 |
| Orange County NC Public Facilities Co. Revenue | 5.000% | 10/1/15 | | 1,680 | 1,754 |
| Orange County NC Public Facilities Co. Revenue | 5.000% | 10/1/16 | | 1,250 | 1,360 |
| Orange County NC Public Facilities Co. Revenue | 5.000% | 10/1/18 | | 1,695 | 1,956 |
| Wake County NC GO | 5.000% | 2/1/16 | | 1,310 | 1,387 |
| Wake County NC GO | 4.000% | 2/1/17 | | 6,440 | 6,949 |
| Wake County NC GO | 5.000% | 9/1/17 | | 9,000 | 10,117 |
| Winston-Salem NC Water & Sewer System Revenue VRDO | 0.040% | 11/7/14 | | 8,710 | 8,710 |
| | | | | | 203,258 |
| Ohio (2.7%) | | | | | |
| Akron OH Bath & Copley Joint Township Hospital District Revenue | | | | | |
| (Akron General Health System) VRDO | 0.070% | 11/7/14 | LOC | 19,500 | 19,500 |
| American Municipal Power Ohio Inc. Revenue (Fremont Energy Center Project) | 5.000% | 2/15/17 | | 1,000 | 1,098 |
| American Municipal Power Ohio Inc. Revenue (Fremont Energy Center Project) | 5.000% | 2/15/18 | | 1,480 | 1,674 |
| Buckeye Tobacco Settlement Financing Authority Ohio Revenue | 5.000% | 6/1/15 | | 2,500 | 2,552 |
| Central Ohio Solid Waste Authority GO | 4.000% | 12/1/16 | (ETM) | 150 | 161 |
| Central Ohio Solid Waste Authority GO | 4.000% | 12/1/16 | | 1,550 | 1,661 |
| Central Ohio Solid Waste Authority GO | 4.000% | 12/1/17 | (ETM) | 150 | 165 |
| Central Ohio Solid Waste Authority GO | 4.000% | 12/1/17 | | 1,525 | 1,675 |
| Cleveland-Cuyahoga County OH Port Authority Revenue | | | | | |
| (Carnegie/89th Garage & Service Center LLC Project) VRDO | 0.050% | 11/7/14 | LOC | 33,690 | 33,690 |
| Cleveland-Cuyahoga County OH Port Authority Revenue | | | | | |
| (Cleveland Museum of Art Project) VRDO | 0.040% | 11/7/14 | | 2,600 | 2,600 |
| Cleveland-Cuyahoga County OH Port Authority Revenue | | | | | |
| (Cleveland Museum of Art Project) VRDO | 0.050% | 11/7/14 | | 14,100 | 14,100 |
| Cleveland-Cuyahoga County OH Port Authority Revenue (SPC Buildings 1 & 3 LLC) VRDO | 0.050% | 11/7/14 | LOC | 28,880 | 28,880 |
| Columbus OH GO | 5.000% | 7/1/15 | | 3,000 | 3,098 |
| Columbus OH GO | 5.000% | 7/1/15 | | 2,310 | 2,385 |
| Columbus OH GO | 5.000% | 7/1/15 | | 6,735 | 6,954 |
| Columbus OH GO | 5.000% | 12/15/15 | | 3,210 | 3,306 |
| Columbus OH GO | 5.000% | 2/15/16 | | 1,715 | 1,819 |
| Columbus OH GO | 5.000% | 7/1/16 | | 6,760 | 7,283 |
| Dayton OH City School District GO | 4.000% | 11/1/16 | | 3,000 | 3,210 |
| Euclid OH BAN | 1.125% | 6/11/15 | | 1,755 | 1,760 |
| Fairfield County OH Hospital Facilities Revenue (Fairfield Medical Center) | 4.000% | 6/15/16 | | 1,000 | 1,044 |
| Fairfield County OH Hospital Facilities Revenue (Fairfield Medical Center) | 5.000% | 6/15/18 | | 1,000 | 1,102 |
| Franklin County OH Hospital Facilities Revenue (Doctors OhioHealth Corp.) VRDO | 0.050% | 11/7/14 | LOC | 3,900 | 3,900 |
| Franklin County OH Hospital Facilities Revenue (OhioHealth Corp.) PUT | 5.000% | 7/12/17 | | 7,500 | 8,365 |
| Franklin County OH Hospital Revenue (Nationwide Children’s Hospital Project) VRDO | 0.050% | 11/7/14 | | 12,460 | 12,460 |
| Hamilton County OH Hospital Facilities Revenue (UC Health) | 4.000% | 2/1/15 | | 400 | 404 |
| Hamilton County OH Hospital Facilities Revenue (UC Health) | 4.000% | 2/1/16 | | 400 | 417 |
| Hamilton County OH Hospital Facilities Revenue (UC Health) | 4.000% | 2/1/17 | | 375 | 401 |
20
Short-Term Tax-Exempt Fund
| | | | | |
| | | | | Face | Market |
| | | Maturity | | Amount | Value• |
| | Coupon | Date | | ($000) | ($000) |
| Hamilton County OH Hospital Facilities Revenue (UC Health) | 4.000% | 2/1/18 | | 525 | 570 |
| 1 Lorain County OH Hospital Facilities Revenue (Catholic Healthcare Partners) TOB PUT | 0.310% | 7/9/15 | | 20,000 | 20,000 |
| 1 Miami University of Ohio General Receipts Revenue TOB VRDO | 0.060% | 11/7/14 | | 3,365 | 3,365 |
| 1 Montgomery County OH Revenue (Catholic Health Initiatives) TOB VRDO | 0.250% | 11/7/14 | | 6,970 | 6,970 |
| Montgomery County OH Revenue (Miami Valley Hospital) VRDO | 0.060% | 11/3/14 | | 1,300 | 1,300 |
| Ohio Air Quality Development Authority Pollution Control Revenue | | | | | |
| (FirstEnergy Generation Corp. Project) PUT | 3.100% | 3/1/19 | | 5,500 | 5,585 |
| Ohio Common Schools GO | 5.000% | 9/15/15 | | 5,000 | 5,211 |
| Ohio Common Schools GO | 5.000% | 3/15/18 | | 10,860 | 12,381 |
| Ohio GO | 5.000% | 9/15/15 | | 10,000 | 10,422 |
| Ohio GO | 5.500% | 9/15/15 | | 3,000 | 3,140 |
| Ohio GO | 3.000% | 5/1/16 | | 10,480 | 10,899 |
| Ohio GO | 5.000% | 9/15/16 | | 10,000 | 10,865 |
| Ohio Higher Educational Facility Commission Revenue | | | | | |
| (Case Western Reserve University Project) VRDO | 0.080% | 11/3/14 | | 1,400 | 1,400 |
| 1 Ohio Higher Educational Facility Commission Revenue | | | | | |
| (Cleveland Clinic Health System Obligated Group) TOB VRDO | 0.060% | 11/7/14 | | 10,300 | 10,300 |
| Ohio Higher Educational Facility Commission Revenue | | | | | |
| (Cleveland Clinic Health System Obligated Group) VRDO | 0.060% | 11/3/14 | | 4,700 | 4,700 |
| Ohio Higher Educational Facility Commission Revenue (Marietta College Project) VRDO | 0.060% | 11/7/14 | LOC | 2,035 | 2,035 |
| Ohio Higher Educational Facility Commission Revenue (University of Dayton Project) | 5.000% | 12/1/14 | | 1,000 | 1,004 |
| Ohio Higher Educational Facility Commission Revenue (University of Dayton Project) | 5.000% | 12/1/15 | | 1,000 | 1,050 |
| Ohio Higher Educational Facility Commission Revenue (University of Dayton Project) | 4.000% | 12/1/16 | | 625 | 668 |
| Ohio Hospital Revenue (Cleveland Clinic Health System Obligated Group) | 5.000% | 1/1/15 | | 1,550 | 1,562 |
| 1 Ohio Hospital Revenue (Cleveland Clinic Health System Obligated Group) TOB VRDO | 0.060% | 11/7/14 | | 12,800 | 12,800 |
| Ohio Hospital Revenue (University Hospitals Health System Inc.) | 5.000% | 1/15/15 | | 500 | 505 |
| 3 Ohio Hospital Revenue (University Hospitals Health System Inc.) VRDO | 0.000% | 10/31/17 | | 2,750 | 2,750 |
| Ohio Solid Waste Revenue (Republic Services Inc. Project) PUT | 0.300% | 12/1/14 | | 1,000 | 1,000 |
| 1 Ohio Water Development Authority Fresh Water Revenue TOB VRDO | 0.170% | 11/7/14 | | 10,715 | 10,715 |
| Ohio Water Development Authority Pollution Control Revenue | | | | | |
| (FirstEnergy Generation Corp. Project) | 3.000% | 5/15/19 | | 10,540 | 10,751 |
| Ohio Water Development Authority Pollution Control Revenue (Water Quality) | 4.000% | 6/1/15 | | 1,315 | 1,345 |
| Ohio Water Development Authority Pollution Control Revenue (Water Quality) | 5.000% | 6/1/16 | | 1,070 | 1,150 |
| Ohio Water Development Authority Solid Waste Disposal Revenue | | | | | |
| (Waste Management Project) PUT | 2.250% | 7/1/16 | | 2,000 | 2,062 |
| Ross County OH Hospital Facilities Revenue (Adena Health System) | 5.000% | 12/1/15 | | 2,380 | 2,485 |
| Ross County OH Hospital Facilities Revenue (Adena Health System) | 5.000% | 12/1/16 | | 2,495 | 2,694 |
| Ross County OH Hospital Facilities Revenue (Adena Health System) | 5.250% | 12/1/17 | | 2,215 | 2,463 |
| Ross County OH Hospital Facilities Revenue (Adena Health System) | 5.250% | 12/1/18 | | 1,510 | 1,708 |
| South-Western City OH School District GO | 3.000% | 12/1/15 | | 1,000 | 1,030 |
| University of Cincinnati Ohio General Receipts Revenue | 4.000% | 6/1/15 | | 1,515 | 1,549 |
| University of Cincinnati Ohio General Receipts Revenue | 5.000% | 6/1/17 | | 2,180 | 2,429 |
| Warren County OH Health Care Facilities Improvement Revenue (Otterbein Homes Project) | 5.000% | 7/1/18 | | 1,555 | 1,750 |
| Wright State University Ohio General Revenue | 4.000% | 5/1/15 | | 1,140 | 1,161 |
| Wright State University Ohio General Revenue | 5.000% | 5/1/17 | | 1,195 | 1,315 |
| | | | | | 340,753 |
| Oklahoma (0.3%) | | | | | |
| Cleveland County OK Educational Facilities Authority Lease Revenue | | | | | |
| (Norman Public Schools Project) | 5.000% | 7/1/16 | | 1,000 | 1,074 |
| Cleveland County OK Educational Facilities Authority Lease Revenue | | | | | |
| (Norman Public Schools Project) | 5.000% | 7/1/17 | | 760 | 845 |
| Cleveland County OK Educational Facilities Authority Lease Revenue | | | | | |
| (Norman Public Schools Project) | 5.000% | 7/1/18 | | 1,325 | 1,508 |
| Cleveland County OK Educational Facilities Authority Lease Revenue | | | | | |
| (Norman Public Schools Project) | 5.000% | 7/1/19 | | 2,250 | 2,608 |
| 1 Grand River Dam Authority Oklahoma Revenue TOB VRDO | 0.060% | 11/7/14 | (13) | 26,100 | 26,100 |
| Oklahoma City OK GO | 2.000% | 3/1/16 | | 4,855 | 4,967 |
| 1 Tulsa County OK Industrial Authority Health Care Revenue | | | | | |
| (St. Francis Health System Inc.) TOB VRDO | 0.070% | 11/7/14 | | 7,041 | 7,041 |
| | | | | | 44,143 |
| Oregon (0.6%) | | | | | |
| Oregon Facilities Authority Revenue (Legacy Health Project) | 5.000% | 5/1/15 | | 2,350 | 2,406 |
| Oregon Facilities Authority Revenue (PeaceHealth) | 5.000% | 3/15/15 | | 1,500 | 1,525 |
| 2 Oregon Facilities Authority Revenue (Providence Health & Services) PUT | 0.280% | 9/30/16 | | 7,575 | 7,575 |
| 2 Oregon Facilities Authority Revenue (Providence Health & Services) PUT | 0.930% | 10/1/17 | | 8,750 | 8,788 |
| Oregon GO | 5.000% | 5/1/16 | | 2,000 | 2,141 |
| Oregon GO | 5.000% | 5/1/16 | | 3,500 | 3,746 |
| Oregon GO | 5.000% | 11/1/16 | | 3,000 | 3,276 |
| Oregon GO | 5.000% | 5/1/18 | | 1,125 | 1,289 |
| Oregon GO | 5.000% | 5/1/18 | | 1,500 | 1,719 |
| Oregon GO | 5.000% | 11/1/18 | | 3,750 | 4,356 |
21
Short-Term Tax-Exempt Fund
| | | | | |
| | | | | Face | Market |
| | | Maturity | | Amount | Value• |
| | Coupon | Date | | ($000) | ($000) |
| Oregon Health & Science University Revenue | 5.000% | 7/1/16 | | 500 | 537 |
| Oregon Health & Science University Revenue | 5.000% | 7/1/18 | | 1,000 | 1,140 |
| Portland OR Water System Revenue | 5.000% | 10/1/15 | | 6,000 | 6,266 |
| Tri-County Metropolitan Transportation District of Oregon Capital Grant Receipt Revenue | 3.000% | 11/1/16 | | 10,500 | 10,640 |
| Tri-County Metropolitan Transportation District of Oregon Capital Grant Receipt Revenue | 4.000% | 11/1/17 | | 8,300 | 8,736 |
| Tri-County Metropolitan Transportation District of Oregon Capital Grant Receipt Revenue | 3.000% | 11/1/18 | | 4,490 | 4,723 |
| Tri-County Metropolitan Transportation District of Oregon Capital Grant Receipt Revenue | 5.000% | 11/1/18 | | 5,000 | 5,537 |
| | | | | | 74,400 |
| Pennsylvania (6.0%) | | | | | |
| Allegheny County PA Higher Education Building Authority University Revenue | | | | | |
| (Carnegie Mellon University) | 5.000% | 3/1/15 | | 5,780 | 5,874 |
| Allegheny County PA Hospital Development Authority Revenue | | | | | |
| (University of Pittsburgh Medical Center) | 5.000% | 5/15/15 | | 8,350 | 8,567 |
| Allegheny County PA Hospital Development Authority Revenue | | | | | |
| (University of Pittsburgh Medical Center) | 4.000% | 10/15/15 | | 750 | 777 |
| Allegheny County PA Hospital Development Authority Revenue | | | | | |
| (University of Pittsburgh Medical Center) | 5.000% | 10/15/16 | | 1,025 | 1,116 |
| Allegheny County PA Hospital Development Authority Revenue | | | | | |
| (University of Pittsburgh Medical Center) | 0.881% | 2/1/21 | | 9,725 | 9,722 |
| 1 Allegheny County PA Hospital Development Authority Revenue | | | | | |
| (University of Pittsburgh Medical Center) TOB VRDO | 0.170% | 11/3/14 | LOC | 31,300 | 31,300 |
| Beaver County PA Hospital Authority Revenue (Heritage Valley Health System Inc.) | 5.000% | 5/15/16 | | 2,120 | 2,269 |
| Beaver County PA Industrial Development Authority Pollution Control Revenue | | | | | |
| (FirstEnergy Generation Project) PUT | 2.500% | 6/1/17 | | 10,000 | 10,178 |
| 1 Berks County PA Municipal Authority Revenue | | | | | |
| (Reading Hospital & Medical Center Project) TOB VRDO | 0.050% | 11/7/14 | LOC | 5,100 | 5,100 |
| Bethlehem PA Water Authority Revenue | 3.000% | 11/15/15 | (15) | 750 | 770 |
| Bethlehem PA Water Authority Revenue | 4.000% | 11/15/16 | (15) | 1,525 | 1,624 |
| Bethlehem PA Water Authority Revenue | 5.000% | 11/15/17 | (15) | 650 | 726 |
| Bethlehem PA Water Authority Revenue | 5.000% | 11/15/18 | (15) | 500 | 570 |
| Clarion County PA Industrial Development Authority Revenue | | | | | |
| (Clarion University Foundation Inc. Student Housing Project) BAN | 1.050% | 5/1/16 | | 2,500 | 2,502 |
| Commonwealth Financing Authority Pennsylvania Revenue | 4.000% | 6/1/16 | | 650 | 686 |
| Delaware County PA GO | 5.000% | 10/1/17 | | 1,370 | 1,429 |
| Delaware River Port Authority Pennsylvania & New Jersey Revenue | 4.000% | 1/1/15 | | 1,000 | 1,006 |
| Delaware River Port Authority Pennsylvania & New Jersey Revenue | 5.000% | 1/1/16 | | 3,615 | 3,797 |
| Delaware River Port Authority Pennsylvania & New Jersey Revenue | 5.000% | 1/1/17 | | 1,070 | 1,165 |
| 1 Lancaster County PA Hospital Authority Health System Revenue | | | | | |
| (Lancaster General Hospital Project) TOB VRDO | 0.060% | 11/7/14 | | 6,765 | 6,765 |
| 2 Manheim Township PA School District GO PUT | 0.384% | 5/1/17 | | 1,400 | 1,400 |
| 2 Manheim Township PA School District GO PUT | 0.504% | 5/1/18 | | 6,850 | 6,849 |
| Montgomery County PA Higher Education & Health Authority Hospital Revenue | | | | | |
| (Abington Memorial Hospital) | 5.000% | 6/1/19 | | 1,000 | 1,153 |
| Montgomery County PA Higher Education & Health Authority Revenue | | | | | |
| (Holy Redeemer Health System) | 4.000% | 10/1/18 | | 1,000 | 1,083 |
| Montgomery County PA Higher Education & Health Authority Revenue | | | | | |
| (Holy Redeemer Health System) | 4.000% | 10/1/19 | | 500 | 542 |
| Montgomery County PA Industrial Development Authority Revenue | | | | | |
| (New Regional Medical Center Project) | 5.000% | 2/1/16 | (7) | 1,180 | 1,247 |
| Montgomery County PA Industrial Development Authority Revenue | | | | | |
| (New Regional Medical Center Project) | 5.000% | 2/1/17 | (7) | 995 | 1,092 |
| Moon Industrial Development Authority Pennsylvania Mortgage Revenue | | | | | |
| (Providence Point Project) VRDO | 0.070% | 11/7/14 | LOC | 4,000 | 4,000 |
| 1 Mount Lebanon PA School District GO TOB VRDO | 0.140% | 11/7/14 | | 15,500 | 15,500 |
| 2 Northampton County PA General Purpose Authority Hospital Revenue | | | | | |
| (St. Luke’s Hospital Project) PUT | 1.450% | 8/15/20 | | 8,125 | 8,050 |
| Northampton County PA General Purpose Authority University Revenue (Lafayette College) VRDO | 0.070% | 11/7/14 | | 10,700 | 10,700 |
| Northampton County PA General Purpose Authority University Revenue (Lafayette College) VRDO | 0.070% | 11/7/14 | | 9,070 | 9,070 |
| Northampton County PA General Purpose Authority University Revenue (Lehigh University) VRDO | 0.030% | 11/7/14 | | 1,940 | 1,940 |
| Pennsylvania Economic Development Financing Authority Exempt Facilities Revenue | | | | | |
| (PPL Energy Supply LLC Project) PUT | 3.000% | 9/1/15 | | 15,750 | 15,964 |
| Pennsylvania Economic Development Financing Authority Exempt Facilities Revenue | | | | | |
| (PPL Energy Supply LLC Project) PUT | 3.000% | 9/1/15 | | 10,570 | 10,714 |
| Pennsylvania Economic Development Financing Authority Exempt Facilities Revenue | | | | | |
| (PPL Energy Supply LLC Project) PUT | 3.000% | 9/1/15 | | 11,250 | 11,403 |
| Pennsylvania Economic Development Financing Authority Solid Waste Disposal Revenue | | | | | |
| (Waste Management Inc. Project) PUT | 1.750% | 12/1/15 | | 8,050 | 8,146 |
| Pennsylvania Economic Development Financing Authority Unemployment Compensation Revenue | 4.000% | 7/1/16 | | 2,000 | 2,122 |
| Pennsylvania Economic Development Financing Authority Unemployment Compensation Revenue | 5.000% | 7/1/16 | | 14,730 | 15,875 |
| Pennsylvania Economic Development Financing Authority Unemployment Compensation Revenue | 5.000% | 1/1/22 | | 8,000 | 8,884 |
| Pennsylvania Economic Development Financing Authority Unemployment Compensation Revenue | 5.000% | 7/1/22 | | 15,000 | 16,111 |
22
Short-Term Tax-Exempt Fund
| | | | | |
| | | | | Face | Market |
| | | Maturity | | Amount | Value• |
| | Coupon | Date | | ($000) | ($000) |
| Pennsylvania GO | 5.000% | 4/1/15 | | 32,880 | 33,547 |
| Pennsylvania GO | 5.250% | 7/1/15 | | 15,000 | 15,511 |
| Pennsylvania GO | 5.000% | 9/1/15 | (4) | 45,450 | 45,634 |
| Pennsylvania GO | 5.000% | 6/15/16 | | 17,375 | 18,674 |
| Pennsylvania GO | 5.000% | 7/1/16 | | 9,075 | 9,771 |
| Pennsylvania GO | 5.000% | 7/1/16 | | 40,470 | 43,573 |
| Pennsylvania GO | 5.000% | 9/1/16 | | 10,000 | 10,041 |
| Pennsylvania GO | 5.000% | 3/1/17 | | 16,540 | 18,254 |
| Pennsylvania GO | 5.000% | 4/1/17 | | 11,150 | 12,342 |
| Pennsylvania GO | 5.000% | 4/1/18 | | 35,410 | 40,323 |
| Pennsylvania GO | 5.000% | 7/1/18 | | 2,675 | 3,064 |
| Pennsylvania Higher Educational Facilities Authority Revenue | | | | | |
| (University of Pennsylvania Health System) | 5.000% | 8/15/16 | (2) | 2,000 | 2,074 |
| Pennsylvania Higher Educational Facilities Authority Revenue | | | | | |
| (University of Pittsburgh Medical Center) | 5.000% | 5/15/15 | | 4,250 | 4,360 |
| 1 Pennsylvania State University Revenue TOB VRDO | 0.050% | 11/7/14 | LOC | 11,000 | 11,000 |
| 1 Pennsylvania State University Revenue TOB VRDO | 0.180% | 11/7/14 | | 12,520 | 12,520 |
| Pennsylvania Turnpike Commission Registration Fee Revenue VRDO | 0.100% | 11/7/14 | (4) | 10,000 | 10,000 |
| Pennsylvania Turnpike Commission Revenue | 5.000% | 6/1/15 | | 1,600 | 1,645 |
| 2 Pennsylvania Turnpike Commission Revenue | 0.600% | 12/1/16 | | 23,000 | 23,074 |
| Pennsylvania Turnpike Commission Revenue | 5.000% | 12/1/16 | | 3,150 | 3,433 |
| 2 Pennsylvania Turnpike Commission Revenue | 0.500% | 12/1/17 | | 15,000 | 15,006 |
| 2 Pennsylvania Turnpike Commission Revenue | 0.650% | 12/1/17 | | 10,405 | 10,444 |
| 2 Pennsylvania Turnpike Commission Revenue | 0.650% | 12/1/18 | | 8,750 | 8,778 |
| 1 Pennsylvania Turnpike Commission Revenue TOB VRDO | 0.170% | 11/7/14 | (12) | 3,245 | 3,245 |
| Pennsylvania Turnpike Commission Revenue VRDO | 0.090% | 11/7/14 | (4) | 34,350 | 34,350 |
| Philadelphia PA Airport Revenue | 5.000% | 6/15/15 | | 3,100 | 3,190 |
| Philadelphia PA Gas Works Revenue | 5.375% | 7/1/15 | (4) | 2,880 | 2,976 |
| Philadelphia PA Gas Works Revenue | 5.375% | 7/1/18 | (4) | 2,775 | 3,172 |
| Philadelphia PA GO | 5.000% | 8/1/18 | (14) | 6,170 | 6,645 |
| Philadelphia PA Hospitals & Higher Education Facilities Authority Hospital Revenue | | | | | |
| (Children’s Hospital of Philadelphia Project) VRDO | 0.070% | 11/3/14 | | 700 | 700 |
| Philadelphia PA Municipal Authority Revenue | 1.250% | 11/15/14 | | 16,685 | 16,692 |
| Philadelphia PA Municipal Authority Revenue | 5.000% | 11/15/15 | | 3,000 | 3,142 |
| Philadelphia PA School District GO | 5.000% | 4/1/17 | (2) | 5,000 | 5,096 |
| Philadelphia PA Water & Waste Water Revenue | 5.000% | 6/15/16 | | 5,000 | 5,376 |
| Pittsburgh & Allegheny County PA Sports & Exhibition Authority Lease Revenue VRDO | 0.170% | 11/7/14 | (4) | 50,465 | 50,465 |
| Pittsburgh PA Water & Sewer Authority Revenue | 4.000% | 9/1/16 | (4) | 1,350 | 1,438 |
| Pittsburgh PA Water & Sewer Authority Revenue PUT | 1.400% | 9/1/15 | (4) | 6,270 | 6,314 |
| Pittsburgh PA Water & Sewer Authority Revenue VRDO | 0.130% | 11/7/14 | (4) | 13,825 | 13,825 |
| 2 University Area Joint Authority Pennsylvania Sewer Revenue | 0.250% | 11/1/15 | | 1,550 | 1,550 |
| 2 University Area Joint Authority Pennsylvania Sewer Revenue PUT | 0.450% | 11/1/17 | | 2,900 | 2,902 |
| 1 University of Pittsburgh PA Revenue TOB VRDO | 0.060% | 11/7/14 | | 6,660 | 6,660 |
| Washington County PA Hospital Authority Revenue (Washington Hospital Project) | 5.500% | 7/1/16 | (2) | 2,375 | 2,545 |
| West Chester University Pennsylvania Student Housing Revenue BAN | 1.600% | 2/1/15 | | 2,250 | 2,253 |
| | | | | | 773,392 |
| Puerto Rico (0.0%) | | | | | |
| Puerto Rico Government Development Bank Revenue | 4.750% | 12/1/15 | (14) | 1,100 | 1,101 |
| |
| Rhode Island (0.1%) | | | | | |
| Rhode Island Health & Educational Building Corp. Hospital Financing Revenue | | | | | |
| (Care New England Health System Obligated Group) | 4.000% | 9/1/15 | | 1,000 | 1,026 |
| Rhode Island Health & Educational Building Corp. Hospital Financing Revenue | | | | | |
| (Care New England Health System Obligated Group) | 5.000% | 9/1/16 | | 4,825 | 5,154 |
| Rhode Island Health & Educational Building Corp. Hospital Financing Revenue | | | | | |
| (Care New England Health System Obligated Group) | 5.000% | 9/1/17 | | 2,640 | 2,885 |
| Rhode Island Health & Educational Building Corp. Hospital Financing Revenue | | | | | |
| (Care New England Health System Obligated Group) | 5.000% | 9/1/18 | | 1,325 | 1,470 |
| Rhode Island Health & Educational Building Corp. Providence Public Schools Revenue | | | | | |
| (Providence Public Buildings Authority) | 3.000% | 5/15/15 | | 2,000 | 2,022 |
| Rhode Island Health & Educational Building Corp. Providence Public Schools Revenue | | | | | |
| (Providence Public Buildings Authority) | 4.000% | 5/15/16 | | 1,000 | 1,043 |
| Rhode Island Health & Educational Building Corp. Providence Public Schools Revenue | | | | | |
| (Providence Public Buildings Authority) | 4.000% | 5/15/17 | | 2,000 | 2,126 |
| Rhode Island Health & Educational Building Corp. Providence Public Schools Revenue | | | | | |
| (Providence Public Buildings Authority) | 5.000% | 5/15/18 | | 1,500 | 1,688 |
| | | | | | 17,414 |
| South Carolina (0.7%) | | | | | |
| Charleston County SC GO | 5.250% | 11/1/15 | | 3,270 | 3,436 |
| 2 Charleston SC Waterworks & Sewer Capital Improvement Revenue PUT | 0.780% | 1/1/18 | | 8,770 | 8,777 |
| Florence County SC GO | 3.000% | 6/1/16 | | 16,075 | 16,743 |
23
Short-Term Tax-Exempt Fund
| | | | | |
| | | | | Face | Market |
| | | Maturity | | Amount | Value• |
| | Coupon | Date | | ($000) | ($000) |
| Greenville County SC School District GO | 5.000% | 12/1/15 | | 5,000 | 5,260 |
| Lexington County SC Health Services District Inc. Hospital Revenue | 5.000% | 11/1/15 | | 1,100 | 1,151 |
| Lexington County SC Health Services District Inc. Hospital Revenue | 5.000% | 11/1/16 | | 1,750 | 1,907 |
| Piedmont SC Municipal Power Agency Revenue | 5.000% | 1/1/15 | | 2,000 | 2,016 |
| Piedmont SC Municipal Power Agency Revenue | 5.000% | 1/1/16 | | 1,805 | 1,901 |
| South Carolina GO | 5.000% | 4/1/16 | | 1,450 | 1,547 |
| South Carolina GO | 5.000% | 4/1/16 | | 7,260 | 7,744 |
| South Carolina GO | 5.000% | 4/1/16 | | 30 | 32 |
| South Carolina GO | 5.000% | 4/1/16 | | 6,475 | 6,906 |
| South Carolina GO | 5.000% | 4/1/16 | | 2,275 | 2,427 |
| South Carolina Jobs Economic Development Authority Hospital Revenue (AnMed Health Project) | 5.000% | 2/1/15 | | 1,000 | 1,011 |
| South Carolina Jobs Economic Development Authority Hospital Revenue (Palmetto Health) | 3.000% | 8/1/15 | | 1,935 | 1,963 |
| South Carolina Jobs Economic Development Authority Hospital Revenue (Palmetto Health) | 5.000% | 8/1/16 | | 1,000 | 1,061 |
| South Carolina Jobs Economic Development Authority Hospital Revenue (Palmetto Health) | 5.000% | 8/1/17 | | 300 | 326 |
| South Carolina Jobs Economic Development Authority Hospital Revenue (Palmetto Health) | 5.000% | 8/1/18 | | 500 | 550 |
| South Carolina Jobs Economic Development Authority Revenue (Bon Secours Health System Inc.) | 4.000% | 11/1/15 | | 250 | 258 |
| South Carolina Jobs Economic Development Authority Revenue | | | | | |
| (Waste Management of South Carolina Inc. Project) | 2.875% | 2/1/15 | | 2,000 | 2,014 |
| South Carolina Ports Authority Revenue | 4.000% | 7/1/15 | | 2,355 | 2,414 |
| South Carolina Public Service Authority Revenue | 5.000% | 1/1/15 | | 3,500 | 3,528 |
| South Carolina Transportation Infrastructure Revenue | 5.000% | 10/1/15 | | 8,870 | 9,261 |
| South Carolina Transportation Infrastructure Revenue | 5.250% | 10/1/15 | (2) | 4,295 | 4,494 |
| | | | | | 86,727 |
| South Dakota (0.2%) | | | | | |
| South Dakota Health & Educational Facilities Authority Revenue (Sanford Health) | 3.000% | 11/1/16 | | 500 | 524 |
| South Dakota Health & Educational Facilities Authority Revenue (Sanford Health) | 3.000% | 11/1/17 | | 500 | 531 |
| South Dakota Health & Educational Facilities Authority Revenue (Sanford Health) | 3.000% | 11/1/18 | | 500 | 537 |
| South Dakota Health & Educational Facilities Authority Revenue (Sanford Health) | 4.000% | 11/1/19 | | 395 | 444 |
| 1 South Dakota Health & Educational Facilities Authority Revenue (Sanford Health) TOB VRDO | 0.280% | 11/7/14 | LOC | 26,000 | 26,000 |
| | | | | | 28,036 |
| Tennessee (2.1%) | | | | | |
| Knox County TN Health Educational & Housing Facilities Board Hospital Facilities Revenue | | | | | |
| (Covenant Healthcare) | 5.250% | 1/1/15 | (14) | 5,000 | 5,042 |
| Knox County TN Health Educational & Housing Facilities Board Hospital Facilities Revenue | | | | | |
| (Covenant Healthcare) | 5.000% | 1/1/19 | | 2,925 | 3,354 |
| Memphis TN Electric System Revenue | 5.000% | 12/1/14 | | 31,205 | 31,333 |
| Memphis TN Electric System Revenue | 5.000% | 12/1/15 | | 25,000 | 26,300 |
| 2 Metropolitan Government of Nashville & Davidson County TN Health & Educational | | | | | |
| Facilities Board Revenue (Vanderbilt University) PUT | 0.450% | 10/1/15 | | 36,500 | 36,484 |
| Metropolitan Government of Nashville & Davidson County TN Water & Sewer Revenue | 5.000% | 7/1/17 | | 5,500 | 6,136 |
| Shelby County TN GO VRDO | 0.060% | 11/7/14 | | 34,725 | 34,725 |
| Shelby County TN Health Educational & Housing Facility Board Revenue | | | | | |
| (Methodist Le Bonheur Healthcare) VRDO | 0.060% | 11/3/14 | (4) | 34,700 | 34,700 |
| Shelby County TN Health Educational & Housing Facility Board Revenue | | | | | |
| (Methodist Le Bonheur Healthcare) VRDO | 0.070% | 11/3/14 | (4) | 39,600 | 39,600 |
| Tennessee Energy Acquisition Corp. Gas Revenue | 5.000% | 2/1/15 | | 1,240 | 1,252 |
| Tennessee Energy Acquisition Corp. Gas Revenue | 5.000% | 9/1/15 | | 2,295 | 2,371 |
| Tennessee Energy Acquisition Corp. Gas Revenue | 5.000% | 2/1/16 | | 1,290 | 1,352 |
| Tennessee Energy Acquisition Corp. Gas Revenue | 5.000% | 9/1/16 | | 2,715 | 2,899 |
| Tennessee Energy Acquisition Corp. Gas Revenue | 5.000% | 2/1/17 | | 5,000 | 5,412 |
| Tennessee Energy Acquisition Corp. Gas Revenue | 5.250% | 9/1/17 | | 3,155 | 3,489 |
| Tennessee Energy Acquisition Corp. Gas Revenue | 5.000% | 2/1/18 | | 4,900 | 5,439 |
| Tennessee Energy Acquisition Corp. Gas Revenue | 5.000% | 2/1/19 | | 8,815 | 9,807 |
| Tennessee Energy Acquisition Corp. Gas Revenue | 5.250% | 9/1/19 | | 15,000 | 17,079 |
| | | | | | 266,774 |
| Texas (10.5%) | | | | | |
| Austin TX Water & Wastewater System Revenue | 5.000% | 11/15/14 | | 2,000 | 2,004 |
| 1 Brownsville TX Utility System Revenue TOB VRDO | 0.200% | 11/7/14 | (4) | 6,060 | 6,060 |
| Central Texas Regional Mobility Authority Revenue | 4.000% | 1/1/15 | | 575 | 578 |
| Central Texas Regional Mobility Authority Revenue | 5.000% | 1/1/16 | | 1,250 | 1,314 |
| Central Texas Regional Mobility Authority Revenue | 5.000% | 1/1/17 | | 500 | 545 |
| Central Texas Regional Mobility Authority Revenue | 5.000% | 1/1/18 | | 500 | 562 |
| Central Texas Regional Mobility Authority Revenue PUT | 3.000% | 1/4/16 | | 2,750 | 2,787 |
| College Station TX Independent School District GO | 4.000% | 8/15/16 | | 3,280 | 3,494 |
| 1 Dallas TX Area Rapid Transit Sales Tax Revenue TOB VRDO | 0.050% | 11/7/14 | | 5,400 | 5,400 |
| Dallas TX GO | 5.000% | 2/15/15 | (ETM) | 15 | 15 |
| Dallas TX GO | 5.000% | 2/15/15 | | 6,280 | 6,369 |
| Dallas TX GO | 5.000% | 2/15/16 | | 1,250 | 1,267 |
| Dallas TX Independent School District GO | 5.000% | 2/15/15 | | 4,990 | 5,061 |
| Dallas TX Independent School District GO | 4.000% | 8/15/16 | | 3,365 | 3,584 |
24
Short-Term Tax-Exempt Fund
| | | | | |
| | | | | Face | Market |
| | | Maturity | | Amount | Value• |
| | Coupon | Date | | ($000) | ($000) |
| Denton TX Independent School District GO PUT | 2.125% | 8/1/15 | | 8,620 | 8,736 |
| Denton TX Independent School District GO PUT | 2.000% | 8/1/16 | | 7,000 | 7,172 |
| Denton TX Independent School District GO VRDO | 0.060% | 11/7/14 | | 43,900 | 43,900 |
| Eagle Mountain & Saginaw TX Independent School District GO PUT | 2.000% | 8/1/19 | | 9,000 | 9,265 |
| Fort Worth TX Water & Sewer Revenue | 5.000% | 2/15/16 | | 1,300 | 1,378 |
| Frisco TX GO | 4.000% | 2/15/15 | | 1,580 | 1,598 |
| Grand Parkway TX Transportation Corp. System BAN | 3.000% | 12/15/16 | | 195,465 | 205,801 |
| 2 Harris County TX Cultural Education Facilities Finance Corp. Hospital Revenue | | | | | |
| (Memorial Hermann Healthcare System) | 0.350% | 6/1/15 | | 1,700 | 1,701 |
| 2 Harris County TX Cultural Education Facilities Finance Corp. Hospital Revenue | | | | | |
| (Memorial Hermann Healthcare System) | 0.450% | 6/1/16 | | 2,000 | 2,002 |
| 2 Harris County TX Cultural Education Facilities Finance Corp. Medical Facilities Revenue | | | | | |
| (Baylor College of Medicine) PUT | 1.100% | 11/15/15 | | 8,030 | 8,047 |
| Harris County TX GO | 4.750% | 10/1/16 | (Prere.) | 20,100 | 21,749 |
| Harris County TX GO | 5.000% | 10/1/18 | | 2,675 | 3,096 |
| Harris County TX Health Facilities Development Corp. Hospital Revenue (CHRISTUS Health) | 0.290% | 11/6/14 | (4) | 4,600 | 4,600 |
| Harris County TX Health Facilities Development Corp. Hospital Revenue (CHRISTUS Health) | 0.360% | 11/6/14 | (4) | 1,700 | 1,700 |
| 2 Harris County TX Toll Road Revenue | 0.680% | 8/15/17 | | 5,260 | 5,304 |
| Houston TX Airport System Revenue | 5.000% | 7/1/15 | | 2,000 | 2,064 |
| 1 Houston TX Airport System Revenue TOB VRDO | 0.060% | 11/7/14 | | 12,000 | 12,000 |
| 1 Houston TX Airport System Revenue TOB VRDO | 0.200% | 11/7/14 | (4)(3) | 49,500 | 49,500 |
| Houston TX GO | 3.000% | 3/1/15 | | 8,835 | 8,920 |
| Houston TX GO | 4.000% | 3/1/16 | | 2,900 | 3,042 |
| Houston TX GO | 4.000% | 3/1/17 | | 9,000 | 9,728 |
| Houston TX GO | 4.000% | 3/1/17 | | 2,075 | 2,243 |
| Houston TX GO | 5.000% | 3/1/18 | | 11,835 | 13,466 |
| 2 Houston TX Higher Education Finance Corp. Revenue (Rice University Project) PUT | 0.580% | 11/16/17 | | 11,000 | 11,042 |
| Houston TX Hotel Occupancy Tax & Special Revenue (Convention & Entertainment Facilities) | 5.000% | 9/1/16 | | 2,435 | 2,634 |
| Houston TX Hotel Occupancy Tax & Special Revenue (Convention & Entertainment Facilities) | 5.000% | 9/1/16 | | 8,310 | 8,988 |
| Houston TX Independent School District GO PUT | 2.500% | 6/1/15 | | 7,200 | 7,291 |
| Houston TX Independent School District GO PUT | 0.950% | 6/1/17 | | 16,000 | 16,087 |
| Houston TX Utility System Revenue | 5.000% | 11/15/16 | | 2,000 | 2,185 |
| Houston TX Utility System Revenue | 5.000% | 11/15/17 | | 2,000 | 2,259 |
| Houston TX Utility System Revenue | 5.000% | 11/15/18 | | 1,750 | 2,024 |
| 2 Houston TX Utility System Revenue PUT | 0.600% | 6/1/15 | | 47,010 | 47,027 |
| 2 Houston TX Utility System Revenue PUT | 0.650% | 8/1/16 | | 32,000 | 32,136 |
| 1 Houston TX Utility System Revenue TOB VRDO | 0.070% | 11/7/14 | | 17,540 | 17,540 |
| Katy TX Independent School District GO | 5.000% | 2/15/15 | | 4,295 | 4,356 |
| 2 Katy TX Independent School District GO PUT | 0.752% | 8/15/15 | | 25,000 | 25,036 |
| Katy TX Independent School District GO PUT | 1.600% | 8/15/17 | | 1,830 | 1,831 |
| 1 Lone Star College System Texas GO TOB VRDO | 0.060% | 11/7/14 | | 12,560 | 12,560 |
| Lower Colorado River Authority Texas Revenue | 5.000% | 5/15/15 | (ETM) | 10 | 10 |
| Lower Colorado River Authority Texas Revenue | 5.000% | 5/15/15 | | 2,140 | 2,196 |
| Lubbock TX Electric Light & Power System Revenue | 4.000% | 4/15/15 | | 1,125 | 1,145 |
| Lubbock TX GO | 5.000% | 2/15/16 | (14) | 1,000 | 1,014 |
| Lubbock TX Health Facilities Development Corp. Revenue (St. Joseph Health System) | 5.000% | 7/1/15 | | 4,000 | 4,124 |
| Mesquite TX Independent School District GO | 5.000% | 8/15/16 | | 1,500 | 1,623 |
| Mission TX Economic Development Corp. Solid Waste Disposal Revenue | | | | | |
| (Allied Waste Inc. Project) PUT | 0.300% | 1/2/15 | | 5,600 | 5,600 |
| North Central TX Health Facilities Development Corp. Hospital Revenue | | | | | |
| (Children’s Medical Center of Dallas Project) | 5.000% | 8/15/18 | | 750 | 859 |
| North East TX Independent School District GO PUT | 2.000% | 8/1/15 | | 4,900 | 4,958 |
| North East TX Independent School District GO PUT | 2.000% | 8/1/18 | | 5,000 | 5,151 |
| North Texas Tollway Authority System Revenue | 4.000% | 9/1/15 | | 1,820 | 1,878 |
| North Texas Tollway Authority System Revenue | 5.000% | 9/1/16 | | 1,200 | 1,300 |
| Northside TX Independent School District GO PUT | 2.125% | 8/1/20 | | 6,750 | 6,758 |
| Pflugerville TX Independent School District GO | 5.000% | 2/15/17 | (Prere.) | 3,760 | 4,145 |
| 1 Port Arthur TX Independent School District GO TOB VRDO | 0.060% | 11/7/14 | (12) | 9,125 | 9,125 |
| SA Energy Acquisition Public Facility Corp. Texas Gas Supply Revenue | 5.250% | 8/1/15 | | 3,180 | 3,281 |
| Sam Rayburn TX Municipal Power Agency Revenue | 5.000% | 10/1/16 | | 2,000 | 2,156 |
| San Antonio TX Electric & Gas Systems Revenue | 5.375% | 2/1/15 | | 14,135 | 14,321 |
| 3 San Antonio TX Electric & Gas Systems Revenue | 5.000% | 2/1/19 | | 16,360 | 18,989 |
| San Antonio TX Electric & Gas Systems Revenue PUT | 2.000% | 12/1/14 | | 13,090 | 13,109 |
| San Antonio TX Electric & Gas Systems Revenue PUT | 2.000% | 12/1/15 | | 11,300 | 11,488 |
| San Antonio TX Electric & Gas Systems Revenue PUT | 2.000% | 12/1/16 | | 3,500 | 3,605 |
| 1 San Antonio TX Electric & Gas Systems Revenue TOB VRDO | 0.060% | 11/7/14 | | 4,965 | 4,965 |
| 1 San Antonio TX Electric & Gas Systems Revenue TOB VRDO | 0.070% | 11/7/14 | | 11,985 | 11,985 |
| San Antonio TX Independent School District GO PUT | 2.000% | 8/1/18 | | 7,500 | 7,743 |
| 2 San Antonio TX Water Revenue PUT | 0.730% | 11/1/16 | | 15,100 | 15,200 |
| 2 San Antonio TX Water Revenue PUT | 0.450% | 11/1/17 | | 11,875 | 11,945 |
| Spring Branch TX Independent School District GO PUT | 3.000% | 6/15/15 | | 13,500 | 13,730 |
25
Short-Term Tax-Exempt Fund
| | | | | |
| | | | | Face | Market |
| | | Maturity | | Amount | Value• |
| | Coupon | Date | | ($000) | ($000) |
| Tarrant County TX Cultural Education Facilities Finance Corp. Hospital Revenue | | | | | |
| (Baylor Health Care System Project) | 5.000% | 11/15/14 | | 1,600 | 1,603 |
| Tarrant County TX Cultural Education Facilities Finance Corp. Hospital Revenue | | | | | |
| (Methodist Hospitals of Dallas) | 5.000% | 10/1/17 | | 1,100 | 1,235 |
| Tarrant County TX Cultural Education Facilities Finance Corp. Hospital Revenue | | | | | |
| (Methodist Hospitals of Dallas) | 4.000% | 10/1/18 | | 1,350 | 1,504 |
| Tarrant County TX Health Facilities Development Corp. Hospital Revenue | | | | | |
| (Cook Children’s Medical Center Project) | 5.000% | 12/1/15 | | 1,580 | 1,661 |
| Texas GO | 5.000% | 10/1/15 | | 10,905 | 11,391 |
| Texas GO | 4.000% | 10/1/16 | | 2,965 | 3,173 |
| Texas GO | 5.000% | 10/1/18 | | 4,650 | 5,381 |
| 1 Texas GO TOB VRDO | 0.050% | 11/7/14 | | 25,510 | 25,510 |
| 1 Texas GO TOB VRDO | 0.060% | 11/7/14 | | 17,875 | 17,875 |
| 1 Texas GO TOB VRDO | 0.070% | 11/7/14 | | 12,190 | 12,190 |
| Texas Municipal Gas Acquisition & Supply Corp. Revenue | 5.000% | 12/15/16 | | 5,035 | 5,465 |
| Texas Municipal Gas Acquisition & Supply Corp. Revenue | 5.000% | 12/15/17 | | 4,000 | 4,428 |
| Texas Municipal Gas Acquisition & Supply Corp. Revenue | 5.250% | 12/15/17 | | 10,900 | 12,110 |
| Texas Municipal Gas Acquisition & Supply Corp. Revenue | 5.625% | 12/15/17 | | 18,400 | 20,060 |
| Texas Municipal Gas Acquisition & Supply Corp. Revenue | 5.000% | 12/15/18 | | 4,500 | 5,058 |
| Texas Public Finance Authority Revenue (Texas Southern University) | 5.000% | 11/1/16 | (15) | 1,000 | 1,077 |
| Texas Public Finance Authority Revenue (Texas Southern University) | 5.000% | 11/1/17 | (15) | 2,615 | 2,875 |
| Texas Public Finance Authority Revenue (Texas Southern University) | 5.000% | 11/1/18 | (15) | 1,000 | 1,111 |
| Texas Public Finance Authority Revenue (Unemployment Compensation) | 5.000% | 1/1/15 | | 11,525 | 11,619 |
| Texas Public Finance Authority Revenue (Unemployment Compensation) | 5.000% | 7/1/15 | | 34,500 | 35,624 |
| Texas Public Finance Authority Revenue (Unemployment Compensation) | 5.000% | 1/1/16 | | 13,550 | 14,304 |
| Texas Public Finance Authority Revenue (Unemployment Compensation) | 5.000% | 1/1/16 | (Prere.) | 4,205 | 4,438 |
| Texas Public Finance Authority Revenue (Unemployment Compensation) | 5.000% | 7/1/16 | | 30,200 | 32,547 |
| Texas Public Finance Authority Revenue (Unemployment Compensation) | 4.000% | 7/1/17 | | 19,500 | 20,975 |
| Texas Public Finance Authority Revenue (Unemployment Compensation) | 4.000% | 7/1/18 | | 6,350 | 6,599 |
| Texas Public Finance Authority Revenue (Unemployment Compensation) | 4.000% | 1/1/19 | | 8,750 | 8,955 |
| Texas State Veterans Housing VRDO | 0.040% | 11/7/14 | | 10,000 | 10,000 |
| Texas State Veterans VRDO | 0.060% | 11/7/14 | | 57,500 | 57,500 |
| Texas TRAN | 1.500% | 8/31/15 | | 55,000 | 55,622 |
| 1 Texas Transportation Commission Mobility Fund GO TOB VRDO | 0.050% | 11/7/14 | | 11,700 | 11,700 |
| Texas Transportation Commission Revenue | 4.500% | 4/1/15 | | 1,000 | 1,018 |
| Texas Transportation Commission Revenue PUT | 1.250% | 2/15/15 | | 28,800 | 28,870 |
| 2 Texas Transportation Commission Revenue PUT | 0.400% | 4/1/17 | | 43,000 | 43,113 |
| Texas Water Development Board Revenue | 5.000% | 7/15/15 | | 5,750 | 5,947 |
| Texas Water Development Board Revenue | 5.000% | 7/15/16 | | 4,000 | 4,316 |
| University of Houston Texas Revenue | 5.000% | 2/15/15 | | 2,000 | 2,028 |
| University of North Texas Revenue | 5.000% | 4/15/15 | | 880 | 899 |
| University of North Texas Revenue | 5.000% | 4/15/16 | | 1,000 | 1,067 |
| University of North Texas Revenue | 5.000% | 4/15/17 | | 725 | 802 |
| University of Texas Permanent University Fund Revenue | 5.000% | 7/1/16 | | 7,500 | 7,736 |
| | | | | | 1,340,837 |
| Utah (0.6%) | | | | | |
| Salt Lake County UT Sales Tax Revenue | 4.000% | 2/1/16 | | 3,630 | 3,799 |
| Utah Associated Municipal Power Systems Revenue (Horse Butte Wind Project) | 5.000% | 9/1/18 | | 1,015 | 1,157 |
| Utah Associated Municipal Power Systems Revenue (Payson Power Project) | 4.000% | 4/1/15 | | 4,115 | 4,177 |
| 1 Utah Board of Regents Hospital Revenue (University of Utah) TOB VRDO | 0.050% | 11/7/14 | LOC | 7,505 | 7,505 |
| Utah Board of Regents Student Loan Revenue | 4.000% | 11/1/14 | | 10,000 | 10,000 |
| Utah GO | 5.000% | 7/1/16 | | 1,500 | 1,616 |
| Utah GO | 5.000% | 7/1/16 | | 23,735 | 25,576 |
| Utah GO | 5.000% | 7/1/17 | | 2,715 | 3,036 |
| Utah GO | 5.000% | 7/1/18 | | 2,925 | 3,369 |
| Utah Transit Authority Sales Tax Revenue | 1.350% | 6/15/17 | | 21,000 | 21,215 |
| | | | | | 81,450 |
| Virgin Islands (0.1%) | | | | | |
| Virgin Islands Public Finance Authority Revenue | 4.000% | 10/1/16 | | 3,250 | 3,391 |
| Virgin Islands Public Finance Authority Revenue | 5.000% | 10/1/17 | | 3,480 | 3,816 |
| | | | | | 7,207 |
| Virginia (1.0%) | | | | | |
| Fairfax County VA Economic Development Authority Facilities Revenue (County Facilities Project) | 4.000% | 10/1/17 | | 3,730 | 4,091 |
| Fairfax County VA Economic Development Authority Facilities Revenue (County Facilities Project) | 4.000% | 10/1/18 | | 2,150 | 2,398 |
| Fairfax County VA Economic Development Authority Facilities Revenue (County Facilities Project) | 5.000% | 10/1/19 | | 2,000 | 2,356 |
| Fairfax County VA Public Improvement GO | 5.000% | 10/1/15 | (Prere.) | 2,945 | 3,075 |
| Fairfax County VA Public Improvement GO | 5.000% | 10/1/16 | | 5,630 | 5,876 |
| 2 Fredericksburg VA Economic Development Authority Hospital Facilities Revenue | | | | | |
| (Mary Washington Healthcare Obligated Group) PUT | 1.950% | 2/1/17 | | 6,500 | 6,664 |
| Henrico County VA Economic Development Authority Revenue (Bon Secours Health System) | 4.000% | 11/1/16 | | 1,000 | 1,064 |
26
Short-Term Tax-Exempt Fund
| | | | | |
| | | | | Face | Market |
| | | Maturity | | Amount | Value• |
| | Coupon | Date | | ($000) | ($000) |
| Norfolk VA GO | 4.000% | 10/1/16 | | 4,960 | 5,304 |
| Norfolk VA Water Revenue | 5.000% | 11/1/18 | | 725 | 839 |
| Roanoke VA Economic Development Authority Hospital Revenue (Carilion Clinic Obligated Group) | 5.000% | 7/1/16 | | 1,765 | 1,899 |
| Roanoke VA Economic Development Authority Hospital Revenue (Carilion Clinic Obligated Group) | 5.000% | 7/1/17 | | 3,500 | 3,872 |
| Upper Occoquan VA Sewage Authority Regional Sewerage System Revenue | 5.000% | 7/1/15 | (Prere.) | 4,895 | 5,051 |
| Virginia College Building Authority Educational Facilities Revenue | | | | | |
| (21st Century College & Equipment Programs) | 5.000% | 2/1/16 | | 8,660 | 9,169 |
| Virginia College Building Authority Educational Facilities Revenue | | | | | |
| (21st Century College & Equipment Programs) | 5.000% | 2/1/16 | | 8,190 | 8,673 |
| Virginia College Building Authority Educational Facilities Revenue | | | | | |
| (Public Higher Education Financing Program) | 4.000% | 9/1/15 | (ETM) | 10 | 10 |
| Virginia College Building Authority Educational Facilities Revenue | | | | | |
| (Public Higher Education Financing Program) | 4.000% | 9/1/15 | | 1,590 | 1,641 |
| 3 Virginia College Building Authority Educational Facilities Revenue | | | | | |
| (Public Higher Education Financing Program) | 5.000% | 9/1/16 | | 13,450 | 14,578 |
| Virginia GO | 5.000% | 6/1/17 | | 1,000 | 1,115 |
| Virginia Public Building Authority Public Facilities Revenue | 5.000% | 8/1/15 | | 5,000 | 5,182 |
| Virginia Public Building Authority Public Facilities Revenue | 5.000% | 8/1/16 | | 2,845 | 3,073 |
| Virginia Public Building Authority Public Facilities Revenue | 5.000% | 8/1/16 | | 4,880 | 5,272 |
| Virginia Public Building Authority Revenue | 5.000% | 8/1/16 | | 2,000 | 2,071 |
| Virginia Public School Authority Revenue | 5.000% | 8/1/15 | | 11,440 | 11,857 |
| Virginia Public School Authority Revenue | 5.000% | 4/15/16 | | 2,940 | 3,140 |
| 3 Virginia Public School Authority Revenue | 4.000% | 8/1/16 | | 3,565 | 3,789 |
| Virginia Public School Authority Revenue | 5.000% | 8/1/16 | | 3,860 | 4,172 |
| Wise County VA Industrial Development Authority Solid Waste & Sewage Disposal Revenue | | | | | |
| (Virginia Electric & Power Co.) PUT | 2.375% | 11/1/15 | | 16,000 | 16,306 |
| | | | | | 132,537 |
| Washington (2.5%) | | | | | |
| 1 Central Puget Sound WA Regional Transit Authority Sales & Use Tax Revenue TOB VRDO | 0.060% | 11/7/14 | | 8,280 | 8,280 |
| Clark County WA Public Utility Revenue | 5.000% | 1/1/15 | | 1,500 | 1,512 |
| Energy Northwest Washington Electric Revenue (Columbia Generating Station) | 5.000% | 7/1/15 | (Prere.) | 5,505 | 5,682 |
| Energy Northwest Washington Electric Revenue (Columbia Generating Station) | 5.000% | 7/1/15 | (Prere.) | 6,480 | 6,689 |
| 2 Everett WA GO PUT | 0.450% | 12/1/19 | | 4,000 | 4,001 |
| King County WA GO | 5.000% | 6/1/15 | | 2,500 | 2,570 |
| King County WA GO | 5.000% | 1/1/18 | | 2,000 | 2,267 |
| King County WA GO | 5.000% | 7/1/18 | | 7,515 | 8,630 |
| 1 King County WA Sewer Revenue TOB VRDO | 0.060% | 11/7/14 | | 6,950 | 6,950 |
| 1 Seattle WA Drain & Wastewater Revenue TOB VRDO | 0.050% | 11/7/14 | | 8,100 | 8,100 |
| 3 Seattle WA Municipal Light & Power Revenue | 5.000% | 9/1/17 | | 3,320 | 3,730 |
| Seattle WA Water System Revenue | 5.000% | 9/1/15 | (14) | 2,035 | 2,043 |
| Seattle WA Water System Revenue | 5.000% | 9/1/17 | (14) | 2,290 | 2,299 |
| Tacoma WA School District No. 10 (Pierce County) BAN | 2.000% | 12/1/14 | | 30,815 | 30,862 |
| 1 TES Properties Washington Lease Revenue TOB VRDO | 0.060% | 11/7/14 | | 10,120 | 10,120 |
| Tobacco Settlement Authority Washington Revenue | 5.000% | 6/1/17 | | 4,130 | 4,564 |
| Tobacco Settlement Authority Washington Revenue | 5.000% | 6/1/18 | | 3,215 | 3,635 |
| Tobacco Settlement Authority Washington Revenue | 5.000% | 6/1/24 | | 4,240 | 4,255 |
| Washington (Motor Vehicle Fuel Tax) GO | 5.000% | 7/1/16 | | 14,675 | 15,816 |
| Washington (Motor Vehicle Fuel Tax) GO | 5.000% | 7/1/16 | | 10,000 | 10,777 |
| Washington (Motor Vehicle Fuel Tax) GO | 5.000% | 2/1/18 | | 1,995 | 2,267 |
| Washington Economic Development Finance Authority Solid Waste Disposal Revenue | | | | | |
| (Waste Management Inc. Project) PUT | 1.250% | 11/1/17 | | 2,525 | 2,536 |
| Washington Federal Highway Grant Anticipation Revenue (520 Corridor Program) | 5.000% | 9/1/18 | | 5,000 | 5,746 |
| Washington Federal Highway Grant Anticipation Revenue (520 Corridor Program) | 5.000% | 9/1/18 | | 13,957 | 16,040 |
| Washington Federal Highway Grant Anticipation Revenue (520 Corridor Program) | 5.000% | 9/1/19 | | 29,645 | 34,740 |
| Washington GO | 5.000% | 1/1/15 | (2) | 4,500 | 4,537 |
| Washington GO | 5.000% | 7/1/15 | (2) | 1,000 | 1,033 |
| Washington GO | 5.000% | 1/1/16 | | 5,000 | 5,277 |
| 3 Washington GO | 4.000% | 7/1/16 | | 14,160 | 15,021 |
| Washington GO | 5.000% | 7/1/16 | | 10,000 | 10,777 |
| 1 Washington GO TOB VRDO | 0.060% | 11/7/14 | | 5,030 | 5,030 |
| 1 Washington GO TOB VRDO | 0.060% | 11/7/14 | | 6,325 | 6,325 |
| 1 Washington GO TOB VRDO | 0.060% | 11/7/14 | | 6,145 | 6,145 |
| 1 Washington Health Care Facilities Authority Revenue (Catholic Health Initiatives) TOB VRDO | 0.250% | 11/7/14 | | 7,515 | 7,515 |
| 1 Washington Health Care Facilities Authority Revenue | | | | | |
| (Children’s Hospital & Regional Medical Center)TOB VRDO | 0.070% | 11/7/14 | | 19,280 | 19,280 |
| Washington Health Care Facilities Authority Revenue (PeaceHealth) | 4.000% | 11/15/15 | | 1,000 | 1,038 |
| Washington Health Care Facilities Authority Revenue (Providence Health & Services) | 4.000% | 10/1/15 | | 805 | 832 |
| Washington Health Care Facilities Authority Revenue (Providence Health & Services) | 5.000% | 10/1/15 | | 1,445 | 1,508 |
| Washington Health Care Facilities Authority Revenue (Providence Health & Services) | 5.000% | 10/1/16 | | 700 | 760 |
| Washington Health Care Facilities Authority Revenue (Providence Health & Services) | 5.000% | 10/1/17 | | 1,375 | 1,544 |
| Washington Health Care Facilities Authority Revenue (Seattle Cancer Care Alliance) | 4.000% | 3/1/15 | | 425 | 430 |
27
Short-Term Tax-Exempt Fund
| | | | | |
| | | | | Face | Market |
| | | Maturity | | Amount | Value• |
| | Coupon | Date | | ($000) | ($000) |
| Washington Health Care Facilities Authority Revenue (Seattle Cancer Care Alliance) | 5.000% | 3/1/16 | | 465 | 492 |
| Washington Health Care Facilities Authority Revenue (Seattle Cancer Care Alliance) | 5.000% | 3/1/17 | | 300 | 327 |
| Washington Health Care Facilities Authority Revenue (Seattle Cancer Care Alliance) | 5.000% | 3/1/18 | | 250 | 279 |
| Washington Higher Education Facilities Authority Revenue (Whitman College Project) VRDO | 0.050% | 11/7/14 | | 28,670 | 28,670 |
| | | | | | 320,931 |
| West Virginia (0.1%) | | | | | |
| Mason County WV Pollution Control Revenue (Appalachian Power Co. Project) PUT | 1.625% | 10/1/18 | | 6,000 | 6,040 |
| West Virginia Economic Development Authority Solid Waste Facilities Disposal Revenue | | | | | |
| (Ohio Power Co.–Amos Project) PUT | 3.125% | 4/1/15 | | 5,000 | 5,051 |
| West Virginia University Revenue | 5.000% | 10/1/16 | | 725 | 788 |
| 2 West Virginia University Revenue PUT | 0.580% | 10/1/19 | | 3,500 | 3,502 |
| | | | | | 15,381 |
| Wisconsin (0.9%) | | | | | |
| Milwaukee WI GO | 5.000% | 5/1/16 | | 6,010 | 6,428 |
| Wisconsin GO | 4.000% | 5/1/15 | | 5,000 | 5,097 |
| Wisconsin GO | 5.000% | 5/1/15 | | 10,000 | 10,244 |
| Wisconsin GO | 4.000% | 11/1/15 | | 2,860 | 2,970 |
| Wisconsin GO | 4.000% | 5/1/16 | | 4,470 | 4,716 |
| Wisconsin GO | 4.000% | 11/1/16 | | 6,000 | 6,433 |
| Wisconsin GO | 5.000% | 5/1/17 | | 1,000 | 1,111 |
| Wisconsin Health & Educational Facilities Authority Revenue (Agnesian Healthcare Inc.) | 5.000% | 7/1/15 | | 1,010 | 1,038 |
| Wisconsin Health & Educational Facilities Authority Revenue | | | | | |
| (Ascension Health Alliance Credit Group) PUT | 4.000% | 3/1/18 | | 7,200 | 7,955 |
| Wisconsin Health & Educational Facilities Authority Revenue | | | | | |
| (Ascension Health Alliance Credit Group) PUT | 4.000% | 5/30/19 | | 13,000 | 14,542 |
| 1 Wisconsin Health & Educational Facilities Authority Revenue | | | | | |
| (Ascension Health Credit Group) TOB VRDO | 0.060% | 11/7/14 | | 750 | 750 |
| Wisconsin Health & Educational Facilities Authority Revenue (Aurora Health Care Inc.) | 5.000% | 4/15/15 | | 1,500 | 1,530 |
| Wisconsin Health & Educational Facilities Authority Revenue (Aurora Health Care Inc.) | 4.000% | 7/15/15 | | 700 | 717 |
| Wisconsin Health & Educational Facilities Authority Revenue (Aurora Health Care Inc.) | 5.000% | 7/15/15 | | 6,000 | 6,187 |
| Wisconsin Health & Educational Facilities Authority Revenue (Aurora Health Care Inc.) | 5.000% | 7/15/17 | | 1,235 | 1,355 |
| Wisconsin Health & Educational Facilities Authority Revenue (Aurora Health Care Inc.) PUT | 5.125% | 8/15/16 | | 3,100 | 3,351 |
| Wisconsin Health & Educational Facilities Authority Revenue (Aurora Health Care Inc.) PUT | 1.250% | 8/15/17 | | 3,500 | 3,530 |
| Wisconsin Health & Educational Facilities Authority Revenue (Aurora Health Care Inc.) VRDO | 0.040% | 11/7/14 | LOC | 10,000 | 10,000 |
| Wisconsin Health & Educational Facilities Authority Revenue (Gundersen Lutheran) VRDO | 0.080% | 11/7/14 | LOC | 7,000 | 7,000 |
| Wisconsin Health & Educational Facilities Authority Revenue | | | | | |
| (Hospital Sisters Services Inc. Obligated Group) | 5.000% | 8/15/16 | | 1,345 | 1,456 |
| Wisconsin Health & Educational Facilities Authority Revenue (Hospital Sisters Services, Inc.) | 4.000% | 8/15/15 | | 1,100 | 1,133 |
| Wisconsin Health & Educational Facilities Authority Revenue (Ministry Health Care Inc.) | 5.000% | 8/15/15 | | 1,790 | 1,857 |
| Wisconsin Health & Educational Facilities Authority Revenue (Ministry Health Care Inc.) | 5.000% | 8/15/16 | | 6,115 | 6,607 |
| Wisconsin Health & Educational Facilities Authority Revenue (Ministry Health Care Inc.) | 5.000% | 8/15/16 | | 665 | 719 |
| Wisconsin Transportation Revenue | 5.000% | 7/1/16 | | 9,830 | 10,594 |
| | | | | | 117,320 |
| |
| Wyoming (0.0%) | | | | | |
| Lincoln County WY Pollution Control Revenue (Exxonmobil Project) VRDO | 0.060% | 11/3/14 | | 3,700 | 3,700 |
| Total Tax-Exempt Municipal Bonds (Cost $12,831,755) | | | | | 12,909,610 |
| |
| | | | | Shares | |
| Temporary Cash Investment (1.7%) | | | | | |
| Money Market Fund (1.7%) | | | | | |
| 4 Vanguard Municipal Cash Management Fund (Cost $225,345) | 0.047% | | | 225,345,000 | 225,345 |
| Total Investments (102.5%) (Cost $13,057,100) | | | | | 13,134,955 |
| Other Assets and Liabilities (–2.5%) | | | | | |
| Other Assets | | | | | 126,638 |
| Liabilities | | | | | (449,485) |
| | | | | | (322,847) |
| Net Assets (100%) | | | | | 12,812,108 |
28
| |
| Short-Term Tax-Exempt Fund | |
| |
| |
| |
| |
| At October 31, 2014, net assets consisted of: | |
| | Amount |
| | ($000) |
| Paid-in Capital | 12,751,255 |
| Undistributed Net Investment Income | — |
| Accumulated Net Realized Losses | (17,002) |
| Unrealized Appreciation (Depreciation) | 77,855 |
| Net Assets | 12,812,108 |
| |
| Investor Shares—Net Assets | |
| Applicable to 107,962,620 outstanding $.001 par value shares of beneficial interest (unlimited authorization) | 1,712,513 |
| Net Asset Value Per Share—Investor Shares | $15.86 |
| |
| Admiral Shares—Net Assets | |
| Applicable to 699,756,162 outstanding $.001 par value shares of beneficial interest (unlimited authorization) | 11,099,595 |
| Net Asset Value Per Share—Admiral Shares | $15.86 |
• See Note A in Notes to Financial Statements.
1 Security exempt from registration under Rule 144A of the Securities Act of 1933. Such securities may be sold in transactions exempt from registration, normally to qualified institutional buyers. At October 31, 2014,
the aggregate value of these securities was $1,880,751,000, representing 14.7% of net assets.
2 Adjustable-rate security.
3 Security purchased on a when-issued or delayed-delivery basis for which the fund has not taken delivery as of October 31, 2014.
4 Affiliated money market fund available only to Vanguard funds and certain trusts and accounts managed by Vanguard. Rate shown is the 7-day yield.
For key to abbreviations and other references, see back cover of report.
See accompanying Notes, which are an integral part of the Financial Statements.
29
Limited-Term Tax-Exempt Fund
| | | | | |
| | | | | Face | Market |
| | | Maturity | | Amount | Value• |
| | Coupon | Date | | ($000) | ($000) |
| Tax-Exempt Municipal Bonds (98.8%) | | | | | |
| Alabama (0.2%) | | | | | |
| Auburn University Alabama General Fee Revenue | 5.000% | 6/1/19 | | 2,000 | 2,337 |
| Jefferson County AL Sewer Revenue | 5.000% | 10/1/16 | | 1,000 | 1,069 |
| Jefferson County AL Sewer Revenue | 5.000% | 10/1/17 | | 1,620 | 1,769 |
| Jefferson County AL Sewer Revenue | 5.000% | 10/1/18 | | 1,500 | 1,666 |
| Jefferson County AL Sewer Revenue | 5.000% | 10/1/21 | | 1,300 | 1,455 |
| Mobile AL Infirmary Health System Special Care Facilities Financing Authority Revenue | | | | | |
| (Infirmary Health System Inc.) | 5.000% | 2/1/15 | | 1,615 | 1,631 |
| Mobile AL Infirmary Health System Special Care Facilities Financing Authority Revenue | | | | | |
| (Infirmary Health System Inc.) | 5.000% | 2/1/16 | | 3,540 | 3,700 |
| Mobile AL Infirmary Health System Special Care Facilities Financing Authority Revenue | | | | | |
| (Infirmary Health System Inc.) | 5.000% | 2/1/17 | | 2,475 | 2,657 |
| University of Alabama at Birmingham Hospital Revenue | 5.000% | 9/1/15 | | 1,005 | 1,045 |
| University of Alabama at Birmingham Revenue | 5.000% | 10/1/16 | | 3,390 | 3,686 |
| University of Alabama at Birmingham Revenue | 5.000% | 10/1/17 | | 1,630 | 1,836 |
| University of Alabama at Birmingham Revenue | 5.000% | 10/1/17 | | 3,565 | 4,016 |
| University of Alabama General Revenue | 5.000% | 7/1/18 | | 4,680 | 5,369 |
| University of Alabama General Revenue | 5.000% | 7/1/19 | | 5,345 | 6,269 |
| | | | | | 38,505 |
| Alaska (0.1%) | | | | | |
| North Slope Borough AK | 5.000% | 6/30/18 | | 13,035 | 14,954 |
| Valdez AK Marine Terminal Revenue (BP Pipelines) | 5.000% | 1/1/16 | | 10,000 | 10,543 |
| Valdez AK Marine Terminal Revenue (BP Pipelines) | 5.000% | 1/1/16 | | 2,000 | 2,109 |
| | | | | | 27,606 |
| Arizona (1.0%) | | | | | |
| Arizona Board Regents Arizona State University System Revenue | 5.000% | 8/1/19 | | 2,140 | 2,508 |
| Arizona Board Regents Arizona State University System Revenue | 5.000% | 8/1/20 | | 1,700 | 2,023 |
| Arizona COP | 5.000% | 9/1/15 | (4) | 4,000 | 4,160 |
| Arizona COP | 5.000% | 10/1/17 | | 1,000 | 1,114 |
| Arizona COP | 5.000% | 10/1/18 | | 900 | 1,024 |
| Arizona Health Facilities Authority Hospital System Revenue (Phoenix Children’s Hospital) | 5.000% | 2/1/18 | | 1,000 | 1,121 |
| Arizona Health Facilities Authority Hospital System Revenue (Phoenix Children’s Hospital) | 5.000% | 2/1/19 | | 2,500 | 2,857 |
| Arizona Health Facilities Authority Hospital System Revenue (Phoenix Children’s Hospital) | 5.000% | 2/1/20 | | 3,800 | 4,403 |
| Arizona Health Facilities Authority Revenue (Banner Health) VRDO | 0.050% | 11/7/14 | LOC | 8,135 | 8,135 |
| 1 Arizona Health Facilities Authority Revenue (Phoenix Children’s Hospital) PUT | 1.900% | 2/5/20 | | 20,000 | 20,320 |
| 1 Arizona Health Facilities Authority Revenue (Phoenix Children’s Hospital) PUT | 1.900% | 2/5/20 | | 5,000 | 5,080 |
| Arizona School Facilities Board COP | 5.000% | 9/1/15 | | 9,000 | 9,359 |
| Arizona School Facilities Board COP | 5.000% | 9/1/15 | (Prere.) | 15,000 | 15,599 |
| Arizona School Facilities Board COP | 5.000% | 9/1/18 | | 1,500 | 1,715 |
| Arizona Transportation Board Excise Tax Revenue (Maricopa County Regional Area) | 5.000% | 7/1/15 | | 5,000 | 5,162 |
| Arizona Transportation Board Excise Tax Revenue (Maricopa County Regional Area) | 5.000% | 7/1/15 | | 5,300 | 5,472 |
| Arizona Transportation Board Excise Tax Revenue (Maricopa County Regional Area) | 5.000% | 7/1/15 | | 5,025 | 5,188 |
| Arizona Transportation Board Highway Revenue | 5.000% | 7/1/16 | | 7,465 | 8,043 |
| Arizona Transportation Board Highway Revenue | 5.000% | 7/1/20 | | 3,360 | 4,007 |
| Arizona Water Infrastructure Finance Authority Revenue | 5.000% | 10/1/19 | | 2,000 | 2,366 |
| Glendale AZ Industrial Development Authority Revenue (Midwestern University) | 5.000% | 5/15/15 | | 1,500 | 1,536 |
| Glendale AZ Industrial Development Authority Revenue (Midwestern University) | 5.000% | 5/15/16 | | 1,665 | 1,770 |
| Glendale AZ Industrial Development Authority Revenue (Midwestern University) | 5.000% | 5/15/17 | | 3,115 | 3,405 |
| Maricopa County AZ Regional Public Transportation Authority Excise Tax Revenue | 5.000% | 7/1/16 | | 2,630 | 2,834 |
| Maricopa County AZ Unified School District No. 4 (Mesa) GO | 4.000% | 7/1/18 | | 3,220 | 3,578 |
| Maricopa County AZ Unified School District No. 4 (Mesa) GO | 4.000% | 7/1/19 | | 3,750 | 4,229 |
| Phoenix AZ Civic Improvement Corp. Airport Revenue | 5.000% | 7/1/15 | | 6,000 | 6,194 |
| Phoenix AZ Civic Improvement Corp. Airport Revenue | 5.000% | 7/1/16 | | 3,055 | 3,287 |
| Phoenix AZ Civic Improvement Corp. Excise Tax Revenue | 5.000% | 7/1/17 | | 3,310 | 3,698 |
| Pima County AZ Regional Transportation Authority Excise Tax Revenue | 5.000% | 6/1/19 | | 3,155 | 3,694 |
| Pima County AZ Regional Transportation Authority Excise Tax Revenue | 5.000% | 6/1/20 | | 2,840 | 3,382 |
| Pima County AZ Regional Transportation Authority Excise Tax Revenue | 5.000% | 6/1/21 | | 3,000 | 3,613 |
| Pima County AZ Sewer Revenue | 5.000% | 7/1/19 | | 1,000 | 1,171 |
| Regional Public Transportation Authority Arizona Excise Tax Revenue | | | | | |
| (Maricopa County Public Transportation) | 5.250% | 7/1/20 | | 4,850 | 5,864 |
| Salt River Project Arizona Agricultural Improvement & Power District Revenue | 4.000% | 12/1/17 | | 1,000 | 1,103 |
| Salt River Project Arizona Agricultural Improvement & Power District Revenue | 5.000% | 12/1/18 | | 4,520 | 5,247 |
| 2 Salt River Project Arizona Agricultural Improvement & Power District Revenue TOB VRDO | 0.060% | 11/7/14 | | 9,745 | 9,745 |
| Salt Verde AZ Financial Corp. Gas Revenue | 5.000% | 12/1/18 | | 165 | 185 |
| Salt Verde AZ Financial Corp. Gas Revenue | 5.250% | 12/1/19 | | 1,565 | 1,799 |
| Scottsdale AZ GO | 5.000% | 7/1/17 | | 2,700 | 3,017 |
| Scottsdale AZ GO | 5.000% | 7/1/19 | | 1,860 | 2,190 |
| Scottsdale AZ GO | 4.000% | 7/1/20 | | 11,150 | 12,770 |
| University Medical Center Corp. Arizona Hospital Revenue | 5.000% | 7/1/21 | | 2,740 | 3,070 |
30
Limited-Term Tax-Exempt Fund
| | | | | | |
| | | | | | Face | Market |
| | | | Maturity | | Amount | Value• |
| | | Coupon | Date | | ($000) | ($000) |
| | Yavapai County AZ Industrial Development Authority Hospital Facility Revenue | | | | | |
| | (Northern Arizona Healthcare System) | 5.000% | 10/1/17 | | 1,445 | 1,620 |
| | Yavapai County AZ Industrial Development Authority Hospital Facility Revenue | | | | | |
| | (Northern Arizona Healthcare System) | 5.000% | 10/1/18 | | 2,185 | 2,505 |
| | Yuma AZ Industrial Development Authority Hospital Revenue (Yuma Regional Medical Center) | 5.000% | 8/1/20 | | 1,000 | 1,158 |
| | Yuma AZ Industrial Development Authority Hospital Revenue (Yuma Regional Medical Center) | 5.000% | 8/1/21 | | 750 | 870 |
| | Yuma AZ Industrial Development Authority Hospital Revenue (Yuma Regional Medical Center) | 5.000% | 8/1/22 | | 1,000 | 1,162 |
| | Yuma AZ Industrial Development Authority Hospital Revenue (Yuma Regional Medical Center) | 5.000% | 8/1/23 | | 1,000 | 1,161 |
| | | | | | | 205,513 |
| Arkansas (0.1%) | | | | | |
| | Independence County AR Pollution Control Revenue (Entergy Arkansas, Inc. Project) | 2.375% | 1/1/21 | | 15,000 | 15,416 |
| | Jefferson County AR Pollution Control Revenue (Entergy Arkansas, Inc. Project) | 1.550% | 10/1/17 | | 10,000 | 10,154 |
| | | | | | | 25,570 |
| California (12.6%) | | | | | |
| | ABAG Finance Authority for Nonprofit Corps. California Revenue (Jackson Laboratory) | 5.000% | 7/1/18 | | 1,000 | 1,133 |
| | ABAG Finance Authority for Nonprofit Corps. California Revenue (Jackson Laboratory) | 5.000% | 7/1/19 | | 750 | 865 |
| | ABAG Finance Authority for Nonprofit Corps. California Revenue (Sharp Healthcare) | 5.000% | 8/1/19 | | 1,000 | 1,172 |
| | ABAG Finance Authority for Nonprofit Corps. California Revenue (Sharp Healthcare) | 4.000% | 8/1/20 | | 500 | 562 |
| | Alameda CA Corridor Transportation Authority Revenue | 0.000% | 10/1/16 | (2) | 10,000 | 9,822 |
| | Alameda CA Corridor Transportation Authority Revenue | 5.000% | 10/1/19 | | 1,000 | 1,176 |
| | Alameda CA Corridor Transportation Authority Revenue | 0.000% | 10/1/20 | (2) | 5,600 | 4,868 |
| | Alameda CA Corridor Transportation Authority Revenue | 5.000% | 10/1/20 | | 1,730 | 2,063 |
| | Bay Area Toll Authority California Toll Bridge Revenue (San Francisco Bay Area) PUT | 0.958% | 8/1/17 | | 28,500 | 28,827 |
| | Bay Area Toll Authority California Toll Bridge Revenue (San Francisco Bay Area) PUT | 1.450% | 8/1/17 | | 7,000 | 7,091 |
| | Bay Area Toll Authority California Toll Bridge Revenue (San Francisco Bay Area) PUT | 1.450% | 8/1/17 | | 17,000 | 17,228 |
| 1 | Bay Area Toll Authority California Toll Bridge Revenue (San Francisco Bay Area) PUT | 0.750% | 10/1/19 | | 9,825 | 9,857 |
| 1 | Bay Area Toll Authority California Toll Bridge Revenue (San Francisco Bay Area) PUT | 0.950% | 5/1/23 | | 4,000 | 4,009 |
| 1 | Bay Area Toll Authority California Toll Bridge Revenue (San Francisco Bay Area) PUT | 0.950% | 5/1/23 | | 28,500 | 28,562 |
| 2 | Bay Area Toll Authority California Toll Bridge Revenue (San Francisco Bay Area) TOB VRDO | 0.060% | 11/7/14 | | 9,270 | 9,270 |
| 2 | Bay Area Toll Authority California Toll Bridge Revenue (San Francisco Bay Area) TOB VRDO | 0.070% | 11/7/14 | | 4,910 | 4,910 |
| | Bay Area Toll Authority California Toll Bridge Revenue PUT | 1.500% | 4/2/18 | | 13,500 | 13,680 |
| | Bay Area Toll Authority California Toll Bridge Revenue PUT | 1.875% | 4/1/19 | | 15,200 | 15,586 |
| | Brea CA Redevelopment Agency Successor Agency Tax Allocation Revenue | | | | | |
| | (Redevelopment Project AB) | 5.000% | 8/1/18 | | 1,200 | 1,381 |
| | Brea CA Redevelopment Agency Successor Agency Tax Allocation Revenue | | | | | |
| | (Redevelopment Project AB) | 5.000% | 8/1/19 | | 2,000 | 2,348 |
| | Brea CA Redevelopment Agency Successor Agency Tax Allocation Revenue | | | | | |
| | (Redevelopment Project AB) | 5.000% | 8/1/20 | | 2,200 | 2,629 |
| | California County CA Tobacco Securitization Agency Revenue | 5.000% | 6/1/19 | | 1,000 | 1,140 |
| | California County CA Tobacco Securitization Agency Revenue | 5.000% | 6/1/20 | | 1,200 | 1,381 |
| | California Department of Water Resources Power Supply Revenue | 5.000% | 5/1/15 | | 40,000 | 40,976 |
| | California Department of Water Resources Power Supply Revenue | 5.000% | 5/1/15 | | 21,250 | 21,768 |
| | California Department of Water Resources Power Supply Revenue | 5.000% | 5/1/16 | | 12,055 | 12,905 |
| | California Department of Water Resources Power Supply Revenue | 5.000% | 5/1/17 | | 22,000 | 24,474 |
| | California Department of Water Resources Power Supply Revenue | 5.000% | 5/1/19 | | 10,000 | 11,764 |
| | California Department of Water Resources Water System Revenue (Central Valley Project) | 5.000% | 12/1/17 | | 2,500 | 2,840 |
| | California Department of Water Resources Water System Revenue (Central Valley Project) | 5.000% | 12/1/18 | | 1,365 | 1,592 |
| | California Department of Water Resources Water System Revenue (Central Valley Project) | 5.000% | 12/1/19 | | 4,000 | 4,771 |
| 1,3 | California Department of Water Resources Water System Revenue (Central Valley Project) PUT | 0.000% | 12/1/17 | | 29,750 | 29,755 |
| | California Economic Recovery GO | 5.000% | 7/1/16 | | 1,500 | 1,616 |
| | California Economic Recovery GO | 5.000% | 7/1/17 | | 15,090 | 16,886 |
| | California Economic Recovery GO | 5.000% | 7/1/18 | | 41,600 | 47,982 |
| | California GO | 5.000% | 12/1/14 | (Prere.) | 3,250 | 3,263 |
| | California GO | 5.000% | 4/1/15 | | 21,300 | 21,732 |
| | California GO | 5.000% | 6/1/15 | (14) | 5,100 | 5,244 |
| | California GO | 5.000% | 3/1/16 | | 3,210 | 3,412 |
| | California GO | 5.000% | 3/1/16 | (14) | 1,120 | 1,190 |
| | California GO | 5.000% | 3/1/16 | | 4,460 | 4,741 |
| | California GO | 5.000% | 4/1/16 | | 6,670 | 7,115 |
| | California GO | 5.000% | 5/1/16 | | 2,150 | 2,201 |
| | California GO | 5.000% | 8/1/16 | | 2,825 | 3,055 |
| | California GO | 5.000% | 10/1/16 | | 28,605 | 31,146 |
| | California GO | 5.000% | 10/1/16 | | 1,225 | 1,334 |
| | California GO | 5.000% | 11/1/16 | (2) | 5,375 | 5,872 |
| | California GO | 5.000% | 12/1/16 | | 2,500 | 2,740 |
| | California GO | 6.000% | 2/1/17 | (2) | 3,500 | 3,934 |
| | California GO | 5.000% | 3/1/17 | (14) | 1,300 | 1,378 |
| | California GO | 5.000% | 3/1/17 | | 3,755 | 4,145 |
| 1 | California GO | 0.800% | 5/1/17 | | 3,700 | 3,737 |
| | California GO | 5.000% | 9/1/17 | | 4,250 | 4,769 |
| | California GO | 5.000% | 9/1/17 | | 2,805 | 3,148 |
31
Limited-Term Tax-Exempt Fund
| | | | | |
| | | | | Face | Market |
| | | Maturity | | Amount | Value• |
| | Coupon | Date | | ($000) | ($000) |
| California GO | 5.000% | 10/1/17 | | 20,000 | 22,503 |
| California GO | 5.000% | 10/1/17 | | 4,005 | 4,506 |
| California GO | 5.000% | 9/1/18 | | 32,260 | 37,201 |
| California GO | 5.000% | 9/1/18 | | 8,050 | 9,283 |
| California GO | 5.000% | 10/1/18 | | 34,000 | 39,295 |
| California GO | 5.000% | 2/1/19 | | 11,000 | 12,783 |
| California GO | 5.000% | 4/1/19 | | 21,425 | 24,998 |
| California GO | 5.000% | 9/1/19 | | 19,000 | 22,376 |
| California GO | 5.000% | 9/1/19 | | 17,825 | 20,993 |
| California GO | 5.000% | 12/1/19 | | 35,000 | 41,438 |
| California GO | 5.000% | 2/1/20 | | 44,500 | 52,617 |
| California GO | 5.000% | 11/1/20 | | 21,520 | 25,798 |
| California GO | 5.000% | 12/1/20 | | 25,475 | 30,582 |
| California GO | 5.000% | 2/1/21 | | 10,000 | 11,971 |
| California GO | 5.000% | 10/1/21 | | 28,000 | 33,832 |
| California GO | 5.000% | 10/1/21 | | 41,940 | 50,676 |
| 1 California GO PUT | 0.600% | 12/1/16 | | 7,500 | 7,535 |
| 1 California GO PUT | 0.810% | 12/1/17 | | 14,250 | 14,382 |
| 1 California GO PUT | 0.939% | 12/3/18 | | 6,500 | 6,601 |
| 2 California GO TOB VRDO | 0.140% | 11/7/14 | LOC | 18,740 | 18,740 |
| California GO VRDO | 0.040% | 11/7/14 | LOC | 31,100 | 31,100 |
| California GO VRDO | 0.040% | 11/7/14 | LOC | 18,000 | 18,000 |
| California Health Facilities Financing Authority Revenue (Catholic Healthcare West) | 5.000% | 3/1/19 | | 5,125 | 5,971 |
| California Health Facilities Financing Authority Revenue (Cedars-Sinai Medical Center) | 5.000% | 8/15/17 | | 3,000 | 3,366 |
| California Health Facilities Financing Authority Revenue (Cedars-Sinai Medical Center) | 5.000% | 8/15/18 | | 3,000 | 3,459 |
| 1 California Health Facilities Financing Authority Revenue (Children’s Hospital of Los Angeles) PUT | 1.850% | 7/1/17 | | 8,825 | 8,891 |
| California Health Facilities Financing Authority Revenue | | | | | |
| (Children’s Hospital of Orange County) VRDO | 0.030% | 11/7/14 | LOC | 1,500 | 1,500 |
| California Health Facilities Financing Authority Revenue (City of Hope Medical Center) | 4.000% | 11/15/18 | | 1,000 | 1,111 |
| California Health Facilities Financing Authority Revenue | | | | | |
| (Lucile Salter Packard Children’s Hospital at Stanford) PUT | 1.450% | 3/15/17 | | 5,000 | 5,108 |
| California Health Facilities Financing Authority Revenue (Providence Health & Services) | 5.000% | 10/1/21 | | 750 | 906 |
| California Health Facilities Financing Authority Revenue (Providence Health & Services) | 5.000% | 10/1/22 | | 2,205 | 2,682 |
| California Health Facilities Financing Authority Revenue (St. Joseph Health System) PUT | 5.000% | 10/18/16 | | 20,000 | 21,790 |
| California Health Facilities Financing Authority Revenue (St. Joseph Health System) PUT | 5.000% | 10/15/19 | | 23,500 | 27,772 |
| California Health Facilities Financing Authority Revenue (St. Joseph Health System) PUT | 5.000% | 10/15/20 | | 10,000 | 11,899 |
| California Health Facilities Financing Authority Revenue (St. Joseph Health System) PUT | 5.000% | 10/18/22 | | 6,000 | 7,215 |
| California Health Facilities Financing Authority Revenue (Sutter Health) | 4.000% | 8/15/17 | | 5,000 | 5,491 |
| 2 California Health Facilities Financing Authority Revenue (Sutter Health) TOB VRDO | 0.060% | 11/7/14 | | 24,170 | 24,170 |
| 2 California Health Facilities Financing Authority Revenue (Sutter Health) TOB VRDO | 0.060% | 11/7/14 | | 850 | 850 |
| 1 California Infrastructure & Economic Development Bank Revenue (Index-Museum Art Project) PUT | 1.858% | 8/1/18 | | 29,000 | 29,908 |
| 1 California Infrastructure & Economic Development Bank Revenue (J. Paul Getty Trust) PUT | 0.330% | 4/1/16 | | 22,200 | 22,202 |
| 1 California Infrastructure & Economic Development Bank Revenue (J. Paul Getty Trust) PUT | 0.330% | 4/1/16 | | 5,800 | 5,801 |
| 1 California Infrastructure & Economic Development Bank Revenue (J. Paul Getty Trust) PUT | 0.330% | 4/3/17 | | 8,500 | 8,501 |
| 1 California Infrastructure & Economic Development Bank Revenue (J. Paul Getty Trust) PUT | 0.330% | 4/3/17 | | 32,200 | 32,202 |
| California Municipal Finance Authority | | | | | |
| (Community Hospitals of Central California Obligated Group) COP | 5.000% | 2/1/16 | | 2,450 | 2,579 |
| California Municipal Finance Authority | | | | | |
| (Community Hospitals of Central California Obligated Group) COP | 5.000% | 2/1/17 | | 1,145 | 1,238 |
| California Municipal Finance Authority Revenue (Anaheim Electric Utility Distribution System) | 5.000% | 10/1/21 | | 1,300 | 1,575 |
| 1 California Municipal Finance Authority Revenue (NorthBay Healthcare Group) PUT | 2.150% | 11/1/16 | | 5,000 | 5,013 |
| California Municipal Finance Authority Solid Waste Revenue (Republic Services Inc. Project) PUT | 0.300% | 1/2/15 | | 11,000 | 11,000 |
| California Public Works Board Lease Revenue (Department of Corrections) | 5.000% | 6/1/17 | | 5,000 | 5,558 |
| California Public Works Board Lease Revenue (Department of Corrections) | 4.000% | 9/1/17 | | 4,500 | 4,916 |
| California Public Works Board Lease Revenue (Department of Corrections) | 5.000% | 10/1/17 | | 5,820 | 6,536 |
| California Public Works Board Lease Revenue (Department of Corrections) | 5.000% | 6/1/18 | | 2,500 | 2,857 |
| California Public Works Board Lease Revenue (Department of Corrections) | 5.000% | 6/1/18 | | 10,650 | 12,171 |
| California Public Works Board Lease Revenue (Department of Corrections) | 5.000% | 9/1/18 | | 5,790 | 6,659 |
| California Public Works Board Lease Revenue (Department of Corrections) | 5.000% | 10/1/18 | | 1,845 | 2,126 |
| California Public Works Board Lease Revenue (Department of Corrections) | 5.250% | 11/1/18 | (14) | 1,180 | 1,374 |
| California Public Works Board Lease Revenue (Department of Corrections) | 5.000% | 6/1/19 | | 16,620 | 19,388 |
| California Public Works Board Lease Revenue (Department of Corrections) | 5.000% | 10/1/20 | | 1,690 | 2,013 |
| California Public Works Board Lease Revenue (Department of State Hospitals) | 5.000% | 6/1/19 | | 5,600 | 6,532 |
| California Public Works Board Lease Revenue (Department of State Hospitals) | 5.000% | 6/1/20 | | 5,200 | 6,157 |
| California Public Works Board Lease Revenue (Judicial Council Projects) | 5.000% | 12/1/17 | | 5,200 | 5,868 |
| California Public Works Board Lease Revenue (Judicial Council Projects) | 5.000% | 12/1/18 | | 4,000 | 4,627 |
| California Public Works Board Lease Revenue (Judicial Council Projects) | 5.000% | 3/1/20 | | 1,175 | 1,385 |
| California Public Works Board Lease Revenue (Judicial Council Projects) | 5.000% | 10/1/20 | | 1,240 | 1,477 |
| California Public Works Board Lease Revenue (Regents of The University of California) | 5.000% | 6/1/15 | (ETM) | 10,000 | 10,283 |
| California Public Works Board Lease Revenue (Regents of The University of California) | 5.000% | 10/1/18 | (ETM) | 2,665 | 3,095 |
| California Public Works Board Lease Revenue (Regents of The University of California) | 5.000% | 10/1/19 | (ETM) | 2,960 | 3,509 |
32
Limited-Term Tax-Exempt Fund
| | | | | |
| | | | | Face | Market |
| | | Maturity | | Amount | Value• |
| | Coupon | Date | | ($000) | ($000) |
| California Public Works Board Lease Revenue (Various Capital Projects) | 5.000% | 11/1/15 | | 5,295 | 5,550 |
| California Public Works Board Lease Revenue (Various Capital Projects) | 5.000% | 4/1/17 | | 2,385 | 2,637 |
| California Public Works Board Lease Revenue (Various Capital Projects) | 5.000% | 10/1/17 | | 3,000 | 3,369 |
| California Public Works Board Lease Revenue (Various Capital Projects) | 5.000% | 11/1/17 | | 1,000 | 1,126 |
| California Public Works Board Lease Revenue (Various Capital Projects) | 5.000% | 4/1/18 | | 1,000 | 1,137 |
| California Public Works Board Lease Revenue (Various Capital Projects) | 5.000% | 10/1/18 | | 3,500 | 4,033 |
| California Public Works Board Lease Revenue (Various Capital Projects) | 5.000% | 11/1/18 | | 2,500 | 2,886 |
| California Public Works Board Lease Revenue (Various Capital Projects) | 5.000% | 11/1/18 | | 1,200 | 1,385 |
| California Public Works Board Lease Revenue (Various Capital Projects) | 5.000% | 11/1/19 | | 2,000 | 2,353 |
| California Public Works Board Lease Revenue (Various Capital Projects) | 5.000% | 11/1/19 | | 2,750 | 3,236 |
| California Public Works Board Lease Revenue (Various Capital Projects) | 5.000% | 4/1/20 | | 3,050 | 3,601 |
| California Public Works Board Lease Revenue (Various Capital Projects) | 5.000% | 11/1/20 | | 2,000 | 2,385 |
| California State University Revenue Systemwide | 5.000% | 11/1/17 | | 5,505 | 6,239 |
| California State University Revenue Systemwide | 5.000% | 11/1/18 | | 4,000 | 4,651 |
| 2 California State University Revenue Systemwide TOB VRDO | 0.060% | 11/7/14 | | 9,240 | 9,240 |
| California Statewide Communities Development Authority Pollution Control Revenue | | | | | |
| (Southern California Edison Co.) PUT | 1.375% | 4/2/18 | | 45,200 | 45,653 |
| 2 California Statewide Communities Development Authority Revenue | | | | | |
| (Huntington Memorial Hospital) TOB VRDO | 0.280% | 11/7/14 | LOC | 24,995 | 24,995 |
| 2 California Statewide Communities Development Authority Revenue | | | | | |
| (Kaiser Permanente) TOB VRDO | 0.200% | 11/7/14 | | 6,195 | 6,195 |
| California Statewide Communities Development Authority Revenue (Kaiser Permanente) VRDO | 0.030% | 11/7/14 | | 3,560 | 3,560 |
| 2 California Statewide Communities Development Authority Revenue | | | | | |
| (St. Joseph Health System) TOB VRDO | 0.220% | 11/7/14 | (4) | 39,400 | 39,400 |
| California Statewide Communities Development Authority Senior Living Health Facility Revenue | | | | | |
| (Los Angeles Jewish Home for the Aging) | 2.500% | 8/1/20 | | 1,165 | 1,195 |
| California Statewide Communities Development Authority Senior Living Health Facility Revenue | | | | | |
| (Los Angeles Jewish Home for the Aging) | 3.000% | 8/1/21 | | 2,600 | 2,669 |
| California Statewide Communities Development Authority Senior Living Revenue | | | | | |
| (Southern California Presbyterian Homes) | 5.250% | 11/15/14 | | 260 | 260 |
| Central Valley CA Financing Authority Cogeneration Project Revenue (Carson Ice-Gen Project) | 5.000% | 7/1/15 | | 750 | 774 |
| Central Valley CA Financing Authority Cogeneration Project Revenue (Carson Ice-Gen Project) | 5.000% | 7/1/16 | | 805 | 865 |
| Chula Vista CA Industrial Development Revenue (San Diego Gas & Electric Co.) | 1.650% | 7/1/18 | | 9,000 | 9,059 |
| Chula Vista CA Municipal Financing Authority Special Tax Revenue | 5.000% | 9/1/17 | | 585 | 647 |
| Chula Vista CA Municipal Financing Authority Special Tax Revenue | 5.000% | 9/1/18 | | 2,380 | 2,691 |
| Chula Vista CA Municipal Financing Authority Special Tax Revenue | 5.000% | 9/1/19 | | 2,695 | 3,102 |
| Contra Costa CA Municipal Water District Revenue | 5.000% | 10/1/18 | | 2,000 | 2,325 |
| Contra Costa CA Municipal Water District Revenue | 5.000% | 10/1/19 | | 2,100 | 2,501 |
| Contra Costa CA Municipal Water District Revenue | 5.000% | 10/1/20 | | 1,500 | 1,817 |
| Contra Costa CA Municipal Water District Revenue | 5.000% | 10/1/21 | | 2,000 | 2,448 |
| 1 Contra Costa CA Transportation Authority Sales Tax Revenue PUT | 0.472% | 12/15/15 | | 23,750 | 23,792 |
| 1 East Bay CA Municipal Utility District Waste Water System Revenue PUT | 0.250% | 12/1/15 | | 21,935 | 21,943 |
| 1 East Bay CA Municipal Utility District Waste Water System Revenue PUT | 0.250% | 12/1/15 | | 14,540 | 14,546 |
| East Bay CA Municipal Utility District Water System Revenue | 5.000% | 6/1/17 | | 2,450 | 2,737 |
| East Bay CA Municipal Utility District Water System Revenue | 5.000% | 6/1/19 | | 2,000 | 2,359 |
| Foothill/Eastern Transportation Corridor Agency California Toll Road Revenue | 0.000% | 1/1/15 | (ETM) | 18,535 | 18,530 |
| Foothill/Eastern Transportation Corridor Agency California Toll Road Revenue | 0.000% | 1/15/21 | (4) | 4,115 | 3,504 |
| Foothill/Eastern Transportation Corridor Agency California Toll Road Revenue PUT | 5.000% | 1/15/18 | | 19,990 | 21,873 |
| Foothill/Eastern Transportation Corridor Agency California Toll Road Revenue PUT | 5.000% | 1/15/20 | | 51,040 | 57,302 |
| Glendale CA Redevelopment Agency Successor Agency Tax Allocation Revenue | | | | | |
| (Central Glendale Redevelopment Project) | 4.000% | 12/1/17 | (4) | 2,500 | 2,742 |
| Glendale CA Redevelopment Agency Successor Agency Tax Allocation Revenue | | | | | |
| (Central Glendale Redevelopment Project) | 4.000% | 12/1/18 | (4) | 1,185 | 1,318 |
| Glendale CA Redevelopment Agency Successor Agency Tax Allocation Revenue | | | | | |
| (Central Glendale Redevelopment Project) | 4.000% | 12/1/19 | (4) | 2,910 | 3,272 |
| Glendale CA Redevelopment Agency Successor Agency Tax Allocation Revenue | | | | | |
| (Central Glendale Redevelopment Project) | 5.000% | 12/1/21 | (4) | 1,725 | 2,071 |
| 2 Golden State Tobacco Securitization Corp. California TOB VRDO | 0.220% | 11/7/14 | (12)LOC | 14,155 | 14,155 |
| Irvine CA Reassessment District No. 12-1 Improvement Revenue | 3.000% | 9/2/15 | | 1,160 | 1,185 |
| Irvine CA Reassessment District No. 12-1 Improvement Revenue | 3.000% | 9/2/16 | | 2,000 | 2,085 |
| Irvine CA Reassessment District No. 13-1 Improvement Revenue | 4.000% | 9/2/18 | | 1,450 | 1,569 |
| La Quinta CA Redevelopment Agency Tax Allocation Revenue | 4.000% | 9/1/17 | | 1,130 | 1,225 |
| La Quinta CA Redevelopment Agency Tax Allocation Revenue | 5.000% | 9/1/18 | | 1,745 | 1,984 |
| La Quinta CA Redevelopment Agency Tax Allocation Revenue | 5.000% | 9/1/19 | | 1,150 | 1,333 |
| La Quinta CA Redevelopment Agency Tax Allocation Revenue | 5.000% | 9/1/20 | | 1,045 | 1,224 |
| La Quinta CA Redevelopment Agency Tax Allocation Revenue | 5.000% | 9/1/21 | | 1,250 | 1,475 |
| La Verne CA (Brethren Hillcrest Homes) COP | 5.000% | 5/15/20 | | 640 | 728 |
| La Verne CA (Brethren Hillcrest Homes) COP | 5.000% | 5/15/21 | | 310 | 354 |
| La Verne CA (Brethren Hillcrest Homes) COP | 5.000% | 5/15/22 | | 250 | 286 |
| Long Beach CA Finance Authority Natural Gas Purchase Revenue | 5.250% | 11/15/20 | | 1,505 | 1,733 |
| Long Beach CA Harbor Revenue | 5.000% | 11/15/18 | | 32,500 | 37,784 |
33
Limited-Term Tax-Exempt Fund
| | | | | |
| | | | | Face | Market |
| | | Maturity | | Amount | Value• |
| | Coupon | Date | | ($000) | ($000) |
| Los Angeles CA Department of Airports International Airport Revenue | 5.000% | 5/15/19 | | 1,000 | 1,179 |
| Los Angeles CA Department of Airports International Airport Revenue | 5.000% | 5/15/20 | | 1,275 | 1,523 |
| Los Angeles CA Department of Water & Power Revenue | 5.000% | 1/1/16 | | 8,500 | 8,876 |
| 2 Los Angeles CA Department of Water & Power Revenue TOB VRDO | 0.060% | 11/7/14 | | 2,430 | 2,430 |
| Los Angeles CA Department of Water & Power Revenue VRDO | 0.040% | 11/7/14 | | 7,500 | 7,500 |
| Los Angeles CA Department of Water & Power Revenue VRDO | 0.040% | 11/7/14 | | 5,625 | 5,625 |
| Los Angeles CA GO | 5.000% | 9/1/17 | | 32,500 | 36,651 |
| Los Angeles CA GO | 5.000% | 9/1/19 | | 5,000 | 5,925 |
| Los Angeles CA Unified School District GO | 5.000% | 7/1/15 | | 10,240 | 10,574 |
| Los Angeles CA Unified School District GO | 5.000% | 7/1/15 | | 4,200 | 4,337 |
| Los Angeles CA Unified School District GO | 5.000% | 7/1/15 | | 14,510 | 14,983 |
| Los Angeles CA Unified School District GO | 5.000% | 7/1/15 | | 20,000 | 20,652 |
| Los Angeles CA Unified School District GO | 5.000% | 7/1/16 | | 19,595 | 21,115 |
| Los Angeles CA Unified School District GO | 5.000% | 7/1/17 | | 19,090 | 21,346 |
| Los Angeles CA Unified School District GO | 5.000% | 7/1/19 | | 13,205 | 15,528 |
| Los Angeles CA Unified School District GO | 5.000% | 7/1/19 | | 11,100 | 13,053 |
| Los Angeles CA Unified School District GO | 5.000% | 7/1/19 | | 7,035 | 8,273 |
| Los Angeles CA Unified School District GO | 5.000% | 7/1/19 | | 8,510 | 10,007 |
| Los Angeles CA Unified School District GO | 5.000% | 7/1/20 | | 17,195 | 20,592 |
| Los Angeles CA Unified School District GO | 5.000% | 7/1/20 | | 22,525 | 26,975 |
| Los Angeles CA Unified School District GO | 5.000% | 7/1/20 | | 20,920 | 25,053 |
| Los Angeles CA Unified School District GO | 5.000% | 7/1/20 | | 14,755 | 17,670 |
| Los Angeles County CA Metropolitan Transportation Authority Sales Tax Revenue | 5.000% | 7/1/16 | | 22,315 | 24,085 |
| Los Angeles County CA Metropolitan Transportation Authority Sales Tax Revenue | 5.000% | 7/1/16 | | 5,000 | 5,396 |
| Los Angeles County CA Metropolitan Transportation Authority Sales Tax Revenue | 5.000% | 7/1/19 | | 20,000 | 23,709 |
| Los Angeles County CA Public Works Financing Authority Lease Revenue | 5.000% | 8/1/16 | | 3,450 | 3,730 |
| Los Angeles County CA Public Works Financing Authority Lease Revenue | 5.000% | 8/1/17 | | 5,000 | 5,592 |
| Los Angeles County CA Public Works Financing Authority Lease Revenue | 5.000% | 8/1/18 | | 750 | 862 |
| Los Angeles County CA Public Works Financing Authority Lease Revenue | 5.000% | 8/1/19 | | 1,000 | 1,172 |
| Los Angeles County CA Public Works Financing Authority Lease Revenue | 5.000% | 8/1/20 | | 500 | 595 |
| Los Angeles County CA Redevelopment Authority Tax Allocation Revenue (Various Project Areas) | 5.000% | 9/1/18 | | 1,000 | 1,137 |
| Los Angeles County CA Redevelopment Authority Tax Allocation Revenue (Various Project Areas) | 5.000% | 9/1/19 | | 2,000 | 2,318 |
| Los Angeles County CA Redevelopment Authority Tax Allocation Revenue (Various Project Areas) | 5.000% | 9/1/20 | | 5,495 | 6,461 |
| Los Angeles County CA Redevelopment Authority Tax Allocation Revenue (Various Project Areas) | 5.000% | 9/1/21 | (4) | 5,000 | 5,930 |
| Los Angeles County CA Regional Financing Authority Revenue (Montecedro Inc. Project) | 2.500% | 11/15/20 | | 1,665 | 1,693 |
| Los Angeles County CA Regional Financing Authority Revenue (Montecedro Inc. Project) | 3.000% | 11/15/20 | | 925 | 944 |
| Los Angeles County CA Regional Financing Authority Revenue (Montecedro Inc. Project) | 3.000% | 11/15/21 | | 2,125 | 2,157 |
| Modesto CA Irrigation District Electric Revenue | 5.000% | 7/1/18 | | 750 | 864 |
| Modesto CA Irrigation District Electric Revenue | 5.000% | 7/1/19 | | 3,000 | 3,532 |
| Modesto CA Irrigation District Electric Revenue | 5.000% | 7/1/19 | | 500 | 589 |
| Modesto CA Irrigation District Electric Revenue | 5.000% | 7/1/20 | | 750 | 897 |
| Northern California Gas Authority No. 1 Revenue | 0.788% | 7/1/19 | | 12,815 | 12,615 |
| Northern California Power Agency Revenue (Hydroelectric Project) | 4.000% | 7/1/15 | | 3,000 | 3,078 |
| Northern California Power Agency Revenue (Hydroelectric Project) | 5.000% | 7/1/15 | (12) | 4,000 | 4,131 |
| Oakland CA Redevelopment Agency Tax Allocation Revenue (Central District Project) | 5.000% | 9/1/16 | | 2,100 | 2,267 |
| Oakland CA Redevelopment Agency Tax Allocation Revenue (Central District Project) | 5.000% | 9/1/17 | | 3,500 | 3,897 |
| Oakland CA Redevelopment Agency Tax Allocation Revenue (Central District Project) | 5.000% | 9/1/18 | | 1,550 | 1,766 |
| Oakland CA Redevelopment Agency Tax Allocation Revenue (Central District Project) | 5.000% | 9/1/19 | | 1,500 | 1,742 |
| Oakland CA Redevelopment Agency Tax Allocation Revenue (Central District Project) | 5.000% | 9/1/20 | | 4,000 | 4,703 |
| Orange County CA Airport Revenue | 5.000% | 7/1/16 | | 3,435 | 3,700 |
| Orange County CA Transportation Authority Toll Road Revenue | 5.000% | 8/15/19 | | 1,000 | 1,169 |
| Palomar Pomerado Health California COP | 4.500% | 11/1/15 | | 2,265 | 2,316 |
| Palomar Pomerado Health California COP | 5.000% | 11/1/16 | | 3,500 | 3,666 |
| Riverside County CA Asset Leasing Corp. Leasehold Revenue (Riverside County Hospital Project) | 0.000% | 6/1/15 | (14) | 1,750 | 1,745 |
| Riverside County CA Asset Leasing Corp. Leasehold Revenue (Riverside County Hospital Project) | 5.000% | 6/1/18 | | 6,500 | 7,383 |
| Riverside County CA Transportation Commission Sales Tax Revenue | 5.000% | 6/1/18 | | 500 | 575 |
| Riverside County CA Transportation Commission Sales Tax Revenue | 5.000% | 6/1/19 | | 850 | 1,001 |
| Riverside County CA Transportation Commission Sales Tax Revenue | 5.000% | 6/1/20 | | 1,750 | 2,100 |
| Roseville CA Natural Gas Financing Authority Gas Revenue | 5.000% | 2/15/18 | | 50 | 55 |
| Sacramento CA Cogeneration Authority Revenue | 5.000% | 7/1/15 | | 700 | 722 |
| Sacramento CA Cogeneration Authority Revenue | 5.000% | 7/1/16 | | 1,000 | 1,075 |
| Sacramento CA Municipal Utility District Revenue | 5.000% | 8/15/16 | (4) | 7,800 | 8,447 |
| Sacramento CA Municipal Utility District Revenue | 5.000% | 7/1/17 | (14) | 5,000 | 5,368 |
| Sacramento CA Transportation Authority Sales Tax Revenue VRDO | 0.030% | 11/7/14 | | 2,600 | 2,600 |
| Sacramento County CA Airport Revenue | 5.000% | 7/1/15 | | 8,245 | 8,489 |
| San Bernardino CA City Unified School District GO | 5.000% | 8/1/18 | | 850 | 971 |
| San Bernardino CA City Unified School District GO | 5.000% | 8/1/19 | (4) | 600 | 699 |
| San Bernardino County CA Medical Center (Arrowhead Project) COP | 5.000% | 8/1/15 | | 3,000 | 3,102 |
| San Bernardino County CA Medical Center (Arrowhead Project) COP | 5.000% | 8/1/16 | | 5,445 | 5,848 |
| 2 San Diego CA Community College District GO TOB VRDO | 0.060% | 11/7/14 | | 4,880 | 4,880 |
| San Diego CA Public Facilities Financing Authority Sewer Revenue | 5.000% | 5/15/16 | | 11,840 | 12,722 |
34
Limited-Term Tax-Exempt Fund
| | | | | |
| | | | | Face | Market |
| | | Maturity | | Amount | Value• |
| | Coupon | Date | | ($000) | ($000) |
| San Diego CA Public Facilities Financing Authority Sewer Revenue | 5.000% | 5/15/16 | | 14,000 | 15,043 |
| 2 San Diego CA Public Facilities Financing Authority Water Revenue TOB VRDO | 0.060% | 11/7/14 | | 9,900 | 9,900 |
| San Diego County CA Regional Transportation Commission Sales Tax Revenue VRDO | 0.040% | 11/7/14 | | 15,400 | 15,400 |
| 2 San Francisco CA Bay Area Rapid Transit District Sales Tax Revenue TOB VRDO | 0.060% | 11/7/14 | | 6,450 | 6,450 |
| San Francisco CA City & County International Airport Revenue | 5.000% | 5/1/15 | (4) | 5,000 | 5,123 |
| San Francisco CA City & County International Airport Revenue | 5.000% | 5/1/16 | | 9,120 | 9,772 |
| San Francisco CA City & County International Airport Revenue | 5.000% | 5/1/17 | | 16,555 | 18,409 |
| 2 San Francisco CA City & County Public Utilities Commission Water Revenue TOB VRDO | 0.060% | 11/7/14 | | 2,000 | 2,000 |
| San Juan CA Unified School District GO | 5.000% | 8/1/19 | | 1,090 | 1,283 |
| San Juan CA Unified School District GO | 5.000% | 8/1/21 | | 1,000 | 1,212 |
| San Mateo County CA Joint Powers Financing Authority Lease Revenue | | | | | |
| (Maple Street Correctional Center) | 5.000% | 6/15/17 | | 1,000 | 1,118 |
| San Mateo County CA Joint Powers Financing Authority Lease Revenue | | | | | |
| (Maple Street Correctional Center) | 5.000% | 6/15/18 | | 1,000 | 1,150 |
| San Mateo County CA Joint Powers Financing Authority Lease Revenue | | | | | |
| (Maple Street Correctional Center) | 5.000% | 6/15/19 | | 1,000 | 1,176 |
| San Mateo County CA Joint Powers Financing Authority Lease Revenue | | | | | |
| (Maple Street Correctional Center) | 5.000% | 6/15/20 | | 1,000 | 1,196 |
| San Mateo County CA Joint Powers Financing Authority Lease Revenue | | | | | |
| (Maple Street Correctional Center) | 5.000% | 6/15/21 | | 500 | 604 |
| 2 San Mateo County CA Joint Powers Financing Authority Lease Revenue | | | | | |
| (Maple Street Correctional Center) TOB VRDO | 0.120% | 11/7/14 | | 6,200 | 6,200 |
| San Pablo CA Redevelopment Agency Successor Agency Tax Allocation Revenue | 5.000% | 6/15/20 | (4) | 1,045 | 1,234 |
| San Pablo CA Redevelopment Agency Successor Agency Tax Allocation Revenue | 5.000% | 6/15/21 | (4) | 500 | 595 |
| South Orange County CA Public Financing Authority Special Tax Revenue | 3.000% | 8/15/15 | | 500 | 511 |
| South Orange County CA Public Financing Authority Special Tax Revenue | 3.000% | 8/15/16 | | 500 | 522 |
| South Orange County CA Public Financing Authority Special Tax Revenue | 5.000% | 8/15/19 | | 1,000 | 1,166 |
| South Orange County CA Public Financing Authority Special Tax Revenue | 5.000% | 8/15/20 | | 600 | 711 |
| Southern California Public Power Authority Revenue | 5.000% | 7/1/18 | | 2,000 | 2,304 |
| Southern California Public Power Authority Revenue (Natural Gas Project) | 5.000% | 11/1/17 | | 1,000 | 1,109 |
| Southern California Public Power Authority Revenue (Transmission Project) | 5.000% | 7/1/17 | | 9,895 | 11,065 |
| 2 Sweetwater CA Unified School District GO TOB VRDO | 0.070% | 11/7/14 | (13) | 13,600 | 13,600 |
| University of California Revenue | 5.000% | 5/15/17 | | 2,250 | 2,512 |
| University of California Revenue | 5.000% | 5/15/18 | | 2,000 | 2,299 |
| University of California Revenue | 5.000% | 5/15/19 | | 4,435 | 5,224 |
| 2 University of California Revenue TOB VRDO | 0.060% | 11/7/14 | | 9,300 | 9,300 |
| Ventura County CA Public Financing Authority COP | 5.000% | 8/15/16 | | 2,750 | 2,966 |
| | | | | | 2,499,595 |
| Colorado (1.1%) | | | | | |
| Colorado (UCDHSC Fitzsimons Academic Projects) COP | 5.000% | 11/1/18 | | 3,080 | 3,537 |
| Colorado Department of Transportation Revenue | 5.000% | 12/15/15 | (14) | 3,000 | 3,162 |
| Colorado Educational & Cultural Facilities Authority Revenue (Johnson & Wales University) | 5.000% | 4/1/20 | | 2,500 | 2,883 |
| Colorado Health Facilities Authority Revenue (Catholic Health Initiatives) | 5.000% | 7/1/16 | | 5,000 | 5,376 |
| Colorado Health Facilities Authority Revenue (Catholic Health Initiatives) | 5.000% | 7/1/18 | | 3,000 | 3,429 |
| 2 Colorado Health Facilities Authority Revenue (Catholic Health Initiatives) TOB VRDO | 0.250% | 11/7/14 | | 9,995 | 9,995 |
| 2 Colorado Health Facilities Authority Revenue (Catholic Health Initiatives) TOB VRDO | 0.250% | 11/7/14 | | 12,495 | 12,495 |
| Colorado Health Facilities Authority Revenue (Covenant Retirement Community Inc.) | 3.150% | 12/1/18 | | 8,465 | 8,535 |
| Colorado Health Facilities Authority Revenue (Sisters of Charity of Leavenworth Health System) | 5.000% | 1/1/16 | | 3,165 | 3,336 |
| Colorado Health Facilities Authority Revenue (Sisters of Charity of Leavenworth Health System) | 5.000% | 1/1/16 | | 6,415 | 6,761 |
| Colorado Health Facilities Authority Revenue (Sisters of Charity of Leavenworth Health System) | 5.000% | 1/1/17 | | 3,715 | 4,071 |
| Colorado Health Facilities Authority Revenue (Sisters of Charity of Leavenworth Health System) | 5.000% | 1/1/17 | | 7,920 | 8,680 |
| Colorado Health Facilities Authority Revenue (Sisters of Charity of Leavenworth Health System) | | | | | |
| VRDO | 0.050% | 11/7/14 | | 22,715 | 22,715 |
| Colorado Health Facilities Authority Revenue (Sisters of Charity of Leavenworth Health System) | | | | | |
| VRDO | 0.050% | 11/7/14 | | 4,800 | 4,800 |
| Colorado Springs CO Utility System Revenue | 4.000% | 11/15/16 | | 1,250 | 1,342 |
| Colorado Springs CO Utility System Revenue | 5.000% | 11/15/17 | | 2,100 | 2,376 |
| Colorado Springs CO Utility System Revenue | 5.000% | 11/15/18 | | 2,000 | 2,319 |
| Colorado Springs CO Utility System Revenue | 5.000% | 11/15/19 | | 3,000 | 3,552 |
| Colorado Springs CO Utility System Revenue VRDO | 0.050% | 11/7/14 | | 22,285 | 22,285 |
| Denver CO City & County Airport Revenue | 5.000% | 11/15/14 | | 1,840 | 1,844 |
| Denver CO City & County Airport Revenue | 5.000% | 11/15/16 | | 2,500 | 2,733 |
| Denver CO City & County Airport Revenue | 5.000% | 11/15/19 | | 1,310 | 1,547 |
| Denver CO City & County COP VRDO | 0.070% | 11/3/14 | | 7,600 | 7,600 |
| Denver CO City & County COP VRDO | 0.070% | 11/3/14 | | 4,155 | 4,155 |
| Denver CO City & County Excise Tax Revenue | 5.250% | 9/1/18 | (4) | 2,555 | 2,951 |
| E-470 Public Highway Authority Colorado Revenue | 0.000% | 9/1/16 | (14) | 5,000 | 4,883 |
| E-470 Public Highway Authority Colorado Revenue | 5.000% | 9/1/17 | (14) | 500 | 552 |
| E-470 Public Highway Authority Colorado Revenue | 0.000% | 9/1/20 | (14) | 2,000 | 1,749 |
| 1 E-470 Public Highway Authority Colorado Revenue PUT | 1.230% | 8/31/17 | | 7,500 | 7,508 |
| 1 E-470 Public Highway Authority Colorado Revenue PUT | 1.800% | 9/1/17 | (14) | 7,000 | 7,051 |
35
Limited-Term Tax-Exempt Fund
| | | | | |
| | | | | Face | Market |
| | | Maturity | | Amount | Value• |
| | Coupon | Date | | ($000) | ($000) |
| Jefferson County CO School District GO | 5.000% | 12/15/17 | (4) | 7,985 | 8,405 |
| Regional Transportation District of Colorado Sales Tax Revenue (FasTracks Project) | 5.000% | 11/1/16 | (Prere.) | 22,500 | 24,561 |
| University of Colorado Enterprise System Revenue | 5.000% | 6/1/18 | | 2,000 | 2,290 |
| University of Colorado Enterprise System Revenue | 5.000% | 6/1/19 | | 1,000 | 1,171 |
| University of Colorado Enterprise System Revenue | 5.000% | 6/1/19 | | 2,500 | 2,928 |
| University of Colorado Hospital Authority Revenue | 5.000% | 11/15/14 | | 1,000 | 1,002 |
| University of Colorado Hospital Authority Revenue | 5.000% | 11/15/16 | | 1,290 | 1,400 |
| | | | | | 215,979 |
| Connecticut (2.6%) | | | | | |
| Connecticut GO | 0.290% | 11/3/14 | | 7,000 | 7,000 |
| Connecticut GO | 0.330% | 11/3/14 | | 12,735 | 12,735 |
| Connecticut GO | 0.330% | 11/3/14 | | 15,825 | 15,825 |
| Connecticut GO | 0.330% | 11/3/14 | | 13,315 | 13,315 |
| Connecticut GO | 5.000% | 1/1/15 | | 14,710 | 14,831 |
| Connecticut GO | 5.250% | 11/1/15 | | 1,000 | 1,051 |
| Connecticut GO | 5.000% | 11/15/15 | (Prere.) | 7,070 | 7,423 |
| Connecticut GO | 5.000% | 1/1/16 | | 30,000 | 31,652 |
| Connecticut GO | 5.000% | 3/1/16 | | 4,705 | 4,999 |
| Connecticut GO | 5.000% | 5/1/16 | | 10,000 | 10,697 |
| 1 Connecticut GO | 0.700% | 5/15/16 | | 8,300 | 8,357 |
| 1 Connecticut GO | 0.640% | 8/15/16 | | 4,500 | 4,529 |
| 1 Connecticut GO | 0.480% | 9/15/16 | | 3,000 | 3,015 |
| Connecticut GO | 5.000% | 4/1/17 | | 1,165 | 1,289 |
| 1 Connecticut GO | 0.820% | 5/15/17 | | 23,000 | 23,261 |
| Connecticut GO | 5.000% | 7/15/17 | | 5,000 | 5,589 |
| 1 Connecticut GO | 0.570% | 9/15/17 | | 1,750 | 1,761 |
| Connecticut GO | 5.000% | 12/1/17 | | 15,000 | 16,423 |
| 1 Connecticut GO | 0.470% | 3/1/18 | | 2,500 | 2,496 |
| 1 Connecticut GO | 0.930% | 4/15/18 | | 6,750 | 6,844 |
| Connecticut GO | 5.000% | 6/1/18 | | 14,955 | 17,144 |
| Connecticut GO | 5.000% | 7/15/18 | | 10,000 | 11,501 |
| 1 Connecticut GO | 0.930% | 8/15/18 | | 3,000 | 3,047 |
| Connecticut GO | 5.000% | 11/1/18 | | 1,000 | 1,158 |
| 1 Connecticut GO | 0.540% | 3/1/19 | | 2,300 | 2,291 |
| 1 Connecticut GO | 0.600% | 3/1/19 | | 2,000 | 2,004 |
| 1 Connecticut GO | 1.150% | 4/15/19 | | 6,000 | 6,131 |
| 1 Connecticut GO | 1.150% | 5/15/19 | | 5,000 | 5,112 |
| Connecticut GO | 5.000% | 6/1/19 | | 44,265 | 51,719 |
| 1 Connecticut GO | 0.970% | 9/15/19 | | 4,000 | 4,081 |
| 1 Connecticut GO | 0.700% | 3/1/20 | | 7,500 | 7,519 |
| Connecticut GO | 5.000% | 6/15/20 | | 17,975 | 21,371 |
| Connecticut GO | 5.000% | 12/15/20 | | 5,865 | 7,044 |
| 1 Connecticut GO PUT | 0.700% | 9/15/17 | | 7,150 | 7,219 |
| 1 Connecticut GO PUT | 1.400% | 3/1/18 | | 17,500 | 17,571 |
| Connecticut Health & Educational Facilities Authority Revenue (Hartford Healthcare) | 5.000% | 7/1/17 | | 2,090 | 2,318 |
| Connecticut Health & Educational Facilities Authority Revenue (Hartford Healthcare) | 5.000% | 7/1/18 | | 3,500 | 3,980 |
| Connecticut Health & Educational Facilities Authority Revenue (Hartford Healthcare) | 5.000% | 7/1/19 | | 4,270 | 4,943 |
| Connecticut Health & Educational Facilities Authority Revenue (Stamford Hospital) | 5.000% | 7/1/15 | | 1,975 | 2,037 |
| Connecticut Health & Educational Facilities Authority Revenue (Stamford Hospital) | 5.000% | 7/1/16 | | 5,085 | 5,466 |
| Connecticut Health & Educational Facilities Authority Revenue (Stamford Hospital) | 5.000% | 7/1/17 | | 2,365 | 2,631 |
| Connecticut Health & Educational Facilities Authority Revenue (Yale University) PUT | 5.000% | 2/12/15 | | 20,810 | 21,091 |
| Connecticut Health & Educational Facilities Authority Revenue (Yale University) PUT | 0.800% | 7/26/17 | | 40,000 | 40,217 |
| 1 Connecticut Health & Educational Facilities Authority Revenue (Yale-New Haven Hospital Inc.) PUT | 0.652% | 7/1/19 | | 15,000 | 15,044 |
| Connecticut Housing Finance Authority Revenue Housing Mortgage Finance Program | 4.000% | 11/15/44 | | 3,000 | 3,288 |
| Connecticut Housing Finance Authority Revenue Housing Mortgage Finance Program | 4.000% | 11/15/44 | | 9,000 | 9,895 |
| 3 Connecticut Housing Finance Authority Revenue Housing Mortgage Finance Program | 4.000% | 11/15/44 | | 6,600 | 7,227 |
| Connecticut Special Tax Revenue (Transportation Infrastructure) | 5.000% | 2/1/16 | | 5,300 | 5,612 |
| Connecticut Special Tax Revenue (Transportation Infrastructure) | 5.250% | 7/1/16 | (2) | 7,745 | 8,376 |
| Connecticut Special Tax Revenue (Transportation Infrastructure) | 5.000% | 1/1/17 | | 5,000 | 5,487 |
| Connecticut Special Tax Revenue (Transportation Infrastructure) | 5.000% | 11/1/18 | | 1,475 | 1,707 |
| Connecticut Special Tax Revenue (Transportation Infrastructure) | 5.000% | 12/1/19 | | 4,915 | 5,816 |
| Connecticut Special Tax Revenue (Transportation Infrastructure) | 5.000% | 10/1/20 | | 4,085 | 4,880 |
| Connecticut Special Tax Revenue (Transportation Infrastructure) | 5.000% | 9/1/21 | | 11,340 | 13,668 |
| Greater New Haven CT Water Pollution Control Authority Regional Wastewater System Revenue | 5.000% | 8/15/20 | | 200 | 237 |
| Greater New Haven CT Water Pollution Control Authority Regional Wastewater System Revenue | 5.000% | 8/15/22 | | 400 | 481 |
| New Haven CT GO | 5.000% | 8/1/20 | (4) | 2,015 | 2,361 |
| | | | | | 524,766 |
36
Limited-Term Tax-Exempt Fund
| | | | | |
| | | | | Face | Market |
| | | Maturity | | Amount | Value• |
| | Coupon | Date | | ($000) | ($000) |
| Delaware (0.2%) | | | | | |
| Delaware GO | 5.000% | 7/1/17 | | 5,250 | 5,872 |
| Delaware GO | 5.000% | 10/1/18 | | 3,540 | 4,106 |
| Delaware River & Bay Authority Delaware Revenue | 5.000% | 1/1/18 | | 6,155 | 6,941 |
| Delaware River & Bay Authority Delaware Revenue | 5.000% | 1/1/19 | | 3,760 | 4,339 |
| Delaware River & Bay Authority Delaware Revenue | 5.000% | 1/1/20 | | 225 | 265 |
| Delaware River & Bay Authority Delaware Revenue | 5.000% | 1/1/20 | | 2,575 | 3,023 |
| Delaware River & Bay Authority Delaware Revenue | 5.000% | 1/1/21 | | 250 | 297 |
| Delaware River & Bay Authority Delaware Revenue | 5.000% | 1/1/21 | | 2,295 | 2,720 |
| Delaware River & Bay Authority Delaware Revenue | 5.000% | 1/1/22 | | 325 | 389 |
| Delaware River & Bay Authority Delaware Revenue | 5.000% | 1/1/22 | | 3,000 | 3,583 |
| Delaware Transportation Authority Transportation System Revenue | 5.000% | 7/1/16 | | 4,485 | 4,835 |
| University of Delaware Revenue PUT | 0.700% | 5/1/16 | | 8,750 | 8,787 |
| | | | | | 45,157 |
| District of Columbia (0.4%) | | | | | |
| District of Columbia Income Tax Revenue | 5.000% | 12/1/18 | | 5,500 | 6,387 |
| District of Columbia Income Tax Revenue | 5.000% | 12/1/18 | | 5,250 | 6,097 |
| District of Columbia Income Tax Revenue | 5.000% | 12/1/19 | | 1,500 | 1,779 |
| 2 District of Columbia Income Tax Revenue TOB VRDO | 0.060% | 11/7/14 | | 7,425 | 7,425 |
| District of Columbia Revenue (American College of Cardiology) VRDO | 0.200% | 11/7/14 | LOC | 39,200 | 39,200 |
| 1 District of Columbia Water & Sewer Authority Public Utility Revenue PUT | 0.530% | 12/1/14 | (Prere.) | 7,300 | 7,300 |
| 1 District of Columbia Water & Sewer Authority Public Utility Revenue PUT | 0.630% | 6/1/16 | | 6,000 | 6,014 |
| Washington DC Metropolitan Area Transit Authority Revenue | 5.000% | 7/1/15 | | 3,375 | 3,485 |
| | | | | | 77,687 |
| Florida (4.5%) | | | | | |
| Alachua County FL Health Facilities Authority Revenue (Shands HealthCare Project) | 5.000% | 12/1/14 | | 4,390 | 4,406 |
| Alachua County FL Health Facilities Authority Revenue (Shands HealthCare Project) | 5.000% | 12/1/15 | | 5,000 | 5,227 |
| Boynton Beach FL Utility System Revenue | 5.500% | 11/1/18 | (14) | 3,125 | 3,534 |
| Broward County FL Airport System Revenue | 5.000% | 10/1/16 | | 700 | 760 |
| Broward County FL Airport System Revenue | 5.000% | 10/1/19 | | 750 | 876 |
| Broward County FL Airport System Revenue | 5.000% | 10/1/19 | | 500 | 584 |
| Broward County FL Airport System Revenue | 5.000% | 10/1/20 | | 1,060 | 1,257 |
| Broward County FL Airport System Revenue | 5.000% | 10/1/21 | | 480 | 575 |
| Broward County FL School Board COP | 5.000% | 7/1/18 | | 4,400 | 4,993 |
| Broward County FL School Board COP | 5.000% | 7/1/19 | | 8,140 | 9,415 |
| 2 Broward County FL Water & Sewer Utility Revenue TOB VRDO | 0.060% | 11/7/14 | | 5,665 | 5,665 |
| Citizens Property Insurance Corp. Florida Revenue (Coastal Account) | 5.000% | 3/1/15 | (14) | 12,675 | 12,880 |
| Citizens Property Insurance Corp. Florida Revenue (Coastal Account) | 4.000% | 6/1/15 | | 2,500 | 2,555 |
| Citizens Property Insurance Corp. Florida Revenue (Coastal Account) | 5.000% | 6/1/15 | | 5,000 | 5,140 |
| Citizens Property Insurance Corp. Florida Revenue (Coastal Account) | 5.000% | 6/1/15 | | 45,000 | 46,258 |
| Citizens Property Insurance Corp. Florida Revenue (Coastal Account) | 5.000% | 6/1/16 | | 15,150 | 16,224 |
| Citizens Property Insurance Corp. Florida Revenue (Coastal Account) | 5.000% | 6/1/16 | | 22,000 | 23,560 |
| Citizens Property Insurance Corp. Florida Revenue (Coastal Account) | 5.000% | 3/1/17 | (14) | 1,100 | 1,211 |
| Citizens Property Insurance Corp. Florida Revenue (Coastal Account) | 5.250% | 6/1/17 | | 19,000 | 21,150 |
| Citizens Property Insurance Corp. Florida Revenue (Coastal Account) | 5.000% | 6/1/18 | | 6,000 | 6,796 |
| 1 Citizens Property Insurance Corp. Florida Revenue | | | | | |
| (Personal Lines Account/Commercial Lines Account) | 1.300% | 6/1/15 | | 4,100 | 4,121 |
| Citizens Property Insurance Corp. Florida Revenue | | | | | |
| (Personal Lines Account/Commercial Lines Account) | 5.000% | 6/1/17 | | 35,445 | 39,229 |
| Citizens Property Insurance Corp. Florida Revenue | | | | | |
| (Personal Lines Account/Commercial Lines Account) | 5.000% | 6/1/18 | | 36,770 | 41,646 |
| Citizens Property Insurance Corp. Florida Revenue | | | | | |
| (Personal Lines Account/Commercial Lines Account) | 5.000% | 6/1/19 | | 19,150 | 22,117 |
| Escambia County FL Pollution Control Revenue (Gulf Power Co. Project) PUT | 1.550% | 6/15/16 | | 3,000 | 3,052 |
| Escambia County FL Pollution Control Revenue (Gulf Power Co. Project) PUT | 2.100% | 4/11/19 | | 2,500 | 2,573 |
| Escambia County FL Solid Waste Disposal System Revenue (Gulf Power Co. Project) PUT | 1.350% | 6/2/15 | | 3,750 | 3,766 |
| Florida Board of Education Lottery Revenue | 5.000% | 7/1/15 | | 8,830 | 9,116 |
| Florida Board of Education Lottery Revenue | 5.000% | 7/1/15 | (14) | 9,555 | 9,864 |
| Florida Board of Education Lottery Revenue | 5.000% | 7/1/16 | | 7,500 | 8,075 |
| Florida Board of Education Lottery Revenue | 5.000% | 7/1/17 | | 2,500 | 2,793 |
| Florida Board of Education Public Education Capital Outlay GO | 5.000% | 6/1/17 | | 13,700 | 15,278 |
| Florida Board of Education Public Education Capital Outlay GO | 5.000% | 6/1/18 | | 11,240 | 12,881 |
| Florida Board of Education Public Education Capital Outlay GO | 5.000% | 6/1/18 | | 3,615 | 4,143 |
| 2 Florida Board of Education Public Education Capital Outlay GO TOB VRDO | 0.060% | 11/7/14 | | 7,995 | 7,995 |
| Florida Department of Environmental Protection & Preservation Revenue | 5.000% | 7/1/15 | | 6,415 | 6,623 |
| Florida Department of Environmental Protection & Preservation Revenue | 5.000% | 7/1/18 | | 8,585 | 9,835 |
| Florida Department of Environmental Protection & Preservation Revenue | 5.000% | 7/1/19 | | 9,015 | 10,543 |
| Florida Hurricane Catastrophe Fund Finance Corp. Revenue | 5.000% | 7/1/15 | (ETM) | 24,050 | 24,827 |
| Florida Municipal Power Agency Revenue (St. Lucie Project) | 5.000% | 10/1/15 | | 2,135 | 2,226 |
| Florida Municipal Power Agency Revenue (St. Lucie Project) | 5.000% | 10/1/16 | | 3,290 | 3,562 |
| Florida Municipal Power Agency Revenue (Stanton II Project) | 5.000% | 10/1/19 | | 2,800 | 3,270 |
37
Limited-Term Tax-Exempt Fund
| | | | | | |
| | | | | | Face | Market |
| | | | Maturity | | Amount | Value• |
| | | Coupon | Date | | ($000) | ($000) |
| | Florida Turnpike Authority Revenue | 5.000% | 7/1/16 | | 3,480 | 3,746 |
| | Florida Turnpike Authority Revenue | 5.000% | 7/1/19 | | 10,000 | 11,715 |
| | Highlands County FL Health Facilities Authority Hospital Revenue | | | | | |
| | (Adventist Health System/Sunbelt Obligated Group) | 5.000% | 11/15/14 | | 2,000 | 2,004 |
| | Highlands County FL Health Facilities Authority Hospital Revenue | | | | | |
| | (Adventist Health System/Sunbelt Obligated Group) | 5.000% | 11/15/16 | | 2,000 | 2,186 |
| | Highlands County FL Health Facilities Authority Hospital Revenue | | | | | |
| | (Adventist Health System/Sunbelt Obligated Group) | 5.000% | 11/15/19 | | 3,000 | 3,513 |
| 2 | Highlands County FL Health Facilities Authority Hospital Revenue | | | | | |
| | (Adventist Health System/Sunbelt Obligated Group) TOB VRDO | 0.060% | 11/7/14 | (13) | 18,130 | 18,130 |
| | Hillsborough County FL Aviation Authority Revenue (Tampa International Airport) | 5.000% | 10/1/16 | | 2,505 | 2,708 |
| | Jacksonville FL Electric Authority Electric System Revenue | 5.000% | 10/1/16 | | 4,675 | 5,088 |
| | Jacksonville FL Electric Authority Electric System Revenue | 5.000% | 10/1/16 | | 1,500 | 1,633 |
| | Jacksonville FL Electric Authority Electric System Revenue | 5.000% | 10/1/17 | | 1,000 | 1,126 |
| | Jacksonville FL Electric Authority Electric System Revenue | 5.000% | 10/1/20 | | 1,600 | 1,901 |
| | Jacksonville FL Electric Authority Electric System Revenue VRDO | 0.050% | 11/7/14 | | 5,500 | 5,500 |
| | Jacksonville FL Electric Authority Revenue (St. John’s River Power Park) | 5.000% | 10/1/16 | | 15,000 | 16,308 |
| | Jacksonville FL Electric Authority Water & Sewer Revenue | 5.000% | 10/1/18 | | 1,200 | 1,384 |
| | Jacksonville FL Excise Taxes Revenue | 5.000% | 10/1/16 | | 1,185 | 1,286 |
| | Kissimmee FL Utility Authority Electric System Revenue | 5.250% | 10/1/16 | (4) | 3,750 | 4,071 |
| 1 | Lakeland FL Energy System Revenue | 0.800% | 10/1/17 | | 10,000 | 10,046 |
| | Miami Beach FL Health Facilities Authority Revenue (Mount Sinai Medical Center) | 4.000% | 11/15/16 | | 200 | 213 |
| | Miami Beach FL Health Facilities Authority Revenue (Mount Sinai Medical Center) | 4.000% | 11/15/17 | | 200 | 217 |
| | Miami Beach FL Health Facilities Authority Revenue (Mount Sinai Medical Center) | 4.000% | 11/15/18 | | 385 | 423 |
| | Miami Beach FL Health Facilities Authority Revenue (Mount Sinai Medical Center) | 4.000% | 11/15/18 | | 1,125 | 1,208 |
| | Miami Beach FL Health Facilities Authority Revenue (Mount Sinai Medical Center) | 5.000% | 11/15/19 | | 1,650 | 1,883 |
| | Miami Beach FL Health Facilities Authority Revenue (Mount Sinai Medical Center) | 5.000% | 11/15/20 | | 400 | 464 |
| 2 | Miami-Dade County FL Aviation Revenue (Miami International Airport) TOB VRDO | 0.060% | 11/7/14 | (13) | 8,700 | 8,700 |
| 2 | Miami-Dade County FL Building Better Communities GO TOB VRDO | 0.050% | 11/7/14 | LOC | 16,060 | 16,060 |
| | Miami-Dade County FL Expressway Authority Toll System Revenue | 5.000% | 7/1/18 | | 2,000 | 2,283 |
| | Miami-Dade County FL Expressway Authority Toll System Revenue | 5.000% | 7/1/19 | | 1,900 | 2,210 |
| | Miami-Dade County FL Expressway Authority Toll System Revenue | 5.000% | 7/1/20 | | 1,500 | 1,772 |
| | Miami-Dade County FL Expressway Authority Toll System Revenue | 5.000% | 7/1/20 | | 2,525 | 2,982 |
| | Miami-Dade County FL Expressway Authority Toll System Revenue | 5.000% | 7/1/21 | | 1,000 | 1,195 |
| | Miami-Dade County FL Expressway Authority Toll System Revenue | 5.000% | 7/1/21 | | 2,250 | 2,675 |
| | Miami-Dade County FL Expressway Authority Toll System Revenue | 5.000% | 7/1/22 | | 625 | 746 |
| | Miami-Dade County FL Health Facilities Authority Hospital Revenue (Miami Children’s Hospital) | 5.000% | 8/1/19 | | 1,000 | 1,142 |
| | Miami-Dade County FL Health Facilities Authority Hospital Revenue (Miami Children’s Hospital) | 4.000% | 8/1/20 | | 2,180 | 2,401 |
| | Miami-Dade County FL Health Facilities Authority Hospital Revenue (Miami Children’s Hospital) | 5.000% | 8/1/21 | | 1,300 | 1,509 |
| | Miami-Dade County FL School Board COP | 5.000% | 5/1/15 | (ETM) | 4,000 | 4,097 |
| | Miami-Dade County FL School Board COP | 5.000% | 8/1/18 | | 4,850 | 5,532 |
| | Miami-Dade County FL School Board COP PUT | 5.000% | 5/1/16 | | 7,000 | 7,450 |
| 1,2 | Miami-Dade County FL School Board COP TOB PUT | 0.490% | 11/6/14 | LOC | 15,760 | 15,760 |
| 1,2 | Miami-Dade County FL School Board COP TOB PUT | 0.490% | 11/6/14 | LOC | 15,760 | 15,760 |
| 1,2 | Miami-Dade County FL School Board COP TOB PUT | 0.530% | 11/6/14 | LOC | 12,690 | 12,690 |
| 1,2 | Miami-Dade County FL School Board COP TOB PUT | 0.510% | 12/11/14 | LOC | 27,245 | 27,245 |
| 2 | Miami-Dade County FL School Board COP TOB VRDO | 0.150% | 11/7/14 | (12) | 26,500 | 26,500 |
| | Miami-Dade County FL Transit Sales Surtax Revenue | 5.000% | 7/1/17 | | 1,110 | 1,234 |
| | Miami-Dade County FL Transit Sales Surtax Revenue | 5.000% | 7/1/19 | | 1,250 | 1,457 |
| | Miami-Dade County FL Transit Sales Surtax Revenue | 5.000% | 7/1/19 | (4) | 2,000 | 2,331 |
| 2 | Miami-Dade County FL Water & Sewer Revenue TOB VRDO | 0.090% | 11/7/14 | (4) | 3,800 | 3,800 |
| 2 | Miami-Dade County FL Water & Sewer Revenue TOB VRDO | 0.150% | 11/7/14 | (4) | 13,995 | 13,995 |
| | Orange County FL Health Facilities Authority Hospital Revenue (Orlando Health Inc.) | 5.000% | 10/1/16 | | 1,000 | 1,082 |
| | Orange County FL Health Facilities Authority Hospital Revenue | | | | | |
| | (Orlando Regional Healthcare System) | 6.250% | 10/1/18 | (14) | 5,770 | 6,684 |
| | Orange County FL School Board COP | 5.000% | 8/1/15 | | 2,000 | 2,072 |
| | Orange County FL School Board COP | 5.000% | 8/1/16 | | 700 | 754 |
| | Orange County FL School Board COP | 5.000% | 8/1/17 | | 1,500 | 1,669 |
| | Orange County FL School Board COP | 5.000% | 8/1/18 | | 1,400 | 1,598 |
| | Orange County FL School Board COP | 5.000% | 8/1/19 | | 1,765 | 2,054 |
| | Orange County FL Tourist Development Revenue | 5.000% | 10/1/16 | | 16,260 | 17,652 |
| | Orange County FL Tourist Development Revenue | 5.000% | 10/1/20 | | 2,525 | 2,964 |
| | Orlando & Orange County FL Expressway Authority Revenue | 5.000% | 7/1/17 | | 2,000 | 2,230 |
| | Orlando & Orange County FL Expressway Authority Revenue | 5.000% | 7/1/17 | | 4,690 | 5,230 |
| | Orlando & Orange County FL Expressway Authority Revenue | 5.000% | 7/1/18 | | 2,785 | 3,190 |
| | Orlando & Orange County FL Expressway Authority Revenue | 5.000% | 7/1/18 | | 9,000 | 10,310 |
| | Orlando & Orange County FL Expressway Authority Revenue | 5.000% | 7/1/19 | | 3,770 | 4,409 |
| | Orlando & Orange County FL Expressway Authority Revenue | 5.000% | 7/1/19 | | 10,725 | 12,542 |
| | Orlando FL Utility Commission Utility System Revenue | 5.000% | 10/1/15 | | 3,500 | 3,655 |
| | Orlando FL Utility Commission Utility System Revenue | 5.000% | 10/1/15 | | 3,365 | 3,514 |
| | Orlando FL Utility Commission Utility System Revenue | 5.000% | 10/1/16 | | 5,250 | 5,709 |
38
Limited-Term Tax-Exempt Fund
| | | | | |
| | | | | Face | Market |
| | | Maturity | | Amount | Value• |
| | Coupon | Date | | ($000) | ($000) |
| Orlando FL Utility Commission Utility System Revenue | 5.000% | 10/1/17 | | 3,000 | 3,380 |
| Orlando FL Utility Commission Utility System Revenue | 5.000% | 10/1/19 | | 5,500 | 6,486 |
| Palm Beach County FL Criminal Justice Facilities Revenue | 7.200% | 6/1/15 | (14) | 3,000 | 3,117 |
| Palm Beach County FL Health Facilities Authority Hospital Revenue (BRRH Corp. Obligated Group) | 4.000% | 12/1/18 | | 750 | 819 |
| Palm Beach County FL Health Facilities Authority Hospital Revenue (BRRH Corp. Obligated Group) | 4.000% | 12/1/19 | | 1,000 | 1,097 |
| Palm Beach County FL Health Facilities Authority Hospital Revenue (BRRH Corp. Obligated Group) | 5.000% | 12/1/20 | | 850 | 977 |
| Palm Beach County FL Health Facilities Authority Hospital Revenue (BRRH Corp. Obligated Group) | 5.000% | 12/1/21 | | 1,165 | 1,337 |
| Palm Beach County FL Health Facilities Authority Revenue (Jupiter Medical Center Inc. Project) | 4.000% | 11/1/18 | | 635 | 682 |
| Palm Beach County FL Health Facilities Authority Revenue (Jupiter Medical Center Inc. Project) | 5.000% | 11/1/19 | | 2,740 | 3,082 |
| Palm Beach County FL Health Facilities Authority Revenue (Jupiter Medical Center Inc. Project) | 5.000% | 11/1/20 | | 1,500 | 1,701 |
| Palm Beach County FL Health Facilities Authority Revenue (Jupiter Medical Center Inc. Project) | 5.000% | 11/1/21 | | 750 | 851 |
| 2 Palm Beach County FL School Board COP TOB VRDO | 0.060% | 11/7/14 | | 11,400 | 11,400 |
| 2 Palm Beach County FL School Board COP TOB VRDO | 0.090% | 11/7/14 | | 6,100 | 6,100 |
| Reedy Creek FL Improvement District GO | 5.000% | 6/1/20 | | 1,000 | 1,189 |
| Reedy Creek FL Improvement District Utilities Revenue | 5.000% | 10/1/18 | | 750 | 857 |
| Sarasota County FL Infrastructure Sales Surtax Revenue | 5.000% | 10/1/21 | | 1,500 | 1,811 |
| Seacoast FL Utility Authority Water & Sewer Revenue | 5.500% | 3/1/19 | (14) | 3,595 | 4,230 |
| Sunrise FL Utility System Revenue | 5.200% | 10/1/20 | (Prere.) | 7,255 | 8,579 |
| Sunshine State Governmental Financing Commission Florida Revenue | | | | | |
| (Miami Dade County Program) | 5.000% | 9/1/15 | | 10,000 | 10,396 |
| Sunshine State Governmental Financing Commission Florida Revenue | | | | | |
| (Miami Dade County Program) | 5.000% | 9/1/19 | | 2,390 | 2,763 |
| Sunshine State Governmental Financing Commission Florida Revenue | | | | | |
| (Miami Dade County Program) | 5.000% | 9/1/19 | | 2,360 | 2,728 |
| Sunshine State Governmental Financing Commission Florida Revenue | | | | | |
| (Miami Dade County Program) | 5.000% | 9/1/20 | | 2,830 | 3,315 |
| Sunshine State Governmental Financing Commission Florida Revenue | | | | | |
| (Miami Dade County Program) | 5.000% | 9/1/20 | | 1,185 | 1,388 |
| Sunshine State Governmental Financing Commission Florida Revenue | | | | | |
| (Miami Dade County Program) | 5.000% | 9/1/21 | | 2,090 | 2,469 |
| Sunshine State Governmental Financing Commission Florida Revenue | | | | | |
| (Miami Dade County Program) | 5.000% | 9/1/21 | | 1,500 | 1,772 |
| Tampa FL Cigarette Tax Allocation Revenue (H. Lee Moffitt Cancer Center Project) | 5.000% | 9/1/20 | | 1,650 | 1,935 |
| Tampa FL Health System Revenue (Baycare Health System) | 5.000% | 11/15/16 | | 3,000 | 3,281 |
| Tampa FL Hospital Revenue | 4.000% | 7/1/18 | | 1,625 | 1,765 |
| Tampa FL Hospital Revenue | 5.000% | 7/1/19 | | 1,755 | 2,001 |
| Tampa FL Hospital Revenue | 4.000% | 7/1/20 | | 1,100 | 1,211 |
| Tohopekaliga FL Water Authority Utility System Revenue | 4.000% | 10/1/15 | | 4,305 | 4,456 |
| Tohopekaliga FL Water Authority Utility System Revenue | 5.000% | 10/1/16 | | 4,515 | 4,910 |
| Tohopekaliga FL Water Authority Utility System Revenue | 5.000% | 10/1/17 | | 4,505 | 5,075 |
| Tohopekaliga FL Water Authority Utility System Revenue | 5.000% | 10/1/19 | | 1,165 | 1,371 |
| Tohopekaliga FL Water Authority Utility System Revenue | 5.000% | 10/1/20 | | 1,825 | 2,178 |
| | | | | | 896,907 |
| Georgia (3.0%) | | | | | |
| Atlanta GA Airport Passenger Facility Charge Revenue | 5.000% | 1/1/18 | | 2,520 | 2,853 |
| Atlanta GA Airport Revenue | 5.000% | 1/1/18 | | 8,500 | 9,611 |
| Atlanta GA Airport Revenue | 5.000% | 1/1/18 | | 500 | 565 |
| Atlanta GA Airport Revenue | 5.000% | 1/1/19 | | 1,675 | 1,938 |
| Atlanta GA Airport Revenue | 5.000% | 1/1/20 | | 1,205 | 1,415 |
| Atlanta GA Airport Revenue | 5.000% | 1/1/21 | | 750 | 890 |
| Atlanta GA Water & Wastewater Revenue | 5.000% | 11/1/14 | | 5,000 | 5,000 |
| Atlanta GA Water & Wastewater Revenue | 5.000% | 11/1/16 | | 9,385 | 10,243 |
| 1 Atlanta GA Water & Wastewater Revenue PUT | 1.603% | 11/1/18 | | 47,300 | 48,591 |
| 2 Atlanta GA Water & Wastewater Revenue TOB VRDO | 0.150% | 11/7/14 | | 9,995 | 9,995 |
| Bartow County GA Development Authority Pollution Control Revenue | | | | | |
| (Georgia Power Co. Plant Bowen Project) PUT | 2.700% | 8/23/18 | | 9,000 | 9,364 |
| Burke County GA Development Authority Pollution Control Revenue | | | | | |
| (Georgia Power Co. Plant Vogtle Project) PUT | 1.400% | 4/1/15 | | 5,500 | 5,522 |
| Burke County GA Development Authority Pollution Control Revenue | | | | | |
| (Georgia Power Co. Plant Vogtle Project) PUT | 1.250% | 5/1/15 | | 8,500 | 8,534 |
| Burke County GA Development Authority Pollution Control Revenue | | | | | |
| (Georgia Power Co. Plant Vogtle Project) PUT | 1.550% | 6/21/16 | | 20,000 | 20,219 |
| Burke County GA Development Authority Pollution Control Revenue | | | | | |
| (Georgia Power Co. Plant Vogtle Project) PUT | 1.750% | 6/1/17 | | 13,000 | 13,241 |
| Burke County GA Development Authority Pollution Control Revenue | | | | | |
| (Georgia Power Co. Plant Vogtle Project) PUT | 1.750% | 6/1/17 | | 20,000 | 20,371 |
| Burke County GA Development Authority Pollution Control Revenue | | | | | |
| (Georgia Power Co. Plant Vogtle Project) PUT | 1.800% | 4/3/18 | | 5,250 | 5,324 |
| Burke County GA Development Authority Pollution Control Revenue | | | | | |
| (Georgia Power Co. Plant Vogtle Project) PUT | 2.200% | 4/2/19 | | 3,500 | 3,575 |
39
Limited-Term Tax-Exempt Fund
| | | | | |
| | | | | Face | Market |
| | | Maturity | | Amount | Value• |
| | Coupon | Date | ($000) | ($000) |
| Burke County GA Development Authority Pollution Control Revenue | | | | | |
| (Georgia Power Co. Plant Vogtle Project) PUT | 2.200% | 4/2/19 | | 10,000 | 10,214 |
| Burke County GA Development Authority Pollution Control Revenue | | | | | |
| (Georgia Power Co. Plant Vogtle Project) PUT | 2.200% | 4/2/19 | | 7,500 | 7,661 |
| Burke County GA Development Authority Pollution Control Revenue | | | | | |
| (Georgia Power Co. Plant Vogtle Project) PUT | 2.200% | 4/2/19 | | 10,000 | 10,214 |
| Carroll County GA School District GO | 5.000% | 4/1/18 | | 5,075 | 5,776 |
| Cobb County GA Kennestone Hospital Authority Revenue | 5.000% | 4/1/17 | | 1,250 | 1,377 |
| Cobb County GA Kennestone Hospital Authority Revenue | 5.000% | 4/1/18 | | 1,000 | 1,133 |
| Cobb County GA Kennestone Hospital Authority Revenue | 5.000% | 4/1/18 | | 1,250 | 1,422 |
| Cobb County GA Kennestone Hospital Authority Revenue | 5.000% | 4/1/19 | | 250 | 290 |
| Cobb County GA Kennestone Hospital Authority Revenue | 5.000% | 4/1/20 | | 350 | 411 |
| Dalton GA Development Authority Revenue (Hamilton Health Care System) | 4.000% | 8/15/18 | | 1,000 | 1,103 |
| Dalton GA Development Authority Revenue (Hamilton Health Care System) | 5.000% | 8/15/19 | | 1,000 | 1,160 |
| Dalton GA Development Authority Revenue (Hamilton Health Care System) | 5.000% | 8/15/20 | | 1,500 | 1,742 |
| Dalton GA Development Authority Revenue (Hamilton Health Care System) | 5.000% | 8/15/21 | | 1,890 | 2,203 |
| DeKalb County GA Water & Sewer Revenue | 5.000% | 10/1/18 | | 1,000 | 1,153 |
| DeKalb County GA Water & Sewer Revenue | 5.000% | 10/1/19 | | 1,300 | 1,527 |
| DeKalb County GA Water & Sewer Revenue | 5.000% | 10/1/19 | | 1,000 | 1,174 |
| DeKalb County GA Water & Sewer Revenue | 5.000% | 10/1/20 | | 1,250 | 1,484 |
| Floyd County GA Development Authority Revenue | | | | | |
| (Georgia Power Co. Plant Hammond Project) PUT | 0.850% | 11/19/15 | | 2,500 | 2,509 |
| 2 Fulton County GA Development Authority Revenue | | | | | |
| (Piedmont Healthcare Inc. Project) TOB VRDO | 0.060% | 11/7/14 | | 11,415 | 11,415 |
| Georgia GO | 4.000% | 1/1/15 | | 2,360 | 2,375 |
| Georgia GO | 5.000% | 7/1/16 | | 5,000 | 5,388 |
| Georgia GO | 5.000% | 7/1/16 | | 9,500 | 10,237 |
| Georgia GO | 5.000% | 7/1/16 | | 20,000 | 21,551 |
| Georgia GO | 5.000% | 10/1/16 | | 1,910 | 2,079 |
| Georgia GO | 5.000% | 7/1/17 | | 2,840 | 3,175 |
| Georgia GO | 5.000% | 7/1/17 | | 13,695 | 15,310 |
| Georgia GO | 5.000% | 7/1/18 | | 12,050 | 13,875 |
| Georgia GO | 5.000% | 7/1/18 | | 2,340 | 2,694 |
| Georgia GO | 5.000% | 7/1/18 | | 23,330 | 26,863 |
| Georgia GO | 4.000% | 11/1/18 | | 11,000 | 12,346 |
| Georgia GO | 5.000% | 12/1/18 | | 7,800 | 9,079 |
| Georgia GO | 5.000% | 9/1/20 | | 10,100 | 12,171 |
| Georgia Housing & Finance Authority Single Family Mortgage Revenue | 4.000% | 6/1/44 | | 4,230 | 4,629 |
| Georgia Municipal Electric Power Authority Revenue | 5.000% | 1/1/17 | | 1,400 | 1,535 |
| Georgia Municipal Electric Power Authority Revenue | 5.000% | 1/1/18 | | 3,600 | 4,073 |
| Georgia Municipal Electric Power Authority Revenue | 5.000% | 1/1/19 | | 1,000 | 1,158 |
| Georgia Municipal Electric Power Authority Revenue | 5.000% | 1/1/20 | | 750 | 884 |
| Georgia Road & Tollway Authority GAN | 5.000% | 6/1/20 | | 25,760 | 29,768 |
| Georgia Road & Tollway Authority Revenue | 5.000% | 10/1/16 | | 6,000 | 6,531 |
| Georgia Road & Tollway Authority Revenue | 5.000% | 10/1/18 | | 18,240 | 21,127 |
| Georgia Road & Tollway Authority Revenue (Federal Highway Grant) | 5.000% | 6/1/16 | | 8,125 | 8,709 |
| Gwinnett County GA School District GO | 5.000% | 2/1/19 | | 1,500 | 1,750 |
| Gwinnett County GA School District GO | 5.000% | 2/1/20 | | 1,000 | 1,192 |
| Gwinnett County GA Water & Sewer Authority Revenue | 5.000% | 8/1/17 | | 1,675 | 1,883 |
| Gwinnett County GA Water & Sewer Authority Revenue | 5.000% | 8/1/18 | | 4,335 | 5,020 |
| Main Street Natural Gas Inc. Georgia Gas Project Revenue | 5.000% | 3/15/16 | | 16,070 | 16,951 |
| Main Street Natural Gas Inc. Georgia Gas Project Revenue | 5.000% | 3/15/17 | | 5,350 | 5,761 |
| Main Street Natural Gas Inc. Georgia Gas Project Revenue | 5.000% | 3/15/17 | | 7,140 | 7,724 |
| Main Street Natural Gas Inc. Georgia Gas Project Revenue | 5.000% | 3/15/18 | | 1,885 | 2,078 |
| Main Street Natural Gas Inc. Georgia Gas Project Revenue | 5.000% | 3/15/18 | | 7,125 | 7,814 |
| Main Street Natural Gas Inc. Georgia Gas Project Revenue | 5.000% | 3/15/19 | | 1,160 | 1,292 |
| Main Street Natural Gas Inc. Georgia Gas Project Revenue | 5.000% | 3/15/21 | | 2,330 | 2,633 |
| 1 Metropolitan Atlanta GA Rapid Transportation Authority Georgia Sales Tax Revenue PUT | 0.330% | 7/1/17 | | 14,000 | 14,001 |
| 1 Metropolitan Atlanta GA Rapid Transportation Authority Georgia Sales Tax Revenue PUT | 0.350% | 7/1/17 | | 17,500 | 17,502 |
| Monroe County GA Development Authority Pollution Control Revenue | | | | | |
| (Georgia Power Co. Plant Scherer Project) PUT | 2.000% | 6/13/19 | | 2,000 | 2,057 |
| Municipal Electric Authority Georgia Revenue | 5.000% | 1/1/16 | | 5,285 | 5,580 |
| Municipal Electric Authority Georgia Revenue | 5.000% | 1/1/20 | | 12,655 | 14,849 |
| Municipal Electric Authority Georgia Revenue (Combined Cycle Project) | 5.000% | 11/1/17 | | 1,500 | 1,692 |
| Municipal Electric Authority Georgia Revenue (Combined Cycle Project) | 5.000% | 11/1/18 | | 1,250 | 1,446 |
| Municipal Electric Authority Georgia Revenue (General Resolution Projects) | 5.000% | 1/1/15 | | 2,060 | 2,077 |
| Municipal Electric Authority Georgia Revenue (General Resolution Projects) | 5.750% | 1/1/19 | | 4,015 | 4,707 |
| Municipal Electric Authority Georgia Revenue (Project One) | 5.000% | 1/1/15 | | 3,685 | 3,715 |
| Municipal Electric Authority Georgia Revenue (Project One) | 5.000% | 1/1/17 | | 8,165 | 8,954 |
| Municipal Gas Authority Georgia Revenue (Gas Portfolio III Project) | 5.000% | 10/1/18 | | 2,000 | 2,303 |
| Municipal Gas Authority Georgia Revenue (Gas Portfolio III Project) | 5.000% | 10/1/19 | | 1,500 | 1,760 |
40
Limited-Term Tax-Exempt Fund
| | | | | | |
| | | | | | Face | Market |
| | | | Maturity | | Amount | Value• |
| | | Coupon | Date | | ($000) | ($000) |
| | Municipal Gas Authority Georgia Revenue (Gas Portfolio III Project) | 5.000% | 10/1/20 | | 1,000 | 1,189 |
| | Municipal Gas Authority Georgia Revenue (Gas Portfolio III Project) | 5.000% | 10/1/21 | | 1,500 | 1,797 |
| | Municipal Gas Authority Georgia Revenue (Gas Portfolio III Project) | 5.000% | 10/1/22 | | 1,000 | 1,204 |
| | | | | | | 595,707 |
| Guam (0.0%) | | | | | |
| | Guam Government Waterworks Authority Water & Waste Water System Revenue | 5.250% | 7/1/20 | | 350 | 403 |
| | Guam Government Waterworks Authority Water & Waste Water System Revenue | 5.250% | 7/1/21 | | 1,050 | 1,213 |
| | Guam Power Authority Revenue | 5.000% | 10/1/18 | | 475 | 536 |
| | Guam Power Authority Revenue | 5.000% | 10/1/20 | | 520 | 601 |
| | | | | | | 2,753 |
| Hawaii (0.7%) | | | | | |
| | Hawaii GO | 5.000% | 6/1/16 | (ETM) | 3,115 | 3,345 |
| | Hawaii GO | 5.000% | 6/1/16 | | 13,920 | 14,951 |
| | Hawaii GO | 5.000% | 12/1/18 | | 17,250 | 20,047 |
| | Hawaii GO | 5.000% | 6/1/19 | | 6,960 | 8,172 |
| | Hawaii GO | 5.000% | 6/1/19 | | 2,370 | 2,783 |
| | Hawaii GO | 5.000% | 11/1/19 | | 11,960 | 14,174 |
| | Hawaii GO | 5.000% | 11/1/19 | | 40,725 | 48,263 |
| | Hawaii GO | 5.000% | 12/1/19 | | 5,000 | 5,936 |
| | Hawaii Highway Revenue | 5.500% | 7/1/18 | | 2,000 | 2,332 |
| | Hawaii Highway Revenue | 5.000% | 1/1/20 | | 1,000 | 1,185 |
| | Honolulu HI City & County GO | 5.000% | 8/1/17 | | 4,130 | 4,628 |
| | Honolulu HI City & County GO | 5.000% | 8/1/18 | | 2,715 | 3,125 |
| | Honolulu HI City & County GO | 5.000% | 11/1/18 | | 4,000 | 4,634 |
| | Honolulu HI City & County GO | 5.000% | 11/1/19 | | 6,000 | 7,101 |
| | | | | | | 140,676 |
| Illinois (5.2%) | | | | | |
| | Chicago IL Board of Education GO | 5.000% | 12/1/14 | | 1,545 | 1,551 |
| | Chicago IL Board of Education GO | 5.000% | 12/1/16 | | 2,500 | 2,692 |
| | Chicago IL Board of Education GO | 5.000% | 12/1/18 | (12) | 7,305 | 8,131 |
| | Chicago IL Board of Education GO | 5.250% | 12/1/18 | (14) | 4,970 | 5,585 |
| | Chicago IL Board of Education GO | 5.000% | 12/1/19 | (2) | 3,090 | 3,328 |
| | Chicago IL Board of Education GO | 5.250% | 12/1/19 | (14)(3) | 1,000 | 1,130 |
| | Chicago IL Board of Education GO | 5.000% | 12/1/20 | (2) | 2,000 | 2,155 |
| | Chicago IL Board of Education GO | 5.250% | 12/1/20 | (14)(3) | 1,250 | 1,425 |
| 1 | Chicago IL Board of Education GO PUT | 0.686% | 6/2/16 | | 25,750 | 25,424 |
| 1,2 | Chicago IL Board of Education GO TOB PUT | 0.580% | 11/20/14 | LOC | 85,000 | 85,000 |
| | Chicago IL GO | 5.500% | 1/1/16 | (4) | 6,070 | 6,402 |
| | Chicago IL GO | 5.000% | 12/1/18 | | 2,000 | 2,212 |
| | Chicago IL GO | 5.000% | 1/1/19 | | 5,750 | 6,205 |
| | Chicago IL GO | 5.000% | 1/1/19 | (4) | 4,645 | 4,850 |
| | Chicago IL Metropolitan Water Reclamation District GO | 5.000% | 12/1/18 | | 5,000 | 5,785 |
| | Chicago IL Midway Airport Revenue | 5.000% | 1/1/20 | | 2,075 | 2,423 |
| | Chicago IL O’Hare International Airport Revenue | 5.000% | 1/1/17 | | 7,500 | 8,206 |
| | Chicago IL O’Hare International Airport Revenue | 5.000% | 1/1/17 | | 750 | 821 |
| | Chicago IL O’Hare International Airport Revenue | 5.250% | 1/1/17 | (14) | 4,540 | 4,992 |
| | Chicago IL O’Hare International Airport Revenue | 5.000% | 1/1/18 | | 1,250 | 1,404 |
| | Chicago IL O’Hare International Airport Revenue | 5.000% | 1/1/18 | | 1,950 | 2,168 |
| | Chicago IL O’Hare International Airport Revenue | 5.000% | 1/1/19 | | 1,000 | 1,149 |
| | Chicago IL O’Hare International Airport Revenue | 5.000% | 1/1/19 | | 1,170 | 1,323 |
| 2 | Chicago IL O’Hare International Airport Revenue TOB VRDO | 0.140% | 11/7/14 | LOC | 23,925 | 23,925 |
| 2 | Chicago IL O’Hare International Airport Revenue TOB VRDO | 0.200% | 11/7/14 | (4) | 21,135 | 21,135 |
| 2 | Chicago IL Transit Authority Sales Tax Receipts Revenue TOB VRDO | 0.160% | 11/7/14 | | 24,520 | 24,520 |
| | Chicago IL Water Revenue | 5.000% | 11/1/18 | | 675 | 768 |
| | Cook County IL Forest Preservation District GO | 5.000% | 12/15/17 | | 1,000 | 1,124 |
| | Cook County IL Forest Preservation District GO | 5.000% | 12/15/18 | | 1,000 | 1,149 |
| | Cook County IL Forest Preservation District GO | 5.000% | 12/15/19 | | 1,580 | 1,844 |
| | Cook County IL GO | 5.000% | 11/15/18 | | 2,000 | 2,274 |
| | Cook County IL GO | 5.000% | 11/15/19 | | 1,500 | 1,718 |
| | Cook County IL GO | 5.000% | 11/15/20 | | 1,500 | 1,735 |
| | Illinois Educational Facilities Authority Revenue (Field Museum of Natural History) VRDO | 0.050% | 11/7/14 | LOC | 19,800 | 19,800 |
| | Illinois Educational Facilities Authority Revenue (University of Chicago) PUT | 1.875% | 2/12/15 | | 5,000 | 5,023 |
| | Illinois Finance Authority Gas Supply Revenue (Peoples Gas Light & Coke) PUT | 2.625% | 8/1/15 | | 2,500 | 2,541 |
| | Illinois Finance Authority Revenue (Advocate Health Care Network) PUT | 5.000% | 5/1/19 | | 26,795 | 31,056 |
| | Illinois Finance Authority Revenue (Advocate Health Care Network) PUT | 5.000% | 1/15/20 | | 5,850 | 6,812 |
| 2 | Illinois Finance Authority Revenue (Advocate Health Care Network) TOB VRDO | 0.060% | 11/7/14 | | 14,840 | 14,840 |
| | Illinois Finance Authority Revenue (Advocate Health Care Network) VRDO | 0.050% | 11/7/14 | | 6,500 | 6,500 |
| | Illinois Finance Authority Revenue (Art Institute of Chicago) | 5.000% | 3/1/15 | | 10,000 | 10,159 |
| | Illinois Finance Authority Revenue (Ascension Health Credit Group) PUT | 5.000% | 5/1/17 | | 3,275 | 3,629 |
| | Illinois Finance Authority Revenue (Carle Foundation) | 5.000% | 8/15/17 | | 1,500 | 1,668 |
41
Limited-Term Tax-Exempt Fund
| | | | | |
| | | | | Face | Market |
| | | Maturity | | Amount | Value• |
| | Coupon | Date | | ($000) | ($000) |
| 2 Illinois Finance Authority Revenue (Carle Foundation) TOB VRDO | 0.170% | 11/7/14 | (12) | 15,000 | 15,000 |
| Illinois Finance Authority Revenue (Centegra Health System) | 5.000% | 9/1/18 | | 235 | 261 |
| Illinois Finance Authority Revenue (Centegra Health System) | 5.000% | 9/1/19 | | 1,115 | 1,246 |
| Illinois Finance Authority Revenue (Centegra Health System) | 5.000% | 9/1/20 | | 500 | 563 |
| Illinois Finance Authority Revenue (Centegra Health System) | 5.000% | 9/1/20 | | 2,940 | 3,308 |
| Illinois Finance Authority Revenue (Centegra Health System) | 5.000% | 9/1/21 | | 975 | 1,097 |
| Illinois Finance Authority Revenue (Children’s Memorial Hospital) | 5.250% | 8/15/16 | | 4,270 | 4,584 |
| Illinois Finance Authority Revenue (Hospital Sister Services Inc.) | 5.000% | 8/15/18 | | 4,000 | 4,571 |
| Illinois Finance Authority Revenue (Hospital Sister Services Inc.) | 5.000% | 8/15/19 | | 4,205 | 4,865 |
| Illinois Finance Authority Revenue (Hospital Sister Services Inc.) | 5.000% | 8/15/20 | | 4,210 | 4,899 |
| 2 Illinois Finance Authority Revenue (Northwestern University) TOB VRDO | 0.070% | 11/3/14 | | 2,100 | 2,100 |
| Illinois Finance Authority Revenue (Northwestern University) VRDN VRDO | 0.030% | 11/7/14 | | 6,700 | 6,700 |
| Illinois Finance Authority Revenue (Northwestern University) VRDO | 0.030% | 11/7/14 | | 9,500 | 9,500 |
| Illinois Finance Authority Revenue (OSF Healthcare System) | 5.000% | 5/15/22 | | 1,925 | 2,236 |
| Illinois Finance Authority Revenue (Palos Community Hospital) | 5.000% | 5/15/16 | | 1,500 | 1,602 |
| Illinois Finance Authority Revenue (Palos Community Hospital) | 5.000% | 5/15/17 | | 2,500 | 2,764 |
| Illinois Finance Authority Revenue (Presbyterian Homes) VRDO | 0.060% | 11/7/14 | LOC | 12,200 | 12,200 |
| Illinois Finance Authority Revenue (Trinity Health Corp.) | 3.000% | 12/1/17 | | 3,075 | 3,275 |
| Illinois Finance Authority Revenue (University of Chicago Medical Center) | 5.000% | 8/15/15 | | 1,500 | 1,556 |
| Illinois Finance Authority Revenue (University of Chicago) | 5.000% | 10/1/19 | | 1,745 | 2,049 |
| Illinois Finance Authority Revenue (University of Chicago) | 5.000% | 10/1/20 | | 7,000 | 8,332 |
| Illinois Finance Authority Solid Waste Disposal Revenue (Prairie Power Inc. Project) PUT | 1.300% | 5/8/17 | | 2,450 | 2,474 |
| Illinois GO | 1.000% | 2/1/15 | | 21,000 | 21,026 |
| Illinois GO | 5.000% | 8/1/15 | | 11,240 | 11,612 |
| Illinois GO | 5.500% | 8/1/15 | (14) | 1,020 | 1,058 |
| Illinois GO | 5.500% | 8/1/17 | (14) | 1,425 | 1,585 |
| Illinois GO | 5.000% | 4/1/18 | | 2,500 | 2,778 |
| Illinois GO | 5.000% | 5/1/18 | | 8,000 | 8,900 |
| Illinois GO | 5.000% | 8/1/18 | | 22,000 | 24,563 |
| Illinois GO | 5.250% | 1/1/19 | | 8,060 | 9,054 |
| Illinois GO | 5.000% | 2/1/19 | | 875 | 975 |
| Illinois GO | 5.000% | 3/1/19 | | 6,500 | 7,248 |
| Illinois GO | 5.000% | 5/1/19 | | 12,000 | 13,396 |
| Illinois GO | 5.000% | 7/1/19 | | 4,700 | 5,252 |
| Illinois GO | 5.000% | 8/1/19 | | 48,625 | 54,374 |
| Illinois GO | 5.000% | 2/1/20 | | 3,000 | 3,364 |
| Illinois GO | 5.000% | 3/1/20 | | 10,115 | 11,354 |
| Illinois GO | 5.000% | 4/1/20 | | 2,000 | 2,247 |
| Illinois GO | 5.000% | 5/1/20 | | 24,500 | 27,562 |
| Illinois GO | 5.000% | 7/1/20 | | 12,500 | 14,092 |
| Illinois GO | 5.000% | 8/1/20 | | 10,500 | 11,849 |
| Illinois GO | 5.000% | 8/1/20 | (4) | 6,500 | 7,418 |
| Illinois GO | 5.000% | 1/1/21 | (4) | 8,425 | 9,383 |
| Illinois GO | 5.000% | 2/1/21 | | 4,000 | 4,486 |
| Illinois GO | 5.000% | 4/1/21 | | 8,500 | 9,544 |
| Illinois GO | 5.000% | 5/1/21 | | 17,000 | 19,098 |
| Illinois Sales Tax Revenue | 5.000% | 6/15/15 | | 10,810 | 11,137 |
| Illinois Sales Tax Revenue | 5.000% | 6/15/16 | | 10,000 | 10,746 |
| Illinois Sales Tax Revenue | 5.000% | 6/15/19 | | 14,220 | 16,594 |
| Illinois Sales Tax Revenue | 5.000% | 6/15/20 | | 15,050 | 17,790 |
| Illinois Toll Highway Authority Revenue | 5.000% | 1/1/15 | (4) | 17,970 | 18,117 |
| Illinois Toll Highway Authority Revenue | 5.000% | 12/1/17 | | 6,500 | 7,355 |
| Illinois Toll Highway Authority Revenue | 5.000% | 12/1/18 | | 7,000 | 8,108 |
| Illinois Toll Highway Authority Revenue | 5.000% | 12/1/19 | | 20,100 | 23,723 |
| Illinois Toll Highway Authority Revenue | 5.000% | 12/1/20 | | 20,000 | 23,920 |
| Illinois Toll Highway Authority Revenue | 5.000% | 12/1/21 | | 15,000 | 18,029 |
| 2 Illinois Toll Highway Authority Toll Highway Revenue TOB VRDO | 0.060% | 11/7/14 | | 7,915 | 7,915 |
| Illinois Unemployment Insurance Fund Building Receipts Revenue | 5.000% | 6/15/15 | | 6,270 | 6,460 |
| Illinois Unemployment Insurance Fund Building Receipts Revenue | 5.000% | 12/15/15 | | 3,000 | 3,162 |
| Illinois Unemployment Insurance Fund Building Receipts Revenue | 5.000% | 6/15/18 | | 17,875 | 19,531 |
| Illinois Unemployment Insurance Fund Building Receipts Revenue | 5.000% | 12/15/18 | | 7,000 | 7,498 |
| Illinois Unemployment Insurance Fund Building Receipts Revenue | 5.000% | 12/15/19 | | 3,500 | 3,600 |
| Lake County IL Community High School District No. 117 GO | 0.000% | 12/1/17 | (14) | 5,155 | 4,889 |
| Metropolitan Pier & Exposition Authority Illinois Dedicated Sales Tax Revenue | 0.000% | 6/15/21 | (14) | 16,775 | 13,829 |
| Metropolitan Pier & Exposition Authority Illinois Dedicated Sales Tax Revenue | | | | | |
| (McCormick Place Expansion Project) | 5.000% | 12/15/22 | | 2,500 | 2,731 |
| 2 Metropolitan Pier & Exposition Authority Illinois Dedicated Sales Tax Revenue TOB VRDO | 0.160% | 11/7/14 | LOC | 5,500 | 5,500 |
| 2 Metropolitan Pier & Exposition Authority Illinois Dedicated Sales Tax Revenue TOB VRDO | 0.160% | 11/7/14 | (14)LOC | 9,715 | 9,715 |
| Railsplitter Tobacco Settlement Authority Illinois Tobacco Settlement Revenue | 5.000% | 6/1/15 | | 5,000 | 5,130 |
| Railsplitter Tobacco Settlement Authority Illinois Tobacco Settlement Revenue | 5.000% | 6/1/16 | | 10,000 | 10,657 |
| Railsplitter Tobacco Settlement Authority Illinois Tobacco Settlement Revenue | 5.000% | 6/1/17 | | 9,580 | 10,527 |
42
Limited-Term Tax-Exempt Fund
| | | | | |
| | | | | Face | Market |
| | | Maturity | | Amount | Value• |
| | Coupon | Date | | ($000) | ($000) |
| Railsplitter Tobacco Settlement Authority Illinois Tobacco Settlement Revenue | 5.000% | 6/1/18 | | 1,875 | 2,111 |
| Railsplitter Tobacco Settlement Authority Illinois Tobacco Settlement Revenue | 5.250% | 6/1/20 | | 6,600 | 7,749 |
| Railsplitter Tobacco Settlement Authority Illinois Tobacco Settlement Revenue | 6.250% | 6/1/24 | | 2,100 | 2,282 |
| | | | | | 1,022,786 |
| Indiana (1.1%) | | | | | |
| Indiana Bond Bank Special Program Gas Revenue | 5.250% | 10/15/16 | | 4,810 | 5,195 |
| Indiana Bond Bank Special Program Gas Revenue | 5.250% | 10/15/19 | | 50 | 58 |
| Indiana Finance Authority Health System Revenue | | | | | |
| (Sisters of St. Francis Health Services Inc. Obligated Group) | 5.000% | 11/1/14 | | 3,485 | 3,485 |
| Indiana Finance Authority Health System Revenue | | | | | |
| (Sisters of St. Francis Health Services Inc. Obligated Group) | 5.000% | 11/1/15 | | 2,515 | 2,633 |
| Indiana Finance Authority Health System Revenue | | | | | |
| (Sisters of St. Francis Health Services Inc. Obligated Group) | 5.000% | 11/1/15 | | 3,570 | 3,738 |
| Indiana Finance Authority Health System Revenue | | | | | |
| (Sisters of St. Francis Health Services Inc. Obligated Group) | 5.000% | 11/1/16 | | 3,000 | 3,273 |
| Indiana Finance Authority Health System Revenue | | | | | |
| (Sisters of St. Francis Health Services Inc. Obligated Group) | 5.000% | 11/1/21 | | 2,380 | 2,697 |
| Indiana Finance Authority Hospital Revenue (Community Health Network) | 5.000% | 5/1/20 | | 860 | 1,003 |
| Indiana Finance Authority Hospital Revenue (Indiana University Health Obligated Group) | 5.000% | 3/1/18 | | 10,445 | 11,884 |
| Indiana Finance Authority Hospital Revenue (Indiana University Health Obligated Group) | 5.000% | 3/1/19 | | 5,000 | 5,799 |
| Indiana Finance Authority Hospital Revenue (Indiana University Health Obligated Group) | 5.000% | 12/1/20 | | 1,000 | 1,192 |
| Indiana Finance Authority Hospital Revenue (Parkview Health System) | 5.000% | 5/1/19 | | 1,650 | 1,890 |
| Indiana Finance Authority Lease Revenue | 5.000% | 2/1/18 | | 4,500 | 5,118 |
| Indiana Finance Authority Lease Revenue | 5.000% | 2/1/19 | | 3,700 | 4,310 |
| Indiana Finance Authority Lease Revenue | 5.000% | 2/1/20 | | 3,500 | 4,159 |
| Indiana Finance Authority Revenue (Community Foundation of Northwest Indiana Obligated Group) | 5.000% | 3/1/18 | | 825 | 916 |
| Indiana Finance Authority Revenue (Community Foundation of Northwest Indiana Obligated Group) | 5.000% | 3/1/19 | | 1,000 | 1,129 |
| Indiana Finance Authority Revenue (Community Foundation of Northwest Indiana Obligated Group) | 5.000% | 3/1/20 | | 1,300 | 1,485 |
| Indiana Finance Authority Revenue (Community Foundation of Northwest Indiana Obligated Group) | 5.000% | 3/1/23 | | 750 | 852 |
| Indiana Finance Authority Revenue (State Revolving Fund) | 5.000% | 2/1/17 | | 7,625 | 8,400 |
| Indiana Finance Authority Wastewater Utility Revenue (CWA Authority Project) | 5.000% | 10/1/18 | | 1,000 | 1,146 |
| Indiana Finance Authority Wastewater Utility Revenue (CWA Authority Project) | 5.000% | 10/1/19 | | 335 | 393 |
| Indiana Finance Authority Wastewater Utility Revenue (CWA Authority Project) | 5.000% | 10/1/20 | | 375 | 446 |
| Indiana Finance Authority Wastewater Utility Revenue (CWA Authority Project) | 5.000% | 10/1/21 | | 380 | 455 |
| Indiana Health & Educational Facility Financing Authority Revenue | | | | | |
| (Ascension Health Credit Group) PUT | 4.100% | 11/3/16 | | 10,000 | 10,726 |
| Indiana Health Facility Financing Authority Revenue (Ascension Health Credit Group) PUT | 5.000% | 6/1/15 | | 14,825 | 15,239 |
| Indiana Health Facility Financing Authority Revenue (Ascension Health Credit Group) PUT | 5.000% | 7/28/16 | | 2,695 | 2,909 |
| Indiana Health Facility Financing Authority Revenue (Ascension Health Credit Group) PUT | 1.600% | 2/1/17 | | 7,000 | 7,149 |
| Indiana Health Facility Financing Authority Revenue (Ascension Health Credit Group) PUT | 4.000% | 8/1/17 | | 8,000 | 8,714 |
| Indiana Municipal Power Agency Revenue | 5.000% | 1/1/18 | | 1,500 | 1,697 |
| Indiana University Student Fee Revenue | 5.000% | 8/1/17 | | 1,000 | 1,121 |
| Indiana University Student Fee Revenue | 5.000% | 6/1/18 | | 1,000 | 1,146 |
| Indiana University Student Fee Revenue | 5.000% | 8/1/18 | | 4,000 | 4,604 |
| Indiana University Student Fee Revenue | 5.000% | 6/1/19 | | 1,500 | 1,759 |
| Ivy IN Tech Community College Revenue | 5.000% | 7/1/19 | | 850 | 990 |
| Ivy IN Tech Community College Revenue | 5.000% | 7/1/20 | | 500 | 591 |
| Purdue University Indiana COP VRDO | 0.030% | 11/7/14 | | 5,750 | 5,750 |
| Purdue University Indiana University Student Fee Revenue | 4.500% | 7/1/16 | | 1,500 | 1,603 |
| Purdue University Indiana University Student Fee Revenue | 5.000% | 7/1/16 | | 1,300 | 1,400 |
| Purdue University Indiana University Student Fee Revenue | 5.000% | 7/1/17 | | 1,000 | 1,118 |
| Rockport IN Pollution Control Revenue (Indiana Michigan Power Co. Project) PUT | 1.750% | 6/1/18 | | 5,500 | 5,533 |
| Terre Haute IN Sanitation District Special Tax Revenue | 4.000% | 1/1/17 | | 3,455 | 3,641 |
| Terre Haute IN Sanitation District Special Tax Revenue | 4.000% | 7/1/17 | | 3,520 | 3,742 |
| Terre Haute IN Sanitation District Special Tax Revenue | 4.000% | 1/1/18 | | 3,590 | 3,840 |
| Terre Haute IN Sanitation District Special Tax Revenue | 4.000% | 7/1/18 | | 3,665 | 3,943 |
| Terre Haute IN Sanitation District Special Tax Revenue | 4.000% | 1/1/19 | | 3,740 | 4,034 |
| 2 Tri-Creek Middle School Building Corp. Indiana Revenue TOB VRDO | 0.060% | 11/7/14 | | 14,210 | 14,210 |
| Whiting IN Environmental Facilities Revenue (BP Products North America Inc. Project) | 5.000% | 7/1/17 | | 5,000 | 5,528 |
| Whiting IN Environmental Facilities Revenue (BP Products North America Inc. Project) PUT | 1.850% | 10/1/19 | | 30,000 | 30,165 |
| | | | | | 212,808 |
| Iowa (0.4%) | | | | | |
| Iowa Board of Regents Hospital Revenue (University of Iowa Hospitals & Clinics) | 4.000% | 9/1/19 | | 5,675 | 6,424 |
| Iowa Finance Authority Health Facilities Revenue (Iowa Health System) | 5.000% | 2/15/15 | (12) | 2,395 | 2,426 |
| Iowa Finance Authority Health Facilities Revenue (Iowa Health System) | 5.000% | 2/15/16 | (12) | 1,655 | 1,749 |
| Iowa Finance Authority Healthcare Revenue (Genesis Health System) | 5.000% | 7/1/16 | | 2,320 | 2,487 |
| Iowa Finance Authority Healthcare Revenue (Genesis Health System) | 5.000% | 7/1/19 | | 4,075 | 4,704 |
| Iowa Finance Authority Midwestern Disaster Area Revenue (Iowa Fertilizer Co. Project) | 5.000% | 12/1/19 | | 45,500 | 48,606 |
| Iowa Higher Education Loan Authority Revenue Private College Facility (Grinnell College Project) | 4.000% | 12/1/17 | | 1,300 | 1,430 |
| Iowa Student Loan Liquidity Corp. Revenue | 5.000% | 12/1/15 | | 5,620 | 5,867 |
| | | | | | 73,693 |
43
Limited-Term Tax-Exempt Fund
| | | | | |
| | | | | Face | Market |
| | | Maturity | | Amount | Value• |
| | Coupon | Date | | ($000) | ($000) |
| Kansas (0.3%) | | | | | |
| Burlington KS Environmental Improvement Revenue | | | | | |
| (Kansas City Power & Light Co. Project) VRDO | 0.050% | 11/7/14 | LOC | 18,850 | 18,850 |
| 1 Kansas Department of Transportation Highway Revenue | 0.342% | 9/1/17 | | 4,000 | 4,000 |
| 1 Kansas Department of Transportation Highway Revenue | 0.422% | 9/1/18 | | 3,500 | 3,501 |
| 1 Kansas Department of Transportation Highway Revenue | 0.502% | 9/1/19 | | 3,000 | 3,003 |
| Kansas Development Finance Authority Health Facilities Revenue | | | | | |
| (Kansas University Health System) | 5.000% | 3/1/17 | | 1,000 | 1,095 |
| Kansas Development Finance Authority Health Facilities Revenue | | | | | |
| (Kansas University Health System) | 5.000% | 3/1/18 | | 1,035 | 1,164 |
| Kansas Development Finance Authority Health Facilities Revenue | | | | | |
| (Kansas University Health System) | 5.000% | 3/1/19 | | 1,150 | 1,319 |
| Kansas Development Finance Authority Revenue | | | | | |
| (Sisters of Charity of Leavenworth Health System) | 5.000% | 1/1/15 | | 2,895 | 2,918 |
| Kansas Development Finance Authority Revenue | | | | | |
| (Sisters of Charity of Leavenworth Health System) | 5.000% | 1/1/16 | | 5,615 | 5,916 |
| Kansas Development Finance Authority Revenue | | | | | |
| (Sisters of Charity of Leavenworth Health System) | 5.000% | 1/1/17 | | 5,670 | 6,210 |
| Kansas Development Finance Authority Revenue (Wichita State University Projects) | 5.000% | 6/1/18 | | 2,420 | 2,755 |
| University of Kansas Hospital Authority Health Facilities Improvement Revenue | 5.000% | 9/1/15 | | 2,000 | 2,070 |
| Wichita KS Hospital Facilities Revenue (Via Christi Health System Inc.) | 5.000% | 11/15/15 | (ETM) | 4,000 | 4,201 |
| Wichita KS Hospital Facilities Revenue (Via Christi Health System Inc.) | 5.000% | 11/15/17 | (ETM) | 1,130 | 1,279 |
| Wichita KS Hospital Facilities Revenue (Via Christi Health System Inc.) | 5.000% | 11/15/18 | (ETM) | 2,250 | 2,610 |
| Wyandotte County/Kansas City KS Unified Government Utility System Revenue | 5.000% | 9/1/19 | | 500 | 584 |
| Wyandotte County/Kansas City KS Unified Government Utility System Revenue | 5.000% | 9/1/20 | | 1,565 | 1,848 |
| Wyandotte County/Kansas City KS Unified Government Utility System Revenue | 5.000% | 9/1/22 | | 750 | 894 |
| | | | | | 64,217 |
| Kentucky (0.7%) | | | | | |
| 1 Ashland KY Medical Center Revenue (King’s Daughters Medical Center Project) PUT | 1.800% | 2/1/17 | | 11,675 | 11,734 |
| Kentucky Asset/Liability Commission Agency Fund Revenue (Federal Highway Trust) | 5.000% | 9/1/18 | | 2,500 | 2,870 |
| Kentucky Economic Development Finance Authority Hospital Facilities Revenue | | | | | |
| (Baptist Healthcare System Obligated Group) VRDO | 0.070% | 11/3/14 | LOC | 10,100 | 10,100 |
| Kentucky Economic Development Finance Authority Revenue (Catholic Health Initiatives) PUT | 5.000% | 11/11/14 | | 17,000 | 17,022 |
| Kentucky Property & Building Commission Revenue | 5.250% | 10/1/15 | (4) | 40,000 | 41,836 |
| Kentucky Property & Building Commission Revenue | 5.250% | 10/1/16 | (4) | 6,100 | 6,658 |
| Kentucky Property & Building Commission Revenue | 5.000% | 11/1/16 | | 5,340 | 5,822 |
| Kentucky Public Transportation Infrastructure Authority Toll Revenue | | | | | |
| (Downtown Crossing Project) BAN | 5.000% | 7/1/17 | | 27,800 | 30,672 |
| Kentucky Turnpike Authority Economic Development Road Revenue (Revitalization Project) | 5.000% | 7/1/18 | | 2,500 | 2,866 |
| Louisville & Jefferson County KY Metropolitan Government Environmental Facilities Revenue | | | | | |
| (Louisville Gas & Electric Co. Project) PUT | 1.150% | 6/1/17 | | 5,000 | 4,982 |
| Louisville & Jefferson County KY Metropolitan Government Environmental Facilities Revenue | | | | | |
| (Louisville Gas & Electric Co. Project) PUT | 1.600% | 6/1/17 | | 9,500 | 9,640 |
| Warren County KY Hospital Revenue | | | | | |
| (Bowling Green-Warren County Community Hospital Corp. Project) | 5.000% | 8/1/16 | | 990 | 1,051 |
| Warren County KY Hospital Revenue | | | | | |
| (Bowling Green-Warren County Community Hospital Corp. Project) | 5.000% | 4/1/18 | | 1,100 | 1,232 |
| | | | | | 146,485 |
| Louisiana (0.8%) | | | | | |
| 1 East Baton Rouge Parish LA Sewer Commission Revenue PUT | 0.606% | 8/1/18 | | 25,000 | 25,018 |
| Ernest N. Morial–New Orleans LA Exhibition Hall Authority Special Tax Revenue | 4.000% | 7/15/18 | | 1,040 | 1,144 |
| Ernest N. Morial–New Orleans LA Exhibition Hall Authority Special Tax Revenue | 5.000% | 7/15/19 | | 1,190 | 1,370 |
| 1 Louisiana Gasoline & Fuel Tax Revenue PUT | 0.577% | 5/1/17 | | 44,500 | 44,608 |
| 1 Louisiana Gasoline & Fuel Tax Revenue PUT | 0.577% | 5/1/18 | | 12,500 | 12,517 |
| 1 Louisiana Gasoline & Fuel Tax Revenue PUT | 0.657% | 5/1/18 | | 5,000 | 5,030 |
| Louisiana GO | 5.000% | 8/1/16 | | 5,000 | 5,408 |
| Louisiana GO | 5.250% | 8/1/16 | (14) | 5,000 | 5,188 |
| Louisiana Highway Improvement Revenue | 5.000% | 6/15/18 | | 1,325 | 1,519 |
| Louisiana Highway Improvement Revenue | 5.000% | 6/15/19 | | 1,000 | 1,172 |
| Louisiana Highway Improvement Revenue | 5.000% | 6/15/20 | | 1,325 | 1,577 |
| Louisiana Highway Improvement Revenue | 5.000% | 6/15/21 | | 1,100 | 1,323 |
| Louisiana Housing Finance Agency Single Family Mortgage Revenue (Home Ownership Program) | 5.850% | 6/1/38 | | 1,655 | 1,754 |
| Louisiana Offshore Terminal Authority Deep Water Port Revenue (LOOP LLC Project) PUT | 2.125% | 10/1/15 | | 5,000 | 5,057 |
| Louisiana Offshore Terminal Authority Deep Water Port Revenue (LOOP LLC Project) PUT | 2.200% | 10/1/17 | | 4,125 | 4,158 |
| Louisiana Public Facilities Authority Revenue (CHRISTUS Health) | 5.000% | 7/1/15 | (4) | 1,320 | 1,357 |
| Louisiana Public Facilities Authority Revenue (Entergy Gulf States Project) | 2.875% | 11/1/15 | | 2,250 | 2,291 |
| Louisiana Stadium & Exposition District Revenue | 5.000% | 7/1/18 | | 1,050 | 1,198 |
| Louisiana Stadium & Exposition District Revenue | 5.000% | 7/1/19 | | 1,250 | 1,454 |
| Louisiana Stadium & Exposition District Revenue | 5.000% | 7/1/20 | | 1,100 | 1,299 |
| New Orleans LA GO | 5.000% | 12/1/18 | | 4,065 | 4,602 |
| New Orleans LA Sewage Service Revenue | 5.000% | 6/1/18 | | 500 | 564 |
44
Limited-Term Tax-Exempt Fund
| | | | | |
| | | | | Face | Market |
| | | Maturity | | Amount | Value• |
| | Coupon | Date | | ($000) | ($000) |
| New Orleans LA Sewage Service Revenue | 5.000% | 6/1/19 | | 500 | 574 |
| New Orleans LA Sewage Service Revenue | 5.000% | 6/1/22 | | 1,595 | 1,869 |
| New Orleans LA Water Revenue | 5.000% | 12/1/20 | | 400 | 464 |
| New Orleans LA Water Revenue | 5.000% | 12/1/22 | | 1,500 | 1,755 |
| St. Charles Parish LA Gulf Opportunity Zone Revenue (Valero Energy Corp.) PUT | 4.000% | 6/1/22 | | 9,220 | 9,912 |
| Tobacco Settlement Financing Corp. Louisiana Revenue | 5.000% | 5/15/19 | | 2,500 | 2,840 |
| Tobacco Settlement Financing Corp. Louisiana Revenue | 5.000% | 5/15/20 | | 8,085 | 9,323 |
| | | | | | 156,345 |
| Maine (0.0%) | | | | | |
| Maine Municipal Bond Bank Infrastructure Revenue (Transcap Project) | 5.000% | 9/1/16 | | 4,225 | 4,578 |
| |
| Maryland (3.0%) | | | | | |
| Anne Arundel County MD GO | 5.000% | 4/1/19 | | 6,960 | 8,147 |
| Anne Arundel County MD GO | 5.000% | 4/1/19 | | 7,615 | 8,913 |
| Anne Arundel County MD GO | 5.000% | 4/1/19 | | 2,640 | 3,090 |
| Baltimore County MD GO | 5.000% | 2/1/18 | | 2,900 | 3,299 |
| Baltimore County MD GO | 5.000% | 2/1/18 | | 9,000 | 10,239 |
| Baltimore County MD GO | 5.000% | 2/1/20 | | 2,100 | 2,503 |
| Baltimore County MD GO | 5.000% | 10/15/21 | | 10,400 | 12,599 |
| Baltimore MD Consolidated Public Improvement GO | 5.000% | 10/15/17 | | 500 | 564 |
| Baltimore MD Consolidated Public Improvement GO | 5.000% | 10/15/18 | | 2,280 | 2,639 |
| Howard County MD GO | 5.000% | 2/15/17 | | 3,450 | 3,805 |
| Howard County MD GO | 5.000% | 2/15/18 | | 3,895 | 4,436 |
| Howard County MD GO | 5.000% | 2/15/19 | | 3,830 | 4,472 |
| Howard County MD GO | 5.000% | 8/15/19 | | 5,000 | 5,898 |
| Howard County MD GO | 5.000% | 2/15/20 | | 4,475 | 5,338 |
| Maryland Department of Transportation Revenue | 4.000% | 5/15/15 | | 6,250 | 6,381 |
| Maryland Department of Transportation Revenue | 5.000% | 5/1/18 | | 3,250 | 3,722 |
| Maryland Department of Transportation Revenue | 5.000% | 5/1/19 | | 14,000 | 16,407 |
| Maryland Department of Transportation Revenue | 5.000% | 12/1/20 | | 15,495 | 18,703 |
| Maryland GO | 5.000% | 3/1/16 | | 10,000 | 10,629 |
| Maryland GO | 5.000% | 11/1/16 | | 15,350 | 16,762 |
| Maryland GO | 5.000% | 8/1/17 | | 5,000 | 5,605 |
| Maryland GO | 5.000% | 8/1/17 | | 5,070 | 5,684 |
| Maryland GO | 5.000% | 8/1/17 | | 26,445 | 29,646 |
| Maryland GO | 5.000% | 8/1/17 | | 8,495 | 9,523 |
| Maryland GO | 5.000% | 8/15/17 | (Prere.) | 2,795 | 3,133 |
| Maryland GO | 5.000% | 3/1/18 | | 1,150 | 1,312 |
| Maryland GO | 5.250% | 3/1/18 | | 2,400 | 2,757 |
| Maryland GO | 5.000% | 8/1/18 | | 24,160 | 27,881 |
| Maryland GO | 5.000% | 8/1/18 | | 28,795 | 33,230 |
| Maryland GO | 5.000% | 11/1/18 | | 2,525 | 2,933 |
| Maryland GO | 5.000% | 3/15/19 | | 7,625 | 8,923 |
| Maryland GO | 5.000% | 11/1/19 | | 4,265 | 5,062 |
| Maryland GO | 5.000% | 3/1/20 | | 34,535 | 41,230 |
| Maryland GO | 5.000% | 3/1/20 | | 10,000 | 11,939 |
| Maryland GO | 4.500% | 8/1/20 | | 4,215 | 4,950 |
| Maryland GO | 5.000% | 3/1/21 | (Prere.) | 3,745 | 4,541 |
| Maryland GO | 5.000% | 8/1/21 | | 30,000 | 36,539 |
| Maryland GO | 5.000% | 8/1/26 | | 28,995 | 33,758 |
| Maryland Health & Higher Educational Facilities Authority Revenue (Anne Arundel Health System) | 4.000% | 7/1/18 | | 835 | 916 |
| Maryland Health & Higher Educational Facilities Authority Revenue (Anne Arundel Health System) | 4.000% | 7/1/19 | | 850 | 943 |
| Maryland Health & Higher Educational Facilities Authority Revenue (Anne Arundel Health System) | 5.000% | 7/1/20 | | 1,000 | 1,165 |
| 1 Maryland Health & Higher Educational Facilities Authority Revenue | | | | | |
| (Johns Hopkins Health System Obligated Group) PUT | 1.252% | 11/15/16 | | 2,000 | 2,020 |
| 1 Maryland Health & Higher Educational Facilities Authority Revenue | | | | | |
| (Johns Hopkins Health System Obligated Group) PUT | 0.932% | 11/15/17 | | 5,955 | 5,983 |
| 1 Maryland Health & Higher Educational Facilities Authority Revenue | | | | | |
| (Johns Hopkins Health System Obligated Group) PUT | 0.932% | 11/15/17 | | 19,750 | 19,843 |
| 1 Maryland Health & Higher Educational Facilities Authority Revenue | | | | | |
| (Johns Hopkins Health System Obligated Group) PUT | 0.682% | 5/15/18 | | 5,300 | 5,296 |
| 1 Maryland Health & Higher Educational Facilities Authority Revenue | | | | | |
| (Johns Hopkins Health System Obligated Group) PUT | 0.702% | 5/15/18 | | 9,500 | 9,500 |
| Maryland Health & Higher Educational Facilities Authority Revenue (Loyola University) | 5.000% | 10/1/18 | | 1,095 | 1,260 |
| Maryland Health & Higher Educational Facilities Authority Revenue (Medstar Health) | 5.000% | 8/15/17 | | 1,500 | 1,671 |
| Maryland Health & Higher Educational Facilities Authority Revenue (Medstar Health) | 5.000% | 8/15/18 | | 1,400 | 1,598 |
| Maryland Health & Higher Educational Facilities Authority Revenue (Medstar Health) | 5.000% | 8/15/19 | | 1,400 | 1,627 |
| Maryland Health & Higher Educational Facilities Authority Revenue | | | | | |
| (University of Maryland Medical System) | 5.000% | 7/1/15 | | 5,900 | 6,086 |
| 3 Maryland Health & Higher Educational Facilities Authority Revenue | | | | | |
| (Western Maryland Health System) | 5.000% | 7/1/19 | | 2,500 | 2,863 |
45
Limited-Term Tax-Exempt Fund
| | | | | |
| | | | | Face | Market |
| | | Maturity | | Amount | Value• |
| | Coupon | Date | | ($000) | ($000) |
| 3 Maryland Health & Higher Educational Facilities Authority Revenue | | | | | |
| (Western Maryland Health System) | 5.000% | 7/1/20 | | 3,150 | 3,643 |
| 3 Maryland Health & Higher Educational Facilities Authority Revenue | | | | | |
| (Western Maryland Health System) | 5.000% | 7/1/21 | | 7,045 | 8,160 |
| 3 Maryland Health & Higher Educational Facilities Authority Revenue | | | | | |
| (Western Maryland Health System) | 5.000% | 7/1/22 | | 5,000 | 5,805 |
| Maryland Transportation Authority Facilities Projects Revenue | 5.000% | 7/1/15 | | 9,995 | 10,319 |
| Montgomery County MD GO | 5.000% | 11/1/16 | | 4,730 | 5,165 |
| Montgomery County MD GO | 5.000% | 8/1/17 | | 12,100 | 13,564 |
| Montgomery County MD GO | 5.000% | 7/1/18 | | 32,050 | 36,904 |
| Montgomery County MD GO | 5.000% | 7/1/18 | | 3,400 | 3,915 |
| Montgomery County MD GO | 5.000% | 8/1/18 | | 2,000 | 2,308 |
| Montgomery County MD GO | 5.000% | 11/1/19 | | 2,840 | 3,371 |
| Washington Suburban Sanitation District Maryland GO | 4.000% | 6/1/16 | | 2,630 | 2,783 |
| Washington Suburban Sanitation District Maryland GO | 5.000% | 6/1/17 | | 4,000 | 4,459 |
| Washington Suburban Sanitation District Maryland GO | 5.000% | 6/1/18 | | 2,735 | 3,142 |
| Washington Suburban Sanitation District Maryland GO | 5.000% | 6/1/20 | | 5,000 | 5,998 |
| Westminster MD Revenue (Lutheran Village at Miller’s Grant) | 3.875% | 7/1/19 | | 1,060 | 1,073 |
| Westminster MD Revenue (Lutheran Village at Miller’s Grant) | 4.375% | 7/1/21 | | 4,500 | 4,550 |
| | | | | | 593,122 |
| Massachusetts (4.5%) | | | | | |
| Massachusetts Bay Transportation Authority Assessment Revenue | 5.000% | 7/1/18 | | 1,250 | 1,438 |
| Massachusetts Bay Transportation Authority Sales Tax Revenue | 5.000% | 7/1/18 | (Prere.) | 10,000 | 11,511 |
| 2 Massachusetts Bay Transportation Authority Sales Tax Revenue TOB VRDO | 0.170% | 11/7/14 | | 19,912 | 19,911 |
| Massachusetts College Building Authority Revenue | 5.000% | 5/1/20 | | 3,000 | 3,568 |
| Massachusetts College Building Authority Revenue | 5.000% | 5/1/21 | | 5,495 | 6,608 |
| Massachusetts Department of Transportation Metropolitan Highway System Revenue VRDO | 0.050% | 11/7/14 | | 46,695 | 46,695 |
| Massachusetts Development Finance Agency Revenue (Berkshire Health System) | 5.000% | 10/1/18 | | 1,245 | 1,401 |
| Massachusetts Development Finance Agency Revenue (Berkshire Health System) | 5.000% | 10/1/19 | | 1,215 | 1,387 |
| Massachusetts Development Finance Agency Revenue (Boston Medical Center) | 5.000% | 7/1/15 | | 1,200 | 1,231 |
| Massachusetts Development Finance Agency Revenue (Boston Medical Center) | 5.000% | 7/1/16 | | 1,600 | 1,693 |
| Massachusetts Development Finance Agency Revenue (Boston Medical Center) | 5.000% | 7/1/17 | | 2,060 | 2,233 |
| Massachusetts Development Finance Agency Revenue (Boston Medical Center) | 5.000% | 7/1/18 | | 875 | 965 |
| 1 Massachusetts Development Finance Agency Revenue (Boston University) PUT | 0.600% | 9/30/16 | | 11,000 | 11,039 |
| Massachusetts Development Finance Agency Revenue (Dominion Energy Brayton Project) PUT | 2.250% | 9/1/16 | (Prere.) | 42,730 | 44,164 |
| Massachusetts Development Finance Agency Revenue (Partners Healthcare) | 5.000% | 7/1/20 | | 800 | 951 |
| Massachusetts Development Finance Agency Revenue (Partners Healthcare) PUT | 5.000% | 1/14/16 | | 6,000 | 6,334 |
| 1 Massachusetts Development Finance Agency Revenue (Partners Healthcare) PUT | 0.600% | 1/30/18 | | 8,935 | 8,932 |
| Massachusetts Development Finance Agency Revenue (UMass Memorial Medical Center) | 5.000% | 7/1/16 | | 2,475 | 2,614 |
| Massachusetts Development Finance Agency Revenue (UMass Memorial Medical Center) | 5.000% | 7/1/17 | | 2,265 | 2,439 |
| Massachusetts Development Finance Agency Revenue (UMass Memorial Medical Center) | 5.000% | 7/1/19 | | 2,000 | 2,174 |
| Massachusetts Development Finance Agency Revenue (UMass Memorial Medical Center) | 5.000% | 7/1/21 | | 3,200 | 3,474 |
| 1 Massachusetts Development Finance Agency Revenue (Williams College) PUT | 0.330% | 7/1/17 | | 14,860 | 14,835 |
| Massachusetts Educational Financing Authority Education Loan Revenue | 5.500% | 1/1/22 | | 1,000 | 1,146 |
| Massachusetts Federal Highway GAN (Accelerated Bridge Program) | 5.000% | 6/15/20 | | 5,000 | 5,982 |
| Massachusetts GO | 5.000% | 11/1/14 | | 2,350 | 2,350 |
| Massachusetts GO | 5.000% | 3/1/15 | (Prere.) | 5,000 | 5,081 |
| Massachusetts GO | 5.000% | 3/1/15 | (Prere.) | 3,840 | 3,902 |
| Massachusetts GO | 5.000% | 8/1/15 | (4) | 10,000 | 10,365 |
| 1 Massachusetts GO | 0.500% | 9/1/15 | | 11,500 | 11,522 |
| 1 Massachusetts GO | 0.170% | 2/1/16 | | 37,185 | 37,188 |
| 1 Massachusetts GO | 0.530% | 2/1/16 | | 15,645 | 15,649 |
| Massachusetts GO | 5.000% | 10/1/16 | | 6,800 | 7,395 |
| 1 Massachusetts GO | 0.390% | 1/1/17 | | 11,750 | 11,763 |
| 1 Massachusetts GO | 0.410% | 2/1/17 | | 7,500 | 7,516 |
| Massachusetts GO | 5.000% | 10/1/17 | | 27,000 | 30,434 |
| Massachusetts GO | 5.500% | 11/1/17 | | 2,100 | 2,404 |
| Massachusetts GO | 5.500% | 12/1/17 | (14) | 3,255 | 3,737 |
| 1 Massachusetts GO | 0.480% | 1/1/18 | | 10,000 | 10,045 |
| Massachusetts GO | 5.250% | 8/1/18 | (4) | 5,060 | 5,874 |
| Massachusetts GO | 5.500% | 8/1/18 | (14) | 2,000 | 2,340 |
| Massachusetts GO | 5.000% | 10/1/18 | | 30,000 | 34,710 |
| Massachusetts GO | 5.500% | 10/1/18 | (4) | 10,200 | 11,997 |
| Massachusetts GO | 5.500% | 10/1/18 | | 4,955 | 5,828 |
| Massachusetts GO | 5.000% | 12/1/18 | | 30,000 | 34,863 |
| Massachusetts GO | 5.500% | 12/1/19 | (14) | 9,160 | 11,110 |
| Massachusetts GO | 5.000% | 4/1/20 | | 45,000 | 53,577 |
| Massachusetts GO | 5.000% | 8/1/20 | | 33,155 | 39,713 |
| Massachusetts GO | 5.000% | 8/1/21 | | 40,500 | 49,046 |
| Massachusetts GO | 5.000% | 11/1/23 | | 10,000 | 12,123 |
| Massachusetts GO | 5.000% | 6/1/24 | | 10,000 | 11,805 |
46
Limited-Term Tax-Exempt Fund
| | | | | |
| | | | | Face | Market |
| | | Maturity | | Amount | Value• |
| | Coupon | Date | | ($000) | ($000) |
| Massachusetts GO | 5.000% | 10/1/24 | | 7,860 | 9,403 |
| Massachusetts GO | 5.000% | 7/1/25 | | 11,565 | 13,807 |
| 2 Massachusetts GO TOB VRDO | 0.070% | 11/3/14 | | 6,900 | 6,900 |
| Massachusetts Health & Educational Facilities Authority Revenue (Amherst College) PUT | 1.700% | 11/1/16 | | 5,710 | 5,822 |
| Massachusetts Health & Educational Facilities Authority Revenue (Amherst College) PUT | 0.800% | 12/1/17 | | 2,000 | 2,001 |
| Massachusetts Health & Educational Facilities Authority Revenue (Lahey Clinic Medical Center) | 5.000% | 8/15/19 | (14) | 500 | 518 |
| Massachusetts Health & Educational Facilities Authority Revenue (Milford Regional Medical Center) | 5.000% | 7/15/22 | | 500 | 522 |
| Massachusetts Health & Educational Facilities Authority Revenue (Museum of Fine Arts) VRDO | 0.060% | 11/3/14 | | 3,900 | 3,900 |
| Massachusetts Health & Educational Facilities Authority Revenue (Northeastern University) | 5.000% | 10/1/17 | | 5,000 | 5,603 |
| Massachusetts Health & Educational Facilities Authority Revenue (Partners Healthcare System) | 5.000% | 7/1/16 | | 2,000 | 2,154 |
| Massachusetts Health & Educational Facilities Authority Revenue | | | | | |
| (UMass Memorial Medical Center) | 5.000% | 7/1/20 | | 960 | 1,047 |
| Massachusetts Health & Educational Facilities Authority Revenue | | | | | |
| (UMass Memorial Medical Center) | 5.000% | 7/1/21 | | 1,415 | 1,520 |
| 3 Massachusetts Housing Finance Agency Single Family Housing Revenue | 4.000% | 6/1/45 | | 5,750 | 6,317 |
| Massachusetts Municipal Wholesale Electric Co. Power System Revenue | 5.000% | 7/1/15 | | 2,500 | 2,580 |
| Massachusetts Municipal Wholesale Electric Co. Power System Revenue | 5.000% | 7/1/17 | | 9,560 | 10,641 |
| Massachusetts Port Authority Revenue | 5.500% | 7/1/16 | (4) | 6,000 | 6,504 |
| Massachusetts Port Authority Revenue | 5.000% | 7/1/17 | (4) | 6,600 | 7,358 |
| Massachusetts School Building Authority Dedicated Sales Tax Revenue | 5.000% | 8/15/15 | (Prere.) | 1,930 | 2,004 |
| Massachusetts School Building Authority Dedicated Sales Tax Revenue | 5.000% | 8/15/15 | (Prere.) | 5,230 | 5,430 |
| Massachusetts School Building Authority Dedicated Sales Tax Revenue | 5.000% | 8/15/15 | (Prere.) | 16,725 | 17,363 |
| Massachusetts School Building Authority Dedicated Sales Tax Revenue | 5.000% | 5/15/19 | | 2,250 | 2,639 |
| Massachusetts School Building Authority Dedicated Sales Tax Revenue | 5.000% | 8/15/19 | | 15,000 | 17,695 |
| Massachusetts Transportation Fund Revenue (Accelerated Bridge Program) | 5.000% | 6/1/19 | | 11,460 | 13,478 |
| Massachusetts Turnpike Authority Revenue (Metropolitan Highway System) | 0.000% | 1/1/18 | (14) | 10,000 | 9,720 |
| Massachusetts Turnpike Authority Revenue (Metropolitan Highway System) | 0.000% | 1/1/20 | (14) | 17,000 | 15,680 |
| Massachusetts Water Pollution Abatement Trust Revenue | 5.000% | 8/1/17 | | 1,500 | 1,682 |
| Massachusetts Water Pollution Abatement Trust Revenue | 5.000% | 8/1/18 | | 1,810 | 1,956 |
| Massachusetts Water Pollution Abatement Trust Revenue | 5.000% | 8/1/18 | | 3,000 | 3,462 |
| Massachusetts Water Pollution Abatement Trust Revenue | 5.250% | 8/1/18 | | 2,065 | 2,402 |
| Massachusetts Water Pollution Abatement Trust Revenue | 5.250% | 8/1/18 | | 1,000 | 1,163 |
| Massachusetts Water Pollution Abatement Trust Revenue | 5.000% | 8/1/19 | | 4,500 | 5,313 |
| Massachusetts Water Pollution Abatement Trust Revenue | 5.000% | 8/1/20 | | 16,000 | 19,253 |
| Massachusetts Water Pollution Abatement Trust Revenue | 5.000% | 8/1/21 | | 4,580 | 5,578 |
| Massachusetts Water Resources Authority Revenue | 5.000% | 8/1/20 | | 5,510 | 6,457 |
| 2 Massachusetts Water Resources Authority Revenue TOB VRDO | 0.190% | 11/7/14 | (4)LOC | 27,335 | 27,335 |
| Massachusetts Water Resources Authority Revenue VRDO | 0.070% | 11/7/14 | | 4,000 | 4,000 |
| University of Massachusetts Building Authority Revenue | 5.000% | 11/1/16 | | 7,555 | 8,244 |
| University of Massachusetts Building Authority Revenue | 5.000% | 11/1/20 | | 1,250 | 1,497 |
| | | | | | 894,010 |
| Michigan (2.4%) | | | | | |
| Detroit MI Water Supply System Revenue | 5.000% | 7/1/20 | | 1,755 | 1,993 |
| Detroit/Wayne County MI Stadium Authority Revenue | 5.000% | 10/1/17 | | 625 | 677 |
| Detroit/Wayne County MI Stadium Authority Revenue | 5.000% | 10/1/18 | | 1,225 | 1,344 |
| Kent Hospital MI Finance Authority Revenue (Spectrum Health) | 5.000% | 11/15/16 | | 1,050 | 1,145 |
| Kent Hospital MI Finance Authority Revenue (Spectrum Health) | 5.000% | 11/15/17 | | 1,500 | 1,687 |
| Livonia MI Public Schools School District GO | 5.000% | 5/1/19 | (15) | 1,000 | 1,159 |
| Livonia MI Public Schools School District GO | 5.000% | 5/1/20 | (15) | 3,365 | 3,955 |
| Livonia MI Public Schools School District GO | 5.000% | 5/1/21 | (15) | 2,000 | 2,367 |
| Michigan Building Authority Revenue | 5.000% | 10/15/16 | | 2,750 | 2,986 |
| Michigan Building Authority Revenue | 5.000% | 10/15/17 | | 1,250 | 1,396 |
| Michigan Finance Authority Revenue | 5.000% | 10/1/19 | | 850 | 989 |
| Michigan Finance Authority Revenue | 5.000% | 10/1/20 | | 1,200 | 1,375 |
| Michigan Finance Authority Revenue | 5.000% | 10/1/21 | | 1,275 | 1,473 |
| Michigan Finance Authority Revenue | 5.000% | 10/1/22 | | 525 | 611 |
| Michigan Finance Authority Revenue (Detroit School District) | 2.850% | 8/20/15 | | 2,550 | 2,559 |
| Michigan Finance Authority Revenue (Detroit Water & Sewer) | 5.000% | 7/1/16 | | 885 | 937 |
| Michigan Finance Authority Revenue (Detroit Water & Sewer) | 5.000% | 7/1/16 | | 5,115 | 5,445 |
| Michigan Finance Authority Revenue (Detroit Water & Sewer) | 5.000% | 7/1/16 | | 4,000 | 4,258 |
| Michigan Finance Authority Revenue (Detroit Water & Sewer) | 5.000% | 7/1/17 | | 1,100 | 1,195 |
| Michigan Finance Authority Revenue (Detroit Water & Sewer) | 5.000% | 7/1/17 | (14) | 5,000 | 5,501 |
| Michigan Finance Authority Revenue (Detroit Water & Sewer) | 5.000% | 7/1/17 | | 5,000 | 5,468 |
| Michigan Finance Authority Revenue (Detroit Water & Sewer) | 5.000% | 7/1/17 | | 500 | 543 |
| Michigan Finance Authority Revenue (Detroit Water & Sewer) | 5.000% | 7/1/18 | | 1,000 | 1,107 |
| Michigan Finance Authority Revenue (Detroit Water & Sewer) | 5.000% | 7/1/18 | (14) | 6,000 | 6,740 |
| Michigan Finance Authority Revenue (Detroit Water & Sewer) | 5.000% | 7/1/18 | (14) | 5,500 | 6,178 |
| Michigan Finance Authority Revenue (Detroit Water & Sewer) | 5.000% | 7/1/18 | | 1,150 | 1,273 |
| Michigan Finance Authority Revenue (Detroit Water & Sewer) | 5.000% | 7/1/19 | (14) | 2,000 | 2,246 |
| Michigan Finance Authority Revenue (Detroit Water & Sewer) | 5.000% | 7/1/19 | (14) | 2,855 | 3,247 |
| Michigan Finance Authority Revenue (Detroit Water & Sewer) | 5.000% | 7/1/19 | (14) | 3,500 | 3,981 |
47
Limited-Term Tax-Exempt Fund
| | | | | |
| | | | | Face | Market |
| | | Maturity | | Amount | Value• |
| | Coupon | Date | | ($000) | ($000) |
| Michigan Finance Authority Revenue (Detroit Water & Sewer) | 5.000% | 7/1/19 | (14) | 1,310 | 1,471 |
| Michigan Finance Authority Revenue (Detroit Water & Sewer) | 5.000% | 7/1/20 | (14) | 8,000 | 9,166 |
| Michigan Finance Authority Revenue (Detroit Water & Sewer) | 5.000% | 7/1/20 | (4) | 8,500 | 9,813 |
| Michigan Finance Authority Revenue (Detroit Water & Sewer) | 5.000% | 7/1/20 | (14) | 1,890 | 2,134 |
| Michigan Finance Authority Revenue (Detroit Water & Sewer) | 5.000% | 7/1/20 | (14) | 3,000 | 3,388 |
| Michigan Finance Authority Revenue (Detroit Water & Sewer) | 5.000% | 7/1/21 | (4) | 16,260 | 18,888 |
| Michigan Finance Authority Revenue (Detroit Water & Sewer) | 5.000% | 7/1/21 | (4) | 10,000 | 11,616 |
| Michigan Finance Authority Revenue (Detroit Water & Sewer) | 5.000% | 7/1/21 | (14) | 3,000 | 3,445 |
| Michigan Finance Authority Revenue (Sparrow Obligated Group) | 4.000% | 11/15/17 | | 500 | 538 |
| Michigan Finance Authority Revenue (Sparrow Obligated Group) | 4.000% | 11/15/18 | | 500 | 540 |
| Michigan Finance Authority Revenue (Sparrow Obligated Group) | 4.000% | 11/15/19 | | 600 | 651 |
| Michigan Finance Authority Revenue (State Clean Water Revolving Fund) | 4.000% | 10/1/17 | | 1,150 | 1,262 |
| Michigan Finance Authority Revenue (State Clean Water Revolving Fund) | 5.000% | 10/1/18 | | 500 | 578 |
| Michigan Finance Authority Revenue (State Clean Water Revolving Fund) | 5.000% | 10/1/19 | | 1,500 | 1,770 |
| Michigan Finance Authority Revenue (Unemployment Obligation Assessment) | 5.000% | 1/1/17 | | 1,225 | 1,344 |
| Michigan Finance Authority Revenue (Unemployment Obligation Assessment) | 5.000% | 7/1/18 | | 50,500 | 57,951 |
| Michigan Finance Authority Revenue (Unemployment Obligation Assessment) | 5.000% | 7/1/19 | | 39,000 | 45,764 |
| Michigan Finance Authority Revenue (Unemployment Obligation Assessment) | 5.000% | 7/1/22 | | 11,350 | 12,194 |
| Michigan Finance Authority Revenue (Unemployment Obligation Assessment) | 5.000% | 7/1/23 | | 12,365 | 12,414 |
| Michigan Higher Education Facilities Authority Revenue (Albion College Project) VRDO | 0.040% | 11/7/14 | LOC | 9,730 | 9,730 |
| Michigan Hospital Finance Authority Revenue (Ascension Health Credit Group) | 5.000% | 11/15/17 | | 5,000 | 5,628 |
| Michigan Hospital Finance Authority Revenue (Ascension Health Credit Group) | 5.000% | 11/15/23 | | 7,330 | 8,405 |
| Michigan Hospital Finance Authority Revenue (Ascension Health Credit Group) PUT | 1.500% | 3/1/17 | | 12,845 | 13,092 |
| Michigan Hospital Finance Authority Revenue (Ascension Health Credit Group) PUT | 1.400% | 6/29/18 | | 11,750 | 11,898 |
| Michigan Hospital Finance Authority Revenue (Henry Ford Health System) | 5.500% | 11/15/15 | | 2,000 | 2,088 |
| Michigan Hospital Finance Authority Revenue (Henry Ford Health System) | 5.000% | 11/15/16 | | 6,140 | 6,577 |
| Michigan Hospital Finance Authority Revenue (McLaren Health Care) | 5.000% | 6/1/18 | | 6,375 | 7,262 |
| Michigan Hospital Finance Authority Revenue (McLaren Health Care) | 5.000% | 6/1/19 | | 3,350 | 3,864 |
| Michigan Hospital Finance Authority Revenue (Trinity Health) | 5.000% | 12/1/15 | | 1,000 | 1,050 |
| Michigan Hospital Finance Authority Revenue (Trinity Health) PUT | 6.000% | 12/1/17 | | 5,000 | 5,795 |
| Michigan Municipal Bond Authority Revenue (State Clean Water Revolving Fund) | 5.000% | 10/1/15 | | 2,315 | 2,418 |
| Michigan Municipal Bond Authority Revenue (State Clean Water Revolving Fund) | 5.000% | 10/1/18 | | 400 | 462 |
| Michigan State University Revenue | 5.000% | 2/15/15 | | 3,910 | 3,965 |
| Michigan State University Revenue | 5.000% | 8/15/15 | | 1,000 | 1,038 |
| Michigan State University Revenue | 5.000% | 2/15/17 | | 6,135 | 6,763 |
| Michigan Strategic Fund Limited Obligation Revenue (Detroit Edison Co. Project) PUT | 5.500% | 8/1/16 | | 7,425 | 7,955 |
| Michigan Strategic Fund Limited Obligation Revenue (Detroit Edison Co. Project) PUT | 2.125% | 9/1/16 | | 20,000 | 20,371 |
| Michigan Strategic Fund Limited Obligation Revenue | | | | | |
| (Facility for Rare Isotope Beams Project at Michigan State University) | 4.000% | 3/1/17 | | 250 | 269 |
| Michigan Strategic Fund Limited Obligation Revenue | | | | | |
| (Facility for Rare Isotope Beams Project at Michigan State University) | 4.000% | 3/1/18 | | 500 | 551 |
| Michigan Strategic Fund Limited Obligation Revenue | | | | | |
| (Facility for Rare Isotope Beams Project at Michigan State University) | 5.000% | 3/1/19 | | 1,000 | 1,159 |
| Michigan Strategic Fund Limited Obligation Revenue | | | | | |
| (Facility for Rare Isotope Beams Project at Michigan State University) | 5.000% | 3/1/20 | | 800 | 942 |
| Michigan Strategic Fund Limited Obligation Revenue | | | | | |
| (Facility for Rare Isotope Beams Project at Michigan State University) | 5.000% | 3/1/21 | | 600 | 714 |
| 3 Royal Oak City MI School District GO | 5.000% | 5/1/20 | | 1,250 | 1,475 |
| 3 Royal Oak City MI School District GO | 5.000% | 5/1/21 | | 600 | 715 |
| Royal Oak MI Hospital Finance Authority Hospital Revenue (William Beaumont Hospital) | 5.250% | 8/1/16 | | 5,000 | 5,409 |
| Royal Oak MI Hospital Finance Authority Hospital Revenue (William Beaumont Hospital) | 5.000% | 9/1/17 | | 1,400 | 1,561 |
| Royal Oak MI Hospital Finance Authority Hospital Revenue (William Beaumont Hospital) | 5.000% | 9/1/19 | | 1,500 | 1,744 |
| Royal Oak MI Hospital Finance Authority Hospital Revenue (William Beaumont Hospital) | 5.000% | 9/1/20 | | 1,200 | 1,414 |
| Saginaw MI Hospital Finance Authority Hospital Revenue (Covenant Medical Center Inc.) | 5.000% | 7/1/16 | | 2,385 | 2,527 |
| Saginaw MI Hospital Finance Authority Hospital Revenue (Covenant Medical Center Inc.) | 5.000% | 7/1/17 | | 2,880 | 3,125 |
| 1 Saline MI Area Schools GO PUT | 0.600% | 11/2/15 | | 9,285 | 9,279 |
| University of Michigan Revenue | 4.000% | 4/1/16 | | 10,650 | 11,211 |
| University of Michigan Revenue | 4.000% | 4/1/17 | | 11,385 | 12,344 |
| University of Michigan University Revenue VRDO | 0.030% | 11/7/14 | | 44,900 | 44,900 |
| | | | | | 486,462 |
| Minnesota (0.8%) | | | | | |
| Maple Grove MN Health Care Facilities Revenue (Maple Grove Hospital Corp.) | 5.000% | 5/1/15 | | 1,245 | 1,269 |
| Minneapolis & St. Paul MN Housing & Redevelopment Authority Health Care System Revenue | | | | | |
| (Allina Health System) | 5.000% | 11/15/15 | | 1,700 | 1,783 |
| Minneapolis & St. Paul MN Housing & Redevelopment Authority Health Care System Revenue | | | | | |
| (Allina Health System) | 5.000% | 11/15/16 | | 1,900 | 2,077 |
| Minneapolis & St. Paul MN Housing & Redevelopment Authority Health Care System Revenue | | | | | |
| (Children’s Hospital Clinics) VRDO | 0.100% | 11/3/14 | (4) | 24,325 | 24,325 |
| Minneapolis & St. Paul MN Metropolitan Airports Commission Revenue | 5.000% | 1/1/21 | | 350 | 418 |
| Minneapolis & St. Paul MN Metropolitan Airports Commission Revenue | 5.000% | 1/1/22 | | 1,000 | 1,202 |
| Minnesota 911 Revenue | 5.000% | 6/1/18 | | 2,320 | 2,652 |
48
Limited-Term Tax-Exempt Fund
| | | | | |
| | | | | Face | Market |
| | | Maturity | | Amount | Value• |
| | Coupon | Date | | ($000) | ($000) |
| Minnesota General Fund Revenue | 5.000% | 3/1/19 | | 6,410 | 7,461 |
| Minnesota GO | 5.000% | 12/1/14 | | 8,145 | 8,178 |
| Minnesota GO | 5.000% | 10/1/15 | | 13,970 | 14,590 |
| Minnesota GO | 5.000% | 12/1/15 | | 8,145 | 8,570 |
| Minnesota GO | 5.000% | 10/1/16 | (ETM) | 50 | 54 |
| Minnesota GO | 5.000% | 10/1/16 | | 4,950 | 5,388 |
| Minnesota GO | 5.000% | 12/1/16 | | 8,150 | 8,929 |
| Minnesota GO | 5.000% | 10/1/17 | (ETM) | 35 | 39 |
| Minnesota GO | 5.000% | 10/1/17 | | 2,240 | 2,525 |
| Minnesota GO | 5.000% | 8/1/18 | | 8,375 | 9,665 |
| Minnesota GO | 5.000% | 8/1/18 | | 3,825 | 4,414 |
| Minnesota GO | 5.000% | 8/1/18 | | 3,000 | 3,462 |
| Minnesota GO | 5.000% | 11/1/19 | | 2,000 | 2,374 |
| Minnesota GO | 5.000% | 8/1/21 | | 6,000 | 7,297 |
| Minnesota Higher Education Facilities Authority Revenue (Carleton College) VRDO | 0.110% | 11/7/14 | | 10,645 | 10,645 |
| Minnesota Municipal Power Agency Revenue | 5.000% | 1/1/20 | | 2,000 | 2,364 |
| Minnesota Municipal Power Agency Revenue | 5.000% | 1/1/21 | | 1,250 | 1,497 |
| Minnesota Public Facilities Authority Revenue (State Revolving Fund) | 5.000% | 3/1/18 | | 8,500 | 9,688 |
| Shakopee MN Healthcare Facilities Revenue (St. Francis Regional Medical Center) | 5.000% | 9/1/20 | | 1,340 | 1,570 |
| Shakopee MN Healthcare Facilities Revenue (St. Francis Regional Medical Center) | 5.000% | 9/1/21 | | 1,195 | 1,408 |
| Shakopee MN Healthcare Facilities Revenue (St. Francis Regional Medical Center) | 5.000% | 9/1/22 | | 1,580 | 1,864 |
| St. Cloud MN Health Care Revenue (Centracare Health System) | 5.000% | 5/1/15 | | 1,170 | 1,198 |
| St. Cloud MN Health Care Revenue (Centracare Health System) | 5.000% | 5/1/16 | | 1,250 | 1,335 |
| St. Cloud MN Health Care Revenue (Centracare Health System) | 5.000% | 5/1/17 | | 1,000 | 1,107 |
| 3 St. Cloud MN Health Care Revenue (Centracare Health System) | 5.000% | 5/1/22 | | 2,800 | 3,318 |
| University of Minnesota Revenue | 5.000% | 8/1/17 | | 3,215 | 3,602 |
| University of Minnesota Revenue | 5.000% | 12/1/17 | | 10,000 | 11,319 |
| | | | | | 167,587 |
| Mississippi (0.4%) | | | | | |
| DeSoto County MS School District GO | 5.000% | 5/1/18 | | 10,340 | 11,828 |
| DeSoto County MS School District GO | 5.000% | 5/1/19 | | 8,000 | 9,354 |
| Mississippi Business Finance Corp. Gulf Opportunity Zone Industrial Development Revenue | | | | | |
| (Chevron USA Inc. Project) VRDO | 0.080% | 11/3/14 | | 11,345 | 11,345 |
| Mississippi Business Finance Corp. Solid Waste Disposal Revenue | | | | | |
| (Waste Management Inc. Project) PUT | 1.125% | 9/1/17 | | 1,250 | 1,253 |
| Mississippi GO | 5.250% | 11/1/14 | | 8,970 | 8,970 |
| Mississippi GO | 5.000% | 11/1/15 | (14) | 7,475 | 7,835 |
| 1 Mississippi GO | 0.580% | 9/1/17 | | 5,345 | 5,348 |
| Mississippi Hospital Equipment & Facilities Authority Revenue (Baptist Health System) | 5.000% | 8/15/15 | | 1,500 | 1,550 |
| Mississippi Hospital Equipment & Facilities Authority Revenue (North Mississippi Health Services) | 5.000% | 10/1/17 | | 2,500 | 2,798 |
| Mississippi Hospital Equipment & Facilities Authority Revenue | | | | | |
| (North Mississippi Health Services) VRDO | 0.060% | 11/7/14 | | 16,000 | 16,000 |
| | | | | | 76,281 |
| Missouri (0.8%) | | | | | |
| Cape Girardeau County MO Industrial Development Authority of the Health Facilities Revenue | | | | | |
| (St. Francis Medical Center) | 5.000% | 6/1/19 | | 2,000 | 2,305 |
| Cape Girardeau County MO Industrial Development Authority of the Health Facilities Revenue | | | | | |
| (St. Francis Medical Center) | 5.000% | 6/1/20 | | 1,000 | 1,165 |
| Curators of the University of Missouri System Facilities Revenue | 5.000% | 11/1/17 | | 3,270 | 3,699 |
| Curators of the University of Missouri System Facilities Revenue | 5.000% | 11/1/18 | | 2,225 | 2,581 |
| Curators of the University of Missouri System Facilities Revenue | 5.000% | 11/1/18 | | 1,445 | 1,676 |
| Curators of the University of Missouri System Facilities Revenue | 5.000% | 11/1/19 | | 805 | 954 |
| Curators of the University of Missouri System Facilities Revenue | 5.000% | 11/1/20 | | 2,000 | 2,407 |
| Kansas City MO Airport Revenue | 5.000% | 9/1/18 | | 1,500 | 1,717 |
| Kansas City MO Airport Revenue | 5.000% | 9/1/19 | | 2,715 | 3,164 |
| Missouri Board of Public Buildings Special Obligation Revenue | 5.000% | 10/1/19 | | 17,225 | 20,350 |
| Missouri Development Finance Board Cultural Facilities Revenue | | | | | |
| (Nelson Gallery Foundation) VRDO | 0.070% | 11/3/14 | | 13,250 | 13,250 |
| Missouri Development Finance Board Infrastructure Facilities Revenue (Branson Landing Project) | 4.000% | 12/1/20 | | 1,300 | 1,416 |
| Missouri Environmental Improvement & Energy Resources Authority Revenue | | | | | |
| (Kansas City Power & Light) | 1.250% | 7/1/17 | | 4,200 | 4,261 |
| Missouri Health & Educational Facilities Authority Educational Facilities Revenue | | | | | |
| (St. Louis College of Pharmacy Project) | 5.000% | 5/1/19 | | 750 | 846 |
| Missouri Health & Educational Facilities Authority Educational Facilities Revenue | | | | | |
| (St. Louis College of Pharmacy Project) | 5.000% | 5/1/20 | | 870 | 987 |
| Missouri Health & Educational Facilities Authority Educational Facilities Revenue | | | | | |
| (St. Louis College of Pharmacy Project) | 5.000% | 5/1/21 | | 1,420 | 1,614 |
| Missouri Health & Educational Facilities Authority Health Facilities Revenue | | | | | |
| (Freeman Health System) | 5.000% | 2/15/16 | | 1,500 | 1,582 |
| Missouri Health & Educational Facilities Authority Health Facilities Revenue | | | | | |
| (Freeman Health System) | 5.000% | 2/15/17 | | 1,500 | 1,631 |
49
Limited-Term Tax-Exempt Fund
| | | | | |
| | | | | Face | Market |
| | | Maturity | | Amount | Value• |
| | Coupon | Date | | ($000) | ($000) |
| Missouri Health & Educational Facilities Authority Health Facilities Revenue | | | | | |
| (Freeman Health System) | 5.000% | 2/15/18 | | 2,890 | 3,205 |
| Missouri Health & Educational Facilities Authority Health Facilities Revenue | | | | | |
| (Freeman Health System) | 5.000% | 2/15/19 | | 3,040 | 3,430 |
| Missouri Health & Educational Facilities Authority Health Facilities Revenue | | | | | |
| (Freeman Health System) | 5.000% | 2/15/20 | | 3,085 | 3,487 |
| Missouri Health & Educational Facilities Authority Health Facilities Revenue | | | | | |
| (St. Louis University) VRDO | 0.070% | 11/3/14 | LOC | 2,550 | 2,550 |
| Missouri Highways & Transportation Commission Road Revenue | 5.000% | 5/1/20 | | 7,295 | 8,742 |
| Missouri Highways & Transportation Commission Road Revenue | 5.000% | 5/1/20 | | 43,310 | 51,901 |
| St. Louis County MO Industrial Development Authority Senior Living Facilities Revenue | | | | | |
| (Friendship Village Sunset Hills) | 2.850% | 9/1/18 | | 5,400 | 5,450 |
| St. Louis MO Airport Revenue (Lambert-St. Louis International Airport) | 5.000% | 7/1/18 | | 1,295 | 1,475 |
| St. Louis MO Municipal Finance Corp. Lease Revenue (City Justice Center Project) | 5.000% | 2/15/17 | | 2,000 | 2,167 |
| St. Louis MO Municipal Finance Corp. Lease Revenue (City Justice Center Project) | 5.000% | 2/15/18 | | 4,000 | 4,434 |
| | | | | | 152,446 |
| Montana (0.1%) | | | | | |
| Montana Facility Finance Authority Revenue (Sisters of Charity of Leavenworth Health System) | 5.000% | 1/1/16 | | 5,870 | 6,185 |
| Montana Facility Finance Authority Revenue (Sisters of Charity of Leavenworth Health System) | 5.000% | 1/1/17 | | 5,305 | 5,810 |
| | | | | | 11,995 |
| Nebraska (0.3%) | | | | | |
| Central Plains Energy Project Nebraska Gas Project Revenue (Project No. 1) | 5.000% | 12/1/15 | | 5,000 | 5,215 |
| Lincoln County NE Hospital Authority No. 1 Hospital Revenue | | | | | |
| (Great Plains Regional Medical Center Project) | 5.000% | 11/1/18 | | 500 | 563 |
| Lincoln County NE Hospital Authority No. 1 Hospital Revenue | | | | | |
| (Great Plains Regional Medical Center Project) | 4.000% | 11/1/19 | | 750 | 822 |
| Lincoln County NE Hospital Authority No. 1 Hospital Revenue | | | | | |
| (Great Plains Regional Medical Center Project) | 4.000% | 11/1/20 | | 600 | 657 |
| Municipal Energy Agency of Nebraska Power Supply System Revenue | 5.000% | 4/1/19 | | 1,500 | 1,736 |
| Municipal Energy Agency of Nebraska Power Supply System Revenue | 5.000% | 4/1/20 | | 1,350 | 1,587 |
| Nebraska Investment Finance Authority Single Family Housing Revenue | 3.000% | 3/1/43 | | 4,545 | 4,725 |
| Nebraska Investment Finance Authority Single Family Housing Revenue | 3.000% | 9/1/43 | | 4,150 | 4,357 |
| Nebraska Investment Finance Authority Single Family Housing Revenue | 3.000% | 3/1/44 | | 5,270 | 5,513 |
| Nebraska Investment Finance Authority Single Family Housing Revenue | 4.000% | 9/1/44 | | 6,000 | 6,585 |
| Nebraska Public Power District Revenue | 4.000% | 1/1/15 | | 1,000 | 1,006 |
| Nebraska Public Power District Revenue | 5.000% | 1/1/16 | | 1,000 | 1,056 |
| Nebraska Public Power District Revenue | 5.000% | 1/1/17 | | 1,000 | 1,097 |
| Nebraska Public Power District Revenue | 5.000% | 1/1/18 | | 1,500 | 1,699 |
| Nebraska Public Power District Revenue | 5.000% | 1/1/19 | | 1,000 | 1,161 |
| Nebraska Public Power District Revenue | 5.000% | 1/1/19 | | 1,000 | 1,161 |
| University of Nebraska Facilities Corp. Revenue (UNMC Eye Institute) | 5.000% | 3/1/18 | | 8,850 | 10,088 |
| University of Nebraska Student Fee Revenue | 5.000% | 7/1/18 | | 1,500 | 1,722 |
| | | | | | 50,750 |
| Nevada (0.5%) | | | | | |
| Carson City NV Hospital Revenue (Carson Tahoe Regional Medical Center) | 5.000% | 9/1/17 | | 1,915 | 2,096 |
| Carson City NV Hospital Revenue (Carson Tahoe Regional Medical Center) | 5.000% | 9/1/19 | | 1,030 | 1,164 |
| Carson City NV Hospital Revenue (Carson Tahoe Regional Medical Center) | 5.000% | 9/1/20 | | 1,165 | 1,329 |
| Clark County NV Airport Improvement Revenue | 5.000% | 7/1/18 | | 32,000 | 36,559 |
| Clark County NV School District GO | 5.000% | 6/15/15 | (4) | 17,760 | 18,294 |
| Clark County NV School District GO | 5.000% | 6/15/15 | (2) | 5,020 | 5,171 |
| Nevada Highway Improvement Revenue (Motor Vehicle Fuel Tax) | 5.500% | 12/1/14 | (14) | 5,905 | 5,932 |
| Nevada Unemployment Compensation Revenue | 4.000% | 6/1/15 | | 5,500 | 5,624 |
| Nevada Unemployment Compensation Revenue | 4.000% | 12/1/15 | | 6,250 | 6,509 |
| Nevada Unemployment Compensation Revenue | 5.000% | 12/1/17 | | 6,000 | 6,801 |
| | | | | | 89,479 |
| New Hampshire (0.1%) | | | | | |
| Manchester NH General Airport Revenue | 5.000% | 1/1/15 | | 2,475 | 2,492 |
| Manchester NH General Airport Revenue | 5.000% | 1/1/15 | | 1,470 | 1,480 |
| Manchester NH General Airport Revenue | 5.000% | 1/1/22 | | 6,820 | 7,708 |
| New Hampshire GO | 5.000% | 8/15/17 | | 3,200 | 3,591 |
| New Hampshire Municipal Bond Bank Revenue | 5.000% | 8/15/16 | | 4,280 | 4,632 |
| | | | | | 19,903 |
| New Jersey (4.6%) | | | | | |
| Atlantic City NJ GO | 5.000% | 11/1/19 | | 3,315 | 3,426 |
| Atlantic City NJ GO | 5.000% | 12/1/19 | | 6,995 | 7,358 |
| Atlantic City NJ GO | 5.000% | 11/1/20 | | 4,025 | 4,118 |
| Atlantic City NJ GO | 5.000% | 12/1/20 | | 7,185 | 7,501 |
| Atlantic City NJ GO | 5.000% | 11/1/21 | | 3,020 | 3,048 |
| Atlantic City NJ GO | 5.000% | 12/1/21 | | 1,970 | 2,035 |
50
Limited-Term Tax-Exempt Fund
| | | | | |
| | | | | Face | Market |
| | | Maturity | | Amount | Value• |
| | Coupon | Date | | ($000) | ($000) |
| 3 Camden County NJ Improvement Authority Health Care Redevelopment Project Revenue | | | | | |
| (Cooper Health System Obligated Group) | 5.000% | 2/15/20 | | 2,040 | 2,342 |
| 3 Camden County NJ Improvement Authority Health Care Redevelopment Project Revenue | | | | | |
| (Cooper Health System Obligated Group) | 5.000% | 2/15/21 | | 2,460 | 2,833 |
| 3 Camden County NJ Improvement Authority Health Care Redevelopment Project Revenue | | | | | |
| (Cooper Health System Obligated Group) | 5.000% | 2/15/22 | | 2,295 | 2,650 |
| Camden County NJ Improvement Authority Health Care Redevelopment Project Revenue | | | | | |
| (Cooper Health System Obligated Group) VRDO | 0.050% | 11/7/14 | LOC | 3,000 | 3,000 |
| Gloucester County NJ Improvement Authority Solid Waste Resource Revenue PUT | 2.125% | 12/1/17 | | 3,000 | 3,127 |
| Jersey City NJ BAN | 2.000% | 12/12/14 | | 3,300 | 3,304 |
| Jersey City NJ BAN | 2.000% | 12/12/14 | | 10,000 | 10,013 |
| New Jersey Building Authority Revenue | 5.000% | 6/15/15 | | 7,650 | 7,870 |
| New Jersey COP | 5.000% | 6/15/16 | | 6,695 | 7,173 |
| New Jersey Economic Development Authority Revenue | 5.000% | 3/1/18 | | 14,425 | 16,061 |
| New Jersey Economic Development Authority Revenue | 5.000% | 3/1/19 | | 29,800 | 33,652 |
| New Jersey Economic Development Authority Revenue (Cigarette Tax) | 5.000% | 6/15/16 | | 5,500 | 5,872 |
| New Jersey Economic Development Authority Revenue (Cigarette Tax) | 5.000% | 6/15/18 | | 7,235 | 8,127 |
| New Jersey Economic Development Authority Revenue (Cigarette Tax) | 5.000% | 6/15/19 | | 8,000 | 9,104 |
| New Jersey Economic Development Authority Revenue (Cigarette Tax) | 5.000% | 6/15/20 | | 7,000 | 8,061 |
| New Jersey Economic Development Authority Revenue (Provident Group-Montclair | | | | | |
| Properties LLC–Montclair State University Student Housing Project) | 5.000% | 6/1/15 | | 2,525 | 2,583 |
| New Jersey Economic Development Authority Revenue (Provident Group-Montclair | | | | | |
| Properties LLC–Montclair State University Student Housing Project) | 5.000% | 6/1/16 | | 2,905 | 3,068 |
| New Jersey Economic Development Authority Revenue (Provident Group-Montclair | | | | | |
| Properties LLC–Montclair State University Student Housing Project) | 5.000% | 6/1/17 | | 3,525 | 3,801 |
| 1 New Jersey Economic Development Authority Revenue (School Facilities Construction) | 0.630% | 2/1/15 | | 9,000 | 9,000 |
| 1 New Jersey Economic Development Authority Revenue (School Facilities Construction) | 1.750% | 2/1/16 | | 9,500 | 9,587 |
| New Jersey Economic Development Authority Revenue (School Facilities Construction) | 5.000% | 12/15/16 | | 32,425 | 35,228 |
| 1 New Jersey Economic Development Authority Revenue (School Facilities Construction) | 0.950% | 2/1/17 | | 14,000 | 14,037 |
| New Jersey Economic Development Authority Revenue (School Facilities Construction) | 5.000% | 9/1/17 | | 6,450 | 7,138 |
| New Jersey Economic Development Authority Revenue (School Facilities Construction) | 5.000% | 9/1/17 | | 7,500 | 8,299 |
| New Jersey Economic Development Authority Revenue (School Facilities Construction) | 5.000% | 12/15/17 | | 14,300 | 15,934 |
| New Jersey Economic Development Authority Revenue (School Facilities Construction) | 5.500% | 9/1/18 | (14) | 5,000 | 5,759 |
| New Jersey Economic Development Authority Revenue (School Facilities Construction) | 5.000% | 3/1/19 | | 15,000 | 16,939 |
| New Jersey Economic Development Authority Revenue (School Facilities Construction) | 5.000% | 12/15/19 | | 16,780 | 19,166 |
| New Jersey Economic Development Authority Revenue (School Facilities Construction) | 5.000% | 3/1/20 | | 9,235 | 10,517 |
| New Jersey Economic Development Authority Revenue (School Facilities Construction) | 5.000% | 9/1/20 | | 7,745 | 8,866 |
| New Jersey Economic Development Authority Revenue (School Facilities Construction) | 5.250% | 12/15/20 | (2) | 9,670 | 11,260 |
| New Jersey Economic Development Authority Revenue (School Facilities Construction) | 5.250% | 9/1/22 | | 18,470 | 21,105 |
| 2 New Jersey Economic Development Authority Revenue (School Facilities Construction) | | | | | |
| TOB VRDO | 0.150% | 11/7/14 | LOC | 10,000 | 10,000 |
| New Jersey Economic Development Authority Sublease Revenue (New Jersey Transit Corp. | | | | | |
| Light Rail Transit System Project) | 5.000% | 5/1/15 | | 11,255 | 11,512 |
| New Jersey Economic Development Authority Sublease Revenue (New Jersey Transit Corp. | | | | | |
| Light Rail Transit System Project) | 5.000% | 5/1/19 | | 1,000 | 1,132 |
| New Jersey Educational Facilities Authority Revenue (Kean University) | 5.000% | 9/1/17 | | 2,500 | 2,766 |
| New Jersey Educational Facilities Authority Revenue (Princeton University) | 5.000% | 7/1/17 | | 5,095 | 5,702 |
| New Jersey Educational Facilities Authority Revenue (Princeton University) | 5.000% | 7/1/18 | | 5,345 | 6,167 |
| New Jersey Educational Facilities Authority Revenue (Princeton University) | 5.000% | 7/1/18 | | 2,500 | 2,579 |
| New Jersey Educational Facilities Authority Revenue (University Medical & Dentistry) | 6.000% | 12/1/14 | (ETM) | 5,015 | 5,040 |
| New Jersey Equipment Lease Purchase COP | 5.000% | 6/15/15 | | 5,530 | 5,693 |
| New Jersey Equipment Lease Purchase COP | 5.000% | 6/15/17 | | 2,625 | 2,900 |
| New Jersey Equipment Lease Purchase COP | 5.000% | 6/15/18 | | 4,550 | 5,104 |
| New Jersey Equipment Lease Purchase COP | 5.000% | 6/15/19 | | 10,255 | 11,435 |
| New Jersey Equipment Lease Purchase COP | 5.000% | 6/15/20 | | 1,500 | 1,661 |
| New Jersey GO | 5.000% | 8/15/16 | | 12,120 | 13,077 |
| New Jersey GO | 5.000% | 8/15/17 | | 11,660 | 12,976 |
| New Jersey GO | 5.000% | 6/1/18 | | 5,000 | 5,675 |
| New Jersey GO | 5.000% | 8/15/19 | | 8,395 | 9,707 |
| New Jersey Health Care Facilities Financing Authority Revenue (AHS Hospital Corp.) | 5.000% | 7/1/18 | | 2,500 | 2,828 |
| New Jersey Health Care Facilities Financing Authority Revenue (Barnabas Health) | 5.000% | 7/1/17 | | 2,000 | 2,210 |
| New Jersey Health Care Facilities Financing Authority Revenue (Barnabas Health) | 5.000% | 7/1/18 | | 1,000 | 1,124 |
| New Jersey Health Care Facilities Financing Authority Revenue (Barnabas Health) | 4.500% | 7/1/22 | | 3,550 | 3,959 |
| New Jersey Health Care Facilities Financing Authority Revenue | | | | | |
| (Hackensack University Medical Center) | 5.000% | 1/1/17 | | 2,595 | 2,823 |
| New Jersey Health Care Facilities Financing Authority Revenue | | | | | |
| (Hackensack University Medical Center) | 5.000% | 1/1/18 | | 3,605 | 3,994 |
| New Jersey Health Care Facilities Financing Authority Revenue (Holy Name Medical Center) | 4.000% | 7/1/17 | | 1,000 | 1,069 |
| New Jersey Health Care Facilities Financing Authority Revenue | | | | | |
| (Meridian Health System Obligated Group) | 5.000% | 7/1/18 | | 2,000 | 2,268 |
51
Limited-Term Tax-Exempt Fund
| | | | | |
| | | | | Face | Market |
| | | Maturity | | Amount | Value• |
| | Coupon | Date | | ($000) | ($000) |
| New Jersey Health Care Facilities Financing Authority Revenue | | | | | |
| (Meridian Health System Obligated Group) | 5.000% | 7/1/19 | | 2,000 | 2,308 |
| New Jersey Health Care Facilities Financing Authority Revenue | | | | | |
| (Meridian Health System Obligated Group) | 5.000% | 7/1/21 | | 2,000 | 2,343 |
| 2 New Jersey Health Care Facilities Financing Authority Revenue | | | | | |
| (Meridian Health System Obligated Group) TOB VRDO | 0.200% | 11/7/14 | (12) | 9,255 | 9,255 |
| New Jersey Higher Education Assistance Authority Student Loan Revenue | 5.000% | 12/1/14 | | 12,655 | 12,706 |
| New Jersey Higher Education Assistance Authority Student Loan Revenue | 4.500% | 12/1/15 | | 15,860 | 16,549 |
| New Jersey Higher Education Assistance Authority Student Loan Revenue | 5.000% | 12/1/15 | | 2,500 | 2,628 |
| New Jersey Higher Education Assistance Authority Student Loan Revenue | 5.000% | 12/1/16 | | 9,990 | 10,851 |
| New Jersey Higher Education Assistance Authority Student Loan Revenue | 5.000% | 12/1/16 | | 3,810 | 4,138 |
| New Jersey Housing & Mortgage Finance Agency Single Family Housing Revenue VRDO | 0.050% | 11/7/14 | | 12,100 | 12,100 |
| New Jersey Transportation Corp. GAN | 5.000% | 9/15/20 | | 22,550 | 26,116 |
| New Jersey Transportation Trust Fund Authority Transportation System Revenue | 5.000% | 6/15/15 | (Prere.) | 19,130 | 19,707 |
| New Jersey Transportation Trust Fund Authority Transportation System Revenue | 5.000% | 12/15/17 | | 10,000 | 11,121 |
| New Jersey Transportation Trust Fund Authority Transportation System Revenue | 5.000% | 12/15/17 | | 30,000 | 33,364 |
| New Jersey Transportation Trust Fund Authority Transportation System Revenue | 5.000% | 12/15/17 | | 7,500 | 8,341 |
| New Jersey Transportation Trust Fund Authority Transportation System Revenue | 5.000% | 6/15/18 | | 2,500 | 2,800 |
| New Jersey Transportation Trust Fund Authority Transportation System Revenue | 5.000% | 12/15/18 | | 15,810 | 17,903 |
| New Jersey Transportation Trust Fund Authority Transportation System Revenue | 5.000% | 6/15/19 | | 2,815 | 3,185 |
| New Jersey Transportation Trust Fund Authority Transportation System Revenue | 5.000% | 12/15/19 | | 31,245 | 35,605 |
| New Jersey Transportation Trust Fund Authority Transportation System Revenue | 5.000% | 6/15/20 | | 14,635 | 16,719 |
| New Jersey Transportation Trust Fund Authority Transportation System Revenue | 5.250% | 12/15/20 | (4) | 5,000 | 5,850 |
| New Jersey Transportation Trust Fund Authority Transportation System Revenue | 5.250% | 12/15/20 | (4) | 5,800 | 6,786 |
| New Jersey Transportation Trust Fund Authority Transportation System Revenue | 5.250% | 12/15/20 | | 4,875 | 5,667 |
| New Jersey Transportation Trust Fund Authority Transportation System Revenue VRDO | 0.050% | 11/7/14 | LOC | 6,000 | 6,000 |
| 1 New Jersey Turnpike Authority Revenue | 0.600% | 1/1/18 | | 40,000 | 39,984 |
| New Jersey Turnpike Authority Revenue | 5.000% | 1/1/20 | | 750 | 879 |
| New Jersey Turnpike Authority Revenue | 5.000% | 1/1/21 | | 1,000 | 1,183 |
| 1 New Jersey Turnpike Authority Revenue PUT | 0.580% | 1/1/16 | | 5,000 | 5,012 |
| 1 New Jersey Turnpike Authority Revenue PUT | 0.670% | 1/1/17 | | 10,000 | 10,037 |
| 1 New Jersey Turnpike Authority Revenue PUT | 0.730% | 1/1/18 | | 10,000 | 10,035 |
| 1 New Jersey Turnpike Authority Revenue PUT | 0.730% | 1/1/18 | | 15,000 | 15,054 |
| Rutgers State University New Jersey Revenue | 5.000% | 5/1/19 | | 1,000 | 1,167 |
| Rutgers State University New Jersey Revenue | 5.000% | 5/1/19 | | 1,000 | 1,167 |
| Rutgers State University New Jersey Revenue | 5.000% | 5/1/20 | | 2,000 | 2,373 |
| Tobacco Settlement Financing Corp. New Jersey Revenue | 5.000% | 6/1/15 | | 2,000 | 2,045 |
| Tobacco Settlement Financing Corp. New Jersey Revenue | 0.000% | 6/1/41 | | 250,000 | 61,090 |
| | | | | | 908,431 |
| New Mexico (0.7%) | | | | | |
| Albuquerque Bernalillo County NM Water Utility Authority Revenue | 5.000% | 7/1/20 | | 2,000 | 2,387 |
| Albuquerque Bernalillo County NM Water Utility Authority Revenue | 5.000% | 7/1/20 | | 3,225 | 3,849 |
| Albuquerque NM Municipal School District No. 12 GO | 5.000% | 8/1/20 | | 1,800 | 2,155 |
| Albuquerque NM Municipal School District No. 12 GO | 5.000% | 8/1/20 | | 6,580 | 7,877 |
| Albuquerque NM Municipal School District No. 12 GO | 5.000% | 8/1/21 | | 1,130 | 1,369 |
| Albuquerque NM Municipal School District No. 12 GO | 5.000% | 8/1/21 | | 5,450 | 6,605 |
| Farmington NM Pollution Control Revenue (El Paso Electric Co. Four Corners Project) PUT | 1.875% | 9/1/17 | | 4,500 | 4,559 |
| New Mexico Educational Assistance Foundation Revenue | 4.000% | 9/1/16 | | 10,000 | 10,647 |
| New Mexico Educational Assistance Foundation Revenue | 4.000% | 12/1/16 | | 7,000 | 7,509 |
| New Mexico Educational Assistance Foundation Revenue | 4.000% | 12/1/17 | | 5,000 | 5,494 |
| New Mexico Finance Authority Transportation Revenue | 5.000% | 6/15/17 | | 9,000 | 10,041 |
| New Mexico GO | 5.000% | 3/1/16 | | 19,290 | 20,509 |
| 2 New Mexico Hospital Equipment Loan Council Hospital System Revenue | | | | | |
| (Presbyterian Healthcare Services) TOB VRDO | 0.060% | 11/7/14 | | 6,660 | 6,660 |
| 1 New Mexico Municipal Energy Acquisition Authority Gas Supply Revenue | 0.672% | 2/1/18 | | 5,000 | 5,022 |
| 1 New Mexico Municipal Energy Acquisition Authority Gas Supply Revenue | 0.722% | 8/1/18 | | 5,200 | 5,227 |
| 1 New Mexico Municipal Energy Acquisition Authority Gas Supply Revenue PUT | 0.852% | 8/1/19 | | 37,500 | 37,761 |
| New Mexico Severance Tax Revenue | 5.000% | 7/1/17 | | 6,015 | 6,717 |
| | | | | | 144,388 |
| New York (14.7%) | | | | | |
| Albany NY Industrial Development Agency Civic Facility Revenue | | | | | |
| (Albany Medical Center Hospital Project) VRDO | 0.070% | 11/7/14 | LOC | 4,480 | 4,480 |
| Brooklyn NY Local Development Corp. PILOT Revenue (Barclays Center Project) | 5.750% | 7/15/16 | | 1,195 | 1,285 |
| Erie County NY Industrial Development Agency School Facility Revenue | | | | | |
| (Buffalo City School District Project) | 5.000% | 5/1/15 | (ETM) | 1,690 | 1,731 |
| Erie County NY Industrial Development Agency School Facility Revenue | | | | | |
| (Buffalo City School District Project) | 5.000% | 5/1/15 | | 1,945 | 1,992 |
| Erie County NY Industrial Development Agency School Facility Revenue | | | | | |
| (Buffalo City School District Project) | 5.000% | 5/1/17 | | 1,125 | 1,248 |
| Erie County NY Industrial Development Agency School Facility Revenue | | | | | |
| (Buffalo City School District Project) | 5.000% | 5/1/17 | | 3,000 | 3,329 |
52
Limited-Term Tax-Exempt Fund
| | | | | |
| | | | | Face | Market |
| | | Maturity | | Amount | Value• |
| | Coupon | Date | ($000) | ($000) |
| Hempstead NY GO | 3.000% | 4/15/15 | | 5,260 | 5,329 |
| Long Island NY Power Authority Electric System Revenue | 5.000% | 5/1/18 | | 2,000 | 2,255 |
| Long Island NY Power Authority Electric System Revenue | 5.000% | 5/1/19 | | 1,500 | 1,724 |
| Monroe County NY Industrial Development Agency School Facility Revenue | | | | | |
| (Rochester Schools Modernization Project) | 5.000% | 5/1/18 | | 2,000 | 2,282 |
| Monroe County NY Industrial Development Agency School Facility Revenue | | | | | |
| (Rochester Schools Modernization Project) | 5.000% | 5/1/18 | | 1,000 | 1,141 |
| Monroe County NY Industrial Development Agency School Facility Revenue | | | | | |
| (Rochester Schools Modernization Project) | 5.000% | 5/1/19 | | 3,520 | 4,106 |
| Monroe County NY Industrial Development Agency School Facility Revenue | | | | | |
| (Rochester Schools Modernization Project) | 5.000% | 5/1/19 | | 2,000 | 2,333 |
| Nassau County NY Interim Finance Authority Sales Tax Revenue VRDO | 0.050% | 11/7/14 | | 21,550 | 21,550 |
| Nassau County NY Local Economic Assistance & Financing Corp. Revenue | | | | | |
| (Catholic Health Services) | 5.000% | 7/1/20 | | 4,640 | 5,382 |
| Nassau County NY Local Economic Assistance & Financing Corp. Revenue | | | | | |
| (South Nassau Communities Hospital) | 5.000% | 7/1/18 | | 2,550 | 2,852 |
| Nassau County NY Local Economic Assistance & Financing Corp. Revenue | | | | | |
| (South Nassau Communities Hospital) | 5.000% | 7/1/20 | | 1,660 | 1,905 |
| Nassau County NY Local Economic Assistance & Financing Corp. Revenue | | | | | |
| (Winthrop University Hospital Association Project) | 5.000% | 7/1/18 | | 2,000 | 2,237 |
| Nassau County NY Local Economic Assistance & Financing Corp. Revenue | | | | | |
| (Winthrop University Hospital Association Project) | 5.000% | 7/1/19 | | 1,000 | 1,135 |
| Nassau County NY Local Economic Assistance Corp. Revenue | | | | | |
| (Catholic Health Services of Long Island Obligated Group Project) | 4.000% | 7/1/19 | | 375 | 411 |
| Nassau County NY Local Economic Assistance Corp. Revenue | | | | | |
| (Catholic Health Services of Long Island Obligated Group Project) | 5.000% | 7/1/21 | | 1,340 | 1,561 |
| New York City NY GO | 5.000% | 8/1/15 | | 26,260 | 27,207 |
| New York City NY GO | 5.000% | 8/1/15 | | 10,815 | 11,205 |
| New York City NY GO | 5.000% | 8/15/15 | | 17,910 | 18,590 |
| New York City NY GO | 5.000% | 9/1/15 | | 21,325 | 22,179 |
| New York City NY GO | 5.000% | 2/1/16 | | 1,000 | 1,059 |
| New York City NY GO | 5.000% | 3/1/16 | | 2,500 | 2,657 |
| New York City NY GO | 5.000% | 3/1/16 | | 10,795 | 11,472 |
| New York City NY GO | 5.000% | 4/1/16 | | 3,500 | 3,732 |
| New York City NY GO | 5.000% | 8/1/16 | | 16,925 | 18,283 |
| New York City NY GO | 5.000% | 8/1/16 | | 27,500 | 29,706 |
| New York City NY GO | 5.000% | 8/1/16 | | 7,150 | 7,724 |
| New York City NY GO | 5.000% | 8/1/16 | | 5,000 | 5,401 |
| New York City NY GO | 5.000% | 8/1/16 | | 1,000 | 1,080 |
| New York City NY GO | 5.000% | 8/1/16 | | 1,000 | 1,080 |
| New York City NY GO | 5.000% | 8/1/17 | | 3,800 | 4,242 |
| New York City NY GO | 5.000% | 8/1/17 | | 6,000 | 6,698 |
| New York City NY GO | 5.000% | 8/1/17 | | 13,590 | 15,171 |
| New York City NY GO | 5.000% | 8/1/17 | | 9,750 | 10,884 |
| New York City NY GO | 5.000% | 8/1/17 | | 8,185 | 9,137 |
| New York City NY GO | 5.000% | 10/1/17 | | 2,500 | 2,805 |
| New York City NY GO | 5.000% | 10/1/17 | | 5,150 | 5,779 |
| New York City NY GO | 5.000% | 8/1/18 | | 6,000 | 6,887 |
| New York City NY GO | 5.000% | 8/1/18 | | 4,650 | 5,337 |
| New York City NY GO | 5.000% | 8/1/18 | | 3,250 | 3,730 |
| New York City NY GO | 5.000% | 8/1/18 | | 13,030 | 14,955 |
| New York City NY GO | 5.000% | 8/1/18 | | 25,315 | 29,056 |
| New York City NY GO | 5.000% | 8/1/18 | | 6,000 | 6,887 |
| New York City NY GO | 5.000% | 8/1/18 | | 5,000 | 5,739 |
| New York City NY GO | 5.000% | 8/1/18 | | 7,500 | 8,608 |
| New York City NY GO | 5.000% | 10/1/18 | | 7,650 | 8,819 |
| New York City NY GO | 4.000% | 8/1/19 | | 12,165 | 13,642 |
| New York City NY GO | 5.000% | 8/1/19 | | 7,225 | 8,433 |
| New York City NY GO | 5.000% | 8/1/19 | | 20,155 | 23,526 |
| New York City NY GO | 5.000% | 8/1/19 | | 15,000 | 17,509 |
| New York City NY GO | 5.000% | 8/1/19 | | 8,000 | 9,338 |
| New York City NY GO | 5.000% | 8/1/19 | | 15,000 | 17,509 |
| New York City NY GO | 5.000% | 8/1/19 | | 5,830 | 6,805 |
| New York City NY GO | 5.000% | 8/1/19 | | 5,000 | 5,836 |
| New York City NY GO | 5.000% | 8/1/19 | | 5,000 | 5,836 |
| New York City NY GO | 5.000% | 8/1/20 | | 20,000 | 23,692 |
| New York City NY GO | 5.000% | 8/1/20 | | 4,500 | 5,331 |
| New York City NY GO | 5.000% | 10/1/20 | | 4,375 | 5,194 |
| 1 New York City NY GO | 0.430% | 8/1/21 | | 4,650 | 4,651 |
| 1 New York City NY GO | 0.520% | 8/1/21 | | 6,350 | 6,352 |
| New York City NY GO | 5.000% | 8/1/21 | | 11,985 | 14,323 |
53
Limited-Term Tax-Exempt Fund
| | | | | |
| | | | | Face | Market |
| | | Maturity | | Amount | Value• |
| | Coupon | Date | | ($000) | ($000) |
| New York City NY GO | 5.000% | 8/1/21 | | 2,000 | 2,390 |
| New York City NY GO | 5.000% | 8/1/21 | | 4,000 | 4,780 |
| 1 New York City NY GO | 0.600% | 8/1/25 | | 5,500 | 5,499 |
| 1 New York City NY GO | 0.450% | 8/1/27 | | 18,500 | 18,501 |
| New York City NY GO VRDO | 0.070% | 11/3/14 | | 7,000 | 7,000 |
| New York City NY GO VRDO | 0.070% | 11/3/14 | | 33,200 | 33,200 |
| New York City NY GO VRDO | 0.070% | 11/3/14 | | 2,900 | 2,900 |
| New York City NY GO VRDO | 0.070% | 11/3/14 | | 4,100 | 4,100 |
| New York City NY GO VRDO | 0.070% | 11/3/14 | | 27,065 | 27,065 |
| New York City NY GO VRDO | 0.060% | 11/7/14 | | 30,000 | 30,000 |
| New York City NY Health & Hospital Corp. Revenue (Health System) | 5.000% | 2/15/17 | | 8,150 | 8,968 |
| New York City NY Health & Hospital Corp. Revenue (Health System) | 5.000% | 2/15/21 | | 3,000 | 3,556 |
| New York City NY Housing Development Corp. Multi-Family Housing Revenue | 0.750% | 11/1/16 | | 8,000 | 8,004 |
| New York City NY Housing Development Corp. Multi-Family Housing Revenue | 1.100% | 11/1/16 | | 8,865 | 8,868 |
| New York City NY Housing Development Corp. Multi-Family Housing Revenue | 1.200% | 11/1/17 | | 25,640 | 25,759 |
| New York City NY Housing Development Corp. Multi-Family Housing Revenue | 1.250% | 5/1/18 | | 2,390 | 2,396 |
| New York City NY Housing Development Corp. Multi-Family Housing Revenue | 1.250% | 5/1/18 | | 10,010 | 10,031 |
| New York City NY Housing Development Corp. Multi-Family Housing Revenue | 5.000% | 7/1/18 | | 3,500 | 3,982 |
| New York City NY Housing Development Corp. Multi-Family Housing Revenue | 5.000% | 7/1/19 | | 4,300 | 4,972 |
| New York City NY Housing Development Corp. Multi-Family Housing Revenue | 5.000% | 7/1/20 | | 4,760 | 5,579 |
| 2 New York City NY Housing Development Corp. Multi-Family Housing Revenue TOB VRDO | 0.200% | 11/7/14 | | 10,000 | 10,000 |
| New York City NY Industrial Development Agency Civic Facility Revenue | | | | | |
| (New York Law School) VRDO | 0.050% | 11/7/14 | LOC | 13,570 | 13,570 |
| New York City NY Municipal Water Finance Authority Water & Sewer System Revenue | 5.000% | 6/15/18 | | 4,180 | 4,582 |
| New York City NY Municipal Water Finance Authority Water & Sewer System Revenue | 5.000% | 6/15/19 | | 16,385 | 19,223 |
| New York City NY Municipal Water Finance Authority Water & Sewer System Revenue | 5.000% | 6/15/19 | | 3,000 | 3,402 |
| New York City NY Municipal Water Finance Authority Water & Sewer System Revenue VRDO | 0.060% | 11/3/14 | | 3,700 | 3,700 |
| New York City NY Municipal Water Finance Authority Water & Sewer System Revenue VRDO | 0.060% | 11/3/14 | | 1,300 | 1,300 |
| New York City NY Municipal Water Finance Authority Water & Sewer System Revenue VRDO | 0.060% | 11/3/14 | | 10,400 | 10,400 |
| New York City NY Municipal Water Finance Authority Water & Sewer System Revenue VRDO | 0.070% | 11/3/14 | | 43,900 | 43,900 |
| New York City NY Municipal Water Finance Authority Water & Sewer System Revenue VRDO | 0.070% | 11/3/14 | | 10,200 | 10,200 |
| New York City NY Municipal Water Finance Authority Water & Sewer System Revenue VRDO | 0.070% | 11/3/14 | | 4,500 | 4,500 |
| New York City NY Municipal Water Finance Authority Water & Sewer System Revenue VRDO | 0.070% | 11/3/14 | | 11,400 | 11,400 |
| New York City NY Municipal Water Finance Authority Water & Sewer System Revenue VRDO | 0.040% | 11/7/14 | | 5,600 | 5,600 |
| New York City NY Sales Tax Asset Receivable Corp. Revenue | 5.000% | 10/15/21 | | 19,510 | 23,866 |
| New York City NY Transitional Finance Authority Building Aid Revenue | 5.000% | 7/15/19 | | 1,000 | 1,169 |
| New York City NY Transitional Finance Authority Future Tax Revenue | 5.000% | 11/1/14 | (ETM) | 2,720 | 2,720 |
| New York City NY Transitional Finance Authority Future Tax Revenue | 5.000% | 11/1/14 | | 2,890 | 2,890 |
| New York City NY Transitional Finance Authority Future Tax Revenue | 5.000% | 11/1/15 | | 8,000 | 8,388 |
| New York City NY Transitional Finance Authority Future Tax Revenue | 5.000% | 11/1/16 | | 10,115 | 11,049 |
| New York City NY Transitional Finance Authority Future Tax Revenue | 5.000% | 11/1/16 | (ETM) | 24,805 | 27,072 |
| New York City NY Transitional Finance Authority Future Tax Revenue | 5.000% | 11/1/16 | | 18,680 | 20,405 |
| New York City NY Transitional Finance Authority Future Tax Revenue | 5.000% | 2/1/17 | | 2,500 | 2,752 |
| New York City NY Transitional Finance Authority Future Tax Revenue | 5.000% | 11/1/17 | | 7,000 | 7,897 |
| New York City NY Transitional Finance Authority Future Tax Revenue | 5.000% | 11/1/17 | | 20,000 | 22,563 |
| New York City NY Transitional Finance Authority Future Tax Revenue | 5.000% | 11/1/17 | | 16,500 | 17,284 |
| New York City NY Transitional Finance Authority Future Tax Revenue | 5.000% | 11/1/17 | | 20,000 | 22,563 |
| New York City NY Transitional Finance Authority Future Tax Revenue | 5.000% | 11/1/18 | | 7,455 | 8,630 |
| New York City NY Transitional Finance Authority Future Tax Revenue | 5.000% | 11/15/18 | | 11,950 | 13,847 |
| New York City NY Transitional Finance Authority Future Tax Revenue | 5.000% | 11/1/19 | | 8,560 | 10,085 |
| New York City NY Transitional Finance Authority Future Tax Revenue | 5.000% | 11/1/19 | | 25,115 | 29,590 |
| New York City NY Transitional Finance Authority Future Tax Revenue | 5.000% | 2/1/20 | | 6,395 | 7,529 |
| New York City NY Transitional Finance Authority Future Tax Revenue | 5.000% | 2/1/20 | | 8,925 | 10,508 |
| New York City NY Transitional Finance Authority Future Tax Revenue | 5.000% | 11/1/20 | | 3,090 | 3,684 |
| New York City NY Trust for Cultural Resources Revenue | | | | | |
| (American Museum of Natural History) VRDO | 0.040% | 11/7/14 | | 6,465 | 6,465 |
| New York City NY Trust for Cultural Resources Revenue (Asia Society) VRDO | 0.050% | 11/7/14 | LOC | 9,945 | 9,945 |
| New York City NY Trust for Cultural Resources Revenue (The Juilliard School) PUT | 1.350% | 8/1/17 | | 6,200 | 6,307 |
| New York City NY Trust for Cultural Resources Revenue (Whitney Museum of American Art) | 5.000% | 7/1/17 | | 6,250 | 6,939 |
| 2 New York Liberty Development Corp. Revenue (Port Authority Consolidated Bonds) TOB VRDO | 0.070% | 11/7/14 | | 35,220 | 35,220 |
| 1 New York Metropolitan Transportation Authority Revenue | 0.792% | 11/1/16 | | 3,495 | 3,521 |
| New York Metropolitan Transportation Authority Revenue | 5.000% | 11/15/16 | | 6,000 | 6,553 |
| 1 New York Metropolitan Transportation Authority Revenue | 0.932% | 11/1/17 | | 2,950 | 2,985 |
| New York Metropolitan Transportation Authority Revenue | 5.000% | 11/15/17 | | 5,000 | 5,645 |
| New York Metropolitan Transportation Authority Revenue | 5.000% | 11/15/17 | | 7,000 | 7,902 |
| New York Metropolitan Transportation Authority Revenue | 5.000% | 11/15/17 | | 12,500 | 14,111 |
| New York Metropolitan Transportation Authority Revenue | 5.000% | 11/15/18 | | 4,055 | 4,687 |
| New York Metropolitan Transportation Authority Revenue | 5.000% | 11/15/18 | | 2,500 | 2,890 |
| New York Metropolitan Transportation Authority Revenue | 5.000% | 11/15/18 | | 2,650 | 3,063 |
| New York Metropolitan Transportation Authority Revenue | 5.000% | 11/15/18 | | 1,500 | 1,734 |
| New York Metropolitan Transportation Authority Revenue | 5.000% | 11/15/18 | | 2,000 | 2,312 |
54
Limited-Term Tax-Exempt Fund
| | | | | | |
| | | | | | Face | Market |
| | | | Maturity | | Amount | Value• |
| | | Coupon | Date | | ($000) | ($000) |
| | New York Metropolitan Transportation Authority Revenue | 5.000% | 11/15/18 | | 1,000 | 1,156 |
| | New York Metropolitan Transportation Authority Revenue | 5.000% | 11/15/18 | | 1,500 | 1,734 |
| | New York Metropolitan Transportation Authority Revenue | 5.000% | 11/15/18 | | 4,775 | 5,519 |
| | New York Metropolitan Transportation Authority Revenue | 5.000% | 11/15/18 | | 1,255 | 1,451 |
| | New York Metropolitan Transportation Authority Revenue | 5.000% | 11/15/19 | | 9,535 | 11,199 |
| | New York Metropolitan Transportation Authority Revenue | 5.000% | 11/15/19 | | 1,000 | 1,175 |
| | New York Metropolitan Transportation Authority Revenue | 5.000% | 11/15/19 | | 2,530 | 2,972 |
| | New York Metropolitan Transportation Authority Revenue | 5.000% | 11/15/19 | | 4,725 | 5,550 |
| | New York Metropolitan Transportation Authority Revenue | 5.000% | 11/15/19 | | 8,930 | 10,489 |
| | New York Metropolitan Transportation Authority Revenue | 5.000% | 11/15/19 | | 1,100 | 1,292 |
| | New York Metropolitan Transportation Authority Revenue | 5.500% | 11/15/19 | (14) | 5,000 | 5,994 |
| | New York Metropolitan Transportation Authority Revenue | 5.000% | 11/15/20 | | 5,000 | 5,936 |
| | New York Metropolitan Transportation Authority Revenue | 5.000% | 11/15/20 | | 2,400 | 2,849 |
| | New York Metropolitan Transportation Authority Revenue | 5.000% | 11/15/20 | | 1,560 | 1,852 |
| | New York Metropolitan Transportation Authority Revenue | 5.000% | 11/15/21 | | 5,000 | 5,978 |
| | New York Metropolitan Transportation Authority Revenue | 5.000% | 11/15/21 | | 1,230 | 1,471 |
| 2 | New York Metropolitan Transportation Authority Revenue (Dedicated Petroleum Tax) TOB VRDO | 0.050% | 11/7/14 | (13) | 6,805 | 6,805 |
| 2 | New York Metropolitan Transportation Authority Revenue (Dedicated Petroleum Tax) TOB VRDO | 0.060% | 11/7/14 | (13) | 4,495 | 4,495 |
| 1 | New York Metropolitan Transportation Authority Revenue (Dedicated Tax Fund) | 1.000% | 11/1/19 | | 9,300 | 9,454 |
| | New York Metropolitan Transportation Authority Revenue (Dedicated Tax Fund) | 5.000% | 11/15/20 | | 4,600 | 5,515 |
| 1 | New York Metropolitan Transportation Authority Revenue (Dedicated Tax Fund) PUT | 0.430% | 6/1/17 | | 20,400 | 20,402 |
| 1,3 | New York Metropolitan Transportation Authority Revenue (Dedicated Tax Fund) PUT | 0.280% | 11/1/18 | | 2,000 | 2,000 |
| 1 | New York Metropolitan Transportation Authority Revenue (Dedicated Tax Fund) PUT | 0.630% | 11/1/19 | | 21,000 | 20,997 |
| 1,3 | New York Metropolitan Transportation Authority Revenue (Dedicated Tax Fund) PUT | 0.730% | 11/1/19 | | 9,070 | 9,069 |
| | New York Metropolitan Transportation Authority Revenue (Dedicated Tax Fund) VRDO | 0.070% | 11/3/14 | LOC | 2,880 | 2,880 |
| | New York Metropolitan Transportation Authority Revenue (Transit Revenue) | 5.000% | 11/15/17 | | 2,500 | 2,822 |
| | New York Metropolitan Transportation Authority Revenue (Transit Revenue) | 5.000% | 11/15/18 | | 4,000 | 4,624 |
| | New York Metropolitan Transportation Authority Revenue (Transit Revenue) | 5.000% | 11/15/19 | | 3,500 | 4,111 |
| | New York Metropolitan Transportation Authority Revenue (Transit Revenue) PUT | 5.000% | 11/15/14 | | 52,980 | 53,078 |
| 1 | New York Metropolitan Transportation Authority Revenue PUT | 0.752% | 11/1/15 | | 11,925 | 11,967 |
| 1 | New York Metropolitan Transportation Authority Revenue PUT | 0.802% | 11/1/16 | | 12,500 | 12,595 |
| 1 | New York Metropolitan Transportation Authority Revenue PUT | 0.952% | 11/1/16 | | 15,000 | 15,158 |
| 1 | New York Metropolitan Transportation Authority Revenue PUT | 0.575% | 5/15/17 | (4) | 17,500 | 17,513 |
| 1 | New York Metropolitan Transportation Authority Revenue PUT | 0.452% | 11/1/17 | | 2,280 | 2,286 |
| 1 | New York Metropolitan Transportation Authority Revenue PUT | 0.942% | 11/1/17 | | 8,845 | 8,939 |
| 1,3 | New York Metropolitan Transportation Authority Revenue PUT | 0.000% | 11/15/17 | | 44,600 | 44,564 |
| 1 | New York Metropolitan Transportation Authority Revenue PUT | 0.705% | 5/15/18 | (4) | 14,000 | 14,033 |
| | New York State Dormitory Authority Revenue (Brooklyn Law School) | 4.000% | 7/1/17 | (ETM) | 2,360 | 2,571 |
| | New York State Dormitory Authority Revenue (Brooklyn Law School) | 5.000% | 7/1/18 | (ETM) | 2,105 | 2,422 |
| | New York State Dormitory Authority Revenue (Brooklyn Law School) | 5.000% | 7/1/19 | (ETM) | 2,180 | 2,562 |
| | New York State Dormitory Authority Revenue (Cornell University) VRDO | 0.050% | 11/7/14 | | 17,330 | 17,330 |
| | New York State Dormitory Authority Revenue (Fordham University) PUT | 5.000% | 7/1/16 | | 9,000 | 9,654 |
| 2 | New York State Dormitory Authority Revenue (Fordham University) TOB VRDO | 0.060% | 11/7/14 | (13) | 3,500 | 3,500 |
| | New York State Dormitory Authority Revenue (Fordham University) VRDO | 0.050% | 11/7/14 | LOC | 3,330 | 3,330 |
| | New York State Dormitory Authority Revenue (Mental Health Services Facilities Improvement) | 5.000% | 8/15/17 | (ETM) | 55 | 62 |
| | New York State Dormitory Authority Revenue (Mental Health Services Facilities Improvement) | 5.000% | 8/15/17 | | 6,185 | 6,936 |
| | New York State Dormitory Authority Revenue (Mount Sinai Hospital Obligated Group) | 5.000% | 7/1/16 | | 2,270 | 2,441 |
| | New York State Dormitory Authority Revenue | | | | | |
| | (Mount Sinai School of Medicine of New York University) | 5.000% | 7/1/16 | | 1,260 | 1,351 |
| | New York State Dormitory Authority Revenue | | | | | |
| | (Mount Sinai School of Medicine of New York University) | 5.000% | 7/1/17 | | 1,750 | 1,940 |
| | New York State Dormitory Authority Revenue | | | | | |
| | (Mount Sinai School of Medicine of New York University) | 5.000% | 7/1/18 | | 2,500 | 2,833 |
| | New York State Dormitory Authority Revenue (North Shore–Long Island Jewish Obligated Group) | 5.000% | 5/1/18 | | 1,115 | 1,258 |
| | New York State Dormitory Authority Revenue (Pace University) | 5.000% | 5/1/17 | | 1,000 | 1,073 |
| | New York State Dormitory Authority Revenue (Pace University) | 4.000% | 5/1/20 | | 1,740 | 1,853 |
| | New York State Dormitory Authority Revenue (Personal Income Tax) | 5.000% | 3/15/15 | | 3,935 | 4,007 |
| | New York State Dormitory Authority Revenue (Personal Income Tax) | 5.000% | 2/15/17 | (ETM) | 5 | 6 |
| | New York State Dormitory Authority Revenue (Personal Income Tax) | 5.000% | 2/15/17 | | 16,840 | 18,552 |
| | New York State Dormitory Authority Revenue (Personal Income Tax) | 5.000% | 2/15/17 | (ETM) | 5 | 6 |
| | New York State Dormitory Authority Revenue (Personal Income Tax) | 5.000% | 2/15/17 | | 9,605 | 10,582 |
| | New York State Dormitory Authority Revenue (Personal Income Tax) | 5.000% | 2/15/18 | | 27,490 | 31,213 |
| | New York State Dormitory Authority Revenue (Personal Income Tax) | 5.000% | 2/15/18 | | 11,515 | 13,075 |
| | New York State Dormitory Authority Revenue (Personal Income Tax) | 5.000% | 3/15/18 | | 18,010 | 20,499 |
| | New York State Dormitory Authority Revenue (Personal Income Tax) | 5.000% | 8/15/18 | | 2,400 | 2,763 |
| | New York State Dormitory Authority Revenue (Personal Income Tax) | 5.000% | 12/15/18 | | 22,675 | 26,328 |
| | New York State Dormitory Authority Revenue (Personal Income Tax) | 5.000% | 2/15/19 | | 17,500 | 20,357 |
| | New York State Dormitory Authority Revenue (Personal Income Tax) | 5.000% | 2/15/19 | | 4,150 | 4,828 |
| | New York State Dormitory Authority Revenue (Personal Income Tax) | 5.250% | 2/15/19 | (Prere.) | 5 | 6 |
| | New York State Dormitory Authority Revenue (Personal Income Tax) | 5.000% | 8/15/19 | | 11,665 | 13,727 |
| | New York State Dormitory Authority Revenue (Personal Income Tax) | 5.000% | 2/15/20 | | 4,000 | 4,726 |
55
Limited-Term Tax-Exempt Fund
| | | | | |
| | | | | Face | Market |
| | | Maturity | | Amount | Value• |
| | Coupon | Date | | ($000) | ($000) |
| New York State Dormitory Authority Revenue (Personal Income Tax) | 5.000% | 8/15/20 | | 9,550 | 11,382 |
| New York State Dormitory Authority Revenue (Personal Income Tax) | 5.000% | 3/15/21 | | 33,395 | 39,911 |
| New York State Dormitory Authority Revenue (Personal Income Tax) | 5.000% | 6/15/21 | | 7,710 | 9,243 |
| New York State Dormitory Authority Revenue (Personal Income Tax) | 5.250% | 2/15/22 | | 4,995 | 5,838 |
| New York State Dormitory Authority Revenue (Rockefeller University) VRDO | 0.030% | 11/7/14 | | 26,200 | 26,200 |
| New York State Dormitory Authority Revenue (School Districts Financing Program) | 5.000% | 10/1/16 | (4) | 5,000 | 5,438 |
| New York State Dormitory Authority Revenue (School Districts Financing Program) | 5.000% | 10/1/17 | | 7,030 | 7,901 |
| New York State Dormitory Authority Revenue (School Districts Financing Program) | 5.000% | 10/1/17 | (4) | 3,250 | 3,657 |
| New York State Dormitory Authority Revenue (School Districts Financing Program) | 5.000% | 10/1/17 | | 2,000 | 2,239 |
| New York State Dormitory Authority Revenue (School Districts Financing Program) | 5.000% | 10/1/18 | (4) | 1,350 | 1,558 |
| New York State Dormitory Authority Revenue (School Districts Financing Program) | 5.000% | 10/1/18 | (4) | 2,500 | 2,886 |
| New York State Dormitory Authority Revenue (School Districts Financing Program) | 5.000% | 10/1/18 | | 1,500 | 1,722 |
| New York State Dormitory Authority Revenue (School Districts Financing Program) | 5.000% | 10/1/18 | (4) | 5,000 | 5,771 |
| New York State Dormitory Authority Revenue (School Districts Financing Program) | 5.000% | 10/1/18 | | 2,155 | 2,466 |
| New York State Dormitory Authority Revenue (School Districts Financing Program) | 5.000% | 10/1/19 | (4) | 3,200 | 3,768 |
| New York State Dormitory Authority Revenue (School Districts Financing Program) | 5.000% | 10/1/19 | (15) | 1,000 | 1,177 |
| New York State Dormitory Authority Revenue (School Districts Financing Program) | 5.000% | 10/1/19 | (4) | 6,010 | 7,077 |
| New York State Dormitory Authority Revenue (School Districts Financing Program) | 5.000% | 10/1/19 | | 5,905 | 6,873 |
| New York State Dormitory Authority Revenue (School Districts Financing Program) | 5.000% | 10/1/20 | (4) | 1,125 | 1,342 |
| New York State Dormitory Authority Revenue (School Districts Financing Program) | 5.000% | 10/1/20 | (15) | 1,690 | 2,017 |
| New York State Dormitory Authority Revenue (School Districts Financing Program) | 5.000% | 10/1/21 | (15) | 1,425 | 1,714 |
| New York State Dormitory Authority Revenue (Service Contract) | 5.000% | 7/1/16 | | 8,500 | 9,143 |
| New York State Dormitory Authority Revenue (Service Contract) | 5.000% | 7/1/17 | | 10,510 | 11,699 |
| New York State Dormitory Authority Revenue (State University Educational Facilities) | 5.000% | 5/15/18 | | 5,000 | 5,723 |
| New York State Dormitory Authority Revenue (State University Educational Facilities) | 5.000% | 5/15/19 | | 3,500 | 4,096 |
| New York State Dormitory Authority Revenue (Yeshiva University) | 5.000% | 9/1/21 | | 1,290 | 1,381 |
| New York State Dormitory Authority Sales Tax Revenue | 5.000% | 3/15/22 | | 2,500 | 3,055 |
| New York State Energy Research & Development Authority Pollution Control Revenue | | | | | |
| (New York State Electric & Gas Corp. Project) | 2.125% | 3/15/15 | | 3,000 | 3,016 |
| New York State Energy Research & Development Authority Pollution Control Revenue | | | | | |
| (New York State Electric & Gas Corp. Project) | 2.250% | 10/15/15 | | 5,000 | 5,069 |
| New York State Energy Research & Development Authority Pollution Control Revenue | | | | | |
| (Rochester Gas & Electric Corp. Project) PUT | 4.750% | 7/1/16 | (14) | 2,250 | 2,382 |
| New York State Environmental Facilities Corp. Revenue | | | | | |
| (State Clean Water & Drinking Water Revolving Funds) | 5.000% | 6/15/18 | | 4,900 | 5,633 |
| New York State Environmental Facilities Corp. Revenue | | | | | |
| (State Clean Water & Drinking Water Revolving Funds) | 5.000% | 6/15/18 | | 10,000 | 11,496 |
| New York State Environmental Facilities Corp. Revenue | | | | | |
| (State Clean Water & Drinking Water Revolving Funds) | 5.000% | 6/15/19 | | 3,700 | 4,357 |
| New York State Environmental Facilities Corp. Revenue | | | | | |
| (State Clean Water & Drinking Water Revolving Funds) | 5.000% | 6/15/20 | | 3,000 | 3,591 |
| New York State GO | 5.000% | 3/1/19 | | 12,715 | 14,826 |
| New York State Housing Finance Agency Affordable Housing Revenue | 1.250% | 5/1/18 | | 2,500 | 2,502 |
| New York State Housing Finance Agency Affordable Housing Revenue | 1.250% | 5/1/18 | | 4,750 | 4,756 |
| New York State Housing Finance Agency Revenue (Dock Street Rental LLC) VRDO | 0.050% | 11/7/14 | LOC | 3,800 | 3,800 |
| New York State Housing Finance Agency Revenue (Personal Income Tax) VRDO | 0.050% | 11/7/14 | | 25,025 | 25,025 |
| New York State Local Government Assistance Corp. Revenue | 5.000% | 4/1/18 | | 6,325 | 7,220 |
| New York State Local Government Assistance Corp. Revenue VRDO | 0.050% | 11/7/14 | | 6,800 | 6,800 |
| New York State Mortgage Agency Homeowner Mortgage Revenue | 2.625% | 4/1/41 | | 775 | 800 |
| New York State Thruway Authority Revenue | 5.000% | 1/1/15 | (Prere.) | 2,510 | 2,530 |
| New York State Thruway Authority Revenue | 5.000% | 1/1/19 | | 3,700 | 4,255 |
| New York State Thruway Authority Revenue | 5.000% | 5/1/19 | | 83,125 | 96,172 |
| New York State Thruway Authority Revenue | 5.000% | 1/1/20 | (2) | 8,400 | 8,465 |
| New York State Thruway Authority Revenue | 5.000% | 1/1/20 | | 1,500 | 1,751 |
| New York State Thruway Authority Revenue (Highway & Bridge Trust Fund) | 5.000% | 4/1/16 | (14) | 7,500 | 7,823 |
| New York State Thruway Authority Revenue (Highway & Bridge Trust Fund) | 5.000% | 4/1/16 | | 40,000 | 42,617 |
| New York State Thruway Authority Revenue (Highway & Bridge Trust Fund) | 5.000% | 4/1/17 | | 18,145 | 20,053 |
| New York State Thruway Authority Revenue (Highway & Bridge Trust Fund) | 5.000% | 4/1/18 | | 3,500 | 3,981 |
| New York State Thruway Authority Revenue (Personal Income Tax) | 5.000% | 3/15/16 | | 6,620 | 7,049 |
| New York State Thruway Authority Revenue (Personal Income Tax) | 5.000% | 3/15/18 | | 8,440 | 9,607 |
| New York State Thruway Authority Revenue (Personal Income Tax) | 5.000% | 3/15/18 | | 625 | 711 |
| New York State Thruway Authority Revenue (Personal Income Tax) | 5.000% | 3/15/19 | | 500 | 583 |
| New York State Urban Development Corp. Revenue | 5.000% | 1/1/15 | | 5,145 | 5,187 |
| New York State Urban Development Corp. Revenue | 5.250% | 1/1/17 | | 10,095 | 11,132 |
| New York State Urban Development Corp. Revenue (Personal Income Tax) | 5.000% | 12/15/15 | | 6,685 | 7,048 |
| New York State Urban Development Corp. Revenue (Personal Income Tax) | 5.000% | 12/15/16 | | 20,000 | 21,941 |
| New York State Urban Development Corp. Revenue (Personal Income Tax) | 5.000% | 3/15/18 | | 20,000 | 22,764 |
| New York State Urban Development Corp. Revenue (Personal Income Tax) | 5.000% | 3/15/19 | | 8,030 | 9,361 |
| New York State Urban Development Corp. Revenue (Personal Income Tax) | 5.000% | 3/15/20 | | 23,430 | 27,726 |
| New York State Urban Development Corp. Revenue (Personal Income Tax) | 5.000% | 3/15/20 | | 10,145 | 12,005 |
| New York State Urban Development Corp. Revenue (Personal Income Tax) | 5.000% | 3/15/20 | | 8,525 | 10,088 |
56
Limited-Term Tax-Exempt Fund
| | | | | | |
| | | | | | Face | Market |
| | | | Maturity | | Amount | Value• |
| | | Coupon | Date | | ($000) | ($000) |
| | New York State Urban Development Corp. Revenue (Personal Income Tax) | 5.000% | 3/15/21 | | 24,900 | 29,759 |
| | New York State Urban Development Corp. Revenue (Personal Income Tax) | 5.000% | 3/15/21 | | 10,625 | 12,698 |
| | New York State Urban Development Corp. Revenue (Service Contract) | 5.000% | 1/1/15 | | 27,950 | 28,179 |
| | New York State Urban Development Corp. Revenue (Service Contract) | 5.000% | 1/1/16 | | 25,000 | 26,392 |
| | New York State Urban Development Corp. Revenue (Service Contract) | 5.000% | 1/1/16 | | 3,340 | 3,526 |
| | New York State Urban Development Corp. Revenue (Service Contract) | 5.000% | 1/1/16 | | 19,295 | 20,369 |
| | New York State Urban Development Corp. Revenue (Service Contract) VRDO | 0.050% | 11/7/14 | | 9,700 | 9,700 |
| | New York State Urban Development Corp. Revenue (Service Contract) VRDO | 0.060% | 11/7/14 | | 10,200 | 10,200 |
| | Niagara NY Frontier Transportation Authority (Buffalo Niagara International Airport) | 5.000% | 4/1/17 | | 1,000 | 1,099 |
| | Niagara NY Frontier Transportation Authority (Buffalo Niagara International Airport) | 4.000% | 4/1/18 | | 500 | 547 |
| | Niagara NY Frontier Transportation Authority (Buffalo Niagara International Airport) | 5.000% | 4/1/19 | | 500 | 575 |
| 1,2 | Nuveen New York AMT-Free Municipal Income Fund iMTP | 0.670% | 10/1/17 | | 17,500 | 17,505 |
| | Onondaga County NY Civic Development Corp. Revenue (St. Joseph’s Hospital & Health Center) | 5.000% | 7/1/19 | | 500 | 538 |
| | Oyster Bay NY GO | 4.000% | 1/15/17 | (15) | 1,500 | 1,599 |
| | Oyster Bay NY GO | 3.250% | 8/1/17 | | 4,155 | 4,370 |
| | Oyster Bay NY GO | 4.000% | 8/15/17 | (15) | 2,500 | 2,710 |
| | Oyster Bay NY GO | 4.000% | 1/15/18 | (15) | 3,000 | 3,277 |
| | Oyster Bay NY GO | 3.250% | 8/1/18 | | 8,560 | 9,064 |
| | Oyster Bay NY GO | 4.000% | 8/15/18 | (15) | 2,000 | 2,188 |
| | Oyster Bay NY GO | 5.000% | 1/15/19 | (15) | 5,140 | 5,900 |
| | Oyster Bay NY GO | 5.000% | 8/15/19 | (15) | 3,125 | 3,627 |
| | Oyster Bay NY GO | 5.000% | 1/15/20 | (15) | 3,105 | 3,619 |
| | Oyster Bay NY GO | 5.000% | 8/15/20 | (15) | 4,350 | 5,114 |
| 2 | Port Authority of New York & New Jersey Revenue TOB VRDO | 0.060% | 11/7/14 | | 7,770 | 7,770 |
| | Suffolk County NY Economic Development Corp. Revenue (Catholic Health Services) | 5.000% | 7/1/17 | | 2,000 | 2,205 |
| | Suffolk County NY Economic Development Corp. Revenue (Catholic Health Services) | 5.000% | 7/1/18 | | 4,000 | 4,505 |
| | Suffolk County NY Economic Development Corp. Revenue (Catholic Health Services) | 5.000% | 7/1/19 | | 9,190 | 10,536 |
| | Suffolk County NY Economic Development Corp. Revenue (Catholic Health Services) | 5.000% | 7/1/20 | | 835 | 969 |
| | Suffolk County NY GO | 5.000% | 2/1/18 | (4) | 7,805 | 8,818 |
| | Suffolk County NY GO | 5.000% | 2/1/19 | (4) | 3,915 | 4,526 |
| | Suffolk County NY GO | 5.000% | 2/1/20 | (4) | 4,000 | 4,707 |
| | Suffolk County NY GO | 5.000% | 2/1/21 | (4) | 4,580 | 5,438 |
| | Suffolk County NY RAN | 1.500% | 3/26/15 | | 12,250 | 12,293 |
| | Syracuse NY Industrial Development Agency Civic Facility Revenue | | | | | |
| | (Syracuse University Project) VRDO | 0.070% | 11/7/14 | LOC | 9,900 | 9,900 |
| | Tobacco Settlement Financing Corp. New York Revenue | 5.000% | 6/1/17 | | 1,225 | 1,363 |
| | Tobacco Settlement Financing Corp. New York Revenue | 5.000% | 6/1/17 | | 6,500 | 7,230 |
| | Tobacco Settlement Financing Corp. New York Revenue | 5.000% | 6/1/20 | | 1,500 | 1,541 |
| | Tobacco Settlement Financing Corp. New York Revenue | 5.000% | 6/1/20 | | 29,615 | 31,734 |
| | Tobacco Settlement Financing Corp. New York Revenue | 5.000% | 6/1/21 | | 25,500 | 27,289 |
| | Tobacco Settlement Financing Corp. New York Revenue | 5.000% | 6/1/21 | | 10,100 | 11,205 |
| | Tobacco Settlement Financing Corp. New York Revenue | 5.000% | 6/1/22 | | 5,000 | 5,543 |
| | Triborough Bridge & Tunnel Authority New York Revenue | 5.000% | 11/15/14 | | 11,690 | 11,712 |
| | Triborough Bridge & Tunnel Authority New York Revenue | 5.000% | 11/15/17 | | 3,815 | 4,305 |
| 1 | Triborough Bridge & Tunnel Authority New York Revenue | 0.400% | 1/1/18 | (4) | 5,000 | 5,009 |
| | Triborough Bridge & Tunnel Authority New York Revenue | 5.000% | 1/1/18 | | 13,435 | 15,187 |
| | Triborough Bridge & Tunnel Authority New York Revenue | 5.000% | 11/15/18 | | 7,000 | 8,102 |
| 1 | Triborough Bridge & Tunnel Authority New York Revenue | 0.490% | 1/1/19 | (4) | 1,450 | 1,452 |
| 1 | Triborough Bridge & Tunnel Authority New York Revenue PUT | 0.472% | 1/1/15 | | 3,000 | 3,000 |
| 1 | Triborough Bridge & Tunnel Authority New York Revenue PUT | 0.622% | 1/3/17 | | 5,000 | 5,012 |
| | Utility Debt Securitization Authority New York Revenue | 5.000% | 12/15/16 | | 15,200 | 15,290 |
| | Utility Debt Securitization Authority New York Revenue | 5.000% | 12/15/17 | | 875 | 921 |
| | Utility Debt Securitization Authority New York Revenue | 5.000% | 6/15/18 | | 875 | 942 |
| | Utility Debt Securitization Authority New York Revenue | 5.000% | 12/15/18 | | 500 | 549 |
| | Westchester County NY Health Care Corp. Revenue | 5.000% | 11/1/16 | | 8,170 | 8,836 |
| | Westchester County NY Health Care Corp. Revenue | 5.000% | 11/1/17 | | 8,600 | 9,553 |
| | Westchester County NY Health Care Corp. Revenue | 5.000% | 11/1/21 | | 4,700 | 5,450 |
| | Yonkers NY GO | 4.000% | 10/1/17 | | 505 | 547 |
| | Yonkers NY GO | 3.000% | 7/1/18 | | 500 | 528 |
| | Yonkers NY GO | 3.000% | 8/15/18 | | 1,000 | 1,056 |
| | Yonkers NY GO | 3.000% | 8/15/19 | | 885 | 934 |
| | Yonkers NY GO | 3.000% | 8/15/20 | | 1,115 | 1,160 |
| | | | | | | 2,929,237 |
| North Carolina (2.3%) | | | | | |
| | Cabarrus NC COP | 5.000% | 1/1/16 | | 4,555 | 4,800 |
| | Cary NC GO VRDO | 0.050% | 11/7/14 | | 6,455 | 6,455 |
| | Charlotte NC Water & Sewer System Revenue | 4.000% | 7/1/16 | | 1,280 | 1,356 |
| | Charlotte NC Water & Sewer System Revenue | 5.000% | 12/1/17 | | 3,000 | 3,396 |
| | Charlotte NC Water & Sewer System Revenue | 5.000% | 12/1/18 | | 2,625 | 3,051 |
| | Fayetteville NC Public Works Commission Revenue | 5.000% | 3/1/17 | | 5,000 | 5,524 |
| | Guilford County NC GO | 5.000% | 8/1/15 | | 8,250 | 8,551 |
57
Limited-Term Tax-Exempt Fund
| | | | | |
| | | | | Face | Market |
| | | Maturity | | Amount | Value• |
| | Coupon | Date | ($000) | ($000) |
| Guilford County NC GO | 5.000% | 8/1/16 | | 5,000 | 5,406 |
| Guilford County NC GO | 5.000% | 8/1/17 | | 5,000 | 5,605 |
| Guilford County NC GO | 5.000% | 3/1/18 | | 3,340 | 3,809 |
| Mecklenburg County NC GO | 5.000% | 3/1/20 | | 5,000 | 5,969 |
| New Hanover County NC Hospital Revenue (New Hanover Regional Medical Center Project) | 5.000% | 10/1/19 | | 1,000 | 1,163 |
| New Hanover County NC Hospital Revenue (New Hanover Regional Medical Center Project) | 5.000% | 10/1/21 | | 3,200 | 3,759 |
| 2 North Carolina Capital Facilities Finance Agency Revenue (Duke University Project) TOB VRDO | 0.070% | 11/3/14 | | 6,200 | 6,200 |
| North Carolina Capital Facilities Finance Agency Solid Waste Disposal Revenue | | | | | |
| (Republic Services, Inc. Project) PUT | 0.300% | 12/1/14 | | 24,750 | 24,739 |
| North Carolina Capital Improvement Revenue | 5.000% | 5/1/17 | | 9,600 | 10,659 |
| North Carolina Capital Improvement Revenue | 5.000% | 5/1/18 | | 17,975 | 20,525 |
| 2 North Carolina Capital Improvement Revenue TOB VRDO | 0.050% | 11/7/14 | | 4,000 | 4,000 |
| North Carolina Eastern Municipal Power Agency Power Systems Revenue | 5.000% | 1/1/15 | | 3,465 | 3,493 |
| North Carolina Eastern Municipal Power Agency Power Systems Revenue | 5.000% | 1/1/15 | | 20,000 | 20,162 |
| North Carolina Eastern Municipal Power Agency Power Systems Revenue | 5.000% | 1/1/16 | | 2,725 | 2,872 |
| North Carolina Eastern Municipal Power Agency Power Systems Revenue | 5.000% | 1/1/16 | | 7,000 | 7,378 |
| North Carolina Eastern Municipal Power Agency Power Systems Revenue | 5.000% | 1/1/16 | | 3,000 | 3,162 |
| North Carolina Eastern Municipal Power Agency Power Systems Revenue | 5.000% | 1/1/17 | | 2,500 | 2,732 |
| North Carolina Eastern Municipal Power Agency Power Systems Revenue | 5.000% | 1/1/17 | | 7,175 | 7,842 |
| North Carolina Eastern Municipal Power Agency Power Systems Revenue | 5.000% | 1/1/18 | | 1,250 | 1,408 |
| North Carolina Eastern Municipal Power Agency Power Systems Revenue | 5.000% | 1/1/19 | | 1,025 | 1,179 |
| North Carolina Eastern Municipal Power Agency Power Systems Revenue | 5.000% | 1/1/19 | | 3,515 | 4,044 |
| North Carolina Eastern Municipal Power Agency Power Systems Revenue | 5.000% | 1/1/20 | | 2,500 | 2,919 |
| North Carolina Eastern Municipal Power Agency Power Systems Revenue | 5.000% | 1/1/20 | | 13,050 | 15,235 |
| North Carolina GAN PUT | 4.000% | 3/1/18 | | 21,000 | 22,705 |
| North Carolina GO | 5.000% | 3/1/18 | | 16,770 | 19,021 |
| North Carolina GO | 5.000% | 5/1/18 | | 5,000 | 5,730 |
| North Carolina GO | 5.000% | 5/1/18 | | 7,050 | 8,080 |
| North Carolina GO | 5.000% | 6/1/18 | | 20,720 | 23,802 |
| North Carolina GO | 5.000% | 3/1/19 | | 5,200 | 6,079 |
| North Carolina GO | 5.000% | 5/1/19 | | 30,000 | 35,215 |
| North Carolina GO | 5.000% | 6/1/19 | | 2,000 | 2,352 |
| North Carolina Medical Care Commission Health Care Facilities Revenue | | | | | |
| (Cape Fear Valley Health System) | 5.000% | 10/1/19 | | 3,350 | 3,855 |
| North Carolina Medical Care Commission Health Care Facilities Revenue | | | | | |
| (Cape Fear Valley Health System) | 5.000% | 10/1/20 | | 7,885 | 9,148 |
| 1 North Carolina Medical Care Commission Health Care Facilities Revenue | | | | | |
| (Wake Forest Baptist Obligated Group) PUT | 0.790% | 12/1/17 | | 2,410 | 2,404 |
| North Carolina Medical Care Commission Health Care Facilities Revenue (WakeMed) | 5.000% | 10/1/17 | | 2,000 | 2,243 |
| North Carolina Medical Care Commission Health Care Facilities Revenue (WakeMed) | 5.000% | 10/1/18 | | 3,000 | 3,440 |
| North Carolina Medical Care Commission Hospital Revenue (North Carolina Baptist Hospital) | 5.000% | 6/1/16 | | 1,705 | 1,828 |
| North Carolina Medical Care Commission Hospital Revenue (North Carolina Baptist Hospital) | 5.000% | 6/1/17 | | 6,500 | 7,201 |
| North Carolina Medical Care Commission Hospital Revenue (North Carolina Baptist Hospital) | 5.000% | 6/1/19 | | 3,910 | 4,520 |
| North Carolina Medical Care Commission Hospital Revenue | | | | | |
| (Southeastern Regional Medical Center) | 4.000% | 6/1/19 | | 1,450 | 1,603 |
| North Carolina Medical Care Commission Hospital Revenue | | | | | |
| (Southeastern Regional Medical Center) | 4.000% | 6/1/20 | | 500 | 553 |
| North Carolina Municipal Power Agency Revenue | 5.000% | 1/1/18 | | 20,000 | 22,574 |
| North Carolina Municipal Power Agency Revenue | 5.000% | 1/1/19 | | 16,500 | 19,033 |
| North Carolina Municipal Power Agency Revenue | 5.000% | 1/1/20 | | 8,500 | 9,964 |
| Raleigh NC GO | 5.000% | 12/1/16 | | 2,470 | 2,706 |
| Raleigh NC GO | 5.000% | 12/1/16 | | 2,605 | 2,854 |
| Raleigh NC GO | 5.000% | 4/1/20 | | 4,700 | 5,620 |
| Wake County NC GO | 5.000% | 2/1/20 | | 4,500 | 5,363 |
| Wake County NC GO | 5.000% | 2/1/20 | | 17,845 | 21,268 |
| Wake County NC Public Improvement GO | 5.000% | 3/1/16 | | 5,110 | 5,431 |
| Wake County NC Public Improvement GO | 5.000% | 4/1/18 | | 3,495 | 3,996 |
| | | | | | 455,981 |
| North Dakota (0.0%) | | | | | |
| Burleigh County ND Health Care Revenue (St. Alexis Medical Center Project) | 5.000% | 7/1/21 | | 650 | 748 |
| Burleigh County ND Health Care Revenue (St. Alexis Medical Center Project) | 5.000% | 7/1/22 | | 1,200 | 1,360 |
| | | | | | 2,108 |
| Ohio (3.5%) | | | | | |
| Akron OH Bath & Copley Joint Township Hospital District Revenue | | | | | |
| (Children’s Hospital Medical Center of Akron) | 5.000% | 11/15/18 | | 1,000 | 1,143 |
| Akron OH Bath & Copley Joint Township Hospital District Revenue | | | | | |
| (Children’s Hospital Medical Center of Akron) | 5.000% | 11/15/25 | | 3,450 | 3,990 |
| Allen County OH Hospital Facilities Revenue (Catholic Healthcare Partners) | 5.000% | 9/1/15 | | 10,170 | 10,559 |
| Allen County OH Hospital Facilities Revenue (Catholic Healthcare Partners) | 5.000% | 9/1/16 | | 11,830 | 12,782 |
| American Municipal Power Ohio Inc. Revenue (Fremont Energy Center Project) | 5.000% | 2/15/18 | | 1,480 | 1,674 |
58
Limited-Term Tax-Exempt Fund
| | | | | |
| | | | | Face | Market |
| | | Maturity | | Amount | Value• |
| | Coupon | Date | | ($000) | ($000) |
| American Municipal Power Ohio Inc. Revenue (Fremont Energy Center Project) | 5.000% | 2/15/19 | | 1,500 | 1,735 |
| American Municipal Power Ohio Inc. Revenue (Fremont Energy Center Project) | 5.000% | 2/15/20 | | 2,000 | 2,352 |
| American Municipal Power Ohio Inc. Revenue (Hydroelectric Projects) | 5.000% | 2/15/17 | | 6,000 | 6,580 |
| 2 American Municipal Power Ohio Inc. Revenue (Prairie State Energy Campus Project) TOB VRDO | 0.200% | 11/7/14 | (12) | 9,315 | 9,315 |
| Butler County OH Hospital Facilities Revenue (UC Health) | 5.500% | 11/1/22 | | 3,415 | 3,961 |
| Butler County OH Waterworks Revenue | 5.250% | 6/1/15 | (Prere.) | 4,000 | 4,158 |
| Chillicothe OH City School District GO | 5.250% | 12/1/14 | (Prere.) | 1,745 | 1,752 |
| Cleveland OH Airport System Revenue | 5.000% | 1/1/20 | | 1,500 | 1,721 |
| Cleveland OH Income Tax Revenue (Police & Fire Pension Payment) | 5.000% | 5/15/17 | | 1,190 | 1,318 |
| Cleveland OH Water Revenue | 5.000% | 1/1/18 | | 1,780 | 2,013 |
| Cleveland OH Water Revenue | 5.000% | 1/1/19 | | 3,100 | 3,584 |
| Cleveland OH Water Revenue | 5.000% | 1/1/20 | | 1,500 | 1,767 |
| Cleveland OH Water Works Revenue | 5.000% | 1/1/18 | | 1,000 | 1,132 |
| Cleveland State University Ohio General Receipts Revenue | 5.000% | 6/1/19 | | 2,000 | 2,309 |
| Cleveland-Cuyahoga County OH Port Authority Revenue (Cleveland Museum of Art Project) | 5.000% | 10/1/19 | | 6,000 | 7,016 |
| Columbus OH City School District School Facilities Construction & Improvement GO | 5.250% | 12/1/14 | (Prere.) | 2,390 | 2,400 |
| Columbus OH City School District School Facilities Construction & Improvement GO | 5.250% | 12/1/14 | (Prere.) | 2,070 | 2,079 |
| Columbus OH GO | 5.000% | 9/1/16 | | 5,000 | 5,424 |
| Columbus OH GO | 5.000% | 6/1/17 | | 7,510 | 8,369 |
| Columbus OH GO | 5.000% | 7/1/17 | | 7,245 | 8,097 |
| Columbus OH GO | 5.000% | 7/1/17 | | 5,740 | 6,415 |
| Columbus OH GO | 5.000% | 6/1/18 | | 8,000 | 9,187 |
| Columbus OH GO | 5.000% | 7/1/18 | | 7,280 | 8,380 |
| Columbus OH GO | 5.000% | 7/1/18 | | 4,500 | 5,180 |
| Columbus OH GO | 5.000% | 2/15/19 | | 1,910 | 2,227 |
| Columbus OH GO | 5.000% | 6/1/19 | | 3,000 | 3,527 |
| Columbus OH GO | 5.000% | 7/1/19 | | 6,690 | 7,884 |
| Columbus OH GO | 5.000% | 2/15/20 | | 1,905 | 2,267 |
| Cuyahoga County OH (Convention Hotel Project) COP | 5.000% | 12/1/19 | | 5,340 | 6,255 |
| Cuyahoga County OH (Convention Hotel Project) COP | 5.000% | 12/1/20 | | 5,575 | 6,629 |
| Cuyahoga County OH (Convention Hotel Project) COP | 5.000% | 12/1/21 | | 4,075 | 4,889 |
| Cuyahoga County OH Economic Development Revenue (Med Mart/Convention Center Project) | 5.000% | 12/1/19 | | 7,000 | 8,143 |
| Dayton OH City School District GO | 5.000% | 11/1/19 | | 3,500 | 4,111 |
| Dayton OH City School District GO | 5.000% | 11/1/20 | | 5,000 | 5,933 |
| Fairfield County OH Hospital Facilities Revenue (Fairfield Medical Center) | 5.000% | 6/15/21 | | 1,045 | 1,167 |
| Fairfield County OH Hospital Facilities Revenue (Lancaster-Fairfield Community Hospital) | 5.375% | 6/15/15 | (14) | 1,050 | 1,078 |
| Franklin County OH Hospital Facilities Revenue (OhioHealth Corp.) PUT | 5.000% | 7/12/17 | | 7,500 | 8,365 |
| Franklin County OH Hospital Revenue (Nationwide Hospital) VRDO | 0.030% | 11/7/14 | | 5,485 | 5,485 |
| Franklin County OH Revenue (Trinity Health Credit Group) | 5.000% | 6/1/19 | | 4,035 | 4,143 |
| Franklin County OH Revenue (Trinity Health Credit Group) | 5.000% | 6/1/21 | | 4,465 | 4,581 |
| Hamilton County OH Hospital Facilities Revenue (Cincinnati Children’s Hospital Medical Center) | 4.000% | 5/15/17 | | 785 | 852 |
| Hamilton County OH Hospital Facilities Revenue (Cincinnati Children’s Hospital Medical Center) | 5.000% | 5/15/18 | | 450 | 513 |
| Hamilton County OH Hospital Facilities Revenue (Cincinnati Children’s Hospital Medical Center) | 5.000% | 5/15/19 | | 1,000 | 1,159 |
| Hamilton County OH Hospital Facilities Revenue (Cincinnati Children’s Hospital Medical Center) | 5.000% | 5/15/20 | | 1,000 | 1,180 |
| Hamilton County OH Hospital Facilities Revenue (Cincinnati Children’s Hospital Medical Center) | 5.000% | 5/15/21 | | 1,000 | 1,194 |
| Hamilton County OH Hospital Facilities Revenue (Cincinnati Children’s Hospital Medical Center) | 5.000% | 5/15/22 | | 500 | 596 |
| Hamilton County OH Hospital Facilities Revenue (UC Health) | 4.000% | 2/1/18 | | 525 | 570 |
| Hamilton County OH Hospital Facilities Revenue (UC Health) | 5.000% | 2/1/19 | | 750 | 854 |
| Hamilton County OH Hospital Facilities Revenue (UC Health) | 5.000% | 2/1/20 | | 800 | 922 |
| Hamilton County OH Hospital Facilities Revenue (UC Health) | 5.000% | 2/1/22 | | 500 | 582 |
| 3 Hamilton County OH Sewer System Revenue | 5.000% | 12/1/20 | | 3,605 | 4,326 |
| 3 Hamilton County OH Sewer System Revenue | 5.000% | 12/1/21 | | 2,085 | 2,526 |
| Hilliard OH School District GO | 0.000% | 12/1/14 | (14) | 2,720 | 2,719 |
| Hilliard OH School District GO | 0.000% | 12/1/15 | (14) | 3,720 | 3,706 |
| JobsOhio Beverage System Statewide Liquor Profits Revenue | 5.000% | 1/1/18 | | 540 | 609 |
| JobsOhio Beverage System Statewide Liquor Profits Revenue | 5.000% | 1/1/20 | | 14,225 | 16,699 |
| JobsOhio Beverage System Statewide Liquor Profits Revenue | 5.000% | 1/1/21 | | 2,260 | 2,676 |
| Kent State University OH Revenue | 5.000% | 5/1/17 | | 500 | 553 |
| Kent State University OH Revenue | 5.000% | 5/1/20 | | 1,650 | 1,942 |
| 1 Lancaster OH Port Authority Gas Supply Revenue PUT | 0.822% | 8/1/19 | | 3,500 | 3,525 |
| Lorain County OH Hospital Facilities Revenue (Catholic Healthcare Partners) | 5.000% | 4/1/15 | (4) | 5,200 | 5,303 |
| 2 Lorain County OH Hospital Facilities Revenue (Catholic Healthcare Partners) TOB VRDO | 0.070% | 11/7/14 | | 10,500 | 10,500 |
| 2 Lorain County OH Hospital Facilities Revenue (Catholic Healthcare Partners) TOB VRDO | 0.100% | 11/7/14 | (4) | 7,715 | 7,715 |
| Marysville OH Exempt Village School District COP | 5.250% | 6/1/15 | (Prere.) | 3,000 | 3,089 |
| 2 Montgomery County OH Revenue (Catholic Health Initiatives) TOB VRDO | 0.250% | 11/7/14 | | 3,990 | 3,990 |
| Ohio Air Quality Development Authority Pollution Control Revenue | | | | | |
| (FirstEnergy Generation Corp. Project) PUT | 3.375% | 7/1/15 | | 5,000 | 5,054 |
| Ohio Air Quality Development Authority Pollution Control Revenue | | | | | |
| (FirstEnergy Generation Corp. Project) PUT | 3.100% | 3/1/19 | | 5,500 | 5,585 |
| Ohio Building Authority Revenue (Administration Building Fund) | 5.250% | 10/1/15 | (14) | 11,780 | 12,325 |
| Ohio Building Authority Revenue (Administration Building Fund) | 5.000% | 10/1/18 | | 1,750 | 2,024 |
59
Limited-Term Tax-Exempt Fund
| | | | | |
| | | | | Face | Market |
| | | Maturity | | Amount | Value• |
| | Coupon | Date | | ($000) | ($000) |
| Ohio Building Authority Revenue (Adult Correctional Building) | 5.000% | 10/1/15 | | 1,200 | 1,253 |
| Ohio Building Authority Revenue (Adult Correctional Building) | 5.250% | 10/1/16 | (14) | 14,830 | 16,203 |
| Ohio Building Authority Revenue (Highway Safety Building) | 5.000% | 10/1/15 | | 1,225 | 1,279 |
| Ohio Building Authority Revenue (Highway Safety Building) | 5.000% | 10/1/15 | | 2,420 | 2,526 |
| Ohio Building Authority Revenue (Highway Safety Building) | 5.000% | 10/1/16 | | 1,285 | 1,398 |
| Ohio Building Authority Revenue (Highway Safety Building) | 5.000% | 10/1/16 | | 2,540 | 2,763 |
| Ohio Building Authority Revenue (Highway Safety Building) | 5.000% | 10/1/16 | | 1,650 | 1,795 |
| Ohio Building Authority Revenue (Highway Safety Building) | 5.000% | 10/1/17 | | 1,040 | 1,174 |
| Ohio Building Authority Revenue (Highway Safety Building) | 5.000% | 10/1/17 | | 2,670 | 3,014 |
| Ohio Building Authority Revenue (Highway Safety Building) | 5.000% | 10/1/20 | | 1,265 | 1,516 |
| Ohio Capital Facilities Lease-Appropriation Revenue (Administrative Building Fund Projects) | 5.000% | 4/1/19 | | 1,395 | 1,622 |
| Ohio Common Schools GO | 5.000% | 9/15/19 | | 3,910 | 4,615 |
| Ohio GO | 5.000% | 9/15/15 | | 5,000 | 5,211 |
| Ohio GO | 5.000% | 9/15/16 | | 10,000 | 10,865 |
| Ohio GO | 5.000% | 9/15/17 | | 19,680 | 22,151 |
| Ohio GO | 5.000% | 5/1/18 | | 10,960 | 12,535 |
| Ohio GO | 5.000% | 9/15/18 | | 10,000 | 11,546 |
| Ohio GO | 5.000% | 9/15/18 | | 5,000 | 5,773 |
| Ohio GO | 5.000% | 5/1/19 | | 6,680 | 7,819 |
| Ohio GO | 5.000% | 5/1/19 | | 5,000 | 5,860 |
| Ohio GO | 5.000% | 9/15/19 | | 5,000 | 5,901 |
| Ohio GO | 5.000% | 5/1/20 | | 12,080 | 14,422 |
| Ohio GO | 5.000% | 9/15/20 | | 26,315 | 31,562 |
| Ohio GO | 5.000% | 5/1/21 | | 2,645 | 3,197 |
| Ohio Higher Education GO | 5.000% | 11/1/14 | | 4,250 | 4,250 |
| 2 Ohio Higher Educational Facility Commission Revenue | | | | | |
| (Cleveland Clinic Health System Obligated Group) TOB VRDO | 0.060% | 11/7/14 | | 2,200 | 2,200 |
| Ohio Higher Educational Facility Commission Revenue | | | | | |
| (Cleveland Clinic Health System Obligated Group) VRDO | 0.070% | 11/3/14 | | 8,700 | 8,700 |
| 2 Ohio Hospital Revenue (Cleveland Clinic Health System Obligated Group) TOB VRDO | 0.060% | 11/7/14 | | 6,745 | 6,745 |
| 2 Ohio Hospital Revenue (Cleveland Clinic Health System Obligated Group) TOB VRDO | 0.060% | 11/7/14 | | 4,995 | 4,995 |
| 2 Ohio Hospital Revenue (Cleveland Clinic Health System Obligated Group) TOB VRDO | 0.060% | 11/7/14 | | 2,850 | 2,850 |
| Ohio Hospital Revenue (University Hospitals Health System Inc.) | 5.000% | 1/15/19 | | 1,595 | 1,821 |
| 3 Ohio Hospital Revenue (University Hospitals Health System Inc.) VRDO | 0.000% | 11/3/14 | | 2,750 | 2,750 |
| Ohio Infrastructure Improvement GO | 5.000% | 9/1/15 | | 8,600 | 8,947 |
| Ohio Infrastructure Improvement GO | 5.000% | 9/1/16 | | 3,210 | 3,482 |
| Ohio Infrastructure Improvement GO | 5.000% | 8/1/18 | | 3,450 | 3,964 |
| Ohio Major New State Infrastructure Project Revenue | 5.000% | 12/15/17 | | 8,635 | 9,768 |
| Ohio Major New State Infrastructure Project Revenue | 5.000% | 12/15/17 | | 1,500 | 1,697 |
| Ohio Major New State Infrastructure Project Revenue | 4.000% | 12/15/18 | | 2,750 | 3,068 |
| Ohio Major New State Infrastructure Project Revenue | 4.000% | 12/15/19 | | 2,450 | 2,757 |
| Ohio Public Facilities Commission GO | 5.000% | 2/1/21 | | 1,390 | 1,669 |
| Ohio Public Facilities Commission GO | 5.000% | 4/1/21 | | 2,280 | 2,745 |
| Ohio State University General Receipts Revenue | 5.000% | 12/1/14 | (ETM) | 300 | 301 |
| Ohio State University General Receipts Revenue | 5.000% | 12/1/14 | | 2,700 | 2,711 |
| Ohio State University General Receipts Revenue | 5.000% | 12/1/16 | (ETM) | 355 | 389 |
| Ohio State University General Receipts Revenue | 5.000% | 12/1/16 | | 3,160 | 3,463 |
| Ohio State University General Receipts Revenue | 5.000% | 12/1/17 | (ETM) | 280 | 317 |
| Ohio State University General Receipts Revenue | 5.000% | 12/1/17 | | 4,720 | 5,349 |
| Ohio State University General Receipts Revenue | 5.000% | 12/1/19 | | 1,440 | 1,658 |
| Ohio Turnpike Commission Turnpike Revenue | 5.000% | 2/15/15 | | 3,500 | 3,550 |
| Ohio Turnpike Commission Turnpike Revenue | 5.500% | 2/15/18 | (14) | 3,625 | 4,180 |
| Ohio Water Development Authority Drinking Water Assistance Fund Revenue | 5.000% | 6/1/17 | | 4,500 | 5,018 |
| 2 Ohio Water Development Authority Fresh Water Revenue TOB VRDO | 0.170% | 11/7/14 | | 17,790 | 17,790 |
| Ohio Water Development Authority Pollution Control Revenue | | | | | |
| (FirstEnergy Generation Corp. Project) | 3.000% | 5/15/19 | | 24,000 | 24,481 |
| Ohio Water Development Authority Pollution Control Revenue (Water Quality) | 5.000% | 12/1/18 | | 1,105 | 1,284 |
| Ohio Water Development Authority Pollution Control Revenue (Water Quality) | 5.000% | 12/1/19 | | 1,925 | 2,285 |
| Ohio Water Development Authority Pollution Control Revenue (Water Quality) | 5.000% | 6/1/20 | | 10,205 | 12,201 |
| Ohio Water Development Authority Pollution Control Revenue (Water Quality) | 5.000% | 12/1/20 | | 7,500 | 9,039 |
| Ohio Water Development Authority Water Pollution Control Loan Fund Revenue | 5.000% | 12/1/17 | | 1,000 | 1,134 |
| Ohio Water Development Authority Water Pollution Control Loan Fund Revenue | 5.000% | 6/1/19 | | 1,695 | 1,990 |
| Olentangy OH Local School District GO | 5.000% | 6/1/16 | (Prere.) | 1,235 | 1,326 |
| Penta Career Center Ohio COP | 5.000% | 4/1/19 | | 2,470 | 2,815 |
| Penta Career Center Ohio COP | 5.000% | 4/1/20 | | 1,095 | 1,265 |
| Ross County OH Hospital Facilities Revenue (Adena Health System) | 5.375% | 12/1/19 | | 1,560 | 1,762 |
| Ross County OH Hospital Facilities Revenue (Adena Health System) | 5.750% | 12/1/22 | | 4,750 | 5,518 |
| Toledo OH City School District GO | 5.000% | 12/1/18 | | 3,055 | 3,530 |
| Toledo OH City School District GO | 5.000% | 12/1/19 | | 2,220 | 2,610 |
| University of Cincinnati Ohio General Receipts Revenue | 5.000% | 6/1/18 | | 1,585 | 1,815 |
| University of Toledo Ohio General Receipts Revenue | 5.000% | 6/1/15 | | 1,435 | 1,474 |
60
Limited-Term Tax-Exempt Fund
| | | | | |
| | | | | Face | Market |
| | | Maturity | | Amount | Value• |
| | Coupon | Date | | ($000) | ($000) |
| University of Toledo Ohio General Receipts Revenue | 5.000% | 6/1/16 | | 3,430 | 3,664 |
| University of Toledo Ohio General Receipts Revenue | 5.000% | 6/1/17 | | 1,855 | 2,050 |
| University of Toledo Ohio General Receipts Revenue | 5.000% | 6/1/19 | | 2,805 | 3,228 |
| Warren County OH Health Care Facilities Improvement Revenue (Otterbein Homes Project) | 5.000% | 7/1/19 | | 1,750 | 1,999 |
| Warren County OH Health Care Facilities Improvement Revenue (Otterbein Homes Project) | 5.000% | 7/1/20 | | 2,550 | 2,934 |
| Warren County OH Health Care Facilities Improvement Revenue (Otterbein Homes Project) | 5.000% | 7/1/21 | | 2,495 | 2,873 |
| | | | | | 700,775 |
| Oklahoma (0.1%) | | | | | |
| Cleveland County OK Educational Facilities Authority Lease Revenue | | | | | |
| (Norman Public Schools Project) | 5.000% | 7/1/17 | | 760 | 845 |
| Cleveland County OK Educational Facilities Authority Lease Revenue | | | | | |
| (Norman Public Schools Project) | 5.000% | 7/1/18 | | 1,325 | 1,508 |
| Cleveland County OK Educational Facilities Authority Lease Revenue | | | | | |
| (Norman Public Schools Project) | 5.000% | 7/1/19 | | 2,250 | 2,608 |
| Oklahoma Capitol Improvement Authority Facilities Revenue | 5.000% | 7/1/21 | | 1,000 | 1,200 |
| Oklahoma City OK Water Utilities Trust Water & Sewer Revenue | 5.000% | 7/1/18 | | 1,000 | 1,151 |
| Oklahoma Development Finance Authority Health System Revenue (Integris Baptist) | 5.000% | 8/15/15 | | 4,670 | 4,843 |
| | | | | | 12,155 |
| Oregon (0.6%) | | | | | |
| Gilliam County OR Solid Waste Disposal Revenue (Waste Management Inc. Project) PUT | 1.500% | 10/1/18 | | 3,000 | 3,001 |
| Oregon Department of Administrative Services COP | 5.000% | 5/1/15 | | 4,160 | 4,261 |
| Oregon Department of Administrative Services COP | 5.000% | 5/1/16 | | 3,190 | 3,415 |
| Oregon Department of Administrative Services Lottery Revenue | 5.000% | 4/1/16 | | 2,185 | 2,330 |
| Oregon Department of Administrative Services Lottery Revenue | 4.000% | 4/1/17 | | 2,000 | 2,168 |
| 2 Oregon Department of Administrative Services Lottery Revenue TOB VRDO | 0.060% | 11/7/14 | | 5,000 | 5,000 |
| Oregon Department of Transportation Highway User Tax Revenue | 5.000% | 11/15/14 | | 5,880 | 5,891 |
| Oregon Facilities Authority Revenue (Legacy Health Project) | 5.000% | 5/1/16 | | 2,600 | 2,778 |
| Oregon Facilities Authority Revenue (Legacy Health Project) | 5.000% | 5/1/17 | | 3,090 | 3,419 |
| Oregon Facilities Authority Revenue (Legacy Health Project) | 5.000% | 5/1/18 | | 3,500 | 3,984 |
| Oregon Facilities Authority Revenue (PeaceHealth) | 5.000% | 11/1/14 | | 1,000 | 1,000 |
| Oregon Facilities Authority Revenue (PeaceHealth) | 5.000% | 3/15/15 | | 1,500 | 1,525 |
| Oregon Facilities Authority Revenue (PeaceHealth) | 5.000% | 11/1/15 | | 1,000 | 1,047 |
| Oregon Facilities Authority Revenue (PeaceHealth) | 5.000% | 3/15/16 | | 1,700 | 1,800 |
| Oregon Facilities Authority Revenue (PeaceHealth) | 5.000% | 11/1/16 | | 2,000 | 2,178 |
| Oregon Facilities Authority Revenue (PeaceHealth) | 5.000% | 11/15/19 | | 1,000 | 1,174 |
| Oregon Facilities Authority Revenue (PeaceHealth) | 5.000% | 11/15/20 | | 1,275 | 1,516 |
| 1 Oregon Facilities Authority Revenue (Providence Health & Services) PUT | 0.930% | 10/1/17 | | 8,750 | 8,788 |
| 1 Oregon Facilities Authority Revenue (Providence Health & Services) PUT | 1.050% | 9/15/18 | | 10,000 | 10,047 |
| Oregon Facilities Authority Revenue (Reed College Projects) VRDO | 0.070% | 11/7/14 | | 6,335 | 6,335 |
| Oregon GO | 5.000% | 8/1/18 | | 3,215 | 3,710 |
| Oregon Housing & Community Service Department Single Family Mortgage Revenue | 4.000% | 7/1/44 | | 5,080 | 5,574 |
| Tri-County Metropolitan Transportation District of Oregon Capital Grant Receipt Revenue | 3.000% | 11/1/16 | | 10,500 | 10,640 |
| Tri-County Metropolitan Transportation District of Oregon Capital Grant Receipt Revenue | 4.000% | 11/1/17 | | 8,300 | 8,736 |
| Tri-County Metropolitan Transportation District of Oregon Capital Grant Receipt Revenue | 5.000% | 10/1/18 | | 3,000 | 3,446 |
| Tri-County Metropolitan Transportation District of Oregon Capital Grant Receipt Revenue | 3.000% | 11/1/18 | | 4,250 | 4,471 |
| Tri-County Metropolitan Transportation District of Oregon Capital Grant Receipt Revenue | 5.000% | 11/1/18 | | 5,000 | 5,537 |
| | | | | | 113,771 |
| Pennsylvania (5.8%) | | | | | |
| Allegheny County PA GO | 5.000% | 11/1/14 | | 2,895 | 2,895 |
| Allegheny County PA GO | 4.000% | 12/1/16 | | 17,830 | 19,106 |
| Allegheny County PA GO | 5.000% | 12/1/18 | | 7,000 | 8,076 |
| Allegheny County PA GO | 5.000% | 12/1/19 | | 5,250 | 6,149 |
| Allegheny County PA Hospital Development Authority Revenue | | | | | |
| (University of Pittsburgh Medical Center) | 5.000% | 5/15/16 | | 17,175 | 18,391 |
| Allegheny County PA Hospital Development Authority Revenue | | | | | |
| (University of Pittsburgh Medical Center) | 5.000% | 5/15/17 | | 22,750 | 25,284 |
| Allegheny County PA Hospital Development Authority Revenue | | | | | |
| (University of Pittsburgh Medical Center) | 5.000% | 10/15/17 | | 1,000 | 1,126 |
| Allegheny County PA Hospital Development Authority Revenue | | | | | |
| (University of Pittsburgh Medical Center) | 5.000% | 10/15/18 | | 1,000 | 1,154 |
| Allegheny County PA Hospital Development Authority Revenue | | | | | |
| (University of Pittsburgh Medical Center) | 0.881% | 2/1/21 | | 9,725 | 9,722 |
| 2 Allegheny County PA Hospital Development Authority Revenue | | | | | |
| (University of Pittsburgh Medical Center) TOB VRDO | 0.170% | 11/3/14 | LOC | 31,200 | 31,200 |
| Allegheny County PA Port Authority Revenue | 5.000% | 3/1/17 | | 2,500 | 2,742 |
| Allegheny County PA Sanitary Authority Sewer Revenue | 5.000% | 6/1/18 | (4) | 3,000 | 3,420 |
| Allegheny County PA Sanitary Authority Sewer Revenue | 5.000% | 12/1/18 | (4) | 3,685 | 4,255 |
| Beaver County PA Industrial Development Authority Pollution Control Revenue | | | | | |
| (FirstEnergy Generation Project) PUT | 2.500% | 6/1/17 | | 17,250 | 17,558 |
| Berks County PA GO | 0.000% | 11/15/14 | (14) | 8,615 | 8,614 |
61
Limited-Term Tax-Exempt Fund
| | | | | |
| | | | | Face | Market |
| | | Maturity | | Amount | Value• |
| | Coupon | Date | | ($000) | ($000) |
| Bethlehem PA Water Authority Revenue | 5.000% | 11/15/17 | (15) | 650 | 726 |
| Bethlehem PA Water Authority Revenue | 5.000% | 11/15/18 | (15) | 500 | 570 |
| Bethlehem PA Water Authority Revenue | 5.000% | 11/15/19 | (15) | 1,165 | 1,343 |
| Bethlehem PA Water Authority Revenue | 5.000% | 11/15/20 | (15) | 1,000 | 1,165 |
| Chester County PA GO | 5.000% | 5/15/15 | (Prere.) | 13,355 | 13,703 |
| Clarion County PA Industrial Development Authority Revenue | | | | | |
| (Clarion University Foundation Inc. Student Housing Project) BAN | 1.050% | 5/1/16 | | 2,500 | 2,502 |
| Commonwealth Financing Authority Pennsylvania Revenue | 5.000% | 6/1/18 | | 670 | 762 |
| Commonwealth Financing Authority Pennsylvania Revenue | 5.000% | 6/1/19 | | 500 | 580 |
| Cumberland County PA Municipal Authority Revenue (Diakon Lutheran Social Ministries Project) | 5.000% | 1/1/16 | | 2,700 | 2,830 |
| Delaware County PA Authority Hospital Revenue (Crozer-Keystone Obligated Group) | 5.000% | 12/15/14 | | 1,165 | 1,170 |
| Delaware County PA Authority Hospital Revenue (Crozer-Keystone Obligated Group) | 5.000% | 12/15/14 | | 3,280 | 3,294 |
| Delaware County PA Authority Hospital Revenue (Crozer-Keystone Obligated Group) | 5.000% | 12/15/15 | | 1,140 | 1,181 |
| Delaware County PA Authority Hospital Revenue (Crozer-Keystone Obligated Group) | 5.000% | 12/15/15 | | 3,440 | 3,564 |
| Delaware County PA Authority Hospital Revenue (Crozer-Keystone Obligated Group) | 5.000% | 12/15/16 | | 1,175 | 1,249 |
| Delaware County PA Authority Hospital Revenue (Crozer-Keystone Obligated Group) | 5.000% | 12/15/16 | | 3,510 | 3,732 |
| Delaware County PA Authority University Revenue (Villanova University) | 5.000% | 8/1/18 | | 300 | 345 |
| Delaware County PA Authority University Revenue (Villanova University) | 5.000% | 8/1/19 | | 600 | 704 |
| Delaware County PA Authority University Revenue (Villanova University) | 5.000% | 8/1/19 | | 240 | 282 |
| Delaware County PA Authority University Revenue (Villanova University) | 5.000% | 8/1/20 | | 500 | 596 |
| Delaware County PA Authority University Revenue (Villanova University) | 5.000% | 8/1/21 | | 700 | 842 |
| Delaware County PA Authority University Revenue (Villanova University) | 5.000% | 8/1/22 | | 400 | 485 |
| Delaware County PA Industrial Development Authority Solid Waste Revenue | | | | | |
| (Scott Paper Co.) VRDO | 0.060% | 11/7/14 | | 4,500 | 4,500 |
| Delaware County PA Industrial Development Authority Solid Waste Revenue | | | | | |
| (Scott Paper Co.) VRDO | 0.060% | 11/7/14 | | 8,000 | 8,000 |
| Delaware River Joint Toll Bridge Commission Pennsylvania & New Jersey Revenue | 5.500% | 7/1/19 | (14) | 1,300 | 1,539 |
| Delaware River Port Authority Pennsylvania & New Jersey Revenue | 5.000% | 1/1/17 | | 1,065 | 1,160 |
| Delaware River Port Authority Pennsylvania & New Jersey Revenue | 5.000% | 1/1/18 | | 1,230 | 1,378 |
| Delaware River Port Authority Pennsylvania & New Jersey Revenue | 5.000% | 1/1/19 | | 1,745 | 1,991 |
| Delaware River Port Authority Pennsylvania & New Jersey Revenue | 5.000% | 1/1/20 | | 7,320 | 8,431 |
| Delaware River Port Authority Pennsylvania & New Jersey Revenue VRDO | 0.040% | 11/7/14 | LOC | 5,300 | 5,300 |
| Delaware River Port Authority Pennsylvania & New Jersey Revenue VRDO | 0.050% | 11/7/14 | LOC | 4,900 | 4,900 |
| Lancaster County PA Solid Waste Management Authority Solid Waste Disposal System Revenue | 5.000% | 12/15/18 | | 1,625 | 1,877 |
| Lancaster County PA Solid Waste Management Authority Solid Waste Disposal System Revenue | 5.000% | 12/15/20 | | 2,850 | 3,369 |
| 1 Manheim Township PA School District GO PUT | 0.504% | 5/1/18 | | 6,850 | 6,849 |
| Monroeville PA Finance Authority Revenue (UPMC Health System) | 4.000% | 2/15/17 | | 750 | 809 |
| Monroeville PA Finance Authority Revenue (UPMC Health System) | 4.000% | 2/15/18 | | 1,250 | 1,378 |
| Monroeville PA Finance Authority Revenue (UPMC Health System) | 5.000% | 2/15/19 | | 1,000 | 1,160 |
| Montgomery County PA Higher Education & Health Authority Hospital Revenue | | | | | |
| (Abington Memorial Hospital) | 5.000% | 6/1/15 | | 4,120 | 4,228 |
| Montgomery County PA Higher Education & Health Authority Hospital Revenue | | | | | |
| (Abington Memorial Hospital) | 5.000% | 6/1/16 | | 10,510 | 11,230 |
| Montgomery County PA Higher Education & Health Authority Hospital Revenue | | | | | |
| (Abington Memorial Hospital) | 5.000% | 6/1/18 | | 1,000 | 1,132 |
| Montgomery County PA Higher Education & Health Authority Hospital Revenue | | | | | |
| (Abington Memorial Hospital) | 5.000% | 6/1/19 | | 3,300 | 3,803 |
| Montgomery County PA Higher Education & Health Authority Hospital Revenue | | | | | |
| (Abington Memorial Hospital) | 5.000% | 6/1/20 | | 6,410 | 7,445 |
| Montgomery County PA Higher Education & Health Authority Revenue | | | | | |
| (Holy Redeemer Health System) | 4.000% | 10/1/19 | | 500 | 542 |
| Montgomery County PA Higher Education & Health Authority Revenue | | | | | |
| (Holy Redeemer Health System) | 5.000% | 10/1/20 | | 1,265 | 1,435 |
| Montgomery County PA Higher Education & Health Authority Revenue | | | | | |
| (Holy Redeemer Health System) | 5.000% | 10/1/21 | | 1,320 | 1,493 |
| Montgomery County PA Higher Education & Health Authority Revenue | | | | | |
| (Holy Redeemer Health System) | 5.000% | 10/1/22 | | 1,380 | 1,557 |
| Montgomery County PA Industrial Development Authority Retirement Community Revenue | | | | | |
| (ACTS Retirement–Life Communities Obligated Group) | 5.000% | 11/15/14 | | 1,570 | 1,573 |
| Montgomery County PA Industrial Development Authority Retirement Community Revenue | | | | | |
| (ACTS Retirement–Life Communities Obligated Group) | 5.250% | 11/15/15 | | 1,120 | 1,168 |
| Moon Industrial Development Authority Pennsylvania Mortgage Revenue | | | | | |
| (Providence Point Project) VRDO | 0.070% | 11/7/14 | LOC | 18,000 | 18,000 |
| North Hills PA School District GO | 5.250% | 12/15/15 | (Prere.) | 5,030 | 5,315 |
| 1 Northampton County PA General Purpose Authority Hospital Revenue | | | | | |
| (St. Luke’s Hospital Project) PUT | 1.450% | 8/15/20 | | 8,125 | 8,050 |
| Pennsylvania Convention Center Authority Revenue | 6.700% | 9/1/16 | (ETM) | 7,550 | 8,128 |
| Pennsylvania Economic Development Financing Authority Exempt Facilities Revenue | | | | | |
| (PPL Energy Supply LLC Project) PUT | 3.000% | 9/1/15 | | 8,250 | 8,362 |
| Pennsylvania Economic Development Financing Authority Exempt Facilities Revenue | | | | | |
| (PPL Energy Supply LLC Project) PUT | 3.000% | 9/1/15 | | 5,000 | 5,068 |
62
Limited-Term Tax-Exempt Fund
| | | | | |
| | | | | Face | Market |
| | | Maturity | | Amount | Value• |
| | Coupon | Date | | ($000) | ($000) |
| Pennsylvania Economic Development Financing Authority Exempt Facilities Revenue | | | | | |
| (PPL Energy Supply LLC Project) PUT | 3.000% | 9/1/15 | | 4,250 | 4,308 |
| Pennsylvania Economic Development Financing Authority Revenue (UPMC Obligated Group) | 4.000% | 2/1/20 | | 1,650 | 1,861 |
| Pennsylvania Economic Development Financing Authority Revenue (UPMC Obligated Group) | 5.000% | 2/1/21 | | 2,250 | 2,671 |
| Pennsylvania Economic Development Financing Authority Revenue (UPMC Obligated Group) | 5.000% | 2/1/22 | | 2,775 | 3,302 |
| Pennsylvania Economic Development Financing Authority Solid Waste Disposal Revenue | | | | | |
| (Waste Management Inc. Project) PUT | 3.700% | 5/1/15 | | 7,000 | 7,126 |
| Pennsylvania Economic Development Financing Authority Solid Waste Disposal Revenue | | | | | |
| (Waste Management Inc. Project) PUT | 1.750% | 12/1/15 | | 4,250 | 4,301 |
| Pennsylvania Economic Development Financing Authority Unemployment Compensation Revenue | 5.000% | 7/1/18 | | 27,000 | 31,036 |
| Pennsylvania Economic Development Financing Authority Unemployment Compensation Revenue | 5.000% | 7/1/21 | | 19,775 | 22,247 |
| Pennsylvania Economic Development Financing Authority Unemployment Compensation Revenue | 5.000% | 1/1/23 | | 5,000 | 5,263 |
| Pennsylvania GO | 5.000% | 3/1/15 | | 20,000 | 20,325 |
| Pennsylvania GO | 5.250% | 7/1/15 | | 28,630 | 29,605 |
| Pennsylvania GO | 5.000% | 2/15/16 | | 12,105 | 12,833 |
| Pennsylvania GO | 5.000% | 7/1/16 | | 5,355 | 5,766 |
| Pennsylvania GO | 5.000% | 11/1/16 | | 4,700 | 5,129 |
| Pennsylvania GO | 5.000% | 6/1/17 | | 3,060 | 3,407 |
| Pennsylvania GO | 5.000% | 7/1/17 | | 4,155 | 4,640 |
| Pennsylvania GO | 5.000% | 7/15/17 | | 15,005 | 16,779 |
| Pennsylvania GO | 5.000% | 10/15/17 | | 8,500 | 9,582 |
| Pennsylvania GO | 5.000% | 10/15/18 | | 10,000 | 11,542 |
| Pennsylvania GO | 5.000% | 4/1/19 | | 30,390 | 35,372 |
| Pennsylvania GO | 5.000% | 5/1/19 | | 5,000 | 5,831 |
| Pennsylvania GO | 5.000% | 6/1/19 | | 15,000 | 17,525 |
| Pennsylvania GO | 5.000% | 7/1/19 | | 10,000 | 11,705 |
| Pennsylvania GO | 5.000% | 7/1/19 | | 9,900 | 11,587 |
| Pennsylvania GO | 5.000% | 4/1/20 | | 7,450 | 8,821 |
| Pennsylvania GO | 5.000% | 6/15/20 | | 21,120 | 25,091 |
| Pennsylvania GO | 5.000% | 7/1/20 | | 20,925 | 24,877 |
| Pennsylvania GO | 5.000% | 10/15/20 | | 22,345 | 26,681 |
| Pennsylvania GO | 5.000% | 6/1/23 | | 3,000 | 3,595 |
| 2 Pennsylvania GO TOB VRDO | 0.060% | 11/7/14 | | 6,500 | 6,500 |
| Pennsylvania Higher Education Assistance Agency Revenue | 5.000% | 12/15/17 | | 2,205 | 2,478 |
| Pennsylvania Higher Education Assistance Agency Revenue | 5.000% | 12/15/18 | | 3,490 | 3,999 |
| Pennsylvania Higher Education Assistance Agency Revenue | 5.000% | 12/15/19 | | 2,490 | 2,902 |
| Pennsylvania Higher Educational Facilities Authority Revenue | | | | | |
| (AICUP Financing Program–Delaware Valley College Project) | 5.000% | 11/1/18 | | 1,075 | 1,173 |
| Pennsylvania Higher Educational Facilities Authority Revenue (Higher Education System) | 5.000% | 6/15/17 | | 4,655 | 5,185 |
| Pennsylvania Higher Educational Facilities Authority Revenue (Higher Education System) | 5.000% | 6/15/19 | | 4,445 | 5,185 |
| Pennsylvania Higher Educational Facilities Authority Revenue (La Salle University) | 5.000% | 5/1/18 | | 1,000 | 1,104 |
| Pennsylvania Higher Educational Facilities Authority Revenue (La Salle University) | 5.000% | 5/1/19 | | 1,850 | 2,072 |
| Pennsylvania Higher Educational Facilities Authority Revenue (St. Joseph’s University) | 5.000% | 11/1/17 | | 1,060 | 1,182 |
| Pennsylvania Higher Educational Facilities Authority Revenue (St. Joseph’s University) | 5.000% | 11/1/18 | | 700 | 795 |
| 2 Pennsylvania Higher Educational Facilities Authority Revenue | | | | | |
| (Trustees of the University of Pennsylvania) TOB VRDO | 0.060% | 11/7/14 | | 4,740 | 4,740 |
| Pennsylvania Higher Educational Facilities Authority Revenue | | | | | |
| (University of Pennsylvania Health System) | 5.000% | 5/15/20 | | 8,000 | 9,350 |
| Pennsylvania Higher Educational Facilities Authority Revenue | | | | | |
| (University of Pittsburgh Medical Center) | 5.000% | 5/15/16 | | 3,735 | 3,997 |
| Pennsylvania Higher Educational Facilities Authority Revenue | | | | | |
| (University of Pittsburgh Medical Center) | 5.000% | 5/15/17 | | 9,740 | 10,800 |
| Pennsylvania Intergovernmental Cooperation Authority Special Tax Revenue | | | | | |
| (Philadelphia Funding Program) | 5.000% | 6/15/16 | | 3,000 | 3,223 |
| Pennsylvania State University Revenue | 5.000% | 3/1/20 | | 1,500 | 1,740 |
| 2 Pennsylvania State University Revenue TOB VRDO | 0.050% | 11/7/14 | LOC | 10,145 | 10,145 |
| Pennsylvania Turnpike Commission Motor License Fund Revenue | 5.000% | 12/1/19 | | 1,020 | 1,192 |
| 2 Pennsylvania Turnpike Commission Oil Franchise Tax Revenue TOB VRDO | 0.070% | 11/7/14 | | 8,500 | 8,500 |
| Pennsylvania Turnpike Commission Registration Fee Revenue VRDO | 0.100% | 11/7/14 | (4) | 11,125 | 11,125 |
| Pennsylvania Turnpike Commission Revenue | 5.000% | 6/1/15 | (12) | 1,055 | 1,085 |
| Pennsylvania Turnpike Commission Revenue | 5.000% | 6/1/15 | | 5,500 | 5,654 |
| 1 Pennsylvania Turnpike Commission Revenue | 0.450% | 12/1/15 | | 22,000 | 22,001 |
| Pennsylvania Turnpike Commission Revenue | 5.000% | 6/1/16 | (12) | 5,170 | 5,543 |
| Pennsylvania Turnpike Commission Revenue | 5.000% | 6/1/16 | | 6,680 | 7,147 |
| 1 Pennsylvania Turnpike Commission Revenue | 0.600% | 12/1/16 | | 8,000 | 8,026 |
| Pennsylvania Turnpike Commission Revenue | 5.000% | 12/1/17 | | 3,515 | 3,948 |
| 1 Pennsylvania Turnpike Commission Revenue | 0.650% | 12/1/18 | | 8,750 | 8,778 |
| 1 Pennsylvania Turnpike Commission Revenue | 0.730% | 12/1/18 | | 10,000 | 10,055 |
| Pennsylvania Turnpike Commission Revenue | 5.000% | 12/1/18 | | 3,240 | 3,713 |
| Pennsylvania Turnpike Commission Revenue | 5.000% | 12/1/18 | | 1,150 | 1,318 |
| 1 Pennsylvania Turnpike Commission Revenue | 0.750% | 12/1/19 | | 15,000 | 15,079 |
63
Limited-Term Tax-Exempt Fund
| | | | | |
| | | | | Face | Market |
| | | Maturity | | Amount | Value• |
| | Coupon | Date | | ($000) | ($000) |
| 1 Pennsylvania Turnpike Commission Revenue | 1.200% | 12/1/19 | | 20,000 | 20,469 |
| Pennsylvania Turnpike Commission Revenue | 5.000% | 12/1/19 | | 1,175 | 1,369 |
| Pennsylvania Turnpike Commission Revenue | 5.000% | 12/1/19 | | 1,015 | 1,183 |
| 1 Pennsylvania Turnpike Commission Revenue | 0.930% | 12/1/20 | | 20,000 | 20,122 |
| Pennsylvania Turnpike Commission Revenue | 5.000% | 12/1/20 | | 1,805 | 2,127 |
| Pennsylvania Turnpike Commission Revenue | 5.000% | 6/1/21 | | 5,000 | 5,738 |
| Pennsylvania Turnpike Commission Revenue | 5.000% | 12/1/21 | | 1,000 | 1,178 |
| Philadelphia PA Airport Parking Authority Revenue | 5.000% | 9/1/15 | | 4,570 | 4,740 |
| Philadelphia PA Gas Works Revenue | 5.375% | 7/1/15 | (4) | 2,880 | 2,975 |
| Philadelphia PA Gas Works Revenue | 5.375% | 7/1/18 | (4) | 2,780 | 3,178 |
| Philadelphia PA GO | 5.000% | 7/15/16 | | 1,120 | 1,206 |
| Philadelphia PA GO | 5.000% | 7/15/17 | | 1,000 | 1,114 |
| Philadelphia PA GO | 5.000% | 12/15/17 | (4) | 5,555 | 6,249 |
| Philadelphia PA GO | 5.000% | 7/15/18 | | 2,000 | 2,285 |
| Philadelphia PA GO | 5.000% | 7/15/19 | | 1,410 | 1,636 |
| Philadelphia PA GO | 5.000% | 8/1/19 | (14) | 7,735 | 8,325 |
| Philadelphia PA GO | 5.000% | 8/1/24 | (12) | 2,000 | 2,217 |
| Philadelphia PA Hospitals & Higher Education Facilities Authority Hospital Revenue | | | | | |
| (Temple University Health System Obligated Group) | 5.000% | 7/1/15 | | 1,500 | 1,527 |
| Philadelphia PA Hospitals & Higher Education Facilities Authority Hospital Revenue | | | | | |
| (Temple University Health System Obligated Group) | 5.000% | 7/1/16 | | 1,995 | 2,081 |
| Philadelphia PA Hospitals & Higher Education Facilities Authority Hospital Revenue | | | | | |
| (Temple University Health System Obligated Group) | 5.000% | 7/1/17 | | 2,325 | 2,474 |
| Philadelphia PA Municipal Authority Revenue | 5.000% | 11/15/18 | | 2,500 | 2,853 |
| Philadelphia PA School District GO | 5.000% | 9/1/18 | | 2,780 | 3,157 |
| Philadelphia PA School District GO VRDO | 0.050% | 11/7/14 | LOC | 1,000 | 1,000 |
| Philadelphia PA Water & Waste Water Revenue | 5.250% | 12/15/14 | (2) | 3,645 | 3,664 |
| Philadelphia PA Water & Waste Water Revenue | 5.000% | 8/1/15 | (ETM) | 1,500 | 1,554 |
| Philadelphia PA Water & Waste Water Revenue | 5.000% | 6/15/16 | | 20,000 | 21,503 |
| Philadelphia PA Water & Waste Water Revenue | 5.000% | 6/15/19 | (4) | 2,500 | 2,920 |
| Philadelphia PA Water & Waste Water Revenue | 5.000% | 7/1/19 | | 1,000 | 1,168 |
| Philadelphia PA Water & Waste Water Revenue | 5.000% | 1/1/20 | | 7,165 | 8,427 |
| Philadelphia PA Water & Waste Water Revenue | 5.000% | 7/1/20 | | 2,000 | 2,372 |
| Philadelphia PA Water & Waste Water Revenue | 5.000% | 7/1/21 | | 1,000 | 1,197 |
| Pittsburgh & Allegheny County PA Sports & Exhibition Authority Lease Revenue VRDO | 0.170% | 11/7/14 | (4) | 46,750 | 46,750 |
| 3 Pittsburgh PA GO | 5.000% | 9/1/18 | | 11,000 | 12,601 |
| Pittsburgh PA Water & Sewer Authority Revenue | 5.000% | 9/1/19 | (4) | 2,500 | 2,934 |
| Pittsburgh PA Water & Sewer Authority Revenue | 5.000% | 9/1/20 | (4) | 3,385 | 4,031 |
| Pittsburgh PA Water & Sewer Authority Revenue VRDO | 0.130% | 11/7/14 | (4) | 13,800 | 13,800 |
| Reading PA School District GO | 5.000% | 4/1/19 | | 6,230 | 6,934 |
| Southcentral Pennsylvania General Authority Revenue (WellSpan Health Obligated Group) | 5.500% | 6/1/15 | | 5,000 | 5,151 |
| 1 University Area Joint Authority Pennsylvania Sewer Revenue PUT | 0.450% | 11/1/17 | | 2,900 | 2,902 |
| University of Pittsburgh of the Commonwealth System of Higher Education | | | | | |
| Pennsylvania Revenue (University Capital Project) | 5.500% | 9/15/20 | | 1,030 | 1,218 |
| West Chester University Pennsylvania Student Housing Revenue BAN | 1.600% | 2/1/15 | | 2,250 | 2,253 |
| Westmoreland County PA Industrial Development Authority Revenue (Excela Health Project) | 4.000% | 7/1/15 | | 1,440 | 1,472 |
| Westmoreland County PA Industrial Development Authority Revenue (Excela Health Project) | 5.000% | 7/1/16 | | 2,010 | 2,135 |
| York County PA Solid Waste & Refuse Authority Revenue | 5.500% | 12/1/14 | (14) | 4,050 | 4,068 |
| | | | | | 1,153,286 |
| Rhode Island (0.1%) | | | | | |
| Rhode Island & Providence Plantations GO | 5.000% | 11/15/16 | (14) | 2,000 | 2,189 |
| Rhode Island Economic Development Corp. Airport Revenue | 5.000% | 7/1/19 | | 700 | 786 |
| Rhode Island Economic Development Corp. Airport Revenue | 5.000% | 7/1/20 | | 1,165 | 1,319 |
| Rhode Island Economic Development Corp. Airport Revenue | 5.000% | 7/1/21 | | 1,355 | 1,541 |
| Rhode Island Health & Educational Building Corp. Hospital Financing Revenue | | | | | |
| (Care New England Health System Obligated Group) | 5.000% | 9/1/18 | | 1,325 | 1,470 |
| Rhode Island Health & Educational Building Corp. Hospital Financing Revenue | | | | | |
| (Care New England Health System Obligated Group) | 5.000% | 9/1/19 | | 1,650 | 1,838 |
| Rhode Island Health & Educational Building Corp. Hospital Financing Revenue | | | | | |
| (Care New England Health System Obligated Group) | 5.000% | 9/1/20 | | 1,455 | 1,616 |
| Rhode Island Health & Educational Building Corp. Hospital Financing Revenue | | | | | |
| (Care New England Health System Obligated Group) | 5.000% | 9/1/21 | | 1,650 | 1,817 |
| Rhode Island Health & Educational Building Corp. Providence Public Schools Revenue | | | | | |
| (Providence Public Buildings Authority) | 5.000% | 5/15/19 | | 1,255 | 1,425 |
| Rhode Island Health & Educational Building Corp. Providence Public Schools Revenue | | | | | |
| (Providence Public Buildings Authority) | 5.000% | 5/15/20 | | 2,760 | 3,152 |
| Rhode Island Health & Educational Building Corp. Providence Public Schools Revenue | | | | | |
| (Providence Public Buildings Authority) | 5.000% | 5/15/21 | | 2,000 | 2,292 |
| | | | | | 19,445 |
64
Limited-Term Tax-Exempt Fund
| | | | | |
| | | | | Face | Market |
| | | Maturity | | Amount | Value• |
| | Coupon | Date | | ($000) | ($000) |
| South Carolina (1.1%) | | | | | |
| Berkeley County SC School District Revenue | 5.000% | 12/1/17 | | 600 | 673 |
| Berkeley County SC School District Revenue | 5.000% | 12/1/18 | | 1,000 | 1,146 |
| Berkeley County SC School District Revenue | 5.000% | 12/1/20 | | 1,000 | 1,170 |
| Charleston County SC GO | 5.000% | 11/1/17 | | 1,045 | 1,181 |
| Charleston County SC GO | 5.000% | 11/1/17 | | 6,485 | 7,329 |
| Charleston County SC GO | 5.000% | 11/1/18 | | 7,085 | 8,230 |
| Charleston SC Educational Excellence Financing Corp. Revenue | | | | | |
| (Charleston County School District, South Carolina Project) | 5.000% | 12/1/19 | | 2,000 | 2,367 |
| 1 Charleston SC Waterworks & Sewer Capital Improvement Revenue PUT | 0.780% | 1/1/18 | | 8,700 | 8,707 |
| Greenville County SC Hospital Revenue (Greenville Hospital System) | 5.000% | 5/1/15 | | 7,380 | 7,549 |
| Greenville County SC School District GO | 5.500% | 12/1/16 | | 13,450 | 14,854 |
| 2 Greenville County SC School District Installment Revenue TOB VRDO | 0.100% | 11/7/14 | | 7,440 | 7,440 |
| 2 Greenwood SC Metropolitan Sewer System Revenue TOB VRDO | 0.100% | 11/7/14 | (4) | 5,625 | 5,625 |
| Lexington County SC Health Services District Inc. Hospital Revenue | 5.000% | 11/1/17 | | 2,660 | 2,992 |
| Lexington County SC Health Services District Inc. Hospital Revenue | 5.000% | 11/1/18 | | 1,345 | 1,548 |
| Myrtle Beach SC Hospitality Fee Revenue | 5.000% | 6/1/20 | | 500 | 582 |
| Myrtle Beach SC Hospitality Fee Revenue | 5.000% | 6/1/21 | | 1,000 | 1,173 |
| Oconee County SC Pollution Control Facilities Revenue (Duke Energy Carolinas Project) | 3.600% | 2/1/17 | | 15,100 | 16,052 |
| Piedmont SC Municipal Power Agency Revenue | 5.000% | 1/1/16 | | 8,100 | 8,530 |
| Piedmont SC Municipal Power Agency Revenue | 5.000% | 1/1/17 | | 7,225 | 7,892 |
| South Carolina Jobs Economic Development Authority Hospital Revenue (AnMed Health Project) | 5.000% | 2/1/16 | | 2,000 | 2,108 |
| South Carolina Jobs Economic Development Authority Hospital Revenue (AnMed Health Project) | 5.000% | 2/1/17 | | 2,320 | 2,530 |
| South Carolina Jobs Economic Development Authority Hospital Revenue (Palmetto Health) | 5.000% | 8/1/17 | | 300 | 325 |
| South Carolina Jobs Economic Development Authority Hospital Revenue (Palmetto Health) | 5.000% | 8/1/18 | | 500 | 550 |
| South Carolina Jobs Economic Development Authority Hospital Revenue (Palmetto Health) | 5.000% | 8/1/19 | | 1,000 | 1,110 |
| South Carolina Jobs Economic Development Authority Hospital Revenue (Palmetto Health) | 5.000% | 8/1/20 | | 2,000 | 2,229 |
| South Carolina Jobs Economic Development Authority Revenue (Bon Secours Health System Inc.) | 4.500% | 11/1/17 | | 1,000 | 1,101 |
| South Carolina Jobs Economic Development Authority Revenue (Bon Secours Health System Inc.) | 5.000% | 11/1/18 | | 1,500 | 1,709 |
| South Carolina Jobs Economic Development Authority Revenue (Bon Secours Health System Inc.) | 5.000% | 11/1/19 | | 1,000 | 1,158 |
| South Carolina Jobs Economic Development Authority Revenue (Bon Secours Health System Inc.) | 5.000% | 11/1/20 | | 1,750 | 2,051 |
| South Carolina Ports Authority Revenue | 5.000% | 7/1/17 | | 1,535 | 1,700 |
| South Carolina Public Service Authority Revenue | 5.000% | 1/1/16 | | 5,000 | 5,270 |
| South Carolina Public Service Authority Revenue | 5.000% | 1/1/17 | | 2,000 | 2,191 |
| South Carolina Public Service Authority Revenue | 5.000% | 12/1/17 | | 6,035 | 6,813 |
| South Carolina Public Service Authority Revenue | 5.250% | 1/1/19 | (14) | 8,255 | 8,720 |
| South Carolina Public Service Authority Revenue | 5.000% | 12/1/21 | | 2,500 | 2,998 |
| South Carolina Public Service Authority Revenue | 5.000% | 12/1/22 | | 1,500 | 1,805 |
| 2 South Carolina Public Service Authority Revenue TOB VRDO | 0.170% | 11/7/14 | | 7,280 | 7,280 |
| South Carolina Transportation Infrastructure Revenue | 5.250% | 10/1/15 | (2) | 4,430 | 4,635 |
| South Carolina Transportation Infrastructure Revenue | 5.000% | 10/1/16 | | 17,940 | 19,487 |
| South Carolina Transportation Infrastructure Revenue | 5.000% | 10/1/19 | | 25,805 | 30,304 |
| | | | | | 211,114 |
| South Dakota (0.1%) | | | | | |
| South Dakota Building Authority Revenue | 5.000% | 6/1/20 | | 500 | 594 |
| South Dakota Health & Educational Facilities Authority Revenue (Sanford Health) | 4.000% | 11/1/20 | | 635 | 715 |
| South Dakota Health & Educational Facilities Authority Revenue (Sanford Health) | 4.000% | 11/1/21 | | 500 | 559 |
| South Dakota Health & Educational Facilities Authority Revenue (Sanford Health) | 5.000% | 11/1/22 | | 375 | 444 |
| 2 South Dakota Health & Educational Facilities Authority Revenue (Sanford Health) TOB VRDO | 0.280% | 11/7/14 | LOC | 25,995 | 25,995 |
| | | | | | 28,307 |
| Tennessee (1.9%) | | | | | |
| Jackson TN Hospital Improvement Revenue (Jackson-Madison County General Hospital Project) | 5.250% | 4/1/15 | | 1,390 | 1,417 |
| Knox County TN Health Educational & Housing Facilities Board Hospital Facilities Revenue | | | | | |
| (Covenant Healthcare) | 5.000% | 1/1/20 | | 2,500 | 2,909 |
| Memphis TN Electric System Revenue | 5.000% | 12/1/16 | | 44,095 | 48,278 |
| Memphis TN Electric System Revenue | 5.000% | 12/1/17 | | 12,500 | 14,152 |
| Memphis TN GO | 5.000% | 10/1/17 | | 2,500 | 2,817 |
| Metropolitan Government of Nashville & Davidson County TN Electric Revenue | 5.500% | 5/15/15 | (13) | 5,675 | 5,839 |
| Metropolitan Government of Nashville & Davidson County TN Electric Revenue | 5.500% | 5/15/17 | (13) | 6,345 | 7,139 |
| Metropolitan Government of Nashville & Davidson County TN GO | 5.000% | 7/1/17 | | 10,000 | 11,188 |
| Metropolitan Government of Nashville & Davidson County TN GO | 5.000% | 7/1/19 | | 25,130 | 29,488 |
| 1 Metropolitan Government of Nashville & Davidson County | | | | | |
| TN Health & Educational Facilities Board Revenue (Vanderbilt University) PUT | 0.650% | 10/1/17 | | 9,500 | 9,541 |
| Metropolitan Government of Nashville & Davidson County TN Water & Sewer Revenue | 5.000% | 7/1/18 | | 5,000 | 5,730 |
| Metropolitan Government of Nashville & Davidson County TN Water & Sewer Revenue | 5.000% | 7/1/19 | | 6,070 | 7,102 |
| Metropolitan Government of Nashville & Davidson County TN Water & Sewer Revenue | 5.000% | 7/1/20 | | 1,000 | 1,188 |
| Shelby County TN GO | 5.000% | 3/1/19 | | 10,275 | 11,998 |
| Shelby County TN Health Educational & Housing Facility Board Revenue | | | | | |
| (Baptist Memorial Health Care) | 5.000% | 9/1/16 | | 6,925 | 7,482 |
| Shelby County TN Health Educational & Housing Facility Board Revenue | | | | | |
| (Methodist Le Bonheur Healthcare) VRDO | 0.060% | 11/3/14 | (4) | 15,000 | 15,000 |
65
Limited-Term Tax-Exempt Fund
| | | | | |
| | | | | Face | Market |
| | | Maturity | | Amount | Value• |
| | Coupon | Date | | ($000) | ($000) |
| Shelby County TN Health Educational & Housing Facility Board Revenue | | | | | |
| (Methodist Le Bonheur Healthcare) VRDO | 0.070% | 11/3/14 | (4) | 50,600 | 50,600 |
| Shelby County TN Health Educational & Housing Facility Board Revenue | | | | | |
| (St. Jude Children’s Research Hospital) | 5.000% | 7/1/15 | | 5,390 | 5,563 |
| Shelby County TN Health Educational & Housing Facility Board Revenue | | | | | |
| (St. Jude Children’s Research Hospital) | 5.000% | 7/1/16 | | 2,500 | 2,691 |
| Tennessee Energy Acquisition Corp. Gas Revenue | 5.000% | 9/1/16 | | 9,500 | 10,142 |
| Tennessee Energy Acquisition Corp. Gas Revenue | 5.000% | 2/1/18 | | 8,590 | 9,534 |
| Tennessee Energy Acquisition Corp. Gas Revenue | 5.000% | 2/1/19 | | 12,825 | 14,268 |
| Tennessee Energy Acquisition Corp. Gas Revenue | 5.000% | 2/1/20 | | 2,735 | 3,058 |
| Tennessee Energy Acquisition Corp. Gas Revenue | 5.250% | 9/1/20 | | 19,005 | 21,736 |
| Tennessee Energy Acquisition Corp. Gas Revenue | 5.000% | 2/1/21 | | 8,510 | 9,602 |
| Tennessee Energy Acquisition Corp. Gas Revenue | 5.250% | 9/1/21 | | 13,125 | 15,156 |
| Tennessee Energy Acquisition Corp. Gas Revenue | 5.000% | 2/1/22 | | 210 | 239 |
| Tennessee Energy Acquisition Corp. Gas Revenue | 5.250% | 9/1/22 | | 1,280 | 1,493 |
| Tennessee Energy Acquisition Corp. Gas Revenue | 5.250% | 9/1/23 | | 2,780 | 3,272 |
| Tennessee GO | 5.000% | 5/1/16 | | 3,200 | 3,425 |
| Tennessee GO | 5.000% | 8/1/18 | | 16,000 | 18,464 |
| Tennessee GO | 5.000% | 8/1/18 | | 5,185 | 5,984 |
| Tennessee GO | 5.000% | 10/1/18 | | 3,730 | 4,323 |
| Tennessee Housing Development Agency Residential Finance Program Revenue | 4.000% | 7/1/39 | | 3,500 | 3,840 |
| 3 Tennessee Housing Development Agency Residential Finance Program Revenue | 4.000% | 1/1/45 | | 5,000 | 5,497 |
| | | | | | 370,155 |
| Texas (7.5%) | | | | | |
| Austin TX Electric Utility System Revenue | 5.000% | 11/15/18 | | 500 | 578 |
| Austin TX Electric Utility System Revenue | 5.000% | 11/15/19 | | 500 | 589 |
| Austin TX Electric Utility System Revenue | 5.000% | 11/15/20 | | 1,000 | 1,195 |
| Austin TX GO | 4.250% | 9/1/16 | | 2,480 | 2,658 |
| Austin TX GO | 5.000% | 9/1/17 | | 3,250 | 3,656 |
| Austin TX Water & Wastewater System Revenue | 5.000% | 11/15/19 | | 1,000 | 1,181 |
| Austin TX Water & Wastewater System Revenue | 5.000% | 11/15/20 | | 2,420 | 2,899 |
| Central Texas Regional Mobility Authority Revenue | 5.750% | 1/1/17 | | 570 | 626 |
| Central Texas Regional Mobility Authority Revenue | 5.000% | 1/1/18 | | 250 | 281 |
| Central Texas Regional Mobility Authority Revenue | 5.750% | 1/1/18 | | 1,450 | 1,645 |
| Central Texas Regional Mobility Authority Revenue | 5.000% | 1/1/19 | | 530 | 609 |
| Central Texas Regional Mobility Authority Revenue | 5.000% | 1/1/20 | | 610 | 712 |
| Central Texas Regional Mobility Authority Revenue PUT | 3.000% | 1/4/16 | | 2,750 | 2,787 |
| Dallas TX GO | 5.000% | 2/15/16 | (ETM) | 10 | 11 |
| Dallas TX GO | 5.000% | 2/15/16 | | 3,990 | 4,233 |
| Dallas TX GO | 5.000% | 2/15/17 | (ETM) | 25 | 27 |
| Dallas TX GO | 5.000% | 2/15/17 | | 8,855 | 9,769 |
| Dallas TX Waterworks & Sewer System Revenue | 5.000% | 10/1/17 | | 3,105 | 3,503 |
| Dallas-Fort Worth TX International Airport Revenue | 5.000% | 11/1/14 | | 3,000 | 3,000 |
| Dallas-Fort Worth TX International Airport Revenue | 5.000% | 11/1/16 | | 4,000 | 4,358 |
| Dallas-Fort Worth TX International Airport Revenue | 5.000% | 11/1/17 | | 1,200 | 1,350 |
| Dallas-Fort Worth TX International Airport Revenue | 5.000% | 11/1/18 | | 500 | 576 |
| Dallas-Fort Worth TX International Airport Revenue | 5.000% | 11/1/19 | | 2,500 | 2,928 |
| Dallas-Fort Worth TX International Airport Revenue | 5.000% | 11/1/19 | | 1,000 | 1,171 |
| Dallas-Fort Worth TX International Airport Revenue | 5.000% | 11/1/19 | | 2,500 | 2,928 |
| Dallas-Fort Worth TX International Airport Revenue | 5.000% | 11/1/20 | | 2,500 | 2,965 |
| Dallas-Fort Worth TX International Airport Revenue | 5.000% | 11/1/20 | | 1,000 | 1,189 |
| Dallas-Fort Worth TX International Airport Revenue | 5.000% | 11/1/21 | | 4,000 | 4,782 |
| Denton TX Independent School District GO PUT | 2.125% | 8/1/15 | | 8,460 | 8,574 |
| Eagle Mountain & Saginaw TX Independent School District GO PUT | 2.000% | 8/1/19 | | 9,000 | 9,265 |
| El Paso TX Water & Sewer Revenue | 5.000% | 3/1/15 | (4) | 1,500 | 1,524 |
| El Paso TX Water & Sewer Revenue | 5.000% | 3/1/18 | | 1,000 | 1,136 |
| El Paso TX Water & Sewer Revenue | 5.000% | 3/1/21 | | 1,000 | 1,196 |
| Fort Bend County TX GO | 5.000% | 3/1/20 | | 5,530 | 6,557 |
| Fort Worth TX GO | 5.000% | 3/1/18 | | 4,375 | 4,978 |
| Fort Worth TX GO | 5.000% | 3/1/19 | | 3,500 | 4,074 |
| Fort Worth TX Water & Sewer Revenue | 5.000% | 2/15/18 | | 4,100 | 4,659 |
| Frisco TX GO | 5.000% | 2/15/17 | | 3,000 | 3,307 |
| Frisco TX GO | 5.000% | 2/15/18 | | 3,325 | 3,779 |
| Frisco TX GO | 5.000% | 2/15/20 | | 4,110 | 4,869 |
| Frisco TX Independent School District GO | 5.000% | 8/15/17 | | 2,350 | 2,641 |
| Grand Parkway TX Transportation Corp. System BAN | 3.000% | 12/15/16 | | 194,500 | 204,785 |
| 2 Harris County TX Cultural Education Facilities Finance Corp. Hospital Revenue | | | | | |
| (Children’s Hospital Project) TOB VRDO | 0.090% | 11/7/14 | | 8,195 | 8,195 |
| 1 Harris County TX Cultural Education Facilities Finance Corp. Hospital Revenue | | | | | |
| (Memorial Hermann Healthcare System) | 0.550% | 6/1/17 | | 3,865 | 3,872 |
66
Limited-Term Tax-Exempt Fund
| | | | | |
| | | | | Face | Market |
| | | Maturity | | Amount | Value• |
| | Coupon | Date | | ($000) | ($000) |
| 1 Harris County TX Cultural Education Facilities Finance Corp. Hospital Revenue | | | | | |
| (Memorial Hermann Healthcare System) | 0.650% | 6/1/18 | | 1,750 | 1,751 |
| 1 Harris County TX Cultural Education Facilities Finance Corp. Hospital Revenue | | | | | |
| (Memorial Hermann Healthcare System) | 0.750% | 6/1/19 | | 2,250 | 2,252 |
| 1 Harris County TX Cultural Education Facilities Finance Corp. Hospital Revenue | | | | | |
| (Memorial Hermann Healthcare System) | 0.800% | 6/1/20 | | 2,000 | 1,998 |
| 1 Harris County TX Cultural Education Facilities Finance Corp. Hospital Revenue | | | | | |
| (Memorial Hermann Healthcare System) PUT | 0.630% | 12/1/19 | | 9,000 | 9,002 |
| 1 Harris County TX Cultural Education Facilities Finance Corp. Medical Facilities Revenue | | | | | |
| (Baylor College of Medicine) PUT | 1.100% | 11/15/15 | | 8,000 | 8,017 |
| Harris County TX Cultural Education Facilities Finance Corp. Revenue (Methodist Hospital System) | 5.250% | 12/1/14 | | 11,000 | 11,047 |
| Harris County TX Cultural Education Facilities Finance Corp. Revenue (Methodist Hospital System) | 5.250% | 12/1/15 | | 6,630 | 6,984 |
| Harris County TX Cultural Education Facilities Finance Corp. Revenue | | | | | |
| (Methodist Hospital System) VRDO | 0.070% | 11/3/14 | | 4,865 | 4,865 |
| Harris County TX Cultural Education Facilities Finance Corp. Revenue | | | | | |
| (Methodist Hospital System) VRDO | 0.070% | 11/3/14 | | 4,420 | 4,420 |
| Harris County TX Cultural Education Facilities Finance Corp. Revenue | | | | | |
| (YMCA of the Greater Houston Area) | 5.000% | 6/1/16 | | 720 | 762 |
| Harris County TX Cultural Education Facilities Finance Corp. Revenue | | | | | |
| (YMCA of the Greater Houston Area) | 5.000% | 6/1/18 | | 425 | 469 |
| Harris County TX Cultural Education Facilities Finance Corp. Revenue | | | | | |
| (YMCA of the Greater Houston Area) | 5.000% | 6/1/19 | | 1,410 | 1,579 |
| Harris County TX Cultural Education Facilities Finance Corp. Thermal Utility Revenue | | | | | |
| (TECO Project) | 5.000% | 11/15/16 | | 1,000 | 1,092 |
| Harris County TX Flood Control District GO | 5.250% | 10/1/18 | | 2,000 | 2,334 |
| Harris County TX GO | 5.000% | 10/1/15 | | 2,000 | 2,089 |
| Harris County TX GO | 5.000% | 10/1/16 | | 4,500 | 4,898 |
| Harris County TX GO | 5.000% | 10/1/17 | | 6,775 | 7,637 |
| Harris County TX GO | 5.000% | 10/1/18 | | 4,805 | 5,554 |
| Harris County TX GO | 5.000% | 10/1/18 | | 2,675 | 3,096 |
| 2 Harris County TX GO TOB VRDO | 0.060% | 11/7/14 | | 8,155 | 8,155 |
| Harris County TX Health Facilities Development Corp. Hospital Revenue | | | | | |
| (Memorial Hermann Healthcare System) | 5.000% | 12/1/18 | | 1,000 | 1,154 |
| Harris County TX Health Facilities Development Corp. Hospital Revenue | | | | | |
| (Memorial Hermann Healthcare System) | 5.000% | 12/1/19 | | 400 | 470 |
| Harris County TX Health Facilities Development Corp. Revenue (Methodist Hospital System) VRDO | 0.070% | 11/3/14 | | 7,500 | 7,500 |
| 2 Harris County TX Health Facilities Development Corp. Thermal Utility Revenue TOB VRDO | 0.080% | 11/7/14 | (4) | 5,060 | 5,060 |
| Harris County TX Metropolitan Transit Authority Sales & Use Tax Revenue | 5.000% | 11/1/19 | | 2,000 | 2,357 |
| Harris County TX Toll Road Revenue | 5.000% | 8/15/16 | | 5,000 | 5,408 |
| 1 Harris County TX Toll Road Revenue | 0.830% | 8/15/18 | | 4,000 | 4,038 |
| Houston TX Airport System Revenue | 5.000% | 7/1/16 | | 1,000 | 1,074 |
| Houston TX Airport System Revenue | 5.000% | 7/1/16 | | 1,000 | 1,074 |
| Houston TX Airport System Revenue | 5.000% | 7/1/17 | | 1,500 | 1,665 |
| Houston TX Airport System Revenue | 5.000% | 7/1/18 | | 1,720 | 1,956 |
| Houston TX Airport System Revenue | 5.000% | 7/1/18 | (14) | 6,070 | 6,702 |
| Houston TX Airport System Revenue | 5.000% | 7/1/19 | (14) | 3,960 | 4,341 |
| 2 Houston TX Airport System Revenue TOB VRDO | 0.060% | 11/7/14 | | 1,360 | 1,360 |
| Houston TX Community College System GO | 5.000% | 2/15/18 | | 2,500 | 2,841 |
| Houston TX Community College System GO | 5.000% | 2/15/19 | | 2,860 | 3,323 |
| Houston TX Community College System GO | 5.000% | 2/15/19 | | 870 | 1,011 |
| 2 Houston TX Community College System GO TOB VRDO | 0.120% | 11/7/14 | (4) | 3,990 | 3,990 |
| Houston TX GO | 5.500% | 3/1/16 | | 6,905 | 7,380 |
| Houston TX GO | 5.000% | 3/1/17 | | 1,000 | 1,104 |
| Houston TX GO | 5.000% | 3/1/18 | | 1,000 | 1,138 |
| Houston TX GO | 5.000% | 3/1/19 | | 10,000 | 11,640 |
| Houston TX GO | 5.000% | 3/1/19 | | 12,195 | 14,195 |
| Houston TX GO | 5.000% | 3/1/19 | | 1,135 | 1,321 |
| 1 Houston TX Higher Education Finance Corp. Revenue (Rice University Project) PUT | 0.580% | 11/16/17 | | 10,000 | 10,038 |
| Houston TX Independent School District GO | 5.000% | 2/15/17 | | 2,375 | 2,620 |
| Houston TX Independent School District GO | 5.000% | 2/15/18 | | 1,755 | 1,995 |
| Houston TX Independent School District GO | 5.000% | 2/15/19 | | 2,890 | 3,364 |
| Houston TX Independent School District GO PUT | 2.500% | 6/1/15 | | 7,200 | 7,291 |
| Houston TX Utility System Revenue | 5.000% | 11/15/14 | | 5,385 | 5,395 |
| Houston TX Utility System Revenue | 5.000% | 11/15/15 | | 5,000 | 5,250 |
| Houston TX Utility System Revenue | 5.000% | 11/15/16 | | 1,855 | 2,027 |
| Houston TX Utility System Revenue | 5.000% | 11/15/17 | | 13,500 | 15,268 |
| Houston TX Utility System Revenue | 5.250% | 11/15/17 | (4) | 13,600 | 15,483 |
| Houston TX Utility System Revenue | 5.000% | 11/15/18 | | 2,500 | 2,896 |
| Houston TX Utility System Revenue | 5.000% | 11/15/19 | | 3,000 | 3,544 |
| Houston TX Utility System Revenue | 5.000% | 5/15/20 | | 6,000 | 7,140 |
| Houston TX Utility System Revenue | 5.000% | 11/15/20 | | 3,500 | 4,189 |
67
Limited-Term Tax-Exempt Fund
| | | | | |
| | | | | Face | Market |
| | | Maturity | | Amount | Value• |
| | Coupon | Date | | ($000) | ($000) |
| Houston TX Utility System Revenue | 5.000% | 5/15/21 | | 5,000 | 6,016 |
| Houston TX Utility System Revenue | 5.000% | 11/15/21 | | 5,000 | 6,044 |
| 1 Houston TX Utility System Revenue PUT | 0.650% | 8/1/16 | | 41,000 | 41,174 |
| 1 Houston TX Utility System Revenue PUT | 0.800% | 6/1/17 | | 18,000 | 18,081 |
| Klein TX Independent School District GO | 5.000% | 8/1/15 | (Prere.) | 2,800 | 2,902 |
| 2 Lone Star College System Texas GO TOB VRDO | 0.060% | 11/7/14 | | 2,900 | 2,900 |
| Lower Colorado River Authority Texas Revenue | 5.000% | 5/15/16 | (ETM) | 5 | 5 |
| Lower Colorado River Authority Texas Revenue | 5.000% | 5/15/16 | | 1,295 | 1,384 |
| Lower Colorado River Authority Texas Revenue | 5.000% | 5/15/17 | | 1,710 | 1,897 |
| Lower Colorado River Authority Texas Revenue | 5.875% | 5/15/17 | (2) | 9,895 | 9,941 |
| Lubbock TX Electric Light & Power System Revenue | 5.000% | 4/15/16 | | 2,000 | 2,132 |
| Lubbock TX Health Facilities Development Corp. Revenue (St. Joseph Health System) | 5.000% | 7/1/16 | | 2,740 | 2,942 |
| Lubbock TX Health Facilities Development Corp. Revenue (St. Joseph Health System) | 5.000% | 7/1/17 | | 3,310 | 3,676 |
| Lubbock TX Health Facilities Development Corp. Revenue (St. Joseph Health System) | 5.000% | 7/1/18 | | 1,765 | 2,008 |
| Lubbock TX Independent School District GO VRDO | 0.060% | 11/7/14 | | 14,800 | 14,800 |
| Mission TX Economic Development Corp. Solid Waste Disposal Revenue | | | | | |
| (Allied Waste Inc. Project) PUT | 0.300% | 1/2/15 | | 5,600 | 5,600 |
| Mission TX Economic Development Corp. Solid Waste Disposal Revenue | | | | | |
| (Waste Management Inc. Project) PUT | 3.750% | 6/1/15 | | 8,500 | 8,681 |
| North Central TX Health Facilities Development Corp. Hospital Revenue | | | | | |
| (Children’s Medical Center of Dallas Project) | 5.000% | 8/15/17 | | 1,000 | 1,118 |
| North Central TX Health Facilities Development Corp. Hospital Revenue | | | | | |
| (Children’s Medical Center of Dallas Project) | 5.000% | 8/15/18 | | 750 | 859 |
| North Central TX Health Facilities Development Corp. Hospital Revenue | | | | | |
| (Children’s Medical Center of Dallas Project) | 5.000% | 8/15/19 | | 1,900 | 2,206 |
| North Texas Tollway Authority System Revenue | 4.000% | 9/1/16 | | 1,000 | 1,065 |
| North Texas Tollway Authority System Revenue | 4.000% | 9/1/17 | | 1,725 | 1,888 |
| North Texas Tollway Authority System Revenue | 5.000% | 9/1/17 | | 1,480 | 1,661 |
| North Texas Tollway Authority System Revenue | 5.000% | 1/1/19 | | 4,000 | 4,619 |
| North Texas Tollway Authority System Revenue | 5.000% | 1/1/20 | | 5,000 | 5,897 |
| North Texas Tollway Authority System Revenue (Dallas North Tollway) | 5.000% | 1/1/15 | (Prere.) | 10,000 | 10,081 |
| 1 North Texas Tollway Authority System Revenue PUT | 0.850% | 1/1/19 | | 15,000 | 14,998 |
| 2 North Texas Tollway Authority System Revenue TOB VRDO | 0.060% | 11/7/14 | (13) | 5,800 | 5,800 |
| Northside TX Independent School District GO PUT | 2.125% | 8/1/20 | | 6,775 | 6,783 |
| Olmos Park TX Higher Education Facilities Corp. Revenue | | | | | |
| (University of the Incarnate Word Project) | 5.000% | 12/1/19 | | 1,735 | 2,017 |
| SA Energy Acquisition Public Facility Corp. Texas Gas Supply Revenue | 5.250% | 8/1/16 | | 7,795 | 8,354 |
| SA Energy Acquisition Public Facility Corp. Texas Gas Supply Revenue | 5.500% | 8/1/21 | | 5,100 | 5,958 |
| Sam Rayburn TX Municipal Power Agency Revenue | 5.000% | 10/1/18 | | 2,250 | 2,549 |
| Sam Rayburn TX Municipal Power Agency Revenue | 5.000% | 10/1/19 | | 1,000 | 1,153 |
| San Antonio TX Electric & Gas Systems Revenue | 5.375% | 2/1/15 | | 7,210 | 7,305 |
| San Antonio TX Electric & Gas Systems Revenue PUT | 2.000% | 12/1/16 | | 3,500 | 3,605 |
| 2 San Antonio TX Electric & Gas Systems Revenue TOB VRDO | 0.060% | 11/7/14 | | 9,020 | 9,020 |
| San Antonio TX GO | 5.000% | 2/1/17 | | 1,300 | 1,432 |
| San Antonio TX GO | 5.000% | 2/1/17 | | 4,135 | 4,555 |
| San Antonio TX GO | 5.000% | 8/1/17 | | 1,070 | 1,200 |
| San Antonio TX GO | 5.000% | 2/1/18 | | 3,500 | 3,981 |
| San Antonio TX GO | 5.000% | 8/1/18 | | 1,000 | 1,152 |
| San Antonio TX Independent School District GO PUT | 2.000% | 8/1/18 | | 7,500 | 7,743 |
| San Antonio TX Water Revenue | 5.000% | 5/15/17 | | 2,160 | 2,403 |
| San Antonio TX Water Revenue | 5.000% | 5/15/19 | | 2,250 | 2,632 |
| San Antonio TX Water Revenue | 5.000% | 5/15/20 | | 1,500 | 1,785 |
| 1 San Antonio TX Water Revenue PUT | 0.730% | 11/1/16 | | 15,000 | 15,099 |
| 1 San Antonio TX Water Revenue PUT | 0.450% | 11/1/17 | | 11,875 | 11,945 |
| Southwest Texas Higher Education Authority Inc. Revenue (Southern Methodist University Project) | 5.000% | 10/1/16 | (2) | 2,000 | 2,172 |
| Tarrant County TX Cultural Education Facilities Finance Corp. Hospital Revenue | | | | | |
| (Methodist Hospitals of Dallas) | 5.000% | 10/1/19 | | 2,225 | 2,607 |
| Tarrant County TX Cultural Education Facilities Finance Corp. Hospital Revenue | | | | | |
| (Methodist Hospitals of Dallas) | 5.000% | 10/1/20 | | 1,845 | 2,186 |
| Tarrant County TX Cultural Education Facilities Finance Corp. Hospital Revenue | | | | | |
| (Methodist Hospitals of Dallas) | 5.000% | 10/1/21 | | 2,400 | 2,833 |
| Tarrant County TX Cultural Education Facilities Finance Corp. Hospital Revenue | | | | | |
| (Scott & White Healthcare Project) | 5.000% | 8/15/15 | | 2,905 | 3,011 |
| Tarrant County TX Cultural Education Facilities Finance Corp. Hospital Revenue | | | | | |
| (Scott & White Healthcare Project) | 5.000% | 8/15/16 | | 1,310 | 1,410 |
| Tarrant County TX Cultural Education Facilities Finance Corp. Hospital Revenue | | | | | |
| (Scott & White Healthcare Project) | 5.000% | 8/15/17 | | 2,000 | 2,222 |
| Tarrant County TX Cultural Education Facilities Finance Corp. Hospital Revenue | | | | | |
| (Scott & White Healthcare Project) | 5.000% | 8/15/20 | | 1,520 | 1,787 |
| Tarrant County TX Cultural Education Facilities Finance Corp. Revenue (CHRISTUS Health) | 5.000% | 7/1/15 | (ETM) | 835 | 862 |
| Tarrant County TX Cultural Education Facilities Finance Corp. Revenue (CHRISTUS Health) | 5.000% | 7/1/15 | | 6,895 | 7,087 |
| Tarrant County TX Cultural Education Facilities Finance Corp. Revenue (CHRISTUS Health) | 5.000% | 7/1/16 | | 8,130 | 8,667 |
68
Limited-Term Tax-Exempt Fund
| | | | | |
| | | | | Face | Market |
| | | Maturity | | Amount | Value• |
| | Coupon | Date | | ($000) | ($000) |
| Texas GO | 5.000% | 10/1/17 | | 7,500 | 8,461 |
| Texas GO | 5.000% | 10/1/18 | | 4,650 | 5,381 |
| Texas GO | 5.000% | 10/1/18 | | 7,500 | 8,685 |
| Texas GO | 5.000% | 10/1/19 | | 8,000 | 9,464 |
| Texas GO | 5.000% | 10/1/20 | | 10,000 | 12,021 |
| Texas GO | 5.000% | 10/1/21 | | 19,000 | 23,089 |
| 2 Texas GO TOB VRDO | 0.050% | 11/7/14 | | 24,550 | 24,550 |
| Texas Municipal Gas Acquisition & Supply Corp. Revenue | 5.000% | 12/15/16 | | 170 | 184 |
| 1 Texas Municipal Gas Acquisition & Supply Corp. Revenue | 0.520% | 9/15/17 | | 4,645 | 4,653 |
| Texas Municipal Gas Acquisition & Supply Corp. Revenue | 5.250% | 12/15/17 | | 2,425 | 2,694 |
| Texas Municipal Gas Acquisition & Supply Corp. Revenue | 5.625% | 12/15/17 | | 54,450 | 59,362 |
| Texas Municipal Gas Acquisition & Supply Corp. Revenue | 5.250% | 12/15/18 | | 1,130 | 1,274 |
| Texas Municipal Gas Acquisition & Supply Corp. Revenue | 5.000% | 12/15/19 | | 5,000 | 5,719 |
| Texas Municipal Gas Acquisition & Supply Corp. Revenue | 5.250% | 12/15/19 | | 6,495 | 7,433 |
| Texas Municipal Gas Acquisition & Supply Corp. Revenue | 5.000% | 12/15/20 | | 6,000 | 6,961 |
| Texas Municipal Gas Acquisition & Supply Corp. Revenue | 5.250% | 12/15/20 | | 3,750 | 4,325 |
| Texas Municipal Gas Acquisition & Supply Corp. Revenue | 5.000% | 12/15/21 | | 2,000 | 2,350 |
| Texas Public Finance Authority Revenue (Texas Southern University) | 5.000% | 11/1/18 | (15) | 1,000 | 1,111 |
| Texas Public Finance Authority Revenue (Texas Southern University) | 5.000% | 11/1/19 | (15) | 2,300 | 2,585 |
| Texas Public Finance Authority Revenue (Texas Southern University) | 5.000% | 11/1/20 | (15) | 1,500 | 1,695 |
| Texas Public Finance Authority Revenue (Unemployment Compensation) | 5.000% | 7/1/15 | (Prere.) | 1,865 | 1,925 |
| Texas Public Finance Authority Revenue (Unemployment Compensation) | 4.000% | 1/1/18 | | 15,000 | 15,862 |
| Texas Public Finance Authority Revenue (Unemployment Compensation) | 4.000% | 7/1/18 | | 6,350 | 6,599 |
| Texas Public Finance Authority Revenue (Unemployment Compensation) | 4.000% | 1/1/19 | | 8,750 | 8,955 |
| Texas State Veterans Housing VRDO | 0.040% | 11/7/14 | | 10,000 | 10,000 |
| Texas State Veterans Housing VRDO | 0.050% | 11/7/14 | | 12,000 | 12,000 |
| Texas Tech University System Financing System Revenue | 5.000% | 2/15/15 | | 4,000 | 4,056 |
| Texas State University System Financing System Revenue | 5.000% | 3/15/15 | | 7,005 | 7,132 |
| Texas Tech University System Financing System Revenue | 5.000% | 8/15/17 | | 2,115 | 2,372 |
| Texas Tech University System Financing System Revenue | 5.000% | 8/15/18 | | 3,065 | 3,524 |
| Texas Tech University System Financing System Revenue | 5.000% | 8/15/19 | | 3,040 | 3,571 |
| Texas Tech University System Financing System Revenue | 5.000% | 8/15/20 | | 5,000 | 5,962 |
| Texas TRAN | 1.500% | 8/31/15 | | 55,000 | 55,622 |
| 2 Texas Transportation Commission Mobility Fund GO TOB VRDO | 0.050% | 11/7/14 | | 14,005 | 14,005 |
| 2 Texas Transportation Commission Mobility Fund GO TOB VRDO | 0.060% | 11/7/14 | | 20,410 | 20,410 |
| Texas Transportation Commission Revenue | 5.000% | 4/1/17 | | 1,845 | 2,044 |
| Texas Transportation Commission Revenue | 5.000% | 4/1/20 | | 27,500 | 32,805 |
| Texas Transportation Commission Revenue PUT | 1.250% | 2/15/15 | | 10,000 | 10,024 |
| 1 Texas Transportation Commission Revenue PUT | 0.400% | 4/1/17 | | 57,000 | 57,150 |
| Texas Turnpike Authority Central Texas Turnpike System Revenue | 0.000% | 8/15/22 | (2) | 10,285 | 8,430 |
| 2 Texas University System Revenue Financing System Revenue TOB VRDO | 0.060% | 11/7/14 | | 4,995 | 4,995 |
| Texas Water Development Board Revenue | 5.000% | 7/15/16 | | 6,330 | 6,833 |
| University of North Texas Revenue | 5.000% | 4/15/18 | | 1,000 | 1,140 |
| University of North Texas Revenue | 5.000% | 4/15/20 | | 2,505 | 2,959 |
| University of Texas System Revenue Financing System Revenue | 5.250% | 8/15/16 | | 10,090 | 10,979 |
| University of Texas System Revenue Financing System Revenue | 5.000% | 8/15/17 | | 25,135 | 28,214 |
| University of Texas System Revenue Financing System Revenue | 5.000% | 8/15/18 | | 6,505 | 7,509 |
| University of Texas System Revenue Financing System Revenue | 5.000% | 8/15/18 | | 4,525 | 5,224 |
| University of Texas System Revenue Financing System Revenue | 5.000% | 8/15/19 | | 9,255 | 10,926 |
| University of Texas System Revenue Financing System Revenue | 5.000% | 8/15/19 | | 5,000 | 5,903 |
| University of Texas System Revenue Financing System Revenue VRDO | 0.050% | 11/7/14 | | 16,035 | 16,035 |
| | | | | | 1,493,272 |
| Utah (0.7%) | | | | | |
| Alpine UT School District GO | 5.000% | 3/15/17 | | 4,320 | 4,778 |
| Intermountain Power Agency Utah Power Supply Revenue | 5.000% | 7/1/15 | | 17,420 | 17,985 |
| Intermountain Power Agency Utah Power Supply Revenue | 5.000% | 7/1/17 | | 1,300 | 1,450 |
| Intermountain Power Agency Utah Power Supply Revenue | 5.000% | 7/1/17 | | 5,625 | 6,274 |
| Intermountain Power Agency Utah Power Supply Revenue | 5.000% | 7/1/18 | | 2,425 | 2,778 |
| Intermountain Power Agency Utah Power Supply Revenue | 5.000% | 7/1/18 | | 8,000 | 9,165 |
| Intermountain Power Agency Utah Power Supply Revenue | 5.000% | 7/1/19 | | 2,360 | 2,760 |
| Intermountain Power Agency Utah Power Supply Revenue | 5.000% | 7/1/20 | | 3,500 | 3,995 |
| Murray UT Hospital Revenue (IHC Health Services) VRDO | 0.060% | 11/3/14 | | 11,290 | 11,290 |
| Utah Associated Municipal Power Systems Revenue (Payson Power Project) | 4.000% | 4/1/18 | | 3,550 | 3,889 |
| Utah Board of Regents Student Loan Revenue | 4.000% | 11/1/16 | | 10,000 | 10,717 |
| Utah GO | 5.000% | 7/1/17 | | 6,125 | 6,849 |
| Utah GO | 5.000% | 7/1/17 | | 10,000 | 11,182 |
| Utah GO | 5.000% | 7/1/18 | | 3,000 | 3,455 |
| Utah GO | 5.000% | 7/1/18 | | 19,000 | 21,885 |
| Utah Transit Authority Sales Tax Revenue | 1.600% | 6/15/18 | | 14,000 | 14,229 |
| Utah Water Finance Agency Revenue VRDO | 0.070% | 11/7/14 | | 9,875 | 9,875 |
| | | | | | 142,556 |
69
Limited-Term Tax-Exempt Fund
| | | | | |
| | | | | Face | Market |
| | | Maturity | | Amount | Value• |
| | Coupon | Date | | ($000) | ($000) |
| Virgin Islands (0.1%) | | | | | |
| Virgin Islands Public Finance Authority Revenue | 5.000% | 10/1/15 | | 5,000 | 5,183 |
| Virgin Islands Public Finance Authority Revenue | 5.000% | 10/1/16 | | 8,000 | 8,567 |
| Virgin Islands Public Finance Authority Revenue | 5.000% | 10/1/22 | | 5,950 | 6,611 |
| | | | | | 20,361 |
| Virginia (2.5%) | | | | | |
| Arlington County VA Industrial Development Authority Hospital Revenue | | | | | |
| (Virginia Hospital Center Arlington Health System) | 5.000% | 7/1/16 | | 3,755 | 4,024 |
| Fairfax County VA Economic Development Authority Facilities Revenue (County Facilities Project) | 5.000% | 10/1/20 | | 2,500 | 2,987 |
| Fairfax County VA Economic Development Authority Facilities Revenue (County Facilities Project) | 5.000% | 10/1/21 | | 6,185 | 7,462 |
| Fairfax County VA Economic Development Authority Transportation | | | | | |
| District Improvement Revenue (Silver Line Phase I Project) | 5.000% | 4/1/17 | | 2,480 | 2,740 |
| Fairfax County VA Economic Development Authority Transportation | | | | | |
| District Improvement Revenue (Silver Line Phase I Project) | 5.000% | 4/1/18 | | 4,255 | 4,835 |
| Fairfax County VA Public Improvement GO | 5.000% | 4/1/18 | | 10,885 | 12,445 |
| Fairfax County VA Public Improvement GO | 5.000% | 4/1/19 | | 10,885 | 12,751 |
| 1 Fredericksburg VA Economic Development Authority Hospital Facilities Revenue | | | | | |
| (Mary Washington Healthcare Obligated Group) PUT | 1.950% | 2/1/17 | | 6,500 | 6,664 |
| Henrico County VA School District GO | 5.000% | 8/1/20 | | 1,055 | 1,270 |
| Loudoun County VA GO | 5.000% | 12/1/18 | | 3,435 | 3,995 |
| Loudoun County VA Industrial Development Authority Revenue | | | | | |
| (Howard Hughes Medical Institute) VRDO | 0.040% | 11/7/14 | | 34,435 | 34,435 |
| Norfolk VA GO | 5.000% | 3/1/15 | | 5,910 | 6,006 |
| Norfolk VA GO | 5.000% | 3/1/16 | | 4,000 | 4,251 |
| Roanoke VA Economic Development Authority Hospital Revenue (Carilion Clinic Obligated Group) | 5.000% | 7/1/19 | | 5,015 | 5,774 |
| Roanoke VA Economic Development Authority Hospital Revenue (Carilion Clinic Obligated Group) | 5.000% | 7/1/20 | | 1,460 | 1,702 |
| Tobacco Settlement Financing Corp. Virginia Revenue | 5.625% | 6/1/15 | (Prere.) | 5,000 | 5,158 |
| University of Virginia Revenue | 5.000% | 9/1/17 | | 1,275 | 1,432 |
| University of Virginia Revenue | 5.000% | 6/1/20 | | 500 | 599 |
| University of Virginia Revenue | 5.000% | 6/1/21 | | 2,660 | 3,229 |
| Virginia Beach VA GO | 5.000% | 7/15/15 | | 2,825 | 2,922 |
| Virginia Beach VA GO | 5.000% | 7/15/16 | | 6,905 | 7,452 |
| Virginia Beach VA GO | 5.000% | 4/1/18 | | 3,250 | 3,716 |
| Virginia Beach VA GO | 5.000% | 7/15/18 | | 2,995 | 3,452 |
| Virginia Beach VA GO | 5.000% | 5/1/20 | | 4,300 | 5,150 |
| Virginia College Building Authority Educational Facilities Revenue | | | | | |
| (21st Century College & Equipment Programs) | 5.000% | 2/1/16 | | 3,090 | 3,272 |
| Virginia College Building Authority Educational Facilities Revenue | | | | | |
| (21st Century College & Equipment Programs) | 5.000% | 2/1/18 | | 9,585 | 10,888 |
| Virginia College Building Authority Educational Facilities Revenue | | | | | |
| (Public Higher Education Financing Program) | 5.000% | 9/1/15 | | 7,330 | 7,627 |
| Virginia College Building Authority Educational Facilities Revenue | | | | | |
| (Public Higher Education Financing Program) | 5.000% | 9/1/15 | (ETM) | 20 | 21 |
| Virginia College Building Authority Educational Facilities Revenue | | | | | |
| (Public Higher Education Financing Program) | 5.000% | 9/1/15 | | 3,380 | 3,517 |
| Virginia College Building Authority Educational Facilities Revenue | | | | | |
| (Public Higher Education Financing Program) | 5.000% | 9/1/16 | (ETM) | 5 | 5 |
| Virginia College Building Authority Educational Facilities Revenue | | | | | |
| (Public Higher Education Financing Program) | 5.000% | 9/1/16 | | 695 | 754 |
| 3 Virginia College Building Authority Educational Facilities Revenue | | | | | |
| (Public Higher Education Financing Program) | 5.000% | 9/1/20 | | 7,685 | 9,188 |
| 3 Virginia College Building Authority Educational Facilities Revenue | | | | | |
| (Public Higher Education Financing Program) | 5.000% | 9/1/21 | | 18,585 | 22,414 |
| Virginia Commonwealth Transportation Board GAN | 5.000% | 9/15/20 | | 3,130 | 3,744 |
| Virginia Commonwealth Transportation Board Revenue | 5.000% | 3/15/17 | | 3,015 | 3,334 |
| Virginia Commonwealth Transportation Board Revenue | 5.000% | 3/15/17 | | 5,070 | 5,606 |
| Virginia Commonwealth Transportation Board Revenue | 5.000% | 9/15/17 | | 2,970 | 3,341 |
| Virginia Commonwealth Transportation Board Revenue | 5.000% | 3/15/18 | | 3,280 | 3,736 |
| Virginia Commonwealth Transportation Board Revenue | 5.000% | 5/15/18 | | 8,115 | 9,290 |
| Virginia Commonwealth Transportation Board Revenue | 5.000% | 3/15/19 | | 1,750 | 2,039 |
| Virginia Commonwealth Transportation Board Revenue | 5.000% | 5/15/19 | | 8,525 | 9,971 |
| Virginia Commonwealth Transportation Board Revenue | 5.000% | 9/15/19 | | 1,605 | 1,891 |
| Virginia Public Building Authority Public Facilities Revenue | 5.000% | 8/1/15 | | 4,115 | 4,265 |
| Virginia Public Building Authority Public Facilities Revenue | 5.000% | 8/1/17 | | 12,550 | 14,062 |
| Virginia Public Building Authority Public Facilities Revenue | 5.000% | 8/1/18 | | 4,725 | 5,432 |
| Virginia Public Building Authority Public Facilities Revenue | 5.000% | 8/1/19 | | 8,530 | 10,023 |
| Virginia Public Building Authority Public Facilities Revenue | 5.000% | 8/1/19 | | 4,965 | 5,834 |
| Virginia Public Building Authority Public Facilities Revenue | 5.000% | 8/1/19 | | 17,870 | 20,990 |
| Virginia Public Building Authority Public Facilities Revenue | 5.000% | 8/1/20 | | 5,220 | 6,233 |
| Virginia Public Building Authority Public Facilities Revenue | 5.000% | 8/1/20 | | 18,830 | 22,484 |
| Virginia Public School Authority Revenue | 5.000% | 8/1/15 | | 1,500 | 1,555 |
70
Limited-Term Tax-Exempt Fund
| | | | | |
| | | | | Face | Market |
| | | Maturity | | Amount | Value• |
| | Coupon | Date | | ($000) | ($000) |
| Virginia Public School Authority Revenue | 5.000% | 8/1/15 | | 15,000 | 15,546 |
| Virginia Public School Authority Revenue | 5.000% | 8/1/16 | | 1,570 | 1,697 |
| Virginia Public School Authority Revenue | 5.000% | 8/1/16 | | 32,000 | 34,588 |
| Virginia Public School Authority Revenue | 5.000% | 8/1/16 | | 5,810 | 6,280 |
| Virginia Public School Authority Revenue | 5.000% | 8/1/18 | | 16,665 | 19,173 |
| Virginia Public School Authority Revenue | 5.000% | 8/1/19 | | 16,220 | 19,076 |
| Virginia Public School Authority Revenue | 5.000% | 8/1/20 | | 20,425 | 24,413 |
| Virginia Resources Authority Clean Water Revenue (State Revolving Fund) | 5.000% | 10/1/18 | | 5,360 | 6,208 |
| Virginia Resources Authority Clean Water Revenue (State Revolving Fund) | 5.000% | 10/1/19 | | 3,500 | 4,143 |
| Wise County VA Industrial Development Authority Solid Waste & Sewage Disposal Revenue | | | | | |
| (Virginia Electric & Power Co.) PUT | 2.375% | 11/1/15 | | 15,000 | 15,287 |
| York County VA Economic Development Authority Pollution Control Revenue | | | �� | | |
| (VA Electric & Power Co. Project) PUT | 1.875% | 5/16/19 | | 5,000 | 5,099 |
| | | | | | 487,477 |
| Washington (3.0%) | | | | | |
| Central Puget Sound WA Regional Transit Authority Sales & Use Tax Revenue | 5.000% | 11/1/14 | (2) | 8,125 | 8,125 |
| Central Washington University System Revenue | 5.000% | 5/1/17 | | 1,860 | 2,053 |
| Central Washington University System Revenue | 5.000% | 5/1/18 | | 1,960 | 2,222 |
| Central Washington University System Revenue | 5.000% | 5/1/19 | | 2,050 | 2,368 |
| Central Washington University System Revenue | 5.000% | 5/1/20 | | 2,150 | 2,518 |
| Clark County WA Public Utility Revenue | 5.000% | 1/1/15 | | 1,500 | 1,512 |
| Energy Northwest Washington Electric Revenue (Columbia Generating Station) | 5.000% | 7/1/18 | | 22,000 | 25,263 |
| Energy Northwest Washington Electric Revenue (Columbia Generating Station) | 5.000% | 7/1/20 | | 1,160 | 1,387 |
| Energy Northwest Washington Electric Revenue (Project No. 1) | 5.000% | 7/1/17 | | 14,000 | 15,651 |
| Energy Northwest Washington Electric Revenue (Project No. 3) | 5.000% | 7/1/15 | | 6,000 | 6,195 |
| Energy Northwest Washington Electric Revenue (Project No. 3) | 5.000% | 7/1/15 | | 8,450 | 8,724 |
| Energy Northwest Washington Electric Revenue (Project No. 3) | 5.000% | 7/1/16 | | 24,000 | 25,857 |
| Energy Northwest Washington Electric Revenue (Project No. 3) | 5.000% | 7/1/17 | | 20,000 | 22,358 |
| 1 Everett WA GO PUT | 0.450% | 12/1/19 | | 4,000 | 4,001 |
| King County WA (Public Hospital District) GO | 5.000% | 12/1/19 | | 2,500 | 2,910 |
| King County WA (Public Hospital District) GO | 5.000% | 12/1/20 | | 2,500 | 2,946 |
| King County WA Sewer Revenue | 5.000% | 1/1/19 | | 12,835 | 14,902 |
| Lewis County WA Public Utility District No. 1 Revenue (Cowlitz Falls Hydroelectric Project) | 5.000% | 10/1/18 | | 1,400 | 1,611 |
| Lewis County WA Public Utility District No. 1 Revenue (Cowlitz Falls Hydroelectric Project) | 5.000% | 10/1/20 | | 1,000 | 1,191 |
| Lewis County WA Public Utility District No. 1 Revenue (Cowlitz Falls Hydroelectric Project) | 5.000% | 10/1/21 | | 1,000 | 1,202 |
| Port of Seattle WA Passenger Facility Charge Revenue | 5.000% | 12/1/17 | | 4,000 | 4,478 |
| Seattle WA GO | 5.000% | 5/1/18 | | 7,935 | 9,084 |
| Seattle WA GO | 5.000% | 5/1/19 | | 8,385 | 9,826 |
| Seattle WA Municipal Light & Power Revenue | 5.000% | 2/1/16 | | 3,500 | 3,705 |
| Seattle WA Water System Revenue | 5.000% | 2/1/15 | (4) | 4,725 | 4,783 |
| Snohomish County WA School District No. 15 (Edmonds) GO | 5.000% | 12/1/20 | | 1,000 | 1,203 |
| Tobacco Settlement Authority Washington Revenue | 5.000% | 6/1/25 | | 16,485 | 16,863 |
| University of Washington Revenue | 5.000% | 4/1/17 | | 6,880 | 7,623 |
| University of Washington Revenue | 5.000% | 4/1/18 | | 7,225 | 8,246 |
| Washington (Motor Vehicle Fuel Tax) GO | 5.000% | 7/1/19 | | 10,000 | 11,749 |
| Washington (Motor Vehicle Fuel Tax) GO | 5.000% | 7/1/20 | | 41,360 | 49,444 |
| Washington (Motor Vehicle Fuel Tax) GO | 5.000% | 7/1/21 | | 41,175 | 49,734 |
| Washington Economic Development Finance Authority Lease Revenue | | | | | |
| (Washington Biomedical Research Properties 2) | 5.000% | 6/1/18 | | 1,150 | 1,317 |
| Washington Economic Development Finance Authority Lease Revenue | | | | | |
| (Washington Biomedical Research Properties 2) | 5.000% | 6/1/19 | | 850 | 995 |
| Washington Economic Development Finance Authority Solid Waste Disposal Revenue | | | | | |
| (Waste Management Inc. Project) PUT | 1.250% | 11/1/17 | | 2,525 | 2,536 |
| Washington Federal Highway Grant Anticipation Revenue (520 Corridor Program) | 5.000% | 9/1/18 | | 14,273 | 16,403 |
| Washington Federal Highway Grant Anticipation Revenue (520 Corridor Program) | 5.000% | 9/1/20 | | 9,210 | 10,926 |
| Washington GO | 5.000% | 7/1/15 | (2) | 2,400 | 2,478 |
| Washington GO | 5.700% | 10/1/15 | | 1,410 | 1,482 |
| Washington GO | 5.000% | 1/1/16 | | 5,285 | 5,578 |
| Washington GO | 5.000% | 1/1/16 | | 20,000 | 21,108 |
| Washington GO | 5.000% | 2/1/16 | | 3,995 | 4,231 |
| Washington GO | 5.000% | 2/1/16 | | 13,040 | 13,812 |
| Washington GO | 5.000% | 7/1/17 | | 5,000 | 5,590 |
| Washington GO | 5.000% | 8/1/17 | | 11,175 | 12,528 |
| Washington GO | 5.000% | 8/1/17 | | 6,605 | 7,404 |
| Washington GO | 5.000% | 7/1/18 | | 24,315 | 27,921 |
| Washington GO | 5.000% | 7/1/18 | | 15,000 | 17,225 |
| Washington GO | 5.000% | 7/1/18 | | 21,220 | 24,367 |
| Washington GO | 5.000% | 7/1/19 | | 19,770 | 23,228 |
| Washington GO | 5.000% | 7/1/19 | | 14,580 | 17,130 |
| Washington GO | 5.000% | 7/1/20 | | 9,070 | 10,843 |
| Washington GO | 5.000% | 8/1/20 | | 10,000 | 11,971 |
71
Limited-Term Tax-Exempt Fund
| | | | | |
| | | | | Face | Market |
| | | Maturity | | Amount | Value• |
| | Coupon | Date | | ($000) | ($000) |
| Washington GO | 5.000% | 7/1/21 | | 11,000 | 13,124 |
| 2 Washington GO TOB VRDO | 0.060% | 11/7/14 | | 4,000 | 4,000 |
| Washington Health Care Facilities Authority Revenue (MultiCare Health System) | 5.000% | 8/15/15 | | 2,500 | 2,590 |
| Washington Health Care Facilities Authority Revenue (MultiCare Health System) | 5.000% | 8/15/16 | | 2,500 | 2,696 |
| Washington Health Care Facilities Authority Revenue (PeaceHealth) | 5.000% | 11/1/14 | | 1,340 | 1,340 |
| Washington Health Care Facilities Authority Revenue (PeaceHealth) | 5.000% | 11/15/20 | | 1,000 | 1,185 |
| Washington Health Care Facilities Authority Revenue (PeaceHealth) | 5.000% | 11/15/21 | | 1,000 | 1,188 |
| Washington Health Care Facilities Authority Revenue (Providence Health & Services) | 5.000% | 10/1/16 | | 1,300 | 1,412 |
| Washington Health Care Facilities Authority Revenue (Providence Health & Services) | 5.000% | 10/1/17 | | 1,360 | 1,527 |
| Washington Health Care Facilities Authority Revenue (Providence Health & Services) | 5.000% | 10/1/18 | | 700 | 805 |
| Washington Health Care Facilities Authority Revenue (Providence Health & Services) | 5.000% | 10/1/19 | | 1,000 | 1,167 |
| Washington Health Care Facilities Authority Revenue (Seattle Cancer Care Alliance) | 5.000% | 3/1/19 | | 600 | 682 |
| Washington Health Care Facilities Authority Revenue (Seattle Cancer Care Alliance) | 5.000% | 3/1/20 | | 605 | 695 |
| Washington Health Care Facilities Authority Revenue (Seattle Cancer Care Alliance) | 4.000% | 3/1/21 | | 800 | 875 |
| Washington Health Care Facilities Authority Revenue (Seattle Cancer Care Alliance) | 5.000% | 3/1/22 | | 735 | 849 |
| | | | | | 602,942 |
| West Virginia (0.3%) | | | | | |
| Mason County WV Pollution Control Revenue (Appalachian Power Co. Project) PUT | 1.625% | 10/1/18 | | 6,000 | 6,040 |
| West Virginia Commissioner of Highways Special Obligation Revenue | 5.000% | 9/1/15 | | 7,150 | 7,434 |
| West Virginia Economic Development Authority Pollution Control Revenue | | | | | |
| (American Electric Power Co.Inc.) | 3.250% | 5/1/19 | | 10,000 | 10,361 |
| West Virginia Economic Development Authority Solid Waste Facilities Disposal Revenue | | | | | |
| (Ohio Power Co.–Amos Project) PUT | 3.125% | 4/1/15 | | 15,000 | 15,152 |
| West Virginia Hospital Finance Authority Hospital Revenue (Charleston Area Medical Center Inc.) | 5.000% | 9/1/15 | | 3,070 | 3,172 |
| West Virginia Hospital Finance Authority Hospital Revenue (Charleston Area Medical Center Inc.) | 4.125% | 9/1/16 | | 1,755 | 1,849 |
| West Virginia University Revenue | 5.000% | 10/1/18 | | 1,300 | 1,498 |
| 1 West Virginia University Revenue PUT | 0.580% | 10/1/19 | | 3,500 | 3,502 |
| West Virginia Water Development Authority (Chesapeake Bay & Greenbrier River Projects) | 5.000% | 7/1/21 | | 750 | 902 |
| | | | | | 49,910 |
| Wisconsin (1.3%) | | | | | |
| Madison WI Community Development Authority Revenue (Wisconsin Alumni Research Project) | 5.000% | 10/1/16 | | 3,125 | 3,391 |
| Madison WI Community Development Authority Revenue (Wisconsin Alumni Research Project) | 5.000% | 10/1/17 | | 3,370 | 3,780 |
| Milwaukee WI GO | 5.000% | 5/1/16 | | 6,000 | 6,417 |
| Milwaukee WI GO | 5.000% | 5/1/18 | | 11,655 | 13,317 |
| University of Wisconsin Hospitals & Clinics Authority Revenue | 5.000% | 4/1/18 | | 750 | 856 |
| University of Wisconsin Hospitals & Clinics Authority Revenue | 5.000% | 4/1/20 | | 660 | 781 |
| Wisconsin Annual Appropriation Revenue | 5.000% | 5/1/16 | | 6,575 | 7,032 |
| Wisconsin GO | 5.000% | 5/1/16 | | 13,870 | 14,842 |
| Wisconsin GO | 5.000% | 5/1/16 | | 10,530 | 11,268 |
| Wisconsin GO | 5.000% | 5/1/17 | | 7,000 | 7,779 |
| Wisconsin GO | 5.000% | 5/1/17 | | 8,100 | 9,002 |
| Wisconsin GO | 5.000% | 11/1/17 | | 4,500 | 5,086 |
| Wisconsin GO | 5.000% | 11/1/18 | | 11,000 | 12,743 |
| Wisconsin GO | 5.000% | 5/1/19 | | 5,000 | 5,852 |
| Wisconsin GO | 5.000% | 5/1/19 | | 12,955 | 15,163 |
| Wisconsin GO | 5.000% | 11/1/19 | | 3,100 | 3,669 |
| Wisconsin GO | 5.000% | 11/1/20 | | 7,400 | 8,879 |
| Wisconsin GO | 5.000% | 5/1/24 | | 9,045 | 10,859 |
| Wisconsin Health & Educational Facilities Authority Health Facilities Revenue | | | | | |
| (Iowa Health System Obligated Group) | 5.000% | 12/1/18 | | 850 | 982 |
| Wisconsin Health & Educational Facilities Authority Health Facilities Revenue | | | | | |
| (Iowa Health System Obligated Group) | 5.000% | 12/1/20 | | 820 | 968 |
| Wisconsin Health & Educational Facilities Authority Revenue | | | | | |
| (Ascension Health Alliance Credit Group) PUT | 5.000% | 6/1/20 | | 33,465 | 39,372 |
| Wisconsin Health & Educational Facilities Authority Revenue (Aurora Health Care Inc.) | 5.000% | 4/15/15 | | 1,495 | 1,525 |
| Wisconsin Health & Educational Facilities Authority Revenue (Aurora Health Care Inc.) | 5.000% | 4/15/16 | | 1,100 | 1,166 |
| Wisconsin Health & Educational Facilities Authority Revenue (Aurora Health Care Inc.) | 5.000% | 7/15/16 | | 7,500 | 8,025 |
| Wisconsin Health & Educational Facilities Authority Revenue (Aurora Health Care Inc.) | 5.000% | 7/15/17 | | 5,025 | 5,514 |
| Wisconsin Health & Educational Facilities Authority Revenue (Aurora Health Care Inc.) | 5.000% | 7/15/17 | | 1,000 | 1,097 |
| Wisconsin Health & Educational Facilities Authority Revenue (Aurora Health Care Inc.) | 5.000% | 7/15/19 | | 1,160 | 1,307 |
| Wisconsin Health & Educational Facilities Authority Revenue (Aurora Health Care Inc.) PUT | 5.125% | 8/15/16 | | 10,390 | 11,233 |
| Wisconsin Health & Educational Facilities Authority Revenue (Aurora Health Care Inc.) PUT | 1.250% | 8/15/17 | | 3,500 | 3,530 |
| Wisconsin Health & Educational Facilities Authority Revenue (Hospital Sisters Services Inc. | | | | | |
| Obligated Group) | 4.000% | 8/15/17 | | 1,000 | 1,094 |
| Wisconsin Health & Educational Facilities Authority Revenue (Hospital Sisters Services Inc. | | | | | |
| Obligated Group) | 5.000% | 8/15/18 | | 1,000 | 1,152 |
| Wisconsin Health & Educational Facilities Authority Revenue (Hospital Sisters Services Inc. | | | | | |
| Obligated Group) | 4.000% | 8/15/19 | | 1,500 | 1,670 |
| Wisconsin Health & Educational Facilities Authority Revenue (Hospital Sisters Services Inc. | | | | | |
| Obligated Group) | 5.000% | 8/15/20 | | 5,335 | 6,248 |
| Wisconsin Health & Educational Facilities Authority Revenue (Ministry Health Care Inc.) | 5.000% | 8/1/15 | (4) | 2,000 | 2,071 |
72
| | | | |
| Limited-Term Tax-Exempt Fund | | | | |
| |
| |
| |
| |
| | | | Face | Market |
| | | Maturity | Amount | Value• |
| | Coupon | Date | ($000) | ($000) |
| Wisconsin Health & Educational Facilities Authority Revenue (Ministry Health Care Inc.) | 5.000% | 8/15/18 | 730 | 828 |
| Wisconsin Health & Educational Facilities Authority Revenue (Ministry Health Care Inc.) | 5.000% | 8/15/19 | 3,740 | 4,230 |
| Wisconsin Petroleum Inspection Fee Revenue | 5.000% | 7/1/16 | 10,000 | 10,769 |
| Wisconsin Public Power System Power Supply System Revenue | 5.000% | 7/1/15 (4) | 11,390 | 11,751 |
| Wisconsin Transportation Revenue | 5.000% | 7/1/15 | 2,100 | 2,168 |
| | | | | 257,416 |
| Wyoming (0.0%) | | | | |
| Lincoln County WY Pollution Control Revenue (Exxonmobil Project) VRDO | 0.060% | 11/3/14 | 2,100 | 2,100 |
| Total Tax-Exempt Municipal Bonds (Cost $19,259,511) | | | | 19,624,555 |
| |
| | | | Shares | |
| Temporary Cash Investment (1.6%) | | | | |
| Money Market Fund (1.6%) | | | | |
| 4 Vanguard Municipal Cash Management Fund (Cost $314,510) | 0.047% | | 314,510,000 | 314,510 |
| Total Investments (100.4%) (Cost $19,574,021) | | | | 19,939,065 |
| Other Assets and Liabilities (–0.4%) | | | | |
| Other Assets | | | | 269,587 |
| Liabilities | | | | (347,048) |
| | | | | (77,461) |
| Net Assets (100%) | | | | 19,861,604 |
| |
| |
| At October 31, 2014, net assets consisted of: | | | | |
| | | | | Amount |
| | | | | ($000) |
| Paid-in Capital | | | | 19,601,168 |
| Undistributed Net Investment Income | | | | — |
| Accumulated Net Realized Losses | | | | (104,608) |
| Unrealized Appreciation (Depreciation) | | | | 365,044 |
| Net Assets | | | | 19,861,604 |
| |
| Investor Shares—Net Assets | | | | |
| Applicable to 202,280,729 outstanding $.001 par value shares of beneficial interest (unlimited authorization) | | | 2,240,914 |
| Net Asset Value Per Share—Investor Shares | | | | $11.08 |
| |
| Admiral Shares—Net Assets | | | | |
| Applicable to 1,590,569,517 outstanding $.001 par value shares of beneficial interest (unlimited authorization) | | | 17,620,690 |
| Net Asset Value Per Share—Admiral Shares | | | | $11.08 |
• See Note A in Notes to Financial Statements.
1 Adjustable-rate security.
2 Security exempt from registration under Rule 144A of the Securities Act of 1933. Such securities may be sold in transactions exempt from registration, normally to qualified institutional buyers. At October 31, 2014,
the aggregate value of these securities was $1,147,936,000, representing 5.8% of net assets.
3 Security purchased on a when-issued or delayed-delivery basis for which the fund has not taken delivery as of October 31, 2014.
4 Affiliated money market fund available only to Vanguard funds and certain trusts and accounts managed by Vanguard. Rate shown is the 7-day yield.
For key to abbreviations and other references, see back cover of report.
See accompanying Notes, which are an integral part of the Financial Statements.
73
Intermediate-Term Tax-Exempt Fund
| | | | | |
| | | | | Face | Market |
| | | Maturity | | Amount | Value• |
| | Coupon | Date | | ($000) | ($000) |
| Tax-Exempt Municipal Bonds (98.4%) | | | | | |
| Alabama (0.9%) | | | | | |
| Alabama 21st Century Authority Tobacco Settlement Revenue | 5.000% | 6/1/20 | | 1,000 | 1,165 |
| Alabama 21st Century Authority Tobacco Settlement Revenue | 5.000% | 6/1/21 | | 1,500 | 1,757 |
| Alabama Incentives Financing Authority Special Obligation Revenue | 5.000% | 9/1/24 | | 3,695 | 4,211 |
| Alabama Incentives Financing Authority Special Obligation Revenue | 5.000% | 9/1/24 | | 2,520 | 2,872 |
| Alabama Incentives Financing Authority Special Obligation Revenue | 5.000% | 9/1/30 | | 6,905 | 7,750 |
| Alabama Incentives Financing Authority Special Obligation Revenue | 5.000% | 9/1/31 | | 7,245 | 8,094 |
| Alabama Incentives Financing Authority Special Obligation Revenue | 5.000% | 9/1/32 | | 7,000 | 7,795 |
| Alabama Public School & College Authority Capital Improvement Revenue | 5.000% | 12/1/17 | (Prere.) | 58,350 | 66,117 |
| Alabama Public School & College Authority Capital Improvement Revenue | 5.000% | 12/1/17 | (Prere.) | 60,660 | 68,735 |
| Alabama Public School & College Authority Capital Improvement Revenue | 5.000% | 12/1/17 | (Prere.) | 62,600 | 70,933 |
| Alabama Public School & College Authority Capital Improvement Revenue | 5.000% | 12/1/17 | (Prere.) | 13,595 | 15,405 |
| Auburn University Alabama General Fee Revenue | 4.000% | 6/1/15 | | 2,500 | 2,556 |
| Auburn University Alabama General Fee Revenue | 5.000% | 6/1/16 | | 3,690 | 3,958 |
| Auburn University Alabama General Fee Revenue | 5.000% | 6/1/17 | | 3,160 | 3,519 |
| Auburn University Alabama General Fee Revenue | 5.000% | 6/1/17 | | 1,550 | 1,725 |
| Auburn University Alabama General Fee Revenue | 5.000% | 6/1/31 | | 3,000 | 3,437 |
| Birmingham AL GO | 0.000% | 3/1/32 | | 5,000 | 5,020 |
| Courtland AL Development Board Pollution Control Revenue (International Paper Co.) | 5.000% | 6/1/25 | | 5,000 | 5,068 |
| Huntsville AL GO | 5.000% | 3/1/26 | | 2,540 | 2,976 |
| Huntsville AL GO | 5.000% | 5/1/33 | | 5,000 | 5,678 |
| Infirmary Health System Special Care Facilities Financing Authority Mobile Alabama Revenue | | | | | |
| (Infirmary Health System Inc.) | 5.000% | 2/1/18 | | 2,830 | 3,105 |
| Infirmary Health System Special Care Facilities Financing Authority Mobile Alabama Revenue | | | | | |
| (Infirmary Health System Inc.) | 5.250% | 2/1/19 | | 2,415 | 2,711 |
| Infirmary Health System Special Care Facilities Financing Authority Mobile Alabama Revenue | | | | | |
| (Infirmary Health System Inc.) | 5.250% | 2/1/20 | | 2,845 | 3,231 |
| Infirmary Health System Special Care Facilities Financing Authority Mobile Alabama Revenue | | | | | |
| (Infirmary Health System Inc.) | 5.250% | 2/1/21 | | 3,630 | 4,066 |
| Infirmary Health System Special Care Facilities Financing Authority Mobile Alabama Revenue | | | | | |
| (Infirmary Health System Inc.) | 5.250% | 2/1/30 | | 5,450 | 5,944 |
| Jefferson County AL Sewer Revenue | 5.000% | 10/1/22 | | 1,730 | 1,931 |
| Jefferson County AL Sewer Revenue | 5.000% | 10/1/23 | | 3,500 | 3,893 |
| Jefferson County AL Sewer Revenue | 0.000% | 10/1/26 | (4) | 1,000 | 581 |
| Jefferson County AL Sewer Revenue | 0.000% | 10/1/27 | (4) | 1,410 | 778 |
| Jefferson County AL Sewer Revenue | 0.000% | 10/1/28 | (4) | 1,500 | 776 |
| Mobile AL Industrial Development Board Pollution Control Revenue (Alabama Power Co.) PUT | 1.650% | 3/20/17 | | 8,700 | 8,891 |
| 1 Mobile AL Water & Sewer Commissioners Revenue TOB VRDO | 0.060% | 11/3/14 | LOC | 4,580 | 4,580 |
| University of Alabama General Revenue | 5.000% | 7/1/21 | | 10,530 | 12,697 |
| | | | | | 341,955 |
| Alaska (0.2%) | | | | | |
| Alaska GO | 5.000% | 8/1/24 | | 5,000 | 6,105 |
| Alaska Housing Finance Corp. General Housing Revenue | 5.000% | 12/1/25 | | 3,075 | 3,616 |
| Alaska Housing Finance Corp. General Housing Revenue | 5.000% | 12/1/26 | | 5,330 | 6,231 |
| Alaska Housing Finance Corp. General Housing Revenue | 5.000% | 12/1/29 | | 2,000 | 2,306 |
| Alaska Housing Finance Corp. Home Mortgage Revenue VRDO | 0.050% | 11/7/14 | | 10,000 | 10,000 |
| Alaska Municipal Bond Bank Authority Revenue | 5.000% | 2/1/32 | | 4,845 | 5,602 |
| 2 Anchorage AK Electric Utility Revenue | 5.000% | 12/1/26 | | 2,350 | 2,801 |
| 2 Anchorage AK Electric Utility Revenue | 5.000% | 12/1/34 | | 4,500 | 5,143 |
| Matanuska-Susitna Borough AK GO | 5.000% | 3/1/17 | | 3,595 | 3,967 |
| Northern Alaska Tobacco Securitization Corp. Revenue | 4.625% | 6/1/23 | | 12,640 | 12,621 |
| Valdez AK Marine Terminal Revenue (BP Pipelines) | 5.000% | 1/1/16 | | 1,000 | 1,054 |
| Valdez AK Marine Terminal Revenue (BP Pipelines) | 5.000% | 1/1/16 | | 12,755 | 13,448 |
| | | | | | 72,894 |
| Arizona (2.1%) | | | | | |
| Arizona Board Regents Arizona State University System COP | 5.000% | 6/1/20 | (2) | 2,430 | 2,595 |
| Arizona Board Regents Arizona State University System COP | 5.000% | 7/1/20 | (14) | 5,120 | 5,647 |
| Arizona Board Regents Arizona State University System COP | 5.000% | 6/1/21 | (2) | 4,310 | 4,603 |
| Arizona Board Regents Arizona State University System Revenue | 5.000% | 7/1/27 | | 1,115 | 1,308 |
| Arizona Board Regents Arizona State University System Revenue | 6.000% | 7/1/27 | | 1,135 | 1,323 |
| Arizona Board Regents Arizona State University System Revenue | 5.000% | 6/1/28 | | 2,545 | 2,886 |
| Arizona Board Regents Arizona State University System Revenue | 5.000% | 7/1/28 | | 1,000 | 1,167 |
| Arizona Board Regents Arizona State University System Revenue | 5.000% | 6/1/31 | | 1,000 | 1,142 |
| Arizona Board Regents Arizona State University System Revenue | 5.000% | 6/1/32 | | 1,290 | 1,467 |
| Arizona COP | 5.000% | 9/1/25 | (4) | 10,000 | 10,744 |
| Arizona COP | 5.000% | 9/1/27 | (4) | 5,000 | 5,335 |
| Arizona Health Facilities Authority Hospital System Revenue (Phoenix Children’s Hospital) | 5.000% | 2/1/21 | | 3,480 | 4,045 |
| Arizona Health Facilities Authority Hospital System Revenue (Phoenix Children’s Hospital) | 5.000% | 2/1/22 | | 3,100 | 3,617 |
| Arizona Health Facilities Authority Hospital System Revenue (Phoenix Children’s Hospital) | 5.000% | 2/1/23 | | 5,000 | 5,771 |
74
Intermediate-Term Tax-Exempt Fund
| | | | | |
| | | | | Face | Market |
| | | Maturity | | Amount | Value• |
| | Coupon | Date | | ($000) | ($000) |
| Arizona Health Facilities Authority Hospital System Revenue (Phoenix Children’s Hospital) | 5.000% | 2/1/27 | | 6,500 | 7,251 |
| Arizona Health Facilities Authority Revenue (Banner Health) | 5.000% | 1/1/24 | | 10,000 | 11,141 |
| Arizona Health Facilities Authority Revenue (Banner Health) | 5.000% | 1/1/25 | | 7,500 | 8,341 |
| 3 Arizona Health Facilities Authority Revenue (Phoenix Children’s Hospital) PUT | 1.900% | 2/5/20 | | 12,500 | 12,700 |
| Arizona Lottery Revenue | 5.000% | 7/1/22 | (4) | 18,000 | 20,524 |
| Arizona Lottery Revenue | 5.000% | 7/1/24 | (4) | 15,000 | 16,869 |
| Arizona Lottery Revenue | 5.000% | 7/1/25 | (4) | 15,000 | 16,772 |
| Arizona Lottery Revenue | 5.000% | 7/1/26 | (4) | 13,975 | 15,526 |
| Arizona School Facilities Board COP | 5.000% | 9/1/15 | (Prere.) | 34,300 | 35,669 |
| Arizona School Facilities Board COP | 5.000% | 9/1/15 | (Prere.) | 26,755 | 27,823 |
| Arizona School Facilities Board COP | 5.000% | 9/1/16 | | 24,000 | 25,977 |
| Arizona School Facilities Board COP | 5.000% | 9/1/17 | | 21,000 | 23,495 |
| Arizona School Facilities Board COP | 5.000% | 9/1/18 | | 13,000 | 14,861 |
| Arizona School Facilities Board COP | 5.125% | 9/1/21 | | 5,000 | 5,751 |
| Arizona Transportation Board Excise Tax Revenue (Maricopa County Regional Area) | 5.000% | 7/1/18 | | 10,000 | 11,097 |
| Arizona Transportation Board Excise Tax Revenue (Maricopa County Regional Area) | 5.000% | 7/1/19 | | 10,000 | 11,104 |
| Arizona Transportation Board Excise Tax Revenue (Maricopa County Regional Area) | 5.000% | 7/1/20 | | 11,500 | 12,751 |
| Arizona Transportation Board Excise Tax Revenue (Maricopa County Regional Area) | 5.000% | 7/1/21 | | 16,300 | 18,060 |
| Arizona Transportation Board Excise Tax Revenue (Maricopa County Regional Area) | 5.000% | 7/1/22 | | 9,940 | 11,746 |
| Arizona Transportation Board Excise Tax Revenue (Maricopa County Regional Area) | 5.000% | 7/1/24 | | 10,000 | 11,029 |
| Arizona Transportation Board Excise Tax Revenue (Maricopa County Regional Area) | 5.000% | 7/1/25 | | 7,540 | 8,316 |
| Arizona Transportation Board Highway Revenue | 5.000% | 7/1/15 | (Prere.) | 9,460 | 9,766 |
| Arizona Transportation Board Highway Revenue | 5.000% | 7/1/16 | (Prere.) | 10,035 | 10,815 |
| Arizona Transportation Board Highway Revenue | 5.000% | 7/1/22 | | 8,500 | 10,328 |
| Arizona Transportation Board Highway Revenue | 5.000% | 7/1/25 | | 5,000 | 5,676 |
| Arizona Transportation Board Highway Revenue | 5.000% | 7/1/30 | | 5,000 | 5,629 |
| Arizona Transportation Board Highway Revenue | 5.000% | 7/1/32 | | 14,580 | 16,877 |
| Arizona Water Infrastructure Finance Authority Revenue | 5.000% | 10/1/20 | | 3,500 | 4,207 |
| Arizona Water Infrastructure Finance Authority Revenue | 5.000% | 10/1/22 | | 6,000 | 7,362 |
| Chandler AZ GO | 4.000% | 7/1/22 | | 3,390 | 3,874 |
| Chandler AZ GO | 5.000% | 7/1/23 | | 3,400 | 4,203 |
| Chandler AZ GO | 5.000% | 7/1/24 | | 4,250 | 5,321 |
| Glendale AZ Industrial Development Authority Revenue (Midwestern University) | 5.000% | 5/15/18 | | 3,325 | 3,714 |
| Glendale AZ Industrial Development Authority Revenue (Midwestern University) | 5.000% | 5/15/19 | | 2,000 | 2,273 |
| Glendale AZ Industrial Development Authority Revenue (Midwestern University) | 5.000% | 5/15/20 | | 1,500 | 1,726 |
| Glendale AZ Industrial Development Authority Revenue (Midwestern University) | 5.000% | 5/15/21 | | 1,500 | 1,704 |
| Glendale AZ Industrial Development Authority Revenue (Midwestern University) | 5.000% | 5/15/22 | | 3,500 | 3,936 |
| Glendale AZ Industrial Development Authority Revenue (Midwestern University) | 5.000% | 5/15/23 | | 3,805 | 4,250 |
| Glendale AZ Industrial Development Authority Revenue (Midwestern University) | 5.000% | 5/15/25 | | 3,750 | 4,133 |
| Glendale AZ Industrial Development Authority Revenue (Midwestern University) | 5.000% | 5/15/26 | | 2,890 | 3,174 |
| Glendale AZ Industrial Development Authority Revenue (Midwestern University) | 5.000% | 5/15/27 | | 5,000 | 5,486 |
| Glendale AZ Industrial Development Authority Revenue (Midwestern University) | 5.000% | 5/15/30 | | 14,000 | 15,337 |
| Glendale AZ Transportation Excise Tax Revenue | 5.000% | 7/1/23 | (14) | 4,235 | 4,667 |
| Maricopa County AZ Industrial Development Authority Health Facilities Revenue | | | | | |
| (Catholic Healthcare West) | 5.000% | 7/1/16 | | 6,500 | 6,977 |
| Maricopa County AZ Industrial Development Authority Health Facilities Revenue | | | | | |
| (Catholic Healthcare West) | 5.000% | 7/1/17 | | 10,000 | 11,089 |
| Maricopa County AZ Industrial Development Authority Health Facilities Revenue | | | | | |
| (Catholic Healthcare West) | 5.000% | 7/1/18 | | 6,000 | 6,627 |
| Maricopa County AZ Regional Public Transportation Authority Excise Tax Revenue | 5.000% | 7/1/21 | | 6,220 | 7,244 |
| Maricopa County AZ School District No. 28 (Kyrene Elementary) GO | 1.000% | 7/1/20 | | 1,355 | 1,452 |
| Maricopa County AZ School District No. 28 (Kyrene Elementary) GO | 1.000% | 7/1/28 | | 690 | 786 |
| Maricopa County AZ School District No. 28 (Kyrene Elementary) GO | 1.000% | 7/1/29 | | 480 | 555 |
| Maricopa County AZ School District No. 28 (Kyrene Elementary) GO | 1.000% | 7/1/30 | | 375 | 434 |
| Maricopa County AZ Unified School District GO | 5.000% | 7/1/22 | | 8,450 | 10,392 |
| Mesa AZ Excise Tax Revenue | 5.000% | 7/1/27 | | 4,000 | 4,399 |
| Mesa AZ Utility System Revenue | 5.000% | 7/1/19 | (14) | 10,000 | 11,719 |
| Mesa AZ Utility System Revenue | 5.000% | 7/1/21 | (14) | 11,900 | 14,299 |
| 1 Mesa AZ Utility System Revenue TOB VRDO | 0.060% | 11/7/14 | | 6,500 | 6,500 |
| Phoenix AZ Civic Improvement Corp. Airport Revenue | 5.000% | 7/1/23 | | 5,000 | 5,653 |
| Phoenix AZ Civic Improvement Corp. Airport Revenue | 5.000% | 7/1/24 | | 2,235 | 2,527 |
| Phoenix AZ Civic Improvement Corp. Airport Revenue | 5.000% | 7/1/27 | | 9,530 | 10,688 |
| Phoenix AZ Civic Improvement Corp. Airport Revenue | 5.000% | 7/1/28 | | 9,555 | 10,877 |
| Phoenix AZ Civic Improvement Corp. Airport Revenue | 5.000% | 7/1/30 | | 13,330 | 15,053 |
| Phoenix AZ Civic Improvement Corp. Excise Tax Revenue | 5.000% | 7/1/20 | | 5,165 | 5,742 |
| Phoenix AZ Civic Improvement Corp. Excise Tax Revenue | 5.000% | 7/1/22 | (14) | 5,420 | 5,796 |
| Phoenix AZ Civic Improvement Corp. Excise Tax Revenue | 4.750% | 7/1/24 | | 7,805 | 8,562 |
| Phoenix AZ Civic Improvement Corp. Wastewater System Revenue | 5.500% | 7/1/24 | | 2,500 | 2,889 |
| Phoenix AZ Civic Improvement Corp. Water System Revenue | 5.000% | 7/1/21 | (14) | 4,200 | 4,332 |
| Phoenix AZ GO | 5.000% | 7/1/20 | | 5,150 | 5,734 |
| Pima County AZ Industrial Development Authority Revenue (Tucson Electric Power Co. Project) | 4.000% | 9/1/29 | | 12,000 | 12,256 |
75
Intermediate-Term Tax-Exempt Fund
| | | | | |
| | | | | Face | Market |
| | | Maturity | | Amount | Value• |
| | Coupon | Date | | ($000) | ($000) |
| Pima County AZ Regional Transportation Authority Excise Tax Revenue | 5.000% | 6/1/22 | | 3,000 | 3,649 |
| Pima County AZ Regional Transportation Authority Excise Tax Revenue | 5.000% | 6/1/23 | | 3,500 | 4,272 |
| Pima County AZ Regional Transportation Authority Excise Tax Revenue | 5.000% | 6/1/26 | | 3,590 | 4,285 |
| Regional Public Transportation Authority Arizona Excise Tax Revenue | | | | | |
| (Maricopa County Public Transportation) | 5.250% | 7/1/22 | | 2,000 | 2,470 |
| Regional Public Transportation Authority Arizona Excise Tax Revenue | | | | | |
| (Maricopa County Public Transportation) | 5.250% | 7/1/23 | | 1,000 | 1,246 |
| Regional Public Transportation Authority Arizona Excise Tax Revenue | | | | | |
| (Maricopa County Public Transportation) | 5.250% | 7/1/25 | | 1,000 | 1,246 |
| Salt River Project Arizona Agricultural Improvement & Power District Revenue | 5.000% | 1/1/22 | | 4,350 | 5,035 |
| Salt River Project Arizona Agricultural Improvement & Power District Revenue | 5.000% | 1/1/27 | | 10,000 | 11,217 |
| Salt River Project Arizona Agricultural Improvement & Power District Revenue | 5.000% | 1/1/28 | | 2,750 | 3,048 |
| Salt River Project Arizona Agricultural Improvement & Power District Revenue | 5.000% | 12/1/30 | | 2,095 | 2,445 |
| Salt River Project Arizona Agricultural Improvement & Power District Revenue | 5.000% | 1/1/35 | | 7,250 | 7,564 |
| Salt Verde AZ Financial Corp. Gas Revenue | 5.250% | 12/1/19 | | 25 | 29 |
| Salt Verde AZ Financial Corp. Gas Revenue | 5.250% | 12/1/21 | | 3,770 | 4,396 |
| Salt Verde AZ Financial Corp. Gas Revenue | 5.250% | 12/1/22 | | 3,965 | 4,641 |
| Salt Verde AZ Financial Corp. Gas Revenue | 5.250% | 12/1/23 | | 8,370 | 9,836 |
| Salt Verde AZ Financial Corp. Gas Revenue | 5.250% | 12/1/24 | | 4,510 | 5,340 |
| Salt Verde AZ Financial Corp. Gas Revenue | 5.250% | 12/1/25 | | 19,125 | 22,660 |
| Salt Verde AZ Financial Corp. Gas Revenue | 5.250% | 12/1/26 | | 2,725 | 3,245 |
| Salt Verde AZ Financial Corp. Gas Revenue | 5.250% | 12/1/28 | | 270 | 322 |
| Scottsdale AZ GO | 5.000% | 7/1/22 | | 3,000 | 3,683 |
| Scottsdale AZ Municipal Property Corp. Excise Tax Revenue | 5.000% | 7/1/16 | (Prere.) | 6,850 | 7,382 |
| Scottsdale AZ Municipal Property Corp. Excise Tax Revenue | 5.000% | 7/1/16 | (Prere.) | 7,280 | 7,846 |
| Scottsdale AZ Municipal Property Corp. Excise Tax Revenue | 5.000% | 7/1/16 | (Prere.) | 5,710 | 6,154 |
| Scottsdale AZ Municipal Property Corp. Excise Tax Revenue | 5.000% | 7/1/22 | | 12,415 | 15,174 |
| Tucson AZ GO | 5.000% | 7/1/26 | (12) | 1,000 | 1,094 |
| Tucson AZ GO | 5.000% | 7/1/29 | (12) | 1,000 | 1,084 |
| University Medical Center Corp. Arizona Hospital Revenue | 6.250% | 7/1/29 | | 1,500 | 1,743 |
| Yuma AZ Industrial Development Authority Hospital Revenue (Yuma Regional Medical Center) | 5.000% | 8/1/24 | | 1,200 | 1,401 |
| Yuma AZ Industrial Development Authority Hospital Revenue (Yuma Regional Medical Center) | 5.000% | 8/1/25 | | 1,250 | 1,451 |
| Yuma AZ Industrial Development Authority Hospital Revenue (Yuma Regional Medical Center) | 5.000% | 8/1/32 | | 1,000 | 1,128 |
| Yuma AZ Industrial Development Authority Hospital Revenue (Yuma Regional Medical Center) | 5.250% | 8/1/32 | | 1,500 | 1,727 |
| | | | | | 832,306 |
| Arkansas (0.1%) | | | | | |
| University of Arkansas Revenue (Fayetteville Campus) | 5.000% | 11/1/22 | | 2,000 | 2,433 |
| University of Arkansas Revenue (Fayetteville Campus) | 5.000% | 11/1/23 | | 1,280 | 1,570 |
| University of Arkansas Revenue (Fayetteville Campus) | 5.000% | 11/1/25 | | 1,815 | 2,113 |
| University of Arkansas Revenue (Fayetteville Campus) | 5.000% | 11/1/25 | | 2,000 | 2,432 |
| University of Arkansas Revenue (Fayetteville Campus) | 5.000% | 11/1/26 | | 1,075 | 1,244 |
| University of Arkansas Revenue (Fayetteville Campus) | 5.000% | 11/1/26 | | 2,190 | 2,644 |
| University of Arkansas Revenue (Fayetteville Campus) | 5.000% | 11/1/27 | | 1,695 | 1,952 |
| University of Arkansas Revenue (Fayetteville Campus) | 5.000% | 11/1/28 | | 3,210 | 3,819 |
| University of Arkansas Revenue (Fayetteville Campus) | 5.000% | 11/1/29 | | 3,355 | 3,982 |
| University of Arkansas Revenue (Fayetteville Campus) | 5.000% | 11/1/30 | | 2,555 | 3,026 |
| University of Arkansas Revenue (UAMS Campus) | 5.000% | 11/1/27 | | 1,000 | 1,198 |
| University of Arkansas Revenue (UAMS Campus) | 5.000% | 11/1/28 | | 3,000 | 3,559 |
| University of Arkansas Revenue (UAMS Campus) | 5.000% | 11/1/29 | | 1,970 | 2,328 |
| University of Arkansas Revenue (UAMS Campus) | 5.000% | 11/1/30 | | 2,000 | 2,351 |
| | | | | | 34,651 |
| California (12.1%) | | | | | |
| ABAG Finance Authority for Nonprofit Corps. California Revenue (Jackson Laboratory) | 5.000% | 7/1/27 | | 1,375 | 1,551 |
| ABAG Finance Authority for Nonprofit Corps. California Revenue (Jackson Laboratory) | 5.000% | 7/1/29 | | 2,795 | 3,102 |
| Alameda CA Corridor Transportation Authority Revenue | 5.000% | 3/1/21 | | 3,250 | 3,949 |
| Alameda County CA Joint Powers Authority Lease Revenue | 5.250% | 12/1/27 | | 3,000 | 3,597 |
| Alameda County CA Joint Powers Authority Lease Revenue | 5.250% | 12/1/28 | | 6,165 | 7,358 |
| Alameda County CA Joint Powers Authority Lease Revenue | 5.000% | 12/1/30 | | 12,395 | 14,385 |
| Anaheim CA Public Financing Authority Revenue (Electric System) | 5.250% | 10/1/28 | | 5,030 | 5,950 |
| Anaheim CA Public Financing Authority Revenue (Electric System) | 5.250% | 10/1/29 | | 5,300 | 6,266 |
| Antelope Valley-East Kern CA Water Agency COP VRDO | 0.040% | 11/7/14 | LOC | 29,150 | 29,150 |
| Bay Area Toll Authority California Toll Bridge Revenue (San Francisco Bay Area) | 5.000% | 4/1/16 | (Prere.) | 20,195 | 21,540 |
| Bay Area Toll Authority California Toll Bridge Revenue (San Francisco Bay Area) | 5.000% | 4/1/16 | (Prere.) | 26,400 | 28,159 |
| Bay Area Toll Authority California Toll Bridge Revenue (San Francisco Bay Area) | 5.000% | 4/1/17 | (Prere.) | 7,000 | 7,754 |
| 3 Bay Area Toll Authority California Toll Bridge Revenue (San Francisco Bay Area) PUT | 0.950% | 5/1/23 | | 13,500 | 13,529 |
| Beverly Hills CA Unified School District GO | 0.000% | 8/1/28 | | 5,000 | 3,289 |
| Beverly Hills CA Unified School District GO | 0.000% | 8/1/29 | | 8,000 | 5,038 |
| California Department of Water Resources Power Supply Revenue | 5.000% | 5/1/16 | | 7,790 | 8,340 |
| California Department of Water Resources Power Supply Revenue | 5.000% | 5/1/16 | | 5,000 | 5,353 |
| California Department of Water Resources Power Supply Revenue | 5.000% | 5/1/20 | | 20,000 | 24,042 |
| California Department of Water Resources Power Supply Revenue | 5.000% | 5/1/21 | | 20,000 | 23,936 |
76
Intermediate-Term Tax-Exempt Fund
| | | | | |
| | | | | Face | Market |
| | | Maturity | | Amount | Value• |
| | Coupon | Date | | ($000) | ($000) |
| California Department of Water Resources Power Supply Revenue | 5.000% | 5/1/21 | | 20,000 | 22,908 |
| California Department of Water Resources Power Supply Revenue | 5.000% | 5/1/22 | | 19,250 | 22,020 |
| California Department of Water Resources Power Supply Revenue | 5.000% | 5/1/22 | | 10,000 | 11,968 |
| California Department of Water Resources Water System Revenue (Central Valley Project) | 5.000% | 12/1/14 | | 2,000 | 2,008 |
| California Department of Water Resources Water System Revenue (Central Valley Project) | 5.000% | 12/1/14 | | 3,070 | 3,083 |
| California Department of Water Resources Water System Revenue (Central Valley Project) | 5.000% | 12/1/16 | | 2,695 | 2,957 |
| California Department of Water Resources Water System Revenue (Central Valley Project) | 5.000% | 12/1/16 | | 5,000 | 5,485 |
| California Department of Water Resources Water System Revenue (Central Valley Project) | 5.000% | 12/1/23 | | 15,000 | 18,802 |
| California Department of Water Resources Water System Revenue (Central Valley Project) | 5.000% | 12/1/24 | | 10,000 | 12,681 |
| California Department of Water Resources Water System Revenue (Central Valley Project) | 5.000% | 12/1/28 | | 15,000 | 18,399 |
| California Department of Water Resources Water System Revenue (Central Valley Project) | 5.000% | 12/1/29 | | 2,500 | 3,051 |
| California Economic Recovery GO | 5.000% | 7/1/19 | (Prere.) | 20,000 | 23,518 |
| California Economic Recovery GO | 5.250% | 7/1/21 | | 50,000 | 58,976 |
| California GO | 5.000% | 3/1/15 | | 6,000 | 6,098 |
| California GO | 5.000% | 3/1/15 | (Prere.) | 4,785 | 4,862 |
| California GO | 5.000% | 6/1/15 | (Prere.) | 3,000 | 3,085 |
| California GO | 6.000% | 2/1/16 | | 1,500 | 1,608 |
| California GO | 5.000% | 4/1/16 | | 10,000 | 10,667 |
| California GO | 5.000% | 9/1/16 | | 8,000 | 8,681 |
| California GO | 5.000% | 3/1/17 | | 3,000 | 3,312 |
| California GO | 5.000% | 4/1/17 | | 13,050 | 14,447 |
| 3 California GO | 0.800% | 5/1/17 | | 3,500 | 3,535 |
| California GO | 5.000% | 10/1/17 | | 20,000 | 22,503 |
| California GO | 5.500% | 4/1/18 | | 30,000 | 34,705 |
| California GO | 6.000% | 4/1/18 | | 11,480 | 13,490 |
| California GO | 5.000% | 9/1/18 | | 33,800 | 36,707 |
| California GO | 5.000% | 12/1/18 | | 85 | 85 |
| California GO | 5.000% | 4/1/20 | | 18,000 | 20,892 |
| California GO | 5.000% | 8/1/20 | | 18,970 | 20,712 |
| California GO | 5.000% | 11/1/20 | (14) | 5,000 | 5,630 |
| California GO | 5.000% | 12/1/21 | | 16,365 | 18,363 |
| California GO | 5.000% | 3/1/22 | | 6,375 | 6,770 |
| California GO | 5.000% | 3/1/22 | (2) | 4,440 | 4,510 |
| California GO | 5.250% | 10/1/22 | | 15,000 | 17,876 |
| California GO | 5.000% | 3/1/23 | | 36,120 | 36,680 |
| California GO | 5.000% | 3/1/23 | | 29,000 | 30,784 |
| California GO | 5.000% | 9/1/23 | | 9,770 | 11,958 |
| California GO | 5.000% | 10/1/23 | | 3,000 | 3,675 |
| California GO | 5.000% | 12/1/23 | | 34,000 | 41,731 |
| California GO | 5.000% | 3/1/24 | | 30,115 | 31,963 |
| California GO | 5.000% | 5/1/24 | | 35,000 | 43,035 |
| California GO | 5.000% | 10/1/24 | | 19,500 | 22,092 |
| California GO | 5.000% | 10/1/24 | | 10,500 | 12,982 |
| California GO | 5.000% | 12/1/24 | | 5,640 | 6,868 |
| California GO | 5.000% | 10/1/25 | | 20,000 | 23,803 |
| California GO | 5.000% | 12/1/25 | | 5,490 | 6,602 |
| California GO | 5.500% | 8/1/26 | | 23,665 | 27,566 |
| California GO | 5.000% | 10/1/26 | | 31,140 | 36,750 |
| California GO | 5.000% | 10/1/27 | | 11,250 | 13,200 |
| California GO | 5.250% | 10/1/27 | | 26,440 | 31,700 |
| California GO | 5.000% | 11/1/27 | | 17,380 | 20,570 |
| California GO | 5.000% | 2/1/28 | | 12,500 | 14,573 |
| California GO | 5.000% | 11/1/28 | | 9,175 | 10,819 |
| California GO | 5.000% | 12/1/28 | | 3,575 | 4,221 |
| California GO | 5.750% | 4/1/29 | | 2,395 | 2,848 |
| California GO | 5.250% | 9/1/29 | | 10,460 | 12,543 |
| California GO | 5.000% | 10/1/29 | | 27,000 | 30,734 |
| California GO | 5.000% | 10/1/29 | | 4,445 | 4,942 |
| California GO | 5.000% | 10/1/29 | | 15,000 | 17,854 |
| California GO | 5.250% | 3/1/30 | | 29,500 | 34,359 |
| California GO | 5.000% | 5/1/30 | | 30,000 | 35,335 |
| California GO | 5.250% | 9/1/30 | | 25,480 | 30,422 |
| California GO | 5.750% | 4/1/31 | | 79,190 | 93,594 |
| California GO | 5.000% | 10/1/31 | | 29,000 | 34,188 |
| California GO | 5.000% | 2/1/32 | | 50,640 | 58,190 |
| California GO | 5.000% | 10/1/32 | | 28,000 | 32,903 |
| California GO | 5.000% | 2/1/33 | | 79,605 | 91,035 |
| California GO | 6.500% | 4/1/33 | | 54,500 | 66,678 |
| California GO | 5.000% | 10/1/33 | | 6,000 | 7,011 |
| California GO | 5.000% | 10/1/34 | | 10,000 | 11,648 |
| California GO PUT | 3.000% | 12/1/19 | | 6,000 | 6,468 |
77
Intermediate-Term Tax-Exempt Fund
| | | | | |
| | | | | Face | Market |
| | | Maturity | | Amount | Value• |
| | Coupon | Date | | ($000) | ($000) |
| 1 California GO TOB VRDO | 0.190% | 11/7/14 | (4) | 11,000 | 11,000 |
| California GO VRDO | 0.040% | 11/7/14 | LOC | 43,000 | 43,000 |
| California Health Facilities Financing Authority Revenue (Catholic Healthcare West) | 5.125% | 7/1/15 | (Prere.) | 5,790 | 5,980 |
| California Health Facilities Financing Authority Revenue (Catholic Healthcare West) | 5.250% | 3/1/27 | | 19,000 | 21,648 |
| California Health Facilities Financing Authority Revenue (Catholic Healthcare West) | 5.250% | 3/1/28 | | 9,160 | 10,363 |
| California Health Facilities Financing Authority Revenue (Catholic Healthcare West) VRDO | 0.060% | 11/7/14 | LOC | 14,200 | 14,200 |
| California Health Facilities Financing Authority Revenue (Cedars-Sinai Medical Center) | 5.000% | 11/15/17 | | 8,000 | 8,385 |
| California Health Facilities Financing Authority Revenue (Cedars-Sinai Medical Center) | 5.000% | 11/15/19 | | 3,135 | 3,285 |
| California Health Facilities Financing Authority Revenue (Cedars-Sinai Medical Center) | 5.000% | 11/15/20 | | 4,180 | 4,377 |
| California Health Facilities Financing Authority Revenue (Cedars-Sinai Medical Center) | 5.000% | 11/15/21 | | 6,165 | 6,450 |
| California Health Facilities Financing Authority Revenue (Children’s Hospital of Los Angeles) | 5.000% | 11/15/25 | | 5,000 | 5,525 |
| California Health Facilities Financing Authority Revenue (Children’s Hospital of Los Angeles) | 5.000% | 11/15/26 | | 5,000 | 5,488 |
| California Health Facilities Financing Authority Revenue (Children’s Hospital of Los Angeles) | 5.000% | 11/15/27 | | 3,845 | 4,209 |
| California Health Facilities Financing Authority Revenue (City of Hope Medical Center) | 5.000% | 11/15/26 | | 2,430 | 2,801 |
| 1 California Health Facilities Financing Authority Revenue (Dignity Health) TOB VRDO | 0.150% | 11/7/14 | LOC | 13,000 | 13,000 |
| California Health Facilities Financing Authority Revenue | | | | | |
| (Lucile Salter Packard Children’s Hospital at Stanford) PUT | 1.450% | 3/15/17 | | 4,000 | 4,086 |
| California Health Facilities Financing Authority Revenue | | | | | |
| (Lucile Salter Packard Children’s Hospital at Stanford) PUT | 1.450% | 3/15/17 | | 5,000 | 5,108 |
| 1 California Health Facilities Financing Authority Revenue | | | | | |
| (Lucile Salter Packard Children’s Hospital at Stanford) TOB VRDO | 0.080% | 11/7/14 | | 650 | 650 |
| California Health Facilities Financing Authority Revenue (Providence Health & Services) | 5.000% | 10/1/27 | | 6,380 | 7,618 |
| California Health Facilities Financing Authority Revenue (Scripps Health) | 5.000% | 10/1/19 | | 8,080 | 9,384 |
| California Health Facilities Financing Authority Revenue (Scripps Health) | 5.500% | 10/1/20 | | 4,000 | 4,701 |
| California Health Facilities Financing Authority Revenue (Scripps Health) | 5.000% | 10/1/21 | | 7,110 | 8,219 |
| California Health Facilities Financing Authority Revenue (Scripps Health) | 5.000% | 10/1/22 | | 3,250 | 3,753 |
| California Health Facilities Financing Authority Revenue (St. Joseph Health System) | 5.250% | 7/1/21 | | 25,980 | 30,285 |
| California Health Facilities Financing Authority Revenue (St. Joseph Health System) | 5.500% | 7/1/29 | | 15,000 | 17,415 |
| California Health Facilities Financing Authority Revenue (St. Joseph Health System) | 5.000% | 7/1/33 | | 4,250 | 4,884 |
| California Health Facilities Financing Authority Revenue (St. Joseph Health System) PUT | 5.000% | 10/15/20 | | 12,500 | 14,874 |
| California Health Facilities Financing Authority Revenue (Sutter Health) | 5.000% | 8/15/15 | | 7,550 | 7,843 |
| California Health Facilities Financing Authority Revenue (Sutter Health) | 5.500% | 8/15/16 | | 5,000 | 5,467 |
| California Health Facilities Financing Authority Revenue (Sutter Health) | 5.500% | 8/15/17 | | 5,100 | 5,813 |
| California Health Facilities Financing Authority Revenue (Sutter Health) | 5.500% | 8/15/26 | | 4,500 | 5,368 |
| California Health Facilities Financing Authority Revenue (Sutter Health) | 5.875% | 8/15/31 | | 10,000 | 12,041 |
| 1 California Infrastructure & Economic Development Bank Revenue | | | | | |
| (Bay Area Toll Bridges Seismic Retrofit) TOB VRDO | 0.070% | 11/3/14 | (ETM) | 20,760 | 20,760 |
| 3 California Infrastructure & Economic Development Bank Revenue (J. Paul Getty Trust) PUT | 0.330% | 4/1/16 | | 18,000 | 18,002 |
| California Municipal Finance Authority | | | | | |
| (Community Hospitals of Central California Obligated Group) COP | 5.000% | 2/1/15 | | 1,615 | 1,632 |
| California Municipal Finance Authority | | | | | |
| (Community Hospitals of Central California Obligated Group) COP | 5.000% | 2/1/16 | | 2,070 | 2,179 |
| California Municipal Finance Authority | | | | | |
| (Community Hospitals of Central California Obligated Group) COP | 5.000% | 2/1/20 | | 1,575 | 1,740 |
| California Municipal Finance Authority | | | | | |
| (Community Hospitals of Central California Obligated Group) COP | 5.000% | 2/1/21 | | 1,740 | 1,896 |
| California Municipal Finance Authority | | | | | |
| (Community Hospitals of Central California Obligated Group) COP | 5.250% | 2/1/24 | | 5,000 | 5,430 |
| California Municipal Finance Authority Revenue (University of La Verne) | 5.750% | 6/1/25 | | 8,525 | 9,694 |
| California Municipal Finance Authority Revenue (University of La Verne) | 6.125% | 6/1/30 | | 3,000 | 3,541 |
| California Public Works Board Lease Revenue (Department of Corrections) | 5.250% | 1/1/16 | (2) | 5,265 | 5,571 |
| California Public Works Board Lease Revenue (Department of Corrections) | 5.000% | 6/1/25 | | 3,100 | 3,111 |
| California Public Works Board Lease Revenue (Department of Corrections) | 5.000% | 6/1/27 | | 7,420 | 8,663 |
| California Public Works Board Lease Revenue (Department of Corrections) | 5.250% | 10/1/27 | | 1,325 | 1,611 |
| California Public Works Board Lease Revenue (Department of General Services) | 6.125% | 4/1/28 | | 5,000 | 6,027 |
| California Public Works Board Lease Revenue (Department of General Services) | 6.125% | 4/1/29 | | 2,000 | 2,421 |
| California Public Works Board Lease Revenue (Department of State Hospitals) | 5.000% | 6/1/27 | | 5,000 | 5,836 |
| California Public Works Board Lease Revenue (Judicial Council Projects) | 5.000% | 10/1/23 | | 750 | 913 |
| California Public Works Board Lease Revenue (Judicial Council Projects) | 5.000% | 10/1/24 | | 900 | 1,102 |
| California Public Works Board Lease Revenue (Judicial Council Projects) | 5.000% | 12/1/24 | | 10,000 | 11,903 |
| California Public Works Board Lease Revenue (Judicial Council Projects) | 5.250% | 12/1/25 | | 7,000 | 8,406 |
| California Public Works Board Lease Revenue (Judicial Council Projects) | 5.250% | 12/1/26 | | 5,000 | 6,045 |
| California Public Works Board Lease Revenue (Judicial Council Projects) | 5.000% | 3/1/27 | | 3,120 | 3,632 |
| California Public Works Board Lease Revenue (Judicial Council Projects) | 5.000% | 12/1/27 | | 13,000 | 15,230 |
| California Public Works Board Lease Revenue (Judicial Council Projects) | 5.000% | 12/1/28 | | 8,000 | 9,353 |
| California Public Works Board Lease Revenue (Judicial Council Projects) | 5.000% | 3/1/29 | | 4,250 | 4,889 |
| California Public Works Board Lease Revenue (Judicial Council Projects) | 5.000% | 12/1/29 | | 10,705 | 12,447 |
| California Public Works Board Lease Revenue (Judicial Council Projects) | 5.000% | 3/1/30 | | 3,930 | 4,506 |
| California Public Works Board Lease Revenue (Judicial Council Projects) | 5.000% | 3/1/31 | | 5,000 | 5,709 |
| California Public Works Board Lease Revenue (Judicial Council Projects) | 5.000% | 3/1/33 | | 3,350 | 3,793 |
| California Public Works Board Lease Revenue (Regents of The University of California) | 5.000% | 5/1/15 | (ETM) | 9,980 | 10,221 |
78
Intermediate-Term Tax-Exempt Fund
| | | | | |
| | | | | Face | Market |
| | | Maturity | | Amount | Value• |
| | Coupon | Date | | ($000) | ($000) |
| California Public Works Board Lease Revenue (Regents of The University of California) | 5.000% | 5/1/15 | (Prere.) | 8,750 | 8,961 |
| California Public Works Board Lease Revenue (Regents of The University of California) | 5.000% | 5/1/15 | (Prere.) | 4,985 | 5,105 |
| California Public Works Board Lease Revenue (Regents of The University of California) | 5.000% | 5/1/15 | (Prere.) | 5,700 | 5,838 |
| California Public Works Board Lease Revenue (Regents of The University of California) | 5.000% | 5/1/15 | (Prere.) | 11,820 | 12,106 |
| California Public Works Board Lease Revenue (Regents of The University of California) | 5.000% | 5/1/15 | (Prere.) | 10,000 | 10,242 |
| California Public Works Board Lease Revenue (Regents of The University of California) | 5.000% | 5/1/15 | (Prere.) | 15,230 | 15,598 |
| California Public Works Board Lease Revenue (Regents of The University of California) | 5.000% | 5/1/15 | (Prere.) | 15,235 | 15,603 |
| California Public Works Board Lease Revenue (Regents of The University of California) | 5.000% | 5/1/15 | (Prere.) | 8,765 | 8,977 |
| California Public Works Board Lease Revenue (Regents of The University of California) | 5.000% | 5/1/15 | (Prere.) | 9,650 | 9,883 |
| California Public Works Board Lease Revenue (Regents of The University of California) | 5.000% | 5/1/15 | (Prere.) | 7,500 | 7,681 |
| California Public Works Board Lease Revenue (Regents of The University of California) | 5.000% | 12/1/21 | (Prere.) | 8,145 | 9,997 |
| California Public Works Board Lease Revenue (Various Capital Projects) | 5.000% | 4/1/20 | | 2,700 | 3,188 |
| California Public Works Board Lease Revenue (Various Capital Projects) | 5.000% | 12/1/21 | (Prere.) | 10,000 | 12,274 |
| California Public Works Board Lease Revenue (Various Capital Projects) | 6.250% | 11/1/24 | | 13,665 | 16,836 |
| California Public Works Board Lease Revenue (Various Capital Projects) | 5.000% | 4/1/27 | | 3,075 | 3,582 |
| California Public Works Board Lease Revenue (Various Capital Projects) | 5.500% | 11/1/30 | | 2,495 | 3,041 |
| California Public Works Board Lease Revenue (Various Capital Projects) | 5.125% | 10/1/31 | | 4,250 | 4,914 |
| California Public Works Board Lease Revenue (Various Capital Projects) | 5.000% | 4/1/32 | | 9,650 | 11,056 |
| California State University Revenue Systemwide | 5.000% | 11/1/26 | | 14,775 | 17,012 |
| California State University Revenue Systemwide | 5.750% | 11/1/27 | | 5,000 | 5,953 |
| California State University Revenue Systemwide | 5.250% | 11/1/28 | | 7,395 | 8,818 |
| California State University Revenue Systemwide | 5.250% | 11/1/29 | | 7,790 | 9,260 |
| California State University Revenue Systemwide | 5.000% | 11/1/30 | | 24,850 | 29,806 |
| California State University Revenue Systemwide | 5.250% | 11/1/30 | | 7,960 | 9,419 |
| California State University Revenue Systemwide | 5.000% | 11/1/31 | | 21,630 | 25,714 |
| California State University Revenue Systemwide | 5.250% | 11/1/31 | | 4,000 | 4,705 |
| California State University Revenue Systemwide | 5.000% | 11/1/32 | | 10,000 | 11,831 |
| California State University Revenue Systemwide | 5.000% | 11/1/33 | | 20,000 | 23,566 |
| California State University Revenue Systemwide | 5.000% | 11/1/34 | | 24,190 | 28,389 |
| California State University Revenue Systemwide | 5.000% | 11/1/35 | | 4,355 | 5,086 |
| California Statewide Communities Development Authority Revenue | | | | | |
| (Daughters of Charity Health System) | 5.250% | 7/1/24 | | 4,465 | 4,431 |
| California Statewide Communities Development Authority Revenue (Kaiser Permanente) | 5.000% | 4/1/16 | | 36,970 | 39,386 |
| California Statewide Communities Development Authority Revenue (Kaiser Permanente) VRDO | 0.040% | 11/7/14 | | 21,100 | 21,100 |
| Cerritos CA Community College District GO | 0.000% | 8/1/28 | | 1,000 | 618 |
| Cerritos CA Community College District GO | 5.250% | 8/1/28 | | 3,540 | 4,114 |
| Cerritos CA Community College District GO | 5.250% | 8/1/29 | | 3,160 | 3,666 |
| Cerritos CA Community College District GO | 0.000% | 8/1/30 | | 1,850 | 1,005 |
| Cerritos CA Community College District GO | 5.250% | 8/1/30 | | 4,235 | 4,905 |
| Cerritos CA Community College District GO | 0.000% | 8/1/31 | | 1,000 | 513 |
| Chabot-Las Positas CA Community College District GO | 5.000% | 8/1/27 | | 7,000 | 8,317 |
| Chabot-Las Positas CA Community College District GO | 5.000% | 8/1/30 | | 15,000 | 17,570 |
| Chabot-Las Positas CA Community College District GO | 5.000% | 8/1/31 | | 5,000 | 5,831 |
| Chabot-Las Positas CA Community College District GO | 5.000% | 8/1/32 | | 17,000 | 19,784 |
| Chaffey CA Community College District GO | 5.000% | 6/1/24 | | 1,120 | 1,391 |
| Chaffey CA Community College District GO | 5.000% | 6/1/29 | | 1,250 | 1,498 |
| Chaffey CA Community College District GO | 5.000% | 6/1/30 | | 2,000 | 2,381 |
| Contra Costa CA Community College District GO | 5.000% | 8/1/29 | | 2,000 | 2,370 |
| Contra Costa CA Community College District GO | 5.000% | 8/1/30 | | 3,000 | 3,532 |
| Contra Costa CA Community College District GO | 5.000% | 8/1/34 | | 4,000 | 4,642 |
| Contra Costa CA Transportation Authority Sales Tax Revenue | 5.000% | 3/1/25 | | 2,000 | 2,378 |
| Cupertino CA Union School District GO | 5.000% | 8/1/30 | | 2,000 | 2,428 |
| Cupertino CA Union School District GO | 5.000% | 8/1/34 | | 2,000 | 2,382 |
| Cupertino CA Union School District GO | 5.000% | 8/1/35 | | 5,000 | 5,923 |
| Cupertino CA Union School District GO | 5.000% | 8/1/35 | | 1,000 | 1,151 |
| 3 East Bay CA Municipal Utility District Waste Water System Revenue PUT | 0.370% | 7/8/15 | | 3,475 | 3,474 |
| East Bay CA Municipal Utility District Water System Revenue | 5.000% | 6/1/31 | | 2,410 | 2,905 |
| East Bay CA Municipal Utility District Water System Revenue | 5.000% | 6/1/32 | | 4,000 | 4,802 |
| East Bay CA Municipal Utility District Water System Revenue | 5.000% | 6/1/33 | | 5,000 | 5,970 |
| East Side CA Union High School District Santa Clara County GO | 5.000% | 8/1/26 | | 2,500 | 2,961 |
| East Side CA Union High School District Santa Clara County GO | 5.000% | 8/1/27 | | 2,000 | 2,349 |
| East Side CA Union High School District Santa Clara County GO | 5.000% | 8/1/28 | | 3,000 | 3,501 |
| East Side CA Union High School District Santa Clara County GO | 5.000% | 8/1/28 | | 2,655 | 3,061 |
| El Dorado CA Irrigation District Revenue | 5.000% | 3/1/22 | (4) | 1,035 | 1,241 |
| El Dorado CA Irrigation District Revenue | 5.000% | 3/1/23 | (4) | 1,750 | 2,069 |
| El Dorado CA Irrigation District Revenue | 5.000% | 3/1/24 | (4) | 1,000 | 1,172 |
| El Dorado CA Irrigation District Revenue | 5.000% | 3/1/25 | (4) | 1,000 | 1,161 |
| El Dorado CA Irrigation District Revenue | 5.000% | 3/1/26 | (4) | 2,485 | 2,857 |
| El Dorado CA Irrigation District Revenue | 5.000% | 3/1/27 | (4) | 2,110 | 2,399 |
| El Dorado CA Irrigation District Revenue | 5.000% | 3/1/28 | (4) | 2,000 | 2,263 |
| El Dorado CA Irrigation District Revenue | 5.000% | 3/1/34 | (4) | 3,060 | 3,493 |
79
Intermediate-Term Tax-Exempt Fund
| | | | | |
| | | | | Face | Market |
| | | Maturity | | Amount | Value• |
| | Coupon | Date | | ($000) | ($000) |
| El Monte CA High School District GO | 5.500% | 6/1/27 | (12) | 2,630 | 3,063 |
| El Monte CA High School District GO | 5.500% | 6/1/28 | (12) | 2,355 | 2,729 |
| El Segundo CA Unified School District GO | 0.000% | 8/1/28 | | 2,705 | 1,619 |
| El Segundo CA Unified School District GO | 0.000% | 8/1/29 | | 8,655 | 4,924 |
| El Segundo CA Unified School District GO | 0.000% | 8/1/30 | | 9,160 | 4,849 |
| Folsom Cordova CA Unified School District School Facilities Improvement District No. 3 GO | 0.000% | 10/1/23 | (14) | 2,875 | 2,079 |
| Folsom Cordova CA Unified School District School Facilities Improvement District No. 3 GO | 0.000% | 10/1/24 | (14) | 1,700 | 1,170 |
| Folsom Cordova CA Unified School District School Facilities Improvement District No. 3 GO | 0.000% | 10/1/25 | (14) | 2,055 | 1,344 |
| Folsom Cordova CA Unified School District School Facilities Improvement District No. 3 GO | 0.000% | 10/1/26 | (14) | 2,985 | 1,833 |
| Folsom Cordova CA Unified School District School Facilities Improvement District No. 3 GO | 0.000% | 10/1/28 | (14) | 2,875 | 1,580 |
| Foothill/Eastern Transportation Corridor Agency California Toll Road Revenue | 0.000% | 1/15/28 | | 20,090 | 13,084 |
| Foothill/Eastern Transportation Corridor Agency California Toll Road Revenue | 0.000% | 1/15/29 | | 2,000 | 1,311 |
| Foothill/Eastern Transportation Corridor Agency California Toll Road Revenue | 6.250% | 1/15/33 | | 2,000 | 2,360 |
| Foothill/Eastern Transportation Corridor Agency California Toll Road Revenue PUT | 5.500% | 1/15/23 | | 40,500 | 46,965 |
| Fresno CA Sewer Revenue | 5.000% | 9/1/25 | (12) | 2,275 | 2,598 |
| Fresno CA Sewer Revenue | 5.000% | 9/1/26 | (12) | 7,425 | 8,428 |
| Fresno CA Sewer Revenue | 5.000% | 9/1/27 | (12) | 7,835 | 8,808 |
| Gilroy CA Unified School District GO | 0.000% | 8/1/30 | (ETM) | 255 | 163 |
| Gilroy CA Unified School District GO | 0.000% | 8/1/30 | (12) | 5,245 | 2,881 |
| Golden State Tobacco Securitization Corp. California Revenue | 5.000% | 6/1/15 | | 6,505 | 6,629 |
| Golden State Tobacco Securitization Corp. California Revenue | 5.000% | 6/1/16 | | 12,545 | 13,226 |
| Golden State Tobacco Securitization Corp. California Revenue | 5.000% | 6/1/33 | | 4,595 | 3,754 |
| Hacienda La Puente CA Unified School District GO | 5.000% | 8/1/25 | (4) | 7,000 | 8,320 |
| Imperial CA Irrigation District Electric Revenue | 5.000% | 11/1/31 | | 5,200 | 5,816 |
| La Mesa-Spring Valley CA School District GO | 0.000% | 8/1/23 | (14) | 2,090 | 1,597 |
| La Mesa-Spring Valley CA School District GO | 0.000% | 8/1/25 | (14) | 3,635 | 2,534 |
| La Mesa-Spring Valley CA School District GO | 0.000% | 8/1/27 | (14) | 1,500 | 919 |
| La Mesa-Spring Valley CA School District GO | 0.000% | 8/1/28 | (14) | 3,170 | 1,817 |
| Long Beach CA Finance Authority Natural Gas Purchase Revenue | 5.250% | 11/15/20 | | 50 | 58 |
| Long Beach CA Finance Authority Natural Gas Purchase Revenue | 5.250% | 11/15/23 | | 230 | 269 |
| Long Beach CA Finance Authority Natural Gas Purchase Revenue | 5.000% | 11/15/24 | | 90 | 104 |
| Long Beach CA Finance Authority Natural Gas Purchase Revenue | 5.500% | 11/15/28 | | 125 | 151 |
| Long Beach CA Finance Authority Tax Revenue | 5.500% | 11/1/18 | (2) | 5,495 | 6,359 |
| Long Beach CA Finance Authority Tax Revenue | 5.500% | 11/1/19 | (2) | 3,970 | 4,694 |
| Long Beach CA Finance Authority Tax Revenue | 5.500% | 11/1/20 | (2) | 3,250 | 3,905 |
| Long Beach CA Finance Authority Tax Revenue | 5.500% | 11/1/21 | (2) | 7,645 | 9,285 |
| Long Beach CA Finance Authority Tax Revenue | 5.500% | 11/1/22 | (2) | 3,535 | 4,332 |
| Long Beach CA Unified School District GO | 0.000% | 8/1/23 | (12) | 1,995 | 1,554 |
| Long Beach CA Unified School District GO | 0.000% | 8/1/26 | (12) | 2,925 | 1,982 |
| Los Angeles CA Community College District GO | 5.000% | 8/1/28 | | 7,210 | 8,287 |
| Los Angeles CA Community College District GO | 5.250% | 8/1/29 | | 4,145 | 4,834 |
| Los Angeles CA Department of Airports International Airport Revenue | 5.000% | 5/15/23 | | 3,115 | 3,550 |
| Los Angeles CA Department of Airports International Airport Revenue | 5.000% | 5/15/26 | | 3,250 | 3,669 |
| Los Angeles CA Department of Airports International Airport Revenue | 5.000% | 5/15/26 | | 5,705 | 6,654 |
| Los Angeles CA Department of Airports International Airport Revenue | 5.000% | 5/15/27 | | 3,250 | 3,653 |
| Los Angeles CA Department of Airports International Airport Revenue | 5.000% | 5/15/28 | | 3,960 | 4,430 |
| Los Angeles CA Department of Airports International Airport Revenue | 5.250% | 5/15/28 | | 12,750 | 14,974 |
| Los Angeles CA Department of Airports International Airport Revenue | 5.250% | 5/15/29 | | 5,000 | 5,855 |
| Los Angeles CA Department of Water & Power Revenue | 5.000% | 7/1/24 | | 1,000 | 1,248 |
| Los Angeles CA Department of Water & Power Revenue | 5.000% | 7/1/27 | | 7,985 | 9,671 |
| Los Angeles CA Department of Water & Power Revenue | 5.000% | 7/1/31 | | 22,715 | 26,612 |
| Los Angeles CA Department of Water & Power Revenue | 5.000% | 7/1/33 | | 11,185 | 12,992 |
| Los Angeles CA Department of Water & Power Revenue VRDO | 0.040% | 11/7/14 | | 4,300 | 4,300 |
| Los Angeles CA Department of Water & Power Revenue VRDO | 0.040% | 11/7/14 | | 11,400 | 11,400 |
| Los Angeles CA Department of Water & Power Revenue VRDO | 0.050% | 11/7/14 | | 15,100 | 15,100 |
| Los Angeles CA Harbor Department Revenue | 5.000% | 8/1/28 | | 6,930 | 7,999 |
| Los Angeles CA Municipal Improvement Corp. Lease Revenue (Police Headquarters Facility) | 5.000% | 1/1/24 | (14) | 15,435 | 16,779 |
| Los Angeles CA Municipal Improvement Corp. Lease Revenue (Police Headquarters Facility) | 4.750% | 1/1/31 | (14) | 9,000 | 9,554 |
| Los Angeles CA Unified School District GO | 5.000% | 7/1/16 | | 7,290 | 7,855 |
| Los Angeles CA Unified School District GO | 5.000% | 7/1/16 | (4) | 6,900 | 7,435 |
| Los Angeles CA Unified School District GO | 5.000% | 7/1/16 | (Prere.) | 24,035 | 25,903 |
| Los Angeles CA Unified School District GO | 5.000% | 7/1/17 | (Prere.) | 4,000 | 4,474 |
| Los Angeles CA Unified School District GO | 5.000% | 7/1/17 | (Prere.) | 6,425 | 7,186 |
| Los Angeles CA Unified School District GO | 5.000% | 7/1/17 | (Prere.) | 7,330 | 8,190 |
| Los Angeles CA Unified School District GO | 5.000% | 7/1/17 | (Prere.) | 10,000 | 11,185 |
| Los Angeles CA Unified School District GO | 5.000% | 7/1/17 | (Prere.) | 22,410 | 25,065 |
| Los Angeles CA Unified School District GO | 4.750% | 7/1/19 | (4) | 12,500 | 13,370 |
| Los Angeles CA Unified School District GO | 5.000% | 7/1/22 | | 20,000 | 24,388 |
| Los Angeles CA Unified School District GO | 5.000% | 7/1/23 | (3) | 31,690 | 32,678 |
| Los Angeles CA Unified School District GO | 5.250% | 7/1/23 | | 8,835 | 10,394 |
| Los Angeles CA Unified School District GO | 5.250% | 7/1/23 | | 5,000 | 5,882 |
80
Intermediate-Term Tax-Exempt Fund
| | | | | |
| | | | | Face | Market |
| | | Maturity | | Amount | Value• |
| | Coupon | Date | | ($000) | ($000) |
| Los Angeles CA Unified School District GO | 5.000% | 7/1/24 | (14) | 10,000 | 10,310 |
| Los Angeles CA Unified School District GO | 5.000% | 7/1/24 | | 17,300 | 21,463 |
| Los Angeles CA Unified School District GO | 5.000% | 7/1/26 | | 7,500 | 8,702 |
| Los Angeles CA Unified School District GO | 5.000% | 7/1/26 | | 20,000 | 24,346 |
| Los Angeles CA Unified School District GO | 5.250% | 7/1/28 | | 8,000 | 9,516 |
| Los Angeles CA Unified School District GO | 5.000% | 7/1/29 | | 1,400 | 1,680 |
| Los Angeles CA Unified School District GO | 5.200% | 7/1/29 | | 6,295 | 7,321 |
| Los Angeles CA Unified School District GO | 4.500% | 7/1/31 | (2) | 4,000 | 4,288 |
| Los Angeles CA Wastewater System Revenue | 5.000% | 6/1/29 | | 6,520 | 7,475 |
| Los Angeles County CA Metropolitan Transportation Authority Sales Tax Revenue | 5.000% | 7/1/15 | | 10,665 | 11,014 |
| Los Angeles County CA Metropolitan Transportation Authority Sales Tax Revenue | 5.000% | 7/1/21 | | 5,000 | 5,875 |
| Los Angeles County CA Public Works Financing Authority Lease Revenue | 5.000% | 8/1/16 | | 3,450 | 3,730 |
| Los Angeles County CA Public Works Financing Authority Lease Revenue | 5.000% | 8/1/17 | | 5,000 | 5,592 |
| Los Angeles County CA Public Works Financing Authority Lease Revenue | 5.000% | 8/1/27 | | 1,475 | 1,697 |
| Los Angeles County CA Public Works Financing Authority Lease Revenue | 5.000% | 8/1/28 | | 2,000 | 2,299 |
| Los Angeles County CA Public Works Financing Authority Lease Revenue | 5.000% | 8/1/29 | | 2,365 | 2,714 |
| Los Angeles County CA Public Works Financing Authority Lease Revenue | 5.000% | 8/1/32 | | 3,000 | 3,414 |
| M-S-R California Energy Authority Revenue | 7.000% | 11/1/34 | | 6,000 | 8,380 |
| Metropolitan Water District of Southern California Revenue PUT | 2.000% | 10/1/16 | | 6,000 | 6,147 |
| Mount Diablo CA Unified School District GO | 5.000% | 8/1/29 | | 6,415 | 7,516 |
| Mount Diablo CA Unified School District GO | 5.000% | 8/1/30 | | 5,510 | 6,424 |
| Mount Diablo CA Unified School District GO | 5.000% | 8/1/32 | | 12,910 | 14,987 |
| Mount San Antonio CA Community College District GO | 0.000% | 8/1/28 | | 3,000 | 2,386 |
| Oakland CA Redevelopment Agency Tax Allocation Revenue (Central District Project) | 5.000% | 9/1/15 | (Prere.) | 14,775 | 15,362 |
| Oakland CA Redevelopment Agency Tax Allocation Revenue (Central District Project) | 5.000% | 9/1/21 | | 4,500 | 5,337 |
| Oakland CA Redevelopment Agency Tax Allocation Revenue (Central District Project) | 5.000% | 9/1/22 | | 1,500 | 1,786 |
| Oakland CA Unified School District GO | 6.250% | 8/1/18 | | 1,000 | 1,150 |
| Oakland CA Unified School District GO | 6.250% | 8/1/19 | | 1,150 | 1,348 |
| Orange County CA Airport Revenue | 5.250% | 7/1/25 | | 6,480 | 7,509 |
| Orange County CA Sanitation District COP | 5.000% | 2/1/28 | | 7,250 | 8,233 |
| Orange County CA Sanitation District COP | 5.000% | 2/1/29 | (4) | 2,500 | 2,717 |
| Orange County CA Sanitation District COP | 5.000% | 2/1/29 | | 4,510 | 5,117 |
| Palmdale CA Community Redevelopment Agency Tax Allocation Revenue | 5.000% | 9/1/28 | (14) | 9,290 | 9,302 |
| Palo Alto CA Unified School District GO | 0.000% | 8/1/23 | | 13,900 | 11,228 |
| Palo Alto CA Unified School District GO | 0.000% | 8/1/28 | | 20,320 | 13,222 |
| Palo Alto CA Unified School District GO | 0.000% | 8/1/29 | | 19,530 | 12,157 |
| Palo Alto CA Unified School District GO | 0.000% | 8/1/31 | | 12,305 | 6,893 |
| Palomar Pomerado Health California GO | 0.000% | 8/1/32 | (12) | 9,300 | 4,378 |
| Paramount CA Redevelopment Agency Tax Allocation Revenue | | | | | |
| (Redevelopment Project Area No. 1) | 0.000% | 8/1/26 | (14) | 5,000 | 3,136 |
| Peralta CA Community College District Revenue | 5.000% | 8/1/28 | | 3,000 | 3,579 |
| Poway CA Unified School District GO | 0.000% | 8/1/29 | | 5,000 | 2,845 |
| Rancho Santiago CA Community College District GO | 5.000% | 9/1/25 | | 6,690 | 8,160 |
| Rancho Santiago CA Community College District GO | 5.000% | 9/1/26 | | 16,145 | 19,482 |
| Redding CA Electric System COP | 5.000% | 6/1/23 | (4) | 6,875 | 7,770 |
| Redding CA Electric System COP | 5.000% | 6/1/25 | (4) | 7,860 | 8,845 |
| Redding CA Electric System COP | 5.000% | 6/1/27 | (4) | 4,660 | 5,230 |
| Riverside County CA Transportation Commission Sales Tax Revenue | 5.000% | 6/1/23 | | 3,000 | 3,709 |
| Riverside County CA Transportation Commission Sales Tax Revenue | 5.250% | 6/1/27 | | 4,980 | 6,083 |
| Riverside County CA Transportation Commission Sales Tax Revenue | 5.250% | 6/1/29 | | 7,805 | 9,434 |
| Riverside County CA Transportation Commission Toll Revenue | 0.000% | 6/1/25 | | 8,790 | 5,605 |
| Riverside County CA Transportation Commission Toll Revenue | 0.000% | 6/1/26 | | 3,375 | 2,055 |
| Riverside County CA Transportation Commission Toll Revenue | 0.000% | 6/1/27 | | 5,480 | 3,132 |
| Riverside County CA Transportation Commission Toll Revenue | 0.000% | 6/1/28 | | 9,395 | 5,012 |
| Riverside County CA Transportation Commission Toll Revenue | 0.000% | 6/1/29 | | 11,075 | 5,593 |
| Rocklin CA Unified School District GO | 0.000% | 8/1/22 | (14) | 5,450 | 4,538 |
| Roseville CA Natural Gas Financing Authority Gas Revenue | 5.000% | 2/15/20 | | 4,735 | 5,310 |
| Roseville CA Natural Gas Financing Authority Gas Revenue | 5.000% | 2/15/23 | | 105 | 119 |
| Roseville CA Natural Gas Financing Authority Gas Revenue | 5.000% | 2/15/25 | | 125 | 144 |
| Roseville CA Natural Gas Financing Authority Gas Revenue | 5.000% | 2/15/26 | | 125 | 144 |
| Roseville CA Natural Gas Financing Authority Gas Revenue | 5.000% | 2/15/28 | | 110 | 127 |
| Sacramento CA Municipal Utility District Financing Authority Revenue | 5.000% | 7/1/18 | (14) | 2,000 | 2,147 |
| Sacramento CA Regional Transit District Farebox Revenue | 5.000% | 3/1/24 | | 720 | 816 |
| Sacramento CA Regional Transit District Farebox Revenue | 5.000% | 3/1/26 | | 1,200 | 1,343 |
| Sacramento CA Transportation Authority Sales Tax Revenue VRDO | 0.040% | 11/7/14 | | 21,800 | 21,800 |
| Sacramento County CA Airport Revenue | 5.500% | 7/1/27 | | 7,870 | 8,990 |
| Sacramento County CA Airport Revenue | 5.500% | 7/1/28 | | 5,000 | 5,695 |
| Sacramento County CA Airport Revenue | 5.625% | 7/1/29 | | 5,485 | 6,262 |
| Sacramento County CA GO | 5.000% | 2/1/15 | | 9,190 | 9,291 |
| Sacramento County CA GO | 5.000% | 2/1/17 | | 4,650 | 5,006 |
| Sacramento County CA GO | 5.250% | 2/1/18 | | 6,140 | 6,876 |
| Sacramento County CA GO | 5.250% | 2/1/19 | | 4,940 | 5,574 |
81
Intermediate-Term Tax-Exempt Fund
| | | | | |
| | | | | Face | Market |
| | | Maturity | | Amount | Value• |
| | Coupon | Date | | ($000) | ($000) |
| Sacramento County CA GO | 5.500% | 2/1/20 | | 4,700 | 5,430 |
| Sacramento County CA Sanitation Districts Financing Authority Revenue | 5.000% | 12/1/30 | | 2,000 | 2,381 |
| Sacramento County CA Sanitation Districts Financing Authority Revenue | 5.000% | 12/1/31 | | 3,000 | 3,551 |
| San Bernardino CA City Unified School District GO | 5.000% | 8/1/29 | (4) | 1,960 | 2,274 |
| San Bernardino CA City Unified School District GO | 5.000% | 8/1/30 | (4) | 1,180 | 1,346 |
| San Bernardino CA City Unified School District GO | 5.000% | 8/1/31 | (4) | 1,320 | 1,500 |
| San Bernardino CA City Unified School District GO | 5.000% | 8/1/32 | (4) | 1,400 | 1,582 |
| San Bernardino CA Community College District GO | 5.000% | 8/1/24 | | 12,065 | 14,658 |
| San Bernardino CA Community College District GO | 5.000% | 8/1/25 | | 13,965 | 16,794 |
| San Bernardino CA Community College District GO | 5.000% | 8/1/26 | | 14,080 | 16,739 |
| San Bernardino County CA Medical Center (Arrowhead Project) COP | 5.000% | 8/1/17 | | 2,500 | 2,765 |
| San Bernardino County CA Medical Center (Arrowhead Project) COP | 5.000% | 8/1/18 | | 8,995 | 10,181 |
| San Bernardino County CA Medical Center (Arrowhead Project) COP | 5.000% | 8/1/19 | | 8,500 | 9,802 |
| San Diego CA Community College District GO | 5.000% | 8/1/26 | | 3,895 | 4,665 |
| San Diego CA Community College District GO | 5.000% | 8/1/27 | | 3,865 | 4,616 |
| San Diego CA Community College District GO | 5.000% | 8/1/27 | | 8,350 | 9,972 |
| San Diego CA Community College District GO | 5.000% | 8/1/28 | | 7,400 | 8,836 |
| San Diego CA Community College District GO | 5.000% | 8/1/28 | | 8,820 | 10,531 |
| San Diego CA Community College District GO | 5.000% | 8/1/29 | | 4,315 | 5,121 |
| San Diego CA Community College District GO | 5.000% | 8/1/30 | | 5,000 | 5,942 |
| San Diego CA Community College District GO | 5.000% | 8/1/30 | (4) | 19,015 | 20,990 |
| San Diego CA Community College District GO | 5.250% | 8/1/33 | | 3,325 | 3,850 |
| San Diego CA Public Facilities Financing Authority Sewer Revenue | 5.250% | 5/15/25 | | 10,000 | 11,829 |
| San Diego CA Public Facilities Financing Authority Sewer Revenue | 5.000% | 5/15/28 | | 2,000 | 2,291 |
| San Diego CA Unified School District GO | 5.500% | 7/1/27 | (4) | 17,020 | 22,061 |
| San Diego CA Unified School District GO | 0.000% | 7/1/30 | | 17,310 | 9,613 |
| San Diego County CA Regional Airport Authority Revenue | 5.000% | 7/1/28 | | 2,500 | 2,877 |
| San Francisco CA City & County International Airport Revenue | 5.000% | 5/1/21 | | 5,000 | 5,869 |
| San Francisco CA City & County International Airport Revenue | 5.000% | 5/1/22 | | 9,135 | 10,679 |
| San Francisco CA City & County International Airport Revenue | 5.250% | 5/1/22 | | 5,500 | 6,460 |
| San Francisco CA City & County International Airport Revenue | 5.500% | 5/1/26 | | 3,370 | 3,976 |
| San Francisco CA City & County Public Utilities Commission Water Revenue | 5.000% | 10/1/32 | | 10,000 | 11,491 |
| San Francisco CA City & County Public Utilities Commission Water Revenue | 5.000% | 11/1/34 | | 14,000 | 15,969 |
| San Francisco CA City & County Unified School District GO | 4.000% | 6/15/31 | | 13,670 | 14,357 |
| San Francisco CA City & County Unified School District GO | 4.000% | 6/15/32 | | 3,950 | 4,129 |
| San Joaquin Hills CA Transportation Corridor Agency Toll Road Revenue | 0.000% | 1/15/21 | (14) | 12,385 | 10,232 |
| San Jose CA Airport Revenue | 5.000% | 3/1/27 | | 2,255 | 2,648 |
| San Jose CA Airport Revenue | 5.000% | 3/1/27 | | 3,500 | 4,110 |
| San Jose CA Airport Revenue | 5.000% | 3/1/28 | | 2,185 | 2,548 |
| San Jose CA Redevelopment Agency Tax Allocation Revenue | 5.000% | 8/1/20 | (2) | 20,000 | 21,463 |
| San Jose CA Redevelopment Agency Tax Allocation Revenue | 5.000% | 8/1/23 | (2) | 24,900 | 26,722 |
| San Jose CA Redevelopment Agency Tax Allocation Revenue | 5.000% | 8/1/24 | (14) | 29,885 | 32,204 |
| San Jose CA Redevelopment Agency Tax Allocation Revenue | 5.250% | 8/1/27 | | 2,400 | 2,659 |
| San Jose CA Redevelopment Agency Tax Allocation Revenue | 5.375% | 8/1/28 | | 1,175 | 1,308 |
| San Jose CA Redevelopment Agency Tax Allocation Revenue | 6.500% | 8/1/28 | | 25,385 | 28,137 |
| San Jose-Evergreen CA Community College District GO | 5.000% | 9/1/29 | | 1,510 | 1,817 |
| San Jose-Evergreen CA Community College District GO | 5.000% | 9/1/30 | | 2,745 | 3,279 |
| San Jose-Evergreen CA Community College District GO | 5.000% | 9/1/30 | | 3,445 | 4,115 |
| San Jose-Evergreen CA Community College District GO | 5.000% | 9/1/31 | | 3,010 | 3,576 |
| San Jose-Evergreen CA Community College District GO | 5.000% | 9/1/31 | | 3,840 | 4,562 |
| San Jose-Evergreen CA Community College District GO | 5.000% | 9/1/32 | | 3,095 | 3,671 |
| San Mateo County CA Joint Powers Financing Authority Lease Revenue | | | | | |
| (Maple Street Correctional Center) | 5.000% | 6/15/27 | | 2,000 | 2,399 |
| San Mateo County CA Joint Powers Financing Authority Lease Revenue | | | | | |
| (Maple Street Correctional Center) | 5.000% | 6/15/28 | | 2,500 | 2,968 |
| San Mateo County CA Joint Powers Financing Authority Lease Revenue | | | | | |
| (Maple Street Correctional Center) | 5.000% | 6/15/29 | | 1,675 | 1,984 |
| San Mateo County CA Joint Powers Financing Authority Lease Revenue | | | | | |
| (Youth Services Campus) | 4.625% | 7/15/25 | | 1,000 | 1,115 |
| San Mateo County CA Joint Powers Financing Authority Lease Revenue | | | | | |
| (Youth Services Campus) | 5.250% | 7/15/28 | | 2,000 | 2,269 |
| San Ramon Valley CA Unified School District GO | 5.000% | 8/1/26 | | 3,385 | 4,077 |
| San Ramon Valley CA Unified School District GO | 5.000% | 8/1/27 | | 1,080 | 1,293 |
| Santa Ana CA Unified School District GO | 0.000% | 8/1/29 | (14) | 3,315 | 1,886 |
| Santa Ana CA Unified School District GO | 0.000% | 8/1/30 | (14) | 2,150 | 1,168 |
| Santa Clara County CA Financing Authority Lease Revenue (Multiple Facilities Projects) | 5.000% | 11/15/19 | | 13,825 | 15,893 |
| Santa Monica CA Community College District GO | 0.000% | 8/1/23 | | 9,045 | 7,306 |
| Santa Monica CA Community College District GO | 5.000% | 8/1/24 | | 4,210 | 5,171 |
| Santa Monica CA Community College District GO | 5.000% | 8/1/25 | | 5,000 | 6,079 |
| Santa Monica CA Community College District GO | 5.000% | 8/1/26 | | 8,650 | 10,404 |
| Santa Monica CA Community College District GO | 0.000% | 8/1/27 | | 6,565 | 4,422 |
82
Intermediate-Term Tax-Exempt Fund
| | | | | |
| | | | | Face | Market |
| | | Maturity | | Amount | Value• |
| | Coupon | Date | | ($000) | ($000) |
| Santa Monica CA Community College District GO | 5.000% | 8/1/27 | | 5,145 | 6,151 |
| Santa Monica CA Community College District GO | 0.000% | 8/1/28 | | 7,105 | 4,487 |
| Santa Monica CA Community College District GO | 0.000% | 8/1/29 | | 12,640 | 7,621 |
| Santa Rosa CA Wastewater Revenue | 0.000% | 9/1/27 | (2) | 11,125 | 7,121 |
| Southern California Public Power Authority Revenue | 5.000% | 7/1/22 | | 10,000 | 11,955 |
| Southern California Public Power Authority Revenue | 5.000% | 7/1/27 | | 10,000 | 11,793 |
| Southern California Public Power Authority Revenue | 5.000% | 7/1/28 | | 10,000 | 11,684 |
| Southern California Public Power Authority Revenue | 5.000% | 7/1/29 | | 2,500 | 2,921 |
| Southern California Public Power Authority Revenue (Milford Wind Corridor Phase I Project) | 5.000% | 7/1/26 | | 9,000 | 10,604 |
| Southern California Public Power Authority Revenue (Natural Gas Project) | 5.250% | 11/1/27 | | 375 | 444 |
| Sweetwater CA Unified School District GO | 5.000% | 8/1/29 | (15) | 3,300 | 3,812 |
| 1 Sweetwater CA Unified School District GO TOB VRDO | 0.070% | 11/7/14 | (13) | 2,845 | 2,845 |
| Tulare County CA Transportation Authority Sales Tax Revenue | 4.000% | 2/1/34 | | 3,000 | 3,101 |
| Tulare County CA Transportation Authority Sales Tax Revenue | 4.000% | 2/1/35 | | 2,000 | 2,051 |
| Tuolumne CA Wind Project Authority Revenue | 5.000% | 1/1/19 | | 3,000 | 3,457 |
| Tuolumne CA Wind Project Authority Revenue | 5.000% | 1/1/20 | | 13,130 | 15,036 |
| Tuolumne CA Wind Project Authority Revenue | 5.000% | 1/1/21 | | 13,465 | 15,233 |
| Tuolumne CA Wind Project Authority Revenue | 5.625% | 1/1/29 | | 9,000 | 10,510 |
| Turlock CA Irrigation District Revenue | 5.000% | 1/1/27 | | 3,935 | 4,373 |
| Turlock CA Irrigation District Revenue | 5.000% | 1/1/28 | | 4,160 | 4,595 |
| Turlock CA Irrigation District Revenue | 5.000% | 1/1/29 | | 4,335 | 4,786 |
| Turlock CA Irrigation District Revenue | 5.000% | 1/1/30 | | 2,250 | 2,482 |
| University of California Revenue | 5.000% | 5/15/21 | | 10,625 | 11,001 |
| University of California Revenue | 5.000% | 5/15/23 | | 1,500 | 1,795 |
| University of California Revenue | 5.500% | 5/15/24 | | 14,675 | 17,552 |
| University of California Revenue | 5.000% | 5/15/26 | | 12,915 | 15,300 |
| University of California Revenue | 5.000% | 5/15/27 | | 5,000 | 5,883 |
| University of California Revenue | 5.000% | 5/15/28 | | 25,995 | 30,838 |
| University of California Revenue | 5.000% | 5/15/30 | | 2,830 | 3,306 |
| University of California Revenue | 5.000% | 5/15/32 | | 21,800 | 25,384 |
| University of California Revenue | 5.000% | 5/15/33 | | 31,200 | 36,201 |
| University of California Revenue | 5.000% | 5/15/34 | | 38,420 | 44,389 |
| University of California Revenue PUT | 5.000% | 5/15/23 | | 87,665 | 107,641 |
| Ventura County CA Community College District GO | 0.000% | 8/1/23 | | 6,155 | 4,824 |
| Ventura County CA Community College District GO | 0.000% | 8/1/24 | | 8,050 | 6,080 |
| Ventura County CA Community College District GO | 5.000% | 8/1/24 | | 1,070 | 1,330 |
| Ventura County CA Community College District GO | 0.000% | 8/1/25 | | 8,000 | 5,788 |
| Ventura County CA Community College District GO | 0.000% | 8/1/26 | | 8,500 | 5,895 |
| Ventura County CA Community College District GO | 0.000% | 8/1/27 | | 8,500 | 5,521 |
| Ventura County CA Community College District GO | 5.000% | 8/1/27 | | 1,000 | 1,208 |
| Ventura County CA Community College District GO | 5.000% | 8/1/28 | | 1,000 | 1,201 |
| Ventura County CA Community College District GO | 5.000% | 8/1/29 | | 1,000 | 1,196 |
| Ventura County CA Public Financing Authority COP | 5.625% | 8/15/27 | | 1,000 | 1,189 |
| Ventura County CA Public Financing Authority COP | 5.750% | 8/15/28 | | 1,750 | 2,093 |
| Ventura County CA Public Financing Authority COP | 5.750% | 8/15/29 | | 1,750 | 2,062 |
| Victor Valley CA Community College District GO | 5.375% | 8/1/29 | | 4,250 | 4,932 |
| Walnut CA Energy Center Authority Revenue | 5.000% | 1/1/29 | | 2,510 | 2,788 |
| Walnut CA Energy Center Authority Revenue | 5.000% | 1/1/30 | | 3,775 | 4,185 |
| West Basin CA Municipal Water District COP | 5.000% | 8/1/25 | (12) | 5,365 | 6,138 |
| West Basin CA Municipal Water District COP | 5.000% | 8/1/27 | (12) | 5,000 | 5,705 |
| West Contra Costa CA Unified School District GO | 0.000% | 8/1/17 | (12) | 1,565 | 1,522 |
| West Contra Costa CA Unified School District GO | 0.000% | 8/1/18 | (12) | 3,000 | 2,860 |
| West Contra Costa CA Unified School District GO | 0.000% | 8/1/19 | (12) | 4,190 | 3,864 |
| West Contra Costa CA Unified School District GO | 0.000% | 8/1/20 | (12) | 6,000 | 5,305 |
| West Contra Costa CA Unified School District GO | 5.000% | 8/1/27 | | 2,405 | 2,833 |
| West Contra Costa CA Unified School District GO | 0.000% | 8/1/28 | (14) | 5,230 | 3,100 |
| West Contra Costa CA Unified School District GO | 5.000% | 8/1/29 | | 3,500 | 4,075 |
| West Contra Costa CA Unified School District GO | 0.000% | 8/1/32 | (12) | 5,000 | 2,378 |
| West Contra Costa CA Unified School District GO | 5.000% | 8/1/32 | (4) | 6,270 | 7,099 |
| West Contra Costa CA Unified School District GO | 0.000% | 8/1/33 | (12) | 2,810 | 1,256 |
| Westlands CA Water District Revenue | 5.000% | 9/1/26 | (4) | 1,000 | 1,163 |
| | | | | | 4,800,004 |
| Colorado (1.4%) | | | | | |
| Aurora CO COP | 5.000% | 12/1/19 | | 1,050 | 1,222 |
| Aurora CO COP | 5.000% | 12/1/20 | | 2,000 | 2,306 |
| Aurora CO COP | 5.000% | 12/1/21 | | 3,505 | 4,060 |
| Aurora CO COP | 5.000% | 12/1/22 | | 4,730 | 5,467 |
| Aurora CO COP | 5.000% | 12/1/23 | | 4,465 | 5,149 |
| Aurora CO COP | 5.000% | 12/1/24 | | 4,215 | 4,861 |
| Aurora CO COP | 5.000% | 12/1/25 | | 5,475 | 6,299 |
| Board of Governors of the Colorado State University System Enterprise Revenue | 5.000% | 3/1/24 | | 1,000 | 1,220 |
83
Intermediate-Term Tax-Exempt Fund
| | | | | |
| | | | | Face | Market |
| | | Maturity | | Amount | Value• |
| | Coupon | Date | | ($000) | ($000) |
| Broomfield CO City & County COP | 5.000% | 12/1/24 | | 2,685 | 3,051 |
| Broomfield CO City & County COP | 5.000% | 12/1/25 | | 2,820 | 3,201 |
| Broomfield CO City & County COP | 5.000% | 12/1/26 | | 2,965 | 3,338 |
| Broomfield CO City & County COP | 5.000% | 12/1/29 | | 7,470 | 8,361 |
| Castle Rock CO COP VRDO | 0.070% | 11/7/14 | LOC | 28,195 | 28,195 |
| Colorado (UCDHSC Fitzsimons Academic Projects) COP | 5.250% | 11/1/23 | | 5,000 | 6,104 |
| Colorado Department of Transportation Revenue | 5.000% | 12/15/15 | (14) | 37,825 | 39,865 |
| Colorado Health Facilities Authority Revenue (Catholic Health Initiatives) | 6.125% | 10/1/28 | | 10,000 | 11,605 |
| Colorado Health Facilities Authority Revenue (Catholic Health Initiatives) | 5.500% | 7/1/29 | | 50,000 | 57,447 |
| Colorado Health Facilities Authority Revenue (Catholic Health Initiatives) | 5.250% | 2/1/31 | | 14,000 | 15,740 |
| Colorado Health Facilities Authority Revenue (Catholic Health Initiatives) | 5.000% | 1/1/33 | | 8,385 | 9,265 |
| 1 Colorado Health Facilities Authority Revenue (Catholic Health Initiatives) TOB VRDO | 0.250% | 11/3/14 | | 5,300 | 5,300 |
| Colorado Health Facilities Authority Revenue (Covenant Retirement Community Inc.) | 5.000% | 12/1/27 | | 2,025 | 2,187 |
| Colorado Health Facilities Authority Revenue (Covenant Retirement Community Inc.) | 5.000% | 12/1/33 | | 6,750 | 7,169 |
| Colorado Health Facilities Authority Revenue | | | | | |
| (Poudre Valley Health Care Inc. & Medical Center of the Rockies) | 5.000% | 3/1/25 | | 4,900 | 4,946 |
| Colorado Health Facilities Authority Revenue (Sisters of Charity of Leavenworth Health System) | 5.000% | 1/1/22 | | 6,100 | 7,010 |
| Colorado Health Facilities Authority Revenue (Sisters of Charity of Leavenworth Health System) | 5.000% | 1/1/22 | | 13,175 | 15,141 |
| Colorado Health Facilities Authority Revenue (Sisters of Charity of Leavenworth Health System) | 5.250% | 1/1/30 | | 20,955 | 23,623 |
| Commerce City CO Sales & Use Tax Revenue | 5.000% | 8/1/31 | (4) | 2,415 | 2,803 |
| Commerce City CO Sales & Use Tax Revenue | 5.000% | 8/1/33 | (4) | 2,410 | 2,777 |
| Denver CO City & County Airport Revenue | 5.000% | 11/15/24 | (10) | 8,965 | 9,398 |
| Denver CO City & County Airport Revenue | 5.000% | 11/15/25 | | 15,000 | 17,678 |
| Denver CO City & County Airport Revenue | 5.000% | 11/15/26 | | 5,750 | 6,735 |
| Denver CO City & County Airport Revenue | 5.250% | 11/15/28 | | 3,000 | 3,534 |
| Denver CO City & County Airport Revenue | 5.250% | 11/15/28 | | 3,210 | 3,671 |
| Denver CO City & County Airport Revenue | 5.250% | 11/15/29 | | 5,000 | 5,872 |
| Denver CO City & County Airport Revenue | 5.250% | 11/15/30 | | 14,400 | 16,861 |
| Denver CO City & County COP VRDO | 0.070% | 11/3/14 | | 1,000 | 1,000 |
| E-470 Public Highway Authority Colorado Revenue | 0.000% | 9/1/17 | (14) | 24,490 | 23,373 |
| E-470 Public Highway Authority Colorado Revenue | 5.250% | 9/1/18 | (14) | 7,850 | 8,913 |
| E-470 Public Highway Authority Colorado Revenue | 5.250% | 9/1/18 | (14) | 6,355 | 7,216 |
| E-470 Public Highway Authority Colorado Revenue | 0.000% | 9/1/19 | (14) | 15,100 | 13,621 |
| E-470 Public Highway Authority Colorado Revenue | 0.000% | 9/1/21 | | 27,500 | 23,190 |
| E-470 Public Highway Authority Colorado Revenue | 0.000% | 9/1/22 | (14) | 11,315 | 9,230 |
| E-470 Public Highway Authority Colorado Revenue | 0.000% | 9/1/23 | (14) | 15,435 | 11,934 |
| E-470 Public Highway Authority Colorado Revenue | 0.000% | 9/1/24 | (14) | 20,000 | 14,628 |
| E-470 Public Highway Authority Colorado Revenue | 5.250% | 9/1/25 | | 1,500 | 1,669 |
| E-470 Public Highway Authority Colorado Revenue | 5.375% | 9/1/26 | | 2,500 | 2,793 |
| Regional Transportation District of Colorado Sales Tax Revenue (FasTracks Project) | 5.000% | 11/1/24 | | 5,000 | 5,983 |
| Regional Transportation District of Colorado Sales Tax Revenue (FasTracks Project) | 5.000% | 11/1/25 | | 5,875 | 7,005 |
| University of Colorado Enterprise System Revenue | 5.000% | 6/1/15 | (Prere.) | 6,515 | 6,699 |
| University of Colorado Enterprise System Revenue | 5.500% | 6/1/19 | (Prere.) | 2,000 | 2,390 |
| University of Colorado Enterprise System Revenue | 5.500% | 6/1/19 | (Prere.) | 2,750 | 3,287 |
| University of Colorado Enterprise System Revenue | 5.000% | 6/1/20 | (14) | 5,785 | 6,429 |
| University of Colorado Enterprise System Revenue | 5.000% | 6/1/21 | (14) | 90 | 92 |
| University of Colorado Enterprise System Revenue | 5.000% | 6/1/26 | | 1,250 | 1,483 |
| University of Colorado Enterprise System Revenue | 5.000% | 6/1/26 | | 1,500 | 1,822 |
| University of Colorado Enterprise System Revenue | 5.000% | 6/1/27 | | 2,085 | 2,463 |
| University of Colorado Enterprise System Revenue | 4.000% | 6/1/28 | | 5,600 | 6,133 |
| University of Colorado Enterprise System Revenue | 5.000% | 6/1/28 | | 2,480 | 2,916 |
| University of Colorado Enterprise System Revenue | 5.000% | 6/1/28 | | 2,000 | 2,403 |
| University of Colorado Enterprise System Revenue | 5.000% | 6/1/29 | | 2,445 | 2,863 |
| University of Colorado Enterprise System Revenue | 5.000% | 6/1/29 | | 2,250 | 2,691 |
| University of Colorado Enterprise System Revenue | 5.000% | 6/1/30 | | 2,720 | 3,171 |
| University of Colorado Enterprise System Revenue | 5.000% | 6/1/31 | | 1,850 | 2,147 |
| University of Colorado Enterprise System Revenue | 5.000% | 6/1/32 | | 1,950 | 2,254 |
| University of Colorado Enterprise System Revenue | 5.000% | 6/1/33 | | 3,155 | 3,636 |
| University of Colorado Hospital Authority Revenue | 5.000% | 11/15/27 | | 6,000 | 6,930 |
| University of Colorado Hospital Authority Revenue | 6.000% | 11/15/29 | | 9,850 | 11,672 |
| | | | | | 553,497 |
| Connecticut (1.6%) | | | | | |
| Connecticut GO | 5.500% | 12/15/14 | | 7,700 | 7,751 |
| Connecticut GO | 5.000% | 4/15/15 | | 16,155 | 16,515 |
| Connecticut GO | 5.000% | 4/15/15 | | 2,325 | 2,377 |
| Connecticut GO | 5.000% | 5/1/15 | | 1,865 | 1,911 |
| 3 Connecticut GO | 0.550% | 5/15/15 | | 5,000 | 5,010 |
| Connecticut GO | 5.000% | 11/1/15 | | 5,000 | 5,241 |
| Connecticut GO | 5.000% | 12/15/15 | | 14,345 | 15,119 |
| Connecticut GO | 5.000% | 4/15/16 | | 13,725 | 14,655 |
| 3 Connecticut GO | 0.700% | 5/15/16 | | 8,400 | 8,458 |
84
Intermediate-Term Tax-Exempt Fund
| | | | | |
| | | | | Face | Market |
| | | Maturity | | Amount | Value• |
| | Coupon | Date | | ($000) | ($000) |
| 3 Connecticut GO | 0.700% | 5/15/16 | | 5,000 | 5,034 |
| 3 Connecticut GO | 0.820% | 5/15/17 | | 5,000 | 5,057 |
| Connecticut GO | 5.000% | 11/1/17 | | 7,750 | 8,752 |
| 3 Connecticut GO | 0.970% | 5/15/18 | | 14,000 | 14,232 |
| Connecticut GO | 5.000% | 12/15/18 | | 11,000 | 12,046 |
| 3 Connecticut GO | 1.300% | 4/15/20 | | 17,000 | 17,433 |
| Connecticut GO | 5.000% | 11/1/20 | | 4,970 | 5,955 |
| 3 Connecticut GO | 0.800% | 3/1/21 | | 4,305 | 4,317 |
| Connecticut GO | 5.000% | 11/1/21 | | 5,000 | 6,034 |
| Connecticut GO | 5.000% | 4/15/22 | | 6,005 | 7,236 |
| Connecticut GO | 5.000% | 5/15/22 | | 11,310 | 13,354 |
| Connecticut GO | 5.000% | 6/1/22 | | 8,010 | 9,668 |
| Connecticut GO | 5.000% | 6/15/22 | | 9,355 | 11,297 |
| Connecticut GO | 5.000% | 9/1/22 | | 15,000 | 18,163 |
| Connecticut GO | 5.000% | 9/15/22 | | 6,830 | 8,274 |
| Connecticut GO | 5.000% | 6/15/23 | | 5,890 | 7,175 |
| Connecticut GO | 5.000% | 11/1/23 | | 10,000 | 11,911 |
| Connecticut GO | 5.000% | 6/1/24 | | 14,410 | 17,137 |
| Connecticut GO | 5.000% | 9/1/24 | | 20,000 | 24,681 |
| Connecticut GO | 5.000% | 10/15/24 | | 10,805 | 12,954 |
| Connecticut GO | 5.000% | 3/1/25 | | 19,440 | 23,226 |
| Connecticut GO | 5.000% | 9/1/25 | | 19,395 | 23,680 |
| Connecticut GO | 5.000% | 9/1/26 | | 13,170 | 15,930 |
| Connecticut GO | 5.000% | 11/1/26 | | 9,250 | 10,844 |
| Connecticut GO | 5.000% | 3/1/30 | | 8,900 | 10,530 |
| Connecticut GO | 5.000% | 3/1/31 | | 10,500 | 12,376 |
| Connecticut GO | 4.000% | 9/1/31 | | 14,100 | 15,119 |
| Connecticut GO | 5.000% | 4/15/32 | | 4,000 | 4,568 |
| Connecticut GO | 5.000% | 8/15/32 | | 20,000 | 23,321 |
| Connecticut GO | 4.000% | 9/1/32 | | 18,455 | 19,659 |
| Connecticut Health & Educational Facilities Authority Revenue (Hartford Healthcare) | 5.000% | 7/1/32 | | 4,000 | 4,359 |
| Connecticut Health & Educational Facilities Authority Revenue (Stamford Hospital) | 5.000% | 7/1/32 | | 15,000 | 16,565 |
| Connecticut Health & Educational Facilities Authority Revenue (Wesleyan University) | 5.000% | 7/1/28 | | 8,550 | 9,861 |
| Connecticut Special Tax Revenue (Transportation Infrastructure) | 5.000% | 11/1/14 | | 7,315 | 7,315 |
| Connecticut Special Tax Revenue (Transportation Infrastructure) | 5.000% | 11/1/17 | | 7,090 | 8,008 |
| Connecticut Special Tax Revenue (Transportation Infrastructure) | 5.000% | 9/1/22 | | 5,000 | 6,081 |
| Connecticut Special Tax Revenue (Transportation Infrastructure) | 5.000% | 11/1/23 | | 12,085 | 13,819 |
| Connecticut Special Tax Revenue (Transportation Infrastructure) | 5.000% | 11/1/24 | | 10,880 | 12,423 |
| Connecticut Special Tax Revenue (Transportation Infrastructure) | 5.000% | 1/1/25 | | 19,445 | 23,237 |
| Connecticut Special Tax Revenue (Transportation Infrastructure) | 5.000% | 11/1/25 | | 12,515 | 14,268 |
| Connecticut Special Tax Revenue (Transportation Infrastructure) | 5.000% | 1/1/26 | | 8,225 | 9,769 |
| Connecticut Special Tax Revenue (Transportation Infrastructure) | 5.000% | 1/1/27 | | 15,000 | 17,730 |
| Connecticut Special Tax Revenue (Transportation Infrastructure) | 5.000% | 9/1/31 | | 10,000 | 11,813 |
| Connecticut Special Tax Revenue (Transportation Infrastructure) | 5.000% | 9/1/32 | | 6,000 | 7,054 |
| Connecticut Special Tax Revenue (Transportation Infrastructure) | 5.000% | 9/1/34 | | 3,745 | 4,375 |
| Hartford CT GO | 5.000% | 4/1/28 | | 2,055 | 2,347 |
| Hartford CT GO | 5.000% | 4/1/30 | | 2,000 | 2,269 |
| | | | | | 628,293 |
| Delaware (0.1%) | | | | | |
| Delaware GO | 5.000% | 7/1/16 | | 3,215 | 3,465 |
| Delaware GO | 5.000% | 10/1/16 | | 19,895 | 21,658 |
| Delaware GO | 5.000% | 8/1/24 | | 6,040 | 7,465 |
| Delaware Transportation Authority Transportation System Revenue | 5.000% | 7/1/29 | | 10,000 | 11,407 |
| University of Delaware Revenue | 5.000% | 11/1/22 | | 1,000 | 1,165 |
| | | | | | 45,160 |
| District of Columbia (0.4%) | | | | | |
| District of Columbia GO | 5.000% | 6/1/19 | (4) | 5,325 | 5,984 |
| District of Columbia GO | 5.000% | 6/1/20 | (4) | 11,840 | 13,286 |
| District of Columbia GO | 5.000% | 6/1/21 | (4) | 10,380 | 11,648 |
| District of Columbia GO | 5.000% | 6/1/32 | | 6,000 | 7,047 |
| District of Columbia GO | 5.000% | 6/1/33 | | 4,000 | 4,680 |
| District of Columbia Income Tax Revenue | 5.000% | 12/1/22 | | 3,500 | 4,287 |
| District of Columbia Income Tax Revenue | 5.000% | 12/1/32 | | 5,210 | 6,018 |
| District of Columbia Revenue (American University) VRDO | 0.070% | 11/3/14 | LOC | 9,400 | 9,400 |
| District of Columbia Revenue (Georgetown University) | 5.000% | 4/1/21 | (2) | 5,610 | 6,096 |
| District of Columbia Revenue (Georgetown University) | 5.000% | 4/1/22 | (2) | 5,800 | 6,285 |
| District of Columbia Revenue (Georgetown University) | 5.000% | 4/1/23 | (2) | 6,600 | 7,152 |
| District of Columbia Revenue (Georgetown University) | 5.000% | 4/1/24 | (2) | 6,190 | 6,707 |
| District of Columbia Revenue (Georgetown University) PUT | 4.700% | 4/1/18 | | 23,500 | 26,149 |
| District of Columbia Revenue (World Wildlife Fund Inc.) VRDO | 0.060% | 11/7/14 | LOC | 18,600 | 18,600 |
| District of Columbia Water & Sewer Authority Public Utility Revenue | 5.000% | 10/1/31 | | 9,595 | 11,084 |
85
Intermediate-Term Tax-Exempt Fund
| | | | | |
| | | | | Face | Market |
| | | Maturity | | Amount | Value• |
| | Coupon | Date | | ($000) | ($000) |
| District of Columbia Water & Sewer Authority Public Utility Revenue | 5.000% | 10/1/31 | | 5,115 | 5,909 |
| District of Columbia Water & Sewer Authority Public Utility Revenue | 5.000% | 10/1/32 | | 5,000 | 5,753 |
| District of Columbia Water & Sewer Authority Public Utility Revenue | 5.000% | 10/1/32 | | 7,695 | 8,854 |
| | | | | | 164,939 |
| Florida (6.5%) | | | | | |
| Alachua County FL Health Facilities Authority Revenue | | | | | |
| (Shands Teaching Hospital & Clinics Project) | 5.000% | 12/1/25 | | 1,000 | 1,173 |
| Alachua County FL Health Facilities Authority Revenue | | | | | |
| (Shands Teaching Hospital & Clinics Project) | 5.000% | 12/1/26 | | 1,250 | 1,453 |
| Alachua County FL Health Facilities Authority Revenue | | | | | |
| (Shands Teaching Hospital & Clinics Project) | 5.000% | 12/1/27 | | 1,300 | 1,488 |
| Alachua County FL Health Facilities Authority Revenue | | | | | |
| (Shands Teaching Hospital & Clinics Project) | 5.000% | 12/1/34 | | 22,000 | 24,525 |
| Brevard County FL Health Facilities Authority Revenue (Health First Inc. Project) | 5.000% | 4/1/22 | | 5,050 | 5,856 |
| Brevard County FL Health Facilities Authority Revenue (Health First Inc. Project) | 5.000% | 4/1/23 | | 5,065 | 5,897 |
| Brevard County FL Health Facilities Authority Revenue (Health First Inc. Project) | 5.000% | 4/1/24 | | 5,595 | 6,459 |
| Brevard County FL Health Facilities Authority Revenue (Health First Inc. Project) | 5.000% | 4/1/25 | | 5,890 | 6,752 |
| Brevard County FL Health Facilities Authority Revenue (Health First Inc. Project) | 5.000% | 4/1/26 | | 6,200 | 7,058 |
| Brevard County FL Health Facilities Authority Revenue (Health First Inc. Project) | 5.000% | 4/1/27 | | 6,280 | 7,108 |
| Brevard County FL Health Facilities Authority Revenue (Health First Inc. Project) | 5.000% | 4/1/31 | | 7,000 | 7,814 |
| Brevard County FL School Board COP | 5.000% | 7/1/23 | (12) | 4,615 | 5,059 |
| Brevard County FL School Board COP | 5.000% | 7/1/24 | (12) | 4,850 | 5,317 |
| Brevard County FL School Board COP | 5.000% | 7/1/25 | | 1,000 | 1,185 |
| Brevard County FL School Board COP | 5.000% | 7/1/25 | (12) | 5,090 | 5,580 |
| Broward County FL Airport System Revenue | 5.000% | 10/1/25 | | 2,000 | 2,316 |
| Broward County FL Airport System Revenue | 5.000% | 10/1/26 | | 2,730 | 3,135 |
| Broward County FL Airport System Revenue | 5.000% | 10/1/27 | | 5,785 | 6,609 |
| Broward County FL Airport System Revenue | 5.000% | 10/1/28 | | 5,000 | 5,689 |
| Broward County FL Airport System Revenue | 5.500% | 10/1/31 | | 7,210 | 8,439 |
| Broward County FL Airport System Revenue | 5.500% | 10/1/32 | | 7,610 | 8,868 |
| Broward County FL Airport System Revenue | 5.500% | 10/1/33 | | 8,025 | 9,332 |
| Broward County FL GO | 5.000% | 1/1/20 | | 9,185 | 10,883 |
| Broward County FL Port Facilities Revenue | 5.500% | 9/1/29 | | 5,500 | 6,321 |
| Broward County FL School Board COP | 5.250% | 7/1/24 | (4) | 12,480 | 14,140 |
| Broward County FL Water & Sewer Utility Revenue | 5.000% | 10/1/22 | | 10,650 | 12,920 |
| Broward County FL Water & Sewer Utility Revenue | 5.000% | 10/1/23 | | 2,000 | 2,285 |
| Citizens Property Insurance Corp. Florida Revenue (Coastal Account) | 5.000% | 6/1/15 | | 70,000 | 71,957 |
| Citizens Property Insurance Corp. Florida Revenue (Coastal Account) | 5.000% | 6/1/16 | | 10,000 | 10,709 |
| Citizens Property Insurance Corp. Florida Revenue (Coastal Account) | 5.000% | 6/1/16 | | 16,000 | 17,134 |
| Citizens Property Insurance Corp. Florida Revenue (Coastal Account) | 5.250% | 6/1/17 | | 23,000 | 25,602 |
| Citizens Property Insurance Corp. Florida Revenue | | | | | |
| (Personal Lines Account/Commercial Lines Account) | 5.000% | 6/1/16 | | 50,000 | 53,545 |
| Citizens Property Insurance Corp. Florida Revenue | | | | | |
| (Personal Lines Account/Commercial Lines Account) | 5.000% | 6/1/19 | | 19,150 | 22,117 |
| Citizens Property Insurance Corp. Florida Revenue | | | | | |
| (Personal Lines Account/Commercial Lines Account) | 5.000% | 6/1/20 | | 21,100 | 24,684 |
| Clay County FL Sales Surtax Revenue | 5.000% | 10/1/16 | (12) | 8,135 | 8,761 |
| Florida Board of Education Capital Outlay GO | 5.000% | 6/1/22 | | 7,050 | 8,609 |
| Florida Board of Education Lottery Revenue | 5.000% | 7/1/15 | (Prere.) | 5,410 | 5,639 |
| Florida Board of Education Lottery Revenue | 5.000% | 7/1/15 | (Prere.) | 12,545 | 13,076 |
| Florida Board of Education Lottery Revenue | 5.000% | 7/1/15 | (Prere.) | 11,590 | 12,080 |
| Florida Board of Education Lottery Revenue | 5.000% | 7/1/15 | (Prere.) | 11,235 | 11,710 |
| Florida Board of Education Lottery Revenue | 5.000% | 7/1/16 | (2) | 5,305 | 5,527 |
| Florida Board of Education Lottery Revenue | 5.000% | 7/1/18 | | 4,000 | 4,589 |
| Florida Board of Education Lottery Revenue | 5.000% | 7/1/19 | | 4,550 | 5,225 |
| Florida Board of Education Lottery Revenue | 5.000% | 7/1/22 | (14) | 14,690 | 16,432 |
| Florida Board of Education Lottery Revenue | 5.000% | 7/1/24 | | 13,700 | 15,289 |
| Florida Board of Education Lottery Revenue | 5.000% | 7/1/24 | | 11,385 | 13,034 |
| Florida Board of Education Lottery Revenue | 5.000% | 7/1/25 | | 14,385 | 16,030 |
| Florida Board of Education Lottery Revenue | 5.000% | 7/1/25 | | 13,215 | 15,109 |
| Florida Board of Education Lottery Revenue | 5.000% | 7/1/26 | | 13,875 | 15,863 |
| Florida Board of Education Lottery Revenue | 5.000% | 7/1/27 | | 15,855 | 17,628 |
| Florida Board of Education Public Education Capital Outlay GO | 5.000% | 1/1/15 | (Prere.) | 255 | 260 |
| Florida Board of Education Public Education Capital Outlay GO | 5.000% | 1/1/15 | (Prere.) | 7,745 | 7,885 |
| Florida Board of Education Public Education Capital Outlay GO | 5.000% | 1/1/15 | (Prere.) | 385 | 392 |
| Florida Board of Education Public Education Capital Outlay GO | 5.000% | 1/1/15 | (Prere.) | 4,215 | 4,291 |
| Florida Board of Education Public Education Capital Outlay GO | 5.000% | 6/1/15 | | 4,105 | 4,222 |
| Florida Board of Education Public Education Capital Outlay GO | 5.000% | 6/1/15 | | 4,205 | 4,325 |
| Florida Board of Education Public Education Capital Outlay GO | 5.000% | 6/1/15 | | 5,540 | 5,698 |
| Florida Board of Education Public Education Capital Outlay GO | 5.000% | 6/1/19 | | 2,905 | 3,407 |
| Florida Board of Education Public Education Capital Outlay GO | 4.750% | 6/1/20 | | 26,350 | 27,287 |
86
Intermediate-Term Tax-Exempt Fund
| | | | | |
| | | | | Face | Market |
| | | Maturity | | Amount | Value• |
| | Coupon | Date | | ($000) | ($000) |
| Florida Board of Education Public Education Capital Outlay GO | 5.000% | 6/1/20 | | 3,500 | 3,924 |
| Florida Board of Education Public Education Capital Outlay GO | 5.000% | 6/1/20 | | 5,585 | 6,585 |
| Florida Board of Education Public Education Capital Outlay GO | 5.000% | 6/1/22 | | 3,040 | 3,712 |
| Florida Board of Education Public Education Capital Outlay GO | 5.000% | 6/1/23 | | 2,125 | 2,490 |
| Florida Board of Education Public Education Capital Outlay GO | 6.000% | 6/1/23 | | 7,000 | 9,140 |
| Florida Board of Education Public Education Capital Outlay GO | 5.000% | 6/1/30 | | 15,000 | 17,409 |
| Florida Board of Education Public Education Capital Outlay GO | 5.000% | 6/1/31 | | 5,000 | 5,780 |
| Florida Department of Environmental Protection & Preservation Revenue | 5.000% | 7/1/15 | (Prere.) | 10,045 | 10,467 |
| Florida Department of Environmental Protection & Preservation Revenue | 5.000% | 7/1/15 | (Prere.) | 10,000 | 10,420 |
| Florida Department of Environmental Protection & Preservation Revenue | 5.000% | 7/1/17 | | 8,175 | 9,116 |
| Florida Department of Environmental Protection & Preservation Revenue | 5.000% | 7/1/19 | | 5,855 | 6,704 |
| Florida Department of Environmental Protection & Preservation Revenue | 5.000% | 7/1/24 | | 9,025 | 10,014 |
| Florida Department of Environmental Protection & Preservation Revenue | 5.000% | 7/1/24 | | 10,025 | 11,430 |
| Florida Department of Environmental Protection & Preservation Revenue | 5.000% | 7/1/25 | (14) | 6,700 | 7,423 |
| Florida Department of Environmental Protection & Preservation Revenue | 5.000% | 7/1/25 | | 9,475 | 10,513 |
| Florida Department of Environmental Protection & Preservation Revenue | 5.000% | 7/1/25 | | 10,525 | 11,956 |
| Florida Department of Environmental Protection & Preservation Revenue | 5.000% | 7/1/26 | (14) | 10,045 | 11,129 |
| Florida Department of Environmental Protection & Preservation Revenue | 5.000% | 7/1/26 | | 9,950 | 11,004 |
| Florida Department of Environmental Protection & Preservation Revenue | 5.000% | 7/1/26 | | 11,055 | 12,558 |
| Florida Department of Environmental Protection & Preservation Revenue | 5.000% | 7/1/27 | | 5,445 | 5,991 |
| Florida Department of Environmental Protection & Preservation Revenue | 5.000% | 7/1/27 | | 11,605 | 13,125 |
| Florida Department of Environmental Protection & Preservation Revenue | 5.000% | 7/1/28 | | 10,970 | 12,015 |
| Florida Department of Transportation GO | 5.000% | 7/1/19 | | 7,895 | 9,276 |
| Florida Department of Transportation GO | 5.000% | 7/1/22 | | 6,055 | 7,094 |
| Florida Higher Educational Facilities Financing Authority Revenue (University of Tampa Project) | 5.000% | 4/1/32 | | 1,000 | 1,084 |
| Florida Hurricane Catastrophe Fund Finance Corp. Revenue | 5.000% | 7/1/16 | (ETM) | 50,000 | 53,808 |
| Florida Municipal Power Agency Revenue | 5.250% | 10/1/19 | (4) | 10,000 | 11,792 |
| Florida Municipal Power Agency Revenue | 5.000% | 10/1/27 | | 12,500 | 14,222 |
| Florida Municipal Power Agency Revenue | 5.750% | 10/1/27 | | 3,000 | 3,555 |
| Florida Ports Financing Commission Revenue | 5.000% | 10/1/24 | | 2,075 | 2,444 |
| Florida Ports Financing Commission Revenue | 5.000% | 10/1/26 | | 1,420 | 1,661 |
| Florida Ports Financing Commission Revenue | 5.000% | 10/1/28 | | 2,000 | 2,335 |
| Florida Turnpike Authority Revenue | 5.000% | 7/1/17 | | 1,420 | 1,585 |
| Florida Turnpike Authority Revenue | 5.000% | 7/1/19 | (2) | 4,150 | 4,321 |
| Florida Turnpike Authority Revenue | 5.000% | 7/1/19 | | 1,365 | 1,530 |
| Florida Turnpike Authority Revenue | 5.000% | 7/1/20 | (2) | 2,745 | 2,858 |
| Florida Turnpike Authority Revenue | 5.000% | 7/1/20 | | 3,000 | 3,361 |
| Florida Turnpike Authority Revenue | 5.000% | 7/1/22 | (2) | 5,120 | 5,330 |
| Florida Water Pollution Control Financing Corp. Revenue | 5.000% | 1/15/20 | | 2,000 | 2,308 |
| Fort Myers FL Improvement Revenue | 5.000% | 12/1/16 | (Prere.) | 6,330 | 6,934 |
| Fort Myers FL Improvement Revenue | 5.000% | 12/1/25 | (14) | 1,010 | 1,098 |
| Gainesville FL Utility System Revenue VRDO | 0.070% | 11/3/14 | | 10,710 | 10,710 |
| Greater Orlando Aviation Authority Florida Airport Facilities Revenue | 5.000% | 10/1/25 | | 1,690 | 1,950 |
| Highlands County FL Health Facilities Authority Hospital Revenue | | | | | |
| (Adventist Health System/Sunbelt Obligated Group) | 5.000% | 11/15/15 | (Prere.) | 820 | 861 |
| Highlands County FL Health Facilities Authority Hospital Revenue | | | | | |
| (Adventist Health System/Sunbelt Obligated Group) | 5.000% | 11/15/15 | (Prere.) | 125 | 131 |
| Highlands County FL Health Facilities Authority Hospital Revenue | | | | | |
| (Adventist Health System/Sunbelt Obligated Group) | 5.000% | 11/15/15 | (Prere.) | 145 | 152 |
| Highlands County FL Health Facilities Authority Hospital Revenue | | | | | |
| (Adventist Health System/Sunbelt Obligated Group) | 5.000% | 11/15/15 | (Prere.) | 260 | 273 |
| Highlands County FL Health Facilities Authority Hospital Revenue | | | | | |
| (Adventist Health System/Sunbelt Obligated Group) | 5.000% | 11/15/15 | (Prere.) | 190 | 199 |
| Highlands County FL Health Facilities Authority Hospital Revenue | | | | | |
| (Adventist Health System/Sunbelt Obligated Group) | 5.000% | 11/15/17 | | 3,000 | 3,386 |
| Highlands County FL Health Facilities Authority Hospital Revenue | | | | | |
| (Adventist Health System/Sunbelt Obligated Group) | 5.000% | 11/15/18 | | 1,700 | 1,782 |
| Highlands County FL Health Facilities Authority Hospital Revenue | | | | | |
| (Adventist Health System/Sunbelt Obligated Group) | 5.000% | 11/15/18 | | 3,000 | 3,461 |
| Highlands County FL Health Facilities Authority Hospital Revenue | | | | | |
| (Adventist Health System/Sunbelt Obligated Group) | 5.000% | 11/15/18 | | 2,000 | 2,298 |
| Highlands County FL Health Facilities Authority Hospital Revenue | | | | | |
| (Adventist Health System/Sunbelt Obligated Group) | 5.000% | 11/15/20 | | 1,000 | 1,048 |
| Highlands County FL Health Facilities Authority Hospital Revenue | | | | | |
| (Adventist Health System/Sunbelt Obligated Group) | 5.000% | 11/15/20 | | 7,000 | 8,166 |
| Highlands County FL Health Facilities Authority Hospital Revenue | | | | | |
| (Adventist Health System/Sunbelt Obligated Group) | 5.000% | 11/15/20 | | 875 | 917 |
| Highlands County FL Health Facilities Authority Hospital Revenue | | | | | |
| (Adventist Health System/Sunbelt Obligated Group) | 5.000% | 11/15/20 | | 2,155 | 2,521 |
| Highlands County FL Health Facilities Authority Hospital Revenue | | | | | |
| (Adventist Health System/Sunbelt Obligated Group) | 4.500% | 11/15/21 | | 2,250 | 2,489 |
87
Intermediate-Term Tax-Exempt Fund
| | | | | |
| | | | | Face | Market |
| | | Maturity | | Amount | Value• |
| | Coupon | Date | | ($000) | ($000) |
| Highlands County FL Health Facilities Authority Hospital Revenue | | | | | |
| (Adventist Health System/Sunbelt Obligated Group) | 5.000% | 11/15/21 | | 1,000 | 1,048 |
| Highlands County FL Health Facilities Authority Hospital Revenue | | | | | |
| (Adventist Health System/Sunbelt Obligated Group) | 5.000% | 11/15/21 | | 135 | 141 |
| Highlands County FL Health Facilities Authority Hospital Revenue | | | | | |
| (Adventist Health System/Sunbelt Obligated Group) | 5.250% | 11/15/21 | | 2,000 | 2,349 |
| Highlands County FL Health Facilities Authority Hospital Revenue | | | | | |
| (Adventist Health System/Sunbelt Obligated Group) | 5.000% | 11/15/22 | | 1,000 | 1,048 |
| Highlands County FL Health Facilities Authority Hospital Revenue | | | | | |
| (Adventist Health System/Sunbelt Obligated Group) | 5.000% | 11/15/22 | | 740 | 775 |
| Highlands County FL Health Facilities Authority Hospital Revenue | | | | | |
| (Adventist Health System/Sunbelt Obligated Group) | 5.000% | 11/15/23 | | 500 | 524 |
| Highlands County FL Health Facilities Authority Hospital Revenue | | | | | |
| (Adventist Health System/Sunbelt Obligated Group) | 5.000% | 11/15/23 | | 1,310 | 1,372 |
| Hillsborough County FL Assessment Revenue | 5.000% | 3/1/22 | (14) | 6,260 | 6,454 |
| Hillsborough County FL Aviation Authority Revenue (Tampa International Airport) | 5.000% | 10/1/15 | | 2,500 | 2,606 |
| Hillsborough County FL Aviation Authority Revenue (Tampa International Airport) | 5.000% | 10/1/17 | | 2,750 | 3,067 |
| Hillsborough County FL Aviation Authority Revenue (Tampa International Airport) | 5.000% | 10/1/18 | | 3,400 | 3,873 |
| Hillsborough County FL Industrial Development Authority Health Facilities Revenue | | | | | |
| (University Community Hospital) | 5.500% | 8/15/17 | (ETM) | 3,650 | 3,966 |
| Hillsborough County FL Industrial Development Authority Hospital Revenue | | | | | |
| (Tampa General Hospital Project) | 5.000% | 10/1/28 | | 12,300 | 14,046 |
| Hillsborough County FL Industrial Development Authority Hospital Revenue | | | | | |
| (Tampa General Hospital Project) | 5.000% | 10/1/31 | | 12,500 | 14,130 |
| Hillsborough County FL Industrial Development Authority Hospital Revenue | | | | | |
| (Tampa General Hospital Project) | 5.000% | 10/1/34 | | 3,000 | 3,364 |
| Hillsborough County FL Industrial Development Authority Revenue | | | | | |
| (University Community Hospital) | 6.500% | 8/15/19 | (ETM) | 3,500 | 4,045 |
| Hillsborough County FL School Board (Master Lease Program) COP | 5.000% | 7/1/27 | | 12,000 | 13,685 |
| Hillsborough County FL School Board (Master Lease Program) COP | 5.000% | 7/1/28 | | 14,000 | 15,833 |
| Hillsborough County FL School Board (Master Lease Program) COP | 5.000% | 7/1/29 | | 15,070 | 16,988 |
| Hillsborough County FL School Board COP | 5.000% | 7/1/24 | | 16,305 | 18,809 |
| Hillsborough County FL School Board COP | 5.000% | 7/1/25 | | 6,000 | 6,901 |
| Jacksonville FL Electric Authority Electric System Revenue | 5.000% | 10/1/22 | | 2,500 | 2,890 |
| Jacksonville FL Electric Authority Electric System Revenue | 5.000% | 10/1/22 | | 600 | 721 |
| Jacksonville FL Electric Authority Electric System Revenue | 5.000% | 10/1/23 | | 750 | 899 |
| Jacksonville FL Electric Authority Electric System Revenue | 5.000% | 10/1/24 | | 7,025 | 8,365 |
| Jacksonville FL Electric Authority Electric System Revenue | 5.000% | 10/1/25 | | 2,000 | 2,363 |
| Jacksonville FL Electric Authority Electric System Revenue | 5.000% | 10/1/27 | | 4,490 | 5,222 |
| Jacksonville FL Electric Authority Electric System Revenue | 5.000% | 10/1/28 | | 3,900 | 4,417 |
| Jacksonville FL Electric Authority Electric System Revenue | 5.000% | 10/1/29 | | 2,075 | 2,355 |
| Jacksonville FL Electric Authority Electric System Revenue VRDO | 0.060% | 11/3/14 | | 10,655 | 10,655 |
| Jacksonville FL Electric Authority Electric System Revenue VRDO | 0.050% | 11/7/14 | | 11,445 | 11,445 |
| Jacksonville FL Electric Authority Revenue (St. John’s River Power Park) | 5.000% | 10/1/20 | (14) | 5,000 | 5,099 |
| Jacksonville FL Electric Authority Water & Sewer Revenue | 5.000% | 10/1/28 | | 8,000 | 9,499 |
| Jacksonville FL Electric Authority Water & Sewer Revenue | 5.000% | 10/1/29 | | 2,000 | 2,369 |
| Jacksonville FL Electric Authority Water & Sewer Revenue | 5.000% | 10/1/29 | | 6,160 | 7,118 |
| Jacksonville FL Electric Authority Water & Sewer Revenue | 4.000% | 10/1/30 | | 3,000 | 3,184 |
| Jacksonville FL Electric Authority Water & Sewer Revenue | 5.000% | 10/1/31 | | 17,495 | 19,932 |
| Jacksonville FL Sales Taxes Revenue | 5.000% | 10/1/23 | | 5,415 | 6,137 |
| Jacksonville FL Sales Taxes Revenue | 5.000% | 10/1/24 | | 5,685 | 6,443 |
| Jacksonville FL Sales Taxes Revenue | 5.000% | 10/1/25 | | 5,970 | 6,751 |
| Jacksonville FL Sales Taxes Revenue | 4.750% | 10/1/28 | | 13,280 | 14,661 |
| Jacksonville FL Special Revenue | 5.000% | 10/1/20 | | 15,420 | 18,387 |
| Jacksonville FL Special Revenue | 5.000% | 10/1/25 | | 4,500 | 5,369 |
| Jacksonville FL Special Revenue | 5.000% | 10/1/25 | | 4,800 | 5,507 |
| 2 Jacksonville FL Special Revenue | 5.000% | 10/1/26 | | 7,710 | 9,135 |
| 2 Jacksonville FL Special Revenue | 5.000% | 10/1/28 | | 6,385 | 7,455 |
| 2 Jacksonville FL Special Revenue | 5.000% | 10/1/29 | | 7,750 | 9,027 |
| 2 Jacksonville FL Special Revenue | 5.000% | 10/1/30 | | 3,145 | 3,643 |
| Jacksonville FL Special Revenue | 5.000% | 10/1/32 | | 1,750 | 2,006 |
| 2 Jacksonville FL Special Revenue | 5.000% | 10/1/33 | | 3,105 | 3,557 |
| 2 Jacksonville FL Special Revenue | 5.000% | 10/1/34 | | 1,765 | 2,012 |
| Lake County FL School Board COP | 5.250% | 6/1/15 | (2) | 4,075 | 4,194 |
| Lake County FL School Board COP | 5.250% | 6/1/15 | (2) | 2,050 | 2,110 |
| Lake County FL School Board COP | 5.000% | 6/1/28 | (4) | 1,500 | 1,737 |
| Lake County FL School Board COP | 5.000% | 6/1/29 | (4) | 1,750 | 2,019 |
| Lake County FL School Board COP | 5.000% | 6/1/30 | (4) | 3,000 | 3,451 |
| Lakeland FL Educational Facilities Revenue (Florida Southern College Project) | 5.000% | 9/1/31 | | 500 | 535 |
| Lee County FL Non-Ad Valorem Revenue | 5.000% | 10/1/22 | | 1,750 | 2,071 |
| Lee County FL Non-Ad Valorem Revenue | 5.000% | 10/1/23 | | 2,750 | 3,270 |
88
Intermediate-Term Tax-Exempt Fund
| | | | | | |
| | | | | | Face | Market |
| | | | Maturity | | Amount | Value• |
| | | Coupon | Date | | ($000) | ($000) |
| | Lee County FL Non-Ad Valorem Revenue | 5.000% | 10/1/24 | | 3,000 | 3,595 |
| | Lee County FL School Board COP | 5.000% | 8/1/27 | | 5,000 | 5,908 |
| | Lee County FL School Board COP | 5.000% | 8/1/28 | | 4,000 | 4,694 |
| | Lee County FL Transportation Facilities Revenue | 5.000% | 10/1/26 | (4) | 1,000 | 1,179 |
| | Lee County FL Transportation Facilities Revenue | 5.000% | 10/1/28 | (4) | 3,055 | 3,561 |
| | Lee County FL Transportation Facilities Revenue | 5.000% | 10/1/30 | (4) | 3,300 | 3,816 |
| | Lee County FL Transportation Facilities Revenue | 5.000% | 10/1/32 | (4) | 1,820 | 2,091 |
| | Lee County FL Transportation Facilities Revenue | 5.000% | 10/1/33 | (4) | 1,000 | 1,145 |
| | Lee County FL Transportation Facilities Revenue | 5.000% | 10/1/34 | (4) | 1,000 | 1,138 |
| | Lee County FL Transportation Facilities Revenue | 5.000% | 10/1/35 | (4) | 1,000 | 1,135 |
| | Lee County FL Water & Sewer Revenue | 5.250% | 10/1/25 | | 5,950 | 7,112 |
| | Manatee County FL Revenue | 5.000% | 10/1/22 | | 1,255 | 1,524 |
| | Manatee County FL Revenue | 5.000% | 10/1/23 | | 1,300 | 1,587 |
| | Manatee County FL Revenue | 5.000% | 10/1/25 | | 1,325 | 1,590 |
| | Manatee County FL Revenue | 5.000% | 10/1/26 | | 1,520 | 1,808 |
| | Manatee County FL Revenue | 5.000% | 10/1/27 | | 1,580 | 1,868 |
| | Marco Island FL Utility System Revenue | 5.250% | 10/1/32 | | 3,300 | 3,883 |
| | Marco Island FL Utility System Revenue | 5.250% | 10/1/33 | | 2,000 | 2,346 |
| | Miami Beach FL Health Facilities Authority Revenue (Mount Sinai Medical Center) | 5.000% | 11/15/20 | | 1,250 | 1,440 |
| | Miami Beach FL Health Facilities Authority Revenue (Mount Sinai Medical Center) | 5.000% | 11/15/21 | | 3,415 | 3,944 |
| | Miami Beach FL Health Facilities Authority Revenue (Mount Sinai Medical Center) | 5.000% | 11/15/22 | | 3,000 | 3,451 |
| | Miami Beach FL Health Facilities Authority Revenue (Mount Sinai Medical Center) | 5.000% | 11/15/23 | | 2,525 | 2,868 |
| | Miami Beach FL Health Facilities Authority Revenue (Mount Sinai Medical Center) | 5.000% | 11/15/29 | | 1,325 | 1,456 |
| | Miami Beach FL Health Facilities Authority Revenue (Mount Sinai Medical Center) | 5.000% | 11/15/30 | | 1,000 | 1,115 |
| 1 | Miami-County FL Transit Sales Surtax Revenue TOB VRDO | 0.090% | 11/7/14 | | 7,600 | 7,600 |
| | Miami-Dade County FL Aviation Revenue (Miami International Airport) | 5.000% | 10/1/23 | | 1,460 | 1,681 |
| | Miami-Dade County FL Aviation Revenue (Miami International Airport) | 5.000% | 10/1/23 | (12) | 1,800 | 2,048 |
| | Miami-Dade County FL Aviation Revenue (Miami International Airport) | 5.000% | 10/1/24 | | 2,630 | 3,012 |
| | Miami-Dade County FL Aviation Revenue (Miami International Airport) | 5.750% | 10/1/25 | | 5,000 | 5,925 |
| | Miami-Dade County FL Aviation Revenue (Miami International Airport) | 5.000% | 10/1/26 | | 6,500 | 7,411 |
| | Miami-Dade County FL Aviation Revenue (Miami International Airport) | 5.000% | 10/1/29 | | 7,200 | 8,239 |
| | Miami-Dade County FL Aviation Revenue (Miami International Airport) | 5.000% | 10/1/29 | (12) | 4,000 | 4,514 |
| | Miami-Dade County FL Aviation Revenue (Miami International Airport) | 5.000% | 10/1/30 | | 5,500 | 6,152 |
| 1 | Miami-Dade County FL Aviation Revenue (Miami International Airport) TOB VRDO | 0.060% | 11/7/14 | (13) | 8,420 | 8,420 |
| | Miami-Dade County FL Educational Facilities Authority Revenue (University of Miami) | 5.000% | 4/1/20 | (2) | 2,040 | 2,221 |
| | Miami-Dade County FL Educational Facilities Authority Revenue (University of Miami) | 5.000% | 4/1/24 | (2) | 5,275 | 5,702 |
| | Miami-Dade County FL Expressway Authority Toll System Revenue | 5.000% | 7/1/23 | | 4,000 | 4,775 |
| | Miami-Dade County FL Expressway Authority Toll System Revenue | 5.000% | 7/1/24 | | 4,250 | 5,109 |
| | Miami-Dade County FL Expressway Authority Toll System Revenue | 5.000% | 7/1/25 | | 3,750 | 4,469 |
| | Miami-Dade County FL Expressway Authority Toll System Revenue | 5.000% | 7/1/26 | | 3,250 | 3,844 |
| | Miami-Dade County FL Expressway Authority Toll System Revenue | 5.000% | 7/1/27 | | 2,250 | 2,646 |
| | Miami-Dade County FL Expressway Authority Toll System Revenue | 5.000% | 7/1/31 | | 2,000 | 2,292 |
| | Miami-Dade County FL Expressway Authority Toll System Revenue | 5.000% | 7/1/32 | | 2,550 | 2,911 |
| | Miami-Dade County FL Expressway Authority Toll System Revenue | 5.000% | 7/1/33 | | 5,000 | 5,690 |
| | Miami-Dade County FL School Board COP | 5.000% | 5/1/16 | (ETM) | 9,335 | 9,988 |
| | Miami-Dade County FL School Board COP | 5.000% | 8/1/16 | (2) | 4,280 | 4,618 |
| | Miami-Dade County FL School Board COP | 5.000% | 11/1/16 | (Prere.) | 3,280 | 3,579 |
| | Miami-Dade County FL School Board COP | 5.000% | 11/1/16 | (Prere.) | 2,655 | 2,897 |
| | Miami-Dade County FL School Board COP | 5.000% | 11/1/16 | (Prere.) | 2,500 | 2,728 |
| | Miami-Dade County FL School Board COP | 5.000% | 11/1/16 | (Prere.) | 5,025 | 5,483 |
| | Miami-Dade County FL School Board COP | 5.000% | 11/1/16 | (Prere.) | 3,500 | 3,819 |
| | Miami-Dade County FL School Board COP | 5.000% | 5/1/19 | (14) | 5,685 | 6,271 |
| | Miami-Dade County FL School Board COP | 5.000% | 8/1/19 | (2) | 5,265 | 5,955 |
| | Miami-Dade County FL School Board COP | 5.250% | 5/1/23 | (12) | 25,200 | 28,429 |
| | Miami-Dade County FL School Board COP | 5.250% | 5/1/24 | (12) | 27,650 | 31,122 |
| | Miami-Dade County FL School Board COP | 5.250% | 5/1/25 | (12) | 14,225 | 15,970 |
| | Miami-Dade County FL School Board COP | 5.250% | 5/1/26 | (12) | 12,980 | 14,516 |
| 2 | Miami-Dade County FL School Board COP | 5.000% | 11/1/26 | | 7,935 | 9,231 |
| 2 | Miami-Dade County FL School Board COP | 5.000% | 11/1/27 | | 10,000 | 11,575 |
| | Miami-Dade County FL School Board COP | 5.250% | 5/1/28 | (12) | 15,530 | 17,373 |
| 2 | Miami-Dade County FL School Board COP | 5.000% | 11/1/28 | | 10,000 | 11,493 |
| 2 | Miami-Dade County FL School Board COP | 5.000% | 11/1/29 | | 10,000 | 11,447 |
| | Miami-Dade County FL School Board COP PUT | 5.000% | 5/1/16 | | 10,000 | 10,643 |
| 1,3 | Miami-Dade County FL School Board COP TOB PUT | 0.490% | 11/6/14 | LOC | 15,760 | 15,760 |
| 1,3 | Miami-Dade County FL School Board COP TOB PUT | 0.490% | 11/6/14 | LOC | 15,765 | 15,765 |
| 1,3 | Miami-Dade County FL School Board COP TOB PUT | 0.530% | 11/6/14 | LOC | 12,690 | 12,690 |
| 1,3 | Miami-Dade County FL School Board COP TOB PUT | 0.510% | 12/11/14 | LOC | 27,245 | 27,245 |
| | Miami-Dade County FL Seaport Revenue | 5.750% | 10/1/30 | | 2,300 | 2,728 |
| | Miami-Dade County FL Seaport Revenue | 5.750% | 10/1/32 | | 2,600 | 3,080 |
| | Miami-Dade County FL Special Obligation Revenue | 5.000% | 10/1/24 | | 2,000 | 2,331 |
| | Miami-Dade County FL Special Obligation Revenue | 5.000% | 10/1/25 | | 2,750 | 3,183 |
89
Intermediate-Term Tax-Exempt Fund
| | | | | |
| | | | | Face | Market |
| | | Maturity | | Amount | Value• |
| | Coupon | Date | | ($000) | ($000) |
| Miami-Dade County FL Special Obligation Revenue | 5.000% | 10/1/26 | | 11,340 | 13,007 |
| Miami-Dade County FL Special Obligation Revenue | 5.000% | 10/1/27 | | 2,500 | 2,852 |
| Miami-Dade County FL Special Obligation Revenue | 5.000% | 10/1/28 | | 8,840 | 10,018 |
| Miami-Dade County FL Special Obligation Revenue | 0.000% | 10/1/29 | | 5,000 | 2,643 |
| Miami-Dade County FL Special Obligation Revenue | 5.000% | 10/1/29 | | 10,000 | 11,302 |
| Miami-Dade County FL Special Obligation Revenue | 5.000% | 10/1/30 | | 12,000 | 13,527 |
| Miami-Dade County FL Special Obligation Revenue | 5.000% | 10/1/30 | | 4,000 | 4,506 |
| Miami-Dade County FL Special Obligation Revenue | 0.000% | 10/1/31 | | 2,155 | 1,030 |
| Miami-Dade County FL Special Obligation Revenue | 5.000% | 10/1/31 | | 13,500 | 15,137 |
| Miami-Dade County FL Special Obligation Revenue | 0.000% | 10/1/32 | | 2,890 | 1,309 |
| Miami-Dade County FL Special Obligation Revenue | 5.000% | 10/1/32 | | 11,550 | 12,916 |
| 1 Miami-Dade County FL Special Obligation Revenue TOB VRDO | 0.060% | 11/3/14 | LOC | 4,929 | 4,929 |
| Miami-Dade County FL Transit Sales Surtax Revenue | 5.000% | 7/1/27 | | 4,000 | 4,621 |
| Miami-Dade County FL Transit Sales Surtax Revenue | 5.000% | 7/1/28 | | 2,060 | 2,354 |
| Miami-Dade County FL Transit Sales Surtax Revenue | 5.000% | 7/1/30 | | 8,000 | 9,094 |
| Miami-Dade County FL Transit Sales Surtax Revenue | 5.000% | 7/1/31 | | 6,250 | 7,073 |
| Miami-Dade County FL Transit Sales Surtax Revenue | 5.000% | 7/1/32 | | 1,650 | 1,864 |
| Miami-Dade County FL Water & Sewer Revenue | 5.250% | 10/1/21 | | 20,000 | 23,894 |
| Miami-Dade County FL Water & Sewer Revenue | 5.000% | 10/1/26 | (14) | 7,400 | 8,212 |
| North Brevard County FL Hospital District Revenue (Parrish Medical Center Project) | 5.500% | 10/1/18 | (Prere.) | 3,560 | 4,185 |
| North Brevard County FL Hospital District Revenue (Parrish Medical Center Project) | 5.500% | 10/1/28 | | 1,440 | 1,599 |
| North Broward FL Hospital District Revenue VRDO | 0.050% | 11/7/14 | LOC | 39,900 | 39,900 |
| Orange County FL Health Facilities Authority Hospital Revenue (Orlando Health Inc.) | 5.250% | 10/1/21 | | 8,000 | 9,265 |
| Orange County FL School Board COP | 5.000% | 8/1/23 | (14) | 9,000 | 9,585 |
| Orange County FL School Board COP | 5.000% | 8/1/24 | (14) | 4,000 | 4,254 |
| Orange County FL School Board COP | 4.500% | 8/1/26 | | 8,400 | 9,280 |
| Orange County FL School Board COP | 4.500% | 8/1/27 | | 7,000 | 7,609 |
| Orange County FL Tourist Development Revenue | 5.000% | 10/1/17 | | 5,955 | 6,680 |
| Orange County FL Tourist Development Revenue | 5.000% | 10/1/18 | (14) | 18,980 | 21,185 |
| Orange County FL Tourist Development Revenue | 5.000% | 10/1/20 | (14) | 15,345 | 17,029 |
| Orange County FL Tourist Development Revenue | 5.000% | 10/1/21 | (14) | 16,605 | 18,322 |
| Orange County FL Tourist Development Revenue | 5.000% | 10/1/27 | (2) | 12,630 | 13,152 |
| Orlando & Orange County FL Expressway Authority Revenue | 5.000% | 7/1/27 | | 7,780 | 8,846 |
| Orlando & Orange County FL Expressway Authority Revenue | 5.000% | 7/1/30 | | 3,500 | 3,932 |
| Orlando & Orange County FL Expressway Authority Revenue | 5.000% | 7/1/31 | | 23,030 | 26,483 |
| Orlando & Orange County FL Expressway Authority Revenue | 5.000% | 7/1/32 | | 9,875 | 11,331 |
| Orlando & Orange County FL Expressway Authority Revenue | 5.000% | 7/1/35 | | 5,000 | 5,578 |
| Orlando FL Utility Commission Utility System Revenue | 5.250% | 10/1/22 | | 3,245 | 4,020 |
| Orlando FL Utility Commission Utility System Revenue | 5.000% | 10/1/23 | | 4,000 | 4,917 |
| Osceola County FL Expressway System Revenue (Poinciana Parkway Project) | 0.000% | 10/1/29 | | 1,000 | 617 |
| Osceola County FL Expressway System Revenue (Poinciana Parkway Project) | 0.000% | 10/1/30 | | 1,400 | 865 |
| Osceola County FL Expressway System Revenue (Poinciana Parkway Project) | 0.000% | 10/1/31 | | 1,600 | 986 |
| Osceola County FL Expressway System Revenue (Poinciana Parkway Project) | 0.000% | 10/1/32 | | 2,060 | 1,268 |
| Osceola County FL Expressway System Revenue (Poinciana Parkway Project) | 0.000% | 10/1/33 | | 3,000 | 1,825 |
| Palm Beach County FL Health Facilities Authority Hospital Revenue (BRRH Corp. Obligated Group) | 5.000% | 12/1/22 | | 850 | 975 |
| Palm Beach County FL Health Facilities Authority Hospital Revenue (BRRH Corp. Obligated Group) | 5.000% | 12/1/23 | | 1,250 | 1,439 |
| Palm Beach County FL Health Facilities Authority Hospital Revenue (BRRH Corp. Obligated Group) | 5.000% | 12/1/24 | | 1,000 | 1,156 |
| Palm Beach County FL School Board COP | 5.000% | 8/1/28 | | 6,115 | 7,042 |
| Palm Beach County FL School Board COP | 5.000% | 8/1/29 | | 5,970 | 6,861 |
| Palm Beach County FL School Board COP PUT | 5.000% | 8/1/16 | | 6,000 | 6,467 |
| Palm Beach County FL Solid Waste Authority Revenue | 5.000% | 10/1/17 | | 6,000 | 6,747 |
| Palm Beach County FL Solid Waste Authority Revenue | 5.000% | 10/1/18 | | 6,000 | 6,922 |
| Palm Beach County FL Solid Waste Authority Revenue | 5.500% | 10/1/28 | | 15,000 | 17,375 |
| Pasco County FL School Board COP | 5.000% | 8/1/24 | | 2,315 | 2,707 |
| Port St. Lucie FL Utility Revenue | 5.000% | 9/1/29 | (12) | 4,180 | 4,670 |
| 2 Port St. Lucie FL Utility Revenue | 5.000% | 9/1/30 | | 2,000 | 2,250 |
| 2 Port St. Lucie FL Utility Revenue | 5.000% | 9/1/31 | | 2,100 | 2,351 |
| Reedy Creek FL Improvement District GO | 5.250% | 6/1/32 | | 9,600 | 11,059 |
| Reedy Creek FL Improvement District GO | 5.250% | 6/1/33 | | 10,000 | 11,503 |
| Reedy Creek FL Improvement District Utilities Revenue | 5.000% | 10/1/23 | | 2,505 | 2,946 |
| Sarasota County FL Infrastructure Sales Surtax Revenue | 5.000% | 10/1/23 | | 1,000 | 1,226 |
| Sarasota County FL Infrastructure Sales Surtax Revenue | 5.000% | 10/1/24 | | 1,550 | 1,920 |
| Sarasota County FL School Board COP | 5.000% | 7/1/18 | | 2,185 | 2,487 |
| Sarasota County FL School Board COP | 5.000% | 7/1/20 | | 2,855 | 3,338 |
| Sarasota County FL School Board COP | 5.000% | 7/1/23 | | 5,380 | 6,178 |
| Sarasota County FL School Board COP | 5.000% | 7/1/25 | | 5,050 | 5,737 |
| Seminole County FL School Board COP | 5.000% | 7/1/22 | (4) | 2,000 | 2,150 |
| Seminole County FL Water & Sewer Revenue | 5.000% | 10/1/23 | | 5,000 | 5,410 |
| Seminole County FL Water & Sewer Revenue | 5.000% | 10/1/24 | | 7,805 | 8,444 |
| South Florida Water Management District COP | 5.000% | 10/1/15 | (2) | 5,800 | 6,041 |
| South Florida Water Management District COP | 5.000% | 10/1/16 | (2) | 3,000 | 3,246 |
90
Intermediate-Term Tax-Exempt Fund
| | | | | |
| | | | | Face | Market |
| | | Maturity | | Amount | Value• |
| | Coupon | Date | | ($000) | ($000) |
| South Florida Water Management District COP | 5.000% | 10/1/24 | (2) | 4,000 | 4,328 |
| South Florida Water Management District COP | 5.000% | 10/1/25 | (2) | 8,000 | 8,647 |
| St. Johns County FL Development Authority Revenue | | | | | |
| (Presbyterian Retirement Communities Project) | 5.750% | 8/1/30 | | 1,500 | 1,692 |
| St. Lucie County FL School Board COP | 5.000% | 7/1/24 | | 1,595 | 1,859 |
| Sumter County FL Industrial Development Authority Hospital Revenue | | | | | |
| (Central Florida Health Alliance Project) | 5.000% | 7/1/24 | | 500 | 570 |
| Sumter County FL Industrial Development Authority Hospital Revenue | | | | | |
| (Central Florida Health Alliance Project) | 5.000% | 7/1/28 | | 500 | 556 |
| Sumter County FL Industrial Development Authority Hospital Revenue | | | | | |
| (Central Florida Health Alliance Project) | 5.000% | 7/1/29 | | 500 | 554 |
| Sumter County FL Industrial Development Authority Hospital Revenue | | | | | |
| (Central Florida Health Alliance Project) | 5.125% | 7/1/34 | | 1,135 | 1,246 |
| Sunshine State Governmental Financing Commission Florida Revenue | | | | | |
| (Miami Dade County Program) | 5.000% | 9/1/23 | | 5,985 | 6,822 |
| Sunshine State Governmental Financing Commission Florida Revenue | | | | | |
| (Miami Dade County Program) | 5.125% | 9/1/24 | | 4,625 | 5,259 |
| Sunshine State Governmental Financing Commission Florida Revenue | | | | | |
| (Miami Dade County Program) | 5.000% | 9/1/27 | | 4,250 | 4,924 |
| Sunshine State Governmental Financing Commission Florida Revenue | | | | | |
| (Miami Dade County Program) | 5.000% | 9/1/28 | | 4,450 | 5,117 |
| Tallahassee FL Health Facilities Revenue (Tallahassee Memorial HealthCare Inc. Project) | 6.250% | 12/1/20 | | 10,000 | 10,044 |
| Tampa Bay FL Water Utility System Revenue | 6.000% | 10/1/29 | (14) | 10,000 | 13,485 |
| Tampa Bay FL Water Utility System Revenue | 5.000% | 10/1/32 | | 2,305 | 2,697 |
| Tampa FL Cigarette Tax Allocation Revenue (H. Lee Moffitt Cancer Center Project) | 5.000% | 9/1/21 | | 1,220 | 1,436 |
| Tampa FL Cigarette Tax Allocation Revenue (H. Lee Moffitt Cancer Center Project) | 5.000% | 9/1/23 | | 1,400 | 1,630 |
| Tampa FL Health System Revenue (Baycare Health System) | 5.000% | 11/15/19 | | 3,580 | 4,209 |
| Tampa FL Health System Revenue (Baycare Health System) | 5.000% | 11/15/21 | | 18,420 | 21,452 |
| Tampa FL Health System Revenue (Baycare Health System) | 5.000% | 11/15/22 | | 13,395 | 15,378 |
| Tampa FL Health System Revenue (Baycare Health System) | 5.000% | 11/15/33 | | 14,686 | 16,330 |
| Tampa FL Hospital Revenue | 5.000% | 7/1/21 | | 1,000 | 1,160 |
| Tampa FL Hospital Revenue | 5.000% | 7/1/22 | | 1,075 | 1,249 |
| Tampa FL Hospital Revenue | 5.000% | 7/1/24 | | 1,000 | 1,141 |
| Tampa FL Hospital Revenue | 5.000% | 7/1/25 | | 1,935 | 2,193 |
| Tampa FL Hospital Revenue | 5.000% | 7/1/26 | | 1,500 | 1,689 |
| Tampa FL Hospital Revenue | 5.000% | 7/1/27 | | 1,000 | 1,121 |
| Tampa-Hillsborough County FL Expressway Authority Revenue | 5.000% | 7/1/15 | (Prere.) | 2,675 | 2,788 |
| Tampa-Hillsborough County FL Expressway Authority Revenue | 5.000% | 7/1/15 | (Prere.) | 15,100 | 15,739 |
| Tampa-Hillsborough County FL Expressway Authority Revenue | 5.000% | 7/1/15 | (Prere.) | 5,000 | 5,211 |
| Tampa-Hillsborough County FL Expressway Authority Revenue | 5.000% | 7/1/15 | (Prere.) | 11,355 | 11,835 |
| Tampa-Hillsborough County FL Expressway Authority Revenue | 5.000% | 7/1/15 | (Prere.) | 13,470 | 14,040 |
| Tampa-Hillsborough County FL Expressway Authority Revenue | 5.000% | 7/1/15 | (Prere.) | 5,000 | 5,211 |
| Tampa-Hillsborough County FL Expressway Authority Revenue | 5.000% | 7/1/15 | (Prere.) | 2,020 | 2,105 |
| Tampa-Hillsborough County FL Expressway Authority Revenue | 5.000% | 7/1/15 | (Prere.) | 9,450 | 9,850 |
| Tohopekaliga FL Water Authority Utility System Revenue | 5.750% | 10/1/29 | | 2,300 | 2,855 |
| Volusia County FL School Board COP | 5.000% | 8/1/21 | (4) | 3,495 | 3,615 |
| Volusia County FL School Board COP | 5.000% | 8/1/23 | | 1,000 | 1,190 |
| Volusia County FL School Board COP | 5.000% | 8/1/24 | | 500 | 597 |
| Volusia County FL School Board COP | 5.000% | 8/1/25 | | 1,675 | 2,006 |
| Volusia County FL School Board COP | 5.000% | 8/1/27 | | 1,800 | 2,117 |
| Volusia County FL School Board COP | 5.000% | 8/1/28 | | 1,650 | 1,924 |
| Volusia County FL School Board COP | 5.000% | 8/1/29 | | 2,350 | 2,734 |
| Volusia County FL School Board COP | 5.000% | 8/1/30 | | 3,880 | 4,489 |
| Volusia County FL School Board COP | 5.000% | 8/1/31 | | 2,350 | 2,704 |
| Winter Park FL Water & Sewer Revenue | 5.000% | 12/1/29 | | 1,975 | 2,260 |
| | | | | | 2,583,196 |
| Georgia (2.3%) | | | | | |
| Atlanta GA Airport Passenger Facility Charge Revenue | 5.000% | 1/1/21 | | 4,000 | 4,685 |
| Atlanta GA Airport Passenger Facility Charge Revenue | 5.000% | 1/1/22 | | 10,000 | 11,679 |
| Atlanta GA Airport Passenger Facility Charge Revenue | 5.000% | 1/1/24 | | 1,600 | 1,955 |
| Atlanta GA Airport Passenger Facility Charge Revenue | 5.000% | 1/1/28 | | 3,000 | 3,506 |
| Atlanta GA Airport Passenger Facility Charge Revenue | 5.000% | 1/1/29 | | 3,000 | 3,499 |
| Atlanta GA Airport Passenger Facility Charge Revenue | 5.000% | 1/1/30 | | 5,000 | 5,818 |
| Atlanta GA Airport Passenger Facility Charge Revenue | 5.000% | 1/1/31 | | 5,000 | 5,770 |
| Atlanta GA Airport Passenger Facility Charge Revenue | 5.000% | 1/1/32 | | 5,500 | 6,333 |
| Atlanta GA Airport Passenger Facility Charge Revenue | 5.000% | 1/1/33 | | 2,000 | 2,296 |
| Atlanta GA Airport Passenger Facility Charge Revenue | 5.000% | 1/1/34 | | 2,000 | 2,279 |
| Atlanta GA Airport Revenue | 5.000% | 1/1/21 | | 2,000 | 2,326 |
| Atlanta GA Airport Revenue | 5.000% | 1/1/22 | | 2,300 | 2,642 |
| Atlanta GA Airport Revenue | 5.000% | 1/1/24 | | 1,000 | 1,210 |
| Atlanta GA Airport Revenue | 5.875% | 1/1/24 | | 3,145 | 3,875 |
91
Intermediate-Term Tax-Exempt Fund
| | | | | |
| | | | | Face | Market |
| | | Maturity | | Amount | Value• |
| | Coupon | Date | | ($000) | ($000) |
| Atlanta GA Airport Revenue | 5.000% | 1/1/26 | | 1,600 | 1,858 |
| Atlanta GA Airport Revenue | 5.000% | 1/1/27 | | 1,390 | 1,606 |
| Atlanta GA Airport Revenue | 5.000% | 1/1/31 | | 2,525 | 2,918 |
| Atlanta GA GO | 5.250% | 12/1/19 | (12) | 4,925 | 5,841 |
| Atlanta GA GO | 5.250% | 12/1/20 | (12) | 3,280 | 3,870 |
| Atlanta GA Water & Wastewater Revenue | 5.500% | 11/1/16 | (4) | 7,000 | 7,702 |
| Atlanta GA Water & Wastewater Revenue | 5.500% | 11/1/17 | (3) | 5,400 | 6,165 |
| Atlanta GA Water & Wastewater Revenue | 5.500% | 11/1/17 | (4) | 8,000 | 9,134 |
| Atlanta GA Water & Wastewater Revenue | 6.000% | 11/1/21 | | 1,000 | 1,225 |
| Atlanta GA Water & Wastewater Revenue | 5.500% | 11/1/22 | (4) | 9,800 | 11,597 |
| Atlanta GA Water & Wastewater Revenue | 5.750% | 11/1/25 | (4) | 6,500 | 8,256 |
| Atlanta GA Water & Wastewater Revenue | 5.750% | 11/1/26 | (4) | 15,220 | 19,344 |
| Atlanta GA Water & Wastewater Revenue | 5.750% | 11/1/27 | (4) | 5,585 | 7,151 |
| 3 Atlanta GA Water & Wastewater Revenue PUT | 1.603% | 11/1/18 | | 21,685 | 22,277 |
| Burke County GA Development Authority Pollution Control Revenue | | | | | |
| (Georgia Power Co. Plant Vogtle Project) PUT | 1.750% | 6/1/17 | | 15,500 | 15,788 |
| Carroll County GA School District GO | 4.000% | 4/1/15 | | 1,300 | 1,321 |
| Carroll County GA School District GO | 5.000% | 4/1/16 | | 3,000 | 3,196 |
| Cobb County GA Kennestone Hospital Authority Revenue | 6.250% | 4/1/34 | (2) | 1,000 | 1,189 |
| Cobb County GA Kennestone Hospital Authority Revenue | 5.500% | 4/1/37 | (2) | 7,500 | 8,483 |
| Dalton GA Development Authority Revenue (Hamilton Health Care System) | 5.000% | 8/15/22 | | 1,675 | 1,956 |
| Dalton GA Development Authority Revenue (Hamilton Health Care System) | 5.000% | 8/15/23 | | 1,975 | 2,284 |
| Dalton GA Development Authority Revenue (Hamilton Health Care System) | 5.000% | 8/15/24 | | 1,000 | 1,153 |
| Dalton GA Development Authority Revenue (Hamilton Health Care System) | 5.000% | 8/15/27 | | 6,880 | 7,793 |
| DeKalb County GA Private Hospital Authority (Children’s Healthcare of Atlanta Inc. Project) RAN | 5.000% | 11/15/17 | | 1,250 | 1,404 |
| DeKalb County GA Private Hospital Authority (Children’s Healthcare of Atlanta Inc. Project) RAN | 5.000% | 11/15/20 | | 1,400 | 1,629 |
| DeKalb County GA Water & Sewer Revenue | 5.250% | 10/1/23 | | 1,410 | 1,698 |
| DeKalb County GA Water & Sewer Revenue | 5.250% | 10/1/24 | | 1,500 | 1,794 |
| DeKalb County GA Water & Sewer Revenue | 5.250% | 10/1/31 | | 2,225 | 2,594 |
| DeKalb County GA Water & Sewer Revenue | 5.250% | 10/1/32 | | 4,000 | 4,646 |
| Fayette County GA Hospital Authority (Fayette Community Hospital Project) RAN | 5.250% | 6/15/23 | | 11,395 | 13,104 |
| Fulton County GA Development Authority Revenue (Piedmont Healthcare Inc. Project) | 5.250% | 6/15/23 | | 6,110 | 7,026 |
| Fulton County GA Water & Sewer Revenue | 5.000% | 1/1/33 | | 10,000 | 11,470 |
| Georgia GO | 5.000% | 7/1/15 | | 15,000 | 15,488 |
| Georgia GO | 5.000% | 7/1/15 | | 28,875 | 29,814 |
| Georgia GO | 5.000% | 9/1/15 | (Prere.) | 7,080 | 7,366 |
| Georgia GO | 5.000% | 10/1/15 | | 16,495 | 17,227 |
| Georgia GO | 5.000% | 12/1/15 | | 10,000 | 10,522 |
| Georgia GO | 5.000% | 7/1/16 | | 5,300 | 5,469 |
| Georgia GO | 5.000% | 7/1/16 | | 8,625 | 9,294 |
| Georgia GO | 5.000% | 7/1/16 | | 2,705 | 2,915 |
| Georgia GO | 5.000% | 7/1/16 | | 18,290 | 19,708 |
| Georgia GO | 5.000% | 11/1/17 | | 5,590 | 6,318 |
| Georgia GO | 5.000% | 7/1/20 | | 14,920 | 17,926 |
| Georgia GO | 5.000% | 11/1/20 | | 9,240 | 11,167 |
| Georgia GO | 5.000% | 10/1/21 | | 8,000 | 9,764 |
| Georgia GO | 5.000% | 1/1/22 | | 9,415 | 11,510 |
| Georgia GO | 5.000% | 2/1/23 | | 28,720 | 35,469 |
| Georgia GO | 5.000% | 7/1/23 | | 20,160 | 24,623 |
| Georgia GO | 5.000% | 2/1/25 | | 3,000 | 3,726 |
| Georgia GO | 5.000% | 2/1/27 | | 10,000 | 12,261 |
| Georgia Municipal Electric Power Authority Revenue | 6.500% | 1/1/17 | (14) | 6,045 | 6,397 |
| Georgia Municipal Electric Power Authority Revenue | 5.000% | 1/1/22 | | 12,000 | 14,322 |
| Georgia Municipal Electric Power Authority Revenue | 5.000% | 1/1/24 | | 4,000 | 4,790 |
| Georgia Municipal Electric Power Authority Revenue | 5.000% | 1/1/25 | | 1,300 | 1,546 |
| Georgia Road & Tollway Authority Revenue | 5.000% | 6/1/15 | | 21,260 | 21,853 |
| Georgia Road & Tollway Authority Revenue | 5.000% | 6/1/16 | | 26,105 | 27,982 |
| Georgia Road & Tollway Authority Revenue | 5.000% | 3/1/19 | | 15,500 | 18,107 |
| Georgia Road & Tollway Authority Revenue | 5.000% | 10/1/21 | | 2,420 | 2,945 |
| Gwinnett County GA Water & Sewer Authority Revenue | 5.000% | 8/1/15 | | 7,915 | 8,206 |
| 2 Henry County GA Hospital Authority Revenue (Piedmont Fayette Hospital Project) | 5.000% | 7/1/30 | | 5,375 | 6,097 |
| 2 Henry County GA Hospital Authority Revenue (Piedmont Fayette Hospital Project) | 5.000% | 7/1/34 | | 10,000 | 11,186 |
| Macon-Bibb County GA Hospital Authority Revenue (Medical Center of Central Georgia) | 5.000% | 8/1/22 | | 1,430 | 1,640 |
| Macon-Bibb County GA Hospital Authority Revenue (Medical Center of Central Georgia) | 5.000% | 8/1/24 | | 1,250 | 1,423 |
| Main Street Natural Gas Inc. Georgia Gas Project Revenue | 5.000% | 3/15/15 | | 6,380 | 6,477 |
| Main Street Natural Gas Inc. Georgia Gas Project Revenue | 5.000% | 3/15/17 | | 2,340 | 2,532 |
| Main Street Natural Gas Inc. Georgia Gas Project Revenue | 5.250% | 9/15/19 | | 30 | 34 |
| Main Street Natural Gas Inc. Georgia Gas Project Revenue | 5.000% | 3/15/20 | | 23,970 | 27,367 |
| Main Street Natural Gas Inc. Georgia Gas Project Revenue | 5.000% | 3/15/21 | | 6,765 | 7,645 |
| Main Street Natural Gas Inc. Georgia Gas Project Revenue | 5.000% | 3/15/21 | | 37,000 | 42,844 |
| Main Street Natural Gas Inc. Georgia Gas Project Revenue | 5.000% | 3/15/22 | | 10,720 | 12,181 |
92
Intermediate-Term Tax-Exempt Fund
| | | | | |
| | | | | Face | Market |
| | | Maturity | | Amount | Value• |
| | Coupon | Date | | ($000) | ($000) |
| Main Street Natural Gas Inc. Georgia Gas Project Revenue | 5.500% | 9/15/28 | | 70 | 85 |
| Metropolitan Atlanta GA Rapid Transportation Authority Georgia Sales Tax Revenue | 5.250% | 7/1/26 | (14) | 4,800 | 5,985 |
| Municipal Electric Authority Georgia Revenue | 5.000% | 4/1/17 | | 3,980 | 4,404 |
| Municipal Electric Authority Georgia Revenue | 5.000% | 4/1/19 | | 3,160 | 3,672 |
| Municipal Electric Authority Georgia Revenue | 5.000% | 1/1/20 | | 15,000 | 17,600 |
| Municipal Electric Authority Georgia Revenue | 5.000% | 11/1/23 | | 14,605 | 17,040 |
| Municipal Electric Authority Georgia Revenue | 5.000% | 11/1/24 | | 11,650 | 13,593 |
| Municipal Electric Authority Georgia Revenue (General Resolution Projects) | 5.250% | 1/1/16 | | 3,480 | 3,684 |
| Municipal Electric Authority Georgia Revenue (General Resolution Projects) | 5.750% | 1/1/19 | | 51,440 | 60,304 |
| Municipal Electric Authority Georgia Revenue (Project One) | 5.250% | 1/1/16 | | 6,580 | 6,966 |
| Municipal Electric Authority Georgia Revenue (Project One) | 5.000% | 1/1/21 | | 7,600 | 9,004 |
| Private Colleges & University Authority of Georgia Revenue (Emory University) | 5.000% | 9/1/29 | | 3,340 | 3,860 |
| Richmond County GA Hospital Authority (University Health Services Inc. Project) RAN | 5.500% | 1/1/24 | | 17,500 | 19,697 |
| Savannah GA Hospital Authority Revenue (St. Joseph’s/Candler Health System, Inc.) | 5.500% | 7/1/30 | | 4,000 | 4,721 |
| Savannah GA Hospital Authority Revenue (St. Joseph’s/Candler Health System, Inc.) | 5.500% | 7/1/31 | | 4,000 | 4,655 |
| | | | | | 906,756 |
| Guam (0.0%) | | | | | |
| Guam International Airport Authority Revenue | 5.000% | 10/1/23 | | 2,310 | 2,739 |
| |
| Hawaii (0.5%) | | | | | |
| Hawaii Airports System Revenue | 5.250% | 7/1/30 | | 13,975 | 16,287 |
| Hawaii GO | 5.000% | 3/1/16 | (Prere.) | 4,515 | 4,798 |
| Hawaii GO | 5.000% | 6/1/16 | | 4,295 | 4,613 |
| Hawaii GO | 5.000% | 11/1/16 | | 8,275 | 9,041 |
| Hawaii GO | 5.000% | 7/1/17 | (2) | 45,035 | 46,460 |
| Hawaii GO | 5.000% | 12/1/18 | | 9,250 | 10,750 |
| Hawaii GO | 5.000% | 12/1/20 | | 4,480 | 5,399 |
| Hawaii GO | 5.000% | 11/1/22 | | 11,155 | 13,681 |
| Hawaii GO | 5.000% | 12/1/22 | | 10,000 | 12,249 |
| Hawaii GO | 5.000% | 11/1/24 | | 22,305 | 26,869 |
| Hawaii GO | 5.000% | 3/1/25 | (4) | 1,485 | 1,575 |
| Hawaii GO | 5.000% | 11/1/25 | | 7,500 | 8,979 |
| Hawaii Highway Revenue | 5.000% | 1/1/32 | | 2,180 | 2,581 |
| Hawaii Highway Revenue | 5.000% | 1/1/33 | | 2,065 | 2,436 |
| Hawaii Pacific Health Revenue | 5.625% | 7/1/30 | | 2,345 | 2,656 |
| 1 Honolulu HI City & County Board Water Supply Water System Revenue TOB VRDO | 0.050% | 11/7/14 | LOC | 7,000 | 7,000 |
| Honolulu HI City & County GO | 5.000% | 7/1/19 | (4) | 3,000 | 3,343 |
| Honolulu HI City & County GO | 5.000% | 7/1/20 | (4) | 2,705 | 3,012 |
| Honolulu HI City & County GO | 5.000% | 11/1/22 | | 3,000 | 3,664 |
| Honolulu HI City & County GO | 5.000% | 11/1/23 | | 3,500 | 4,247 |
| Honolulu HI City & County GO | 5.000% | 8/1/24 | | 4,535 | 5,397 |
| Honolulu HI City & County GO | 5.000% | 8/1/28 | | 5,000 | 5,867 |
| Honolulu HI City & County GO | 5.000% | 11/1/33 | | 1,150 | 1,338 |
| | | | | | 202,242 |
| Idaho (0.1%) | | | | | |
| Idaho Bond Bank Authority Revenue | 5.250% | 9/15/24 | | 2,000 | 2,311 |
| Idaho Bond Bank Authority Revenue | 5.250% | 9/15/26 | | 1,000 | 1,151 |
| Idaho Building Authority Revenue (Prison Facilities Project) VRDO | 0.050% | 11/7/14 | | 17,345 | 17,345 |
| Idaho Health Facilities Authority Revenue (Trinity Health Group) | 6.125% | 12/1/28 | | 12,050 | 14,024 |
| Idaho Housing & Finance Association RAN | 4.750% | 7/15/19 | | 5,000 | 5,761 |
| | | | | | 40,592 |
| Illinois (7.7%) | | | | | |
| Berwyn IL GO | 5.000% | 12/1/25 | (4) | 5,000 | 5,533 |
| Chicago IL Board of Education GO | 5.000% | 12/1/16 | (4) | 2,435 | 2,627 |
| Chicago IL Board of Education GO | 0.000% | 12/1/18 | (14) | 4,520 | 4,151 |
| Chicago IL Board of Education GO | 5.000% | 12/1/18 | | 2,500 | 2,760 |
| Chicago IL Board of Education GO | 5.000% | 12/1/18 | (4) | 2,500 | 2,748 |
| Chicago IL Board of Education GO | 0.000% | 12/1/19 | (14) | 5,610 | 4,964 |
| Chicago IL Board of Education GO | 5.000% | 12/1/19 | (12) | 1,015 | 1,112 |
| Chicago IL Board of Education GO | 5.000% | 12/1/19 | | 2,600 | 2,863 |
| Chicago IL Board of Education GO | 5.000% | 12/1/19 | (4) | 6,130 | 6,698 |
| Chicago IL Board of Education GO | 6.000% | 1/1/20 | (14) | 6,300 | 7,048 |
| Chicago IL Board of Education GO | 5.000% | 12/1/20 | (2) | 20,100 | 21,663 |
| Chicago IL Board of Education GO | 5.000% | 12/1/20 | | 2,250 | 2,472 |
| Chicago IL Board of Education GO | 5.000% | 12/1/20 | (4) | 1,500 | 1,627 |
| Chicago IL Board of Education GO | 5.000% | 12/1/21 | (2) | 14,500 | 15,573 |
| Chicago IL Board of Education GO | 5.500% | 12/1/21 | (4)(2) | 4,090 | 4,706 |
| Chicago IL Board of Education GO | 5.500% | 12/1/22 | (4) | 9,625 | 11,173 |
| Chicago IL Board of Education GO | 5.000% | 12/1/23 | (4) | 1,105 | 1,200 |
| Chicago IL Board of Education GO | 5.250% | 12/1/24 | (4) | 1,840 | 2,034 |
93
Intermediate-Term Tax-Exempt Fund
| | | | | | |
| | | | | | Face | Market |
| | | | Maturity | | Amount | Value• |
| | | Coupon | Date | | ($000) | ($000) |
| | Chicago IL Board of Education GO | 5.250% | 12/1/25 | | 10,500 | 11,030 |
| | Chicago IL Board of Education GO | 5.000% | 12/1/26 | (4) | 12,640 | 13,509 |
| | Chicago IL Board of Education GO | 0.000% | 12/1/27 | (14) | 4,990 | 2,739 |
| | Chicago IL Board of Education GO | 0.000% | 12/1/28 | (14) | 22,500 | 11,696 |
| | Chicago IL Board of Education GO | 0.000% | 12/1/30 | (14) | 10,000 | 4,576 |
| | Chicago IL Board of Education GO | 0.000% | 12/1/31 | (14) | 27,180 | 11,711 |
| | Chicago IL Board of Education GO | 0.000% | 12/1/31 | (14) | 4,500 | 1,939 |
| | Chicago IL Board of Education GO | 5.000% | 12/1/33 | | 20,000 | 20,453 |
| | Chicago IL Board of Education GO | 5.000% | 12/1/34 | | 9,245 | 9,429 |
| 1,3 | Chicago IL Board of Education GO TOB PUT | 0.580% | 11/20/14 | LOC | 75,000 | 75,000 |
| | Chicago IL GO | 5.250% | 1/1/17 | (14) | 2,300 | 2,491 |
| | Chicago IL GO | 5.500% | 1/1/17 | (4) | 18,430 | 20,057 |
| | Chicago IL GO | 5.000% | 1/1/18 | (4) | 17,530 | 17,653 |
| | Chicago IL GO | 5.000% | 1/1/21 | (14) | 5,490 | 5,898 |
| | Chicago IL GO | 5.000% | 1/1/21 | (4) | 18,155 | 18,878 |
| | Chicago IL GO | 0.000% | 1/1/22 | | 4,750 | 3,576 |
| | Chicago IL GO | 0.000% | 1/1/23 | | 4,900 | 3,495 |
| | Chicago IL GO | 5.000% | 1/1/26 | (4) | 10,000 | 10,340 |
| | Chicago IL GO | 5.000% | 1/1/27 | (14) | 8,200 | 8,646 |
| | Chicago IL GO | 5.000% | 1/1/28 | (14) | 5,000 | 5,261 |
| | Chicago IL Metropolitan Water Reclamation District GO | 5.000% | 12/1/30 | | 35,000 | 40,110 |
| | Chicago IL Midway Airport Revenue | 5.000% | 1/1/23 | | 2,500 | 2,955 |
| | Chicago IL Midway Airport Revenue | 5.000% | 1/1/24 | | 3,400 | 4,031 |
| | Chicago IL Midway Airport Revenue | 5.000% | 1/1/26 | | 6,040 | 6,961 |
| | Chicago IL Midway Airport Revenue | 5.000% | 1/1/32 | | 10,000 | 11,284 |
| | Chicago IL Midway Airport Revenue | 5.000% | 1/1/33 | | 10,000 | 11,259 |
| | Chicago IL Midway Airport Revenue | 5.000% | 1/1/34 | | 6,700 | 7,515 |
| | Chicago IL Midway Airport Revenue | 5.000% | 1/1/35 | | 2,200 | 2,457 |
| | Chicago IL Motor Fuel Tax Revenue | 5.000% | 1/1/23 | | 1,200 | 1,384 |
| | Chicago IL Motor Fuel Tax Revenue | 5.000% | 1/1/28 | | 1,000 | 1,113 |
| | Chicago IL Motor Fuel Tax Revenue | 5.000% | 1/1/29 | | 1,000 | 1,108 |
| | Chicago IL Motor Fuel Tax Revenue | 5.000% | 1/1/30 | (4) | 1,000 | 1,114 |
| | Chicago IL Motor Fuel Tax Revenue | 5.000% | 1/1/31 | (4) | 1,095 | 1,213 |
| | Chicago IL O’Hare International Airport Revenue | 5.250% | 1/1/15 | (14) | 5,200 | 5,244 |
| | Chicago IL O’Hare International Airport Revenue | 5.000% | 1/1/18 | (4) | 7,025 | 7,638 |
| | Chicago IL O’Hare International Airport Revenue | 5.000% | 1/1/18 | | 4,000 | 4,493 |
| | Chicago IL O’Hare International Airport Revenue | 5.000% | 1/1/19 | (4) | 8,920 | 9,949 |
| | Chicago IL O’Hare International Airport Revenue | 5.000% | 1/1/19 | (4) | 22,920 | 24,921 |
| | Chicago IL O’Hare International Airport Revenue | 5.000% | 1/1/22 | (4) | 18,295 | 20,370 |
| | Chicago IL O’Hare International Airport Revenue | 5.000% | 1/1/23 | (4) | 15,275 | 16,987 |
| | Chicago IL O’Hare International Airport Revenue | 5.000% | 1/1/24 | (4) | 18,250 | 20,296 |
| | Chicago IL O’Hare International Airport Revenue | 5.000% | 1/1/24 | | 3,000 | 3,479 |
| | Chicago IL O’Hare International Airport Revenue | 5.250% | 1/1/24 | | 1,250 | 1,451 |
| | Chicago IL O’Hare International Airport Revenue | 5.000% | 1/1/25 | | 7,410 | 8,540 |
| | Chicago IL O’Hare International Airport Revenue | 5.500% | 1/1/25 | | 1,500 | 1,759 |
| | Chicago IL O’Hare International Airport Revenue | 5.000% | 1/1/26 | | 4,000 | 4,582 |
| | Chicago IL O’Hare International Airport Revenue | 5.500% | 1/1/26 | | 1,000 | 1,160 |
| | Chicago IL O’Hare International Airport Revenue | 5.000% | 1/1/27 | | 3,560 | 4,053 |
| | Chicago IL O’Hare International Airport Revenue | 5.500% | 1/1/27 | | 2,435 | 2,831 |
| | Chicago IL O’Hare International Airport Revenue | 5.000% | 1/1/28 | | 3,000 | 3,395 |
| | Chicago IL O’Hare International Airport Revenue | 5.000% | 1/1/29 | | 3,000 | 3,386 |
| | Chicago IL O’Hare International Airport Revenue | 5.000% | 1/1/29 | (4) | 2,300 | 2,608 |
| | Chicago IL O’Hare International Airport Revenue | 5.000% | 1/1/29 | (14) | 19,315 | 20,225 |
| | Chicago IL O’Hare International Airport Revenue | 5.000% | 1/1/30 | | 3,220 | 3,626 |
| | Chicago IL O’Hare International Airport Revenue | 5.000% | 1/1/31 | | 2,900 | 3,265 |
| | Chicago IL O’Hare International Airport Revenue | 5.500% | 1/1/31 | | 13,495 | 15,405 |
| | Chicago IL O’Hare International Airport Revenue | 5.500% | 1/1/31 | | 10,000 | 11,416 |
| | Chicago IL O’Hare International Airport Revenue | 5.250% | 1/1/33 | (4) | 1,000 | 1,138 |
| | Chicago IL Park District Harbor Facilities GO | 5.000% | 1/1/28 | | 4,835 | 5,341 |
| | Chicago IL Park District Harbor Facilities GO | 5.000% | 1/1/29 | | 5,170 | 5,696 |
| | Chicago IL Park District Harbor Facilities GO | 5.000% | 1/1/30 | | 2,770 | 3,039 |
| | Chicago IL Transit Authority Capital Grant Receipts Revenue | 5.000% | 6/1/15 | | 6,060 | 6,221 |
| | Chicago IL Transit Authority Capital Grant Receipts Revenue | 5.000% | 12/1/16 | (Prere.) | 2,455 | 2,690 |
| | Chicago IL Transit Authority Capital Grant Receipts Revenue | 5.000% | 6/1/18 | (2) | 7,545 | 8,174 |
| | Chicago IL Transit Authority Capital Grant Receipts Revenue | 5.500% | 6/1/18 | | 7,435 | 8,429 |
| | Chicago IL Transit Authority Capital Grant Receipts Revenue | 5.000% | 6/1/20 | | 4,900 | 5,389 |
| | Chicago IL Transit Authority Capital Grant Receipts Revenue | 5.000% | 6/1/20 | (12) | 3,185 | 3,542 |
| | Chicago IL Transit Authority Capital Grant Receipts Revenue | 5.250% | 6/1/24 | (12) | 5,000 | 5,568 |
| | Chicago IL Transit Authority Capital Grant Receipts Revenue | 5.250% | 6/1/25 | (12) | 11,000 | 12,201 |
| | Chicago IL Transit Authority Capital Grant Receipts Revenue | 5.250% | 6/1/26 | (12) | 8,260 | 9,125 |
| | Chicago IL Transit Authority Capital Grant Receipts Revenue | 5.000% | 6/1/27 | | 31,170 | 34,066 |
94
Intermediate-Term Tax-Exempt Fund
| | | | | |
| | | | | Face | Market |
| | | Maturity | | Amount | Value• |
| | Coupon | Date | | ($000) | ($000) |
| Chicago IL Transit Authority Capital Grant Receipts Revenue | 5.000% | 6/1/27 | | 13,085 | 14,301 |
| Chicago IL Transit Authority Capital Grant Receipts Revenue | 5.000% | 6/1/28 | | 30,225 | 32,857 |
| Chicago IL Transit Authority Sales Tax Receipts Revenue | 5.000% | 12/1/19 | | 9,915 | 11,474 |
| Chicago IL Transit Authority Sales Tax Receipts Revenue | 5.250% | 12/1/30 | | 10,000 | 11,453 |
| Chicago IL Wastewater Transmission Revenue | 5.000% | 1/1/23 | | 2,435 | 2,862 |
| Chicago IL Wastewater Transmission Revenue | 5.000% | 1/1/28 | | 1,550 | 1,770 |
| Chicago IL Wastewater Transmission Revenue | 5.000% | 1/1/30 | | 1,450 | 1,645 |
| Chicago IL Wastewater Transmission Revenue | 5.000% | 1/1/31 | | 2,000 | 2,259 |
| Chicago IL Wastewater Transmission Revenue | 5.000% | 1/1/32 | | 1,875 | 2,109 |
| Chicago IL Wastewater Transmission Revenue | 5.000% | 1/1/33 | | 2,100 | 2,354 |
| Chicago IL Water Revenue | 0.000% | 11/1/14 | (2) | 7,460 | 7,460 |
| Chicago IL Water Revenue | 0.000% | 11/1/15 | (2) | 7,555 | 7,513 |
| Chicago IL Water Revenue | 5.000% | 11/1/19 | (4) | 17,565 | 19,887 |
| Chicago IL Water Revenue | 5.000% | 11/1/23 | | 1,670 | 1,946 |
| Chicago IL Water Revenue | 5.000% | 11/1/24 | | 1,500 | 1,730 |
| Chicago IL Water Revenue | 5.000% | 11/1/25 | | 2,000 | 2,291 |
| Chicago IL Water Revenue | 5.000% | 11/1/26 | | 2,000 | 2,275 |
| Chicago IL Water Revenue | 5.000% | 11/1/28 | | 5,000 | 5,631 |
| Chicago IL Water Revenue | 5.000% | 11/1/30 | | 3,590 | 4,019 |
| Chicago IL Water Revenue | 5.000% | 11/1/31 | | 3,000 | 3,345 |
| Chicago IL Water Revenue | 5.000% | 11/1/32 | | 3,000 | 3,334 |
| Chicago IL Waterworks Revenue | 5.000% | 11/1/22 | | 1,000 | 1,176 |
| Chicago IL Waterworks Revenue | 5.000% | 11/1/29 | | 1,000 | 1,152 |
| Chicago IL Waterworks Revenue | 5.000% | 11/1/31 | | 2,000 | 2,278 |
| Chicago IL Waterworks Revenue | 5.000% | 11/1/33 | | 2,000 | 2,246 |
| Chicago IL Waterworks Revenue | 5.000% | 11/1/36 | (2) | 7,580 | 8,016 |
| Cook County IL Community College District GO | 5.000% | 3/1/19 | (Prere.) | 1,100 | 1,236 |
| Cook County IL Community College District GO | 5.000% | 12/1/24 | | 2,000 | 2,348 |
| Cook County IL Community College District GO | 5.250% | 12/1/26 | | 2,000 | 2,353 |
| Cook County IL Community College District GO | 5.250% | 12/1/27 | | 2,000 | 2,344 |
| Cook County IL Community College District GO | 5.250% | 12/1/28 | | 2,000 | 2,329 |
| Cook County IL Forest Preservation District GO | 5.000% | 12/15/24 | | 1,020 | 1,176 |
| Cook County IL Forest Preservation District GO | 5.000% | 12/15/25 | | 1,000 | 1,145 |
| Cook County IL Forest Preservation District GO | 5.000% | 12/15/26 | | 2,485 | 2,820 |
| Cook County IL Forest Preservation District GO | 5.000% | 12/15/26 | | 2,225 | 2,525 |
| Cook County IL Forest Preservation District GO | 5.000% | 12/15/27 | | 2,605 | 2,945 |
| Cook County IL Forest Preservation District GO | 5.000% | 12/15/27 | | 2,335 | 2,638 |
| Cook County IL Forest Preservation District GO | 5.000% | 12/15/28 | | 2,240 | 2,517 |
| Cook County IL Forest Preservation District GO | 5.000% | 12/15/28 | | 2,455 | 2,759 |
| Cook County IL Forest Preservation District GO | 5.000% | 12/15/32 | | 5,000 | 5,558 |
| Cook County IL GO | 5.000% | 11/15/18 | | 8,000 | 9,096 |
| Cook County IL GO | 5.000% | 11/15/20 | | 7,500 | 8,522 |
| Cook County IL GO | 5.000% | 11/15/21 | | 5,410 | 6,080 |
| Cook County IL GO | 5.250% | 11/15/28 | | 35,500 | 39,982 |
| Cook County IL High School District No. 205 (Thornton Township) GO | 5.000% | 12/1/15 | (12) | 2,020 | 2,118 |
| Cook County IL High School District No. 205 (Thornton Township) GO | 5.500% | 12/1/17 | (12) | 2,000 | 2,272 |
| Du Page & Cook Counties IL Community Consolidated School District GO | 4.500% | 1/1/21 | (14) | 4,900 | 5,256 |
| Du Page & Cook Counties IL Community Consolidated School District GO | 5.000% | 6/1/24 | | 1,750 | 2,110 |
| Du Page & Cook Counties IL Community Consolidated School District GO | 5.000% | 6/1/25 | | 1,820 | 2,177 |
| Du Page & Cook Counties IL Community Consolidated School District GO | 5.000% | 6/1/26 | | 2,290 | 2,722 |
| Du Page & Cook Counties IL Community Consolidated School District GO | 5.000% | 6/1/27 | | 2,000 | 2,372 |
| Grundy & Will Counties IL Community Unified School District GO | 5.875% | 2/1/23 | | 2,315 | 2,679 |
| Grundy & Will Counties IL Community Unified School District GO | 5.875% | 2/1/25 | | 2,720 | 3,136 |
| Grundy & Will Counties IL Community Unified School District GO | 5.875% | 2/1/26 | | 3,060 | 3,528 |
| Grundy & Will Counties IL Community Unified School District GO | 5.875% | 8/1/28 | | 6,520 | 7,504 |
| Illinois Educational Facilities Authority Revenue (ACI/Cultural Pooled Financing Program) VRDO | 0.040% | 11/7/14 | LOC | 18,800 | 18,800 |
| Illinois Educational Facilities Authority Revenue (ACI/Cultural Pooled Financing Program) VRDO | 0.040% | 11/7/14 | LOC | 29,500 | 29,500 |
| Illinois Educational Facilities Authority Revenue (Field Museum of Natural History) VRDO | 0.050% | 11/7/14 | LOC | 9,100 | 9,100 |
| Illinois Finance Authority Revenue (Advocate Health Care Network) | 5.000% | 4/1/19 | | 1,500 | 1,729 |
| Illinois Finance Authority Revenue (Advocate Health Care Network) | 5.000% | 4/1/20 | | 2,000 | 2,292 |
| Illinois Finance Authority Revenue (Advocate Health Care Network) | 5.000% | 4/1/21 | | 6,535 | 7,409 |
| Illinois Finance Authority Revenue (Advocate Health Care Network) | 5.000% | 4/1/22 | | 10,000 | 11,292 |
| Illinois Finance Authority Revenue (Advocate Health Care Network) | 6.125% | 11/1/23 | | 3,000 | 3,563 |
| Illinois Finance Authority Revenue (Advocate Health Care Network) PUT | 5.000% | 2/12/20 | | 6,595 | 7,689 |
| Illinois Finance Authority Revenue (Advocate Health Care Network) VRDO | 0.050% | 11/7/14 | | 28,700 | 28,700 |
| Illinois Finance Authority Revenue (Art Institute of Chicago) | 5.000% | 3/1/30 | | 3,000 | 3,377 |
| Illinois Finance Authority Revenue (Carle Foundation) | 5.625% | 8/15/31 | | 10,000 | 11,371 |
| Illinois Finance Authority Revenue (Carle Foundation) VRDO | 0.040% | 11/7/14 | LOC | 28,525 | 28,525 |
| Illinois Finance Authority Revenue (Centegra Health System) | 5.000% | 9/1/27 | | 15,000 | 16,177 |
| Illinois Finance Authority Revenue (Centegra Health System) | 5.000% | 9/1/28 | | 1,290 | 1,404 |
| Illinois Finance Authority Revenue (Centegra Health System) | 5.000% | 9/1/32 | | 7,575 | 8,027 |
95
Intermediate-Term Tax-Exempt Fund
| | | | | |
| | | | | Face | Market |
| | | Maturity | | Amount | Value• |
| | Coupon | Date | | ($000) | ($000) |
| Illinois Finance Authority Revenue (Centegra Health System) | 5.000% | 9/1/34 | | 5,000 | 5,353 |
| Illinois Finance Authority Revenue (Central DuPage Health) | 5.000% | 11/1/27 | | 18,725 | 21,104 |
| Illinois Finance Authority Revenue (Central DuPage Health) | 5.125% | 11/1/29 | | 15,000 | 16,654 |
| Illinois Finance Authority Revenue (Children’s Memorial Hospital) | 5.500% | 8/15/28 | | 21,760 | 24,047 |
| Illinois Finance Authority Revenue (Franciscan Communities Inc.) | 4.000% | 5/15/23 | | 1,000 | 1,011 |
| Illinois Finance Authority Revenue (Franciscan Communities Inc.) | 4.750% | 5/15/33 | | 8,225 | 8,340 |
| Illinois Finance Authority Revenue (Ingalls Health System Obligated Group) VRDO | 0.060% | 11/7/14 | LOC | 17,000 | 17,000 |
| Illinois Finance Authority Revenue (Loyola University) | 5.000% | 7/1/25 | | 8,750 | 9,886 |
| Illinois Finance Authority Revenue (Loyola University) | 5.000% | 7/1/26 | | 3,595 | 4,036 |
| Illinois Finance Authority Revenue (Loyola University) | 5.000% | 7/1/27 | | 1,495 | 1,672 |
| Illinois Finance Authority Revenue (Loyola University) | 5.000% | 7/1/28 | | 1,570 | 1,743 |
| Illinois Finance Authority Revenue (Loyola University) | 5.000% | 7/1/29 | | 1,650 | 1,826 |
| Illinois Finance Authority Revenue (Loyola University) | 5.000% | 7/1/30 | | 1,730 | 1,909 |
| Illinois Finance Authority Revenue (Loyola University) | 5.000% | 7/1/31 | | 1,815 | 1,995 |
| Illinois Finance Authority Revenue (Loyola University) | 5.000% | 7/1/32 | | 1,905 | 2,088 |
| Illinois Finance Authority Revenue (Memorial Health System) | 5.250% | 4/1/29 | | 12,670 | 14,023 |
| Illinois Finance Authority Revenue (Northwestern Community Hospital) | 5.250% | 7/1/28 | | 8,500 | 9,280 |
| Illinois Finance Authority Revenue (Northwestern Community Hospital) | 5.750% | 8/15/30 | | 9,000 | 10,462 |
| Illinois Finance Authority Revenue (Northwestern Memorial Hospital) VRDO | 0.050% | 11/7/14 | | 47,135 | 47,135 |
| 1 Illinois Finance Authority Revenue (Northwestern University) TOB VRDO | 0.070% | 11/3/14 | | 1,605 | 1,605 |
| Illinois Finance Authority Revenue (Northwestern University) VRDN VRDO | 0.030% | 11/7/14 | | 32,800 | 32,800 |
| Illinois Finance Authority Revenue (OSF Healthcare System) | 5.000% | 5/15/22 | | 2,000 | 2,323 |
| Illinois Finance Authority Revenue (OSF Healthcare System) | 5.000% | 5/15/23 | | 3,750 | 4,275 |
| Illinois Finance Authority Revenue (OSF Healthcare System) | 4.500% | 5/15/24 | | 5,000 | 5,360 |
| Illinois Finance Authority Revenue (OSF Healthcare System) | 7.000% | 11/15/29 | | 10,000 | 12,038 |
| Illinois Finance Authority Revenue (Palos Community Hospital) | 5.375% | 5/15/30 | | 24,070 | 27,282 |
| Illinois Finance Authority Revenue (Rush University Medical Center) | 5.000% | 11/1/23 | (14) | 5,000 | 5,513 |
| Illinois Finance Authority Revenue (Rush University Medical Center) | 5.750% | 11/1/28 | (14) | 3,000 | 3,368 |
| Illinois Finance Authority Revenue (Rush University Medical Center) | 6.375% | 11/1/29 | | 7,000 | 8,145 |
| Illinois Finance Authority Revenue (Silver Cross & Medical Centers) | 5.500% | 8/15/30 | | 8,000 | 8,601 |
| Illinois Finance Authority Revenue (Southern Illinois Healthcare) | 5.250% | 3/1/30 | (4) | 7,000 | 7,896 |
| Illinois Finance Authority Revenue (University of Chicago Medical Center) | 5.000% | 8/15/19 | | 11,605 | 13,563 |
| Illinois Finance Authority Revenue (University of Chicago Medical Center) | 5.000% | 8/15/20 | | 3,185 | 3,766 |
| Illinois Finance Authority Revenue (University of Chicago Medical Center) | 5.000% | 8/15/22 | | 10,000 | 11,538 |
| Illinois Finance Authority Revenue (University of Chicago) | 5.000% | 10/1/22 | | 2,000 | 2,423 |
| Illinois Finance Authority Revenue (University of Chicago) | 5.000% | 10/1/22 | | 2,000 | 2,373 |
| Illinois Finance Authority Revenue (University of Chicago) | 5.000% | 10/1/23 | | 5,265 | 6,405 |
| Illinois Finance Authority Revenue (University of Chicago) | 5.000% | 10/1/23 | | 4,000 | 4,687 |
| Illinois Finance Authority Revenue (University of Chicago) | 5.000% | 10/1/24 | | 5,195 | 6,044 |
| Illinois Finance Authority Revenue (University of Chicago) | 5.000% | 10/1/25 | | 2,990 | 3,457 |
| Illinois Finance Authority Revenue (University of Chicago) | 5.000% | 10/1/26 | | 3,500 | 4,027 |
| Illinois Finance Authority Revenue (University of Chicago) | 5.000% | 10/1/28 | | 15,000 | 17,847 |
| Illinois Finance Authority Revenue (University of Chicago) | 5.000% | 10/1/28 | | 4,400 | 5,039 |
| Illinois Finance Authority Revenue (University of Chicago) | 5.000% | 10/1/29 | | 12,250 | 14,511 |
| Illinois Finance Authority Revenue (University of Chicago) | 5.000% | 10/1/29 | | 4,250 | 4,851 |
| Illinois Finance Authority Revenue (University of Chicago) | 5.000% | 10/1/30 | | 5,250 | 5,975 |
| Illinois Finance Authority Revenue (University of Chicago) | 5.000% | 10/1/31 | | 15,000 | 17,599 |
| Illinois Finance Authority Revenue (University of Chicago) | 5.000% | 10/1/31 | | 5,300 | 6,004 |
| Illinois Finance Authority Revenue (University of Chicago) | 5.000% | 10/1/32 | | 15,000 | 17,514 |
| Illinois Finance Authority Revenue (University of Chicago) | 5.000% | 10/1/32 | | 1,050 | 1,186 |
| Illinois Finance Authority Revenue (University of Chicago) | 5.000% | 10/1/35 | | 28,975 | 33,536 |
| Illinois GO | 5.000% | 1/1/15 | | 6,050 | 6,095 |
| Illinois GO | 2.000% | 5/1/15 | | 6,000 | 6,044 |
| Illinois GO | 5.000% | 1/1/16 | | 2,010 | 2,109 |
| Illinois GO | 5.000% | 1/1/16 | | 7,500 | 7,868 |
| Illinois GO | 5.000% | 8/1/16 | | 40,000 | 42,814 |
| Illinois GO | 5.000% | 1/1/17 | | 22,985 | 24,857 |
| Illinois GO | 5.000% | 3/1/17 | | 1,550 | 1,685 |
| Illinois GO | 5.000% | 8/1/17 | | 8,760 | 9,629 |
| Illinois GO | 5.000% | 1/1/20 | (4) | 8,635 | 9,814 |
| Illinois GO | 5.000% | 8/1/20 | | 23,000 | 25,956 |
| Illinois GO | 5.000% | 1/1/21 | (4) | 21,470 | 23,912 |
| Illinois GO | 5.250% | 1/1/21 | | 7,525 | 8,539 |
| Illinois GO | 5.000% | 7/1/21 | | 7,000 | 7,872 |
| Illinois GO | 5.000% | 8/1/21 | | 25,000 | 28,126 |
| Illinois GO | 5.000% | 1/1/22 | | 2,740 | 2,985 |
| Illinois GO | 5.000% | 2/1/22 | | 5,000 | 5,603 |
| Illinois GO | 5.000% | 7/1/22 | | 7,000 | 7,846 |
| Illinois GO | 5.000% | 8/1/22 | (4) | 11,720 | 13,354 |
| Illinois GO | 5.000% | 2/1/23 | | 7,000 | 7,791 |
| Illinois GO | 5.000% | 7/1/23 | | 6,000 | 6,694 |
| Illinois GO | 5.000% | 8/1/23 | | 17,000 | 18,974 |
96
Intermediate-Term Tax-Exempt Fund
| | | | | |
| | | | | Face | Market |
| | | Maturity | | Amount | Value• |
| | Coupon | Date | | ($000) | ($000) |
| Illinois GO | 5.000% | 2/1/24 | | 5,700 | 6,359 |
| Illinois GO | 5.500% | 7/1/24 | | 19,000 | 21,750 |
| Illinois GO | 5.000% | 8/1/24 | | 11,335 | 12,440 |
| Illinois GO | 5.000% | 11/1/24 | (2) | 5,000 | 5,019 |
| Illinois GO | 5.000% | 2/1/26 | | 10,150 | 11,137 |
| Illinois GO | 5.000% | 4/1/26 | (4) | 16,175 | 17,896 |
| Illinois GO | 5.000% | 4/1/26 | (2) | 12,600 | 12,777 |
| Illinois GO | 5.000% | 6/1/26 | | 5,100 | 5,351 |
| Illinois GO | 5.000% | 6/1/26 | | 120 | 120 |
| Illinois GO | 5.500% | 7/1/26 | | 7,000 | 7,888 |
| Illinois GO | 5.000% | 2/1/27 | | 15,500 | 16,864 |
| Illinois GO | 5.500% | 7/1/27 | | 8,000 | 8,961 |
| Illinois GO | 5.000% | 4/1/28 | (4) | 4,515 | 4,933 |
| Illinois GO | 5.250% | 2/1/29 | | 8,750 | 9,645 |
| Illinois GO | 5.250% | 2/1/30 | | 13,000 | 14,309 |
| Illinois GO | 5.250% | 2/1/31 | | 9,000 | 9,869 |
| Illinois GO | 5.250% | 7/1/31 | | 6,000 | 6,549 |
| Illinois GO | 5.000% | 9/1/31 | | 6,500 | 6,806 |
| Illinois GO | 5.000% | 5/1/32 | | 7,000 | 7,543 |
| Illinois GO | 5.000% | 5/1/33 | | 8,200 | 8,796 |
| Illinois GO | 5.500% | 7/1/33 | (4) | 3,300 | 3,729 |
| Illinois Regional Transportation Authority Revenue | 6.250% | 7/1/22 | (4) | 5,000 | 6,383 |
| Illinois Regional Transportation Authority Revenue | 6.000% | 7/1/23 | (14) | 5,000 | 6,358 |
| Illinois Regional Transportation Authority Revenue | 6.250% | 7/1/23 | (4) | 11,475 | 14,809 |
| Illinois Sales Tax Revenue | 0.000% | 12/15/16 | (2) | 5,000 | 4,820 |
| Illinois Sales Tax Revenue | 5.000% | 6/15/18 | | 12,000 | 13,727 |
| Illinois Sales Tax Revenue | 5.375% | 6/15/18 | | 9,860 | 11,358 |
| Illinois Sales Tax Revenue | 5.000% | 6/15/19 | | 6,000 | 7,002 |
| Illinois Sales Tax Revenue | 5.000% | 6/15/19 | (Prere.) | 1,345 | 1,577 |
| Illinois Sales Tax Revenue | 5.000% | 6/15/20 | | 3,880 | 4,499 |
| Illinois Sales Tax Revenue | 5.375% | 6/15/20 | | 9,635 | 11,591 |
| Illinois Sales Tax Revenue | 5.000% | 6/15/21 | | 15,000 | 17,868 |
| Illinois Sales Tax Revenue | 5.000% | 6/15/22 | | 22,720 | 27,157 |
| Illinois Sales Tax Revenue | 5.000% | 6/15/28 | (14) | 6,000 | 6,355 |
| Illinois Toll Highway Authority Revenue | 5.000% | 7/1/15 | (Prere.) | 23,000 | 23,741 |
| Illinois Toll Highway Authority Revenue | 5.000% | 12/1/22 | | 12,700 | 15,334 |
| Illinois Toll Highway Authority Revenue | 5.000% | 1/1/23 | (4) | 5,000 | 5,359 |
| Illinois Toll Highway Authority Revenue | 5.000% | 1/1/24 | (4) | 20,000 | 21,410 |
| Illinois Toll Highway Authority Revenue | 5.000% | 1/1/25 | (4) | 5,700 | 6,107 |
| Illinois Toll Highway Authority Revenue | 5.000% | 1/1/27 | | 1,250 | 1,455 |
| Illinois Toll Highway Authority Revenue | 5.000% | 1/1/28 | | 1,250 | 1,442 |
| Illinois Toll Highway Authority Revenue | 5.000% | 1/1/28 | | 2,500 | 2,831 |
| Illinois Toll Highway Authority Revenue | 5.000% | 1/1/29 | | 3,500 | 4,031 |
| Illinois Toll Highway Authority Revenue | 5.000% | 1/1/30 | | 3,745 | 4,310 |
| 2 Illinois Toll Highway Authority Revenue | 5.000% | 1/1/31 | | 6,100 | 7,046 |
| Illinois Toll Highway Authority Revenue | 5.000% | 1/1/31 | | 8,000 | 9,170 |
| Illinois Toll Highway Authority Revenue | 5.000% | 1/1/31 | | 1,410 | 1,611 |
| Illinois Toll Highway Authority Revenue | 5.000% | 1/1/32 | | 9,000 | 10,295 |
| Illinois Toll Highway Authority Revenue | 5.000% | 1/1/32 | | 1,650 | 1,883 |
| 2 Illinois Toll Highway Authority Revenue | 5.000% | 1/1/33 | | 11,100 | 12,718 |
| Illinois Toll Highway Authority Revenue | 5.000% | 1/1/33 | | 2,500 | 2,844 |
| Illinois Toll Highway Authority Revenue | 5.000% | 1/1/33 | | 9,000 | 10,253 |
| 2 Illinois Toll Highway Authority Revenue | 5.000% | 1/1/34 | | 11,700 | 13,340 |
| Illinois Toll Highway Authority Revenue | 5.000% | 1/1/34 | | 3,850 | 4,361 |
| Illinois Toll Highway Authority Toll Highway Revenue VRDO | 0.050% | 11/7/14 | LOC | 30,900 | 30,900 |
| Illinois Unemployment Insurance Fund Building Receipts Revenue | 5.000% | 6/15/16 | | 15,000 | 16,130 |
| Illinois Unemployment Insurance Fund Building Receipts Revenue | 4.000% | 12/15/16 | | 2,650 | 2,852 |
| Illinois Unemployment Insurance Fund Building Receipts Revenue | 5.000% | 12/15/16 | | 5,490 | 6,025 |
| Illinois Unemployment Insurance Fund Building Receipts Revenue | 5.000% | 6/15/18 | | 7,500 | 8,195 |
| Illinois Unemployment Insurance Fund Building Receipts Revenue | 5.000% | 6/15/19 | | 14,350 | 14,761 |
| Illinois Unemployment Insurance Fund Building Receipts Revenue | 5.000% | 12/15/19 | | 3,000 | 3,017 |
| Lake County IL Community High School District No. 127 GO | 0.000% | 2/1/19 | | 5,000 | 4,677 |
| Lake County IL Community High School District No. 127 GO | 0.000% | 2/1/20 | | 5,000 | 4,555 |
| Lake County IL Community High School District No. 127 GO | 0.000% | 2/1/22 | | 5,690 | 4,849 |
| McHenry & Kane Counties IL Community Consolidated School District No. 158 GO | 5.625% | 1/15/31 | | 3,500 | 4,150 |
| McHenry & Kane Counties IL Community Consolidated School District No. 158 GO | 5.625% | 1/15/32 | | 4,000 | 4,735 |
| Metropolitan Pier & Exposition Authority Illinois Dedicated Sales Tax Revenue | 0.000% | 12/15/15 | (14) | 13,000 | 12,880 |
| Metropolitan Pier & Exposition Authority Illinois Dedicated Sales Tax Revenue | 0.000% | 12/15/16 | (14) | 11,330 | 11,050 |
| Metropolitan Pier & Exposition Authority Illinois Dedicated Sales Tax Revenue | 0.000% | 6/15/19 | (14) | 38,440 | 34,791 |
| Metropolitan Pier & Exposition Authority Illinois Dedicated Sales Tax Revenue | 0.000% | 12/15/21 | (14) | 6,000 | 4,849 |
| Metropolitan Pier & Exposition Authority Illinois Dedicated Sales Tax Revenue | 0.000% | 12/15/23 | (14) | 21,000 | 15,691 |
| Metropolitan Pier & Exposition Authority Illinois Dedicated Sales Tax Revenue | 0.000% | 12/15/23 | (14) | 32,515 | 24,295 |
97
Intermediate-Term Tax-Exempt Fund
| | | | | |
| | | | | Face | Market |
| | | Maturity | | Amount | Value• |
| | Coupon | Date | | ($000) | ($000) |
| Metropolitan Pier & Exposition Authority Illinois Dedicated Sales Tax Revenue | 0.000% | 12/15/24 | (14) | 23,795 | 16,803 |
| Metropolitan Pier & Exposition Authority Illinois Dedicated Sales Tax Revenue | 0.000% | 12/15/25 | (14) | 29,785 | 19,906 |
| Metropolitan Pier & Exposition Authority Illinois Dedicated Sales Tax Revenue | 0.000% | 6/15/26 | (4) | 10,725 | 6,880 |
| Metropolitan Pier & Exposition Authority Illinois Dedicated Sales Tax Revenue | 0.000% | 6/15/27 | (4) | 6,400 | 3,877 |
| Metropolitan Pier & Exposition Authority Illinois Dedicated Sales Tax Revenue | 0.000% | 12/15/29 | (14) | 30,000 | 15,977 |
| Metropolitan Pier & Exposition Authority Illinois Dedicated Sales Tax Revenue | | | | | |
| (McCormick Place Expansion Project) | 5.000% | 12/15/26 | | 12,470 | 14,308 |
| Metropolitan Pier & Exposition Authority Illinois Dedicated Sales Tax Revenue | | | | | |
| (McCormick Place Expansion Project) | 5.000% | 12/15/28 | | 40,685 | 46,340 |
| Peoria IL Public Building Community School District Revenue | 0.000% | 12/1/14 | (12) | 2,800 | 2,799 |
| Peoria IL Public Building Community School District Revenue | 0.000% | 12/1/15 | (12) | 2,800 | 2,778 |
| Peoria IL Public Building Community School District Revenue | 0.000% | 12/1/16 | (12) | 2,900 | 2,827 |
| Railsplitter Tobacco Settlement Authority Illinois Tobacco Settlement Revenue | 5.000% | 6/1/16 | | 10,000 | 10,657 |
| Railsplitter Tobacco Settlement Authority Illinois Tobacco Settlement Revenue | 5.000% | 6/1/17 | | 6,000 | 6,593 |
| Railsplitter Tobacco Settlement Authority Illinois Tobacco Settlement Revenue | 5.000% | 6/1/18 | | 5,000 | 5,631 |
| Railsplitter Tobacco Settlement Authority Illinois Tobacco Settlement Revenue | 5.500% | 6/1/23 | | 37,000 | 43,279 |
| Railsplitter Tobacco Settlement Authority Illinois Tobacco Settlement Revenue | 6.000% | 6/1/28 | | 10,000 | 11,734 |
| Southwestern IL Development Authority Revenue (Local Government Program) | 5.000% | 4/15/30 | | 10,000 | 11,053 |
| Springfield IL Water Revenue | 5.000% | 3/1/29 | | 2,525 | 2,875 |
| Springfield IL Water Revenue | 5.000% | 3/1/30 | | 2,000 | 2,266 |
| Springfield IL Water Revenue | 5.000% | 3/1/31 | | 2,785 | 3,141 |
| Springfield IL Water Revenue | 5.000% | 3/1/32 | | 3,035 | 3,406 |
| University of Illinois Auxiliary Facilities System Revenue | 0.000% | 4/1/16 | (14) | 15,270 | 15,082 |
| University of Illinois Auxiliary Facilities System Revenue | 5.000% | 4/1/21 | | 3,430 | 3,966 |
| University of Illinois Auxiliary Facilities System Revenue | 5.000% | 4/1/22 | | 6,015 | 6,875 |
| University of Illinois Auxiliary Facilities System Revenue | 5.000% | 4/1/29 | | 2,075 | 2,398 |
| University of Illinois Auxiliary Facilities System Revenue | 5.000% | 4/1/30 | | 2,000 | 2,303 |
| University of Illinois Auxiliary Facilities System Revenue | 5.250% | 4/1/30 | | 5,000 | 5,598 |
| University of Illinois Auxiliary Facilities System Revenue | 5.000% | 4/1/31 | | 2,420 | 2,765 |
| University of Illinois Auxiliary Facilities System Revenue | 5.000% | 4/1/33 | | 2,000 | 2,273 |
| University of Illinois Auxiliary Facilities System Revenue | 5.000% | 4/1/34 | | 2,000 | 2,259 |
| Waubonsee IL Community College District No. 516 GO | 5.000% | 12/15/23 | | 1,715 | 2,008 |
| Waubonsee IL Community College District No. 516 GO | 5.000% | 12/15/24 | | 7,950 | 9,247 |
| Waubonsee IL Community College District No. 516 GO | 5.000% | 12/15/25 | | 3,405 | 3,936 |
| Will County IL Community High School District No. 210 (Lincoln-Way) GO | 5.000% | 1/1/28 | | 8,800 | 9,998 |
| Will County IL Community High School District No. 210 (Lincoln-Way) GO | 5.000% | 1/1/30 | | 4,500 | 5,088 |
| Will County IL Community High School District No. 210 (Lincoln-Way) GO | 0.000% | 1/1/33 | | 1,250 | 548 |
| Winnebago & Boone Counties IL Rockford School District No. 205 GO | 0.000% | 2/1/24 | | 7,980 | 5,899 |
| Winnebago & Boone Counties IL Rockford School District No. 205 GO | 0.000% | 2/1/25 | | 4,065 | 2,850 |
| Winnebago & Boone Counties IL Rockford School District No. 205 GO | 0.000% | 2/1/26 | | 3,645 | 2,407 |
| Winnebago & Boone Counties IL Rockford School District No. 205 GO | 0.000% | 2/1/27 | | 2,000 | 1,240 |
| | | | | | 3,033,856 |
| Indiana (1.3%) | | | | | |
| Decatur Township IN Multi-School Buildings Corp. Revenue | 5.000% | 7/15/21 | (4) | 5,695 | 6,203 |
| Franklin IN Community Multi-School Building Corp. Revenue | 5.000% | 7/15/23 | (4) | 2,480 | 2,931 |
| Hammond IN Multi-School Building Corp. Mortgage Revenue | 5.000% | 1/15/15 | (Prere.) | 2,735 | 2,762 |
| Hammond IN Multi-School Building Corp. Mortgage Revenue | 5.000% | 1/15/15 | (Prere.) | 2,875 | 2,904 |
| Indiana Bond Bank Special Program Gas Revenue | 5.250% | 10/15/21 | | 145 | 172 |
| Indiana Finance Authority Economic Development Revenue (Republic Services Inc. Project) PUT | 0.300% | 12/1/14 | | 12,000 | 12,000 |
| Indiana Finance Authority Facilities Revenue (Miami Correctional Facility–Phase II) | 5.000% | 7/1/15 | (ETM) | 3,865 | 3,990 |
| Indiana Finance Authority Facilities Revenue (Miami Correctional Facility–Phase II) | 5.000% | 7/1/17 | (ETM) | 3,315 | 3,696 |
| Indiana Finance Authority Facilities Revenue (Miami Correctional Facility–Phase II) | 5.000% | 7/1/18 | (ETM) | 4,085 | 4,686 |
| Indiana Finance Authority Health System Revenue | | | | | |
| (Sisters of St. Francis Health Services Inc. Obligated Group) | 5.000% | 11/1/18 | | 5,000 | 5,740 |
| Indiana Finance Authority Health System Revenue | | | | | |
| (Sisters of St. Francis Health Services Inc. Obligated Group) | 5.000% | 11/1/20 | | 4,370 | 4,962 |
| Indiana Finance Authority Health System Revenue | | | | | |
| (Sisters of St. Francis Health Services Inc. Obligated Group) | 5.000% | 11/1/23 | | 3,570 | 4,045 |
| Indiana Finance Authority Health System Revenue | | | | | |
| (Sisters of St. Francis Health Services Inc. Obligated Group) | 5.250% | 11/1/24 | | 10,855 | 12,336 |
| Indiana Finance Authority Health System Revenue | | | | | |
| (Sisters of St. Francis Health Services Inc. Obligated Group) | 5.250% | 11/1/25 | | 13,895 | 15,837 |
| Indiana Finance Authority Health System Revenue | | | | | |
| (Sisters of St. Francis Health Services Inc. Obligated Group) | 5.250% | 11/1/26 | | 14,425 | 16,441 |
| Indiana Finance Authority Health System Revenue | | | | | |
| (Sisters of St. Francis Health Services Inc. Obligated Group) | 5.250% | 11/1/27 | | 8,615 | 9,819 |
| Indiana Finance Authority Highway Revenue | 4.500% | 12/1/23 | (14) | 29,010 | 31,236 |
| Indiana Finance Authority Hospital Revenue (Community Health Network) | 5.000% | 5/1/22 | | 1,295 | 1,524 |
| Indiana Finance Authority Hospital Revenue (Community Health Network) | 5.000% | 5/1/24 | | 2,500 | 2,929 |
| Indiana Finance Authority Hospital Revenue (Community Health Network) | 5.000% | 5/1/25 | | 2,500 | 2,899 |
| Indiana Finance Authority Hospital Revenue (Community Health Network) | 5.000% | 5/1/26 | | 2,500 | 2,858 |
98
Intermediate-Term Tax-Exempt Fund
| | | | | |
| | | | | Face | Market |
| | | Maturity | | Amount | Value• |
| | Coupon | Date | | ($000) | ($000) |
| Indiana Finance Authority Hospital Revenue (Community Health Network) | 5.000% | 5/1/27 | | 2,500 | 2,843 |
| Indiana Finance Authority Hospital Revenue (Indiana University Health Obligated Group) | 5.000% | 12/1/24 | | 1,400 | 1,705 |
| Indiana Finance Authority Hospital Revenue (Indiana University Health Obligated Group) | 5.000% | 12/1/26 | | 1,030 | 1,239 |
| Indiana Finance Authority Hospital Revenue (Indiana University Health Obligated Group) | 5.000% | 12/1/27 | | 1,000 | 1,194 |
| Indiana Finance Authority Hospital Revenue (Indiana University Health Obligated Group) | 5.000% | 12/1/28 | | 2,600 | 3,077 |
| Indiana Finance Authority Hospital Revenue (Indiana University Health Obligated Group) | 5.000% | 12/1/30 | | 1,000 | 1,164 |
| Indiana Finance Authority Hospital Revenue (Parkview Health System) | 5.000% | 5/1/29 | | 3,000 | 3,392 |
| Indiana Finance Authority Lease Revenue | 5.000% | 11/1/17 | | 7,500 | 8,415 |
| Indiana Finance Authority Revenue (Community Foundation of Northwest Indiana Obligated Group) | 5.000% | 3/1/21 | | 1,225 | 1,407 |
| Indiana Finance Authority Revenue (Community Foundation of Northwest Indiana Obligated Group) | 5.000% | 3/1/22 | | 1,000 | 1,151 |
| Indiana Finance Authority Revenue (Community Foundation of Northwest Indiana Obligated Group) | 5.000% | 3/1/24 | | 2,000 | 2,257 |
| Indiana Finance Authority Revenue (Community Foundation of Northwest Indiana Obligated Group) | 5.000% | 3/1/25 | | 1,000 | 1,123 |
| Indiana Finance Authority Revenue (Community Foundation of Northwest Indiana Obligated Group) | 5.000% | 3/1/30 | | 3,250 | 3,587 |
| Indiana Finance Authority Revenue (Lease Appropriation) VRDO | 0.080% | 11/3/14 | | 9,400 | 9,400 |
| Indiana Finance Authority Revenue (Lease Appropriation) VRDO | 0.080% | 11/3/14 | | 21,300 | 21,300 |
| Indiana Finance Authority Revenue (Lease Appropriation) VRDO | 0.040% | 11/7/14 | | 45,000 | 45,000 |
| Indiana Finance Authority Revenue (State Revolving Fund) | 5.000% | 2/1/32 | | 9,150 | 10,660 |
| Indiana Finance Authority Revenue (Trinity Health) | 5.000% | 12/1/28 | | 6,295 | 7,110 |
| Indiana Finance Authority Wastewater Utility Revenue (CWA Authority Project) | 5.000% | 10/1/29 | | 5,000 | 5,745 |
| Indiana Finance Authority Wastewater Utility Revenue (CWA Authority Project) | 5.000% | 10/1/30 | | 5,490 | 6,283 |
| Indiana Finance Authority Wastewater Utility Revenue (CWA Authority Project) | 5.000% | 10/1/31 | | 3,325 | 3,775 |
| Indiana Finance Authority Wastewater Utility Revenue (CWA Authority Project) | 5.250% | 10/1/31 | | 10,000 | 11,660 |
| Indiana Health & Educational Facility Financing Authority Hospital Revenue | | | | | |
| (Clarian Health Obligated Group) | 5.000% | 2/15/24 | | 2,000 | 2,108 |
| Indiana Health & Educational Facility Financing Authority Hospital Revenue | | | | | |
| (Clarian Health Obligated Group) | 5.000% | 2/15/25 | | 14,000 | 14,741 |
| Indiana Health & Educational Facility Financing Authority Hospital Revenue | | | | | |
| (Clarian Health Obligated Group) | 5.000% | 2/15/26 | | 18,475 | 19,429 |
| 1 Indiana Health & Educational Facility Financing Authority Revenue | | | | | |
| (Ascension Health Credit Group) TOB VRDO | 0.070% | 11/3/14 | | 1,140 | 1,140 |
| Indiana Health Facility Financing Authority Revenue (Ascension Health Credit Group) PUT | 1.600% | 2/1/17 | | 9,000 | 9,192 |
| Indiana Municipal Power Agency Revenue | 5.625% | 1/1/28 | | 4,640 | 5,349 |
| Indiana Municipal Power Agency Revenue | 5.750% | 1/1/29 | | 2,000 | 2,317 |
| Indiana Office Building Commission Facilities Revenue (New Castle Correctional Facility) | 5.250% | 7/1/19 | (14) | 2,515 | 2,960 |
| Indiana University Student Fee Revenue | 5.000% | 8/1/15 | | 1,000 | 1,036 |
| Indiana University Student Fee Revenue | 5.000% | 8/1/16 | | 2,500 | 2,703 |
| Indiana University Student Fee Revenue | 5.000% | 8/1/21 | | 4,500 | 5,451 |
| Indiana University Student Fee Revenue | 5.000% | 8/1/22 | | 6,370 | 7,792 |
| Indiana University Student Fee Revenue | 5.000% | 8/1/23 | | 3,510 | 4,229 |
| Indiana University Student Fee Revenue | 5.000% | 8/1/24 | | 2,175 | 2,600 |
| Indiana University Student Fee Revenue | 5.000% | 8/1/25 | | 2,040 | 2,424 |
| Indiana University Student Fee Revenue | 5.000% | 8/1/26 | | 1,000 | 1,160 |
| Indiana University Student Fee Revenue | 5.000% | 8/1/29 | | 1,000 | 1,147 |
| Indiana University Student Fee Revenue | 5.000% | 6/1/30 | | 2,000 | 2,316 |
| Indiana University Student Fee Revenue | 5.000% | 8/1/30 | | 1,560 | 1,782 |
| Indiana University Student Fee Revenue | 5.000% | 6/1/31 | | 1,500 | 1,730 |
| Indianapolis IN Gas Utility Revenue | 5.000% | 8/15/21 | (4) | 3,530 | 4,129 |
| Indianapolis IN Gas Utility Revenue | 5.000% | 8/15/22 | (4) | 15,655 | 18,257 |
| Indianapolis IN Local Public Improvement Bond Bank Revenue | 5.000% | 1/15/19 | | 3,000 | 3,459 |
| Indianapolis IN Local Public Improvement Bond Bank Revenue | 5.000% | 1/15/20 | | 1,545 | 1,809 |
| Indianapolis IN Local Public Improvement Bond Bank Revenue | 5.000% | 2/1/20 | | 5,000 | 5,718 |
| Indianapolis IN Local Public Improvement Bond Bank Revenue | 5.000% | 1/15/21 | | 8,590 | 9,937 |
| Indianapolis IN Local Public Improvement Bond Bank Revenue | 5.000% | 1/15/22 | | 7,000 | 8,005 |
| Indianapolis IN Local Public Improvement Bond Bank Revenue | 5.000% | 8/1/22 | | 1,425 | 1,621 |
| Indianapolis IN Local Public Improvement Bond Bank Revenue | 5.000% | 8/1/23 | | 1,895 | 2,153 |
| Indianapolis IN Local Public Improvement Bond Bank Revenue | 5.000% | 8/1/25 | | 2,085 | 2,372 |
| Indianapolis IN Local Public Improvement Bond Bank Revenue | 5.000% | 8/1/26 | | 1,985 | 2,258 |
| Indianapolis IN Local Public Improvement Bond Bank Revenue (Bank-Waterworks Project) | 5.500% | 1/1/29 | | 10,000 | 11,358 |
| Indianapolis IN Local Public Improvement Bond Bank Revenue (PILOT Infrastructure Project) | 5.000% | 1/1/23 | (4) | 4,285 | 4,975 |
| Indianapolis IN Local Public Improvement Bond Bank Revenue (PILOT Infrastructure Project) | 5.000% | 1/1/25 | (4) | 3,535 | 4,093 |
| Indianapolis IN Local Public Improvement Bond Bank Revenue | | | | | |
| (Qualified Midwestern Disaster Area) | 5.500% | 2/1/28 | | 4,065 | 4,705 |
| Indianapolis IN Local Public Improvement Bond Bank Revenue | | | | | |
| (Qualified Midwestern Disaster Area) | 5.500% | 2/1/29 | | 4,370 | 5,050 |
| Lake Central IN Multi-District School Building Corp. Revenue | 5.000% | 7/15/25 | | 4,330 | 5,073 |
| Lake Central IN Multi-District School Building Corp. Revenue | 5.000% | 7/15/26 | | 4,835 | 5,610 |
| Whiting IN Environmental Facilities Revenue (BP Products North America Inc. Project) | 5.000% | 7/1/17 | | 5,000 | 5,528 |
| | | | | | 501,173 |
| Iowa (0.3%) | | | | | |
| Ames IA Hospital Revenue (Mary Greeley Medical Center) | 5.500% | 6/15/29 | | 2,000 | 2,252 |
| Ames IA Hospital Revenue (Mary Greeley Medical Center) | 5.625% | 6/15/31 | | 2,000 | 2,254 |
| Iowa Finance Authority Health Facilities Revenue (Iowa Health System) | 5.250% | 2/15/29 | (12) | 13,500 | 15,183 |
99
Intermediate-Term Tax-Exempt Fund
| | | | | |
| | | | | Face | Market |
| | | Maturity | | Amount | Value• |
| | Coupon | Date | | ($000) | ($000) |
| Iowa Finance Authority Health Facilities Revenue (Iowa Health System) | 5.250% | 8/15/29 | (12) | 5,500 | 6,243 |
| Iowa Finance Authority Midwestern Disaster Area Revenue (Iowa Fertilizer Co. Project) | 5.000% | 12/1/19 | | 6,900 | 7,371 |
| Iowa Finance Authority Midwestern Disaster Area Revenue (Iowa Fertilizer Co. Project) | 5.500% | 12/1/22 | | 51,500 | 54,567 |
| Iowa Special Obligation Revenue (Ijobs Program) | 5.000% | 6/1/27 | | 5,985 | 6,971 |
| Iowa Special Obligation Revenue (Ijobs Program) | 5.000% | 6/1/28 | | 6,280 | 7,270 |
| Iowa Special Obligation Revenue (Prison Infrastructure) | 5.000% | 6/15/21 | | 1,150 | 1,352 |
| Iowa Special Obligation Revenue (Prison Infrastructure) | 5.000% | 6/15/22 | | 2,100 | 2,492 |
| Iowa Special Obligation Revenue (Prison Infrastructure) | 5.000% | 6/15/27 | | 4,000 | 4,662 |
| Iowa Student Loan Liquidity Corp. Revenue | 5.000% | 12/1/16 | | 8,545 | 9,235 |
| Iowa Student Loan Liquidity Corp. Revenue | 5.250% | 12/1/17 | | 5,655 | 6,324 |
| | | | | | 126,176 |
| Kansas (0.7%) | | | | | |
| Burlington KS Environmental Improvement Revenue | | | | | |
| (Kansas City Power & Light Co. Project) VRDO | 0.050% | 11/7/14 | LOC | 61,250 | 61,250 |
| Burlington KS Environmental Improvement Revenue | | | | | |
| (Kansas City Power & Light Co. Project) VRDO | 0.050% | 11/7/14 | LOC | 23,400 | 23,400 |
| Cowley County KS Unified School District GO | 4.750% | 9/1/18 | (Prere.) | 380 | 427 |
| Cowley County KS Unified School District GO | 4.750% | 9/1/18 | (Prere.) | 3,500 | 3,929 |
| Cowley County KS Unified School District GO | 4.750% | 9/1/26 | (4) | 3,300 | 3,678 |
| 3 Kansas Department of Transportation Highway Revenue | 0.350% | 9/1/15 | | 6,750 | 6,761 |
| Kansas Department of Transportation Highway Revenue | 5.000% | 9/1/25 | | 10,000 | 12,437 |
| Kansas Department of Transportation Highway Revenue | 5.000% | 9/1/26 | | 13,300 | 16,435 |
| Kansas Department of Transportation Highway Revenue | 5.000% | 9/1/27 | | 14,000 | 17,198 |
| Kansas Department of Transportation Highway Revenue | 5.000% | 9/1/28 | | 11,400 | 13,926 |
| Kansas Department of Transportation Highway Revenue | 5.000% | 9/1/29 | | 15,525 | 18,875 |
| Kansas Department of Transportation Highway Revenue VRDO | 0.050% | 11/7/14 | | 9,700 | 9,700 |
| Kansas Development Finance Authority Health Facilities Revenue | | | | | |
| (Kansas University Health System) | 5.375% | 3/1/30 | | 1,000 | 1,124 |
| Kansas Development Finance Authority Health Facilities Revenue | | | | | |
| (Kansas University Health System) | 5.000% | 3/1/31 | | 1,000 | 1,082 |
| Kansas Development Finance Authority Health Facilities Revenue | | | | | |
| (Kansas University Health System) | 5.000% | 3/1/34 | | 2,000 | 2,148 |
| Kansas Development Finance Authority Hospital Revenue | | | | | |
| (Adventist Health System/Sunbelt Obligated Group) | 5.000% | 11/15/22 | | 1,500 | 1,670 |
| Kansas Development Finance Authority Hospital Revenue | | | | | |
| (Adventist Health System/Sunbelt Obligated Group) | 5.000% | 11/15/24 | | 2,800 | 3,110 |
| Kansas Development Finance Authority Hospital Revenue | | | | | |
| (Adventist Health System/Sunbelt Obligated Group) | 5.000% | 11/15/29 | | 6,000 | 6,574 |
| Kansas Development Finance Authority Hospital Revenue | | | | | |
| (Adventist Health System/Sunbelt Obligated Group) | 5.500% | 11/15/29 | | 10,435 | 12,026 |
| Kansas Development Finance Authority Revenue | | | | | |
| (Kansas Department of Commerce Impact Program) | 5.000% | 6/1/19 | | 6,730 | 7,853 |
| Kansas Development Finance Authority Revenue | | | | | |
| (Kansas Department of Commerce Impact Program) | 5.000% | 6/1/20 | | 7,070 | 8,389 |
| Kansas Development Finance Authority Revenue | | | | | |
| (Sisters of Charity of Leavenworth Health System) | 5.250% | 1/1/25 | | 7,500 | 8,556 |
| Leavenworth County KS Unified School District GO | 4.500% | 3/1/18 | (12) | 1,030 | 1,149 |
| Leavenworth County KS Unified School District GO | 4.500% | 3/1/19 | (12) | 1,000 | 1,135 |
| Leavenworth County KS Unified School District GO | 4.500% | 9/1/19 | (12) | 600 | 687 |
| Leavenworth County KS Unified School District GO | 4.500% | 3/1/20 | (12) | 1,115 | 1,268 |
| Leavenworth County KS Unified School District GO | 4.750% | 3/1/21 | (12) | 1,165 | 1,327 |
| Leavenworth County KS Unified School District GO | 4.750% | 9/1/21 | (12) | 1,265 | 1,440 |
| Leavenworth County KS Unified School District GO | 5.000% | 3/1/22 | (12) | 1,060 | 1,227 |
| Leavenworth County KS Unified School District GO | 5.000% | 9/1/22 | (12) | 1,360 | 1,574 |
| University of Kansas Hospital Authority Health Facilities Improvement Revenue | 5.000% | 9/1/18 | | 1,000 | 1,079 |
| University of Kansas Hospital Authority Health Facilities Improvement Revenue | 5.000% | 9/1/19 | | 1,500 | 1,617 |
| University of Kansas Hospital Authority Health Facilities Improvement Revenue | 5.000% | 9/1/20 | | 1,500 | 1,615 |
| University of Kansas Hospital Authority Health Facilities Improvement Revenue | 5.000% | 9/1/21 | | 1,500 | 1,615 |
| University of Kansas Hospital Authority Health Facilities Improvement Revenue | 5.000% | 9/1/24 | | 5,055 | 5,414 |
| University of Kansas Hospital Authority Health Facilities Improvement Revenue | 5.000% | 9/1/26 | | 4,300 | 4,599 |
| Wichita KS Hospital Facilities Revenue (Via Christi Health System Inc.) | 5.000% | 11/15/16 | (ETM) | 1,000 | 1,094 |
| Wyandotte County/Kansas City KS Unified Government Utility System Revenue | 5.000% | 9/1/22 | | 750 | 895 |
| Wyandotte County/Kansas City KS Unified Government Utility System Revenue | 5.000% | 9/1/23 | | 1,500 | 1,795 |
| | | | | | 270,078 |
| Kentucky (0.6%) | | | | | |
| 3 Ashland KY Medical Center Revenue (King’s Daughters Medical Center Project) PUT | 1.800% | 2/1/17 | | 11,650 | 11,708 |
| Kentucky Asset/Liability Commission Agency Fund Revenue (Federal Highway Trust) | 5.250% | 9/1/18 | (14) | 5,000 | 5,787 |
| Kentucky Asset/Liability Commission Agency Fund Revenue (Federal Highway Trust) | 5.000% | 9/1/21 | | 14,000 | 16,377 |
| Kentucky Asset/Liability Commission Agency Fund Revenue (Federal Highway Trust) | 5.000% | 9/1/22 | | 7,000 | 8,094 |
100
Intermediate-Term Tax-Exempt Fund
| | | | | |
| | | | | Face | Market |
| | | Maturity | | Amount | Value• |
| | Coupon | Date | | ($000) | ($000) |
| Kentucky Economic Development Finance Authority Medical Center Revenue | | | | | |
| (King’s Daughters Medical Center Project) | 5.000% | 2/1/18 | | 1,840 | 2,015 |
| Kentucky Economic Development Finance Authority Medical Center Revenue | | | | | |
| (King’s Daughters Medical Center Project) | 5.000% | 2/1/19 | | 1,475 | 1,631 |
| Kentucky Economic Development Finance Authority Medical Center Revenue | | | | | |
| (King’s Daughters Medical Center Project) | 5.000% | 2/1/20 | | 2,985 | 3,306 |
| Kentucky Economic Development Finance Authority Medical Center Revenue | | | | | |
| (King’s Daughters Medical Center Project) | 5.000% | 2/1/21 | | 2,000 | 2,208 |
| Kentucky Economic Development Finance Authority Solid Waste Revenue | | | | | |
| (Republic Services Inc. Project) PUT | 0.300% | 12/1/14 | | 8,445 | 8,445 |
| Kentucky Property & Building Commission Revenue | 5.250% | 10/1/15 | (4) | 1,500 | 1,569 |
| Kentucky Property & Building Commission Revenue | 5.000% | 10/1/17 | | 1,170 | 1,311 |
| Kentucky Property & Building Commission Revenue | 5.000% | 11/1/17 | | 8,570 | 9,649 |
| Kentucky Property & Building Commission Revenue | 5.500% | 8/1/19 | (2) | 6,870 | 8,177 |
| Kentucky Property & Building Commission Revenue | 5.000% | 10/1/19 | (2) | 5,000 | 5,855 |
| Kentucky Property & Building Commission Revenue | 5.500% | 8/1/20 | (2) | 4,320 | 5,226 |
| Kentucky Property & Building Commission Revenue | 5.000% | 11/1/20 | | 4,500 | 5,164 |
| Kentucky Property & Building Commission Revenue | 5.000% | 8/1/21 | | 35,000 | 41,018 |
| Kentucky Property & Building Commission Revenue | 5.250% | 2/1/23 | (12) | 6,215 | 7,211 |
| Kentucky Property & Building Commission Revenue | 5.000% | 11/1/23 | (4) | 5,120 | 5,837 |
| Kentucky Property & Building Commission Revenue | 5.000% | 11/1/24 | (4) | 5,000 | 5,700 |
| Kentucky Property & Building Commission Revenue | 5.250% | 2/1/25 | (12) | 4,995 | 5,769 |
| Kentucky Public Transportation Infrastructure Authority Toll Revenue | | | | | |
| (Downtown Crossing Project) BAN | 0.000% | 7/1/20 | | 1,700 | 1,411 |
| Kentucky Public Transportation Infrastructure Authority Toll Revenue | | | | | |
| (Downtown Crossing Project) BAN | 0.000% | 7/1/23 | | 1,720 | 1,224 |
| Kentucky Turnpike Authority Economic Development Road Revenue (Revitalization Project) | 5.000% | 7/1/22 | | 1,000 | 1,213 |
| Kentucky Turnpike Authority Economic Development Road Revenue (Revitalization Project) | 5.000% | 7/1/23 | | 9,890 | 11,228 |
| Kentucky Turnpike Authority Economic Development Road Revenue (Revitalization Project) | 5.000% | 7/1/24 | | 7,065 | 8,010 |
| Kentucky Turnpike Authority Economic Development Road Revenue (Revitalization Project) | 5.000% | 7/1/24 | | 1,450 | 1,788 |
| Kentucky Turnpike Authority Economic Development Road Revenue (Revitalization Project) | 5.000% | 7/1/25 | | 7,000 | 7,925 |
| Kentucky Turnpike Authority Economic Development Road Revenue (Revitalization Project) | 5.000% | 7/1/29 | | 3,905 | 4,605 |
| Kentucky Turnpike Authority Economic Development Road Revenue (Revitalization Project) | 5.000% | 7/1/31 | | 5,210 | 6,086 |
| Louisville & Jefferson County KY Metropolitan Government Pollution Control Revenue | | | | | |
| (Louisville Gas & Electric Co. Project) PUT | 1.650% | 4/3/17 | | 14,500 | 14,739 |
| Louisville & Jefferson County KY Metropolitan Government Revenue (Catholic Health Initiatives) | 5.000% | 12/1/30 | | 14,775 | 16,521 |
| Louisville & Jefferson County KY Metropolitan Government Revenue (Catholic Health Initiatives) | 5.000% | 12/1/31 | | 9,000 | 10,019 |
| Warren County KY Hospital Revenue | | | | | |
| (Bowling Green-Warren County Community Hospital Corp. Project) | 5.000% | 4/1/20 | | 1,180 | 1,349 |
| Warren County KY Hospital Revenue | | | | | |
| (Bowling Green-Warren County Community Hospital Corp. Project) | 5.000% | 4/1/28 | | 4,000 | 4,540 |
| | | | | | 252,715 |
| Louisiana (1.3%) | | | | | |
| Bossier City LA Utilities Revenue | 5.000% | 10/1/29 | | 1,000 | 1,176 |
| Bossier City LA Utilities Revenue | 5.000% | 10/1/31 | | 1,000 | 1,165 |
| Bossier City LA Utilities Revenue | 5.000% | 10/1/32 | | 1,000 | 1,162 |
| Bossier City LA Utilities Revenue | 5.000% | 10/1/33 | | 3,000 | 3,475 |
| East Baton Rouge Parish LA Sales Tax Revenue | 5.000% | 8/1/23 | (12) | 5,165 | 5,967 |
| Ernest N. Morial–New Orleans LA Exhibition Hall Authority Special Tax Revenue | 5.000% | 7/15/27 | | 2,800 | 3,122 |
| Jefferson Parish LA Environmental Facilities & Community Development Authority Revenue | 5.000% | 4/1/17 | | 1,000 | 1,096 |
| Jefferson Parish LA Environmental Facilities & Community Development Authority Revenue | 5.000% | 4/1/18 | | 1,000 | 1,124 |
| Jefferson Parish LA Environmental Facilities & Community Development Authority Revenue | 5.000% | 4/1/19 | | 1,030 | 1,180 |
| Jefferson Parish LA Environmental Facilities & Community Development Authority Revenue | 5.000% | 4/1/20 | | 1,000 | 1,133 |
| Jefferson Parish LA Environmental Facilities & Community Development Authority Revenue | 5.000% | 4/1/21 | | 1,000 | 1,120 |
| Louisiana Citizens Property Insurance Corp. Assessment Revenue | 5.000% | 6/1/18 | (2) | 14,470 | 15,452 |
| Louisiana Citizens Property Insurance Corp. Assessment Revenue | 5.000% | 6/1/21 | (2) | 20,000 | 21,282 |
| Louisiana Citizens Property Insurance Corp. Assessment Revenue | 5.000% | 6/1/22 | (2) | 13,660 | 14,511 |
| Louisiana Citizens Property Insurance Corp. Assessment Revenue | 5.000% | 6/1/23 | (2) | 10,000 | 10,609 |
| Louisiana Gasoline & Fuel Tax Revenue | 5.250% | 5/1/15 | (Prere.) | 6,200 | 6,358 |
| Louisiana Gasoline & Fuel Tax Revenue | 5.000% | 5/1/31 | | 20,665 | 24,491 |
| Louisiana Gasoline & Fuel Tax Revenue | 5.000% | 5/1/32 | | 10,000 | 11,797 |
| Louisiana Gasoline & Fuel Tax Revenue | 5.000% | 5/1/33 | | 5,905 | 6,939 |
| Louisiana Gasoline & Fuel Tax Revenue | 5.000% | 5/1/34 | | 4,000 | 4,675 |
| Louisiana Gasoline & Fuel Tax Revenue | 5.000% | 5/1/35 | | 7,095 | 8,260 |
| 3 Louisiana Gasoline & Fuel Tax Revenue PUT | 0.657% | 5/1/18 | | 31,500 | 31,686 |
| Louisiana GO | 5.000% | 8/1/15 | (14) | 2,500 | 2,592 |
| Louisiana GO | 5.000% | 5/1/16 | (Prere.) | 25,210 | 26,974 |
| Louisiana GO | 5.000% | 5/1/16 | (Prere.) | 9,765 | 10,448 |
| Louisiana GO | 5.000% | 5/1/16 | (Prere.) | 26,665 | 28,531 |
| Louisiana GO | 5.000% | 11/15/17 | | 10,000 | 11,322 |
| Louisiana GO | 5.000% | 11/15/17 | | 17,040 | 19,293 |
101
Intermediate-Term Tax-Exempt Fund
| | | | | |
| | | | | Face | Market |
| | | Maturity | | Amount | Value• |
| | Coupon | Date | | ($000) | ($000) |
| Louisiana Local Government Environmental Facilities & Community Development | | | | | |
| Authority Revenue (East Baton Rouge Sewerage Commission Projects) | 5.000% | 2/1/29 | | 1,525 | 1,760 |
| Louisiana Local Government Environmental Facilities & Community Development | | | | | |
| Authority Revenue (East Baton Rouge Sewerage Commission Projects) | 5.000% | 2/1/31 | | 3,140 | 3,581 |
| Louisiana Local Government Environmental Facilities & Community Development | | | | | |
| Authority Revenue (East Baton Rouge Sewerage Commission Projects) | 5.000% | 2/1/33 | | 3,500 | 3,965 |
| Louisiana Local Government Environmental Facilities & Community Development | | | | | |
| Authority Revenue (East Baton Rouge Sewerage Commission Projects) | 5.000% | 2/1/34 | | 2,550 | 2,876 |
| Louisiana Local Government Environmental Facilities & Community Development | | | | | |
| Authority Revenue (LCTCS Facilities Corp. Project) | 5.000% | 10/1/22 | | 2,790 | 3,208 |
| Louisiana Local Government Environmental Facilities & Community Development | | | | | |
| Authority Revenue (LCTCS Facilities Corp. Project) | 5.000% | 10/1/24 | | 11,000 | 12,423 |
| Louisiana Local Government Environmental Facilities & Community Development | | | | | |
| Authority Revenue (LCTCS Facilities Corp. Project) | 5.000% | 10/1/25 | | 2,000 | 2,265 |
| Louisiana Local Government Environmental Facilities & Community Development | | | | | |
| Authority Revenue (Plaquemines Project) | 5.000% | 9/1/26 | (4) | 1,700 | 1,932 |
| Louisiana Local Government Environmental Facilities & Community Development | | | | | |
| Authority Revenue (Plaquemines Project) | 5.000% | 9/1/28 | (4) | 1,875 | 2,110 |
| Louisiana Local Government Environmental Facilities & Community Development | | | | | |
| Authority Revenue (Plaquemines Project) | 5.000% | 9/1/31 | (4) | 1,420 | 1,581 |
| Louisiana Local Government Environmental Facilities & Community Development | | | | | |
| Authority Revenue (Women’s Hospital Foundation Project) | 5.625% | 10/1/30 | | 15,905 | 17,868 |
| Louisiana Office Facilities Corp. Lease Revenue (Capitol Complex Project) | 5.000% | 5/1/17 | | 5,300 | 5,843 |
| Louisiana Office Facilities Corp. Lease Revenue (Capitol Complex Project) | 5.000% | 5/1/19 | | 4,495 | 5,193 |
| Louisiana Public Facilities Authority Revenue (Loyola University) | 5.250% | 10/1/29 | | 4,000 | 4,582 |
| Louisiana Public Facilities Authority Revenue (Loyola University) | 5.250% | 10/1/30 | | 4,930 | 5,638 |
| Louisiana Public Facilities Authority Revenue (Loyola University) | 5.250% | 10/1/31 | | 2,485 | 2,834 |
| Louisiana Public Facilities Authority Revenue (Ochsner Clinic Foundation Project) | 5.000% | 5/15/15 | | 4,055 | 4,140 |
| Louisiana Public Facilities Authority Revenue (Ochsner Clinic Foundation Project) | 5.000% | 5/15/17 | | 1,520 | 1,644 |
| Louisiana Public Facilities Authority Revenue (Ochsner Clinic Foundation Project) | 5.250% | 5/15/27 | | 15,165 | 15,974 |
| Louisiana Stadium & Exposition District Revenue | 5.000% | 7/1/24 | | 2,125 | 2,541 |
| Louisiana Stadium & Exposition District Revenue | 5.000% | 7/1/25 | | 5,445 | 6,460 |
| Louisiana Stadium & Exposition District Revenue | 5.000% | 7/1/26 | | 5,000 | 5,879 |
| Louisiana Stadium & Exposition District Revenue | 5.000% | 7/1/27 | | 3,770 | 4,381 |
| Louisiana Stadium & Exposition District Revenue | 5.000% | 7/1/28 | | 3,650 | 4,218 |
| Louisiana State University Revenue | 5.000% | 7/1/29 | | 3,180 | 3,715 |
| Louisiana State University Revenue | 5.000% | 7/1/30 | | 1,000 | 1,166 |
| Louisiana State University Revenue | 5.000% | 7/1/32 | | 2,765 | 3,196 |
| New Orleans LA Aviation Board Revenue | 4.500% | 1/1/16 | (12) | 1,860 | 1,944 |
| New Orleans LA Aviation Board Revenue | 4.500% | 1/1/16 | (12) | 4,535 | 4,739 |
| New Orleans LA Aviation Board Revenue | 4.500% | 1/1/17 | (12) | 1,955 | 2,105 |
| New Orleans LA Aviation Board Revenue | 4.500% | 1/1/17 | (12) | 1,540 | 1,658 |
| New Orleans LA Aviation Board Revenue | 5.000% | 1/1/18 | (12) | 2,440 | 2,724 |
| New Orleans LA Aviation Board Revenue | 5.000% | 1/1/18 | (12) | 2,200 | 2,456 |
| New Orleans LA GO | 5.000% | 12/1/23 | | 2,250 | 2,536 |
| New Orleans LA GO | 5.000% | 12/1/24 | | 2,500 | 2,825 |
| New Orleans LA GO | 5.000% | 12/1/25 | | 2,500 | 2,802 |
| New Orleans LA GO | 5.000% | 12/1/26 | (4) | 3,770 | 4,272 |
| New Orleans LA GO | 5.000% | 12/1/27 | (4) | 2,260 | 2,548 |
| New Orleans LA GO | 5.000% | 12/1/28 | (4) | 2,310 | 2,590 |
| New Orleans LA GO | 5.125% | 12/1/33 | (17) | 10,000 | 10,598 |
| New Orleans LA Water Revenue | 5.000% | 12/1/23 | | 1,000 | 1,179 |
| New Orleans LA Water Revenue | 5.000% | 12/1/24 | | 550 | 647 |
| New Orleans LA Water Revenue | 5.000% | 12/1/28 | | 1,200 | 1,376 |
| New Orleans LA Water Revenue | 5.000% | 12/1/29 | | 1,000 | 1,139 |
| New Orleans LA Water Revenue | 5.000% | 12/1/34 | | 2,600 | 2,910 |
| St. Charles Parish LA Gulf Opportunity Zone Revenue (Valero Energy Corp.) PUT | 4.000% | 6/1/22 | | 18,135 | 19,497 |
| Tobacco Settlement Financing Corp. Louisiana Revenue | 5.250% | 5/15/31 | | 10,000 | 10,863 |
| Tobacco Settlement Financing Corp. Louisiana Revenue | 5.250% | 5/15/32 | | 12,365 | 13,524 |
| Tobacco Settlement Financing Corp. Louisiana Revenue | 5.250% | 5/15/33 | | 5,000 | 5,447 |
| | | | | | 508,292 |
| Maine (0.1%) | | | | | |
| Maine GO | 5.000% | 6/1/16 | | 3,770 | 4,050 |
| Maine Municipal Bond Bank Revenue | 5.000% | 11/1/25 | | 2,000 | 2,456 |
| Maine Municipal Bond Bank Revenue | 5.000% | 11/1/26 | | 2,000 | 2,442 |
| Maine Municipal Bond Bank Revenue | 5.000% | 11/1/27 | | 2,215 | 2,689 |
| Portland ME Airport Revenue | 5.000% | 1/1/21 | (4) | 1,000 | 1,144 |
| Portland ME Airport Revenue | 5.000% | 1/1/22 | (4) | 1,000 | 1,131 |
| Portland ME Airport Revenue | 5.000% | 1/1/23 | (4) | 1,000 | 1,120 |
| Portland ME Airport Revenue | 5.000% | 1/1/24 | (4) | 1,610 | 1,792 |
| Portland ME Airport Revenue | 5.000% | 1/1/25 | (4) | 1,000 | 1,108 |
102
Intermediate-Term Tax-Exempt Fund
| | | | | |
| | | | | Face | Market |
| | | Maturity | | Amount | Value• |
| | Coupon | Date | | ($000) | ($000) |
| Portland ME Airport Revenue | 5.000% | 1/1/26 | (4) | 1,720 | 1,896 |
| Portland ME Airport Revenue | 5.000% | 1/1/28 | (4) | 1,200 | 1,308 |
| Portland ME Airport Revenue | 5.000% | 1/1/29 | (4) | 1,265 | 1,378 |
| | | | | | 22,514 |
| Maryland (1.4%) | | | | | |
| Baltimore MD Project Revenue | 5.000% | 7/1/26 | | 1,585 | 1,838 |
| Baltimore MD Project Revenue | 5.000% | 7/1/26 | | 1,250 | 1,450 |
| Baltimore MD Project Revenue | 5.000% | 7/1/27 | | 1,745 | 2,015 |
| Baltimore MD Project Revenue | 5.000% | 7/1/28 | | 1,570 | 1,805 |
| Baltimore MD Project Revenue | 5.000% | 7/1/28 | | 1,905 | 2,191 |
| Baltimore MD Project Revenue | 5.000% | 7/1/29 | | 2,075 | 2,377 |
| Baltimore MD Project Revenue | 5.000% | 7/1/30 | | 1,905 | 2,173 |
| Baltimore MD Project Revenue | 5.000% | 7/1/30 | | 3,255 | 3,713 |
| Baltimore MD Project Revenue | 5.000% | 7/1/31 | | 2,000 | 2,272 |
| Howard County MD GO | 5.000% | 8/15/20 | | 14,125 | 16,965 |
| Howard County MD GO | 5.000% | 8/15/21 | | 14,440 | 17,544 |
| Howard County MD GO | 5.000% | 8/15/24 | | 4,500 | 5,355 |
| Maryland Department of Transportation Revenue | 5.000% | 6/1/15 | | 1,825 | 1,877 |
| Maryland Economic Development Corp. Pollution Control Revenue (Potomac Electric Power Co.) | 6.200% | 9/1/22 | | 6,000 | 7,160 |
| Maryland GO | 5.000% | 8/1/15 | | 3,225 | 3,343 |
| Maryland GO | 5.000% | 8/1/15 | (Prere.) | 15,260 | 15,814 |
| Maryland GO | 5.000% | 8/1/15 | | 19,620 | 20,336 |
| Maryland GO | 5.000% | 3/1/16 | | 2,900 | 3,082 |
| Maryland GO | 5.000% | 8/1/16 | | 10,000 | 10,812 |
| Maryland GO | 5.000% | 8/1/16 | | 1,100 | 1,189 |
| Maryland GO | 5.000% | 8/1/16 | | 1,010 | 1,092 |
| Maryland GO | 4.000% | 8/15/16 | | 3,025 | 3,222 |
| Maryland GO | 5.000% | 3/1/17 | | 3,440 | 3,800 |
| Maryland GO | 5.000% | 8/1/17 | | 20,000 | 22,421 |
| Maryland GO | 5.000% | 3/15/18 | | 20,000 | 22,836 |
| Maryland GO | 4.500% | 8/1/18 | | 35,465 | 40,274 |
| Maryland GO | 5.000% | 3/15/19 | | 15,935 | 18,647 |
| Maryland GO | 5.000% | 8/1/19 | | 5,015 | 5,921 |
| Maryland GO | 5.000% | 3/1/22 | | 32,550 | 39,831 |
| Maryland GO | 5.000% | 8/1/22 | | 35,000 | 43,098 |
| Maryland GO | 5.000% | 3/1/23 | | 37,360 | 45,268 |
| Maryland GO | 5.000% | 8/1/23 | | 46,695 | 58,089 |
| Maryland Health & Higher Educational Facilities Authority Revenue (Anne Arundel Health System) | 5.000% | 7/1/21 | | 800 | 937 |
| Maryland Health & Higher Educational Facilities Authority Revenue (Anne Arundel Health System) | 5.000% | 7/1/23 | | 900 | 1,047 |
| Maryland Health & Higher Educational Facilities Authority Revenue | | | | | |
| (Johns Hopkins Health System Obligated Group) PUT | 5.000% | 5/15/15 | | 3,500 | 3,593 |
| Maryland Health & Higher Educational Facilities Authority Revenue | | | | | |
| (Maryland Institute College of Art) | 5.000% | 6/1/29 | | 1,000 | 1,114 |
| Maryland Health & Higher Educational Facilities Authority Revenue (MedStar Health, Inc.) | 5.000% | 8/15/31 | | 7,080 | 7,945 |
| Maryland Health & Higher Educational Facilities Authority Revenue (MedStar Health, Inc.) | 5.000% | 8/15/32 | | 6,630 | 7,392 |
| Maryland Health & Higher Educational Facilities Authority Revenue (MedStar Health, Inc.) | 5.000% | 8/15/33 | | 5,000 | 5,551 |
| Maryland Health & Higher Educational Facilities Authority Revenue | | | | | |
| (University of Maryland Medical System) | 5.000% | 7/1/16 | | 3,895 | 4,188 |
| Maryland Health & Higher Educational Facilities Authority Revenue | | | | | |
| (University of Maryland Medical System) | 5.000% | 7/1/17 | | 3,000 | 3,335 |
| Maryland Health & Higher Educational Facilities Authority Revenue | | | | | |
| (University of Maryland Medical System) | 5.000% | 7/1/18 | | 2,500 | 2,831 |
| Maryland Health & Higher Educational Facilities Authority Revenue | | | | | |
| (University of Maryland Medical System) | 5.250% | 7/1/19 | | 1,700 | 1,929 |
| Maryland Health & Higher Educational Facilities Authority Revenue | | | | | |
| (University of Maryland Medical System) | 4.500% | 7/1/20 | | 1,500 | 1,640 |
| Maryland Health & Higher Educational Facilities Authority Revenue | | | | | |
| (University of Maryland Medical System) | 5.250% | 7/1/21 | | 2,000 | 2,249 |
| Maryland Health & Higher Educational Facilities Authority Revenue | | | | | |
| (University of Maryland Medical System) | 4.750% | 7/1/23 | | 900 | 968 |
| Maryland Health & Higher Educational Facilities Authority Revenue | | | | | |
| (University of Maryland Medical System) | 5.500% | 7/1/24 | (2) | 3,800 | 4,284 |
| Maryland Health & Higher Educational Facilities Authority Revenue | | | | | |
| (University of Maryland Medical System) | 5.250% | 7/1/28 | (2) | 9,000 | 10,017 |
| Maryland Transportation Authority GAN | 5.000% | 3/1/16 | | 2,500 | 2,657 |
| Maryland Transportation Authority GAN | 5.250% | 3/1/16 | | 4,000 | 4,264 |
| Maryland Transportation Authority GAN | 5.250% | 3/1/20 | | 8,085 | 9,420 |
| Montgomery County MD GO | 5.000% | 7/1/15 | | 15,000 | 15,488 |
| Montgomery County MD GO | 5.000% | 7/1/16 | | 1,500 | 1,616 |
| Montgomery County MD GO | 5.000% | 7/1/17 | | 3,460 | 3,868 |
| Montgomery County MD GO | 5.000% | 7/1/21 | | 2,275 | 2,768 |
103
Intermediate-Term Tax-Exempt Fund
| | | | | |
| | | | | Face | Market |
| | | Maturity | | Amount | Value• |
| | Coupon | Date | | ($000) | ($000) |
| Prince Georges County MD GO | 5.000% | 8/1/21 | | 13,745 | 16,741 |
| Prince Georges County MD GO | 5.000% | 9/15/21 | | 4,975 | 6,069 |
| Westminster MD Revenue (Lutheran Village at Miller’s Grant) | 4.875% | 7/1/23 | | 4,720 | 4,840 |
| | | | | | 554,561 |
| Massachusetts (3.8%) | | | | | |
| Boston MA GO | 5.000% | 4/1/16 | | 3,410 | 3,637 |
| Boston MA GO | 5.000% | 8/1/17 | | 5,035 | 5,644 |
| Boston MA GO | 5.000% | 2/1/23 | | 4,760 | 5,752 |
| Massachusetts Bay Transportation Authority Assessment Revenue | 5.000% | 7/1/19 | | 15,000 | 17,669 |
| Massachusetts Bay Transportation Authority Sales Tax Revenue | 5.000% | 7/1/24 | | 5,000 | 6,228 |
| 1 Massachusetts Bay Transportation Authority Sales Tax Revenue TOB VRDO | 0.170% | 11/7/14 | | 40,925 | 40,925 |
| Massachusetts Bay Transportation Authority Sales Tax Revenue VRDO | 0.050% | 11/7/14 | | 7,100 | 7,100 |
| Massachusetts College Building Authority Revenue | 5.000% | 5/1/28 | | 1,290 | 1,502 |
| Massachusetts College Building Authority Revenue | 5.125% | 5/1/28 | | 1,420 | 1,614 |
| Massachusetts College Building Authority Revenue | 5.000% | 5/1/29 | | 2,905 | 3,421 |
| Massachusetts College Building Authority Revenue | 5.250% | 5/1/29 | | 2,250 | 2,579 |
| Massachusetts College Building Authority Revenue | 5.000% | 5/1/30 | | 4,820 | 5,650 |
| Massachusetts College Building Authority Revenue | 5.000% | 5/1/31 | | 6,040 | 7,044 |
| Massachusetts Department of Transportation Metropolitan Highway System Revenue | 5.000% | 1/1/20 | | 2,610 | 3,077 |
| Massachusetts Department of Transportation Metropolitan Highway System Revenue | 5.000% | 1/1/23 | | 14,750 | 16,671 |
| Massachusetts Department of Transportation Metropolitan Highway System Revenue | 5.000% | 1/1/26 | | 13,625 | 15,133 |
| Massachusetts Department of Transportation Metropolitan Highway System Revenue VRDO | 0.050% | 11/7/14 | | 45,900 | 45,900 |
| Massachusetts Department of Transportation Metropolitan Highway System Revenue VRDO | 0.060% | 11/7/14 | | 3,500 | 3,500 |
| Massachusetts Development Finance Agency Revenue (Berklee College of Music) | 5.000% | 10/1/29 | | 3,110 | 3,508 |
| Massachusetts Development Finance Agency Revenue (Berklee College of Music) | 5.000% | 10/1/31 | | 1,200 | 1,337 |
| Massachusetts Development Finance Agency Revenue (Berkshire Health System) | 5.000% | 10/1/20 | | 1,205 | 1,376 |
| Massachusetts Development Finance Agency Revenue (Berkshire Health System) | 5.000% | 10/1/21 | | 1,760 | 2,031 |
| Massachusetts Development Finance Agency Revenue (Berkshire Health System) | 5.000% | 10/1/22 | | 2,125 | 2,417 |
| Massachusetts Development Finance Agency Revenue (Berkshire Health System) | 5.000% | 10/1/23 | | 2,235 | 2,516 |
| Massachusetts Development Finance Agency Revenue (Berkshire Health System) | 5.000% | 10/1/24 | | 1,500 | 1,685 |
| Massachusetts Development Finance Agency Revenue (Berkshire Health System) | 5.000% | 10/1/25 | | 1,600 | 1,789 |
| Massachusetts Development Finance Agency Revenue (Berkshire Health System) | 5.000% | 10/1/26 | | 1,100 | 1,222 |
| Massachusetts Development Finance Agency Revenue (Berkshire Health System) | 5.000% | 10/1/27 | | 1,165 | 1,291 |
| Massachusetts Development Finance Agency Revenue (Boston College) | 5.000% | 7/1/29 | | 9,500 | 10,858 |
| Massachusetts Development Finance Agency Revenue (Draper Laboratory) | 5.750% | 9/1/25 | | 6,765 | 7,870 |
| Massachusetts Development Finance Agency Revenue (Emerson College) | 5.500% | 1/1/30 | | 15,000 | 16,936 |
| Massachusetts Development Finance Agency Revenue (UMass Memorial Medical Center) | 5.125% | 7/1/26 | | 2,690 | 2,860 |
| Massachusetts Educational Financing Authority Education Loan Revenue | 5.500% | 1/1/22 | | 3,500 | 4,009 |
| Massachusetts GO | 5.500% | 11/1/14 | (14) | 3,000 | 3,000 |
| Massachusetts GO | 5.500% | 12/1/14 | (4) | 1,000 | 1,005 |
| Massachusetts GO | 5.000% | 1/1/15 | | 1,500 | 1,512 |
| 3 Massachusetts GO | 0.450% | 2/1/15 | | 7,500 | 7,504 |
| Massachusetts GO | 5.000% | 8/1/15 | | 11,745 | 12,174 |
| Massachusetts GO | 5.250% | 8/1/15 | | 5,000 | 5,192 |
| 3 Massachusetts GO | 0.500% | 9/1/15 | | 6,500 | 6,512 |
| Massachusetts GO | 5.000% | 9/1/15 | | 14,360 | 14,942 |
| 3 Massachusetts GO | 0.340% | 2/1/16 | | 41,060 | 41,106 |
| Massachusetts GO | 5.250% | 8/1/16 | | 5,615 | 6,090 |
| 3 Massachusetts GO | 0.570% | 9/1/16 | | 2,000 | 2,007 |
| Massachusetts GO | 5.000% | 9/1/16 | | 7,710 | 8,357 |
| Massachusetts GO | 5.500% | 11/1/16 | (ETM) | 50,000 | 55,088 |
| Massachusetts GO | 5.500% | 11/1/16 | (ETM) | 24,500 | 26,993 |
| Massachusetts GO | 5.500% | 11/1/16 | (ETM) | 73,000 | 80,429 |
| Massachusetts GO | 5.000% | 8/1/17 | | 24,060 | 26,977 |
| Massachusetts GO | 5.500% | 11/1/17 | | 10,000 | 11,449 |
| Massachusetts GO | 5.500% | 11/1/17 | (14) | 20,100 | 23,013 |
| Massachusetts GO | 5.500% | 11/1/17 | (4) | 7,000 | 8,014 |
| Massachusetts GO | 5.500% | 8/1/18 | (14) | 5,000 | 5,851 |
| Massachusetts GO | 5.500% | 10/1/18 | | 9,500 | 11,174 |
| Massachusetts GO | 5.500% | 10/1/20 | (14) | 11,065 | 13,604 |
| Massachusetts GO | 5.250% | 8/1/21 | | 20,870 | 25,605 |
| Massachusetts GO | 5.250% | 8/1/21 | (2) | 4,445 | 5,454 |
| Massachusetts GO | 5.000% | 8/1/22 | | 14,000 | 17,127 |
| Massachusetts GO | 5.000% | 8/1/24 | | 65,150 | 80,738 |
| Massachusetts GO | 5.000% | 8/1/25 | | 20,000 | 23,802 |
| Massachusetts GO | 5.000% | 4/1/27 | | 18,000 | 21,216 |
| Massachusetts GO | 5.000% | 4/1/29 | | 26,675 | 31,340 |
| Massachusetts GO | 5.000% | 9/1/30 | | 4,000 | 4,703 |
| Massachusetts GO | 5.000% | 9/1/31 | | 5,770 | 6,748 |
| 1 Massachusetts GO TOB VRDO | 0.070% | 11/3/14 | | 2,000 | 2,000 |
| Massachusetts Health & Educational Facilities Authority Revenue (Boston College) | 5.500% | 6/1/30 | | 5,000 | 6,474 |
104
Intermediate-Term Tax-Exempt Fund
| | | | | |
| | | | | Face | Market |
| | | Maturity | | Amount | Value• |
| | Coupon | Date | | ($000) | ($000) |
| Massachusetts Health & Educational Facilities Authority Revenue (Boston Medical Center) | 5.000% | 7/1/28 | | 18,000 | 18,889 |
| Massachusetts Health & Educational Facilities Authority Revenue (Caregroup) | 5.375% | 7/1/23 | | 3,380 | 3,825 |
| Massachusetts Health & Educational Facilities Authority Revenue (Caregroup) | 5.375% | 7/1/24 | | 5,500 | 6,200 |
| Massachusetts Health & Educational Facilities Authority Revenue (Caregroup) | 5.375% | 7/1/25 | | 3,500 | 3,929 |
| Massachusetts Health & Educational Facilities Authority Revenue (Harvard University) | 6.250% | 4/1/20 | | 1,685 | 2,134 |
| Massachusetts Health & Educational Facilities Authority Revenue (Museum of Fine Arts) VRDO | 0.060% | 11/3/14 | | 4,700 | 4,700 |
| Massachusetts Health & Educational Facilities Authority Revenue (Northeastern University) | 5.000% | 10/1/20 | | 3,740 | 4,425 |
| Massachusetts Health & Educational Facilities Authority Revenue (Northeastern University) | 5.000% | 10/1/25 | | 1,460 | 1,655 |
| Massachusetts Health & Educational Facilities Authority Revenue (Northeastern University) | 5.000% | 10/1/26 | | 2,000 | 2,262 |
| Massachusetts Health & Educational Facilities Authority Revenue (Northeastern University) | 5.000% | 10/1/28 | | 1,155 | 1,287 |
| Massachusetts Health & Educational Facilities Authority Revenue | | | | | |
| (Partners Healthcare System) VRDO | 0.050% | 11/7/14 | | 42,600 | 42,600 |
| Massachusetts Health & Educational Facilities Authority Revenue (Suffolk University) | 6.250% | 7/1/30 | | 5,000 | 5,879 |
| Massachusetts Health & Educational Facilities Authority Revenue | | | | | |
| (UMass Memorial Medical Center) | 5.250% | 7/1/25 | | 6,815 | 6,929 |
| Massachusetts Port Authority Revenue | 5.000% | 7/1/29 | | 8,345 | 9,628 |
| Massachusetts Port Authority Revenue | 5.000% | 7/1/31 | | 3,680 | 4,208 |
| Massachusetts Port Authority Revenue | 5.000% | 7/1/31 | | 3,000 | 3,536 |
| Massachusetts Port Authority Revenue | 5.000% | 7/1/32 | | 3,500 | 4,106 |
| Massachusetts Port Authority Revenue | 5.000% | 7/1/33 | | 4,005 | 4,680 |
| Massachusetts Port Authority Revenue | 5.000% | 7/1/34 | | 1,470 | 1,711 |
| Massachusetts Port Authority Revenue | 5.000% | 7/1/35 | | 2,500 | 2,899 |
| Massachusetts School Building Authority Dedicated Sales Tax Revenue | 5.000% | 8/15/15 | (Prere.) | 3,015 | 3,130 |
| Massachusetts School Building Authority Dedicated Sales Tax Revenue | 5.000% | 8/15/15 | (Prere.) | 3,880 | 4,028 |
| Massachusetts School Building Authority Dedicated Sales Tax Revenue | 5.000% | 8/15/15 | (Prere.) | 4,815 | 4,999 |
| Massachusetts School Building Authority Dedicated Sales Tax Revenue | 5.000% | 8/15/15 | (Prere.) | 23,255 | 24,142 |
| Massachusetts School Building Authority Dedicated Sales Tax Revenue | 5.000% | 8/15/15 | (4) | 10,000 | 10,384 |
| Massachusetts School Building Authority Dedicated Sales Tax Revenue | 5.000% | 8/15/15 | (Prere.) | 41,095 | 42,663 |
| Massachusetts School Building Authority Dedicated Sales Tax Revenue | 5.000% | 8/15/15 | (Prere.) | 6,800 | 7,059 |
| Massachusetts School Building Authority Dedicated Sales Tax Revenue | 5.000% | 8/15/24 | | 20,000 | 24,324 |
| Massachusetts School Building Authority Dedicated Sales Tax Revenue | 5.000% | 8/15/27 | | 5,000 | 5,977 |
| Massachusetts School Building Authority Dedicated Sales Tax Revenue | 5.000% | 8/15/28 | | 32,750 | 38,913 |
| Massachusetts School Building Authority Dedicated Sales Tax Revenue | 5.000% | 8/15/30 | (4) | 1,105 | 1,142 |
| Massachusetts School Building Authority Dedicated Sales Tax Revenue | 5.000% | 5/15/32 | | 6,400 | 7,442 |
| Massachusetts School Building Authority Dedicated Sales Tax Revenue | 5.000% | 10/15/32 | | 8,010 | 9,310 |
| Massachusetts School Building Authority Dedicated Sales Tax Revenue | 5.000% | 5/15/33 | | 7,610 | 8,817 |
| Massachusetts Special Obligation Dedicated Tax Revenue | 5.250% | 1/1/19 | (14) | 5,125 | 5,925 |
| Massachusetts Special Obligation Dedicated Tax Revenue | 5.500% | 1/1/26 | (3) | 29,860 | 36,866 |
| Massachusetts Special Obligation Dedicated Tax Revenue | 5.500% | 1/1/28 | (14) | 11,075 | 13,862 |
| Massachusetts Special Obligation Revenue | 5.000% | 12/15/14 | | 15,805 | 15,900 |
| Massachusetts Special Obligation Revenue | 5.000% | 6/15/15 | | 10,000 | 10,302 |
| Massachusetts Water Pollution Abatement Trust Revenue | 5.250% | 2/1/21 | | 5,955 | 7,291 |
| Massachusetts Water Pollution Abatement Trust Revenue | 5.000% | 8/1/23 | | 16,430 | 20,364 |
| Massachusetts Water Pollution Abatement Trust Revenue | 5.000% | 8/1/24 | | 7,665 | 9,615 |
| Massachusetts Water Resources Authority Revenue | 6.500% | 7/15/19 | (ETM) | 27,280 | 30,908 |
| Massachusetts Water Resources Authority Revenue | 5.000% | 8/1/19 | | 21,580 | 25,435 |
| Massachusetts Water Resources Authority Revenue | 5.000% | 8/1/28 | | 2,350 | 2,774 |
| Massachusetts Water Resources Authority Revenue | 5.000% | 8/1/30 | | 5,000 | 5,782 |
| Massachusetts Water Resources Authority Revenue | 5.000% | 8/1/30 | | 3,500 | 4,113 |
| Massachusetts Water Resources Authority Revenue | 5.000% | 8/1/31 | | 5,000 | 5,755 |
| Massachusetts Water Resources Authority Revenue | 5.000% | 8/1/31 | | 2,000 | 2,338 |
| 1 Massachusetts Water Resources Authority Revenue TOB VRDO | 0.190% | 11/7/14 | LOC | 38,085 | 38,085 |
| Metropolitan Boston MA Transit Parking Corp. Revenue | 5.000% | 7/1/26 | | 3,000 | 3,511 |
| Metropolitan Boston MA Transit Parking Corp. Revenue | 5.000% | 7/1/27 | | 3,440 | 4,012 |
| Metropolitan Boston MA Transit Parking Corp. Revenue | 5.000% | 7/1/28 | | 5,100 | 5,907 |
| Metropolitan Boston MA Transit Parking Corp. Revenue | 5.000% | 7/1/29 | | 11,580 | 13,300 |
| Metropolitan Boston MA Transit Parking Corp. Revenue | 5.000% | 7/1/30 | | 11,000 | 12,603 |
| Metropolitan Boston MA Transit Parking Corp. Revenue | 5.000% | 7/1/31 | | 11,575 | 13,247 |
| University of Massachusetts Building Authority Revenue | 5.000% | 11/1/15 | (Prere.) | 25,625 | 26,861 |
| | | | | | 1,494,519 |
| Michigan (2.7%) | | | | | |
| Birmingham MI City School District GO | 4.000% | 5/1/24 | | 1,000 | 1,137 |
| Birmingham MI City School District GO | 4.000% | 5/1/25 | | 1,465 | 1,649 |
| Dearborn MI School District GO | 5.000% | 5/1/26 | | 3,755 | 4,381 |
| Dearborn MI School District GO | 5.000% | 5/1/27 | | 3,650 | 4,229 |
| Dearborn MI School District GO | 5.000% | 5/1/28 | | 3,635 | 4,174 |
| Dearborn MI School District GO | 5.000% | 5/1/30 | | 4,000 | 4,559 |
| Dearborn MI School District GO | 5.000% | 5/1/32 | | 3,150 | 3,569 |
| Detroit MI GO | 5.000% | 4/1/15 | (12) | 7,970 | 7,978 |
| Detroit MI GO | 5.000% | 4/1/16 | (12) | 3,440 | 3,514 |
| Detroit MI GO | 5.000% | 4/1/17 | (12) | 3,580 | 3,667 |
105
Intermediate-Term Tax-Exempt Fund
| | | | | |
| | | | | Face | Market |
| | | Maturity | | Amount | Value• |
| | Coupon | Date | | ($000) | ($000) |
| Detroit MI Sewage Disposal System Revenue | 5.125% | 7/1/15 | (Prere.) | 12,000 | 12,393 |
| Detroit/Wayne County MI Stadium Authority Revenue | 5.000% | 10/1/19 | (4) | 1,300 | 1,453 |
| Detroit/Wayne County MI Stadium Authority Revenue | 5.000% | 10/1/20 | (4) | 1,500 | 1,685 |
| Detroit/Wayne County MI Stadium Authority Revenue | 5.000% | 10/1/21 | (4) | 1,100 | 1,238 |
| Detroit/Wayne County MI Stadium Authority Revenue | 5.000% | 10/1/22 | (4) | 1,000 | 1,130 |
| Jackson County MI Hospital Finance Authority Hospital Revenue (Allegiance Health) | 5.000% | 6/1/17 | | 2,420 | 2,625 |
| Kalamazoo MI Hospital Financing Authority Hospital Revenue (Bronson Methodist Hospital) | 5.000% | 5/15/30 | | 18,370 | 19,509 |
| Karegnondi Water Authority Michigan Water Supply System Revenue (Karegnondi Water Pipeline) | 5.000% | 11/1/22 | | 1,000 | 1,167 |
| Karegnondi Water Authority Michigan Water Supply System Revenue (Karegnondi Water Pipeline) | 5.000% | 11/1/23 | | 1,000 | 1,183 |
| Karegnondi Water Authority Michigan Water Supply System Revenue (Karegnondi Water Pipeline) | 5.000% | 11/1/25 | | 3,250 | 3,757 |
| Karegnondi Water Authority Michigan Water Supply System Revenue (Karegnondi Water Pipeline) | 5.250% | 11/1/29 | | 5,325 | 6,110 |
| Karegnondi Water Authority Michigan Water Supply System Revenue (Karegnondi Water Pipeline) | 5.250% | 11/1/30 | | 1,750 | 2,004 |
| Karegnondi Water Authority Michigan Water Supply System Revenue (Karegnondi Water Pipeline) | 5.250% | 11/1/31 | | 4,750 | 5,411 |
| Karegnondi Water Authority Michigan Water Supply System Revenue (Karegnondi Water Pipeline) | 5.250% | 11/1/32 | | 5,000 | 5,671 |
| Karegnondi Water Authority Michigan Water Supply System Revenue (Karegnondi Water Pipeline) | 5.250% | 11/1/34 | | 1,500 | 1,686 |
| Karegnondi Water Authority Michigan Water Supply System Revenue (Karegnondi Water Pipeline) | 5.250% | 11/1/35 | | 8,730 | 9,800 |
| Kent Hospital MI Finance Authority Revenue (Spectrum Health) PUT | 5.500% | 1/15/15 | | 11,500 | 11,624 |
| Michigan Building Authority Revenue | 5.000% | 10/15/18 | | 12,575 | 14,446 |
| Michigan Building Authority Revenue | 5.000% | 10/15/19 | | 8,315 | 9,706 |
| Michigan Building Authority Revenue | 5.000% | 10/15/24 | | 2,500 | 2,876 |
| Michigan Building Authority Revenue | 5.000% | 10/15/24 | | 3,000 | 3,451 |
| Michigan Building Authority Revenue | 5.000% | 10/15/25 | | 5,920 | 6,792 |
| Michigan Building Authority Revenue | 5.000% | 10/15/29 | | 9,625 | 11,184 |
| Michigan Finance Authority Revenue | 5.000% | 10/1/23 | | 2,000 | 2,347 |
| Michigan Finance Authority Revenue | 5.000% | 10/1/24 | | 2,010 | 2,367 |
| Michigan Finance Authority Revenue | 5.000% | 10/1/26 | | 3,300 | 3,843 |
| Michigan Finance Authority Revenue | 5.000% | 10/1/27 | | 3,375 | 3,907 |
| Michigan Finance Authority Revenue | 5.000% | 10/1/29 | | 4,350 | 4,983 |
| Michigan Finance Authority Revenue | 5.000% | 10/1/30 | | 5,240 | 5,983 |
| Michigan Finance Authority Revenue | 5.000% | 10/1/32 | | 2,500 | 2,830 |
| Michigan Finance Authority Revenue (Detroit Water & Sewer) | 5.000% | 7/1/22 | (4) | 20,000 | 23,054 |
| Michigan Finance Authority Revenue (Detroit Water & Sewer) | 5.000% | 7/1/22 | (14) | 1,210 | 1,392 |
| Michigan Finance Authority Revenue (Detroit Water & Sewer) | 5.000% | 7/1/23 | (4) | 19,000 | 21,951 |
| Michigan Finance Authority Revenue (Detroit Water & Sewer) | 5.000% | 7/1/24 | (4) | 15,000 | 17,446 |
| Michigan Finance Authority Revenue (Detroit Water & Sewer) | 5.000% | 7/1/24 | (14) | 1,840 | 2,124 |
| Michigan Finance Authority Revenue (Detroit Water & Sewer) | 5.000% | 7/1/26 | (4) | 8,500 | 9,650 |
| Michigan Finance Authority Revenue (Detroit Water & Sewer) | 5.000% | 7/1/27 | (4) | 10,000 | 11,295 |
| Michigan Finance Authority Revenue (Detroit Water & Sewer) | 5.000% | 7/1/28 | (4) | 7,000 | 7,845 |
| Michigan Finance Authority Revenue (Detroit Water & Sewer) | 5.000% | 7/1/29 | | 16,500 | 18,019 |
| Michigan Finance Authority Revenue (Detroit Water & Sewer) | 5.000% | 7/1/30 | | 15,000 | 16,419 |
| Michigan Finance Authority Revenue (Detroit Water & Sewer) | 5.000% | 7/1/31 | | 10,000 | 10,912 |
| Michigan Finance Authority Revenue (Detroit Water & Sewer) | 5.000% | 7/1/32 | | 7,500 | 8,165 |
| Michigan Finance Authority Revenue (Detroit Water & Sewer) | 5.000% | 7/1/33 | | 10,000 | 10,845 |
| Michigan Finance Authority Revenue (Sparrow Obligated Group) | 5.000% | 11/15/23 | | 830 | 949 |
| Michigan Finance Authority Revenue (Sparrow Obligated Group) | 5.000% | 11/15/24 | | 425 | 478 |
| Michigan Finance Authority Revenue (Sparrow Obligated Group) | 5.000% | 11/15/25 | | 1,190 | 1,332 |
| Michigan Finance Authority Revenue (Sparrow Obligated Group) | 5.000% | 11/15/26 | | 400 | 445 |
| Michigan Finance Authority Revenue (State Clean Water Revolving Fund) | 5.000% | 10/1/32 | | 1,500 | 1,749 |
| Michigan Finance Authority Revenue (Unemployment Obligation Assessment) | 5.000% | 7/1/17 | | 65,000 | 72,628 |
| Michigan Finance Authority Revenue (Unemployment Obligation Assessment) | 5.000% | 7/1/18 | | 50,500 | 57,951 |
| Michigan Finance Authority Revenue (Unemployment Obligation Assessment) | 5.000% | 7/1/19 | | 39,000 | 45,764 |
| Michigan Finance Authority Revenue (Unemployment Obligation Assessment) | 5.000% | 1/1/22 | | 7,735 | 8,692 |
| Michigan Finance Authority Revenue (Unemployment Obligation Assessment) | 5.000% | 7/1/22 | | 8,500 | 9,132 |
| Michigan Finance Authority Revenue (Unemployment Obligation Assessment) | 5.000% | 7/1/23 | | 6,180 | 6,205 |
| Michigan GO | 5.000% | 5/1/17 | | 33,880 | 37,598 |
| Michigan GO | 5.250% | 9/15/25 | (4) | 10,810 | 12,053 |
| Michigan GO | 5.250% | 9/15/26 | (4) | 12,805 | 14,277 |
| Michigan Higher Education Facilities Authority Revenue (Albion College Project) VRDO | 0.040% | 11/7/14 | LOC | 41,675 | 41,675 |
| Michigan Hospital Finance Authority Revenue (Ascension Health Credit Group) PUT | 1.500% | 3/15/17 | | 45,000 | 45,871 |
| Michigan Hospital Finance Authority Revenue (Henry Ford Health System) | 5.250% | 11/15/24 | | 5,000 | 5,726 |
| Michigan Hospital Finance Authority Revenue (Henry Ford Health System) | 5.625% | 11/15/29 | | 15,775 | 17,769 |
| Michigan Hospital Finance Authority Revenue (Holland Community Hospital) VRDO | 0.050% | 11/7/14 | LOC | 6,010 | 6,010 |
| Michigan Hospital Finance Authority Revenue (McLaren Health Care) | 5.000% | 6/1/27 | | 2,000 | 2,268 |
| Michigan Hospital Finance Authority Revenue (McLaren Health Care) | 5.000% | 6/1/28 | | 2,600 | 2,939 |
| Michigan Hospital Finance Authority Revenue (MidMichigan Obligated Group) | 5.125% | 6/1/19 | | 2,500 | 2,730 |
| Michigan Hospital Finance Authority Revenue (MidMichigan Obligated Group) | 5.625% | 6/1/24 | | 5,000 | 5,757 |
| Michigan Hospital Finance Authority Revenue (MidMichigan Obligated Group) | 6.000% | 6/1/29 | | 4,000 | 4,642 |
| Michigan Hospital Finance Authority Revenue (Sparrow Obligated Group) | 5.000% | 11/15/26 | (14) | 13,015 | 13,295 |
| Michigan Hospital Finance Authority Revenue (Trinity Health) | 5.000% | 12/1/27 | | 8,000 | 9,093 |
| Michigan Hospital Finance Authority Revenue (Trinity Health) PUT | 6.000% | 12/1/17 | | 3,950 | 4,578 |
| Michigan Municipal Bond Authority Revenue (State Clean Water Revolving Fund) | 5.000% | 10/1/22 | | 4,000 | 4,742 |
106
Intermediate-Term Tax-Exempt Fund
| | | | | |
| | | | | Face | Market |
| | | Maturity | | Amount | Value• |
| | Coupon | Date | | ($000) | ($000) |
| Michigan State University Board of Trustees General Revenue VRDO | 0.040% | 11/7/14 | | 7,225 | 7,225 |
| Michigan Strategic Fund Limited Obligation Revenue (Detroit Edison Co. Project) PUT | 2.125% | 9/1/16 | | 9,350 | 9,523 |
| Michigan Strategic Fund Limited Obligation Revenue (Facility for Rare Isotope Beams | | | | | |
| Project at Michigan State University) | 5.000% | 3/1/23 | | 1,250 | 1,508 |
| Michigan Strategic Fund Limited Obligation Revenue (Facility for Rare Isotope Beams | | | | | |
| Project at Michigan State University) | 5.000% | 3/1/24 | | 1,500 | 1,817 |
| Michigan Strategic Fund Limited Obligation Revenue (Facility for Rare Isotope Beams | | | | | |
| Project at Michigan State University) | 5.000% | 3/1/25 | | 1,250 | 1,498 |
| Michigan Strategic Fund Limited Obligation Revenue (Facility for Rare Isotope Beams | | | | | |
| Project at Michigan State University) | 5.000% | 3/1/26 | | 2,000 | 2,372 |
| Michigan Strategic Fund Limited Obligation Revenue (Facility for Rare Isotope Beams | | | | | |
| Project at Michigan State University) | 5.000% | 3/1/27 | | 1,700 | 1,994 |
| Michigan Strategic Fund Limited Obligation Revenue (Facility for Rare Isotope Beams | | | | | |
| Project at Michigan State University) | 5.000% | 3/1/28 | | 1,250 | 1,457 |
| Michigan Strategic Fund Limited Obligation Revenue (Facility for Rare Isotope Beams | | | | | |
| Project at Michigan State University) | 5.000% | 3/1/29 | | 2,500 | 2,907 |
| Monroe County MI Economic Development Corp. Revenue (Detroit Edison Co. Project) | 6.950% | 9/1/22 | (14) | 27,000 | 35,716 |
| Oakland University of Michigan Revenue VRDO | 0.050% | 11/7/14 | LOC | 10,240 | 10,240 |
| Royal Oak MI Hospital Finance Authority Hospital Revenue (William Beaumont Hospital) | 8.000% | 9/1/18 | (Prere.) | 13,900 | 17,642 |
| Royal Oak MI Hospital Finance Authority Hospital Revenue (William Beaumont Hospital) | 5.500% | 8/1/19 | | 20,000 | 22,658 |
| Royal Oak MI Hospital Finance Authority Hospital Revenue (William Beaumont Hospital) | 5.000% | 9/1/22 | | 2,500 | 2,962 |
| Royal Oak MI Hospital Finance Authority Hospital Revenue (William Beaumont Hospital) | 5.000% | 9/1/23 | | 2,000 | 2,382 |
| Royal Oak MI Hospital Finance Authority Hospital Revenue (William Beaumont Hospital) | 5.000% | 9/1/26 | | 2,225 | 2,585 |
| Royal Oak MI Hospital Finance Authority Hospital Revenue (William Beaumont Hospital) | 6.375% | 8/1/29 | | 25,000 | 29,349 |
| Saginaw MI Hospital Finance Authority Hospital Revenue (Covenant Medical Center Inc.) | 5.000% | 7/1/18 | | 2,195 | 2,427 |
| Saginaw MI Hospital Finance Authority Hospital Revenue (Covenant Medical Center Inc.) | 5.000% | 7/1/19 | | 2,300 | 2,574 |
| Saginaw MI Hospital Finance Authority Hospital Revenue (Covenant Medical Center Inc.) | 5.000% | 7/1/30 | | 10,000 | 10,690 |
| University of Michigan Revenue | 5.000% | 4/1/17 | | 30,000 | 33,247 |
| 3 University of Michigan Revenue PUT | 0.250% | 4/1/15 | | 25,100 | 25,101 |
| University of Michigan University Revenue VRDO | 0.030% | 11/7/14 | | 11,300 | 11,300 |
| Wayne County MI Airport Authority Revenue (Detroit Metropolitan Wayne County Airport) | 5.000% | 12/1/16 | | 5,000 | 5,440 |
| Wayne County MI Airport Authority Revenue (Detroit Metropolitan Wayne County Airport) | 4.500% | 12/1/25 | (14) | 8,050 | 8,699 |
| Wayne County MI Airport Authority Revenue (Detroit Metropolitan Wayne County Airport) | 5.000% | 12/1/27 | | 5,655 | 6,398 |
| Wayne County MI Airport Authority Revenue (Detroit Metropolitan Wayne County Airport) | 5.000% | 12/1/28 | | 5,935 | 6,677 |
| Wayne County MI Airport Authority Revenue (Detroit Metropolitan Wayne County Airport) | 5.000% | 12/1/29 | | 3,895 | 4,370 |
| Wayne County MI Airport Authority Revenue (Detroit Metropolitan Wayne County Airport) | 5.000% | 12/1/30 | | 6,540 | 7,318 |
| Wayne County MI Airport Authority Revenue (Detroit Metropolitan Wayne County Airport) | 5.000% | 12/1/31 | | 6,370 | 7,104 |
| Wayne County MI Airport Authority Revenue (Detroit Metropolitan Wayne County Airport) | 5.000% | 12/1/32 | | 4,300 | 4,776 |
| | | | | | 1,087,439 |
| Minnesota (0.9%) | | | | | |
| Minneapolis & St. Paul MN Housing & Redevelopment Authority Health Care System Revenue | | | | | |
| (Allina Health System) | 5.000% | 11/15/17 | | 1,785 | 2,014 |
| Minneapolis & St. Paul MN Housing & Redevelopment Authority Health Care System Revenue | | | | | |
| (Allina Health System) | 5.000% | 11/15/18 | | 2,190 | 2,485 |
| Minneapolis & St. Paul MN Housing & Redevelopment Authority Health Care System Revenue | | | | | |
| (Allina Health System) | 5.000% | 11/15/20 | | 1,585 | 1,813 |
| Minneapolis & St. Paul MN Housing & Redevelopment Authority Health Care System Revenue | | | | | |
| (Allina Health System) | 5.000% | 11/15/20 | | 1,805 | 2,085 |
| Minneapolis & St. Paul MN Housing & Redevelopment Authority Health Care System Revenue | | | | | |
| (Allina Health System) | 5.000% | 11/15/21 | | 2,205 | 2,515 |
| Minneapolis & St. Paul MN Housing & Redevelopment Authority Health Care System Revenue | | | | | |
| (Allina Health System) | 5.000% | 11/15/21 | | 3,925 | 4,500 |
| Minneapolis & St. Paul MN Housing & Redevelopment Authority Health Care System Revenue | | | | | |
| (Allina Health System) | 5.000% | 11/15/22 | | 2,425 | 2,756 |
| Minneapolis & St. Paul MN Housing & Redevelopment Authority Health Care System Revenue | | | | | |
| (Allina Health System) | 5.250% | 11/15/29 | | 7,000 | 8,019 |
| Minneapolis & St. Paul MN Metropolitan Airports Commission Revenue | 5.000% | 1/1/28 | | 4,000 | 4,689 |
| Minneapolis & St. Paul MN Metropolitan Airports Commission Revenue | 5.000% | 1/1/29 | | 2,280 | 2,665 |
| Minneapolis & St. Paul MN Metropolitan Airports Commission Revenue | 5.000% | 1/1/30 | | 2,500 | 2,916 |
| Minneapolis & St. Paul MN Metropolitan Airports Commission Revenue | 5.000% | 1/1/31 | | 2,500 | 2,902 |
| Minneapolis MN Health Care System Revenue (Fairview Health Services) | 6.000% | 11/15/18 | | 15,000 | 16,551 |
| Minneapolis MN Health Care System Revenue (Fairview Health Services) | 6.625% | 11/15/28 | | 15,500 | 18,335 |
| Minneapolis-St. Paul Metropolitan Area Minnesota Metropolitan Council GO | 5.000% | 9/1/15 | | 2,950 | 3,069 |
| Minneapolis-St. Paul Metropolitan Area Minnesota Metropolitan Council GO | 5.000% | 9/1/15 | | 4,805 | 4,999 |
| Minnesota COP | 5.000% | 6/1/16 | (Prere.) | 1,945 | 2,089 |
| Minnesota COP | 5.000% | 6/1/16 | (Prere.) | 1,790 | 1,922 |
| Minnesota COP | 5.000% | 6/1/16 | (Prere.) | 2,140 | 2,298 |
| Minnesota COP | 5.000% | 6/1/17 | | 7,745 | 8,276 |
| Minnesota COP | 5.000% | 6/1/18 | | 7,135 | 7,640 |
| Minnesota COP | 5.000% | 6/1/19 | | 8,540 | 9,145 |
| Minnesota COP | 5.000% | 6/1/28 | | 3,225 | 3,860 |
107
Intermediate-Term Tax-Exempt Fund
| | | | | |
| | | | | Face | Market |
| | | Maturity | | Amount | Value• |
| | Coupon | Date | | ($000) | ($000) |
| Minnesota COP | 5.000% | 6/1/29 | | 3,385 | 4,032 |
| Minnesota COP | 5.000% | 6/1/30 | | 3,405 | 4,037 |
| Minnesota COP | 5.000% | 6/1/32 | | 3,670 | 4,307 |
| Minnesota COP | 5.000% | 6/1/33 | | 3,615 | 4,226 |
| Minnesota COP | 5.000% | 6/1/34 | | 3,820 | 4,445 |
| Minnesota General Fund Revenue | 5.000% | 3/1/24 | | 7,500 | 8,964 |
| Minnesota General Fund Revenue | 5.000% | 3/1/25 | | 6,000 | 7,140 |
| Minnesota GO | 5.000% | 11/1/14 | | 19,275 | 19,275 |
| Minnesota GO | 4.000% | 12/1/14 | | 3,730 | 3,742 |
| Minnesota GO | 5.000% | 12/1/14 | | 8,150 | 8,184 |
| Minnesota GO | 5.000% | 11/1/15 | | 19,775 | 20,730 |
| Minnesota GO | 5.000% | 12/1/15 | | 8,150 | 8,575 |
| Minnesota GO | 5.000% | 12/1/16 | | 5,145 | 5,637 |
| Minnesota GO | 5.000% | 8/1/17 | | 1,000 | 1,121 |
| Minnesota GO | 5.000% | 10/1/21 | (Prere.) | 155 | 189 |
| Minnesota GO | 5.000% | 10/1/24 | | 9,845 | 11,805 |
| Minnesota GO | 5.000% | 8/1/32 | | 11,290 | 13,621 |
| Minnesota Office of Higher Education Revenue (Supplemental Student Loan Program) | 5.000% | 11/1/16 | | 1,120 | 1,212 |
| Minnesota Office of Higher Education Revenue (Supplemental Student Loan Program) | 5.000% | 11/1/18 | | 4,305 | 4,882 |
| Minnesota Public Facilities Authority Revenue (State Revolving Fund) | 5.000% | 3/1/21 | | 5,000 | 5,995 |
| Rochester MN Health Care Facilities Revenue (Mayo Clinic) PUT | 4.000% | 11/15/18 | | 11,500 | 12,871 |
| Southern Minnesota Municipal Power Agency Power Supply System Revenue | 5.250% | 1/1/30 | | 2,000 | 2,181 |
| 2 St. Cloud MN Health Care Revenue (Centracare Health System) | 5.000% | 5/1/23 | | 2,000 | 2,394 |
| 2 St. Cloud MN Health Care Revenue (Centracare Health System) | 5.000% | 5/1/24 | | 1,500 | 1,804 |
| St. Louis Park MN Health Care Facilities Revenue (Park Nicollet Health Services) | 5.500% | 7/1/15 | | 5,675 | 5,848 |
| St. Louis Park MN Health Care Facilities Revenue (Park Nicollet Health Services) | 5.500% | 7/1/16 | | 11,775 | 12,628 |
| St. Louis Park MN Health Care Facilities Revenue (Park Nicollet Health Services) | 5.500% | 7/1/23 | | 21,700 | 24,229 |
| St. Louis Park MN Health Care Facilities Revenue (Park Nicollet Health Services) | 5.625% | 7/1/26 | | 6,000 | 6,680 |
| University of Minnesota Revenue | 5.000% | 12/1/14 | | 9,840 | 9,880 |
| University of Minnesota Revenue | 5.000% | 12/1/15 | | 16,235 | 17,082 |
| University of Minnesota Revenue | 5.000% | 8/1/19 | | 1,150 | 1,351 |
| University of Minnesota Revenue | 5.000% | 4/1/22 | | 500 | 575 |
| University of Minnesota Revenue | 5.000% | 8/1/22 | | 1,585 | 1,893 |
| University of Minnesota Revenue | 5.000% | 8/1/23 | | 2,500 | 2,977 |
| University of Minnesota Revenue | 5.000% | 8/1/24 | | 4,515 | 5,368 |
| | | | | | 367,423 |
| Mississippi (0.3%) | | | | | |
| Mississippi Business Finance Corp. Gulf Opportunity Zone Industrial Development Revenue | | | | | |
| (Chevron USA Inc. Project) VRDO | 0.070% | 11/3/14 | | 19,200 | 19,200 |
| Mississippi Business Finance Corp. Gulf Opportunity Zone Industrial Development Revenue | | | | | |
| (Chevron USA Inc. Project) VRDO | 0.080% | 11/3/14 | | 7,000 | 7,000 |
| Mississippi Business Finance Corp. Gulf Opportunity Zone Industrial Development Revenue | | | | | |
| (Chevron USA Inc. Project) VRDO | 0.080% | 11/3/14 | | 3,600 | 3,600 |
| Mississippi Development Bank Special Obligation Revenue (Capital City Convention Center Project) | 5.000% | 3/1/23 | | 1,000 | 1,207 |
| Mississippi Development Bank Special Obligation Revenue (Capital City Convention Center Project) | 5.000% | 3/1/24 | | 1,625 | 1,976 |
| Mississippi Development Bank Special Obligation Revenue (Harrison County Highway Project) | 5.000% | 1/1/24 | | 2,500 | 3,034 |
| Mississippi Development Bank Special Obligation Revenue (Madison County Highway Project) | 5.000% | 1/1/24 | | 2,500 | 3,034 |
| Mississippi GO | 5.500% | 12/1/16 | | 3,435 | 3,799 |
| Mississippi GO | 5.000% | 12/1/17 | (Prere.) | 16,890 | 19,116 |
| Mississippi GO | 5.000% | 12/1/20 | | 10,000 | 11,241 |
| Mississippi GO | 5.000% | 10/1/30 | | 12,035 | 14,127 |
| Mississippi GO | 5.000% | 10/1/31 | | 11,735 | 13,672 |
| Mississippi GO | 5.000% | 12/1/31 | | 11,250 | 13,332 |
| Mississippi GO | 5.000% | 12/1/32 | | 7,000 | 8,258 |
| Mississippi Hospital Equipment & Facilities Authority Revenue (North Mississippi Health Services) | 5.000% | 10/1/17 | | 2,500 | 2,798 |
| University of Southern Mississippi S.M. Educational Building Corp. Revenue | | | | | |
| (Athletics Facilities Improvements Project) | 5.000% | 3/1/34 | (4) | 10,000 | 10,763 |
| | | | | | 136,157 |
| Missouri (0.8%) | | | | | |
| Bi-State Development Agency of the Missouri-Illinois Metropolitan District Mass | | | | | |
| Transit Sales Tax Revenue | 5.000% | 10/1/33 | | 7,500 | 8,595 |
| Cape Girardeau County MO Industrial Development Authority of the Health Facilities | | | | | |
| Revenue (St. Francis Medical Center) | 5.000% | 6/1/26 | | 1,000 | 1,144 |
| Cape Girardeau County MO Industrial Development Authority of the Health Facilities Revenue | | | | | |
| (St. Francis Medical Center) | 5.000% | 6/1/27 | | 1,850 | 2,106 |
| Curators of the University of Missouri System Facilities Revenue | 5.000% | 11/1/26 | | 1,830 | 2,144 |
| Curators of the University of Missouri System Facilities Revenue | 5.000% | 11/1/27 | | 1,000 | 1,168 |
| Curators of the University of Missouri System Facilities Revenue | 4.000% | 11/1/30 | | 3,000 | 3,287 |
| Curators of the University of Missouri System Facilities Revenue | 4.000% | 11/1/31 | | 6,415 | 6,977 |
| 2 Jackson County MO Special Obligation Revenue (Truman Sports Complex Project) | 5.000% | 12/1/25 | | 6,000 | 7,233 |
108
Intermediate-Term Tax-Exempt Fund
| | | | | |
| | | | | Face | Market |
| | | Maturity | | Amount | Value• |
| | Coupon | Date | | ($000) | ($000) |
| 2 Jackson County MO Special Obligation Revenue (Truman Sports Complex Project) | 5.000% | 12/1/26 | | 5,000 | 5,959 |
| 2 Jackson County MO Special Obligation Revenue (Truman Sports Complex Project) | 5.000% | 12/1/29 | | 13,625 | 15,994 |
| 2 Jackson County MO Special Obligation Revenue (Truman Sports Complex Project) | 5.000% | 12/1/30 | | 13,675 | 15,974 |
| 2 Jackson County MO Special Obligation Revenue (Truman Sports Complex Project) | 5.000% | 12/1/31 | | 5,535 | 6,429 |
| Kansas City MO Special Obligation Revenue (Performing Arts Center Garage Project) | 0.000% | 2/1/18 | | 3,000 | 2,824 |
| Kansas City MO Special Obligation Revenue (Performing Arts Center Garage Project) | 0.000% | 2/1/19 | | 7,615 | 6,928 |
| Missouri Development Finance Board Infrastructure Facilities Revenue (Branson Landing Project) | 4.750% | 6/1/25 | | 3,230 | 3,300 |
| Missouri Health & Educational Facilities Authority Health Facilities Revenue | | | | | |
| (BJC Health System) VRDO | 0.030% | 11/7/14 | | 35,000 | 35,000 |
| Missouri Health & Educational Facilities Authority Health Facilities Revenue | | | | | |
| (BJC Health System) VRDO | 0.040% | 11/7/14 | | 27,200 | 27,200 |
| Missouri Health & Educational Facilities Authority Health Facilities Revenue (Cox Health) | 5.000% | 11/15/26 | | 2,045 | 2,374 |
| Missouri Health & Educational Facilities Authority Health Facilities Revenue (Cox Health) | 5.000% | 11/15/28 | | 1,000 | 1,146 |
| Missouri Health & Educational Facilities Authority Health Facilities Revenue | | | | | |
| (Freeman Health System) | 5.000% | 2/15/21 | | 2,845 | 3,223 |
| Missouri Health & Educational Facilities Authority Health Facilities Revenue | | | | | |
| (Freeman Health System) | 5.000% | 2/15/22 | | 3,490 | 3,920 |
| Missouri Health & Educational Facilities Authority Health Facilities Revenue | | | | | |
| (Freeman Health System) | 5.000% | 2/15/23 | | 3,690 | 4,113 |
| Missouri Health & Educational Facilities Authority Health Facilities Revenue | | | | | |
| (Freeman Health System) | 5.000% | 2/15/24 | | 3,320 | 3,692 |
| Missouri Health & Educational Facilities Authority Health Facilities Revenue (SSM Health System) | 5.000% | 6/1/19 | | 2,420 | 2,786 |
| Missouri Health & Educational Facilities Authority Health Facilities Revenue (SSM Health System) | 5.000% | 6/1/22 | | 5,270 | 6,064 |
| Missouri Health & Educational Facilities Authority Health Facilities Revenue (SSM Health System) | 5.000% | 6/1/26 | | 3,000 | 3,549 |
| Missouri Health & Educational Facilities Authority Health Facilities Revenue (SSM Health System) | 5.000% | 6/1/27 | | 4,000 | 4,706 |
| Missouri Health & Educational Facilities Authority Health Facilities Revenue (SSM Health System) | 5.000% | 6/1/28 | | 3,500 | 4,098 |
| Missouri Health & Educational Facilities Authority Health Facilities Revenue (SSM Health System) | 5.000% | 6/1/29 | | 4,000 | 4,669 |
| Missouri Health & Educational Facilities Authority Health Facilities Revenue (SSM Health System) | 5.000% | 6/1/30 | | 4,000 | 4,629 |
| Missouri Health & Educational Facilities Authority Health Facilities Revenue (SSM Health System) | 5.000% | 6/1/31 | | 3,000 | 3,443 |
| Missouri Health & Educational Facilities Authority Health Facilities Revenue | | | | | |
| (St. Luke’s Health System) | 5.000% | 11/15/20 | | 3,975 | 4,671 |
| Missouri Health & Educational Facilities Authority Health Facilities Revenue | | | | | |
| (St. Luke’s Health System) | 5.250% | 11/15/25 | | 8,000 | 9,295 |
| Missouri Health & Educational Facilities Authority Health Facilities Revenue | | | | | |
| (St. Luke’s Health System) | 5.000% | 11/15/30 | | 5,000 | 5,499 |
| Missouri Health & Educational Facilities Authority Revenue (Children’s Mercy Hospital) | 5.250% | 5/15/29 | | 19,230 | 21,363 |
| Missouri Health & Educational Facilities Authority Revenue (Washington University) | 5.000% | 11/15/30 | | 15,000 | 17,427 |
| 1 Missouri Health & Educational Facilities Authority Revenue (Washington University) TOB VRDO | 0.070% | 11/3/14 | | 8,910 | 8,910 |
| Missouri Health & Educational Facilities Authority Revenue (Washington University) VRDO | 0.080% | 11/3/14 | | 4,300 | 4,300 |
| Missouri Highways & Transportation Commission Road Revenue | 5.000% | 5/1/24 | | 15,000 | 18,753 |
| Missouri Joint Municipal Electric Utility Commission Power Project Revenue (Prairie Project) | 5.000% | 1/1/24 | (2) | 12,225 | 13,216 |
| Missouri Joint Municipal Electric Utility Commission Power Project Revenue (Prairie Project) | 5.000% | 1/1/26 | (2) | 15,730 | 16,976 |
| St. Louis MO Airport Revenue (Lambert-St. Louis International Airport) | 6.125% | 7/1/24 | | 6,000 | 7,087 |
| | | | | | 332,171 |
| Montana (0.0%) | | | | | |
| Forsyth MT Pollution Control Revenue (Puget Sound Energy Project) | 3.900% | 3/1/23 | | 2,925 | 3,025 |
| |
| Nebraska (0.2%) | | | | | |
| Central Plains Energy Project Nebraska Gas Project Revenue (Project No. 3) | 5.000% | 9/1/27 | | 9,330 | 10,430 |
| Lincoln County NE Hospital Authority No. 1 Hospital Revenue | | | | | |
| (Great Plains Regional Medical Center Project) | 4.000% | 11/1/21 | | 1,000 | 1,095 |
| Lincoln County NE Hospital Authority No. 1 Hospital Revenue | | | | | |
| (Great Plains Regional Medical Center Project) | 4.000% | 11/1/22 | | 860 | 928 |
| Lincoln County NE Hospital Authority No. 1 Hospital Revenue | | | | | |
| (Great Plains Regional Medical Center Project) | 5.000% | 11/1/24 | | 1,320 | 1,474 |
| Lincoln County NE Hospital Authority No. 1 Hospital Revenue | | | | | |
| (Great Plains Regional Medical Center Project) | 5.000% | 11/1/25 | | 1,000 | 1,111 |
| Lincoln County NE Hospital Authority No. 1 Hospital Revenue | | | | | |
| (Great Plains Regional Medical Center Project) | 5.000% | 11/1/32 | | 5,000 | 5,452 |
| Lincoln NE Electric System Revenue | 5.000% | 9/1/25 | | 3,000 | 3,557 |
| Municipal Energy Agency of Nebraska Power Supply System Revenue | 5.000% | 4/1/26 | | 3,065 | 3,515 |
| Municipal Energy Agency of Nebraska Power Supply System Revenue | 5.000% | 4/1/29 | | 2,125 | 2,394 |
| Municipal Energy Agency of Nebraska Power Supply System Revenue | 5.000% | 4/1/31 | | 2,500 | 2,793 |
| Municipal Energy Agency of Nebraska Power Supply System Revenue | 5.000% | 4/1/32 | | 2,800 | 3,121 |
| Nebraska Public Power District Revenue | 4.000% | 1/1/15 | | 1,000 | 1,007 |
| Nebraska Public Power District Revenue | 5.000% | 1/1/16 | | 1,000 | 1,056 |
| Nebraska Public Power District Revenue | 5.000% | 1/1/24 | | 8,000 | 8,947 |
| Nebraska Public Power District Revenue | 5.000% | 1/1/30 | | 2,000 | 2,309 |
| Nebraska Public Power District Revenue | 5.000% | 1/1/31 | | 2,000 | 2,301 |
| Nebraska Public Power District Revenue | 5.000% | 1/1/33 | | 5,000 | 5,720 |
109
Intermediate-Term Tax-Exempt Fund
| | | | | |
| | | | | Face | Market |
| | | Maturity | | Amount | Value• |
| | Coupon | Date | | ($000) | ($000) |
| University of Nebraska Student Fee Revenue | 5.000% | 7/1/22 | | 4,000 | 4,873 |
| University of Nebraska Student Fee Revenue | 5.000% | 7/1/24 | | 1,645 | 1,977 |
| | | | | | 64,060 |
| Nevada (0.7%) | | | | | |
| Carson City NV Hospital Revenue (Carson Tahoe Regional Medical Center) | 5.000% | 9/1/21 | | 2,330 | 2,663 |
| Carson City NV Hospital Revenue (Carson Tahoe Regional Medical Center) | 5.000% | 9/1/27 | | 3,500 | 3,874 |
| Clark County NV Airport Improvement Revenue | 5.000% | 7/1/21 | | 2,000 | 2,335 |
| Clark County NV Airport Improvement Revenue | 5.000% | 7/1/30 | | 15,000 | 16,524 |
| Clark County NV GO | 5.000% | 7/1/33 | | 7,915 | 8,962 |
| Clark County NV Industrial Development Revenue (Southwest Gas Corp. Project) VRDO | 0.060% | 11/7/14 | LOC | 14,000 | 14,000 |
| Clark County NV Passenger Facility Charge Revenue (Las Vegas McCarran International Airport) | 5.000% | 7/1/15 | | 6,525 | 6,734 |
| Clark County NV Passenger Facility Charge Revenue (Las Vegas McCarran International Airport) | 5.000% | 7/1/16 | | 5,575 | 5,993 |
| Clark County NV Passenger Facility Charge Revenue (Las Vegas McCarran International Airport) | 5.000% | 7/1/30 | | 15,000 | 16,864 |
| Clark County NV School District GO | 5.000% | 6/15/20 | | 14,335 | 16,114 |
| Clark County NV School District GO | 5.000% | 6/15/21 | | 8,980 | 10,089 |
| Clark County NV School District GO | 5.000% | 6/15/22 | | 14,655 | 16,446 |
| Clark County NV School District GO | 5.000% | 6/15/23 | | 16,360 | 18,335 |
| Clark County NV School District GO | 5.000% | 6/15/24 | (4) | 5,000 | 5,649 |
| Clark County NV School District GO | 5.000% | 6/15/25 | | 12,445 | 14,003 |
| Clark County NV School District GO | 5.000% | 6/15/26 | | 29,900 | 33,498 |
| Clark County NV Water Reclamation District GO | 5.375% | 7/1/27 | | 2,985 | 3,415 |
| Las Vegas Valley Water District Nevada GO | 5.000% | 6/1/17 | | 5,000 | 5,558 |
| Las Vegas Valley Water District Nevada GO | 5.000% | 6/1/18 | | 7,370 | 8,423 |
| Las Vegas Valley Water District Nevada GO | 5.000% | 6/1/21 | (3) | 16,075 | 16,514 |
| Las Vegas Valley Water District Nevada GO | 5.000% | 6/1/26 | (14) | 15,280 | 15,694 |
| Las Vegas Valley Water District Nevada GO | 5.250% | 6/1/27 | | 10,460 | 12,181 |
| Las Vegas Valley Water District Nevada GO | 5.000% | 6/1/31 | | 4,500 | 5,205 |
| Las Vegas Valley Water District Nevada GO | 5.000% | 6/1/32 | | 5,395 | 6,225 |
| Las Vegas Valley Water District Nevada GO | 5.000% | 6/1/32 | | 2,000 | 2,308 |
| Nevada GO | 5.000% | 12/1/14 | (4) | 8,435 | 8,470 |
| Reno NV Health Facility Revenue (Dignity Health Obligated Group) | 5.250% | 7/1/31 | | 4,000 | 4,256 |
| Reno NV Hospital Revenue (Washoe Medical Center Project) | 5.500% | 6/1/28 | (2) | 1,750 | 1,925 |
| | | | | | 282,257 |
| New Hampshire (0.1%) | | | | | |
| New Hampshire GO | 5.000% | 2/15/18 | | 1,010 | 1,148 |
| New Hampshire GO | 5.000% | 2/15/19 | | 1,010 | 1,175 |
| New Hampshire GO | 5.000% | 8/15/19 | | 1,500 | 1,766 |
| New Hampshire Health & Education Facilities Authority Revenue (Concord Hospital) | 5.000% | 10/1/25 | | 2,140 | 2,431 |
| New Hampshire Health & Education Facilities Authority Revenue (Concord Hospital) | 5.000% | 10/1/26 | | 1,070 | 1,208 |
| New Hampshire Health & Education Facilities Authority Revenue (Concord Hospital) | 5.000% | 10/1/27 | | 1,185 | 1,333 |
| New Hampshire Health & Education Facilities Authority Revenue | | | | | |
| (Southern New Hampshire Medical Center) | 5.000% | 10/1/32 | | 6,000 | 6,426 |
| New Hampshire Health & Education Facilities Authority Revenue | | | | | |
| (Southern New Hampshire University) | 5.000% | 1/1/27 | | 2,500 | 2,687 |
| New Hampshire Health & Education Facilities Authority Revenue | | | | | |
| (University System of New Hampshire) | 5.500% | 7/1/20 | | 10,000 | 11,737 |
| New Hampshire Health & Education Facilities Authority Revenue (Wentworth Douglas Hospital) | 6.000% | 1/1/31 | | 10,000 | 11,210 |
| | | | | | 41,121 |
| New Jersey (4.3%) | | | | | |
| Essex County NJ Improvement Authority Revenue | 5.500% | 10/1/23 | (14) | 10,000 | 12,461 |
| Essex County NJ Improvement Authority Revenue | 5.250% | 12/15/23 | (2) | 3,635 | 4,497 |
| Essex County NJ Improvement Authority Revenue | 5.250% | 12/15/24 | (2) | 3,720 | 4,650 |
| Essex County NJ Improvement Authority Revenue (Pooled Government Loan) VRDO | 0.040% | 11/7/14 | LOC | 10,000 | 10,000 |
| Jersey City NJ GO | 5.000% | 3/1/16 | | 1,390 | 1,469 |
| Jersey City NJ GO | 5.000% | 3/1/20 | | 1,610 | 1,856 |
| Jersey City NJ GO | 5.000% | 3/1/21 | | 1,200 | 1,389 |
| New Jersey Casino Reinvestment Development Authority Revenue (Hotel Room Fee) | 5.250% | 1/1/23 | (2) | 3,900 | 3,997 |
| New Jersey Casino Reinvestment Development Authority Revenue (Hotel Room Fee) | 5.250% | 1/1/24 | (2) | 3,500 | 3,585 |
| New Jersey Casino Reinvestment Development Authority Revenue (Luxury Tax) | 5.000% | 11/1/24 | (4) | 1,000 | 1,127 |
| New Jersey Casino Reinvestment Development Authority Revenue (Luxury Tax) | 5.000% | 11/1/26 | (4) | 2,205 | 2,463 |
| New Jersey Casino Reinvestment Development Authority Revenue (Luxury Tax) | 5.000% | 11/1/27 | (4) | 2,500 | 2,782 |
| New Jersey COP | 5.000% | 6/15/17 | | 4,840 | 5,347 |
| New Jersey COP | 5.250% | 6/15/28 | | 4,675 | 5,254 |
| New Jersey COP | 5.250% | 6/15/29 | | 1,000 | 1,123 |
| New Jersey Economic Development Authority Revenue (Cigarette Tax) | 5.000% | 6/15/23 | | 12,000 | 13,805 |
| New Jersey Economic Development Authority Revenue (Cigarette Tax) | 5.000% | 6/15/24 | | 7,500 | 8,531 |
| New Jersey Economic Development Authority Revenue (Provident Group-Montclair | | | | | |
| Properties LLC–Montclair State University Student Housing Project) | 5.000% | 6/1/18 | | 2,000 | 2,187 |
| New Jersey Economic Development Authority Revenue (Provident Group-Montclair | | | | | |
| Properties LLC–Montclair State University Student Housing Project) | 5.250% | 6/1/19 | | 2,000 | 2,237 |
110
Intermediate-Term Tax-Exempt Fund
| | | | | |
| | | | | Face | Market |
| | | Maturity | | Amount | Value• |
| | Coupon | Date | | ($000) | ($000) |
| New Jersey Economic Development Authority Revenue (Provident Group-Montclair | | | | | |
| Properties LLC–Montclair State University Student Housing Project) | 5.250% | 6/1/20 | | 2,000 | 2,254 |
| New Jersey Economic Development Authority Revenue (Provident Group-Montclair | | | | | |
| Properties LLC–Montclair State University Student Housing Project) | 5.375% | 6/1/25 | | 5,000 | 5,482 |
| New Jersey Economic Development Authority Revenue (School Facilities Construction) | 5.000% | 12/15/14 | (ETM) | 4,000 | 4,024 |
| New Jersey Economic Development Authority Revenue (School Facilities Construction) | 5.250% | 12/15/15 | (ETM) | 1,695 | 1,791 |
| New Jersey Economic Development Authority Revenue (School Facilities Construction) | 5.250% | 12/15/15 | (14) | 2,405 | 2,535 |
| New Jersey Economic Development Authority Revenue (School Facilities Construction) | 5.000% | 12/15/16 | | 38,385 | 41,704 |
| New Jersey Economic Development Authority Revenue (School Facilities Construction) | 5.000% | 12/15/18 | | 22,500 | 25,454 |
| New Jersey Economic Development Authority Revenue (School Facilities Construction) | 5.000% | 12/15/19 | | 17,410 | 19,885 |
| New Jersey Economic Development Authority Revenue (School Facilities Construction) | 5.250% | 12/15/21 | (3) | 7,975 | 9,477 |
| New Jersey Economic Development Authority Revenue (School Facilities Construction) | 5.250% | 12/15/21 | (12) | 5,000 | 5,967 |
| New Jersey Economic Development Authority Revenue (School Facilities Construction) | 5.000% | 9/1/23 | | 8,690 | 9,731 |
| New Jersey Economic Development Authority Revenue (School Facilities Construction) | 5.500% | 9/1/23 | (14) | 51,630 | 62,695 |
| New Jersey Economic Development Authority Revenue (School Facilities Construction) | 5.250% | 9/1/24 | | 1,000 | 1,137 |
| New Jersey Economic Development Authority Revenue (School Facilities Construction) | 5.000% | 3/1/25 | | 2,985 | 3,363 |
| New Jersey Economic Development Authority Revenue (School Facilities Construction) | 5.500% | 9/1/25 | (4) | 18,130 | 22,415 |
| New Jersey Economic Development Authority Revenue (School Facilities Construction) | 5.000% | 3/1/27 | | 4,205 | 4,684 |
| New Jersey Economic Development Authority Revenue (School Facilities Construction) | 5.500% | 9/1/27 | (14) | 8,000 | 9,892 |
| New Jersey Economic Development Authority Revenue (School Facilities Construction) | 5.000% | 3/1/28 | | 5,515 | 6,105 |
| New Jersey Economic Development Authority Revenue (School Facilities Construction) | 5.250% | 9/1/29 | | 10,500 | 11,610 |
| New Jersey Economic Development Authority Revenue (School Facilities Construction) | 5.500% | 12/15/29 | | 5,000 | 5,563 |
| 1 New Jersey Economic Development Authority Revenue (School Facilities Construction) TOB VRDO | 0.170% | 11/7/14 | (12) | 3,065 | 3,065 |
| 1 New Jersey Educational Facilities Authority Revenue (Institute for Advanced Studies) VRDO | 0.030% | 11/7/14 | LOC | 5,000 | 5,000 |
| New Jersey Educational Facilities Authority Revenue (Kean University) | 5.250% | 9/1/29 | | 25,170 | 27,404 |
| New Jersey Educational Facilities Authority Revenue (Princeton University) | 5.000% | 7/1/16 | | 4,700 | 5,068 |
| New Jersey Educational Facilities Authority Revenue (Princeton University) | 5.000% | 7/1/27 | | 2,965 | 3,535 |
| New Jersey Educational Facilities Authority Revenue (University Medical & Dentistry) | 7.125% | 6/1/19 | (Prere.) | 6,000 | 7,621 |
| New Jersey Equipment Lease Purchase COP | 5.250% | 6/15/20 | | 6,180 | 7,128 |
| New Jersey Equipment Lease Purchase COP | 5.250% | 6/15/21 | | 5,820 | 6,698 |
| New Jersey Equipment Lease Purchase COP | 5.375% | 6/15/29 | | 11,000 | 12,406 |
| New Jersey GO | 5.250% | 7/1/15 | (4) | 3,500 | 3,617 |
| New Jersey GO | 5.250% | 7/15/15 | (2) | 8,500 | 8,800 |
| New Jersey GO | 5.250% | 7/1/16 | (14) | 1,500 | 1,619 |
| New Jersey GO | 5.000% | 8/15/20 | | 30,000 | 35,127 |
| 1 New Jersey GO TOB VRDO | 0.070% | 11/3/14 | LOC | 38,800 | 38,800 |
| New Jersey Health Care Facilities Financing Authority Department of Human Services | | | | | |
| Lease Revenue (Greystone Park Psychiatric Hospital Project) | 5.000% | 9/15/21 | | 8,140 | 9,524 |
| New Jersey Health Care Facilities Financing Authority Department of Human Services | | | | | |
| Lease Revenue (Greystone Park Psychiatric Hospital Project) | 5.000% | 9/15/24 | | 3,415 | 4,002 |
| New Jersey Health Care Facilities Financing Authority Department of Human Services | | | | | |
| Lease Revenue (Greystone Park Psychiatric Hospital Project) | 5.000% | 9/15/25 | | 12,965 | 15,016 |
| New Jersey Health Care Facilities Financing Authority Department of Human Services | | | | | |
| Lease Revenue (Greystone Park Psychiatric Hospital Project) | 5.000% | 9/15/26 | | 12,505 | 14,336 |
| New Jersey Health Care Facilities Financing Authority Department of Human Services | | | | | |
| Lease Revenue (Greystone Park Psychiatric Hospital Project) | 5.000% | 9/15/28 | | 13,835 | 15,688 |
| New Jersey Health Care Facilities Financing Authority Department of Human Services | | | | | |
| Lease Revenue (Marlboro Psychiatric Hospital Project) | 5.000% | 9/15/29 | | 2,735 | 3,092 |
| New Jersey Health Care Facilities Financing Authority Department of Human Services | | | | | |
| Lease Revenue (Marlboro Psychiatric Hospital Project) | 5.000% | 9/15/33 | | 5,000 | 5,527 |
| New Jersey Health Care Facilities Financing Authority Revenue (AHS Hospital Corp.) | 5.000% | 7/1/16 | | 8,420 | 9,025 |
| New Jersey Health Care Facilities Financing Authority Revenue (AHS Hospital Corp.) | 5.000% | 7/1/17 | | 8,875 | 9,807 |
| New Jersey Health Care Facilities Financing Authority Revenue (AHS Hospital Corp.) VRDO | 0.050% | 11/7/14 | LOC | 13,200 | 13,200 |
| New Jersey Health Care Facilities Financing Authority Revenue (Barnabas Health) | 4.625% | 7/1/23 | | 3,700 | 4,115 |
| New Jersey Health Care Facilities Financing Authority Revenue | | | | | |
| (Hackensack University Medical Center) | 5.000% | 1/1/19 | | 2,610 | 2,933 |
| New Jersey Health Care Facilities Financing Authority Revenue | | | | | |
| (Hackensack University Medical Center) | 5.000% | 1/1/20 | | 2,120 | 2,399 |
| New Jersey Health Care Facilities Financing Authority Revenue | | | | | |
| (Hackensack University Medical Center) | 5.000% | 1/1/22 | | 1,500 | 1,649 |
| New Jersey Health Care Facilities Financing Authority Revenue | | | | | |
| (Hospital Asset Transformation Program) | 5.500% | 10/1/23 | | 12,860 | 14,845 |
| New Jersey Health Care Facilities Financing Authority Revenue | | | | | |
| (Hospital Capital Asset Pooled Program) VRDO | 0.060% | 11/7/14 | LOC | 7,900 | 7,900 |
| New Jersey Health Care Facilities Financing Authority Revenue | | | | | |
| (Hospital Capital Asset Pooled Program) VRDO | 0.060% | 11/7/14 | LOC | 5,600 | 5,600 |
| New Jersey Health Care Facilities Financing Authority Revenue | | | | | |
| (Hospital Capital Asset Pooled Program) VRDO | 0.060% | 11/7/14 | LOC | 6,500 | 6,500 |
| New Jersey Health Care Facilities Financing Authority Revenue | | | | | |
| (Meridian Health System Obligated Group) | 5.000% | 7/1/20 | | 3,000 | 3,499 |
111
Intermediate-Term Tax-Exempt Fund
| | | | | |
| | | | | Face | Market |
| | | Maturity | | Amount | Value• |
| | Coupon | Date | | ($000) | ($000) |
| New Jersey Health Care Facilities Financing Authority Revenue | | | | | |
| (Meridian Health System Obligated Group) | 5.000% | 7/1/21 | | 2,000 | 2,343 |
| New Jersey Health Care Facilities Financing Authority Revenue | | | | | |
| (Meridian Health System Obligated Group) | 5.000% | 7/1/22 | | 2,000 | 2,342 |
| New Jersey Health Care Facilities Financing Authority Revenue | | | | | |
| (Meridian Health System Obligated Group) | 5.000% | 7/1/26 | | 1,000 | 1,137 |
| New Jersey Health Care Facilities Financing Authority Revenue | | | | | |
| (Meridian Health System Obligated Group) VRDO | 0.050% | 11/7/14 | LOC | 16,140 | 16,140 |
| New Jersey Health Care Facilities Financing Authority Revenue | | | | | |
| (Palisades Medical Center Obligated Group) | 5.000% | 7/1/26 | | 5,000 | 5,547 |
| New Jersey Health Care Facilities Financing Authority Revenue (South Jersey Hospital) | 5.000% | 7/1/18 | | 1,925 | 2,033 |
| New Jersey Health Care Facilities Financing Authority Revenue (St. Barnabas Health Care System) | 5.000% | 7/1/29 | | 3,365 | 3,537 |
| New Jersey Health Care Facilities Financing Authority Revenue (Virtua Health) | 5.750% | 7/1/33 | | 20,000 | 22,713 |
| New Jersey Higher Education Assistance Authority Student Loan Revenue | 4.500% | 12/1/20 | | 5,385 | 5,720 |
| New Jersey Housing & Mortgage Finance Agency Single Family Housing Revenue VRDO | 0.050% | 11/7/14 | | 27,100 | 27,100 |
| New Jersey Sports & Exposition Authority Revenue | 5.000% | 9/1/17 | (ETM) | 100 | 112 |
| New Jersey Sports & Exposition Authority Revenue | 5.000% | 9/1/17 | | 9,900 | 10,988 |
| New Jersey Sports & Exposition Authority Revenue | 4.500% | 9/1/18 | (Prere.) | 20 | 23 |
| New Jersey Sports & Exposition Authority Revenue | 4.500% | 9/1/24 | | 2,035 | 2,262 |
| New Jersey Transportation Corp. COP | 5.000% | 9/15/15 | (Prere.) | 6,500 | 6,774 |
| New Jersey Transportation Corp. COP | 5.250% | 9/15/15 | (ETM) | 3,800 | 3,968 |
| New Jersey Transportation Corp. COP | 5.250% | 9/15/15 | (ETM) | 10,000 | 10,443 |
| New Jersey Transportation Corp. COP | 5.500% | 9/15/15 | (ETM) | 7,270 | 7,608 |
| New Jersey Transportation Corp. COP | 5.500% | 9/15/15 | (ETM) | 5,335 | 5,583 |
| New Jersey Transportation Trust Fund Authority Transportation System Revenue | 5.250% | 6/15/15 | (Prere.) | 17,680 | 18,241 |
| New Jersey Transportation Trust Fund Authority Transportation System Revenue | 5.500% | 12/15/15 | (2) | 1,750 | 1,849 |
| New Jersey Transportation Trust Fund Authority Transportation System Revenue | 5.750% | 6/15/17 | | 1,250 | 1,395 |
| New Jersey Transportation Trust Fund Authority Transportation System Revenue | 5.000% | 12/15/17 | | 15,000 | 16,682 |
| New Jersey Transportation Trust Fund Authority Transportation System Revenue | 5.250% | 12/15/19 | | 1,040 | 1,198 |
| New Jersey Transportation Trust Fund Authority Transportation System Revenue | 5.250% | 12/15/19 | (14) | 25,000 | 28,869 |
| New Jersey Transportation Trust Fund Authority Transportation System Revenue | 5.250% | 12/15/19 | | 5,000 | 5,758 |
| New Jersey Transportation Trust Fund Authority Transportation System Revenue | 5.750% | 6/15/20 | | 7,000 | 8,162 |
| New Jersey Transportation Trust Fund Authority Transportation System Revenue | 5.250% | 12/15/20 | | 27,915 | 32,451 |
| New Jersey Transportation Trust Fund Authority Transportation System Revenue | 5.250% | 12/15/20 | (4) | 9,000 | 10,529 |
| New Jersey Transportation Trust Fund Authority Transportation System Revenue | 5.500% | 12/15/20 | (3) | 30,000 | 35,524 |
| New Jersey Transportation Trust Fund Authority Transportation System Revenue | 5.250% | 12/15/21 | | 11,000 | 12,791 |
| New Jersey Transportation Trust Fund Authority Transportation System Revenue | 5.500% | 12/15/21 | | 9,620 | 11,341 |
| New Jersey Transportation Trust Fund Authority Transportation System Revenue | 5.500% | 12/15/21 | (14) | 25,000 | 29,686 |
| New Jersey Transportation Trust Fund Authority Transportation System Revenue | 5.500% | 12/15/21 | (12) | 3,745 | 4,471 |
| New Jersey Transportation Trust Fund Authority Transportation System Revenue | 5.250% | 12/15/22 | | 2,500 | 2,914 |
| New Jersey Transportation Trust Fund Authority Transportation System Revenue | 5.250% | 12/15/22 | (2) | 30,900 | 36,014 |
| New Jersey Transportation Trust Fund Authority Transportation System Revenue | 5.500% | 12/15/22 | | 22,000 | 26,035 |
| New Jersey Transportation Trust Fund Authority Transportation System Revenue | 5.750% | 6/15/24 | (14) | 25,000 | 30,678 |
| New Jersey Transportation Trust Fund Authority Transportation System Revenue | 5.000% | 12/15/24 | | 20,000 | 23,134 |
| New Jersey Transportation Trust Fund Authority Transportation System Revenue | 0.000% | 12/15/25 | | 72,680 | 46,250 |
| New Jersey Transportation Trust Fund Authority Transportation System Revenue | 0.000% | 12/15/25 | | 1,000 | 636 |
| New Jersey Transportation Trust Fund Authority Transportation System Revenue | 0.000% | 12/15/26 | | 19,000 | 11,428 |
| New Jersey Transportation Trust Fund Authority Transportation System Revenue | 0.000% | 12/15/27 | | 98,285 | 55,962 |
| New Jersey Transportation Trust Fund Authority Transportation System Revenue | 5.000% | 6/15/28 | | 19,620 | 21,753 |
| New Jersey Transportation Trust Fund Authority Transportation System Revenue | 5.125% | 6/15/28 | | 3,500 | 3,897 |
| New Jersey Transportation Trust Fund Authority Transportation System Revenue | 0.000% | 12/15/28 | | 3,000 | 1,618 |
| New Jersey Transportation Trust Fund Authority Transportation System Revenue | 5.000% | 6/15/29 | | 12,500 | 13,824 |
| New Jersey Transportation Trust Fund Authority Transportation System Revenue | 5.500% | 6/15/31 | | 6,000 | 6,941 |
| New Jersey Transportation Trust Fund Authority Transportation System Revenue | 0.000% | 12/15/32 | | 3,000 | 1,320 |
| 1 New Jersey Transportation Trust Fund Authority Transportation System Revenue TOB VRDO | 0.160% | 11/7/14 | (4) | 10,000 | 10,000 |
| 1 New Jersey Transportation Trust Fund Authority Transportation System Revenue TOB VRDO | 0.170% | 11/7/14 | LOC | 32,620 | 32,620 |
| New Jersey Turnpike Authority Revenue | 5.000% | 1/1/21 | | 19,705 | 22,472 |
| New Jersey Turnpike Authority Revenue | 5.000% | 1/1/22 | | 4,500 | 5,124 |
| New Jersey Turnpike Authority Revenue | 5.500% | 1/1/25 | (2) | 13,000 | 16,296 |
| New Jersey Turnpike Authority Revenue | 5.000% | 1/1/32 | | 3,000 | 3,380 |
| New Jersey Turnpike Authority Revenue | 5.000% | 1/1/32 | | 26,460 | 30,040 |
| New Jersey Turnpike Authority Revenue | 5.000% | 1/1/33 | | 23,540 | 26,622 |
| Newark NJ GO | 5.000% | 10/1/19 | | 3,505 | 4,021 |
| Newark NJ GO | 5.000% | 10/1/20 | | 2,455 | 2,848 |
| South Jersey Transportation Authority New Jersey Transportation System Revenue | 5.000% | 11/1/16 | | 7,590 | 8,200 |
| South Jersey Transportation Authority New Jersey Transportation System Revenue | 5.000% | 11/1/23 | | 2,430 | 2,758 |
| South Jersey Transportation Authority New Jersey Transportation System Revenue | 5.000% | 11/1/24 | | 2,800 | 3,144 |
| Sussex County NJ GO | 5.000% | 2/15/23 | | 5,485 | 6,688 |
| Sussex County NJ GO | 5.000% | 2/15/24 | | 4,356 | 5,367 |
| Tobacco Settlement Financing Corp. New Jersey Revenue | 5.000% | 6/1/15 | | 11,425 | 11,679 |
| Tobacco Settlement Financing Corp. New Jersey Revenue | 5.000% | 6/1/16 | | 14,585 | 15,461 |
112
Intermediate-Term Tax-Exempt Fund
| | | | | |
| | | | | Face | Market |
| | | Maturity | | Amount | Value• |
| | Coupon | Date | | ($000) | ($000) |
| Tobacco Settlement Financing Corp. New Jersey Revenue | 5.000% | 6/1/17 | | 15,925 | 17,477 |
| Tobacco Settlement Financing Corp. New Jersey Revenue | 5.000% | 6/1/18 | | 16,975 | 18,607 |
| Tobacco Settlement Financing Corp. New Jersey Revenue | 5.000% | 6/1/19 | | 30,805 | 33,478 |
| Tobacco Settlement Financing Corp. New Jersey Revenue | 4.500% | 6/1/23 | | 33,522 | 33,143 |
| Tobacco Settlement Financing Corp. New Jersey Revenue | 4.625% | 6/1/26 | | 28,410 | 26,003 |
| Tobacco Settlement Financing Corp. New Jersey Revenue | 0.000% | 6/1/41 | | 243,000 | 59,379 |
| West Deptford Township NJ GO | 5.000% | 7/1/24 | (4) | 1,210 | 1,333 |
| West Deptford Township NJ GO | 5.000% | 7/1/25 | (4) | 1,260 | 1,385 |
| West Deptford Township NJ GO | 5.000% | 7/1/26 | (4) | 1,000 | 1,098 |
| | | | | | 1,695,420 |
| New Mexico (0.2%) | | | | | |
| New Mexico Educational Assistance Foundation Revenue | 4.000% | 9/1/18 | | 16,440 | 18,277 |
| New Mexico Educational Assistance Foundation Revenue | 4.000% | 9/1/19 | | 5,990 | 6,740 |
| New Mexico Educational Assistance Foundation Revenue | 5.000% | 12/1/19 | | 1,500 | 1,766 |
| New Mexico Educational Assistance Foundation Revenue | 4.000% | 12/1/20 | | 1,500 | 1,703 |
| New Mexico Finance Authority Transportation Revenue | 5.000% | 12/15/16 | | 7,260 | 7,961 |
| New Mexico Hospital Equipment Loan Council Hospital System Revenue | | | | | |
| (Presbyterian Healthcare Services) VRDO | 0.050% | 11/7/14 | | 13,695 | 13,695 |
| New Mexico Hospital Equipment Loan Council Hospital System Revenue | | | | | |
| (Presbyterian Healthcare Services) VRDO | 0.070% | 11/7/14 | | 23,930 | 23,930 |
| | | | | | 74,072 |
| New York (16.7%) | | | | | |
| Amherst NY Development Corp. Student Housing Facility Revenue | 3.500% | 10/1/19 | | 1,185 | 1,288 |
| Amherst NY Development Corp. Student Housing Facility Revenue | 4.000% | 10/1/21 | | 2,575 | 2,827 |
| Amherst NY Development Corp. Student Housing Facility Revenue | 4.000% | 10/1/22 | | 2,680 | 2,904 |
| Brooklyn NY Local Development Corp. PILOT Revenue (Barclays Center Project) | 6.000% | 7/15/30 | | 6,735 | 7,553 |
| Erie County NY Industrial Development Agency School Facility Revenue | | | | | |
| (Buffalo City School District Project) | 5.000% | 5/1/15 | | 1,000 | 1,024 |
| Erie County NY Industrial Development Agency School Facility Revenue | | | | | |
| (Buffalo City School District Project) | 5.000% | 5/1/15 | | 1,500 | 1,537 |
| Erie County NY Industrial Development Agency School Facility Revenue | | | | | |
| (Buffalo City School District Project) | 5.250% | 5/1/26 | | 6,775 | 8,011 |
| Erie County NY Industrial Development Agency School Facility Revenue | | | | | |
| (Buffalo City School District Project) | 5.250% | 5/1/27 | | 8,560 | 10,088 |
| Erie County NY Industrial Development Agency School Facility Revenue | | | | | |
| (Buffalo City School District Project) | 5.250% | 5/1/29 | | 6,315 | 7,442 |
| Erie County NY Industrial Development Agency School Facility Revenue | | | | | |
| (Buffalo City School District Project) | 5.250% | 5/1/31 | | 2,500 | 2,928 |
| Freeport NY GO | 5.000% | 1/15/20 | | 2,070 | 2,420 |
| Long Island NY Power Authority Electric System Revenue | 5.000% | 12/1/18 | (14) | 2,900 | 3,156 |
| Long Island NY Power Authority Electric System Revenue | 5.000% | 12/1/18 | (14) | 1,335 | 1,453 |
| Long Island NY Power Authority Electric System Revenue | 5.000% | 4/1/23 | | 5,800 | 6,448 |
| Long Island NY Power Authority Electric System Revenue | 5.750% | 4/1/25 | | 20,000 | 22,753 |
| Long Island NY Power Authority Electric System Revenue | 5.000% | 9/1/29 | | 10,000 | 11,312 |
| Monroe County NY Industrial Development Agency School Facility Revenue | | | | | |
| (Rochester Schools Modernization Project) | 5.000% | 5/1/16 | | 4,630 | 4,952 |
| Monroe County NY Industrial Development Agency School Facility Revenue | | | | | |
| (Rochester Schools Modernization Project) | 5.000% | 5/1/20 | | 3,500 | 4,149 |
| Monroe County NY Industrial Development Corp. Mortgage Revenue | | | | | |
| (Unity Hospital Rochester Project) | 5.500% | 8/15/23 | | 3,000 | 3,121 |
| Nassau County NY GO | 4.000% | 10/1/22 | | 8,755 | 9,325 |
| Nassau County NY GO | 4.000% | 10/1/23 | | 5,245 | 5,532 |
| Nassau County NY Interim Finance Authority Sales Tax Revenue VRDO | 0.050% | 11/7/14 | | 18,150 | 18,150 |
| Nassau County NY Local Economic Assistance & Financing Corp. Revenue | | | | | |
| (Winthrop University Hospital Association Project) | 5.000% | 7/1/21 | | 2,605 | 3,002 |
| Nassau County NY Local Economic Assistance Corp. Revenue | | | | | |
| (Catholic Health Services of Long Island Obligated Group Project) | 5.000% | 7/1/25 | | 1,350 | 1,572 |
| Nassau County NY Local Economic Assistance Corp. Revenue | | | | | |
| (Catholic Health Services of Long Island Obligated Group Project) | 5.000% | 7/1/27 | | 3,090 | 3,541 |
| New York City NY GO | 5.000% | 11/1/14 | (Prere.) | 2,400 | 2,400 |
| New York City NY GO | 5.000% | 4/1/15 | (4)(ETM) | 1,850 | 1,887 |
| New York City NY GO | 5.000% | 4/1/15 | (4) | 2,910 | 2,968 |
| New York City NY GO | 5.000% | 6/1/15 | (Prere.) | 3,960 | 4,072 |
| New York City NY GO | 5.750% | 8/1/15 | (2) | 1,135 | 1,140 |
| New York City NY GO | 5.000% | 2/1/16 | (Prere.) | 35 | 37 |
| New York City NY GO | 5.000% | 8/1/16 | (Prere.) | 225 | 243 |
| New York City NY GO | 5.000% | 8/1/16 | | 5,000 | 5,401 |
| New York City NY GO | 5.000% | 2/1/17 | (Prere.) | 8,425 | 9,273 |
| New York City NY GO | 5.000% | 8/1/17 | (Prere.) | 115 | 129 |
| New York City NY GO | 5.000% | 8/1/17 | (Prere.) | 1,555 | 1,742 |
| New York City NY GO | 5.000% | 8/1/17 | | 7,610 | 8,495 |
113
Intermediate-Term Tax-Exempt Fund
| | | | | |
| | | | | Face | Market |
| | | Maturity | | Amount | Value• |
| | Coupon | Date | | ($000) | ($000) |
| New York City NY GO | 5.250% | 8/15/18 | (Prere.) | 2,130 | 2,480 |
| New York City NY GO | 5.000% | 6/1/19 | | 8,675 | 10,094 |
| New York City NY GO | 5.000% | 8/1/19 | | 4,500 | 5,253 |
| New York City NY GO | 5.000% | 8/1/19 | | 12,130 | 13,519 |
| New York City NY GO | 5.000% | 8/1/19 | | 3,100 | 3,618 |
| New York City NY GO | 5.000% | 8/1/19 | | 5,000 | 5,836 |
| New York City NY GO | 5.000% | 8/1/20 | | 3,895 | 4,341 |
| New York City NY GO | 5.000% | 8/1/20 | | 8,445 | 9,412 |
| New York City NY GO | 5.000% | 8/1/20 | | 32,355 | 37,716 |
| New York City NY GO | 5.250% | 9/1/20 | | 4,565 | 5,304 |
| New York City NY GO | 5.000% | 10/1/20 | | 1,445 | 1,618 |
| New York City NY GO | 5.000% | 2/1/21 | | 3,875 | 4,240 |
| New York City NY GO | 5.250% | 3/1/21 | | 4,255 | 4,946 |
| New York City NY GO | 5.000% | 8/1/21 | | 22,840 | 24,620 |
| New York City NY GO | 5.000% | 8/1/21 | | 9,600 | 10,671 |
| New York City NY GO | 5.000% | 8/1/21 | | 13,965 | 14,757 |
| New York City NY GO | 5.000% | 8/1/21 | | 15,750 | 18,580 |
| New York City NY GO | 5.000% | 8/1/21 | | 59,135 | 68,731 |
| New York City NY GO | 5.250% | 9/1/21 | | 14,250 | 16,509 |
| New York City NY GO | 5.000% | 10/1/21 | | 7,545 | 9,039 |
| New York City NY GO | 5.000% | 8/1/22 | | 18,475 | 21,664 |
| New York City NY GO | 5.000% | 8/1/22 | | 6,740 | 8,097 |
| New York City NY GO | 5.000% | 8/1/22 | | 7,050 | 7,831 |
| New York City NY GO | 5.000% | 8/1/22 | | 7,415 | 8,908 |
| New York City NY GO | 5.000% | 8/1/22 | | 6,400 | 7,688 |
| New York City NY GO | 5.000% | 8/1/22 | | 6,020 | 7,059 |
| New York City NY GO | 5.000% | 8/1/22 | | 32,000 | 37,097 |
| New York City NY GO | 5.250% | 8/15/22 | | 25,250 | 29,133 |
| New York City NY GO | 5.000% | 8/1/23 | | 3,690 | 4,441 |
| New York City NY GO | 5.000% | 8/1/23 | | 7,740 | 9,316 |
| New York City NY GO | 5.000% | 8/1/23 | | 3,905 | 4,706 |
| New York City NY GO | 5.000% | 8/1/23 | | 6,250 | 7,532 |
| New York City NY GO | 5.000% | 8/1/23 | | 5,650 | 6,809 |
| New York City NY GO | 5.000% | 8/1/23 | | 11,000 | 13,185 |
| New York City NY GO | 5.000% | 8/1/23 | | 2,000 | 2,313 |
| New York City NY GO | 5.250% | 8/15/23 | | 21,820 | 25,141 |
| New York City NY GO | 5.000% | 10/1/23 | | 4,430 | 5,321 |
| New York City NY GO | 5.000% | 11/1/23 | | 5,600 | 5,600 |
| New York City NY GO | 5.000% | 4/1/24 | | 17,335 | 20,571 |
| New York City NY GO | 5.000% | 8/1/24 | | 20,000 | 24,165 |
| New York City NY GO | 5.000% | 8/1/24 | | 8,085 | 9,423 |
| New York City NY GO | 5.000% | 8/1/24 | | 5,310 | 6,286 |
| New York City NY GO | 5.000% | 8/1/24 | | 4,000 | 4,768 |
| New York City NY GO | 5.250% | 8/15/24 | | 23,815 | 27,410 |
| New York City NY GO | 5.000% | 10/1/24 | | 5,000 | 5,931 |
| New York City NY GO | 5.000% | 10/1/24 | | 4,500 | 5,376 |
| New York City NY GO | 5.000% | 6/1/25 | | 1,185 | 1,217 |
| New York City NY GO | 5.000% | 8/1/25 | | 3,300 | 3,856 |
| New York City NY GO | 5.000% | 8/1/25 | | 5,000 | 5,895 |
| New York City NY GO | 5.000% | 10/1/25 | | 10,985 | 12,983 |
| New York City NY GO | 5.000% | 4/1/26 | | 10,000 | 11,699 |
| New York City NY GO | 5.000% | 4/1/26 | | 3,590 | 4,100 |
| New York City NY GO | 5.000% | 8/1/26 | | 9,735 | 11,605 |
| New York City NY GO | 5.000% | 8/1/26 | | 14,215 | 16,946 |
| New York City NY GO | 5.000% | 8/1/26 | | 1,455 | 1,672 |
| New York City NY GO | 5.000% | 8/1/26 | | 5,000 | 5,880 |
| New York City NY GO | 5.000% | 10/1/26 | | 23,890 | 28,169 |
| New York City NY GO | 5.000% | 4/1/27 | | 14,780 | 17,237 |
| 3 New York City NY GO | 0.450% | 8/1/27 | | 16,500 | 16,501 |
| New York City NY GO | 5.000% | 8/1/27 | | 4,705 | 5,468 |
| New York City NY GO | 5.000% | 8/1/27 | | 6,585 | 7,822 |
| New York City NY GO | 5.000% | 10/1/27 | | 15,000 | 17,628 |
| New York City NY GO | 5.000% | 8/1/28 | | 18,000 | 20,824 |
| New York City NY GO | 5.000% | 8/1/28 | | 9,300 | 11,087 |
| New York City NY GO | 5.000% | 3/1/29 | | 27,590 | 32,445 |
| New York City NY GO | 5.000% | 5/15/29 | | 7,900 | 8,974 |
| New York City NY GO | 5.000% | 8/1/29 | | 9,715 | 11,380 |
| New York City NY GO | 5.000% | 3/1/30 | | 16,230 | 19,013 |
| New York City NY GO | 5.000% | 8/1/30 | | 5,380 | 6,338 |
| New York City NY GO | 5.000% | 8/1/30 | | 6,845 | 7,972 |
| New York City NY GO | 5.000% | 8/1/30 | | 23,000 | 26,874 |
114
Intermediate-Term Tax-Exempt Fund
| | | | | |
| | | | | Face | Market |
| | | Maturity | | Amount | Value• |
| | Coupon | Date | | ($000) | ($000) |
| New York City NY GO | 5.000% | 8/1/30 | | 10,655 | 12,409 |
| New York City NY GO | 5.000% | 3/1/31 | | 33,315 | 38,969 |
| New York City NY GO | 5.450% | 4/1/31 | | 6,560 | 7,604 |
| New York City NY GO | 5.000% | 10/1/31 | | 34,050 | 39,531 |
| New York City NY GO | 5.000% | 8/1/32 | | 1,475 | 1,700 |
| New York City NY GO | 5.000% | 8/1/32 | | 8,280 | 9,580 |
| New York City NY GO | 5.000% | 3/1/33 | | 15,215 | 17,443 |
| New York City NY GO VRDO | 0.070% | 11/3/14 | | 22,700 | 22,700 |
| New York City NY GO VRDO | 0.070% | 11/3/14 | LOC | 32,230 | 32,230 |
| New York City NY GO VRDO | 0.070% | 11/3/14 | | 44,300 | 44,300 |
| New York City NY GO VRDO | 0.070% | 11/3/14 | LOC | 11,185 | 11,185 |
| New York City NY GO VRDO | 0.070% | 11/3/14 | | 24,200 | 24,200 |
| New York City NY GO VRDO | 0.070% | 11/3/14 | LOC | 32,040 | 32,040 |
| New York City NY GO VRDO | 0.060% | 11/7/14 | | 40,000 | 40,000 |
| New York City NY Health & Hospital Corp. Revenue (Health System) | 5.000% | 2/15/24 | | 3,500 | 4,011 |
| New York City NY Health & Hospital Corp. Revenue (Health System) | 5.000% | 2/15/30 | | 19,200 | 21,312 |
| New York City NY Housing Development Corp. Multi-Family Housing Revenue | 5.000% | 7/1/26 | | 12,940 | 15,237 |
| New York City NY Housing Development Corp. Multi-Family Housing Revenue | 5.250% | 7/1/28 | | 17,300 | 20,417 |
| New York City NY Housing Development Corp. Multi-Family Housing Revenue | 5.250% | 7/1/29 | | 22,000 | 25,716 |
| New York City NY Housing Development Corp. Multi-Family Housing Revenue | 5.250% | 7/1/30 | | 12,500 | 14,570 |
| 2 New York City NY Housing Development Corp. Multi-Family Mortgage Revenue (8 Spruce Street) | 3.000% | 2/15/48 | | 13,000 | 13,097 |
| New York City NY Housing Development Corp. Multi-Family Rental Housing Revenue | | | | | |
| (2 Gold Street) VRDO | 0.050% | 11/7/14 | | 1,500 | 1,500 |
| New York City NY Industrial Development Agency Civic Facility Revenue | | | | | |
| (Civil Liberties Union) VRDO | 0.070% | 11/3/14 | LOC | 11,080 | 11,080 |
| New York City NY Industrial Development Agency Civic Facility Revenue | | | | | |
| (New York Law School) VRDO | 0.050% | 11/7/14 | LOC | 4,510 | 4,510 |
| New York City NY Municipal Water Finance Authority Water & Sewer System Revenue | 5.000% | 6/15/26 | | 35,000 | 41,510 |
| New York City NY Municipal Water Finance Authority Water & Sewer System Revenue | 5.000% | 6/15/26 | | 25,880 | 30,694 |
| New York City NY Municipal Water Finance Authority Water & Sewer System Revenue | 5.000% | 6/15/29 | | 5,000 | 5,955 |
| New York City NY Municipal Water Finance Authority Water & Sewer System Revenue | 5.000% | 6/15/29 | | 41,500 | 48,420 |
| New York City NY Municipal Water Finance Authority Water & Sewer System Revenue | 5.000% | 6/15/29 | | 4,500 | 5,179 |
| New York City NY Municipal Water Finance Authority Water & Sewer System Revenue | 5.000% | 6/15/29 | | 3,580 | 4,055 |
| New York City NY Municipal Water Finance Authority Water & Sewer System Revenue | 5.000% | 6/15/30 | | 10,000 | 11,497 |
| New York City NY Municipal Water Finance Authority Water & Sewer System Revenue | 5.000% | 6/15/31 | | 30,000 | 34,545 |
| New York City NY Municipal Water Finance Authority Water & Sewer System Revenue | 5.000% | 6/15/31 | | 24,500 | 28,032 |
| New York City NY Municipal Water Finance Authority Water & Sewer System Revenue | 5.000% | 6/15/31 | | 7,500 | 7,698 |
| New York City NY Municipal Water Finance Authority Water & Sewer System Revenue | 5.000% | 6/15/31 | | 9,000 | 10,264 |
| New York City NY Municipal Water Finance Authority Water & Sewer System Revenue | 5.000% | 6/15/32 | | 17,500 | 20,009 |
| New York City NY Municipal Water Finance Authority Water & Sewer System Revenue | 5.000% | 6/15/32 | | 5,545 | 6,340 |
| New York City NY Municipal Water Finance Authority Water & Sewer System Revenue | 5.000% | 6/15/34 | | 50,000 | 57,669 |
| New York City NY Municipal Water Finance Authority Water & Sewer System Revenue | 5.000% | 6/15/35 | | 10,415 | 12,088 |
| 1 New York City NY Municipal Water Finance Authority Water & Sewer System Revenue TOB VRDO | 0.070% | 11/3/14 | | 2,015 | 2,015 |
| New York City NY Municipal Water Finance Authority Water & Sewer System Revenue VRDO | 0.060% | 11/3/14 | | 8,480 | 8,480 |
| New York City NY Municipal Water Finance Authority Water & Sewer System Revenue VRDO | 0.060% | 11/3/14 | | 1,800 | 1,800 |
| New York City NY Municipal Water Finance Authority Water & Sewer System Revenue VRDO | 0.060% | 11/3/14 | | 2,200 | 2,200 |
| New York City NY Municipal Water Finance Authority Water & Sewer System Revenue VRDO | 0.070% | 11/3/14 | | 52,100 | 52,100 |
| New York City NY Municipal Water Finance Authority Water & Sewer System Revenue VRDO | 0.070% | 11/3/14 | | 75,200 | 75,200 |
| New York City NY Municipal Water Finance Authority Water & Sewer System Revenue VRDO | 0.070% | 11/3/14 | | 3,500 | 3,500 |
| New York City NY Municipal Water Finance Authority Water & Sewer System Revenue VRDO | 0.070% | 11/3/14 | | 9,320 | 9,320 |
| New York City NY Municipal Water Finance Authority Water & Sewer System Revenue VRDO | 0.070% | 11/3/14 | | 5,720 | 5,720 |
| New York City NY Municipal Water Finance Authority Water & Sewer System Revenue VRDO | 0.070% | 11/3/14 | | 26,900 | 26,900 |
| New York City NY Municipal Water Finance Authority Water & Sewer System Revenue VRDO | 0.050% | 11/7/14 | | 15,675 | 15,675 |
| New York City NY Sales Tax Asset Receivable Corp. Revenue | 5.000% | 10/15/28 | | 6,000 | 7,356 |
| New York City NY Transitional Finance Authority Building Aid Revenue | 5.000% | 1/15/15 | | 2,820 | 2,848 |
| New York City NY Transitional Finance Authority Building Aid Revenue | 5.000% | 1/15/16 | | 2,925 | 3,087 |
| New York City NY Transitional Finance Authority Building Aid Revenue | 5.000% | 1/15/17 | | 5,150 | 5,644 |
| New York City NY Transitional Finance Authority Building Aid Revenue | 5.000% | 7/15/17 | | 6,335 | 7,060 |
| New York City NY Transitional Finance Authority Building Aid Revenue | 5.000% | 1/15/19 | | 3,875 | 4,479 |
| New York City NY Transitional Finance Authority Building Aid Revenue | 5.000% | 1/15/23 | | 4,440 | 5,058 |
| New York City NY Transitional Finance Authority Building Aid Revenue | 5.000% | 1/15/24 | | 7,040 | 8,004 |
| New York City NY Transitional Finance Authority Building Aid Revenue | 5.000% | 1/15/25 | (14) | 10,170 | 11,023 |
| New York City NY Transitional Finance Authority Building Aid Revenue | 5.250% | 1/15/25 | | 13,090 | 15,016 |
| New York City NY Transitional Finance Authority Building Aid Revenue | 5.000% | 1/15/26 | (14) | 7,620 | 8,259 |
| New York City NY Transitional Finance Authority Building Aid Revenue | 5.250% | 1/15/26 | | 10,520 | 12,045 |
| New York City NY Transitional Finance Authority Building Aid Revenue | 5.250% | 1/15/26 | | 8,185 | 9,371 |
| New York City NY Transitional Finance Authority Building Aid Revenue | 5.250% | 1/15/27 | | 4,615 | 5,274 |
| New York City NY Transitional Finance Authority Building Aid Revenue | 5.125% | 1/15/28 | | 3,465 | 3,933 |
| New York City NY Transitional Finance Authority Building Aid Revenue | 5.000% | 1/15/29 | | 3,550 | 3,925 |
| New York City NY Transitional Finance Authority Building Aid Revenue | 5.000% | 1/15/30 | | 9,500 | 10,719 |
| New York City NY Transitional Finance Authority Building Aid Revenue | 5.000% | 7/15/31 | | 18,000 | 20,488 |
115
Intermediate-Term Tax-Exempt Fund
| | | | | |
| | | | | Face | Market |
| | | Maturity | | Amount | Value• |
| | Coupon | Date | | ($000) | ($000) |
| New York City NY Transitional Finance Authority Building Aid Revenue | 5.000% | 7/15/31 | | 6,000 | 6,891 |
| New York City NY Transitional Finance Authority Building Aid Revenue | 5.000% | 7/15/32 | | 3,950 | 4,528 |
| 1 New York City NY Transitional Finance Authority Building Aid Revenue TOB VRDO | 0.050% | 11/7/14 | LOC | 9,950 | 9,950 |
| New York City NY Transitional Finance Authority Future Tax Revenue | 5.000% | 11/1/14 | | 6,065 | 6,065 |
| New York City NY Transitional Finance Authority Future Tax Revenue | 5.000% | 8/1/15 | | 6,000 | 6,220 |
| New York City NY Transitional Finance Authority Future Tax Revenue | 5.000% | 11/1/15 | | 8,000 | 8,388 |
| New York City NY Transitional Finance Authority Future Tax Revenue | 5.000% | 11/1/15 | (ETM) | 80 | 84 |
| New York City NY Transitional Finance Authority Future Tax Revenue | 5.000% | 11/1/15 | | 920 | 965 |
| New York City NY Transitional Finance Authority Future Tax Revenue | 5.000% | 8/1/16 | (Prere.) | 2,500 | 2,703 |
| New York City NY Transitional Finance Authority Future Tax Revenue | 5.000% | 8/1/16 | (Prere.) | 3,250 | 3,514 |
| New York City NY Transitional Finance Authority Future Tax Revenue | 5.000% | 8/1/16 | (Prere.) | 51,100 | 55,249 |
| New York City NY Transitional Finance Authority Future Tax Revenue | 5.000% | 11/1/17 | | 12,000 | 13,538 |
| New York City NY Transitional Finance Authority Future Tax Revenue | 5.000% | 11/1/17 | | 8,965 | 10,114 |
| New York City NY Transitional Finance Authority Future Tax Revenue | 5.000% | 11/1/17 | | 4,580 | 5,082 |
| New York City NY Transitional Finance Authority Future Tax Revenue | 5.000% | 8/1/18 | (ETM) | 1,300 | 1,498 |
| New York City NY Transitional Finance Authority Future Tax Revenue | 5.000% | 11/1/18 | | 5,000 | 5,788 |
| New York City NY Transitional Finance Authority Future Tax Revenue | 5.000% | 11/1/18 | | 15,000 | 17,364 |
| New York City NY Transitional Finance Authority Future Tax Revenue | 5.000% | 11/1/19 | | 2,535 | 2,987 |
| New York City NY Transitional Finance Authority Future Tax Revenue | 5.000% | 11/1/19 | | 9,835 | 11,587 |
| New York City NY Transitional Finance Authority Future Tax Revenue | 5.000% | 11/1/21 | | 16,030 | 19,265 |
| New York City NY Transitional Finance Authority Future Tax Revenue | 5.000% | 11/1/21 | | 30,000 | 35,427 |
| New York City NY Transitional Finance Authority Future Tax Revenue | 5.000% | 5/1/22 | | 11,090 | 12,895 |
| New York City NY Transitional Finance Authority Future Tax Revenue | 5.000% | 5/1/23 | | 16,740 | 20,192 |
| New York City NY Transitional Finance Authority Future Tax Revenue | 5.000% | 2/1/24 | | 6,000 | 7,090 |
| New York City NY Transitional Finance Authority Future Tax Revenue | 5.000% | 11/1/24 | | 14,245 | 17,321 |
| New York City NY Transitional Finance Authority Future Tax Revenue | 5.000% | 11/1/24 | | 13,770 | 17,008 |
| New York City NY Transitional Finance Authority Future Tax Revenue | 5.000% | 11/1/24 | | 10,030 | 12,388 |
| New York City NY Transitional Finance Authority Future Tax Revenue | 5.000% | 11/1/24 | | 8,000 | 9,552 |
| New York City NY Transitional Finance Authority Future Tax Revenue | 5.000% | 11/1/24 | | 15,550 | 18,566 |
| New York City NY Transitional Finance Authority Future Tax Revenue | 5.000% | 11/1/24 | | 1,000 | 1,198 |
| New York City NY Transitional Finance Authority Future Tax Revenue | 5.000% | 2/1/25 | | 4,285 | 5,055 |
| New York City NY Transitional Finance Authority Future Tax Revenue | 5.000% | 11/1/25 | | 5,000 | 5,959 |
| New York City NY Transitional Finance Authority Future Tax Revenue | 5.000% | 11/1/25 | | 5,000 | 5,959 |
| New York City NY Transitional Finance Authority Future Tax Revenue | 5.000% | 11/1/25 | | 5,500 | 6,555 |
| New York City NY Transitional Finance Authority Future Tax Revenue | 5.000% | 2/1/26 | | 10,795 | 12,652 |
| New York City NY Transitional Finance Authority Future Tax Revenue | 5.000% | 2/1/26 | | 10,290 | 12,060 |
| New York City NY Transitional Finance Authority Future Tax Revenue | 5.000% | 11/1/26 | | 2,635 | 3,118 |
| New York City NY Transitional Finance Authority Future Tax Revenue | 5.000% | 11/1/26 | | 8,620 | 10,199 |
| New York City NY Transitional Finance Authority Future Tax Revenue | 5.250% | 11/1/26 | | 8,255 | 9,804 |
| New York City NY Transitional Finance Authority Future Tax Revenue | 5.000% | 11/1/27 | | 1,435 | 1,692 |
| New York City NY Transitional Finance Authority Future Tax Revenue | 5.000% | 11/1/27 | | 4,000 | 4,716 |
| New York City NY Transitional Finance Authority Future Tax Revenue | 5.000% | 2/1/28 | | 10,000 | 11,727 |
| New York City NY Transitional Finance Authority Future Tax Revenue | 5.000% | 2/1/28 | | 25,675 | 29,877 |
| New York City NY Transitional Finance Authority Future Tax Revenue | 5.000% | 5/1/29 | | 12,000 | 14,124 |
| New York City NY Transitional Finance Authority Future Tax Revenue | 5.000% | 2/1/31 | | 8,000 | 9,135 |
| New York City NY Transitional Finance Authority Future Tax Revenue | 5.000% | 5/1/31 | | 19,000 | 22,160 |
| New York City NY Transitional Finance Authority Future Tax Revenue | 5.000% | 11/1/31 | | 24,475 | 28,262 |
| New York City NY Transitional Finance Authority Future Tax Revenue | 5.000% | 2/1/32 | | 12,700 | 14,624 |
| New York City NY Transitional Finance Authority Future Tax Revenue | 5.000% | 8/1/32 | | 13,750 | 16,161 |
| New York City NY Transitional Finance Authority Future Tax Revenue | 5.000% | 11/1/32 | | 16,500 | 18,901 |
| New York City NY Transitional Finance Authority Future Tax Revenue | 5.000% | 11/1/32 | | 4,270 | 5,013 |
| New York City NY Transitional Finance Authority Future Tax Revenue | 5.000% | 2/1/33 | | 17,500 | 20,027 |
| New York City NY Transitional Finance Authority Future Tax Revenue | 5.000% | 8/1/33 | | 12,150 | 14,168 |
| New York City NY Transitional Finance Authority Future Tax Revenue | 5.000% | 8/1/34 | | 15,910 | 18,451 |
| New York City NY Transitional Finance Authority Future Tax Revenue | 5.000% | 11/1/34 | | 27,325 | 31,561 |
| New York City NY Transitional Finance Authority Future Tax Revenue | 5.000% | 8/1/35 | | 22,020 | 25,456 |
| 1 New York City NY Transitional Finance Authority Future Tax Revenue TOB VRDO | 0.070% | 11/3/14 | | 9,700 | 9,700 |
| New York City NY Transitional Finance Authority Future Tax Revenue VRDO | 0.060% | 11/3/14 | | 1,590 | 1,590 |
| New York City NY Trust for Cultural Resources Revenue | | | | | |
| (American Museum of Natural History) VRDO | 0.070% | 11/3/14 | | 4,250 | 4,250 |
| New York City NY Trust for Cultural Resources Revenue | | | | | |
| (Lincoln Center for the Performing Arts Inc.) | 5.250% | 12/1/18 | | 7,600 | 8,711 |
| New York City NY Trust for Cultural Resources Revenue (Wildlife Conservation Society) | 5.000% | 8/1/33 | | 5,270 | 6,067 |
| New York Liberty Development Corp. Revenue | 5.000% | 11/15/31 | | 13,200 | 14,802 |
| New York Liberty Development Corp. Revenue (7 World Trade Center Project) | 5.000% | 9/15/31 | | 14,000 | 16,190 |
| New York Metropolitan Transportation Authority Revenue | 5.750% | 7/1/18 | | 1,975 | 2,313 |
| New York Metropolitan Transportation Authority Revenue | 5.000% | 11/15/21 | | 2,685 | 3,009 |
| New York Metropolitan Transportation Authority Revenue | 5.500% | 11/15/21 | (4) | 15,900 | 19,764 |
| New York Metropolitan Transportation Authority Revenue | 5.000% | 11/15/23 | | 6,550 | 7,885 |
| New York Metropolitan Transportation Authority Revenue | 5.000% | 11/15/23 | | 6,800 | 7,595 |
| New York Metropolitan Transportation Authority Revenue | 5.000% | 11/15/23 | | 5,000 | 6,047 |
116
Intermediate-Term Tax-Exempt Fund
| | | | | | |
| | | | | | Face | Market |
| | | | Maturity | | Amount | Value• |
| | | Coupon | Date | | ($000) | ($000) |
| | New York Metropolitan Transportation Authority Revenue | 5.000% | 11/15/23 | (4) | 10,000 | 11,140 |
| | New York Metropolitan Transportation Authority Revenue | 4.750% | 11/15/24 | (14) | 9,005 | 9,407 |
| | New York Metropolitan Transportation Authority Revenue | 5.000% | 11/15/24 | | 6,505 | 7,806 |
| | New York Metropolitan Transportation Authority Revenue | 5.000% | 11/15/24 | | 2,525 | 2,815 |
| | New York Metropolitan Transportation Authority Revenue | 5.000% | 11/15/24 | | 2,250 | 2,547 |
| | New York Metropolitan Transportation Authority Revenue | 5.000% | 11/15/24 | | 10,000 | 12,086 |
| | New York Metropolitan Transportation Authority Revenue | 4.750% | 11/15/25 | (14) | 9,435 | 9,854 |
| | New York Metropolitan Transportation Authority Revenue | 5.000% | 11/15/25 | | 31,000 | 36,808 |
| | New York Metropolitan Transportation Authority Revenue | 5.000% | 11/15/25 | | 1,330 | 1,570 |
| | New York Metropolitan Transportation Authority Revenue | 5.000% | 11/15/25 | | 1,500 | 1,760 |
| | New York Metropolitan Transportation Authority Revenue | 5.000% | 11/15/25 | | 10,000 | 11,730 |
| | New York Metropolitan Transportation Authority Revenue | 5.000% | 11/15/26 | | 5,355 | 6,319 |
| | New York Metropolitan Transportation Authority Revenue | 5.000% | 11/15/26 | | 2,300 | 2,684 |
| | New York Metropolitan Transportation Authority Revenue | 5.000% | 11/15/26 | | 3,000 | 3,388 |
| | New York Metropolitan Transportation Authority Revenue | 5.000% | 11/15/26 | | 15,000 | 17,596 |
| | New York Metropolitan Transportation Authority Revenue | 5.000% | 11/15/27 | | 1,695 | 1,966 |
| | New York Metropolitan Transportation Authority Revenue | 5.000% | 11/15/27 | | 3,885 | 4,381 |
| | New York Metropolitan Transportation Authority Revenue | 5.000% | 11/15/27 | | 1,500 | 1,713 |
| | New York Metropolitan Transportation Authority Revenue | 5.000% | 11/15/27 | | 3,850 | 4,500 |
| | New York Metropolitan Transportation Authority Revenue | 5.250% | 11/15/27 | | 22,625 | 26,044 |
| | New York Metropolitan Transportation Authority Revenue | 5.000% | 11/15/28 | | 15,000 | 17,466 |
| | New York Metropolitan Transportation Authority Revenue | 5.250% | 11/15/28 | | 9,000 | 10,292 |
| | New York Metropolitan Transportation Authority Revenue | 5.000% | 11/15/29 | | 13,635 | 15,834 |
| | New York Metropolitan Transportation Authority Revenue | 5.250% | 11/15/29 | | 20,730 | 23,632 |
| | New York Metropolitan Transportation Authority Revenue | 5.000% | 11/15/30 | | 12,735 | 14,719 |
| | New York Metropolitan Transportation Authority Revenue | 5.000% | 11/15/30 | | 12,125 | 13,818 |
| | New York Metropolitan Transportation Authority Revenue | 5.000% | 11/15/30 | | 10,260 | 11,859 |
| | New York Metropolitan Transportation Authority Revenue | 5.250% | 11/15/30 | | 24,500 | 27,916 |
| | New York Metropolitan Transportation Authority Revenue | 4.750% | 11/15/31 | | 8,000 | 8,936 |
| | New York Metropolitan Transportation Authority Revenue | 5.000% | 11/15/31 | | 8,500 | 9,752 |
| | New York Metropolitan Transportation Authority Revenue | 5.000% | 11/15/31 | | 5,500 | 6,243 |
| | New York Metropolitan Transportation Authority Revenue | 5.000% | 11/15/32 | | 5,480 | 6,207 |
| | New York Metropolitan Transportation Authority Revenue | 5.000% | 11/15/32 | | 12,705 | 14,392 |
| | New York Metropolitan Transportation Authority Revenue | 5.000% | 11/15/33 | | 5,000 | 5,730 |
| | New York Metropolitan Transportation Authority Revenue | 5.000% | 11/15/33 | | 13,055 | 14,746 |
| | New York Metropolitan Transportation Authority Revenue | 5.000% | 11/15/34 | | 19,605 | 22,052 |
| | New York Metropolitan Transportation Authority Revenue (Dedicated Petroleum Tax) | 6.000% | 4/1/20 | (ETM) | 20,300 | 23,991 |
| 1 | New York Metropolitan Transportation Authority Revenue (Dedicated Petroleum Tax) TOB VRDO | 0.060% | 11/7/14 | (13) | 6,550 | 6,550 |
| 3 | New York Metropolitan Transportation Authority Revenue (Dedicated Tax Fund) | 0.800% | 11/1/17 | | 18,000 | 18,079 |
| 3 | New York Metropolitan Transportation Authority Revenue (Dedicated Tax Fund) | 1.000% | 11/1/19 | | 8,000 | 8,132 |
| | New York Metropolitan Transportation Authority Revenue (Dedicated Tax Fund) | 5.000% | 11/15/25 | | 6,125 | 7,330 |
| | New York Metropolitan Transportation Authority Revenue (Dedicated Tax Fund) | 5.000% | 11/15/25 | | 10,360 | 12,398 |
| | New York Metropolitan Transportation Authority Revenue (Dedicated Tax Fund) | 5.000% | 11/15/26 | | 7,245 | 8,654 |
| | New York Metropolitan Transportation Authority Revenue (Dedicated Tax Fund) | 5.000% | 11/15/26 | | 10,910 | 13,032 |
| | New York Metropolitan Transportation Authority Revenue (Dedicated Tax Fund) | 5.000% | 11/15/27 | | 11,530 | 13,723 |
| | New York Metropolitan Transportation Authority Revenue (Dedicated Tax Fund) | 5.000% | 11/15/27 | | 11,415 | 13,586 |
| | New York Metropolitan Transportation Authority Revenue (Dedicated Tax Fund) | 5.125% | 11/15/28 | | 2,000 | 2,375 |
| | New York Metropolitan Transportation Authority Revenue (Dedicated Tax Fund) | 5.125% | 11/15/28 | | 10,500 | 12,470 |
| | New York Metropolitan Transportation Authority Revenue (Service Contract) | 5.500% | 7/1/15 | | 17,315 | 17,936 |
| | New York Metropolitan Transportation Authority Revenue (Service Contract) | 5.750% | 1/1/17 | (14) | 1,615 | 1,796 |
| | New York Metropolitan Transportation Authority Revenue (Transit Revenue) | 5.500% | 11/15/14 | (2) | 6,910 | 6,925 |
| | New York Metropolitan Transportation Authority Revenue (Transit Revenue) | 5.500% | 11/15/18 | | 25,240 | 27,403 |
| | New York Metropolitan Transportation Authority Revenue (Transit Revenue) | 5.000% | 11/15/20 | | 5,000 | 5,608 |
| | New York Metropolitan Transportation Authority Revenue (Transit Revenue) | 5.000% | 11/15/21 | | 5,000 | 5,454 |
| | New York Metropolitan Transportation Authority Revenue (Transit Revenue) | 5.000% | 11/15/26 | | 2,500 | 2,950 |
| | New York Metropolitan Transportation Authority Revenue (Transit Revenue) | 5.000% | 11/15/28 | | 2,000 | 2,329 |
| 3 | New York Metropolitan Transportation Authority Revenue PUT | 0.802% | 11/1/16 | | 12,500 | 12,595 |
| 3 | New York Metropolitan Transportation Authority Revenue PUT | 0.942% | 11/1/17 | | 8,845 | 8,939 |
| 2,3 | New York Metropolitan Transportation Authority Revenue PUT | 0.000% | 11/15/17 | | 26,200 | 26,179 |
| | New York State Dormitory Authority Lease Revenue (Mental Health Services Facilities) | 5.000% | 8/15/21 | | 10,000 | 11,762 |
| | New York State Dormitory Authority Lease Revenue (Mental Health Services Facilities) | 5.000% | 8/15/22 | | 2,000 | 2,328 |
| | New York State Dormitory Authority Lease Revenue (State University Dormitory Facilities) | 5.000% | 7/1/24 | | 2,000 | 2,361 |
| | New York State Dormitory Authority Lease Revenue (State University Dormitory Facilities) | 5.000% | 7/1/28 | | 3,925 | 4,527 |
| | New York State Dormitory Authority Lease Revenue (State University Dormitory Facilities) | 5.000% | 7/1/29 | | 2,125 | 2,451 |
| | New York State Dormitory Authority Lease Revenue (State University Dormitory Facilities) | 5.000% | 7/1/29 | | 2,320 | 2,734 |
| | New York State Dormitory Authority Lease Revenue (State University Dormitory Facilities) | 5.000% | 7/1/30 | | 4,330 | 4,994 |
| | New York State Dormitory Authority Revenue (City University System) | 5.000% | 7/1/19 | | 3,000 | 3,423 |
| | New York State Dormitory Authority Revenue (City University System) | 5.000% | 7/1/21 | | 5,000 | 5,864 |
| | New York State Dormitory Authority Revenue (City University System) | 5.000% | 7/1/22 | | 5,340 | 6,202 |
| | New York State Dormitory Authority Revenue (City University System) | 5.000% | 7/1/25 | | 6,100 | 6,948 |
| | New York State Dormitory Authority Revenue (Columbia University) | 5.000% | 10/1/21 | | 19,375 | 23,661 |
117
Intermediate-Term Tax-Exempt Fund
| | | | | |
| | | | | Face | Market |
| | | Maturity | | Amount | Value• |
| | Coupon | Date | | ($000) | ($000) |
| New York State Dormitory Authority Revenue (Fordham University) | 5.000% | 7/1/28 | | 1,070 | 1,234 |
| New York State Dormitory Authority Revenue (Fordham University) | 5.125% | 7/1/29 | | 1,625 | 1,887 |
| New York State Dormitory Authority Revenue (Fordham University) | 5.200% | 7/1/30 | | 1,200 | 1,399 |
| New York State Dormitory Authority Revenue (Fordham University) PUT | 5.000% | 7/1/16 | | 18,000 | 19,308 |
| New York State Dormitory Authority Revenue (Memorial Sloan-Kettering Cancer Center) | 5.000% | 7/1/26 | | 1,500 | 1,765 |
| New York State Dormitory Authority Revenue (Memorial Sloan-Kettering Cancer Center) | 5.000% | 7/1/29 | | 1,000 | 1,147 |
| New York State Dormitory Authority Revenue (Memorial Sloan-Kettering Cancer Center) | 5.000% | 7/1/30 | | 1,000 | 1,145 |
| New York State Dormitory Authority Revenue (Mental Health Services Facilities Improvement) | 5.000% | 2/15/15 | (Prere.) | 6,415 | 6,505 |
| New York State Dormitory Authority Revenue (Mental Health Services Facilities Improvement) | 5.000% | 2/15/15 | (Prere.) | 6,740 | 6,835 |
| New York State Dormitory Authority Revenue (Mental Health Services Facilities Improvement) | 5.000% | 2/15/17 | (Prere.) | 5 | 6 |
| New York State Dormitory Authority Revenue (Mental Health Services Facilities Improvement) | 5.000% | 2/15/19 | (4) | 3,000 | 3,438 |
| New York State Dormitory Authority Revenue (Mental Health Services Facilities Improvement) | 5.000% | 2/15/19 | (4) | 5,030 | 5,765 |
| New York State Dormitory Authority Revenue (Mental Health Services Facilities Improvement) | 5.000% | 2/15/19 | (4) | 3,195 | 3,474 |
| New York State Dormitory Authority Revenue (Mental Health Services Facilities Improvement) | 5.000% | 8/15/20 | (ETM) | 10 | 12 |
| New York State Dormitory Authority Revenue (Mental Health Services Facilities Improvement) | 5.000% | 8/15/20 | | 13,280 | 15,828 |
| New York State Dormitory Authority Revenue (Mental Health Services Facilities Improvement) | 5.000% | 2/15/25 | (4) | 2,735 | 3,104 |
| New York State Dormitory Authority Revenue (Mount Sinai Hospital Obligated Group) | 5.000% | 7/1/26 | | 3,500 | 4,009 |
| New York State Dormitory Authority Revenue (Mount Sinai School of Medicine of | | | | | |
| New York University) | 5.000% | 7/1/21 | | 1,500 | 1,728 |
| New York State Dormitory Authority Revenue (Mount Sinai School of Medicine of | | | | | |
| New York University) | 5.000% | 7/1/23 | (14) | 4,000 | 4,365 |
| New York State Dormitory Authority Revenue (Mount Sinai School of Medicine of | | | | | |
| New York University) | 5.000% | 7/1/24 | (14) | 3,300 | 3,601 |
| New York State Dormitory Authority Revenue (Mount Sinai School of Medicine of | | | | | |
| New York University) | 5.000% | 7/1/27 | (14) | 8,000 | 8,730 |
| New York State Dormitory Authority Revenue (New York University) | 5.750% | 7/1/16 | (14) | 3,500 | 3,811 |
| New York State Dormitory Authority Revenue (New York University) | 6.000% | 7/1/19 | (14) | 1,700 | 2,050 |
| New York State Dormitory Authority Revenue (New York University) | 5.000% | 7/1/22 | | 3,445 | 4,002 |
| New York State Dormitory Authority Revenue (New York University) | 5.000% | 7/1/29 | | 2,000 | 2,239 |
| New York State Dormitory Authority Revenue (Personal Income Tax) | 5.000% | 12/15/14 | | 3,250 | 3,269 |
| New York State Dormitory Authority Revenue (Personal Income Tax) | 5.000% | 3/15/15 | (Prere.) | 255 | 260 |
| New York State Dormitory Authority Revenue (Personal Income Tax) | 5.000% | 3/15/15 | (Prere.) | 4,745 | 4,831 |
| New York State Dormitory Authority Revenue (Personal Income Tax) | 5.000% | 12/15/18 | | 36,270 | 42,113 |
| New York State Dormitory Authority Revenue (Personal Income Tax) | 5.000% | 2/15/20 | (Prere.) | 20 | 24 |
| New York State Dormitory Authority Revenue (Personal Income Tax) | 5.000% | 3/15/20 | | 33,000 | 37,377 |
| New York State Dormitory Authority Revenue (Personal Income Tax) | 5.000% | 2/15/21 | | 12,060 | 14,202 |
| New York State Dormitory Authority Revenue (Personal Income Tax) | 5.000% | 3/15/21 | | 34,650 | 39,209 |
| New York State Dormitory Authority Revenue (Personal Income Tax) | 5.500% | 3/15/22 | (2) | 7,000 | 8,696 |
| New York State Dormitory Authority Revenue (Personal Income Tax) | 5.000% | 12/15/23 | | 5,000 | 5,458 |
| New York State Dormitory Authority Revenue (Personal Income Tax) | 5.000% | 2/15/24 | | 35,885 | 44,094 |
| New York State Dormitory Authority Revenue (Personal Income Tax) | 5.000% | 2/15/24 | | 5,615 | 6,720 |
| New York State Dormitory Authority Revenue (Personal Income Tax) | 5.000% | 2/15/25 | | 8,500 | 10,339 |
| New York State Dormitory Authority Revenue (Personal Income Tax) | 5.000% | 3/15/25 | | 16,820 | 18,198 |
| New York State Dormitory Authority Revenue (Personal Income Tax) | 5.000% | 2/15/26 | | 10,000 | 12,072 |
| New York State Dormitory Authority Revenue (Personal Income Tax) | 5.000% | 2/15/26 | | 23,375 | 27,575 |
| New York State Dormitory Authority Revenue (Personal Income Tax) | 5.000% | 3/15/26 | | 10,000 | 10,811 |
| New York State Dormitory Authority Revenue (Personal Income Tax) | 5.000% | 3/15/26 | | 17,630 | 20,664 |
| New York State Dormitory Authority Revenue (Personal Income Tax) | 5.000% | 3/15/26 | | 2,585 | 3,030 |
| New York State Dormitory Authority Revenue (Personal Income Tax) | 5.000% | 12/15/26 | | 10,300 | 12,301 |
| New York State Dormitory Authority Revenue (Personal Income Tax) | 5.000% | 2/15/27 | | 10,035 | 12,041 |
| New York State Dormitory Authority Revenue (Personal Income Tax) | 5.000% | 3/15/27 | | 30,650 | 35,805 |
| New York State Dormitory Authority Revenue (Personal Income Tax) | 5.000% | 3/15/28 | | 2,565 | 2,797 |
| New York State Dormitory Authority Revenue (Personal Income Tax) | 5.000% | 3/15/28 | | 5,790 | 6,490 |
| New York State Dormitory Authority Revenue (Personal Income Tax) | 5.000% | 3/15/28 | | 20,000 | 22,798 |
| New York State Dormitory Authority Revenue (Personal Income Tax) | 5.000% | 3/15/28 | | 2,875 | 3,277 |
| New York State Dormitory Authority Revenue (Personal Income Tax) | 5.000% | 3/15/28 | | 25,000 | 29,286 |
| New York State Dormitory Authority Revenue (Personal Income Tax) | 5.000% | 2/15/29 | | 10,000 | 11,797 |
| New York State Dormitory Authority Revenue (Personal Income Tax) | 5.000% | 3/15/29 | | 25,000 | 29,206 |
| New York State Dormitory Authority Revenue (Personal Income Tax) | 5.000% | 2/15/30 | | 20,245 | 23,321 |
| New York State Dormitory Authority Revenue (Personal Income Tax) | 5.000% | 2/15/30 | | 10,000 | 11,743 |
| New York State Dormitory Authority Revenue (Personal Income Tax) | 5.000% | 2/15/30 | | 1,000 | 1,154 |
| New York State Dormitory Authority Revenue (Personal Income Tax) | 5.000% | 3/15/30 | | 32,000 | 37,294 |
| New York State Dormitory Authority Revenue (Personal Income Tax) | 5.000% | 3/15/30 | | 30,740 | 36,141 |
| New York State Dormitory Authority Revenue (Personal Income Tax) | 5.000% | 3/15/31 | | 17,240 | 19,787 |
| New York State Dormitory Authority Revenue (Personal Income Tax) | 5.000% | 2/15/32 | | 7,500 | 8,560 |
| New York State Dormitory Authority Revenue (Personal Income Tax) | 5.000% | 2/15/33 | | 1,070 | 1,217 |
| New York State Dormitory Authority Revenue (Personal Income Tax) | 5.000% | 3/15/33 | | 10,135 | 11,545 |
| New York State Dormitory Authority Revenue (Personal Income Tax) | 5.000% | 3/15/34 | | 36,795 | 42,669 |
| New York State Dormitory Authority Revenue (Rockefeller University) VRDO | 0.050% | 11/7/14 | | 21,200 | 21,200 |
| New York State Dormitory Authority Revenue (Royal Charter Properties) VRDO | 0.060% | 11/7/14 | LOC | 4,000 | 4,000 |
| New York State Dormitory Authority Revenue (School Districts Financing Program) | 5.000% | 10/1/19 | | 10,000 | 11,754 |
118
Intermediate-Term Tax-Exempt Fund
| | | | | |
| | | | | Face | Market |
| | | Maturity | | Amount | Value• |
| | Coupon | Date | | ($000) | ($000) |
| New York State Dormitory Authority Revenue (School Districts Financing Program) | 5.000% | 10/1/19 | | 3,475 | 4,092 |
| New York State Dormitory Authority Revenue (School Districts Financing Program) | 5.000% | 10/1/19 | (12) | 2,500 | 2,944 |
| New York State Dormitory Authority Revenue (School Districts Financing Program) | 5.000% | 10/1/20 | | 10,000 | 11,921 |
| New York State Dormitory Authority Revenue (School Districts Financing Program) | 5.000% | 10/1/21 | (4) | 1,250 | 1,503 |
| New York State Dormitory Authority Revenue (School Districts Financing Program) | 5.000% | 10/1/21 | | 750 | 897 |
| New York State Dormitory Authority Revenue (School Districts Financing Program) | 5.000% | 10/1/22 | | 7,000 | 8,094 |
| New York State Dormitory Authority Revenue (School Districts Financing Program) | 5.000% | 10/1/22 | | 16,355 | 19,588 |
| New York State Dormitory Authority Revenue (School Districts Financing Program) | 5.000% | 10/1/22 | | 500 | 601 |
| New York State Dormitory Authority Revenue (School Districts Financing Program) | 5.000% | 10/1/23 | | 19,435 | 23,052 |
| New York State Dormitory Authority Revenue (School Districts Financing Program) | 5.000% | 10/1/23 | (4) | 1,000 | 1,211 |
| New York State Dormitory Authority Revenue (School Districts Financing Program) | 5.000% | 10/1/23 | | 1,250 | 1,485 |
| New York State Dormitory Authority Revenue (School Districts Financing Program) | 5.000% | 10/1/24 | | 6,290 | 7,566 |
| New York State Dormitory Authority Revenue (School Districts Financing Program) | 5.000% | 10/1/24 | (4) | 1,500 | 1,804 |
| New York State Dormitory Authority Revenue (School Districts Financing Program) | 5.000% | 10/1/24 | | 1,000 | 1,180 |
| New York State Dormitory Authority Revenue (School Districts Financing Program) | 5.000% | 10/1/25 | | 7,595 | 9,021 |
| New York State Dormitory Authority Revenue (School Districts Financing Program) | 5.000% | 10/1/25 | (4) | 1,000 | 1,184 |
| New York State Dormitory Authority Revenue (School Districts Financing Program) | 5.000% | 10/1/25 | | 1,000 | 1,165 |
| New York State Dormitory Authority Revenue (School Districts Financing Program) | 5.000% | 10/1/26 | | 4,500 | 5,234 |
| New York State Dormitory Authority Revenue (School Districts Financing Program) | 5.000% | 10/1/26 | (4) | 1,500 | 1,811 |
| New York State Dormitory Authority Revenue (School Districts Financing Program) | 5.000% | 10/1/26 | | 750 | 864 |
| New York State Dormitory Authority Revenue (School Districts Financing Program) | 5.000% | 10/1/27 | (4) | 400 | 466 |
| New York State Dormitory Authority Revenue (School Districts Financing Program) | 5.000% | 10/1/27 | | 500 | 573 |
| New York State Dormitory Authority Revenue (School Districts Financing Program) | 5.000% | 10/1/28 | (4) | 200 | 231 |
| New York State Dormitory Authority Revenue (School Districts Financing Program) | 5.000% | 10/1/28 | | 425 | 484 |
| New York State Dormitory Authority Revenue (School Districts Financing Program) | 5.000% | 10/1/29 | | 500 | 568 |
| New York State Dormitory Authority Revenue (Service Contract) | 5.000% | 7/1/18 | | 11,570 | 13,214 |
| New York State Dormitory Authority Revenue (Service Contract) | 5.000% | 7/1/20 | | 6,815 | 7,917 |
| New York State Dormitory Authority Revenue (Service Contract) | 5.000% | 7/1/21 | | 17,750 | 20,569 |
| New York State Dormitory Authority Revenue (Service Contract) | 5.000% | 7/1/22 | | 3,050 | 3,525 |
| New York State Dormitory Authority Revenue (State University Educational Facilities) | 5.250% | 5/15/15 | | 680 | 699 |
| New York State Dormitory Authority Revenue (State University Educational Facilities) | 5.000% | 5/15/22 | | 9,200 | 11,138 |
| New York State Dormitory Authority Revenue (State University Educational Facilities) | 5.000% | 5/15/28 | | 10,865 | 12,751 |
| New York State Dormitory Authority Revenue (State University Educational Facilities) | 5.000% | 5/15/29 | | 3,000 | 3,509 |
| New York State Dormitory Authority Revenue (State University Educational Facilities) | 5.000% | 5/15/30 | | 1,000 | 1,167 |
| New York State Dormitory Authority Sales Tax Revenue | 5.000% | 3/15/23 | | 2,650 | 3,258 |
| New York State Dormitory Authority Sales Tax Revenue | 5.000% | 3/15/28 | | 5,000 | 6,010 |
| New York State Dormitory Authority Sales Tax Revenue | 5.000% | 3/15/31 | | 18,155 | 21,575 |
| New York State Dormitory Authority Sales Tax Revenue | 5.000% | 3/15/32 | | 5,000 | 5,933 |
| New York State Energy Research & Development Authority Pollution Control Revenue | | | | | |
| (New York State Electric & Gas Corp. Project) | 2.250% | 12/1/15 | | 9,500 | 9,646 |
| New York State Environmental Facilities Corp. Revenue (Personal Income Tax) | 5.250% | 12/15/24 | | 7,240 | 8,365 |
| New York State Environmental Facilities Corp. Revenue (Personal Income Tax) | 5.250% | 12/15/25 | | 15,950 | 18,398 |
| New York State Environmental Facilities Corp. Revenue | | | | | |
| (State Clean Water & Drinking Water Revolving Funds) | 5.000% | 6/15/27 | | 5,000 | 6,004 |
| New York State Environmental Facilities Corp. Revenue | | | | | |
| (State Clean Water & Drinking Water Revolving Funds) | 5.000% | 6/15/27 | | 14,910 | 17,471 |
| New York State Environmental Facilities Corp. Revenue | | | | | |
| (State Clean Water & Drinking Water Revolving Funds) | 5.000% | 6/15/28 | | 11,460 | 13,383 |
| New York State Environmental Facilities Corp. Revenue | | | | | |
| (State Clean Water & Drinking Water Revolving Funds) | 5.000% | 6/15/29 | | 17,830 | 20,714 |
| New York State Environmental Facilities Corp. Revenue | | | | | |
| (State Clean Water & Drinking Water Revolving Funds) | 5.000% | 6/15/30 | | 26,230 | 30,794 |
| New York State Environmental Facilities Corp. Revenue | | | | | |
| (State Clean Water & Drinking Water Revolving Funds) | 5.000% | 6/15/31 | | 3,670 | 4,289 |
| New York State Environmental Facilities Corp. Revenue (State Revolving Funds) | 5.000% | 5/15/16 | | 3,825 | 4,105 |
| New York State Environmental Facilities Corp. Revenue (State Revolving Funds) | 5.000% | 5/15/21 | (Prere.) | 5 | 6 |
| New York State Environmental Facilities Corp. Revenue (State Revolving Funds) | 5.000% | 5/15/21 | (Prere.) | 5 | 6 |
| New York State Environmental Facilities Corp. Revenue (State Revolving Funds) | 5.000% | 5/15/21 | (Prere.) | 5 | 6 |
| New York State Environmental Facilities Corp. Revenue (State Revolving Funds) | 5.000% | 5/15/21 | (Prere.) | 5 | 6 |
| New York State Environmental Facilities Corp. Revenue (State Revolving Funds) | 5.000% | 5/15/21 | (Prere.) | 10 | 12 |
| New York State Environmental Facilities Corp. Revenue (State Revolving Funds) | 5.000% | 5/15/21 | (Prere.) | 5 | 6 |
| New York State Environmental Facilities Corp. Revenue (State Revolving Funds) | 5.000% | 5/15/21 | (Prere.) | 5 | 6 |
| New York State Environmental Facilities Corp. Revenue (State Revolving Funds) | 5.000% | 11/15/23 | | 3,785 | 4,541 |
| New York State Environmental Facilities Corp. Revenue (State Revolving Funds) | 5.000% | 11/15/24 | | 3,470 | 4,146 |
| New York State Environmental Facilities Corp. Revenue (State Revolving Funds) | 5.000% | 11/15/25 | | 6,030 | 7,168 |
| New York State Environmental Facilities Corp. Revenue (State Revolving Funds) | 5.000% | 11/15/27 | | 3,345 | 3,929 |
| New York State Environmental Facilities Corp. Revenue (State Revolving Funds) | 5.000% | 11/15/28 | | 6,150 | 7,230 |
| New York State Environmental Facilities Corp. Revenue (State Revolving Funds) | 5.000% | 11/15/29 | | 5,315 | 6,263 |
| New York State Environmental Facilities Corp. Revenue (State Revolving Funds) | 5.000% | 11/15/30 | | 1,835 | 2,161 |
| New York State GO | 4.500% | 2/1/17 | | 14,125 | 15,398 |
| New York State GO | 4.500% | 2/1/18 | | 24,735 | 27,683 |
119
Intermediate-Term Tax-Exempt Fund
| | | | | |
| | | | | Face | Market |
| | | Maturity | | Amount | Value• |
| | Coupon | Date | | ($000) | ($000) |
| New York State GO | 4.500% | 2/1/19 | | 10,670 | 12,170 |
| New York State GO | 5.000% | 2/1/30 | | 3,000 | 3,444 |
| New York State GO | 5.000% | 2/15/30 | | 20,000 | 23,295 |
| New York State Housing Finance Agency Housing Revenue (10 Liberty Street) VRDO | 0.060% | 11/7/14 | LOC | 11,300 | 11,300 |
| New York State Housing Finance Agency Revenue (Personal Income Tax) VRDO | 0.050% | 11/7/14 | | 41,275 | 41,275 |
| New York State Housing Finance Agency Revenue (Service Contract) VRDO | 0.070% | 11/7/14 | LOC | 5,115 | 5,115 |
| 2 New York State Liberty Development Corp. Liberty Revenue (3 World Trade Center Project) | 5.150% | 11/15/34 | | 16,980 | 17,244 |
| New York State Local Government Assistance Corp. Revenue | 5.500% | 4/1/17 | (4) | 5,000 | 5,391 |
| New York State Local Government Assistance Corp. Revenue | 5.500% | 4/1/17 | | 1,250 | 1,352 |
| New York State Local Government Assistance Corp. Revenue | 5.000% | 4/1/19 | | 6,640 | 7,764 |
| New York State Local Government Assistance Corp. Revenue VRDO | 0.050% | 11/7/14 | | 9,085 | 9,085 |
| New York State Local Government Assistance Corp. Revenue VRDO | 0.050% | 11/7/14 | | 40,590 | 40,590 |
| New York State Mortgage Agency Revenue (NYHELP’s Education Loan) | 5.000% | 11/1/22 | | 50 | 55 |
| New York State Thruway Authority Revenue | 5.000% | 1/1/15 | (Prere.) | 4,555 | 4,592 |
| New York State Thruway Authority Revenue | 5.000% | 1/1/15 | (Prere.) | 3,395 | 3,423 |
| New York State Thruway Authority Revenue | 5.000% | 1/1/20 | (14) | 8,940 | 10,043 |
| New York State Thruway Authority Revenue | 5.000% | 1/1/21 | (14) | 8,000 | 8,979 |
| New York State Thruway Authority Revenue | 5.000% | 1/1/22 | (14) | 10,000 | 11,204 |
| New York State Thruway Authority Revenue | 5.000% | 1/1/23 | (2) | 15,445 | 15,564 |
| New York State Thruway Authority Revenue | 5.000% | 1/1/24 | (2) | 11,490 | 11,579 |
| New York State Thruway Authority Revenue | 5.000% | 1/1/29 | | 21,195 | 24,292 |
| New York State Thruway Authority Revenue | 5.000% | 1/1/31 | | 7,000 | 7,906 |
| New York State Thruway Authority Revenue (Highway & Bridge Trust Fund) | 5.000% | 10/1/15 | (Prere.) | 670 | 700 |
| New York State Thruway Authority Revenue (Highway & Bridge Trust Fund) | 5.000% | 10/1/15 | (Prere.) | 800 | 835 |
| New York State Thruway Authority Revenue (Highway & Bridge Trust Fund) | 5.000% | 4/1/16 | (14) | 8,185 | 8,538 |
| New York State Thruway Authority Revenue (Highway & Bridge Trust Fund) | 5.000% | 4/1/17 | (14) | 4,330 | 4,516 |
| New York State Thruway Authority Revenue (Highway & Bridge Trust Fund) | 5.000% | 4/1/18 | (2) | 5,195 | 5,418 |
| New York State Thruway Authority Revenue (Highway & Bridge Trust Fund) | 5.000% | 4/1/18 | | 13,260 | 15,083 |
| New York State Thruway Authority Revenue (Highway & Bridge Trust Fund) | 5.000% | 4/1/19 | | 6,650 | 7,342 |
| New York State Thruway Authority Revenue (Highway & Bridge Trust Fund) | 5.000% | 4/1/20 | | 5,650 | 6,235 |
| New York State Thruway Authority Revenue (Highway & Bridge Trust Fund) | 5.000% | 4/1/20 | | 10,400 | 11,931 |
| New York State Thruway Authority Revenue (Highway & Bridge Trust Fund) | 5.000% | 4/1/20 | | 9,890 | 11,566 |
| New York State Thruway Authority Revenue (Highway & Bridge Trust Fund) | 5.000% | 4/1/20 | | 11,395 | 12,757 |
| New York State Thruway Authority Revenue (Highway & Bridge Trust Fund) | 5.000% | 4/1/23 | | 8,515 | 9,538 |
| New York State Thruway Authority Revenue (Highway & Bridge Trust Fund) | 5.000% | 4/1/25 | | 4,500 | 5,100 |
| New York State Thruway Authority Revenue (Highway & Bridge Trust Fund) | 5.000% | 4/1/27 | | 21,600 | 24,995 |
| New York State Thruway Authority Revenue (Highway & Bridge Trust Fund) | 5.000% | 4/1/27 | | 7,000 | 7,889 |
| New York State Thruway Authority Revenue (Highway & Bridge Trust Fund) | 5.000% | 4/1/28 | | 13,505 | 15,690 |
| New York State Thruway Authority Revenue (Highway & Bridge Trust Fund) | 5.000% | 4/1/30 | | 27,175 | 31,505 |
| New York State Thruway Authority Revenue (Personal Income Tax) | 5.000% | 3/15/21 | | 24,890 | 28,562 |
| New York State Thruway Authority Revenue (Personal Income Tax) | 5.250% | 3/15/27 | | 7,115 | 7,941 |
| New York State Thruway Authority Revenue (Personal Income Tax) | 5.000% | 3/15/29 | | 7,000 | 7,954 |
| New York State Thruway Authority Revenue (Second Generation Highway & Bridge Trust Fund) | 5.000% | 4/1/22 | | 22,710 | 26,315 |
| New York State Urban Development Corp. Revenue | 5.000% | 12/15/14 | | 3,125 | 3,144 |
| New York State Urban Development Corp. Revenue | 5.000% | 1/1/15 | | 19,500 | 19,660 |
| New York State Urban Development Corp. Revenue | 5.000% | 12/15/15 | | 4,000 | 4,217 |
| New York State Urban Development Corp. Revenue | 5.000% | 1/1/16 | | 22,360 | 23,605 |
| New York State Urban Development Corp. Revenue | 5.250% | 1/1/17 | | 12,000 | 13,232 |
| New York State Urban Development Corp. Revenue | 5.250% | 1/1/18 | | 36,140 | 41,195 |
| New York State Urban Development Corp. Revenue | 5.250% | 1/1/22 | | 7,500 | 8,587 |
| New York State Urban Development Corp. Revenue | 4.375% | 3/15/22 | | 9,020 | 9,967 |
| New York State Urban Development Corp. Revenue | 5.000% | 12/15/22 | | 2,000 | 2,299 |
| New York State Urban Development Corp. Revenue | 5.000% | 12/15/23 | | 2,615 | 3,001 |
| New York State Urban Development Corp. Revenue | 5.000% | 1/1/26 | | 7,910 | 8,898 |
| New York State Urban Development Corp. Revenue (Personal Income Tax) | 5.000% | 12/15/18 | | 20,000 | 23,222 |
| New York State Urban Development Corp. Revenue (Personal Income Tax) | 5.000% | 12/15/19 | | 30,760 | 36,418 |
| New York State Urban Development Corp. Revenue (Personal Income Tax) | 5.000% | 12/15/20 | | 36,240 | 42,946 |
| New York State Urban Development Corp. Revenue (Personal Income Tax) | 5.500% | 3/15/21 | (14) | 10,000 | 12,265 |
| New York State Urban Development Corp. Revenue (Personal Income Tax) | 5.000% | 12/15/21 | | 18,310 | 21,648 |
| New York State Urban Development Corp. Revenue (Personal Income Tax) | 5.000% | 3/15/22 | | 18,695 | 22,558 |
| New York State Urban Development Corp. Revenue (Personal Income Tax) | 5.500% | 3/15/22 | (14) | 21,000 | 26,089 |
| New York State Urban Development Corp. Revenue (Personal Income Tax) | 5.000% | 3/15/23 | | 11,150 | 13,515 |
| New York State Urban Development Corp. Revenue (Personal Income Tax) | 5.000% | 12/15/23 | | 7,180 | 8,094 |
| New York State Urban Development Corp. Revenue (Personal Income Tax) | 5.000% | 3/15/26 | | 18,425 | 21,596 |
| New York State Urban Development Corp. Revenue (Personal Income Tax) | 5.000% | 3/15/28 | | 6,950 | 7,922 |
| New York State Urban Development Corp. Revenue (Personal Income Tax) | 5.000% | 3/15/30 | | 14,910 | 17,377 |
| New York State Urban Development Corp. Revenue (Personal Income Tax) | 5.000% | 3/15/31 | | 16,000 | 18,494 |
| New York State Urban Development Corp. Revenue (Personal Income Tax) | 5.000% | 3/15/31 | | 28,030 | 32,399 |
| New York State Urban Development Corp. Revenue (Personal Income Tax) | 5.000% | 3/15/31 | | 10,000 | 11,612 |
| New York State Urban Development Corp. Revenue (Personal Income Tax) | 5.000% | 3/15/33 | | 30,890 | 35,507 |
| New York State Urban Development Corp. Revenue (Personal Income Tax) | 5.000% | 3/15/33 | | 28,000 | 32,185 |
120
Intermediate-Term Tax-Exempt Fund
| | | | | |
| | | | | Face | Market |
| | | Maturity | | Amount | Value• |
| | Coupon | Date | | ($000) | ($000) |
| New York State Urban Development Corp. Revenue (Service Contract) | 5.000% | 1/1/15 | | 50,000 | 50,410 |
| New York State Urban Development Corp. Revenue (Service Contract) | 5.000% | 1/1/18 | | 8,000 | 9,057 |
| New York State Urban Development Corp. Revenue (Service Contract) | 5.000% | 1/1/18 | | 24,275 | 27,481 |
| New York State Urban Development Corp. Revenue (Service Contract) | 5.000% | 1/1/19 | | 3,625 | 4,204 |
| New York State Urban Development Corp. Revenue (Service Contract) | 5.250% | 1/1/19 | (4) | 7,050 | 7,965 |
| New York State Urban Development Corp. Revenue (Service Contract) | 5.000% | 1/1/20 | | 8,165 | 9,634 |
| New York State Urban Development Corp. Revenue (Service Contract) | 5.000% | 1/1/21 | | 11,345 | 13,306 |
| New York State Urban Development Corp. Revenue (Service Contract) | 5.000% | 1/1/22 | | 5,120 | 5,972 |
| New York State Urban Development Corp. Revenue (Service Contract) | 5.250% | 1/1/25 | | 15,000 | 17,105 |
| New York State Urban Development Corp. Revenue (Service Contract) VRDO | 0.050% | 11/7/14 | | 4,900 | 4,900 |
| New York State Urban Development Corp. Revenue (Service Contract) VRDO | 0.060% | 11/7/14 | | 17,315 | 17,315 |
| New York State Urban Development Corp. Revenue (Service Contract) VRDO | 0.070% | 11/7/14 | | 18,500 | 18,500 |
| Niagara NY Area Development Corp. Revenue (Niagara University Project) | 5.000% | 5/1/17 | | 250 | 271 |
| Niagara NY Area Development Corp. Revenue (Niagara University Project) | 5.000% | 5/1/18 | | 280 | 309 |
| Niagara NY Area Development Corp. Revenue (Niagara University Project) | 5.000% | 5/1/19 | | 350 | 392 |
| Port Authority of New York & New Jersey Revenue | 5.000% | 9/1/27 | | 1,250 | 1,516 |
| Port Authority of New York & New Jersey Revenue | 5.250% | 7/15/30 | | 18,635 | 21,367 |
| Port Authority of New York & New Jersey Revenue | 5.000% | 9/1/31 | | 2,450 | 2,915 |
| Port Authority of New York & New Jersey Revenue | 5.000% | 6/1/33 | | 10,000 | 11,675 |
| Port Authority of New York & New Jersey Revenue | 5.000% | 9/1/33 | | 1,000 | 1,179 |
| Port Authority of New York & New Jersey Special Obligation Revenue | | | | | |
| (John F. Kennedy International Air Terminal LLC) | 6.500% | 12/1/28 | | 25,000 | 26,418 |
| Syracuse NY Industrial Development Agency Civic Facility Revenue | | | | | |
| (Syracuse University Project) VRDO | 0.102% | 12/1/29 | (2) | 4,375 | 4,009 |
| Tobacco Settlement Financing Corp. New York Revenue | 5.000% | 6/1/15 | | 15,000 | 15,427 |
| Tobacco Settlement Financing Corp. New York Revenue | 5.000% | 6/1/22 | | 13,040 | 13,925 |
| Tobacco Settlement Financing Corp. New York Revenue | 5.000% | 6/1/22 | | 5,000 | 5,543 |
| Triborough Bridge & Tunnel Authority New York Revenue | 5.250% | 11/15/14 | | 3,130 | 3,136 |
| Triborough Bridge & Tunnel Authority New York Revenue | 5.250% | 11/15/15 | | 3,000 | 3,159 |
| Triborough Bridge & Tunnel Authority New York Revenue | 5.000% | 1/1/16 | | 3,000 | 3,167 |
| Triborough Bridge & Tunnel Authority New York Revenue | 5.000% | 11/15/16 | | 2,000 | 2,187 |
| Triborough Bridge & Tunnel Authority New York Revenue | 5.000% | 5/15/18 | (Prere.) | 4,550 | 5,234 |
| Triborough Bridge & Tunnel Authority New York Revenue | 5.000% | 11/15/25 | | 24,975 | 28,606 |
| Triborough Bridge & Tunnel Authority New York Revenue | 5.000% | 1/1/26 | | 15,000 | 17,661 |
| Triborough Bridge & Tunnel Authority New York Revenue | 5.000% | 1/1/28 | | 15,000 | 17,727 |
| Triborough Bridge & Tunnel Authority New York Revenue | 5.000% | 11/15/30 | | 7,415 | 8,426 |
| Triborough Bridge & Tunnel Authority New York Revenue PUT | 5.000% | 11/15/14 | | 20,000 | 20,037 |
| Triborough Bridge & Tunnel Authority New York Revenue PUT | 5.000% | 11/15/15 | | 20,000 | 20,977 |
| United Nations Development Corp. New York Revenue | 5.000% | 7/1/21 | | 7,200 | 8,273 |
| Utility Debt Securitization Authority New York Revenue | 5.000% | 12/15/29 | | 33,000 | 39,483 |
| Utility Debt Securitization Authority New York Revenue | 5.000% | 12/15/30 | | 17,500 | 20,859 |
| Utility Debt Securitization Authority New York Revenue | 5.000% | 12/15/31 | | 25,140 | 29,832 |
| Utility Debt Securitization Authority New York Revenue | 5.000% | 12/15/32 | | 15,350 | 18,160 |
| Westchester County NY GO | 5.000% | 7/1/21 | (ETM) | 240 | 293 |
| Westchester County NY GO | 5.000% | 7/1/21 | | 12,075 | 14,700 |
| Westchester County NY Health Care Corp. Revenue | 5.000% | 11/1/30 | | 1,935 | 2,130 |
| Westchester County NY Health Care Corp. Revenue | 6.000% | 11/1/30 | | 1,000 | 1,165 |
| | | | | | 6,611,646 |
| North Carolina (1.2%) | | | | | |
| Board of Governors of the University of North Carolina Revenue | | | | | |
| (University of North Carolina Hospitals at Chapel Hill) VRDO | 0.050% | 11/7/14 | | 16,115 | 16,115 |
| Charlotte NC COP | 5.000% | 6/1/16 | | 2,000 | 2,147 |
| Charlotte NC GO | 5.000% | 7/1/16 | | 5,000 | 5,388 |
| Charlotte NC GO | 5.000% | 7/1/22 | | 3,280 | 4,030 |
| Charlotte NC GO | 5.000% | 7/1/23 | | 3,355 | 4,082 |
| Durham Capital Financing Corp. North Carolina Limited Obligation Revenue | 5.000% | 6/1/33 | | 3,210 | 3,729 |
| Forsyth County NC GO VRDO | 0.060% | 11/7/14 | | 2,145 | 2,145 |
| Guilford County NC GO | 5.000% | 3/1/22 | | 3,220 | 3,930 |
| Mecklenburg County NC COP | 5.000% | 2/1/22 | | 3,390 | 3,856 |
| Mecklenburg County NC COP | 5.000% | 2/1/23 | | 1,200 | 1,360 |
| Mecklenburg County NC COP | 5.000% | 2/1/25 | | 1,000 | 1,125 |
| Mecklenburg County NC COP | 4.750% | 2/1/26 | | 2,500 | 2,740 |
| Mecklenburg County NC GO | 5.000% | 2/1/17 | | 3,635 | 4,003 |
| Mecklenburg County NC GO | 5.000% | 3/1/17 | | 1,000 | 1,105 |
| Mecklenburg County NC GO | 5.000% | 3/1/20 | | 3,715 | 4,310 |
| Mecklenburg County NC GO | 5.000% | 2/1/21 | | 1,120 | 1,355 |
| New Hanover County NC Hospital Revenue (New Hanover Regional Medical Center Project) | 5.000% | 10/1/27 | (4) | 9,900 | 11,014 |
| 1 North Carolina Capital Facilities Finance Agency Revenue (Duke University Project) TOB VRDO | 0.070% | 11/3/14 | | 9,200 | 9,200 |
| 1 North Carolina Capital Facilities Finance Agency Revenue (Duke University Project) TOB VRDO | 0.050% | 11/7/14 | | 1,900 | 1,900 |
| North Carolina Capital Facilities Financial Solid Waste Disposal Revenue (Duke Energy) | 4.375% | 10/1/31 | | 4,250 | 4,557 |
| North Carolina Capital Improvement Revenue | 5.000% | 5/1/17 | | 11,115 | 12,341 |
121
Intermediate-Term Tax-Exempt Fund
| | | | | |
| | | | | Face | Market |
| | | Maturity | | Amount | Value• |
| | Coupon | Date | | ($000) | ($000) |
| North Carolina Capital Improvement Revenue | 5.000% | 5/1/19 | | 15,500 | 18,098 |
| North Carolina Capital Improvement Revenue | 5.000% | 5/1/20 | | 15,385 | 18,260 |
| North Carolina Capital Improvement Revenue | 5.000% | 5/1/21 | | 13,495 | 16,191 |
| North Carolina Capital Improvement Revenue | 5.000% | 5/1/27 | | 30,510 | 35,422 |
| North Carolina Capital Improvement Revenue | 5.000% | 5/1/29 | | 28,585 | 32,966 |
| North Carolina Eastern Municipal Power Agency Power Systems Revenue | 3.000% | 1/1/16 | | 1,815 | 1,871 |
| North Carolina Eastern Municipal Power Agency Power Systems Revenue | 5.000% | 1/1/16 | | 4,000 | 4,216 |
| North Carolina Eastern Municipal Power Agency Power Systems Revenue | 5.000% | 1/1/16 | | 1,500 | 1,581 |
| North Carolina Eastern Municipal Power Agency Power Systems Revenue | 5.000% | 1/1/16 | | 5,000 | 5,270 |
| North Carolina Eastern Municipal Power Agency Power Systems Revenue | 5.000% | 1/1/26 | | 22,510 | 25,612 |
| North Carolina Eastern Municipal Power Agency Power Systems Revenue | 5.500% | 1/1/26 | | 3,000 | 3,474 |
| North Carolina GAN PUT | 4.000% | 3/1/18 | | 11,000 | 11,893 |
| North Carolina GO | 5.000% | 6/1/16 | | 15,050 | 16,163 |
| North Carolina GO | 5.000% | 9/1/16 | | 1,165 | 1,264 |
| North Carolina GO | 5.000% | 3/1/17 | | 1,925 | 2,127 |
| North Carolina GO | 5.000% | 3/1/17 | (Prere.) | 700 | 774 |
| North Carolina GO | 5.000% | 3/1/17 | (Prere.) | 9,300 | 10,288 |
| North Carolina GO | 5.000% | 6/1/19 | | 5,000 | 5,881 |
| North Carolina GO | 4.000% | 5/1/23 | | 39,470 | 45,680 |
| North Carolina Infrastructure Financial Corp. Capital Improvements COP | 5.000% | 2/1/18 | (4) | 9,675 | 10,618 |
| North Carolina Infrastructure Financial Corp. Capital Improvements COP | 5.000% | 2/1/19 | (4) | 10,000 | 11,023 |
| North Carolina Medical Care Commission Health Care Facilities Revenue | | | | | |
| (Cape Fear Valley Health System) | 5.000% | 10/1/21 | | 8,610 | 9,971 |
| North Carolina Medical Care Commission Health Care Facilities Revenue | | | | | |
| (Cape Fear Valley Health System) | 5.000% | 10/1/22 | | 9,155 | 10,574 |
| North Carolina Medical Care Commission Health Care Facilities Revenue | | | | | |
| (Novant Health Obligated Group) | 5.000% | 11/1/30 | | 2,435 | 2,720 |
| North Carolina Medical Care Commission Health Care Facilities Revenue (WakeMed) | 5.000% | 10/1/31 | | 12,500 | 14,016 |
| North Carolina Medical Care Commission Hospital Revenue (North Carolina Baptist Hospital) | 5.000% | 6/1/20 | | 1,375 | 1,611 |
| North Carolina Medical Care Commission Hospital Revenue (North Carolina Baptist Hospital) | 5.000% | 6/1/21 | | 5,000 | 5,780 |
| North Carolina Medical Care Commission Hospital Revenue (North Carolina Baptist Hospital) | 5.000% | 6/1/22 | | 5,000 | 5,717 |
| North Carolina Medical Care Commission Hospital Revenue | | | | | |
| (Southeastern Regional Medical Center) | 5.000% | 6/1/23 | | 1,825 | 2,087 |
| North Carolina Medical Care Commission Hospital Revenue | | | | | |
| (Southeastern Regional Medical Center) | 5.000% | 6/1/25 | | 1,035 | 1,169 |
| North Carolina Municipal Power Agency Revenue | 5.250% | 1/1/18 | | 5,000 | 5,682 |
| North Carolina Municipal Power Agency Revenue | 5.250% | 1/1/19 | | 3,085 | 3,479 |
| North Carolina Municipal Power Agency Revenue | 5.250% | 1/1/20 | | 2,000 | 2,234 |
| North Carolina Municipal Power Agency Revenue | 5.000% | 1/1/30 | | 4,500 | 5,043 |
| North Carolina State University at Raleigh General Revenue | 5.000% | 10/1/25 | | 2,655 | 3,246 |
| University of North Carolina University System Revenue | 5.250% | 10/1/27 | | 1,720 | 1,983 |
| University of North Carolina University System Revenue | 5.250% | 10/1/28 | | 1,590 | 1,837 |
| Wake County NC GO | 5.000% | 3/1/21 | | 3,125 | 3,785 |
| Wake County NC Limited Obligation Revenue | 5.000% | 6/1/28 | | 3,000 | 3,442 |
| Winston-Salem NC Revenue | 4.000% | 3/1/15 | | 2,400 | 2,431 |
| Winston-Salem NC Water & Sewer System Revenue VRDO | 0.040% | 11/7/14 | | 8,320 | 8,320 |
| | | | | | 474,231 |
| North Dakota (0.0%) | | | | | |
| Burleigh County ND Health Care Revenue (St. Alexis Medical Center Project) | 5.000% | 7/1/28 | | 1,500 | 1,649 |
| Burleigh County ND Health Care Revenue (St. Alexis Medical Center Project) | 5.000% | 7/1/29 | | 1,000 | 1,097 |
| Burleigh County ND Health Care Revenue (St. Alexis Medical Center Project) | 5.000% | 7/1/31 | | 1,300 | 1,421 |
| | | | | | 4,167 |
| Ohio (2.9%) | | | | | |
| Akron OH Bath & Copley Joint Township Hospital District Revenue | | | | | |
| (Children’s Hospital Medical Center of Akron) | 5.000% | 11/15/32 | | 7,500 | 8,409 |
| Akron OH GO | 5.000% | 12/1/15 | (Prere.) | 5,300 | 5,577 |
| Akron OH Income Tax Revenue (Community Learning Centers) | 5.000% | 12/1/27 | | 5,830 | 6,780 |
| Allen County OH Hospital Facilities Revenue (Catholic Healthcare Partners) | 5.000% | 9/1/17 | | 14,645 | 16,335 |
| Allen County OH Hospital Facilities Revenue (Catholic Healthcare Partners) | 5.250% | 9/1/27 | | 30,000 | 34,434 |
| American Municipal Power Ohio Inc. Revenue (Fremont Energy Center Project) | 5.000% | 2/15/23 | | 2,375 | 2,780 |
| American Municipal Power Ohio Inc. Revenue (Fremont Energy Center Project) | 5.250% | 2/15/29 | | 6,120 | 6,998 |
| American Municipal Power Ohio Inc. Revenue (Fremont Energy Center Project) | 5.000% | 2/15/31 | | 9,145 | 10,170 |
| American Municipal Power Ohio Inc. Revenue (Fremont Energy Center Project) | 5.000% | 2/15/32 | | 13,480 | 14,953 |
| American Municipal Power Ohio Inc. Revenue (Hydroelectric Projects) | 5.250% | 2/15/18 | | 16,000 | 18,201 |
| American Municipal Power Ohio Inc. Revenue (Hydroelectric Projects) | 5.250% | 2/15/19 | | 13,050 | 15,192 |
| American Municipal Power Ohio Inc. Revenue (Hydroelectric Projects) | 5.000% | 2/15/20 | | 10,310 | 12,083 |
| American Municipal Power Ohio Inc. Revenue (Prairie State Energy Campus Project) | 5.000% | 2/15/16 | | 4,000 | 4,235 |
| American Municipal Power Ohio Inc. Revenue (Prairie State Energy Campus Project) | 5.000% | 2/15/17 | | 6,770 | 7,434 |
| American Municipal Power Ohio Inc. Revenue (Prairie State Energy Campus Project) | 5.000% | 2/15/24 | (12) | 5,000 | 5,491 |
| American Municipal Power Ohio Inc. Revenue (Prairie State Energy Campus Project) | 5.250% | 2/15/28 | | 17,555 | 19,509 |
| Buckeye Tobacco Settlement Financing Authority Ohio Revenue | 5.125% | 6/1/24 | | 22,345 | 18,647 |
122
Intermediate-Term Tax-Exempt Fund
| | | | | |
| | | | | Face | Market |
| | | Maturity | | Amount | Value• |
| | Coupon | Date | | ($000) | ($000) |
| Cincinnati OH City School District GO | 5.250% | 12/1/20 | (14) | 7,000 | 8,460 |
| Cincinnati OH City School District GO | 5.250% | 6/1/21 | | 3,810 | 4,519 |
| Cincinnati OH City School District GO | 5.250% | 12/1/21 | (14) | 5,710 | 6,967 |
| Cincinnati OH City School District GO | 5.250% | 6/1/22 | | 3,180 | 3,761 |
| Cincinnati OH City School District GO | 5.250% | 12/1/22 | (14) | 10,000 | 12,349 |
| Cleveland OH Municipal School District GO | 5.000% | 12/1/26 | | 1,660 | 1,913 |
| Cleveland OH Municipal School District GO | 5.000% | 12/1/27 | | 1,000 | 1,147 |
| Cleveland OH Public Power System Revenue | 5.000% | 11/15/20 | (14) | 4,500 | 4,875 |
| Cleveland OH Public Power System Revenue | 5.000% | 11/15/21 | (14) | 7,455 | 8,069 |
| Cleveland OH Public Power System Revenue | 5.000% | 11/15/22 | (14) | 14,065 | 15,200 |
| Cleveland OH Public Power System Revenue | 5.000% | 11/15/23 | (14) | 7,505 | 8,090 |
| Cleveland OH Public Power System Revenue | 5.000% | 11/15/24 | (14) | 7,350 | 7,923 |
| Cleveland OH Water Revenue | 5.000% | 1/1/23 | | 2,400 | 2,857 |
| Cleveland OH Water Revenue | 5.000% | 1/1/25 | | 2,500 | 2,938 |
| Cleveland OH Water Revenue | 5.000% | 1/1/26 | | 2,250 | 2,630 |
| Cleveland State University Ohio General Receipts Revenue | 5.000% | 6/1/29 | | 5,000 | 5,682 |
| Cleveland State University Ohio General Receipts Revenue | 5.000% | 6/1/30 | | 5,225 | 5,927 |
| Cleveland State University Ohio General Receipts Revenue | 5.000% | 6/1/31 | | 8,640 | 9,765 |
| Cleveland State University Ohio General Receipts Revenue | 5.000% | 6/1/32 | | 9,060 | 10,221 |
| Cleveland-Cuyahoga County OH Port Authority Revenue | | | | | |
| (Carnegie/89th Garage & Service Center LLC Project) VRDO | 0.050% | 11/7/14 | LOC | 15,300 | 15,300 |
| Cleveland-Cuyahoga County OH Port Authority Revenue (Cleveland Museum of Art Project) VRDO | 0.040% | 11/7/14 | | 4,115 | 4,115 |
| Cleveland-Cuyahoga County OH Port Authority Revenue (Cleveland Museum of Art Project) VRDO | 0.050% | 11/7/14 | | 15,250 | 15,250 |
| Columbus OH City School District GO | 4.000% | 12/1/17 | | 1,000 | 1,098 |
| Columbus OH City School District School Facilities Construction & Improvement GO | 5.000% | 12/1/16 | (4) | 6,000 | 6,557 |
| Columbus OH City School District School Facilities Construction & Improvement GO | 4.000% | 12/1/19 | | 2,000 | 2,233 |
| Columbus OH GO | 5.000% | 7/1/16 | | 2,500 | 2,693 |
| Columbus OH GO | 5.000% | 2/15/22 | | 3,000 | 3,655 |
| Columbus OH GO | 5.000% | 8/15/24 | | 10,295 | 12,807 |
| Columbus OH Metropolitan Library Special Obligation Revenue | 5.000% | 12/1/24 | | 1,325 | 1,552 |
| Cuyahoga County OH Economic Development Revenue (Med Mart/Convention Center Project) | 5.000% | 12/1/20 | | 7,000 | 8,235 |
| Cuyahoga County OH Economic Development Revenue (Med Mart/Convention Center Project) | 5.000% | 12/1/21 | | 7,300 | 8,447 |
| Cuyahoga County OH GO | 5.000% | 12/1/19 | | 2,120 | 2,505 |
| Cuyahoga OH Community College District Revenue | 5.000% | 8/1/22 | | 6,610 | 7,685 |
| Cuyahoga OH Community College District Revenue | 5.000% | 8/1/23 | | 3,470 | 4,023 |
| Cuyahoga OH Community College District Revenue | 5.000% | 8/1/24 | | 2,500 | 2,890 |
| Dayton OH City School District GO | 5.000% | 11/1/21 | | 9,210 | 10,995 |
| Dayton OH City School District GO | 5.000% | 11/1/22 | | 5,500 | 6,614 |
| Fairfield County OH Hospital Facilities Revenue (Fairfield Medical Center) | 5.125% | 6/15/33 | | 11,000 | 12,012 |
| Franklin County OH Hospital Facilities Revenue (OhioHealth Corp.) VRDO | 0.040% | 11/7/14 | | 18,100 | 18,100 |
| Franklin County OH Hospital Facilities Revenue (OhioHealth Corp.) VRDO | 0.040% | 11/7/14 | | 18,000 | 18,000 |
| Franklin County OH Hospital Revenue (Nationwide Children’s Hospital Project) VRDO | 0.050% | 11/7/14 | | 1,645 | 1,645 |
| Franklin County OH Hospital Revenue (Nationwide Hospital) VRDO | 0.030% | 11/7/14 | | 5,680 | 5,680 |
| Hamilton County OH Economic Development Revenue (King Highland Community | | | | | |
| Urban Redevelopment Corp.–University of Cincinnati Lessee Project) | 5.000% | 6/1/33 | (14) | 5,000 | 5,251 |
| Hamilton County OH Sales Tax Revenue | 5.000% | 12/1/18 | (2) | 7,950 | 8,677 |
| Hamilton County OH Sales Tax Revenue | 5.000% | 12/1/19 | (2) | 22,380 | 24,416 |
| Hamilton County OH Sales Tax Revenue | 5.000% | 12/1/23 | (2) | 18,515 | 20,130 |
| Huber Heights OH City School District GO | 4.750% | 12/1/24 | | 890 | 1,017 |
| Huber Heights OH City School District GO | 4.875% | 12/1/27 | | 150 | 172 |
| Huber Heights OH City School District GO | 5.000% | 12/1/28 | | 1,000 | 1,144 |
| Huber Heights OH City School District GO | 5.000% | 12/1/30 | | 1,000 | 1,143 |
| Kent State University OH Revenue | 5.000% | 5/1/29 | | 1,000 | 1,152 |
| Kent State University OH Revenue | 5.000% | 5/1/30 | | 1,750 | 2,011 |
| Kent State University OH Revenue | 5.000% | 5/1/31 | | 4,000 | 4,580 |
| Lorain County OH Hospital Facilities Revenue (Catholic Healthcare Partners) | 5.000% | 4/1/16 | (4) | 6,200 | 6,601 |
| Lorain County OH Hospital Facilities Revenue (Catholic Healthcare Partners) | 5.000% | 4/1/16 | (4) | 6,200 | 6,601 |
| Lorain County OH Hospital Facilities Revenue (Catholic Healthcare Partners) | 5.000% | 4/1/17 | (4) | 6,600 | 7,272 |
| Lorain County OH Hospital Facilities Revenue (Catholic Healthcare Partners) | 5.000% | 4/1/17 | (4) | 6,600 | 7,272 |
| Lorain County OH Hospital Facilities Revenue (Catholic Healthcare Partners) | 5.000% | 4/1/18 | (4) | 7,300 | 8,236 |
| Lorain County OH Hospital Facilities Revenue (Catholic Healthcare Partners) | 5.000% | 4/1/18 | (4) | 7,300 | 8,236 |
| Lucas County OH Hospital Revenue (ProMedica Healthcare Obligated Group) | 5.000% | 11/15/26 | | 11,920 | 13,568 |
| Lucas County OH Hospital Revenue (ProMedica Healthcare Obligated Group) | 5.750% | 11/15/31 | | 6,000 | 7,209 |
| Miami University of Ohio General Receipts Revenue | 5.000% | 9/1/31 | | 2,000 | 2,264 |
| Montgomery County OH Revenue (Miami Valley Hospital) VRDO | 0.060% | 11/3/14 | | 18,900 | 18,900 |
| Montgomery County OH Revenue (Miami Valley Hospital) VRDO | 0.060% | 11/3/14 | | 3,985 | 3,985 |
| Montgomery County OH Revenue (Miami Valley Hospital) VRDO | 0.060% | 11/3/14 | | 1,200 | 1,200 |
| Montgomery County OH Revenue (Miami Valley Hospital) VRDO | 0.060% | 11/3/14 | | 3,600 | 3,600 |
| Ohio Building Authority Revenue (Administration Building Fund) | 5.000% | 10/1/19 | | 5,000 | 5,897 |
| Ohio Building Authority Revenue (Administration Building Fund) | 5.000% | 10/1/26 | | 1,975 | 2,255 |
| Ohio Building Authority Revenue (Adult Correctional Building) | 5.250% | 4/1/17 | | 5,565 | 6,208 |
123
Intermediate-Term Tax-Exempt Fund
| | | | | |
| | | | | Face | Market |
| | | Maturity | | Amount | Value• |
| | Coupon | Date | | ($000) | ($000) |
| Ohio Building Authority Revenue (Adult Correctional Building) | 5.125% | 4/1/30 | | 1,475 | 1,670 |
| Ohio Capital Facilities Lease-Appropriation Revenue | | | | | |
| (Mental Health Facilities Improvement Fund Projects) | 5.000% | 2/1/23 | | 2,075 | 2,506 |
| Ohio Common Schools GO | 5.000% | 9/15/19 | | 9,655 | 11,365 |
| Ohio Common Schools GO VRDO | 0.030% | 11/7/14 | | 10,675 | 10,675 |
| Ohio GO | 5.500% | 11/1/14 | | 7,000 | 7,000 |
| Ohio GO | 5.000% | 3/15/16 | (Prere.) | 12,755 | 13,583 |
| Ohio GO | 5.000% | 3/15/16 | (Prere.) | 13,000 | 13,844 |
| Ohio GO | 5.000% | 5/1/16 | (Prere.) | 7,710 | 8,254 |
| Ohio GO | 5.000% | 8/1/16 | | 3,000 | 3,243 |
| Ohio GO | 5.000% | 9/1/16 | | 2,870 | 3,113 |
| Ohio GO | 5.000% | 9/15/16 | | 5,130 | 5,574 |
| Ohio GO | 5.000% | 9/15/16 | | 5,415 | 5,878 |
| Ohio GO | 5.000% | 9/15/19 | | 9,025 | 10,652 |
| Ohio GO | 5.000% | 4/1/21 | | 4,440 | 5,302 |
| Ohio GO VRDO | 0.040% | 11/7/14 | | 11,965 | 11,965 |
| Ohio GO VRDO | 0.040% | 11/7/14 | | 16,220 | 16,220 |
| Ohio Higher Education GO | 5.000% | 5/1/16 | (Prere.) | 7,405 | 7,928 |
| Ohio Higher Educational Facility Commission Revenue | | | | | |
| (Cleveland Clinic Health System Obligated Group) | 5.000% | 1/1/29 | | 4,500 | 5,183 |
| Ohio Higher Educational Facility Commission Revenue (Denison University Project) | 5.000% | 11/1/26 | | 4,000 | 4,453 |
| Ohio Higher Educational Facility Commission Revenue (Denison University Project) | 5.000% | 11/1/32 | | 1,880 | 2,065 |
| Ohio Higher Educational Facility Commission Revenue (Oberlin College Project) | 5.000% | 10/1/19 | | 24,015 | 28,264 |
| Ohio Higher Educational Facility Commission Revenue (University of Dayton Project) | 5.000% | 12/1/33 | (3) | 2,500 | 2,672 |
| Ohio Highway Capital Improvements GO | 5.000% | 5/1/16 | | 11,010 | 11,780 |
| Ohio Highway Capital Improvements GO | 5.000% | 5/1/27 | | 10,220 | 12,090 |
| Ohio Hospital Revenue (Cleveland Clinic Health System Obligated Group) | 5.000% | 1/1/27 | | 9,330 | 10,416 |
| Ohio Hospital Revenue (Cleveland Clinic Health System Obligated Group) | 5.125% | 1/1/28 | | 11,670 | 13,066 |
| 1 Ohio Hospital Revenue (Cleveland Clinic Health System Obligated Group) TOB VRDO | 0.070% | 11/3/14 | | 12,400 | 12,400 |
| Ohio Housing Finance Agency Residential Mortgage Revenue | 6.125% | 9/1/28 | | 1,755 | 1,845 |
| Ohio Infrastructure Improvement GO VRDO | 0.040% | 11/7/14 | | 7,875 | 7,875 |
| Ohio Major New State Infrastructure Project Revenue | 5.000% | 6/15/16 | (4) | 5,000 | 5,369 |
| Ohio Major New State Infrastructure Project Revenue | 5.000% | 6/15/16 | | 5,000 | 5,369 |
| Ohio Major New State Infrastructure Project Revenue | 5.500% | 6/15/20 | | 4,000 | 4,626 |
| Ohio Major New State Infrastructure Project Revenue | 5.000% | 12/15/23 | | 3,250 | 3,872 |
| Ohio Solid Waste Revenue (Republic Services Inc. Project) PUT | 0.300% | 12/1/14 | | 3,500 | 3,500 |
| Ohio State University General Receipts Revenue | 5.000% | 12/1/18 | (Prere.) | 250 | 291 |
| Ohio State University General Receipts Revenue | 5.000% | 12/1/19 | (Prere.) | 215 | 255 |
| Ohio State University General Receipts Revenue | 5.000% | 12/1/20 | | 3,535 | 4,146 |
| Ohio State University General Receipts Revenue | 5.000% | 12/1/26 | | 2,250 | 2,574 |
| Ohio State University General Receipts Revenue VRDO | 0.030% | 11/7/14 | | 43,200 | 43,200 |
| Ohio Turnpike Commission Turnpike Revenue | 5.000% | 2/15/22 | | 1,750 | 2,059 |
| Ohio Turnpike Commission Turnpike Revenue | 5.000% | 2/15/28 | | 2,000 | 2,284 |
| Ohio Turnpike Commission Turnpike Revenue | 5.250% | 2/15/29 | | 3,000 | 3,511 |
| Ohio Turnpike Commission Turnpike Revenue | 5.000% | 2/15/31 | | 7,195 | 8,171 |
| Ohio Water Development Authority Drinking Water Assistance Fund Revenue | 5.250% | 12/1/19 | | 5,775 | 6,918 |
| Ohio Water Development Authority Drinking Water Assistance Fund Revenue | 5.000% | 12/1/20 | | 3,585 | 4,095 |
| Ohio Water Development Authority Drinking Water Assistance Fund Revenue | 5.250% | 12/1/20 | | 5,570 | 6,783 |
| 1 Ohio Water Development Authority Fresh Water Revenue TOB VRDO | 0.170% | 11/7/14 | | 5,910 | 5,910 |
| Ohio Water Development Authority Pollution Control Revenue | | | | | |
| (FirstEnergy Nuclear Generation Corp. Project) PUT | 2.200% | 6/1/16 | | 10,000 | 10,040 |
| Ohio Water Development Authority Pollution Control Revenue (Water Quality) | 5.000% | 6/1/24 | | 3,325 | 4,147 |
| Ohio Water Development Authority Water Pollution Control Loan Fund Revenue | 5.250% | 6/1/18 | | 5,635 | 6,507 |
| Ohio Water Development Authority Water Pollution Control Loan Fund Revenue | 5.000% | 12/1/19 | | 5,000 | 5,936 |
| Ohio Water Development Authority Water Pollution Control Loan Fund Revenue | 5.000% | 6/1/21 | | 9,160 | 11,052 |
| Penta Career Center Ohio COP | 5.250% | 4/1/23 | | 2,480 | 2,923 |
| Scioto County OH Hospital Facilities Revenue (Southern Ohio Medical Center) | 5.000% | 2/15/15 | | 3,040 | 3,073 |
| Scioto County OH Hospital Facilities Revenue (Southern Ohio Medical Center) | 5.000% | 2/15/16 | | 3,190 | 3,335 |
| Scioto County OH Hospital Facilities Revenue (Southern Ohio Medical Center) | 5.000% | 2/15/17 | | 3,350 | 3,594 |
| Scioto County OH Hospital Facilities Revenue (Southern Ohio Medical Center) | 5.000% | 2/15/18 | | 3,520 | 3,853 |
| Scioto County OH Hospital Facilities Revenue (Southern Ohio Medical Center) | 5.000% | 2/15/19 | | 3,195 | 3,464 |
| Scioto County OH Hospital Facilities Revenue (Southern Ohio Medical Center) | 5.000% | 2/15/20 | | 3,680 | 3,970 |
| Scioto County OH Hospital Facilities Revenue (Southern Ohio Medical Center) | 5.500% | 2/15/28 | | 17,000 | 18,611 |
| University of Akron Ohio General Receipts Revenue | 5.000% | 1/1/23 | (4) | 8,010 | 9,197 |
| University of Akron Ohio General Receipts Revenue | 5.000% | 1/1/24 | (4) | 3,335 | 3,818 |
| University of Akron Ohio General Receipts Revenue | 5.000% | 1/1/25 | (4) | 2,500 | 2,854 |
| University of Akron Ohio General Receipts Revenue | 5.000% | 1/1/26 | (4) | 2,000 | 2,277 |
| University of Akron Ohio General Receipts Revenue | 5.000% | 1/1/27 | (4) | 2,000 | 2,269 |
| University of Akron Ohio General Receipts Revenue | 5.000% | 1/1/28 | (4) | 2,500 | 2,832 |
| University of Akron Ohio General Receipts Revenue | 5.000% | 1/1/31 | | 2,175 | 2,484 |
| University of Cincinnati Ohio COP | 5.000% | 6/1/17 | (14) | 3,180 | 3,261 |
124
Intermediate-Term Tax-Exempt Fund
| | | | | |
| | | | | Face | Market |
| | | Maturity | | Amount | Value• |
| | Coupon | Date | | ($000) | ($000) |
| University of Cincinnati Ohio General Receipts Revenue | 5.000% | 6/1/22 | | 2,455 | 2,978 |
| University of Cincinnati Ohio General Receipts Revenue | 5.000% | 6/1/29 | | 6,385 | 7,400 |
| University of Cincinnati Ohio General Receipts Revenue | 5.000% | 6/1/30 | | 1,000 | 1,155 |
| | | | | | 1,166,453 |
| Oklahoma (0.3%) | | | | | |
| Norman OK Regional Hospital Authority Revenue | 0.140% | 9/1/22 | (14) | 13,050 | 12,039 |
| Oklahoma Capitol Improvement Authority Facilities Revenue | 5.000% | 7/1/15 | (Prere.) | 12,000 | 12,386 |
| Oklahoma Capitol Improvement Authority Facilities Revenue | 5.000% | 7/1/15 | (Prere.) | 18,070 | 18,651 |
| Oklahoma Capitol Improvement Authority Facilities Revenue | 5.000% | 7/1/22 | | 1,350 | 1,642 |
| Oklahoma Capitol Improvement Authority Facilities Revenue | 5.000% | 7/1/23 | | 2,500 | 3,063 |
| Oklahoma Capitol Improvement Authority Facilities Revenue | 5.000% | 7/1/24 | | 1,500 | 1,854 |
| Oklahoma Capitol Improvement Authority Facilities Revenue | 5.000% | 7/1/25 | | 3,000 | 3,674 |
| Oklahoma Capitol Improvement Authority Facilities Revenue | 5.000% | 7/1/26 | | 2,500 | 3,042 |
| Oklahoma Capitol Improvement Authority Facilities Revenue | 5.000% | 7/1/27 | | 3,000 | 3,628 |
| Oklahoma Capitol Improvement Authority Facilities Revenue | 5.000% | 7/1/28 | | 2,000 | 2,406 |
| Oklahoma Capitol Improvement Authority Facilities Revenue | 5.000% | 7/1/29 | | 2,500 | 2,993 |
| Oklahoma Capitol Improvement Authority Facilities Revenue | 5.000% | 7/1/30 | | 2,500 | 2,977 |
| Oklahoma City OK GO | 5.000% | 3/1/17 | | 7,335 | 8,105 |
| Oklahoma City OK Water Utilities Trust Water & Sewer Revenue | 5.000% | 7/1/23 | | 1,500 | 1,846 |
| Oklahoma City OK Water Utilities Trust Water & Sewer Revenue | 5.000% | 7/1/31 | | 4,255 | 5,036 |
| Oklahoma City OK Water Utilities Trust Water & Sewer Revenue | 5.000% | 7/1/32 | | 5,000 | 5,896 |
| Oklahoma Development Finance Authority Health System Revenue (Integris Baptist) | 5.000% | 8/15/24 | | 12,100 | 13,458 |
| Oklahoma Municipal Power Authority Power Supply System Revenue | 5.875% | 1/1/28 | | 1,045 | 1,182 |
| 2 Oklahoma Municipal Power Authority Power Supply System Revenue | 5.000% | 1/1/31 | | 1,495 | 1,735 |
| 2 Oklahoma Municipal Power Authority Power Supply System Revenue | 5.000% | 1/1/32 | | 3,770 | 4,362 |
| 2 Oklahoma Municipal Power Authority Power Supply System Revenue | 5.000% | 1/1/33 | | 6,055 | 6,972 |
| Oklahoma Turnpike Authority Revenue | 5.000% | 1/1/17 | | 7,000 | 7,683 |
| Oklahoma Turnpike Authority Revenue | 5.000% | 1/1/27 | | 1,160 | 1,345 |
| University of Oklahoma Revenue | 5.000% | 7/1/29 | | 1,895 | 2,235 |
| University of Oklahoma Revenue | 5.000% | 7/1/30 | | 2,230 | 2,606 |
| University of Oklahoma Revenue | 5.000% | 7/1/31 | | 2,000 | 2,325 |
| University of Oklahoma Revenue | 5.000% | 7/1/32 | | 670 | 776 |
| | | | | | 133,917 |
| Oregon (0.6%) | | | | | |
| Oregon Department of Administrative Services COP | 5.000% | 11/1/19 | | 2,000 | 2,361 |
| Oregon Department of Administrative Services COP | 5.000% | 11/1/20 | | 9,660 | 11,322 |
| Oregon Department of Administrative Services COP | 5.000% | 5/1/23 | | 3,130 | 3,594 |
| Oregon Department of Administrative Services COP | 5.000% | 5/1/24 | | 1,750 | 2,005 |
| Oregon Department of Administrative Services COP | 5.000% | 5/1/25 | | 2,220 | 2,538 |
| Oregon Department of Administrative Services COP | 5.000% | 5/1/26 | | 3,520 | 4,017 |
| Oregon Department of Administrative Services Lottery Revenue | 5.000% | 4/1/16 | | 1,750 | 1,866 |
| Oregon Department of Administrative Services Lottery Revenue | 5.000% | 4/1/17 | (Prere.) | 5,675 | 6,287 |
| Oregon Department of Administrative Services Lottery Revenue | 5.000% | 4/1/23 | | 1,430 | 1,760 |
| Oregon Department of Administrative Services Lottery Revenue | 5.000% | 4/1/23 | | 6,355 | 7,820 |
| Oregon Department of Administrative Services Lottery Revenue | 5.000% | 4/1/24 | | 7,000 | 8,699 |
| Oregon Department of Administrative Services Lottery Revenue | 5.000% | 4/1/25 | | 2,130 | 2,629 |
| Oregon Department of Administrative Services Lottery Revenue | 5.000% | 4/1/25 | | 8,015 | 9,893 |
| Oregon Department of Administrative Services Lottery Revenue | 5.000% | 4/1/31 | | 11,010 | 12,932 |
| Oregon Department of Administrative Services Lottery Revenue | 5.250% | 4/1/31 | | 6,200 | 7,289 |
| Oregon Department of Administrative Services Lottery Revenue | 5.000% | 4/1/32 | | 5,560 | 6,503 |
| Oregon Department of Administrative Services Lottery Revenue | 5.000% | 4/1/33 | | 5,545 | 6,463 |
| Oregon Department of Transportation Highway User Tax Revenue | 5.000% | 11/15/24 | | 3,000 | 3,768 |
| Oregon Department of Transportation Highway User Tax Revenue | 5.000% | 11/15/27 | | 2,000 | 2,455 |
| Oregon Department of Transportation Highway User Tax Revenue | 5.000% | 11/15/28 | | 5,500 | 6,719 |
| Oregon Department of Transportation Highway User Tax Revenue | 5.000% | 11/15/29 | | 9,500 | 11,569 |
| Oregon Department of Transportation Highway User Tax Revenue | 5.000% | 11/15/30 | | 2,500 | 3,022 |
| Oregon Facilities Authority Revenue (Legacy Health Project) | 5.250% | 5/1/20 | | 6,085 | 7,254 |
| Oregon Facilities Authority Revenue (Legacy Health Project) | 5.250% | 5/1/21 | | 7,500 | 9,016 |
| Oregon Facilities Authority Revenue (PeaceHealth) | 5.000% | 11/15/22 | | 1,000 | 1,195 |
| Oregon Facilities Authority Revenue (PeaceHealth) | 5.000% | 11/15/23 | | 1,250 | 1,504 |
| Oregon Facilities Authority Revenue (PeaceHealth) | 5.000% | 11/15/26 | | 1,810 | 2,151 |
| Oregon Facilities Authority Revenue (PeaceHealth) | 5.000% | 11/15/27 | | 2,000 | 2,361 |
| Oregon Facilities Authority Revenue (PeaceHealth) | 5.000% | 11/15/28 | | 2,500 | 2,926 |
| Oregon Facilities Authority Revenue (PeaceHealth) | 5.000% | 11/15/29 | | 1,420 | 1,649 |
| Oregon GO | 5.000% | 5/1/15 | | 1,500 | 1,537 |
| Oregon GO | 5.000% | 5/1/15 | | 2,475 | 2,535 |
| Oregon GO | 5.000% | 5/1/15 | | 4,000 | 4,098 |
| Oregon GO | 5.000% | 11/1/15 | | 5,860 | 6,143 |
| Oregon GO | 5.000% | 5/1/16 | | 1,750 | 1,873 |
| Oregon GO | 5.000% | 5/1/18 | | 1,500 | 1,719 |
| Oregon GO | 5.000% | 11/1/18 | | 3,750 | 4,356 |
125
Intermediate-Term Tax-Exempt Fund
| | | | | |
| | | | | Face | Market |
| | | Maturity | | Amount | Value• |
| | Coupon | Date | | ($000) | ($000) |
| Oregon GO | 5.000% | 5/1/19 | | 2,770 | 3,251 |
| Oregon GO | 5.000% | 5/1/26 | | 1,570 | 1,859 |
| Oregon GO | 5.000% | 5/1/26 | | 1,490 | 1,764 |
| Oregon GO | 5.000% | 5/1/27 | | 2,415 | 2,850 |
| Oregon GO | 5.000% | 5/1/27 | | 2,460 | 2,903 |
| Oregon GO | 5.000% | 5/1/28 | | 5,165 | 6,040 |
| Oregon GO | 5.000% | 5/1/28 | | 2,755 | 3,222 |
| Oregon GO | 5.000% | 5/1/29 | | 2,890 | 3,362 |
| Oregon GO | 5.000% | 5/1/30 | | 5,685 | 6,511 |
| Oregon GO | 5.000% | 5/1/31 | | 3,370 | 3,853 |
| Oregon GO | 5.000% | 5/1/31 | | 1,760 | 2,012 |
| Oregon GO | 5.000% | 5/1/31 | | 2,915 | 3,443 |
| Oregon GO | 5.000% | 5/1/32 | | 2,060 | 2,425 |
| Oregon GO | 5.000% | 11/1/32 | | 1,440 | 1,708 |
| Oregon GO (Oregon University System Projects) | 5.250% | 8/1/28 | | 1,650 | 1,967 |
| Oregon GO (Oregon University System Projects) | 5.250% | 8/1/28 | | 2,585 | 3,093 |
| Oregon GO (Oregon University System Projects) | 5.250% | 8/1/29 | | 2,725 | 3,242 |
| Oregon GO (Oregon University System Projects) | 5.250% | 8/1/30 | | 2,050 | 2,429 |
| Oregon GO (Oregon University System Projects) | 5.250% | 8/1/30 | | 2,865 | 3,387 |
| Oregon GO (Oregon University System Projects) | 5.250% | 8/1/31 | | 3,015 | 3,549 |
| Oregon GO (Veterans Welfare) VRDO | 0.070% | 11/3/14 | | 6,400 | 6,400 |
| Portland OR Sewer System Revenue | 5.000% | 8/1/18 | (4) | 11,470 | 12,106 |
| | | | | | 257,204 |
| Pennsylvania (3.7%) | | | | | |
| Allegheny County PA GO | 3.000% | 12/1/15 | | 8,480 | 8,734 |
| Allegheny County PA GO | 5.000% | 11/1/29 | | 15,000 | 17,064 |
| Allegheny County PA Higher Education Building Authority University Revenue | | | | | |
| (Duquesne University) | 5.500% | 3/1/29 | | 1,290 | 1,466 |
| Allegheny County PA Higher Education Building Authority University Revenue | | | | | |
| (Duquesne University) | 5.500% | 3/1/31 | | 2,720 | 3,086 |
| Allegheny County PA Hospital Development Authority Revenue | | | | | |
| (University of Pittsburgh Medical Center) | 0.881% | 2/1/21 | | 19,085 | 19,079 |
| Allegheny County PA Port Authority Revenue | 5.750% | 3/1/29 | | 17,000 | 20,294 |
| Allentown PA Neighborhood Improvement Zone Development Authority Tax Revenue | 5.000% | 5/1/24 | | 2,795 | 3,150 |
| Allentown PA Neighborhood Improvement Zone Development Authority Tax Revenue | 5.000% | 5/1/28 | | 2,310 | 2,540 |
| Allentown PA Neighborhood Improvement Zone Development Authority Tax Revenue | 5.000% | 5/1/29 | | 3,740 | 4,100 |
| Allentown PA Neighborhood Improvement Zone Development Authority Tax Revenue | 5.000% | 5/1/31 | | 3,000 | 3,262 |
| Allentown PA Neighborhood Improvement Zone Development Authority Tax Revenue | 5.000% | 5/1/32 | | 3,685 | 3,994 |
| Beaver County PA Industrial Development Authority Pollution Control Revenue | | | | | |
| (FirstEnergy Generation Project) PUT | 2.200% | 7/1/16 | | 4,500 | 4,552 |
| Beaver County PA Industrial Development Authority Pollution Control Revenue | | | | | |
| (FirstEnergy Generation Project) PUT | 2.500% | 6/1/17 | | 4,500 | 4,580 |
| Beaver County PA Industrial Development Authority Pollution Control Revenue | | | | | |
| (FirstEnergy Generation Project) PUT | 2.700% | 4/2/18 | | 16,100 | 16,369 |
| Blair County PA Hospital Authority Revenue (Altoona Regional Health System) | 4.500% | 11/15/14 | (Prere.) | 1,410 | 1,412 |
| Blair County PA Hospital Authority Revenue (Altoona Regional Health System) | 4.750% | 11/15/14 | (Prere.) | 1,010 | 1,012 |
| Blair County PA Hospital Authority Revenue (Altoona Regional Health System) | 5.000% | 11/15/14 | (Prere.) | 1,100 | 1,102 |
| Central Bradford PA Progress Authority Revenue (Guthrie Healthcare System) | 5.500% | 12/1/31 | | 12,500 | 14,787 |
| Commonwealth Financing Authority Pennsylvania Revenue | 5.000% | 6/1/21 | (4) | 3,940 | 4,583 |
| Commonwealth Financing Authority Pennsylvania Revenue | 5.000% | 6/1/24 | (14) | 14,050 | 14,427 |
| Commonwealth Financing Authority Pennsylvania Revenue | 5.000% | 6/1/25 | | 875 | 1,014 |
| Commonwealth Financing Authority Pennsylvania Revenue | 5.000% | 6/1/25 | (14) | 9,500 | 9,755 |
| Commonwealth Financing Authority Pennsylvania Revenue | 5.000% | 6/1/32 | | 7,715 | 8,649 |
| Cumberland County PA Municipal Authority Revenue (Diakon Lutheran Social Ministries Project) | 5.250% | 1/1/17 | | 2,375 | 2,585 |
| Cumberland County PA Municipal Authority Revenue (Diakon Lutheran Social Ministries Project) | 5.500% | 1/1/18 | | 2,735 | 3,083 |
| Cumberland County PA Municipal Authority Revenue (Diakon Lutheran Social Ministries Project) | 5.750% | 1/1/20 | | 3,415 | 3,907 |
| Cumberland County PA Municipal Authority Revenue (Diakon Lutheran Social Ministries Project) | 6.000% | 1/1/21 | | 4,190 | 4,751 |
| Dauphin County PA General Authority Health System Revenue (Pinnacle Health System Project) | 6.000% | 6/1/29 | | 14,800 | 17,532 |
| Delaware County PA Authority Hospital Revenue (Crozer-Keystone Obligated Group) | 5.000% | 12/15/17 | | 3,790 | 3,997 |
| Delaware County PA Authority Hospital Revenue (Crozer-Keystone Obligated Group) | 5.000% | 12/15/18 | | 3,985 | 4,169 |
| Delaware County PA Authority Hospital Revenue (Crozer-Keystone Obligated Group) | 5.000% | 12/15/19 | | 4,175 | 4,355 |
| Delaware County PA Authority Hospital Revenue (Crozer-Keystone Obligated Group) | 5.000% | 12/15/26 | | 2,070 | 2,096 |
| Delaware River Port Authority Pennsylvania & New Jersey Revenue | 5.000% | 1/1/23 | | 4,850 | 5,605 |
| Geisinger Authority Health System Pennsylvania Revenue (Geisinger Health System) VRDO | 0.050% | 11/3/14 | | 4,500 | 4,500 |
| Lancaster County PA Solid Waste Management Authority Solid Waste Disposal System Revenue | 5.000% | 12/15/33 | | 5,750 | 6,485 |
| Lancaster PA Higher Education Authority College Revenue (Franklin & Marshall College) | 5.000% | 4/15/22 | | 3,500 | 3,722 |
| Middletown PA School District GO | 5.000% | 3/1/31 | | 3,030 | 3,463 |
| Middletown PA School District GO | 5.000% | 3/1/32 | | 3,375 | 3,850 |
| Monroeville PA Finance Authority Revenue (UPMC Health System) | 5.000% | 2/15/29 | | 6,995 | 7,915 |
| Montgomery County PA Higher Education & Health Authority Hospital Revenue | | | | | |
| (Abington Memorial Hospital) | 5.000% | 6/1/25 | | 7,000 | 7,928 |
126
Intermediate-Term Tax-Exempt Fund
| | | | | |
| | | | | Face | Market |
| | | Maturity | | Amount | Value• |
| | Coupon | Date | | ($000) | ($000) |
| Montgomery County PA Higher Education & Health Authority Hospital Revenue | | | | | |
| (Abington Memorial Hospital) | 5.000% | 6/1/25 | | 5,765 | 6,397 |
| Montgomery County PA Higher Education & Health Authority Hospital Revenue | | | | | |
| (Abington Memorial Hospital) | 5.000% | 6/1/27 | | 6,000 | 6,705 |
| Montgomery County PA Higher Education & Health Authority Hospital Revenue | | | | | |
| (Abington Memorial Hospital) | 5.000% | 6/1/31 | | 8,500 | 9,384 |
| Moon Industrial Development Authority Pennsylvania Mortgage Revenue | | | | | |
| (Providence Point Project) VRDO | 0.070% | 11/7/14 | LOC | 20,750 | 20,750 |
| Northampton County PA General Purpose Authority Hospital Revenue (St. Luke’s Hospital Project) | 5.000% | 8/15/20 | | 1,000 | 1,097 |
| Northampton County PA General Purpose Authority Hospital Revenue (St. Luke’s Hospital Project) | 5.125% | 8/15/21 | | 1,000 | 1,100 |
| Northampton County PA General Purpose Authority Hospital Revenue (St. Luke’s Hospital Project) | 5.250% | 8/15/22 | | 1,000 | 1,104 |
| Northampton County PA General Purpose Authority Hospital Revenue (St. Luke’s Hospital Project) | 5.250% | 8/15/23 | | 1,500 | 1,649 |
| Northampton County PA General Purpose Authority Hospital Revenue (St. Luke’s Hospital Project) | 5.250% | 8/15/24 | | 3,000 | 3,294 |
| Pennsylvania Convention Center Authority Revenue | 6.700% | 9/1/16 | (ETM) | 905 | 974 |
| Pennsylvania Economic Development Financing Authority Health System Revenue | | | | | |
| (Albert Einstein Healthcare Network) | 6.250% | 10/15/23 | | 3,110 | 3,641 |
| Pennsylvania Economic Development Financing Authority Pollution Control Revenue | | | | | |
| (PPL Electric Utilities Corp. Project) | 4.000% | 10/1/23 | | 17,500 | 18,652 |
| Pennsylvania Economic Development Financing Authority Revenue (UPMC Obligated Group) | 5.000% | 2/1/23 | | 1,250 | 1,493 |
| Pennsylvania Economic Development Financing Authority Revenue (UPMC Obligated Group) | 5.000% | 2/1/24 | | 3,000 | 3,591 |
| Pennsylvania Economic Development Financing Authority Revenue (UPMC Obligated Group) | 5.000% | 2/1/25 | | 2,180 | 2,609 |
| Pennsylvania Economic Development Financing Authority Revenue (UPMC Obligated Group) | 5.000% | 2/1/26 | | 3,000 | 3,568 |
| Pennsylvania Economic Development Financing Authority Revenue (UPMC Obligated Group) | 5.000% | 2/1/27 | | 4,705 | 5,543 |
| Pennsylvania Economic Development Financing Authority Revenue (UPMC Obligated Group) | 5.000% | 2/1/29 | | 6,000 | 6,987 |
| Pennsylvania Economic Development Financing Authority Revenue (UPMC Obligated Group) | 5.000% | 2/1/31 | | 12,965 | 14,941 |
| Pennsylvania Economic Development Financing Authority Revenue (UPMC Obligated Group) | 5.000% | 2/1/32 | | 6,865 | 7,874 |
| Pennsylvania Economic Development Financing Authority Revenue (UPMC Obligated Group) | 5.000% | 2/1/33 | | 10,000 | 11,416 |
| Pennsylvania Economic Development Financing Authority Revenue (UPMC Obligated Group) | 5.000% | 7/1/33 | | 10,000 | 11,377 |
| Pennsylvania Economic Development Financing Authority Unemployment Compensation Revenue | 5.000% | 7/1/20 | | 20,000 | 23,389 |
| Pennsylvania Economic Development Financing Authority Unemployment Compensation Revenue | 5.000% | 1/1/21 | | 7,000 | 8,044 |
| Pennsylvania Economic Development Financing Authority Unemployment Compensation Revenue | 5.000% | 7/1/22 | | 15,000 | 16,111 |
| Pennsylvania GO | 5.000% | 5/1/15 | | 16,000 | 16,389 |
| Pennsylvania GO | 5.000% | 8/1/15 | | 5,120 | 5,306 |
| Pennsylvania GO | 5.000% | 5/1/19 | | 15,000 | 17,492 |
| Pennsylvania GO | 5.000% | 7/1/19 | | 24,925 | 29,173 |
| Pennsylvania GO | 5.000% | 6/1/21 | | 20,000 | 24,007 |
| Pennsylvania GO | 5.000% | 7/1/21 | | 32,365 | 38,889 |
| Pennsylvania GO | 5.375% | 7/1/21 | | 4,950 | 6,050 |
| Pennsylvania GO | 5.000% | 6/1/22 | | 19,450 | 23,566 |
| Pennsylvania GO | 5.000% | 11/15/23 | | 4,705 | 5,590 |
| Pennsylvania GO | 5.000% | 4/1/25 | | 7,500 | 8,948 |
| Pennsylvania GO | 4.000% | 10/15/28 | | 11,550 | 12,540 |
| Pennsylvania GO | 4.000% | 6/15/30 | | 24,400 | 26,256 |
| Pennsylvania GO | 5.000% | 10/15/31 | | 10,000 | 11,646 |
| Pennsylvania Higher Education Assistance Agency Revenue | 5.000% | 12/15/20 | | 2,560 | 3,017 |
| Pennsylvania Higher Education Assistance Agency Revenue | 5.000% | 12/15/21 | | 1,830 | 2,125 |
| Pennsylvania Higher Educational Facilities Authority Revenue | | | | | |
| (Foundation for Indiana University of Pennsylvania Student Housing) | 5.000% | 7/1/27 | | 1,745 | 1,931 |
| Pennsylvania Higher Educational Facilities Authority Revenue (Gwynedd Mercy College) VRDO | 0.050% | 11/7/14 | LOC | 3,850 | 3,850 |
| Pennsylvania Higher Educational Facilities Authority Revenue (Higher Education System) | 5.000% | 6/15/15 | | 4,200 | 4,326 |
| Pennsylvania Higher Educational Facilities Authority Revenue (Higher Education System) | 5.000% | 6/15/29 | | 4,125 | 4,745 |
| Pennsylvania Higher Educational Facilities Authority Revenue (Higher Education System) | 5.000% | 6/15/29 | | 1,300 | 1,478 |
| Pennsylvania Higher Educational Facilities Authority Revenue (La Salle University) | 5.000% | 5/1/24 | | 1,435 | 1,629 |
| Pennsylvania Higher Educational Facilities Authority Revenue (La Salle University) | 5.000% | 5/1/25 | | 1,670 | 1,879 |
| Pennsylvania Higher Educational Facilities Authority Revenue (La Salle University) | 5.000% | 5/1/26 | | 1,690 | 1,886 |
| Pennsylvania Higher Educational Facilities Authority Revenue (Temple University) | 5.000% | 4/1/25 | | 2,065 | 2,404 |
| Pennsylvania Higher Educational Facilities Authority Revenue (Temple University) | 5.000% | 4/1/26 | | 1,140 | 1,318 |
| Pennsylvania Higher Educational Facilities Authority Revenue (Temple University) | 5.000% | 4/1/27 | | 1,120 | 1,285 |
| Pennsylvania Higher Educational Facilities Authority Revenue (Temple University) | 5.000% | 4/1/28 | | 3,085 | 3,519 |
| Pennsylvania Higher Educational Facilities Authority Revenue (Temple University) | 5.000% | 4/1/30 | | 2,985 | 3,392 |
| Pennsylvania Higher Educational Facilities Authority Revenue (Temple University) | 5.000% | 4/1/31 | | 3,500 | 3,962 |
| Pennsylvania Higher Educational Facilities Authority Revenue (Thomas Jefferson University) | 5.250% | 9/1/19 | (2) | 2,935 | 3,406 |
| Pennsylvania Higher Educational Facilities Authority Revenue (Thomas Jefferson University) | 5.000% | 3/1/27 | | 700 | 798 |
| Pennsylvania Higher Educational Facilities Authority Revenue (Thomas Jefferson University) | 5.000% | 3/1/28 | | 1,650 | 1,860 |
| Pennsylvania Higher Educational Facilities Authority Revenue (Thomas Jefferson University) | 5.000% | 3/1/30 | | 500 | 559 |
| Pennsylvania Higher Educational Facilities Authority Revenue (Thomas Jefferson University) | 5.000% | 3/1/32 | | 1,000 | 1,106 |
| Pennsylvania Higher Educational Facilities Authority Revenue (Thomas Jefferson University) VRDO | 0.030% | 11/7/14 | LOC | 5,800 | 5,800 |
| Pennsylvania Higher Educational Facilities Authority Revenue | | | | | |
| (Trustees of the University of Pennsylvania) | 5.000% | 9/1/28 | | 2,405 | 2,747 |
| Pennsylvania Higher Educational Facilities Authority Revenue | | | | | |
| (University of Pittsburgh Medical Center) | 5.000% | 5/15/31 | | 500 | 555 |
127
Intermediate-Term Tax-Exempt Fund
| | | | | |
| | | | | Face | Market |
| | | Maturity | | Amount | Value• |
| | Coupon | Date | | ($000) | ($000) |
| Pennsylvania Housing Finance Agency Single Family Mortgage Revenue | 4.000% | 10/1/18 | | 2,000 | 2,214 |
| Pennsylvania Housing Finance Agency Single Family Mortgage Revenue | 5.000% | 10/1/19 | | 2,000 | 2,306 |
| Pennsylvania Housing Finance Agency Single Family Mortgage Revenue | 5.000% | 10/1/20 | | 1,500 | 1,761 |
| Pennsylvania Industrial Development Authority Economic Development Revenue | 5.500% | 7/1/20 | | 12,180 | 13,830 |
| Pennsylvania Industrial Development Authority Economic Development Revenue | 5.500% | 7/1/23 | | 17,530 | 19,557 |
| Pennsylvania Public School Building Authority Lease Revenue (School District of Philadelphia) | 5.000% | 6/1/23 | (4) | 6,080 | 6,532 |
| Pennsylvania Public School Building Authority Lease Revenue (School District of Philadelphia) | 5.000% | 6/1/23 | (4) | 10,600 | 11,387 |
| Pennsylvania Public School Building Authority Lease Revenue (School District of Philadelphia) | 5.000% | 6/1/24 | (4) | 6,620 | 7,112 |
| Pennsylvania Public School Building Authority Lease Revenue (School District of Philadelphia) | 5.000% | 6/1/24 | (4) | 11,130 | 11,957 |
| Pennsylvania Public School Building Authority Lease Revenue (School District of Philadelphia) | 5.000% | 6/1/25 | (4) | 11,585 | 12,446 |
| Pennsylvania Public School Building Authority Lease Revenue (School District of Philadelphia) | 5.000% | 6/1/26 | (4) | 10,070 | 10,818 |
| Pennsylvania Turnpike Commission Motor License Fund Revenue | 5.000% | 12/1/23 | | 1,770 | 2,102 |
| Pennsylvania Turnpike Commission Motor License Fund Revenue | 5.000% | 12/1/24 | | 1,825 | 2,152 |
| Pennsylvania Turnpike Commission Motor License Fund Revenue | 5.000% | 12/1/25 | | 2,190 | 2,555 |
| Pennsylvania Turnpike Commission Motor License Fund Revenue | 5.000% | 12/1/26 | | 2,165 | 2,495 |
| Pennsylvania Turnpike Commission Oil Franchise Tax Revenue | 5.000% | 12/1/17 | (2) | 5,155 | 5,585 |
| 1 Pennsylvania Turnpike Commission Oil Franchise Tax Revenue TOB VRDO | 0.070% | 11/7/14 | | 2,000 | 2,000 |
| 3 Pennsylvania Turnpike Commission Revenue | 1.320% | 12/1/20 | | 22,500 | 23,045 |
| Pennsylvania Turnpike Commission Revenue | 5.000% | 6/1/21 | (12) | 4,520 | 5,207 |
| 3 Pennsylvania Turnpike Commission Revenue | 1.030% | 12/1/21 | | 37,500 | 37,622 |
| Pennsylvania Turnpike Commission Revenue | 5.000% | 12/1/21 | | 16,660 | 19,344 |
| Pennsylvania Turnpike Commission Revenue | 5.000% | 12/1/21 | | 14,210 | 16,462 |
| Pennsylvania Turnpike Commission Revenue | 5.000% | 6/1/23 | (12) | 8,585 | 9,853 |
| Pennsylvania Turnpike Commission Revenue | 5.000% | 6/1/24 (12) | 3,535 | 4,049 |
| Pennsylvania Turnpike Commission Revenue | 5.250% | 6/1/24 | | 4,715 | 5,429 |
| Pennsylvania Turnpike Commission Revenue | 5.000% | 6/1/25 | (12) | 2,500 | 2,805 |
| Pennsylvania Turnpike Commission Revenue | 5.250% | 12/1/26 | | 1,710 | 1,995 |
| Pennsylvania Turnpike Commission Revenue | 5.250% | 6/1/27 | | 12,345 | 13,778 |
| Pennsylvania Turnpike Commission Revenue | 0.000% | 12/1/28 | | 3,500 | 3,376 |
| Pennsylvania Turnpike Commission Revenue | 5.250% | 12/1/28 | | 4,015 | 4,643 |
| Pennsylvania Turnpike Commission Revenue | 5.000% | 6/1/29 | | 50,000 | 56,006 |
| Pennsylvania Turnpike Commission Revenue | 5.500% | 12/1/31 | (2) | 6,000 | 6,076 |
| Pennsylvania Turnpike Commission Revenue | 5.500% | 12/1/31 | | 6,185 | 7,134 |
| Pennsylvania Turnpike Commission Revenue | 5.625% | 12/1/31 | | 10,000 | 11,307 |
| Pennsylvania Turnpike Commission Revenue | 0.000% | 12/1/33 | | 4,500 | 4,282 |
| Pennsylvania Turnpike Commission Revenue | 5.000% | 12/1/33 | | 4,940 | 5,587 |
| Pennsylvania Turnpike Commission Revenue | 5.000% | 12/1/34 | | 2,620 | 2,951 |
| 1 Pennsylvania Turnpike Commission Revenue TOB VRDO | 0.170% | 11/7/14 | (12) | 3,245 | 3,245 |
| Philadelphia PA Airport Parking Authority Revenue | 5.000% | 9/1/16 | | 3,000 | 3,223 |
| Philadelphia PA Airport Revenue | 5.000% | 6/15/23 | | 2,000 | 2,275 |
| Philadelphia PA Gas Works Revenue | 5.000% | 8/1/15 | | 3,000 | 3,099 |
| Philadelphia PA GO | 5.000% | 8/1/15 | (4) | 23,000 | 23,806 |
| Philadelphia PA GO | 5.250% | 8/1/16 | (4) | 13,110 | 14,159 |
| Philadelphia PA Hospitals & Higher Education Facilities Authority Health System Revenue | | | | | |
| (Jefferson Health System) | 5.250% | 5/15/20 | (Prere.) | 24,000 | 28,908 |
| Philadelphia PA Hospitals & Higher Education Facilities Authority Hospital Revenue | | | | | |
| (Children’s Hospital of Philadelphia Project) VRDO | 0.070% | 11/3/14 | | 8,100 | 8,100 |
| Philadelphia PA Hospitals & Higher Education Facilities Authority Hospital Revenue | | | | | |
| (Temple University Health System Obligated Group) | 6.250% | 7/1/23 | | 8,600 | 9,281 |
| Philadelphia PA Hospitals & Higher Education Facilities Authority Hospital Revenue | | | | | |
| (Temple University Health System Obligated Group) | 5.500% | 7/1/26 | | 4,275 | 4,494 |
| Philadelphia PA Hospitals & Higher Education Facilities Authority Hospital Revenue | | | | | |
| (Temple University Health System Obligated Group) | 5.500% | 7/1/30 | | 6,040 | 6,190 |
| Philadelphia PA Municipal Authority Revenue | 6.375% | 4/1/29 | | 3,500 | 4,057 |
| Philadelphia PA School District GO | 5.000% | 8/1/19 | (2) | 7,500 | 7,759 |
| Philadelphia PA School District GO | 5.000% | 8/1/20 | (2) | 18,745 | 19,393 |
| Philadelphia PA School District GO | 5.000% | 8/1/21 | (2) | 9,900 | 10,242 |
| Philadelphia PA School District GO | 5.000% | 6/1/24 | (4)(3) | 2,000 | 2,261 |
| Philadelphia PA Water & Waste Water Revenue | 5.000% | 8/1/22 | (4) | 3,000 | 3,475 |
| Philadelphia PA Water & Waste Water Revenue | 5.000% | 1/1/23 | | 2,300 | 2,758 |
| Philadelphia PA Water & Waste Water Revenue | 5.000% | 7/1/23 | | 2,000 | 2,413 |
| Philadelphia PA Water & Waste Water Revenue | 5.000% | 7/1/24 | | 3,800 | 4,620 |
| Philadelphia PA Water & Waste Water Revenue | 5.000% | 7/1/26 | | 5,500 | 6,526 |
| Pittsburgh & Allegheny County PA Sports & Exhibition Authority Lease Revenue VRDO | 0.170% | 11/7/14 | (4) | 43,045 | 43,045 |
| Plum Borough PA School District GO | 5.000% | 9/15/23 | (15) | 1,000 | 1,184 |
| Southcentral Pennsylvania General Authority Revenue (WellSpan Health Obligated Group) | 6.000% | 6/1/25 | | 30,000 | 33,785 |
| Southeastern Pennsylvania Transportation Authority Revenue | 5.000% | 3/1/27 | | 6,100 | 7,022 |
| Southeastern Pennsylvania Transportation Authority Revenue | 5.000% | 3/1/28 | | 5,000 | 5,683 |
| St. Mary Hospital Authority Pennsylvania Health System Revenue (Catholic Health Initiatives) | 5.000% | 11/15/25 | | 15,385 | 17,638 |
| St. Mary Hospital Authority Pennsylvania Health System Revenue (Catholic Health Initiatives) | 5.000% | 11/15/27 | | 4,905 | 5,585 |
| University of Pittsburgh of the Commonwealth System of Higher Education Pennsylvania Revenue | 5.000% | 9/15/17 | | 3,990 | 4,481 |
128
Intermediate-Term Tax-Exempt Fund
| | | | | |
| | | | | Face | Market |
| | | Maturity | | Amount | Value• |
| | Coupon | Date | | ($000) | ($000) |
| University of Pittsburgh of the Commonwealth System of Higher Education | | | | | |
| Pennsylvania Revenue (University Capital Project) | 5.000% | 9/15/19 | | 2,575 | 2,977 |
| University of Pittsburgh of the Commonwealth System of Higher Education | | | | | |
| Pennsylvania Revenue (University Capital Project) | 5.500% | 9/15/23 | | 9,000 | 10,537 |
| University of Pittsburgh of the Commonwealth System of Higher Education | | | | | |
| Pennsylvania Revenue (University Capital Project) | 5.250% | 9/15/27 | | 12,500 | 14,571 |
| University of Pittsburgh of the Commonwealth System of Higher Education | | | | | |
| Pennsylvania Revenue (University Capital Project) | 5.250% | 9/15/28 | | 2,375 | 2,760 |
| University of Pittsburgh of the Commonwealth System of Higher Education | | | | | |
| Pennsylvania Revenue (University Capital Project) | 5.250% | 9/15/29 | | 11,250 | 13,019 |
| Westmoreland County PA Industrial Development Authority Revenue (Excela Health Project) | 5.000% | 7/1/19 | | 1,235 | 1,372 |
| Westmoreland County PA Industrial Development Authority Revenue (Excela Health Project) | 5.250% | 7/1/20 | | 1,330 | 1,509 |
| Westmoreland County PA Industrial Development Authority Revenue (Excela Health Project) | 5.000% | 7/1/25 | | 4,500 | 4,852 |
| Westmoreland County PA Municipal Authority Revenue | 5.000% | 8/15/32 | | 15,000 | 16,749 |
| Wilkes-Barre PA Finance Authority Revenue (University of Scranton Project) | 5.000% | 11/1/21 | | 1,015 | 1,171 |
| Wilkes-Barre PA Finance Authority Revenue (University of Scranton Project) | 5.000% | 11/1/22 | | 1,160 | 1,324 |
| Wilkes-Barre PA Finance Authority Revenue (University of Scranton Project) | 5.000% | 11/1/23 | | 1,350 | 1,528 |
| Wilkes-Barre PA Finance Authority Revenue (University of Scranton Project) | 5.000% | 11/1/24 | | 1,420 | 1,599 |
| Wilkes-Barre PA Finance Authority Revenue (University of Scranton Project) | 5.000% | 11/1/25 | | 1,465 | 1,639 |
| Wilkes-Barre PA Finance Authority Revenue (University of Scranton Project) | 5.000% | 11/1/30 | | 6,185 | 6,764 |
| | | | | | 1,464,911 |
| Puerto Rico (0.3%) | | | | | |
| Puerto Rico Electric Power Authority Revenue | 5.000% | 7/1/19 | (14) | 35,430 | 35,473 |
| Puerto Rico Electric Power Authority Revenue | 5.000% | 7/1/20 | (14) | 18,245 | 18,250 |
| Puerto Rico Electric Power Authority Revenue | 5.000% | 7/1/21 | (14) | 24,290 | 24,207 |
| Puerto Rico Electric Power Authority Revenue | 5.250% | 7/1/21 | (14) | 5,000 | 5,070 |
| Puerto Rico Electric Power Authority Revenue | 5.250% | 7/1/22 | (14) | 17,050 | 17,199 |
| Puerto Rico Sales Tax Financing Corp. Revenue | 5.500% | 8/1/19 | (Prere.) | 255 | 305 |
| | | | | | 100,504 |
| Rhode Island (0.3%) | | | | | |
| Rhode Island & Providence Plantations GO | 5.000% | 8/1/17 | (4) | 3,120 | 3,231 |
| Rhode Island & Providence Plantations GO | 5.500% | 8/1/28 | | 9,805 | 11,846 |
| Rhode Island & Providence Plantations GO | 5.500% | 8/1/30 | | 3,610 | 4,308 |
| Rhode Island Economic Development Corp. Revenue (Department of Transportation) | 5.250% | 6/15/20 | (12) | 20,000 | 22,964 |
| Rhode Island Economic Development Corp. Revenue (Department of Transportation) | 5.250% | 6/15/21 | (12) | 25,000 | 28,344 |
| Rhode Island Health & Educational Building Corp. Hospital Financing Revenue | | | | | |
| (Care New England Health System Obligated Group) | 5.500% | 9/1/28 | | 6,000 | 6,570 |
| Rhode Island Health & Educational Building Corp. Hospital Financing Revenue | | | | | |
| (Care New England Health System Obligated Group) | 6.000% | 9/1/33 | | 5,500 | 6,138 |
| Rhode Island Health & Educational Building Corp. Hospital Financing Revenue | | | | | |
| (Lifespan Obligated Group) | 5.000% | 5/15/26 | (4) | 4,900 | 5,082 |
| Rhode Island Health & Educational Building Corp. Public Schools Revenue (Pooled Issue) | 4.500% | 5/15/25 | (4) | 2,880 | 3,169 |
| Rhode Island Health & Educational Building Corp. Public Schools Revenue (Pooled Issue) | 4.625% | 5/15/26 | (4) | 3,210 | 3,548 |
| Rhode Island Health & Educational Building Corp. Public Schools Revenue (Pooled Issue) | 4.750% | 5/15/29 | (4) | 3,500 | 3,834 |
| | | | | | 99,034 |
| South Carolina (1.4%) | | | | | |
| Berkeley County SC Utility Revenue | 5.000% | 6/1/30 | | 8,170 | 9,499 |
| Charleston SC Educational Excellence Financing Corp. Revenue | | | | | |
| (Charleston County School District, South Carolina Project) | 5.250% | 12/1/15 | (Prere.) | 12,610 | 13,296 |
| Charleston SC Educational Excellence Financing Corp. Revenue | | | | | |
| (Charleston County School District, South Carolina Project) | 5.250% | 12/1/15 | (Prere.) | 33,070 | 34,868 |
| Charleston SC Educational Excellence Financing Corp. Revenue | | | | | |
| (Charleston County School District, South Carolina Project) | 5.250% | 12/1/15 | (Prere.) | 2,730 | 2,878 |
| Charleston SC Educational Excellence Financing Corp. Revenue | | | | | |
| (Charleston County School District, South Carolina Project) | 5.000% | 12/1/16 | (Prere.) | 3,105 | 3,399 |
| Charleston SC Educational Excellence Financing Corp. Revenue | | | | | |
| (Charleston County School District, South Carolina Project) | 5.000% | 12/1/27 | | 10,000 | 11,969 |
| Dorchester County SC School District No. 2 Installment Purchase Revenue | 4.000% | 12/1/25 | | 8,805 | 9,622 |
| Dorchester County SC School District No. 2 Installment Purchase Revenue | 4.000% | 12/1/26 | | 9,760 | 10,560 |
| Greenville County SC Hospital Revenue (Greenville Hospital System) | 5.000% | 5/1/16 | | 5,000 | 5,329 |
| Greenville County SC Hospital Revenue (Greenville Hospital System) | 4.125% | 5/1/17 | | 5,315 | 5,750 |
| Greenville County SC Hospital Revenue (Greenville Hospital System) | 5.000% | 5/1/18 | | 2,655 | 3,003 |
| Greenville County SC School District Installment Revenue | 5.500% | 12/1/19 | | 32,480 | 39,024 |
| Greenville County SC School District Installment Revenue | 5.000% | 12/1/26 | | 28,255 | 30,628 |
| 1 Greenville County SC School District Installment Revenue TOB VRDO | 0.100% | 11/7/14 | | 7,440 | 7,440 |
| Lexington County SC Health Services District Inc. Hospital Revenue | 5.000% | 11/1/26 | | 6,220 | 6,963 |
| Myrtle Beach SC Hospitality Fee Revenue | 5.000% | 6/1/26 | | 1,000 | 1,172 |
| Myrtle Beach SC Hospitality Fee Revenue | 5.000% | 6/1/27 | | 2,075 | 2,418 |
| Myrtle Beach SC Hospitality Fee Revenue | 5.000% | 6/1/30 | | 1,000 | 1,150 |
| Myrtle Beach SC Hospitality Fee Revenue | 5.000% | 6/1/31 | | 2,500 | 2,862 |
129
Intermediate-Term Tax-Exempt Fund
| | | | | |
| | | | | Face | Market |
| | | Maturity | | Amount | Value• |
| | Coupon | Date | | ($000) | ($000) |
| Myrtle Beach SC Hospitality Fee Revenue | 5.000% | 6/1/33 | | 2,750 | 3,127 |
| Newberry County SC School District Installment Purchase Revenue | 5.000% | 12/1/26 | | 4,000 | 4,733 |
| Newberry County SC School District Installment Purchase Revenue | 5.000% | 12/1/29 | | 3,390 | 3,954 |
| Newberry County SC School District Installment Purchase Revenue | 5.000% | 12/1/30 | | 5,210 | 6,042 |
| North Charleston SC Tax Revenue | 5.000% | 12/1/14 | (12) | 4,725 | 4,743 |
| North Charleston SC Tax Revenue | 5.000% | 12/1/15 | (12) | 4,715 | 4,944 |
| Piedmont SC Municipal Power Agency Revenue | 5.000% | 1/1/20 | | 10,000 | 11,685 |
| Piedmont SC Municipal Power Agency Revenue | 0.000% | 1/1/22 | (14) | 9,950 | 8,280 |
| Piedmont SC Municipal Power Agency Revenue | 0.000% | 1/1/23 | (14) | 8,780 | 6,996 |
| Piedmont SC Municipal Power Agency Revenue | 0.000% | 1/1/24 | (14) | 2,400 | 1,830 |
| Piedmont SC Municipal Power Agency Revenue | 5.000% | 1/1/24 | | 3,535 | 4,024 |
| Piedmont SC Municipal Power Agency Revenue | 5.000% | 1/1/24 | | 13,620 | 15,089 |
| Piedmont SC Municipal Power Agency Revenue | 5.000% | 1/1/25 | | 8,020 | 9,056 |
| Piedmont SC Municipal Power Agency Revenue | 5.000% | 1/1/29 | (4) | 8,600 | 9,571 |
| Piedmont SC Municipal Power Agency Revenue | 5.000% | 1/1/29 | (4) | 2,800 | 3,116 |
| South Carolina GO | 5.000% | 3/1/16 | | 6,165 | 6,553 |
| South Carolina GO | 5.000% | 4/1/16 | | 3,560 | 3,797 |
| South Carolina GO | 5.000% | 4/1/18 | | 2,400 | 2,744 |
| South Carolina GO | 5.000% | 4/1/19 | | 7,825 | 9,167 |
| South Carolina GO | 5.000% | 4/1/19 | | 2,495 | 2,923 |
| South Carolina Jobs Economic Development Authority Hospital Revenue (AnMed Health Project) | 5.000% | 2/1/18 | | 2,000 | 2,236 |
| South Carolina Jobs Economic Development Authority Hospital Revenue | | | | | |
| (AnMed Health Project) VRDO | 0.050% | 11/7/14 | LOC | 34,585 | 34,585 |
| South Carolina Jobs Economic Development Authority Hospital Revenue (Palmetto Health) | 5.250% | 8/1/23 | (4) | 6,275 | 6,927 |
| South Carolina Jobs Economic Development Authority Hospital Revenue (Palmetto Health) | 5.250% | 8/1/24 | (4) | 6,200 | 6,823 |
| South Carolina Jobs Economic Development Authority Hospital Revenue (Palmetto Health) | 5.250% | 8/1/25 | (4) | 6,925 | 7,598 |
| South Carolina Jobs Economic Development Authority Hospital Revenue (Palmetto Health) | 5.000% | 8/1/27 | | 11,740 | 13,198 |
| South Carolina Jobs Economic Development Authority Hospital Revenue (Palmetto Health) | 5.250% | 8/1/27 | (4) | 13,550 | 14,800 |
| South Carolina Jobs Economic Development Authority Hospital Revenue (Palmetto Health) | 5.000% | 8/1/28 | | 7,850 | 8,793 |
| South Carolina Public Service Authority Revenue | 5.000% | 12/1/16 | | 7,225 | 7,901 |
| South Carolina Public Service Authority Revenue | 5.000% | 12/1/23 | | 10,000 | 12,038 |
| South Carolina Public Service Authority Revenue | 5.000% | 12/1/24 | | 13,900 | 16,865 |
| South Carolina Public Service Authority Revenue | 5.000% | 12/1/25 | | 5,615 | 6,751 |
| South Carolina Public Service Authority Revenue | 5.000% | 12/1/27 | | 4,295 | 5,097 |
| South Carolina Public Service Authority Revenue | 5.000% | 12/1/28 | | 15,130 | 17,849 |
| South Carolina Public Service Authority Revenue | 5.000% | 12/1/29 | | 6,065 | 7,125 |
| South Carolina Public Service Authority Revenue | 5.000% | 12/1/30 | | 10,510 | 12,277 |
| South Carolina Public Service Authority Revenue | 5.000% | 12/1/31 | | 13,980 | 16,225 |
| South Carolina Public Service Authority Revenue | 5.000% | 12/1/32 | | 12,035 | 13,878 |
| South Carolina Public Service Authority Revenue | 5.000% | 12/1/33 | | 10,465 | 11,971 |
| | | | | | 547,141 |
| South Dakota (0.1%) | | | | | |
| Educational Enhancement Funding Corp. South Dakota Tobacco Settlement Revenue | 5.000% | 6/1/23 | | 1,000 | 1,163 |
| South Dakota Building Authority Revenue | 5.000% | 6/1/33 | | 4,000 | 4,598 |
| South Dakota Health & Educational Facilities Authority Revenue (Sanford Health) | 5.000% | 11/1/23 | | 650 | 776 |
| South Dakota Health & Educational Facilities Authority Revenue (Sanford Health) | 5.000% | 11/1/24 | | 650 | 783 |
| South Dakota Health & Educational Facilities Authority Revenue (Sanford Health) | 5.000% | 11/1/25 | | 600 | 717 |
| South Dakota Health & Educational Facilities Authority Revenue (Sanford Health) | 5.000% | 11/1/26 | | 675 | 800 |
| South Dakota Health & Educational Facilities Authority Revenue (Sanford Health) | 5.000% | 11/1/27 | | 1,025 | 1,211 |
| South Dakota Health & Educational Facilities Authority Revenue (Sanford Health) | 5.000% | 11/1/28 | | 825 | 971 |
| South Dakota Health & Educational Facilities Authority Revenue (Sanford Health) | 5.000% | 11/1/29 | | 1,415 | 1,659 |
| South Dakota Health & Educational Facilities Authority Revenue (Sanford Health) | 5.250% | 11/1/29 | | 2,000 | 2,243 |
| South Dakota Health & Educational Facilities Authority Revenue (Sanford Health) | 5.000% | 11/1/34 | | 8,250 | 9,384 |
| | | | | | 24,305 |
| Tennessee (1.0%) | | | | | |
| Jackson TN Hospital Improvement Revenue (Jackson-Madison County General Hospital Project) | 5.250% | 4/1/23 | | 8,280 | 9,102 |
| Jackson TN Hospital Improvement Revenue (Jackson-Madison County General Hospital Project) | 5.375% | 4/1/28 | | 8,000 | 8,746 |
| Knox County TN Health Educational & Housing Facilities Board Hospital Facilities Revenue | | | | | |
| (Covenant Healthcare) | 5.000% | 1/1/21 | | 2,500 | 2,935 |
| Knox County TN Health Educational & Housing Facilities Board Hospital Facilities Revenue | | | | | |
| (Covenant Healthcare) | 5.000% | 1/1/22 | | 1,100 | 1,296 |
| Knox County TN Health Educational & Housing Facilities Board Hospital Facilities Revenue | | | | | |
| (Covenant Healthcare) | 5.000% | 1/1/23 | | 4,860 | 5,737 |
| Memphis TN GO | 5.000% | 11/1/15 | (Prere.) | 16,000 | 16,769 |
| Memphis TN GO | 5.000% | 11/1/15 | (Prere.) | 4,730 | 4,957 |
| Memphis TN GO | 5.000% | 11/1/15 | (Prere.) | 4,750 | 4,978 |
| Memphis TN GO | 5.000% | 11/1/20 | (10) | 4,000 | 4,350 |
| Memphis TN GO | 5.000% | 5/1/28 | | 3,145 | 3,606 |
| Memphis TN GO | 5.000% | 5/1/30 | | 1,715 | 1,952 |
| Metropolitan Government of Nashville & Davidson County TN GO | 5.000% | 7/1/16 | | 3,825 | 4,122 |
| Metropolitan Government of Nashville & Davidson County TN GO | 5.000% | 1/1/18 | (Prere.) | 5,000 | 5,667 |
130
Intermediate-Term Tax-Exempt Fund
| | | | | |
| | | | | Face | Market |
| | | Maturity | | Amount | Value• |
| | Coupon | Date | | ($000) | ($000) |
| Metropolitan Government of Nashville & Davidson County TN Health & Educational Facilities | | | | | |
| Board Revenue (Blakeford at Green Hills) | 5.000% | 7/1/27 | | 1,000 | 1,088 |
| 3 Metropolitan Government of Nashville & Davidson County TN Health & Educational Facilities | | | | | |
| Board Revenue (Vanderbilt University) PUT | 0.650% | 10/1/17 | | 11,500 | 11,550 |
| Shelby County TN GO | 5.000% | 4/1/19 | (ETM) | 100 | 117 |
| Shelby County TN GO | 5.000% | 4/1/19 | | 400 | 468 |
| Shelby County TN Health Educational & Housing Facility Board Revenue | | | | | |
| (Baptist Memorial Health Care) | 5.000% | 9/1/18 | | 7,180 | 8,172 |
| Shelby County TN Health Educational & Housing Facility Board Revenue | | | | | |
| (Baptist Memorial Health Care) | 5.000% | 9/1/19 | | 2,000 | 2,301 |
| Shelby County TN Health Educational & Housing Facility Board Revenue | | | | | |
| (Methodist Le Bonheur Healthcare) VRDO | 0.060% | 11/3/14 | (4) | 13,500 | 13,500 |
| Shelby County TN Health Educational & Housing Facility Board Revenue | | | | | |
| (Methodist Le Bonheur Healthcare) VRDO | 0.070% | 11/3/14 | (4) | 10,800 | 10,800 |
| Shelby County TN Health Educational & Housing Facility Board Revenue | | | | | |
| (St. Jude Children’s Research Hospital) | 5.000% | 7/1/21 | | 5,000 | 5,371 |
| Shelby County TN Health Educational & Housing Facility Board Revenue | | | | | |
| (St. Jude Children’s Research Hospital) | 5.000% | 7/1/22 | | 5,000 | 5,370 |
| Tennessee Energy Acquisition Corp. Gas Revenue | 5.000% | 9/1/16 | | 24,340 | 25,984 |
| Tennessee Energy Acquisition Corp. Gas Revenue | 5.250% | 9/1/17 | | 39,340 | 43,509 |
| Tennessee Energy Acquisition Corp. Gas Revenue | 5.250% | 9/1/18 | | 57,705 | 65,690 |
| Tennessee Energy Acquisition Corp. Gas Revenue | 5.250% | 9/1/21 | | 50 | 58 |
| Tennessee Energy Acquisition Corp. Gas Revenue | 5.000% | 2/1/22 | | 10,135 | 11,546 |
| Tennessee Energy Acquisition Corp. Gas Revenue | 5.000% | 2/1/25 | | 5,215 | 6,015 |
| Tennessee Energy Acquisition Corp. Gas Revenue | 5.250% | 9/1/26 | | 270 | 319 |
| Tennessee Energy Acquisition Corp. Gas Revenue | 5.000% | 2/1/27 | | 16,460 | 18,937 |
| Tennessee GO | 5.000% | 5/1/17 | (Prere.) | 2,075 | 2,306 |
| Tennessee GO | 5.000% | 8/1/17 | | 3,165 | 3,548 |
| Tennessee GO | 5.000% | 10/1/17 | | 6,000 | 6,763 |
| Tennessee GO | 5.000% | 9/1/25 | | 8,250 | 10,310 |
| Tennessee GO | 5.000% | 9/1/26 | | 1,850 | 2,295 |
| Tennessee GO | 5.000% | 9/1/26 | | 6,000 | 7,444 |
| Tennessee GO | 5.000% | 9/1/27 | | 2,000 | 2,467 |
| Tennessee GO | 5.000% | 9/1/27 | | 4,300 | 5,304 |
| Tennessee GO | 5.000% | 9/1/28 | | 1,850 | 2,269 |
| Tennessee GO | 5.000% | 9/1/29 | | 1,000 | 1,222 |
| Tennessee GO | 5.000% | 9/1/30 | | 1,180 | 1,436 |
| Tennessee GO | 5.000% | 9/1/31 | | 1,300 | 1,574 |
| Tennessee Housing Development Agency Homeownership Program Revenue | 4.500% | 7/1/37 | | 3,185 | 3,560 |
| Tennessee School Bond Authority Higher Educational Facilities Revenue (2nd Program) | 5.000% | 11/1/22 | | 3,000 | 3,674 |
| Tennessee School Bond Authority Higher Educational Facilities Revenue (2nd Program) | 5.000% | 11/1/23 | | 3,520 | 4,350 |
| Tennessee School Bond Authority Higher Educational Facilities Revenue (2nd Program) | 5.000% | 11/1/24 | | 2,500 | 3,113 |
| Tennessee School Bond Authority Higher Educational Facilities Revenue (2nd Program) | 5.000% | 11/1/25 | | 5,000 | 6,180 |
| Tennessee School Bond Authority Higher Educational Facilities Revenue (2nd Program) | 5.000% | 11/1/26 | | 2,055 | 2,525 |
| Tennessee School Bond Authority Higher Educational Facilities Revenue (2nd Program) | 5.000% | 11/1/27 | | 2,305 | 2,816 |
| Tennessee School Bond Authority Higher Educational Facilities Revenue (2nd Program) | 5.000% | 11/1/28 | | 1,555 | 1,890 |
| Tennessee School Bond Authority Higher Educational Facilities Revenue (2nd Program) | 5.000% | 11/1/29 | | 1,400 | 1,694 |
| Tennessee School Bond Authority Higher Educational Facilities Revenue (2nd Program) | 5.000% | 11/1/30 | | 2,000 | 2,403 |
| Tennessee School Bond Authority Higher Educational Facilities Revenue (2nd Program) | 5.000% | 11/1/31 | | 1,500 | 1,795 |
| Tennessee School Bond Authority Higher Educational Facilities Revenue (2nd Program) | 5.000% | 11/1/32 | | 2,230 | 2,662 |
| Tennessee School Bond Authority Higher Educational Facilities Revenue (2nd Program) | 5.000% | 11/1/33 | | 2,150 | 2,556 |
| Tennessee School Bond Authority Higher Educational Facilities Revenue (2nd Program) | 5.000% | 11/1/34 | | 1,150 | 1,360 |
| | | | | | 392,528 |
| Texas (8.5%) | | | | | |
| Austin TX Combined Utility System Revenue | 0.000% | 5/15/18 | (14) | 24,215 | 23,259 |
| Austin TX Electric Utility System Revenue | 5.000% | 11/15/25 | | 4,750 | 5,660 |
| Austin TX GO | 5.000% | 9/1/29 | | 2,855 | 3,452 |
| Austin TX GO | 5.000% | 9/1/30 | | 1,240 | 1,494 |
| Austin TX GO | 5.000% | 9/1/31 | | 2,140 | 2,565 |
| Austin TX GO | 5.000% | 9/1/33 | | 4,315 | 5,126 |
| Austin TX GO | 5.000% | 9/1/34 | | 5,975 | 7,064 |
| Austin TX Independent School District GO | 5.000% | 8/1/30 | | 1,225 | 1,473 |
| Austin TX Independent School District GO | 5.000% | 8/1/31 | | 1,695 | 2,027 |
| Austin TX Water & Wastewater System Revenue | 5.000% | 11/15/21 | | 350 | 423 |
| Austin TX Water & Wastewater System Revenue | 5.000% | 11/15/21 | | 2,500 | 2,908 |
| Austin TX Water & Wastewater System Revenue | 5.000% | 11/15/29 | | 6,045 | 7,135 |
| Austin TX Water & Wastewater System Revenue | 5.000% | 11/15/30 | | 5,000 | 5,873 |
| Austin TX Water & Wastewater System Revenue | 5.000% | 11/15/31 | | 4,000 | 4,677 |
| Austin TX Water & Wastewater System Revenue | 5.000% | 11/15/32 | | 10,705 | 12,606 |
| Austin TX Water & Wastewater System Revenue | 5.000% | 11/15/33 | | 11,410 | 13,384 |
| Austin TX Water & Wastewater System Revenue | 5.000% | 11/15/34 | | 12,075 | 14,098 |
131
Intermediate-Term Tax-Exempt Fund
| | | | | |
| | | | | Face | Market |
| | | Maturity | | Amount | Value• |
| | Coupon | Date | | ($000) | ($000) |
| Camino Real Texas Mobility Authority Revenue | 5.250% | 2/15/18 | | 11,960 | 13,622 |
| Camino Real Texas Mobility Authority Revenue | 5.250% | 8/15/18 | | 11,770 | 13,352 |
| Camino Real Texas Mobility Authority Revenue | 5.250% | 2/15/19 | | 12,595 | 14,218 |
| Camino Real Texas Mobility Authority Revenue | 5.250% | 8/15/19 | | 12,925 | 14,537 |
| Camino Real Texas Mobility Authority Revenue | 5.250% | 2/15/20 | | 13,265 | 14,843 |
| Camino Real Texas Mobility Authority Revenue | 5.250% | 8/15/20 | | 13,580 | 15,145 |
| Camino Real Texas Mobility Authority Revenue | 5.000% | 2/15/21 | | 4,600 | 4,618 |
| Central Texas Regional Mobility Authority Revenue | 4.000% | 1/1/15 | | 400 | 402 |
| Central Texas Regional Mobility Authority Revenue | 5.000% | 1/1/16 | | 250 | 260 |
| Central Texas Regional Mobility Authority Revenue | 5.000% | 1/1/17 | | 250 | 267 |
| Central Texas Regional Mobility Authority Revenue | 5.000% | 1/1/18 | | 250 | 272 |
| Central Texas Regional Mobility Authority Revenue | 5.000% | 1/1/19 | | 735 | 810 |
| Central Texas Regional Mobility Authority Revenue | 5.000% | 1/1/20 | | 1,550 | 1,725 |
| Central Texas Regional Mobility Authority Revenue | 5.750% | 1/1/20 | | 1,150 | 1,355 |
| Central Texas Regional Mobility Authority Revenue | 5.000% | 1/1/21 | | 1,000 | 1,115 |
| Central Texas Regional Mobility Authority Revenue | 5.000% | 1/1/22 | | 750 | 836 |
| Central Texas Regional Mobility Authority Revenue | 5.000% | 1/1/23 | | 725 | 807 |
| Central Texas Regional Mobility Authority Revenue | 0.000% | 1/1/25 | | 4,650 | 3,096 |
| Central Texas Regional Mobility Authority Revenue | 5.750% | 1/1/25 | | 2,000 | 2,237 |
| Central Texas Regional Mobility Authority Revenue | 0.000% | 1/1/26 | | 6,490 | 4,111 |
| Central Texas Regional Mobility Authority Revenue | 0.000% | 1/1/27 | | 7,750 | 4,635 |
| Central Texas Regional Mobility Authority Revenue | 0.000% | 1/1/28 | | 5,500 | 3,101 |
| Central Texas Regional Mobility Authority Revenue | 0.000% | 1/1/29 | | 5,220 | 2,802 |
| Central Texas Regional Mobility Authority Revenue | 0.000% | 1/1/30 | | 4,355 | 2,227 |
| Central Texas Regional Mobility Authority Revenue | 0.000% | 1/1/31 | | 4,880 | 2,369 |
| Central Texas Regional Mobility Authority Revenue | 5.750% | 1/1/31 | | 4,000 | 4,620 |
| Central Texas Regional Mobility Authority Revenue | 0.000% | 1/1/33 | | 4,000 | 1,732 |
| Central Texas Regional Mobility Authority Revenue | 5.000% | 1/1/33 | | 3,500 | 3,799 |
| Central Texas Regional Mobility Authority Revenue | 0.000% | 1/1/34 | | 4,000 | 1,621 |
| Central Texas Regional Mobility Authority Revenue | 0.000% | 1/1/35 | | 4,950 | 1,909 |
| Central Texas Regional Mobility Authority Revenue | 0.000% | 1/1/37 | | 5,525 | 1,930 |
| Central Texas Regional Mobility Authority Revenue | 0.000% | 1/1/38 | | 3,500 | 1,160 |
| Central Texas Regional Mobility Authority Revenue | 0.000% | 1/1/39 | | 4,500 | 1,402 |
| Central Texas Regional Mobility Authority Revenue | 0.000% | 1/1/40 | | 5,700 | 1,684 |
| Clear Creek TX Independent School District GO | 5.000% | 2/15/15 | (Prere.) | 10,270 | 10,414 |
| Clear Creek TX Independent School District GO | 5.000% | 2/15/15 | (Prere.) | 11,635 | 11,798 |
| Clifton TX Higher Education Finance Corp. Revenue (Baylor University) | 5.250% | 3/1/25 | | 5,080 | 5,877 |
| Clifton TX Higher Education Finance Corp. Revenue (Baylor University) | 5.250% | 3/1/26 | | 4,305 | 4,951 |
| Clifton TX Higher Education Finance Corp. Revenue (Baylor University) | 5.250% | 3/1/27 | | 5,995 | 6,862 |
| Clifton TX Higher Education Finance Corp. Revenue (Baylor University) | 5.250% | 3/1/28 | | 6,180 | 7,041 |
| Clifton TX Higher Education Finance Corp. Revenue (Baylor University) | 5.250% | 3/1/29 | | 3,190 | 3,637 |
| Clifton TX Higher Education Finance Corp. Revenue (Baylor University) | 5.250% | 3/1/30 | | 6,535 | 7,466 |
| Conroe TX Independent School District GO | 5.000% | 2/15/26 | | 8,190 | 9,732 |
| Corpus Christi TX GO | 5.000% | 3/1/29 | | 5,235 | 6,094 |
| Corpus Christi TX GO | 5.000% | 3/1/30 | | 5,495 | 6,348 |
| Corpus Christi TX GO | 5.000% | 3/1/31 | | 5,770 | 6,624 |
| Dallas County TX GO | 5.000% | 2/15/15 | | 1,845 | 1,871 |
| Dallas County TX Utility & Reclamation District GO | 5.000% | 2/15/24 | | 8,000 | 9,452 |
| Dallas County TX Utility & Reclamation District GO | 5.250% | 2/15/25 | (2) | 11,245 | 12,095 |
| Dallas County TX Utility & Reclamation District GO | 5.250% | 2/15/25 | (2) | 11,245 | 12,095 |
| Dallas TX Area Rapid Transit Sales Tax Revenue | 4.500% | 12/1/26 | | 11,385 | 12,316 |
| Dallas TX Area Rapid Transit Sales Tax Revenue | 4.500% | 12/1/27 | | 14,130 | 15,228 |
| Dallas TX Area Rapid Transit Sales Tax Revenue | 5.000% | 12/1/27 | | 2,295 | 2,708 |
| Dallas TX Area Rapid Transit Sales Tax Revenue | 5.000% | 12/1/29 | | 1,195 | 1,399 |
| Dallas TX Area Rapid Transit Sales Tax Revenue | 5.000% | 12/1/30 | | 2,160 | 2,519 |
| Dallas TX Area Rapid Transit Sales Tax Revenue | 5.000% | 12/1/31 | | 2,120 | 2,460 |
| Dallas TX Civic Center Improvement Revenue | 5.000% | 8/15/23 | (12) | 9,880 | 10,915 |
| Dallas TX Civic Center Improvement Revenue | 5.000% | 8/15/24 | (12) | 8,345 | 9,179 |
| Dallas TX Civic Center Improvement Revenue | 5.000% | 8/15/25 | (12) | 5,050 | 5,525 |
| Dallas TX Civic Center Improvement Revenue | 5.000% | 8/15/26 | (12) | 1,650 | 1,797 |
| Dallas TX GO | 5.000% | 2/15/15 | (Prere.) | 11,675 | 11,839 |
| Dallas TX GO | 5.000% | 2/15/22 | (ETM) | 45 | 55 |
| Dallas TX Independent School District GO | 5.000% | 2/15/24 | | 17,450 | 20,729 |
| Dallas TX Waterworks & Sewer System Revenue | 5.000% | 10/1/18 | | 2,000 | 2,316 |
| Dallas-Fort Worth TX International Airport Revenue | 5.000% | 11/1/20 | | 2,740 | 2,986 |
| Dallas-Fort Worth TX International Airport Revenue | 5.000% | 11/1/28 | | 7,335 | 8,473 |
| Dallas-Fort Worth TX International Airport Revenue | 5.250% | 11/1/28 | | 2,235 | 2,625 |
| Dallas-Fort Worth TX International Airport Revenue | 5.000% | 11/1/29 | | 6,360 | 7,288 |
| Dallas-Fort Worth TX International Airport Revenue | 5.250% | 11/1/29 | | 14,950 | 17,432 |
| Dallas-Fort Worth TX International Airport Revenue | 5.000% | 11/1/30 | | 14,195 | 16,082 |
| Dallas-Fort Worth TX International Airport Revenue | 5.000% | 11/1/30 | | 6,680 | 7,566 |
132
Intermediate-Term Tax-Exempt Fund
| | | | | |
| | | | | Face | Market |
| | | Maturity | | Amount | Value• |
| | Coupon | Date | | ($000) | ($000) |
| Dallas-Fort Worth TX International Airport Revenue | 5.250% | 11/1/30 | | 12,500 | 14,533 |
| Dallas-Fort Worth TX International Airport Revenue | 5.000% | 11/1/31 | | 7,750 | 8,745 |
| Dallas-Fort Worth TX International Airport Revenue | 5.000% | 11/1/32 | | 5,775 | 6,495 |
| Dallas-Fort Worth TX International Airport Revenue | 5.000% | 11/1/33 | | 9,000 | 10,102 |
| Fort Worth TX Water & Sewer Revenue | 5.000% | 2/15/29 | | 6,155 | 7,103 |
| Fort Worth TX Water & Sewer Revenue | 5.000% | 2/15/30 | | 6,430 | 7,358 |
| Fort Worth TX Water & Sewer Revenue | 5.000% | 2/15/31 | | 6,255 | 7,127 |
| Frisco TX Independent School District GO | 5.000% | 8/15/15 | | 1,690 | 1,755 |
| Frisco TX Independent School District GO | 5.000% | 8/15/16 | | 4,205 | 4,554 |
| Frisco TX Independent School District GO | 5.000% | 8/15/32 | | 6,665 | 7,768 |
| Grand Parkway Transportation Corp. Texas System Toll Revenue | 0.000% | 10/1/31 | | 2,875 | 2,171 |
| Grand Parkway Transportation Corp. Texas System Toll Revenue | 0.000% | 10/1/32 | | 5,320 | 4,008 |
| Grand Parkway Transportation Corp. Texas System Toll Revenue | 0.000% | 10/1/33 | | 18,100 | 13,568 |
| 1 Harris County TX Cultural Education Facilities Finance Corp. Hospital Revenue | | | | | |
| (Memorial Hermann Healthcare System) TOB VRDO | 0.050% | 11/7/14 | LOC | 21,000 | 21,000 |
| Harris County TX Cultural Education Facilities Finance Corp. Revenue (Methodist Hospital System) | 5.250% | 12/1/15 | | 10,000 | 10,534 |
| Harris County TX Cultural Education Facilities Finance Corp. Revenue (Methodist Hospital System) | 5.250% | 12/1/16 | | 12,000 | 13,182 |
| Harris County TX Cultural Education Facilities Finance Corp. Revenue (Methodist Hospital System) | 5.250% | 12/1/17 | | 17,000 | 19,295 |
| Harris County TX Cultural Education Facilities Finance Corp. Revenue | | | | | |
| (Methodist Hospital System) VRDO | 0.070% | 11/3/14 | | 23,860 | 23,860 |
| Harris County TX Cultural Education Facilities Finance Corp. Revenue | | | | | |
| (St. Luke’s Episcopal Health System) | 5.000% | 2/15/19 | (ETM) | 4,000 | 4,653 |
| Harris County TX Cultural Education Facilities Finance Corp. Revenue | | | | | |
| (St. Luke’s Episcopal Health System) | 5.000% | 2/15/19 | (Prere.) | 10,225 | 11,895 |
| Harris County TX Cultural Education Facilities Finance Corp. Revenue | | | | | |
| (St. Luke’s Episcopal Health System) | 5.625% | 2/15/19 | (Prere.) | 39,530 | 47,017 |
| Harris County TX Flood Control District GO | 5.000% | 10/1/26 | | 6,000 | 7,365 |
| Harris County TX Flood Control District GO | 5.000% | 10/1/27 | | 5,000 | 6,098 |
| Harris County TX Flood Control District GO | 5.000% | 10/1/28 | | 3,000 | 3,639 |
| Harris County TX Flood Control District GO | 5.000% | 10/1/29 | | 2,000 | 2,415 |
| Harris County TX GO | 5.000% | 10/1/16 | | 4,755 | 5,176 |
| Harris County TX GO | 5.000% | 10/1/17 | | 4,705 | 5,303 |
| Harris County TX GO | 5.000% | 10/1/21 | | 8,000 | 9,540 |
| Harris County TX GO | 5.000% | 8/15/31 | | 11,485 | 13,311 |
| Harris County TX GO | 5.000% | 8/15/32 | | 15,010 | 17,329 |
| Harris County TX Health Facilities Development Corp. Hospital Revenue | | | | | |
| (Memorial Hermann Healthcare System) | 7.200% | 12/1/14 | (Prere.) | 4,000 | 4,024 |
| Harris County TX Health Facilities Development Corp. Hospital Revenue | | | | | |
| (Memorial Hermann Healthcare System) | 7.000% | 12/1/18 | (Prere.) | 5,000 | 6,206 |
| Harris County TX Health Facilities Development Corp. Hospital Revenue | | | | | |
| (Texas Children’s Hospital) | 5.000% | 10/1/24 | | 8,500 | 9,735 |
| Harris County TX Health Facilities Development Corp. Revenue | | | | | |
| (Methodist Hospital System) VRDO | 0.070% | 11/3/14 | | 32,500 | 32,500 |
| Harris County TX Metropolitan Transit Authority Revenue | 5.000% | 11/1/26 | | 3,000 | 3,481 |
| Harris County TX Metropolitan Transit Authority Revenue | 5.000% | 11/1/27 | | 6,475 | 7,497 |
| Harris County TX Metropolitan Transit Authority Revenue | 5.000% | 11/1/28 | | 5,665 | 6,526 |
| Harris County TX Metropolitan Transportation Authority Lease Revenue | 5.000% | 11/1/14 | | 3,475 | 3,475 |
| Harris County TX Metropolitan Transportation Authority Lease Revenue | 5.625% | 11/1/19 | | 4,535 | 5,280 |
| Harris County TX Metropolitan Transportation Authority Lease Revenue | 5.875% | 11/1/20 | | 3,640 | 4,298 |
| Harris County TX Metropolitan Transportation Authority Lease Revenue | 6.000% | 11/1/21 | | 4,295 | 5,084 |
| Harris County TX Sports Authority Revenue | 0.000% | 11/15/23 | (14) | 7,000 | 4,577 |
| Harris County TX Toll Road Revenue | 5.000% | 8/15/15 | | 1,435 | 1,489 |
| Harris County TX Toll Road Revenue | 5.000% | 8/15/20 | | 2,000 | 2,347 |
| Harris County TX Toll Road Revenue | 5.000% | 8/15/25 | | 3,375 | 3,994 |
| Harris County TX Toll Road Revenue | 5.000% | 8/15/27 | | 22,160 | 25,919 |
| Houston TX Airport System Revenue | 5.000% | 7/1/16 | | 1,500 | 1,610 |
| Houston TX Airport System Revenue | 5.000% | 7/1/18 | | 1,750 | 1,995 |
| Houston TX Airport System Revenue | 5.000% | 7/1/19 | | 1,750 | 1,980 |
| Houston TX Airport System Revenue | 5.000% | 7/1/20 | | 2,130 | 2,387 |
| Houston TX Airport System Revenue | 5.000% | 7/1/25 | | 1,000 | 1,162 |
| Houston TX Airport System Revenue | 5.000% | 7/1/26 | | 3,000 | 3,475 |
| Houston TX Community College System GO | 5.000% | 2/15/17 | | 1,000 | 1,102 |
| Houston TX Community College System Revenue | 5.000% | 4/15/21 | (10) | 9,200 | 9,802 |
| Houston TX GO | 5.000% | 3/1/17 | | 17,880 | 19,741 |
| Houston TX GO | 5.000% | 3/1/22 | | 5,000 | 6,053 |
| Houston TX GO | 5.000% | 3/1/23 | | 16,680 | 19,927 |
| Houston TX GO | 5.000% | 3/1/23 | | 4,000 | 4,876 |
| Houston TX GO | 5.000% | 3/1/26 | | 10,000 | 12,136 |
| Houston TX GO | 5.000% | 3/1/30 | | 4,000 | 4,751 |
| 3 Houston TX Higher Education Finance Corp. Revenue (Rice University Project) PUT | 0.450% | 11/16/16 | | 75,000 | 75,004 |
| Houston TX Hotel Occupancy Tax & Special Revenue (Convention & Entertainment Facilities) | 5.000% | 9/1/15 | | 5,600 | 5,821 |
133
Intermediate-Term Tax-Exempt Fund
| | | | | |
| | | | | Face | Market |
| | | Maturity | | Amount | Value• |
| | Coupon | Date | | ($000) | ($000) |
| Houston TX Hotel Occupancy Tax & Special Revenue (Convention & Entertainment Facilities) | 0.000% | 9/1/17 | (2) | 13,760 | 13,168 |
| Houston TX Hotel Occupancy Tax & Special Revenue (Convention & Entertainment Facilities) | 0.000% | 9/1/18 | (2) | 16,285 | 15,138 |
| Houston TX Hotel Occupancy Tax & Special Revenue (Convention & Entertainment Facilities) | 0.000% | 9/1/21 | (2) | 22,720 | 18,232 |
| Houston TX Independent School District GO PUT | 1.000% | 6/1/15 | | 73,000 | 73,256 |
| Houston TX Utility System Revenue | 5.000% | 11/15/16 | | 3,730 | 4,075 |
| Houston TX Utility System Revenue | 5.250% | 11/15/17 | (4) | 13,500 | 15,369 |
| Houston TX Utility System Revenue | 5.000% | 5/15/23 | | 7,000 | 8,558 |
| Houston TX Utility System Revenue | 5.000% | 11/15/23 | | 3,000 | 3,678 |
| Houston TX Utility System Revenue | 5.000% | 5/15/24 | | 9,000 | 11,088 |
| Houston TX Utility System Revenue | 5.000% | 5/15/25 | | 5,000 | 6,114 |
| Houston TX Utility System Revenue | 5.000% | 11/15/27 | | 6,000 | 7,287 |
| Houston TX Utility System Revenue | 5.250% | 11/15/29 | | 16,650 | 19,818 |
| Houston TX Utility System Revenue | 5.000% | 11/15/30 | | 8,020 | 9,390 |
| Houston TX Utility System Revenue | 5.000% | 11/15/30 | | 14,670 | 17,175 |
| Houston TX Utility System Revenue | 5.000% | 11/15/31 | | 10,000 | 11,618 |
| Houston TX Utility System Revenue | 5.000% | 11/15/31 | | 5,010 | 5,821 |
| Houston TX Utility System Revenue | 5.000% | 11/15/31 | | 10,335 | 12,008 |
| Houston TX Utility System Revenue | 5.000% | 11/15/32 | | 10,000 | 11,556 |
| Houston TX Utility System Revenue | 5.000% | 11/15/32 | | 8,190 | 9,465 |
| 3 Houston TX Utility System Revenue PUT | 0.650% | 8/1/16 | | 4,375 | 4,394 |
| 1 Judson TX Independent School District GO TOB VRDO | 0.070% | 11/7/14 | (12) | 11,495 | 11,495 |
| Lake Travis TX Independent School District GO | 5.000% | 2/15/33 | | 2,665 | 3,055 |
| Laredo TX Community College District GO | 5.000% | 8/1/22 | | 1,500 | 1,806 |
| Laredo TX Community College District GO | 5.000% | 8/1/30 | | 2,000 | 2,360 |
| Laredo TX Community College District GO | 5.000% | 8/1/32 | | 1,250 | 1,465 |
| Laredo TX Community College District GO | 5.000% | 8/1/34 | | 1,500 | 1,744 |
| Lower Colorado River Authority Texas Revenue | 5.875% | 5/15/15 | (4) | 3,005 | 3,019 |
| Lower Colorado River Authority Texas Revenue | 5.375% | 5/15/16 | (14) | 45 | 45 |
| Lower Colorado River Authority Texas Revenue | 5.375% | 5/15/17 | (14) | 65 | 65 |
| Lower Colorado River Authority Texas Revenue | 5.250% | 5/15/19 | (Prere.) | 5 | 6 |
| Lower Colorado River Authority Texas Revenue | 5.250% | 5/15/19 | (Prere.) | 5 | 6 |
| Lower Colorado River Authority Texas Revenue | 5.250% | 5/15/19 | (Prere.) | 105 | 124 |
| Lower Colorado River Authority Texas Revenue | 5.250% | 5/15/19 | (Prere.) | 5 | 6 |
| Lower Colorado River Authority Texas Revenue | 5.375% | 5/15/20 | (14) | 30 | 30 |
| Lower Colorado River Authority Texas Revenue | 5.000% | 5/15/29 | | 10,000 | 11,135 |
| Lower Colorado River Authority Texas Revenue | 5.250% | 5/15/29 | | 2,380 | 2,690 |
| Lower Colorado River Authority Texas Revenue | 5.250% | 5/15/29 | | 9,070 | 9,995 |
| Lower Colorado River Authority Texas Revenue | 5.000% | 5/15/30 | | 10,000 | 11,030 |
| Lower Colorado River Authority Texas Revenue | 5.000% | 5/15/30 | | 4,000 | 4,437 |
| Lower Colorado River Authority Texas Revenue | 5.000% | 5/15/32 | | 13,955 | 15,752 |
| Lower Colorado River Authority Texas Revenue | 5.000% | 5/15/33 | | 8,500 | 9,581 |
| Lubbock TX GO | 5.000% | 2/15/23 | | 700 | 851 |
| Lubbock TX GO | 5.000% | 2/15/27 | | 5,735 | 6,664 |
| Lubbock TX GO | 5.000% | 2/15/29 | | 4,335 | 4,989 |
| Lubbock TX GO | 5.000% | 2/15/30 | | 6,660 | 7,636 |
| Lubbock TX GO | 5.000% | 2/15/31 | | 4,120 | 4,703 |
| Mesquite TX Health Facilities Development Corp. Retirement Facility Revenue | | | | | |
| (Christian Care CentersInc. Project) | 5.125% | 2/15/30 | | 1,000 | 1,053 |
| New Hope TX Cultural Education Facilities Finance Corp. Student Housing Revenue | | | | | |
| (Tarleton State University Project) | 5.000% | 4/1/29 | | 725 | 794 |
| New Hope TX Cultural Education Facilities Finance Corp. Student Housing Revenue | | | | | |
| (Tarleton State University Project) | 5.000% | 4/1/34 | | 1,000 | 1,071 |
| North Harris County TX Regional Water Authority Revenue | 5.125% | 12/15/23 | | 7,410 | 8,483 |
| North Harris County TX Regional Water Authority Revenue | 5.125% | 12/15/24 | | 5,895 | 6,748 |
| North Harris County TX Regional Water Authority Revenue | 5.125% | 12/15/25 | | 5,250 | 5,985 |
| North Harris County TX Regional Water Authority Revenue | 5.125% | 12/15/26 | | 6,225 | 7,097 |
| North Harris County TX Regional Water Authority Revenue | 5.125% | 12/15/27 | | 8,920 | 10,146 |
| North Harris County TX Regional Water Authority Revenue | 5.125% | 12/15/28 | | 8,040 | 9,075 |
| North Texas Tollway Authority System Revenue | 5.500% | 1/1/17 | | 4,750 | 5,217 |
| North Texas Tollway Authority System Revenue | 5.500% | 1/1/18 | | 4,000 | 4,552 |
| North Texas Tollway Authority System Revenue | 6.000% | 1/1/19 | | 15,000 | 17,241 |
| North Texas Tollway Authority System Revenue | 6.000% | 1/1/20 | | 22,100 | 25,267 |
| North Texas Tollway Authority System Revenue | 6.000% | 1/1/21 | | 41,330 | 47,046 |
| North Texas Tollway Authority System Revenue | 6.000% | 1/1/22 | | 26,045 | 29,717 |
| North Texas Tollway Authority System Revenue | 6.250% | 2/1/23 | | 46,220 | 52,221 |
| North Texas Tollway Authority System Revenue | 6.000% | 1/1/24 | | 19,700 | 22,268 |
| North Texas Tollway Authority System Revenue | 6.000% | 1/1/25 | | 11,035 | 12,473 |
| North Texas Tollway Authority System Revenue | 6.000% | 1/1/25 | | 5,075 | 5,736 |
| North Texas Tollway Authority System Revenue | 6.000% | 1/1/26 | | 4,395 | 4,985 |
| North Texas Tollway Authority System Revenue | 6.000% | 1/1/27 | | 3,950 | 4,496 |
134
Intermediate-Term Tax-Exempt Fund
| | | | | |
| | | | | Face | Market |
| | | Maturity | | Amount | Value• |
| | Coupon | Date | | ($000) | ($000) |
| North Texas Tollway Authority System Revenue | 6.000% | 1/1/28 | | 3,220 | 3,785 |
| North Texas Tollway Authority System Revenue | 5.500% | 9/1/28 | | 1,250 | 1,510 |
| North Texas Tollway Authority System Revenue | 5.250% | 9/1/29 | | 4,130 | 4,839 |
| North Texas Tollway Authority System Revenue | 5.000% | 9/1/30 | | 3,150 | 3,616 |
| North Texas Tollway Authority System Revenue | 5.000% | 9/1/30 | | 9,000 | 10,332 |
| North Texas Tollway Authority System Revenue | 5.000% | 1/1/31 | | 12,400 | 13,785 |
| North Texas Tollway Authority System Revenue | 5.000% | 9/1/31 | | 4,000 | 4,573 |
| North Texas Tollway Authority System Revenue | 5.000% | 9/1/31 | | 28,500 | 32,583 |
| North Texas Tollway Authority System Revenue PUT | 5.750% | 1/1/16 | | 75,000 | 79,411 |
| 1 North Texas Tollway Authority System Revenue TOB VRDO | 0.060% | 11/7/14 | (13) | 2,200 | 2,200 |
| Panhandle-Plains TX Higher Education Authority Inc. Student Loan Revenue | 1.035% | 10/1/20 | | 2,635 | 2,619 |
| SA Energy Acquisition Public Facility Corp. Texas Gas Supply Revenue | 5.250% | 8/1/17 | | 16,100 | 17,826 |
| SA Energy Acquisition Public Facility Corp. Texas Gas Supply Revenue | 5.250% | 8/1/18 | | 18,985 | 21,556 |
| SA Energy Acquisition Public Facility Corp. Texas Gas Supply Revenue | 5.500% | 8/1/19 | | 22,010 | 25,257 |
| SA Energy Acquisition Public Facility Corp. Texas Gas Supply Revenue | 5.500% | 8/1/20 | | 9,465 | 10,933 |
| SA Energy Acquisition Public Facility Corp. Texas Gas Supply Revenue | 5.500% | 8/1/21 | | 3,000 | 3,505 |
| SA Energy Acquisition Public Facility Corp. Texas Gas Supply Revenue | 5.500% | 8/1/23 | | 200 | 239 |
| SA Energy Acquisition Public Facility Corp. Texas Gas Supply Revenue | 5.500% | 8/1/25 | | 1,525 | 1,837 |
| SA Energy Acquisition Public Facility Corp. Texas Gas Supply Revenue | 5.500% | 8/1/27 | | 60 | 72 |
| Sabine River Authority TX Pollution Control Revenue (Southwestern Electric Power Co. Project) | 4.950% | 3/1/18 | (14) | 16,000 | 17,394 |
| Sam Rayburn TX Municipal Power Agency Revenue | 5.000% | 10/1/20 | | 1,000 | 1,167 |
| San Antonio TX Electric & Gas Systems Revenue | 5.000% | 2/1/15 | (Prere.) | 15,000 | 15,182 |
| San Antonio TX Electric & Gas Systems Revenue | 5.000% | 2/1/16 | (Prere.) | 9,750 | 10,322 |
| San Antonio TX Electric & Gas Systems Revenue | 5.000% | 2/1/16 | (Prere.) | 25,450 | 26,943 |
| San Antonio TX Electric & Gas Systems Revenue | 5.000% | 2/1/16 | (Prere.) | 22,000 | 23,290 |
| San Antonio TX Electric & Gas Systems Revenue | 5.000% | 2/1/22 | | 20,000 | 24,234 |
| San Antonio TX Electric & Gas Systems Revenue | 5.000% | 2/1/23 | | 52,060 | 63,615 |
| San Antonio TX Electric & Gas Systems Revenue | 5.000% | 2/1/30 | | 2,710 | 3,186 |
| San Antonio TX Electric & Gas Systems Revenue | 5.000% | 2/1/31 | | 3,000 | 3,508 |
| San Antonio TX GO | 5.000% | 8/1/17 | (Prere.) | 5,685 | 6,372 |
| San Antonio TX GO | 5.000% | 8/1/17 | (Prere.) | 6,030 | 6,758 |
| San Antonio TX GO | 5.000% | 2/1/23 | | 12,630 | 15,530 |
| San Antonio TX GO | 5.000% | 2/1/26 | | 2,500 | 3,056 |
| San Antonio TX GO | 5.000% | 2/1/27 | | 1,750 | 2,126 |
| San Antonio TX GO | 5.000% | 2/1/28 | | 1,000 | 1,207 |
| San Antonio TX GO | 5.000% | 2/1/29 | | 1,250 | 1,501 |
| Southwest Texas Higher Education Authority Inc. Revenue (Southern Methodist University Project) | 5.000% | 10/1/20 | | 2,250 | 2,647 |
| Southwest Texas Higher Education Authority Inc. Revenue (Southern Methodist University Project) | 5.000% | 10/1/22 | | 9,100 | 10,665 |
| Southwest Texas Higher Education Authority Inc. Revenue (Southern Methodist University Project) | 5.000% | 10/1/29 | | 4,375 | 5,014 |
| Sugar Land TX GO | 5.000% | 2/15/30 | | 3,445 | 3,989 |
| Tarrant County TX Cultural Education Facilities Finance Corp. Hospital Revenue | | | | | |
| (Methodist Hospitals of Dallas) | 5.250% | 10/1/31 | | 21,880 | 25,875 |
| Tarrant County TX Cultural Education Facilities Finance Corp. Hospital Revenue | | | | | |
| (Scott & White Healthcare Project) | 5.000% | 8/15/30 | | 40,335 | 45,343 |
| Tarrant County TX Cultural Education Facilities Finance Corp. Revenue (CHRISTUS Health) | 5.000% | 7/1/17 | | 8,570 | 9,405 |
| Tarrant County TX Cultural Education Facilities Finance Corp. Revenue (CHRISTUS Health) | 5.000% | 7/1/18 | | 9,000 | 10,092 |
| Tarrant County TX Cultural Education Facilities Finance Corp. Revenue (CHRISTUS Health) | 5.000% | 7/1/19 | | 9,455 | 10,781 |
| Tarrant County TX Cultural Education Facilities Finance Corp. Revenue (CHRISTUS Health) | 6.250% | 7/1/28 | (12) | 16,500 | 18,976 |
| Temple TX GO | 5.250% | 8/1/17 | (Prere.) | 1,665 | 1,875 |
| Temple TX GO | 5.250% | 8/1/17 | (Prere.) | 1,525 | 1,718 |
| Texas (Veterans Housing Assistance Program) GO VRDO | 0.050% | 11/7/14 | | 24,850 | 24,850 |
| Texas A&M University System Permanent University Fund Revenue | 5.000% | 7/1/19 | | 3,335 | 3,923 |
| Texas A&M University System Revenue Financing System Revenue | 5.000% | 7/1/30 | | 3,940 | 4,627 |
| Texas GO | 5.000% | 4/1/15 | | 1,435 | 1,464 |
| Texas GO | 5.000% | 8/1/17 | | 3,165 | 3,551 |
| Texas GO | 5.000% | 10/1/22 | | 19,000 | 23,314 |
| Texas GO | 5.000% | 10/1/27 | | 33,600 | 40,963 |
| Texas GO | 5.000% | 10/1/28 | | 31,975 | 38,779 |
| Texas GO | 5.000% | 10/1/30 | | 10,000 | 12,012 |
| 1 Texas GO TOB VRDO | 0.050% | 11/7/14 | | 4,000 | 4,000 |
| Texas GO VRDO | 0.040% | 11/7/14 | | 12,390 | 12,390 |
| Texas Municipal Gas Acquisition & Supply Corp. Revenue | 5.625% | 12/15/17 | | 59,445 | 64,808 |
| Texas Municipal Gas Acquisition & Supply Corp. Revenue | 5.000% | 12/15/21 | | 6,000 | 7,050 |
| Texas Municipal Gas Acquisition & Supply Corp. Revenue | 5.250% | 12/15/21 | | 10,510 | 12,191 |
| Texas Municipal Gas Acquisition & Supply Corp. Revenue | 5.250% | 12/15/22 | | 3,625 | 4,229 |
| Texas Municipal Gas Acquisition & Supply Corp. Revenue | 5.000% | 12/15/23 | | 8,000 | 9,171 |
| Texas Municipal Gas Acquisition & Supply Corp. Revenue | 5.250% | 12/15/23 | | 1,650 | 1,930 |
| Texas Municipal Gas Acquisition & Supply Corp. Revenue | 6.250% | 12/15/26 | | 25,010 | 30,807 |
| Texas Municipal Gas Acquisition & Supply Corp. Revenue | 5.000% | 12/15/27 | | 12,000 | 13,325 |
| Texas Municipal Gas Acquisition & Supply Corp. Revenue | 5.000% | 12/15/29 | | 10,000 | 11,030 |
| Texas Municipal Gas Acquisition & Supply Corp. Revenue | 5.000% | 12/15/31 | | 12,000 | 13,138 |
135
Intermediate-Term Tax-Exempt Fund
| | | | | |
| | | | | Face | Market |
| | | Maturity | | Amount | Value• |
| | Coupon | Date | | ($000) | ($000) |
| Texas Municipal Power Agency Revenue | 0.000% | 9/1/15 | (ETM) | 110 | 110 |
| Texas Municipal Power Agency Revenue | 0.000% | 9/1/15 | (14) | 10,140 | 10,110 |
| Texas Municipal Power Agency Revenue | 0.000% | 9/1/16 | (ETM) | 110 | 109 |
| Texas Municipal Power Agency Revenue | 0.000% | 9/1/16 | (14) | 22,795 | 22,535 |
| Texas Municipal Power Agency Revenue | 0.000% | 9/1/17 | (ETM) | 415 | 407 |
| Texas Municipal Power Agency Revenue | 0.000% | 9/1/17 | (14) | 31,295 | 30,428 |
| Texas Private Activity Surface Transportation Corp. Revenue | 7.500% | 12/31/31 | | 32,000 | 39,134 |
| Texas Private Activity Surface Transportation Corp. Revenue | 7.500% | 6/30/32 | | 47,510 | 59,175 |
| Texas Public Finance Authority Revenue (Unemployment Compensation) | 5.000% | 7/1/15 | (Prere.) | 75,000 | 77,423 |
| Texas Public Finance Authority Revenue (Unemployment Compensation) | 5.000% | 7/1/15 | | 2,000 | 2,065 |
| Texas Public Finance Authority Revenue (Unemployment Compensation) | 4.000% | 1/1/18 | | 11,000 | 11,633 |
| Texas State University System Financing System Revenue | 5.000% | 3/15/25 | | 750 | 897 |
| Texas State University System Financing System Revenue | 5.000% | 3/15/27 | | 1,200 | 1,418 |
| Texas State University System Financing System Revenue | 5.000% | 3/15/28 | | 3,870 | 4,416 |
| Texas State University System Financing System Revenue | 5.000% | 3/15/30 | | 3,255 | 3,688 |
| Texas State University System Financing System Revenue | 5.000% | 3/15/31 | | 4,480 | 5,057 |
| Texas State Veterans VRDO | 0.060% | 11/7/14 | | 17,500 | 17,500 |
| Texas Tech University System Financing System Revenue | 5.000% | 2/15/23 | (2) | 10,040 | 10,632 |
| Texas Tech University System Financing System Revenue | 5.000% | 2/15/24 | (2) | 11,940 | 12,642 |
| Texas TRAN | 1.500% | 8/31/15 | | 55,000 | 55,622 |
| Texas Transportation Commission GO | 5.000% | 4/1/22 | | 14,000 | 17,084 |
| Texas Transportation Commission GO | 5.000% | 4/1/24 | | 6,000 | 7,474 |
| Texas Transportation Commission GO | 5.000% | 4/1/31 | | 10,000 | 11,947 |
| Texas Transportation Commission Revenue | 4.750% | 4/1/16 | (Prere.) | 9,500 | 10,096 |
| Texas Transportation Commission Revenue | 5.000% | 4/1/16 | | 2,000 | 2,133 |
| Texas Transportation Commission Revenue | 5.000% | 4/1/16 | (Prere.) | 10,000 | 10,663 |
| Texas Transportation Commission Revenue | 5.000% | 4/1/16 | (Prere.) | 8,850 | 9,437 |
| Texas Transportation Commission Revenue | 5.000% | 4/1/16 | (Prere.) | 10,555 | 11,255 |
| Texas Transportation Commission Revenue | 5.000% | 4/1/20 | | 20,000 | 22,067 |
| Texas Transportation Commission Revenue | 5.000% | 4/1/21 | | 23,405 | 25,773 |
| Texas Transportation Commission Revenue | 5.000% | 4/1/22 | | 5,000 | 5,514 |
| Texas Turnpike Authority Central Texas Turnpike System Revenue | 0.000% | 8/15/20 | (2) | 10,000 | 8,887 |
| Texas Water Development Board Revenue | 5.000% | 7/15/20 | | 3,800 | 4,480 |
| Texas Water Development Board Revenue | 5.000% | 7/15/21 | | 4,535 | 5,345 |
| Texas Water Financial Assistance GO | 5.000% | 8/1/20 | | 2,000 | 2,350 |
| University of Houston Texas Revenue | 4.000% | 2/15/16 | | 1,425 | 1,493 |
| University of Houston Texas Revenue | 4.750% | 2/15/28 | (4) | 8,615 | 9,434 |
| University of Houston Texas Revenue | 5.000% | 2/15/29 | | 5,000 | 5,819 |
| University of Texas System Revenue Financing System Revenue | 5.000% | 8/15/20 | | 2,700 | 3,248 |
| University of Texas System Revenue Financing System Revenue | 5.000% | 8/15/20 | | 9,785 | 10,745 |
| University of Texas System Revenue Financing System Revenue | 4.750% | 8/15/30 | | 11,195 | 12,019 |
| University of Texas System Revenue Financing System Revenue | 5.000% | 8/15/31 | | 9,835 | 11,535 |
| University of Texas System Revenue Financing System Revenue | 5.000% | 8/15/32 | | 4,180 | 4,886 |
| Williamson County TX GO | 5.000% | 2/15/23 | | 6,000 | 7,233 |
| | | | | | 3,364,077 |
| Utah (0.3%) | | | | | |
| Central Utah Water Conservancy District GO | 5.000% | 4/1/26 | | 6,155 | 7,140 |
| Central Utah Water Conservancy District GO | 5.000% | 4/1/27 | | 4,000 | 4,635 |
| Central Utah Water Conservancy District GO | 5.000% | 4/1/28 | | 3,000 | 3,460 |
| Central Utah Water Conservancy District GO | 5.000% | 4/1/28 | | 765 | 882 |
| Central Utah Water Conservancy District GO | 5.000% | 4/1/29 | | 7,000 | 8,049 |
| Central Utah Water Conservancy District GO | 5.000% | 10/1/32 | | 5,640 | 6,555 |
| Emery County UT Pollution Control Revenue (PacifiCorp Projects) VRDO | 0.060% | 11/7/14 | LOC | 6,530 | 6,530 |
| Intermountain Power Agency Utah Power Supply Revenue | 5.000% | 7/1/22 | | 2,000 | 2,264 |
| Intermountain Power Agency Utah Power Supply Revenue | 5.000% | 7/1/23 | | 1,045 | 1,189 |
| Riverton UT Hospital Revenue (IHC Health Services Inc.) | 5.000% | 8/15/19 | | 2,100 | 2,438 |
| Salt Lake & Sandy UT Metropolitan Water District Revenue | 5.000% | 7/1/32 | | 2,000 | 2,309 |
| Salt Lake County UT GO | 5.000% | 12/15/15 | | 5,000 | 5,268 |
| Utah Associated Municipal Power Systems Revenue (Horse Butte Wind Project) | 5.000% | 9/1/27 | | 4,060 | 4,610 |
| Utah Associated Municipal Power Systems Revenue (Horse Butte Wind Project) | 5.000% | 9/1/28 | | 4,260 | 4,794 |
| Utah Board of Regents Student Loan Revenue | 4.000% | 11/1/15 | | 24,000 | 24,915 |
| Utah Board of Regents Student Loan Revenue | 5.000% | 11/1/22 | | 10,800 | 12,482 |
| Utah Board of Regents Student Loan Revenue | 5.000% | 11/1/23 | | 4,200 | 4,813 |
| Utah GO | 5.000% | 7/1/16 | | 3,320 | 3,578 |
| Utah Water Finance Agency Revenue VRDO | 0.070% | 11/7/14 | | 19,750 | 19,750 |
| | | | | | 125,661 |
136
Intermediate-Term Tax-Exempt Fund
| | | | | |
| | | | | Face | Market |
| | | Maturity | | Amount | Value• |
| | Coupon | Date | | ($000) | ($000) |
| Vermont (0.0%) | | | | | |
| Vermont Educational & Health Buildings Financing Agency Hospital Revenue | | | | | |
| (Fletcher Allen Health Care Project) | 5.000% | 12/1/22 | (4) | 8,000 | 8,772 |
| Vermont Educational & Health Buildings Financing Agency Revenue (Middlebury College Project) | 5.000% | 11/1/31 | | 4,130 | 4,842 |
| | | | | | 13,614 |
| Virgin Islands (0.1%) | | | | | |
| Virgin Islands Public Finance Authority Revenue | 5.000% | 10/1/18 | | 4,500 | 5,020 |
| Virgin Islands Public Finance Authority Revenue | 5.000% | 10/1/19 | | 3,000 | 3,385 |
| Virgin Islands Public Finance Authority Revenue | 5.000% | 10/1/24 | | 1,025 | 1,128 |
| Virgin Islands Public Finance Authority Revenue | 5.000% | 10/1/27 | | 1,500 | 1,684 |
| Virgin Islands Public Finance Authority Revenue | 5.000% | 10/1/29 | | 5,020 | 5,532 |
| Virgin Islands Public Finance Authority Revenue | 5.000% | 10/1/32 | | 6,500 | 7,188 |
| | | | | | 23,937 |
| Virginia (1.6%) | | | | | |
| Chesapeake VA Toll Road Revenue | 5.000% | 7/15/23 | | 1,600 | 1,783 |
| Fairfax County VA Economic Development Authority Facilities Revenue (County Facilities Project) | 5.000% | 10/1/22 | | 7,945 | 9,671 |
| Fairfax County VA Economic Development Authority Facilities Revenue (County Facilities Project) | 5.000% | 10/1/24 | | 5,195 | 6,458 |
| Fairfax County VA Economic Development Authority Facilities Revenue (County Facilities Project) | 5.000% | 10/1/33 | | 2,000 | 2,367 |
| Fairfax County VA Economic Development Authority Transportation District Improvement Revenue | | | | | |
| (Silver Line Phase I Project) | 5.000% | 4/1/16 | | 2,320 | 2,470 |
| Fairfax County VA Economic Development Authority Transportation District Improvement Revenue | | | | | |
| (Silver Line Phase I Project) | 5.000% | 4/1/29 | | 9,730 | 11,115 |
| Fairfax County VA Economic Development Authority Transportation District Improvement Revenue | | | | | |
| (Silver Line Phase I Project) | 5.000% | 4/1/30 | | 5,000 | 5,712 |
| Fairfax County VA Economic Development Authority Transportation District Improvement Revenue | | | | | |
| (Silver Line Phase I Project) | 5.000% | 4/1/31 | | 4,890 | 5,531 |
| Fairfax County VA Industrial Development Authority Hospital Revenue | | | | | |
| (Inova Health System Hospital Project) | 5.000% | 5/15/25 | | 2,000 | 2,237 |
| Fairfax County VA Public Improvement GO | 5.000% | 10/1/16 | | 12,950 | 14,095 |
| Fairfax County VA Public Improvement GO | 5.000% | 4/1/19 | | 2,050 | 2,341 |
| Fairfax County VA Public Improvement GO | 5.000% | 4/1/20 | | 10,940 | 13,082 |
| Fairfax County VA Public Improvement GO | 5.000% | 10/1/21 | | 4,315 | 5,266 |
| Fairfax County VA Public Improvement GO | 5.000% | 10/1/23 | | 7,315 | 8,912 |
| Fairfax County VA Public Improvement GO | 5.000% | 10/1/24 | | 10,315 | 12,567 |
| Fairfax County VA Water Authority Revenue | 5.000% | 4/1/25 | | 2,500 | 3,004 |
| Fredericksburg VA Economic Development Authority Hospital Facilities Revenue | | | | | |
| (MediCorp Health System Obligated Group) | 5.250% | 6/15/23 | | 2,500 | 2,842 |
| Hampton VA GO | 5.000% | 1/15/20 | | 3,000 | 3,478 |
| Norfolk VA Water Revenue | 5.000% | 11/1/15 | | 550 | 577 |
| Norfolk VA Water Revenue | 5.000% | 11/1/19 | | 2,615 | 3,089 |
| Richmond VA GO | 5.000% | 7/15/16 | | 4,120 | 4,446 |
| Roanoke VA Economic Development Authority Hospital Revenue (Carilion Clinic Obligated Group) | 5.000% | 7/1/21 | | 2,500 | 2,928 |
| Roanoke VA Economic Development Authority Hospital Revenue (Carilion Clinic Obligated Group) | 5.000% | 7/1/22 | | 3,040 | 3,571 |
| Roanoke VA Economic Development Authority Hospital Revenue (Carilion Clinic Obligated Group) | 5.000% | 7/1/25 | | 10,375 | 11,699 |
| Roanoke VA Economic Development Authority Hospital Revenue (Carilion Clinic Obligated Group) | 5.000% | 7/1/25 | | 1,400 | 1,608 |
| Roanoke VA Economic Development Authority Hospital Revenue (Carilion Clinic Obligated Group) | 5.000% | 7/1/26 | | 1,475 | 1,683 |
| Stafford County VA Economic Development Authority Hospital Facilities Revenue | | | | | |
| (MediCorp Health System Obligated Group) | 5.250% | 6/15/26 | | 2,425 | 2,507 |
| Stafford County VA Economic Development Authority Hospital Facilities Revenue | | | | | |
| (MediCorp Health System Obligated Group) | 5.250% | 6/15/31 | | 15,000 | 15,446 |
| Tobacco Settlement Financing Corp. Virginia Revenue | 5.625% | 6/1/15 | (Prere.) | 42,520 | 43,865 |
| 1 University of Virginia Revenue TOB VRDO | 0.070% | 11/3/14 | | 7,400 | 7,400 |
| Virginia Beach VA Development Authority Public Facility Revenue | 5.000% | 7/15/17 | (Prere.) | 5,125 | 5,744 |
| Virginia Beach VA Development Authority Public Facility Revenue | 5.000% | 7/15/24 | | 5,335 | 5,891 |
| Virginia Beach VA Development Authority Public Facility Revenue | 5.000% | 7/15/25 | | 5,665 | 6,237 |
| Virginia Beach VA Development Authority Public Facility Revenue | 5.000% | 7/15/26 | | 5,955 | 6,557 |
| Virginia Beach VA GO | 5.000% | 5/1/22 | | 4,300 | 5,280 |
| Virginia Beach VA GO | 5.000% | 5/1/23 | | 4,300 | 5,330 |
| Virginia Beach VA GO | 5.000% | 5/1/24 | | 4,300 | 5,397 |
| Virginia College Building Authority Educational Facilities Revenue | | | | | |
| (21st Century College & Equipment Programs) | 5.000% | 2/1/16 | | 1,020 | 1,080 |
| Virginia College Building Authority Educational Facilities Revenue | | | | | |
| (21st Century College & Equipment Programs) | 5.000% | 2/1/17 | | 1,000 | 1,101 |
| Virginia College Building Authority Educational Facilities Revenue | | | | | |
| (21st Century College & Equipment Programs) | 5.000% | 2/1/18 | | 10,595 | 11,596 |
| Virginia College Building Authority Educational Facilities Revenue | | | | | |
| (21st Century College & Equipment Programs) | 5.000% | 2/1/19 | | 18,575 | 21,594 |
| Virginia College Building Authority Educational Facilities Revenue | | | | | |
| (21st Century College & Equipment Programs) | 5.000% | 2/1/19 | | 10,415 | 12,108 |
| Virginia College Building Authority Educational Facilities Revenue | | | | | |
| (21st Century College & Equipment Programs) | 5.000% | 2/1/22 | | 1,000 | 1,207 |
137
Intermediate-Term Tax-Exempt Fund
| | | | | |
| | | | | Face | Market |
| | | Maturity | | Amount | Value• |
| | Coupon | Date | | ($000) | ($000) |
| Virginia College Building Authority Educational Facilities Revenue | | | | | |
| (21st Century College & Equipment Programs) | 5.000% | 2/1/28 | | 5,840 | 6,842 |
| Virginia College Building Authority Educational Facilities Revenue | | | | | |
| (Public Higher Education Financing Program) | 5.000% | 9/1/15 | (ETM) | 155 | 161 |
| Virginia College Building Authority Educational Facilities Revenue | | | | | |
| (Public Higher Education Financing Program) | 5.000% | 9/1/15 | | 2,845 | 2,960 |
| Virginia College Building Authority Educational Facilities Revenue | | | | | |
| (Public Higher Education Financing Program) | 5.000% | 9/1/16 | (Prere.) | 405 | 439 |
| Virginia College Building Authority Educational Facilities Revenue | | | | | |
| (Public Higher Education Financing Program) | 5.000% | 9/1/16 | (Prere.) | 430 | 466 |
| Virginia College Building Authority Educational Facilities Revenue | | | | | |
| (Public Higher Education Financing Program) | 5.000% | 9/1/16 | (Prere.) | 450 | 488 |
| Virginia College Building Authority Educational Facilities Revenue | | | | | |
| (Public Higher Education Financing Program) | 5.000% | 9/1/16 | (Prere.) | 475 | 515 |
| Virginia College Building Authority Educational Facilities Revenue | | | | | |
| (Public Higher Education Financing Program) | 5.000% | 9/1/16 | (Prere.) | 495 | 537 |
| Virginia College Building Authority Educational Facilities Revenue | | | | | |
| (Public Higher Education Financing Program) | 5.000% | 9/1/18 | | 7,605 | 8,241 |
| Virginia College Building Authority Educational Facilities Revenue | | | | | |
| (Public Higher Education Financing Program) | 5.000% | 9/1/19 | | 8,000 | 8,669 |
| Virginia College Building Authority Educational Facilities Revenue | | | | | |
| (Public Higher Education Financing Program) | 5.000% | 9/1/20 | | 8,405 | 9,108 |
| Virginia College Building Authority Educational Facilities Revenue | | | | | |
| (Public Higher Education Financing Program) | 5.000% | 9/1/21 | | 8,845 | 9,585 |
| Virginia College Building Authority Educational Facilities Revenue | | | | | |
| (Public Higher Education Financing Program) | 5.000% | 9/1/22 | | 18,000 | 21,950 |
| Virginia College Building Authority Educational Facilities Revenue | | | | | |
| (Public Higher Education Financing Program) | 5.000% | 9/1/22 | | 8,610 | 9,330 |
| Virginia Commonwealth Transportation Board Revenue | 5.000% | 3/15/22 | | 2,000 | 2,427 |
| Virginia Commonwealth Transportation Board Revenue | 5.000% | 3/15/24 | | 2,790 | 3,350 |
| Virginia Commonwealth Transportation Board Revenue | 5.000% | 5/15/24 | | 21,000 | 25,129 |
| Virginia Commonwealth Transportation Board Revenue | 5.000% | 9/15/24 | | 1,800 | 2,156 |
| Virginia Commonwealth Transportation Board Revenue | 5.000% | 9/15/25 | | 5,035 | 5,993 |
| Virginia Commonwealth Transportation Board Revenue | 5.000% | 3/15/26 | | 5,040 | 5,979 |
| Virginia Commonwealth Transportation Board Revenue | 5.000% | 9/15/26 | | 2,000 | 2,369 |
| Virginia Commonwealth Transportation Board Revenue | 5.000% | 3/15/27 | | 2,100 | 2,480 |
| Virginia Commonwealth Transportation Board Revenue | 5.000% | 5/15/27 | | 13,765 | 16,233 |
| Virginia Commonwealth Transportation Board Revenue | 5.000% | 5/15/27 | | 12,560 | 14,792 |
| Virginia Commonwealth Transportation Board Revenue | 5.000% | 9/15/27 | | 5,260 | 6,200 |
| Virginia Commonwealth Transportation Board Revenue | 5.000% | 5/15/30 | | 30,140 | 35,285 |
| Virginia Commonwealth Transportation Board Revenue | 5.000% | 5/15/31 | | 10,000 | 11,544 |
| Virginia Commonwealth Transportation Board Revenue | 5.000% | 5/15/31 | | 31,550 | 36,803 |
| Virginia Public Building Authority Public Facilities Revenue | 5.000% | 8/1/16 | | 11,940 | 12,899 |
| Virginia Public Building Authority Public Facilities Revenue | 5.000% | 8/1/17 | | 7,815 | 8,756 |
| Virginia Public Building Authority Public Facilities Revenue | 5.000% | 8/1/25 | | 11,540 | 13,694 |
| Virginia Public School Authority Revenue | 5.000% | 8/1/20 | | 2,500 | 2,931 |
| Virginia Resources Authority Clean Water Revenue (State Revolving Fund) | 5.000% | 10/1/22 | | 8,500 | 10,451 |
| Virginia Resources Authority Clean Water Revenue (State Revolving Fund) | 5.000% | 10/1/23 | | 9,985 | 12,404 |
| Virginia Resources Authority Clean Water Revenue (State Revolving Fund) | 5.000% | 10/1/23 | | 5,845 | 7,245 |
| Wise County VA Industrial Development Authority Solid Waste & Sewage Disposal Revenue | | | | | |
| (Virginia Electric & Power Co.) PUT | 2.375% | 11/1/15 | | 10,000 | 10,192 |
| | | | | | 629,475 |
| Washington (2.7%) | | | | | |
| Chelan County WA Public Utility District No. 1 Hydro-Electric System Revenue | | | | | |
| (Columbia River-Rock Island Hydro) | 0.000% | 6/1/15 | (14) | 6,400 | 6,388 |
| Clark County WA GO | 4.750% | 12/1/14 | (Prere.) | 3,275 | 3,288 |
| Energy Northwest Washington Electric Revenue (Columbia Generating Station) | 5.000% | 7/1/19 | | 25,000 | 29,373 |
| Energy Northwest Washington Electric Revenue (Columbia Generating Station) | 5.000% | 7/1/20 | | 20,000 | 23,909 |
| Energy Northwest Washington Electric Revenue (Columbia Generating Station) | 5.000% | 7/1/22 | | 3,250 | 3,972 |
| Energy Northwest Washington Electric Revenue (Columbia Generating Station) | 5.000% | 7/1/23 | | 3,500 | 4,316 |
| Energy Northwest Washington Electric Revenue (Columbia Generating Station) | 5.000% | 7/1/24 | | 1,250 | 1,557 |
| Energy Northwest Washington Electric Revenue (Columbia Generating Station) | 5.000% | 7/1/30 | | 6,000 | 7,167 |
| Energy Northwest Washington Electric Revenue (Columbia Generating Station) | 5.000% | 7/1/31 | | 10,000 | 11,879 |
| Energy Northwest Washington Electric Revenue (Columbia Generating Station) | 5.000% | 7/1/32 | | 5,000 | 5,912 |
| Energy Northwest Washington Electric Revenue (Project No. 1) | 5.000% | 7/1/15 | | 6,710 | 6,928 |
| Energy Northwest Washington Electric Revenue (Project No. 1) | 5.000% | 7/1/16 | | 9,735 | 10,488 |
| Energy Northwest Washington Electric Revenue (Project No. 1) | 5.000% | 7/1/27 | | 19,000 | 23,047 |
| Energy Northwest Washington Electric Revenue (Project No. 3) | 5.000% | 7/1/28 | | 13,000 | 15,676 |
| King County WA (Bellevue School District) GO | 5.000% | 12/1/27 | | 16,505 | 19,152 |
| King County WA (Bellevue School District) GO | 5.000% | 12/1/28 | | 17,335 | 20,043 |
| King County WA (Bellevue School District) GO | 5.000% | 12/1/29 | | 18,200 | 20,994 |
138
Intermediate-Term Tax-Exempt Fund
| | | | | |
| | | | | Face | Market |
| | | Maturity | | Amount | Value• |
| | Coupon | Date | | ($000) | ($000) |
| King County WA GO | 4.750% | 1/1/34 | | 3,075 | 3,342 |
| Port of Seattle WA Passenger Facility Charge Revenue | 5.000% | 12/1/17 | | 1,000 | 1,119 |
| Port of Seattle WA Passenger Facility Charge Revenue | 5.000% | 12/1/20 | | 3,000 | 3,524 |
| Port of Seattle WA Passenger Facility Charge Revenue | 5.000% | 12/1/22 | | 5,525 | 6,351 |
| Port of Seattle WA Revenue | 5.000% | 3/1/21 | (14) | 5,000 | 5,077 |
| Port of Seattle WA Revenue | 5.000% | 6/1/22 | | 2,000 | 2,326 |
| Port of Seattle WA Revenue | 5.000% | 8/1/27 | | 8,635 | 10,098 |
| Port of Seattle WA Revenue | 5.000% | 8/1/28 | | 7,485 | 8,687 |
| Port of Seattle WA Revenue | 5.000% | 6/1/30 | | 6,000 | 6,818 |
| Port of Seattle WA Revenue | 5.000% | 8/1/30 | | 8,000 | 9,248 |
| Port of Seattle WA Revenue | 5.000% | 8/1/31 | | 5,500 | 6,333 |
| Snohomish County WA School District No. 15 (Edmonds) GO | 5.000% | 12/1/29 | | 3,700 | 4,445 |
| Snohomish County WA School District No. 15 (Edmonds) GO | 5.000% | 12/1/30 | | 3,000 | 3,585 |
| Snohomish County WA School District No. 15 (Edmonds) GO | 5.000% | 12/1/31 | | 3,650 | 4,338 |
| Snohomish County WA School District No. 201 GO | 5.250% | 12/1/26 | | 5,500 | 6,281 |
| Tobacco Settlement Authority Washington Revenue | 5.000% | 6/1/27 | | 10,000 | 10,734 |
| Tobacco Settlement Authority Washington Revenue | 5.250% | 6/1/28 | | 17,670 | 19,397 |
| University of Washington Revenue | 5.000% | 4/1/15 | | 9,830 | 10,030 |
| University of Washington Revenue | 5.000% | 7/1/27 | | 6,925 | 8,192 |
| University of Washington Revenue | 5.000% | 4/1/28 | | 10,195 | 11,948 |
| University of Washington Revenue | 5.000% | 7/1/28 | | 11,490 | 13,526 |
| University of Washington Revenue | 5.000% | 7/1/29 | | 7,500 | 8,795 |
| University of Washington Revenue | 5.000% | 4/1/30 | | 9,315 | 10,884 |
| University of Washington Revenue | 5.000% | 7/1/30 | | 10,495 | 12,251 |
| University of Washington Revenue | 5.000% | 4/1/31 | | 10,500 | 12,148 |
| University of Washington Revenue | 5.000% | 4/1/32 | | 11,375 | 13,139 |
| University of Washington Revenue | 5.000% | 7/1/32 | | 5,000 | 5,788 |
| Washington (Motor Vehicle Fuel Tax) GO | 5.000% | 8/1/20 | | 3,185 | 3,740 |
| Washington (Motor Vehicle Fuel Tax) GO | 5.000% | 8/1/23 | | 5,435 | 6,574 |
| Washington (Motor Vehicle Fuel Tax) GO | 5.000% | 8/1/25 | | 5,260 | 6,275 |
| Washington (Motor Vehicle Fuel Tax) GO | 5.000% | 8/1/26 | | 6,175 | 7,328 |
| Washington (Motor Vehicle Fuel Tax) GO | 5.000% | 6/1/29 | | 10,545 | 12,326 |
| Washington (Motor Vehicle Fuel Tax) GO | 5.000% | 6/1/30 | | 7,525 | 8,753 |
| Washington (Motor Vehicle Fuel Tax) GO | 5.000% | 8/1/33 | | 6,800 | 7,913 |
| Washington (Motor Vehicle Fuel Tax) GO | 5.000% | 8/1/34 | | 11,640 | 13,478 |
| Washington Economic Development Finance Authority Lease Revenue | | | | | |
| (Washington Biomedical Research Properties 2) | 5.000% | 6/1/27 | | 1,410 | 1,716 |
| Washington Economic Development Finance Authority Lease Revenue | | | | | |
| (Washington Biomedical Research Properties 2) | 5.000% | 6/1/29 | | 1,435 | 1,739 |
| Washington Economic Development Finance Authority Lease Revenue | | | | | |
| (Washington Biomedical Research Properties 2) | 5.000% | 6/1/31 | | 2,165 | 2,602 |
| Washington Economic Development Finance Authority Lease Revenue | | | | | |
| (Washington Biomedical Research Properties 2) | 5.000% | 6/1/32 | | 1,460 | 1,749 |
| Washington GO | 5.700% | 10/1/15 | (4) | 2,105 | 2,212 |
| Washington GO | 5.000% | 7/1/17 | | 32,460 | 36,288 |
| Washington GO | 5.000% | 7/1/19 | | 6,940 | 8,154 |
| Washington GO | 0.000% | 6/1/20 | (14) | 5,500 | 5,038 |
| Washington GO | 5.000% | 7/1/20 | | 10,000 | 11,145 |
| Washington GO | 5.000% | 8/1/20 | | 4,845 | 5,689 |
| Washington GO | 5.000% | 7/1/22 | | 20,000 | 24,396 |
| Washington GO | 5.000% | 7/1/23 | | 10,000 | 12,083 |
| Washington GO | 5.000% | 7/1/23 | | 31,290 | 38,418 |
| Washington GO | 5.000% | 7/1/24 | | 2,875 | 3,573 |
| Washington GO | 5.000% | 7/1/24 | | 5,000 | 5,994 |
| Washington GO | 5.000% | 1/1/25 | | 1,750 | 2,064 |
| Washington GO | 5.000% | 7/1/25 | | 50,585 | 61,895 |
| Washington GO | 5.000% | 2/1/28 | | 10,000 | 11,754 |
| Washington GO | 5.000% | 2/1/29 | | 6,790 | 7,680 |
| Washington GO | 5.000% | 2/1/29 | | 9,650 | 11,251 |
| Washington GO | 5.000% | 2/1/30 | | 8,545 | 10,121 |
| Washington GO | 5.000% | 7/1/30 | | 5,000 | 5,606 |
| Washington GO | 5.000% | 8/1/30 | | 20,980 | 24,431 |
| Washington GO | 5.000% | 6/1/31 | | 5,250 | 6,069 |
| Washington GO | 5.000% | 8/1/31 | | 13,860 | 16,445 |
| Washington GO | 5.000% | 2/1/32 | | 6,170 | 7,077 |
| Washington GO | 5.000% | 6/1/32 | | 5,500 | 6,341 |
| Washington GO | 5.000% | 8/1/32 | | 29,775 | 34,801 |
| Washington Health Care Facilities Authority Revenue (MultiCare Health System) | 5.000% | 8/15/18 | | 2,000 | 2,280 |
| Washington Health Care Facilities Authority Revenue (MultiCare Health System) | 5.250% | 8/15/19 | | 3,800 | 4,426 |
| Washington Health Care Facilities Authority Revenue (MultiCare Health System) | 5.250% | 8/15/20 | | 4,250 | 4,970 |
| Washington Health Care Facilities Authority Revenue (MultiCare Health System) | 5.250% | 8/15/21 | | 6,525 | 7,525 |
139
Intermediate-Term Tax-Exempt Fund
| | | | | |
| | | | | Face | Market |
| | | Maturity | | Amount | Value• |
| | Coupon | Date | | ($000) | ($000) |
| Washington Health Care Facilities Authority Revenue (MultiCare Health System) | 5.250% | 8/15/22 | | 5,500 | 6,304 |
| Washington Health Care Facilities Authority Revenue (MultiCare Health System) | 5.250% | 8/15/23 | (4) | 3,425 | 3,797 |
| Washington Health Care Facilities Authority Revenue (MultiCare Health System) | 5.250% | 8/15/24 | (4) | 3,550 | 3,923 |
| Washington Health Care Facilities Authority Revenue (MultiCare Health System) | 5.250% | 8/15/25 | (4) | 3,675 | 4,048 |
| Washington Health Care Facilities Authority Revenue (MultiCare Health System) | 5.250% | 8/15/25 | (4) | 3,625 | 3,993 |
| Washington Health Care Facilities Authority Revenue (MultiCare Health System) | 5.250% | 8/15/26 | (4) | 3,550 | 3,901 |
| Washington Health Care Facilities Authority Revenue (MultiCare Health System) | 5.250% | 8/15/26 | (4) | 3,800 | 4,175 |
| Washington Health Care Facilities Authority Revenue (MultiCare Health System) | 5.250% | 8/15/27 | (4) | 3,925 | 4,304 |
| Washington Health Care Facilities Authority Revenue (PeaceHealth) | 5.000% | 11/1/18 | | 23,000 | 26,494 |
| Washington Health Care Facilities Authority Revenue (PeaceHealth) | 5.000% | 11/15/23 | | 1,500 | 1,797 |
| Washington Health Care Facilities Authority Revenue (PeaceHealth) | 5.000% | 11/1/24 | | 19,830 | 22,279 |
| Washington Health Care Facilities Authority Revenue (PeaceHealth) | 5.000% | 11/15/25 | | 1,710 | 2,063 |
| Washington Health Care Facilities Authority Revenue (PeaceHealth) | 5.000% | 11/15/27 | | 1,035 | 1,222 |
| Washington Health Care Facilities Authority Revenue (Providence Health & Services) | 5.000% | 10/1/31 | (14) | 17,745 | 18,813 |
| Washington Health Care Facilities Authority Revenue (Providence Health & Services) | 5.000% | 10/1/32 | | 3,785 | 4,289 |
| Washington Health Care Facilities Authority Revenue (Providence Health & Services) PUT | 4.000% | 10/1/21 | | 2,700 | 3,038 |
| Washington Higher Education Facilities Authority Revenue (Gonzaga University Project) | 5.000% | 4/1/21 | | 2,580 | 2,867 |
| Washington Higher Education Facilities Authority Revenue (Gonzaga University Project) | 5.000% | 4/1/22 | | 3,005 | 3,310 |
| Washington Higher Education Facilities Authority Revenue (Gonzaga University Project) | 5.000% | 4/1/23 | | 4,470 | 4,895 |
| Washington Higher Education Facilities Authority Revenue (Gonzaga University Project) | 5.000% | 4/1/24 | | 2,000 | 2,176 |
| Washington Housing Finance Commission Multi-Family Housing Revenue | | | | | |
| (Emerald Heights Project) | 5.000% | 7/1/28 | | 1,675 | 1,825 |
| Washington Housing Finance Commission Multi-Family Housing Revenue | | | | | |
| (Emerald Heights Project) | 5.000% | 7/1/33 | | 2,840 | 3,081 |
| Washington State University General Revenue | 5.000% | 10/1/28 | | 3,070 | 3,630 |
| Washington State University General Revenue | 5.000% | 10/1/29 | | 3,070 | 3,621 |
| Washington State University General Revenue | 5.000% | 10/1/30 | | 3,140 | 3,682 |
| Washington State University General Revenue | 5.000% | 10/1/31 | | 3,170 | 3,703 |
| Washington State University General Revenue | 5.000% | 10/1/32 | | 1,600 | 1,866 |
| Washington State University Student Fee Revenue | 5.000% | 10/1/31 | (2) | 15,950 | 16,725 |
| | | | | | 1,050,233 |
| West Virginia (0.3%) | | | | | |
| West Virginia Economic Development Authority Lottery Revenue | 5.000% | 6/15/19 | | 1,395 | 1,620 |
| West Virginia Economic Development Authority Lottery Revenue | 5.000% | 6/15/21 | | 3,500 | 4,120 |
| West Virginia Economic Development Authority Lottery Revenue | 5.000% | 6/15/22 | | 2,055 | 2,412 |
| West Virginia Economic Development Authority Lottery Revenue | 5.000% | 6/15/23 | | 1,745 | 2,042 |
| West Virginia Economic Development Authority Lottery Revenue | 5.000% | 6/15/25 | | 2,445 | 2,836 |
| West Virginia Economic Development Authority Lottery Revenue | 5.000% | 6/15/27 | | 5,085 | 5,862 |
| West Virginia Higher Education Policy Commission Revenue | 5.000% | 4/1/25 | | 2,000 | 2,358 |
| West Virginia Higher Education Policy Commission Revenue | 5.000% | 4/1/27 | | 1,500 | 1,746 |
| West Virginia Higher Education Policy Commission Revenue | 5.000% | 4/1/28 | | 2,000 | 2,309 |
| West Virginia Higher Education Policy Commission Revenue | 5.000% | 4/1/29 | | 2,000 | 2,304 |
| West Virginia Hospital Finance Authority Hospital Revenue (Charleston Area Medical Center Inc.) | 5.000% | 9/1/17 | | 6,335 | 6,952 |
| West Virginia Hospital Finance Authority Hospital Revenue (Charleston Area Medical Center Inc.) | 5.000% | 9/1/18 | | 4,985 | 5,578 |
| West Virginia Hospital Finance Authority Hospital Revenue (Charleston Area Medical Center Inc.) | 5.000% | 9/1/19 | | 2,990 | 3,393 |
| West Virginia Hospital Finance Authority Hospital Revenue (Charleston Area Medical Center Inc.) | 5.000% | 9/1/20 | | 3,560 | 4,064 |
| West Virginia Hospital Finance Authority Hospital Revenue (Charleston Area Medical Center Inc.) | 5.125% | 9/1/21 | | 3,265 | 3,693 |
| West Virginia Hospital Finance Authority Hospital Revenue (Charleston Area Medical Center Inc.) | 5.000% | 9/1/24 | | 2,840 | 3,290 |
| West Virginia Hospital Finance Authority Hospital Revenue (Charleston Area Medical Center Inc.) | 5.000% | 9/1/25 | | 2,880 | 3,315 |
| West Virginia Hospital Finance Authority Hospital Revenue (Charleston Area Medical Center Inc.) | 5.000% | 9/1/26 | | 2,280 | 2,604 |
| West Virginia Hospital Finance Authority Hospital Revenue (Charleston Area Medical Center Inc.) | 5.000% | 9/1/27 | | 2,840 | 3,230 |
| West Virginia Hospital Finance Authority Hospital Revenue (Charleston Area Medical Center Inc.) | 5.000% | 9/1/28 | | 3,095 | 3,506 |
| West Virginia Hospital Finance Authority Hospital Revenue | | | | | |
| (United Health System Obligated Group) | 5.000% | 6/1/18 | | 1,920 | 2,179 |
| West Virginia Hospital Finance Authority Hospital Revenue | | | | | |
| (United Health System Obligated Group) | 5.000% | 6/1/24 | | 12,620 | 14,060 |
| West Virginia School Building Authority Excess Lottery Revenue | 5.250% | 7/1/20 | | 2,500 | 2,837 |
| West Virginia School Building Authority Excess Lottery Revenue | 5.250% | 7/1/22 | | 5,810 | 6,596 |
| West Virginia University Revenue | 5.000% | 10/1/17 | | 1,500 | 1,687 |
| West Virginia University Revenue | 5.000% | 10/1/30 | | 3,000 | 3,449 |
| West Virginia Water Development Authority (Chesapeake Bay & Greenbrier River Projects) | 5.000% | 7/1/27 | | 2,710 | 3,254 |
| West Virginia Water Development Authority (Chesapeake Bay & Greenbrier River Projects) | 5.000% | 7/1/31 | | 3,435 | 4,030 |
| West Virginia Water Development Authority (Chesapeake Bay & Greenbrier River Projects) | 5.000% | 7/1/33 | | 3,690 | 4,302 |
| | | | | | 109,628 |
140
Intermediate-Term Tax-Exempt Fund
| | | | | |
| | | | | Face | Market |
| | | Maturity | | Amount | Value• |
| | Coupon | Date | | ($000) | ($000) |
| Wisconsin (0.6%) | | | | | |
| Central Brown County WI Water Authority Water System Revenue | 5.000% | 11/1/30 | | 1,890 | 2,220 |
| Central Brown County WI Water Authority Water System Revenue | 5.000% | 11/1/31 | | 2,000 | 2,336 |
| Central Brown County WI Water Authority Water System Revenue | 5.000% | 11/1/32 | | 2,000 | 2,330 |
| Central Brown County WI Water Authority Water System Revenue | 5.000% | 11/1/33 | | 1,500 | 1,736 |
| Central Brown County WI Water Authority Water System Revenue | 5.000% | 11/1/34 | | 1,500 | 1,728 |
| Central Brown County WI Water Authority Water System Revenue | 5.000% | 11/1/35 | | 1,500 | 1,721 |
| Madison WI Community Development Authority Revenue (Wisconsin Alumni Research Project) | 5.000% | 10/1/18 | | 1,640 | 1,891 |
| Madison WI Community Development Authority Revenue (Wisconsin Alumni Research Project) | 5.000% | 10/1/19 | | 3,705 | 4,361 |
| Milwaukee WI Metropolitan Sewer District GO | 5.250% | 10/1/22 | | 2,690 | 3,330 |
| Wisconsin Clean Water Revenue | 4.000% | 6/1/16 | | 720 | 762 |
| Wisconsin Clean Water Revenue | 4.000% | 6/1/17 | | 1,000 | 1,089 |
| Wisconsin GO | 5.000% | 5/1/15 | | 3,000 | 3,073 |
| Wisconsin GO | 5.000% | 5/1/15 | (Prere.) | 6,000 | 6,145 |
| Wisconsin GO | 5.500% | 5/1/15 | (14) | 15,000 | 15,403 |
| Wisconsin GO | 5.000% | 5/1/16 | | 4,000 | 4,280 |
| Wisconsin GO | 5.000% | 11/1/17 | | 4,500 | 5,086 |
| Wisconsin GO | 5.000% | 5/1/18 | | 3,800 | 4,346 |
| Wisconsin GO | 5.000% | 5/1/19 | | 7,135 | 8,167 |
| Wisconsin GO | 5.000% | 5/1/22 | | 3,500 | 4,124 |
| Wisconsin GO | 5.000% | 5/1/22 | | 10,425 | 12,484 |
| Wisconsin GO | 5.000% | 5/1/25 | | 7,500 | 9,023 |
| Wisconsin GO | 5.000% | 5/1/27 | | 2,750 | 3,272 |
| Wisconsin GO | 5.000% | 5/1/27 | | 1,400 | 1,666 |
| Wisconsin GO | 6.000% | 5/1/27 | | 10,000 | 12,005 |
| Wisconsin GO | 5.000% | 5/1/28 | | 2,060 | 2,435 |
| Wisconsin GO | 5.000% | 5/1/29 | | 1,715 | 2,019 |
| Wisconsin Health & Educational Facilities Authority Health Facilities Revenue (SSM Health Care) | 5.000% | 6/1/19 | | 4,110 | 4,738 |
| Wisconsin Health & Educational Facilities Authority Health Facilities Revenue (SSM Health Care) | 5.000% | 6/1/20 | | 3,240 | 3,769 |
| Wisconsin Health & Educational Facilities Authority Health Facilities Revenue (SSM Health Care) | 5.000% | 6/1/21 | | 5,230 | 6,101 |
| Wisconsin Health & Educational Facilities Authority Health Facilities Revenue (SSM Health Care) | 5.000% | 6/1/22 | | 3,295 | 3,792 |
| Wisconsin Health & Educational Facilities Authority Revenue | | | | | |
| (Ascension Health Alliance Credit Group) PUT | 5.000% | 6/1/21 | | 34,215 | 40,494 |
| Wisconsin Health & Educational Facilities Authority Revenue (Aurora Health Care Inc.) | 5.000% | 7/15/28 | | 8,500 | 9,368 |
| Wisconsin Health & Educational Facilities Authority Revenue (Aurora Health Care Inc.) | 5.500% | 4/15/29 | | 11,700 | 13,137 |
| Wisconsin Health & Educational Facilities Authority Revenue (Children’s Hospital of Wisconsin Inc.) | 5.375% | 8/15/24 | | 5,900 | 6,782 |
| Wisconsin Health & Educational Facilities Authority Revenue (Marquette University) | 5.000% | 10/1/24 | | 700 | 825 |
| Wisconsin Health & Educational Facilities Authority Revenue (Marquette University) | 5.000% | 10/1/28 | | 1,865 | 2,142 |
| Wisconsin Health & Educational Facilities Authority Revenue (Marquette University) | 5.000% | 10/1/29 | | 1,500 | 1,719 |
| Wisconsin Health & Educational Facilities Authority Revenue (Marquette University) | 5.000% | 10/1/30 | | 1,660 | 1,899 |
| Wisconsin Health & Educational Facilities Authority Revenue (Ministry Health Care Inc.) | 5.000% | 8/15/32 | | 11,800 | 13,142 |
| Wisconsin Public Power System Power Supply System Revenue | 5.000% | 7/1/32 | | 4,000 | 4,564 |
| Wisconsin Public Power System Power Supply System Revenue | 5.000% | 7/1/33 | | 3,500 | 3,982 |
| Wisconsin Transportation Revenue | 5.000% | 7/1/17 | | 3,000 | 3,355 |
| Wisconsin Transportation Revenue | 5.000% | 7/1/29 | | 5,100 | 5,702 |
| Wisconsin Transportation Revenue | 5.000% | 7/1/30 | | 7,000 | 8,198 |
| | | | | | 250,741 |
| |
| Wyoming (0.1%) | | | | | |
| Lincoln County WY Pollution Control Revenue (Exxonmobil Project) VRDO | 0.060% | 11/3/14 | | 27,200 | 27,200 |
| Total Tax-Exempt Municipal Bonds (Cost $36,625,610) | | | | | 38,926,860 |
| |
| | | | | Shares | |
| Temporary Cash Investment (1.7%) | | | | | |
| Money Market Fund (1.7%) | | | | | |
| 4 Vanguard Municipal Cash Management Fund (Cost $671,354) | 0.047% | | 671,353,957 | 671,354 |
| Total Investments (100.1%) (Cost $37,296,964) | | | | | 39,598,214 |
| Other Assets and Liabilities (–0.1%) | | | | | |
| Other Assets | | | | | 531,970 |
| Liabilities | | | | | (566,371) |
| | | | | | (34,401) |
| Net Assets (100%) | | | | | 39,563,813 |
141
| |
| Intermediate-Term Tax-Exempt Fund | |
| |
| |
| |
| |
| At October 31, 2014, net assets consisted of: | |
| | Amount |
| | ($000) |
| Paid-in Capital | 37,345,564 |
| Undistributed Net Investment Income | — |
| Accumulated Net Realized Losses | (83,001) |
| Unrealized Appreciation (Depreciation) | 2,301,250 |
| Net Assets | 39,563,813 |
| |
| Investor Shares—Net Assets | |
| Applicable to 325,198,221 outstanding $.001 par value shares of beneficial interest (unlimited authorization) | 4,637,213 |
| Net Asset Value Per Share—Investor Shares | $14.26 |
| |
| Admiral Shares—Net Assets | |
| Applicable to 2,449,331,053 outstanding $.001 par value shares of beneficial interest (unlimited authorization) | 34,926,600 |
| Net Asset Value Per Share—Admiral Shares | $14.26 |
• See Note A in Notes to Financial Statements.
1 Security exempt from registration under Rule 144A of the Securities Act of 1933. Such securities may be sold in transactions exempt from registration, normally to qualified institutional buyers. At October 31, 2014,
the aggregate value of these securities was $537,599,000, representing 1.4% of net assets.
2 Security purchased on a when-issued or delayed-delivery basis for which the fund has not taken delivery as of October 31, 2014.
3 Adjustable-rate security.
4 Affiliated money market fund available only to Vanguard funds and certain trusts and accounts managed by Vanguard. Rate shown is the 7-day yield.
For key to abbreviations and other references, see back cover of report.
See accompanying Notes, which are an integral part of the Financial Statements.
142
Long-Term Tax-Exempt Fund
| | | | | |
| | | | | Face | Market |
| | | Maturity | | Amount | Value• |
| | Coupon | Date | | ($000) | ($000) |
| Tax-Exempt Municipal Bonds (98.5%) | | | | | |
| Alabama (1.1%) | | | | | |
| Alabama Incentives Financing Authority Special Obligation Revenue | 5.000% | 9/1/37 | | 10,945 | 12,077 |
| Alabama Incentives Financing Authority Special Obligation Revenue | 5.000% | 9/1/42 | | 3,325 | 3,640 |
| Alabama Port Authority Docks Facilities Revenue | 6.000% | 10/1/40 | | 5,000 | 5,850 |
| Auburn University Alabama General Fee Revenue | 5.000% | 6/1/42 | | 8,455 | 9,388 |
| Birmingham AL GO | 0.000% | 3/1/27 | | 2,500 | 2,567 |
| Birmingham AL GO | 0.000% | 3/1/37 | | 2,500 | 2,463 |
| Houston County AL Health Care Authority Revenue | 5.250% | 10/1/30 | (2) | 9,000 | 9,130 |
| Huntsville AL GO | 5.000% | 5/1/26 | | 2,860 | 3,327 |
| Jefferson County AL Sewer Revenue | 0.000% | 10/1/42 | (4) | 12,500 | 8,355 |
| Jefferson County AL Sewer Revenue | 6.000% | 10/1/42 | | 8,670 | 9,440 |
| Jefferson County AL Sewer Revenue | 7.000% | 10/1/51 | | 10,000 | 11,730 |
| Jefferson County AL Sewer Revenue | 6.500% | 10/1/53 | | 10,525 | 11,772 |
| Selma AL Industrial Development Board Revenue (International Paper Co. Project) | 5.375% | 12/1/35 | | 2,000 | 2,224 |
| | | | | | 91,963 |
| Alaska (0.1%) | | | | | |
| Alaska Industrial Development & Export Authority Revenue (Providence Health & Services) | 5.500% | 10/1/41 | | 6,000 | 6,794 |
| |
| Arizona (1.3%) | | | | | |
| Arizona Board Regents Arizona State University System Revenue | 5.000% | 7/1/31 | | 2,000 | 2,306 |
| Arizona Board Regents Arizona State University System Revenue | 5.000% | 7/1/32 | | 2,365 | 2,716 |
| Arizona Board Regents Arizona State University System Revenue | 5.000% | 6/1/37 | | 3,750 | 4,212 |
| Arizona COP | 5.000% | 9/1/23 | (4) | 12,140 | 13,152 |
| Arizona Health Facilities Authority Hospital System Revenue (Phoenix Children’s Hospital) | 5.000% | 2/1/42 | | 2,500 | 2,683 |
| Arizona Health Facilities Authority Revenue (Banner Health) | 5.500% | 1/1/38 | | 12,500 | 13,551 |
| Arizona Transportation Board Excise Tax Revenue (Maricopa County Regional Area) | 5.000% | 7/1/21 | | 4,190 | 4,974 |
| Arizona Transportation Board Highway Revenue | 5.000% | 7/1/34 | | 11,175 | 12,810 |
| Maricopa County AZ Industrial Development Authority Hospital System Revenue | | | | | |
| (Samaritan Health Services) | 7.000% | 12/1/16 | (ETM) | 8,650 | 9,091 |
| Maricopa County AZ Pollution Control Corp. Revenue (Southern California Edison Co.) | 5.000% | 6/1/35 | | 5,500 | 6,041 |
| Phoenix AZ Civic Improvement Corp. Airport Revenue | 5.000% | 7/1/21 | | 4,000 | 4,677 |
| Phoenix AZ Civic Improvement Corp. Airport Revenue | 5.000% | 7/1/22 | | 6,375 | 7,421 |
| Phoenix AZ Civic Improvement Corp. Excise Tax Revenue | 5.000% | 7/1/21 | (14) | 5,135 | 5,492 |
| Phoenix AZ Civic Improvement Corp. Water System Revenue | 5.000% | 7/1/34 | | 10,000 | 11,264 |
| Pima County AZ Sewer Revenue | 5.000% | 7/1/26 | | 2,000 | 2,361 |
| Pima County AZ Sewer Revenue | 5.000% | 7/1/27 | | 1,000 | 1,175 |
| Salt Verde AZ Financial Corp. Gas Revenue | 5.250% | 12/1/20 | | 500 | 581 |
| Salt Verde AZ Financial Corp. Gas Revenue | 5.250% | 12/1/24 | | 2,220 | 2,628 |
| Salt Verde AZ Financial Corp. Gas Revenue | 5.250% | 12/1/27 | | 785 | 934 |
| | | | | | 108,069 |
| Arkansas (0.1%) | | | | | |
| North Little Rock AR Electric Revenue | 6.500% | 7/1/15 | (ETM) | 1,015 | 1,057 |
| University of Arkansas Revenue (Fayetteville Campus) | 5.000% | 11/1/31 | | 2,170 | 2,558 |
| University of Arkansas Revenue (Fayetteville Campus) | 5.000% | 11/1/32 | | 2,845 | 3,346 |
| | | | | | 6,961 |
| California (14.1%) | | | | | |
| Alameda CA Corridor Transportation Authority Revenue | 0.000% | 10/1/30 | (2) | 5,000 | 2,428 |
| Alameda CA Corridor Transportation Authority Revenue | 0.000% | 10/1/31 | (14) | 8,450 | 4,218 |
| Alameda CA Corridor Transportation Authority Revenue | 0.000% | 10/1/33 | (14) | 12,000 | 5,376 |
| Alameda County CA Joint Powers Authority Lease Revenue | 5.250% | 12/1/29 | | 8,300 | 9,869 |
| Bay Area Toll Authority California Toll Bridge Revenue (San Francisco Bay Area) | 5.000% | 4/1/16 | (Prere.) | 11,000 | 11,733 |
| Bay Area Toll Authority California Toll Bridge Revenue (San Francisco Bay Area) | 5.000% | 4/1/17 | (Prere.) | 8,000 | 8,862 |
| Bay Area Toll Authority California Toll Bridge Revenue (San Francisco Bay Area) | 5.000% | 4/1/32 | | 2,060 | 2,363 |
| 1 Bay Area Toll Authority California Toll Bridge Revenue (San Francisco Bay Area) PUT | 1.150% | 4/1/24 | | 10,000 | 10,202 |
| California Department of Water Resources Power Supply Revenue | 5.000% | 5/1/21 | | 7,650 | 8,762 |
| California Department of Water Resources Power Supply Revenue | 5.000% | 5/1/22 | | 5,000 | 5,984 |
| California Department of Water Resources Power Supply Revenue | 5.000% | 5/1/22 | | 5,375 | 6,149 |
| California Department of Water Resources Water System Revenue (Central Valley Project) | 5.000% | 12/1/27 | | 10,000 | 12,331 |
| California Department of Water Resources Water System Revenue (Central Valley Project) | 5.000% | 12/1/27 | | 7,560 | 8,635 |
| California Department of Water Resources Water System Revenue (Central Valley Project) | 5.000% | 12/1/29 | | 10,000 | 11,660 |
| California Educational Facilities Authority Revenue (University of Southern California) | 5.250% | 10/1/38 | | 1,000 | 1,135 |
| California Educational Facilities Authority Revenue (University of Southern California) | 5.250% | 10/1/39 | | 5,000 | 5,656 |
| California GO | 5.000% | 9/1/20 | | 5,130 | 5,568 |
| California GO | 5.000% | 9/1/23 | | 4,285 | 5,245 |
| California GO | 5.000% | 9/1/23 | | 2,000 | 2,401 |
| California GO | 5.250% | 9/1/24 | | 12,500 | 15,136 |
| California GO | 5.250% | 10/1/24 | | 3,000 | 3,640 |
| California GO | 5.625% | 4/1/26 | | 21,900 | 25,839 |
| California GO | 5.000% | 10/1/27 | | 4,500 | 5,280 |
143
Long-Term Tax-Exempt Fund
| | | | | |
| | | | | Face | Market |
| | | Maturity | | Amount | Value• |
| | Coupon | Date | | ($000) | ($000) |
| California GO | 5.000% | 10/1/29 | | 5,000 | 5,951 |
| California GO | 5.000% | 10/1/30 | | 12,600 | 14,926 |
| California GO | 5.000% | 11/1/31 | | 5,000 | 5,822 |
| California GO | 6.000% | 3/1/33 | | 4,000 | 4,905 |
| California GO | 6.500% | 4/1/33 | | 41,500 | 50,773 |
| California GO | 6.000% | 11/1/35 | | 10,000 | 12,128 |
| California GO | 5.000% | 9/1/36 | | 3,250 | 3,713 |
| California GO | 6.000% | 4/1/38 | | 10,340 | 12,390 |
| California GO | 6.000% | 11/1/39 | | 6,500 | 7,918 |
| California GO | 5.000% | 9/1/41 | | 5,000 | 5,604 |
| California GO | 5.000% | 9/1/42 | | 11,360 | 12,675 |
| California GO | 5.000% | 2/1/43 | | 5,500 | 6,145 |
| California GO | 5.000% | 4/1/43 | | 1,000 | 1,119 |
| California GO | 5.000% | 11/1/43 | | 5,000 | 5,632 |
| California GO | 5.000% | 12/1/43 | | 8,250 | 9,301 |
| California GO | 5.000% | 10/1/44 | | 2,500 | 2,841 |
| California Health Facilities Financing Authority Revenue (Adventist Health System/West) | 5.750% | 9/1/39 | | 5,500 | 6,382 |
| California Health Facilities Financing Authority Revenue (Catholic Healthcare West) | 5.625% | 7/1/35 | | 5,000 | 5,572 |
| California Health Facilities Financing Authority Revenue (Catholic Healthcare West) | 6.000% | 7/1/39 | | 4,500 | 5,261 |
| California Health Facilities Financing Authority Revenue (Pomona Valley Hospital Medical Center) | 5.750% | 7/1/15 | (14) | 1,820 | 1,828 |
| California Health Facilities Financing Authority Revenue (St. Joseph Health System) | 5.000% | 7/1/33 | | 2,000 | 2,298 |
| California Health Facilities Financing Authority Revenue (St. Joseph Health System) | 5.750% | 7/1/39 | | 8,000 | 9,315 |
| California Health Facilities Financing Authority Revenue (Sutter Health) | 5.875% | 8/15/31 | | 6,000 | 7,225 |
| California Health Facilities Financing Authority Revenue (Sutter Health) | 6.000% | 8/15/42 | | 15,000 | 18,136 |
| California Infrastructure & Economic Development Bank Revenue | | | | | |
| (Independent System Operator Corp. Project) | 5.000% | 2/1/34 | | 13,800 | 15,376 |
| California Municipal Finance Authority Revenue (University of La Verne) | 6.250% | 6/1/40 | | 5,000 | 5,843 |
| California Public Works Board Lease Revenue (Community Colleges) | 5.625% | 3/1/16 | (2) | 4,290 | 4,309 |
| California Public Works Board Lease Revenue (Department of General Services) | 6.250% | 4/1/34 | | 10,000 | 12,058 |
| California Public Works Board Lease Revenue (Judicial Council Projects) | 5.000% | 3/1/38 | | 1,125 | 1,254 |
| California Public Works Board Lease Revenue (Various Capital Projects) | 5.000% | 10/1/28 | | 4,000 | 4,662 |
| California Public Works Board Lease Revenue (Various Capital Projects) | 5.000% | 11/1/30 | | 4,205 | 4,897 |
| California Public Works Board Lease Revenue (Various Capital Projects) | 5.500% | 11/1/30 | | 1,320 | 1,609 |
| California Public Works Board Lease Revenue (Various Capital Projects) | 5.250% | 11/1/32 | | 7,280 | 8,557 |
| California Public Works Board Lease Revenue (Various Capital Projects) | 5.000% | 4/1/37 | | 14,705 | 16,626 |
| California Public Works Board Lease Revenue (Various Capital Projects) | 5.000% | 11/1/37 | | 5,000 | 5,699 |
| California Public Works Board Lease Revenue (Various Capital Projects) | 5.000% | 11/1/38 | | 2,615 | 2,935 |
| California State University Revenue Systemwide | 5.000% | 11/1/32 | (4) | 10,000 | 10,904 |
| California State University Revenue Systemwide | 5.000% | 11/1/34 | | 5,000 | 5,868 |
| California State University Revenue Systemwide | 5.250% | 11/1/34 | | 8,600 | 9,860 |
| California State University Revenue Systemwide | 5.000% | 11/1/35 | | 4,300 | 5,022 |
| California Statewide Communities Development Authority Revenue (Kaiser Permanente) | 5.000% | 4/1/42 | | 26,250 | 28,950 |
| California Statewide Communities Development Authority Revenue (Trinity Health) | 5.000% | 12/1/41 | | 13,975 | 15,436 |
| California Statewide Communities Development Authority Senior Living Revenue | | | | | |
| (Southern California Presbyterian Homes) | 7.250% | 11/15/41 | | 3,000 | 3,535 |
| California Statewide Communities Development Authority Student Housing Revenue | | | | | |
| (CHF-Irvine LLC–UCI East Campus Apartments Phase II) | 5.750% | 5/15/32 | | 4,000 | 4,421 |
| Chabot-Las Positas CA Community College District GO | 5.000% | 8/1/27 | | 4,175 | 4,960 |
| Chula Vista CA Industrial Development Revenue (San Diego Gas & Electric Co.) | 5.875% | 2/15/34 | | 10,000 | 11,910 |
| Chula Vista CA Municipal Financing Authority Special Tax Revenue | 5.000% | 9/1/34 | | 3,000 | 3,318 |
| Clovis CA Unified School District GO | 5.000% | 8/1/38 | | 3,850 | 4,388 |
| Contra Costa CA Community College District GO | 4.000% | 8/1/29 | | 5,725 | 6,147 |
| Corona-Norco CA Unified School District Special Tax Revenue | | | | | |
| (Community Facilities District No. 98-1) | 5.000% | 9/1/29 | | 1,705 | 1,935 |
| Corona-Norco CA Unified School District Special Tax Revenue | | | | | |
| (Community Facilities District No. 98-1) | 5.000% | 9/1/32 | | 1,500 | 1,677 |
| El Dorado CA Irrigation District Revenue | 5.000% | 3/1/34 | (4) | 1,480 | 1,690 |
| Foothill-De Anza CA Community College District GO | 5.000% | 8/1/36 | | 1,645 | 1,935 |
| Foothill/Eastern Transportation Corridor Agency California Toll Road Revenue | 5.750% | 1/15/46 | | 10,000 | 11,485 |
| Gilroy CA School Facilities Finance Authority Revenue | 5.000% | 8/1/46 | | 5,000 | 5,431 |
| Grossmont CA Healthcare District GO | 5.000% | 7/15/37 | (2) | 15,770 | 17,184 |
| Grossmont CA Healthcare District GO | 6.125% | 7/15/40 | | 5,000 | 6,199 |
| Imperial CA Irrigation District Electric Revenue | 6.250% | 11/1/31 | | 2,225 | 2,696 |
| Kern County CA GO | 6.000% | 8/1/35 | (12) | 2,500 | 2,920 |
| Los Angeles CA Community College District GO | 5.000% | 8/1/28 | | 6,600 | 7,480 |
| Los Angeles CA Community College District GO | 6.000% | 8/1/33 | | 10,000 | 12,077 |
| Los Angeles CA Community College District GO | 5.250% | 8/1/39 | | 3,000 | 3,476 |
| Los Angeles CA Department of Airports International Airport Revenue | 5.000% | 5/15/35 | | 2,000 | 2,267 |
| Los Angeles CA Department of Water & Power Revenue | 5.000% | 7/1/31 | (4) | 12,500 | 12,870 |
| Los Angeles CA Department of Water & Power Revenue | 5.000% | 7/1/35 | | 2,500 | 2,901 |
| Los Angeles CA Department of Water & Power Revenue | 5.375% | 7/1/38 | | 4,000 | 4,575 |
144
Long-Term Tax-Exempt Fund
| | | | | |
| | | | | Face | Market |
| | | Maturity | | Amount | Value• |
| | Coupon | Date | | ($000) | ($000) |
| Los Angeles CA Department of Water & Power Revenue | 5.000% | 7/1/43 | | 9,000 | 10,119 |
| Los Angeles CA Department of Water & Power Revenue | 5.000% | 7/1/43 | | 5,000 | 5,611 |
| Los Angeles CA Department of Water & Power Revenue | 5.000% | 7/1/43 | | 3,500 | 3,928 |
| Los Angeles CA Unified School District GO | 5.000% | 7/1/17 | (Prere.) | 6,980 | 7,807 |
| Los Angeles CA Unified School District GO | 5.000% | 7/1/17 | (Prere.) | 7,435 | 8,316 |
| Los Angeles CA Unified School District GO | 5.000% | 7/1/17 | (Prere.) | 27,240 | 30,467 |
| Los Angeles CA Unified School District GO | 5.000% | 7/1/25 | (3) | 10,000 | 10,309 |
| Los Angeles CA Unified School District GO | 5.000% | 7/1/26 | | 6,950 | 8,064 |
| Los Angeles CA Unified School District GO | 5.000% | 7/1/27 | | 7,295 | 8,446 |
| Los Angeles CA Wastewater System Revenue | 5.750% | 6/1/28 | | 11,080 | 13,175 |
| Los Angeles County CA Public Works Financing Authority Lease Revenue | 5.000% | 8/1/31 | | 2,790 | 3,181 |
| M-S-R California Energy Authority Revenue | 6.125% | 11/1/29 | | 4,700 | 5,984 |
| M-S-R California Public Power Agency Revenue (San Juan Project) | 6.750% | 7/1/20 | (ETM) | 6,185 | 7,322 |
| Metropolitan Water District of Southern California Revenue | 5.000% | 7/1/30 | | 3,000 | 3,525 |
| Metropolitan Water District of Southern California Revenue | 5.000% | 7/1/35 | | 5,000 | 5,691 |
| Modesto CA Irrigation District COP | 5.500% | 7/1/35 | | 5,700 | 6,179 |
| Modesto CA Irrigation District Financing Authority Revenue (Woodland Project) | 6.500% | 10/1/22 | (ETM) | 16,020 | 19,393 |
| Mount Diablo CA Unified School District GO | 5.000% | 8/1/32 | | 2,675 | 3,105 |
| Newport Beach CA Revenue (Hoag Memorial Hospital Presbyterian) | 6.000% | 12/1/21 | (Prere.) | 3,500 | 4,502 |
| Palomar Pomerado Health California GO | 0.000% | 8/1/37 | | 5,000 | 1,697 |
| Palomar Pomerado Health California GO | 0.000% | 8/1/38 | (12) | 10,000 | 10,342 |
| Riverside County CA Transportation Commission Toll Revenue | 5.750% | 6/1/44 | | 3,000 | 3,418 |
| Riverside County CA Transportation Commission Toll Revenue | 5.750% | 6/1/48 | | 1,000 | 1,136 |
| Sacramento CA Municipal Utility District Revenue | 5.000% | 8/15/26 | | 5,750 | 6,834 |
| Sacramento CA Municipal Utility District Revenue | 5.000% | 8/15/27 | | 1,385 | 1,637 |
| Sacramento CA Regional Transit District Farebox Revenue | 5.000% | 3/1/42 | | 3,250 | 3,502 |
| Sacramento County CA Airport Revenue | 6.000% | 7/1/41 | | 10,500 | 12,046 |
| San Bernardino CA Community College District GO | 4.000% | 8/1/27 | | 10,000 | 10,879 |
| San Bernardino County CA Medical Center COP | 6.875% | 8/1/24 | (ETM) | 13,000 | 17,452 |
| San Diego CA Community College District GO | 5.000% | 8/1/36 | | 1,500 | 1,731 |
| San Diego CA Public Facilities Financing Authority Water Revenue | 5.000% | 8/1/29 | | 5,770 | 6,763 |
| San Diego CA Unified School District GO | 5.500% | 7/1/22 | (14) | 9,160 | 11,355 |
| San Diego CA Unified School District GO | 0.000% | 7/1/37 | | 14,000 | 5,361 |
| San Diego County CA Regional Airport Authority Revenue | 5.000% | 7/1/43 | | 5,450 | 6,121 |
| San Francisco CA Bay Area Rapid Transit District GO | 5.000% | 8/1/31 | | 3,000 | 3,576 |
| San Francisco CA Bay Area Rapid Transit District GO | 5.000% | 8/1/37 | | 1,125 | 1,312 |
| San Francisco CA City & County International Airport Revenue | 5.000% | 5/1/26 | | 2,000 | 2,344 |
| San Francisco CA City & County International Airport Revenue | 6.000% | 5/1/39 | | 10,000 | 11,892 |
| San Francisco CA City & County International Airport Revenue | 5.000% | 5/1/43 | | 9,000 | 10,084 |
| San Francisco CA City & County Public Utilities Commission Water Revenue | 5.000% | 11/1/35 | | 5,255 | 5,971 |
| San Joaquin Hills CA Transportation Corridor Agency Toll Road Revenue | 0.000% | 1/15/25 | (14) | 9,250 | 6,431 |
| San Jose CA Redevelopment Agency Tax Allocation Revenue | 5.000% | 8/1/27 | (14) | 5,000 | 5,167 |
| San Luis & Delta Mendota CA Water Authority Revenue | 5.000% | 3/1/43 | (15) | 5,140 | 5,611 |
| San Mateo County CA Joint Powers Financing Authority Lease Revenue (Youth Services Campus) | 5.000% | 7/15/33 | | 5,000 | 5,568 |
| San Ramon Valley CA Unified School District GO | 4.000% | 8/1/28 | | 1,225 | 1,340 |
| San Ramon Valley CA Unified School District GO | 4.000% | 8/1/28 | | 1,225 | 1,334 |
| San Ramon Valley CA Unified School District GO | 4.000% | 8/1/29 | | 3,495 | 3,790 |
| Santa Monica CA Community College District GO | 0.000% | 8/1/25 | | 5,490 | 4,057 |
| Santa Rosa CA Wastewater Revenue | 6.000% | 9/1/15 | (4) | 960 | 1,003 |
| Simi Valley CA School Financing Authority Revenue | 5.000% | 8/1/27 | (4) | 10,000 | 11,241 |
| Southern California Public Power Authority Revenue | 5.000% | 7/1/27 | | 5,000 | 5,897 |
| Southern California Public Power Authority Revenue | 5.000% | 7/1/29 | | 2,670 | 3,120 |
| Southern California Public Power Authority Revenue (Magnolia Power Project) VRDO | 0.040% | 11/7/14 | LOC | 16,600 | 16,600 |
| State Center California Community College District GO | 5.000% | 8/1/31 | (4) | 16,100 | 17,528 |
| Stockton CA Unified School District GO | 5.000% | 8/1/42 | (4) | 4,650 | 5,177 |
| Twin Rivers CA Unified School District GO | 5.000% | 8/1/40 | (15) | 5,000 | 5,580 |
| Ukiah CA Electric Revenue | 6.250% | 6/1/18 | (14) | 3,030 | 3,317 |
| University of California Revenue | 5.250% | 5/15/37 | | 3,000 | 3,545 |
| University of California Revenue | 5.000% | 5/15/38 | | 20,000 | 22,799 |
| University of California Revenue | 5.250% | 5/15/38 | | 10,000 | 11,782 |
| Ventura County CA Community College District GO | 5.500% | 8/1/33 | | 12,000 | 13,813 |
| Victor Valley CA Community College District GO | 6.000% | 8/1/39 | | 12,000 | 14,334 |
| Walnut CA Energy Center Authority Revenue | 5.000% | 1/1/35 | | 8,985 | 9,848 |
| Washington Township CA Health Care District GO | 5.500% | 8/1/38 | | 5,125 | 6,148 |
| Whittier CA Health Facilities Revenue (Presbyterian Intercommunity Hospital Obligated Group) | 5.000% | 6/1/44 | | 8,200 | 9,166 |
| | | | | | 1,188,447 |
| Colorado (2.2%) | | | | | |
| Colorado Health Facilities Authority Revenue (Catholic Health Initiatives) | 5.250% | 2/1/31 | | 4,000 | 4,497 |
| Colorado Health Facilities Authority Revenue (Catholic Health Initiatives) | 5.500% | 7/1/34 | | 5,000 | 5,738 |
| Colorado Health Facilities Authority Revenue (Covenant Retirement Community Inc.) | 5.000% | 12/1/33 | | 5,000 | 5,310 |
145
Long-Term Tax-Exempt Fund
| | | | | |
| | | | | Face | Market |
| | | Maturity | | Amount | Value• |
| | Coupon | Date | | ($000) | ($000) |
| Colorado Health Facilities Authority Revenue | | | | | |
| (Sisters of Charity of Leavenworth Health System) VRDO | 0.050% | 11/7/14 | | 8,700 | 8,700 |
| Commerce City CO Sales & Use Tax Revenue | 5.000% | 8/1/44 | (4) | 4,000 | 4,481 |
| Denver CO City & County Airport Revenue | 5.000% | 11/15/43 | | 8,000 | 8,916 |
| Denver CO City & County COP VRDO | 0.070% | 11/3/14 | | 17,940 | 17,940 |
| Denver CO City & County COP VRDO | 0.070% | 11/3/14 | | 33,080 | 33,080 |
| E-470 Public Highway Authority Colorado Revenue | 0.000% | 9/1/15 | (14) | 5,795 | 5,751 |
| E-470 Public Highway Authority Colorado Revenue | 0.000% | 9/1/16 | (14) | 10,185 | 9,948 |
| E-470 Public Highway Authority Colorado Revenue | 0.000% | 9/1/19 | (14) | 13,000 | 11,727 |
| E-470 Public Highway Authority Colorado Revenue | 0.000% | 9/1/23 | (14) | 20,775 | 16,063 |
| E-470 Public Highway Authority Colorado Revenue | 0.000% | 9/1/25 | (14) | 9,700 | 6,730 |
| E-470 Public Highway Authority Colorado Revenue | 0.000% | 9/1/30 | (14) | 16,500 | 8,924 |
| Northwest Parkway Public Highway Authority Colorado Revenue | 5.800% | 6/15/16 | (Prere.) | 16,000 | 17,395 |
| Regional Transportation District of Colorado Sales Tax Revenue | | | | | |
| (Denver Transit Partners Eagle P3 Project) | 6.000% | 1/15/34 | | 5,000 | 5,627 |
| Regional Transportation District of Colorado Sales Tax Revenue | | | | | |
| (Denver Transit Partners Eagle P3 Project) | 6.000% | 1/15/41 | | 14,765 | 16,537 |
| University of Colorado Enterprise System Revenue | 5.750% | 6/1/19 | (Prere.) | 1,000 | 1,206 |
| | | | | | 188,570 |
| Connecticut (1.4%) | | | | | |
| Connecticut GO | 5.000% | 11/1/16 | | 2,000 | 2,182 |
| Connecticut GO | 5.000% | 12/1/19 | | 8,225 | 9,711 |
| Connecticut GO | 5.000% | 6/1/23 | | 5,000 | 5,985 |
| Connecticut GO | 5.000% | 10/15/23 | | 2,500 | 3,008 |
| Connecticut GO | 5.000% | 10/15/24 | | 5,925 | 7,103 |
| Connecticut GO | 5.000% | 4/15/25 | | 10,000 | 11,802 |
| Connecticut GO | 5.000% | 4/15/26 | | 5,000 | 5,868 |
| Connecticut GO | 5.000% | 10/15/26 | | 4,140 | 4,891 |
| Connecticut GO | 5.000% | 11/1/26 | | 3,000 | 3,517 |
| Connecticut GO | 5.000% | 3/1/27 | | 3,000 | 3,525 |
| Connecticut GO | 5.000% | 10/15/31 | | 1,850 | 2,136 |
| Connecticut GO | 5.000% | 6/15/32 | | 8,905 | 10,506 |
| Connecticut GO | 5.000% | 6/15/33 | | 6,255 | 7,339 |
| Connecticut Health & Educational Facilities Authority Revenue (Connecticut State University) | 5.000% | 11/1/25 | | 1,860 | 2,200 |
| Connecticut Health & Educational Facilities Authority Revenue (Connecticut State University) | 5.000% | 11/1/26 | | 1,955 | 2,298 |
| Connecticut Health & Educational Facilities Authority Revenue (Connecticut State University) | 5.000% | 11/1/27 | | 1,850 | 2,164 |
| Connecticut Housing Finance Authority Revenue Housing Mortgage Finance Program | 4.000% | 11/15/32 | | 4,855 | 5,304 |
| Connecticut Housing Finance Authority Revenue Housing Mortgage Finance Program | 4.000% | 11/15/44 | | 3,000 | 3,288 |
| Connecticut Special Tax Revenue (Transportation Infrastructure) | 5.000% | 10/1/31 | | 7,500 | 8,794 |
| Connecticut Special Tax Revenue (Transportation Infrastructure) | 5.000% | 9/1/33 | | 7,000 | 8,204 |
| Hartford CT GO | 5.000% | 4/1/24 | | 1,215 | 1,439 |
| Hartford CT GO | 5.000% | 4/1/27 | | 1,650 | 1,906 |
| Hartford CT GO | 5.000% | 4/1/28 | | 3,565 | 4,072 |
| | | | | | 117,242 |
| Delaware (0.0%) | | | | | |
| University of Delaware Revenue | 5.000% | 11/1/32 | | 1,990 | 2,324 |
| University of Delaware Revenue | 5.000% | 11/1/33 | | 1,000 | 1,162 |
| | | | | | 3,486 |
| District of Columbia (0.7%) | | | | | |
| District of Columbia GO | 5.000% | 6/1/31 | | 10,000 | 11,801 |
| District of Columbia Income Tax Revenue | 5.000% | 12/1/23 | | 4,110 | 5,079 |
| District of Columbia Revenue (Georgetown University) | 5.500% | 4/1/36 | | 5,000 | 5,570 |
| District of Columbia Water & Sewer Authority Public Utility Revenue | 5.000% | 10/1/37 | | 10,000 | 11,325 |
| District of Columbia Water & Sewer Authority Public Utility Revenue | 5.500% | 10/1/39 | | 13,000 | 14,711 |
| Metropolitan Washington DC/VA Airports Authority Dulles Toll Road Revenue | | | | | |
| (Dulles Metrorail & Capital Improvement Projects) | 5.000% | 10/1/53 | | 7,500 | 7,843 |
| | | | | | 56,329 |
| Florida (8.7%) | | | | | |
| Alachua County FL Health Facilities Authority Revenue (East Ridge Retirement Village) | 6.250% | 11/15/44 | | 4,250 | 4,648 |
| Alachua County FL Health Facilities Authority Revenue | | | | | |
| (Shands Teaching Hospital & Clinics Inc. Project) | 6.250% | 12/1/16 | (14) | 5,530 | 5,783 |
| Alachua County FL Health Facilities Authority Revenue (Shands Teaching Hospital & Clinics Project) | 5.000% | 12/1/44 | | 15,000 | 16,351 |
| Boynton Beach FL Utility System Revenue | 5.375% | 11/1/15 | (14) | 2,665 | 2,779 |
| Brevard County FL Health Facilities Authority Revenue (Health First Inc. Project) | 7.000% | 4/1/39 | | 7,000 | 8,144 |
| Broward County FL Airport System Revenue | 5.375% | 10/1/29 | | 1,500 | 1,725 |
| Broward County FL Airport System Revenue | 5.250% | 10/1/38 | | 14,000 | 15,782 |
| Broward County FL Port Facilities Revenue | 6.000% | 9/1/25 | | 2,000 | 2,380 |
| Broward County FL Sales Tax Revenue (Main Courthouse Project) | 5.250% | 10/1/36 | | 17,500 | 20,131 |
| Citizens Property Insurance Corp. Florida Revenue (Coastal Account) | 5.250% | 6/1/17 | | 6,000 | 6,679 |
| Clearwater FL Water & Sewer Revenue | 5.250% | 12/1/39 | | 5,000 | 5,690 |
146
Long-Term Tax-Exempt Fund
| | | | | |
| | | | | Face | Market |
| | | Maturity | | Amount | Value• |
| | Coupon | Date | | ($000) | ($000) |
| Collier County FL Special Obligation Revenue | 5.000% | 7/1/34 | | 3,000 | 3,328 |
| Florida Board of Education Capital Outlay GO | 5.000% | 6/1/33 | | 3,000 | 3,444 |
| Florida Board of Education Lottery Revenue | 5.000% | 7/1/22 | (2) | 12,995 | 14,536 |
| Florida Board of Education Public Education Capital Outlay GO | 6.000% | 6/1/23 | | 3,000 | 3,917 |
| Florida Board of Education Public Education Capital Outlay GO | 5.000% | 6/1/34 | | 2,695 | 3,036 |
| Florida Board of Education Public Education Capital Outlay GO | 5.000% | 6/1/35 | | 7,000 | 7,885 |
| Florida Department of Environmental Protection & Preservation Revenue | 5.000% | 7/1/20 | | 8,175 | 9,273 |
| Florida Department of Environmental Protection & Preservation Revenue | 5.000% | 7/1/21 | | 8,610 | 9,830 |
| Florida Department of Environmental Protection & Preservation Revenue | 5.000% | 7/1/27 | | 5,000 | 5,502 |
| Florida Municipal Power Agency Revenue | 5.000% | 10/1/31 | | 6,075 | 6,724 |
| Florida Municipal Power Agency Revenue | 6.250% | 10/1/31 | | 2,000 | 2,381 |
| Florida Water Pollution Control Financing Corp. Revenue | 5.000% | 1/15/20 | | 2,000 | 2,308 |
| Florida Water Pollution Control Financing Corp. Revenue | 5.000% | 1/15/25 | | 3,000 | 3,436 |
| Gainesville FL Utilities System Revenue VRDO | 0.070% | 11/3/14 | | 8,200 | 8,200 |
| Halifax Hospital Medical Center Florida Hospital Revenue | 5.500% | 6/1/38 | (4) | 3,000 | 3,263 |
| Highlands County FL Health Facilities Authority Hospital Revenue | | | | | |
| (Adventist Health System/Sunbelt Obligated Group) | 5.000% | 11/15/15 | (Prere.) | 245 | 257 |
| Highlands County FL Health Facilities Authority Hospital Revenue | | | | | |
| (Adventist Health System/Sunbelt Obligated Group) | 5.000% | 11/15/15 | (Prere.) | 185 | 194 |
| Highlands County FL Health Facilities Authority Hospital Revenue | | | | | |
| (Adventist Health System/Sunbelt Obligated Group) | 5.250% | 11/15/16 | (Prere.) | 245 | 269 |
| Highlands County FL Health Facilities Authority Hospital Revenue | | | | | |
| (Adventist Health System/Sunbelt Obligated Group) | 5.625% | 11/15/37 | | 5,000 | 5,808 |
| Hillsborough County FL Industrial Development Authority Hospital Revenue | | | | | |
| (H. Lee Moffitt Cancer Center Project) | 5.250% | 7/1/27 | | 7,085 | 7,526 |
| Hillsborough County FL Industrial Development Authority Hospital Revenue | | | | | |
| (Tampa General Hospital Project) | 5.000% | 10/1/34 | | 12,750 | 14,297 |
| Hillsborough County FL Industrial Development Authority Revenue | | | | | |
| (University Community Hospital) | 6.500% | 8/15/19 | (ETM) | 8,500 | 9,823 |
| Hillsborough County FL School Board COP | 5.000% | 7/1/25 | | 2,500 | 2,875 |
| Jacksonville FL Electric Authority Electric System Revenue VRDO | 0.050% | 11/7/14 | | 11,300 | 11,300 |
| Jacksonville FL Electric Authority Revenue (St. John’s River Power Park) | 5.000% | 10/1/37 | | 4,500 | 4,922 |
| Jacksonville FL Electric Authority Water & Sewer Revenue | 5.000% | 10/1/33 | | 3,500 | 3,951 |
| Jacksonville FL Health Facilities Authority Hospital Revenue (Baptist Medical Center Project) | 5.000% | 8/15/27 | | 2,500 | 2,718 |
| Jacksonville FL Health Facilities Authority Hospital Revenue (Baptist Medical Center Project) | 5.000% | 8/15/37 | | 3,800 | 4,029 |
| Jacksonville FL Sales Taxes Revenue | 5.000% | 10/1/30 | | 5,000 | 5,542 |
| Jacksonville FL Transportation Revenue | 5.000% | 10/1/31 | | 2,000 | 2,327 |
| Lee Memorial Health System Florida Hospital Revenue | 5.250% | 4/1/35 | (14) | 12,480 | 13,156 |
| Marion County FL Hospital District Health System Improvement Revenue | | | | | |
| (Munroe Regional Health System) | 5.000% | 10/1/17 | (Prere.) | 14,290 | 16,087 |
| Miami Beach FL Health Facilities Authority Revenue (Mount Sinai Medical Center) | 5.000% | 11/15/44 | | 5,000 | 5,423 |
| Miami FL Special Obligation Revenue (Marlins Stadium Project) | 5.250% | 7/1/35 | (4) | 2,000 | 2,175 |
| Miami FL Special Obligation Revenue (Street & Sidewalk Improvement Program) | 5.625% | 1/1/39 | | 2,000 | 2,144 |
| Miami-Dade County FL Aviation Revenue (Miami International Airport) | 5.750% | 10/1/21 | | 2,000 | 2,396 |
| Miami-Dade County FL Aviation Revenue (Miami International Airport) | 5.000% | 10/1/23 | | 3,000 | 3,454 |
| Miami-Dade County FL Aviation Revenue (Miami International Airport) | 5.000% | 10/1/24 | | 3,000 | 3,436 |
| Miami-Dade County FL Aviation Revenue (Miami International Airport) | 5.000% | 10/1/24 | | 2,165 | 2,543 |
| Miami-Dade County FL Aviation Revenue (Miami International Airport) | 5.750% | 10/1/25 | | 4,720 | 5,593 |
| Miami-Dade County FL Aviation Revenue (Miami International Airport) | 5.000% | 10/1/28 | | 2,000 | 2,279 |
| Miami-Dade County FL Aviation Revenue (Miami International Airport) | 5.000% | 10/1/29 | | 14,165 | 15,869 |
| Miami-Dade County FL Aviation Revenue (Miami International Airport) | 5.000% | 10/1/30 | | 4,270 | 4,776 |
| Miami-Dade County FL Aviation Revenue (Miami International Airport) | 5.375% | 10/1/35 | | 5,200 | 6,002 |
| Miami-Dade County FL Aviation Revenue (Miami International Airport) | 5.500% | 10/1/41 | | 9,000 | 10,279 |
| Miami-Dade County FL Aviation Revenue (Miami International Airport) | 5.500% | 10/1/41 | | 1,775 | 2,027 |
| Miami-Dade County FL Educational Facilities Authority Revenue (University of Miami) | 5.250% | 4/1/19 | | 2,505 | 2,671 |
| Miami-Dade County FL Expressway Authority Toll System Revenue | 5.000% | 7/1/16 | (Prere.) | 17,240 | 18,565 |
| Miami-Dade County FL Public Facilities Revenue (Jackson Memorial Hospital) | 5.000% | 6/1/28 | (14) | 2,090 | 2,147 |
| Miami-Dade County FL School Board COP | 5.250% | 5/1/19 | (12) | 5,000 | 5,660 |
| Miami-Dade County FL School Board COP | 5.250% | 5/1/29 | (12) | 5,850 | 6,500 |
| Miami-Dade County FL School Board COP | 5.250% | 5/1/30 | (12) | 10,000 | 11,076 |
| Miami-Dade County FL School Board COP | 5.250% | 5/1/31 | (12) | 8,165 | 9,034 |
| Miami-Dade County FL Seaport Revenue | 5.750% | 10/1/32 | | 5,150 | 6,100 |
| Miami-Dade County FL Seaport Revenue | 5.500% | 10/1/42 | | 5,000 | 5,719 |
| Miami-Dade County FL Special Obligation Revenue | 5.000% | 10/1/31 | | 10,000 | 11,213 |
| Miami-Dade County FL Special Obligation Revenue | 5.000% | 10/1/37 | | 2,500 | 2,770 |
| Miami-Dade County FL Transit Sales Surtax Revenue | 5.000% | 7/1/31 | (10) | 5,000 | 5,280 |
| Miami-Dade County FL Transit Sales Surtax Revenue | 5.000% | 7/1/37 | | 7,000 | 7,780 |
| Miami-Dade County FL Water & Sewer Revenue | 5.000% | 10/1/20 | (10) | 4,385 | 4,906 |
| Miami-Dade County FL Water & Sewer Revenue | 5.000% | 10/1/26 | (14) | 7,000 | 7,768 |
| North Brevard County FL Hospital District Revenue (Parrish Medical Center Project) | 5.750% | 10/1/18 | (Prere.) | 1,425 | 1,689 |
| North Brevard County FL Hospital District Revenue (Parrish Medical Center Project) | 5.750% | 10/1/38 | | 575 | 636 |
147
Long-Term Tax-Exempt Fund
| | | | | |
| | | | | Face | Market |
| | | Maturity | | Amount | Value• |
| | Coupon | Date | | ($000) | ($000) |
| Orange County FL Health Facilities Authority Hospital Revenue (Orlando Health Inc.) | 5.000% | 10/1/42 | | 6,940 | 7,427 |
| Orange County FL Health Facilities Authority Hospital Revenue (Orlando Health Inc.) | 5.000% | 10/1/42 | | 2,000 | 2,140 |
| Orange County FL Health Facilities Authority Hospital Revenue | | | | | |
| (Orlando Regional Healthcare System) | 6.250% | 10/1/16 | (14) | 1,010 | 1,074 |
| Orange County FL Health Facilities Authority Revenue (Nemours Foundation Project) | 5.000% | 1/1/39 | | 6,500 | 7,072 |
| Orange County FL School Board COP | 5.000% | 8/1/23 | (14) | 5,000 | 5,503 |
| Orange County FL Tourist Development Revenue | 4.750% | 10/1/32 | (10) | 8,500 | 8,975 |
| Orlando & Orange County FL Expressway Authority Revenue | 5.000% | 7/1/28 | | 2,000 | 2,263 |
| Orlando & Orange County FL Expressway Authority Revenue | 5.000% | 7/1/28 | (4) | 5,000 | 5,669 |
| Orlando & Orange County FL Expressway Authority Revenue | 5.000% | 7/1/30 | | 1,000 | 1,123 |
| Orlando & Orange County FL Expressway Authority Revenue | 5.000% | 7/1/32 | (4) | 5,340 | 5,784 |
| Orlando FL Utility Commission Utility System Revenue | 5.000% | 10/1/29 | | 3,675 | 4,161 |
| Orlando FL Utility Commission Utility System Revenue | 5.000% | 10/1/33 | | 3,555 | 4,016 |
| Orlando FL Utility Commission Utility System Revenue | 5.250% | 10/1/39 | | 2,500 | 2,832 |
| Orlando FL Utility Commission Water & Electric Revenue | 5.000% | 10/1/15 | (Prere.) | 2,100 | 2,193 |
| Osceola County FL Expressway System Revenue (Poinciana Parkway Project) | 0.000% | 10/1/39 | | 6,000 | 3,557 |
| Osceola County FL Expressway System Revenue (Poinciana Parkway Project) | 0.000% | 10/1/42 | | 7,540 | 4,427 |
| Osceola County FL Expressway System Revenue (Poinciana Parkway Project) | 5.375% | 10/1/47 | | 2,000 | 2,095 |
| Palm Beach County FL Criminal Justice Facilities Revenue | 7.200% | 6/1/15 | (14) | 4,000 | 4,156 |
| Palm Beach County FL Public Improvement Revenue | 5.000% | 5/1/33 | | 1,700 | 1,876 |
| Palm Beach County FL Public Improvement Revenue | 5.000% | 5/1/38 | | 8,000 | 8,835 |
| Palm Beach County FL School Board COP | 5.000% | 8/1/24 | (14) | 7,135 | 7,882 |
| Palm Beach County FL School Board COP | 5.000% | 8/1/27 | (14) | 2,000 | 2,193 |
| Palm Beach County FL Solid Waste Authority Revenue | 5.500% | 10/1/28 | | 25,000 | 28,958 |
| Palm Beach County FL Water & Sewer Revenue | 5.000% | 10/1/16 | (Prere.) | 2,000 | 2,177 |
| Polk County FL Public Facilities Revenue | 5.000% | 12/1/15 | (Prere.) | 17,835 | 18,762 |
| Port St. Lucie FL Revenue | 6.250% | 9/1/27 | (12) | 10,000 | 11,413 |
| Port St. Lucie FL Utility Revenue | 5.000% | 9/1/35 | (12) | 2,000 | 2,224 |
| Sarasota County FL Public Hospital District Hospital Revenue (Sarasota Memorial Hospital Project) | 5.625% | 7/1/39 | | 10,000 | 11,162 |
| Sarasota County FL School Board COP | 5.375% | 7/1/23 | | 3,000 | 3,477 |
| Sarasota County FL School Board COP | 5.500% | 7/1/24 | | 2,775 | 3,215 |
| Seminole County FL School Board COP | 5.000% | 7/1/22 | (4) | 1,990 | 2,139 |
| Seminole County FL Water & Sewer Revenue | 6.000% | 10/1/19 | (14) | 510 | 531 |
| Seminole County FL Water & Sewer Revenue | 5.000% | 10/1/36 | | 4,400 | 4,688 |
| South Florida Water Management District COP | 5.000% | 10/1/36 | (2) | 10,000 | 10,647 |
| South Miami FL Health Facilities Authority Hospital Revenue | | | | | |
| (Baptist Health South Florida Obligated Group) | 5.000% | 8/15/20 | | 5,000 | 5,564 |
| South Miami FL Health Facilities Authority Hospital Revenue | | | | | |
| (Baptist Health South Florida Obligated Group) | 5.000% | 8/15/22 | | 5,000 | 5,551 |
| St. Johns County FL Development Authority Revenue | | | | | |
| (Presbyterian Retirement Communities Project) | 6.000% | 8/1/45 | | 5,000 | 5,623 |
| St. Johns County FL Industrial Development Authority Health Care Revenue | | | | | |
| (Vicars Landing Project) | 5.000% | 2/15/17 | | 705 | 728 |
| St. Johns County FL Ponte Vedra Utility Systems Revenue | 5.000% | 10/1/30 | (4) | 3,650 | 3,768 |
| St. Petersburg FL Health Facilities Authority Revenue (All Children’s Hospital Inc. Obligated Group) | 6.500% | 11/15/39 | | 2,000 | 2,379 |
| St. Petersburg FL Public Utility Revenue | 5.500% | 10/1/37 | | 1,000 | 1,161 |
| Sumter County FL Industrial Development Authority Hospital Revenue | | | | | |
| (Central Florida Health Alliance Project) | 5.250% | 7/1/44 | | 3,000 | 3,278 |
| Sunrise FL Utility System Revenue | 5.500% | 10/1/18 | (ETM) | 11,010 | 12,394 |
| Sunrise FL Utility System Revenue | 5.200% | 10/1/22 | (2) | 9,550 | 10,534 |
| Tallahassee FL Energy System Revenue | 5.000% | 10/1/37 | (14) | 2,500 | 2,729 |
| Tampa Bay FL Water Utility System Revenue | 5.000% | 10/1/34 | | 7,000 | 7,821 |
| Tampa FL Cigarette Tax Allocation Revenue (H. Lee Moffitt Cancer Center Project) | 5.000% | 9/1/26 | | 1,000 | 1,139 |
| Tampa FL Cigarette Tax Allocation Revenue (H. Lee Moffitt Cancer Center Project) | 5.000% | 9/1/28 | | 1,700 | 1,917 |
| Tampa FL Cigarette Tax Allocation Revenue (H. Lee Moffitt Cancer Center Project) | 5.000% | 9/1/29 | | 1,950 | 2,193 |
| Tampa FL Health System Revenue (Baycare Health System) | 5.000% | 11/15/33 | | 7,407 | 8,236 |
| Tohopekaliga FL Water Authority Utility System Revenue | 5.750% | 10/1/30 | | 1,525 | 1,881 |
| Tohopekaliga FL Water Authority Utility System Revenue | 5.750% | 10/1/31 | | 1,600 | 1,963 |
| Tohopekaliga FL Water Authority Utility System Revenue | 5.750% | 10/1/32 | | 1,750 | 2,147 |
| | | | | | 735,798 |
| Georgia (2.0%) | | | | | |
| Atlanta GA Airport Passenger Facility Charge Revenue | 5.000% | 1/1/21 | | 3,360 | 3,935 |
| Atlanta GA Airport Revenue | 5.000% | 1/1/33 | | 2,615 | 2,970 |
| Atlanta GA Airport Revenue | 5.000% | 1/1/33 | | 5,000 | 5,678 |
| Atlanta GA Airport Revenue | 5.000% | 1/1/34 | | 2,750 | 3,114 |
| Atlanta GA Airport Revenue | 5.000% | 1/1/34 | | 5,000 | 5,661 |
| Atlanta GA Airport Revenue | 5.000% | 1/1/37 | | 6,010 | 6,751 |
| Atlanta GA Water & Wastewater Revenue | 5.500% | 11/1/15 | (4) | 8,500 | 8,950 |
| Atlanta GA Water & Wastewater Revenue | 5.000% | 11/1/33 | (14) | 11,650 | 11,692 |
| Burke County GA Development Authority Pollution Control Revenue | | | | | |
| (Oglethorpe Power Corp. Vogtle Project) | 5.500% | 1/1/33 | | 3,000 | 3,219 |
148
Long-Term Tax-Exempt Fund
| | | | | |
| | | | | Face | Market |
| | | Maturity | | Amount | Value• |
| | Coupon | Date | | ($000) | ($000) |
| Dalton GA Development Authority Revenue (Hamilton Health Care System) | 5.500% | 8/15/26 | (14) | 12,000 | 13,417 |
| DeKalb County GA Water & Sewer Revenue | 5.250% | 10/1/36 | | 3,000 | 3,472 |
| Georgia GO | 5.000% | 2/1/22 | | 9,000 | 11,014 |
| Georgia GO | 5.000% | 7/1/29 | | 2,000 | 2,328 |
| Georgia Municipal Electric Power Authority Revenue | 5.000% | 1/1/30 | | 4,315 | 4,993 |
| Georgia Municipal Electric Power Authority Revenue | 5.000% | 1/1/39 | | 7,000 | 7,756 |
| Georgia Road & Tollway Authority Revenue | 5.000% | 3/1/21 | | 2,815 | 3,400 |
| Gwinnett County GA School District GO | 5.000% | 2/1/36 | | 5,000 | 5,805 |
| Gwinnett County GA Water & Sewer Authority Revenue | 5.000% | 8/1/20 | | 2,900 | 3,509 |
| Macon-Bibb County GA Hospital Authority Revenue (Medical Center of Central Georgia) | 5.000% | 8/1/32 | | 4,500 | 4,912 |
| Macon-Bibb County GA Hospital Authority Revenue (Medical Center of Central Georgia) | 5.000% | 8/1/35 | | 3,405 | 3,698 |
| Main Street Natural Gas Inc. Georgia Gas Project Revenue | 5.000% | 3/15/17 | | 310 | 334 |
| Main Street Natural Gas Inc. Georgia Gas Project Revenue | 5.000% | 3/15/20 | | 1,680 | 1,887 |
| Main Street Natural Gas Inc. Georgia Gas Project Revenue | 5.000% | 3/15/21 | | 10,305 | 11,933 |
| Main Street Natural Gas Inc. Georgia Gas Project Revenue | 5.500% | 9/15/25 | | 15,000 | 18,024 |
| Metropolitan Atlanta GA Rapid Transportation Authority Georgia Sales Tax Revenue | 6.250% | 7/1/18 | | 6,840 | 7,610 |
| Municipal Electric Authority Georgia Revenue (General Resolution Projects) | 5.500% | 1/1/26 | | 7,000 | 8,091 |
| Municipal Electric Authority Georgia Revenue (Project One) | 5.000% | 1/1/21 | | 3,000 | 3,554 |
| Private Colleges & University Authority of Georgia Revenue (Emory University) | 5.000% | 9/1/32 | | 1,500 | 1,714 |
| Private Colleges & University Authority of Georgia Revenue (Mercer University) | 6.500% | 11/1/15 | (ETM) | 1,370 | 1,413 |
| | | | | | 170,834 |
| Hawaii (0.7%) | | | | | |
| Hawaii Department of Budget & Finance Special Purpose Revenue | | | | | |
| (Hawaii Pacific Health Obligated Group) | 5.500% | 7/1/38 | | 4,360 | 4,996 |
| Hawaii GO | 5.000% | 12/1/18 | | 2,000 | 2,324 |
| Hawaii GO | 5.000% | 12/1/21 | | 5,150 | 6,263 |
| Hawaii Harbor System Revenue | 5.500% | 7/1/35 | | 5,000 | 5,655 |
| Hawaii Harbor System Revenue | 5.625% | 7/1/40 | | 5,000 | 5,640 |
| Honolulu HI City & County GO | 5.250% | 4/1/28 | | 8,000 | 9,250 |
| Honolulu HI City & County GO | 5.250% | 4/1/30 | | 8,000 | 9,235 |
| Honolulu HI City & County GO | 5.250% | 8/1/33 | | 2,000 | 2,357 |
| Honolulu HI City & County GO | 5.250% | 8/1/34 | | 3,025 | 3,551 |
| Honolulu HI City & County Wastewater System Revenue | 5.250% | 7/1/36 | | 5,000 | 5,734 |
| University of Hawaii Revenue | 6.000% | 10/1/38 | | 2,500 | 2,974 |
| | | | | | 57,979 |
| Idaho (0.2%) | | | | | |
| Idaho Building Authority Revenue (Prison Facilities Project) VRDO | 0.050% | 11/7/14 | | 3,710 | 3,710 |
| Idaho Health Facilities Authority Revenue (Trinity Health Group) | 6.250% | 12/1/33 | | 6,000 | 6,998 |
| Idaho Housing & Finance Association RAN | 5.000% | 7/15/22 | | 6,465 | 7,390 |
| | | | | | 18,098 |
| Illinois (8.5%) | | | | | |
| Chicago IL (City Colleges Capital Improvement Project) GO | 0.000% | 1/1/16 | (14) | 8,500 | 8,402 |
| Chicago IL Board of Education GO | 5.500% | 12/1/26 | (14) | 5,225 | 5,965 |
| Chicago IL Board of Education GO | 5.500% | 12/1/39 | | 10,000 | 10,582 |
| Chicago IL Board of Education GO | 5.000% | 12/1/42 | | 19,925 | 19,924 |
| Chicago IL GO | 5.600% | 1/1/16 | (Prere.) | 7,010 | 7,514 |
| Chicago IL GO | 5.610% | 1/1/16 | (Prere.) | 3,695 | 3,961 |
| Chicago IL GO | 5.650% | 1/1/16 | (Prere.) | 7,985 | 8,564 |
| Chicago IL GO | 5.530% | 1/1/20 | (14) | 5,000 | 5,294 |
| Chicago IL GO | 5.000% | 1/1/21 | (4) | 3,000 | 3,017 |
| Chicago IL GO | 5.580% | 1/1/22 | (14) | 5,000 | 5,255 |
| Chicago IL GO | 5.600% | 1/1/24 | (14) | 2,480 | 2,595 |
| Chicago IL GO | 5.610% | 1/1/25 | (14) | 1,305 | 1,365 |
| Chicago IL GO | 5.650% | 1/1/28 | (14) | 2,820 | 2,953 |
| Chicago IL Metropolitan Water Reclamation District GO | 5.000% | 12/1/31 | | 7,500 | 8,552 |
| Chicago IL Midway Airport Revenue | 5.000% | 1/1/34 | | 3,300 | 3,702 |
| Chicago IL Midway Airport Revenue | 5.000% | 1/1/35 | | 7,800 | 8,710 |
| Chicago IL Midway Airport Revenue | 5.000% | 1/1/36 | | 2,000 | 2,232 |
| Chicago IL O’Hare International Airport Revenue | 5.000% | 1/1/25 | (4) | 17,000 | 18,906 |
| Chicago IL O’Hare International Airport Revenue | 5.000% | 1/1/26 | (4) | 17,600 | 19,573 |
| Chicago IL O’Hare International Airport Revenue | 6.500% | 1/1/41 | | 3,000 | 3,649 |
| Chicago IL O’Hare International Airport Revenue | 5.750% | 1/1/43 | | 9,000 | 10,021 |
| 2 Chicago IL O’Hare International Airport Revenue TOB VRDO | 0.200% | 11/7/14 | (12) | 5,805 | 5,805 |
| Chicago IL Park District GO | 5.000% | 1/1/36 | | 4,000 | 4,364 |
| Chicago IL Public Building Commission GO | 7.000% | 1/1/20 | (ETM) | 27,500 | 34,114 |
| Chicago IL Sales Tax Revenue | 5.000% | 1/1/29 | | 4,265 | 4,600 |
| Chicago IL Sales Tax Revenue | 5.250% | 1/1/38 | | 2,055 | 2,239 |
| Chicago IL Transit Authority Sales Tax Receipts Revenue | 5.250% | 12/1/36 | | 6,400 | 7,247 |
| Chicago IL Wastewater Transmission Revenue | 5.000% | 1/1/39 | | 9,000 | 9,917 |
| Cook County IL Community College District GO | 5.125% | 12/1/38 | | 4,250 | 4,753 |
149
Long-Term Tax-Exempt Fund
| | | | | |
| | | | | Face | Market |
| | | Maturity | | Amount | Value• |
| | Coupon | Date | | ($000) | ($000) |
| Cook County IL Forest Preservation District GO | 5.000% | 12/15/32 | | 1,000 | 1,111 |
| Cook County IL Forest Preservation District GO | 5.000% | 12/15/37 | | 2,500 | 2,745 |
| Du Page & Cook Counties IL Community Consolidated School District GO | 5.000% | 6/1/23 | | 4,695 | 5,714 |
| Illinois Finance Authority Revenue (Advocate Health Care Network) | 5.000% | 6/1/42 | | 16,580 | 17,868 |
| Illinois Finance Authority Revenue (Art Institute of Chicago) | 5.000% | 3/1/34 | | 7,750 | 8,618 |
| Illinois Finance Authority Revenue (Ascension Health Credit Group) | 5.000% | 11/15/37 | | 5,000 | 5,567 |
| Illinois Finance Authority Revenue (Ascension Health Credit Group) | 5.000% | 11/15/42 | | 17,895 | 19,768 |
| Illinois Finance Authority Revenue (Carle Foundation) | 6.000% | 8/15/41 | | 5,000 | 5,779 |
| Illinois Finance Authority Revenue (Carle Foundation) | 6.000% | 8/15/41 | (4) | 1,500 | 1,740 |
| Illinois Finance Authority Revenue (Centegra Health System) | 5.000% | 9/1/39 | | 5,000 | 5,290 |
| Illinois Finance Authority Revenue (Central DuPage Health) | 5.250% | 11/1/39 | | 4,000 | 4,431 |
| Illinois Finance Authority Revenue (Chicago University) | 5.500% | 8/15/36 | | 15,000 | 17,179 |
| Illinois Finance Authority Revenue (Children’s Memorial Hospital) | 5.375% | 8/15/39 | | 10,000 | 10,811 |
| Illinois Finance Authority Revenue (Franciscan Communities Inc.) | 5.125% | 5/15/43 | | 2,500 | 2,576 |
| Illinois Finance Authority Revenue (Franciscan Communities Inc.) | 5.250% | 5/15/47 | | 9,670 | 9,791 |
| Illinois Finance Authority Revenue (Loyola University) | 5.000% | 7/1/42 | | 2,000 | 2,149 |
| Illinois Finance Authority Revenue (Northwestern Community Hospital) | 5.375% | 7/1/33 | | 3,000 | 3,277 |
| 2 Illinois Finance Authority Revenue (Northwestern University) TOB VRDO | 0.070% | 11/3/14 | | 6,400 | 6,400 |
| Illinois Finance Authority Revenue (OSF Healthcare System) | 7.000% | 11/15/29 | | 15,000 | 18,057 |
| Illinois Finance Authority Revenue (OSF Healthcare System) | 6.000% | 5/15/39 | | 6,360 | 7,233 |
| Illinois Finance Authority Revenue (OSF Healthcare System) | 5.000% | 5/15/41 | | 6,000 | 6,440 |
| Illinois Finance Authority Revenue (Riverside Health System) | 6.250% | 11/15/35 | | 4,600 | 5,367 |
| Illinois Finance Authority Revenue (Silver Cross & Medical Centers) | 7.000% | 8/15/44 | | 16,000 | 18,517 |
| Illinois Finance Authority Revenue (Southern Illinois Healthcare) | 5.375% | 3/1/35 | (4) | 5,120 | 5,742 |
| Illinois Finance Authority Revenue (Trinity Health Corp.) | 5.000% | 12/1/30 | | 3,000 | 3,360 |
| Illinois Finance Authority Revenue (University of Chicago) | 5.500% | 7/1/18 | (Prere.) | 10,000 | 11,695 |
| Illinois Finance Authority Revenue (University of Chicago) | 5.750% | 7/1/18 | (Prere.) | 7,750 | 9,133 |
| Illinois Finance Authority Revenue (University of Chicago) | 5.000% | 10/1/32 | | 790 | 892 |
| Illinois Finance Authority Revenue (University of Chicago) | 5.000% | 10/1/33 | | 10,000 | 11,639 |
| Illinois GO | 5.000% | 8/1/20 | | 10,000 | 11,285 |
| Illinois GO | 5.000% | 3/1/21 | | 4,000 | 4,489 |
| Illinois GO | 5.000% | 8/1/21 | | 7,000 | 7,875 |
| Illinois GO | 5.000% | 8/1/23 | | 1,500 | 1,674 |
| Illinois GO | 5.000% | 8/1/24 | | 9,000 | 9,878 |
| Illinois GO | 5.000% | 2/1/25 | | 2,270 | 2,513 |
| Illinois GO | 5.000% | 8/1/25 | | 2,000 | 2,181 |
| Illinois GO | 5.250% | 2/1/32 | | 8,075 | 8,842 |
| Illinois GO | 5.250% | 2/1/33 | (4) | 5,200 | 5,749 |
| Illinois GO | 5.500% | 7/1/33 | (4) | 3,350 | 3,785 |
| Illinois GO | 5.250% | 2/1/34 | (4) | 3,125 | 3,445 |
| Illinois GO | 5.000% | 5/1/34 | | 2,500 | 2,676 |
| Illinois GO | 5.000% | 5/1/36 | | 3,000 | 3,194 |
| Illinois GO | 5.500% | 7/1/38 | | 7,500 | 8,213 |
| Illinois GO | 5.000% | 5/1/39 | | 5,000 | 5,283 |
| Illinois Regional Transportation Authority Revenue | 7.200% | 11/1/20 | (2) | 15,320 | 17,705 |
| Illinois Sales Tax Revenue | 5.000% | 6/15/17 | | 3,000 | 3,339 |
| Illinois Sports Facility Authority Revenue | 5.500% | 6/15/15 | (Prere.) | 2,915 | 3,040 |
| Illinois Sports Facility Authority Revenue | 5.500% | 6/15/30 | (2) | 7,085 | 7,335 |
| Illinois Toll Highway Authority Revenue | 5.000% | 7/1/15 | (Prere.) | 7,095 | 7,324 |
| Illinois Toll Highway Authority Revenue | 5.000% | 12/1/22 | | 2,400 | 2,898 |
| Illinois Toll Highway Authority Revenue | 5.000% | 1/1/23 | (4) | 2,600 | 2,786 |
| Illinois Toll Highway Authority Revenue | 5.000% | 1/1/24 | (4) | 3,465 | 3,709 |
| Illinois Toll Highway Authority Revenue | 5.500% | 1/1/33 | | 20,000 | 22,189 |
| Illinois Toll Highway Authority Revenue | 5.000% | 1/1/36 | | 10,000 | 11,259 |
| 3 Illinois Toll Highway Authority Revenue | 5.000% | 1/1/36 | | 10,000 | 11,301 |
| Illinois Toll Highway Authority Revenue | 5.000% | 1/1/38 | | 10,000 | 11,170 |
| Illinois Toll Highway Authority Revenue | 5.000% | 1/1/39 | | 2,000 | 2,245 |
| Illinois Unemployment Insurance Fund Building Receipts Revenue | 5.000% | 6/15/20 | | 5,500 | 5,531 |
| Metropolitan Pier & Exposition Authority Illinois Dedicated Sales Tax Revenue | 0.000% | 6/15/25 | (14) | 10,000 | 6,834 |
| Metropolitan Pier & Exposition Authority Illinois Dedicated Sales Tax Revenue | 0.000% | 12/15/34 | (14) | 4,870 | 1,989 |
| Metropolitan Pier & Exposition Authority Illinois Dedicated Sales Tax Revenue | 0.000% | 6/15/44 | (4) | 10,000 | 2,432 |
| Metropolitan Pier & Exposition Authority Illinois Dedicated Sales Tax Revenue | 5.250% | 6/15/50 | | 9,210 | 9,841 |
| Metropolitan Pier & Exposition Authority Illinois Dedicated Sales Tax Revenue | | | | | |
| (McCormick Place Expansion Project) | 5.000% | 12/15/22 | | 5,000 | 5,997 |
| Metropolitan Pier & Exposition Authority Illinois Dedicated Sales Tax Revenue | | | | | |
| (McCormick Place Expansion Project) | 0.000% | 12/15/24 | (14) | 2,715 | 1,917 |
| Metropolitan Pier & Exposition Authority Illinois Dedicated Sales Tax Revenue | | | | | |
| (McCormick Place Expansion Project) | 5.000% | 12/15/26 | | 2,000 | 2,295 |
| Metropolitan Pier & Exposition Authority Illinois Dedicated Sales Tax Revenue | | | | | |
| (McCormick Place Expansion Project) | 5.000% | 6/15/42 | | 3,965 | 4,277 |
150
Long-Term Tax-Exempt Fund
| | | | | |
| | | | | Face | Market |
| | | Maturity | | Amount | Value• |
| | Coupon | Date | | ($000) | ($000) |
| Railsplitter Tobacco Settlement Authority Illinois Tobacco Settlement Revenue | 6.000% | 6/1/28 | | 15,000 | 17,601 |
| Springfield IL Water Revenue | 5.000% | 3/1/37 | | 8,000 | 8,857 |
| University of Illinois Auxiliary Facilities System Revenue | 5.500% | 4/1/31 | | 3,000 | 3,465 |
| | | | | | 721,082 |
| Indiana (1.1%) | | | | | |
| Indiana Finance Authority Facilities Revenue (Wabash Valley Correctional Facility) | 5.250% | 7/1/19 | | 2,500 | 2,944 |
| Indiana Finance Authority Health System Revenue | | | | | |
| (Sisters of St. Francis Health Services Inc. Obligated Group) | 5.250% | 11/1/39 | | 3,000 | 3,326 |
| Indiana Finance Authority Hospital Revenue (Community Health Network) | 5.000% | 5/1/42 | | 9,000 | 9,799 |
| Indiana Finance Authority Lease Revenue | 5.000% | 2/1/21 | | 2,500 | 3,011 |
| Indiana Finance Authority Revenue (BHI Senior Living) | 6.000% | 11/15/41 | | 10,000 | 11,294 |
| Indiana Finance Authority Revenue (Community Foundation of Northwest Indiana Obligated Group) | 5.000% | 3/1/41 | | 6,500 | 6,999 |
| Indiana Finance Authority Wastewater Utility Revenue (CWA Authority Project) | 5.000% | 10/1/37 | | 7,000 | 7,715 |
| Indiana Finance Authority Wastewater Utility Revenue (CWA Authority Project) | 5.000% | 10/1/39 | | 7,000 | 7,892 |
| 2 Indiana Health & Educational Facility Financing Authority Revenue | | | | | |
| (Ascension Health Credit Group) TOB VRDO | 0.070% | 11/3/14 | | 10,400 | 10,400 |
| Indianapolis IN Local Public Improvement Bond Bank Revenue (Bank-Waterworks Project) | 5.750% | 1/1/38 | | 10,000 | 11,406 |
| Indianapolis IN Local Public Improvement Bond Bank Revenue (PILOT Infrastructure Project) | 5.000% | 1/1/29 | (4) | 5,245 | 5,994 |
| Indianapolis IN Local Public Improvement Bond Bank Revenue | | | | | |
| (Qualified Midwestern Disaster Area) | 5.750% | 2/1/36 | | 8,800 | 10,169 |
| | | | | | 90,949 |
| Iowa (0.3%) | | | | | |
| Iowa Finance Authority Midwestern Disaster Area Revenue (Iowa Fertilizer Co. Project) | 5.000% | 12/1/19 | | 3,000 | 3,205 |
| Iowa Finance Authority Midwestern Disaster Area Revenue (Iowa Fertilizer Co. Project) | 5.500% | 12/1/22 | | 3,000 | 3,179 |
| Iowa Finance Authority Midwestern Disaster Area Revenue (Iowa Fertilizer Co. Project) | 5.250% | 12/1/25 | | 15,000 | 16,143 |
| | | | | | 22,527 |
| Kansas (0.1%) | | | | | |
| Kansas Department of Transportation Highway Revenue VRDO | 0.050% | 11/7/14 | | 4,300 | 4,300 |
| Wyandotte County/Kansas City KS Unified Government Utility System Revenue | 5.000% | 9/1/44 | | 2,750 | 3,062 |
| | | | | | 7,362 |
| Kentucky (1.0%) | | | | | |
| Kentucky Asset/Liability Commission General Fund Revenue | 0.561% | 11/1/17 | (14) | 4,625 | 4,632 |
| Kentucky Asset/Liability Commission General Fund Revenue | 0.681% | 11/1/21 | (14) | 23,165 | 23,589 |
| Kentucky Economic Development Finance Authority Hospital Revenue | | | | | |
| (Baptist Healthcare System Obligated Group) | 5.375% | 8/15/24 | | 5,000 | 5,606 |
| Kentucky Economic Development Finance Authority Hospital Revenue | | | | | |
| (Baptist Healthcare System Obligated Group) | 5.000% | 8/15/42 | | 6,225 | 6,645 |
| Kentucky Public Transportation Infrastructure Authority Toll Revenue | | | | | |
| (Downtown Crossing Project) BAN | 0.000% | 7/1/34 | | 2,000 | 1,404 |
| Kentucky Public Transportation Infrastructure Authority Toll Revenue | | | | | |
| (Downtown Crossing Project) BAN | 0.000% | 7/1/43 | | 10,000 | 6,798 |
| Kentucky Public Transportation Infrastructure Authority Toll Revenue | | | | | |
| (Downtown Crossing Project) BAN | 5.750% | 7/1/49 | | 10,100 | 11,495 |
| Kentucky Public Transportation Infrastructure Authority Toll Revenue | | | | | |
| (Downtown Crossing Project) BAN | 6.000% | 7/1/53 | | 5,000 | 5,745 |
| Louisville & Jefferson County KY Metropolitan Government Health System Revenue | | | | | |
| (Norton Healthcare Obligated Group) | 5.750% | 10/1/42 | | 13,000 | 14,849 |
| Louisville & Jefferson County KY Metropolitan Government Revenue (Catholic Health Initiatives) | 5.000% | 12/1/35 | | 4,500 | 4,965 |
| Warren County KY Hospital Revenue | | | | | |
| (Bowling Green-Warren County Community Hospital Corp. Project) | 5.000% | 4/1/35 | | 1,600 | 1,759 |
| | | | | | 87,487 |
| Louisiana (0.8%) | | | | | |
| Louisiana Gasoline & Fuel Tax Revenue | 5.000% | 5/1/15 | (Prere.) | 6,880 | 7,046 |
| Louisiana Gasoline & Fuel Tax Revenue | 5.000% | 5/1/15 | (Prere.) | 5,000 | 5,121 |
| Louisiana Gasoline & Fuel Tax Revenue | 5.000% | 5/1/15 | (Prere.) | 8,065 | 8,260 |
| Louisiana Gasoline & Fuel Tax Revenue | 5.000% | 5/1/16 | (Prere.) | 2,500 | 2,676 |
| Louisiana Local Government Environmental Facilities & Community Development | | | | | |
| Authority Revenue (East Baton Rouge Sewerage Commission Projects) | 5.000% | 2/1/39 | | 4,250 | 4,729 |
| Louisiana Local Government Environmental Facilities & Community Development | | | | | |
| Authority Revenue (Women’s Hospital Foundation Project) | 5.875% | 10/1/40 | | 14,000 | 15,755 |
| Louisiana Stadium & Exposition District Revenue | 5.000% | 7/1/28 | | 4,000 | 4,623 |
| Louisiana Stadium & Exposition District Revenue | 5.000% | 7/1/29 | | 3,000 | 3,457 |
| Louisiana State University Revenue | 5.000% | 7/1/24 | | 1,000 | 1,206 |
| Louisiana State University Revenue | 5.000% | 7/1/25 | | 505 | 603 |
| New Orleans LA GO | 0.000% | 9/1/16 | (2) | 5,785 | 5,581 |
| St. Charles Parish LA Gulf Opportunity Zone Revenue (Valero Energy Corp.) PUT | 4.000% | 6/1/22 | | 4,000 | 4,300 |
| | | | | | 63,357 |
151
Long-Term Tax-Exempt Fund
| | | | | |
| | | | | Face | Market |
| | | Maturity | | Amount | Value• |
| | Coupon | Date | | ($000) | ($000) |
| Maine (0.1%) | | | | | |
| Maine Health & Higher Educational Facilities Authority Revenue (Bates College) | 5.000% | 7/1/38 | | 4,000 | 4,445 |
| Maine Health & Higher Educational Facilities Authority Revenue | | | | | |
| (Eastern Maine Medical Center Obligated Group) | 5.000% | 7/1/33 | | 1,500 | 1,633 |
| | | | | | 6,078 |
| Maryland (0.7%) | | | | | |
| Anne Arundel County MD GO | 5.000% | 4/1/20 | | 7,390 | 8,828 |
| Anne Arundel County MD GO | 5.000% | 4/1/20 | | 2,640 | 3,154 |
| Baltimore County MD GO | 5.000% | 2/1/26 | | 2,800 | 3,324 |
| Baltimore MD Project Revenue | 5.000% | 7/1/38 | | 5,000 | 5,731 |
| Maryland Economic Development Corp. Pollution Control Revenue (Potomac Electric Power Co.) | 6.200% | 9/1/22 | | 4,000 | 4,773 |
| Maryland Economic Development Corp. Student Housing Revenue | | | | | |
| (University of Maryland College Park) | 5.000% | 6/1/28 | (12) | 500 | 523 |
| Maryland GO | 5.000% | 8/1/15 | | 2,425 | 2,513 |
| Maryland GO | 5.000% | 3/1/16 | | 3,720 | 3,954 |
| Maryland Health & Higher Educational Facilities Authority Revenue (MedStar Health, Inc.) | 5.000% | 8/15/38 | | 10,000 | 10,944 |
| Maryland Health & Higher Educational Facilities Authority Revenue | | | | | |
| (University of Maryland Medical System) | 7.000% | 7/1/22 | (14) | 10,285 | 12,518 |
| | | | | | 56,262 |
| Massachusetts (3.8%) | | | | | |
| Massachusetts Bay Transportation Authority Assessment Revenue | 5.250% | 7/1/34 | | 2,500 | 2,848 |
| Massachusetts Bay Transportation Authority General Transportation Revenue | 7.000% | 3/1/21 | (ETM) | 5,440 | 5,887 |
| Massachusetts Bay Transportation Authority General Transportation Revenue | 7.000% | 3/1/21 | | 6,070 | 7,508 |
| Massachusetts Bay Transportation Authority Sales Tax Revenue | 5.500% | 7/1/29 | (14) | 3,085 | 4,042 |
| 2 Massachusetts Bay Transportation Authority Sales Tax Revenue TOB VRDO | 0.170% | 11/7/14 | | 10,307 | 10,307 |
| Massachusetts College Building Authority Revenue | 0.000% | 5/1/17 | (ETM) | 7,460 | 7,348 |
| Massachusetts College Building Authority Revenue | 5.000% | 5/1/35 | | 2,500 | 2,846 |
| Massachusetts Department of Transportation Metropolitan Highway System Revenue | 5.000% | 1/1/26 | | 8,000 | 8,886 |
| Massachusetts Department of Transportation Metropolitan Highway System Revenue | 5.000% | 1/1/27 | | 8,000 | 8,837 |
| Massachusetts Department of Transportation Metropolitan Highway System Revenue | 5.000% | 1/1/35 | | 5,000 | 5,664 |
| 3 Massachusetts Development Finance Agency Revenue (Baystate Medical Obligated Group) | 5.000% | 7/1/44 | | 5,000 | 5,481 |
| Massachusetts Development Finance Agency Revenue (Commonwealth Contract Assistance) | 5.500% | 2/1/40 | | 10,000 | 11,564 |
| Massachusetts Development Finance Agency Revenue (Harvard University) | 5.250% | 2/1/34 | | 3,000 | 3,500 |
| Massachusetts Development Finance Agency Revenue (Wellesley College) | 5.000% | 7/1/42 | | 5,000 | 5,776 |
| Massachusetts GO | 5.000% | 10/1/16 | | 3,000 | 3,263 |
| Massachusetts GO | 5.000% | 10/1/17 | | 3,000 | 3,381 |
| Massachusetts GO | 5.000% | 8/1/36 | | 9,855 | 11,355 |
| Massachusetts GO | 4.000% | 6/1/43 | | 3,000 | 3,068 |
| Massachusetts GO VRDO | 0.060% | 11/3/14 | | 5,300 | 5,300 |
| Massachusetts Health & Educational Facilities Authority Revenue (Boston Medical Center) | 5.750% | 7/1/31 | | 8,500 | 9,198 |
| Massachusetts Health & Educational Facilities Authority Revenue (Harvard University) | 5.500% | 11/15/36 | | 21,500 | 25,116 |
| 2 Massachusetts Health & Educational Facilities Authority Revenue (Harvard University) TOB VRDO | 0.080% | 11/3/14 | | 2,015 | 2,015 |
| Massachusetts Health & Educational Facilities Authority Revenue (Lahey Clinic Medical Center) | 5.000% | 8/15/30 | (14) | 7,460 | 7,590 |
| Massachusetts Health & Educational Facilities Authority Revenue (Tufts University) VRDO | 0.060% | 11/3/14 | | 4,700 | 4,700 |
| Massachusetts School Building Authority Dedicated Sales Tax Revenue | 5.000% | 8/15/15 | (Prere.) | 7,755 | 8,051 |
| Massachusetts School Building Authority Dedicated Sales Tax Revenue | 5.000% | 8/15/15 | (Prere.) | 10,000 | 10,382 |
| Massachusetts School Building Authority Dedicated Sales Tax Revenue | 5.000% | 8/15/15 | (Prere.) | 2,400 | 2,492 |
| Massachusetts School Building Authority Dedicated Sales Tax Revenue | 5.000% | 8/15/15 | (Prere.) | 15,485 | 16,076 |
| Massachusetts School Building Authority Dedicated Sales Tax Revenue | 5.000% | 8/15/30 | | 2,000 | 2,356 |
| Massachusetts School Building Authority Dedicated Sales Tax Revenue | 5.000% | 8/15/30 | (4) | 745 | 770 |
| Massachusetts School Building Authority Dedicated Sales Tax Revenue | 5.000% | 8/15/30 | | 10,100 | 11,900 |
| Massachusetts School Building Authority Dedicated Sales Tax Revenue | 5.250% | 10/15/35 | | 3,000 | 3,524 |
| Massachusetts Special Obligation Dedicated Tax Revenue | 5.500% | 1/1/27 | (14) | 7,190 | 8,977 |
| Massachusetts Transportation Fund Revenue (Accelerated Bridge Program) | 5.000% | 6/1/35 | | 4,000 | 4,612 |
| Massachusetts Water Pollution Abatement Trust Revenue | 5.000% | 8/1/22 | | 5,000 | 6,149 |
| Massachusetts Water Resources Authority Revenue | 6.500% | 7/15/19 | (ETM) | 14,540 | 16,474 |
| Massachusetts Water Resources Authority Revenue | 5.000% | 8/1/27 | | 3,000 | 3,514 |
| Massachusetts Water Resources Authority Revenue | 5.000% | 8/1/31 | (2) | 21,000 | 22,417 |
| Massachusetts Water Resources Authority Revenue | 5.000% | 8/1/35 | (14) | 12,000 | 13,159 |
| Massachusetts Water Resources Authority Revenue | 5.000% | 8/1/35 | | 5,000 | 5,666 |
| Massachusetts Water Resources Authority Revenue | 5.000% | 8/1/36 | | 1,000 | 1,152 |
| Metropolitan Boston MA Transit Parking Corp. Revenue | 5.250% | 7/1/36 | | 4,500 | 5,224 |
| University of Massachusetts Building Authority Revenue | 5.000% | 11/1/39 | | 10,795 | 12,206 |
| | | | | | 320,581 |
| Michigan (1.8%) | | | | | |
| Detroit MI GO | 5.000% | 4/1/15 | (12) | 2,875 | 2,902 |
| Detroit MI GO | 5.000% | 4/1/16 | (12) | 3,015 | 3,127 |
| Detroit MI GO | 5.000% | 4/1/17 | (12) | 3,170 | 3,314 |
| Detroit MI Sewage Disposal System Revenue | 5.125% | 7/1/15 | (Prere.) | 3,970 | 4,100 |
| Detroit MI Water & Sewerage Department Sewage Disposal System Revenue | 5.250% | 7/1/39 | | 1,000 | 1,074 |
152
Long-Term Tax-Exempt Fund
| | | | | |
| | | | | Face | Market |
| | | Maturity | | Amount | Value• |
| | Coupon | Date | | ($000) | ($000) |
| Detroit/Wayne County MI Stadium Authority Revenue | 5.000% | 10/1/26 | (4) | 2,500 | 2,721 |
| Karegnondi Water Authority Michigan Water Supply System Revenue (Karegnondi Water Pipeline) | 5.250% | 11/1/40 | | 17,330 | 19,272 |
| Kent Hospital MI Finance Authority Revenue (Spectrum Health) | 5.000% | 1/15/42 | | 10,805 | 11,686 |
| Michigan Building Authority Revenue | 5.000% | 10/15/29 | | 1,375 | 1,598 |
| Michigan Building Authority Revenue | 5.250% | 10/15/47 | | 2,000 | 2,261 |
| Michigan Finance Authority Revenue | 5.000% | 10/1/39 | | 13,195 | 14,631 |
| Michigan Finance Authority Revenue (Detroit Water & Sewer) | 5.000% | 7/1/32 | | 5,000 | 5,443 |
| Michigan Finance Authority Revenue (Detroit Water & Sewer) | 5.000% | 7/1/34 | | 7,500 | 8,096 |
| Michigan Finance Authority Revenue (Detroit Water & Sewer) | 5.000% | 7/1/44 | | 3,670 | 3,856 |
| Michigan Finance Authority Revenue (State Clean Water Revolving Fund) | 5.000% | 10/1/23 | | 6,785 | 8,289 |
| Michigan Finance Authority Revenue (State Clean Water Revolving Fund) | 5.000% | 10/1/25 | | 1,500 | 1,807 |
| Michigan Finance Authority Revenue (State Clean Water Revolving Fund) | 5.000% | 10/1/26 | | 3,100 | 3,716 |
| Michigan GO | 5.250% | 9/15/26 | (4) | 14,000 | 15,609 |
| Michigan Hospital Finance Authority Revenue (Henry Ford Health System) | 5.750% | 11/15/39 | | 5,000 | 5,552 |
| Michigan Hospital Finance Authority Revenue (MidMichigan Obligated Group) | 6.125% | 6/1/39 | | 9,000 | 10,350 |
| Michigan Municipal Bond Authority Revenue (State Clean Water Revolving Fund) | 5.000% | 10/1/24 | | 10,000 | 11,195 |
| Michigan State University Revenue | 5.000% | 8/15/26 | | 1,165 | 1,397 |
| Michigan State University Revenue | 5.000% | 8/15/27 | | 1,000 | 1,193 |
| Royal Oak MI Hospital Finance Authority Hospital Revenue (William Beaumont Hospital) | 6.000% | 8/1/39 | | 8,000 | 9,123 |
| Wayne County MI Airport Authority Revenue (Detroit Metropolitan Wayne County Airport) | 5.000% | 12/1/39 | (15) | 3,000 | 3,404 |
| | | | | | 155,716 |
| Minnesota (0.5%) | | | | | |
| Minneapolis MN Health Care System Revenue (Fairview Health Services) | 6.750% | 11/15/32 | | 4,250 | 5,022 |
| Minnesota COP | 5.000% | 6/1/31 | | 3,730 | 4,398 |
| Minnesota GO | 5.000% | 10/1/16 | (ETM) | 25 | 27 |
| Minnesota GO | 5.000% | 10/1/16 | | 2,825 | 3,075 |
| Minnesota GO | 5.000% | 8/1/23 | | 3,180 | 3,947 |
| Minnesota GO | 5.000% | 8/1/32 | | 10,000 | 12,064 |
| Minnesota Office of Higher Education Revenue (Supplemental Student Loan Program) | 5.000% | 11/1/17 | | 1,940 | 2,157 |
| Minnesota Office of Higher Education Revenue (Supplemental Student Loan Program) | 5.000% | 11/1/19 | | 2,100 | 2,415 |
| University of Minnesota Revenue | 5.125% | 4/1/34 | | 1,250 | 1,422 |
| University of Minnesota Revenue | 5.000% | 8/1/35 | | 10,300 | 11,774 |
| | | | | | 46,301 |
| Mississippi (0.4%) | | | | | |
| Mississippi State University Educational Building Corp. Revenue | 5.250% | 8/1/38 | | 2,500 | 2,886 |
| S.M. Educational Building Corp. Mississippi Revenue | | | | | |
| (Residence Hall Construction & Refunding Project) | 5.000% | 3/1/43 | | 14,490 | 15,906 |
| Warren County MS Gulf Opportunity Zone Revenue (International Paper Co. Projects) | 6.500% | 9/1/32 | | 10,000 | 11,402 |
| Warren County MS Gulf Opportunity Zone Revenue (International Paper Co. Projects) | 5.375% | 12/1/35 | | 4,750 | 5,314 |
| | | | | | 35,508 |
| Missouri (1.1%) | | | | | |
| Bi-State Development Agency of the Missouri-Illinois Metropolitan District | | | | | |
| Mass Transit Sales Tax Revenue | 5.000% | 10/1/44 | | 4,670 | 5,205 |
| Curators of the University of Missouri System Facilities Revenue | 5.000% | 11/1/24 | | 1,500 | 1,775 |
| Curators of the University of Missouri System Facilities Revenue | 4.000% | 11/1/33 | | 5,000 | 5,384 |
| Kansas City MO Special Obligation Revenue (Kansas City Downtown Redevelopment District) | 5.000% | 9/1/39 | | 3,150 | 3,468 |
| Missouri Development Finance Board Infrastructure Facilities Revenue (Branson Landing Project) | 5.000% | 6/1/35 | | 7,685 | 7,837 |
| Missouri Health & Educational Facilities Authority Health Facilities Revenue (Cox Health) | 5.500% | 11/15/33 | | 3,500 | 3,864 |
| Missouri Health & Educational Facilities Authority Health Facilities Revenue | | | | | |
| (Lester Cox Medical Center) | 5.250% | 6/1/15 | (14) | 1,415 | 1,436 |
| Missouri Health & Educational Facilities Authority Revenue (Washington University) | 5.000% | 11/15/37 | | 14,950 | 16,997 |
| Missouri Health & Educational Facilities Authority Revenue (Washington University) | 5.375% | 3/15/39 | | 8,000 | 8,945 |
| Missouri Health & Educational Facilities Authority Revenue (Washington University) VRDO | 0.080% | 11/3/14 | | 7,900 | 7,900 |
| Missouri Highways & Transportation Commission Road Revenue | 5.000% | 5/1/25 | | 16,900 | 21,162 |
| Missouri Joint Municipal Electric Utility Commission Power Project Revenue (Iatan 2 Project) | 5.750% | 1/1/16 | (Prere.) | 5,000 | 5,313 |
| | | | | | 89,286 |
| Montana (0.0%) | | | | | |
| Forsyth MT Pollution Control Revenue (Puget Sound Energy Project) | 3.900% | 3/1/23 | | 3,575 | 3,697 |
| |
| Nebraska (0.3%) | | | | | |
| Central Plains Energy Project Nebraska Gas Project Revenue (Project No. 1) | 5.250% | 12/1/20 | | 5,000 | 5,747 |
| Municipal Energy Agency of Nebraska Power Supply System Revenue | 5.000% | 4/1/29 | | 2,000 | 2,253 |
| Municipal Energy Agency of Nebraska Power Supply System Revenue | 5.375% | 4/1/39 | (13) | 3,000 | 3,424 |
| Omaha NE Public Power District Electric Revenue | 5.500% | 2/1/39 | | 5,000 | 5,601 |
| University of Nebraska Student Fee Revenue | 5.000% | 7/1/37 | | 5,000 | 5,623 |
| | | | | | 22,648 |
| Nevada (1.1%) | | | | | |
| Clark County NV GO | 6.500% | 6/1/17 | (2) | 5,000 | 5,730 |
| Clark County NV Industrial Development Revenue (Southwest Gas Corp. Project) VRDO | 0.060% | 11/7/14 | LOC | 20,000 | 20,000 |
| Clark County NV School District GO | 5.000% | 12/15/14 | (Prere.) | 12,590 | 12,665 |
153
Long-Term Tax-Exempt Fund
| | | | | |
| | | | | Face | Market |
| | | Maturity | | Amount | Value• |
| | Coupon | Date | | ($000) | ($000) |
| Henderson NV Health Facility Revenue (Catholic Healthcare West) | 5.250% | 7/1/31 | | 11,710 | 12,460 |
| Las Vegas Valley Water District Nevada GO | 5.000% | 6/1/27 | | 1,050 | 1,229 |
| Las Vegas Valley Water District Nevada GO | 5.000% | 6/1/29 | | 7,470 | 8,697 |
| Las Vegas Valley Water District Nevada GO | 5.000% | 6/1/30 | | 7,845 | 9,110 |
| Las Vegas Valley Water District Nevada GO | 5.000% | 2/1/31 | | 2,125 | 2,336 |
| Nevada Highway Improvement Revenue (Motor Vehicle Fuel Tax) | 5.000% | 12/1/23 | (4) | 5,000 | 5,675 |
| Nevada Highway Improvement Revenue (Motor Vehicle Fuel Tax) | 5.000% | 12/1/25 | (4) | 10,255 | 11,601 |
| | | | | | 89,503 |
| New Hampshire (0.3%) | | | | | |
| New Hampshire Health & Education Facilities Authority Revenue (Dartmouth College) | 6.000% | 8/1/38 | | 2,400 | 2,782 |
| New Hampshire Health & Education Facilities Authority Revenue | | | | | |
| (Southern New Hampshire University) | 5.000% | 1/1/34 | | 1,375 | 1,451 |
| New Hampshire Health & Education Facilities Authority Revenue | | | | | |
| (Southern New Hampshire University) | 5.000% | 1/1/42 | | 7,955 | 8,325 |
| New Hampshire Health & Education Facilities Authority Revenue (Wentworth Douglas Hospital) | 7.000% | 1/1/38 | | 8,000 | 9,328 |
| | | | | | 21,886 |
| New Jersey (4.1%) | | | | | |
| Camden County NJ Improvement Authority Health Care Redevelopment Project Revenue | | | | | |
| (Cooper Health System Obligated Group) | 5.750% | 2/15/42 | | 5,000 | 5,730 |
| Hoboken-Union City-Weehawken NJ Sewerage Authority Revenue | 6.250% | 8/1/15 | (ETM) | 10,820 | 11,314 |
| New Jersey Economic Development Authority Revenue (School Facilities Construction) | 5.000% | 3/1/15 | (Prere.) | 6,515 | 6,619 |
| New Jersey Economic Development Authority Revenue (School Facilities Construction) | 5.500% | 12/15/19 | (2) | 10,000 | 11,664 |
| New Jersey Economic Development Authority Revenue (School Facilities Construction) | 5.000% | 3/1/26 | | 3,000 | 3,334 |
| New Jersey Economic Development Authority Revenue (School Facilities Construction) | 5.500% | 9/1/26 | (2) | 10,000 | 11,949 |
| New Jersey Economic Development Authority Revenue (School Facilities Construction) | 5.500% | 9/1/27 | (14) | 9,000 | 11,128 |
| New Jersey Economic Development Authority Revenue (School Facilities Construction) | 5.000% | 3/1/28 | | 20,000 | 21,999 |
| New Jersey Economic Development Authority Revenue (School Facilities Construction) PUT | 5.000% | 9/1/15 | (Prere.) | 22,000 | 22,882 |
| New Jersey Economic Development Authority Revenue | | | | | |
| (Trustees of the Lawrenceville School Project) VRDO | 0.070% | 11/3/14 | | 2,100 | 2,100 |
| New Jersey Educational Facilities Authority Revenue (New Jersey Institute of Technology) | 5.000% | 7/1/31 | | 3,000 | 3,374 |
| New Jersey Educational Facilities Authority Revenue (University Medical & Dentistry) | 7.500% | 6/1/19 | (Prere.) | 7,250 | 9,330 |
| New Jersey Health Care Facilities Financing Authority Department of Human Services | | | | | |
| Lease Revenue (Greystone Park Psychiatric Hospital Project) | 5.000% | 9/15/29 | | 7,335 | 8,293 |
| New Jersey Health Care Facilities Financing Authority Revenue | | | | | |
| (Hospital Capital Asset Pooled Program) VRDO | 0.060% | 11/7/14 | LOC | 4,300 | 4,300 |
| New Jersey Health Care Facilities Financing Authority Revenue (Virtua Health) | 5.750% | 7/1/33 | | 8,190 | 9,301 |
| New Jersey Health Care Facilities Financing Authority Revenue (Virtua Health) VRDO | 0.060% | 11/3/14 | LOC | 3,600 | 3,600 |
| New Jersey Housing & Mortgage Finance Agency Single Family Housing Revenue | 4.250% | 10/1/32 | | 2,050 | 2,160 |
| New Jersey Housing & Mortgage Finance Agency Single Family Housing Revenue | 6.500% | 10/1/38 | | 545 | 567 |
| New Jersey Transportation Trust Fund Authority Transportation System Revenue | 5.500% | 12/15/21 | (14) | 36,000 | 42,748 |
| New Jersey Transportation Trust Fund Authority Transportation System Revenue | 5.250% | 6/15/22 | | 5,000 | 5,807 |
| New Jersey Transportation Trust Fund Authority Transportation System Revenue | 5.250% | 12/15/22 | (2) | 8,500 | 9,907 |
| New Jersey Transportation Trust Fund Authority Transportation System Revenue | 5.250% | 12/15/23 | | 5,180 | 6,065 |
| New Jersey Transportation Trust Fund Authority Transportation System Revenue | 0.000% | 12/15/25 | (2) | 15,000 | 9,860 |
| New Jersey Transportation Trust Fund Authority Transportation System Revenue | 5.250% | 6/15/26 | | 2,000 | 2,272 |
| New Jersey Transportation Trust Fund Authority Transportation System Revenue | 0.000% | 12/15/27 | | 15,000 | 8,541 |
| New Jersey Transportation Trust Fund Authority Transportation System Revenue | 5.000% | 6/15/28 | | 12,000 | 13,481 |
| New Jersey Transportation Trust Fund Authority Transportation System Revenue | 0.000% | 12/15/28 | | 16,000 | 8,629 |
| New Jersey Transportation Trust Fund Authority Transportation System Revenue | 5.000% | 6/15/29 | | 1,925 | 2,129 |
| New Jersey Transportation Trust Fund Authority Transportation System Revenue | 6.000% | 6/15/35 | | 2,000 | 2,444 |
| New Jersey Transportation Trust Fund Authority Transportation System Revenue | 5.500% | 12/15/38 | (12) | 8,000 | 9,173 |
| New Jersey Transportation Trust Fund Authority Transportation System Revenue | 5.500% | 6/15/39 | | 5,300 | 6,019 |
| New Jersey Turnpike Authority Revenue | 6.500% | 1/1/16 | (ETM) | 270 | 290 |
| New Jersey Turnpike Authority Revenue | 6.500% | 1/1/16 | (ETM) | 1,375 | 1,400 |
| New Jersey Turnpike Authority Revenue | 6.500% | 1/1/16 | (14)(ETM) | 270 | 290 |
| New Jersey Turnpike Authority Revenue | 5.000% | 1/1/29 | | 10,000 | 11,434 |
| New Jersey Turnpike Authority Revenue | 5.000% | 1/1/29 | | 4,550 | 5,219 |
| New Jersey Turnpike Authority Revenue | 5.000% | 1/1/30 | | 13,295 | 15,172 |
| New Jersey Turnpike Authority Revenue | 0.000% | 1/1/35 | (2) | 34,500 | 35,913 |
| | | | | | 346,437 |
| New Mexico (0.4%) | | | | | |
| New Mexico Hospital Equipment Loan Council Hospital System Revenue | | | | | |
| (Presbyterian Healthcare Services) | 5.000% | 8/1/39 | | 6,500 | 7,132 |
| New Mexico Hospital Equipment Loan Council Hospital System Revenue | | | | | |
| (Presbyterian Healthcare Services) | 5.000% | 8/1/42 | | 14,820 | 16,253 |
| New Mexico Hospital Equipment Loan Council Hospital System Revenue | | | | | |
| (Presbyterian Healthcare Services) VRDO | 0.070% | 11/7/14 | | 13,500 | 13,500 |
| | | | | | 36,885 |
154
Long-Term Tax-Exempt Fund
| | | | | |
| | | | | Face | Market |
| | | Maturity | | Amount | Value• |
| | Coupon | Date | | ($000) | ($000) |
| New York (15.6%) | | | | | |
| Brooklyn NY Local Development Corp. PILOT Revenue (Barclays Center Project) | 6.375% | 7/15/43 | | 6,000 | 6,807 |
| Erie County NY Industrial Development Agency School Facility Revenue | | | | | |
| (Buffalo City School District Project) | 5.000% | 5/1/22 | | 2,000 | 2,399 |
| Erie County NY Industrial Development Agency School Facility Revenue | | | | | |
| (Buffalo City School District Project) | 5.000% | 5/1/24 | | 8,120 | 9,703 |
| Erie County NY Industrial Development Agency School Facility Revenue | | | | | |
| (Buffalo City School District Project) | 5.000% | 5/1/25 | | 6,710 | 7,962 |
| Hudson Yards Infrastructure Corp. New York Revenue | 5.750% | 2/15/47 | | 28,730 | 33,079 |
| Long Island NY Power Authority Electric System Revenue | 6.250% | 4/1/33 | | 3,000 | 3,523 |
| Nassau County NY Local Economic Assistance & Financing Corp. Revenue | | | | | |
| (Winthrop University Hospital Association Project) | 5.000% | 7/1/32 | | 3,000 | 3,264 |
| New York City NY GO | 5.000% | 8/1/17 | (Prere.) | 780 | 874 |
| New York City NY GO | 5.000% | 8/1/21 | | 6,000 | 7,078 |
| New York City NY GO | 5.000% | 8/1/22 | | 10,000 | 12,013 |
| New York City NY GO | 5.000% | 4/1/23 | | 10,855 | 12,953 |
| New York City NY GO | 5.000% | 8/1/23 | | 9,550 | 11,447 |
| New York City NY GO | 5.000% | 8/1/23 | | 5,000 | 6,025 |
| New York City NY GO | 5.125% | 12/1/23 | | 12,875 | 14,463 |
| New York City NY GO | 5.000% | 8/1/24 | | 10,195 | 12,208 |
| New York City NY GO | 5.000% | 8/1/24 | | 4,665 | 5,561 |
| New York City NY GO | 5.000% | 8/1/24 | | 4,220 | 4,673 |
| New York City NY GO | 5.000% | 8/1/25 | | 9,160 | 10,858 |
| New York City NY GO | 5.000% | 8/1/25 | | 5,000 | 5,927 |
| New York City NY GO | 5.000% | 8/1/25 | | 5,000 | 5,759 |
| New York City NY GO | 5.000% | 8/1/27 | | 7,000 | 8,028 |
| New York City NY GO | 5.000% | 8/1/31 | | 5,000 | 5,799 |
| New York City NY GO | 5.000% | 3/1/32 | | 5,000 | 5,752 |
| New York City NY GO | 5.000% | 8/1/32 | | 14,000 | 16,134 |
| New York City NY GO | 5.000% | 10/1/32 | | 5,260 | 6,024 |
| New York City NY GO | 5.000% | 8/1/35 | | 1,500 | 1,701 |
| New York City NY GO VRDO | 0.070% | 11/3/14 | | 5,600 | 5,600 |
| New York City NY Health & Hospital Corp. Revenue (Health System) | 5.000% | 2/15/30 | | 6,000 | 6,660 |
| New York City NY Housing Development Corp. Multi-Family Mortgage Revenue | | | | | |
| (Bruckner by the Bridge) VRDO | 0.050% | 11/7/14 | LOC | 2,900 | 2,900 |
| New York City NY Industrial Development Agency PILOT Revenue (Yankee Stadium Project) | 0.000% | 3/1/20 | (12) | 8,400 | 7,500 |
| New York City NY Industrial Development Agency PILOT Revenue (Yankee Stadium Project) | 0.000% | 3/1/22 | (12) | 4,585 | 3,807 |
| New York City NY Industrial Development Agency PILOT Revenue (Yankee Stadium Project) | 0.000% | 3/1/24 | (12) | 9,670 | 7,325 |
| New York City NY Municipal Water Finance Authority Water & Sewer System Revenue | 5.000% | 6/15/28 | | 2,000 | 2,325 |
| New York City NY Municipal Water Finance Authority Water & Sewer System Revenue | 5.000% | 6/15/31 | | 10,000 | 11,404 |
| New York City NY Municipal Water Finance Authority Water & Sewer System Revenue | 5.000% | 6/15/32 | | 15,000 | 16,719 |
| New York City NY Municipal Water Finance Authority Water & Sewer System Revenue | 5.000% | 6/15/32 | | 6,580 | 7,523 |
| New York City NY Municipal Water Finance Authority Water & Sewer System Revenue | 5.250% | 6/15/32 | | 7,500 | 8,684 |
| New York City NY Municipal Water Finance Authority Water & Sewer System Revenue | 5.000% | 6/15/34 | | 9,000 | 10,380 |
| New York City NY Municipal Water Finance Authority Water & Sewer System Revenue | 5.000% | 6/15/34 | | 3,500 | 4,007 |
| New York City NY Municipal Water Finance Authority Water & Sewer System Revenue | 5.000% | 6/15/35 | | 4,150 | 4,817 |
| New York City NY Municipal Water Finance Authority Water & Sewer System Revenue | 5.000% | 6/15/35 | | 7,500 | 8,430 |
| New York City NY Municipal Water Finance Authority Water & Sewer System Revenue | 5.000% | 6/15/36 | | 15,000 | 17,368 |
| New York City NY Municipal Water Finance Authority Water & Sewer System Revenue | 5.000% | 6/15/43 | | 10,000 | 10,991 |
| New York City NY Municipal Water Finance Authority Water & Sewer System Revenue | 5.375% | 6/15/43 | | 21,000 | 24,600 |
| New York City NY Municipal Water Finance Authority Water & Sewer System Revenue | 5.500% | 6/15/43 | | 4,110 | 4,839 |
| New York City NY Municipal Water Finance Authority Water & Sewer System Revenue | 5.000% | 6/15/44 | | 9,065 | 10,018 |
| New York City NY Municipal Water Finance Authority Water & Sewer System Revenue | 5.000% | 6/15/44 | | 13,775 | 15,132 |
| New York City NY Municipal Water Finance Authority Water & Sewer System Revenue | 5.000% | 6/15/45 | | 1,000 | 1,104 |
| New York City NY Municipal Water Finance Authority Water & Sewer System Revenue | 5.000% | 6/15/45 | | 6,320 | 6,998 |
| New York City NY Municipal Water Finance Authority Water & Sewer System Revenue VRDO | 0.070% | 11/3/14 | | 8,600 | 8,600 |
| New York City NY Municipal Water Finance Authority Water & Sewer System Revenue VRDO | 0.070% | 11/3/14 | | 9,800 | 9,800 |
| New York City NY Transitional Finance Authority Building Aid Revenue | 5.000% | 1/15/28 | | 12,000 | 13,284 |
| New York City NY Transitional Finance Authority Building Aid Revenue | 5.000% | 7/15/31 | | 5,000 | 5,742 |
| New York City NY Transitional Finance Authority Building Aid Revenue | 5.000% | 7/15/32 | | 800 | 917 |
| New York City NY Transitional Finance Authority Building Aid Revenue | 5.000% | 7/15/32 | | 16,000 | 18,211 |
| New York City NY Transitional Finance Authority Building Aid Revenue | 5.000% | 7/15/33 | | 5,000 | 5,675 |
| New York City NY Transitional Finance Authority Building Aid Revenue | 5.000% | 7/15/37 | | 10,000 | 11,330 |
| New York City NY Transitional Finance Authority Building Aid Revenue | 5.250% | 7/15/37 | | 2,750 | 3,154 |
| New York City NY Transitional Finance Authority Future Tax Revenue | 5.000% | 5/1/17 | (Prere.) | 5 | 6 |
| New York City NY Transitional Finance Authority Future Tax Revenue | 5.000% | 11/1/18 | | 3,000 | 3,473 |
| New York City NY Transitional Finance Authority Future Tax Revenue | 5.000% | 5/1/19 | (Prere.) | 865 | 1,015 |
| New York City NY Transitional Finance Authority Future Tax Revenue | 5.000% | 11/1/22 | | 2,000 | 2,416 |
| New York City NY Transitional Finance Authority Future Tax Revenue | 5.000% | 11/1/29 | | 15,000 | 17,752 |
| New York City NY Transitional Finance Authority Future Tax Revenue | 5.000% | 11/1/30 | | 11,775 | 12,814 |
| New York City NY Transitional Finance Authority Future Tax Revenue | 5.000% | 2/1/33 | | 2,500 | 2,861 |
155
Long-Term Tax-Exempt Fund
| | | | | |
| | | | | Face | Market |
| | | Maturity | | Amount | Value• |
| | Coupon | Date | | ($000) | ($000) |
| New York City NY Transitional Finance Authority Future Tax Revenue | 5.000% | 11/1/33 | | 5,000 | 5,675 |
| New York City NY Transitional Finance Authority Future Tax Revenue | 5.000% | 5/1/34 | | 6,135 | 6,900 |
| New York City NY Transitional Finance Authority Future Tax Revenue | 5.000% | 2/1/35 | | 10,940 | 12,382 |
| New York City NY Transitional Finance Authority Future Tax Revenue | 5.000% | 11/1/35 | | 10,000 | 11,516 |
| New York City NY Transitional Finance Authority Future Tax Revenue | 5.000% | 2/1/37 | | 9,000 | 10,327 |
| New York City NY Transitional Finance Authority Future Tax Revenue | 5.000% | 8/1/37 | | 7,135 | 8,235 |
| New York City NY Transitional Finance Authority Future Tax Revenue | 5.000% | 11/1/39 | | 15,875 | 18,219 |
| New York City NY Transitional Finance Authority Future Tax Revenue | 5.000% | 2/1/42 | | 4,500 | 5,008 |
| 2 New York City NY Transitional Finance Authority Future Tax Revenue TOB VRDO | 0.070% | 11/3/14 | | 4,395 | 4,395 |
| New York Liberty Development Corp. Revenue | 5.000% | 11/15/31 | | 3,000 | 3,364 |
| New York Liberty Development Corp. Revenue | 5.000% | 12/15/41 | | 12,100 | 13,583 |
| New York Liberty Development Corp. Revenue | 5.125% | 1/15/44 | | 5,000 | 5,544 |
| New York Liberty Development Corp. Revenue | 5.000% | 11/15/44 | | 7,550 | 8,370 |
| New York Liberty Development Corp. Revenue | 5.750% | 11/15/51 | | 13,000 | 15,128 |
| New York Metropolitan Transportation Authority Revenue | 5.000% | 11/15/23 | | 6,800 | 7,595 |
| New York Metropolitan Transportation Authority Revenue | 5.000% | 11/15/24 | | 2,525 | 2,815 |
| New York Metropolitan Transportation Authority Revenue | 5.000% | 11/15/29 | | 5,000 | 5,728 |
| New York Metropolitan Transportation Authority Revenue | 5.000% | 11/15/30 | | 6,000 | 6,966 |
| New York Metropolitan Transportation Authority Revenue | 5.000% | 11/15/30 | | 4,750 | 5,490 |
| New York Metropolitan Transportation Authority Revenue | 5.000% | 11/15/30 | | 6,500 | 7,513 |
| New York Metropolitan Transportation Authority Revenue | 5.000% | 11/15/31 | | 2,000 | 2,295 |
| New York Metropolitan Transportation Authority Revenue | 5.000% | 11/15/31 | | 6,000 | 6,966 |
| New York Metropolitan Transportation Authority Revenue | 5.000% | 11/15/31 | | 11,935 | 13,548 |
| New York Metropolitan Transportation Authority Revenue | 5.000% | 11/15/32 | | 4,500 | 5,142 |
| New York Metropolitan Transportation Authority Revenue | 5.000% | 11/15/33 | | 5,400 | 6,100 |
| New York Metropolitan Transportation Authority Revenue | 5.250% | 11/15/37 | | 11,105 | 12,766 |
| New York Metropolitan Transportation Authority Revenue | 5.000% | 11/15/38 | | 8,550 | 9,489 |
| New York Metropolitan Transportation Authority Revenue | 5.000% | 11/15/38 | | 5,000 | 5,549 |
| New York Metropolitan Transportation Authority Revenue | 5.250% | 11/15/40 | | 7,500 | 8,364 |
| New York Metropolitan Transportation Authority Revenue (Dedicated Petroleum Tax) | 5.000% | 11/15/34 | | 3,750 | 4,239 |
| New York Metropolitan Transportation Authority Revenue (Dedicated Tax Fund) | 5.000% | 11/15/24 | | 5,000 | 6,002 |
| New York Metropolitan Transportation Authority Revenue (Dedicated Tax Fund) | 5.000% | 11/15/24 | | 3,000 | 3,601 |
| New York Metropolitan Transportation Authority Revenue (Dedicated Tax Fund) | 5.000% | 11/15/28 | | 10,250 | 12,157 |
| New York Metropolitan Transportation Authority Revenue (Dedicated Tax Fund) | 5.125% | 11/15/28 | | 2,000 | 2,375 |
| New York Metropolitan Transportation Authority Revenue (Transit Revenue) | 5.000% | 11/1/25 | | 5,575 | 6,638 |
| New York Metropolitan Transportation Authority Revenue (Transit Revenue) | 5.000% | 11/15/25 | | 7,000 | 8,339 |
| New York Metropolitan Transportation Authority Revenue (Transit Revenue) | 5.000% | 11/1/26 | | 2,570 | 3,031 |
| New York Metropolitan Transportation Authority Revenue (Transit Revenue) | 5.000% | 11/15/26 | | 9,885 | 11,665 |
| New York Metropolitan Transportation Authority Revenue (Transit Revenue) | 5.000% | 11/15/31 | | 3,000 | 3,403 |
| New York Metropolitan Transportation Authority Revenue (Transit Revenue) | 5.000% | 11/15/38 | | 10,000 | 11,154 |
| New York Metropolitan Transportation Authority Revenue (Transit Revenue) | 5.250% | 11/15/41 | | 8,000 | 9,048 |
| New York State Dormitory Authority Lease Revenue (State University Dormitory Facilities) | 5.000% | 7/1/40 | | 8,700 | 9,728 |
| New York State Dormitory Authority Revenue (Cornell University) | 5.000% | 7/1/37 | | 1,000 | 1,147 |
| New York State Dormitory Authority Revenue (Mental Health Services Facilities Improvement) | 5.000% | 8/15/19 | (ETM) | 10 | 12 |
| New York State Dormitory Authority Revenue (New York University) | 5.750% | 7/1/27 | (14) | 10,000 | 12,539 |
| New York State Dormitory Authority Revenue (New York University) | 5.000% | 7/1/37 | | 2,300 | 2,609 |
| New York State Dormitory Authority Revenue (Personal Income Tax) | 5.000% | 6/15/19 | | 9,765 | 11,451 |
| New York State Dormitory Authority Revenue (Personal Income Tax) | 5.000% | 6/15/20 | | 10,000 | 11,724 |
| New York State Dormitory Authority Revenue (Personal Income Tax) | 5.000% | 12/15/21 | (ETM) | 5 | 6 |
| New York State Dormitory Authority Revenue (Personal Income Tax) | 5.000% | 12/15/23 | | 5,000 | 5,458 |
| New York State Dormitory Authority Revenue (Personal Income Tax) | 5.000% | 3/15/28 | | 4,750 | 5,415 |
| New York State Dormitory Authority Revenue (Personal Income Tax) | 5.000% | 12/15/30 | | 26,300 | 30,705 |
| New York State Dormitory Authority Revenue (Personal Income Tax) | 5.000% | 2/15/31 | | 9,730 | 11,153 |
| New York State Dormitory Authority Revenue (Personal Income Tax) | 5.000% | 6/15/31 | | 2,000 | 2,322 |
| New York State Dormitory Authority Revenue (Personal Income Tax) | 5.000% | 3/15/33 | | 10,000 | 11,392 |
| New York State Dormitory Authority Revenue (Personal Income Tax) | 5.000% | 3/15/34 | | 22,000 | 25,171 |
| New York State Dormitory Authority Revenue (Personal Income Tax) | 5.000% | 3/15/35 | | 5,000 | 5,076 |
| New York State Dormitory Authority Revenue (Personal Income Tax) | 5.000% | 2/15/37 | | 2,250 | 2,521 |
| New York State Dormitory Authority Revenue (Personal Income Tax) | 5.000% | 3/15/38 | | 7,500 | 8,585 |
| New York State Dormitory Authority Revenue (Personal Income Tax) | 5.000% | 3/15/42 | | 26,565 | 29,516 |
| New York State Dormitory Authority Revenue (School Districts Financing Program) | 5.000% | 10/1/21 | (4) | 4,000 | 4,822 |
| New York State Dormitory Authority Revenue (School Districts Financing Program) | 5.000% | 10/1/22 | (4) | 7,240 | 8,671 |
| New York State Dormitory Authority Revenue (State University Educational Facilities) | 5.000% | 5/15/26 | | 2,000 | 2,376 |
| New York State Dormitory Authority Revenue (The New School) | 6.000% | 7/1/50 | | 5,000 | 5,833 |
| New York State Environmental Facilities Corp. Revenue | | | | | |
| (State Clean Water & Drinking Water Revolving Funds) | 5.000% | 6/15/29 | | 5,860 | 6,945 |
| New York State Environmental Facilities Corp. Revenue | | | | | |
| (State Clean Water & Drinking Water Revolving Funds) | 5.000% | 6/15/36 | | 3,500 | 4,025 |
| New York State Environmental Facilities Corp. Revenue (State Revolving Funds) | 5.000% | 5/15/43 | | 5,000 | 5,708 |
| New York State GO | 5.000% | 2/1/30 | | 3,385 | 3,886 |
| New York State GO | 5.000% | 2/15/30 | | 4,000 | 4,659 |
156
Long-Term Tax-Exempt Fund
| | | | | |
| | | | | Face | Market |
| | | Maturity | | Amount | Value• |
| | Coupon | Date | | ($000) | ($000) |
| 3 New York State Liberty Development Corp. Liberty Revenue (3 World Trade Center Project) | 5.000% | 11/15/44 | | 30,000 | 30,140 |
| New York State Thruway Authority Revenue | 5.000% | 1/1/26 | | 10,000 | 11,910 |
| New York State Thruway Authority Revenue | 5.000% | 1/1/37 | | 7,000 | 7,810 |
| New York State Thruway Authority Revenue (Highway & Bridge Trust Fund) | 5.000% | 4/1/27 | | 5,000 | 5,693 |
| New York State Thruway Authority Revenue (Highway & Bridge Trust Fund) | 5.000% | 4/1/30 | | 5,000 | 5,732 |
| New York State Thruway Authority Revenue (Highway & Bridge Trust Fund) | 5.000% | 4/1/31 | | 6,265 | 7,142 |
| New York State Thruway Authority Revenue (Personal Income Tax) | 5.000% | 3/15/30 | | 8,000 | 9,320 |
| New York State Urban Development Corp. Revenue | 5.000% | 1/1/23 | | 7,785 | 8,775 |
| New York State Urban Development Corp. Revenue | 5.625% | 1/1/28 | | 7,385 | 8,588 |
| New York State Urban Development Corp. Revenue (Personal Income Tax) | 5.000% | 12/15/21 | | 10,000 | 11,823 |
| New York State Urban Development Corp. Revenue (Personal Income Tax) | 5.000% | 3/15/31 | | 10,000 | 11,559 |
| New York State Urban Development Corp. Revenue (Personal Income Tax) | 5.000% | 3/15/32 | | 11,170 | 12,884 |
| New York State Urban Development Corp. Revenue (Personal Income Tax) | 5.000% | 3/15/33 | | 10,000 | 11,495 |
| Port Authority of New York & New Jersey Revenue | 5.000% | 9/1/33 | | 3,905 | 4,606 |
| Port Authority of New York & New Jersey Revenue | 5.000% | 9/1/34 | | 6,100 | 7,172 |
| Port Authority of New York & New Jersey Revenue | 5.000% | 9/1/35 | | 7,000 | 8,184 |
| Port Authority of New York & New Jersey Revenue | 5.000% | 9/1/36 | | 2,250 | 2,616 |
| Port Authority of New York & New Jersey Special Obligation Revenue | | | | | |
| (John F. Kennedy International Air Terminal LLC) | 6.000% | 12/1/42 | | 10,000 | 11,590 |
| Tompkins County NY Industrial Development Agency Civic Facility Revenue (Cornell University) | 5.000% | 7/1/37 | | 10,000 | 11,392 |
| Triborough Bridge & Tunnel Authority New York Revenue | 6.125% | 1/1/21 | (ETM) | 6,565 | 7,996 |
| Triborough Bridge & Tunnel Authority New York Revenue | 5.250% | 11/15/38 | | 12,500 | 14,018 |
| Utility Debt Securitization Authority New York Revenue | 5.000% | 12/15/30 | | 8,750 | 10,430 |
| Utility Debt Securitization Authority New York Revenue | 5.000% | 12/15/35 | | 5,600 | 6,551 |
| | | | | | 1,313,700 |
| North Carolina (0.5%) | | | | | |
| Charlotte NC Airport Revenue | 5.000% | 7/1/26 | | 2,205 | 2,521 |
| Charlotte NC Airport Revenue | 5.000% | 7/1/36 | | 2,000 | 2,227 |
| Charlotte NC Water & Sewer System Revenue | 5.000% | 7/1/33 | | 5,000 | 5,756 |
| North Carolina Eastern Municipal Power Agency Power Systems Revenue | 5.000% | 1/1/23 | | 5,010 | 5,631 |
| North Carolina Eastern Municipal Power Agency Power Systems Revenue | 5.000% | 1/1/26 | | 5,000 | 5,689 |
| North Carolina Eastern Municipal Power Agency Power Systems Revenue | 5.500% | 1/1/26 | | 3,000 | 3,474 |
| North Carolina GO | 5.000% | 5/1/20 | | 5,000 | 5,989 |
| North Carolina Medical Care Commission Health Care Facilities Revenue (Vidant Health) | 5.000% | 6/1/36 | | 500 | 551 |
| North Carolina Medical Care Commission Hospital Revenue (North Carolina Baptist Hospital) | 5.250% | 6/1/29 | | 3,000 | 3,414 |
| North Carolina Municipal Power Agency Revenue | 5.250% | 1/1/20 | | 4,000 | 4,469 |
| | | | | | 39,721 |
| Ohio (1.6%) | | | | | |
| Allen County OH Hospital Facilities Revenue (Catholic Healthcare Partners) | 5.250% | 9/1/27 | | 10,000 | 11,478 |
| Allen County OH Hospital Facilities Revenue (Catholic Healthcare Partners) | 5.000% | 5/1/42 | | 1,300 | 1,421 |
| American Municipal Power Ohio Inc. Revenue (Fremont Energy Center Project) | 5.000% | 2/15/25 | | 4,000 | 4,597 |
| Buckeye Tobacco Settlement Financing Authority Ohio Revenue | 5.750% | 6/1/34 | | 4,500 | 3,544 |
| Buckeye Tobacco Settlement Financing Authority Ohio Revenue | 5.875% | 6/1/47 | | 5,000 | 3,950 |
| Butler County OH Hospital Facilities Revenue (Kettering Health Network) | 6.375% | 4/1/36 | | 5,465 | 6,419 |
| Butler County OH Hospital Facilities Revenue (Kettering Health Network) | 5.625% | 4/1/41 | | 5,000 | 5,557 |
| Columbus OH GO | 5.000% | 2/15/22 | | 7,380 | 8,991 |
| Franklin County OH GO | 5.000% | 12/1/15 | | 2,000 | 2,104 |
| Franklin County OH Hospital Facilities Revenue (OhioHealth Corp.) VRDO | 0.040% | 11/7/14 | | 2,700 | 2,700 |
| Lucas County OH Hospital Revenue (ProMedica Healthcare Obligated Group) | 5.250% | 11/15/27 | | 3,250 | 3,744 |
| Lucas County OH Hospital Revenue (ProMedica Healthcare Obligated Group) | 5.250% | 11/15/28 | | 6,000 | 6,904 |
| Lucas County OH Hospital Revenue (ProMedica Healthcare Obligated Group) | 5.000% | 11/15/29 | | 5,270 | 5,927 |
| Lucas County OH Hospital Revenue (ProMedica Healthcare Obligated Group) | 6.000% | 11/15/41 | | 3,220 | 3,845 |
| Middletown OH City School District GO | 5.000% | 12/1/25 | (4) | 4,715 | 5,147 |
| Ohio Capital Facilities Lease-Appropriation Revenue (Administrative Building Fund Projects) | 5.000% | 10/1/24 | | 1,000 | 1,190 |
| Ohio GO | 5.000% | 5/1/15 | (Prere.) | 4,450 | 4,558 |
| Ohio GO | 5.000% | 2/1/29 | | 3,000 | 3,520 |
| Ohio GO VRDO | 0.030% | 11/7/14 | | 6,900 | 6,900 |
| 1 Ohio Higher Educational Facility Commission Revenue | | | | | |
| (Cleveland Clinic Health System Obligated Group) | 0.520% | 1/1/18 | | 2,250 | 2,248 |
| Ohio Higher Educational Facility Commission Revenue | | | | | |
| (Cleveland Clinic Health System Obligated Group) VRDO | 0.060% | 11/3/14 | | 3,200 | 3,200 |
| Ohio Hospital Revenue (Cleveland Clinic Health System Obligated Group) | 5.500% | 1/1/39 | | 10,000 | 11,277 |
| Ohio Hospital Revenue (University Hospitals Health System Inc.) | 5.000% | 1/15/41 | | 7,750 | 8,311 |
| Ohio Housing Finance Agency Residential Mortgage Revenue | 5.250% | 9/1/28 | | 160 | 160 |
| Ohio State University General Receipts Revenue | 5.000% | 6/1/38 | | 7,000 | 7,939 |
| Ohio State University General Receipts Revenue VRDO | 0.030% | 11/7/14 | | 6,400 | 6,400 |
| Scioto County OH Hospital Facilities Revenue (Southern Ohio Medical Center) | 5.750% | 2/15/38 | | 3,500 | 3,819 |
| | | | | | 135,850 |
157
Long-Term Tax-Exempt Fund
| | | | | |
| | | | | Face | Market |
| | | Maturity | | Amount | Value• |
| | Coupon | Date | | ($000) | ($000) |
| Oklahoma (0.0%) | | | | | |
| Oklahoma Turnpike Authority Revenue | 5.000% | 1/1/28 | | 775 | 904 |
| |
| Oregon (0.4%) | | | | | |
| Oregon Department of Administrative Services COP | 5.000% | 5/1/27 | | 6,755 | 7,692 |
| Oregon Department of Administrative Services Lottery Revenue | 5.000% | 4/1/22 | | 4,000 | 4,878 |
| Oregon Department of Administrative Services Lottery Revenue | 5.250% | 4/1/30 | | 4,000 | 4,726 |
| Oregon GO (Oregon University System Projects) | 5.000% | 8/1/36 | | 2,000 | 2,257 |
| Oregon Health & Science University Revenue | 5.000% | 7/1/27 | | 2,150 | 2,500 |
| Umatilla County OR Hospital Facility Authority Revenue (Catholic Health Initiatives) | 5.000% | 5/1/22 | | 12,380 | 12,428 |
| | | | | | 34,481 |
| Pennsylvania (4.1%) | | | | | |
| Allegheny County PA Port Authority Revenue | 5.750% | 3/1/29 | | 8,000 | 9,550 |
| Centre County PA Hospital Authority Revenue (Mount Nittany Medical Center Project) | 5.000% | 11/15/32 | | 3,000 | 3,282 |
| Commonwealth Financing Authority Pennsylvania Revenue | 5.000% | 6/1/36 | | 8,000 | 8,866 |
| Delaware County PA Authority Hospital Revenue (Crozer-Keystone Obligated Group) | 5.000% | 12/15/31 | | 4,920 | 4,942 |
| Delaware River Port Authority Pennsylvania & New Jersey Revenue VRDO | 0.040% | 11/7/14 | LOC | 2,800 | 2,800 |
| Franklin County PA Industrial Development Authority Revenue (Chambersburg Hospital Project) | 5.375% | 7/1/42 | | 4,325 | 4,781 |
| Monroeville PA Finance Authority Revenue (UPMC Health System) | 5.000% | 2/15/27 | | 3,095 | 3,766 |
| Montgomery County PA GO VRDO | 0.070% | 11/3/14 | | 4,900 | 4,900 |
| Montgomery County PA Industrial Development Authority Revenue | | | | | |
| (Philadelphia Presbyterian Homes Inc. Project) | 7.000% | 12/1/35 | | 3,000 | 3,508 |
| Montgomery County PA Industrial Development Authority Revenue | | | | | |
| (Philadelphia Presbyterian Homes Inc. Project) | 7.000% | 12/1/40 | | 2,390 | 2,769 |
| Northampton County PA General Purpose Authority Hospital Revenue (St. Luke’s Hospital Project) | 5.500% | 8/15/35 | | 2,500 | 2,741 |
| Northampton County PA General Purpose Authority Hospital Revenue (St. Luke’s Hospital Project) | 5.500% | 8/15/40 | | 3,500 | 3,815 |
| Pennsylvania Convention Center Authority Revenue | 6.700% | 9/1/16 | (ETM) | 2,990 | 3,219 |
| Pennsylvania Economic Development Financing Authority Revenue (UPMC Obligated Group) | 5.000% | 2/1/30 | | 13,955 | 16,247 |
| Pennsylvania Economic Development Financing Authority Revenue (UPMC Obligated Group) | 5.000% | 2/1/34 | | 5,000 | 5,695 |
| Pennsylvania Economic Development Financing Authority Revenue (UPMC Obligated Group) | 5.000% | 7/1/38 | | 12,000 | 13,459 |
| Pennsylvania GO | 5.000% | 3/1/15 | | 2,065 | 2,099 |
| Pennsylvania GO | 5.000% | 4/1/24 | | 3,000 | 3,606 |
| Pennsylvania GO | 5.000% | 6/1/27 | | 4,890 | 5,726 |
| Pennsylvania GO | 5.000% | 10/15/32 | | 15,000 | 17,379 |
| Pennsylvania Higher Educational Facilities Authority Revenue (Bryn Mawr College) | 5.000% | 12/1/38 | | 4,500 | 5,219 |
| Pennsylvania Higher Educational Facilities Authority Revenue (Higher Education System) | 5.000% | 6/15/29 | | 1,000 | 1,137 |
| Pennsylvania Higher Educational Facilities Authority Revenue (St. Joseph’s University) | 5.000% | 11/1/40 | | 5,160 | 5,487 |
| Pennsylvania Higher Educational Facilities Authority Revenue (Temple University) | 5.000% | 4/1/27 | | 1,120 | 1,285 |
| Pennsylvania Higher Educational Facilities Authority Revenue (Temple University) | 5.000% | 4/1/28 | | 3,100 | 3,536 |
| Pennsylvania Higher Educational Facilities Authority Revenue (Temple University) | 5.000% | 4/1/30 | | 3,000 | 3,409 |
| Pennsylvania Higher Educational Facilities Authority Revenue (Temple University) | 5.000% | 4/1/31 | | 1,500 | 1,698 |
| Pennsylvania Higher Educational Facilities Authority Revenue (Temple University) | 5.000% | 4/1/32 | | 1,500 | 1,686 |
| Pennsylvania Higher Educational Facilities Authority Student Housing Revenue | | | | | |
| (University Properties Inc.) | 5.000% | 7/1/42 | | 4,790 | 4,993 |
| Pennsylvania Public School Building Authority Lease Revenue (School District of Philadelphia) | 5.000% | 6/1/31 | (4) | 15,000 | 15,986 |
| Pennsylvania Turnpike Commission Motor License Fund Revenue | 5.000% | 12/1/25 | | 3,410 | 4,028 |
| Pennsylvania Turnpike Commission Motor License Fund Revenue | 5.000% | 12/1/26 | | 3,820 | 4,466 |
| Pennsylvania Turnpike Commission Motor License Fund Revenue | 5.500% | 12/1/28 | | 9,015 | 10,787 |
| Pennsylvania Turnpike Commission Motor License Fund Revenue | 5.500% | 12/1/31 | | 7,255 | 8,637 |
| Pennsylvania Turnpike Commission Motor License Fund Revenue | 5.000% | 12/1/42 | | 1,000 | 1,097 |
| Pennsylvania Turnpike Commission Motor License Fund Revenue | 5.000% | 12/1/43 | | 5,000 | 5,483 |
| Pennsylvania Turnpike Commission Revenue | 5.000% | 6/1/29 | | 6,000 | 6,721 |
| Pennsylvania Turnpike Commission Revenue | 5.500% | 6/1/33 | | 5,000 | 5,577 |
| Pennsylvania Turnpike Commission Revenue | 0.000% | 12/1/34 | | 3,500 | 2,719 |
| Pennsylvania Turnpike Commission Revenue | 5.250% | 6/1/36 | | 4,000 | 4,382 |
| Pennsylvania Turnpike Commission Revenue | 6.500% | 12/1/36 | | 6,000 | 7,251 |
| Pennsylvania Turnpike Commission Revenue | 0.000% | 12/1/37 | | 6,000 | 4,574 |
| Pennsylvania Turnpike Commission Revenue | 6.250% | 6/1/38 | (12) | 3,135 | 3,596 |
| Pennsylvania Turnpike Commission Revenue | 5.000% | 12/1/38 | | 20,990 | 22,688 |
| Pennsylvania Turnpike Commission Revenue | 5.750% | 6/1/39 | | 2,000 | 2,278 |
| Pennsylvania Turnpike Commission Revenue | 5.250% | 12/1/44 | | 12,000 | 13,361 |
| Philadelphia PA Hospitals & Higher Education Facilities Authority Hospital Revenue | | | | | |
| (Children’s Hospital of Philadelphia Project) VRDO | 0.070% | 11/3/14 | | 2,835 | 2,835 |
| Philadelphia PA Hospitals & Higher Education Facilities Authority Hospital Revenue | | | | | |
| (Temple University Health System Obligated Group) | 5.500% | 7/1/26 | | 3,000 | 3,154 |
| Philadelphia PA Hospitals & Higher Education Facilities Authority Hospital Revenue | | | | | |
| (Temple University Health System Obligated Group) | 5.500% | 7/1/30 | | 5,000 | 5,124 |
| Philadelphia PA Hospitals & Higher Education Facilities Authority Hospital Revenue | | | | | |
| (Temple University Health System Obligated Group) | 5.625% | 7/1/42 | | 3,000 | 3,161 |
| Philadelphia PA School District GO | 6.000% | 9/1/18 | (Prere.) | 100 | 119 |
| Philadelphia PA School District GO | 6.000% | 9/1/38 | | 6,900 | 7,819 |
158
Long-Term Tax-Exempt Fund
| | | | | |
| | | | | Face | Market |
| | | Maturity | | Amount | Value• |
| | Coupon | Date | | ($000) | ($000) |
| Pittsburgh & Allegheny County PA Sports & Exhibition Authority Lease Revenue VRDO | 0.170% | 11/7/14 | (4) | 32,385 | 32,385 |
| University of Pittsburgh of the Commonwealth System of Higher Education | | | | | |
| Pennsylvania Revenue (University Capital Project) | 5.250% | 9/15/30 | | 5,000 | 5,793 |
| Westmoreland County PA Municipal Authority Revenue | 5.000% | 8/15/31 | | 3,000 | 3,359 |
| Westmoreland County PA Municipal Authority Revenue | 5.000% | 8/15/37 | | 4,210 | 4,637 |
| Wilkes-Barre PA Finance Authority Revenue (University of Scranton Project) | 5.000% | 11/1/40 | | 3,500 | 3,756 |
| | | | | | 347,373 |
| Puerto Rico (0.5%) | | | | | |
| Puerto Rico Electric Power Authority Revenue | 5.250% | 7/1/22 | (14) | 2,930 | 2,956 |
| Puerto Rico Electric Power Authority Revenue | 5.250% | 7/1/30 | (14) | 5,000 | 4,819 |
| Puerto Rico GO | 6.000% | 7/1/27 | (14) | 6,500 | 6,602 |
| Puerto Rico Sales Tax Financing Corp. Revenue | 0.000% | 8/1/37 | | 7,475 | 1,137 |
| Puerto Rico Sales Tax Financing Corp. Revenue | 0.000% | 8/1/38 | | 15,875 | 2,246 |
| Puerto Rico Sales Tax Financing Corp. Revenue | 0.000% | 8/1/39 | | 15,010 | 1,993 |
| Puerto Rico Sales Tax Financing Corp. Revenue | 5.375% | 8/1/39 | | 11,765 | 8,646 |
| Puerto Rico Sales Tax Financing Corp. Revenue | 5.000% | 8/1/40 | | 12,885 | 9,841 |
| Puerto Rico Sales Tax Financing Corp. Revenue | 5.250% | 8/1/40 | | 4,000 | 3,160 |
| Puerto Rico Sales Tax Financing Corp. Revenue | 0.000% | 8/1/42 | (14) | 5,170 | 859 |
| Puerto Rico Sales Tax Financing Corp. Revenue | 5.000% | 8/1/43 | | 3,005 | 2,076 |
| Puerto Rico Sales Tax Financing Corp. Revenue | 0.000% | 8/1/44 | (14) | 10,000 | 1,462 |
| | | | | | 45,797 |
| Rhode Island (0.2%) | | | | | |
| Rhode Island & Providence Plantations GO | 5.500% | 8/1/29 | | 7,355 | 8,803 |
| Rhode Island & Providence Plantations GO | 5.500% | 8/1/31 | | 2,520 | 2,985 |
| Rhode Island Health & Educational Building Corp. Public Schools Revenue (Pooled Issue) | 4.500% | 5/15/23 | (4) | 1,665 | 1,835 |
| Rhode Island Health & Educational Building Corp. Public Schools Revenue (Pooled Issue) | 4.500% | 5/15/24 | (4) | 2,575 | 2,839 |
| Rhode Island Housing & Mortgage Finance Corp. Revenue | 4.000% | 10/1/40 | | 1,380 | 1,451 |
| | | | | | 17,913 |
| South Carolina (1.7%) | | | | | |
| Charleston County SC Airport District System Revenue | 5.000% | 7/1/43 | | 5,000 | 5,505 |
| Charleston SC Educational Excellence Financing Corp. Revenue | | | | | |
| (Charleston County School District, South Carolina Project) | 5.000% | 12/1/14 | (Prere.) | 5,000 | 5,020 |
| Charleston SC Educational Excellence Financing Corp. Revenue | | | | | |
| (Charleston County School District, South Carolina Project) | 5.250% | 12/1/15 | (Prere.) | 11,800 | 12,441 |
| Charleston SC Educational Excellence Financing Corp. Revenue | | | | | |
| (Charleston County School District, South Carolina Project) | 5.000% | 12/1/16 | (Prere.) | 10,580 | 11,582 |
| Charleston SC Educational Excellence Financing Corp. Revenue | | | | | |
| (Charleston County School District, South Carolina Project) | 5.000% | 12/1/16 | (Prere.) | 7,000 | 7,663 |
| Charleston SC Educational Excellence Financing Corp. Revenue | | | | | |
| (Charleston County School District, South Carolina Project) | 5.000% | 12/1/24 | | 3,000 | 3,670 |
| Charleston SC Educational Excellence Financing Corp. Revenue | | | | | |
| (Charleston County School District, South Carolina Project) | 5.000% | 12/1/26 | | 10,000 | 12,043 |
| Charleston SC Educational Excellence Financing Corp. Revenue | | | | | |
| (Charleston County School District, South Carolina Project) | 5.000% | 12/1/29 | | 2,500 | 3,012 |
| Charleston SC Educational Excellence Financing Corp. Revenue | | | | | |
| (Charleston County School District, South Carolina Project) | 5.000% | 12/1/30 | | 2,500 | 3,005 |
| Greenville County SC School District GO | 5.000% | 12/1/27 | | 6,700 | 7,263 |
| Piedmont SC Municipal Power Agency Revenue | 6.500% | 1/1/15 | (ETM) | 2,035 | 2,057 |
| Piedmont SC Municipal Power Agency Revenue | 5.750% | 1/1/34 | (4) | 10,000 | 11,500 |
| South Carolina Educational Facilities Authority Revenue (Furman University) VRDO | 0.090% | 11/3/14 | | 7,150 | 7,150 |
| South Carolina Public Service Authority Revenue | 5.000% | 12/1/36 | | 6,415 | 7,273 |
| South Carolina Public Service Authority Revenue | 5.500% | 1/1/38 | | 10,000 | 11,388 |
| South Carolina Public Service Authority Revenue | 5.000% | 12/1/38 | | 10,000 | 11,166 |
| South Carolina Public Service Authority Revenue | 5.250% | 1/1/39 | | 6,000 | 6,742 |
| South Carolina Public Service Authority Revenue | 5.500% | 12/1/54 | | 10,000 | 11,389 |
| University of South Carolina Higher Education Revenue | 5.250% | 6/1/38 | (4) | 5,610 | 6,248 |
| | | | | | 146,117 |
| South Dakota (0.2%) | | | | | |
| South Dakota Health & Educational Facilities Authority Revenue (Sanford Health) | 5.000% | 11/1/37 | | 10,045 | 11,089 |
| South Dakota Health & Educational Facilities Authority Revenue (Sanford Health) | 4.000% | 11/1/44 | | 3,775 | 3,672 |
| | | | | | 14,761 |
| Tennessee (1.1%) | | | | | |
| Chattanooga TN Health Educational & Housing Facility Board Revenue (Catholic Health Initiatives) | 5.250% | 1/1/45 | | 14,005 | 15,807 |
| Shelby County TN Health Educational & Housing Facility Board Revenue (Methodist Healthcare) | 5.250% | 9/1/27 | (4) | 350 | 390 |
| Shelby County TN Health Educational & Housing Facility Board Revenue | | | | | |
| (Methodist Le Bonheur Healthcare) VRDO | 0.070% | 11/3/14 | (4) | 1,200 | 1,200 |
| Tennessee Energy Acquisition Corp. Gas Revenue | 5.000% | 2/1/19 | | 600 | 668 |
| Tennessee Energy Acquisition Corp. Gas Revenue | 5.000% | 2/1/20 | | 360 | 403 |
| Tennessee Energy Acquisition Corp. Gas Revenue | 5.250% | 9/1/20 | | 740 | 846 |
| Tennessee Energy Acquisition Corp. Gas Revenue | 5.250% | 9/1/22 | | 990 | 1,155 |
159
Long-Term Tax-Exempt Fund
| | | | | |
| | | | | Face | Market |
| | | Maturity | | Amount | Value• |
| | Coupon | Date | | ($000) | ($000) |
| Tennessee Energy Acquisition Corp. Gas Revenue | 5.000% | 2/1/23 | | 9,645 | 11,075 |
| Tennessee Energy Acquisition Corp. Gas Revenue | 5.250% | 9/1/23 | | 3,710 | 4,366 |
| Tennessee Energy Acquisition Corp. Gas Revenue | 5.250% | 9/1/24 | | 6,175 | 7,275 |
| Tennessee Energy Acquisition Corp. Gas Revenue | 5.250% | 9/1/26 | | 2,160 | 2,551 |
| Tennessee Energy Acquisition Corp. Gas Revenue | 5.000% | 2/1/27 | | 19,950 | 22,953 |
| Tennessee GO | 5.000% | 10/1/16 | | 2,000 | 2,177 |
| Tennessee GO | 5.000% | 9/1/28 | | 5,750 | 7,052 |
| Tennessee GO | 5.000% | 9/1/29 | | 2,500 | 3,054 |
| Tennessee GO | 5.000% | 9/1/32 | | 650 | 784 |
| Tennessee GO | 5.000% | 9/1/33 | | 1,000 | 1,199 |
| Tennessee GO | 5.000% | 9/1/34 | | 700 | 837 |
| Tennessee Housing Development Agency Homeownership Program Revenue | 4.500% | 7/1/37 | | 1,690 | 1,889 |
| Tennessee Housing Development Agency Homeownership Program Revenue | 4.000% | 7/1/38 | | 4,205 | 4,631 |
| | | | | | 90,312 |
| Texas (7.5%) | | | | | |
| Austin TX Combined Utility System Revenue | 0.000% | 5/15/17 | (14) | 4,900 | 4,783 |
| Austin TX GO | 5.000% | 9/1/32 | | 1,300 | 1,550 |
| Austin TX Water & Wastewater System Revenue | 5.000% | 11/15/25 | | 5,000 | 6,005 |
| Austin TX Water & Wastewater System Revenue | 5.000% | 11/15/25 | | 3,000 | 3,564 |
| Central Texas Regional Mobility Authority Revenue | 5.750% | 1/1/31 | | 4,260 | 4,920 |
| Central Texas Regional Mobility Authority Revenue | 6.750% | 1/1/41 | | 2,000 | 2,355 |
| Central Texas Regional Mobility Authority Revenue | 6.250% | 1/1/46 | | 1,000 | 1,165 |
| Clifton TX Higher Education Finance Corp. Revenue (Baylor University) | 5.250% | 3/1/29 | | 3,000 | 3,420 |
| Dallas County TX Utility & Reclamation District GO | 5.375% | 2/15/29 | (2) | 5,000 | 5,375 |
| Dallas TX Area Rapid Transit Sales Tax Revenue | 5.250% | 12/1/43 | | 1,760 | 1,986 |
| Dallas TX Civic Center Improvement Revenue | 5.000% | 8/15/27 | (12) | 5,000 | 5,455 |
| Dallas TX Civic Center Improvement Revenue | 5.000% | 8/15/28 | (12) | 2,125 | 2,295 |
| Dallas-Fort Worth TX International Airport Revenue | 5.250% | 11/1/31 | | 5,800 | 6,714 |
| Dallas-Fort Worth TX International Airport Revenue | 5.250% | 11/1/33 | | 8,000 | 9,179 |
| Dallas-Fort Worth TX International Airport Revenue | 5.000% | 11/1/37 | | 5,000 | 5,553 |
| Dallas-Fort Worth TX International Airport Revenue | 5.000% | 11/1/38 | | 6,410 | 7,118 |
| Fort Bend TX Grand Parkway Toll Road Authority Revenue | 5.000% | 3/1/23 | | 1,000 | 1,193 |
| Grand Parkway Transportation Corp. Texas System Toll Revenue | 0.000% | 10/1/35 | | 21,495 | 15,991 |
| Grand Parkway Transportation Corp. Texas System Toll Revenue | 0.000% | 10/1/36 | | 8,475 | 6,296 |
| Grand Parkway Transportation Corp. Texas System Toll Revenue | 5.250% | 10/1/51 | | 12,000 | 13,394 |
| Harris County TX Cultural Education Facilities Finance Corp. Hospital Revenue | | | | | |
| (Memorial Hermann Healthcare System) | 5.000% | 12/1/35 | | 8,000 | 8,803 |
| Harris County TX GO | 0.000% | 10/1/15 | (14) | 17,545 | 17,501 |
| Harris County TX GO | 5.000% | 10/1/32 | | 5,385 | 6,451 |
| Harris County TX Health Facilities Development Corp. Hospital Revenue | | | | | |
| (Memorial Hermann Healthcare System) | 7.125% | 12/1/18 | (Prere.) | 3,250 | 4,050 |
| Harris County TX Health Facilities Development Corp. Revenue | | | | | |
| (Methodist Hospital System) VRDO | 0.070% | 11/3/14 | | 23,000 | 23,000 |
| Harris County TX Hospital District Revenue | 5.125% | 2/15/32 | (14) | 10,000 | 10,418 |
| Harris County TX Hospital District Revenue | 5.250% | 2/15/37 | (14) | 10,190 | 10,608 |
| Harris County TX Toll Road Revenue | 5.000% | 8/15/22 | | 2,000 | 2,294 |
| Houston TX Airport System Revenue | 5.000% | 7/1/32 | | 3,000 | 3,412 |
| Houston TX Airport System Revenue | 5.500% | 7/1/39 | | 5,000 | 5,661 |
| Houston TX Community College System GO | 5.000% | 2/15/36 | | 10,000 | 11,383 |
| Houston TX GO | 5.000% | 3/1/25 | | 3,335 | 4,074 |
| Houston TX Utility System Revenue | 5.250% | 11/15/31 | | 5,000 | 5,911 |
| Laredo TX Community College District GO | 5.000% | 8/1/23 | | 1,250 | 1,516 |
| Laredo TX Community College District GO | 5.000% | 8/1/24 | | 1,715 | 2,100 |
| Laredo TX Community College District GO | 5.000% | 8/1/30 | | 2,000 | 2,360 |
| Laredo TX Community College District GO | 5.000% | 8/1/32 | | 1,250 | 1,465 |
| Laredo TX Community College District GO | 5.000% | 8/1/34 | | 1,500 | 1,744 |
| Lower Colorado River Authority Texas Revenue | 5.625% | 1/1/15 | (Prere.) | 3,055 | 3,083 |
| Lower Colorado River Authority Texas Revenue | 5.875% | 5/15/16 | (4) | 5,905 | 5,933 |
| Lower Colorado River Authority Texas Revenue | 5.625% | 5/15/19 | (Prere.) | 20 | 24 |
| Lower Colorado River Authority Texas Revenue | 5.625% | 5/15/19 | (Prere.) | 5 | 6 |
| Lower Colorado River Authority Texas Revenue | 5.625% | 5/15/19 | (Prere.) | 205 | 245 |
| Lower Colorado River Authority Texas Revenue | 5.625% | 5/15/19 | (Prere.) | 10 | 12 |
| Lower Colorado River Authority Texas Revenue | 5.000% | 5/15/26 | | 3,000 | 3,492 |
| Lower Colorado River Authority Texas Revenue | 5.500% | 5/15/36 | | 5,000 | 5,513 |
| Lower Colorado River Authority Texas Revenue | 5.625% | 5/15/39 | | 4,760 | 5,308 |
| Lower Colorado River Authority Texas Revenue | 5.000% | 5/15/40 | | 5,000 | 5,401 |
| Matagorda County TX Navigation District No. 1 Pollution Control Revenue | | | | | |
| (Central Power & Light Co. Project) | 6.300% | 11/1/29 | | 7,500 | 8,626 |
| Montgomery County TX GO | 5.125% | 3/1/31 | | 4,000 | 4,526 |
| Montgomery County TX GO | 5.250% | 3/1/32 | | 5,000 | 5,705 |
| New Hope TX Cultural Education Facilities First Mortgage Revenue | | | | | |
| (Morningside Ministries Project) | 6.500% | 1/1/48 | | 10,350 | 11,224 |
160
Long-Term Tax-Exempt Fund
| | | | | |
| | | | | Face | Market |
| | | Maturity | | Amount | Value• |
| | Coupon | Date | | ($000) | ($000) |
| North Texas Tollway Authority System Revenue | 6.250% | 2/1/23 | | 10,000 | 11,298 |
| North Texas Tollway Authority System Revenue | 5.000% | 9/1/30 | | 9,000 | 10,332 |
| North Texas Tollway Authority System Revenue | 6.125% | 1/1/31 | | 4,000 | 4,208 |
| North Texas Tollway Authority System Revenue | 5.000% | 9/1/31 | | 2,000 | 2,287 |
| North Texas Tollway Authority System Revenue | 5.000% | 1/1/33 | | 13,675 | 15,101 |
| North Texas Tollway Authority System Revenue | 5.000% | 1/1/34 | | 14,355 | 15,804 |
| North Texas Tollway Authority System Revenue | 6.000% | 1/1/38 | | 12,500 | 14,627 |
| North Texas Tollway Authority System Revenue | 6.250% | 1/1/39 | | 6,000 | 6,978 |
| North Texas Tollway Authority System Revenue | 6.000% | 9/1/41 | | 2,500 | 3,048 |
| Northeast Texas Hospital Authority Revenue (Northeast Medical Center Hospital) | 5.625% | 5/15/17 | (4) | 4,695 | 4,714 |
| Northeast Texas Hospital Authority Revenue (Northeast Medical Center Hospital) | 5.625% | 5/15/22 | (4) | 7,110 | 7,137 |
| Olmos Park TX Higher Education Facilities Corp. Revenue | | | | | |
| (University of the Incarnate Word Project) | 5.000% | 12/1/23 | | 1,000 | 1,175 |
| Olmos Park TX Higher Education Facilities Corp. Revenue | | | | | |
| (University of the Incarnate Word Project) | 5.000% | 12/1/24 | | 4,325 | 5,045 |
| Olmos Park TX Higher Education Facilities Corp. Revenue | | | | | |
| (University of the Incarnate Word Project) | 5.000% | 12/1/25 | | 4,520 | 5,233 |
| Olmos Park TX Higher Education Facilities Corp. Revenue | | | | | |
| (University of the Incarnate Word Project) | 5.000% | 12/1/26 | | 2,250 | 2,582 |
| Olmos Park TX Higher Education Facilities Corp. Revenue | | | | | |
| (University of the Incarnate Word Project) | 5.000% | 12/1/27 | | 1,845 | 2,107 |
| Panhandle-Plains TX Higher Education Authority Inc. Student Loan Revenue | 1.035% | 10/1/20 | | 2,630 | 2,614 |
| SA Energy Acquisition Public Facility Corp. Texas Gas Supply Revenue | 5.500% | 8/1/22 | | 5,380 | 6,361 |
| SA Energy Acquisition Public Facility Corp. Texas Gas Supply Revenue | 5.500% | 8/1/23 | | 6,155 | 7,352 |
| San Antonio TX Electric & Gas Systems Revenue | 5.000% | 2/1/38 | | 6,500 | 7,307 |
| San Antonio TX GO | 5.000% | 2/1/25 | | 2,250 | 2,769 |
| San Antonio TX Water Revenue | 5.000% | 5/15/26 | | 2,000 | 2,378 |
| Tarrant Regional Water District Texas Water Revenue | 5.000% | 3/1/28 | | 3,000 | 3,386 |
| Texas GO | 5.750% | 8/1/32 | | 10,380 | 10,425 |
| Texas Municipal Gas Acquisition & Supply Corp. Revenue | 5.625% | 12/15/17 | | 7,360 | 8,024 |
| Texas Municipal Gas Acquisition & Supply Corp. Revenue | 5.250% | 12/15/19 | | 600 | 687 |
| Texas Municipal Gas Acquisition & Supply Corp. Revenue | 5.250% | 12/15/20 | | 550 | 634 |
| Texas Municipal Gas Acquisition & Supply Corp. Revenue | 5.250% | 12/15/23 | | 1,335 | 1,561 |
| Texas Municipal Gas Acquisition & Supply Corp. Revenue | 5.250% | 12/15/24 | | 6,545 | 7,703 |
| Texas Municipal Gas Acquisition & Supply Corp. Revenue | 5.000% | 12/15/25 | | 7,500 | 8,385 |
| Texas Municipal Gas Acquisition & Supply Corp. Revenue | 5.250% | 12/15/25 | | 1,855 | 2,193 |
| Texas Municipal Gas Acquisition & Supply Corp. Revenue | 5.000% | 12/15/26 | | 2,700 | 3,008 |
| Texas Municipal Gas Acquisition & Supply Corp. Revenue | 5.250% | 12/15/26 | | 1,155 | 1,370 |
| Texas Municipal Power Agency Revenue | 0.000% | 9/1/15 | (14) | 33,070 | 32,974 |
| Texas Private Activity Surface Transportation Corp. Revenue | 7.500% | 12/31/31 | | 4,000 | 4,892 |
| Texas Private Activity Surface Transportation Corp. Revenue | 6.875% | 12/31/39 | | 9,000 | 10,656 |
| Texas Private Activity Surface Transportation Corp. Revenue | 7.000% | 6/30/40 | | 29,730 | 35,857 |
| Texas State University System Financing System Revenue | 5.000% | 3/15/38 | | 3,300 | 3,757 |
| Texas State University System Financing System Revenue | 5.000% | 3/15/42 | | 2,000 | 2,201 |
| Texas TRAN | 1.500% | 8/31/15 | | 30,000 | 30,339 |
| Texas Transportation Commission Revenue | 5.000% | 8/15/41 | | 3,765 | 4,059 |
| Texas Turnpike Authority Central Texas Turnpike System Revenue | 0.000% | 8/15/26 | (2) | 10,000 | 6,627 |
| Texas Turnpike Authority Central Texas Turnpike System Revenue | 0.000% | 8/15/28 | (2) | 30,005 | 17,355 |
| University of Houston Texas Revenue | 5.000% | 2/15/43 | | 7,485 | 8,470 |
| | | | | | 635,180 |
| Utah (0.3%) | | | | | |
| Central Utah Water Conservancy District GO | 5.000% | 4/1/30 | | 4,500 | 5,140 |
| Utah Transit Authority Sales Tax Revenue | 5.000% | 6/15/29 | | 2,500 | 2,817 |
| Utah Transit Authority Sales Tax Revenue | 5.000% | 6/15/30 | | 4,180 | 4,688 |
| Utah Transit Authority Sales Tax Revenue | 5.000% | 6/15/31 | | 3,110 | 3,472 |
| Utah Transit Authority Sales Tax Revenue | 5.000% | 6/15/32 | | 1,855 | 2,066 |
| Utah Water Finance Agency Revenue VRDO | 0.070% | 11/7/14 | | 9,830 | 9,830 |
| | | | | | 28,013 |
| Virgin Islands (0.1%) | | | | | |
| Virgin Islands Public Finance Authority Revenue | 5.000% | 10/1/25 | | 2,665 | 2,940 |
| Virgin Islands Public Finance Authority Revenue | 5.000% | 10/1/29 | | 2,000 | 2,204 |
| | | | | | 5,144 |
| |
| Virginia (1.6%) | | | | | |
| Fairfax County VA Economic Development Authority Facilities Revenue (County Facilities Project) | 5.000% | 10/1/32 | | 1,800 | 2,139 |
| Fairfax County VA Economic Development Authority Facilities Revenue (County Facilities Project) | 5.000% | 10/1/34 | | 1,145 | 1,349 |
| Fairfax County VA Economic Development Authority Transportation District Improvement | | | | | |
| Revenue (Silver Line Phase I Project) | 5.000% | 4/1/36 | | 1,000 | 1,115 |
| Fairfax County VA Industrial Development Authority Hospital Revenue | | | | | |
| (Inova Health System Hospital Project) | 5.500% | 5/15/35 | | 10,000 | 11,358 |
161
Long-Term Tax-Exempt Fund
| | | | | |
| | | | | Face | Market |
| | | Maturity | | Amount | Value• |
| | Coupon | Date | | ($000) | ($000) |
| Henrico County VA Economic Development Authority Revenue (Bon Secours Health System) | 5.250% | 11/1/42 | (12) | 3,500 | 3,936 |
| Roanoke VA Economic Development Authority Hospital Revenue (Carilion Clinic Obligated Group) | 5.000% | 7/1/28 | | 1,640 | 1,853 |
| Tobacco Settlement Financing Corp. Virginia Revenue | 5.625% | 6/1/15 | (Prere.) | 10,000 | 10,316 |
| University of Virginia Revenue | 5.000% | 6/1/32 | | 1,000 | 1,184 |
| University of Virginia Revenue | 5.000% | 6/1/37 | | 8,000 | 9,308 |
| Virginia Commonwealth Transportation Board Revenue | 4.000% | 3/15/26 | | 12,455 | 13,600 |
| Virginia Commonwealth Transportation Board Revenue | 5.000% | 5/15/30 | | 28,875 | 33,484 |
| Virginia Commonwealth Transportation Board Revenue | 5.000% | 5/15/32 | | 17,375 | 20,148 |
| Virginia Commonwealth Transportation Board Revenue | 5.000% | 5/15/33 | | 4,000 | 4,608 |
| Virginia Public Building Authority Public Facilities Revenue | 4.000% | 8/1/27 | | 8,335 | 9,141 |
| Virginia Public Building Authority Public Facilities Revenue | 4.000% | 8/1/28 | | 8,675 | 9,434 |
| | | | | | 132,973 |
| Washington (2.2%) | | | | | |
| Chelan County WA Public Utility District No. 1 Hydro-Electric System Revenue | | | | | |
| (Columbia River-Rock Island Hydro) | 0.000% | 6/1/17 | (14) | 11,685 | 11,363 |
| Chelan County WA Public Utility District No. 1 Hydro-Electric System Revenue | | | | | |
| (Columbia River-Rock Island Hydro) | 0.000% | 6/1/18 | (14) | 10,000 | 9,553 |
| King County WA Sewer Revenue | 5.750% | 1/1/43 | | 7,170 | 8,043 |
| Port of Seattle WA Revenue | 5.000% | 8/1/29 | | 10,500 | 12,162 |
| Port of Seattle WA Revenue | 5.000% | 6/1/30 | | 2,000 | 2,273 |
| Port of Seattle WA Revenue | 5.000% | 8/1/32 | | 3,000 | 3,448 |
| Port of Seattle WA Revenue | 5.000% | 8/1/33 | | 2,000 | 2,291 |
| Seattle WA Municipal Light & Power Revenue | 5.250% | 2/1/33 | | 2,000 | 2,280 |
| Tobacco Settlement Authority Washington Revenue | 5.250% | 6/1/29 | | 10,125 | 11,067 |
| Tobacco Settlement Authority Washington Revenue | 5.250% | 6/1/30 | | 9,065 | 9,835 |
| University of Washington Revenue | 5.000% | 7/1/34 | | 2,000 | 2,296 |
| Washington Economic Development Finance Authority Lease Revenue | | | | | |
| (Washington Biomedical Research Properties 2) | 5.000% | 6/1/21 | | 1,315 | 1,580 |
| Washington Economic Development Finance Authority Lease Revenue | | | | | |
| (Washington Biomedical Research Properties 2) | 5.000% | 6/1/22 | | 1,500 | 1,813 |
| Washington Economic Development Finance Authority Lease Revenue | | | | | |
| (Washington Biomedical Research Properties 2) | 5.000% | 6/1/23 | | 1,800 | 2,190 |
| Washington GO | 6.750% | 2/1/15 | | 785 | 798 |
| Washington GO | 5.000% | 7/1/24 | | 20,000 | 24,793 |
| Washington GO | 5.000% | 2/1/35 | | 10,000 | 11,343 |
| Washington GO | 5.000% | 8/1/35 | | 2,000 | 2,286 |
| Washington Health Care Facilities Authority Revenue (MultiCare Health System) | 5.250% | 8/15/31 | (4) | 5,000 | 5,441 |
| Washington Health Care Facilities Authority Revenue (MultiCare Health System) | 5.250% | 8/15/34 | (4) | 6,000 | 6,502 |
| Washington Health Care Facilities Authority Revenue (MultiCare Health System) | 5.500% | 8/15/43 | (12) | 5,490 | 6,011 |
| Washington Health Care Facilities Authority Revenue (MultiCare Health System) | 5.000% | 8/15/44 | | 5,000 | 5,394 |
| Washington Health Care Facilities Authority Revenue (Providence Health & Services) | 5.000% | 10/1/33 | | 7,500 | 8,465 |
| Washington Health Care Facilities Authority Revenue (Seattle Children’s Hospital) | 5.625% | 10/1/38 | | 12,000 | 13,878 |
| Washington Health Care Facilities Authority Revenue (Seattle Children’s Hospital) | 5.000% | 10/1/40 | | 2,215 | 2,432 |
| Washington Health Care Facilities Authority Revenue (Swedish Health Services) | 6.250% | 5/15/21 | (Prere.) | 6,500 | 8,408 |
| Whidbey Island WA Public Hospital District GO | 5.375% | 12/1/39 | | 9,055 | 9,934 |
| | | | | | 185,879 |
| West Virginia (0.5%) | | | | | |
| West Virginia Economic Development Authority Solid Waste Facilities Disposal Revenue | | | | | |
| (Appalachian Power Co.–Amos Project) | 5.375% | 12/1/38 | | 2,500 | 2,753 |
| West Virginia Hospital Finance Authority Hospital Revenue (Charleston Area Medical Center Inc.) | 5.625% | 9/1/32 | | 6,500 | 7,136 |
| West Virginia Hospital Finance Authority Hospital Revenue | | | | | |
| (United Health System Obligated Group) | 5.500% | 6/1/44 | | 20,000 | 22,863 |
| West Virginia University Revenue | 5.000% | 10/1/36 | | 5,985 | 6,760 |
| West Virginia Water Development Authority (Chesapeake Bay & Greenbrier River Projects) | 5.000% | 7/1/30 | | 3,000 | 3,542 |
| | | | | | 43,054 |
| Wisconsin (1.2%) | | | | | |
| Wisconsin GO | 5.000% | 11/1/20 | | 2,500 | 3,000 |
| Wisconsin GO | 6.000% | 5/1/36 | | 10,000 | 11,863 |
| Wisconsin Health & Educational Facilities Authority Health Care Facilities Revenue (Luther Hospital) | 5.750% | 11/15/30 | | 7,500 | 8,694 |
| Wisconsin Health & Educational Facilities Authority Health Facilities Revenue (SSM Health Care) | 5.250% | 6/1/34 | | 6,785 | 7,590 |
| Wisconsin Health & Educational Facilities Authority Revenue (Agnesian Healthcare Inc.) | 5.750% | 7/1/30 | | 6,150 | 6,926 |
| Wisconsin Health & Educational Facilities Authority Revenue (Aurora Health Care Inc.) | 5.625% | 4/15/39 | | 12,110 | 13,448 |
| Wisconsin Health & Educational Facilities Authority Revenue (Froedtert & Community Health Inc.) | 5.000% | 4/1/42 | | 20,690 | 22,759 |
| Wisconsin Health & Educational Facilities Authority Revenue (Marquette University) | 5.000% | 10/1/29 | | 1,700 | 1,948 |
| Wisconsin Health & Educational Facilities Authority Revenue (Marquette University) | 5.000% | 10/1/30 | | 3,260 | 3,729 |
| Wisconsin Health & Educational Facilities Authority Revenue (Ministry Health Care Inc.) | 5.000% | 8/15/32 | | 2,950 | 3,285 |
| Wisconsin Public Power System Power Supply System Revenue | 5.000% | 7/1/24 | | 3,000 | 3,601 |
| Wisconsin Transportation Revenue | 4.500% | 7/1/15 | (Prere.) | 11,470 | 11,802 |
| Wisconsin Transportation Revenue | 5.000% | 7/1/31 | | 2,815 | 3,282 |
| | | | | | 101,927 |
162
| | | | |
| Long-Term Tax-Exempt Fund | | | | |
| |
| |
| |
| |
| | | | Face | Market |
| | | Maturity | Amount | Value• |
| | Coupon | Date | ($000) | ($000) |
| Wyoming (0.2%) | | | | |
| Sublette County WY Pollution Control Revenue (ExxonMobil Project) VRDO | 0.060% | 11/3/14 | 18,400 | 18,400 |
| Total Tax-Exempt Municipal Bonds (Cost $7,667,482) | | | | 8,311,621 |
| |
| | | | Shares | |
| Temporary Cash Investment (1.2%) | | | | |
| Money Market Fund (1.2%) | | | | |
| 4 Vanguard Municipal Cash Management Fund (Cost $96,514) | 0.047% | | 96,514,000 | 96,514 |
| Total Investments (99.7%) (Cost $7,763,996) | | | | 8,408,135 |
| Other Assets and Liabilities (0.3%) | | | | |
| Other Assets | | | | 126,543 |
| Liabilities | | | | (97,602) |
| | | | | 28,941 |
| Net Assets (100%) | | | | 8,437,076 |
| |
| |
| At October 31, 2014, net assets consisted of: | | | | |
| | | | | Amount |
| | | | | ($000) |
| Paid-in Capital | | | | 7,796,042 |
| Undistributed Net Investment Income | | | | — |
| Accumulated Net Realized Losses | | | | (3,105) |
| Unrealized Appreciation (Depreciation) | | | | 644,139 |
| Net Assets | | | | 8,437,076 |
| |
| Investor Shares—Net Assets | | | | |
| Applicable to 81,650,777 outstanding $.001 par value shares of beneficial interest (unlimited authorization) | | | 957,556 |
| Net Asset Value Per Share—Investor Shares | | | | $11.73 |
| |
| Admiral Shares—Net Assets | | | | |
| Applicable to 637,778,604 outstanding $.001 par value shares of beneficial interest (unlimited authorization) | | | 7,479,520 |
| Net Asset Value Per Share—Admiral Shares | | | | $11.73 |
• See Note A in Notes to Financial Statements.
1 Adjustable-rate security.
2 Security exempt from registration under Rule 144A of the Securities Act of 1933. Such securities may be sold in transactions exempt from registration, normally to qualified institutional buyers. At October 31, 2014,
the aggregate value of these securities was $39,322,000, representing 0.5% of net assets.
3 Security purchased on a when-issued or delayed-delivery basis for which the fund has not taken delivery as of October 31, 2014.
4 Affiliated money market fund available only to Vanguard funds and certain trusts and accounts managed by Vanguard. Rate shown is the 7-day yield.
For key to abbreviations and other references, see back cover.
See accompanying Notes, which are an integral part of the Financial Statements.
163
High-Yield Tax-Exempt Fund
| | | | | |
| | | | | Face | Market |
| | | Maturity | | Amount | Value• |
| | Coupon | Date | | ($000) | ($000) |
| Tax-Exempt Municipal Bonds (97.6%) | | | | | |
| Alabama (1.0%) | | | | | |
| Alabama Port Authority Docks Facilities Revenue | 6.000% | 10/1/40 | | 3,000 | 3,510 |
| Birmingham AL GO | 0.000% | 3/1/37 | | 2,500 | 2,464 |
| Butler AL Industrial Development Board Solid Waste Disposal Revenue | | | | | |
| (Georgia-Pacific Corp. Project) | 5.750% | 9/1/28 | | 1,350 | 1,354 |
| Courtland AL Development Board Solid Waste Disposal Revenue (International Paper Co.) | 5.200% | 6/1/25 | | 5,000 | 5,049 |
| Jefferson County AL Sewer Revenue | 0.000% | 10/1/38 | (4) | 7,500 | 5,057 |
| Jefferson County AL Sewer Revenue | 7.000% | 10/1/51 | | 29,000 | 34,017 |
| Jefferson County AL Sewer Revenue | 6.500% | 10/1/53 | | 15,000 | 16,777 |
| Mobile AL Industrial Development Board Pollution Control Revenue (Alabama Power Co.) PUT | 1.650% | 3/20/17 | | 6,300 | 6,438 |
| Selma AL Industrial Development Board Revenue (International Paper Co. Project) | 5.375% | 12/1/35 | | 4,000 | 4,448 |
| | | | | | 79,114 |
| Alaska (0.2%) | | | | | |
| Alaska Industrial Development & Export Authority Revenue (Providence Health & Services) | 5.500% | 10/1/41 | | 6,105 | 6,913 |
| 1 Anchorage AK Electric Utility Revenue | 5.000% | 12/1/35 | | 5,000 | 5,683 |
| 1 Anchorage AK Electric Utility Revenue | 5.000% | 12/1/36 | | 5,000 | 5,669 |
| | | | | | 18,265 |
| Arizona (1.4%) | | | | | |
| Arizona Health Facilities Authority Health Care Facilities Revenue (Beatitudes Campus Project) | 5.200% | 10/1/37 | | 7,000 | 6,712 |
| Arizona Health Facilities Authority Hospital System Revenue (Phoenix Children’s Hospital) | 5.000% | 2/1/30 | | 3,250 | 3,592 |
| Arizona Health Facilities Authority Hospital System Revenue (Phoenix Children’s Hospital) | 5.000% | 2/1/33 | | 1,700 | 1,865 |
| Arizona Health Facilities Authority Hospital System Revenue (Phoenix Children’s Hospital) | 5.000% | 2/1/34 | | 8,250 | 9,025 |
| Arizona Health Facilities Authority Hospital System Revenue (Phoenix Children’s Hospital) | 5.000% | 2/1/42 | | 2,500 | 2,684 |
| Arizona Health Facilities Authority Revenue (Banner Health) VRDO | 0.050% | 11/7/14 | LOC | 15,100 | 15,100 |
| Arizona Transportation Board Highway Revenue | 5.000% | 7/1/33 | | 8,790 | 10,142 |
| Maricopa County AZ Pollution Control Corp. Revenue (Southern California Edison Co.) | 5.000% | 6/1/35 | | 12,500 | 13,729 |
| Phoenix AZ Civic Improvement Corp. Airport Revenue | 5.250% | 7/1/33 | | 10,175 | 11,434 |
| Pima County AZ Industrial Development Authority Revenue (Tucson Electric Power Co. Project) | 4.000% | 9/1/29 | | 3,000 | 3,064 |
| Salt Verde AZ Financial Corp. Gas Revenue | 5.250% | 12/1/26 | | 8,545 | 10,175 |
| Salt Verde AZ Financial Corp. Gas Revenue | 5.250% | 12/1/27 | | 17,105 | 20,344 |
| University Medical Center Corp. Arizona Hospital Revenue | 6.500% | 7/1/39 | | 2,500 | 2,922 |
| | | | | | 110,788 |
| Arkansas (0.0%) | | | | | |
| North Little Rock AR Electric Revenue | 6.500% | 7/1/15 | (ETM) | 780 | 813 |
| |
| California (14.4%) | | | | | |
| ABAG Finance Authority for Nonprofit Corps. California Revenue | | | | | |
| (Lakeside Village Apartments) VRDO | 0.050% | 11/7/14 | LOC | 6,700 | 6,700 |
| Alameda CA Corridor Transportation Authority Revenue | 5.400% | 10/1/24 | (2) | 5,250 | 5,671 |
| Alameda CA Corridor Transportation Authority Revenue | 0.000% | 10/1/30 | (2) | 1,000 | 486 |
| Bay Area Toll Authority California Toll Bridge Revenue (San Francisco Bay Area) | 5.000% | 4/1/16 | (Prere.) | 2,500 | 2,667 |
| Bay Area Toll Authority California Toll Bridge Revenue (San Francisco Bay Area) | 5.250% | 4/1/48 | | 2,500 | 2,835 |
| 2 Bay Area Toll Authority California Toll Bridge Revenue (San Francisco Bay Area) PUT | 0.950% | 5/1/23 | | 10,000 | 10,022 |
| 2 Bay Area Toll Authority California Toll Bridge Revenue (San Francisco Bay Area) PUT | 1.150% | 4/1/24 | | 10,000 | 10,202 |
| California Department of Water Resources Water System Revenue (Central Valley Project) | 5.000% | 12/1/28 | | 5,375 | 6,112 |
| California GO | 5.500% | 4/1/18 | | 15,000 | 17,352 |
| California GO | 5.000% | 10/1/20 | | 15,840 | 18,962 |
| California GO | 5.000% | 11/1/21 | | 13,845 | 15,499 |
| California GO | 5.250% | 9/1/24 | | 6,500 | 7,871 |
| California GO | 5.000% | 10/1/25 | | 4,000 | 4,520 |
| California GO | 5.000% | 9/1/29 | | 4,565 | 5,296 |
| California GO | 5.000% | 10/1/29 | | 9,300 | 10,341 |
| California GO | 5.000% | 10/1/30 | | 12,600 | 14,926 |
| California GO | 5.000% | 10/1/31 | | 5,000 | 5,894 |
| California GO | 6.000% | 3/1/33 | | 3,000 | 3,679 |
| California GO | 5.125% | 4/1/33 | | 15,000 | 16,703 |
| California GO | 6.500% | 4/1/33 | | 34,000 | 41,597 |
| California GO | 5.000% | 9/1/36 | | 3,250 | 3,713 |
| California GO | 5.000% | 2/1/38 | | 6,375 | 7,186 |
| California GO | 5.250% | 3/1/38 | | 5,000 | 5,561 |
| California GO | 5.500% | 11/1/39 | | 10,000 | 11,554 |
| California GO | 6.000% | 11/1/39 | | 5,000 | 6,091 |
| California GO | 5.000% | 2/1/43 | | 2,750 | 3,072 |
| California GO | 5.000% | 11/1/43 | | 12,500 | 14,081 |
| California GO VRDO | 0.040% | 11/7/14 | LOC | 16,300 | 16,300 |
| California Health Facilities Financing Authority Revenue (Adventist Health System/West) | 5.750% | 9/1/39 | | 4,500 | 5,222 |
| California Health Facilities Financing Authority Revenue (Catholic Healthcare West) | 6.000% | 7/1/39 | | 7,500 | 8,768 |
| California Health Facilities Financing Authority Revenue (Children’s Hospital of Los Angeles) | 5.000% | 11/15/29 | | 5,650 | 6,136 |
| California Health Facilities Financing Authority Revenue (St. Joseph Health System) | 5.750% | 7/1/39 | | 7,000 | 8,150 |
164
High-Yield Tax-Exempt Fund
| | | | | |
| | | | | Face | Market |
| | | Maturity | | Amount | Value• |
| | Coupon | Date | | ($000) | ($000) |
| California Health Facilities Financing Authority Revenue (Sutter Health) | 6.000% | 8/15/42 | | 12,000 | 14,509 |
| 3 California Infrastructure & Economic Development Bank Revenue | | | | | |
| (Bay Area Toll Bridges Seismic Retrofit) TOB VRDO | 0.070% | 11/3/14 | (ETM) | 15,240 | 15,240 |
| California Infrastructure & Economic Development Bank Revenue | | | | | |
| (Independent System Operator Corp. Project) | 6.000% | 2/1/15 | (Prere.) | 10,000 | 10,147 |
| California Infrastructure & Economic Development Bank Revenue | | | | | |
| (Independent System Operator Corp. Project) | 5.000% | 2/1/34 | | 13,770 | 15,343 |
| California Infrastructure & Economic Development Bank Revenue | | | | | |
| (Pacific Gas & Electric Co.) VRDO | 0.080% | 11/3/14 | LOC | 1,800 | 1,800 |
| California Municipal Finance Authority Revenue (University of La Verne) | 6.250% | 6/1/40 | | 3,585 | 4,190 |
| California Pollution Control Financing Authority Solid Waste Disposal Revenue | | | | | |
| (Republic Services Inc. Project) PUT | 0.450% | 2/2/15 | | 18,000 | 17,999 |
| California Pollution Control Financing Authority Solid Waste Disposal Revenue | | | | | |
| (Republic Services Inc. Project) PUT | 5.250% | 12/1/17 | | 12,155 | 13,265 |
| California Pollution Control Financing Authority Solid Waste Disposal Revenue | | | | | |
| (Waste Management Inc. Project) | 5.400% | 4/1/25 | | 3,000 | 3,076 |
| California Public Works Board Lease Revenue (Butterfield State Office Complex) | 5.000% | 6/1/21 | | 7,675 | 7,885 |
| California Public Works Board Lease Revenue (Butterfield State Office Complex) | 5.000% | 6/1/22 | | 5,000 | 5,136 |
| California Public Works Board Lease Revenue (Butterfield State Office Complex) | 5.000% | 6/1/23 | | 2,870 | 2,948 |
| California Public Works Board Lease Revenue (Department of Corrections) | 5.000% | 6/1/26 | | 8,795 | 10,319 |
| California Public Works Board Lease Revenue (Judicial Council Projects) | 5.000% | 12/1/28 | | 3,600 | 4,209 |
| California Public Works Board Lease Revenue (Judicial Council Projects) | 5.000% | 3/1/34 | | 7,380 | 8,322 |
| California Public Works Board Lease Revenue (Various Capital Projects) | 5.000% | 12/1/21 | (Prere.) | 10,000 | 12,274 |
| California Public Works Board Lease Revenue (Various Capital Projects) | 5.000% | 11/1/37 | | 9,035 | 10,298 |
| California Public Works Board Lease Revenue (Various Capital Projects) | 5.000% | 11/1/38 | | 5,415 | 6,077 |
| California State University Revenue Systemwide | 5.000% | 11/1/34 | | 5,000 | 5,868 |
| California State University Revenue Systemwide | 5.250% | 11/1/34 | | 9,275 | 10,634 |
| California State University Revenue Systemwide | 5.000% | 11/1/35 | | 4,300 | 5,022 |
| California Statewide Communities Development Authority Revenue (Kaiser Permanente) | 5.000% | 4/1/42 | | 18,930 | 20,877 |
| California Statewide Communities Development Authority Student Housing Revenue | | | | | |
| (CHF-Irvine LLC–UCI East Campus Apartments Phase II) | 5.750% | 5/15/32 | | 8,000 | 8,841 |
| Corona-Norco CA School District Public Financing Authority Special Tax Revenue | 5.000% | 9/1/32 | | 1,125 | 1,258 |
| Corona-Norco CA School District Public Financing Authority Special Tax Revenue | 5.000% | 9/1/35 | | 585 | 645 |
| 3 Foothill-De Anza CA Community College District GO TOB VRDO | 0.050% | 11/7/14 | LOC | 20,000 | 20,000 |
| Foothill/Eastern Transportation Corridor Agency California Toll Road Revenue | 0.000% | 1/15/42 | | 6,000 | 3,833 |
| Foothill/Eastern Transportation Corridor Agency California Toll Road Revenue | 6.500% | 1/15/43 | | 8,730 | 10,322 |
| Foothill/Eastern Transportation Corridor Agency California Toll Road Revenue | 5.750% | 1/15/46 | | 18,000 | 20,674 |
| Golden State Tobacco Securitization Corp. California Revenue | 5.300% | 6/1/37 | | 7,000 | 5,533 |
| Golden State Tobacco Securitization Corp. California Revenue | 5.125% | 6/1/47 | | 6,100 | 4,530 |
| Golden State Tobacco Securitization Corp. California Revenue | 5.750% | 6/1/47 | | 14,245 | 11,571 |
| Grossmont CA Healthcare District GO | 5.000% | 7/15/37 | (2) | 4,000 | 4,359 |
| Grossmont CA Healthcare District GO | 6.125% | 7/15/40 | | 5,000 | 6,199 |
| Kern County CA GO | 5.750% | 8/1/35 | (12) | 4,500 | 5,180 |
| Lee Lake CA Public Financing Authority Revenue | 5.000% | 9/1/28 | | 2,805 | 3,156 |
| Lee Lake CA Public Financing Authority Revenue | 5.000% | 9/1/29 | | 2,825 | 3,167 |
| Lee Lake CA Public Financing Authority Revenue | 5.000% | 9/1/32 | | 3,500 | 3,865 |
| Lee Lake CA Public Financing Authority Revenue | 5.125% | 9/1/35 | | 2,350 | 2,583 |
| Los Angeles CA Community College District GO | 5.000% | 8/1/24 | | 3,430 | 3,946 |
| Los Angeles CA Community College District GO | 5.000% | 8/1/25 | | 4,120 | 4,728 |
| Los Angeles CA Community College District GO | 5.000% | 8/1/27 | | 6,215 | 7,091 |
| Los Angeles CA Department of Airports International Airport Revenue | 5.375% | 5/15/30 | | 15,000 | 16,733 |
| Los Angeles CA Department of Airports International Airport Revenue | 5.000% | 5/15/32 | | 5,000 | 5,712 |
| Los Angeles CA Department of Water & Power Revenue | 5.000% | 7/1/15 | (Prere.) | 8,000 | 8,257 |
| Los Angeles CA Regional Airports Improvement Corp. Lease Revenue (LAXFuel Corp.) | 5.000% | 1/1/32 | | 4,000 | 4,377 |
| Los Angeles CA Wastewater System Revenue | 5.750% | 6/1/27 | | 7,780 | 9,269 |
| Los Angeles County CA Public Works Financing Authority Lease Revenue | 5.000% | 8/1/33 | | 2,500 | 2,840 |
| Merced CA Irrigation District Electric System Revenue | 5.000% | 9/1/26 | (10) | 6,000 | 6,085 |
| Modesto CA Irrigation District COP | 5.500% | 7/1/35 | | 11,300 | 12,249 |
| Northstar Community Services District California Community Facilities | | | | | |
| District No. 1 Special Tax Revenue | 5.000% | 9/1/37 | | 10,000 | 10,017 |
| Oakland CA Unified School District GO | 6.125% | 8/1/29 | | 4,000 | 4,595 |
| Oakland CA Unified School District GO | 5.500% | 8/1/32 | | 3,000 | 3,374 |
| Oakland CA Unified School District GO | 6.625% | 8/1/38 | | 4,000 | 4,960 |
| Palo Alto CA Unified School District GO | 0.000% | 8/1/30 | | 21,100 | 12,640 |
| Palomar Pomerado Health California GO | 0.000% | 8/1/33 | (12) | 8,805 | 3,893 |
| Palomar Pomerado Health California GO | 0.000% | 8/1/38 | (12) | 10,740 | 11,108 |
| Port of Oakland CA Revenue | 5.000% | 5/1/22 | | 4,290 | 4,992 |
| Port of Oakland CA Revenue | 5.000% | 5/1/23 | | 5,890 | 6,793 |
| Port of Oakland CA Revenue | 5.000% | 5/1/28 | | 10,000 | 11,327 |
| Port of Oakland CA Revenue | 5.000% | 5/1/29 | | 2,250 | 2,517 |
| Port of Oakland CA Revenue | 5.000% | 5/1/29 | | 10,000 | 11,306 |
165
High-Yield Tax-Exempt Fund
| | | | | |
| | | | | Face | Market |
| | | Maturity | | Amount | Value• |
| | Coupon | Date | | ($000) | ($000) |
| Port of Oakland CA Revenue | 5.125% | 5/1/30 | | 2,000 | 2,241 |
| Port of Oakland CA Revenue | 5.125% | 5/1/31 | | 2,000 | 2,227 |
| Rancho Mirage CA Joint Powers Financing Authority Revenue (Eisenhower Medical Center) | 5.000% | 7/1/27 | | 1,000 | 1,041 |
| Riverside CA Electric Revenue VRDO | 0.040% | 11/7/14 | LOC | 20,000 | 20,000 |
| Riverside County CA Transportation Commission Toll Revenue | 0.000% | 6/1/42 | | 7,000 | 1,629 |
| Roseville CA Financing Authority Electric System Revenue | 5.000% | 2/1/37 | | 11,000 | 11,861 |
| Roseville CA Natural Gas Financing Authority Gas Revenue | 5.000% | 2/15/21 | | 425 | 480 |
| Sacramento County CA Airport Revenue | 6.000% | 7/1/41 | | 9,500 | 10,899 |
| San Bernardino CA City Unified School District GO | 5.000% | 8/1/26 | (4) | 1,310 | 1,531 |
| San Bernardino CA City Unified School District GO | 5.000% | 8/1/28 | (4) | 1,500 | 1,736 |
| San Bernardino County CA Medical Center COP | 7.000% | 8/1/20 | | 12,180 | 14,868 |
| San Bernardino County CA Medical Center COP | 6.875% | 8/1/24 | (ETM) | 25,220 | 33,858 |
| San Diego CA Community College District GO | 5.250% | 8/1/33 | | 5,500 | 6,369 |
| San Diego CA Unified School District GO | 5.500% | 7/1/21 | (14) | 12,725 | 15,621 |
| San Diego CA Unified School District GO | 0.000% | 7/1/30 | | 15,000 | 8,266 |
| 3 San Diego County CA Water Authority Revenue COP TOB VRDO | 0.060% | 11/7/14 | | 6,310 | 6,310 |
| San Francisco CA City & County International Airport Revenue | 5.750% | 5/1/19 | | 20,565 | 23,712 |
| San Francisco CA City & County International Airport Revenue | 5.750% | 5/1/20 | | 26,405 | 30,324 |
| San Francisco CA City & County International Airport Revenue | 5.000% | 5/1/30 | | 5,000 | 5,599 |
| San Francisco CA City & County International Airport Revenue | 5.000% | 5/1/31 | | 2,095 | 2,337 |
| San Francisco CA City & County International Airport Revenue | 5.250% | 5/1/33 | | 10,000 | 11,459 |
| San Francisco CA City & County International Airport Revenue | 5.000% | 5/1/39 | | 2,500 | 2,782 |
| San Francisco CA City & County International Airport Revenue | 6.000% | 5/1/39 | | 2,130 | 2,533 |
| San Francisco CA City & County International Airport Revenue | 5.000% | 5/1/40 | | 5,000 | 5,555 |
| San Francisco CA City & County Redevelopment Agency Community Facilities District No. 7 | | | | | |
| Special Tax Revenue (Hunters Point Shipyard Improvements) | 5.000% | 8/1/39 | | 2,240 | 2,396 |
| San Francisco CA City & County Redevelopment Agency Community Facilities District No. 7 | | | | | |
| Special Tax Revenue (Hunters Point Shipyard Improvements) | 5.000% | 8/1/44 | | 2,500 | 2,667 |
| San Francisco CA City & County Redevelopment Financing Authority Tax Allocation Revenue | | | | | |
| (Mission Bay North) | 6.625% | 8/1/39 | | 2,000 | 2,327 |
| San Francisco CA City & County Redevelopment Financing Authority Tax Allocation Revenue | | | | | |
| (Mission Bay South) | 7.000% | 8/1/41 | | 1,500 | 1,836 |
| San Francisco Office of Community Investment & Infrastructure Special Tax Revenue | | | | | |
| (Mission Bay) | 5.000% | 8/1/25 | | 1,600 | 1,809 |
| San Francisco Office of Community Investment & Infrastructure Special Tax Revenue | | | | | |
| (Mission Bay) | 5.000% | 8/1/26 | | 1,250 | 1,408 |
| San Francisco Office of Community Investment & Infrastructure Special Tax Revenue | | | | | |
| (Mission Bay) | 5.000% | 8/1/28 | | 1,510 | 1,685 |
| San Francisco Office of Community Investment & Infrastructure Special Tax Revenue | | | | | |
| (Mission Bay) | 5.000% | 8/1/30 | | 1,000 | 1,109 |
| San Francisco Office of Community Investment & Infrastructure Special Tax Revenue | | | | | |
| (Mission Bay) | 5.000% | 8/1/33 | | 1,335 | 1,468 |
| San Joaquin Hills CA Transportation Corridor Agency Toll Road Revenue | 0.000% | 1/15/24 | (14) | 2,000 | 1,451 |
| San Joaquin Hills CA Transportation Corridor Agency Toll Road Revenue | 0.000% | 1/15/25 | (14) | 15,900 | 11,055 |
| San Jose CA Airport Revenue | 5.000% | 3/1/25 | | 3,600 | 4,209 |
| San Jose CA Redevelopment Agency Tax Allocation Revenue | 4.440% | 8/1/17 | (14) | 2,420 | 2,428 |
| San Jose CA Redevelopment Agency Tax Allocation Revenue | 4.540% | 8/1/18 | (14) | 780 | 783 |
| San Jose CA Redevelopment Agency Tax Allocation Revenue | 5.000% | 8/1/19 | (2) | 1,700 | 1,832 |
| San Marcos CA Public Facilities Authority Tax Allocation Revenue | | | | | |
| (Project Areas No. 2 & No. 3 Financing Project) | 5.000% | 8/1/35 | (2) | 5,385 | 5,430 |
| San Marcos CA Unified School District GO | 5.000% | 8/1/34 | | 7,000 | 7,863 |
| San Mateo CA Community Facilities District No. 2008-1 Special Tax Revenue (Bay Meadows) | 5.000% | 9/1/42 | | 2,000 | 2,167 |
| Simi Valley CA School Financing Authority Revenue | 5.000% | 8/1/27 | (4) | 10,000 | 11,241 |
| Southern California Public Power Authority Revenue (Natural Gas Project) | 5.250% | 11/1/20 | | 1,700 | 1,951 |
| Stockton CA Public Financing Authority Water Revenue (Delta Water Supply Project) | 6.250% | 10/1/40 | | 6,200 | 7,298 |
| Sweetwater CA Unified School District GO | 5.000% | 8/1/26 | (15) | 6,465 | 7,604 |
| Turlock CA Irrigation District Revenue | 5.000% | 1/1/35 | | 6,385 | 6,976 |
| Ukiah CA Unified School District GO | 0.000% | 8/1/31 | (10) | 9,245 | 4,380 |
| Ventura County CA Public Financing Authority Lease Revenue | 5.000% | 11/1/31 | | 1,750 | 2,035 |
| Victor Valley CA Community College District GO | 6.000% | 8/1/39 | | 8,000 | 9,556 |
| Walnut CA Energy Center Authority Revenue | 5.000% | 1/1/35 | | 10,000 | 10,960 |
| West Contra Costa CA Unified School District GO | 6.000% | 8/1/27 | | 3,000 | 4,007 |
| West Contra Costa CA Unified School District GO | 5.000% | 8/1/34 | | 5,375 | 6,122 |
| West Contra Costa CA Unified School District GO | 5.000% | 8/1/35 | | 2,650 | 3,006 |
| Westlands CA Water District Revenue | 5.000% | 9/1/29 | (4) | 1,805 | 2,067 |
| Whittier CA Health Facilities Revenue (Presbyterian Intercommunity Hospital Obligated Group) | 5.000% | 6/1/44 | | 18,865 | 21,086 |
| | | | | | 1,168,582 |
166
High-Yield Tax-Exempt Fund
| | | | | |
| | | | | Face | Market |
| | | Maturity | | Amount | Value• |
| | Coupon | Date | | ($000) | ($000) |
| Colorado (2.0%) | | | | | |
| Colorado Health Facilities Authority Revenue (Covenant Retirement Community Inc.) | 5.250% | 12/1/25 | | 11,725 | 12,017 |
| Colorado Health Facilities Authority Revenue (Covenant Retirement Community Inc.) | 5.000% | 12/1/33 | | 3,250 | 3,452 |
| Denver CO City & County Airport Revenue | 5.000% | 11/15/15 | | 10,000 | 10,502 |
| Denver CO City & County Airport Revenue | 5.250% | 11/15/36 | | 7,500 | 8,529 |
| Denver CO City & County Airport Revenue | 5.250% | 11/15/43 | | 8,000 | 8,822 |
| Denver CO City & County Single Family Mortgage Revenue | 5.550% | 12/1/39 | | 548 | 578 |
| E-470 Public Highway Authority Colorado Revenue | 0.000% | 9/1/15 | (14) | 5,000 | 4,962 |
| E-470 Public Highway Authority Colorado Revenue | 0.000% | 9/1/18 | (14) | 5,000 | 4,647 |
| E-470 Public Highway Authority Colorado Revenue | 0.000% | 9/1/24 | (14) | 29,225 | 21,375 |
| E-470 Public Highway Authority Colorado Revenue | 0.000% | 9/1/25 | (14) | 14,900 | 10,337 |
| E-470 Public Highway Authority Colorado Revenue | 0.000% | 9/1/29 | (14) | 21,600 | 12,269 |
| E-470 Public Highway Authority Colorado Revenue | 0.000% | 9/1/30 | (14) | 10,025 | 5,422 |
| Northwest Parkway Public Highway Authority Colorado Revenue | 5.800% | 6/15/16 | (Prere.) | 10,000 | 10,872 |
| Plaza CO Metropolitan District No. 1 Tax Allocation Revenue | 5.000% | 12/1/17 | | 1,000 | 1,051 |
| Plaza CO Metropolitan District No. 1 Tax Allocation Revenue | 5.000% | 12/1/18 | | 1,375 | 1,461 |
| Plaza CO Metropolitan District No. 1 Tax Allocation Revenue | 5.000% | 12/1/20 | | 1,000 | 1,074 |
| Plaza CO Metropolitan District No. 1 Tax Allocation Revenue | 5.000% | 12/1/21 | | 1,000 | 1,074 |
| Plaza CO Metropolitan District No. 1 Tax Allocation Revenue | 5.000% | 12/1/22 | | 500 | 538 |
| Regional Transportation District of Colorado Sales Tax Revenue | | | | | |
| (Denver Transit Partners Eagle P3 Project) | 6.000% | 1/15/34 | | 6,000 | 6,753 |
| Regional Transportation District of Colorado Sales Tax Revenue | | | | | |
| (Denver Transit Partners Eagle P3 Project) | 6.000% | 1/15/41 | | 14,765 | 16,537 |
| University of Colorado Hospital Authority Revenue | 5.000% | 11/15/36 | | 8,000 | 8,799 |
| University of Colorado Hospital Authority Revenue | 5.000% | 11/15/42 | | 12,500 | 13,567 |
| | | | | | 164,638 |
| Connecticut (0.6%) | | | | | |
| Connecticut GO | 5.000% | 12/1/15 | | 1,200 | 1,263 |
| 2 Connecticut GO | 0.640% | 8/15/16 | | 2,000 | 2,013 |
| Connecticut GO | 5.000% | 11/1/16 | | 6,000 | 6,545 |
| Connecticut GO | 5.000% | 11/1/16 | | 8,100 | 8,835 |
| Connecticut GO | 5.000% | 12/15/16 | | 8,000 | 8,766 |
| Connecticut GO | 5.000% | 6/15/21 | | 10,025 | 12,046 |
| Connecticut Health & Educational Facilities Authority Revenue (Hartford Healthcare) | 5.000% | 7/1/32 | | 3,250 | 3,541 |
| Connecticut Health & Educational Facilities Authority Revenue (Stamford Hospital) | 5.000% | 7/1/37 | | 6,500 | 7,091 |
| | | | | | 50,100 |
| Delaware (0.1%) | | | | | |
| Delaware Economic Development Authority Revenue (Delaware State University Project) | 5.000% | 10/1/36 | | 3,890 | 4,330 |
| Delaware Housing Authority Single Family Mortgage Revenue | 5.875% | 1/1/38 | | 585 | 589 |
| | | | | | 4,919 |
| District of Columbia (0.5%) | | | | | |
| District of Columbia Student Dormitory Revenue (Provident Group - Howard Properties LLC) | 5.000% | 10/1/45 | | 6,000 | 6,174 |
| District of Columbia Water & Sewer Authority Public Utility Revenue | 5.500% | 10/1/39 | | 10,000 | 11,316 |
| Metropolitan Washington DC/VA Airports Authority Airport System Revenue | 5.250% | 10/1/25 | | 10,000 | 11,550 |
| Metropolitan Washington DC/VA Airports Authority Airport System Revenue | 5.000% | 10/1/30 | | 4,000 | 4,604 |
| Metropolitan Washington DC/VA Airports Authority Airport System Revenue | 5.000% | 10/1/44 | | 2,500 | 2,765 |
| Metropolitan Washington DC/VA Airports Authority Dulles Toll Road Revenue | | | | | |
| (Dulles Metrorail & Capital Improvement Projects) | 5.000% | 10/1/53 | | 7,500 | 7,843 |
| | | | | | 44,252 |
| Florida (5.5%) | | | | | |
| Alachua County FL Health Facilities Authority Revenue | | | | | |
| (Shands Teaching Hospital & Clinics Project) | 5.000% | 12/1/44 | | 25,000 | 27,252 |
| Broward County FL Airport System Revenue | 5.000% | 10/1/37 | | 6,180 | 6,691 |
| Broward County FL School Board COP | 5.000% | 7/1/20 | (4) | 5,935 | 6,357 |
| Citizens Property Insurance Corp. Florida Revenue (Coastal Account) | 5.250% | 6/1/17 | | 5,000 | 5,566 |
| Citizens Property Insurance Corp. Florida Revenue | | | | | |
| (Personal Lines Account/Commercial Lines Account) | 5.000% | 6/1/20 | | 8,450 | 9,885 |
| East Homestead Community Development District Florida Special Assessment Revenue | 7.250% | 5/1/21 | | 1,670 | 1,795 |
| Escambia County FL Environmental Improvement Revenue | 5.750% | 11/1/27 | | 6,000 | 6,006 |
| Florida Board of Education Lottery Revenue | 5.000% | 7/1/21 | (14) | 14,455 | 16,193 |
| Florida Housing Finance Corp. Homeowner Mortgage Revenue | 5.750% | 1/1/37 | | 1,410 | 1,428 |
| Florida Housing Finance Corp. Homeowner Mortgage Revenue | 5.750% | 1/1/37 | | 1,595 | 1,678 |
| Florida Housing Finance Corp. Homeowner Mortgage Revenue | 5.000% | 7/1/41 | | 2,925 | 3,166 |
| Florida Housing Finance Corp. Homeowner Mortgage Revenue | 5.500% | 7/1/48 | | 3,610 | 3,803 |
| Florida Municipal Power Agency Revenue | 6.250% | 10/1/31 | | 3,250 | 3,869 |
| Florida Municipal Power Agency Revenue (St. Lucie Project) | 5.000% | 10/1/26 | | 5,500 | 6,367 |
| Highlands County FL Health Facilities Authority Hospital Revenue | | | | | |
| (Adventist Health System/Sunbelt Obligated Group) | 5.250% | 11/15/16 | (Prere.) | 365 | 401 |
| Highlands County FL Health Facilities Authority Hospital Revenue | | | | | |
| (Adventist Health System/Sunbelt Obligated Group) | 6.000% | 11/15/37 | | 5,000 | 5,902 |
167
High-Yield Tax-Exempt Fund
| | | | | |
| | | | | Face | Market |
| | | Maturity | | Amount | Value• |
| | Coupon | Date | | ($000) | ($000) |
| Hillsborough County FL Industrial Development Authority Health Facilities Revenue | | | | | |
| (University Community Hospital) | 5.625% | 8/15/18 | (Prere.) | 6,000 | 7,032 |
| Jacksonville FL Electric Authority Electric System Revenue | 5.000% | 10/1/22 | | 1,890 | 2,272 |
| Jacksonville FL Electric Authority Electric System Revenue VRDO | 0.050% | 11/7/14 | | 7,300 | 7,300 |
| Jacksonville FL Transportation Revenue | 5.000% | 10/1/28 | | 8,425 | 9,932 |
| Lakeland FL Educational Facilities Revenue (Florida Southern College Project) | 5.000% | 9/1/37 | | 750 | 793 |
| Lakeland FL Educational Facilities Revenue (Florida Southern College Project) | 5.000% | 9/1/42 | | 1,500 | 1,575 |
| Lee Memorial Health System Florida Hospital Revenue | 5.250% | 4/1/35 | (14) | 13,350 | 14,074 |
| Martin County FL Health Facilities Authority Revenue (Martin Memorial Medical Center) | 5.000% | 11/15/28 | | 8,360 | 9,183 |
| Martin County FL Industrial Development Authority Revenue (Indiantown Cogeneration, LP Project) | 3.950% | 12/15/21 | | 14,900 | 15,584 |
| Martin County FL Industrial Development Authority Revenue (Indiantown Cogeneration, LP Project) | 4.200% | 12/15/25 | | 9,000 | 9,201 |
| Miami Beach FL Health Facilities Authority Revenue (Mount Sinai Medical Center) | 5.000% | 11/15/29 | | 2,175 | 2,391 |
| Miami-Dade County FL Aviation Revenue (Miami International Airport) | 5.000% | 10/1/24 | | 5,000 | 5,791 |
| Miami-Dade County FL Aviation Revenue (Miami International Airport) | 5.125% | 10/1/24 | (14) | 18,575 | 20,732 |
| Miami-Dade County FL Aviation Revenue (Miami International Airport) | 5.000% | 10/1/25 | | 5,000 | 5,765 |
| Miami-Dade County FL Aviation Revenue (Miami International Airport) | 5.000% | 10/1/26 | | 5,000 | 5,711 |
| Miami-Dade County FL Aviation Revenue (Miami International Airport) | 5.000% | 10/1/27 | | 7,215 | 8,173 |
| Miami-Dade County FL Aviation Revenue (Miami International Airport) | 5.000% | 10/1/27 | | 7,170 | 8,125 |
| Miami-Dade County FL Aviation Revenue (Miami International Airport) | 5.000% | 10/1/28 | | 5,800 | 6,520 |
| Miami-Dade County FL Aviation Revenue (Miami International Airport) | 5.000% | 10/1/28 | | 11,440 | 13,036 |
| Miami-Dade County FL Aviation Revenue (Miami International Airport) | 5.000% | 10/1/29 | | 17,000 | 18,986 |
| Miami-Dade County FL Aviation Revenue (Miami International Airport) | 5.000% | 10/1/31 | | 4,705 | 5,224 |
| Miami-Dade County FL Aviation Revenue (Miami International Airport) | 5.500% | 10/1/41 | | 4,000 | 4,568 |
| Miami-Dade County FL Health Facilities Authority Hospital Revenue (Miami Children’s Hospital) | 6.125% | 8/1/42 | | 3,500 | 4,014 |
| Miami-Dade County FL Industrial Development Authority Solid Waste Disposal Revenue | | | | | |
| (Waste Management Inc. of Florida Project) PUT | 1.500% | 8/1/17 | | 17,500 | 17,516 |
| Miami-Dade County FL Public Facilities Revenue (Jackson Memorial Hospital) | 5.750% | 6/1/39 | (12) | 5,250 | 5,888 |
| Miami-Dade County FL Seaport Revenue | 6.000% | 10/1/24 | | 1,590 | 1,977 |
| Miami-Dade County FL Seaport Revenue | 6.000% | 10/1/25 | | 1,680 | 2,088 |
| Miami-Dade County FL Seaport Revenue | 6.250% | 10/1/38 | | 5,000 | 6,105 |
| Miami-Dade County FL Special Obligation Revenue | 0.000% | 10/1/31 | | 5,000 | 2,391 |
| Miami-Dade County FL Special Obligation Revenue | 5.000% | 10/1/31 | | 4,170 | 4,676 |
| Miami-Dade County FL Special Obligation Revenue | 5.000% | 10/1/32 | | 2,460 | 2,751 |
| Miami-Dade County FL Special Obligation Revenue | 5.000% | 10/1/35 | | 6,500 | 7,207 |
| Miami-Dade County FL Special Obligation Revenue | 5.000% | 10/1/37 | | 2,500 | 2,770 |
| Miami-Dade County FL Transit Sales Surtax Revenue | 5.000% | 7/1/33 | | 3,000 | 3,380 |
| North Brevard County FL Hospital District Revenue (Parrish Medical Center Project) | 5.750% | 10/1/18 | (Prere.) | 2,845 | 3,372 |
| North Brevard County FL Hospital District Revenue (Parrish Medical Center Project) | 5.750% | 10/1/38 | | 1,155 | 1,277 |
| Orange County FL Health Facilities Authority Health Care Facility Revenue | | | | | |
| (Orlando Lutheran Towers Inc.) | 5.375% | 7/1/20 | | 975 | 986 |
| Orange County FL Health Facilities Authority Health Care Facility Revenue | | | | | |
| (Orlando Lutheran Towers Inc.) | 5.700% | 7/1/26 | | 1,500 | 1,511 |
| Orange County FL Health Facilities Authority Hospital Revenue (Orlando Health Inc.) | 5.000% | 10/1/42 | | 7,500 | 8,027 |
| Orlando & Orange County FL Expressway Authority Revenue | 5.000% | 7/1/21 | (4) | 20,000 | 23,599 |
| Orlando & Orange County FL Expressway Authority Revenue | 5.000% | 7/1/35 | | 10,000 | 11,353 |
| Orlando FL Utility Commission Water & Electric Revenue | 6.750% | 10/1/17 | (ETM) | 1,070 | 1,191 |
| Osceola County FL Expressway System Revenue (Poinciana Parkway Project) | 0.000% | 10/1/39 | | 6,000 | 3,557 |
| Osceola County FL Expressway System Revenue (Poinciana Parkway Project) | 0.000% | 10/1/42 | | 7,540 | 4,427 |
| Osceola County FL Expressway System Revenue (Poinciana Parkway Project) | 5.375% | 10/1/47 | | 2,000 | 2,095 |
| Palm Beach County FL Health Facilities Authority Revenue (Jupiter Medical Center Inc. Project) | 5.000% | 11/1/43 | | 3,250 | 3,430 |
| Palm Beach County FL Health Facilities Authority Revenue (Sinai Residences Boca Raton Project) | 7.500% | 6/1/49 | | 3,000 | 3,407 |
| Palm Glades FL Community Development District Revenue | 7.250% | 8/1/16 | | 1,145 | 1,186 |
| Sarasota County FL Public Hospital District Hospital Revenue (Sarasota Memorial Hospital Project) | 5.500% | 7/1/34 | | 3,500 | 3,914 |
| St. Petersburg FL Health Facilities Authority Revenue (All Children’s Hospital Inc. Obligated Group) | 6.500% | 11/15/39 | | 8,000 | 9,514 |
| Tallahassee FL Health Facilities Revenue (Tallahassee Memorial HealthCare Inc. Project) | 6.375% | 12/1/30 | | 2,800 | 2,810 |
| Tampa FL Health System Revenue (Baycare Health System) | 5.000% | 11/15/33 | | 7,407 | 8,236 |
| | | | | | 442,982 |
| Georgia (2.2%) | | | | | |
| Americus & Sumter County GA Hospital Authority Revenue (Magnolia Manor Obligated Group) | 6.375% | 5/15/43 | | 5,615 | 6,099 |
| Atlanta GA Airport Passenger Facility Charge Revenue | 5.000% | 1/1/22 | | 2,000 | 2,336 |
| Atlanta GA Water & Wastewater Revenue | 6.250% | 11/1/34 | | 2,500 | 2,986 |
| Atlanta GA Water & Wastewater Revenue | 6.250% | 11/1/39 | | 15,000 | 17,764 |
| Burke County GA Development Authority Pollution Control Revenue | | | | | |
| (Oglethorpe Power Corp. Vogtle Project) | 5.500% | 1/1/33 | | 5,000 | 5,365 |
| Dalton GA Development Authority Revenue (Hamilton Health Care System) | 5.500% | 8/15/17 | (14) | 2,155 | 2,270 |
| Dalton GA Development Authority Revenue (Hamilton Health Care System) | 5.000% | 8/15/28 | | 6,685 | 7,543 |
| Georgia GO | 5.000% | 7/1/15 | | 8,200 | 8,467 |
| Georgia GO | 5.000% | 7/1/15 | | 2,570 | 2,654 |
| Georgia GO | 5.000% | 7/1/15 | | 2,400 | 2,478 |
| Georgia GO | 5.000% | 7/1/15 | | 7,820 | 8,074 |
| Georgia GO | 5.500% | 7/1/15 | | 19,095 | 19,779 |
168
High-Yield Tax-Exempt Fund
| | | | | |
| | | | | Face | Market |
| | | Maturity | | Amount | Value• |
| | Coupon | Date | ($000) | ($000) |
| Georgia GO | 5.000% | 11/1/16 | | 8,055 | 8,796 |
| Georgia GO | 5.000% | 2/1/22 | | 8,545 | 10,458 |
| Georgia Housing & Finance Authority Single Family Mortgage Revenue | 5.000% | 12/1/26 | | 3,450 | 3,506 |
| Georgia Municipal Electric Power Authority Revenue | 6.600% | 1/1/18 (14) | | 2,520 | 2,751 |
| Main Street Natural Gas Inc. Georgia Gas Project Revenue | 5.000% | 3/15/18 | | 5,385 | 5,935 |
| Main Street Natural Gas Inc. Georgia Gas Project Revenue | 5.000% | 3/15/19 | | 15,000 | 16,856 |
| Main Street Natural Gas Inc. Georgia Gas Project Revenue | 5.000% | 3/15/20 | | 1,270 | 1,427 |
| Main Street Natural Gas Inc. Georgia Gas Project Revenue | 5.250% | 9/15/20 | | 5,240 | 6,013 |
| Main Street Natural Gas Inc. Georgia Gas Project Revenue | 5.500% | 9/15/22 | | 2,330 | 2,748 |
| Main Street Natural Gas Inc. Georgia Gas Project Revenue | 5.500% | 9/15/23 | | 2,340 | 2,773 |
| Main Street Natural Gas Inc. Georgia Gas Project Revenue | 5.500% | 9/15/26 | | 5,630 | 6,795 |
| Main Street Natural Gas Inc. Georgia Gas Project Revenue | 5.500% | 9/15/27 | | 530 | 644 |
| Marietta GA Development Authority Revenue | 7.000% | 6/15/30 | | 4,000 | 4,154 |
| Marietta GA Development Authority Revenue | 7.000% | 6/15/39 | | 7,500 | 7,725 |
| Municipal Electric Authority Georgia Revenue (General Resolution Projects) | 5.500% | 1/1/26 | | 7,000 | 8,091 |
| | | | | | 174,487 |
| Guam (0.1%) | | | | | |
| Guam International Airport Authority Revenue | 6.250% | 10/1/34 | | 5,500 | 6,331 |
| Guam International Airport Authority Revenue | 6.375% | 10/1/43 | | 3,000 | 3,445 |
| | | | | | 9,776 |
| Hawaii (0.6%) | | | | | |
| Hawaii Airports System Revenue | 5.000% | 7/1/15 | | 7,000 | 7,229 |
| Hawaii Department of Transportation - Airports Division Lease Revenue COP | 5.250% | 8/1/25 | | 2,250 | 2,658 |
| Hawaii Department of Transportation - Airports Division Lease Revenue COP | 5.250% | 8/1/26 | | 3,500 | 4,105 |
| Hawaii Department of Transportation - Airports Division Lease Revenue COP | 5.000% | 8/1/27 | | 2,000 | 2,296 |
| Hawaii Harbor System Revenue | 5.500% | 7/1/35 | | 5,000 | 5,655 |
| Hawaii Harbor System Revenue | 5.625% | 7/1/40 | | 5,000 | 5,640 |
| Hawaii Pacific Health Revenue | 5.500% | 7/1/40 | | 7,000 | 7,740 |
| Hawaii Pacific Health Revenue | 5.750% | 7/1/40 | | 2,365 | 2,649 |
| Honolulu HI City & County Wastewater System Revenue | 0.000% | 7/1/17 (14) | | 6,000 | 5,793 |
| Honolulu HI City & County Wastewater System Revenue | 0.000% | 7/1/18 (14) | | 2,000 | 1,891 |
| | | | | | 45,656 |
| Idaho (0.2%) | | | | | |
| Idaho Housing & Finance Association RAN | 5.000% | 7/15/23 | | 8,430 | 9,612 |
| Idaho Housing & Finance Association RAN | 5.000% | 7/15/27 | | 7,000 | 7,880 |
| | | | | | 17,492 |
| Illinois (8.4%) | | | | | |
| Chicago IL Board of Education GO | 5.250% | 12/1/25 | | 6,000 | 6,303 |
| Chicago IL Board of Education GO | 5.000% | 12/1/29 | | 5,480 | 5,636 |
| Chicago IL Board of Education GO | 5.000% | 12/1/31 | | 7,000 | 7,163 |
| Chicago IL Board of Education GO | 5.000% | 12/1/33 | | 8,750 | 8,948 |
| Chicago IL Board of Education GO | 5.000% | 12/1/42 | | 26,015 | 26,014 |
| Chicago IL GO | 5.620% | 1/1/16 (Prere.) | | 7,795 | 8,357 |
| Chicago IL GO | 5.650% | 1/1/16 (Prere.) | | 7,445 | 7,985 |
| Chicago IL GO | 5.620% | 1/1/26 (14) | | 2,755 | 2,883 |
| Chicago IL GO | 5.650% | 1/1/27 (14) | | 2,630 | 2,753 |
| Chicago IL GO (Neighborhoods Alive 21 Program) VRDO | 0.050% | 11/3/14 LOC | | 13,115 | 13,115 |
| Chicago IL Midway Airport Revenue | 5.000% | 1/1/29 | | 16,180 | 18,109 |
| Chicago IL Midway Airport Revenue | 5.000% | 1/1/31 | | 6,945 | 7,710 |
| Chicago IL Midway Airport Revenue | 5.000% | 1/1/33 | | 7,200 | 7,904 |
| Chicago IL Midway Airport Revenue | 5.375% | 1/1/33 | | 4,000 | 4,479 |
| Chicago IL Midway Airport Revenue | 5.000% | 1/1/34 | | 7,105 | 7,771 |
| Chicago IL Midway Airport Revenue | 5.000% | 1/1/41 | | 11,700 | 12,590 |
| Chicago IL O’Hare International Airport Revenue | 5.000% | 1/1/29 (14) | | 5,000 | 5,235 |
| Chicago IL O’Hare International Airport Revenue | 5.000% | 1/1/30 | | 11,000 | 12,030 |
| Chicago IL O’Hare International Airport Revenue | 5.250% | 1/1/30 | | 3,655 | 4,022 |
| Chicago IL O’Hare International Airport Revenue | 5.000% | 1/1/31 | | 15,595 | 16,983 |
| Chicago IL O’Hare International Airport Revenue | 5.625% | 1/1/35 | | 7,000 | 7,939 |
| Chicago IL O’Hare International Airport Revenue | 5.750% | 1/1/38 | | 12,000 | 13,344 |
| Chicago IL O’Hare International Airport Revenue | 5.750% | 1/1/39 | | 3,000 | 3,423 |
| Chicago IL Public Building Commission GO | 7.000% | 1/1/20 (ETM) | | 10,000 | 12,405 |
| Chicago IL Sales Tax Revenue | 5.250% | 1/1/38 | | 7,300 | 7,953 |
| Chicago IL Transit Authority Sales Tax Receipts Revenue | 5.250% | 12/1/30 | | 2,950 | 3,379 |
| Chicago IL Transit Authority Sales Tax Receipts Revenue | 5.250% | 12/1/36 | | 5,400 | 6,115 |
| Chicago IL Wastewater Transmission Revenue | 5.000% | 1/1/34 | | 2,525 | 2,820 |
| Chicago IL Wastewater Transmission Revenue | 5.000% | 1/1/39 | | 9,000 | 9,917 |
| Chicago IL Water Revenue | 5.250% | 11/1/38 | | 15,000 | 16,547 |
| Chicago IL Waterworks Revenue | 5.000% | 11/1/39 | | 1,000 | 1,100 |
| Chicago IL Waterworks Revenue | 5.000% | 11/1/44 | | 7,000 | 7,639 |
| Illinois Finance Authority Revenue (Advocate Health Care Network) | 5.000% | 6/1/42 | | 1,500 | 1,617 |
169
High-Yield Tax-Exempt Fund
| | | | | |
| | | | | Face | Market |
| | | Maturity | | Amount | Value• |
| | Coupon | Date | | ($000) | ($000) |
| Illinois Finance Authority Revenue (Carle Foundation) | 6.000% | 8/15/41 | | 2,000 | 2,311 |
| Illinois Finance Authority Revenue (Carle Foundation) | 6.000% | 8/15/41 | (4) | 1,500 | 1,739 |
| Illinois Finance Authority Revenue (Carle Foundation) VRDO | 0.040% | 11/7/14 | LOC | 4,175 | 4,175 |
| Illinois Finance Authority Revenue (Centegra Health System) | 5.000% | 9/1/38 | | 7,500 | 7,871 |
| Illinois Finance Authority Revenue (Centegra Health System) | 5.000% | 9/1/39 | | 5,000 | 5,290 |
| Illinois Finance Authority Revenue (Centegra Health System) | 5.000% | 9/1/42 | | 2,000 | 2,101 |
| Illinois Finance Authority Revenue (Children’s Memorial Hospital) | 5.375% | 8/15/39 | | 22,500 | 24,324 |
| Illinois Finance Authority Revenue (Columbia College) | 5.000% | 12/1/27 | (14) | 8,230 | 8,642 |
| Illinois Finance Authority Revenue (Franciscan Communities Inc.) | 5.125% | 5/15/43 | | 9,235 | 9,517 |
| Illinois Finance Authority Revenue (Lutheran Home & Services) | 5.625% | 5/15/42 | | 5,500 | 5,769 |
| Illinois Finance Authority Revenue (Lutheran Home & Services) | 5.750% | 5/15/46 | | 5,750 | 6,075 |
| Illinois Finance Authority Revenue (Northwestern Community Hospital) | 5.375% | 7/1/33 | | 6,000 | 6,554 |
| Illinois Finance Authority Revenue (Northwestern Memorial Hospital) PUT | 5.000% | 8/15/37 | | 6,250 | 6,911 |
| Illinois Finance Authority Revenue (Northwestern University) VRDO | 0.030% | 11/7/14 | | 10,400 | 10,400 |
| Illinois Finance Authority Revenue (OSF Healthcare System) | 7.000% | 11/15/29 | | 10,000 | 12,038 |
| Illinois Finance Authority Revenue (OSF Healthcare System) | 6.000% | 5/15/39 | | 6,265 | 7,125 |
| Illinois Finance Authority Revenue (OSF Healthcare System) | 5.000% | 5/15/41 | | 6,000 | 6,440 |
| Illinois Finance Authority Revenue (Rehabilitation Institute of Chicago) | 6.000% | 7/1/43 | | 10,000 | 11,667 |
| Illinois Finance Authority Revenue (Riverside Health System) | 6.250% | 11/15/35 | | 4,600 | 5,367 |
| Illinois Finance Authority Revenue (Rush University Medical Center) | 6.625% | 11/1/39 | | 10,000 | 11,593 |
| Illinois Finance Authority Revenue (Silver Cross & Medical Centers) | 6.875% | 8/15/38 | | 500 | 578 |
| Illinois Finance Authority Revenue (Silver Cross & Medical Centers) | 7.000% | 8/15/44 | | 14,000 | 16,202 |
| Illinois Finance Authority Revenue (University of Chicago) | 5.000% | 10/1/32 | | 10,000 | 11,676 |
| Illinois GO | 5.000% | 1/1/15 | | 3,465 | 3,491 |
| Illinois GO | 4.000% | 3/1/15 | | 10,000 | 10,116 |
| Illinois GO | 5.000% | 8/1/15 | | 12,685 | 13,105 |
| Illinois GO | 5.000% | 1/1/16 | | 4,870 | 5,109 |
| Illinois GO | 5.000% | 8/1/20 | | 4,000 | 4,514 |
| Illinois GO | 5.000% | 8/1/21 | | 8,000 | 9,000 |
| Illinois GO | 5.000% | 3/1/22 | | 5,000 | 5,604 |
| Illinois GO | 5.000% | 3/1/23 | | 6,165 | 6,791 |
| Illinois GO | 5.000% | 8/1/23 | | 5,000 | 5,580 |
| Illinois GO | 5.000% | 3/1/24 | | 5,000 | 5,472 |
| Illinois GO | 5.000% | 8/1/24 | | 13,660 | 14,992 |
| Illinois GO | 5.000% | 2/1/25 | | 2,270 | 2,513 |
| Illinois GO | 5.000% | 8/1/25 | | 3,000 | 3,271 |
| Illinois GO | 5.000% | 2/1/27 | | 3,000 | 3,264 |
| Illinois GO | 5.000% | 6/1/30 | | 4,725 | 4,880 |
| Illinois GO | 5.250% | 2/1/32 | | 9,575 | 10,484 |
| Illinois GO | 5.250% | 2/1/33 | (4) | 6,200 | 6,855 |
| Illinois GO | 5.500% | 7/1/33 | (4) | 3,350 | 3,785 |
| Illinois GO | 5.000% | 1/1/34 | | 6,805 | 7,182 |
| Illinois GO | 5.250% | 2/1/34 | (4) | 3,125 | 3,445 |
| Illinois GO | 5.000% | 5/1/34 | | 2,500 | 2,676 |
| Illinois GO | 5.000% | 5/1/36 | | 3,000 | 3,194 |
| Illinois GO | 5.500% | 7/1/38 | | 7,500 | 8,213 |
| Illinois GO | 5.000% | 5/1/39 | | 5,000 | 5,283 |
| Illinois Sales Tax Revenue | 5.000% | 6/15/17 | | 7,000 | 7,792 |
| Illinois Sports Facility Authority Revenue | 5.500% | 6/15/15 | (Prere.) | 2,515 | 2,623 |
| Illinois Sports Facility Authority Revenue | 5.500% | 6/15/30 | (2) | 6,120 | 6,336 |
| Illinois Toll Highway Authority Revenue | 5.000% | 12/1/22 | | 2,400 | 2,898 |
| Illinois Toll Highway Authority Revenue | 5.250% | 1/1/30 | | 5,000 | 5,743 |
| Illinois Toll Highway Authority Revenue | 5.000% | 1/1/31 | | 6,000 | 6,735 |
| 1 Illinois Toll Highway Authority Revenue | 5.000% | 1/1/36 | | 5,000 | 5,650 |
| 1 Illinois Toll Highway Authority Revenue | 5.000% | 1/1/37 | | 5,000 | 5,628 |
| Illinois Unemployment Insurance Fund Building Receipts Revenue | 5.000% | 6/15/20 | | 4,500 | 4,526 |
| Metropolitan Pier & Exposition Authority Illinois Dedicated Sales Tax Revenue | 0.000% | 6/15/44 | (4) | 10,000 | 2,432 |
| Metropolitan Pier & Exposition Authority Illinois Dedicated Sales Tax Revenue | | | | | |
| (McCormick Place Expansion Project) | 5.000% | 6/15/42 | | 5,000 | 5,394 |
| Will County IL Community High School District No. 210 (Lincoln-Way) GO | 5.000% | 1/1/27 | | 10,265 | 11,766 |
| | | | | | 680,895 |
| Indiana (2.2%) | | | | | |
| Indiana Finance Authority Hospital Revenue (Community Health Network) | 5.000% | 5/1/42 | | 14,000 | 15,242 |
| Indiana Finance Authority Hospital Revenue (Deaconess Health System Obligated Group) | 5.000% | 3/1/32 | | 5,000 | 5,474 |
| Indiana Finance Authority Hospital Revenue (Deaconess Health System Obligated Group) | 5.000% | 3/1/35 | | 6,000 | 6,537 |
| Indiana Finance Authority Revenue (Community Foundation of Northwest Indiana Obligated Group) | 5.000% | 3/1/41 | | 5,500 | 5,922 |
| Indiana Finance Authority Revenue (I-69 Development Partners LLC) | 5.250% | 9/1/34 | | 4,000 | 4,420 |
| Indiana Finance Authority Revenue (I-69 Development Partners LLC) | 5.250% | 9/1/40 | | 7,500 | 8,208 |
| Indiana Finance Authority Revenue (Ohio River Bridges East End Crossing Project) | 5.000% | 7/1/40 | | 2,500 | 2,633 |
| Indiana Finance Authority Revenue (Ohio River Bridges East End Crossing Project) | 5.000% | 7/1/44 | | 25,550 | 26,907 |
170
High-Yield Tax-Exempt Fund
| | | | | |
| | | | | Face | Market |
| | | Maturity | | Amount | Value• |
| | Coupon | Date | | ($000) | ($000) |
| Indiana Finance Authority Revenue (Ohio River Bridges East End Crossing Project) | 5.000% | 7/1/48 | | 28,025 | 29,451 |
| Indiana Health Facility Financing Authority Hospital Revenue (Ancilla System Inc.) | 7.375% | 7/1/23 | (ETM) | 19,400 | 26,388 |
| Indiana Municipal Power Agency Revenue | 6.000% | 1/1/39 | | 13,275 | 15,215 |
| Indianapolis IN Airport Authority Special Facilities Revenue (Federal Express Corp. Project) | 5.100% | 1/15/17 | | 14,500 | 15,798 |
| Indianapolis IN Local Public Improvement Bond Bank Revenue | | | | | |
| (Indianapolis Airport Authority Project) | 5.000% | 1/1/31 | | 5,000 | 5,625 |
| Indianapolis IN Local Public Improvement Bond Bank Revenue | | | | | |
| (Indianapolis Airport Authority Project) | 5.000% | 1/1/32 | | 4,500 | 5,036 |
| Indianapolis IN Local Public Improvement Bond Bank Revenue | | | | | |
| (Indianapolis Airport Authority Project) | 5.000% | 1/1/33 | | 3,150 | 3,492 |
| Indianapolis IN Local Public Improvement Bond Bank Revenue | | | | | |
| (Qualified Midwestern Disaster Area) | 5.750% | 2/1/36 | | 5,000 | 5,778 |
| | | | | | 182,126 |
| Iowa (0.9%) | | | | | |
| Iowa Finance Authority Midwestern Disaster Area Revenue (Iowa Fertilizer Co. Project) | 5.000% | 12/1/19 | | 20,500 | 21,899 |
| Iowa Finance Authority Midwestern Disaster Area Revenue (Iowa Fertilizer Co. Project) | 5.500% | 12/1/22 | | 20,775 | 22,012 |
| Iowa Finance Authority Midwestern Disaster Area Revenue (Iowa Fertilizer Co. Project) | 5.250% | 12/1/25 | | 15,000 | 16,144 |
| Tobacco Settlement Authority Iowa Revenue | 5.600% | 6/1/34 | | 14,290 | 12,722 |
| | | | | | 72,777 |
| Kansas (0.3%) | | | | | |
| Kansas Development Finance Authority Health Facilities Revenue | | | | | |
| (Kansas University Health System) | 5.375% | 3/1/29 | | 3,000 | 3,366 |
| Wichita KS Health Care Facilities Revenue | 6.375% | 5/15/43 | | 7,000 | 7,558 |
| Wichita KS Health Care Facilities Revenue | 6.500% | 5/15/48 | | 8,000 | 8,672 |
| Wichita KS Health Care Facilities Revenue (Larksfield Place Obligated Group) | 7.375% | 12/15/43 | | 5,000 | 5,644 |
| Wichita KS Health Care Facilities Revenue (Presbyterian Manors Obligated Group) | 3.375% | 11/15/20 | | 1,000 | 1,001 |
| | | | | | 26,241 |
| Kentucky (0.9%) | | | | | |
| Kentucky Asset/Liability Commission General Fund Revenue | 5.000% | 3/1/15 | (Prere.) | 7,500 | 7,621 |
| Kentucky Economic Development Finance Authority Hospital Revenue | | | | | |
| (Baptist Healthcare System Obligated Group) | 5.250% | 8/15/46 | | 8,000 | 8,658 |
| Kentucky Housing Corp. Housing Revenue | 5.250% | 7/1/32 | | 2,155 | 2,190 |
| Kentucky Public Transportation Infrastructure Authority Toll Revenue | | | | | |
| (Downtown Crossing Project) BAN | 0.000% | 7/1/33 | | 3,065 | 2,158 |
| Kentucky Public Transportation Infrastructure Authority Toll Revenue | | | | | |
| (Downtown Crossing Project) BAN | 0.000% | 7/1/39 | | 3,000 | 2,060 |
| Kentucky Public Transportation Infrastructure Authority Toll Revenue | | | | | |
| (Downtown Crossing Project) BAN | 6.000% | 7/1/53 | | 12,025 | 13,817 |
| Kentucky Turnpike Authority Economic Development Road Revenue (Revitalization Project) | 5.000% | 7/1/30 | | 3,000 | 3,522 |
| Louisville & Jefferson County KY Metropolitan Government Health Facilities Revenue | | | | | |
| (Jewish Hospital & St. Mary’s Healthcare Inc. Project) | 5.750% | 2/1/18 | (Prere.) | 9,400 | 10,913 |
| Louisville & Jefferson County KY Metropolitan Government Health System Revenue | | | | | |
| (Norton Healthcare Obligated Group) | 5.750% | 10/1/42 | | 9,500 | 10,851 |
| Louisville & Jefferson County KY Metropolitan Government Pollution Control Revenue | | | | | |
| (Louisville Gas & Electric Co. Project) PUT | 1.650% | 4/3/17 | | 8,500 | 8,640 |
| Louisville & Jefferson County KY Metropolitan Government Revenue (Catholic Health Initiatives) | 5.000% | 12/1/35 | | 6,250 | 6,896 |
| | | | | | 77,326 |
| Louisiana (1.2%) | | | | | |
| Louisiana Citizens Property Insurance Corp. Assessment Revenue | 6.750% | 6/1/26 | (12) | 6,000 | 7,087 |
| Louisiana Housing Finance Agency Single Family Mortgage Revenue (Home Ownership Program) | 5.950% | 6/1/38 | | 2,365 | 2,477 |
| Louisiana Local Government Environmental Facilities & Community Development | | | | | |
| Authority Revenue (East Baton Rouge Sewerage Commission Projects) | 5.000% | 2/1/39 | | 4,250 | 4,728 |
| Louisiana Local Government Environmental Facilities & Community Development | | | | | |
| Authority Revenue (Women’s Hospital Foundation Project) | 5.875% | 10/1/40 | | 9,990 | 11,242 |
| Louisiana Local Government Environmental Facilities & Community Development | | | | | |
| Authority Revenue (Women’s Hospital Foundation Project) | 6.000% | 10/1/44 | | 8,095 | 9,355 |
| 3 Louisiana Public Facilities Authority Dock & Wharf Revenue (Impala Warehousing LLC Project) | 6.500% | 7/1/36 | | 10,000 | 11,131 |
| Louisiana Public Facilities Authority Hospital Revenue (Franciscan Missionaries of | | | | | |
| Our Lady Health System Project) | 5.000% | 7/1/42 | | 8,000 | 8,633 |
| New Orleans LA Aviation Board Revenue | 6.000% | 1/1/23 | (12) | 5,000 | 5,835 |
| New Orleans LA Sewage Service Revenue | 5.000% | 6/1/44 | | 3,000 | 3,307 |
| New Orleans LA Water Revenue | 5.000% | 12/1/44 | | 10,000 | 10,936 |
| Port of New Orleans LA Board of Commissioners Port Facility Revenue | 5.000% | 4/1/29 | | 1,500 | 1,659 |
| Port of New Orleans LA Board of Commissioners Port Facility Revenue | 5.000% | 4/1/30 | | 1,210 | 1,324 |
| Port of New Orleans LA Board of Commissioners Port Facility Revenue | 5.000% | 4/1/32 | | 2,720 | 2,949 |
| St. Charles Parish LA Gulf Opportunity Zone Revenue (Valero Energy Corp.) PUT | 4.000% | 6/1/22 | | 12,515 | 13,455 |
| | | | | | 94,118 |
171
High-Yield Tax-Exempt Fund
| | | | | |
| | | | | Face | Market |
| | | Maturity | | Amount | Value• |
| | Coupon | Date | | ($000) | ($000) |
| Maine (0.1%) | | | | | |
| Maine Health & Higher Educational Facilities Authority Revenue | | | | | |
| (Eastern Maine Medical Center Obligated Group) | 5.000% | 7/1/33 | | 4,000 | 4,355 |
| Maine Housing Authority Mortgage Revenue | 4.500% | 11/15/28 | | 2,735 | 2,871 |
| | | | | | 7,226 |
| Maryland (1.3%) | | | | | |
| Anne Arundel County MD Special Tax Revenue (Villages at 2 Rivers Project) | 5.125% | 7/1/36 | | 1,030 | 1,046 |
| Anne Arundel County MD Special Tax Revenue (Villages at 2 Rivers Project) | 5.250% | 7/1/44 | | 2,150 | 2,179 |
| Baltimore MD Special Obligation Revenue | 7.000% | 9/1/38 | | 8,000 | 8,777 |
| Frederick County MD Special Tax Revenue (Jefferson Technology Park) | 7.125% | 7/1/43 | | 5,000 | 5,525 |
| Harford County MD GO | 5.000% | 7/1/15 | | 2,000 | 2,065 |
| Maryland Department of Housing & Community Development Revenue | 5.750% | 3/1/41 | | 1,565 | 1,592 |
| 4 Maryland Economic Development Corp. Revenue (Chesapeake Bay Conference Center Project) | 5.000% | 12/1/31 | | 4,000 | 1,828 |
| Maryland GO | 5.000% | 2/15/15 | (Prere.) | 6,000 | 6,084 |
| Maryland GO | 5.000% | 11/1/15 | | 6,000 | 6,290 |
| Maryland GO | 5.000% | 3/1/22 | | 10,000 | 12,004 |
| Maryland GO | 5.000% | 8/1/22 | | 15,000 | 18,471 |
| Maryland Health & Higher Educational Facilities Authority Revenue (MedStar Health, Inc.) | 5.000% | 8/15/26 | | 4,000 | 4,650 |
| Maryland Health & Higher Educational Facilities Authority Revenue (MedStar Health, Inc.) | 5.000% | 8/15/27 | | 7,005 | 8,074 |
| Maryland Health & Higher Educational Facilities Authority Revenue | | | | | |
| (University of Maryland Medical System) | 5.000% | 7/1/33 | | 6,750 | 7,468 |
| Maryland Industrial Development Financing Authority Economic Development Revenue | | | | | |
| (Our Lady of Good Counsel School) | 5.500% | 5/1/15 | (Prere.) | 220 | 226 |
| Maryland Industrial Development Financing Authority Economic Development Revenue | | | | | |
| (Our Lady of Good Counsel School) | 6.000% | 5/1/15 | (Prere.) | 2,000 | 2,057 |
| Prince Georges County MD GO | 5.000% | 9/15/15 | | 3,740 | 3,898 |
| Prince Georges County MD GO | 5.000% | 9/15/16 | | 10,000 | 10,865 |
| Westminster MD Revenue (Lutheran Village at Miller’s Grant) | 6.125% | 7/1/39 | | 750 | 790 |
| Westminster MD Revenue (Lutheran Village at Miller’s Grant) | 6.250% | 7/1/44 | | 2,000 | 2,119 |
| | | | | | 106,008 |
| Massachusetts (1.4%) | | | | | |
| Massachusetts Department of Transportation Metropolitan Highway System Revenue | 5.000% | 1/1/32 | | 12,500 | 13,852 |
| Massachusetts Development Finance Agency Revenue (Boston Medical Center) | 5.000% | 7/1/29 | | 1,500 | 1,615 |
| Massachusetts Development Finance Agency Revenue (Lowell General Hospital) | 5.000% | 7/1/44 | | 7,165 | 7,583 |
| Massachusetts Development Finance Agency Revenue (Merrimack College) | 5.125% | 7/1/44 | | 5,950 | 6,215 |
| Massachusetts Development Finance Agency Revenue (Milford Regional Medical Center) | 5.750% | 7/15/43 | | 3,750 | 4,176 |
| Massachusetts Development Finance Agency Revenue (Suffolk University) | 5.125% | 7/1/40 | | 9,000 | 9,534 |
| Massachusetts Development Finance Agency Revenue (Tufts Medical Center) | 7.250% | 1/1/32 | | 3,500 | 4,298 |
| Massachusetts Development Finance Agency Revenue (Tufts Medical Center) | 6.875% | 1/1/41 | | 1,500 | 1,782 |
| Massachusetts Development Finance Agency Solid Waste Disposal Revenue | | | | | |
| (Waste Management, Inc. Project) PUT | 1.600% | 5/1/17 | | 4,000 | 4,014 |
| Massachusetts Educational Financing Authority Education Loan Revenue | 5.000% | 7/1/20 | | 5,000 | 5,689 |
| Massachusetts Educational Financing Authority Education Loan Revenue | 5.000% | 7/1/21 | | 5,000 | 5,701 |
| Massachusetts GO | 5.000% | 9/1/15 | (Prere.) | 8,000 | 8,321 |
| Massachusetts GO | 5.000% | 10/1/15 | | 2,000 | 2,089 |
| Massachusetts GO VRDO | 0.060% | 11/3/14 | | 1,900 | 1,900 |
| Massachusetts Health & Educational Facilities Authority Revenue (Harvard University) | 5.500% | 11/15/36 | | 6,975 | 8,148 |
| Massachusetts Health & Educational Facilities Authority Revenue (MIT) | 5.500% | 7/1/18 | (Prere.) | 5,100 | 5,958 |
| Massachusetts Health & Educational Facilities Authority Revenue (MIT) VRDO | 0.050% | 11/7/14 | | 14,200 | 14,200 |
| Massachusetts Health & Educational Facilities Authority Revenue (Suffolk University) | 6.250% | 7/1/30 | | 5,000 | 5,879 |
| Massachusetts School Building Authority Dedicated Sales Tax Revenue | 5.000% | 8/15/15 | (Prere.) | 6,000 | 6,229 |
| | | | | | 117,183 |
| Michigan (2.6%) | | | | | |
| Detroit MI Sewage Disposal System Revenue | 5.125% | 7/1/33 | (14) | 6,030 | 6,094 |
| Detroit MI Water Supply System Revenue | 5.000% | 7/1/29 | (4) | 4,415 | 4,580 |
| Detroit MI Water Supply System Revenue | 5.000% | 7/1/31 | | 5,000 | 5,332 |
| Detroit MI Water Supply System Revenue | 5.250% | 7/1/41 | | 1,270 | 1,349 |
| Jackson County MI Hospital Finance Authority Hospital Revenue (Allegiance Health) | 5.250% | 6/1/37 | | 10,000 | 10,796 |
| Kalamazoo MI Hospital Financing Authority Hospital Revenue (Bronson Methodist Hospital) | 5.000% | 5/15/30 | | 10,000 | 10,620 |
| Karegnondi Water Authority Michigan Water Supply System Revenue (Karegnondi Water Pipeline) | 5.250% | 11/1/40 | | 7,500 | 8,341 |
| Karegnondi Water Authority Michigan Water Supply System Revenue (Karegnondi Water Pipeline) | 5.000% | 11/1/43 | | 16,110 | 17,381 |
| Michigan Building Authority Revenue | 5.000% | 11/15/36 | (4) | 6,500 | 7,059 |
| Michigan Finance Authority Revenue | 5.000% | 10/1/33 | | 3,000 | 3,390 |
| Michigan Finance Authority Revenue | 5.000% | 10/1/34 | | 3,670 | 4,131 |
| Michigan Finance Authority Revenue (Detroit Water & Sewer) | 5.000% | 7/1/44 | | 14,830 | 15,580 |
| Michigan Finance Authority Revenue (Detroit Water & Sewer) | 5.000% | 7/1/44 | | 4,625 | 4,755 |
| Michigan Finance Authority Revenue (Sparrow Obligated Group) | 5.000% | 11/15/36 | | 2,500 | 2,692 |
| Michigan Finance Authority Revenue (Unemployment Obligation Assessment) | 5.000% | 7/1/22 | | 4,060 | 4,362 |
| Michigan Finance Authority Revenue (Unemployment Obligation Assessment) | 5.000% | 7/1/23 | | 6,180 | 6,205 |
172
High-Yield Tax-Exempt Fund
| | | | | |
| | | | | Face | Market |
| | | Maturity | | Amount | Value• |
| | Coupon | Date | | ($000) | ($000) |
| Michigan GO | 5.250% | 9/15/26 | (4) | 12,000 | 13,379 |
| Michigan Hospital Finance Authority Revenue (McLaren Health Care) | 5.000% | 6/1/35 | | 2,115 | 2,313 |
| Michigan Hospital Finance Authority Revenue (MidMichigan Obligated Group) | 6.125% | 6/1/34 | | 4,315 | 4,998 |
| Michigan Tobacco Settlement Financing Authority Revenue | 5.250% | 6/1/22 | | 3,870 | 3,365 |
| Michigan Tobacco Settlement Financing Authority Revenue | 6.000% | 6/1/34 | | 10,675 | 9,068 |
| Michigan Tobacco Settlement Financing Authority Revenue | 6.875% | 6/1/42 | | 15,000 | 14,157 |
| Michigan Tobacco Settlement Financing Authority Revenue | 6.000% | 6/1/48 | | 9,220 | 7,465 |
| Oakland University of Michigan Revenue VRDO | 0.050% | 11/7/14 | LOC | 4,100 | 4,100 |
| Royal Oak MI Hospital Finance Authority Hospital Revenue (William Beaumont Hospital) | 6.000% | 8/1/39 | | 7,000 | 7,983 |
| Royal Oak MI Hospital Finance Authority Hospital Revenue (William Beaumont Hospital) | 5.000% | 9/1/39 | | 2,000 | 2,202 |
| Saginaw MI Hospital Finance Authority Hospital Revenue (Covenant Medical Center Inc.) | 5.000% | 7/1/30 | | 10,000 | 10,690 |
| Wayne County MI Airport Authority Revenue (Detroit Metropolitan Wayne County Airport) | 5.000% | 12/1/28 | | 6,125 | 6,726 |
| Wayne County MI Airport Authority Revenue (Detroit Metropolitan Wayne County Airport) | 5.000% | 12/1/32 | | 2,065 | 2,211 |
| Wayne County MI Airport Authority Revenue (Detroit Metropolitan Wayne County Airport) | 5.000% | 12/1/37 | | 2,000 | 2,107 |
| Wayne County MI Airport Authority Revenue (Detroit Metropolitan Wayne County Airport) | 5.000% | 12/1/39 | | 1,700 | 1,837 |
| Wayne County MI Airport Authority Revenue (Detroit Metropolitan Wayne County Airport) | 5.000% | 12/1/44 | | 2,000 | 2,149 |
| | | | | | 207,417 |
| Minnesota (0.5%) | | | | | |
| Dakota County MN Community Development Agency Multifamily Housing Revenue | | | | | |
| (Highview Hills Senior Housing Project) | 7.000% | 8/1/45 | | 8,000 | 8,186 |
| Minneapolis MN Health Care System Revenue (Fairview Health Services) | 6.750% | 11/15/32 | | 8,250 | 9,749 |
| Minnesota Housing Finance Agency Residential Housing Revenue | 4.000% | 7/1/40 | | 715 | 756 |
| Minnesota Public Facilities Authority Revenue (State Revolving Fund) | 5.000% | 3/1/21 | | 5,000 | 5,995 |
| Rochester MN Health Care & Housing Facility Revenue (Homestead At Rochester, Inc. Project) | 6.875% | 12/1/48 | | 10,000 | 11,200 |
| St. Paul MN Port Authority Solid Waste Disposal Revenue (Gerdau St. Paul Steel Mill Project) | 4.500% | 10/1/37 | | 8,500 | 8,494 |
| | | | | | 44,380 |
| Mississippi (0.1%) | | | | | |
| Warren County MS Gulf Opportunity Zone Revenue (International Paper Co. Projects) | 5.375% | 12/1/35 | | 5,500 | 6,152 |
| |
| Missouri (0.7%) | | | | | |
| Cape Girardeau County MO Industrial Development Authority of the Health Facilities Revenue | | | | | |
| (St. Francis Medical Center) | 5.000% | 6/1/33 | | 10,000 | 11,019 |
| Kirkwood MO Industrial Development Authority Retirement Community Revenue | | | | | |
| (Aberdeen Heights Project) | 8.250% | 5/15/39 | | 5,000 | 5,764 |
| Kirkwood MO Industrial Development Authority Retirement Community Revenue | | | | | |
| (Aberdeen Heights Project) | 8.250% | 5/15/45 | | 5,000 | 5,752 |
| Missouri Development Finance Board Infrastructure Facilities Revenue (Branson Landing Project) | 5.000% | 6/1/35 | | 6,125 | 6,246 |
| Missouri Health & Educational Facilities Authority Educational Facilities Revenue | | | | | |
| (St. Louis College of Pharmacy Project) | 5.500% | 5/1/43 | | 8,500 | 9,328 |
| Missouri Health & Educational Facilities Authority Health Facilities Revenue (Cox Health) | 5.500% | 11/15/33 | | 6,500 | 7,176 |
| Missouri Health & Educational Facilities Authority Health Facilities Revenue (Cox Health) | 5.000% | 11/15/48 | | 2,475 | 2,700 |
| Missouri Housing Development Corp. Single Family Mortgage Revenue | 6.050% | 3/1/37 | | 1,830 | 1,893 |
| Missouri Housing Development Corp. Single Family Mortgage Revenue | 6.000% | 3/1/38 | | 1,405 | 1,469 |
| Missouri Housing Development Corp. Single Family Mortgage Revenue | 5.600% | 9/1/38 | | 3,140 | 3,262 |
| Missouri Joint Municipal Electric Utility Commission Power Project Revenue (Plum Point Project) | 5.000% | 1/1/28 | (14) | 2,000 | 2,071 |
| | | | | | 56,680 |
| Montana (0.0%) | | | | | |
| Montana Board Housing Single Family Mortgage Revenue | 5.750% | 12/1/37 | | 785 | 808 |
| |
| Nebraska (0.1%) | | | | | |
| Washington County NE Wastewater & Solid Waste Disposal Facilities Revenue | | | | | |
| (Cargill Inc. Project) PUT | 1.375% | 9/1/15 | | 4,500 | 4,528 |
| |
| Nevada (0.4%) | | | | | |
| Carson City NV Hospital Revenue (Carson Tahoe Regional Medical Center) | 5.000% | 9/1/33 | | 9,500 | 10,286 |
| Clark County NV School District GO | 5.000% | 6/15/25 | | 10,000 | 11,252 |
| Nevada Capital Improvement & Cultural Affairs GO | 5.000% | 12/1/23 | (14) | 2,550 | 2,866 |
| Sparks NV Local Improvement District Revenue | 6.500% | 9/1/20 | | 1,505 | 1,644 |
| Sparks NV Local Improvement District Revenue | 6.750% | 9/1/27 | | 2,640 | 2,817 |
| | | | | | 28,865 |
| New Hampshire (0.2%) | | | | | |
| New Hampshire Health & Education Facilities Authority Revenue | | | | | |
| (Southern New Hampshire University) | 5.000% | 1/1/34 | | 1,375 | 1,451 |
| New Hampshire Health & Education Facilities Authority Revenue | | | | | |
| (Southern New Hampshire University) | 5.000% | 1/1/42 | | 4,450 | 4,657 |
| New Hampshire Health & Education Facilities Authority Revenue (Wentworth Douglas Hospital) | 7.000% | 1/1/38 | | 7,000 | 8,162 |
| | | | | | 14,270 |
173
High-Yield Tax-Exempt Fund
| | | | | |
| | | | | Face | Market |
| | | Maturity | | Amount | Value• |
| | Coupon | Date | | ($000) | ($000) |
| New Jersey (8.2%) | | | | | |
| Camden County NJ Improvement Authority Health Care Redevelopment Project Revenue | | | | | |
| (Cooper Health System Obligated Group) | 5.750% | 2/15/42 | | 5,000 | 5,730 |
| Gloucester County NJ Pollution Control Financing Authority Revenue (Logan Project) | 5.000% | 12/1/24 | | 11,500 | 12,850 |
| New Jersey Building Authority Revenue | 5.000% | 6/15/19 | | 13,670 | 15,468 |
| New Jersey Casino Reinvestment Development Authority Revenue (Hotel Room Fee) | 5.250% | 1/1/23 | (2) | 1,450 | 1,486 |
| New Jersey Casino Reinvestment Development Authority Revenue (Luxury Tax) | 5.250% | 11/1/39 | | 8,000 | 8,572 |
| New Jersey Casino Reinvestment Development Authority Revenue (Luxury Tax) | 5.250% | 11/1/44 | | 6,500 | 6,921 |
| New Jersey COP | 5.250% | 6/15/27 | | 5,000 | 5,613 |
| New Jersey Economic Development Authority Retirement Community Revenue | | | | | |
| (Seabrook Village Inc.) | 5.250% | 11/15/26 | | 1,500 | 1,544 |
| New Jersey Economic Development Authority Retirement Community Revenue | | | | | |
| (Seabrook Village Inc.) | 5.250% | 11/15/36 | | 2,000 | 2,035 |
| New Jersey Economic Development Authority Revenue (Bayonne/IMTT Project) VRDO | 0.050% | 11/3/14 | LOC | 2,100 | 2,100 |
| New Jersey Economic Development Authority Revenue (Goethals Bridge Replacement Project) | 5.375% | 1/1/43 | | 750 | 830 |
| New Jersey Economic Development Authority Revenue (Motor Vehicle Surcharges) | 5.250% | 7/1/24 | (14) | 18,055 | 21,761 |
| New Jersey Economic Development Authority Revenue (Provident Group-Montclair Properties | | | | | |
| LLC–Montclair State University Student Housing Project) | 5.750% | 6/1/31 | | 4,000 | 4,425 |
| New Jersey Economic Development Authority Revenue (School Facilities Construction) | 5.000% | 9/1/21 | | 6,745 | 7,711 |
| New Jersey Economic Development Authority Revenue (School Facilities Construction) | 5.500% | 9/1/21 | | 2,810 | 3,301 |
| New Jersey Economic Development Authority Revenue (School Facilities Construction) | 5.250% | 12/15/21 | (3) | 4,500 | 5,347 |
| New Jersey Economic Development Authority Revenue (School Facilities Construction) | 5.000% | 3/1/22 | | 8,000 | 9,124 |
| New Jersey Economic Development Authority Revenue (School Facilities Construction) | 5.000% | 9/1/22 | | 7,150 | 8,067 |
| New Jersey Economic Development Authority Revenue (School Facilities Construction) | 5.250% | 9/1/23 | | 10,000 | 11,402 |
| New Jersey Economic Development Authority Revenue (School Facilities Construction) | 5.750% | 9/1/23 | | 7,000 | 8,183 |
| New Jersey Economic Development Authority Revenue (School Facilities Construction) | 5.500% | 9/1/24 | (2) | 6,300 | 7,496 |
| New Jersey Economic Development Authority Revenue (School Facilities Construction) | 5.000% | 3/1/27 | | 1,650 | 1,827 |
| New Jersey Economic Development Authority Revenue (School Facilities Construction) | 5.250% | 9/1/27 | | 2,385 | 2,680 |
| New Jersey Economic Development Authority Revenue (School Facilities Construction) | 5.250% | 9/1/28 | | 10,200 | 11,298 |
| New Jersey Economic Development Authority Revenue (School Facilities Construction) | 5.000% | 3/1/32 | | 3,000 | 3,284 |
| New Jersey Economic Development Authority Revenue (School Facilities Construction) | 5.000% | 6/15/34 | | 1,760 | 1,911 |
| New Jersey Economic Development Authority Revenue (School Facilities Construction) | 5.000% | 6/15/40 | | 19,485 | 21,044 |
| New Jersey Economic Development Authority Revenue | | | | | |
| (Trustees of the Lawrenceville School Project) VRDO | 0.070% | 11/3/14 | | 7,100 | 7,100 |
| New Jersey Economic Development Authority Special Facility Revenue | | | | | |
| (Continental Airlines Inc. Project) | 5.125% | 9/15/23 | | 12,730 | 13,651 |
| New Jersey Economic Development Authority Special Facility Revenue | | | | | |
| (Continental Airlines Inc. Project) | 5.250% | 9/15/29 | | 9,750 | 10,335 |
| New Jersey Educational Facilities Authority Revenue (University Medical & Dentistry) | 7.500% | 6/1/19 | (Prere.) | 6,500 | 8,365 |
| New Jersey Environmental Infrastructure Trust Revenue | 5.000% | 9/1/15 | (ETM) | 75 | 78 |
| New Jersey Environmental Infrastructure Trust Revenue | 5.000% | 9/1/15 | | 4,390 | 4,567 |
| New Jersey Equipment Lease Purchase COP | 5.000% | 6/15/23 | | 4,100 | 4,448 |
| New Jersey Health Care Facilities Financing Authority Department of Human Services | | | | | |
| Lease Revenue (Marlboro Psychiatric Hospital Project) | 5.000% | 9/15/29 | | 5,000 | 5,653 |
| New Jersey Health Care Facilities Financing Authority Revenue (South Jersey Hospital) | 5.000% | 7/1/22 | | 2,400 | 2,491 |
| New Jersey Health Care Facilities Financing Authority Revenue (Virtua Health) | 5.750% | 7/1/33 | | 6,700 | 7,609 |
| New Jersey Health Care Facilities Financing Authority Revenue (Virtua Health) VRDO | 0.050% | 11/3/14 | LOC | 4,100 | 4,100 |
| New Jersey Health Care Facilities Financing Authority Revenue (Virtua Health) VRDO | 0.060% | 11/3/14 | LOC | 700 | 700 |
| New Jersey Higher Education Assistance Authority Student Loan Revenue | 4.000% | 12/1/15 | | 1,750 | 1,818 |
| New Jersey Higher Education Assistance Authority Student Loan Revenue | 5.000% | 12/1/18 | | 15,000 | 16,906 |
| New Jersey Higher Education Assistance Authority Student Loan Revenue | 5.000% | 12/1/20 | | 10,205 | 11,622 |
| New Jersey Higher Education Assistance Authority Student Loan Revenue | 5.000% | 12/1/20 | | 5,000 | 5,710 |
| New Jersey Higher Education Assistance Authority Student Loan Revenue | 5.000% | 12/1/21 | | 5,000 | 5,694 |
| New Jersey Higher Education Assistance Authority Student Loan Revenue | 5.000% | 12/1/21 | | 2,835 | 3,229 |
| New Jersey Higher Education Assistance Authority Student Loan Revenue | 5.000% | 12/1/22 | | 2,500 | 2,841 |
| New Jersey Higher Education Assistance Authority Student Loan Revenue | 4.000% | 12/1/27 | | 3,455 | 3,549 |
| New Jersey Higher Education Assistance Authority Student Loan Revenue | 5.750% | 12/1/28 | | 2,250 | 2,561 |
| New Jersey Higher Education Assistance Authority Student Loan Revenue | 3.625% | 12/1/30 | | 5,000 | 5,072 |
| New Jersey Housing & Mortgage Finance Agency Multi-Family Housing Revenue VRDO | 0.250% | 11/7/14 | (4) | 6,330 | 6,330 |
| New Jersey Transportation Corp. COP | 5.000% | 9/15/15 | (Prere.) | 7,000 | 7,295 |
| New Jersey Transportation Trust Fund Authority Transportation System Revenue | 5.500% | 12/15/21 | (14) | 15,250 | 18,109 |
| New Jersey Transportation Trust Fund Authority Transportation System Revenue | 5.750% | 6/15/23 | (14) | 10,000 | 12,125 |
| New Jersey Transportation Trust Fund Authority Transportation System Revenue | 0.000% | 12/15/25 | (2) | 30,000 | 19,720 |
| New Jersey Transportation Trust Fund Authority Transportation System Revenue | 5.000% | 6/15/26 | | 21,615 | 24,663 |
| New Jersey Transportation Trust Fund Authority Transportation System Revenue | 0.000% | 12/15/27 | | 15,000 | 8,541 |
| New Jersey Transportation Trust Fund Authority Transportation System Revenue | 0.000% | 12/15/28 | | 3,430 | 1,850 |
| New Jersey Transportation Trust Fund Authority Transportation System Revenue | 5.625% | 12/15/28 | | 20,000 | 23,121 |
| New Jersey Transportation Trust Fund Authority Transportation System Revenue | 5.500% | 6/15/31 | | 16,940 | 19,598 |
| New Jersey Transportation Trust Fund Authority Transportation System Revenue | 0.000% | 12/15/31 | | 4,275 | 1,979 |
| New Jersey Transportation Trust Fund Authority Transportation System Revenue | 5.250% | 6/15/33 | | 5,000 | 5,607 |
| New Jersey Transportation Trust Fund Authority Transportation System Revenue | 0.000% | 12/15/35 | | 21,150 | 7,766 |
174
High-Yield Tax-Exempt Fund
| | | | | |
| | | | | Face | Market |
| | | Maturity | | Amount | Value• |
| | Coupon | Date | | ($000) | ($000) |
| New Jersey Transportation Trust Fund Authority Transportation System Revenue | 5.000% | 6/15/36 | | 5,000 | 5,437 |
| New Jersey Transportation Trust Fund Authority Transportation System Revenue | 5.250% | 6/15/36 | | 5,000 | 5,535 |
| New Jersey Transportation Trust Fund Authority Transportation System Revenue | 5.500% | 12/15/38 | (12) | 8,000 | 9,173 |
| New Jersey Transportation Trust Fund Authority Transportation System Revenue | 5.500% | 6/15/39 | | 5,300 | 6,019 |
| New Jersey Transportation Trust Fund Authority Transportation System Revenue | 5.000% | 6/15/44 | | 19,665 | 21,086 |
| New Jersey Turnpike Authority Revenue | 5.000% | 1/1/30 | | 8,295 | 9,466 |
| New Jersey Turnpike Authority Revenue | 5.000% | 1/1/31 | | 11,785 | 13,397 |
| New Jersey Turnpike Authority Revenue | 0.000% | 1/1/35 | (2) | 21,495 | 22,376 |
| New Jersey Turnpike Authority Revenue | 5.000% | 1/1/38 | | 15,000 | 16,628 |
| New Jersey Turnpike Authority Revenue | 5.000% | 1/1/43 | | 5,000 | 5,514 |
| 2 New Jersey Turnpike Authority Revenue PUT | 0.580% | 1/1/16 | | 4,500 | 4,511 |
| Rutgers State University New Jersey Revenue VRDO | 0.060% | 11/3/14 | | 5,500 | 5,500 |
| Salem County NJ Pollution Control Financing Authority Revenue (Chambers Project) | 5.000% | 12/1/23 | | 15,000 | 16,878 |
| South Jersey Transportation Authority New Jersey Transportation System Revenue VRDO | 0.040% | 11/7/14 | LOC | 10,155 | 10,155 |
| Tobacco Settlement Financing Corp. New Jersey Revenue | 4.625% | 6/1/26 | | 13,645 | 12,489 |
| Tobacco Settlement Financing Corp. New Jersey Revenue | 4.750% | 6/1/34 | | 5,000 | 3,722 |
| Tobacco Settlement Financing Corp. New Jersey Revenue | 5.000% | 6/1/41 | | 22,825 | 17,021 |
| | | | | | 661,720 |
| New Mexico (0.3%) | | | | | |
| New Mexico Hospital Equipment Loan Council Hospital System Revenue | | | | | |
| (Gerald Champion Regional Medical Center) | 5.500% | 7/1/42 | | 19,750 | 18,575 |
| New Mexico Mortgage Finance Authority Single Family Mortgage Revenue | 5.600% | 7/1/38 | | 2,580 | 2,676 |
| New Mexico Mortgage Finance Authority Single Family Mortgage Revenue | 5.300% | 1/1/39 | | 2,025 | 2,134 |
| | | | | | 23,385 |
| New York (12.9%) | | | | | |
| Brooklyn NY Local Development Corp. PILOT Revenue (Barclays Center Project) | 6.375% | 7/15/43 | | 5,000 | 5,672 |
| Hudson Yards Infrastructure Corp. New York Revenue | 5.750% | 2/15/47 | | 25,400 | 29,245 |
| Long Island NY Power Authority Electric System Revenue | 5.500% | 4/1/22 | | 10,010 | 11,446 |
| Nassau County NY GO | 4.000% | 10/1/21 | | 9,400 | 10,117 |
| Nassau County NY Local Economic Assistance Corp. Revenue | | | | | |
| (Catholic Health Services of Long Island Obligated Group Project) | 5.000% | 7/1/30 | | 1,500 | 1,700 |
| New York City NY GO | 5.000% | 11/1/14 | (Prere.) | 7,225 | 7,225 |
| New York City NY GO | 5.000% | 1/1/17 | (Prere.) | 3,935 | 4,318 |
| New York City NY GO | 5.000% | 8/1/20 | | 4,330 | 5,129 |
| New York City NY GO | 5.000% | 8/1/20 | | 3,905 | 4,626 |
| New York City NY GO | 5.000% | 8/1/22 | | 5,000 | 6,007 |
| New York City NY GO | 5.000% | 1/1/25 | | 1,815 | 1,972 |
| New York City NY GO | 5.000% | 10/1/30 | | 10,000 | 11,698 |
| New York City NY GO | 5.000% | 8/1/32 | | 10,000 | 11,524 |
| New York City NY GO | 5.000% | 8/1/36 | | 15,000 | 17,033 |
| New York City NY GO VRDO | 0.070% | 11/3/14 | | 1,900 | 1,900 |
| New York City NY GO VRDO | 0.060% | 11/7/14 | LOC | 14,705 | 14,705 |
| New York City NY Health & Hospital Corp. Revenue (Health System) | 5.000% | 2/15/30 | | 6,000 | 6,660 |
| 1 New York City NY Housing Development Corp. Multi-Family Mortgage Revenue (8 Spruce Street) | 4.500% | 2/15/48 | | 10,000 | 10,200 |
| New York City NY Industrial Development Agency Airport Facilities Revenue | | | | | |
| (TRIPS Obligated Group) | 5.000% | 7/1/28 | | 4,000 | 4,376 |
| New York City NY Industrial Development Agency PILOT Revenue (Yankee Stadium Project) | 0.000% | 3/1/26 | (12) | 5,000 | 3,436 |
| New York City NY Industrial Development Agency Special Facility Revenue (American Airlines Inc.) | 7.750% | 8/1/31 | | 26,000 | 28,536 |
| New York City NY Industrial Development Agency Special Facility Revenue | | | | | |
| (Terminal One Group Association Project) PUT | 5.500% | 1/1/16 | | 3,250 | 3,413 |
| New York City NY Industrial Development Agency Special Facility Revenue | | | | | |
| (Terminal One Group Association Project) PUT | 5.500% | 1/1/16 | | 3,500 | 3,699 |
| New York City NY Industrial Development Agency Special Facility Revenue | | | | | |
| (Terminal One Group Association Project) PUT | 5.500% | 1/1/16 | | 4,500 | 4,750 |
| New York City NY Industrial Development Agency Special Facility Revenue | | | | | |
| (Terminal One Group Association Project) PUT | 5.500% | 1/1/16 | | 4,000 | 4,212 |
| New York City NY Municipal Water Finance Authority Water & Sewer System Revenue | 5.000% | 6/15/35 | | 10,000 | 11,501 |
| New York City NY Municipal Water Finance Authority Water & Sewer System Revenue | 5.000% | 6/15/35 | | 7,500 | 8,430 |
| New York City NY Municipal Water Finance Authority Water & Sewer System Revenue | 5.375% | 6/15/43 | | 10,000 | 11,714 |
| New York City NY Municipal Water Finance Authority Water & Sewer System Revenue | 5.000% | 6/15/44 | | 5,000 | 5,525 |
| New York City NY Municipal Water Finance Authority Water & Sewer System Revenue | 5.000% | 6/15/45 | | 10,000 | 11,037 |
| New York City NY Municipal Water Finance Authority Water & Sewer System Revenue VRDO | 0.060% | 11/3/14 | | 5,435 | 5,435 |
| New York City NY Transitional Finance Authority Building Aid Revenue | 5.125% | 1/15/33 | | 5,000 | 5,588 |
| New York City NY Transitional Finance Authority Building Aid Revenue | 5.000% | 1/15/34 | | 8,650 | 9,532 |
| New York City NY Transitional Finance Authority Building Aid Revenue | 5.000% | 7/15/37 | | 20,000 | 22,659 |
| New York City NY Transitional Finance Authority Building Aid Revenue | 5.000% | 7/15/40 | | 12,000 | 13,386 |
| New York City NY Transitional Finance Authority Future Tax Revenue | 5.000% | 11/1/15 | | 8,000 | 8,388 |
| New York City NY Transitional Finance Authority Future Tax Revenue | 5.000% | 11/1/16 | | 8,000 | 8,739 |
| New York City NY Transitional Finance Authority Future Tax Revenue | 5.000% | 2/1/36 | | 15,000 | 17,211 |
| New York City NY Transitional Finance Authority Future Tax Revenue | 5.000% | 11/1/38 | | 7,865 | 8,965 |
| 3 New York City NY Transitional Finance Authority Future Tax Revenue TOB VRDO | 0.070% | 11/3/14 | | 10,995 | 10,995 |
175
High-Yield Tax-Exempt Fund
| | | | | | |
| | | | | | Face | Market |
| | | | Maturity | | Amount | Value• |
| | | Coupon | Date | | ($000) | ($000) |
| | New York Liberty Development Corp. Revenue | 5.000% | 11/15/31 | | 2,000 | 2,243 |
| | New York Liberty Development Corp. Revenue | 5.125% | 1/15/44 | | 5,000 | 5,544 |
| | New York Liberty Development Corp. Revenue | 5.000% | 11/15/44 | | 5,080 | 5,632 |
| | New York Liberty Development Corp. Revenue | 6.375% | 7/15/49 | | 10,870 | 12,306 |
| | New York Liberty Development Corp. Revenue | 5.750% | 11/15/51 | | 11,000 | 12,800 |
| | New York Metropolitan Transportation Authority Revenue | 5.000% | 11/15/23 | | 9,100 | 10,164 |
| | New York Metropolitan Transportation Authority Revenue | 5.000% | 11/15/24 | | 3,450 | 3,847 |
| | New York Metropolitan Transportation Authority Revenue | 5.000% | 11/15/25 | | 1,500 | 1,696 |
| | New York Metropolitan Transportation Authority Revenue | 5.000% | 11/15/28 | | 10,000 | 11,644 |
| | New York Metropolitan Transportation Authority Revenue | 5.000% | 11/15/29 | | 3,515 | 3,904 |
| | New York Metropolitan Transportation Authority Revenue | 5.000% | 11/15/30 | | 13,000 | 15,026 |
| | New York Metropolitan Transportation Authority Revenue | 5.000% | 11/15/31 | | 2,000 | 2,270 |
| | New York Metropolitan Transportation Authority Revenue | 5.000% | 11/15/32 | | 2,000 | 2,265 |
| | New York Metropolitan Transportation Authority Revenue | 5.250% | 11/15/32 | | 2,250 | 2,633 |
| | New York Metropolitan Transportation Authority Revenue | 5.250% | 11/15/33 | | 2,500 | 2,917 |
| | New York Metropolitan Transportation Authority Revenue | 5.000% | 11/15/36 | | 14,000 | 15,670 |
| | New York Metropolitan Transportation Authority Revenue | 5.250% | 11/15/36 | | 9,225 | 10,613 |
| | New York Metropolitan Transportation Authority Revenue | 5.000% | 11/15/38 | | 8,315 | 9,229 |
| | New York Metropolitan Transportation Authority Revenue | 5.000% | 11/15/38 | | 8,575 | 9,517 |
| | New York Metropolitan Transportation Authority Revenue | 5.000% | 11/15/38 | | 10,000 | 11,099 |
| | New York Metropolitan Transportation Authority Revenue | 5.250% | 11/15/40 | | 13,000 | 14,498 |
| | New York Metropolitan Transportation Authority Revenue (Dedicated Petroleum Tax) | 6.000% | 4/1/20 | (ETM) | 9,000 | 10,636 |
| | New York Metropolitan Transportation Authority Revenue (Dedicated Petroleum Tax) | 5.000% | 11/15/34 | | 3,250 | 3,674 |
| | New York Metropolitan Transportation Authority Revenue (Transit Revenue) | 5.000% | 11/1/25 | | 5,575 | 6,638 |
| | New York Metropolitan Transportation Authority Revenue (Transit Revenue) | 5.000% | 11/1/26 | | 2,570 | 3,031 |
| | New York Metropolitan Transportation Authority Revenue (Transit Revenue) | 5.000% | 11/15/31 | | 6,000 | 6,884 |
| | New York Metropolitan Transportation Authority Revenue (Transit Revenue) | 5.250% | 11/15/41 | | 8,500 | 9,613 |
| | New York Metropolitan Transportation Authority Revenue VRDO | 0.070% | 11/3/14 | LOC | 51,650 | 51,650 |
| | New York State Dormitory Authority Revenue (Fordham University) VRDO | 0.050% | 11/7/14 | LOC | 13,490 | 13,490 |
| | New York State Dormitory Authority Revenue (New York University Hospitals Center) | 5.625% | 7/1/37 | | 8,750 | 9,565 |
| | New York State Dormitory Authority Revenue (North Shore - Long Island Jewish Obligated Group) | 0.891% | 5/1/18 | | 19,440 | 19,387 |
| | New York State Dormitory Authority Revenue (Personal Income Tax) | 5.000% | 3/15/15 | (Prere.) | 5,220 | 5,314 |
| | New York State Dormitory Authority Revenue (Personal Income Tax) | 5.000% | 3/15/15 | (Prere.) | 280 | 285 |
| | New York State Dormitory Authority Revenue (Personal Income Tax) | 5.000% | 3/15/15 | | 5,090 | 5,183 |
| | New York State Dormitory Authority Revenue (Personal Income Tax) | 5.000% | 3/15/35 | | 10,000 | 10,153 |
| | New York State Dormitory Authority Revenue (Personal Income Tax) | 5.000% | 3/15/37 | | 6,400 | 7,178 |
| | New York State Dormitory Authority Revenue (Rockefeller University) VRDO | 0.030% | 11/7/14 | | 5,200 | 5,200 |
| | New York State Dormitory Authority Revenue (The New School) | 5.500% | 7/1/40 | | 5,000 | 5,638 |
| | New York State Environmental Facilities Corp. Revenue | | | | | |
| | (State Clean Water & Drinking Water Revolving Funds) | 5.000% | 10/15/35 | | 5,815 | 6,257 |
| | New York State Housing Finance Agency Housing Revenue (20 River Terrace Housing) VRDO | 0.050% | 11/7/14 | LOC | 11,000 | 11,000 |
| 1 | New York State Liberty Development Corp. Liberty Revenue (3 World Trade Center Project) | 5.375% | 11/15/40 | | 15,500 | 15,861 |
| 1 | New York State Liberty Development Corp. Liberty Revenue (3 World Trade Center Project) | 5.000% | 11/15/44 | | 22,000 | 22,103 |
| 1 | New York State Liberty Development Corp. Liberty Revenue (3 World Trade Center Project) | 7.250% | 11/15/44 | | 4,000 | 4,290 |
| | New York State Local Government Assistance Corp. Revenue VRDO | 0.050% | 11/7/14 | | 16,500 | 16,500 |
| 3 | New York State Mortgage Agency Homeowner Mortgage Revenue TOB VRDO | 0.180% | 11/7/14 | | 10,760 | 10,760 |
| | New York State Thruway Authority Revenue | 5.000% | 1/1/37 | | 20,000 | 22,316 |
| | New York State Urban Development Corp. Revenue (Service Contract) VRDO | 0.070% | 11/7/14 | | 8,500 | 8,500 |
| | Niagara NY Frontier Transportation Authority (Buffalo Niagara International Airport) | 5.000% | 4/1/25 | | 2,000 | 2,332 |
| | Niagara NY Frontier Transportation Authority (Buffalo Niagara International Airport) | 5.000% | 4/1/26 | | 3,750 | 4,263 |
| 2,3 | Nuveen Dividend Advantage Municipal Fund 3 iMTP | 0.800% | 10/1/17 | | 25,000 | 25,007 |
| | Port Authority of New York & New Jersey Revenue | 5.000% | 10/15/24 | | 5,985 | 6,901 |
| | Port Authority of New York & New Jersey Revenue | 5.000% | 9/15/25 | | 5,835 | 6,621 |
| | Port Authority of New York & New Jersey Revenue | 5.000% | 9/1/27 | | 1,695 | 1,978 |
| | Port Authority of New York & New Jersey Revenue | 5.000% | 3/15/28 | | 8,600 | 9,611 |
| | Port Authority of New York & New Jersey Revenue | 5.000% | 9/1/32 | | 4,500 | 5,134 |
| | Port Authority of New York & New Jersey Revenue | 5.000% | 10/15/32 | | 9,900 | 11,023 |
| | Port Authority of New York & New Jersey Revenue | 5.000% | 10/15/33 | | 4,000 | 4,547 |
| | Port Authority of New York & New Jersey Revenue | 5.000% | 12/1/33 | | 5,000 | 5,633 |
| | Port Authority of New York & New Jersey Revenue | 5.000% | 10/15/34 | | 6,650 | 7,536 |
| | Port Authority of New York & New Jersey Revenue | 5.750% | 3/15/35 | | 25,000 | 28,049 |
| | Port Authority of New York & New Jersey Revenue | 5.000% | 10/15/35 | | 3,740 | 4,222 |
| | Port Authority of New York & New Jersey Revenue | 5.000% | 10/15/36 | | 2,665 | 2,996 |
| | Port Authority of New York & New Jersey Revenue | 5.000% | 10/15/37 | | 4,665 | 5,240 |
| | Port Authority of New York & New Jersey Revenue | 5.000% | 10/15/44 | | 10,000 | 11,136 |
| 3 | Port Authority of New York & New Jersey Revenue TOB VRDO | 0.100% | 11/7/14 | | 5,190 | 5,190 |
| 3 | Port Authority of New York & New Jersey Revenue TOB VRDO | 0.100% | 11/7/14 | | 3,400 | 3,400 |
| | Port Authority of New York & New Jersey Special Obligation Revenue | | | | | |
| | (John F. Kennedy International Air Terminal LLC) | 5.500% | 12/1/31 | | 4,000 | 4,595 |
| | Port Authority of New York & New Jersey Special Obligation Revenue | | | | | |
| | (John F. Kennedy International Air Terminal LLC) | 6.000% | 12/1/42 | | 13,000 | 15,067 |
| | Suffolk County NY Economic Development Corp. Revenue (Catholic Health Services) | 5.000% | 7/1/30 | | 2,315 | 2,624 |
176
High-Yield Tax-Exempt Fund
| | | | | |
| | | | | Face | Market |
| | | Maturity | | Amount | Value• |
| | Coupon | Date | | ($000) | ($000) |
| Suffolk County NY Economic Development Corp. Revenue (Catholic Health Services) | 5.000% | 7/1/31 | | 1,000 | 1,129 |
| Tompkins County NY Development Corp. Revenue (Tompkins Cortland Community College) | 5.000% | 7/1/27 | | 3,485 | 3,721 |
| Tompkins County NY Development Corp. Revenue (Tompkins Cortland Community College) | 5.000% | 7/1/32 | | 3,000 | 3,173 |
| Tompkins County NY Development Corp. Revenue (Tompkins Cortland Community College) | 5.000% | 7/1/38 | | 4,000 | 4,189 |
| Triborough Bridge & Tunnel Authority New York Revenue | 5.000% | 11/15/28 | | 4,000 | 4,704 |
| Triborough Bridge & Tunnel Authority New York Revenue | 5.000% | 11/15/29 | | 2,000 | 2,337 |
| Ulster County NY Capital Resource Corp. Revenue | | | | | |
| (Health Alliance Senior Living Corp.–Woodland Pond at New Paltz Project) | 0.000% | 9/15/44 | | 2,710 | 1,874 |
| Ulster County NY Industrial Development Agency Civic Facility Revenue | | | | | |
| (Kingston Regional Senior Living Corp.–Woodland Pond at New Paltz Project) | 6.000% | 9/15/37 | | 7,000 | 6,280 |
| Ulster County NY Industrial Development Agency Civic Facility Revenue | | | | | |
| (Kingston Regional Senior Living Corp.–Woodland Pond at New Paltz Project) | 6.000% | 9/15/42 | | 7,000 | 6,185 |
| Utility Debt Securitization Authority New York Revenue | 5.000% | 12/15/35 | | 5,600 | 6,551 |
| Westchester County NY Health Care Corp. Revenue | 6.125% | 11/1/37 | | 3,000 | 3,467 |
| | | | | | 1,046,042 |
| North Carolina (0.8%) | | | | | |
| North Carolina GO | 5.500% | 3/1/15 | | 2,355 | 2,397 |
| North Carolina GO | 5.000% | 6/1/15 | | 3,000 | 3,085 |
| North Carolina GO | 5.000% | 5/1/18 | | 3,000 | 3,438 |
| North Carolina GO | 5.000% | 6/1/20 | | 5,000 | 5,998 |
| North Carolina GO | 5.000% | 6/1/20 | | 10,360 | 12,428 |
| North Carolina Housing Finance Agency Home Ownership Revenue | 5.500% | 1/1/38 | | 335 | 339 |
| North Carolina Housing Finance Agency Home Ownership Revenue | 5.500% | 7/1/38 | | 1,085 | 1,105 |
| North Carolina Medical Care Commission Health Care Facilities Mortgage Revenue (Salemtowne) | 5.000% | 10/1/23 | | 1,850 | 1,877 |
| North Carolina Medical Care Commission Health Care Facilities Revenue | | | | | |
| (Cape Fear Valley Health System) | 5.000% | 10/1/23 | | 9,785 | 11,173 |
| North Carolina Medical Care Commission Health Care Facilities Revenue (Vidant Health) | 5.000% | 6/1/36 | | 2,000 | 2,204 |
| North Carolina Medical Care Commission Hospital Revenue (North Carolina Baptist Hospital) | 5.000% | 6/1/34 | | 5,050 | 5,511 |
| North Carolina Medical Care Commission Retirement Facilities Mortgage Revenue (Aldersgate) | 6.250% | 7/1/35 | | 4,500 | 4,862 |
| North Carolina Medical Care Commission Retirement Facilities Mortgage Revenue | | | | | |
| (Givens Estates Project) | 5.000% | 7/1/27 | | 2,750 | 2,888 |
| Wake County NC GO | 5.000% | 2/1/16 | | 7,800 | 8,262 |
| | | | | | 65,567 |
| Ohio (1.6%) | | | | | |
| Allen County OH Hospital Facilities Revenue (Catholic Healthcare Partners) | 5.250% | 9/1/27 | | 10,000 | 11,478 |
| Bowling Green State University Ohio Student Housing Revenue | | | | | |
| (CFP I LLC–State University Project) | 5.750% | 6/1/31 | | 5,000 | 5,413 |
| Buckeye Tobacco Settlement Financing Authority Ohio Revenue | 5.750% | 6/1/34 | | 14,195 | 11,178 |
| Buckeye Tobacco Settlement Financing Authority Ohio Revenue | 6.250% | 6/1/37 | | 5,000 | 4,197 |
| Buckeye Tobacco Settlement Financing Authority Ohio Revenue | 6.000% | 6/1/42 | | 5,350 | 4,215 |
| Buckeye Tobacco Settlement Financing Authority Ohio Revenue | 5.875% | 6/1/47 | | 25,730 | 20,326 |
| Buckeye Tobacco Settlement Financing Authority Ohio Revenue | 6.500% | 6/1/47 | | 15,365 | 13,161 |
| Butler County OH Hospital Facilities Revenue (Kettering Health Network) | 6.375% | 4/1/36 | | 3,750 | 4,405 |
| Butler County OH Hospital Facilities Revenue (Kettering Health Network) | 5.625% | 4/1/41 | | 5,000 | 5,557 |
| Butler County OH Hospital Facilities Revenue (UC Health) | 5.250% | 11/1/29 | | 3,380 | 3,771 |
| Columbus OH GO | 5.000% | 2/15/22 | | 7,375 | 8,985 |
| Hamilton County OH Hospital Facilities Revenue (UC Health) | 5.000% | 2/1/44 | | 440 | 479 |
| Lucas County OH Hospital Revenue (ProMedica Healthcare Obligated Group) | 6.000% | 11/15/41 | | 3,000 | 3,582 |
| Ohio GO | 4.500% | 3/15/16 | (Prere.) | 2,030 | 2,148 |
| 3 Ohio Hospital Revenue (Cleveland Clinic Health System Obligated Group) TOB VRDO | 0.070% | 11/3/14 | | 7,700 | 7,700 |
| Ohio Hospital Revenue (University Hospitals Health System Inc.) | 5.000% | 1/15/41 | | 10,250 | 10,992 |
| Penta Career Center Ohio COP | 5.250% | 4/1/26 | | 3,505 | 4,034 |
| Penta Career Center Ohio COP | 5.250% | 4/1/27 | | 3,490 | 4,000 |
| Wood County OH Hospital Facilities Revenue (Wood County Hospital) | 5.000% | 12/1/32 | | 3,000 | 3,190 |
| | | | | | 128,811 |
| Oklahoma (0.6%) | | | | | |
| Oklahoma Capitol Improvement Authority Facilities Revenue | 5.000% | 7/1/15 | (Prere.) | 4,250 | 4,387 |
| Oklahoma Capitol Improvement Authority Facilities Revenue | 5.000% | 7/1/15 | (Prere.) | 4,510 | 4,655 |
| Oklahoma County OK Finance Authority Revenue (Epworth Villa Project) | 5.125% | 4/1/42 | | 10,260 | 8,408 |
| Oklahoma Housing Finance Agency Single Family Mortgage Revenue | | | | | |
| (Homeownership Loan Program) | 5.750% | 9/1/36 | | 1,065 | 1,097 |
| Oklahoma Housing Finance Agency Single Family Mortgage Revenue | | | | | |
| (Homeownership Loan Program) | 5.800% | 9/1/37 | | 1,365 | 1,433 |
| Oklahoma Housing Finance Agency Single Family Mortgage Revenue | | | | | |
| (Homeownership Loan Program) | 5.875% | 9/1/37 | | 1,560 | 1,621 |
| Oklahoma Housing Finance Agency Single Family Mortgage Revenue | | | | | |
| (Homeownership Loan Program) | 5.950% | 9/1/37 | | 3,000 | 3,222 |
| 1 Oklahoma Municipal Power Authority Power Supply System Revenue | 5.000% | 1/1/38 | | 3,500 | 3,965 |
| Oklahoma Municipal Power Authority Power Supply System Revenue | 6.000% | 1/1/38 | | 4,500 | 5,043 |
| Tulsa OK Municipal Airport Trust Revenue PUT | 7.750% | 12/1/14 | | 16,210 | 16,284 |
| | | | | | 50,115 |
177
High-Yield Tax-Exempt Fund
| | | | | |
| | | | | Face | Market |
| | | Maturity | | Amount | Value• |
| | Coupon | Date | | ($000) | ($000) |
| Oregon (0.2%) | | | | | |
| Oregon Health & Science University Revenue | 5.750% | 7/1/39 | | 6,750 | 7,882 |
| Oregon Housing & Community Service Department Single Family Mortgage Revenue | 4.000% | 7/1/44 | | 3,040 | 3,293 |
| Port of Portland OR International Airport Revenue | 5.000% | 7/1/32 | | 1,000 | 1,147 |
| Port of Portland OR International Airport Revenue | 5.000% | 7/1/33 | | 3,485 | 3,978 |
| Port of Portland OR International Airport Revenue | 5.000% | 7/1/34 | | 3,160 | 3,596 |
| | | | | | 19,896 |
| Pennsylvania (3.6%) | | | | | |
| Allegheny County PA GO | 5.000% | 11/1/29 | | 3,265 | 3,714 |
| Allegheny County PA Higher Education Building Authority University Revenue (Chatham University) | 5.000% | 9/1/30 | | 500 | 543 |
| Allegheny County PA Higher Education Building Authority University Revenue (Chatham University) | 5.000% | 9/1/35 | | 2,165 | 2,303 |
| Allegheny County PA Hospital Development Authority Revenue | | | | | |
| (University of Pittsburgh Medical Center) | 0.981% | 2/1/37 | | 10,425 | 9,281 |
| Allentown PA Neighborhood Improvement Zone Development Authority Tax Revenue | 5.000% | 5/1/30 | | 2,800 | 3,056 |
| Allentown PA Neighborhood Improvement Zone Development Authority Tax Revenue | 5.000% | 5/1/42 | | 4,500 | 4,801 |
| 3 Bristol Township PA School District GO TOB VRDO | 0.100% | 11/7/14 | | 12,935 | 12,935 |
| Commonwealth Financing Authority Pennsylvania Revenue | 5.000% | 6/1/22 | | 1,000 | 1,193 |
| Cumberland County PA Municipal Authority Revenue (Asbury Pennsylvania CCRC Obligated Group) | 5.250% | 1/1/41 | | 4,000 | 4,094 |
| East Hempfield Township PA Industrial Development Authority Revenue | | | | | |
| (Millersville University Student Housing Project) | 5.000% | 7/1/39 | | 1,625 | 1,708 |
| East Hempfield Township PA Industrial Development Authority Revenue | | | | | |
| (Millersville University Student Housing Project) | 5.000% | 7/1/46 | | 3,175 | 3,318 |
| Emmaus PA General Authority Revenue VRDO | 0.050% | 11/7/14 | LOC | 1,700 | 1,700 |
| 2 Geisinger Authority Health System Pennsylvania Revenue (Geisinger Health System) PUT | 1.175% | 6/1/24 | | 18,500 | 18,507 |
| Lebanon County PA Health Facilities Authority Health Center Revenue | | | | | |
| (Pleasant View Retirement Community Project) | 5.125% | 12/15/20 | | 1,000 | 1,002 |
| Lebanon County PA Health Facilities Authority Health Center Revenue | | | | | |
| (Pleasant View Retirement Community Project) | 5.300% | 12/15/26 | | 500 | 501 |
| Lehigh County PA Authority Water & Sewer Revenue | 5.000% | 12/1/43 | | 4,285 | 4,736 |
| Lehigh County PA General Purpose Authority Revenue | | | | | |
| (Bible Fellowship Church Homes Inc. Project) | 5.125% | 7/1/32 | | 2,710 | 2,772 |
| Lehigh County PA General Purpose Authority Revenue | | | | | |
| (Bible Fellowship Church Homes Inc. Project) | 5.250% | 7/1/42 | | 4,000 | 4,056 |
| Monroeville PA Finance Authority Revenue (UPMC Health System) | 5.000% | 2/15/30 | | 4,000 | 4,522 |
| Montgomery County PA GO VRDO | 0.070% | 11/3/14 | | 5,185 | 5,185 |
| Montgomery County PA Higher Education & Health Authority Revenue (Arcadia University) | 5.750% | 4/1/40 | | 3,530 | 3,843 |
| Montgomery County PA Industrial Development Authority Revenue | | | | | |
| (Philadelphia Presbyterian Homes Inc. Project) | 7.000% | 12/1/35 | | 2,670 | 3,122 |
| Montgomery County PA Industrial Development Authority Revenue | | | | | |
| (Philadelphia Presbyterian Homes Inc. Project) | 7.000% | 12/1/40 | | 2,500 | 2,897 |
| Northampton County PA General Purpose Authority Hospital Revenue (St. Luke’s Hospital Project) | 5.500% | 8/15/35 | | 5,000 | 5,482 |
| Northampton County PA General Purpose Authority Hospital Revenue (St. Luke’s Hospital Project) | 5.500% | 8/15/40 | | 6,500 | 7,085 |
| Pennsylvania Economic Development Financing Authority Resource Recovery Revenue | | | | | |
| (Colver Project) | 5.000% | 12/1/14 | (2) | 6,000 | 6,016 |
| Pennsylvania Economic Development Financing Authority Resource Recovery Revenue | | | | | |
| (Colver Project) | 4.625% | 12/1/18 | (2) | 10,500 | 10,776 |
| Pennsylvania Economic Development Financing Authority Solid Waste Disposal Revenue | | | | | |
| (Republic Services Inc. Project) PUT | 0.400% | 1/2/15 | | 15,000 | 15,000 |
| Pennsylvania Economic Development Financing Authority Solid Waste Disposal Revenue | | | | | |
| (Waste Management Inc. Project) PUT | 4.700% | 11/1/14 | | 7,250 | 7,250 |
| Pennsylvania GO | 5.000% | 4/1/22 | | 12,875 | 15,572 |
| Pennsylvania Higher Educational Facilities Authority Revenue | | | | | |
| (Foundation for Indiana University of Pennsylvania Student Housing) | 5.000% | 7/1/41 | | 2,275 | 2,416 |
| 3 Pennsylvania State University Revenue TOB VRDO | 0.050% | 11/7/14 | LOC | 7,500 | 7,500 |
| Pennsylvania Turnpike Commission Revenue | 5.000% | 6/1/26 | (12) | 10,040 | 11,451 |
| Pennsylvania Turnpike Commission Revenue | 5.000% | 6/1/27 | (12) | 6,865 | 7,810 |
| Pennsylvania Turnpike Commission Revenue | 5.000% | 6/1/29 | | 3,990 | 4,469 |
| Pennsylvania Turnpike Commission Revenue | 5.500% | 12/1/33 | | 4,000 | 4,790 |
| Pennsylvania Turnpike Commission Revenue | 6.500% | 12/1/36 | | 4,000 | 4,834 |
| Pennsylvania Turnpike Commission Revenue | 0.000% | 12/1/39 | | 8,000 | 5,434 |
| Pennsylvania Turnpike Commission Revenue | 5.250% | 12/1/39 | | 13,000 | 14,648 |
| Philadelphia PA Airport Revenue | 5.000% | 6/15/21 | | 2,820 | 3,301 |
| Philadelphia PA Hospitals & Higher Education Facilities Authority Hospital Revenue | | | | | |
| (Temple University Health System Obligated Group) | 5.625% | 7/1/36 | | 5,850 | 6,183 |
| Philadelphia PA Hospitals & Higher Education Facilities Authority Hospital Revenue | | | | | |
| (Temple University Health System Obligated Group) | 5.625% | 7/1/42 | | 7,845 | 8,266 |
| Philadelphia PA School District GO | 6.000% | 9/1/18 | (Prere.) | 190 | 226 |
| Philadelphia PA School District GO | 6.000% | 9/1/38 | | 12,810 | 14,516 |
| Pittsburgh & Allegheny County PA Sports & Exhibition Authority Lease Revenue VRDO | 0.170% | 11/7/14 | (4) | 5,950 | 5,950 |
| Sayre PA Health Care Facilities Authority Revenue (Guthrie Health Care System) | 0.807% | 12/1/17 | | 20,150 | 20,001 |
178
High-Yield Tax-Exempt Fund
| | | | | |
| | | | | Face | Market |
| | | Maturity | | Amount | Value• |
| | Coupon | Date | | ($000) | ($000) |
| Puerto Rico (1.3%) | | | | | |
| Puerto Rico Aqueduct & Sewer Authority Revenue | 5.125% | 7/1/37 | | 4,905 | 3,358 |
| Puerto Rico Aqueduct & Sewer Authority Revenue | 5.250% | 7/1/42 | | 13,965 | 9,428 |
| Puerto Rico Electric Power Authority Revenue | 5.250% | 7/1/30 | (14) | 5,000 | 4,819 |
| Puerto Rico GO | 5.000% | 7/1/28 | | 1,845 | 1,329 |
| Puerto Rico GO | 5.125% | 7/1/28 | | 3,245 | 2,354 |
| Puerto Rico GO | 5.375% | 7/1/30 | | 3,665 | 2,640 |
| Puerto Rico GO | 5.125% | 7/1/31 | | 3,125 | 2,216 |
| Puerto Rico GO | 8.000% | 7/1/35 | | 12,000 | 10,499 |
| Puerto Rico GO | 5.250% | 7/1/37 | | 5,055 | 3,527 |
| Puerto Rico GO | 5.750% | 7/1/38 | | 4,320 | 3,105 |
| Puerto Rico GO | 5.500% | 7/1/39 | | 7,315 | 5,139 |
| Puerto Rico GO | 6.500% | 7/1/40 | | 4,000 | 2,990 |
| Puerto Rico GO | 6.500% | 7/1/40 | | 1,830 | 1,368 |
| Puerto Rico GO | 5.000% | 7/1/41 | | 14,295 | 9,652 |
| Puerto Rico GO | 5.750% | 7/1/41 | | 10,290 | 7,357 |
| Puerto Rico Sales Tax Financing Corp. Revenue | 0.000% | 8/1/38 | | 38,370 | 5,429 |
| Puerto Rico Sales Tax Financing Corp. Revenue | 5.375% | 8/1/38 | | 3,690 | 2,726 |
| Puerto Rico Sales Tax Financing Corp. Revenue | 5.375% | 8/1/39 | | 3,000 | 2,205 |
| Puerto Rico Sales Tax Financing Corp. Revenue | 5.000% | 8/1/40 | | 9,900 | 7,561 |
| Puerto Rico Sales Tax Financing Corp. Revenue | 5.250% | 8/1/40 | | 8,225 | 6,498 |
| Puerto Rico Sales Tax Financing Corp. Revenue | 5.250% | 8/1/41 | | 1,000 | 719 |
| Puerto Rico Sales Tax Financing Corp. Revenue | 5.000% | 8/1/43 | | 7,000 | 4,836 |
| Puerto Rico Sales Tax Financing Corp. Revenue | 5.000% | 8/1/46 | | 4,880 | 3,647 |
| | | | | | 103,402 |
| South Carolina (1.5%) | | | | | |
| Charleston SC Educational Excellence Financing Corp. Revenue | | | | | |
| (Charleston County School District, South Carolina Project) | 5.250% | 12/1/15 | (Prere.) | 5,000 | 5,272 |
| Charleston SC Educational Excellence Financing Corp. Revenue | | | | | |
| (Charleston County School District, South Carolina Project) | 5.250% | 12/1/15 | (Prere.) | 14,650 | 15,446 |
| Charleston SC Educational Excellence Financing Corp. Revenue | | | | | |
| (Charleston County School District, South Carolina Project) | 5.000% | 12/1/16 | (Prere.) | 10,120 | 11,078 |
| Charleston SC Educational Excellence Financing Corp. Revenue | | | | | |
| (Charleston County School District, South Carolina Project) | 5.000% | 12/1/28 | | 4,000 | 4,831 |
| Charleston SC Educational Excellence Financing Corp. Revenue | | | | | |
| (Charleston County School District, South Carolina Project) | 5.000% | 12/1/31 | | 2,500 | 2,990 |
| Lancaster County SC Assessment Revenue | 5.450% | 12/1/37 | | 1,270 | 1,284 |
| Piedmont SC Municipal Power Agency Revenue | 5.250% | 1/1/19 | | 11,770 | 13,235 |
| Piedmont SC Municipal Power Agency Revenue | 5.750% | 1/1/34 | (4) | 10,000 | 11,500 |
| South Carolina Jobs Economic Development Authority Health Care Facilities Revenue | | | | | |
| (Lutheran Homes of South Carolina Inc.) | 5.375% | 5/1/21 | | 1,500 | 1,563 |
| South Carolina Public Service Authority Revenue | 5.000% | 12/1/34 | | 7,430 | 8,451 |
| South Carolina Public Service Authority Revenue | 5.000% | 12/1/35 | | 7,940 | 9,031 |
| South Carolina Public Service Authority Revenue | 5.500% | 1/1/38 | | 15,000 | 17,082 |
| South Carolina Public Service Authority Revenue | 5.000% | 12/1/38 | | 15,335 | 17,123 |
| South Carolina Public Service Authority Revenue | 5.000% | 12/1/39 | | 5,000 | 5,597 |
| | | | | | 124,483 |
| South Dakota (0.3%) | | | | | |
| South Dakota Building Authority Revenue | 5.000% | 6/1/38 | | 4,000 | 4,533 |
| South Dakota Health & Educational Facilities Authority Revenue (Sanford Health) | 5.000% | 11/1/37 | | 10,000 | 11,039 |
| South Dakota Health & Educational Facilities Authority Revenue (Sanford Health) | 4.000% | 11/1/44 | | 3,775 | 3,672 |
| South Dakota Health & Educational Facilities Authority Revenue (Sanford Health) | 5.000% | 11/1/44 | | 5,000 | 5,544 |
| | | | | | 24,788 |
| Tennessee (2.1%) | | | | | |
| Chattanooga TN Health Educational & Housing Facility Board Revenue (Catholic Health Initiatives) | 5.250% | 1/1/45 | | 6,500 | 7,336 |
| Knox County TN Health Educational & Housing Facilities Board Hospital Facilities Revenue | | | | | |
| (Covenant Healthcare) | 0.000% | 1/1/42 | | 3,215 | 767 |
| Metropolitan Government of Nashville & Davidson County TN Industrial Development | | | | | |
| Board Revenue (Waste Management Inc. Tennessee Project) PUT | 1.500% | 8/1/17 | | 7,500 | 7,507 |
| Shelby County TN Health Educational & Housing Facility Board Revenue | | | | | |
| (Methodist Le Bonheur Healthcare) VRDO | 0.060% | 11/3/14 | (4) | 9,350 | 9,350 |
| Shelby County TN Health Educational & Housing Facility Board Revenue | | | | | |
| (Methodist Le Bonheur Healthcare) VRDO | 0.070% | 11/3/14 | (4) | 27,700 | 27,700 |
| Tennessee Energy Acquisition Corp. Gas Revenue | 5.000% | 9/1/15 | | 20,495 | 21,173 |
| Tennessee Energy Acquisition Corp. Gas Revenue | 5.000% | 2/1/19 | | 22,820 | 25,388 |
| Tennessee Energy Acquisition Corp. Gas Revenue | 5.250% | 9/1/19 | | 7,280 | 8,289 |
| Tennessee Energy Acquisition Corp. Gas Revenue | 5.000% | 2/1/20 | | 3,460 | 3,869 |
| Tennessee Energy Acquisition Corp. Gas Revenue | 5.250% | 9/1/21 | | 2,295 | 2,650 |
| Tennessee Energy Acquisition Corp. Gas Revenue | 5.000% | 2/1/22 | | 890 | 1,014 |
| Tennessee Energy Acquisition Corp. Gas Revenue | 5.250% | 9/1/22 | | 6,045 | 7,052 |
179
High-Yield Tax-Exempt Fund
| | | | | |
| | | | | Face | Market |
| | | Maturity | | Amount | Value• |
| | Coupon | Date | | ($000) | ($000) |
| Tennessee Energy Acquisition Corp. Gas Revenue | 5.000% | 2/1/23 | | 2,055 | 2,360 |
| Tennessee Energy Acquisition Corp. Gas Revenue | 5.250% | 9/1/23 | | 1,655 | 1,948 |
| Tennessee Energy Acquisition Corp. Gas Revenue | 5.000% | 2/1/24 | | 5,780 | 6,642 |
| Tennessee Energy Acquisition Corp. Gas Revenue | 5.250% | 9/1/24 | | 2,500 | 2,946 |
| Tennessee Energy Acquisition Corp. Gas Revenue | 5.250% | 9/1/26 | | 2,460 | 2,905 |
| Tennessee Energy Acquisition Corp. Gas Revenue | 5.000% | 2/1/27 | | 16,215 | 18,655 |
| Tennessee Housing Development Agency Homeownership Program Revenue | 5.750% | 1/1/37 | | 1,840 | 1,896 |
| Tennessee Housing Development Agency Homeownership Program Revenue | 5.750% | 7/1/37 | | 2,490 | 2,564 |
| Tennessee Housing Development Agency Homeownership Program Revenue | 4.500% | 1/1/38 | | 1,570 | 1,685 |
| Tennessee Housing Development Agency Residential Finance Program Revenue | 4.000% | 7/1/39 | | 4,500 | 4,875 |
| | | | | | 168,571 |
| Texas (8.7%) | | | | | |
| Central Texas Regional Mobility Authority Revenue | 0.000% | 1/1/32 | | 4,090 | 1,889 |
| Central Texas Regional Mobility Authority Revenue | 0.000% | 1/1/33 | | 3,000 | 1,299 |
| Central Texas Regional Mobility Authority Revenue | 5.000% | 1/1/33 | | 6,590 | 7,069 |
| Central Texas Regional Mobility Authority Revenue | 6.250% | 1/1/46 | | 1,500 | 1,747 |
| Dallas-Fort Worth TX International Airport Revenue | 5.000% | 11/1/26 | | 10,000 | 11,173 |
| Dallas-Fort Worth TX International Airport Revenue | 5.000% | 11/1/32 | | 7,200 | 7,792 |
| Dallas-Fort Worth TX International Airport Revenue | 5.000% | 11/1/35 | | 3,760 | 4,046 |
| Dallas-Fort Worth TX International Airport Revenue | 5.000% | 11/1/35 | | 7,000 | 7,532 |
| Dallas-Fort Worth TX International Airport Revenue | 5.000% | 11/1/38 | | 7,085 | 7,580 |
| Dallas-Fort Worth TX International Airport Revenue | 5.000% | 11/1/38 | | 21,275 | 22,981 |
| Dallas-Fort Worth TX International Airport Revenue | 5.000% | 11/1/42 | | 16,785 | 18,013 |
| Dallas-Fort Worth TX International Airport Revenue | 5.000% | 11/1/42 | | 10,000 | 10,732 |
| Dallas-Fort Worth TX International Airport Revenue | 5.000% | 11/1/43 | | 4,240 | 4,506 |
| Grand Parkway Transportation Corp. Texas System Toll Revenue | 0.000% | 10/1/34 | | 19,500 | 14,571 |
| Grand Parkway Transportation Corp. Texas System Toll Revenue | 5.250% | 10/1/51 | | 8,000 | 8,929 |
| Harris County TX Cultural Education Facilities Finance Corp. Hospital Revenue | | | | | |
| (Memorial Hermann Healthcare System) | 5.000% | 12/1/31 | | 8,000 | 9,018 |
| Harris County TX Cultural Education Facilities Finance Corp. Revenue | | | | | |
| (YMCA of the Greater Houston Area) | 5.000% | 6/1/38 | | 2,500 | 2,678 |
| Houston TX Airport System Revenue | 5.000% | 7/1/23 | | 3,000 | 3,476 |
| Houston TX Airport System Revenue | 5.000% | 7/1/32 | | 5,000 | 5,511 |
| Houston TX Airport System Revenue | 5.500% | 7/1/39 | | 5,000 | 5,661 |
| Houston TX Airport System Special Facilities Revenue | | | | | |
| (Continental Airlines Inc. Terminal Improvement Projects) | 4.750% | 7/1/24 | | 7,500 | 8,025 |
| Houston TX Airport System Special Facilities Revenue | | | | | |
| (Continental Airlines Inc. Terminal Improvement Projects) | 6.125% | 7/15/27 | | 11,000 | 11,041 |
| Houston TX Airport System Special Facilities Revenue | | | | | |
| (Continental Airlines Inc. Terminal Improvement Projects) | 5.000% | 7/1/29 | | 23,150 | 24,438 |
| Houston TX Airport System Special Facilities Revenue | | | | | |
| (Continental Airlines Inc. Terminal Improvement Projects) | 6.500% | 7/15/30 | | 4,000 | 4,518 |
| Love Field Airport Modernization Corp. Texas Special Facilities Revenue | | | | | |
| (Southwest Airlines Co. Project) | 5.000% | 11/1/22 | | 2,250 | 2,578 |
| Love Field Airport Modernization Corp. Texas Special Facilities Revenue | | | | | |
| (Southwest Airlines Co. Project) | 5.000% | 11/1/28 | | 4,000 | 4,283 |
| Lower Colorado River Authority Texas Revenue | 5.625% | 5/15/19 | (Prere.) | 5 | 6 |
| Lower Colorado River Authority Texas Revenue | 5.625% | 5/15/19 | (Prere.) | 10 | 12 |
| Lower Colorado River Authority Texas Revenue | 5.625% | 5/15/19 | (Prere.) | 15 | 18 |
| Lower Colorado River Authority Texas Revenue | 5.625% | 5/15/19 | (Prere.) | 205 | 245 |
| Lower Colorado River Authority Texas Revenue | 5.000% | 5/15/30 | | 5,000 | 5,515 |
| Lower Colorado River Authority Texas Revenue | 5.000% | 5/15/35 | | 2,940 | 3,279 |
| Lower Colorado River Authority Texas Revenue | 5.500% | 5/15/36 | | 10,000 | 11,027 |
| Lower Colorado River Authority Texas Revenue | 5.625% | 5/15/39 | | 4,765 | 5,313 |
| Lubbock TX Independent School District GO | 5.750% | 2/15/42 | (12) | 4,500 | 5,242 |
| Mesquite TX Health Facilities Development Corp. Retirement Facility Revenue | | | | | |
| (Christian Care CentersInc. Project) | 5.500% | 2/15/25 | | 2,100 | 2,137 |
| Mesquite TX Health Facilities Development Corp. Retirement Facility Revenue | | | | | |
| (Christian Care CentersInc. Project) | 5.625% | 2/15/35 | | 3,195 | 3,235 |
| Mesquite TX Health Facilities Development Corp. Retirement Facility Revenue | | | | | |
| (Christian Care CentersInc. Project) | 5.125% | 2/15/42 | | 2,750 | 2,791 |
| Mission TX Economic Development Corp. Solid Waste Disposal Revenue | | | | | |
| (Republic Services Inc.) PUT | 0.450% | 2/2/15 | | 12,000 | 11,999 |
| New Hope TX Cultural Education Facilities Student Housing Revenue | | | | | |
| (Tarleton State University Project) | 5.000% | 4/1/39 | | 1,250 | 1,324 |
| New Hope TX Cultural Education Facilities Student Housing Revenue | | | | | |
| (Tarleton State University Project) | 5.000% | 4/1/46 | | 3,000 | 3,166 |
| North Texas Tollway Authority System Revenue | 6.250% | 2/1/23 | | 20,000 | 22,597 |
| North Texas Tollway Authority System Revenue | 6.000% | 1/1/28 | | 9,040 | 10,625 |
| North Texas Tollway Authority System Revenue | 5.000% | 9/1/30 | | 7,000 | 8,036 |
| North Texas Tollway Authority System Revenue | 6.125% | 1/1/31 | | 12,000 | 12,625 |
180
High-Yield Tax-Exempt Fund
| | | | | |
| | | | | Face | Market |
| | | Maturity | | Amount | Value• |
| | Coupon | Date | | ($000) | ($000) |
| North Texas Tollway Authority System Revenue | 5.000% | 1/1/32 | | 13,020 | 14,439 |
| North Texas Tollway Authority System Revenue | 5.625% | 1/1/33 | | 8,145 | 9,049 |
| North Texas Tollway Authority System Revenue | 5.750% | 1/1/38 | | 29,000 | 32,197 |
| North Texas Tollway Authority System Revenue | 6.250% | 1/1/39 | | 15,480 | 18,003 |
| North Texas Tollway Authority System Revenue | 6.000% | 9/1/41 | | 5,000 | 6,096 |
| Round Rock TX Independent School District GO | 5.000% | 8/1/15 | | 2,505 | 2,597 |
| SA Energy Acquisition Public Facility Corp. Texas Gas Supply Revenue | 5.500% | 8/1/20 | | 1,070 | 1,236 |
| SA Energy Acquisition Public Facility Corp. Texas Gas Supply Revenue | 5.500% | 8/1/24 | | 7,650 | 9,163 |
| SA Energy Acquisition Public Facility Corp. Texas Gas Supply Revenue | 5.500% | 8/1/25 | | 1,000 | 1,205 |
| Tarrant County TX Cultural Education Facilities Finance Corp. Retirement Facilities Revenue | | | | | |
| (SQLC Senior Living Center Mirador Project) | 7.250% | 11/15/16 | | 3,825 | 3,797 |
| Tarrant County TX Cultural Education Facilities Finance Corp. Retirement Facilities Revenue | | | | | |
| (Stayton at Museum Way Project) | 8.250% | 11/15/44 | | 10,000 | 9,563 |
| Texas Department of Housing & Community Affairs Single Family Revenue | 5.625% | 3/1/39 | | 595 | 612 |
| Texas GO | 5.750% | 8/1/31 | | 405 | 407 |
| Texas Municipal Gas Acquisition & Supply Corp. Revenue | 0.857% | 9/15/17 | | 16,165 | 16,170 |
| Texas Municipal Gas Acquisition & Supply Corp. Revenue | 5.250% | 12/15/19 | | 10,000 | 11,444 |
| Texas Municipal Gas Acquisition & Supply Corp. Revenue | 5.250% | 12/15/20 | | 15,400 | 17,761 |
| Texas Municipal Gas Acquisition & Supply Corp. Revenue | 5.000% | 12/15/25 | | 16,500 | 18,446 |
| Texas Municipal Gas Acquisition & Supply Corp. Revenue | 5.000% | 12/15/26 | | 2,700 | 3,008 |
| Texas Municipal Gas Acquisition & Supply Corp. Revenue | 5.250% | 12/15/26 | | 1,550 | 1,838 |
| Texas Municipal Gas Acquisition & Supply Corp. Revenue | 6.250% | 12/15/26 | | 12,710 | 15,656 |
| Texas Municipal Gas Acquisition & Supply Corp. Revenue | 5.000% | 12/15/29 | | 3,395 | 3,745 |
| Texas Municipal Gas Acquisition & Supply Corp. Revenue | 5.000% | 12/15/32 | | 6,480 | 7,033 |
| Texas Municipal Power Agency Revenue | 0.000% | 9/1/16 | (ETM) | 280 | 278 |
| Texas Municipal Power Agency Revenue | 0.000% | 9/1/17 | (14) | 58,660 | 57,036 |
| Texas Private Activity Surface Transportation Corp. Revenue | 7.500% | 12/31/31 | | 3,705 | 4,531 |
| Texas Private Activity Surface Transportation Corp. Revenue | 7.500% | 6/30/32 | | 20,000 | 24,911 |
| Texas Private Activity Surface Transportation Corp. Revenue | 7.500% | 6/30/33 | | 10,000 | 12,437 |
| Texas Private Activity Surface Transportation Corp. Revenue | 7.000% | 12/31/38 | | 12,500 | 15,493 |
| Texas Private Activity Surface Transportation Corp. Revenue | 6.875% | 12/31/39 | | 8,525 | 10,093 |
| Texas Private Activity Surface Transportation Corp. Revenue | 6.750% | 6/30/43 | | 15,000 | 18,155 |
| Texas TRAN | 1.500% | 8/31/15 | | 30,000 | 30,339 |
| University of Texas Permanent University Fund Revenue | 5.000% | 7/1/15 | | 3,800 | 3,924 |
| | | | | | 700,940 |
| Utah (0.3%) | | | | | |
| Utah Associated Municipal Power Systems Revenue (Horse Butte Wind Project) | 5.000% | 9/1/29 | | 4,475 | 5,013 |
| Utah Associated Municipal Power Systems Revenue (Horse Butte Wind Project) | 5.000% | 9/1/30 | | 3,700 | 4,125 |
| Utah Associated Municipal Power Systems Revenue (Horse Butte Wind Project) | 5.000% | 9/1/31 | | 4,685 | 5,217 |
| Utah Associated Municipal Power Systems Revenue (Horse Butte Wind Project) | 5.000% | 9/1/32 | | 3,500 | 3,892 |
| Utah GO | 5.000% | 7/1/15 | | 5,000 | 5,163 |
| | | | | | 23,410 |
| Vermont (0.3%) | | | | | |
| Vermont Housing Finance Agency Revenue | 4.125% | 11/1/42 | | 3,275 | 3,458 |
| 2 Vermont Student Assistance Corp. Education Loan Revenue | 1.733% | 6/1/22 | | 7,391 | 7,405 |
| 2 Vermont Student Assistance Corp. Education Loan Revenue | 3.233% | 12/3/35 | | 10,000 | 10,059 |
| | | | | | 20,922 |
| Virgin Islands (0.1%) | | | | | |
| Virgin Islands Port Authority Marine Revenue | 5.000% | 9/1/29 | | 3,500 | 3,924 |
| Virgin Islands Port Authority Marine Revenue | 5.000% | 9/1/33 | | 2,250 | 2,474 |
| Virgin Islands Public Finance Authority Revenue | 5.000% | 10/1/25 | | 2,400 | 2,647 |
| Virgin Islands Public Finance Authority Revenue | 5.000% | 10/1/39 | | 2,000 | 2,131 |
| | | | | | 11,176 |
| Virginia (1.5%) | | | | | |
| 3 Alexandria VA Redevelopment & Housing Authority Multi-Family Housing Mortgage Revenue | | | | | |
| (Portals West Apartment) | 8.250% | 4/1/32 | (ETM) | 435 | 577 |
| Charles City County VA Economic Development Authority Solid Waste Disposal Revenue | | | | | |
| (Waste Management, Inc. Project) PUT | 1.600% | 5/1/17 | | 3,500 | 3,512 |
| Chesapeake VA Toll Road Revenue | 0.000% | 7/15/40 | | 7,800 | 5,049 |
| Chesterfield County VA Economic Development Authority Retirement Facilities Revenue | | | | | |
| (Brandermill Woods Project) | 5.125% | 1/1/43 | | 4,750 | 4,897 |
| Fredericksburg VA Economic Development Authority Hospital Facilities Revenue | | | | | |
| (Mary Washington Healthcare Obligated Group) | 5.000% | 6/15/29 | | 1,425 | 1,581 |
| Fredericksburg VA Economic Development Authority Hospital Facilities Revenue | | | | | |
| (Mary Washington Healthcare Obligated Group) | 5.000% | 6/15/30 | | 2,000 | 2,211 |
| Fredericksburg VA Economic Development Authority Hospital Facilities Revenue | | | | | |
| (Mary Washington Healthcare Obligated Group) | 5.000% | 6/15/31 | | 1,155 | 1,273 |
| Fredericksburg VA Economic Development Authority Hospital Facilities Revenue | | | | | |
| (Mary Washington Healthcare Obligated Group) | 5.000% | 6/15/33 | | 1,000 | 1,094 |
181
High-Yield Tax-Exempt Fund
| | | | | |
| | | | | Face | Market |
| | | Maturity | | Amount | Value• |
| | Coupon | Date | | ($000) | ($000) |
| Gloucester County VA Industrial Development Authority Solid Waste Disposal Revenue | | | | | |
| (Waste Management, Inc. Project) PUT | 1.600% | 5/1/17 | | 4,000 | 4,014 |
| Hanover County VA Economic Development Authority Residential Care Facility Revenue | | | | | |
| (Covenant Woods) | 5.000% | 7/1/42 | | 5,550 | 5,645 |
| Tobacco Settlement Financing Corp. Virginia Revenue | 5.625% | 6/1/15 | (Prere.) | 10,000 | 10,316 |
| Tobacco Settlement Financing Corp. Virginia Revenue | 5.200% | 6/1/46 | | 9,500 | 6,740 |
| Virginia GO | 5.000% | 6/1/17 | | 7,480 | 8,338 |
| Virginia Small Business Financing Authority Revenue (Elizabeth River Crossings Project) | 5.250% | 1/1/32 | | 12,670 | 13,816 |
| Virginia Small Business Financing Authority Revenue (Elizabeth River Crossings Project) | 6.000% | 1/1/37 | | 18,000 | 20,438 |
| Virginia Small Business Financing Authority Revenue (Elizabeth River Crossings Project) | 5.500% | 1/1/42 | | 13,350 | 14,494 |
| Virginia Small Business Financing Authority Revenue (Express Lanes LLC) | 5.000% | 7/1/34 | | 11,500 | 12,136 |
| Winchester VA Economic Development Authority Hospital Revenue | | | | | |
| (Valley Health System Obligated Group) | 5.000% | 1/1/44 | | 4,000 | 4,440 |
| | | | | | 120,571 |
| Washington (0.9%) | | | | | |
| Chelan County WA Public Utility District No. 1 Consolidated System Revenue (Chelan Hydro) | 5.500% | 7/1/25 | | 2,500 | 2,904 |
| Chelan County WA Public Utility District No. 1 Consolidated System Revenue (Chelan Hydro) | 5.500% | 7/1/26 | | 4,000 | 4,621 |
| Port of Seattle WA Passenger Facility Charge Revenue | 5.000% | 12/1/21 | | 5,000 | 5,801 |
| Port of Seattle WA Revenue | 5.000% | 8/1/23 | | 2,810 | 3,273 |
| Port of Seattle WA Revenue | 5.000% | 9/1/25 | | 3,000 | 3,419 |
| Port of Seattle WA Revenue | 5.000% | 6/1/30 | | 9,000 | 10,227 |
| Tobacco Settlement Authority Washington Revenue | 5.250% | 6/1/30 | | 9,060 | 9,830 |
| Tobacco Settlement Authority Washington Revenue | 5.250% | 6/1/31 | | 5,000 | 5,501 |
| Washington GO | 5.000% | 7/1/15 | (2) | 2,425 | 2,504 |
| Washington Health Care Facilities Authority Revenue (MultiCare Health System) | 5.500% | 8/15/43 | (12) | 10,000 | 10,949 |
| Washington Health Care Facilities Authority Revenue (Seattle Cancer Care Alliance) | 5.000% | 3/1/38 | | 10,000 | 10,963 |
| Washington Higher Education Facilities Authority Revenue (Seattle University Project) | 5.250% | 5/1/34 | | 5,000 | 5,503 |
| | | | | | 75,495 |
| West Virginia (0.3%) | | | | | |
| West Virginia Economic Development Authority Solid Waste Facilities Disposal Revenue | | | | | |
| (Appalachian Power Co.–Amos Project) | 5.375% | 12/1/38 | | 2,500 | 2,753 |
| West Virginia Hospital Finance Authority Hospital Revenue (Charleston Area Medical Center Inc.) | 5.625% | 9/1/32 | | 6,000 | 6,587 |
| West Virginia Hospital Finance Authority Hospital Revenue | | | | | |
| (United Health System Obligated Group) | 5.375% | 6/1/38 | | 5,000 | 5,670 |
| West Virginia Hospital Finance Authority Hospital Revenue | | | | | |
| (United Health System Obligated Group) | 5.500% | 6/1/39 | | 400 | 443 |
| West Virginia Hospital Finance Authority Hospital Revenue | | | | | |
| (United Health System Obligated Group) | 5.500% | 6/1/44 | | 5,000 | 5,716 |
| West Virginia Hospital Finance Authority Hospital Revenue | | | | | |
| (Valley Health System Obligated Group) | 5.000% | 1/1/44 | | 2,250 | 2,483 |
| | | | | | 23,652 |
| Wisconsin (1.9%) | | | | | |
| Platteville WI Redevelopment Authority Revenue (Platteville Real Estate) | 5.000% | 7/1/42 | | 3,000 | 3,128 |
| Public Finance Authority of Wisconsin Airport Facilities Revenue (AFCO Investors II Portfolio) | 5.000% | 10/1/23 | | 9,200 | 9,118 |
| Public Finance Authority of Wisconsin Airport Facilities Revenue (TRIPS Obligated Group) | 5.000% | 7/1/17 | | 6,100 | 6,719 |
| Public Finance Authority of Wisconsin Airport Facilities Revenue (TRIPS Obligated Group) | 5.000% | 7/1/22 | | 11,275 | 12,589 |
| Public Finance Authority of Wisconsin Airport Facilities Revenue (TRIPS Obligated Group) | 5.250% | 7/1/28 | | 12,000 | 12,907 |
| Public Finance Authority of Wisconsin Airport Facilities Revenue (TRIPS Obligated Group) | 5.000% | 7/1/42 | | 5,000 | 5,131 |
| Public Finance Authority of Wisconsin CCRC Revenue (Glenridge on Palmer Ranch Inc. Project) | 8.250% | 6/1/46 | | 14,500 | 17,037 |
| University of Wisconsin Hospitals & Clinics Authority Revenue | 5.000% | 4/1/26 | | 2,410 | 2,827 |
| Wisconsin GO | 6.000% | 5/1/27 | | 17,000 | 20,409 |
| Wisconsin GO | 6.250% | 5/1/37 | | 20,200 | 24,221 |
| Wisconsin Health & Educational Facilities Authority Revenue (Agnesian Healthcare Inc.) | 5.500% | 7/1/40 | | 5,675 | 6,220 |
| Wisconsin Health & Educational Facilities Authority Revenue (Aurora Health Care Inc.) | 5.625% | 4/15/39 | | 10,810 | 12,004 |
| Wisconsin Health & Educational Facilities Authority Revenue (Children’s Hospital of Wisconsin Inc.) | 5.375% | 8/15/37 | | 5,000 | 5,590 |
| Wisconsin Health & Educational Facilities Authority Revenue (Gundersen Lutheran) | 5.250% | 10/15/39 | | 6,765 | 7,433 |
| Wisconsin Health & Educational Facilities Authority Revenue (Ministry Health Care Inc.) | 5.000% | 8/15/32 | | 5,500 | 6,125 |
| | | | | | 151,458 |
| Wyoming (0.1%) | | | | | |
| Lincoln County WY Pollution Control Revenue (Exxonmobil Project) VRDO | 0.060% | 11/3/14 | | 7,000 | 7,000 |
| Total Tax-Exempt Municipal Bonds (Cost $7,411,253) | | | | | 7,899,033 |
182
| | | |
| High-Yield Tax-Exempt Fund | | | |
| |
| |
| |
| |
| | | | Market |
| | | | Value• |
| | Coupon | Shares | ($000) |
| Temporary Cash Investment (1.5%) | | | |
| Money Market Fund (1.5%) | | | |
| 5 Vanguard Municipal Cash Management Fund (Cost $122,358) | 0.047% | 122,358,000 | 122,358 |
| Total Investments (99.1%) (Cost $7,533,611) | | | 8,021,391 |
| Other Assets and Liabilities (0.9%) | | | |
| Other Assets | | | 226,282 |
| Liabilities | | | (155,635) |
| | | | 70,647 |
| Net Assets (100%) | | | 8,092,038 |
| |
| |
| At October 31, 2014, net assets consisted of: | | | |
| | | | Amount |
| | | | ($000) |
| Paid-in Capital | | | 7,719,709 |
| Undistributed Net Investment Income | | | — |
| Accumulated Net Realized Losses | | | (115,451) |
| Unrealized Appreciation (Depreciation) | | | 487,780 |
| Net Assets | | | 8,092,038 |
| |
| Investor Shares—Net Assets | | | |
| Applicable to 132,130,614 outstanding $.001 par value shares of beneficial interest (unlimited authorization) | | 1,484,331 |
| Net Asset Value Per Share—Investor Shares | | | $11.23 |
| |
| Admiral Shares—Net Assets | | | |
| Applicable to 588,197,904 outstanding $.001 par value shares of beneficial interest (unlimited authorization) | | 6,607,707 |
| Net Asset Value Per Share—Admiral Shares | | | $11.23 |
• See Note A in Notes to Financial Statements.
1 Security purchased on a when-issued or delayed-delivery basis for which the fund has not taken delivery as of October 31, 2014.
2 Adjustable-rate security.
3 Security exempt from registration under Rule 144A of the Securities Act of 1933. Such securities may be sold in transactions exempt from registration, normally to qualified institutional buyers. At October 31, 2014,
the aggregate value of these securities was $136,745,000, representing 1.7% of net assets.
4 Security made only partial interest payments during the year ended October 31, 2014.
5 Affiliated money market fund available only to Vanguard funds and certain trusts and accounts managed by Vanguard. Rate shown is the 7-day yield.
For key to abbreviations and other references, see back cover of report.
See accompanying Notes, which are an integral part of the Financial Statements.
183
Key to Abbreviations
ARS—Auction Rate Security.
BAN—Bond Anticipation Note.
COP—Certificate of Participation.
CP—Commercial Paper.
FR—Floating Rate.
GAN—Grant Anticipation Note.
GO—General Obligation Bond.
PILOT—Payments in Lieu of Taxes.
PUT—Put Option Obligation.
RAN—Revenue Anticipation Note.
TAN—Tax Anticipation Note.
TOB—Tender Option Bond.
TRAN—Tax Revenue Anticipation Note.
VRDO—Variable Rate Demand Obligation.
VRDP—Variable Rate Demand Preferred.
(ETM)—Escrowed to Maturity.
(Prere.)—Prerefunded.
Scheduled principal and interest payments are guaranteed by:
(1) MBIA (Municipal Bond Investors Assurance).
(2) AMBAC (Ambac Assurance Corporation).
(3) FGIC (Financial Guaranty Insurance Company).
(4) AGM (Assured Guaranty Municipal Corporation).
(5) BIGI (Bond Investors Guaranty Insurance).
(6) Connie Lee Inc.
(7) FHA (Federal Housing Authority).
(8) CapMAC (Capital Markets Assurance Corporation).
(9) American Capital Access Financial Guaranty Corporation.
(10) XL Capital Assurance Inc.
(11) CIFG (CDC IXIS Financial Guaranty).
(12) AGC (Assured Guaranty Corporation).
(13) BHAC (Berkshire Hathaway Assurance Corporation).
(14) NPFG (National Public Finance Guarantee Corporation).
(15) BAM (Build America Mutual Assurance Company).
(16) MAC (Municipal Assurance Corporation).
(17) RAA (Radian Asset Assurance Inc.).
The insurance does not guarantee the market value of the municipal bonds.
LOC—Scheduled principal and interest payments are guaranteed by bank letter of credit.
© 2014 The Vanguard Group, Inc.
All rights reserved.
Vanguard Marketing Corporation, Distributor.
F950 122014
Item 2: Code of Ethics. The Registrant has adopted a code of ethics that applies to the Registrant’s principal executive officer, principal financial officer, principal accounting officer or controller or persons performing similar functions. The Code of Ethics was amended during the reporting period covered by this report to make certain technical, non-material changes.
Item 3: Audit Committee Financial Expert. The following members of the Audit Committee have been determined by the Registrant’s Board of Trustees to be Audit Committee Financial Experts serving on its Audit Committee, and to be independent: Rajiv L. Gupta, Amy Gutmann, JoAnn Heffernan Heisen, F. Joseph Loughrey, Mark Loughridge, Scott C. Malpass, André F. Perold, and Alfred M. Rankin, Jr.
Item 4: Principal Accountant Fees and Services.
(a) Audit Fees.
Audit Fees of the Registrant
Fiscal Year Ended October 31, 2014: $190,000
Fiscal Year Ended October 31, 2013: $166,000
Aggregate Audit Fees of Registered Investment Companies in the Vanguard Group.
Fiscal Year Ended October 31, 2014: $6,605,127
Fiscal Year Ended October 31, 2013: $5,714,113
Includes fees billed in connection with audits of the Registrant, other registered investment companies in the Vanguard complex, The Vanguard Group, Inc. and Vanguard Marketing Corporation.
(b) Audit-Related Fees.
Fiscal Year Ended October 31, 2014: $2,176,479
Fiscal Year Ended October 31, 2013: $1,552,950
Includes fees billed in connection with assurance and related services provided to the Registrant, other registered investment companies in the Vanguard complex, The Vanguard Group, Inc., and Vanguard Marketing Corporation.
(c) Tax Fees.
Fiscal Year Ended October 31, 2014: $316,869
Fiscal Year Ended October 31, 2013: $110,000
Includes fees billed in connection with tax compliance, planning, and advice services provided to the Registrant, other registered investment companies in the Vanguard complex, The Vanguard Group, Inc., and Vanguard Marketing Corporation.
(d) All Other Fees.
Fiscal Year Ended October 31, 2014: $198,163
Fiscal Year Ended October 31, 2013: $132,000
Includes fees billed for services related to tax reported information provided to the Registrant, other registered investment companies in the Vanguard complex, The Vanguard Group, Inc., and Vanguard Marketing Corporation.
(e) (1) Pre-Approval Policies. The policy of the Registrant’s Audit Committee is to consider and, if appropriate, approve before the principal accountant is engaged for such services, all specific audit and non-audit services provided to: the Registrant, other registered investment companies in the Vanguard complex, The Vanguard Group, Inc., and entities controlled by The Vanguard Group, Inc. that provide ongoing services to the Registrant. In making a determination, the Audit Committee considers whether the services are consistent with maintaining the principal accountant’s independence.
In the event of a contingency situation in which the principal accountant is needed to provide services in between scheduled Audit Committee meetings, the Chairman of the Audit Committee would be called on to consider and, if appropriate, pre-approve audit or permitted non-audit services in an amount sufficient to complete services through the next Audit Committee meeting, and to determine if such services would be consistent with maintaining the accountant’s independence. At the next scheduled Audit Committee meeting, services and fees would be presented to the Audit Committee for formal consideration, and, if appropriate, approval by the entire Audit Committee. The Audit Committee would again consider whether such services and fees are consistent with maintaining the principal accountant’s independence.
The Registrant’s Audit Committee is informed at least annually of all audit and non-audit services provided by the principal accountant to the Vanguard complex, whether such services are provided to: the Registrant, other registered investment companies in the Vanguard complex, The Vanguard Group, Inc., or other entities controlled by The Vanguard Group, Inc. that provide ongoing services to the Registrant.
(2) No percentage of the principal accountant’s fees or services were approved pursuant to the waiver provision of paragraph (c)(7)(i)(C) of Rule 2-01 of Regulation S-X.
(f) For the most recent fiscal year, over 50% of the hours worked under the principal accountant’s engagement were not performed by persons other than full-time, permanent employees of the principal accountant.
(g) Aggregate Non-Audit Fees.
Fiscal Year Ended October 31, 2014: $515,032
Fiscal Year Ended October 31, 2013: $242,000
Includes fees billed for non-audit services provided to the Registrant, other registered investment companies in the Vanguard complex, The Vanguard Group, Inc., and Vanguard Marketing Corporation.
(h) For the most recent fiscal year, the Audit Committee has determined that the provision of all non-audit services was consistent with maintaining the principal accountant’s independence.
Item 5: Audit Committee of Listed Registrants.
Not Applicable.
Item 6: Investments.
Not Applicable.
Item 7: Disclosure of Proxy Voting Policies and Procedures for Closed-End Management Investment Companies.
Not Applicable.
Item 8: Portfolio Managers of Closed-End Management Investment Companies.
Not Applicable.
Item 9: Purchase of Equity Securities by Closed-End Management Investment Company and Affiliated Purchasers.
Not Applicable.
Item 10: Submission of Matters to a Vote of Security Holders.
Not Applicable.
Item 11: Controls and Procedures.
(a) Disclosure Controls and Procedures. The Principal Executive and Financial Officers concluded that the Registrant’s Disclosure Controls and Procedures are effective based on their evaluation of the Disclosure Controls and Procedures as of a date within 90 days of the filing date of this report.
(b) Internal Control Over Financial Reporting. There were no significant changes in Registrant’s Internal Control Over Financial Reporting or in other factors that could significantly affect this control subsequent to the date of the evaluation, including any corrective actions with regard to significant deficiencies and material weaknesses.
Item 12: Exhibits.
(a) Code of Ethics. (b) Certifications.
Pursuant to the requirements of the Securities Exchange Act of 1934 and the Investment Company Act of 1940, the registrant has duly caused this report to be signed on its behalf by the undersigned, thereunto duly authorized.
| |
| | VANGUARD MUNICIPAL BOND FUNDS |
| |
| |
| BY: | /s/ F. WILLIAM MCNABB III* |
| F. WILLIAM MCNABB III |
| | CHIEF EXECUTIVE OFFICER |
| |
| Date: December 18, 2014 |
Pursuant to the requirements of the Securities Exchange Act of 1934 and the Investment Company Act of 1940, this report has been signed below by the following persons on behalf of the registrant and in the capacities and on the dates indicated.
| |
| | VANGUARD MUNICIPAL BOND FUNDS |
| |
| |
| BY: | /s/ F. WILLIAM MCNABB III* |
| F. WILLIAM MCNABB III |
| | CHIEF EXECUTIVE OFFICER |
| |
| Date: December 18, 2014 |
| |
| | VANGUARD MUNICIPAL BOND FUNDS |
| |
| |
| BY: | /s/ THOMAS J. HIGGINS* |
| | THOMAS J. HIGGINS |
| | CHIEF FINANCIAL OFFICER |
| |
| Date: December 18, 2014 |
* By: /s/ Heidi Stam
Heidi Stam, pursuant to a Power of Attorney filed on April 22, 2014 see file Number 2-17620, Incorporated by Reference.