UNITED STATES
SECURITIES AND EXCHANGE COMMISSION
Washington, D.C. 20549
FORM N-CSR
CERTIFIED SHAREHOLDER REPORT
OF
REGISTERED MANAGEMENT INVESTMENT COMPANIES
Investment Company Act file number: 811-2687
Name of Registrant: Vanguard Municipal Bond Funds
Address of Registrant:
P.O. Box 2600
Valley Forge, PA 19482
Name and address of agent for service:
Heidi Stam, Esquire
P.O. Box 876
Valley Forge, PA 19482
Registrant’s telephone number, including area code: (610) 669-1000
Date of fiscal year end: October 31
Date of reporting period: November 1, 2010 – October 31, 2011
Item 1: Reports to Shareholders

Annual Report | October 31, 2011
Vanguard Municipal Bond Funds
Vanguard Tax-Exempt Money Market Fund
Vanguard Short-Term Tax-Exempt Fund
Vanguard Limited-Term Tax-Exempt Fund
Vanguard Intermediate-Term Tax-Exempt Fund
Vanguard Long-Term Tax-Exempt Fund
Vanguard High-Yield Tax-Exempt Fund
> For the 12 months ended October 31, 2011, Vanguard Tax-Exempt Money Market Fund returned 0.09%, as the Federal Reserve extended its low-interest-rate policy for short-term assets until at least 2013.
> Total returns for Vanguard’s municipal bond funds ranged from 0.92% for Investor Shares of the Short-Term Tax-Exempt Fund to 3.43% for Admiral Shares of the Intermediate-Term Tax-Exempt Fund.
> Governments at both the state and local levels continued to take a hard look at their cost structures as they wrestled with reduced revenue and increased demand for support services as a consequence of the recession.
| |
| Contents | |
| Your Fund’s Total Returns | 1 |
| Chairman’s Letter | 2 |
| Advisor’s Report | 6 |
| Tax-Exempt Money Market Fund | 8 |
| Short-Term Tax-Exempt Fund | 35 |
| Limited-Term Tax-Exempt Fund | 42 |
| Intermediate-Term Tax-Exempt Fund | 50 |
| Long-Term Tax-Exempt Fund | 57 |
| High-Yield Tax-Exempt Fund | 64 |
| About Your Fund’s Expenses | 72 |
| Glossary | 74 |
Please note: The opinions expressed in this report are just that—informed opinions. They should not be considered promises or advice. Also, please keep in mind that the information and opinions cover the period through the date on the front of this report. Of course, the risks of investing in your fund are spelled out in the prospectus.
See the Glossary for definitions of investment terms used in this report.
About the cover: Vanguard was named for the HMS Vanguard, flagship of British Admiral Horatio Nelson. A ship—whose performance and safety depend on the work of all hands—has served as a fitting metaphor for the Vanguard crew as we strive to help clients reach their financial goals.
Your Fund’s Total Returns
| | | | | | |
| Fiscal Year Ended October 31, 2011 | | | | | |
| | | | | | | Taxable- |
| | Ticker | Total | Income | Capital | | Equivalent |
| Vanguard Tax-Exempt Fund | Symbol | Returns | Return | Return | Yield1 | Yield2 |
| Money Market | VMSXX | 0.09% | 0.09% | 0.00% | 0.02% | 0.03% |
| Short-Term | | | | | | |
| Investor Shares | VWSTX | 0.92 | 1.23 | –0.31 | 0.51 | 0.78 |
| AdmiralTM Shares3 | VWSUX | 1.00 | 1.31 | –0.31 | 0.59 | 0.91 |
| Limited-Term | | | | | | |
| Investor Shares | VMLTX | 1.53 | 2.25 | –0.72 | 1.04 | 1.60 |
| Admiral Shares3 | VMLUX | 1.61 | 2.33 | –0.72 | 1.12 | 1.72 |
| Intermediate-Term | | | | | | |
| Investor Shares | VWITX | 3.35 | 3.71 | –0.36 | 2.55 | 3.92 |
| Admiral Shares3 | VWIUX | 3.43 | 3.79 | –0.36 | 2.63 | 4.05 |
| Long-Term | | | | | | |
| Investor Shares | VWLTX | 3.29 | 4.36 | –1.07 | 3.23 | 4.97 |
| Admiral Shares3 | VWLUX | 3.37 | 4.44 | –1.07 | 3.31 | 5.09 |
| High-Yield | | | | | | |
| Investor Shares | VWAHX | 3.26 | 4.57 | –1.31 | 3.70 | 5.69 |
| Admiral Shares3 | VWALX | 3.34 | 4.65 | –1.31 | 3.78 | 5.82 |
Your Fund’s Performance at a Glance
October 31, 2010–October 31, 2011
| | | | |
| | | | Distributions Per Share |
| | Starting | Ending | Income | Capital |
| Vanguard Tax-Exempt Fund | Share Price | Share Price | Dividends | Gains |
| Money Market | $1.00 | $1.00 | $0.001 | $0.000 |
| Short-Term | | | | |
| Investor Shares | 15.95 | 15.90 | 0.196 | 0.000 |
| Admiral Shares | 15.95 | 15.90 | 0.209 | 0.000 |
| Limited-Term | | | | |
| Investor Shares | 11.15 | 11.07 | 0.247 | 0.000 |
| Admiral Shares | 11.15 | 11.07 | 0.256 | 0.000 |
| Intermediate-Term | | | | |
| Investor Shares | 13.80 | 13.75 | 0.494 | 0.000 |
| Admiral Shares | 13.80 | 13.75 | 0.505 | 0.000 |
| Long-Term | | | | |
| Investor Shares | 11.25 | 11.13 | 0.468 | 0.000 |
| Admiral Shares | 11.25 | 11.13 | 0.477 | 0.000 |
| High-Yield | | | | |
| Investor Shares | 10.67 | 10.53 | 0.465 | 0.000 |
| Admiral Shares | 10.67 | 10.53 | 0.473 | 0.000 |
1 7-day SEC yield for the Tax-Exempt Money Market Fund; 30-day SEC yield for the other funds.
2 This calculation, which assumes a typical itemized tax return, is based on the maximum federal income tax rate of 35%. State and local taxes were not considered. Please see the prospectus for a detailed explanation of the calculation.
3 Admiral Shares carry lower expenses and are available to investors who meet certain account-balance requirements.
1

Chairman’s Letter
Dear Shareholder,
The municipal bond market regained its footing after experiencing turbulence in the opening three months of the fiscal year ended October 31, 2011. All of the Vanguard Municipal Bond Funds produced positive returns for the 12 months, as high levels of income offset price declines. The returns for all but one of the funds exceeded the average returns of competing funds.
As I noted in my semiannual report to you six months ago, a confluence of negative events influenced the municipal bond market at the start of the year. Especially prominent were concerns that the fiscal straits of state and local governments might lead to large-scale defaults. Thankfully, that hasn’t happened—and in our view isn’t likely to—although the muni market is likely to continue to struggle for some time. State and local governments typically recover more slowly than the broader economy after a national slump, and in this instance they are coping with a fiscal body blow from the worst recession since the Great Depression.
There are some hopeful signs for the sector. Governments are closely reexamining their cost structures. Tax revenue has continued to recover, although receipts are far from adequate. The low levels of interest rates has made it more affordable for state and local governments to borrow even as they more carefully chose which projects to finance given their restricted budgets. Of course, in assessing the health of bond issuers, there is no substitute for the constant review and analysis of issuers’ finances that is provided by our staff of highly experienced credit analysts.
By the end of the fiscal year, SEC yields for the Vanguard Municipal Bond Funds were at about the same level as where they began, but only after rising significantly earlier in the year in response to market strains. The yield of the Tax-Exempt Money Market Fund continued to be affected by the Federal Reserve’s decision to keep its target for short-term interest rates near zero, a policy that has pushed money market fund yields (taxable and tax-exempt) to record lows. In August, the Fed said it planned to maintain that level until at least mid-2013.
| | | |
| Market Barometer | | | |
| | | Average Annual Total Returns |
| | | Periods Ended October 31, 2011 |
| | One Year | Three Years | Five Years |
| Bonds | | | |
| Barclays Capital U.S. Aggregate Bond Index | | | |
| (Broad taxable market) | 5.00% | 8.87% | 6.41% |
| Barclays Capital Municipal Bond Index (Broad tax-exempt market) | 3.78 | 8.31 | 4.80 |
| Citigroup 3-Month Treasury Bill Index | 0.10 | 0.15 | 1.53 |
| |
| Stocks | | | |
| Russell 1000 Index (Large-caps) | 8.01% | 12.22% | 0.54% |
| Russell 2000 Index (Small-caps) | 6.71 | 12.87 | 0.68 |
| Dow Jones U.S. Total Stock Market Index | 7.67 | 12.58 | 0.90 |
| MSCI All Country World Index ex USA (International) | –4.66 | 12.92 | –0.37 |
| |
| CPI | | | |
| Consumer Price Index | 3.53% | 1.49% | 2.33% |
2
Unsteady yields reflected fast-changing sentiment
Taxable bonds produced strong returns during the 12 months, and municipal bonds turned in solid but unspectacular results. The yield of the 10-year U.S. Treasury note—a benchmark for longer- term interest rates—began the period at 2.61%. Yields drifted higher (and prices lower) as the economic expansion seemed to gather steam, then fluttered lower to close the period at 2.17%. The decline in Treasury yields (and rise in prices) was driven by Europe’s sovereign-debt dramas, underwhelming economic reports, and a flight to safety that was prompted, paradoxically, by a credit-rating agency’s decision to downgrade U.S. government debt. Vanguard’s confidence in the full faith and credit of the U.S. Treasury remains unshaken.
Taxable investment-grade bonds returned 5.00% for the full 12 months. It’s important to note, of course, that as yields decline, the opportunity for similarly strong returns diminishes. The broad municipal market returned 3.78%.
A positive finish to an anxious 12 months
U.S. stock indexes ended the 12 months with solid returns, though the gains were shadowed by anxiety in a volatile period. This turbulence was so pronounced, in fact, that a one-month change in the start date would have yielded a very different perspective on performance. For the 12 months through October 31, the broad U.S. stock market returned 7.67%. For the 12 months ended September 30, however, the return was a mere 0.31%.
Volatility has been a theme in international markets, too. International stock markets returned a combined –4.66% as stock prices retreated in Europe. Prices also fell in the Pacific region’s developed economies and emerging markets, where growth has moderated.
After a difficult start, municipal bonds rallied
The sharp change in the market for municipal bonds during the fiscal year can be seen by looking at its performance during the first fiscal quarter, from November 2010 to January 2011, and since then.
The Barclays Capital Municipal Bond Index declined about 5% during the beginning three months. This was attributed to, among other possibilities, fears of widespread muni bond defaults, a rallying stock market, signs of a strengthening economy, rising interest rates, and the expiration of a popular subsidized taxable muni bond program. Even though the municipal market rose by almost 9% in the succeeding nine months, it couldn’t entirely shake off the earlier results and returned about 4% for the full fiscal year.
During this period, the Vanguard funds continued their strategy of investing in higher-quality municipal bonds, concentrating on essential-service bonds (because of their relatively stable revenue streams from, for example, electric, water, and sewer facilities). The funds’ advisor—Vanguard Fixed Income Group—also selectively focused on investments in attractive sectors, such as health care. The accompanying Advisor’s Report provides additional details about its tactics during the year.
At the shortest end of the yield curve, the Tax-Exempt Money Market Fund had a marginally positive return for the year, a consequence of the Fed’s policy of keeping the shortest-term interest rates low in an attempt to stimulate the economy. The average return of competing funds was 0%. The Short-Term Tax-Exempt Fund, which holds bonds with an average maturity of 1–2 years, was affected by the anchoring effect on short-term rates of the Fed’s policy. The fund returned 0.92%, slightly behind the average return of competing funds, largely because of its shorter duration, a gauge of interest rate sensitivity. (All returns are for Investor Shares.) Because bond prices and interest rates move in opposite directions, shorter-duration funds can lag longer-duration funds during periods of declining interest rates.
The Limited-Term Tax-Exempt Fund, which focuses on bonds with somewhat longer maturities, edged out competitors with a return of 1.53%. As with the Short-Term Fund, the Limited-Term Fund’s relatively shorter duration detracted from results. But the fund benefited from its higher-quality orientation, not only during the opening months of the period but later in the year as Europe’s debt problems and the Treasury bond downgrade weighed on the market.
The Intermediate-Term Tax-Exempt Fund returned 3.35%, and the Long-Term Tax-Exempt Fund returned 3.29%, both outpacing their peer groups. The two funds benefited from declining longer-term interest rates (and rising long-term bond prices), which followed yet another Federal Reserve economic-stimulus policy. The policy, announced in September and known as Operation Twist, involves Fed purchases of long-term Treasury bonds.
3
The solid performance of the High-Yield Tax-Exempt Fund reflected the fund’s relatively high-quality orientation, which mandates that at least 80% of its assets be committed to investment-grade bonds. Investors typically favor higher-quality bonds during periods of heightened uncertainty, boosting their prices. That’s what happened in August, as fears of sovereign-debt defaults in Europe ratcheted up, Congress seemed to be gridlocked on the issue of raising the U.S. debt ceiling, and Standard & Poor’s downgraded U.S. bonds a notch. In this environment, the fund returned 3.26% for the year, double the average return of competitors.
By October, the market’s dynamics had changed as stocks rallied after months of decline, at the expense of bonds. In the muni bond sector, bond issuance picked up somewhat after a slower-than-expected year. Supply, which included a particularly large issue of California bonds, exceeded demand, pushing prices down.
Nevertheless, the Vanguard funds ended the fiscal year on a positive note. And yields, which had climbed (as bond prices fell) in response to the opening months’ worries, steadily slid back during the year to about where they had started.
A long-term view shows skillful management at work
Given the unpredictable twists and turns that characterize the performance of the market in the short run, we think it’s always helpful to look at a fund’s results over the longer term.
On that score, it’s gratifying to show that the average annual returns of the Vanguard tax-exempt bond funds have exceeded those of their peer groups over the ten years ended October 31. The funds have benefited from their high-quality orientation and low costs. Especially important has been the skill of the funds’ advisor, the Fixed Income Group, which includes not only the portfolio managers and traders but also a team of seasoned credit analysts.
Investors have become wiser, but basic principles don’t change
The turbulent municipal bond market at the start of the fiscal year had a positive side. Many investors learned more about that segment of the bond market as they absorbed explanations from Vanguard and elsewhere about why some headline- grabbing concerns may have been excessive.
And the events early in the year highlighted yet again a truism about the financial markets: Uncertainty—sometimes at elevated levels—is a part of the landscape. A time-tested defense against uncertainty is to hold a portfolio that is balanced among asset classes, such as stock, bond, and money market funds, and to be diversified within them. The Vanguard Municipal Bond Funds can be an important part of such a portfolio.
Thank you for entrusting your assets to Vanguard.
Sincerely,

F. William McNabb III
Chairman and Chief Executive Officer
November 10, 2011
4
Total Returns
Fiscal Year Ended October 31, 2011
| | |
| | Vanguard | Peer-Group |
| Tax-Exempt Fund Investor Shares | Fund | Average1 |
| Money Market | 0.09% | 0.00% |
| Short-Term | 0.92 | 1.17 |
| Limited-Term | 1.53 | 1.47 |
| Intermediate-Term | 3.35 | 2.91 |
| Long-Term | 3.29 | 2.78 |
| High-Yield | 3.26 | 1.62 |
Total Returns
Ten Years Ended October 31, 2011
| | |
| | Average Annual Return |
| | Vanguard | Peer-Group |
| Tax-Exempt Fund Investor Shares | Fund | Average1 |
| Money Market | 1.59% | 1.12% |
| Short-Term | 2.45 | 1.15 |
| Limited-Term | 3.16 | 2.56 |
| Intermediate-Term | 4.27 | 3.77 |
| Long-Term | 4.52 | 3.80 |
| High-Yield | 4.67 | 3.53 |
The figures shown represent past performance, which is not a guarantee of future results. (Current performance may be lower or higher than the performance data cited. For performance data current to the most recent month-end, visit our website at vanguard.com/performance.) Note, too, that both investment returns and principal value can fluctuate widely, so an investor’s shares, when sold, could be worth more or less than their original cost.
Expense Ratios2
Your Fund Compared With Its Peer Group
| | | |
| | Investor | Admiral | Peer-Group |
| Tax-Exempt Fund | Shares | Shares | Average1 |
| Money Market | 0.17% | — | 0.43% |
| Short-Term | 0.20 | 0.12% | 0.39 |
| Limited-Term | 0.20 | 0.12 | 0.75 |
| Intermediate-Term | 0.20 | 0.12 | 0.87 |
| Long-Term | 0.20 | 0.12 | 0.99 |
| High-Yield | 0.20 | 0.12 | 1.11 |
1 Peer groups are: for the Tax-Exempt Money Market Fund, Tax-Exempt Money Market Funds; for the Short-Term Tax-Exempt Fund, 1–2 Year Municipal Funds; for the Limited-Term Tax-Exempt Fund, 1–5 Year Municipal Funds; for the Intermediate-Term Tax-Exempt Fund, Intermediate Municipal Funds; for the Long-Term Tax-Exempt Fund, General Municipal Funds; and for the High-Yield Tax-Exempt Fund, High-Yield Municipal Funds. Peer-group values are derived from data provided by Lipper Inc. and capture data through year-end 2010.
2 The fund expense ratios shown are from the prospectus dated February 28, 2011, and represent estimated costs for the current fiscal year. For the fiscal year ended October 31, 2011, expense ratios were: for the Tax-Exempt Money Market Fund, 0.17%; for the Short-Term Tax-Exempt Fund, 0.20% for Investor Shares and 0.12% for Admiral Shares; for the Limited-Term Tax-Exempt Fund, 0.20% for Investor Shares and 0.12% for Admiral Shares; for the Intermediate-Term Tax-Exempt Fund, 0.20% for Investor Shares and 0.12% for Admiral Shares; for the Long-Term Tax-Exempt Fund, 0.20% for Investor Shares and 0.12% for Admiral Shares; and for the High-Yield Tax-Exempt Fund, 0.20% for Investor Shares and 0.12% for Admiral Shares.
5
Advisor’s Report
For the fiscal year ended October 31, 2011, the Vanguard Municipal Bond Funds posted returns that ranged from 0.92% for the Investor Shares of the Short-Term Tax-Exempt Fund to 3.43% for the Admiral Shares of the Intermediate-Term Tax-Exempt Fund. Four of the five bond funds (all except the Short-Term Fund) outperformed their peer-group averages. The Tax-Exempt Money Market Fund returned 0.09%, a direct result of the Federal Reserve’s monetary policy. The average return of peer-group funds was 0%.
The investment environment
From October a year ago through January, the municipal bond market was jolted by several concurrent events—almost a perfect storm—which have been attributed to economic and market factors that we described in more detail in our last report to you six months ago. One of these factors, sometimes highly publicized, was the fear of a systematic decline in the creditworthiness of municipal bonds, as state and local government tax revenues plunged in the wake of the Great Recession. Returns fell and yields climbed, accompanied by an outflow of funds from municipal bond mutual funds that began to ebb only in the spring.
After that disruptive start to the fiscal year, a more “normal” set of dynamics returned to the municipal bond market. State and local governments continued to react to the forced austerity programs that the recession had set in motion. They issued fewer bonds than the industry anticipated and were more selective in those that they did. With demand at a healthy level, bond prices moved higher.
At the same time, munis offered attractive yields compared with Treasury bonds. Muni yields historically have been lower than Treasury yields, a relationship that takes into account the federal-tax-free nature of most muni bond income. During the latter part of the fiscal year, municipal bonds became increasingly attractive compared with Treasuries—muni yields approached and then surpassed Treasury yields—as investors sought “safe” assets such as Treasuries in reaction to concerns about, among other things, Europe’s sovereign-debt problems. The flight to safety also fueled demand for higher-quality munis, even as state and local governments continued to struggle with their finances.
Given the unusual steepness of the yield curve during the year—that is, the difference in yields between the shortest-and longest-maturity bonds, as shown in the accompanying table—issuers sought to lower borrowing costs by favoring shorter-maturity bonds over the longer-dated variety they have traditionally favored. They found a match with individual investors who were fleeing from the almost nonexistent yields offered by money market mutual funds to short- and medium-term bonds that yielded more.
The low money market fund yields, of course, were a consequence of the Federal Reserve’s policy, in place since December 2008, of keeping the shortest-term interest rates in the neighborhood of zero. In August, the Fed said that it would continue that policy until at least mid-2013, and one month later it said it would also strive to lower longer-term interest rates. Under its new policy, informally known as Operation Twist, the Fed has begun purchasing Treasury bonds with remaining maturities of six to 30 years. The purchases have had the effect of lowering yields and raising prices of longer-term bonds, which made this segment of the muni market attractive to opportunistic institutional
Yields of Municipal Bonds
(AAA-Rated General-Obligation Issues)
| | |
| | October 31, | October 31, |
| Maturity | 2010 | 2011 |
| 2 years | 0.46% | 0.44% |
| 5 years | 1.20 | 1.26 |
| 10 years | 2.51 | 2.39 |
| 30 years | 3.86 | 3.75 |
Source: Vanguard.
6
investors. The decline in new bond issues in this segment of the market, noted previously, also helped buoy prices.
Management of the funds
Bond-fund returns during the fiscal year were helped substantially by our decision to redeploy certain assets from the shorter- to the longer-maturity regions of the yield curve.
We also looked to modestly overweight revenue bonds that provided attractive yields compared with those of the highest-quality general-obligation bonds and were offered by issuers with solid financial and operating characteristics. Some of the spreads between those yields were among the highest we have seen. Among the sectors in which we saw value based on our spread strategy were essential-service revenue bonds and A-rated hospital bonds.
We shied away from local government general-obligation bonds. We concluded that this sector would come under additional pressure in an already challenging fiscal environment because of its dependency on property taxes, which have been dropping because of falling property values and accompanying reassessments. Local entities have also seen cutbacks in aid from states, which have been seeking to balance their budgets.
During the year, we have been cautious about our positioning regarding duration, which is a gauge of how sensitive our portfolios are to interest rates. Our duration positioning reflects the year’s uncertainties in both the U.S. and European economies as well as future U.S. tax policy.
Although the heightened level of anxiety about the creditworthiness of state and local government bonds that characterized the beginning of the fiscal period has dissipated, credit concerns still weigh on the municipal market. This is understandable, given the financial stresses that these governments will continue to face for some time. In any kind of economic weather, the ability of bond issuers to repay their debts is uppermost in our minds, and we closely monitor their financial condition. That is why we take great comfort in the abilities of our credit analysts, who conduct an in-depth review of each bond issue that we consider adding to our portfolios.
Christopher W. Alwine, CFA, Principal, Head of Municipal Bond Group
Marlin G. Brown, Portfolio Manager
Mathew M. Kiselak, Principal, Portfolio Manager
Michael G. Kobs, Portfolio Manager
Pamela Wisehaupt Tynan, Principal, Head of Municipal Money Market Funds
Vanguard Fixed Income Group
November 17, 2011
7
Tax-Exempt Money Market Fund
Fund Profile
As of October 31, 2011
| |
| Financial Attributes | |
| Yield1 | 0.02% |
| Average Weighted Maturity | 40 days |
| Expense Ratio2 | 0.17% |
| |
| Largest Area Concentrations | |
| Texas | 11.7% |
| Georgia | 5.3 |
| Illinois | 4.9 |
| California | 4.7 |
| Tennessee | 4.1 |
| North Carolina | 4.1 |
| Florida | 3.8 |
| New York | 3.7 |
| Michigan | 3.6 |
| Washington | 3.1 |
| Top Ten | 49.0% |
| |
| Distribution by Credit Quality (% of portfolio) |
| First Tier | 100.0% |
| For information about these ratings, see the Glossary entry for Credit Quality. |
1 7-day SEC yield. See the Glossary.
2 The expense ratio shown is from the prospectus dated February 28, 2011, and represents estimated costs for the current fiscal year. For the fiscal year ended October 31, 2011, the expense ratio was 0.17%.
8
Tax-Exempt Money Market Fund
Performance Summary
Investment returns will fluctuate. All of the returns in this report represent past performance, which is not a guarantee of future results that may be achieved by the fund. (Current performance may be lower or higher than the performance data cited. For performance data current to the most recent month-end, visit our website at vanguard.com/performance.) The returns shown do not reflect taxes that a shareholder would pay on fund distributions. An investment in a money market fund is not insured or guaranteed by the Federal Deposit Insurance Corporation or any other government agency. Although the fund seeks to preserve the value of your investment at $1 per share, it is possible to lose money by investing in the fund. The fund’s 7-day SEC yield reflects its current earnings more closely than do the average annual returns.
Cumulative Performance: October 31, 2001–October 31, 2011
Initial Investment of $10,000
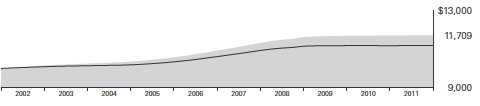
| | | | |
| | | Average Annual Total Returns | Final Value |
| | | Periods Ended October 31, 2011 | of a $10,000 |
| | One Year | Five Years | Ten Years | Investment |
| Tax-Exempt Money Market Fund | 0.09% | 1.41% | 1.59% | $11,709 |
| Tax-Exempt Money Market Funds Average1 | 0.00 | 1.05 | 1.12 | 11,182 |
| | |
| Fiscal-Year Total Returns (%): October 31, 2001–October 31, 2011 | | |
| |
| Fiscal | Total | Peer-Group |
| Year | Return | Average1 |
| 2002 | 1.5% | 0.9% |
| 2003 | 1.0 | 0.5 |
| 2004 | 1.0 | 0.5 |
| 2005 | 2.1 | 1.5 |
| 2006 | 3.3 | 2.6 |
| 2007 | 3.6 | 3.0 |
| 2008 | 2.6 | 2.0 |
| 2009 | 0.6 | 0.3 |
| 2010 | 0.1 | 0.0 |
| 2011 | 0.1 | 0.0 |
| 7-day SEC yield (10/31/2011): 0.02% |
Average Annual Total Returns: Periods Ended September 30, 2011
This table presents returns through the latest calendar quarter—rather than through the end of the fiscal period.
Securities and Exchange Commission rules require that we provide this information.
| | | | | | |
| | | | | | | Ten Years |
| | Inception Date | One Year | Five Years | Capital | Income | Total |
| Tax-Exempt Money Market | 6/10/1980 | 0.10% | 1.47% | 0.00% | 1.61% | 1.61% |
1 Derived from data provided by Lipper Inc.
See Financial Highlights for dividend information.
9
Tax-Exempt Money Market Fund
Financial Statements
Statement of Net Assets
As of October 31, 2011
The fund reports a complete list of its holdings in various monthly and quarterly regulatory filings. The fund publishes its holdings on a monthly basis at vanguard.com and files them with the Securities and Exchange Commission on Form N-MFP. The fund’s Form N-MFP filings become public 60 days after the relevant month-end, and may be viewed at sec.gov or via a link on the “Portfolio Holdings” page on vanguard.com. For the second and fourth fiscal quarters, the lists appear in the fund’s semiannual and annual reports to shareholders. For the first and third fiscal quarters, the fund files the lists with the SEC on Form N-Q. Shareholders can look up the fund’s Forms N-Q on the SEC’s website at sec.gov. Forms N-Q may also be reviewed and copied at the SEC’s Public Reference Room (see the back cover of this report for further information).
| | | | |
| | | | Face | Market |
| | | Maturity | Amount | Value• |
| | Coupon | Date | ($000) | ($000) |
| Tax-Exempt Municipal Bonds (97.4%) | | | | |
| Alabama (0.7%) | | | | |
| 1 Alabama Housing Finance Authority Single Family Mortgage Revenue TOB VRDO | 0.240% | 11/7/11 LOC | 8,290 | 8,290 |
| Alabama Public School & College Authority Capital Improvement Revenue | 5.000% | 5/1/12 | 2,000 | 2,046 |
| Alabama Public School & College Authority Capital Improvement Revenue | 5.000% | 5/1/12 | 2,750 | 2,813 |
| 1 Alabama Public School & College Authority Capital Improvement Revenue TOB VRDO | 0.140% | 11/7/11 | 7,175 | 7,175 |
| 1 Alabama Public School & College Authority Capital Improvement Revenue TOB VRDO | 0.140% | 11/7/11 | 16,370 | 16,370 |
| 1 Alabama Public School & College Authority Capital Improvement Revenue TOB VRDO | 0.200% | 11/7/11 | 5,100 | 5,100 |
| 1 Alabama Special Care Facilities Financing Authority Birmingham Revenue | | | | |
| (Ascension Health Credit Group) TOB VRDO | 0.140% | 11/7/11 | 6,375 | 6,375 |
| 1 Auburn University Alabama General Fee Revenue TOBVRDO | 0.140% | 11/7/11 | 14,400 | 14,400 |
| Birmingham AL Public Educational Building Student Housing Revenue | | | | |
| (University of Alabama at Birmingham Project) VRDO | 0.140% | 11/7/11 LOC | 4,300 | 4,300 |
| Homewood AL Educational Building Authority Revenue (Samford University) VRDO | 0.150% | 11/7/11 LOC | 25,000 | 25,000 |
| Mobile AL Industrial Development Board Exempt Facility Revenue | | | | |
| (Kimberly-Clark Tissue Co. Project) VRDO | 0.130% | 11/7/11 | 33,550 | 33,550 |
| | | | | 125,419 |
| Alaska (0.2%) | | | | |
| 1 Alaska Housing Finance Corp. General Housing Revenue TOB VRDO | 0.130% | 11/7/11 LOC | 4,930 | 4,930 |
| 1 Alaska Housing Finance Corp. General Housing Revenue TOB VRDO | 0.170% | 11/7/11 | 15,625 | 15,625 |
| 1 Anchorage AK Water Revenue TOB VRDO | 0.140% | 11/7/11 | 15,255 | 15,255 |
| 1 Valdez AK Marine Terminal Revenue (BP Pipelines) TOB VRDO | 0.140% | 11/7/11 LOC | 3,335 | 3,335 |
| | | | | 39,145 |
| Arizona (2.8%) | | | | |
| 1 Arizona Health Facilities Authority Revenue (Banner Health) TOB VRDO | 0.140% | 11/7/11 | 9,750 | 9,750 |
| 1 Arizona Health Facilities Authority Revenue (Banner Health) TOB VRDO | 0.140% | 11/7/11 | 14,620 | 14,620 |
| Arizona Health Facilities Authority Revenue (Banner Health) VRDO | 0.090% | 11/7/11 LOC | 61,420 | 61,420 |
| Arizona Health Facilities Authority Revenue (Banner Health) VRDO | 0.090% | 11/7/11 LOC | 72,865 | 72,865 |
| Arizona Health Facilities Authority Revenue (Banner Health) VRDO | 0.110% | 11/7/11 LOC | 24,105 | 24,105 |
| Arizona Health Facilities Authority Revenue (Banner Health) VRDO | 0.120% | 11/7/11 LOC | 44,685 | 44,685 |
| Arizona Health Facilities Authority Revenue (Banner Health) VRDO | 0.140% | 11/7/11 LOC | 10,055 | 10,055 |
| 1 Arizona School Facilites Board Revenue TOB VRDO | 0.200% | 11/7/11 | 5,285 | 5,285 |
| 1 Arizona Transportation Board Highway Revenue TOB VRDO | 0.140% | 11/7/11 | 7,860 | 7,860 |
| 1 BlackRock MuniYield Arizona Fund, Inc. VRDP VRDO | 0.280% | 11/7/11 LOC | 7,800 | 7,800 |
| Coconino County AZ Pollution Control Corp. Revenue (Tuscan Electric Power Navajo Project) VRDO | 0.180% | 11/7/11 LOC | 18,300 | 18,300 |
| 1 Gilbert AZ GO TOB VRDO | 0.140% | 11/7/11 | 27,940 | 27,940 |
| Glendale AZ Industrial Development Authority Revenue (Midwestern University) VRDO | 0.140% | 11/7/11 LOC | 10,000 | 10,000 |
| 1 Maricopa County AZ Public Finance Corp. Lease Revenue TOB VRDO | 0.140% | 11/7/11 | 11,760 | 11,760 |
| 1 Phoenix AZ Civic Improvement Corp. Transit Revenue TOB VRDO | 0.130% | 11/7/11 LOC | 30,630 | 30,630 |
| 1 Phoenix AZ Civic Improvement Corp. Wastewater System Revenue TOB VRDO | 0.130% | 11/7/11 LOC | 20,490 | 20,490 |
| 1 Phoenix AZ Civic Improvement Corp. Water System Revenue TOB VRDO | 0.140% | 11/7/11 | 8,240 | 8,240 |
| 1 Phoenix AZ Civic Improvement Corp. Water System Revenue TOB VRDO | 0.140% | 11/7/11 | 4,995 | 4,995 |
| 1 Phoenix AZ GO TOB VRDO | 0.130% | 11/7/11 | 17,035 | 17,035 |
| 1 Salt River Project Arizona Agricultural Improvement & Power District Revenue TOB VRDO | 0.140% | 11/7/11 | 16,000 | 16,000 |
| 1 Salt River Project Arizona Agricultural Improvement & Power District Revenue TOB VRDO | 0.140% | 11/7/11 | 6,450 | 6,450 |
| 1 Salt River Project Arizona Agricultural Improvement & Power District Revenue TOB VRDO | 0.140% | 11/7/11 | 8,500 | 8,500 |
| 1 Salt River Project Arizona Agricultural Improvement & Power District Revenue TOB VRDO | 0.140% | 11/7/11 | 6,500 | 6,500 |
| 1 Salt River Project Arizona Agricultural Improvement & Power District Revenue TOB VRDO | 0.140% | 11/7/11 | 4,560 | 4,560 |
| 1 Salt River Project Arizona Agricultural Improvement & Power District Revenue TOB VRDO | 0.140% | 11/7/11 | 13,220 | 13,220 |
| Scottsdale Arizona Industrial Development Authority Hospital Revenue | 5.800% | 12/1/11 (Prere.) | 14,865 | 15,079 |
| Tempe AZ Transit Excise Tax Revenue VRDO | 0.140% | 11/7/11 | 13,655 | 13,655 |
| | | | | 491,799 |
| Arkansas (0.2%) | | | | |
| Pulaski County AR Health Facilities Board Revenue | | | | |
| (St. Vincent Infirmary - Catholic Health Initiatives) VRDO | 0.140% | 11/7/11 | 28,500 | 28,500 |
10
Tax-Exempt Money Market Fund
| | | | | |
| | | | | Face | Market |
| | | | Maturity | Amount | Value• |
| | | Coupon | Date | ($000) | ($000) |
| California (4.7%) | | | | |
| 2 | ABAG Finance Authority for Nonprofit Corps. California Revenue | | | | |
| | (Computer History Museum) VRDO | 0.130% | 11/7/11 LOC | 7,000 | 7,000 |
| | California Department of Water Resources Power Supply Revenue | 5.000% | 5/1/12 (Prere.) | 1,000 | 1,034 |
| | California Department of Water Resources Power Supply Revenue | 5.125% | 5/1/12 (Prere.) | 7,500 | 7,758 |
| | California Department of Water Resources Power Supply Revenue | 5.250% | 5/1/12 (Prere.) | 1,300 | 1,346 |
| | California Department of Water Resources Power Supply Revenue | 5.250% | 5/1/12 (Prere.) | 2,500 | 2,587 |
| | California Department of Water Resources Power Supply Revenue | 5.375% | 5/1/12 (Prere.) | 1,000 | 1,036 |
| 1,2 | California Educational Facilities Authority Revenue (Stanford University) TOB PUT | 0.250% | 2/9/12 | 19,960 | 19,960 |
| 1 | California Educational Facilities Authority Revenue (University of Southern California) TOB VRDO | 0.140% | 11/7/11 | 5,050 | 5,050 |
| | California GO VRDO | 0.100% | 11/7/11 LOC | 23,150 | 23,150 |
| | California GO VRDO | 0.130% | 11/7/11 LOC | 21,780 | 21,780 |
| | California Health Facilities Financing Authority Revenue (Catholic Healthcare West) VRDO | 0.130% | 11/7/11 LOC | 6,000 | 6,000 |
| | California Health Facilities Financing Authority Revenue | | | | |
| | (Children’s Hospital of Orange County) VRDO | 0.120% | 11/7/11 LOC | 7,100 | 7,100 |
| | California Health Facilities Financing Authority Revenue | | | | |
| | (Lucile Salter Packard Children’s Hospitalat Stanford) VRDO | 0.040% | 11/7/11 | 8,000 | 8,000 |
| | California Infrastructure & Economic Development Bank Revenue | | | | |
| | (American National Red Cross) VRDO | 0.090% | 11/7/11 LOC | 5,600 | 5,600 |
| | California Infrastructure & Economic Development Bank Revenue | | | | |
| | (Buck Institute for Age Research) VRDO | 0.120% | 11/7/11 LOC | 9,110 | 9,110 |
| | California RAN | 2.000% | 5/24/12 | 200,000 | 201,818 |
| | California School Cash Reserve Program Authority Pool TRAN | 2.000% | 6/1/12 | 13,800 | 13,925 |
| | California Statewide Communities Development Authority Gas Supply Revenue VRDO | 0.130% | 11/7/11 | 79,575 | 79,575 |
| 1 | California Statewide Communities Development Authority Revenue (Sutter Health) TOB VRDO | 0.140% | 11/7/11 | 17,545 | 17,545 |
| | Irvine CA Assessment District No. 89-10 Improvement Revenue (Northwest Irvine) VRDO | 3.939% | 11/1/11 LOC | 1,982 | 1,982 |
| | Irvine CA Public Facilities & Infrastructure Authority Assessment Revenue VRDO | 3.380% | 11/1/11 LOC | 6,400 | 6,400 |
| | Kern County CA TRAN | 3.000% | 6/29/12 | 75,000 | 76,339 |
| | Livermore CA COP VRDO | 0.130% | 11/7/11 LOC | 11,285 | 11,285 |
| 1 | Los Angeles CA Department of Water & Power Revenue TOB VRDO | 0.130% | 11/7/11 LOC | 6,210 | 6,210 |
| 1 | Los Angeles CA GO TOB VRDO | 0.150% | 11/1/11 | 6,800 | 6,800 |
| | Los Angeles CA Harbor Department Revenue CP | 0.250% | 2/13/12 | 30,000 | 30,000 |
| | Los Angeles CA TRAN | 2.500% | 2/29/12 | 12,930 | 13,024 |
| | Los Angeles CA TRAN | 2.500% | 4/30/12 | 36,000 | 36,385 |
| | Los Angeles County CA TRAN | 2.500% | 2/29/12 | 8,000 | 8,057 |
| | Los Angeles County CA TRAN | 2.500% | 3/30/12 | 20,000 | 20,177 |
| | Los Angeles County CA TRAN | 2.500% | 6/29/12 | 52,500 | 53,227 |
| 2 | Metropolitan Water District of Southern California Revenue PUT | 0.140% | 7/9/12 | 15,000 | 15,000 |
| 1 | Metropolitan Water District of Southern California Revenue TOB VRDO | 0.240% | 11/7/11 | 4,985 | 4,985 |
| 1 | Nuveen California Select Quality Municipal Fund VRDP VRDO | 0.260% | 11/7/11 LOC | 26,000 | 26,000 |
| | Riverside County CA TRAN | 2.000% | 3/30/12 | 17,500 | 17,625 |
| | San Bernardino County CA TRAN | 2.000% | 6/29/12 | 25,000 | 25,282 |
| | San Diego County CA Regional Transportation Authority Sales Tax Revenue VRDO | 0.140% | 11/7/11 | 18,245 | 18,245 |
| 1 | San Francisco CA Bay Area Rapid Transit District Sales Tax Revenue TOB VRDO | 0.130% | 11/7/11 | 8,900 | 8,900 |
| | San Francisco CA City & County Unified School District TRAN | 2.000% | 6/29/12 | 10,000 | 10,112 |
| | Whittier CA Health Facility Revenue (Presbyterian Intercommunity Hospital) VRDO | 0.090% | 11/7/11 LOC | 1,000 | 1,000 |
| | | | | | 836,409 |
| Colorado (2.9%) | | | | |
| 1 | Board of Governors of the Colorado State University System Revenue TOB VRDO | 0.130% | 11/7/11 LOC | 21,995 | 21,995 |
| | Castle Rock CO COP VRDO | 0.200% | 11/7/11 LOC | 10,400 | 10,400 |
| | Colorado Educational & Cultural Facilities Authority Revenue | | | | |
| | (National Jewish Federation Bond Program) VRDO | 0.230% | 11/1/11 LOC | 1,630 | 1,630 |
| | Colorado Educational & Cultural Facilities Authority Revenue | | | | |
| | (National Jewish Federation Bond Program) VRDO | 0.500% | 11/1/11 LOC | 9,200 | 9,200 |
| | Colorado Educational & Cultural Facilities Authority Revenue (Nature Conservancy Project) VRDO | 0.140% | 11/7/11 | 10,560 | 10,560 |
| | Colorado Health Facilities Authority Hospital Revenue | | | | |
| | (Adventist Health System/Sunbelt Obligated Group) VRDO | 0.100% | 11/7/11 LOC | 9,600 | 9,600 |
| | Colorado Health Facilities Authority Revenue (Catholic Health Initiatives) PUT | 4.100% | 11/10/11 | 17,000 | 17,015 |
| | Colorado Health Facilities Authority Revenue | | | | |
| | (Evangelical Lutheran Good Samaritan Society Project) VRDO | 0.110% | 11/7/11 LOC | 2,400 | 2,400 |
| 1 | Colorado Health Facilities Authority Revenue | | | | |
| | (Sisters of Charity of Leavenworth Health System) TOB VRDO | 0.140% | 11/7/11 | 6,770 | 6,770 |
| | Colorado Housing & Finance Authority Multi-Family Mortgage Revenue VRDO | 0.150% | 11/7/11 | 19,825 | 19,825 |
| | Colorado Housing & Finance Authority Multi-Family Mortgage Revenue VRDO | 0.150% | 11/7/11 | 10,200 | 10,200 |
| | Colorado Housing & Finance Authority Multi-Family Mortgage Revenue VRDO | 0.160% | 11/7/11 | 59,510 | 59,510 |
| | Colorado Housing & Finance Authority Single Family Mortgage Revenue VRDO | 0.130% | 11/7/11 | 31,000 | 31,000 |
| | Colorado Housing & Finance Authority Single Family Mortgage Revenue VRDO | 0.130% | 11/7/11 | 25,025 | 25,025 |
| | Colorado Housing & Finance Authority Single Family Mortgage Revenue VRDO | 0.130% | 11/7/11 LOC | 4,640 | 4,640 |
11
Tax-Exempt Money Market Fund
| | | | |
| | | | Face | Market |
| | | Maturity | Amount | Value• |
| | Coupon | Date | ($000) | ($000) |
| Colorado Housing & Finance Authority Single Family Mortgage Revenue VRDO | 0.130% | 11/7/11 LOC | 17,250 | 17,250 |
| Colorado Housing & Finance Authority Single Family Mortgage Revenue VRDO | 0.130% | 11/7/11 LOC | 22,730 | 22,730 |
| Colorado Housing & Finance Authority Single Family Mortgage Revenue VRDO | 0.140% | 11/7/11 LOC | 10,100 | 10,100 |
| Colorado Housing & Finance Authority Single Family Mortgage Revenue VRDO | 0.150% | 11/7/11 | 10,210 | 10,210 |
| Colorado Housing & Finance Authority Single Family Mortgage Revenue VRDO | 0.150% | 11/7/11 | 12,500 | 12,500 |
| Colorado Housing & Finance Authority Single Family Mortgage Revenue VRDO | 0.160% | 11/7/11 | 11,800 | 11,800 |
| Colorado Housing & Finance Authority Single Family Mortgage Revenue VRDO | 0.170% | 11/7/11 | 23,000 | 23,000 |
| 1 Colorado Regional Transportation District Sales Tax Revenue (FasTracks Project) TOB VRDO | 0.140% | 11/7/11 | 20,630 | 20,630 |
| 1 Colorado Regional Transportation District Sales Tax Revenue TOB VRDO | 0.130% | 11/7/11 | 11,390 | 11,390 |
| Colorado Springs CO Utility System Revenue VRDO | 0.130% | 11/7/11 | 12,800 | 12,800 |
| 1 Denver CO City & County Airport Revenue TOB VRDO | 0.170% | 11/7/11 LOC | 25,000 | 25,000 |
| Denver CO City & County COP VRDO | 0.150% | 11/1/11 | 2,280 | 2,280 |
| Denver CO Urban Renewal Authority Tax Increment Revenue (Stapleton) VRDO | 0.140% | 11/7/11 LOC | 14,445 | 14,445 |
| 1 El Paso CO COP TOB VRDO | 0.130% | 11/7/11 LOC | 11,105 | 11,105 |
| Moffat County CO Pollution Control Revenue (PacifiCorp Projects) VRDO | 0.130% | 11/7/11 LOC | 14,900 | 14,900 |
| University of Colorado Hospital Authority Revenue VRDO | 0.120% | 11/7/11 LOC | 15,140 | 15,140 |
| University of Colorado Hospital Authority Revenue VRDO | 0.130% | 11/7/11 LOC | 27,715 | 27,715 |
| | | | | 502,765 |
| Connecticut (0.2%) | | | | |
| 1 Connecticut Health & Educational Facilities Authority Revenue (Yale University) TOB VRDO | 0.120% | 11/7/11 | 7,300 | 7,300 |
| Connecticut Housing Finance Authority Revenue Housing Mortgage Finance Program PUT | 0.450% | 11/15/11 | 7,325 | 7,325 |
| Hartford CT BAN | 2.000% | 4/12/12 | 15,350 | 15,444 |
| | | | | 30,069 |
| Delaware (0.1%) | | | | |
| Delaware Economic Development Authority Revenue (Archmere Academy Project) VRDO | 0.130% | 11/7/11 LOC | 1,125 | 1,125 |
| Delaware Health Facilities Authority Revenue (Bayhealth Medical Center Project) VRDO | 0.110% | 11/7/11 LOC | 4,740 | 4,740 |
| Delaware Health Facilities Authority Revenue (Nemours Foundation Project) VRDO | 0.180% | 11/7/11 | 4,970 | 4,970 |
| 1 Delaware Housing Authority Single Family Mortgage Revenue TOB VRDO | 0.190% | 11/7/11 | 5,705 | 5,705 |
| 1 Delaware Housing Authority Single Family Mortgage Revenue TOB VRDO | 0.390% | 11/7/11 | 2,920 | 2,920 |
| | | | | 19,460 |
| District of Columbia (1.8%) | | | | |
| 1 District of Columbia COP TOB VRDO | 0.130% | 11/7/11 LOC | 17,400 | 17,400 |
| 1 District of Columbia GO TOB VRDO | 0.130% | 11/7/11 LOC | 22,790 | 22,790 |
| District of Columbia GO VRDO | 0.130% | 11/7/11 LOC | 7,700 | 7,700 |
| 2 District of Columbia Income Tax Revenue | 0.320% | 12/1/11 | 16,400 | 16,403 |
| 1 District of Columbia Income Tax Revenue TOB VRDO | 0.140% | 11/7/11 | 9,995 | 9,995 |
| District of Columbia Revenue (Henry J. Kaiser Family Foundation) VRDO | 0.130% | 11/7/11 | 12,000 | 12,000 |
| District of Columbia Revenue (The Pew Charitable Trust) VRDO | 0.110% | 11/7/11 LOC | 31,000 | 31,000 |
| District of Columbia Revenue (Washington Drama Society) VRDO | 0.130% | 11/7/11 LOC | 13,900 | 13,900 |
| District of Columbia Revenue (Wesley Theological Seminary) VRDO | 0.140% | 11/7/11 LOC | 4,800 | 4,800 |
| District of Columbia Revenue (World Wildlife Fund Inc.) VRDO | 0.130% | 11/7/11 LOC | 10,600 | 10,600 |
| District of Columbia TRAN | 2.000% | 9/28/12 | 100,000 | 101,557 |
| 1 District of Columbia Water & Sewer Authority Public Utility Revenue TOB VRDO | 0.130% | 11/7/11 LOC | 12,850 | 12,850 |
| 1 District of Columbia Water & Sewer Authority Public Utility Revenue TOB VRDO | 0.140% | 11/7/11 | 8,330 | 8,330 |
| 1 District of Columbia Water & Sewer Authority Public Utility Revenue TOB VRDO | 0.160% | 11/7/11 | 11,865 | 11,865 |
| Metropolitan Washington DC/VA Airports Authority Airport System Revenue VRDO | 0.130% | 11/7/11 LOC | 30,225 | 30,225 |
| | | | | 311,415 |
| Florida (3.8%) | | | | |
| 1 BlackRock MuniHoldings Investment Quality Fund VRDP VRDO | 0.290% | 11/7/11 LOC | 45,000 | 45,000 |
| 1 Brevard County FL School Board COP TOB VRDO | 0.130% | 11/7/11 LOC | 13,810 | 13,810 |
| 1 Broward County FL GO TOB VRDO | 0.130% | 11/7/11 | 8,180 | 8,180 |
| 1 Broward County FL School Board COP TOB VRDO | 0.130% | 11/7/11 LOC | 34,555 | 34,555 |
| 1 Broward County FL Water & Sewer Utility Revenue TOB VRDO | 0.140% | 11/7/11 | 5,660 | 5,660 |
| Florida Board of Education Capital Outlay GO | 3.000% | 6/1/12 | 23,485 | 23,836 |
| 1 Florida Board of Education Public Education Capital Outlay GO TOB VRDO | 0.130% | 11/7/11 | 10,265 | 10,265 |
| 1 Florida Board of Education Public Education Capital Outlay GO TOB VRDO | 0.130% | 11/7/11 | 15,000 | 15,000 |
| 1 Florida Board of Education Public Education Capital Outlay GO TOB VRDO | 0.130% | 11/7/11 | 12,815 | 12,815 |
| 1 Florida Board of Education Public Education Capital Outlay GO TOB VRDO | 0.140% | 11/7/11 | 9,000 | 9,000 |
| 1 Florida Board of Education Public Education Capital Outlay GO TOB VRDO | 0.140% | 11/7/11 | 6,265 | 6,265 |
| 1 Florida Board of Education Public Education Capital Outlay GO TOB VRDO | 0.140% | 11/7/11 | 3,995 | 3,995 |
| 1 Florida Board of Education Public Education Capital Outlay GO TOB VRDO | 0.140% | 11/7/11 | 8,800 | 8,800 |
| 1 Florida Board of Education Public Education Capital Outlay GO TOB VRDO | 0.140% | 11/7/11 | 5,680 | 5,680 |
| 1 Florida Board of Education Public Education Capital Outlay GO TOB VRDO | 0.200% | 11/7/11 | 5,970 | 5,970 |
| 1 Florida Department of Management Services COP TOB VRDO | 0.140% | 11/7/11 | 6,955 | 6,955 |
| 1 Florida Department Transportation Revenue TOB VRDO | 0.140% | 11/7/11 | 8,225 | 8,225 |
| 1 Florida Housing Finance Corp. Homeowner Mortgage Revenue TOB VRDO | 0.190% | 11/7/11 | 2,745 | 2,745 |
| 1 Florida Housing Finance Corp. Homeowner Mortgage Revenue TOB VRDO | 0.190% | 11/7/11 | 6,155 | 6,155 |
| 1 Florida Housing Finance Corp. Homeowner Mortgage Revenue TOB VRDO | 0.190% | 11/7/11 | 7,945 | 7,945 |
12
Tax-Exempt Money Market Fund
| | | | |
| | | | Face | Market |
| | | Maturity | Amount | Value• |
| | Coupon | Date | ($000) | ($000) |
| 1 Florida Housing Finance Corp. Homeowner Mortgage Revenue TOB VRDO | 0.190% | 11/7/11 | 5,700 | 5,700 |
| Florida Keys Aqueduct Authority Water Revenue VRDO | 0.100% | 11/7/11 LOC | 4,050 | 4,050 |
| Highlands County FL Health Facilities Authority Hospital Revenue | | | | |
| (Adventist Health System/Sunbelt Obligated Group) VRDO | 0.100% | 11/7/11 LOC | 12,200 | 12,200 |
| Highlands County FL Health Facilities Authority Hospital Revenue | | | | |
| (Adventist Health System/Sunbelt Obligated Group) VRDO | 0.100% | 11/7/11 LOC | 5,000 | 5,000 |
| Highlands County FL Health Facilities Authority Revenue | | | | |
| (Adventist Health System/Sunbelt Inc.) VRDO | 0.100% | 11/7/11 LOC | 9,890 | 9,890 |
| Highlands County FL Health Facilities Authority Revenue | | | | |
| (Adventist Health System/Sunbelt Inc.) VRDO | 0.120% | 11/7/11 LOC | 15,115 | 15,115 |
| Highlands County FL Health Facilities Authority Revenue | | | | |
| (Adventist Health System/Sunbelt Inc.) VRDO | 0.130% | 11/7/11 LOC | 6,500 | 6,500 |
| Jacksonville FL Electric Authority Electric System Revenue VRDO | 0.100% | 11/1/11 | 25,000 | 25,000 |
| Jacksonville FL Electric Authority Electric System Revenue VRDO | 0.100% | 11/7/11 LOC | 17,310 | 17,310 |
| Jacksonville FL Health Facilities Authority Hospital Revenue | | | | |
| (Baptist Medical Center Project) VRDO | 0.140% | 11/7/11 LOC | 5,090 | 5,090 |
| 1 Jacksonville FL US Government Guaranteed Notes TOB VRDO | 0.140% | 11/7/11 | 3,900 | 3,900 |
| 1 Lee Memorial Health System Florida Hospital Revenue TOB VRDO | 0.130% | 11/7/11 LOC | 14,435 | 14,435 |
| Lee Memorial Health System Florida Hospital Revenue VRDO | 0.130% | 11/7/11 LOC | 6,540 | 6,540 |
| Miami FL GO | 5.500% | 1/1/12 (Prere.) | 3,000 | 3,025 |
| Miami FL GO | 5.500% | 1/1/12 (Prere.) | 7,015 | 7,073 |
| 1 Miami-Dade County FL School Board COP TOB VRDO | 0.130% | 11/7/11 LOC | 16,095 | 16,095 |
| 1 Miami-Dade County FL School Board COP TOB VRDO | 0.150% | 11/7/11 (13) | 36,630 | 36,630 |
| Orange County FL Health Facilities Authority Hospital Revenue | | | | |
| (Orlando Regional Healthcare System) VRDO | 0.130% | 11/7/11 LOC | 4,630 | 4,630 |
| Orange County FL Health Facilities Authority Revenue (Nemours Foundation Project) VRDO | 0.130% | 11/7/11 | 25,555 | 25,555 |
| Orange County FL Health Facilities Authority Revenue (Nemours Foundation Project) VRDO | 0.130% | 11/7/11 | 4,145 | 4,145 |
| 1 Orange County FL Housing Finance Authority Homeowner Revenue | | | | |
| (Multi-County Program) TOB VRDO | 0.190% | 11/7/11 | 2,275 | 2,275 |
| 1 Orange County FL School Board COP TOB VRDO | 0.130% | 11/7/11 LOC | 9,120 | 9,120 |
| 1 Palm Beach County FL Public Improvement Revenue TOB VRDO | 0.130% | 11/7/11 | 8,485 | 8,485 |
| Palm Beach County FL Revenue (Children’s Home Society Project) VRDO | 0.350% | 11/7/11 LOC | 11,745 | 11,745 |
| Palm Beach County FL Revenue (Community Foundation Palm Beach Project) VRDO | 0.150% | 11/7/11 LOC | 5,700 | 5,700 |
| Palm Beach County FL School Board COP TOB VRDO | 0.130% | 11/7/11 | 11,300 | 11,300 |
| Palm Beach County FL Solid Waste Authority Revenue PUT | 1.000% | 1/12/12 (Prere.) | 100,000 | 100,114 |
| 1 Palm Beach County FL Water & Sewer Revenue TOB VRDO | 0.140% | 11/7/11 | 5,535 | 5,535 |
| Polk County FL Industrial Development Authority Health Care Facilities Revenue | | | | |
| (Winter Haven Hospital Project) VRDO | 0.110% | 11/7/11 LOC | 9,300 | 9,300 |
| 1 South Florida Water Management District COP TOB VRDO | 0.160% | 11/7/11 | 9,800 | 9,800 |
| 1 South Florida Water Management District COP TOB VRDO | 0.200% | 11/7/11 | 8,985 | 8,985 |
| Sunshine State Governmental Financing Commission Florida Revenue VRDO | 0.120% | 11/7/11 LOC | 3,600 | 3,600 |
| 1 Tampa Bay FL Water Utility System Revenue TOB VRDO | 0.160% | 11/7/11 | 4,505 | 4,505 |
| 1 University of North Florida Financing Corp. Capital Improvement Revenue TOB VRDO | 0.170% | 11/7/11 LOC | 5,210 | 5,210 |
| West Orange FL Healthcare District Revenue VRDO | 0.130% | 11/7/11 LOC | 12,500 | 12,500 |
| | | | | 676,913 |
| Georgia (5.3%) | | | | |
| Atlanta GA Airport Revenue CP | 0.190% | 11/8/11 LOC | 30,000 | 30,000 |
| Atlanta GA Development Authority Revenue (Georgia Aquarium Inc. Project) VRDO | 0.130% | 11/7/11 LOC | 10,000 | 10,000 |
| 1 Augusta GA Water & Sewer Revenue TOB VRDO | 0.240% | 11/7/11 (4) | 7,645 | 7,645 |
| Cobb County GA Hospital Authority (Equipment Pool Project) RAN VRDO | 0.140% | 11/7/11 LOC | 13,600 | 13,600 |
| Cobb County GA School District TAN | 1.500% | 12/29/11 | 62,000 | 62,111 |
| Dalton County GA Development Authority Revenue (Hamilton Health Care System) VRDO | 0.200% | 11/7/11 LOC | 15,940 | 15,940 |
| 1 DeKalb County GA Water & Sewer Revenue TOB VRDO | 0.130% | 11/7/11 LOC | 26,445 | 26,445 |
| Floyd County GA Development Authority Revenue (Berry College Project) VRDO | 0.130% | 11/7/11 LOC | 31,250 | 31,250 |
| Floyd County GA Development Authority Revenue (Berry College Project) VRDO | 0.130% | 11/7/11 LOC | 42,705 | 42,705 |
| Floyd County GA Development Authority Revenue (Berry College Project) VRDO | 0.130% | 11/7/11 LOC | 14,350 | 14,350 |
| Fulton County GA Development Authority Revenue (Lovett School Project) VRDO | 0.130% | 11/7/11 LOC | 25,800 | 25,800 |
| 1 Fulton County GA Development Authority Revenue (Piedmont Healthcare Inc. Project) TOB VRDO | 0.140% | 11/7/11 | 22,835 | 22,835 |
| Fulton County GA Development Authority Revenue (Piedmont Healthcare Inc. Project) VRDO | 0.130% | 11/7/11 LOC | 69,415 | 69,415 |
| Fulton County GA Development Authority Revenue (Robert A. Woodruff Arts Center) VRDO | 0.130% | 11/7/11 LOC | 22,000 | 22,000 |
| Fulton County GA Development Authority Revenue (Shepherd Center Inc. Project) VRDO | 0.130% | 11/7/11 LOC | 37,000 | 37,000 |
| Fulton County GA Development Authority Revenue (Woodward Academy Project) VRDO | 0.130% | 11/7/11 LOC | 32,000 | 32,000 |
| Fulton County GA Development Authority Revenue (Woodward Academy Project) VRDO | 0.130% | 11/7/11 LOC | 20,595 | 20,595 |
| Fulton County GA Development Authority Revenue (Woodward Academy Project) VRDO | 0.130% | 11/7/11 LOC | 8,600 | 8,600 |
| Fulton County GA Development Authority Revenue (Woodward Academy Project) VRDO | 0.130% | 11/7/11 LOC | 6,800 | 6,800 |
| Fulton County GA Development Authority Revenue (Woodward Academy Project) VRDO | 0.130% | 11/7/11 LOC | 13,000 | 13,000 |
| 1 Gainesville GA Redevelopment Authority Revenue (Brenau University Inc. Project) VRDO | 0.150% | 11/7/11 LOC | 10,550 | 10,550 |
| Georgia GO | 5.000% | 5/1/12 (Prere.) | 3,500 | 3,583 |
| Georgia GO | 5.000% | 7/1/12 | 2,265 | 2,337 |
| Georgia GO | 5.000% | 8/1/12 | 2,125 | 2,200 |
13
Tax-Exempt Money Market Fund
| | | | |
| | | | Face | Market |
| | | Maturity | Amount | Value• |
| | Coupon | Date | ($000) | ($000) |
| Georgia GO | 5.000% | 10/1/12 | 9,000 | 9,391 |
| 1 Georgia GO TOB VRDO | 0.130% | 11/7/11 | 9,810 | 9,810 |
| 1 Georgia GO TOB VRDO | 0.200% | 11/7/11 | 5,000 | 5,000 |
| Georgia Ports Authority Revenue (Garden City Terminal Project) VRDO | 0.150% | 11/7/11 LOC | 3,770 | 3,770 |
| Gwinnett County GA Development Authority Revenue (Nilhan Hospitality LLC) VRDO | 0.100% | 11/7/11 LOC | 2,200 | 2,200 |
| Gwinnett County GA Hospital Authority (Gwinnett Hospital System Inc. Project ) RAN VRDO | 0.130% | 11/7/11 LOC | 45,610 | 45,610 |
| Gwinnett County GA School District GO | 5.000% | 2/1/12 | 9,990 | 10,103 |
| 1 Gwinnett County GA School District GO TOB VRDO | 0.130% | 11/7/11 | 12,250 | 12,250 |
| Macon-Bibb County GA Hospital Authority Revenue (Medical Center of Central Georgia) VRDO | 0.130% | 11/7/11 LOC | 43,350 | 43,350 |
| Macon-Bibb County GA Hospital Authority Revenue (Medical Center of Central Georgia) VRDO | 0.130% | 11/7/11 LOC | 15,075 | 15,075 |
| Macon-Bibb County GA Hospital Authority Revenue (Medical Center of Central Georgia) VRDO | 0.140% | 11/7/11 LOC | 15,300 | 15,300 |
| Macon-Bibb County GA Hospital Authority Revenue (Medical Center of Central Georgia) VRDO | 0.140% | 11/7/11 LOC | 5,500 | 5,500 |
| Main Street Natural Gas Inc. Georgia Gas Project Revenue VRDO | 0.140% | 11/7/11 | 89,900 | 89,900 |
| Metropolitan Atlanta GA Rapid Transportation Authority Georgia Sales Tax Revenue CP | 0.180% | 12/9/11 | 30,000 | 30,000 |
| Metropolitan Atlanta GA Rapid Transportation Authority Georgia Sales Tax Revenue CP | 0.180% | 12/9/11 | 3,000 | 3,000 |
| Metropolitan Atlanta GA Rapid Transportation Authority Georgia Sales Tax Revenue VRDO | 0.130% | 11/7/11 LOC | 37,000 | 37,000 |
| Municipal Electric Authority of Georgia Electric Revenue VRDO | 0.150% | 11/7/11 LOC | 12,500 | 12,500 |
| 1 Private Colleges & University Authority of Georgia Revenue (Emory University) TOB VRDO | 0.130% | 11/7/11 | 15,240 | 15,240 |
| 1 Private Colleges & University Authority of Georgia Revenue (Emory University) TOB VRDO | 0.140% | 11/7/11 | 5,805 | 5,805 |
| 1 Private Colleges & University Authority of Georgia Revenue (Emory University) TOB VRDO | 0.140% | 11/7/11 | 3,700 | 3,700 |
| 1 Private Colleges & University Authority of Georgia Revenue (Emory University) TOB VRDO | 0.140% | 11/7/11 | 5,630 | 5,630 |
| 1 Private Colleges & University Authority of Georgia Revenue (Emory University) TOB VRDO | 0.140% | 11/7/11 | 9,745 | 9,745 |
| Thomasville GA Hospital Revenue (John D. Archbold Memorial Hospital Inc. Project) VRDO | 0.150% | 11/7/11 LOC | 2,550 | 2,550 |
| Thomasville GA Hospital Revenue (John D. Archbold Memorial Hospital Inc. Project) VRDO | 0.150% | 11/7/11 LOC | 3,700 | 3,700 |
| | | | | 926,890 |
| Hawaii (0.5%) | | | | |
| 1 Hawaii GO TOB VRDO | 0.140% | 11/7/11 | 11,245 | 11,245 |
| 1 Hawaii Housing Finance & Development Revenue TOB VRDO | 0.140% | 11/7/11 LOC | 12,510 | 12,510 |
| 1 Honolulu HI City & County Board Water Supply Water System Revenue TOB VRDO | 0.130% | 11/7/11 LOC | 7,000 | 7,000 |
| 1 Honolulu HI City & County GO TOB VRDO | 0.140% | 11/7/11 | 7,715 | 7,715 |
| 1 Honolulu HI City & County Wastewater System Revenue TOB VRDO | 0.130% | 11/7/11 LOC | 16,295 | 16,295 |
| 1 University of Hawaii Revenue TOB VRDO | 0.130% | 11/7/11 LOC | 12,830 | 12,830 |
| 1 University of Hawaii Revenue TOB VRDO | 0.150% | 11/7/11 (13) | 19,800 | 19,800 |
| | | | | 87,395 |
| Idaho (1.7%) | | | | |
| Idaho Building Authority Revenue (Prison Facilities Project) VRDO | 0.150% | 11/7/11 | 15,955 | 15,955 |
| Idaho Housing & Finance Association Nonprofit Facilities Revenue | | | | |
| (College of Idaho Project) VRDO | 0.100% | 11/7/11 LOC | 6,060 | 6,060 |
| Idaho Housing & Finance Association Single Family Mortgage Revenue VRDO | 0.140% | 11/7/11 LOC | 5,985 | 5,985 |
| Idaho Housing & Finance Association Single Family Mortgage Revenue VRDO | 0.140% | 11/7/11 LOC | 9,325 | 9,325 |
| Idaho Housing & Finance Association Single Family Mortgage Revenue VRDO | 0.140% | 11/7/11 LOC | 13,000 | 13,000 |
| Idaho Housing & Finance Association Single Family Mortgage Revenue VRDO | 0.160% | 11/7/11 LOC | 12,085 | 12,085 |
| Idaho Housing & Finance Association Single Family Mortgage Revenue VRDO | 0.160% | 11/7/11 LOC | 12,360 | 12,360 |
| Idaho Housing & Finance Association Single Family Mortgage Revenue VRDO | 0.160% | 11/7/11 LOC | 13,445 | 13,445 |
| Idaho Housing & Finance Association Single Family Mortgage Revenue VRDO | 0.160% | 11/7/11 LOC | 13,465 | 13,465 |
| Idaho Housing & Finance Association Single Family Mortgage Revenue VRDO | 0.160% | 11/7/11 LOC | 5,500 | 5,500 |
| Idaho Housing & Finance Association Single Family Mortgage Revenue VRDO | 0.160% | 11/7/11 LOC | 7,205 | 7,205 |
| Idaho Housing & Finance Association Single Family Mortgage Revenue VRDO | 0.160% | 11/7/11 LOC | 4,805 | 4,805 |
| Idaho Housing & Finance Association Single Family Mortgage Revenue VRDO | 0.160% | 11/7/11 LOC | 9,080 | 9,080 |
| Idaho Housing & Finance Association Single Family Mortgage Revenue VRDO | 0.160% | 11/7/11 LOC | 6,855 | 6,855 |
| Idaho Housing & Finance Association Single Family Mortgage Revenue VRDO | 0.160% | 11/7/11 LOC | 6,855 | 6,855 |
| Idaho Housing & Finance Association Single Family Mortgage Revenue VRDO | 0.160% | 11/7/11 LOC | 9,515 | 9,515 |
| Idaho Housing & Finance Association Single Family Mortgage Revenue VRDO | 0.160% | 11/7/11 LOC | 8,945 | 8,945 |
| Idaho Housing & Finance Association Single Family Mortgage Revenue VRDO | 0.160% | 11/7/11 LOC | 11,500 | 11,500 |
| Idaho Housing & Finance Association Single Family Mortgage Revenue VRDO | 0.160% | 11/7/11 LOC | 9,685 | 9,685 |
| Idaho Housing & Finance Association Single Family Mortgage Revenue VRDO | 0.160% | 11/7/11 LOC | 9,400 | 9,400 |
| Idaho Housing & Finance Association Single Family Mortgage Revenue VRDO | 0.160% | 11/7/11 LOC | 10,225 | 10,225 |
| Idaho Housing & Finance Association Single Family Mortgage Revenue VRDO | 0.160% | 11/7/11 LOC | 12,605 | 12,605 |
| Idaho Housing & Finance Association Single Family Mortgage Revenue VRDO | 0.160% | 11/7/11 LOC | 11,735 | 11,735 |
| Idaho Housing & Finance Association Single Family Mortgage Revenue VRDO | 0.160% | 11/7/11 LOC | 5,600 | 5,600 |
| Idaho Housing & Finance Association Single Family Mortgage Revenue VRDO | 0.160% | 11/7/11 LOC | 10,265 | 10,265 |
| Idaho Housing & Finance Association Single Family Mortgage Revenue VRDO | 0.220% | 11/7/11 | 11,735 | 11,735 |
| Idaho TAN | 2.000% | 6/29/12 | 50,000 | 50,571 |
| | | | | 303,761 |
| Illinois (4.9%) | | | | |
| Bartlett IL Special Service Area No. 1 (Bluff City LLC) GO VRDO | 0.150% | 11/7/11 LOC | 12,000 | 12,000 |
| Channahon IL Revenue (Morris Hospital) VRDO | 0.150% | 11/7/11 LOC | 5,105 | 5,105 |
| Channahon IL Revenue (Morris Hospital) VRDO | 0.150% | 11/7/11 LOC | 4,060 | 4,060 |
14
Tax-Exempt Money Market Fund
| | | | |
| | | | Face | Market |
| | | Maturity | Amount | Value• |
| | Coupon | Date | ($000) | ($000) |
| Chicago IL Board of Education GO VRDO | 0.110% | 11/7/11 LOC | 17,400 | 17,400 |
| Chicago IL Board of Education GO VRDO | 0.110% | 11/7/11 LOC | 5,900 | 5,900 |
| 1 Chicago IL GO TOB VRDO | 0.140% | 11/7/11 | 12,150 | 12,150 |
| 1 Chicago IL GO TOB VRDO | 0.150% | 11/7/11 | 5,500 | 5,500 |
| 1 Chicago IL GO TOB VRDO | 0.160% | 11/7/11 LOC | 18,140 | 18,140 |
| 1 Chicago IL GO TOB VRDO | 0.170% | 11/7/11 | 6,000 | 6,000 |
| Chicago IL GO VRDO | 0.150% | 11/1/11 | 4,500 | 4,500 |
| 1 Chicago IL Metropolitan Water Reclamation District GO TOB VRDO | 0.130% | 11/7/11 | 18,820 | 18,820 |
| 1 Chicago IL Metropolitan Water Reclamation District GO TOB VRDO | 0.130% | 11/7/11 | 5,000 | 5,000 |
| 1 Chicago IL Metropolitan Water Reclamation District GO TOB VRDO | 0.130% | 11/7/11 | 6,270 | 6,270 |
| 1 Chicago IL Metropolitan Water Reclamation District GO TOB VRDO | 0.140% | 11/7/11 | 12,000 | 12,000 |
| 1 Chicago IL Metropolitan Water Reclamation District GO TOB VRDO | 0.200% | 11/7/11 | 15,485 | 15,485 |
| 1 Chicago IL O’Hare International Airport Revenue TOB VRDO | 0.130% | 11/7/11 LOC | 29,590 | 29,590 |
| 1 Chicago IL O’Hare International Airport Revenue TOB VRDO | 0.140% | 11/7/11 | 10,155 | 10,155 |
| 1 Chicago IL O’Hare International Airport Revenue TOB VRDO | 0.170% | 11/7/11 LOC | 13,595 | 13,595 |
| 1 Chicago IL Water Revenue TOB VRDO | 0.240% | 11/7/11 (4) | 17,870 | 17,870 |
| Chicago IL Water Revenue VRDO | 0.170% | 11/7/11 LOC | 19,575 | 19,575 |
| Chicago IL Water Revenue VRDO | 0.170% | 11/7/11 LOC | 5,285 | 5,285 |
| 1 Cook County IL GO TOB VRDO | 0.160% | 11/7/11 | 7,460 | 7,460 |
| 1 Hoffman Estates IL GO TOB VRDO | 0.150% | 11/7/11 | 7,295 | 7,295 |
| Illinois Educational Facilities Authority Revenue (ACI/Cultural Pooled Financing Program) VRDO | 0.130% | 11/7/11 LOC | 2,500 | 2,500 |
| Illinois Educational Facilities Authority Revenue (Columbia College Chicago) VRDO | 0.110% | 11/7/11 LOC | 12,650 | 12,650 |
| 2 Illinois Educational Facilities Authority Revenue (University of Chicago) PUT | 0.440% | 5/3/12 | 15,000 | 15,000 |
| 1 Illinois Educational Facilities Authority Revenue (University of Chicago) TOB VRDO | 0.200% | 11/7/11 | 9,185 | 9,185 |
| Illinois Finance Authority Industrial Development Revenue | | | | |
| (Gusto Packing Co. Inc. Project) Revenue VRDO | 0.470% | 11/7/11 LOC | 6,175 | 6,175 |
| Illinois Finance Authority Revenue (Advocate Health Care Network) VRDO | 0.110% | 11/7/11 | 29,605 | 29,605 |
| Illinois Finance Authority Revenue (Advocate Health Care) PUT | 0.480% | 2/1/12 | 11,500 | 11,500 |
| 2 Illinois Finance Authority Revenue (Advocate Health Care) PUT | 0.260% | 5/28/12 | 11,500 | 11,500 |
| 1 Illinois Finance Authority Revenue (Advocate Health Care) TOB VRDO | 0.140% | 11/7/11 | 26,810 | 26,810 |
| 1 Illinois Finance Authority Revenue (Advocate Health Care) TOB VRDO | 0.140% | 11/7/11 | 26,955 | 26,955 |
| Illinois Finance Authority Revenue (Bradley University) VRDO | 0.110% | 11/7/11 LOC | 3,750 | 3,750 |
| 1 Illinois Finance Authority Revenue (Central DuPage Health) TOB VRDO | 0.140% | 11/7/11 | 8,750 | 8,750 |
| Illinois Finance Authority Revenue (Chicago Horticulture Project) VRDO | 0.150% | 11/7/11 LOC | 12,000 | 12,000 |
| 1 Illinois Finance Authority Revenue (Chicago University) TOB VRDO | 0.140% | 11/7/11 | 13,330 | 13,330 |
| Illinois Finance Authority Revenue (Evangelical Project) VRDO | 0.140% | 11/7/11 LOC | 4,925 | 4,925 |
| Illinois Finance Authority Revenue (Hospital Sister Services Inc.) CP | 0.180% | 11/8/11 | 27,970 | 27,970 |
| Illinois Finance Authority Revenue (Hospital Sister Services Inc.) CP | 0.180% | 11/14/11 | 15,710 | 15,710 |
| Illinois Finance Authority Revenue (Hospital Sister Services Inc.) CP | 0.180% | 1/6/12 | 25,485 | 25,485 |
| Illinois Finance Authority Revenue (Hospital Sister Services Inc.) CP | 0.180% | 1/9/12 | 29,985 | 29,985 |
| Illinois Finance Authority Revenue (Institute of Chicago) VRDO | 0.120% | 11/7/11 LOC | 12,000 | 12,000 |
| Illinois Finance Authority Revenue (Institute of Chicago) VRDO | 0.120% | 11/7/11 LOC | 16,000 | 16,000 |
| Illinois Finance Authority Revenue (Institute of Chicago) VRDO | 0.120% | 11/7/11 LOC | 4,175 | 4,175 |
| Illinois Finance Authority Revenue (ITT Research Institute) VRDO | 0.140% | 11/7/11 LOC | 5,600 | 5,600 |
| Illinois Finance Authority Revenue (Methodist Medical Center) VRDO | 0.130% | 11/7/11 LOC | 11,500 | 11,500 |
| 1 Illinois Finance Authority Revenue (Northshore University Health System) TOB VRDO | 0.140% | 11/7/11 | 4,375 | 4,375 |
| Illinois Finance Authority Revenue (Northwest Community Hospital) VRDO | 0.130% | 11/7/11 LOC | 15,740 | 15,740 |
| Illinois Finance Authority Revenue (Northwest Community Hospital) VRDO | 0.130% | 11/7/11 LOC | 5,145 | 5,145 |
| 1 Illinois Finance Authority Revenue (Northwestern Memorial Hospital) TOB VRDO | 0.140% | 11/7/11 | 6,000 | 6,000 |
| 1 Illinois Finance Authority Revenue (Northwestern University) TOB VRDO | 0.130% | 11/7/11 | 8,165 | 8,165 |
| Illinois Finance Authority Revenue (Rush University Medical Center) VRDO | 0.130% | 11/7/11 LOC | 5,000 | 5,000 |
| Illinois Finance Authority Revenue (Southern Illinois Healthcare) VRDO | 0.130% | 11/7/11 LOC | 9,430 | 9,430 |
| Illinois Finance Authority Revenue (Trinity International University) VRDO | 0.150% | 11/7/11 LOC | 12,870 | 12,870 |
| 1 Illinois Finance Authority Revenue (University of Chicago) TOB VRDO | 0.130% | 11/7/11 | 20,500 | 20,500 |
| 1 Illinois Finance Authority Revenue (University of Chicago) TOB VRDO | 0.140% | 11/7/11 | 3,000 | 3,000 |
| 1 Illinois Finance Authority Revenue (University of Chicago) TOB VRDO | 0.170% | 11/7/11 | 10,265 | 10,265 |
| Illinois Finance Authority Revenue (University of Chicago) VRDO | 0.090% | 11/7/11 | 4,669 | 4,669 |
| Illinois Finance Authority Revenue (YMCA Metropolitan Chicago Project) VRDO | 0.120% | 11/7/11 LOC | 4,200 | 4,200 |
| Illinois Health Facilities Authority Revenue (Advocate Health Care Network) PUT | 0.450% | 3/28/12 | 9,235 | 9,235 |
| Illinois Health Facilities Authority Revenue (Elmhurst Memorial Hospital) VRDO | 0.110% | 11/7/11 LOC | 8,600 | 8,600 |
| Illinois Health Facilities Authority Revenue (Ingalls Memorial Hospital) VRDO | 0.090% | 11/7/11 LOC | 13,800 | 13,800 |
| Illinois Regional Transportation Authority Revenue | 5.375% | 6/1/12 (Prere.) | 7,730 | 8,037 |
| 1 Illinois Regional Transportation Authority Revenue TOB VRDO | 0.140% | 11/7/11 (13) | 11,305 | 11,305 |
| 1 Illinois Regional Transportation Authority Revenue TOB VRDO | 0.140% | 11/7/11 | 6,040 | 6,040 |
| 1 Illinois Toll Highway Authority Toll Highway Revenue TOB VRDO | 0.140% | 11/7/11 | 14,430 | 14,430 |
| 1 Illinois Toll Highway Authority Toll Highway Revenue TOB VRDO | 0.140% | 11/7/11 | 5,330 | 5,330 |
| Illinois Toll Highway Authority Toll Highway Revenue VRDO | 0.090% | 11/7/11 LOC | 20,000 | 20,000 |
| 1 Lake, Cook, Kane, & McHenry Counties IL Community Unified School District GO TOB VRDO | 0.140% | 11/7/11 | 10,355 | 10,355 |
| 1 Metropolitan Pier & Exposition Authority Illinois Dedicated Sales Tax Revenue TOB VRDO | 0.140% | 11/7/11 (4) | 9,225 | 9,225 |
15
Tax-Exempt Money Market Fund
| | | | |
| | | | Face | Market |
| | | Maturity | Amount | Value• |
| | Coupon | Date | ($000) | ($000) |
| 1 Metropolitan Pier & Exposition Authority Illinois Dedicated Sales Tax Revenue TOB VRDO | 0.140% | 11/7/11 | 12,640 | 12,640 |
| 1 Schaumburg IL GO TOB VRDO | 0.150% | 11/7/11 (13) | 11,330 | 11,330 |
| 1 Southern Illinois University Revenue TOB VRDO | 0.130% | 11/7/11 LOC | 11,405 | 11,405 |
| | | | | 863,306 |
| Indiana (1.8%) | | | | |
| Indiana Bond Bank Revenue Advance Funding BAN | 2.000% | 1/5/12 LOC | 37,800 | 37,898 |
| Indiana Finance Authority Environmental Improvement Revenue (Ispat Inland Inc. Project) VRDO | 0.130% | 11/7/11 LOC | 18,280 | 18,280 |
| Indiana Finance Authority Health System Revenue | | | | |
| (Sisters of St. Francis Health Services Inc. Obligated Group) VRDO | 0.080% | 11/7/11 LOC | 5,000 | 5,000 |
| Indiana Finance Authority Health System Revenue | | | | |
| (Sisters of St. Francis Health Services Inc. Obligated Group) VRDO | 0.120% | 11/7/11 LOC | 11,000 | 11,000 |
| 1 Indiana Finance Authority Hospital Revenue (Indiana University) TOB VRDO | 0.140% | 11/7/11 LOC | 10,000 | 10,000 |
| Indiana Finance Authority Hospital Revenue (Indiana University) VRDO | 0.090% | 11/7/11 LOC | 6,525 | 6,525 |
| Indiana Finance Authority Hospital Revenue (Indiana University) VRDO | 0.110% | 11/7/11 LOC | 18,000 | 18,000 |
| Indiana Finance Authority Revenue (Columbus Regional Hospital) VRDO | 0.140% | 11/7/11 LOC | 6,700 | 6,700 |
| Indiana Finance Authority Revenue (DePauw University Project) VRDO | 0.110% | 11/7/11 LOC | 36,890 | 36,890 |
| 1 Indiana Finance Authority Revenue (Lease Appropriation) TOB VRDO | 0.140% | 11/7/11 | 4,620 | 4,620 |
| Indiana Health & Educational Facility Financing Authority Educational Facilities Revenue | | | | |
| (Marian College) VRDO | 0.140% | 11/7/11 LOC | 5,100 | 5,100 |
| 1 Indiana Health & Educational Facility Financing Authority Health System Revenue | | | | |
| (Sisters of St. Francis Health Services Inc.) TOB VRDO | 0.150% | 11/7/11 | 5,850 | 5,850 |
| 1 Indiana Health & Educational Facility Financing Authority Health System Revenue | | | | |
| (Sisters of St. Francis Health Services Inc.) TOB VRDO | 0.160% | 11/7/11 | 3,300 | 3,300 |
| 1 Indiana Health & Educational Facility Financing Authority Revenue | | | | |
| (Ascension Health Credit Group) TOB VRDO | 0.140% | 11/7/11 | 19,275 | 19,275 |
| 1 Indiana Health Facility Financing Authority Hospital Revenue | | | | |
| (Community Hospital Project) TOB VRDO | 0.130% | 11/7/11 LOC | 6,420 | 6,420 |
| Indiana Health Facility Financing Authority Revenue (Ascension Health Credit Group) VRDO | 0.130% | 11/7/11 | 13,000 | 13,000 |
| 1 Indiana Housing & Community Development Authority Single Family Mortgage Revenue | | | | |
| TOB VRDO | 0.150% | 11/7/11 | 49,540 | 49,540 |
| 1 Indiana Housing & Community Development Authority Single Family Mortgage Revenue | | | | |
| TOB VRDO | 0.190% | 11/7/11 | 1,780 | 1,780 |
| 1 Indiana Housing & Community Development Authority Single Family Mortgage Revenue | | | | |
| TOB VRDO | 0.270% | 11/7/11 | 3,505 | 3,505 |
| 1 Indianapolis IN Local Public Improvement Bond Bank Revenue (PILOT Infrastructure Project) | | | | |
| TOB VRDO | 0.160% | 11/7/11 | 3,500 | 3,500 |
| 1 Indianapolis IN Local Public Improvement Bond Bank Revenue (PILOT Infrastructure Project) | | | | |
| TOB VRDO | 0.160% | 11/7/11 | 11,775 | 11,775 |
| Lawrenceburg IN Pollution Control Revenue VRDO | 0.100% | 11/7/11 LOC | 5,500 | 5,500 |
| Noblesville IN Economic Development Revenue (Greystone Apartments Project) VRDO | 0.220% | 11/7/11 LOC | 10,920 | 10,920 |
| 1 Wayne Township Marion County IN School Building Corp. Mortgage Revenue TOB VRDO | 0.130% | 11/7/11 LOC | 30,515 | 30,515 |
| | | | | 324,893 |
| Iowa (0.2%) | | | | |
| Iowa Finance Authority Single Family Mortgage Revenue VRDO | 0.170% | 11/7/11 | 11,140 | 11,140 |
| Iowa Finance Authority Single Family Mortgage Revenue VRDO | 0.170% | 11/7/11 | 8,830 | 8,830 |
| Iowa Finance Authority Single Family Mortgage Revenue VRDO | 0.170% | 11/7/11 | 3,300 | 3,300 |
| 1 Iowa Special Obligation Revenue TOB VRDO | 0.150% | 11/7/11 | 11,200 | 11,200 |
| 1 Iowa Special Obligation Revenue TOB VRDO | 0.150% | 11/7/11 | 3,800 | 3,800 |
| Polk County IA GO | 5.000% | 6/1/12 (Prere.) | 4,070 | 4,182 |
| | | | | 42,452 |
| Kansas (0.3%) | | | | |
| 1 Kansas Department of Transportation Highway Revenue TOB VRDO | 0.130% | 11/7/11 | 6,185 | 6,185 |
| 1 Kansas Development Finance Authority Hospital Revenue | | | | |
| (Adventist Health System/Sunbelt Obligated Group) TOB VRDO | 0.150% | 11/7/11 | 8,285 | 8,285 |
| Sedgwick County KS Airport Facility Revenue (Flight Safety International Inc. Project) VRDO | 0.180% | 11/7/11 | 34,000 | 34,000 |
| Wichita Kansas GO Airport Renewal BAN | 0.700% | 2/9/12 | 3,085 | 3,085 |
| | | | | 51,555 |
| Kentucky (0.8%) | | | | |
| Boone County KY Pollution Control Revenue (Duke Energy Kentucky Inc. Project) VRDO | 0.120% | 11/7/11 LOC | 4,100 | 4,100 |
| Boyle County KY Hospital Revenue (Ephraim McDowell Health Project) VRDO | 0.140% | 11/7/11 LOC | 11,820 | 11,820 |
| Jeffersontown KY Lease Program Revenue (Kentucky League of Cities Funding Trust) VRDO | 0.130% | 11/7/11 LOC | 2,500 | 2,500 |
| Kentucky Economic Development Finance Authority Hospital Facilities Revenue | | | | |
| (St. Elizabeth Medical Center Inc.) VRDO | 0.120% | 11/7/11 LOC | 5,300 | 5,300 |
| Kentucky Economic Development Finance Authority Hospital Revenue | | | | |
| (Baptist Healthcare System Obligated Group) VRDO | 0.140% | 11/7/11 LOC | 12,000 | 12,000 |
| Kentucky Economic Development Finance Authority Medical Center Revenue | | | | |
| (King’s Daughters Medical Center Project) VRDO | 0.130% | 11/7/11 LOC | 5,000 | 5,000 |
16
Tax-Exempt Money Market Fund
| | | | |
| | | | Face | Market |
| | | Maturity | Amount | Value• |
| | Coupon | Date | ($000) | ($000) |
| Kentucky Economic Development Finance Authority Medical Center Revenue | | | | |
| (King’s Daughters Medical Center Project) VRDO | 0.130% | 11/7/11 LOC | 35,000 | 35,000 |
| 1 Kentucky Higher Education Student Loan Corp. Student Loan Revenue TOB VRDO | 0.140% | 11/7/11 LOC | 11,995 | 11,995 |
| 1 Kentucky Housing Corp. Housing Revenue TOB VRDO | 0.190% | 11/7/11 | 8,220 | 8,220 |
| 1 Kentucky Housing Corp. Housing Revenue TOB VRDO | 0.200% | 11/7/11 | 2,740 | 2,740 |
| 1 Kentucky Turnpike Authority Economic Development Road Revenue | | | | |
| (Revitalization Project) TOB VRDO | 0.130% | 11/7/11 | 10,370 | 10,370 |
| 1 Lexington-Fayette Urban County Airport Board Kentucky General Airport Revenue TOB VRDO | 0.140% | 11/7/11 | 4,660 | 4,660 |
| 1 Louisville & Jefferson County KY Metropolitan Government Parking Revenue TOB VRDO | 0.140% | 11/7/11 | 6,125 | 6,125 |
| Richmond KY League of Cities Funding Lease Program Revenue VRDO | 0.130% | 11/7/11 LOC | 8,400 | 8,400 |
| Warren County KY Revenue (Western Kentucky University Student Life Foundation Inc. Project) | | | | |
| VRDO | 0.140% | 11/7/11 LOC | 3,650 | 3,650 |
| Williamstown KY League of Cities Funding Trust Lease Revenue VRDO | 0.130% | 11/7/11 LOC | 4,500 | 4,500 |
| Williamstown KY League of Cities Funding Trust Lease Revenue VRDO | 0.130% | 11/7/11 LOC | 4,035 | 4,035 |
| | | | | 140,415 |
| Louisiana (0.8%) | | | | |
| Ascension Parish LA Industrial Development Board Revenue (IMTT-Geismar Project) VRDO | 0.130% | 11/7/11 LOC | 17,000 | 17,000 |
| Louisiana Public Facilities Authority Revenue (CHRISTUS Health) VRDO | 0.130% | 11/7/11 LOC | 12,000 | 12,000 |
| Louisiana Public Facilities Authority Revenue (International-Matex Tank Terminals Project) VRDO | 0.130% | 11/7/11 LOC | 30,000 | 30,000 |
| Louisiana Public Facilities Authority Revenue (International-Matex Tank Terminals Project) VRDO | 0.130% | 11/7/11 LOC | 34,000 | 34,000 |
| Louisiana Public Facilities Authority Revenue (Tiger Athletic Foundation Project) VRDO | 0.140% | 11/7/11 LOC | 20,355 | 20,355 |
| St. James Parish LA Revenue (Nustar Logistics LP Project) VRDO | 0.150% | 11/7/11 LOC | 12,500 | 12,500 |
| St. James Parish LA Revenue (Nustar Logistics LP Project) VRDO | 0.150% | 11/7/11 LOC | 17,500 | 17,500 |
| | | | | 143,355 |
| Maine (0.3%) | | | | |
| Maine Health & Higher Educational Facilities Authority Revenue VRDO | 0.150% | 11/7/11 LOC | 4,600 | 4,600 |
| Maine Health & Higher Educational Facilities Authority Revenue VRDO | 0.150% | 11/7/11 LOC | 2,700 | 2,700 |
| 1 Maine Housing Authority Mortgage Revenue TOB VRDO | 0.190% | 11/7/11 | 3,720 | 3,720 |
| 1 Maine Housing Authority Mortgage Revenue TOB VRDO | 0.200% | 11/7/11 | 5,510 | 5,510 |
| Maine Housing Authority Mortgage Revenue VRDO | 0.180% | 11/7/11 | 20,000 | 20,000 |
| Maine Housing Authority Mortgage Revenue VRDO | 0.180% | 11/7/11 | 9,000 | 9,000 |
| | | | | 45,530 |
| Maryland (1.5%) | | | | |
| Baltimore MD Consolidated Public Improvement GO | 5.000% | 2/1/12 | 1,000 | 1,011 |
| Howard County MD GO | 4.000% | 2/15/12 | 1,010 | 1,020 |
| Howard County MD GO | 5.000% | 2/15/12 | 1,900 | 1,925 |
| Howard County MD GO CP | 0.180% | 12/16/11 | 17,250 | 17,250 |
| 1 Maryland Department of Housing & Community Development Revenue TOB VRDO | 0.190% | 11/7/11 | 5,095 | 5,095 |
| 1 Maryland Department of Housing & Community Development Revenue TOB VRDO | 0.200% | 11/7/11 | 6,325 | 6,325 |
| 1 Maryland Department of Housing & Community Development Revenue TOB VRDO | 0.200% | 11/7/11 | 4,430 | 4,430 |
| 1 Maryland Department of Housing & Community Development Revenue TOB VRDO | 0.200% | 11/7/11 | 4,245 | 4,245 |
| 1 Maryland Department of Housing & Community Development Revenue TOB VRDO | 0.200% | 11/7/11 | 8,250 | 8,250 |
| 1 Maryland Department of Housing & Community Development Revenue TOB VRDO | 0.200% | 11/7/11 | 7,520 | 7,520 |
| Maryland GO | 5.250% | 2/15/12 | 2,000 | 2,028 |
| Maryland GO | 5.000% | 8/1/12 | 5,250 | 5,437 |
| Maryland GO | 5.250% | 8/15/12 | 12,200 | 12,680 |
| 1 Maryland GO TOB VRDO | 0.200% | 11/7/11 | 4,750 | 4,750 |
| Maryland Health & Higher Educational Facilities Authority Revenue | | | | |
| (Johns Hopkins Health System Obligated Group) CP | 0.210% | 11/14/11 | 15,620 | 15,620 |
| Maryland Health & Higher Educational Facilities Authority Revenue (Johns Hopkins Hospital) VRDO | 0.110% | 11/7/11 LOC | 8,100 | 8,100 |
| Maryland Health & Higher Educational Facilities Authority Revenue (Johns Hopkins University) CP | 0.160% | 11/14/11 | 42,555 | 42,555 |
| 1 Maryland Health & Higher Educational Facilities Authority Revenue (Johns Hopkins University) | | | | |
| TOB VRDO | 0.130% | 11/7/11 | 7,655 | 7,655 |
| Maryland Health & Higher Educational Facilities Authority Revenue (Johns Hopkins University) | | | | |
| VRDO | 0.110% | 11/7/11 | 12,500 | 12,500 |
| Maryland Health & Higher Educational Facilities Authority Revenue (Johns Hopkins University) | | | | |
| VRDO | 0.110% | 11/7/11 LOC | 4,800 | 4,800 |
| Maryland Health & Higher Educational Facilities Authority Revenue (Suburban Hospital) VRDO | 0.110% | 11/7/11 LOC | 9,560 | 9,560 |
| Maryland Health & Higher Educational Facilities Authority Revenue | | | | |
| (University of Maryland Medical System) VRDO | 0.100% | 11/7/11 LOC | 5,000 | 5,000 |
| 1 Maryland Transportation Authority Facilities Projects Revenue TOB VRDO | 0.130% | 11/7/11 | 15,440 | 15,440 |
| 1 Maryland Transportation Authority Facilities Projects Revenue TOB VRDO | 0.140% | 11/7/11 | 8,800 | 8,800 |
| 1 Maryland Transportation Authority Facilities Projects Revenue TOB VRDO | 0.150% | 11/7/11 | 13,860 | 13,860 |
| 1 Maryland Transportation Authority Facilities Projects Revenue TOB VRDO | 0.240% | 11/7/11 | 9,000 | 9,000 |
| Maryland Transportation Authority Passenger Facility Charge Revenue (BWI Airport) VRDO | 0.120% | 11/7/11 LOC | 12,350 | 12,350 |
| Montgomery County MD Housing Opportunities Commission Multifamily Housing Revenue | | | | |
| (Canterbury Apartments) VRDO | 0.120% | 11/7/11 LOC | 5,065 | 5,065 |
| University of Maryland Auxilary Facility & Tuition Revenue | 3.000% | 4/1/12 | 3,880 | 3,924 |
| | | | | 256,195 |
17
Tax-Exempt Money Market Fund
| | | | | |
| | | | | Face | Market |
| | | | Maturity | Amount | Value• |
| | | Coupon | Date | ($000) | ($000) |
| Massachusetts (1.7%) | | | | |
| | Massachusetts Bay Transportation Authority Sales Tax Revenue VRDO | 0.120% | 11/7/11 | 5,400 | 5,400 |
| | Massachusetts Development Finance Agency Revenue (Cushing Academy Issue) VRDO | 0.140% | 11/7/11 LOC | 11,795 | 11,795 |
| | Massachusetts Development Finance Agency Revenue (Fay School) VRDO | 0.140% | 11/7/11 LOC | 10,800 | 10,800 |
| | Massachusetts Development Finance Agency Revenue (Shady Hill) VRDO | 0.140% | 11/7/11 LOC | 9,345 | 9,345 |
| | Massachusetts Development Finance Agency Revenue (Wentworth Institute of Technology) VRDO | 0.150% | 11/7/11 LOC | 16,200 | 16,200 |
| 2 | Massachusetts GO | 0.380% | 2/1/12 | 5,000 | 5,001 |
| 1 | Massachusetts GO TOB VRDO | 0.130% | 11/7/11 | 13,545 | 13,545 |
| 1 | Massachusetts GO TOB VRDO | 0.140% | 11/7/11 | 23,485 | 23,485 |
| 1 | Massachusetts GO TOB VRDO | 0.140% | 11/7/11 | 23,935 | 23,935 |
| 1 | Massachusetts GO TOB VRDO | 0.140% | 11/7/11 | 3,750 | 3,750 |
| 1 | Massachusetts GO TOB VRDO | 0.140% | 11/7/11 | 1,850 | 1,850 |
| 1 | Massachusetts GO TOB VRDO | 0.140% | 11/7/11 | 6,665 | 6,665 |
| 1 | Massachusetts GO TOB VRDO | 0.200% | 11/7/11 | 9,475 | 9,475 |
| | Massachusetts Health & Educational Facilities Authority Revenue (Baystate Medical Center) VRDO | 0.120% | 11/7/11 LOC | 3,030 | 3,030 |
| | Massachusetts Health & Educational Facilities Authority Revenue (Cil Realty) VRDO | 0.120% | 11/7/11 LOC | 3,900 | 3,900 |
| 1 | Massachusetts Health & Educational Facilities Authority Revenue (Partners Healthcare System) | | | | |
| | TOB VRDO | 0.140% | 11/7/11 | 10,000 | 10,000 |
| | Massachusetts Health & Educational Facilities Authority Revenue (Pool Loan Program) VRDO | 0.100% | 11/7/11 LOC | 25,600 | 25,600 |
| 1 | Massachusetts Housing Finance Agency Multifamily Housing Revenue TOB VRDO | 0.190% | 11/7/11 | 10,635 | 10,635 |
| 1 | Massachusetts Housing Finance Agency Multifamily Housing Revenue TOB VRDO | 0.200% | 11/7/11 | 5,515 | 5,515 |
| 1 | Massachusetts Water Pollution Abatement Trust Revenue TOB VRDO | 0.140% | 11/7/11 | 3,240 | 3,240 |
| 1 | Massachusetts Water Resources Authority Revenue TOB VRDO | 0.140% | 11/7/11 | 7,300 | 7,300 |
| 1 | Massachusetts Water Resources Authority Revenue TOB VRDO | 0.140% | 11/7/11 | 5,000 | 5,000 |
| 1 | Massachusetts Water Resources Authority Revenue TOB VRDO | 0.140% | 11/7/11 | 15,595 | 15,595 |
| 1 | Massachusetts Water Resources Authority Revenue TOB VRDO | 0.140% | 11/7/11 | 8,205 | 8,205 |
| 1 | Massachusetts Water Resources Authority Revenue TOB VRDO | 0.240% | 11/7/11 | 6,650 | 6,650 |
| | Massachusetts Water Resources Authority Revenue VRDO | 0.100% | 11/7/11 | 28,000 | 28,000 |
| | Massachusetts Water Resources Authority Revenue VRDO | 0.100% | 11/7/11 | 3,100 | 3,100 |
| | Massachusetts Water Resources Authority Revenue VRDO | 0.110% | 11/7/11 | 785 | 785 |
| 2 | University of Massachusetts Building Authority Revenue PUT | 0.230% | 5/28/12 | 13,800 | 13,800 |
| | | | | | 291,601 |
| Michigan (3.6%) | | | | |
| 1 | BlackRock MuniYield Michigan Quality Fund II, Inc. VRDP VRDO | 0.280% | 11/7/11 LOC | 15,400 | 15,400 |
| 1 | BlackRock MuniYield Michigan Quality Fund, Inc. VRDP VRDO | 0.280% | 11/7/11 LOC | 21,000 | 21,000 |
| | Kent Hospital MI Finance Authority Revenue (Spectrum Health) VRDO | 0.120% | 11/7/11 LOC | 30,000 | 30,000 |
| 1 | Lansing MI Board of Water & Light Utility System Revenue TOB VRDO | 0.140% | 11/7/11 LOC | 6,000 | 6,000 |
| | Michigan Finance Authority State Aid RAN | 2.000% | 8/20/12 | 50,000 | 50,557 |
| | Michigan Finance Authority State Aid RAN | 2.000% | 8/20/12 LOC | 57,560 | 58,341 |
| 1 | Michigan Higher Education Student Loan Authority Revenue TOB VRDO | 0.200% | 11/7/11 LOC | 66,995 | 66,995 |
| 1 | Michigan Higher Education Student Loan Authority Revenue TOB VRDO | 0.200% | 11/7/11 LOC | 67,945 | 67,945 |
| 1 | Michigan Higher Education Student Loan Authority Revenue TOB VRDO | 0.200% | 11/7/11 LOC | 36,545 | 36,545 |
| 1 | Michigan Higher Education Student Loan Authority Revenue TOB VRDO | 0.200% | 11/7/11 LOC | 59,245 | 59,245 |
| | Michigan Hospital Finance Authority Revenue (Holland Community Hospital) VRDO | 0.140% | 11/7/11 LOC | 6,900 | 6,900 |
| | Michigan Hospital Finance Authority Revenue (Trinity Health) CP | 0.200% | 1/9/12 | 28,420 | 28,420 |
| | Michigan Housing Development Authority Revenue (Rental Housing) VRDO | 0.140% | 11/7/11 | 5,900 | 5,900 |
| | Michigan Housing Development Authority Revenue (Rental Housing) VRDO | 0.140% | 11/7/11 | 8,395 | 8,395 |
| | Michigan Housing Development Authority Single Family Mortgage Revenue VRDO | 0.130% | 11/7/11 | 19,045 | 19,045 |
| | Michigan Housing Development Authority Single Family Mortgage Revenue VRDO | 0.140% | 11/7/11 LOC | 23,220 | 23,220 |
| | Michigan Housing Development Authority Single Family Mortgage Revenue VRDO | 0.160% | 11/7/11 LOC | 19,500 | 19,500 |
| 1 | Michigan Municipal Bond Authority Revenue (State Clean Water Revolving Fund) TOB VRDO | 0.140% | 11/7/11 | 3,845 | 3,845 |
| 1 | Michigan State University Board of Trustees General Revenue TOB VRDO | 0.140% | 11/7/11 | 9,855 | 9,855 |
| | Michigan State University Revenue CP | 0.180% | 12/5/11 | 8,625 | 8,625 |
| | Michigan State University Revenue CP | 0.180% | 1/9/12 | 18,250 | 18,250 |
| | Michigan Strategic Fund Limited Obligation Revenue (Evangelical Homes) VRDO | 0.140% | 11/7/11 LOC | 7,680 | 7,680 |
| | Oakland County MI Economic Development Corp. Revenue | | | | |
| | (Cranbrook Educational Community Project) VRDO | 0.130% | 11/7/11 LOC | 16,215 | 16,215 |
| | Oakland University of Michigan Revenue VRDO | 0.150% | 11/7/11 LOC | 28,580 | 28,580 |
| | University of Michigan Hospital Medical Service Plan Revenue VRDO | 0.110% | 11/7/11 | 1,050 | 1,050 |
| | Wayne County MI Airport Authority Revenue (Detroit Metropolitan Wayne County Airport) VRDO | 0.130% | 11/7/11 LOC | 10,000 | 10,000 |
| 1 | Wayne State University Michigan Revenue TOB VRDO | 0.160% | 11/7/11 | 5,295 | 5,295 |
| 1 | Wayne State University Michigan Revenue TOB VRDO | 0.240% | 11/7/11 (4) | 5,000 | 5,000 |
| | | | | | 637,803 |
| Minnesota (2.0%) | | | | |
| 1 | Hennepin County MN Sales Tax Revenue TOB VRDO | 0.140% | 11/7/11 | 23,640 | 23,640 |
| 1,2 | Minneapolis MN Health Care System Revenue (Fairview Health Services) TOB PUT | 0.210% | 12/1/11 LOC | 20,000 | 20,000 |
| | Minnesota GO | 2.000% | 10/1/12 | 27,350 | 27,787 |
| | Minnesota GO | 3.000% | 10/1/12 | 16,000 | 16,402 |
| | Minnesota GO | 5.250% | 11/1/12 (Prere.) | 1,005 | 1,054 |
18
Tax-Exempt Money Market Fund
| | | | |
| | | | Face | Market |
| | | Maturity | Amount | Value• |
| | Coupon | Date | ($000) | ($000) |
| 1 Minnesota GO TOB VRDO | 0.140% | 11/7/11 | 9,415 | 9,415 |
| 1 Minnesota GO TOB VRDO | 0.140% | 11/7/11 | 3,510 | 3,510 |
| Minnesota Higher Education Facilities Authority Revenue (Carleton College) VRDO | 0.130% | 11/7/11 | 2,000 | 2,000 |
| Minnesota Housing Finance Agency Residential Housing Revenue VRDO | 0.160% | 11/7/11 | 19,000 | 19,000 |
| Minnesota Housing Finance Agency Residential Housing Revenue VRDO | 0.160% | 11/7/11 | 12,030 | 12,030 |
| Minnesota Public Facilities Authority Revenue (State Revolving Fund) | 5.000% | 3/1/12 | 1,000 | 1,016 |
| Minnesota School District TRAN | 2.000% | 9/9/12 | 38,000 | 38,559 |
| Rochester MN Healthcare Facilities Revenue (Mayo Foundation) CP | 0.180% | 12/7/11 | 22,000 | 22,000 |
| Rochester MN Healthcare Facilities Revenue (Mayo Foundation) CP | 0.150% | 12/8/11 | 75,000 | 75,000 |
| Rochester MN Healthcare Facilities Revenue (Mayo Foundation) CP | 0.150% | 12/15/11 | 25,000 | 25,000 |
| University of Minnesota Revenue CP | 0.140% | 12/5/11 | 30,150 | 30,150 |
| University of Minnesota Revenue CP | 0.140% | 12/5/11 | 15,575 | 15,575 |
| University of Minnesota Revenue CP | 0.200% | 2/1/12 | 16,250 | 16,250 |
| | | | | 358,388 |
| Mississippi (0.5%) | | | | |
| Mississippi Business Finance Corp. Gulf Opportunity Zone Industrial Development Revenue | | | | |
| (Chevron USA Inc. Project) VRDO | 0.110% | 11/7/11 | 40,600 | 40,600 |
| Mississippi Business Finance Corp. Health Care Facilities Revenue | | | | |
| (Rush Medical Foundation Project)VRDO | 0.110% | 11/7/11 LOC | 9,600 | 9,600 |
| Mississippi Business Finance Corp. Revenue (Hattiesburg Project) VRDO | 0.140% | 11/7/11 LOC | 7,800 | 7,800 |
| Mississippi Business Finance Corp. Revenue (Renaissance at Colony Park LLC Project) VRDO | 0.140% | 11/7/11 LOC | 16,605 | 16,605 |
| 1 Mississippi Development Bank Special Obligation Revenue | | | | |
| (Capital City Convention Center Project) TOB VRDO | 0.130% | 11/7/11 LOC | 5,000 | 5,000 |
| Mississippi Hospital Equipment & Facilities Authority Revenue | | | | |
| (North Mississippi Health Services) VRDO | 0.110% | 11/7/11 | 8,000 | 8,000 |
| | | | | 87,605 |
| Missouri (1.4%) | | | | |
| 1 Columbia MO Special Obligation Electrical Improvement Revenue TOB VRDO | 0.130% | 11/7/11 LOC | 16,590 | 16,590 |
| Kansas City MO GO | 2.500% | 2/1/12 | 1,955 | 1,965 |
| Missouri Development Finance Board (Missouri Association of Municipal Utilities Lease | | | | |
| Financing Program) CP | 0.170% | 11/15/11 LOC | 29,575 | 29,575 |
| Missouri Health & Educational Facilities Authority Health Facilities Revenue | | | | |
| (Sisters of Mercy Health System) VRDO | 0.110% | 11/7/11 | 20,000 | 20,000 |
| Missouri Health & Educational Facilities Authority Revenue (Ascension Health Credit Group) VRDO | 0.130% | 11/7/11 | 8,000 | 8,000 |
| Missouri Health & Educational Facilities Authority Revenue (Sisters Mercy Health) VRDO | 0.100% | 11/7/11 | 10,000 | 10,000 |
| Missouri Health & Educational Facilities Authority Revenue (Sisters Mercy Health) VRDO | 0.100% | 11/7/11 | 25,000 | 25,000 |
| Missouri Health & Educational Facilities Authority Revenue (Sisters Mercy Health) VRDO | 0.100% | 11/7/11 | 5,000 | 5,000 |
| Missouri Health & Educational Facilities Authority Revenue (Sisters Mercy Health) VRDO | 0.100% | 11/7/11 | 25,000 | 25,000 |
| 1 Missouri Health & Educational Facilities Authority Revenue (Washington University) TOB VRDO | 0.150% | 11/1/11 | 4,300 | 4,300 |
| 1 Missouri Health & Educational Facilities Authority Revenue (Washington University) TOB VRDO | 0.130% | 11/7/11 | 13,955 | 13,955 |
| 1 Missouri Health & Educational Facilities Authority Revenue (Washington University) TOB VRDO | 0.140% | 11/7/11 | 11,300 | 11,300 |
| 1 Missouri Health & Educational Facilities Authority Revenue (Washington University) TOB VRDO | 0.140% | 11/7/11 | 5,570 | 5,570 |
| 1 Missouri Highways & Transportation Commission Revenue (State Road) TOB VRDO | 0.130% | 11/7/11 | 25,360 | 25,360 |
| 1 Missouri Highways & Transportation Commission Revenue (State Road) TOB VRDO | 0.200% | 11/7/11 | 18,295 | 18,295 |
| St. Louis County MO Special Obligation TAN | 0.750% | 8/1/12 | 22,080 | 22,103 |
| St. Louis MO General Fund TRAN | 2.000% | 6/29/12 | 10,000 | 10,106 |
| | | | | 252,119 |
| Montana (0.1%) | | | | |
| Montana Board of Investments Revenue (INTERCAP Revolving Program) PUT | 0.480% | 3/1/12 | 14,560 | 14,560 |
| |
| Multiple States (7.8%) | | | | |
| 1 BlackRock Muni Intermediate Duration Fund, Inc. VRDP VRDO | 0.270% | 11/7/11 LOC | 65,600 | 65,600 |
| 1 BlackRock MuniEnhanced Fund, Inc. VRDP VRDO | 0.280% | 11/7/11 LOC | 30,000 | 30,000 |
| 1 BlackRock MuniYield Quality Fund III, Inc. VRDP VRDO | 0.280% | 11/7/11 LOC | 48,500 | 48,500 |
| 1 Federal Home Loan Mortgage Corp. Multifamily Housing Revenue TOB VRDO | 0.190% | 11/7/11 LOC | 290,275 | 290,275 |
| Federal Home Loan Mortgage Corp. Multifamily Housing Revenue TOB VRDO | 0.190% | 11/7/11 LOC | 38,161 | 38,161 |
| 1 Federal Home Loan Mortgage Corp. Multifamily Housing Revenue TOB VRDO | 0.190% | 11/7/11 LOC | 19,020 | 19,020 |
| 1 Nuveen Insured Municipal Opportunity Fund VRDP VRDO | 0.280% | 11/7/11 LOC | 150,000 | 150,000 |
| 1 Nuveen Investment Quality Municipal Fund, Inc. VRDP VRDO | 0.290% | 11/7/11 LOC | 53,800 | 53,800 |
| 1 Nuveen Municipal Advantage Fund VRDP VRDO | 0.270% | 11/7/11 LOC | 34,100 | 34,100 |
| 1 Nuveen Municipal Market Opportunity Fund VRDP VRDO | 0.330% | 11/7/11 LOC | 97,500 | 97,500 |
| 1 Nuveen Premier Municipal Income Fund, Inc. VRDP VRDO | 0.290% | 11/7/11 LOC | 58,700 | 58,700 |
| 1 Nuveen Premium Income Municipal Fund 2, Inc. VRDP VRDO | 0.290% | 11/7/11 LOC | 130,000 | 130,000 |
| 1 Nuveen Premium Income Municipal Fund 4 VRDP VRDO | 0.270% | 11/7/11 LOC | 170,000 | 170,000 |
| 1 Nuveen Premium Insured Municipal Fund VRDP VRDO | 0.280% | 11/7/11 LOC | 24,000 | 24,000 |
| 1 Nuveen Quality Income Municipal Fund Inc VRDP VRDO | 0.270% | 11/7/11 LOC | 100,000 | 100,000 |
| 1 Nuveen Select Quality Municipal Fund, Inc. VRDP VRDO | 0.290% | 11/7/11 LOC | 57,500 | 57,500 |
| | | | | 1,367,156 |
19
Tax-Exempt Money Market Fund
| | | | |
| | | | Face | Market |
| | | Maturity | Amount | Value• |
| | Coupon | Date | ($000) | ($000) |
| Nebraska (1.3%) | | | | |
| Central Plains Energy Project Nebraska Gas Project Revenue (Project No. 2) VRDO | 0.140% | 11/7/11 | 89,225 | 89,225 |
| 1 Nebraska Investment Finance Authority Multifamily Housing Revenue | | | | |
| (Riverbend Apartments Project) VRDO | 0.160% | 11/7/11 LOC | 6,000 | 6,000 |
| 1 Nebraska Investment Finance Authority Single Family Housing Revenue TOB VRDO | 0.190% | 11/7/11 | 1,410 | 1,410 |
| Nebraska Investment Finance Authority Single Family Housing Revenue VRDO | 0.130% | 11/7/11 | 44,535 | 44,535 |
| 1 Nebraska Public Power District Revenue TOB VRDO | 0.150% | 11/7/11 (13) | 15,995 | 15,995 |
| 1 Omaha NE Public Power District Electric Revenue TOB VRDO | 0.130% | 11/7/11 | 10,125 | 10,125 |
| 1 Omaha NE Public Power District Electric Revenue TOB VRDO | 0.140% | 11/7/11 | 6,975 | 6,975 |
| 1 Omaha NE Public Power District Electric Revenue TOB VRDO | 0.140% | 11/7/11 (13) | 9,810 | 9,810 |
| 1 Omaha NE Public Power District Separate Electric Revenue TOB VRDO | 0.150% | 11/7/11 (13) | 34,610 | 34,610 |
| 1 Omaha NE Special Obligation Revenue TOB VRDO | 0.170% | 11/7/11 | 4,025 | 4,025 |
| | | | | 222,710 |
| Nevada (1.4%) | | | | |
| Clark County NV Airport System Revenue VRDO | 0.140% | 11/7/11 LOC | 15,000 | 15,000 |
| Clark County NV Economic Development Revenue (Opportunity Village Foundation Project) VRDO | 0.130% | 11/7/11 LOC | 9,400 | 9,400 |
| 1 Clark County NV GO TOB VRDO | 0.130% | 11/7/11 LOC | 27,820 | 27,820 |
| 1 Clark County NV GO TOB VRDO | 0.140% | 11/7/11 | 14,355 | 14,355 |
| 1 Clark County NV GO TOB VRDO | 0.200% | 11/7/11 | 9,770 | 9,770 |
| 1 Clark County NV School District GO TOB VRDO | 0.130% | 11/7/11 | 18,740 | 18,740 |
| 1 Clark County NV Water Reclamation District GO TOB VRDO | 0.140% | 11/7/11 | 14,800 | 14,800 |
| 1 Clark County NV Water Reclamation District GO TOB VRDO | 0.140% | 11/7/11 | 7,495 | 7,495 |
| 1 Clark County NV Water Reclamation District GO TOB VRDO | 0.140% | 11/7/11 | 6,085 | 6,085 |
| 1 Las Vegas NV GO TOB VRDO | 0.140% | 11/7/11 | 10,850 | 10,850 |
| Las Vegas Valley Water District Nevada GO CP | 0.170% | 12/5/11 | 10,500 | 10,500 |
| 1 Las Vegas Valley Water District Nevada GO TOB VRDO | 0.140% | 11/7/11 | 48,495 | 48,495 |
| 1 Las Vegas Valley Water District Nevada GO TOB VRDO | 0.140% | 11/7/11 | 4,685 | 4,685 |
| 1 Nevada GO TOB VRDO | 0.240% | 11/7/11 | 9,400 | 9,400 |
| 1 Nevada Higher Education Revenue TOB VRDO | 0.130% | 11/7/11 LOC | 13,020 | 13,020 |
| Nevada Housing Division Multi-Unit Housing Revenue (City Center Project) VRDO | 0.290% | 11/7/11 LOC | 7,440 | 7,440 |
| 1 Nevada System of Higher Education University Revenue TOB VRDO | 0.140% | 11/7/11 | 10,555 | 10,555 |
| Reno NV Hospital Revenue (Renown Regional Medical Center Project) VRDO | 0.130% | 11/7/11 LOC | 5,400 | 5,400 |
| 1 Truckee Meadows NV Water Authority Water Revenue TOB VRDO | 0.130% | 11/7/11 LOC | 9,990 | 9,990 |
| | | | | 253,800 |
| New Hampshire (0.1%) | | | | |
| 1 New Hampshire Health & Education Facilities Authority Revenue (Dartmouth College) TOB VRDO | 0.140% | 11/7/11 | 10,000 | 10,000 |
| |
| New Jersey (0.2%) | | | | |
| Burlington County NJ BAN | 1.500% | 9/7/12 | 15,000 | 15,155 |
| Cape May County NJ BAN | 2.000% | 8/31/12 | 8,000 | 8,107 |
| 1 Nuveen New Jersey Premium Income Municipal Fund VRDP VRDO | 0.280% | 11/7/11 LOC | 20,000 | 20,000 |
| | | | | 43,262 |
| New Mexico (1.0%) | | | | |
| Albuquerque NM GO | 3.000% | 7/1/12 | 7,000 | 7,128 |
| 1 New Mexico Educational Assistance Foundation Revenue TOB VRDO | 0.200% | 11/7/11 | 24,495 | 24,495 |
| New Mexico Educational Assistance Foundation Revenue VRDO | 0.170% | 11/7/11 LOC | 8,150 | 8,150 |
| New Mexico Educational Assistance Foundation Revenue VRDO | 0.170% | 11/7/11 LOC | 7,850 | 7,850 |
| 1 New Mexico Finance Authority Revenue TOB VRDO | 0.130% | 11/7/11 LOC | 10,265 | 10,265 |
| 1 New Mexico Finance Authority Revenue TOB VRDO | 0.130% | 11/7/11 | 10,700 | 10,700 |
| 1 New Mexico Finance Authority Transportation Revenue TOB VRDO | 0.200% | 11/7/11 | 8,975 | 8,975 |
| New Mexico Hospital Equipment Loan Council Hospital System Revenue | | | | |
| (Presbyterian Healthcare Services) VRDO | 0.120% | 11/7/11 | 20,435 | 20,435 |
| New Mexico Municipal Energy Acquisition Authority Gas Supply Revenue VRDO | 0.140% | 11/7/11 | 69,865 | 69,865 |
| | | | | 167,863 |
| New York (3.7%) | | | | |
| 1 BlackRock MuniYield New York Quality Fund, Inc. VRDP VRDO | 0.260% | 11/7/11 LOC | 15,000 | 15,000 |
| Erie County NY Fiscal Stability Authority BAN | 1.500% | 7/31/12 | 21,000 | 21,180 |
| Long Island NY Power Authority Electric System Revenue CP | 0.230% | 12/8/11 LOC | 10,000 | 10,000 |
| Nassau County NY Interim Finance Authority Sales Tax Revenue VRDO | 0.100% | 11/7/11 | 4,000 | 4,000 |
| Nassau County NY Interim Finance Authority Sales Tax Revenue VRDO | 0.120% | 11/7/11 | 6,400 | 6,400 |
| New York City NY Cultural Resources Revenue (Asia Society) VRDO | 0.120% | 11/7/11 LOC | 5,000 | 5,000 |
| New York City NY GO VRDO | 0.100% | 11/7/11 LOC | 3,300 | 3,300 |
| New York City NY GO VRDO | 0.110% | 11/7/11 LOC | 10,000 | 10,000 |
| New York City NY Housing Development Corp. Multi-Family Rental Housing Revenue | | | | |
| (2 Gold Street) VRDO | 0.130% | 11/7/11 | 22,500 | 22,500 |
| New York City NY Industrial Development Agency Civic Facility Revenue (New York Law School) | | | | |
| VRDO | 0.100% | 11/7/11 LOC | 19,510 | 19,510 |
| New York City NY Municipal Water Finance Authority Water & Sewer System Revenue CP | 0.150% | 11/10/11 | 20,000 | 20,000 |
20
Tax-Exempt Money Market Fund
| | | | |
| | | | Face | Market |
| | | Maturity | Amount | Value• |
| | Coupon | Date | ($000) | ($000) |
| 1 New York City NY Municipal Water Finance Authority Water & Sewer System Revenue | | | | |
| TOB VRDO | 0.150% | 11/1/11 | 10,000 | 10,000 |
| New York City NY Transitional Finance Authority Future Tax Revenue VRDO | 0.110% | 11/7/11 | 15,000 | 15,000 |
| New York City NY Transitional Finance Authority Recovery Revenue VRDO | 0.120% | 11/7/11 | 25,190 | 25,190 |
| New York Liberty Development Corp. Revenue PUT | 0.330% | 5/8/12 | 88,000 | 88,000 |
| New York Liberty Development Corp. Revenue PUT | 0.300% | 11/8/12 | 67,800 | 67,800 |
| New York Metropolitan Transportation Authority Revenue CP | 0.160% | 1/5/12 LOC | 20,000 | 20,000 |
| New York State Dormitory Authority Revenue (LeMoyne College) VRDO | 0.110% | 11/7/11 LOC | 4,550 | 4,550 |
| New York State Dormitory Authority Revenue (Mental Health Services Facilities Improvement) | | | | |
| VRDO | 0.110% | 11/7/11 LOC | 11,900 | 11,900 |
| New York State Dormitory Authority Revenue (North Shore - Long Island Jewish Obligated Group) | | | | |
| VRDO | 0.100% | 11/7/11 LOC | 2,000 | 2,000 |
| New York State Dormitory Authority Revenue (Personal Income Tax) | 5.000% | 2/15/12 | 15,000 | 15,196 |
| 1 New York State Dormitory Authority Revenue (Personal Income Tax) TOB VRDO | 0.140% | 11/7/11 | 3,510 | 3,510 |
| 1 New York State Dormitory Authority Revenue (Personal Income Tax) TOB VRDO | 0.140% | 11/7/11 | 6,420 | 6,420 |
| 1 New York State Dormitory Authority Revenue (Personal Income Tax) TOB VRDO | 0.140% | 11/7/11 | 5,000 | 5,000 |
| 1 New York State Dormitory Authority Revenue (Personal Income Tax) TOB VRDO | 0.140% | 11/7/11 | 1,000 | 1,000 |
| New York State Dormitory Authority Revenue (Rockefeller University) VRDO | 0.120% | 11/7/11 | 6,700 | 6,700 |
| New York State Dormitory Authority Revenue (State University Educational Facilities) PUT | 5.250% | 5/15/12 | 17,550 | 17,992 |
| New York State Dormitory Authority Revenue (State University Educational Facilities) PUT | 5.250% | 5/15/12 | 755 | 774 |
| New York State Dormitory Authority Revenue (State University Educational Facilities) PUT | 5.250% | 5/15/12 | 10,570 | 10,837 |
| New York State Housing Finance Agency Housing Revenue (Avalon Bowery Place I) VRDO | 0.100% | 11/7/11 LOC | 26,900 | 26,900 |
| New York State Housing Finance Agency Housing Revenue (Chelsea Apartments) VRDO | 0.120% | 11/7/11 LOC | 10,000 | 10,000 |
| New York State Housing Finance Agency Housing Revenue (West 17th Street) VRDO | 0.100% | 11/7/11 LOC | 8,700 | 8,700 |
| New York State Housing Finance Agency Housing Revenue (West 23rd Street) VRDO | 0.130% | 11/7/11 LOC | 10,400 | 10,400 |
| New York State Housing Finance Agency Housing Revenue (West 38th Street) VRDO | 0.100% | 11/7/11 LOC | 4,425 | 4,425 |
| New York State Housing Finance Agency Revenue (Personal Income Tax) VRDO | 0.140% | 11/7/11 | 15,000 | 15,000 |
| New York State Local Government Assistance Corp. Revenue VRDO | 0.100% | 11/7/11 | 17,955 | 17,955 |
| 1 New York State Mortgage Agency Homeowner Mortgage Revenue TOB VRDO | 0.270% | 11/7/11 | 7,480 | 7,480 |
| New York State Thruway Authority BAN | 2.000% | 7/12/12 | 60,000 | 60,685 |
| 1 Nuveen New York Investment Quality Municipal Fund VRDP VRDO | 0.260% | 11/7/11 LOC | 20,000 | 20,000 |
| 1 Nuveen New York Quality Income Municipal Fund VRDP VRDO | 0.260% | 11/7/11 LOC | 10,000 | 10,000 |
| 1 Suffolk County NY Water Authority Revenue TOB VRDO | 0.150% | 11/1/11 | 9,795 | 9,795 |
| 1 Triborough Bridge & Tunnel Authority New York Revenue TOB VRDO | 0.140% | 11/7/11 | 4,000 | 4,000 |
| | | | | 654,099 |
| North Carolina (4.1%) | | | | |
| Charlotte NC GO CP | 0.370% | 11/10/11 | 5,182 | 5,182 |
| Charlotte NC GO CP | 0.350% | 12/6/11 | 4,556 | 4,556 |
| Charlotte NC GO CP | 0.200% | 1/5/12 | 3,263 | 3,263 |
| Charlotte NC GO CP | 0.200% | 1/5/12 | 6,395 | 6,395 |
| Charlotte NC GO CP | 0.200% | 1/9/12 | 5,384 | 5,384 |
| Charlotte NC GO CP | 0.300% | 1/11/12 | 6,925 | 6,925 |
| Charlotte NC GO CP | 0.330% | 1/11/12 | 4,151 | 4,151 |
| Charlotte NC GO CP | 0.200% | 1/25/12 | 1,433 | 1,433 |
| Charlotte NC GO CP | 0.220% | 1/25/12 | 5,776 | 5,776 |
| Charlotte NC GO CP | 0.220% | 1/25/12 | 38,103 | 38,103 |
| 1 Charlotte NC Water & Sewer System Revenue TOB VRDO | 0.130% | 11/7/11 | 7,590 | 7,590 |
| 1 Charlotte NC Water & Sewer System Revenue TOB VRDO | 0.140% | 11/7/11 | 5,955 | 5,955 |
| 1 Charlotte-Mecklenberg NC Hospital Authority Health Care System Revenue | | | | |
| (Carolinas HealthCare System) TOB VRDO | 0.140% | 11/7/11 LOC | 11,200 | 11,200 |
| Durham NC COP VRDO | 0.130% | 11/7/11 LOC | 32,985 | 32,985 |
| Guilford County NC GO VRDO | 0.120% | 11/7/11 | 6,700 | 6,700 |
| Mecklenburg County NC COP VRDO | 0.150% | 11/7/11 | 8,400 | 8,400 |
| Mecklenburg County NC GO VRDO | 0.150% | 11/7/11 | 7,000 | 7,000 |
| Mecklenburg County NC GO VRDO | 0.150% | 11/7/11 | 7,000 | 7,000 |
| Mecklenburg County NC GO VRDO | 0.150% | 11/7/11 | 7,000 | 7,000 |
| Mecklenburg County NC Public Facilities Corp. Revenue (Annual Appropriation) | 5.000% | 3/1/12 | 2,895 | 2,941 |
| North Carolina Capital Facilities Finance Agency Educational Facilities Revenue | | | | |
| (Campbell University) VRDO | 0.150% | 11/7/11 LOC | 11,000 | 11,000 |
| 1 North Carolina Capital Facilities Finance Agency Revenue (Duke University Project) TOB VRDO | 0.150% | 11/1/11 | 6,900 | 6,900 |
| 1 North Carolina Capital Facilities Finance Agency Revenue (Duke University Project) TOB VRDO | 0.130% | 11/7/11 | 11,100 | 11,100 |
| 1 North Carolina Capital Facilities Finance Agency Revenue (Duke University Project) TOB VRDO | 0.140% | 11/7/11 | 15,700 | 15,700 |
| 1 North Carolina Capital Facilities Finance Agency Revenue (Duke University Project) TOB VRDO | 0.140% | 11/7/11 | 12,000 | 12,000 |
| 1 North Carolina Capital Facilities Finance Agency Revenue (Duke University Project) TOB VRDO | 0.140% | 11/7/11 | 14,100 | 14,100 |
| 1 North Carolina Capital Facilities Finance Agency Revenue (Duke University Project) TOB VRDO | 0.140% | 11/7/11 | 2,495 | 2,495 |
| 1 North Carolina Capital Facilities Finance Agency Revenue (Duke University Project) TOB VRDO | 0.140% | 11/7/11 | 48,010 | 48,010 |
| North Carolina Capital Facilities Finance Agency Revenue (Lake Norman Charter School) VRDO | 0.130% | 11/7/11 LOC | 3,375 | 3,375 |
| North Carolina Capital Facilities Finance Agency Revenue (YMCA of the Triangle) VRDO | 0.130% | 11/7/11 LOC | 12,000 | 12,000 |
| North Carolina Capital Facilities Finance Agency Revenue (YMCA of the Triangle) VRDO | 0.130% | 11/7/11 LOC | 13,870 | 13,870 |
21
Tax-Exempt Money Market Fund
| | | | |
| | | | Face | Market |
| | | Maturity | Amount | Value• |
| | Coupon | Date | ($000) | ($000) |
| 1 North Carolina Capital Improvement Revenue TOB VRDO | 0.130% | 11/7/11 | 10,800 | 10,800 |
| North Carolina Educational Facilities Finance Agency Revenue (Duke University) VRDO | 0.100% | 11/7/11 | 8,485 | 8,485 |
| North Carolina Infrastructure Financial Corp. Capital Improvements COP | 5.000% | 2/1/12 | 1,000 | 1,011 |
| 1 North Carolina Infrastructure Financial Corp. Capital Improvements COP TOB VRDO | 0.140% | 11/7/11 | 29,085 | 29,085 |
| North Carolina Medical Care Commission Health Care Facilities Revenue | | | | |
| (Duke University Health System) VRDO | 0.130% | 11/7/11 | 95,530 | 95,530 |
| North Carolina Medical Care Commission Health Care Facilities Revenue | | | | |
| (Lenoir Memorial Hospital Project) VRDO | 0.150% | 11/7/11 LOC | 13,545 | 13,545 |
| North Carolina Medical Care Commission Health Care Facilities Revenue | | | | |
| (University Health Systems of Eastern Carolina) VRDO | 0.130% | 11/7/11 LOC | 15,130 | 15,130 |
| North Carolina Medical Care Commission Health Care Facilities Revenue | | | | |
| (University Health Systems of Eastern Carolina) VRDO | 0.130% | 11/7/11 LOC | 38,300 | 38,300 |
| North Carolina Medical Care Commission Health Care Facilities Revenue | | | | |
| (Wake Forest University Health Sciences) VRDO | 0.130% | 11/7/11 LOC | 37,175 | 37,175 |
| North Carolina Medical Care Commission Health Care Facilities Revenue (WakeMed) VRDO | 0.130% | 11/7/11 LOC | 1,895 | 1,895 |
| North Carolina Medical Care Commission Health Care Facilities Revenue (WakeMed) VRDO | 0.130% | 11/7/11 LOC | 28,000 | 28,000 |
| North Carolina Medical Care Commission Health Systems Revenue (Catholic Health East) VRDO | 0.120% | 11/7/11 LOC | 5,725 | 5,725 |
| 1 North Carolina Medical Care Commission Hospital Revenue (Baptist Hospital) TOB VRDO | 0.140% | 11/7/11 | 3,800 | 3,800 |
| North Carolina Medical Care Commission Hospital Revenue (Baptist Hospital) VRDO | 0.130% | 11/7/11 LOC | 9,680 | 9,680 |
| 2 North Carolina Medical Care Commission Hospital Revenue (Moses Cone Health System) PUT | 0.260% | 5/28/12 | 12,000 | 12,000 |
| Raleigh Durham NC Airport Authority Revenue VRDO | 0.110% | 11/7/11 LOC | 10,600 | 10,600 |
| 1 Raleigh North Carolina Combined Enterprise System Revenue TOB VRDO | 0.140% | 11/7/11 | 8,995 | 8,995 |
| 1 Sampson County NC COP TOB VRDO | 0.150% | 11/7/11 LOC | 5,000 | 5,000 |
| Union County NC GO VRDO | 0.130% | 11/7/11 | 3,500 | 3,500 |
| Union County NC GO VRDO | 0.130% | 11/7/11 | 6,095 | 6,095 |
| 1 University of North Carolina University Revenue TOB VRDO | 0.140% | 11/7/11 | 6,710 | 6,710 |
| 1 Wake County NC Limited Obligation Revenue TOB VRDO | 0.140% | 11/7/11 | 6,745 | 6,745 |
| Winston-Salem NC Water & Sewer System Revenue VRDO | 0.120% | 11/7/11 | 6,000 | 6,000 |
| Winston-Salem NC Water & Sewer System Revenue VRDO | 0.120% | 11/7/11 | 22,300 | 22,300 |
| | | | | 714,595 |
| North Dakota (0.2%) | | | | |
| North Dakota Housing Finance Agency Home Mortgage Revenue VRDO | 0.110% | 11/7/11 | 21,850 | 21,850 |
| North Dakota Housing Finance Agency Home Mortgage Revenue VRDO | 0.160% | 11/7/11 | 9,600 | 9,600 |
| | | | | 31,450 |
| Ohio (2.0%) | | | | |
| Akron OH BAN | 1.125% | 12/8/11 | 1,715 | 1,716 |
| Allen County OH Hospital Facilities Revenue (Catholic Healthcare Partners) VRDO | 0.130% | 11/7/11 LOC | 8,000 | 8,000 |
| Cleveland OH Water BAN | 1.000% | 7/26/12 | 10,500 | 10,538 |
| Cleveland-Cuyahoga County OH Port Authority Revenue | | | | |
| (Carnegie/89th Garage & Service Center LLC Project) VRDO | 0.140% | 11/7/11 LOC | 3,360 | 3,360 |
| Cleveland-Cuyahoga County OH Port Authority Revenue (Cleveland Museum of Art Project) VRDO | 0.110% | 11/7/11 | 20,000 | 20,000 |
| Columbus OH Regional Airport Authority Airport Revenue (Oasbo Expanded Asset Program) VRDO | 0.140% | 11/7/11 LOC | 29,765 | 29,765 |
| Columbus OH Regional Airport Authority Airport Revenue (Oasbo Expanded Asset Program) VRDO | 0.140% | 11/7/11 LOC | 8,780 | 8,780 |
| Delaware County OH Port Authority Economic Development Revenue | | | | |
| (Columbus Zoological Park Association Project) VRDO | 0.140% | 11/7/11 LOC | 4,780 | 4,780 |
| Franklin County OH Hospital Facilities Revenue (OhioHealth Corp.) VRDO | 0.100% | 11/7/11 | 1,200 | 1,200 |
| Franklin County OH Hospital Facilities Revenue (OhioHealth Corp.) VRDO | 0.100% | 11/7/11 | 7,550 | 7,550 |
| Franklin County OH Hospital Facilities Revenue (OhioHealth Corp.) VRDO | 0.110% | 11/7/11 LOC | 8,695 | 8,695 |
| Lancaster Port Authority Ohio Gas Revenue VRDO | 0.140% | 11/7/11 | 56,385 | 56,385 |
| Miamisburg OH City School District BAN | 1.500% | 7/19/12 | 13,100 | 13,188 |
| Milford OH Exempt Village School District School Improvement GO | 5.125% | 12/1/11 (Prere.) | 7,125 | 7,153 |
| Ohio Air Quality Development Authority Revenue (Ohio Valley Electric Corp. Project) VRDO | 0.100% | 11/7/11 LOC | 4,000 | 4,000 |
| Ohio Common Schools GO VRDO | 0.080% | 11/7/11 | 9,455 | 9,455 |
| Ohio Common Schools GO VRDO | 0.100% | 11/7/11 | 11,425 | 11,425 |
| Ohio Development Assistance & Revitalization Project BAN | 0.350% | 6/1/12 | 6,170 | 6,170 |
| Ohio Development Assistance & Revitalization Project BAN | 0.350% | 6/1/12 | 11,330 | 11,330 |
| Ohio GO VRDO | 0.080% | 11/7/11 | 4,200 | 4,200 |
| Ohio GO VRDO | 0.110% | 11/7/11 | 12,675 | 12,675 |
| Ohio GO VRDO | 0.110% | 11/7/11 | 14,750 | 14,750 |
| Ohio Higher Educational Facility Commission Revenue | | | | |
| (Case Western Reserve University Project) CP | 0.180% | 11/3/11 | 13,000 | 13,000 |
| Ohio Higher Educational Facility Commission Revenue | | | | |
| (Case Western Reserve University Project) CP | 0.240% | 12/7/11 | 12,700 | 12,700 |
| 1 Ohio Hospital Revenue (Cleveland Clinic Health System Obligated Group) TOB VRDO | 0.150% | 11/1/11 | 8,130 | 8,130 |
| Ohio Infrastructure Improvement GO VRDO | 0.110% | 11/7/11 | 9,520 | 9,520 |
| Ohio State University General Receipts Revenue VRDO | 0.080% | 11/7/11 | 10,000 | 10,000 |
| Ohio State University General Receipts Revenue VRDO | 0.080% | 11/7/11 | 8,100 | 8,100 |
| Pickerington OH Local School District (School Facilities Construction & Improvement) GO | 5.000% | 12/1/11 (Prere.) | 8,000 | 8,030 |
| University of Cincinnati OH BAN | 2.000% | 7/19/12 | 4,000 | 4,047 |
22
Tax-Exempt Money Market Fund
| | | | |
| | | | Face | Market |
| | | Maturity | Amount | Value• |
| | Coupon | Date | ($000) | ($000) |
| University of Cincinnati Ohio General Receipts BAN | 2.000% | 12/16/11 | 2,900 | 2,905 |
| University of Cincinnati Ohio General Receipts BAN | 2.000% | 5/11/12 | 16,000 | 16,126 |
| | | | | 347,673 |
| Oklahoma (0.3%) | | | | |
| 1 Oklahoma Housing Finance Agency Single Family Mortgage Revenue | | | | |
| (Homeownership Loan Program) TOB VRDO | 0.190% | 11/7/11 | 4,490 | 4,490 |
| 1 Oklahoma Student Loan Authority Revenue TOB VRDO | 0.140% | 11/7/11 | 24,995 | 24,995 |
| 1 Oklahoma Student Loan Authority Revenue TOB VRDO | 0.140% | 11/7/11 LOC | 28,830 | 28,830 |
| | | | | 58,315 |
| Oregon (1.7%) | | | | |
| Clackamas County OR Hospital Facility Authority Revenue (Legacy Health System) VRDO | 0.110% | 11/7/11 LOC | 11,800 | 11,800 |
| Clackamas County OR Hospital Facility Authority Revenue (Providence Health System) CP | 0.180% | 11/3/11 | 10,000 | 10,000 |
| Clackamas County OR Hospital Facility Authority Revenue (Providence Health System) CP | 0.180% | 11/3/11 | 28,675 | 28,675 |
| Clackamas County OR Hospital Facility Authority Revenue (Providence Health System) CP | 0.180% | 1/5/12 | 10,000 | 10,000 |
| 1 Jackson County OR School District GO TOB VRDO | 0.240% | 11/7/11 | 6,000 | 6,000 |
| 1 Oregon Business Development Commission Revenue TOB VRDO | 0.140% | 11/7/11 | 5,930 | 5,930 |
| 1 Oregon Department of Administrative Services COP TOB VRDO | 0.130% | 11/7/11 LOC | 15,425 | 15,425 |
| Oregon Facilities Authority Revenue (Reed College Projects) VRDO | 0.150% | 11/7/11 | 44,095 | 44,095 |
| Oregon Health Sciences University Revenue VRDO | 0.120% | 11/7/11 LOC | 16,100 | 16,100 |
| 1 Oregon Housing & Community Service Department Single Family Mortgage Revenue TOB VRDO | 0.200% | 11/7/11 | 8,665 | 8,665 |
| Oregon Housing & Community Service Department Single Family Mortgage Revenue VRDO | 0.110% | 11/7/11 | 6,190 | 6,190 |
| Oregon Housing & Community Service Department Single Family Mortgage Revenue VRDO | 0.140% | 11/7/11 | 9,300 | 9,300 |
| Oregon Housing & Community Service Department Single Family Mortgage Revenue VRDO | 0.140% | 11/7/11 | 12,500 | 12,500 |
| Oregon Housing & Community Service Department Single Family Mortgage Revenue VRDO | 0.160% | 11/7/11 | 7,100 | 7,100 |
| Oregon TAN | 2.000% | 6/29/12 | 75,000 | 75,871 |
| Salem OR Hospital Facility Authority Revenue (Salem Hospital Project) VRDO | 0.100% | 11/7/11 LOC | 20,000 | 20,000 |
| Salem OR Hospital Facility Authority Revenue (Salem Hospital Project) VRDO | 0.180% | 11/7/11 LOC | 12,500 | 12,500 |
| | | | | 300,151 |
| Pennsylvania (1.0%) | | | | |
| 1 Allegheny County PA Hospital Development Authority Revenue | | | | |
| (University of Pittsburgh Medical Center) TOB VRDO | 0.140% | 11/7/11 | 4,000 | 4,000 |
| 2 Berks County PA Municipal Authority Revenue (Reading Hospital & Medical Center Project) PUT | 0.310% | 1/19/12 | 10,250 | 10,250 |
| Cambria County PA Industrial Development Authority Revenue (American National Red Cross) | | | | |
| VRDO | 0.120% | 11/7/11 LOC | 2,100 | 2,100 |
| Delaware River Port Authority Pennsylvania & New Jersey Revenue VRDO | 0.120% | 11/7/11 LOC | 5,625 | 5,625 |
| Emmaus PA General Authority Revenue VRDO | 0.130% | 11/7/11 LOC | 600 | 600 |
| Northampton County PA General Purpose Authority University Revenue (Lehigh University) VRDO | 0.100% | 11/7/11 | 4,000 | 4,000 |
| 1 Nuveen Pennsylvania Premium Income Municipal Fund2 VRDP VRDO | 0.280% | 11/7/11 LOC | 22,000 | 22,000 |
| Pennsylvania Higher Educational Facilities Authority Revenue (Drexel University) VRDO | 0.110% | 11/7/11 LOC | 14,270 | 14,270 |
| 1 Pennsylvania Housing Finance Agency Single Family Mortgage Revenue TOB VRDO | 0.190% | 11/7/11 | 13,735 | 13,735 |
| Pennsylvania Infrastructure & Investment Authority CP | 0.250% | 11/7/11 LOC | 15,000 | 15,000 |
| 1 Pennsylvania Turnpike Commission Revenue TOB VRDO | 0.140% | 11/7/11 LOC | 10,000 | 10,000 |
| 1 Philadelphia PA Authority Industrial Development Revenue (Girard Estate Aramark Project) VRDO | 0.240% | 11/7/11 LOC | 15,350 | 15,350 |
| 1 Philadelphia PA Industrial Development Authority Lease Revenue (Fox Chase Cancer Center) | | | | |
| TOB VRDO | 0.150% | 11/1/11 LOC | 1,000 | 1,000 |
| Temple University of the Commonwealth System of Higher Education Pennsylvania University | | | | |
| Funding Obligation RAN | 1.500% | 4/4/12 | 57,000 | 57,245 |
| 1 Washington County PA Authority Revenue (Girard Estate Project) VRDO | 0.140% | 11/7/11 LOC | 8,340 | 8,340 |
| | | | | 183,515 |
| Puerto Rico (0.1%) | | | | |
| Puerto Rico Public Finance Corp. Revenue | 5.500% | 2/1/12 (Prere.) | 5,000 | 5,063 |
| Puerto Rico Public Finance Corp. Revenue | 5.500% | 2/1/12 (Prere.) | 14,750 | 14,932 |
| | | | | 19,995 |
| Rhode Island (0.6%) | | | | |
| East Greenwich RI BAN | 1.500% | 2/15/12 | 11,000 | 11,032 |
| 1 Narragansett RI Commission WasteWater System Revenue TOB VRDO | 0.130% | 11/7/11 LOC | 11,860 | 11,860 |
| Rhode Island & Providence Plantations GO | 2.000% | 8/1/12 | 2,955 | 2,990 |
| Rhode Island & Providence Plantations GO | 2.000% | 8/1/12 | 3,770 | 3,815 |
| Rhode Island & Providence Plantations TAN | 2.000% | 6/29/12 | 27,000 | 27,302 |
| Rhode Island Health & Educational Building Corp. Health Facilities Revenue (St. Antoine) VRDO | 0.130% | 11/7/11 LOC | 8,035 | 8,035 |
| Rhode Island Health & Educational Building Corp. Health Facilities Revenue (St. Antoine) VRDO | 0.130% | 11/7/11 LOC | 7,350 | 7,350 |
| Rhode Island Health & Educational Building Corp. Higher Education Facility Revenue | | | | |
| (Rhode Island School of Design) VRDO | 0.200% | 11/7/11 LOC | 20,225 | 20,225 |
| 1 Rhode Island Housing & Mortgage Finance Corp. Revenue TOB VRDO | 0.310% | 11/7/11 | 5,000 | 5,000 |
| | | | | 97,609 |
23
Tax-Exempt Money Market Fund
| | | | |
| | | | Face | Market |
| | | Maturity | Amount | Value• |
| | Coupon | Date | ($000) | ($000) |
| South Carolina (0.8%) | | | | |
| Anderson County SC Joint Municipal Water System Waterworks System Revenue | 5.500% | 7/15/12 (Prere.) | 1,445 | 1,497 |
| Greenville County SC Hospital System Revenue VRDO | 0.100% | 11/7/11 LOC | 6,000 | 6,000 |
| 1 Greenville County SC School District Installment Revenue TOB VRDO | 0.140% | 11/7/11 | 15,995 | 15,995 |
| 1 Greenville County SC School District Installment Revenue TOB VRDO | 0.140% | 11/7/11 | 13,865 | 13,865 |
| 1 Greer SC Combined Utility System Revenue TOB VRDO | 0.140% | 11/7/11 (13) | 9,685 | 9,685 |
| Piedmont SC Municipal Power Agency Revenue VRDO | 0.110% | 11/7/11 LOC | 4,700 | 4,700 |
| South Carolina Association of Governmental Organizations COP | 1.500% | 4/13/12 | 45,000 | 45,255 |
| South Carolina GO | 2.000% | 3/1/12 | 16,520 | 16,608 |
| 1 South Carolina Housing Revenue TOB VRDO | 0.140% | 11/7/11 | 6,130 | 6,130 |
| South Carolina Jobs Economic Development Authority Hospital Revenue (AnMed Health Project) | | | | |
| VRDO | 0.130% | 11/7/11 LOC | 11,000 | 11,000 |
| South Carolina Jobs Economic Development Authority Industrial Revenue | | | | |
| (South Carolina Electric & Gas Co. Project) VRDO | 0.190% | 11/7/11 LOC | 7,000 | 7,000 |
| 1 South Carolina Public Service Authority Revenue TOB VRDO | 0.130% | 11/7/11 LOC | 5,930 | 5,930 |
| | | | | 143,665 |
| South Dakota (0.2%) | | | | |
| South Dakota Health & Educational Facilities Authority Revenue | | | | |
| (Sioux Valley Hospital & Health System) VRDO | 0.140% | 11/7/11 LOC | 15,000 | 15,000 |
| South Dakota Health & Educational Facilities Authority Revenue | | | | |
| (Sioux Valley Hospital & Health System) VRDO | 0.140% | 11/7/11 LOC | 6,465 | 6,465 |
| South Dakota Housing Development Authority Homeownership Mortgage Revenue VRDO | 0.110% | 11/7/11 | 8,220 | 8,220 |
| South Dakota Housing Development Authority Homeownership Mortgage Revenue VRDO | 0.120% | 11/7/11 | 9,000 | 9,000 |
| | | | | 38,685 |
| Tennessee (4.1%) | | | | |
| Blount County & Alcoa & Maryville TN Industrial Development Board Revenue | | | | |
| (Local Government Public Improvement) VRDO | 0.150% | 11/7/11 LOC | 4,900 | 4,900 |
| Blount County TN Public Building Authority Revenue (Local Government Public Improvement) | | | | |
| VRDO | 0.150% | 11/7/11 LOC | 24,930 | 24,930 |
| Blount County TN Public Building Authority Revenue (Local Government Public Improvement) | | | | |
| VRDO | 0.150% | 11/7/11 LOC | 14,670 | 14,670 |
| Blount County TN Public Building Authority Revenue (Local Government Public Improvement) | | | | |
| VRDO | 0.150% | 11/7/11 LOC | 4,000 | 4,000 |
| Blount County TN Public Building Authority Revenue (Local Government Public Improvement) | | | | |
| VRDO | 0.150% | 11/7/11 LOC | 5,650 | 5,650 |
| Blount County TN Public Building Authority Revenue (Local Government Public Improvement) | | | | |
| VRDO | 0.150% | 11/7/11 LOC | 10,975 | 10,975 |
| Blount County TN Public Building Authority Revenue (Local Government Public Improvement) | | | | |
| VRDO | 0.150% | 11/7/11 | 20,700 | 20,700 |
| Jackson TN Energy Authority Gas System Revenue VRDO | 0.130% | 11/7/11 LOC | 8,340 | 8,340 |
| Johnson City TN Health & Educational Facilities Board Hospital Revenue (STS Health Alliance) | | | | |
| VRDO | 0.110% | 11/7/11 LOC | 4,415 | 4,415 |
| Johnson City TN Health & Educational Facilities Board Hospital Revenue (STS Health Alliance) | | | | |
| VRDO | 0.110% | 11/7/11 LOC | 10,000 | 10,000 |
| Knox County TN Health Educational & Housing Facilities Board Hospital Facilities | | | | |
| (Catholic Healthcare) VRDO | 0.110% | 11/7/11 LOC | 14,100 | 14,100 |
| 1 Knoxville TN Waste Water System Revenue TOB VRDO | 0.130% | 11/7/11 | 15,940 | 15,940 |
| 1 Knoxville TN Waste Water System Revenue TOB VRDO | 0.140% | 11/7/11 | 16,310 | 16,310 |
| Metropolitan Government of Nashville & Davidson County TN GO CP | 0.170% | 11/3/11 | 42,000 | 42,000 |
| Metropolitan Government of Nashville & Davidson County TN GO CP | 0.200% | 12/7/11 | 10,000 | 10,000 |
| Metropolitan Government of Nashville & Davidson County TN Health & Educational Facilities | | | | |
| Board Revenue (Belmont University) VRDO | 0.130% | 11/7/11 LOC | 11,400 | 11,400 |
| Metropolitan Government of Nashville & Davidson County TN Health & Educational Facilities | | | | |
| Board Revenue (Lipscomb University) VRDO | 0.130% | 11/7/11 LOC | 13,500 | 13,500 |
| 1 Rutherford County TN Health & Educational Facilities Board Revenue | | | | |
| (Ascension Health Credit Group) TOB VRDO | 0.150% | 11/7/11 | 6,250 | 6,250 |
| Sevier County TN Public Building Authority Local Government Public Improvement Revenue VRDO | 0.150% | 11/7/11 | 24,500 | 24,500 |
| Sevier County TN Public Building Authority Local Government Public Improvement Revenue VRDO | 0.150% | 11/7/11 LOC | 4,800 | 4,800 |
| Sevier County TN Public Building Authority Local Government Public Improvement Revenue VRDO | 0.220% | 11/7/11 LOC | 12,600 | 12,600 |
| Shelby County TN GO VRDO | 0.120% | 11/7/11 | 78,990 | 78,990 |
| Shelby County TN GO VRDO | 0.130% | 11/7/11 | 98,100 | 98,100 |
| Shelby County TN Health Educational & Housing Facility Board Revenue (Methodist Healthcare) | 6.500% | 9/1/12 (Prere.) | 5,890 | 6,194 |
| Tennessee GO CP | 0.350% | 11/4/11 | 10,000 | 10,000 |
| Tennessee GO CP | 0.140% | 11/14/11 | 45,810 | 45,810 |
| Tennessee GO CP | 0.180% | 12/5/11 | 10,000 | 10,000 |
| Tennessee GO CP | 0.150% | 12/6/11 | 40,000 | 40,000 |
| Tennessee GO CP | 0.190% | 12/6/11 | 10,000 | 10,000 |
| Tennessee GO CP | 0.130% | 12/7/11 | 33,658 | 33,658 |
| Tennessee GO CP | 0.230% | 12/7/11 | 18,000 | 18,000 |
24
Tax-Exempt Money Market Fund
| | | | |
| | | | Face | Market |
| | | Maturity | Amount | Value• |
| | Coupon | Date | ($000) | ($000) |
| Tennessee GO CP | 0.200% | 1/11/12 | 25,000 | 25,000 |
| 1 Tennessee Housing Development Agency Homeownership Program Revenue TOB VRDO | 0.190% | 11/7/11 | 6,325 | 6,325 |
| Tennessee School Bond Authority Revenue CP | 0.190% | 12/7/11 | 25,591 | 25,591 |
| Tennessee School Bond Authority Revenue CP | 0.160% | 1/10/12 | 42,958 | 42,958 |
| | | | | 730,606 |
| Texas (11.7%) | | | | |
| Alvin TX Independent School District GO | 5.000% | 2/15/12 | 1,000 | 1,014 |
| 1 Austin TX Revenue TOB VRDO | 0.140% | 11/7/11 (13) | 18,245 | 18,245 |
| 1 Austin TX Revenue TOB VRDO | 0.140% | 11/7/11 (13) | 10,000 | 10,000 |
| 1 Austin TX Water & Wastewater System Revenue TOB VRDO | 0.130% | 11/7/11 LOC | 16,815 | 16,815 |
| 1 Austin TX Water & Wastewater System Revenue TOB VRDO | 0.140% | 11/7/11 (13) | 5,635 | 5,635 |
| 1 Beaumont TX Independent School District School Building GO TOB VRDO | 0.170% | 11/7/11 | 3,350 | 3,350 |
| 1 Bexar County TX Combined Flood Control GO TOB VRDO | 0.140% | 11/7/11 | 28,515 | 28,515 |
| 1 Board of Regents of the University of Texas System Revenue Financing System Revenue | | | | |
| TOB VRDO | 0.130% | 11/7/11 | 5,100 | 5,100 |
| 1 Board of Regents of the University of Texas System Revenue Financing System Revenue | | | | |
| TOB VRDO | 0.200% | 11/7/11 | 29,215 | 29,215 |
| 1 Board of Regents of the University of Texas System Revenue Financing System Revenue | | | | |
| TOB VRDO | 0.240% | 11/7/11 | 6,600 | 6,600 |
| Clear Creek TX Independent School District GO | 4.000% | 2/15/12 | 1,770 | 1,789 |
| 1 Collin County TX GO TOB VRDO | 0.130% | 11/7/11 | 10,925 | 10,925 |
| 1 Comal TX Independent School District GO TOB VRDO | 0.130% | 11/7/11 LOC | 10,280 | 10,280 |
| 1 Conroe TX Independent School District GO TOB VRDO | 0.140% | 11/7/11 | 5,010 | 5,010 |
| 1 Dallas TX Area Rapid Transit Sales Tax Revenue TOB VRDO | 0.130% | 11/7/11 | 18,145 | 18,145 |
| 1 Dallas TX Area Rapid Transit Sales Tax Revenue TOB VRDO | 0.130% | 11/7/11 LOC | 19,525 | 19,525 |
| 1 Dallas TX Independent School District GO TOB VRDO | 0.140% | 11/7/11 | 14,720 | 14,720 |
| 1 Denton TX Independent School District GO TOB VRDO | 0.140% | 11/7/11 | 6,945 | 6,945 |
| 1 Denton TX Independent School District GO TOB VRDO | 0.140% | 11/7/11 | 3,690 | 3,690 |
| 1 Denton TX Independent School District GO TOB VRDO | 0.170% | 11/7/11 | 10,445 | 10,445 |
| Denton TX Independent School District GO VRDO | 0.190% | 11/7/11 | 18,305 | 18,305 |
| 1 Edinburg TX Consolidated Independent School District COP TOB VRDO | 0.140% | 11/7/11 | 12,020 | 12,020 |
| 1 Fort Bend TX Independent School District GO TOB VRDO | 0.140% | 11/7/11 | 5,000 | 5,000 |
| Fort Worth TX Water & Sewer Revenue | 4.000% | 2/15/12 | 5,120 | 5,172 |
| Fort Worth TX Water & Sewer Revenue | 5.000% | 2/15/12 | 1,065 | 1,079 |
| 1 Fort Worth TX Water & Sewer Revenue TOB VRDO | 0.170% | 11/7/11 | 37,390 | 37,390 |
| 1 Frisco TX GO TOB VRDO | 0.140% | 11/7/11 | 4,075 | 4,075 |
| 1 Galveston County TX GO TOB VRDO | 0.140% | 11/7/11 | 18,740 | 18,740 |
| 1 Harris County TX Cultural Education Facilities Finance Corp. Hospital Revenue | | | | |
| (Memorial Hermann Healthcare System) TOB VRDO | 0.140% | 11/7/11 LOC | 22,000 | 22,000 |
| Harris County TX Cultural Education Facilities Finance Corp. Revenue | | | | |
| (Methodist Hospital System) CP | 0.280% | 3/5/12 | 25,500 | 25,500 |
| 1 Harris County TX Cultural Education Facilities Finance Corp. Thermal Utility Revenue | | | | |
| (TECO Project)TOB VRDO | 0.140% | 11/7/11 | 8,755 | 8,755 |
| 1 Harris County TX Flood Control District GO TOB VRDO | 0.140% | 11/7/11 | 5,000 | 5,000 |
| 1 Harris County TX GO TOB VRDO | 0.140% | 11/7/11 | 2,515 | 2,515 |
| Harris County TX Health Facilities Development Corp. Hospital Revenue | | | | |
| (Baylor College of Medicine) VRDO | 0.140% | 11/1/11 LOC | 11,010 | 11,010 |
| Harris County TX Health Facilities Development Corp. Hospital Revenue | | | | |
| (Baylor College of Medicine) VRDO | 0.090% | 11/7/11 LOC | 2,500 | 2,500 |
| 1 Harris County TX Health Facilities Development Corp. Hospital Revenue | | | | |
| (Memorial Hermann Healthcare System) TOB VRDO | 0.140% | 11/7/11 | 13,000 | 13,000 |
| 1 Harris County TX Health Facilities Development Corp. Revenue | | | | |
| (Sisters of Charity of the Incarnate Word) TOB VRDO | 0.150% | 11/1/11 (ETM) | 4,900 | 4,900 |
| Harris County TX Health Facilities Development Corp. Revenue | | | | |
| (St. Luke’s Episcopal Hospital) VRDO | 0.190% | 11/7/11 | 38,000 | 38,000 |
| Harris County TX Hospital District Revenue VRDO | 0.140% | 11/7/11 LOC | 9,900 | 9,900 |
| Harris County TX Industrial Development Corp. Revenue (Baytank (Houston) Inc. Project) VRDO | 0.110% | 11/7/11 LOC | 8,000 | 8,000 |
| 1 Harris County TX Toll Road Revenue TOB VRDO | 0.140% | 11/7/11 (13) | 5,200 | 5,200 |
| 1 Houston TX Airport System Revenue TOB VRDO | 0.140% | 11/7/11 | 12,000 | 12,000 |
| Houston TX Airport System Revenue VRDO | 0.110% | 11/7/11 LOC | 13,900 | 13,900 |
| Houston TX Higher Education Finance Corp. Revenue (Rice University Project) CP | 0.130% | 12/2/11 | 10,000 | 10,000 |
| Houston TX Higher Education Finance Corp. Revenue (Rice University Project) CP | 0.180% | 1/12/12 | 10,000 | 10,000 |
| 1 Houston TX Higher Education Finance Corp. Revenue (Rice University Project) TOB VRDO | 0.140% | 11/7/11 | 22,155 | 22,155 |
| 1 Houston TX Higher Education Finance Corp. Revenue (Rice University Project) TOB VRDO | 0.140% | 11/7/11 | 6,665 | 6,665 |
| Houston TX Higher Education Finance Corp. Revenue (Rice University Project) VRDO | 0.110% | 11/7/11 | 11,000 | 11,000 |
| Houston TX Higher Education Finance Corp. Revenue (Rice University Project) VRDO | 0.130% | 11/7/11 | 30,750 | 30,750 |
| 1 Houston TX Independent School District Revenue TOB VRDO | 0.200% | 11/7/11 | 9,805 | 9,805 |
| Houston TX TRAN | 1.750% | 6/29/12 | 120,000 | 121,215 |
25
Tax-Exempt Money Market Fund
| | | | | |
| | | | | Face | Market |
| | | | Maturity | Amount | Value• |
| | | Coupon | Date | ($000) | ($000) |
| 1 | Houston TX Utility System Revenue TOB VRDO | 0.130% | 11/7/11 LOC | 9,000 | 9,000 |
| 1 | Houston TX Utility System Revenue TOB VRDO | 0.130% | 11/7/11 LOC | 15,350 | 15,350 |
| 1 | Houston TX Utility System Revenue TOB VRDO | 0.140% | 11/7/11 LOC | 45,000 | 45,000 |
| 1 | Houston TX Utility System Revenue TOB VRDO | 0.200% | 11/7/11 | 4,080 | 4,080 |
| | Houston TX Utility System Revenue VRDO | 0.120% | 11/7/11 LOC | 26,000 | 26,000 |
| 1 | Hutto TX Independent School District TOB VRDO | 0.140% | 11/7/11 | 21,130 | 21,130 |
| 1 | Katy TX Independent School District GO TOB VRDO | 0.140% | 11/7/11 | 5,730 | 5,730 |
| 1 | Keller TX Independent School District GO TOB VRDO | 0.140% | 11/7/11 | 5,660 | 5,660 |
| 1 | Leander TX Independent School District GO TOB VRDO | 0.140% | 11/7/11 | 15,355 | 15,355 |
| 1 | Lone Star College System Texas GO TOB VRDO | 0.140% | 11/7/11 | 15,460 | 15,460 |
| | Lubbock TX GO | 3.000% | 2/15/12 | 2,915 | 2,936 |
| | Lubbock TX Independent School District GO | 3.000% | 2/15/12 | 6,000 | 6,045 |
| 1 | Mansfield TX Independent School District GO TOB VRDO | 0.140% | 11/7/11 | 7,960 | 7,960 |
| 1 | Mansfield TX Independent School District GO TOB VRDO | 0.200% | 11/7/11 | 4,250 | 4,250 |
| 1 | McKinney TX Independent School District GO TOB VRDO | 0.130% | 11/7/11 LOC | 10,205 | 10,205 |
| 2 | Mesquite TX Independent School District GO PUT | 0.230% | 12/7/11 | 25,255 | 25,255 |
| 1 | North East TX Independent School District GO TOB VRDO | 0.130% | 11/7/11 LOC | 5,000 | 5,000 |
| 1 | North East TX Independent School District GO TOB VRDO | 0.140% | 11/7/11 | 26,805 | 26,805 |
| 1 | North East TX Independent School District GO TOB VRDO | 0.140% | 11/7/11 | 3,355 | 3,355 |
| 1 | North Texas Health Facilities Development Corp. Hospital Revenue | | | | |
| | (United Regional Health Care System) TOB VRDO | 0.130% | 11/7/11 LOC | 13,185 | 13,185 |
| | North Texas Higher Education Authority Student Loan Revenue VRDO | 0.160% | 11/7/11 LOC | 18,300 | 18,300 |
| | North Texas Higher Education Authority Student Loan VRDO | 0.210% | 11/7/11 LOC | 28,700 | 28,700 |
| 1 | North Texas Tollway Authority System Revenue TOB VRDO | 0.150% | 11/7/11 | 7,600 | 7,600 |
| 1 | North Texas Tollway Authority System Revenue TOB VRDO | 0.170% | 11/7/11 LOC | 14,633 | 14,633 |
| 1 | North Texas Tollway Authority System Revenue TOB VRDO | 0.170% | 11/7/11 (13) | 22,360 | 22,360 |
| | North Texas Tollway Authority System Revenue VRDO | 0.130% | 11/7/11 LOC | 30,150 | 30,150 |
| 1 | Northside TX Independent School District GO TOB VRDO | 0.140% | 11/7/11 | 17,315 | 17,315 |
| 1 | Northside TX Independent School District GO TOB VRDO | 0.140% | 11/7/11 | 14,440 | 14,440 |
| 1 | Northside TX Independent School District GO TOB VRDO | 0.140% | 11/7/11 | 4,500 | 4,500 |
| | Northwest Texas Independent School District GO VRDO | 0.120% | 11/7/11 | 8,170 | 8,170 |
| 1 | Pearland TX GO TOB VRDO | 0.130% | 11/7/11 LOC | 10,160 | 10,160 |
| 1 | Pearland TX Independent School District GO TOB VRDO | 0.240% | 11/7/11 | 9,000 | 9,000 |
| 1 | Plano TX Independent School District GO TOB VRDO | 0.140% | 11/7/11 | 14,055 | 14,055 |
| 1 | San Antonio TX Electric & Gas Systems Revenue TOB VRDO | 0.130% | 11/7/11 | 10,660 | 10,660 |
| 1 | San Antonio TX Electric & Gas Systems Revenue TOB VRDO | 0.140% | 11/7/11 | 3,200 | 3,200 |
| 1 | San Antonio TX Electric & Gas Systems Revenue TOB VRDO | 0.140% | 11/7/11 | 5,000 | 5,000 |
| 1 | San Antonio TX Electric & Gas Systems Revenue TOB VRDO | 0.140% | 11/7/11 | 7,665 | 7,665 |
| 1 | San Antonio TX Independent School District Revenue TOB VRDO | 0.200% | 11/7/11 | 10,355 | 10,355 |
| 1 | San Antonio TX Water Revenue TOB VRDO | 0.130% | 11/7/11 LOC | 11,125 | 11,125 |
| 1 | San Antonio TX Water Revenue TOB VRDO | 0.140% | 11/7/11 | 10,000 | 10,000 |
| 1 | Sheldon TX Independent School District GO TOB VRDO | 0.170% | 11/7/11 | 5,170 | 5,170 |
| | South Texas Community College District GO | 5.500% | 8/15/12 (Prere.) | 4,875 | 5,075 |
| | Southlake TX GO | 4.000% | 2/15/12 | 1,825 | 1,844 |
| | Southwest Texas Higher Education Authority Inc. Revenue | | | | |
| | (Southern Methodist University Project) VRDO | 0.130% | 11/7/11 | 19,000 | 19,000 |
| | Tarrant County TX Cultural Education Facilities Finance Corp. Hospital Revenue | | | | |
| | (Baylor Healthcare) VRDO | 0.100% | 11/7/11 LOC | 3,500 | 3,500 |
| | Tarrant County TX Cultural Education Facilities Finance Corp. Hospital Revenue | | | | |
| | (Baylor Healthcare) VRDO | 0.120% | 11/7/11 LOC | 5,600 | 5,600 |
| 1 | Tarrant County TX Cultural Education Facilities Finance Corp. Revenue | | | | |
| | (Texas Health Resources) TOB VRDO | 0.140% | 11/7/11 | 10,350 | 10,350 |
| 1 | Texas A&M University System Revenue Financing System Revenue TOB VRDO | 0.140% | 11/7/11 | 4,575 | 4,575 |
| 1 | Texas Department of Housing & Community Affairs Single Family Revenue TOB VRDO | 0.190% | 11/7/11 | 5,995 | 5,995 |
| 1 | Texas Department of Housing & Community Affairs Single Family Revenue TOB VRDO | 0.200% | 11/7/11 | 4,250 | 4,250 |
| 1,2 | Texas GO TOB PUT | 0.200% | 8/30/12 | 124,995 | 124,995 |
| 1 | Texas GO TOB VRDO | 0.130% | 11/7/11 | 10,060 | 10,060 |
| 1 | Texas GO TOB VRDO | 0.130% | 11/7/11 | 15,050 | 15,050 |
| 1 | Texas GO TOB VRDO | 0.140% | 11/7/11 | 13,900 | 13,900 |
| 1 | Texas GO TOB VRDO | 0.140% | 11/7/11 | 27,000 | 27,000 |
| 1 | Texas GO TOB VRDO | 0.140% | 11/7/11 | 21,560 | 21,560 |
| 1 | Texas GO TOB VRDO | 0.140% | 11/7/11 | 17,370 | 17,370 |
| 1 | Texas GO TOB VRDO | 0.140% | 11/7/11 | 4,300 | 4,300 |
| 1 | Texas GO TOB VRDO | 0.190% | 11/7/11 | 17,675 | 17,675 |
| 1 | Texas GO TOB VRDO | 0.220% | 11/7/11 | 4,350 | 4,350 |
| 1 | Texas GO TOB VRDO | 0.240% | 11/7/11 | 8,750 | 8,750 |
| | Texas GO TRAN | 2.500% | 8/30/12 | 200,000 | 203,700 |
| | Texas Public Finance Authority GO CP | 0.150% | 11/4/11 | 25,000 | 25,000 |
| | Texas Public Finance Authority Revenue (Unemployment Compensation) | 3.000% | 1/1/12 | 25,000 | 25,106 |
26
Tax-Exempt Money Market Fund
| | | | |
| | | | Face | Market |
| | | Maturity | Amount | Value• |
| | Coupon | Date | ($000) | ($000) |
| Texas Small Business Industrial Development Corp. Revenue | | | | |
| (Texas Public Facilities Capital Access Program) VRDO | 0.140% | 11/7/11 LOC | 34,950 | 34,950 |
| 1 Texas State University Student Loan GO TOB VRDO | 0.190% | 11/7/11 | 20,065 | 20,065 |
| 1 Texas Transportation Commission Mobility Fund GO TOB VRDO | 0.130% | 11/7/11 | 7,540 | 7,540 |
| 1 Texas Transportation Commission Mobility Fund GO TOB VRDO | 0.140% | 11/7/11 | 11,700 | 11,700 |
| 1 Texas Transportation Commission Revenue TOB VRDO | 0.130% | 11/7/11 | 20,625 | 20,625 |
| 1 Texas Transportation Commission Revenue TOB VRDO | 0.130% | 11/7/11 | 13,940 | 13,940 |
| 1 Texas Transportation Commission Revenue TOB VRDO | 0.140% | 11/7/11 | 7,500 | 7,500 |
| 1 Texas Transportation Commission Revenue TOB VRDO | 0.240% | 11/7/11 | 4,925 | 4,925 |
| 1 Texas University System Revenue Financing System Revenue TOB VRDO | 0.140% | 11/7/11 | 14,375 | 14,375 |
| 1 Texas Water Development Board Revenue TOB VRDO | 0.240% | 11/7/11 | 7,500 | 7,500 |
| 1 Travis County TX GO TOB VRDO | 0.130% | 11/7/11 | 11,050 | 11,050 |
| Trinity River Authority Texas Solid Waste Disposal Revenue VRDO | 0.230% | 11/7/11 LOC | 4,530 | 4,530 |
| 1 University of Houston Texas Revenue TOB VRDO | 0.140% | 11/7/11 | 7,600 | 7,600 |
| University of Texas Permanent University Fund Revenue | 5.250% | 1/1/12 (Prere.) | 7,000 | 7,056 |
| 1 University of Texas Permanent University Fund Revenue TOB VRDO | 0.130% | 11/7/11 | 6,560 | 6,560 |
| 1 University of Texas System Revenue Financing System Revenue TOB VRDO | 0.140% | 11/7/11 | 33,215 | 33,215 |
| 1 Waco TX Education Finance Corp. Revenue (Baylor University) TOB VRDO | 0.140% | 11/7/11 | 9,855 | 9,855 |
| | | | | 2,063,824 |
| Utah (0.8%) | | | | |
| Emery County UT Pollution Control Revenue (PacifiCorp Projects) VRDO | 0.140% | 11/7/11 LOC | 1,200 | 1,200 |
| Murray UT Hospital Revenue (IHC Health Services) VRDO | 0.140% | 11/1/11 | 1,000 | 1,000 |
| 1 Riverton UT Hospital Revenue (IHC Health Services Inc ) TOB VRDO | 0.140% | 11/7/11 | 5,500 | 5,500 |
| Utah Board of Regents Student Loan Revenue | 3.000% | 11/1/11 | 1,500 | 1,500 |
| Utah Board of Regents Student Loan Revenue VRDO | 0.170% | 11/7/11 LOC | 15,000 | 15,000 |
| 1 Utah Housing Corp. Single Family Mortgage Revenue TOB VRDO | 0.640% | 11/7/11 | 1,650 | 1,650 |
| Utah Housing Corp. Single Family Mortgage Revenue VRDO | 0.160% | 11/7/11 LOC | 8,900 | 8,900 |
| Utah Housing Corp. Single Family Mortgage Revenue VRDO | 0.160% | 11/7/11 LOC | 13,465 | 13,465 |
| Utah Housing Corp. Single Family Mortgage Revenue VRDO | 0.170% | 11/7/11 | 13,985 | 13,985 |
| Utah Housing Finance Agency Single Family Mortgage Revenue VRDO | 0.160% | 11/7/11 LOC | 5,580 | 5,580 |
| Utah Housing Finance Agency Single Family Mortgage Revenue VRDO | 0.160% | 11/7/11 LOC | 4,100 | 4,100 |
| 1 Utah Transit Authority Sales Tax Revenue TOB VRDO | 0.130% | 11/7/11 | 11,400 | 11,400 |
| 1 Utah Transit Authority Sales Tax Revenue TOB VRDO | 0.140% | 11/7/11 | 28,675 | 28,675 |
| 1 Utah Transit Authority Sales Tax Revenue TOB VRDO | 0.140% | 11/7/11 | 10,690 | 10,690 |
| 1 Utah Transit Authority Sales Tax Revenue TOB VRDO | 0.140% | 11/7/11 | 1,175 | 1,175 |
| 1 Utah Transit Authority Sales Tax Revenue TOB VRDO | 0.240% | 11/7/11 | 9,720 | 9,720 |
| | | | | 133,540 |
| Vermont (0.0%) | | | | |
| 1 Vermont Housing Finance Agency Revenue TOB VRDO | 0.190% | 11/7/11 | 3,175 | 3,175 |
| |
| Virginia (2.3%) | | | | |
| Albemarle County VA Economic Development Authority Hospital Revenue | | | | |
| (Martha Jefferson Hospital) VRDO | 0.130% | 11/7/11 LOC | 6,000 | 6,000 |
| Alexandria VA Industrial Development Authority Revenue | | | | |
| (Institute for Defense Analyses Project) VRDO | 0.140% | 11/7/11 LOC | 7,885 | 7,885 |
| 1 BlackRock MuniYield Fund, Inc. VRDP VRDO | 0.290% | 11/7/11 LOC | 53,400 | 53,400 |
| Capital Beltway Funding Corp. of Virginia Toll Revenue (I-495 Hot Lanes Project) VRDO | 0.070% | 11/7/11 LOC | 5,000 | 5,000 |
| Capital Region Airport Commission Virginia Passenger Facility Charge Revenue VRDO | 0.180% | 11/7/11 LOC | 15,185 | 15,185 |
| Fairfax County VA Industrial Development Authority Hospital Revenue | | | | |
| (Inova Health System Hospital Project) VRDO | 0.110% | 11/7/11 | 42,100 | 42,100 |
| Fairfax County VA Industrial Development Authority Revenue (Fairfax Hospital System Inc.) VRDO | 0.140% | 11/7/11 | 5,120 | 5,120 |
| Fairfax County VA Public Improvement GO | 5.000% | 10/1/12 | 5,300 | 5,529 |
| 1 Hampton VA Roads Sanitation District Wastewater Revenue TOB VRDO | 0.130% | 11/7/11 | 19,135 | 19,135 |
| Hanover County VA Economic Development Authority Revenue (Bon Secours Health System Inc.) | | | | |
| VRDO | 0.110% | 11/7/11 LOC | 17,200 | 17,200 |
| Harrisonburg VA Industrial Development Authority Revenue (Mennonite Retirement) VRDO | 0.150% | 11/7/11 LOC | 5,000 | 5,000 |
| 1 Newport News VA GO TOB VRDO | 0.130% | 11/7/11 | 10,735 | 10,735 |
| Norfolk VA Economic Development Authority Hospital Facilities Revenue (Sentara Healthcare) PUT | 0.410% | 4/26/12 | 12,000 | 12,000 |
| Norfolk VA GO VRDO | 0.130% | 11/7/11 | 22,815 | 22,815 |
| Peninsula Ports Authority Virginia Health System Revenue (Riverside Health System Project) VRDO | 0.170% | 11/7/11 | 30,360 | 30,360 |
| 1 Richmond VA Public Utility Revenue TOB VRDO | 0.140% | 11/7/11 | 4,875 | 4,875 |
| 1 Richmond VA Public Utility Revenue TOB VRDO | 0.240% | 11/7/11 | 4,990 | 4,990 |
| Russell County VA Industrial Development Authority Hospital Revenue (STS Health Alliance) VRDO | 0.110% | 11/7/11 LOC | 11,630 | 11,630 |
| Smyth County VA Industrial Development Authority Hospital Revenue VRDO | 0.110% | 11/7/11 LOC | 5,000 | 5,000 |
| Stafford County VA Industrial Development Authority Revenue | | | | |
| (VML/VACo Commonwealth Loan Program) VRDO | 0.130% | 11/7/11 LOC | 4,600 | 4,600 |
| 1 University of Virginia Revenue TOB VRDO | 0.150% | 11/1/11 | 8,400 | 8,400 |
| 1 University of Virginia Revenue TOB VRDO | 0.130% | 11/7/11 | 12,000 | 12,000 |
| 1 University of Virginia Revenue TOB VRDO | 0.130% | 11/7/11 | 3,300 | 3,300 |
27
Tax-Exempt Money Market Fund
| | | | |
| | | | Face | Market |
| | | Maturity | Amount | Value• |
| | Coupon | Date | ($000) | ($000) |
| 1 University of Virginia Revenue TOB VRDO | 0.130% | 11/7/11 | 7,510 | 7,510 |
| 1 Virginia College Building Authority Educational Facilities Revenue | | | | |
| (Public Higher Education Financing Program) TOB VRDO | 0.130% | 11/7/11 | 12,260 | 12,260 |
| 1 Virginia Commonwealth Transportation Revenue TOB VRDO | 0.140% | 11/7/11 | 8,715 | 8,715 |
| 1 Virginia Housing Development Authority Commonwealth Mortgage Revenue TOB VRDO | 0.190% | 11/7/11 | 6,485 | 6,485 |
| 1 Virginia Housing Development Authority Rental Housing Revenue TOB VRDO | 0.190% | 11/7/11 | 13,735 | 13,735 |
| 1 Virginia Public Building Authority Facility Revenue TOB VRDO | 0.140% | 11/7/11 | 13,650 | 13,650 |
| Virginia Public Building Authority Facility Revenue VRDO | 0.120% | 11/7/11 | 25,000 | 25,000 |
| Virginia Public Building Authority Public Facilities Revenue | 5.000% | 8/1/12 | 1,325 | 1,372 |
| 1 Virginia Resources Authority Clean Water Revenue (State Revolving Fund) TOB VRDO | 0.130% | 11/7/11 | 5,000 | 5,000 |
| | | | | 405,986 |
| Washington (3.1%) | | | | |
| 1 Central Puget Sound WA Regional Transit Authority Sales & Use Tax Revenue TOB VRDO | 0.130% | 11/7/11 | 6,200 | 6,200 |
| 1 Chelan County WA Public Utility District No. 1 Consolidated System Revenue TOB VRDO | 0.170% | 11/7/11 | 4,475 | 4,475 |
| Chelan County WA Public Utility District No. 1 Consolidated System Revenue VRDO | 0.150% | 11/7/11 | 69,755 | 69,755 |
| Everett WA Industrial Development Corp. Exempt Facilities Revenue | | | | |
| (Kimberly-Clark Corp. Project) VRDO | 0.170% | 11/7/11 | 6,400 | 6,400 |
| 1 King County WA GO TOB VRDO | 0.150% | 11/1/11 | 5,900 | 5,900 |
| 1 King County WA Sewer Revenue TOB VRDO | 0.130% | 11/7/11 LOC | 10,185 | 10,185 |
| 1 King County WA Sewer Revenue TOB VRDO | 0.140% | 11/7/11 | 4,615 | 4,615 |
| 1 King County WA Sewer Revenue TOB VRDO | 0.140% | 11/7/11 | 21,390 | 21,390 |
| 1 King County WA Sewer Revenue TOB VRDO | 0.140% | 11/7/11 | 2,100 | 2,100 |
| 1 Port of Seattle WA Revenue TOB VRDO | 0.190% | 11/7/11 | 13,795 | 13,795 |
| 1 Port of Seattle WA Revenue TOB VRDO | 0.200% | 11/7/11 | 25,830 | 25,830 |
| 1 Port of Seattle WA Revenue TOB VRDO | 0.240% | 11/7/11 | 7,375 | 7,375 |
| 1 Seattle WA Drain & Wastewater Revenue TOB VRDO | 0.130% | 11/7/11 | 9,815 | 9,815 |
| 1 Seattle WA Drain & Wastewater Revenue TOB VRDO | 0.140% | 11/7/11 | 11,200 | 11,200 |
| 1 Seattle WA Municipal Light & Power Revenue TOB VRDO | 0.140% | 11/7/11 | 5,000 | 5,000 |
| 1 Seattle WA Water System Revenue TOB VRDO | 0.130% | 11/7/11 LOC | 12,785 | 12,785 |
| Tacoma WA Housing Authority Revenue (Sunset Apartment Projects) VRDO | 0.170% | 11/7/11 LOC | 12,250 | 12,250 |
| 1 TES Properties Washington Lease Revenue TOB VRDO | 0.140% | 11/7/11 | 10,120 | 10,120 |
| 1 University of Washington Revenue TOB VRDO | 0.130% | 11/7/11 LOC | 38,305 | 38,305 |
| Washington Economic Development Finance Authority Revenue | | | | |
| (Puget Sound Blood Center Project) VRDO | 0.130% | 11/7/11 LOC | 2,760 | 2,760 |
| 1 Washington GO TOB VRDO | 0.130% | 11/7/11 | 18,185 | 18,185 |
| 1 Washington GO TOB VRDO | 0.130% | 11/7/11 LOC | 11,030 | 11,030 |
| 1 Washington GO TOB VRDO | 0.130% | 11/7/11 LOC | 8,650 | 8,650 |
| 1 Washington GO TOB VRDO | 0.130% | 11/7/11 | 10,545 | 10,545 |
| 1 Washington GO TOB VRDO | 0.130% | 11/7/11 | 15,235 | 15,235 |
| 1 Washington GO TOB VRDO | 0.140% | 11/7/11 | 21,400 | 21,400 |
| 1 Washington GO TOB VRDO | 0.140% | 11/7/11 | 10,000 | 10,000 |
| 1 Washington GO TOB VRDO | 0.140% | 11/7/11 | 12,055 | 12,055 |
| 1 Washington GO TOB VRDO | 0.140% | 11/7/11 | 7,995 | 7,995 |
| 1 Washington GO TOB VRDO | 0.140% | 11/7/11 | 8,325 | 8,325 |
| 1 Washington GO TOB VRDO | 0.200% | 11/7/11 | 9,285 | 9,285 |
| 1 Washington Health Care Facilities Authority Revenue (Catholic Health Initiatives) TOB VRDO | 0.140% | 11/7/11 | 15,010 | 15,010 |
| Washington Health Care Facilities Authority Revenue (Fred Hutchinson Cancer Center) VRDO | 0.140% | 11/7/11 LOC | 11,505 | 11,505 |
| Washington Health Care Facilities Authority Revenue (MultiCare Health System) VRDO | 0.110% | 11/7/11 LOC | 8,500 | 8,500 |
| 1 Washington Health Care Facilities Authority Revenue (Providence Health & Services) TOB VRDO | 0.140% | 11/7/11 | 12,475 | 12,475 |
| 1 Washington Health Care Facilities Authority Revenue (Providence Health & Services) TOB VRDO | 0.140% | 11/7/11 | 8,610 | 8,610 |
| 1 Washington Health Care Facilities Authority Revenue (Seattle Children’s Hospital) TOB VRDO | 0.140% | 11/7/11 | 9,995 | 9,995 |
| 1 Washington Health Care Facilities Authority Revenue (Seattle Children’s Hospital) TOB VRDO | 0.140% | 11/7/11 | 10,800 | 10,800 |
| Washington Higher Education Facilities Authority Revenue (Bastyr University Project) VRDO | 0.110% | 11/7/11 LOC | 9,500 | 9,500 |
| Washington Housing Finance Commission Multi-Family Housing Revenue | | | | |
| (Deer Run West Apartments Project) VRDO | 0.160% | 11/7/11 LOC | 5,200 | 5,200 |
| Washington Housing Finance Commission Multi-Family Housing Revenue | | | | |
| (New Haven Apartments Project) VRDO | 0.130% | 11/7/11 LOC | 4,000 | 4,000 |
| Washington Housing Finance Commission Multi-Family Housing Revenue | | | | |
| (Vintage at Silverdale Senior Living Project) VRDO | 0.170% | 11/7/11 LOC | 11,880 | 11,880 |
| Washington Housing Finance Commission Multi-Family Housing Revenue | | | | |
| (Willow Tree Grove Apartments Project) VRDO | 0.200% | 11/7/11 LOC | 19,840 | 19,840 |
| Washington Housing Finance Commission Multifamily Housing Revenue | | | | |
| (Canyon Lakes II Project) VRDO | 0.170% | 11/7/11 LOC | 3,980 | 3,980 |
| Washington Housing Finance Commission Non-profit Housing Revenue | | | | |
| (Rockwood Retirement Communities Program) VRDO | 0.130% | 11/7/11 LOC | 7,700 | 7,700 |
| | | | | 551,955 |
28
Tax-Exempt Money Market Fund
| | | | |
| | | | Face | Market |
| | | Maturity | Amount | Value• |
| | Coupon | Date | ($000) | ($000) |
| West Virginia (0.6%) | | | | |
| West Virginia Economic Development Authority Pollution Control Revenue | | | | |
| (Ohio Power Co. - Kammer Project) VRDO | 0.110% | 11/7/11 LOC | 25,400 | 25,400 |
| West Virginia Hospital Finance Authority Hospital Revenue (Cabell Huntington Hospital Inc.) VRDO | 0.150% | 11/7/11 LOC | 10,000 | 10,000 |
| West Virginia Hospital Finance Authority Hospital Revenue (Charleston Area Medical Center Inc.) | | | | |
| VRDO | 0.130% | 11/7/11 LOC | 50,410 | 50,410 |
| West Virginia Hospital Finance Authority Hospital Revenue | | | | |
| (United Health System Obligated Group) | | | | |
| VRDO | 0.150% | 11/7/11 LOC | 7,815 | 7,815 |
| 1 West Virginia Housing Development Revenue TOB VRDO | 0.190% | 11/7/11 | 3,875 | 3,875 |
| | | | | 97,500 |
| Wisconsin (3.0%) | | | | |
| Badger Tobacco Asset Securitization Corp. Wisconsin Revenue | 6.375% | 6/1/12 (Prere.) | 1,175 | 1,215 |
| Badger Tobacco Asset Securitization Corp. Wisconsin Revenue | 7.000% | 6/1/12 (Prere.) | 17,500 | 18,164 |
| Madison WI Area Technical College District GO | 3.000% | 3/1/12 | 2,670 | 2,694 |
| Milwaukee WI GO | 2.000% | 5/1/12 | 2,585 | 2,606 |
| Milwaukee WI Redevelopment Authority Redevelopment Lease Revenue | | | | |
| (University Wisconsin Kenilworth Project) VRDO | 0.140% | 11/7/11 LOC | 6,210 | 6,210 |
| 1 Wisconsin Annual Appropriation Revenue TOB VRDO | 0.140% | 11/7/11 | 5,000 | 5,000 |
| 1 Wisconsin Annual Appropriation Revenue TOB VRDO | 0.150% | 11/7/11 | 12,500 | 12,500 |
| Wisconsin GO | 5.500% | 11/1/11 | 6,275 | 6,275 |
| Wisconsin GO | 5.000% | 5/1/12 | 2,000 | 2,046 |
| 1 Wisconsin GO TOB VRDO | 0.130% | 11/7/11 | 12,660 | 12,660 |
| 1 Wisconsin GO TOB VRDO | 0.200% | 11/7/11 | 23,600 | 23,600 |
| 1 Wisconsin Health & Educational Facilities Authority Revenue (Ascension Health Credit Group) | | | | |
| TOB VRDO | 0.140% | 11/7/11 | 750 | 750 |
| 1 Wisconsin Health & Educational Facilities Authority Revenue | | | | |
| (Children’s Hospital of Wisconsin Inc.)TOB VRDO | 0.150% | 11/7/11 | 2,945 | 2,945 |
| Wisconsin Health & Educational Facilities Authority Revenue (Concordia University Inc.) VRDO | 0.140% | 11/7/11 LOC | 3,870 | 3,870 |
| Wisconsin Health & Educational Facilities Authority Revenue (Felician Services Inc.) VRDO | 0.150% | 11/7/11 LOC | 20,000 | 20,000 |
| Wisconsin Health & Educational Facilities Authority Revenue (Felician Services Inc.) VRDO | 0.150% | 11/7/11 LOC | 11,375 | 11,375 |
| Wisconsin Health & Educational Facilities Authority Revenue (Franciscan Sisters) VRDO | 0.100% | 11/7/11 LOC | 4,800 | 4,800 |
| Wisconsin Health & Educational Facilities Authority Revenue (Gundersen Lutheran) VRDO | 0.140% | 11/7/11 LOC | 40,000 | 40,000 |
| Wisconsin Health & Educational Facilities Authority Revenue | | | | |
| (Hospital Sisters Services Inc. Obligated Group) CP | 0.180% | 12/5/11 | 10,000 | 10,000 |
| Wisconsin Health & Educational Facilities Authority Revenue | | | | |
| (Hospital Sisters Services Inc. Obligated Group) CP | 0.180% | 1/9/12 | 5,770 | 5,770 |
| Wisconsin Health & Educational Facilities Authority Revenue (Ministry Health Care Inc.) CP | 0.150% | 11/14/11 LOC | 25,530 | 25,530 |
| Wisconsin Health & Educational Facilities Authority Revenue (St. Norbert College Inc.) VRDO | 0.150% | 11/7/11 LOC | 7,135 | 7,135 |
| 1 Wisconsin Housing & Economic Development Authority Home Ownership Revenue TOB VRDO | 0.200% | 11/7/11 | 4,750 | 4,750 |
| Wisconsin Housing & Economic Development Authority Home Ownership Revenue VRDO | 0.180% | 11/7/11 | 29,685 | 29,685 |
| Wisconsin Housing & Economic Development Authority Home Ownership Revenue VRDO | 0.180% | 11/7/11 | 12,300 | 12,300 |
| Wisconsin Housing & Economic Development Authority Single Family Revenue VRDO | 0.240% | 11/7/11 | 5,220 | 5,220 |
| Wisconsin Housing & Economic Development Authority Single Family Revenue VRDO | 0.240% | 11/7/11 | 9,890 | 9,890 |
| Wisconsin Housing & Economic Development Authority Single Family Revenue VRDO | 0.240% | 11/7/11 | 10,880 | 10,880 |
| Wisconsin Housing & Economic Development Authority Single Family Revenue VRDO | 0.240% | 11/7/11 | 5,140 | 5,140 |
| 1 Wisconsin Public Power System Power Supply System Revenue TOB VRDO | 0.130% | 11/7/11 LOC | 10,140 | 10,140 |
| Wisconsin School Districts Cash Flow Administration Program Revenue | 1.000% | 10/15/12 | 6,000 | 6,035 |
| Wisconsin TRAN | 2.000% | 6/15/12 | 206,000 | 208,265 |
| | | | | 527,450 |
| Wyoming (0.5%) | | | | |
| Lincoln County WY Pollution Control Revenue (PacifiCorp Project) VRDO | 0.140% | 11/7/11 LOC | 20,900 | 20,900 |
| Wyoming Community Development Authority Housing Revenue VRDO | 0.140% | 11/7/11 LOC | 14,000 | 14,000 |
| Wyoming Student Loan Corp. Student Loan Revenue VRDO | 0.120% | 11/7/11 LOC | 50,000 | 50,000 |
| | | | | 84,900 |
| Total Tax-Exempt Municipal Bonds (Cost $17,143,196) | | | | 17,143,196 |
29
| | | |
| Tax-Exempt Money Market Fund | | | |
| |
| |
| |
| |
| | | | Market |
| | | | Value• |
| | Coupon | Shares | ($000) |
| Temporary Cash Investment (2.8%) | | | |
| Money Market Fund (2.8%) | | | |
| 3 Vanguard Municipal Cash Management Fund (Cost $487,534) | 0.117% | 487,534,015 | 487,534 |
| Total Investments (100.2%) (Cost $17,630,730) | | | 17,630,730 |
| Other Assets and Liabilities (–0.2%) | | | |
| Other Assets | | | 104,618 |
| Liabilities | | | (142,026) |
| | | | (37,408) |
| Net Assets (100%) | | | |
| Applicable to 17,591,527,179 outstanding $.001 par value shares of | | | |
| beneficial interest (unlimited authorization) | | | 17,593,322 |
| Net Asset Value Per Share | | | $1.00 |
| |
| |
| At October 31, 2011, net assets consisted of: | | | |
| | | | Amount |
| | | | ($000) |
| Paid-in Capital | | | 17,593,293 |
| Undistributed Net Investment Income | | | — |
| Accumulated Net Realized Gains | | | 29 |
| Net Assets | | | 17,593,322 |
• See Note A in Notes to Financial Statements.
1 Security exempt from registration under Rule 144A of the Securities Act of 1933. Such securities may be sold in transactions exempt from registration, normally to qualified institutional buyers. At October 31, 2011, the aggregate value of these securities was $6,814,783,000, representing 38.7% of net assets.
2 Adjustable-rate security.
3 Affiliated money market fund available only to Vanguard funds and certain trusts and accounts managed by Vanguard. Rate shown is the 7-day yield.
A key to abbreviations and other references follows the Statement of Net Assets.
See accompanying Notes, which are an integral part of the Financial Statements.
30
Tax-Exempt Money Market Fund
Key to Abbreviations
ARS—Auction Rate Security.
BAN—Bond Anticipation Note.
COP—Certificate of Participation.
CP—Commercial Paper.
FR—Floating Rate.
GAN—Grant Anticipation Note.
GO—General Obligation Bond.
PUT—Put Option Obligation.
RAN—Revenue Anticipation Note.
TAN—Tax Anticipation Note.
TOB—Tender Option Bond.
TRAN—Tax Revenue Anticipation Note.
VRDO—Variable Rate Demand Obligation.
VRDP—Variable Rate Demand Preferred.
(ETM)—Escrowed to Maturity.
(Prere.)—Prerefunded.
Scheduled principal and interest payments are guaranteed by:
(1) MBIA (Municipal Bond Investors Assurance).
(2) AMBAC (Ambac Assurance Corporation).
(3) FGIC (Financial Guaranty Insurance Company).
(4) AGM (Assured Guaranty Municipal Corporation).
(5) BIGI (Bond Investors Guaranty Insurance).
(6) Connie Lee Inc.
(7) FHA (Federal Housing Authority).
(8) CapMAC (Capital Markets Assurance Corporation).
(9) American Capital Access Financial Guaranty Corporation.
(10) XL Capital Assurance Inc.
(11) CIFG (CDC IXIS Financial Guaranty).
(12) Assured Guaranty Corporation.
(13) Berkshire Hathaway Assurance Corporation.
(14) National Public Finance Guarantee Corporation.
The insurance does not guarantee the market value of the municipal bonds.
LOC—Scheduled principal and interest payments are guaranteed by bank letter of credit.
31
Tax-Exempt Money Market Fund
Statement of Operations
| |
| | Year Ended |
| October 31, 2011 |
| | ($000) |
| Investment Income | |
| Income | |
| Interest1 | 46,419 |
| Total Income | 46,419 |
| Expenses | |
| The Vanguard Group—Note B | |
| Investment Advisory Services | 5,151 |
| Management and Administrative | 19,267 |
| Marketing and Distribution | 5,624 |
| Custodian Fees | 205 |
| Auditing Fees | 23 |
| Shareholders’ Reports | 163 |
| Trustees’ Fees and Expenses | 18 |
| Total Expenses | 30,451 |
| Net Investment Income | 15,968 |
| Realized Net Gain (Loss) | |
| on Investment Securities Sold | 68 |
| Net Increase (Decrease) in Net Assets | |
| Resulting from Operations | 16,036 |
Statement of Changes in Net Assets
| | |
| | Year Ended October 31, |
| | 2011 | 2010 |
| | ($000) | ($000) |
| Increase (Decrease) in Net Assets | | |
| Operations | | |
| Net Investment Income | 15,968 | 26,453 |
| Realized Net Gain (Loss) | 68 | 60 |
| Net Increase (Decrease) in Net Assets Resulting from Operations | 16,036 | 26,513 |
| Distributions | | |
| Net Investment Income | (15,968) | (26,453) |
| Realized Capital Gain | — | — |
| Total Distributions | (15,968) | (26,453) |
| Capital Share Transactions (at $1.00) | | |
| Issued | 17,592,119 | 15,253,213 |
| Issued in Lieu of Cash Distributions | 15,376 | 25,417 |
| Redeemed | (18,419,340) | (17,293,433) |
| Net Increase (Decrease) from Capital Share Transactions | (811,845) | (2,014,803) |
| Total Increase (Decrease) | (811,777) | (2,014,743) |
| Net Assets | | |
| Beginning of Period | 18,405,099 | 20,419,842 |
| End of Period | 17,593,322 | 18,405,099 |
1 Interest income from an affiliated company of the fund was $1,222,000.
See accompanying Notes, which are an integral part of the Financial Statements.
32
Tax-Exempt Money Market Fund
Financial Highlights
| | | | | |
| For a Share Outstanding | | | Year Ended October 31, |
| Throughout Each Period | 2011 | 2010 | 2009 | 2008 | 2007 |
| Net Asset Value, Beginning of Period | $1.00 | $1.00 | $1.00 | $1.00 | $1.00 |
| Investment Operations | | | | | |
| Net Investment Income | .001 | .001 | .006 | .026 | .036 |
| Net Realized and Unrealized Gain (Loss) | | | | | |
| on Investments | — | — | — | — | — |
| Total from Investment Operations | .001 | .001 | .006 | .026 | .036 |
| Distributions | | | | | |
| Dividends from Net Investment Income | (.001) | (.001) | (.006) | (.026) | (.036) |
| Distributions from Realized Capital Gains | — | — | — | — | — |
| Total Distributions | (.001) | (.001) | (.006) | (.026) | (.036) |
| Net Asset Value, End of Period | $1.00 | $1.00 | $1.00 | $1.00 | $1.00 |
| |
| Total Return1 | 0.09% | 0.14% | 0.60% | 2.63% | 3.65% |
| |
| Ratios/Supplemental Data | | | | | |
| Net Assets, End of Period (Millions) | $17,593 | $18,405 | $20,420 | $23,881 | $22,019 |
| Ratio of Total Expenses to | | | | | |
| Average Net Assets | 0.17% | 0.17% | 0.17%2 | 0.11% | 0.10% |
| Ratio of Net Investment Income to | | | | | |
| Average Net Assets | 0.09% | 0.14% | 0.61% | 2.59% | 3.59% |
1 Total returns do not include account service fees that may have applied in the periods shown. Fund prospectuses provide information about any applicable account service fees.
2 Includes 0.04% of fees to participate in the Treasury Temporary Guarantee Program for Money Market Funds.
See accompanying Notes, which are an integral part of the Financial Statements.
33
Tax-Exempt Money Market Fund
Notes to Financial Statements
Vanguard Tax-Exempt Money Market Fund is registered under the Investment Company Act of 1940 as an open-end investment company, or mutual fund. The fund invests in debt instruments of many municipal issuers; the issuers’ abilities to meet their obligations may be affected by economic and political developments in a specific state or region.
A. The following significant accounting policies conform to generally accepted accounting principles for U.S. mutual funds. The fund consistently follows such policies in preparing its financial statements.
1. Security Valuation: Securities are valued at amortized cost, which approximates market value. Investments in Vanguard Municipal Cash Management Fund are valued at that fund’s net asset value.
2. Federal Income Taxes: The fund intends to continue to qualify as a regulated investment company and distribute all of its income. Management has analyzed the fund’s tax positions taken for all open federal income tax years (October 31, 2008–2011), and has concluded that no provision for federal income tax is required in the fund’s financial statements.
3. Distributions: Distributions from net investment income are declared daily and paid on the first business day of the following month.
4. Other: Interest income includes income distributions received from Vanguard Municipal Cash Management Fund and is accrued daily. Premiums and discounts on debt securities purchased are amortized and accreted, respectively, to interest income over the lives of the respective securities. Security transactions are accounted for on the date securities are bought or sold. Costs used to determine realized gains (losses) on the sale of investment securities are those of the specific securities sold.
B. The Vanguard Group furnishes at cost investment advisory, corporate management, administrative, marketing, and distribution services. The costs of such services are allocated to the fund under methods approved by the board of trustees. The fund has committed to provide up to 0.40% of its net assets in capital contributions to Vanguard. At October 31, 2011, the fund had contributed capital of $3,040,000 to Vanguard (included in Other Assets), representing 0.02% of the fund’s net assets and 1.21% of Vanguard’s capitalization. The fund’s trustees and officers are also directors and officers of Vanguard. Vanguard and the board of trustees have agreed to temporarily limit certain net operating expenses in excess of the fund’s daily yield so as to maintain a zero or positive yield for the fund. Vanguard and the board of trustees may terminate the temporary expense limitation at any time.
C. Various inputs may be used to determine the value of the fund’s investments. These inputs are summarized in three broad levels for financial statement purposes. The inputs or methodologies used to value securities are not necessarily an indication of the risk associated with investing in those securities.
Level 1—Quoted prices in active markets for identical securities.
Level 2—Other significant observable inputs (including quoted prices for similar securities, interest rates, prepayment speeds, credit risk, etc.).
Level 3—Significant unobservable inputs (including the fund’s own assumptions used to determine the fair value of investments).
The fund’s investment in Vanguard Municipal Cash Management Fund is valued based on Level 1 inputs. All of the fund’s other investments were valued using amortized cost, in accordance with rules under the Investment Company Act of 1940. Amortized cost approximates the current fair value of a security, but since the value is not obtained from a quoted price in an active market, securities valued at amortized cost are considered to be valued using Level 2 inputs.
D. In preparing the financial statements as of October 31, 2011, management considered the impact of subsequent events for potential recognition or disclosure in these financial statements.
34
Short-Term Tax-Exempt Fund
Fund Profile
As of October 31, 2011
| | | |
| Financial Attributes | | |
| | | Comparative | Broad |
| | Fund | Index1 | Index2 |
| Number of Issues | 1,209 | 5,842 | 45,625 |
| Yield3 | | 1.21% | 3.15% |
| Investor Shares | 0.51% | | |
| Admiral Shares | 0.59% | | |
| Yield to Maturity | 0.7%4 | 1.2% | 3.2% |
| Average Coupon | 2.7% | 4.8% | 4.9% |
| Average Effective | | | |
| Maturity | 1.2 years | 3.0 years 13.4 years |
| Average Duration | 1.1 years | 2.6 years | 8.2 years |
| Expense Ratio5 | | — | — |
| Investor Shares | 0.20% | | |
| Admiral Shares | 0.12% | | |
| Short-Term Reserves | 37.7% | — | — |
| | |
| Largest Area Concentrations6 | |
| |
| Texas | | 11.5% |
| New York | | 10.9 |
| California | | 9.4 |
| Florida | | 7.8 |
| Pennsylvania | | 6.5 |
| Illinois | | 4.2 |
| Massachusetts | | 3.9 |
| North Carolina | | 3.3 |
| New Jersey | | 3.2 |
| Ohio | | 2.9 |
| Top Ten | | 63.6% |
| |
| |
| Volatility Measures7 | |
| | Fund Versus | Fund Versus |
| | Comparative Index1 | Broad Index2 |
| R-Squared | 0.92 | 0.53 |
| Beta | 0.41 | 0.12 |
| |
| Distribution by Maturity (% of portfolio) | |
| |
| Under 1 Year | 57.6% |
| 1–3 Years | 27.5 |
| 3–5 Years | 14.1 |
| Over 5 Years | 0.8 |
| |
| |
| Distribution by Credit Quality (% of portfolio) |
| |
| AAA | 21.7% |
| AA | 60.2 |
| A | 16.2 |
| BBB | 1.5 |
| Not Rated | 0.4 |
| For information about these ratings, see the Glossary entry for Credit Quality. |
Investment Focus
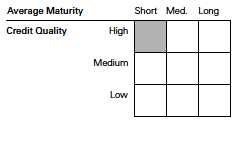
1 Barclays Capital 3 Year Municipal Bond Index.
2 Barclays Capital Municipal Bond Index.
3 30-day SEC yield for the fund; index yield assumes that all bonds are called or prepaid at the earliest possible dates. See the Glossary.
4 Before expenses.
5 The expense ratios shown are from the prospectus dated February 28, 2011, and represent estimated costs for the current fiscal year. For the fiscal year ended October 31, 2011, the expense ratios were 0.20% for the Investor Shares and 0.12% for the Admiral Shares.
6 Percentage of net assets, excluding any futures contracts.
7 For an explanation of R-squared, beta, and other terms used here, see the Glossary.
35
Short-Term Tax-Exempt Fund
Performance Summary
All of the returns in this report represent past performance, which is not a guarantee of future results that may be achieved by the fund. (Current performance may be lower or higher than the performance data cited. For performance data current to the most recent month-end, visit our website at vanguard.com/performance.) Note, too, that both investment returns and principal value can fluctuate widely, so an investor’s shares, when sold, could be worth more or less than their original cost. The returns shown do not reflect taxes that a shareholder would pay on fund distributions or on the sale of fund shares.
Cumulative Performance: October 31, 2001–October 31, 2011
Initial Investment of $10,000
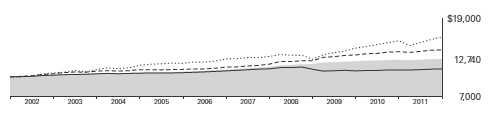
| | | | |
| | | Average Annual Total Returns | Final Value |
| | | Periods Ended October 31, 2011 | of a $10,000 |
| | One Year | Five Years | Ten Years | Investment |
| Short-Term Tax-Exempt Fund Investor Shares | 0.92% | 2.73% | 2.45% | $12,740 |
| Barclays Capital Municipal Bond Index | 3.78 | 4.80 | 4.93 | 16,178 |
| Barclays Capital 3 Year Municipal Bond Index | 1.95 | 4.24 | 3.54 | 14,160 |
| 1–2 Year Municipal Funds Average1 | 1.17 | 0.48 | 1.15 | 11,210 |
| | | | |
| | | | | Final Value |
| | | | | of a $50,000 |
| | One Year | Five Years | Ten Years | Investment |
| Short-Term Tax-Exempt Fund Admiral Shares | 1.00% | 2.81% | 2.52% | $64,141 |
| Barclays Capital Municipal Bond Index | 3.78 | 4.80 | 4.93 | 80,888 |
| Barclays Capital 3 Year Municipal Bond Index | 1.95 | 4.24 | 3.54 | 70,802 |
1 Derived from data provided by Lipper Inc.
See Financial Highlights for dividend and capital gains information.
36
Short-Term Tax-Exempt Fund
| | | | |
| Fiscal-Year Total Returns (%): October 31, 2001–October 31, 2011 | | | |
| | | | | Barclays |
| | | | Investor Shares | Capital1 |
| Fiscal | Capital | Income | Total | Total |
| Year | Return | Return | Return | Return |
| 2002 | –0.1% | 2.9% | 2.8% | 4.8% |
| 2003 | 0.3 | 2.0 | 2.3 | 3.9 |
| 2004 | –0.6 | 1.8 | 1.2 | 2.2 |
| 2005 | –0.9 | 2.2 | 1.3 | 0.3 |
| 2006 | 0.3 | 2.9 | 3.2 | 3.1 |
| 2007 | 0.3 | 3.4 | 3.7 | 4.0 |
| 2008 | 0.4 | 3.3 | 3.7 | 4.3 |
| 2009 | 1.3 | 2.3 | 3.6 | 7.3 |
| 2010 | 0.4 | 1.4 | 1.8 | 3.7 |
| 2011 | –0.3 | 1.2 | 0.9 | 1.9 |
Average Annual Total Returns: Periods Ended September 30, 2011
This table presents returns through the latest calendar quarter—rather than through the end of the fiscal period.
Securities and Exchange Commission rules require that we provide this information.
| | | | | | |
| | | | | | | Ten Years |
| | Inception Date | One Year Five Years | Capital | Income | Total |
| Investor Shares | 9/1/1977 | 1.06% | 2.81% | 0.12% | 2.37% | 2.49% |
| Admiral Shares | 2/12/2001 | 1.14 | 2.89 | 0.12 | 2.44 | 2.56 |
1 Barclays Capital 3 Year Municipal Bond Index.
37
Short-Term Tax-Exempt Fund
Financial Statements
The Statement of Net Assets—an integral part of the Financial Statements for Vanguard Short-Term Tax-Exempt Fund—is included as an insert to this report.
Statement of Operations
| |
| | Year Ended |
| October 31, 2011 |
| | ($000) |
| Investment Income | |
| Income | |
| Interest1 | 164,106 |
| Total Income | 164,106 |
| Expenses | |
| The Vanguard Group—Note B | |
| Investment Advisory Services | 1,234 |
| Management and Administrative— | |
| Investor Shares | 4,321 |
| Management and Administrative— | |
| Admiral Shares | 6,651 |
| Marketing and Distribution— | |
| Investor Shares | 889 |
| Marketing and Distribution— | |
| Admiral Shares | 2,642 |
| Custodian Fees | 137 |
| Auditing Fees | 27 |
| Shareholders’ Reports—Investor Shares | 59 |
| Shareholders’ Reports—Admiral Shares | 28 |
| Trustees’ Fees and Expenses | 11 |
| Total Expenses | 15,999 |
| Net Investment Income | 148,107 |
| Realized Net Gain (Loss) | |
| Investment Securities Sold | (1,179) |
| Futures Contracts | (10,634) |
| Realized Net Gain (Loss) | (11,813) |
| Change in Unrealized Appreciation | |
| (Depreciation) | |
| Investment Securities | (26,876) |
| Futures Contracts | (861) |
| Change in Unrealized Appreciation | |
| (Depreciation) | (27,737) |
| Net Increase (Decrease) in Net Assets | |
| Resulting from Operations | 108,557 |
Statement of Changes in Net Assets
| | |
| | Year Ended October 31, |
| | 2011 | 2010 |
| | ($000) | ($000) |
| Increase (Decrease) in Net Assets | | |
| Operations | | |
| Net Investment Income | 148,107 | 166,172 |
| Realized Net Gain (Loss) | (11,813) | (4,661) |
| Change in Unrealized Appreciation (Depreciation) | (27,737) | 50,140 |
| Net Increase (Decrease) in Net Assets Resulting from Operations | 108,557 | 211,651 |
| Distributions | | |
| Net Investment Income | | |
| Investor Shares | (34,633) | (42,139) |
| Admiral Shares | (113,474) | (124,033) |
| Realized Capital Gain | | |
| Investor Shares | — | — |
| Admiral Shares | — | — |
| Total Distributions | (148,107) | (166,172) |
| Capital Share Transactions | | |
| Investor Shares | (447,032) | 352,186 |
| Admiral Shares | (272,454) | 1,192,139 |
| Net Increase (Decrease) from Capital Share Transactions | (719,486) | 1,544,325 |
| Total Increase (Decrease) | (759,036) | 1,589,804 |
| Net Assets | | |
| Beginning of Period | 11,988,637 | 10,398,833 |
| End of Period | 11,229,601 | 11,988,637 |
1 Interest income from an affiliated company of the fund was $381,000.
See accompanying Notes, which are an integral part of the Financial Statements.
38
Short-Term Tax-Exempt Fund
Financial Highlights
| | | | | |
| Investor Shares | | | | | |
| |
| For a Share Outstanding | | | Year Ended October 31, |
| Throughout Each Period | 2011 | 2010 | 2009 | 2008 | 2007 |
| Net Asset Value, Beginning of Period | $15.95 | $15.88 | $15.68 | $15.62 | $15.58 |
| Investment Operations | | | | | |
| Net Investment Income | .196 | .217 | .357 | .509 | .526 |
| Net Realized and Unrealized Gain (Loss) | | | | | |
| on Investments | (.050) | .070 | .200 | .060 | .040 |
| Total from Investment Operations | .146 | .287 | .557 | .569 | .566 |
| Distributions | | | | | |
| Dividends from Net Investment Income | (.196) | (.217) | (.357) | (.509) | (.526) |
| Distributions from Realized Capital Gains | — | — | — | — | — |
| Total Distributions | (.196) | (.217) | (.357) | (.509) | (.526) |
| Net Asset Value, End of Period | $15.90 | $15.95 | $15.88 | $15.68 | $15.62 |
| |
| Total Return1 | 0.92% | 1.82% | 3.59% | 3.68% | 3.70% |
| |
| Ratios/Supplemental Data | | | | | |
| Net Assets, End of Period (Millions) | $2,668 | $3,126 | $2,761 | $1,319 | $1,040 |
| Ratio of Total Expenses to | | | | | |
| Average Net Assets | 0.20% | 0.20% | 0.20% | 0.15% | 0.15% |
| Ratio of Net Investment Income to | | | | | |
| Average Net Assets | 1.23% | 1.36% | 2.15% | 3.23% | 3.37% |
| Portfolio Turnover Rate | 28% | 29% | 32% | 32% | 51% |
1 Total returns do not include account service fees that may have applied in the periods shown. Fund prospectuses provide information about any applicable account service fees.
| | | | | |
| Admiral Shares | | | | | |
| |
| For a Share Outstanding | | | Year Ended October 31, |
| Throughout Each Period | 2011 | 2010 | 2009 | 2008 | 2007 |
| Net Asset Value, Beginning of Period | $15.95 | $15.88 | $15.68 | $15.62 | $15.58 |
| Investment Operations | | | | | |
| Net Investment Income | .209 | .230 | .370 | .520 | .537 |
| Net Realized and Unrealized Gain (Loss) | | | | | |
| on Investments | (.050) | .070 | .200 | .060 | .040 |
| Total from Investment Operations | .159 | .300 | .570 | .580 | .577 |
| Distributions | | | | | |
| Dividends from Net Investment Income | (.209) | (.230) | (.370) | (.520) | (.537) |
| Distributions from Realized Capital Gains | — | — | — | — | — |
| Total Distributions | (.209) | (.230) | (.370) | (.520) | (.537) |
| Net Asset Value, End of Period | $15.90 | $15.95 | $15.88 | $15.68 | $15.62 |
| |
| Total Return | 1.00% | 1.90% | 3.67% | 3.76% | 3.77% |
| |
| Ratios/Supplemental Data | | | | | |
| Net Assets, End of Period (Millions) | $8,561 | $8,863 | $7,637 | $3,723 | $3,078 |
| Ratio of Total Expenses to | | | | | |
| Average Net Assets | 0.12% | 0.12% | 0.12% | 0.08% | 0.08% |
| Ratio of Net Investment Income to | | | | | |
| Average Net Assets | 1.31% | 1.44% | 2.23% | 3.30% | 3.44% |
| Portfolio Turnover Rate | 28% | 29% | 32% | 32% | 51% |
See accompanying Notes, which are an integral part of the Financial Statements.
39
Short-Term Tax-Exempt Fund
Notes to Financial Statements
Vanguard Short-Term Tax-Exempt Fund is registered under the Investment Company Act of 1940 as an open-end investment company, or mutual fund. The fund invests in debt instruments of many municipal issuers; the issuers’ abilities to meet their obligations may be affected by economic and political developments in a specific state or region. The fund offers two classes of shares: Investor Shares and Admiral Shares. Investor Shares are available to any investor who meets the fund’s minimum purchase requirements. Admiral Shares are designed for investors who meet certain administrative, service, and account-size criteria.
A. The following significant accounting policies conform to generally accepted accounting principles for U.S. mutual funds. The fund consistently follows such policies in preparing its financial statements.
1. Security Valuation: Bonds, and temporary cash investments acquired over 60 days to maturity, are valued using the latest bid prices or using valuations based on a matrix system (which considers such factors as security prices, yields, maturities, and ratings), both as furnished by independent pricing services. Investments in Vanguard Municipal Cash Management Fund are valued at that fund’s net asset value. Other temporary cash investments are valued at amortized cost, which approximates market value. Securities for which market quotations are not readily available, or whose values have been affected by events occurring before the fund’s pricing time but after the close of the securities’ primary markets, are valued by methods deemed by the board of trustees to represent fair value.
2. Futures Contracts: The fund uses futures contracts to invest in fixed income asset classes with greater efficiency and lower cost than is possible through direct investment, to add value when these instruments are attractively priced, or to adjust sensitivity to changes in interest rates. The primary risks associated with the use of futures contracts are imperfect correlation between changes in market values of bonds held by the fund and the prices of futures contracts, and the possibility of an illiquid market.
Futures contracts are valued based upon their quoted daily settlement prices. The aggregate principal amounts of the contracts are not recorded in the Statement of Net Assets. Fluctuations in the value of the contracts are recorded in the Statement of Net Assets as an asset (liability) and in the Statement of Operations as unrealized appreciation (depreciation) until the contracts are closed, when they are recorded as realized futures gains (losses).
The fund had no open futures contracts at October 31, 2011.
3. Federal Income Taxes: The fund intends to continue to qualify as a regulated investment company and distribute all of its income. Management has analyzed the fund’s tax positions taken for all open federal income tax years (October 31, 2008–2011), and has concluded that no provision for federal income tax is required in the fund’s financial statements.
4. Distributions: Distributions from net investment income are declared daily and paid on the first business day of the following month. Annual distributions from realized capital gains, if any, are recorded on the ex-dividend date.
5. Other: Interest income includes income distributions received from Vanguard Municipal Cash Management Fund and is accrued daily. Premiums and discounts on debt securities purchased are amortized and accreted, respectively, to interest income over the lives of the respective securities. Security transactions are accounted for on the date securities are bought or sold. Costs used to determine realized gains (losses) on the sale of investment securities are those of the specific securities sold.
Each class of shares has equal rights as to assets and earnings, except that each class separately bears certain class-specific expenses related to maintenance of shareholder accounts (included in Management and Administrative expenses) and shareholder reporting. Marketing and distribution expenses are allocated to each class of shares based on a method approved by the board of trustees. Income, other non-class-specific expenses, and gains and losses on investments are allocated to each class of shares based on its relative net assets.
B. The Vanguard Group furnishes at cost investment advisory, corporate management, administrative, marketing, and distribution services. The costs of such services are allocated to the fund under methods approved by the board of trustees. The fund has committed to provide up to 0.40% of its net assets in capital contributions to Vanguard. At October 31, 2011, the fund had contributed capital of $1,943,000 to Vanguard (included in Other Assets), representing 0.02% of the fund’s net assets and 0.78% of Vanguard’s capitalization. The fund’s trustees and officers are also directors and officers of Vanguard.
40
Short-Term Tax-Exempt Fund
C. Various inputs may be used to determine the value of the fund’s investments. These inputs are summarized in three broad levels for financial statement purposes. The inputs or methodologies used to value securities are not necessarily an indication of the risk associated with investing in those securities.
Level 1—Quoted prices in active markets for identical securities.
Level 2—Other significant observable inputs (including quoted prices for similar securities, interest rates, prepayment speeds, credit risk, etc.).
Level 3—Significant unobservable inputs (including the fund’s own assumptions used to determine the fair value of investments).
The following table summarizes the market value of the fund’s investments as of October 31, 2011, based on the inputs used to value them:
| | | |
| | Level 1 | Level 2 | Level 3 |
| Investments | ($000) | ($000) | ($000) |
| Tax-Exempt Municipal Bonds | — | 11,087,594 | — |
| Temporary Cash Investments | 246,823 | — | — |
| Total | 246,823 | 11,087,594 | — |
D. Capital gain distributions are determined on a tax basis and may differ from realized capital gains for financial reporting purposes. Differences may be permanent or temporary. Permanent differences are reclassified among capital accounts in the financial statements to reflect their tax character. Temporary differences arise when gains or losses are recognized in different periods for financial statement and tax purposes; these differences will reverse at some time in the future.
For tax purposes, at October 31, 2011, the fund had available capital loss carryforwards totaling $18,681,000 to offset future net capital gains of $2,389,000 through October 31, 2014, $2,945,000 through October 31, 2015, $2,332,000 through October 31, 2018, and $11,015,000 through October 31, 2019.
The fund had realized losses totaling $3,907,000 through October 31, 2011, which are deferred for tax purposes and reduce the amount of tax-basis unrealized appreciation on investment securities.
At October 31, 2011, the cost of investment securities for tax purposes was $11,228,745,000. Net unrealized appreciation of investment securities for tax purposes was $105,672,000, consisting of unrealized gains of $107,757,000 on securities that had risen in value since their purchase and $2,085,000 in unrealized losses on securities that had fallen in value since their purchase.
E. During the year ended October 31, 2011, the fund purchased $1,859,991,000 of investment securities and sold $1,889,128,000 of investment securities, other than temporary cash investments.
F. Capital share transactions for each class of shares were:
| | | | |
| | | | Year Ended October 31, |
| | | 2011 | | 2010 |
| | Amount | Shares | Amount | Shares |
| | ($000) | (000) | ($000) | (000) |
| Investor Shares | | | | |
| Issued | 1,370,297 | 86,207 | 2,248,750 | 141,140 |
| Issued in Lieu of Cash Distributions | 27,313 | 1,719 | 33,787 | 2,120 |
| Redeemed | (1,844,642) | (116,057) | (1,930,351) | (121,140) |
| Net Increase (Decrease)—Investor Shares | (447,032) | (28,131) | 352,186 | 22,120 |
| Admiral Shares | | | | |
| Issued | 4,098,267 | 257,836 | 5,153,629 | 323,452 |
| Issued in Lieu of Cash Distributions | 91,249 | 5,741 | 100,504 | 6,307 |
| Redeemed | (4,461,970) | (280,758) | (4,061,994) | (254,931) |
| Net Increase (Decrease)—Admiral Shares | (272,454) | (17,181) | 1,192,139 | 74,828 |
G. In preparing the financial statements as of October 31, 2011, management considered the impact of subsequent events for potential recognition or disclosure in these financial statements.
41
Limited-Term Tax-Exempt Fund
Fund Profile
As of October 31, 2011
| | | |
| Financial Attributes | | |
| | | Comparative | Broad |
| | Fund | Index1 | Index2 |
| Number of Issues | 1,579 | 5,842 | 45,625 |
| Yield3 | | 1.21% | 3.15% |
| Investor Shares | 1.04% | | |
| Admiral Shares | 1.12% | | |
| Yield to Maturity | 1.2%4 | 1.2% | 3.2% |
| Average Coupon | 4.0% | 4.8% | 4.9% |
| Average Effective | | | |
| Maturity | 2.8 years | 3.0 years | 13.4 years |
| Average Duration | 2.4 years | 2.6 years | 8.2 years |
| Expense Ratio5 | | — | — |
| Investor Shares | 0.20% | | |
| Admiral Shares | 0.12% | | |
| Short-Term Reserves | 16.7% | — | — |
| | |
| Largest Area Concentrations6 | |
| |
| California | | 11.5% |
| New York | | 11.4 |
| Texas | | 8.3 |
| Pennsylvania | | 7.5 |
| New Jersey | | 6.1 |
| Florida | | 5.5 |
| Ohio | | 4.3 |
| Massachusetts | | 4.0 |
| Washington | | 3.1 |
| North Carolina | | 2.9 |
| Top Ten | | 64.6% |
| |
| |
| Volatility Measures7 | |
| | Fund Versus | Fund Versus |
| | Comparative Index1 | Broad Index2 |
| R-Squared | 0.81 | 0.69 |
| Beta | 0.92 | 0.34 |
| |
| Distribution by Maturity (% of portfolio) | |
| |
| Under 1 Year | 29.4% |
| 1–3 Years | 27.5 |
| 3–5 Years | 23.9 |
| Over 5 Years | 19.2 |
| |
| |
| Distribution by Credit Quality (% of portfolio) |
| |
| AAA | 22.2% |
| AA | 54.9 |
| A | 19.7 |
| BBB | 2.5 |
| BB | 0.4 |
| Not Rated | 0.3 |
| For information about these ratings, see the Glossary entry for Credit Quality. |
| |
Investment Focus
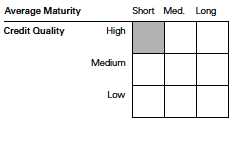
1 Barclays Capital 3 Year Municipal Bond Index.
2 Barclays Capital Municipal Bond Index.
3 30-day SEC yield for the fund; index yield assumes that all bonds are called or prepaid at the earliest possible dates. See the Glossary.
4 Before expenses.
5 The expense ratios shown are from the prospectus dated February 28, 2011, and represent estimated costs for the current fiscal year. For the fiscal year ended October 31, 2011, the expense ratios were 0.20% for the Investor Shares and 0.12% for the Admiral Shares.
6 Percentage of net assets, excluding any futures contracts.
7 For an explanation of R-squared, beta, and other terms used here, see the Glossary.
42
Limited-Term Tax-Exempt Fund
Performance Summary
All of the returns in this report represent past performance, which is not a guarantee of future results that may be achieved by the fund. (Current performance may be lower or higher than the performance data cited. For performance data current to the most recent month-end, visit our website at vanguard.com/performance.) Note, too, that both investment returns and principal value can fluctuate widely, so an investor’s shares, when sold, could be worth more or less than their original cost. The returns shown do not reflect taxes that a shareholder would pay on fund distributions or on the sale of fund shares.
Cumulative Performance: October 31, 2001–October 31, 2011
Initial Investment of $10,000
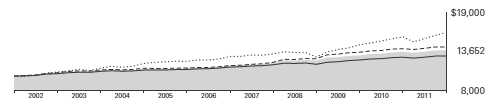
| | | | |
| | | Average Annual Total Returns | Final Value |
| | | Periods Ended October 31, 2011 | of a $10,000 |
| | One Year | Five Years | Ten Years | Investment |
| Limited-Term Tax-Exempt Fund | | | | |
| Investor Shares | 1.53% | 3.55% | 3.16% | $13,652 |
| Barclays Capital Municipal Bond Index | 3.78 | 4.80 | 4.93 | 16,178 |
| Barclays Capital 3 Year Municipal Bond Index | 1.95 | 4.24 | 3.54 | 14,160 |
| 1–5 Year Municipal Funds Average1 | 1.47 | 2.66 | 2.56 | 12,875 |
| | | | |
| | | | | Final Value |
| | | | | of a $50,000 |
| | One Year | Five Years | Ten Years | Investment |
| Limited-Term Tax-Exempt Fund Admiral Shares | 1.61% | 3.62% | 3.23% | $68,740 |
| Barclays Capital Municipal Bond Index | 3.78 | 4.80 | 4.93 | 80,888 |
| Barclays Capital 3 Year Municipal Bond Index | 1.95 | 4.24 | 3.54 | 70,802 |
1 Derived from data provided by Lipper Inc.
See Financial Highlights for dividend and capital gains information.
43
Limited-Term Tax-Exempt Fund
| | | | |
| Fiscal-Year Total Returns (%): October 31, 2001–October 31, 2011 | | | |
| | | | | Barclays |
| | | | Investor Shares | Capital1 |
| Fiscal | Capital | Income | Total | Total |
| Year | Return | Return | Return | Return |
| 2002 | 0.1% | 3.9% | 4.0% | 4.8% |
| 2003 | 0.7 | 3.3 | 4.0 | 3.9 |
| 2004 | –1.1 | 2.9 | 1.8 | 2.2 |
| 2005 | –2.3 | 3.0 | 0.7 | 0.3 |
| 2006 | 0.1 | 3.3 | 3.4 | 3.1 |
| 2007 | 0.1 | 3.5 | 3.6 | 4.0 |
| 2008 | –0.7 | 3.4 | 2.7 | 4.3 |
| 2009 | 3.0 | 2.9 | 5.9 | 7.3 |
| 2010 | 1.6 | 2.4 | 4.0 | 3.7 |
| 2011 | –0.7 | 2.2 | 1.5 | 1.9 |
Average Annual Total Returns: Periods Ended September 30, 2011
This table presents returns through the latest calendar quarter—rather than through the end of the fiscal period.
Securities and Exchange Commission rules require that we provide this information.
| | | | | | |
| | | | | | | Ten Years |
| | Inception Date | One Year Five Years | Capital | Income | Total |
| Investor Shares | 8/31/1987 | 2.00% | 3.68% | 0.14% | 3.11% | 3.25% |
| Admiral Shares | 2/12/2001 | 2.08 | 3.76 | 0.14 | 3.18 | 3.32 |
1 Barclays Capital 3 Year Municipal Bond Index.
44
Limited-Term Tax-Exempt Fund
Financial Statements
The Statement of Net Assets—an integral part of the Financial Statements for Vanguard Limited-Term Tax-Exempt Fund—is included as an insert to this report.
Statement of Operations
| |
| | Year Ended |
| October 31, 2011 |
| | ($000) |
| Investment Income | |
| Income | |
| Interest1 | 341,480 |
| Total Income | 341,480 |
| Expenses | |
| The Vanguard Group—Note B | |
| Investment Advisory Services | 1,492 |
| Management and Administrative— | |
| Investor Shares | 4,814 |
| Management and Administrative— | |
| Admiral Shares | 8,519 |
| Marketing and Distribution— | |
| Investor Shares | 978 |
| Marketing and Distribution— | |
| Admiral Shares | 3,204 |
| Custodian Fees | 158 |
| Auditing Fees | 27 |
| Shareholders’ Reports—Investor Shares | 87 |
| Shareholders’ Reports—Admiral Shares | 40 |
| Trustees’ Fees and Expenses | 13 |
| Total Expenses | 19,332 |
| Net Investment Income | 322,148 |
| Realized Net Gain (Loss) | |
| Investment Securities Sold | 5,865 |
| Futures Contracts | (26,417) |
| Realized Net Gain (Loss) | (20,552) |
| Change in Unrealized Appreciation | |
| (Depreciation) | |
| Investment Securities | (76,345) |
| Futures Contracts | (1,002) |
| Change in Unrealized Appreciation | |
| (Depreciation) | (77,347) |
| Net Increase (Decrease) in Net Assets | |
| Resulting from Operations | 224,249 |
Statement of Changes in Net Assets
| | |
| | Year Ended October 31, |
| | 2011 | 2010 |
| | ($000) | ($000) |
| Increase (Decrease) in Net Assets | | |
| Operations | | |
| Net Investment Income | 322,148 | 316,180 |
| Realized Net Gain (Loss) | (20,552) | (10,332) |
| Change in Unrealized Appreciation (Depreciation) | (77,347) | 213,147 |
| Net Increase (Decrease) in Net Assets Resulting from Operations | 224,249 | 518,995 |
| Distributions | | |
| Net Investment Income | | |
| Investor Shares | (69,723) | (79,420) |
| Admiral Shares | (252,425) | (236,760) |
| Realized Capital Gain | | |
| Investor Shares | — | — |
| Admiral Shares | — | — |
| Total Distributions | (322,148) | (316,180) |
| Capital Share Transactions | | |
| Investor Shares | (336,064) | 361,100 |
| Admiral Shares | 1,011,429 | 1,793,590 |
| Net Increase (Decrease) from Capital Share Transactions | 675,365 | 2,154,690 |
| Total Increase (Decrease) | 577,466 | 2,357,505 |
| Net Assets | | |
| Beginning of Period | 14,007,765 | 11,650,260 |
| End of Period | 14,585,231 | 14,007,765 |
1 Interest income from an affiliated company of the fund was $534,000.
See accompanying Notes, which are an integral part of the Financial Statements.
45
Limited-Term Tax-Exempt Fund
Financial Highlights
| | | | | |
| Investor Shares | | | | | |
| |
| For a Share Outstanding | | | Year Ended October 31, |
| Throughout Each Period | 2011 | 2010 | 2009 | 2008 | 2007 |
| Net Asset Value, Beginning of Period | $11.15 | $10.97 | $10.65 | $10.73 | $10.72 |
| Investment Operations | | | | | |
| Net Investment Income | .247 | .259 | .304 | .366 | .371 |
| Net Realized and Unrealized Gain | | | | | |
| (Loss) on Investments | (.080) | .180 | .320 | (.080) | .010 |
| Total from Investment Operations | .167 | .439 | .624 | .286 | .381 |
| Distributions | | | | | |
| Dividends from Net Investment Income | (.247) | (.259) | (.304) | (.366) | (.371) |
| Distributions from Realized Capital Gains | — | — | — | — | — |
| Total Distributions | (.247) | (.259) | (.304) | (.366) | (.371) |
| Net Asset Value, End of Period | $11.07 | $11.15 | $10.97 | $10.65 | $10.73 |
| |
| Total Return1 | 1.53% | 4.04% | 5.92% | 2.68% | 3.62% |
| |
| Ratios/Supplemental Data | | | | | |
| Net Assets, End of Period (Millions) | $3,123 | $3,484 | $3,070 | $2,094 | $1,798 |
| Ratio of Total Expenses to | | | | | |
| Average Net Assets | 0.20% | 0.20% | 0.20% | 0.15% | 0.15% |
| Ratio of Net Investment Income to | | | | | |
| Average Net Assets | 2.24% | 2.33% | 2.77% | 3.38% | 3.46% |
| Portfolio Turnover Rate | 14% | 14% | 11% | 23% | 32% |
1 Total returns do not include account service fees that may have applied in the periods shown. Fund prospectuses provide information about any applicable account service fees.
| | | | | |
| Admiral Shares | | | | | |
| |
| For a Share Outstanding | | | Year Ended October 31, |
| Throughout Each Period | 2011 | 2010 | 2009 | 2008 | 2007 |
| Net Asset Value, Beginning of Period | $11.15 | $10.97 | $10.65 | $10.73 | $10.72 |
| Investment Operations | | | | | |
| Net Investment Income | .256 | .268 | .313 | .374 | .378 |
| Net Realized and Unrealized Gain (Loss) | | | | | |
| on Investments | (.080) | .180 | .320 | (.080) | .010 |
| Total from Investment Operations | .176 | .448 | .633 | .294 | .388 |
| Distributions | | | | | |
| Dividends from Net Investment Income | (.256) | (.268) | (.313) | (.374) | (.378) |
| Distributions from Realized Capital Gains | — | — | — | — | — |
| Total Distributions | (.256) | (.268) | (.313) | (.374) | (.378) |
| Net Asset Value, End of Period | $11.07 | $11.15 | $10.97 | $10.65 | $10.73 |
| |
| Total Return | 1.61% | 4.12% | 6.01% | 2.75% | 3.69% |
| |
| Ratios/Supplemental Data | | | | | |
| Net Assets, End of Period (Millions) | $11,463 | $10,524 | $8,580 | $5,744 | $4,914 |
| Ratio of Total Expenses to | | | | | |
| Average Net Assets | 0.12% | 0.12% | 0.12% | 0.08% | 0.08% |
| Ratio of Net Investment Income to | | | | | |
| Average Net Assets | 2.32% | 2.41% | 2.85% | 3.45% | 3.53% |
| Portfolio Turnover Rate | 14% | 14% | 11% | 23% | 32% |
See accompanying Notes, which are an integral part of the Financial Statements.
46
Limited-Term Tax-Exempt Fund
Notes to Financial Statements
Vanguard Limited-Term Tax-Exempt Fund is registered under the Investment Company Act of 1940 as an open-end investment company, or mutual fund. The fund invests in debt instruments of many municipal issuers; the issuers’ abilities to meet their obligations may be affected by economic and political developments in a specific state or region. The fund offers two classes of shares: Investor Shares and Admiral Shares. Investor Shares are available to any investor who meets the fund’s minimum purchase requirements. Admiral Shares are designed for investors who meet certain administrative, service, and account-size criteria.
A. The following significant accounting policies conform to generally accepted accounting principles for U.S. mutual funds. The fund consistently follows such policies in preparing its financial statements.
1. Security Valuation: Bonds, and temporary cash investments acquired over 60 days to maturity, are valued using the latest bid prices or using valuations based on a matrix system (which considers such factors as security prices, yields, maturities, and ratings), both as furnished by independent pricing services. Investments in Vanguard Municipal Cash Management Fund are valued at that fund’s net asset value. Other temporary cash investments are valued at amortized cost, which approximates market value. Securities for which market quotations are not readily available, or whose values have been affected by events occurring before the fund’s pricing time but after the close of the securities’ primary markets, are valued by methods deemed by the board of trustees to represent fair value.
2. Futures Contracts: The fund uses futures contracts to invest in fixed income asset classes with greater efficiency and lower cost than is possible through direct investment, to add value when these instruments are attractively priced, or to adjust sensitivity to changes in interest rates. The primary risks associated with the use of futures contracts are imperfect correlation between changes in market values of bonds held by the fund and the prices of futures contracts, and the possibility of an illiquid market.
Futures contracts are valued based upon their quoted daily settlement prices. The aggregate principal amounts of the contracts are not recorded in the Statement of Net Assets. Fluctuations in the value of the contracts are recorded in the Statement of Net Assets as an asset (liability) and in the Statement of Operations as unrealized appreciation (depreciation) until the contracts are closed, when they are recorded as realized futures gains (losses).
The fund had no open futures contracts at October 31, 2011.
3. Federal Income Taxes: The fund intends to continue to qualify as a regulated investment company and distribute all of its income. Management has analyzed the fund’s tax positions taken for all open federal income tax years (October 31, 2008–2011), and has concluded that no provision for federal income tax is required in the fund’s financial statements.
4. Distributions: Distributions from net investment income are declared daily and paid on the first business day of the following month. Annual distributions from realized capital gains, if any, are recorded on the ex-dividend date.
5. Other: Interest income includes income distributions received from Vanguard Municipal Cash Management Fund and is accrued daily. Premiums and discounts on debt securities purchased are amortized and accreted, respectively, to interest income over the lives of the respective securities. Security transactions are accounted for on the date securities are bought or sold. Costs used to determine realized gains (losses) on the sale of investment securities are those of the specific securities sold.
Each class of shares has equal rights as to assets and earnings, except that each class separately bears certain class-specific expenses related to maintenance of shareholder accounts (included in Management and Administrative expenses) and shareholder reporting. Marketing and distribution expenses are allocated to each class of shares based on a method approved by the board of trustees. Income, other non-class-specific expenses, and gains and losses on investments are allocated to each class of shares based on its relative net assets.
B. The Vanguard Group furnishes at cost investment advisory, corporate management, administrative, marketing, and distribution services. The costs of such services are allocated to the fund under methods approved by the board of trustees. The fund has committed to provide up to 0.40% of its net assets in capital contributions to Vanguard. At October 31, 2011, the fund had contributed capital of $2,525,000 to Vanguard (included in Other Assets), representing 0.02% of the fund’s net assets and 1.01% of Vanguard’s capitalization. The fund’s trustees and officers are also directors and officers of Vanguard.
47
Limited-Term Tax-Exempt Fund
C. Various inputs may be used to determine the value of the fund’s investments. These inputs are summarized in three broad levels for financial statement purposes. The inputs or methodologies used to value securities are not necessarily an indication of the risk associated with investing in those securities.
Level 1—Quoted prices in active markets for identical securities.
Level 2—Other significant observable inputs (including quoted prices for similar securities, interest rates, prepayment speeds, credit risk, etc.).
Level 3—Significant unobservable inputs (including the fund’s own assumptions used to determine the fair value of investments).
The following table summarizes the market value of the fund’s investments as of October 31, 2011, based on the inputs used to value them:
| | | |
| | Level 1 | Level 2 | Level 3 |
| Investments | ($000) | ($000) | ($000) |
| Tax-Exempt Municipal Bonds | — | 14,358,530 | — |
| Temporary Cash Investments | 262,028 | — | — |
| Total | 262,028 | 14,358,530 | — |
D. Capital gain distributions are determined on a tax basis and may differ from realized capital gains for financial reporting purposes. Differences may be permanent or temporary. Permanent differences are reclassified among capital accounts in the financial statements to reflect their tax character. Temporary differences arise when gains or losses are recognized in different periods for financial statement and tax purposes; these differences will reverse at some time in the future.
For tax purposes, at October 31, 2011, the fund had available capital loss carryforwards totaling $114,519,000 to offset future net capital gains of $1,396,000 through October 31, 2012, $20,383,000 through October 31, 2013, $16,166,000 through October 31, 2014, $12,485,000 through October 31, 2015, $2,743,000 through October 31, 2016, $29,710,000 through October 31, 2017, $4,375,000 through October 31, 2018, and $27,261,000 through October 31, 2019. Capital loss carryforwards of $31,765,000 expired on October 31, 2011; accordingly, such losses have been reclassified from accumulated net realized losses to paid-in capital.
The fund had realized losses totaling $13,303,000 through October 31, 2011, which are deferred for tax purposes and reduce the amount of tax-basis unrealized appreciation on investment securities.
At October 31, 2011, the cost of investment securities for tax purposes was $14,266,032,000. Net unrealized appreciation of investment securities for tax purposes was $354,526,000, consisting of unrealized gains of $364,289,000 on securities that had risen in value since their purchase and $9,763,000 in unrealized losses on securities that had fallen in value since their purchase.
E. During the year ended October 31, 2011, the fund purchased $2,480,122,000 of investment securities and sold $1,575,442,000 of investment securities, other than temporary cash investments.
48
Limited-Term Tax-Exempt Fund
F. Capital share transactions for each class of shares were:
| | | | |
| | | | Year Ended October 31, |
| | | 2011 | | 2010 |
| | Amount | Shares | Amount | Shares |
| | ($000) | (000) | ($000) | (000) |
| Investor Shares | | | | |
| Issued | 1,247,080 | 112,781 | 1,896,854 | 171,199 |
| Issued in Lieu of Cash Distributions | 58,012 | 5,249 | 66,725 | 6,015 |
| Redeemed | (1,641,156) | (148,494) | (1,602,479) | (144,551) |
| Net Increase (Decrease)—Investor Shares | (336,064) | (30,464) | 361,100 | 32,663 |
| Admiral Shares | | | | |
| Issued | 4,545,031 | 411,131 | 4,506,223 | 406,643 |
| Issued in Lieu of Cash Distributions | 196,859 | 17,808 | 187,512 | 16,902 |
| Redeemed | (3,730,461) | (337,754) | (2,900,145) | (261,548) |
| Net Increase (Decrease)—Admiral Shares | 1,011,429 | 91,185 | 1,793,590 | 161,997 |
G. In preparing the financial statements as of October 31, 2011, management considered the impact of subsequent events for potential recognition or disclosure in these financial statements.
49
Intermediate-Term Tax-Exempt Fund
Fund Profile
As of October 31, 2011
| | | |
| Financial Attributes | | |
| | | Comparative | Broad |
| | Fund | Index1 | Index2 |
| Number of Issues | 3,072 | 4,833 | 45,625 |
| Yield3 | | 2.37% | 3.15% |
| Investor Shares | 2.55% | | |
| Admiral Shares | 2.63% | | |
| Yield to Maturity | 2.7%4 | 2.4% | 3.2% |
| Average Coupon | 4.5% | 4.9% | 4.9% |
| Average Effective | | | |
| Maturity | 5.7 years | 7.0 years | 13.4 years |
| Average Duration | 5.4 years | 5.0 years | 8.2 years |
| Expense Ratio5 | | — | — |
| Investor Shares | 0.20% | | |
| Admiral Shares | 0.12% | | |
| Short-Term Reserves | 7.2% | — | — |
| | |
| Largest Area Concentrations6 | |
| |
| New York | | 14.3% |
| California | | 12.7 |
| Texas | | 8.3 |
| Florida | | 7.2 |
| New Jersey | | 6.0 |
| Illinois | | 5.8 |
| Massachusetts | | 4.3 |
| Pennsylvania | | 3.6 |
| Ohio | | 3.4 |
| Georgia | | 2.8 |
| Top Ten | | 68.4% |
| |
| |
| Volatility Measures7 | |
| | Fund Versus | Fund Versus |
| | Comparative Index1 | Broad Index2 |
| R-Squared | 0.83 | 0.96 |
| Beta | 0.88 | 0.94 |
| |
| Distribution by Maturity (% of portfolio) | |
| |
| Under 1 Year | 13.5% |
| 1–5 Years | 27.7 |
| 5–10 Years | 51.6 |
| 10–20 Years | 7.1 |
| 20–30 Years | 0.1 |
| |
| |
| Distribution by Credit Quality (% of portfolio) |
| |
| AAA | 14.5% |
| AA | 52.4 |
| A | 27.8 |
| BBB | 4.0 |
| BB | 0.9 |
| Not Rated | 0.4 |
| For information about these ratings, see the Glossary entry for Credit Quality. |
| |
Investment Focus
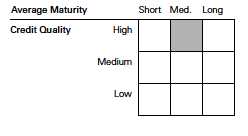
1 Barclays Capital 7 Year Municipal Bond Index.
2 Barclays Capital Municipal Bond Index.
3 30-day SEC yield for the fund; index yield assumes that all bonds are called or prepaid at the earliest possible dates. See the Glossary.
4 Before expenses.
5 The expense ratios shown are from the prospectus dated February 28, 2011, and represent estimated costs for the current fiscal year. For the fiscal year ended October 31, 2011, the expense ratios were 0.20% for the Investor Shares and 0.12% for the Admiral Shares.
6 Percentage of net assets, excluding any futures contracts.
7 For an explanation of R-squared, beta, and other terms used here, see the Glossary.
50
Intermediate-Term Tax-Exempt Fund
Performance Summary
All of the returns in this report represent past performance, which is not a guarantee of future results that may be achieved by the fund. (Current performance may be lower or higher than the performance data cited. For performance data current to the most recent month-end, visit our website at vanguard.com/performance.) Note, too, that both investment returns and principal value can fluctuate widely, so an investor’s shares, when sold, could be worth more or less than their original cost. The returns shown do not reflect taxes that a shareholder would pay on fund distributions or on the sale of fund shares.
Cumulative Performance: October 31, 2001–October 31, 2011
Initial Investment of $10,000
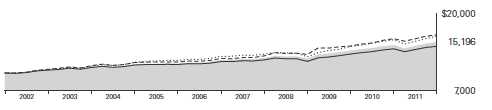
| | | | |
| | | Average Annual Total Returns | Final Value |
| | | Periods Ended October 31, 2011 | of a $10,000 |
| | One Year | Five Years | Ten Years | Investment |
| Intermediate-Term Tax-Exempt Fund | | | | |
| Investor Shares | 3.35% | 4.54% | 4.27% | $15,196 |
| Barclays Capital Municipal Bond Index | 3.78 | 4.80 | 4.93 | 16,178 |
| Barclays Capital 7 Year Municipal Bond Index | 4.11 | 5.72 | 5.08 | 16,412 |
| Intermediate Municipal Funds Average1 | 2.91 | 3.96 | 3.77 | 14,477 |
| | | | |
| | | | | Final Value |
| | | | | of a $50,000 |
| | One Year | Five Years | Ten Years | Investment |
| Intermediate-Term Tax-Exempt Fund Admiral Shares | 3.43% | 4.62% | 4.35% | $76,516 |
| Barclays Capital Municipal Bond Index | 3.78 | 4.80 | 4.93 | 80,888 |
| Barclays Capital 7 Year Municipal Bond Index | 4.11 | 5.72 | 5.08 | 82,062 |
1 Derived from data provided by Lipper Inc.
See Financial Highlights for dividend and capital gains information.
51
Intermediate-Term Tax-Exempt Fund
| | | | |
| Fiscal-Year Total Returns (%): October 31, 2001–October 31, 2011 | | | |
| | | | | Barclays |
| | | | Investor Shares | Capital1 |
| Fiscal | Capital | Income | Total | Total |
| Year | Return | Return | Return | Return |
| 2002 | –0.2% | 4.6% | 4.4% | 6.3% |
| 2003 | 0.5 | 4.2 | 4.7 | 5.8 |
| 2004 | 0.7 | 4.1 | 4.8 | 4.6 |
| 2005 | –3.0 | 4.0 | 1.0 | 0.6 |
| 2006 | 0.8 | 4.3 | 5.1 | 5.0 |
| 2007 | –1.4 | 4.1 | 2.7 | 3.6 |
| 2008 | –4.5 | 4.0 | –0.5 | 1.9 |
| 2009 | 6.3 | 4.2 | 10.5 | 10.7 |
| 2010 | 3.1 | 3.8 | 6.9 | 8.5 |
| 2011 | –0.4 | 3.7 | 3.3 | 4.1 |
Average Annual Total Returns: Periods Ended September 30, 2011
This table presents returns through the latest calendar quarter—rather than through the end of the fiscal period.
Securities and Exchange Commission rules require that we provide this information.
| | | | | | |
| | | | | | | Ten Years |
| | Inception Date | One Year | Five Years | Capital | Income | Total |
| Investor Shares | 9/1/1977 | 3.35% | 4.72% | 0.26% | 4.14% | 4.40% |
| Admiral Shares | 2/12/2001 | 3.43 | 4.80 | 0.26 | 4.21 | 4.47 |
1 Barclays Capital 7 Year Municipal Bond Index.
52
Intermediate-Term Tax-Exempt Fund
Financial Statements
The Statement of Net Assets—an integral part of the Financial Statements for Vanguard Intermediate-Term Tax-Exempt Fund—is included as an insert to this report.
Statement of Operations
| |
| | Year Ended |
| October 31, 2011 |
| | ($000) |
| Investment Income | |
| Income | |
| Interest1 | 1,128,536 |
| Total Income | 1,128,536 |
| Expenses | |
| The Vanguard Group—Note B | |
| Investment Advisory Services | 3,118 |
| Management and Administrative— | |
| Investor Shares | 10,413 |
| Management and Administrative— | |
| Admiral Shares | 18,661 |
| Marketing and Distribution— | |
| Investor Shares | 2,182 |
| Marketing and Distribution— | |
| Admiral Shares | 5,515 |
| Custodian Fees | 328 |
| Auditing Fees | 29 |
| Shareholders’ Reports—Investor Shares | 180 |
| Shareholders’ Reports—Admiral Shares | 91 |
| Trustees’ Fees and Expenses | 30 |
| Total Expenses | 40,547 |
| Net Investment Income | 1,087,989 |
| Realized Net Gain (Loss) | |
| Investment Securities Sold | (16,975) |
| Futures Contracts | (54,200) |
| Realized Net Gain (Loss) | (71,175) |
| Change in Unrealized Appreciation | |
| (Depreciation) | |
| Investment Securities | (84,357) |
| Futures Contracts | (2,208) |
| Change in Unrealized Appreciation | |
| (Depreciation) | (86,565) |
| Net Increase (Decrease) in Net Assets | |
| Resulting from Operations | 930,249 |
Statement of Changes in Net Assets
| | |
| | Year Ended October 31, |
| | 2011 | 2010 |
| | ($000) | ($000) |
| Increase (Decrease) in Net Assets | | |
| Operations | | |
| Net Investment Income | 1,087,989 | 1,053,468 |
| Realized Net Gain (Loss) | (71,175) | 137,253 |
| Change in Unrealized Appreciation (Depreciation) | (86,565) | 729,290 |
| Net Increase (Decrease) in Net Assets Resulting from Operations | 930,249 | 1,920,011 |
| Distributions | | |
| Net Investment Income | | |
| Investor Shares | (248,975) | (291,138) |
| Admiral Shares | (839,014) | (762,330) |
| Realized Capital Gain | | |
| Investor Shares | — | — |
| Admiral Shares | — | — |
| Total Distributions | (1,087,989) | (1,053,468) |
| Capital Share Transactions | | |
| Investor Shares | (1,280,710) | 350,640 |
| Admiral Shares | 1,539,350 | 3,829,124 |
| Net Increase (Decrease) from Capital Share Transactions | 258,640 | 4,179,764 |
| Total Increase (Decrease) | 100,900 | 5,046,307 |
| Net Assets | | |
| Beginning of Period | 30,822,755 | 25,776,448 |
| End of Period | 30,923,655 | 30,822,755 |
1 Interest income from an affiliated company of the fund was $493,000.
See accompanying Notes, which are an integral part of the Financial Statements.
53
Intermediate-Term Tax-Exempt Fund
Financial Highlights
| | | | | |
| Investor Shares | | | | | |
| |
| For a Share Outstanding | | | Year Ended October 31, |
| Throughout Each Period | 2011 | 2010 | 2009 | 2008 | 2007 |
| Net Asset Value, Beginning of Period | $13.80 | $13.38 | $12.59 | $13.18 | $13.37 |
| Investment Operations | | | | | |
| Net Investment Income | .494 | .495 | .514 | .535 | .548 |
| Net Realized and Unrealized Gain (Loss) | | | | | |
| on Investments | (.050) | .420 | .790 | (.590) | (.190) |
| Total from Investment Operations | .444 | .915 | 1.304 | (.055) | .358 |
| Distributions | | | | | |
| Dividends from Net Investment Income | (.494) | (.495) | (.514) | (.535) | (.548) |
| Distributions from Realized Capital Gains | — | — | — | — | — |
| Total Distributions | (.494) | (.495) | (.514) | (.535) | (.548) |
| Net Asset Value, End of Period | $13.75 | $13.80 | $13.38 | $12.59 | $13.18 |
| |
| Total Return1 | 3.35% | 6.95% | 10.51% | –0.49% | 2.74% |
| |
| Ratios/Supplemental Data | | | | | |
| Net Assets, End of Period (Millions) | $6,783 | $8,122 | $7,525 | $5,524 | $4,851 |
| Ratio of Total Expenses to | | | | | |
| Average Net Assets | 0.20% | 0.20% | 0.20% | 0.15% | 0.15% |
| Ratio of Net Investment Income to | | | | | |
| Average Net Assets | 3.66% | 3.63% | 3.91% | 4.08% | 4.14% |
| Portfolio Turnover Rate | 15% | 20% | 19% | 23% | 12% |
1 Total returns do not include account service fees that may have applied in the periods shown. Fund prospectuses provide information about any applicable account service fees.
| | | | | |
| Admiral Shares | | | | | |
| |
| For a Share Outstanding | | | Year Ended October 31, |
| Throughout Each Period | 2011 | 2010 | 2009 | 2008 | 2007 |
| Net Asset Value, Beginning of Period | $13.80 | $13.38 | $12.59 | $13.18 | $13.37 |
| Investment Operations | | | | | |
| Net Investment Income | .505 | .506 | .524 | .544 | .557 |
| Net Realized and Unrealized Gain (Loss) | | | | | |
| on Investments | (.050) | .420 | .790 | (.590) | (.190) |
| Total from Investment Operations | .455 | .926 | 1.314 | (.046) | .367 |
| Distributions | | | | | |
| Dividends from Net Investment Income | (.505) | (.506) | (.524) | (.544) | (.557) |
| Distributions from Realized Capital Gains | — | — | — | — | — |
| Total Distributions | (.505) | (.506) | (.524) | (.544) | (.557) |
| Net Asset Value, End of Period | $13.75 | $13.80 | $13.38 | $12.59 | $13.18 |
| |
| Total Return | 3.43% | 7.03% | 10.60% | –0.42% | 2.81% |
| |
| Ratios/Supplemental Data | | | | | |
| Net Assets, End of Period (Millions) | $24,140 | $22,701 | $18,251 | $13,338 | $11,484 |
| Ratio of Total Expenses to | | | | | |
| Average Net Assets | 0.12% | 0.12% | 0.12% | 0.08% | 0.08% |
| Ratio of Net Investment Income to | | | | | |
| Average Net Assets | 3.74% | 3.71% | 3.99% | 4.15% | 4.21% |
| Portfolio Turnover Rate | 15% | 20% | 19% | 23% | 12% |
See accompanying Notes, which are an integral part of the Financial Statements.
54
Intermediate-Term Tax-Exempt Fund
Notes to Financial Statements
Vanguard Intermediate-Term Tax-Exempt Fund is registered under the Investment Company Act of 1940 as an open-end investment company, or mutual fund. The fund invests in debt instruments of many municipal issuers; the issuers’ abilities to meet their obligations may be affected by economic and political developments in a specific state or region. The fund offers two classes of shares: Investor Shares and Admiral Shares. Investor Shares are available to any investor who meets the fund’s minimum purchase requirements. Admiral Shares are designed for investors who meet certain administrative, service, and account-size criteria.
A. The following significant accounting policies conform to generally accepted accounting principles for U.S. mutual funds. The fund consistently follows such policies in preparing its financial statements.
1. Security Valuation: Bonds, and temporary cash investments acquired over 60 days to maturity, are valued using the latest bid prices or using valuations based on a matrix system (which considers such factors as security prices, yields, maturities, and ratings), both as furnished by independent pricing services. Investments in Vanguard Municipal Cash Management Fund are valued at that fund’s net asset value. Other temporary cash investments are valued at amortized cost, which approximates market value. Securities for which market quotations are not readily available, or whose values have been affected by events occurring before the fund’s pricing time but after the close of the securities’ primary markets, are valued by methods deemed by the board of trustees to represent fair value.
2. Futures Contracts: The fund uses futures contracts to invest in fixed income asset classes with greater efficiency and lower cost than is possible through direct investment, to add value when these instruments are attractively priced, or to adjust sensitivity to changes in interest rates. The primary risks associated with the use of futures contracts are imperfect correlation between changes in market values of bonds held by the fund and the prices of futures contracts, and the possibility of an illiquid market.
Futures contracts are valued based upon their quoted daily settlement prices. The aggregate principal amounts of the contracts are not recorded in the Statement of Net Assets. Fluctuations in the value of the contracts are recorded in the Statement of Net Assets as an asset (liability) and in the Statement of Operations as unrealized appreciation (depreciation) until the contracts are closed, when they are recorded as realized futures gains (losses).
The fund had no open futures contacts at October 31, 2011.
3. Federal Income Taxes: The fund intends to continue to qualify as a regulated investment company and distribute all of its income. Management has analyzed the fund’s tax positions taken for all open federal income tax years (October 31, 2008–2011), and has concluded that no provision for federal income tax is required in the fund’s financial statements.
4. Distributions: Distributions from net investment income are declared daily and paid on the first business day of the following month. Annual distributions from realized capital gains, if any, are recorded on the ex-dividend date.
5. Other: Interest income includes income distributions received from Vanguard Municipal Cash Management Fund and is accrued daily. Premiums and discounts on debt securities purchased are amortized and accreted, respectively, to interest income over the lives of the respective securities. Security transactions are accounted for on the date securities are bought or sold. Costs used to determine realized gains (losses) on the sale of investment securities are those of the specific securities sold.
Each class of shares has equal rights as to assets and earnings, except that each class separately bears certain class-specific expenses related to maintenance of shareholder accounts (included in Management and Administrative expenses) and shareholder reporting. Marketing and distribution expenses are allocated to each class of shares based on a method approved by the board of trustees. Income, other non-class-specific expenses, and gains and losses on investments are allocated to each class of shares based on its relative net assets.
B. The Vanguard Group furnishes at cost investment advisory, corporate management, administrative, marketing, and distribution services. The costs of such services are allocated to the fund under methods approved by the board of trustees. The fund has committed to provide up to 0.40% of its net assets in capital contributions to Vanguard. At October 31, 2011, the fund had contributed capital of $5,350,000 to Vanguard (included in Other Assets), representing 0.02% of the fund’s net assets and 2.14% of Vanguard’s capitalization. The fund’s trustees and officers are also directors and officers of Vanguard.
55
Intermediate-Term Tax-Exempt Fund
C. Various inputs may be used to determine the value of the fund’s investments. These inputs are summarized in three broad levels for financial statement purposes. The inputs or methodologies used to value securities are not necessarily an indication of the risk associated with investing in those securities.
Level 1—Quoted prices in active markets for identical securities.
Level 2—Other significant observable inputs (including quoted prices for similar securities, interest rates, prepayment speeds, credit risk, etc.).
Level 3—Significant unobservable inputs (including the fund’s own assumptions used to determine the fair value of investments).
The following table summarizes the market value of the fund’s investments as of October 31, 2011, based on the inputs used to value them:
| | | |
| | Level 1 | Level 2 | Level 3 |
| Investments | ($000) | ($000) | ($000) |
| Tax-Exempt Municipal Bonds | — | 30,446,851 | — |
| Temporary Cash Investments | 412,442 | — | — |
| Total | 412,442 | 30,446,851 | — |
D. Capital gain distributions are determined on a tax basis and may differ from realized capital gains for financial reporting purposes. Differences may be permanent or temporary. Permanent differences are reclassified among capital accounts in the financial statements to reflect their tax character. Temporary differences arise when gains or losses are recognized in different periods for financial statement and tax purposes; these differences will reverse at some time in the future.
For tax purposes, at October 31, 2011, the fund had available capital loss carryforwards totaling $68,629,000 to offset future net capital gains of $14,677,000 through October 31, 2017, and $53,952,000 through October 31, 2019.
The fund had realized losses totaling $50,457,000 through October 31, 2011, which are deferred for tax purposes and reduce the amount of tax-basis unrealized appreciation on investment securities.
At October 31, 2011, the cost of investment securities for tax purposes was $29,645,798,000. Net unrealized appreciation of investment securities for tax purposes was $1,213,495,000, consisting of unrealized gains of $1,282,902,000 on securities that had risen in value since their purchase and $69,407,000 in unrealized losses on securities that had fallen in value since their purchase.
E. During the year ended October 31, 2011, the fund purchased $4,870,640,000 of investment securities and sold $4,029,010,000 of investment securities, other than U.S. government securities and temporary cash investments.
F. Capital share transactions for each class of shares were:
| | | | |
| | | | Year Ended October 31, |
| | | 2011 | | 2010 |
| | Amount | Shares | Amount | Shares |
| | ($000) | (000) | ($000) | (000) |
| Investor Shares | | | | |
| Issued | 2,181,878 | 161,869 | 3,074,387 | 225,980 |
| Issued in Lieu of Cash Distributions | 187,555 | 13,907 | 226,976 | 16,648 |
| Redeemed | (3,650,143) | (270,932) | (2,950,723) | (216,456) |
| Net Increase (Decrease)—Investor Shares | (1,280,710) | (95,156) | 350,640 | 26,172 |
| Admiral Shares | | | | |
| Issued | 7,338,197 | 544,019 | 7,161,127 | 526,019 |
| Issued in Lieu of Cash Distributions | 605,567 | 44,870 | 548,722 | 40,236 |
| Redeemed | (6,404,414) | (477,987) | (3,880,725) | (285,077) |
| Net Increase (Decrease)—Admiral Shares | 1,539,350 | 110,902 | 3,829,124 | 281,178 |
G. In preparing the financial statements as of October 31, 2011, management considered the impact of subsequent events for potential recognition or disclosure in these financial statements.
56
Long-Term Tax-Exempt Fund
Fund Profile
As of October 31, 2011
| | | |
| Financial Attributes | | |
| | | Comparative | Broad |
| | Fund | Index1 | Index2 |
| Number of Issues | 884 | 8,812 | 45,625 |
| Yield3 | | 2.99% | 3.15% |
| Investor Shares | 3.23% | | |
| Admiral Shares | 3.31% | | |
| Yield to Maturity | 3.3%4 | 3.0% | 3.2% |
| Average Coupon | 4.4% | 4.8% | 4.9% |
| Average Effective | | | |
| Maturity | 7.3 years | 10.0 years | 13.4 years |
| Average Duration | 6.6 years | 6.7 years | 8.2 years |
| Expense Ratio5 | | — | — |
| Investor Shares | 0.20% | | |
| Admiral Shares | 0.12% | | |
| Short-Term Reserves | 6.9% | — | — |
| | |
| Largest Area Concentrations6 | |
| |
| California | | 16.4% |
| New York | | 12.3 |
| Texas | | 7.7 |
| Illinois | | 7.1 |
| Florida | | 7.0 |
| New Jersey | | 5.0 |
| Massachusetts | | 4.2 |
| Pennsylvania | | 3.5 |
| Colorado | | 2.7 |
| South Carolina | | 2.5 |
| Top Ten | | 68.4% |
| |
| |
| Volatility Measures7 | |
| | Fund Versus | Fund Versus |
| | Comparative Index1 | Broad Index2 |
| R-Squared | 0.80 | 0.97 |
| Beta | 0.87 | 1.11 |
| |
| Distribution by Maturity (% of portfolio) | |
| |
| Under 1 Year | 11.7% |
| 1–5 Years | 22.2 |
| 5–10 Years | 52.5 |
| 10–20 Years | 8.4 |
| 20–30 Years | 3.8 |
| Over 30 Years | 1.4 |
| |
| |
| Distribution by Credit Quality (% of portfolio) |
| |
| AAA | 14.3% |
| AA | 47.9 |
| A | 26.6 |
| BBB | 9.2 |
| BB | 0.7 |
| B or Lower | 0.2 |
| Not Rated | 1.1 |
| For information about these ratings, see the Glossary entry for Credit Quality. |
| |
Investment Focus
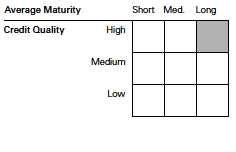
1 Barclays Capital 10 Year Municipal Bond Index.
2 Barclays Capital Municipal Bond Index.
3 30-day SEC yield for the fund; index yield assumes that all bonds are called or prepaid at the earliest possible dates. See the Glossary.
4 Before expenses.
5 The expense ratios shown are from the prospectus dated February 28, 2011, and represent estimated costs for the current fiscal year. For the fiscal year ended October 31, 2011, the expense ratios were 0.20% for the Investor Shares and 0.12% for the Admiral Shares.
6 Percentage of net assets, excluding any futures contracts.
7 For an explanation of R-squared, beta, and other terms used here, see the Glossary.
57
Long-Term Tax-Exempt Fund
Performance Summary
All of the returns in this report represent past performance, which is not a guarantee of future results that may be achieved by the fund. (Current performance may be lower or higher than the performance data cited. For performance data current to the most recent month-end, visit our website at vanguard.com/performance.) Note, too, that both investment returns and principal value can fluctuate widely, so an investor’s shares, when sold, could be worth more or less than their original cost. The returns shown do not reflect taxes that a shareholder would pay on fund distributions or on the sale of fund shares.
Cumulative Performance: October 31, 2001–October 31, 2011
Initial Investment of $10,000
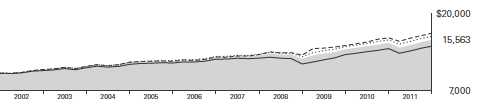
| | | | |
| | | Average Annual Total Returns | Final Value |
| | | Periods Ended October 31, 2011 | of a $10,000 |
| One Year | Five Years | Ten Years | Investment |
| Long-Term Tax-Exempt Fund Investor Shares | 3.29% | 4.18% | 4.52% | $15,563 |
| Barclays Capital Municipal Bond Index | 3.78 | 4.80 | 4.93 | 16,178 |
| Barclays Capital 10 Year Municipal Bond Index | 4.78 | 5.62 | 5.26 | 16,697 |
| General Municipal Funds Average1 | 2.78 | 3.30 | 3.80 | 14,515 |
| | | | |
| | | | | Final Value |
| | | | | of a $50,000 |
| | One Year | Five Years | Ten Years | Investment |
| Long-Term Tax-Exempt Fund Admiral Shares | 3.37% | 4.26% | 4.60% | $78,358 |
| Barclays Capital Municipal Bond Index | 3.78 | 4.80 | 4.93 | 80,888 |
| Barclays Capital 10 Year Municipal Bond Index | 4.78 | 5.62 | 5.26 | 83,486 |
1 Derived from data provided by Lipper Inc.
See Financial Highlights for dividend and capital gains information.
58
Long-Term Tax-Exempt Fund
Fiscal-Year Total Returns (%): October 31, 2001–October 31, 2011
| | | | |
| | | | | Barclays |
| | | | Investor Shares | Capital1 |
| Fiscal | Capital | Income | Total | Total |
| Year | Return | Return | Return | Return |
| 2002 | 0.1% | 4.9% | 5.0% | 6.2% |
| 2003 | 0.7 | 4.7 | 5.4 | 4.9 |
| 2004 | 1.4 | 4.7 | 6.1 | 6.3 |
| 2005 | –2.8 | 4.5 | 1.7 | 1.2 |
| 2006 | 1.4 | 4.7 | 6.1 | 6.0 |
| 2007 | –2.2 | 4.6 | 2.4 | 3.2 |
| 2008 | –9.0 | 4.3 | –4.7 | –0.6 |
| 2009 | 8.2 | 5.1 | 13.3 | 12.4 |
| 2010 | 3.0 | 4.5 | 7.5 | 8.8 |
| 2011 | –1.1 | 4.4 | 3.3 | 4.8 |
Average Annual Total Returns: Periods Ended September 30, 2011
This table presents returns through the latest calendar quarter—rather than through the end of the fiscal period.
Securities and Exchange Commission rules require that we provide this information.
| | | | | | |
| | | | | | | Ten Years |
| | Inception Date | One Year | Five Years | Capital | Income | Total |
| Investor Shares | 9/1/1977 | 3.39% | 4.39% | 0.04% | 4.65% | 4.69% |
| Admiral Shares | 2/12/2001 | 3.48 | 4.47 | 0.04 | 4.72 | 4.76 |
1 Barclays Capital 10 Year Municipal Bond Index.
59
Long-Term Tax-Exempt Fund
Financial Statements
The Statement of Net Assets—an integral part of the Financial Statements for Vanguard Long-Term Tax-Exempt Fund—is included as an insert to this report.
Statement of Operations
| |
| | Year Ended |
| October 31, 2011 |
| | ($000) |
| Investment Income | |
| Income | |
| Interest1 | 320,350 |
| Total Income | 320,350 |
| Expenses | |
| The Vanguard Group—Note B | |
| Investment Advisory Services | 766 |
| Management and Administrative— | |
| Investor Shares | 1,682 |
| Management and Administrative— | |
| Admiral Shares | 5,035 |
| Marketing and Distribution— | |
| Investor Shares | 388 |
| Marketing and Distribution— | |
| Admiral Shares | 1,343 |
| Custodian Fees | 86 |
| Auditing Fees | 29 |
| Shareholders’ Reports—Investor Shares | 46 |
| Shareholders’ Reports—Admiral Shares | 28 |
| Trustees’ Fees and Expenses | 8 |
| Total Expenses | 9,411 |
| Net Investment Income | 310,939 |
| Realized Net Gain (Loss) | |
| Investment Securities Sold | (9,438) |
| Futures Contracts | (13,545) |
| Realized Net Gain (Loss) | (22,983) |
| Change in Unrealized Appreciation | |
| (Depreciation) | |
| Investment Securities | (88,005) |
| Futures Contracts | (572) |
| Change in Unrealized Appreciation | |
| (Depreciation) | (88,577) |
| Net Increase (Decrease) in Net Assets | |
| Resulting from Operations | 199,379 |
Statement of Changes in Net Assets
| | |
| | Year Ended October 31, |
| | 2011 | 2010 |
| | ($000) | ($000) |
| Increase (Decrease) in Net Assets | | |
| Operations | | |
| Net Investment Income | 310,939 | 332,437 |
| Realized Net Gain (Loss) | (22,983) | 25,627 |
| Change in Unrealized Appreciation (Depreciation) | (88,577) | 204,704 |
| Net Increase (Decrease) in Net Assets Resulting from Operations | 199,379 | 562,768 |
| Distributions | | |
| Net Investment Income | | |
| Investor Shares | (48,270) | (73,763) |
| Admiral Shares | (262,669) | (258,674) |
| Realized Capital Gain | | |
| Investor Shares | — | — |
| Admiral Shares | — | — |
| Total Distributions | (310,939) | (332,437) |
| Capital Share Transactions | | |
| Investor Shares | (487,223) | (204,738) |
| Admiral Shares | (126,952) | 635,848 |
| Net Increase (Decrease) from Capital Share Transactions | (614,175) | 431,110 |
| Total Increase (Decrease) | (725,735) | 661,441 |
| Net Assets | | |
| Beginning of Period | 7,976,642 | 7,315,201 |
| End of Period | 7,250,907 | 7,976,642 |
1 Interest income from an affiliated company of the fund was $217,000.
See accompanying Notes, which are an integral part of the Financial Statements.
60
Long-Term Tax-Exempt Fund
Financial Highlights
| | | | | |
| Investor Shares | | | | | |
| |
| For a Share Outstanding | | | Year Ended October 31, |
| Throughout Each Period | 2011 | 2010 | 2009 | 2008 | 2007 |
| Net Asset Value, Beginning of Period | $11.25 | $10.92 | $10.09 | $11.09 | $11.34 |
| Investment Operations | | | | | |
| Net Investment Income | .468 | .475 | .487 | .497 | .512 |
| Net Realized and Unrealized Gain (Loss) | | | | | |
| on Investments | (.120) | .330 | .830 | (1.000) | (.250) |
| Total from Investment Operations | .348 | .805 | 1.317 | (.503) | .262 |
| Distributions | | | | | |
| Dividends from Net Investment Income | (.468) | (.475) | (.487) | (.497) | (.512) |
| Distributions from Realized Capital Gains | — | — | — | — | — |
| Total Distributions | (.468) | (.475) | (.487) | (.497) | (.512) |
| Net Asset Value, End of Period | $11.13 | $11.25 | $10.92 | $10.09 | $11.09 |
| |
| Total Return1 | 3.29% | 7.52% | 13.32% | –4.74% | 2.37% |
| |
| Ratios/Supplemental Data | | | | | |
| Net Assets, End of Period (Millions) | $1,100 | $1,615 | $1,768 | $686 | $653 |
| Ratio of Total Expenses to | | | | | |
| Average Net Assets | 0.20% | 0.20% | 0.20% | 0.15% | 0.15% |
| Ratio of Net Investment Income to | | | | | |
| Average Net Assets | 4.33% | 4.28% | 4.59% | 4.56% | 4.57% |
| Portfolio Turnover Rate | 19% | 23% | 15% | 26% | 13% |
1 Total returns do not include account service fees that may have applied in the periods shown. Fund prospectuses provide information about any applicable account service fees.
| | | | | |
| Admiral Shares | | | | | |
| |
| For a Share Outstanding | | | Year Ended October 31, |
| Throughout Each Period | 2011 | 2010 | 2009 | 2008 | 2007 |
| Net Asset Value, Beginning of Period | $11.25 | $10.92 | $10.09 | $11.09 | $11.34 |
| Investment Operations | | | | | |
| Net Investment Income | .477 | .484 | .495 | .504 | .520 |
| Net Realized and Unrealized Gain (Loss) | | | | | |
| on Investments | (.120) | .330 | .830 | (1.000) | (.250) |
| Total from Investment Operations | .357 | .814 | 1.325 | (.496) | .270 |
| Distributions | | | | | |
| Dividends from Net Investment Income | (.477) | (.484) | (.495) | (.504) | (.520) |
| Distributions from Realized Capital Gains | — | — | — | — | — |
| Total Distributions | (.477) | (.484) | (.495) | (.504) | (.520) |
| Net Asset Value, End of Period | $11.13 | $11.25 | $10.92 | $10.09 | $11.09 |
| |
| Total Return | 3.37% | 7.61% | 13.41% | –4.68% | 2.44% |
| |
| Ratios/Supplemental Data | | | | | |
| Net Assets, End of Period (Millions) | $6,150 | $6,361 | $5,547 | $2,180 | $1,962 |
| Ratio of Total Expenses to | | | | | |
| Average Net Assets | 0.12% | 0.12% | 0.12% | 0.08% | 0.08% |
| Ratio of Net Investment Income to | | | | | |
| Average Net Assets | 4.41% | 4.36% | 4.67% | 4.63% | 4.64% |
| Portfolio Turnover Rate | 19% | 23% | 15% | 26% | 13% |
See accompanying Notes, which are an integral part of the Financial Statements.
61
Long-Term Tax-Exempt Fund
Notes to Financial Statements
Vanguard Long-Term Tax-Exempt Fund is registered under the Investment Company Act of 1940 as an open-end investment company, or mutual fund. The fund invests in debt instruments of many municipal issuers; the issuers’ abilities to meet their obligations may be affected by economic and political developments in a specific state or region. The fund offers two classes of shares: Investor Shares and Admiral Shares. Investor Shares are available to any investor who meets the fund’s minimum purchase requirements. Admiral Shares are designed for investors who meet certain administrative, service, and account-size criteria.
A. The following significant accounting policies conform to generally accepted accounting principles for U.S. mutual funds. The fund consistently follows such policies in preparing its financial statements.
1. Security Valuation: Bonds, and temporary cash investments acquired over 60 days to maturity, are valued using the latest bid prices or using valuations based on a matrix system (which considers such factors as security prices, yields, maturities, and ratings), both as furnished by independent pricing services. Investments in Vanguard Municipal Cash Management Fund are valued at that fund’s net asset value. Other temporary cash investments are valued at amortized cost, which approximates market value. Securities for which market quotations are not readily available, or whose values have been affected by events occurring before the fund’s pricing time but after the close of the securities’ primary markets, are valued by methods deemed by the board of trustees to represent fair value.
2. Futures Contracts: The fund uses futures contracts to invest in fixed income asset classes with greater efficiency and lower cost than is possible through direct investment, to add value when these instruments are attractively priced, or to adjust sensitivity to changes in interest rates. The primary risks associated with the use of futures contracts are imperfect correlation between changes in market values of bonds held by the fund and the prices of futures contracts, and the possibility of an illiquid market.
Futures contracts are valued based upon their quoted daily settlement prices. The aggregate principal amounts of the contracts are not recorded in the Statement of Net Assets. Fluctuations in the value of the contracts are recorded in the Statement of Net Assets as an asset (liability) and in the Statement of Operations as unrealized appreciation (depreciation) until the contracts are closed, when they are recorded as realized futures gains (losses).
The fund had no open futures contracts at October 31, 2011.
3. Federal Income Taxes: The fund intends to continue to qualify as a regulated investment company and distribute all of its income. Management has analyzed the fund’s tax positions taken for all open federal income tax years (October 31, 2008–2011), and has concluded that no provision for federal income tax is required in the fund’s financial statements.
4. Distributions: Distributions from net investment income are declared daily and paid on the first business day of the following month. Annual distributions from realized capital gains, if any, are recorded on the ex-dividend date.
5. Other: Interest income includes income distributions received from Vanguard Municipal Cash Management Fund and is accrued daily. Premiums and discounts on debt securities purchased are amortized and accreted, respectively, to interest income over the lives of the respective securities. Security transactions are accounted for on the date securities are bought or sold. Costs used to determine realized gains (losses) on the sale of investment securities are those of the specific securities sold.
Each class of shares has equal rights as to assets and earnings, except that each class separately bears certain class-specific expenses related to maintenance of shareholder accounts (included in Management and Administrative expenses) and shareholder reporting. Marketing and distribution expenses are allocated to each class of shares based on a method approved by the board of trustees. Income, other non-class-specific expenses, and gains and losses on investments are allocated to each class of shares based on its relative net assets.
B. The Vanguard Group furnishes at cost investment advisory, corporate management, administrative, marketing, and distribution services. The costs of such services are allocated to the fund under methods approved by the board of trustees. The fund has committed to provide up to 0.40% of its net assets in capital contributions to Vanguard. At October 31, 2011, the fund had contributed capital of $1,259,000 to Vanguard (included in Other Assets), representing 0.02% of the fund’s net assets and 0.50% of Vanguard’s capitalization. The fund’s trustees and officers are also directors and officers of Vanguard.
62
Long-Term Tax-Exempt Fund
C. Various inputs may be used to determine the value of the fund’s investments. These inputs are summarized in three broad levels for financial statement purposes. The inputs or methodologies used to value securities are not necessarily an indication of the risk associated with investing in those securities.
Level 1—Quoted prices in active markets for identical securities.
Level 2—Other significant observable inputs (including quoted prices for similar securities, interest rates, prepayment speeds, credit risk, etc.).
Level 3—Significant unobservable inputs (including the fund’s own assumptions used to determine the fair value of investments).
The following table summarizes the market value of the fund’s investments as of October 31, 2011, based on the inputs used to value them:
| | | |
| | Level 1 | Level 2 | Level 3 |
| Investments | ($000) | ($000) | ($000) |
| Tax-Exempt Municipal Bonds | — | 7,086,832 | — |
| Temporary Cash Investments | 144,922 | — | — |
| Total | 144,922 | 7,086,832 | — |
D. Capital gain distributions are determined on a tax basis and may differ from realized capital gains for financial reporting purposes. Differences may be permanent or temporary. Permanent differences are reclassified among capital accounts in the financial statements to reflect their tax character. Temporary differences arise when gains or losses are recognized in different periods for financial statement and tax purposes; these differences will reverse at some time in the future.
For tax purposes, at October 31, 2011, the fund had available capital loss carryforwards totaling $53,436,000 to offset future net capital gains of $21,275,000 through October 31, 2016, $12,877,000 through October 31, 2017, and $19,284,000 through October 31, 2019.
The fund had realized losses totaling $33,914,000 through October 31, 2011, which are deferred for tax purposes and reduce the amount of tax-basis unrealized appreciation on investment securities.
At October 31, 2011, the cost of investment securities for tax purposes was $6,953,637,000. Net unrealized appreciation of investment securities for tax purposes was $278,117,000, consisting of unrealized gains of $336,516,000 on securities that had risen in value since their purchase and $58,399,000 in unrealized losses on securities that had fallen in value since their purchase.
E. During the year ended October 31, 2011, the fund purchased $1,279,976,000 of investment securities and sold $1,896,700,000 of investment securities, other than temporary cash investments.
F. Capital share transactions for each class of shares were:
| | | | |
| | | | Year Ended October 31, |
| | | 2011 | | 2010 |
| | Amount | Shares | Amount | Shares |
| | ($000) | (000) | ($000) | (000) |
| Investor Shares | | | | |
| Issued | 264,077 | 24,274 | 446,803 | 40,359 |
| Issued in Lieu of Cash Distributions | 37,743 | 3,480 | 57,444 | 5,179 |
| Redeemed | (789,043) | (72,463) | (708,985) | (63,888) |
| Net Increase (Decrease)—Investor Shares | (487,223) | (44,709) | (204,738) | (18,350) |
| Admiral Shares | | | | |
| Issued | 1,346,792 | 123,816 | 1,474,526 | 133,038 |
| Issued in Lieu of Cash Distributions | 168,689 | 15,548 | 169,860 | 15,309 |
| Redeemed | (1,642,433) | (152,196) | (1,008,538) | (91,050) |
| Net Increase (Decrease)—Admiral Shares | (126,952) | (12,832) | 635,848 | 57,297 |
G. In preparing the financial statements as of October 31, 2011, management considered the impact of subsequent events for potential recognition or disclosure in these financial statements.
63
High-Yield Tax-Exempt Fund
Fund Profile
As of October 31, 2011
| | | |
| Financial Attributes | | |
| | | Comparative | Broad |
| | Fund | Index1 | Index2 |
| Number of Issues | 768 | 8,812 | 45,625 |
| Yield3 | | 2.99% | 3.15% |
| Investor Shares | 3.70% | | |
| Admiral Shares | 3.78% | | |
| Yield to Maturity | 3.9%4 | 3.0% | 3.2% |
| Average Coupon | 4.5% | 4.8% | 4.9% |
| Average Effective | | | |
| Maturity | 8.5 years | 10.0 years | 13.4 years |
| Average Duration | 6.7 years | 6.7 years | 8.2 years |
| Expense Ratio5 | | — | — |
| Investor Shares | 0.20% | | |
| Admiral Shares | 0.12% | | |
| Short-Term Reserves | 7.9% | — | — |
| | |
| Largest Area Concentrations6 | |
| |
| California | | 16.8% |
| New York | | 10.9 |
| Texas | | 8.7 |
| New Jersey | | 6.3 |
| Florida | | 6.0 |
| Illinois | | 5.8 |
| Pennsylvania | | 3.9 |
| Massachusetts | | 3.1 |
| Puerto Rico | | 3.0 |
| Colorado | | 3.0 |
| Top Ten | | 67.5% |
| |
| |
| Volatility Measures7 | |
| | Fund Versus | Fund Versus |
| | Comparative Index1 | Broad Index2 |
| R-Squared | 0.59 | 0.83 |
| Beta | 0.86 | 1.19 |
| |
| Distribution by Maturity (% of portfolio) | |
| |
| Under 1 Year | 13.9% |
| 1–5 Years | 16.6 |
| 5–10 Years | 49.8 |
| 10–20 Years | 10.4 |
| 20–30 Years | 7.2 |
| Over 30 Years | 2.1 |
| |
| |
| Distribution by Credit Quality (% of portfolio) |
| |
| AAA | 8.0% |
| AA | 32.7 |
| A | 35.3 |
| BBB | 15.6 |
| BB | 2.6 |
| B or Lower | 1.7 |
| Not Rated | 4.1 |
| For information about these ratings, see the Glossary entry for Credit Quality. |
| |
Investment Focus
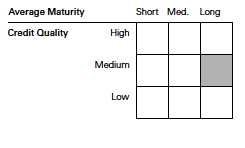
1 Barclays Capital 10 Year Municipal Bond Index.
2 Barclays Capital Municipal Bond Index.
3 30-day SEC yield for the fund; index yield assumes that all bonds are called or prepaid at the earliest possible dates. See the Glossary.
4 Before expenses.
5 The expense ratios shown are from the prospectus dated February 28, 2011, and represent estimated costs for the current fiscal year. For the fiscal year ended October 31, 2011, the expense ratios were 0.20% for the Investor Shares and 0.12% for the Admiral Shares.
6 Percentage of net assets, excluding any futures contracts.
7 For an explanation of R-squared, beta, and other terms used here, see the Glossary.
64
High-Yield Tax-Exempt Fund
Performance Summary
All of the returns in this report represent past performance, which is not a guarantee of future results that may be achieved by the fund. (Current performance may be lower or higher than the performance data cited. For performance data current to the most recent month-end, visit our website at vanguard.com/performance.) Note, too, that both investment returns and principal value can fluctuate widely, so an investor’s shares, when sold, could be worth more or less than their original cost. The returns shown do not reflect taxes that a shareholder would pay on fund distributions or on the sale of fund shares.
Cumulative Performance: October 31, 2001–October 31, 2011
Initial Investment of $10,000
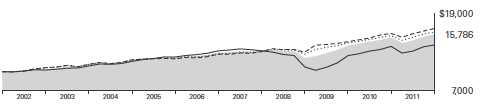
| | | | |
| | | Average Annual Total Returns | Final Value |
| | | Periods Ended October 31, 2011 | of a $10,000 |
| One Year | Five Years | Ten Years | Investment |
| High-Yield Tax-Exempt Fund Investor Shares | 3.26% | 4.06% | 4.67% | $15,786 |
| Barclays Capital Municipal Bond Index | 3.78 | 4.80 | 4.93 | 16,178 |
| Barclays Capital 10 Year Municipal Bond Index | 4.78 | 5.62 | 5.26 | 16,697 |
| High-Yield Municipal Funds Average1 | 1.62 | 1.34 | 3.53 | 14,143 |
| | | | |
| | | | | Final Value |
| | | | Since | of a $50,000 |
| | One Year | Five Years | Inception2 | Investment |
| High-Yield Tax-Exempt Fund Admiral Shares | 3.34% | 4.14% | 4.68% | $78,894 |
| Barclays Capital Municipal Bond Index | 3.78 | 4.80 | 4.89 | 80,504 |
| Barclays Capital 10 Year Municipal Bond Index | 4.78 | 5.62 | 5.28 | 83,466 |
1 Derived from data provided by Lipper Inc.
2 Performance for the fund’s Admiral Shares and comparative standards is calculated since the Admiral Shares’ inception: November 12, 2001.
See Financial Highlights for dividend and capital gains information.
65
High-Yield Tax-Exempt Fund
| | | | |
| Fiscal-Year Total Returns (%): October 31, 2001–October 31, 2011 | | | |
| | | | | Barclays |
| | | | Investor Shares | Capital1 |
| Fiscal | Capital | Income | Total | Total |
| Year | Return | Return | Return | Return |
| 2002 | –1.7% | 5.4% | 3.7% | 6.2% |
| 2003 | 1.4 | 5.1 | 6.5 | 4.9 |
| 2004 | 1.6 | 4.9 | 6.5 | 6.3 |
| 2005 | –1.4 | 4.6 | 3.2 | 1.2 |
| 2006 | 1.9 | 4.7 | 6.6 | 6.0 |
| 2007 | –2.7 | 4.6 | 1.9 | 3.2 |
| 2008 | –12.5 | 4.3 | –8.2 | –0.6 |
| 2009 | 10.4 | 5.7 | 16.1 | 12.4 |
| 2010 | 4.0 | 4.8 | 8.8 | 8.8 |
| 2011 | –1.3 | 4.6 | 3.3 | 4.8 |
Average Annual Total Returns: Periods Ended September 30, 2011
This table presents returns through the latest calendar quarter—rather than through the end of the fiscal period.
Securities and Exchange Commission rules require that we provide this information.
| | | | | | |
| | | | | | | Ten Years |
| | Inception Date | One Year | Five Years | Capital | Income | Total |
| Investor Shares | 12/27/1978 | 3.37% | 4.26% | –0.09% | 4.86% | 4.77% |
| Admiral Shares | 11/12/2001 | 3.45 | 4.34 | –0.172 | 4.922 | 4.752 |
1 Barclays Capital 10 Year Municipal Bond Index.
2 Return since inception.
66
High-Yield Tax-Exempt Fund
Financial Statements
The Statement of Net Assets—an integral part of the Financial Statements for Vanguard High-Yield Tax-Exempt Fund—is included as an insert to this report.
Statement of Operations
| |
| | Year Ended |
| October 31, 2011 |
| | ($000) |
| Investment Income | |
| Income | |
| Interest1 | 285,854 |
| Total Income | 285,854 |
| Expenses | |
| The Vanguard Group—Note B | |
| Investment Advisory Services | 653 |
| Management and Administrative— | |
| Investor Shares | 1,989 |
| Management and Administrative— | |
| Admiral Shares | 3,943 |
| Marketing and Distribution— | |
| Investor Shares | 453 |
| Marketing and Distribution— | |
| Admiral Shares | 1,088 |
| Custodian Fees | 77 |
| Auditing Fees | 29 |
| Shareholders’ Reports—Investor Shares | 56 |
| Shareholders’ Reports—Admiral Shares | 26 |
| Trustees’ Fees and Expenses | 6 |
| Total Expenses | 8,320 |
| Net Investment Income | 277,534 |
| Realized Net Gain (Loss) | |
| Investment Securities Sold | (28,267) |
| Futures Contracts | (11,461) |
| Realized Net Gain (Loss) | (39,728) |
| Change in Unrealized Appreciation | |
| (Depreciation) | |
| Investment Securities | (93,107) |
| Futures Contracts | (510) |
| Change in Unrealized Appreciation | |
| (Depreciation) | (93,617) |
| Net Increase (Decrease) in Net Assets | |
| Resulting from Operations | 144,189 |
Statement of Changes in Net Assets
| | |
| | Year Ended October 31, |
| | 2011 | 2010 |
| | ($000) | ($000) |
| Increase (Decrease) in Net Assets | | |
| Operations | | |
| Net Investment Income | 277,534 | 303,602 |
| Realized Net Gain (Loss) | (39,728) | (4,220) |
| Change in Unrealized Appreciation (Depreciation) | (93,617) | 268,658 |
| Net Increase (Decrease) in Net Assets Resulting from Operations | 144,189 | 568,040 |
| Distributions | | |
| Net Investment Income | | |
| Investor Shares | (60,480) | (85,773) |
| Admiral Shares | (217,054) | (217,829) |
| Realized Capital Gain | | |
| Investor Shares | — | — |
| Admiral Shares | — | — |
| Total Distributions | (277,534) | (303,602) |
| Capital Share Transactions | | |
| Investor Shares | (482,724) | (107,642) |
| Admiral Shares | (323,161) | 595,219 |
| Net Increase (Decrease) from Capital Share Transactions | (805,885) | 487,577 |
| Total Increase (Decrease) | (939,230) | 752,015 |
| Net Assets | | |
| Beginning of Period | 7,090,869 | 6,338,854 |
| End of Period | 6,151,639 | 7,090,869 |
1 Interest income from an affiliated company of the fund was $176,000.
See accompanying Notes, which are an integral part of the Financial Statements.
67
High-Yield Tax-Exempt Fund
Financial Highlights
| | | | | |
| Investor Shares | | | | | |
| |
| For a Share Outstanding | | | Year Ended October 31, |
| Throughout Each Period | 2011 | 2010 | 2009 | 2008 | 2007 |
| Net Asset Value, Beginning of Period | $10.67 | $10.26 | $9.29 | $10.62 | $10.91 |
| Investment Operations | | | | | |
| Net Investment Income | .465 | .470 | .483 | .494 | .497 |
| Net Realized and Unrealized Gain (Loss) | | | | | |
| on Investments | (.140) | .410 | .970 | (1.330) | (.290) |
| Total from Investment Operations | .325 | .880 | 1.453 | (.836) | .207 |
| Distributions | | | | | |
| Dividends from Net Investment Income | (.465) | (.470) | (.483) | (.494) | (.497) |
| Distributions from Realized Capital Gains | — | — | — | — | — |
| Total Distributions | (.465) | (.470) | (.483) | (.494) | (.497) |
| Net Asset Value, End of Period | $10.53 | $10.67 | $10.26 | $9.29 | $10.62 |
| |
| Total Return1 | 3.26% | 8.76% | 16.09% | –8.20% | 1.94% |
| |
| Ratios/Supplemental Data | | | | | |
| Net Assets, End of Period (Millions) | $1,339 | $1,861 | $1,892 | $1,660 | $1,965 |
| Ratio of Total Expenses to | | | | | |
| Average Net Assets | 0.20% | 0.20% | 0.20% | 0.15% | 0.15% |
| Ratio of Net Investment Income to | | | | | |
| Average Net Assets | 4.54% | 4.49% | 4.99% | 4.78% | 4.61% |
| Portfolio Turnover Rate | 19% | 19% | 23% | 24% | 22% |
1 Total returns do not include account service fees that may have applied in the periods shown. Fund prospectuses provide information about any applicable account service fees.
| | | | | |
| Admiral Shares | | | | | |
| |
| For a Share Outstanding | | | Year Ended October 31, |
| Throughout Each Period | 2011 | 2010 | 2009 | 2008 | 2007 |
| Net Asset Value, Beginning of Period | $10.67 | $10.26 | $9.29 | $10.62 | $10.91 |
| Investment Operations | | | | | |
| Net Investment Income | .473 | .479 | .491 | .501 | .505 |
| Net Realized and Unrealized Gain (Loss) | | | | | |
| on Investments | (.140) | .410 | .970 | (1.330) | (.290) |
| Total from Investment Operations | .333 | .889 | 1.461 | (.829) | .215 |
| Distributions | | | | | |
| Dividends from Net Investment Income | (.473) | (.479) | (.491) | (.501) | (.505) |
| Distributions from Realized Capital Gains | — | — | — | — | — |
| Total Distributions | (.473) | (.479) | (.491) | (.501) | (.505) |
| Net Asset Value, End of Period | $10.53 | $10.67 | $10.26 | $9.29 | $10.62 |
| |
| Total Return | 3.34% | 8.85% | 16.18% | –8.14% | 2.01% |
| |
| Ratios/Supplemental Data | | | | | |
| Net Assets, End of Period (Millions) | $4,813 | $5,230 | $4,447 | $3,769 | $4,256 |
| Ratio of Total Expenses to | | | | | |
| Average Net Assets | 0.12% | 0.12% | 0.12% | 0.08% | 0.08% |
| Ratio of Net Investment Income to | | | | | |
| Average Net Assets | 4.62% | 4.57% | 5.07% | 4.85% | 4.68% |
| Portfolio Turnover Rate | 19% | 19% | 23% | 24% | 22% |
See accompanying Notes, which are an integral part of the Financial Statements.
68
High-Yield Tax-Exempt Fund
Notes to Financial Statements
Vanguard High-Yield Tax-Exempt Fund is registered under the Investment Company Act of 1940 as an open-end investment company, or mutual fund. The fund invests in debt instruments of many municipal issuers; the issuers’ abilities to meet their obligations may be affected by economic and political developments in a specific state or region. The fund offers two classes of shares: Investor Shares and Admiral Shares. Investor Shares are available to any investor who meets the fund’s minimum purchase requirements. Admiral Shares are designed for investors who meet certain administrative, service, and account-size criteria.
A. The following significant accounting policies conform to generally accepted accounting principles for U.S. mutual funds. The fund consistently follows such policies in preparing its financial statements.
1. Security Valuation: Bonds, and temporary cash investments acquired over 60 days to maturity, are valued using the latest bid prices or using valuations based on a matrix system (which considers such factors as security prices, yields, maturities, and ratings), both as furnished by independent pricing services. Investments in Vanguard Municipal Cash Management Fund are valued at that fund’s net asset value. Other temporary cash investments are valued at amortized cost, which approximates market value. Securities for which market quotations are not readily available, or whose values have been affected by events occurring before the fund’s pricing time but after the close of the securities’ primary markets, are valued by methods deemed by the board of trustees to represent fair value.
2. Futures Contracts: The fund uses futures contracts to invest in fixed income asset classes with greater efficiency and lower cost than is possible through direct investment, to add value when these instruments are attractively priced, or to adjust sensitivity to changes in interest rates. The primary risks associated with the use of futures contracts are imperfect correlation between changes in market values of bonds held by the fund and the prices of futures contracts, and the possibility of an illiquid market.
Futures contracts are valued based upon their quoted daily settlement prices. The aggregate principal amounts of the contracts are not recorded in the Statement of Net Assets. Fluctuations in the value of the contracts are recorded in the Statement of Net Assets as an asset (liability) and in the Statement of Operations as unrealized appreciation (depreciation) until the contracts are closed, when they are recorded as realized futures gains (losses).
The fund had no open futures contracts at October 31, 2011.
3. Federal Income Taxes: The fund intends to continue to qualify as a regulated investment company and distribute all of its income. Management has analyzed the fund’s tax positions taken for all open federal income tax years (October 31, 2008–2011), and has concluded that no provision for federal income tax is required in the fund’s financial statements.
4. Distributions: Distributions from net investment income are declared daily and paid on the first business day of the following month. Annual distributions from realized capital gains, if any, are recorded on the ex-dividend date.
5. Other: Interest income includes income distributions received from Vanguard Municipal Cash Management Fund and is accrued daily. Premiums and discounts on debt securities purchased are amortized and accreted, respectively, to interest income over the lives of the respective securities. Security transactions are accounted for on the date securities are bought or sold. Costs used to determine realized gains (losses) on the sale of investment securities are those of the specific securities sold.
Each class of shares has equal rights as to assets and earnings, except that each class separately bears certain class-specific expenses related to maintenance of shareholder accounts (included in Management and Administrative expenses) and shareholder reporting. Marketing and distribution expenses are allocated to each class of shares based on a method approved by the board of trustees. Income, other non-class-specific expenses, and gains and losses on investments are allocated to each class of shares based on its relative net assets.
B. The Vanguard Group furnishes at cost investment advisory, corporate management, administrative, marketing, and distribution services. The costs of such services are allocated to the fund under methods approved by the board of trustees. The fund has committed to provide up to 0.40% of its net assets in capital contributions to Vanguard. At October 31, 2011, the fund had contributed capital of $1,069,000 to Vanguard (included in Other Assets), representing 0.02% of the fund’s net assets and 0.43% of Vanguard’s capitalization. The fund’s trustees and officers are also directors and officers of Vanguard.
69
High-Yield Tax-Exempt Fund
C. Various inputs may be used to determine the value of the fund’s investments. These inputs are summarized in three broad levels for financial statement purposes. The inputs or methodologies used to value securities are not necessarily an indication of the risk associated with investing in those securities.
Level 1—Quoted prices in active markets for identical securities.
Level 2—Other significant observable inputs (including quoted prices for similar securities, interest rates, prepayment speeds, credit risk, etc.).
Level 3—Significant unobservable inputs (including the fund’s own assumptions used to determine the fair value of investments).
The following table summarizes the market value of the fund’s investments as of October 31, 2011, based on the inputs used to value them:
| | | |
| | Level 1 | Level 2 | Level 3 |
| Investments | ($000) | ($000) | ($000) |
| Tax-Exempt Municipal Bonds | — | 6,087,316 | — |
| Temporary Cash Investments | 93,614 | — | — |
| Total | 93,614 | 6,087,316 | — |
D. Capital gain distributions are determined on a tax basis and may differ from realized capital gains for financial reporting purposes. Differences may be permanent or temporary. Permanent differences are reclassified among capital accounts in the financial statements to reflect their tax character. Temporary differences arise when gains or losses are recognized in different periods for financial statement and tax purposes; these differences will reverse at some time in the future.
For tax purposes, at October 31, 2011, the fund had available capital loss carryforwards totaling $183,878,000 to offset future net capital gains of $21,859,000 through October 31, 2015, $20,927,000 through October 31, 2016, $96,270,000 through October 31, 2017, $2,545,000 through October 31, 2018, and $42,277,000 through October 31, 2019. Capital loss carryforwards of $49,222,000 expired on October 31, 2011; accordingly, such losses have been reclassified from accumulated net realized losses to paid-in capital.
The fund had realized losses totaling $8,589,000 through October 31, 2011, which are deferred for tax purposes and reduce the amount of tax-basis unrealized appreciation on investment securities.
At October 31, 2011, the cost of investment securities for tax purposes was $6,028,959,000. Net unrealized appreciation of investment securities for tax purposes was $151,971,000, consisting of unrealized gains of $248,290,000 on securities that had risen in value since their purchase and $96,319,000 in unrealized losses on securities that had fallen in value since their purchase.
E. During the year ended October 31, 2011, the fund purchased $1,102,295,000 of investment securities and sold $1,985,573,000 of investment securities, other than temporary cash investments.
F. Capital share transactions for each class of shares were:
| | | | |
| | | | Year Ended October 31, |
| | | 2011 | | 2010 |
| | Amount | Shares | Amount | Shares |
| | ($000) | (000) | ($000) | (000) |
| Investor Shares | | | | |
| Issued | 348,378 | 33,917 | 614,114 | 58,756 |
| Issued in Lieu of Cash Distributions | 47,006 | 4,586 | 66,925 | 6,392 |
| Redeemed | (878,108) | (85,633) | (788,681) | (75,234) |
| Net Increase (Decrease)—Investor Shares | (482,724) | (47,130) | (107,642) | (10,086) |
| Admiral Shares | | | | |
| Issued | 1,113,305 | 108,266 | 1,419,487 | 135,477 |
| Issued in Lieu of Cash Distributions | 144,013 | 14,052 | 147,277 | 14,061 |
| Redeemed | (1,580,479) | (155,217) | (971,545) | (92,974) |
| Net Increase (Decrease)—Admiral Shares | (323,161) | (32,899) | 595,219 | 56,564 |
G. In preparing the financial statements as of October 31, 2011, management considered the impact of subsequent events for potential recognition or disclosure in these financial statements.
70
Report of Independent Registered
Public Accounting Firm
To the Trustees of Vanguard Municipal Bond Funds and the Shareholders of Vanguard Tax-Exempt Money Market Fund, Vanguard Short-Term Tax-Exempt Fund, Vanguard Limited-Term Tax-Exempt Fund, Vanguard Intermediate-Term Tax-Exempt Fund, Vanguard Long-Term Tax-Exempt Fund and Vanguard High-Yield Tax-Exempt Fund: In our opinion, the statement of net assets appearing herein and the accompanying statements of net assets appearing in the insert to this annual report and the related statements of operations and of changes in net assets and the financial highlights present fairly, in all material respects, the financial position of Vanguard Tax-Exempt Money Market Fund, Vanguard Short-Term Tax-Exempt Fund, Vanguard Limited-Term Tax-Exempt Fund, Vanguard Intermediate-Term Tax-Exempt Fund, Vanguard Long-Term Tax-Exempt Fund and Vanguard High-Yield Tax-Exempt Fund (constituting six separate portfolios of Vanguard Municipal Bond Funds, hereafter referred to as the “Funds”) at October 31, 2011, the results of each of their operations for the year then ended, the changes in each of their net assets for each of the two years in the period then ended and the financial highlights for each of the five years in the period then ended, in conformity with accounting principles generally accepted in the United States of America. These financial statements and financial highlights (hereafter referred to as “financial statements”) are the responsibility of the Funds’ management; our responsibility is to express an opinion on these financial statements based on our audits. We conducted our audits of these financial statements in accordance with the standards of the Public Company Accounting Oversight Board (United States). Those standards require that we plan and perform the audit to obtain reasonable assurance about whether the financial statements are free of material misstatement. An audit includes examining, on a test basis, evidence supporting the amounts and disclosures in the financial statements, assessing the accounting principles used and significant estimates made by management, and evaluating the overall financial statement presentation. We believe that our audits, which included confirmation of securities at October 31, 2011 by correspondence with the custodian and by agreement to the underlying ownership records for Vanguard Municipal Cash Management Fund, provide a reasonable basis for our opinion.
PricewaterhouseCoopers LLP
Philadelphia, Pennsylvania
December 9, 2011
|
| Special 2011 tax information (unaudited) for Vanguard Municipal Bond Funds |
This information for the fiscal year ended October 31, 2011, is included pursuant to provisions of the Internal Revenue Code.
Each fund designates 100% of its income dividends as exempt-interest dividends.
71
About Your Fund’s Expenses
As a shareholder of the fund, you incur ongoing costs, which include costs for portfolio management, administrative services, and shareholder reports (like this one), among others. Operating expenses, which are deducted from a fund’s gross income, directly reduce the investment return of the fund.
A fund’s expenses are expressed as a percentage of its average net assets. This figure is known as the expense ratio. The following examples are intended to help you understand the ongoing costs (in dollars) of investing in your fund and to compare these costs with those of other mutual funds. The examples are based on an investment of $1,000 made at the beginning of the period shown and held for the entire period.
The accompanying table illustrates your fund’s costs in two ways:
• Based on actual fund return. This section helps you to estimate the actual expenses that you paid over the period. The “Ending Account Value” shown is derived from the fund’s actual return, and the third column shows the dollar amount that would have been paid by an investor who started with $1,000 in the fund. You may use the information in this table, together with the amount you invested, to estimate the expenses that you paid over the period.
To do so, simply divide your account value by $1,000 (for example, an $8,600 account value divided by $1,000 = 8.6), then multiply the result by the number given for your fund under the heading “Expenses Paid During Period.”
• Based on hypothetical 5% yearly return. This section is intended to help you compare your fund’s costs with those of other mutual funds. It assumes that the fund had a yearly return of 5% before expenses, but that the expense ratio is unchanged. In this case—because the return used is not the fund’s actual return—the results do not apply to your investment. The example is useful in making comparisons because the Securities and Exchange Commission requires all mutual funds to calculate expenses based on a 5% return. You can assess your fund’s costs by comparing this hypothetical example with the hypothetical examples that appear in shareholder reports of other funds.
Note that the expenses shown in the table are meant to highlight and help you compare ongoing costs only and do not reflect transaction costs incurred by the fund for buying and selling securities. Further, the expenses do not include any purchase, redemption, or account service fees described in the fund prospectus. If such fees were applied to your account, your costs would be higher. Your fund does not carry a “sales load.” The calculations assume no shares were bought or sold during the period. Your actual costs may have been higher or lower, depending on the amount of your investment and the timing of any purchases or redemptions.
You can find more information about the fund’s expenses, including annual expense ratios, in the Financial Statements section of this report. For additional information on operating expenses and other shareholder costs, please refer to your fund’s current prospectus.
72
| | | |
| Six Months Ended October 31, 2011 | | | |
| | Beginning | Ending | Expenses |
| | Account Value | Account Value | Paid During |
| Tax-Exempt Fund | 4/30/2011 | 10/31/2011 | Period1 |
| Based on Actual Fund Return | | | |
| Money Market | $1,000.00 | $1,000.19 | $0.81 |
| Short-Term | | | |
| Investor Shares | 1,000.00 | 1,007.17 | 1.01 |
| Admiral Shares | 1,000.00 | 1,007.58 | 0.61 |
| Limited-Term | | | |
| Investor Shares | 1,000.00 | 1,014.56 | 1.02 |
| Admiral Shares | 1,000.00 | 1,014.97 | 0.61 |
| Intermediate-Term | | | |
| Investor Shares | 1,000.00 | 1,045.52 | 1.03 |
| Admiral Shares | 1,000.00 | 1,045.94 | 0.62 |
| Long-Term | | | |
| Investor Shares | 1,000.00 | 1,060.32 | 1.04 |
| Admiral Shares | 1,000.00 | 1,060.75 | 0.62 |
| High-Yield | | | |
| Investor Shares | 1,000.00 | 1,065.89 | 1.04 |
| Admiral Shares | 1,000.00 | 1,066.32 | 0.62 |
| Based on Hypothetical 5% Yearly Return | | | |
| Money Market | $1,000.00 | $1,024.40 | $0.82 |
| Short-Term | | | |
| Investor Shares | 1,000.00 | 1,024.20 | 1.02 |
| Admiral Shares | 1,000.00 | 1,024.60 | 0.61 |
| Limited-Term | | | |
| Investor Shares | 1,000.00 | 1,024.20 | 1.02 |
| Admiral Shares | 1,000.00 | 1,024.60 | 0.61 |
| Intermediate-Term | | | |
| Investor Shares | 1,000.00 | 1,024.20 | 1.02 |
| Admiral Shares | 1,000.00 | 1,024.60 | 0.61 |
| Long-Term | | | |
| Investor Shares | 1,000.00 | 1,024.20 | 1.02 |
| Admiral Shares | 1,000.00 | 1,024.60 | 0.61 |
| High-Yield | | | |
| Investor Shares | 1,000.00 | 1,024.20 | 1.02 |
| Admiral Shares | 1,000.00 | 1,024.60 | 0.61 |
1 The calculations are based on expenses incurred in the most recent six-month period. The funds’ annualized six-month expense ratios for that period are: for the Tax-Exempt Money Market Fund, 0.16%; for the Short-Term Tax-Exempt Fund, 0.20% for Investor Shares and 0.12% for Admiral Shares; for the Limited-Term Tax-Exempt Fund, 0.20% for Investor Shares and 0.12% for Admiral Shares; for the Intermediate-Term Tax-Exempt Fund, 0.20% for Investor Shares and 0.12% for Admiral Shares; for the Long-Term Tax-Exempt Fund, 0.20% for Investor Shares and 0.12% for Admiral Shares; and for the High-Yield Tax-Exempt Fund, 0.20% for Investor Shares and 0.12% for Admiral Shares. The dollar amounts shown as “Expenses Paid” are equal to the annualized expense ratio multiplied by the average account value over the period, multiplied by the number of days in the most recent six-month period, then divided by the number of days in the most recent 12-month period.
73
Glossary
Average Coupon. The average interest rate paid on the fixed income securities held by a fund. It is expressed as a percentage of face value.
Average Duration. An estimate of how much the value of the bonds held by a fund will fluctuate in response to a change in interest rates. To see how the value could change, multiply the average duration by the change in rates. If interest rates rise by 1 percentage point, the value of the bonds in a fund with an average duration of five years would decline by about 5%. If rates decrease by a percentage point, the value would rise by 5%.
Average Effective Maturity. The average length of time until fixed income securities held by a fund reach maturity and are repaid, taking into consideration the possibility that the issuer may call the bond before its maturity date. The figure reflects the proportion of fund assets represented by each security; it also reflects any futures contracts held. In general, the longer the average effective maturity, the more a fund’s share price will fluctuate in response to changes in market interest rates.
Average Weighted Maturity. The average length of time until fixed income securities held by a fund reach maturity and are repaid. The figure reflects the proportion of fund assets represented by each security.
Beta. A measure of the magnitude of a fund’s past share-price fluctuations in relation to the ups and downs of a given market index. The index is assigned a beta of 1.00. Compared with a given index, a fund with a beta of 1.20 typically would have seen its share price rise or fall by 12% when the index rose or fell by 10%. For this report, beta is based on returns over the past 36 months for both the fund and the index. Note that a fund’s beta should be reviewed in conjunction with its R-squared (see definition). The lower the R-squared, the less correlation there is between the fund and the index, and the less reliable beta is as an indicator of volatility.
Credit Quality. For the Tax-Exempt Money Market Fund, the Distribution by Credit Quality table includes tier ratings for consistency with SEC Rule 2a-7 under the Investment Company Act of 1940, which governs money market funds. A First Tier security is one that is eligible for money market funds and has been rated in the highest short-term rating category for debt obligations by the requisite nationally recognized statistical rating organizations. An unrated security is First Tier if it represents quality comparable to that of a rated security, as determined in accordance with SEC Rule 2a-7. A Second Tier security is one that is eligible for money market funds and is not a First Tier security. For the tax-exempt bond funds, credit-quality ratings are measured on a scale that generally ranges from AAA (highest) to D (lowest). “Not Rated” is used to classify securities for which a rating is not available. Credit-quality ratings for each issue are obtained from Moody’s and S&P, and the higher rating for each issue is used.
Expense Ratio. The percentage of a fund’s average net assets used to pay its annual administrative and advisory expenses. These expenses directly reduce returns to investors.
Inception Date. The date on which the assets of a fund (or one of its share classes) are first invested in accordance with the fund’s investment objective. For funds with a subscription period, the inception date is the day after that period ends. Investment performance is measured from the inception date.
R-Squared. A measure of how much of a fund’s past returns can be explained by the returns from the market in general, as measured by a given index. If a fund’s total returns were precisely synchronized with an index’s returns, its R-squared would be 1.00. If the fund’s returns bore no relationship to the index’s returns, its R-squared would be 0. For this report, R-squared is based on returns over the past 36 months for both the fund and the index.
Short-Term Reserves. The percentage of a fund invested in highly liquid, short-term securities that can be readily converted to cash.
Yield. A money market fund’s 7-day SEC yield is calculated by annualizing its income distributions for the previous seven days, as required by the U.S. Securities and Exchange Commission. For other funds, 30-day SEC yield is derived using a formula specified by the commission. Under the formula, data related to the fund’s security holdings in the previous 30 days are used to calculate the fund’s hypothetical net income for that period, which is then annualized and divided by the fund’s estimated average net assets over the calculation period. For the purposes of this calculation, a security’s income is based on its current market yield to maturity (in the case of bonds) or its projected dividend yield (for stocks). Because the SEC yield represents hypothetical annualized income, it will differ—at times significantly—from the fund’s actual experience. As a result, the fund’s income distributions may be higher or lower than implied by the SEC yield.
Yield to Maturity. The rate of return an investor would receive if the fixed income securities held by a fund were held to their maturity dates.
74
This page intentionally left blank.
This page intentionally left blank.
The People Who Govern Your Fund
The trustees of your mutual fund are there to see that the fund is operated and managed in your best interests since, as a shareholder, you are a part owner of the fund. Your fund’s trustees also serve on the board of directors of The Vanguard Group, Inc., which is owned by the Vanguard funds and provides services to them on an at-cost basis.
A majority of Vanguard’s board members are independent, meaning that they have no affiliation with Vanguard or the funds they oversee, apart from the sizable personal investments they have made as private individuals.
The independent board members have distinguished backgrounds in business, academia, and public service. Each of the trustees and executive officers oversees 180 Vanguard funds.
The following table provides information for each trustee and executive officer of the fund. More information about the trustees is in the Statement of Additional Information, which can be obtained, without charge, by contacting Vanguard at 800-662-7447, or online at vanguard.com.
| | | |
| Interested Trustee1 | JoAnn Heffernan Heisen | Executive Officers | |
| | Born 1950. Trustee Since July 1998. Principal | | |
| F. William McNabb III | Occupation(s) During the Past Five Years: Corporate | Glenn Booraem | |
| Born 1957. Trustee Since July 2009. Chairman of the | Vice President and Chief Global Diversity Officer | Born 1967. Controller Since July 2010. Principal |
| Board. Principal Occupation(s) During the Past Five | (retired 2008) and Member of the Executive | Occupation(s) During the Past Five Years: Principal |
| Years: Chairman of the Board of The Vanguard Group, | Committee (1997–2008) of Johnson & Johnson | of The Vanguard Group, Inc.; Controller of each of |
| Inc., and of each of the investment companies served | (pharmaceuticals/consumer products); Director of | the investment companies served by The Vanguard |
| by The Vanguard Group, since January 2010; Director | Skytop Lodge Corporation (hotels), the University | Group since 2010; Assistant Controller of each of |
| of The Vanguard Group since 2008; Chief Executive | Medical Center at Princeton, the Robert Wood | the investment companies served by The Vanguard |
| Officer and President of The Vanguard Group and of | Johnson Foundation, and the Center for Work Life | Group (2001–2010). | |
| each of the investment companies served by The | Policy; Member of the Advisory Board of the | | |
| Vanguard Group since 2008; Director of Vanguard | Maxwell School of Citizenship and Public Affairs | Thomas J. Higgins | |
| Marketing Corporation; Managing Director of The | at Syracuse University. | Born 1957. Chief Financial Officer Since September |
| Vanguard Group (1995–2008). | | 2008. Principal Occupation(s) During the Past Five |
| | F. Joseph Loughrey | Years: Principal of The Vanguard Group, Inc.; Chief |
| | Born 1949. Trustee Since October 2009. Principal | Financial Officer of each of the investment companies |
| Independent Trustees | Occupation(s) During the Past Five Years: President | served by The Vanguard Group since 2008; Treasurer |
| | and Chief Operating Officer (retired 2009) and Vice | of each of the investment companies served by The |
| Emerson U. Fullwood | Chairman of the Board (2008–2009) of Cummins Inc. | Vanguard Group (1998–2008). |
| Born 1948. Trustee Since January 2008. Principal | (industrial machinery); Director of SKF AB (industrial | | |
| Occupation(s) During the Past Five Years: Executive | machinery), Hillenbrand, Inc. (specialized consumer | Kathryn J. Hyatt | |
| Chief Staff and Marketing Officer for North America | services), the Lumina Foundation for Education, and | Born 1955. Treasurer Since November 2008. Principal |
| and Corporate Vice President (retired 2008) of Xerox | Oxfam America; Chairman of the Advisory Council | Occupation(s) During the Past Five Years: Principal |
| Corporation (document management products and | for the College of Arts and Letters and Member | of The Vanguard Group, Inc.; Treasurer of each of |
| services); Executive in Residence and 2010 | of the Advisory Board to the Kellogg Institute for | the investment companies served by The Vanguard |
| Distinguished Minett Professor at the Rochester | International Studies at the University of Notre Dame. | Group since 2008; Assistant Treasurer of each of the |
| Institute of Technology; Director of SPX Corporation | | investment companies served by The Vanguard Group |
| (multi-industry manufacturing), the United Way of | André F. Perold | (1988–2008). | |
| Rochester, Amerigroup Corporation (managed health | Born 1952. Trustee Since December 2004. Principal | | |
| care), the University of Rochester Medical Center, | Occupation(s) During the Past Five Years: George | Heidi Stam | |
| Monroe Community College Foundation, and North | Gund Professor of Finance and Banking at the Harvard | Born 1956. Secretary Since July 2005. Principal |
| Carolina A&T University. | Business School (retired July 2011); Chief Investment | Occupation(s) During the Past Five Years: Managing |
| | Officer and co-Managing Partner of HighVista | Director of The Vanguard Group, Inc., since 2006; |
| Rajiv L. Gupta | Strategies LLC (private investment firm); Director of | General Counsel of The Vanguard Group since 2005; |
| Born 1945. Trustee Since December 2001.2 | Rand Merchant Bank; Overseer of the Museum of | Secretary of The Vanguard Group and of each of the |
| Principal Occupation(s) During the Past Five Years: | Fine Arts Boston. | investment companies served by The Vanguard Group |
| Chairman and Chief Executive Officer (retired 2009) | | since 2005; Director and Senior Vice President of |
| and President (2006–2008) of Rohm and Haas Co. | Alfred M. Rankin, Jr. | Vanguard Marketing Corporation since 2005; |
| (chemicals); Director of Tyco International, Ltd. | Born 1941. Trustee Since January 1993. Principal | Principal of The Vanguard Group (1997–2006). |
| (diversified manufacturing and services) and Hewlett- | Occupation(s) During the Past Five Years: Chairman, | | |
| Packard Co. (electronic computer manufacturing); | President, and Chief Executive Officer of NACCO | | |
| Senior Advisor at New Mountain Capital; Trustee | Industries, Inc. (forklift trucks/housewares/lignite); | Vanguard Senior Management Team |
| of The Conference Board; Member of the Board of | Director of Goodrich Corporation (industrial products/ | | |
| Managers of Delphi Automotive LLP (automotive | aircraft systems and services) and the National | R. Gregory Barton | Chris D. McIsaac |
| components) . | Association of Manufacturers; Chairman of the | Mortimer J. Buckley | Michael S. Miller |
| | Federal Reserve Bank of Cleveland; Vice Chairman | Kathleen C. Gubanich | James M. Norris |
| Amy Gutmann | of University Hospitals of Cleveland; President of | Paul A. Heller | Glenn W. Reed |
| Born 1949. Trustee Since June 2006. Principal | the Board of The Cleveland Museum of Art. | Martha G. King | George U. Sauter |
| Occupation(s) During the Past Five Years: President | | | |
| of the University of Pennsylvania; Christopher H. | Peter F. Volanakis | | |
| Browne Distinguished Professor of Political Science | Born 1955. Trustee Since July 2009. Principal | Chairman Emeritus and Senior Advisor |
| in the School of Arts and Sciences with secondary | Occupation(s) During the Past Five Years: President | | |
| appointments at the Annenberg School for Commu- | and Chief Operating Officer (retired 2010) of Corning | John J. Brennan | |
| nication and the Graduate School of Education | Incorporated (communications equipment); Director of | Chairman, 1996–2009 | |
| of the University of Pennsylvania; Director of | Corning Incorporated (2000–2010) and Dow Corning | Chief Executive Officer and President, 1996–2008 |
| Carnegie Corporation of New York, Schuylkill River | (2001–2010); Overseer of the Amos Tuck School of | | |
| Development Corporation, and Greater Philadelphia | Business Administration at Dartmouth College. | | |
| Chamber of Commerce; Trustee of the National | | Founder | |
| Constitution Center; Chair of the Presidential | | | |
| Commission for the Study of Bioethical Issues. | | John C. Bogle | |
| | | Chairman and Chief Executive Officer, 1974–1996 |
1 Mr. McNabb is considered an “interested person,” as defined in the Investment Company Act of 1940, because he is an officer of the Vanguard funds.
2 December 2002 for Vanguard Equity Income Fund, Vanguard Growth Equity Fund, the Vanguard Municipal Bond Funds, and the Vanguard State Tax-Exempt Funds.
|  |
| P.O. Box 2600 |
| Valley Forge, PA 19482-2600 |
Connect with Vanguard® > vanguard.com
| |
| Fund Information > 800-662-7447 | All comparative mutual fund data are from Lipper Inc. |
| | or Morningstar, Inc., unless otherwise noted. |
| Direct Investor Account Services > 800-662-2739 | |
| Institutional Investor Services > 800-523-1036 | You can obtain a free copy of Vanguard’s proxy voting |
| | guidelines by visiting vanguard.com/proxyreporting or |
| Text Telephone for People | by calling Vanguard at 800-662-2739. The guidelines |
| With Hearing Impairment > 800-749-7273 | are also available from the SEC’s website, sec.gov. |
| | In addition, you may obtain a free report on how your |
| | fund voted the proxies for securities it owned during |
| This material may be used in conjunction | the 12 months ended June 30. To get the report, visit |
| with the offering of shares of any Vanguard | either vanguard.com/proxyreporting or sec.gov. |
| fund only if preceded or accompanied by the | You can review and copy information about your fund |
| fund’s current prospectus. | at the SEC’s Public Reference Room in Washington, D.C. |
| | To find out more about this public service, call the SEC |
| CFA® is a trademark owned by CFA Institute. | at 202-551-8090. Information about your fund is also |
| | available on the SEC’s website, and you can receive |
| | copies of this information, for a fee, by sending a |
| | request in either of two ways: via e-mail addressed to |
| | publicinfo@sec.gov or via regular mail addressed to the |
| | Public Reference Section, Securities and Exchange |
| | Commission, Washington, DC 20549-1520. |
| |
| |
| |
| |
| | © 2011 The Vanguard Group, Inc. |
| | All rights reserved. |
| | Vanguard Marketing Corporation, Distributor. |
| | Q950 122011 |
Vanguard® Municipal Bond Funds
Statement of Net Assets
As of October 31, 2011
The Statement of Net Assets should be read in conjunction with each fund’s Statement of Operations,
Statement of Changes in Net Assets, Financial Highlights, and Notes to Financial Statements, all of which appear in the accompanying report.
Each fund reports a complete list of its holdings in regulatory filings four times in each fiscal year, at the quarter-ends. For the second and fourth fiscal quarters, the lists appear in the fund’s semiannual and annual reports to shareholders. For the first and third fiscal quarters, the fund files the lists with the Securities and Exchange Commission on Form N-Q. Shareholders can look up the fund’s Forms N-Q on the SEC’s website at sec.gov. Forms N-Q may also be reviewed and copied at the SEC’s Public Reference Room (see the back cover of the accompanying report for further information).
| |
| Contents | |
| |
| Short-Term Tax-Exempt Fund | 1 |
| Limited-Term Tax-Exempt Fund | 23 |
| Intermediate-Term Tax-Exempt Fund | 51 |
| Long-Term Tax-Exempt Fund | 100 |
| High-Yield Tax-Exempt Fund | 116 |
| Key to Abbreviations | Back cover |
Short-Term Tax-Exempt Fund
| | | | |
| | | | Face | Market |
| | | Maturity | Amount | Value• |
| | Coupon | Date | ($000) | ($000) |
| Tax-Exempt Municipal Bonds (98.7%) | | | | |
| Alabama (1.1%) | | | | |
| Alabama Public School & College Authority Capital Improvement Revenue | 5.000% | 12/1/11 | 7,500 | 7,530 |
| Alabama Public School & College Authority Capital Improvement Revenue | 5.000% | 5/1/12 | 3,500 | 3,583 |
| Alabama Public School & College Authority Capital Improvement Revenue | 5.000% | 5/1/12 | 4,000 | 4,094 |
| Alabama Public School & College Authority Capital Improvement Revenue | 5.000% | 12/1/12 | 21,510 | 22,590 |
| Alabama Public School & College Authority Capital Improvement Revenue | 5.000% | 5/1/13 | 11,760 | 12,549 |
| Alabama Public School & College Authority Capital Improvement Revenue | 5.000% | 5/1/13 | 7,500 | 8,003 |
| Alabama Public School & College Authority Capital Improvement Revenue | 5.000% | 5/1/14 | 8,000 | 8,834 |
| 1 Alabama Public School & College Authority Capital Improvement Revenue TOB VRDO | 0.170% | 11/7/11 | 12,360 | 12,360 |
| 1 Alabama Special Care Facilities Financing Authority Birmingham Revenue | | | | |
| (Ascension Health Credit Group) TOB VRDO | 0.140% | 11/7/11 | 6,375 | 6,375 |
| Chatom AL Industrial Development Board Gulf Opportunity Zone Revenue | | | | |
| (Powersouth Energy Cooperative Projects) PUT | 1.000% | 11/15/11 | 18,600 | 18,602 |
| Chatom AL Industrial Development Board Gulf Opportunity Zone Revenue | | | | |
| (Powersouth Energy Cooperative Projects) PUT | 1.000% | 12/1/11 | 9,200 | 9,202 |
| Mobile AL Infirmary Health System Special Care Facilities Financing Authority Revenue | | | | |
| (Infirmary Health System Inc.) | 5.000% | 2/1/12 | 1,000 | 1,009 |
| Mobile AL Infirmary Health System Special Care Facilities Financing Authority Revenue | | | | |
| (Infirmary Health System Inc.) | 5.000% | 2/1/13 | 1,715 | 1,785 |
| Mobile AL Infirmary Health System Special Care Facilities Financing Authority Revenue | | | | |
| (Infirmary Health System Inc.) | 5.000% | 2/1/14 | 4,155 | 4,388 |
| Mobile AL Infirmary Health System Special Care Facilities Financing Authority Revenue | | | | |
| (Infirmary Health System Inc.) | 5.000% | 2/1/15 | 1,615 | 1,729 |
| | | | | 122,633 |
| Alaska (0.5%) | | | | |
| Alaska Housing Finance Corp. Home Mortgage Revenue VRDO | 0.170% | 11/7/11 | 25,870 | 25,870 |
| Alaska Industrial Development & Export Authority Revenue | 5.000% | 4/1/12 | 1,800 | 1,833 |
| Alaska Industrial Development & Export Authority Revenue | 5.000% | 4/1/15 | 3,000 | 3,339 |
| Anchorage AK GO | 5.500% | 7/1/12 (Prere.) | 5,680 | 5,878 |
| North Slope Borough AK GO | 5.000% | 6/30/12 | 1,750 | 1,805 |
| North Slope Borough AK GO | 5.000% | 6/30/13 | 1,500 | 1,609 |
| Valdez AK Marine Terminal Revenue (BP Pipelines) | 5.000% | 1/1/16 | 10,000 | 11,113 |
| Valdez AK Marine Terminal Revenue (BP Pipelines) | 5.000% | 1/1/16 | 2,000 | 2,223 |
| | | | | 53,670 |
| Arizona (1.2%) | | | | |
| Arizona Board Regents Arizona State University System Revenue VRDO | 0.100% | 11/7/11 LOC | 10,510 | 10,510 |
| Arizona COP | 5.000% | 10/1/12 (4) | 1,000 | 1,039 |
| Arizona Health Facilities Authority Revenue (Banner Health) | 5.000% | 1/1/12 | 3,000 | 3,022 |
| Arizona Health Facilities Authority Revenue (Banner Health) | 5.000% | 1/1/16 | 5,000 | 5,601 |
| 1 Arizona Health Facilities Authority Revenue (Banner Health) TOB VRDO | 0.160% | 11/7/11 | 8,840 | 8,840 |
| Arizona School Facilities Board COP | 5.000% | 9/1/14 (14) | 5,975 | 6,493 |
| Arizona Transportation Board Excise Tax Revenue (Maricopa County Regional Area) | 5.000% | 7/1/12 | 5,000 | 5,158 |
| Arizona Transportation Board Excise Tax Revenue (Maricopa County Regional Area) | 5.000% | 7/1/13 | 5,000 | 5,375 |
1
Short-Term Tax-Exempt Fund
| | | | |
| | | | Face | Market |
| | | Maturity | Amount | Value• |
| | Coupon | Date | ($000) | ($000) |
| 1 Arizona Transportation Board Highway Revenue TOB VRDO | 0.140% | 11/7/11 | 7,260 | 7,260 |
| Arizona Water Infrastructure Finance Authority Revenue | 5.000% | 10/1/13 | 1,105 | 1,200 |
| Maricopa County AZ Regional Public Transportation Authority Excise Tax Revenue | 4.000% | 7/1/12 | 4,985 | 5,099 |
| 1 Mesa AZ Utility System Revenue TOB VRDO | 0.150% | 11/7/11 (4) | 7,500 | 7,500 |
| 1 Mesa AZ Utility System Revenue TOB VRDO | 0.150% | 11/7/11 (4) | 8,250 | 8,250 |
| 1 Phoenix AZ Civic Improvement Corp. Airport Revenue TOB VRDO | 0.240% | 11/7/11 | 8,990 | 8,990 |
| 1 Phoenix AZ Civic Improvement Corp. Airport Revenue TOB VRDO | 0.290% | 11/7/11 | 4,000 | 4,000 |
| 1 Phoenix AZ Civic Improvement Corp. Water System Revenue TOB VRDO | 0.140% | 11/7/11 | 4,500 | 4,500 |
| 1 Salt River Project Arizona Agricultural Improvement & Power District Revenue TOB VRDO | 0.140% | 11/7/11 | 8,500 | 8,500 |
| 1 Salt River Project Arizona Agricultural Improvement & Power District Revenue TOB VRDO | 0.140% | 11/7/11 | 6,285 | 6,285 |
| Yavapai County AZ Industrial Development Authority Hospital Facility Revenue | | | | |
| (Northern Arizona Healthcare System) | 3.000% | 10/1/13 | 780 | 808 |
| Yavapai County AZ Industrial Development Authority Hospital Facility Revenue | | | | |
| (Northern Arizona Healthcare System) | 4.000% | 10/1/14 | 1,175 | 1,255 |
| Yavapai County AZ Industrial Development Authority Hospital Facility Revenue | | | | |
| (Northern Arizona Healthcare System) | 5.000% | 10/1/15 | 1,750 | 1,954 |
| Yavapai County AZ Industrial Development Authority Hospital Facility Revenue | | | | |
| (Northern Arizona Healthcare System) | 5.000% | 10/1/16 | 2,120 | 2,376 |
| Yavapai County AZ Industrial Development Authority Solid Waste Disposal Revenue | | | | |
| (Republic Services Inc.) PUT | 0.750% | 12/1/11 | 25,000 | 24,995 |
| | | | | 139,010 |
| California (9.4%) | | | | |
| ABAG Finance Authority for Nonprofit Corps. California Revenue (Valley Christian Schools) VRDO | 0.140% | 11/7/11 LOC | 21,600 | 21,600 |
| California Department of Water Resources Power Supply Revenue | 3.000% | 5/1/12 | 6,535 | 6,624 |
| California Department of Water Resources Power Supply Revenue | 4.000% | 5/1/12 | 2,000 | 2,037 |
| California Department of Water Resources Power Supply Revenue | 5.000% | 5/1/12 | 22,130 | 22,653 |
| California Department of Water Resources Power Supply Revenue | 6.000% | 5/1/12 (Prere.) | 35,000 | 36,360 |
| California Department of Water Resources Power Supply Revenue | 5.000% | 5/1/14 | 15,000 | 16,580 |
| California Department of Water Resources Power Supply Revenue | 5.000% | 5/1/15 | 13,750 | 15,575 |
| California Department of Water Resources Power Supply Revenue | 5.000% | 5/1/16 | 14,500 | 16,683 |
| California Economic Recovery Bonds GO | 5.250% | 7/1/13 | 2,500 | 2,694 |
| California Economic Recovery Bonds GO | 5.250% | 7/1/13 (ETM) | 975 | 1,053 |
| California Economic Recovery Bonds GO | 5.250% | 7/1/13 (14) | 1,025 | 1,104 |
| California Economic Recovery Bonds GO | 5.250% | 7/1/14 (14) | 10,700 | 11,930 |
| California Educational Facilities Authority Revenue (St. Mary’s College of California) VRDO | 0.190% | 11/7/11 LOC | 17,045 | 17,045 |
| California GO | 5.000% | 3/1/13 | 2,500 | 2,640 |
| California GO | 5.000% | 4/1/13 | 2,205 | 2,335 |
| California GO | 5.000% | 6/1/13 | 2,025 | 2,158 |
| California GO | 4.000% | 11/1/14 | 2,650 | 2,863 |
| California GO | 5.000% | 11/1/15 | 1,600 | 1,799 |
| California GO | 5.000% | 9/1/16 | 8,000 | 9,051 |
| California GO | 5.000% | 9/1/16 | 1,465 | 1,658 |
| California GO | 5.000% | 10/1/16 | 12,070 | 13,674 |
| California GO | 5.000% | 9/1/17 | 4,250 | 4,816 |
| California GO | 5.000% | 10/1/17 | 35,000 | 39,675 |
| 1 California GO TOB VRDO | 0.290% | 11/7/11 (4) | 15,925 | 15,925 |
| California Health Facilities Financing Authority Revenue (Catholic Healthcare West) PUT | 5.000% | 7/2/12 | 15,240 | 15,690 |
| California Health Facilities Financing Authority Revenue (Catholic Healthcare West) PUT | 5.000% | 7/2/12 | 12,000 | 12,355 |
| California Health Facilities Financing Authority Revenue (Catholic Healthcare West) PUT | 5.000% | 7/1/14 | 17,670 | 19,510 |
| California Health Facilities Financing Authority Revenue (St. Joseph Health System) PUT | 5.000% | 10/16/14 | 15,300 | 16,804 |
| 1 California Health Facilities Financing Authority Revenue (Sutter Health) TOB VRDO | 0.140% | 11/7/11 | 22,685 | 22,685 |
| 1 California Health Facilities Financing Authority Revenue (Sutter Health) TOB VRDO | 0.140% | 11/7/11 | 20,885 | 20,885 |
| California Infrastructure & Economic Development Bank Revenue | | | | |
| (Independent System Operator Corp. Project) | 5.000% | 2/1/14 | 2,500 | 2,702 |
| California Infrastructure & Economic Development Bank Revenue (J. Paul Getty Trust) PUT | 2.500% | 4/1/13 | 20,000 | 20,574 |
| California Municipal Finance Authority (Community Hospitals of | | | | |
| Central California Obligated Group) COP | 5.000% | 2/1/13 | 1,160 | 1,191 |
| California Municipal Finance Authority (Community Hospitals of | | | | |
| Central California Obligated Group) COP | 5.000% | 2/1/13 | 2,000 | 2,053 |
| California Municipal Finance Authority Revenue (University of La Verne) | 5.000% | 6/1/14 | 1,845 | 1,933 |
| California Municipal Finance Authority Revenue (University of La Verne) | 5.000% | 6/1/15 | 2,120 | 2,236 |
| California Municipal Finance Authority Solid Waste Revenue (Republic Services Inc. Project) PUT | 0.900% | 1/3/12 | 20,000 | 19,998 |
| California Pollution Control Financing Authority Environmental Improvement Revenue | | | | |
| (BP West Coast Products LLC Project) PUT | 2.600% | 9/2/14 | 4,000 | 4,121 |
| California Pollution Control Financing Authority Solid Waste Disposal Revenue | | | | |
| (Republic Services Inc. Project) PUT | 1.125% | 11/1/11 | 2,500 | 2,500 |
| California Public Works Board Lease Revenue (Department of Corrections) | 5.000% | 6/1/12 | 5,000 | 5,121 |
| California Public Works Board Lease Revenue (Department of Corrections) | 2.000% | 10/1/12 | 4,790 | 4,838 |
| California Public Works Board Lease Revenue (Various Capital Projects) | 4.000% | 10/1/14 | 8,375 | 8,910 |
| California Public Works Board Lease Revenue (Various Capital Projects) | 5.000% | 11/1/14 | 4,000 | 4,378 |
| California Public Works Board Lease Revenue (Various Capital Projects) | 4.000% | 10/1/15 | 3,000 | 3,200 |
| California Public Works Board Lease Revenue (Various Capital Projects) | 4.000% | 10/1/16 | 3,070 | 3,258 |
2
Short-Term Tax-Exempt Fund
| | | | |
| | | | Face | Market |
| | | Maturity | Amount | Value• |
| | Coupon | Date | ($000) | ($000) |
| California Statewide Communities Development Authority Revenue (Kaiser Permanente) | 5.000% | 4/1/13 | 5,000 | 5,311 |
| California Statewide Communities Development Authority Revenue (Kaiser Permanente) | 5.000% | 4/1/14 | 10,000 | 10,915 |
| California Statewide Communities Development Authority Revenue | | | | |
| (Proposition 1A Receivables Program) | 5.000% | 6/15/13 | 74,000 | 78,780 |
| California Statewide Communities Development Authority Revenue | | | | |
| (Redlands Community Hospital) VRDO | 0.090% | 11/7/11 LOC | 13,200 | 13,200 |
| Central Valley CA Financing Authority Cogeneration Project Revenue (Carson Ice-Gen Project) | 4.000% | 7/1/12 | 650 | 664 |
| 1 Desert CA Community College District GO TOB VRDO | 0.140% | 11/7/11 | 14,340 | 14,340 |
| 1 East Bay CA Municipal Utility District Waste Water System Revenue TOB VRDO | 0.140% | 11/7/11 | 10,475 | 10,475 |
| 1 East Side CA Union High School District GO TOB VRDO | 1.640% | 11/7/11 | 23,805 | 23,805 |
| Eastern California Municipal Water District Water& Sewer Revenue VRDO | 0.110% | 11/7/11 | 15,850 | 15,850 |
| Fontana CA Unified School District BAN | 4.000% | 12/1/12 | 20,000 | 20,667 |
| Fresno County CA TRAN | 3.000% | 6/29/12 | 10,000 | 10,188 |
| Golden State Tobacco Securitization Corp. California | 5.500% | 6/1/13 (Prere.) | 44,730 | 48,188 |
| Golden State Tobacco Securitization Corp. California | 5.500% | 6/1/13 (Prere.) | 11,500 | 12,389 |
| Golden State Tobacco Securitization Corp. California | 5.625% | 6/1/13 (Prere.) | 5,000 | 5,396 |
| Golden State Tobacco Securitization Corp. California | 6.625% | 6/1/13 (Prere.) | 3,000 | 3,285 |
| Golden State Tobacco Securitization Corp. California | 6.750% | 6/1/13 (Prere.) | 19,490 | 21,380 |
| Golden State Tobacco Securitization Corp. California | 6.250% | 6/1/33 (Prere.) | 15,485 | 16,651 |
| 1 Los Angeles CA Department of Water & Power Revenue TOB VRDO | 0.140% | 11/7/11 | 15,335 | 15,335 |
| 1 Los Angeles CA Department of Water & Power Revenue TOB VRDO | 0.220% | 11/7/11 | 11,455 | 11,455 |
| 3 Los Angeles CA Unified School District GO | 4.000% | 7/1/14 | 13,000 | 13,959 |
| 1 Los Angeles CA Unified School District GO TOB VRDO | 0.140% | 11/7/11 | 6,700 | 6,700 |
| Los Angeles County CA Metropolitan Transportation Authority Sales Tax Revenue | 5.000% | 7/1/12 | 5,500 | 5,673 |
| Los Angeles County CA Metropolitan Transportation Authority Sales Tax Revenue | 5.000% | 7/1/14 | 6,000 | 6,662 |
| Los Angeles County CA Metropolitan Transportation Authority Sales Tax Revenue | 5.250% | 7/1/16 (4) | 5,000 | 5,069 |
| Los Angeles County CA Public Works Financing Authority Lease Revenue | 5.000% | 8/1/15 | 10,850 | 12,156 |
| Los Angeles County CA Public Works Financing Authority Lease Revenue | 5.000% | 8/1/16 | 3,450 | 3,919 |
| 2 Metropolitan Water District of Southern California Revenue PUT | 0.290% | 6/1/13 | 5,000 | 4,977 |
| Modesto CA Irrigation District Electric Revenue | 5.000% | 7/1/14 | 1,000 | 1,099 |
| Modesto CA Irrigation District Electric Revenue | 5.000% | 7/1/15 | 1,000 | 1,124 |
| Modesto CA Irrigation District Electric Revenue | 5.000% | 7/1/16 | 3,100 | 3,529 |
| Northern California Power Agency Revenue (Hydroelectric Project) | 4.000% | 7/1/13 | 2,500 | 2,616 |
| Northern California Power Agency Revenue (Hydroelectric Project) | 4.000% | 7/1/14 | 1,000 | 1,067 |
| Orange County CA Airport Revenue | 3.000% | 7/1/13 | 1,670 | 1,730 |
| 1 Peralta CA Community College District Revenue TOB VRDO | 0.140% | 11/7/11 (4) | 7,715 | 7,715 |
| 1 Peralta CA Community College District Revenue TOB VRDO | 0.160% | 11/7/11 (4) | 15,000 | 15,000 |
| Sacramento CA Cogeneration Authority Revenue | 5.000% | 7/1/12 | 500 | 515 |
| Sacramento CA Cogeneration Authority Revenue | 5.000% | 7/1/14 | 600 | 657 |
| San Bernardino County CA Medical Center (Arrowhead Project) COP | 5.000% | 8/1/13 | 6,000 | 6,347 |
| San Bernardino County CA Medical Center (Arrowhead Project) COP | 5.000% | 8/1/14 | 3,205 | 3,459 |
| San Bernardino County CA Medical Center (Arrowhead Project) COP | 5.000% | 8/1/15 | 2,965 | 3,228 |
| San Bernardino County CA Transportation Authority Sales Tax RAN | 5.000% | 5/1/12 | 15,000 | 15,351 |
| San Diego CA Public Facilities Financing Authority Sewer Revenue | 5.000% | 5/15/14 | 6,000 | 6,614 |
| San Francisco CA City & County International Airport Revenue | 5.000% | 5/1/15 (4) | 5,000 | 5,578 |
| San Francisco CA City & County International Airport Revenue | 5.000% | 5/1/15 | 4,435 | 4,948 |
| San Francisco CA City & County International Airport Revenue | 5.000% | 5/1/16 | 21,100 | 23,928 |
| San Francisco CA City & County International Airport Revenue PUT | 2.250% | 12/4/12 | 29,755 | 30,250 |
| San Francisco CA City & County International Airport Revenue VRDO | 0.100% | 11/7/11 LOC | 12,500 | 12,500 |
| 1 San Jose CA Financing Authority Lease Revenue TOB VRDO | 0.140% | 11/7/11 (13) | 5,000 | 5,000 |
| Southern California Public Power Authority Revenue (Transmission Project) VRDO | 0.120% | 11/7/11 (4) | 43,000 | 43,000 |
| Tuolumne CA Wind Project Authority Revenue | 4.000% | 1/1/13 | 2,375 | 2,458 |
| | | | | 1,058,576 |
| Colorado (2.6%) | | | | |
| Broomfield CO City & County COP | 5.000% | 12/1/15 | 5,790 | 6,544 |
| Colorado Department of Transportation RAN | 5.250% | 6/15/12 (14) | 21,350 | 22,000 |
| Colorado Educational & Cultural Facilities Authority Revenue | | | | |
| (National Jewish Federation Bond Program) VRDO | 0.180% | 11/1/11 LOC | 3,400 | 3,400 |
| 3 Colorado Health Facilities Authority Revenue (Catholic Health Initiatives) | 2.000% | 2/1/13 | 18,250 | 18,526 |
| Colorado Health Facilities Authority Revenue (Catholic Health Initiatives) | 5.000% | 7/1/13 | 4,000 | 4,294 |
| Colorado Health Facilities Authority Revenue (Catholic Health Initiatives) PUT | 5.000% | 11/8/12 | 4,225 | 4,417 |
| Colorado Health Facilities Authority Revenue (Catholic Health Initiatives) PUT | 5.000% | 11/12/13 | 12,000 | 13,020 |
| Colorado Health Facilities Authority Revenue (Catholic Health Initiatives) PUT | 5.250% | 11/12/13 (Prere.) | 1,010 | 1,106 |
| Colorado Health Facilities Authority Revenue (Catholic Health Initiatives) PUT | 5.250% | 11/12/13 | 6,990 | 7,619 |
| 1 Colorado Health Facilities Authority Revenue (Catholic Health Initiatives) TOB VRDO | 0.150% | 11/1/11 | 1,795 | 1,795 |
| 1 Colorado Health Facilities Authority Revenue (Catholic Health Initiatives) TOB VRDO | 0.160% | 11/7/11 | 10,000 | 10,000 |
| Colorado Health Facilities Authority Revenue (Catholic Health Initiatives) VRDO | 0.130% | 11/7/11 | 47,700 | 47,700 |
| Colorado Health Facilities Authority Revenue (Sisters of Charity of Leavenworth Health System) | 5.000% | 1/1/13 | 5,165 | 5,408 |
| Colorado Health Facilities Authority Revenue (Sisters of Charity of Leavenworth Health System) | 5.000% | 1/1/13 | 1,605 | 1,681 |
| Colorado Health Facilities Authority Revenue (Sisters of Charity of Leavenworth Health System) | 5.000% | 1/1/14 | 8,615 | 9,257 |
| Colorado Health Facilities Authority Revenue (Sisters of Charity of Leavenworth Health System) | 5.000% | 1/1/14 | 3,510 | 3,772 |
| Colorado Health Facilities Authority Revenue (Sisters of Charity of Leavenworth Health System) | 5.000% | 1/1/15 | 3,500 | 3,864 |
3
Short-Term Tax-Exempt Fund
| | | | |
| | | | Face | Market |
| | | Maturity | Amount | Value• |
| | Coupon | Date | ($000) | ($000) |
| Colorado Health Facilities Authority Revenue | | | | |
| (Sisters of Charity of Leavenworth Health System) | 5.000% | 1/1/15 | 1,945 | 2,147 |
| Colorado Health Facilities Authority Revenue | | | | |
| (Sisters of Charity of Leavenworth Health System) VRDO | 0.130% | 11/7/11 | 20,705 | 20,705 |
| Colorado Health Facilities Authority Revenue | | | | |
| (Sisters of Charity of Leavenworth Health System) VRDO | 0.130% | 11/7/11 | 44,200 | 44,200 |
| Denver CO City & County Airport Revenue | 6.000% | 11/15/13 (14) | 5,000 | 5,505 |
| 2 E-470 Public Highway Authority Colorado Revenue PUT | 2.860% | 9/14/14 | 17,065 | 17,070 |
| 1 Jefferson County CO School District GO TOB VRDO | 0.140% | 11/7/11 | 13,660 | 13,660 |
| Regional Transportation District of Colorado COP | 3.000% | 6/1/12 | 1,000 | 1,013 |
| Regional Transportation District of Colorado COP | 5.000% | 6/1/14 | 1,500 | 1,624 |
| Regional Transportation District of Colorado COP | 5.000% | 6/1/15 | 2,330 | 2,571 |
| Regional Transportation District of Colorado Sales Tax Revenue | 3.000% | 11/1/11 | 1,230 | 1,230 |
| Regional Transportation District of Colorado Sales Tax Revenue | 5.000% | 11/1/13 | 4,305 | 4,693 |
| Regional Transportation District of Colorado Sales Tax Revenue | 5.000% | 11/1/14 | 5,000 | 5,625 |
| 1 University of Colorado Enterprise System Revenue TOB VRDO | 2.340% | 11/7/11 LOC | 7,935 | 7,935 |
| | | | | 292,381 |
| Connecticut (1.3%) | | | | |
| Connecticut General Revenue (State Revolving Fund) | 5.000% | 2/1/12 | 4,000 | 4,048 |
| Connecticut GO | 5.375% | 11/15/12 (Prere.) | 7,985 | 8,406 |
| Connecticut GO | 5.000% | 3/1/15 (14) | 3,000 | 3,280 |
| 2 Connecticut GO | 0.640% | 5/15/15 | 20,000 | 20,000 |
| Connecticut GO | 5.000% | 12/1/15 (14) | 16,150 | 17,803 |
| 2 Connecticut GO | 0.790% | 5/15/16 | 20,000 | 20,000 |
| 2 Connecticut GO | 0.790% | 5/15/16 | 8,300 | 8,300 |
| 2 Connecticut GO PUT | 1.490% | 3/1/18 | 17,500 | 17,621 |
| Connecticut Health & Educational Facilities Authority Revenue (Stamford Hospital) | 4.000% | 7/1/12 | 1,235 | 1,257 |
| Connecticut Health & Educational Facilities Authority Revenue (Stamford Hospital) | 5.000% | 7/1/13 | 1,915 | 2,035 |
| Connecticut Health & Educational Facilities Authority Revenue (Stamford Hospital) | 5.000% | 7/1/14 | 2,050 | 2,216 |
| Connecticut Health & Educational Facilities Authority Revenue (Yale University) PUT | 4.000% | 2/7/13 | 7,610 | 7,957 |
| Connecticut Health & Educational Facilities Authority Revenue (Yale University) PUT | 5.000% | 2/12/15 | 20,810 | 23,531 |
| 1 Connecticut Health & Educational Facilities Authority Revenue (Yale University) TOB VRDO | 0.150% | 11/1/11 | 5,000 | 5,000 |
| | | | | 141,454 |
| Delaware (0.3%) | | | | |
| Delaware GO | 5.000% | 10/1/12 | 9,445 | 9,855 |
| Kent County DE Student Housing Revenue (Delaware State University Student Housing) VRDO | 0.130% | 11/7/11 LOC | 7,910 | 7,910 |
| University of Delaware Revenue PUT | 0.850% | 6/4/13 | 12,000 | 12,075 |
| | | | | 29,840 |
| District of Columbia (0.5%) | | | | |
| 2 District of Columbia Income Tax Revenue | 0.490% | 12/1/13 | 10,665 | 10,665 |
| District of Columbia Revenue (Georgetown Day School) VRDO | 0.360% | 11/7/11 LOC | 14,300 | 14,300 |
| District of Columbia Revenue (Georgetown University) | 5.000% | 4/1/13 | 5,000 | 5,262 |
| District of Columbia Revenue (Georgetown University) | 5.000% | 4/1/14 | 2,000 | 2,162 |
| District of Columbia Revenue (Medlantic/Helix) VRDO | 0.180% | 11/7/11 LOC | 14,000 | 14,000 |
| District of Columbia Revenue (World Wildlife Fund Inc.) VRDO | 0.130% | 11/7/11 LOC | 10,600 | 10,600 |
| | | | | 56,989 |
| Florida (7.8%) | | | | |
| Alachua County FL Health Facilities Authority Revenue (Shands HealthCare Project) | 3.000% | 12/1/11 | 3,000 | 3,004 |
| Alachua County FL Health Facilities Authority Revenue (Shands HealthCare Project) | 5.000% | 12/1/13 | 4,200 | 4,454 |
| Citizens Property Insurance Corp. Florida Revenue (Coastal Account) | 5.500% | 6/1/14 | 20,000 | 21,607 |
| Citizens Property Insurance Corp. Florida Revenue (Coastal Account) | 5.000% | 6/1/15 | 15,000 | 16,162 |
| Citizens Property Insurance Corp. Florida Revenue (Coastal Account) | 5.000% | 6/1/15 | 30,000 | 32,325 |
| Citizens Property Insurance Corp. Florida Revenue (Coastal Account) | 5.000% | 6/1/16 | 16,545 | 17,901 |
| 1 Collier County FL School Board COP TOB VRDO | 0.130% | 11/7/11 | 21,345 | 21,345 |
| Escambia County FL Health Facilities Authority Revenue (Ascension Health Credit Group) | 5.250% | 11/15/13 | 5,350 | 5,848 |
| Escambia County FL Solid Waste Disposal System Revenue (Gulf Power Co. Project) PUT | 2.000% | 4/3/12 | 5,000 | 5,028 |
| Escambia County FL Solid Waste Disposal System Revenue (Gulf Power Co. Project) PUT | 1.750% | 6/15/12 | 5,500 | 5,541 |
| Florida Board of Education Lottery Revenue | 5.000% | 7/1/15 | 11,750 | 13,283 |
| Florida Board of Education Lottery Revenue | 5.000% | 7/1/16 | 11,655 | 13,402 |
| Florida Board of Education Lottery Revenue | 5.000% | 7/1/16 | 16,710 | 19,214 |
| Florida Board of Education Public Education Capital Outlay GO | 4.000% | 6/1/12 | 1,945 | 1,987 |
| Florida Board of Education Public Education Capital Outlay GO | 5.000% | 6/1/12 | 4,020 | 4,131 |
| Florida Board of Education Public Education Capital Outlay GO | 5.000% | 6/1/12 | 16,195 | 16,643 |
| Florida Board of Education Public Education Capital Outlay GO | 5.000% | 6/1/12 | 4,500 | 4,624 |
| Florida Board of Education Public Education Capital Outlay GO | 5.000% | 6/1/13 | 9,580 | 10,265 |
| Florida Board of Education Public Education Capital Outlay GO | 5.000% | 6/1/13 | 8,820 | 9,451 |
| Florida Board of Education Public Education Capital Outlay GO | 5.000% | 6/1/14 | 5,065 | 5,618 |
| Florida Board of Education Public Education Capital Outlay GO | 5.000% | 6/1/14 | 9,235 | 10,243 |
| Florida Board of Education Public Education Capital Outlay GO | 5.000% | 6/1/14 (4) | 11,315 | 12,187 |
| Florida Board of Education Public Education Capital Outlay GO | 5.000% | 6/1/15 | 5,540 | 6,315 |
| Florida Board of Education Public Education Capital Outlay GO | 5.000% | 6/1/15 | 7,250 | 7,799 |
4
Short-Term Tax-Exempt Fund
| | | | |
| | | | Face | Market |
| | | Maturity | Amount | Value• |
| | Coupon | Date | ($000) | ($000) |
| Florida Department of Environmental Protection & Preservation Revenue | 5.000% | 7/1/12 | 5,545 | 5,719 |
| Florida Department of Environmental Protection & Preservation Revenue | 5.250% | 7/1/12 | 31,580 | 32,621 |
| Florida Department of Environmental Protection & Preservation Revenue | 5.000% | 7/1/13 | 34,040 | 36,452 |
| Florida Department of Environmental Protection & Preservation Revenue | 5.000% | 7/1/14 | 14,605 | 16,130 |
| Florida Department of Management Services COP | 5.000% | 8/1/12 | 8,850 | 9,133 |
| Florida Department of Management Services COP | 5.000% | 8/1/13 | 6,595 | 7,029 |
| Florida Department of Transportation GO | 5.000% | 7/1/12 | 6,940 | 7,159 |
| Florida Department of Transportation GO | 5.000% | 7/1/13 | 9,605 | 10,326 |
| Florida Hurricane Catastrophe Fund Finance Corp. Revenue | 5.000% | 7/1/13 | 10,000 | 10,557 |
| Florida Hurricane Catastrophe Fund Finance Corp. Revenue | 5.000% | 7/1/15 | 20,150 | 21,985 |
| Florida Rural Utility Financing Commission Revenue | 3.500% | 11/1/11 | 925 | 925 |
| Florida Turnpike Authority Revenue | 5.000% | 7/1/13 | 3,825 | 4,105 |
| Florida Turnpike Authority Revenue | 5.000% | 7/1/13 (4) | 4,780 | 5,130 |
| Florida Turnpike Authority Revenue | 5.000% | 7/1/15 (4) | 10,000 | 10,791 |
| Gainsville FL Utility System Revenue VRDO | 0.230% | 11/1/11 | 28,865 | 28,865 |
| Highlands County FL Health Facilities Authority Hospital Revenue | | | | |
| (Adventist Health System/Sunbelt Obligated Group) | 5.000% | 11/15/13 | 1,000 | 1,082 |
| Highlands County FL Health Facilities Authority Hospital Revenue | | | | |
| (Adventist Health System/Sunbelt Obligated Group) | 5.000% | 11/15/14 | 2,000 | 2,219 |
| 1 Highlands County FL Health Facilities Authority Hospital Revenue | | | | |
| (Adventist Health System/Sunbelt Obligated Group) TOB VRDO | 0.140% | 11/7/11 | 15,730 | 15,730 |
| Hillsborough County FL Aviation Authority Revenue (Tampa International Airport) | 5.000% | 10/1/12 | 2,000 | 2,080 |
| Hillsborough County FL Aviation Authority Revenue (Tampa International Airport) | 5.500% | 10/1/12 (4) | 5,670 | 5,906 |
| Hillsborough County FL Aviation Authority Revenue (Tampa International Airport) | 5.000% | 10/1/13 | 2,000 | 2,148 |
| Hillsborough County FL Aviation Authority Revenue (Tampa International Airport) | 5.500% | 10/1/13 (4) | 3,000 | 3,249 |
| Hillsborough County FL Aviation Authority Revenue (Tampa International Airport) | 5.500% | 10/1/15 (4) | 2,000 | 2,278 |
| Hillsborough County FL Industrial Development Authority Pollution Control Revenue | | | | |
| (Tampa Electric Co. Project) PUT | 5.000% | 3/15/12 | 4,500 | 4,570 |
| Hillsborough County FL School Board COP | 5.000% | 7/1/14 | 2,110 | 2,297 |
| Hillsborough County FL School Board COP | 5.000% | 7/1/15 | 1,170 | 1,300 |
| Jacksonville FL Electric Authority Electric System Revenue | 5.000% | 10/1/12 | 12,000 | 12,468 |
| Jacksonville FL Electric Authority Electric System Revenue | 5.000% | 10/1/14 | 4,000 | 4,412 |
| Jacksonville FL Electric Authority Electric System Revenue VRDO | 0.110% | 11/7/11 | 23,375 | 23,375 |
| Jacksonville FL Electric Authority Water & Sewer Revenue VRDO | 0.130% | 11/7/11 | 22,550 | 22,550 |
| Jacksonville FL Electric Authority Water & Sewer Revenue VRDO | 0.140% | 11/7/11 | 21,485 | 21,485 |
| Jacksonville FL Excise Taxes Revenue | 4.000% | 10/1/12 | 1,000 | 1,032 |
| Jacksonville FL Excise Taxes Revenue | 5.000% | 10/1/14 | 1,000 | 1,105 |
| Jacksonville FL Health Facilities Authority Hospital Revenue | | | | |
| (Baptist Medical Center Project) VRDO | 0.140% | 11/1/11 LOC | 1,000 | 1,000 |
| Kissimmee FL Utility Authority Electric System Revenue | 4.000% | 10/1/13 | 1,000 | 1,058 |
| Kissimmee FL Utility Authority Electric System Revenue | 4.000% | 10/1/14 | 1,250 | 1,345 |
| Kissimmee FL Utility Authority Electric System Revenue | 5.250% | 10/1/14 (4) | 1,750 | 1,942 |
| Kissimmee FL Utility Authority Electric System Revenue | 4.000% | 10/1/15 | 2,000 | 2,177 |
| Lake County FL School Board COP | 5.250% | 6/1/14 | 2,945 | 3,179 |
| Lakeland FL Hospital System Revenue (Lakeland Regional Health) | 2.000% | 11/15/11 | 1,000 | 1,000 |
| Lakeland FL Hospital System Revenue (Lakeland Regional Health) | 3.000% | 11/15/12 | 500 | 508 |
| 1 Miami-Dade County FL Building Better Communities GO TOB VRDO | 0.140% | 11/7/11 | 26,340 | 26,340 |
| 1 Miami-Dade County FL Building Better Communities GO TOB VRDO | 0.140% | 11/7/11 | 9,995 | 9,995 |
| 1 Miami-Dade County FL Educational Facilities Authority Revenue | | | | |
| (University of Miami) TOB VRDO | 0.200% | 11/7/11 (12) | 5,070 | 5,070 |
| Miami-Dade County FL Industrial Development Authority Solid Waste Disposal Revenue | | | | |
| (Waste Management Inc. of Florida Project) PUT | 1.250% | 11/3/14 | 8,750 | 8,755 |
| Miami-Dade County FL School Board COP | 5.000% | 8/1/12 | 4,000 | 4,111 |
| Miami-Dade County FL School Board COP PUT | 5.000% | 5/1/14 | 8,500 | 9,135 |
| 1 Miami-Dade County FL Transit Sales Surtax Revenue TOB VRDO | 0.200% | 11/7/11 (4) | 32,570 | 32,570 |
| Orange County FL Health Facilities Authority Hospital Revenue (Orlando Health Inc.) | 5.000% | 10/1/14 | 2,000 | 2,140 |
| Orange County FL Health Facilities Authority Revenue (Nemours Foundation Project) | 4.000% | 1/1/13 | 335 | 345 |
| Orange County FL Health Facilities Authority Revenue (Nemours Foundation Project) | 4.000% | 1/1/14 | 500 | 524 |
| Orange County FL Health Facilities Authority Revenue (Nemours Foundation Project) | 4.000% | 1/1/15 | 500 | 530 |
| 1 Orange County FL School Board COP TOB VRDO | 0.130% | 11/7/11 LOC | 25,965 | 25,965 |
| Orange County FL Tourist Development Revenue | 5.000% | 10/1/12 | 7,335 | 7,618 |
| Orange County FL Tourist Development Revenue | 5.000% | 10/1/13 | 7,705 | 8,225 |
| Orange County FL Tourist Development Revenue | 5.000% | 10/1/14 | 8,710 | 9,529 |
| Orlando & Orange County FL Expressway Authority Revenue | 5.000% | 7/1/12 | 5,000 | 5,151 |
| Orlando FL Utility Commission Utility System Revenue | 5.000% | 10/1/12 | 1,750 | 1,824 |
| Orlando FL Utility Commission Utility System Revenue | 5.000% | 10/1/13 | 2,500 | 2,709 |
| Orlando FL Utility Commission Utility System Revenue | 5.000% | 10/1/13 | 2,500 | 2,709 |
| Orlando FL Utility Commission Utility System Revenue | 5.000% | 10/1/14 | 4,000 | 4,470 |
| Orlando FL Utility Commission Utility System Revenue | 5.000% | 10/1/14 | 3,075 | 3,437 |
| Palm Beach County FL School Board COP PUT | 5.000% | 8/1/16 | 6,000 | 6,709 |
| South Broward FL Hospital District Revenue | 5.625% | 5/1/12 (Prere.) | 4,640 | 4,811 |
| 1 South Florida Water Management District COP TOB VRDO | 0.140% | 11/7/11 | 21,000 | 21,000 |
5
Short-Term Tax-Exempt Fund
| | | | |
| | | | Face | Market |
| | | Maturity | Amount | Value• |
| | Coupon | Date | ($000) | ($000) |
| South Miami FL Health Facilities Authority Hospital Revenue | | | | |
| (Baptist Health South Florida Obligated Group) | 5.250% | 2/1/13 (Prere.) | 7,755 | 8,217 |
| South Miami FL Health Facilities Authority Hospital Revenue | | | | |
| (Baptist Health South Florida Obligated Group) | 5.750% | 2/1/13 (Prere.) | 5,000 | 5,329 |
| 1 South Miami FL Health Facilities Authority Hospital Revenue | | | | |
| (Baptist Health South Florida Obligated Group) TOB VRDO | 0.140% | 11/7/11 | 9,400 | 9,400 |
| 1 South Miami FL Health Facilities Authority Hospital Revenue | | | | |
| (Baptist Health South Florida Obligated Group) TOB VRDO | 0.140% | 11/7/11 | 6,000 | 6,000 |
| 1 South Miami FL Health Facilities Authority Hospital Revenue | | | | |
| (Baptist Health South Florida Obligated Group) TOB VRDO | 0.240% | 11/7/11 | 8,850 | 8,850 |
| Sunshine State Governmental Financing Commission Florida Revenue | | | | |
| (Miami Dade County Program) | 5.000% | 9/1/13 | 9,405 | 9,989 |
| Tallahassee FL Energy System Revenue | 5.250% | 10/1/15 (4) | 5,240 | 5,973 |
| Tampa Bay FL Water Utility System Revenue | 5.000% | 10/1/16 | 5,500 | 6,416 |
| | | | | 880,645 |
| Georgia (2.0%) | | | | |
| Atlanta GA Airport Passenger Facility Charge Revenue | 5.000% | 1/1/15 | 2,440 | 2,689 |
| Atlanta GA Airport Revenue | 4.000% | 1/1/13 | 5,000 | 5,187 |
| Atlanta GA Airport Revenue | 4.000% | 1/1/15 | 500 | 538 |
| Atlanta GA Airport Revenue | 5.000% | 1/1/16 | 6,500 | 7,309 |
| 1 Atlanta GA Airport Revenue TOB VRDO | 0.240% | 11/7/11 (4) | 11,170 | 11,170 |
| Atlanta GA Development Authority Revenue (Georgia Aquarium Inc. Project) VRDO | 0.130% | 11/7/11 LOC | 14,750 | 14,750 |
| Atlanta GA Water & Wastewater Revenue | 4.000% | 11/1/11 | 2,500 | 2,500 |
| Atlanta GA Water & Wastewater Revenue | 4.000% | 11/1/12 | 3,000 | 3,104 |
| Atlanta GA Water & Wastewater Revenue | 5.000% | 11/1/13 | 3,500 | 3,784 |
| Burke County GA Development Authority Pollution Control Revenue | | | | |
| (Georgia Power Co. Plant Vogtle Project) PUT | 3.750% | 1/12/12 | 1,000 | 1,006 |
| Burke County GA Development Authority Pollution Control Revenue | | | | |
| (Georgia Power Co. Plant Vogtle Project) PUT | 3.750% | 1/12/12 | 19,880 | 20,001 |
| Burke County GA Development Authority Pollution Control Revenue | | | | |
| (Georgia Power Co. Plant Vogtle Project) PUT | 3.750% | 1/12/12 | 5,000 | 5,030 |
| Burke County GA Development Authority Pollution Control Revenue | | | | |
| (Georgia Power Co. Plant Vogtle Project) PUT | 5.050% | 1/12/12 | 6,000 | 6,052 |
| Burke County GA Development Authority Pollution Control Revenue | | | | |
| (Georgia Power Co. Plant Vogtle Project) PUT | 2.500% | 3/1/13 | 2,250 | 2,285 |
| Cobb County GA Kennestone Hospital Authority Revenue | 4.000% | 4/1/12 | 2,240 | 2,272 |
| Dalton County GA Development Authority Revenue (Hamilton Health Care System) VRDO | 0.200% | 11/7/11 LOC | 5,445 | 5,445 |
| DeKalb County GA School District GO | 5.000% | 2/1/12 | 30,000 | 30,352 |
| Georgia GO | 5.000% | 5/1/12 (Prere.) | 5,125 | 5,247 |
| Georgia GO | 5.000% | 9/1/14 | 4,000 | 4,487 |
| Georgia Road & Tollway Authority Revenue | 5.000% | 6/1/13 | 13,875 | 14,858 |
| Gwinnett County GA Development Authority Revenue (Nilhan Hospitality LLC) VRDO | 0.100% | 11/7/11 LOC | 4,800 | 4,800 |
| Gwinnett County GA Water & Sewer Authority Revenue | 4.000% | 8/1/12 | 10,020 | 10,302 |
| Main Street Natural Gas Inc. Georgia Gas Project Revenue | 5.000% | 3/15/13 | 7,500 | 7,785 |
| Main Street Natural Gas Inc. Georgia Gas Project Revenue | 5.000% | 3/15/13 | 10,995 | 11,526 |
| Main Street Natural Gas Inc. Georgia Gas Project Revenue | 5.000% | 3/15/15 | 13,000 | 13,430 |
| Main Street Natural Gas Inc. Georgia Gas Project Revenue | 5.000% | 3/15/15 | 6,715 | 7,297 |
| Monroe County GA Development Authority Pollution Control Revenue | | | | |
| (Gulf Power Co. Plant Scherer Project) PUT | 2.125% | 6/4/13 | 5,000 | 5,039 |
| Monroe County GA Development Authority Pollution Control Revenue | | | | |
| (Oglethorpe Power Scherer Project)PUT | 2.500% | 3/1/13 | 7,500 | 7,589 |
| Municipal Electric Authority Georgia Revenue (Project One) | 5.000% | 1/1/12 | 4,010 | 4,039 |
| Municipal Electric Authority Georgia Revenue (Project One) | 5.000% | 1/1/15 | 2,000 | 2,211 |
| Municipal Electric Authority Georgia Revenue (Project One) | 5.000% | 1/1/16 | 3,000 | 3,373 |
| Richmond County GA Hospital Authority (University Health Services Inc. Project) RAN | 5.000% | 1/1/13 | 1,330 | 1,383 |
| | | | | 226,840 |
| Hawaii (0.1%) | | | | |
| Hawaii GO | 5.000% | 6/1/14 | 1,195 | 1,326 |
| Hawaii GO | 5.000% | 6/1/14 (ETM) | 1,045 | 1,160 |
| Hawaii GO | 5.000% | 2/1/15 | 3,600 | 4,066 |
| Hawaii GO | 5.000% | 2/1/16 | 4,000 | 4,618 |
| Honolulu HI City & County GO | 5.250% | 7/1/12 (ETM) | 4,950 | 5,114 |
| | | | | 16,284 |
| Idaho (0.4%) | | | | |
| Idaho Housing & Finance Association RAN | 5.000% | 7/15/12 | 6,675 | 6,892 |
| Idaho Housing & Finance Association Unemployment Compensation Revenue | 5.000% | 8/15/15 | 31,375 | 35,576 |
| | | | | 42,468 |
| Illinois (4.2%) | | | | |
| Chicago IL Board of Education GO | 5.000% | 12/1/15 | 2,000 | 2,208 |
| Chicago IL Board of Education GO | 5.000% | 12/1/16 | 2,855 | 3,182 |
| 1 Chicago IL Board of Education GO TOB VRDO | 0.160% | 11/7/11 (4) | 6,520 | 6,520 |
6
Short-Term Tax-Exempt Fund
| | | | |
| | | | Face | Market |
| | | Maturity | Amount | Value• |
| | Coupon | Date | ($000) | ($000) |
| Chicago IL Board of Education GO VRDO | 0.110% | 11/7/11 LOC | 7,000 | 7,000 |
| Chicago IL GO | 5.000% | 1/1/15 (4) | 1,250 | 1,369 |
| Chicago IL GO | 6.250% | 1/1/15 | 2,500 | 2,831 |
| 1 Chicago IL GO TOB VRDO | 0.140% | 11/7/11 | 9,995 | 9,995 |
| 1 Chicago IL GO TOB VRDO | 0.240% | 11/7/11 (4) | 10,035 | 10,035 |
| Chicago IL Midway Airport Revenue PUT | 5.000% | 1/1/15 | 10,750 | 11,717 |
| Chicago IL O’Hare International Airport Revenue | 5.000% | 1/1/12 (14) | 4,400 | 4,432 |
| Chicago IL O’Hare International Airport Revenue | 4.000% | 1/1/15 | 1,000 | 1,065 |
| Chicago IL O’Hare International Airport Revenue | 5.000% | 1/1/16 | 3,000 | 3,339 |
| 1 Chicago IL O’Hare International Airport Revenue TOB VRDO | 0.290% | 11/7/11 (4) | 7,000 | 7,000 |
| 1 Chicago IL O’Hare International Airport Revenue TOB VRDO | 0.290% | 11/7/11 (12) | 27,185 | 27,185 |
| 1 Chicago IL Park District GO TOB VRDO | 0.140% | 11/7/11 | 19,630 | 19,630 |
| Chicago IL Wastewater Transmission Revenue VRDO | 0.180% | 11/1/11 LOC | 7,500 | 7,500 |
| 1 Chicago IL Water Revenue TOB VRDO | 0.160% | 11/7/11 (4) | 7,495 | 7,495 |
| 1 Chicago IL Water Revenue TOB VRDO | 0.160% | 11/7/11 (4) | 7,745 | 7,745 |
| Du Page & Cook Counties IL Community Consolidated School District GO | 5.250% | 12/1/12 (Prere.) | 3,750 | 3,950 |
| Illinois Build Revenue | 5.000% | 6/15/16 | 10,000 | 11,312 |
| Illinois Development Finance Authority Revenue (St. Vincent De Paul Center) PUT | 1.400% | 2/28/13 | 11,650 | 11,784 |
| Illinois Educational Facilities Authority Revenue (ACI/Cultural Pooled Financing Program) VRDO | 0.130% | 11/7/11 LOC | 18,800 | 18,800 |
| Illinois Educational Facilities Authority Revenue (University of Chicago) PUT | 1.125% | 2/14/13 | 8,325 | 8,382 |
| Illinois Educational Facilities Authority Revenue (University of Chicago) PUT | 3.375% | 2/3/14 | 5,000 | 5,260 |
| Illinois Educational Facilities Authority Student Housing Revenue | | | | |
| (Educational Advancement Fund) | 6.250% | 5/1/12 (Prere.) | 4,000 | 4,160 |
| Illinois Finance Authority Gas Supply Revenue (Peoples Gas Light & Coke) PUT | 2.625% | 8/1/15 | 2,500 | 2,541 |
| Illinois Finance Authority Revenue (Advocate Health Care Network) PUT | 3.875% | 5/1/12 | 5,200 | 5,291 |
| Illinois Finance Authority Revenue (Advocate Health Care Network) PUT | 1.400% | 2/1/13 | 11,180 | 11,288 |
| Illinois Finance Authority Revenue (Carle Foundation) | 5.000% | 8/15/16 | 2,220 | 2,400 |
| Illinois Finance Authority Revenue (Chicago Horticulture Project) VRDO | 0.150% | 11/7/11 LOC | 9,000 | 9,000 |
| Illinois Finance Authority Revenue (Little Co. of Mary Hospital & Health Care Centers) VRDO | 0.150% | 11/7/11 LOC | 10,800 | 10,800 |
| Illinois Finance Authority Revenue (Northwestern Community Hospital) | 5.000% | 8/15/12 | 4,630 | 4,792 |
| Illinois Finance Authority Revenue (Northwestern Community Hospital) | 5.000% | 8/15/13 | 3,250 | 3,482 |
| Illinois Finance Authority Revenue (Northwestern University) PUT | 1.200% | 3/1/13 | 10,000 | 10,110 |
| Illinois Finance Authority Revenue (OSF Healthcare System) VRDO | 0.250% | 11/7/11 (4) | 30,510 | 30,510 |
| Illinois Finance Authority Revenue (Presbyterian Homes) VRDO | 0.240% | 11/7/11 (4) | 7,700 | 7,700 |
| Illinois Finance Authority Revenue (Provena Health) | 5.000% | 5/1/12 | 1,840 | 1,858 |
| Illinois Finance Authority Revenue (Provena Health) | 5.000% | 5/1/14 | 1,305 | 1,351 |
| Illinois Finance Authority Revenue (Provena Health) | 5.250% | 5/1/15 | 2,555 | 2,680 |
| Illinois Finance Authority Revenue (Resurrection Health Care) | 5.000% | 5/15/12 (4) | 4,200 | 4,269 |
| Illinois Finance Authority Revenue (Trinity Health Corp.) | 3.000% | 12/1/16 | 1,865 | 1,930 |
| Illinois Finance Authority Revenue (University of Chicago Medical Center) | 5.000% | 8/15/15 | 1,500 | 1,670 |
| Illinois Finance Authority Revenue (University of Chicago) VRDO | 0.090% | 11/7/11 | 5,564 | 5,564 |
| Illinois GO | 5.000% | 1/1/16 | 25,000 | 27,572 |
| 1 Illinois GO TOB VRDO | 0.640% | 11/7/11 | 3,750 | 3,750 |
| Illinois Health Facilities Authority Revenue (Advocate Health Care Network) PUT | 4.375% | 7/1/14 | 4,450 | 4,778 |
| Illinois Health Facilities Authority Revenue (Evanston Hospital Corp.) VRDO | 0.110% | 11/7/11 | 48,265 | 48,265 |
| Illinois Regional Transportation Authority Revenue PUT | 1.000% | 11/1/11 | 31,300 | 31,300 |
| 1 Illinois Toll Highway Authority Toll Highway Revenue TOB VRDO | 0.140% | 11/7/11 | 5,335 | 5,335 |
| Railsplitter Tobacco Settlement Authority Illinois Tobacco Settlement Revenue | 4.000% | 6/1/12 | 8,000 | 8,137 |
| Railsplitter Tobacco Settlement Authority Illinois Tobacco Settlement Revenue | 4.000% | 6/1/13 | 8,130 | 8,457 |
| Railsplitter Tobacco Settlement Authority Illinois Tobacco Settlement Revenue | 5.000% | 6/1/14 | 10,000 | 10,767 |
| Railsplitter Tobacco Settlement Authority Illinois Tobacco Settlement Revenue | 5.000% | 6/1/15 | 5,000 | 5,460 |
| | | | | 474,953 |
| Indiana (2.7%) | | | | |
| Indiana Bond Bank Revenue | 5.375% | 4/1/12 (Prere.) | 2,500 | 2,554 |
| Indiana Finance Authority Economic Development Revenue | | | | |
| (Republic Services Inc. Project) PUT | 0.800% | 12/1/11 | 4,500 | 4,500 |
| Indiana Finance Authority Facilities Revenue (Miami Correctional Facility - Phase II) | 5.000% | 7/1/12 | 3,415 | 3,513 |
| Indiana Finance Authority Facilities Revenue (Pendleton Juvenile Correctional Facility) | 5.000% | 7/1/12 | 1,495 | 1,538 |
| Indiana Finance Authority Health System Revenue | | | | |
| (Sisters of St. Francis Health Services Inc. Obligated Group) | 5.000% | 11/1/11 | 1,000 | 1,000 |
| Indiana Finance Authority Health System Revenue | | | | |
| (Sisters of St. Francis Health Services Inc. Obligated Group) | 5.000% | 11/1/12 | 1,700 | 1,768 |
| Indiana Finance Authority Health System Revenue | | | | |
| (Sisters of St. Francis Health Services Inc. Obligated Group) | 5.000% | 11/1/14 | 1,415 | 1,555 |
| Indiana Finance Authority Health System Revenue | | | | |
| (Sisters of St. Francis Health Services Inc. Obligated Group) VRDO | 0.120% | 11/7/11 LOC | 40,500 | 40,500 |
| Indiana Finance Authority Health System Revenue | | | | |
| (Sisters of St. Francis Health Services Inc. Obligated Group) VRDO | 0.120% | 11/7/11 LOC | 20,815 | 20,815 |
| Indiana Finance Authority Lease Revenue | 5.000% | 11/1/12 | 12,130 | 12,650 |
| Indiana Finance Authority Revenue (Ascension Health Credit Group) PUT | 1.250% | 5/16/12 | 24,705 | 24,815 |
| 1 Indiana Finance Authority Revenue (Lease Appropriation) TOB VRDO | 0.240% | 11/7/11 | 9,975 | 9,975 |
| Indiana Finance Authority Revenue (Lease Appropriation) VRDO | 0.170% | 11/1/11 | 12,625 | 12,625 |
7
Short-Term Tax-Exempt Fund
| | | | |
| | | | Face | Market |
| | | Maturity | Amount | Value• |
| | Coupon | Date | ($000) | ($000) |
| Indiana Finance Authority Revenue (Marion General Hospital) VRDO | 0.140% | 11/7/11 LOC | 11,200 | 11,200 |
| Indiana Finance Authority Water Utility Revenue (Citizens Energy Project) | 3.000% | 10/1/14 | 5,000 | 5,166 |
| 1 Indiana Health & Educational Facility Financing Authority Revenue | | | | |
| (Ascension Health Credit Group) TOB VRDO | 0.150% | 11/1/11 | 4,470 | 4,470 |
| Indiana Health Facility Financing Authority Revenue (Ascension Health Credit Group) PUT | 3.750% | 2/1/12 | 10,000 | 10,082 |
| Indiana Health Facility Financing Authority Revenue (Ascension Health Credit Group) PUT | 5.000% | 5/1/13 | 2,000 | 2,125 |
| Indiana Health Facility Financing Authority Revenue (Ascension Health Credit Group) PUT | 5.000% | 8/1/13 | 7,605 | 8,178 |
| Indiana Health Facility Financing Authority Revenue (Ascension Health Credit Group) PUT | 1.500% | 8/1/14 | 15,000 | 15,195 |
| Indiana Health Facility Financing Authority Revenue (Ascension Health Credit Group) PUT | 1.700% | 9/1/14 | 10,000 | 10,189 |
| Indiana Health Facility Financing Authority Revenue (Ascension Health Credit Group) PUT | 5.000% | 6/1/15 | 14,825 | 16,666 |
| Indiana Health Facility Financing Authority Revenue (Ascension Health Credit Group) PUT | 5.000% | 7/28/16 | 2,700 | 3,080 |
| Indiana Municipal Power Agency Revenue | 5.000% | 1/1/16 | 800 | 902 |
| Indiana Municipal Power Agency Revenue | 5.000% | 1/1/17 | 1,250 | 1,425 |
| 1 Indiana Transportation Finance Authority Highway Revenue TOB VRDO | 0.140% | 11/7/11 | 18,020 | 18,020 |
| Indianapolis IN Gas Utility Revenue | 5.000% | 6/1/12 | 8,870 | 9,084 |
| Purdue University Indiana University Student Fee Revenue | 5.000% | 7/1/13 | 1,000 | 1,075 |
| Purdue University Indiana University Student Fee Revenue | 4.000% | 7/1/14 | 2,085 | 2,264 |
| St. Joseph County IN Educational Facilities Revenue | | | | |
| (University of Notre Dame Du Lac Project) PUT | 3.875% | 3/1/12 | 12,500 | 12,644 |
| Whiting IN Environmental Facilities Revenue (BP Products North America Inc. Project) PUT | 2.800% | 6/2/14 | 35,000 | 36,141 |
| | | | | 305,714 |
| Iowa (0.3%) | | | | |
| Iowa Finance Authority Health Facilities Revenue (Iowa Health System) | 5.000% | 2/15/12 (12) | 1,540 | 1,559 |
| Iowa Finance Authority Health Facilities Revenue (Iowa Health System) | 5.000% | 2/15/13 (12) | 3,265 | 3,423 |
| Iowa Finance Authority Health Facilities Revenue (Iowa Health System) PUT | 5.000% | 8/15/12 | 9,500 | 9,829 |
| Iowa Finance Authority Health Facilities Revenue (Iowa Health System) VRDO | 0.250% | 11/1/11 LOC | 4,500 | 4,500 |
| Iowa Finance Authority Healthcare Revenue (Genesis Health System) | 4.000% | 7/1/12 | 1,860 | 1,900 |
| Iowa Higher Education Loan Authority Revenue Private College Facility (Grinnell College Project) | 2.100% | 12/1/11 (ETM) | 8,000 | 8,012 |
| Iowa Higher Education Loan Authority Revenue Private College Facility (Grinnell College Project) | 4.000% | 12/1/11 | 1,000 | 1,003 |
| Iowa Higher Education Loan Authority Revenue Private College Facility (Grinnell College Project) | 5.000% | 12/1/12 | 1,700 | 1,786 |
| Iowa Higher Education Loan Authority Revenue Private College Facility (Grinnell College Project) | 5.000% | 12/1/15 | 1,400 | 1,618 |
| Polk County IA GO | 3.000% | 6/1/12 | 510 | 518 |
| | | | | 34,148 |
| Kansas (0.2%) | | | | |
| Kansas Development Finance Authority Hospital Revenue | | | | |
| (Adventist Health System/Sunbelt Obligated Group) | 4.000% | 11/15/13 | 1,000 | 1,062 |
| Kansas Development Finance Authority Hospital Revenue | | | | |
| (Adventist Health System/Sunbelt Obligated Group) | 4.500% | 11/15/14 | 2,500 | 2,737 |
| Kansas Development Finance Authority Revenue | | | | |
| (Sisters of Charity of Leavenworth Health System) | 5.000% | 1/1/14 | 5,150 | 5,534 |
| Wichita KS Hospital Facilities Revenue (Via Christi Health System Inc.) | 3.000% | 11/15/11 | 500 | 501 |
| Wichita KS Hospital Facilities Revenue (Via Christi Health System Inc.) | 4.500% | 11/15/12 | 1,000 | 1,038 |
| Wichita KS Hospital Facilities Revenue (Via Christi Health System Inc.) | 4.000% | 11/15/13 | 225 | 237 |
| Wichita KS Hospital Facilities Revenue (Via Christi Health System Inc.) | 5.000% | 11/15/13 | 2,000 | 2,148 |
| Wichita KS Hospital Facilities Revenue (Via Christi Health System Inc.) | 4.000% | 11/15/14 | 200 | 213 |
| Wichita KS Hospital Facilities Revenue (Via Christi Health System Inc.) | 5.000% | 11/15/14 | 2,000 | 2,189 |
| Wichita KS Hospital Facilities Revenue (Via Christi Health System Inc.) | 5.000% | 11/15/14 | 2,060 | 2,254 |
| Wichita KS Hospital Facilities Revenue (Via Christi Health System Inc.) | 4.500% | 11/15/15 | 355 | 386 |
| Wichita KS Hospital Facilities Revenue (Via Christi Health System Inc.) | 5.000% | 11/15/16 | 750 | 836 |
| | | | | 19,135 |
| Kentucky (0.5%) | | | | |
| Boone County KY Pollution Control Revenue (Duke Energy Kentucky Inc. Project) VRDO | 0.120% | 11/7/11 LOC | 1,900 | 1,900 |
| Kentucky Economic Development Finance Authority Medical Center Revenue | | | | |
| (King’s Daughters Medical Center Project) | 3.000% | 2/1/12 | 1,000 | 1,005 |
| Kentucky Economic Development Finance Authority Solid Waste Revenue | | | | |
| (Republic Services Inc. Project) PUT | 0.800% | 12/1/11 | 5,200 | 5,200 |
| Kentucky Property & Building Commission Revenue | 5.000% | 8/1/15 | 3,675 | 4,156 |
| Kentucky Property & Building Commission Revenue | 5.000% | 11/1/15 | 4,000 | 4,550 |
| Kentucky Property & Building Commission Revenue | 5.000% | 10/1/16 | 3,850 | 4,430 |
| Kentucky Turnpike Authority Economic Development Road Revenue (Revitalization Project) | 5.000% | 7/1/12 | 4,335 | 4,469 |
| Kentucky Turnpike Authority Economic Development Road Revenue (Revitalization Project) | 5.000% | 7/1/13 | 3,730 | 4,000 |
| Louisville & Jefferson County KY Metropolitan Government Pollution Control Revenue | | | | |
| (Louisville Gas & Electric Co. Project) PUT | 5.375% | 12/1/11 | 10,000 | 10,035 |
| Louisville & Jefferson County KY Metropolitan Government Pollution Control Revenue | | | | |
| (Louisville Gas & Electric Co. Project) PUT | 1.900% | 4/2/12 | 15,000 | 15,072 |
| 1 Louisville & Jefferson County KY Metropolitan Sewer District | | | | |
| Sewer & Drainage System Revenue TOB VRDO | 0.140% | 11/7/11 (13) | 4,295 | 4,295 |
| | | | | 59,112 |
| Louisiana (1.7%) | | | | |
| 1 Louisiana Gas & Fuels Tax Revenue TOB VRDO | 0.140% | 11/7/11 | 6,490 | 6,490 |
| 2 Louisiana Gasoline & Fuel Tax Revenue PUT | 0.890% | 6/1/13 | 25,100 | 25,141 |
8
Short-Term Tax-Exempt Fund
| | | | |
| | | | Face | Market |
| | | Maturity | Amount | Value• |
| | Coupon | Date | ($000) | ($000) |
| Louisiana GO | 0.967% | 7/15/14 | 37,000 | 37,006 |
| Louisiana Local Government Environmental Facilities & | | | | |
| Community Development Authority Revenue (LCTCS Facilities Corp. Project) | 4.000% | 10/1/12 | 2,000 | 2,058 |
| Louisiana Office Facilities Corp. Lease Revenue (Capitol Complex Project) | 5.000% | 3/1/14 | 2,900 | 3,120 |
| Louisiana Office Facilities Corp. Lease Revenue (Capitol Complex Project) | 5.000% | 5/1/14 | 1,350 | 1,459 |
| Louisiana Office Facilities Corp. Lease Revenue (Capitol Complex Project) | 5.000% | 5/1/15 | 1,500 | 1,654 |
| Louisiana Offshore Terminal Authority Deep Water Port Revenue (LOOP LLC Project) PUT | 1.600% | 10/1/12 | 4,000 | 4,016 |
| Louisiana Offshore Terminal Authority Deep Water Port Revenue (LOOP LLC Project) PUT | 1.875% | 10/1/13 | 5,000 | 5,045 |
| Louisiana Offshore Terminal Authority Deep Water Port Revenue (LOOP LLC Project) PUT | 2.100% | 10/1/14 | 3,500 | 3,549 |
| Louisiana Offshore Terminal Authority Deep Water Port Revenue (LOOP LLC Project) PUT | 2.125% | 10/1/15 | 5,000 | 4,984 |
| 1 Louisiana Public Facilities Authority Hospital Revenue | | | | |
| (Franciscan Missionaries of Our Lady Health System Project) TOB VRDO | 0.240% | 11/7/11 (4) | 3,330 | 3,330 |
| Louisiana Public Facilities Authority Revenue (CHRISTUS Health) | 5.000% | 7/1/12 (4) | 6,000 | 6,151 |
| Louisiana Public Facilities Authority Revenue (CHRISTUS Health) | 5.000% | 7/1/13 (4) | 6,000 | 6,332 |
| Louisiana Public Facilities Authority Revenue (CHRISTUS Health) | 5.000% | 7/1/14 (4) | 9,785 | 10,527 |
| Louisiana Public Facilities Authority Revenue (Entergy Gulf States Project) | 2.875% | 11/1/15 | 2,250 | 2,281 |
| Orleans Parish LA GO | 4.000% | 9/1/12 (4) | 1,500 | 1,538 |
| Orleans Parish LA GO | 4.000% | 9/1/13 (4) | 2,500 | 2,619 |
| St. James Parish LA Revenue (Nustar Logistics LP Project) VRDO | 0.150% | 11/7/11 LOC | 35,740 | 35,740 |
| St. James Parish LA Revenue (Nustar Logistics LP Project) VRDO | 0.150% | 11/7/11 LOC | 22,500 | 22,500 |
| | | | | 185,540 |
| Maine (0.1%) | | | | |
| 1 Maine Turnpike Authority Turnpike Revenue TOB VRDO | 0.170% | 11/7/11 | 10,005 | 10,005 |
| |
| Maryland (0.9%) | | | | |
| Maryland GO | 5.250% | 3/1/12 | 3,000 | 3,051 |
| Maryland GO | 5.000% | 8/1/16 | 27,680 | 32,503 |
| Maryland Health & Higher Educational Facilities Authority Revenue | | | | |
| (Johns Hopkins Health System Obligated Group) PUT | 5.000% | 11/15/11 | 5,000 | 5,009 |
| Maryland Health & Higher Educational Facilities Authority Revenue | | | | |
| (University of Maryland Medical System) | 5.000% | 7/1/12 | 1,000 | 1,027 |
| Maryland Health & Higher Educational Facilities Authority Revenue | | | | |
| (University of Maryland Medical System) | 6.000% | 7/1/12 (Prere.) | 6,500 | 6,748 |
| Maryland Health & Higher Educational Facilities Authority Revenue VRDO | 0.130% | 11/7/11 LOC | 20,200 | 20,200 |
| Maryland Transportation Authority GAN | 5.000% | 3/1/14 | 7,480 | 8,242 |
| Washington Suburban Sanitation District Maryland GO VRDO | 0.210% | 11/7/11 | 27,900 | 27,900 |
| | | | | 104,680 |
| Massachusetts (3.9%) | | | | |
| 1 Massachusetts Bay Transportation Authority Sales Tax Revenue TOB VRDO | 1.750% | 11/1/11 | 25,575 | 25,575 |
| 1 Massachusetts Bay Transportation Authority Sales Tax Revenue TOB VRDO | 2.000% | 11/7/11 | 19,989 | 19,989 |
| Massachusetts Department of Transportation Metropolitan Highway System Revenue | 5.000% | 1/1/13 | 8,000 | 8,389 |
| Massachusetts Department of Transportation Metropolitan Highway System Revenue VRDO | 0.100% | 11/7/11 LOC | 1,000 | 1,000 |
| Massachusetts Development Finance Agency Revenue (Boston University) | 2.875% | 10/1/14 | 5,000 | 5,193 |
| Massachusetts Development Finance Agency Revenue (Boston University) | 2.875% | 10/1/14 | 2,500 | 2,597 |
| Massachusetts Development Finance Agency Revenue (Dominion Energy Brayton Project) PUT | 2.250% | 9/1/16 | 20,000 | 20,087 |
| Massachusetts Development Finance Agency Revenue (Partners Healthcare) PUT | 5.000% | 1/14/16 | 6,000 | 6,726 |
| Massachusetts Development Finance Agency Revenue (Tufts Medical Center) | 4.000% | 1/1/13 | 1,400 | 1,430 |
| Massachusetts Development Finance Agency Revenue (Tufts Medical Center) | 5.000% | 1/1/15 | 1,245 | 1,321 |
| 2 Massachusetts Development Finance Agency Revenue (Williams College) PUT | 0.640% | 7/1/14 | 13,850 | 13,876 |
| Massachusetts GO | 5.250% | 11/1/11 (Prere.) | 10,000 | 10,000 |
| Massachusetts GO | 5.250% | 11/1/11 (Prere.) | 15,000 | 15,000 |
| Massachusetts GO | 6.000% | 11/1/11 | 10,810 | 10,810 |
| 2 Massachusetts GO | 0.380% | 2/1/12 | 13,000 | 13,000 |
| 2 Massachusetts GO | 0.520% | 2/1/13 | 20,630 | 20,630 |
| 2 Massachusetts GO | 0.620% | 2/1/14 | 15,000 | 15,000 |
| 2 Massachusetts GO | 0.670% | 2/1/14 | 15,000 | 15,008 |
| Massachusetts GO | 5.000% | 1/1/15 | 4,000 | 4,496 |
| 2 Massachusetts GO | 0.800% | 2/1/15 | 8,300 | 8,306 |
| 1 Massachusetts GO TOB VRDO | 0.140% | 11/7/11 | 36,740 | 36,740 |
| 1 Massachusetts GO TOB VRDO | 2.250% | 11/7/11 LOC | 15,975 | 15,975 |
| Massachusetts GO VRDO | 0.170% | 11/1/11 | 2,000 | 2,000 |
| Massachusetts GO VRDO | 0.250% | 11/7/11 | 50,000 | 50,000 |
| Massachusetts Health & Educational Facilities Authority Revenue (Amherst College) PUT | 2.750% | 1/5/12 | 4,000 | 4,018 |
| Massachusetts Health & Educational Facilities Authority Revenue (Amherst College) PUT | 1.000% | 11/1/14 | 8,400 | 8,390 |
| Massachusetts Health & Educational Facilities Authority Revenue (Caregroup) | 5.000% | 7/1/12 | 3,000 | 3,079 |
| 1 Massachusetts Health & Educational Facilities Authority Revenue (Harvard University) TOB VRDO | 0.140% | 11/7/11 | 7,500 | 7,500 |
| Massachusetts Health & Educational Facilities Authority Revenue (Northeastern University) | 4.000% | 10/1/12 | 5,000 | 5,142 |
| Massachusetts Health & Educational Facilities Authority Revenue (Northeastern University) | 5.000% | 10/1/12 | 2,500 | 2,592 |
| Massachusetts Health & Educational Facilities Authority Revenue (Northeastern University) PUT | 4.125% | 2/16/12 | 6,000 | 6,068 |
| Massachusetts Health & Educational Facilities Authority Revenue (Northeastern University) PUT | 4.100% | 4/19/12 | 13,100 | 13,327 |
| Massachusetts Health & Educational Facilities Authority Revenue (Northeastern University) PUT | 2.700% | 2/20/14 | 5,000 | 5,183 |
9
Short-Term Tax-Exempt Fund
| | | | |
| | | | Face | Market |
| | | Maturity | Amount | Value• |
| | Coupon | Date | ($000) | ($000) |
| Massachusetts Health & Educational Facilities Authority Revenue | | | | |
| (Partners Healthcare System) VRDO | 0.100% | 11/7/11 | 5,000 | 5,000 |
| Massachusetts Special Obligation Revenue | 4.000% | 6/15/12 | 5,695 | 5,826 |
| 1 Massachusetts Water Resources Authority Revenue TOB VRDO | 0.140% | 11/7/11 | 3,920 | 3,920 |
| 1 Massachusetts Water Resources Authority Revenue TOB VRDO | 2.430% | 11/7/11 (4)LOC | 19,795 | 19,795 |
| Massachusetts Water Resources Authority Revenue VRDO | 0.110% | 11/7/11 | 23,390 | 23,390 |
| | | | | 436,378 |
| Michigan (1.6%) | | | | |
| Detroit MI GO | 5.000% | 4/1/12 (12) | 8,860 | 8,944 |
| Detroit MI Sewer System Revenue | 5.000% | 7/1/13 (Prere.) | 14,935 | 16,039 |
| Kent Hospital MI Finance Authority Revenue (Spectrum Health) | 5.000% | 11/15/13 | 1,000 | 1,074 |
| Kent Hospital MI Finance Authority Revenue (Spectrum Health) | 5.000% | 11/15/14 | 1,000 | 1,097 |
| Macomb County MI Revenue | 5.875% | 11/15/13 (Prere.) | 9,590 | 10,615 |
| Michigan Building Authority Revenue | 3.000% | 10/15/12 | 1,150 | 1,175 |
| Michigan Hospital Finance Authority Revenue (Ascension Health Credit Group) | 5.000% | 11/15/15 | 3,000 | 3,379 |
| Michigan Hospital Finance Authority Revenue (Ascension Health Credit Group) PUT | 3.750% | 3/15/12 | 10,000 | 10,125 |
| Michigan Hospital Finance Authority Revenue (Ascension Health Credit Group) PUT | 1.500% | 6/1/12 | 17,300 | 17,424 |
| Michigan Hospital Finance Authority Revenue (Ascension Health Credit Group) PUT | 5.000% | 11/1/12 | 4,735 | 4,945 |
| Michigan Hospital Finance Authority Revenue (Ascension Health Credit Group) PUT | 1.350% | 4/1/13 | 10,000 | 10,111 |
| Michigan Hospital Finance Authority Revenue (Henry Ford Health System) | 4.000% | 11/15/13 | 1,000 | 1,038 |
| Michigan Hospital Finance Authority Revenue (Henry Ford Health System) | 4.000% | 11/15/14 | 1,500 | 1,562 |
| Michigan Hospital Finance Authority Revenue (McClaren Health) VRDO | 0.130% | 11/7/11 LOC | 11,700 | 11,700 |
| Michigan Hospital Finance Authority Revenue (Trinity Health) | 4.000% | 12/1/13 | 1,000 | 1,063 |
| Michigan Housing Development Authority Single Family Mortgage Revenue VRDO | 0.130% | 11/7/11 | 10,000 | 10,000 |
| Michigan Municipal Bond Authority Revenue (State Clean Water Revolving Fund) | 5.000% | 10/1/12 | 3,065 | 3,198 |
| Michigan Municipal Bond Authority Revenue (State Clean Water Revolving Fund) | 5.000% | 10/1/12 | 1,910 | 1,993 |
| Michigan Municipal Bond Authority Revenue (State Clean Water Revolving Fund) | 5.000% | 10/1/15 | 3,185 | 3,664 |
| Michigan Municipal Bond Authority Revenue (State Clean Water Revolving Fund) | 5.000% | 10/1/15 | 1,835 | 2,111 |
| Michigan Strategic Fund Limited Obligation Revenue (Detroit Edison Co. Project) PUT | 3.050% | 12/3/12 | 9,000 | 9,183 |
| Michigan Strategic Fund Limited Obligation Revenue (Detroit Edison Co. Project) PUT | 2.125% | 9/1/16 | 10,000 | 9,999 |
| Oakland County MI Economic Development Corp. Revenue | | | | |
| (Cranbrook Educational Community Project) VRDO | 0.130% | 11/7/11 LOC | 3,475 | 3,475 |
| Royal Oak MI Hospital Finance Authority Hospital Revenue (Beaumont Hospital) | 5.000% | 8/1/15 | 2,500 | 2,686 |
| Saginaw MI Hospital Finance Authority Hospital Revenue (Covenant Medical Center Inc.) | 4.000% | 7/1/12 | 2,150 | 2,176 |
| Saginaw MI Hospital Finance Authority Hospital Revenue (Covenant Medical Center Inc.) | 5.000% | 7/1/13 | 2,250 | 2,338 |
| Saginaw MI Hospital Finance Authority Hospital Revenue (Covenant Medical Center Inc.) | 5.000% | 7/1/14 | 2,310 | 2,428 |
| Saginaw MI Hospital Finance Authority Hospital Revenue (Covenant Medical Center Inc.) | 5.000% | 7/1/15 | 2,215 | 2,349 |
| 1 Saginaw Valley State University Michigan Revenue TOB VRDO | 0.340% | 11/7/11 (4) | 5,000 | 5,000 |
| University of Michigan University Revenue | 4.000% | 4/1/15 | 9,600 | 10,555 |
| Wayne County MI Airport Authority Revenue (Detroit Metropolitan Wayne County Airport) | 4.000% | 12/1/11 | 3,995 | 4,006 |
| Wayne State University Michigan Revenue | 5.000% | 11/15/12 | 1,500 | 1,564 |
| Wayne State University Michigan Revenue | 5.000% | 11/15/13 | 1,540 | 1,651 |
| | | | | 178,667 |
| Minnesota (0.7%) | | | | |
| Minnesota GO | 4.000% | 12/1/11 | 11,725 | 11,762 |
| Minnesota GO | 4.000% | 8/1/12 | 17,810 | 18,311 |
| Minnesota Higher Education Facilities Authority Revenue (Carleton College) VRDO | 0.130% | 11/7/11 | 10,000 | 10,000 |
| Minnesota Public Facilities Authority Revenue (State Revolving Fund) | 5.000% | 3/1/15 | 11,180 | 12,664 |
| Minnesota Public Facilities Authority Revenue (State Revolving Fund) | 5.000% | 3/1/16 | 11,535 | 13,357 |
| St. Cloud MN Health Care Revenue (Centracare Health System) | 5.000% | 5/1/12 | 1,000 | 1,021 |
| St. Cloud MN Health Care Revenue (Centracare Health System) | 5.000% | 5/1/13 | 1,000 | 1,054 |
| St. Cloud MN Health Care Revenue (Centracare Health System) | 5.000% | 5/1/14 | 1,000 | 1,076 |
| St. Louis Park MN Health Care Facilities Revenue (Park Nicollet Health Services) | 5.500% | 7/1/12 | 5,000 | 5,133 |
| | | | | 74,378 |
| Mississippi (0.3%) | | | | |
| Medical Center Educational Building Corp. Revenue (University of Mississippi Medical Center) | 4.000% | 6/1/12 | 1,250 | 1,274 |
| Medical Center Educational Building Corp. Revenue (University of Mississippi Medical Center) | 4.000% | 6/1/14 | 1,000 | 1,068 |
| Mississippi Business Finance Corp. Revenue (Mississippi Power Co. Project) PUT | 2.250% | 1/15/13 | 6,000 | 6,054 |
| Mississippi Business Finance Corp. Solid Waste Disposal Revenue | | | | |
| (Waste Management Inc. Project) PUT | 2.000% | 9/2/14 | 4,900 | 4,902 |
| Mississippi Business Finance Corp. Solid Waste Disposal Revenue | | | | |
| (Waste Management Inc. Project) PUT | 1.250% | 11/3/14 | 13,700 | 13,708 |
| Mississippi GO (Nissan Project) VRDO | 0.180% | 11/7/11 | 12,370 | 12,370 |
| | | | | 39,376 |
| Missouri (1.3%) | | | | |
| Missouri Health & Educational Facilities Authority Health Facilities Revenue | | | | |
| (Sisters of Mercy Health System) VRDO | 0.110% | 11/7/11 | 5,000 | 5,000 |
| Missouri Health & Educational Facilities Authority Health Facilities Revenue | | | | |
| (St. Luke’s Episcopal - Presbyterian Hospital) | 2.000% | 12/1/11 | 3,970 | 3,974 |
10
Short-Term Tax-Exempt Fund
| | | | |
| | | | Face | Market |
| | | Maturity | Amount | Value• |
| | Coupon | Date | ($000) | ($000) |
| Missouri Health & Educational Facilities Authority Health Facilities Revenue | | | | |
| (St. Luke’s Episcopal - Presbyterian Hospital) | 5.000% | 12/1/13 | 1,000 | 1,069 |
| Missouri Health & Educational Facilities Authority Health Facilities Revenue | | | | |
| (St. Luke’s Health System) VRDO | 0.180% | 11/7/11 LOC | 18,025 | 18,025 |
| Missouri Health & Educational Facilities Authority Health Facilities Revenue | | | | |
| (St. Luke’s Health System) VRDO | 0.180% | 11/7/11 LOC | 18,550 | 18,550 |
| Missouri Health & Educational Facilities Authority Health Facilities Revenue | | | | |
| (St. Luke’s Health System) VRDO | 0.180% | 11/7/11 LOC | 41,200 | 41,200 |
| Missouri Health & Educational Facilities Authority Revenue (Ascension Health Credit Group) PUT | 1.250% | 5/16/12 | 16,050 | 16,136 |
| Missouri Health & Educational Facilities Authority Revenue (Ascension Health Credit Group) PUT | 1.250% | 5/16/12 | 29,100 | 29,244 |
| Missouri Highways & Transportation Commission Road Revenue | 3.000% | 2/1/13 | 15,500 | 16,012 |
| | | | | 149,210 |
| Montana (0.1%) | | | | |
| Montana Facility Finance Authority Revenue (Sisters of Charity of Leavenworth Health System) | 5.000% | 1/1/13 | 3,035 | 3,175 |
| Montana Facility Finance Authority Revenue (Sisters of Charity of Leavenworth Health System) | 5.000% | 1/1/14 | 6,135 | 6,614 |
| | | | | 9,789 |
| Nebraska (0.9%) | | | | |
| Central Plains Energy Project Nebraska Gas Project Revenue (Project No. 2) VRDO | 0.140% | 11/7/11 | 40 | 40 |
| Nebraska Investment Finance Authority Single Family Housing Revenue VRDO | 0.130% | 11/7/11 | 76,985 | 76,985 |
| 1 Nebraska Public Power District Revenue TOB VRDO | 0.150% | 11/7/11 (13) | 5,665 | 5,665 |
| 1 Omaha NE Public Power District Separate Electric Revenue TOB VRDO | 0.130% | 11/7/11 LOC | 18,220 | 18,220 |
| | | | | 100,910 |
| Nevada (1.4%) | | | | |
| Clark County NV Airport BAN | 5.000% | 7/1/12 | 30,000 | 30,836 |
| Clark County NV Bond Bank GO | 5.000% | 6/1/12 (ETM) | 5,000 | 5,139 |
| Clark County NV GO | 5.000% | 11/1/11 | 7,315 | 7,315 |
| Clark County NV GO | 5.000% | 11/1/12 | 6,755 | 7,046 |
| Clark County NV Industrial Development Revenue (Southwest Gas Corp. Project) VRDO | 0.130% | 11/7/11 LOC | 34,000 | 34,000 |
| Clark County NV Passenger Facility Charge Revenue (Las Vegas McCarran International Airport) | 3.000% | 7/1/12 | 2,000 | 2,029 |
| Clark County NV Passenger Facility Charge Revenue (Las Vegas McCarran International Airport) | 5.000% | 7/1/12 | 2,700 | 2,776 |
| Clark County NV Passenger Facility Charge Revenue (Las Vegas McCarran International Airport) | 4.000% | 7/1/13 | 2,000 | 2,088 |
| Clark County NV School District GO | 5.500% | 12/15/11 (Prere.) | 6,000 | 6,039 |
| Clark County NV School District GO | 5.000% | 6/15/13 (14) | 9,645 | 10,282 |
| Clark County NV School District GO | 5.250% | 6/15/13 (14) | 20,335 | 21,760 |
| Las Vegas Valley Water District Nevada GO | 5.000% | 6/1/12 (14) | 5,125 | 5,261 |
| Las Vegas Valley Water District Nevada GO | 5.000% | 6/1/13 | 500 | 533 |
| Las Vegas Valley Water District Nevada GO | 5.000% | 6/1/14 | 250 | 274 |
| Las Vegas Valley Water District Nevada GO | 5.000% | 6/1/15 | 500 | 559 |
| Nevada Capital Improvement & Cultural Affairs GO | 5.000% | 12/1/11 (14) | 5,210 | 5,230 |
| Nevada Capital Improvement & Cultural Affairs GO | 5.000% | 5/1/12 | 2,545 | 2,603 |
| Nevada Capital Improvement & Cultural Affairs GO | 5.000% | 5/1/13 | 4,000 | 4,250 |
| 1 Nevada System of Higher Education University Revenue TOB VRDO | 0.140% | 11/7/11 | 7,555 | 7,555 |
| | | | | 155,575 |
| New Hampshire (0.1%) | | | | |
| New Hampshire GO | 5.000% | 8/15/14 | 2,500 | 2,792 |
| New Hampshire GO | 5.000% | 2/15/15 | 1,285 | 1,453 |
| New Hampshire GO | 5.000% | 8/15/15 | 5,000 | 5,732 |
| | | | | 9,977 |
| New Jersey (3.2%) | | | | |
| Garden State Preservation Trust New Jersey Revenue (Open Space & Farmland Preservation) | 5.250% | 11/1/12 (4) | 10,000 | 10,491 |
| Garden State Preservation Trust New Jersey Revenue (Open Space & Farmland Preservation) | 5.500% | 11/1/14 (4) | 6,725 | 7,666 |
| New Jersey Building Authority Revenue | 5.000% | 12/15/11 | 10,415 | 10,474 |
| New Jersey Building Authority Revenue | 5.000% | 12/15/12 | 11,145 | 11,682 |
| New Jersey Building Authority Revenue | 5.000% | 12/15/13 | 11,710 | 12,708 |
| New Jersey COP | 5.000% | 6/15/12 | 3,800 | 3,909 |
| New Jersey COP | 5.000% | 6/15/13 | 5,000 | 5,284 |
| New Jersey COP | 5.000% | 6/15/14 | 5,120 | 5,488 |
| New Jersey Economic Development Authority Revenue (School Facilities Construction) | 5.000% | 9/1/15 | 5,000 | 5,553 |
| New Jersey Economic Development Authority Revenue (School Facilities Construction) | 5.000% | 9/1/15 | 12,000 | 13,327 |
| New Jersey Economic Development Authority Revenue (School Facilities Construction) | 5.000% | 9/1/16 | 5,000 | 5,617 |
| New Jersey Economic Development Authority Revenue (School Facilities Construction) | 5.000% | 12/15/16 | 5,125 | 5,779 |
| New Jersey Educational Facilities Authority Revenue (University Medical & Dentistry) | 5.500% | 12/1/13 | 8,200 | 8,761 |
| New Jersey Equipment Lease Purchase COP | 5.000% | 6/15/12 | 7,570 | 7,786 |
| New Jersey GO | 6.000% | 2/15/13 | 5,000 | 5,344 |
| New Jersey GO | 6.000% | 2/15/13 (14) | 15,000 | 16,031 |
| 1 New Jersey GO TOB VRDO | 0.150% | 11/1/11 | 29,495 | 29,495 |
| New Jersey Health Care Facilities Financing Authority Revenue | | | | |
| (Hospital Asset Transformation Program) | 5.000% | 10/1/12 | 3,995 | 4,143 |
| New Jersey Health Care Facilities Financing Authority Revenue | | | | |
| (Hospital Capital Asset Pooled Program) VRDO | 0.130% | 11/7/11 LOC | 6,100 | 6,100 |
11
Short-Term Tax-Exempt Fund
| | | | |
| | | | Face | Market |
| | | Maturity | Amount | Value• |
| | Coupon | Date | ($000) | ($000) |
| 3 New Jersey Health Care Facilities Financing Authority Revenue | | | | |
| (St. Barnabas Health Care System) | 3.000% | 7/1/12 | 2,200 | 2,219 |
| 3 New Jersey Health Care Facilities Financing Authority Revenue | | | | |
| (St. Barnabas Health Care System) | 5.000% | 7/1/13 | 3,035 | 3,176 |
| New Jersey Higher Education Assistance Authority Student Loan Revenue | 4.000% | 12/1/13 | 8,470 | 8,849 |
| New Jersey Higher Education Assistance Authority Student Loan Revenue | 5.000% | 12/1/13 | 2,500 | 2,666 |
| New Jersey Higher Education Assistance Authority Student Loan Revenue | 5.000% | 12/1/15 | 2,500 | 2,760 |
| New Jersey Transportation Trust Fund Authority Transportation System Revenue | 6.000% | 12/15/11 (Prere.) | 2,025 | 2,039 |
| New Jersey Transportation Trust Fund Authority Transportation System Revenue | 5.500% | 12/15/13 (4) | 5,705 | 6,227 |
| 1 New Jersey Transportation Trust Fund Authority Transportation System Revenue TOB VRDO | 0.140% | 11/7/11 LOC | 10,800 | 10,800 |
| New Jersey Turnpike Authority Revenue VRDO | 0.350% | 11/7/11 (4) | 40,650 | 40,650 |
| Salem County NJ Pollution Control Financing Authority Revenue | | | | |
| (Public Service Electric & Gas Co. Project) PUT | 0.950% | 11/1/11 | 16,500 | 16,500 |
| Tobacco Settlement Financing Corp. New Jersey Revenue | 5.750% | 6/1/12 (Prere.) | 24,065 | 24,835 |
| Tobacco Settlement Financing Corp. New Jersey Revenue | 6.000% | 6/1/12 (Prere.) | 12,900 | 13,331 |
| Tobacco Settlement Financing Corp. New Jersey Revenue | 6.125% | 6/1/12 (Prere.) | 17,285 | 17,875 |
| Tobacco Settlement Financing Corp. New Jersey Revenue | 6.125% | 6/1/12 (Prere.) | 1,455 | 1,505 |
| Tobacco Settlement Financing Corp. New Jersey Revenue | 6.250% | 6/1/13 (Prere.) | 14,000 | 15,292 |
| Tobacco Settlement Financing Corp. New Jersey Revenue | 6.375% | 6/1/13 (Prere.) | 19,140 | 20,677 |
| | | | | 365,039 |
| New Mexico (1.3%) | | | | |
| New Mexico Educational Assistance Foundation Revenue | 4.000% | 9/1/15 | 4,400 | 4,784 |
| New Mexico Educational Assistance Foundation Revenue | 4.000% | 12/1/15 | 3,800 | 4,146 |
| New Mexico Finance Authority Transportation Revenue VRDO | 0.090% | 11/7/11 LOC | 10,880 | 10,880 |
| New Mexico GO | 5.000% | 3/1/13 | 5,535 | 5,873 |
| New Mexico GO | 5.000% | 3/1/13 | 7,845 | 8,324 |
| New Mexico GO | 5.000% | 3/1/14 | 9,405 | 10,352 |
| New Mexico Hospital Equipment Loan Council Hospital System Revenue | | | | |
| (Presbyterian Healthcare Services) VRDO | 0.120% | 11/7/11 | 8,760 | 8,760 |
| New Mexico Hospital Equipment Loan Council Hospital System Revenue | | | | |
| (Presbyterian Healthcare Services) VRDO | 0.140% | 11/7/11 | 27,800 | 27,800 |
| New Mexico Municipal Energy Acquisition Authority Gas Supply Revenue VRDO | 0.140% | 11/7/11 | 9,965 | 9,965 |
| New Mexico Severance Tax Revenue | 5.000% | 7/1/13 | 27,900 | 30,005 |
| New Mexico Severance Tax Revenue | 5.000% | 7/1/15 | 9,150 | 10,461 |
| New Mexico Severance Tax Revenue | 5.000% | 7/1/15 | 5,815 | 6,648 |
| New Mexico Severance Tax Revenue | 5.000% | 7/1/16 | 7,445 | 8,684 |
| | | | | 146,682 |
| New York (10.9%) | | | | |
| Erie County NY Industrial Development Agency School Facility Revenue | | | | |
| (Buffalo City School District Project) | 5.000% | 5/1/13 | 4,620 | 4,914 |
| Erie County NY Industrial Development Agency School Facility Revenue | | | | |
| (Buffalo City School District Project) | 5.000% | 5/1/13 | 1,350 | 1,436 |
| Erie County NY Industrial Development Agency School Facility Revenue | | | | |
| (Buffalo City School District Project) | 5.000% | 5/1/14 | 1,000 | 1,097 |
| Long Island NY Power Authority Electric System Revenue | 5.500% | 12/1/11 | 1,000 | 1,004 |
| Long Island NY Power Authority Electric System Revenue | 5.000% | 5/1/14 | 8,000 | 8,737 |
| Long Island NY Power Authority Electric System Revenue | 5.000% | 5/1/15 (14) | 1,000 | 1,117 |
| Long Island NY Power Authority Electric System Revenue | 5.000% | 5/1/15 | 8,320 | 9,295 |
| Long Island NY Power Authority Electric System Revenue | 5.000% | 5/1/16 | 4,315 | 4,889 |
| Metropolitan New York Transportation Authority Revenue | 5.250% | 11/15/15 (14) | 5,000 | 5,334 |
| 1 Metropolitan New York Transportation Authority Revenue | | | | |
| (Dedicated Petroleum Tax) TOB VRDO | 0.140% | 11/7/11 (13) | 20,000 | 20,000 |
| 2 Metropolitan New York Transportation Authority Revenue (Dedicated Tax Fund) PUT | 0.540% | 11/1/12 | 11,500 | 11,502 |
| 2 Metropolitan New York Transportation Authority Revenue (Dedicated Tax Fund) PUT | 0.690% | 11/1/13 | 17,000 | 17,000 |
| 2 Metropolitan New York Transportation Authority Revenue (Dedicated Tax Fund) PUT | 0.820% | 11/1/14 | 6,320 | 6,321 |
| Metropolitan New York Transportation Authority Revenue (Transit Revenue) PUT | 5.000% | 11/15/12 | 20,000 | 20,865 |
| Metropolitan New York Transportation Authority Revenue (Transit Revenue) PUT | 5.000% | 11/15/13 | 20,710 | 22,305 |
| Metropolitan New York Transportation Authority Revenue (Transit Revenue) PUT | 5.000% | 11/15/14 | 3,585 | 3,975 |
| 1 Metropolitan New York Transportation Authority Revenue TOB VRDO | 0.150% | 11/7/11 (13) | 12,780 | 12,780 |
| 1 Metropolitan New York Transportation Authority Revenue TOB VRDO | 0.240% | 11/7/11 (4) | 6,125 | 6,125 |
| Nassau County NY Interim Finance Authority Sales Tax Revenue VRDO | 0.100% | 11/7/11 | 9,900 | 9,900 |
| Nassau County NY Interim Finance Authority Sales Tax Revenue VRDO | 0.120% | 11/7/11 | 20,350 | 20,350 |
| Nassau County NY Interim Finance Authority Sales Tax Revenue VRDO | 0.180% | 11/7/11 | 13,100 | 13,100 |
| Nassau County NY Sewer & Storm Water Finance Authority System Revenue | 5.000% | 11/1/12 | 4,980 | 5,187 |
| New York City NY Cultural Resources Revenue (Julliard School) PUT | 2.750% | 7/1/12 | 8,000 | 8,131 |
| New York City NY GO | 5.000% | 8/1/12 | 27,760 | 28,727 |
| New York City NY GO | 5.250% | 8/1/12 (ETM) | 1,215 | 1,260 |
| New York City NY GO | 5.250% | 8/1/12 | 7,320 | 7,589 |
| New York City NY GO | 5.500% | 2/1/13 (Prere.) | 180 | 192 |
| New York City NY GO | 5.000% | 2/1/14 | 3,500 | 3,828 |
| New York City NY GO | 5.000% | 8/1/14 | 11,525 | 12,812 |
12
Short-Term Tax-Exempt Fund
| | | | |
| | | | Face | Market |
| | | Maturity | Amount | Value• |
| | Coupon | Date | ($000) | ($000) |
| New York City NY GO | 5.000% | 8/1/15 | 1,500 | 1,701 |
| New York City NY GO | 5.250% | 8/1/15 | 10,355 | 11,520 |
| New York City NY GO | 5.500% | 8/1/15 | 9,495 | 10,039 |
| New York City NY GO | 5.000% | 8/1/16 | 5,000 | 5,775 |
| 1 New York City NY GO TOB VRDO | 0.140% | 11/7/11 | 6,845 | 6,845 |
| New York City NY GO VRDO | 0.110% | 11/7/11 LOC | 2,400 | 2,400 |
| New York City NY Health & Hospital Corp. Revenue (Health System) | 5.000% | 2/15/12 | 6,655 | 6,738 |
| New York City NY Health & Hospital Corp. Revenue (Health System) | 5.000% | 2/15/15 | 1,500 | 1,661 |
| New York City NY Housing Development Corp. Multi-Family Housing Revenue | 5.000% | 11/1/11 | 15,740 | 15,740 |
| New York City NY Housing Development Corp. Multi-Family Housing Revenue | 5.000% | 5/1/12 | 10,960 | 11,174 |
| New York City NY Housing Development Corp. Multi-Family Housing Revenue PUT | 2.500% | 12/27/13 | 27,745 | 27,778 |
| 1 New York City NY Housing Development Corp. Multi-Family Housing Revenue TOB VRDO | 0.140% | 11/7/11 | 4,325 | 4,325 |
| 1 New York City NY Housing Development Corp. Multi-Family Housing Revenue TOB VRDO | 0.160% | 11/7/11 | 6,400 | 6,400 |
| New York City NY Municipal Water Finance Authority Water & Sewer System Revenue | 5.000% | 6/15/15 (4) | 5,000 | 5,546 |
| 1 New York City NY Municipal Water Finance Authority Water & Sewer System Revenue | | | | |
| TOB VRDO | 0.150% | 11/1/11 | 10,000 | 10,000 |
| 1 New York City NY Municipal Water Finance Authority Water & Sewer System Revenue | | | | |
| TOB VRDO | 0.140% | 11/7/11 | 3,000 | 3,000 |
| 1 New York City NY Municipal Water Finance Authority Water & Sewer System Revenue | | | | |
| TOB VRDO | 0.140% | 11/7/11 | 5,840 | 5,840 |
| 1 New York City NY Transitional Finance Authority Building Aid Revenue TOB VRDO | 0.150% | 11/7/11 (4) | 25,650 | 25,650 |
| New York City NY Transitional Finance Authority Future Tax Revenue | 5.500% | 11/1/11 | 4,950 | 4,950 |
| New York City NY Transitional Finance Authority Future Tax Revenue | 4.000% | 11/1/11 | 33,810 | 33,810 |
| New York City NY Transitional Finance Authority Future Tax Revenue | 5.000% | 11/1/13 (ETM) | 15,860 | 17,281 |
| New York City NY Transitional Finance Authority Future Tax Revenue | 5.000% | 11/1/13 | 28,475 | 31,002 |
| New York City NY Transitional Finance Authority Future Tax Revenue | 5.000% | 11/1/14 (ETM) | 2,405 | 2,713 |
| New York City NY Transitional Finance Authority Future Tax Revenue | 5.000% | 11/1/14 | 23,355 | 26,247 |
| New York City NY Transitional Finance Authority Future Tax Revenue | 5.000% | 11/1/15 | 10,000 | 11,470 |
| New York City NY Transitional Finance Authority Future Tax Revenue | 5.000% | 11/1/16 | 4,000 | 4,666 |
| 3 New York City NY Transitional Finance Authority Future Tax Revenue | 5.000% | 11/1/16 | 10,000 | 11,664 |
| 1 New York City NY Transitional Finance Authority Future Tax Revenue TOB VRDO | 0.140% | 11/7/11 | 1,000 | 1,000 |
| 1 New York City NY Transitional Finance Authority Future Tax Revenue TOB VRDO | 0.140% | 11/7/11 | 5,800 | 5,800 |
| New York City NY Transitional Finance Authority Future Tax Revenue VRDO | 0.110% | 11/7/11 | 11,000 | 11,000 |
| New York State Dormitory Authority Lease Revenue (Mental Health Services Facilities) | 5.000% | 2/15/15 | 2,000 | 2,232 |
| New York State Dormitory Authority Lease Revenue (Mental Health Services Facilities) | 5.000% | 8/15/15 | 5,000 | 5,648 |
| 1 New York State Dormitory Authority Lease Revenue | | | | |
| (State University Dormitory Facilities) TOB VRDO | 0.140% | 11/7/11 | 8,995 | 8,995 |
| New York State Dormitory Authority Revenue (City University System) | 5.000% | 7/1/15 | 11,410 | 12,877 |
| New York State Dormitory Authority Revenue (Mental Health Services Facilities Improvement) | 4.000% | 2/15/12 | 2,230 | 2,253 |
| New York State Dormitory Authority Revenue (Mental Health Services Facilities Improvement) | 5.000% | 2/15/12 | 5,000 | 5,068 |
| New York State Dormitory Authority Revenue (Mental Health Services Facilities Improvement) | 5.000% | 8/15/12 | 7,025 | 7,277 |
| New York State Dormitory Authority Revenue | | | | |
| (Mount Sinai School of Medicine of New York University) | 5.000% | 7/1/13 | 2,000 | 2,121 |
| New York State Dormitory Authority Revenue | | | | |
| (Mount Sinai School of Medicine of New York University) | 5.000% | 7/1/14 | 2,000 | 2,175 |
| New York State Dormitory Authority Revenue | | | | |
| (Mount Sinai School of Medicine of New York University) | 5.000% | 7/1/15 | 1,095 | 1,214 |
| New York State Dormitory Authority Revenue (Personal Income Tax) | 5.000% | 3/15/12 | 3,890 | 3,959 |
| New York State Dormitory Authority Revenue (Personal Income Tax) | 5.000% | 3/15/12 | 8,140 | 8,284 |
| New York State Dormitory Authority Revenue (Personal Income Tax) | 5.000% | 2/15/15 | 14,125 | 15,881 |
| New York State Dormitory Authority Revenue (Personal Income Tax) | 5.000% | 2/15/16 | 10,000 | 11,465 |
| 1 New York State Dormitory Authority Revenue (Personal Income Tax) TOB VRDO | 0.140% | 11/7/11 | 5,000 | 5,000 |
| 1 New York State Dormitory Authority Revenue (Personal Income Tax) TOB VRDO | 0.200% | 11/7/11 | 6,500 | 6,500 |
| New York State Dormitory Authority Revenue (Rockefeller University) VRDO | 0.120% | 11/7/11 | 1,500 | 1,500 |
| New York State Dormitory Authority Revenue (School Districts Financing Program) | 5.000% | 10/1/16 | 10,205 | 11,604 |
| New York State Dormitory Authority Revenue (Service Contract) | 4.000% | 7/1/12 | 13,210 | 13,524 |
| New York State Dormitory Authority Revenue (Service Contract) | 5.000% | 7/1/13 | 15,095 | 16,171 |
| New York State Dormitory Authority Revenue (Service Contract) | 4.000% | 7/1/14 | 1,270 | 1,365 |
| New York State Dormitory Authority Revenue (State University Educational Facilities) PUT | 5.250% | 5/15/12 | 10,670 | 10,941 |
| New York State Energy Research & Development Authority Pollution Control Revenue | | | | |
| (New York State Electric & Gas Corp. Project) | 2.125% | 3/15/15 | 7,000 | 6,933 |
| New York State Energy Research & Development Authority Pollution Control Revenue | | | | |
| (New York State Electric & Gas Corp. Project) PUT | 3.000% | 6/3/13 | 5,000 | 5,098 |
| New York State Energy Research & Development Authority Pollution Control Revenue | | | | |
| (New York State Electric & Gas Corp. Project) PUT | 3.000% | 6/3/13 | 5,000 | 5,098 |
| 1 New York State Local Government Assistance Corp. Revenue TOB VRDO | 0.200% | 11/7/11 | 6,305 | 6,305 |
| New York State Local Government Assistance Corp. Revenue VRDO | 0.110% | 11/7/11 | 16,100 | 16,100 |
| New York State Municipal Bond Bank Agency Special School Purpose Revenue | 5.500% | 12/1/12 | 6,955 | 7,322 |
| New York State Thruway Authority Revenue (Highway& Bridge Trust Fund) | 5.000% | 4/1/12 | 3,770 | 3,845 |
| New York State Thruway Authority Revenue (Highway& Bridge Trust Fund) | 4.000% | 4/1/14 | 2,500 | 2,684 |
| New York State Thruway Authority Revenue (Highway& Bridge Trust Fund) | 4.000% | 4/1/14 | 2,665 | 2,861 |
| New York State Thruway Authority Revenue (Highway& Bridge Trust Fund) | 4.000% | 4/1/15 | 2,840 | 3,098 |
13
Short-Term Tax-Exempt Fund
| | | | |
| | | | Face | Market |
| | | Maturity | Amount | Value• |
| | Coupon | Date | ($000) | ($000) |
| New York State Thruway Authority Revenue (Highway& Bridge Trust Fund) | 5.000% | 4/1/15 | 15,000 | 16,809 |
| New York State Thruway Authority Revenue (Second Generation Highway & Bridge Trust Fund) | 5.000% | 4/1/15 | 7,000 | 7,914 |
| New York State Urban Development Corp. Revenue | 5.000% | 1/1/12 | 5,000 | 5,039 |
| New York State Urban Development Corp. Revenue (Personal Income Tax) | 5.000% | 12/15/14 | 27,235 | 30,686 |
| New York State Urban Development Corp. Revenue (Service Contract) | 4.000% | 1/1/12 | 8,665 | 8,720 |
| New York State Urban Development Corp. Revenue (Service Contract) | 5.000% | 1/1/13 | 14,475 | 15,225 |
| New York State Urban Development Corp. Revenue (Service Contract) | 5.000% | 1/1/13 | 4,000 | 4,207 |
| New York State Urban Development Corp. Revenue (Service Contract) | 5.000% | 1/1/15 | 27,900 | 31,212 |
| New York State Urban Development Corp. Revenue (Service Contract) | 5.000% | 1/1/16 | 25,000 | 28,413 |
| New York State Urban Development Corp. Revenue (Service Contract) VRDO | 0.120% | 11/7/11 | 34,600 | 34,600 |
| New York State Urban Development Corp. Revenue (Service Contract) VRDO | 0.120% | 11/7/11 | 8,420 | 8,420 |
| New York State Urban Development Corp. Revenue (Service Contract) VRDO | 0.120% | 11/7/11 | 46,925 | 46,925 |
| Onondaga County NY Industrial Development Agency Civic Facility Revenue | | | | |
| (Syracuse University Project) VRDO | 0.090% | 11/7/11 LOC | 7,100 | 7,100 |
| Tobacco Settlement Financing Corp. New York Revenue | 4.000% | 6/1/12 | 20,000 | 20,408 |
| Tobacco Settlement Financing Corp. New York Revenue | 4.000% | 6/1/13 | 11,000 | 11,556 |
| Tobacco Settlement Financing Corp. New York Revenue | 5.000% | 6/1/14 | 19,900 | 21,781 |
| Tobacco Settlement Financing Corp. New York Revenue | 5.000% | 6/1/15 | 15,000 | 16,794 |
| Triborough Bridge & Tunnel Authority New York Revenue | 5.250% | 11/15/15 | 6,500 | 7,542 |
| 1 Triborough Bridge & Tunnel Authority New York Revenue TOB VRDO | 0.140% | 11/7/11 | 11,545 | 11,545 |
| 1 Triborough Bridge & Tunnel Authority New York Revenue TOB VRDO | 0.140% | 11/7/11 | 9,500 | 9,500 |
| Triborough Bridge & Tunnel Authority New York Revenue VRDO | 0.130% | 11/7/11 (4) | 54,430 | 54,430 |
| Westchester County NY Health Care Corp. Revenue | 4.000% | 11/1/11 | 7,995 | 7,995 |
| Westchester County NY Health Care Corp. Revenue | 4.000% | 11/1/12 | 500 | 509 |
| Westchester County NY Health Care Corp. Revenue | 5.000% | 11/1/12 | 1,400 | 1,439 |
| Westchester County NY Health Care Corp. Revenue | 5.000% | 11/1/13 | 3,355 | 3,515 |
| | | | | 1,221,189 |
| North Carolina (3.3%) | | | | |
| Cary NC GO VRDO | 0.110% | 11/7/11 | 8,130 | 8,130 |
| Charlotte NC Airport Revenue | 5.000% | 7/1/12 | 6,530 | 6,723 |
| Charlotte NC Airport Revenue | 5.000% | 7/1/14 | 2,485 | 2,728 |
| Charlotte NC Water & Sewer System Revenue | 4.000% | 12/1/15 | 2,140 | 2,391 |
| Charlotte NC Water & Sewer System Revenue | 5.000% | 12/1/16 | 1,390 | 1,642 |
| Charlotte-Mecklenberg NC Hospital Authority Health Care System Revenue | | | | |
| (Carolinas HealthCare System) | 5.000% | 1/15/13 | 250 | 263 |
| Charlotte-Mecklenberg NC Hospital Authority Health Care System Revenue | | | | |
| (Carolinas HealthCare System) | 5.000% | 1/15/16 | 530 | 593 |
| 1 Charlotte-Mecklenberg NC Hospital Authority Health Care System Revenue | | | | |
| (Carolinas HealthCare System) TOB VRDO | 0.140% | 11/7/11 LOC | 11,220 | 11,220 |
| Charlotte-Mecklenberg NC Hospital Authority Health Care System Revenue | | | | |
| (Carolinas HealthCare System) VRDO | 0.110% | 11/7/11 | 4,900 | 4,900 |
| 1 Charlotte-Mecklenburg Hospital North Carolina Health Care Authority | | | | |
| Health Care System Revenue (Carolinas Healthcare System) TOB VRDO | 0.240% | 11/7/11 | 3,350 | 3,350 |
| 1 Johnston NC Memorial Hospital Authority Revenue TOB VRDO | 0.240% | 11/7/11 (4) | 5,025 | 5,025 |
| 1 Johnston NC Memorial Hospital Authority Revenue TOB VRDO | 0.240% | 11/7/11 (4) | 6,000 | 6,000 |
| 1 Johnston NC Memorial Hospital Authority Revenue TOB VRDO | 0.240% | 11/7/11 (4) | 6,565 | 6,565 |
| Mecklenburg County NC Public Facilities Corp. Revenue (Annual Appropriation) | 5.000% | 3/1/12 | 5,000 | 5,080 |
| Mecklenburg County NC Public Facilities Corp. Revenue (Annual Appropriation) | 5.000% | 3/1/13 | 2,700 | 2,865 |
| Mecklenburg County NC Public Facilities Corp. Revenue (Annual Appropriation) | 5.000% | 3/1/14 | 5,005 | 5,506 |
| 1 North Carolina Capital Facilities Finance Agency Revenue (Duke University Project) TOB VRDO | 0.150% | 11/1/11 | 12,000 | 12,000 |
| 1 North Carolina Capital Facilities Finance Agency Revenue (Duke University Project) TOB VRDO | 0.150% | 11/1/11 | 2,655 | 2,655 |
| North Carolina Capital Facilities Finance Agency Revenue (YMCA of the Triangle) VRDO | 0.130% | 11/7/11 LOC | 2,780 | 2,780 |
| North Carolina Capital Facilities Finance Agency Solid Waste Disposal Revenue Bonds | | | | |
| (Republic Services, Inc.) PUT | 0.750% | 12/1/11 | 32,500 | 32,494 |
| North Carolina Capital Improvement Revenue | 3.000% | 5/1/12 | 12,295 | 12,465 |
| North Carolina Eastern Municipal Power Agency Power Systems Revenue | 5.000% | 1/1/15 | 5,000 | 5,533 |
| North Carolina Eastern Municipal Power Agency Revenue | 5.500% | 1/1/12 | 4,600 | 4,637 |
| North Carolina Eastern Municipal Power Agency Revenue | 5.375% | 1/1/13 | 6,000 | 6,307 |
| North Carolina Eastern Municipal Power Agency Revenue | 5.000% | 1/1/14 | 2,170 | 2,347 |
| North Carolina Eastern Municipal Power Agency Revenue | 5.000% | 1/1/15 | 2,000 | 2,213 |
| North Carolina Eastern Municipal Power Agency Revenue | 5.300% | 1/1/15 | 3,500 | 3,651 |
| North Carolina Eastern Municipal Power Agency Revenue | 5.500% | 1/1/15 | 8,000 | 8,348 |
| North Carolina GAN | 5.000% | 3/1/13 | 11,740 | 12,432 |
| North Carolina GO | 5.500% | 3/1/13 | 9,000 | 9,615 |
| North Carolina Medical Care Commission Health Care Facilities Revenue | | | | |
| (Duke University Health System) VRDO | 0.170% | 11/7/11 | 40,970 | 40,970 |
| North Carolina Medical Care Commission Health Care Facilities Revenue | | | | |
| (University Health Systems of Eastern Carolina) VRDO | 0.170% | 11/7/11 LOC | 27,800 | 27,800 |
| North Carolina Medical Care Commission Health Systems Revenue (Catholic Health East) VRDO | 0.120% | 11/7/11 LOC | 3,445 | 3,445 |
| 1 North Carolina Medical Care Commission Hospital Revenue (Baptist Hospital) TOB VRDO | 0.140% | 11/7/11 | 3,800 | 3,800 |
| North Carolina Medical Care Commission Hospital Revenue (Baptist Hospital) VRDO | 0.130% | 11/7/11 LOC | 9,360 | 9,360 |
| North Carolina Medical Care Commission Hospital Revenue (CaroMont Health) VRDO | 0.170% | 11/7/11 LOC | 19,960 | 19,960 |
14
Short-Term Tax-Exempt Fund
| | | | |
| | | | Face | Market |
| | | Maturity | Amount | Value• |
| | Coupon | Date | ($000) | ($000) |
| North Carolina Medical Care Commission Hospital Revenue (Moses Cone Health System) | 4.000% | 10/1/13 | 1,055 | 1,114 |
| North Carolina Medical Care Commission Hospital Revenue (North Carolina Baptist Hospital) | 5.000% | 6/1/13 | 1,560 | 1,665 |
| North Carolina Medical Care Commission Hospital Revenue (North Carolina Baptist Hospital) | 5.000% | 6/1/14 | 2,495 | 2,749 |
| North Carolina Medical Care Commission Hospital Revenue (North Carolina Baptist Hospital) | 5.000% | 6/1/15 | 1,500 | 1,675 |
| North Carolina Municipal Power Agency Revenue | 5.250% | 1/1/13 | 6,000 | 6,312 |
| North Carolina Municipal Power Agency Revenue | 5.500% | 1/1/13 (ETM) | 4,540 | 4,811 |
| North Carolina Municipal Power Agency Revenue | 5.500% | 1/1/13 | 9,635 | 10,164 |
| University of North Carolina Chapel Hill Foundation Revenue VRDO | 0.130% | 11/7/11 | 14,310 | 14,310 |
| University of North Carolina Chapel Hill Foundation Revenue VRDO | 0.170% | 11/7/11 | 19,600 | 19,600 |
| Wake County NC GO | 4.000% | 2/1/14 | 16,060 | 17,289 |
| | | | | 375,482 |
| Ohio (2.9%) | | | | |
| Akron OH Bath & Copley Joint Township Hospital District Revenue | | | | |
| (Akron General Health System) VRDO | 0.120% | 11/7/11 LOC | 6,900 | 6,900 |
| Allen County OH Hospital Facilities Revenue (Catholic Healthcare Partners) | 5.000% | 9/1/12 | 5,640 | 5,817 |
| Allen County OH Hospital Facilities Revenue (Catholic Healthcare Partners) | 5.000% | 9/1/13 | 21,675 | 22,987 |
| American Municipal Power Ohio Inc. Revenue (Electricity Purchase) | 5.000% | 2/1/12 | 2,460 | 2,492 |
| 1 American Municipal Power Ohio Inc. Revenue (Prairie State Energy Campus Project) TOB VRDO | 0.260% | 11/7/11 (12) | 1,100 | 1,100 |
| Columbus OH GO | 5.000% | 7/1/12 | 1,250 | 1,289 |
| Columbus OH GO | 5.000% | 7/1/15 | 3,000 | 3,424 |
| Columbus OH GO | 5.000% | 7/1/15 | 2,310 | 2,636 |
| Columbus OH GO | 5.000% | 7/1/16 | 6,760 | 7,866 |
| Columbus OH GO VRDO | 0.080% | 11/7/11 | 2,055 | 2,055 |
| Cuyahoga County OH Economic Development Revenue (Cleveland Hearing & Speech) VRDO | 0.140% | 11/7/11 LOC | 4,195 | 4,195 |
| 2 Franklin County OH Hospital Facilities Revenue (OhioHealth Corp.) PUT | 0.590% | 6/3/13 | 10,000 | 10,000 |
| Franklin County OH Hospital Revenue (Nationwide Children’s Hospital Project) VRDO | 0.110% | 11/7/11 | 17,065 | 17,065 |
| Franklin County OH Hospital Revenue (Nationwide Children’s Hospital Project) VRDO | 0.110% | 11/7/11 | 16,535 | 16,535 |
| Franklin County OH Hospital Revenue (Nationwide Children’s Hospital Project) VRDO | 0.110% | 11/7/11 | 2,040 | 2,040 |
| Middletown OH Hospital Facilities Revenue (Atrium Medical Center) VRDO | 0.130% | 11/7/11 LOC | 32,835 | 32,835 |
| Montgomery County OH Revenue (Catholic Health Initiatives) PUT | 5.000% | 11/12/13 | 8,000 | 8,646 |
| Ohio Air Quality Development Authority Pollution Control Revenue | | | | |
| (FirstEnergy Generation Corp. Project) PUT | 3.000% | 4/2/12 | 2,900 | 2,914 |
| Ohio Air Quality Development Authority Pollution Control Revenue | | | | |
| (FirstEnergy Generation Corp. Project) PUT | 3.000% | 4/2/12 | 5,500 | 5,527 |
| Ohio Air Quality Development Authority Pollution Control Revenue | | | | |
| (FirstEnergy Generation Corp. Project) PUT | 4.750% | 8/1/12 | 14,000 | 14,297 |
| Ohio Air Quality Development Authority Revenue (Columbus Southern Power Co. Project) PUT | 3.875% | 6/1/14 | 3,500 | 3,623 |
| Ohio Air Quality Development Authority Revenue (Ohio Power Co. Project) PUT | 3.250% | 6/2/14 | 5,000 | 5,098 |
| Ohio Building Authority Revenue (Adult Correctional Building) | 5.000% | 10/1/14 | 6,085 | 6,764 |
| Ohio Common Schools GO VRDO | 0.100% | 11/7/11 | 1,300 | 1,300 |
| Ohio Conservation Projects GO | 5.000% | 8/1/14 | 15,000 | 16,720 |
| Ohio GO | 5.000% | 5/1/12 | 2,100 | 2,150 |
| Ohio GO | 5.000% | 8/1/12 | 9,800 | 10,147 |
| Ohio GO | 5.000% | 9/15/15 | 10,000 | 11,463 |
| Ohio GO | 5.000% | 9/15/16 | 10,000 | 11,656 |
| 1 Ohio Higher Educational Facility Commission Revenue | | | | |
| (Cleveland Clinic Health System Obligated Group) TOB VRDO | 0.140% | 11/7/11 | 6,275 | 6,275 |
| Ohio Higher Educational Facility Commission Revenue (Marietta College Project) VRDO | 0.140% | 11/7/11 LOC | 2,560 | 2,560 |
| Ohio Higher Educational Facility Commission Revenue (Oberlin College Project) | 5.000% | 10/1/14 | 3,000 | 3,350 |
| Ohio Higher Educational Facility Commission Revenue (University of Dayton Project) | 4.000% | 12/1/13 | 1,600 | 1,688 |
| Ohio Higher Educational Facility Commission Revenue (University of Dayton Project) | 5.000% | 12/1/14 | 1,000 | 1,100 |
| Ohio Higher Educational Facility Commission Revenue (University of Dayton Project) | 5.000% | 12/1/15 | 1,000 | 1,122 |
| Ohio Higher Educational Facility Commission Revenue (University of Dayton Project) | 4.000% | 12/1/16 | 625 | 678 |
| Ohio Hospital Revenue (University Hospitals Health System Inc.) | 5.000% | 1/15/14 | 625 | 661 |
| Ohio Hospital Revenue (University Hospitals Health System Inc.) | 5.000% | 1/15/15 | 500 | 536 |
| Ohio Infrastructure Improvement GO | 4.000% | 8/1/12 | 12,315 | 12,658 |
| Ohio Major New State Infrastructure Project Revenue | 5.000% | 6/15/12 | 10,000 | 10,286 |
| Ohio Solid Waste Revenue (Republic Services Inc. Project) PUT | 0.800% | 12/1/11 | 5,500 | 5,500 |
| 1 Ohio Water Development Authority Fresh Water Revenue TOB VRDO | 2.000% | 11/7/11 | 9,910 | 9,910 |
| Ohio Water Development Authority Solid Waste Disposal Revenue | | | | |
| (Waste Management Project) | 1.750% | 6/1/13 | 3,000 | 3,018 |
| Ohio Water Development Authority Solid Waste Disposal Revenue | | | | |
| (Waste Management Project) PUT | 2.625% | 1/2/13 | 4,000 | 4,045 |
| Ohio Water Development Authority Water Pollution Control Loan Fund Revenue | 5.050% | 6/1/12 (Prere.) | 11,780 | 12,110 |
| University of Akron Ohio General Receipts Revenue | 5.000% | 1/1/14 (4) | 2,440 | 2,639 |
| University of Cincinnati Ohio General Receipts Revenue | 5.000% | 6/1/14 | 3,000 | 3,285 |
| | | | | 320,962 |
| Oklahoma (1.0%) | | | | |
| Oklahoma Development Finance Authority Health System Revenue (Integris Baptist) | 5.000% | 8/15/12 | 1,875 | 1,939 |
| Oklahoma Development Finance Authority Health System Revenue (Integris Baptist) VRDO | 0.120% | 11/7/11 (12) | 49,440 | 49,440 |
| Oklahoma Development Finance Authority Health System Revenue (Integris Baptist) VRDO | 0.140% | 11/7/11 (12) | 32,940 | 32,940 |
15
Short-Term Tax-Exempt Fund
| | | | |
| | | | Face | Market |
| | | Maturity | Amount | Value• |
| | Coupon | Date | ($000) | ($000) |
| Oklahoma Municipal Power Authority Power Supply System Revenue PUT | 3.875% | 7/1/12 (4) | 5,000 | 5,110 |
| 2 Oklahoma Municipal Power Authority Power Supply System Revenue PUT | 0.890% | 8/1/13 | 6,595 | 6,534 |
| Oklahoma Transportation Authority Turnpike System Revenue | 5.375% | 1/1/12 | 11,900 | 12,002 |
| 1 Tulsa County OK Industrial Authority Health Care Revenue | | | | |
| (St. Francis Health System Inc.) TOB VRDO | 0.200% | 11/7/11 | 7,041 | 7,041 |
| | | | | 115,006 |
| Oregon (0.5%) | | | | |
| Clackamas County OR Hospital Facility Authority Revenue (Legacy Health System) PUT | 5.000% | 7/15/12 | 7,000 | 7,204 |
| Gilliam County OR Solid Waste Disposal Revenue (Waste Management Inc. Project) PUT | 2.000% | 9/2/14 | 10,000 | 10,011 |
| Oregon Department of Administrative Services COP | 5.000% | 5/1/12 | 2,500 | 2,559 |
| Oregon Department of Administrative Services Lottery Revenue | 5.000% | 4/1/14 | 2,000 | 2,203 |
| Oregon Department of Transportation Highway Usertax Revenue | 4.000% | 11/15/11 | 2,000 | 2,003 |
| Oregon Facilities Authority Revenue (Legacy Health Project) | 3.000% | 5/1/12 | 1,000 | 1,009 |
| Oregon Facilities Authority Revenue (Legacy Health Project) | 4.000% | 5/1/13 | 1,285 | 1,331 |
| Oregon Facilities Authority Revenue (Legacy Health Project) | 4.000% | 5/1/14 | 1,150 | 1,204 |
| Oregon Facilities Authority Revenue (Legacy Health Project) | 5.000% | 5/1/15 | 2,350 | 2,558 |
| Oregon Facilities Authority Revenue (PeaceHealth) | 5.000% | 3/15/13 | 1,000 | 1,048 |
| Oregon Facilities Authority Revenue (PeaceHealth) | 4.000% | 11/1/13 | 500 | 529 |
| Oregon Facilities Authority Revenue (PeaceHealth) | 5.000% | 3/15/14 | 1,050 | 1,123 |
| Oregon Facilities Authority Revenue (PeaceHealth) | 5.000% | 3/15/15 | 1,500 | 1,629 |
| 1 Oregon GO TOB VRDO | 0.150% | 11/1/11 | 17,000 | 17,000 |
| | | | | 51,411 |
| Pennsylvania (6.5%) | | | | |
| Allegheny County PA Hospital Development Authority Revenue | | | | |
| (University of Pittsburgh Medical Center) | 4.000% | 5/15/12 | 5,000 | 5,093 |
| Allegheny County PA Hospital Development Authority Revenue | | | | |
| (University of Pittsburgh Medical Center) | 5.000% | 6/15/12 | 2,000 | 2,055 |
| Allegheny County PA Hospital Development Authority Revenue | | | | |
| (University of Pittsburgh Medical Center) | 5.000% | 5/15/13 | 11,000 | 11,691 |
| Allegheny County PA Hospital Development Authority Revenue | | | | |
| (University of Pittsburgh Medical Center) | 5.000% | 5/15/14 | 10,500 | 11,480 |
| Allegheny County PA Hospital Development Authority Revenue | | | | |
| (University of Pittsburgh Medical Center) | 5.000% | 5/15/15 | 8,350 | 9,336 |
| 2 Allegheny County PA Hospital Development Authority Revenue | | | | |
| (University of Pittsburgh Medical Center) PUT | 1.190% | 8/1/13 | 10,000 | 10,002 |
| 1 Allegheny County PA Hospital Development Authority Revenue | | | | |
| (University of Pittsburgh Medical Center) TOB VRDO | 0.140% | 11/7/11 | 48,200 | 48,200 |
| Central Bucks PA School District GO | 5.500% | 5/15/12 (Prere.) | 3,785 | 3,892 |
| Central Bucks PA School District GO | 5.500% | 5/15/12 (Prere.) | 2,400 | 2,468 |
| Central Bucks PA School District GO | 5.500% | 5/15/12 (Prere.) | 1,500 | 1,543 |
| Delaware County PA GO | 5.000% | 10/1/12 | 1,115 | 1,163 |
| Delaware County PA Industrial Development Authority Pollution Control Revenue | | | | |
| (PECO Energy Co. Project) | 4.000% | 12/1/12 | 10,000 | 10,313 |
| Delaware River Port Authority Pennsylvania & New Jersey Revenue VRDO | 0.120% | 11/7/11 LOC | 30,200 | 30,200 |
| 1 Geisinger Health System Authority of Pennsylvania Revenue TOB VRDO | 0.140% | 11/7/11 | 5,000 | 5,000 |
| Governor Mifflin PA School District GO VRDO | 0.180% | 11/7/11 (4) | 12,895 | 12,895 |
| Governor Mifflin PA School District GO VRDO | 0.180% | 11/7/11 (4) | 14,955 | 14,955 |
| Lehigh County PA General Purpose Hospital Authority Revenue | | | | |
| (Lehigh Valley Health Network) VRDO | 0.170% | 11/1/11 LOC | 8,200 | 8,200 |
| Montgomery County PA Higher Education & Health Authority Hospital Revenue | | | | |
| (Abington Memorial Hospital) | 5.000% | 6/1/13 | 2,000 | 2,106 |
| Montgomery County PA Higher Education & Health Authority Hospital Revenue | | | | |
| (Abington Memorial Hospital) | 5.000% | 6/1/14 | 2,670 | 2,862 |
| Northampton County PA General Purpose Authority University Revenue | | | | |
| (Lafayette College) VRDO | 0.130% | 11/7/11 | 6,970 | 6,970 |
| Northampton County PA General Purpose Authority University Revenue | | | | |
| (Lafayette College) VRDO | 0.130% | 11/7/11 | 13,700 | 13,700 |
| Northampton County PA General Purpose Authority University Revenue | | | | |
| (Lehigh University) VRDO | 0.110% | 11/7/11 | 9,855 | 9,855 |
| Northampton County PA General Purpose Authority University Revenue | | | | |
| (Lehigh University) VRDO | 0.110% | 11/7/11 | 9,375 | 9,375 |
| Pennsylvania Economic Development Financing Authority Exempt Facilities Revenue | | | | |
| (PPL Energy Supply LLC Project) PUT | 3.000% | 9/1/15 | 4,250 | 4,336 |
| Pennsylvania Economic Development Financing Authority Exempt Facilities Revenue | | | | |
| (PPL Energy Supply LLC Project) PUT | 3.000% | 9/1/15 | 8,250 | 8,363 |
| Pennsylvania Economic Development Financing Authority Exempt Facilities Revenue | | | | |
| (PPL Energy Supply LLC Project) PUT | 3.000% | 9/1/15 | 5,000 | 5,116 |
| Pennsylvania Economic Development Financing Authority Revenue (Convention Center Project) | 5.000% | 6/15/12 | 3,730 | 3,831 |
| Pennsylvania Economic Development Financing Authority Solid Waste Disposal Revenue | | | | |
| (Waste Management Inc. Project) | 2.750% | 9/1/13 | 4,500 | 4,584 |
16
Short-Term Tax-Exempt Fund
| | | | |
| | | | Face | Market |
| | | Maturity | Amount | Value• |
| | Coupon | Date | ($000) | ($000) |
| Pennsylvania Economic Development Financing Authority Solid Waste Disposal Revenue | | | | |
| (Waste Management Inc. Project) PUT | 2.625% | 12/3/12 | 11,375 | 11,536 |
| Pennsylvania GO | 5.100% | 5/1/12 (Prere.) | 6,800 | 6,965 |
| Pennsylvania GO | 5.000% | 4/15/13 | 10,745 | 11,462 |
| Pennsylvania GO | 4.000% | 7/15/13 | 16,995 | 18,026 |
| Pennsylvania GO | 5.000% | 9/1/13 | 4,300 | 4,658 |
| Pennsylvania GO | 5.000% | 9/1/14 (4) | 12,000 | 13,435 |
| Pennsylvania GO | 5.000% | 7/1/15 (14) | 2,380 | 2,548 |
| Pennsylvania GO | 5.000% | 9/1/15 (4) | 10,230 | 11,369 |
| Pennsylvania Higher Educational Facilities Authority Revenue (Drexel University) VRDO | 0.090% | 11/7/11 LOC | 10,150 | 10,150 |
| Pennsylvania Higher Educational Facilities Authority Revenue | | | | |
| (University of Pittsburgh Medical Center) | 3.500% | 5/15/12 | 3,000 | 3,047 |
| Pennsylvania Higher Educational Facilities Authority Revenue | | | | |
| (University of Pittsburgh Medical Center) | 5.000% | 5/15/15 | 4,250 | 4,752 |
| Pennsylvania Intergovernmental Cooperation Authority Special Tax Revenue | | | | |
| (Philadelphia Funding Program) | 5.000% | 6/15/12 | 8,470 | 8,718 |
| Pennsylvania Intergovernmental Cooperation Authority Special Tax Revenue | | | | |
| (Philadelphia Funding Program) | 5.000% | 6/15/12 | 2,750 | 2,830 |
| Pennsylvania Intergovernmental Cooperation Authority Special Tax Revenue | | | | |
| (Philadelphia Funding Program) | 5.000% | 6/15/13 | 13,945 | 14,938 |
| Pennsylvania Intergovernmental Cooperation Authority Special Tax Revenue | | | | |
| (Philadelphia Funding Program) | 5.000% | 6/15/13 | 3,000 | 3,214 |
| Pennsylvania Intergovernmental Cooperation Authority Special Tax Revenue | | | | |
| (Philadelphia Funding Program) | 5.000% | 6/15/14 | 8,000 | 8,847 |
| Pennsylvania State University Revenue | 5.250% | 8/15/12 | 5,980 | 6,214 |
| 1 Pennsylvania State University Revenue TOB VRDO | 2.340% | 11/7/11 | 12,685 | 12,685 |
| 1 Pennsylvania Turnpike Commission Registration Fee Revenue TOB VRDO | 0.240% | 11/7/11 (4) | 9,790 | 9,790 |
| Pennsylvania Turnpike Commission Registration Fee Revenue VRDO | 0.140% | 11/7/11 (4) | 31,160 | 31,160 |
| Pennsylvania Turnpike Commission Registration Fee Revenue VRDO | 0.140% | 11/7/11 (4) | 38,495 | 38,495 |
| 2 Pennsylvania Turnpike Commission Revenue | 0.660% | 12/1/11 | 13,000 | 13,000 |
| 2 Pennsylvania Turnpike Commission Revenue | 0.760% | 12/1/12 | 12,000 | 12,000 |
| Pennsylvania Turnpike Commission Revenue | 2.000% | 12/1/12 | 3,105 | 3,140 |
| Pennsylvania Turnpike Commission Revenue | 5.000% | 6/1/14 | 8,095 | 8,759 |
| Pennsylvania Turnpike Commission Revenue | 5.000% | 12/1/16 | 3,150 | 3,537 |
| Pennsylvania Turnpike Commission Revenue VRDO | 0.130% | 11/7/11 (4) | 40,880 | 40,880 |
| Pennsylvania Turnpike Commission Revenue VRDO | 0.130% | 11/7/11 | 52,263 | 52,263 |
| Pennsylvania Turnpike Commission Revenue VRDO | 0.140% | 11/7/11 | 46,193 | 46,193 |
| Philadelphia PA Airport Parking Authority Revenue | 5.000% | 9/1/12 | 3,000 | 3,093 |
| Philadelphia PA Airport Revenue | 5.000% | 6/15/14 | 1,000 | 1,083 |
| Philadelphia PA Airport Revenue | 5.000% | 6/15/15 | 3,100 | 3,419 |
| Philadelphia PA Authority Industrial Development Revenue (Inglis House Project) VRDO | 0.120% | 11/7/11 | 5,400 | 5,400 |
| Philadelphia PA Water & Waste Water Revenue | 5.000% | 6/15/16 | 5,000 | 5,623 |
| Southcentral Pennsylvania General Authority Revenue (WellSpan Health Obligated Group) | 5.250% | 6/1/12 | 5,755 | 5,915 |
| St. Mary’s Hospital Authority Bucks County PA Revenue (Catholic Health Initiatives) VRDO | 0.280% | 11/7/11 | 6,600 | 6,600 |
| Uniontown PA Area School District GO | 5.500% | 10/1/12 (Prere.) | 9,950 | 10,424 |
| University of Pittsburgh of the Commonwealth System of Higher Education | | | | |
| Pennsylvania Revenue (University Capital Project) | 5.000% | 9/15/12 | 8,090 | 8,426 |
| Westmoreland County PA Industrial Development Authority Revenue (Excela Health Project) | 3.500% | 7/1/13 | 1,830 | 1,877 |
| Westmoreland County PA Industrial Development Authority Revenue (Excela Health Project) | 4.000% | 7/1/14 | 1,380 | 1,434 |
| | | | | 727,489 |
| Rhode Island (0.2%) | | | | |
| Rhode Island & Providence Plantations GO | 5.000% | 10/1/12 | 4,000 | 4,167 |
| Rhode Island Health & Educational Building Corp. Higher Education Facility Revenue | | | | |
| (Rogers Williams University) VRDO | 0.200% | 11/7/11 LOC | 19,715 | 19,715 |
| | | | | 23,882 |
| South Carolina (1.0%) | | | | |
| Charleston SC Waterworks & Sewer Capital Improvement Revenue VRDO | 0.150% | 11/7/11 | 7,400 | 7,400 |
| Greenville County SC Hospital Revenue (Greenville Hospital System) | 5.000% | 5/1/12 | 5,275 | 5,383 |
| Greenville County SC Hospital System Revenue VRDO | 0.100% | 11/7/11 LOC | 2,000 | 2,000 |
| Greenville County SC School District GO | 5.000% | 12/1/15 | 5,000 | 5,698 |
| 1 Greer SC Combined Utility System Revenue TOB VRDO | 0.140% | 11/7/11 (13) | 9,685 | 9,685 |
| Lexington County SC Health Services District Inc. Hospital Revenue | 5.000% | 11/1/15 | 1,100 | 1,212 |
| Lexington County SC Health Services District Inc. Hospital Revenue | 5.000% | 11/1/16 | 1,750 | 1,953 |
| Piedmont SC Municipal Power Agency Revenue | 5.000% | 1/1/15 | 2,000 | 2,211 |
| Piedmont SC Municipal Power Agency Revenue | 5.000% | 1/1/16 | 1,805 | 2,032 |
| South Carolina Jobs Economic Development Authority Hospital Revenue (AnMed Health Project) | 3.000% | 2/1/12 | 1,000 | 1,006 |
| South Carolina Jobs Economic Development Authority Hospital Revenue (AnMed Health Project) | 5.000% | 2/1/13 | 1,000 | 1,048 |
| South Carolina Jobs Economic Development Authority Hospital Revenue (AnMed Health Project) | 5.000% | 2/1/14 | 2,000 | 2,156 |
| South Carolina Jobs Economic Development Authority Hospital Revenue (AnMed Health Project) | 5.000% | 2/1/15 | 1,000 | 1,098 |
| South Carolina Jobs Economic Development Authority Revenue | | | | |
| (Waste Management of South Carolina Inc. Project) | 1.250% | 11/1/11 | 9,060 | 9,060 |
17
Short-Term Tax-Exempt Fund
| | | | |
| | | | Face | Market |
| | | Maturity | Amount | Value• |
| | Coupon | Date | ($000) | ($000) |
| South Carolina Ports Authority Revenue | 4.000% | 7/1/13 | 1,000 | 1,046 |
| South Carolina Ports Authority Revenue | 4.000% | 7/1/15 | 2,355 | 2,542 |
| South Carolina Public Service Authority Revenue | 5.000% | 1/1/14 | 3,000 | 3,276 |
| South Carolina Transportation Infrastructure Revenue | 5.000% | 10/1/14 | 14,220 | 15,723 |
| South Carolina Transportation Infrastructure Revenue | 5.250% | 10/1/15 | 4,295 | 4,883 |
| Spartanburg County SC Regional Health Services District Revenue VRDO | 0.250% | 11/7/11 (12) | 28,435 | 28,435 |
| | | | | 107,847 |
| Tennessee (1.3%) | | | | |
| Clarksville TN Public Building Authority Revenue (Pooled Financing) VRDO | 2.493% | 11/1/11 LOC | 10,000 | 10,000 |
| Jackson TN Hospital Improvement Revenue (Jackson-Madison County General Hospital Project) | 5.000% | 4/1/12 | 500 | 508 |
| Jackson TN Hospital Improvement Revenue (Jackson-Madison County General Hospital Project) | 5.000% | 4/1/13 | 645 | 675 |
| 1 Knoxville TN Waste Water System Revenue TOB VRDO | 0.140% | 11/7/11 | 7,450 | 7,450 |
| Lewisburg TN Industrial Development Board Solid Waste Disposal Revenue | | | | |
| (Waste Management Inc. of Tennessee Project) | 2.500% | 7/1/12 | 5,250 | 5,273 |
| Memphis TN Electric System Revenue | 5.000% | 12/1/13 (14) | 5,200 | 5,664 |
| Memphis TN Electric System Revenue | 5.000% | 12/1/14 | 25,000 | 28,059 |
| Memphis TN Electric System Revenue | 5.000% | 12/1/15 | 25,000 | 28,732 |
| Metropolitan Government of Nashville TN Airport Authority Improvement Revenue | 4.000% | 7/1/14 (4) | 4,450 | 4,769 |
| Murfreesboro TN GO | 5.000% | 6/1/12 | 8,090 | 8,314 |
| Shelby County TN Health Educational & Housing Facility Board Revenue | | | | |
| (Baptist Memorial Health Care) | 4.000% | 9/1/12 | 6,135 | 6,304 |
| Shelby County TN Health Educational & Housing Facility Board Revenue | | | | |
| (Baptist Memorial Health Care) | 5.000% | 9/1/13 | 9,600 | 10,297 |
| Shelby County TN Health Educational & Housing Facility Board Revenue | | | | |
| (Baptist Memorial Health Care) | 5.000% | 9/1/14 | 2,500 | 2,750 |
| Shelby County TN Health Educational & Housing Facility Board Revenue | | | | |
| (Methodist Le Bonheur Healthcare) | 5.000% | 6/1/12 | 5,000 | 5,118 |
| Tennessee Energy Acquisition Corp. Gas Revenue | 5.000% | 2/1/13 | 5,965 | 6,253 |
| Tennessee GO | 5.000% | 5/1/12 | 3,500 | 3,584 |
| Tennessee GO | 5.000% | 5/1/14 | 3,000 | 3,319 |
| Tennessee School Bond Authority Revenue | 5.000% | 5/1/13 | 5,460 | 5,839 |
| | | | | 142,908 |
| Texas (11.5%) | | | | |
| 1 Brownsville TX Utility System Revenue TOB VRDO | 0.340% | 11/7/11 (4) | 6,060 | 6,060 |
| 1 Corpus Christi TX Utility Systems Revenue TOB VRDO | 0.160% | 11/7/11 (4) | 5,130 | 5,130 |
| 1 Dallas TX Area Rapid Transit Sales Tax Revenue TOB VRDO | 0.140% | 11/7/11 | 5,400 | 5,400 |
| Dallas TX Civic Center Improvement Revenue | 5.000% | 8/15/13 (12) | 2,775 | 2,959 |
| Dallas TX Civic Center Improvement Revenue | 5.000% | 8/15/14 (12) | 2,775 | 3,039 |
| Dallas TX GO | 5.000% | 2/15/12 | 10,000 | 10,138 |
| Dallas TX GO | 5.000% | 2/15/15 | 6,295 | 7,116 |
| Dallas TX Independent School District GO | 5.000% | 2/15/15 | 4,990 | 5,645 |
| Dallas-Fort Worth TX International Airport Revenue | 2.000% | 11/1/12 | 5,485 | 5,560 |
| Dallas-Fort Worth TX International Airport Revenue | 4.000% | 11/1/12 | 3,500 | 3,618 |
| Dallas-Fort Worth TX International Airport Revenue | 5.000% | 11/1/13 | 4,000 | 4,327 |
| Denton TX Independent School District GO VRDO | 0.150% | 11/7/11 | 32,050 | 32,050 |
| Eagle Mountain & Saginaw TX Independent School District PUT | 2.500% | 8/1/14 | 11,140 | 11,577 |
| Fort Bend County TX GO | 4.000% | 3/1/13 | 1,305 | 1,367 |
| Fort Worth TX GO | 4.000% | 3/1/12 | 4,260 | 4,314 |
| Fort Worth TX Water & Sewer Revenue | 5.000% | 2/15/16 | 1,000 | 1,154 |
| Frisco TX GO | 4.000% | 2/15/15 | 1,580 | 1,734 |
| Gulf Coast TX Waste Disposal Authority Environmental Facilities Revenue | | | | |
| (BP Products North America Project) PUT | 2.300% | 9/3/13 | 9,000 | 9,148 |
| Gulf Coast TX Waste Disposal Authority Environmental Facilities Revenue | | | | |
| (BP Products North America Project) PUT | 2.300% | 9/3/13 | 5,000 | 5,082 |
| Harris County TX Cultural Education Facilities Finance Corp. Revenue | | | | |
| (Methodist Hospital System) | 5.250% | 12/1/12 | 15,000 | 15,750 |
| Harris County TX Cultural Education Facilities Finance Corp. Revenue | | | | |
| (St. Luke’s Episcopal Health System) | 5.000% | 2/15/13 | 4,335 | 4,559 |
| Harris County TX Cultural Education Facilities Finance Corp. Revenue | | | | |
| (St. Luke’s Episcopal Health System) | 5.000% | 2/15/14 | 5,915 | 6,397 |
| Harris County TX Cultural Education Facilities Finance Corp. Thermal Utility Revenue | | | | |
| (TECO Project) | 5.000% | 11/15/11 | 1,000 | 1,002 |
| Harris County TX Cultural Education Facilities Finance Corp. Thermal Utility Revenue | | | | |
| (TECO Project) | 5.000% | 11/15/13 | 835 | 910 |
| Harris County TX GO | 5.000% | 10/1/12 | 3,000 | 3,129 |
| Harris County TX GO | 6.000% | 8/1/14 (14) | 23,045 | 26,272 |
| 1 Harris County TX GO TOB VRDO | 0.140% | 11/7/11 | 13,400 | 13,400 |
| 1 Harris County TX GO TOB VRDO | 0.140% | 11/7/11 (13) | 9,600 | 9,600 |
| Harris County TX Health Facilities Development Corp. Hospital Revenue | | | | |
| (Texas Children’s Hospital) VRDO | 0.130% | 11/7/11 | 58,600 | 58,600 |
18
Short-Term Tax-Exempt Fund
| | | | |
| | | | Face | Market |
| | | Maturity | Amount | Value• |
| | Coupon | Date | ($000) | ($000) |
| Harris County TX Health Facilities Development Corp. Revenue | | | | |
| (St. Luke’s Episcopal Hospital) VRDO | 0.180% | 11/7/11 | 10,000 | 10,000 |
| 1 Harris County TX Metropolitan Transit Authority Revenue TOB VRDO | 0.140% | 11/7/11 | 5,865 | 5,865 |
| Harris County TX Toll Road Revenue | 5.375% | 8/15/12 (Prere.) | 3,250 | 3,381 |
| Harris County TX Toll Road Revenue | 5.375% | 8/15/12 (Prere.) | 6,000 | 6,241 |
| Harris County TX Toll Road Revenue PUT | 5.000% | 8/15/12 (4) | 5,000 | 5,176 |
| Houston TX Airport System Revenue | 5.000% | 7/1/14 | 2,000 | 2,191 |
| Houston TX Airport System Revenue | 5.000% | 7/1/15 | 2,000 | 2,233 |
| Houston TX GO | 5.000% | 3/1/12 (14) | 21,040 | 21,375 |
| Houston TX Higher Education Finance Corp. Revenue(Rice University Project) VRDO | 0.130% | 11/7/11 | 18,205 | 18,205 |
| Houston TX Hotel Occupancy Tax & Special Revenue (Convention & Entertainment Facilities) | 5.000% | 9/1/13 | 3,000 | 3,214 |
| Houston TX Hotel Occupancy Tax & Special Revenue (Convention & Entertainment Facilities) | 5.000% | 9/1/14 | 2,000 | 2,196 |
| Houston TX Hotel Occupancy Tax & Special Revenue (Convention & Entertainment Facilities) | 5.000% | 9/1/14 | 1,300 | 1,427 |
| Houston TX Hotel Occupancy Tax & Special Revenue (Convention & Entertainment Facilities) | 5.000% | 9/1/16 | 2,435 | 2,725 |
| Houston TX Hotel Occupancy Tax & Special Revenue (Convention & Entertainment Facilities) | 5.000% | 9/1/16 | 8,310 | 9,298 |
| Houston TX Independent School District GO | 4.000% | 7/15/12 | 3,010 | 3,089 |
| Houston TX Independent School District GO PUT | 0.570% | 3/27/12 | 15,000 | 15,004 |
| Houston TX Utility System Revenue | 5.250% | 5/15/14 (14) | 2,500 | 2,779 |
| Houston TX Utility System Revenue | 5.250% | 5/15/15 (14) | 1,020 | 1,127 |
| 1 Houston TX Utility System Revenue TOB VRDO | 0.160% | 11/7/11 | 9,995 | 9,995 |
| 1 Houston TX Utility System Revenue TOB VRDO | 0.160% | 11/7/11 | 25,430 | 25,430 |
| 1 Houston TX Utility System Revenue TOB VRDO | 0.200% | 11/7/11 | 17,540 | 17,540 |
| Houston TX Water & Sewer System Revenue | 5.250% | 12/1/12 (Prere.) | 10,260 | 10,801 |
| Katy TX Independent School District GO | 5.000% | 2/15/15 | 4,295 | 4,858 |
| Lone Star College System Texas GO | 5.000% | 8/15/12 | 615 | 638 |
| Lower Colorado River Authority Texas Revenue | 5.000% | 5/15/15 | 2,150 | 2,429 |
| Lubbock TX Electric Light & Power System Revenue | 4.000% | 4/15/14 | 1,890 | 2,026 |
| Lubbock TX Electric Light & Power System Revenue | 4.000% | 4/15/15 | 1,125 | 1,226 |
| Lubbock TX GO | 5.000% | 2/15/12 (Prere.) | 4,355 | 4,415 |
| Lubbock TX Health Facilities Development Corp. Revenue (St. Joseph Health System) | 5.000% | 7/1/13 | 1,000 | 1,063 |
| Lubbock TX Health Facilities Development Corp. Revenue (St. Joseph Health System) | 5.000% | 7/1/14 | 1,510 | 1,645 |
| Lubbock TX Health Facilities Development Corp. Revenue (St. Joseph Health System) | 5.000% | 7/1/15 | 4,000 | 4,430 |
| Lubbock TX Health Facilities Development Corp. Revenue (St. Joseph Health System) PUT | 3.050% | 10/16/12 | 17,075 | 17,366 |
| Mansfield TX Independent School District GO | 5.000% | 2/15/12 | 2,000 | 2,027 |
| Mission TX Economic Development Corp. Solid Waste Disposal Revenue | | | | |
| (Allied Waste Inc. Project) PUT | 1.050% | 1/3/12 | 7,500 | 7,499 |
| Montgomery County TX (Pass-Through Toll Revenue) | 4.000% | 3/1/12 (12) | 2,000 | 2,025 |
| Montgomery County TX (Pass-Through Toll Revenue) | 5.000% | 3/1/14 (12) | 1,625 | 1,784 |
| North Texas Tollway Authority System Revenue | 4.000% | 9/1/14 | 1,100 | 1,184 |
| North Texas Tollway Authority System Revenue | 4.000% | 9/1/15 | 1,820 | 1,987 |
| North Texas Tollway Authority System Revenue | 5.000% | 9/1/16 | 1,200 | 1,377 |
| North Texas Tollway Authority System Revenue PUT | 5.250% | 1/1/12 | 31,050 | 31,297 |
| North Texas Tollway Authority System Revenue PUT | 5.000% | 1/1/13 | 20,000 | 20,944 |
| Northside TX Independent School District GO PUT | 1.500% | 8/1/12 | 17,000 | 17,120 |
| Northside TX Independent School District GO PUT | 1.750% | 6/1/13 | 19,600 | 19,615 |
| Northside TX Independent School District GO PUT | 0.950% | 8/1/13 | 19,275 | 19,400 |
| Northside TX Independent School District GO PUT | 1.350% | 6/1/14 | 21,335 | 21,559 |
| Northside TX Independent School District GO PUT | 1.900% | 8/1/14 | 12,000 | 12,315 |
| Plano TX Independent School District GO | 4.000% | 2/15/13 | 1,210 | 1,265 |
| 1 Port Arthur TX Independent School District GO TOB VRDO | 0.150% | 11/7/11 (12) | 9,125 | 9,125 |
| Richardson TX Independent School District GO VRDO | 0.160% | 11/7/11 | 20,300 | 20,300 |
| San Antonio TX Education Facilities Corp. Higher Education Revenue (Trinity University) VRDO | 0.180% | 11/1/11 | 3,100 | 3,100 |
| San Antonio TX Electric & Gas Systems Revenue | 5.250% | 2/1/13 (ETM) | 515 | 546 |
| San Antonio TX Electric & Gas Systems Revenue | 5.250% | 2/1/13 | 9,410 | 9,977 |
| San Antonio TX Electric & Gas Systems Revenue | 5.375% | 2/1/13 (4) | 8,000 | 8,495 |
| San Antonio TX Electric & Gas Systems Revenue | 5.500% | 2/1/14 | 6,210 | 6,878 |
| San Antonio TX Electric & Gas Systems Revenue | 5.375% | 2/1/15 | 14,000 | 15,981 |
| 1 San Antonio TX Electric & Gas Systems Revenue TOB VRDO | 0.140% | 11/7/11 | 5,965 | 5,965 |
| 1 San Antonio TX Electric & Gas Systems Revenue TOB VRDO | 0.140% | 11/7/11 | 7,000 | 7,000 |
| 1 San Antonio TX Electric & Gas Systems Revenue TOB VRDO | 0.200% | 11/7/11 | 11,985 | 11,985 |
| San Antonio TX GO PUT | 1.150% | 12/3/12 | 17,965 | 18,029 |
| Tarrant County TX Cultural Education Facilities Finance Corp. Hospital Revenue | | | | |
| (Baylor Healthcare) | 5.000% | 11/15/14 | 1,600 | 1,781 |
| Tarrant County TX Cultural Education Facilities Finance Corp. Hospital Revenue | | | | |
| (Scott & White Healthcare Project) | 5.000% | 8/15/12 | 2,745 | 2,831 |
| Tarrant County TX Cultural Education Facilities Finance Corp. Revenue (CHRISTUS Health) | 5.000% | 7/1/13 | 1,155 | 1,221 |
| Tarrant County TX Cultural Education Facilities Finance Corp. Revenue (CHRISTUS Health) | 5.000% | 7/1/14 | 1,785 | 1,907 |
| Tarrant County TX Health Facilities Development Corp. Hospital Revenue | | | | |
| (Cook Children’s Medical Center Project) | 5.000% | 12/1/15 | 1,580 | 1,796 |
| Tarrant County TX Health Facilities Development Corp. Hospital Revenue | | | | |
| (Cook Children’s Medical Center Project) VRDO | 0.130% | 11/7/11 | 12,000 | 12,000 |
| Tarrant Regional Water District Texas Water Revenue | 5.000% | 3/1/12 | 5,000 | 5,079 |
19
Short-Term Tax-Exempt Fund
| | | | |
| | | | Face | Market |
| | | Maturity | Amount | Value• |
| | Coupon | Date | ($000) | ($000) |
| Tarrant Regional Water District Texas Water Revenue | 5.000% | 3/1/13 | 2,000 | 2,121 |
| Texas A&M University System Revenue Financing System Revenue | 5.000% | 5/15/12 | 7,000 | 7,179 |
| Texas GO | 5.000% | 10/1/12 | 7,000 | 7,303 |
| Texas GO | 5.000% | 10/1/13 | 7,500 | 8,150 |
| Texas GO | 5.000% | 10/1/14 | 8,370 | 9,398 |
| 1 Texas GO TOB PUT | 0.200% | 12/13/11 | 25,000 | 25,000 |
| 1 Texas GO TOB VRDO | 0.150% | 11/1/11 | 6,100 | 6,100 |
| 1 Texas GO TOB VRDO | 0.140% | 11/7/11 | 73,750 | 73,750 |
| 1 Texas GO TOB VRDO | 0.140% | 11/7/11 | 8,685 | 8,685 |
| 1 Texas GO TOB VRDO | 0.200% | 11/7/11 | 12,190 | 12,190 |
| Texas GO TRAN | 2.500% | 8/30/12 | 60,000 | 61,117 |
| Texas Public Finance Authority Revenue (Unemployment Compensation) | 3.000% | 7/1/12 | 5,200 | 5,295 |
| Texas Public Finance Authority Revenue (Unemployment Compensation) | 5.000% | 7/1/12 | 45,000 | 46,420 |
| Texas Public Finance Authority Revenue (Unemployment Compensation) | 5.000% | 7/1/14 | 20,735 | 23,063 |
| Texas Public Finance Authority Revenue (Unemployment Compensation) | 5.000% | 1/1/15 | 9,000 | 10,137 |
| Texas Public Finance Authority Revenue (Unemployment Compensation) | 5.000% | 7/1/15 | 34,500 | 39,416 |
| Texas Public Finance Authority Revenue (Unemployment Compensation) | 5.000% | 1/1/16 | 8,000 | 9,211 |
| Texas State University System Revenue | 5.000% | 3/15/13 | 1,000 | 1,061 |
| Texas Tech University System Revenue Financing System Revenue | 4.000% | 2/15/12 | 2,000 | 2,022 |
| Texas Transportation Commission Central Texas System Revenue PUT | 2.750% | 2/15/13 | 20,365 | 20,632 |
| Texas Transportation Commission Mobility Fund GO VRDO | 0.100% | 11/7/11 | 9,900 | 9,900 |
| Texas Transportation Commission Revenue | 5.000% | 4/1/12 | 8,085 | 8,245 |
| 1 Texas Transportation Commission Revenue TOB VRDO | 0.140% | 11/7/11 | 7,495 | 7,495 |
| Texas Water Development Board Revenue | 5.000% | 7/15/14 | 1,355 | 1,512 |
| Texas Water Development Board Revenue | 5.000% | 7/15/14 | 5,260 | 5,867 |
| Tyler TX Independent School District GO | 3.750% | 2/15/13 | 2,150 | 2,242 |
| University of Texas System Revenue Financing System Revenue | 5.000% | 8/15/13 (Prere.) | 24,900 | 26,917 |
| University of Texas System Revenue Financing System Revenue | 5.000% | 8/15/13 (Prere.) | 10,000 | 10,810 |
| Waco TX Education Finance Corp. Revenue (Baylor University) VRDO | 0.130% | 11/7/11 | 53,225 | 53,225 |
| | | | | 1,294,282 |
| Utah (0.4%) | | | | |
| Utah Board of Regents Student Loan Revenue | 4.000% | 11/1/13 | 5,000 | 5,327 |
| Utah Board of Regents Student Loan Revenue | 4.000% | 11/1/14 | 10,000 | 10,898 |
| Utah GO | 5.375% | 7/1/12 | 11,000 | 11,378 |
| Utah GO | 4.000% | 7/1/14 | 10,000 | 10,892 |
| Utah GO | 5.000% | 7/1/14 | 4,000 | 4,463 |
| | | | | 42,958 |
| Virgin Islands (0.0%) | | | | |
| Virgin Islands Public Finance Authority Revenue | 5.000% | 10/1/14 | 3,350 | 3,575 |
| |
| Virginia (1.4%) | | | | |
| Charles City County VA Economic Development Authority Solid Waste Disposal Revenue | | | | |
| (Waste Management Inc. Project) PUT | 1.200% | 11/1/11 | 6,350 | 6,356 |
| Louisa VA Industrial Development Authority Pollution Control Revenue | | | | |
| (Virginia Electric & Power Co. Project) PUT | 5.000% | 12/1/11 | 15,000 | 15,051 |
| Louisa VA Industrial Development Authority Pollution Control Revenue | | | | |
| (Virginia Electric & Power Co. Project) PUT | 5.375% | 12/2/13 | 14,500 | 15,619 |
| Norfolk VA BAN | 3.000% | 1/1/14 | 5,000 | 5,083 |
| 1 Richmond VA Public Utility Revenue TOB VRDO | 0.200% | 11/7/11 | 7,490 | 7,490 |
| 1 University of Virginia Revenue TOB VRDO | 0.150% | 11/1/11 | 13,345 | 13,345 |
| Virginia College Building Authority Educational Facilities Revenue | | | | |
| (21st Century College & Equipment Programs) | 5.000% | 2/1/12 | 10,000 | 10,120 |
| Virginia College Building Authority Educational Facilities Revenue | | | | |
| (21st Century College & Equipment Programs) | 5.000% | 2/1/12 | 1,650 | 1,670 |
| Virginia College Building Authority Educational Facilities Revenue | | | | |
| (21st Century College & Equipment Programs) | 5.000% | 2/1/13 | 3,525 | 3,727 |
| Virginia College Building Authority Educational Facilities Revenue | | | | |
| (21st Century College & Equipment Programs) | 5.000% | 2/1/13 | 2,010 | 2,125 |
| Virginia Public Building Authority Public Facilities Revenue | 5.000% | 8/1/12 | 6,525 | 6,758 |
| Virginia Public Building Authority Public Facilities Revenue | 5.000% | 8/1/14 | 4,080 | 4,541 |
| Virginia Public Building Authority Revenue | 5.000% | 8/1/12 | 1,100 | 1,139 |
| Virginia Public Building Authority Revenue | 5.000% | 8/1/16 | 2,000 | 2,274 |
| Virginia Public School Authority Revenue | 4.000% | 8/1/12 | 6,435 | 6,619 |
| Virginia Public School Authority Revenue | 5.000% | 8/1/14 | 20,000 | 22,333 |
| Virginia Public School Authority Revenue | 5.000% | 8/1/15 | 11,440 | 13,128 |
| 1 Virginia Resource Authority Infrastructure Revenue TOB VRDO | 0.140% | 11/7/11 | 5,415 | 5,415 |
| Virginia Small Business Financing Authority Health Care Facilities Revenue (Sentara Healthcare) | 5.000% | 11/1/13 | 3,505 | 3,784 |
| Wise County VA Industrial Development Authority Solid Waste & Sewage Disposal Revenue | | | | |
| (Virginia Electric & Power Co.) PUT | 2.375% | 11/1/15 | 15,000 | 15,354 |
| | | | | 161,931 |
20
Short-Term Tax-Exempt Fund
| | | | |
| | | | Face | Market |
| | | Maturity | Amount | Value• |
| | Coupon | Date | ($000) | ($000) |
| Washington (2.7%) | | | | |
| 1 Bellevue WA GO TOB VRDO | 0.270% | 11/7/11 | 5,445 | 5,445 |
| 1 Central Puget Sound WA Regional Transit Authority Sales & Use Tax Revenue TOB VRDO | 0.150% | 11/1/11 | 8,380 | 8,380 |
| 1 Central Puget Sound WA Regional Transit Authority Sales & Use Tax Revenue TOB VRDO | 0.140% | 11/7/11 | 8,280 | 8,280 |
| Chelan County WA Public Utility District No. 1 Consolidated System Revenue VRDO | 0.150% | 11/7/11 | 13,295 | 13,295 |
| Clark County WA Public Utility Revenue | 5.000% | 1/1/15 | 1,500 | 1,656 |
| 3 Energy Northwest Washington Electric Revenue (Project No. 1) | 5.000% | 7/1/13 | 5,000 | 5,219 |
| Energy Northwest Washington Electric Revenue (Project No. 3) | 5.000% | 7/1/14 | 6,940 | 7,711 |
| 1 King County WA GO TOB VRDO | 0.150% | 11/1/11 | 8,490 | 8,490 |
| King County WA School District GO | 5.000% | 6/1/12 | 6,700 | 6,885 |
| 1 King County WA Sewer Revenue TOB VRDO | 0.150% | 11/1/11 | 3,685 | 3,685 |
| 1 King County WA Sewer Revenue TOB VRDO | 0.130% | 11/7/11 LOC | 20,170 | 20,170 |
| 1 King County WA Sewer Revenue TOB VRDO | 0.140% | 11/7/11 | 25,425 | 25,425 |
| Spokane County WA School District No. 81 GO | 5.125% | 6/1/13 (Prere.) | 4,985 | 5,357 |
| Washington (Motor Vehicle Fuel Tax) GO | 5.000% | 7/1/12 | 5,555 | 5,730 |
| Washington (Motor Vehicle Fuel Tax) GO | 5.000% | 7/1/13 | 5,050 | 5,433 |
| Washington (Motor Vehicle Fuel Tax) GO | 5.000% | 8/1/13 | 9,215 | 9,947 |
| Washington (Motor Vehicle Fuel Tax) GO | 5.000% | 8/1/14 | 9,440 | 10,530 |
| Washington Economic Development Finance Authority Solid Waste Disposal Revenue | | | | |
| (Waste Management Inc. Project) PUT | 2.000% | 9/2/14 | 5,000 | 5,005 |
| Washington GO | 5.000% | 1/1/12 | 12,255 | 12,353 |
| Washington GO | 4.000% | 2/1/12 | 3,915 | 3,952 |
| Washington GO | 5.000% | 1/1/13 | 10,535 | 11,101 |
| Washington GO | 5.000% | 1/1/13 | 13,605 | 14,336 |
| Washington GO | 5.000% | 2/1/13 | 5,285 | 5,589 |
| Washington GO | 5.000% | 1/1/15 | 4,500 | 5,067 |
| Washington GO | 5.000% | 1/1/16 | 5,000 | 5,765 |
| 1 Washington GO TOB VRDO | 0.140% | 11/7/11 | 6,145 | 6,145 |
| 3 Washington Health Care Facilities Authority Revenue (Catholic Health Initiatives) | 2.000% | 2/1/13 | 1,750 | 1,774 |
| Washington Health Care Facilities Authority Revenue | | | | |
| (Fred Hutchinson Cancer Research Center) VRDO | 0.180% | 11/1/11 LOC | 3,780 | 3,780 |
| Washington Health Care Facilities Authority Revenue (MultiCare Health System) | 5.000% | 8/15/12 | 1,625 | 1,669 |
| Washington Health Care Facilities Authority Revenue (MultiCare Health System) | 5.000% | 8/15/13 | 1,450 | 1,525 |
| Washington Health Care Facilities Authority Revenue (MultiCare Health System) | 5.000% | 8/15/14 | 1,590 | 1,696 |
| Washington Health Care Facilities Authority Revenue (MultiCare Health System) VRDO | 0.130% | 11/7/11 LOC | 10,900 | 10,900 |
| Washington Health Care Facilities Authority Revenue (PeaceHealth) | 5.000% | 11/1/11 | 900 | 900 |
| Washington Health Care Facilities Authority Revenue (PeaceHealth) | 5.000% | 11/1/12 | 1,315 | 1,365 |
| Washington Health Care Facilities Authority Revenue (Providence Health & Services) | 5.000% | 10/1/15 | 1,445 | 1,631 |
| Washington Health Care Facilities Authority Revenue | | | | |
| (Southwest Washington Medical Center) VRDO | 0.180% | 11/7/11 LOC | 26,360 | 26,360 |
| Washington Higher Education Facilities Authority Revenue (Whitman College Project) VRDO | 0.110% | 11/7/11 | 26,250 | 26,250 |
| | | | | 298,801 |
| West Virginia (0.4%) | | | | |
| Mason County WV Pollution Control Revenue (Appalachian Power Co. Project) PUT | 2.000% | 10/1/14 | 10,000 | 9,972 |
| West Virginia Commissioner of Highways Special Obligation Revenue | 5.000% | 9/1/12 | 4,970 | 5,160 |
| West Virginia Commissioner of Highways Special Obligation Revenue | 5.000% | 9/1/13 | 4,645 | 5,014 |
| West Virginia Economic Development Authority Solid Waste Facilities Disposal Revenue | | | | |
| (Ohio Power Co. - Amos Project) PUT | 3.125% | 4/1/15 | 5,000 | 5,140 |
| West Virginia Hospital Finance Authority Hospital Revenue (Charleston Area Medical Center Inc.) | 5.000% | 9/1/13 | 1,300 | 1,366 |
| West Virginia Hospital Finance Authority Hospital Revenue (Charleston Area Medical Center Inc.) | 5.000% | 9/1/14 | 5,150 | 5,479 |
| West Virginia University Revenue | 3.000% | 10/1/12 | 1,000 | 1,023 |
| West Virginia University Revenue | 5.000% | 10/1/16 | 725 | 833 |
| 2 West Virginia University Revenue PUT | 0.790% | 10/1/14 | 10,000 | 10,000 |
| | | | | 43,987 |
| Wisconsin (2.1%) | | | | |
| Badger Tobacco Asset Securitization Corp. Wisconsin Revenue | 5.750% | 6/1/12 (ETM) | 8,610 | 8,877 |
| Badger Tobacco Asset Securitization Corp. Wisconsin Revenue | 6.000% | 6/1/12 (Prere.) | 26,580 | 27,452 |
| Badger Tobacco Asset Securitization Corp. Wisconsin Revenue | 6.125% | 6/1/12 (Prere.) | 38,090 | 39,368 |
| Badger Tobacco Asset Securitization Corp. Wisconsin Revenue | 6.375% | 6/1/12 (Prere.) | 42,920 | 44,422 |
| Wisconsin GO | 5.000% | 5/1/12 | 2,250 | 2,303 |
| Wisconsin GO | 5.000% | 5/1/14 | 6,490 | 7,182 |
| Wisconsin GO | 5.000% | 5/1/15 | 10,000 | 11,380 |
| Wisconsin GO | 4.000% | 11/1/16 | 6,000 | 6,749 |
| Wisconsin Health & Educational Facilities Authority Health Care Facilities Revenue | | | | |
| (Luther Hospital) | 5.000% | 11/15/13 | 1,000 | 1,081 |
| Wisconsin Health & Educational Facilities Authority Revenue (Agnesian Healthcare Inc.) | 5.000% | 7/1/15 | 1,010 | 1,084 |
| 1 Wisconsin Health & Educational Facilities Authority Revenue | | | | |
| (Ascension Health Credit Group) TOB VRDO | 0.140% | 11/7/11 | 750 | 750 |
| Wisconsin Health & Educational Facilities Authority Revenue (Aurora Health Care Inc.) | 5.000% | 4/15/13 | 1,500 | 1,561 |
| Wisconsin Health & Educational Facilities Authority Revenue (Aurora Health Care Inc.) | 5.000% | 7/15/13 | 6,000 | 6,284 |
| Wisconsin Health & Educational Facilities Authority Revenue (Aurora Health Care Inc.) | 5.000% | 7/15/14 | 6,000 | 6,357 |
21
| | | | |
| Short-Term Tax-Exempt Fund | | | | |
| |
| |
| |
| |
| | | | Face | Market |
| | | Maturity | Amount | Value• |
| | Coupon | Date | ($000) | ($000) |
| Wisconsin Health & Educational Facilities Authority Revenue (Aurora Health Care Inc.) | 5.000% | 4/15/15 | 1,500 | 1,600 |
| Wisconsin Health & Educational Facilities Authority Revenue (Aurora Health Care Inc.) | 5.000% | 7/15/15 | 6,000 | 6,418 |
| Wisconsin Health & Educational Facilities Authority Revenue (Aurora Health Care Inc.) PUT | 4.750% | 8/15/14 | 14,500 | 15,488 |
| Wisconsin Health & Educational Facilities Authority Revenue (Beloit College) VRDO | 0.140% | 11/7/11 LOC | 10,000 | 10,000 |
| Wisconsin Health & Educational Facilities Authority Revenue (Felician Services Inc.) VRDO | 0.150% | 11/7/11 LOC | 4,170 | 4,170 |
| Wisconsin Health & Educational Facilities Authority Revenue | | | | |
| (Goodwill Industries of North Central Wisconsin Inc.) VRDO | 0.130% | 11/7/11 LOC | 4,540 | 4,540 |
| Wisconsin Health & Educational Facilities Authority Revenue (Ministry Health Care Inc.) | 4.000% | 8/1/12 (4) | 1,330 | 1,360 |
| Wisconsin Health & Educational Facilities Authority Revenue (Ministry Health Care Inc.) | 4.000% | 8/1/13 (4) | 1,320 | 1,379 |
| Wisconsin Health & Educational Facilities Authority Revenue (Ministry Health Care Inc.) | 5.000% | 8/15/13 | 1,500 | 1,589 |
| Wisconsin Health & Educational Facilities Authority Revenue (Ministry Health Care Inc.) | 5.000% | 8/15/15 | 1,790 | 1,948 |
| Wisconsin Health & Educational Facilities Authority Revenue (Ministry Health Care Inc.) | 5.000% | 8/15/16 | 6,115 | 6,721 |
| Wisconsin Health & Educational Facilities Authority Revenue | | | | |
| (Wheaton Franciscan Services Inc. System) | 5.750% | 2/15/12 (Prere.) | 5,775 | 5,925 |
| Wisconsin Petroleum Inspection Fee Revenue | 5.000% | 7/1/14 | 5,000 | 5,533 |
| Wisconsin Transportation Revenue | 5.000% | 7/1/13 (Prere.) | 4,000 | 4,305 |
| | | | | 235,826 |
| Total Tax-Exempt Municipal Bonds (Cost $10,978,015) | | | | 11,087,594 |
| |
| | | | Shares | |
| Temporary Cash Investment (2.2%) | | | | |
| Money Market Fund (2.2%) | | | | |
| 4 Vanguard Municipal Cash Management Fund (Cost $246,823) | 0.117% | | 246,823,379 | 246,823 |
| Total Investments (100.9%) (Cost $11,224,838) | | | | 11,334,417 |
| Other Assets and Liabilities (-0.9%) | | | | |
| Other Assets | | | | 119,359 |
| Liabilities | | | | (224,175) |
| | | | | (104,816) |
| Net Assets (100%) | | | | 11,229,601 |
| |
| |
| At October 31, 2011, net assets consisted of: | | | | |
| | | | | Amount |
| | | | | ($000) |
| Paid-in Capital | | | | 11,142,610 |
| Undistributed Net Investment Income | | | | — |
| Accumulated Net Realized Losses | | | | (22,588) |
| Unrealized Appreciation (Depreciation) | | | | 109,579 |
| Net Assets | | | | 11,229,601 |
| |
| |
| Investor Shares—Net Assets | | | | |
| Applicable to 167,835,937 outstanding $.001 par value shares of beneficial interest (unlimited authorization) | | | 2,668,428 |
| Net Asset Value Per Share—Investor Shares | | | | $15.90 |
| |
| |
| Admiral Shares—Net Assets | | | | |
| Applicable to 538,471,726 outstanding $.001 par value shares of beneficial interest (unlimited authorization) | | | 8,561,173 |
| Net Asset Value Per Share—Admiral Shares | | | | $15.90 |
• See Note A in Notes to Financial Statements.
1 Security exempt from registration under Rule 144A of the Securities Act of 1933. Such securities may be sold in transactions exempt from registration, normally to qualified institutional buyers. At October 31, 2011, the aggregate value of these securities was $1,570,605,000, representing 14.0% of net assets.
2 Adjustable-rate security.
3 Security purchased on a when-issued or delayed-delivery basis for which the fund has not taken delivery as of October 31, 2011.
4 Affiliated money market fund available only to Vanguard funds and certain trusts and accounts managed by Vanguard. Rate shown is the 7-day yield.
For key to abbreviations and other references, see back cover.
See accompanying Notes, which are an integral part of the Financial Statements.
22
Limited-Term Tax-Exempt Fund
| | | | |
| | | | Face | Market |
| | | Maturity | Amount | Value• |
| | Coupon | Date | ($000) | ($000) |
| Tax-Exempt Municipal Bonds (98.4%) | | | | |
| Alabama (0.7%) | | | | |
| Alabama Public School & College Authority Capital Improvement Revenue | 5.000% | 11/1/11 (Prere.) | 10,000 | 10,000 |
| Alabama Public School & College Authority Capital Improvement Revenue | 5.000% | 12/1/11 | 7,750 | 7,781 |
| Alabama Public School & College Authority Capital Improvement Revenue | 5.000% | 12/1/12 | 20,000 | 21,005 |
| Alabama Public School & College Authority Capital Improvement Revenue | 5.000% | 12/1/13 | 35,840 | 39,123 |
| Mobile AL Infirmary Health System Special Care Facilities Financing Authority Revenue | | | | |
| (Infirmary Health System Inc.) | 5.000% | 2/1/15 | 1,615 | 1,728 |
| Mobile AL Infirmary Health System Special Care Facilities Financing Authority Revenue | | | | |
| (Infirmary Health System Inc.) | 5.000% | 2/1/16 | 3,540 | 3,817 |
| Mobile AL Infirmary Health System Special Care Facilities Financing Authority Revenue | | | | |
| (Infirmary Health System Inc.) | 5.000% | 2/1/17 | 2,475 | 2,672 |
| University of Alabama at Birmingham Revenue | 5.000% | 10/1/16 | 3,390 | 3,933 |
| University of Alabama at Birmingham Revenue | 5.000% | 10/1/17 | 3,565 | 4,177 |
| University of Alabama at Birmingham Revenue | 5.000% | 10/1/17 | 1,630 | 1,910 |
| University of Alabama Birmingham Hospital Revenue | 5.000% | 9/1/15 | 1,005 | 1,093 |
| | | | | 97,239 |
| Alaska (0.1%) | | | | |
| Valdez AK Marine Terminal Revenue (BP Pipelines) | 5.000% | 1/1/16 | 10,000 | 11,113 |
| Valdez AK Marine Terminal Revenue (BP Pipelines) | 5.000% | 1/1/16 | 2,000 | 2,223 |
| | | | | 13,336 |
| Arizona (1.4%) | | | | |
| Arizona COP | 5.000% | 9/1/14 (4) | 4,800 | 5,257 |
| Arizona COP | 5.000% | 9/1/15 (4) | 4,000 | 4,462 |
| Arizona Health Facilities Authority Revenue (Banner Health) | 5.000% | 1/1/12 | 2,000 | 2,014 |
| Arizona Health Facilities Authority Revenue (Catholic Healthcare West) PUT | 5.000% | 7/2/12 | 10,000 | 10,297 |
| Arizona School Facilities Board COP | 5.250% | 9/1/12 (4) | 12,350 | 12,774 |
| Arizona School Facilities Board COP | 5.000% | 9/1/14 | 16,000 | 17,388 |
| Arizona School Facilities Board COP | 5.000% | 9/1/15 | 9,000 | 9,921 |
| Arizona School Facilities Board COP | 5.000% | 9/1/16 (14) | 15,000 | 16,339 |
| Arizona School Facilities Board Revenue (School Improvement) | 5.000% | 1/1/14 | 5,000 | 5,460 |
| Arizona Transportation Board Excise Tax Revenue (Maricopa County Regional Area) | 5.000% | 7/1/13 | 7,090 | 7,621 |
| Arizona Transportation Board Excise Tax Revenue (Maricopa County Regional Area) | 5.000% | 7/1/13 | 2,415 | 2,596 |
| Arizona Transportation Board Excise Tax Revenue (Maricopa County Regional Area) | 5.000% | 7/1/14 | 8,055 | 8,944 |
| Arizona Transportation Board Excise Tax Revenue (Maricopa County Regional Area) | 5.000% | 7/1/14 | 5,600 | 6,218 |
| Arizona Transportation Board Excise Tax Revenue (Maricopa County Regional Area) | 5.000% | 7/1/15 | 5,300 | 6,041 |
| Arizona Transportation Board Excise Tax Revenue (Maricopa County Regional Area) | 5.000% | 7/1/15 | 5,000 | 5,699 |
| Arizona Transportation Board Excise Tax Revenue (Maricopa County Regional Area) | 5.000% | 7/1/15 | 5,025 | 5,727 |
| Arizona Transportation Board Highway Revenue | 5.000% | 7/1/14 | 9,075 | 10,081 |
| Arizona Transportation Board Highway Revenue | 5.000% | 7/1/16 | 7,465 | 8,678 |
| Glendale AZ Industrial Development Authority Revenue (Midwestern University) | 5.000% | 5/15/14 | 2,775 | 2,982 |
| Glendale AZ Industrial Development Authority Revenue (Midwestern University) | 5.000% | 5/15/15 | 1,500 | 1,639 |
| Glendale AZ Industrial Development Authority Revenue (Midwestern University) | 5.000% | 5/15/16 | 1,665 | 1,840 |
| Glendale AZ Industrial Development Authority Revenue (Midwestern University) | 5.000% | 5/15/17 | 3,115 | 3,448 |
| Maricopa County AZ Regional Public Transportation Authority Excise Tax Revenue | 5.000% | 7/1/16 | 2,630 | 3,010 |
| Mesa AZ Utility System Revenue | 5.000% | 7/1/14 (Prere.) | 3,500 | 3,899 |
| Phoenix AZ Civic Improvement Corp. Airport Revenue | 5.000% | 7/1/12 | 5,075 | 5,221 |
| Phoenix AZ Civic Improvement Corp. Airport Revenue | 5.000% | 7/1/13 | 3,660 | 3,900 |
| Phoenix AZ Civic Improvement Corp. Airport Revenue | 5.000% | 7/1/15 | 6,000 | 6,712 |
| Phoenix AZ Civic Improvement Corp. Airport Revenue | 5.000% | 7/1/16 | 3,055 | 3,472 |
| Phoenix AZ Civic Improvement Corp. Water System Revenue | 5.000% | 7/1/12 (14) | 5,100 | 5,261 |
| Salt River Project Arizona Agricultural Improvement & Power District Revenue | 4.000% | 12/1/17 | 1,000 | 1,128 |
| Salt River Project Arizona Agricultural Improvement & Power District Revenue | 5.000% | 12/1/18 | 4,520 | 5,393 |
| Scottsdale AZ GO | 5.000% | 7/1/13 | 5,000 | 5,378 |
| Yavapai County AZ Industrial Development Authority Hospital Facility Revenue | | | | |
| (Northern Arizona Healthcare System) | 5.000% | 10/1/17 | 1,445 | 1,620 |
| Yavapai County AZ Industrial Development Authority Hospital Facility Revenue | | | | |
| (Northern Arizona Healthcare System) | 5.000% | 10/1/18 | 2,185 | 2,451 |
| | | | | 202,871 |
| California (11.5%) | | | | |
| Bay Area CA Infrastructure Financing Authority Revenue | 5.000% | 8/1/17 (14) | 16,140 | 17,026 |
| California Department of Water Resources Power Supply Revenue | 5.500% | 5/1/12 (Prere.) | 10,955 | 11,353 |
| California Department of Water Resources Power Supply Revenue | 5.500% | 5/1/12 (Prere.) | 3,000 | 3,109 |
| California Department of Water Resources Power Supply Revenue | 5.000% | 5/1/14 | 30,000 | 33,160 |
| California Department of Water Resources Power Supply Revenue | 5.000% | 5/1/15 | 21,250 | 24,070 |
| California Department of Water Resources Power Supply Revenue | 5.000% | 5/1/15 | 40,000 | 45,308 |
| California Department of Water Resources Power Supply Revenue | 5.000% | 5/1/16 | 12,055 | 13,870 |
| California Department of Water Resources Power Supply Revenue | 5.000% | 5/1/17 | 22,000 | 25,685 |
| California Department of Water Resources Power Supply Revenue | 5.000% | 5/1/19 | 10,000 | 11,731 |
| California Economic Recovery Bonds GO | 5.250% | 7/1/13 | 2,500 | 2,694 |
| California Economic Recovery Bonds GO | 5.250% | 7/1/14 (14) | 2,500 | 2,787 |
23
Limited-Term Tax-Exempt Fund
| | | | |
| | | | Face | Market |
| | | Maturity | Amount | Value• |
| | Coupon | Date | ($000) | ($000) |
| California Economic Recovery Bonds GO | 5.250% | 7/1/14 (ETM) | 3,390 | 3,803 |
| California Economic Recovery Bonds GO | 5.250% | 7/1/14 | 11,610 | 12,944 |
| California Economic Recovery Bonds GO | 5.000% | 7/1/16 | 1,500 | 1,724 |
| California Economic Recovery Bonds GO | 5.000% | 7/1/17 | 15,090 | 17,518 |
| California Economic Recovery Bonds GO | 5.000% | 7/1/18 | 41,600 | 48,090 |
| California Educational Facilities Authority Revenue (University of San Francisco) VRDO | 0.120% | 11/7/11 LOC | 13,450 | 13,450 |
| California Educational Facilities Authority Revenue (University of San Francisco) VRDO | 0.120% | 11/7/11 LOC | 9,400 | 9,400 |
| California GO | 5.000% | 3/1/12 | 10,755 | 10,918 |
| California GO | 5.000% | 4/1/12 | 5,000 | 5,094 |
| California GO | 5.000% | 5/1/13 | 23,475 | 24,938 |
| California GO | 5.000% | 9/1/13 | 32,125 | 34,539 |
| California GO | 5.000% | 11/1/13 | 13,695 | 14,811 |
| California GO | 5.000% | 8/1/14 | 1,970 | 2,170 |
| California GO | 5.000% | 4/1/15 | 21,300 | 23,785 |
| California GO | 5.000% | 6/1/15 | 3,250 | 3,587 |
| California GO | 5.000% | 6/1/15 (14) | 5,100 | 5,712 |
| California GO | 5.000% | 3/1/16 | 3,210 | 3,602 |
| California GO | 5.000% | 3/1/16 (14) | 1,120 | 1,257 |
| California GO | 5.000% | 3/1/16 | 4,460 | 5,005 |
| California GO | 5.000% | 3/1/16 (14) | 6,510 | 7,062 |
| California GO | 5.000% | 4/1/16 | 6,670 | 7,496 |
| California GO | 5.000% | 5/1/16 | 2,150 | 2,362 |
| California GO | 5.000% | 8/1/16 | 2,825 | 3,192 |
| California GO | 5.000% | 10/1/16 | 1,225 | 1,388 |
| California GO | 5.000% | 10/1/16 | 28,605 | 32,406 |
| California GO | 5.000% | 11/1/16 (2) | 5,375 | 6,097 |
| California GO | 5.000% | 12/1/16 | 2,500 | 2,839 |
| California GO | 6.000% | 2/1/17 (2) | 3,500 | 4,119 |
| California GO | 5.000% | 3/1/17 (14) | 1,300 | 1,439 |
| California GO | 5.000% | 3/1/17 | 3,755 | 4,242 |
| California GO | 5.000% | 4/1/17 | 7,275 | 8,224 |
| California GO | 5.000% | 9/1/17 | 4,250 | 4,816 |
| California GO | 5.000% | 10/1/17 | 20,000 | 22,671 |
| California GO | 5.000% | 10/1/17 | 4,005 | 4,540 |
| California GO | 5.000% | 9/1/18 | 32,260 | 36,538 |
| California GO | 5.000% | 10/1/18 | 25,000 | 28,327 |
| California GO | 5.000% | 9/1/19 | 19,000 | 21,475 |
| California GO VRDO | 0.130% | 11/7/11 LOC | 5,600 | 5,600 |
| California Health Facilities Financing Authority Revenue (Catholic Healthcare West) | 5.000% | 7/1/14 | 3,000 | 3,246 |
| 1 California Health Facilities Financing Authority Revenue (Catholic Healthcare West) | 5.000% | 3/1/19 | 5,125 | 5,595 |
| California Health Facilities Financing Authority Revenue (Catholic Healthcare West) PUT | 5.000% | 7/1/14 | 23,180 | 25,594 |
| California Health Facilities Financing Authority Revenue (Cedars-Sinai Medical Center) | 5.000% | 11/15/12 | 3,000 | 3,126 |
| California Health Facilities Financing Authority Revenue (St. Joseph Health System) PUT | 5.000% | 10/16/14 | 20,000 | 21,966 |
| California Health Facilities Financing Authority Revenue (St. Joseph Health System) PUT | 5.000% | 10/18/16 | 20,000 | 22,591 |
| California Health Facilities Financing Authority Revenue (Sutter Health) | 5.000% | 8/15/12 | 5,000 | 5,173 |
| California Health Facilities Financing Authority Revenue (Sutter Health) | 5.000% | 8/15/13 | 2,210 | 2,363 |
| California Health Facilities Financing Authority Revenue (Sutter Health) | 5.000% | 8/15/14 | 5,000 | 5,453 |
| California Health Facilities Financing Authority Revenue (Sutter Health) | 4.000% | 8/15/17 | 5,000 | 5,384 |
| California Infrastructure & Economic Development Bank Revenue | | | | |
| (Independent System Operator Corp. Project) | 5.000% | 2/1/12 | 5,000 | 5,059 |
| California Municipal Finance Authority | | | | |
| (Community Hospitals of Central California Obligated Group) COP | 5.000% | 2/1/14 | 1,230 | 1,276 |
| California Municipal Finance Authority | | | | |
| (Community Hospitals of Central California Obligated Group) COP | 5.000% | 2/1/16 | 2,450 | 2,554 |
| California Municipal Finance Authority Solid Waste Disposal | | | | |
| Revenue (Waste Management Inc. Project) PUT | 2.000% | 9/2/14 | 12,600 | 12,624 |
| 2 California Municipal Finance Authority Solid Waste Revenue | | | | |
| (Republic Services Inc. Project) PUT | 0.900% | 1/3/12 | 20,000 | 19,998 |
| California Pollution Control Financing Authority Environmental Improvement Revenue | | | | |
| (BP West Coast Products LLC Project) PUT | 2.600% | 9/2/14 | 4,000 | 4,121 |
| California Public Works Board Lease Revenue (Department of Corrections) | 5.000% | 10/1/17 | 5,820 | 6,477 |
| California Public Works Board Lease Revenue (Department of Corrections) | 5.000% | 10/1/18 | 1,845 | 2,045 |
| California Public Works Board Lease Revenue (Regents of The University of California) | 5.000% | 5/1/12 | 2,500 | 2,558 |
| California Public Works Board Lease Revenue (Regents of The University of California) | 5.000% | 5/1/13 | 7,500 | 7,956 |
| California Public Works Board Lease Revenue (Regents of The University of California) | 5.000% | 6/1/15 (14) | 10,000 | 11,207 |
| California Public Works Board Lease Revenue (Various Capital Projects) | 5.000% | 11/1/15 | 5,295 | 5,858 |
| California Public Works Board Lease Revenue (Various Capital Projects) | 5.000% | 10/1/17 | 3,000 | 3,338 |
| California Public Works Board Lease Revenue (Various Capital Projects) | 5.000% | 10/1/18 | 3,500 | 3,880 |
| California Statewide Communities Development Authority Pollution Control Revenue | | | | |
| (Southern California Edison Co.) PUT | 4.100% | 4/1/13 (10) | 5,000 | 5,210 |
| California Statewide Communities Development Authority Revenue (Kaiser Permanente) | 5.000% | 4/1/14 | 15,000 | 16,372 |
| California Statewide Communities Development Authority Revenue (Kaiser Permanente) PUT | 3.850% | 6/1/12 | 10,000 | 10,204 |
24
Limited-Term Tax-Exempt Fund
| | | | |
| | | | Face | Market |
| | | Maturity | Amount | Value• |
| | Coupon | Date | ($000) | ($000) |
| 3 California Statewide Communities Development Authority Revenue (Sutter Health) TOB VRDO | 0.140% | 11/7/11 | 5,268 | 5,268 |
| California Statewide Communities Development Authority Senior Living Revenue | | | | |
| (Southern California Presbyterian Homes) | 5.250% | 11/15/14 | 860 | 884 |
| Central Valley CA Financing Authority Cogeneration Project Revenue (Carson Ice-Gen Project) | 5.000% | 7/1/15 | 750 | 831 |
| Central Valley CA Financing Authority Cogeneration Project Revenue (Carson Ice-Gen Project) | 5.000% | 7/1/16 | 805 | 903 |
| Desert Sands CA School District GO | 0.000% | 6/1/12 (2) | 10,000 | 9,965 |
| Foothill/Eastern Corridor Agency California Toll Road Revenue | 0.000% | 1/1/15 (ETM) | 18,535 | 17,942 |
| Foothill/Eastern Corridor Agency California Toll Road Revenue | 5.000% | 1/15/16 (14) | 8,400 | 8,308 |
| Fresno County CA TRAN | 3.000% | 6/29/12 | 10,000 | 10,188 |
| Golden State Tobacco Securitization Corp. California | 5.000% | 6/1/12 | 10,000 | 10,151 |
| Golden State Tobacco Securitization Corp. California | 5.000% | 6/1/13 | 5,655 | 5,826 |
| Golden State Tobacco Securitization Corp. California | 5.500% | 6/1/13 (Prere.) | 37,210 | 40,087 |
| Golden State Tobacco Securitization Corp. California | 5.625% | 6/1/13 (Prere.) | 21,410 | 23,107 |
| Golden State Tobacco Securitization Corp. California | 6.750% | 6/1/13 (Prere.) | 30,000 | 32,909 |
| Golden State Tobacco Securitization Corp. California | 7.900% | 6/1/13 (Prere.) | 20,000 | 22,289 |
| Golden State Tobacco Securitization Corp. California | 6.250% | 6/1/33 (Prere.) | 48,920 | 52,603 |
| 3 Los Angeles CA Department of Water & Power Revenue TOB VRDO | 0.140% | 11/7/11 | 4,000 | 4,000 |
| Los Angeles CA Department of Water & Power Revenue VRDO | 0.150% | 11/7/11 | 3,400 | 3,400 |
| Los Angeles CA GO | 5.000% | 9/1/17 | 32,500 | 38,188 |
| Los Angeles CA Unified School District COP VRDO | 0.120% | 11/7/11 LOC | 5,900 | 5,900 |
| Los Angeles CA Unified School District GO | 5.000% | 7/1/14 | 31,995 | 35,194 |
| Los Angeles CA Unified School District GO | 5.000% | 7/1/14 | 5,725 | 6,297 |
| Los Angeles CA Unified School District GO | 5.000% | 7/1/15 | 14,510 | 16,332 |
| Los Angeles CA Unified School District GO | 5.000% | 7/1/15 | 20,000 | 22,511 |
| Los Angeles CA Unified School District GO | 5.000% | 7/1/15 | 10,240 | 11,526 |
| Los Angeles CA Unified School District GO | 5.000% | 7/1/15 | 4,200 | 4,727 |
| Los Angeles CA Unified School District GO | 5.000% | 7/1/16 | 19,595 | 22,455 |
| Los Angeles CA Unified School District GO | 5.000% | 7/1/17 | 19,090 | 22,078 |
| 3 Los Angeles CA Unified School District GO TOB VRDO | 0.140% | 11/7/11 (4) | 22,500 | 22,500 |
| Los Angeles CA Wastewater System Revenue | 5.000% | 6/1/13 | 11,205 | 11,976 |
| Los Angeles CA Wastewater System Revenue VRDO | 0.120% | 11/7/11 LOC | 8,800 | 8,800 |
| Los Angeles County CA Metropolitan Transportation Authority Sales Tax Revenue | 5.000% | 7/1/16 | 22,315 | 25,931 |
| Los Angeles County CA Metropolitan Transportation Authority Sales Tax Revenue | 5.000% | 7/1/16 | 5,000 | 5,813 |
| Los Angeles County CA Public Works Financing Authority Lease Revenue | 5.000% | 12/1/12 (14) | 7,710 | 8,012 |
| Los Angeles County CA Public Works Financing Authority Lease Revenue | 5.000% | 8/1/16 | 3,450 | 3,919 |
| Los Angeles County CA Public Works Financing Authority Lease Revenue | 5.000% | 8/1/17 | 5,000 | 5,721 |
| Modesto CA Water Revenue VRDO | 0.110% | 11/7/11 (4)LOC | 16,960 | 16,960 |
| Newport Beach CA Revenue (Hoag Memorial Hospital Presbyterian) PUT | 5.000% | 2/7/13 | 8,490 | 8,956 |
| Newport Beach CA Revenue (Hoag Memorial Hospital Presbyterian) VRDO | 0.100% | 11/7/11 | 13,195 | 13,195 |
| Northern California Power Agency Revenue (Hydroelectric Project) | 5.000% | 7/1/14 (12) | 2,760 | 3,031 |
| Northern California Power Agency Revenue (Hydroelectric Project) | 4.000% | 7/1/15 | 3,000 | 3,243 |
| Northern California Power Agency Revenue (Hydroelectric Project) | 5.000% | 7/1/15 (12) | 4,000 | 4,496 |
| Orange County CA Airport Revenue | 5.000% | 7/1/16 | 3,435 | 3,935 |
| Orange County CA Public Financing Authority Lease Revenue | 5.000% | 7/1/12 (14) | 3,165 | 3,260 |
| Orange County CA Water District COP VRDO | 0.110% | 11/7/11 | 22,000 | 22,000 |
| Palomar PowerAde Health System California Revenue COP | 4.500% | 11/1/15 | 2,265 | 2,326 |
| Palomar PowerAde Health System California Revenue COP | 5.000% | 11/1/16 | 3,500 | 3,656 |
| Riverside CA Electric Revenue VRDO | 0.130% | 11/7/11 LOC | 5,300 | 5,300 |
| Sacramento CA Cogeneration Authority Revenue | 5.000% | 7/1/13 | 750 | 799 |
| Sacramento CA Cogeneration Authority Revenue | 5.000% | 7/1/15 | 700 | 784 |
| Sacramento CA Cogeneration Authority Revenue | 5.000% | 7/1/16 | 1,000 | 1,137 |
| Sacramento CA Municipal Utility District Revenue | 5.000% | 8/15/16 (4) | 7,800 | 9,004 |
| Sacramento CA Municipal Utility District Revenue | 5.000% | 7/1/17 (14) | 5,000 | 5,350 |
| Sacramento County CA Airport Revenue | 5.000% | 7/1/13 | 7,200 | 7,629 |
| Sacramento County CA Airport Revenue | 5.000% | 7/1/14 | 6,615 | 7,195 |
| Sacramento County CA Airport Revenue | 5.000% | 7/1/15 | 8,245 | 9,143 |
| San Bernardino County CA Medical Center (Arrowhead Project) COP | 5.000% | 8/1/13 | 3,290 | 3,480 |
| San Bernardino County CA Medical Center (Arrowhead Project) COP | 5.000% | 8/1/15 | 3,000 | 3,266 |
| San Bernardino County CA Medical Center (Arrowhead Project) COP | 5.000% | 8/1/16 | 5,445 | 5,975 |
| San Diego CA Public Facilities Financing Authority Sewer Revenue | 5.000% | 5/15/16 | 11,840 | 13,749 |
| San Diego CA Public Facilities Financing Authority Sewer Revenue | 5.000% | 5/15/16 | 14,000 | 16,224 |
| San Diego County CA Regional Transportation Authority Sales Tax Revenue VRDO | 0.120% | 11/7/11 | 4,880 | 4,880 |
| San Francisco CA City & County International Airport Revenue | 5.000% | 5/1/15 (4) | 5,000 | 5,578 |
| San Francisco CA City & County International Airport Revenue | 5.000% | 5/1/16 | 9,120 | 10,342 |
| San Francisco CA City & County International Airport Revenue | 5.000% | 5/1/17 | 16,555 | 18,960 |
| 3 San Marcos CA Public Facilities Authority Tax Allocation Revenue TOB VRDO | 0.130% | 11/1/11 LOC | 4,300 | 4,300 |
| 3 Sonoma County CA Junior College District GO TOB VRDO | 0.240% | 11/7/11 | 3,440 | 3,440 |
| Southern California Public Power Authority Revenue (Transmission Project) | 5.000% | 7/1/17 | 9,895 | 11,492 |
| Southern California Public Power Authority Revenue (Transmission Project) VRDO | 0.120% | 11/7/11 (4) | 22,370 | 22,370 |
| 3 Torrance CA Hospital Revenue (Torrance Memorial Medical Center) TOB VRDO | 0.130% | 11/7/11 LOC | 5,400 | 5,400 |
| University of California Revenue | 5.000% | 5/15/12 (14) | 3,000 | 3,077 |
| University of California Revenue | 5.000% | 5/15/17 | 2,250 | 2,644 |
25
Limited-Term Tax-Exempt Fund
| | | | |
| | | | Face | Market |
| | | Maturity | Amount | Value• |
| | Coupon | Date | ($000) | ($000) |
| University of California Revenue | 5.000% | 5/15/18 | 2,000 | 2,368 |
| University of California Revenue | 5.000% | 5/15/19 | 4,435 | 5,268 |
| 3 University of California Revenue TOB VRDO | 0.140% | 11/7/11 | 4,600 | 4,600 |
| Ventura County CA Public Financing Authority COP | 5.000% | 8/15/16 | 2,750 | 3,109 |
| Whittier CA Health Facility Revenue (Presbyterian Intercommunity Hospital) VRDO | 0.090% | 11/7/11 LOC | 8,000 | 8,000 |
| | | | | 1,675,663 |
| Colorado (1.4%) | | | | |
| Colorado Department of Transportation Revenue | 5.000% | 12/15/15 (14) | 3,000 | 3,453 |
| Colorado Educational & Cultural Facilities Authority Revenue | | | | |
| (National Jewish Federation Bond Program) VRDO | 0.150% | 11/1/11 LOC | 3,280 | 3,280 |
| Colorado Educational & Cultural Facilities Authority Revenue | | | | |
| (National Jewish Federation Bond Program) VRDO | 0.180% | 11/1/11 LOC | 8,500 | 8,500 |
| Colorado Educational & Cultural Facilities Authority Revenue | | | | |
| (National Jewish Federation Bond Program) VRDO | 0.150% | 11/1/11 LOC | 10,315 | 10,315 |
| Colorado Health Facilities Authority Revenue (Catholic Health Initiatives) | 5.000% | 7/1/16 | 5,000 | 5,703 |
| Colorado Health Facilities Authority Revenue (Catholic Health Initiatives) VRDO | 0.130% | 11/7/11 | 46,250 | 46,250 |
| Colorado Health Facilities Authority Revenue | | | | |
| (Sisters of Charity of Leavenworth Health System) | 5.000% | 1/1/16 | 3,165 | 3,533 |
| Colorado Health Facilities Authority Revenue | | | | |
| (Sisters of Charity of Leavenworth Health System) | 5.000% | 1/1/16 | 6,415 | 7,161 |
| Colorado Health Facilities Authority Revenue | | | | |
| (Sisters of Charity of Leavenworth Health System) | 5.000% | 1/1/17 | 3,715 | 4,168 |
| Colorado Health Facilities Authority Revenue | | | | |
| (Sisters of Charity of Leavenworth Health System) | 5.000% | 1/1/17 | 7,920 | 8,886 |
| Colorado Health Facilities Authority Revenue | | | | |
| (Sisters of Charity of Leavenworth Health System) VRDO | 0.130% | 11/7/11 | 19,560 | 19,560 |
| Denver CO City & County Airport Revenue | 5.000% | 11/15/14 | 1,840 | 2,048 |
| Denver CO City & County Airport Revenue | 5.000% | 11/15/16 | 2,500 | 2,867 |
| Denver CO City & County COP VRDO | 0.150% | 11/1/11 | 2,100 | 2,100 |
| E-470 Public Highway Authority Colorado Revenue PUT | 5.000% | 9/2/13 (14) | 11,485 | 12,115 |
| 2 E-470 Public Highway Authority Colorado Revenue PUT | 2.860% | 9/14/14 | 16,500 | 16,504 |
| Jefferson County CO School District GO | 5.000% | 12/15/12 (2) | 3,500 | 3,683 |
| Jefferson County CO School District GO | 5.000% | 12/15/17 (4) | 7,985 | 9,134 |
| Regional Transportation District of Colorado Sales Tax Revenue | 5.000% | 11/1/16 (Prere.) | 22,500 | 26,406 |
| University of Colorado Hospital Authority Revenue | 5.000% | 11/15/13 | 1,960 | 2,084 |
| University of Colorado Hospital Authority Revenue | 5.000% | 11/15/14 | 1,000 | 1,079 |
| University of Colorado Hospital Authority Revenue | 5.000% | 11/15/16 | 1,290 | 1,415 |
| | | | | 200,244 |
| Connecticut (1.8%) | | | | |
| Connecticut GO | 5.500% | 12/15/11 | 5,435 | 5,471 |
| Connecticut GO | 5.000% | 4/1/12 (14) | 9,190 | 9,374 |
| Connecticut GO | 5.000% | 3/15/13 | 10,000 | 10,629 |
| Connecticut GO | 5.000% | 12/1/13 (14) | 3,930 | 4,298 |
| Connecticut GO | 5.000% | 1/1/14 | 18,250 | 19,959 |
| Connecticut GO | 5.000% | 1/1/15 | 14,710 | 16,579 |
| Connecticut GO | 5.250% | 11/1/15 | 1,000 | 1,164 |
| Connecticut GO | 5.000% | 1/1/16 | 30,000 | 34,566 |
| Connecticut GO | 5.000% | 3/1/16 | 4,705 | 5,442 |
| Connecticut GO | 5.000% | 5/1/16 | 10,000 | 11,609 |
| 2 Connecticut GO | 0.790% | 5/15/16 | 8,300 | 8,300 |
| Connecticut GO | 5.000% | 4/1/17 | 1,165 | 1,373 |
| 2 Connecticut GO | 0.910% | 5/15/17 | 20,000 | 20,000 |
| Connecticut GO | 5.000% | 12/1/17 | 15,000 | 17,523 |
| 2 Connecticut GO PUT | 1.490% | 3/1/18 | 17,500 | 17,621 |
| Connecticut Health & Educational Facilities Authority Revenue (Hartford Healthcare) | 5.000% | 7/1/17 | 2,090 | 2,319 |
| Connecticut Health & Educational Facilities Authority Revenue (Hartford Healthcare) | 5.000% | 7/1/18 | 3,500 | 3,874 |
| Connecticut Health & Educational Facilities Authority Revenue (Hartford Healthcare) | 5.000% | 7/1/19 | 4,270 | 4,700 |
| Connecticut Health & Educational Facilities Authority Revenue (Stamford Hospital) | 5.000% | 7/1/15 | 1,975 | 2,166 |
| Connecticut Health & Educational Facilities Authority Revenue (Stamford Hospital) | 5.000% | 7/1/16 | 5,085 | 5,630 |
| Connecticut Health & Educational Facilities Authority Revenue (Stamford Hospital) | 5.000% | 7/1/17 | 2,365 | 2,629 |
| Connecticut Health & Educational Facilities Authority Revenue (Yale University) PUT | 4.000% | 2/7/13 | 6,625 | 6,927 |
| Connecticut Health & Educational Facilities Authority Revenue (Yale University) PUT | 5.000% | 2/12/15 | 20,810 | 23,531 |
| Connecticut Special Tax Revenue (Transportation Infrastructure) | 5.000% | 2/1/14 | 5,270 | 5,776 |
| Connecticut Special Tax Revenue (Transportation Infrastructure) | 5.000% | 2/1/16 | 5,300 | 6,102 |
| Connecticut Special Tax Revenue (Transportation Infrastructure) | 5.250% | 7/1/16 (2) | 7,745 | 9,087 |
| | | | | 256,649 |
| Delaware (0.3%) | | | | |
| Delaware GO | 5.000% | 1/1/13 | 9,450 | 9,962 |
| Delaware GO | 5.000% | 8/1/14 (Prere.) | 5,000 | 5,586 |
| Delaware Health Facilities Authority Revenue (Christiana Care Health Services) VRDO | 0.110% | 11/7/11 | 4,000 | 4,000 |
| Delaware Transportation Authority Transportation System Revenue | 5.000% | 7/1/14 | 4,070 | 4,528 |
26
Limited-Term Tax-Exempt Fund
| | | | |
| | | | Face | Market |
| | | Maturity | Amount | Value• |
| | Coupon | Date | ($000) | ($000) |
| Delaware Transportation Authority Transportation System Revenue | 5.000% | 7/1/16 | 4,485 | 5,234 |
| University of Delaware Revenue PUT | 0.850% | 6/4/13 | 8,000 | 8,050 |
| | | | | 37,360 |
| District of Columbia (0.7%) | | | | |
| District of Columbia GO | 5.000% | 6/1/12 (4) | 2,500 | 2,568 |
| District of Columbia GO | 5.000% | 6/1/13 (Prere.) | 4,900 | 5,256 |
| District of Columbia GO | 5.000% | 6/1/13 (4) | 4,000 | 4,280 |
| District of Columbia GO | 5.000% | 6/1/15 (14) | 5,000 | 5,269 |
| 2 District of Columbia Income Tax Revenue | 0.490% | 12/1/13 | 10,500 | 10,500 |
| District of Columbia Income Tax Revenue | 5.000% | 12/1/18 | 5,500 | 6,567 |
| 3 District of Columbia Income Tax Revenue TOB VRDO | 0.140% | 11/7/11 | 7,425 | 7,425 |
| District of Columbia Revenue (American College of Cardiology) VRDO | 0.360% | 11/7/11 LOC | 39,200 | 39,200 |
| District of Columbia Revenue (Washington Drama Society) VRDO | 0.130% | 11/7/11 LOC | 13,900 | 13,900 |
| Washington DC Metropolitan Area Transit Authority Revenue | 5.000% | 7/1/13 | 3,000 | 3,211 |
| Washington DC Metropolitan Area Transit Authority Revenue | 5.000% | 7/1/15 | 3,375 | 3,813 |
| | | | | 101,989 |
| Florida (5.5%) | | | | |
| Alachua County FL Health Facilities Authority Revenue (Shands HealthCare Project) | 5.000% | 12/1/14 | 4,390 | 4,694 |
| Alachua County FL Health Facilities Authority Revenue (Shands HealthCare Project) | 5.000% | 12/1/15 | 5,000 | 5,373 |
| 3 Broward County FL Water & Sewer Utility Revenue TOB VRDO | 0.140% | 11/7/11 | 5,665 | 5,665 |
| 3 Cape Coral FL Water & Sewer Revenue TOB VRDO | 0.140% | 11/7/11 (4)LOC | 20,100 | 20,100 |
| Citizens Property Insurance Corp. Florida Revenue (Coastal Account) | 5.000% | 3/1/12 (14) | 15,000 | 15,212 |
| Citizens Property Insurance Corp. Florida Revenue (Coastal Account) | 5.500% | 6/1/14 | 15,000 | 16,205 |
| Citizens Property Insurance Corp. Florida Revenue (Coastal Account) | 5.000% | 3/1/15 (14) | 11,000 | 11,812 |
| Citizens Property Insurance Corp. Florida Revenue (Coastal Account) | 5.000% | 6/1/15 | 5,000 | 5,388 |
| Citizens Property Insurance Corp. Florida Revenue (Coastal Account) | 5.000% | 6/1/15 | 40,000 | 43,100 |
| Citizens Property Insurance Corp. Florida Revenue (Coastal Account) | 5.000% | 6/1/16 | 15,000 | 16,229 |
| Citizens Property Insurance Corp. Florida Revenue (Coastal Account) | 5.250% | 6/1/17 | 15,000 | 16,398 |
| Citizens Property Insurance Corp. Florida Revenue (Coastal Account) | 5.000% | 6/1/18 | 6,000 | 6,457 |
| Clay County FL Sales Surtax Revenue | 5.000% | 10/1/13 (12) | 7,025 | 7,472 |
| Escambia County FL Solid Waste Disposal System Revenue (Gulf Power Co. Project) PUT | 2.000% | 4/3/12 | 5,000 | 5,028 |
| Escambia County FL Solid Waste Disposal System Revenue (Gulf Power Co. Project) PUT | 1.750% | 6/15/12 | 5,500 | 5,541 |
| Florida Board of Education Capital Outlay GO | 5.000% | 1/1/12 | 27,730 | 27,951 |
| Florida Board of Education Lottery Revenue | 5.000% | 7/1/12 | 7,630 | 7,865 |
| Florida Board of Education Lottery Revenue | 5.000% | 7/1/13 | 8,010 | 8,583 |
| Florida Board of Education Lottery Revenue | 5.000% | 7/1/14 | 8,410 | 9,291 |
| Florida Board of Education Lottery Revenue | 5.000% | 7/1/15 | 8,830 | 9,982 |
| Florida Board of Education Lottery Revenue | 5.000% | 7/1/15 (14) | 9,555 | 10,802 |
| Florida Board of Education Lottery Revenue | 5.000% | 7/1/16 | 7,500 | 8,624 |
| Florida Board of Education Lottery Revenue | 5.000% | 7/1/17 | 2,500 | 2,901 |
| Florida Board of Education Public Education Capital Outlay GO | 5.000% | 6/1/16 | 5,065 | 5,445 |
| Florida Board of Education Public Education Capital Outlay GO | 5.000% | 6/1/17 | 13,700 | 16,121 |
| Florida Board of Education Public Education Capital Outlay GO | 5.000% | 6/1/18 | 11,240 | 13,337 |
| Florida Board of Education Public Education Capital Outlay GO | 5.000% | 6/1/18 | 3,615 | 4,289 |
| 3 Florida Board of Education Public Education Capital Outlay GO TOB VRDO | 0.140% | 11/7/11 | 4,000 | 4,000 |
| Florida Department of Environmental Protection & Preservation Revenue | 5.250% | 7/1/12 | 20,000 | 20,659 |
| Florida Department of Environmental Protection & Preservation Revenue | 5.000% | 7/1/13 | 5,820 | 6,232 |
| Florida Department of Environmental Protection & Preservation Revenue | 5.000% | 7/1/14 | 6,110 | 6,748 |
| Florida Department of Environmental Protection & Preservation Revenue | 5.000% | 7/1/15 | 6,415 | 7,230 |
| Florida Department of Environmental Protection & Preservation Revenue | 5.000% | 7/1/18 | 8,585 | 9,947 |
| Florida Department of Environmental Protection & Preservation Revenue | 5.000% | 7/1/19 | 9,015 | 10,412 |
| Florida Department of Environmental Protection & Preservation Revenue VRDO | 0.150% | 11/7/11 (12) | 3,300 | 3,300 |
| Florida Hurricane Catastrophe Fund Finance Corp. Revenue | 5.250% | 7/1/12 | 37,600 | 38,772 |
| Florida Hurricane Catastrophe Fund Finance Corp. Revenue | 5.000% | 7/1/14 | 22,000 | 23,702 |
| Florida Hurricane Catastrophe Fund Finance Corp. Revenue | 5.000% | 7/1/15 | 20,000 | 21,821 |
| Florida Municipal Power Agency Revenue (St. Lucie Project) | 5.000% | 10/1/15 | 2,135 | 2,383 |
| Florida Municipal Power Agency Revenue (St. Lucie Project) | 5.000% | 10/1/16 | 3,290 | 3,715 |
| Florida Rural Utility Financing Commission Revenue | 3.500% | 11/1/11 | 1,385 | 1,385 |
| Florida Turnpike Authority Revenue | 5.000% | 7/1/15 (4) | 5,000 | 5,395 |
| Florida Turnpike Authority Revenue | 5.000% | 7/1/16 | 3,480 | 3,996 |
| Florida Turnpike Authority Revenue | 5.000% | 7/1/17 (4) | 20,000 | 21,443 |
| Gainsville FL Utility System Revenue VRDO | 0.200% | 11/1/11 | 8,625 | 8,625 |
| Highlands County FL Health Facilities Authority Hospital Revenue | | | | |
| (Adventist Health System/Sunbelt Obligated Group) | 5.000% | 11/15/14 | 2,000 | 2,219 |
| Highlands County FL Health Facilities Authority Hospital Revenue | | | | |
| (Adventist Health System/Sunbelt Obligated Group) | 5.000% | 11/15/16 | 2,000 | 2,263 |
| Hillsborough County FL Aviation Authority Revenue(Tampa International Airport) | 5.000% | 10/1/14 | 2,000 | 2,205 |
| Hillsborough County FL Aviation Authority Revenue(Tampa International Airport) | 5.000% | 10/1/16 | 2,505 | 2,852 |
| Hillsborough County FL Industrial Development Authority Pollution Control Revenue | | | | |
| (Tampa Electric Co. Project) PUT | 5.150% | 9/1/13 | 8,000 | 8,581 |
| Jacksonville FL Electric Authority Electric System Revenue | 5.000% | 10/1/16 | 1,500 | 1,739 |
27
Limited-Term Tax-Exempt Fund
| | | | |
| | | | Face | Market |
| | | Maturity | Amount | Value• |
| | Coupon | Date | ($000) | ($000) |
| Jacksonville FL Electric Authority Electric System Revenue | 5.000% | 10/1/16 | 4,675 | 5,420 |
| Jacksonville FL Electric Authority Electric System Revenue | 5.000% | 10/1/17 | 1,000 | 1,170 |
| Jacksonville FL Electric Authority Electric System Revenue VRDO | 0.110% | 11/7/11 | 13,800 | 13,800 |
| Jacksonville FL Electric Authority Electric System Revenue VRDO | 0.110% | 11/7/11 | 25,725 | 25,725 |
| Jacksonville FL Electric Authority Water & Sewer Revenue VRDO | 0.130% | 11/7/11 | 6,600 | 6,600 |
| Jacksonville FL Excise Taxes Revenue | 5.000% | 10/1/13 | 1,185 | 1,278 |
| Jacksonville FL Excise Taxes Revenue | 5.000% | 10/1/16 | 1,185 | 1,353 |
| Jacksonville FL Health Facilities Authority Hospital Revenue | | | | |
| (Baptist Medical Center Project) VRDO | 0.140% | 11/1/11 LOC | 5,400 | 5,400 |
| Kissimmee FL Utility Authority Electric System Revenue | 5.250% | 10/1/16 (4) | 3,750 | 4,319 |
| Lee Memorial Health System Florida Hospital Revenue VRDO | 0.130% | 11/7/11 LOC | 6,545 | 6,545 |
| 3 Miami-Dade County FL Aviation Revenue (Miami International Airport) TOB VRDO | 0.150% | 11/7/11 (4) | 11,500 | 11,500 |
| Miami-Dade County FL Health Facilities Authority Hospital Revenue | | | | |
| (Miami Children’s Hospital) PUT | 4.550% | 8/1/13 (14) | 5,000 | 5,225 |
| Miami-Dade County FL School Board COP | 5.000% | 5/1/15 (12) | 4,000 | 4,437 |
| Miami-Dade County FL School Board COP PUT | 5.000% | 5/1/14 | 8,500 | 9,135 |
| Miami-Dade County FL School Board COP PUT | 5.000% | 5/1/16 | 7,000 | 7,642 |
| North Broward FL Hospital District Revenue VRDO | 0.110% | 11/7/11 LOC | 5,000 | 5,000 |
| Orange County FL Health Facilities Authority Hospital Revenue (Orlando Health Inc.) | 5.000% | 10/1/16 | 1,000 | 1,087 |
| Orange County FL Health Facilities Authority Revenue (Nemours Foundation Project) VRDO | 0.180% | 11/7/11 LOC | 29,400 | 29,400 |
| Orange County FL Tourist Development Revenue | 5.000% | 10/1/14 | 8,715 | 9,535 |
| Orange County FL Tourist Development Revenue | 5.000% | 10/1/16 | 16,260 | 18,302 |
| Orlando FL Utility Commission Utility System Revenue | 5.000% | 10/1/15 | 3,365 | 3,852 |
| Orlando FL Utility Commission Utility System Revenue | 5.000% | 10/1/15 | 3,500 | 4,007 |
| Orlando FL Utility Commission Utility System Revenue | 5.000% | 10/1/16 | 5,250 | 6,103 |
| Orlando FL Utility Commission Utility System Revenue | 5.000% | 10/1/17 | 3,000 | 3,513 |
| Palm Beach County FL Airport System Revenue | 5.750% | 10/1/14 (ETM) | 2,060 | 2,353 |
| Palm Beach County FL Criminal Justice Facilities Revenue | 7.200% | 6/1/14 (14) | 16,300 | 18,513 |
| Palm Beach County FL School Board COP | 5.375% | 8/1/12 (Prere.) | 4,430 | 4,599 |
| Palm Beach County FL School Board COP | 5.375% | 8/1/12 (Prere.) | 4,500 | 4,672 |
| South Broward FL Hospital District Revenue | 5.625% | 5/1/12 (Prere.) | 9,000 | 9,332 |
| South Florida Water Management District COP | 5.000% | 10/1/12 (2) | 2,150 | 2,230 |
| South Miami FL Health Facilities Authority Hospital Revenue | | | | |
| (Baptist Health South Florida Obligated Group) | 5.000% | 8/15/12 | 3,000 | 3,102 |
| South Miami FL Health Facilities Authority Hospital Revenue | | | | |
| (Baptist Health South Florida Obligated Group) | 5.250% | 2/1/13 (Prere.) | 7,755 | 8,217 |
| South Miami FL Health Facilities Authority Hospital Revenue | | | | |
| (Baptist Health South Florida Obligated Group) | 5.500% | 2/1/13 (Prere.) | 10,000 | 10,627 |
| South Miami FL Health Facilities Authority Hospital Revenue | | | | |
| (Baptist Health South Florida Obligated Group) | 5.000% | 8/15/13 | 2,500 | 2,680 |
| Sunshine State Governmental Financing Commission Florida Revenue | | | | |
| (Miami Dade County Program) | 5.000% | 9/1/15 | 10,000 | 10,858 |
| Sunshine State Governmental Financing Commission Florida Revenue VRDO | 0.120% | 11/7/11 LOC | 5,000 | 5,000 |
| Tampa FL Health System Revenue (Baycare Health System) | 5.000% | 11/15/16 | 3,000 | 3,373 |
| | | | | 805,393 |
| Georgia (2.5%) | | | | |
| Atlanta GA Airport Passenger Facility Charge Revenue | 5.000% | 1/1/18 | 2,500 | 2,838 |
| Atlanta GA Airport Revenue | 5.000% | 1/1/18 | 8,500 | 9,702 |
| Atlanta GA Water & Wastewater Revenue | 5.000% | 11/1/14 | 5,000 | 5,560 |
| Atlanta GA Water & Wastewater Revenue | 5.000% | 11/1/16 | 9,385 | 10,739 |
| Burke County GA Development Authority Pollution Control Revenue | | | | |
| (Georgia Power Co. Plant Vogtle Project) PUT | 3.750% | 1/12/12 | 5,000 | 5,030 |
| Burke County GA Development Authority Pollution Control Revenue | | | | |
| (Georgia Power Co. Plant Vogtle Project) PUT | 3.750% | 1/12/12 | 10,000 | 10,061 |
| Burke County GA Development Authority Pollution Control Revenue | | | | |
| (Georgia Power Co. Plant Vogtle Project) PUT | 5.050% | 1/12/12 | 11,000 | 11,095 |
| Burke County GA Development Authority Pollution Control Revenue | | | | |
| (Georgia Power Co. Plant Vogtle Project) PUT | 2.500% | 3/1/13 | 2,250 | 2,285 |
| Cobb County GA Hospital Authority (Equipment Pool Project) RAN VRDO | 0.140% | 11/7/11 LOC | 10,000 | 10,000 |
| 1 Cobb County GA Kennestone Hospital Authority Revenue | 5.000% | 4/1/17 | 1,250 | 1,409 |
| 1 Cobb County GA Kennestone Hospital Authority Revenue | 5.000% | 4/1/18 | 1,000 | 1,132 |
| Gainesville & Hall County GA Development Authority Revenue | | | | |
| (Hall County Sewage Treatment Facility Project) VRDO | 0.200% | 11/7/11 LOC | 7,000 | 7,000 |
| Georgia GO | 3.500% | 1/1/13 | 8,315 | 8,621 |
| Georgia GO | 5.000% | 4/1/13 | 10,815 | 11,521 |
| Georgia GO | 5.500% | 7/1/14 | 4,000 | 4,513 |
| Georgia GO | 4.000% | 1/1/15 | 2,110 | 2,319 |
| Georgia GO | 5.000% | 7/1/16 | 9,500 | 11,119 |
| Georgia GO | 5.000% | 7/1/16 | 20,000 | 23,429 |
| Georgia GO | 5.000% | 7/1/16 | 5,000 | 5,857 |
| Georgia GO | 5.500% | 7/1/16 | 5,000 | 5,611 |
| Georgia GO | 5.000% | 10/1/16 | 1,910 | 2,248 |
28
Limited-Term Tax-Exempt Fund
| | | | |
| | | | Face | Market |
| | | Maturity | Amount | Value• |
| | Coupon | Date | ($000) | ($000) |
| Georgia GO | 5.000% | 7/1/17 | 2,840 | 3,387 |
| Georgia GO | 5.000% | 7/1/17 | 13,695 | 16,330 |
| Georgia GO | 5.000% | 7/1/19 | 7,000 | 8,513 |
| Georgia Road & Tollway Authority GAN | 5.000% | 6/1/13 (4) | 4,885 | 5,231 |
| Georgia Road & Tollway Authority Revenue | 5.000% | 6/1/14 | 16,000 | 17,694 |
| Georgia Road & Tollway Authority Revenue | 5.000% | 10/1/16 | 6,000 | 7,063 |
| Georgia Road & Tollway Authority Revenue | 5.000% | 10/1/18 | 18,240 | 22,103 |
| Georgia Road & Tollway Authority Revenue (Federal Highway Grant) | 5.000% | 6/1/16 | 8,000 | 9,203 |
| Georgia Road & Tollway Authority Revenue (Governor’s Transportation Choices Initiative) | 5.375% | 3/1/12 (Prere.) | 5,260 | 5,350 |
| Gwinnett County GA School District GO | 5.000% | 2/1/12 | 10,000 | 10,120 |
| Gwinnett County GA School District GO | 5.000% | 2/1/13 | 10,000 | 10,577 |
| Gwinnett County GA Water & Sewer Authority Revenue | 5.000% | 8/1/17 | 1,675 | 1,999 |
| Gwinnett County GA Water & Sewer Authority Revenue | 5.000% | 8/1/18 | 4,335 | 5,241 |
| Main Street Natural Gas Inc. Georgia Gas Project Revenue | 5.000% | 3/15/12 | 15,000 | 15,280 |
| Main Street Natural Gas Inc. Georgia Gas Project Revenue | 5.000% | 3/15/12 | 12,000 | 12,147 |
| Main Street Natural Gas Inc. Georgia Gas Project Revenue | 5.000% | 3/15/14 | 5,000 | 5,359 |
| Main Street Natural Gas Inc. Georgia Gas Project Revenue | 5.000% | 3/15/16 | 10,310 | 10,638 |
| Main Street Natural Gas Inc. Georgia Gas Project Revenue | 5.000% | 3/15/17 | 6,910 | 7,633 |
| Monroe County GA Development Authority Pollution Control Revenue | | | | |
| (Oglethorpe Power Scherer Project)PUT | 2.500% | 3/1/13 | 7,500 | 7,589 |
| Municipal Electric Authority Georgia Revenue | 5.000% | 1/1/16 | 5,285 | 5,943 |
| Municipal Electric Authority Georgia Revenue (General Resolution Projects) | 5.000% | 1/1/15 | 2,060 | 2,289 |
| Municipal Electric Authority Georgia Revenue (Project One) | 5.000% | 1/1/14 | 4,995 | 5,386 |
| Municipal Electric Authority Georgia Revenue (Project One) | 5.000% | 1/1/15 | 3,685 | 4,074 |
| Municipal Electric Authority Georgia Revenue (Project One) | 5.000% | 1/1/17 | 8,165 | 9,263 |
| Savannah GA Economic Development Authority Pollution Control Revenue | | | | |
| (International Paper Co. Projects) | 5.100% | 8/1/14 | 3,000 | 3,181 |
| | | | | 363,682 |
| Hawaii (0.5%) | | | | |
| Hawaii GO | 5.000% | 7/1/12 (2) | 23,735 | 24,486 |
| Hawaii GO | 5.000% | 6/1/16 (ETM) | 3,115 | 3,647 |
| Hawaii GO | 5.000% | 6/1/16 | 13,920 | 16,194 |
| Hawaii GO | 5.000% | 5/1/17 (14) | 9,840 | 10,791 |
| Honolulu HI City & County GO | 5.000% | 7/1/12 (14) | 4,320 | 4,455 |
| Honolulu HI City & County GO | 5.000% | 8/1/17 | 4,130 | 4,871 |
| Honolulu HI City & County GO | 5.000% | 8/1/18 | 2,715 | 3,230 |
| | | | | 67,674 |
| Idaho (0.0%) | | | | |
| Idaho Housing & Finance Association RAN | 5.000% | 7/15/13 | 4,070 | 4,352 |
| |
| Illinois (2.5%) | | | | |
| Chicago IL Board of Education (School Reform) GO | 0.000% | 12/1/11 (14) | 5,185 | 5,181 |
| Chicago IL Board of Education (School Reform) GO | 0.000% | 12/1/13 (14) | 13,400 | 12,904 |
| Chicago IL Board of Education GO | 5.000% | 12/1/14 | 1,545 | 1,703 |
| Chicago IL Board of Education GO | 5.000% | 12/1/16 | 2,500 | 2,786 |
| 3 Chicago IL Board of Education GO TOB VRDO | 0.160% | 11/7/11 (4) | 4,995 | 4,995 |
| Chicago IL GO | 5.000% | 1/1/14 (4) | 37,590 | 40,442 |
| Chicago IL GO | 5.000% | 1/1/14 (Prere.) | 4,135 | 4,519 |
| Chicago IL GO | 5.500% | 1/1/16 (4) | 6,070 | 6,835 |
| Chicago IL Metropolitan Water Reclamation District GO | 5.000% | 12/1/18 | 5,000 | 5,937 |
| Chicago IL O’Hare International Airport Revenue | 5.000% | 1/1/12 (4) | 2,500 | 2,518 |
| Chicago IL O’Hare International Airport Revenue | 5.000% | 1/1/13 (4) | 4,200 | 4,393 |
| Chicago IL O’Hare International Airport Revenue | 5.000% | 1/1/14 (4) | 4,035 | 4,346 |
| Chicago IL O’Hare International Airport Revenue | 5.000% | 1/1/17 | 7,500 | 8,407 |
| 3 Chicago IL O’Hare International Airport Revenue TOB VRDO | 0.170% | 11/7/11 LOC | 24,105 | 24,105 |
| 3 Chicago IL O’Hare International Airport Revenue TOB VRDO | 0.290% | 11/7/11 (4) | 21,135 | 21,135 |
| Chicago IL Wastewater Transmission Revenue VRDO | 0.140% | 11/1/11 LOC | 4,700 | 4,700 |
| Du Page & Will Counties IL Community School District GO | 5.500% | 12/30/11 (Prere.) | 4,725 | 4,767 |
| Illinois Build Revenue | 5.000% | 6/15/16 | 10,000 | 11,312 |
| 3 Illinois Educational Facilities Authority Revenue (Northwestern University) TOB VRDO | 0.140% | 11/7/11 | 6,935 | 6,935 |
| Illinois Educational Facilities Authority Revenue (University of Chicago) PUT | 3.375% | 2/3/14 | 5,000 | 5,260 |
| Illinois Educational Facilities Authority Revenue (University of Chicago) PUT | 1.875% | 2/12/15 | 5,000 | 5,027 |
| Illinois Finance Authority Gas Supply Revenue (Peoples Gas Light & Coke) PUT | 2.125% | 7/1/14 | 2,875 | 2,898 |
| Illinois Finance Authority Gas Supply Revenue (Peoples Gas Light & Coke) PUT | 2.625% | 8/1/15 | 2,500 | 2,541 |
| Illinois Finance Authority Revenue (Advocate Health Care Network) PUT | 3.875% | 5/1/12 | 5,000 | 5,088 |
| Illinois Finance Authority Revenue (Art Institute of Chicago) | 5.000% | 3/1/15 | 10,000 | 11,124 |
| Illinois Finance Authority Revenue (Carle Foundation) | 5.000% | 8/15/17 | 1,500 | 1,612 |
| Illinois Finance Authority Revenue (Children’s Memorial Hospital) | 5.250% | 8/15/16 | 4,270 | 4,655 |
| Illinois Finance Authority Revenue (Northwestern Community Hospital) | 5.000% | 8/15/14 | 5,500 | 6,038 |
| Illinois Finance Authority Revenue (Palos Community Hospital) | 5.000% | 5/15/16 | 1,500 | 1,626 |
| Illinois Finance Authority Revenue (Palos Community Hospital) | 5.000% | 5/15/17 | 2,500 | 2,720 |
29
Limited-Term Tax-Exempt Fund
| | | | | |
| | | | | Face | Market |
| | | | Maturity | Amount | Value• |
| | | Coupon | Date | ($000) | ($000) |
| | Illinois Finance Authority Revenue (Resurrection Health Care) | 5.000% | 5/15/12 (4) | 4,200 | 4,269 |
| | Illinois Finance Authority Revenue (Resurrection Health Care) | 5.000% | 5/15/13 (4) | 4,275 | 4,445 |
| | Illinois Finance Authority Revenue (Resurrection Health Care) | 5.000% | 5/15/13 (4) | 4,300 | 4,471 |
| | Illinois Finance Authority Revenue (Trinity Health Corp.) | 3.000% | 12/1/17 | 3,075 | 3,142 |
| | Illinois Finance Authority Revenue (University of Chicago Medical Center) | 5.000% | 8/15/15 | 1,500 | 1,670 |
| | Illinois GO | 5.500% | 8/1/14 (14) | 8,295 | 9,156 |
| | Illinois Health Facilities Authority Revenue (Advocate Health Care Network) PUT | 4.375% | 7/1/14 | 4,450 | 4,778 |
| | Illinois Sales Tax Revenue | 5.250% | 6/15/12 | 2,000 | 2,059 |
| | Illinois Sales Tax Revenue | 5.000% | 6/15/15 | 10,110 | 11,284 |
| | Illinois Toll Highway Authority Revenue | 5.000% | 1/1/15 (4) | 17,970 | 19,849 |
| | Metropolitan Pier & Exposition Authority Illinois Dedicated Sales Tax Revenue | 0.000% | 12/15/11 (14) | 20,000 | 19,962 |
| | Railsplitter Tobacco Settlement Authority Illinois Tobacco Settlement Revenue | 5.000% | 6/1/14 | 10,000 | 10,767 |
| | Railsplitter Tobacco Settlement Authority Illinois Tobacco Settlement Revenue | 5.000% | 6/1/15 | 5,000 | 5,460 |
| | Railsplitter Tobacco Settlement Authority Illinois Tobacco Settlement Revenue | 5.000% | 6/1/16 | 10,000 | 11,035 |
| | Railsplitter Tobacco Settlement Authority Illinois Tobacco Settlement Revenue | 5.000% | 6/1/17 | 6,000 | 6,510 |
| 3 | University of Illinois Auxiliary Facilities System Revenue TOB VRDO | 0.140% | 11/7/11 (14) | 9,455 | 9,455 |
| | Winnebago & Bonne Counties IL School District GO | 5.000% | 2/1/12 (2) | 4,000 | 4,037 |
| | Winnebago & Boone Counties IL School District GO | 5.000% | 2/1/13 (2) | 5,000 | 5,197 |
| | | | | | 364,055 |
| Indiana (1.6%) | | | | |
| | Indiana Bond Bank Special Program Gas Revenue | 5.250% | 10/15/16 | 4,810 | 5,357 |
| | Indiana Finance Authority Facilities Revenue (Indiana Government Center South) | 5.000% | 7/1/12 | 13,725 | 14,120 |
| | Indiana Finance Authority Facilities Revenue (Miami Correctional Facility) | 5.000% | 7/1/13 | 6,620 | 7,047 |
| | Indiana Finance Authority Health System Revenue | | | | |
| | (Sisters of St. Francis Health Services Inc. Obligated Group) | 5.000% | 11/1/13 | 3,000 | 3,224 |
| | Indiana Finance Authority Health System Revenue | | | | |
| | (Sisters of St. Francis Health Services Inc. Obligated Group) | 5.000% | 11/1/14 | 3,485 | 3,830 |
| | Indiana Finance Authority Health System Revenue | | | | |
| | (Sisters of St. Francis Health Services Inc. Obligated Group) | 5.000% | 11/1/15 | 2,515 | 2,808 |
| | Indiana Finance Authority Health System Revenue | | | | |
| | (Sisters of St. Francis Health Services Inc. Obligated Group) | 5.000% | 11/1/15 | 3,570 | 3,986 |
| | Indiana Finance Authority Health System Revenue | | | | |
| | (Sisters of St. Francis Health Services Inc. Obligated Group) | 5.000% | 11/1/16 | 3,000 | 3,381 |
| | Indiana Finance Authority Health System Revenue | | | | |
| | (Sisters of St. Francis Health Services Inc. Obligated Group) VRDO | 0.080% | 11/7/11 LOC | 10,000 | 10,000 |
| | Indiana Finance Authority Health System Revenue | | | | |
| | (Sisters of St. Francis Health Services Inc. Obligated Group) VRDO | 0.080% | 11/7/11 LOC | 8,700 | 8,700 |
| | Indiana Finance Authority Lease Revenue | 5.000% | 11/1/13 | 10,585 | 11,430 |
| | Indiana Finance Authority Revenue (Ascension Health Credit Group) PUT | 1.250% | 5/16/12 | 10,000 | 10,045 |
| | Indiana Finance Authority Revenue (State Revolving Fund) | 5.000% | 2/1/17 | 7,625 | 8,915 |
| | Indiana Finance Authority Wastewater Utility Revenue (CWA Authority Project) | 5.000% | 10/1/18 | 1,000 | 1,140 |
| | Indiana Health & Educational Facility Financing Authority Revenue | | | | |
| | (Ascension Health Credit Group) PUT | 4.100% | 11/3/16 | 10,000 | 10,939 |
| 3 | Indiana Health & Educational Facility Financing Authority Revenue | | | | |
| | (Ascension Health Credit Group) TOB VRDO | 0.150% | 11/1/11 | 4,000 | 4,000 |
| | Indiana Health Facility Financing Authority Revenue (Ascension Health Credit Group) PUT | 5.000% | 11/1/11 | 5,500 | 5,500 |
| | Indiana Health Facility Financing Authority Revenue (Ascension Health Credit Group) PUT | 5.000% | 5/1/13 | 3,750 | 3,985 |
| | Indiana Health Facility Financing Authority Revenue (Ascension Health Credit Group) PUT | 5.000% | 6/1/15 | 14,825 | 16,666 |
| | Indiana Health Facility Financing Authority Revenue (Ascension Health Credit Group) PUT | 5.000% | 7/28/16 | 2,695 | 3,074 |
| | Indiana Municipal Power Agency Revenue | 5.250% | 1/1/15 (14) | 3,190 | 3,332 |
| | Indiana Municipal Power Agency Revenue | 5.000% | 1/1/18 | 1,500 | 1,721 |
| | Indiana University Student Fee Revenue | 5.000% | 8/1/17 | 1,000 | 1,183 |
| | Indiana University Student Fee Revenue | 5.000% | 8/1/18 | 4,000 | 4,772 |
| 2,3 | Monroe County IN Hospital Authority Revenue (Bloomington Hospital) | 1.230% | 7/1/14 | 837 | 824 |
| 2,3 | Monroe County IN Hospital Authority Revenue (Bloomington Hospital) | 1.350% | 7/1/16 | 6,246 | 6,137 |
| | Purdue University Indiana University Student Fee Revenue | 4.500% | 7/1/16 | 1,500 | 1,711 |
| | Purdue University Indiana University Student Fee Revenue | 5.000% | 7/1/16 | 1,300 | 1,513 |
| | Purdue University Indiana University Student Fee Revenue | 5.000% | 7/1/17 | 1,000 | 1,178 |
| | Rockport IN Pollution Control Revenue (Indiana Michigan Power Co. Project) PUT | 6.250% | 6/2/14 | 11,000 | 12,182 |
| | St. Joseph County IN Educational Facilities Revenue | | | | |
| | (University of Notre Dame Du Lac Project) PUT | 3.875% | 3/1/12 | 7,500 | 7,586 |
| 3 | Tri-Creek Middle School Building Corp. Indiana Revenue TOB VRDO | 0.140% | 11/7/11 | 14,210 | 14,210 |
| | Whiting IN Environmental Facilities Revenue (BP Products North America Inc. Project) | 5.000% | 7/1/17 | 5,000 | 5,637 |
| | Whiting IN Environmental Facilities Revenue (BP Products North America Inc. Project) PUT | 2.800% | 6/2/14 | 28,000 | 28,913 |
| | | | | | 229,046 |
| Iowa (0.1%) | | | | |
| | Iowa Finance Authority Health Facilities Revenue (Iowa Health System) | 5.000% | 2/15/14 (12) | 2,800 | 3,022 |
| | Iowa Finance Authority Health Facilities Revenue (Iowa Health System) | 5.000% | 2/15/15 (12) | 2,395 | 2,643 |
| | Iowa Finance Authority Health Facilities Revenue (Iowa Health System) | 5.000% | 2/15/16 (12) | 1,655 | 1,856 |
| | Iowa Finance Authority Healthcare Revenue (Genesis Health System) | 5.000% | 7/1/14 | 1,065 | 1,151 |
| | Iowa Finance Authority Healthcare Revenue (Genesis Health System) | 5.000% | 7/1/16 | 2,320 | 2,575 |
30
Limited-Term Tax-Exempt Fund
| | | | |
| | | | Face | Market |
| | | Maturity | Amount | Value• |
| | Coupon | Date | ($000) | ($000) |
| Iowa Higher Education Loan Authority Revenue Private College Facility | | | | |
| (Grinnell College Project) | 4.000% | 12/1/17 | 1,300 | 1,470 |
| Iowa Student Loan Liquidity Corp. Revenue | 5.000% | 12/1/15 | 5,620 | 6,117 |
| | | | | 18,834 |
| Kansas (0.5%) | | | | |
| Kansas Department of Transportation Highway Revenue | 5.000% | 9/1/13 | 32,590 | 35,292 |
| Kansas Development Finance Authority Health Facilities Revenue | | | | |
| (Kansas University Health System) | 5.000% | 3/1/17 | 1,000 | 1,105 |
| Kansas Development Finance Authority Health Facilities Revenue | | | | |
| (Kansas University Health System) | 5.000% | 3/1/18 | 1,035 | 1,145 |
| Kansas Development Finance Authority Health Facilities Revenue | | | | |
| (Kansas University Health System) | 5.000% | 3/1/19 | 1,150 | 1,269 |
| Kansas Development Finance Authority Revenue | | | | |
| (Sisters of Charity of Leavenworth Health System) | 5.000% | 1/1/15 | 2,895 | 3,196 |
| Kansas Development Finance Authority Revenue | | | | |
| (Sisters of Charity of Leavenworth Health System) | 5.000% | 1/1/16 | 5,615 | 6,259 |
| Kansas Development Finance Authority Revenue | | | | |
| (Sisters of Charity of Leavenworth Health System) | 5.000% | 1/1/17 | 5,670 | 6,361 |
| University of Kansas Hospital Authority Health Facilities Improvement Revenue | 5.000% | 9/1/12 | 1,525 | 1,581 |
| University of Kansas Hospital Authority Health Facilities Improvement Revenue | 5.000% | 9/1/14 | 1,470 | 1,627 |
| University of Kansas Hospital Authority Health Facilities Improvement Revenue | 5.000% | 9/1/15 | 2,000 | 2,193 |
| Wichita KS Hospital Facilities Revenue (Via Christi Health System Inc.) | 5.000% | 11/15/15 | 4,000 | 4,427 |
| Wichita KS Hospital Facilities Revenue (Via Christi Health System Inc.) | 5.000% | 11/15/17 | 1,130 | 1,259 |
| Wichita KS Hospital Facilities Revenue (Via Christi Health System Inc.) | 5.000% | 11/15/18 | 2,250 | 2,510 |
| | | | | 68,224 |
| Kentucky (0.8%) | | | | |
| Kentucky Asset/Liability Commission General Fund Revenue | 5.000% | 9/1/12 (14) | 13,065 | 13,563 |
| Kentucky Economic Development Finance Authority Revenue (Catholic Health Initiatives) PUT | 5.000% | 11/11/14 | 17,000 | 18,891 |
| Kentucky Property & Building Commission Revenue | 5.250% | 10/1/15 (4) | 40,000 | 45,799 |
| Kentucky Property & Building Commission Revenue | 5.250% | 10/1/16 (4) | 6,100 | 7,080 |
| Kentucky Property & Building Commission Revenue | 5.000% | 11/1/16 | 5,340 | 6,154 |
| Kentucky Turnpike Authority Economic Development Road Revenue (Revitalization Project) | 5.000% | 7/1/18 | 2,500 | 2,944 |
| Louisville & Jefferson County KY Metropolitan Government Environmental Facilities Revenue | | | | |
| (Louisville Gas & Electric Co. Project) PUT | 5.625% | 12/3/12 | 10,000 | 10,436 |
| Louisville & Jefferson County KY Metropolitan Government Pollution Control Revenue | | | | |
| (Louisville Gas & Electric Co. Project) PUT | 1.900% | 4/2/12 | 15,000 | 15,072 |
| Warren County KY Hospital Revenue | | | | |
| (Bowling Green-Warren County Community Hospital Corp. Project) | 5.000% | 8/1/12 | 810 | 829 |
| Warren County KY Hospital Revenue | | | | |
| (Bowling Green-Warren County Community Hospital Corp. Project) | 5.000% | 8/1/13 | 855 | 895 |
| Warren County KY Hospital Revenue | | | | |
| (Bowling Green-Warren County Community Hospital Corp. Project) | 5.000% | 8/1/16 | 990 | 1,066 |
| | | | | 122,729 |
| Louisiana (0.7%) | | | | |
| Louisiana Citizens Property Insurance Corp. Assessment Revenue | 5.250% | 6/1/14 (2) | 5,000 | 5,307 |
| 3 Louisiana Gas & Fuels Tax Revenue TOB VRDO | 0.140% | 11/7/11 | 15,000 | 15,000 |
| 2 Louisiana Gasoline & Fuel Tax Revenue PUT | 0.890% | 6/1/13 | 25,000 | 25,040 |
| Louisiana GO | 0.967% | 11/1/11 | 10,000 | 10,000 |
| Louisiana GO | 5.250% | 8/1/16 (14) | 5,000 | 5,713 |
| Louisiana Housing Finance Agency Single Family Mortgage Revenue | | | | |
| (Home Ownership Program) | 5.850% | 6/1/38 | 4,230 | 4,353 |
| Louisiana Offshore Terminal Authority Deep Water Port Revenue (LOOP LLC Project) PUT | 1.875% | 10/1/13 | 5,000 | 5,045 |
| Louisiana Offshore Terminal Authority Deep Water Port Revenue (LOOP LLC Project) PUT | 2.100% | 10/1/14 | 3,500 | 3,549 |
| Louisiana Offshore Terminal Authority Deep Water Port Revenue (LOOP LLC Project) PUT | 2.125% | 10/1/15 | 5,000 | 4,984 |
| Louisiana Public Facilities Authority Hospital Revenue | | | | |
| (Franciscan Missionaries of Our Lady Health System Project) VRDO | 0.130% | 11/7/11 LOC | 13,900 | 13,900 |
| Louisiana Public Facilities Authority Revenue (CHRISTUS Health) | 5.000% | 7/1/15 (4) | 1,320 | 1,443 |
| Louisiana Public Facilities Authority Revenue (Entergy Gulf States Project) | 2.875% | 11/1/15 | 2,250 | 2,281 |
| Louisiana Public Facilities Authority Revenue (Ochsner Clinic Foundation Project) | 5.000% | 5/15/13 | 2,675 | 2,788 |
| Louisiana Public Facilities Authority Revenue (Ochsner Clinic Foundation Project) | 5.000% | 5/15/14 | 3,950 | 4,175 |
| | | | | 103,578 |
| Maine (0.1%) | | | | |
| Maine GO | 5.000% | 7/15/12 (2) | 8,055 | 8,326 |
| Maine Health & Higher Educational Facilities Authority Revenue VRDO | 0.150% | 11/7/11 LOC | 2,800 | 2,800 |
| Maine Municipal Bond Bank Infrastructure Revenue (Transcap Project) | 5.000% | 9/1/13 | 2,090 | 2,261 |
| Maine Municipal Bond Bank Infrastructure Revenue (Transcap Project) | 5.000% | 9/1/16 | 4,225 | 4,921 |
| | | | | 18,308 |
| Maryland (2.2%) | | | | |
| Maryland Department of Transportation Revenue | 4.000% | 5/15/15 | 6,250 | 6,921 |
| Maryland Economic Development Corp. Revenue (Chesapeake Bay Conference Center Project) | 4.750% | 12/1/11 | 250 | 250 |
31
Limited-Term Tax-Exempt Fund
| | | | |
| | | | Face | Market |
| | | Maturity | Amount | Value• |
| | Coupon | Date | ($000) | ($000) |
| Maryland GO | 5.000% | 3/15/12 | 20,415 | 20,779 |
| Maryland GO | 5.000% | 8/1/14 | 10,000 | 11,187 |
| Maryland GO | 5.000% | 3/1/16 | 10,000 | 11,631 |
| Maryland GO | 5.000% | 11/1/16 | 15,100 | 17,833 |
| Maryland GO | 5.000% | 3/15/17 | 23,445 | 27,809 |
| Maryland GO | 5.000% | 8/1/17 | 5,000 | 5,975 |
| Maryland GO | 5.000% | 8/1/17 | 5,070 | 6,058 |
| Maryland GO | 5.000% | 8/1/17 | 26,445 | 31,601 |
| Maryland GO | 5.000% | 8/1/17 | 8,495 | 10,151 |
| Maryland GO | 5.000% | 8/1/18 | 23,960 | 29,017 |
| Maryland Health & Higher Educational Facilities Authority Revenue | | | | |
| (Johns Hopkins Health System Obligated Group) PUT | 5.000% | 5/15/13 | 3,000 | 3,201 |
| Maryland Health & Higher Educational Facilities Authority Revenue | | | | |
| (University of Maryland Medical System) | 5.000% | 7/1/13 | 2,395 | 2,535 |
| Maryland Health & Higher Educational Facilities Authority Revenue | | | | |
| (University of Maryland Medical System) | 5.000% | 7/1/14 | 3,150 | 3,396 |
| Maryland Health & Higher Educational Facilities Authority Revenue | | | | |
| (University of Maryland Medical System) | 5.000% | 7/1/15 | 5,900 | 6,424 |
| Maryland Health & Higher Educational Facilities Authority Revenue | | | | |
| (University of Maryland Medical System) VRDO | 0.170% | 11/7/11 LOC | 4,200 | 4,200 |
| Maryland Transportation Authority Facilities Projects Revenue | 5.000% | 7/1/13 | 9,085 | 9,771 |
| Maryland Transportation Authority Facilities Projects Revenue | 5.000% | 7/1/14 | 9,615 | 10,692 |
| Maryland Transportation Authority Facilities Projects Revenue | 5.000% | 7/1/15 | 9,995 | 11,415 |
| Maryland Transportation Authority GAN | 5.000% | 3/1/12 | 5,000 | 5,081 |
| Maryland Transportation Authority GAN | 5.000% | 3/1/14 | 8,000 | 8,815 |
| Montgomery County MD GO | 5.000% | 5/1/14 | 12,310 | 13,650 |
| Montgomery County MD GO | 5.000% | 7/1/18 | 32,050 | 38,767 |
| Washington Suburban Sanitation District Maryland GO | 4.000% | 6/1/13 | 4,200 | 4,439 |
| Washington Suburban Sanitation District Maryland GO | 4.000% | 6/1/14 | 8,500 | 9,233 |
| Washington Suburban Sanitation District Maryland GO | 4.000% | 6/1/16 | 2,630 | 2,958 |
| Washington Suburban Sanitation District Maryland GO | 5.000% | 6/1/17 | 4,000 | 4,762 |
| | | | | 318,551 |
| Massachusetts (4.0%) | | | | |
| Massachusetts Bay Transportation Authority Sales Tax Revenue | 5.000% | 7/1/12 (Prere.) | 3,395 | 3,502 |
| 3 Massachusetts Bay Transportation Authority Sales Tax Revenue TOB VRDO | 2.000% | 11/7/11 | 19,989 | 19,989 |
| Massachusetts Development Finance Agency Revenue (Boston University) | 2.875% | 10/1/14 | 5,000 | 5,193 |
| Massachusetts Development Finance Agency Revenue (Boston University) | 2.875% | 10/1/14 | 2,500 | 2,597 |
| Massachusetts Development Finance Agency Revenue (College of the Holy Cross) VRDO | 0.170% | 11/1/11 LOC | 17,500 | 17,500 |
| Massachusetts Development Finance Agency Revenue (Dominion Energy Brayton Project) PUT | 2.250% | 9/1/16 | 40,500 | 40,677 |
| Massachusetts Development Finance Agency Revenue (Partners Healthcare) PUT | 5.000% | 1/14/16 | 6,000 | 6,726 |
| Massachusetts GO | 5.500% | 11/1/11 (4) | 34,300 | 34,300 |
| 2 Massachusetts GO | 0.380% | 2/1/12 | 15,000 | 15,000 |
| Massachusetts GO | 5.000% | 8/1/12 | 4,945 | 5,121 |
| Massachusetts GO | 5.000% | 9/1/12 | 8,000 | 8,316 |
| Massachusetts GO | 5.500% | 11/1/12 (4) | 9,000 | 9,468 |
| 2 Massachusetts GO | 0.520% | 2/1/13 | 35,000 | 35,000 |
| 2 Massachusetts GO | 0.620% | 2/1/14 | 15,000 | 15,000 |
| Massachusetts GO | 5.000% | 8/1/14 | 11,635 | 12,955 |
| Massachusetts GO | 5.000% | 8/1/14 | 11,965 | 13,323 |
| Massachusetts GO | 5.000% | 11/1/14 | 2,350 | 2,639 |
| Massachusetts GO | 5.000% | 3/1/15 (Prere.) | 3,840 | 4,367 |
| Massachusetts GO | 5.000% | 8/1/15 (4) | 10,000 | 11,428 |
| Massachusetts GO | 5.000% | 10/1/16 | 6,800 | 7,956 |
| Massachusetts GO | 5.000% | 10/1/17 | 23,000 | 27,259 |
| Massachusetts GO | 5.500% | 12/1/17 (14) | 3,255 | 3,959 |
| Massachusetts GO | 5.000% | 10/1/18 | 24,000 | 28,689 |
| Massachusetts GO | 5.500% | 10/1/18 (4) | 10,200 | 12,521 |
| 3 Massachusetts GO TOB VRDO | 2.250% | 11/7/11 LOC | 12,900 | 12,900 |
| Massachusetts GO VRDO | 0.250% | 11/7/11 | 50,000 | 50,000 |
| Massachusetts Health & Educational Facilities Authority Revenue | | | | |
| (Baystate Medical Center) VRDO | 0.120% | 11/7/11 LOC | 11,700 | 11,700 |
| 3 Massachusetts Health & Educational Facilities Authority Revenue | | | | |
| (Harvard University) TOB VRDO | 0.140% | 11/7/11 | 7,500 | 7,500 |
| Massachusetts Health & Educational Facilities Authority Revenue (Northeastern University) | 5.000% | 10/1/13 | 2,000 | 2,147 |
| Massachusetts Health & Educational Facilities Authority Revenue (Northeastern University) | 5.000% | 10/1/14 | 2,945 | 3,249 |
| Massachusetts Health & Educational Facilities Authority Revenue (Northeastern University) | 5.000% | 10/1/17 | 5,000 | 5,752 |
| Massachusetts Health & Educational Facilities Authority Revenue (Northeastern University) PUT | 4.100% | 4/19/12 | 6,000 | 6,104 |
| Massachusetts Health & Educational Facilities Authority Revenue (Northeastern University) PUT | 2.700% | 2/20/14 | 5,000 | 5,183 |
| Massachusetts Health & Educational Facilities Authority Revenue (Partners Healthcare System) | 5.000% | 7/1/16 | 2,000 | 2,288 |
| Massachusetts Health & Educational Facilities Authority Revenue | | | | |
| (Partners Healthcare System) VRDO | 0.100% | 11/7/11 | 11,400 | 11,400 |
| Massachusetts Municipal Wholesale Electric Co. Power System Revenue | 5.000% | 7/1/15 | 2,500 | 2,775 |
32
Limited-Term Tax-Exempt Fund
| | | | |
| | | | Face | Market |
| | | Maturity | Amount | Value• |
| | Coupon | Date | ($000) | ($000) |
| Massachusetts Municipal Wholesale Electric Co. Power System Revenue | 5.000% | 7/1/17 | 7,500 | 8,445 |
| Massachusetts Port Authority Revenue | 5.500% | 7/1/16 (4) | 6,000 | 6,969 |
| Massachusetts Special Obligation Dedicated Tax Revenue | 5.250% | 1/1/14 (Prere.) | 10,000 | 10,954 |
| Massachusetts Special Obligation Dedicated Tax Revenue | 5.750% | 1/1/14 (Prere.) | 4,550 | 5,033 |
| Massachusetts Special Obligation Revenue | 5.500% | 6/1/12 | 10,000 | 10,303 |
| Massachusetts Water Pollution Abatement Trust Revenue | 5.250% | 8/1/13 | 4,000 | 4,334 |
| Massachusetts Water Pollution Abatement Trust Revenue | 5.000% | 8/1/17 | 1,500 | 1,785 |
| Massachusetts Water Resources Authority Revenue | 5.250% | 8/1/15 (14) | 3,000 | 3,461 |
| 3 Massachusetts Water Resources Authority Revenue TOB VRDO | 2.430% | 11/7/11 (4)LOC | 27,690 | 27,690 |
| Massachusetts Water Resources Authority Revenue VRDO | 0.110% | 11/7/11 | 19,400 | 19,400 |
| University of Massachusetts Building Authority Revenue | 5.000% | 11/1/11 (2) | 6,905 | 6,905 |
| University of Massachusetts Building Authority Revenue | 5.000% | 11/1/16 | 7,555 | 8,821 |
| | | | | 578,583 |
| Michigan (1.9%) | | | | |
| Clarkston MI Community School GO | 5.000% | 5/1/14 (4) | 5,180 | 5,657 |
| Detroit MI GO | 5.000% | 4/1/13 (12) | 9,345 | 9,592 |
| Detroit MI GO | 5.000% | 4/1/14 (12) | 2,735 | 2,830 |
| Kent Hospital MI Finance Authority Revenue (Spectrum Health) | 5.000% | 11/15/16 | 1,050 | 1,178 |
| Kent Hospital MI Finance Authority Revenue (Spectrum Health) | 5.000% | 11/15/17 | 1,500 | 1,695 |
| Kent Hospital MI Finance Authority Revenue (Spectrum Health) PUT | 5.000% | 1/15/12 | 25,000 | 25,236 |
| Michigan Building Authority Revenue | 5.000% | 10/15/12 (2) | 5,615 | 5,844 |
| Michigan Building Authority Revenue | 5.250% | 10/15/16 (4) | 7,200 | 7,745 |
| Michigan GO | 5.000% | 5/1/14 | 12,000 | 13,127 |
| Michigan Hospital Finance Authority Revenue (Ascension Health Credit Group) | 5.000% | 11/15/17 | 5,000 | 5,707 |
| Michigan Hospital Finance Authority Revenue (Ascension Health Credit Group) PUT | 5.000% | 5/1/12 | 17,000 | 17,378 |
| Michigan Hospital Finance Authority Revenue (Ascension Health Credit Group) PUT | 1.350% | 4/1/13 | 15,000 | 15,166 |
| Michigan Hospital Finance Authority Revenue (Ascension Health Credit Group) PUT | 2.625% | 6/30/14 | 20,000 | 20,831 |
| Michigan Hospital Finance Authority Revenue (Henry Ford Health System) | 5.500% | 11/15/15 | 2,000 | 2,197 |
| Michigan Hospital Finance Authority Revenue (Henry Ford Health System) | 5.000% | 11/15/16 | 6,140 | 6,670 |
| Michigan Hospital Finance Authority Revenue (Trinity Health) | 5.000% | 12/1/15 | 1,000 | 1,128 |
| Michigan Hospital Finance Authority Revenue (Trinity Health) PUT | 6.000% | 12/1/17 | 5,000 | 6,014 |
| Michigan Housing Development Authority Single Family Mortgage Revenue VRDO | 0.130% | 11/7/11 | 1,500 | 1,500 |
| Michigan Municipal Bond Authority Revenue (State Clean Water Revolving Fund) | 5.000% | 10/1/15 | 2,315 | 2,663 |
| Michigan State University Revenue | 5.000% | 8/15/13 | 6,620 | 7,148 |
| Michigan State University Revenue | 5.000% | 2/15/14 | 5,385 | 5,906 |
| Michigan State University Revenue | 5.000% | 8/15/14 | 7,005 | 7,814 |
| Michigan State University Revenue | 5.000% | 2/15/15 | 3,910 | 4,415 |
| Michigan State University Revenue | 5.000% | 8/15/15 | 1,000 | 1,145 |
| Michigan State University Revenue | 5.000% | 2/15/17 | 6,135 | 7,175 |
| Michigan Strategic Fund Limited Obligation Revenue (Detroit Edison Co. Project) PUT | 5.500% | 8/1/16 | 7,425 | 8,469 |
| Michigan Strategic Fund Limited Obligation Revenue (Detroit Edison Co. Project) PUT | 2.125% | 9/1/16 | 20,000 | 19,998 |
| Michigan Trunk Line Revenue | 5.000% | 9/1/12 (4) | 13,015 | 13,498 |
| Royal Oak MI Hospital Finance Authority Hospital Revenue (Beaumont Hospital) | 5.250% | 8/1/16 | 5,000 | 5,464 |
| Saginaw MI Hospital Finance Authority Hospital Revenue (Covenant Medical Center Inc.) | 5.000% | 7/1/16 | 2,385 | 2,539 |
| Saginaw MI Hospital Finance Authority Hospital Revenue (Covenant Medical Center Inc.) | 5.000% | 7/1/17 | 2,880 | 3,059 |
| University of Michigan University Revenue | 5.250% | 12/1/11 | 5,000 | 5,019 |
| University of Michigan University Revenue | 5.250% | 12/1/12 | 8,500 | 8,896 |
| University of Michigan University Revenue | 4.000% | 4/1/16 | 10,650 | 11,866 |
| University of Michigan University Revenue | 4.000% | 4/1/17 | 11,385 | 12,810 |
| | | | | 277,379 |
| Minnesota (1.4%) | | | | |
| Maple Grove MN Health Care Facilities Revenue (Maple Grove Hospital Corp.) | 5.000% | 5/1/14 | 1,000 | 1,060 |
| Maple Grove MN Health Care Facilities Revenue (Maple Grove Hospital Corp.) | 5.000% | 5/1/15 | 1,245 | 1,335 |
| Minneapolis & St. Paul MN Housing & Redevelopment Authority Health Care System Revenue | | | | |
| (Allina Health System) | 5.000% | 11/15/15 | 1,700 | 1,883 |
| Minneapolis & St. Paul MN Housing & Redevelopment Authority Health Care System Revenue | | | | |
| (Allina Health System) | 5.000% | 11/15/16 | 1,900 | 2,140 |
| Minneapolis & St. Paul MN Housing & Redevelopment Authority Health Care System Revenue | | | | |
| (Children’s Hospital Clinics) VRDO | 0.180% | 11/1/11 (4) | 31,300 | 31,300 |
| Minneapolis MN Health Care System Revenue (Allina Health System) | 5.750% | 11/15/12 (Prere.) | 39,000 | 41,197 |
| Minneapolis MN Health Care System Revenue (Allina Health System) | 6.000% | 11/15/12 (Prere.) | 4,000 | 4,236 |
| Minnesota 911 Revenue | 5.000% | 6/1/18 | 2,320 | 2,728 |
| Minnesota GO | 4.000% | 12/1/13 | 3,900 | 4,186 |
| Minnesota GO | 5.000% | 12/1/13 | 10,615 | 11,612 |
| Minnesota GO | 5.000% | 8/1/14 | 6,970 | 7,787 |
| Minnesota GO | 5.000% | 12/1/14 | 8,145 | 9,206 |
| Minnesota GO | 5.000% | 12/1/15 | 8,145 | 9,442 |
| Minnesota GO | 5.000% | 10/1/16 | 5,000 | 5,878 |
| Minnesota GO | 5.000% | 12/1/16 | 8,150 | 9,617 |
| Minnesota GO | 5.000% | 8/1/18 | 4,000 | 4,827 |
| Minnesota Higher Education Facilities Authority Revenue (Carleton College) VRDO | 0.130% | 11/7/11 | 12,090 | 12,090 |
33
Limited-Term Tax-Exempt Fund
| | | | |
| | | | Face | Market |
| | | Maturity | Amount | Value• |
| | Coupon | Date | ($000) | ($000) |
| Minnesota Public Facilities Authority Revenue (State Revolving Fund) | 5.000% | 3/1/18 | 8,500 | 10,167 |
| St. Cloud MN Health Care Revenue (Centracare Health System) | 5.000% | 5/1/15 | 1,170 | 1,280 |
| St. Cloud MN Health Care Revenue (Centracare Health System) | 5.000% | 5/1/16 | 1,250 | 1,387 |
| St. Cloud MN Health Care Revenue (Centracare Health System) | 5.000% | 5/1/17 | 1,000 | 1,118 |
| St. Louis Park MN Health Care Facilities Revenue (Park Nicollet Health Services) | 5.500% | 7/1/13 | 7,825 | 8,279 |
| St. Louis Park MN Health Care Facilities Revenue (Park Nicollet Health Services) | 5.500% | 7/1/14 | 5,250 | 5,665 |
| University of Minnesota Revenue | 5.000% | 8/1/17 | 3,215 | 3,773 |
| University of Minnesota Revenue | 5.000% | 12/1/17 | 10,000 | 11,914 |
| | | | | 204,107 |
| Mississippi (0.2%) | | | | |
| Mississippi GO | 5.250% | 11/1/14 | 8,970 | 10,161 |
| Mississippi GO | 5.000% | 11/1/15 (14) | 7,475 | 8,620 |
| Mississippi Hospital Equipment & Facilities Authority Revenue (Baptist Health System) | 5.000% | 8/15/12 | 1,000 | 1,029 |
| Mississippi Hospital Equipment & Facilities Authority Revenue (Baptist Health System) | 5.000% | 8/15/15 | 1,500 | 1,628 |
| Mississippi Hospital Equipment & Facilities Authority Revenue | | | | |
| (North Mississippi Health Services) | 5.000% | 10/1/17 | 2,500 | 2,845 |
| | | | | 24,283 |
| Missouri (0.5%) | | | | |
| Curators of the University of Missouri System Facilities Revenue | 5.000% | 11/1/13 (Prere.) | 15,320 | 16,688 |
| Curators of the University of Missouri System Facilities Revenue | 5.000% | 11/1/17 | 3,270 | 3,874 |
| Curators of the University of Missouri System Facilities Revenue | 5.000% | 11/1/18 | 1,445 | 1,725 |
| Missouri Health & Educational Facilities Authority Health Facilities Revenue | | | | |
| (SSM Health System) VRDO | 0.180% | 11/7/11 LOC | 5,500 | 5,500 |
| Missouri Health & Educational Facilities Authority Health Facilities Revenue | | | | |
| (St. Luke’s Health System) VRDO | 0.180% | 11/7/11 LOC | 8,200 | 8,200 |
| Missouri Health & Educational Facilities Authority Revenue (Ascension Health Credit Group) PUT | 1.250% | 5/16/12 | 10,000 | 10,049 |
| Missouri Highways & Transportation Commission Road Revenue | 5.000% | 2/1/12 (Prere.) | 10,000 | 10,120 |
| Missouri Highways & Transportation Commission Road Revenue | 3.000% | 2/1/13 | 15,645 | 16,162 |
| Missouri Joint Municipal Electric Utility Commission Power Project Revenue (Plum Point Project) | 5.000% | 1/1/12 (14) | 2,000 | 2,012 |
| | | | | 74,330 |
| Montana (0.1%) | | | | |
| Montana Facility Finance Authority Revenue (Sisters of Charity of Leavenworth Health System) | 5.000% | 1/1/16 | 5,870 | 6,563 |
| Montana Facility Finance Authority Revenue (Sisters of Charity of Leavenworth Health System) | 5.000% | 1/1/17 | 5,305 | 5,974 |
| | | | | 12,537 |
| Nebraska (0.2%) | | | | |
| Central Plains Energy Project Nebraska Gas Project Revenue (Project No. 1) | 5.000% | 12/1/15 | 5,000 | 5,303 |
| 3 Nebraska Investment Finance Authority Single Family Housing Revenue TOB VRDO | 0.140% | 11/7/11 | 8,000 | 8,000 |
| Nebraska Public Power District Revenue | 4.000% | 1/1/15 | 1,000 | 1,088 |
| Nebraska Public Power District Revenue | 5.000% | 1/1/16 | 1,000 | 1,142 |
| Nebraska Public Power District Revenue | 5.000% | 1/1/17 | 1,000 | 1,150 |
| 3 Nebraska Public Power District Revenue TOB VRDO | 0.130% | 11/7/11 (4) | 14,925 | 14,925 |
| Omaha NE Public Power District Electric Revenue | 5.500% | 2/1/14 | 3,250 | 3,423 |
| | | | | 35,031 |
| Nevada (1.2%) | | | | |
| Clark County NV Airport BAN | 5.000% | 7/1/12 | 20,000 | 20,557 |
| 3 Clark County NV GO TOB VRDO | 0.130% | 11/7/11 LOC | 16,880 | 16,880 |
| Clark County NV Passenger Facility Charge Revenue (Las Vegas McCarran International Airport) | 5.000% | 7/1/13 | 6,355 | 6,749 |
| Clark County NV Passenger Facility Charge Revenue (Las Vegas McCarran International Airport) | 5.000% | 7/1/14 | 6,100 | 6,658 |
| Clark County NV School District GO | 5.500% | 12/15/11 (Prere.) | 5,000 | 5,032 |
| Clark County NV School District GO | 5.000% | 6/15/12 | 10,115 | 10,403 |
| Clark County NV School District GO | 5.000% | 6/15/12 (14) | 5,380 | 5,533 |
| Clark County NV School District GO | 5.000% | 6/15/13 (14) | 16,050 | 17,110 |
| Clark County NV School District GO | 5.000% | 6/15/14 | 4,000 | 4,380 |
| Clark County NV School District GO | 5.000% | 6/15/14 (14) | 9,680 | 10,600 |
| Clark County NV School District GO | 5.000% | 6/15/15 (4) | 17,760 | 19,908 |
| Clark County NV School District GO | 5.000% | 6/15/15 (2) | 5,020 | 5,627 |
| Henderson NV Health Facility Revenue (Catholic Healthcare West) | 5.000% | 7/1/14 | 8,000 | 8,543 |
| Nevada GO | 5.000% | 12/1/12 (4) | 11,165 | 11,702 |
| Nevada Highway Improvement Revenue (Motor Vehicle Fuel Tax) | 5.000% | 12/1/12 (14) | 14,495 | 15,149 |
| Nevada Highway Improvement Revenue (Motor Vehicle Fuel Tax) | 5.500% | 12/1/14 (14) | 5,905 | 6,628 |
| | | | | 171,459 |
| New Hampshire (0.1%) | | | | |
| Manchester NH General Airport Revenue | 5.000% | 1/1/15 | 2,475 | 2,655 |
| Manchester NH General Airport Revenue | 5.000% | 1/1/15 | 1,470 | 1,577 |
| New Hampshire GO | 5.000% | 8/15/16 | 4,280 | 4,999 |
| New Hampshire GO | 5.000% | 8/15/17 | 3,200 | 3,786 |
| New Hampshire Health & Education Facilities Authority Revenue | | | | |
| (University System of New Hampshire) | 5.000% | 7/1/14 | 8,430 | 9,252 |
| | | | | 22,269 |
34
Limited-Term Tax-Exempt Fund
| | | | |
| | | | Face | Market |
| | | Maturity | Amount | Value• |
| | Coupon | Date | ($000) | ($000) |
| New Jersey (6.1%) | | | | |
| Garden State Preservation Trust New Jersey Revenue (Open Space & Farmland Preservation) | 5.250% | 11/1/12 (4) | 6,260 | 6,567 |
| Gloucester County NJ Improvement Authority Solid Waste Resource Revenue PUT | 2.625% | 12/3/12 | 4,625 | 4,690 |
| New Jersey Building Authority Revenue | 5.000% | 6/15/12 | 11,465 | 11,781 |
| New Jersey Building Authority Revenue | 5.000% | 6/15/14 | 6,790 | 7,429 |
| New Jersey Building Authority Revenue | 5.000% | 6/15/15 | 7,650 | 8,547 |
| New Jersey COP | 5.000% | 6/15/16 | 6,695 | 7,276 |
| New Jersey Economic Development Authority Revenue | | | | |
| (Kapkowski Road Landfill Improvement District Project (City of Elizabeth)) | 6.375% | 5/15/14 (Prere.) | 30,500 | 34,738 |
| New Jersey Economic Development Authority Revenue | | | | |
| (Provident Group-Montclair Properties LLC - Montclair State University Student Housing Project) | 5.000% | 6/1/15 | 2,525 | 2,677 |
| New Jersey Economic Development Authority Revenue | | | | |
| (Provident Group-Montclair Properties LLC - Montclair State University Student Housing Project) | 5.000% | 6/1/16 | 2,905 | 3,080 |
| New Jersey Economic Development Authority Revenue | | | | |
| (Provident Group-Montclair Properties LLC - Montclair State University Student Housing Project) | 5.000% | 6/1/17 | 3,525 | 3,712 |
| New Jersey Economic Development Authority Revenue (School Facilities Construction) | 5.000% | 3/1/13 (ETM) | 14,670 | 15,570 |
| New Jersey Economic Development Authority Revenue (School Facilities Construction) | 5.000% | 9/1/13 (Prere.) | 25,000 | 27,073 |
| New Jersey Economic Development Authority Revenue (School Facilities Construction) | 5.000% | 3/1/14 | 14,565 | 15,760 |
| New Jersey Economic Development Authority Revenue (School Facilities Construction) | 5.000% | 12/15/16 | 37,500 | 42,284 |
| New Jersey Economic Development Authority Revenue (School Facilities Construction) | 5.000% | 9/1/17 | 7,500 | 8,487 |
| New Jersey Economic Development Authority Revenue (School Facilities Construction) | 5.000% | 9/1/17 | 6,450 | 7,317 |
| New Jersey Economic Development Authority Revenue (School Facilities Construction) PUT | 5.000% | 9/1/14 (4) | 10,000 | 10,923 |
| New Jersey Economic Development Authority Transportation Project Sublease Revenue | | | | |
| (New Jersey Transit Corp. Light Rail Transit System Project) | 5.000% | 5/1/14 | 11,165 | 12,139 |
| New Jersey Economic Development Authority Transportation Project Sublease Revenue | | | | |
| (New Jersey Transit Corp. Light Rail Transit System Project) | 5.000% | 5/1/15 | 11,255 | 12,419 |
| New Jersey Educational Facilities Authority Revenue (Princeton University) | 5.000% | 7/1/17 | 5,095 | 6,094 |
| New Jersey Educational Facilities Authority Revenue (Princeton University) | 5.000% | 7/1/18 | 5,345 | 6,484 |
| New Jersey Educational Facilities Authority Revenue (University Medical & Dentistry) | 6.000% | 12/1/14 | 5,015 | 5,552 |
| New Jersey Equipment Lease Purchase COP | 5.000% | 6/15/14 | 7,000 | 7,504 |
| New Jersey Equipment Lease Purchase COP | 5.000% | 6/15/15 | 5,420 | 5,895 |
| New Jersey Equipment Lease Purchase COP | 5.000% | 6/15/17 | 2,625 | 2,851 |
| New Jersey GO | 5.000% | 8/15/16 | 12,120 | 14,023 |
| New Jersey GO | 5.000% | 8/15/17 | 11,660 | 13,646 |
| 3 New Jersey GO TOB VRDO | 0.150% | 11/1/11 | 95,500 | 95,500 |
| New Jersey Health Care Facilities Financing Authority Revenue (AHS Hospital Corp.) | 5.000% | 7/1/12 | 6,955 | 7,136 |
| New Jersey Health Care Facilities Financing Authority Revenue | | | | |
| (Hackensack University Medical Center) | 5.000% | 1/1/17 | 2,595 | 2,791 |
| New Jersey Health Care Facilities Financing Authority Revenue | | | | |
| (Hackensack University Medical Center) | 5.000% | 1/1/18 | 3,525 | 3,796 |
| New Jersey Health Care Facilities Financing Authority Revenue | | | | |
| (Hospital Capital Asset Pooled Program) VRDO | 0.130% | 11/7/11 LOC | 4,550 | 4,550 |
| 3 New Jersey Health Care Facilities Financing Authority Revenue | | | | |
| (Meridian Health System Obligated Group) TOB VRDO | 0.290% | 11/7/11 (12) | 9,565 | 9,565 |
| New Jersey Health Care Facilities Financing Authority Revenue (RWJ Health Care Corp.) VRDO | 0.090% | 11/7/11 LOC | 7,765 | 7,765 |
| New Jersey Higher Education Assistance Authority Student Loan Revenue | 5.000% | 12/1/13 | 2,500 | 2,666 |
| New Jersey Higher Education Assistance Authority Student Loan Revenue | 5.000% | 12/1/14 | 12,655 | 13,745 |
| New Jersey Higher Education Assistance Authority Student Loan Revenue | 4.500% | 12/1/15 | 15,860 | 17,171 |
| New Jersey Higher Education Assistance Authority Student Loan Revenue | 5.000% | 12/1/15 | 2,500 | 2,760 |
| New Jersey Higher Education Assistance Authority Student Loan Revenue | 5.000% | 12/1/16 | 9,990 | 11,037 |
| New Jersey Higher Education Assistance Authority Student Loan Revenue | 5.000% | 12/1/16 | 3,810 | 4,236 |
| New Jersey Housing & Mortgage Finance Agency Single Family Housing Revenue VRDO | 0.120% | 11/7/11 | 28,085 | 28,085 |
| New Jersey Sports & Exposition Authority Revenue | 5.000% | 9/1/14 (ETM) | 60 | 67 |
| New Jersey Sports & Exposition Authority Revenue | 5.000% | 9/1/14 | 6,480 | 7,100 |
| New Jersey Transportation Trust Fund Authority Transportation System Revenue | 5.250% | 12/15/11 (14) | 30,000 | 30,181 |
| New Jersey Transportation Trust Fund Authority Transportation System Revenue | 5.000% | 6/15/12 (14) | 4,200 | 4,314 |
| New Jersey Transportation Trust Fund Authority Transportation System Revenue | 5.750% | 12/15/12 (4) | 8,000 | 8,459 |
| New Jersey Transportation Trust Fund Authority Transportation System Revenue | 5.250% | 12/15/13 (14) | 22,680 | 24,622 |
| New Jersey Transportation Trust Fund Authority Transportation System Revenue | 5.000% | 6/15/15 (Prere.) | 19,130 | 21,931 |
| New Jersey Transportation Trust Fund Authority Transportation System Revenue | 5.000% | 12/15/17 | 7,500 | 8,479 |
| New Jersey Transportation Trust Fund Authority Transportation System Revenue | 5.000% | 12/15/17 | 10,000 | 11,305 |
| New Jersey Transportation Trust Fund Authority Transportation System Revenue | 5.000% | 12/15/18 | 15,810 | 17,896 |
| 3 New Jersey Transportation Trust Fund Authority Transportation System Revenue TOB VRDO | 0.170% | 11/7/11 LOC | 100 | 100 |
| 3 New Jersey Turnpike Authority Revenue TOB VRDO | 0.150% | 11/7/11 LOC | 20,160 | 20,160 |
| 3 New Jersey Turnpike Authority Revenue TOB VRDO | 0.240% | 11/7/11 (4) | 9,220 | 9,220 |
| New Jersey Turnpike Authority Revenue VRDO | 0.350% | 11/7/11 (4) | 49,880 | 49,880 |
| Salem County NJ Pollution Control Financing Authority Revenue | | | | |
| (Public Service Electric & Gas Co. Project) PUT | 0.950% | 11/1/11 | 16,500 | 16,500 |
| Tobacco Settlement Financing Corp. New Jersey Revenue | 4.250% | 6/1/12 | 5,000 | 5,055 |
| Tobacco Settlement Financing Corp. New Jersey Revenue | 5.000% | 6/1/12 (Prere.) | 10,200 | 10,482 |
| Tobacco Settlement Financing Corp. New Jersey Revenue | 6.125% | 6/1/12 (Prere.) | 14,495 | 14,990 |
| Tobacco Settlement Financing Corp. New Jersey Revenue | 6.250% | 6/1/13 (Prere.) | 18,515 | 20,224 |
35
Limited-Term Tax-Exempt Fund
| | | | |
| | | | Face | Market |
| | | Maturity | Amount | Value• |
| | Coupon | Date | ($000) | ($000) |
| Tobacco Settlement Financing Corp. New Jersey Revenue | 6.750% | 6/1/13 (Prere.) | 7,815 | 8,598 |
| Tobacco Settlement Financing Corp. New Jersey Revenue | 7.000% | 6/1/13 (Prere.) | 17,705 | 19,545 |
| Tobacco Settlement Financing Corp. New Jersey Revenue | 5.000% | 6/1/15 | 2,000 | 2,120 |
| Tobacco Settlement Financing Corp. New Jersey Revenue | 6.125% | 6/1/24 (Prere.) | 810 | 838 |
| Tobacco Settlement Financing Corp. New Jersey Revenue | 5.750% | 6/1/32 (Prere.) | 50,755 | 52,378 |
| Tobacco Settlement Financing Corp. New Jersey Revenue | 6.375% | 6/1/32 (Prere.) | 10,000 | 10,803 |
| | | | | 890,568 |
| New Mexico (1.0%) | | | | |
| Albuquerque NM GO | 5.000% | 7/1/12 (2) | 11,350 | 11,708 |
| Farmington NM Pollution Control Revenue (El Paso Electric Co. Four Corners Project) PUT | 4.000% | 8/1/12 (3) | 8,000 | 8,131 |
| New Mexico Educational Assistance Foundation Revenue | 4.000% | 9/1/16 | 10,000 | 10,854 |
| New Mexico Educational Assistance Foundation Revenue | 4.000% | 12/1/16 | 7,000 | 7,686 |
| New Mexico Educational Assistance Foundation Revenue | 4.000% | 12/1/17 | 5,000 | 5,501 |
| New Mexico Finance Authority Transportation Revenue | 5.000% | 6/15/17 | 9,000 | 10,630 |
| New Mexico GO | 5.000% | 3/1/13 | 8,000 | 8,488 |
| New Mexico GO | 5.000% | 3/1/13 | 10,000 | 10,610 |
| New Mexico GO | 5.000% | 3/1/14 | 7,000 | 7,705 |
| New Mexico GO | 5.000% | 3/1/16 | 19,290 | 22,365 |
| 3 New Mexico Hospital Equipment Loan Council Hospital System Revenue | | | | |
| (Presbyterian Healthcare Services) TOB VRDO | 0.140% | 11/7/11 | 6,660 | 6,660 |
| New Mexico Hospital Equipment Loan Council Hospital System Revenue | | | | |
| (Presbyterian Healthcare Services) VRDO | 0.140% | 11/7/11 | 27,945 | 27,945 |
| New Mexico Severance Tax Revenue | 5.000% | 7/1/12 | 1,550 | 1,599 |
| New Mexico Severance Tax Revenue | 5.000% | 7/1/17 | 6,015 | 7,110 |
| | | | | 146,992 |
| New York (11.4%) | | | | |
| Albany NY Industrial Development Agency Civic Facility Revenue | | | | |
| (Albany Medical Center Hospital Project) VRDO | 0.220% | 11/7/11 LOC | 4,640 | 4,640 |
| Battery Park City NY Authority Revenue | 5.250% | 11/1/16 | 14,275 | 15,528 |
| Brooklyn NY Local Development Corp. PILOT Revenue (Barclays Center Project) | 5.750% | 7/15/16 | 1,195 | 1,306 |
| Erie County NY Industrial Development Agency School Facility Revenue | | | | |
| (Buffalo City School District Project) | 5.000% | 5/1/14 | 2,000 | 2,194 |
| Erie County NY Industrial Development Agency School Facility Revenue | | | | |
| (Buffalo City School District Project) | 5.000% | 5/1/15 | 3,635 | 4,083 |
| Erie County NY Industrial Development Agency School Facility Revenue | | | | |
| (Buffalo City School District Project) | 5.000% | 5/1/17 | 1,125 | 1,297 |
| Erie County NY Industrial Development Agency School Facility Revenue | | | | |
| (Buffalo City School District Project) | 5.000% | 5/1/17 | 3,000 | 3,459 |
| Hempstead NY GO | 3.000% | 4/15/15 | 5,260 | 5,652 |
| Long Island NY Power Authority Electric System Revenue | 5.000% | 5/1/12 (14) | 48,900 | 50,027 |
| Long Island NY Power Authority Electric System Revenue | 5.250% | 6/1/13 | 15,690 | 16,788 |
| Long Island NY Power Authority Electric System Revenue | 5.000% | 5/1/18 | 2,000 | 2,302 |
| Long Island NY Power Authority Electric System Revenue | 5.000% | 5/1/19 | 1,500 | 1,725 |
| Metropolitan New York Transportation Authority Revenue | 5.000% | 11/15/16 | 6,000 | 6,804 |
| Metropolitan New York Transportation Authority Revenue | 5.000% | 11/15/17 | 5,000 | 5,689 |
| Metropolitan New York Transportation Authority Revenue | 5.000% | 11/15/18 | 2,500 | 2,854 |
| 3 Metropolitan New York Transportation Authority Revenue (Dedicated Petroleum Tax) TOB VRDO | 0.140% | 11/7/11 | 10,980 | 10,980 |
| 3 Metropolitan New York Transportation Authority Revenue (Dedicated Petroleum Tax) TOB VRDO | 0.140% | 11/7/11 (13) | 14,605 | 14,605 |
| 2 Metropolitan New York Transportation Authority Revenue (Dedicated Tax Fund) PUT | 0.690% | 11/1/13 | 4,000 | 4,000 |
| 2 Metropolitan New York Transportation Authority Revenue (Dedicated Tax Fund) PUT | 0.820% | 11/1/14 | 6,320 | 6,321 |
| Metropolitan New York Transportation Authority Revenue (Service Contract) | 5.500% | 7/1/14 | 15,460 | 17,143 |
| Metropolitan New York Transportation Authority Revenue (Transit Revenue) | 5.250% | 11/15/11 | 22,080 | 22,123 |
| Metropolitan New York Transportation Authority Revenue (Transit Revenue) | 5.000% | 11/15/12 | 3,500 | 3,664 |
| Metropolitan New York Transportation Authority Revenue (Transit Revenue) | 5.250% | 11/15/12 | 14,110 | 14,806 |
| Metropolitan New York Transportation Authority Revenue (Transit Revenue) | 5.000% | 11/15/13 | 3,325 | 3,583 |
| Metropolitan New York Transportation Authority Revenue (Transit Revenue) PUT | 5.000% | 11/15/13 | 10,000 | 10,770 |
| Metropolitan New York Transportation Authority Revenue (Transit Revenue) PUT | 5.000% | 11/15/14 | 52,980 | 58,743 |
| New York City NY Cultural Resources Revenue (American Museum of Natural History) VRDO | 0.140% | 11/1/11 | 3,025 | 3,025 |
| New York City NY Cultural Resources Revenue (American Museum of Natural History) VRDO | 0.160% | 11/1/11 | 4,300 | 4,300 |
| New York City NY Cultural Resources Revenue (Julliard School) PUT | 2.750% | 7/1/12 | 8,000 | 8,131 |
| New York City NY Cultural Resources Revenue (Pierpont Morgan Library) VRDO | 0.110% | 11/7/11 LOC | 6,765 | 6,765 |
| New York City NY GO | 5.000% | 8/1/12 | 8,000 | 8,279 |
| New York City NY GO | 5.000% | 8/1/12 | 8,450 | 8,744 |
| New York City NY GO | 5.750% | 8/1/12 (Prere.) | 35 | 36 |
| New York City NY GO | 5.000% | 8/15/13 | 2,690 | 2,903 |
| New York City NY GO | 5.000% | 8/1/14 | 25,000 | 27,793 |
| New York City NY GO | 5.750% | 8/1/14 (2) | 7,750 | 8,047 |
| New York City NY GO | 5.000% | 8/15/14 | 12,890 | 14,347 |
| New York City NY GO | 5.000% | 9/1/14 | 16,860 | 18,791 |
| New York City NY GO | 5.000% | 8/1/15 | 10,815 | 12,263 |
| New York City NY GO | 5.000% | 8/1/15 | 26,260 | 29,776 |
36
Limited-Term Tax-Exempt Fund
| | | | |
| | | | Face | Market |
| | | Maturity | Amount | Value• |
| | Coupon | Date | ($000) | ($000) |
| New York City NY GO | 5.000% | 8/1/15 | 8,005 | 8,851 |
| New York City NY GO | 5.000% | 8/15/15 | 17,910 | 20,327 |
| New York City NY GO | 5.000% | 9/1/15 | 21,325 | 24,228 |
| New York City NY GO | 5.000% | 2/1/16 | 1,000 | 1,143 |
| New York City NY GO | 5.000% | 3/1/16 | 2,500 | 2,862 |
| New York City NY GO | 5.000% | 3/1/16 | 10,795 | 12,357 |
| New York City NY GO | 5.000% | 4/1/16 | 3,500 | 4,014 |
| New York City NY GO | 5.000% | 8/1/16 | 27,500 | 31,762 |
| New York City NY GO | 5.000% | 8/1/16 | 1,000 | 1,155 |
| New York City NY GO | 5.000% | 8/1/16 | 1,000 | 1,155 |
| New York City NY GO | 5.000% | 8/1/17 | 9,750 | 11,351 |
| New York City NY GO | 5.000% | 8/1/17 | 13,470 | 15,682 |
| New York City NY GO | 5.000% | 8/1/17 | 13,590 | 15,822 |
| New York City NY GO | 5.000% | 8/1/17 | 3,800 | 4,424 |
| New York City NY GO | 5.000% | 8/1/17 | 6,000 | 6,985 |
| New York City NY GO | 5.000% | 10/1/17 | 2,500 | 2,917 |
| New York City NY GO | 5.000% | 8/1/18 | 6,000 | 7,069 |
| New York City NY GO | 5.000% | 8/1/18 | 4,650 | 5,479 |
| New York City NY GO VRDO | 0.160% | 11/1/11 | 54,585 | 54,585 |
| New York City NY GO VRDO | 0.160% | 11/1/11 LOC | 3,500 | 3,500 |
| New York City NY GO VRDO | 0.110% | 11/7/11 LOC | 7,900 | 7,900 |
| New York City NY Health & Hospital Corp. Revenue (Health System) | 5.000% | 2/15/12 | 6,665 | 6,748 |
| New York City NY Health & Hospital Corp. Revenue (Health System) | 5.000% | 2/15/17 | 8,150 | 9,220 |
| New York City NY Housing Development Corp. Multi-Family Housing Revenue | 5.000% | 5/1/12 | 5,000 | 5,098 |
| 3 New York City NY Housing Development Corp. Multi-Family Housing Revenue TOB VRDO | 0.160% | 11/7/11 | 3,755 | 3,755 |
| New York City NY Housing Development Corp. Revenue (Capital Fund Program) | 5.000% | 7/1/12 (14) | 5,000 | 5,138 |
| New York City NY Industrial Development Agency Civic Facility Revenue | | | | |
| (USTA National Tennis Center) | 5.000% | 11/15/13 (4) | 4,435 | 4,814 |
| 3 New York City NY Municipal Water Finance Authority Water & Sewer System Revenue | | | | |
| TOB VRDO | 0.200% | 11/7/11 | 8,760 | 8,760 |
| 3 New York City NY Municipal Water Finance Authority Water & Sewer System Revenue | | | | |
| TOB VRDO | 0.200% | 11/7/11 | 9,150 | 9,150 |
| 3 New York City NY Municipal Water Finance Authority Water & Sewer System Revenue | | | | |
| TOB VRDO | 0.200% | 11/7/11 | 20,855 | 20,855 |
| 3 New York City NY Transitional Finance Authority Building Aid Revenue TOB VRDO | 0.150% | 11/7/11 (4) | 14,000 | 14,000 |
| New York City NY Transitional Finance Authority Future Tax Revenue | 5.000% | 11/1/11 | 14,370 | 14,370 |
| New York City NY Transitional Finance Authority Future Tax Revenue | 5.500% | 11/1/11 | 24,375 | 24,375 |
| New York City NY Transitional Finance Authority Future Tax Revenue | 5.000% | 11/1/13 (ETM) | 1,030 | 1,122 |
| New York City NY Transitional Finance Authority Future Tax Revenue | 5.000% | 11/1/13 | 11,290 | 12,292 |
| New York City NY Transitional Finance Authority Future Tax Revenue | 5.000% | 11/1/14 (ETM) | 320 | 361 |
| New York City NY Transitional Finance Authority Future Tax Revenue | 5.000% | 11/1/14 | 5,290 | 5,945 |
| New York City NY Transitional Finance Authority Future Tax Revenue | 5.000% | 11/1/15 | 8,000 | 9,176 |
| New York City NY Transitional Finance Authority Future Tax Revenue | 5.000% | 11/1/16 | 43,485 | 50,722 |
| New York City NY Transitional Finance Authority Future Tax Revenue | 5.000% | 11/1/16 | 10,115 | 11,798 |
| New York City NY Transitional Finance Authority Future Tax Revenue | 5.000% | 2/1/17 | 2,500 | 2,911 |
| New York City NY Transitional Finance Authority Future Tax Revenue | 5.000% | 11/1/17 | 16,500 | 18,643 |
| New York City NY Transitional Finance Authority Future Tax Revenue | 5.000% | 11/1/17 | 20,000 | 23,572 |
| New York City NY Transitional Finance Authority Future Tax Revenue | 5.000% | 11/1/17 | 7,000 | 8,250 |
| 1 New York City NY Transitional Finance Authority Future Tax Revenue | 5.000% | 11/1/17 | 20,000 | 23,572 |
| New York City NY Transitional Finance Authority Future Tax Revenue VRDO | 0.110% | 11/7/11 | 3,700 | 3,700 |
| New York City NY Trust for Cultural Resources Revenue (Whitney Museum of American Art) | 5.000% | 7/1/17 | 6,250 | 7,154 |
| New York State Dormitory Authority Lease Revenue (Mental Health Services Facilities) | 5.000% | 8/15/17 | 6,240 | 7,247 |
| New York State Dormitory Authority Revenue (Fordham University) PUT | 5.000% | 7/1/16 | 9,000 | 10,092 |
| New York State Dormitory Authority Revenue (Mount Sinai Hospital Obligated Group) | 5.000% | 7/1/16 | 2,270 | 2,509 |
| New York State Dormitory Authority Revenue | | | | |
| (Mount Sinai School of Medicine of New York University) | 5.000% | 7/1/16 | 1,260 | 1,411 |
| New York State Dormitory Authority Revenue | | | | |
| (Mount Sinai School of Medicine of New York University) | 5.000% | 7/1/17 | 1,750 | 1,970 |
| New York State Dormitory Authority Revenue (New York University Hospitals Center) | 5.000% | 7/1/12 | 1,000 | 1,025 |
| New York State Dormitory Authority Revenue | | | | |
| (North Shore - Long Island Jewish Obligated Group) | 5.000% | 5/1/18 | 1,000 | 1,117 |
| New York State Dormitory Authority Revenue (Personal Income Tax) | 5.000% | 12/15/12 | 5,250 | 5,524 |
| New York State Dormitory Authority Revenue (Personal Income Tax) | 5.000% | 3/15/13 | 3,450 | 3,663 |
| New York State Dormitory Authority Revenue (Personal Income Tax) | 5.000% | 3/15/14 | 3,760 | 4,129 |
| New York State Dormitory Authority Revenue (Personal Income Tax) | 5.000% | 3/15/15 | 3,935 | 4,435 |
| New York State Dormitory Authority Revenue (Personal Income Tax) | 5.000% | 2/15/17 | 16,845 | 19,625 |
| New York State Dormitory Authority Revenue (Personal Income Tax) | 5.000% | 2/15/17 | 9,610 | 11,196 |
| New York State Dormitory Authority Revenue (Personal Income Tax) | 5.000% | 3/15/18 | 18,010 | 21,303 |
| New York State Dormitory Authority Revenue (School Districts Financing Program) | 5.000% | 10/1/17 | 7,030 | 8,042 |
| New York State Dormitory Authority Revenue (Service Contract) | 5.000% | 7/1/16 | 8,500 | 9,683 |
| New York State Dormitory Authority Revenue (Service Contract) | 5.000% | 7/1/17 | 10,510 | 12,091 |
| New York State Dormitory Authority Revenue (State University Educational Facilities) | 5.500% | 5/15/13 (14) | 20,350 | 20,954 |
37
Limited-Term Tax-Exempt Fund
| | | | |
| | | | Face | Market |
| | | Maturity | Amount | Value• |
| | Coupon | Date | ($000) | ($000) |
| New York State Dormitory Authority Revenue (State University Educational Facilities) PUT | 5.250% | 5/15/12 (2) | 12,560 | 12,873 |
| 3 New York State Dormitory Authority Revenue (Vassar College) TOB VRDO | 0.140% | 11/7/11 | 7,805 | 7,805 |
| New York State Energy Research & Development Authority Pollution Control Revenue | | | | |
| (New York State Electric & Gas Corp. Project) | 2.125% | 3/15/15 | 3,000 | 2,971 |
| New York State Energy Research & Development Authority Pollution Control Revenue | | | | |
| (New York State Electric & Gas Corp. Project) | 2.250% | 10/15/15 | 5,000 | 4,944 |
| New York State Energy Research & Development Authority Pollution Control Revenue | | | | |
| (New York State Electric & Gas Corp. Project) ARS | 0.676% | 11/7/11 (14) | 14,650 | 14,154 |
| New York State Energy Research & Development Authority Pollution Control Revenue | | | | |
| (New York State Electric & Gas Corp. Project) PUT | 3.000% | 6/3/13 | 7,500 | 7,647 |
| New York State Energy Research & Development Authority Pollution Control Revenue | | | | |
| (New York State Electric & Gas Corp. Project) PUT | 3.000% | 6/3/13 | 8,500 | 8,667 |
| New York State Energy Research & Development Authority Pollution Control Revenue | | | | |
| (Rochester Gas & Electric Corp. Project) PUT | 4.750% | 7/1/16 (14) | 2,250 | 2,437 |
| New York State Environmental Facilities Corp. Revenue | | | | |
| (State Clean Water & Drinking Water Revolving Funds) | 5.250% | 7/15/14 | 2,160 | 2,428 |
| New York State Housing Finance Agency Housing Revenue (80 DeKalb Avenue) VRDO | 0.100% | 11/7/11 LOC | 10,800 | 10,800 |
| New York State Housing Finance Agency Revenue (Clinton Park) VRDO | 0.100% | 11/7/11 LOC | 7,000 | 7,000 |
| New York State Municipal Bond Bank Agency Special School Purpose Revenue | 5.500% | 12/1/15 | 5,410 | 5,794 |
| New York State Municipal Bond Bank Agency Special School Purpose Revenue | 5.250% | 6/1/18 | 7,000 | 7,428 |
| New York State Municipal Bond Bank Agency Special School Purpose Revenue | 5.250% | 12/1/18 | 8,415 | 8,930 |
| New York State Thruway Authority Revenue (Highway & Bridge Trust Fund) | 5.000% | 4/1/16 (14) | 7,500 | 8,536 |
| New York State Thruway Authority Revenue (Highway& Bridge Trust Fund) | 5.000% | 4/1/13 (14) | 15,000 | 15,967 |
| New York State Thruway Authority Revenue (Highway& Bridge Trust Fund) | 5.000% | 4/1/16 | 40,000 | 45,584 |
| New York State Thruway Authority Revenue (Highway& Bridge Trust Fund) | 5.000% | 4/1/17 | 18,145 | 20,904 |
| New York State Thruway Authority Revenue (Highway& Bridge Trust Fund) | 5.000% | 4/1/18 | 3,500 | 4,107 |
| New York State Thruway Authority Revenue (Personal Income Tax) | 5.000% | 3/15/16 | 6,620 | 7,604 |
| New York State Thruway Authority Revenue (Personal Income Tax) | 5.000% | 3/15/18 | 8,440 | 9,983 |
| New York State Thruway Authority Revenue (Service Contract) | 5.500% | 4/1/13 | 5,500 | 5,615 |
| New York State Urban Development Corp. Revenue | 5.000% | 1/1/15 | 5,145 | 5,756 |
| New York State Urban Development Corp. Revenue | 5.250% | 1/1/17 | 8,000 | 9,253 |
| New York State Urban Development Corp. Revenue (Personal Income Tax) | 5.000% | 12/15/15 | 6,685 | 7,669 |
| New York State Urban Development Corp. Revenue (Personal Income Tax) | 5.000% | 12/15/16 | 20,000 | 23,318 |
| New York State Urban Development Corp. Revenue (Personal Income Tax) | 5.000% | 3/15/18 | 20,000 | 23,657 |
| New York State Urban Development Corp. Revenue (Service Contract) | 5.000% | 1/1/12 | 6,500 | 6,551 |
| New York State Urban Development Corp. Revenue (Service Contract) | 5.000% | 1/1/15 | 27,950 | 31,268 |
| New York State Urban Development Corp. Revenue (Service Contract) | 5.000% | 1/1/16 | 25,000 | 28,412 |
| New York State Urban Development Corp. Revenue (Service Contract) | 5.000% | 1/1/16 | 3,340 | 3,796 |
| New York State Urban Development Corp. Revenue (Service Contract) | 5.000% | 1/1/16 | 19,295 | 21,929 |
| New York State Urban Development Corp. Revenue (Service Contract) VRDO | 0.120% | 11/7/11 | 19,735 | 19,735 |
| New York State Urban Development Corp. Revenue (Service Contract) VRDO | 0.120% | 11/7/11 | 19,015 | 19,015 |
| Onondaga County NY Trust Cultural Resource Revenue (Syracuse University) VRDO | 0.150% | 11/7/11 LOC | 3,800 | 3,800 |
| Tobacco Settlement Financing Corp. New York Revenue | 4.000% | 6/1/12 | 10,000 | 10,204 |
| Tobacco Settlement Financing Corp. New York Revenue | 5.000% | 6/1/12 | 7,000 | 7,184 |
| Tobacco Settlement Financing Corp. New York Revenue | 5.500% | 6/1/12 (Prere.) | 13,345 | 13,752 |
| Tobacco Settlement Financing Corp. New York Revenue | 5.000% | 6/1/17 | 6,500 | 7,450 |
| Tobacco Settlement Financing Corp. New York Revenue | 5.500% | 6/1/18 | 6,655 | 6,814 |
| Triborough Bridge & Tunnel Authority New York Revenue | 5.000% | 1/1/14 (ETM) | 2,045 | 2,236 |
| Triborough Bridge & Tunnel Authority New York Revenue | 5.000% | 11/15/14 | 11,690 | 13,203 |
| Triborough Bridge & Tunnel Authority New York Revenue | 5.000% | 1/1/18 | 13,435 | 15,762 |
| Westchester County NY Health Care Corp. Revenue | 5.000% | 11/1/16 | 8,170 | 8,708 |
| Westchester County NY Health Care Corp. Revenue | 5.000% | 11/1/17 | 8,600 | 9,113 |
| | | | | 1,660,134 |
| North Carolina (2.9%) | | | | |
| Cabarrus NC COP | 5.000% | 1/1/14 | 2,500 | 2,721 |
| Cabarrus NC COP | 5.000% | 1/1/16 | 4,555 | 5,197 |
| Charlotte NC Airport Revenue | 5.000% | 7/1/14 | 4,000 | 4,391 |
| Charlotte NC Water & Sewer System Revenue | 5.000% | 7/1/13 | 1,420 | 1,528 |
| Charlotte NC Water & Sewer System Revenue | 4.000% | 7/1/16 | 1,280 | 1,437 |
| Charlotte NC Water & Sewer System Revenue | 5.000% | 12/1/17 | 3,000 | 3,599 |
| Charlotte NC Water & Sewer System Revenue | 5.000% | 12/1/18 | 1,250 | 1,517 |
| Durham NC COP | 5.000% | 6/1/13 | 1,000 | 1,070 |
| Fayetteville NC Public Works Commission Revenue | 5.000% | 3/1/17 | 5,000 | 5,855 |
| Guilford County NC GO | 5.000% | 8/1/15 | 8,250 | 9,490 |
| Guilford County NC GO | 5.000% | 8/1/16 | 5,000 | 5,871 |
| Guilford County NC GO | 5.000% | 8/1/17 | 5,000 | 5,975 |
| New Hanover County NC Hospital Revenue | | | | |
| (New Hanover Regional Medical Center Project) VRDO | 0.200% | 11/7/11 (4) | 11,050 | 11,050 |
| North Carolina Capital Facilities Finance Agency Solid Waste Disposal Revenue Bonds | | | | |
| (Republic Services, Inc.) PUT | 0.750% | 12/1/11 | 32,500 | 32,494 |
| North Carolina Capital Improvement Revenue | 5.000% | 5/1/17 | 9,600 | 11,275 |
| North Carolina Capital Improvement Revenue | 5.000% | 5/1/18 | 15,325 | 18,177 |
38
Limited-Term Tax-Exempt Fund
| | | | |
| | | | Face | Market |
| | | Maturity | Amount | Value• |
| | Coupon | Date | ($000) | ($000) |
| North Carolina Eastern Municipal Power Agency Power Systems Revenue | 5.000% | 1/1/16 | 7,000 | 7,850 |
| North Carolina Eastern Municipal Power Agency Revenue | 5.500% | 1/1/12 | 9,565 | 9,643 |
| North Carolina Eastern Municipal Power Agency Revenue | 5.375% | 1/1/13 | 5,000 | 5,256 |
| North Carolina Eastern Municipal Power Agency Revenue | 5.000% | 1/1/14 | 5,000 | 5,407 |
| North Carolina Eastern Municipal Power Agency Revenue | 5.500% | 1/1/14 | 6,000 | 6,545 |
| North Carolina Eastern Municipal Power Agency Revenue | 5.000% | 1/1/15 | 3,465 | 3,834 |
| North Carolina Eastern Municipal Power Agency Revenue | 5.000% | 1/1/15 | 20,000 | 22,130 |
| North Carolina Eastern Municipal Power Agency Revenue | 5.000% | 1/1/16 | 2,725 | 3,056 |
| North Carolina Eastern Municipal Power Agency Revenue | 5.000% | 1/1/16 | 3,000 | 3,364 |
| North Carolina Eastern Municipal Power Agency Revenue | 5.000% | 1/1/17 | 2,500 | 2,835 |
| North Carolina Educational Facilities Finance Agency Revenue (Duke University) VRDO | 0.100% | 11/7/11 | 4,000 | 4,000 |
| North Carolina GO | 5.000% | 3/1/12 | 13,980 | 14,204 |
| North Carolina GO | 5.000% | 3/1/14 | 23,160 | 25,527 |
| North Carolina GO | 5.000% | 6/1/18 | 15,100 | 18,242 |
| North Carolina Medical Care Commission Health Care Facilities Revenue | | | | |
| (Duke University Health System) VRDO | 0.170% | 11/7/11 | 53,600 | 53,600 |
| North Carolina Medical Care Commission Health Care Facilities Revenue | | | | |
| (Novant Health Obligated Group) | 5.000% | 11/1/14 | 2,775 | 2,909 |
| North Carolina Medical Care Commission Health Care Facilities Revenue | | | | |
| (Novant Health Obligated Group) | 5.000% | 11/1/15 (4) | 7,370 | 7,678 |
| North Carolina Medical Care Commission Hospital Revenue (CaroMont Health) VRDO | 0.170% | 11/7/11 LOC | 4,990 | 4,990 |
| North Carolina Medical Care Commission Hospital Revenue (Moses Cone Health System) VRDO | 0.120% | 11/1/11 | 2,900 | 2,900 |
| North Carolina Medical Care Commission Hospital Revenue (North Carolina Baptist Hospital) | 5.000% | 6/1/16 | 1,705 | 1,922 |
| North Carolina Medical Care Commission Hospital Revenue (North Carolina Baptist Hospital) | 5.000% | 6/1/17 | 5,000 | 5,670 |
| North Carolina Municipal Power Agency Revenue | 5.500% | 1/1/13 (ETM) | 1,340 | 1,420 |
| North Carolina Municipal Power Agency Revenue | 5.500% | 1/1/13 | 2,835 | 2,991 |
| Raleigh NC GO | 5.000% | 12/1/16 | 2,470 | 2,917 |
| Raleigh NC GO | 5.000% | 12/1/16 | 2,605 | 3,077 |
| Union County NC GO VRDO | 0.100% | 11/7/11 | 14,545 | 14,545 |
| Wake County NC GO | 4.000% | 2/1/14 | 13,000 | 13,995 |
| Wake County NC Public Improvement GO | 5.000% | 3/1/13 | 16,000 | 16,987 |
| Wake County NC Public Improvement GO | 5.000% | 3/1/14 | 23,000 | 25,351 |
| Wake County NC Public Improvement GO | 5.000% | 3/1/16 | 5,110 | 5,943 |
| | | | | 420,435 |
| Ohio (4.3%) | | | | |
| Allen County OH Hospital Facilities Revenue (Catholic Healthcare Partners) | 5.000% | 9/1/14 | 20,120 | 21,689 |
| Allen County OH Hospital Facilities Revenue (Catholic Healthcare Partners) | 5.000% | 9/1/15 | 10,170 | 11,092 |
| Allen County OH Hospital Facilities Revenue (Catholic Healthcare Partners) | 5.000% | 9/1/16 | 11,830 | 13,032 |
| American Municipal Power Ohio Inc. Revenue (Electricity Purchase) | 5.000% | 2/1/13 | 10,000 | 10,483 |
| American Municipal Power Ohio Inc. Revenue (Hydroelectric Projects) | 5.000% | 2/15/17 | 6,000 | 6,715 |
| Avon OH Local School District GO | 5.250% | 12/1/13 (Prere.) | 2,400 | 2,635 |
| Buckeye Tobacco Settlement Financing Authority Ohio Revenue | 5.000% | 6/1/12 | 1,480 | 1,503 |
| Buckeye Tobacco Settlement Financing Authority Ohio Revenue | 5.000% | 6/1/14 | 5,495 | 5,786 |
| Chillicothe OH City School District GO | 5.250% | 12/1/14 (Prere.) | 1,745 | 1,984 |
| Cincinnati OH City School District GO | 5.375% | 12/1/11 (Prere.) | 3,350 | 3,364 |
| Cincinnati OH City School District GO | 5.000% | 12/1/12 (4) | 1,140 | 1,196 |
| Cincinnati OH City School District GO | 5.000% | 12/1/13 (Prere.) | 5,525 | 6,038 |
| Cincinnati OH City School District GO | 5.000% | 12/1/13 (4) | 2,000 | 2,180 |
| Cleveland OH Airport System Revenue | 5.000% | 1/1/14 | 7,575 | 7,926 |
| Cleveland OH GO | 5.500% | 12/1/11 (14) | 1,340 | 1,346 |
| Cleveland OH GO | 5.250% | 8/1/13 (Prere.) | 2,400 | 2,602 |
| Cleveland OH Income Tax Revenue (Police & Fire Pension Payment) | 5.000% | 5/15/17 | 1,190 | 1,358 |
| 3 Cleveland OH Water Works Revenue TOB VRDO | 0.140% | 11/7/11 | 4,700 | 4,700 |
| Columbus OH City School District School Facilities Construction & Improvement GO | 5.250% | 12/1/14 (Prere.) | 2,390 | 2,712 |
| Columbus OH City School District School Facilities Construction & Improvement GO | 5.250% | 12/1/14 (Prere.) | 2,070 | 2,349 |
| Columbus OH GO | 5.000% | 6/15/12 | 7,955 | 8,189 |
| Columbus OH GO | 5.000% | 9/1/12 | 5,600 | 5,820 |
| Columbus OH GO | 5.000% | 9/1/13 | 10,430 | 11,289 |
| Columbus OH GO | 5.000% | 9/1/13 | 5,600 | 6,061 |
| Columbus OH GO | 5.000% | 12/15/13 | 3,000 | 3,284 |
| Columbus OH GO | 5.000% | 9/1/16 | 9,225 | 10,773 |
| Columbus OH GO | 5.000% | 6/1/17 | 7,510 | 8,870 |
| Columbus OH GO | 5.000% | 7/1/17 | 7,245 | 8,570 |
| Columbus OH GO | 5.000% | 7/1/17 | 5,740 | 6,790 |
| Columbus OH GO | 5.000% | 6/1/18 | 8,000 | 9,549 |
| Columbus OH GO | 5.000% | 7/1/18 | 7,280 | 8,699 |
| Columbus OH GO | 5.000% | 7/1/18 | 4,500 | 5,377 |
| Franklin County OH Hospital Facilities Revenue (US Health Corp. of Columbus) VRDO | 0.110% | 11/7/11 LOC | 11,845 | 11,845 |
| Hamilton County OH Convention Center Facilities Authority Revenue | 5.250% | 6/1/14 (Prere.) | 1,270 | 1,418 |
| Hamilton County OH Sewer System Revenue | 5.000% | 12/1/13 (14) | 4,450 | 4,862 |
| Hilliard OH School District GO | 0.000% | 12/1/14 (14) | 2,720 | 2,612 |
| Hilliard OH School District GO | 0.000% | 12/1/15 (14) | 3,720 | 3,483 |
39
Limited-Term Tax-Exempt Fund
| | | | |
| | | | Face | Market |
| | | Maturity | Amount | Value• |
| | Coupon | Date | ($000) | ($000) |
| Jackson OH Local School District Stark & Summit Counties GO | 5.250% | 6/1/14 (Prere.) | 4,350 | 4,847 |
| Lorain County OH Hospital Facilities Revenue (Catholic Healthcare Partners) | 5.000% | 4/1/14 (4) | 4,500 | 4,847 |
| Lorain County OH Hospital Facilities Revenue (Catholic Healthcare Partners) | 5.000% | 4/1/14 (4) | 4,500 | 4,847 |
| Lorain County OH Hospital Facilities Revenue (Catholic Healthcare Partners) | 5.000% | 4/1/15 (4) | 5,200 | 5,712 |
| 3 Lorain County OH Hospital Facilities Revenue (Catholic Healthcare Partners) TOB VRDO | 0.140% | 11/7/11 (4) | 9,810 | 9,810 |
| 3 Lorain County OH Hospital Facilities Revenue (Catholic Healthcare Partners) TOB VRDO | 0.200% | 11/7/11 (4) | 7,500 | 7,500 |
| 3 Lorain County OH Hospital Facilities Revenue (Catholic Healthcare Partners) TOB VRDO | 0.240% | 11/7/11 (4) | 7,715 | 7,715 |
| Marysville OH Exempt Village School District COP | 5.250% | 6/1/15 (Prere.) | 3,000 | 3,459 |
| Montgomery County OH Revenue (Catholic Health Initiatives) PUT | 4.100% | 11/10/11 | 12,000 | 12,011 |
| Montgomery County OH Revenue (Catholic Health Initiatives) PUT | 5.000% | 11/12/13 | 6,000 | 6,484 |
| Ohio Air Quality Development Authority Pollution Control Revenue | | | | |
| (FirstEnergy Generation Corp. Project) | 5.700% | 2/1/14 | 4,000 | 4,316 |
| Ohio Air Quality Development Authority Pollution Control Revenue | | | | |
| (FirstEnergy Generation Corp. Project) PUT | 3.375% | 7/1/15 | 5,000 | 5,091 |
| Ohio Air Quality Development Authority Revenue (Columbus Southern Power Co. Project) PUT | 3.875% | 6/1/14 | 3,500 | 3,623 |
| Ohio Air Quality Development Authority Revenue (Ohio Power Co. Project) PUT | 3.250% | 6/2/14 | 5,000 | 5,098 |
| Ohio Building Authority Revenue (Administration Building Fund) | 5.250% | 10/1/15 (14) | 11,780 | 13,423 |
| Ohio Building Authority Revenue (Adult Correctional Building) | 5.000% | 4/1/12 (ETM) | 3,055 | 3,116 |
| Ohio Building Authority Revenue (Adult Correctional Building) | 5.250% | 4/1/14 | 12,000 | 13,166 |
| Ohio Building Authority Revenue (Adult Correctional Building) | 5.000% | 10/1/15 | 1,200 | 1,356 |
| Ohio Building Authority Revenue (Adult Correctional Building) | 5.250% | 10/1/16 (14) | 14,830 | 17,159 |
| Ohio Building Authority Revenue (Highway Safety Building) | 5.000% | 10/1/13 | 1,520 | 1,638 |
| Ohio Building Authority Revenue (Highway Safety Building) | 5.000% | 10/1/13 | 1,050 | 1,131 |
| Ohio Building Authority Revenue (Highway Safety Building) | 5.000% | 10/1/13 | 1,105 | 1,191 |
| Ohio Building Authority Revenue (Highway Safety Building) | 5.000% | 10/1/14 | 2,300 | 2,548 |
| Ohio Building Authority Revenue (Highway Safety Building) | 5.000% | 10/1/14 | 1,165 | 1,291 |
| Ohio Building Authority Revenue (Highway Safety Building) | 5.000% | 10/1/15 | 2,420 | 2,735 |
| Ohio Building Authority Revenue (Highway Safety Building) | 5.000% | 10/1/15 | 1,225 | 1,384 |
| Ohio Building Authority Revenue (Highway Safety Building) | 5.000% | 10/1/16 | 1,285 | 1,472 |
| Ohio Building Authority Revenue (Highway Safety Building) | 5.000% | 10/1/16 | 2,540 | 2,909 |
| Ohio Building Authority Revenue (Highway Safety Building) | 5.000% | 10/1/16 | 1,650 | 1,890 |
| Ohio Building Authority Revenue (Highway Safety Building) | 5.000% | 10/1/17 | 2,670 | 3,101 |
| Ohio Common Schools GO VRDO | 0.100% | 11/7/11 | 1,400 | 1,400 |
| Ohio GO | 5.000% | 9/15/14 | 5,920 | 6,626 |
| Ohio GO | 5.000% | 9/15/15 | 5,000 | 5,731 |
| Ohio GO | 5.000% | 9/15/16 | 10,000 | 11,656 |
| Ohio GO | 5.000% | 9/15/17 | 19,680 | 23,198 |
| Ohio GO | 5.000% | 9/15/18 | 5,000 | 5,938 |
| Ohio Higher Education Capital Facilities Revenue | 5.250% | 12/1/11 | 6,115 | 6,141 |
| Ohio Higher Education GO | 5.250% | 11/1/11 (ETM) | 5,000 | 5,000 |
| Ohio Higher Education GO | 5.250% | 12/1/11 (14) | 4,500 | 4,519 |
| Ohio Higher Education GO | 5.000% | 8/1/12 | 6,525 | 6,756 |
| Ohio Higher Education GO | 5.000% | 11/1/14 | 4,250 | 4,778 |
| Ohio Higher Educational Facility Commission Revenue | | | | |
| (Case Western Reserve University Project) | 5.500% | 10/1/12 (Prere.) | 5,000 | 5,238 |
| Ohio Higher Educational Facility Commission Revenue | | | | |
| (Case Western Reserve University Project) | 5.000% | 12/1/13 (Prere.) | 3,885 | 4,246 |
| Ohio Higher Educational Facility Commission Revenue | | | | |
| (Case Western Reserve University Project) VRDO | 0.130% | 11/7/11 LOC | 5,000 | 5,000 |
| Ohio Highway Capital Improvements GO | 5.000% | 5/1/12 | 6,280 | 6,429 |
| Ohio Highway Capital Improvements GO | 5.250% | 5/1/12 | 6,805 | 6,976 |
| Ohio Highway Capital Improvements GO | 5.000% | 5/1/13 | 6,300 | 6,727 |
| 3 Ohio Hospital Revenue (Cleveland Clinic Health System Obligated Group) TOB VRDO | 0.140% | 11/7/11 | 2,850 | 2,850 |
| Ohio Hospital Revenue (University Hospitals Health System Inc.) PUT | 3.750% | 1/15/13 | 2,500 | 2,572 |
| Ohio Infrastructure Improvement GO | 5.000% | 9/1/14 | 6,055 | 6,759 |
| Ohio Infrastructure Improvement GO | 5.000% | 9/1/15 | 8,600 | 9,847 |
| Ohio Infrastructure Improvement GO | 5.000% | 9/1/16 | 3,210 | 3,739 |
| Ohio Infrastructure Improvement GO | 5.000% | 8/1/18 | 3,450 | 4,085 |
| Ohio State University General Receipts Revenue | 5.000% | 12/1/13 | 6,000 | 6,548 |
| Ohio State University General Receipts Revenue | 5.000% | 12/1/14 | 3,000 | 3,377 |
| Ohio State University General Receipts Revenue | 5.000% | 12/1/16 | 3,515 | 4,107 |
| Ohio State University General Receipts Revenue | 5.000% | 12/1/17 | 5,000 | 5,903 |
| Ohio Turnpike Commission Turnpike Revenue | 5.000% | 2/15/15 | 3,500 | 3,933 |
| Ohio Water Development Authority Drinking Water Assistance Fund Revenue | 5.000% | 6/1/17 | 4,000 | 4,693 |
| Ohio Water Development Authority Fresh Water Revenue | 5.000% | 12/1/13 | 4,000 | 4,370 |
| Ohio Water Development Authority Fresh Water Revenue | 5.000% | 6/1/14 (Prere.) | 6,300 | 6,997 |
| 3 Ohio Water Development Authority Fresh Water Revenue TOB VRDO | 2.000% | 11/7/11 | 17,955 | 17,955 |
| Ohio Water Development Authority Water Pollution Control Loan Fund Revenue | 5.000% | 12/1/11 | 4,030 | 4,046 |
| Ohio Water Development Authority Water Pollution Control Loan Fund Revenue | 5.000% | 6/1/13 | 7,000 | 7,506 |
| Ohio Water Development Authority Water Pollution Control Loan Fund Revenue | 5.000% | 12/1/17 | 1,000 | 1,190 |
| Olentangy OH Local School District GO | 5.000% | 6/1/16 (Prere.) | 1,235 | 1,444 |
| Olentangy OH Local School District School Facilities Construction & Improvement GO | 5.500% | 6/1/14 (Prere.) | 1,300 | 1,460 |
40
Limited-Term Tax-Exempt Fund
| | | | |
| | | | Face | Market |
| | | Maturity | Amount | Value• |
| | Coupon | Date | ($000) | ($000) |
| Scioto County OH Hospital Facilities Revenue (Southern Ohio Medical Center) | 5.000% | 2/15/12 | 2,625 | 2,650 |
| Scioto County OH Hospital Facilities Revenue (Southern Ohio Medical Center) | 5.000% | 2/15/13 | 2,760 | 2,861 |
| Scioto County OH Hospital Facilities Revenue (Southern Ohio Medical Center) | 5.000% | 2/15/14 | 2,895 | 3,050 |
| University of Toledo Ohio General Receipts Revenue | 5.000% | 6/1/14 | 6,145 | 6,700 |
| University of Toledo Ohio General Receipts Revenue | 5.000% | 6/1/15 | 1,435 | 1,588 |
| University of Toledo Ohio General Receipts Revenue | 5.000% | 6/1/16 | 3,430 | 3,844 |
| University of Toledo Ohio General Receipts Revenue | 5.000% | 6/1/17 | 1,855 | 2,090 |
| | | | | 625,574 |
| Oklahoma (0.4%) | | | | |
| Grand River Dam Authority Oklahoma Revenue | 5.000% | 6/1/12 (4) | 3,500 | 3,595 |
| Oklahoma Capitol Improvement Authority Facilities Revenue | 5.000% | 9/1/15 (14) | 9,035 | 9,964 |
| Oklahoma Development Finance Authority Health System Revenue (Integris Baptist) | 5.000% | 8/15/13 | 2,000 | 2,135 |
| Oklahoma Development Finance Authority Health System Revenue (Integris Baptist) | 5.000% | 8/15/14 | 4,900 | 5,360 |
| Oklahoma Development Finance Authority Health System Revenue (Integris Baptist) | 5.000% | 8/15/15 | 4,670 | 5,203 |
| Oklahoma Development Finance Authority Health System Revenue (Integris Baptist) VRDO | 0.150% | 11/1/11 (12) | 4,310 | 4,310 |
| Oklahoma Development Finance Authority Health System Revenue (Integris Baptist) VRDO | 0.140% | 11/7/11 (12) | 16,465 | 16,465 |
| Oklahoma Development Finance Authority Pollution Control Revenue (Public Service Co. Project) | 5.250% | 6/1/14 | 3,300 | 3,520 |
| 2 Oklahoma Municipal Power Authority Power Supply System Revenue PUT | 0.890% | 8/1/13 | 6,380 | 6,321 |
| Oklahoma Water Resource Board Revenue | 5.000% | 4/1/15 | 8,640 | 9,480 |
| | | | | 66,353 |
| Oregon (0.4%) | | | | |
| Oregon Department of Administrative Services COP | 5.250% | 11/1/11 (14) | 12,090 | 12,090 |
| Oregon Department of Administrative Services COP | 5.000% | 5/1/14 | 3,750 | 4,128 |
| Oregon Department of Administrative Services COP | 5.000% | 5/1/15 | 4,160 | 4,694 |
| Oregon Department of Administrative Services COP | 5.000% | 5/1/16 | 3,105 | 3,570 |
| Oregon Department of Administrative Services Lottery Revenue | 5.000% | 4/1/16 | 2,185 | 2,526 |
| 3 Oregon Department of Administrative Services Lottery Revenue TOB VRDO | 0.140% | 11/7/11 | 5,000 | 5,000 |
| Oregon Department of Transportation Highway Usertax Revenue | 5.000% | 11/15/14 | 5,880 | 6,630 |
| Oregon Facilities Authority Revenue (Legacy Health Project) | 5.000% | 5/1/16 | 2,600 | 2,863 |
| Oregon Facilities Authority Revenue (Legacy Health Project) | 5.000% | 5/1/17 | 3,090 | 3,415 |
| Oregon Facilities Authority Revenue (Legacy Health Project) | 5.000% | 5/1/18 | 3,500 | 3,871 |
| Oregon Facilities Authority Revenue (PeaceHealth) | 5.000% | 11/1/14 | 1,000 | 1,105 |
| Oregon Facilities Authority Revenue (PeaceHealth) | 5.000% | 3/15/15 | 1,500 | 1,629 |
| Oregon Facilities Authority Revenue (PeaceHealth) | 5.000% | 11/1/15 | 1,000 | 1,136 |
| Oregon Facilities Authority Revenue (PeaceHealth) | 5.000% | 3/15/16 | 1,700 | 1,868 |
| Oregon Facilities Authority Revenue (PeaceHealth) | 5.000% | 11/1/16 | 2,000 | 2,286 |
| Tri-County Metropolitan Transportation District Oregon (Payroll Tax & Grant Project) | 5.000% | 5/1/12 (14) | 5,000 | 5,113 |
| Tri-County Metropolitan Transportation District Oregon (Payroll Tax & Grant Project) | 5.000% | 10/1/18 | 3,000 | 3,488 |
| | | | | 65,412 |
| Pennsylvania (7.5%) | | | | |
| Allegheny County PA GO | 5.000% | 11/1/13 | 3,560 | 3,806 |
| Allegheny County PA GO | 5.000% | 11/1/14 | 2,895 | 3,164 |
| Allegheny County PA Hospital Development Authority Revenue | | | | |
| (University of Pittsburgh Medical Center) | 5.000% | 9/1/14 | 36,120 | 39,832 |
| Allegheny County PA Hospital Development Authority Revenue | | | | |
| (University of Pittsburgh Medical Center) | 5.000% | 5/15/16 | 17,175 | 19,397 |
| Allegheny County PA Hospital Development Authority Revenue | | | | |
| (University of Pittsburgh Medical Center) | 5.000% | 5/15/17 | 22,750 | 25,790 |
| 2 Allegheny County PA Hospital Development Authority Revenue | | | | |
| (University of Pittsburgh Medical Center) PUT | 1.190% | 8/1/13 | 10,000 | 10,002 |
| 3 Allegheny County PA Hospital Development Authority Revenue | | | | |
| (University of Pittsburgh Medical Center) TOB VRDO | 0.140% | 11/7/11 | 20,700 | 20,700 |
| Allegheny County PA Port Authority Revenue | 5.000% | 3/1/17 | 2,350 | 2,667 |
| Allegheny County PA Sanitation Authority Sewer Revenue | 5.000% | 6/1/18 (4) | 3,000 | 3,404 |
| Allegheny County PA Sanitation Authority Sewer Revenue | 5.000% | 12/1/18 (4) | 3,685 | 4,198 |
| Central Bucks PA School District GO | 5.500% | 5/15/12 (Prere.) | 5,540 | 5,697 |
| Chester County PA GO | 5.000% | 5/15/15 (Prere.) | 13,355 | 15,272 |
| Cumberland County PA Municipal Authority Revenue (Diakon Lutheran Social Ministries Project) | 5.000% | 1/1/14 | 1,320 | 1,377 |
| Cumberland County PA Municipal Authority Revenue (Diakon Lutheran Social Ministries Project) | 5.000% | 1/1/16 | 2,700 | 2,844 |
| Delaware County PA Authority Hospital Revenue (Crozer-Keystone Obligated Group) | 5.000% | 12/15/12 | 2,970 | 3,047 |
| Delaware County PA Authority Hospital Revenue (Crozer-Keystone Obligated Group) | 5.000% | 12/15/14 | 3,280 | 3,432 |
| Delaware County PA Authority Hospital Revenue (Crozer-Keystone Obligated Group) | 5.000% | 12/15/14 | 1,165 | 1,219 |
| Delaware County PA Authority Hospital Revenue (Crozer-Keystone Obligated Group) | 5.000% | 12/15/15 | 3,440 | 3,608 |
| Delaware County PA Authority Hospital Revenue (Crozer-Keystone Obligated Group) | 5.000% | 12/15/15 | 1,140 | 1,196 |
| Delaware County PA Authority Hospital Revenue (Crozer-Keystone Obligated Group) | 5.000% | 12/15/16 | 3,510 | 3,659 |
| Delaware County PA Authority Hospital Revenue (Crozer-Keystone Obligated Group) | 5.000% | 12/15/16 | 1,175 | 1,225 |
| Delaware County PA Industrial Development Authority Pollution Control Revenue | | | | |
| (PECO Energy Co. Project) | 4.000% | 12/1/12 | 17,000 | 17,532 |
| Delaware County PA Industrial Development Authority Resource Recovery Facility Revenue | | | | |
| (General Electric Capital Corp.) VRDO | 0.110% | 11/7/11 | 1,200 | 1,200 |
41
Limited-Term Tax-Exempt Fund
| | | | |
| | | | Face | Market |
| | | Maturity | Amount | Value• |
| | Coupon | Date | ($000) | ($000) |
| Geisinger Health System Authority of Pennsylvania Revenue | | | | |
| (Penn State Geisinger Health System) VRDO | 0.100% | 11/1/11 | 18,255 | 18,255 |
| 3 Geisinger Health System Authority of Pennsylvania Revenue TOB VRDO | 0.140% | 11/7/11 | 7,800 | 7,800 |
| Lancaster County PA Hospital Authority Revenue (Lancaster General Hospital) | 5.750% | 9/15/13 (Prere.) | 4,560 | 4,983 |
| Montgomery County PA Higher Education & Health Authority Hospital Revenue | | | | |
| (Abington Memorial Hospital) | 5.000% | 6/1/15 | 4,120 | 4,458 |
| Montgomery County PA Higher Education & Health Authority Hospital Revenue | | | | |
| (Abington Memorial Hospital) | 5.000% | 6/1/16 | 10,510 | 11,379 |
| 3 Montgomery County PA Higher Education & Health Authority Hospital Revenue | | | | |
| (Abington Memorial Hospital) TOB VRDO | 0.140% | 11/7/11 LOC | 11,010 | 11,010 |
| Montgomery County PA Industrial Development Authority Retirement Community Revenue | | | | |
| (ACTS Retirement- Life Communities Obligated Group) | 5.000% | 11/15/11 | 2,500 | 2,502 |
| Montgomery County PA Industrial Development Authority Retirement Community Revenue | | | | |
| (ACTS Retirement- Life Communities Obligated Group) | 5.000% | 11/15/13 | 1,500 | 1,559 |
| Montgomery County PA Industrial Development Authority Retirement Community Revenue | | | | |
| (ACTS Retirement- Life Communities Obligated Group) | 5.000% | 11/15/13 | 5,675 | 5,898 |
| Montgomery County PA Industrial Development Authority Retirement Community Revenue | | | | |
| (ACTS Retirement- Life Communities Obligated Group) | 5.000% | 11/15/14 | 1,570 | 1,647 |
| Montgomery County PA Industrial Development Authority Retirement Community Revenue | | | | |
| (ACTS Retirement- Life Communities Obligated Group) | 5.250% | 11/15/15 | 1,120 | 1,192 |
| Mount Lebanon PA School District GO | 5.000% | 2/15/13 (Prere.) | 5,000 | 5,297 |
| North Hills PA School District GO | 5.250% | 12/15/15 (Prere.) | 5,030 | 5,873 |
| Northampton County PA General Purpose Authority University Revenue | | | | |
| (Lafayette College) VRDO | 0.130% | 11/7/11 | 18,100 | 18,100 |
| Pennsylvania Convention Center Authority Revenue | 6.700% | 9/1/16 (ETM) | 17,195 | 19,872 |
| Pennsylvania Economic Development Financing Authority Exempt Facilities Revenue | | | | |
| (PPL Energy Supply LLC Project) PUT | 3.000% | 9/1/15 | 8,250 | 8,363 |
| Pennsylvania Economic Development Financing Authority Exempt Facilities Revenue | | | | |
| (PPL Energy Supply LLC Project) PUT | 3.000% | 9/1/15 | 5,000 | 5,116 |
| Pennsylvania Economic Development Financing Authority Exempt Facilities Revenue | | | | |
| (PPL Energy Supply LLC Project) PUT | 3.000% | 9/1/15 | 4,250 | 4,336 |
| Pennsylvania Economic Development Financing Authority Exempt Facilities Revenue | | | | |
| (PSEG Power LLC Project) VRDO | 0.150% | 11/7/11 LOC | 16,500 | 16,500 |
| Pennsylvania Economic Development Financing Authority Solid Waste Disposal Revenue | | | | |
| (Waste Management Inc. Project) | 2.750% | 9/1/13 | 5,500 | 5,603 |
| Pennsylvania Economic Development Financing Authority Solid Waste Disposal Revenue | | | | |
| (Waste Management Inc. Project) PUT | 2.625% | 12/3/12 | 11,375 | 11,536 |
| Pennsylvania Economic Development Financing Authority Solid Waste Disposal Revenue | | | | |
| (Waste Management Inc. Project) PUT | 3.700% | 5/1/15 | 7,000 | 7,320 |
| Pennsylvania GO | 5.500% | 2/1/12 | 20,950 | 21,227 |
| Pennsylvania GO | 5.000% | 8/1/12 | 20,705 | 21,443 |
| Pennsylvania GO | 5.500% | 1/1/13 | 10,000 | 10,597 |
| Pennsylvania GO | 5.000% | 2/15/14 | 6,000 | 6,592 |
| Pennsylvania GO | 5.000% | 4/15/14 | 16,300 | 18,013 |
| Pennsylvania GO | 5.000% | 7/1/14 | 27,300 | 30,388 |
| Pennsylvania GO | 4.000% | 7/15/14 | 15,070 | 16,395 |
| Pennsylvania GO | 5.000% | 9/1/14 (4) | 43,500 | 48,703 |
| Pennsylvania GO | 5.000% | 3/1/15 | 20,000 | 22,668 |
| Pennsylvania GO | 5.250% | 7/1/15 | 28,630 | 33,022 |
| Pennsylvania GO | 5.000% | 2/15/16 | 12,105 | 13,999 |
| Pennsylvania GO | 5.000% | 7/1/16 | 5,355 | 6,247 |
| Pennsylvania GO | 5.000% | 7/1/17 | 4,155 | 4,911 |
| Pennsylvania GO | 5.000% | 7/15/17 | 15,005 | 17,748 |
| 3 Pennsylvania GO TOB VRDO | 0.140% | 11/7/11 | 19,320 | 19,320 |
| Pennsylvania Higher Educational Facilities Authority Revenue (Gwynedd Mercy College) VRDO | 0.110% | 11/7/11 LOC | 10,950 | 10,950 |
| Pennsylvania Higher Educational Facilities Authority Revenue (Higher Education System) | 5.000% | 6/15/17 | 4,655 | 5,410 |
| 3 Pennsylvania Higher Educational Facilities Authority Revenue | | | | |
| (Presbyterian Medical Center) TOB VRDO | 0.140% | 11/7/11 | 7,200 | 7,200 |
| Pennsylvania Higher Educational Facilities Authority Revenue (St. Joseph’s University) VRDO | 0.130% | 11/7/11 LOC | 5,300 | 5,300 |
| 3 Pennsylvania Higher Educational Facilities Authority Revenue | | | | |
| (Trustees of the University of Pennsylvania) TOB VRDO | 0.140% | 11/7/11 | 4,740 | 4,740 |
| Pennsylvania Higher Educational Facilities Authority Revenue | | | | |
| (University of Pennsylvania Health System) | 5.000% | 8/15/14 (2) | 9,610 | 10,562 |
| Pennsylvania Higher Educational Facilities Authority Revenue | | | | |
| (University of Pittsburgh Medical Center) | 5.000% | 5/15/16 | 3,735 | 4,227 |
| Pennsylvania Higher Educational Facilities Authority Revenue | | | | |
| (University of Pittsburgh Medical Center) | 5.000% | 5/15/17 | 9,740 | 11,123 |
| Pennsylvania Housing Finance Agency Rental Housing Revenue (Section 8 Assisted) VRDO | 0.180% | 11/7/11 | 10,305 | 10,305 |
| Pennsylvania Industrial Development Authority Economic Development Revenue | 5.000% | 7/1/13 | 5,630 | 5,997 |
| Pennsylvania Industrial Development Authority Economic Development Revenue | 5.500% | 7/1/16 (2) | 14,290 | 14,835 |
| Pennsylvania Intergovernmental Cooperation Authority Special Tax Revenue | | | | |
| (Philadelphia Funding Program) | 5.000% | 6/15/16 | 3,000 | 3,471 |
42
Limited-Term Tax-Exempt Fund
| | | | |
| | | | Face | Market |
| | | Maturity | Amount | Value• |
| | Coupon | Date | ($000) | ($000) |
| Pennsylvania State University Revenue VRDO | 0.110% | 11/7/11 | 6,400 | 6,400 |
| Pennsylvania Turnpike Commission Registration Fee Revenue VRDO | 0.140% | 11/7/11 (4) | 11,000 | 11,000 |
| Pennsylvania Turnpike Commission Revenue | 5.000% | 6/1/15 (12) | 1,055 | 1,184 |
| Pennsylvania Turnpike Commission Revenue | 5.000% | 6/1/15 | 5,500 | 6,061 |
| Pennsylvania Turnpike Commission Revenue | 5.000% | 6/1/16 (12) | 5,170 | 5,871 |
| Pennsylvania Turnpike Commission Revenue | 5.000% | 6/1/16 | 6,680 | 7,452 |
| Pennsylvania Turnpike Commission Revenue | 5.000% | 12/1/17 | 3,515 | 3,949 |
| Pennsylvania Turnpike Commission Revenue | 5.000% | 12/1/18 | 3,240 | 3,645 |
| Pennsylvania Turnpike Commission Revenue VRDO | 0.130% | 11/7/11 (4) | 10,000 | 10,000 |
| Pennsylvania Turnpike Commission Revenue VRDO | 0.130% | 11/7/11 | 24,908 | 24,908 |
| Pennsylvania Turnpike Commission Revenue VRDO | 0.140% | 11/7/11 | 9,693 | 9,693 |
| Philadelphia PA Airport Parking Authority Revenue | 5.000% | 9/1/14 | 2,355 | 2,567 |
| Philadelphia PA Airport Parking Authority Revenue | 5.000% | 9/1/15 | 4,570 | 5,072 |
| Philadelphia PA Gas Works Revenue | 5.000% | 8/1/13 | 3,260 | 3,453 |
| Philadelphia PA Gas Works Revenue VRDO | 0.150% | 11/7/11 LOC | 12,500 | 12,500 |
| Philadelphia PA GO | 5.000% | 8/1/13 (4) | 19,000 | 20,156 |
| Philadelphia PA GO | 5.125% | 8/1/13 (11) | 6,050 | 6,413 |
| Philadelphia PA GO | 5.000% | 8/1/14 (4) | 20,385 | 22,149 |
| Philadelphia PA Hospitals & Higher Education Facilities Authority Hospital Revenue | | | | |
| (Children’s Hospital of Philadelphia Project) VRDO | 0.130% | 11/1/11 | 12,745 | 12,745 |
| Philadelphia PA Hospitals & Higher Education Facilities Authority Hospital Revenue | | | | |
| (Children’s Hospital of Philadelphia Project) VRDO | 0.130% | 11/1/11 | 17,100 | 17,100 |
| Philadelphia PA School District GO | 5.500% | 2/1/12 (Prere.) | 6,200 | 6,282 |
| Philadelphia PA School District GO | 5.625% | 8/1/12 (Prere.) | 10,235 | 10,646 |
| Philadelphia PA Water & Waste Water Revenue | 5.250% | 12/15/14 (2) | 7,100 | 7,968 |
| Philadelphia PA Water & Waste Water Revenue | 5.000% | 8/1/15 (2) | 1,500 | 1,686 |
| Philadelphia PA Water & Waste Water Revenue | 5.000% | 6/15/16 | 20,000 | 22,493 |
| 3 Philadelphia PA Water & Waste Water Revenue TOB VRDO | 0.140% | 11/7/11 (4) | 3,340 | 3,340 |
| Pittsburgh PA GO | 5.500% | 3/1/12 (Prere.) | 5,330 | 5,424 |
| Sayre PA Health Care Facilities Authority Revenue (Guthrie Health Care System) | 5.875% | 12/1/11 (Prere.) | 9,660 | 9,802 |
| Sayre PA Health Care Facilities Authority Revenue (Guthrie Health Care System) | 6.250% | 12/1/11 (Prere.) | 4,915 | 4,989 |
| Southcentral Pennsylvania General Authority Revenue (WellSpan Health Obligated Group) | 5.250% | 6/1/13 | 6,265 | 6,666 |
| Southcentral Pennsylvania General Authority Revenue (WellSpan Health Obligated Group) | 5.250% | 6/1/14 | 5,470 | 5,982 |
| Southcentral Pennsylvania General Authority Revenue (WellSpan Health Obligated Group) | 5.500% | 6/1/15 | 5,000 | 5,636 |
| St. Mary’s Hospital Authority Bucks County PA Revenue (Catholic Health Initiatives) VRDO | 0.250% | 11/7/11 | 10,000 | 10,000 |
| State Public School Building Authority Pennsylvania School Revenue | | | | |
| (Daniel Boone School District Project) | 5.000% | 4/1/13 (Prere.) | 10,000 | 10,630 |
| State Public School Building Authority Pennsylvania School Revenue | | | | |
| (Philadelphia School District Project) | 5.000% | 6/1/13 (Prere.) | 30,800 | 33,035 |
| Westmoreland County PA Industrial Development Authority Revenue (Excela Health Project) | 4.000% | 7/1/15 | 1,440 | 1,500 |
| Westmoreland County PA Industrial Development Authority Revenue (Excela Health Project) | 5.000% | 7/1/16 | 2,010 | 2,178 |
| | | | | 1,098,835 |
| Puerto Rico (0.4%) | | | | |
| Puerto Rico Electric Power Authority Revenue | 5.000% | 7/1/12 | 4,510 | 4,628 |
| Puerto Rico Electric Power Authority Revenue | 5.250% | 7/1/13 | 4,000 | 4,239 |
| Puerto Rico GO PUT | 5.000% | 7/1/12 | 16,000 | 16,356 |
| Puerto Rico Infrastructure Financing Authority Special Tax Revenue | 5.500% | 7/1/12 (2) | 3,000 | 3,067 |
| Puerto Rico Public Finance Corp. Revenue PUT | 5.750% | 2/1/12 LOC | 23,265 | 23,504 |
| | | | | 51,794 |
| Rhode Island (0.0%) | | | | |
| Rhode Island & Providence Plantations GO | 5.000% | 11/15/16 (14) | 2,000 | 2,324 |
| |
| South Carolina (1.4%) | | | | |
| Charleston County SC GO | 5.000% | 11/1/17 | 1,045 | 1,254 |
| Charleston County SC GO | 5.000% | 11/1/17 | 6,485 | 7,781 |
| Charleston County SC GO | 5.000% | 11/1/18 | 7,085 | 8,600 |
| 3 Charleston SC Educational Excellence Financing Corp. Revenue | | | | |
| (Charleston County School District, South Carolina Project) TOB VRDO | 0.140% | 11/7/11 | 24,750 | 24,750 |
| Charleston SC Waterworks & Sewer Capital Improvement Revenue VRDO | 0.150% | 11/7/11 | 2,000 | 2,000 |
| Greenville County SC Hospital Revenue (Greenville Hospital System) | 5.000% | 5/1/13 | 8,575 | 9,065 |
| Greenville County SC Hospital Revenue (Greenville Hospital System) | 5.000% | 5/1/14 | 9,355 | 10,153 |
| Greenville County SC Hospital Revenue (Greenville Hospital System) | 5.000% | 5/1/15 | 7,380 | 8,172 |
| Greenville County SC School District GO | 5.500% | 12/1/16 | 13,450 | 15,825 |
| 3 Greenville County SC School District Installment Revenue TOB VRDO | 0.130% | 11/7/11 | 7,440 | 7,440 |
| 3 Greenwood SC Metropolitan Sewer System Revenue TOB VRDO | 0.240% | 11/7/11 (4) | 5,625 | 5,625 |
| Lexington County SC Health Services District Inc. Hospital Revenue | 5.000% | 11/1/17 | 2,660 | 2,968 |
| Lexington County SC Health Services District Inc. Hospital Revenue | 5.000% | 11/1/18 | 1,345 | 1,502 |
| Oconee County SC Pollution Control Facilities Revenue (Duke Energy Carolinas Project) | 3.600% | 2/1/17 | 15,000 | 15,935 |
| Piedmont SC Municipal Power Agency Revenue | 5.000% | 1/1/16 | 8,100 | 9,118 |
| Piedmont SC Municipal Power Agency Revenue | 5.000% | 1/1/17 | 7,225 | 8,177 |
43
Limited-Term Tax-Exempt Fund
| | | | |
| | | | Face | Market |
| | | Maturity | Amount | Value• |
| | Coupon | Date | ($000) | ($000) |
| South Carolina Jobs Economic Development Authority Hospital Revenue | | | | |
| (AnMed Health Project) | 5.000% | 2/1/16 | 2,000 | 2,222 |
| South Carolina Jobs Economic Development Authority Hospital Revenue | | | | |
| (AnMed Health Project) | 5.000% | 2/1/17 | 2,320 | 2,596 |
| South Carolina Ports Authority Revenue | 5.000% | 7/1/17 | 1,535 | 1,731 |
| South Carolina Public Service Authority Revenue | 5.000% | 1/1/16 | 5,000 | 5,752 |
| South Carolina Public Service Authority Revenue | 5.000% | 1/1/17 | 2,000 | 2,336 |
| South Carolina Public Service Authority Revenue | 5.000% | 12/1/17 | 6,035 | 7,095 |
| South Carolina Transportation Infrastructure Revenue | 5.250% | 10/1/15 (2) | 4,295 | 4,883 |
| South Carolina Transportation Infrastructure Revenue | 5.000% | 10/1/16 | 17,940 | 20,534 |
| Spartanburg County SC Regional Health Services District Revenue VRDO | 0.250% | 11/7/11 (12) | 20,200 | 20,200 |
| Tobacco Settlement Revenue (Authority of South Carolina Tobacco Settlement) | 5.000% | 6/1/18 | 1,735 | 1,737 |
| | | | | 207,451 |
| South Dakota (0.0%) | | | | |
| South Dakota Building Authority Revenue | 5.000% | 12/1/11 (2) | 1,000 | 1,004 |
| South Dakota Building Authority Revenue | 5.000% | 12/1/12 (2) | 3,005 | 3,154 |
| | | | | 4,158 |
| Tennessee (2.1%) | | | | |
| Clarksville TN Public Building Authority Revenue (Pooled Financing) VRDO | 0.250% | 11/1/11 LOC | 3,000 | 3,000 |
| Jackson TN Hospital Improvement Revenue (Jackson-Madison County General Hospital Project) | 5.250% | 4/1/14 | 1,500 | 1,609 |
| Jackson TN Hospital Improvement Revenue (Jackson-Madison County General Hospital Project) | 5.250% | 4/1/15 | 1,390 | 1,515 |
| Memphis TN Electric System Revenue | 5.000% | 12/1/11 (14) | 17,000 | 17,067 |
| Memphis TN Electric System Revenue | 5.000% | 12/1/16 | 44,095 | 51,470 |
| Memphis TN Electric System Revenue | 5.000% | 12/1/17 | 12,500 | 14,735 |
| Memphis TN GO | 5.000% | 10/1/17 | 2,500 | 2,950 |
| Metropolitan Government of Nashville & Davidson County TN Electric Revenue | 5.500% | 5/15/14 (13) | 6,345 | 7,105 |
| Metropolitan Government of Nashville & Davidson County TN Electric Revenue | 5.500% | 5/15/16 (13) | 5,675 | 6,715 |
| Metropolitan Government of Nashville & Davidson County TN GO | 5.000% | 7/1/17 | 10,000 | 11,808 |
| Metropolitan Government of Nashville & Davidson County TN Health & | | | | |
| Educational Facilities Board Revenue (Vanderbilt University) | 5.000% | 10/1/14 | 15,000 | 16,824 |
| Murfreesboro TN GO | 5.000% | 6/1/14 | 3,900 | 4,325 |
| Shelby County TN GO | 5.000% | 4/1/13 (ETM) | 800 | 852 |
| Shelby County TN GO | 5.000% | 4/1/13 | 3,200 | 3,408 |
| Shelby County TN GO | 5.000% | 4/1/14 (ETM) | 200 | 221 |
| Shelby County TN GO | 5.000% | 4/1/14 | 800 | 883 |
| Shelby County TN Health Educational & Housing Facility Board Revenue | | | | |
| (Baptist Memorial Health Care) | 5.000% | 9/1/16 | 6,925 | 7,828 |
| Shelby County TN Health Educational & Housing Facility Board Revenue | | | | |
| (Methodist Le Bonheur Healthcare) | 5.000% | 6/1/13 | 4,500 | 4,750 |
| Shelby County TN Health Educational & Housing Facility Board Revenue | | | | |
| (Methodist Le Bonheur Healthcare) VRDO | 0.140% | 11/7/11 (12) | 56,000 | 56,000 |
| Shelby County TN Health Educational & Housing Facility Board Revenue | | | | |
| (St. Jude Children’s Research Hospital) | 5.000% | 7/1/12 | 2,300 | 2,371 |
| Shelby County TN Health Educational & Housing Facility Board Revenue | | | | |
| (St. Jude Children’s Research Hospital) | 5.000% | 7/1/13 | 3,600 | 3,862 |
| Shelby County TN Health Educational & Housing Facility Board Revenue | | | | |
| (St. Jude Children’s Research Hospital) | 5.000% | 7/1/14 | 4,805 | 5,318 |
| Shelby County TN Health Educational & Housing Facility Board Revenue | | | | |
| (St. Jude Children’s Research Hospital) | 5.000% | 7/1/15 | 5,390 | 6,106 |
| Shelby County TN Health Educational & Housing Facility Board Revenue | | | | |
| (St. Jude Children’s Research Hospital) | 5.000% | 7/1/16 | 2,500 | 2,883 |
| Tennessee Energy Acquisition Corp. Gas Revenue | 5.000% | 9/1/12 | 10,000 | 10,347 |
| Tennessee Energy Acquisition Corp. Gas Revenue | 5.000% | 9/1/13 | 28,000 | 29,206 |
| Tennessee Energy Acquisition Corp. Gas Revenue | 5.000% | 9/1/16 | 9,000 | 9,350 |
| Tennessee GO | 5.000% | 5/1/14 | 2,825 | 3,126 |
| Tennessee GO | 5.000% | 5/1/16 | 3,200 | 3,724 |
| Tennessee GO | 5.000% | 8/1/18 | 5,185 | 6,265 |
| Tennessee GO | 5.000% | 10/1/18 | 3,730 | 4,517 |
| | | | | 300,140 |
| Texas (8.3%) | | | | |
| 1 Austin TX GO | 4.250% | 9/1/16 | 2,480 | 2,816 |
| 1 Austin TX GO | 5.000% | 9/1/17 | 3,250 | 3,852 |
| Board of Regents of the University of Texas System Revenue Financing System Revenue CP | 5.250% | 8/15/14 | 2,855 | 3,213 |
| Central Texas Regional Mobility Authority Revenue | 5.750% | 1/1/17 | 570 | 613 |
| Central Texas Regional Mobility Authority Revenue | 5.750% | 1/1/18 | 1,450 | 1,562 |
| Dallas TX GO | 5.000% | 2/15/12 | 26,935 | 27,306 |
| Dallas TX GO | 5.000% | 2/15/16 | 4,000 | 4,620 |
| Dallas TX GO | 5.000% | 2/15/17 | 8,880 | 10,409 |
| Dallas TX Waterworks & Sewer System Revenue | 5.000% | 10/1/17 | 3,105 | 3,686 |
| Dallas-Fort Worth TX International Airport Revenue | 5.000% | 11/1/14 | 3,000 | 3,334 |
| Dallas-Fort Worth TX International Airport Revenue | 5.000% | 11/1/16 | 4,000 | 4,609 |
44
Limited-Term Tax-Exempt Fund
| | | | |
| | | | Face | Market |
| | | Maturity | Amount | Value• |
| | Coupon | Date | ($000) | ($000) |
| Denton TX Independent School District GO VRDO | 0.150% | 11/7/11 | 5,600 | 5,600 |
| Eagle Mountain & Saginaw TX Independent School District PUT | 2.500% | 8/1/14 | 11,140 | 11,577 |
| El Paso TX Water & Sewer Revenue | 5.000% | 3/1/14 (4) | 2,175 | 2,388 |
| El Paso TX Water & Sewer Revenue | 5.000% | 3/1/15 (4) | 1,500 | 1,692 |
| Fort Worth TX GO | 5.000% | 3/1/18 | 4,375 | 5,178 |
| Fort Worth TX Water & Sewer Revenue | 5.000% | 2/15/18 | 4,100 | 4,849 |
| Frisco TX GO | 5.000% | 2/15/17 | 3,000 | 3,512 |
| Frisco TX GO | 5.000% | 2/15/18 | 3,325 | 3,933 |
| Frisco TX Independent School District GO | 5.000% | 8/15/17 | 2,350 | 2,786 |
| Garland TX GO | 5.250% | 2/15/12 (4) | 2,500 | 2,536 |
| Garland TX Independent School District GO | 5.000% | 2/15/12 | 4,210 | 4,269 |
| Grapevine-Colleyville TX Independent School District School Building GO PUT | 4.000% | 8/1/12 | 25,980 | 26,632 |
| Gulf Coast TX Waste Disposal Authority Environmental Facilities Revenue | | | | |
| (BP Products North America Project) PUT | 2.300% | 9/3/13 | 9,000 | 9,148 |
| 3 Harris County TX Cultural Education Facilities Finance Corp. Hospital Revenue | | | | |
| (Children’s Hospital Project) TOB VRDO | 0.140% | 11/7/11 | 8,195 | 8,195 |
| Harris County TX Cultural Education Facilities Finance Corp. Revenue | | | | |
| (Methodist Hospital System) | 5.250% | 12/1/13 | 15,000 | 16,402 |
| Harris County TX Cultural Education Facilities Finance Corp. Revenue | | | | |
| (Methodist Hospital System) | 5.250% | 12/1/14 | 11,000 | 12,343 |
| Harris County TX Cultural Education Facilities Finance Corp. Revenue | | | | |
| (Methodist Hospital System) | 5.250% | 12/1/15 | 6,530 | 7,430 |
| Harris County TX Cultural Education Facilities Finance Corp. Special Facilities Revenue | | | | |
| (Texas Medical Center) VRDO | 0.140% | 11/1/11 LOC | 450 | 450 |
| Harris County TX Cultural Education Facilities Finance Corp. Thermal Utility Revenue | | | | |
| (TECO Project) | 5.000% | 11/15/13 | 500 | 545 |
| Harris County TX Cultural Education Facilities Finance Corp. Thermal Utility Revenue | | | | |
| (TECO Project) | 5.000% | 11/15/16 | 1,000 | 1,167 |
| Harris County TX Flood Control District GO | 5.250% | 10/1/14 (Prere.) | 8,360 | 9,420 |
| Harris County TX GO | 6.000% | 8/1/13 (14) | 21,795 | 23,877 |
| Harris County TX GO | 5.000% | 10/1/15 | 2,000 | 2,303 |
| Harris County TX GO | 5.000% | 10/1/16 | 4,500 | 5,276 |
| Harris County TX GO | 5.000% | 10/1/17 | 6,775 | 8,042 |
| Harris County TX GO | 5.000% | 10/1/18 | 4,805 | 5,754 |
| 3 Harris County TX GO TOB VRDO | 0.140% | 11/7/11 | 8,155 | 8,155 |
| Harris County TX Toll Road Revenue | 5.000% | 8/15/16 | 5,000 | 5,766 |
| Harris County TX Toll Road Revenue PUT | 5.000% | 8/15/12 (4) | 24,250 | 25,104 |
| Houston TX Airport System Revenue | 5.000% | 7/1/16 | 1,000 | 1,133 |
| Houston TX Airport System Revenue | 5.000% | 7/1/16 | 1,000 | 1,139 |
| Houston TX Airport System Revenue | 5.000% | 7/1/17 | 1,500 | 1,710 |
| Houston TX Airport System Revenue | 5.000% | 7/1/18 | 1,720 | 1,972 |
| 3 Houston TX Airport System Revenue TOB VRDO | 0.140% | 11/7/11 | 13,360 | 13,360 |
| Houston TX Community College GO | 5.000% | 2/15/18 | 2,500 | 2,957 |
| Houston TX Community College GO | 5.000% | 2/15/19 | 2,860 | 3,399 |
| 3 Houston TX Community College GO TOB VRDO | 0.170% | 11/7/11 (4) | 4,095 | 4,095 |
| Houston TX GO | 5.500% | 3/1/16 | 6,905 | 8,113 |
| Houston TX Independent School District GO | 0.000% | 2/15/12 | 5,535 | 5,530 |
| Houston TX Independent School District GO | 5.000% | 2/15/13 | 9,000 | 9,534 |
| 2 Houston TX Independent School District GO PUT | 0.570% | 3/27/12 | 15,000 | 15,004 |
| Houston TX Utility System Revenue | 5.250% | 11/15/11 (4) | 4,425 | 4,434 |
| Houston TX Utility System Revenue | 5.000% | 11/15/12 (4) | 4,270 | 4,471 |
| Houston TX Utility System Revenue | 5.000% | 11/15/14 | 5,385 | 6,053 |
| Houston TX Utility System Revenue | 5.000% | 11/15/15 | 5,000 | 5,759 |
| Houston TX Utility System Revenue | 5.250% | 5/15/16 (14) | 10,000 | 11,022 |
| Houston TX Utility System Revenue | 5.000% | 11/15/16 | 1,855 | 2,171 |
| Houston TX Utility System Revenue | 5.000% | 11/15/17 | 13,500 | 15,912 |
| Houston TX Utility System Revenue | 5.250% | 11/15/17 (4) | 13,600 | 16,283 |
| Houston TX Utility System Revenue | 5.000% | 11/15/18 | 2,500 | 2,962 |
| Lewisville TX Independent School District GO | 5.000% | 8/15/13 | 8,225 | 8,895 |
| Lower Colorado River Authority Texas Revenue | 5.000% | 5/15/14 | 9,000 | 9,902 |
| Lower Colorado River Authority Texas Revenue | 5.000% | 5/15/16 | 1,300 | 1,493 |
| Lower Colorado River Authority Texas Revenue | 5.000% | 5/15/17 | 1,710 | 1,989 |
| Lower Colorado River Authority Texas Revenue | 5.875% | 5/15/17 (2) | 9,895 | 9,936 |
| Lubbock TX Electric Light & Power System Revenue | 5.000% | 4/15/16 | 2,000 | 2,288 |
| Lubbock TX Health Facilities Development Corp. Revenue (St. Joseph Health System) | 5.000% | 7/1/16 | 2,740 | 3,057 |
| Lubbock TX Health Facilities Development Corp. Revenue (St. Joseph Health System) | 5.000% | 7/1/17 | 3,310 | 3,705 |
| Lubbock TX Health Facilities Development Corp. Revenue (St. Joseph Health System) | 5.000% | 7/1/18 | 1,765 | 1,964 |
| Mission TX Economic Development Corp. Solid Waste Disposal Revenue | | | | |
| (Waste Management Inc. Project) PUT | 3.750% | 5/1/15 | 8,500 | 8,926 |
| North Texas Tollway Authority System Revenue | 5.000% | 1/1/12 | 5,580 | 5,621 |
| North Texas Tollway Authority System Revenue | 4.000% | 9/1/16 | 1,000 | 1,101 |
| North Texas Tollway Authority System Revenue | 4.000% | 9/1/17 | 1,725 | 1,906 |
45
Limited-Term Tax-Exempt Fund
| | | | | |
| | | | | Face | Market |
| | | | Maturity | Amount | Value• |
| | | Coupon | Date | ($000) | ($000) |
| | North Texas Tollway Authority System Revenue | 5.000% | 9/1/17 | 1,480 | 1,716 |
| | North Texas Tollway Authority System Revenue (Dallas North Tollway) | 5.000% | 1/1/15 (Prere.) | 10,000 | 11,237 |
| | North Texas Tollway Authority System Revenue PUT | 5.250% | 1/1/12 | 71,215 | 71,782 |
| | North Texas Tollway Authority System Revenue PUT | 5.000% | 1/1/13 | 31,190 | 32,663 |
| | Northside TX Independent School District GO PUT | 0.950% | 8/1/13 | 10,000 | 10,065 |
| | Northside TX Independent School District GO PUT | 1.350% | 6/1/14 | 14,800 | 14,956 |
| | Northside TX Independent School District GO PUT | 1.900% | 8/1/14 | 15,500 | 15,907 |
| | SA Energy Acquisition Public Facility Corp. Texas Gas Supply Revenue | 5.250% | 8/1/13 | 24,325 | 25,736 |
| | SA Energy Acquisition Public Facility Corp. Texas Gas Supply Revenue | 5.250% | 8/1/14 | 12,360 | 13,218 |
| | SA Energy Acquisition Public Facility Corp. Texas Gas Supply Revenue | 5.250% | 8/1/16 | 7,790 | 8,229 |
| | San Antonio TX Electric & Gas Systems Revenue | 5.375% | 2/1/13 (4) | 12,000 | 12,742 |
| | San Antonio TX Electric & Gas Systems Revenue | 5.000% | 2/1/14 | 10,115 | 11,090 |
| | San Antonio TX Electric & Gas Systems Revenue | 5.500% | 2/1/14 | 6,210 | 6,878 |
| | San Antonio TX Electric & Gas Systems Revenue | 5.375% | 2/1/15 | 7,210 | 8,230 |
| 3 | San Antonio TX Electric & Gas Systems Revenue TOB VRDO | 0.140% | 11/7/11 | 9,020 | 9,020 |
| | San Antonio TX GO | 5.000% | 2/1/17 | 4,135 | 4,857 |
| | San Antonio TX GO | 5.000% | 8/1/17 | 1,070 | 1,266 |
| | San Antonio TX GO | 5.000% | 8/1/18 | 1,000 | 1,194 |
| | San Antonio TX GO PUT | 1.150% | 12/3/12 | 17,900 | 17,964 |
| | Southwest Texas Higher Education Authority Inc. Revenue | | | | |
| | (Southern Methodist University Project) | 5.000% | 10/1/14 | 1,000 | 1,109 |
| | Southwest Texas Higher Education Authority Inc. Revenue | | | | |
| | (Southern Methodist University Project) | 5.000% | 10/1/16 (2) | 2,000 | 2,294 |
| | Spring Branch TX Independent School District GO | 5.000% | 2/1/13 | 3,000 | 3,173 |
| | Spring Branch TX Independent School District GO | 5.000% | 2/1/14 | 3,635 | 3,986 |
| | Tarrant County TX Cultural Education Facilities Finance Corp. Hospital Revenue | | | | |
| | (Scott & White Healthcare Project) | 5.000% | 8/15/15 | 2,905 | 3,186 |
| | Tarrant County TX Cultural Education Facilities Finance Corp. Hospital Revenue | | | | |
| | (Scott & White Healthcare Project) | 5.000% | 8/15/16 | 1,310 | 1,457 |
| | Tarrant County TX Cultural Education Facilities Finance Corp. Hospital Revenue | | | | |
| | (Scott & White Healthcare Project) | 5.000% | 8/15/17 | 2,000 | 2,234 |
| | Tarrant County TX Cultural Education Facilities Finance Corp. Revenue (CHRISTUS Health) | 5.000% | 7/1/15 | 7,730 | 8,349 |
| | Tarrant County TX Cultural Education Facilities Finance Corp. Revenue (CHRISTUS Health) | 5.000% | 7/1/16 | 8,130 | 8,800 |
| | Tarrant County TX Cultural Education Facilities Finance Corp. Revenue (Texas Health Resources) | 5.000% | 2/15/12 | 3,500 | 3,544 |
| | Tarrant County TX Cultural Education Facilities Finance Corp. Revenue (Texas Health Resources) | 5.000% | 2/15/13 | 1,835 | 1,928 |
| | Texas A&M University System Revenue Financing System Revenue | 5.000% | 5/15/13 | 5,000 | 5,350 |
| | Texas GO | 5.000% | 10/1/17 | 7,500 | 8,916 |
| | Texas GO | 5.000% | 10/1/18 | 7,500 | 8,997 |
| 2,3 | Texas GO TOB PUT | 0.200% | 12/13/11 | 25,000 | 25,000 |
| 3 | Texas GO TOB VRDO | 0.140% | 11/7/11 | 35,000 | 35,000 |
| | Texas GO TRAN | 2.500% | 8/30/12 | 60,000 | 61,117 |
| | Texas Municipal Gas Acquisition & Supply Corp. Revenue | 5.000% | 12/15/12 | 5,000 | 5,228 |
| | Texas Municipal Gas Acquisition & Supply Corp. Revenue | 5.000% | 12/15/13 | 1,000 | 1,054 |
| 2 | Texas Municipal Gas Acquisition & Supply Corp. Revenue | 0.610% | 9/15/17 | 8,740 | 8,369 |
| | Texas Municipal Gas Acquisition & Supply Corp. Revenue | 5.625% | 12/15/17 | 43,575 | 45,943 |
| | Texas State University System Revenue | 5.000% | 3/15/12 | 2,380 | 2,421 |
| | Texas State University System Revenue | 5.000% | 3/15/15 | 7,005 | 7,916 |
| | Texas Tech University System Revenue Financing System Revenue | 4.000% | 2/15/13 | 3,000 | 3,138 |
| | Texas Tech University System Revenue Financing System Revenue | 3.000% | 2/15/14 | 5,000 | 5,263 |
| | Texas Tech University System Revenue Financing System Revenue | 5.000% | 2/15/15 | 4,000 | 4,523 |
| | Texas Transportation Commission Central Texas System Revenue PUT | 2.750% | 2/15/13 | 20,000 | 20,262 |
| 3 | Texas Transportation Commission Mobility Fund GO TOB VRDO | 0.140% | 11/7/11 | 20,410 | 20,410 |
| | Texas Transportation Commission Revenue | 5.000% | 4/1/12 | 9,605 | 9,795 |
| | Texas Transportation Commission Revenue | 5.000% | 4/1/13 | 12,000 | 12,775 |
| | Texas Transportation Commission Revenue | 5.000% | 4/1/14 | 27,410 | 30,229 |
| | Texas Transportation Commission Revenue | 5.000% | 4/1/17 | 1,845 | 2,171 |
| 3 | Texas University System Revenue Financing System Revenue TOB VRDO | 0.140% | 11/7/11 | 4,995 | 4,995 |
| | Texas Water Development Board Revenue | 5.000% | 7/15/13 | 5,275 | 5,687 |
| | Texas Water Development Board Revenue | 5.000% | 7/15/13 | 1,375 | 1,483 |
| | Texas Water Development Board Revenue | 5.000% | 7/15/16 | 6,330 | 7,406 |
| | University of Houston Texas Revenue | 4.000% | 2/15/13 | 2,000 | 2,087 |
| | University of Texas Permanent University Fund Revenue | 5.250% | 8/15/16 | 10,090 | 11,842 |
| | University of Texas System Revenue Financing System Revenue | 5.000% | 8/15/14 | 1,325 | 1,482 |
| | University of Texas System Revenue Financing System Revenue | 5.000% | 8/15/14 | 1,775 | 1,985 |
| | University of Texas System Revenue Financing System Revenue | 5.000% | 8/15/17 | 25,135 | 29,797 |
| | Waco TX Education Finance Corp. Revenue (Baylor University) VRDO | 0.130% | 11/7/11 | 15,000 | 15,000 |
| | | | | | 1,212,596 |
| Utah (0.6%) | | | | |
| | Alpine UT School District GO | 5.000% | 3/15/17 | 4,320 | 5,097 |
| | Intermountain Power Agency Utah Power Supply Revenue | 5.000% | 7/1/13 | 7,590 | 8,108 |
| | Intermountain Power Agency Utah Power Supply Revenue | 5.000% | 7/1/14 | 5,000 | 5,492 |
| | Intermountain Power Agency Utah Power Supply Revenue | 5.000% | 7/1/15 | 17,270 | 19,744 |
46
Limited-Term Tax-Exempt Fund
| | | | |
| | | | Face | Market |
| | | Maturity | Amount | Value• |
| | Coupon | Date | ($000) | ($000) |
| Intermountain Power Agency Utah Power Supply Revenue | 5.000% | 7/1/17 | 1,300 | 1,502 |
| Utah Board of Regents Student Loan Revenue | 4.000% | 11/1/16 | 10,000 | 11,154 |
| Utah GO | 5.000% | 7/1/17 | 10,000 | 11,930 |
| Utah GO | 5.000% | 7/1/18 | 15,000 | 18,144 |
| Utah Transit Authority Sales Tax Revenue | 5.000% | 12/15/12 (Prere.) | 4,425 | 4,656 |
| | | | | 85,827 |
| Virgin Islands (0.1%) | | | | |
| Virgin Islands Public Finance Authority Revenue | 5.000% | 10/1/15 | 5,000 | 5,395 |
| Virgin Islands Public Finance Authority Revenue | 5.000% | 10/1/16 | 8,000 | 8,683 |
| | | | | 14,078 |
| Virginia (1.8%) | | | | |
| Arlington County VA Industrial Development Authority Hospital Revenue | | | | |
| (Virginia Hospital Center Arlington Health System) | 5.000% | 7/1/16 | 3,755 | 4,162 |
| Chesapeake VA Economic Development Authority Pollution Control Revenue | | | | |
| (Virginia Electric & Power Co. Project) PUT | 3.600% | 2/1/13 | 5,000 | 5,141 |
| Clarke County VA Industrial Development Authority Hospital Facilities Revenue | | | | |
| (Winchester Medical Center Inc.) VRDO | 0.200% | 11/7/11 (4) | 10,850 | 10,850 |
| Fairfax County VA Economic Development Authority Transportation District | | | | |
| Improvement Revenue (Silver Line Phase I Project) | 5.000% | 4/1/17 | 2,480 | 2,907 |
| Fairfax County VA Economic Development Authority Transportation District | | | | |
| Improvement Revenue (Silver Line Phase I Project) | 5.000% | 4/1/18 | 4,255 | 5,013 |
| Fairfax County VA Water Authority Revenue | 5.000% | 4/1/14 (Prere.) | 21,535 | 23,725 |
| Norfolk VA GO | 5.000% | 3/1/15 | 5,910 | 6,701 |
| Norfolk VA GO | 5.000% | 3/1/16 | 4,000 | 4,638 |
| Russell County VA Industrial Development Authority Hospital Revenue | | | | |
| (STS Health Alliance) VRDO | 0.110% | 11/7/11 LOC | 6,000 | 6,000 |
| Tobacco Settlement Financing Corp. Virginia Revenue | 5.625% | 6/1/15 (Prere.) | 5,000 | 5,800 |
| Virginia Beach VA Public Improvement Revenue | 5.000% | 7/15/15 | 2,825 | 3,246 |
| Virginia Beach VA Public Improvement Revenue | 5.000% | 7/15/16 | 6,905 | 8,100 |
| Virginia College Building Authority Educational Facilities Revenue | | | | |
| (21st Century College & Equipment Programs) | 5.000% | 2/1/14 | 1,350 | 1,480 |
| Virginia College Building Authority Educational Facilities Revenue | | | | |
| (21st Century College & Equipment Programs) | 5.000% | 2/1/16 | 3,090 | 3,567 |
| Virginia College Building Authority Educational Facilities Revenue | | | | |
| (Public Higher Education Financing Program) | 5.000% | 9/1/13 | 5,205 | 5,636 |
| Virginia College Building Authority Educational Facilities Revenue | | | | |
| (Public Higher Education Financing Program) | 5.000% | 9/1/13 | 3,135 | 3,395 |
| Virginia College Building Authority Educational Facilities Revenue | | | | |
| (Public Higher Education Financing Program) | 5.000% | 9/1/14 | 2,000 | 2,238 |
| Virginia College Building Authority Educational Facilities Revenue | | | | |
| (Public Higher Education Financing Program) | 5.000% | 9/1/15 | 2,400 | 2,756 |
| Virginia College Building Authority Educational Facilities Revenue | | | | |
| (Public Higher Education Financing Program) | 5.000% | 9/1/15 | 7,330 | 8,417 |
| Virginia College Building Authority Educational Facilities Revenue | | | | |
| (Public Higher Education Financing Program) | 5.000% | 9/1/16 | 500 | 585 |
| Virginia GO | 5.000% | 6/1/14 | 8,750 | 9,731 |
| Virginia Public Building Authority Public Facilities Revenue | 5.000% | 8/1/15 | 4,115 | 4,709 |
| Virginia Public Building Authority Public Facilities Revenue | 5.000% | 8/1/17 | 12,550 | 14,848 |
| Virginia Public Building Authority Revenue | 5.000% | 8/1/13 | 5,000 | 5,386 |
| Virginia Public Building Authority Revenue | 5.000% | 8/1/14 | 8,000 | 8,903 |
| Virginia Public School Authority Revenue | 4.000% | 8/1/12 | 3,605 | 3,708 |
| Virginia Public School Authority Revenue | 5.000% | 8/1/13 | 7,655 | 8,266 |
| Virginia Public School Authority Revenue | 5.000% | 8/1/14 | 3,815 | 4,260 |
| Virginia Public School Authority Revenue | 5.250% | 8/1/14 | 3,000 | 3,369 |
| Virginia Public School Authority Revenue | 5.000% | 8/1/15 | 1,500 | 1,721 |
| Virginia Public School Authority Revenue | 5.000% | 8/1/15 | 15,000 | 17,213 |
| Virginia Public School Authority Revenue | 5.000% | 8/1/16 | 32,000 | 37,457 |
| Virginia Public School Authority Revenue | 5.000% | 8/1/16 | 1,570 | 1,838 |
| Virginia Public School Authority Revenue | 5.000% | 8/1/16 | 5,810 | 6,801 |
| Virginia Small Business Financing Authority Health Care Facilities Revenue | | | | |
| (Sentara Healthcare) | 5.000% | 11/1/13 | 3,500 | 3,778 |
| Wise County VA Industrial Development Authority Solid Waste & Sewage Disposal Revenue | | | | |
| (Virginia Electric & Power Co.) PUT | 2.375% | 11/1/15 | 15,000 | 15,354 |
| York County VA Economic Development Authority Pollution Control Revenue | | | | |
| (VA Electric & Power Co. Project) PUT | 4.050% | 5/1/14 | 6,750 | 7,151 |
| | | | | 268,850 |
| Washington (3.1%) | | | | |
| 3 Bellevue WA GO TOB VRDO | 0.140% | 11/7/11 | 17,870 | 17,870 |
| Central Puget Sound WA Regional Transit Authority Sales & Use Tax Revenue | 5.000% | 11/1/14 (2) | 8,125 | 9,115 |
| Clark County WA Public Utility Revenue | 5.000% | 1/1/15 | 1,500 | 1,656 |
| Energy Northwest Washington Electric Revenue (Project No. 1) | 5.000% | 7/1/12 | 2,500 | 2,579 |
47
Limited-Term Tax-Exempt Fund
| | | | |
| | | | Face | Market |
| | | Maturity | Amount | Value• |
| | Coupon | Date | ($000) | ($000) |
| 1 Energy Northwest Washington Electric Revenue (Project No. 1) | 5.000% | 7/1/17 | 14,000 | 15,811 |
| Energy Northwest Washington Electric Revenue (Project No. 1) | 5.500% | 7/1/17 (14) | 8,000 | 8,259 |
| Energy Northwest Washington Electric Revenue (Project No. 1) | 6.000% | 7/1/17 (14) | 7,300 | 7,561 |
| Energy Northwest Washington Electric Revenue (Project No. 3) | 5.000% | 7/1/15 | 8,450 | 9,644 |
| Energy Northwest Washington Electric Revenue (Project No. 3) | 5.000% | 7/1/15 | 6,000 | 6,848 |
| Energy Northwest Washington Electric Revenue (Project No. 3) | 5.000% | 7/1/16 | 24,000 | 27,889 |
| Energy Northwest Washington Electric Revenue (Project No. 3) | 6.000% | 7/1/16 (4) | 10,000 | 10,363 |
| Energy Northwest Washington Electric Revenue (Project No. 3) | 6.000% | 7/1/16 (2) | 9,000 | 9,327 |
| Energy Northwest Washington Electric Revenue (Project No. 3) | 5.000% | 7/1/17 | 20,000 | 23,521 |
| King County WA (Bellevue School District) GO | 5.000% | 12/1/11 | 18,000 | 18,072 |
| King County WA Sewer Revenue | 5.000% | 1/1/19 | 12,835 | 15,271 |
| Port of Seattle WA Passenger Facility Charge Revenue | 5.000% | 12/1/17 | 4,000 | 4,585 |
| Port of Seattle WA Revenue | 5.000% | 3/1/12 (4) | 5,000 | 5,075 |
| Seattle WA Municipal Light & Power Revenue | 5.000% | 2/1/16 | 3,500 | 4,039 |
| Seattle WA Water System Revenue | 5.000% | 2/1/15 (4) | 4,725 | 5,337 |
| Tacoma WA Electric System Revenue | 5.000% | 1/1/12 (4) | 5,000 | 5,039 |
| Tacoma WA Electric System Revenue | 5.000% | 1/1/13 (4) | 10,485 | 11,036 |
| Tacoma WA Electric System Revenue | 5.000% | 1/1/14 (4) | 25,720 | 28,024 |
| Thurston County Washington School District GO | 5.000% | 6/1/13 (Prere.) | 7,100 | 7,615 |
| University of Washington Revenue | 5.000% | 4/1/17 | 6,880 | 8,092 |
| University of Washington Revenue | 5.000% | 4/1/18 | 7,225 | 8,593 |
| Washington Economic Development Finance Authority Solid Waste Disposal Revenue | | | | |
| (Waste Management Inc. Project) PUT | 2.000% | 9/2/14 | 7,500 | 7,508 |
| Washington GO | 5.000% | 7/1/12 (2) | 11,530 | 11,894 |
| Washington GO | 5.000% | 2/1/13 | 5,290 | 5,594 |
| Washington GO | 5.000% | 7/1/13 (4) | 4,890 | 5,261 |
| Washington GO | 5.000% | 1/1/14 | 19,395 | 21,203 |
| Washington GO | 5.000% | 2/1/14 | 11,105 | 12,176 |
| Washington GO | 5.000% | 7/1/15 (2) | 2,400 | 2,741 |
| Washington GO | 5.700% | 10/1/15 | 5,150 | 5,585 |
| Washington GO | 5.000% | 1/1/16 | 5,285 | 6,094 |
| Washington GO | 5.000% | 1/1/16 | 20,000 | 23,062 |
| Washington GO | 5.000% | 2/1/16 | 13,040 | 15,066 |
| Washington GO | 5.000% | 2/1/16 | 3,995 | 4,616 |
| Washington GO | 5.000% | 7/1/17 | 5,000 | 5,907 |
| Washington GO | 5.000% | 8/1/17 | 11,175 | 13,221 |
| 1 Washington GO | 5.000% | 7/1/18 | 21,220 | 25,276 |
| 3 Washington GO TOB VRDO | 0.140% | 11/7/11 | 4,000 | 4,000 |
| Washington Health Care Facilities Authority Revenue (MultiCare Health System) | 5.000% | 8/15/15 | 2,500 | 2,693 |
| Washington Health Care Facilities Authority Revenue (MultiCare Health System) | 5.000% | 8/15/16 | 2,500 | 2,713 |
| Washington Health Care Facilities Authority Revenue (PeaceHealth) | 5.000% | 11/1/13 | 1,205 | 1,286 |
| Washington Health Care Facilities Authority Revenue (PeaceHealth) | 5.000% | 11/1/14 | 1,340 | 1,453 |
| Washington Health Care Facilities Authority Revenue (Providence Health & Services) | 5.000% | 10/1/16 | 1,300 | 1,482 |
| Washington Health Care Facilities Authority Revenue (Providence Health & Services) | 5.000% | 10/1/17 | 1,360 | 1,560 |
| Washington Health Care Facilities Authority Revenue | | | | |
| (Southwest Washington Medical Center) VRDO | 0.180% | 11/7/11 LOC | 6,640 | 6,640 |
| | | | | 458,252 |
| West Virginia (0.5%) | | | | |
| Mason County WV Pollution Control Revenue (Appalachian Power Co. Project) PUT | 2.000% | 10/1/14 | 10,000 | 9,972 |
| West Virginia Commissioner of Highways Special Obligation Revenue | 5.000% | 9/1/12 | 4,970 | 5,160 |
| West Virginia Commissioner of Highways Special Obligation Revenue | 5.000% | 9/1/13 | 4,650 | 5,020 |
| West Virginia Commissioner of Highways Special Obligation Revenue | 5.000% | 9/1/14 | 9,265 | 10,309 |
| West Virginia Commissioner of Highways Special Obligation Revenue | 5.000% | 9/1/15 | 7,150 | 8,136 |
| West Virginia Economic Development Authority Pollution Control Revenue | | | | |
| (Appalachian Power Co. - Amos Project) PUT | 4.850% | 9/4/13 | 6,000 | 6,328 |
| West Virginia Economic Development Authority Solid Waste Facilities Disposal Revenue | | | | |
| (Ohio Power Co. - Amos Project) PUT | 3.125% | 4/1/15 | 15,000 | 15,419 |
| West Virginia Hospital Finance Authority Hospital Revenue (Charleston Area Medical Center Inc.) | 5.000% | 9/1/15 | 3,070 | 3,296 |
| West Virginia Hospital Finance Authority Hospital Revenue (Charleston Area Medical Center Inc.) | 4.125% | 9/1/16 | 1,755 | 1,827 |
| West Virginia University Revenue | 5.000% | 10/1/18 | 1,300 | 1,513 |
| 2 West Virginia University Revenue PUT | 0.790% | 10/1/14 | 10,000 | 10,000 |
| | | | | 76,980 |
| Wisconsin (1.6%) | | | | |
| Badger Tobacco Asset Securitization Corp. Wisconsin Revenue | 6.000% | 6/1/12 (Prere.) | 5,000 | 5,164 |
| Badger Tobacco Asset Securitization Corp. Wisconsin Revenue | 6.125% | 6/1/12 (Prere.) | 3,060 | 3,163 |
| Madison WI Community Development Authority Revenue (Wisconsin Alumni Research Project) | 5.000% | 10/1/16 | 3,125 | 3,656 |
| Madison WI Community Development Authority Revenue (Wisconsin Alumni Research Project) | 5.000% | 10/1/17 | 3,370 | 4,004 |
| Wisconsin Annual Appropriation Revenue | 5.000% | 5/1/16 | 6,575 | 7,584 |
| Wisconsin GO | 5.000% | 5/1/12 (14) | 15,775 | 16,150 |
| Wisconsin GO | 5.000% | 5/1/13 | 5,000 | 5,343 |
| Wisconsin GO | 5.250% | 5/1/13 | 16,810 | 18,025 |
48
| | | | |
| Limited-Term Tax-Exempt Fund | | | | |
| |
| |
| |
| |
| | | | Face | Market |
| | | Maturity | Amount | Value• |
| | Coupon | Date | ($000) | ($000) |
| Wisconsin GO | 5.000% | 5/1/14 (14) | 5,000 | 5,533 |
| Wisconsin GO | 5.000% | 5/1/16 (14) | 11,240 | 12,371 |
| Wisconsin GO | 5.000% | 5/1/16 | 13,870 | 16,099 |
| Wisconsin GO | 5.000% | 5/1/16 | 10,530 | 12,223 |
| Wisconsin GO | 5.000% | 5/1/17 | 6,000 | 7,061 |
| Wisconsin GO | 5.000% | 5/1/17 | 8,100 | 9,532 |
| Wisconsin GO | 5.000% | 11/1/17 | 4,500 | 5,340 |
| Wisconsin GO | 5.000% | 11/1/18 | 11,000 | 13,154 |
| Wisconsin GO | 5.000% | 5/1/19 | 12,955 | 15,471 |
| Wisconsin Health & Educational Facilities Authority Revenue (Agnesian Healthcare Inc.) | 5.000% | 7/1/14 | 1,035 | 1,102 |
| Wisconsin Health & Educational Facilities Authority Revenue (Aurora Health Care Inc.) | 5.000% | 4/15/15 | 1,495 | 1,595 |
| Wisconsin Health & Educational Facilities Authority Revenue (Aurora Health Care Inc.) | 5.000% | 4/15/16 | 1,100 | 1,179 |
| Wisconsin Health & Educational Facilities Authority Revenue (Aurora Health Care Inc.) | 5.000% | 7/15/16 | 7,500 | 8,063 |
| Wisconsin Health & Educational Facilities Authority Revenue (Aurora Health Care Inc.) | 5.000% | 7/15/17 | 5,025 | 5,403 |
| Wisconsin Health & Educational Facilities Authority Revenue (Aurora Health Care Inc.) PUT | 4.750% | 8/15/14 | 2,000 | 2,136 |
| Wisconsin Health & Educational Facilities Authority Revenue (Aurora Health Care Inc.) PUT | 5.125% | 8/15/16 | 10,390 | 11,417 |
| Wisconsin Health & Educational Facilities Authority Revenue (Ministry Health Care Inc.) | 5.000% | 8/1/14 (4) | 5,000 | 5,441 |
| Wisconsin Health & Educational Facilities Authority Revenue (Ministry Health Care Inc.) | 5.000% | 8/1/15 (4) | 2,000 | 2,217 |
| Wisconsin Petroleum Inspection Fee Revenue | 5.000% | 7/1/16 | 10,000 | 11,533 |
| Wisconsin Public Power System Power Supply System Revenue | 5.000% | 7/1/14 (4) | 4,145 | 4,578 |
| Wisconsin Public Power System Power Supply System Revenue | 5.000% | 7/1/15 (4) | 11,390 | 12,868 |
| Wisconsin Transportation Revenue | 5.000% | 7/1/12 | 1,000 | 1,032 |
| Wisconsin Transportation Revenue | 5.000% | 7/1/13 | 1,100 | 1,183 |
| Wisconsin Transportation Revenue | 5.000% | 7/1/15 | 2,100 | 2,402 |
| | | | | 232,022 |
| Total Tax-Exempt Municipal Bonds (Cost $13,990,701) | | | | 14,358,530 |
| |
| | | | Shares | |
| Temporary Cash Investment (1.8%) | | | | |
| Money Market Fund (1.8%) | | | | |
| 4 Vanguard Municipal Cash Management Fund (Cost $262,028) | 0.117% | | 262,027,985 | 262,028 |
| Total Investments (100.2%) (Cost $14,252,729) | | | | 14,620,558 |
| Other Assets and Liabilities (-0.2%) | | | | |
| Other Assets | | | | 185,158 |
| Liabilities | | | | (220,485) |
| | | | | (35,327) |
| Net Assets (100%) | | | | 14,585,231 |
49
| |
| Limited-Term Tax-Exempt Fund | |
| |
| |
| |
| |
| At October 31, 2011, net assets consisted of: | |
| | Amount |
| | ($000) |
| Paid-in Capital | 14,345,224 |
| Undistributed Net Investment Income | — |
| Accumulated Net Realized Losses | (127,822) |
| Unrealized Appreciation (Depreciation) | 367,829 |
| Net Assets | 14,585,231 |
| |
| Investor Shares—Net Assets | |
| Applicable to 282,013,024 outstanding $.001 par value shares of beneficial interest (unlimited authorization) | 3,122,614 |
| Net Asset Value Per Share—Investor Shares | $11.07 |
| |
| Admiral Shares—Net Assets | |
| Applicable to 1,035,224,579 outstanding $.001 par value shares of beneficial interest (unlimited authorization) | 11,462,617 |
| Net Asset Value Per Share—Admiral Shares | $11.07 |
• See Note A in Notes to Financial Statements.
1 Security purchased on a when-issued or delayed-delivery basis for which the fund has not taken delivery as of October 31, 2011.
2 Adjustable-rate security.
3 Security exempt from registration under Rule 144A of the Securities Act of 1933. Such securities may be sold in transactions exempt from registration, normally to qualified institutional buyers. At October 31, 2011, the aggregate value of these securities was $861,548,000, representing 5.9% of net assets.
4 Affiliated money market fund available only to Vanguard funds and certain trusts and accounts managed by Vanguard. Rate shown is the 7-day yield.
For key to abbreviations and other references, see back cover.
See accompanying Notes, which are an integral part of the Financial Statements.
50
Intermediate-Term Tax-Exempt Fund
| | | | |
| | | | Face | Market |
| | | Maturity | Amount | Value• |
| | Coupon | Date | ($000) | ($000) |
| Tax-Exempt Municipal Bonds (98.5%) | | | | |
| Alabama (0.9%) | | | | |
| Alabama Incentives Financing Authority Special Obligation Revenue | 5.000% | 9/1/24 | 3,695 | 4,070 |
| Alabama Incentives Financing Authority Special Obligation Revenue | 5.000% | 9/1/24 | 2,520 | 2,776 |
| Alabama Public School & College Authority Capital Improvement Revenue | 5.000% | 12/1/19 | 58,350 | 67,145 |
| Alabama Public School & College Authority Capital Improvement Revenue | 5.000% | 12/1/20 | 60,660 | 68,947 |
| Alabama Public School & College Authority Capital Improvement Revenue | 5.000% | 12/1/21 | 62,600 | 70,652 |
| Alabama Public School & College Authority Capital Improvement Revenue | 5.000% | 12/1/22 | 13,595 | 15,222 |
| Auburn University Alabama General Fee Revenue | 5.000% | 6/1/16 | 3,690 | 4,282 |
| Auburn University Alabama General Fee Revenue | 5.000% | 6/1/17 | 1,550 | 1,821 |
| Courtland AL Development Board Pollution Control Revenue (International Paper Co.) | 5.000% | 6/1/25 | 5,000 | 4,917 |
| Infirmary Health System Special Care Facilities Financing Authority Mobile Alabama Revenue | | | | |
| (Infirmary Health System Inc.) | 5.000% | 2/1/18 | 2,830 | 3,040 |
| Infirmary Health System Special Care Facilities Financing Authority Mobile Alabama Revenue | | | | |
| (Infirmary Health System Inc.) | 5.250% | 2/1/19 | 2,415 | 2,609 |
| Infirmary Health System Special Care Facilities Financing Authority Mobile Alabama Revenue | | | | |
| (Infirmary Health System Inc.) | 5.250% | 2/1/20 | 2,845 | 3,067 |
| Infirmary Health System Special Care Facilities Financing Authority Mobile Alabama Revenue | | | | |
| (Infirmary Health System Inc.) | 5.250% | 2/1/21 | 3,630 | 3,877 |
| Infirmary Health System Special Care Facilities Financing Authority Mobile Alabama Revenue | | | | |
| (Infirmary Health System Inc.) | 5.250% | 2/1/30 | 10,000 | 10,059 |
| Jefferson County AL Sewer Revenue (Capital Improvement) | 5.000% | 8/1/12 (Prere.) | 15,040 | 15,564 |
| | | | | 278,048 |
| Alaska (0.1%) | | | | |
| Anchorage AK Electric Revenue | 8.000% | 12/1/11 (14) | 5,395 | 5,428 |
| Matanuska-Susitna Borough AK GO | 5.500% | 3/1/12 (3) | 2,110 | 2,140 |
| Northern Tobacco Securitization Corp. Alaska | 4.625% | 6/1/23 | 17,340 | 15,954 |
| Valdez AK Marine Terminal Revenue (BP Pipelines) | 5.000% | 1/1/16 | 1,000 | 1,111 |
| Valdez AK Marine Terminal Revenue (BP Pipelines) | 5.000% | 1/1/16 | 12,755 | 14,175 |
| | | | | 38,808 |
| Arizona (2.7%) | | | | |
| Arizona Board Regents Arizona State University System COP | 5.000% | 6/1/20 (2) | 2,430 | 2,586 |
| Arizona Board Regents Arizona State University System COP | 5.000% | 7/1/20 (14) | 5,120 | 5,598 |
| Arizona Board Regents Arizona State University System COP | 5.000% | 6/1/21 (2) | 4,310 | 4,553 |
| Arizona Board Regents Arizona State University System Revenue | 6.000% | 7/1/27 | 1,135 | 1,301 |
| Arizona Board Regents Arizona State University System Revenue | 5.000% | 6/1/28 | 2,545 | 2,762 |
| Arizona COP | 5.000% | 9/1/25 (4) | 10,000 | 10,560 |
| Arizona COP | 5.000% | 9/1/27 (4) | 5,000 | 5,217 |
| Arizona Health Facilities Authority Revenue (Banner Health) | 5.000% | 1/1/24 | 10,000 | 10,620 |
| Arizona Health Facilities Authority Revenue (Banner Health) | 5.000% | 1/1/25 | 7,500 | 7,906 |
| Arizona Lottery Revenue | 5.000% | 7/1/22 (4) | 18,000 | 20,031 |
| Arizona Lottery Revenue | 5.000% | 7/1/24 (4) | 15,000 | 16,368 |
| Arizona Lottery Revenue | 5.000% | 7/1/25 (4) | 15,000 | 16,209 |
| Arizona Lottery Revenue | 5.000% | 7/1/26 (4) | 13,975 | 15,020 |
| Arizona School Facilities Board COP | 5.000% | 9/1/16 (14) | 34,300 | 37,362 |
| Arizona School Facilities Board COP | 5.000% | 9/1/16 | 24,000 | 26,554 |
| Arizona School Facilities Board COP | 5.000% | 9/1/17 (14) | 26,755 | 28,842 |
| Arizona School Facilities Board COP | 5.000% | 9/1/17 | 21,000 | 23,303 |
| Arizona School Facilities Board COP | 5.000% | 9/1/18 | 13,000 | 14,415 |
| Arizona School Facilities Board COP | 5.125% | 9/1/21 | 5,000 | 5,475 |
| Arizona Transportation Board Excise Tax Revenue (Maricopa County Regional Area) | 5.000% | 7/1/13 | 7,090 | 7,621 |
| Arizona Transportation Board Excise Tax Revenue (Maricopa County Regional Area) | 5.000% | 7/1/14 | 8,000 | 8,882 |
| Arizona Transportation Board Excise Tax Revenue (Maricopa County Regional Area) | 5.000% | 7/1/18 | 10,000 | 11,611 |
| Arizona Transportation Board Excise Tax Revenue (Maricopa County Regional Area) | 5.000% | 7/1/19 | 10,000 | 11,452 |
| Arizona Transportation Board Excise Tax Revenue (Maricopa County Regional Area) | 5.000% | 7/1/20 | 11,500 | 13,029 |
| Arizona Transportation Board Excise Tax Revenue (Maricopa County Regional Area) | 5.000% | 7/1/21 | 16,300 | 18,353 |
| Arizona Transportation Board Excise Tax Revenue (Maricopa County Regional Area) | 5.000% | 7/1/22 | 9,940 | 11,637 |
| Arizona Transportation Board Excise Tax Revenue (Maricopa County Regional Area) | 5.000% | 7/1/24 | 10,000 | 11,013 |
| Arizona Transportation Board Excise Tax Revenue (Maricopa County Regional Area) | 5.000% | 7/1/25 | 7,540 | 8,265 |
| Arizona Transportation Board Highway Revenue | 5.000% | 7/1/17 | 9,460 | 10,711 |
| Arizona Transportation Board Highway Revenue | 5.250% | 7/1/18 | 4,000 | 4,120 |
| Arizona Transportation Board Highway Revenue | 5.250% | 7/1/19 | 4,110 | 4,232 |
| Arizona Transportation Board Highway Revenue | 5.000% | 7/1/22 | 10,035 | 11,232 |
| Arizona Transportation Board Highway Revenue | 5.000% | 7/1/23 | 8,180 | 8,861 |
| Arizona Transportation Board Highway Revenue | 5.000% | 7/1/24 | 2,000 | 2,169 |
| Arizona Transportation Board Highway Revenue | 5.000% | 7/1/25 | 5,000 | 5,652 |
| Arizona Transportation Board Highway Revenue | 5.000% | 7/1/30 | 5,000 | 5,481 |
| Arizona Water Infrastructure Finance Authority Revenue | 5.000% | 10/1/30 | 5,000 | 5,522 |
| Glendale AZ Industrial Development Authority Revenue (Midwestern University) | 5.000% | 5/15/18 | 3,325 | 3,668 |
| Glendale AZ Industrial Development Authority Revenue (Midwestern University) | 5.000% | 5/15/19 | 2,000 | 2,203 |
| Glendale AZ Industrial Development Authority Revenue (Midwestern University) | 5.000% | 5/15/20 | 1,500 | 1,644 |
51
Intermediate-Term Tax-Exempt Fund
| | | | |
| | | | Face | Market |
| | | Maturity | Amount | Value• |
| | Coupon | Date | ($000) | ($000) |
| Glendale AZ Industrial Development Authority Revenue (Midwestern University) | 5.000% | 5/15/21 | 1,500 | 1,620 |
| Glendale AZ Industrial Development Authority Revenue (Midwestern University) | 5.000% | 5/15/22 | 3,500 | 3,730 |
| Glendale AZ Industrial Development Authority Revenue (Midwestern University) | 5.000% | 5/15/23 | 3,805 | 4,021 |
| Glendale AZ Industrial Development Authority Revenue (Midwestern University) | 5.000% | 5/15/25 | 3,750 | 3,922 |
| Glendale AZ Industrial Development Authority Revenue (Midwestern University) | 5.000% | 5/15/26 | 2,890 | 2,998 |
| Glendale AZ Industrial Development Authority Revenue (Midwestern University) | 5.000% | 5/15/27 | 5,000 | 5,140 |
| Glendale AZ Industrial Development Authority Revenue (Midwestern University) | 5.000% | 5/15/30 | 14,000 | 14,233 |
| Glendale AZ Industrial Development Authority Revenue (Midwestern University) VRDO | 0.160% | 11/7/11 LOC | 10,000 | 10,000 |
| Glendale AZ Transportation Excise Tax Revenue | 5.000% | 7/1/23 (14) | 4,235 | 4,560 |
| Maricopa County AZ Industrial Development Authority Health Facilities Revenue | | | | |
| (Catholic Healthcare West) | 5.000% | 7/1/16 | 6,500 | 7,112 |
| Maricopa County AZ Industrial Development Authority Health Facilities Revenue | | | | |
| (Catholic Healthcare West) | 5.000% | 7/1/17 | 10,000 | 10,985 |
| Maricopa County AZ Industrial Development Authority Health Facilities Revenue | | | | |
| (Catholic Healthcare West) | 5.000% | 7/1/18 | 6,000 | 6,515 |
| Maricopa County AZ Regional Public Transportation Authority Excise Tax Revenue | 5.000% | 7/1/21 | 6,220 | 6,991 |
| Maricopa County AZ Unified School District GO | 5.000% | 7/1/21 | 11,915 | 13,896 |
| Maricopa County AZ Unified School District GO | 5.000% | 7/1/22 (ETM) | 4,810 | 5,854 |
| Maricopa County AZ Unified School District GO | 5.000% | 7/1/22 | 8,450 | 9,823 |
| Mesa AZ GO | 5.250% | 7/1/12 (14) | 10,000 | 10,318 |
| Mesa AZ Utility System Revenue | 5.000% | 7/1/19 (14) | 10,000 | 11,707 |
| Mesa AZ Utility System Revenue | 5.000% | 7/1/21 (14) | 11,900 | 13,862 |
| Phoenix AZ Civic Improvement Corp. Airport Revenue | 5.000% | 7/1/14 | 5,110 | 5,592 |
| Phoenix AZ Civic Improvement Corp. Airport Revenue | 5.000% | 7/1/23 | 5,000 | 5,476 |
| Phoenix AZ Civic Improvement Corp. Airport Revenue | 5.000% | 7/1/24 | 2,235 | 2,426 |
| Phoenix AZ Civic Improvement Corp. Airport Revenue | 5.000% | 7/1/25 | 5,000 | 5,384 |
| Phoenix AZ Civic Improvement Corp. Airport Revenue | 5.000% | 7/1/27 | 9,530 | 10,134 |
| Phoenix AZ Civic Improvement Corp. Airport Revenue | 5.000% | 7/1/28 | 9,555 | 9,971 |
| Phoenix AZ Civic Improvement Corp. Airport Revenue | 5.000% | 7/1/30 | 13,330 | 13,871 |
| Phoenix AZ Civic Improvement Corp. Airport Revenue (Light Rail Project) | 5.000% | 7/1/18 (2) | 7,840 | 8,515 |
| Phoenix AZ Civic Improvement Corp. Airport Revenue (Light Rail Project) | 5.000% | 7/1/19 (2) | 19,000 | 20,563 |
| Phoenix AZ Civic Improvement Corp. Excise Tax Revenue | 5.000% | 7/1/20 | 5,165 | 5,837 |
| Phoenix AZ Civic Improvement Corp. Excise Tax Revenue | 5.000% | 7/1/22 (14) | 5,420 | 5,771 |
| Phoenix AZ Civic Improvement Corp. Excise Tax Revenue | 4.750% | 7/1/24 | 7,805 | 8,419 |
| Phoenix AZ Civic Improvement Corp. Wastewater System Revenue | 5.375% | 7/1/12 (14) | 9,645 | 9,685 |
| Phoenix AZ Civic Improvement Corp. Wastewater System Revenue | 5.375% | 7/1/13 (14) | 5,000 | 5,019 |
| Phoenix AZ Civic Improvement Corp. Wastewater System Revenue | 5.375% | 7/1/14 (14) | 6,820 | 6,845 |
| Phoenix AZ Civic Improvement Corp. Wastewater System Revenue | 5.500% | 7/1/24 | 2,500 | 2,921 |
| Phoenix AZ Civic Improvement Corp. Water System Revenue | 5.500% | 7/1/14 (14) | 4,215 | 4,352 |
| Phoenix AZ Civic Improvement Corp. Water System Revenue | 5.000% | 7/1/21 (14) | 4,200 | 4,631 |
| Phoenix AZ Civic Improvement Corp. Water System Revenue | 5.000% | 7/1/28 | 4,890 | 5,390 |
| Phoenix AZ GO | 5.000% | 7/1/20 | 5,150 | 5,844 |
| Salt River Project Arizona Agricultural Improvement & Power District Revenue | 4.000% | 12/1/17 | 1,000 | 1,128 |
| Salt River Project Arizona Agricultural Improvement & Power District Revenue | 5.000% | 1/1/22 | 4,350 | 5,004 |
| Salt River Project Arizona Agricultural Improvement & Power District Revenue | 5.000% | 1/1/27 | 10,000 | 10,877 |
| Salt River Project Arizona Agricultural Improvement & Power District Revenue | 5.000% | 1/1/28 | 2,750 | 2,974 |
| Salt River Project Arizona Agricultural Improvement & Power District Revenue | 5.000% | 12/1/30 | 2,095 | 2,295 |
| Salt Verde AZ Financial Project Revenue | 5.250% | 12/1/21 | 3,500 | 3,527 |
| Salt Verde AZ Financial Project Revenue | 5.250% | 12/1/22 | 3,790 | 3,806 |
| Salt Verde AZ Financial Project Revenue | 5.250% | 12/1/23 | 8,335 | 8,335 |
| Salt Verde AZ Financial Project Revenue | 5.250% | 12/1/24 | 4,485 | 4,464 |
| Salt Verde AZ Financial Project Revenue | 5.250% | 12/1/25 | 18,880 | 18,694 |
| Salt Verde AZ Financial Project Revenue | 5.250% | 12/1/26 | 2,645 | 2,604 |
| Scottsdale AZ Municipal Property Corp. Excise Tax Revenue | 5.000% | 7/1/16 (Prere.) | 5,710 | 6,672 |
| Scottsdale AZ Municipal Property Corp. Excise Tax Revenue | 5.000% | 7/1/16 (Prere.) | 7,280 | 8,506 |
| Scottsdale AZ Municipal Property Corp. Excise Tax Revenue | 5.000% | 7/1/16 (Prere.) | 6,850 | 8,004 |
| Scottsdale AZ Municipal Property Corp. Excise Tax Revenue | 5.000% | 7/1/22 | 12,415 | 14,817 |
| Tucson AZ GO | 7.375% | 7/1/13 | 3,750 | 4,146 |
| Tucson AZ GO | 5.000% | 7/1/26 (12) | 1,000 | 1,068 |
| Tucson AZ GO | 5.000% | 7/1/29 (12) | 1,000 | 1,049 |
| University Medical Center Corp. Arizona Hospital Revenue | 6.250% | 7/1/29 | 1,500 | 1,570 |
| | | | | 825,513 |
| Arkansas (0.0%) | | | | |
| University of Arkansas Revenue (Fayetteville Campus) | 5.000% | 11/1/25 | 1,815 | 2,057 |
| University of Arkansas Revenue (Fayetteville Campus) | 5.000% | 11/1/26 | 1,075 | 1,205 |
| University of Arkansas Revenue (Fayetteville Campus) | 5.000% | 11/1/27 | 1,695 | 1,882 |
| | | | | 5,144 |
| California (12.7%) | | | | |
| Anaheim CA Public Financing Authority Revenue (Electric System) | 5.250% | 10/1/28 | 5,030 | 5,517 |
| Anaheim CA Public Financing Authority Revenue (Electric System) | 5.250% | 10/1/29 | 5,300 | 5,779 |
| 1 Atwater CA Public Financing Authority Wastewater Revenue TOB VRDO | 0.220% | 11/7/11 (4) | 16,995 | 16,995 |
52
Intermediate-Term Tax-Exempt Fund
| | | | |
| | | | Face | Market |
| | | Maturity | Amount | Value• |
| | Coupon | Date | ($000) | ($000) |
| Bay Area CA Infrastructure Financing Authority Revenue | 5.000% | 8/1/17 (14) | 2,000 | 2,031 |
| Bay Area CA Infrastructure Financing Authority Revenue | 5.000% | 8/1/17 (10) | 4,500 | 4,654 |
| Bay Area CA Infrastructure Financing Authority Revenue | 5.000% | 8/1/17 (14) | 16,140 | 17,026 |
| Bay Area Toll Authority California Toll Bridge Revenue (San Francisco Bay Area) | 5.000% | 4/1/21 | 7,000 | 7,832 |
| Bay Area Toll Authority California Toll Bridge Revenue (San Francisco Bay Area) | 5.000% | 4/1/21 | 20,195 | 22,725 |
| Bay Area Toll Authority California Toll Bridge Revenue (San Francisco Bay Area) | 5.000% | 4/1/23 | 26,400 | 29,389 |
| Bay Area Toll Authority California Toll Bridge Revenue (San Francisco Bay Area) | 5.000% | 4/1/24 | 22,435 | 24,845 |
| Beverly Hills CA Unified School District GO | 0.000% | 8/1/28 | 5,000 | 2,140 |
| Beverly Hills CA Unified School District GO | 0.000% | 8/1/29 | 8,000 | 3,194 |
| 1 California Department of Veteran Affairs Revenue TOB VRDO | 0.140% | 11/7/11 | 11,140 | 11,140 |
| California Department of Water Resources Power Supply Revenue | 5.375% | 5/1/12 (Prere.) | 37,000 | 38,322 |
| California Department of Water Resources Power Supply Revenue | 5.500% | 5/1/12 (Prere.) | 10,000 | 10,364 |
| California Department of Water Resources Power Supply Revenue | 5.500% | 5/1/12 (Prere.) | 61,875 | 64,125 |
| California Department of Water Resources Power Supply Revenue | 5.500% | 5/1/12 (14) | 8,000 | 8,209 |
| California Department of Water Resources Power Supply Revenue | 6.000% | 5/1/12 (Prere.) | 20,000 | 20,777 |
| California Department of Water Resources Power Supply Revenue | 6.000% | 5/1/12 (Prere.) | 10,000 | 10,389 |
| California Department of Water Resources Power Supply Revenue | 5.000% | 5/1/16 | 7,790 | 8,963 |
| California Department of Water Resources Power Supply Revenue | 5.000% | 5/1/16 | 5,000 | 5,753 |
| California Department of Water Resources Power Supply Revenue | 5.000% | 5/1/18 | 12,000 | 14,067 |
| California Department of Water Resources Power Supply Revenue | 5.000% | 5/1/19 | 44,535 | 52,243 |
| California Department of Water Resources Power Supply Revenue | 5.000% | 5/1/20 | 20,000 | 23,568 |
| California Department of Water Resources Power Supply Revenue | 5.000% | 5/1/21 | 30,000 | 34,831 |
| California Department of Water Resources Power Supply Revenue | 5.000% | 5/1/21 | 20,000 | 22,531 |
| California Department of Water Resources Power Supply Revenue | 5.000% | 5/1/22 | 10,000 | 11,480 |
| California Department of Water Resources Power Supply Revenue | 5.000% | 5/1/22 | 19,250 | 21,493 |
| California Economic Recovery Bonds GO | 5.000% | 7/1/14 (Prere.) | 28,925 | 32,262 |
| California Economic Recovery Bonds GO | 5.000% | 7/1/15 | 41,775 | 45,905 |
| California Economic Recovery Bonds GO | 5.000% | 7/1/16 | 6,035 | 6,057 |
| California Economic Recovery Bonds GO | 5.000% | 7/1/20 | 29,500 | 33,752 |
| California Economic Recovery Bonds GO | 5.250% | 7/1/21 | 50,000 | 57,689 |
| California GO | 5.000% | 4/1/12 | 2,500 | 2,547 |
| California GO | 5.250% | 10/1/13 (14) | 5,615 | 6,081 |
| California GO | 5.250% | 2/1/14 | 20,000 | 21,420 |
| California GO | 5.000% | 6/1/14 (Prere.) | 8,580 | 9,494 |
| California GO | 5.000% | 8/1/14 | 6,355 | 6,999 |
| California GO | 5.250% | 11/1/14 | 10,000 | 10,785 |
| California GO | 5.000% | 3/1/15 | 6,000 | 6,690 |
| California GO | 5.250% | 11/1/15 | 10,225 | 11,044 |
| California GO | 6.000% | 2/1/16 | 1,500 | 1,740 |
| California GO | 5.000% | 4/1/16 | 10,000 | 11,239 |
| California GO | 5.000% | 9/1/16 | 8,000 | 9,051 |
| California GO | 5.000% | 3/1/17 | 3,000 | 3,389 |
| California GO | 5.000% | 4/1/17 | 9,500 | 10,739 |
| California GO | 5.000% | 4/1/17 | 13,050 | 14,751 |
| California GO | 5.000% | 10/1/17 | 20,000 | 22,671 |
| California GO | 5.500% | 4/1/18 | 45,035 | 52,202 |
| California GO | 6.000% | 4/1/18 | 11,480 | 13,627 |
| California GO | 5.000% | 9/1/18 | 33,800 | 37,058 |
| California GO | 5.000% | 12/1/18 | 85 | 92 |
| California GO | 5.500% | 4/1/19 | 5,000 | 5,806 |
| California GO | 5.000% | 4/1/20 | 18,000 | 19,967 |
| California GO | 5.000% | 8/1/20 | 18,970 | 21,142 |
| California GO | 5.000% | 11/1/20 (14) | 5,000 | 5,635 |
| California GO | 5.250% | 11/1/20 | 9,000 | 9,652 |
| California GO | 5.000% | 2/1/21 | 13,000 | 13,830 |
| California GO | 5.000% | 12/1/21 | 16,365 | 18,240 |
| California GO | 5.000% | 3/1/22 | 6,375 | 6,870 |
| California GO | 5.000% | 3/1/22 (2) | 9,225 | 9,784 |
| California GO | 5.250% | 10/1/22 | 15,000 | 16,617 |
| California GO | 5.000% | 3/1/23 | 36,120 | 38,170 |
| California GO | 5.000% | 3/1/23 | 29,000 | 31,107 |
| California GO | 5.125% | 11/1/23 | 7,000 | 7,441 |
| California GO | 5.000% | 3/1/24 | 30,115 | 32,156 |
| California GO | 5.500% | 8/1/26 | 23,665 | 26,039 |
| California GO | 5.250% | 10/1/27 | 26,440 | 28,472 |
| California GO | 5.750% | 4/1/29 | 2,395 | 2,634 |
| California GO | 5.000% | 10/1/29 | 27,000 | 27,817 |
| California GO | 5.250% | 3/1/30 | 29,500 | 30,730 |
| California GO | 5.750% | 4/1/31 | 79,190 | 86,308 |
| California GO | 5.000% | 6/1/31 | 3,000 | 3,029 |
| California GO | 6.500% | 4/1/33 | 54,500 | 63,548 |
| California GO VRDO | 0.080% | 11/7/11 LOC | 6,000 | 6,000 |
53
Intermediate-Term Tax-Exempt Fund
| | | | |
| | | | Face | Market |
| | | Maturity | Amount | Value• |
| | Coupon | Date | ($000) | ($000) |
| California GO VRDO | 0.130% | 11/7/11 LOC | 10,000 | 10,000 |
| California Health Facilities Financing Authority Revenue (Adventist Health System/West) | 5.000% | 3/1/12 | 2,000 | 2,025 |
| California Health Facilities Financing Authority Revenue (Adventist Health System/West) | 5.000% | 3/1/13 | 2,000 | 2,090 |
| California Health Facilities Financing Authority Revenue (Adventist Health System/West) | 5.000% | 3/1/14 | 2,205 | 2,356 |
| California Health Facilities Financing Authority Revenue (Catholic Healthcare West) | 5.125% | 7/1/22 | 13,995 | 14,824 |
| 2 California Health Facilities Financing Authority Revenue (Catholic Healthcare West) | 5.250% | 3/1/27 | 19,000 | 19,694 |
| 2 California Health Facilities Financing Authority Revenue (Catholic Healthcare West) | 5.250% | 3/1/28 | 9,160 | 9,432 |
| California Health Facilities Financing Authority Revenue (Catholic Healthcare West) PUT | 5.000% | 7/1/14 | 15,000 | 16,220 |
| California Health Facilities Financing Authority Revenue (Cedars-Sinai Medical Center) | 5.000% | 11/15/17 | 8,000 | 8,681 |
| California Health Facilities Financing Authority Revenue (Cedars-Sinai Medical Center) | 5.000% | 11/15/19 | 3,135 | 3,316 |
| California Health Facilities Financing Authority Revenue (Cedars-Sinai Medical Center) | 5.000% | 11/15/20 | 4,180 | 4,383 |
| California Health Facilities Financing Authority Revenue (Cedars-Sinai Medical Center) | 5.000% | 11/15/21 | 6,165 | 6,431 |
| California Health Facilities Financing Authority Revenue (Memorial Health Services) VRDO | 0.120% | 11/7/11 | 6,825 | 6,825 |
| California Health Facilities Financing Authority Revenue (Scripps Health) | 5.000% | 10/1/19 | 8,080 | 9,130 |
| California Health Facilities Financing Authority Revenue (Scripps Health) | 5.500% | 10/1/20 | 4,000 | 4,587 |
| California Health Facilities Financing Authority Revenue (Scripps Health) | 5.000% | 10/1/21 | 7,110 | 7,944 |
| California Health Facilities Financing Authority Revenue (Scripps Health) | 5.000% | 10/1/22 | 3,250 | 3,595 |
| California Health Facilities Financing Authority Revenue (St. Joseph Health System) | 5.250% | 7/1/21 | 25,980 | 28,709 |
| California Health Facilities Financing Authority Revenue (St. Joseph Health System) | 5.500% | 7/1/29 | 15,000 | 15,646 |
| California Health Facilities Financing Authority Revenue (Sutter Health) | 5.000% | 8/15/15 | 7,550 | 8,370 |
| California Health Facilities Financing Authority Revenue (Sutter Health) | 5.500% | 8/15/16 | 5,000 | 5,737 |
| California Health Facilities Financing Authority Revenue (Sutter Health) | 5.500% | 8/15/17 | 5,100 | 5,901 |
| California Health Facilities Financing Authority Revenue (Sutter Health) | 5.500% | 8/15/26 | 4,500 | 4,912 |
| California Health Facilities Financing Authority Revenue (Sutter Health) | 5.875% | 8/15/31 | 10,000 | 10,800 |
| 1 California Health Facilities Financing Authority Revenue (Sutter Health) TOB VRDO | 0.140% | 11/7/11 | 5,400 | 5,400 |
| 1 California Infrastructure & Economic Development Bank Revenue | | | | |
| (Bay Area Toll Bridges Seismic Retrofit) TOB VRDO | 0.150% | 11/1/11 (ETM) | 20,115 | 20,115 |
| California Infrastructure & Economic Development Bank Revenue | | | | |
| (Independent System Operator Corp. Project) | 5.000% | 2/1/14 | 9,000 | 9,726 |
| California Municipal Finance Authority | | | | |
| (Community Hospitals of Central California Obligated Group) COP | 5.000% | 2/1/15 | 1,615 | 1,687 |
| California Municipal Finance Authority | | | | |
| (Community Hospitals of Central California Obligated Group) COP | 5.000% | 2/1/16 | 2,070 | 2,158 |
| California Municipal Finance Authority | | | | |
| (Community Hospitals of Central California Obligated Group) COP | 5.000% | 2/1/20 | 1,575 | 1,577 |
| California Municipal Finance Authority | | | | |
| (Community Hospitals of Central California Obligated Group) COP | 5.000% | 2/1/21 | 1,700 | 1,678 |
| California Municipal Finance Authority | | | | |
| (Community Hospitals of Central California Obligated Group) COP | 5.250% | 2/1/24 | 5,000 | 4,829 |
| California Municipal Finance Authority Revenue (University of La Verne) | 5.750% | 6/1/25 | 8,525 | 8,745 |
| California Municipal Finance Authority Revenue (University of La Verne) | 6.125% | 6/1/30 | 3,000 | 3,085 |
| California Public Works Board Lease Revenue (Department of Corrections) | 5.250% | 1/1/16 (2) | 5,265 | 5,830 |
| California Public Works Board Lease Revenue (Department of Corrections) | 5.000% | 6/1/25 | 3,100 | 3,116 |
| California Public Works Board Lease Revenue (Department of General Services) | 6.125% | 4/1/28 | 5,000 | 5,451 |
| California Public Works Board Lease Revenue (Department of General Services) | 6.125% | 4/1/29 | 2,000 | 2,174 |
| California Public Works Board Lease Revenue (Regents of The University of California) | 5.000% | 5/1/14 | 8,370 | 9,128 |
| California Public Works Board Lease Revenue (Regents of The University of California) | 5.000% | 5/1/15 | 9,980 | 11,163 |
| California Public Works Board Lease Revenue (Regents of The University of California) | 5.000% | 5/1/16 | 8,750 | 9,652 |
| California Public Works Board Lease Revenue (Regents of The University of California) | 5.000% | 5/1/17 | 4,985 | 5,501 |
| California Public Works Board Lease Revenue (Regents of The University of California) | 5.000% | 5/1/18 | 5,700 | 6,276 |
| California Public Works Board Lease Revenue (Regents of The University of California) | 5.000% | 5/1/19 | 11,820 | 12,952 |
| California Public Works Board Lease Revenue (Regents of The University of California) | 5.000% | 5/1/20 | 10,000 | 10,929 |
| California Public Works Board Lease Revenue (Regents of The University of California) | 5.000% | 5/1/21 | 15,230 | 16,549 |
| California Public Works Board Lease Revenue (Regents of The University of California) | 5.000% | 5/1/22 | 15,235 | 16,428 |
| California Public Works Board Lease Revenue (Regents of The University of California) | 5.000% | 5/1/23 | 8,765 | 9,366 |
| California Public Works Board Lease Revenue (Regents of The University of California) | 5.000% | 5/1/24 | 9,650 | 10,212 |
| California Public Works Board Lease Revenue (Regents of The University of California) | 5.000% | 5/1/25 | 7,500 | 7,869 |
| California Public Works Board Lease Revenue | | | | |
| (Secretary of State & State Archives Building Complex) | 5.375% | 12/1/12 | 7,895 | 7,924 |
| California Public Works Board Lease Revenue (Various Capital Projects) | 6.250% | 11/1/24 | 13,665 | 15,463 |
| California Public Works Board Lease Revenue (Various Capital Projects) | 5.125% | 10/1/31 | 4,250 | 4,268 |
| California RAN | 2.000% | 5/24/12 | 43,000 | 43,392 |
| California State University Revenue Systemwide | 5.000% | 11/1/26 | 14,775 | 15,983 |
| California State University Revenue Systemwide | 5.750% | 11/1/27 | 5,000 | 5,593 |
| California State University Revenue Systemwide | 5.250% | 11/1/28 | 7,395 | 8,176 |
| California State University Revenue Systemwide | 5.250% | 11/1/29 | 7,790 | 8,546 |
| California State University Revenue Systemwide | 5.250% | 11/1/30 | 7,960 | 8,691 |
| California State University Revenue Systemwide | 5.250% | 11/1/31 | 4,000 | 4,343 |
| California Statewide Communities Development Authority Revenue | | | | |
| (Cottage Health System Obligated Group) | 5.250% | 11/1/30 | 8,520 | 8,735 |
| California Statewide Communities Development Authority Revenue (Kaiser Permanente) | 5.000% | 4/1/16 | 36,970 | 41,803 |
| California Statewide Communities Development Authority Revenue (Kaiser Permanente) PUT | 3.900% | 7/1/14 | 23,550 | 24,958 |
54
Intermediate-Term Tax-Exempt Fund
| | | | |
| | | | Face | Market |
| | | Maturity | Amount | Value• |
| | Coupon | Date | ($000) | ($000) |
| California Statewide Communities Development Authority Revenue (Kaiser Permanente) VRDO | 0.100% | 11/7/11 | 1,400 | 1,400 |
| California Statewide Communities Development Authority Revenue | | | | |
| (Proposition 1A Receivables Program) | 5.000% | 6/15/13 | 135,500 | 144,253 |
| 1 California Statewide Communities Development Authority Revenue (Sutter Health) TOB VRDO | 0.140% | 11/7/11 | 21,676 | 21,676 |
| Castaic Lake CA Water Agency Revenue COP VRDO | 0.100% | 11/7/11 LOC | 10,300 | 10,300 |
| Cerritos CA Community College District GO | 5.250% | 8/1/28 | 3,540 | 3,847 |
| Cerritos CA Community College District GO | 5.250% | 8/1/29 | 3,160 | 3,409 |
| Cerritos CA Community College District GO | 5.250% | 8/1/30 | 4,235 | 4,558 |
| Eastern California Municipal Water District Water& Sewer Revenue VRDO | 0.080% | 11/7/11 | 19,450 | 19,450 |
| Eastern California Municipal Water District Water& Sewer Revenue VRDO | 0.110% | 11/7/11 | 11,525 | 11,525 |
| El Monte CA High School District GO | 5.500% | 6/1/27 (12) | 2,630 | 2,884 |
| El Monte CA High School District GO | 5.500% | 6/1/28 (12) | 2,355 | 2,569 |
| El Segundo CA Unified School District GO | 0.000% | 8/1/28 | 2,705 | 1,007 |
| El Segundo CA Unified School District GO | 0.000% | 8/1/29 | 8,655 | 2,989 |
| El Segundo CA Unified School District GO | 0.000% | 8/1/30 | 9,160 | 2,953 |
| Fairfield CA (Fairfield Water) COP | 0.000% | 4/1/23 (10) | 1,000 | 511 |
| Fairfield CA (Fairfield Water) COP | 0.000% | 4/1/24 (10) | 3,455 | 1,637 |
| Fairfield CA (Fairfield Water) COP | 0.000% | 4/1/25 (10) | 6,340 | 2,776 |
| Fairfield CA (Fairfield Water) COP | 0.000% | 4/1/27 (10) | 6,480 | 2,392 |
| Folsom Cordova CA Unified School District School Facilities Improvement District No. 3 GO | 0.000% | 10/1/23 (14) | 2,875 | 1,426 |
| Folsom Cordova CA Unified School District School Facilities Improvement District No. 3 GO | 0.000% | 10/1/24 (14) | 1,700 | 782 |
| Folsom Cordova CA Unified School District School Facilities Improvement District No. 3 GO | 0.000% | 10/1/25 (14) | 2,055 | 872 |
| Folsom Cordova CA Unified School District School Facilities Improvement District No. 3 GO | 0.000% | 10/1/26 (14) | 2,985 | 1,174 |
| Folsom Cordova CA Unified School District School Facilities Improvement District No. 3 GO | 0.000% | 10/1/28 (14) | 2,875 | 966 |
| Foothill/Eastern Corridor Agency California Toll Road Revenue | 5.125% | 1/15/19 (14) | 5,200 | 5,082 |
| Foothill/Eastern Corridor Agency California Toll Road Revenue | 5.875% | 1/15/28 (14) | 15,000 | 14,890 |
| Fresno CA Sewer Revenue | 6.250% | 9/1/14 (2) | 9,270 | 9,949 |
| Fresno CA Sewer Revenue | 5.000% | 9/1/25 (12) | 2,275 | 2,456 |
| Fresno CA Sewer Revenue | 5.000% | 9/1/26 (12) | 7,425 | 7,956 |
| Fresno CA Sewer Revenue | 5.000% | 9/1/27 (12) | 7,835 | 8,342 |
| Fresno County CA TRAN | 3.000% | 6/29/12 | 10,000 | 10,188 |
| Gilroy CA Unified School District GO | 0.000% | 8/1/30 (12) | 5,500 | 1,773 |
| Golden State Tobacco Securitization Corp. California | 6.750% | 6/1/13 (Prere.) | 79,735 | 87,468 |
| Golden State Tobacco Securitization Corp. California | 5.000% | 6/1/14 | 9,000 | 9,383 |
| Golden State Tobacco Securitization Corp. California | 5.000% | 6/1/15 | 6,505 | 6,813 |
| Golden State Tobacco Securitization Corp. California | 5.000% | 6/1/16 | 12,545 | 13,156 |
| Golden State Tobacco Securitization Corp. California | 5.000% | 6/1/21 (2) | 15,000 | 15,003 |
| Golden State Tobacco Securitization Corp. California | 4.500% | 6/1/27 | 79,085 | 63,727 |
| Golden State Tobacco Securitization Corp. California | 5.000% | 6/1/29 (2) | 30,000 | 29,898 |
| Golden State Tobacco Securitization Corp. California | 6.250% | 6/1/33 (Prere.) | 71,660 | 77,055 |
| Hacienda La Puente CA Unified School District GO | 5.000% | 8/1/25 (4) | 7,000 | 7,742 |
| La Mesa-Spring Valley CA School District GO | 0.000% | 8/1/23 (14) | 2,090 | 1,116 |
| La Mesa-Spring Valley CA School District GO | 0.000% | 8/1/25 (14) | 3,635 | 1,649 |
| La Mesa-Spring Valley CA School District GO | 0.000% | 8/1/27 (14) | 1,500 | 588 |
| La Mesa-Spring Valley CA School District GO | 0.000% | 8/1/28 (14) | 3,170 | 1,157 |
| Long Beach CA Finance Authority Tax Revenue | 5.500% | 11/1/18 (2) | 5,495 | 5,871 |
| Long Beach CA Finance Authority Tax Revenue | 5.500% | 11/1/19 (2) | 3,970 | 4,208 |
| Long Beach CA Finance Authority Tax Revenue | 5.500% | 11/1/20 (2) | 3,250 | 3,420 |
| Long Beach CA Finance Authority Tax Revenue | 5.500% | 11/1/21 (2) | 7,645 | 7,983 |
| Long Beach CA Finance Authority Tax Revenue | 5.500% | 11/1/22 (2) | 3,535 | 3,644 |
| Long Beach CA Unified School District GO | 0.000% | 8/1/23 (12) | 1,995 | 1,090 |
| Long Beach CA Unified School District GO | 0.000% | 8/1/26 (12) | 2,925 | 1,282 |
| Los Angeles CA Community College District GO | 5.000% | 8/1/28 | 7,210 | 7,736 |
| Los Angeles CA Community College District GO | 5.250% | 8/1/29 | 4,145 | 4,518 |
| Los Angeles CA Department of Airports International Airport Revenue | 5.000% | 5/15/23 | 3,115 | 3,382 |
| Los Angeles CA Department of Airports International Airport Revenue | 5.000% | 5/15/26 | 3,250 | 3,447 |
| Los Angeles CA Department of Airports International Airport Revenue | 5.000% | 5/15/26 | 5,705 | 6,218 |
| Los Angeles CA Department of Airports International Airport Revenue | 5.000% | 5/15/27 | 3,250 | 3,426 |
| Los Angeles CA Department of Airports International Airport Revenue | 5.000% | 5/15/28 | 3,960 | 4,151 |
| Los Angeles CA Department of Airports International Airport Revenue | 5.250% | 5/15/28 | 12,750 | 13,932 |
| Los Angeles CA Department of Airports International Airport Revenue | 5.250% | 5/15/29 | 5,000 | 5,426 |
| Los Angeles CA Department of Water & Power Revenue VRDO | 0.150% | 11/7/11 | 6,100 | 6,100 |
| Los Angeles CA Harbor Department Revenue | 5.000% | 8/1/28 | 6,930 | 7,488 |
| Los Angeles CA Municipal Improvement Corp. Lease Revenue (Police Headquarters Facility) | 5.000% | 1/1/24 (14) | 15,435 | 15,952 |
| Los Angeles CA Unified School District COP VRDO | 0.120% | 11/7/11 LOC | 5,045 | 5,045 |
| Los Angeles CA Unified School District GO | 5.000% | 7/1/16 | 7,290 | 8,354 |
| Los Angeles CA Unified School District GO | 5.000% | 7/1/16 (4) | 6,900 | 7,921 |
| Los Angeles CA Unified School District GO | 4.750% | 7/1/19 (4) | 12,500 | 13,754 |
| Los Angeles CA Unified School District GO | 5.000% | 7/1/19 | 3,635 | 4,235 |
| Los Angeles CA Unified School District GO | 5.000% | 7/1/21 (4) | 4,000 | 4,452 |
| Los Angeles CA Unified School District GO | 5.000% | 7/1/21 (4) | 10,000 | 11,131 |
| Los Angeles CA Unified School District GO | 5.000% | 7/1/22 (4) | 22,410 | 24,753 |
55
Intermediate-Term Tax-Exempt Fund
| | | | |
| | | | Face | Market |
| | | Maturity | Amount | Value• |
| | Coupon | Date | ($000) | ($000) |
| Los Angeles CA Unified School District GO | 5.000% | 7/1/23 (3) | 31,690 | 34,220 |
| Los Angeles CA Unified School District GO | 5.000% | 7/1/23 (3) | 24,035 | 26,047 |
| Los Angeles CA Unified School District GO | 5.000% | 7/1/23 (4) | 6,425 | 7,042 |
| Los Angeles CA Unified School District GO | 5.250% | 7/1/23 | 8,835 | 10,086 |
| Los Angeles CA Unified School District GO | 5.250% | 7/1/23 | 5,000 | 5,708 |
| Los Angeles CA Unified School District GO | 5.000% | 7/1/24 (14) | 19,915 | 21,285 |
| Los Angeles CA Unified School District GO | 5.000% | 7/1/25 (4) | 7,330 | 7,853 |
| Los Angeles CA Unified School District GO | 5.000% | 7/1/26 | 7,500 | 8,145 |
| Los Angeles CA Unified School District GO | 4.500% | 1/1/28 (14) | 10,000 | 10,009 |
| Los Angeles CA Unified School District GO | 5.250% | 7/1/28 | 8,000 | 8,837 |
| Los Angeles CA Unified School District GO | 5.200% | 7/1/29 | 6,295 | 6,809 |
| Los Angeles CA Wastewater System Revenue | 5.000% | 6/1/29 | 6,520 | 6,969 |
| Los Angeles County CA Metropolitan Transportation Authority Sales Tax Revenue | 5.000% | 7/1/15 | 10,665 | 12,160 |
| Los Angeles County CA Metropolitan Transportation Authority Sales Tax Revenue | 5.000% | 7/1/21 | 5,000 | 5,858 |
| Los Angeles County CA Public Works Financing Authority Lease Revenue | 5.000% | 8/1/16 | 3,450 | 3,919 |
| Los Angeles County CA Public Works Financing Authority Lease Revenue | 5.000% | 8/1/17 | 5,000 | 5,721 |
| M-S-R California Energy Authority Revenue | 7.000% | 11/1/34 | 6,000 | 7,123 |
| Newport Beach CA Revenue (Hoag Memorial Hospital Presbyterian) PUT | 5.000% | 2/7/13 | 5,000 | 5,274 |
| Newport Beach CA Revenue (Hoag Memorial Hospital Presbyterian) VRDO | 0.100% | 11/7/11 LOC | 4,000 | 4,000 |
| Northern California Power Agency Revenue (Hydroelectric Project) | 5.000% | 7/1/24 (12) | 1,130 | 1,229 |
| Oakland CA Redevelopment Agency Tax Allocation Revenue (Central District Project) | 5.000% | 9/1/21 (2) | 14,775 | 14,175 |
| Oakland CA Unified School District GO | 6.250% | 8/1/18 | 1,000 | 1,149 |
| Oakland CA Unified School District GO | 6.250% | 8/1/19 | 1,150 | 1,322 |
| Orange County CA Airport Revenue | 5.250% | 7/1/25 | 6,480 | 7,140 |
| Orange County CA Sanitation District COP | 5.000% | 2/1/28 | 7,250 | 7,849 |
| Orange County CA Sanitation District COP | 5.000% | 2/1/29 | 4,510 | 4,847 |
| Orange County CA Sanitation District COP | 5.000% | 2/1/29 (4) | 2,500 | 2,652 |
| Orange County CA Water District COP VRDO | 0.110% | 11/7/11 | 3,000 | 3,000 |
| Palmdale CA Community Redevelopment Agency Tax Allocation Revenue | 5.000% | 9/1/28 (14) | 10,575 | 9,780 |
| Palo Alto CA Unified School District GO | 0.000% | 8/1/23 | 13,900 | 8,440 |
| Palo Alto CA Unified School District GO | 0.000% | 8/1/28 | 20,320 | 9,106 |
| Palo Alto CA Unified School District GO | 0.000% | 8/1/29 | 19,530 | 8,142 |
| Palo Alto CA Unified School District GO | 0.000% | 8/1/31 | 12,305 | 4,495 |
| 1 Palomar PowerAde Health System California Revenue GO TOB VRDO | 0.130% | 11/7/11 (12) | 9,000 | 9,000 |
| Pittsburg CA Redevelopment Agency Tax Allocation Revenue | | | | |
| (Los Medanos Community Development Project) | 6.500% | 9/1/28 | 9,000 | 8,926 |
| Poway CA Unified School District GO | 0.000% | 8/1/29 | 5,000 | 1,763 |
| Redding CA Electric System COP | 5.000% | 6/1/23 (4) | 6,875 | 7,398 |
| Redding CA Electric System COP | 5.000% | 6/1/25 (4) | 7,860 | 8,310 |
| Redding CA Electric System COP | 5.000% | 6/1/27 (4) | 4,660 | 4,886 |
| Riverside CA Electric Revenue VRDO | 0.130% | 11/7/11 LOC | 12,000 | 12,000 |
| Riverside County CA Transportation Commission Sales Tax Revenue VRDO | 0.110% | 11/7/11 | 4,730 | 4,730 |
| Rocklin CA Unified School District GO | 0.000% | 8/1/22 (14) | 5,450 | 3,250 |
| Roseville CA Natural Gas Financing Authority Gas Revenue | 5.000% | 2/15/20 | 4,705 | 4,689 |
| Sacramento CA Municipal Utility District Financing Authority Revenue | 5.000% | 7/1/18 (14) | 2,000 | 2,115 |
| Sacramento County CA Airport Revenue | 5.500% | 7/1/27 | 7,870 | 8,402 |
| Sacramento County CA Airport Revenue | 5.500% | 7/1/28 | 5,000 | 5,291 |
| Sacramento County CA Airport Revenue | 5.625% | 7/1/29 | 5,485 | 5,817 |
| Sacramento County CA GO | 5.000% | 2/1/15 | 9,190 | 9,898 |
| Sacramento County CA GO | 5.000% | 2/1/17 | 4,650 | 5,062 |
| Sacramento County CA GO | 5.250% | 2/1/18 | 6,140 | 6,776 |
| Sacramento County CA GO | 5.250% | 2/1/19 | 4,940 | 5,435 |
| Sacramento County CA GO | 5.500% | 2/1/20 | 4,700 | 5,225 |
| Saddleback Valley CA Unified School District GO | 5.000% | 8/1/23 (4) | 5,460 | 5,894 |
| San Bernardino County CA Medical Center (Arrowhead Project) COP | 5.000% | 8/1/17 | 2,500 | 2,745 |
| San Bernardino County CA Medical Center (Arrowhead Project) COP | 5.000% | 8/1/18 | 8,995 | 9,853 |
| San Bernardino County CA Medical Center (Arrowhead Project) COP | 5.000% | 8/1/19 | 8,500 | 9,264 |
| San Diego CA Community College District GO | 5.000% | 8/1/26 | 3,895 | 4,336 |
| San Diego CA Community College District GO | 5.000% | 8/1/27 | 3,865 | 4,266 |
| San Diego CA Community College District GO | 5.000% | 8/1/27 | 8,350 | 9,217 |
| San Diego CA Community College District GO | 5.000% | 8/1/28 | 7,400 | 8,111 |
| San Diego CA Community College District GO | 5.000% | 8/1/28 | 8,820 | 9,668 |
| San Diego CA Community College District GO | 5.000% | 8/1/29 | 4,315 | 4,693 |
| San Diego CA Community College District GO | 5.000% | 8/1/30 (4) | 19,015 | 20,122 |
| San Diego CA Community College District GO | 5.250% | 8/1/33 | 3,325 | 3,623 |
| San Diego CA Public Facilities Financing Authority Sewer Revenue | 5.000% | 5/15/13 | 8,000 | 8,525 |
| San Diego CA Public Facilities Financing Authority Sewer Revenue | 5.250% | 5/15/25 | 10,000 | 11,274 |
| San Diego CA Public Facilities Financing Authority Sewer Revenue | 5.000% | 5/15/28 | 2,000 | 2,148 |
| San Diego CA Unified School District GO | 5.500% | 7/1/25 (14) | 10,000 | 11,671 |
| San Diego CA Unified School District GO | 5.500% | 7/1/27 (4) | 17,195 | 20,667 |
| San Diego CA Unified School District GO | 0.000% | 7/1/30 | 17,310 | 5,868 |
| 1 San Diego CA Unified School District GO TOB VRDO | 0.130% | 11/7/11 | 9,800 | 9,800 |
56
Intermediate-Term Tax-Exempt Fund
| | | | |
| | | | Face | Market |
| | | Maturity | Amount | Value• |
| | Coupon | Date | ($000) | ($000) |
| San Diego County CA Regional Airport Authority Revenue | 5.000% | 7/1/28 | 2,500 | 2,605 |
| San Diego County CA Regional Transportation Authority Sales Tax Revenue VRDO | 0.120% | 11/7/11 | 34,985 | 34,985 |
| San Francisco CA City & County International Airport Revenue | 5.000% | 5/1/18 | 15,000 | 17,312 |
| San Francisco CA City & County International Airport Revenue | 5.000% | 5/1/21 | 5,000 | 5,652 |
| San Francisco CA City & County International Airport Revenue | 5.000% | 5/1/22 | 9,135 | 10,213 |
| San Francisco CA City & County International Airport Revenue | 5.250% | 5/1/22 | 5,500 | 6,172 |
| San Francisco CA City & County International Airport Revenue | 5.500% | 5/1/26 | 3,370 | 3,663 |
| San Francisco CA City & County International Airport Revenue | 5.000% | 5/1/28 | 5,730 | 6,128 |
| San Francisco CA City & County International Airport Revenue | 5.000% | 5/1/29 | 6,270 | 6,655 |
| San Joaquin Hills CA Transportation Corridor Agency Toll Road Revenue | 0.000% | 1/1/21 (ETM) | 6,000 | 4,692 |
| San Joaquin Hills CA Transportation Corridor Agency Toll Road Revenue | 0.000% | 1/15/21 (14) | 12,385 | 6,219 |
| San Jose CA Redevelopment Agency Tax Allocation Revenue | 5.000% | 8/1/20 (2) | 20,000 | 19,665 |
| San Jose CA Redevelopment Agency Tax Allocation Revenue | 5.000% | 8/1/23 (2) | 24,900 | 23,686 |
| San Jose CA Redevelopment Agency Tax Allocation Revenue | 5.000% | 8/1/24 (14) | 29,885 | 28,005 |
| San Jose CA Redevelopment Agency Tax Allocation Revenue | 5.250% | 8/1/27 | 2,400 | 2,258 |
| San Jose CA Redevelopment Agency Tax Allocation Revenue | 5.375% | 8/1/28 | 1,175 | 1,109 |
| San Jose CA Redevelopment Agency Tax Allocation Revenue | 6.500% | 8/1/28 | 25,385 | 26,050 |
| 1 San Jose CA Unified School District Santa Clara County GO TOB VRDO | 0.240% | 11/7/11 | 5,000 | 5,000 |
| San Mateo County CA Joint Powers Financing Authority Lease Revenue | | | | |
| (Youth Services Campus) | 4.625% | 7/15/25 | 1,000 | 1,025 |
| San Mateo County CA Joint Powers Financing Authority Lease Revenue | | | | |
| (Youth Services Campus) | 5.250% | 7/15/28 | 2,000 | 2,102 |
| San Ramon Valley CA Unified School District GO | 5.000% | 8/1/26 (4) | 12,800 | 13,547 |
| 1 San Ramon Valley CA Unified School District GO TOB VRDO | 0.200% | 11/7/11 | 4,925 | 4,925 |
| Santa Clara County CA Financing Authority Lease Revenue (Multiple Facilities Projects) | 5.000% | 11/15/19 | 13,825 | 15,604 |
| Santa Clara County CA Financing Authority Lease Revenue | | | | |
| (VMC Facility Replacement Project) VRDO | 0.120% | 11/7/11 | 8,600 | 8,600 |
| Santa Clara Valley CA Transportation Authority Sales Tax Revenue VRDO | 0.070% | 11/7/11 | 8,500 | 8,500 |
| Santa Monica CA Community College District GO | 0.000% | 8/1/23 | 9,045 | 5,103 |
| Santa Monica CA Community College District GO | 0.000% | 8/1/27 | 6,565 | 2,806 |
| Santa Monica CA Community College District GO | 0.000% | 8/1/28 | 7,105 | 2,845 |
| Santa Monica CA Community College District GO | 0.000% | 8/1/29 | 12,640 | 4,710 |
| Santa Rosa CA Wastewater Revenue | 0.000% | 9/1/27 (2) | 11,125 | 4,343 |
| Southern California Public Power Authority Revenue | 5.000% | 7/1/22 | 10,000 | 11,397 |
| Southern California Public Power Authority Revenue | 5.000% | 7/1/27 | 10,000 | 10,871 |
| Southern California Public Power Authority Revenue | 5.000% | 7/1/28 | 10,000 | 10,756 |
| Southern California Public Power Authority Revenue | 5.000% | 7/1/29 | 2,500 | 2,670 |
| Torrance CA Hospital Revenue (Torrance Memorial Medical Center) | 5.000% | 9/1/30 | 4,735 | 4,748 |
| Tuolumne CA Wind Project Authority Revenue | 5.000% | 1/1/19 | 3,000 | 3,424 |
| Tuolumne CA Wind Project Authority Revenue | 5.000% | 1/1/20 | 13,130 | 14,794 |
| Tuolumne CA Wind Project Authority Revenue | 5.000% | 1/1/21 | 13,465 | 14,997 |
| Tuolumne CA Wind Project Authority Revenue | 5.625% | 1/1/29 | 9,000 | 9,815 |
| Turlock CA Irrigation District Revenue | 5.000% | 1/1/27 | 3,935 | 4,137 |
| Turlock CA Irrigation District Revenue | 5.000% | 1/1/28 | 4,160 | 4,344 |
| Turlock CA Irrigation District Revenue | 5.000% | 1/1/29 | 4,335 | 4,497 |
| Turlock CA Irrigation District Revenue | 5.000% | 1/1/30 | 2,250 | 2,323 |
| University of California Revenue | 5.000% | 5/15/21 | 10,625 | 11,617 |
| University of California Revenue | 5.500% | 5/15/24 | 14,675 | 17,229 |
| University of California Revenue | 5.000% | 5/15/26 | 12,915 | 14,386 |
| University of California Revenue | 5.000% | 5/15/27 | 5,000 | 5,518 |
| University of California Revenue | 5.000% | 5/15/30 | 2,830 | 3,043 |
| 1 University of California Revenue TOB VRDO | 0.140% | 11/7/11 | 14,000 | 14,000 |
| 1 University of California Revenue TOB VRDO | 0.200% | 11/7/11 | 9,520 | 9,520 |
| Ventura County CA Community College District GO | 0.000% | 8/1/23 | 6,155 | 3,398 |
| Ventura County CA Community College District GO | 0.000% | 8/1/24 | 8,050 | 4,150 |
| Ventura County CA Community College District GO | 0.000% | 8/1/25 | 8,000 | 3,854 |
| Ventura County CA Community College District GO | 0.000% | 8/1/26 | 8,500 | 3,829 |
| Ventura County CA Community College District GO | 0.000% | 8/1/27 | 8,500 | 3,578 |
| Ventura County CA Public Financing Authority COP | 5.625% | 8/15/27 | 1,000 | 1,097 |
| Ventura County CA Public Financing Authority COP | 5.750% | 8/15/28 | 1,750 | 1,926 |
| Ventura County CA Public Financing Authority COP | 5.750% | 8/15/29 | 1,750 | 1,914 |
| Victor Valley CA Community College District GO | 5.375% | 8/1/29 | 4,250 | 4,551 |
| Walnut CA Energy Center Authority Revenue | 5.000% | 1/1/29 | 2,510 | 2,586 |
| Walnut CA Energy Center Authority Revenue | 5.000% | 1/1/30 | 3,775 | 3,874 |
| West Basin CA Municipal Water District COP | 5.000% | 8/1/25 (12) | 5,365 | 5,683 |
| West Basin CA Municipal Water District COP | 5.000% | 8/1/27 (12) | 5,000 | 5,233 |
| West Contra Costa CA Unified School District GO | 0.000% | 8/1/17 (12) | 1,565 | 1,269 |
| West Contra Costa CA Unified School District GO | 0.000% | 8/1/18 (12) | 3,000 | 2,303 |
| West Contra Costa CA Unified School District GO | 0.000% | 8/1/19 (12) | 4,190 | 2,996 |
| West Contra Costa CA Unified School District GO | 0.000% | 8/1/20 (12) | 6,000 | 3,913 |
| West Contra Costa CA Unified School District GO | 0.000% | 8/1/33 (12) | 2,810 | 734 |
| | | | | 3,935,667 |
57
Intermediate-Term Tax-Exempt Fund
| | | | |
| | | | Face | Market |
| | | Maturity | Amount | Value• |
| | Coupon | Date | ($000) | ($000) |
| Colorado (1.3%) | | | | |
| Aurora CO COP | 5.000% | 12/1/19 | 1,050 | 1,227 |
| Aurora CO COP | 5.000% | 12/1/20 | 2,000 | 2,289 |
| Aurora CO COP | 5.000% | 12/1/21 | 3,505 | 3,969 |
| Aurora CO COP | 5.000% | 12/1/22 | 4,730 | 5,274 |
| Aurora CO COP | 5.000% | 12/1/23 | 4,465 | 4,939 |
| Aurora CO COP | 5.000% | 12/1/24 | 4,215 | 4,609 |
| Aurora CO COP | 5.000% | 12/1/25 | 5,475 | 5,936 |
| Broomfield CO City & County COP | 5.000% | 12/1/24 | 2,685 | 2,978 |
| Broomfield CO City & County COP | 5.000% | 12/1/25 | 2,820 | 3,098 |
| Broomfield CO City & County COP | 5.000% | 12/1/26 | 2,965 | 3,231 |
| Broomfield CO City & County COP | 5.000% | 12/1/27 | 3,115 | 3,370 |
| Broomfield CO City & County COP | 5.000% | 12/1/29 | 7,470 | 7,975 |
| Colorado Department of Transportation RAN | 5.375% | 6/15/12 (Prere.) | 8,500 | 8,856 |
| Colorado Department of Transportation Revenue | 5.500% | 6/15/12 (14) | 11,780 | 12,157 |
| Colorado Department of Transportation Revenue | 5.500% | 6/15/13 (14) | 14,500 | 15,646 |
| Colorado Department of Transportation Revenue | 5.000% | 12/15/15 (14) | 37,825 | 43,532 |
| Colorado Health Facilities Authority Revenue (Catholic Health Initiatives) | 6.125% | 10/1/28 | 10,000 | 11,170 |
| Colorado Health Facilities Authority Revenue (Catholic Health Initiatives) | 5.500% | 7/1/29 | 50,000 | 53,242 |
| 2 Colorado Health Facilities Authority Revenue (Catholic Health Initiatives) | 5.250% | 2/1/31 | 14,000 | 14,381 |
| Colorado Health Facilities Authority Revenue | | | | |
| (Poudre Valley Health Care Inc. & Medical Center of the Rockies) | 5.000% | 3/1/25 | 4,900 | 4,918 |
| Colorado Health Facilities Authority Revenue (Sisters of Charity of Leavenworth Health System) | 5.000% | 1/1/22 | 6,100 | 6,672 |
| Colorado Health Facilities Authority Revenue (Sisters of Charity of Leavenworth Health System) | 5.000% | 1/1/22 | 13,175 | 14,411 |
| Colorado Health Facilities Authority Revenue (Sisters of Charity of Leavenworth Health System) | 5.250% | 1/1/30 | 20,955 | 21,656 |
| Colorado Springs CO Utility System Revenue | 5.375% | 11/15/11 (Prere.) | 2,795 | 2,801 |
| Colorado Springs CO Utility System Revenue | 5.375% | 11/15/11 (Prere.) | 2,825 | 2,831 |
| Colorado Springs CO Utility System Revenue | 5.375% | 11/15/11 (Prere.) | 9,825 | 9,845 |
| Colorado Springs CO Utility System Revenue | 5.375% | 11/15/11 (Prere.) | 9,920 | 9,940 |
| Denver CO City & County (Medical Facilities) GO | 5.000% | 8/1/14 | 7,065 | 7,600 |
| Denver CO City & County Airport Revenue | 5.000% | 11/15/24 (10) | 8,965 | 9,633 |
| Denver CO City & County Airport Revenue | 5.250% | 11/15/28 | 3,210 | 3,488 |
| E-470 Public Highway Authority Colorado Revenue | 0.000% | 9/1/17 (14) | 24,490 | 18,060 |
| E-470 Public Highway Authority Colorado Revenue | 5.250% | 9/1/18 (14) | 7,850 | 8,136 |
| E-470 Public Highway Authority Colorado Revenue | 5.250% | 9/1/18 (14) | 6,355 | 6,587 |
| E-470 Public Highway Authority Colorado Revenue | 0.000% | 9/1/19 (14) | 15,100 | 9,565 |
| E-470 Public Highway Authority Colorado Revenue | 0.000% | 9/1/21 | 27,500 | 15,072 |
| E-470 Public Highway Authority Colorado Revenue | 0.000% | 9/1/24 (14) | 20,000 | 8,779 |
| E-470 Public Highway Authority Colorado Revenue | 5.250% | 9/1/25 | 1,500 | 1,465 |
| E-470 Public Highway Authority Colorado Revenue | 5.375% | 9/1/26 | 2,000 | 1,961 |
| 1 Regional Transportation District of Colorado Sales Tax Revenue TOB VRDO | 0.140% | 11/7/11 | 5,105 | 5,105 |
| University of Colorado Enterprise System Revenue | 5.000% | 6/1/20 (14) | 5,785 | 6,574 |
| University of Colorado Enterprise System Revenue | 5.000% | 6/1/21 (14) | 6,605 | 7,353 |
| University of Colorado Enterprise System Revenue | 5.500% | 6/1/24 | 2,000 | 2,318 |
| University of Colorado Enterprise System Revenue | 5.500% | 6/1/26 | 2,750 | 3,135 |
| University of Colorado Hospital Authority Revenue | 6.000% | 11/15/29 | 9,850 | 10,576 |
| | | | | 406,360 |
| Connecticut (1.3%) | | | | |
| Connecticut Development Authority Pollution Control Revenue | | | | |
| (Connecticut Light & Power Co. Project) | 4.375% | 9/1/28 | 5,000 | 5,004 |
| Connecticut GO | 5.125% | 11/15/11 (Prere.) | 25,375 | 25,423 |
| Connecticut GO | 5.125% | 11/15/11 (Prere.) | 5,675 | 5,686 |
| Connecticut GO | 5.500% | 11/15/11 (4) | 21,215 | 21,259 |
| Connecticut GO | 5.500% | 12/15/11 (14) | 9,000 | 9,059 |
| Connecticut GO | 5.500% | 12/15/12 (4) | 5,020 | 5,313 |
| Connecticut GO | 5.000% | 4/15/13 | 9,745 | 10,393 |
| Connecticut GO | 5.000% | 11/1/13 | 10,000 | 10,901 |
| Connecticut GO | 5.125% | 11/15/13 | 19,000 | 19,073 |
| Connecticut GO | 5.500% | 12/15/13 | 1,705 | 1,886 |
| Connecticut GO | 5.000% | 4/15/14 | 13,690 | 15,128 |
| Connecticut GO | 5.500% | 12/15/14 | 7,700 | 8,825 |
| Connecticut GO | 5.000% | 4/15/15 | 16,155 | 18,365 |
| Connecticut GO | 5.000% | 4/15/15 | 2,325 | 2,643 |
| Connecticut GO | 5.000% | 5/1/15 | 1,765 | 2,009 |
| 3 Connecticut GO | 0.640% | 5/15/15 | 5,000 | 5,000 |
| Connecticut GO | 5.000% | 11/1/15 | 5,000 | 5,772 |
| Connecticut GO | 5.000% | 12/1/15 (14) | 6,700 | 7,386 |
| Connecticut GO | 5.000% | 12/15/15 | 14,345 | 16,616 |
| Connecticut GO | 5.000% | 4/15/16 | 13,725 | 15,918 |
| 3 Connecticut GO | 0.790% | 5/15/16 | 5,000 | 5,000 |
| 3 Connecticut GO | 0.790% | 5/15/16 | 8,400 | 8,400 |
| 3 Connecticut GO | 0.910% | 5/15/17 | 5,000 | 5,000 |
58
Intermediate-Term Tax-Exempt Fund
| | | | |
| | | | Face | Market |
| | | Maturity | Amount | Value• |
| | Coupon | Date | ($000) | ($000) |
| 3 Connecticut GO | 1.060% | 5/15/18 | 14,000 | 14,000 |
| Connecticut GO | 5.000% | 12/15/18 | 11,000 | 12,800 |
| Connecticut Health & Educational Facilities Authority Revenue | | | | |
| (Connecticut State University System) | 5.000% | 11/1/12 (4) | 6,275 | 6,569 |
| Connecticut Health & Educational Facilities Authority Revenue (Hartford Healthcare) | 5.000% | 7/1/32 | 4,000 | 4,021 |
| Connecticut Health & Educational Facilities Authority Revenue (Wesleyan University) | 5.000% | 7/1/28 | 8,550 | 9,454 |
| Connecticut Health & Educational Facilities Authority Revenue (Yale University) VRDO | 0.050% | 11/7/11 | 4,750 | 4,750 |
| Connecticut Special Tax Revenue (Transportation Infrastructure) | 5.000% | 11/1/11 | 4,035 | 4,035 |
| Connecticut Special Tax Revenue (Transportation Infrastructure) | 6.500% | 10/1/12 | 6,600 | 6,957 |
| Connecticut Special Tax Revenue (Transportation Infrastructure) | 5.000% | 11/1/12 | 4,685 | 4,904 |
| Connecticut Special Tax Revenue (Transportation Infrastructure) | 5.375% | 10/1/13 (4) | 20,000 | 20,081 |
| Connecticut Special Tax Revenue (Transportation Infrastructure) | 5.000% | 11/1/13 | 2,970 | 3,236 |
| Connecticut Special Tax Revenue (Transportation Infrastructure) | 5.000% | 2/1/14 | 12,000 | 13,152 |
| Connecticut Special Tax Revenue (Transportation Infrastructure) | 5.000% | 11/1/14 | 7,315 | 8,225 |
| Connecticut Special Tax Revenue (Transportation Infrastructure) | 5.000% | 11/1/17 | 7,090 | 8,383 |
| Connecticut Special Tax Revenue (Transportation Infrastructure) | 5.000% | 11/1/23 | 12,085 | 13,635 |
| Connecticut Special Tax Revenue (Transportation Infrastructure) | 5.000% | 11/1/24 | 10,880 | 12,172 |
| Connecticut Special Tax Revenue (Transportation Infrastructure) | 5.000% | 11/1/25 | 12,515 | 13,905 |
| | | | | 390,338 |
| Delaware (0.1%) | | | | |
| Delaware GO | 5.000% | 10/1/16 | 19,895 | 23,462 |
| Delaware Transportation Authority Transportation System Revenue | 5.000% | 7/1/12 | 3,690 | 3,807 |
| Delaware Transportation Authority Transportation System Revenue | 5.000% | 7/1/13 | 3,875 | 4,168 |
| Delaware Transportation Authority Transportation System Revenue | 5.000% | 7/1/29 | 10,000 | 10,937 |
| University of Delaware Revenue | 5.000% | 11/1/18 | 1,000 | 1,210 |
| University of Delaware Revenue | 5.000% | 11/1/22 | 1,000 | 1,172 |
| | | | | 44,756 |
| District of Columbia (0.4%) | | | | |
| District of Columbia GO | 0.000% | 6/1/13 (14) | 10,945 | 10,708 |
| District of Columbia GO | 5.000% | 6/1/13 (Prere.) | 10,880 | 11,670 |
| District of Columbia GO | 0.000% | 6/1/14 (14) | 16,650 | 15,929 |
| District of Columbia GO | 5.000% | 6/1/19 (4) | 5,325 | 6,084 |
| District of Columbia GO | 5.000% | 6/1/20 (4) | 11,840 | 13,351 |
| District of Columbia GO | 5.000% | 6/1/21 (4) | 10,380 | 11,608 |
| District of Columbia Hospital Revenue (Medlantic Healthcare Group Inc.) | 6.000% | 8/15/12 (ETM) | 2,995 | 3,130 |
| District of Columbia Revenue (Georgetown University) | 5.000% | 4/1/21 (2) | 5,610 | 6,022 |
| District of Columbia Revenue (Georgetown University) | 5.000% | 4/1/22 (2) | 5,800 | 6,184 |
| District of Columbia Revenue (Georgetown University) | 5.000% | 4/1/23 (2) | 6,600 | 7,001 |
| District of Columbia Revenue (Georgetown University) | 5.000% | 4/1/24 (2) | 6,190 | 6,520 |
| District of Columbia Revenue (Georgetown University) PUT | 4.700% | 4/1/18 | 23,500 | 25,950 |
| | | | | 124,157 |
| Florida (7.2%) | | | | |
| Brevard County FL School Board COP | 5.000% | 7/1/23 (12) | 4,615 | 4,975 |
| Brevard County FL School Board COP | 5.000% | 7/1/24 (12) | 4,850 | 5,186 |
| Brevard County FL School Board COP | 5.000% | 7/1/25 (12) | 5,090 | 5,388 |
| Broward County FL GO | 5.000% | 1/1/20 | 9,185 | 10,680 |
| Broward County FL Port Facilities Revenue | 5.500% | 9/1/29 | 5,500 | 5,770 |
| Broward County FL School Board COP | 5.250% | 7/1/20 (14) | 4,155 | 4,383 |
| Broward County FL School Board COP | 5.250% | 7/1/24 (4) | 12,480 | 13,396 |
| Broward County FL Water & Sewer Utility Revenue | 5.000% | 10/1/23 | 2,000 | 2,240 |
| Citizens Property Insurance Corp. Florida Revenue(Coastal Account) | 5.000% | 3/1/14 (14) | 35,000 | 37,166 |
| Citizens Property Insurance Corp. Florida Revenue(Coastal Account) | 5.500% | 6/1/14 | 20,000 | 21,607 |
| Citizens Property Insurance Corp. Florida Revenue(Coastal Account) | 5.000% | 6/1/15 | 70,000 | 75,425 |
| Citizens Property Insurance Corp. Florida Revenue(Coastal Account) | 5.000% | 6/1/16 | 16,000 | 17,311 |
| Citizens Property Insurance Corp. Florida Revenue(Coastal Account) | 5.000% | 6/1/16 | 10,000 | 10,820 |
| Citizens Property Insurance Corp. Florida Revenue(Coastal Account) | 5.250% | 6/1/17 | 23,000 | 25,144 |
| Clay County FL Sales Surtax Revenue | 5.000% | 10/1/12 (12) | 6,690 | 6,905 |
| Clay County FL Sales Surtax Revenue | 5.000% | 10/1/16 (12) | 8,135 | 9,025 |
| Florida Board of Education Capital Outlay GO | 5.375% | 1/1/13 | 4,855 | 4,944 |
| Florida Board of Education Capital Outlay GO | 5.000% | 1/1/16 | 8,000 | 9,005 |
| Florida Board of Education Capital Outlay GO | 5.000% | 1/1/17 | 4,600 | 5,161 |
| Florida Board of Education Lottery Revenue | 5.250% | 7/1/12 (Prere.) | 7,150 | 7,455 |
| Florida Board of Education Lottery Revenue | 5.250% | 7/1/12 (Prere.) | 3,700 | 3,858 |
| Florida Board of Education Lottery Revenue | 5.375% | 7/1/12 (Prere.) | 6,000 | 6,261 |
| Florida Board of Education Lottery Revenue | 5.500% | 7/1/12 (Prere.) | 7,860 | 8,209 |
| Florida Board of Education Lottery Revenue | 5.000% | 7/1/13 (Prere.) | 10,240 | 11,098 |
| Florida Board of Education Lottery Revenue | 5.000% | 7/1/13 (Prere.) | 6,000 | 6,503 |
| Florida Board of Education Lottery Revenue | 5.000% | 7/1/16 (2) | 10,715 | 12,088 |
| Florida Board of Education Lottery Revenue | 5.000% | 7/1/18 | 4,000 | 4,667 |
| Florida Board of Education Lottery Revenue | 5.000% | 7/1/19 | 4,550 | 5,254 |
| Florida Board of Education Lottery Revenue | 5.000% | 7/1/20 (2) | 12,545 | 13,581 |
59
Intermediate-Term Tax-Exempt Fund
| | | | |
| | | | Face | Market |
| | | Maturity | Amount | Value• |
| | Coupon | Date | ($000) | ($000) |
| Florida Board of Education Lottery Revenue | 5.000% | 7/1/21 (2) | 11,590 | 12,476 |
| Florida Board of Education Lottery Revenue | 5.000% | 7/1/22 (14) | 14,690 | 16,217 |
| Florida Board of Education Lottery Revenue | 5.000% | 7/1/23 (2) | 11,235 | 12,005 |
| Florida Board of Education Lottery Revenue | 5.000% | 7/1/24 | 11,385 | 12,543 |
| Florida Board of Education Lottery Revenue | 5.000% | 7/1/24 | 13,700 | 14,923 |
| Florida Board of Education Lottery Revenue | 5.000% | 7/1/25 | 13,215 | 14,431 |
| Florida Board of Education Lottery Revenue | 5.000% | 7/1/25 | 14,385 | 15,549 |
| Florida Board of Education Lottery Revenue | 5.000% | 7/1/26 | 13,875 | 15,057 |
| Florida Board of Education Lottery Revenue | 5.000% | 7/1/27 | 15,855 | 16,961 |
| Florida Board of Education Public Education Capital Outlay GO | 5.250% | 6/1/12 (Prere.) | 1,285 | 1,335 |
| Florida Board of Education Public Education Capital Outlay GO | 5.000% | 6/1/13 | 3,815 | 4,088 |
| Florida Board of Education Public Education Capital Outlay GO | 5.000% | 6/1/13 | 8,395 | 8,995 |
| Florida Board of Education Public Education Capital Outlay GO | 5.000% | 6/1/13 | 3,720 | 3,986 |
| Florida Board of Education Public Education Capital Outlay GO | 5.250% | 6/1/13 | 5,045 | 5,426 |
| Florida Board of Education Public Education Capital Outlay GO | 5.250% | 6/1/13 | 3,845 | 4,134 |
| Florida Board of Education Public Education Capital Outlay GO | 5.250% | 6/1/13 (4) | 16,540 | 17,166 |
| Florida Board of Education Public Education Capital Outlay GO | 5.375% | 6/1/13 | 6,820 | 7,083 |
| Florida Board of Education Public Education Capital Outlay GO | 5.000% | 6/1/14 | 4,005 | 4,442 |
| Florida Board of Education Public Education Capital Outlay GO | 5.000% | 6/1/14 | 3,910 | 4,337 |
| Florida Board of Education Public Education Capital Outlay GO | 5.000% | 6/1/14 | 5,040 | 5,428 |
| Florida Board of Education Public Education Capital Outlay GO | 5.000% | 6/1/15 | 4,205 | 4,783 |
| Florida Board of Education Public Education Capital Outlay GO | 5.000% | 6/1/15 | 7,295 | 7,848 |
| Florida Board of Education Public Education Capital Outlay GO | 5.000% | 6/1/15 | 5,540 | 6,315 |
| Florida Board of Education Public Education Capital Outlay GO | 5.000% | 6/1/15 | 4,105 | 4,679 |
| Florida Board of Education Public Education Capital Outlay GO | 5.375% | 6/1/15 | 11,000 | 11,306 |
| Florida Board of Education Public Education Capital Outlay GO | 5.000% | 6/1/19 | 2,905 | 3,461 |
| Florida Board of Education Public Education Capital Outlay GO | 4.750% | 6/1/20 | 26,350 | 28,667 |
| Florida Board of Education Public Education Capital Outlay GO | 5.000% | 6/1/20 | 3,500 | 4,003 |
| Florida Board of Education Public Education Capital Outlay GO | 5.000% | 6/1/20 | 5,585 | 6,633 |
| Florida Board of Education Public Education Capital Outlay GO | 5.000% | 6/1/22 | 9,245 | 10,842 |
| Florida Board of Education Public Education Capital Outlay GO | 5.000% | 6/1/22 | 5,000 | 5,827 |
| Florida Board of Education Public Education Capital Outlay GO | 5.000% | 6/1/23 | 2,125 | 2,447 |
| Florida Board of Education Public Education Capital Outlay GO | 6.000% | 6/1/23 | 7,000 | 9,195 |
| Florida Board of Education Public Education Capital Outlay GO | 4.750% | 6/1/27 | 2,600 | 2,830 |
| Florida Department of Environmental Protection & Preservation Revenue | 5.000% | 7/1/12 (14) | 3,000 | 3,094 |
| Florida Department of Environmental Protection & Preservation Revenue | 5.250% | 7/1/12 | 20,000 | 20,659 |
| Florida Department of Environmental Protection & Preservation Revenue | 5.375% | 7/1/13 (14) | 7,645 | 7,982 |
| Florida Department of Environmental Protection & Preservation Revenue | 5.500% | 7/1/13 (4) | 11,920 | 12,863 |
| Florida Department of Environmental Protection & Preservation Revenue | 5.000% | 7/1/17 | 8,175 | 9,447 |
| Florida Department of Environmental Protection & Preservation Revenue | 5.000% | 7/1/19 | 5,855 | 6,742 |
| Florida Department of Environmental Protection & Preservation Revenue | 5.000% | 7/1/24 | 10,025 | 10,907 |
| Florida Department of Environmental Protection & Preservation Revenue | 5.000% | 7/1/24 (14) | 10,045 | 10,599 |
| Florida Department of Environmental Protection & Preservation Revenue | 5.000% | 7/1/24 (14) | 10,000 | 10,552 |
| Florida Department of Environmental Protection & Preservation Revenue | 5.000% | 7/1/24 | 9,025 | 9,724 |
| Florida Department of Environmental Protection & Preservation Revenue | 5.000% | 7/1/25 | 10,525 | 11,331 |
| Florida Department of Environmental Protection & Preservation Revenue | 5.000% | 7/1/25 (14) | 6,700 | 7,153 |
| Florida Department of Environmental Protection & Preservation Revenue | 5.000% | 7/1/25 | 9,475 | 10,116 |
| Florida Department of Environmental Protection & Preservation Revenue | 5.000% | 7/1/26 | 11,055 | 11,834 |
| Florida Department of Environmental Protection & Preservation Revenue | 5.000% | 7/1/26 (14) | 10,045 | 10,672 |
| Florida Department of Environmental Protection & Preservation Revenue | 5.000% | 7/1/26 | 9,950 | 10,571 |
| Florida Department of Environmental Protection & Preservation Revenue | 5.000% | 7/1/27 | 11,605 | 12,341 |
| Florida Department of Environmental Protection & Preservation Revenue | 5.000% | 7/1/27 | 5,445 | 5,751 |
| Florida Department of Environmental Protection & Preservation Revenue | 5.000% | 7/1/28 | 10,970 | 11,521 |
| Florida Department of Environmental Protection & Preservation Revenue VRDO | 0.150% | 11/7/11 (12) | 18,575 | 18,575 |
| Florida Department of General Services Division Facilities Management Revenue | | | | |
| (Florida Facilities Pool) | 5.000% | 9/1/13 (2) | 3,060 | 3,278 |
| Florida Department of Transportation GO | 5.000% | 7/1/19 | 7,895 | 9,400 |
| Florida Department of Transportation GO | 5.000% | 7/1/22 | 6,055 | 7,013 |
| Florida Department of Transportation GO | 5.000% | 7/1/25 | 10,000 | 10,651 |
| Florida Division Board Financial Department of General Services Systems Revenue | | | | |
| (Department of Environmental Protection) | 6.000% | 7/1/12 (2) | 11,500 | 11,921 |
| Florida Hurricane Catastrophe Fund Finance Corp. Revenue | 5.000% | 7/1/12 | 40,000 | 41,180 |
| Florida Hurricane Catastrophe Fund Finance Corp. Revenue | 5.250% | 7/1/12 | 17,865 | 18,422 |
| Florida Hurricane Catastrophe Fund Finance Corp. Revenue | 5.000% | 7/1/13 | 38,000 | 40,116 |
| Florida Hurricane Catastrophe Fund Finance Corp. Revenue | 5.000% | 7/1/14 | 14,000 | 15,083 |
| Florida Hurricane Catastrophe Fund Finance Corp. Revenue | 5.000% | 7/1/16 | 50,000 | 55,009 |
| Florida Municipal Power Agency Revenue | 5.250% | 10/1/19 (4) | 10,000 | 11,650 |
| Florida Municipal Power Agency Revenue | 5.000% | 10/1/27 | 12,500 | 13,133 |
| Florida Municipal Power Agency Revenue | 5.750% | 10/1/27 | 3,000 | 3,345 |
| Florida Municipal Power Agency Revenue (St. Lucie Project) | 5.000% | 10/1/18 | 3,630 | 4,126 |
| Florida Municipal Power Agency Revenue (St. Lucie Project) | 5.000% | 10/1/19 | 3,535 | 4,008 |
| Florida Municipal Power Agency Revenue (Stanton Project) | 5.500% | 10/1/13 (4) | 3,905 | 4,072 |
60
Intermediate-Term Tax-Exempt Fund
| | | | |
| | | | Face | Market |
| | | Maturity | Amount | Value• |
| | Coupon | Date | ($000) | ($000) |
| Florida Ports Financing Commission Revenue | 5.000% | 10/1/24 | 2,075 | 2,271 |
| Florida Ports Financing Commission Revenue | 5.000% | 10/1/26 | 1,420 | 1,524 |
| Florida Ports Financing Commission Revenue | 5.000% | 10/1/28 | 2,000 | 2,112 |
| Florida Turnpike Authority Revenue | 5.000% | 7/1/17 (4) | 10,000 | 10,721 |
| Florida Turnpike Authority Revenue | 5.000% | 7/1/19 | 1,365 | 1,557 |
| Florida Turnpike Authority Revenue | 5.000% | 7/1/19 (2) | 4,150 | 4,568 |
| Florida Turnpike Authority Revenue | 5.000% | 7/1/20 (2) | 2,745 | 3,001 |
| Florida Turnpike Authority Revenue | 5.000% | 7/1/20 | 3,000 | 3,388 |
| Florida Turnpike Authority Revenue | 5.000% | 7/1/22 (2) | 5,120 | 5,539 |
| Florida Water Pollution Control Financing Corp. Revenue | 5.000% | 1/15/20 | 2,000 | 2,362 |
| Fort Myers FL Improvement Revenue | 5.000% | 12/1/25 (14) | 7,340 | 7,613 |
| Gainsville FL Utility System Revenue VRDO | 0.200% | 11/1/11 | 7,385 | 7,385 |
| Greater Orlando Aviation Authority Orlando Florida Airport Facilities Revenue | 5.000% | 10/1/25 | 1,690 | 1,827 |
| Highlands County FL Health Facilities Authority Hospital Revenue | | | | |
| (Adventist Health System/Sunbelt Obligated Group) | 5.000% | 11/15/15 (Prere.) | 125 | 144 |
| Highlands County FL Health Facilities Authority Hospital Revenue | | | | |
| (Adventist Health System/Sunbelt Obligated Group) | 5.000% | 11/15/15 (Prere.) | 145 | 168 |
| Highlands County FL Health Facilities Authority Hospital Revenue | | | | |
| (Adventist Health System/Sunbelt Obligated Group) | 5.000% | 11/15/15 (Prere.) | 260 | 300 |
| Highlands County FL Health Facilities Authority Hospital Revenue | | | | |
| (Adventist Health System/Sunbelt Obligated Group) | 5.000% | 11/15/15 (Prere.) | 190 | 220 |
| Highlands County FL Health Facilities Authority Hospital Revenue | | | | |
| (Adventist Health System/Sunbelt Obligated Group) | 5.000% | 11/15/15 (Prere.) | 820 | 947 |
| Highlands County FL Health Facilities Authority Hospital Revenue | | | | |
| (Adventist Health System/Sunbelt Obligated Group) | 5.000% | 11/15/17 | 3,000 | 3,414 |
| Highlands County FL Health Facilities Authority Hospital Revenue | | | | |
| (Adventist Health System/Sunbelt Obligated Group) | 5.000% | 11/15/18 | 2,000 | 2,272 |
| Highlands County FL Health Facilities Authority Hospital Revenue | | | | |
| (Adventist Health System/Sunbelt Obligated Group) | 5.000% | 11/15/18 | 1,700 | 1,838 |
| Highlands County FL Health Facilities Authority Hospital Revenue | | | | |
| (Adventist Health System/Sunbelt Obligated Group) | 5.000% | 11/15/18 | 3,000 | 3,408 |
| Highlands County FL Health Facilities Authority Hospital Revenue | | | | |
| (Adventist Health System/Sunbelt Obligated Group) | 5.000% | 11/15/19 | 3,000 | 3,411 |
| Highlands County FL Health Facilities Authority Hospital Revenue | | | | |
| (Adventist Health System/Sunbelt Obligated Group) | 5.000% | 11/15/20 | 875 | 930 |
| Highlands County FL Health Facilities Authority Hospital Revenue | | | | |
| (Adventist Health System/Sunbelt Obligated Group) | 5.000% | 11/15/20 | 2,155 | 2,409 |
| Highlands County FL Health Facilities Authority Hospital Revenue | | | | |
| (Adventist Health System/Sunbelt Obligated Group) | 5.000% | 11/15/20 | 7,000 | 7,826 |
| Highlands County FL Health Facilities Authority Hospital Revenue | | | | |
| (Adventist Health System/Sunbelt Obligated Group) | 5.000% | 11/15/20 | 1,000 | 1,063 |
| Highlands County FL Health Facilities Authority Hospital Revenue | | | | |
| (Adventist Health System/Sunbelt Obligated Group) | 4.500% | 11/15/21 | 2,250 | 2,409 |
| Highlands County FL Health Facilities Authority Hospital Revenue | | | | |
| (Adventist Health System/Sunbelt Obligated Group) | 5.000% | 11/15/21 | 135 | 143 |
| Highlands County FL Health Facilities Authority Hospital Revenue | | | | |
| (Adventist Health System/Sunbelt Obligated Group) | 5.000% | 11/15/21 | 1,000 | 1,057 |
| Highlands County FL Health Facilities Authority Hospital Revenue | | | | |
| (Adventist Health System/Sunbelt Obligated Group) | 5.250% | 11/15/21 | 2,000 | 2,248 |
| Highlands County FL Health Facilities Authority Hospital Revenue | | | | |
| (Adventist Health System/Sunbelt Obligated Group) | 5.000% | 11/15/22 | 740 | 778 |
| Highlands County FL Health Facilities Authority Hospital Revenue | | | | |
| (Adventist Health System/Sunbelt Obligated Group) | 5.000% | 11/15/22 | 1,000 | 1,052 |
| Highlands County FL Health Facilities Authority Hospital Revenue | | | | |
| (Adventist Health System/Sunbelt Obligated Group) | 5.000% | 11/15/23 | 1,310 | 1,371 |
| Highlands County FL Health Facilities Authority Hospital Revenue | | | | |
| (Adventist Health System/Sunbelt Obligated Group) | 5.000% | 11/15/23 | 500 | 523 |
| Hillsborough County FL Assement Revenue | 5.000% | 3/1/22 (14) | 6,260 | 6,556 |
| Hillsborough County FL Aviation Authority Revenue (Tampa International Airport) | 5.000% | 10/1/15 | 2,500 | 2,811 |
| Hillsborough County FL Aviation Authority Revenue (Tampa International Airport) | 5.000% | 10/1/17 | 2,750 | 3,148 |
| Hillsborough County FL Aviation Authority Revenue (Tampa International Airport) | 5.000% | 10/1/18 | 3,400 | 3,909 |
| Hillsborough County FL Industrial Development Authority Health Facilities Revenue | | | | |
| (University Community Hospital) | 5.500% | 8/15/17 (ETM) | 3,650 | 4,419 |
| Hillsborough County FL Industrial Development Authority Pollution Control Revenue | | | | |
| (Tampa Electric Co. Project) PUT | 5.000% | 3/15/12 (2) | 8,000 | 8,124 |
| Hillsborough County FL Industrial Development Authority Revenue | | | | |
| (University Community Hospital) | 6.500% | 8/15/19 (ETM) | 3,500 | 4,354 |
| Hillsborough County FL School Board (Master Lease Program) COP | 5.500% | 7/1/14 (14) | 4,370 | 4,790 |
| Hillsborough County FL School Board COP | 5.000% | 7/1/24 | 16,305 | 17,845 |
| Hillsborough County FL School Board COP | 5.000% | 7/1/25 | 6,000 | 6,499 |
| Hillsborough County FL Utility Revenue | 5.500% | 8/1/13 (ETM) | 5,255 | 5,701 |
| Hillsborough County FL Utility Revenue | 5.500% | 8/1/13 (2) | 4,745 | 5,134 |
61
Intermediate-Term Tax-Exempt Fund
| | | | |
| | | | Face | Market |
| | | Maturity | Amount | Value• |
| | Coupon | Date | ($000) | ($000) |
| Jacksonville FL Electric Authority Electric System Revenue | 5.000% | 10/1/22 | 2,500 | 2,844 |
| Jacksonville FL Electric Authority Electric System Revenue | 5.000% | 10/1/28 | 3,900 | 4,199 |
| Jacksonville FL Electric Authority Electric System Revenue | 5.000% | 10/1/29 | 2,075 | 2,219 |
| Jacksonville FL Electric Authority Electric System Revenue VRDO | 0.110% | 11/7/11 | 38,950 | 38,950 |
| Jacksonville FL Electric Authority Revenue (St. John’s River Power Park) | 5.000% | 10/1/17 | 6,000 | 6,990 |
| Jacksonville FL Electric Authority Revenue (St. John’s River Power Park) | 5.000% | 10/1/19 (14) | 5,000 | 5,541 |
| Jacksonville FL Electric Authority Revenue (St. John’s River Power Park) | 5.000% | 10/1/20 (14) | 5,000 | 5,528 |
| Jacksonville FL Electric Authority Water & Sewer Revenue VRDO | 0.130% | 11/7/11 | 1,700 | 1,700 |
| Jacksonville FL Health Facilities Authority Hospital Revenue | | | | |
| (Baptist Medical Center Project) VRDO | 0.140% | 11/1/11 LOC | 4,600 | 4,600 |
| Jacksonville FL Sales Taxes Revenue | 5.500% | 10/1/13 (14) | 3,045 | 3,307 |
| Jacksonville FL Sales Taxes Revenue | 5.000% | 10/1/23 | 5,415 | 5,976 |
| Jacksonville FL Sales Taxes Revenue | 5.000% | 10/1/24 | 5,685 | 6,221 |
| Jacksonville FL Sales Taxes Revenue | 5.000% | 10/1/25 | 5,970 | 6,495 |
| Jacksonville FL Sales Taxes Revenue | 4.750% | 10/1/28 | 13,280 | 13,876 |
| Jacksonville FL Special Revenue | 5.000% | 10/1/20 | 15,420 | 17,849 |
| Jacksonville FL Special Revenue | 5.000% | 10/1/25 | 4,800 | 5,228 |
| Kissimmee FL Utility Authority Electric System Revenue | 5.250% | 10/1/18 (4) | 3,000 | 3,504 |
| Lake County FL School Board COP | 5.250% | 6/1/15 (2) | 4,075 | 4,495 |
| Lake County FL School Board COP | 5.250% | 6/1/15 (2) | 2,050 | 2,251 |
| Lakeland FL Electric & Water Revenue | 6.050% | 10/1/12 (4) | 10,000 | 10,496 |
| Lee County FL Water & Sewer Revenue | 5.250% | 10/1/25 | 5,950 | 6,668 |
| Manatee County FL School District Tax Revenue | 5.000% | 10/1/13 (2) | 5,140 | 5,459 |
| Miami-Dade County FL Aviation Revenue (Miami International Airport) | 5.000% | 10/1/23 (12) | 1,800 | 1,939 |
| Miami-Dade County FL Aviation Revenue (Miami International Airport) | 5.000% | 10/1/23 | 1,460 | 1,558 |
| Miami-Dade County FL Aviation Revenue (Miami International Airport) | 5.000% | 10/1/24 | 2,630 | 2,774 |
| Miami-Dade County FL Aviation Revenue (Miami International Airport) | 5.750% | 10/1/25 | 5,000 | 5,464 |
| Miami-Dade County FL Aviation Revenue (Miami International Airport) | 5.000% | 10/1/26 | 6,500 | 6,780 |
| Miami-Dade County FL Aviation Revenue (Miami International Airport) | 5.000% | 10/1/29 | 7,200 | 7,356 |
| Miami-Dade County FL Aviation Revenue (Miami International Airport) | 5.000% | 10/1/29 (12) | 4,000 | 4,170 |
| Miami-Dade County FL Aviation Revenue (Miami International Airport) | 5.000% | 10/1/30 | 5,500 | 5,587 |
| 1 Miami-Dade County FL Aviation Revenue (Miami International Airport) TOB VRDO | 0.150% | 11/7/11 (4) | 5,620 | 5,620 |
| Miami-Dade County FL Educational Facilities Authority Revenue (University of Miami) | 5.000% | 4/1/14 (Prere.) | 13,760 | 15,118 |
| Miami-Dade County FL Educational Facilities Authority Revenue (University of Miami) | 5.000% | 4/1/14 (Prere.) | 10,910 | 11,986 |
| Miami-Dade County FL Educational Facilities Authority Revenue (University of Miami) | 5.000% | 4/1/20 (2) | 2,040 | 2,198 |
| Miami-Dade County FL Educational Facilities Authority Revenue (University of Miami) | 5.000% | 4/1/24 (2) | 5,275 | 5,520 |
| Miami-Dade County FL School Board COP | 5.000% | 8/1/12 (2) | 8,525 | 8,761 |
| Miami-Dade County FL School Board COP | 5.000% | 2/1/13 (ETM) | 5,175 | 5,467 |
| Miami-Dade County FL School Board COP | 5.000% | 8/1/13 (2) | 10,000 | 10,537 |
| Miami-Dade County FL School Board COP | 5.000% | 5/1/16 (12) | 9,335 | 10,500 |
| Miami-Dade County FL School Board COP | 5.000% | 8/1/16 (2) | 4,280 | 4,713 |
| Miami-Dade County FL School Board COP | 5.000% | 5/1/19 (14) | 5,685 | 6,109 |
| Miami-Dade County FL School Board COP | 5.000% | 8/1/19 (2) | 5,265 | 5,730 |
| Miami-Dade County FL School Board COP | 5.000% | 11/1/21 (2) | 3,280 | 3,437 |
| Miami-Dade County FL School Board COP | 5.000% | 11/1/22 (2) | 2,655 | 2,766 |
| Miami-Dade County FL School Board COP | 5.250% | 5/1/23 (12) | 25,200 | 27,536 |
| Miami-Dade County FL School Board COP | 5.000% | 11/1/23 (2) | 2,500 | 2,594 |
| Miami-Dade County FL School Board COP | 5.250% | 5/1/24 (12) | 27,650 | 30,001 |
| Miami-Dade County FL School Board COP | 5.250% | 5/1/25 (12) | 14,225 | 15,310 |
| Miami-Dade County FL School Board COP | 5.000% | 11/1/25 (2) | 5,025 | 5,152 |
| Miami-Dade County FL School Board COP | 5.250% | 5/1/26 (12) | 12,980 | 13,893 |
| Miami-Dade County FL School Board COP | 5.250% | 5/1/28 (12) | 15,530 | 16,431 |
| Miami-Dade County FL School Board COP PUT | 5.000% | 5/1/16 | 10,000 | 10,917 |
| Miami-Dade County FL Water & Sewer Revenue | 5.250% | 10/1/21 | 20,000 | 23,321 |
| Miami-Dade County FL Water & Sewer Revenue | 5.000% | 10/1/26 (14) | 7,400 | 7,907 |
| North Brevard County FL Hospital District Revenue (Parrish Medical Center Project) | 5.500% | 10/1/28 | 5,000 | 5,112 |
| Orange County FL Health Facilities Authority Hospital Revenue (Orlando Health Inc.) | 5.250% | 10/1/21 | 8,000 | 8,587 |
| Orange County FL Health Facilities Authority Revenue (Nemours Foundation Project) | 5.000% | 1/1/21 | 2,215 | 2,422 |
| Orange County FL Health Facilities Authority Revenue (Nemours Foundation Project) | 5.000% | 1/1/23 | 2,000 | 2,144 |
| Orange County FL Health Facilities Authority Revenue (Nemours Foundation Project) | 5.000% | 1/1/29 | 11,000 | 11,272 |
| Orange County FL School Board COP | 5.000% | 8/1/23 (14) | 9,000 | 9,442 |
| Orange County FL School Board COP | 5.000% | 8/1/24 (14) | 4,000 | 4,171 |
| Orange County FL School Board COP | 4.500% | 8/1/26 | 8,400 | 8,571 |
| Orange County FL School Board COP | 4.500% | 8/1/27 | 7,000 | 7,118 |
| Orange County FL Tourist Development Revenue | 5.000% | 10/1/17 | 5,955 | 6,738 |
| Orange County FL Tourist Development Revenue | 5.000% | 10/1/18 (14) | 18,980 | 21,203 |
| Orange County FL Tourist Development Revenue | 5.000% | 10/1/20 (14) | 15,345 | 16,741 |
| Orange County FL Tourist Development Revenue | 5.000% | 10/1/21 (14) | 16,605 | 17,976 |
| Orange County FL Tourist Development Revenue | 5.000% | 10/1/27 (2) | 12,630 | 12,959 |
| Orlando & Orange County FL Expressway Authority Revenue | 5.000% | 7/1/13 (2) | 5,000 | 5,342 |
| Orlando & Orange County FL Expressway Authority Revenue | 5.250% | 7/1/14 (2) | 4,000 | 4,260 |
| Orlando & Orange County FL Expressway Authority Revenue | 5.000% | 7/1/27 | 7,780 | 8,292 |
62
Intermediate-Term Tax-Exempt Fund
| | | | |
| | | | Face | Market |
| | | Maturity | Amount | Value• |
| | Coupon | Date | ($000) | ($000) |
| Orlando & Orange County FL Expressway Authority Revenue | 5.000% | 7/1/30 | 3,500 | 3,681 |
| Orlando FL Utility Commission Utility System Revenue | 5.250% | 10/1/21 | 5,000 | 6,051 |
| Orlando FL Utility Commission Utility System Revenue | 5.250% | 10/1/22 | 3,245 | 3,934 |
| Orlando FL Utility Commission Water & Electric Revenue | 5.250% | 10/1/13 (ETM) | 9,500 | 10,356 |
| Orlando FL Utility Commission Water & Electric Revenue | 5.250% | 10/1/14 (ETM) | 4,500 | 5,083 |
| Palm Beach County FL School Board COP | 5.000% | 8/1/13 (14) | 2,095 | 2,230 |
| Palm Beach County FL School Board COP | 5.375% | 8/1/13 (2) | 2,690 | 2,880 |
| Palm Beach County FL School Board COP PUT | 5.000% | 8/1/16 | 6,000 | 6,709 |
| Palm Beach County FL Solid Waste Authority Revenue | 5.000% | 10/1/17 | 6,000 | 6,983 |
| Palm Beach County FL Solid Waste Authority Revenue | 5.000% | 10/1/18 | 6,000 | 7,018 |
| Palm Beach County FL Solid Waste Authority Revenue | 5.500% | 10/1/28 | 15,000 | 16,225 |
| Port St. Lucie FL Utility Revenue | 5.000% | 9/1/29 (12) | 4,180 | 4,384 |
| Putman County FL Authority Pollution Control Revenue | | | | |
| (Seminole Electric Cooperative Inc. Project) PUT | 5.350% | 5/1/18 (2) | 7,500 | 8,217 |
| Sarasota County FL School Board COP | 5.000% | 7/1/18 | 2,185 | 2,463 |
| Sarasota County FL School Board COP | 5.000% | 7/1/20 | 2,855 | 3,196 |
| Sarasota County FL School Board COP | 5.000% | 7/1/23 | 5,380 | 5,857 |
| Sarasota County FL School Board COP | 5.000% | 7/1/25 | 5,050 | 5,405 |
| Seminole County FL School Board COP | 5.000% | 7/1/22 (4) | 2,000 | 2,111 |
| Seminole County FL Water & Sewer Revenue | 5.000% | 10/1/23 | 5,000 | 5,402 |
| Seminole County FL Water & Sewer Revenue | 5.000% | 10/1/24 | 7,805 | 8,387 |
| South Florida Water Management District COP | 5.000% | 10/1/13 (2) | 5,000 | 5,349 |
| South Florida Water Management District COP | 5.000% | 10/1/14 (2) | 9,460 | 10,383 |
| South Florida Water Management District COP | 5.000% | 10/1/15 (2) | 5,800 | 6,488 |
| South Florida Water Management District COP | 5.000% | 10/1/16 (2) | 3,000 | 3,396 |
| South Florida Water Management District COP | 5.000% | 10/1/24 (2) | 4,000 | 4,216 |
| South Florida Water Management District COP | 5.000% | 10/1/25 (2) | 8,000 | 8,397 |
| St. Johns County FL Development Authority Revenue | | | | |
| (Presbyterian Retirement Communities Project) | 5.750% | 8/1/30 | 1,500 | 1,521 |
| Sunshine State Governmental Financing Commission Florida Revenue | | | | |
| (Miami Dade County Program) | 5.000% | 9/1/23 | 5,985 | 6,328 |
| Sunshine State Governmental Financing Commission Florida Revenue | | | | |
| (Miami Dade County Program) | 5.125% | 9/1/24 | 4,625 | 4,866 |
| Sunshine State Governmental Financing Commission Florida Revenue VRDO | 0.120% | 11/7/11 LOC | 11,950 | 11,950 |
| Tallahassee FL Energy System Revenue | 5.250% | 10/1/13 (4) | 4,380 | 4,741 |
| Tallahassee FL Energy System Revenue | 5.250% | 10/1/14 (4) | 3,980 | 4,429 |
| Tallahassee FL Health Facilities Revenue (Tallahassee Memorial HealthCare Inc. Project) | 6.250% | 12/1/20 | 10,000 | 10,178 |
| Tampa Bay FL Water Utility System Revenue | 6.000% | 10/1/29 (14) | 10,000 | 12,526 |
| Tampa FL Health System Revenue (Baycare Health System) | 5.000% | 11/15/19 | 3,580 | 4,018 |
| Tampa FL Health System Revenue (Baycare Health System) | 5.000% | 11/15/21 | 18,420 | 20,264 |
| Tampa FL Health System Revenue (Baycare Health System) | 5.000% | 11/15/22 | 13,395 | 14,541 |
| Tampa-Hillsborough County FL Expressway Authority Revenue | 5.000% | 7/1/15 (Prere.) | 2,020 | 2,331 |
| Tampa-Hillsborough County FL Expressway Authority Revenue | 5.000% | 7/1/18 (2) | 2,675 | 2,916 |
| Tampa-Hillsborough County FL Expressway Authority Revenue | 5.000% | 7/1/19 (2) | 9,450 | 10,205 |
| Tampa-Hillsborough County FL Expressway Authority Revenue | 5.000% | 7/1/21 (2) | 11,355 | 12,088 |
| Tampa-Hillsborough County FL Expressway Authority Revenue | 5.000% | 7/1/22 (2) | 13,470 | 14,275 |
| Tampa-Hillsborough County FL Expressway Authority Revenue | 5.000% | 7/1/23 (2) | 5,000 | 5,291 |
| Tampa-Hillsborough County FL Expressway Authority Revenue | 5.000% | 7/1/24 (2) | 15,100 | 15,901 |
| Tampa-Hillsborough County FL Expressway Authority Revenue | 5.000% | 7/1/25 (2) | 5,000 | 5,240 |
| Tohopekaliga FL Water Authority Utility System Revenue | 5.750% | 10/1/29 | 2,300 | 2,633 |
| Volusia County FL School Board COP | 5.000% | 8/1/21 (4) | 3,495 | 3,658 |
| Winter Park FL Water & Sewer Revenue | 5.000% | 12/1/29 | 1,975 | 2,105 |
| | | | | 2,219,557 |
| Georgia (2.8%) | | | | |
| Atlanta GA Airport Passenger Facility Charge Revenue | 5.000% | 1/1/21 | 4,000 | 4,498 |
| Atlanta GA Airport Passenger Facility Charge Revenue | 5.000% | 1/1/22 | 10,000 | 11,102 |
| Atlanta GA Airport Revenue | 5.000% | 1/1/20 | 1,000 | 1,140 |
| Atlanta GA Airport Revenue | 5.000% | 1/1/21 | 2,000 | 2,245 |
| Atlanta GA Airport Revenue | 5.000% | 1/1/22 | 2,300 | 2,555 |
| Atlanta GA Airport Revenue | 5.000% | 1/1/30 | 6,410 | 6,618 |
| Atlanta GA GO | 5.250% | 12/1/19 (12) | 4,925 | 5,860 |
| Atlanta GA GO | 5.250% | 12/1/20 (12) | 3,280 | 3,840 |
| Atlanta GA Water & Wastewater Revenue | 5.500% | 11/1/11 (4) | 10,000 | 10,000 |
| Atlanta GA Water & Wastewater Revenue | 5.500% | 11/1/16 (4) | 7,000 | 8,081 |
| Atlanta GA Water & Wastewater Revenue | 5.500% | 11/1/17 (3) | 5,400 | 6,317 |
| Atlanta GA Water & Wastewater Revenue | 5.500% | 11/1/17 (4) | 8,000 | 9,315 |
| Atlanta GA Water & Wastewater Revenue | 6.000% | 11/1/21 | 1,000 | 1,201 |
| Atlanta GA Water & Wastewater Revenue | 5.500% | 11/1/22 (4) | 9,800 | 10,997 |
| Atlanta GA Water & Wastewater Revenue | 5.750% | 11/1/25 (4) | 6,500 | 7,695 |
| Atlanta GA Water & Wastewater Revenue | 5.750% | 11/1/26 (4) | 15,220 | 18,070 |
| Atlanta GA Water & Wastewater Revenue | 5.750% | 11/1/27 (4) | 5,585 | 6,615 |
63
Intermediate-Term Tax-Exempt Fund
| | | | |
| | | | Face | Market |
| | | Maturity | Amount | Value• |
| | Coupon | Date | ($000) | ($000) |
| Burke County GA Development Authority Pollution Control Revenue | | | | |
| (Georgia Power Co. Plant Vogtle Project) PUT | 5.050% | 1/12/12 | 10,000 | 10,086 |
| Carroll County GA School District GO | 4.000% | 4/1/14 | 1,400 | 1,502 |
| Carroll County GA School District GO | 4.000% | 4/1/15 | 1,300 | 1,421 |
| Carroll County GA School District GO | 5.000% | 4/1/16 | 3,000 | 3,463 |
| Cobb County GA Kennestone Hospital Authority Revenue | 6.250% | 4/1/34 (2) | 1,000 | 1,121 |
| Cobb County GA Kennestone Hospital Authority Revenue | 5.500% | 4/1/37 (2) | 7,500 | 7,839 |
| Columbus GA Building Authority Lease Revenue | 4.000% | 1/1/19 | 1,910 | 2,152 |
| DeKalb County GA Private Hospital Authority (Children’s Healthcare of Atlanta Inc. Project) RAN | 5.000% | 11/15/17 | 1,250 | 1,426 |
| DeKalb County GA Private Hospital Authority (Children’s Healthcare of Atlanta Inc. Project) RAN | 5.000% | 11/15/20 | 1,400 | 1,567 |
| Fayette County GA Hospital Authority (Fayette Community Hospital Project) RAN | 5.250% | 6/15/23 | 11,395 | 12,432 |
| Fulton County GA Development Authority Revenue (Piedmont Healthcare Inc. Project) | 5.250% | 6/15/23 | 6,110 | 6,645 |
| Georgia GO | 5.000% | 11/1/11 (Prere.) | 15,570 | 15,570 |
| Georgia GO | 5.000% | 4/1/12 | 8,020 | 8,180 |
| Georgia GO | 5.000% | 10/1/13 | 20,095 | 21,850 |
| Georgia GO | 5.000% | 7/1/14 | 7,800 | 8,700 |
| Georgia GO | 5.000% | 7/1/14 | 16,550 | 18,459 |
| Georgia GO | 5.000% | 7/1/14 | 7,290 | 8,131 |
| Georgia GO | 5.500% | 7/1/14 | 10,750 | 12,129 |
| Georgia GO | 5.000% | 10/1/14 | 18,385 | 20,683 |
| Georgia GO | 5.000% | 7/1/15 | 15,000 | 17,213 |
| Georgia GO | 5.000% | 9/1/15 (Prere.) | 7,080 | 8,169 |
| Georgia GO | 5.000% | 10/1/15 | 16,495 | 19,061 |
| Georgia GO | 5.000% | 12/1/15 | 10,000 | 11,614 |
| Georgia GO | 5.000% | 7/1/16 | 8,625 | 10,104 |
| Georgia GO | 5.000% | 7/1/16 | 2,705 | 3,169 |
| Georgia GO | 5.000% | 7/1/16 | 18,290 | 21,426 |
| Georgia GO | 5.000% | 7/1/16 | 5,300 | 6,033 |
| Georgia Municipal Electric Power Authority Revenue | 6.500% | 1/1/17 (14) | 9,420 | 10,764 |
| Georgia Road & Tollway Authority GAN | 5.000% | 6/1/14 | 27,395 | 30,296 |
| Georgia Road & Tollway Authority GAN | 5.000% | 6/1/14 (14) | 3,000 | 3,318 |
| Georgia Road & Tollway Authority Revenue | 5.000% | 6/1/14 | 16,735 | 18,507 |
| Georgia Road & Tollway Authority Revenue | 5.000% | 6/1/15 | 21,260 | 24,007 |
| Georgia Road & Tollway Authority Revenue | 5.000% | 6/1/16 | 26,105 | 30,031 |
| Georgia Road & Tollway Authority Revenue | 5.000% | 3/1/19 | 15,000 | 18,142 |
| Georgia Road & Tollway Authority Revenue (Governor’s Transportation Choices Initiative) | 5.375% | 3/1/12 (Prere.) | 9,000 | 9,155 |
| Georgia Road & Tollway Authority Revenue (Governor’s Transportation Choices Initiative) | 5.375% | 3/1/12 (Prere.) | 8,775 | 8,926 |
| Georgia Road & Tollway Authority Revenue (Governor’s Transportation Choices Initiative) | 5.375% | 3/1/12 (Prere.) | 9,385 | 9,546 |
| Gwinnett County GA Water & Sewer Authority Revenue | 5.000% | 8/1/15 | 7,915 | 9,099 |
| Macon-Bibb County GA Hospital Authority (Medical Center of Central Georgia) RAN | 4.625% | 8/1/29 | 5,500 | 5,437 |
| Macon-Bibb County GA Hospital Authority Revenue (Medical Center of Central Georgia) | 5.000% | 8/1/22 | 1,430 | 1,540 |
| Macon-Bibb County GA Hospital Authority Revenue (Medical Center of Central Georgia) | 5.000% | 8/1/24 | 1,250 | 1,322 |
| Main Street Natural Gas Inc. Georgia Gas Project Revenue | 5.000% | 3/15/15 | 6,380 | 6,933 |
| Main Street Natural Gas Inc. Georgia Gas Project Revenue | 5.000% | 3/15/17 | 2,035 | 2,248 |
| Main Street Natural Gas Inc. Georgia Gas Project Revenue | 5.000% | 3/15/20 | 23,970 | 25,935 |
| Main Street Natural Gas Inc. Georgia Gas Project Revenue | 5.000% | 3/15/21 | 5,000 | 4,944 |
| Main Street Natural Gas Inc. Georgia Gas Project Revenue | 5.000% | 3/15/21 | 37,000 | 39,431 |
| Main Street Natural Gas Inc. Georgia Gas Project Revenue | 5.000% | 3/15/22 | 9,490 | 9,301 |
| Metropolitan Atlanta GA Rapid Transportation Authority Georgia Sales Tax Revenue | 5.250% | 7/1/26 (14) | 4,800 | 5,513 |
| Municipal Electric Authority Georgia Revenue | 5.000% | 4/1/17 | 3,980 | 4,552 |
| Municipal Electric Authority Georgia Revenue | 5.000% | 4/1/18 | 3,565 | 4,111 |
| Municipal Electric Authority Georgia Revenue | 5.000% | 4/1/18 | 3,500 | 4,016 |
| Municipal Electric Authority Georgia Revenue | 5.000% | 4/1/19 | 3,160 | 3,646 |
| Municipal Electric Authority Georgia Revenue | 5.000% | 4/1/19 | 3,000 | 3,462 |
| Municipal Electric Authority Georgia Revenue | 5.000% | 1/1/20 | 35,000 | 40,117 |
| Municipal Electric Authority Georgia Revenue | 5.000% | 11/1/23 | 14,605 | 16,276 |
| Municipal Electric Authority Georgia Revenue | 5.000% | 11/1/24 | 11,650 | 12,830 |
| Municipal Electric Authority Georgia Revenue (General Resolution Projects) | 5.250% | 1/1/16 | 3,480 | 3,957 |
| Municipal Electric Authority Georgia Revenue (General Resolution Projects) | 5.750% | 1/1/19 | 51,440 | 60,917 |
| Municipal Electric Authority Georgia Revenue (Project One) | 5.250% | 1/1/16 | 6,580 | 7,464 |
| Municipal Electric Authority Georgia Revenue (Project One) | 5.000% | 1/1/18 | 5,000 | 5,722 |
| Municipal Electric Authority Georgia Revenue (Project One) | 5.000% | 1/1/21 | 7,600 | 8,679 |
| Private Colleges & University Authority of Georgia Revenue (Emory University) | 5.000% | 9/1/29 | 3,340 | 3,630 |
| Richmond County GA Hospital Authority (University Health Services Inc. Project) RAN | 5.500% | 1/1/24 | 17,500 | 18,256 |
| South Fulton GA Municipal Regional Water & Sewer Authority Water Revenue VRDO | 0.180% | 11/7/11 LOC | 8,900 | 8,900 |
| | | | | 857,224 |
| Hawaii (0.5%) | | | | |
| Hawaii Airports System Revenue | 5.250% | 7/1/30 | 16,975 | 17,967 |
| Hawaii GO | 5.375% | 8/1/12 (14) | 10,480 | 10,525 |
| Hawaii GO | 5.375% | 8/1/13 (14) | 10,635 | 10,678 |
| Hawaii GO | 5.375% | 8/1/14 (14) | 11,650 | 11,697 |
| Hawaii GO | 5.000% | 11/1/16 | 8,275 | 9,710 |
64
Intermediate-Term Tax-Exempt Fund
| | | | |
| | | | Face | Market |
| | | Maturity | Amount | Value• |
| | Coupon | Date | ($000) | ($000) |
| Hawaii GO | 5.000% | 7/1/17 (2) | 45,035 | 50,904 |
| Hawaii GO | 5.000% | 10/1/22 (14) | 7,000 | 7,690 |
| Hawaii GO | 5.000% | 10/1/23 (14) | 5,000 | 5,464 |
| Hawaii GO | 5.000% | 10/1/24 (14) | 3,000 | 3,279 |
| Hawaii GO | 5.000% | 3/1/25 (4) | 6,000 | 6,615 |
| Hawaii Pacific Health Revenue | 5.625% | 7/1/30 | 2,345 | 2,386 |
| Honolulu HI City & County GO | 5.000% | 7/1/19 (4) | 3,000 | 3,456 |
| Honolulu HI City & County GO | 5.000% | 7/1/20 (4) | 2,705 | 3,079 |
| Honolulu HI City & County GO | 5.000% | 8/1/28 | 5,000 | 5,588 |
| Honolulu HI City & County Wastewater System Revenue | 4.500% | 7/1/27 | 3,075 | 3,263 |
| | | | | 152,301 |
| Idaho (0.1%) | | | | |
| Idaho Bond Bank Authority Revenue | 5.250% | 9/15/24 | 2,000 | 2,301 |
| Idaho Bond Bank Authority Revenue | 5.250% | 9/15/26 | 1,000 | 1,134 |
| Idaho Health Facilities Authority Revenue (Trinity Health Group) | 6.125% | 12/1/28 | 12,050 | 13,481 |
| Idaho Housing & Finance Association RAN | 5.000% | 7/15/14 | 4,890 | 5,373 |
| Idaho Housing & Finance Association RAN | 4.750% | 7/15/19 | 5,000 | 5,739 |
| | | | | 28,028 |
| Illinois (5.8%) | | | | |
| Berwyn IL GO | 5.000% | 12/1/25 (4) | 5,000 | 5,285 |
| Chicago IL (City Colleges Capital Improvement Project) GO | 0.000% | 1/1/12 (3) | 26,000 | 25,951 |
| Chicago IL (City Colleges Capital Improvement Project) GO | 0.000% | 1/1/13 (14) | 29,170 | 28,445 |
| Chicago IL Board of Education (School Reform) GO | 0.000% | 12/1/19 (14) | 5,610 | 4,088 |
| Chicago IL Board of Education GO | 5.000% | 12/1/16 (4) | 1,985 | 2,221 |
| Chicago IL Board of Education GO | 0.000% | 12/1/18 (14) | 4,520 | 3,484 |
| Chicago IL Board of Education GO | 5.000% | 12/1/18 (4) | 2,500 | 2,731 |
| Chicago IL Board of Education GO | 5.000% | 12/1/18 | 2,500 | 2,762 |
| Chicago IL Board of Education GO | 5.000% | 12/1/19 (4) | 6,130 | 6,606 |
| Chicago IL Board of Education GO | 5.000% | 12/1/19 | 2,500 | 2,746 |
| Chicago IL Board of Education GO | 6.000% | 1/1/20 (14) | 5,300 | 5,983 |
| Chicago IL Board of Education GO | 5.000% | 12/1/20 (4) | 1,500 | 1,595 |
| Chicago IL Board of Education GO | 5.000% | 12/1/20 (2) | 20,000 | 21,294 |
| Chicago IL Board of Education GO | 5.000% | 12/1/20 | 2,250 | 2,456 |
| Chicago IL Board of Education GO | 5.000% | 12/1/26 (4) | 12,640 | 12,976 |
| Chicago IL Board of Education GO | 0.000% | 12/1/31 (14) | 5,180 | 1,630 |
| Chicago IL GO | 5.250% | 1/1/17 (14) | 2,300 | 2,581 |
| Chicago IL GO | 5.500% | 1/1/17 (4) | 18,430 | 20,931 |
| Chicago IL GO | 5.000% | 1/1/18 (4) | 17,530 | 18,773 |
| Chicago IL GO | 5.000% | 1/1/18 | 1,525 | 1,695 |
| Chicago IL GO | 5.000% | 1/1/19 | 3,825 | 4,229 |
| Chicago IL GO | 5.000% | 1/1/21 (4) | 18,155 | 19,392 |
| Chicago IL GO | 5.000% | 1/1/21 | 5,490 | 5,840 |
| Chicago IL GO | 5.000% | 12/1/21 | 5,730 | 6,198 |
| Chicago IL GO | 0.000% | 1/1/22 | 4,750 | 2,869 |
| Chicago IL GO | 0.000% | 1/1/23 | 4,900 | 2,741 |
| Chicago IL GO | 5.000% | 1/1/23 | 10,585 | 11,270 |
| Chicago IL GO | 5.000% | 12/1/23 | 7,000 | 7,465 |
| Chicago IL GO | 5.000% | 1/1/26 (4) | 10,000 | 10,402 |
| Chicago IL GO | 0.000% | 1/1/27 | 7,000 | 2,924 |
| Chicago IL GO | 5.000% | 1/1/27 (14) | 8,200 | 8,409 |
| Chicago IL GO | 5.000% | 1/1/28 (14) | 9,900 | 10,094 |
| Chicago IL GO VRDO | 0.150% | 11/1/11 | 1,490 | 1,490 |
| Chicago IL Housing Authority Capital Project Revenue | 5.375% | 7/1/12 (Prere.) | 5,540 | 5,728 |
| Chicago IL Housing Authority Capital Project Revenue | 5.375% | 7/1/12 (Prere.) | 13,425 | 13,881 |
| Chicago IL Housing Authority Capital Project Revenue | 5.375% | 7/1/12 (Prere.) | 7,150 | 7,393 |
| Chicago IL Housing Authority Capital Project Revenue | 5.375% | 7/1/12 (Prere.) | 3,715 | 3,841 |
| Chicago IL Metropolitan Water Reclamation District GO | 5.000% | 12/1/30 | 35,000 | 38,153 |
| Chicago IL O’Hare International Airport Revenue | 5.000% | 1/1/12 (14) | 10,000 | 10,073 |
| Chicago IL O’Hare International Airport Revenue | 5.250% | 1/1/14 (14) | 2,000 | 2,160 |
| Chicago IL O’Hare International Airport Revenue | 5.250% | 1/1/15 (14) | 5,200 | 5,743 |
| Chicago IL O’Hare International Airport Revenue | 5.000% | 1/1/18 | 4,000 | 4,502 |
| Chicago IL O’Hare International Airport Revenue | 5.000% | 1/1/18 | 4,200 | 4,727 |
| Chicago IL O’Hare International Airport Revenue | 5.000% | 1/1/18 (4) | 7,025 | 7,817 |
| Chicago IL O’Hare International Airport Revenue | 5.000% | 1/1/19 (4) | 8,920 | 9,949 |
| Chicago IL O’Hare International Airport Revenue | 5.000% | 1/1/19 (4) | 22,920 | 25,167 |
| Chicago IL O’Hare International Airport Revenue | 5.000% | 1/1/22 (4) | 18,295 | 19,773 |
| Chicago IL O’Hare International Airport Revenue | 5.000% | 1/1/23 (4) | 15,275 | 16,413 |
| Chicago IL O’Hare International Airport Revenue | 5.000% | 1/1/24 (4) | 18,250 | 19,464 |
| Chicago IL O’Hare International Airport Revenue | 5.500% | 1/1/31 | 13,495 | 14,478 |
| Chicago IL O’Hare International Airport Revenue | 5.500% | 1/1/31 | 10,000 | 10,728 |
| Chicago IL Park District Harbor Facilities GO | 5.000% | 1/1/28 | 4,835 | 5,191 |
65
Intermediate-Term Tax-Exempt Fund
| | | | |
| | | | Face | Market |
| | | Maturity | Amount | Value• |
| | Coupon | Date | ($000) | ($000) |
| Chicago IL Park District Harbor Facilities GO | 5.000% | 1/1/29 | 5,170 | 5,510 |
| Chicago IL Park District Harbor Facilities GO | 5.000% | 1/1/30 | 2,770 | 2,909 |
| Chicago IL Transit Authority Capital Grant Receipts Revenue | 5.000% | 6/1/13 | 4,000 | 4,212 |
| Chicago IL Transit Authority Capital Grant Receipts Revenue | 5.000% | 6/1/14 | 4,200 | 4,512 |
| Chicago IL Transit Authority Capital Grant Receipts Revenue | 5.000% | 6/1/15 | 6,060 | 6,612 |
| Chicago IL Transit Authority Capital Grant Receipts Revenue | 5.000% | 6/1/18 (2) | 10,000 | 10,743 |
| Chicago IL Transit Authority Capital Grant Receipts Revenue | 5.500% | 6/1/18 | 7,435 | 8,351 |
| Chicago IL Transit Authority Capital Grant Receipts Revenue | 5.000% | 6/1/20 (12) | 3,185 | 3,398 |
| Chicago IL Transit Authority Capital Grant Receipts Revenue | 5.000% | 6/1/20 | 4,900 | 5,216 |
| Chicago IL Transit Authority Capital Grant Receipts Revenue | 5.250% | 6/1/24 (12) | 5,000 | 5,304 |
| Chicago IL Transit Authority Capital Grant Receipts Revenue | 5.250% | 6/1/25 (12) | 11,000 | 11,561 |
| Chicago IL Transit Authority Capital Grant Receipts Revenue | 5.250% | 6/1/26 (12) | 8,260 | 8,624 |
| Chicago IL Transit Authority Capital Grant Receipts Revenue | 5.000% | 6/1/27 | 31,170 | 31,801 |
| Chicago IL Transit Authority Capital Grant Receipts Revenue | 5.000% | 6/1/27 | 13,085 | 13,350 |
| Chicago IL Transit Authority Capital Grant Receipts Revenue | 5.000% | 6/1/28 | 30,225 | 30,624 |
| Chicago IL Transit Authority Sales Tax Receipts Revenue | 5.000% | 12/1/19 | 9,915 | 11,407 |
| 2 Chicago IL Transit Authority Sales Tax Receipts Revenue | 5.250% | 12/1/30 | 10,000 | 10,470 |
| Chicago IL Wastewater Transmission Revenue VRDO | 0.180% | 11/1/11 LOC | 11,900 | 11,900 |
| Chicago IL Water Revenue | 5.500% | 11/1/11 (Prere.) | 3,595 | 3,595 |
| Chicago IL Water Revenue | 5.500% | 11/1/11 (Prere.) | 3,200 | 3,200 |
| Chicago IL Water Revenue | 5.500% | 11/1/11 (Prere.) | 4,035 | 4,035 |
| Chicago IL Water Revenue | 5.500% | 11/1/11 (Prere.) | 2,000 | 2,000 |
| Chicago IL Water Revenue | 0.000% | 11/1/14 (2) | 7,460 | 6,861 |
| Chicago IL Water Revenue | 0.000% | 11/1/15 (2) | 7,555 | 6,646 |
| Chicago IL Water Revenue | 5.000% | 11/1/19 (4) | 17,565 | 19,727 |
| Cook County IL Community College District GO | 5.000% | 12/1/23 | 1,100 | 1,217 |
| Cook County IL GO | 5.000% | 11/15/18 | 8,000 | 8,981 |
| Cook County IL GO | 5.000% | 11/15/20 | 7,500 | 8,188 |
| Cook County IL GO | 5.000% | 11/15/21 | 5,410 | 5,849 |
| Cook County IL GO | 5.250% | 11/15/28 | 35,500 | 37,251 |
| Cook County IL High School District No. 205 (Thornton Township) GO | 5.000% | 12/1/15 (12) | 2,020 | 2,294 |
| Cook County IL High School District No. 205 (Thornton Township) GO | 5.500% | 12/1/17 (12) | 2,000 | 2,353 |
| Du Page & Cook Counties IL Community Consolidated School District GO | 4.500% | 1/1/21 (14) | 4,900 | 5,281 |
| Grundy & Will Counties IL Community Unified School District GO | 5.875% | 2/1/23 | 2,315 | 2,654 |
| Grundy & Will Counties IL Community Unified School District GO | 5.875% | 2/1/25 | 2,720 | 3,056 |
| Grundy & Will Counties IL Community Unified School District GO | 5.875% | 2/1/26 | 3,060 | 3,423 |
| Grundy & Will Counties IL Community Unified School District GO | 5.875% | 8/1/28 | 6,520 | 7,224 |
| Illinois Build Revenue | 5.000% | 6/15/18 | 12,000 | 13,715 |
| Illinois Build Revenue | 5.000% | 6/15/19 | 6,000 | 6,852 |
| Illinois Build Revenue | 5.000% | 6/15/20 | 5,225 | 5,915 |
| Illinois Educational Facilities Authority Revenue (ACI/Cultural Pooled Financing Program) VRDO | 0.130% | 11/7/11 LOC | 5,000 | 5,000 |
| Illinois Educational Facilities Authority Revenue (University of Chicago) PUT | 3.375% | 2/3/14 | 10,000 | 10,519 |
| Illinois Finance Authority Gas Supply Revenue (Peoples Gas Light & Coke) PUT | 2.125% | 7/1/14 | 2,875 | 2,898 |
| Illinois Finance Authority Revenue (Advocate Health Care Network) | 5.000% | 4/1/19 | 1,500 | 1,676 |
| Illinois Finance Authority Revenue (Advocate Health Care Network) | 5.000% | 4/1/20 | 2,000 | 2,195 |
| Illinois Finance Authority Revenue (Advocate Health Care Network) | 5.000% | 4/1/21 | 6,535 | 7,096 |
| Illinois Finance Authority Revenue (Advocate Health Care Network) | 5.000% | 4/1/22 | 10,000 | 10,731 |
| Illinois Finance Authority Revenue (Advocate Health Care Network) | 6.125% | 11/1/23 | 3,000 | 3,503 |
| 3 Illinois Finance Authority Revenue (Advocate Health Care Network) PUT | 4.375% | 7/1/14 | 7,500 | 8,053 |
| Illinois Finance Authority Revenue (Carle Foundation) | 5.625% | 8/15/31 | 10,000 | 10,176 |
| 1 Illinois Finance Authority Revenue (Carle Foundation) TOB VRDO | 0.240% | 11/7/11 (12) | 12,680 | 12,680 |
| 1 Illinois Finance Authority Revenue (Carle Foundation) TOB VRDO | 0.240% | 11/7/11 (12) | 15,000 | 15,000 |
| Illinois Finance Authority Revenue (Central DuPage Health) | 5.000% | 11/1/27 | 18,725 | 19,450 |
| Illinois Finance Authority Revenue (Central Dupage Health) | 5.125% | 11/1/29 | 15,000 | 15,482 |
| Illinois Finance Authority Revenue (Children’s Memorial Hospital) | 5.500% | 8/15/28 | 21,760 | 22,215 |
| Illinois Finance Authority Revenue (Institute of Chicago) VRDO | 0.120% | 11/7/11 LOC | 8,500 | 8,500 |
| Illinois Finance Authority Revenue (Little Co. of Mary Hospital & Health Care Centers) | 5.250% | 8/15/36 | 6,500 | 6,114 |
| Illinois Finance Authority Revenue (Memorial Health System) | 5.250% | 4/1/29 | 12,670 | 12,700 |
| Illinois Finance Authority Revenue (Northwestern Community Hospital) | 5.250% | 7/1/28 | 8,500 | 8,794 |
| Illinois Finance Authority Revenue (Northwestern Community Hospital) | 5.750% | 8/15/30 | 9,000 | 9,732 |
| 1 Illinois Finance Authority Revenue (Northwestern University) TOB VRDO | 0.150% | 11/1/11 | 3,595 | 3,595 |
| Illinois Finance Authority Revenue (OSF Healthcare System) | 7.000% | 11/15/29 | 10,000 | 11,078 |
| Illinois Finance Authority Revenue (Palos Community Hospital) | 5.375% | 5/15/30 | 34,070 | 34,711 |
| Illinois Finance Authority Revenue (Rush University Medical Center) | 5.000% | 11/1/23 (14) | 5,000 | 5,200 |
| Illinois Finance Authority Revenue (Rush University Medical Center) | 5.750% | 11/1/28 (14) | 3,000 | 3,128 |
| Illinois Finance Authority Revenue (Rush University Medical Center) | 6.375% | 11/1/29 | 7,000 | 7,483 |
| Illinois Finance Authority Revenue (Silver Cross & Medical Centers) | 5.500% | 8/15/30 | 8,000 | 7,333 |
| Illinois Finance Authority Revenue (Southern Illinois Healthcare) | 5.250% | 3/1/30 (4) | 7,000 | 7,209 |
| Illinois Finance Authority Revenue (University of Chicago Medical Center) | 5.000% | 8/15/18 | 3,555 | 4,017 |
| Illinois Finance Authority Revenue (University of Chicago Medical Center) | 5.000% | 8/15/19 | 11,605 | 13,092 |
| Illinois Finance Authority Revenue (University of Chicago Medical Center) | 5.000% | 8/15/20 | 3,185 | 3,522 |
| Illinois Finance Authority Revenue (University of Chicago Medical Center) | 5.000% | 8/15/22 | 10,000 | 10,882 |
66
Intermediate-Term Tax-Exempt Fund
| | | | |
| | | | Face | Market |
| | | Maturity | Amount | Value• |
| | Coupon | Date | ($000) | ($000) |
| Illinois GO | 5.375% | 7/1/12 (Prere.) | 5,500 | 5,686 |
| Illinois GO | 5.375% | 7/1/12 (Prere.) | 5,000 | 5,169 |
| Illinois GO | 5.250% | 10/1/12 | 14,000 | 14,566 |
| Illinois GO | 5.500% | 8/1/13 (14) | 14,005 | 15,024 |
| Illinois GO | 5.250% | 10/1/14 | 40,000 | 43,062 |
| Illinois GO | 5.000% | 1/1/15 | 6,050 | 6,631 |
| Illinois GO | 5.500% | 8/1/17 (14) | 7,500 | 7,732 |
| Illinois GO | 5.500% | 8/1/18 (14) | 6,000 | 6,172 |
| Illinois GO | 5.000% | 1/1/19 (4) | 15,000 | 16,504 |
| Illinois GO | 5.000% | 1/1/19 | 15,475 | 16,924 |
| Illinois GO | 5.000% | 1/1/20 (4) | 8,635 | 9,375 |
| Illinois GO | 5.000% | 1/1/21 (4) | 31,470 | 33,597 |
| Illinois GO | 5.250% | 1/1/21 | 7,425 | 8,089 |
| Illinois GO | 5.000% | 1/1/22 | 2,740 | 2,886 |
| Illinois GO | 5.000% | 11/1/24 (2) | 5,000 | 5,079 |
| Illinois GO | 5.000% | 4/1/26 (2) | 12,600 | 12,741 |
| Illinois GO | 5.000% | 6/1/26 | 900 | 905 |
| Illinois GO | 5.000% | 6/1/26 | 5,100 | 5,182 |
| Illinois GO | 5.000% | 6/1/27 (14) | 4,000 | 4,019 |
| Illinois GO | 5.000% | 3/1/28 | 5,500 | 5,535 |
| Illinois GO | 5.000% | 9/1/31 | 2,500 | 2,507 |
| 1 Illinois GO TOB VRDO | 0.140% | 11/7/11 LOC | 29,660 | 29,660 |
| Illinois Health Facilities Authority Revenue (Elmhurst Memorial Hospital) | 6.250% | 1/1/17 | 5,060 | 5,196 |
| Illinois Health Facilities Authority Revenue (Northwest Community Hospital) VRDO | 0.170% | 11/1/11 | 26,200 | 26,200 |
| Illinois Regional Transportation Authority Revenue | 6.250% | 7/1/22 (4) | 5,000 | 6,318 |
| Illinois Regional Transportation Authority Revenue | 6.000% | 7/1/23 (14) | 5,000 | 6,145 |
| Illinois Regional Transportation Authority Revenue | 6.250% | 7/1/23 (4) | 11,475 | 14,579 |
| 1 Illinois Regional Transportation Authority Revenue TOB VRDO | 0.140% | 11/7/11 | 14,255 | 14,255 |
| Illinois Sales Tax Revenue | 0.000% | 12/15/16 (2) | 5,000 | 4,154 |
| Illinois Sales Tax Revenue | 5.375% | 6/15/18 | 9,860 | 11,617 |
| Illinois Sales Tax Revenue | 5.375% | 6/15/20 | 9,635 | 11,367 |
| Illinois Sales Tax Revenue | 5.000% | 6/15/28 (14) | 6,000 | 6,210 |
| Illinois Toll Highway Authority Revenue | 5.000% | 1/1/23 (4) | 23,000 | 24,282 |
| Illinois Toll Highway Authority Revenue | 5.000% | 1/1/23 (4) | 5,000 | 5,349 |
| Illinois Toll Highway Authority Revenue | 5.000% | 1/1/24 (4) | 20,000 | 21,254 |
| Illinois Toll Highway Authority Revenue | 5.000% | 1/1/25 (4) | 5,700 | 6,010 |
| Lake County IL Community High School District No.127 GO | 0.000% | 2/1/19 | 5,000 | 3,982 |
| Lake County IL Community High School District No.127 GO | 0.000% | 2/1/20 | 5,000 | 3,780 |
| Lake County IL Community High School District No.127 GO | 0.000% | 2/1/22 | 5,690 | 3,843 |
| Metropolitan Pier & Exposition Authority Illinois Dedicated Sales Tax Revenue | 0.000% | 12/15/15 (14) | 13,000 | 11,478 |
| Metropolitan Pier & Exposition Authority Illinois Dedicated Sales Tax Revenue | 0.000% | 12/15/16 (14) | 11,330 | 9,566 |
| Metropolitan Pier & Exposition Authority Illinois Dedicated Sales Tax Revenue | 0.000% | 6/15/19 (3) | 38,340 | 28,114 |
| Metropolitan Pier & Exposition Authority Illinois Dedicated Sales Tax Revenue | 0.000% | 12/15/21 (14) | 6,000 | 3,777 |
| Metropolitan Pier & Exposition Authority Illinois Dedicated Sales Tax Revenue | 0.000% | 12/15/23 (14) | 21,000 | 11,490 |
| Metropolitan Pier & Exposition Authority Illinois Dedicated Sales Tax Revenue | 0.000% | 12/15/23 (14) | 32,515 | 17,791 |
| Metropolitan Pier & Exposition Authority Illinois Dedicated Sales Tax Revenue | 0.000% | 12/15/24 (14) | 15,795 | 8,025 |
| Metropolitan Pier & Exposition Authority Illinois Dedicated Sales Tax Revenue | 0.000% | 12/15/25 (14) | 19,785 | 9,350 |
| Metropolitan Pier & Exposition Authority Illinois Dedicated Sales Tax Revenue | 0.000% | 6/15/26 (4) | 10,725 | 4,872 |
| Metropolitan Pier & Exposition Authority Illinois Dedicated Sales Tax Revenue | 0.000% | 6/15/27 (4) | 6,400 | 2,709 |
| Metropolitan Pier & Exposition Authority Illinois Dedicated Sales Tax Revenue | 0.000% | 12/15/29 (14) | 30,000 | 10,739 |
| Peoria IL Public Building Community School District Revenue | 0.000% | 12/1/14 (12) | 2,800 | 2,579 |
| Peoria IL Public Building Community School District Revenue | 0.000% | 12/1/15 (12) | 2,800 | 2,469 |
| Peoria IL Public Building Community School District Revenue | 0.000% | 12/1/16 (12) | 2,900 | 2,444 |
| Railsplitter Tobacco Settlement Authority Illinois Tobacco Settlement Revenue | 5.000% | 6/1/16 | 10,000 | 11,035 |
| Railsplitter Tobacco Settlement Authority Illinois Tobacco Settlement Revenue | 5.000% | 6/1/17 | 6,000 | 6,510 |
| Railsplitter Tobacco Settlement Authority Illinois Tobacco Settlement Revenue | 5.000% | 6/1/18 | 5,000 | 5,361 |
| Railsplitter Tobacco Settlement Authority Illinois Tobacco Settlement Revenue | 5.500% | 6/1/23 | 27,000 | 28,501 |
| Railsplitter Tobacco Settlement Authority Illinois Tobacco Settlement Revenue | 6.000% | 6/1/28 | 10,000 | 10,398 |
| Southwestern IL Development Authority Revenue (Local Government Program) | 5.000% | 4/15/30 | 10,000 | 10,362 |
| University of Illinois Auxiliary Facilities System Revenue | 0.000% | 4/1/16 (14) | 15,270 | 13,443 |
| University of Illinois Auxiliary Facilities System Revenue | 5.000% | 4/1/21 | 3,430 | 3,772 |
| University of Illinois Auxiliary Facilities System Revenue | 5.000% | 4/1/22 | 6,015 | 6,548 |
| University of Illinois Auxiliary Facilities System Revenue | 5.250% | 4/1/30 | 5,000 | 5,235 |
| | | | | 1,801,476 |
| Indiana (1.1%) | | | | |
| Decatur Township IN Multi-School Buildings Corp. Revenue | 5.000% | 7/15/21 (4) | 5,695 | 6,183 |
| Franklin IN Community Multi-School Building Corp. Revenue | 5.000% | 7/15/23 (4) | 2,480 | 2,766 |
| Hammond IN Multi-School Building Corp. Mortgage Revenue | 5.000% | 7/15/24 (14) | 2,735 | 2,852 |
| Hammond IN Multi-School Building Corp. Mortgage Revenue | 5.000% | 7/15/25 (14) | 2,875 | 2,990 |
| Indiana Finance Authority Facilities Revenue (Miami Correctional Facility - Phase II) | 5.000% | 7/1/15 | 3,865 | 4,324 |
| Indiana Finance Authority Facilities Revenue (Miami Correctional Facility - Phase II) | 5.000% | 7/1/17 | 3,315 | 3,804 |
| Indiana Finance Authority Facilities Revenue (Miami Correctional Facility - Phase II) | 5.000% | 7/1/18 | 4,085 | 4,719 |
67
Intermediate-Term Tax-Exempt Fund
| | | | |
| | | | Face | Market |
| | | Maturity | Amount | Value• |
| | Coupon | Date | ($000) | ($000) |
| Indiana Finance Authority Facilities Revenue (Wabash Valley Correctional Facility) | 5.000% | 7/1/14 | 2,510 | 2,747 |
| Indiana Finance Authority Health System Revenue | | | | |
| (Sisters of St. Francis Health Services Inc. Obligated Group) | 5.000% | 11/1/18 | 5,000 | 5,657 |
| Indiana Finance Authority Health System Revenue | | | | |
| (Sisters of St. Francis Health Services Inc. Obligated Group) | 5.000% | 11/1/20 | 4,370 | 4,792 |
| Indiana Finance Authority Health System Revenue | | | | |
| (Sisters of St. Francis Health Services Inc. Obligated Group) | 5.000% | 11/1/23 | 3,570 | 3,806 |
| Indiana Finance Authority Health System Revenue | | | | |
| (Sisters of St. Francis Health Services Inc. Obligated Group) | 5.250% | 11/1/24 | 10,855 | 11,635 |
| Indiana Finance Authority Health System Revenue | | | | |
| (Sisters of St. Francis Health Services Inc. Obligated Group) | 5.250% | 11/1/25 | 13,895 | 14,772 |
| Indiana Finance Authority Health System Revenue | | | | |
| (Sisters of St. Francis Health Services Inc. Obligated Group) | 5.250% | 11/1/26 | 14,425 | 15,317 |
| Indiana Finance Authority Health System Revenue | | | | |
| (Sisters of St. Francis Health Services Inc. Obligated Group) | 5.250% | 11/1/27 | 8,615 | 9,079 |
| Indiana Finance Authority Lease Revenue | 5.000% | 11/1/17 | 7,500 | 8,693 |
| Indiana Finance Authority Revenue (Marion General Hospital) VRDO | 0.140% | 11/7/11 LOC | 10,000 | 10,000 |
| Indiana Finance Authority Revenue (Trinity Health) | 5.000% | 12/1/28 | 6,295 | 6,585 |
| Indiana Finance Authority Wastewater Utility Revenue (CWA Authority Project) | 5.250% | 10/1/31 | 10,000 | 10,810 |
| Indiana Health & Educational Facility Financing Authority Hospital Revenue | | | | |
| (Clarian Health Obligated Group) | 5.000% | 2/15/24 | 2,000 | 2,051 |
| Indiana Health & Educational Facility Financing Authority Hospital Revenue | | | | |
| (Clarian Health Obligated Group) | 5.000% | 2/15/25 | 14,000 | 14,239 |
| Indiana Health & Educational Facility Financing Authority Hospital Revenue | | | | |
| (Clarian Health Obligated Group) | 5.000% | 2/15/26 | 18,475 | 18,665 |
| Indiana Health Facility Financing Authority Revenue (Ascension Health Credit Group) PUT | 3.750% | 2/1/12 | 10,000 | 10,082 |
| Indiana Municipal Power Agency Revenue | 5.250% | 1/1/15 (14) | 750 | 783 |
| Indiana Municipal Power Agency Revenue | 5.625% | 1/1/28 | 4,640 | 5,081 |
| Indiana Municipal Power Agency Revenue | 5.750% | 1/1/29 | 2,000 | 2,193 |
| Indiana Office Building Commission Facilities Revenue (New Castle Correctional Facility) | 5.250% | 7/1/19 (14) | 2,515 | 2,925 |
| Indiana Transportation Finance Authority Highway Revenue | 5.000% | 12/1/12 (14) | 4,500 | 4,726 |
| Indiana University Student Fee Revenue | 5.000% | 8/1/15 | 1,000 | 1,147 |
| Indiana University Student Fee Revenue | 5.000% | 8/1/16 | 2,500 | 2,925 |
| Indiana University Student Fee Revenue | 5.000% | 8/1/26 | 1,000 | 1,138 |
| Indiana University Student Fee Revenue | 5.000% | 8/1/29 | 1,000 | 1,111 |
| Indiana University Student Fee Revenue | 5.000% | 8/1/30 | 1,560 | 1,721 |
| Indianapolis IN Gas Utility Revenue | 5.000% | 8/15/21 (4) | 3,530 | 3,933 |
| Indianapolis IN Gas Utility Revenue | 5.000% | 8/15/22 (4) | 15,655 | 17,261 |
| Indianapolis IN Local Public Improvement Bond Bank Revenue | 5.000% | 1/15/19 | 3,000 | 3,482 |
| Indianapolis IN Local Public Improvement Bond Bank Revenue | 5.000% | 1/15/20 | 1,545 | 1,787 |
| Indianapolis IN Local Public Improvement Bond Bank Revenue | 5.000% | 2/1/20 | 5,000 | 5,713 |
| Indianapolis IN Local Public Improvement Bond Bank Revenue | 5.000% | 1/15/21 | 8,590 | 9,808 |
| Indianapolis IN Local Public Improvement Bond Bank Revenue | 5.000% | 1/15/22 | 7,000 | 7,901 |
| Indianapolis IN Local Public Improvement Bond Bank Revenue | 5.000% | 8/1/22 | 1,425 | 1,621 |
| Indianapolis IN Local Public Improvement Bond Bank Revenue | 5.000% | 8/1/23 | 1,895 | 2,138 |
| Indianapolis IN Local Public Improvement Bond Bank Revenue | 5.000% | 8/1/25 | 2,085 | 2,316 |
| Indianapolis IN Local Public Improvement Bond Bank Revenue | 5.000% | 8/1/26 | 1,985 | 2,186 |
| Indianapolis IN Local Public Improvement Bond Bank Revenue (Bank-Waterworks Project) | 5.500% | 1/1/29 | 10,000 | 10,777 |
| Indianapolis IN Local Public Improvement Bond Bank Revenue (PILOT Infrastructure Project) | 5.000% | 1/1/23 (4) | 4,285 | 4,845 |
| Indianapolis IN Local Public Improvement Bond Bank Revenue (PILOT Infrastructure Project) | 5.000% | 1/1/25 (4) | 3,535 | 3,895 |
| Indianapolis IN Local Public Improvement Bond Bank Revenue | | | | |
| (Qualified Midwestern Disaster Area) | 5.500% | 2/1/28 | 4,065 | 4,519 |
| Indianapolis IN Local Public Improvement Bond Bank Revenue | | | | |
| (Qualified Midwestern Disaster Area) | 5.500% | 2/1/29 | 4,370 | 4,830 |
| Rockport IN Pollution Control Revenue (Indiana Michigan Power Co. Project) PUT | 6.250% | 6/2/14 | 13,250 | 14,674 |
| Rockport IN Pollution Control Revenue (Indiana Michigan Power Co. Project) PUT | 6.250% | 6/2/14 | 11,750 | 13,013 |
| Whiting IN Environmental Facilities Revenue (BP Products North America Inc. Project) | 5.000% | 7/1/17 | 5,000 | 5,637 |
| Whiting IN Environmental Facilities Revenue (BP Products North America Inc. Project) PUT | 2.800% | 6/2/14 | 18,000 | 18,587 |
| | | | | 339,241 |
| Iowa (0.3%) | | | | |
| Ames IA Hospital Revenue (Mary Greeley Medical Center) | 5.500% | 6/15/29 | 2,000 | 2,062 |
| Ames IA Hospital Revenue (Mary Greeley Medical Center) | 5.625% | 6/15/31 | 2,000 | 2,051 |
| Clinton Community School District Iowa School Infrastructure | | | | |
| Sales, Services, & Use Tax Revenue | 4.750% | 7/1/26 | 1,970 | 2,125 |
| Clinton Community School District Iowa School Infrastructure | | | | |
| Sales, Services, & Use Tax Revenue | 4.750% | 7/1/27 | 1,565 | 1,675 |
| Clinton Community School District Iowa School Infrastructure | | | | |
| Sales, Services, & Use Tax Revenue | 5.000% | 1/1/30 | 6,080 | 6,498 |
| Des Moines IA Independent Community School District School Infrastructure Revenue | 5.000% | 6/1/19 | 3,400 | 3,893 |
| Iowa Finance Authority Health Facilities Revenue (Iowa Health System) | 5.250% | 2/15/29 (12) | 13,500 | 14,174 |
| Iowa Finance Authority Health Facilities Revenue (Iowa Health System) | 5.250% | 8/15/29 (12) | 5,500 | 5,790 |
| Iowa GO | 5.500% | 2/15/13 (14) | 8,945 | 9,509 |
68
Intermediate-Term Tax-Exempt Fund
| | | | |
| | | | Face | Market |
| | | Maturity | Amount | Value• |
| | Coupon | Date | ($000) | ($000) |
| Iowa Special Obligation Revenue (Ijobs Program) | 5.000% | 6/1/27 | 5,985 | 6,711 |
| Iowa Special Obligation Revenue (Ijobs Program) | 5.000% | 6/1/28 | 6,280 | 6,988 |
| Iowa Special Obligation Revenue (Prison Infrastructure) | 5.000% | 6/15/21 | 1,150 | 1,368 |
| Iowa Special Obligation Revenue (Prison Infrastructure) | 5.000% | 6/15/22 | 2,100 | 2,472 |
| Iowa Special Obligation Revenue (Prison Infrastructure) | 5.000% | 6/15/27 | 4,000 | 4,487 |
| Iowa Student Loan Liquidity Corp. Revenue | 5.000% | 12/1/16 | 8,545 | 9,318 |
| Iowa Student Loan Liquidity Corp. Revenue | 5.250% | 12/1/17 | 5,655 | 6,200 |
| | | | | 85,321 |
| Kansas (0.3%) | | | | |
| Cowley County KS Unified School District GO | 4.750% | 9/1/26 (4) | 3,680 | 3,891 |
| Cowley County KS Unified School District GO | 4.750% | 9/1/27 (4) | 3,500 | 3,677 |
| Kansas Department of Transportation Highway Revenue | 5.000% | 9/1/12 | 7,400 | 7,690 |
| Kansas Development Finance Authority Health Facilities Revenue | | | | |
| (Kansas University Health System) | 5.375% | 3/1/30 | 1,000 | 1,025 |
| Kansas Development Finance Authority Health Facilities Revenue | | | | |
| (Kansas University Health System) | 5.000% | 3/1/31 | 1,000 | 1,001 |
| Kansas Development Finance Authority Health Facilities Revenue | | | | |
| (Kansas University Health System) | 5.000% | 3/1/34 | 2,000 | 2,003 |
| Kansas Development Finance Authority Hospital Revenue | | | | |
| (Adventist Health System/Sunbelt Obligated Group) | 5.000% | 11/15/22 | 1,500 | 1,618 |
| Kansas Development Finance Authority Hospital Revenue | | | | |
| (Adventist Health System/Sunbelt Obligated Group) | 5.000% | 11/15/24 | 2,800 | 2,978 |
| Kansas Development Finance Authority Hospital Revenue | | | | |
| (Adventist Health System/Sunbelt Obligated Group) | 5.000% | 11/15/29 | 6,000 | 6,254 |
| Kansas Development Finance Authority Hospital Revenue | | | | |
| (Adventist Health System/Sunbelt Obligated Group) | 5.500% | 11/15/29 | 10,435 | 11,352 |
| Kansas Development Finance Authority Revenue | | | | |
| (Kansas Department of Commerce Impact Program) | 5.000% | 6/1/19 | 6,730 | 7,905 |
| Kansas Development Finance Authority Revenue | | | | |
| (Kansas Department of Commerce Impact Program) | 5.000% | 6/1/20 | 7,070 | 8,302 |
| Kansas Development Finance Authority Revenue | | | | |
| (Kansas Department of Health & Environment) | 5.000% | 3/1/21 | 5,000 | 5,970 |
| Kansas Development Finance Authority Revenue | | | | |
| (Sisters of Charity of Leavenworth Health System) | 5.250% | 1/1/25 | 7,500 | 8,093 |
| Leavenworth County KS Unified School District GO | 4.500% | 3/1/18 (12) | 1,030 | 1,154 |
| Leavenworth County KS Unified School District GO | 4.500% | 9/1/18 (12) | 1,030 | 1,157 |
| Leavenworth County KS Unified School District GO | 4.500% | 3/1/19 (12) | 1,000 | 1,115 |
| Leavenworth County KS Unified School District GO | 4.500% | 9/1/19 (12) | 600 | 670 |
| Leavenworth County KS Unified School District GO | 4.500% | 3/1/20 (12) | 1,115 | 1,229 |
| Leavenworth County KS Unified School District GO | 4.750% | 3/1/21 (12) | 1,165 | 1,321 |
| Leavenworth County KS Unified School District GO | 4.750% | 9/1/21 (12) | 1,265 | 1,430 |
| Leavenworth County KS Unified School District GO | 5.000% | 3/1/22 (12) | 1,060 | 1,204 |
| Leavenworth County KS Unified School District GO | 5.000% | 9/1/22 (12) | 1,360 | 1,541 |
| University of Kansas Hospital Authority Health Facilities Improvement Revenue | 5.000% | 9/1/18 | 1,000 | 1,131 |
| University of Kansas Hospital Authority Health Facilities Improvement Revenue | 5.000% | 9/1/19 | 1,500 | 1,684 |
| University of Kansas Hospital Authority Health Facilities Improvement Revenue | 5.000% | 9/1/20 | 1,500 | 1,665 |
| University of Kansas Hospital Authority Health Facilities Improvement Revenue | 5.000% | 9/1/21 | 1,500 | 1,654 |
| University of Kansas Hospital Authority Health Facilities Improvement Revenue | 5.000% | 9/1/24 | 5,055 | 5,307 |
| University of Kansas Hospital Authority Health Facilities Improvement Revenue | 5.000% | 9/1/26 | 4,300 | 4,464 |
| Wichita KS Hospital Facilities Revenue (Via Christi Health System Inc.) | 5.000% | 11/15/16 | 1,000 | 1,114 |
| Wichita KS Hospital Facilities Revenue (Via Christi Health System Inc.) | 5.250% | 11/15/24 | 5,000 | 5,291 |
| Wichita KS Hospital Facilities Revenue (Via Christi Health System Inc.) VRDO | 0.130% | 11/1/11 LOC | 700 | 700 |
| | | | | 105,590 |
| Kentucky (0.8%) | | | | |
| Kentucky Asset/Liability Commission Agency Fund Revenue (Federal Highway Trust) | 5.250% | 9/1/18 (14) | 5,000 | 5,966 |
| Kentucky Asset/Liability Commission Agency Fund Revenue (Federal Highway Trust) | 5.000% | 9/1/21 | 14,000 | 16,300 |
| Kentucky Asset/Liability Commission Agency Fund Revenue (Federal Highway Trust) | 5.000% | 9/1/22 | 7,000 | 8,036 |
| Kentucky Economic Development Finance Authority Medical Center Revenue | | | | |
| (King’s Daughters Medical Center Project) | 5.000% | 2/1/18 | 1,840 | 2,024 |
| Kentucky Economic Development Finance Authority Medical Center Revenue | | | | |
| (King’s Daughters Medical Center Project) | 5.000% | 2/1/19 | 1,475 | 1,613 |
| Kentucky Economic Development Finance Authority Medical Center Revenue | | | | |
| (King’s Daughters Medical Center Project) | 5.000% | 2/1/20 | 1,125 | 1,230 |
| Kentucky Economic Development Finance Authority Medical Center Revenue | | | | |
| (King’s Daughters Medical Center Project) | 5.000% | 2/1/21 | 2,000 | 2,161 |
| Kentucky Property & Building Commission Revenue | 5.500% | 8/1/12 (4) | 10,000 | 10,376 |
| Kentucky Property & Building Commission Revenue | 5.250% | 10/1/13 (4) | 14,965 | 16,253 |
| Kentucky Property & Building Commission Revenue | 5.250% | 10/1/15 (4) | 1,500 | 1,717 |
| Kentucky Property & Building Commission Revenue | 5.000% | 11/1/17 | 8,570 | 9,965 |
| Kentucky Property & Building Commission Revenue | 5.000% | 11/1/18 | 14,880 | 17,324 |
| Kentucky Property & Building Commission Revenue | 5.500% | 8/1/19 (2) | 6,870 | 8,214 |
69
Intermediate-Term Tax-Exempt Fund
| | | | |
| | | | Face | Market |
| | | Maturity | Amount | Value• |
| | Coupon | Date | ($000) | ($000) |
| Kentucky Property & Building Commission Revenue | 5.000% | 10/1/19 (2) | 5,000 | 5,810 |
| Kentucky Property & Building Commission Revenue | 5.500% | 8/1/20 (2) | 4,320 | 5,126 |
| Kentucky Property & Building Commission Revenue | 5.000% | 11/1/20 | 4,500 | 5,087 |
| Kentucky Property & Building Commission Revenue | 5.000% | 8/1/21 | 45,000 | 51,218 |
| Kentucky Property & Building Commission Revenue | 5.250% | 2/1/23 (12) | 6,215 | 6,920 |
| Kentucky Property & Building Commission Revenue | 5.000% | 11/1/23 (4) | 5,120 | 5,607 |
| Kentucky Property & Building Commission Revenue | 5.000% | 11/1/24 (4) | 5,000 | 5,430 |
| Kentucky Property & Building Commission Revenue | 5.250% | 2/1/25 (12) | 4,995 | 5,492 |
| Kentucky Turnpike Authority Economic Development Road Revenue (Revitalization Project) | 5.000% | 7/1/23 | 9,890 | 11,055 |
| Kentucky Turnpike Authority Economic Development Road Revenue (Revitalization Project) | 5.000% | 7/1/24 | 7,065 | 7,827 |
| Kentucky Turnpike Authority Economic Development Road Revenue (Revitalization Project) | 5.000% | 7/1/25 | 7,000 | 7,702 |
| Louisville & Jefferson County KY Metropolitan Government Pollution Control Revenue | | | | |
| (Louisville Gas & Electric Co. Project) PUT | 5.750% | 12/2/13 | 23,000 | 25,055 |
| | | | | 243,508 |
| Louisiana (1.2%) | | | | |
| East Baton Rouge Parish LA Sales Tax Revenue | 5.000% | 8/1/23 (12) | 5,165 | 5,768 |
| Jefferson Parish LA Environmental Facilities & Community Development Authority Revenue | 5.000% | 4/1/17 | 1,000 | 1,131 |
| Jefferson Parish LA Environmental Facilities & Community Development Authority Revenue | 5.000% | 4/1/18 | 1,000 | 1,138 |
| Jefferson Parish LA Environmental Facilities & Community Development Authority Revenue | 5.000% | 4/1/19 | 1,030 | 1,171 |
| Jefferson Parish LA Environmental Facilities & Community Development Authority Revenue | 5.000% | 4/1/20 | 1,000 | 1,123 |
| Jefferson Parish LA Environmental Facilities & Community Development Authority Revenue | 5.000% | 4/1/21 | 1,000 | 1,111 |
| Louisiana Citizens Property Insurance Corp. Assessment Revenue | 5.000% | 6/1/18 (2) | 14,470 | 15,153 |
| Louisiana Citizens Property Insurance Corp. Assessment Revenue | 5.000% | 6/1/21 (2) | 20,000 | 20,450 |
| Louisiana Citizens Property Insurance Corp. Assessment Revenue | 5.000% | 6/1/22 (2) | 13,660 | 13,879 |
| Louisiana Citizens Property Insurance Corp. Assessment Revenue | 5.000% | 6/1/23 (2) | 10,000 | 10,108 |
| Louisiana Gasoline & Fuel Tax Revenue | 5.250% | 5/1/20 (14) | 6,200 | 6,854 |
| Louisiana GO | 5.000% | 5/1/12 (4) | 18,955 | 19,405 |
| Louisiana GO | 5.250% | 5/1/12 (14) | 10,000 | 10,250 |
| Louisiana GO | 5.500% | 5/15/12 (14) | 12,660 | 12,715 |
| Louisiana GO | 5.500% | 5/15/13 (14) | 5,345 | 5,368 |
| Louisiana GO | 5.000% | 8/1/14 (14) | 22,880 | 25,503 |
| Louisiana GO | 5.000% | 11/15/17 | 10,000 | 11,862 |
| Louisiana GO | 5.000% | 11/15/17 | 17,040 | 20,212 |
| Louisiana GO | 5.000% | 5/1/18 (4) | 25,210 | 28,567 |
| Louisiana GO | 5.000% | 11/15/18 | 18,500 | 22,118 |
| Louisiana GO | 5.000% | 5/1/21 (4) | 9,765 | 10,965 |
| Louisiana GO | 5.000% | 5/1/23 (4) | 26,665 | 29,835 |
| Louisiana Local Government Environmental Facilities & | | | | |
| Community Development Authority Revenue (LCTCS Facilities Corp. Project) | 5.000% | 10/1/22 | 2,790 | 3,109 |
| Louisiana Local Government Environmental Facilities & | | | | |
| Community Development Authority Revenue (LCTCS Facilities Corp. Project) | 5.000% | 10/1/24 | 11,000 | 12,014 |
| Louisiana Local Government Environmental Facilities & | | | | |
| Community Development Authority Revenue (LCTCS Facilities Corp. Project) | 5.000% | 10/1/25 | 2,000 | 2,167 |
| Louisiana Local Government Environmental Facilities & | | | | |
| Community Development Authority Revenue (Women’s Hospital Foundation Project) | 5.625% | 10/1/30 | 15,905 | 15,954 |
| Louisiana Office Facilities Corp. Lease Revenue (Capitol Complex Project) | 5.000% | 5/1/17 | 5,300 | 5,947 |
| Louisiana Office Facilities Corp. Lease Revenue (Capitol Complex Project) | 5.000% | 5/1/19 | 4,495 | 5,071 |
| Louisiana Public Facilities Authority Revenue (Loyola University) | 5.250% | 10/1/29 | 4,000 | 4,241 |
| Louisiana Public Facilities Authority Revenue (Loyola University) | 5.250% | 10/1/30 | 4,930 | 5,199 |
| Louisiana Public Facilities Authority Revenue (Loyola University) | 5.250% | 10/1/31 | 2,485 | 2,604 |
| Louisiana Public Facilities Authority Revenue (Ochsner Clinic Foundation Project) | 5.000% | 5/15/15 | 4,055 | 4,333 |
| Louisiana Public Facilities Authority Revenue (Ochsner Clinic Foundation Project) | 5.000% | 5/15/17 | 1,520 | 1,633 |
| Louisiana Public Facilities Authority Revenue (Ochsner Clinic Foundation Project) | 5.250% | 5/15/27 | 15,165 | 14,912 |
| New Orleans LA Aviation Board Revenue | 4.500% | 1/1/16 (12) | 1,860 | 2,003 |
| New Orleans LA Aviation Board Revenue | 4.500% | 1/1/16 (12) | 4,535 | 4,882 |
| New Orleans LA Aviation Board Revenue | 4.500% | 1/1/17 (12) | 1,955 | 2,107 |
| New Orleans LA Aviation Board Revenue | 4.500% | 1/1/17 (12) | 1,540 | 1,660 |
| New Orleans LA Aviation Board Revenue | 5.000% | 1/1/18 (12) | 2,440 | 2,691 |
| New Orleans LA Aviation Board Revenue | 5.000% | 1/1/18 (12) | 2,200 | 2,426 |
| | | | | 367,639 |
| Maine (0.1%) | | | | |
| Maine GO | 4.000% | 6/1/13 | 1,640 | 1,733 |
| Maine GO | 5.000% | 6/1/16 | 3,770 | 4,397 |
| Maine Health & Higher Educational Facilities Authority Revenue VRDO | 0.150% | 11/7/11 LOC | 5,400 | 5,400 |
| Portland ME Airport Revenue | 5.000% | 1/1/21 (4) | 1,000 | 1,115 |
| Portland ME Airport Revenue | 5.000% | 1/1/22 (4) | 1,000 | 1,103 |
| Portland ME Airport Revenue | 5.000% | 1/1/23 | 1,000 | 1,095 |
| Portland ME Airport Revenue | 5.000% | 1/1/24 (4) | 1,610 | 1,747 |
| Portland ME Airport Revenue | 5.000% | 1/1/25 (4) | 1,000 | 1,073 |
| Portland ME Airport Revenue | 5.000% | 1/1/26 (4) | 1,720 | 1,834 |
70
Intermediate-Term Tax-Exempt Fund
| | | | |
| | | | Face | Market |
| | | Maturity | Amount | Value• |
| | Coupon | Date | ($000) | ($000) |
| Portland ME Airport Revenue | 5.000% | 1/1/28 (4) | 1,200 | 1,261 |
| Portland ME Airport Revenue | 5.000% | 1/1/29 (4) | 1,265 | 1,332 |
| | | | | 22,090 |
| Maryland (0.9%) | | | | |
| Baltimore MD Consolidated Public Improvement GO | 5.000% | 10/15/18 (2) | 1,365 | 1,508 |
| Baltimore MD Consolidated Public Improvement GO | 5.000% | 10/15/19 (2) | 2,185 | 2,415 |
| Baltimore MD Project Revenue | 5.000% | 7/1/26 | 1,585 | 1,806 |
| Baltimore MD Project Revenue | 5.000% | 7/1/26 | 1,250 | 1,425 |
| Baltimore MD Project Revenue | 5.000% | 7/1/27 | 1,745 | 1,972 |
| Baltimore MD Project Revenue | 5.000% | 7/1/28 | 1,570 | 1,759 |
| Baltimore MD Project Revenue | 5.000% | 7/1/28 | 1,905 | 2,134 |
| Baltimore MD Project Revenue | 4.000% | 7/1/29 | 1,030 | 1,038 |
| Baltimore MD Project Revenue | 5.000% | 7/1/29 | 2,075 | 2,303 |
| Baltimore MD Project Revenue | 5.000% | 7/1/30 | 1,905 | 2,097 |
| Baltimore MD Project Revenue | 5.000% | 7/1/30 | 3,255 | 3,582 |
| Baltimore MD Project Revenue | 5.000% | 7/1/31 | 2,000 | 2,186 |
| Maryland Department of Transportation Revenue | 5.000% | 6/1/15 | 1,825 | 2,087 |
| Maryland Economic Development Corp. Pollution Control Revenue (Potomac Electric Power Co.) | 6.200% | 9/1/22 | 6,000 | 7,044 |
| Maryland GO | 5.000% | 8/1/12 | 10,000 | 10,356 |
| Maryland GO | 5.000% | 8/1/12 | 10,000 | 10,356 |
| Maryland GO | 5.000% | 2/15/13 | 58,765 | 62,274 |
| Maryland GO | 5.000% | 8/1/13 | 10,685 | 11,542 |
| Maryland GO | 5.000% | 8/1/15 (Prere.) | 15,260 | 17,563 |
| Maryland GO | 5.000% | 8/1/15 | 19,620 | 22,570 |
| Maryland GO | 5.000% | 3/1/16 | 2,900 | 3,373 |
| Maryland GO | 5.000% | 8/1/16 | 1,100 | 1,292 |
| Maryland GO | 5.000% | 8/1/16 | 1,010 | 1,186 |
| Maryland GO | 5.000% | 8/1/16 | 10,000 | 11,742 |
| Maryland GO | 5.000% | 8/1/17 | 20,000 | 23,899 |
| Maryland Health & Higher Educational Facilities Authority Revenue | | | | |
| (Johns Hopkins Health System Obligated Group) PUT | 5.000% | 5/15/15 | 3,500 | 3,923 |
| Maryland Health & Higher Educational Facilities Authority Revenue (LifeBridge Health) | 5.000% | 7/1/14 (Prere.) | 3,915 | 4,341 |
| Maryland Health & Higher Educational Facilities Authority Revenue (LifeBridge Health) | 5.000% | 7/1/14 (Prere.) | 2,980 | 3,305 |
| Maryland Health & Higher Educational Facilities Authority Revenue | | | | |
| (University of Maryland Medical System) | 5.000% | 7/1/16 | 3,895 | 4,278 |
| Maryland Health & Higher Educational Facilities Authority Revenue | | | | |
| (University of Maryland Medical System) | 5.000% | 7/1/17 | 3,000 | 3,315 |
| Maryland Health & Higher Educational Facilities Authority Revenue | | | | |
| (University of Maryland Medical System) | 5.000% | 7/1/18 | 2,500 | 2,767 |
| Maryland Health & Higher Educational Facilities Authority Revenue | | | | |
| (University of Maryland Medical System) | 5.250% | 7/1/19 | 1,700 | 1,879 |
| Maryland Health & Higher Educational Facilities Authority Revenue | | | | |
| (University of Maryland Medical System) | 4.500% | 7/1/20 | 1,500 | 1,579 |
| Maryland Health & Higher Educational Facilities Authority Revenue | | | | |
| (University of Maryland Medical System) | 5.250% | 7/1/21 | 2,000 | 2,176 |
| Maryland Health & Higher Educational Facilities Authority Revenue | | | | |
| (University of Maryland Medical System) | 4.750% | 7/1/23 | 900 | 934 |
| Maryland Health & Higher Educational Facilities Authority Revenue | | | | |
| (University of Maryland Medical System) | 5.500% | 7/1/24 (2) | 3,800 | 4,167 |
| Maryland Health & Higher Educational Facilities Authority Revenue | | | | |
| (University of Maryland Medical System) | 5.250% | 7/1/28 (2) | 9,000 | 9,549 |
| Maryland Health & Higher Educational Facilities Authority Revenue VRDO | 0.130% | 11/7/11 LOC | 4,800 | 4,800 |
| Maryland Transportation Authority GAN | 5.000% | 3/1/14 | 13,240 | 14,589 |
| Maryland Transportation Authority GAN | 5.000% | 3/1/16 | 2,500 | 2,902 |
| Maryland Transportation Authority GAN | 5.250% | 3/1/16 | 4,000 | 4,686 |
| Maryland Transportation Authority GAN | 5.250% | 3/1/20 | 8,085 | 9,698 |
| | | | | 288,397 |
| Massachusetts (4.3%) | | | | |
| Boston MA Water & Sewer Commission Revenue | 5.750% | 11/1/13 | 2,145 | 2,243 |
| 1 Massachusetts Bay Transportation Authority Sales Tax Revenue TOB VRDO | 2.000% | 11/7/11 | 41,082 | 41,082 |
| Massachusetts College Building Authority Revenue | 5.000% | 5/1/28 | 1,290 | 1,425 |
| Massachusetts College Building Authority Revenue | 5.125% | 5/1/28 | 1,420 | 1,565 |
| Massachusetts College Building Authority Revenue | 5.250% | 5/1/29 | 2,250 | 2,481 |
| Massachusetts Department of Transportation Metropolitan Highway System Revenue | 5.000% | 1/1/19 | 5,000 | 5,731 |
| Massachusetts Department of Transportation Metropolitan Highway System Revenue | 5.000% | 1/1/20 | 2,610 | 3,113 |
| Massachusetts Department of Transportation Metropolitan Highway System Revenue | 5.000% | 1/1/22 | 11,000 | 12,287 |
| Massachusetts Department of Transportation Metropolitan Highway System Revenue | 5.000% | 1/1/23 | 14,750 | 16,331 |
| Massachusetts Department of Transportation Metropolitan Highway System Revenue | 5.000% | 1/1/26 | 13,625 | 14,605 |
| Massachusetts Department of Transportation Metropolitan Highway System Revenue VRDO | 0.110% | 11/7/11 | 26,430 | 26,430 |
| Massachusetts Development Finance Agency Resource Recovery Revenue (SEMASS System) | 5.625% | 1/1/13 (14) | 16,670 | 16,921 |
| Massachusetts Development Finance Agency Resource Recovery Revenue (SEMASS System) | 5.625% | 1/1/14 (14) | 7,340 | 7,442 |
71
Intermediate-Term Tax-Exempt Fund
| | | | |
| | | | Face | Market |
| | | Maturity | Amount | Value• |
| | Coupon | Date | ($000) | ($000) |
| Massachusetts Development Finance Agency Resource Recovery Revenue (SEMASS System) | 5.625% | 1/1/15 (14) | 8,310 | 8,426 |
| Massachusetts Development Finance Agency Resource Recovery Revenue (SEMASS System) | 5.625% | 1/1/16 (14) | 3,500 | 3,548 |
| Massachusetts Development Finance Agency Revenue (Berklee College of Music) | 5.000% | 10/1/29 | 3,110 | 3,236 |
| Massachusetts Development Finance Agency Revenue (Berklee College of Music) | 5.000% | 10/1/31 | 1,200 | 1,234 |
| Massachusetts Development Finance Agency Revenue (Boston College) | 5.000% | 7/1/29 | 9,500 | 10,445 |
| Massachusetts Development Finance Agency Revenue (College of the Holy Cross) VRDO | 0.170% | 11/1/11 LOC | 4,115 | 4,115 |
| Massachusetts Development Finance Agency Revenue (Draper Laboratory) | 5.750% | 9/1/25 | 6,765 | 7,508 |
| Massachusetts Development Finance Agency Revenue (Emerson College) | 5.500% | 1/1/30 | 15,000 | 15,994 |
| Massachusetts Development Finance Agency Revenue (UMASS Memorial Medical Center) | 5.125% | 7/1/26 | 2,690 | 2,693 |
| Massachusetts Educational Financing Authority Education Loan Revenue | 5.500% | 1/1/22 | 3,500 | 3,865 |
| Massachusetts GO | 5.000% | 11/1/13 | 8,000 | 8,713 |
| Massachusetts GO | 5.500% | 11/1/13 (3) | 8,905 | 9,787 |
| Massachusetts GO | 5.500% | 11/1/14 (14) | 3,000 | 3,413 |
| Massachusetts GO | 5.500% | 12/1/14 (4) | 1,000 | 1,141 |
| Massachusetts GO | 5.000% | 1/1/15 | 1,500 | 1,686 |
| Massachusetts GO | 5.000% | 8/1/15 | 11,745 | 13,422 |
| Massachusetts GO | 5.250% | 8/1/15 | 5,000 | 5,760 |
| Massachusetts GO | 5.000% | 9/1/15 | 14,360 | 16,448 |
| Massachusetts GO | 5.250% | 8/1/16 | 5,615 | 6,611 |
| Massachusetts GO | 5.000% | 9/1/16 | 7,710 | 9,005 |
| Massachusetts GO | 5.500% | 11/1/16 (ETM) | 24,500 | 29,526 |
| Massachusetts GO | 5.500% | 11/1/16 (ETM) | 73,000 | 87,977 |
| Massachusetts GO | 5.500% | 11/1/16 (ETM) | 50,000 | 60,258 |
| Massachusetts GO | 5.000% | 8/1/17 | 24,060 | 28,436 |
| Massachusetts GO | 5.500% | 11/1/17 | 10,000 | 12,145 |
| Massachusetts GO | 5.500% | 11/1/17 (14) | 20,000 | 24,290 |
| Massachusetts GO | 5.500% | 11/1/17 (4) | 7,000 | 8,501 |
| Massachusetts GO | 5.500% | 8/1/18 (14) | 5,000 | 6,123 |
| Massachusetts GO | 5.500% | 10/1/18 | 9,500 | 11,662 |
| Massachusetts GO | 5.500% | 10/1/20 (14) | 10,915 | 13,547 |
| Massachusetts GO | 5.250% | 8/1/21 | 20,870 | 25,641 |
| Massachusetts GO | 5.000% | 4/1/27 | 28,000 | 31,632 |
| Massachusetts GO | 5.000% | 4/1/29 | 26,675 | 29,612 |
| 1 Massachusetts GO TOB VRDO | 2.250% | 11/7/11 LOC | 25,166 | 25,166 |
| Massachusetts GO VRDO | 0.170% | 11/1/11 | 17,005 | 17,005 |
| Massachusetts GO VRDO | 0.100% | 11/7/11 | 4,300 | 4,300 |
| Massachusetts GO VRDO | 0.250% | 11/7/11 | 69,970 | 69,970 |
| Massachusetts Health & Educational Facilities Authority Revenue (Boston College) | 5.500% | 6/1/30 | 5,000 | 5,962 |
| Massachusetts Health & Educational Facilities Authority Revenue (Boston Medical Center) | 5.250% | 7/1/12 (14) | 1,850 | 1,854 |
| Massachusetts Health & Educational Facilities Authority Revenue (Boston Medical Center) | 5.000% | 7/1/28 | 18,000 | 16,401 |
| Massachusetts Health & Educational Facilities Authority Revenue (Caregroup) | 5.375% | 7/1/23 | 3,380 | 3,642 |
| Massachusetts Health & Educational Facilities Authority Revenue (Caregroup) | 5.375% | 7/1/24 | 5,500 | 5,857 |
| Massachusetts Health & Educational Facilities Authority Revenue (Caregroup) | 5.375% | 7/1/25 | 3,500 | 3,665 |
| Massachusetts Health & Educational Facilities Authority Revenue | | | | |
| (Caritas Christi Obligated Group) | 6.500% | 7/1/12 (ETM) | 2,675 | 2,775 |
| Massachusetts Health & Educational Facilities Authority Revenue (Children’s Hospital) VRDO | 0.150% | 11/1/11 LOC | 2,900 | 2,900 |
| Massachusetts Health & Educational Facilities Authority Revenue (Harvard University) | 6.250% | 4/1/20 | 1,685 | 2,213 |
| Massachusetts Health & Educational Facilities Authority Revenue (Northeastern University) | 5.000% | 10/1/20 | 3,740 | 4,295 |
| Massachusetts Health & Educational Facilities Authority Revenue (Northeastern University) | 5.000% | 10/1/25 | 1,460 | 1,551 |
| Massachusetts Health & Educational Facilities Authority Revenue (Northeastern University) | 5.000% | 10/1/26 | 2,000 | 2,115 |
| Massachusetts Health & Educational Facilities Authority Revenue (Northeastern University) | 5.000% | 10/1/28 | 1,155 | 1,218 |
| Massachusetts Health & Educational Facilities Authority Revenue (Northeastern University) PUT | 4.100% | 4/19/12 | 8,000 | 8,139 |
| Massachusetts Health & Educational Facilities Authority Revenue | | | | |
| (Partners Healthcare System) VRDO | 0.130% | 11/7/11 | 8,100 | 8,100 |
| Massachusetts Health & Educational Facilities Authority Revenue (Stonehill College) VRDO | 0.170% | 11/1/11 LOC | 7,975 | 7,975 |
| Massachusetts Health & Educational Facilities Authority Revenue (Suffolk University) | 6.250% | 7/1/30 | 5,000 | 5,361 |
| Massachusetts Health & Educational Facilities Authority Revenue | | | | |
| (University of Massachusetts Memorial Health Care Inc.) | 5.250% | 7/1/25 | 6,815 | 6,798 |
| Massachusetts Municipal Wholesale Electric Co. Power System Revenue | 5.250% | 7/1/12 (14) | 22,865 | 23,264 |
| Massachusetts Municipal Wholesale Electric Co. Power System Revenue | 5.250% | 7/1/13 (14) | 20,000 | 20,317 |
| Massachusetts School Building Authority Dedicated Sales Tax Revenue | 5.000% | 8/15/13 (4) | 5,000 | 5,400 |
| Massachusetts School Building Authority Dedicated Sales Tax Revenue | 5.000% | 8/15/15 (4) | 10,000 | 11,452 |
| Massachusetts School Building Authority Dedicated Sales Tax Revenue | 5.000% | 8/15/21 (4) | 41,095 | 45,861 |
| Massachusetts School Building Authority Dedicated Sales Tax Revenue | 5.000% | 8/15/23 (4) | 6,800 | 7,521 |
| Massachusetts School Building Authority Dedicated Sales Tax Revenue | 5.000% | 8/15/27 (14) | 7,830 | 8,522 |
| Massachusetts School Building Authority Dedicated Sales Tax Revenue | 5.000% | 8/15/30 (4) | 27,615 | 29,460 |
| Massachusetts Special Obligation Dedicated Tax Revenue | 5.250% | 1/1/14 (Prere.) | 8,685 | 9,513 |
| Massachusetts Special Obligation Dedicated Tax Revenue | 5.250% | 1/1/19 (14) | 5,125 | 5,892 |
| Massachusetts Special Obligation Dedicated Tax Revenue | 5.250% | 1/1/21 (14) | 6,875 | 7,887 |
| Massachusetts Special Obligation Dedicated Tax Revenue | 5.500% | 1/1/26 (3) | 29,860 | 34,178 |
| Massachusetts Special Obligation Dedicated Tax Revenue | 5.500% | 1/1/28 (14) | 11,075 | 12,405 |
| Massachusetts Special Obligation Revenue | 5.000% | 12/15/14 | 15,805 | 17,735 |
72
Intermediate-Term Tax-Exempt Fund
| | | | |
| | | | Face | Market |
| | | Maturity | Amount | Value• |
| | Coupon | Date | ($000) | ($000) |
| Massachusetts Special Obligation Revenue | 5.000% | 6/15/15 | 10,000 | 11,311 |
| Massachusetts Water Pollution Abatement Trust Revenue | 5.250% | 8/1/12 | 295 | 296 |
| Massachusetts Water Pollution Abatement Trust Revenue | 5.125% | 8/1/14 | 140 | 140 |
| Massachusetts Water Pollution Abatement Trust Revenue | 5.250% | 2/1/21 | 5,955 | 7,379 |
| Massachusetts Water Resources Authority Revenue | 6.500% | 7/15/19 (ETM) | 37,515 | 45,650 |
| Massachusetts Water Resources Authority Revenue | 5.000% | 8/1/19 | 21,580 | 25,783 |
| Massachusetts Water Resources Authority Revenue | 5.500% | 8/1/22 (4) | 3,300 | 4,116 |
| Massachusetts Water Resources Authority Revenue | 5.000% | 8/1/28 | 2,350 | 2,643 |
| Massachusetts Water Resources Authority Revenue | 5.000% | 8/1/30 | 3,500 | 3,857 |
| Massachusetts Water Resources Authority Revenue | 5.000% | 8/1/31 | 2,000 | 2,189 |
| 1 Massachusetts Water Resources Authority Revenue TOB VRDO | 2.430% | 11/7/11 LOC | 38,635 | 38,635 |
| Massachusetts Water Resources Authority Revenue VRDO | 0.110% | 11/7/11 | 1,000 | 1,000 |
| Metropolitan Boston MA Transit Parking Corp. Revenue | 5.000% | 7/1/26 | 3,000 | 3,289 |
| Metropolitan Boston MA Transit Parking Corp. Revenue | 5.000% | 7/1/27 | 3,440 | 3,731 |
| Metropolitan Boston MA Transit Parking Corp. Revenue | 5.000% | 7/1/28 | 5,000 | 5,381 |
| Metropolitan Boston MA Transit Parking Corp. Revenue | 5.000% | 7/1/29 | 11,580 | 12,319 |
| Metropolitan Boston MA Transit Parking Corp. Revenue | 5.000% | 7/1/30 | 11,000 | 11,621 |
| Metropolitan Boston MA Transit Parking Corp. Revenue | 5.000% | 7/1/31 | 11,575 | 12,154 |
| University of Massachusetts Building Authority Revenue | 5.000% | 11/1/19 (2) | 25,625 | 27,983 |
| | | | | 1,324,202 |
| Michigan (2.0%) | | | | |
| Detroit MI GO | 5.000% | 4/1/14 (12) | 9,780 | 10,119 |
| Detroit MI GO | 5.000% | 4/1/15 (12) | 7,970 | 8,281 |
| Detroit MI GO | 5.000% | 4/1/16 (12) | 3,440 | 3,560 |
| Detroit MI GO | 5.000% | 4/1/17 (12) | 3,580 | 3,667 |
| Detroit MI Sewer System Revenue | 5.000% | 7/1/13 (Prere.) | 15,665 | 16,822 |
| Detroit MI Sewer System Revenue | 5.125% | 7/1/15 (Prere.) | 12,000 | 13,764 |
| Detroit MI Sewer System Revenue | 0.000% | 7/1/16 (14) | 7,500 | 6,296 |
| Detroit MI Sewer System Revenue | 5.250% | 7/1/22 (14) | 5,735 | 5,981 |
| Detroit MI Sewer System Revenue | 7.000% | 7/1/27 (4) | 10,300 | 12,055 |
| Detroit MI Water Supply System Revenue | 5.000% | 7/1/19 (14) | 5,000 | 5,271 |
| Detroit MI Water Supply System Revenue | 5.000% | 7/1/20 (14) | 7,665 | 8,006 |
| Detroit MI Water Supply System Revenue | 5.000% | 7/1/20 (4) | 8,535 | 8,915 |
| Detroit MI Water Supply System Revenue | 5.000% | 7/1/22 (14) | 4,000 | 4,126 |
| Detroit MI Water Supply System Revenue | 5.000% | 7/1/23 (14) | 4,000 | 4,100 |
| Detroit MI Water Supply System Revenue | 5.000% | 7/1/24 (4) | 26,825 | 27,236 |
| Detroit MI Water Supply System Revenue | 5.000% | 7/1/25 (4) | 4,000 | 4,048 |
| Jackson County MI Hospital Finance Authority Hospital Revenue (Allegiance Health) | 5.000% | 6/1/17 | 2,420 | 2,619 |
| Kalamazoo MI Hospital Financing Authority Hospital Revenue (Bronson Methodist Hospital) | 5.000% | 5/15/30 | 18,370 | 17,893 |
| Kent Hospital MI Finance Authority Revenue (Spectrum Health) PUT | 5.250% | 1/15/14 | 10,000 | 10,875 |
| Kent Hospital MI Finance Authority Revenue (Spectrum Health) PUT | 5.500% | 1/15/15 | 11,500 | 12,958 |
| Michigan Building Authority Revenue | 5.250% | 10/15/13 (4) | 12,000 | 13,013 |
| Michigan Building Authority Revenue | 5.250% | 10/15/14 (4) | 15,000 | 16,172 |
| Michigan Building Authority Revenue | 5.250% | 10/15/15 (4) | 22,445 | 24,177 |
| Michigan Building Authority Revenue | 5.250% | 10/15/16 (4) | 9,000 | 9,682 |
| Michigan Building Authority Revenue | 5.000% | 10/15/18 | 12,575 | 14,287 |
| Michigan Building Authority Revenue | 5.000% | 10/15/19 | 8,315 | 9,429 |
| Michigan Building Authority Revenue | 5.000% | 10/15/24 | 2,500 | 2,730 |
| Michigan Building Authority Revenue | 5.000% | 10/15/24 | 3,000 | 3,276 |
| Michigan Building Authority Revenue | 5.000% | 10/15/25 | 5,920 | 6,397 |
| Michigan GO | 5.500% | 12/1/13 | 6,125 | 6,700 |
| Michigan GO | 5.000% | 5/1/17 | 33,880 | 38,971 |
| Michigan GO | 5.250% | 9/15/25 (4) | 10,810 | 11,681 |
| Michigan GO | 5.250% | 9/15/26 (4) | 12,805 | 13,759 |
| Michigan Hospital Finance Authority Revenue (Ascension Health Credit Group) PUT | 3.750% | 3/15/12 | 15,000 | 15,187 |
| Michigan Hospital Finance Authority Revenue (Ascension Health Credit Group) PUT | 5.000% | 5/1/12 | 9,595 | 9,808 |
| Michigan Hospital Finance Authority Revenue (Ascension Health Credit Group) PUT | 5.000% | 11/1/12 | 2,500 | 2,611 |
| Michigan Hospital Finance Authority Revenue (Ascension Health Credit Group) PUT | 1.350% | 4/1/13 | 10,000 | 10,111 |
| Michigan Hospital Finance Authority Revenue (Ascension Health Credit Group) PUT | 2.625% | 6/30/14 | 30,000 | 31,247 |
| Michigan Hospital Finance Authority Revenue (Genesys Regional Medical Center Obligated Group) | 5.375% | 10/1/13 (ETM) | 4,000 | 4,191 |
| Michigan Hospital Finance Authority Revenue (Henry Ford Health System) | 5.250% | 11/15/24 | 5,000 | 5,201 |
| Michigan Hospital Finance Authority Revenue (Henry Ford Health System) | 5.625% | 11/15/29 | 15,775 | 16,284 |
| Michigan Hospital Finance Authority Revenue (MidMichigan Obligated Group) | 5.125% | 6/1/19 | 2,500 | 2,719 |
| Michigan Hospital Finance Authority Revenue (MidMichigan Obligated Group) | 5.625% | 6/1/24 | 5,000 | 5,318 |
| Michigan Hospital Finance Authority Revenue (MidMichigan Obligated Group) | 6.000% | 6/1/29 | 4,000 | 4,237 |
| Michigan Hospital Finance Authority Revenue (Sparrow Obligated Group) | 5.000% | 11/15/26 (14) | 13,015 | 13,090 |
| Michigan Hospital Finance Authority Revenue (Trinity Health) | 5.000% | 12/1/27 | 8,000 | 8,417 |
| Michigan Hospital Finance Authority Revenue (Trinity Health) PUT | 6.000% | 12/1/17 | 3,950 | 4,751 |
| Michigan Municipal Bond Authority Revenue (State Clean Water Revolving Fund) | 5.000% | 10/1/22 | 4,000 | 4,673 |
| Michigan Strategic Fund Limited Obligation Revenue (Detroit Edison Co. Project) PUT | 2.125% | 9/1/16 | 9,350 | 9,349 |
| Monroe County MI Economic Development Corp. Revenue (Detroit Edison Co. Project) | 6.950% | 9/1/22 (14) | 27,000 | 34,259 |
| Royal Oak MI Hospital Finance Authority Hospital Revenue (Beaumont Hospital) | 5.500% | 8/1/19 | 20,000 | 22,137 |
73
Intermediate-Term Tax-Exempt Fund
| | | | |
| | | | Face | Market |
| | | Maturity | Amount | Value• |
| | Coupon | Date | ($000) | ($000) |
| Royal Oak MI Hospital Finance Authority Hospital Revenue (Beaumont Hospital) | 6.375% | 8/1/29 | 25,000 | 26,951 |
| Royal Oak MI Hospital Finance Authority Hospital Revenue (Beaumont Hospital) | 8.000% | 9/1/29 | 13,900 | 16,562 |
| Saginaw MI Hospital Finance Authority Hospital Revenue (Covenant Medical Center Inc.) | 5.000% | 7/1/18 | 2,195 | 2,324 |
| Saginaw MI Hospital Finance Authority Hospital Revenue (Covenant Medical Center Inc.) | 5.000% | 7/1/19 | 2,300 | 2,412 |
| Saginaw MI Hospital Finance Authority Hospital Revenue (Covenant Medical Center Inc.) | 5.000% | 7/1/30 | 10,000 | 9,465 |
| Wayne County MI Airport Authority Revenue (Detroit Metropolitan Wayne County Airport) | 5.000% | 12/1/16 | 5,000 | 5,452 |
| | | | | 623,622 |
| Minnesota (1.7%) | | | | |
| Minneapolis & St. Paul MN Housing & Redevelopment Authority Health Care System Revenue | | | | |
| (Allina Health System) | 5.000% | 11/15/17 | 1,785 | 2,014 |
| Minneapolis & St. Paul MN Housing & Redevelopment Authority Health Care System Revenue | | | | |
| (Allina Health System) | 5.000% | 11/15/18 | 2,190 | 2,455 |
| Minneapolis & St. Paul MN Housing & Redevelopment Authority Health Care System Revenue | | | | |
| (Allina Health System) | 5.000% | 11/15/20 | 1,585 | 1,749 |
| Minneapolis & St. Paul MN Housing & Redevelopment Authority Health Care System Revenue | | | | |
| (Allina Health System) | 5.000% | 11/15/20 | 1,805 | 1,991 |
| Minneapolis & St. Paul MN Housing & Redevelopment Authority Health Care System Revenue | | | | |
| (Allina Health System) | 5.000% | 11/15/21 | 2,205 | 2,407 |
| Minneapolis & St. Paul MN Housing & Redevelopment Authority Health Care System Revenue | | | | |
| (Allina Health System) | 5.000% | 11/15/21 | 3,925 | 4,284 |
| Minneapolis & St. Paul MN Housing & Redevelopment Authority Health Care System Revenue | | | | |
| (Allina Health System) | 5.000% | 11/15/22 | 2,425 | 2,611 |
| Minneapolis & St. Paul MN Housing & Redevelopment Authority Health Care System Revenue | | | | |
| (Allina Health System) | 5.250% | 11/15/29 | 7,000 | 7,198 |
| Minneapolis & St. Paul MN Housing & Redevelopment Authority Health Care System Revenue | | | | |
| (Allina Health System) VRDO | 0.120% | 11/7/11 LOC | 5,650 | 5,650 |
| Minneapolis MN Health Care System Revenue (Fairview Health Services) | 6.000% | 11/15/18 | 15,000 | 16,837 |
| Minneapolis MN Health Care System Revenue (Fairview Health Services) | 6.625% | 11/15/28 | 15,500 | 17,192 |
| Minnesota GO | 5.000% | 11/1/11 | 24,545 | 24,545 |
| Minnesota GO | 5.000% | 6/1/12 | 21,700 | 22,304 |
| Minnesota GO | 5.000% | 11/1/12 (ETM) | 8,235 | 8,621 |
| Minnesota GO | 5.000% | 11/1/12 | 13,685 | 14,329 |
| Minnesota GO | 5.000% | 11/1/12 | 19,775 | 20,706 |
| Minnesota GO | 5.000% | 8/1/13 (ETM) | 5,780 | 6,231 |
| Minnesota GO | 5.000% | 10/1/13 | 5,445 | 5,917 |
| Minnesota GO | 5.000% | 11/1/13 (ETM) | 10,655 | 11,609 |
| Minnesota GO | 5.000% | 11/1/13 | 17,615 | 19,206 |
| Minnesota GO | 5.000% | 11/1/13 | 19,500 | 21,262 |
| Minnesota GO | 5.000% | 12/1/13 | 10,610 | 11,607 |
| Minnesota GO | 5.000% | 11/1/14 | 19,275 | 21,723 |
| Minnesota GO | 4.000% | 12/1/14 | 3,730 | 4,102 |
| Minnesota GO | 5.000% | 12/1/14 | 8,150 | 9,211 |
| Minnesota GO | 5.000% | 11/1/15 | 19,775 | 22,872 |
| Minnesota GO | 5.000% | 12/1/15 | 8,150 | 9,448 |
| Minnesota GO | 5.000% | 12/1/16 | 5,145 | 6,071 |
| Minnesota GO | 5.000% | 8/1/28 | 23,085 | 26,652 |
| Minnesota Office of Higher Education Revenue (Supply Student Loan) | 5.000% | 11/1/16 | 1,120 | 1,267 |
| Minnesota Office of Higher Education Revenue (Supply Student Loan) | 5.000% | 11/1/18 | 4,305 | 4,875 |
| Minnesota Public Facilities Authority Revenue (State Revolving Fund) | 5.000% | 3/1/21 | 5,000 | 5,978 |
| Minnesota Technology Lease Purchase COP | 5.000% | 6/1/17 | 9,690 | 11,089 |
| Minnesota Technology Lease Purchase COP | 5.000% | 6/1/18 | 8,925 | 10,094 |
| Minnesota Technology Lease Purchase COP | 5.000% | 6/1/19 | 10,680 | 11,931 |
| Rochester MN Healthcare Facilities Revenue (Mayo Clinic) PUT | 4.000% | 11/15/18 | 11,500 | 12,509 |
| Southern Minnesota Municipal Power Agency Power Supply System Revenue | 5.250% | 1/1/30 | 2,000 | 2,153 |
| St. Cloud MN Health Care Revenue (Centracare Health System) | 5.125% | 5/1/30 | 7,000 | 7,211 |
| St. Louis Park MN Health Care Facilities Revenue (Park Nicollet Health Services) | 5.500% | 7/1/15 | 5,675 | 6,220 |
| St. Louis Park MN Health Care Facilities Revenue (Park Nicollet Health Services) | 5.500% | 7/1/16 | 11,775 | 13,064 |
| St. Louis Park MN Health Care Facilities Revenue (Park Nicollet Health Services) | 5.500% | 7/1/23 | 21,700 | 22,949 |
| St. Louis Park MN Health Care Facilities Revenue (Park Nicollet Health Services) | 5.625% | 7/1/26 | 6,000 | 6,206 |
| University of Minnesota Revenue | 5.000% | 12/1/14 | 9,840 | 11,089 |
| University of Minnesota Revenue | 5.000% | 12/1/15 | 16,235 | 18,743 |
| University of Minnesota Revenue | 5.000% | 8/1/19 | 1,150 | 1,362 |
| University of Minnesota Revenue | 5.000% | 4/1/22 | 500 | 579 |
| University of Minnesota Revenue | 5.000% | 8/1/22 | 1,585 | 1,841 |
| University of Minnesota Revenue | 5.000% | 8/1/23 | 2,500 | 2,878 |
| University of Minnesota Revenue | 5.000% | 8/1/24 | 4,515 | 5,144 |
| University of Minnesota Revenue | 5.250% | 12/1/27 | 5,000 | 5,806 |
| University of Minnesota Revenue | 5.250% | 12/1/28 | 7,045 | 8,121 |
| University of Minnesota Revenue | 5.000% | 8/1/29 | 5,615 | 6,121 |
| University of Minnesota Revenue | 5.250% | 12/1/29 | 3,500 | 4,011 |
| University of Minnesota Revenue | 5.000% | 8/1/30 | 2,500 | 2,706 |
| | | | | 514,751 |
74
Intermediate-Term Tax-Exempt Fund
| | | | |
| | | | Face | Market |
| | | Maturity | Amount | Value• |
| | Coupon | Date | ($000) | ($000) |
| Mississippi (0.2%) | | | | |
| Mississippi GO | 5.750% | 12/1/11 | 6,000 | 6,028 |
| Mississippi GO | 5.500% | 9/1/12 (4) | 5,000 | 5,218 |
| Mississippi GO | 5.500% | 12/1/16 | 3,435 | 4,115 |
| Mississippi GO | 5.000% | 12/1/20 | 10,000 | 11,378 |
| Mississippi GO | 5.000% | 12/1/21 | 16,890 | 19,073 |
| Mississippi GO | 5.000% | 10/1/30 | 12,035 | 13,219 |
| Mississippi GO | 5.000% | 10/1/31 | 11,735 | 12,798 |
| Mississippi Hospital Equipment & Facilities Authority Revenue | | | | |
| (North Mississippi Health Services) | 5.000% | 10/1/17 | 2,500 | 2,845 |
| | | | | 74,674 |
| Missouri (0.7%) | | | | |
| Cape Girardeau County MO Industrial Development Authority Health Facilities Revenue | | | | |
| (Southeast Missouri Hospital Association) | 5.625% | 6/1/12 (Prere.) | 5,655 | 5,831 |
| Curators of the University of Missouri System Facilities Revenue | 5.000% | 11/1/26 | 1,830 | 2,093 |
| Curators of the University of Missouri System Facilities Revenue | 5.000% | 11/1/27 | 1,000 | 1,134 |
| Kansas City MO Airport Revenue | 5.000% | 9/1/13 | 11,550 | 12,397 |
| Kansas City MO Airport Revenue | 5.000% | 9/1/14 | 10,000 | 11,016 |
| Kansas City MO Special Obligation Revenue | 0.000% | 2/1/18 | 3,000 | 2,369 |
| Kansas City MO Special Obligation Revenue | 0.000% | 2/1/19 | 7,615 | 5,640 |
| Missouri Board Public Building Special Obligation Revenue | 5.000% | 10/15/27 | 13,275 | 14,035 |
| Missouri Development Finance Board Infrastructure Facilities Revenue | | | | |
| (Branson Landing Project) | 4.750% | 6/1/25 | 3,230 | 3,273 |
| Missouri Environmental Improvement & Energy Resources Authority | | | | |
| Water Pollution Control Revenue (State Revolving Fund Program) | 5.500% | 7/1/12 | 4,190 | 4,276 |
| Missouri Environmental Improvement & Energy Resources Authority | | | | |
| Water Pollution Control Revenue (State Revolving Fund Program) | 5.500% | 7/1/13 | 5,250 | 5,585 |
| Missouri Health & Educational Facilities Authority Health Facilities Revenue | | | | |
| (SSM Health System) | 5.000% | 6/1/19 | 2,420 | 2,732 |
| Missouri Health & Educational Facilities Authority Health Facilities Revenue | | | | |
| (SSM Health System) | 5.000% | 6/1/21 | 4,000 | 4,447 |
| Missouri Health & Educational Facilities Authority Health Facilities Revenue | | | | |
| (SSM Health System) | 5.000% | 6/1/22 | 5,270 | 5,781 |
| Missouri Health & Educational Facilities Authority Health Facilities Revenue | | | | |
| (SSM Health System) VRDO | 0.180% | 11/7/11 LOC | 10,900 | 10,900 |
| Missouri Health & Educational Facilities Authority Health Facilities Revenue | | | | |
| (St. Luke’s Health System) | 5.000% | 11/15/20 | 3,975 | 4,419 |
| Missouri Health & Educational Facilities Authority Health Facilities Revenue | | | | |
| (St. Luke’s Health System) | 5.250% | 11/15/25 | 8,000 | 8,518 |
| Missouri Health & Educational Facilities Authority Health Facilities Revenue | | | | |
| (St. Luke’s Health System) | 5.000% | 11/15/30 | 5,000 | 5,113 |
| Missouri Health & Educational Facilities Authority Revenue (Children’s Mercy Hospital) | 5.250% | 5/15/29 | 19,230 | 19,686 |
| Missouri Health & Educational Facilities Authority Revenue (Washington University) | 5.000% | 11/15/30 | 15,000 | 16,731 |
| 1 Missouri Health & Educational Facilities Authority Revenue (Washington University) TOB VRDO | 0.150% | 11/1/11 | 4,610 | 4,610 |
| 1 Missouri Highways & Transportation Commission Revenue (State Road) TOB VRDO | 0.200% | 11/7/11 | 14,375 | 14,375 |
| Missouri Highways & Transportation Commission Road Revenue | 5.250% | 2/1/12 (Prere.) | 11,410 | 11,554 |
| Missouri Highways & Transportation Commission Road Revenue | 5.000% | 5/1/19 | 1,825 | 2,185 |
| Missouri Joint Municipal Electric Utility Commission Power Project Revenue (Prairie Project) | 5.000% | 1/1/24 (2) | 12,225 | 12,918 |
| Missouri Joint Municipal Electric Utility Commission Power Project Revenue (Prairie Project) | 5.000% | 1/1/26 (2) | 15,730 | 16,427 |
| St. Joseph MO Industrial Development Authority Health Facilities Revenue | | | | |
| (Heartland Regional Medical Center) VRDO | 0.110% | 11/7/11 LOC | 10,500 | 10,500 |
| St. Louis MO Airport Revenue (Lambert-St. Louis International Airport) | 6.125% | 7/1/24 | 6,000 | 6,605 |
| | | | | 225,150 |
| Nebraska (0.1%) | | | | |
| Nebraska Investment Finance Authority Single Family Housing Revenue | 5.700% | 9/1/31 | 8,000 | 8,579 |
| Nebraska Public Power District Revenue | 4.000% | 1/1/15 | 1,000 | 1,088 |
| Nebraska Public Power District Revenue | 5.000% | 1/1/16 | 1,000 | 1,142 |
| Nebraska Public Power District Revenue | 5.000% | 1/1/24 | 8,000 | 8,697 |
| | | | | 19,506 |
| Nevada (1.2%) | | | | |
| Clark County NV Airport Improvement Revenue | 5.000% | 7/1/21 | 2,000 | 2,244 |
| Clark County NV Airport Improvement Revenue | 5.000% | 7/1/30 | 15,000 | 15,424 |
| Clark County NV Passenger Facility Charge Revenue (Las Vegas McCarran International Airport) | 5.000% | 7/1/15 | 6,525 | 7,275 |
| Clark County NV Passenger Facility Charge Revenue (Las Vegas McCarran International Airport) | 5.000% | 7/1/16 | 5,575 | 6,303 |
| Clark County NV Passenger Facility Charge Revenue (Las Vegas McCarran International Airport) | 5.000% | 7/1/30 | 15,000 | 15,445 |
| Clark County NV School District GO | 5.375% | 6/15/12 (Prere.) | 28,385 | 29,290 |
| Clark County NV School District GO | 5.375% | 6/15/12 (Prere.) | 29,765 | 30,714 |
| Clark County NV School District GO | 5.000% | 6/15/14 | 6,320 | 6,920 |
| Clark County NV School District GO | 5.000% | 6/15/18 | 11,500 | 13,064 |
| Clark County NV School District GO | 5.000% | 6/15/19 | 13,750 | 15,360 |
| Clark County NV School District GO | 5.000% | 6/15/20 | 14,335 | 15,797 |
75
Intermediate-Term Tax-Exempt Fund
| | | | |
| | | | Face | Market |
| | | Maturity | Amount | Value• |
| | Coupon | Date | ($000) | ($000) |
| Clark County NV School District GO | 5.000% | 6/15/21 | 14,980 | 16,316 |
| Clark County NV School District GO | 5.000% | 6/15/21 (14) | 12,900 | 14,184 |
| Clark County NV School District GO | 5.000% | 6/15/22 | 14,655 | 15,797 |
| Clark County NV School District GO | 5.000% | 6/15/23 | 16,360 | 17,537 |
| Clark County NV School District GO | 5.000% | 6/15/24 (4) | 12,905 | 13,987 |
| Clark County NV School District GO | 5.000% | 6/15/25 | 12,445 | 13,170 |
| Clark County NV School District GO | 5.000% | 6/15/26 | 29,900 | 31,463 |
| Clark County NV Water Reclamation District GO | 5.375% | 7/1/27 | 2,985 | 3,284 |
| Henderson NV Health Facility Revenue (Catholic Healthcare West) | 5.625% | 7/1/24 | 5,000 | 5,176 |
| Las Vegas Valley Water District Nevada GO | 5.000% | 6/1/13 (14) | 11,165 | 11,897 |
| Las Vegas Valley Water District Nevada GO | 5.000% | 6/1/17 | 5,000 | 5,719 |
| Las Vegas Valley Water District Nevada GO | 5.000% | 6/1/18 | 7,370 | 8,469 |
| Las Vegas Valley Water District Nevada GO | 5.000% | 6/1/21 (3) | 16,075 | 17,189 |
| Las Vegas Valley Water District Nevada GO | 5.000% | 6/1/26 (14) | 15,280 | 16,418 |
| Nevada GO | 5.000% | 12/1/14 (4) | 8,435 | 9,419 |
| Reno NV Hospital Revenue (Washoe Medical Center Project) | 5.500% | 6/1/28 (2) | 1,750 | 1,713 |
| | | | | 359,574 |
| New Hampshire (0.1%) | | | | |
| New Hampshire GO | 5.000% | 2/15/18 | 1,010 | 1,198 |
| New Hampshire GO | 5.000% | 2/15/19 | 1,010 | 1,204 |
| New Hampshire GO | 5.000% | 8/15/19 | 1,500 | 1,798 |
| New Hampshire Health & Education Facilities Authority Revenue | | | | |
| (University System of New Hampshire) | 5.500% | 7/1/20 | 10,000 | 11,775 |
| New Hampshire Health & Education Facilities Authority Revenue (Wentworth Douglas Hospital) | 6.000% | 1/1/31 | 10,000 | 10,502 |
| | | | | 26,477 |
| New Jersey (6.0%) | | | | |
| Essex County NJ Improvement Authority Revenue | 5.500% | 10/1/23 (14) | 10,000 | 11,946 |
| Essex County NJ Improvement Authority Revenue | 5.250% | 12/15/23 (2) | 3,635 | 4,300 |
| Essex County NJ Improvement Authority Revenue | 5.250% | 12/15/24 (2) | 3,720 | 4,401 |
| New Jersey Building Authority Revenue | 5.000% | 12/15/18 | 5,610 | 6,270 |
| New Jersey Casino Reinvestment Development Authority Revenue (Hotel Room Fee) | 5.250% | 1/1/23 (2) | 3,900 | 3,972 |
| New Jersey Casino Reinvestment Development Authority Revenue (Hotel Room Fee) | 5.250% | 1/1/24 (2) | 3,500 | 3,557 |
| New Jersey COP | 5.000% | 6/15/17 | 4,840 | 5,257 |
| New Jersey COP | 5.000% | 6/15/18 | 12,915 | 14,002 |
| New Jersey COP | 5.250% | 6/15/28 | 4,675 | 4,877 |
| New Jersey COP | 5.250% | 6/15/29 | 1,000 | 1,039 |
| New Jersey Economic Development Authority Revenue (Cigarette Tax) | 5.625% | 6/15/18 | 8,835 | 8,840 |
| New Jersey Economic Development Authority Revenue (Cigarette Tax) | 5.625% | 6/15/19 | 5,565 | 5,567 |
| New Jersey Economic Development Authority Revenue (Cigarette Tax) | 5.500% | 6/15/24 | 12,000 | 11,806 |
| New Jersey Economic Development Authority Revenue | | | | |
| (Provident Group-Montclair Properties LLC - Montclair State University Student Housing Project) | 5.000% | 6/1/18 | 2,000 | 2,092 |
| New Jersey Economic Development Authority Revenue | | | | |
| (Provident Group-Montclair Properties LLC - Montclair State University Student Housing Project) | 5.250% | 6/1/19 | 2,000 | 2,107 |
| New Jersey Economic Development Authority Revenue | | | | |
| (Provident Group-Montclair Properties LLC - Montclair State University Student Housing Project) | 5.250% | 6/1/20 | 2,000 | 2,081 |
| New Jersey Economic Development Authority Revenue | | | | |
| (Provident Group-Montclair Properties LLC - Montclair State University Student Housing Project) | 5.375% | 6/1/25 | 5,000 | 5,039 |
| New Jersey Economic Development Authority Revenue (School Facilities Construction) | 5.000% | 9/1/13 | 12,315 | 13,187 |
| New Jersey Economic Development Authority Revenue (School Facilities Construction) | 5.000% | 9/1/13 (Prere.) | 12,475 | 13,509 |
| New Jersey Economic Development Authority Revenue (School Facilities Construction) | 5.000% | 9/1/13 (Prere.) | 4,800 | 5,198 |
| New Jersey Economic Development Authority Revenue (School Facilities Construction) | 5.000% | 9/1/14 | 10,400 | 11,411 |
| New Jersey Economic Development Authority Revenue (School Facilities Construction) | 5.000% | 12/15/14 | 4,000 | 4,422 |
| New Jersey Economic Development Authority Revenue (School Facilities Construction) | 5.250% | 12/15/15 (14) | 4,100 | 4,617 |
| New Jersey Economic Development Authority Revenue (School Facilities Construction) | 5.000% | 12/15/16 | 38,385 | 43,282 |
| New Jersey Economic Development Authority Revenue (School Facilities Construction) | 5.000% | 12/15/17 | 38,000 | 43,259 |
| New Jersey Economic Development Authority Revenue (School Facilities Construction) | 5.000% | 12/15/18 | 63,000 | 71,313 |
| New Jersey Economic Development Authority Revenue (School Facilities Construction) | 5.500% | 9/1/19 (3) | 4,285 | 4,977 |
| New Jersey Economic Development Authority Revenue (School Facilities Construction) | 5.000% | 12/15/19 | 38,410 | 43,311 |
| New Jersey Economic Development Authority Revenue (School Facilities Construction) | 5.250% | 12/15/21 (3) | 7,975 | 9,057 |
| New Jersey Economic Development Authority Revenue (School Facilities Construction) | 5.250% | 12/15/21 (4) | 5,000 | 5,724 |
| New Jersey Economic Development Authority Revenue (School Facilities Construction) | 5.000% | 9/1/23 | 8,690 | 9,486 |
| New Jersey Economic Development Authority Revenue (School Facilities Construction) | 5.500% | 9/1/23 (14) | 81,630 | 93,802 |
| New Jersey Economic Development Authority Revenue (School Facilities Construction) | 5.250% | 9/1/24 | 1,000 | 1,097 |
| New Jersey Economic Development Authority Revenue (School Facilities Construction) | 5.500% | 9/1/24 (2) | 15,000 | 17,132 |
| New Jersey Economic Development Authority Revenue (School Facilities Construction) | 5.250% | 9/1/25 | 17,000 | 18,516 |
| New Jersey Economic Development Authority Revenue (School Facilities Construction) | 5.500% | 9/1/25 (4) | 18,130 | 20,481 |
| New Jersey Economic Development Authority Revenue (School Facilities Construction) | 5.250% | 9/1/29 | 10,500 | 11,164 |
| New Jersey Economic Development Authority Revenue (School Facilities Construction) | 5.500% | 12/15/29 | 5,000 | 5,390 |
| New Jersey Economic Development Authority Revenue (School Facilities Construction) PUT | 5.000% | 9/1/14 (4) | 40,455 | 44,191 |
| New Jersey Economic Development Authority Transportation Project Sublease Revenue | | | | |
| (New Jersey Transit Corp. Light Rail Transit System Project) | 5.000% | 5/1/13 | 7,215 | 7,639 |
76
Intermediate-Term Tax-Exempt Fund
| | | | |
| | | | Face | Market |
| | | Maturity | Amount | Value• |
| | Coupon | Date | ($000) | ($000) |
| New Jersey Educational Facilities Authority Revenue (Kean University) | 5.250% | 9/1/29 | 30,920 | 33,045 |
| New Jersey Educational Facilities Authority Revenue (Princeton University) | 5.000% | 7/1/16 | 4,700 | 5,520 |
| New Jersey Educational Facilities Authority Revenue (Princeton University) | 5.000% | 7/1/27 | 2,965 | 3,440 |
| New Jersey Educational Facilities Authority Revenue (University Medical & Dentistry) | 7.125% | 12/1/23 | 6,000 | 7,149 |
| New Jersey Environmental Infrastructure Trust Revenue | 5.000% | 9/1/28 | 3,000 | 3,349 |
| New Jersey Equipment Lease Purchase COP | 5.250% | 6/15/20 | 6,180 | 6,673 |
| New Jersey Equipment Lease Purchase COP | 5.250% | 6/15/21 | 5,820 | 6,221 |
| New Jersey Equipment Lease Purchase COP | 5.375% | 6/15/29 | 11,000 | 11,513 |
| New Jersey GO | 5.250% | 7/1/14 (4) | 25,000 | 27,894 |
| New Jersey GO | 5.250% | 7/15/15 (2) | 8,500 | 9,725 |
| New Jersey GO | 5.250% | 7/1/16 (14) | 1,500 | 1,748 |
| New Jersey GO | 5.250% | 7/15/19 (2) | 5,000 | 5,993 |
| New Jersey GO | 5.000% | 8/15/20 | 30,000 | 35,322 |
| New Jersey Health Care Facilities Financing Authority Revenue (AHS Hospital Corp.) | 5.000% | 7/1/16 | 8,420 | 9,279 |
| New Jersey Health Care Facilities Financing Authority Revenue (AHS Hospital Corp.) | 5.000% | 7/1/17 | 8,875 | 9,818 |
| New Jersey Health Care Facilities Financing Authority Revenue (AHS Hospital Corp.) | 5.000% | 7/1/18 | 5,000 | 5,541 |
| New Jersey Health Care Facilities Financing Authority Revenue (AHS Hospital Corp.) VRDO | 0.110% | 11/7/11 LOC | 15,000 | 15,000 |
| New Jersey Health Care Facilities Financing Authority Revenue | | | | |
| (Hackensack University Medical Center) | 5.000% | 1/1/19 | 2,610 | 2,790 |
| New Jersey Health Care Facilities Financing Authority Revenue | | | | |
| (Hackensack University Medical Center) | 5.000% | 1/1/20 | 2,120 | 2,266 |
| New Jersey Health Care Facilities Financing Authority Revenue | | | | |
| (Hackensack University Medical Center) | 5.000% | 1/1/22 | 1,500 | 1,567 |
| New Jersey Health Care Facilities Financing Authority Revenue (Holy Name Hospital) | 5.000% | 7/1/18 | 1,925 | 2,071 |
| New Jersey Health Care Facilities Financing Authority Revenue | | | | |
| (Hospital Asset Transformation Program) | 5.500% | 10/1/23 | 12,860 | 13,966 |
| New Jersey Health Care Facilities Financing Authority Revenue | | | | |
| (St. Barnabas Health Care System) | 5.250% | 7/1/12 (14) | 965 | 967 |
| New Jersey Health Care Facilities Financing Authority Revenue | | | | |
| (St. Barnabas Health Care System) | 5.250% | 7/1/14 (14) | 1,885 | 1,888 |
| New Jersey Health Care Facilities Financing Authority Revenue | | | | |
| (St. Barnabas Health Care System) | 5.000% | 7/1/29 | 3,375 | 3,219 |
| New Jersey Health Care Facilities Financing Authority Revenue (Virtua Health) | 5.750% | 7/1/33 | 20,000 | 21,087 |
| New Jersey Higher Education Assistance Authority Student Loan Revenue | 4.500% | 12/1/20 | 6,500 | 6,815 |
| New Jersey Higher Education Assistance Authority Student Loan Revenue | 4.750% | 12/1/29 | 5,000 | 5,008 |
| New Jersey Sports & Exposition Authority Revenue | 5.000% | 9/1/17 (ETM) | 100 | 119 |
| New Jersey Sports & Exposition Authority Revenue | 5.000% | 9/1/17 | 9,900 | 11,231 |
| New Jersey Sports & Exposition Authority Revenue | 4.500% | 9/1/18 (Prere.) | 20 | 23 |
| New Jersey Sports & Exposition Authority Revenue | 4.500% | 9/1/24 | 2,035 | 2,080 |
| New Jersey Transportation Corp. COP | 5.500% | 9/15/13 (2) | 1,410 | 1,510 |
| New Jersey Transportation Corp. COP | 5.250% | 9/15/15 (4) | 3,800 | 4,286 |
| New Jersey Transportation Corp. COP | 5.250% | 9/15/15 (2) | 10,000 | 11,124 |
| New Jersey Transportation Corp. COP | 5.500% | 9/15/15 (4) | 7,270 | 8,267 |
| New Jersey Transportation Corp. COP | 5.500% | 9/15/15 (2) | 5,335 | 5,984 |
| New Jersey Transportation Corp. COP | 5.000% | 9/15/19 (4) | 6,500 | 6,851 |
| New Jersey Transportation Trust Fund Authority Transportation System Revenue | 7.000% | 6/15/12 (14) | 12,490 | 12,973 |
| New Jersey Transportation Trust Fund Authority Transportation System Revenue | 7.000% | 6/15/12 (ETM) | 7,510 | 7,825 |
| New Jersey Transportation Trust Fund Authority Transportation System Revenue | 5.250% | 6/15/14 (Prere.) | 11,900 | 13,276 |
| New Jersey Transportation Trust Fund Authority Transportation System Revenue | 5.500% | 12/15/15 (2) | 1,750 | 2,008 |
| New Jersey Transportation Trust Fund Authority Transportation System Revenue | 5.750% | 6/15/17 | 1,250 | 1,451 |
| New Jersey Transportation Trust Fund Authority Transportation System Revenue | 5.000% | 12/15/17 | 15,000 | 16,958 |
| New Jersey Transportation Trust Fund Authority Transportation System Revenue | 5.000% | 12/15/18 | 15,000 | 16,979 |
| New Jersey Transportation Trust Fund Authority Transportation System Revenue | 5.250% | 12/15/19 | 5,000 | 5,727 |
| New Jersey Transportation Trust Fund Authority Transportation System Revenue | 5.250% | 12/15/19 (14) | 25,000 | 28,634 |
| New Jersey Transportation Trust Fund Authority Transportation System Revenue | 5.250% | 12/15/19 | 1,040 | 1,191 |
| New Jersey Transportation Trust Fund Authority Transportation System Revenue | 5.250% | 6/15/20 (3) | 17,680 | 19,159 |
| New Jersey Transportation Trust Fund Authority Transportation System Revenue | 5.750% | 6/15/20 | 7,000 | 8,146 |
| New Jersey Transportation Trust Fund Authority Transportation System Revenue | 5.250% | 12/15/20 (4) | 9,000 | 10,369 |
| New Jersey Transportation Trust Fund Authority Transportation System Revenue | 5.250% | 12/15/20 | 27,915 | 31,853 |
| New Jersey Transportation Trust Fund Authority Transportation System Revenue | 5.500% | 12/15/20 (3) | 34,200 | 39,689 |
| New Jersey Transportation Trust Fund Authority Transportation System Revenue | 5.250% | 12/15/21 | 11,000 | 12,533 |
| New Jersey Transportation Trust Fund Authority Transportation System Revenue | 5.500% | 12/15/21 (14) | 25,000 | 29,010 |
| New Jersey Transportation Trust Fund Authority Transportation System Revenue | 5.500% | 12/15/21 (12) | 3,745 | 4,384 |
| New Jersey Transportation Trust Fund Authority Transportation System Revenue | 5.500% | 12/15/21 | 9,620 | 11,163 |
| New Jersey Transportation Trust Fund Authority Transportation System Revenue | 5.250% | 12/15/22 | 2,500 | 2,854 |
| New Jersey Transportation Trust Fund Authority Transportation System Revenue | 5.250% | 12/15/22 (2) | 45,900 | 52,400 |
| New Jersey Transportation Trust Fund Authority Transportation System Revenue | 5.500% | 12/15/22 | 22,000 | 25,614 |
| New Jersey Transportation Trust Fund Authority Transportation System Revenue | 5.750% | 6/15/24 (14) | 25,000 | 29,027 |
| New Jersey Transportation Trust Fund Authority Transportation System Revenue | 5.000% | 12/15/24 | 20,000 | 21,839 |
| New Jersey Transportation Trust Fund Authority Transportation System Revenue | 0.000% | 12/15/25 (2) | 15,000 | 7,206 |
| New Jersey Transportation Trust Fund Authority Transportation System Revenue | 0.000% | 12/15/25 | 74,680 | 35,583 |
| New Jersey Transportation Trust Fund Authority Transportation System Revenue | 0.000% | 12/15/25 | 1,000 | 476 |
77
Intermediate-Term Tax-Exempt Fund
| | | | |
| | | | Face | Market |
| | | Maturity | Amount | Value• |
| | Coupon | Date | ($000) | ($000) |
| New Jersey Transportation Trust Fund Authority Transportation System Revenue | 0.000% | 12/15/26 | 24,000 | 10,706 |
| New Jersey Transportation Trust Fund Authority Transportation System Revenue | 0.000% | 12/15/27 | 98,285 | 40,661 |
| New Jersey Transportation Trust Fund Authority Transportation System Revenue | 0.000% | 12/15/28 | 25,000 | 9,598 |
| New Jersey Transportation Trust Fund Authority Transportation System Revenue | 0.000% | 12/15/28 | 44,000 | 16,892 |
| New Jersey Transportation Trust Fund Authority Transportation System Revenue | 0.000% | 12/15/29 | 47,325 | 16,792 |
| New Jersey Transportation Trust Fund Authority Transportation System Revenue | 0.000% | 12/15/30 | 14,800 | 4,877 |
| New Jersey Transportation Trust Fund Authority Transportation System Revenue | 0.000% | 12/15/32 | 15,000 | 4,251 |
| 1 New Jersey Transportation Trust Fund Authority Transportation System Revenue TOB VRDO | 2.000% | 11/7/11 LOC | 33,250 | 33,250 |
| New Jersey Turnpike Authority Revenue | 6.000% | 1/1/13 (14) | 2,325 | 2,456 |
| New Jersey Turnpike Authority Revenue | 5.000% | 1/1/20 | 14,440 | 16,329 |
| New Jersey Turnpike Authority Revenue | 5.000% | 1/1/21 | 19,705 | 21,986 |
| New Jersey Turnpike Authority Revenue | 5.000% | 1/1/22 | 4,500 | 4,960 |
| New Jersey Turnpike Authority Revenue | 5.500% | 1/1/25 (2) | 13,500 | 15,952 |
| New Jersey Turnpike Authority Revenue VRDO | 0.350% | 11/7/11 (4) | 30,000 | 30,000 |
| Newark NJ GO | 5.000% | 10/1/19 | 3,505 | 3,958 |
| Newark NJ GO | 5.000% | 10/1/20 | 2,455 | 2,766 |
| Rutgers State University New Jersey Revenue | 6.400% | 5/1/13 | 1,755 | 1,838 |
| South Jersey Transportation Authority New Jersey Transportation System Revenue | 5.000% | 11/1/16 | 7,590 | 8,545 |
| Tobacco Settlement Financing Corp. New Jersey Revenue | 4.250% | 6/1/12 | 6,385 | 6,455 |
| Tobacco Settlement Financing Corp. New Jersey Revenue | 5.000% | 6/1/13 | 14,945 | 15,485 |
| Tobacco Settlement Financing Corp. New Jersey Revenue | 5.000% | 6/1/15 | 11,425 | 12,108 |
| Tobacco Settlement Financing Corp. New Jersey Revenue | 5.000% | 6/1/16 | 14,585 | 15,401 |
| Tobacco Settlement Financing Corp. New Jersey Revenue | 5.000% | 6/1/17 | 15,925 | 16,633 |
| Tobacco Settlement Financing Corp. New Jersey Revenue | 5.000% | 6/1/18 | 16,975 | 17,372 |
| Tobacco Settlement Financing Corp. New Jersey Revenue | 5.000% | 6/1/19 | 30,595 | 30,712 |
| Tobacco Settlement Financing Corp. New Jersey Revenue | 4.500% | 6/1/23 | 51,472 | 46,732 |
| Tobacco Settlement Financing Corp. New Jersey Revenue | 6.125% | 6/1/24 (Prere.) | 1,620 | 1,675 |
| Tobacco Settlement Financing Corp. New Jersey Revenue | 4.625% | 6/1/26 | 33,410 | 26,725 |
| Tobacco Settlement Financing Corp. New Jersey Revenue | 5.750% | 6/1/32 (Prere.) | 28,445 | 29,355 |
| University of Medicine & Dentistry New Jersey Revenue | 5.500% | 12/1/23 (2) | 7,330 | 7,430 |
| University of Medicine & Dentistry New Jersey Revenue | 5.500% | 12/1/27 (2) | 10,100 | 10,184 |
| | | | | 1,840,078 |
| New Mexico (0.3%) | | | | |
| New Mexico Educational Assistance Foundation Revenue | 4.000% | 9/1/18 | 16,440 | 18,037 |
| New Mexico Educational Assistance Foundation Revenue | 4.000% | 9/1/19 | 5,990 | 6,523 |
| New Mexico Educational Assistance Foundation Revenue | 5.000% | 12/1/19 | 1,500 | 1,741 |
| New Mexico Educational Assistance Foundation Revenue | 4.000% | 12/1/20 | 1,500 | 1,615 |
| New Mexico Finance Authority Transportation Revenue | 5.000% | 6/15/13 (2) | 12,395 | 13,283 |
| New Mexico Finance Authority Transportation Revenue | 5.250% | 6/15/14 (Prere.) | 18,000 | 20,136 |
| New Mexico Finance Authority Transportation Revenue | 5.250% | 6/15/14 (Prere.) | 30,525 | 34,147 |
| New Mexico Finance Authority Transportation Revenue | 5.000% | 12/15/16 | 7,260 | 8,508 |
| Santa Fe NM Gross Receipts Tax Revenue | 4.000% | 6/1/12 | 3,260 | 3,324 |
| | | | | 107,314 |
| New York (14.3%) | | | | |
| Amherst NY Development Corp. Student Housing Facility Revenue | 3.500% | 10/1/19 | 1,185 | 1,214 |
| Amherst NY Development Corp. Student Housing Facility Revenue | 4.000% | 10/1/21 | 2,575 | 2,654 |
| Amherst NY Development Corp. Student Housing Facility Revenue | 4.000% | 10/1/22 | 2,680 | 2,723 |
| Amherst NY Development Corp. Student Housing Facility Revenue | 4.375% | 10/1/30 | 1,100 | 1,092 |
| Brooklyn NY Local Development Corp. PILOT Revenue(Barclays Center Project) | 6.000% | 7/15/30 | 6,735 | 6,984 |
| Erie County NY Industrial Development Agency School Facility Revenue | | | | |
| (Buffalo City School District Project) | 5.000% | 5/1/15 | 1,000 | 1,123 |
| Erie County NY Industrial Development Agency School Facility Revenue | | | | |
| (Buffalo City School District Project) | 5.000% | 5/1/15 | 1,500 | 1,685 |
| Erie County NY Industrial Development Agency School Facility Revenue | | | | |
| (Buffalo City School District Project) | 5.750% | 5/1/23 (4) | 7,000 | 7,563 |
| Erie County NY Industrial Development Agency School Facility Revenue | | | | |
| (Buffalo City School District Project) | 5.750% | 5/1/24 (4) | 3,750 | 4,051 |
| Erie County NY Industrial Development Agency School Facility Revenue | | | | |
| (Buffalo City School District Project) | 5.750% | 5/1/25 (4) | 3,000 | 3,241 |
| Erie County NY Industrial Development Agency School Facility Revenue | | | | |
| (Buffalo City School District Project) | 5.250% | 5/1/26 | 6,775 | 7,490 |
| Erie County NY Industrial Development Agency School Facility Revenue | | | | |
| (Buffalo City School District Project) | 5.250% | 5/1/27 | 8,560 | 9,378 |
| Erie County NY Industrial Development Agency School Facility Revenue | | | | |
| (Buffalo City School District Project) | 5.250% | 5/1/29 | 6,315 | 6,851 |
| Erie County NY Industrial Development Agency School Facility Revenue | | | | |
| (Buffalo City School District Project) | 5.250% | 5/1/31 | 2,500 | 2,700 |
| Long Island NY Power Authority Electric System Revenue | 5.250% | 6/1/12 | 40,505 | 41,647 |
| Long Island NY Power Authority Electric System Revenue | 5.000% | 12/1/18 (14) | 1,335 | 1,497 |
| Long Island NY Power Authority Electric System Revenue | 5.000% | 12/1/18 (14) | 2,900 | 3,252 |
| Long Island NY Power Authority Electric System Revenue | 5.000% | 12/1/20 (14) | 10,000 | 11,042 |
78
Intermediate-Term Tax-Exempt Fund
| | | | |
| | | | Face | Market |
| | | Maturity | Amount | Value• |
| | Coupon | Date | ($000) | ($000) |
| Long Island NY Power Authority Electric System Revenue | 5.000% | 12/1/21 (14) | 10,000 | 10,990 |
| Long Island NY Power Authority Electric System Revenue | 5.000% | 12/1/21 (14) | 33,615 | 36,942 |
| Long Island NY Power Authority Electric System Revenue | 5.000% | 4/1/23 | 5,800 | 6,392 |
| Long Island NY Power Authority Electric System Revenue | 5.750% | 4/1/25 | 20,000 | 22,431 |
| Metropolitan New York Transportation Authority Revenue | 5.750% | 7/1/18 | 1,975 | 2,388 |
| Metropolitan New York Transportation Authority Revenue | 5.000% | 11/15/18 | 3,425 | 3,910 |
| Metropolitan New York Transportation Authority Revenue | 5.000% | 11/15/21 | 2,685 | 2,946 |
| Metropolitan New York Transportation Authority Revenue | 5.500% | 11/15/21 (4) | 15,900 | 19,160 |
| Metropolitan New York Transportation Authority Revenue | 5.000% | 11/15/23 (4) | 10,000 | 11,004 |
| Metropolitan New York Transportation Authority Revenue | 4.750% | 11/15/24 (14) | 9,005 | 9,331 |
| Metropolitan New York Transportation Authority Revenue | 4.750% | 11/15/25 (14) | 9,435 | 9,718 |
| Metropolitan New York Transportation Authority Revenue | 5.250% | 11/15/27 | 22,625 | 24,538 |
| Metropolitan New York Transportation Authority Revenue | 5.250% | 11/15/28 | 9,000 | 9,697 |
| Metropolitan New York Transportation Authority Revenue | 5.250% | 11/15/29 | 20,730 | 22,256 |
| Metropolitan New York Transportation Authority Revenue | 5.250% | 11/15/30 | 24,500 | 26,152 |
| Metropolitan New York Transportation Authority Revenue (Commuter Facilities) | 5.000% | 1/1/12 (Prere.) | 8,100 | 8,165 |
| Metropolitan New York Transportation Authority Revenue (Dedicated Petroleum Tax) | 6.000% | 4/1/20 (ETM) | 20,300 | 26,103 |
| 1 Metropolitan New York Transportation Authority Revenue (Dedicated Petroleum Tax) TOB VRDO | 0.140% | 11/7/11 (13) | 8,000 | 8,000 |
| Metropolitan New York Transportation Authority Revenue (Dedicated Tax Fund) | 5.000% | 11/15/25 | 6,125 | 6,864 |
| Metropolitan New York Transportation Authority Revenue (Dedicated Tax Fund) | 5.000% | 11/15/25 | 10,360 | 11,610 |
| Metropolitan New York Transportation Authority Revenue (Dedicated Tax Fund) | 5.000% | 11/15/26 | 7,245 | 8,035 |
| Metropolitan New York Transportation Authority Revenue (Dedicated Tax Fund) | 5.000% | 11/15/26 | 10,910 | 12,100 |
| Metropolitan New York Transportation Authority Revenue (Dedicated Tax Fund) | 5.000% | 11/15/27 | 11,530 | 12,676 |
| Metropolitan New York Transportation Authority Revenue (Dedicated Tax Fund) | 5.000% | 11/15/27 | 11,415 | 12,549 |
| Metropolitan New York Transportation Authority Revenue (Dedicated Tax Fund) | 5.125% | 11/15/28 | 2,000 | 2,205 |
| Metropolitan New York Transportation Authority Revenue (Dedicated Tax Fund) | 5.125% | 11/15/28 | 10,500 | 11,578 |
| 1 Metropolitan New York Transportation Authority Revenue (Dedicated Tax Fund) TOB VRDO | 0.140% | 11/7/11 | 7,840 | 7,840 |
| Metropolitan New York Transportation Authority Revenue (Service Contract) | 5.500% | 7/1/15 | 17,315 | 19,717 |
| Metropolitan New York Transportation Authority Revenue (Service Contract) | 5.750% | 1/1/17 (14) | 1,615 | 1,906 |
| Metropolitan New York Transportation Authority Revenue (Service Contract) | 5.750% | 1/1/17 | 7,000 | 8,263 |
| Metropolitan New York Transportation Authority Revenue (Transit Revenue) | 4.750% | 7/1/12 (Prere.) | 25,835 | 26,609 |
| Metropolitan New York Transportation Authority Revenue (Transit Revenue) | 5.500% | 11/15/14 (2) | 5,210 | 5,847 |
| Metropolitan New York Transportation Authority Revenue (Transit Revenue) | 5.500% | 11/15/15 (2) | 45,130 | 47,317 |
| Metropolitan New York Transportation Authority Revenue (Transit Revenue) | 5.500% | 11/15/16 (2) | 38,075 | 39,851 |
| Metropolitan New York Transportation Authority Revenue (Transit Revenue) | 5.500% | 11/15/18 | 30,750 | 34,549 |
| Metropolitan New York Transportation Authority Revenue (Transit Revenue) | 5.000% | 11/15/20 | 5,000 | 5,522 |
| Metropolitan New York Transportation Authority Revenue (Transit Revenue) | 5.000% | 11/15/21 | 5,000 | 5,412 |
| Metropolitan New York Transportation Authority Revenue (Transit Revenue) PUT | 5.000% | 11/15/13 | 31,500 | 33,925 |
| 1 Metropolitan New York Transportation Authority Revenue TOB VRDO | 0.150% | 11/7/11 | 2,000 | 2,000 |
| 1 Monroe County NY Industrial Development Corp. Mortgage Revenue | | | | |
| (Unity Hospital Rochester Project) TOB VRDO | 0.170% | 11/7/11 | 6,665 | 6,665 |
| Nassau County NY GO | 4.000% | 10/1/22 | 8,755 | 8,967 |
| Nassau County NY GO | 4.000% | 10/1/23 | 5,245 | 5,316 |
| New York City NY Capital Resources Corp. Revenue (Loan Enhanced Assistance Program) VRDO | 0.280% | 11/7/11 LOC | 12,427 | 12,427 |
| New York City NY Cultural Resources Revenue (Lincoln Center for the Performing Arts Inc.) | 5.250% | 12/1/18 | 7,600 | 8,865 |
| New York City NY GO | 5.750% | 8/1/12 (Prere.) | 350 | 364 |
| New York City NY GO | 5.000% | 8/1/13 | 2,370 | 2,553 |
| New York City NY GO | 5.250% | 8/1/13 | 17,515 | 18,946 |
| New York City NY GO | 5.750% | 8/1/13 | 7,650 | 7,958 |
| New York City NY GO | 5.000% | 8/1/14 | 6,500 | 7,226 |
| New York City NY GO | 5.000% | 8/1/14 | 2,505 | 2,785 |
| New York City NY GO | 5.000% | 8/1/14 | 2,500 | 2,779 |
| New York City NY GO | 5.250% | 9/1/14 | 3,560 | 3,993 |
| New York City NY GO | 5.000% | 4/1/15 (4) | 4,760 | 5,371 |
| New York City NY GO | 5.750% | 8/1/15 (2) | 38,000 | 39,405 |
| New York City NY GO | 5.000% | 8/1/17 | 7,610 | 8,860 |
| New York City NY GO | 5.000% | 3/1/18 | 1,990 | 2,333 |
| New York City NY GO | 5.000% | 6/1/19 | 8,675 | 10,179 |
| New York City NY GO | 5.000% | 8/1/19 | 12,130 | 13,827 |
| New York City NY GO | 5.000% | 8/1/19 | 4,500 | 5,287 |
| New York City NY GO | 5.000% | 8/1/19 | 5,000 | 5,875 |
| New York City NY GO | 5.000% | 8/1/19 | 3,100 | 3,642 |
| New York City NY GO | 5.000% | 8/1/20 | 10,000 | 11,275 |
| New York City NY GO | 5.000% | 8/1/20 | 32,355 | 37,533 |
| New York City NY GO | 5.000% | 8/1/20 | 9,010 | 10,159 |
| New York City NY GO | 5.250% | 9/1/20 | 4,565 | 5,314 |
| New York City NY GO | 5.000% | 10/1/20 | 1,445 | 1,633 |
| New York City NY GO | 5.000% | 2/1/21 | 12,300 | 13,704 |
| New York City NY GO | 5.250% | 3/1/21 | 4,255 | 4,954 |
| New York City NY GO | 5.000% | 8/1/21 | 9,600 | 10,773 |
| New York City NY GO | 5.000% | 8/1/21 | 14,000 | 15,657 |
| New York City NY GO | 5.000% | 8/1/21 | 59,135 | 68,180 |
79
Intermediate-Term Tax-Exempt Fund
| | | | |
| | | | Face | Market |
| | | Maturity | Amount | Value• |
| | Coupon | Date | ($000) | ($000) |
| New York City NY GO | 5.000% | 8/1/21 | 23,065 | 25,796 |
| New York City NY GO | 5.000% | 8/1/21 | 15,750 | 18,434 |
| New York City NY GO | 5.250% | 9/1/21 | 20,000 | 23,153 |
| New York City NY GO | 5.000% | 1/1/22 | 15,000 | 16,516 |
| New York City NY GO | 5.000% | 8/1/22 | 7,050 | 7,823 |
| New York City NY GO | 5.000% | 8/1/22 | 18,475 | 21,276 |
| New York City NY GO | 5.000% | 8/1/22 | 32,000 | 36,359 |
| New York City NY GO | 5.000% | 8/1/22 | 6,020 | 6,933 |
| New York City NY GO | 5.250% | 8/15/22 | 25,250 | 28,837 |
| New York City NY GO | 5.000% | 8/1/23 | 2,000 | 2,250 |
| New York City NY GO | 5.250% | 8/15/23 | 21,820 | 24,704 |
| New York City NY GO | 5.000% | 11/1/23 | 8,000 | 8,762 |
| New York City NY GO | 5.250% | 8/15/24 | 25,945 | 29,165 |
| New York City NY GO | 5.000% | 3/1/25 | 9,000 | 9,418 |
| New York City NY GO | 5.000% | 6/1/25 | 5,145 | 5,540 |
| New York City NY GO | 5.000% | 8/1/25 | 5,000 | 5,515 |
| New York City NY GO | 5.000% | 4/1/26 | 3,590 | 3,921 |
| New York City NY GO | 5.000% | 8/1/26 | 1,455 | 1,594 |
| New York City NY GO | 5.000% | 8/1/28 | 17,000 | 18,750 |
| New York City NY GO | 5.000% | 5/15/29 | 7,900 | 8,500 |
| New York City NY GO | 5.000% | 8/1/29 | 17,500 | 19,152 |
| New York City NY GO | 5.000% | 8/1/30 | 23,000 | 25,015 |
| New York City NY GO | 5.000% | 10/1/30 | 18,425 | 20,062 |
| New York City NY GO | 5.450% | 4/1/31 | 6,560 | 7,338 |
| New York City NY GO | 5.000% | 5/15/31 | 5,000 | 5,326 |
| New York City NY GO | 5.000% | 10/1/31 | 34,050 | 36,843 |
| New York City NY GO VRDO | 0.160% | 11/1/11 LOC | 8,220 | 8,220 |
| New York City NY GO VRDO | 0.160% | 11/1/11 | 52,155 | 52,155 |
| New York City NY Health & Hospital Corp. Revenue (Health System) | 5.000% | 2/15/18 | 1,500 | 1,695 |
| New York City NY Health & Hospital Corp. Revenue (Health System) | 5.000% | 2/15/30 | 19,200 | 20,059 |
| New York City NY Housing Development Corp. Multi-Family Housing Revenue | 4.750% | 11/1/30 | 4,975 | 5,027 |
| New York City NY Housing Development Corp. Multi-Family Housing Revenue | 4.750% | 11/1/30 | 1,875 | 1,895 |
| New York City NY Municipal Water Finance Authority Water & Sewer System Revenue | 5.000% | 6/15/26 | 25,880 | 28,893 |
| New York City NY Municipal Water Finance Authority Water & Sewer System Revenue | 5.000% | 6/15/26 | 35,000 | 39,074 |
| New York City NY Municipal Water Finance Authority Water & Sewer System Revenue | 5.000% | 6/15/29 | 4,500 | 4,887 |
| New York City NY Municipal Water Finance Authority Water & Sewer System Revenue | 5.000% | 6/15/29 | 3,580 | 3,831 |
| New York City NY Municipal Water Finance Authority Water & Sewer System Revenue | 5.000% | 6/15/29 | 41,500 | 45,411 |
| New York City NY Municipal Water Finance Authority Water & Sewer System Revenue | 5.000% | 6/15/30 | 10,000 | 10,821 |
| New York City NY Municipal Water Finance Authority Water & Sewer System Revenue | 5.000% | 6/15/31 | 24,500 | 26,521 |
| New York City NY Municipal Water Finance Authority Water & Sewer System Revenue | 5.000% | 6/15/31 | 9,000 | 9,678 |
| New York City NY Municipal Water Finance Authority Water & Sewer System Revenue | 5.000% | 6/15/32 | 15,000 | 16,188 |
| New York City NY Municipal Water Finance Authority Water & Sewer System Revenue | 5.000% | 6/15/32 | 5,545 | 5,984 |
| 1 New York City NY Municipal Water Finance Authority Water & Sewer System Revenue | | | | |
| TOB VRDO | 0.150% | 11/1/11 | 17,490 | 17,490 |
| New York City NY Sales Tax Asset Receivable Corp. Revenue | 5.000% | 10/15/26 (14) | 9,500 | 10,261 |
| New York City NY Transitional Finance Authority Building Aid Revenue | 5.000% | 1/15/13 (ETM) | 2,000 | 2,111 |
| New York City NY Transitional Finance Authority Building Aid Revenue | 5.000% | 1/15/14 | 3,525 | 3,836 |
| New York City NY Transitional Finance Authority Building Aid Revenue | 5.000% | 1/15/15 | 2,820 | 3,145 |
| New York City NY Transitional Finance Authority Building Aid Revenue | 5.000% | 1/15/16 | 2,925 | 3,323 |
| New York City NY Transitional Finance Authority Building Aid Revenue | 5.000% | 1/15/17 | 5,150 | 5,922 |
| New York City NY Transitional Finance Authority Building Aid Revenue | 5.000% | 7/15/17 | 6,335 | 7,340 |
| New York City NY Transitional Finance Authority Building Aid Revenue | 5.000% | 1/15/19 | 3,875 | 4,519 |
| New York City NY Transitional Finance Authority Building Aid Revenue | 5.000% | 1/15/23 | 4,440 | 4,911 |
| New York City NY Transitional Finance Authority Building Aid Revenue | 5.000% | 1/15/24 | 7,040 | 7,744 |
| New York City NY Transitional Finance Authority Building Aid Revenue | 5.000% | 1/15/25 (14) | 10,170 | 10,940 |
| New York City NY Transitional Finance Authority Building Aid Revenue | 5.250% | 1/15/25 | 13,090 | 14,520 |
| New York City NY Transitional Finance Authority Building Aid Revenue | 5.000% | 1/15/26 (14) | 7,620 | 8,107 |
| New York City NY Transitional Finance Authority Building Aid Revenue | 5.250% | 1/15/26 | 8,185 | 9,008 |
| New York City NY Transitional Finance Authority Building Aid Revenue | 5.250% | 1/15/26 | 10,520 | 11,577 |
| New York City NY Transitional Finance Authority Building Aid Revenue | 5.250% | 1/15/27 | 4,615 | 5,045 |
| New York City NY Transitional Finance Authority Building Aid Revenue | 5.125% | 1/15/28 | 3,465 | 3,734 |
| New York City NY Transitional Finance Authority Building Aid Revenue | 5.000% | 1/15/29 | 3,550 | 3,751 |
| New York City NY Transitional Finance Authority Building Aid Revenue | 5.000% | 1/15/30 | 9,500 | 10,095 |
| New York City NY Transitional Finance Authority Future Tax Revenue | 5.250% | 8/1/12 (Prere.) | 750 | 778 |
| New York City NY Transitional Finance Authority Future Tax Revenue | 5.375% | 2/1/13 | 15 | 15 |
| New York City NY Transitional Finance Authority Future Tax Revenue | 5.000% | 11/1/14 | 6,065 | 6,827 |
| New York City NY Transitional Finance Authority Future Tax Revenue | 5.000% | 11/1/15 | 8,000 | 9,176 |
| New York City NY Transitional Finance Authority Future Tax Revenue | 5.000% | 11/1/17 | 5,965 | 7,030 |
| 2 New York City NY Transitional Finance Authority Future Tax Revenue | 5.000% | 11/1/17 | 12,000 | 14,143 |
| New York City NY Transitional Finance Authority Future Tax Revenue | 5.000% | 8/1/18 | 1,300 | 1,536 |
| New York City NY Transitional Finance Authority Future Tax Revenue | 5.000% | 11/1/18 | 20,000 | 23,686 |
| New York City NY Transitional Finance Authority Future Tax Revenue | 5.000% | 11/1/18 | 5,000 | 5,921 |
80
Intermediate-Term Tax-Exempt Fund
| | | | |
| | | | Face | Market |
| | | Maturity | Amount | Value• |
| | Coupon | Date | ($000) | ($000) |
| 2 New York City NY Transitional Finance Authority Future Tax Revenue | 5.000% | 11/1/18 | 11,000 | 13,027 |
| New York City NY Transitional Finance Authority Future Tax Revenue | 5.000% | 11/1/19 | 2,535 | 3,001 |
| New York City NY Transitional Finance Authority Future Tax Revenue | 5.000% | 11/1/19 | 9,835 | 11,643 |
| New York City NY Transitional Finance Authority Future Tax Revenue | 5.000% | 8/1/20 | 3,250 | 3,670 |
| New York City NY Transitional Finance Authority Future Tax Revenue | 5.000% | 8/1/21 | 51,100 | 57,464 |
| New York City NY Transitional Finance Authority Future Tax Revenue | 5.000% | 11/1/21 | 30,000 | 34,825 |
| New York City NY Transitional Finance Authority Future Tax Revenue | 5.000% | 5/1/22 | 11,090 | 12,687 |
| New York City NY Transitional Finance Authority Future Tax Revenue | 5.000% | 8/1/22 | 2,500 | 2,782 |
| New York City NY Transitional Finance Authority Future Tax Revenue | 5.000% | 2/1/24 | 6,000 | 6,868 |
| New York City NY Transitional Finance Authority Future Tax Revenue | 5.000% | 11/1/24 | 8,000 | 9,226 |
| 2 New York City NY Transitional Finance Authority Future Tax Revenue | 5.000% | 11/1/25 | 5,000 | 5,705 |
| 2 New York City NY Transitional Finance Authority Future Tax Revenue | 5.000% | 11/1/25 | 5,000 | 5,705 |
| New York City NY Transitional Finance Authority Future Tax Revenue | 5.000% | 2/1/26 | 10,290 | 11,535 |
| 2 New York City NY Transitional Finance Authority Future Tax Revenue | 5.000% | 11/1/26 | 2,635 | 2,976 |
| 2 New York City NY Transitional Finance Authority Future Tax Revenue | 5.000% | 11/1/26 | 8,620 | 9,734 |
| New York City NY Transitional Finance Authority Future Tax Revenue | 5.250% | 11/1/26 | 8,255 | 9,417 |
| 2 New York City NY Transitional Finance Authority Future Tax Revenue | 5.000% | 11/1/27 | 1,435 | 1,606 |
| 2 New York City NY Transitional Finance Authority Future Tax Revenue | 5.000% | 11/1/27 | 4,000 | 4,478 |
| New York City NY Transitional Finance Authority Future Tax Revenue | 5.000% | 2/1/28 | 25,675 | 28,332 |
| New York City NY Transitional Finance Authority Future Tax Revenue | 5.000% | 5/1/29 | 10,000 | 10,865 |
| New York City NY Transitional Finance Authority Future Tax Revenue | 5.000% | 2/1/31 | 8,000 | 8,729 |
| New York GO | 4.500% | 2/1/17 | 14,125 | 15,986 |
| New York GO | 4.500% | 2/1/18 | 24,735 | 28,124 |
| New York GO | 4.500% | 2/1/19 | 10,670 | 12,097 |
| New York GO | 5.000% | 2/1/30 | 3,000 | 3,286 |
| New York GO | 5.000% | 2/15/30 | 20,000 | 22,110 |
| 1 New York GO TOB VRDO | 0.140% | 11/7/11 | 2,100 | 2,100 |
| New York Metropolitan Transportation Authority Revenue | 5.000% | 11/15/25 | 1,500 | 1,637 |
| New York Metropolitan Transportation Authority Revenue | 5.000% | 11/15/30 | 12,125 | 12,770 |
| New York Metropolitan Transportation Authority Revenue | 4.750% | 11/15/31 | 8,000 | 8,134 |
| New York State Dormitory Authority Lease Revenue (Mental Health Services Facilities) | 5.000% | 8/15/20 | 13,290 | 15,501 |
| New York State Dormitory Authority Lease Revenue (Mental Health Services Facilities) | 5.000% | 8/15/21 | 10,000 | 11,516 |
| New York State Dormitory Authority Lease Revenue (Mental Health Services Facilities) | 5.000% | 8/15/22 | 2,000 | 2,245 |
| New York State Dormitory Authority Lease Revenue (State University Dormitory Facilities) | 5.000% | 7/1/28 | 3,925 | 4,243 |
| New York State Dormitory Authority Lease Revenue (State University Dormitory Facilities) | 5.000% | 7/1/29 | 2,125 | 2,289 |
| New York State Dormitory Authority Lease Revenue (State University Dormitory Facilities) | 5.000% | 7/1/30 | 4,330 | 4,634 |
| New York State Dormitory Authority Revenue (City University System) | 5.750% | 7/1/13 (14) | 7,755 | 8,061 |
| New York State Dormitory Authority Revenue (City University System) | 5.750% | 7/1/13 (14) | 6,485 | 6,781 |
| New York State Dormitory Authority Revenue (City University System) | 5.000% | 7/1/19 | 3,000 | 3,433 |
| New York State Dormitory Authority Revenue (City University System) | 5.000% | 7/1/21 | 5,000 | 5,737 |
| New York State Dormitory Authority Revenue (City University System) | 5.000% | 7/1/22 | 5,340 | 6,047 |
| New York State Dormitory Authority Revenue (City University System) | 5.000% | 7/1/25 | 6,100 | 6,674 |
| New York State Dormitory Authority Revenue (Fordham University) | 5.000% | 7/1/28 | 1,070 | 1,147 |
| New York State Dormitory Authority Revenue (Fordham University) | 5.125% | 7/1/29 | 1,625 | 1,745 |
| New York State Dormitory Authority Revenue (Fordham University) | 5.200% | 7/1/30 | 1,200 | 1,289 |
| New York State Dormitory Authority Revenue (Fordham University) PUT | 5.000% | 7/1/16 | 18,000 | 20,185 |
| New York State Dormitory Authority Revenue (Memorial Sloan-Kettering Cancer Center) | 5.000% | 7/1/30 | 7,500 | 7,819 |
| New York State Dormitory Authority Revenue (Mental Health Services Facilities Improvement) | 5.000% | 2/15/19 (4) | 3,200 | 3,586 |
| New York State Dormitory Authority Revenue (Mental Health Services Facilities Improvement) | 5.000% | 2/15/19 (4) | 3,000 | 3,456 |
| New York State Dormitory Authority Revenue (Mental Health Services Facilities Improvement) | 5.000% | 2/15/19 (4) | 5,030 | 5,794 |
| New York State Dormitory Authority Revenue (Mental Health Services Facilities Improvement) | 5.000% | 2/15/23 (14) | 6,415 | 6,803 |
| New York State Dormitory Authority Revenue (Mental Health Services Facilities Improvement) | 5.000% | 2/15/24 (14) | 6,740 | 7,118 |
| New York State Dormitory Authority Revenue (Mental Health Services Facilities Improvement) | 5.000% | 2/15/25 (4) | 2,735 | 2,950 |
| New York State Dormitory Authority Revenue (Mount Sinai Hospital Obligated Group) | 5.000% | 7/1/22 | 3,500 | 3,751 |
| New York State Dormitory Authority Revenue (Mount Sinai Hospital Obligated Group) | 5.000% | 7/1/26 | 3,500 | 3,599 |
| New York State Dormitory Authority Revenue | | | | |
| (Mount Sinai School of Medicine of New York University) | 5.000% | 7/1/21 | 1,500 | 1,670 |
| New York State Dormitory Authority Revenue | | | | |
| (Mount Sinai School of Medicine of New York University) | 5.000% | 7/1/23 (14) | 4,000 | 4,215 |
| New York State Dormitory Authority Revenue | | | | |
| (Mount Sinai School of Medicine of New York University) | 5.000% | 7/1/24 (14) | 3,300 | 3,449 |
| New York State Dormitory Authority Revenue | | | | |
| (Mount Sinai School of Medicine of New York University) | 5.000% | 7/1/27 (14) | 8,000 | 8,230 |
| New York State Dormitory Authority Revenue (New York University) | 5.750% | 7/1/16 (14) | 3,500 | 4,138 |
| New York State Dormitory Authority Revenue (New York University) | 6.000% | 7/1/19 (14) | 1,700 | 2,107 |
| New York State Dormitory Authority Revenue (New York University) | 5.000% | 7/1/22 | 3,445 | 3,880 |
| New York State Dormitory Authority Revenue (New York University) | 5.000% | 7/1/29 | 2,000 | 2,130 |
| New York State Dormitory Authority Revenue (North Shore - Long Island Jewish Obligated Group) | 5.000% | 5/1/32 | 2,475 | 2,472 |
| New York State Dormitory Authority Revenue (Personal Income Tax) | 5.000% | 12/15/13 | 2,135 | 2,333 |
| New York State Dormitory Authority Revenue (Personal Income Tax) | 5.000% | 12/15/14 | 3,250 | 3,662 |
| New York State Dormitory Authority Revenue (Personal Income Tax) | 5.000% | 3/15/20 | 33,000 | 38,172 |
| New York State Dormitory Authority Revenue (Personal Income Tax) | 5.000% | 2/15/21 | 12,080 | 14,131 |
81
Intermediate-Term Tax-Exempt Fund
| | | | |
| | | | Face | Market |
| | | Maturity | Amount | Value• |
| | Coupon | Date | ($000) | ($000) |
| New York State Dormitory Authority Revenue (Personal Income Tax) | 5.000% | 3/15/21 | 34,650 | 39,775 |
| New York State Dormitory Authority Revenue (Personal Income Tax) | 5.500% | 3/15/22 (2) | 7,000 | 8,750 |
| New York State Dormitory Authority Revenue (Personal Income Tax) | 5.000% | 3/15/23 | 5,000 | 5,501 |
| New York State Dormitory Authority Revenue (Personal Income Tax) | 5.000% | 12/15/23 | 5,000 | 5,553 |
| New York State Dormitory Authority Revenue (Personal Income Tax) | 5.000% | 3/15/25 | 16,820 | 18,493 |
| New York State Dormitory Authority Revenue (Personal Income Tax) | 5.000% | 3/15/26 | 17,630 | 19,787 |
| New York State Dormitory Authority Revenue (Personal Income Tax) | 5.000% | 3/15/26 | 2,585 | 2,901 |
| New York State Dormitory Authority Revenue (Personal Income Tax) | 5.000% | 3/15/26 | 10,000 | 10,958 |
| New York State Dormitory Authority Revenue (Personal Income Tax) | 5.000% | 3/15/27 | 20,650 | 22,984 |
| New York State Dormitory Authority Revenue (Personal Income Tax) | 5.000% | 3/15/28 | 2,565 | 2,747 |
| New York State Dormitory Authority Revenue (Personal Income Tax) | 5.000% | 3/15/28 | 5,790 | 6,268 |
| New York State Dormitory Authority Revenue (Personal Income Tax) | 5.000% | 3/15/28 | 20,000 | 21,704 |
| New York State Dormitory Authority Revenue (Personal Income Tax) | 5.000% | 3/15/28 | 25,000 | 27,616 |
| New York State Dormitory Authority Revenue (Personal Income Tax) | 5.000% | 3/15/28 | 2,875 | 3,120 |
| New York State Dormitory Authority Revenue (Personal Income Tax) | 5.000% | 2/15/29 | 6,810 | 7,427 |
| New York State Dormitory Authority Revenue (Personal Income Tax) | 5.000% | 3/15/29 | 25,000 | 27,511 |
| New York State Dormitory Authority Revenue (Personal Income Tax) | 5.000% | 2/15/30 | 1,000 | 1,088 |
| New York State Dormitory Authority Revenue (Personal Income Tax) | 5.000% | 3/15/30 | 32,000 | 35,108 |
| 1 New York State Dormitory Authority Revenue (Personal Income Tax) TOB VRDO | 0.140% | 11/7/11 | 12,800 | 12,800 |
| New York State Dormitory Authority Revenue (Rockefeller University) VRDO | 0.120% | 11/7/11 | 10,000 | 10,000 |
| New York State Dormitory Authority Revenue (School Districts Financing Program) | 5.000% | 10/1/19 (12) | 2,500 | 2,882 |
| New York State Dormitory Authority Revenue (School Districts Financing Program) | 5.000% | 10/1/19 | 10,000 | 11,466 |
| New York State Dormitory Authority Revenue (School Districts Financing Program) | 5.000% | 10/1/19 | 3,475 | 4,006 |
| New York State Dormitory Authority Revenue (School Districts Financing Program) | 5.000% | 10/1/20 | 10,000 | 11,374 |
| New York State Dormitory Authority Revenue (School Districts Financing Program) | 5.000% | 10/1/21 | 4,320 | 4,939 |
| New York State Dormitory Authority Revenue (School Districts Financing Program) | 5.000% | 10/1/22 | 16,355 | 18,269 |
| New York State Dormitory Authority Revenue (School Districts Financing Program) | 5.000% | 10/1/22 | 7,000 | 7,891 |
| New York State Dormitory Authority Revenue (School Districts Financing Program) | 5.000% | 10/1/23 | 19,435 | 21,516 |
| New York State Dormitory Authority Revenue (School Districts Financing Program) | 5.000% | 10/1/26 | 4,500 | 4,854 |
| New York State Dormitory Authority Revenue (Service Contract) | 5.000% | 7/1/18 | 11,570 | 13,405 |
| New York State Dormitory Authority Revenue (Service Contract) | 5.000% | 7/1/20 | 6,815 | 7,782 |
| New York State Dormitory Authority Revenue (Service Contract) | 5.000% | 7/1/21 | 17,750 | 20,035 |
| New York State Dormitory Authority Revenue (Service Contract) | 5.000% | 7/1/22 | 3,050 | 3,404 |
| New York State Dormitory Authority Revenue (St. John’s University) VRDO | 0.110% | 11/7/11 LOC | 7,400 | 7,400 |
| New York State Dormitory Authority Revenue (State University Educational Facilities) | 5.250% | 5/15/15 | 1,905 | 2,091 |
| New York State Energy Research & Development Authority Pollution Control Revenue | | | | |
| (New York State Electric & Gas Corp. Project) | 2.250% | 12/1/15 | 9,500 | 9,381 |
| New York State Energy Research & Development Authority Pollution Control Revenue | | | | |
| (New York State Electric & Gas Corp. Project) PUT | 3.000% | 6/3/13 | 5,000 | 5,098 |
| New York State Energy Research & Development Authority Pollution Control Revenue | | | | |
| (New York State Electric & Gas Corp. Project) PUT | 3.000% | 6/3/13 | 5,000 | 5,098 |
| New York State Environmental Facilities Corp. Revenue (Personal Income Tax) | 5.250% | 12/15/24 | 7,240 | 8,333 |
| New York State Environmental Facilities Corp. Revenue (Personal Income Tax) | 5.250% | 12/15/25 | 15,950 | 18,213 |
| New York State Environmental Facilities Corp. Revenue | | | | |
| (State Clean Water & Drinking Water Revolving Funds) | 5.375% | 6/15/15 | 7,650 | 7,885 |
| New York State Environmental Facilities Corp. Revenue | | | | |
| (State Clean Water & Drinking Water Revolving Funds) | 5.375% | 6/15/16 | 6,000 | 6,183 |
| New York State Environmental Facilities Corp. Revenue | | | | |
| (State Clean Water & Drinking Water Revolving Funds) | 5.000% | 6/15/27 | 14,910 | 16,697 |
| New York State Environmental Facilities Corp. Revenue | | | | |
| (State Clean Water & Drinking Water Revolving Funds) | 5.000% | 6/15/28 | 11,460 | 12,735 |
| New York State Environmental Facilities Corp. Revenue | | | | |
| (State Clean Water & Drinking Water Revolving Funds) | 5.000% | 6/15/29 | 17,830 | 19,737 |
| New York State Environmental Facilities Corp. Revenue | | | | |
| (State Clean Water & Drinking Water Revolving Funds) | 5.000% | 6/15/30 | 26,230 | 28,946 |
| New York State Environmental Facilities Corp. Revenue | | | | |
| (State Clean Water & Drinking Water Revolving Funds) | 5.000% | 6/15/31 | 3,670 | 4,031 |
| New York State Environmental Facilities Corp. Revenue (State Revolving Funds) | 4.000% | 5/15/14 | 1,415 | 1,533 |
| New York State Environmental Facilities Corp. Revenue (State Revolving Funds) | 5.000% | 5/15/16 | 3,725 | 4,335 |
| New York State Environmental Facilities Corp. Revenue (State Revolving Funds) | 5.000% | 11/15/23 | 3,790 | 4,406 |
| New York State Environmental Facilities Corp. Revenue (State Revolving Funds) | 5.000% | 11/15/24 | 3,475 | 3,999 |
| New York State Environmental Facilities Corp. Revenue (State Revolving Funds) | 5.000% | 11/15/25 | 6,035 | 6,879 |
| New York State Environmental Facilities Corp. Revenue (State Revolving Funds) | 5.000% | 11/15/27 | 3,350 | 3,749 |
| New York State Environmental Facilities Corp. Revenue (State Revolving Funds) | 5.000% | 11/15/28 | 6,160 | 6,840 |
| New York State Environmental Facilities Corp. Revenue (State Revolving Funds) | 5.000% | 11/15/29 | 5,320 | 5,921 |
| New York State Environmental Facilities Corp. Revenue (State Revolving Funds) | 5.000% | 11/15/30 | 1,840 | 2,043 |
| New York State Housing Finance Agency Housing Revenue (320 West 38th Street) VRDO | 0.100% | 11/7/11 LOC | 8,000 | 8,000 |
| New York State Housing Finance Agency Revenue (Clinton Park) VRDO | 0.100% | 11/7/11 LOC | 12,000 | 12,000 |
| New York State Housing Finance Agency Revenue (Service Contract) VRDO | 0.160% | 11/7/11 LOC | 6,600 | 6,600 |
| New York State Local Government Assistance Corp. Revenue | 5.500% | 4/1/17 (4) | 5,000 | 5,817 |
| New York State Local Government Assistance Corp. Revenue | 5.500% | 4/1/17 | 1,250 | 1,454 |
| New York State Local Government Assistance Corp. Revenue VRDO | 0.100% | 11/7/11 | 7,500 | 7,500 |
82
Intermediate-Term Tax-Exempt Fund
| | | | |
| | | | Face | Market |
| | | Maturity | Amount | Value• |
| | Coupon | Date | ($000) | ($000) |
| New York State Local Government Assistance Corp. Revenue VRDO | 0.110% | 11/7/11 | 6,800 | 6,800 |
| New York State Mortgage Agency Homeowner Mortgage Revenue VRDO | 0.170% | 11/7/11 | 11,500 | 11,500 |
| New York State Mortgage Agency Revenue (NYHELP’s Education Loan) | 5.000% | 11/1/22 | 995 | 1,075 |
| New York State Power Authority Revenue | 5.250% | 11/15/12 (Prere.) | 2,600 | 2,734 |
| New York State Thruway Authority Revenue | 5.000% | 1/1/20 (14) | 8,940 | 10,041 |
| New York State Thruway Authority Revenue | 5.000% | 1/1/21 (14) | 8,000 | 8,928 |
| New York State Thruway Authority Revenue | 5.000% | 1/1/22 (14) | 10,000 | 11,064 |
| New York State Thruway Authority Revenue | 5.000% | 1/1/23 (2) | 20,000 | 21,655 |
| New York State Thruway Authority Revenue | 5.000% | 1/1/24 (2) | 14,885 | 15,966 |
| New York State Thruway Authority Revenue (Highway & Bridge Trust Fund) | 5.000% | 4/1/16 (14) | 8,185 | 9,316 |
| New York State Thruway Authority Revenue (Highway & Bridge Trust Fund) | 5.000% | 4/1/18 | 13,260 | 15,371 |
| New York State Thruway Authority Revenue (Highway& Bridge Trust Fund) | 5.500% | 4/1/12 (14) | 20,000 | 20,441 |
| New York State Thruway Authority Revenue (Highway& Bridge Trust Fund) | 5.000% | 4/1/13 | 2,500 | 2,661 |
| New York State Thruway Authority Revenue (Highway& Bridge Trust Fund) | 5.500% | 4/1/13 (14) | 15,000 | 15,333 |
| New York State Thruway Authority Revenue (Highway& Bridge Trust Fund) | 5.000% | 4/1/14 | 12,055 | 13,277 |
| New York State Thruway Authority Revenue (Highway& Bridge Trust Fund) | 5.250% | 4/1/14 (14) | 3,515 | 3,892 |
| New York State Thruway Authority Revenue (Highway& Bridge Trust Fund) | 5.000% | 4/1/17 (14) | 5,000 | 5,626 |
| New York State Thruway Authority Revenue (Highway& Bridge Trust Fund) | 5.000% | 4/1/18 (2) | 5,995 | 6,726 |
| New York State Thruway Authority Revenue (Highway& Bridge Trust Fund) | 5.000% | 4/1/19 | 6,650 | 7,532 |
| New York State Thruway Authority Revenue (Highway& Bridge Trust Fund) | 5.000% | 4/1/20 | 5,650 | 6,324 |
| New York State Thruway Authority Revenue (Highway& Bridge Trust Fund) | 5.000% | 4/1/20 | 10,400 | 11,920 |
| New York State Thruway Authority Revenue (Highway& Bridge Trust Fund) | 5.000% | 4/1/20 | 9,890 | 11,378 |
| New York State Thruway Authority Revenue (Highway& Bridge Trust Fund) | 5.000% | 4/1/20 | 11,395 | 12,871 |
| New York State Thruway Authority Revenue (Highway& Bridge Trust Fund) | 5.000% | 4/1/23 | 8,515 | 9,567 |
| New York State Thruway Authority Revenue (Highway& Bridge Trust Fund) | 5.000% | 4/1/25 | 4,500 | 4,968 |
| New York State Thruway Authority Revenue (Highway& Bridge Trust Fund) | 5.000% | 4/1/27 | 21,600 | 23,833 |
| New York State Thruway Authority Revenue (Highway& Bridge Trust Fund) | 5.000% | 4/1/27 | 7,000 | 7,590 |
| New York State Thruway Authority Revenue (Highway& Bridge Trust Fund) | 5.000% | 4/1/28 | 13,505 | 14,811 |
| New York State Thruway Authority Revenue (Highway& Bridge Trust Fund) | 5.000% | 4/1/30 | 27,175 | 29,511 |
| New York State Thruway Authority Revenue (Personal Income Tax) | 5.500% | 3/15/12 (Prere.) | 3,000 | 3,059 |
| New York State Thruway Authority Revenue (Personal Income Tax) | 5.000% | 3/15/21 | 24,890 | 28,837 |
| New York State Thruway Authority Revenue (Personal Income Tax) | 5.250% | 3/15/27 | 7,115 | 8,024 |
| New York State Thruway Authority Revenue (Personal Income Tax) | 5.000% | 3/15/29 | 7,000 | 7,573 |
| New York State Thruway Authority Revenue (Second Generation Highway & Bridge Trust Fund) | 5.000% | 4/1/22 | 22,710 | 26,117 |
| New York State Thruway Authority Revenue (Service Contract) | 5.500% | 4/1/13 | 5,000 | 5,104 |
| New York State Urban Development Corp. Revenue | 5.000% | 12/15/14 | 3,125 | 3,521 |
| New York State Urban Development Corp. Revenue | 5.000% | 1/1/15 | 19,500 | 21,815 |
| New York State Urban Development Corp. Revenue | 5.000% | 12/15/15 | 4,000 | 4,589 |
| New York State Urban Development Corp. Revenue | 5.000% | 1/1/16 | 22,360 | 25,412 |
| New York State Urban Development Corp. Revenue | 5.250% | 1/1/17 | 12,000 | 13,879 |
| New York State Urban Development Corp. Revenue | 5.250% | 1/1/18 | 36,140 | 42,168 |
| New York State Urban Development Corp. Revenue | 5.250% | 1/1/22 | 7,500 | 8,431 |
| New York State Urban Development Corp. Revenue | 4.375% | 3/15/22 | 9,020 | 9,930 |
| New York State Urban Development Corp. Revenue | 5.000% | 12/15/22 | 2,000 | 2,298 |
| New York State Urban Development Corp. Revenue | 5.000% | 12/15/23 | 2,615 | 2,984 |
| New York State Urban Development Corp. Revenue | 5.000% | 1/1/26 | 7,910 | 8,478 |
| New York State Urban Development Corp. Revenue (Correctional Capital Facilities) | 5.250% | 1/1/14 (4) | 7,770 | 8,135 |
| New York State Urban Development Corp. Revenue (Personal Income Tax) | 5.000% | 12/15/18 | 20,000 | 23,859 |
| New York State Urban Development Corp. Revenue (Personal Income Tax) | 5.000% | 12/15/19 | 46,125 | 55,027 |
| New York State Urban Development Corp. Revenue (Personal Income Tax) | 5.000% | 12/15/20 | 36,240 | 42,466 |
| New York State Urban Development Corp. Revenue (Personal Income Tax) | 5.500% | 3/15/21 (14) | 10,000 | 12,421 |
| New York State Urban Development Corp. Revenue (Personal Income Tax) | 5.000% | 12/15/21 | 18,310 | 21,267 |
| New York State Urban Development Corp. Revenue (Personal Income Tax) | 5.500% | 3/15/22 (14) | 21,000 | 26,249 |
| New York State Urban Development Corp. Revenue (Personal Income Tax) | 5.000% | 12/15/23 | 7,180 | 8,070 |
| New York State Urban Development Corp. Revenue (Personal Income Tax) | 5.000% | 3/15/28 | 6,950 | 7,565 |
| New York State Urban Development Corp. Revenue (Service Contract) | 5.000% | 1/1/15 | 50,000 | 55,935 |
| New York State Urban Development Corp. Revenue (Service Contract) | 5.000% | 1/1/18 | 8,000 | 9,220 |
| New York State Urban Development Corp. Revenue (Service Contract) | 5.000% | 1/1/18 | 24,275 | 27,977 |
| New York State Urban Development Corp. Revenue (Service Contract) | 5.000% | 1/1/19 | 3,625 | 4,170 |
| New York State Urban Development Corp. Revenue (Service Contract) | 5.250% | 1/1/19 (4) | 7,050 | 8,130 |
| New York State Urban Development Corp. Revenue (Service Contract) | 5.000% | 1/1/20 | 8,165 | 9,352 |
| New York State Urban Development Corp. Revenue (Service Contract) | 5.000% | 1/1/21 | 11,345 | 12,995 |
| New York State Urban Development Corp. Revenue (Service Contract) | 5.000% | 1/1/22 | 5,120 | 5,789 |
| New York State Urban Development Corp. Revenue (Service Contract) | 5.250% | 1/1/25 | 15,000 | 16,399 |
| New York State Urban Development Corp. Revenue (Service Contract) VRDO | 0.120% | 11/7/11 | 22,690 | 22,690 |
| Port Authority of New York & New Jersey Revenue | 5.250% | 7/15/30 | 18,635 | 20,994 |
| Port Authority of New York & New Jersey Special Obligation Revenue | | | | |
| (John F. Kennedy International Air Terminal LLC) | 6.500% | 12/1/28 | 25,000 | 26,359 |
| Suffolk County NY Water Authority Revenue | 6.800% | 6/1/12 (ETM) | 665 | 690 |
| Syracuse NY Industrial Development Agency Civic Facility Revenue | | | | |
| (Syracuse University Project) VRDO | 0.090% | 11/7/11 LOC | 4,000 | 4,000 |
| Tobacco Settlement Financing Corp. New York Revenue | 4.000% | 6/1/12 | 50,000 | 51,020 |
83
Intermediate-Term Tax-Exempt Fund
| | | | |
| | | | Face | Market |
| | | Maturity | Amount | Value• |
| | Coupon | Date | ($000) | ($000) |
| Tobacco Settlement Financing Corp. New York Revenue | 5.000% | 6/1/15 | 15,000 | 16,794 |
| Triborough Bridge & Tunnel Authority New York Revenue | 5.500% | 1/1/12 (ETM) | 4,195 | 4,232 |
| Triborough Bridge & Tunnel Authority New York Revenue | 6.000% | 1/1/12 (ETM) | 3,640 | 3,675 |
| Triborough Bridge & Tunnel Authority New York Revenue | 5.250% | 11/15/14 | 3,000 | 3,411 |
| Triborough Bridge & Tunnel Authority New York Revenue | 5.250% | 11/15/15 | 3,000 | 3,481 |
| Triborough Bridge & Tunnel Authority New York Revenue | 5.000% | 1/1/16 | 3,000 | 3,446 |
| Triborough Bridge & Tunnel Authority New York Revenue | 5.000% | 11/15/20 | 4,550 | 5,244 |
| Triborough Bridge & Tunnel Authority New York Revenue | 5.000% | 11/15/25 | 24,975 | 27,099 |
| Triborough Bridge & Tunnel Authority New York Revenue | 5.000% | 1/1/26 | 15,000 | 16,924 |
| Triborough Bridge & Tunnel Authority New York Revenue | 5.000% | 1/1/28 | 15,000 | 16,653 |
| Triborough Bridge & Tunnel Authority New York Revenue | 5.000% | 11/15/30 | 7,415 | 8,084 |
| Triborough Bridge & Tunnel Authority New York Revenue PUT | 5.000% | 11/15/14 | 20,000 | 22,157 |
| Triborough Bridge & Tunnel Authority New York Revenue PUT | 5.000% | 11/15/15 | 20,000 | 22,557 |
| Troy NY Capital Resource Corp. Revenue (Rensselaer Polytechnic Institute Project) | 5.000% | 9/1/30 | 3,500 | 3,580 |
| United Nations Development Corp. New York Revenue | 5.000% | 7/1/21 | 7,200 | 8,214 |
| Westchester County NY Health Care Corp. Revenue | 6.000% | 11/1/30 | 1,000 | 1,040 |
| | | | | 4,413,931 |
| North Carolina (2.0%) | | | | |
| Cary NC GO VRDO | 0.110% | 11/7/11 | 19,125 | 19,125 |
| Charlotte NC COP | 5.000% | 6/1/16 | 2,000 | 2,305 |
| Mecklenburg County NC COP | 5.000% | 2/1/22 | 3,390 | 3,815 |
| Mecklenburg County NC COP | 5.000% | 2/1/23 | 1,200 | 1,341 |
| Mecklenburg County NC COP | 5.000% | 2/1/25 | 1,000 | 1,097 |
| Mecklenburg County NC COP | 4.750% | 2/1/26 | 2,500 | 2,652 |
| Mecklenburg County NC GO | 5.000% | 3/1/20 | 3,715 | 4,375 |
| Mecklenburg County NC Public Facilities Corp. Revenue (Annual Appropriation) | 5.000% | 3/1/19 | 3,000 | 3,572 |
| Moore County NC Revenue | 4.000% | 6/1/16 | 1,245 | 1,368 |
| New Hanover County NC Hospital Revenue (New Hanover Regional Medical Center Project) | 5.000% | 10/1/27 (4) | 9,900 | 10,394 |
| New Hanover County NC Hospital Revenue (New Hanover Regional Medical Center Project) VRDO | 0.200% | 11/7/11 (4) | 11,055 | 11,055 |
| North Carolina Capital Facilities Financial SolidWaste Disposal Revenue (Duke Energy) | 4.375% | 10/1/31 | 10,000 | 10,033 |
| North Carolina Capital Facilities Financial SolidWaste Disposal Revenue (Duke Energy) | 4.375% | 10/1/31 | 4,250 | 4,264 |
| North Carolina Capital Improvement Revenue | 5.000% | 5/1/27 | 30,510 | 33,921 |
| North Carolina Capital Improvement Revenue | 4.625% | 5/1/29 | 4,255 | 4,465 |
| North Carolina Capital Improvement Revenue | 5.000% | 5/1/29 | 28,585 | 31,318 |
| North Carolina Eastern Municipal Power Agency Revenue | 5.375% | 1/1/12 | 14,875 | 14,994 |
| North Carolina Eastern Municipal Power Agency Revenue | 5.375% | 1/1/13 | 25,000 | 26,280 |
| North Carolina Eastern Municipal Power Agency Revenue | 5.500% | 1/1/14 | 15,000 | 16,362 |
| North Carolina Eastern Municipal Power Agency Revenue | 5.300% | 1/1/15 | 4,000 | 4,173 |
| North Carolina Eastern Municipal Power Agency Revenue | 5.000% | 1/1/16 | 4,000 | 4,486 |
| North Carolina Eastern Municipal Power Agency Revenue | 5.375% | 1/1/16 | 3,000 | 3,121 |
| North Carolina Eastern Municipal Power Agency Revenue | 5.375% | 1/1/17 | 4,700 | 4,881 |
| North Carolina Eastern Municipal Power Agency Revenue | 5.000% | 1/1/26 | 22,510 | 23,899 |
| North Carolina Eastern Municipal Power Agency Revenue | 5.500% | 1/1/26 | 3,000 | 3,305 |
| North Carolina GO | 5.000% | 3/1/12 | 7,400 | 7,518 |
| North Carolina GO | 5.000% | 5/1/14 | 16,780 | 17,905 |
| North Carolina GO | 5.000% | 6/1/16 | 15,050 | 17,605 |
| North Carolina GO | 5.000% | 9/1/16 | 1,065 | 1,253 |
| North Carolina GO | 5.000% | 3/1/18 | 10,000 | 11,727 |
| North Carolina GO | 5.000% | 6/1/18 | 30,780 | 37,185 |
| North Carolina Infrastructure Financial Corp. Capital Improvements COP | 5.000% | 2/1/18 (4) | 9,675 | 11,117 |
| North Carolina Infrastructure Financial Corp. Capital Improvements COP | 5.000% | 2/1/19 (4) | 10,000 | 11,342 |
| North Carolina Medical Care Commission Health Care Facilities Revenue | | | | |
| (Novant Health Obligated Group) | 5.000% | 11/1/18 | 3,075 | 3,161 |
| North Carolina Medical Care Commission Health Care Facilities Revenue | | | | |
| (Novant Health Obligated Group) | 5.000% | 11/1/30 | 2,435 | 2,463 |
| North Carolina Medical Care Commission Health Care Facilities Revenue | | | | |
| (University Health Systems of Eastern Carolina) VRDO | 0.170% | 11/7/11 LOC | 6,585 | 6,585 |
| North Carolina Medical Care Commission Hospital Revenue (North Carolina Baptist Hospital) | 5.000% | 6/1/19 | 3,910 | 4,419 |
| North Carolina Medical Care Commission Hospital Revenue (North Carolina Baptist Hospital) | 5.000% | 6/1/20 | 1,375 | 1,547 |
| North Carolina Medical Care Commission Hospital Revenue (North Carolina Baptist Hospital) | 5.000% | 6/1/21 | 5,000 | 5,567 |
| North Carolina Medical Care Commission Hospital Revenue (North Carolina Baptist Hospital) | 5.000% | 6/1/22 | 5,000 | 5,493 |
| North Carolina Municipal Power Agency Revenue | 5.250% | 1/1/16 (4) | 10,000 | 10,482 |
| North Carolina Municipal Power Agency Revenue | 5.250% | 1/1/17 (4) | 15,290 | 16,014 |
| North Carolina Municipal Power Agency Revenue | 5.250% | 1/1/17 | 5,000 | 5,804 |
| North Carolina Municipal Power Agency Revenue | 5.250% | 1/1/18 (14) | 69,495 | 72,662 |
| North Carolina Municipal Power Agency Revenue | 5.250% | 1/1/18 | 5,000 | 5,878 |
| North Carolina Municipal Power Agency Revenue | 5.250% | 1/1/19 (14) | 38,600 | 40,290 |
| North Carolina Municipal Power Agency Revenue | 5.250% | 1/1/19 | 3,085 | 3,569 |
| North Carolina Municipal Power Agency Revenue | 5.000% | 1/1/20 | 8,500 | 9,809 |
| North Carolina Municipal Power Agency Revenue | 5.250% | 1/1/20 (14) | 10,000 | 10,420 |
| North Carolina Municipal Power Agency Revenue | 5.250% | 1/1/20 | 2,000 | 2,277 |
| North Carolina Municipal Power Agency Revenue | 5.000% | 1/1/30 | 4,500 | 4,695 |
84
Intermediate-Term Tax-Exempt Fund
| | | | |
| | | | Face | Market |
| | | Maturity | Amount | Value• |
| | Coupon | Date | ($000) | ($000) |
| Raleigh NC Downtown Improvement Project COP VRDO | 0.110% | 11/7/11 | 4,000 | 4,000 |
| University of North Carolina Chapel Hill Foundation Revenue VRDO | 0.170% | 11/7/11 | 33,000 | 33,000 |
| University of North Carolina University System Revenue | 5.250% | 10/1/27 | 1,720 | 1,925 |
| University of North Carolina University System Revenue | 5.250% | 10/1/28 | 1,590 | 1,769 |
| Wake County NC GO | 5.000% | 6/1/28 | 3,000 | 3,277 |
| | | | | 617,359 |
| Ohio (3.4%) | | | | |
| Akron OH Bath & Copley Joint Township Hospital District Revenue | | | | |
| (Akron General Health System) VRDO | 0.120% | 11/7/11 LOC | 11,400 | 11,400 |
| Akron OH GO | 5.000% | 12/1/18 (2) | 5,300 | 5,896 |
| Allen County OH Hospital Facilities Revenue (Catholic Healthcare Partners) | 5.000% | 9/1/17 | 14,645 | 16,199 |
| Allen County OH Hospital Facilities Revenue (Catholic Healthcare Partners) | 5.250% | 9/1/27 | 30,000 | 30,743 |
| American Municipal Power Ohio Inc. Revenue (Hydroelectric Projects) | 5.250% | 2/15/18 | 16,000 | 18,248 |
| American Municipal Power Ohio Inc. Revenue (Hydroelectric Projects) | 5.250% | 2/15/19 | 13,000 | 14,865 |
| American Municipal Power Ohio Inc. Revenue (Hydroelectric Projects) | 5.000% | 2/15/20 | 10,310 | 11,526 |
| American Municipal Power Ohio Inc. Revenue (Prairie State Energy Campus Project) | 5.000% | 2/15/16 | 4,000 | 4,503 |
| American Municipal Power Ohio Inc. Revenue (Prairie State Energy Campus Project) | 5.000% | 2/15/17 | 6,770 | 7,677 |
| American Municipal Power Ohio Inc. Revenue (Prairie State Energy Campus Project) | 5.000% | 2/15/24 (12) | 5,000 | 5,432 |
| American Municipal Power Ohio Inc. Revenue (Prairie State Energy Campus Project) | 5.250% | 2/15/28 | 17,555 | 18,703 |
| Buckeye Tobacco Settlement Financing Authority Ohio Revenue | 5.125% | 6/1/24 | 123,360 | 94,726 |
| Buckeye Tobacco Settlement Financing Authority Ohio Revenue | 5.875% | 6/1/30 | 39,390 | 29,663 |
| Cincinnati OH City School District GO | 5.250% | 12/1/20 (14) | 7,000 | 8,348 |
| Cincinnati OH City School District GO | 5.250% | 6/1/21 | 3,810 | 4,477 |
| Cincinnati OH City School District GO | 5.250% | 12/1/21 (14) | 5,710 | 6,835 |
| Cincinnati OH City School District GO | 5.250% | 6/1/22 | 3,180 | 3,686 |
| Cincinnati OH City School District GO | 5.250% | 12/1/22 (14) | 10,000 | 11,938 |
| Cincinnati OH GO | 5.250% | 12/1/13 (Prere.) | 14,710 | 16,152 |
| Cincinnati OH GO | 5.250% | 12/1/13 (Prere.) | 9,185 | 10,085 |
| Cincinnati OH GO | 5.250% | 12/1/13 (Prere.) | 5,000 | 5,490 |
| Cincinnati OH GO | 5.250% | 12/1/13 (Prere.) | 8,150 | 8,949 |
| Cleveland OH Public Power System Revenue | 5.000% | 11/15/20 (3) | 4,500 | 4,839 |
| Cleveland OH Public Power System Revenue | 5.000% | 11/15/21 (14) | 7,455 | 7,958 |
| Cleveland OH Public Power System Revenue | 5.000% | 11/15/22 (14) | 14,065 | 14,919 |
| Cleveland OH Public Power System Revenue | 5.000% | 11/15/23 (14) | 7,505 | 7,914 |
| Cleveland OH Public Power System Revenue | 5.000% | 11/15/24 (14) | 7,350 | 7,702 |
| Cleveland OH Water Works Revenue | 5.375% | 1/1/12 (Prere.) | 3,455 | 3,485 |
| Columbus OH City School District GO | 4.000% | 12/1/17 | 1,000 | 1,120 |
| Columbus OH City School District GO | 5.000% | 12/1/18 | 1,205 | 1,426 |
| Columbus OH City School District School Facilities Construction & Improvement GO | 5.000% | 12/1/16 (4) | 6,000 | 7,000 |
| Columbus OH City School District School Facilities Construction & Improvement GO | 4.000% | 12/1/19 | 2,000 | 2,212 |
| Cuyahoga County OH Economic Development Revenue (Med Mart/Convention Center Project) | 5.000% | 12/1/20 | 7,000 | 8,143 |
| Cuyahoga County OH Economic Development Revenue (Med Mart/Convention Center Project) | 5.000% | 12/1/21 | 7,300 | 8,396 |
| Cuyahoga County OH GO | 5.000% | 12/1/19 | 2,120 | 2,544 |
| Cuyahoga OH Community College District Revenue | 5.000% | 8/1/22 | 6,610 | 7,506 |
| Cuyahoga OH Community College District Revenue | 5.000% | 8/1/23 | 3,470 | 3,899 |
| Cuyahoga OH Community College District Revenue | 5.000% | 8/1/24 | 2,500 | 2,776 |
| Franklin County OH Hospital Facilities Revenue (OhioHealth Corp.) VRDO | 0.100% | 11/7/11 | 16,300 | 16,300 |
| Franklin County OH Hospital Revenue (Nationwide Children’s Hospital Project) VRDO | 0.110% | 11/7/11 | 1,445 | 1,445 |
| Hamilton County OH Sales Tax Revenue | 5.000% | 12/1/18 (2) | 7,950 | 8,886 |
| Hamilton County OH Sales Tax Revenue | 5.000% | 12/1/19 (2) | 22,380 | 24,699 |
| Hamilton County OH Sales Tax Revenue | 5.000% | 12/1/23 (2) | 18,515 | 19,697 |
| Huber Heights OH City School District GO | 4.750% | 12/1/24 | 890 | 969 |
| Huber Heights OH City School District GO | 4.875% | 12/1/27 | 150 | 161 |
| Huber Heights OH City School District GO | 5.000% | 12/1/28 | 1,000 | 1,084 |
| Huber Heights OH City School District GO | 5.000% | 12/1/30 | 1,000 | 1,068 |
| Lorain County OH Hospital Facilities Revenue (Catholic Healthcare Partners) | 5.000% | 4/1/16 (4) | 6,200 | 6,902 |
| Lorain County OH Hospital Facilities Revenue (Catholic Healthcare Partners) | 5.000% | 4/1/16 (4) | 6,200 | 6,902 |
| Lorain County OH Hospital Facilities Revenue (Catholic Healthcare Partners) | 5.000% | 4/1/17 (4) | 6,600 | 7,418 |
| Lorain County OH Hospital Facilities Revenue (Catholic Healthcare Partners) | 5.000% | 4/1/17 (4) | 6,600 | 7,418 |
| Lorain County OH Hospital Facilities Revenue (Catholic Healthcare Partners) | 5.000% | 4/1/18 (4) | 7,300 | 8,239 |
| Lorain County OH Hospital Facilities Revenue (Catholic Healthcare Partners) | 5.000% | 4/1/18 (4) | 7,300 | 8,239 |
| Lucas County OH Hospital Revenue (ProMedica Healthcare Obligated Group) | 5.750% | 11/15/31 | 6,000 | 6,455 |
| 1 Montgomery County OH Revenue (Catholic Health Initiatives) TOB VRDO | 0.140% | 11/7/11 | 2,000 | 2,000 |
| Ohio Air Quality Development Authority Pollution Control Revenue | | | | |
| (FirstEnergy Generation Corp. Project) | 5.700% | 2/1/14 | 5,500 | 5,934 |
| Ohio Air Quality Development Authority Revenue (Ohio Power Co. Project) PUT | 3.250% | 6/2/14 | 3,000 | 3,059 |
| Ohio Building Authority Revenue (Administration Building Fund) | 5.000% | 10/1/19 | 5,000 | 5,829 |
| Ohio Building Authority Revenue (Administration Building Fund) | 5.000% | 10/1/21 | 10,000 | 11,314 |
| Ohio Building Authority Revenue (Administration Building Fund) | 5.000% | 10/1/26 | 1,975 | 2,128 |
| Ohio Building Authority Revenue (Adult Correctional Building) | 5.000% | 10/1/17 | 2,295 | 2,661 |
| Ohio Building Authority Revenue (Adult Correctional Building) | 5.125% | 4/1/30 | 1,475 | 1,594 |
| Ohio Building Authority Revenue (Correctional Facilities) | 5.250% | 4/1/17 | 5,565 | 6,491 |
85
Intermediate-Term Tax-Exempt Fund
| | | | |
| | | | Face | Market |
| | | Maturity | Amount | Value• |
| | Coupon | Date | ($000) | ($000) |
| Ohio Common Schools GO VRDO | 0.100% | 11/7/11 | 4,600 | 4,600 |
| Ohio Conservation Projects GO | 5.000% | 3/1/17 | 2,000 | 2,184 |
| Ohio Conservation Projects GO | 5.000% | 9/15/19 | 9,655 | 11,479 |
| Ohio Conservation Projects GO | 5.000% | 9/15/20 | 3,250 | 3,866 |
| Ohio GO | 5.000% | 8/1/13 | 5,750 | 6,201 |
| Ohio GO | 5.000% | 8/1/13 | 7,160 | 7,722 |
| Ohio GO | 5.000% | 8/1/13 | 2,525 | 2,723 |
| Ohio GO | 5.250% | 8/1/13 (4) | 12,435 | 13,465 |
| Ohio GO | 5.500% | 8/1/13 | 2,945 | 3,202 |
| Ohio GO | 5.000% | 9/15/13 | 9,500 | 10,295 |
| Ohio GO | 5.000% | 8/1/14 | 6,500 | 7,245 |
| Ohio GO | 5.000% | 8/1/14 | 8,265 | 9,212 |
| Ohio GO | 5.000% | 8/1/14 | 6,670 | 7,435 |
| Ohio GO | 5.000% | 9/15/14 | 5,000 | 5,596 |
| Ohio GO | 5.000% | 9/15/14 | 2,155 | 2,412 |
| Ohio GO | 5.500% | 11/1/14 | 7,000 | 7,953 |
| Ohio GO | 5.000% | 8/1/16 | 3,000 | 3,489 |
| Ohio GO | 5.000% | 9/15/16 | 5,415 | 6,321 |
| Ohio GO | 5.000% | 9/15/16 | 5,130 | 5,979 |
| Ohio GO | 5.000% | 9/15/18 | 12,755 | 14,396 |
| Ohio GO | 5.000% | 11/1/18 | 7,710 | 8,722 |
| Ohio GO | 5.000% | 9/15/19 | 13,000 | 14,517 |
| Ohio GO | 5.000% | 9/15/19 | 9,025 | 10,752 |
| Ohio Higher Education Capital Facilities Revenue | 5.250% | 11/1/12 (Prere.) | 3,710 | 3,893 |
| Ohio Higher Education GO | 5.000% | 11/1/23 | 7,405 | 8,080 |
| 1 Ohio Higher Educational Facility Commission Revenue | | | | |
| (Cleveland Clinic Health System Obligated Group) TOB VRDO | 0.140% | 11/7/11 | 4,025 | 4,025 |
| Ohio Higher Educational Facility Commission Revenue (Denison University Project) | 5.000% | 11/1/26 | 4,000 | 4,315 |
| Ohio Higher Educational Facility Commission Revenue (Denison University Project) | 5.000% | 11/1/32 | 1,880 | 1,961 |
| Ohio Higher Educational Facility Commission Revenue (Oberlin College Project) | 5.000% | 10/1/19 | 24,015 | 28,278 |
| Ohio Highway Capital Improvements GO | 5.000% | 5/1/16 | 11,010 | 12,754 |
| Ohio Hospital Revenue (Cleveland Clinic Health System Obligated Group) | 5.000% | 1/1/27 | 9,330 | 9,729 |
| Ohio Hospital Revenue (Cleveland Clinic Health System Obligated Group) | 5.125% | 1/1/28 | 11,670 | 12,199 |
| Ohio Housing Finance Agency Residential Mortgage Revenue | 6.125% | 9/1/28 | 4,150 | 4,486 |
| Ohio Major New State Infrastructure Project Revenue | 5.000% | 12/15/13 (14) | 10,135 | 11,053 |
| Ohio Major New State Infrastructure Project Revenue | 5.000% | 12/15/13 (14) | 2,905 | 3,168 |
| Ohio Major New State Infrastructure Project Revenue | 5.000% | 6/15/16 | 5,000 | 5,763 |
| Ohio Major New State Infrastructure Project Revenue | 5.000% | 6/15/16 (4) | 5,000 | 5,768 |
| Ohio Major New State Infrastructure Project Revenue | 5.000% | 12/15/17 | 8,635 | 10,141 |
| Ohio Major New State Infrastructure Project Revenue | 5.500% | 6/15/20 | 4,000 | 4,652 |
| Ohio State University General Receipts Revenue | 5.250% | 12/1/12 (Prere.) | 2,000 | 2,106 |
| Ohio State University General Receipts Revenue | 5.000% | 12/1/13 | 3,135 | 3,422 |
| Ohio State University General Receipts Revenue | 5.250% | 6/1/14 | 2,865 | 3,190 |
| Ohio State University General Receipts Revenue | 5.000% | 12/1/20 | 3,750 | 4,373 |
| Ohio State University General Receipts Revenue | 5.000% | 12/1/26 | 2,500 | 2,788 |
| Ohio State University General Receipts Revenue VRDO | 0.080% | 11/7/11 | 12,995 | 12,995 |
| Ohio Turnpike Commission Turnpike Revenue | 5.000% | 2/15/22 | 1,750 | 2,000 |
| Ohio Turnpike Commission Turnpike Revenue | 5.000% | 2/15/31 | 7,195 | 7,698 |
| Ohio Water Development Authority Drinking Water Assistance Fund Revenue | 5.250% | 12/1/19 | 5,775 | 6,998 |
| Ohio Water Development Authority Drinking Water Assistance Fund Revenue | 5.000% | 12/1/20 | 3,585 | 4,138 |
| Ohio Water Development Authority Drinking Water Assistance Fund Revenue | 5.250% | 12/1/20 | 5,570 | 6,757 |
| 1 Ohio Water Development Authority Fresh Water Revenue TOB VRDO | 2.000% | 11/7/11 | 5,965 | 5,965 |
| Ohio Water Development Authority Water Pollution Control Loan Fund Revenue | 5.000% | 6/1/14 (Prere.) | 1,575 | 1,748 |
| Ohio Water Development Authority Water Pollution Control Loan Fund Revenue | 5.000% | 6/1/17 | 425 | 468 |
| Ohio Water Development Authority Water Pollution Control Loan Fund Revenue | 5.250% | 6/1/18 | 5,635 | 6,811 |
| Ohio Water Development Authority Water Pollution Control Loan Fund Revenue | 5.000% | 12/1/19 | 5,000 | 5,967 |
| Ohio Water Development Authority Water Pollution Control Loan Fund Revenue | 5.000% | 6/1/21 | 9,160 | 10,931 |
| Scioto County OH Hospital Facilities Revenue (Southern Ohio Medical Center) | 5.000% | 2/15/15 | 3,040 | 3,243 |
| Scioto County OH Hospital Facilities Revenue (Southern Ohio Medical Center) | 5.000% | 2/15/16 | 3,190 | 3,423 |
| Scioto County OH Hospital Facilities Revenue (Southern Ohio Medical Center) | 5.000% | 2/15/17 | 3,350 | 3,599 |
| Scioto County OH Hospital Facilities Revenue (Southern Ohio Medical Center) | 5.000% | 2/15/18 | 3,520 | 3,782 |
| Scioto County OH Hospital Facilities Revenue (Southern Ohio Medical Center) | 5.000% | 2/15/19 | 3,195 | 3,385 |
| Scioto County OH Hospital Facilities Revenue (Southern Ohio Medical Center) | 5.000% | 2/15/20 | 3,680 | 3,877 |
| Scioto County OH Hospital Facilities Revenue (Southern Ohio Medical Center) | 5.500% | 2/15/28 | 17,000 | 17,242 |
| University of Akron Ohio General Receipts Revenue | 5.000% | 1/1/19 (4) | 1,000 | 1,140 |
| University of Akron Ohio General Receipts Revenue | 5.000% | 1/1/22 (4) | 2,700 | 3,002 |
| University of Akron Ohio General Receipts Revenue | 5.000% | 1/1/23 (4) | 8,010 | 8,833 |
| University of Akron Ohio General Receipts Revenue | 5.000% | 1/1/24 (4) | 3,335 | 3,638 |
| University of Akron Ohio General Receipts Revenue | 5.000% | 1/1/25 (4) | 2,500 | 2,705 |
| University of Akron Ohio General Receipts Revenue | 5.000% | 1/1/26 (4) | 2,000 | 2,142 |
| University of Akron Ohio General Receipts Revenue | 5.000% | 1/1/27 (4) | 2,000 | 2,142 |
86
Intermediate-Term Tax-Exempt Fund
| | | | |
| | | | Face | Market |
| | | Maturity | Amount | Value• |
| | Coupon | Date | ($000) | ($000) |
| University of Akron Ohio General Receipts Revenue | 5.000% | 1/1/28 (4) | 2,500 | 2,662 |
| University of Cincinnati Ohio COP | 5.000% | 6/1/17 (14) | 3,180 | 3,454 |
| | | | | 1,060,927 |
| Oklahoma (0.3%) | | | | |
| Oklahoma Capitol Improvement Authority Facilities Revenue | 5.000% | 7/1/25 (2) | 18,070 | 19,659 |
| Oklahoma Capitol Improvement Authority Facilities Revenue | 5.000% | 7/1/26 (2) | 12,000 | 12,631 |
| Oklahoma Capitol Improvement Authority Facilities Revenue | 5.000% | 7/1/27 (2) | 20,110 | 21,089 |
| Oklahoma Development Finance Authority Health System Revenue (Integris Baptist) | 5.000% | 8/15/24 | 12,100 | 12,954 |
| Oklahoma Development Finance Authority Health System Revenue (Integris Baptist) VRDO | 0.150% | 11/1/11 (12) | 3,510 | 3,510 |
| Oklahoma Development Finance Authority Pollution Control Revenue (Public Service Co. Project) | 5.250% | 6/1/14 | 3,400 | 3,626 |
| Oklahoma Development Finance Authority Revenue (Waste Management Inc. Project) PUT | 2.250% | 6/2/14 | 4,000 | 4,016 |
| Oklahoma Municipal Power Authority Power Supply System Revenue | 5.875% | 1/1/28 | 1,045 | 1,187 |
| Oklahoma Turnpike Authority Revenue | 5.000% | 1/1/17 | 7,000 | 8,160 |
| Oklahoma Water Resource Board Revenue | 5.000% | 4/1/28 | 750 | 834 |
| Oklahoma Water Resource Board Revenue | 5.000% | 4/1/29 | 750 | 829 |
| Oklahoma Water Resource Board Revenue | 5.000% | 4/1/30 | 750 | 824 |
| | | | | 89,319 |
| Oregon (0.6%) | | | | |
| Oregon Department of Administrative Services COP | 5.000% | 11/1/19 | 2,000 | 2,345 |
| Oregon Department of Administrative Services COP | 5.000% | 11/1/20 | 9,660 | 11,144 |
| Oregon Department of Administrative Services COP | 5.000% | 5/1/23 | 3,130 | 3,493 |
| Oregon Department of Administrative Services COP | 5.000% | 5/1/24 | 1,750 | 1,932 |
| Oregon Department of Administrative Services COP | 5.000% | 5/1/25 | 2,220 | 2,430 |
| Oregon Department of Administrative Services COP | 5.000% | 5/1/26 | 3,520 | 3,817 |
| Oregon Department of Administrative Services Lottery Revenue | 5.000% | 4/1/25 (4) | 5,675 | 6,248 |
| Oregon Department of Administrative Services Lottery Revenue | 5.250% | 4/1/26 | 9,475 | 10,829 |
| Oregon Department of Administrative Services Lottery Revenue | 5.250% | 4/1/28 | 5,120 | 5,873 |
| Oregon Department of Administrative Services Lottery Revenue | 5.250% | 4/1/30 | 4,000 | 4,516 |
| Oregon Department of Administrative Services Lottery Revenue | 5.250% | 4/1/31 | 6,200 | 6,974 |
| Oregon Department of Transportation Highway Usertax Revenue | 4.500% | 11/15/24 | 3,000 | 3,280 |
| Oregon Facilities Authority Revenue (Legacy Health Project) | 5.250% | 5/1/20 | 5,000 | 5,583 |
| Oregon Facilities Authority Revenue (Legacy Health Project) | 5.250% | 5/1/21 | 7,500 | 8,360 |
| Oregon GO | 5.000% | 5/1/14 | 1,400 | 1,550 |
| Oregon GO | 5.000% | 5/1/15 | 1,500 | 1,709 |
| Oregon GO | 5.000% | 5/1/16 | 1,750 | 2,037 |
| Oregon GO | 5.000% | 5/1/26 | 1,570 | 1,812 |
| Oregon GO | 5.000% | 5/1/26 | 1,490 | 1,720 |
| Oregon GO | 5.000% | 5/1/27 | 2,415 | 2,762 |
| Oregon GO | 5.000% | 5/1/27 | 2,460 | 2,813 |
| Oregon GO | 5.000% | 5/1/28 | 5,165 | 5,858 |
| Oregon GO | 5.000% | 5/1/28 | 2,755 | 3,125 |
| Oregon GO | 5.000% | 5/1/29 | 2,890 | 3,258 |
| Oregon GO | 5.000% | 5/1/30 | 5,685 | 6,358 |
| Oregon GO | 5.000% | 5/1/31 | 3,370 | 3,747 |
| Oregon GO | 5.000% | 5/1/31 | 1,760 | 1,957 |
| Oregon GO (Oregon University System Projects) | 5.250% | 8/1/28 | 1,650 | 1,900 |
| Oregon GO (Oregon University System Projects) | 5.250% | 8/1/28 | 2,585 | 2,977 |
| Oregon GO (Oregon University System Projects) | 5.250% | 8/1/29 | 2,725 | 3,111 |
| Oregon GO (Oregon University System Projects) | 5.250% | 8/1/30 | 2,050 | 2,322 |
| Oregon GO (Oregon University System Projects) | 5.250% | 8/1/30 | 2,865 | 3,246 |
| Oregon GO (Oregon University System Projects) | 5.250% | 8/1/31 | 3,015 | 3,402 |
| 1 Oregon GO TOB VRDO | 0.150% | 11/1/11 | 19,300 | 19,300 |
| Portland OR Sewer System Revenue | 5.000% | 6/1/12 (14) | 27,230 | 27,985 |
| Portland OR Sewer System Revenue | 5.000% | 8/1/18 (4) | 11,470 | 13,157 |
| Tri-County Metropolitan Transportation District Oregon (Payroll Tax & Grant Project) | 5.000% | 10/1/27 | 3,000 | 3,251 |
| | | | | 196,181 |
| Pennsylvania (3.6%) | | | | |
| Allegheny County PA GO | 5.000% | 11/1/29 | 15,000 | 15,079 |
| Allegheny County PA Higher Education Building Authority University Revenue | | | | |
| (Duquesne University) | 5.500% | 3/1/29 | 1,290 | 1,382 |
| Allegheny County PA Higher Education Building Authority University Revenue | | | | |
| (Duquesne University) | 5.500% | 3/1/31 | 2,720 | 2,893 |
| Allegheny County PA Industrial Development Authority Health Care Revenue | | | | |
| (Vincentian Collaborative System) VRDO | 0.140% | 11/7/11 LOC | 7,725 | 7,725 |
| Allegheny County PA Port Authority Revenue | 5.750% | 3/1/29 | 17,000 | 18,795 |
| Allegheny County PA Sanitation Authority Sewer Revenue | 5.000% | 6/1/26 (4) | 1,000 | 1,083 |
| Blair County PA Hospital Authority Revenue (Altoona Regional Health System) | 4.500% | 11/15/16 | 1,410 | 1,454 |
| Blair County PA Hospital Authority Revenue (Altoona Regional Health System) | 4.750% | 11/15/17 | 1,010 | 1,042 |
| Blair County PA Hospital Authority Revenue (Altoona Regional Health System) | 5.000% | 11/15/18 | 1,100 | 1,131 |
| Central Bradford PA Progress Authority Revenue (Guthrie Healthcare System) | 5.500% | 12/1/31 | 12,500 | 13,182 |
| Commonwealth Financing Authority Pennsylvania Revenue | 5.000% | 6/1/21 (4) | 3,940 | 4,564 |
87
Intermediate-Term Tax-Exempt Fund
| | | | |
| | | | Face | Market |
| | | Maturity | Amount | Value• |
| | Coupon | Date | ($000) | ($000) |
| Commonwealth Financing Authority Pennsylvania Revenue | 5.000% | 6/1/24 (14) | 14,050 | 14,740 |
| Commonwealth Financing Authority Pennsylvania Revenue | 5.000% | 6/1/25 (14) | 9,500 | 9,914 |
| Cumberland County PA Municipal Authority Revenue (Diakon Lutheran Social Ministries Project) | 5.250% | 1/1/17 | 2,375 | 2,514 |
| Cumberland County PA Municipal Authority Revenue (Diakon Lutheran Social Ministries Project) | 5.500% | 1/1/18 | 2,735 | 2,925 |
| Cumberland County PA Municipal Authority Revenue (Diakon Lutheran Social Ministries Project) | 5.750% | 1/1/20 | 3,415 | 3,622 |
| Cumberland County PA Municipal Authority Revenue (Diakon Lutheran Social Ministries Project) | 6.000% | 1/1/21 | 4,190 | 4,439 |
| Dauphin County PA General Authority Health System Revenue (Pinnacle Health System Project) | 6.000% | 6/1/29 | 14,800 | 15,355 |
| Delaware County PA Authority Hospital Revenue (Crozer-Keystone Obligated Group) | 5.000% | 12/15/17 | 3,790 | 3,886 |
| Delaware County PA Authority Hospital Revenue (Crozer-Keystone Obligated Group) | 5.000% | 12/15/18 | 3,985 | 4,044 |
| Delaware County PA Authority Hospital Revenue (Crozer-Keystone Obligated Group) | 5.000% | 12/15/19 | 4,175 | 4,195 |
| Delaware County PA Authority Hospital Revenue (Crozer-Keystone Obligated Group) | 5.000% | 12/15/26 | 13,070 | 11,879 |
| Delaware County PA Authority University Revenue (Villanova University) | 5.000% | 12/1/27 | 1,000 | 1,078 |
| Delaware County PA Industrial Development Authority Pollution Control Revenue | | | | |
| (PECO Energy Co. Project) | 4.000% | 12/1/12 | 25,000 | 25,783 |
| Delaware River Port Authority Pennsylvania & New Jersey Revenue VRDO | 0.120% | 11/7/11 LOC | 7,700 | 7,700 |
| Delaware River Port Authority Pennsylvania & New Jersey Revenue VRDO | 0.140% | 11/7/11 LOC | 3,900 | 3,900 |
| Geisinger Health System Authority of Pennsylvania Revenue | | | | |
| (Penn State Geisinger Health System) VRDO | 0.100% | 11/1/11 | 12,480 | 12,480 |
| Indiana County PA Industrial Development Authority Pollution Control Revenue | | | | |
| (New York State Electric & Gas Corp. Project) PUT | 3.000% | 6/3/13 | 6,000 | 6,116 |
| Lancaster PA Higher Education Authority College Revenue (Franklin & Marshall College) | 5.000% | 4/15/22 | 3,500 | 3,753 |
| Lehigh County PA General Purpose Hospital Authority Revenue | | | | |
| (Lehigh Valley Health Network) VRDO | 0.170% | 11/1/11 LOC | 5,700 | 5,700 |
| Montgomery County PA Higher Education & Health Authority Hospital Revenue | | | | |
| (Abington Memorial Hospital) | 5.000% | 6/1/25 | 5,765 | 5,848 |
| Mount Lebanon PA School District GO | 5.000% | 2/15/13 (Prere.) | 5,000 | 5,297 |
| Northampton County PA General Purpose Authority Hospital Revenue | | | | |
| (St. Luke’s Hospital Project) | 5.000% | 8/15/20 | 1,000 | 1,043 |
| Northampton County PA General Purpose Authority Hospital Revenue | | | | |
| (St. Luke’s Hospital Project) | 5.125% | 8/15/21 | 1,000 | 1,042 |
| Northampton County PA General Purpose Authority Hospital Revenue | | | | |
| (St. Luke’s Hospital Project) | 5.250% | 8/15/22 | 1,000 | 1,039 |
| Northampton County PA General Purpose Authority Hospital Revenue | | | | |
| (St. Luke’s Hospital Project) | 5.250% | 8/15/23 | 1,500 | 1,543 |
| Northampton County PA General Purpose Authority Hospital Revenue | | | | |
| (St. Luke’s Hospital Project) | 5.250% | 8/15/24 | 3,000 | 3,049 |
| Pennsylvania Convention Center Authority Revenue | 6.700% | 9/1/16 (ETM) | 2,055 | 2,375 |
| Pennsylvania Economic Development Financing Authority Pollution Control Revenue | | | | |
| (PPL Electric Utilities Corp. Project) | 4.000% | 10/1/23 | 17,500 | 17,247 |
| Pennsylvania GO | 5.250% | 2/1/12 (14) | 8,500 | 8,607 |
| Pennsylvania GO | 5.000% | 3/1/12 | 24,335 | 24,724 |
| Pennsylvania GO | 5.500% | 5/1/12 (Prere.) | 10,000 | 10,263 |
| Pennsylvania GO | 5.250% | 7/1/12 | 25,200 | 26,042 |
| Pennsylvania GO | 5.000% | 10/1/12 (14) | 9,430 | 9,839 |
| Pennsylvania GO | 5.000% | 7/1/13 (Prere.) | 960 | 1,033 |
| Pennsylvania GO | 4.000% | 7/15/13 | 16,995 | 18,026 |
| Pennsylvania GO | 5.000% | 7/1/14 (14) | 5,010 | 5,373 |
| Pennsylvania GO | 5.000% | 5/1/15 | 16,000 | 18,224 |
| Pennsylvania GO | 5.000% | 8/1/15 | 5,120 | 5,874 |
| Pennsylvania GO | 5.000% | 7/1/18 | 2,250 | 2,686 |
| Pennsylvania GO | 5.000% | 5/1/19 | 15,000 | 17,959 |
| Pennsylvania GO | 5.000% | 7/1/19 | 29,000 | 34,778 |
| Pennsylvania GO | 5.375% | 7/1/21 | 4,500 | 5,585 |
| Pennsylvania Higher Educational Facilities Authority Revenue (Higher Education System) | 5.000% | 6/15/15 | 4,200 | 4,749 |
| Pennsylvania Higher Educational Facilities Authority Revenue (Higher Education System) | 5.000% | 6/15/29 | 1,300 | 1,428 |
| Pennsylvania Higher Educational Facilities Authority Revenue (Higher Education System) | 5.000% | 6/15/29 | 5,715 | 6,206 |
| Pennsylvania Higher Educational Facilities Authority Revenue (Thomas Jefferson University) | 5.250% | 9/1/19 (2) | 2,935 | 3,355 |
| Pennsylvania Higher Educational Facilities Authority Revenue | | | | |
| (Thomas Jefferson University) VRDO | 0.110% | 11/7/11 LOC | 7,500 | 7,500 |
| Pennsylvania Higher Educational Facilities Authority Revenue | | | | |
| (Trustees of the University of Pennsylvania) | 5.000% | 9/1/28 | 2,405 | 2,694 |
| Pennsylvania Higher Educational Facilities Authority Revenue | | | | |
| (University of Pennsylvania Health System) | 5.000% | 8/15/13 | 5,000 | 5,359 |
| Pennsylvania Higher Educational Facilities Authority Revenue | | | | |
| (University of Pennsylvania Health System) VRDO | 0.150% | 11/7/11 LOC | 23,300 | 23,300 |
| Pennsylvania Higher Educational Facilities Authority Revenue | | | | |
| (University of Pittsburgh Medical Center) | 5.000% | 5/15/31 | 500 | 512 |
| Pennsylvania Housing Finance Agency Single Family Mortgage Revenue | 4.000% | 10/1/18 | 2,000 | 2,166 |
| Pennsylvania Housing Finance Agency Single Family Mortgage Revenue | 5.000% | 10/1/19 | 2,000 | 2,264 |
| Pennsylvania Housing Finance Agency Single Family Mortgage Revenue | 5.000% | 10/1/20 | 1,500 | 1,691 |
| Pennsylvania Industrial Development Authority Economic Development Revenue | 5.500% | 7/1/20 | 12,180 | 14,031 |
| Pennsylvania Industrial Development Authority Economic Development Revenue | 5.500% | 7/1/23 | 20,000 | 22,422 |
88
Intermediate-Term Tax-Exempt Fund
| | | | |
| | | | Face | Market |
| | | Maturity | Amount | Value• |
| | Coupon | Date | ($000) | ($000) |
| Pennsylvania Public School Building Authority Lease Revenue (School District of Philadelphia) | 5.000% | 6/1/23 (4) | 6,080 | 6,419 |
| Pennsylvania Public School Building Authority Lease Revenue (School District of Philadelphia) | 5.000% | 6/1/23 (4) | 10,600 | 11,190 |
| Pennsylvania Public School Building Authority Lease Revenue (School District of Philadelphia) | 5.000% | 6/1/24 (4) | 6,620 | 6,966 |
| Pennsylvania Public School Building Authority Lease Revenue (School District of Philadelphia) | 5.000% | 6/1/24 (4) | 11,130 | 11,712 |
| Pennsylvania Public School Building Authority Lease Revenue (School District of Philadelphia) | 5.000% | 6/1/25 (4) | 11,585 | 12,118 |
| Pennsylvania Public School Building Authority Lease Revenue (School District of Philadelphia) | 5.000% | 6/1/26 (4) | 10,070 | 10,501 |
| Pennsylvania State University Revenue VRDO | 0.110% | 11/7/11 | 2,200 | 2,200 |
| Pennsylvania Turnpike Commission Oil Franchise Tax Revenue | 5.250% | 12/1/11 (ETM) | 2,875 | 2,887 |
| Pennsylvania Turnpike Commission Oil Franchise Tax Revenue | 5.250% | 12/1/11 (ETM) | 4,095 | 4,112 |
| Pennsylvania Turnpike Commission Oil Franchise Tax Revenue | 5.000% | 12/1/17 (2) | 5,155 | 5,782 |
| 1 Pennsylvania Turnpike Commission Oil Franchise Tax Revenue TOB VRDO | 0.140% | 11/7/11 | 11,000 | 11,000 |
| Pennsylvania Turnpike Commission Registration Fee Revenue VRDO | 0.140% | 11/7/11 (4) | 8,815 | 8,815 |
| Pennsylvania Turnpike Commission Revenue | 5.000% | 6/1/21 (12) | 4,520 | 5,051 |
| Pennsylvania Turnpike Commission Revenue | 5.000% | 12/1/21 | 14,210 | 15,561 |
| Pennsylvania Turnpike Commission Revenue | 5.000% | 12/1/21 | 16,660 | 18,943 |
| Pennsylvania Turnpike Commission Revenue | 5.000% | 6/1/23 (12) | 8,585 | 9,362 |
| Pennsylvania Turnpike Commission Revenue | 5.000% | 6/1/24 (12) | 3,535 | 3,822 |
| Pennsylvania Turnpike Commission Revenue | 5.000% | 6/1/25 (12) | 2,500 | 2,657 |
| Pennsylvania Turnpike Commission Revenue | 5.250% | 12/1/26 | 1,710 | 1,904 |
| Pennsylvania Turnpike Commission Revenue | 5.250% | 6/1/27 | 12,345 | 13,018 |
| Pennsylvania Turnpike Commission Revenue | 5.250% | 12/1/28 | 4,015 | 4,407 |
| Pennsylvania Turnpike Commission Revenue | 5.000% | 6/1/29 | 50,000 | 51,752 |
| Pennsylvania Turnpike Commission Revenue | 5.500% | 12/1/31 | 6,185 | 6,841 |
| Pennsylvania Turnpike Commission Revenue | 5.625% | 12/1/31 | 10,000 | 10,792 |
| 1 Pennsylvania Turnpike Commission Revenue TOB VRDO | 0.240% | 11/7/11 (12) | 4,330 | 4,330 |
| Philadelphia PA Airport Parking Authority Revenue | 5.000% | 9/1/16 | 3,000 | 3,366 |
| Philadelphia PA Gas Works Revenue | 5.000% | 8/1/14 | 3,000 | 3,247 |
| Philadelphia PA Gas Works Revenue | 5.000% | 8/1/15 | 3,000 | 3,280 |
| Philadelphia PA Gas Works Revenue VRDO | 0.150% | 11/7/11 LOC | 12,500 | 12,500 |
| Philadelphia PA GO | 5.000% | 8/1/15 (4) | 23,000 | 25,423 |
| Philadelphia PA GO | 5.250% | 8/1/16 (4) | 13,110 | 14,806 |
| Philadelphia PA Hospitals & Higher Education Facilities Authority Health System Revenue | | | | |
| (Jefferson Health System) | 5.250% | 5/15/30 | 24,000 | 25,299 |
| Philadelphia PA Hospitals & Higher Education Facilities Authority Hospital Revenue | | | | |
| (Children’s Hospital of Philadelphia Project) VRDO | 0.130% | 11/1/11 | 3,865 | 3,865 |
| Philadelphia PA Industrial Development Authority Lease Revenue | 5.000% | 10/1/14 (14) | 6,390 | 6,857 |
| 1 Philadelphia PA Industrial Development Authority Lease Revenue | | | | |
| (Fox Chase Cancer Center) TOB VRDO | 0.150% | 11/1/11 LOC | 14,995 | 14,995 |
| Philadelphia PA Municipal Authority Revenue | 5.250% | 5/15/13 (4) | 11,105 | 11,729 |
| Philadelphia PA Municipal Authority Revenue | 5.250% | 11/15/14 (4) | 5,965 | 6,363 |
| Philadelphia PA Municipal Authority Revenue | 6.375% | 4/1/29 | 3,500 | 3,737 |
| Philadelphia PA School District GO | 5.500% | 8/1/12 (14) | 10,815 | 11,192 |
| Philadelphia PA School District GO | 5.000% | 8/1/19 (2) | 7,500 | 7,997 |
| Philadelphia PA School District GO | 5.000% | 8/1/20 (2) | 18,745 | 19,816 |
| Philadelphia PA School District GO | 5.000% | 8/1/21 (2) | 9,900 | 10,405 |
| Philadelphia PA School District GO VRDO | 0.100% | 11/7/11 LOC | 22,700 | 22,700 |
| Philadelphia PA School District GO VRDO | 0.110% | 11/7/11 LOC | 3,800 | 3,800 |
| Philadelphia PA Water & Waste Water Revenue | 5.000% | 8/1/22 (4) | 3,000 | 3,358 |
| Southcentral Pennsylvania General Authority Revenue (WellSpan Health Obligated Group) | 6.000% | 6/1/25 | 30,000 | 33,500 |
| Southeastern Pennsylvania Transportation Authority Revenue | 5.000% | 3/1/27 | 6,100 | 6,600 |
| Southeastern Pennsylvania Transportation Authority Revenue | 5.000% | 3/1/28 | 5,000 | 5,377 |
| University of Pittsburgh of the Commonwealth System of Higher Education | | | | |
| Pennsylvania Revenue (University Capital Project) | 5.000% | 9/15/19 | 2,575 | 3,070 |
| University of Pittsburgh of the Commonwealth System of Higher Education | | | | |
| Pennsylvania Revenue (University Capital Project) | 5.500% | 9/15/23 | 9,000 | 10,661 |
| University of Pittsburgh of the Commonwealth System of Higher Education | | | | |
| Pennsylvania Revenue (University Capital Project) | 5.250% | 9/15/27 | 12,500 | 14,150 |
| University of Pittsburgh of the Commonwealth System of Higher Education | | | | |
| Pennsylvania Revenue (University Capital Project) | 5.250% | 9/15/28 | 2,375 | 2,669 |
| University of Pittsburgh of the Commonwealth System of Higher Education | | | | |
| Pennsylvania Revenue (University Capital Project) | 5.250% | 9/15/29 | 11,250 | 12,553 |
| Westmoreland County PA Industrial Development Authority Revenue (Excela Health Project) | 5.000% | 7/1/19 | 1,235 | 1,334 |
| Westmoreland County PA Industrial Development Authority Revenue (Excela Health Project) | 5.250% | 7/1/20 | 1,330 | 1,459 |
| Westmoreland County PA Industrial Development Authority Revenue (Excela Health Project) | 5.000% | 7/1/25 | 4,500 | 4,552 |
| Wilkes-Barre PA Finance Authority Revenue (University of Scranton Project) | 5.000% | 11/1/21 | 1,015 | 1,143 |
| Wilkes-Barre PA Finance Authority Revenue (University of Scranton Project) | 5.000% | 11/1/22 | 1,160 | 1,297 |
| Wilkes-Barre PA Finance Authority Revenue (University of Scranton Project) | 5.000% | 11/1/23 | 1,350 | 1,496 |
| Wilkes-Barre PA Finance Authority Revenue (University of Scranton Project) | 5.000% | 11/1/24 | 1,420 | 1,557 |
| Wilkes-Barre PA Finance Authority Revenue (University of Scranton Project) | 5.000% | 11/1/25 | 1,465 | 1,591 |
| Wilkes-Barre PA Finance Authority Revenue (University of Scranton Project) | 5.000% | 11/1/30 | 6,185 | 6,505 |
| | | | | 1,103,917 |
89
Intermediate-Term Tax-Exempt Fund
| | | | |
| | | | Face | Market |
| | | Maturity | Amount | Value• |
| | Coupon | Date | ($000) | ($000) |
| Puerto Rico (1.1%) | | | | |
| Puerto Rico Electric Power Authority Revenue | 5.250% | 7/1/14 | 4,420 | 4,785 |
| Puerto Rico Electric Power Authority Revenue | 5.500% | 7/1/16 | 5,000 | 5,551 |
| Puerto Rico Electric Power Authority Revenue | 5.000% | 7/1/19 (14) | 35,430 | 37,738 |
| Puerto Rico Electric Power Authority Revenue | 5.000% | 7/1/20 (14) | 18,245 | 19,330 |
| Puerto Rico Electric Power Authority Revenue | 5.000% | 7/1/20 | 5,000 | 5,391 |
| Puerto Rico Electric Power Authority Revenue | 5.000% | 7/1/21 (14) | 24,290 | 25,558 |
| Puerto Rico Electric Power Authority Revenue | 5.250% | 7/1/21 (14) | 5,000 | 5,472 |
| Puerto Rico Electric Power Authority Revenue | 5.250% | 7/1/22 (14) | 17,050 | 18,606 |
| Puerto Rico GO | 5.500% | 7/1/13 (14) | 5,000 | 5,307 |
| Puerto Rico GO | 5.500% | 7/1/14 (14) | 5,000 | 5,410 |
| Puerto Rico GO | 5.250% | 7/1/20 | 14,955 | 15,129 |
| Puerto Rico Highway & Transportation Authority Revenue | 6.250% | 7/1/13 (14) | 7,220 | 7,759 |
| Puerto Rico Highway & Transportation Authority Revenue | 6.250% | 7/1/15 (14) | 5,590 | 6,232 |
| Puerto Rico Highway & Transportation Authority Revenue | 5.250% | 7/1/16 (3) | 8,885 | 9,209 |
| Puerto Rico Municipal Finance Agency GO | 5.750% | 8/1/12 (4) | 2,470 | 2,480 |
| Puerto Rico Public Buildings Authority Government Facilities Revenue | 0.000% | 7/1/12 (3) | 34,465 | 33,745 |
| Puerto Rico Public Buildings Authority Government Facilities Revenue | 5.250% | 7/1/14 (Prere.) | 13,600 | 15,136 |
| Puerto Rico Public Buildings Authority Government Facilities Revenue | 5.500% | 7/1/17 (2) | 6,390 | 6,959 |
| Puerto Rico Public Buildings Authority Government Facilities Revenue | 5.500% | 7/1/18 (2) | 5,930 | 6,415 |
| Puerto Rico Public Buildings Authority Government Facilities Revenue | 5.250% | 7/1/29 | 9,700 | 9,589 |
| Puerto Rico Public Finance Corp. Revenue PUT | 5.750% | 2/1/12 LOC | 43,740 | 44,190 |
| Puerto Rico Sales Tax Financing Corp. Revenue | 5.500% | 8/1/28 | 30,000 | 31,862 |
| Puerto Rico Sales Tax Financing Corp. Revenue | 6.125% | 8/1/29 | 30,000 | 31,741 |
| | | | | 353,594 |
| Rhode Island (0.3%) | | | | |
| Rhode Island & Providence Plantations GO | 5.000% | 8/1/17 (4) | 3,120 | 3,509 |
| Rhode Island & Providence Plantations GO | 5.500% | 8/1/28 | 9,805 | 11,255 |
| Rhode Island & Providence Plantations GO | 5.500% | 8/1/30 | 3,610 | 4,081 |
| Rhode Island Economic Development Corp. Revenue (Department of Transportation) | 5.250% | 6/15/12 (4) | 5,000 | 5,153 |
| Rhode Island Economic Development Corp. Revenue (Department of Transportation) | 5.250% | 6/15/20 (12) | 20,000 | 23,261 |
| Rhode Island Economic Development Corp. Revenue (Department of Transportation) | 5.250% | 6/15/21 (12) | 25,000 | 28,779 |
| Rhode Island Health & Educational Building Corp. Hospital Financing Revenue | | | | |
| (Lifespan Obligated Group) | 5.000% | 5/15/26 (4) | 4,900 | 5,075 |
| Rhode Island Health & Educational Building Corp. Public Schools Revenue (Pooled Issue) | 4.500% | 5/15/25 (4) | 2,880 | 2,962 |
| Rhode Island Health & Educational Building Corp. Public Schools Revenue (Pooled Issue) | 4.625% | 5/15/26 (4) | 3,210 | 3,308 |
| Rhode Island Health & Educational Building Corp. Public Schools Revenue (Pooled Issue) | 4.750% | 5/15/29 (4) | 3,500 | 3,591 |
| | | | | 90,974 |
| South Carolina (1.3%) | | | | |
| Charleston SC Educational Excellence Financing Corp. Revenue | | | | |
| (Charleston County School District, South Carolina Project) | 5.000% | 12/1/19 | 3,105 | 3,455 |
| Charleston SC Educational Excellence Financing Corp. Revenue | | | | |
| (Charleston County School District, South Carolina Project) | 5.250% | 12/1/26 | 12,610 | 13,466 |
| Charleston SC Educational Excellence Financing Corp. Revenue | | | | |
| (Charleston County School District, South Carolina Project) | 5.250% | 12/1/27 | 33,070 | 35,137 |
| Charleston SC Educational Excellence Financing Corp. Revenue | | | | |
| (Charleston County School District, South Carolina Project) | 5.250% | 12/1/28 | 2,730 | 2,890 |
| Greenville County SC Hospital Revenue (Greenville Hospital System) | 5.000% | 5/1/16 | 5,000 | 5,596 |
| Greenville County SC Hospital Revenue (Greenville Hospital System) | 4.125% | 5/1/17 | 5,315 | 5,749 |
| Greenville County SC Hospital Revenue (Greenville Hospital System) | 5.000% | 5/1/18 | 2,655 | 2,996 |
| Greenville County SC Hospital System Revenue VRDO | 0.100% | 11/7/11 LOC | 5,000 | 5,000 |
| Greenville County SC School District Installment Revenue | 5.500% | 12/1/19 | 32,480 | 39,180 |
| Greenville County SC School District Installment Revenue | 5.000% | 12/1/26 | 28,255 | 30,172 |
| Medical University South Carolina Hospital Authority Hospital Facilities Revenue | 6.250% | 8/15/12 (Prere.) | 13,000 | 13,612 |
| North Charleston SC Tax Revenue | 5.000% | 12/1/12 (12) | 2,945 | 3,080 |
| North Charleston SC Tax Revenue | 5.000% | 12/1/13 (12) | 4,525 | 4,902 |
| North Charleston SC Tax Revenue | 5.000% | 12/1/14 (12) | 4,725 | 5,258 |
| North Charleston SC Tax Revenue | 5.000% | 12/1/15 (12) | 4,715 | 5,342 |
| Piedmont SC Municipal Power Agency Revenue | 5.000% | 1/1/19 | 18,995 | 21,651 |
| Piedmont SC Municipal Power Agency Revenue | 5.000% | 1/1/20 | 10,000 | 11,292 |
| Piedmont SC Municipal Power Agency Revenue | 0.000% | 1/1/22 (14) | 9,950 | 6,204 |
| Piedmont SC Municipal Power Agency Revenue | 5.000% | 1/1/22 | 6,000 | 6,710 |
| Piedmont SC Municipal Power Agency Revenue | 0.000% | 1/1/23 (14) | 8,780 | 5,136 |
| Piedmont SC Municipal Power Agency Revenue | 0.000% | 1/1/24 (3) | 2,400 | 1,316 |
| Piedmont SC Municipal Power Agency Revenue | 5.000% | 1/1/24 | 13,620 | 14,564 |
| Piedmont SC Municipal Power Agency Revenue | 5.000% | 1/1/24 | 3,535 | 3,881 |
| Piedmont SC Municipal Power Agency Revenue | 5.000% | 1/1/25 | 8,020 | 8,668 |
| Piedmont SC Municipal Power Agency Revenue | 5.000% | 1/1/29 (4) | 8,600 | 9,078 |
| Piedmont SC Municipal Power Agency Revenue | 5.000% | 1/1/29 (4) | 2,800 | 2,956 |
| Piedmont SC Municipal Power Agency Revenue VRDO | 0.110% | 11/7/11 LOC | 1,500 | 1,500 |
| South Carolina GO | 5.000% | 3/1/16 | 6,165 | 7,179 |
90
Intermediate-Term Tax-Exempt Fund
| | | | |
| | | | Face | Market |
| | | Maturity | Amount | Value• |
| | Coupon | Date | ($000) | ($000) |
| South Carolina GO | 5.000% | 4/1/16 | 3,560 | 4,149 |
| South Carolina Jobs Economic Development Authority Hospital Revenue (AnMed Health Project) | 5.000% | 2/1/18 | 2,000 | 2,234 |
| South Carolina Jobs Economic Development Authority Hospital Revenue (Palmetto Health) | 5.250% | 8/1/23 (4) | 6,275 | 6,561 |
| South Carolina Jobs Economic Development Authority Hospital Revenue (Palmetto Health) | 5.250% | 8/1/24 (4) | 6,200 | 6,431 |
| South Carolina Jobs Economic Development Authority Hospital Revenue (Palmetto Health) | 5.250% | 8/1/25 (4) | 6,925 | 7,131 |
| South Carolina Jobs Economic Development Authority Hospital Revenue (Palmetto Health) | 5.250% | 8/1/27 (4) | 13,550 | 13,822 |
| South Carolina Jobs Economic Development Authority Revenue (Bon Secours Health System) | 5.625% | 11/15/12 (Prere.) | 1,775 | 1,873 |
| South Carolina Public Service Authority Revenue | 5.375% | 1/1/12 (Prere.) | 7,300 | 7,363 |
| South Carolina Public Service Authority Revenue | 5.500% | 1/1/13 (4) | 5,000 | 5,215 |
| South Carolina Public Service Authority Revenue | 5.000% | 12/1/16 | 7,225 | 8,395 |
| South Carolina Public Service Authority Revenue | 5.000% | 1/1/28 | 6,735 | 7,281 |
| South Carolina Public Service Authority Revenue | 5.000% | 1/1/29 | 2,900 | 3,113 |
| South Carolina Transportation Infrastructure Revenue | 5.250% | 10/1/13 (2) | 5,200 | 5,630 |
| South Carolina Transportation Infrastructure Revenue | 5.250% | 10/1/25 (2) | 4,035 | 4,355 |
| Spartanburg County SC Regional Health Services District Revenue VRDO | 0.250% | 11/7/11 (12) | 36,885 | 36,885 |
| | | | | 396,408 |
| South Dakota (0.0%) | | | | |
| South Dakota Health & Educational Facilities Authority Revenue (Sanford Health) | 5.250% | 11/1/29 | 2,000 | 2,082 |
| |
| Tennessee (1.2%) | | | | |
| Greeneville TN Health & Educational Facilities Board Revenue | | | | |
| (Laughlin Memorial Hospital Project) VRDO | 0.360% | 11/7/11 LOC | 39,900 | 39,900 |
| Jackson TN Hospital Improvement Revenue (Jackson-Madison County General Hospital Project) | 5.250% | 4/1/23 | 8,280 | 8,795 |
| Jackson TN Hospital Improvement Revenue (Jackson-Madison County General Hospital Project) | 5.375% | 4/1/28 | 8,000 | 8,242 |
| Memphis TN Electric System Revenue | 5.000% | 12/1/13 (Prere.) | 20,000 | 21,839 |
| Memphis TN GO | 5.000% | 11/1/20 (10) | 4,000 | 4,634 |
| Memphis TN GO | 5.000% | 11/1/20 (14) | 16,000 | 18,045 |
| Memphis TN GO | 5.000% | 11/1/21 (14) | 4,730 | 5,335 |
| Memphis TN GO | 5.000% | 7/1/22 | 15,000 | 17,586 |
| Memphis TN GO | 5.000% | 11/1/22 (14) | 4,750 | 5,259 |
| Memphis TN GO | 5.000% | 5/1/28 | 3,145 | 3,470 |
| Memphis TN GO | 5.000% | 5/1/30 | 1,715 | 1,859 |
| Metropolitan Government of Nashville & Davidson County TN GO | 5.000% | 7/1/16 | 3,825 | 4,460 |
| Metropolitan Government of Nashville & Davidson County TN GO | 5.000% | 1/1/20 | 5,000 | 5,756 |
| Murfreesboro TN GO | 5.000% | 6/1/19 | 645 | 768 |
| Shelby County TN GO | 0.000% | 12/1/11 | 10,000 | 9,997 |
| Shelby County TN GO | 5.000% | 4/1/19 | 500 | 598 |
| Shelby County TN GO VRDO | 0.130% | 11/7/11 | 9,000 | 9,000 |
| Shelby County TN Health Educational & Housing Facility Board Revenue | | | | |
| (Baptist Memorial Health Care) | 5.000% | 9/1/18 | 7,180 | 8,174 |
| Shelby County TN Health Educational & Housing Facility Board Revenue | | | | |
| (Baptist Memorial Health Care) | 5.000% | 9/1/19 | 2,000 | 2,268 |
| Shelby County TN Health Educational & Housing Facility Board Revenue | | | | |
| (Methodist Le Bonheur Healthcare) | 5.000% | 6/1/13 | 4,865 | 5,136 |
| Shelby County TN Health Educational & Housing Facility Board Revenue | | | | |
| (Methodist Le Bonheur Healthcare) | 5.250% | 6/1/14 | 13,995 | 15,112 |
| Shelby County TN Health Educational & Housing Facility Board Revenue | | | | |
| (St. Jude Children’s Research Hospital) | 5.000% | 7/1/21 | 5,000 | 5,445 |
| Shelby County TN Health Educational & Housing Facility Board Revenue | | | | |
| (St. Jude Children’s Research Hospital) | 5.000% | 7/1/22 | 5,000 | 5,403 |
| Tennessee Energy Acquisition Corp. Gas Revenue | 5.000% | 9/1/16 | 19,800 | 20,571 |
| Tennessee Energy Acquisition Corp. Gas Revenue | 5.250% | 9/1/17 | 39,290 | 40,567 |
| Tennessee Energy Acquisition Corp. Gas Revenue | 5.250% | 9/1/18 | 57,570 | 58,691 |
| Tennessee Energy Acquisition Corp. Gas Revenue | 5.000% | 2/1/22 | 10,000 | 9,968 |
| Tennessee Energy Acquisition Corp. Gas Revenue | 5.000% | 2/1/25 | 5,000 | 4,947 |
| Tennessee Energy Acquisition Corp. Gas Revenue | 5.000% | 2/1/27 | 10,175 | 10,004 |
| Tennessee GO | 5.000% | 8/1/17 | 3,165 | 3,774 |
| Tennessee GO | 5.000% | 10/1/17 | 6,000 | 7,177 |
| Tennessee GO | 5.000% | 5/1/18 | 2,075 | 2,447 |
| | | | | 365,227 |
| Texas (8.3%) | | | | |
| Austin TX Combined Utility System Revenue | 0.000% | 11/15/11 (2) | 16,050 | 16,047 |
| Austin TX Combined Utility System Revenue | 0.000% | 11/15/11 (14) | 18,100 | 18,097 |
| Austin TX Combined Utility System Revenue | 0.000% | 5/15/18 (3) | 24,215 | 20,261 |
| Austin TX Independent School District GO | 5.000% | 8/1/13 | 10,000 | 10,798 |
| Austin TX Water & Wastewater System Revenue | 5.000% | 11/15/21 | 2,500 | 2,933 |
| Board of Regents of the Texas A&M University System Permanent University Fund Revenue | 5.250% | 7/1/24 | 14,925 | 16,206 |
| Camino Real Texas Mobility Authority Revenue | 5.250% | 2/15/18 | 11,960 | 13,220 |
| Camino Real Texas Mobility Authority Revenue | 5.250% | 8/15/18 | 11,770 | 12,992 |
| Camino Real Texas Mobility Authority Revenue | 5.250% | 2/15/19 | 12,595 | 13,744 |
| Camino Real Texas Mobility Authority Revenue | 5.250% | 8/15/19 | 12,925 | 14,093 |
91
Intermediate-Term Tax-Exempt Fund
| | | | |
| | | | Face | Market |
| | | Maturity | Amount | Value• |
| | Coupon | Date | ($000) | ($000) |
| Camino Real Texas Mobility Authority Revenue | 5.250% | 2/15/20 | 13,265 | 14,328 |
| Camino Real Texas Mobility Authority Revenue | 5.250% | 8/15/20 | 13,580 | 14,656 |
| Camino Real Texas Mobility Authority Revenue | 5.000% | 2/15/21 | 5,970 | 5,975 |
| Camino Real Texas Mobility Authority Revenue | 5.000% | 8/15/21 | 6,320 | 6,325 |
| Central Texas Regional Mobility Authority Revenue | 5.750% | 1/1/20 | 1,150 | 1,234 |
| Central Texas Regional Mobility Authority Revenue | 0.000% | 1/1/25 | 4,650 | 2,135 |
| Central Texas Regional Mobility Authority Revenue | 5.750% | 1/1/25 | 2,000 | 2,071 |
| Central Texas Regional Mobility Authority Revenue | 0.000% | 1/1/26 | 6,490 | 2,774 |
| Central Texas Regional Mobility Authority Revenue | 0.000% | 1/1/27 | 7,750 | 3,074 |
| Central Texas Regional Mobility Authority Revenue | 0.000% | 1/1/28 | 5,500 | 2,030 |
| Central Texas Regional Mobility Authority Revenue | 0.000% | 1/1/29 | 5,220 | 1,782 |
| Central Texas Regional Mobility Authority Revenue | 0.000% | 1/1/30 | 4,355 | 1,379 |
| Central Texas Regional Mobility Authority Revenue | 0.000% | 1/1/31 | 4,880 | 1,440 |
| Central Texas Regional Mobility Authority Revenue | 5.750% | 1/1/31 | 4,000 | 4,031 |
| Central Texas Regional Mobility Authority Revenue | 0.000% | 1/1/33 | 4,000 | 1,035 |
| Central Texas Regional Mobility Authority Revenue | 0.000% | 1/1/34 | 4,000 | 969 |
| Central Texas Regional Mobility Authority Revenue | 0.000% | 1/1/35 | 4,950 | 1,122 |
| Central Texas Regional Mobility Authority Revenue | 0.000% | 1/1/37 | 5,525 | 1,089 |
| Central Texas Regional Mobility Authority Revenue | 0.000% | 1/1/38 | 3,500 | 645 |
| Central Texas Regional Mobility Authority Revenue | 0.000% | 1/1/39 | 4,500 | 775 |
| Central Texas Regional Mobility Authority Revenue | 0.000% | 1/1/40 | 5,700 | 915 |
| Clear Creek TX Independent School District GO | 5.000% | 2/15/23 (4) | 10,270 | 11,222 |
| Clear Creek TX Independent School District GO | 5.000% | 2/15/25 (4) | 11,635 | 12,612 |
| Clifton TX Higher Education Finance Corp. Revenue (Baylor University) | 5.250% | 3/1/25 | 5,080 | 5,778 |
| Clifton TX Higher Education Finance Corp. Revenue (Baylor University) | 5.250% | 3/1/26 | 4,305 | 4,856 |
| Clifton TX Higher Education Finance Corp. Revenue (Baylor University) | 5.250% | 3/1/27 | 5,995 | 6,692 |
| Clifton TX Higher Education Finance Corp. Revenue (Baylor University) | 5.250% | 3/1/28 | 6,180 | 6,858 |
| Clifton TX Higher Education Finance Corp. Revenue (Baylor University) | 5.250% | 3/1/29 | 3,190 | 3,506 |
| Clifton TX Higher Education Finance Corp. Revenue (Baylor University) | 5.250% | 3/1/30 | 6,535 | 7,160 |
| Dallas County TX Community College District GO | 5.000% | 2/15/27 | 2,690 | 3,062 |
| Dallas County TX GO | 4.000% | 2/15/14 | 2,375 | 2,554 |
| Dallas County TX GO | 5.000% | 2/15/15 | 1,845 | 2,087 |
| Dallas County TX Utility & Reclamation District GO | 5.250% | 2/15/25 (2) | 11,245 | 11,675 |
| Dallas County TX Utility & Reclamation District GO | 5.250% | 2/15/25 (2) | 11,245 | 11,675 |
| Dallas TX Area Rapid Transit Sales Tax Revenue | 4.500% | 12/1/26 | 11,385 | 11,991 |
| Dallas TX Area Rapid Transit Sales Tax Revenue | 4.500% | 12/1/27 | 14,130 | 14,774 |
| Dallas TX Civic Center Improvement Revenue | 5.000% | 8/15/23 (12) | 9,880 | 10,707 |
| Dallas TX Civic Center Improvement Revenue | 5.000% | 8/15/24 (12) | 9,345 | 10,040 |
| Dallas TX Civic Center Improvement Revenue | 5.000% | 8/15/25 (12) | 5,050 | 5,388 |
| Dallas TX Civic Center Improvement Revenue | 5.000% | 8/15/26 (12) | 1,650 | 1,749 |
| Dallas TX GO | 5.000% | 2/15/19 | 11,675 | 12,972 |
| Dallas TX Waterworks & Sewer System Revenue | 5.000% | 10/1/18 | 2,000 | 2,392 |
| Dallas TX Waterworks & Sewer System Revenue | 5.000% | 10/1/30 | 6,920 | 7,504 |
| Dallas-Fort Worth TX International Airport Revenue | 5.000% | 11/1/20 | 2,740 | 3,009 |
| Dallas-Fort Worth TX International Airport Revenue | 5.000% | 11/1/21 | 2,000 | 2,181 |
| Dallas-Fort Worth TX International Airport Revenue | 5.000% | 11/1/22 | 2,500 | 2,709 |
| Dallas-Fort Worth TX International Airport Revenue | 5.000% | 11/1/23 | 1,500 | 1,618 |
| Dallas-Fort Worth TX International Airport Revenue | 5.000% | 11/1/27 | 6,745 | 7,172 |
| Dallas-Fort Worth TX International Airport Revenue | 5.000% | 11/1/28 | 7,335 | 7,743 |
| Dallas-Fort Worth TX International Airport Revenue | 5.000% | 11/1/29 | 6,360 | 6,660 |
| Dallas-Fort Worth TX International Airport Revenue | 5.000% | 11/1/30 | 6,680 | 7,016 |
| Fort Worth TX GO | 5.000% | 3/1/17 | 5,090 | 5,960 |
| Fort Worth TX Water & Sewer Revenue | 5.000% | 2/15/29 | 6,155 | 6,774 |
| Fort Worth TX Water & Sewer Revenue | 5.000% | 2/15/30 | 6,430 | 7,029 |
| Fort Worth TX Water & Sewer Revenue | 5.000% | 2/15/31 | 6,255 | 6,792 |
| Frisco TX GO | 5.000% | 2/15/17 | 1,000 | 1,171 |
| Frisco TX Independent School District GO | 5.000% | 8/15/15 | 1,690 | 1,940 |
| Frisco TX Independent School District GO | 5.000% | 8/15/16 | 4,205 | 4,920 |
| Gulf Coast TX Waste Disposal Authority Environmental Facilities Revenue | | | | |
| (BP Products North America Project) PUT | 2.300% | 9/3/13 | 7,375 | 7,496 |
| Gulf Coast TX Waste Disposal Authority Environmental Facilities Revenue | | | | |
| (BP Products North America Project) PUT | 2.300% | 9/3/13 | 2,000 | 2,033 |
| Harris County TX Cultural Education Facilities Finance Corp. Revenue | | | | |
| (Methodist Hospital System) | 5.250% | 12/1/15 | 10,000 | 11,378 |
| Harris County TX Cultural Education Facilities Finance Corp. Revenue | | | | |
| (Methodist Hospital System) | 5.250% | 12/1/16 | 12,000 | 13,793 |
| Harris County TX Cultural Education Facilities Finance Corp. Revenue | | | | |
| (Methodist Hospital System) | 5.250% | 12/1/17 | 17,000 | 19,544 |
| Harris County TX Cultural Education Facilities Finance Corp. Revenue | | | | |
| (St. Luke’s Episcopal Health System) | 5.000% | 2/15/19 | 4,000 | 4,475 |
| Harris County TX Cultural Education Facilities Finance Corp. Revenue | | | | |
| (St. Luke’s Episcopal Health System) | 5.000% | 2/15/20 | 10,225 | 11,277 |
92
Intermediate-Term Tax-Exempt Fund
| | | | |
| | | | Face | Market |
| | | Maturity | Amount | Value• |
| | Coupon | Date | ($000) | ($000) |
| Harris County TX Cultural Education Facilities Finance Corp. Revenue | | | | |
| (St. Luke’s Episcopal Health System) | 5.625% | 2/15/25 | 39,530 | 43,502 |
| Harris County TX Flood Control District Revenue | 5.000% | 10/1/29 | 2,950 | 3,251 |
| Harris County TX Flood Control District Revenue | 5.000% | 10/1/30 | 3,000 | 3,279 |
| Harris County TX GO | 5.000% | 10/1/16 | 4,755 | 5,575 |
| Harris County TX GO | 5.000% | 10/1/17 | 4,705 | 5,585 |
| Harris County TX GO | 5.000% | 10/1/21 | 8,000 | 9,528 |
| Harris County TX Health Facilities Development Corp. Hospital Revenue | | | | |
| (Memorial Hermann Healthcare System) | 7.000% | 12/1/27 | 5,000 | 5,622 |
| Harris County TX Health Facilities Development Corp. Hospital Revenue | | | | |
| (Memorial Hermann Healthcare System) | 7.200% | 12/1/29 | 4,000 | 4,252 |
| Harris County TX Health Facilities Development Corp. Hospital Revenue | | | | |
| (Texas Children’s Hospital) VRDO | 0.180% | 11/1/11 | 9,260 | 9,260 |
| Harris County TX Metropolitan Transit Authority Revenue | 5.000% | 11/1/26 | 3,000 | 3,296 |
| Harris County TX Metropolitan Transit Authority Revenue | 5.000% | 11/1/27 | 6,475 | 7,063 |
| Harris County TX Metropolitan Transit Authority Revenue | 5.000% | 11/1/28 | 5,665 | 6,138 |
| Harris County TX Metropolitan Transit Authority Revenue | 5.000% | 11/1/29 | 6,270 | 6,740 |
| Harris County TX Metropolitan Transportation Authority Lease Revenue | 5.000% | 11/1/11 | 2,975 | 2,975 |
| Harris County TX Metropolitan Transportation Authority Lease Revenue | 5.000% | 11/1/12 | 3,100 | 3,227 |
| Harris County TX Metropolitan Transportation Authority Lease Revenue | 5.000% | 11/1/13 | 3,290 | 3,532 |
| Harris County TX Metropolitan Transportation Authority Lease Revenue | 5.000% | 11/1/14 | 3,475 | 3,826 |
| Harris County TX Metropolitan Transportation Authority Lease Revenue | 5.625% | 11/1/19 | 4,535 | 5,257 |
| Harris County TX Metropolitan Transportation Authority Lease Revenue | 5.875% | 11/1/20 | 3,640 | 4,205 |
| Harris County TX Metropolitan Transportation Authority Lease Revenue | 6.000% | 11/1/21 | 4,295 | 4,950 |
| Harris County TX Sports Authority Revenue | 0.000% | 11/15/23 (14) | 7,000 | 2,953 |
| Harris County TX Toll Road Revenue | 5.375% | 8/15/12 (4) | 10,000 | 10,400 |
| Harris County TX Toll Road Revenue | 5.000% | 8/15/14 | 1,000 | 1,113 |
| Harris County TX Toll Road Revenue | 5.000% | 8/15/15 | 1,435 | 1,633 |
| Harris County TX Toll Road Revenue | 5.000% | 8/15/18 | 1,500 | 1,774 |
| Harris County TX Toll Road Revenue | 5.000% | 8/15/20 | 2,000 | 2,323 |
| Harris County TX Toll Road Revenue | 5.000% | 8/15/27 | 4,000 | 4,355 |
| Harris County TX Toll Road Revenue | 5.000% | 8/15/28 | 5,000 | 5,408 |
| Harris County TX Toll Road Revenue | 5.000% | 8/15/29 | 2,000 | 2,146 |
| Houston TX Airport System Revenue | 5.000% | 7/1/16 | 1,500 | 1,699 |
| Houston TX Airport System Revenue | 5.000% | 7/1/18 | 1,750 | 2,023 |
| Houston TX Airport System Revenue | 5.000% | 7/1/19 | 1,750 | 1,984 |
| Houston TX Airport System Revenue | 5.000% | 7/1/20 | 2,130 | 2,392 |
| Houston TX Airport System Revenue | 5.000% | 7/1/25 | 1,000 | 1,084 |
| Houston TX Airport System Revenue | 5.000% | 7/1/26 | 3,000 | 3,228 |
| Houston TX Community College GO | 5.000% | 2/15/17 | 1,000 | 1,170 |
| Houston TX Community College System Revenue | 5.000% | 4/15/21 (10) | 9,200 | 9,915 |
| Houston TX GO | 5.000% | 3/1/17 | 17,880 | 20,938 |
| Houston TX Hotel Occupancy Tax & Special Revenue (Convention & Entertainment Facilities) | 5.000% | 9/1/15 | 5,600 | 6,220 |
| Houston TX Hotel Occupancy Tax & Special Revenue (Convention & Entertainment Facilities) | 0.000% | 9/1/17 (2) | 13,760 | 10,816 |
| Houston TX Hotel Occupancy Tax & Special Revenue (Convention & Entertainment Facilities) | 0.000% | 9/1/18 (2) | 16,285 | 12,096 |
| Houston TX Hotel Occupancy Tax & Special Revenue (Convention & Entertainment Facilities) | 0.000% | 9/1/21 (2) | 22,720 | 13,754 |
| Houston TX Utility System Revenue | 5.250% | 5/15/13 (14) | 3,500 | 3,755 |
| Houston TX Utility System Revenue | 5.250% | 5/15/14 (14) | 2,500 | 2,779 |
| Houston TX Utility System Revenue | 5.000% | 11/15/16 | 3,730 | 4,352 |
| Houston TX Utility System Revenue | 5.250% | 11/15/17 (4) | 13,500 | 16,163 |
| Houston TX Utility System Revenue | 5.250% | 11/15/29 | 16,650 | 18,469 |
| Houston TX Utility System Revenue | 5.000% | 11/15/30 | 14,670 | 15,898 |
| Houston TX Utility System Revenue | 5.250% | 11/15/30 | 23,805 | 26,195 |
| Houston TX Utility System Revenue | 5.000% | 11/15/31 | 5,625 | 6,057 |
| Houston TX Utility System Revenue VRDO | 0.060% | 11/7/11 LOC | 5,000 | 5,000 |
| Houston TX Water & Sewer System Revenue | 5.500% | 12/1/11 (Prere.) | 22,500 | 22,599 |
| Houston TX Water & Sewer System Revenue | 5.500% | 12/1/11 (Prere.) | 7,250 | 7,282 |
| Houston TX Water & Sewer System Revenue | 5.750% | 12/1/12 (Prere.) | 8,000 | 8,465 |
| Houston TX Water & Sewer System Revenue | 0.000% | 12/1/25 (ETM) | 8,525 | 5,246 |
| Lower Colorado River Authority Texas Revenue | 5.000% | 1/1/12 (ETM) | 2,520 | 2,540 |
| Lower Colorado River Authority Texas Revenue | 5.375% | 5/15/12 (14) | 3,325 | 3,339 |
| Lower Colorado River Authority Texas Revenue | 5.375% | 5/15/13 (14) | 2,475 | 2,484 |
| Lower Colorado River Authority Texas Revenue | 5.375% | 5/15/14 (14) | 3,690 | 3,703 |
| Lower Colorado River Authority Texas Revenue | 5.875% | 5/15/14 (4) | 1,075 | 1,080 |
| Lower Colorado River Authority Texas Revenue | 5.875% | 5/15/15 (4) | 3,005 | 3,018 |
| Lower Colorado River Authority Texas Revenue | 5.375% | 5/15/16 (14) | 1,650 | 1,656 |
| Lower Colorado River Authority Texas Revenue | 5.375% | 5/15/17 | 2,285 | 2,293 |
| Lower Colorado River Authority Texas Revenue | 5.250% | 5/15/19 (Prere.) | 5 | 6 |
| Lower Colorado River Authority Texas Revenue | 5.375% | 5/15/20 (14) | 1,005 | 1,008 |
| Lower Colorado River Authority Texas Revenue | 5.000% | 5/15/29 | 10,000 | 10,495 |
| Lower Colorado River Authority Texas Revenue | 5.250% | 5/15/29 | 2,495 | 2,683 |
| Lower Colorado River Authority Texas Revenue | 5.250% | 5/15/29 | 9,070 | 9,584 |
93
Intermediate-Term Tax-Exempt Fund
| | | | |
| | | | Face | Market |
| | | Maturity | Amount | Value• |
| | Coupon | Date | ($000) | ($000) |
| Lower Colorado River Authority Texas Revenue | 5.000% | 5/15/30 | 10,000 | 10,401 |
| Lower Colorado River Authority Texas Revenue | 5.000% | 5/15/30 | 4,000 | 4,176 |
| Lubbock TX GO | 5.000% | 2/15/27 | 5,735 | 6,407 |
| Lubbock TX GO | 5.000% | 2/15/29 | 4,335 | 4,749 |
| Lubbock TX GO | 5.000% | 2/15/30 | 6,660 | 7,183 |
| Lubbock TX GO | 5.000% | 2/15/31 | 4,120 | 4,417 |
| North Harris County TX Regional Water Authority Revenue | 5.125% | 12/15/23 | 7,410 | 8,180 |
| North Harris County TX Regional Water Authority Revenue | 5.125% | 12/15/24 | 5,895 | 6,441 |
| North Harris County TX Regional Water Authority Revenue | 5.125% | 12/15/25 | 5,250 | 5,694 |
| North Harris County TX Regional Water Authority Revenue | 5.125% | 12/15/26 | 6,225 | 6,711 |
| North Harris County TX Regional Water Authority Revenue | 5.125% | 12/15/27 | 8,920 | 9,553 |
| North Harris County TX Regional Water Authority Revenue | 5.125% | 12/15/28 | 8,040 | 8,565 |
| North Texas Tollway Authority System Revenue | 5.500% | 1/1/17 | 4,750 | 5,363 |
| North Texas Tollway Authority System Revenue | 5.500% | 1/1/18 | 4,000 | 4,583 |
| North Texas Tollway Authority System Revenue | 6.000% | 1/1/19 | 15,000 | 17,397 |
| North Texas Tollway Authority System Revenue | 6.000% | 1/1/20 | 22,100 | 25,457 |
| North Texas Tollway Authority System Revenue | 6.000% | 1/1/21 | 41,330 | 47,310 |
| North Texas Tollway Authority System Revenue | 6.000% | 1/1/22 | 26,045 | 29,488 |
| North Texas Tollway Authority System Revenue | 6.250% | 2/1/23 | 46,220 | 49,393 |
| North Texas Tollway Authority System Revenue | 6.000% | 1/1/24 | 19,700 | 22,050 |
| North Texas Tollway Authority System Revenue | 6.000% | 1/1/25 | 11,035 | 12,249 |
| North Texas Tollway Authority System Revenue | 6.000% | 1/1/25 | 5,075 | 5,633 |
| North Texas Tollway Authority System Revenue | 6.000% | 1/1/26 | 4,395 | 4,846 |
| North Texas Tollway Authority System Revenue | 6.000% | 1/1/27 | 3,950 | 4,344 |
| North Texas Tollway Authority System Revenue | 6.000% | 1/1/28 | 3,220 | 3,567 |
| North Texas Tollway Authority System Revenue | 5.500% | 9/1/28 | 1,250 | 1,409 |
| North Texas Tollway Authority System Revenue | 5.250% | 9/1/29 | 4,130 | 4,536 |
| North Texas Tollway Authority System Revenue | 5.000% | 9/1/30 | 3,150 | 3,380 |
| North Texas Tollway Authority System Revenue | 5.000% | 9/1/31 | 4,000 | 4,269 |
| North Texas Tollway Authority System Revenue PUT | 5.250% | 1/1/12 | 25,000 | 25,199 |
| North Texas Tollway Authority System Revenue PUT | 5.750% | 1/1/16 | 75,000 | 85,575 |
| 1 North Texas Tollway Authority System Revenue TOB VRDO | 0.150% | 11/7/11 (13) | 2,200 | 2,200 |
| North Texas University Revenue | 5.000% | 4/15/20 | 1,500 | 1,744 |
| Northside TX Independent School District GO PUT | 0.950% | 8/1/13 | 10,000 | 10,065 |
| 3 Panhandle-Plains TX Higher Education Authority Inc. Student Loan Revenue | 1.172% | 10/1/20 | 5,000 | 4,951 |
| Pasadena TX Independent School District GO VRDO | 0.190% | 11/7/11 | 16,900 | 16,900 |
| SA Energy Acquisition Public Facility Corp. Texas Gas Supply Revenue | 5.250% | 8/1/17 | 16,000 | 16,481 |
| SA Energy Acquisition Public Facility Corp. Texas Gas Supply Revenue | 5.250% | 8/1/18 | 18,985 | 19,584 |
| SA Energy Acquisition Public Facility Corp. Texas Gas Supply Revenue | 5.500% | 8/1/19 | 22,010 | 23,042 |
| SA Energy Acquisition Public Facility Corp. Texas Gas Supply Revenue | 5.500% | 8/1/20 | 9,455 | 9,875 |
| SA Energy Acquisition Public Facility Corp. Texas Gas Supply Revenue | 5.500% | 8/1/21 | 3,000 | 3,133 |
| Sabine River Authority TX Pollution Control Revenue (Southwestern Electric Power Co. Project) | 4.950% | 3/1/18 (14) | 16,000 | 17,204 |
| San Antonio TX Electric & Gas Systems Revenue | 5.000% | 2/1/12 (4) | 5,000 | 5,060 |
| San Antonio TX Electric & Gas Systems Revenue | 5.375% | 2/1/12 (Prere.) | 5,445 | 5,515 |
| San Antonio TX Electric & Gas Systems Revenue | 5.375% | 2/1/12 (Prere.) | 6,490 | 6,574 |
| San Antonio TX Electric & Gas Systems Revenue | 5.375% | 2/1/12 (Prere.) | 10,000 | 10,129 |
| San Antonio TX Electric & Gas Systems Revenue | 5.375% | 2/1/12 (Prere.) | 8,140 | 8,245 |
| San Antonio TX Electric & Gas Systems Revenue | 5.375% | 2/1/12 (Prere.) | 760 | 770 |
| San Antonio TX Electric & Gas Systems Revenue | 5.250% | 2/1/13 (ETM) | 260 | 276 |
| San Antonio TX Electric & Gas Systems Revenue | 5.250% | 2/1/13 | 4,740 | 5,026 |
| San Antonio TX Electric & Gas Systems Revenue | 5.375% | 2/1/13 | 10,000 | 10,618 |
| San Antonio TX Electric & Gas Systems Revenue | 5.375% | 2/1/13 (4) | 14,865 | 15,784 |
| San Antonio TX Electric & Gas Systems Revenue | 5.000% | 2/1/21 | 9,750 | 10,978 |
| San Antonio TX Electric & Gas Systems Revenue | 5.000% | 2/1/22 | 25,450 | 28,418 |
| San Antonio TX Electric & Gas Systems Revenue | 5.000% | 2/1/23 | 22,000 | 24,355 |
| San Antonio TX Electric & Gas Systems Revenue | 5.000% | 2/1/24 | 15,000 | 16,365 |
| San Antonio TX GO | 5.000% | 8/1/17 (Prere.) | 6,030 | 7,188 |
| San Antonio TX GO | 5.000% | 8/1/17 (Prere.) | 5,685 | 6,777 |
| San Antonio TX Independent School District GO | 5.000% | 8/15/28 | 6,000 | 6,724 |
| San Antonio TX Independent School District GO | 5.000% | 8/15/29 | 5,000 | 5,561 |
| San Antonio TX Water Revenue | 5.000% | 5/15/27 | 5,435 | 6,041 |
| Southwest Texas Higher Education Authority Inc. Revenue | | | | |
| (Southern Methodist University Project) | 5.000% | 10/1/20 | 2,250 | 2,546 |
| Southwest Texas Higher Education Authority Inc. Revenue | | | | |
| (Southern Methodist University Project) | 5.000% | 10/1/22 | 9,100 | 10,070 |
| Southwest Texas Higher Education Authority Inc. Revenue | | | | |
| (Southern Methodist University Project) | 5.000% | 10/1/29 | 4,375 | 4,593 |
| Southwest Texas Higher Education Authority Inc. Revenue | | | | |
| (Southern Methodist University Project) | 5.000% | 10/1/30 | 2,000 | 2,098 |
| Sugar Land TX GO | 5.000% | 2/15/30 | 3,445 | 3,785 |
| Tarrant County TX Cultural Education Facilities Finance Corp. Hospital Revenue | | | | |
| (Scott & White Healthcare Project) | 5.000% | 8/15/30 | 40,335 | 40,617 |
94
Intermediate-Term Tax-Exempt Fund
| | | | | |
| | | | | Face | Market |
| | | | Maturity | Amount | Value• |
| | | Coupon | Date | ($000) | ($000) |
| | Tarrant County TX Cultural Education Facilities Finance Corp. Revenue (CHRISTUS Health) | 5.000% | 7/1/17 | 8,570 | 9,299 |
| | Tarrant County TX Cultural Education Facilities Finance Corp. Revenue (CHRISTUS Health) | 5.000% | 7/1/18 | 9,000 | 9,749 |
| | Tarrant County TX Cultural Education Facilities Finance Corp. Revenue (CHRISTUS Health) | 5.000% | 7/1/19 | 9,455 | 10,170 |
| | Tarrant County TX Cultural Education Facilities Finance Corp. Revenue | | | | |
| | (Texas Health Resources) VRDO | 0.130% | 11/1/11 | 2,005 | 2,005 |
| | Temple TX GO | 5.250% | 8/1/23 (4) | 1,665 | 1,847 |
| | Temple TX GO | 5.250% | 8/1/25 (4) | 1,525 | 1,668 |
| | Texas (Veterans Housing Assistance Program) GO VRDO | 0.110% | 11/7/11 | 40,000 | 40,000 |
| | Texas A&M University System Revenue Financing System Revenue | 5.000% | 5/15/13 | 5,535 | 5,922 |
| | Texas A&M University System Revenue Financing System Revenue | 5.000% | 5/15/26 | 4,495 | 5,074 |
| | Texas A&M University System Revenue Financing System Revenue | 5.000% | 5/15/28 | 4,475 | 4,984 |
| | Texas A&M University System Revenue Financing System Revenue | 5.000% | 7/1/30 | 3,940 | 4,333 |
| | Texas GO | 5.375% | 10/1/12 (Prere.) | 21,310 | 22,303 |
| | Texas GO | 5.000% | 4/1/15 | 1,435 | 1,630 |
| 1,3 | Texas GO TOB PUT | 0.200% | 12/13/11 | 25,000 | 25,000 |
| 1 | Texas GO TOB VRDO | 0.150% | 11/1/11 | 26,260 | 26,260 |
| 1 | Texas GO TOB VRDO | 0.140% | 11/7/11 | 5,000 | 5,000 |
| | Texas GO TRAN | 2.500% | 8/30/12 | 60,000 | 61,117 |
| | Texas Municipal Gas Acquisition & Supply Corp. Revenue | 5.625% | 12/15/17 | 45,580 | 48,057 |
| | Texas Municipal Gas Acquisition & Supply Corp. Revenue | 5.250% | 12/15/21 | 10,370 | 10,450 |
| | Texas Municipal Gas Acquisition & Supply Corp. Revenue | 5.250% | 12/15/22 | 3,260 | 3,260 |
| | Texas Municipal Gas Acquisition & Supply Corp. Revenue | 6.250% | 12/15/26 | 29,390 | 31,012 |
| | Texas Municipal Power Agency Revenue | 0.000% | 9/1/12 (ETM) | 375 | 374 |
| | Texas Municipal Power Agency Revenue | 0.000% | 9/1/12 (2) | 4,800 | 4,776 |
| | Texas Municipal Power Agency Revenue | 0.000% | 9/1/13 (ETM) | 125 | 123 |
| | Texas Municipal Power Agency Revenue | 0.000% | 9/1/13 (14) | 11,375 | 11,183 |
| | Texas Municipal Power Agency Revenue | 0.000% | 9/1/14 (ETM) | 125 | 122 |
| | Texas Municipal Power Agency Revenue | 0.000% | 9/1/14 (14) | 5,540 | 5,339 |
| | Texas Municipal Power Agency Revenue | 0.000% | 9/1/15 (ETM) | 110 | 105 |
| | Texas Municipal Power Agency Revenue | 0.000% | 9/1/15 (14) | 10,140 | 9,514 |
| | Texas Municipal Power Agency Revenue | 0.000% | 9/1/16 (ETM) | 110 | 102 |
| | Texas Municipal Power Agency Revenue | 0.000% | 9/1/16 (14) | 22,795 | 20,658 |
| | Texas Municipal Power Agency Revenue | 0.000% | 9/1/17 (ETM) | 415 | 375 |
| | Texas Municipal Power Agency Revenue | 0.000% | 9/1/17 (14) | 31,295 | 27,292 |
| | Texas Private Activity Surface Transportation Corp. Revenue | 7.500% | 12/31/31 | 32,000 | 35,827 |
| | Texas Private Activity Surface Transportation Corp. Revenue | 7.500% | 6/30/32 | 47,500 | 53,451 |
| | Texas Public Finance Authority Revenue (Unemployment Compensation) | 5.000% | 7/1/15 | 2,000 | 2,285 |
| | Texas Public Finance Authority Revenue (Unemployment Compensation) | 5.000% | 7/1/18 | 75,000 | 84,515 |
| | Texas State University System Revenue | 5.000% | 3/15/28 | 3,870 | 4,240 |
| | Texas State University System Revenue | 5.000% | 3/15/29 | 4,000 | 4,311 |
| | Texas State University System Revenue | 5.000% | 3/15/30 | 3,255 | 3,502 |
| | Texas State University System Revenue | 5.000% | 3/15/31 | 4,480 | 4,791 |
| | Texas Tech University System Revenue Financing System Revenue | 5.000% | 2/15/23 (2) | 10,040 | 11,176 |
| | Texas Tech University System Revenue Financing System Revenue | 5.000% | 2/15/24 (2) | 11,940 | 13,151 |
| | Texas Transportation Commission Central Texas System Revenue PUT | 2.750% | 2/15/13 | 10,000 | 10,131 |
| 1 | Texas Transportation Commission Mobility Fund GO TOB VRDO | 0.140% | 11/7/11 | 21,925 | 21,925 |
| | Texas Transportation Commission Revenue | 5.000% | 4/1/19 | 10,000 | 11,389 |
| | Texas Transportation Commission Revenue | 5.000% | 4/1/20 | 8,850 | 10,055 |
| | Texas Transportation Commission Revenue | 5.000% | 4/1/21 | 10,555 | 12,021 |
| | Texas Transportation Commission Revenue | 5.000% | 4/1/21 | 23,405 | 26,680 |
| | Texas Transportation Commission Revenue | 5.000% | 4/1/22 | 5,000 | 5,622 |
| | Texas Transportation Commission Revenue | 4.750% | 4/1/24 | 9,500 | 10,426 |
| | Texas Turnpike Authority Central Texas Turnpike System Revenue | 0.000% | 8/15/20 (2) | 10,000 | 6,689 |
| | Texas Water Development Board Revenue | 5.000% | 7/15/20 | 3,800 | 4,569 |
| | Texas Water Development Board Revenue | 5.000% | 7/15/21 | 4,535 | 5,424 |
| | Texas Water Financial Assistance GO | 5.000% | 4/1/20 | 20,000 | 23,032 |
| | Texas Water Financial Assistance GO | 5.000% | 8/1/20 | 2,000 | 2,367 |
| | Texas Water Financial Assistance GO | 5.000% | 8/1/28 | 5,755 | 6,488 |
| | Texas Water Financial Assistance GO | 5.000% | 8/1/29 | 2,555 | 2,853 |
| | University of Houston Texas Revenue | 4.000% | 2/15/16 | 1,425 | 1,579 |
| | University of Houston Texas Revenue | 4.750% | 2/15/28 (4) | 8,615 | 9,059 |
| | University of Texas Permanent University Fund Revenue | 5.000% | 8/15/20 | 9,785 | 11,143 |
| | | | | | 2,580,376 |
| Utah (0.4%) | | | | |
| | Central Utah Water Conservancy District GO | 5.000% | 4/1/14 | 1,405 | 1,552 |
| | Central Utah Water Conservancy District GO | 5.000% | 4/1/26 | 6,155 | 7,055 |
| | Central Utah Water Conservancy District GO | 5.000% | 4/1/27 | 4,000 | 4,546 |
| | Central Utah Water Conservancy District GO | 5.000% | 4/1/28 | 3,000 | 3,381 |
| | Central Utah Water Conservancy District GO | 5.000% | 4/1/28 | 765 | 862 |
| | Central Utah Water Conservancy District GO | 5.000% | 4/1/29 | 7,000 | 7,777 |
| | Intermountain Power Agency Utah Power Supply Revenue | 5.000% | 7/1/18 | 6,845 | 7,387 |
| | Murray UT Hospital Revenue (IHC Health Services) VRDO | 0.140% | 11/1/11 | 18,000 | 18,000 |
95
Intermediate-Term Tax-Exempt Fund
| | | | |
| | | | Face | Market |
| | | Maturity | Amount | Value• |
| | Coupon | Date | ($000) | ($000) |
| Riverton UT Hospital Revenue (IHC Health Services Inc ) | 5.000% | 8/15/19 | 2,100 | 2,395 |
| Salt Lake County UT GO | 5.000% | 12/15/15 | 5,000 | 5,800 |
| Utah Board of Regents Student Loan Revenue | 4.000% | 11/1/15 | 24,000 | 26,537 |
| Utah Board of Regents Student Loan Revenue | 5.000% | 11/1/22 | 10,800 | 12,378 |
| Utah Board of Regents Student Loan Revenue | 5.000% | 11/1/23 | 4,200 | 4,771 |
| Utah GO | 5.000% | 7/1/16 | 3,070 | 3,598 |
| Utah GO | 5.000% | 7/1/16 | 23,735 | 27,816 |
| | | | | 133,855 |
| Vermont (0.0%) | | | | |
| Vermont Educational & Health Buildings Financing Agency Hospital Revenue | | | | |
| (Fletcher Allen Health Care Project) | 5.000% | 12/1/22 (4) | 8,000 | 8,538 |
| |
| Virgin Islands (0.1%) | | | | |
| Virgin Islands Public Finance Authority Revenue | 5.000% | 10/1/18 | 4,500 | 4,863 |
| Virgin Islands Public Finance Authority Revenue | 5.000% | 10/1/19 | 3,000 | 3,216 |
| Virgin Islands Public Finance Authority Revenue | 6.375% | 10/1/19 | 5,360 | 5,370 |
| Virgin Islands Public Finance Authority Revenue | 5.000% | 10/1/24 | 1,000 | 1,018 |
| Virgin Islands Public Finance Authority Revenue | 5.000% | 10/1/29 | 5,000 | 4,941 |
| | | | | 19,408 |
| Virginia (1.5%) | | | | |
| Clarke County VA Industrial Development Authority Hospital Facilities Revenue | | | | |
| (Winchester Medical Center Inc.) VRDO | 0.200% | 11/7/11 (4) | 2,675 | 2,675 |
| Fairfax County VA Economic Development Authority Revenue (Public Facilities Projects) | 5.000% | 4/1/18 | 1,280 | 1,515 |
| Fairfax County VA Economic Development Authority Transportation District | | | | |
| Improvement Revenue (Silver Line Phase I Project) | 2.000% | 4/1/14 | 2,905 | 2,995 |
| Fairfax County VA Economic Development Authority Transportation District | | | | |
| Improvement Revenue (Silver Line Phase I Project) | 5.000% | 4/1/16 | 2,320 | 2,681 |
| Fairfax County VA Economic Development Authority Transportation District | | | | |
| Improvement Revenue (Silver Line Phase I Project) | 5.000% | 4/1/29 | 9,730 | 10,630 |
| Fairfax County VA Economic Development Authority Transportation District | | | | |
| Improvement Revenue (Silver Line Phase I Project) | 5.000% | 4/1/30 | 5,000 | 5,440 |
| Fairfax County VA Economic Development Authority Transportation District | | | | |
| Improvement Revenue (Silver Line Phase I Project) | 5.000% | 4/1/31 | 4,890 | 5,280 |
| Fairfax County VA Industrial Development Authority Hospital Revenue | | | | |
| (Inova Health System Hospital Project) | 5.000% | 5/15/25 | 2,000 | 2,175 |
| Fairfax County VA Public Improvement GO | 5.000% | 10/1/16 | 12,950 | 15,252 |
| Hampton VA GO | 4.000% | 1/15/19 | 3,000 | 3,413 |
| Hampton VA GO | 5.000% | 1/15/20 | 3,000 | 3,551 |
| 3 Louisa VA Industrial Development Authority Pollution Control Revenue | | | | |
| (Virginia Electric & Power Co. Project) PUT | 5.375% | 12/1/11 | 32,000 | 34,469 |
| 3 Louisa VA Industrial Development Authority Pollution Control Revenue | | | | |
| (Virginia Electric & Power Co. Project) PUT | 5.375% | 12/2/13 | 10,000 | 10,771 |
| Portsmouth VA GO | 5.000% | 7/1/14 (4) | 3,530 | 3,931 |
| Richmond VA GO | 5.000% | 7/15/16 | 4,120 | 4,822 |
| Roanoke VA Economic Development Authority Hospital Revenue | | | | |
| (Carilion Clinic Obligated Group) | 5.000% | 7/1/25 | 10,375 | 10,846 |
| Stafford County VA Economic Development Authority Hospital Facilities Revenue | | | | |
| (MediCorp Health System Obligated Group) | 5.250% | 6/15/26 | 2,425 | 2,467 |
| Stafford County VA Economic Development Authority Hospital Facilities Revenue | | | | |
| (MediCorp Health System Obligated Group) | 5.250% | 6/15/31 | 19,405 | 19,530 |
| Tobacco Settlement Financing Corp. Virginia Revenue | 5.625% | 6/1/15 (Prere.) | 42,520 | 49,327 |
| Virginia Beach VA Development Authority Public Facility Revenue | 5.000% | 12/1/13 (Prere.) | 8,420 | 9,198 |
| Virginia Beach VA Development Authority Public Facility Revenue | 5.000% | 7/15/17 (Prere.) | 5,125 | 6,107 |
| Virginia Beach VA Development Authority Public Facility Revenue | 5.000% | 12/1/22 | 10,000 | 10,639 |
| Virginia Beach VA Development Authority Public Facility Revenue | 5.000% | 7/15/24 | 5,335 | 5,823 |
| Virginia Beach VA Development Authority Public Facility Revenue | 5.000% | 7/15/25 | 5,665 | 6,146 |
| Virginia Beach VA Development Authority Public Facility Revenue | 5.000% | 7/15/26 | 5,955 | 6,413 |
| Virginia College Building Authority Educational Facilities Revenue | | | | |
| (21st Century College & Equipment Programs) | 5.000% | 2/1/18 | 10,595 | 12,295 |
| Virginia College Building Authority Educational Facilities Revenue | | | | |
| (21st Century College & Equipment Programs) | 5.000% | 2/1/22 | 1,000 | 1,205 |
| Virginia College Building Authority Educational Facilities Revenue | | | | |
| (Public Higher Education Financing Program) | 5.000% | 9/1/18 | 8,010 | 9,155 |
| Virginia College Building Authority Educational Facilities Revenue | | | | |
| (Public Higher Education Financing Program) | 5.000% | 9/1/19 | 8,430 | 9,523 |
| Virginia College Building Authority Educational Facilities Revenue | | | | |
| (Public Higher Education Financing Program) | 5.000% | 9/1/20 | 8,855 | 9,899 |
| Virginia College Building Authority Educational Facilities Revenue | | | | |
| (Public Higher Education Financing Program) | 5.000% | 9/1/21 | 9,320 | 10,356 |
| Virginia College Building Authority Educational Facilities Revenue | | | | |
| (Public Higher Education Financing Program) | 5.000% | 9/1/22 | 9,105 | 10,055 |
96
Intermediate-Term Tax-Exempt Fund
| | | | |
| | | | Face | Market |
| | | Maturity | Amount | Value• |
| | Coupon | Date | ($000) | ($000) |
| Virginia Commonwealth Transportation Board Revenue | 5.000% | 5/15/27 | 13,765 | 15,582 |
| Virginia Commonwealth Transportation Board Revenue | 5.000% | 5/15/30 | 30,140 | 33,214 |
| Virginia Commonwealth Transportation Board Revenue | 5.000% | 5/15/31 | 31,550 | 34,529 |
| Virginia Public Building Authority Public Facilities Revenue | 5.000% | 8/1/16 | 11,940 | 13,921 |
| Virginia Public Building Authority Public Facilities Revenue | 5.000% | 8/1/17 | 7,815 | 9,255 |
| Virginia Public Building Authority Revenue | 5.000% | 8/1/22 | 10,000 | 10,877 |
| Virginia Public School Authority Revenue | 5.000% | 4/15/13 | 7,160 | 7,639 |
| Virginia Public School Authority Revenue | 5.000% | 8/1/13 (Prere.) | 8,865 | 9,573 |
| Virginia Public School Authority Revenue | 5.000% | 8/1/13 | 5,060 | 5,464 |
| Virginia Public School Authority Revenue | 5.000% | 8/1/20 | 2,500 | 3,012 |
| Wise County VA Industrial Development Authority Solid Waste & Sewage Disposal Revenue | | | | |
| (Virginia Electric & Power Co.) PUT | 2.375% | 11/1/15 | 10,000 | 10,236 |
| York County VA Economic Development Authority Pollution Control Revenue | | | | |
| (VA Electric & Power Co. Project) PUT | 4.050% | 5/1/14 | 13,250 | 14,038 |
| | | | | 465,924 |
| Washington (1.9%) | | | | |
| Chelan County WA Public Utility District No. 1 Hydro-Electric System Revenue | | | | |
| (Columbia River-Rock Island Hydro) | 0.000% | 6/1/15 (14) | 6,400 | 5,974 |
| Clark County WA GO | 4.750% | 12/1/27 (14) | 3,275 | 3,404 |
| 2 Energy Northwest Washington Electric Revenue (Columbia Generating Station) | 5.000% | 7/1/19 | 25,000 | 28,491 |
| 2 Energy Northwest Washington Electric Revenue (Columbia Generating Station) | 5.000% | 7/1/20 | 20,000 | 22,745 |
| 2 Energy Northwest Washington Electric Revenue (Project No. 1) | 5.000% | 7/1/15 | 6,710 | 7,378 |
| 2 Energy Northwest Washington Electric Revenue (Project No. 1) | 5.000% | 7/1/16 | 9,735 | 10,865 |
| Energy Northwest Washington Electric Revenue (Project No. 3) | 5.000% | 7/1/18 | 14,000 | 16,609 |
| King County WA (Bellevue School District) GO | 5.000% | 12/1/27 | 16,505 | 18,620 |
| King County WA (Bellevue School District) GO | 5.000% | 12/1/28 | 17,335 | 19,391 |
| King County WA (Bellevue School District) GO | 5.000% | 12/1/29 | 18,200 | 20,218 |
| King County WA Sewer Revenue | 5.250% | 1/1/27 | 1,890 | 2,143 |
| 1 King County WA Sewer Revenue TOB VRDO | 0.140% | 11/7/11 | 6,950 | 6,950 |
| Port of Seattle WA Passenger Facility Charge Revenue | 5.000% | 12/1/17 | 1,000 | 1,146 |
| Port of Seattle WA Passenger Facility Charge Revenue | 5.000% | 12/1/20 | 3,000 | 3,431 |
| Port of Seattle WA Passenger Facility Charge Revenue | 5.000% | 12/1/22 | 5,525 | 6,159 |
| Port of Seattle WA Revenue | 5.000% | 3/1/21 (14) | 5,000 | 5,437 |
| Port of Seattle WA Revenue | 5.000% | 6/1/22 | 2,000 | 2,266 |
| Port of Seattle WA Revenue | 5.000% | 6/1/30 | 6,000 | 6,343 |
| Snohomish County WA Mukilteo School District GO | 6.500% | 12/1/11 | 2,125 | 2,134 |
| University of Washington Revenue | 5.000% | 4/1/15 | 9,830 | 11,158 |
| University of Washington Revenue | 5.000% | 4/1/28 | 10,195 | 11,404 |
| University of Washington Revenue | 5.000% | 4/1/30 | 9,315 | 10,262 |
| University of Washington Revenue | 5.000% | 4/1/31 | 10,500 | 11,498 |
| University of Washington Revenue | 5.000% | 4/1/32 | 11,375 | 12,390 |
| Washington (Motor Vehicle Fuel Tax) GO | 5.000% | 8/1/20 | 3,185 | 3,833 |
| Washington GO | 6.000% | 6/1/12 | 1,000 | 1,033 |
| Washington GO | 5.700% | 10/1/15 (4) | 7,700 | 8,329 |
| 2 Washington GO | 5.000% | 7/1/17 | 32,460 | 38,309 |
| Washington GO | 5.000% | 7/1/19 | 6,940 | 8,317 |
| Washington GO | 0.000% | 6/1/20 (3) | 5,500 | 4,243 |
| Washington GO | 5.000% | 7/1/20 | 10,000 | 11,353 |
| Washington GO | 5.000% | 8/1/20 | 4,845 | 5,830 |
| Washington GO | 5.000% | 2/1/28 | 10,000 | 11,168 |
| Washington GO | 5.000% | 2/1/28 | 5,000 | 5,694 |
| Washington GO | 5.000% | 2/1/29 | 6,790 | 7,556 |
| Washington GO | 5.000% | 2/1/29 | 9,650 | 10,680 |
| Washington GO | 5.000% | 7/1/30 | 5,000 | 5,368 |
| Washington GO | 5.000% | 8/1/30 | 10,000 | 11,210 |
| Washington GO | 5.000% | 8/1/30 | 20,980 | 22,871 |
| Washington GO | 5.000% | 6/1/31 | 5,250 | 5,682 |
| Washington GO | 5.000% | 6/1/32 | 5,500 | 5,916 |
| Washington Health Care Facilities Authority Revenue (Catholic Health Initiatives) VRDO | 0.110% | 11/7/11 | 36,000 | 36,000 |
| Washington Health Care Facilities Authority Revenue | | | | |
| (Fred Hutchinson Cancer Research Center) VRDO | 0.180% | 11/1/11 LOC | 16,470 | 16,470 |
| Washington Health Care Facilities Authority Revenue (MultiCare Health System) | 5.000% | 8/15/18 | 2,000 | 2,172 |
| Washington Health Care Facilities Authority Revenue (MultiCare Health System) | 5.250% | 8/15/19 | 3,800 | 4,191 |
| Washington Health Care Facilities Authority Revenue (MultiCare Health System) | 5.250% | 8/15/20 | 4,250 | 4,648 |
| Washington Health Care Facilities Authority Revenue (MultiCare Health System) | 5.250% | 8/15/21 | 6,525 | 7,075 |
| Washington Health Care Facilities Authority Revenue (MultiCare Health System) | 5.250% | 8/15/22 | 5,500 | 5,889 |
| Washington Health Care Facilities Authority Revenue (MultiCare Health System) | 5.250% | 8/15/23 (4) | 3,425 | 3,720 |
| Washington Health Care Facilities Authority Revenue (MultiCare Health System) | 5.250% | 8/15/24 (4) | 3,550 | 3,824 |
| Washington Health Care Facilities Authority Revenue (MultiCare Health System) | 5.250% | 8/15/25 (4) | 3,675 | 3,932 |
| Washington Health Care Facilities Authority Revenue (MultiCare Health System) | 5.250% | 8/15/25 (4) | 3,625 | 3,878 |
| Washington Health Care Facilities Authority Revenue (MultiCare Health System) | 5.250% | 8/15/26 (4) | 3,550 | 3,772 |
| Washington Health Care Facilities Authority Revenue (MultiCare Health System) | 5.250% | 8/15/26 (4) | 3,800 | 4,038 |
97
Intermediate-Term Tax-Exempt Fund
| | | | |
| | | | Face | Market |
| | | Maturity | Amount | Value• |
| | Coupon | Date | ($000) | ($000) |
| Washington Health Care Facilities Authority Revenue (MultiCare Health System) | 5.250% | 8/15/27 (4) | 3,925 | 4,145 |
| Washington Health Care Facilities Authority Revenue (PeaceHealth) | 5.000% | 11/1/18 | 23,000 | 25,693 |
| Washington Health Care Facilities Authority Revenue (PeaceHealth) | 5.000% | 11/1/24 | 19,830 | 20,910 |
| Washington Health Care Facilities Authority Revenue (Swedish Health Services) VRDO | 0.130% | 11/7/11 LOC | 10,000 | 10,000 |
| Washington Higher Education Facilities Authority Revenue (Gonzaga University Project) | 5.000% | 4/1/21 | 2,580 | 2,821 |
| Washington Higher Education Facilities Authority Revenue (Gonzaga University Project) | 5.000% | 4/1/22 | 3,005 | 3,247 |
| Washington Higher Education Facilities Authority Revenue (Gonzaga University Project) | 5.000% | 4/1/23 | 4,470 | 4,793 |
| Washington Higher Education Facilities Authority Revenue (Gonzaga University Project) | 5.000% | 4/1/24 | 2,000 | 2,129 |
| | | | | 587,155 |
| West Virginia (0.3%) | | | | |
| West Virginia Economic Development Authority Pollution Control Revenue | | | | |
| (Appalachian Power Co. - Amos Project) PUT | 4.850% | 9/4/13 | 3,000 | 3,164 |
| West Virginia Economic Development Authority Pollution Control Revenue | | | | |
| (Appalachian Power Co. - Amos Project) PUT | 4.850% | 9/4/13 | 10,000 | 10,547 |
| West Virginia Economic Development Authority Revenue | 5.000% | 6/15/19 | 1,395 | 1,636 |
| West Virginia Economic Development Authority Revenue | 5.000% | 6/15/21 | 3,500 | 4,080 |
| West Virginia Economic Development Authority Revenue | 5.000% | 6/15/22 | 2,055 | 2,374 |
| West Virginia Economic Development Authority Revenue | 5.000% | 6/15/23 | 1,745 | 1,998 |
| West Virginia Economic Development Authority Revenue | 5.000% | 6/15/25 | 2,445 | 2,737 |
| West Virginia Economic Development Authority Revenue | 5.000% | 6/15/27 | 5,085 | 5,605 |
| West Virginia Hospital Finance Authority Hospital Revenue (Charleston Area Medical Center Inc.) | 5.000% | 9/1/17 | 6,335 | 6,845 |
| West Virginia Hospital Finance Authority Hospital Revenue (Charleston Area Medical Center Inc.) | 5.000% | 9/1/18 | 4,985 | 5,379 |
| West Virginia Hospital Finance Authority Hospital Revenue (Charleston Area Medical Center Inc.) | 5.000% | 9/1/19 | 2,990 | 3,200 |
| West Virginia Hospital Finance Authority Hospital Revenue (Charleston Area Medical Center Inc.) | 5.000% | 9/1/20 | 3,430 | 3,647 |
| West Virginia Hospital Finance Authority Hospital Revenue (Charleston Area Medical Center Inc.) | 5.125% | 9/1/21 | 3,265 | 3,467 |
| West Virginia Hospital Finance Authority Hospital Revenue | | | | |
| (United Health System Obligated Group) | 5.000% | 6/1/18 | 1,920 | 2,098 |
| West Virginia Hospital Finance Authority Hospital Revenue | | | | |
| (United Health System Obligated Group) | 5.000% | 6/1/24 | 12,620 | 13,012 |
| West Virginia School Building Authority Excess Lottery Revenue | 5.250% | 7/1/20 | 2,500 | 2,870 |
| West Virginia School Building Authority Excess Lottery Revenue | 5.250% | 7/1/22 | 5,810 | 6,551 |
| West Virginia University Revenue | 5.000% | 10/1/17 | 1,500 | 1,739 |
| West Virginia University Revenue | 5.000% | 10/1/30 | 3,000 | 3,241 |
| | | | | 84,190 |
| Wisconsin (0.7%) | | | | |
| Madison WI Community Development Authority Revenue (Wisconsin Alumni Research Project) | 5.000% | 10/1/18 | 1,640 | 1,971 |
| Madison WI Community Development Authority Revenue (Wisconsin Alumni Research Project) | 5.000% | 10/1/19 | 3,705 | 4,471 |
| Milwaukee WI Metropolitan Sewer District GO | 5.250% | 10/1/22 | 2,690 | 3,332 |
| Wisconsin Clean Water Revenue | 4.000% | 6/1/16 | 720 | 806 |
| Wisconsin Clean Water Revenue | 4.000% | 6/1/17 | 1,000 | 1,127 |
| Wisconsin GO | 5.250% | 5/1/12 | 15,975 | 16,374 |
| Wisconsin GO | 5.000% | 5/1/13 (14) | 2,000 | 2,137 |
| Wisconsin GO | 5.000% | 5/1/13 | 2,500 | 2,671 |
| Wisconsin GO | 5.500% | 5/1/13 (14) | 7,000 | 7,532 |
| Wisconsin GO | 5.000% | 5/1/14 (14) | 7,390 | 8,178 |
| Wisconsin GO | 5.000% | 5/1/14 | 3,500 | 3,873 |
| Wisconsin GO | 5.000% | 5/1/15 | 3,000 | 3,414 |
| Wisconsin GO | 5.500% | 5/1/15 (14) | 15,000 | 17,322 |
| Wisconsin GO | 5.000% | 5/1/16 (14) | 6,000 | 6,755 |
| Wisconsin GO | 5.000% | 5/1/16 | 4,000 | 4,643 |
| Wisconsin GO | 5.000% | 11/1/17 | 4,500 | 5,340 |
| Wisconsin GO | 5.000% | 5/1/19 | 7,135 | 8,349 |
| Wisconsin GO | 5.000% | 5/1/22 | 3,500 | 4,089 |
| Wisconsin GO | 6.000% | 5/1/27 | 10,000 | 11,629 |
| Wisconsin Health & Educational Facilities Authority Health Facilities Revenue (SSM Health Care) | 5.000% | 6/1/19 | 4,110 | 4,639 |
| Wisconsin Health & Educational Facilities Authority Health Facilities Revenue (SSM Health Care) | 5.000% | 6/1/20 | 3,240 | 3,641 |
| Wisconsin Health & Educational Facilities Authority Health Facilities Revenue (SSM Health Care) | 5.000% | 6/1/21 | 5,230 | 5,815 |
| Wisconsin Health & Educational Facilities Authority Health Facilities Revenue (SSM Health Care) | 5.000% | 6/1/22 | 3,295 | 3,589 |
| Wisconsin Health & Educational Facilities Authority Revenue (Aurora Health Care Inc.) | 5.600% | 2/15/29 | 15,355 | 15,358 |
| Wisconsin Health & Educational Facilities Authority Revenue (Aurora Health Care Inc.) | 5.500% | 4/15/29 | 11,700 | 11,873 |
| Wisconsin Health & Educational Facilities Authority Revenue | | | | |
| (Children’s Hospital of Wisconsin Inc.) | 5.375% | 8/15/24 | 5,900 | 6,463 |
| Wisconsin Health & Educational Facilities Authority Revenue (Marchfield Clininc) VRDO | 0.120% | 11/7/11 LOC | 30,070 | 30,070 |
| Wisconsin Health & Educational Facilities Authority Revenue (Meriter Hospital Inc. Project) VRDO | 0.160% | 11/1/11 LOC | 2,010 | 2,010 |
| Wisconsin Transportation Revenue | 5.000% | 7/1/29 | 5,100 | 5,504 |
| | | | | 202,975 |
| Total Tax-Exempt Municipal Bonds (Cost $29,182,899) | | | | 30,446,851 |
98
| | | |
| Intermediate-Term Tax-Exempt Fund | | | |
| |
| |
| |
| |
| | | | Market |
| | | | Value• |
| | Coupon | Shares | ($000) |
| Temporary Cash Investment (1.3%) | | | |
| Money Market Fund (1.3%) | | | |
| 4 Vanguard Municipal Cash Management Fund (Cost $412,442) | 0.117% | 412,441,862 | 412,442 |
| Total Investments (99.8%) (Cost $29,595,341) | | | 30,859,293 |
| Other Assets and Liabilities (0.2%) | | | |
| Other Assets | | | 446,858 |
| Liabilities | | | (382,496) |
| | | | 64,362 |
| Net Assets (100%) | | | 30,923,655 |
| |
| |
| At October 31, 2011, net assets consisted of: | | | |
| | | | Amount |
| | | | ($000) |
| Paid-in Capital | | | 29,778,789 |
| Undistributed Net Investment Income | | | — |
| Accumulated Net Realized Losses | | | (119,086) |
| Unrealized Appreciation (Depreciation) | | | 1,263,952 |
| Net Assets | | | 30,923,655 |
| |
| Investor Shares—Net Assets | | | |
| Applicable to 493,517,607 outstanding $.001 par value shares of beneficial interest (unlimited authorization) | | 6,783,454 |
| Net Asset Value Per Share—Investor Shares | | | $13.75 |
| |
| Admiral Shares—Net Assets | | | |
| Applicable to 1,756,273,649 outstanding $.001 par value shares of beneficial interest (unlimited authorization) | | 24,140,201 |
| Net Asset Value Per Share—Admiral Shares | | | $13.75 |
• See Note A in Notes to Financial Statements.
1 Security exempt from registration under Rule 144A of the Securities Act of 1933. Such securities may be sold in transactions exempt from registration, normally to qualified institutional buyers. At October 31, 2011, the aggregate value of these securities was $576,449,000, representing 1.9% of net assets.
2 Security purchased on a when-issued or delayed-delivery basis for which the fund has not taken delivery as of October 31, 2011.
3 Adjustable-rate security.
4 Affiliated money market fund available only to Vanguard funds and certain trusts and accounts managed by Vanguard. Rate shown is the 7-day yield
For key to abbreviations and other references, see back cover.
See accompanying Notes, which are an integral part of the Financial Statements
99
Long-Term Tax-Exempt Fund
| | | | |
| | | | Face | Market |
| | | Maturity | Amount | Value• |
| | Coupon | Date | ($000) | ($000) |
| Tax-Exempt Municipal Bonds (97.7%) | | | | |
| Alabama (0.3%) | | | | |
| Alabama Port Authority Docks Facilities Revenue | 6.000% | 10/1/40 | 5,000 | 5,367 |
| East Alabama Health Care Authority Health Care Facilities Revenue | | | | |
| (East Alabama Medical Center) PUT | 5.000% | 9/1/13 | 5,000 | 5,231 |
| Houston County AL Health Care Authority Revenue | 5.250% | 10/1/30 (2) | 9,000 | 8,455 |
| | | | | 19,053 |
| Alaska (0.1%) | | | | |
| Valdez AK Marine Terminal Revenue (BP Pipelines) | 5.000% | 1/1/21 | 6,000 | 6,740 |
| |
| Arizona (2.1%) | | | | |
| Arizona COP | 5.000% | 9/1/23 (4) | 12,140 | 13,080 |
| Arizona Health Facilities Authority Revenue (Banner Health) | 5.500% | 1/1/38 | 12,500 | 12,914 |
| Arizona State University COP | 5.375% | 7/1/12 (Prere.) | 4,340 | 4,487 |
| Arizona State University COP | 5.375% | 7/1/12 (Prere.) | 4,905 | 5,071 |
| Arizona State University COP | 5.375% | 7/1/12 (Prere.) | 5,345 | 5,525 |
| Arizona State University COP | 5.375% | 7/1/12 (Prere.) | 4,460 | 4,611 |
| Arizona State University COP | 5.375% | 7/1/12 (Prere.) | 5,520 | 5,706 |
| Arizona State University COP | 5.375% | 7/1/12 (Prere.) | 2,285 | 2,362 |
| Arizona State University COP | 5.375% | 7/1/13 (14) | 2,905 | 2,990 |
| Arizona Transportation Board Excise Tax Revenue (Maricopa County Regional Area) | 5.000% | 7/1/17 | 3,500 | 4,106 |
| Arizona Transportation Board Excise Tax Revenue (Maricopa County Regional Area) | 5.000% | 7/1/21 | 4,190 | 4,960 |
| Arizona Transportation Board Highway Revenue | 5.000% | 7/1/24 | 5,000 | 5,421 |
| Arizona Water Infrastructure Finance Authority Revenue | 5.000% | 10/1/30 | 5,000 | 5,522 |
| Maricopa County AZ Industrial Development Authority Hospital System Revenue | | | | |
| (Samaritan Health Services) | 7.000% | 12/1/16 (ETM) | 8,650 | 10,368 |
| Maricopa County AZ Pollution Control Corp. Revenue (Southern California Edison Co.) | 5.000% | 6/1/35 | 5,500 | 5,770 |
| Phoenix AZ Civic Improvement Corp. Airport Revenue | 5.000% | 7/1/21 | 4,000 | 4,461 |
| Phoenix AZ Civic Improvement Corp. Airport Revenue | 5.000% | 7/1/22 | 6,375 | 7,022 |
| Phoenix AZ Civic Improvement Corp. Airport Revenue (Light Rail Project) | 5.000% | 7/1/18 (2) | 7,500 | 8,145 |
| Phoenix AZ Civic Improvement Corp. Airport Revenue (Light Rail Project) | 5.000% | 7/1/19 (2) | 15,000 | 16,234 |
| Phoenix AZ Civic Improvement Corp. Excise Tax Revenue | 5.000% | 7/1/21 (14) | 5,135 | 5,497 |
| Phoenix AZ Civic Improvement Corp. Water System Revenue | 5.000% | 7/1/34 | 10,000 | 10,702 |
| Tucson AZ Water System Revenue | 5.500% | 7/1/17 (14) | 4,850 | 5,091 |
| | | | | 150,045 |
| Arkansas (0.1%) | | | | |
| North Little Rock AR Electric Revenue | 6.500% | 7/1/15 (14) | 3,710 | 4,027 |
| |
| California (16.4%) | | | | |
| Alameda CA Corridor Transportation Authority Revenue | 0.000% | 10/1/30 (2) | 5,000 | 1,472 |
| Anaheim CA Public Financing Authority Revenue (Electric System) | 5.000% | 10/1/31 (4) | 16,235 | 16,685 |
| Bay Area Toll Authority California Toll Bridge Revenue (San Francisco Bay Area) | 5.000% | 4/1/26 | 11,000 | 12,069 |
| Bay Area Toll Authority California Toll Bridge Revenue (San Francisco Bay Area) | 5.000% | 4/1/27 | 12,440 | 13,366 |
| Beverly Hills CA Unified School District GO | 0.000% | 8/1/24 | 6,500 | 3,561 |
| Beverly Hills CA Unified School District GO | 0.000% | 8/1/25 | 10,500 | 5,402 |
| California Department of Water Resources Power Supply Revenue | 5.375% | 5/1/12 (Prere.) | 5,000 | 5,179 |
| California Department of Water Resources Power Supply Revenue | 5.500% | 5/1/12 (Prere.) | 6,000 | 6,218 |
| California Department of Water Resources Power Supply Revenue | 5.000% | 5/1/16 | 3,165 | 3,641 |
| California Department of Water Resources Power Supply Revenue | 5.000% | 5/1/21 | 7,650 | 8,618 |
| California Department of Water Resources Power Supply Revenue | 5.000% | 5/1/21 | 5,000 | 5,805 |
| California Department of Water Resources Power Supply Revenue | 5.000% | 5/1/22 | 5,375 | 6,001 |
| California Department of Water Resources Power Supply Revenue | 5.000% | 5/1/22 | 5,000 | 5,740 |
| California Department of Water Resources Water System Revenue (Central Valley Project) | 5.000% | 12/1/27 | 7,560 | 8,282 |
| California Department of Water Resources Water System Revenue (Central Valley Project) | 5.000% | 12/1/29 | 10,000 | 10,945 |
| California Economic Recovery Bonds GO | 5.000% | 7/1/14 (Prere.) | 4,145 | 4,623 |
| California Economic Recovery Bonds GO | 5.000% | 7/1/15 | 5,990 | 6,582 |
| California Economic Recovery Bonds GO | 5.250% | 7/1/21 | 8,750 | 10,096 |
| California Educational Facilities Authority Revenue (California Institute of Technology) | 5.000% | 11/1/39 | 7,000 | 7,565 |
| California Educational Facilities Authority Revenue (University of Southern California) | 5.000% | 10/1/38 | 5,000 | 5,296 |
| California Educational Facilities Authority Revenue (University of Southern California) | 5.250% | 10/1/38 | 1,000 | 1,081 |
| California Educational Facilities Authority Revenue (University of Southern California) | 5.250% | 10/1/39 | 5,000 | 5,402 |
| California GO | 6.250% | 9/1/12 | 1,655 | 1,711 |
| California GO | 5.000% | 2/1/14 (Prere.) | 3,565 | 3,898 |
| California GO | 5.000% | 2/1/14 (Prere.) | 1,500 | 1,640 |
| California GO | 5.500% | 4/1/18 | 7,000 | 8,114 |
| California GO | 5.000% | 6/1/19 (14) | 4,500 | 4,940 |
| California GO | 5.000% | 9/1/20 | 5,130 | 5,670 |
| California GO | 5.000% | 10/1/20 | 10,000 | 11,242 |
| California GO | 5.250% | 11/1/21 | 2,000 | 2,142 |
| California GO | 5.250% | 9/1/22 | 11,500 | 13,119 |
| California GO | 5.250% | 9/1/24 | 12,500 | 13,763 |
100
Long-Term Tax-Exempt Fund
| | | | |
| | | | Face | Market |
| | | Maturity | Amount | Value• |
| | Coupon | Date | ($000) | ($000) |
| California GO | 5.625% | 4/1/26 | 21,900 | 24,461 |
| California GO | 6.000% | 3/1/33 | 4,000 | 4,502 |
| California GO | 6.500% | 4/1/33 | 43,000 | 50,138 |
| California GO | 6.000% | 11/1/35 | 10,000 | 11,162 |
| California GO | 4.500% | 10/1/36 | 13,200 | 12,265 |
| California GO | 6.000% | 4/1/38 | 8,840 | 9,785 |
| California GO | 6.000% | 11/1/39 | 5,000 | 5,567 |
| California GO | 5.250% | 11/1/40 | 18,000 | 18,388 |
| California Health Facilities Financing Authority Revenue (Adventist Health System/West) | 5.750% | 9/1/39 | 5,500 | 5,721 |
| California Health Facilities Financing Authority Revenue (Catholic Healthcare West) | 5.625% | 7/1/35 | 5,000 | 5,169 |
| California Health Facilities Financing Authority Revenue (Catholic Healthcare West) | 6.000% | 7/1/39 | 4,500 | 4,816 |
| California Health Facilities Financing Authority Revenue (Pomona Valley Hospital Medical Center) | 5.750% | 7/1/15 (14) | 6,735 | 6,749 |
| California Health Facilities Financing Authority Revenue (St. Joseph Health System) | 5.750% | 7/1/39 | 8,000 | 8,331 |
| California Health Facilities Financing Authority Revenue (Sutter Health) | 5.875% | 8/15/31 | 6,000 | 6,480 |
| California Health Facilities Financing Authority Revenue (Sutter Health) | 5.000% | 8/15/38 | 4,000 | 3,942 |
| California Health Facilities Financing Authority Revenue (Sutter Health) | 6.000% | 8/15/42 | 15,000 | 16,356 |
| California Infrastructure & Economic Development Bank Revenue | | | | |
| (Independent System Operator Corp. Project) | 6.250% | 2/1/39 | 15,000 | 16,113 |
| California Infrastructure & Economic Development Bank Revenue (J. Paul Getty Trust) PUT | 2.500% | 4/1/13 | 10,000 | 10,287 |
| California Municipal Finance Authority Revenue (University of La Verne) | 6.250% | 6/1/40 | 5,000 | 5,113 |
| California Public Works Board Lease Revenue (Community Colleges) | 5.625% | 3/1/16 (2) | 11,370 | 11,398 |
| California Public Works Board Lease Revenue (Department of General Services) | 6.250% | 4/1/34 | 10,000 | 10,837 |
| California Public Works Board Lease Revenue (Various Capital Projects) | 5.000% | 10/1/28 | 3,000 | 3,016 |
| California State University Revenue Systemwide | 5.000% | 11/1/21 | 5,000 | 5,838 |
| California State University Revenue Systemwide | 5.000% | 11/1/32 (4) | 16,000 | 16,679 |
| California State University Revenue Systemwide | 5.250% | 11/1/34 | 8,600 | 9,018 |
| California Statewide Communities Development Authority Revenue (Kaiser Permanente) | 5.250% | 3/1/45 | 9,000 | 9,017 |
| California Statewide Communities Development Authority Revenue (Trinity Health) | 5.000% | 12/1/41 | 10,500 | 10,435 |
| California Statewide Communities Development Authority Senior Living Revenue | | | | |
| (Southern California Presbyterian Homes) | 7.250% | 11/15/41 | 3,000 | 3,232 |
| California Statewide Communities Development Authority Student Housing Revenue | | | | |
| (CHF-Irvine LLC - UCI East Campus Apartments Phase II) | 5.750% | 5/15/32 | 4,000 | 4,002 |
| 1 Chabot-Las Positas CA Community College District GO TOB VRDO | 0.130% | 11/7/11 | 4,300 | 4,300 |
| Chula Vista CA Industrial Development Revenue (San Diego Gas & Electric Co.) | 5.875% | 2/15/34 | 10,000 | 11,037 |
| Foothill-De Anza CA Community College District GO | 5.000% | 8/1/40 | 10,000 | 10,618 |
| Golden State Tobacco Securitization Corp. California | 5.000% | 6/1/13 (Prere.) | 26,020 | 27,827 |
| Golden State Tobacco Securitization Corp. California | 6.750% | 6/1/13 (Prere.) | 20,000 | 21,940 |
| Golden State Tobacco Securitization Corp. California | 4.500% | 6/1/27 | 24,590 | 19,815 |
| Golden State Tobacco Securitization Corp. California | 6.250% | 6/1/33 (Prere.) | 13,410 | 14,420 |
| Golden State Tobacco Securitization Corp. California | 5.750% | 6/1/47 | 5,345 | 3,848 |
| Grossmont CA Healthcare District GO | 5.000% | 7/15/37 (2) | 15,770 | 16,130 |
| Grossmont CA Healthcare District GO | 6.125% | 7/15/40 | 5,000 | 5,639 |
| Imperial CA Irrigation District Electric Revenue | 6.250% | 11/1/31 | 2,225 | 2,550 |
| Kern County CA GO | 6.000% | 8/1/35 (12) | 2,500 | 2,780 |
| Los Angeles CA Community College District GO | 5.000% | 8/1/28 | 6,600 | 7,059 |
| Los Angeles CA Community College District GO | 6.000% | 8/1/33 | 10,000 | 11,399 |
| Los Angeles CA Community College District GO | 5.250% | 8/1/39 | 3,000 | 3,281 |
| Los Angeles CA Department of Airports International Airport Revenue | 5.000% | 5/15/40 | 10,000 | 10,525 |
| Los Angeles CA Department of Water & Power Revenue | 5.000% | 7/1/31 (4) | 12,500 | 12,840 |
| Los Angeles CA Department of Water & Power Revenue | 5.375% | 7/1/38 | 4,000 | 4,353 |
| Los Angeles CA Department of Water & Power Revenue | 5.000% | 7/1/39 | 5,000 | 5,201 |
| Los Angeles CA GO | 5.000% | 9/1/22 | 3,475 | 4,033 |
| Los Angeles CA GO | 5.000% | 9/1/22 | 9,745 | 11,310 |
| Los Angeles CA Unified School District GO | 5.250% | 7/1/13 (Prere.) | 9,000 | 9,718 |
| Los Angeles CA Unified School District GO | 5.000% | 7/1/25 (3) | 10,000 | 10,600 |
| Los Angeles CA Unified School District GO | 5.000% | 7/1/25 (4) | 6,980 | 7,478 |
| Los Angeles CA Unified School District GO | 5.000% | 7/1/26 (4) | 7,435 | 7,901 |
| Los Angeles CA Unified School District GO | 5.000% | 7/1/26 (4) | 27,240 | 28,948 |
| Los Angeles CA Unified School District GO | 5.000% | 7/1/26 | 6,950 | 7,548 |
| Los Angeles CA Unified School District GO | 5.000% | 7/1/27 | 7,295 | 7,867 |
| Los Angeles CA Wastewater System Revenue | 5.750% | 6/1/28 | 11,080 | 12,531 |
| Los Angeles County CA Public Works Financing Authority Lease Revenue | 5.000% | 8/1/18 | 5,000 | 5,754 |
| M-S-R California Energy Authority Revenue | 7.000% | 11/1/34 | 2,500 | 2,968 |
| M-S-R California Energy Authority Revenue | 6.500% | 11/1/39 | 4,000 | 4,506 |
| M-S-R California Energy Authority Revenue CP | 6.500% | 11/1/39 | 10,000 | 11,265 |
| M-S-R California Public Power Agency Revenue (San Juan Project) | 6.125% | 7/1/13 (2) | 3,925 | 4,072 |
| M-S-R California Public Power Agency Revenue (San Juan Project) | 6.750% | 7/1/20 (ETM) | 8,485 | 10,630 |
| Metropolitan Water District of Southern California Revenue | 5.000% | 7/1/35 | 5,000 | 5,389 |
| Modesto CA Irrigation District COP | 5.500% | 7/1/35 | 5,700 | 5,889 |
| Modesto CA Irrigation District Financing Authority Revenue (Woodland Project) | 6.500% | 10/1/22 (ETM) | 20,225 | 25,405 |
| Newport Beach CA Revenue (Hoag Memorial Hospital Presbyterian) | 6.000% | 12/1/40 | 3,500 | 3,922 |
| Northern California Power Agency Revenue (Hydroelectric Project) | 5.000% | 7/1/19 (12) | 4,000 | 4,605 |
101
Long-Term Tax-Exempt Fund
| | | | |
| | | | Face | Market |
| | | Maturity | Amount | Value• |
| | Coupon | Date | ($000) | ($000) |
| Palomar Pomerado Health System California Revenue GO | 0.000% | 8/1/38 (12) | 10,000 | 7,199 |
| Pittsburg CA Redevelopment Agency Tax Allocation Revenue | | | | |
| (Los Medanos Community Development Project) | 6.500% | 9/1/28 | 10,000 | 9,918 |
| Riverside CA Electric Revenue VRDO | 0.130% | 11/7/11 LOC | 4,900 | 4,900 |
| Sacramento CA Financing Authority Lease Revenue | 5.250% | 12/1/30 (2) | 10,000 | 10,255 |
| Sacramento CA Municipal Utility District Revenue | 6.500% | 9/1/13 (14) | 4,730 | 4,969 |
| Sacramento CA Municipal Utility District Revenue VRDO | 0.140% | 11/7/11 LOC | 3,800 | 3,800 |
| Sacramento County CA Airport Revenue | 6.000% | 7/1/41 | 10,500 | 11,189 |
| San Bernardino County CA Medical Center COP | 6.875% | 8/1/24 (ETM) | 13,000 | 17,583 |
| 1 San Diego CA Public Facilities Financing Authority Sewer Revenue TOB VRDO | 0.200% | 11/7/11 | 8,280 | 8,280 |
| San Diego CA Unified School District GO | 0.000% | 7/1/13 (14) | 7,160 | 7,081 |
| San Diego CA Unified School District GO | 5.500% | 7/1/22 (14) | 9,160 | 10,756 |
| San Diego CA Unified School District GO | 0.000% | 7/1/37 | 14,000 | 2,965 |
| San Diego CA Unified School District GO | 0.000% | 7/1/39 | 6,300 | 1,182 |
| San Diego CA Unified School District GO | 0.000% | 7/1/40 | 7,500 | 1,328 |
| San Diego CA Unified School District GO | 0.000% | 7/1/41 | 10,000 | 1,668 |
| San Francisco CA City & County International Airport Revenue | 5.000% | 5/1/17 | 10,000 | 11,453 |
| San Francisco CA City & County International Airport Revenue | 6.000% | 5/1/39 | 10,000 | 11,121 |
| San Francisco CA City & County Public Utilities Commission Water Revenue | 4.500% | 11/1/31 (4) | 4,200 | 4,205 |
| San Joaquin Hills CA Transportation Corridor Agency Toll Road Revenue | 0.000% | 1/15/25 (14) | 9,250 | 3,130 |
| San Jose CA Redevelopment Agency Tax Allocation Revenue | 5.000% | 8/1/20 (2) | 11,415 | 11,224 |
| San Jose CA Redevelopment Agency Tax Allocation Revenue | 5.000% | 8/1/27 (14) | 5,000 | 4,523 |
| San Mateo County CA Joint Powers Financing Authority Lease Revenue (Youth Services Campus) | 5.000% | 7/15/33 | 5,000 | 5,082 |
| Santa Rosa CA Wastewater Revenue | 6.000% | 9/1/15 (4) | 3,525 | 3,820 |
| Simi Valley CA School Financing Authority Revenue | 5.000% | 8/1/27 (4) | 10,000 | 10,786 |
| Southern California Public Power Authority Revenue | 5.000% | 7/1/27 | 5,000 | 5,435 |
| Southern California Public Power Authority Revenue | 5.000% | 7/1/29 | 2,670 | 2,852 |
| Southern California Public Power Authority Revenue (Transmission Project) | 0.000% | 7/1/14 | 8,500 | 8,056 |
| State Center California Community College District GO | 5.000% | 8/1/31 (4) | 16,100 | 16,643 |
| Tobacco Securitization Authority Revenue (Northern California Tobacco Settlement) | 5.375% | 6/1/38 | 2,500 | 1,702 |
| Tobacco Securitization Authority Revenue (Southern California Tobacco Settlement) | 4.750% | 6/1/25 | 9,185 | 7,734 |
| Ukiah CA Electric Revenue | 6.250% | 6/1/18 (14) | 4,840 | 5,236 |
| University of California Revenue | 4.500% | 5/15/31 (4) | 16,920 | 16,768 |
| University of California Revenue | 5.000% | 5/15/35 | 3,675 | 3,844 |
| Ventura County CA Community College District GO | 5.500% | 8/1/33 | 12,000 | 13,122 |
| Victor Valley CA Community College District GO | 6.000% | 8/1/39 | 12,000 | 13,035 |
| Walnut CA Energy Center Authority Revenue | 5.000% | 1/1/35 | 8,985 | 9,129 |
| | | | | 1,188,559 |
| Colorado (2.7%) | | | | |
| Aurora CO COP | 5.000% | 12/1/27 | 3,675 | 3,929 |
| Colorado Educational & Cultural Facilities Authority Revenue | | | | |
| (National Jewish Federation Bond Program) VRDO | 0.180% | 11/1/11 LOC | 8,570 | 8,570 |
| 2 Colorado Health Facilities Authority Revenue (Catholic Health Initiatives) | 5.250% | 2/1/31 | 4,000 | 4,109 |
| Colorado Health Facilities Authority Revenue (Catholic Health Initiatives) | 5.500% | 7/1/34 | 5,000 | 5,238 |
| 2 Colorado Health Facilities Authority Revenue (Catholic Health Initiatives) | 5.000% | 2/1/41 | 4,000 | 3,975 |
| Colorado Health Facilities Authority Revenue | | | | |
| (Sisters of Charity of Leavenworth Health System) VRDO | 0.130% | 11/7/11 | 4,400 | 4,400 |
| Colorado Springs CO Utility System Revenue | 5.375% | 11/15/16 (2) | 12,790 | 13,393 |
| Colorado Springs CO Utility System Revenue | 5.375% | 11/15/17 (2) | 13,490 | 14,102 |
| Colorado Springs CO Utility System Revenue | 5.000% | 11/15/43 | 12,725 | 12,875 |
| E-470 Public Highway Authority Colorado Revenue | 0.000% | 9/1/13 (14) | 10,000 | 9,300 |
| E-470 Public Highway Authority Colorado Revenue | 0.000% | 9/1/15 (14) | 5,795 | 4,844 |
| E-470 Public Highway Authority Colorado Revenue | 0.000% | 9/1/16 (14) | 10,185 | 8,012 |
| E-470 Public Highway Authority Colorado Revenue | 0.000% | 9/1/19 (14) | 13,000 | 8,235 |
| E-470 Public Highway Authority Colorado Revenue | 0.000% | 9/1/20 (14) | 15,165 | 8,931 |
| E-470 Public Highway Authority Colorado Revenue | 0.000% | 9/1/23 (14) | 35,275 | 16,706 |
| E-470 Public Highway Authority Colorado Revenue | 0.000% | 9/1/25 (14) | 9,700 | 3,960 |
| E-470 Public Highway Authority Colorado Revenue | 0.000% | 9/1/27 (14) | 13,425 | 4,743 |
| E-470 Public Highway Authority Colorado Revenue | 0.000% | 9/1/28 (14) | 13,425 | 4,406 |
| E-470 Public Highway Authority Colorado Revenue | 0.000% | 9/1/30 (14) | 16,500 | 4,607 |
| Northwest Parkway Public Highway Authority Colorado Convertible Revenue | 5.700% | 6/15/16 (Prere.) | 15,000 | 17,740 |
| Northwest Parkway Public Highway Authority Colorado Convertible Revenue | 5.800% | 6/15/16 (Prere.) | 16,000 | 18,993 |
| Regional Transportation District of Colorado Sales Tax Revenue | 6.000% | 1/15/34 | 5,000 | 5,112 |
| Regional Transportation District of Colorado Sales Tax Revenue | 6.000% | 1/15/41 | 11,500 | 11,686 |
| University of Colorado Enterprise System Revenue | 5.750% | 6/1/28 | 1,000 | 1,144 |
| | | | | 199,010 |
| Connecticut (0.3%) | | | | |
| Connecticut GO | 5.000% | 12/1/19 | 8,225 | 9,937 |
| Connecticut GO | 5.000% | 12/1/20 | 10,000 | 11,883 |
| Connecticut Health & Educational Facilities Authority Revenue (Yale University) VRDO | 0.050% | 11/7/11 | 3,100 | 3,100 |
| | | | | 24,920 |
102
Long-Term Tax-Exempt Fund
| | | | |
| | | | Face | Market |
| | | Maturity | Amount | Value• |
| | Coupon | Date | ($000) | ($000) |
| District of Columbia (0.3%) | | | | |
| District of Columbia Revenue (Georgetown University) | 5.500% | 4/1/36 | 5,000 | 5,186 |
| District of Columbia Water & Sewer Authority Public Utility Revenue | 5.500% | 10/1/39 | 13,000 | 14,200 |
| | | | | 19,386 |
| Florida (7.0%) | | | | |
| Alachua County FL Health Facilities Authority Revenue (Shands HealthCare Project) | 1.088% | 12/1/37 | 10,000 | 6,553 |
| Broward County FL Sales Tax Revenue (Main Courthouse Project) | 5.250% | 10/1/36 | 15,000 | 15,897 |
| Citizens Property Insurance Corp. Florida Revenue (Coastal Account) | 5.500% | 6/1/14 | 7,500 | 8,103 |
| Citizens Property Insurance Corp. Florida Revenue (Coastal Account) | 5.000% | 6/1/15 | 18,000 | 19,395 |
| Citizens Property Insurance Corp. Florida Revenue (Coastal Account) | 5.000% | 6/1/16 | 6,000 | 6,492 |
| Citizens Property Insurance Corp. Florida Revenue (Coastal Account) | 5.250% | 6/1/17 | 6,000 | 6,559 |
| Davie FL Water & Sewer Revenue | 6.375% | 10/1/12 (ETM) | 720 | 757 |
| Florida Board of Education Lottery Revenue | 5.000% | 7/1/16 (2) | 10,000 | 11,281 |
| Florida Board of Education Lottery Revenue | 5.000% | 7/1/20 (14) | 13,770 | 15,411 |
| Florida Board of Education Lottery Revenue | 5.000% | 7/1/22 (2) | 12,995 | 14,346 |
| Florida Board of Education Public Education Capital Outlay GO | 5.000% | 6/1/19 (14) | 11,900 | 12,751 |
| Florida Board of Education Public Education Capital Outlay GO | 5.000% | 6/1/19 (3) | 8,000 | 8,996 |
| Florida Board of Education Public Education Capital Outlay GO | 5.500% | 6/1/19 | 5,565 | 6,823 |
| Florida Board of Education Public Education Capital Outlay GO | 5.000% | 6/1/22 | 5,000 | 5,339 |
| Florida Board of Education Public Education Capital Outlay GO | 5.000% | 6/1/34 | 2,695 | 2,917 |
| Florida Department of Environmental Protection & Preservation Revenue | 5.000% | 7/1/20 | 8,175 | 9,244 |
| Florida Department of Environmental Protection & Preservation Revenue | 5.000% | 7/1/21 | 8,610 | 9,631 |
| Florida Department of Transportation GO | 5.000% | 7/1/32 (4) | 9,750 | 10,086 |
| Florida Hurricane Catastrophe Fund Finance Corp. Revenue | 5.000% | 7/1/15 | 5,000 | 5,455 |
| Florida Hurricane Catastrophe Fund Finance Corp. Revenue | 5.000% | 7/1/16 | 5,000 | 5,501 |
| Florida Turnpike Authority Revenue | 5.000% | 7/1/17 (4) | 5,000 | 5,361 |
| Gainsville FL Utility System Revenue VRDO | 0.200% | 11/1/11 | 19,480 | 19,480 |
| Highlands County FL Health Facilities Authority Hospital Revenue | | | | |
| (Adventist Health System/Sunbelt Obligated Group) | 5.000% | 11/15/15 (Prere.) | 245 | 283 |
| Highlands County FL Health Facilities Authority Hospital Revenue | | | | |
| (Adventist Health System/Sunbelt Obligated Group) | 5.000% | 11/15/15 (Prere.) | 185 | 214 |
| Highlands County FL Health Facilities Authority Hospital Revenue | | | | |
| (Adventist Health System/Sunbelt Obligated Group) | 5.250% | 11/15/16 (Prere.) | 245 | 291 |
| Hillsborough County FL Aviation Authority Revenue (Tampa International Airport) | 5.000% | 10/1/18 (14) | 6,130 | 6,401 |
| Hillsborough County FL Aviation Authority Revenue (Tampa International Airport) | 5.000% | 10/1/19 (14) | 6,390 | 6,638 |
| Hillsborough County FL Industrial Development Authority Hospital Revenue | | | | |
| (H. Lee Moffitt Cancer Center Project) | 5.250% | 7/1/27 | 4,085 | 4,097 |
| Hillsborough County FL Industrial Development Authority Revenue | | | | |
| (University Community Hospital) | 6.500% | 8/15/19 (ETM) | 3,500 | 4,354 |
| Hillsborough County FL School Board COP | 5.250% | 7/1/16 (14) | 13,300 | 15,108 |
| Key West FL Utility Board Election Revenue | 5.000% | 10/1/31 (14) | 7,600 | 7,793 |
| Lee Memorial Health System Florida Hospital Revenue | 5.250% | 4/1/35 (14) | 15,280 | 15,097 |
| Marion County FL Hospital District Health System Improvement Revenue | | | | |
| (Munroe Regional Health System) | 5.000% | 10/1/29 | 7,750 | 7,526 |
| Miami-Dade County FL Aviation Revenue (Miami International Airport) | 5.750% | 10/1/21 | 2,000 | 2,256 |
| Miami-Dade County FL Aviation Revenue (Miami International Airport) | 5.750% | 10/1/25 | 4,720 | 5,158 |
| Miami-Dade County FL Aviation Revenue (Miami International Airport) | 5.000% | 10/1/29 | 14,165 | 14,471 |
| Miami-Dade County FL Aviation Revenue (Miami International Airport) | 5.375% | 10/1/35 | 5,200 | 5,388 |
| Miami-Dade County FL Aviation Revenue (Miami International Airport) | 5.375% | 10/1/41 | 8,000 | 8,225 |
| Miami-Dade County FL Educational Facilities Authority Revenue (University of Miami) | 5.250% | 4/1/18 | 3,000 | 3,272 |
| Miami-Dade County FL Educational Facilities Authority Revenue (University of Miami) | 5.250% | 4/1/19 | 2,505 | 2,702 |
| Miami-Dade County FL Expressway Authority Toll System Revenue | 5.000% | 7/1/26 (2) | 17,240 | 17,899 |
| Miami-Dade County FL Expressway Authority Toll System Revenue | 5.000% | 7/1/40 | 6,500 | 6,559 |
| Miami-Dade County FL School Board COP | 5.000% | 8/1/18 (2) | 5,000 | 5,519 |
| Miami-Dade County FL School Board COP | 5.250% | 5/1/29 (12) | 5,850 | 6,155 |
| Miami-Dade County FL School Board COP | 5.250% | 5/1/30 (12) | 12,500 | 13,102 |
| Orange County FL Health Facilities Authority Revenue (Nemours Foundation Project) | 5.000% | 1/1/39 | 5,265 | 5,274 |
| Orange County FL School Board COP | 5.000% | 8/1/31 (14) | 9,000 | 9,136 |
| Orlando & Orange County FL Expressway Authority Revenue | 8.250% | 7/1/13 (14) | 9,695 | 10,746 |
| Orlando FL Utility Commission Utility System Revenue | 5.000% | 10/1/33 | 3,555 | 3,751 |
| Palm Beach County FL Criminal Justice Facilities Revenue | 7.200% | 6/1/15 (14) | 4,000 | 4,706 |
| Palm Beach County FL Public Improvement Revenue | 5.000% | 5/1/38 | 5,000 | 5,177 |
| Palm Beach County FL Solid Waste Authority Revenue | 5.500% | 10/1/28 | 20,000 | 21,633 |
| Polk County FL Public Facilities Revenue | 5.000% | 12/1/30 (14) | 17,835 | 18,271 |
| Port St. Lucie FL Revenue | 6.250% | 9/1/27 (12) | 8,000 | 8,710 |
| Port St. Lucie FL Special Assessment Revenue (Southwest Annexation District) | 5.000% | 7/1/27 (14) | 1,655 | 1,625 |
| Port St. Lucie FL Special Assessment Revenue (Southwest Annexation District) | 5.000% | 7/1/33 (14) | 4,625 | 4,362 |
| Port St. Lucie FL Utility Revenue | 5.000% | 9/1/35 (12) | 2,000 | 2,084 |
| Putman County FL Authority Pollution Control Revenue | | | | |
| (Seminole Electric Cooperative Inc. Project) PUT | 5.350% | 5/1/18 (2) | 4,300 | 4,711 |
| Sarasota County FL Public Hospital District Hospital Revenue | | | | |
| (Sarasota Memorial Hospital Project) | 5.625% | 7/1/39 | 5,000 | 5,091 |
103
Long-Term Tax-Exempt Fund
| | | | |
| | | | Face | Market |
| | | Maturity | Amount | Value• |
| | Coupon | Date | ($000) | ($000) |
| Seminole County FL School Board COP | 5.000% | 7/1/22 (4) | 1,990 | 2,100 |
| South Miami FL Health Facilities Authority Hospital Revenue | | | | |
| (Baptist Health South Florida Obligated Group) | 5.000% | 8/15/32 | 8,000 | 8,043 |
| Sunrise FL Utility System Revenue | 5.500% | 10/1/18 (ETM) | 12,000 | 14,269 |
| Tampa FL Utility Revenue | 6.750% | 10/1/12 (2) | 10,635 | 11,195 |
| Tohopekaliga FL Water Authority Utility System Revenue | 5.750% | 10/1/30 | 1,525 | 1,738 |
| Tohopekaliga FL Water Authority Utility System Revenue | 5.750% | 10/1/31 | 1,600 | 1,812 |
| | | | | 509,320 |
| Georgia (2.3%) | | | | |
| Atlanta GA Airport Passenger Facility Charge Revenue | 5.000% | 1/1/21 | 3,360 | 3,779 |
| Atlanta GA Airport Passenger Facility Charge Revenue | 5.000% | 1/1/33 (4) | 10,020 | 10,212 |
| Atlanta GA Water & Wastewater Revenue | 5.500% | 11/1/15 (4) | 8,500 | 9,689 |
| Atlanta GA Water & Wastewater Revenue | 5.000% | 11/1/33 (14) | 26,425 | 26,473 |
| Burke County GA Development Authority Pollution Control Revenue | | | | |
| (Oglethorpe Power Corp. Vogtle Project) | 5.500% | 1/1/33 | 3,000 | 3,114 |
| 2 Cobb County GA Kennestone Hospital Authority Revenue | 5.250% | 4/1/41 | 10,000 | 10,208 |
| Dalton County GA Development Authority Revenue (Hamilton Health Care System) | 5.500% | 8/15/26 (14) | 12,000 | 12,052 |
| Georgia GO | 5.000% | 12/1/15 | 1,680 | 1,951 |
| Macon-Bibb County GA Hospital Authority Revenue (Medical Center of Central Georgia) | 5.000% | 8/1/32 | 4,500 | 4,557 |
| Macon-Bibb County GA Hospital Authority Revenue (Medical Center of Central Georgia) | 5.000% | 8/1/35 | 3,405 | 3,418 |
| Main Street Natural Gas Inc. Georgia Gas Project Revenue | 5.000% | 3/15/21 | 10,305 | 10,982 |
| Main Street Natural Gas Inc. Georgia Gas Project Revenue | 5.500% | 9/15/25 | 15,000 | 14,999 |
| Main Street Natural Gas Inc. Georgia Gas Project Revenue | 5.500% | 9/15/27 | 5,000 | 4,922 |
| Metropolitan Atlanta GA Rapid Transportation Authority Georgia Sales Tax Revenue | 6.250% | 7/1/18 | 10,960 | 12,666 |
| Municipal Electric Authority Georgia Revenue | 5.000% | 1/1/20 | 8,000 | 9,170 |
| Municipal Electric Authority Georgia Revenue (General Resolution Projects) | 5.250% | 1/1/19 | 5,000 | 5,808 |
| Municipal Electric Authority Georgia Revenue (General Resolution Projects) | 5.500% | 1/1/26 | 7,000 | 7,651 |
| Municipal Electric Authority Georgia Revenue (Project One) | 5.250% | 1/1/18 | 7,000 | 8,111 |
| Private Colleges & University Authority of Georgia Revenue (Emory University) | 5.000% | 9/1/32 | 1,500 | 1,600 |
| Private Colleges & University Authority of Georgia Revenue (Mercer University) | 6.500% | 11/1/15 (ETM) | 5,000 | 5,714 |
| | | | | 167,076 |
| Hawaii (1.0%) | | | | |
| Hawaii Department of Budget & Finance Special Purpose Revenue (Hawaii Electric Co. Inc.) | 4.950% | 4/1/12 (14) | 15,000 | 15,101 |
| Hawaii Harbor System Revenue | 5.500% | 7/1/35 | 5,000 | 5,285 |
| Hawaii Harbor System Revenue | 5.625% | 7/1/40 | 5,000 | 5,304 |
| Honolulu HI City & County GO | 5.250% | 4/1/28 | 8,000 | 8,957 |
| Honolulu HI City & County GO | 5.250% | 4/1/30 | 8,000 | 8,825 |
| Honolulu HI City & County GO | 5.250% | 8/1/31 | 2,680 | 3,017 |
| Honolulu HI City & County GO | 5.250% | 8/1/33 | 2,000 | 2,234 |
| Honolulu HI City & County GO | 5.250% | 8/1/34 | 1,500 | 1,672 |
| 2 Honolulu HI City & County Wastewater System Revenue | 5.000% | 7/1/26 | 2,405 | 2,724 |
| 2 Honolulu HI City & County Wastewater System Revenue | 5.250% | 7/1/36 | 5,000 | 5,493 |
| University of Hawaii Revenue | 6.000% | 10/1/38 | 2,500 | 2,836 |
| University of Hawaii University System Revenue | 5.500% | 7/15/12 (Prere.) | 4,615 | 4,785 |
| University of Hawaii University System Revenue | 5.500% | 7/15/12 (Prere.) | 2,330 | 2,416 |
| | | | | 68,649 |
| Idaho (0.2%) | | | | |
| Idaho Health Facilities Authority Revenue (Trinity Health Group) | 6.250% | 12/1/33 | 6,000 | 6,657 |
| Idaho Housing & Finance Association RAN | 5.000% | 7/15/22 | 6,465 | 7,269 |
| | | | | 13,926 |
| Illinois (7.1%) | | | | |
| Chicago IL (City Colleges Capital Improvement Project) GO | 0.000% | 1/1/16 (14) | 8,500 | 7,477 |
| Chicago IL Board of Education GO | 0.000% | 12/1/13 (2) | 5,000 | 4,815 |
| Chicago IL Board of Education GO | 0.000% | 12/1/14 (2) | 5,000 | 4,691 |
| Chicago IL Board of Education GO | 5.000% | 12/1/18 | 2,500 | 2,762 |
| Chicago IL Board of Education GO | 5.000% | 12/1/19 | 2,500 | 2,746 |
| Chicago IL GO | 5.600% | 1/1/16 (Prere.) | 7,010 | 8,289 |
| Chicago IL GO | 5.610% | 1/1/16 (Prere.) | 3,695 | 4,370 |
| Chicago IL GO | 5.650% | 1/1/16 (Prere.) | 7,985 | 9,458 |
| Chicago IL GO | 5.530% | 1/1/20 (14) | 5,000 | 5,517 |
| Chicago IL GO | 5.580% | 1/1/22 (14) | 5,000 | 5,518 |
| Chicago IL GO | 5.000% | 12/1/22 | 3,230 | 3,460 |
| Chicago IL GO | 5.600% | 1/1/24 (14) | 2,480 | 2,736 |
| Chicago IL GO | 5.610% | 1/1/25 (14) | 1,305 | 1,437 |
| Chicago IL GO | 5.000% | 1/1/28 (4) | 7,500 | 7,698 |
| Chicago IL GO | 5.650% | 1/1/28 (14) | 2,820 | 2,987 |
| Chicago IL GO | 5.500% | 1/1/38 (14) | 6,490 | 6,498 |
| Chicago IL GO VRDO | 0.150% | 11/1/11 | 2,200 | 2,200 |
| Chicago IL GO VRDO | 0.150% | 11/1/11 | 3,200 | 3,200 |
| Chicago IL Metropolitan Water Reclamation District GO | 5.000% | 12/1/31 | 7,500 | 8,117 |
| Chicago IL O’Hare International Airport Revenue | 5.000% | 1/1/25 (4) | 21,225 | 22,421 |
104
Long-Term Tax-Exempt Fund
| | | | |
| | | | Face | Market |
| | | Maturity | Amount | Value• |
| | Coupon | Date | ($000) | ($000) |
| Chicago IL O’Hare International Airport Revenue | 5.000% | 1/1/26 (4) | 17,600 | 18,494 |
| Chicago IL O’Hare International Airport Revenue | 5.000% | 1/1/40 | 2,000 | 1,994 |
| 1 Chicago IL O’Hare International Airport Revenue TOB VRDO | 0.290% | 11/7/11 (12) | 5,805 | 5,805 |
| Chicago IL Park District GO | 5.000% | 1/1/36 | 4,000 | 4,152 |
| Chicago IL Public Building Commission GO | 7.000% | 1/1/20 (ETM) | 27,500 | 36,130 |
| Chicago IL Sales Tax Revenue | 5.000% | 1/1/29 | 4,265 | 4,475 |
| 2 Chicago IL Transit Authority Sales Tax Receipts Revenue | 5.250% | 12/1/36 | 5,400 | 5,584 |
| Chicago IL Wastewater Transmission Revenue VRDO | 0.140% | 11/1/11 LOC | 2,700 | 2,700 |
| Chicago IL Water Revenue | 5.750% | 11/1/30 (2) | 12,000 | 13,868 |
| Cook County IL GO | 5.250% | 11/15/28 | 6,000 | 6,296 |
| Illinois Build Revenue | 5.000% | 6/15/17 | 3,000 | 3,432 |
| Illinois Build Revenue | 5.000% | 6/15/19 | 5,000 | 5,710 |
| Illinois Finance Authority Gas Supply Revenue (Peoples Gas Light & Coke) PUT | 2.125% | 7/1/14 | 2,875 | 2,898 |
| Illinois Finance Authority Revenue (Carle Foundation) | 6.000% | 8/15/41 | 5,000 | 5,118 |
| Illinois Finance Authority Revenue (Carle Foundation) | 6.000% | 8/15/41 (4) | 1,500 | 1,571 |
| Illinois Finance Authority Revenue (Central DuPage Health) | 5.250% | 11/1/39 | 4,000 | 4,076 |
| Illinois Finance Authority Revenue (Chicago University) | 5.500% | 8/15/36 | 15,000 | 15,655 |
| Illinois Finance Authority Revenue (Children’s Memorial Hospital) | 5.375% | 8/15/39 | 10,000 | 10,053 |
| Illinois Finance Authority Revenue (Northwestern Community Hospital) | 5.375% | 7/1/33 | 3,000 | 3,039 |
| Illinois Finance Authority Revenue (OSF Healthcare System) | 7.000% | 11/15/29 | 15,000 | 16,617 |
| Illinois Finance Authority Revenue (OSF Healthcare System) | 6.000% | 5/15/39 | 6,440 | 6,648 |
| Illinois Finance Authority Revenue (Riverside Health System) | 6.250% | 11/15/35 | 4,600 | 4,846 |
| Illinois Finance Authority Revenue (Silver Cross & Medical Centers) | 7.000% | 8/15/44 | 16,000 | 16,769 |
| Illinois Finance Authority Revenue (Southern Illinois Healthcare) | 5.375% | 3/1/35 (4) | 5,000 | 5,140 |
| Illinois Finance Authority Revenue (Trinity Health Corp.) | 5.000% | 12/1/30 | 3,000 | 3,000 |
| Illinois Finance Authority Revenue (University of Chicago) | 5.750% | 7/1/33 | 7,750 | 8,579 |
| Illinois Finance Authority Revenue (University of Chicago) | 5.500% | 7/1/37 | 10,000 | 10,851 |
| Illinois GO | 5.000% | 1/1/17 (4) | 15,000 | 16,668 |
| Illinois GO | 5.000% | 1/1/18 (4) | 2,750 | 3,056 |
| Illinois Health Facilities Authority Revenue (Northwest Community Hospital) VRDO | 0.700% | 11/1/11 | 7,000 | 7,000 |
| Illinois Regional Transportation Authority Revenue | 7.200% | 11/1/20 (2) | 20,885 | 24,885 |
| Illinois Sports Facilities Authority Revenue | 5.500% | 6/15/30 (2) | 10,000 | 10,526 |
| Illinois Toll Highway Authority Revenue | 5.000% | 1/1/23 (4) | 7,095 | 7,490 |
| Illinois Toll Highway Authority Revenue | 5.000% | 1/1/23 (4) | 2,600 | 2,781 |
| Illinois Toll Highway Authority Revenue | 5.000% | 1/1/24 (4) | 3,465 | 3,682 |
| Illinois Toll Highway Authority Revenue | 5.500% | 1/1/33 | 20,000 | 21,098 |
| Metropolitan Pier & Exposition Authority Illinois Dedicated Sales Tax Revenue | 0.000% | 12/15/14 (14) | 16,100 | 14,785 |
| Metropolitan Pier & Exposition Authority Illinois Dedicated Sales Tax Revenue | 0.000% | 6/15/44 (4) | 10,000 | 1,382 |
| Metropolitan Pier & Exposition Authority Illinois Dedicated Sales Tax Revenue | 5.250% | 6/15/50 | 12,000 | 12,049 |
| 1 Metropolitan Pier & Exposition Authority Illinois Hospital Facilities Revenue TOB VRDO | 2.340% | 11/7/11 (ETM) | 11,500 | 11,500 |
| Railsplitter Tobacco Settlement Authority Illinois Tobacco Settlement Revenue | 5.500% | 6/1/23 | 5,000 | 5,278 |
| Railsplitter Tobacco Settlement Authority Illinois Tobacco Settlement Revenue | 6.000% | 6/1/28 | 15,000 | 15,597 |
| University of Illinois Auxiliary Facilities System Revenue | 0.000% | 4/1/12 (14) | 5,795 | 5,782 |
| University of Illinois Auxiliary Facilities System Revenue | 5.500% | 4/1/31 | 3,000 | 3,219 |
| Will County IL Community School District GO | 0.000% | 11/1/13 (ETM) | 10,000 | 9,836 |
| | | | | 516,511 |
| Indiana (1.2%) | | | | |
| Indiana Finance Authority Facilities Revenue (Wabash Valley Correctional Facility) | 5.000% | 7/1/18 | 4,450 | 5,141 |
| Indiana Finance Authority Facilities Revenue (Wabash Valley Correctional Facility) | 5.250% | 7/1/19 | 2,500 | 2,934 |
| Indiana Finance Authority Health System Revenue | | | | |
| (Sisters of St. Francis Health Services Inc. Obligated Group) | 5.250% | 11/1/39 | 3,000 | 3,057 |
| Indiana Finance Authority Revenue (Duke Energy Project) VRDO | 0.140% | 11/1/11 LOC | 11,600 | 11,600 |
| 1 Indiana Finance Authority Revenue (Lease Appropriation) TOB VRDO | 0.140% | 11/7/11 | 3,895 | 3,895 |
| Indiana Health & Educational Facility Financing Authority Hospital Revenue | | | | |
| (Clarian Health Obligated Group) | 5.000% | 2/15/39 | 7,045 | 6,810 |
| Indiana Municipal Power Agency Revenue | 6.125% | 1/1/13 (ETM) | 4,950 | 5,129 |
| Indiana Municipal Power Agency Revenue | 5.750% | 1/1/34 | 8,000 | 8,217 |
| Indianapolis IN Local Public Improvement Bond Bank Revenue (Bank-Waterworks Project) | 5.750% | 1/1/38 | 10,000 | 10,834 |
| Indianapolis IN Local Public Improvement Bond Bank Revenue (PILOT Infrastructure Project) | 5.000% | 1/1/28 (4) | 6,160 | 6,639 |
| Indianapolis IN Local Public Improvement Bond Bank Revenue (PILOT Infrastructure Project) | 5.000% | 1/1/29 (4) | 6,245 | 6,690 |
| Indianapolis IN Local Public Improvement Bond Bank Revenue | | | | |
| (Qualified Midwestern Disaster Area) | 5.750% | 2/1/36 | 8,800 | 9,857 |
| Rockport IN Pollution Control Revenue (Indiana Michigan Power Co. Project) PUT | 6.250% | 6/2/14 | 8,250 | 9,136 |
| | | | | 89,939 |
| Iowa (0.1%) | | | | |
| Iowa Special Obligation Revenue (Ijobs Program) | 5.000% | 6/1/38 | 5,000 | 5,356 |
105
Long-Term Tax-Exempt Fund
| | | | | |
| | | | | Face | Market |
| | | | Maturity | Amount | Value• |
| | | Coupon | Date | ($000) | ($000) |
| Kansas (0.4%) | | | | |
| | Burlington KS Pollution Control Revenue (Kansas Gas & Electric Co. Project) | 4.850% | 6/1/31 (14) | 7,500 | 7,545 |
| | Kansas Development Finance Authority Revenue (Kansas Department of Health & Environment) | 5.000% | 3/1/16 | 2,675 | 3,098 |
| | Overland Park KS Development Corp. Revenue (Convention Center Hotel Project) | 5.250% | 1/1/32 (2) | 20,000 | 17,324 |
| | | | | | 27,967 |
| Kentucky (0.8%) | | | | |
| | Jefferson County KY Health Facilities Revenue (Jewish Hospital HealthCare Services Inc. Project) | 5.750% | 1/1/26 (2) | 3,000 | 3,003 |
| | Kentucky Asset/Liability Commission General Fund Revenue | 0.570% | 11/1/17 (14) | 8,750 | 8,217 |
| | Kentucky Asset/Liability Commission General Fund Revenue | 0.690% | 11/1/21 (14) | 23,945 | 19,144 |
| | Kentucky Economic Development Finance Authority Hospital Revenue | | | | |
| | (Baptist Healthcare System Obligated Group) | 5.375% | 8/15/24 | 5,000 | 5,464 |
| | Kentucky Property & Building Commission Revenue | 5.250% | 2/1/18 | 5,080 | 5,943 |
| | Kentucky Property & Building Commission Revenue | 5.000% | 8/1/20 | 15,000 | 17,228 |
| | | | | | 58,999 |
| Louisiana (1.4%) | | | | |
| | East Baton Rouge Parish LA Sales Tax Revenue | 5.125% | 8/1/26 (12) | 2,500 | 2,735 |
| | Louisiana Gasoline & Fuel Tax Revenue | 5.375% | 6/1/18 (2) | 5,000 | 5,125 |
| | Louisiana Gasoline & Fuel Tax Revenue | 5.000% | 5/1/23 (14) | 8,065 | 8,725 |
| | Louisiana Gasoline & Fuel Tax Revenue | 5.000% | 5/1/24 (14) | 6,880 | 7,370 |
| | Louisiana Gasoline & Fuel Tax Revenue | 5.000% | 5/1/25 (14) | 5,000 | 5,313 |
| | Louisiana Gasoline & Fuel Tax Revenue | 5.000% | 5/1/27 (10) | 4,000 | 4,251 |
| | Louisiana Gasoline & Fuel Tax Revenue | 5.000% | 5/1/28 (10) | 2,500 | 2,644 |
| | Louisiana Local Government Environmental Facilities & | | | | |
| | Community Development Authority Revenue (LCTCS Facilities Corp. Project) | 5.000% | 10/1/22 | 4,000 | 4,457 |
| | Louisiana Local Government Environmental Facilities & | | | | |
| | Community Development Authority Revenue (Women’s Hospital Foundation Project) | 5.875% | 10/1/40 | 14,000 | 14,004 |
| | Louisiana Public Facilities Authority Revenue (Ochsner Clinic Foundation Project) | 5.375% | 5/15/43 | 10,000 | 9,388 |
| | New Orleans LA GO | 0.000% | 9/1/13 (2) | 9,000 | 8,557 |
| | New Orleans LA GO | 0.000% | 9/1/16 (2) | 5,785 | 4,757 |
| | St. John Baptist Parish Louisiana Revenue (Marathon Oil Corp. Project) | 5.125% | 6/1/37 | 12,500 | 12,112 |
| | Tobacco Settlement Financing Corp. Louisiana Revenue | 5.875% | 5/15/39 | 14,500 | 14,507 |
| | | | | | 103,945 |
| Maryland (1.2%) | | | | |
| | Maryland Department of Transportation Revenue | 5.000% | 5/1/16 | 24,840 | 28,951 |
| | Maryland Economic Development Corp. Pollution Control Revenue (Potomac Electric Power Co.) | 6.200% | 9/1/22 | 4,000 | 4,696 |
| | Maryland Economic Development Corp. Student Housing Revenue | | | | |
| | (University of Maryland College Park) | 5.000% | 6/1/28 (11) | 2,000 | 2,015 |
| | Maryland Economic Development Corp. Student Housing Revenue | | | | |
| | (University of Maryland College Park) | 5.000% | 6/1/33 (11) | 4,250 | 4,195 |
| | Maryland GO | 5.000% | 2/15/15 | 3,295 | 3,739 |
| | Maryland GO | 5.000% | 3/15/15 | 1,175 | 1,337 |
| | Maryland GO | 5.000% | 8/1/15 | 1,100 | 1,265 |
| | Maryland GO | 5.000% | 8/1/16 | 6,500 | 7,632 |
| | Maryland Health & Higher Educational Facilities Authority Revenue (Charlestown Community) | 6.250% | 1/1/41 | 5,000 | 5,197 |
| | Maryland Health & Higher Educational Facilities Authority Revenue (Medlantic/Helix) | 5.250% | 8/15/38 (2) | 13,475 | 13,629 |
| | Maryland Health & Higher Educational Facilities Authority Revenue | | | | |
| | (University of Maryland Medical System) | 7.000% | 7/1/22 (14) | 12,025 | 14,186 |
| | Maryland Health & Higher Educational Facilities Authority Revenue | | | | |
| | (Western Maryland Health System) | 5.000% | 7/1/34 (14) | 2,900 | 2,937 |
| | | | | | 89,779 |
| Massachusetts (4.2%) | | | | |
| | Massachusetts Bay Transportation Authority Assessment Revenue | 5.250% | 7/1/34 | 2,500 | 2,704 |
| | Massachusetts Bay Transportation Authority General Transportation Revenue | 7.000% | 3/1/21 (ETM) | 6,680 | 7,905 |
| | Massachusetts Bay Transportation Authority General Transportation Revenue | 7.000% | 3/1/21 | 8,320 | 10,227 |
| | Massachusetts Bay Transportation Authority Sales Tax Revenue | 5.500% | 7/1/29 (14) | 3,085 | 3,787 |
| 1 | Massachusetts Bay Transportation Authority Sales Tax Revenue TOB VRDO | 2.000% | 11/7/11 | 10,347 | 10,347 |
| 1 | Massachusetts Bay Transportation Authority Sales Tax Revenue TOB VRDO | 2.340% | 11/7/11 | 13,000 | 13,000 |
| | Massachusetts College Building Authority Revenue | 0.000% | 5/1/17 (ETM) | 7,460 | 6,749 |
| | Massachusetts College Building Authority Revenue | 5.000% | 5/1/35 | 2,500 | 2,627 |
| | Massachusetts Department of Transportation Metropolitan Highway System Revenue | 5.000% | 1/1/26 | 8,000 | 8,575 |
| | Massachusetts Department of Transportation Metropolitan Highway System Revenue | 5.000% | 1/1/27 | 8,000 | 8,512 |
| | Massachusetts Department of Transportation Metropolitan Highway System Revenue | 5.000% | 1/1/35 | 5,000 | 5,324 |
| | Massachusetts Development Finance Agency Revenue (Commonwealth Contract Assistance) | 5.500% | 2/1/40 | 10,000 | 11,022 |
| | Massachusetts GO | 5.500% | 8/1/20 | 1,000 | 1,239 |
| | Massachusetts GO | 0.740% | 5/1/37 (13) | 20,000 | 15,104 |
| | Massachusetts Health & Educational Facilities Authority Revenue (Boston Medical Center) | 5.750% | 7/1/31 | 8,500 | 8,410 |
| | Massachusetts Health & Educational Facilities Authority Revenue (Harvard University) | 5.500% | 11/15/36 | 10,000 | 11,298 |
| | Massachusetts Health & Educational Facilities Authority Revenue (Lahey Clinic Medical Center) | 5.000% | 8/15/30 (14) | 7,460 | 7,493 |
| | Massachusetts Health & Educational Facilities Authority Revenue | | | | |
| | (Massachusetts General Hospital) | 6.250% | 7/1/12 (ETM) | 3,315 | 3,386 |
| | Massachusetts Health & Educational Facilities Authority Revenue (Northeastern University) PUT | 4.100% | 4/19/12 | 2,000 | 2,035 |
| 106 | | | | | |
Long-Term Tax-Exempt Fund
| | | | |
| | | | Face | Market |
| | | Maturity | Amount | Value• |
| | Coupon | Date | ($000) | ($000) |
| Massachusetts Municipal Wholesale Electric Co. Power System Revenue | 5.250% | 7/1/14 (14) | 11,135 | 11,306 |
| Massachusetts School Building Authority Dedicated Sales Tax Revenue | 5.000% | 8/15/24 (4) | 7,755 | 8,500 |
| Massachusetts School Building Authority Dedicated Sales Tax Revenue | 5.000% | 8/15/25 (4) | 10,000 | 10,885 |
| Massachusetts School Building Authority Dedicated Sales Tax Revenue | 5.000% | 8/15/30 (4) | 18,630 | 19,875 |
| Massachusetts School Building Authority Dedicated Sales Tax Revenue | 5.000% | 8/15/37 (2) | 8,275 | 8,672 |
| Massachusetts Special Obligation Dedicated Tax Revenue | 5.250% | 1/1/14 (Prere.) | 7,295 | 7,991 |
| Massachusetts Special Obligation Dedicated Tax Revenue | 5.750% | 1/1/14 (Prere.) | 10,000 | 11,061 |
| Massachusetts Special Obligation Dedicated Tax Revenue | 5.500% | 1/1/27 (14) | 7,190 | 8,152 |
| Massachusetts Water Pollution Abatement Trust Revenue | 5.250% | 8/1/17 | 105 | 126 |
| Massachusetts Water Pollution Abatement Trust Revenue | 5.250% | 8/1/26 | 4,790 | 5,924 |
| Massachusetts Water Resources Authority Revenue | 6.500% | 7/15/19 (ETM) | 20,000 | 24,337 |
| Massachusetts Water Resources Authority Revenue | 5.000% | 8/1/30 | 4,000 | 4,373 |
| Massachusetts Water Resources Authority Revenue | 5.000% | 8/1/31 (2) | 21,000 | 22,187 |
| Massachusetts Water Resources Authority Revenue | 5.000% | 8/1/35 (14) | 12,000 | 12,598 |
| Massachusetts Water Resources Authority Revenue | 5.000% | 8/1/35 | 5,000 | 5,370 |
| Metropolitan Boston MA Transit Parking Corp. Revenue | 5.250% | 7/1/36 | 3,000 | 3,170 |
| | | | | 304,271 |
| Michigan (1.9%) | | | | |
| Detroit MI GO | 5.000% | 4/1/15 (12) | 2,875 | 2,987 |
| Detroit MI GO | 5.000% | 4/1/16 (12) | 3,015 | 3,120 |
| Detroit MI GO | 5.000% | 4/1/17 (12) | 3,170 | 3,247 |
| Detroit MI Sewer System Revenue | 5.125% | 7/1/15 (Prere.) | 3,970 | 4,553 |
| Detroit MI Sewer System Revenue | 5.500% | 7/1/29 (14) | 13,000 | 13,629 |
| Detroit MI Water Supply System Revenue | 7.000% | 7/1/36 (4) | 5,500 | 6,480 |
| Michigan GO | 5.250% | 9/15/26 (4) | 14,000 | 15,044 |
| Michigan Hospital Finance Authority Revenue (Ascension Health Credit Group) PUT | 5.000% | 11/1/12 | 2,500 | 2,611 |
| Michigan Hospital Finance Authority Revenue (Henry Ford Health System) | 5.750% | 11/15/39 | 5,000 | 5,109 |
| Michigan Hospital Finance Authority Revenue (Henry Ford Health System) | 5.250% | 11/15/46 | 14,000 | 13,539 |
| Michigan Hospital Finance Authority Revenue (MidMichigan Obligated Group) | 6.125% | 6/1/39 | 9,000 | 9,441 |
| Michigan Municipal Bond Authority Revenue (State Clean Water Revolving Fund) | 5.000% | 10/1/24 | 10,000 | 11,034 |
| 1 Michigan Municipal Bond Authority Revenue (State Clean Water Revolving Fund) TOB VRDO | 0.140% | 11/7/11 | 3,800 | 3,800 |
| Michigan Tobacco Settlement Financing Authority Revenue | 5.250% | 6/1/22 | 4,625 | 3,818 |
| Michigan Tobacco Settlement Financing Authority Revenue | 6.000% | 6/1/34 | 10,675 | 8,014 |
| Michigan Tobacco Settlement Financing Authority Revenue | 6.875% | 6/1/42 | 15,000 | 13,391 |
| Michigan Tobacco Settlement Financing Authority Revenue | 6.000% | 6/1/48 | 4,445 | 3,108 |
| Royal Oak MI Hospital Finance Authority Hospital Revenue (Beaumont Hospital) | 6.000% | 8/1/39 | 8,000 | 8,279 |
| University of Michigan University Revenue | 5.000% | 4/1/18 | 6,950 | 8,291 |
| | | | | 139,495 |
| Minnesota (0.3%) | | | | |
| Minneapolis MN Health Care System Revenue (Fairview Health Services) | 6.750% | 11/15/32 | 4,250 | 4,705 |
| Minnesota Office of Higher Education Revenue (Supply Student Loan) | 5.000% | 11/1/17 | 1,940 | 2,196 |
| Minnesota Office of Higher Education Revenue (Supply Student Loan) | 5.000% | 11/1/19 | 2,100 | 2,372 |
| University of Minnesota Revenue | 5.125% | 4/1/34 | 1,250 | 1,358 |
| University of Minnesota Revenue | 5.000% | 8/1/35 | 10,300 | 10,960 |
| | | | | 21,591 |
| Mississippi (0.4%) | | | | |
| Mississippi Development Bank Special Obligation Revenue | | | | |
| (Municipal Energy Agency Power Supply Project) | 5.000% | 3/1/36 (10) | 10,000 | 9,397 |
| Mississippi GO | 5.000% | 10/1/36 | 10,000 | 10,820 |
| Warren County MS Gulf Opportunity Zone Revenue (International Paper Co. Projects) | 6.500% | 9/1/32 | 10,000 | 10,707 |
| | | | | 30,924 |
| Missouri (0.9%) | | | | |
| Missouri Development Finance Board Infrastructure Facilities Revenue (Branson Landing Project) | 5.000% | 6/1/35 | 11,660 | 11,720 |
| Missouri Health & Educational Facilities Authority Health Facilities Revenue (Cox Health) | 5.500% | 11/15/33 | 3,500 | 3,617 |
| Missouri Health & Educational Facilities Authority Health Facilities Revenue | | | | |
| (Lester Cox Medical Center) | 5.250% | 6/1/15 (14) | 4,175 | 4,331 |
| Missouri Health & Educational Facilities Authority Health Facilities Revenue | | | | |
| (SSM Health System) VRDO | 0.180% | 11/7/11 LOC | 2,830 | 2,830 |
| Missouri Health & Educational Facilities Authority Health Facilities Revenue | | | | |
| (St. Luke’s Health System) VRDO | 0.180% | 11/7/11 LOC | 8,500 | 8,500 |
| Missouri Health & Educational Facilities Authority Revenue (Washington University) | 5.000% | 11/15/37 | 12,750 | 14,051 |
| Missouri Health & Educational Facilities Authority Revenue (Washington University) | 5.375% | 3/15/39 | 8,000 | 8,778 |
| Missouri Joint Municipal Electric Utility Commission Power Project Revenue (Iatan 2 Project) | 5.750% | 1/1/29 | 5,000 | 5,388 |
| St. Louis MO Special Obligation Revenue | 5.000% | 12/1/19 | 4,045 | 4,844 |
| | | | | 64,059 |
| Nebraska (0.2%) | | | | |
| Central Plains Energy Project Nebraska Gas Project Revenue (Project No. 1) | 5.250% | 12/1/20 | 5,000 | 5,046 |
| Municipal Energy Agency of Nebraska Power Supply System Revenue | 5.375% | 4/1/39 (13) | 3,000 | 3,207 |
107
Long-Term Tax-Exempt Fund
| | | | |
| | | | Face | Market |
| | | Maturity | Amount | Value• |
| | Coupon | Date | ($000) | ($000) |
| Nebraska Investment Finance Authority Single Family Housing Revenue | 5.900% | 9/1/36 | 3,855 | 4,157 |
| Omaha NE Public Power District Electric Revenue | 5.500% | 2/1/39 | 5,000 | 5,428 |
| | | | | 17,838 |
| Nevada (0.9%) | | | | |
| Clark County NV GO | 6.500% | 6/1/17 (2) | 5,000 | 6,133 |
| Clark County NV School District GO | 5.000% | 6/15/19 (14) | 12,590 | 13,854 |
| Clark County NV School District GO | 5.000% | 6/15/19 (14) | 9,155 | 10,070 |
| Henderson NV Health Facility Revenue (Catholic Healthcare West) | 5.625% | 7/1/24 | 2,000 | 2,070 |
| Henderson NV Health Facility Revenue (Catholic Healthcare West) | 5.250% | 7/1/31 | 11,710 | 11,743 |
| Las Vegas Valley Water District Nevada GO | 5.000% | 2/1/31 | 2,125 | 2,208 |
| Nevada Highway Improvement Revenue (Motor Vehicle Fuel Tax) | 5.000% | 12/1/23 (4) | 5,000 | 5,443 |
| Nevada Highway Improvement Revenue (Motor Vehicle Fuel Tax) | 5.000% | 12/1/25 (4) | 10,255 | 10,978 |
| | | | | 62,499 |
| New Hampshire (0.1%) | | | | |
| New Hampshire Health & Education Facilities Authority Revenue (Dartmouth College) | 6.000% | 8/1/38 | 2,400 | 2,594 |
| New Hampshire Health & Education Facilities Authority Revenue (Wentworth Douglas Hospital) | 7.000% | 1/1/38 | 5,000 | 5,526 |
| | | | | 8,120 |
| New Jersey (5.0%) | | | | |
| Atlantic County NJ Public Facilities COP | 7.400% | 3/1/12 (14) | 4,335 | 4,429 |
| Hoboken-Union City-Weehawken NJ Sewerage Authority Revenue | 6.250% | 8/1/14 (14) | 10,185 | 11,274 |
| Hoboken-Union City-Weehawken NJ Sewerage Authority Revenue | 6.250% | 8/1/15 (14) | 10,820 | 12,253 |
| New Jersey Economic Development Authority Revenue (School Facilities Construction) | 5.500% | 12/15/19 (2) | 25,000 | 29,077 |
| New Jersey Economic Development Authority Revenue (School Facilities Construction) | 5.000% | 3/1/20 (2) | 6,515 | 6,874 |
| New Jersey Economic Development Authority Revenue (School Facilities Construction) | 5.250% | 12/15/20 (2) | 25,000 | 28,592 |
| New Jersey Economic Development Authority Revenue (School Facilities Construction) | 5.500% | 9/1/26 (2) | 10,000 | 11,412 |
| New Jersey Economic Development Authority Revenue (School Facilities Construction) | 5.500% | 9/1/27 (14) | 9,000 | 10,230 |
| New Jersey Economic Development Authority Revenue (School Facilities Construction) PUT | 5.000% | 9/1/15 (4) | 22,000 | 24,465 |
| New Jersey Economic Development Authority Revenue (Cigarette Tax) | 5.500% | 6/15/24 | 10,000 | 9,839 |
| New Jersey Educational Facilities Authority Revenue (Higher Education Trust Fund) | 5.000% | 9/1/19 (4) | 3,285 | 3,519 |
| New Jersey Educational Facilities Authority Revenue (Kean University) | 5.500% | 9/1/36 | 5,000 | 5,381 |
| New Jersey Educational Facilities Authority Revenue (New Jersey Institute of Technology) | 5.000% | 7/1/31 | 3,000 | 3,121 |
| New Jersey Educational Facilities Authority Revenue (University Medical & Dentistry) | 5.250% | 12/1/12 | 5,830 | 6,062 |
| New Jersey Educational Facilities Authority Revenue (University Medical & Dentistry) | 7.500% | 12/1/32 | 7,250 | 8,427 |
| New Jersey GO | 5.000% | 8/15/20 | 4,750 | 5,593 |
| New Jersey Health Care Facilities Financing Authority Revenue (St. Barnabas Health Care System) | 5.250% | 7/1/15 (14) | 3,795 | 3,800 |
| New Jersey Health Care Facilities Financing Authority Revenue (Virtua Health) | 5.750% | 7/1/33 | 8,190 | 8,635 |
| New Jersey Higher Education Assistance Authority Student Loan Revenue | 4.750% | 12/1/29 | 5,000 | 5,008 |
| New Jersey Housing & Mortgage Finance Agency Single Family Housing Revenue | 6.500% | 10/1/38 | 1,435 | 1,557 |
| New Jersey Sports & Exposition Authority Revenue | 6.500% | 3/1/13 (ETM) | 600 | 629 |
| New Jersey Sports & Exposition Authority Revenue | 6.500% | 3/1/13 (4) | 115 | 120 |
| New Jersey Sports & Exposition Authority Revenue | 6.500% | 3/1/13 (14) | 1,130 | 1,181 |
| New Jersey Transportation Trust Fund Authority Transportation System Revenue | 5.500% | 12/15/15 (14) | 3,200 | 3,672 |
| New Jersey Transportation Trust Fund Authority Transportation System Revenue | 5.500% | 12/15/17 (4) | 7,000 | 8,188 |
| New Jersey Transportation Trust Fund Authority Transportation System Revenue | 5.500% | 12/15/21 (14) | 36,000 | 41,774 |
| New Jersey Transportation Trust Fund Authority Transportation System Revenue | 5.250% | 12/15/22 (2) | 8,500 | 9,704 |
| New Jersey Transportation Trust Fund Authority Transportation System Revenue | 0.000% | 12/15/25 (2) | 15,000 | 7,206 |
| New Jersey Transportation Trust Fund Authority Transportation System Revenue | 0.000% | 12/15/27 | 15,000 | 6,206 |
| New Jersey Transportation Trust Fund Authority Transportation System Revenue | 0.000% | 12/15/28 | 23,000 | 8,830 |
| New Jersey Transportation Trust Fund Authority Transportation System Revenue | 5.500% | 12/15/38 (12) | 8,000 | 8,548 |
| New Jersey Turnpike Authority Revenue | 6.500% | 1/1/16 (14) | 790 | 931 |
| New Jersey Turnpike Authority Revenue | 6.500% | 1/1/16 (ETM) | 3,940 | 4,365 |
| New Jersey Turnpike Authority Revenue | 6.500% | 1/1/16 (ETM) | 270 | 329 |
| New Jersey Turnpike Authority Revenue | 0.000% | 1/1/35 (2) | 34,500 | 29,929 |
| New Jersey Turnpike Authority Revenue | 5.250% | 1/1/40 | 3,000 | 3,159 |
| Tobacco Settlement Financing Corp. New Jersey Revenue | 5.000% | 6/1/29 | 19,500 | 14,625 |
| Tobacco Settlement Financing Corp. New Jersey Revenue | 5.750% | 6/1/32 (Prere.) | 7,320 | 7,554 |
| Tobacco Settlement Financing Corp. New Jersey Revenue | 4.750% | 6/1/34 | 3,500 | 2,341 |
| | | | | 358,839 |
| New Mexico (0.2%) | | | | |
| New Mexico Finance Authority Transportation Revenue | 5.250% | 6/15/14 (Prere.) | 10,000 | 11,187 |
| New Mexico Hospital Equipment Loan Council Hospital System Revenue | | | | |
| (Presbyterian Healthcare Services) | 5.000% | 8/1/39 | 6,500 | 6,612 |
| | | | | 17,799 |
| New York (12.3%) | | | | |
| Brooklyn NY Local Development Corp. PILOT Revenue (Barclays Center Project) | 6.375% | 7/15/43 | 6,000 | 6,215 |
| Erie County NY Industrial Development Agency School Facility Revenue | | | | |
| (Buffalo City School District Project) | 5.750% | 5/1/26 (4) | 4,200 | 4,452 |
| Hudson Yards Infrastructure Corp. New York Revenue | 4.500% | 2/15/47 (14) | 14,075 | 12,762 |
| Hudson Yards Infrastructure Corp. New York Revenue | 5.750% | 2/15/47 | 7,000 | 7,412 |
| Liberty New York Development Corp. Revenue (Goldman Sachs Headquarters) | 5.250% | 10/1/35 | 10,000 | 10,164 |
108
Long-Term Tax-Exempt Fund
| | | | |
| | | | Face | Market |
| | | Maturity | Amount | Value• |
| | Coupon | Date | ($000) | ($000) |
| Long Island NY Power Authority Electric System Revenue | 0.000% | 6/1/13 (4) | 11,000 | 10,876 |
| Long Island NY Power Authority Electric System Revenue | 6.250% | 4/1/33 | 3,000 | 3,431 |
| Long Island NY Power Authority Electric System Revenue | 5.000% | 5/1/38 | 2,500 | 2,578 |
| Metropolitan New York Transportation Authority Revenue | 5.250% | 11/15/20 (12) | 8,415 | 9,888 |
| Metropolitan New York Transportation Authority Revenue | 5.000% | 11/15/34 | 5,000 | 5,180 |
| Metropolitan New York Transportation Authority Revenue | 5.250% | 11/15/40 | 7,500 | 7,863 |
| Metropolitan New York Transportation Authority Revenue (Dedicated Petroleum Tax) | 5.000% | 11/15/34 | 3,750 | 3,953 |
| Metropolitan New York Transportation Authority Revenue (Dedicated Tax Fund) | 5.000% | 11/15/24 | 5,000 | 5,721 |
| Metropolitan New York Transportation Authority Revenue (Dedicated Tax Fund) | 5.000% | 11/15/24 | 3,000 | 3,421 |
| Nassau County NY Interim Finance Authority Sales Tax Revenue VRDO | 0.100% | 11/7/11 | 23,500 | 23,500 |
| Nassau County NY Tobacco Settlement Corp. | 5.000% | 6/1/35 | 6,355 | 4,637 |
| New York City NY GO | 5.000% | 8/1/17 | 10,000 | 11,642 |
| New York City NY GO | 5.000% | 8/1/18 | 2,585 | 3,046 |
| New York City NY GO | 5.000% | 8/1/19 | 24,000 | 28,199 |
| New York City NY GO | 5.000% | 8/1/19 | 2,000 | 2,350 |
| New York City NY GO | 5.000% | 8/1/21 | 6,000 | 7,022 |
| New York City NY GO | 5.125% | 12/1/23 | 12,875 | 14,321 |
| New York City NY GO | 5.000% | 8/1/24 | 5,000 | 5,467 |
| New York City NY GO | 5.000% | 8/1/25 | 5,000 | 5,515 |
| New York City NY GO | 5.000% | 8/1/27 | 10,000 | 10,897 |
| New York City NY GO | 5.000% | 8/1/31 | 8,000 | 8,647 |
| New York City NY GO | 5.000% | 8/1/32 | 14,000 | 15,097 |
| New York City NY GO VRDO | 0.160% | 11/1/11 LOC | 1,300 | 1,300 |
| New York City NY GO VRDO | 0.160% | 11/1/11 | 3,450 | 3,450 |
| New York City NY Health & Hospital Corp. Revenue (Health System) | 5.000% | 2/15/30 | 6,000 | 6,269 |
| New York City NY Industrial Development Agency PILOT Revenue (Yankee Stadium Project) | 0.000% | 3/1/20 (12) | 8,400 | 6,050 |
| New York City NY Industrial Development Agency PILOT Revenue (Yankee Stadium Project) | 0.000% | 3/1/22 (12) | 4,585 | 2,906 |
| New York City NY Industrial Development Agency PILOT Revenue (Yankee Stadium Project) | 0.000% | 3/1/24 (12) | 9,670 | 5,400 |
| New York City NY Industrial Development Agency PILOT Revenue (Yankee Stadium Project) | 0.000% | 3/1/25 (12) | 5,000 | 2,614 |
| New York City NY Municipal Water Finance Authority Water & Sewer System Revenue | 5.000% | 6/15/31 | 10,000 | 10,753 |
| New York City NY Municipal Water Finance Authority Water & Sewer System Revenue | 5.000% | 6/15/32 | 15,000 | 15,882 |
| New York City NY Municipal Water Finance Authority Water & Sewer System Revenue | 5.000% | 6/15/32 | 6,580 | 7,101 |
| New York City NY Municipal Water Finance Authority Water & Sewer System Revenue | 5.250% | 6/15/32 | 7,500 | 8,198 |
| New York City NY Municipal Water Finance Authority Water & Sewer System Revenue | 5.000% | 6/15/35 | 7,500 | 7,988 |
| New York City NY Municipal Water Finance Authority Water & Sewer System Revenue | 5.000% | 6/15/39 | 10,000 | 10,577 |
| New York City NY Municipal Water Finance Authority Water & Sewer System Revenue | 5.250% | 6/15/40 | 15,500 | 16,719 |
| New York City NY Municipal Water Finance Authority Water & Sewer System Revenue | 5.000% | 6/15/43 | 12,000 | 12,724 |
| New York City NY Municipal Water Finance Authority Water & Sewer System Revenue | 5.375% | 6/15/43 | 21,000 | 23,087 |
| New York City NY Municipal Water Finance Authority Water & Sewer System Revenue | 5.500% | 6/15/43 | 4,110 | 4,574 |
| New York City NY Municipal Water Finance Authority Water & Sewer System Revenue | 5.000% | 6/15/44 | 10,000 | 10,603 |
| New York City NY Municipal Water Finance Authority Water & Sewer System Revenue VRDO | 0.160% | 11/1/11 | 2,225 | 2,225 |
| New York City NY Transitional Finance Authority Building Aid Revenue | 5.000% | 1/15/28 | 12,000 | 12,714 |
| 2 New York City NY Transitional Finance Authority Future Tax Revenue | 5.000% | 11/1/20 | 3,135 | 3,720 |
| 2 New York City NY Transitional Finance Authority Future Tax Revenue | 5.000% | 11/1/20 | 7,000 | 8,305 |
| New York City NY Transitional Finance Authority Future Tax Revenue | 5.000% | 11/1/20 | 3,195 | 3,791 |
| New York City NY Transitional Finance Authority Future Tax Revenue | 5.000% | 11/1/22 | 2,000 | 2,354 |
| New York City NY Transitional Finance Authority Future Tax Revenue | 5.000% | 2/1/23 | 7,225 | 8,363 |
| New York City NY Transitional Finance Authority Future Tax Revenue | 5.000% | 8/1/26 | 7,000 | 7,342 |
| New York City NY Transitional Finance Authority Future Tax Revenue | 5.000% | 11/1/30 | 11,780 | 12,675 |
| New York City NY Transitional Finance Authority Future Tax Revenue | 5.000% | 5/1/34 | 7,000 | 7,459 |
| New York City NY Transitional Finance Authority Future Tax Revenue | 5.000% | 2/1/35 | 10,940 | 11,734 |
| New York City NY Transitional Finance Authority Future Tax Revenue | 5.000% | 5/1/38 | 7,050 | 7,456 |
| New York City NY Transitional Finance Authority Future Tax Revenue | 5.000% | 11/1/39 | 14,420 | 15,377 |
| New York GO | 5.000% | 2/1/30 | 3,385 | 3,708 |
| New York GO | 5.000% | 2/15/30 | 4,000 | 4,422 |
| New York State Dormitory Authority Lease Revenue (Mental Health Services Facilities) | 5.000% | 8/15/19 | 3,900 | 4,564 |
| New York State Dormitory Authority Lease Revenue | | | | |
| (Municipal Health Facilities Improvement Program) | 5.000% | 1/15/19 | 4,000 | 4,439 |
| New York State Dormitory Authority Lease Revenue (State University Dormitory Facilities) | 5.000% | 7/1/40 | 8,700 | 9,091 |
| New York State Dormitory Authority Revenue (Columbia University) | 5.000% | 7/1/40 | 10,000 | 10,749 |
| New York State Dormitory Authority Revenue (Columbia University) | 5.000% | 10/1/41 | 7,000 | 7,747 |
| New York State Dormitory Authority Revenue (Memorial Sloan-Kettering Cancer Center) | 5.750% | 7/1/20 (14) | 7,500 | 9,070 |
| New York State Dormitory Authority Revenue (New York University) | 5.750% | 7/1/27 (14) | 10,000 | 11,824 |
| New York State Dormitory Authority Revenue (Personal Income Tax) | 5.000% | 2/15/19 | 4,500 | 5,328 |
| New York State Dormitory Authority Revenue (Personal Income Tax) | 5.000% | 6/15/19 | 9,765 | 11,600 |
| New York State Dormitory Authority Revenue (Personal Income Tax) | 5.000% | 6/15/20 | 10,000 | 11,656 |
| New York State Dormitory Authority Revenue (Personal Income Tax) | 5.000% | 12/15/23 | 5,000 | 5,553 |
| New York State Dormitory Authority Revenue (Personal Income Tax) | 5.000% | 3/15/24 (2) | 10,000 | 11,002 |
| New York State Dormitory Authority Revenue (Personal Income Tax) | 5.000% | 3/15/28 | 4,750 | 5,155 |
| New York State Dormitory Authority Revenue (Personal Income Tax) | 5.000% | 3/15/34 | 20,000 | 21,647 |
| New York State Dormitory Authority Revenue (Personal Income Tax) | 5.000% | 2/15/39 | 10,100 | 10,719 |
| New York State Dormitory Authority Revenue (Personal Income Tax) | 5.000% | 2/15/40 | 7,500 | 7,997 |
109
Long-Term Tax-Exempt Fund
| | | | |
| | | | Face | Market |
| | | Maturity | Amount | Value• |
| | Coupon | Date | ($000) | ($000) |
| New York State Dormitory Authority Revenue (Personal Income Tax) | 5.000% | 3/15/41 | 9,000 | 9,567 |
| New York State Dormitory Authority Revenue (St. John’s University) VRDO | 0.110% | 11/7/11 LOC | 2,865 | 2,865 |
| New York State Dormitory Authority Revenue (The New School) | 6.000% | 7/1/50 | 5,000 | 5,436 |
| New York State Environmental Facilities Corp. Revenue | | | | |
| (State Clean Water & Drinking Water Revolving Funds) | 5.000% | 6/15/36 | 3,500 | 3,757 |
| New York State Environmental Facilities Corp. Revenue (State Revolving Funds) | 5.000% | 5/15/41 | 4,000 | 4,318 |
| New York State Thruway Authority Revenue (Highway & Bridge Trust Fund) | 5.000% | 4/1/16 (14) | 11,395 | 12,969 |
| New York State Thruway Authority Revenue (Highway & Bridge Trust Fund) | 5.000% | 4/1/18 | 7,500 | 8,694 |
| New York State Thruway Authority Revenue (Highway & Bridge Trust Fund) | 5.500% | 4/1/20 (2) | 5,000 | 6,064 |
| New York State Thruway Authority Revenue (Highway & Bridge Trust Fund) | 5.000% | 4/1/27 | 5,000 | 5,412 |
| New York State Thruway Authority Revenue (Personal Income Tax) | 5.000% | 3/15/30 | 8,000 | 8,742 |
| New York State Urban Development Corp. Revenue | 5.000% | 1/1/23 | 7,785 | 8,561 |
| New York State Urban Development Corp. Revenue | 5.625% | 1/1/28 | 7,385 | 8,136 |
| New York State Urban Development Corp. Revenue (Personal Income Tax) | 5.000% | 3/15/17 | 30,175 | 35,209 |
| New York State Urban Development Corp. Revenue (Personal Income Tax) | 5.000% | 12/15/21 | 10,000 | 11,615 |
| New York State Urban Development Corp. Revenue (Personal Income Tax) | 5.500% | 3/15/25 (14) | 1,965 | 2,441 |
| New York State Urban Development Corp. Revenue (Service Contract) | 5.000% | 1/1/16 | 8,395 | 9,541 |
| Onondaga County NY Trust Cultural Resource Revenue (Syracuse University) VRDO | 0.150% | 11/7/11 LOC | 2,400 | 2,400 |
| Port Authority of New York & New Jersey Special Obligation Revenue | | | | |
| (John F. Kennedy International Air Terminal LLC) | 6.000% | 12/1/42 | 10,000 | 10,457 |
| Suffolk County NY Water Authority Revenue | 5.750% | 6/1/13 (ETM) | 1,415 | 1,452 |
| Suffolk NY Tobacco Asset Securitization Corp. Revenue | 0.000% | 6/1/44 | 5,500 | 4,403 |
| Suffolk NY Tobacco Asset Securitization Corp. Revenue | 6.000% | 6/1/48 | 4,000 | 3,129 |
| Tobacco Settlement Financing Corp. New York Revenue | 5.500% | 6/1/12 (Prere.) | 11,355 | 11,702 |
| Tobacco Settlement Financing Corp. New York Revenue | 5.500% | 6/1/18 | 4,055 | 4,152 |
| Tobacco Settlement Financing Corp. New York Revenue | 5.500% | 6/1/20 | 12,565 | 13,399 |
| Tobacco Settlement Financing Corp. New York Revenue | 5.250% | 6/1/21 (2) | 12,000 | 12,750 |
| Tobacco Settlement Financing Corp. New York Revenue | 5.250% | 6/1/22 (2) | 5,000 | 5,313 |
| Triborough Bridge & Tunnel Authority New York Revenue | 5.250% | 11/15/17 | 5,000 | 5,247 |
| Triborough Bridge & Tunnel Authority New York Revenue | 6.125% | 1/1/21 (ETM) | 6,565 | 8,516 |
| Triborough Bridge & Tunnel Authority New York Revenue | 5.250% | 11/15/38 | 12,500 | 13,555 |
| | | | | 890,039 |
| North Carolina (1.4%) | | | | |
| Charlotte NC Airport Revenue | 5.000% | 7/1/39 | 1,000 | 1,031 |
| Charlotte NC Water & Sewer System Revenue | 5.000% | 7/1/33 | 15,000 | 16,492 |
| Charlotte-Mecklenberg NC Hospital Authority Health Care System Revenue | | | | |
| (Carolinas HealthCare System) | 5.125% | 1/15/37 | 2,000 | 2,046 |
| Charlotte-Mecklenberg NC Hospital Authority Health Care System Revenue | | | | |
| (Carolinas HealthCare System) | 5.250% | 1/15/42 | 6,000 | 6,167 |
| Charlotte-Mecklenberg NC Hospital Authority Health Care System Revenue | | | | |
| (Carolinas HealthCare System) | 5.000% | 1/15/47 | 3,300 | 3,317 |
| Mecklenburg County NC GO | 5.000% | 12/1/16 | 6,715 | 7,945 |
| North Carolina Capital Facilities Finance Agency Educational Facilities Revenue | | | | |
| (Methodist College) VRDO | 0.130% | 11/7/11 LOC | 7,765 | 7,765 |
| North Carolina Capital Facilities Finance Agency Educational Facilities Revenue | | | | |
| (Wake Forest University) | 5.000% | 1/1/38 | 2,975 | 3,145 |
| North Carolina Capital Facilities Finance Agency Revenue (Duke University Project) | 5.000% | 10/1/38 | 4,140 | 4,478 |
| North Carolina Capital Facilities Finance Agency Revenue (Lenior-Rhyne College) VRDO | 0.130% | 11/7/11 LOC | 5,565 | 5,565 |
| North Carolina Eastern Municipal Power Agency Revenue | 5.000% | 1/1/23 | 5,000 | 5,369 |
| North Carolina Eastern Municipal Power Agency Revenue | 5.000% | 1/1/26 | 5,000 | 5,309 |
| North Carolina Eastern Municipal Power Agency Revenue | 5.500% | 1/1/26 | 3,000 | 3,305 |
| North Carolina Medical Care Commission Health Care Facilities Mortgage Revenue | | | | |
| (Deerfield Episcopal Retirement Community) | 6.125% | 11/1/38 | 1,250 | 1,264 |
| North Carolina Medical Care Commission Hospital Revenue (North Carolina Baptist Hospital) | 5.250% | 6/1/29 | 3,000 | 3,198 |
| North Carolina Municipal Power Agency Revenue | 5.250% | 1/1/16 | 10,000 | 11,444 |
| North Carolina Municipal Power Agency Revenue | 5.250% | 1/1/17 | 10,000 | 11,609 |
| North Carolina Municipal Power Agency Revenue | 5.250% | 1/1/20 | 4,000 | 4,554 |
| | | | | 104,003 |
| Ohio (2.2%) | | | | |
| Allen County OH Hospital Facilities Revenue (Catholic Healthcare Partners) | 5.250% | 9/1/27 | 10,000 | 10,248 |
| Allen County OH Hospital Facilities Revenue (Catholic Healthcare Partners) VRDO | 0.170% | 11/1/11 LOC | 11,550 | 11,550 |
| American Municipal Power Ohio Inc. Revenue (Prairie State Energy Campus Project) | 5.000% | 2/15/38 | 8,000 | 8,230 |
| Buckeye Tobacco Settlement Financing Authority Ohio Revenue | 5.125% | 6/1/24 | 4,315 | 3,313 |
| Buckeye Tobacco Settlement Financing Authority Ohio Revenue | 5.875% | 6/1/30 | 9,930 | 7,478 |
| Buckeye Tobacco Settlement Financing Authority Ohio Revenue | 5.750% | 6/1/34 | 5,500 | 3,975 |
| Buckeye Tobacco Settlement Financing Authority Ohio Revenue | 5.875% | 6/1/47 | 8,860 | 6,265 |
| Butler County OH Hospital Facilities Revenue (Kettering Health Network) | 6.375% | 4/1/36 | 5,465 | 5,837 |
| Butler County OH Hospital Facilities Revenue (Kettering Health Network) | 5.625% | 4/1/41 | 5,000 | 5,042 |
| Cincinnati OH City School District COP | 5.000% | 12/15/32 (4) | 12,000 | 12,471 |
| Erie County OH Hospital Facilities Revenue (Firelands Regional Medical Center) | 5.250% | 8/15/46 | 6,265 | 5,530 |
| Franklin County OH Hospital Facilities Revenue (OhioHealth Corp.) VRDO | 0.100% | 11/7/11 | 5,500 | 5,500 |
110
Long-Term Tax-Exempt Fund
| | | | |
| | | | Face | Market |
| | | Maturity | Amount | Value• |
| | Coupon | Date | ($000) | ($000) |
| Lorain County OH Hospital Facilities Revenue (Catholic Healthcare Partners) | 5.400% | 10/1/21 | 8,000 | 8,101 |
| Lucas County OH Hospital Revenue (ProMedica Healthcare Obligated Group) | 6.000% | 11/15/41 | 3,220 | 3,520 |
| Middletown OH City School District GO | 5.000% | 12/1/25 (4) | 4,715 | 5,025 |
| Ohio Air Quality Development Authority Pollution Control Revenue | | | | |
| (FirstEnergy Generation Corp. Project) | 5.700% | 2/1/14 | 3,000 | 3,237 |
| Ohio Building Authority Revenue (Adult Correctional Building) | 5.000% | 10/1/20 | 8,600 | 10,002 |
| Ohio Common Schools GO | 5.000% | 3/15/13 (Prere.) | 7,020 | 7,463 |
| Ohio Common Schools GO VRDO | 0.100% | 11/7/11 | 1,200 | 1,200 |
| Ohio GO | 5.000% | 5/1/18 | 4,450 | 4,936 |
| Ohio Hospital Revenue (Cleveland Clinic Health System Obligated Group) | 5.500% | 1/1/39 | 10,000 | 10,407 |
| Ohio Hospital Revenue (University Hospitals Health System Inc.) | 5.250% | 1/15/46 | 10,000 | 9,781 |
| Ohio Housing Finance Agency Residential Mortgage Revenue | 5.250% | 9/1/28 | 2,170 | 2,249 |
| Ohio Water Development Authority Water Pollution Control Loan Fund Revenue | 5.000% | 12/1/19 | 6,530 | 7,793 |
| Scioto County OH Hospital Facilities Revenue (Southern Ohio Medical Center) | 5.750% | 2/15/38 | 3,500 | 3,549 |
| | | | | 162,702 |
| Oklahoma (0.1%) | | | | |
| Oklahoma Development Finance Authority Pollution Control Revenue | | | | |
| (Public Service Co. Project) | 5.250% | 6/1/14 | 3,300 | 3,520 |
| |
| Oregon (0.6%) | | | | |
| Oregon Department of Administrative Services COP | 5.000% | 5/1/27 | 6,755 | 7,252 |
| Oregon Department of Administrative Services Lottery Revenue | 5.250% | 4/1/26 | 10,000 | 11,429 |
| Oregon Department of Administrative Services Lottery Revenue | 5.250% | 4/1/30 | 4,000 | 4,516 |
| 1 Oregon GO TOB VRDO | 0.150% | 11/1/11 | 6,200 | 6,200 |
| Umatilla County OR Hospital Facility Authority Revenue (Catholic Health Initiatives) | 5.000% | 5/1/22 | 12,380 | 12,851 |
| | | | | 42,248 |
| Pennsylvania (3.5%) | | | | |
| Allegheny County PA Port Authority Revenue | 5.750% | 3/1/29 | 8,000 | 8,845 |
| Chester County PA Industrial Development Authority Student Housing Revenue | | | | |
| (University Student Housing LLC Project) VRDO | 0.150% | 11/7/11 LOC | 9,450 | 9,450 |
| Delaware County PA Authority Hospital Revenue (Crozer-Keystone Obligated Group) | 5.000% | 12/15/31 | 11,420 | 9,844 |
| Franklin County PA Industrial Development Authority Revenue (Chambersburg Hospital Project) | 5.375% | 7/1/42 | 4,325 | 4,326 |
| Montgomery County PA Industrial Development Authority Revenue | | | | |
| (Philadelphia Presbyterian Homes Inc. Project) | 7.000% | 12/1/35 | 3,000 | 3,155 |
| Montgomery County PA Industrial Development Authority Revenue | | | | |
| (Philadelphia Presbyterian Homes Inc. Project) | 7.000% | 12/1/40 | 2,390 | 2,500 |
| Northampton County PA General Purpose Authority Hospital Revenue (St. Luke’s Hospital Project) | 5.500% | 8/15/35 | 2,500 | 2,474 |
| Northampton County PA General Purpose Authority Hospital Revenue (St. Luke’s Hospital Project) | 5.500% | 8/15/40 | 3,500 | 3,411 |
| Norwin PA School District GO | 3.250% | 4/1/31 (4) | 8,915 | 7,598 |
| Pennsylvania Convention Center Authority Revenue | 6.700% | 9/1/16 (ETM) | 6,815 | 7,876 |
| Pennsylvania GO | 5.000% | 9/1/14 (4) | 5,000 | 5,598 |
| Pennsylvania GO | 5.000% | 7/1/16 | 5,000 | 5,832 |
| 1 Pennsylvania GO TOB VRDO | 0.140% | 11/7/11 | 3,100 | 3,100 |
| Pennsylvania Higher Educational Facilities Authority Revenue (St. Joseph’s University) | 5.000% | 11/1/40 | 5,160 | 5,223 |
| 1 Pennsylvania Housing Finance Agency Single Family Mortgage Revenue TOB VRDO | 0.140% | 11/7/11 | 3,320 | 3,320 |
| Pennsylvania Industrial Development Authority Economic Development Revenue | 5.500% | 7/1/12 (Prere.) | 775 | 810 |
| Pennsylvania Industrial Development Authority Economic Development Revenue | 5.500% | 7/1/15 (2) | 20,030 | 20,833 |
| Pennsylvania Public School Building Authority Lease Revenue (School District of Philadelphia) | 5.000% | 6/1/31 (4) | 19,000 | 19,496 |
| Pennsylvania Turnpike Commission Revenue | 5.000% | 6/1/29 | 6,000 | 6,210 |
| Pennsylvania Turnpike Commission Revenue | 5.500% | 6/1/33 | 5,000 | 5,256 |
| Pennsylvania Turnpike Commission Revenue | 5.250% | 6/1/36 | 4,000 | 4,096 |
| Pennsylvania Turnpike Commission Revenue | 6.500% | 12/1/36 | 4,000 | 4,581 |
| Pennsylvania Turnpike Commission Revenue | 5.000% | 12/1/38 | 20,990 | 21,984 |
| Pennsylvania Turnpike Commission Revenue | 5.250% | 6/1/39 | 7,595 | 7,776 |
| Philadelphia PA Authority Industrial Development Revenue (Inglis House Project) VRDO | 0.120% | 11/7/11 | 9,400 | 9,400 |
| Philadelphia PA GO | 5.250% | 8/1/17 (4) | 12,665 | 14,398 |
| Philadelphia PA GO | 5.000% | 8/1/18 (4) | 17,440 | 19,380 |
| Philadelphia PA School District GO | 6.000% | 9/1/38 | 7,000 | 7,607 |
| 1 Philadelphia PA Water & Waste Water Revenue TOB VRDO | 0.140% | 11/7/11 (4) | 6,430 | 6,430 |
| Pittsburgh PA Water & Sewer Authority Revenue | 6.500% | 9/1/13 (14) | 3,440 | 3,622 |
| Pittsburgh PA Water & Sewer Authority Revenue | 6.500% | 9/1/13 (ETM) | 3,435 | 3,679 |
| Pittsburgh PA Water & Sewer Authority Revenue | 7.250% | 9/1/14 (ETM) | 1,875 | 2,085 |
| Sayre PA Health Care Facilities Authority Revenue (Guthrie Health Care System) | 5.750% | 12/1/11 (Prere.) | 1,725 | 1,750 |
| Sayre PA Health Care Facilities Authority Revenue (Guthrie Health Care System) | 5.750% | 12/1/11 (Prere.) | 610 | 619 |
| University of Pittsburgh of the Commonwealth System of Higher Education | | | | |
| Pennsylvania Revenue (University Capital Project) | 5.250% | 9/15/30 | 5,000 | 5,543 |
| Wilkes-Barre PA Finance Authority Revenue (University of Scranton Project) | 5.000% | 11/1/40 | 3,500 | 3,587 |
| | | | | 251,694 |
| Puerto Rico (1.7%) | | | | |
| Puerto Rico Electric Power Authority Revenue | 5.250% | 7/1/22 (14) | 2,930 | 3,197 |
| Puerto Rico Electric Power Authority Revenue | 5.500% | 7/1/38 | 6,130 | 6,256 |
111
Long-Term Tax-Exempt Fund
| | | | | |
| | | | | Face | Market |
| | | | Maturity | Amount | Value• |
| | | Coupon | Date | ($000) | ($000) |
| | Puerto Rico GO | 6.000% | 7/1/27 (14) | 6,500 | 6,849 |
| | Puerto Rico Infrastructure Financing Authority Special Tax Revenue | 0.000% | 7/1/34 (2) | 15,305 | 3,299 |
| | Puerto Rico Public Finance Corp. Revenue PUT | 5.250% | 2/1/12 (2)LOC | 40,000 | 40,361 |
| | Puerto Rico Public Finance Corp. Revenue PUT | 5.750% | 2/1/12 LOC | 10,000 | 10,103 |
| | Puerto Rico Sales Tax Financing Corp. Revenue | 6.125% | 8/1/29 | 15,000 | 15,871 |
| | Puerto Rico Sales Tax Financing Corp. Revenue | 0.000% | 8/1/37 | 7,475 | 1,495 |
| | Puerto Rico Sales Tax Financing Corp. Revenue | 0.000% | 8/1/39 | 15,010 | 2,606 |
| | Puerto Rico Sales Tax Financing Corp. Revenue | 6.500% | 8/1/44 | 26,500 | 29,841 |
| | Puerto Rico Sales Tax Financing Corp. Revenue | 0.000% | 8/1/54 (2) | 84,500 | 5,414 |
| | | | | | 125,292 |
| Rhode Island (0.2%) | | | | |
| | Rhode Island & Providence Plantations GO | 5.500% | 8/1/29 | 7,355 | 8,365 |
| | Rhode Island & Providence Plantations GO | 5.500% | 8/1/31 | 2,520 | 2,840 |
| | Rhode Island Health & Educational Building Corp. Hospital Financing Revenue | | | | |
| | (Lifespan Obligated Group) | 5.000% | 5/15/32 (4) | 1,000 | 1,015 |
| | Rhode Island Health & Educational Building Corp. Public Schools Revenue (Pooled Issue) | 4.500% | 5/15/23 (4) | 1,665 | 1,739 |
| | Rhode Island Health & Educational Building Corp. Public Schools Revenue (Pooled Issue) | 4.500% | 5/15/24 (4) | 2,575 | 2,665 |
| | | | | | 16,624 |
| South Carolina (2.5%) | | | | |
| | Charleston SC Educational Excellence Financing Corp. Revenue | | | | |
| | (Charleston County School District, South Carolina Project) | 5.000% | 12/1/17 | 5,000 | 5,449 |
| | Charleston SC Educational Excellence Financing Corp. Revenue | | | | |
| | (Charleston County School District, South Carolina Project) | 5.000% | 12/1/26 | 10,580 | 11,252 |
| | Charleston SC Educational Excellence Financing Corp. Revenue | | | | |
| | (Charleston County School District, South Carolina Project) | 5.250% | 12/1/28 | 11,800 | 12,491 |
| | Charleston SC Educational Excellence Financing Corp. Revenue | | | | |
| | (Charleston County School District, South Carolina Project) | 5.000% | 12/1/31 | 7,000 | 7,244 |
| | Greenville County SC School District GO | 5.000% | 12/1/27 | 6,700 | 7,122 |
| | Medical University South Carolina Hospital Authority Hospital Facilities Revenue | 6.375% | 8/15/12 (Prere.) | 7,750 | 8,123 |
| | Piedmont SC Municipal Power Agency Revenue | 6.500% | 1/1/15 (ETM) | 2,035 | 2,382 |
| | Piedmont SC Municipal Power Agency Revenue | 6.500% | 1/1/15 (14) | 12,210 | 14,046 |
| | Piedmont SC Municipal Power Agency Revenue | 5.000% | 1/1/18 | 1,000 | 1,136 |
| | Piedmont SC Municipal Power Agency Revenue | 5.000% | 1/1/21 | 3,200 | 3,619 |
| | Piedmont SC Municipal Power Agency Revenue | 5.750% | 1/1/34 (4) | 10,000 | 10,897 |
| | Piedmont SC Municipal Power Agency Revenue VRDO | 0.110% | 11/7/11 LOC | 2,800 | 2,800 |
| | South Carolina Jobs Economic Development Authority Revenue (Bon Secours Health System) | 5.625% | 11/15/12 (Prere.) | 2,080 | 2,194 |
| | South Carolina Public Service Authority Revenue | 5.500% | 1/1/38 | 10,000 | 10,874 |
| | South Carolina Public Service Authority Revenue | 5.250% | 1/1/39 | 6,000 | 6,420 |
| | South Carolina Transportation Infrastructure Revenue | 5.250% | 10/1/20 (2) | 20,840 | 22,882 |
| | South Carolina Transportation Infrastructure Revenue | 5.250% | 10/1/21 (2) | 27,170 | 29,832 |
| | Tobacco Settlement Revenue (Authority of South Carolina Tobacco Settlement) | 5.000% | 6/1/18 | 2,435 | 2,438 |
| | University of South Carolina Higher Education Revenue | 5.250% | 6/1/38 (4) | 5,610 | 5,916 |
| 1 | York County SC Rock Hill School District No. 3 GO TOB VRDO | 0.140% | 11/7/11 (4) | 12,375 | 12,375 |
| | | | | | 179,492 |
| Tennessee (0.4%) | | | | |
| | Clarksville TN Public Building Authority Revenue (Pooled Financing) VRDO | 2.493% | 11/1/11 LOC | 5,000 | 5,000 |
| | Metropolitan Government of Nashville & Davidson County TN Health & | | | | |
| | Educational Facilities Board Revenue (Meharry Medical College) | 6.000% | 12/1/12 (2) | 2,335 | 2,375 |
| | Shelby County TN Health Educational & Housing Facility Board Hospital Revenue | | | | |
| | (Methodist Health System) | 5.500% | 8/1/12 (ETM) | 465 | 479 |
| | Shelby County TN Health Educational & Housing Facility Board Revenue (Methodist Healthcare) | 5.250% | 9/1/27 (4) | 350 | 369 |
| | Tennessee Energy Acquisition Corp. Gas Revenue | 5.250% | 9/1/21 | 1,895 | 1,902 |
| | Tennessee Energy Acquisition Corp. Gas Revenue | 5.250% | 9/1/24 | 4,660 | 4,617 |
| | Tennessee Energy Acquisition Corp. Gas Revenue | 5.000% | 2/1/27 | 5,350 | 5,260 |
| | Tennessee GO | 5.000% | 8/1/16 | 3,250 | 3,810 |
| | Tennessee GO | 5.000% | 10/1/16 | 4,245 | 4,995 |
| | | | | | 28,807 |
| Texas (7.7%) | | | | |
| | Austin TX Combined Utility System Revenue | 0.000% | 5/15/17 (14) | 4,900 | 4,274 |
| 1 | Beaumont TX Independent School District School Building GO TOB VRDO | 0.170% | 11/7/11 | 6,675 | 6,675 |
| | Central Texas Regional Mobility Authority Revenue | 6.250% | 1/1/46 | 1,000 | 1,017 |
| | Clifton TX Higher Education Finance Corp. Revenue (Baylor University) | 5.250% | 3/1/29 | 3,000 | 3,297 |
| | Dallas County TX Utility & Reclamation District GO | 5.375% | 2/15/29 (2) | 5,000 | 5,156 |
| | Dallas TX Area Rapid Transit Sales Tax Revenue | 4.500% | 12/1/24 (2) | 10,000 | 10,531 |
| | Dallas TX Area Rapid Transit Sales Tax Revenue | 4.500% | 12/1/25 (2) | 4,000 | 4,185 |
| | Dallas TX Civic Center Improvement Revenue | 5.000% | 8/15/27 (12) | 5,000 | 5,263 |
| | Dallas TX Civic Center Improvement Revenue | 5.000% | 8/15/28 (12) | 3,125 | 3,268 |
| | Dallas TX GO | 5.000% | 2/15/19 | 15,000 | 17,871 |
| | Harris County TX GO | 0.000% | 10/1/14 (14) | 5,550 | 5,377 |
| | Harris County TX GO | 0.000% | 10/1/15 (14) | 17,545 | 16,606 |
| |
| 112 | | | | | |
Long-Term Tax-Exempt Fund
| | | | |
| | | | Face | Market |
| | | Maturity | Amount | Value• |
| | Coupon | Date | ($000) | ($000) |
| Harris County TX Health Facilities Development Corp. Hospital Revenue | | | | |
| (Memorial Hermann Healthcare System) | 7.125% | 12/1/31 | 3,250 | 3,651 |
| 1 Harris County TX Health Facilities Development Corp. Revenue | | | | |
| (Sisters of Charity of the Incarnate Word) TOB VRDO | 0.150% | 11/1/11 (ETM) | 1,100 | 1,100 |
| Harris County TX Hospital District Revenue | 5.125% | 2/15/32 (14) | 10,000 | 10,126 |
| Harris County TX Hospital District Revenue | 5.250% | 2/15/37 (14) | 10,190 | 10,335 |
| Harris County TX Toll Road Revenue | 5.000% | 8/15/22 | 2,000 | 2,254 |
| Houston TX Airport System Revenue | 5.500% | 7/1/39 | 5,000 | 5,309 |
| Houston TX Utility System Revenue | 5.250% | 11/15/30 | 7,500 | 8,253 |
| Houston TX Utility System Revenue | 5.250% | 11/15/31 | 5,000 | 5,482 |
| Houston TX Water & Sewer System Revenue | 5.500% | 12/1/11 (Prere.) | 7,000 | 7,031 |
| Love Field Airport Modernization Corp. Texas Special Facilities Revenue | | | | |
| (Southwest Airlines Co. Project) | 5.250% | 11/1/40 | 6,115 | 5,801 |
| Lower Colorado River Authority Texas Revenue | 5.625% | 1/1/15 (Prere.) | 3,055 | 3,513 |
| Lower Colorado River Authority Texas Revenue | 5.875% | 5/15/16 (4) | 5,905 | 5,930 |
| Lower Colorado River Authority Texas Revenue | 5.625% | 5/15/19 (Prere.) | 20 | 25 |
| Lower Colorado River Authority Texas Revenue | 5.500% | 5/15/36 | 5,000 | 5,310 |
| Lower Colorado River Authority Texas Revenue | 5.625% | 5/15/39 | 4,980 | 5,322 |
| Lower Colorado River Authority Texas Revenue | 5.000% | 5/15/40 | 5,000 | 5,090 |
| Lubbock TX Independent School District GO VRDO | 0.160% | 11/7/11 | 14,800 | 14,800 |
| Matagorda County TX Navigation District No. 1 Pollution Control Revenue | | | | |
| (Central Power & Light Co. Project) | 6.300% | 11/1/29 | 7,500 | 8,061 |
| Montgomery County TX GO | 5.125% | 3/1/31 | 4,000 | 4,340 |
| Montgomery County TX GO | 5.250% | 3/1/32 | 5,000 | 5,490 |
| North Texas Tollway Authority System Revenue | 6.250% | 2/1/23 | 10,000 | 10,686 |
| North Texas Tollway Authority System Revenue | 6.125% | 1/1/31 | 4,000 | 4,190 |
| North Texas Tollway Authority System Revenue | 6.000% | 1/1/38 | 12,500 | 13,428 |
| North Texas Tollway Authority System Revenue | 6.250% | 1/1/39 | 6,000 | 6,484 |
| North Texas Tollway Authority System Revenue | 5.500% | 9/1/41 | 10,000 | 10,870 |
| North Texas Tollway Authority System Revenue | 6.000% | 9/1/41 | 2,500 | 2,851 |
| 1 North Texas Tollway Authority System Revenue TOB VRDO | 0.150% | 11/7/11 (13) | 15,800 | 15,800 |
| Northeast Texas Hospital Authority Revenue (Northeast Medical Center Hospital) | 5.625% | 5/15/17 (4) | 7,425 | 7,444 |
| Northeast Texas Hospital Authority Revenue (Northeast Medical Center Hospital) | 5.625% | 5/15/22 (4) | 7,110 | 7,121 |
| Panhandle-Plains TX Higher Education Authority Inc. Student Loan Revenue | 1.172% | 10/1/20 | 5,000 | 4,951 |
| SA Energy Acquisition Public Facility Corp. Texas Gas Supply Revenue | 5.500% | 8/1/22 | 5,000 | 5,218 |
| SA Energy Acquisition Public Facility Corp. Texas Gas Supply Revenue | 5.500% | 8/1/23 | 6,155 | 6,442 |
| San Antonio TX Electric & Gas Systems Revenue | 5.375% | 2/1/12 (Prere.) | 10,000 | 10,129 |
| Tarrant County TX Cultural Education Facilities Finance Corp. Revenue (Texas Health Resources) | 5.000% | 2/15/36 | 7,500 | 7,548 |
| Tarrant County TX Health Facilities Development Corp. Hospital Revenue | | | | |
| (Cook Children’s Medical Center Project) VRDO | 0.130% | 11/7/11 | 13,335 | 13,335 |
| Tarrant Regional Water District Texas Water Revenue | 5.000% | 3/1/28 | 3,000 | 3,277 |
| Texas A&M University System Revenue Financing System Revenue | 5.000% | 7/1/29 | 2,500 | 2,773 |
| Texas A&M University System Revenue Financing System Revenue | 5.000% | 7/1/31 | 1,675 | 1,829 |
| Texas City TX Industrial Development Corp. Marine Terminal Revenue | | | | |
| (ARCO Pipe Line Co. Project) | 7.375% | 10/1/20 | 17,310 | 21,818 |
| Texas GO | 5.750% | 8/1/32 | 10,380 | 10,417 |
| 1 Texas GO TOB PUT | 0.200% | 12/13/11 | 25,000 | 25,000 |
| 3 Texas Municipal Gas Acquisition & Supply Corp. Revenue | 0.610% | 9/15/17 | 4,370 | 4,184 |
| Texas Municipal Power Agency Revenue | 0.000% | 9/1/13 (14) | 38,730 | 38,076 |
| Texas Municipal Power Agency Revenue | 0.000% | 9/1/14 (14) | 34,250 | 33,009 |
| Texas Municipal Power Agency Revenue | 0.000% | 9/1/15 (14) | 33,070 | 31,028 |
| Texas Private Activity Surface Transportation Corp. Revenue | 7.500% | 12/31/31 | 4,000 | 4,478 |
| Texas Private Activity Surface Transportation Corp. Revenue | 6.875% | 12/31/39 | 5,000 | 5,335 |
| Texas Public Finance Authority Revenue (Unemployment Compensation) | 5.000% | 1/1/20 | 16,000 | 17,008 |
| Texas Transportation Commission Central Texas System Revenue PUT | 2.750% | 2/15/13 | 10,000 | 10,131 |
| 1 Texas Transportation Commission Revenue TOB VRDO | 0.200% | 11/7/11 | 5,000 | 5,000 |
| Texas Turnpike Authority Central Texas Turnpike System Revenue | 0.000% | 8/15/26 (2) | 10,000 | 4,118 |
| Texas Turnpike Authority Central Texas Turnpike System Revenue | 0.000% | 8/15/28 (2) | 30,005 | 10,437 |
| | | | | 555,158 |
| Utah (0.3%) | | | | |
| Central Utah Water Conservancy District GO | 5.000% | 4/1/30 | 4,500 | 4,958 |
| Intermountain Power Agency Utah Power Supply Revenue | 5.250% | 7/1/21 | 17,395 | 18,389 |
| | | | | 23,347 |
| Vermont (0.1%) | | | | |
| Vermont Educational & Health Buildings Financing Agency Hospital Revenue | | | | |
| (Fletcher Allen Health Care Project) | 5.000% | 12/1/34 (4) | 10,000 | 10,089 |
| |
| Virgin Islands (0.1%) | | | | |
| Virgin Islands Public Finance Authority Revenue | 5.000% | 10/1/25 | 4,000 | 4,052 |
| Virgin Islands Public Finance Authority Revenue | 5.000% | 10/1/29 | 4,000 | 3,953 |
| | | | | 8,005 |
113
Long-Term Tax-Exempt Fund
| | | | |
| | | | Face | Market |
| | | Maturity | Amount | Value• |
| | Coupon | Date | ($000) | ($000) |
| Virginia (1.0%) | | | | |
| Fairfax County VA Industrial Development Authority Hospital Revenue | | | | |
| (Inova Health System Hospital Project) | 5.500% | 5/15/35 | 10,000 | 10,686 |
| Henrico County VA Economic Development Authority Revenue (Bon Secours Health System) | 5.250% | 11/1/42 (12) | 3,500 | 3,583 |
| Louisa VA Industrial Development Authority Pollution Control Revenue | | | | |
| (Virginia Electric & Power Co. Project) PUT | 5.375% | 12/2/13 | 7,500 | 8,079 |
| Stafford County VA Economic Development Authority Hospital Facilities Revenue | | | | |
| (MediCorp Health System Obligated Group) | 5.250% | 6/15/37 | 6,000 | 5,933 |
| Tobacco Settlement Financing Corp. Virginia Revenue | 5.625% | 6/1/15 (Prere.) | 10,000 | 11,601 |
| Virginia Commonwealth Transportation Board Revenue | 5.000% | 5/15/32 | 17,375 | 18,943 |
| Virginia Commonwealth Transportation Board Revenue | 5.000% | 5/15/33 | 10,000 | 10,877 |
| | | | | 69,702 |
| Washington (2.1%) | | | | |
| Chelan County WA Public Utility District No. 1 Hydro-Electric System Revenue | | | | |
| (Columbia River-Rock Island Hydro) | 0.000% | 6/1/14 (14) | 5,000 | 4,802 |
| Chelan County WA Public Utility District No. 1 Hydro-Electric System Revenue | | | | |
| (Columbia River-Rock Island Hydro) | 0.000% | 6/1/15 (14) | 12,585 | 11,747 |
| Chelan County WA Public Utility District No. 1 Hydro-Electric System Revenue | | | | |
| (Columbia River-Rock Island Hydro) | 0.000% | 6/1/17 (14) | 11,685 | 10,021 |
| Chelan County WA Public Utility District No. 1 Hydro-Electric System Revenue | | | | |
| (Columbia River-Rock Island Hydro) | 0.000% | 6/1/18 (14) | 10,000 | 8,214 |
| 2 Energy Northwest Washington Electric Revenue (Columbia Generating Station) | 5.000% | 7/1/18 | 10,000 | 11,388 |
| King County WA Sewer Revenue | 5.000% | 1/1/39 | 7,500 | 7,882 |
| King County WA Sewer Revenue | 5.250% | 1/1/42 | 7,500 | 8,064 |
| King County WA Sewer Revenue | 5.750% | 1/1/43 | 7,170 | 7,923 |
| Seattle WA Municipal Light & Power Revenue | 5.250% | 2/1/33 | 2,000 | 2,196 |
| Washington (Motor Vehicle Fuel Tax) GO | 5.000% | 8/1/41 | 12,845 | 13,681 |
| Washington GO | 6.750% | 2/1/15 | 2,850 | 3,110 |
| Washington GO | 5.000% | 2/1/19 | 5,000 | 5,965 |
| Washington GO | 5.000% | 2/1/20 | 5,000 | 5,980 |
| Washington GO | 5.000% | 8/1/20 | 9,660 | 11,606 |
| Washington Health Care Facilities Authority Revenue (MultiCare Health System) | 5.250% | 8/15/31 (4) | 5,000 | 5,167 |
| Washington Health Care Facilities Authority Revenue (MultiCare Health System) | 5.250% | 8/15/34 (4) | 6,000 | 6,197 |
| Washington Health Care Facilities Authority Revenue (MultiCare Health System) | 5.500% | 8/15/43 (12) | 5,490 | 5,681 |
| Washington Health Care Facilities Authority Revenue (Seattle Children’s Hospital) | 5.625% | 10/1/38 | 12,000 | 12,718 |
| Washington Health Care Facilities Authority Revenue (Swedish Health Services) | 6.250% | 11/15/41 | 6,500 | 6,922 |
| | | | | 149,264 |
| West Virginia (0.7%) | | | | |
| Pleasants County WV Pollution Control Revenue | 5.250% | 10/15/37 | 6,000 | 6,030 |
| West Virginia Building Commission Lease Revenue (Jail & Correction Facility Authority Projects) | 7.000% | 7/1/12 (ETM) | 7,840 | 8,187 |
| West Virginia Economic Development Authority Revenue | 5.000% | 6/15/28 | 4,340 | 4,750 |
| West Virginia Economic Development Authority Solid Waste Facilities Disposal Revenue | | | | |
| (Appalachian Power Co. - Amos Project) | 5.375% | 12/1/38 | 2,500 | 2,557 |
| West Virginia Hospital Finance Authority Hospital Revenue (Charleston Area Medical Center Inc.) | 5.625% | 9/1/32 | 6,500 | 6,612 |
| West Virginia Hospital Finance Authority Hospital Revenue (United Hospital Center Inc. Project) | 5.250% | 6/1/41 (2) | 16,330 | 16,232 |
| West Virginia University Revenue | 5.000% | 10/1/20 | 1,500 | 1,739 |
| West Virginia University Revenue | 5.000% | 10/1/21 | 1,250 | 1,450 |
| West Virginia University Revenue | 5.000% | 10/1/36 | 5,985 | 6,405 |
| | | | | 53,962 |
| Wisconsin (1.7%) | | | | |
| Badger Tobacco Asset Securitization Corp. Wisconsin Revenue | 6.125% | 6/1/12 (Prere.) | 2,100 | 2,170 |
| Wisconsin GO | 5.000% | 5/1/14 (14) | 5,000 | 5,533 |
| Wisconsin GO | 5.000% | 11/1/20 | 20,000 | 23,989 |
| Wisconsin GO | 6.000% | 5/1/36 | 10,000 | 11,189 |
| Wisconsin Health & Educational Facilities Authority Health Care Facilities Revenue | | | | |
| (Luther Hospital) | 5.750% | 11/15/30 | 7,500 | 8,044 |
| Wisconsin Health & Educational Facilities Authority Health Facilities Revenue (SSM Health Care) | 5.250% | 6/1/34 | 6,785 | 6,935 |
| Wisconsin Health & Educational Facilities Authority Revenue (Agnesian Healthcare Inc.) | 5.750% | 7/1/30 | 6,150 | 6,366 |
| Wisconsin Health & Educational Facilities Authority Revenue (Aurora Health Care Inc.) | 5.625% | 4/15/39 | 12,110 | 12,211 |
| 1 Wisconsin Health & Educational Facilities Authority Revenue | | | | |
| (Children’s Hospital of Wisconsin Inc.) TOB VRDO | 0.140% | 11/7/11 LOC | 10,290 | 10,290 |
| Wisconsin Health & Educational Facilities Authority Revenue (Ministry Health Care Inc.) | 5.000% | 8/15/19 | 3,740 | 4,066 |
| Wisconsin Health & Educational Facilities Authority Revenue | | | | |
| (University of Wisconsin Medical Foundation) VRDO | 0.160% | 11/7/11 LOC | 21,600 | 21,600 |
| Wisconsin Transportation Revenue | 4.500% | 7/1/26 (14) | 11,470 | 11,849 |
| | | | | 124,242 |
| Total Tax-Exempt Municipal Bonds (Cost $6,774,801) | | | | 7,086,832 |
114
| | | |
| Long-Term Tax-Exempt Fund | | | |
| |
| |
| |
| |
| | | | Market |
| | | | Value• |
| | Coupon | Shares | ($000) |
| Temporary Cash Investment (2.0%) | | | |
| Money Market Fund (2.0%) | | | |
| 4 Vanguard Municipal Cash Management Fund (Cost $144,922) | 0.117% | 144,922,259 | 144,922 |
| Total Investments (99.7%) (Cost $6,919,723) | | | 7,231,754 |
| Other Assets and Liabilities (0.3%) | | | |
| Other Assets | | | 106,583 |
| Liabilities | | | (87,430) |
| | | | 19,153 |
| Net Assets (100%) | | | 7,250,907 |
| |
| |
| At October 31, 2011, net assets consisted of: | | | |
| | | | Amount |
| | | | ($000) |
| Paid-in Capital | | | 7,026,226 |
| Undistributed Net Investment Income | | | — |
| Accumulated Net Realized Losses | | | (87,350) |
| Unrealized Appreciation (Depreciation) | | | 312,031 |
| Net Assets | | | 7,250,907 |
| |
| Investor Shares—Net Assets | | | |
| Applicable to 98,860,760 outstanding $.001 par value shares of beneficial interest (unlimited authorization) | | 1,100,444 |
| Net Asset Value Per Share—Investor Shares | | | $11.13 |
| |
| Admiral Shares—Net Assets | | | |
| Applicable to 552,540,305 outstanding $.001 par value shares of beneficial interest (unlimited authorization) | | 6,150,463 |
| Net Asset Value Per Share—Admiral Shares | | | $11.13 |
• See Note A in Notes to Financial Statements.
1 Security exempt from registration under Rule 144A of the Securities Act of 1933. Such securities may be sold in transactions exempt from registration, normally to qualified institutional buyers. At October 31, 2011, the aggregate value of these securities was $156,217,000, representing 2.2% of net assets.
2 Security purchased on a when-issued or delayed-delivery basis for which the fund has not taken delivery as of October 31, 2011.
3 Adjustable-rate security.
4 Affiliated money market fund available only to Vanguard funds and certain trusts and accounts managed by Vanguard. Rate shown is the 7-day yield.
For key to abbreviations and other references, see back cover.
See accompanying Notes, which are an integral part of the Financial Statements
115
High-Yield Tax-Exempt Fund
| | | | |
| | | | Face | Market |
| | | Maturity | Amount | Value• |
| | Coupon | Date | ($000) | ($000) |
| Tax-Exempt Municipal Bonds (99.0%) | | | | |
| Alabama (0.2%) | | | | |
| Alabama Port Authority Docks Facilities Revenue | 6.000% | 10/1/40 | 3,000 | 3,220 |
| Camden AL Industrial Development Board Exempt Facilities Revenue (Weyerhaeuser Co. Project) | 6.125% | 12/1/13 (Prere.) | 3,000 | 3,335 |
| Courtland AL Development Board Solid Waste Disposal Revenue (International Paper Co.) | 5.200% | 6/1/25 | 5,000 | 4,897 |
| | | | | 11,452 |
| Alaska (0.2%) | | | | |
| Valdez AK Marine Terminal Revenue (BP Pipelines) | 5.000% | 1/1/16 | 4,000 | 4,445 |
| Valdez AK Marine Terminal Revenue (BP Pipelines) | 5.000% | 1/1/21 | 6,000 | 6,741 |
| | | | | 11,186 |
| Arizona (1.0%) | | | | |
| Arizona Health Facilities Authority Health Care Facilities Revenue (Beatitudes Campus Project) | 5.200% | 10/1/37 | 7,000 | 5,327 |
| Arizona Health Facilities Authority Revenue (Banner Health) | 5.500% | 1/1/38 | 5,900 | 6,096 |
| Maricopa County AZ Industrial Development Authority Health Facilities Revenue | | | | |
| (Catholic Healthcare West) | 5.250% | 7/1/32 | 5,950 | 5,993 |
| Maricopa County AZ Pollution Control Corp. Revenue (Southern California Edison Co.) | 5.000% | 6/1/35 | 5,500 | 5,770 |
| Phoenix AZ Civic Improvement Corp. Airport Revenue | 5.250% | 7/1/33 | 10,175 | 10,672 |
| Pima County AZ Industrial Development Authority Revenue (Tucson Electric Power Co. Project) | 5.250% | 10/1/40 | 12,500 | 11,817 |
| Salt Verde AZ Financial Project Revenue | 5.250% | 12/1/27 | 17,000 | 16,549 |
| University Medical Center Corp. Arizona Hospital Revenue | 6.500% | 7/1/39 | 2,500 | 2,597 |
| | | | | 64,821 |
| Arkansas (0.1%) | | | | |
| North Little Rock AR Electric Revenue | 6.500% | 7/1/15 (14) | 2,845 | 3,088 |
| |
| California (16.8%) | | | | |
| Adelanto CA Public Utility Authority Revenue | 6.750% | 7/1/39 | 10,000 | 10,361 |
| Bay Area Toll Authority California Toll Bridge Revenue (San Francisco Bay Area) | 5.000% | 4/1/26 | 2,500 | 2,743 |
| Bay Area Toll Authority California Toll Bridge Revenue (San Francisco Bay Area) | 5.250% | 4/1/26 | 1,920 | 2,143 |
| California Department of Water Resources Power Supply Revenue | 5.000% | 5/1/19 | 5,000 | 5,865 |
| California Department of Water Resources Power Supply Revenue | 5.000% | 5/1/20 | 5,000 | 5,892 |
| California Department of Water Resources Power Supply Revenue | 5.000% | 5/1/21 | 10,000 | 11,610 |
| California Department of Water Resources Water System Revenue (Central Valley Project) | 5.500% | 12/1/11 (Prere.) | 30 | 30 |
| California Department of Water Resources Water System Revenue (Central Valley Project) | 5.500% | 12/1/11 (Prere.) | 85 | 85 |
| California Department of Water Resources Water System Revenue (Central Valley Project) | 5.500% | 12/1/11 (Prere.) | 3,290 | 3,305 |
| California Department of Water Resources Water System Revenue (Central Valley Project) | 5.500% | 12/1/11 (Prere.) | 830 | 834 |
| California Department of Water Resources Water System Revenue (Central Valley Project) | 5.500% | 12/1/11 (Prere.) | 1,670 | 1,677 |
| California Department of Water Resources Water System Revenue (Central Valley Project) | 5.000% | 12/1/28 | 5,375 | 5,849 |
| California Economic Recovery Bonds GO | 5.000% | 7/1/20 | 5,000 | 5,721 |
| California Economic Recovery Bonds GO | 5.250% | 7/1/21 | 8,250 | 9,519 |
| California GO | 5.500% | 4/1/18 | 15,000 | 17,387 |
| California GO | 5.000% | 10/1/20 | 10,000 | 11,242 |
| California GO | 5.000% | 11/1/21 | 13,845 | 15,419 |
| California GO | 5.250% | 9/1/22 | 8,830 | 10,073 |
| California GO | 5.250% | 9/1/24 | 6,500 | 7,157 |
| California GO | 5.000% | 9/1/29 | 4,565 | 4,730 |
| California GO | 6.000% | 3/1/33 | 3,000 | 3,376 |
| California GO | 5.125% | 4/1/33 | 15,000 | 15,241 |
| California GO | 6.500% | 4/1/33 | 34,000 | 39,644 |
| California GO | 4.500% | 10/1/36 | 10,435 | 9,696 |
| California GO | 5.500% | 11/1/39 | 10,000 | 10,461 |
| California GO | 6.000% | 11/1/39 | 5,000 | 5,567 |
| California GO | 5.250% | 11/1/40 | 13,500 | 13,791 |
| California Health Facilities Financing Authority Revenue (Adventist Health System/West) | 5.750% | 9/1/39 | 4,500 | 4,681 |
| California Health Facilities Financing Authority Revenue (Catholic Healthcare West) | 6.000% | 7/1/39 | 7,500 | 8,026 |
| California Health Facilities Financing Authority Revenue (St. Joseph Health System) | 5.750% | 7/1/39 | 7,000 | 7,290 |
| California Health Facilities Financing Authority Revenue (Sutter Health) | 5.000% | 8/15/38 | 5,900 | 5,814 |
| California Health Facilities Financing Authority Revenue (Sutter Health) | 6.000% | 8/15/42 | 12,000 | 13,085 |
| California Infrastructure & Economic Development Bank Revenue | | | | |
| (Independent System Operator Corp. Project) | 6.000% | 2/1/30 | 10,000 | 10,669 |
| California Infrastructure & Economic Development Bank Revenue | | | | |
| (J. David Gladstone Institutes Project) | 5.250% | 10/1/34 | 7,580 | 7,673 |
| California Municipal Finance Authority Revenue (University of La Verne) | 6.250% | 6/1/40 | 3,585 | 3,666 |
| California Pollution Control Financing Authority Solid Waste Disposal Revenue | | | | |
| (Republic Services Inc. Project) PUT | 1.450% | 2/1/12 | 38,000 | 37,998 |
| California Pollution Control Financing Authority Solid Waste Disposal Revenue | | | | |
| (Republic Services Inc. Project) PUT | 5.250% | 12/1/17 | 12,155 | 13,090 |
| California Pollution Control Financing Authority Solid Waste Disposal Revenue | | | | |
| (Waste Management Inc. Project) | 5.400% | 4/1/25 | 3,000 | 3,067 |
| California Pollution Control Financing Authority Solid Waste Disposal Revenue | | | | |
| (Waste Management Inc. Project) | 5.000% | 7/1/27 | 6,185 | 6,189 |
116
High-Yield Tax-Exempt Fund
| | | | |
| | | | Face | Market |
| | | Maturity | Amount | Value• |
| | Coupon | Date | ($000) | ($000) |
| California Pollution Control Financing Authority Solid Waste Disposal Revenue | | | | |
| (Waste Management Inc. Project) PUT | 2.625% | 6/2/14 | 8,000 | 8,108 |
| California Pollution Control Financing Authority Solid Waste Disposal Revenue | | | | |
| (Waste Management Inc. Project) PUT | 2.625% | 6/2/14 | 6,500 | 6,584 |
| California Public Works Board Lease Revenue (Butterfield State Office Complex) | 5.000% | 6/1/21 | 7,675 | 7,908 |
| California Public Works Board Lease Revenue (Butterfield State Office Complex) | 5.000% | 6/1/22 | 5,000 | 5,118 |
| California Public Works Board Lease Revenue (Butterfield State Office Complex) | 5.000% | 6/1/23 | 2,870 | 2,923 |
| California Public Works Board Lease Revenue (Department of Corrections) | 5.500% | 6/1/19 | 7,000 | 7,395 |
| California State University Revenue Systemwide | 5.000% | 11/1/20 (2) | 20,995 | 22,469 |
| California State University Revenue Systemwide | 5.250% | 11/1/34 | 9,275 | 9,726 |
| California State University Revenue Systemwide | 5.250% | 11/1/38 | 2,490 | 2,598 |
| California Statewide Communities Development Authority Revenue | | | | |
| (Cottage Health System Obligated Group) | 5.000% | 11/1/40 | 11,040 | 10,792 |
| California Statewide Communities Development Authority Revenue (Kaiser Permanente) | 5.250% | 3/1/45 | 28,000 | 28,052 |
| California Statewide Communities Development Authority Student Housing Revenue | | | | |
| (CHF-Irvine LLC - UCI East Campus Apartments Phase II) | 5.750% | 5/15/32 | 8,000 | 8,004 |
| Carlsbad CA Assessment District No. 2002-01 Improvement Revenue (Poinsettia Lane East) | 5.200% | 9/2/35 | 2,710 | 2,446 |
| Contra Costa County CA Multifamily Housing Revenue | | | | |
| (Pleasant Hill BART Transit Village Apartments Project) VRDO | 0.180% | 11/7/11 LOC | 18,800 | 18,800 |
| El Monte CA High School District GO | 5.500% | 6/1/34 (12) | 8,575 | 9,217 |
| Foothill/Eastern Corridor Agency California Toll Road Revenue | 5.875% | 1/15/28 (14) | 25,000 | 24,817 |
| Golden State Tobacco Securitization Corp. California | 4.500% | 6/1/27 | 10,345 | 8,336 |
| Grossmont CA Healthcare District GO | 5.000% | 7/15/37 (2) | 4,000 | 4,091 |
| Grossmont CA Healthcare District GO | 6.125% | 7/15/40 | 5,000 | 5,639 |
| Irving CA Special Tax Community Facilities District No. 2005-2 Special Tax Revenue | 5.200% | 9/1/26 | 750 | 733 |
| Irving CA Special Tax Community Facilities District No. 2005-2 Special Tax Revenue | 5.250% | 9/1/36 | 2,000 | 1,864 |
| Kern County CA GO | 5.750% | 8/1/35 (12) | 4,500 | 4,804 |
| Lincoln CA Community Facilities District No. 2003-1 Special Tax Revenue | 5.450% | 9/1/13 (Prere.) | 890 | 979 |
| Lincoln CA Community Facilities District No. 2003-1 Special Tax Revenue | 5.750% | 9/1/13 (Prere.) | 885 | 978 |
| Lincoln CA Community Facilities District No. 2003-1 Special Tax Revenue | 5.900% | 9/1/13 (Prere.) | 890 | 986 |
| Lincoln CA Community Facilities District No. 2003-1 Special Tax Revenue | 5.950% | 9/1/13 (Prere.) | 3,555 | 3,942 |
| Lincoln CA Community Facilities District No. 2003-1 Special Tax Revenue | 6.000% | 9/1/13 (Prere.) | 2,670 | 2,963 |
| Los Angeles CA Community College District GO | 5.000% | 8/1/24 | 3,430 | 3,754 |
| Los Angeles CA Community College District GO | 5.000% | 8/1/25 | 4,620 | 5,014 |
| Los Angeles CA Community College District GO | 5.000% | 8/1/27 | 6,215 | 6,682 |
| Los Angeles CA Community Redevelopment Agency Multifamily Housing Revenue | | | | |
| (Second & Central Apartments) VRDO | 0.180% | 11/7/11 LOC | 26,665 | 26,665 |
| Los Angeles CA Department of Airports International Airport Revenue | 5.375% | 5/15/30 | 15,000 | 15,806 |
| Los Angeles CA Department of Water & Power Revenue | 5.000% | 7/1/24 (4) | 11,175 | 12,288 |
| Los Angeles CA Unified School District COP VRDO | 0.120% | 11/7/11 LOC | 4,040 | 4,040 |
| Los Angeles CA Unified School District GO | 5.000% | 7/1/27 | 8,000 | 8,627 |
| Los Angeles CA Unified School District GO | 4.500% | 1/1/28 (14) | 3,750 | 3,754 |
| Los Angeles CA Wastewater System Revenue | 5.750% | 6/1/27 | 7,780 | 8,843 |
| Los Angeles County CA Public Works Financing Authority Lease Revenue | 5.000% | 8/1/18 | 5,000 | 5,754 |
| M-S-R California Energy Authority Revenue | 7.000% | 11/1/34 | 2,500 | 2,968 |
| M-S-R California Energy Authority Revenue | 6.500% | 11/1/39 | 11,000 | 12,391 |
| Modesto CA Irrigation District COP | 5.500% | 7/1/35 | 11,300 | 11,674 |
| Northern California Power Agency Revenue (Hydroelectric Project) | 5.000% | 7/1/20 (12) | 9,305 | 10,572 |
| Northstar Community Services District California Community Facilities District No. 1 | | | | |
| Special Tax Revenue | 5.000% | 9/1/37 | 10,000 | 6,857 |
| Oakland CA Unified School District GO | 6.125% | 8/1/29 | 4,000 | 4,286 |
| Palo Alto CA Unified School District GO | 0.000% | 8/1/30 | 21,100 | 8,267 |
| Palomar Pomerado Health System California Revenue GO | 0.000% | 8/1/38 (12) | 10,740 | 7,731 |
| Port of Oakland CA Revenue | 5.000% | 5/1/22 | 4,290 | 4,574 |
| Port of Oakland CA Revenue | 5.000% | 5/1/23 | 5,890 | 6,223 |
| Port of Oakland CA Revenue | 5.000% | 5/1/29 | 2,250 | 2,206 |
| Port of Oakland CA Revenue | 5.125% | 5/1/30 | 2,000 | 1,989 |
| Port of Oakland CA Revenue | 5.125% | 5/1/31 | 2,000 | 1,979 |
| Rancho Mirage CA Joint Powers Financing Authority Revenue (Eisenhower Medical Center) | 5.000% | 7/1/38 | 18,995 | 16,780 |
| Roseville CA Electric System Revenue | 5.000% | 2/1/37 | 11,000 | 11,375 |
| Sacramento CA Financing Authority Lease Revenue | 5.250% | 12/1/30 (2) | 4,145 | 4,251 |
| Sacramento County CA Airport Revenue | 6.000% | 7/1/41 | 9,500 | 10,124 |
| San Bernardino County CA Medical Center COP | 7.000% | 8/1/20 | 12,180 | 14,642 |
| San Bernardino County CA Medical Center COP | 6.875% | 8/1/24 (ETM) | 25,220 | 34,112 |
| San Diego CA Community College District GO | 5.250% | 8/1/33 | 5,500 | 5,992 |
| San Diego CA Unified School District GO | 5.500% | 7/1/19 (14) | 10,140 | 11,891 |
| San Diego CA Unified School District GO | 5.500% | 7/1/21 (14) | 12,725 | 14,933 |
| San Diego CA Unified School District GO | 0.000% | 7/1/45 | 29,520 | 3,816 |
| San Francisco CA City & County International Airport Revenue | 5.750% | 5/1/19 | 20,295 | 22,631 |
| San Francisco CA City & County International Airport Revenue | 5.750% | 5/1/20 | 26,405 | 29,081 |
| San Francisco CA City & County International Airport Revenue | 5.250% | 5/1/32 | 5,000 | 5,233 |
| San Francisco CA City & County International Airport Revenue | 6.000% | 5/1/39 | 2,130 | 2,369 |
117
High-Yield Tax-Exempt Fund
| | | | |
| | | | Face | Market |
| | | Maturity | Amount | Value• |
| | Coupon | Date | ($000) | ($000) |
| San Francisco CA City & County International Airport Revenue VRDO | 0.100% | 11/7/11 LOC | 10,000 | 10,000 |
| San Francisco CA City & County Redevelopment Financing Authority Tax Allocation Revenue | | | | |
| (Mission Bay North) | 6.625% | 8/1/39 | 2,000 | 2,041 |
| San Francisco CA City & County Redevelopment Financing Authority Tax Allocation Revenue | | | | |
| (Mission Bay South) | 7.000% | 8/1/41 | 1,500 | 1,576 |
| San Joaquin Hills CA Transportation Corridor Agency Toll Road Revenue | 0.000% | 1/15/24 (14) | 2,000 | 757 |
| San Joaquin Hills CA Transportation Corridor Agency Toll Road Revenue | 0.000% | 1/15/25 (14) | 15,900 | 5,381 |
| Santa Clara Valley CA Transportation Authority Sales Tax Revenue VRDO | 0.070% | 11/7/11 | 15,500 | 15,500 |
| Santa Margarita CA Water District Community Facilities District No. 99-1 Special Tax Revenue | 6.000% | 9/1/13 (Prere.) | 3,000 | 3,304 |
| Santa Monica CA Community College District GO | 0.000% | 8/1/24 | 5,000 | 2,639 |
| Santa Monica CA Community College District GO | 0.000% | 8/1/25 | 5,490 | 2,717 |
| Simi Valley CA School Financing Authority Revenue | 5.000% | 8/1/27 (4) | 10,000 | 10,786 |
| Southern California Public Power Authority Revenue | 5.000% | 7/1/27 | 5,000 | 5,435 |
| Southern California Public Power Authority Revenue (Transmission Project) | 5.000% | 7/1/20 | 10,505 | 11,956 |
| Turlock CA Irrigation District Revenue | 5.000% | 1/1/35 | 6,385 | 6,526 |
| Victor Valley CA Community College District GO | 6.000% | 8/1/39 | 8,000 | 8,690 |
| Walnut CA Energy Center Authority Revenue | 5.000% | 1/1/35 | 10,000 | 10,160 |
| West Contra Costa CA Unified School District GO | 6.000% | 8/1/27 | 3,000 | 3,405 |
| | | | | 1,031,985 |
| Colorado (3.0%) | | | | |
| Aurora CO Hospital Revenue (Children’s Hospital Association Project) | 5.000% | 12/1/40 | 5,000 | 4,947 |
| Colorado Educational & Cultural Facilities Authority Revenue | | | | |
| (National Jewish Federation Bond Program) VRDO | 0.180% | 11/1/11 LOC | 7,000 | 7,000 |
| Colorado Health Facilities Authority Revenue (Catholic Health Initiatives) | 4.500% | 9/1/38 | 23,975 | 21,818 |
| Colorado Health Facilities Authority Revenue (Christian Living Communities) | 5.750% | 1/1/26 | 1,000 | 975 |
| Colorado Health Facilities Authority Revenue (Covenant Retirement Community Inc.) | 5.250% | 12/1/25 | 15,500 | 14,411 |
| Colorado Health Facilities Authority Revenue | | | | |
| (Evangelical Lutheran Good Samaritan Society Project) VRDO | 0.110% | 11/7/11 LOC | 5,830 | 5,830 |
| Denver CO City & County Airport Revenue | 5.000% | 11/15/12 (14) | 4,205 | 4,392 |
| Denver CO City & County Airport Revenue | 5.250% | 11/15/36 | 7,500 | 7,990 |
| Denver CO City & County Single Family Mortgage Revenue | 5.550% | 12/1/39 | 2,176 | 2,166 |
| E-470 Public Highway Authority Colorado Revenue | 0.000% | 9/1/12 (14) | 26,795 | 25,993 |
| E-470 Public Highway Authority Colorado Revenue | 0.000% | 9/1/13 (14) | 5,000 | 4,650 |
| E-470 Public Highway Authority Colorado Revenue | 0.000% | 9/1/14 (14) | 8,000 | 7,083 |
| E-470 Public Highway Authority Colorado Revenue | 0.000% | 9/1/15 (14) | 5,000 | 4,179 |
| E-470 Public Highway Authority Colorado Revenue | 0.000% | 9/1/18 (14) | 5,000 | 3,428 |
| E-470 Public Highway Authority Colorado Revenue | 0.000% | 9/1/24 (14) | 29,225 | 12,828 |
| E-470 Public Highway Authority Colorado Revenue | 0.000% | 9/1/25 (14) | 14,900 | 6,082 |
| E-470 Public Highway Authority Colorado Revenue | 0.000% | 9/1/27 (14) | 36,465 | 12,884 |
| E-470 Public Highway Authority Colorado Revenue | 0.000% | 9/1/29 (14) | 21,600 | 6,521 |
| E-470 Public Highway Authority Colorado Revenue | 0.000% | 9/1/30 (14) | 14,200 | 3,965 |
| Northwest Parkway Public Highway Authority Colorado Convertible Revenue | 5.800% | 6/15/16 (Prere.) | 10,000 | 11,871 |
| Regional Transportation District of Colorado Sales Tax Revenue | 6.000% | 1/15/34 | 6,000 | 6,134 |
| Regional Transportation District of Colorado Sales Tax Revenue | 6.000% | 1/15/41 | 11,500 | 11,686 |
| | | | | 186,833 |
| Connecticut (0.2%) | | | | |
| Connecticut GO | 5.000% | 12/1/15 (14) | 6,650 | 7,331 |
| Connecticut GO | 5.000% | 12/1/15 | 1,200 | 1,388 |
| Connecticut Health & Educational Facilities Authority Revenue (Hartford Healthcare) | 5.000% | 7/1/32 | 4,000 | 4,021 |
| | | | | 12,740 |
| Delaware (0.0%) | | | | |
| Delaware Housing Authority Single Family Mortgage Revenue | 5.875% | 1/1/38 | 2,480 | 2,624 |
| |
| District of Columbia (0.6%) | | | | |
| District of Columbia Water & Sewer Authority Public Utility Revenue | 5.500% | 10/1/39 | 10,000 | 10,924 |
| Metropolitan Washington DC/VA Airports Authority Airport System Revenue | 5.000% | 10/1/24 | 1,215 | 1,294 |
| Metropolitan Washington DC/VA Airports Authority Airport System Revenue | 5.250% | 10/1/25 | 10,000 | 11,077 |
| Metropolitan Washington DC/VA Airports Authority Airport System Revenue | 5.000% | 10/1/27 | 4,500 | 4,689 |
| Metropolitan Washington DC/VA Airports Authority Airport System Revenue | 5.000% | 10/1/28 | 1,500 | 1,547 |
| Metropolitan Washington DC/VA Airports Authority Dulles Toll Road Revenue | 5.000% | 10/1/39 | 8,000 | 8,285 |
| | | | | 37,816 |
| Florida (6.0%) | | | | |
| Alachua County FL Industrial Development Revenue | | | | |
| (North Florida Retirement Village Inc. Project) | 5.625% | 11/15/22 | 5,000 | 4,514 |
| Beacon Lakes FL Community Development Special Assessment Revenue | 6.900% | 5/1/35 | 15,230 | 15,344 |
| Broward County FL School Board COP | 5.000% | 7/1/20 (4) | 5,935 | 6,378 |
| Citizens Property Insurance Corp. Florida Revenue (Coastal Account) | 5.500% | 6/1/14 | 7,500 | 8,103 |
| Citizens Property Insurance Corp. Florida Revenue (Coastal Account) | 5.000% | 6/1/15 | 10,000 | 10,775 |
| Citizens Property Insurance Corp. Florida Revenue (Coastal Account) | 5.000% | 6/1/16 | 6,000 | 6,492 |
| Citizens Property Insurance Corp. Florida Revenue (Coastal Account) | 5.250% | 6/1/17 | 5,000 | 5,466 |
| East Homestead Community Development District Florida Special Assessment Revenue | 7.250% | 5/1/21 | 2,515 | 2,558 |
118
High-Yield Tax-Exempt Fund
| | | | |
| | | | Face | Market |
| | | Maturity | Amount | Value• |
| | Coupon | Date | ($000) | ($000) |
| Escambia County FL Environmental Improvement Revenue | 5.750% | 11/1/27 | 6,000 | 6,059 |
| Florida Board of Education Lottery Revenue | 5.000% | 7/1/21 (14) | 14,455 | 16,041 |
| Florida Board of Education Lottery Revenue | 5.500% | 7/1/27 | 4,000 | 4,433 |
| Florida Board of Education Public Education Capital Outlay GO | 5.000% | 6/1/19 (3) | 7,230 | 8,130 |
| Florida Housing Finance Corp. Homeowner Mortgage Revenue | 5.750% | 1/1/37 | 13,860 | 14,134 |
| Florida Housing Finance Corp. Homeowner Mortgage Revenue | 5.750% | 1/1/37 | 7,330 | 7,616 |
| Florida Housing Finance Corp. Homeowner Mortgage Revenue | 5.000% | 7/1/41 | 5,470 | 5,793 |
| Florida Housing Finance Corp. Homeowner Mortgage Revenue | 5.500% | 7/1/48 | 10,235 | 10,645 |
| 1 Florida Housing Finance Corp. Homeowner Mortgage Revenue TOB VRDO | 0.190% | 11/7/11 | 8,150 | 8,150 |
| Florida Hurricane Catastrophe Fund Finance Corp. Revenue | 5.000% | 7/1/15 | 5,000 | 5,455 |
| Florida Hurricane Catastrophe Fund Finance Corp. Revenue | 5.000% | 7/1/16 | 5,000 | 5,501 |
| Florida Municipal Power Agency Revenue | 6.250% | 10/1/31 | 3,250 | 3,711 |
| Florida Turnpike Authority Revenue | 5.000% | 7/1/17 (4) | 5,000 | 5,361 |
| Gainsville FL Utility System Revenue VRDO | 0.200% | 11/1/11 | 3,380 | 3,380 |
| Highlands County FL Health Facilities Authority Hospital Revenue | | | | |
| (Adventist Health System/Sunbelt Obligated Group) | 5.250% | 11/15/16 (Prere.) | 365 | 434 |
| Highlands County FL Health Facilities Authority Hospital Revenue | | | | |
| (Adventist Health System/Sunbelt Obligated Group) | 6.000% | 11/15/37 | 5,000 | 5,400 |
| Hillsborough County FL Industrial Development Authority Health Facilities Revenue | | | | |
| (University Community Hospital) | 5.625% | 8/15/18 (Prere.) | 6,000 | 7,430 |
| Hillsborough County FL Industrial Development Authority Hospital Revenue | | | | |
| (Tampa General Hospital Project) | 5.250% | 10/1/34 | 2,185 | 2,103 |
| Jacksonville FL Health Facilities Authority Hospital Revenue | | | | |
| (Baptist Medical Center Project) VRDO | 0.140% | 11/1/11 LOC | 6,800 | 6,800 |
| Lee Memorial Health System Florida Hospital Revenue | 5.250% | 4/1/35 (14) | 22,600 | 22,329 |
| Miami-Dade County FL Aviation Revenue (Miami International Airport) | 5.125% | 10/1/24 (14) | 18,575 | 19,149 |
| Miami-Dade County FL Aviation Revenue (Miami International Airport) | 5.000% | 10/1/27 | 7,170 | 7,420 |
| Miami-Dade County FL Aviation Revenue (Miami International Airport) | 5.000% | 10/1/28 | 11,440 | 11,788 |
| Miami-Dade County FL Aviation Revenue (Miami International Airport) | 5.000% | 10/1/38 (11) | 8,770 | 8,298 |
| Miami-Dade County FL Aviation Revenue (Miami International Airport) | 5.375% | 10/1/41 | 8,000 | 8,225 |
| Miami-Dade County FL Expressway Authority Toll System Revenue | 5.000% | 7/1/40 | 4,650 | 4,692 |
| Miami-Dade County FL Health Facilities Authority Hospital Revenue (Miami Children’s Hospital) | 6.125% | 8/1/42 | 3,500 | 3,596 |
| Miami-Dade County FL Industrial Development Authority Solid Waste Disposal Revenue | | | | |
| (Waste Management Inc. of Florida Project) PUT | 2.625% | 8/1/14 | 4,000 | 4,012 |
| Miami-Dade County FL Public Facilities Revenue (Jackson Memorial Hospital) | 5.750% | 6/1/39 (12) | 5,250 | 5,424 |
| Miami-Dade County FL School Board COP | 5.250% | 10/1/18 (14) | 7,915 | 8,341 |
| Orange County FL Health Facilities Authority Health Care Facility Revenue | | | | |
| (Orlando Lutheran Towers Inc.) | 5.375% | 7/1/20 | 1,100 | 1,026 |
| Orange County FL Health Facilities Authority Health Care Facility Revenue | | | | |
| (Orlando Lutheran Towers Inc.) | 5.700% | 7/1/26 | 1,000 | 897 |
| Orange County FL Health Facilities Authority Mortgage Revenue | | | | |
| (Orlando Lutheran Towers Inc. Project) | 5.000% | 7/1/12 | 900 | 899 |
| Orlando & Orange County FL Expressway Authority Revenue | 5.000% | 7/1/21 (4) | 25,000 | 28,280 |
| Orlando FL Special Assessment Revenue (Conroy Road Interchange Project) | 5.800% | 5/1/26 | 2,880 | 2,843 |
| Orlando FL Utility Commission Water & Electric Revenue | 6.750% | 10/1/17 (ETM) | 1,945 | 2,297 |
| Palm Beach County FL Airport System Revenue | 5.750% | 10/1/12 (14) | 7,220 | 7,531 |
| Palm Beach County FL Airport System Revenue | 5.750% | 10/1/14 (14) | 6,440 | 7,146 |
| Palm Glades FL Community Development District Revenue | 7.250% | 8/1/16 | 2,155 | 2,051 |
| Putman County FL Authority Pollution Control Revenue | | | | |
| (Seminole Electric Cooperative Inc. Project) PUT | 5.350% | 5/1/18 (2) | 8,700 | 9,532 |
| Sarasota County FL Public Hospital District Hospital Revenue | | | | |
| (Sarasota Memorial Hospital Project) | 5.500% | 7/1/34 | 3,500 | 3,594 |
| St. Petersburg FL Health Facilities Authority Revenue | | | | |
| (All Children’s Hospital Inc. Obligated Group) | 6.500% | 11/15/39 | 8,000 | 8,736 |
| Tallahassee FL Health Facilities Revenue (Tallahassee Memorial HealthCare Inc. Project) | 6.375% | 12/1/30 | 2,800 | 2,801 |
| | | | | 367,113 |
| Georgia (2.7%) | | | | |
| Atlanta GA Airport Passenger Facility Charge Revenue | 5.000% | 1/1/20 | 6,420 | 7,309 |
| Atlanta GA Airport Passenger Facility Charge Revenue | 5.000% | 1/1/22 | 2,000 | 2,220 |
| Atlanta GA Airport Revenue | 5.000% | 1/1/23 | 4,000 | 4,260 |
| Atlanta GA Airport Revenue | 5.000% | 1/1/29 | 1,000 | 1,037 |
| Atlanta GA Airport Revenue | 5.000% | 1/1/30 | 3,000 | 3,008 |
| Atlanta GA Water & Wastewater Revenue | 6.250% | 11/1/34 | 2,500 | 2,781 |
| Atlanta GA Water & Wastewater Revenue | 6.250% | 11/1/39 | 15,000 | 16,652 |
| Burke County GA Development Authority Pollution Control Revenue | | | | |
| (Georgia Power Co. Plant Vogtle Project) PUT | 5.050% | 1/12/12 | 6,000 | 6,052 |
| Burke County GA Development Authority Pollution Control Revenue | | | | |
| (Oglethorpe Power Corp. Vogtle Project) | 5.500% | 1/1/33 | 5,000 | 5,190 |
| Dalton County GA Development Authority Revenue (Hamilton Health Care System) | 5.500% | 8/15/17 (14) | 4,290 | 4,566 |
| Fulton County GA Residential Care Facilities for the Elderly Authority Revenue | | | | |
| (Canterbury Court Project) | 6.125% | 2/15/34 | 2,000 | 1,796 |
| Georgia GO | 5.000% | 7/1/15 | 7,820 | 8,974 |
119
High-Yield Tax-Exempt Fund
| | | | |
| | | | Face | Market |
| | | Maturity | Amount | Value• |
| | Coupon | Date | ($000) | ($000) |
| Georgia GO | 5.000% | 7/1/15 | 8,200 | 9,410 |
| Georgia GO | 5.000% | 7/1/15 | 2,400 | 2,754 |
| Georgia GO | 5.000% | 7/1/15 | 2,570 | 2,949 |
| Georgia GO | 5.500% | 7/1/15 | 19,095 | 22,248 |
| Georgia Housing & Finance Authority Single Family Mortgage Revenue | 5.000% | 12/1/26 | 4,320 | 4,374 |
| Georgia Municipal Electric Power Authority Revenue | 6.600% | 1/1/18 (14) | 4,060 | 4,678 |
| Main Street Natural Gas Inc. Georgia Gas Project Revenue | 5.000% | 3/15/18 | 5,000 | 5,443 |
| Main Street Natural Gas Inc. Georgia Gas Project Revenue | 5.000% | 3/15/19 | 15,000 | 16,204 |
| Main Street Natural Gas Inc. Georgia Gas Project Revenue | 5.500% | 9/15/28 | 7,195 | 7,040 |
| Marietta GA Development Authority Revenue | 7.000% | 6/15/30 | 4,000 | 4,012 |
| Marietta GA Development Authority Revenue | 7.000% | 6/15/39 | 6,000 | 5,856 |
| Municipal Electric Authority Georgia Revenue | 5.000% | 1/1/20 | 7,000 | 8,023 |
| Municipal Electric Authority Georgia Revenue (General Resolution Projects) | 5.500% | 1/1/26 | 7,000 | 7,652 |
| Richmond County GA Development Authority Environmental Improvement Revenue | 5.750% | 11/1/27 | 3,000 | 3,021 |
| | | | | 167,509 |
| Guam (0.7%) | | | | |
| Guam Government GO | 5.000% | 11/15/23 | 4,500 | 4,061 |
| Guam Government GO | 5.125% | 11/15/27 | 5,000 | 4,510 |
| Guam Government GO | 5.250% | 11/15/37 | 20,400 | 17,643 |
| Guam Government GO | 7.000% | 11/15/39 | 10,000 | 10,362 |
| Guam Government Waterworks Authority Water & Wastewater System Revenue | 6.000% | 7/1/25 | 2,000 | 2,008 |
| Guam Government Waterworks Authority Water & Wastewater System Revenue | 5.875% | 7/1/35 | 5,000 | 4,940 |
| | | | | 43,524 |
| Hawaii (0.8%) | | | | |
| Hawaii Airports System Revenue | 5.000% | 7/1/22 | 5,000 | 5,358 |
| Hawaii Airports System Revenue | 5.000% | 7/1/23 | 5,000 | 5,329 |
| Hawaii Airports System Revenue | 5.000% | 7/1/24 | 5,000 | 5,305 |
| Hawaii Department of Budget & Finance Special Purpose Revenue (Kahala Nui Project) | 8.000% | 11/15/33 | 8,750 | 9,102 |
| Hawaii Harbor System Revenue | 5.500% | 7/1/35 | 5,000 | 5,285 |
| Hawaii Harbor System Revenue | 5.625% | 7/1/40 | 5,000 | 5,304 |
| Hawaii Pacific Health Revenue | 5.500% | 7/1/40 | 7,000 | 6,851 |
| Hawaii Pacific Health Revenue | 5.750% | 7/1/40 | 2,250 | 2,279 |
| Honolulu HI City & County Wastewater System Revenue | 0.000% | 7/1/17 (14) | 6,000 | 5,080 |
| Honolulu HI City & County Wastewater System Revenue | 0.000% | 7/1/18 (14) | 2,000 | 1,620 |
| | | | | 51,513 |
| Idaho (0.3%) | | | | |
| Idaho Housing & Finance Association RAN | 5.000% | 7/15/23 | 8,430 | 9,427 |
| Idaho Housing & Finance Association RAN | 5.000% | 7/15/27 | 7,000 | 7,556 |
| Idaho Housing & Finance Association Single Family Mortgage Revenue | 5.125% | 1/1/29 | 2,435 | 2,431 |
| | | | | 19,414 |
| Illinois (5.8%) | | | | |
| Chicago IL Board of Education GO | 5.000% | 12/1/31 | 5,000 | 5,000 |
| Chicago IL GO | 5.620% | 1/1/16 (Prere.) | 7,795 | 9,223 |
| Chicago IL GO | 5.650% | 1/1/16 (Prere.) | 7,445 | 8,818 |
| Chicago IL GO | 5.000% | 12/1/23 | 6,970 | 7,433 |
| Chicago IL GO | 5.620% | 1/1/26 (14) | 2,755 | 3,027 |
| Chicago IL GO | 5.650% | 1/1/27 (14) | 2,630 | 2,795 |
| Chicago IL GO VRDO | 0.150% | 11/1/11 | 3,100 | 3,100 |
| Chicago IL Metropolitan Water Reclamation District GO | 5.000% | 12/1/31 | 7,000 | 7,576 |
| Chicago IL Midway Airport Revenue | 5.500% | 1/1/14 (4) | 6,410 | 6,446 |
| Chicago IL Midway Airport Revenue | 5.500% | 1/1/15 (4) | 4,760 | 4,784 |
| Chicago IL Midway Airport Revenue | 5.500% | 1/1/16 (4) | 7,135 | 7,168 |
| Chicago IL Midway Airport Revenue | 5.500% | 1/1/17 (4) | 7,525 | 7,554 |
| Chicago IL Midway Airport Revenue | 5.500% | 1/1/18 (4) | 7,940 | 7,967 |
| Chicago IL O’Hare International Airport Revenue | 5.250% | 1/1/30 | 3,655 | 3,795 |
| Chicago IL O’Hare International Airport Revenue | 5.625% | 1/1/35 | 7,000 | 7,564 |
| Chicago IL O’Hare International Airport Revenue | 5.750% | 1/1/39 | 3,000 | 3,274 |
| Chicago IL Park District GO | 5.000% | 1/1/33 | 4,500 | 4,666 |
| Chicago IL Public Building Commission GO | 7.000% | 1/1/20 (ETM) | 10,000 | 13,138 |
| 2 Chicago IL Transit Authority Sales Tax Receipts Revenue | 5.250% | 12/1/36 | 5,400 | 5,584 |
| Chicago IL Wastewater Transmission Revenue VRDO | 0.140% | 11/1/11 LOC | 1,100 | 1,100 |
| Chicago IL Wastewater Transmission Revenue VRDO | 0.180% | 11/1/11 LOC | 5,100 | 5,100 |
| Chicago IL Water Revenue | 5.250% | 11/1/38 | 15,000 | 15,460 |
| Cook County IL GO | 5.250% | 11/15/28 | 6,000 | 6,296 |
| Illinois Build Revenue | 5.000% | 6/15/17 | 7,000 | 8,008 |
| Illinois Educational Facilities Authority Revenue (Northwestern University) | 5.500% | 8/15/14 (Prere.) | 500 | 564 |
| Illinois Finance Authority Gas Supply Revenue (Peoples Gas Light & Coke) PUT | 2.125% | 7/1/14 | 2,875 | 2,898 |
| Illinois Finance Authority Revenue (Carle Foundation) | 6.000% | 8/15/41 | 2,000 | 2,047 |
| Illinois Finance Authority Revenue (Carle Foundation) | 6.000% | 8/15/41 (4) | 1,500 | 1,571 |
| Illinois Finance Authority Revenue (Children’s Memorial Hospital) | 5.375% | 8/15/39 | 22,500 | 22,619 |
| Illinois Finance Authority Revenue (Little Co. of Mary Hospital & Health Care Centers) | 5.375% | 8/15/40 | 4,500 | 4,257 |
| 120 | | | | |
High-Yield Tax-Exempt Fund
| | | | |
| | | | Face | Market |
| | | Maturity | Amount | Value• |
| | Coupon | Date | ($000) | ($000) |
| Illinois Finance Authority Revenue (Navistar International Project) | 6.500% | 10/15/40 | 11,400 | 11,761 |
| Illinois Finance Authority Revenue (New Admiral at the Lake Project) | 8.000% | 5/15/40 | 6,000 | 6,092 |
| Illinois Finance Authority Revenue (New Admiral at the Lake Project) | 8.000% | 5/15/46 | 7,500 | 7,615 |
| Illinois Finance Authority Revenue (Northwestern Community Hospital) | 5.375% | 7/1/33 | 6,000 | 6,078 |
| Illinois Finance Authority Revenue (OSF Healthcare System) | 7.000% | 11/15/29 | 10,000 | 11,078 |
| Illinois Finance Authority Revenue (OSF Healthcare System) | 6.000% | 5/15/39 | 6,445 | 6,653 |
| Illinois Finance Authority Revenue (Riverside Health System) | 6.250% | 11/15/35 | 4,600 | 4,846 |
| Illinois Finance Authority Revenue (Rush University Medical Center) | 6.625% | 11/1/39 | 10,000 | 10,652 |
| Illinois Finance Authority Revenue (Silver Cross & Medical Centers) | 7.000% | 8/15/44 | 14,000 | 14,673 |
| Illinois Finance Authority Revenue (Tabor Hills Supportive Living) | 5.250% | 11/15/36 | 3,000 | 2,444 |
| 3 Illinois Finance Authority Student Housing Revenue (Fullerton Village Project) | 5.125% | 6/1/35 | 4,000 | 2,400 |
| Illinois GO | 5.000% | 1/1/16 (4) | 8,000 | 8,853 |
| Illinois Health Facilities Authority Revenue (Centegra Health System) | 5.250% | 9/1/18 (2) | 2,500 | 2,503 |
| Illinois Sports Facilities Authority Revenue | 5.500% | 6/15/30 (2) | 8,635 | 9,089 |
| Illinois Toll Highway Authority Revenue | 5.250% | 1/1/30 | 5,000 | 5,320 |
| Illinois Toll Highway Authority Revenue | 5.000% | 1/1/31 | 6,000 | 6,257 |
| Metropolitan Pier & Exposition Authority Illinois Dedicated Sales Tax Revenue | 5.250% | 6/15/42 (14) | 10,000 | 10,012 |
| Metropolitan Pier & Exposition Authority Illinois Dedicated Sales Tax Revenue | 0.000% | 6/15/44 (4) | 10,000 | 1,382 |
| Metropolitan Pier & Exposition Authority Illinois Dedicated Sales Tax Revenue | 5.250% | 6/15/50 | 7,210 | 7,239 |
| 1 Metropolitan Pier & Exposition Authority Illinois Hospital Facilities Revenue TOB VRDO | 2.340% | 11/7/11 (ETM) | 11,535 | 11,535 |
| Railsplitter Tobacco Settlement Authority Illinois Tobacco Settlement Revenue | 5.500% | 6/1/23 | 5,000 | 5,278 |
| Railsplitter Tobacco Settlement Authority Illinois Tobacco Settlement Revenue | 6.000% | 6/1/28 | 15,000 | 15,597 |
| | | | | 356,189 |
| Indiana (2.2%) | | | | |
| Indiana Finance Authority Health System Revenue | | | | |
| (Sisters of St. Francis Health Services Inc. Obligated Group) VRDO | 0.150% | 11/7/11 LOC | 14,150 | 14,150 |
| Indiana Finance Authority Revenue (Lease Appropriation) VRDO | 0.100% | 11/7/11 | 12,000 | 12,000 |
| Indiana Health & Educational Facility Financing Authority Hospital Revenue | | | | |
| (Clarian Health Obligated Group) | 5.000% | 2/15/39 | 17,535 | 16,951 |
| 1 Indiana Health & Educational Facility Financing Authority Revenue | | | | |
| (Ascension Health Credit Group) TOB VRDO | 0.150% | 11/1/11 | 2,500 | 2,500 |
| Indiana Health Facility Financing Authority Hospital Revenue (Ancilla System Inc.) | 7.375% | 7/1/23 (ETM) | 19,400 | 26,833 |
| Indiana Municipal Power Agency Revenue | 6.000% | 1/1/39 | 13,275 | 14,491 |
| Indianapolis IN Airport Authority Special Facilities Revenue (Federal Express Corp. Project) | 5.100% | 1/15/17 | 13,500 | 14,965 |
| Indianapolis IN Local Public Improvement Bond Bank Revenue | 6.750% | 2/1/14 | 14,350 | 15,158 |
| Indianapolis IN Local Public Improvement Bond Bank Revenue (PILOT Infrastructure Project) | 5.000% | 1/1/30 (4) | 2,720 | 2,900 |
| Indianapolis IN Local Public Improvement Bond Bank Revenue | | | | |
| (Qualified Midwestern Disaster Area) | 5.750% | 2/1/36 | 5,000 | 5,601 |
| Rockport IN Pollution Control Revenue (Indiana Michigan Power Co. Project) PUT | 6.250% | 6/2/14 | 6,750 | 7,475 |
| | | | | 133,024 |
| Iowa (0.3%) | | | | |
| Tobacco Settlement Authority Iowa Revenue | 5.600% | 6/1/34 | 25,000 | 20,932 |
| |
| Kansas (0.1%) | | | | |
| Kansas Development Finance Authority Health Facilities Revenue | | | | |
| (Kansas University Health System) | 5.375% | 3/1/29 | 3,000 | 3,084 |
| |
| Kentucky (0.6%) | | | | |
| Jefferson County KY Health Facilities Revenue (Jewish Hospital HealthCare Services Inc. Project) | 5.650% | 1/1/17 (2) | 8,000 | 8,018 |
| Jefferson County KY Health Facilities Revenue (Jewish Hospital HealthCare Services Inc. Project) | 5.700% | 1/1/21 (2) | 1,750 | 1,752 |
| Kentucky Asset/Liability Commission General Fund Revenue | 5.000% | 9/1/17 (14) | 7,500 | 8,240 |
| Kentucky Housing Corp. Housing Revenue | 5.250% | 7/1/32 | 6,185 | 6,544 |
| Louisville & Jefferson County KY Metropolitan Government Health Facilities Revenue | | | | |
| (Jewish Hospital & St. Mary’s Healthcare Inc. Project) | 5.750% | 2/1/27 | 9,400 | 9,637 |
| | | | | 34,191 |
| Louisiana (1.3%) | | | | |
| Lafayette LA Utilities Revenue | 5.000% | 11/1/33 | 5,000 | 5,247 |
| Louisiana Citizens Property Insurance Corp. Assessment Revenue | 6.750% | 6/1/26 (12) | 6,000 | 6,885 |
| Louisiana Housing Finance Agency Single Family Mortgage Revenue (Home Ownership Program) | 5.950% | 6/1/38 | 6,050 | 6,589 |
| Louisiana Local Government Environmental Facilities & | | | | |
| Community Development Authority Revenue (Women’s Hospital Foundation Project) | 5.875% | 10/1/40 | 9,990 | 9,993 |
| Louisiana Local Government Environmental Facilities & | | | | |
| Community Development Authority Revenue (Women’s Hospital Foundation Project) | 6.000% | 10/1/44 | 8,095 | 8,172 |
| Louisiana Public Facilities Authority Revenue (Ochsner Clinic Foundation Project) | 5.250% | 5/15/38 | 17,650 | 16,616 |
| New Orleans LA Aviation Board Revenue | 6.000% | 1/1/23 (12) | 5,000 | 5,762 |
| St. John Baptist Parish Louisiana Revenue (Marathon Oil Corp. Project) | 5.125% | 6/1/37 | 9,400 | 9,108 |
| Tobacco Settlement Financing Corp. Louisiana Revenue | 5.875% | 5/15/39 | 13,495 | 13,501 |
| | | | | 81,873 |
| Maine (0.2%) | | | | |
| Maine Health & Higher Educational Facilities Authority Revenue VRDO | 0.150% | 11/7/11 LOC | 13,900 | 13,900 |
121
High-Yield Tax-Exempt Fund
| | | | |
| | | | Face | Market |
| | | Maturity | Amount | Value• |
| | Coupon | Date | ($000) | ($000) |
| Maryland (0.8%) | | | | |
| Baltimore MD Special Obligation Revenue | 7.000% | 9/1/38 | 8,000 | 8,204 |
| Harford County MD GO | 5.000% | 7/1/15 | 2,000 | 2,297 |
| Maryland Department of Housing & Community Development Revenue | 5.750% | 3/1/41 | 8,110 | 8,728 |
| Maryland Economic Development Corp. Revenue (Chesapeake Bay Conference Center Project) | 5.000% | 12/1/31 | 4,000 | 2,475 |
| Maryland GO | 5.000% | 2/15/15 (Prere.) | 6,000 | 6,811 |
| Maryland GO | 5.000% | 11/1/15 | 6,000 | 6,952 |
| Maryland Health & Higher Educational Facilities Authority Revenue (Charlestown Community) | 6.250% | 1/1/41 | 5,000 | 5,197 |
| Maryland Health & Higher Educational Facilities Authority Revenue | | | | |
| (King Farm Presbyterian Retirement Community) | 5.000% | 1/1/17 | 2,655 | 2,639 |
| Maryland Industrial Development Financing Authority Economic Development Revenue | | | | |
| (Our Lady of Good Counsel School) | 5.500% | 5/1/20 | 420 | 428 |
| Maryland Industrial Development Financing Authority Economic Development Revenue | | | | |
| (Our Lady of Good Counsel School) | 6.000% | 5/1/35 | 2,000 | 2,008 |
| Prince Georges County MD GO | 5.000% | 9/15/15 | 3,740 | 4,313 |
| | | | | 50,052 |
| Massachusetts (3.1%) | | | | |
| 1 Massachusetts Bay Transportation Authority Sales Tax Revenue TOB VRDO | 2.000% | 11/7/11 | 10,171 | 10,171 |
| 1 Massachusetts Bay Transportation Authority Sales Tax Revenue TOB VRDO | 2.340% | 11/7/11 | 13,060 | 13,060 |
| Massachusetts Department of Transportation Metropolitan Highway System Revenue | 5.000% | 1/1/32 | 12,500 | 13,027 |
| Massachusetts Development Finance Agency Revenue (Suffolk University) | 5.125% | 7/1/40 | 9,000 | 8,679 |
| Massachusetts Development Finance Agency Revenue (Tufts Medical Center) | 7.250% | 1/1/32 | 3,500 | 3,875 |
| Massachusetts Development Finance Agency Revenue (Tufts Medical Center) | 6.875% | 1/1/41 | 1,500 | 1,596 |
| Massachusetts GO | 5.000% | 8/1/14 | 11,865 | 13,211 |
| Massachusetts GO | 5.000% | 9/1/15 (Prere.) | 8,000 | 9,228 |
| Massachusetts Health & Educational Facilities Authority Revenue (Boston Medical Center) | 5.250% | 7/1/38 | 6,440 | 5,715 |
| Massachusetts Health & Educational Facilities Authority Revenue (MIT) | 5.500% | 7/1/36 | 5,100 | 5,756 |
| Massachusetts Health & Educational Facilities Authority Revenue (Museum of Fine Arts) VRDO | 0.170% | 11/1/11 | 12,900 | 12,900 |
| Massachusetts Health & Educational Facilities Authority Revenue (Northeastern University) | 5.000% | 10/1/19 | 7,005 | 8,059 |
| Massachusetts Health & Educational Facilities Authority Revenue (Stonehill College) VRDO | 0.170% | 11/1/11 LOC | 34,000 | 34,000 |
| Massachusetts Health & Educational Facilities Authority Revenue (Suffolk University) | 6.250% | 7/1/30 | 5,000 | 5,361 |
| Massachusetts Municipal Wholesale Electric Co. Power System Revenue | 5.250% | 7/1/15 (14) | 7,535 | 7,651 |
| Massachusetts School Building Authority Dedicated Sales Tax Revenue | 5.000% | 8/15/24 (4) | 9,000 | 9,865 |
| 2 Massachusetts School Building Authority Dedicated Sales Tax Revenue | 5.000% | 10/15/32 | 7,000 | 7,594 |
| Massachusetts Special Obligation Dedicated Tax Revenue | 5.750% | 1/1/14 (Prere.) | 15,000 | 16,591 |
| Metropolitan Boston MA Transit Parking Corp. Revenue | 5.250% | 7/1/36 | 6,295 | 6,651 |
| | | | | 192,990 |
| Michigan (2.5%) | | | | |
| Delta County MI Economic Development Corp. Environmental Improvement Revenue | | | | |
| (MeadWestvaco-Escanaba Paper Co. Project) | 6.250% | 4/15/12 (Prere.) | 11,000 | 11,299 |
| Detroit MI Sewer System Revenue | 5.125% | 7/1/33 (14) | 6,030 | 6,067 |
| Detroit MI Sewer System Revenue | 7.500% | 7/1/33 (4) | 12,000 | 14,226 |
| Detroit MI Water Supply System Revenue | 7.000% | 7/1/36 (4) | 4,500 | 5,302 |
| Jackson County MI Hospital Finance Authority Hospital Revenue (Allegiance Health) | 5.250% | 6/1/37 | 10,000 | 9,579 |
| Kalamazoo MI Hospital Financing Authority Hospital Revenue (Bronson Methodist Hospital) | 5.000% | 5/15/30 | 10,000 | 9,740 |
| Michigan GO | 5.250% | 9/15/26 (4) | 12,000 | 12,895 |
| Michigan Hospital Finance Authority Revenue (Henry Ford Health System) | 5.250% | 11/15/46 | 44,500 | 43,033 |
| Michigan Hospital Finance Authority Revenue (MidMichigan Obligated Group) | 6.125% | 6/1/34 | 4,065 | 4,295 |
| Michigan Municipal Bond Authority Revenue (State Clean Water Revolving Fund) | 5.000% | 10/1/29 | 5,190 | 5,646 |
| Michigan Tobacco Settlement Financing Authority Revenue | 6.875% | 6/1/42 | 15,000 | 13,391 |
| Michigan Tobacco Settlement Financing Authority Revenue | 6.000% | 6/1/48 | 4,775 | 3,339 |
| Royal Oak MI Hospital Finance Authority Hospital Revenue (Beaumont Hospital) | 6.000% | 8/1/39 | 7,000 | 7,245 |
| Saginaw MI Hospital Finance Authority Hospital Revenue (Covenant Medical Center Inc.) | 5.000% | 7/1/30 | 10,000 | 9,465 |
| | | | | 155,522 |
| Minnesota (0.6%) | | | | |
| Dakota County MN Community Development Agency Multifamily Housing Revenue | | | | |
| (Highview Hills Senior Housing Project) | 7.000% | 8/1/45 | 8,000 | 7,797 |
| Maple Grove MN Health Care Facilities Revenue (Maple Grove Hospital Corp.) | 5.250% | 5/1/28 | 4,500 | 4,521 |
| Maple Grove MN Health Care Facilities Revenue (Maple Grove Hospital Corp.) | 5.250% | 5/1/37 | 9,250 | 9,072 |
| Minneapolis MN Health Care System Revenue (Fairview Health Services) | 6.750% | 11/15/32 | 8,250 | 9,134 |
| Minnesota Public Facilities Authority Revenue (State Revolving Fund) | 5.000% | 3/1/21 | 5,000 | 5,978 |
| | | | | 36,502 |
| Mississippi (0.2%) | | | | |
| Mississippi Development Bank Special Obligation Revenue | | | | |
| (Municipal Energy Agency Power Supply Project) | 5.000% | 3/1/31 (10) | 11,365 | 10,849 |
| |
| Missouri (0.9%) | | | | |
| Kirkwood MO Industrial Development Authority Retirement Community Revenue | | | | |
| (Aberdeen Heights Project) | 8.250% | 5/15/39 | 5,000 | 5,192 |
| Kirkwood MO Industrial Development Authority Retirement Community Revenue | | | | |
| (Aberdeen Heights Project) | 8.250% | 5/15/45 | 5,000 | 5,182 |
122
High-Yield Tax-Exempt Fund
| | | | |
| | | | Face | Market |
| | | Maturity | Amount | Value• |
| | Coupon | Date | ($000) | ($000) |
| Missouri Development Finance Board Infrastructure Facilities Revenue (Branson Landing Project) | 5.000% | 6/1/35 | 9,000 | 9,047 |
| Missouri Health & Educational Facilities Authority Health Facilities Revenue (Cox Health) | 5.500% | 11/15/33 | 6,500 | 6,718 |
| Missouri Housing Development Corp. Single Family Mortgage Revenue | 6.050% | 3/1/37 | 5,815 | 5,994 |
| Missouri Housing Development Corp. Single Family Mortgage Revenue | 6.000% | 3/1/38 | 3,010 | 3,200 |
| Missouri Housing Development Corp. Single Family Mortgage Revenue | 5.600% | 9/1/38 | 5,540 | 5,961 |
| Missouri Joint Municipal Electric Utility Commission Power Project Revenue (Plum Point Project) | 5.000% | 1/1/28 (14) | 2,000 | 2,010 |
| Sugar Creek MO Industrial Development Revenue (Lafarge North America Inc. Project) | 5.650% | 6/1/37 | 11,000 | 9,671 |
| | | | | 52,975 |
| Montana (0.1%) | | | | |
| Montana Board Housing Single Family Mortgage Revenue | 5.750% | 12/1/37 | 3,140 | 3,321 |
| Montana Facility Finance Authority Revenue (Sisters of Charity of Leavenworth Health System) | 4.750% | 1/1/40 | 5,500 | 5,526 |
| | | | | 8,847 |
| Nevada (0.4%) | | | | |
| Clark County NV School District GO | 5.000% | 6/15/25 | 10,000 | 10,582 |
| Henderson NV Health Facility Revenue (Catholic Healthcare West) | 5.250% | 7/1/31 | 7,750 | 7,772 |
| Nevada Capital Improvement & Cultural Affairs GO | 5.000% | 12/1/23 (14) | 2,550 | 2,787 |
| Sparks NV Local Improvement District Revenue | 6.500% | 9/1/20 | 2,970 | 2,966 |
| Sparks NV Local Improvement District Revenue | 6.750% | 9/1/27 | 3,785 | 3,628 |
| | | | | 27,735 |
| New Hampshire (0.1%) | | | | |
| New Hampshire Health & Education Facilities Authority Revenue (Wentworth Douglas Hospital) | 7.000% | 1/1/38 | 7,000 | 7,737 |
| |
| New Jersey (6.3%) | | | | |
| New Jersey COP | 5.250% | 6/15/27 | 5,000 | 5,233 |
| New Jersey Economic Development Authority Mortgage Revenue (Lions Gate Project) | 5.000% | 1/1/15 | 705 | 690 |
| New Jersey Economic Development Authority Mortgage Revenue (Lions Gate Project) | 5.750% | 1/1/25 | 710 | 656 |
| New Jersey Economic Development Authority Mortgage Revenue (Lions Gate Project) | 5.875% | 1/1/37 | 1,230 | 1,065 |
| New Jersey Economic Development Authority Mortgage Revenue | | | | |
| (Presbyterian Home at Montgomery Project) | 6.375% | 11/1/31 | 10,000 | 8,813 |
| New Jersey Economic Development Authority Retirement Community Revenue | | | | |
| (Seabrook Village Inc.) | 5.250% | 11/15/26 | 2,000 | 1,762 |
| New Jersey Economic Development Authority Retirement Community Revenue | | | | |
| (Seabrook Village Inc.) | 5.250% | 11/15/36 | 2,000 | 1,625 |
| New Jersey Economic Development Authority Revenue (Bayonne/IMTT Project) VRDO | 0.120% | 11/1/11 LOC | 7,200 | 7,200 |
| New Jersey Economic Development Authority Revenue (Cigarette Tax) | 5.750% | 6/15/29 | 20,000 | 19,480 |
| New Jersey Economic Development Authority Revenue (Cigarette Tax) | 5.500% | 6/15/31 | 6,500 | 6,036 |
| New Jersey Economic Development Authority Revenue | | | | |
| (Kapkowski Road Landfill Improvement District Project (City of Elizabeth)) | 6.375% | 5/15/14 (Prere.) | 2,250 | 2,563 |
| New Jersey Economic Development Authority Revenue (Motor Vehicle Surcharges) | 5.250% | 7/1/24 (14) | 18,055 | 19,892 |
| New Jersey Economic Development Authority Revenue | | | | |
| (Provident Group-Montclair Properties LLC - Montclair State University Student Housing Project) | 5.750% | 6/1/31 | 4,000 | 4,059 |
| New Jersey Economic Development Authority Revenue (School Facilities Construction) | 5.000% | 9/1/20 | 7,000 | 7,867 |
| New Jersey Economic Development Authority Revenue (School Facilities Construction) | 5.000% | 9/1/21 | 4,495 | 5,004 |
| New Jersey Economic Development Authority Revenue (School Facilities Construction) | 5.500% | 9/1/21 | 2,620 | 3,020 |
| New Jersey Economic Development Authority Revenue (School Facilities Construction) | 5.250% | 12/15/21 (3) | 4,500 | 5,111 |
| New Jersey Economic Development Authority Revenue (School Facilities Construction) | 5.000% | 9/1/22 | 5,100 | 5,610 |
| New Jersey Economic Development Authority Revenue (School Facilities Construction) | 5.250% | 9/1/23 | 10,000 | 11,111 |
| New Jersey Economic Development Authority Revenue (School Facilities Construction) | 5.750% | 9/1/23 | 7,000 | 8,020 |
| New Jersey Economic Development Authority Revenue (School Facilities Construction) | 5.500% | 9/1/24 (2) | 6,300 | 7,195 |
| New Jersey Economic Development Authority Revenue (School Facilities Construction) | 5.250% | 9/1/28 | 10,200 | 10,915 |
| New Jersey Economic Development Authority Special Facility Revenue | | | | |
| (Continental Airlines Inc. Project) | 6.625% | 9/15/12 | 14,595 | 14,737 |
| New Jersey Educational Facilities Authority Revenue (University Medical & Dentistry) | 7.500% | 12/1/32 | 6,500 | 7,555 |
| New Jersey Environmental Infrastructure Trust Revenue | 5.000% | 9/1/15 | 4,465 | 5,145 |
| New Jersey Equipment Lease Purchase COP | 5.000% | 6/15/23 | 4,100 | 4,226 |
| New Jersey Health Care Facilities Financing Authority Revenue (South Jersey Hospital) | 5.000% | 7/1/22 | 2,400 | 2,506 |
| New Jersey Health Care Facilities Financing Authority Revenue (Virtua Health) | 5.750% | 7/1/33 | 6,700 | 7,064 |
| New Jersey Higher Education Assistance Authority Student Loan Revenue | 5.750% | 12/1/28 | 2,250 | 2,321 |
| New Jersey Sports & Exposition Authority Revenue | 6.500% | 3/1/13 | 905 | 946 |
| New Jersey Transportation Corp. COP | 5.750% | 9/15/15 | 26,620 | 27,312 |
| New Jersey Transportation Corp. COP | 5.000% | 9/15/19 (4) | 7,000 | 7,378 |
| New Jersey Transportation Trust Fund Authority Transportation System Revenue | 5.500% | 12/15/16 (14) | 10,000 | 11,516 |
| New Jersey Transportation Trust Fund Authority Transportation System Revenue | 5.500% | 12/15/17 (4) | 7,000 | 8,188 |
| New Jersey Transportation Trust Fund Authority Transportation System Revenue | 5.250% | 12/15/19 | 7,000 | 8,017 |
| New Jersey Transportation Trust Fund Authority Transportation System Revenue | 5.500% | 12/15/21 (14) | 14,000 | 16,246 |
| New Jersey Transportation Trust Fund Authority Transportation System Revenue | 5.750% | 6/15/23 (14) | 10,000 | 11,760 |
| New Jersey Transportation Trust Fund Authority Transportation System Revenue | 0.000% | 12/15/25 (2) | 30,000 | 14,413 |
| New Jersey Transportation Trust Fund Authority Transportation System Revenue | 0.000% | 12/15/27 | 15,000 | 6,206 |
| New Jersey Transportation Trust Fund Authority Transportation System Revenue | 0.000% | 12/15/28 | 3,430 | 1,317 |
| New Jersey Transportation Trust Fund Authority Transportation System Revenue | 5.625% | 12/15/28 | 20,000 | 21,918 |
| New Jersey Transportation Trust Fund Authority Transportation System Revenue | 5.500% | 12/15/38 (12) | 8,000 | 8,548 |
123
High-Yield Tax-Exempt Fund
| | | | | |
| | | | | Face | Market |
| | | | Maturity | Amount | Value• |
| | | Coupon | Date | ($000) | ($000) |
| 1 | New Jersey Transportation Trust Fund Authority Transportation System Revenue TOB VRDO | 0.160% | 11/7/11 LOC | 2,600 | 2,600 |
| | New Jersey Turnpike Authority Revenue | 0.000% | 1/1/35 (2) | 21,495 | 18,647 |
| | Tobacco Settlement Financing Corp. New Jersey Revenue | 4.625% | 6/1/26 | 38,500 | 30,797 |
| | Tobacco Settlement Financing Corp. New Jersey Revenue | 4.750% | 6/1/34 | 5,000 | 3,345 |
| | | | | | 385,635 |
| New Mexico (0.2%) | | | | |
| | New Mexico Mortgage Finance Authority Single Family Mortgage Revenue | 5.600% | 7/1/38 | 5,575 | 5,952 |
| | New Mexico Mortgage Finance Authority Single Family Mortgage Revenue | 5.300% | 1/1/39 | 4,335 | 4,608 |
| | | | | | 10,560 |
| New York (10.9%) | | | | |
| | Brooklyn NY Local Development Corp. PILOT Revenue (Barclays Center Project) | 6.375% | 7/15/43 | 5,000 | 5,179 |
| | Erie County NY Industrial Development Agency School Facility Revenue | | | | |
| | (Buffalo City School District Project) | 5.750% | 5/1/20 (4) | 5,000 | 5,423 |
| | Erie County NY Industrial Development Agency School Facility Revenue | | | | |
| | (Buffalo City School District Project) | 5.750% | 5/1/21 (4) | 3,745 | 4,043 |
| | Erie County NY Industrial Development Agency School Facility Revenue | | | | |
| | (Buffalo City School District Project) | 5.750% | 5/1/22 (4) | 4,500 | 4,862 |
| | Hudson Yards Infrastructure Corp. New York Revenue | 4.500% | 2/15/47 (14) | 16,500 | 14,961 |
| | Hudson Yards Infrastructure Corp. New York Revenue | 5.750% | 2/15/47 | 13,000 | 13,766 |
| | Long Island NY Power Authority Electric System Revenue | 5.500% | 4/1/22 | 10,000 | 11,485 |
| | Long Island NY Power Authority Electric System Revenue | 5.500% | 4/1/24 | 5,000 | 5,611 |
| | Metropolitan New York Transportation Authority Revenue | 5.250% | 11/15/20 (14) | 6,650 | 7,694 |
| | Metropolitan New York Transportation Authority Revenue | 5.250% | 11/15/20 (12) | 8,415 | 9,888 |
| | Metropolitan New York Transportation Authority Revenue | 5.250% | 11/15/40 | 10,000 | 10,484 |
| | Metropolitan New York Transportation Authority Revenue (Dedicated Petroleum Tax) | 6.000% | 4/1/20 (ETM) | 9,000 | 11,573 |
| | Metropolitan New York Transportation Authority Revenue (Dedicated Petroleum Tax) | 5.000% | 11/15/34 | 3,250 | 3,426 |
| | Metropolitan New York Transportation Authority Revenue (Transit Revenue) | 5.500% | 11/15/18 (2) | 5,000 | 5,867 |
| | Metropolitan New York Transportation Authority Revenue (Transit Revenue) PUT | 5.000% | 11/15/13 | 10,000 | 10,770 |
| | Nassau County NY GO | 4.000% | 10/1/21 | 9,400 | 9,764 |
| | New York City NY GO | 5.000% | 1/1/25 | 5,750 | 6,194 |
| | New York City NY GO | 5.000% | 11/1/26 | 15,000 | 15,724 |
| | New York City NY GO | 5.000% | 8/1/31 | 6,000 | 6,485 |
| | New York City NY GO | 5.000% | 8/1/32 | 10,000 | 10,783 |
| | New York City NY GO VRDO | 0.160% | 11/1/11 LOC | 1,300 | 1,300 |
| | New York City NY Health & Hospital Corp. Revenue (Health System) | 5.000% | 2/15/30 | 6,000 | 6,269 |
| | New York City NY Industrial Development Agency PILOT Revenue (Yankee Stadium Project) | 0.000% | 3/1/26 (12) | 5,000 | 2,443 |
| | New York City NY Industrial Development Agency PILOT Revenue (Yankee Stadium Project) | 0.000% | 3/1/27 (12) | 4,195 | 1,915 |
| | New York City NY Industrial Development Agency PILOT Revenue (Yankee Stadium Project) | 0.000% | 3/1/28 (12) | 4,200 | 1,796 |
| | New York City NY Industrial Development Agency PILOT Revenue (Yankee Stadium Project) | 5.000% | 3/1/36 (14) | 8,075 | 7,864 |
| | New York City NY Industrial Development Agency Special Facility Revenue | | | | |
| | (American Airlines Inc.) | 7.750% | 8/1/31 | 31,000 | 28,676 |
| | New York City NY Industrial Development Agency Special Facility Revenue | | | | |
| | (Terminal One Group Association Project) PUT | 5.500% | 1/1/16 | 3,250 | 3,517 |
| | New York City NY Industrial Development Agency Special Facility Revenue | | | | |
| | (Terminal One Group Association Project) PUT | 5.500% | 1/1/16 | 3,500 | 3,741 |
| | New York City NY Industrial Development Agency Special Facility Revenue | | | | |
| | (Terminal One Group Association Project) PUT | 5.500% | 1/1/16 | 4,500 | 4,771 |
| | New York City NY Industrial Development Agency Special Facility Revenue | | | | |
| | (Terminal One Group Association Project) PUT | 5.500% | 1/1/16 | 4,000 | 4,208 |
| | New York City NY Municipal Water Finance Authority Water & Sewer System Revenue | 5.000% | 6/15/26 | 5,000 | 5,582 |
| | New York City NY Municipal Water Finance Authority Water & Sewer System Revenue | 5.000% | 6/15/31 | 10,000 | 10,753 |
| | New York City NY Municipal Water Finance Authority Water & Sewer System Revenue | 5.000% | 6/15/32 | 5,000 | 5,396 |
| | New York City NY Municipal Water Finance Authority Water & Sewer System Revenue | 5.000% | 6/15/35 | 7,500 | 7,988 |
| | New York City NY Municipal Water Finance Authority Water & Sewer System Revenue | 5.250% | 6/15/40 | 15,000 | 16,180 |
| | New York City NY Municipal Water Finance Authority Water & Sewer System Revenue | 5.375% | 6/15/43 | 10,000 | 10,994 |
| | New York City NY Sales Tax Asset Receivable Corp. Revenue | 5.000% | 10/15/26 (14) | 9,000 | 9,720 |
| | New York City NY Transitional Finance Authority Building Aid Revenue | 5.125% | 1/15/33 | 5,000 | 5,294 |
| | New York City NY Transitional Finance Authority Building Aid Revenue | 5.000% | 1/15/34 | 8,650 | 9,038 |
| | New York City NY Transitional Finance Authority Future Tax Revenue | 5.000% | 11/1/15 | 8,000 | 9,176 |
| 2 | New York City NY Transitional Finance Authority Future Tax Revenue | 5.000% | 11/1/16 | 8,000 | 9,331 |
| 2 | New York City NY Transitional Finance Authority Future Tax Revenue | 5.000% | 11/1/25 | 2,135 | 2,436 |
| 2 | New York City NY Transitional Finance Authority Future Tax Revenue | 5.000% | 11/1/28 | 2,735 | 3,037 |
| | New York City NY Transitional Finance Authority Future Tax Revenue | 5.000% | 2/1/35 | 10,000 | 10,726 |
| | New York Liberty Development Corp. Revenue | 6.375% | 7/15/49 | 8,750 | 9,080 |
| | New York State Dormitory Authority Revenue | | | | |
| | (Mount Sinai School of Medicine of New York University) | 5.000% | 7/1/18 | 2,500 | 2,825 |
| | New York State Dormitory Authority Revenue | | | | |
| | (Mount Sinai School of Medicine of New York University) | 5.000% | 7/1/20 | 1,000 | 1,126 |
| | New York State Dormitory Authority Revenue (New York University Hospitals Center) | 5.625% | 7/1/37 | 8,750 | 8,891 |
| | New York State Dormitory Authority Revenue | | | | |
| | (North Shore - Long Island Jewish Obligated Group) | 0.900% | 5/1/18 | 22,990 | 21,472 |
| |
| 124 | | | | | |
High-Yield Tax-Exempt Fund
| | | | |
| | | | Face | Market |
| | | Maturity | Amount | Value• |
| | Coupon | Date | ($000) | ($000) |
| New York State Dormitory Authority Revenue (Personal Income Tax) | 5.000% | 3/15/15 | 5,090 | 5,737 |
| New York State Dormitory Authority Revenue (Personal Income Tax) | 5.000% | 3/15/18 | 10,000 | 11,828 |
| New York State Dormitory Authority Revenue (Personal Income Tax) | 5.000% | 3/15/22 (4) | 5,500 | 6,051 |
| New York State Dormitory Authority Revenue (Personal Income Tax) | 5.000% | 3/15/34 | 13,400 | 14,503 |
| New York State Dormitory Authority Revenue (Personal Income Tax) | 5.000% | 2/15/35 | 7,000 | 7,464 |
| New York State Dormitory Authority Revenue (Personal Income Tax) | 5.000% | 3/15/41 | 7,250 | 7,707 |
| New York State Dormitory Authority Revenue (State University Educational Facilities) | 7.500% | 5/15/13 | 13,380 | 14,675 |
| New York State Dormitory Authority Revenue (The New School) | 5.500% | 7/1/40 | 5,000 | 5,296 |
| New York State Energy Research & Development Authority Pollution Control Revenue | | | | |
| (New York State Electric & Gas Corp. Project) | 2.250% | 12/1/15 | 7,000 | 6,913 |
| New York State Environmental Facilities Corp. Revenue | | | | |
| (State Clean Water & Drinking Water Revolving Funds) | 5.000% | 10/15/35 | 5,815 | 6,212 |
| New York State Housing Finance Agency Revenue (Nursing Home & Health Care Project) | 5.000% | 11/1/11 (14) | 4,440 | 4,440 |
| New York State Housing Finance Agency Revenue (Nursing Home & Health Care Project) | 5.100% | 11/1/12 (14) | 5,590 | 5,605 |
| 1 New York State Housing Finance Agency Revenue (Service Contract) TOB VRDO | 0.150% | 11/1/11 | 2,100 | 2,100 |
| New York State Mortgage Agency Homeowner Mortgage Revenue VRDO | 0.250% | 11/7/11 | 10,000 | 10,000 |
| 1 New York State Mortgage Agency Revenue TOB VRDO | 0.150% | 11/1/11 | 4,600 | 4,600 |
| New York State Thruway Authority Revenue (Highway & Bridge Trust Fund) | 5.000% | 4/1/18 | 7,500 | 8,694 |
| Niagara County NY Industrial Development Agency Solid Waste Disposal Revenue | | | | |
| (American Ref-Fuel Co. of Niagara LP Facility) PUT | 5.550% | 11/15/13 | 12,500 | 12,637 |
| Niagara County NY Industrial Development Agency Solid Waste Disposal Revenue | | | | |
| (Covanta Arc LLC) PUT | 5.450% | 11/15/12 | 16,000 | 16,178 |
| Niagara County NY Industrial Development Agency Solid Waste Disposal Revenue | | | | |
| (Covanta Arc LLC) PUT | 5.625% | 11/15/14 | 3,000 | 3,033 |
| Port Authority of New York & New Jersey Revenue | 5.000% | 9/15/25 | 5,835 | 6,325 |
| Port Authority of New York & New Jersey Revenue | 5.000% | 3/15/28 | 8,600 | 9,060 |
| 2 Port Authority of New York & New Jersey Revenue | 5.000% | 10/15/32 | 9,900 | 10,253 |
| Port Authority of New York & New Jersey Revenue | 5.750% | 3/15/35 | 25,000 | 27,059 |
| Port Authority of New York & New Jersey Special Obligation Revenue | | | | |
| (John F. Kennedy International Air Terminal LLC) | 5.500% | 12/1/31 | 4,000 | 4,014 |
| Port Authority of New York & New Jersey Special Obligation Revenue | | | | |
| (John F. Kennedy International Air Terminal LLC) | 6.000% | 12/1/42 | 13,000 | 13,594 |
| Suffolk County NY Economic Development Corp. Revenue (Peconic Landing at Southold Project) | 6.000% | 12/1/40 | 1,225 | 1,232 |
| Suffolk NY Tobacco Asset Securitization Corp. Revenue | 5.375% | 6/1/28 | 6,105 | 5,072 |
| Suffolk NY Tobacco Asset Securitization Corp. Revenue | 0.000% | 6/1/44 | 4,500 | 3,602 |
| Suffolk NY Tobacco Asset Securitization Corp. Revenue | 6.000% | 6/1/48 | 3,500 | 2,738 |
| Ulster County NY Industrial Development Agency Civic Facility Revenue | | | | |
| (Kingston Regional Senior Living Corp. - Woodland Pond at New Paltz Project) | 6.000% | 9/15/37 | 10,500 | 7,684 |
| Ulster County NY Industrial Development Agency Civic Facility Revenue | | | | |
| (Kingston Regional Senior Living Corp. - Woodland Pond at New Paltz Project) | 6.000% | 9/15/42 | 7,000 | 5,012 |
| Westchester County NY Health Care Corp. Revenue | 6.000% | 11/1/30 | 20,000 | 20,007 |
| Westchester County NY Health Care Corp. Revenue | 6.125% | 11/1/37 | 3,000 | 3,087 |
| | | | | 671,939 |
| North Carolina (1.2%) | | | | |
| 2 Charlotte NC Airport Revenue | 5.000% | 7/1/36 | 3,275 | 3,252 |
| 2 Charlotte NC Airport Revenue | 5.000% | 7/1/41 | 3,000 | 2,993 |
| Charlotte NC GO | 5.250% | 6/1/14 | 1,300 | 1,454 |
| Charlotte-Mecklenberg NC Hospital Authority Health Care System Revenue | | | | |
| (Carolinas HealthCare System) | 5.000% | 1/15/47 | 2,750 | 2,764 |
| North Carolina Eastern Municipal Power Agency Power Systems Revenue | 5.000% | 1/1/23 | 5,250 | 5,798 |
| North Carolina Eastern Municipal Power Agency Revenue | 5.500% | 1/1/16 | 3,000 | 3,126 |
| North Carolina Eastern Municipal Power Agency Revenue | 5.500% | 1/1/17 | 2,000 | 2,080 |
| North Carolina Eastern Municipal Power Agency Revenue | 5.000% | 1/1/26 | 5,000 | 5,309 |
| North Carolina GO | 5.000% | 4/1/14 | 10,100 | 11,166 |
| North Carolina GO | 5.500% | 3/1/15 | 2,355 | 2,714 |
| North Carolina GO | 5.000% | 6/1/15 | 3,000 | 3,434 |
| North Carolina Housing Finance Agency Home Ownership Revenue | 5.500% | 1/1/38 | 2,070 | 2,141 |
| North Carolina Housing Finance Agency Home Ownership Revenue | 5.500% | 7/1/38 | 5,125 | 5,360 |
| North Carolina Medical Care Commission Health Care Facilities Mortgage Revenue | | | | |
| (Deerfield Episcopal Retirement Community) | 6.125% | 11/1/38 | 1,250 | 1,264 |
| North Carolina Medical Care Commission Health Care Facilities Mortgage Revenue (Salemtowne) | 5.000% | 10/1/23 | 1,850 | 1,697 |
| North Carolina Medical Care Commission Health Care Facilities Mortgage Revenue (Salemtowne) | 5.100% | 10/1/30 | 655 | 569 |
| North Carolina Medical Care Commission Health Care Facilities Revenue | | | | |
| (University Health Systems of Eastern Carolina) VRDO | 0.170% | 11/7/11 LOC | 10,400 | 10,400 |
| North Carolina Medical Care Commission Retirement Facilities Mortgage Revenue | | | | |
| (Givens Estates Project) | 5.000% | 7/1/27 | 2,750 | 2,665 |
| North Carolina Medical Care Commission Retirement Facilities Mortgage Revenue | | | | |
| (Givens Estates Project) | 5.000% | 7/1/33 | 3,000 | 2,826 |
| | | | | 71,012 |
125
High-Yield Tax-Exempt Fund
| | | | |
| | | | Face | Market |
| | | Maturity | Amount | Value• |
| | Coupon | Date | ($000) | ($000) |
| Ohio (2.9%) | | | | |
| Allen County OH Hospital Facilities Revenue (Catholic Healthcare Partners) | 5.250% | 9/1/27 | 10,000 | 10,248 |
| American Municipal Power Ohio Inc. Revenue (Electricity Purchase) | 5.000% | 2/1/12 | 11,500 | 11,650 |
| American Municipal Power Ohio Inc. Revenue (Electricity Purchase) | 5.000% | 2/1/13 | 7,000 | 7,338 |
| American Municipal Power Ohio Inc. Revenue (Prairie State Energy Campus Project) | 5.000% | 2/15/38 | 14,300 | 14,711 |
| Bowling Green State University Ohio Student Housing Revenue | | | | |
| (CFP I LLC - State University Project) | 5.750% | 6/1/31 | 5,000 | 4,868 |
| Buckeye Tobacco Settlement Financing Authority Ohio Revenue | 5.125% | 6/1/24 | 42,040 | 32,282 |
| Buckeye Tobacco Settlement Financing Authority Ohio Revenue | 5.875% | 6/1/30 | 4,085 | 3,076 |
| Buckeye Tobacco Settlement Financing Authority Ohio Revenue | 5.750% | 6/1/34 | 18,195 | 13,148 |
| Buckeye Tobacco Settlement Financing Authority Ohio Revenue | 0.000% | 6/1/37 | 5,000 | 3,488 |
| Butler County OH Hospital Facilities Revenue (Kettering Health Network) | 6.375% | 4/1/36 | 3,750 | 4,005 |
| Butler County OH Hospital Facilities Revenue (Kettering Health Network) | 5.625% | 4/1/41 | 5,000 | 5,042 |
| Cleveland-Cuyahoga County OH Port Authority Revenue | | | | |
| (Carnegie/89th Garage & Service Center LLC Project) VRDO | 0.140% | 11/7/11 LOC | 7,085 | 7,085 |
| Columbus OH GO | 5.000% | 12/15/15 | 3,210 | 3,661 |
| Erie County OH Hospital Facilities Revenue (Firelands Regional Medical Center) | 5.625% | 8/15/32 | 1,810 | 1,772 |
| Lucas County OH Hospital Revenue (ProMedica Healthcare Obligated Group) | 6.000% | 11/15/41 | 3,000 | 3,279 |
| Ohio Building Authority Revenue (Adult Correctional Building) | 5.000% | 10/1/19 | 4,705 | 5,485 |
| Ohio GO | 4.500% | 9/15/22 (14) | 2,030 | 2,162 |
| Ohio Higher Educational Facility Commission Revenue (Denison University Project) | 5.000% | 11/1/32 | 3,195 | 3,333 |
| 1 Ohio Hospital Revenue (Cleveland Clinic Health System Obligated Group) TOB VRDO | 0.140% | 11/7/11 | 6,745 | 6,745 |
| Ohio Hospital Revenue (University Hospitals Health System Inc.) | 5.250% | 1/15/46 | 12,000 | 11,738 |
| 1 Ohio Water Development Authority Fresh Water Revenue TOB VRDO | 2.000% | 11/7/11 | 900 | 900 |
| Ohio Water Development Authority Water Pollution Control Loan Fund Revenue | 5.000% | 6/1/20 | 5,000 | 5,943 |
| Scioto County OH Marine Terminal Facilities Revenue (Norfolk Southern Corp. Project) | 5.300% | 8/15/13 | 14,750 | 14,788 |
| | | | | 176,747 |
| Oklahoma (0.5%) | | | | |
| Oklahoma Capitol Improvement Authority Facilities Revenue | 5.000% | 7/1/15 (Prere.) | 4,510 | 5,166 |
| Oklahoma Capitol Improvement Authority Facilities Revenue | 5.000% | 7/1/15 (Prere.) | 4,250 | 4,869 |
| Oklahoma Housing Finance Agency Single Family Mortgage Revenue | | | | |
| (Homeownership Loan Program) | 5.750% | 9/1/36 | 3,225 | 3,409 |
| Oklahoma Housing Finance Agency Single Family Mortgage Revenue | | | | |
| (Homeownership Loan Program) | 5.800% | 9/1/37 | 2,785 | 3,012 |
| Oklahoma Housing Finance Agency Single Family Mortgage Revenue | | | | |
| (Homeownership Loan Program) | 5.875% | 9/1/37 | 3,825 | 4,065 |
| Oklahoma Housing Finance Agency Single Family Mortgage Revenue | | | | |
| (Homeownership Loan Program) | 5.950% | 9/1/37 | 5,935 | 6,549 |
| Oklahoma Municipal Power Authority Power Supply System Revenue | 6.000% | 1/1/38 | 4,500 | 4,979 |
| | | | | 32,049 |
| Oregon (0.2%) | | | | |
| Oregon Health Sciences University Revenue | 5.750% | 7/1/39 | 6,750 | 7,319 |
| Oregon Housing & Community Service Department Single Family Mortgage Revenue VRDO | 0.160% | 11/7/11 | 3,900 | 3,900 |
| | | | | 11,219 |
| Pennsylvania (3.9%) | | | | |
| Allegheny County PA GO | 5.000% | 11/1/29 | 3,265 | 3,282 |
| Geisinger Health System Authority of Pennsylvania Revenue | | | | |
| (Penn State Geisinger Health System) | 5.250% | 6/1/39 | 1,750 | 1,818 |
| Lebanon County PA Health Facilities Authority Health Center Revenue | | | | |
| (Pleasant View Retirement Community Project) | 5.125% | 12/15/20 | 1,000 | 950 |
| Lebanon County PA Health Facilities Authority Health Center Revenue | | | | |
| (Pleasant View Retirement Community Project) | 5.300% | 12/15/26 | 500 | 457 |
| Montgomery County PA Industrial Development Authority Revenue | | | | |
| (Philadelphia Presbyterian Homes Inc. Project) | 7.000% | 12/1/35 | 2,670 | 2,808 |
| Montgomery County PA Industrial Development Authority Revenue | | | | |
| (Philadelphia Presbyterian Homes Inc. Project) | 7.000% | 12/1/40 | 2,500 | 2,616 |
| Northampton County PA General Purpose Authority Hospital Revenue | | | | |
| (St. Luke’s Hospital Project) | 5.500% | 8/15/35 | 5,000 | 4,947 |
| Northampton County PA General Purpose Authority Hospital Revenue | | | | |
| (St. Luke’s Hospital Project) | 5.500% | 8/15/40 | 6,500 | 6,334 |
| Northampton County PA General Purpose Authority University Revenue | | | | |
| (Lehigh University) VRDO | 0.110% | 11/7/11 | 5,925 | 5,925 |
| Pennsylvania Economic Development Financing Authority Resource Recovery Revenue | | | | |
| (Colver Project) | 5.000% | 12/1/14 (2) | 6,000 | 6,094 |
| Pennsylvania Economic Development Financing Authority Resource Recovery Revenue | | | | |
| (Colver Project) | 5.000% | 12/1/15 (2) | 3,500 | 3,519 |
| Pennsylvania Economic Development Financing Authority Resource Recovery Revenue | | | | |
| (Colver Project) | 4.625% | 12/1/18 (2) | 10,500 | 10,104 |
| Pennsylvania Economic Development Financing Authority Solid Waste Disposal Revenue | | | | |
| (Republic Services Inc. Project) PUT | 1.100% | 1/3/12 | 7,000 | 6,999 |
126
High-Yield Tax-Exempt Fund
| | | | |
| | | | Face | Market |
| | | Maturity | Amount | Value• |
| | Coupon | Date | ($000) | ($000) |
| Pennsylvania Economic Development Financing Authority Solid Waste Disposal Revenue | | | | |
| (Waste Management Inc. Project) PUT | 4.700% | 11/1/14 | 2,250 | 2,396 |
| Pennsylvania GO | 5.000% | 9/1/14 (4) | 10,000 | 11,196 |
| Pennsylvania Higher Educational Facilities Authority Revenue (Drexel University) VRDO | 0.110% | 11/7/11 LOC | 6,800 | 6,800 |
| 1 Pennsylvania Housing Finance Agency Single Family Mortgage Revenue TOB VRDO | 0.310% | 11/7/11 | 3,875 | 3,875 |
| Pennsylvania Turnpike Commission Revenue | 5.000% | 6/1/25 (12) | 9,550 | 10,227 |
| Pennsylvania Turnpike Commission Revenue | 5.000% | 6/1/26 (12) | 10,040 | 10,684 |
| Pennsylvania Turnpike Commission Revenue | 5.000% | 6/1/27 (12) | 6,865 | 7,255 |
| Pennsylvania Turnpike Commission Revenue | 5.000% | 6/1/29 | 3,990 | 4,130 |
| Pennsylvania Turnpike Commission Revenue | 6.500% | 12/1/36 | 4,000 | 4,581 |
| Pennsylvania Turnpike Commission Revenue | 5.250% | 6/1/39 | 14,455 | 14,799 |
| Philadelphia PA Airport Revenue | 5.000% | 6/15/17 | 10,495 | 11,343 |
| Philadelphia PA Hospitals & Higher Education Facilities Authority Hospital Revenue | | | | |
| (Children’s Hospital of Philadelphia Project) VRDO | 0.130% | 11/1/11 | 12,635 | 12,635 |
| Philadelphia PA Industrial Development Authority Airport Revenue (Philadelphia Airport System) | 5.400% | 7/1/22 (14) | 10,000 | 10,072 |
| Philadelphia PA Municipal Authority Revenue | 5.250% | 11/15/14 (4) | 10,000 | 10,666 |
| Philadelphia PA School District GO | 6.000% | 9/1/38 | 13,000 | 14,127 |
| Philadelphia PA Water & Waste Water Revenue VRDO | 0.150% | 11/7/11 LOC | 13,035 | 13,035 |
| Sayre PA Health Care Facilities Authority Revenue (Guthrie Health Care System) | 0.868% | 12/1/17 | 31,705 | 29,300 |
| Upper St. Clair Township PA GO VRDO | 0.240% | 11/7/11 (4) | 4,155 | 4,155 |
| | | | | 237,129 |
| Puerto Rico (3.0%) | | | | |
| Puerto Rico Aqueduct & Sewer Authority Revenue | 6.125% | 7/1/24 | 25,000 | 27,513 |
| Puerto Rico Electric Power Authority Revenue | 5.250% | 7/1/33 | 5,000 | 5,039 |
| Puerto Rico Electric Power Authority Revenue | 5.500% | 7/1/38 | 5,150 | 5,256 |
| Puerto Rico Highway & Transportation Authority Revenue | 5.250% | 7/1/39 (3) | 2,610 | 2,539 |
| Puerto Rico Infrastructure Financing Authority Special Tax Revenue | 5.500% | 7/1/24 (2) | 12,245 | 12,796 |
| Puerto Rico Infrastructure Financing Authority Special Tax Revenue | 5.000% | 7/1/46 | 5,000 | 4,694 |
| Puerto Rico Municipal Finance Agency GO | 5.250% | 8/1/18 (4) | 23,570 | 25,786 |
| Puerto Rico Public Buildings Authority Government Facilities Revenue | 5.250% | 7/1/14 (Prere.) | 365 | 406 |
| Puerto Rico Public Buildings Authority Government Facilities Revenue PUT | 5.000% | 7/1/12 (2) | 33,000 | 33,681 |
| Puerto Rico Public Finance Corp. Revenue PUT | 5.750% | 2/1/12 LOC | 34,000 | 34,350 |
| Puerto Rico Sales Tax Financing Corp. Revenue | 0.000% | 8/1/38 | 47,495 | 8,852 |
| Puerto Rico Sales Tax Financing Corp. Revenue | 6.500% | 8/1/44 | 18,000 | 20,269 |
| Puerto Rico Sales Tax Financing Corp. Revenue | 0.000% | 8/1/54 (2) | 62,390 | 3,997 |
| Puerto Rico Sales Tax Financing Corp. Revenue | 0.000% | 8/1/56 | 33,000 | 1,861 |
| | | | | 187,039 |
| South Carolina (1.7%) | | | | |
| Charleston SC Educational Excellence Financing Corp. Revenue | | | | |
| (Charleston County School District, South Carolina Project) | 5.250% | 12/1/25 | 5,000 | 5,367 |
| Charleston SC Educational Excellence Financing Corp. Revenue | | | | |
| (Charleston County School District, South Carolina Project) | 5.000% | 12/1/27 | 10,120 | 10,710 |
| Charleston SC Educational Excellence Financing Corp. Revenue | | | | |
| (Charleston County School District, South Carolina Project) | 5.250% | 12/1/29 | 14,650 | 15,446 |
| Lancaster County SC Assessment Revenue | 5.450% | 12/1/37 | 1,440 | 1,207 |
| Lexington County SC Health Services District Inc. Hospital Revenue | 5.000% | 11/1/32 | 10,900 | 11,029 |
| Piedmont SC Municipal Power Agency Revenue | 5.250% | 1/1/19 | 11,770 | 13,328 |
| Piedmont SC Municipal Power Agency Revenue | 5.750% | 1/1/34 (4) | 10,000 | 10,897 |
| Richland County SC Environmental Improvement Revenue (International Paper) | 6.100% | 4/1/23 | 7,750 | 7,973 |
| South Carolina Jobs Economic Development Authority Health Care Facilities Revenue | | | | |
| (Lutheran Homes of South Carolina Inc.) | 5.375% | 5/1/21 | 1,500 | 1,391 |
| South Carolina Jobs Economic Development Authority Health Care Facilities Revenue | | | | |
| (Lutheran Homes of South Carolina Inc.) | 5.500% | 5/1/28 | 1,100 | 957 |
| South Carolina Jobs Economic Development Authority Health Care Facilities Revenue | | | | |
| (Lutheran Homes of South Carolina Inc.) | 5.625% | 5/1/42 | 1,000 | 818 |
| South Carolina Jobs Economic Development Authority Hospital Revenue (AnMed Health Project) | 5.500% | 2/1/38 (12) | 2,250 | 2,337 |
| South Carolina Public Service Authority Revenue | 5.250% | 1/1/34 | 6,000 | 6,455 |
| South Carolina Public Service Authority Revenue | 5.500% | 1/1/38 | 15,000 | 16,311 |
| | | | | 104,226 |
| South Dakota (0.1%) | | | | |
| South Dakota Health & Educational Facilities Authority Revenue (Sanford Health) | 5.500% | 11/1/40 | 5,000 | 5,200 |
| |
| Tennessee (2.1%) | | | | |
| Clarksville TN Public Building Authority Revenue (Pooled Financing) VRDO | 0.190% | 11/1/11 LOC | 8,000 | 8,000 |
| Memphis TN Electric System Revenue | 5.000% | 12/1/13 (Prere.) | 20,000 | 21,839 |
| Tennessee Energy Acquisition Corp. Gas Revenue | 5.000% | 9/1/14 | 25,370 | 26,722 |
| Tennessee Energy Acquisition Corp. Gas Revenue | 5.000% | 9/1/15 | 20,495 | 21,635 |
| Tennessee Energy Acquisition Corp. Gas Revenue | 5.000% | 2/1/19 | 21,365 | 21,414 |
| Tennessee Energy Acquisition Corp. Gas Revenue | 5.250% | 9/1/19 | 5,680 | 5,730 |
| Tennessee Energy Acquisition Corp. Gas Revenue | 5.000% | 2/1/27 | 5,000 | 4,916 |
127
High-Yield Tax-Exempt Fund
| | | | | |
| | | | | Face | Market |
| | | | Maturity | Amount | Value• |
| | | Coupon | Date | ($000) | ($000) |
| | Tennessee Housing Development Agency Homeownership Program Revenue | 5.750% | 1/1/37 | 7,295 | 7,675 |
| | Tennessee Housing Development Agency Homeownership Program Revenue | 5.750% | 7/1/37 | 9,890 | 10,223 |
| | | | | | 128,154 |
| Texas (8.7%) | | | | |
| | Central Texas Regional Mobility Authority Revenue | 0.000% | 1/1/32 | 4,090 | 1,130 |
| | Central Texas Regional Mobility Authority Revenue | 0.000% | 1/1/33 | 3,000 | 776 |
| | Central Texas Regional Mobility Authority Revenue | 6.250% | 1/1/46 | 1,500 | 1,525 |
| | Denton TX Independent School District GO VRDO | 0.150% | 11/7/11 | 6,250 | 6,250 |
| | Harris County TX GO | 0.000% | 10/1/13 (14) | 9,630 | 9,493 |
| | Houston TX Airport System Revenue | 5.000% | 7/1/18 (14) | 5,915 | 6,648 |
| | Houston TX Airport System Revenue | 5.000% | 7/1/22 | 10,000 | 10,556 |
| | Houston TX Airport System Revenue | 5.000% | 7/1/23 | 3,000 | 3,143 |
| | Houston TX Airport System Revenue | 5.000% | 7/1/24 | 2,000 | 2,070 |
| | Houston TX Airport System Revenue | 5.500% | 7/1/39 | 5,000 | 5,309 |
| | Houston TX Airport System Special Facilities Revenue (Continental Airlines Inc. Terminal E Project) | 6.750% | 7/1/29 | 10,000 | 9,738 |
| | Houston TX Utility System Revenue | 5.500% | 11/15/26 (12) | 12,010 | 13,683 |
| | Houston TX Utility System Revenue | 5.500% | 11/15/27 (12) | 11,415 | 12,916 |
| | Love Field Airport Modernization Corp. Texas Special Facilities Revenue | | | | |
| | (Southwest Airlines Co. Project) | 5.250% | 11/1/40 | 5,500 | 5,218 |
| | Lower Colorado River Authority Texas Revenue | 5.625% | 5/15/19 (Prere.) | 15 | 19 |
| | Lower Colorado River Authority Texas Revenue | 5.000% | 5/15/30 | 5,000 | 5,201 |
| | Lower Colorado River Authority Texas Revenue | 5.000% | 5/15/30 | 8,935 | 9,536 |
| | Lower Colorado River Authority Texas Revenue | 5.000% | 5/15/35 | 7,440 | 7,771 |
| | Lower Colorado River Authority Texas Revenue | 5.500% | 5/15/36 | 10,000 | 10,620 |
| | Lower Colorado River Authority Texas Revenue | 5.625% | 5/15/39 | 4,985 | 5,327 |
| | Lower Colorado River Authority Texas Revenue | 5.000% | 5/15/40 | 6,000 | 6,108 |
| | Lubbock TX Independent School District GO | 5.750% | 2/15/42 (12) | 4,500 | 4,875 |
| | Matagorda County TX Navigation District No. 1 Collateralized Revenue | | | | |
| | (Centerpoint Energy Houston Electric LLC Project) | 5.600% | 3/1/27 | 7,500 | 7,734 |
| | Mesquite TX Health Facilities Development Corp. Retirement Facility Revenue | | | | |
| | (Christian Care Centers Inc. Project) | 5.500% | 2/15/25 | 2,100 | 2,016 |
| | Mesquite TX Health Facilities Development Corp. Retirement Facility Revenue | | | | |
| | (Christian Care Centers Inc. Project) | 5.625% | 2/15/35 | 3,195 | 2,911 |
| | Mission TX Economic Development Corp. Solid Waste Disposal Revenue | | | | |
| | (Allied Waste Inc. Project) | 5.200% | 4/1/18 | 4,000 | 4,035 |
| | North Texas Tollway Authority System Revenue | 6.250% | 2/1/23 | 20,000 | 21,373 |
| | North Texas Tollway Authority System Revenue | 6.000% | 1/1/28 | 9,040 | 10,014 |
| | North Texas Tollway Authority System Revenue | 6.125% | 1/1/31 | 12,000 | 12,570 |
| | North Texas Tollway Authority System Revenue | 5.625% | 1/1/33 | 10,145 | 10,609 |
| | North Texas Tollway Authority System Revenue | 5.750% | 1/1/38 | 29,000 | 29,861 |
| | North Texas Tollway Authority System Revenue | 6.250% | 1/1/39 | 15,480 | 16,729 |
| | North Texas Tollway Authority System Revenue | 6.000% | 9/1/41 | 5,000 | 5,701 |
| | Round Rock TX Independent School District GO | 5.000% | 8/1/15 | 2,505 | 2,872 |
| | Sabine River Authority TX Pollution Control Revenue (Southwestern Electric Power Co. Project) | 4.950% | 3/1/18 (14) | 6,840 | 7,355 |
| | Tarrant County TX Cultural Education Facilities Finance Corp. Hospital Revenue | | | | |
| | (Scott & White Healthcare Project) | 5.250% | 8/15/28 | 4,000 | 4,084 |
| | Tarrant County TX Cultural Education Facilities Finance Corp. Retirement Facilities Revenue | | | | |
| | (SQLC Senior Living Center Mirador Project) | 6.250% | 11/15/14 | 4,130 | 4,054 |
| | Tarrant County TX Cultural Education Facilities Finance Corp. Retirement Facilities Revenue | | | | |
| | (SQLC Senior Living Center Mirador Project) | 7.250% | 11/15/16 | 4,000 | 3,987 |
| | Tarrant County TX Cultural Education Facilities Finance Corp. Retirement Facilities Revenue | | | | |
| | (Statonat Museum Way Project) | 8.250% | 11/15/44 | 10,000 | 10,193 |
| | Texas Department of Housing & Community Affairs Single Family Revenue | 5.625% | 3/1/39 | 4,880 | 5,180 |
| | Texas GO | 5.750% | 8/1/31 | 1,745 | 1,751 |
| 1 | Texas GO TOB PUT | 0.200% | 12/13/11 | 25,000 | 25,000 |
| 1 | Texas GO TOB VRDO | 0.150% | 11/1/11 | 21,140 | 21,140 |
| | Texas Municipal Gas Acquisition & Supply Corp. Revenue | 0.610% | 9/15/17 | 4,370 | 4,184 |
| | Texas Municipal Gas Acquisition & Supply Corp. Revenue | 0.933% | 9/15/17 | 30,445 | 29,332 |
| | Texas Municipal Gas Acquisition & Supply Corp. Revenue | 5.250% | 12/15/17 | 8,400 | 8,689 |
| | Texas Municipal Gas Acquisition & Supply Corp. Revenue | 5.250% | 12/15/19 | 10,000 | 10,131 |
| | Texas Municipal Gas Acquisition & Supply Corp. Revenue | 5.250% | 12/15/20 | 15,000 | 15,162 |
| | Texas Municipal Power Agency Revenue | 0.000% | 9/1/16 (ETM) | 280 | 261 |
| | Texas Municipal Power Agency Revenue | 0.000% | 9/1/17 (14) | 58,660 | 51,157 |
| | Texas Private Activity Surface Transportation Corp. Revenue | 7.500% | 12/31/31 | 3,705 | 4,148 |
| | Texas Private Activity Surface Transportation Corp. Revenue | 7.500% | 6/30/32 | 20,000 | 22,506 |
| | Texas Private Activity Surface Transportation Corp. Revenue | 7.500% | 6/30/33 | 10,000 | 11,162 |
| | Texas Private Activity Surface Transportation Corp. Revenue | 6.875% | 12/31/39 | 5,000 | 5,335 |
| | Texas Public Finance Authority Revenue (Unemployment Compensation) | 5.000% | 1/1/20 | 10,000 | 10,630 |
| | Texas Transportation Commission Central Texas System Revenue PUT | 2.750% | 2/15/13 | 10,000 | 10,131 |
| | University of Texas Permanent University Fund Revenue | 5.000% | 7/1/15 | 3,800 | 4,344 |
| | | | | | 534,253 |
| |
| 128 | | | | | |
High-Yield Tax-Exempt Fund
| | | | |
| | | | Face | Market |
| | | Maturity | Amount | Value• |
| | Coupon | Date | ($000) | ($000) |
| Utah (0.3%) | | | | |
| Intermountain Power Agency Utah Power Supply Revenue | 5.250% | 7/1/20 | 11,000 | 11,628 |
| Utah GO | 5.000% | 7/1/15 | 5,000 | 5,740 |
| | | | | 17,368 |
| Virgin Islands (0.4%) | | | | |
| Virgin Islands Public Finance Authority Revenue | 6.375% | 10/1/19 | 9,145 | 9,162 |
| Virgin Islands Public Finance Authority Revenue | 5.000% | 10/1/25 | 3,400 | 3,444 |
| Virgin Islands Public Finance Authority Revenue | 5.000% | 10/1/29 | 2,000 | 1,977 |
| Virgin Islands Public Finance Authority Revenue | 5.000% | 10/1/29 | 6,000 | 5,930 |
| Virgin Islands Public Finance Authority Revenue | 5.000% | 10/1/39 | 2,000 | 1,858 |
| | | | | 22,371 |
| Virginia (1.2%) | | | | |
| 1 Alexandria VA Redevelopment & Housing Authority Multi-Family Housing Mortgage Revenue | | | | |
| (Portals West Apartment) | 8.250% | 4/1/32 (ETM) | 465 | 596 |
| 1 Chesterfield VA Industrial Development Authority Revenue (Brandermill Woods Project) | 6.500% | 1/1/28 | 12,319 | 11,174 |
| Fairfax County VA Economic Development Authority Residential Care Facilities Revenue | | | | |
| (Goodwin House Inc.) | 5.000% | 10/1/22 | 4,000 | 4,069 |
| Fairfax County VA Economic Development Authority Residential Care Facilities Revenue | | | | |
| (Goodwin House Inc.) | 5.000% | 10/1/27 | 1,875 | 1,855 |
| Fairfax County VA Economic Development Authority Residential Care Facilities Revenue | | | | |
| (Goodwin House Inc.) | 5.125% | 10/1/37 | 5,000 | 4,749 |
| Fairfax County VA Public Improvement GO | 5.000% | 10/1/14 | 2,100 | 2,362 |
| Henrico County VA Economic Development Authority Revenue (Bon Secours Health System) | 5.600% | 11/15/12 (Prere.) | 315 | 332 |
| Lynchburg VA Industrial Development Authority Healthcare Facilities Revenue (Centra Health Inc.) | 5.200% | 1/1/18 | 515 | 516 |
| Roanoke VA Economic Development Authority Hospital Revenue (Carilion Clinic Obligated Group) | 5.000% | 7/1/33 | 4,500 | 4,553 |
| Stafford County VA Economic Development Authority Hospital Facilities Revenue | | | | |
| (MediCorp Health System Obligated Group) | 5.250% | 6/15/37 | 11,070 | 10,946 |
| Tobacco Settlement Financing Corp Virginia Revenue | 5.000% | 6/1/47 | 4,995 | 3,048 |
| Tobacco Settlement Financing Corp. Virginia Revenue | 5.625% | 6/1/15 (Prere.) | 10,000 | 11,601 |
| Tobacco Settlement Financing Corp. Virginia Revenue | 0.000% | 6/1/46 | 9,500 | 5,711 |
| Virginia Commonwealth Transportation Board Revenue | 5.000% | 5/15/33 | 5,000 | 5,439 |
| 1 Virginia Commonwealth Transportation Revenue TOB VRDO | 0.200% | 11/7/11 | 9,705 | 9,705 |
| | | | | 76,656 |
| Washington (1.8%) | | | | |
| Chelan County WA Public Utility District No. 1 Consolidated System Revenue (Chelan Hydro) | 5.500% | 7/1/25 | 2,500 | 2,800 |
| Chelan County WA Public Utility District No. 1 Consolidated System Revenue (Chelan Hydro) | 5.500% | 7/1/26 | 4,000 | 4,443 |
| Chelan County WA Public Utility District No. 1 Hydro-Electric System Revenue | | | | |
| (Columbia River-Rock Island Hydro) | 0.000% | 6/1/12 (14) | 19,650 | 19,577 |
| 2 Energy Northwest Washington Electric Revenue (Columbia Generating Station) | 5.000% | 7/1/19 | 8,855 | 10,091 |
| Port Bellingham WA Industrial Development Corp. Environmental Facilities Revenue | | | | |
| (BP West Coast Products LLC Project) | 5.000% | 1/1/16 | 5,095 | 5,666 |
| Port of Seattle WA Passenger Facility Charge Revenue | 5.000% | 12/1/16 | 2,000 | 2,232 |
| Port of Seattle WA Passenger Facility Charge Revenue | 5.000% | 12/1/20 | 2,000 | 2,287 |
| Port of Seattle WA Passenger Facility Charge Revenue | 5.000% | 12/1/21 | 5,000 | 5,649 |
| Port of Seattle WA Revenue | 5.000% | 6/1/30 | 9,000 | 9,514 |
| University of Washington Revenue | 5.000% | 4/1/33 | 8,880 | 9,643 |
| University of Washington Revenue | 5.000% | 4/1/34 | 3,275 | 3,549 |
| Washington GO | 5.000% | 8/1/14 | 3,390 | 3,782 |
| Washington GO | 5.000% | 7/1/15 (2) | 2,425 | 2,770 |
| Washington Health Care Facilities Authority Revenue (MultiCare Health System) | 5.500% | 8/15/38 (4) | 7,395 | 7,691 |
| Washington Health Care Facilities Authority Revenue (MultiCare Health System) | 5.500% | 8/15/43 (12) | 10,000 | 10,348 |
| Washington Health Care Facilities Authority Revenue (MultiCare Health System) VRDO | 0.130% | 11/7/11 LOC | 3,635 | 3,635 |
| Washington Higher Education Facilities Authority Revenue (Seattle University Project) | 5.250% | 5/1/34 | 5,000 | 5,224 |
| | | | | 108,901 |
| West Virginia (0.4%) | | | | |
| Pleasants County WV Pollution Control Revenue | 5.250% | 10/15/37 | 15,205 | 15,282 |
| West Virginia Economic Development Authority Solid Waste Facilities Disposal Revenue | | | | |
| (Appalachian Power Co. - Amos Project) | 5.375% | 12/1/38 | 2,500 | 2,556 |
| West Virginia Hospital Finance Authority Hospital Revenue (Charleston Area Medical Center Inc.) | 5.625% | 9/1/32 | 6,000 | 6,104 |
| | | | | 23,942 |
| Wisconsin (1.4%) | | | | |
| Public Finance Authority of Wisconsin Continuing Care Retirement Community Revenue | | | | |
| (Glenridge on Palmer Ranch Inc. Project) | 8.250% | 6/1/46 | 12,000 | 12,309 |
| Wisconsin GO | 6.000% | 5/1/27 | 17,000 | 19,770 |
| Wisconsin GO | 6.250% | 5/1/37 | 20,200 | 22,966 |
| Wisconsin Health & Educational Facilities Authority Revenue (Agnesian Healthcare Inc.) | 5.500% | 7/1/40 | 5,675 | 5,686 |
| Wisconsin Health & Educational Facilities Authority Revenue (Aurora Health Care Inc.) | 5.625% | 4/15/39 | 10,810 | 10,900 |
| Wisconsin Health & Educational Facilities Authority Revenue | | | | |
| (Beaver Dam Community Hospitals Inc. Project) | 6.750% | 8/15/34 | 3,500 | 3,514 |
129
| | | | |
| High-Yield Tax-Exempt Fund | | | | |
| |
| |
| |
| |
| | | | Face | Market |
| | | Maturity | Amount | Value• |
| | Coupon | Date | ($000) | ($000) |
| Wisconsin Health & Educational Facilities Authority Revenue | | | | |
| (Children’s Hospital of Wisconsin Inc.) | 5.375% | 8/15/37 | 5,000 | 5,146 |
| Wisconsin Health & Educational Facilities Authority Revenue (St. Johns Communities Inc.) | 7.625% | 9/15/39 | 1,000 | 1,060 |
| Wisconsin Housing & Economic Development Authority Home Ownership Revenue VRDO | 0.160% | 11/7/11 | 3,545 | 3,545 |
| | | | | 84,896 |
| Total Tax-Exempt Municipal Bonds (Cost $5,926,756) | | | | 6,087,316 |
| |
| | | | Shares | |
| Temporary Cash Investment (1.5%) | | | | |
| Money Market Fund (1.5%) | | | | |
| 4 Vanguard Municipal Cash Management Fund (Cost $93,614) | 0.117% | | 93,613,827 | 93,614 |
| Total Investments (100.5%) (Cost $6,020,370) | | | | 6,180,930 |
| Other Assets and Liabilities (-0.5%) | | | | |
| Other Assets | | | | 106,781 |
| Liabilities | | | | (136,072) |
| | | | | (29,291) |
| Net Assets (100%) | | | | 6,151,639 |
| |
| |
| At October 31, 2011, net assets consisted of: | | | | |
| | | | | Amount |
| | | | | ($000) |
| Paid-in Capital | | | | 6,183,546 |
| Undistributed Net Investment Income | | | | — |
| Accumulated Net Realized Losses | | | | (192,467) |
| Unrealized Appreciation (Depreciation) | | | | 160,560 |
| Net Assets | | | | 6,151,639 |
| |
| Investor Shares—Net Assets | | | | |
| Applicable to 127,173,897 outstanding $.001 par value shares of beneficial interest (unlimited authorization) | | | 1,339,066 |
| Net Asset Value Per Share—Investor Shares | | | | $10.53 |
| |
| Admiral Shares—Net Assets | | | | |
| Applicable to 457,060,687 outstanding $.001 par value shares of beneficial interest (unlimited authorization) | | | 4,812,573 |
| Net Asset Value Per Share—Admiral Shares | | | | $10.53 |
• See Note A in Notes to Financial Statements.
1 Security exempt from registration under Rule 144A of the Securities Act of 1933. Such securities may be sold in transactions exempt from registration, normally to qualified institutional buyers. At October 31, 2011, the aggregate value of these securities was $133,851,000, representing 2.2% of net assets.
2 Security purchased on a when-issued or delayed-delivery basis for which the fund has not taken delivery as of October 31, 2011.
3 Non-income producing security. Security failed to make last scheduled interest payment.
4 Affiliated money market fund available only to Vanguard funds and certain trusts and accounts managed by Vanguard. Rate shown is the 7-day yield.
For key to abbreviations and other references, see back cover.
See accompanying Notes, which are an integral part of the Financial Statements
130
This page intentionally left blank.
Key to Abbreviations
ARS—Auction Rate Security.
BAN—Bond Anticipation Note.
COP—Certificate of Participation.
CP—Commercial Paper.
FR—Floating Rate.
GAN—Grant Anticipation Note.
GO—General Obligation Bond.
PUT—Put Option Obligation.
RAN—Revenue Anticipation Note.
TAN—Tax Anticipation Note.
TOB—Tender Option Bond.
TRAN—Tax Revenue Anticipation Note.
VRDO—Variable Rate Demand Obligation.
VRDP—Variable Rate Demand Preferred.
(ETM)—Escrowed to Maturity.
(Prere.)—Prerefunded.
Scheduled principal and interest payments are guaranteed by:
(1) MBIA (Municipal Bond Investors Assurance).
(2) AMBAC (Ambac Assurance Corporation).
(3) FGIC (Financial Guaranty Insurance Company).
(4) AGM (Assured Guaranty Municipal Corporation).
(5) BIGI (Bond Investors Guaranty Insurance).
(6) Connie Lee Inc.
(7) FHA (Federal Housing Authority).
(8) CapMAC (Capital Markets Assurance Corporation).
(9) American Capital Access Financial Guaranty Corporation.
(10) XL Capital Assurance Inc.
(11) CIFG (CDC IXIS Financial Guaranty).
(12) Assured Guaranty Corporation.
(13) Berkshire Hathaway Assurance Corporation.
(14) National Public Finance Guarantee Corporation.
The insurance does not guarantee the market value of the municipal bonds.
LOC—Scheduled principal and interest payments are guaranteed by bank letter of credit.
© 2011 The Vanguard Group, Inc.
All rights reserved.
Vanguard Marketing Corporation, Distributor.
F950 122011
Item 2: Code of Ethics. The Registrant has adopted a code of ethics that applies to the Registrant’s principal executive officer, principal financial officer, principal accounting officer or controller or persons performing similar functions. The Code of Ethics was amended during the reporting period covered by this report to make certain technical, non-material changes.
Item 3: Audit Committee Financial Expert. The following members of the Audit Committee have been determined by the Registrant’s Board of Trustees to be Audit Committee Financial Experts serving on its Audit Committee, and to be independent: Charles D. Ellis, Rajiv L. Gupta, JoAnn Heffernan Heisen, André F. Perold, and Alfred M. Rankin, Jr.
Item 4: Principal Accountant Fees and Services.
(a) Audit Fees.
Audit Fees of the Registrant
Fiscal Year Ended October 31, 2011: $164,000
Fiscal Year Ended October 31, 2010: $154,000
Aggregate Audit Fees of Registered Investment Companies in the Vanguard Group.
Fiscal Year Ended October 31, 2011: $3,978,540
Fiscal Year Ended October 31, 2010: $3,607,060
(b) Audit-Related Fees.
Fiscal Year Ended October 31, 2011: $1,341,750
Fiscal Year Ended October 31, 2010: $791,350
Includes fees billed in connection with assurance and related services provided to the Registrant, The Vanguard Group, Inc., Vanguard Marketing Corporation, and other registered investment companies in the Vanguard Group.
(c) Tax Fees.
Fiscal Year Ended October 31, 2011: $373,830
Fiscal Year Ended October 31, 2010: $336,090
Includes fees billed in connection with tax compliance, planning and advice services provided to the Registrant, The Vanguard Group, Inc., Vanguard Marketing Corporation, and other registered investment companies in the Vanguard Group and related to income and excise taxes.
(d) All Other Fees.
Fiscal Year Ended October 31, 2011: $16,000
Fiscal Year Ended October 31, 2010: $16,000
Includes fees billed for services related to risk management and privacy matters. Services were provided to the Registrant, The Vanguard Group, Inc., Vanguard Marketing Corporation, and other registered investment companies in the Vanguard Group.
(e) (1) Pre-Approval Policies. The policy of the Registrant’s Audit Committee is to consider and, if appropriate, approve before the principal accountant is engaged for such services, all specific audit and non-audit services provided to: (1) the Registrant; (2) The Vanguard Group, Inc.; (3) other entities controlled by The Vanguard Group, Inc. that provide ongoing services to the Registrant; and (4) other registered investment
companies in the Vanguard Group. In making a determination, the Audit Committee considers whether the services are consistent with maintaining the principal accountant’s independence.
In the event of a contingency situation in which the principal accountant is needed to provide services in between scheduled Audit Committee meetings, the Chairman of the Audit Committee would be called on to consider and, if appropriate, pre-approve audit or permitted non-audit services in an amount sufficient to complete services through the next Audit Committee meeting, and to determine if such services would be consistent with maintaining the accountant’s independence. At the next scheduled Audit Committee meeting, services and fees would be presented to the Audit Committee for formal consideration, and, if appropriate, approval by the entire Audit Committee. The Audit Committee would again consider whether such services and fees are consistent with maintaining the principal accountant’s independence.
The Registrant’s Audit Committee is informed at least annually of all audit and non-audit services provided by the principal accountant to the Vanguard complex, whether such services are provided to: (1) the Registrant; (2) The Vanguard Group, Inc.; (3) other entities controlled by The Vanguard Group, Inc. that provide ongoing services to the Registrant; or (4) other registered investment companies in the Vanguard Group.
(2) No percentage of the principal accountant’s fees or services were approved pursuant to the waiver provision of paragraph (c)(7)(i)(C) of Rule 2-01 of Regulation S-X.
(f) For the most recent fiscal year, over 50% of the hours worked under the principal accountant’s engagement were not performed by persons other than full-time, permanent employees of the principal accountant.
(g) Aggregate Non-Audit Fees.
Fiscal Year Ended October 31, 2011: $389,830
Fiscal Year Ended October 31, 2010: $352,090
Includes fees billed for non-audit services provided to the Registrant, The Vanguard Group, Inc., Vanguard Marketing Corporation, and other registered investment companies in the Vanguard Group.
(h) For the most recent fiscal year, the Audit Committee has determined that the provision of all non-audit services was consistent with maintaining the principal accountant’s independence.
Item 5: Audit Committee of Listed Registrants.
Not Applicable.
Item 6: Investments.
Not Applicable.
Item 7: Disclosure of Proxy Voting Policies and Procedures for Closed-End Management Investment Companies.
Not Applicable.
Item 8: Portfolio Managers of Closed-End Management Investment Companies.
Not Applicable.
Item 9: Purchase of Equity Securities by Closed-End Management Investment Company and Affiliated Purchasers.
Not Applicable.
Item 10: Submission of Matters to a Vote of Security Holders.
Not Applicable.
Item 11: Controls and Procedures.
(a) Disclosure Controls and Procedures. The Principal Executive and Financial Officers concluded that the Registrant's Disclosure Controls and Procedures are effective based on their evaluation of the Disclosure Controls and Procedures as of a date within 90 days of the filing date of this report.
(b) Internal Control Over Financial Reporting. There were no significant changes in Registrant’s Internal Control Over Financial Reporting or in other factors that could significantly affect this control subsequent to the date of the evaluation, including any corrective actions with regard to significant deficiencies and material weaknesses.
Item 12: Exhibits.
(a) Code of Ethics.
(b) Certifications.
Pursuant to the requirements of the Securities Exchange Act of 1934 and the Investment Company Act of 1940, the registrant has duly caused this report to be signed on its behalf by the undersigned, thereunto duly authorized.
| |
| | VANGUARD MUNICIPAL BOND FUNDS |
| |
| By: | /s/ F. WILLIAM MCNABB III* |
| | F. WILLIAM MCNABB III |
| | CHIEF EXECUTIVE OFFICER |
| |
| Date: December 20, 2011 |
Pursuant to the requirements of the Securities Exchange Act of 1934 and the Investment Company Act of 1940, this report has been signed below by the following persons on behalf of the registrant and in the capacities and on the dates indicated.
| |
| | VANGUARD MUNICIPAL BOND FUNDS |
| |
| By: | /s/ F. WILLIAM MCNABB III* |
| | F. WILLIAM MCNABB III |
| | CHIEF EXECUTIVE OFFICER |
| |
| Date: December 20, 2011 |
| |
| | VANGUARD MUNICIPAL BOND FUNDS |
| |
| By: | /s/ THOMAS J. HIGGINS* |
| | THOMAS J. HIGGINS |
| | CHIEF FINANCIAL OFFICER |
| |
| Date: December 20, 2011 |
* By: /s/ Heidi Stam
Heidi Stam, pursuant to a Power of Attorney filed on November 28, 2011 see file Number 33-23444, Incorporated by Reference.