UNITED STATES SECURITIES AND EXCHANGE COMMISSION
Washington, D.C. 20549
FORM N-CSR
CERTIFIED SHAREHOLDER REPORT OF REGISTERED MANAGEMENT
INVESTMENT COMPANIES
| Investment Company Act file number: | 811-02806 |
| | |
| Exact name of registrant as specified in charter: | Delaware Group® Cash Reserve |
| | |
| Address of principal executive offices: | 610 Market Street
Philadelphia, PA 19106 |
| | |
| Name and address of agent for service: | David F. Connor, Esq.
610 Market Street
Philadelphia, PA 19106 |
| | |
| Registrant’s telephone number, including area code: | (800) 523-1918 |
| | |
| Date of fiscal year end: | March 31 |
| | |
| Date of reporting period: | March 31, 2024 |
Item 1. Reports to Stockholders
Annual report
Fixed income mutual fund
Delaware Investments Ultrashort Fund
March 31, 2024
Carefully consider the Fund’s investment objectives, risk factors, charges, and expenses before investing. This and other information can be found in the Fund’s prospectus and its summary prospectus, which may be obtained by visiting delawarefunds.com/literature or calling 800 523-1918. Investors should read the prospectus and the summary prospectus carefully before investing.
You can obtain shareholder reports and prospectuses online instead of in the mail.
Visit delawarefunds.com/edelivery.
Experience Delaware Funds by Macquarie®
Macquarie Asset Management (MAM) is a global asset manager that aims to deliver positive impact for everyone. MAM’s public markets businesses trace their roots to 1929 and partner with institutional and individual clients to deliver specialist active investment capabilities across global equities, fixed income, and multi-asset solutions using a conviction-based, long-term approach to investing. In the US, retail investors recognize our Delaware Funds by Macquarie family of funds as one of the oldest mutual fund families.
If you are interested in learning more about creating an investment plan, contact your financial advisor.
You can learn more about Delaware Funds or obtain a prospectus for Delaware Investments Ultrashort Fund at delawarefunds.com/literature.
Manage your account online
| ● | Check your account balance and transactions |
| ● | View statements and tax forms |
| ● | Make purchases and redemptions |
Visit delawarefunds.com/account-access.
Macquarie Asset Management (MAM) is the asset management division of Macquarie Group. MAM is an integrated asset manager across public and private markets offering a diverse range of capabilities, including real assets, real estate, credit, equities, and multi-asset solutions.
The Fund is advised by Delaware Management Company, a series of Macquarie Investment Management Business Trust (MIMBT), a US registered investment adviser, and distributed by Delaware Distributors, L.P. (DDLP), an affiliate of MIMBT and Macquarie Group Limited.
Other than Macquarie Bank Limited ABN 46 008 583 542 (“Macquarie Bank”), any Macquarie Group entity noted in this document is not an authorized deposit-taking institution for the purposes of the Banking Act 1959 (Commonwealth of Australia). The obligations of these other Macquarie Group entities do not represent deposits or other liabilities of Macquarie Bank. Macquarie Bank does not guarantee or otherwise provide assurance in respect of the obligations of these other Macquarie Group entities. In addition, if this document relates to an investment, (a) the investor is subject to investment risk including possible delays in repayment and loss of income and principal invested and (b) none of Macquarie Bank or any other Macquarie Group entity guarantees any particular rate of return on or the performance of the investment, nor do they guarantee repayment of capital in respect of the investment.
The Fund is governed by US laws and regulations.
Table of contents
This annual report is for the information of Delaware Investments Ultrashort Fund shareholders, but it may be used with prospective investors when preceded or accompanied by the Fund’s current prospectus or summary prospectus. These documents are available at delawarefunds.com/literature.
Unless otherwise noted, views expressed herein are current as of March 31, 2024, and subject to change for events occurring after such date. These views are not intended to be investment advice, to forecast future events, or to guarantee future results.
The Fund is not FDIC insured and is not guaranteed. It is possible to lose the principal amount invested.
All third-party marks cited are the property of their respective owners.
© 2024 Macquarie Management Holdings, Inc.
Portfolio management review
| Delaware Investments Ultrashort Fund | March 31, 2024 (Unaudited) |
| Performance preview (for the year ended March 31, 2024) | | |
| Delaware Investments Ultrashort Fund (Institutional Class shares) | 1-year return | +5.38% |
| ICE BofA US 6-Month Treasury Bill Index (benchmark) | 1-year return | +5.22% |
Past performance does not guarantee future results.
For complete, annualized performance for Delaware Investments Ultrashort Fund, please see the table on page 4. Institutional Class shares are not subject to a sales charge and are offered for sale exclusively to certain eligible investors. In addition, Institutional Class shares pay no distribution and service fee.
The performance of Institutional Class shares reflects the reinvestment of all distributions.
Please see page 6 for a description of the index. Index performance returns do not reflect any management fees, transaction costs, or expenses. Indices are unmanaged and one cannot invest directly in an index.
Investment objective
The Fund seeks total return to the extent consistent with a relatively low volatility of principal.
Significant Fund Event
On May 24, 2023, the Fund’s Board of Trustees approved the conversion of the Fund’s outstanding Class A, Class C, and Class L shares into the Fund’s Institutional Class shares (the “Conversion”). No contingent deferred sales charge or other fees will be assessed in connection with the Conversion. Effective July 31, 2023, the Fund offers only Institutional Class shares. There are no minimum initial purchase or eligibility requirements to purchase Institutional Class shares of the Fund.
Market review
During the Fund’s fiscal year ended March 31, 2024, declining inflation and the US Federal Reserve’s decision to pause interest rate hikes were the two most important economic factors influencing credit markets. Short-term rates were highly volatile during the period. For example, the 2-year Treasury yield peaked at 5.2% in October 2023 before bottoming out at 4.15% in January 2024.
The Fed signaled in November 2023 and again in December that rate cuts were likely in
| Relative to our peers, we believe the Fund remains well positioned. In anticipation of a potential recession, we are slowly reducing our underweight in duration relative to the index. We could potentially go slightly long to take advantage of a pivot once the Fed shifts from raising interest rates to reducing them. We think being slightly long duration would potentially benefit the Fund when that change occurs. Presently, our intention is to move closer to neutral duration. |
Portfolio management review
Delaware Investments Ultrashort Fund
2024. That led to a market rally as investors speculated that there could be as many as six or seven quarter-point interest rate cuts during the year. But economic data in early 2024 showing an increase in inflation damped investors’ enthusiasm. Markets responded by pricing in just two or three reductions, a meaningful shift.
Geopolitics also played a role as the wars in Ukraine and the Middle East pushed US government spending higher, raising concern over the country’s growing fiscal deficit.
Within the Fund
For the fiscal year ended March 31, 2024, Delaware Investments Ultrashort Fund outperformed its benchmark, the ICE BofA US 6-Month Treasury Bill Index. The Fund’s Institutional Class shares gained 5.38%. For the same period, the Fund’s benchmark gained 5.22%. Complete annualized performance for Delaware Investments Ultrashort Fund is shown in the table on page 4.
Unlike many other investors, the Fund’s management team always viewed the prospect of six or seven rate cuts in 2024 as overly optimistic. Given the strength of the US economy, midway through the fiscal period we thought that three or four cuts in 2024 was more likely. By the end of the fiscal period, we thought even that was doubtful. In hindsight, we think that our evaluation of the Fed’s likely course of action was more accurate than that of investors in general.
Consequently, we maintained an index-level, or neutral, duration in the Fund. (Duration is a measure of an investment’s sensitivity to changes in interest rates.) We thought that if we extended duration in a meaningful way, we would have been giving up yield and would be more susceptible to greater interest rate volatility, which is what we saw happen in the marketplace as the period came to a close.
We think our positioning worked out well. We held some floating rate assets, predominantly in asset-backed securities (ABS). With the delay in Fed action, those assets produced more yield than other fixed-rate instruments. In our opinion, a slower-than-anticipated pace of declining interest rates now seems likely, and we have positioned the Fund for that scenario.
We readjusted the Fund’s sector allocation during the Fund’s fiscal year given credit-market dynamics. Over the past 18 months, investment grade corporate bonds performed well. As a result, yields in investment grade grew less attractive than other parts of the market that the Fund had access to. We initiated sector rotation as investment grade bonds rallied, increasing exposure to ABS and Treasury bills. That provided a boost to yield and increased the Fund’s liquidity.
We also decreased our exposure to commercial paper, investment grade corporates, and commercial mortgage-backed securities (CMBS) while adding exposure to ABS, where we saw better relative value opportunities.
ABS and investment grade bonds were the key contributors to the Fund’s relative performance. Commercial paper also contributed, albeit to a lesser extent. Security selection was positive overall, and our yield-curve positioning likewise contributed.
Within ABS, spread differential was a key element. There was a lot of ABS supply over the past six months, which helped keep spreads relatively stable compared to other sectors. That was positive for yield as well. ABS provided a very attractive yield profile per unit of duration.
Commercial paper contributed to relative returns with fairly high yields for a short duration, money market type of instrument. Given the shape of the yield curve, those asset classes offered high yields considering their status as very high-quality low-risk assets.
We’ve started to see commercial paper gradually moderate given the expectation that rates will slowly come down. As a result, we pulled back exposure a bit near fiscal year end. Overall, in the past 12 months, the yield profile for commercial paper was very attractive and accretive to performance.
Detractors from the Fund’s relative performance were predominantly rate related. Later in the reporting period, rates began to trend higher as uncertainty about rate cuts increased.
We increased our allocation to Treasury bills and government bonds to improve liquidity. However, that detracted from performance as spread products performed well versus Treasurys during the past 12 months. With fixed rates moving higher, that was a drag on performance.
An economic hard landing is one risk that we’ve considered at fiscal year end as we look at market risks and opportunities. If that were to happen, it could certainly push spread products wider given the market’s current expectation for a soft landing or no landing scenario.
Regarding opportunities, we have positioned the portfolio for a soft landing or a no landing scenario with gradually lower rates. Given that there’s a little bit of uncertainty on the economic landing and how many rate cuts we’ll see, it seemed prudent for us to stay duration neutral. So, if that anticipated glide path of a soft landing and gradually lower rates unfolds, we believe the portfolio is positioned well. At this point, we expect the Fed will be patient, as it wouldn’t have much to gain from being too quick to initiate that first rate cut.
Performance summary
| Delaware Investments Ultrashort Fund | March 31, 2024 (Unaudited) |
The performance quoted represents past performance and does not guarantee future results. Investment return and principal value of an investment will fluctuate so that shares, when redeemed, may be worth more or less than their original cost. Current performance may be lower or higher than the performance quoted. Performance data current to the most recent month end may be obtained by calling 800 523-1918 or visiting delawarefunds.com/performance.
| Fund and benchmark performance1,2 | Average annual total returns through March 31, 2024 |
| | 1 year | 5 year | Lifetime |
| Institutional Class (Est. January 5, 2016) | | | |
| Excluding sales charge | +5.38% | +2.07% | +1.84% |
| Including sales charge | +5.38% | +2.07% | +1.84% |
| ICE BofA US 6-Month Treasury Bill Index | +5.22% | +2.14% | +1.80% |
1Returns reflect the reinvestment of all distributions and are presented both with and without the applicable sales charges described below. Returns do not reflect the deduction of taxes the shareholder would pay on Fund distributions or redemptions of Fund shares.
Expense limitations were in effect for certain classes during some or all of the periods shown in the “Fund and benchmark performance” table. Expenses for each class are listed in the “Fund expense ratios” table on page 5. Performance would have been lower had expense limitations not been in effect.
Institutional Class shares are not subject to a sales charge and are offered for sale exclusively to certain eligible investors. In addition, Institutional Class shares pay no 12b-1 fee.
Fixed income securities and bond funds can lose value, and investors can lose principal, as interest rates rise. They also may be affected by economic conditions that hinder an issuer’s ability to make interest and principal payments on its debt. This includes prepayment risk, the risk that the principal of a bond that is held by a portfolio will be prepaid prior to maturity at the time when interest rates are lower than what the bond was paying. A portfolio may then have to reinvest that money at a lower interest rate.
International investments entail risks including fluctuation in currency values, differences in accounting principles, or economic or political instability. Investing in emerging markets can be riskier than investing in established foreign markets due to increased volatility, lower trading volume, and higher risk of market closures. In many emerging markets, there is substantially less publicly available information and the available information may be incomplete or misleading.
Legal claims are generally more difficult to pursue.
The Fund may invest in derivatives, which may involve additional expenses and are subject to risk, including the risk that an underlying security or securities index moves in the opposite direction from what the portfolio manager anticipated. A derivatives transaction depends upon the counterparties’ ability to fulfill their contractual obligations.
Interest payments on inflation-indexed debt securities will vary as the principal and/or interest is adjusted for inflation.
IBOR risk is the risk that changes related to the use of the London interbank offered rate (LIBOR) or similar rates (such as EONIA) could have adverse impacts on financial instruments that reference these rates.
The abandonment of these rates and transition to alternative rates could affect the value and liquidity of instruments that reference them and could affect investment strategy performance.
The disruptions caused by natural disasters, pandemics, or similar events could prevent the Fund from executing advantageous investment decisions in a timely manner and could negatively impact the Fund’s ability to achieve its investment objective and the value of the Fund’s investments.
2The Fund’s expense ratios, as described in the most recent prospectus, are disclosed in the following “Fund expense ratios” table. The expense ratios below may differ from the expense ratios in the “Financial highlights” since they are based on different time periods and the expense ratios in the prospectus include acquired fund fees and expenses, if any. See Note 2 in “Notes to financial statements” for additional details. Please see the “Financial highlights” section in this report for the most recent expense ratios.
| Fund expense ratios | Institutional Class | |
| Total annual operating expenses (without fee waivers) | 0.56% | |
| Net expenses (including fee waivers, if any) | 0.40% | |
| Type of waiver | Contractual | |
Performance summary
Delaware Investments Ultrashort Fund
Performance of a $10,000 investment1
For the period January 5, 2016 (inception date) through March 31, 2024
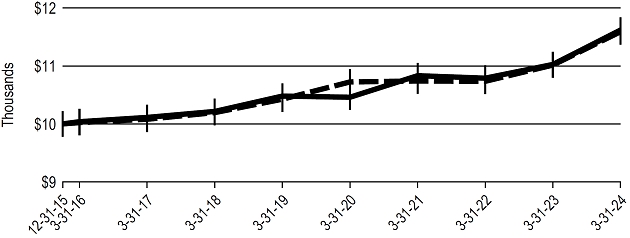
| | | | Starting value | | Ending value |
 | Delaware Investments Ultrashort Fund – Institutional Class shares | | | $10,000 | | | | $11,619 | |
 | ICE BofA US 6-Month Treasury Bill Index | | | $10,000 | | | | $11,590 | |
1The “Performance of a $10,000 investment” graph assumes $10,000 invested in Institutional Class shares of the Fund on January 5, 2016, and includes the reinvestment of all distributions. The graph does not reflect the deduction of taxes the shareholders would pay on Fund distributions or redemptions of Fund shares. Expense limitations were in effect for some or all of the periods shown. Performance would have been lower had expense limitations not been in effect. Expenses are listed in the “Fund expense ratios” table on page 5. Please note additional details on pages 4 through 7.
The graph also assumes $10,000 invested in the ICE BofA US 6-Month Treasury Bill Index as of December 31, 2015. The ICE BofA US 6-Month Treasury Bill Index tracks the performance of US Treasury bills with a maturity of six months. The index comprises a single Treasury issue purchased at the beginning of the month, which is then sold at the end of the month and rolled into a newly selected issue that matures closest to, but not beyond, six months from the transaction date (known as the rebalancing date).
An investment in asset-backed securities may involve risks. Asset-backed securities are often backed by a pool of assets representing the obligations of a number of different parties. The rate of principal payment on asset-backed securities generally depends on the rate of principal payments received on the underlying assets.
Index performance returns do not reflect any management fees, transaction costs, or expenses. Indices are unmanaged and one cannot invest directly in an index. Past performance does not guarantee future results.
| | Nasdaq symbol | CUSIP |
| Institutional Class | DULTX | 245910500 |
Disclosure of Fund expenses
For the six-month period from October 1, 2023 to March 31, 2024 (Unaudited)
As a shareholder of the Fund, you incur two types of costs: (1) transaction costs, including reinvested dividends, or other distributions; redemption fees; and exchange fees; and (2) ongoing costs, including management fees; and other Fund expenses. This example is intended to help you understand your ongoing costs (in dollars) of investing in the Fund and to compare these costs with the ongoing costs of investing in other mutual funds.
The example is based on an investment of $1,000 invested at the beginning of the period and held for the entire six-month period from October 1, 2023 to March 31, 2024.
Actual expenses
The first section of the table shown, “Actual Fund return,” provides information about actual account values and actual expenses. You may use the information in this section of the table, together with the amount you invested, to estimate the expenses that you paid over the period. Simply divide your account value by $1,000 (for example, an $8,600 account value divided by $1,000 = 8.6), then multiply the result by the number in the first section under the heading entitled “Expenses Paid During Period” to estimate the expenses you paid on your account during this period.
Hypothetical example for comparison purposes
The second section of the table shown, “Hypothetical 5% return,” provides information about hypothetical account values and hypothetical expenses based on the Fund’s actual expense ratio and an assumed rate of return of 5% per year before expenses, which is not the Fund’s actual return. The hypothetical account values and expenses may not be used to estimate the actual ending account balance or expenses you paid for the period. You may use this information to compare the ongoing costs of investing in the Fund and other funds. To do so, compare this 5% hypothetical example with the 5% hypothetical examples that appear in the shareholder reports of the other funds.
Please note that the expenses shown in the table are meant to highlight your ongoing costs only and do not reflect any transactional costs, such as redemption fees, or exchange fees. Therefore, the second section of the table is useful in comparing ongoing costs only, and will not help you determine the relative total costs of owning different funds. In addition, if these transactional costs were included, your costs would have been higher. The Fund’s expenses shown in the table reflect fee waivers in effect and assume reinvestment of all dividends and distributions.
Delaware Investments Ultrashort Fund
Expense analysis of an investment of $1,000
| | | Beginning
Account Value
10/1/23 | | Ending
Account Value
3/31/24 | | Annualized
Expense Ratio | | Expenses
Paid During Period
10/1/23 to 3/31/24* |
| Actual Fund return† | | | | | | | | | | |
| Institutional Class | | $ | 1,000.00 | | | $ | 1,028.80 | | | | 0.40% | | | $ | 2.03 | |
| Hypothetical 5% return (5% return before expenses) |
| Institutional Class | | $ | 1,000.00 | | | $ | 1,023.00 | | | | 0.40% | | | $ | 2.02 | |
*“Expenses Paid During Period” are equal to the Fund’s annualized expense ratio, multiplied by the average account value over the period, multiplied by 183/366 (to reflect the one-half year period).
†Because actual returns reflect only the most recent six-month period, the returns shown may differ significantly from fiscal year returns.
In addition to the Fund’s expenses reflected above, the Fund also indirectly bears its portion of the fees and expenses of any investment companies (Underlying Funds), in which it invests. The table above does not reflect the expenses of any Underlying Funds.
Security type / sector allocations
| Delaware Investments Ultrashort Fund | As of March 31, 2024 (Unaudited) |
Sector designations may be different from the sector designations presented in other Fund materials. The sector designations may represent the investment manager’s internal sector classifications, which may result in the sector designations for one fund being different from another fund’s sector designations.
| Security type / sector | | Percentage of net assets |
| Agency Commercial Mortgage-Backed Security | | | 0.61 | % |
| Collateralized Debt Obligations | | | 2.18 | % |
| Corporate Bonds | | | 4.96 | % |
| Non-Agency Asset-Backed Securities | | | 39.12 | % |
| Commercial Papers | | | 34.15 | % |
| Banking | | | 26.70 | % |
| Brokerage | | | 3.41 | % |
| Financials | | | 2.52 | % |
| Natural Gas | | | 1.52 | % |
| Short-Term Investments | | | 21.12 | % |
| Total Value of Securities | | | 102.14 | % |
| Liabilities Net of Receivables and Other Assets | | | (2.14 | %) |
| Total Net Assets | | | 100.00 | % |
Schedule of investments
| Delaware Investments Ultrashort Fund | March 31, 2024 |
| | | Principal
amount° | | | Value (US $) | |
| Agency Commercial Mortgage-Backed Security — 0.61% | | | | | | |
| FREMF Mortgage Trust Series 2017-K729 B 144A 3.684% 11/25/49 #, • | | | 750,000 | | | $ | 736,989 | |
| Total Agency Commercial Mortgage-Backed Security (cost $747,362) | | | | | | | 736,989 | |
| | | | | | | | | |
| Collateralized Debt Obligations — 2.18% | | | | | | | | |
| Goldentree Loan Management US CLO Series 2022-15A XR 144A 6.618% (TSFR03M + 1.30%, Floor 1.30%) 10/20/36 #, • | | | 2,625,000 | | | | 2,624,743 | |
| Total Collateralized Debt Obligations (cost $2,625,000) | | | | | | | 2,624,743 | |
| | | | | | | | | |
| Corporate Bonds — 4.96% | | | | | | | | |
| Consumer Non-Cyclical — 1.66% | | | | | | | | |
| Gilead Sciences 3.70% 4/1/24 | | | 2,000,000 | | | | 2,000,000 | |
| | | | | | | | 2,000,000 | |
| Insurance — 2.27% | | | | | | | | |
| Athene Global Funding 144A 6.057% (SOFR + 0.70%) 5/24/24 #, • | | | 1,490,000 | | | | 1,490,804 | |
| Brighthouse Financial Global Funding 144A 6.109% (SOFR + 0.76%) 4/12/24 #, • | | | 1,250,000 | | | | 1,250,124 | |
| | | | | | | | 2,740,928 | |
| Real Estate Investment Trusts — 1.03% | | | | | | | | |
| Public Storage 5.82% (SOFR + 0.47%) 4/23/24 • | | | 1,250,000 | | | | 1,250,110 | |
| | | | | | | | 1,250,110 | |
| Total Corporate Bonds (cost $5,990,000) | | | | | | | 5,991,038 | |
| | | | | | | | | |
| Non-Agency Asset-Backed Securities — 39.12% | | | | | | | | |
| American Express Credit Account Master Trust Series 2021-1 A 0.90% 11/15/26 | | | 2,100,000 | | | | 2,038,648 | |
| Avis Budget Rental Car Funding AESOP Series 2019-2A A 144A 3.35% 9/22/25 # | | | 300,000 | | | | 298,216 | |
| BA Credit Card Trust Series 2022-A2 5.00% 4/15/28 | | | 2,250,000 | | | | 2,244,109 | |
| Barclays Dryrock Issuance Trust Series 2023-2 A 6.219% (SOFR + 0.90%) 8/15/28 • | | | 2,000,000 | | | | 2,013,133 | |
| BMW Vehicle Lease Trust Series 2023-1 A3 5.16% 11/25/25 | | | 2,734,000 | | | | 2,727,572 | |
| BMW Vehicle Owner Trust Series 2023-A A2B 5.75% (SOFR + 0.43%) 4/27/26 • | | | 1,272,950 | | | | 1,273,833 | |
| CARDS II Trust Series 2021-1A A 144A 0.602% 4/15/27 # | | | 2,000,000 | | | | 1,995,889 | |
Schedule of investments
Delaware Investments Ultrashort Fund
| | | Principal
amount° | | | Value (US $) | |
| Non-Agency Asset-Backed Securities (continued) | | | | | | | | |
| CarMax Auto Owner Trust Series 2021-2 A3 0.52% 2/17/26 | | | 846,557 | | | $ | 832,676 | |
| Chase Issuance Trust Series 2022-A1 A 3.97% 9/15/27 | | | 2,490,000 | | | | 2,447,211 | |
| Citizens Auto Receivables Trust Series 2024-1 A2B 144A 5.919% (SOFR + 0.60%) 10/15/26 #, • | | | 1,800,000 | | | | 1,801,455 | |
| CNH Equipment Trust Series 2022-A A3 2.94% 7/15/27 | | | 1,867,085 | | | | 1,821,364 | |
| Dell Equipment Finance Trust Series 2023-1 A3 144A 5.65% 9/22/28 # | | | 2,000,000 | | | | 2,004,500 | |
| Enterprise Fleet Financing | | | | | | | | |
| Series 2021-3 A2 144A 0.77% 8/20/27 # | | | 264,605 | | | | 260,033 | |
| Series 2022-4 A2 144A 5.76% 10/22/29 # | | | 961,786 | | | | 963,316 | |
| Series 2023-3 A2 144A 6.40% 3/20/30 # | | | 2,000,000 | | | | 2,030,590 | |
| GM Financial Consumer Automobile Receivables Trust Series 2021-4 A3 0.68% 9/16/26 | | | 1,487,991 | | | | 1,444,891 | |
| GTE Auto Receivables Trust Series 2023-1 A2 144A 5.65% 8/17/26 # | | | 609,643 | | | | 608,816 | |
| Harley-Davidson Motorcycle Trust Series 2023-A A2B 5.849% (SOFR + 0.53%) 6/15/26 • | | | 607,844 | | | | 608,174 | |
| Honda Auto Receivables Owner Trust Series 2021-1 A3 0.27% 4/21/25 | | | 97,875 | | | | 97,315 | |
| Hyundai Auto Receivables Trust Series 2023-B A2B 5.799% (SOFR + 0.48%) 5/15/26 • | | | 1,754,585 | | | | 1,756,523 | |
| Master Credit Card Trust Series 2021-1A A 144A 0.53% 11/21/25 # | | | 1,500,000 | | | | 1,489,545 | |
| NextGear Floorplan Master Owner Trust Series 2024-1A A1 144A 6.219% (SOFR + 0.90%, Floor 0.90%) 3/15/29 #, • | | | 2,000,000 | | | | 2,002,721 | |
| OCCU Auto Receivables Trust Series 2023-1A A2 144A 6.23% 4/15/27 # | | | 928,028 | | | | 930,813 | |
| PFS Financing Series 2021-A A 144A 0.71% 4/15/26 # | | | 2,500,000 | | | | 2,494,792 | |
| Porsche Financial Auto Securitization Trust Series 2023-2A A2B 144A 5.90% (SOFR + 0.58%) 11/23/26 #, • | | | 1,482,141 | | | | 1,483,201 | |
| Toyota Auto Receivables Owner Trust | | | | | | | | |
| Series 2021-A A4 0.39% 6/15/26 | | | 1,511,000 | | | | 1,466,244 | |
| Series 2022-C A2B 5.889% (SOFR + 0.57%) 8/15/25 • | | | 173,675 | | | | 173,771 | |
| Series 2023-A A3 4.63% 9/15/27 | | | 1,500,000 | | | | 1,486,923 | |
| Verizon Master Trust Series 2021-2 A 0.99% 4/20/28 | | | 2,786,000 | | | | 2,716,980 | |
| Volkswagen Auto Loan Enhanced Trust Series 2023-2 A2B 5.949% (SOFR + 0.63%) 3/22/27 • | | | 2,000,000 | | | | 2,004,229 | |
| World Omni Auto Receivables Trust Series 2022-B A2A 2.77% 10/15/25 | | | 192,203 | | | | 191,900 | |
| | | Principal
amount° | | | Value (US $) | |
| Non-Agency Asset-Backed Securities (continued) | | | | | | | | |
| World Omni Auto Receivables Trust Series 2023-D A2B 5.899% (SOFR + 0.58%) 2/16/27 • | | | 1,500,000 | | | $ | 1,504,026 | |
| Total Non-Agency Asset-Backed Securities (cost $47,085,049) | | | | | | | 47,213,409 | |
| | | | | | | | | |
| Commercial Papers — 34.15% | | | | | | | | |
| Banking — 26.70% | | | | | | | | |
| Bank Of Montreal 5.911% 7/5/24 | | | 4,500,000 | | | | 4,434,128 | |
| BPCE 5.343% 1/14/25 | | | 5,000,000 | | | | 4,789,178 | |
| HSBC USA | | | | | | | | |
| 5.544% 10/4/24 | | | 1,500,000 | | | | 1,456,181 | |
| 11.813% 2/12/25 | | | 4,000,000 | | | | 3,801,644 | |
| Lloyds Bank Corporate Markets 5.892% 5/3/24 | | | 3,015,000 | | | | 2,998,885 | |
| National Bank Of Canada 5.809% 4/16/24 | | | 3,000,000 | | | | 2,991,552 | |
| Natwest Markets 6.372% 5/21/24 | | | 2,000,000 | | | | 1,984,031 | |
| Societe Generale | | | | | | | | |
| 5.874% 5/6/24 | | | 2,000,000 | | | | 1,988,368 | |
| 9.514% 6/21/24 | | | 2,850,000 | | | | 2,814,357 | |
| Toronto-Dominion 6.036% 5/16/24 | | | 5,000,000 | | | | 4,963,948 | |
| | | | | | | | 32,222,272 | |
| Brokerage — 3.41% | | | | | | | | |
| BofA Securities 7.568% 7/19/24 | | | 3,170,000 | | | | 3,116,547 | |
| Citigroup Global Markets Inc. 5.86% 5/1/24 | | | 1,000,000 | | | | 994,905 | |
| | | | | | | | 4,111,452 | |
| Financials — 2.52% | | | | | | | | |
| ING US Funding | | | | | | | | |
| 5.387% 11/27/24 | | | 2,500,000 | | | | 2,411,093 | |
| 5.474% 9/9/24 | | | 650,000 | | | | 634,240 | |
| | | | | | | | 3,045,333 | |
| Natural Gas — 1.52% | | | | | | | | |
| Wisconsin Gas 5.403% 4/1/24 | | | 1,840,000 | | | | 1,838,892 | |
| | | | | | | | 1,838,892 | |
| Total Commercial Papers (cost $41,246,085) | | | | | | | 41,217,949 | |
Schedule of investments
Delaware Investments Ultrashort Fund
| | | Number of
shares | | | Value (US $) | |
| Short-Term Investments — 21.12% | | | | | | | | |
| Money Market Mutual Funds — 0.06% | | | | | | | | |
| BlackRock Liquidity FedFund – Institutional Shares (seven-day effective yield 5.20%) | | | 17,275 | | | $ | 17,275 | |
| Fidelity Investments Money Market Government Portfolio – Class I (seven-day effective yield 5.21%) | | | 17,274 | | | | 17,274 | |
| Goldman Sachs Financial Square Government Fund – Institutional Shares (seven-day effective yield 5.34%) | | | 17,274 | | | | 17,274 | |
| Morgan Stanley Institutional Liquidity Funds Government Portfolio – Institutional Class (seven-day effective yield 5.22%) | | | 17,274 | | | | 17,274 | |
| | | | | | | | 69,097 | |
| | | | | | | | | |
| | | Principal
amount° | | | | | |
| US Treasury Obligation — 21.06% | | | | | | | | |
| US Treasury Bill 5.233% 9/5/24^ | | | 26,000,000 | | | | 25,420,130 | |
| | | | | | | | 25,420,130 | |
| Total Short-Term Investments (cost $25,490,644) | | | | | | | 25,489,227 | |
Total Value of Securities—102.14%
(cost $123,184,140) | | | | | | $ | 123,273,355 | |
| ° | Principal amount shown is stated in USD unless noted that the security is denominated in another currency. |
| # | Security exempt from registration under Rule 144A of the Securities Act of 1933, as amended. At March 31, 2024, the aggregate value of Rule 144A securities was $24,466,547, which represents 20.27% of the Fund’s net assets. See Note 8 in “Notes to financial statements.” |
| • | Variable rate investment. Rates reset periodically. Rate shown reflects the rate in effect at March 31, 2024. For securities based on a published reference rate and spread, the reference rate and spread are indicated in their descriptions. The reference rate descriptions (i.e. SOFR01M, SOFR03M, etc.) used in this report are identical for different securities, but the underlying reference rates may differ due to the timing of the reset period. Certain variable rate securities are not based on a published reference rate and spread but are determined by the issuer or agent and are based on current market conditions, or for mortgage-backed securities, are impacted by the individual mortgages which are paying off over time. These securities do not indicate a reference rate and spread in their descriptions. |
| ^ | Zero-coupon security. The rate shown is the effective yield at the time of purchase. |
Summary of abbreviations:
BofA – Bank of America
CLO – Collateralized Loan Obligation
Summary of abbreviations: (continued)
FREMF – Freddie Mac Multifamily
SOFR – Secured Overnight Financing Rate
SOFR01M – Secured Overnight Financing Rate 1 Month
SOFR03M – Secured Overnight Financing Rate 3 Month
TSFR03M – 3 Month Term Secured Overnight Financing Rate
USD – US Dollar
See accompanying notes, which are an integral part of the financial statements.
Statement of assets and liabilities
| Delaware Investments Ultrashort Fund | March 31, 2024 |
| Assets: | | | | |
| Investments, at value* | | $ | 123,273,355 | |
| Cash | | | 1,125 | |
| Dividends and interest receivable | | | 180,764 | |
| Receivable due from Advisor | | | 107,398 | |
| Receivable for fund shares sold | | | 75,759 | |
| Prepaid expenses | | | 32,559 | |
| Other assets | | | 555 | |
| Total Assets | | | 123,671,515 | |
| Liabilities: | | | | |
| Payable for securities purchased | | | 2,412,667 | |
| Payable for fund shares redeemed | | | 455,469 | |
| Other accrued expenses | | | 82,307 | |
| Administration expenses payable to affiliates | | | 16,914 | |
| Distribution payable | | | 8,524 | |
| Total Liabilities | | | 2,975,881 | |
| Total Net Assets | | $ | 120,695,634 | |
| | | | | |
| Net Assets Consist of: | | | | |
| Paid-in capital | | $ | 120,981,101 | |
| Total distributable earnings (loss) | | | (285,467 | ) |
| Total Net Assets | | $ | 120,695,634 | |
| | | | | |
| Net Asset Value | | | | |
| | | | | |
| Institutional Class: | | | | |
| Net assets | | $ | 120,695,634 | |
| Shares of beneficial interest outstanding, unlimited authorization, no par | | | 12,124,008 | |
| Net asset value per share | | $ | 9.96 | |
| | | | |
| *Investments, at cost | | $ | 123,184,140 | |
See accompanying notes, which are an integral part of the financial statements.
Statement of operations
| Delaware Investments Ultrashort Fund | Year ended March 31, 2024 |
| Investment Income: | | | |
| Interest | | $ | 7,268,665 | |
| Dividends | | | 28,556 | |
| | | | 7,297,221 | |
| | | | | |
| Expenses: | | | | |
| Management fees | | | 415,877 | |
| Distribution expenses — Class A | | | 29,623 | |
| Distribution expenses — Class C | | | 16,365 | |
| Dividend disbursing and transfer agent fees and expenses | | | 120,604 | |
| Registration fees | | | 82,073 | |
| Legal fees | | | 70,351 | |
| Accounting and administration expenses | | | 53,665 | |
| Audit and tax fees | | | 38,303 | |
| Reports and statements to shareholders expenses | | | 34,252 | |
| Custodian fees | | | 9,861 | |
| Trustees’ fees and expenses | | | 7,648 | |
| Other | | | 27,567 | |
| | | | 906,189 | |
| Less expenses waived | | | (305,377 | ) |
| Less waived distribution expenses — Class A | | | (29,623 | ) |
| Less waived distribution expenses — Class C | | | (16,365 | ) |
| Less expenses paid indirectly | | | (322 | ) |
| Total operating expenses | | | 554,502 | |
| Net Investment Income (Loss) | | | 6,742,719 | |
| | | | | |
| Net Realized and Unrealized Gain (Loss): | | | | |
| Net realized gain (loss) on investments | | | 965 | |
| Net change in unrealized appreciation (depreciation) on investments | | | 422,510 | |
| Net Realized and Unrealized Gain (Loss) | | | 423,475 | |
| Net Increase (Decrease) in Net Assets Resulting from Operations | | $ | 7,166,194 | |
See accompanying notes, which are an integral part of the financial statements.
Statements of changes in net assets
Delaware Investments Ultrashort Fund
| | | Year ended | |
| | | 3/31/24 | | | 3/31/23 | |
| Increase (Decrease) in Net Assets from Operations: | | | | | | | | |
| Net investment income (loss) | | $ | 6,742,719 | | | $ | 3,314,027 | |
| Net realized gain (loss) | | | 965 | | | | (33,621 | ) |
| Net change in unrealized appreciation (depreciation) | | | 422,510 | | | | (4,431 | ) |
| Net increase (decrease) in net assets resulting from operations | | | 7,166,194 | | | | 3,275,975 | |
| | | | | | | | | |
| Dividends and Distributions to Shareholders from: | | | | | | | | |
| Distributable earnings: | | | | | | | | |
| Class A1 | | | (939,352 | ) | | | (2,011,139 | ) |
| Class C1 | | | (54,584 | ) | | | (132,860 | ) |
| Class L1 | | | (382,846 | ) | | | (875,615 | ) |
| Institutional Class | | | (5,325,504 | ) | | | (241,121 | ) |
| | | | (6,702,286 | ) | | | (3,260,735 | ) |
| | | | | | | | | |
| Capital Share Transactions (See Note 6): | | | | | | | | |
| Proceeds from shares sold: | | | | | | | | |
| Class A1 | | | 8,926,067 | | | | 122,032,688 | |
| Class C1 | | | 266,622 | | | | 4,271,779 | |
| Class L1 | | | 7,417 | | | | 2,787 | |
| Institutional Class | | | 145,747,342 | | | | 18,142,376 | |
| | | | | | | | | |
| Net asset value of shares issued upon reinvestment of dividends and distributions: | | | | | | | | |
| Class A1 | | | 916,645 | | | | 1,961,332 | |
| Class C1 | | | 54,286 | | | | 132,103 | |
| Class L1 | | | 376,660 | | | | 862,351 | |
| Institutional Class | | | 5,233,005 | | | | 239,916 | |
| | | | 161,528,044 | | | | 147,645,332 | |
| | | Year ended | |
| | | 3/31/24 | | | 3/31/23 |
| Capital Share Transactions (continued): | | | | | | | | |
| Cost of shares redeemed: | | | | | | | | |
| Class A1 | | $ | (98,447,641 | ) | | $ | (68,149,878 | ) |
| Class C1 | | | (5,772,191 | ) | | | (4,064,891 | ) |
| Class L1 | | | (36,532,082 | ) | | | (4,691,350 | ) |
| Institutional Class | | | (45,216,232 | ) | | | (6,727,139 | ) |
| | | | (185,968,146 | ) | | | (83,633,258 | ) |
| Increase (decrease) in net assets derived from capital share transactions | | | (24,440,102 | ) | | | 64,012,074 | |
| Net Increase (Decrease) in Net Assets | | | (23,976,194 | ) | | | 64,027,314 | |
| | | | | | | | | |
| Net Assets: | | | | | | | | |
| Beginning of year | | | 144,671,828 | | | | 80,644,514 | |
| End of year | | $ | 120,695,634 | | | $ | 144,671,828 | |
| 1 | On July 28, 2023, all Class A, Class C and Class L shares were converted into Institutional Class shares. These transactions are included in proceeds from shares sold of Institutional Class shares and cost of shares redeemed of Class A, Class C and Class L shares in the Statements of changes in net assets above and on the previous page. |
See accompanying notes, which are an integral part of the financial statements.
Financial highlights
Delaware Investments Ultrashort Fund Institutional Class
Selected data for each share of the Fund outstanding throughout each period were as follows:
| Net asset value, beginning of period |
| |
| Income (loss) from investment operations: |
| Net investment income1 |
| Net realized and unrealized gain (loss) |
| Total from investment operations |
| |
| Less dividends and distributions from: |
| Net investment income |
| Total dividends and distributions |
| |
| Net asset value, end of period |
| |
| Total return2 |
| |
| Ratios and supplemental data: |
| Net assets, end of period (000 omitted) |
| Ratio of expenses to average net assets3 |
| Ratio of expenses to average net assets prior to fees waived3 |
| Ratio of net investment income to average net assets |
| Ratio of net investment income (loss) to average net assets prior to fees waived |
| Portfolio turnover |
| 1 | Calculated using average shares outstanding. |
| 2 | Total return is based on the change in net asset value of a share during the period and assumes reinvestment of dividends and distributions at net asset value. Total return during the period presented reflects waivers by the manager. Performance would have been lower had the waivers not been in effect. |
| 3 | Expense ratios do not include expenses of any investment companies in which the Fund invests. |
See accompanying notes, which are an integral part of the financial statements.
| | Year ended | |
| | 3/31/24 | | | 3/31/23 | | | 3/31/22 | | | 3/31/21 | | | 3/31/20 | |
| | $ | 9.92 | | | $ | 9.94 | | | $ | 10.02 | | | $ | 9.75 | | | $ | 9.99 | |
| | | | | | | | | | | | | | | | | | | | |
| | | 0.51 | | | | 0.27 | | | | 0.02 | | | | 0.07 | | | | 0.22 | |
| | | 0.01 | | | | (0.06 | ) | | | (0.06 | ) | | | 0.27 | | | | (0.24 | ) |
| | | 0.52 | | | | 0.21 | | | | (0.04 | ) | | | 0.34 | | | | (0.02 | ) |
| | | | | | | | | | | | | | | | | | | | |
| | | | | | | | | | | | | | | | | | | | |
| | | (0.48 | ) | | | (0.23 | ) | | | (0.04 | ) | | | (0.07 | ) | | | (0.22 | ) |
| | | (0.48 | ) | | | (0.23 | ) | | | (0.04 | ) | | | (0.07 | ) | | | (0.22 | ) |
| | | | | | | | | | | | | | | | | | | | |
| | $ | 9.96 | | | $ | 9.92 | | | $ | 9.94 | | | $ | 10.02 | | | $ | 9.75 | |
| | | | | | | | | | | | | | | | | | | | |
| | | 5.38 | % | | | 2.19 | % | | | (0.39 | %) | | | 3.52 | % | | | (0.21 | %) |
| | | | | | | | | | | | | | | | | | | | |
| | $ | 120,696 | | | $ | 14,545 | | | $ | 2,874 | | | $ | 4,314 | | | $ | 4,053 | |
| | | 0.40 | % | | | 0.40 | % | | | 0.40 | % | | | 0.40 | % | | | 0.40 | % |
| | | 0.66 | % | | | 0.56 | % | | | 0.69 | % | | | 0.72 | % | | | 0.72 | % |
| | | 5.10 | % | | | 2.72 | % | | | 0.21 | % | | | 0.66 | % | | | 2.21 | % |
| | | 4.84 | % | | | 2.56 | % | | | (0.08 | %) | | | 0.34 | % | | | 1.89 | % |
| | | 81 | % | | | 72 | % | | | 53 | % | | | 83 | % | | | 82 | % |
Notes to financial statements
| Delaware Investments Ultrashort Fund | March 31, 2024 |
Delaware Group® Cash Reserve (Trust) is organized as a Delaware statutory trust and offers one series, Delaware Investments Ultrashort Fund (Fund). The Trust is an open-end investment company. The Fund is considered diversified under the Investment Company Act of 1940, as amended (1940 Act), and offers Institutional Class shares. Effective July 28, 2023, all remaining shares of Class A, Class C and Class L were converted to Institutional Class. Institutional Class shares are not subject to a sales charge and are offered for sale exclusively to certain eligible investors.
1. Significant Accounting Policies
The Fund follows accounting and reporting guidance under Financial Accounting Standards Board (FASB) Accounting Standards Codification Topic 946, Financial Services — Investment Companies. The following accounting policies are in accordance with US generally accepted accounting principles (US GAAP) and are consistently followed by the Fund.
Security Valuation — Fixed income securities are generally priced based upon valuations provided by an independent pricing service or broker in accordance with methodologies included within Delaware Management Company (DMC)’s Pricing Policy (the Policy). Fixed income security valuations are then reviewed by DMC as part of its duties as the Fund’s valuation designee and, to the extent required by the Policy and applicable regulation, fair valued consistent with the Policy. To the extent current market prices are not available, the pricing service may take into account developments related to the specific security, as well as transactions in comparable securities. Valuations for fixed income securities utilize matrix systems, which reflect such factors as security prices, yields, maturities, and ratings, and are supplemented by dealer and exchange quotations. For asset-backed securities, collateralized mortgage obligations (CMOs), commercial mortgage securities, and US government agency mortgage securities, pricing vendors utilize matrix pricing which considers prepayment speed, attributes of the collateral, yield or price of bonds of comparable quality, coupon, maturity, and type as well as broker/dealer-supplied prices. Open-end investment companies are valued at their published net asset value (NAV). Generally, other securities and assets for which market quotations are not readily available are valued at fair value as determined in good faith by DMC. Subject to the oversight of the Trust’s Board of Trustees (Board), DMC, as valuation designee, has adopted policies and procedures to fair value securities for which market quotations are not readily available consistent with the requirements of Rule 2a-5 under the 1940 Act. In determining whether market quotations are readily available or fair valuation will be used, various factors will be taken into consideration, such as market closures or suspension of trading in a security. Restricted securities and private placements are valued at fair value.
Federal Income Taxes — No provision for federal income taxes has been made as the Fund intends to continue to qualify for federal income tax purposes as a regulated investment company under Subchapter M of the Internal Revenue Code of 1986, as amended, and make the requisite distributions to shareholders. The Fund evaluates tax positions taken or expected to be taken in the course of preparing the Fund’s tax returns to determine whether the tax positions are “more-likely-than-not” of being sustained by the applicable tax authority. Tax positions not
deemed to meet the “more-likely-than-not” threshold are recorded as a tax benefit or expense in the current year. Management has analyzed the Fund’s tax positions taken or expected to be taken on the Fund’s federal income tax returns through the year ended March 31, 2024, and for all open tax years (years ended March 31, 2021–March 31, 2023), and has concluded that no provision for federal income tax is required in the Fund’s financial statements. If applicable, the Fund recognizes interest accrued on unrecognized tax benefits in interest expense and penalties in “Other” on the “Statement of operations.” During the year ended March 31, 2024, the Fund did not incur any interest or tax penalties.
Use of Estimates — The preparation of financial statements in conformity with US GAAP requires management to make estimates and assumptions that affect the fair value of investments, the reported amounts of assets and liabilities and disclosure of contingent assets and liabilities at the date of the financial statements, and the reported amounts of revenues and expenses during the reporting period. Actual results could differ from those estimates and the differences could be material.
Other — Expenses directly attributable to the Fund are charged directly to the Fund. Other expenses common to various funds within the Delaware Funds by Macquarie® (Delaware Funds) are generally allocated among such funds on the basis of average net assets. Management fees and certain other expenses are paid monthly. Security transactions are recorded on the date the securities are purchased or sold (trade date) for financial reporting purposes. Costs used in calculating realized gains and losses on the sale of investment securities are those of the specific securities sold. Interest income is recorded on an accrual basis. Income and capital gain distributions from any investment companies (Underlying Funds) in which the Fund invests are recorded on the ex-dividend date. Discounts and premiums on debt securities are accreted or amortized to interest income, respectively, over the lives of the respective securities using the effective interest method. Premiums on callable debt securities are amortized to interest income to the earliest call date using the effective interest method. Realized gains (losses) on paydowns of asset- and mortgage-backed securities are classified as interest income. The Fund declares dividends daily from net investment income and pays the dividends monthly and declares and pays distributions from net realized gain on investments, if any, at least annually. The Fund may distribute more frequently, if necessary for tax purposes. Dividends and distributions, if any, are recorded on the ex-dividend date.
The Fund receives earnings credits from its transfer agent when positive cash balances are maintained, which may be used to offset transfer agent fees. If the amount earned is greater than $1, the expenses paid under this arrangement are included on the “Statement of operations” under “Dividend disbursing and transfer agent fees and expenses” with the corresponding expenses offset included under “Less expenses paid indirectly.”
Notes to financial statements
Delaware Investments Ultrashort Fund
2. Investment Management, Administration Agreements, and Other Transactions with Affiliates
In accordance with the terms of its investment management agreement, the Fund pays DMC, a series of Macquarie Investment Management Business Trust and the investment manager, an annual fee which is calculated daily and paid monthly at the rate of 0.30% on average daily net assets of the Fund.
DMC has contractually agreed to waive all or a portion of its investment advisory fees and/or pay/reimburse expenses (excluding any taxes, interest, acquired fund fees and expenses, short sale dividend and interest expenses, brokerage fees, certain insurance costs, and nonroutine expenses or costs, including, but not limited to, those relating to reorganizations, litigation, conducting shareholder meetings, and liquidations), in order to prevent total annual fund operating expenses from exceeding 0.40% of the Fund’s average daily net assets from April 1, 2023 through July 30, 2024. These waivers and reimbursements may only be terminated by agreement of DMC and the Fund. The waivers and reimbursements are accrued daily and received monthly.
DMC may seek investment advice and recommendations from its affiliates: Macquarie Investment Management Austria Kapitalanlage AG, Macquarie Investment Management Europe Limited, and Macquarie Investment Management Global Limited (together, the Affiliated Sub-Advisors). DMC may also permit these Affiliated Sub-Advisors to execute Fund security trades on its behalf and exercise investment discretion for securities in certain markets where DMC believes it will be beneficial to utilize an Affiliated Sub-Advisor’s specialized market knowledge. Although the Affiliated Sub-Advisors serve as sub-advisors, DMC has ultimate responsibility for all investment advisory services. For these services, DMC, not the Fund, pays each Affiliated Sub-Advisor a portion of its investment management fee.
Delaware Investments Fund Services Company (DIFSC), an affiliate of DMC, provides fund accounting and financial administrative oversight services to the Fund. For these services, effective October 1, 2023, DIFSC’s fees are calculated daily and paid monthly, based on the aggregate daily net assets of all funds within the Delaware Funds at the following annual rates: 0.0050% of the first $60 billion; 0.00475% of the next $30 billion; and 0.0015% of aggregate average daily net assets in excess of $90 billion (Total Fee). Prior to October 1, 2023, DIFSC’s annual rates were: 0.00475% of the first $35 billion; 0.0040% of the next $10 billion; 0.0025% of the next $45 billion; and 0.0015% of aggregate average daily net assets in excess of $90 billion. Each fund in the Delaware Funds pays a minimum of $4,000, which, in aggregate, is subtracted from the Total Fee. Each fund then pays its portion of the remainder of the Total Fee on a relative NAV basis. This amount is included on the “Statement of operations” under “Accounting and administration expenses.” For the year ended March 31, 2024, the Fund paid $8,978 for these services.
DIFSC is also the transfer agent and dividend disbursing agent of the Fund. For these services, DIFSC’s fees are calculated daily and paid monthly, based on the aggregate daily net assets of the retail funds within the Delaware Funds at the following annual rates: 0.014% of the first
$20 billion; 0.011% of the next $5 billion; 0.007% of the next $5 billion; 0.004% of the next $20 billion; 0.002% of the next $25 billion; and 0.0015% of average daily net assets in excess of $75 billion. The fees payable to DIFSC under the shareholder services agreement described above are allocated among all retail funds in the Delaware Funds on a relative NAV basis. This amount is included on the “Statement of operations” under “Dividend disbursing and transfer agent fees and expenses.” For the year ended March 31, 2024, the Fund paid $9,032 for these services. Pursuant to a sub-transfer agency agreement between DIFSC and BNY Mellon Investment Servicing (US) Inc. (BNYMIS), BNYMIS provides certain sub- transfer agency services to the Fund. Sub-transfer agency fees are paid by the Fund and are also included on the “Statement of operations” under “Dividend disbursing and transfer agent fees and expenses.” The fees are calculated daily and paid as invoices on a monthly or quarterly basis.
As provided in the investment management agreement, the Fund bears a portion of the cost of certain resources shared with DMC, including the cost of internal personnel of DMC and/or its affiliates that provide legal and regulatory reporting services to the Fund. For the year ended March 31, 2024, the Fund paid $12,393 for internal legal and regulatory reporting services provided by DMC and/or its affiliates’ employees. This amount is included on the “Statement of operations” under “Legal fees.”
For the year ended March 31, 2024, DDLP earned $1,757 for commissions on sales of the Fund’s Class A shares. For the year ended March 31, 2024, DDLP received gross CDSC commissions of $8 and $56 on redemptions of the Fund’s Class A and Class C shares, respectively, and these commissions were entirely used to offset upfront commissions previously paid by DDLP to broker/dealers on sales of those shares.
Trustees’ fees include expenses accrued by the Fund for each Trustee’s retainer and meeting fees. Certain officers of DMC, DIFSC, and DDLP are officers and/or Trustees of the Trust. These officers and Trustees are paid no compensation by the Fund.
In addition to the management fees and other expenses of the Fund, the Fund indirectly bears the investment management fees and other expenses of any Underlying Funds, in which it invests. The amount of these fees and expenses incurred indirectly by the Fund will vary based upon the expense and fee levels of any Underlying Funds and the number of shares that are owned of any Underlying Funds at different times.
3. Investments
For the year ended March 31, 2024, the Fund made purchases and sales of investment securities other than short-term investments and US government securities as follows:
| Purchases | | $ | 47,788,643 | |
| Sales | | | 40,159,768 | |
Notes to financial statements
Delaware Investments Ultrashort Fund
3. Investments (continued)
The tax cost of investments includes adjustments to net unrealized appreciation (depreciation) which may not necessarily be the final tax cost basis adjustments but which approximate the tax basis unrealized gains and losses that may be realized and distributed to shareholders. At March 31, 2024, the cost and unrealized appreciation (depreciation) of investments for federal income tax purposes for the Fund were as follows:
| Cost of investments | | $ | 123,184,140 | |
| Aggregate unrealized appreciation of investments | | $ | 178,594 | |
| Aggregate unrealized depreciation of investments | | | (89,379 | ) |
| Net unrealized appreciation of investments | | $ | 89,215 | |
US GAAP defines fair value as the price that the Fund would receive to sell an asset or pay to transfer a liability in an orderly transaction between market participants at the measurement date under current market conditions. A three-level hierarchy for fair value measurements has been established based upon the transparency of inputs to the valuation of an asset or liability. Inputs may be observable or unobservable and refer broadly to the assumptions that market participants would use in pricing the asset or liability. Observable inputs reflect the assumptions market participants would use in pricing the asset or liability based on market data obtained from sources independent of the reporting entity. Unobservable inputs reflect the reporting entity’s own assumptions about the assumptions that market participants would use in pricing the asset or liability based on the best information available under the circumstances. The Fund’s investment in its entirety is assigned a level based upon the observability of the inputs which are significant to the overall valuation. The three-level hierarchy of inputs is summarized as follows:
| Level 1 – | Inputs are quoted prices in active markets for identical investments. (Examples: equity securities, open-end investment companies, futures contracts, and exchange-traded options contracts) |
| | |
| Level 2 – | Other observable inputs, including, but not limited to: quoted prices for similar assets or liabilities in markets that are active, quoted prices for identical or similar assets or liabilities in markets that are not active, inputs other than quoted prices that are observable for the assets or liabilities (such as interest rates, yield curves, volatilities, prepayment speeds, loss severities, credit risks, and default rates) or other market-corroborated inputs. (Examples: debt securities, government securities, swap contracts, forward foreign currency exchange contracts, foreign securities utilizing international fair value pricing, broker-quoted securities, and fair valued securities) |
| | |
| Level 3 – | Significant unobservable inputs, including the Fund’s own assumptions used to determine the fair value of investments. (Examples: broker-quoted securities and fair valued securities) |
Level 3 investments are valued using significant unobservable inputs. The Fund may also use an income-based valuation approach in which the anticipated future cash flows of the investment are discounted to calculate fair value. Discounts may also be applied due to the nature or
duration of any restrictions on the disposition of the investments. Valuations may also be based upon current market prices of securities that are comparable in coupon, rating, maturity, and industry. The derived value of a Level 3 investment may not represent the value which is received upon disposition and this could impact the results of operations.
The following table summarizes the valuation of the Fund’s investments by fair value hierarchy levels as of March 31, 2024:
| | | Level 1 | | | Level 2 | | | Total | |
| Securities | | | | | | | | | | | | |
| Assets: | | | | | | | | | | | | |
| Agency Commercial Mortgage-Backed Security | | $ | — | | | $ | 736,989 | | | $ | 736,989 | |
| Collateralized Debt Obligations | | | — | | | | 2,624,743 | | | | 2,624,743 | |
| Commercial Papers | | | — | | | | 41,217,949 | | | | 41,217,949 | |
| Corporate Bonds | | | — | | | | 5,991,038 | | | | 5,991,038 | |
| Non-Agency Asset-Backed Securities | | | — | | | | 47,213,409 | | | | 47,213,409 | |
| Short-Term Investments | | | 69,097 | | | | 25,420,130 | | | | 25,489,227 | |
| Total Value of Securities | | $ | 69,097 | | | $ | 123,204,258 | | | $ | 123,273,355 | |
During the year ended March 31, 2024, there were no transfers into or out of Level 3 investments. The Fund’s policy is to recognize transfers into or out of Level 3 investments based on fair value at the beginning of the reporting year.
A reconciliation of Level 3 investments is presented when the Fund has a significant amount of Level 3 investments at the beginning or end of the year in relation to the Fund’s net assets. As of March 31, 2024, there were no Level 3 investments.
4. Dividend and Distribution Information
Income and long-term capital gain distributions are determined in accordance with federal income tax regulations, which may differ from US GAAP. Additionally, distributions from net short-term gains on sales of investment securities are treated as ordinary income for federal income tax purposes. The tax character of dividends and distributions paid during the years ended March 31, 2024 and 2023 were as follows:
| | | Year ended | |
| | | 3/31/24 | | | 3/31/23 | |
| Ordinary income | | $ | 6,702,286 | | | $ | 3,260,735 | |
Notes to financial statements
Delaware Investments Ultrashort Fund
5. Components of Net Assets on a Tax Basis
As of March 31, 2024, the components of net assets on a tax basis were as follows:
| Shares of beneficial interest | | $ | 120,981,101 | |
| Undistributed ordinary income | | | 109,817 | |
| Distributions payable | | | (8,524 | ) |
| Capital loss carryforwards | | | (475,975 | ) |
| Unrealized appreciation of investments and foreign currencies | | | 89,215 | |
| Net assets | | $ | 120,695,634 | |
There are no differences between book basis and tax basis components of net assets.
For financial reporting purposes, capital accounts are adjusted to reflect the tax character of permanent book/tax differences. Results of operations and net assets were not affected by these reclassifications. For the year ended March 31, 2024, the Fund had no reclassifications.
For federal income tax purposes, capital loss carryforwards may be carried forward and applied against future capital gains. At March 31, 2024, the Fund has capital loss carryforwards available to offset future realized capital gains as follows:
| | Loss carryforward character | | | | | |
| | Short-term | | | Long-term | | | Total | | |
| | $ | 475,975 | | | $ | — | | | $ | 475,975 | | |
6. Capital Shares
Transactions in capital shares were as follows:
| | | Year ended | |
| | | 3/31/24 | | | 3/31/23 | |
| Shares sold: | | | | | | | | |
| Class A1 | | | 900,453 | | | | 12,335,388 | |
| Class C1 | | | 26,902 | | | | 431,681 | |
| Class L1 | | | 825 | | | | 203 | |
| Institutional Class | | | 14,675,997 | | | | 1,832,159 | |
| | | | | | | | | |
| Shares issued upon reinvestment of dividends and distributions: | | | | | | | | |
| Class A1 | | | 92,464 | | | | 198,134 | |
| Class C1 | | | 5,476 | | | | 13,345 | |
| Class L1 | | | 37,970 | | | | 87,074 | |
| Institutional Class | | | 526,045 | | | | 24,210 | |
| | | | 16,266,132 | | | | 14,922,194 | |
| | | Year ended | |
| | | 3/31/24 | | | 3/31/23 | |
| Shares redeemed: | | | | | | | | |
| Class A1 | | | (9,924,668 | ) | | | (6,883,810 | ) |
| Class C1 | | | (581,920 | ) | | | (410,560 | ) |
| Class L1 | | | (3,682,699 | ) | | | (473,737 | ) |
| Institutional Class | | | (4,544,486 | ) | | | (679,049 | ) |
| | | | (18,733,773 | ) | | | (8,447,156 | ) |
| Net increase (decrease) | | | (2,467,641 | ) | | | 6,475,038 | |
| 1 | On July 28, 2023, all Class A, Class C and Class L shares were converted into Institutional Class shares. These transactions are included as in shares sold of Institutional Class shares and shares redeemed of Class A, Class C and Class L shares in the tables above and on the previous page. |
Certain shareholders may exchange shares of one class for shares of another class in the same Fund. These exchange transactions are included in shares sold and shares redeemed in the tables on the previous page and on the “Statements of changes in net assets.” For the years ended March 31, 2024 and 2023, the Fund had the following exchange transactions:
| | | Exchange Redemptions | | | Exchange Subscriptions | | | | |
| | | | | | | | | | | | | | | Institutional | | | | |
| | | Class A | | | Class C | | | Class L | | | Class A | | | Class | | | | |
| | | Shares | | | Shares | | | Shares | | | Shares | | | Shares | | | Value | |
| Year ended | | | | | | | | | | | | | | | | | | | | | | | | |
| 3/31/24 | | | 18,873 | | | | 1,553 | | | | — | | | | 586 | | | | 19,834 | | | $ | 202,566 | |
| 3/31/23 | | | 458,878 | | | | 153,509 | | | | 4,678 | | | | 153,588 | | | | 463,794 | | | | 6,116,171 | |
7. Line of Credit
The Fund, along with certain other funds in the Delaware Funds (Participants), was a participant in a $355,000,000 revolving line of credit (Agreement) intended to be used for temporary or emergency purposes as an additional source of liquidity to fund redemptions of investor shares. Under the Agreement, the Participants were charged an annual commitment fee of 0.15%, which was allocated across the Participants based on a weighted average of the respective net assets of each Participant. The Participants were permitted to borrow up to a maximum of one-third of their net assets under the Agreement. Each Participant was individually, and not jointly, liable for its particular advances, if any, under the line of credit. The line of credit available under the Agreement expired on October 30, 2023.
On October 30, 2023, the Fund, along with the other Participants, entered into an amendment to the Agreement for a $335,000,000 revolving line of credit to be used as described above. It operates in substantially the same manner as the original Agreement. Under the amendment to the Agreement, the Participants are charged an annual commitment fee of 0.15%, which is
Notes to financial statements
Delaware Investments Ultrashort Fund
7. Line of Credit (continued)
allocated across the Participants based on a weighted average of the respective net assets of each Participant. The line of credit available under the Agreement expires on October 28, 2024.
The Fund had no amounts outstanding as of March 31, 2024, or at any time during the year then ended.
8. Credit and Market Risks
The impact of COVID-19, and other infectious illness outbreaks that may arise in the future, could adversely affect the economies of many nations or the entire global economy, individual issuers and capital markets in ways that cannot necessarily be foreseen.
When interest rates rise, fixed income securities (i.e. debt obligations) generally will decline in value. These declines in value are greater for fixed income securities with longer maturities or durations. Interest rate changes are influenced by a number of factors, such as government policy, monetary policy, inflation expectations, and the supply and demand of bonds. A fund may be subject to a greater risk of rising interest rates when interest rates are low or inflation rates are high or rising.
The Fund is subject to prepayment risk, which is the risk that the principal on mortgage-backed or asset-backed securities may be prepaid at any time, which will reduce the yield and market value.
The Fund invests in certain obligations that may have liquidity protection designed to ensure that the receipt of payments due on the underlying security is timely. Such protection may be provided through guarantees, insurance policies, or letters of credit obtained by the issuer or sponsor through third parties, through various means of structuring the transaction, or through a combination of such approaches. The Fund will not pay any additional fees for such credit support, although the existence of credit support may increase the price of a security.
The Fund may invest in mortgage-backed and asset-backed securities. Mortgage-backed and asset-backed securities, like other fixed income securities, are subject to credit risk and interest rate risk, and may also be subject to prepayment risk and extension risk. Mortgage-backed and asset-backed securities can be highly sensitive to interest rate changes. As a result, small movements in interest rates can substantially impact the value and liquidity of these securities. Prepayment risk is the risk that the principal on mortgage-backed or asset-backed securities may be prepaid at any time, which will reduce the yield and market value of the securities and may cause the Fund to reinvest the proceeds in lower yielding securities. Extension risk is the risk that principal on mortgage-backed or asset-backed securities will be repaid more slowly than expected, which may reduce the proceeds available for reinvestment in higher yielding securities and may cause the security to experience greater volatility due to the extended maturity of the security. When interest rates rise, the value of mortgage-backed and asset-backed securities can be expected to decline. When interest rates go down, however, the value of these securities may not increase as much as other fixed income securities due to borrowers refinancing their loans at
lower interest rates or prepaying their loans. In addition, mortgage-backed and asset-backed securities may decline in value, become more volatile, face difficulties in valuation, or experience reduced liquidity due to changes in general economic conditions. During periods of economic downturn, for example, underlying borrowers may not make timely payments on their loans and the value of property that secures the loans may decline in value such that it is worth less than the amount of the associated loans. If the collateral securing a mortgage-backed or asset-backed security is insufficient to repay the loan, the Fund could sustain a loss. Such risks generally will be heightened where a mortgage-backed or asset-backed security includes “subprime” loans. Although mortgage-backed securities are often supported by government guarantees or private insurance, there can be no guarantee that those obligations will be met. Furthermore, in certain economic conditions, loan servicers, loan originators and other participants in the market for mortgage-backed and other asset-backed securities may be unable to receive sufficient funding, impairing their ability to perform their obligations on the loans. Certain mortgage-backed or asset-backed securities may be more susceptible to these risks than other mortgage-backed, asset-backed, or fixed-income securities. For example, the Fund’s investments in CMOs, real estate mortgage investment conduits (“REMICs”), and stripped mortgage-backed securities are generally highly susceptible to interest rate risk, prepayment risk, and extension risk. At times, these investments may be difficult to value and/or illiquid. Some classes of CMOs and REMICs may have preference in receiving principal or interest payments relative to more junior classes. The market prices and yields of these junior classes will generally be more volatile than more senior classes and will be more susceptible to interest rate risk, prepayment risk, and extension risk than more senior classes. Stripped mortgage-backed securities that receive only payments of interest (“IOs”) will generally decrease in value if interest rates decline or prepayment rates increase. Stripped mortgage-backed securities that receive only payments of principal (“POs”) will generally decrease in value if interest rates increase or prepayment rates decrease. These changes in value can be substantial and could cause the Fund to lose the entire value of its investment in CMOs, REMICs, and stripped mortgage-backed securities.
The Fund may invest up to 5% of its net assets in illiquid securities, which may include securities with contractual restrictions on resale, securities exempt from registration under Rule 144A promulgated under the Securities Act of 1933 (Act), as amended, and other securities which may not be readily marketable. The relative illiquidity of these securities may impair the Fund from disposing of them in a timely manner and at a fair price when it is necessary or desirable to do so. While maintaining oversight, the Board has delegated to DMC the day-to-day functions of determining whether individual securities are liquid for purposes of the Fund’s limitation on investments in illiquid securities. The Fund may also invest in securities exempt from registration under Section 4(2) of the Act, which exempts from registration transactions by an issuer not involving any public offering. Securities eligible for resale pursuant to Rule 144A, which are determined to be liquid, are not subject to the Fund’s 5% limit on investments in illiquid securities. Rule 144A securities have been identified on the “Schedule of investments.”
Notes to financial statements
Delaware Investments Ultrashort Fund
9. Contractual Obligations
The Fund enters into contracts in the normal course of business that contain a variety of indemnifications. The Fund’s maximum exposure under these arrangements is unknown. However, the Fund has not had prior claims or losses pursuant to these contracts. Management has reviewed the Fund’s existing contracts and expects the risk of loss to be remote.
10. Subsequent Events
Management has determined that no material events or transactions occurred subsequent to March 31, 2024, that would require recognition or disclosure in the Fund’s financial statements.
Report of independent registered public accounting firm
To the Board of Trustees of Delaware Group® Cash Reserve and Shareholders of Delaware Investments Ultrashort Fund
Opinion on the Financial Statements
We have audited the accompanying statement of assets and liabilities, including the schedule of investments, of Delaware Investments Ultrashort Fund (one of the funds constituting Delaware Group® Cash Reserve, referred to hereafter as the “Fund”) as of March 31, 2024, the related statement of operations for the year ended March 31, 2024, the statement of changes in net assets for each of the two years in the period ended March 31, 2024, including the related notes, and the financial highlights for each of the five years in the period ended March 31, 2024 (collectively referred to as the “financial statements”). In our opinion, the financial statements present fairly, in all material respects, the financial position of the Fund as of March 31, 2024, the results of its operations for the year then ended, the changes in its net assets for each of the two years in the period ended March 31, 2024 and the financial highlights for each of the five years in the period ended March 31, 2024 in conformity with accounting principles generally accepted in the United States of America.
Basis for Opinion
These financial statements are the responsibility of the Fund’s management. Our responsibility is to express an opinion on the Fund’s financial statements based on our audits. We are a public accounting firm registered with the Public Company Accounting Oversight Board (United States) (PCAOB) and are required to be independent with respect to the Fund in accordance with the U.S. federal securities laws and the applicable rules and regulations of the Securities and Exchange Commission and the PCAOB.
We conducted our audits of these financial statements in accordance with the standards of the PCAOB. Those standards require that we plan and perform the audit to obtain reasonable assurance about whether the financial statements are free of material misstatement, whether due to error or fraud.
Our audits included performing procedures to assess the risks of material misstatement of the financial statements, whether due to error or fraud, and performing procedures that respond to those risks. Such procedures included examining, on a test basis, evidence regarding the amounts and disclosures in the financial statements. Our audits also included evaluating the accounting principles used and significant estimates made by management, as well as evaluating the overall presentation of the financial statements. Our procedures included confirmation of securities owned as of March 31, 2024 by correspondence with the custodian, transfer agents and brokers; when replies were not received from brokers, we performed other auditing procedures. We believe that our audits provide a reasonable basis for our opinion.
/s/PricewaterhouseCoopers LLP
Philadelphia, Pennsylvania
May 28, 2024
We have served as the auditor of one or more Macquarie investment companies since 2010.
Other Fund information (Unaudited)
Delaware Investments Ultrashort Fund
Tax Information
The information set forth below is for the Fund’s fiscal year as required by federal income tax laws. Shareholders, however, must report distributions on a calendar year basis for income tax purposes, which may include distributions for portions of two fiscal years of the Fund.
Accordingly, the information needed by shareholders for income tax purposes will be sent to them in January of each year. Please consult your tax advisor for proper treatment of this information.
All disclosures are based on financial information available as of the date of this annual report and, accordingly are subject to change. For any and all items requiring reporting, it is the intention of the Fund to report the maximum amount permitted under the Internal Revenue Code and the regulations thereunder.
For the fiscal year ended March 31, 2024, the Fund reports distributions paid during the year as follows:
| (A) Ordinary Income Distributions (Tax Basis) | 100.00% |
(A) is based on a percentage of the Fund’s total distributions.
For the fiscal year ended March 31, 2024, certain distributions paid by the Fund, determined to be from Qualified Interest Income may be subject to relief from US withholding for foreign shareholders, as provided by the American Jobs Creation Act of 2004; the Tax Relief Unemployment Insurance Reauthorization, and Job Creation Act of 2010; and as extended by the American Taxpayer Relief Act of 2012. For the fiscal year ended March 31, 2024, the Fund has reported maximum distributions of Qualified Interest Income of $5,888,501.
The percentage of the ordinary dividends reported by the Fund is treated as a Section 163(j) interest dividend and thus is eligible to be treated as interest income for purposes of Section 163(j) and the regulations thereunder is 100.00%.
Form N-PORT and proxy voting information
The Fund files its complete schedule of portfolio holdings with the Securities and Exchange Commission (SEC) for the first and third quarters of each fiscal year on Form N-PORT. The Fund’s Form N-PORT, as well as a description of the policies and procedures that the Fund uses to determine how to vote proxies (if any) relating to portfolio securities, is available without charge (i) upon request, by calling 800 523-1918; and (ii) on the SEC’s website at sec.gov. In addition, a description of the policies and procedures that the Fund uses to determine how to vote proxies (if any) relating to portfolio securities and the Schedule of Investments included in the Fund’s most recent Form N-PORT are available without charge on the Fund’s website at delawarefunds.com/literature.
Information (if any) regarding how the Fund voted proxies relating to portfolio securities during the most recently disclosed 12-month period ended June 30 is available without charge (i) through the Fund’s website at delawarefunds.com/proxy; and (ii) on the SEC’s website at sec.gov.
Board of trustees and officers addendum
Delaware Funds by Macquarie®
A mutual fund is governed by a Board of Trustees (“Trustees”), which has oversight responsibility for the management of a fund’s business affairs. Trustees establish procedures and oversee and review the performance of the investment manager, the distributor, and others who perform services for the fund. The independent fund trustees, in particular, are advocates for shareholder interests. Each trustee has served in that capacity since he or she was elected to or appointed to the Board of Trustees, and will continue to serve until his or her retirement or the election of a new trustee in his or her place. The following is a list of the Trustees and Officers with certain background and related information.
Name,
Address,
and Birth Year | Position(s)
Held with
the Trust | Length of Time
Served1 | Number of
Funds in Fund
Complex Overseen
by Trustee | Principal
Occupation(s)
During the
Past Five Years | Other
Directorships
Held by Trustee
During the
Past Five Years |
| Interested Trustee |
| |
Shawn K. Lytle2
100 Independence
610 Market Street
Philadelphia, PA
19106-2354
1970 | President,
Chief Executive
Officer,
and Trustee | President and
Chief Executive
Officer
since August 2015
Trustee since
September 2015 | 89 | Macquarie Asset
Management3
(2015–Present)
-Head of Equities &
Multi-Asset
(2023–Present)
-Head of Americas of
Macquarie Group
(2017–Present)
-Global Head of Public
Investments
(2019–2023) | None |
Name,
Address,
and Birth Year | Position(s)
Held with
the Trust | Length of Time
Served1 | Number of
Funds in Fund
Complex Overseen
by Trustee | Principal
Occupation(s)
During the
Past Five Years | Other
Directorships
Held by Trustee
During the
Past Five Years |
| Independent Trustees |
| |
Jerome D.
Abernathy
100 Independence
610 Market Street
Philadelphia, PA
19106-2354
1959 | Trustee | Since January 2019 | 89 | Stonebrook Capital
Management, LLC
(financial
technology: macro
factors and databases)
-Managing Member
(1993-Present) | None |
| |
Ann D. Borowiec
100 Independence
610 Market Street
Philadelphia, PA
19106-2354
1958 | Trustee | Since March 2015 | 89 | J.P. Morgan Chase & Co.
(1987-2013)
-Chief Executive Officer,
Private Wealth
Management
(2011–2013) | Banco Santander International
(2016–2019)
Santander Bank, N.A.
(2016-2019) |
Board of trustees and officers addendum
Delaware Funds by Macquarie®
Name,
Address,
and Birth Year | Position(s)
Held with
the Trust | Length of Time
Served1 | Number of
Funds in Fund
Complex Overseen
by Trustee | Principal
Occupation(s)
During the
Past Five Years | Other
Directorships
Held by Trustee
During the
Past Five Years |
| |
Joseph W. Chow
100 Independence
610 Market Street
Philadelphia, PA
19106-2354
1953 | Trustee | Since January 2013 | 89 | Private Investor
(2011–Present)
State Street Bank and
Trust Company
(1996-2011)
-Executive Vice President
of Enterprise Risk
Management and
Emerging Economies
Strategy; and Chief Risk
and Corporate
Administration Officer | None |
| |
H. Jeffrey Dobbs
100 Independence
610 Market Street
Philadelphia, PA
19106-2354
1955 | Trustee | Since April 20194 | 89 | KPMG LLP
(2002-2015)
-Global Sector Chairman,
Industrial Manufacturing
(2010-2015) | TechAccel LLC
(2015–Present)
PatientsVoices, Inc.
(2018–Present)
Valparaiso University Board
(2012-Present)
Ivy Funds Complex (2019-2021) |
Name,
Address,
and Birth Year | Position(s)
Held with
the Trust | Length of Time
Served1 | Number of
Funds in Fund
Complex Overseen
by Trustee | Principal
Occupation(s)
During the
Past Five Years | Other
Directorships
Held by Trustee
During the
Past Five Years |
| |
John A. Fry
100 Independence
610 Market Street
Philadelphia, PA
19106-2354
1960 | Trustee | Since January 2001 | 89 | Drexel University
-President
(2010–Present) | Federal Reserve
Bank of Philadelphia
(2020–Present)
Kresge Foundation
(2018-Present)
FS Credit Real Estate Income
Trust, Inc. (2018–Present)
vTv Therapeutics Inc.
(2017–Present)
Community Health Systems
(2004–Present)
Drexel Morgan & Co.
(2015–2019) |
Board of trustees and officers addendum
Delaware Funds by Macquarie®
Name,
Address,
and Birth Year | Position(s)
Held with
the Trust | Length of Time
Served1 | Number of
Funds in Fund
Complex Overseen
by Trustee | Principal
Occupation(s)
During the
Past Five Years | Other
Directorships
Held by Trustee
During the
Past Five Years |
| |
Joseph Harroz, Jr.
100 Independence
610 Market Street
Philadelphia, PA
19106-2354
1967 | Trustee | Since November
19984 | 89 | University of Oklahoma
-President
(2020–Present)
-Interim President
(2019–2020)
-Vice President and
Dean, College of Law
(2010–2019)
Brookhaven Investments
LLC (commercial
enterprises)
-Managing Member
(2019–Present)
St. Clair, LLC
(commercial enterprises)
-Managing Member
(2019–Present) | OU Medicine, Inc.
(2020–Present)
Big 12 Athletic Conference
(2019-Present)
Valliance Bank
(2007–Present)
Ivy Funds Complex
(1998-2021) |
Name,
Address,
and Birth Year | Position(s)
Held with
the Trust | Length of Time
Served1 | Number of
Funds in Fund
Complex Overseen
by Trustee | Principal
Occupation(s)
During the
Past Five Years | Other
Directorships
Held by Trustee
During the
Past Five Years |
| |
Sandra A.J.
Lawrence
100 Independence
610 Market Street
Philadelphia, PA
19106-2354
1957 | Trustee | Since April 20194 | 89 | Children’s Mercy
Hospitals and Clinics
(2005–2019)
-Chief Administrative
Officer
(2016–2019) | Brixmor Property Group Inc.
(2021-Present)
Sera Prognostics Inc.
(biotechnology) (2021-Present)
Recology (resource recovery)
(2021-2023)
Evergy, Inc., Kansas City Power
& Light Company, KCP&L
Greater Missouri Operations
Company, Westar Energy, Inc.
and Kansas Gas and Electric
Company (related utility
companies) (2018-Present)
National Association of Corporate
Directors (2017-Present)
American Shared Hospital
Services (medical device)
(2017-2021)
Ivy Funds Complex (2019-2021) |
Board of trustees and officers addendum
Delaware Funds by Macquarie®
Name,
Address,
and Birth Year | Position(s)
Held with
the Trust | Length of Time
Served1 | Number of
Funds in Fund
Complex Overseen
by Trustee | Principal
Occupation(s)
During the
Past Five Years | Other
Directorships
Held by Trustee
During the
Past Five Years |
| | | | | |
Frances A.
Sevilla-Sacasa
100 Independence
610 Market Street
Philadelphia, PA
19106-2354
1956 | Trustee | Since September
2011 | 89 | Banco Itaú International
-Chief Executive Officer
(2012–2016)
US Trust Bank of
America Private Wealth
Management
-President (2007-2008)
U.S. Trust Corp.
-President & CEO
(2005-2007) | Invitation Homes Inc.
(2023-Present)
Florida Chapter of National
Association of Corporate
Directors (2021-Present)
Callon Petroleum Company
(2019-Present)
Camden Property Trust
(2011-Present)
New Senior Investment
Group Inc. (REIT) (2021)
Carrizo Oil & Gas, Inc.
(2018-2019) |
| | | | | |
Thomas K. Whitford
100 Independence
610 Market Street
Philadelphia, PA
19106-2354
1956 | Chair and Trustee | Trustee since January
2013
Chair since January
2023 | 89 | PNC Financial Services
Group (1983–2013)
-Vice Chairman
(2009-2013) | HSBC USA Inc.
(2014–2022)
HSBC North America
Holdings Inc.
(2013–2022) |
Name,
Address,
and Birth Year | Position(s)
Held with
the Trust | Length of Time
Served1 | Number of
Funds in Fund
Complex Overseen
by Trustee | Principal
Occupation(s)
During the
Past Five Years | Other
Directorships
Held by Trustee
During the
Past Five Years |
| |
Christianna Wood
100 Independence
610 Market Street
Philadelphia, PA
19106-2354
1959 | Trustee | Since January 2019 | 89 | Gore Creek
Capital, Ltd.
-Chief Executive Officer
and President
(2009–Present)
Capital Z Asset
Management
-Chief Executive Officer
(2008-2009)
California Public
Employees’ Retirement
System (CalPERS)
-Senior Investment
Officer of Global Equity
(2002-2008) | The Merger Fund
(2013–2021),
The Merger Fund VL
(2013–2021),
WCM Alternatives: Event-Driven
Fund (2013–2021),
and WCM Alternatives: Credit
Event Fund (2017–2021)
Grange Insurance
(2013–Present)
H&R Block Corporation
(2008–2022) |
| |
| Officers | | | | | |
| |
David F. Connor
100 Independence
610 Market Street
Philadelphia, PA
19106-2354
1963 | Senior Vice President,
General Counsel, and
Secretary | Senior Vice President,
since May 2013;
General Counsel
since May 2015;
Secretary since
October 2005 | 89 | David F. Connor has
served in various
capacities at different
times at Macquarie Asset
Management. | None5 |
Board of trustees and officers addendum
Delaware Funds by Macquarie®
Name,
Address,
and Birth Year | Position(s)
Held with
the Trust | Length of Time
Served1 | Number of
Funds in Fund
Complex Overseen
by Trustee | Principal
Occupation(s)
During the
Past Five Years | Other
Directorships
Held by Trustee
During the
Past Five Years |
| |
Daniel V. Geatens
100 Independence
610 Market Street
Philadelphia, PA
19106-2354
1972 | Senior Vice President
and Treasurer | Senior Vice President
and Treasurer since
October 2007 | 89 | Daniel V. Geatens has
served in various
capacities at different
times at Macquarie Asset
Management. | None5 |
| |
Richard Salus
100 Independence
610 Market Street
Philadelphia, PA
19106-2354
1963 | Senior Vice President
and Chief Financial
Officer | Senior Vice President
and Chief Financial
Officer since
November 2006 | 89 | Richard Salus has
served in various
capacities at different
times at Macquarie Asset
Management. | None5 |
| 1 | “Length of Time Served” refers to the time since the Trustee or officer began serving one or more of the Trusts in the Delaware Funds complex. |
| | |
| 2 | Shawn K. Lytle is considered to be an “Interested Trustee” because he is an executive officer of the Funds’ investment advisor. |
| | |
| 3 | Macquarie Asset Management is the marketing name for certain companies comprising the asset management division of Macquarie Group, including the Funds’ investment advisor, principal underwriter, and transfer agent. |
| | |
| 4 | Includes time served on the Board of the Ivy Funds complex prior to the date when the Ivy Funds joined the Delaware Funds complex. |
| 5 | David F. Connor and Daniel V. Geatens serve in similar capacities for the six portfolios of the Optimum Fund Trust, which have the same investment manager, principal underwriter, and transfer agent as the Funds. Mr. Connor also serves as Senior Vice President and Assistant Secretary for the three portfolios of the Macquarie ETF Trust, which have the same investment manager as the Funds. Mr. Geatens also serves as the Chief Financial Officer of the Optimum Fund Trust and as Senior Vice President and Treasurer for the Macquarie ETF Trust. Mr. Salus serves in a similar capacity for the Macquarie ETF Trust. |
The Statement of Additional Information for the Fund(s) includes additional information about the Trustees and Officers and is available, without charge, upon request by calling 800 523-1918.
Item 2. Code of Ethics
The registrant has adopted a code of ethics that applies to the registrant’s principal executive officer, principal financial officer, principal accounting officer or controller, or persons performing similar functions, regardless of whether these individuals are employed by the registrant or a third party. A copy of the registrant’s Code of Business Ethics has been posted on the Delaware Funds by Macquarie® Internet Web site at www.delawarefunds.com. Any amendments to the Code of Business Ethics, and information on any waiver from its provisions granted by the registrant, will also be posted on this Web site within five business days of such amendment or waiver and will remain on the Web site for at least 12 months.
Item 3. Audit Committee Financial Expert
The registrant’s Board of Trustees has determined that certain members of the registrant’s Audit Committee are audit committee financial experts, as defined below. For purposes of this item, an “audit committee financial expert” is a person who has the following attributes:
a.An understanding of generally accepted accounting principles and financial statements;
b.The ability to assess the general application of such principles in connection with the accounting for estimates, accruals, and reserves;
c.Experience preparing, auditing, analyzing, or evaluating financial statements that present a breadth and level of complexity of accounting issues that are generally comparable to the breadth and complexity of issues that can reasonably be expected to be raised by the registrant’s financial statements, or experience actively supervising one or more persons engaged in such activities;
d.An understanding of internal controls and procedures for financial reporting; and
e.An understanding of audit committee functions.
An “audit committee financial expert” shall have acquired such attributes through:
a.Education and experience as a principal financial officer, principal accounting officer, controller, public accountant, or auditor or experience in one or more positions that involve the performance of similar functions;
b.Experience actively supervising a principal financial officer, principal accounting officer, controller, public accountant, auditor, or person performing similar functions;
c.Experience overseeing or assessing the performance of companies or public accountants with respect to the preparation, auditing, or evaluation of financial statements; or
d.Other relevant experience.
The registrant’s Board of Trustees has also determined that each member of the registrant’s Audit Committee is independent. In order to be “independent” for purposes of this item, the Audit Committee member may not: (i) other than in his or her capacity as a member of the Board of Trustees or any committee thereof, accept directly or indirectly any consulting,
advisory or other compensatory fee from the issuer; or (ii) be an “interested person” of the registrant as defined in Section 2(a)(19) of the Investment Company Act of 1940.
The names of the audit committee financial experts on the registrant’s Audit Committee are set forth below:
H. Jeffrey Dobbs
Frances Sevilla-Sacasa, Chair
Christianna Wood
Item 4. Principal Accountant Fees and Services
(a) Audit fees.
The aggregate fees billed for services provided to the registrant by its independent auditors for the audit of the registrant’s annual financial statements and for services normally provided by the independent auditors in connection with statutory and regulatory filings or engagements were $31,765 for the fiscal year ended March 31, 2024.
The aggregate fees billed for services provided to the registrant by its independent auditors for the audit of the registrant’s annual financial statements and for services normally provided by the independent auditors in connection with statutory and regulatory filings or engagements were $31,765 for the fiscal year ended March 31, 2023.
(b) Audit-related fees.
The aggregate fees billed by the registrant’s independent auditors for services relating to the performance of the audit of the registrant’s financial statements and not reported under paragraph (a) of this Item were $0 for the fiscal year ended March 31, 2024.
The aggregate fees billed by the registrant’s independent auditors for services relating to the performance of the audit of the financial statements of the registrant’s investment adviser and other service providers under common control with the adviser and that relate directly to the operations or financial reporting of the registrant were $1,362,878 for the registrant’s fiscal year ended March 31, 2024. The percentage of these fees relating to services approved by the registrant’s Audit Committee pursuant to the de minimis exception from the pre-approval requirement in Rule 2-01(c)(7)(i)(C) of Regulation S-X was 0%. These audit-related services were as follows: year-end audit procedures; group reporting and subsidiary statutory audits.
The aggregate fees billed by the registrant’s independent auditors for services relating to the performance of the audit of the registrant’s financial statements and not reported under paragraph (a) of this Item were $0 for the fiscal year ended March 31, 2023.
The aggregate fees billed by the registrant’s independent auditors for services relating to the performance of the audit of the financial statements of the registrant’s investment adviser and other service providers under common control with the adviser and that relate directly to the operations or financial reporting of the registrant were $2,050,189 for the registrant’s fiscal year ended March 31, 2023. The percentage of these fees relating to services approved by the registrant’s Audit Committee pursuant to the de minimis exception from the pre-approval requirement in Rule 2-01(c)(7)(i)(C) of Regulation S-X was 0%. These audit-related services were as follows: year-end audit procedures; group reporting and subsidiary statutory audits.
(c) Tax fees.
The aggregate fees billed by the registrant’s independent auditors for tax-related services provided to the registrant were $6,260 for the fiscal year ended March 31, 2024. The percentage of these fees relating to services approved by the registrant’s Audit Committee pursuant to the de minimis exception from the pre-approval requirement in Rule 2-01(c)(7)(i)(C) of Regulation S-X was 0%. These tax-related services were as follows: review of income tax returns and review of annual excise distribution calculations.
The aggregate fees billed by the registrant’s independent auditors for tax-related services provided to the registrant’s investment adviser and other service providers under common control with the adviser and that relate directly to the operations or financial reporting of the registrant were $0 for the registrant’s fiscal year ended March 31, 2024.
The aggregate fees billed by the registrant’s independent auditors for tax-related services provided to the registrant were $6,260 for the fiscal year ended March 31, 2023. The percentage of these fees relating to services approved by the registrant’s Audit Committee pursuant to the de minimis exception from the pre-approval requirement in Rule 2-01(c)(7)(i)(C) of Regulation S-X was 0%. These tax-related services were as follows: review of income tax returns and review of annual excise distribution calculations.
The aggregate fees billed by the registrant’s independent auditors for tax-related services provided to the registrant’s investment adviser and other service providers under common control with the adviser and that relate directly to the operations or financial reporting of the registrant were $0 for the registrant’s fiscal year ended March 31, 2023.
(d) All other fees.
The aggregate fees billed for all services provided by the independent auditors to the registrant other than those set forth in paragraphs (a), (b) and (c) of this Item were $0 for the fiscal year ended March 31, 2024.
The aggregate fees billed for all services other than those set forth in paragraphs (b) and (c) of this Item provided by the registrant’s independent auditors to the registrant’s adviser and other service providers under common control with the adviser and that relate directly to the operations or financial reporting of the registrant were $0 for the registrant’s fiscal year ended March 31, 2024. The percentage of these fees relating to services approved by the registrant’s Audit Committee pursuant to the de minimis exception from the pre-approval requirement in Rule 2-01(c)(7)(i)(C) of Regulation S-X was 0%.
The aggregate fees billed for all services provided by the independent auditors to the registrant other than those set forth in paragraphs (a), (b) and (c) of this Item were $0 for the fiscal year ended March 31, 2023.
The aggregate fees billed for all services other than those set forth in paragraphs (b) and (c) of this Item provided by the registrant’s independent auditors to the registrant’s adviser and other service providers under common control with the adviser and that relate directly to the operations or financial reporting of the registrant were $0 for the registrant’s fiscal year ended March 31, 2023. The percentage of these fees relating to services approved by the registrant’s
Audit Committee pursuant to the de minimis exception from the pre-approval requirement in Rule 2-01(c)(7)(i)(C) of Regulation S-X was 0%.
(e)The registrant’s Audit Committee has established pre-approval policies and procedures as permitted by Rule 2-01(c)(7)(i)(B) of Regulation S-X (the “Pre-Approval Policy”) with respect to services provided by the registrant’s independent auditors. Pursuant to the Pre-Approval Policy, the Audit Committee has pre-approved the services set forth in the table below with respect to the registrant up to the specified fee limits. Certain fee limits are based on aggregate fees to the registrant and other registrants within the Delaware Funds by Macquarie®.
| Service | Range of Fees |
| Audit Services | |
| Statutory audits or financial audits for new Funds | up to $50,000 per Fund |
| Services associated with SEC registration statements (e.g., Form N-1A, Form N-14, etc.), periodic reports and other documents filed with the SEC or other documents issued in connection with securities offerings (e.g., comfort letters for closed-end Fund offerings, consents), and assistance in responding to SEC comment letters | up to $10,000 per Fund |
| Consultations by Fund management as to the accounting or disclosure treatment of transactions or events and/or the actual or potential impact of final or proposed rules, standards or interpretations by the SEC, FASB, or other regulatory or standard-setting bodies (Note: Under SEC rules, some consultations may be considered “audit-related services” rather than “audit services”) | up to $25,000 in the aggregate |
| Audit-Related Services | |
| Consultations by Fund management as to the accounting or disclosure treatment of transactions or events and /or the actual or potential impact of final or proposed rules, standards or interpretations by the SEC, FASB, or other regulatory or standard-setting bodies (Note: Under SEC rules, some consultations may be considered “audit services” rather than “audit-related services”) | up to $25,000 in the aggregate |
| Tax Services | |
| U.S. federal, state and local and international tax planning and advice (e.g., consulting on statutory, regulatory or administrative developments, evaluation of Funds’ tax compliance function, etc.) | up to $25,000 in the aggregate |
| U.S. federal, state and local tax compliance (e.g., excise distribution reviews, etc.) | up to $5,000 per Fund |
| Review of federal, state, local and international income, franchise and other tax returns | up to $5,000 per Fund |
Under the Pre-Approval Policy, the Audit Committee has also pre-approved the services set forth in the table below with respect to the registrant’s investment adviser and other entities controlling, controlled by or under common control with the investment adviser that provide ongoing services to the registrant (the “Control Affiliates”) up to the specified fee limit. This fee limit is based on aggregate fees to the investment adviser and its Control Affiliates.
| Service | Range of Fees |
| Non-Audit Services | |
| Services associated with periodic reports and other documents filed with the SEC and assistance in responding to SEC comment letters | up to $10,000 in the aggregate |
The Pre-Approval Policy requires the registrant’s independent auditors to report to the Audit Committee at each of its regular meetings regarding all services initiated since the last such report was rendered, including those services authorized by the Pre-Approval Policy.
(f) Not applicable.
(g) The aggregate non-audit fees billed by the registrant’s independent auditors for services rendered to the registrant and to its investment adviser and other service providers under common control with the adviser were $24,428,000 and $9,044,000 for the registrant’s fiscal years ended March 31, 2024 and March 31, 2023, respectively.
(h) In connection with its selection of the independent auditors, the registrant’s Audit Committee has considered the independent auditors’ provision of non-audit services to the registrant’s investment adviser and other service providers under common control with the adviser that were not required to be pre-approved pursuant to Rule 2-01(c)(7)(ii) of Regulation S-X. The Audit Committee has determined that the independent auditors’ provision of these services is compatible with maintaining the auditors’ independence.
(i) Not applicable.
(j) Not applicable.
Item 5. Audit Committee of Listed Registrants
Not applicable.
Item 6. Investments
(a)Included as part of report to shareholders filed under Item 1 of this Form N-CSR.
(b)Divestment of securities in accordance with Section 13(c) of the Investment Company Act of 1940.
Not applicable.
Item 7. Disclosure of Proxy Voting Policies and Procedures for Closed-End Management Investment Companies
Not applicable.
Item 8. Portfolio Managers of Closed-End Management Investment Companies
Not applicable.
Item 9. Purchases of Equity Securities by Closed-End Management Investment Company and Affiliated Purchasers
Not applicable.
Item 10. Submission of Matters to a Vote of Security Holders
Not applicable.
Item 11. Controls and Procedures
The registrant’s principal executive officer and principal financial officers, or persons performing similar functions, have concluded that the registrant’s disclosure controls and procedures (as defined in Rule 30a-3(c) under the Investment Company Act of 1940, as amended (17 CFR 270.30a-3(c))) are effective, as of a date within 90 days of the filing of this report, based on their evaluation of these controls and procedures required by Rule 30a-3(b) under the Investment Company Act of 1940 (17 CFR 270.30a-3(b)) and Rules 13a-15(b) or 15d-15(b) under the Securities Exchange Act of 1934, as amended (17 CFR 240.13a-15(b) or 240.15d-15(b)) and provide reasonable assurance that the information required to be disclosed by the registrant in its reports or statements filed under the Securities Exchange Act of 1934 is recorded, processed, summarized and reported within the time periods specified in the rules and forms of the Securities and Exchange Commission.
There were no significant changes in the registrant’s internal control over financial reporting (as defined in Rule 30a-3(d) under the Investment Company Act of 1940 (17 CFR 270.30a-3(d)) that occurred during the period covered by the report to stockholders included herein that have materially affected, or are reasonably likely to materially affect, the registrant’s internal control over financial reporting.
Item 12. Disclosure of Securities Lending Activities for Closed-End Management Investment Companies
Not applicable.
Item 13. Recovery of Erroneously Awarded Compensation
Not applicable.
Item 14. Exhibits
(a) (1) Code of Ethics
Not applicable.
(2) Certifications of Principal Executive Officer and Principal Financial Officer pursuant to Rule 30a-2 under the Investment Company Act of 1940 are attached hereto as Exhibit 99.CERT.
(3) Written solicitations to purchase securities pursuant to Rule 23c-1 under the Securities Exchange Act of 1934.
Not applicable.
(b) Certifications pursuant to Section 906 of the Sarbanes-Oxley Act of 2002 are furnished herewith as Exhibit 99.906CERT.
SIGNATURES
Pursuant to the requirements of the Securities Exchange Act of 1934 and the Investment Company Act of 1940, the registrant has duly caused this report to be signed on its behalf, by the undersigned, thereunto duly authorized.
DELAWARE GROUP® CASH RESERVE
| /s/SHAWN K. LYTLE | |
| By: | Shawn K. Lytle |
| Title: | President and Chief Executive Officer |
| Date: | June 5, 2024 |
| | | |
Pursuant to the requirements of the Securities Exchange Act of 1934 and the Investment Company Act of 1940, this report has been signed below by the following persons on behalf of the registrant and in the capacities and on the dates indicated.
| /s/SHAWN K. LYTLE | |
| By: | Shawn K. Lytle |
| Title: | President and Chief Executive Officer |
| Date: | June 5, 2024 |
| | | |
| /s/RICHARD SALUS | |
| By: | Richard Salus |
| Title: | Chief Financial Officer |
| Date: | June 5, 2024 |
| | | |