UNITED STATES SECURITIES AND EXCHANGE COMMISSION
Washington, D.C. 20549
FORM N-CSR
CERTIFIED SHAREHOLDER REPORT OF REGISTERED MANAGEMENT
INVESTMENT COMPANIES
| Investment Company Act file number: | 811-02806 |
| |
| Exact name of registrant as specified in charter: | Delaware Group® Cash Reserve |
| |
| Address of principal executive offices: | 610 Market Street |
| Philadelphia, PA 19106 |
| |
| Name and address of agent for service: | David F. Connor, Esq. |
| 610 Market Street |
| Philadelphia, PA 19106 |
| |
| Registrant’s telephone number, including area code: | (800) 523-1918 |
| |
| Date of fiscal year end: | March 31 |
| |
| Date of reporting period: | March 31, 2022 |
Item 1. Reports to Stockholders
Annual report
Fixed income mutual fund
Delaware Investments Ultrashort Fund
March 31, 2022
Carefully consider the Fund's investment objectives, risk factors, charges, and expenses before investing. This and other information can be found in the Fund's prospectus and its summary prospectus, which may be obtained by visiting delawarefunds.com/literature or calling 800 523-1918. Investors should read the prospectus and the summary prospectus carefully before investing.
You can obtain shareholder reports and prospectuses online instead of in the mail.
Visit delawarefunds.com/edelivery.
Table of Contents
Experience Delaware Funds by Macquarie®
Macquarie Asset Management (MAM) is a global asset manager that aims to deliver positive impact for everyone. MAM Public Investments traces its roots to 1929 and partners with institutional and individual clients to deliver specialist active investment capabilities across global equities, fixed income, and multi-asset solutions using a conviction-based, long-term approach to investing. In the US, retail investors recognize our Delaware Funds by Macquarie family of funds as one of the oldest mutual fund families.
If you are interested in learning more about creating an investment plan, contact your financial advisor.
You can learn more about Delaware Funds or obtain a prospectus for Delaware Investments Ultrashort Fund at delawarefunds.com/literature.
Manage your account online| ● | Check your account balance and transactions |
| ● | View statements and tax forms |
| ● | Make purchases and redemptions |
Visit delawarefunds.com/account-access.
Macquarie Asset Management (MAM) is the asset management division of Macquarie Group. MAM is a full-service asset manager offering a diverse range of products across public and private markets including fixed income, equities, multi-asset solutions, private credit, infrastructure, renewables, natural assets, real estate, and asset finance. The Public Investments business is a part of MAM and includes the following investment advisers: Macquarie Investment Management Business Trust (MIMBT), Macquarie Funds Management Hong Kong Limited, Macquarie Investment Management Austria Kapitalanlage AG, Macquarie Investment Management Global Limited, Macquarie Investment Management Europe Limited, and Macquarie Investment Management Europe S.A.
The Fund is distributed by Delaware Distributors, L.P. (DDLP), an affiliate of MIMBT and Macquarie Group Limited.
Other than Macquarie Bank Limited ABN 46 008 583 542 ("Macquarie Bank"), any Macquarie Group entity noted in this document is not an authorized deposit-taking institution for the purposes of the Banking Act 1959 (Commonwealth of Australia). The obligations of these other Macquarie Group entities do not represent deposits or other liabilities of Macquarie Bank. Macquarie Bank does not guarantee or otherwise provide assurance in respect of the obligations of these other Macquarie Group entities. In addition, if this document relates to an investment, (a) the investor is subject to investment risk including possible delays in repayment and loss of income and principal invested and (b) none of Macquarie Bank or any other Macquarie Group entity guarantees any particular rate of return on or the performance of the investment, nor do they guarantee repayment of capital in respect of the investment.
The Fund is governed by US laws and regulations.
Table of contents
Unless otherwise noted, views expressed herein are current as of March 31, 2022, and subject to change for events occurring after such date.
The Fund is not FDIC insured and is not guaranteed. It is possible to lose the principal amount invested.
Advisory services provided by Delaware Management Company, a series of MIMBT, a US registered investment advisor.
All third-party marks cited are the property of their respective owners.
© 2022 Macquarie Management Holdings, Inc.
Table of Contents
| Portfolio management review | |
| Delaware Investments Ultrashort Fund | March 31, 2022 (Unaudited) |
| | | | | |
| Performance preview (for the year ended March 31, 2022) | | | | | |
| Delaware Investments Ultrashort Fund (Institutional Class shares) | | 1-year return | | -0.39 | % |
| Delaware Investments Ultrashort Fund (Class A shares) | | 1-year return | | -0.39 | % |
| ICE BofA US 6-Month Treasury Bill Index (benchmark) | | 1-year return | | -0.05 | % |
Past performance does not guarantee future results.
For complete, annualized performance for Delaware Investments Ultrashort Fund, please see the table on page 4.
Institutional Class shares are not subject to a sales charge and are offered for sale exclusively to certain eligible investors. In addition, Institutional Class shares pay no distribution and service fee.
The performance of Class A shares excludes the applicable sales charge. The performance of both Institutional Class shares and Class A shares reflects the reinvestment of all distributions.
Please see page 8 for a description of the index. Index performance returns do not reflect any management fees, transaction costs, or expenses. Indices are unmanaged and one cannot invest directly in an index.
Investment objective
The Fund seeks total return to the extent consistent with a relatively low volatility of principal.
Market review
During the Fund’s fiscal year ended March 31, 2022, fixed-income markets fared poorly, faced with the challenges of high inflation, the likelihood of more restrictive central bank monetary policy, and rising geopolitical risk, which shook financial markets towards the end of the period as Russia invaded Ukraine.
Throughout the fiscal year and as far back as last spring, budding optimism about an economic reopening faded as new COVID-19 variants repeatedly caused setbacks to normalization, along with ongoing supply-chain disruptions. The US Federal Reserve initially held to its view that the elevated rate of inflation was transitory. Later in the fiscal period, the Fed acknowledged high inflation would linger. By the fall of 2021, expectations had shifted regarding the speed and extent of changes to central bank monetary policy in the US and elsewhere.
Managing the Fund during the fiscal period involved the challenge of balancing the risk protection offered by less-volatile securities, including Treasury bills, with the additional yields available through spread products.
1
Table of Contents
Portfolio management review
Delaware Investments Ultrashort Fund
By late 2021, it was clear the Fed would have to act in an effort to curb persistent inflation. As a result, markets anticipated that 2022 would be a year of rising interest rates and quantitative tightening. The onset of more restrictive monetary policy, dovetailed with rising geopolitical risks that emerged from Europe as Russia invaded Ukraine in late February, prompted large-scale sanctions and further disruptions to international trade and to the availability of commodities exported by Russia and Ukraine.
Those events resulted in a significant repricing and reshaping of the yield curve. The yield curve flattened as short-term yields rose more than longer-term yields and, for a brief time, the 2-year relative to 10-year yield curve briefly inverted. Historically, yield curve inversions, in which shorter-term yields are higher than longer-term yields, have been a harbinger of an economic recession.
Within the Fund
For the fiscal year ended March 31, 2022, Delaware Investments Ultrashort Fund underperformed its benchmark, the ICE BofA US 6-Month Treasury Bill Index. The Fund’s Institutional Class shares declined 0.39%. The Fund’s Class A shares fell 0.39% at net asset value and 2.34% at maximum offer price (both figures reflect all distributions reinvested). For the same time period, the benchmark declined 0.05%. For complete, annualized performance of Delaware Investments Ultrashort Fund, please see the table on page 4.
In anticipation of and response to the change in the Fed’s monetary policy stance, we shortened the portfolio duration relative to the benchmark in an effort to help offset some interest-rate-related volatility. Specifically, we sold investment-grade corporate bonds and redeployed the funds into short-duration commercial paper holdings along with government securities, such as Treasury bills. That was a timely defensive move to ensure the Fund’s duration was shorter than that of the benchmark, mitigating some of the effects of the interest rate curve repositioning.
Selling investment-grade corporate bonds also helped to reduce the Fund’s exposure to credit market volatility, which began to rise in the second half of 2021.
Asset backed securities (ABS), primarily floating-rate collateralized loan obligations, contributed to the Fund’s performance relative to the benchmark during the fiscal year. Our short-duration, AAA-rated ABS holdings also contributed to Fund performance, along with shorter-duration, investment-grade corporates.
Detractors from relative performance were select lower yielding money market holdings, short maturity commercial paper, and Treasury bills.
Managing the Fund during the fiscal period involved the challenge of balancing the risk protection offered by less-volatile securities, including Treasury bills, with the additional yields available through spread products, such as investment-grade corporate bonds, ABS, and collateralized loan obligations. This was particularly true late in 2021 and early 2022, when the prospect of the anticipated Fed rate hike weighed against geopolitical risks and concern that economic growth was diminishing.
We have sought to reduce risk the Fund in a methodical fashion, reinvesting bonds as they matured while attempting to keep transaction costs low as we gradually repositioned the Fund. Given the rising challenges related to a more restrictive Fed interest rate policy, we advocate a measured approach to help mitigate current market risks.
2
Table of Contents
If we were to move too quickly or too slowly in de-risking or adding risk back into the Fund, there is the possibility of either a greater capital loss or needlessly sacrificing potential yield.
At fiscal year end, we think a key risk is the potential for stagflation and its possible impact on global economies and on US corporate earnings. Although it is a very real risk, we believe there is enough fundamental strength in the economy to weather that scenario for the next year or so. Stagflation is something we’re concerned about, however, and we are monitoring the situation closely.
We see a growing chance the Fed will be unable to orchestrate a soft landing through its restrictive monitory policy. Historically, the Fed does not have a successful track record of executing soft landings—raising interest rates to slow down inflation without going into a recession. With these concerns in mind, we are adopting a defensive-oriented posture for the intermediate term.
3
Table of Contents
| Performance summary | |
| Delaware Investments Ultrashort Fund | March 31, 2022 (Unaudited) |
The performance quoted represents past performance and does not guarantee future results. Investment return and principal value of an investment will fluctuate so that shares, when redeemed, may be worth more or less than their original cost. Current performance may be lower or higher than the performance quoted. Performance data current to the most recent month end may be obtained by calling 800 523-1918 or visiting delawarefunds.com/performance.
| Fund and benchmark performance1,2 | | Average annual total returns through March 31, 2022 |
| | 1 year | | 5 year | | 10 year | | Lifetime |
| Class A (Est. March 10, 1988)* | | | | | | | | | | | | |
| Excluding sales charge | | -0.39 | %** | | +1.28 | % | | +0.76 | % | | +2.59 | % |
| Including sales charge | | -2.34 | % | | +0.88 | % | | +0.56 | % | | +2.53 | % |
| Class C (Est. November 28, 1995) | | | | | | | | | | | | |
| Excluding sales charge | | -0.39 | % | | +1.28 | % | | +0.76 | % | | +1.54 | % |
| Including sales charge | | -1.39 | % | | +1.28 | % | | +0.76 | % | | +1.54 | % |
| Class L (Est. June 30, 1978)* | | | | | | | | | | | | |
| Excluding sales charge | | -0.29 | % | | +1.30 | % | | +0.77 | % | | +4.37 | % |
| Including sales charge | | -0.29 | % | | +1.30 | % | | — | | | +4.37 | % |
| Institutional Class (Est. January 5, 2016) | | | | | | | | | | | | |
| Excluding sales charge | | -0.39 | % | | +1.30 | % | | — | | | +1.23 | % |
| Including sales charge | | -0.39 | % | | +1.30 | % | | — | | | +1.23 | % |
| ICE BofA US 6-Month Treasury Bill Index | | -0.05 | % | | +1.27 | % | | +0.78 | % | | +3.26 | %*** |
| * | In conjunction with the conversion, Class A shares became Class L shares and Consultant Class shares became Class A shares. |
| ** | Total returns for the report period presented in the table differs from the return in “Financial highlights.” The total returns presented in the above table are calculated based on the net asset value (NAV) at which shareholder transactions were processed. The total returns presented in “Financial highlights” are calculated in the same manner, but also takes into account certain adjustments that are necessary under US generally accepted accounting principles (US GAAP) required in the annual report. |
| *** | The benchmark lifetime return is for Class A share comparison only and is calculated using the last business day in the month of the Fund’s Class A inception date. |
| 1 | Returns reflect the reinvestment of all distributions and are presented both with and without the applicable sales charges described below. Returns do not reflect the deduction of taxes the shareholder would pay on Fund distributions or redemptions of Fund shares. |
Expense limitations were in effect for certain classes during some or all of the periods shown in the “Fund and benchmark performance” table. Expenses for each class are listed on the “Fund expense ratios” table on page 6. Performance would have been lower had expense limitations not been in effect.
4
Table of Contents
Institutional Class shares are not subject to a sales charge and are offered for sale exclusively to certain eligible investors. In addition, Institutional Class shares pay no distribution and service (12b-1) fee.
Class A shares are sold with a maximum front-end sales charge of 2.00%, and have an annual 12b-1 fee of 0.25% of average daily net assets. Performance for Class A shares, excluding sales charges, assumes that no front-end sales charge applied.
Class C shares are sold with a contingent deferred sales charge (CDSC) of 1.00% if redeemed during the first 12 months. They are also subject to an annual 12b-1 fee of 1.00% of average daily net assets. Performance for Class C shares, excluding sales charges, assumes either that CDSCs did not apply or that the investment was not redeemed. A sales load was not applicable for periods prior to January 5, 2016 for Class A and Class C shares.
The Fund’s distributor, Delaware Distributors, L.P. (Distributor), has also contracted to limit the Fund’s Class A and Class C shares’ 12b-1 fee to 0.00% of the respective share class’s average daily net assets from April 1, 2021 through March 31, 2022.* These waivers and reimbursements may only be terminated by agreement of the Manager or Distributor, as applicable, and the Fund.
Class L shares are available only to Fund shareholders who held Class A shares of the Fund prior to the conversion of the Fund. Class L shares are closed to all additional purchases.
Fixed income securities and bond funds can lose value, and investors can lose principal, as interest rates rise. They also may be affected by economic conditions that hinder an issuer’s ability to make interest and principal payments on its debt. This includes prepayment risk, the risk that the principal of a bond that is held by a portfolio will be prepaid prior to maturity at the time when interest rates are lower than what the bond was paying. A portfolio may then have to reinvest that money at a lower interest rate.
International investments entail risks including fluctuation in currency values, differences in accounting principles, or economic or political instability. Investing in emerging markets can be riskier than investing in established foreign markets due to increased volatility, lower trading volume, and higher risk of market closures. In many emerging markets, there is substantially less publicly available information and the available information may be incomplete or misleading. Legal claims are generally more difficult to pursue.
The Fund may invest in derivatives, which may involve additional expenses and are subject to risk, including the risk that an underlying security or securities index moves in the opposite direction from what the portfolio manager anticipated. A derivatives transaction depends upon the counterparties’ ability to fulfill their contractual obligations.
Interest payments on inflation-indexed debt securities will vary as the principal and/or interest is adjusted for inflation.
IBOR risk is the risk that changes related to the use of the London interbank offered rate (LIBOR) or similar rates (such as EONIA) could have adverse impacts on financial instruments that reference these rates. The abandonment of these rates and transition to alternative rates could affect the value and liquidity of instruments that reference them and could affect investment strategy performance.
5
Table of Contents
Performance summary
Delaware Investments Ultrashort Fund
The disruptions caused by natural disasters, pandemics, or similar events could prevent the Fund from executing advantageous investment decisions in a timely manner and could negatively impact the Fund’s ability to achieve its investment objective and the value of the Fund’s investments.
| 2 | The Fund’s expense ratios, as described in the most recent prospectus, are disclosed in the following “Fund expense ratios” table. Delaware Management Company has agreed to reimburse certain expenses and/or waive certain fees in order to prevent total annual fund operating expenses (excluding any 12b-1 fees, acquired fund fees and expenses, taxes, interest, short sale dividend and interest expenses, brokerage fees, certain insurance costs, and nonroutine expenses or costs, including, but not limited to, those relating to reorganizations, litigation, conducting shareholder meetings, and liquidations) from exceeding 0.40% of the Fund’s average daily net assets from April 1, 2021 to March 31, 2022.* Please see the most recent prospectus and any applicable supplement(s) for additional information on these fee waivers and/or reimbursements. Please see the “Financial highlights” section in this report for the most recent expense ratios. |
| | | | | | | | Institutional |
| Fund expense ratios | | Class A | | Class C | | Class L | | Class |
| Total annual operating expenses | | | | | | | | |
| (without fee waivers) | | 0.97% | | 1.72% | | 0.72% | | 0.72% |
| Net expenses (including fee | | | | | | | | |
| waivers, if any) | | 0.40% | | 0.40% | | 0.40% | | 0.40% |
| |
| Type of waiver | | Contractual | | Contractual | | Contractual | | Contractual |
| * | The aggregate contractual waiver period covering this report is from July 26, 2020 through July 29, 2022. |
6
Table of Contents
Performance of a $10,000 investment1
Class A shares
Average annual total returns from March 31, 2012 through March 31, 2022
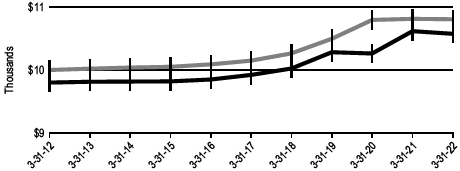
| For period beginning March 31, 2012 through March 31, 2022 | | Starting value | | Ending value |
 | ICE BofA US 6-Month Treasury Bill Index | | | $10,000 | | | | $10,808 | |
 | Delaware Investments Ultrashort Fund — Class A shares | | | $9,800 | | | | $10,576 | |
Institutional Class shares
Average annual total returns from January 5, 2016 (inception date) through March 31, 2022
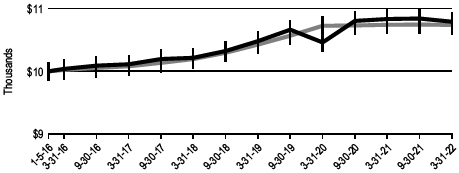
| For period beginning January 5, 2016 through March 31, 2022 | | Starting value | | Ending value |
| Delaware Investments Ultrashort Fund — Institutional Class shares | | | $10,000 | | | | $10,789 | |
| ICE BofA US 6-Month Treasury Bill Index | | | $10,000 | | | | $10,738 | |
7
Table of Contents
Performance summary
Delaware Investments Ultrashort Fund
| 1 | The “Performance of a $10,000 investment” graph for Class A shares assumes $10,000 invested in Class A shares of the Fund on March 31, 2012, and includes the effect of a 2.00% front-end sales charge and the reinvestment of all distributions. The graph also assumes $10,000 invested in the ICE BofA US 6–Month Treasury Bill Index as of March 31, 2012. |
The “Performance of a $10,000 investment” graph for Institutional Class shares assumes $10,000 invested in Institutional Class shares of the Fund on January 5, 2016, and includes the reinvestment of all distributions. The graph also assumes $10,000 invested in the ICE BofA US 6–Month Treasury Bill Index as of December 31, 2015.
The graphs do not reflect the deduction of taxes the shareholders would pay on Fund distributions or redemptions of Fund shares. Expense limitations were in effect for some or all of the periods shown. Performance would have been lower had expense limitations not been in effect. Expenses are listed in the “Fund expense ratios” table on page 6. Please note additional details on pages 4 through 8.
The ICE BofA US 6–Month Treasury Bill Index tracks the performance of US Treasury bills with a maturity of six months. The index comprises a single Treasury issue purchased at the beginning of the month, which is then sold at the end of the month and rolled into a newly selected issue that matures closest to, but not beyond, six months from the transaction date (known as the rebalancing date).
Index performance returns do not reflect any management fees, transaction costs, or expenses. Indices are unmanaged and one cannot invest directly in an index. Past performance does not guarantee future results.
Performance of other Fund classes will vary due to different charges and expenses.
| | Nasdaq symbols | | CUSIPs |
| Class A | | DLTAX | | 245910609 |
| Class C | | DLTCX | | 245910708 |
| Class L | | DLTLX | | 245910807 |
| Institutional Class | | DULTX | | 245910500 |
8
Table of Contents
Disclosure of Fund expenses
For the six-month period from October 1, 2021 to March 31, 2022 (Unaudited)
As a shareholder of the Fund, you incur two types of costs: (1) transaction costs, including sales charges (loads) on purchase payments, reinvested dividends, or other distributions; redemption fees; and exchange fees; and (2) ongoing costs, including management fees; distribution and service (12b-1) fees; and other Fund expenses. This example is intended to help you understand your ongoing costs (in dollars) of investing in the Fund and to compare these costs with the ongoing costs of investing in other mutual funds.
The example is based on an investment of $1,000 invested at the beginning of the period and held for the entire six-month period from October 1, 2021 to March 31, 2022.
Actual expenses
The first section of the table shown, “Actual Fund return,” provides information about actual account values and actual expenses. You may use the information in this section of the table, together with the amount you invested, to estimate the expenses that you paid over the period. Simply divide your account value by $1,000 (for example, an $8,600 account value divided by $1,000 = 8.6), then multiply the result by the number in the first section under the heading entitled “Expenses Paid During Period” to estimate the expenses you paid on your account during this period.
Hypothetical example for comparison purposes
The second section of the table shown, “Hypothetical 5% return,” provides information about hypothetical account values and hypothetical expenses based on the Fund’s actual expense ratio and an assumed rate of return of 5% per year before expenses, which is not the Fund’s actual return. The hypothetical account values and expenses may not be used to estimate the actual ending account balance or expenses you paid for the period. You may use this information to compare the ongoing costs of investing in the Fund and other funds. To do so, compare this 5% hypothetical example with the 5% hypothetical examples that appear in the shareholder reports of the other funds.
Please note that the expenses shown in the table are meant to highlight your ongoing costs only and do not reflect any transactional costs, such as sales charges (loads), redemption fees, or exchange fees. Therefore, the second section of the table is useful in comparing ongoing costs only, and will not help you determine the relative total costs of owning different funds. In addition, if these transactional costs were included, your costs would have been higher. The Fund's expenses shown in the table reflect fee waivers in effect and assume reinvestment of all dividends and distributions.
9
Table of Contents
Disclosure of Fund expenses
For the six-month period from October 1, 2021 to March 31, 2022 (Unaudited)
Delaware Investments Ultrashort Fund
Expense analysis of an investment of $1,000
| | Beginning | | Ending | | | | | | | Expenses |
| | Account Value | | Account Value | | Annualized | | Paid During Period |
| | 10/1/21 | | 3/31/22 | | Expense Ratio | | 10/1/21 to 3/31/22* |
| Actual Fund return† | |
| Class A | | | $ | 1,000.00 | | | | $ | 995.30 | | | | 0.40 | % | | | | $ | 1.99 | |
| Class C | | | | 1,000.00 | | | | | 995.30 | | | | 0.40 | % | | | | | 1.99 | |
| Class L | | | | 1,000.00 | | | | | 995.30 | | | | 0.40 | % | | | | | 1.99 | |
| Institutional Class | | | | 1,000.00 | | | | | 995.30 | | | | 0.40 | % | | | | | 1.99 | |
| Hypothetical 5% return (5% return before expenses) | |
| Class A | | | $ | 1,000.00 | | | | $ | 1,022.94 | | | | 0.40 | % | | | | $ | 2.02 | |
| Class C | | | | 1,000.00 | | | | | 1,022.94 | | | | 0.40 | % | | | | | 2.02 | |
| Class L | | | | 1,000.00 | | | | | 1,022.94 | | | | 0.40 | % | | | | | 2.02 | |
| Institutional Class | | | | 1,000.00 | | | | | 1,022.94 | | | | 0.40 | % | | | | | 2.02 | |
| * | “Expenses Paid During Period” are equal to the Fund's annualized expense ratio, multiplied by the average account value over the period, multiplied by 182/365 (to reflect the one-half year period). |
| ��� | Because actual returns reflect only the most recent six-month period, the returns shown may differ significantly from fiscal year returns. |
10
Table of Contents
| Security type / sector allocation | | |
| Delaware Investments Ultrashort Fund | | As of March 31, 2022 (Unaudited) |
Sector designations may be different from the sector designations presented in other Fund materials. The sector designations may represent the investment manager’s internal sector classifications.
| Security type / sector | | Percentage of net assets |
| Agency Collateralized Mortgage Obligations | | | 2.53 | % | |
| Agency Commercial Mortgage-Backed Security | | | 1.86 | % | |
| Collateralized Debt Obligations | | | 2.23 | % | |
| Corporate Bonds | | | 25.25 | % | |
| Banks | | | 9.41 | % | |
| Capital Goods | | | 1.22 | % | |
| Communications | | | 1.57 | % | |
| Consumer Cyclical | | | 3.37 | % | |
| Consumer Non-Cyclical | | | 3.54 | % | |
| Energy | | | 1.21 | % | |
| Insurance | | | 3.38 | % | |
| Real Estate Investment Trusts | | | 1.55 | % | |
| Non-Agency Asset-Backed Securities | | | 24.41 | % | |
| Commercial Paper | | | 43.87 | % | |
| Total Value of Securities | | | 100.15 | % | |
| Liabilities Net of Receivables and Other Assets | | | (0.15 | %) | |
| Total Net Assets | | | 100.00 | % | |
11
Table of Contents
| Schedule of investments | | |
| Delaware Investments Ultrashort Fund | | March 31, 2022 |
| | | | | Principal | | | |
| | | | amount | | | Value (US $) |
| Agency Collateralized Mortgage Obligations – 2.53% | | | | | |
| Freddie Mac Structured Agency Credit Risk REMIC Trust | | | | | |
| | Series 2020-DNA6 M1 144A 0.999% (SOFR + 0.90%) | | | | | |
| | 12/25/50 #, ● | | 732,818 | | $ | 731,252 |
| | Series 2021-DNA1 M1 144A 0.749% (SOFR + 0.65%) | | | | | |
| | 1/25/51 #, ● | | 67,918 | | | 67,777 |
| | Series 2021-DNA5 M1 144A 0.749% (SOFR + 0.65%) | | | | | |
| | 1/25/34 #, ● | | 88,972 | | | 88,811 |
| | Series 2021-HQA1 M1 144A 0.799% (SOFR + 0.70%) | | | | | |
| | 8/25/33 #, ● | | 348,041 | | | 346,191 |
| | Series 2021-HQA2 M1 144A 0.799% (SOFR + 0.70%) | | | | | |
| | 12/25/33 #, ● | | 808,589 | | | 801,113 |
| Total Agency Collateralized Mortgage Obligations (cost $2,044,201) | | | | | 2,035,144 |
| | | | | | | | |
| Agency Commercial Mortgage-Backed Security – 1.86% | | | | | |
| FREMF Mortgage Trust | | | | | |
| | Series 2015-K720 B 144A 3.425% 7/25/22 #, ● | | 1,500,000 | | | 1,502,611 |
| Total Agency Commercial Mortgage-Backed Security (cost $1,503,701) | | | | | 1,502,611 |
| | | | | | | | |
| Collateralized Debt Obligations – 2.23% | | | | | |
| Ares LVIII CLO | | | | | |
| | Series 2020-58A XR 144A 0.931% (TSFR3M + 0.75%, | | | | | |
| | Floor 0.75%) 1/15/35 #, ● | | 1,000,000 | | | 999,950 |
| Symphony | | | | | |
| | Series 2020-24A X 144A 1.059% (LIBOR03M + 0.80%, | | | | | |
| | Floor 0.80%) 1/23/32 #, ● | | 800,000 | | | 799,651 |
| Total Collateralized Debt Obligations (cost $1,800,000) | | | | | 1,799,601 |
| | | | | | | | |
| Corporate Bonds – 25.25% | | | | | |
| Banks – 9.41% | | | | | |
| Bank of America 1.259% (LIBOR03M + 1.00%) 4/24/23 ● | | 1,500,000 | | | 1,500,407 |
| Citigroup 4.05% 7/30/22 | | 1,890,000 | | | 1,906,218 |
| Goldman Sachs Group 2.108% (LIBOR03M + 1.60%) | | | | | |
| | 11/29/23● | | 1,250,000 | | | 1,266,506 |
| JPMorgan Chase & Co. 1.158% (LIBOR03M + 0.90%) | | | | | |
| | 4/25/23● | | 1,410,000 | | | 1,410,393 |
| Truist Bank 1.00% (SOFR + 0.73%) 3/9/23 ● | | 1,500,000 | | | 1,502,675 |
| | | | | | | | 7,586,199 |
| Capital Goods – 1.22% | | | | | |
| Teledyne Technologies 0.65% 4/1/23 | | 1,000,000 | | | 983,479 |
| | | | | | | 983,479 |
12
Table of Contents
| | | | | Principal | | | |
| | | | amount | | Value (US $) |
| Corporate Bonds (continued) | | | | | |
| Communications – 1.57% | | | | | |
| Verizon Communications 1.606% (LIBOR03M + 1.10%) | | | | | |
| | 5/15/25 ● | | 1,250,000 | | $ | 1,266,834 |
| | | | | | | 1,266,834 |
| Consumer Cyclical – 3.37% | | | | | |
| 7-Eleven 144A 0.625% 2/10/23 # | | 1,500,000 | | | 1,477,260 |
| General Motors Financial 1.017% (SOFR + 0.76%) 3/8/24 ● | | 1,250,000 | | | 1,241,784 |
| | | | | | | 2,719,044 |
| Consumer Non-Cyclical – 3.54% | | | | | |
| AbbVie 1.13% (LIBOR03M + 0.65%) 11/21/22 ● | | 1,405,000 | | | 1,408,505 |
| Gilead Sciences 3.25% 9/1/22 | | 1,440,000 | | | 1,446,474 |
| | | | | | | 2,854,979 |
| Energy – 1.21% | | | | | |
| Pioneer Natural Resources 0.55% 5/15/23 | | 1,000,000 | | | 978,336 |
| | | | | | | 978,336 |
| Insurance – 3.38% | | | | | |
| Athene Global Funding 144A 0.931% (SOFR + 0.70%) | | | | | |
| | 5/24/24 #, ● | | 1,490,000 | | | 1,472,758 |
| Brighthouse Financial Global Funding 144A 1.051% (SOFR | | | | | |
| | + 0.76%) 4/12/24 #, ● | | 1,250,000 | | | 1,253,413 |
| | | | | | | 2,726,171 |
| Real Estate Investment Trusts – 1.55% | | | | | |
| Public Storage 0.613% (SOFR + 0.47%) 4/23/24 ● | | 1,250,000 | | | 1,250,102 |
| | | | | | | 1,250,102 |
| Total Corporate Bonds (cost $20,458,293) | | | | | 20,365,144 |
| | | | | | | | |
| Non-Agency Asset-Backed Securities – 24.41% | | | | | |
| Carvana Auto Receivables Trust | | | | | |
| | Series 2021-P1 A2 0.28% 3/11/24 | | 342,336 | | | 341,933 |
| Dell Equipment Finance Trust | | | | | |
| | Series 2021-2 A2 144A 0.33% 12/22/26 # | | 1,500,000 | | | 1,481,165 |
| | Series 2022-1 A2 144A 2.11% 8/23/27 # | | 1,000,000 | | | 995,687 |
| Dryden 83 | | | | | |
| | Series 2020-83A X 144A 0.991% (LIBOR03M + 0.75%, | | | | | |
| | Floor 0.75%) 1/18/32 #, ● | | 1,600,000 | | | 1,599,309 |
| Enterprise Fleet Financing | | | | | |
| | Series 2020-2 A2 144A 0.61% 7/20/26 # | | 1,710,150 | | | 1,681,012 |
| Honda Auto Receivables Owner Trust | | | | | |
| | Series 2019-4 A3 1.83% 1/18/24 | | 494,628 | | | 495,414 |
13
Table of Contents
Schedule of investments
Delaware Investments Ultrashort Fund
| | | | | Principal | | | |
| | | | amount | | Value (US $) |
| Non-Agency Asset-Backed Securities (continued) | | | | | |
| Hyundai Auto Lease Securitization Trust | | | | | |
| | Series 2020-A A3 144A 1.95% 7/17/23 # | | 185,359 | | $ | 185,423 |
| | Series 2021-A B 144A 0.61% 10/15/25 # | | 1,500,000 | | | 1,465,686 |
| Hyundai Auto Receivables Trust | | | | | |
| | Series 2022-A A2A 1.81% 2/18/25 | | 2,000,000 | | | 1,991,944 |
| John Deere Owner Trust 2022 | | | | | |
| | Series 2022-A A2 1.90% 11/15/24 | | 2,000,000 | | | 1,993,380 |
| JPMorgan Chase Bank | | | | | |
| | Series 2020-2 B 144A 0.84% 2/25/28 # | | 954,056 | | | 941,727 |
| MMAF Equipment Finance | | | | | |
| | Series 2020-BA A2 144A 0.38% 8/14/23 # | | 1,144,220 | | | 1,138,638 |
| PFS Financing | | | | | |
| | Series 2020-B A 144A 1.21% 6/15/24 # | | 2,000,000 | | | 1,998,841 |
| Tesla Auto Lease Trust | | | | | |
| | Series 2021-B A2 144A 0.36% 9/22/25 # | | 2,000,000 | | | 1,991,589 |
| Verizon Owner Trust | | | | | |
| | Series 2019-C A1A 1.94% 4/22/24 | | 1,080,504 | | | 1,081,895 |
| Volvo Financial Equipment | | | | | |
| | Series 2020-1A A2 | | | | | |
| | 144A 0.37% 4/17/23 # | | 300,735 | | | 300,544 |
| Total Non-Agency Asset-Backed Securities (cost $19,825,126) | | | | | 19,684,187 |
| | |
| Commercial Paper – 43.87% | | | | | |
| Banks – 4.09% | | | | | |
| Bayerische Landesbank | | | | | |
| | 0.34% 4/1/22 | | 500,000 | | | 499,996 |
| | 0.351% 5/12/22 | | 350,000 | | | 349,775 |
| BPCE 0.561% 5/6/22 | | 700,000 | | | 699,625 |
| ING US Funding 0.501% 5/17/22 | | 250,000 | | | 249,818 |
| National Bank of Canada 0.20% 6/23/22 | | 500,000 | | | 498,986 |
| Toronto-Dominion 0.20% 6/28/22 | | 1,000,000 | | | 997,785 |
| | | | | | | 3,295,985 |
| Capital Goods – 3.78% | | | | | |
| Stanley Black & Decker | | | | | |
| | 0.30% 4/6/22 | | 500,000 | | | 499,973 |
| | 0.37% 5/2/22 | | 1,000,000 | | | 999,559 |
| | 0.55% 4/26/22 | | 550,000 | | | 549,820 |
| | 0.601% 5/23/22 | | 500,000 | | | 499,418 |
| | 0.902% 6/1/22 | | 500,000 | | | 499,196 |
| | | | | | | 3,047,966 |
14
Table of Contents
| | | | | Principal | | | |
| | | | amount | | Value (US $) |
| Commercial Paper (continued) | | | | | |
| Electric – 1.24% | | | | | |
| Rockwell Automation 0.33% 4/6/22 | | 1,000,000 | | $ | 999,938 |
| | | | | | | 999,938 |
| Financials – 32.25% | | | | | |
| Alberta Province 0.24% 5/24/22 | | 400,000 | | | 399,675 |
| Australia & New Zealand Banking Group | | | | | |
| | 0.401% 7/15/22 | | 250,000 | | | 249,271 |
| | 0.50% 4/26/22 | | 1,000,000 | | | 999,695 |
| Bank Nova Scotia | | | | | |
| | 0.20% 7/13/22 | | 500,000 | | | 498,507 |
| | 0.205% 9/16/22 | | 1,500,000 | | | 1,490,670 |
| | 0.397% 7/20/22 | | 500,000 | | | 498,392 |
| Bank of Montreal Chicago 0.33% 5/13/22 | | 500,000 | | | 499,712 |
| Charles Schwab 1.206% 8/9/22 | | 148,000 | | | 147,401 |
| Commonwealth Bank of Australia | | | | | |
| | 0.23% 5/18/22 | | 500,000 | | | 499,634 |
| | 0.271% 10/17/22 | | 1,300,000 | | | 1,289,773 |
| | 0.40% 4/6/22 | | 250,000 | | | 249,988 |
| Credit Agricole Corporate and Investment Bank 0.33% | | | | | |
| | 5/3/22 | | 325,000 | | | 324,855 |
| DNB Bank 0.23% 5/26/22 | | 500,000 | | | 499,630 |
| DZ Bank | | | | | |
| | 0.30% 4/1/22 | | 250,000 | | | 250,000 |
| | 0.701% 5/24/22 | | 650,000 | | | 649,414 |
| Goldman Sachs Group | | | | | |
| | 0.21% 7/5/22 | | 1,000,000 | | | 997,397 |
| | 0.875% 11/10/22 | | 500,000 | | | 494,988 |
| HSBC | | | | | |
| | 0.281% 8/2/22 | | 250,000 | | | 248,958 |
| | 1.407% 7/15/22 | | 250,000 | | | 249,170 |
| JP Morgan Securities | | | | | |
| | 0.20% 7/15/22 | | 500,000 | | | 498,457 |
| | 0.50% 4/4/22 | | 500,000 | | | 499,982 |
| | 1.267% 8/23/22 | | 1,000,000 | | | 995,062 |
| Lloyds Bank Corporate Markets | | | | | |
| | 0.24% 4/1/22 | | 150,000 | | | 149,999 |
| | 0.28% 5/26/22 | | 400,000 | | | 399,617 |
| NatWest Markets | | | | | |
| | 0.251% 7/18/22 | | 1,000,000 | | | 995,940 |
| | 0.35% 4/22/22 | | 400,000 | | | 399,810 |
| | 0.651% 5/3/22 | | 500,000 | | | 499,613 |
15
Table of Contents
Schedule of investments
Delaware Investments Ultrashort Fund
| | | | | Principal | | | |
| | | | amount | | Value (US $) |
| Commercial Paper (continued) | | | | | |
| Financials (continued) | | | | | |
| Royal Bank of Canada 0.21% 9/23/22 | | 2,000,000 | | $ | 1,985,255 |
| Skandinaviska Enskilda Banken | | | | | |
| | 0.64% 4/12/22 | | 796,000 | | | 795,913 |
| | 0.744% 8/5/22 | | 750,000 | | | 747,053 |
| Societe Generale | | | | | |
| | 0.281% 10/19/22 | | 2,000,000 | | | 1,982,549 |
| | 0.701% 5/10/22 | | 250,000 | | | 249,876 |
| | 0.902% 5/31/22 | | 750,000 | | | 749,043 |
| Svenska Handelsbanken 0.401% 9/15/22 | | 3,000,000 | | | 2,981,114 |
| Westpac Banking Corporation | | | | | |
| | 0.21% 9/29/22 | | 400,000 | | | 397,139 |
| | 0.375% 9/9/22 | | 500,000 | | | 497,041 |
| Westpac Securities | | | | | |
| | 0.30% 4/28/22 | | 400,000 | | | 399,853 |
| | 0.751% 5/23/22 | | 250,000 | | | 249,765 |
| | | | | | | 26,010,211 |
| Utilities – 2.51% | | | | | |
| National Rural Utilities Cooperative Finance Corporation | | | | | |
| | 0.44% 4/11/22 | | 500,000 | | | 499,952 |
| Virginia Electric & Power Company 0.65% 4/6/22 | | 500,000 | | | 499,966 |
| Wisconsin Power & Light Company 0.40% 4/1/22 | | 1,025,000 | | | 1,025,000 |
| | | | | | | 2,024,918 |
| Total Commercial Paper (cost $35,463,248) | | | | | 35,379,018 |
| Total Value of Securities–100.15% | | | | | |
| (cost $81,094,569) | | | | $ | 80,765,705 |
| # | Security exempt from registration under Rule 144A of the Securities Act of 1933, as amended. At March 31, 2022, the aggregate value of Rule 144A securities was $23,320,408, which represents 28.92% of the Fund's net assets. See Note 8 in “Notes to financial statements.” |
| ● | Variable rate investment. Rates reset periodically. Rate shown reflects the rate in effect at March 31, 2022. For securities based on a published reference rate and spread, the reference rate and spread are indicated in their descriptions. The reference rate descriptions (i.e. LIBOR03M, LIBOR06M, etc.) used in this report are identical for different securities, but the underlying reference rates may differ due to the timing of the reset period. Certain variable rate securities are not based on a published reference rate and spread but are determined by the issuer or agent and are based on current market conditions, or for mortgage-backed securities, are impacted by the individual mortgages which are paying off over time. These securities do not indicate a reference rate and spread in their descriptions. |
16
Table of Contents
Summary of abbreviations:
CLO – Collateralized Loan Obligation
FREMF – Freddie Mac Multifamily
ICE – Intercontinental Exchange, Inc.
LIBOR03M – ICE LIBOR USD 3 Month
LIBOR06M – ICE LIBOR USD 6 Month
REMIC – Real Estate Mortgage Investment Conduit
SOFR – Secured Overnight Financing Rate
See accompanying notes, which are an integral part of the financial statements.
17
Table of Contents
| Statement of assets and liabilities | |
| Delaware Investments Ultrashort Fund | March 31, 2022 |
| Assets: | | | | |
| | Investments, at value** | | $ | 80,765,705 | |
| Receivable for fund shares sold | | | 305,866 | |
| Interest receivable | | | 61,647 | |
| Other assets | | | 555 | |
| Total Assets | | | 81,133,773 | |
| Liabilities: | | | | |
| Due to custodian | | $ | 35,083 | |
| Payable for fund shares redeemed | | | 331,312 | |
| Audit and tax fees payable | | | 34,992 | |
| Reports and statements to shareholders expenses payable to non-affiliates | | | 25,553 | |
| Accounting and administration expenses payable to non-affiliates | | | 20,813 | |
| Dividend disbursing and transfer agent fees and expenses payable to | | | | |
| non-affiliates | | | 11,411 | |
| Pricing fees payable | | | 9,614 | |
| Registration fees payable to affiliates | | | 9,175 | |
| Investment management fees payable to affiliates | | | 5,721 | |
| Other accrued expenses | | | 2,913 | |
| Legal fees payable to non-affiliates | | | 742 | |
| Dividend disbursing and transfer agent fees and expenses payable to | | | | |
| affiliates | | | 647 | |
| Accounting and administration expenses payable to affiliates | | | 534 | |
| Trustees' fees and expenses payable | | | 391 | |
| Legal fees payable to affiliates | | | 205 | |
| Distribution payable | | | 112 | |
| Reports and statements to shareholders expenses payable to affiliates | | | 41 | |
| Total Liabilities | | | 489,259 | |
| Total Net Assets | | $ | 80,644,514 | |
| | |
| Net Assets Consist of: | | | | |
| Paid-in capital | | $ | 81,409,129 | |
| Total distributable earnings (loss) | | | (764,615 | ) |
| Total Net Assets | | $ | 80,644,514 | |
18
Table of Contents
| Net Asset Value | | | | |
| Class A: | | | | |
| Net assets | | $ | 32,607,063 | |
| Shares of beneficial interest outstanding, unlimited authorization, no par | | | 3,282,039 | |
| Net asset value per share | | $ | 9.94 | |
| Sales charge | | | 2.00 | % |
| Offering price per share, equal to net asset value per share / (1 - sales | | | | |
| charge) | | $ | 10.14 | |
| Class C: | | | | |
| Net assets | | $ | 5,116,504 | |
| Shares of beneficial interest outstanding, unlimited authorization, no par | | | 515,076 | |
| Net asset value per share | | $ | 9.93 | |
| Class L: | | | | |
| Net assets | | $ | 40,047,261 | |
| Shares of beneficial interest outstanding, unlimited authorization, no par | | | 4,030,364 | |
| Net asset value per share | | $ | 9.94 | |
| Institutional Class: | | | | |
| Net assets | | $ | 2,873,686 | |
| Shares of beneficial interest outstanding, unlimited authorization, no par | | | 289,132 | |
| Net asset value per share | | $ | 9.94 | |
| ____________________ | | | | |
| *Investments, at cost | | $ | 81,094,569 | |
See accompanying notes, which are an integral part of the financial statements.
19
Table of Contents
| Statement of operations | |
| Delaware Investments Ultrashort Fund | Year ended March 31, 2022 |
| Investment Income: | | | | |
| | Interest | | $ | 513,440 | |
| | | | | |
| Expenses: | | | | |
| Management fees | | | 253,832 | |
| Distribution expenses — Class A | | | 81,974 | |
| Distribution expenses — Class C | | | 55,429 | |
| Registration fees | | | 77,084 | |
| Dividend disbursing and transfer agent fees and expenses | | | 76,390 | |
| Accounting and administration expenses | | | 52,216 | |
| Reports and statements to shareholders expenses | | | 37,710 | |
| Audit and tax fees | | | 34,992 | |
| Legal fees | | | 19,384 | |
| Dues and services fees | | | 9,508 | |
| Custodian fees | | | 4,306 | |
| Trustees’ fees and expenses | | | 2,466 | |
| Other | | | 17,852 | |
| | | | 723,143 | |
| Less expenses waived | | | (247,100 | ) |
| Less waived distribution expenses — Class A | | | (81,974 | ) |
| Less waived distribution expenses — Class C | | | (55,429 | ) |
| Total operating expenses | | | 338,640 | |
| Net Investment Income | | | 174,800 | |
| Net Realized and Unrealized Gain (Loss): | | | | |
| Net realized gain on investments | | | 36,909 | |
| Net change in unrealized appreciation (depreciation) of investments | | | (506,655 | ) |
| Net Realized and Unrealized Loss | | | (469,746 | ) |
| Net Decrease in Net Assets Resulting from Operations | | $ | (294,946 | ) |
See accompanying notes, which are an integral part of the financial statements.
20
Table of Contents
Statements of changes in net assets
Delaware Investments Ultrashort Fund
| | | | | Year ended |
| | | | 3/31/22 | | 3/31/21 |
| Increase (Decrease) in Net Assets from Operations: | | | | | | | | |
| Net investment income | | $ | 174,800 | | | $ | 539,274 | |
| Net realized gain (loss) | | | 36,909 | | | | (118,765 | ) |
| Net change in unrealized appreciation (depreciation) | | | (506,655 | ) | | | 2,098,241 | |
| Net increase (decrease) in net assets resulting from | | | | | | | | |
| | operations | | | (294,946 | ) | | | 2,518,750 | |
| | | |
| Dividends and Distributions to Shareholders from: | | | | | | | | |
| Distributable earnings: | | | | | | | | |
| | Class A | | | (135,118 | ) | | | (166,815 | ) |
| | Class C | | | (23,018 | ) | | | (53,025 | ) |
| | Class L | | | (175,611 | ) | | | (339,492 | ) |
| | Institutional Class | | | (16,255 | ) | | | (22,001 | ) |
| | | | | (350,002 | ) | | | (581,333 | ) |
| | | |
| Capital Share Transactions: | | | | | | | | |
| Proceeds from shares sold: | | | | | | | | |
| | Class A | | | 15,699,399 | | | | 39,045,324 | |
| | Class C | | | 1,430,599 | | | | 2,560,209 | |
| | Class L | | | 4,345 | | | | 49,622 | |
| | Institutional Class | | | 941,794 | | | | 4,307,804 | |
| Net asset value of shares issued upon reinvestment of | | | | | | | | |
| | dividends and distributions: | | | | | | | | |
| | Class A | | | 133,363 | | | | 166,733 | |
| | Class C | | | 22,898 | | | | 54,649 | |
| | Class L | | | 171,778 | | | | 346,023 | |
| | Institutional Class | | | 15,988 | | | | 23,467 | |
| | | | | 18,420,164 | | | | 46,553,831 | |
21
Table of Contents
Statements of changes in net assets
Delaware Investments Ultrashort Fund
| | | | | Year ended |
| | | | 3/31/22 | | 3/31/21 |
| Capital Share Transactions (continued): | | | | | | | | |
| Cost of shares redeemed: | | | | | | | | |
| | Class A | | $ | (19,081,490 | ) | | $ | (19,247,657 | ) |
| | Class C | | | (2,310,661 | ) | | | (4,160,176 | ) |
| | Class L | | | (4,215,056 | ) | | | (3,771,416 | ) |
| | Institutional Class | | | (2,370,690 | ) | | | (4,117,049 | ) |
| | | | | (27,977,897 | ) | | | (31,296,298 | ) |
| Increase (decrease) in net assets derived from capital | | | | | | | | |
| | share transactions | | | (9,557,733 | ) | | | 15,257,533 | |
| Net Increase (Decrease) in Net Assets | | | (10,202,681 | ) | | | 17,194,950 | |
| | | | | | | | | |
| Net Assets: | | | | | | | | |
| Beginning of year | | | 90,847,195 | | | | 73,652,245 | |
| End of year | | $ | 80,644,514 | | | $ | 90,847,195 | |
See accompanying notes, which are an integral part of the financial statements.
22
Table of Contents
Financial highlights
Delaware Investments Ultrashort Fund Class A
Selected data for each share of the Fund outstanding throughout each period were as follows:
| Net asset value, beginning of period |
| |
| Income (loss) from investment operations: |
| Net investment income1 |
| Net realized and unrealized gain (loss) |
| Total from investment operations |
| |
| Less dividends and distributions from: |
| Net investment income |
| Net realized gain |
| Total dividends and distributions |
| |
| Net asset value, end of period |
| |
| Total return2 |
| |
| Ratios and supplemental data: |
| Net assets, end of period (000 omitted) |
| Ratio of expenses to average net assets |
| Ratio of expenses to average net assets prior to fees waived |
| Ratio of net investment income to average net assets |
| Ratio of net investment income (loss) to average net assets prior to fees waived |
| Portfolio turnover |
| 1 | Calculated using average shares outstanding. |
| 2 | Total return is based on the change in net asset value of a share during the period and assumes reinvestment of dividends and distributions at net asset value and does not reflect the impact of a sales charge. Total return during all of the periods shown reflects waivers by the manager and/or distributor. Performance would have been lower had the waivers not been in effect. |
See accompanying notes, which are an integral part of the financial statements.
24
Table of Contents
| Year ended | |
| 3/31/22 | | 3/31/21 | | 3/31/20 | | 3/31/19 | | 3/31/18 | |
| | $ | 10.01 | | | $ | 9.75 | | | $ | 9.99 | | | $ | 9.96 | | | $ | 10.00 | | |
| | |
| | |
| | 0.02 | | | | 0.07 | | | | 0.22 | | | | 0.22 | | | | 0.14 | | |
| | (0.05 | ) | | | 0.26 | | | | (0.24 | ) | | | 0.03 | | | | (0.03 | ) | |
| | (0.03 | ) | | | 0.33 | | | | (0.02 | ) | | | 0.25 | | | | 0.11 | | |
| | |
| | |
| | (0.04 | ) | | | (0.07 | ) | | | (0.22 | ) | | | (0.22 | ) | | | (0.14 | ) | |
| | — | | | | — | | | | — | | | | — | | | | (0.01 | ) | |
| | (0.04 | ) | | | (0.07 | ) | | | (0.22 | ) | | | (0.22 | ) | | | (0.15 | ) | |
| | |
| $ | 9.94 | | | $ | 10.01 | | | $ | 9.75 | | | $ | 9.99 | | | $ | 9.96 | | |
| | |
| | (0.29% | ) | | | 3.42% | | | | (0.21% | ) | | | 2.59% | | | | 1.05% | | |
| | |
| | |
| $ | 32,607 | | | $ | 36,109 | | | $ | 15,718 | | | $ | 12,169 | | | $ | 8,722 | | |
| | 0.40% | | | | 0.40% | | | | 0.40% | | | | 0.40% | | | | 0.40% | | |
| | 0.94% | | | | 0.97% | | | | 0.97% | | | | 0.97% | | | | 0.92% | | |
| | 0.21% | | | | 0.66% | | | | 2.21% | | | | 2.24% | | | | 1.38% | | |
| | (0.33% | ) | | | 0.09% | | | | 1.64% | | | | 1.67% | | | | 0.86% | | |
| | 53% | | | | 83% | | | | 82% | | | | 53% | | | | 134% | | |
25
Table of Contents
Financial highlights
Delaware Investments Ultrashort Fund Class C
Selected data for each share of the Fund outstanding throughout each period were as follows:
| Net asset value, beginning of period |
| |
| Income (loss) from investment operations: |
| Net investment income1 |
| Net realized and unrealized gain (loss) |
| Total from investment operations |
| |
| Less dividends and distributions from: |
| Net investment income |
| Net realized gain |
| Total dividends and distributions |
| |
| Net asset value, end of period |
| |
| Total return2 |
| |
| Ratios and supplemental data: |
| Net assets, end of period (000 omitted) |
| Ratio of expenses to average net assets |
| Ratio of expenses to average net assets prior to fees waived |
| Ratio of net investment income to average net assets |
| Ratio of net investment income (loss) to average net assets prior to fees waived |
| Portfolio turnover |
| 1 | Calculated using average shares outstanding. |
| 2 | Total return is based on the change in net asset value of a share during the period and assumes reinvestment of dividends and distributions at net asset value and does not reflect the impact of a sales charge. Total return during all of the periods shown reflects waivers by the manager and/or distributor. Performance would have been lower had the waivers not been in effect. |
See accompanying notes, which are an integral part of the financial statements.
26
Table of Contents
| Year ended | |
| 3/31/22 | | 3/31/21 | | 3/31/20 | | 3/31/19 | | 3/31/18 | |
| | $ | 10.01 | | | $ | 9.75 | | | $ | 9.99 | | | $ | 9.96 | | | $ | 10.00 | | |
| | |
| | |
| | 0.02 | | | | 0.07 | | | | 0.22 | | | | 0.22 | | | | 0.14 | | |
| | (0.06 | ) | | | 0.26 | | | | (0.24 | ) | | | 0.03 | | | | (0.03 | ) | |
| | (0.04 | ) | | | 0.33 | | | | (0.02 | ) | | | 0.25 | | | | 0.11 | | |
| | |
| | |
| | (0.04 | ) | | | (0.07 | ) | | | (0.22 | ) | | | (0.22 | ) | | | (0.14 | ) | |
| | — | | | | — | | | | — | | | | — | | | | (0.01 | ) | |
| | (0.04 | ) | | | (0.07 | ) | | | (0.22 | ) | | | (0.22 | ) | | | (0.15 | ) | |
| | |
| $ | 9.93 | | | $ | 10.01 | | | $ | 9.75 | | | $ | 9.99 | | | $ | 9.96 | | |
| | |
| | (0.39% | ) | | | 3.42% | | | | (0.21% | ) | | | 2.59% | | | | 1.05% | | |
| | |
| | |
| $ | 5,117 | | | $ | 6,015 | | | $ | 7,364 | | | $ | 7,386 | | | $ | 5,752 | | |
| | 0.40% | | | | 0.40% | | | | 0.40% | | | | 0.40% | | | | 0.40% | | |
| | 1.69% | | | | 1.72% | | | | 1.72% | | | | 1.72% | | | | 1.67% | | |
| | 0.21% | | | | 0.66% | | | | 2.21% | | | | 2.24% | | | | 1.38% | | |
| | (1.08% | ) | | | (0.66% | ) | | | 0.89% | | | | 0.92% | | | | 0.11% | | |
| | 53% | | | | 83% | | | | 82% | | | | 53% | | | | 134% | | |
27
Table of Contents
Financial highlights
Delaware Investments Ultrashort Fund Class L
Selected data for each share of the Fund outstanding throughout each period were as follows:
| Net asset value, beginning of period |
| |
| Income (loss) from investment operations: |
| Net investment income1 |
| Net realized and unrealized gain (loss) |
| Total from investment operations |
| |
| Less dividends and distributions from: |
| Net investment income |
| Net realized gain |
| Total dividends and distributions |
| |
| Net asset value, end of period |
| |
| Total return2 |
| |
| Ratios to average net assets: |
| Net assets, end of period (000 omitted) |
| Ratio of expenses to average net assets |
| Ratio of expenses to average net assets prior to fees waived |
| Ratio of net investment income to average net assets |
| Ratio of net investment income (loss) to average net assets prior to fees waived |
| Portfolio turnover |
| 1 | Calculated using average shares outstanding. |
| 2 | Total return is based on the change in net asset value of a share during the period and assumes reinvestment of dividends and distributions at net asset value. Total return during all of the periods shown reflects a waiver by the manager. Performance would have been lower had the waiver not been in effect. |
See accompanying notes, which are an integral part of the financial statements.
28
Table of Contents
| Year ended | |
| 3/31/22 | | 3/31/21 | | 3/31/20 | | 3/31/19 | | 3/31/18 | |
| | $ | 10.01 | | | $ | 9.75 | | | $ | 9.99 | | | $ | 9.96 | | | $ | 10.00 | | |
| | | |
| | | |
| | 0.02 | | | | 0.07 | | | | 0.22 | | | | 0.22 | | | | 0.14 | | |
| | (0.05 | ) | | | 0.26 | | | | (0.24 | ) | | | 0.03 | | | | (0.03 | ) | |
| | (0.03 | ) | | | 0.33 | | | | (0.02 | ) | | | 0.25 | | | | 0.11 | | |
| | | |
| | |
| | (0.04 | ) | | | (0.07 | ) | | | (0.22 | ) | | | (0.22 | ) | | | (0.14 | ) | |
| | — | | | | — | | | | — | | | | — | | | | (0.01 | ) | |
| | (0.04 | ) | | | (0.07 | ) | | | (0.22 | ) | | | (0.22 | ) | | | (0.15 | ) | |
| | | |
| $ | 9.94 | | | $ | 10.01 | | | $ | 9.75 | | | $ | 9.99 | | | $ | 9.96 | | |
| | | |
| | (0.29% | ) | | | 3.42% | | | | (0.21% | ) | | | 2.59% | | | | 1.05% | | |
| | | |
| | | |
| $ | 40,047 | | | $ | 44,409 | | | $ | 46,517 | | | $ | 51,512 | | | $ | 59,084 | | |
| | 0.40% | | | | 0.40% | | | | 0.40% | | | | 0.40% | | | | 0.40% | | |
| | 0.69% | | | | 0.72% | | | | 0.72% | | | | 0.72% | | | | 0.67% | | |
| | 0.21% | | | | 0.66% | | | | 2.21% | | | | 2.24% | | | | 1.38% | | |
| | (0.08% | ) | | | 0.34% | | | | 1.89% | | | | 1.92% | | | | 1.11% | | |
| | 53% | | | | 83% | | | | 82% | | | | 53% | | | | 134% | | |
29
Table of Contents
Financial highlights
Delaware Investments Ultrashort Fund Institutional Class
Selected data for each share of the Fund outstanding throughout each period were as follows:
| Net asset value, beginning of period |
| |
| Income (loss) from investment operations: |
| Net investment income1 |
| Net realized and unrealized gain (loss) |
| Total from investment operations |
| |
| Less dividends and distributions from: |
| Net investment income |
| Net realized gain |
| Total dividends and distributions |
| |
| Net asset value, end of period |
| |
| Total return2 |
| |
| Ratios and supplemental data: |
| Net assets, end of period (000 omitted) |
| Ratio of expenses to average net assets |
| Ratio of expenses to average net assets prior to fees waived. |
| Ratio of net investment income to average net assets |
| Ratio of net investment income (loss) to average net assets prior to fees waived |
| Portfolio turnover |
| 1 | Calculated using average shares outstanding. |
| 2 | Total return is based on the change in net asset value of a share during the period and assumes reinvestment of dividends and distributions at net asset value. Total return during all of the periods shown reflects a waiver by the manager. Performance would have been lower had the waiver not been in effect. |
See accompanying notes, which are an integral part of the financial statements.
30
Table of Contents
| Year ended | |
| | 3/31/22 | | 3/31/21 | | 3/31/20 | | 3/31/19 | | 3/31/18 | |
| $ | 10.02 | | | $ | 9.75 | | | $ | 9.99 | | | $ | 9.96 | | | $ | 10.00 | | |
| | | | | | | | | | | | | | | | | | | | | |
| | | | | | | | | | | | | | | | | | | | | |
| | 0.02 | | | | 0.07 | | | | 0.22 | | | | 0.22 | | | | 0.14 | | |
| | (0.06 | ) | | | 0.27 | | | | (0.24 | ) | | | 0.03 | | | | (0.03 | ) | |
| | (0.04 | ) | | | 0.34 | | | | (0.02 | ) | | | 0.25 | | | | 0.11 | | |
| | | | | | | | | | | | | | | | | | | | | |
| | | | | | | | | | | | | | | | | | | | | |
| | (0.04 | ) | | | (0.07 | ) | | | (0.22 | ) | | | (0.22 | ) | | | (0.14 | ) | |
| | — | | | | — | | | | — | | | | — | | | | (0.01 | ) | |
| | (0.04 | ) | | | (0.07 | ) | | | (0.22 | ) | | | (0.22 | ) | | | (0.15 | ) | |
| | | | | | | | | | | | | | | | | | | | | |
| $ | 9.94 | | | $ | 10.02 | | | $ | 9.75 | | | $ | 9.99 | | | $ | 9.96 | | |
| | | | | | | | | | | | | | | | | | | | | |
| | (0.39% | ) | | | 3.52% | | | | (0.21% | ) | | | 2.59% | | | | 1.05% | | |
| | | | | | | | | | | | | | | | | | | | | |
| | | | | | | | | | | | | | | | | | | | | |
| $ | 2,874 | | | $ | 4,314 | | | $ | 4,053 | | | $ | 1,869 | | | $ | 418 | | |
| | 0.40% | | | | 0.40% | | | | 0.40% | | | | 0.40% | | | | 0.40% | | |
| | 0.69% | | | | 0.72% | | | | 0.72% | | | | 0.72% | | | | 0.67% | | |
| | 0.21% | | | | 0.66% | | | | 2.21% | | | | 2.24% | | | | 1.38% | | |
| | (0.08% | ) | | | 0.34% | | | | 1.89% | | | | 1.92% | | | | 1.11% | | |
| | 53% | | | | 83% | | | | 82% | | | | 53% | | | | 134% | | |
31
Table of Contents
| Notes to financial statements | |
| Delaware Investments Ultrashort Fund | March 31, 2022 |
Delaware Group® Cash Reserve (Trust) is organized as a Delaware statutory trust and offers one series, Delaware Investments Ultrashort Fund (Fund). The Trust is an open-end investment company. The Fund is considered diversified under the Investment Company Act of 1940, as amended, and offers Class A, Class C, Class L, and Institutional Class shares. Class A shares are sold with a maximum front-end sales charge of 2.00%. There is no front-end sales charge when you purchase $1,000,000 or more of Class A shares. However, if Delaware Distributors, L.P. (DDLP) paid your financial intermediary a commission on your purchase of $1,000,000 or more of Class A shares, for shares purchased prior to July 1, 2020, you will have to pay a limited contingent deferred sales charge (Limited CDSC) of 1.00% if you redeem these shares within the first year after your purchase and 0.50% if you redeem these shares within the second year; and for shares purchased on or after July 1, 2020, you will have to pay a Limited CDSC of 1.00% if you redeem these shares within the first 18 months after your purchase, unless a specific waiver of the Limited CDSC applies. Class C shares are sold with a contingent deferred sales charge (CDSC) CDSC of 1.00%, which will be incurred if redeemed during the first 12 months.
1. Significant Accounting Policies
The Fund follows accounting and reporting guidance under Financial Accounting Standards Board (FASB) Accounting Standards Codification Topic 946, Financial Services — Investment Companies. The following accounting policies are in accordance with US generally accepted accounting principles (US GAAP) and are consistently followed by the Fund.
Security Valuation — Debt securities are valued based upon valuations provided by an independent pricing service or broker and reviewed by management. To the extent current market prices are not available, the pricing service may take into account developments related to the specific security, as well as transactions in comparable securities. Valuations for fixed income securities utilize matrix systems, which reflect such factors as security prices, yields, maturities, and ratings, and are supplemented by dealer and exchange quotations. For asset-backed securities, collateralized mortgage obligations (CMOs), commercial mortgage securities, and US government agency mortgage securities, pricing vendors utilize matrix pricing which considers prepayment speed, attributes of the collateral, yield or price of bonds of comparable quality, coupon, maturity, and type as well as broker/dealer-supplied prices. Generally, other securities and assets for which market quotations are not readily available are valued at fair value as determined in good faith under the direction of the Trust’s Board of Trustees (Board). In determining whether market quotations are readily available or fair valuation will be used, various factors will be taken into consideration, such as market closures or suspension of trading in a security. Restricted securities are valued at fair value using methods approved by the Board.
Federal Income Taxes — No provision for federal income taxes has been made as the Fund intends to continue to qualify for federal income tax purposes as a regulated investment company under Subchapter M of the Internal Revenue Code of 1986, as amended, and make the requisite distributions to shareholders. The Fund evaluates tax positions taken or expected to be taken in the course of preparing the Fund's tax returns to determine whether the tax positions are “more-likely-than-not” of being sustained by the applicable tax authority. Tax positions not
32
Table of Contents
deemed to meet the “more-likely-than-not” threshold are recorded as a tax benefit or expense in the current year. Management has analyzed the Fund's tax positions taken or expected to be taken on the Fund's federal income tax returns through the year ended March 31, 2022, and for all open tax years (years ended March 31, 2019–March 31, 2021), and has concluded that no provision for federal income tax is required in the Fund's financial statements. If applicable, the Fund recognizes interest accrued on unrecognized tax benefits in interest expense and penalties in “Other” on the “Statement of operations.” During the year ended March 31, 2022, the Fund did not incur any interest or tax penalties.
Class Accounting — Investment income and common expenses are allocated to the various classes of the Fund on the basis of “settled shares” of each class in relation to the net assets of the Fund. Realized and unrealized gain (loss) on investments are allocated to the various classes of the Fund on the basis of daily net assets of each class. Distribution expenses relating to a specific class are charged directly to that class.
Use of Estimates — The preparation of financial statements in conformity with US GAAP requires management to make estimates and assumptions that affect the fair value of investments, the reported amounts of assets and liabilities and disclosure of contingent assets and liabilities at the date of the financial statements, and the reported amounts of revenues and expenses during the reporting period. Actual results could differ from those estimates and the differences could be material.
Other — Expenses directly attributable to the Fund are charged directly to the Fund. Other expenses common to various funds within the Delaware Funds by Macquarie® (Delaware Funds) are generally allocated among such fund on the basis of average net assets. Management fees and certain other expenses are paid monthly. Security transactions are recorded on the date the securities are purchased or sold (trade date) for financial reporting purposes. Costs used in calculating realized gains and losses on the sale of investment securities are those of the specific securities sold. Interest income is recorded on the accrual basis. Discounts and premiums on debt securities are accreted or amortized to interest income, respectively, over the lives of the respective securities using the effective interest method. Premiums on callable debt securities are amortized to interest income to the earliest call date using the effective interest method. Realized gains (losses) on paydowns of asset- and mortgage-backed securities are classified as interest income. The Fund declares dividends daily from net investment income and pays the dividends monthly and declares and pays distributions from net realized gain on investments, if any, annually. The Fund may distribute more frequently, if necessary for tax purposes. Dividends and distributions, if any, are recorded on the ex-dividend date.
The Fund receives earnings credits from its custodian when positive cash balances are maintained, which may be used to offset custody fees.
The Fund receives earnings credits from its transfer agent when positive cash balances are maintained, which may be used to offset transfer agent fees. If the amount earned is greater than $1, the expenses paid under this arrangement are included on the “Statement of operations” under “Dividend disbursing and transfer agent fees and expenses” with the corresponding
33
Table of Contents
Notes to financial statements
Delaware Investments Ultrashort Fund
1. Significant Accounting Policies (continued)
expenses offset included under “Less expenses paid indirectly.” For the year ended March 31, 2022, the Fund earned $261 under this arrangement.
2. Investment Management, Administration Agreements, and Other Transactions with Affiliates
In accordance with the terms of its investment management agreement, the Fund pays Delaware Management Company (DMC), a series of Macquarie Investment Management Business Trust and the investment manager, an annual fee which is calculated daily and paid monthly at the rate of 0.30% on average daily net assets of the Fund.
DMC has contractually agreed to waive all or a portion of its investment advisory fees and/or pay/reimburse expenses (excluding any distribution and service (12b-1) fees, taxes, interest, acquired fund fees and expenses, short sale dividend and interest expenses, brokerage fees, certain insurance costs, and nonroutine expenses or costs, including, but not limited to, those relating to reorganizations, litigation, conducting shareholder meetings, and liquidations) in order to prevent total annual fund operating expenses from exceeding 0.40% of the Fund’s average daily net assets from April 1, 2021 through March 31, 2022.* These waivers and reimbursements may only be terminated by agreement of DMC and the Fund.
Delaware Investments Fund Services Company (DIFSC), an affiliate of DMC, provides fund accounting and financial administrative oversight services to the Fund. For these services, DIFSC’s fees are calculated daily and paid monthly, based on the aggregate daily net assets of all funds within the Delaware Funds at the following annual rates: 0.00475% of the first $35 billion; 0.0040% of the next $10 billion; and 0.0025% of aggregate average daily net assets in excess of $45 billion (Total Fee). Each fund in the Delaware Funds pays a minimum of $4,000, which, in aggregate, is subtracted from the Total Fee. Each fund then pays its portion of the remainder of the Total Fee on a relative net asset value (NAV) basis. This amount is included on the “Statement of operations” under “Accounting and administration expenses.” For the year ended March 31, 2022, the Fund was charged $6,949 for these services.
DMC may seek investment advice and recommendations from its affiliates: Macquarie Investment Management Europe Limited, Macquarie Investment Management Austria Kapitalanlage AG, and Macquarie Investment Management Global Limited (together, the “Affiliated Sub-Advisors”). The Manager may also permit these Affiliated Sub-Advisors to execute Fund security trades on behalf of the Manager and exercise investment discretion for securities in certain markets where DMC believes it will be beneficial to utilize an Affiliated Sub-Advisor’s specialized market knowledge. Although the Affiliated Sub-Advisors serve as sub-advisors, DMC has ultimate responsibility for all investment advisory services. For these services, DMC, not the Fund, may pay each Affiliated Sub-Advisor a portion of its investment management fee.
DIFSC is also the transfer agent and dividend disbursing agent of the Fund. For these services, DIFSC’s fees are calculated daily and paid monthly, based on the aggregate daily net assets of the retail funds within the Delaware Funds at the following annual rates: 0.014% of the first
34
Table of Contents
$20 billion; 0.011% of the next $5 billion; 0.007% of the next $5 billion; 0.005% of the next $20 billion; and 0.0025% of average daily net assets in excess of $50 billion. The fees payable to DIFSC under the shareholder services agreement described above are allocated among all retail funds in the Delaware Funds on a relative NAV basis. This amount is included on the “Statement of operations” under “Dividend disbursing and transfer agent fees and expenses.” For the year ended March 31, 2022, the Fund was charged $7,300 for these services. Pursuant to a sub-transfer agency agreement between DIFSC and BNY Mellon Investment Servicing (US) Inc. (BNYMIS), BNYMIS provides certain sub- transfer agency services to the Fund. Sub-transfer agency fees are paid by the Fund and are also included on the “Statement of operations” under “Dividend disbursing and transfer agent fees and expenses.” The fees are calculated daily and paid as invoices are received on a monthly or quarterly basis.
Pursuant to a distribution agreement and distribution plan, the Fund pays DDLP, the distributor and an affiliate of DMC, an annual 12b-1 fee of 0.25% of the average daily net assets of the Class A shares, and 1.00% of the average daily net assets of the Class C shares. The fees are calculated daily and paid monthly. Class L and Institutional Class shares do not pay 12b-1 fees. DDLP has contracted to limit the 12b-1 fees to 0.00% of average daily net assets for Class A and Class C shares from April 1, 2021 through March 31, 2022.*
As provided in the investment management agreement, the Fund bears a portion of the cost of certain resources shared with DMC, including the cost of internal personnel of DMC and/or its affiliates that provide legal and regulatory reporting services to the Fund. For the year ended March 31, 2022, the Fund was charged $2,805 for internal legal and regulatory reporting services provided by DMC and/or its affiliates’ employees. This amount is included on the “Statement of operations” under “Legal fees.”
For the year ended March 31, 2022, DDLP earned $2,221 for commissions on sales of the Fund’s Class A shares. For the year ended March 31, 2022, DDLP received gross CDSC commissions of $244 on redemptions of the Fund’s Class C shares, respectively, and these commissions were entirely used to offset upfront commissions previously paid by DDLP to broker/dealers on sales of those shares.
Trustees’ fees include expenses accrued by the Fund for each Trustee’s retainer and meeting fees. Certain officers of DMC, DIFSC, and DDLP are officers and/or Trustees of the Trust. These officers and Trustees are paid no compensation by the Fund.
___________________
* | The aggregate contractual waiver period covering this report is from July 26, 2020 through July 29, 2022. |
35
Table of Contents
Notes to financial statements
Delaware Investments Ultrashort Fund
3. Investments
For the year ended March 31, 2022, the Fund made purchases and sales of investment securities other than short-term investments as follows:
| Purchases other than US government securities | | $ | 29,123,329 |
| Purchases of US government securities | | | 4,712,285 |
| Sales other than US government securities | | | 58,462,305 |
| Sales of US government securities | | | 6,400,000 |
The tax cost of investments includes adjustments to net unrealized appreciation (depreciation), which may not necessarily be the final tax cost basis adjustments but which approximate the tax basis unrealized gains and losses that may be realized and distributed to shareholders. At March 31, 2022, the cost and unrealized appreciation (depreciation) of investments for federal income tax purposes for the Fund were as follows:
| Cost of investments | | $ | 81,094,569 | |
| Aggregate unrealized appreciation of investments | | $ | 14,715 | |
| Aggregate unrealized depreciation of investments | | | (343,579 | ) |
| Net unrealized depreciation of investments | | $ | (328,864 | ) |
US GAAP defines fair value as the price that the Fund would receive to sell an asset or pay to transfer a liability in an orderly transaction between market participants at the measurement date under current market conditions. A three-level hierarchy for fair value measurements has been established based upon the transparency of inputs to the valuation of an asset or liability. Inputs may be observable or unobservable and refer broadly to the assumptions that market participants would use in pricing the asset or liability. Observable inputs reflect the assumptions market participants would use in pricing the asset or liability based on market data obtained from sources independent of the reporting entity. Unobservable inputs reflect the reporting entity’s own assumptions about the assumptions that market participants would use in pricing the asset or liability based on the best information available under the circumstances. The Fund's investment in its entirety is assigned a level based upon the observability of the inputs which are significant to the overall valuation. The three-level hierarchy of inputs is summarized as follows:
| Level 1 | – | Inputs are quoted prices in active markets for identical investments. (Examples: equity securities, open-end investment companies, futures contracts, and exchange-traded options contracts) |
| | | |
| Level 2 | – | Other observable inputs, including, but not limited to: quoted prices for similar assets or liabilities in markets that are active, quoted prices for identical or similar assets or liabilities in markets that are not active, inputs other than quoted prices that are observable for the assets or liabilities (such as interest rates, yield curves, volatilities, prepayment speeds, loss severities, credit risks, and default rates) or other market-corroborated inputs. (Examples: debt securities, government securities, swap contracts, foreign currency exchange contracts, foreign securities utilizing international fair value pricing, broker-quoted securities, and fair valued securities) |
36
Table of Contents
| Level 3 | – | Significant unobservable inputs, including the Fund's own assumptions used to determine the fair value of investments. (Examples: broker-quoted securities and fair valued securities) |
Level 3 investments are valued using significant unobservable inputs. The Fund may also use an income-based valuation approach in which the anticipated future cash flows of the investment are discounted to calculate fair value. Discounts may also be applied due to the nature or duration of any restrictions on the disposition of the investments. Valuations may also be based upon current market prices of securities that are comparable in coupon, rating, maturity, and industry. The derived value of a Level 3 investment may not represent the value which is received upon disposition and this could impact the results of operations.
| | Level 2 |
| Securities | | | |
| Assets: | | | |
| Agency Collateralized Mortgage Obligations | | $ | 2,035,144 |
| Agency Commercial Mortgage-Backed Security | | | 1,502,611 |
| Collateralized Debt Obligations | | | 1,799,601 |
| Commercial Paper | | | 35,379,018 |
| Corporate Bonds | | | 20,365,144 |
| Non-Agency Asset-Backed Securities | | | 19,684,187 |
| Total Value of Securities | | $ | 80,765,705 |
During the year ended March 31, 2022, there were no transfers into or out of Level 3 investments. The Fund's policy is to recognize transfers into or out of Level 3 investments based on fair value at the beginning of the reporting period.
A reconciliation of Level 3 investments is presented when the Fund has a significant amount of Level 3 investments at the beginning or end of the year in relation to the Fund's net assets. During the year ended March 31, 2022, there were no Level 3 investments.
37
Table of Contents
Notes to financial statements
Delaware Investments Ultrashort Fund
3. Investments (continued)
4. Dividend and Distribution Information
Income and long-term capital gain distributions are determined in accordance with federal income tax regulations, which may differ from US GAAP. Additionally, distributions from net short-term gains on sales of investment securities are treated as ordinary income for federal income tax purposes. The tax character of dividends and distributions paid during the years ended March 31, 2022 and 2021 were as follows:
| | Year ended |
| | 3/31/22 | | 3/31/21 |
| Ordinary income | | $ | 350,002 | | $ | 581,333 |
| Total | | $ | 350,002 | | $ | 581,333 |
5. Components of Net Assets on a Tax Basis
As of March 31, 2022, the components of net assets on a tax basis were as follows:
| Shares of beneficial interest | | $ | 81,409,129 | |
| Undistributed ordinary income | | | 1,112 | |
| Distributions payable | | | (112 | ) |
| Capital loss carryforwards | | | (436,751 | ) |
| Net unrealized appreciation on investments and foreign currencies | | | (328,864 | ) |
| Net assets | | $ | 80,644,514 | |
There are no differences between book basis and tax basis components of net assets.
The Fund has capital loss carryforwards available to offset future realized capital gains as follows:
| | | | | |
| Loss carryforward character | | |
| Short-term | | Long-term | | Total |
| $436,751 | | $— | | $436,751 |
For financial reporting purposes, capital accounts are adjusted to reflect the tax character of permanent book/tax differences. Reclassifications are primarily result of the tax treatment of paydown gains(losses). Results of operations and net assets were not affected by these reclassifications. For the year ended March 31, 2022, the Fund had no reclassifications.
38
Table of Contents
6. Capital Shares
Transactions in capital shares were as follows:
| | | Year ended |
| | | 3/31/22 | | 3/31/21 |
| Shares sold: | | | | | | |
| | Class A | | 1,573,355 | | | 3,900,641 | |
| Class C | | 143,296 | | | 255,901 | |
| Class L | | 435 | | | 4,980 | |
| Institutional Class | | 94,343 | | | 430,685 | |
| | | | | | | | |
| Shares issued upon reinvestment of dividends and distributions: | | | | | | |
| Class A | | 13,342 | | | 16,691 | |
| Class C | | 2,291 | | | 5,476 | |
| Class L | | 17,184 | | | 34,677 | |
| Institutional Class | | 1,599 | | | 2,348 | |
| | | 1,845,845 | | | 4,651,399 | |
| | | | | | | | |
| Shares redeemed: | | | | | | |
| Class A | | (1,911,293 | ) | | (1,923,584 | ) |
| Class C | | (231,412 | ) | | (416,131 | ) |
| Class L | | (422,128 | ) | | (377,019 | ) |
| Institutional Class | | (237,505 | ) | | (417,954 | ) |
| | | (2,802,338 | ) | | (3,134,688 | ) |
| Net increase (decrease) | | (956,493 | ) | | 1,516,711 | |
Certain shareholders may exchange shares of one class for shares of another class in the same Fund. These exchange transactions are included as subscriptions and redemptions in the table above and the "Statements of changes in net assets." For the years ended March 31, 2022 and 2021, the Fund had the following exchange transactions.
| | | | | | | | | | | | | | | |
| | Exchange Redemptions | | Exchange Subscriptions | | | |
| | | | | | | | | | | | Institutional | | | |
| | Class A | | Class C | | Class A | | Class | | | |
| | Shares | | Shares | | Shares | | Shares | | Value |
| Year ended | | | | | | | | | | | | | | | |
| 3/31/22 | | 1,445 | | | 3,085 | | | | 3,085 | | | 1,445 | | $ | 45,309 |
| 3/31/21 | | 2,169 | | | 27,462 | | | | 27,468 | | | 2,170 | | | 296,935 |
7. Line of Credit
The Fund, along with certain other funds in the Delaware Funds (Participants), was a participant in a $225,000,000 revolving line of credit (Agreement) intended to be used for temporary or emergency purposes as an additional source of liquidity to fund redemptions of investor shares. Under the Agreement, the Participants were charged an annual commitment fee of 0.15% with
39
Table of Contents
Notes to financial statements
Delaware Investments Ultrashort Fund
7. Line of Credit (continued)
the addition of an upfront fee of 0.05%, which was allocated across the Participants based on a weighted average of the respective net assets of each Participant. The Participants were permitted to borrow up to a maximum of one-third of their net assets under the Agreement. Each Participant was individually, and not jointly, liable for its particular advances, if any, under the line of credit. The line of credit available under the Agreement expired on November 1, 2021.
On November 1, 2021, the Fund, along with the other Participants, entered into an amendment to the agreement for a $355,000,000 revolving line of credit to be used as described above and operates in substantially the same manner as the original Agreement. Under the amendment to the agreement, the Participants are charged an annual commitment fee of 0.15%, with the addition of an upfront fee of 0.05%, which is allocated across the Participants based on a weighted average of the respective net assets of each Participant. The line of credit available under the agreement expires on October 31, 2022.
The Fund had no amounts outstanding as of March 31, 2022, or at any time during the year then ended.
8. Credit and Market Risks
Beginning in January 2020, global financial markets have experienced and may continue to experience significant volatility resulting from the spread of a novel coronavirus known as COVID-19. The outbreak of COVID-19 has resulted in travel and border restrictions, quarantines, supply chain disruptions, lower consumer demand, and general market uncertainty. The effects of COVID-19 have and may continue to adversely affect the global economy, the economies of certain nations, and individual issuers, all of which may negatively impact the Fund’s performance.
IBOR is the risk that changes related to the use of the London interbank offered rate (LIBOR) and other interbank offered rate (collectively, "IBORs") could have adverse impacts on financial instruments that reference LIBOR (or the corresponding IBOR). The abandonment of LIBOR could affect the value and liquidity of instruments that reference LIBOR. The use of alternative reference rate products may impact investment strategy performance. These risks may also apply with respect to changes in connection with other IBORs, such as the euro overnight index average (EONIA), which are also the subject of recent reform.
The Fund is subject to prepayment risk, which is the risk that the principal on mortgage-backed or asset-backed securities may be prepaid at any time, which will reduce the yield and market value.
The Fund invests in certain obligations that may have liquidity protection designed to ensure that the receipt of payments due on the underlying security is timely. Such protection may be provided through guarantees, insurance policies or letters of credit obtained by the issuer or sponsor through third parties, through various means of structuring the transaction, or through a
40
Table of Contents
combination of such approaches. The Fund will not pay any additional fees for such credit support, although the existence of credit support may increase the price of a security.
The Fund may invest up to 5% of its net assets in illiquid securities, which may include securities with contractual restrictions on resale, securities exempt from registration under Rule 144A promulgated under the Securities Act of 1933 (Act), as amended, and other securities which may not be readily marketable. The relative illiquidity of these securities may impair the Fund from disposing of them in a timely manner and at a fair price when it is necessary or desirable to do so. While maintaining oversight, the Board has delegated to DMC, the day-to-day functions of determining whether individual securities are liquid for purposes of the Fund’s limitation on investments in illiquid securities. The Fund may also invest in securities exempt from registration under Section 4(2) of the Act, which exempts from registration transactions by an issuer not involving any public offering. Securities eligible for resale pursuant to Rule 144A, which are determined to be liquid, are not subject to the Fund’s 5% limit on investments in illiquid securities. Rule 144A securities have been identified on the “Schedule of investments.”
9. Contractual Obligations
The Fund enters into contracts in the normal course of business that contain a variety of indemnifications. The Fund's maximum exposure under these arrangements is unknown. However, the Fund has not had prior claims or losses pursuant to these contracts. Management has reviewed the Fund's existing contracts and expects the risk of loss to be remote.
10. Recent Accounting Pronouncements
In March 2020, FASB issued an Accounting Standards Update (ASU), ASU 2020-04, Reference Rate Reform (Topic 848) – Facilitation of the Effects of Reference Rate Reform on Financial Reporting. The amendments in ASU 2020-04 provide optional temporary financial reporting relief from the effect of certain types of contract modifications due to the planned discontinuation of LIBOR and other interbank-offered based reference rates as of the end of 2021. ASU 2020-04 is effective for certain reference rate-related contract modifications that occur during the period March 12, 2020 through December 31, 2022. As of the financial reporting period, Management is evaluating the impact of applying this ASU.
11. Subsequent Events
Management has determined that no material events or transactions occurred subsequent to March 31, 2022, that would require recognition or disclosure in the Fund's financial statements.
41
Table of Contents
Report of independent
registered public accounting firm
To the Board of Trustees of Delaware Group® Cash Reserve and Shareholders of Delaware Investments Ultrashort Fund
Opinion on the Financial Statements
We have audited the accompanying statement of assets and liabilities, including the schedule of investments, of Delaware Investments Ultrashort Fund (one of the funds constituting Delaware Group® Cash Reserve, referred to hereafter as the “Fund”) as of March 31, 2022, the related statement of operations for the year ended March 31, 2022, the statements of changes in net assets for each of the two years in the period ended March 31, 2022, including the related notes, and the financial highlights for each of the five years in the period ended March 31, 2022 (collectively referred to as the “financial statements”). In our opinion, the financial statements present fairly, in all material respects, the financial position of the Fund as of March 31, 2022, the results of its operations for the year then ended, the changes in its net assets for each of the two years in the period ended March 31, 2022 and the financial highlights for each of the five years in the period ended March 31, 2022 in conformity with accounting principles generally accepted in the United States of America.
Basis for Opinion
These financial statements are the responsibility of the Fund’s management. Our responsibility is to express an opinion on the Fund’s financial statements based on our audits. We are a public accounting firm registered with the Public Company Accounting Oversight Board (United States) (PCAOB) and are required to be independent with respect to the Fund in accordance with the U.S. federal securities laws and the applicable rules and regulations of the Securities and Exchange Commission and the PCAOB.
We conducted our audits of these financial statements in accordance with the standards of the PCAOB. Those standards require that we plan and perform the audit to obtain reasonable assurance about whether the financial statements are free of material misstatement, whether due to error or fraud.
Our audits included performing procedures to assess the risks of material misstatement of the financial statements, whether due to error or fraud, and performing procedures that respond to those risks. Such procedures included examining, on a test basis, evidence regarding the amounts and disclosures in the financial statements. Our audits also included evaluating the accounting principles used and significant estimates made by management, as well as evaluating the overall presentation of the financial statements. Our procedures included confirmation of securities owned as of March 31, 2022 by correspondence with the custodian and transfer agents. We believe that our audits provide a reasonable basis for our opinion.
/s/PricewaterhouseCoopers LLP
Philadelphia, Pennsylvania
May 31, 2022
We have served as the auditor of one or more investment companies in Delaware Funds by Macquarie® since 2010.
42
Table of Contents
Other Fund information (Unaudited)
Tax Information
The information set forth below is for the Fund’s fiscal year as required by federal income tax laws. Shareholders, however, must report distributions on a calendar year basis for income tax purposes, which may include distributions for portions of two fiscal years of the Fund. Accordingly, the information needed by shareholders for income tax purposes will be sent to them in January of each year. Please consult your tax advisor for proper treatment of this information.
All disclosures are based on financial information available as of the date of this annual report and, accordingly are subject to change. For any and all items requiring reporting, it is the intention of the Fund to report the maximum amount permitted under the Internal Revenue Code and the regulations thereunder.
For the fiscal year ended March 31, 2022, the Fund reports distributions paid during the year as follows:
| (A) Ordinary Income Distributions (Tax Basis) | 100.00% |
| Total Distributions (Tax Basis) | 100.00% |
____________________
| (A) | is based on a percentage of the Fund's total distributions. |
For the fiscal year ended March 31, 2022, certain distributions paid by the Fund, determined to be from Qualified Interest Income may be subject to relief from US withholding for foreign shareholders, as provided by the American Jobs Creation Act of 2004; the Tax Relief Unemployment Insurance Reauthorization, and Job Creation Act of 2010; and as extended by the American Taxpayer Relief Act of 2012. For the fiscal year ended March 31, 2022, the Fund has reported maximum distributions of Qualified Interest Income of $260,984.
The percentage of the ordinary dividends reported by the Fund is treated as a Section 163(j) interest dividend and thus is eligible to be treated as interest income for purposes of Section 163(j) and the regulations thereunder is 100.00%.
43
Table of Contents
Board of trustees / directors and officers addendum
Delaware Funds by Macquarie®
A mutual fund is governed by a Board of Trustees/Directors (“Trustees”), which has oversight responsibility for the management of a fund’s business affairs. Trustees establish procedures and oversee and review the performance of the investment manager, the distributor, and others who perform services for the fund. The independent fund trustees, in particular, are advocates for shareholder interests. Each trustee has served in that capacity since he or she was elected to or appointed to the Board of Trustees, and will continue to serve until his or her retirement or the election of a new trustee in his or her place. The following is a list of the Trustees and Officers with certain background and related information.
| | | | | | | | Number of | | Other |
| | | | | | Principal | | Portfolios in Fund | | Directorships |
| Name, | | Position(s) | | | | Occupation(s) | | Complex Overseen | | Held by |
| Address, | | Held with | | Length of Time | | During the | | by Trustee | | Trustee |
| and Birth Date | | Fund(s) | | Served | | Past Five Years | | or Officer | | or Officer |
| Interested Trustee | | | | | | | | | | |
| |
| Shawn K. Lytle1 | | President, | | President and | | Global Head of Macquarie Asset | | 146 | | Trustee — UBS Relationship |
| 610 Market Street | | Chief Executive | | Chief Executive | | Management2 | | | | Funds, SMA Relationship Trust, |
| Philadelphia, PA | | Officer, | | Officer | | (January 2019–Present) | | | | and UBS Funds |
| 19106-2354 | | and Trustee | | since August 2015 | | Head of Americas of | | | | (May 2010–April 2015) |
| February 1970 | | | | Trustee since | | Macquarie Group | | | | |
| | | | September 2015 | | (December 2017–Present) | | | | |
| | | | | | Deputy Global Head of Macquarie | | | | |
| | | | | | Asset Management | | | | |
| | | | | | (2017–2019) | | | | |
| | | | | | Head of Macquarie Asset | | | | |
| | | | | | Management Americas | | | | |
| | | | | | (2015–2017) | | | | |
44
Table of Contents
| | | | | | | | Number of | | Other |
| | | | | | Principal | | Portfolios in Fund | | Directorships |
| Name, | | Position(s) | | | | Occupation(s) | | Complex Overseen | | Held by |
| Address, | | Held with | | Length of Time | | During the | | by Trustee | | Trustee |
| and Birth Date | | Fund(s) | | Served | | Past Five Years | | or Officer | | or Officer |
| Independent Trustees | | | | | | | | | | |
| |
| Jerome D. Abernathy | | Trustee | | Since January 2019 | | Managing Member, Stonebrook | | 146 | | None |
| 610 Market Street | | | | | | Capital Management, LLC | | | | |
| Philadelphia, PA | | | | | | (financial technology: macro | | | | |
| 19106-2354 | | | | | | factors and databases) | | | | |
| July 1959 | | | | | | (January 1993-Present) | | | | |
| |
| Thomas L. Bennett | | Chair and Trustee | | Trustee since March | | Private Investor | | 146 | | None |
| 610 Market Street | | | | 2005 | | (March 2004–Present) | | | | |
| Philadelphia, PA | | | | Chair since March | | | | | | |
| 19106-2354 | | | | 2015 | | | | | | |
| October 1947 | | | | | | | | | | |
| |
| Ann D. Borowiec | | Trustee | | Since March 2015 | | Chief Executive Officer, Private | | 146 | | Director — Banco Santander |
| 610 Market Street | | | | | | Wealth Management (2011–2013) | | | | International |
| Philadelphia, PA | | | | | | and Market Manager, New Jersey | | | | (October 2016–December 2019) |
| 19106-2354 | | | | | | Private Bank (2005–2011) — J.P. | | | | Director — Santander Bank, N.A. |
| November 1958 | | | | | | Morgan Chase & Co. | | | | (December 2016–December |
| | | | | | | | | | 2019) |
45
Table of Contents
Board of trustees / directors and officers addendum
Delaware Funds by Macquarie®
| | | | | | | | Number of | | Other |
| | | | | | Principal | | Portfolios in Fund | | Directorships |
| Name, | | Position(s) | | | | Occupation(s) | | Complex Overseen | | Held by |
| Address, | | Held with | | Length of Time | | During the | | by Trustee | | Trustee |
| and Birth Date | | Fund(s) | | Served | | Past Five Years | | or Officer | | or Officer |
| | | | | | | | | | | |
| Joseph W. Chow | | Trustee | | Since January 2013 | | Private Investor | | 146 | | Director and Audit Committee |
| 610 Market Street | | | | | | (April 2011–Present) | | | | Member — Hercules Technology |
| Philadelphia, PA | | | | | | | | | | Growth Capital, Inc. |
| 19106-2354 | | | | | | | | | | (July 2004–July 2014) |
| January 1953 | | | | | | | | | | |
46
Table of Contents
| | | | | | | | Number of | | Other |
| | | | | | Principal | | Portfolios in Fund | | Directorships |
| Name, | | Position(s) | | | | Occupation(s) | | Complex Overseen | | Held by |
| Address, | | Held with | | Length of Time | | During the | | by Trustee | | Trustee |
| and Birth Date | | Fund(s) | | Served | | Past Five Years | | or Officer | | or Officer |
| | | | | | | | | | | |
| H. Jeffrey Dobbs3 | | Trustee | | Since December 2021 | | Global Sector Chairman, | | 146 | | Director, Valparaiso University |
| 610 Market Street | | | | | | Industrial Manufacturing, | | | | (2012–Present) |
| Philadelphia, PA | | | | | | KPMG LLP | | | | Director, TechAccel LLC |
| 19106-2354 | | | | | | (2010-2015) | | | | (2015–Present) (Tech R&D) |
| May 1955 | | | | | | | | | | Board Member, Kansas City |
| | | | | | | | | | Repertory Theatre |
| | | | | | | | | | (2015–Present) |
| | | | | | | | | | Board Member, Patients |
| | | | | | | | | | Voices, Inc. (healthcare) |
| | | | | | | | | | (2018–Present) |
| | | | | | | | | | Kansas City Campus for Animal |
| | | | | | | | | | Care (2018–Present) |
| | | | | | | | | | Director, National Association of |
| | | | | | | | | | Manufacturers (2010–2015) |
| | | | | | | | | | Director, The Children’s Center |
| | | | | | | | | | (2003–2015) |
| | | | | | | | | | Director, Metropolitan Affairs |
| | | | | | | | | | Coalition (2003–2015) |
| | | | | | | | | | Director, Michigan Roundtable for |
| | | | | | | | | | Diversity and Inclusion |
| | | | | | | | | | (2003–2015) |
| | | | | | | | | | Trustee, Ivy Funds Complex |
| | | | | | | | | | (2019–2021) |
47
Table of Contents
Board of trustees / directors and officers addendum
Delaware Funds by Macquarie®
| | | | | | | | Number of | | Other |
| | | | | | Principal | | Portfolios in Fund | | Directorships |
| Name, | | Position(s) | | | | Occupation(s) | | Complex Overseen | | Held by |
| Address, | | Held with | | Length of Time | | During the | | by Trustee | | Trustee |
| and Birth Date | | Fund(s) | | Served | | Past Five Years | | or Officer | | or Officer |
| | | | | | | | | | | |
| John A. Fry | | Trustee | | Since January 2001 | | Drexel University | | 146 | | Director; Compensation |
| 610 Market Street | | | | | | (August 2010–Present) | | | | Committee and Governance |
| Philadelphia, PA | | | | | | President — Franklin & Marshall | | | | Committee Member — |
| 19106-2354 | | | | | | College | | | | Community Health Systems |
| May 1960 | | | | | | (July 2002–June 2010) | | | | (May 2004–Present) |
| | | | | | | | | | Director — Drexel Morgan & Co. |
| | | | | | | | | | (2015–2019) |
| | | | | | | | | | Director, Audit and Compensation |
| | | | | | | | | | Committee Member — vTv |
| | | | | | | | | | Therapeutics Inc. (2017–Present) |
| | | | | | | | | | Director and Audit Committee |
| | | | | | | | | | Member — FS Credit Real Estate |
| | | | | | | | | | Income Trust, Inc. (2018–Present) |
| | | | | | | | | | Director — Federal Reserve |
| | | | | | | | | | Bank of Philadelphia |
| | | | | | | | | | (January 2020–Present) |
48
Table of Contents
| | | | | | | | Number of | | Other |
| | | | | | Principal | | Portfolios in Fund | | Directorships |
| Name, | | Position(s) | | | | Occupation(s) | | Complex Overseen | | Held by |
| Address, | | Held with | | Length of Time | | During the | | by Trustee | | Trustee |
| and Birth Date | | Fund(s) | | Served | | Past Five Years | | or Officer | | or Officer |
| | | | | | | | | | | |
| Joseph Harroz, Jr.3 | | Trustee | | Since December 2021 | | President (2020–Present), Interim | | 146 | | Director, OU Medicine, Inc. |
| 610 Market Street | | | | | | President (2019–2020), Vice | | | | (2020–Present) |
| Philadelphia, PA | | | | | | President (2010–2019) and Dean | | | | Director and Shareholder, |
| 19106-2354 | | | | | | (2010–2019), College of Law, | | | | Valliance Bank |
| January 1967 | | | | | | University of Oklahoma; | | | | (2007–Present) |
| | | | | | Managing Member, Harroz | | | | Director, Foundation Healthcare |
| | | | | | Investments, LLC, (commercial | | | | (formerly Graymark HealthCare) |
| | | | | | enterprises) (1998–2019); | | | | (2008–2017) |
| | | | | | Managing Member, St. Clair, LLC | | | | Trustee, the Mewbourne Family |
| | | | | | (commercial enterprises) | | | | Support Organization |
| | | | | | (2019–Present) | | | | (2006–Present) (non-profit) |
| | | | | | | | | | Independent Director, LSQ |
| | | | | | | | | | Manager, Inc. (real estate) |
| | | | | | | | | | (2007–2016) |
| | | | | | | | | | Director, Oklahoma Foundation |
| | | | | | | | | | for Excellence (non-profit) |
| | | | | | | | | | (2008–Present) |
| | | | | | | | | | Trustee, Ivy Funds Complex |
| | | | | | | | | | (1998–2021) |
49
Table of Contents
Board of trustees / directors and officers addendum
Delaware Funds by Macquarie®
| | | | | | | | Number of | | Other |
| | | | | | Principal | | Portfolios in Fund | | Directorships |
| Name, | | Position(s) | | | | Occupation(s) | | Complex Overseen | | Held by |
| Address, | | Held with | | Length of Time | | During the | | by Trustee | | Trustee |
| and Birth Date | | Fund(s) | | Served | | Past Five Years | | or Officer | | or Officer |
| | | | | | | | | | | |
| Sandra A.J. | | Trustee | | Since December 2021 | | Chief Administrative Officer, | | 146 | | Director, Hall Family Foundation |
| Lawrence3 | | | | | | Children’s Mercy Hospitals and | | | | (1993–Present) |
| 610 Market Street | | | | | | Clinics | | | | Director, Westar Energy (utility) |
| Philadelphia, PA | | | | | | (2016–2019); | | | | (2004–2018) |
| 19106-2354 | | | | | | CFO, Children’s Mercy Hospitals | | | | Trustee, Nelson-Atkins Museum |
| September 1957 | | | | | | and Clinics | | | | of Art (non-profit) (2021–Present) |
| | | | | | (2005–2016) | | | | (2007–2020) |
| | | | | | | | | | Director, Turn the Page KC |
| | | | | | | | | | (non-profit) (2012–2016) |
| | | | | | | | | | Director, Kansas Metropolitan |
| | | | | | | | | | Business and Healthcare |
| | | | | | | | | | Coalition (non-profit) (2017–2019) |
| | | | | | | | | | Director, National Association of |
| | | | | | | | | | Corporate Directors (non-profit) |
| | | | | | | | | | National Board (2022–Present); |
| | | | | | | | | | Regional Board (2017–2021) |
| | | | | | | | | | Director, American Shared |
| | | | | | | | | | Hospital Services (medical |
| | | | | | | | | | device) (2017–2021) |
| | | | | | | | | | Director, Evergy, Inc., Kansas City |
| | | | | | | | | | Power & Light Company, KCP&L |
| | | | | | | | | | Greater Missouri Operations |
| | | | | | | | | | Company, Westar Energy, Inc. |
| | | | | | | | | | and Kansas Gas and Electric |
| | | | | | | | | | Company (related utility |
| | | | | | | | | | companies) (2018–Present) |
50
Table of Contents
| | | | | | | | Number of | | Other |
| | | | | | Principal | | Portfolios in Fund | | Directorships |
| Name, | | Position(s) | | | | Occupation(s) | | Complex Overseen | | Held by |
| Address, | | Held with | | Length of Time | | During the | | by Trustee | | Trustee |
| and Birth Date | | Fund(s) | | Served | | Past Five Years | | or Officer | | or Officer |
| | | | | | | | | | | |
| Sandra A.J. | | Trustee | | Since December 2021 | | Chief Administrative Officer, | | 146 | | Director, Stowers (research) |
| Lawrence3 | | | | | | Children’s Mercy Hospitals and | | | | (2018) |
| (continued) | | | | | | Clinics | | | | Co-Chair, Women Corporate |
| 610 Market Street | | | | | | (2016–2019); | | | | Directors (director education) |
| Philadelphia, PA | | | | | | CFO, Children’s Mercy Hospitals | | | | (2018–2020) |
| 19106-2354 | | | | | | and Clinics | | | | Trustee, Ivy Funds Complex |
| September 1957 | | | | | | (2005–2016) | | | | (2019-2021) |
| | | | | | | | | | Director, Brixmor Property |
| | | | | | | | | | Group Inc. |
| | | | | | | | | | (2021–Present) |
| | | | | | | | | | Director, Sera Prognostics Inc. |
| | | | | | | | | | (biotechnology) |
| | | | | | | | | | (2021–Present) |
| | | | | | | | | | Director, Recology (resource |
| | | | | | | | | | recovery) |
| | | | | | | | | | (2021–Present) |
51
Table of Contents
Board of trustees / directors and officers addendum
Delaware Funds by Macquarie®
| | | | | | | | Number of | | Other |
| | | | | | Principal | | Portfolios in Fund | | Directorships |
| Name, | | Position(s) | | | | Occupation(s) | | Complex Overseen | | Held by |
| Address, | | Held with | | Length of Time | | During the | | by Trustee | | Trustee |
| and Birth Date | | Fund(s) | | Served | | Past Five Years | | or Officer | | or Officer |
| |
| Frances A. | | Trustee | | Since September 2011 | | Private Investor | | 146 | | Trust Manager and Audit |
| Sevilla-Sacasa | | | | | | (January 2017–Present) | | | | Committee Chair — Camden |
| 610 Market Street | | | | | | Chief Executive Officer — Banco | | | | Property Trust |
| Philadelphia, PA | | | | | | Itaú International | | | | (August 2011–Present) |
| 19106-2354 | | | | | | (April 2012–December 2016) | | | | Director; Audit |
| January 1956 | | | | | | Executive Advisor to Dean | | | | and Compensation |
| | | | | | (August 2011–March 2012) and | | | | Committee Member — |
| | | | | | Interim Dean | | | | Callon Petroleum Company |
| | | | | | (January 2011–July 2011) — | | | | (December 2019–Present) |
| | | | | | University of Miami School of | | | | Director — New Senior |
| | | | | | Business Administration | | | | Investment Group Inc. |
| | | | | | President — U.S. Trust, Bank of | | | | (January 2021–September 2021) |
| | | | | | America Private Wealth | | | | Director; Audit Committee |
| | | | | | Management (Private Banking) | | | | Member — Carrizo Oil & Gas, |
| | | | | | (July 2007-December 2008) | | | | Inc. (March 2018–December |
| | | | | | | | | | 2019) |
52
Table of Contents
| | | | | | | | Number of | | Other |
| | | | | | Principal | | Portfolios in Fund | | Directorships |
| Name, | | Position(s) | | | | Occupation(s) | | Complex Overseen | | Held by |
| Address, | | Held with | | Length of Time | | During the | | by Trustee | | Trustee |
| and Birth Date | | Fund(s) | | Served | | Past Five Years | | or Officer | | or Officer |
| |
| Thomas K. Whitford | | Trustee | | Since January 2013 | | Vice Chairman — PNC Financial | | 146 | | Director — HSBC North America |
| 610 Market Street | | | | | | Services Group | | | | Holdings Inc. |
| Philadelphia, PA | | | | | | (2010–April 2013) | | | | (December 2013–Present) |
| 19106-2354 | | | | | | | | | | Director — HSBC USA Inc. |
| March 1956 | | | | | | | | | | (July 2014–Present) |
| | | | | | | | | | Director — HSBC Bank USA, |
| | | | | | | | | | National Association |
| | | | | | | | | | (July 2014–March 2017) |
| | | | | | | | | | Director — HSBC Finance |
| | | | | | | | | | Corporation |
| | | | | | | | | | (December 2013–April 2018) |
53
Table of Contents
Board of trustees / directors and officers addendum
Delaware Funds by Macquarie®
| | | | | | | | Number of | | Other |
| | | | | | Principal | | Portfolios in Fund | | Directorships |
| Name, | | Position(s) | | | | Occupation(s) | | Complex Overseen | | Held by |
| Address, | | Held with | | Length of Time | | During the | | by Trustee | | Trustee |
| and Birth Date | | Fund(s) | | Served | | Past Five Years | | or Officer | | or Officer |
| |
| Christianna Wood | | Trustee | | Since January 2019 | | Chief Executive Officer and | | 146 | | Director; Finance Committee and |
| 610 Market Street | | | | | | President — Gore Creek Capital, | | | | Audit Committee Member — H&R |
| Philadelphia, PA | | | | | | Ltd. (August 2009–Present) | | | | Block Corporation |
| 19106-2354 | | | | | | | | | | (July 2008–Present) |
| August 1959 | | | | | | | | | | Director; Investments Committee, |
| | | | | | | | | | Capital and Finance Committee, |
| | | | | | | | | | and Audit Committee Member — |
| | | | | | | | | | Grange Insurance |
| | | | | | | | | | (2013–Present) |
| | | | | | | | | | Trustee; Chair of Nominating and |
| | | | | | | | | | Governance Committee and Audit |
| | | | | | | | | | Committee Member — |
| | | | | | | | | | The Merger Fund |
| | | | | | | | | | (2013–October 2021), |
| | | | | | | | | | The Merger Fund VL |
| | | | | | | | | | (2013–October 2021); WCM |
| | | | | | | | | | Alternatives: Event-Driven Fund |
| | | | | | | | | | (2013–October 2021), and WCM |
| | | | | | | | | | Alternatives: Credit Event Fund |
| | | | | | | | | | (December 2017–October 2021) |
| | | | | | | | | | Director; Chair of Governance |
| | | | | | | | | | Committee and Audit Committee |
| | | | | | | | | | Member — International |
| | | | | | | | | | Securities Exchange (2010–2016) |
54
Table of Contents
| | | | | | | | Number of | | Other |
| | | | | | Principal | | Portfolios in Fund | | Directorships |
| Name, | | Position(s) | | | | Occupation(s) | | Complex Overseen | | Held by |
| Address, | | Held with | | Length of Time | | During the | | by Trustee | | Trustee |
| and Birth Date | | Fund(s) | | Served | | Past Five Years | | or Officer | | or Officer |
| |
| Janet L. Yeomans | | Trustee | | Since April 1999 | | Vice President and Treasurer | | 146 | | Director; Personnel and |
| 610 Market Street | | | | | | (January 2006–July 2012), Vice | | | | Compensation Committee Chair; |
| Philadelphia, PA | | | | | | President — Mergers & | | | | Member of Nominating, |
| 19106-2354 | | | | | | Acquisitions | | | | Investments, and Audit |
| July 1948 | | | | | | (January 2003–January 2006), | | | | Committees for various periods |
| | | | | | and Vice President and Treasurer | | | | throughout directorship — |
| | | | | | (July 1995–January 2003) — 3M | | | | Okabena Company (2009–2017) |
| | | | | | Company | | | | |
| |
| Officers | | | | | | | | | | |
| |
| David F. Connor | | Senior Vice President, | | Senior Vice President, | | David F. Connor has served in | | 146 | | None4 |
| 610 Market Street | | General Counsel, and | | since May 2013; | | various capacities at different | | | | |
| Philadelphia, PA | | Secretary | | General Counsel | | times at Macquarie Asset | | | | |
| 19106-2354 | | | | since May 2015; | | Management. | | | | |
| December 1963 | | | | Secretary since | | | | | | |
| | | | October 2005 | | | | | | |
| |
| Daniel V. Geatens | | Senior Vice President | | Senior Vice President | | Daniel V. Geatens has served in | | 146 | | None4 |
| 610 Market Street | | and Treasurer | | and Treasurer since | | various capacities at different | | | | |
| Philadelphia, PA | | | | October 2007 | | times at Macquarie Asset | | | | |
| 19106-2354 | | | | | | Management. | | | | |
| October 1972 | | | | | | | | | | |
55
Table of Contents
Board of trustees / directors and officers addendum
Delaware Funds by Macquarie®
| | | | Number of | Other |
| | | Principal | Portfolios in Fund | Directorships |
| Name, | Position(s) | | Occupation(s) | Complex Overseen | Held by |
| Address, | Held with | Length of Time | During the | by Trustee | Trustee |
| and Birth Date | Fund(s) | Served | Past Five Years | or Officer | or Officer |
| |
| Richard Salus | Senior Vice President | Senior Vice President | Richard Salus has served in | 146 | None |
| 610 Market Street | and Chief Financial | and Chief Financial | various capacities at different | | |
| Philadelphia, PA | Officer | Officer since | times at Macquarie Asset | | |
| 19106-2354 | | November 2006 | Management. | | |
| October 1963 | | | | | |
| 1 | Shawn K. Lytle is considered to be an “Interested Trustee” because he is an executive officer of the Fund’s(s’) investment advisor. |
| 2 | Macquarie Asset Management is the marketing name for Macquarie Management Holdings, Inc. and its subsidiaries, including the Fund’s(s’) investment advisor, principal underwriter, and its transfer agent. |
| 3 | Messrs. Dobbs and Harroz and Ms. Lawrence were elected as Trustees of the Trust effective December 17, 2021. |
| 4 | David F. Connor and Daniel V. Geatens serve in similar capacities for the six portfolios of the Optimum Fund Trust, which have the same investment advisor, principal underwriter, and transfer agent as the registrant. Mr. Geatens also serves as the Chief Financial Officer of the Optimum Fund Trust and he is the Chief Financial Officer and Treasurer for Macquarie Global Infrastructure Total Return Fund Inc. |
The Statement of Additional Information for the Fund(s) includes additional information about the Trustees and Officers and is available, without charge, upon request by calling 800 523-1918.
56
Table of Contents
About the organization
| Board of trustees | | | |
| Shawn K. Lytle | Ann D. Borowiec | John A. Fry | Frances A. |
| President and | Former Chief Executive | President | Sevilla-Sacasa |
| Chief Executive Officer | Officer | Drexel University | Former Chief Executive |
| Delaware Funds | Private Wealth Management | Joseph Harroz, Jr. | Officer |
| by Macquarie® | J.P. Morgan Chase & Co. | President | Banco Itaú International |
| Jerome D. Abernathy | Joseph W. Chow | University of Oklahoma | Thomas K. Whitford |
| Managing Member | Private Investor | Sandra A.J. Lawrence | Former Vice Chairman |
| Stonebrook Capital | H. Jeffrey Dobbs | Former Chief Administrative | PNC Financial Services |
| Management, LLC | Former Global Sector | Officer | Group |
| Thomas L. Bennett | Chairman | Children's Mercy Hospitals | Christianna Wood |
| Chairman of the Board | Industrial Manufacturing, | and Clinics | Chief Executive Officer |
| Delaware Funds | KPMG, LLP | | and President |
| by Macquarie | | | Gore Creek Capital, Ltd. |
| Private Investor | | | Janet L. Yeomans |
| | | Former Vice President and |
| | | Treasurer |
| | | 3M Company |
| |
| Affiliated officers | | | |
| David F. Connor | Daniel V. Geatens | Richard Salus | |
| Senior Vice President, | Senior Vice President and | Senior Vice President and | |
| General Counsel, | Treasurer | Chief Financial Officer | |
| and Secretary | Delaware Funds | Delaware Funds | |
| Delaware Funds | by Macquarie | by Macquarie | |
| by Macquarie | | | |
| This annual report is for the information of Delaware Investments Ultrashort Fund shareholders, but it may be used with prospective investors when preceded or accompanied by the Delaware Fund fact sheet for the most recently completed calendar quarter. These documents are available at delawarefunds.com/literature. |
The Fund files its complete schedule of portfolio holdings with the Securities and Exchange Commission (SEC) for the first and third quarters of each fiscal year on Form N-PORT. The Fund’s Forms N-PORT, as well as a description of the policies and procedures that the Fund uses to determine how to vote proxies (if any) relating to portfolio securities, are available without charge (i) upon request, by calling 800 523-1918; and (ii) on the SEC’s website at sec.gov. In addition, a description of the policies and procedures that the Fund uses to determine how to vote proxies (if any) relating to portfolio securities and the Schedule of Investments included in the Fund’s most recent Form N-PORT are available without charge on the Fund’s website at delawarefunds.com/literature. The Fund’s Forms N-PORT may be reviewed and copied at the SEC’s Public Reference Room in Washington, D.C.; information on the operation of the Public Reference Room may be obtained by calling 800 SEC-0330.
Information (if any) regarding how the Fund voted proxies relating to portfolio securities during the most recently disclosed 12-month period ended June 30 is available without charge (i) through the Fund’s website at delawarefunds.com/proxy; and (ii) on the SEC’s website at sec.gov.
57
Item 2. Code of Ethics
Item 3. Audit Committee Financial Expert
The registrant’s Board of Trustees has determined that certain members of the registrant’s Audit Committee are audit committee financial experts, as defined below. For purposes of this item, an “audit committee financial expert” is a person who has the following attributes:
a. An understanding of generally accepted accounting principles and financial statements;
b. The ability to assess the general application of such principles in connection with the accounting for estimates, accruals, and reserves;
c. Experience preparing, auditing, analyzing, or evaluating financial statements that present a breadth and level of complexity of accounting issues that are generally comparable to the breadth and complexity of issues that can reasonably be expected to be raised by the registrant’s financial statements, or experience actively supervising one or more persons engaged in such activities;
d. An understanding of internal controls and procedures for financial reporting; and
e. An understanding of audit committee functions.
An “audit committee financial expert” shall have acquired such attributes through:
a. Education and experience as a principal financial officer, principal accounting officer, controller, public accountant, or auditor or experience in one or more positions that involve the performance of similar functions;
b. Experience actively supervising a principal financial officer, principal accounting officer, controller, public accountant, auditor, or person performing similar functions;
c. Experience overseeing or assessing the performance of companies or public accountants with respect to the preparation, auditing, or evaluation of financial statements; or
d. Other relevant experience.
The registrant’s Board of Trustees has also determined that each member of the registrant’s Audit Committee is independent. In order to be “independent” for purposes of this item, the Audit Committee member may not: (i) other than in his or her capacity as a member of the Board of Trustees or any committee thereof, accept directly or indirectly any consulting, advisory or other compensatory fee from the issuer; or (ii) be an “interested person” of the registrant as defined in Section 2(a)(19) of the Investment Company Act of 1940.
The names of the audit committee financial experts on the registrant’s Audit Committee are set forth below:
H. Jeffrey Dobbs
John A. Fry
Sandra A.J. Lawrence
Frances Sevilla-Sacasa, Chair
Item 4. Principal Accountant Fees and Services
The aggregate fees billed for services provided to the registrant by its independent auditors for the audit of the registrant’s annual financial statements and for services normally provided by the independent auditors in connection with statutory and regulatory filings or engagements were $29,142 for the fiscal year ended March 31, 2022.
The aggregate fees billed for services provided to the registrant by its independent auditors for the audit of the registrant’s annual financial statements and for services normally provided by the independent auditors in connection with statutory and regulatory filings or engagements were $32,380 for the fiscal year ended March 31, 2021.
The aggregate fees billed by the registrant’s independent auditors for services relating to the performance of the audit of the registrant’s financial statements and not reported under paragraph (a) of this Item were $0 for the fiscal year ended March 31, 2022.
The aggregate fees billed by the registrant’s independent auditors for services relating to the performance of the audit of the registrant’s financial statements and not reported under paragraph (a) of this Item were $0 for the fiscal year ended March 31, 2021.
The aggregate fees billed by the registrant’s independent auditors for tax-related services provided to the registrant’s investment adviser and other service providers under common control with the adviser and that relate directly to the operations or financial reporting of the registrant were $0 for the registrant’s fiscal year ended March 31, 2022.
The aggregate fees billed by the registrant’s independent auditors for tax-related services provided to the registrant’s investment adviser and other service providers under common control with the adviser and that relate directly to the operations or financial reporting of the registrant were $0 for the registrant’s fiscal year ended March 31, 2021.
The aggregate fees billed for all services provided by the independent auditors to the registrant other than those set forth in paragraphs (a), (b) and (c) of this Item were $0 for the fiscal year ended March 31, 2022.
The aggregate fees billed for all services provided by the independent auditors to the registrant other than those set forth in paragraphs (a), (b) and (c) of this Item were $0 for the fiscal year ended March 31, 2021.
Under the Pre-Approval Policy, the Audit Committee has also pre-approved the services set forth in the table below with respect to the registrant’s investment adviser and other entities controlling, controlled by or under common control with the investment adviser that provide ongoing services to the registrant (the “Control Affiliates”) up to the specified fee limit. This fee limit is based on aggregate fees to the investment adviser and its Control Affiliates.
The Pre-Approval Policy requires the registrant’s independent auditors to report to the Audit Committee at each of its regular meetings regarding all services initiated since the last such report was rendered, including those services authorized by the Pre-Approval Policy.
(f) Not applicable.
(g) The aggregate non-audit fees billed by the registrant’s independent auditors for services rendered to the registrant and to its investment adviser and other service providers under common control with the adviser were $9,044,000 and $8,455,000 for the registrant’s fiscal years ended March 31, 2022 and March 31, 2021, respectively.
(h) In connection with its selection of the independent auditors, the registrant’s Audit Committee has considered the independent auditors’ provision of non-audit services to the registrant’s investment adviser and other service providers under common control with the adviser that were not required to be pre-approved pursuant to Rule 2-01(c)(7)(ii) of Regulation S-X. The Audit Committee has determined that the independent auditors’ provision of these services is compatible with maintaining the auditors’ independence.
Item 5. Audit Committee of Listed Registrants
Not applicable.
Item 6. Investments
(a) Included as part of report to shareholders filed under Item 1 of this Form N-CSR.
(b) Divestment of securities in accordance with Section 13(c) of the Investment Company Act of 1940.
Not applicable.
Item 7. Disclosure of Proxy Voting Policies and Procedures for Closed-End Management Investment Companies
Not applicable.
Item 8. Portfolio Managers of Closed-End Management Investment Companies
Not applicable.
Item 9. Purchases of Equity Securities by Closed-End Management Investment Company and Affiliated Purchasers
Not applicable.
Item 10. Submission of Matters to a Vote of Security Holders
Not applicable.
Item 11. Controls and Procedures
The registrant’s principal executive officer and principal financial officers, or persons performing similar functions, have concluded that the registrant’s disclosure controls and procedures (as defined in Rule 30a-3(c) under the Investment Company Act of 1940, as amended (17 CFR 270.30a-3(c))) are effective, as of a date within 90 days of the filing of this report, based on their evaluation of these controls and procedures required by Rule 30a-3(b) under the Investment Company Act of 1940 (17 CFR 270.30a-3(b)) and Rules 13a-15(b) or 15d-15(b) under the Securities Exchange Act of 1934, as amended (17 CFR 240.13a-15(b) or 240.15d-15(b)) and provide reasonable assurance that the information required to be disclosed by the registrant in its reports or statements filed under the Securities Exchange Act of 1934 is recorded, processed, summarized and reported within the time periods specified in the rules and forms of the Securities and Exchange Commission.
There were no significant changes in the registrant’s internal control over financial reporting (as defined in Rule 30a-3(d) under the Investment Company Act of 1940 (17 CFR 270.30a-3(d)) that occurred during the period covered by the report to stockholders included herein that have materially affected, or are reasonably likely to materially affect, the registrant’s internal control over financial reporting.
Item 12. Disclosure of Securities Lending Activities for Closed-End Management Investment Companies
Not applicable.
Item 13. Exhibits
Not applicable.
(3) Written solicitations to purchase securities pursuant to Rule 23c-1 under the Securities Exchange Act of 1934.
Not applicable.
Pursuant to the requirements of the Securities Exchange Act of 1934 and the Investment Company Act of 1940, the registrant has duly caused this report to be signed on its behalf, by the undersigned, thereunto duly authorized.
Pursuant to the requirements of the Securities Exchange Act of 1934 and the Investment Company Act of 1940, this report has been signed below by the following persons on behalf of the registrant and in the capacities and on the dates indicated.