Item 1. Reports to Stockholders
Annual report
Fixed income mutual fund
Delaware Investments Ultrashort Fund
March 31, 2020
Beginning on or about June 1, 2021, as permitted by regulations adopted by the Securities and Exchange Commission, paper copies of your Fund’s shareholder reports will no longer be sent to you by mail, unless you specifically request them from the Fund or from your financial intermediary, such as a broker/dealer, bank, or insurance company. Instead, you will be notified by mail each time a report is posted on the website and provided with a link to access the report.
If you already elected to receive shareholder reports electronically, you will not be affected by this change and you do not need to take any action. You may elect to receive shareholder reports and other communications from the Fund electronically by signing up at delawarefunds.com/edelivery. If you own these shares through a financial intermediary, you may contact your financial intermediary.
You may elect to receive paper copies of all future shareholder reports free of charge. You can inform the Fund that you wish to continue receiving paper copies of your shareholder reports by contacting us at 800523-1918. If you own these shares through a financial intermediary, you may contact your financial intermediary to elect to continue to receive paper copies of your shareholder reports. Your election to receive reports in paper will apply to all funds held with the Delaware Funds® by Macquarie or your financial intermediary.
Carefully consider the Fund’s investment objectives, risk factors, charges, and expenses before investing. This and other information can be found in the Fund’s prospectus and its summary prospectus, which may be obtained by visiting delawarefunds.com/literature or calling 800523-1918. Investors should read the prospectus and the summary prospectus carefully before investing.
You can obtain shareholder reports and prospectuses online instead of in the mail.
Visit delawarefunds.com/edelivery.
Experience Delaware Funds®by Macquarie
Macquarie Investment Management (MIM) is a global asset manager with offices in the United States, Europe, Asia, and Australia. As active managers we prioritize autonomy and accountability at the investment team level in pursuit of opportunities that matter for clients. Delaware Funds is one of the longest-standing mutual fund families, with more than 80 years in existence.
If you are interested in learning more about creating an investment plan, contact your financial advisor.
You can learn more about Delaware Funds or obtain a prospectus for Delaware Investments Ultrashort Fund at delawarefunds.com/literature.
Manage your account online
| ● | | Check your account balance and transactions |
| ● | | View statements and tax forms |
| ● | | Make purchases and redemptions |
Visit delawarefunds.com/account-access.
Macquarie Asset Management (MAM) offers a diverse range of products including securities investment management, infrastructure and real asset management, and fund and equity-based structured products. MIM is the marketing name for certain companies comprising the asset management division of Macquarie Group. This includes the following investment advisers: Macquarie Investment Management Business Trust (MIMBT), Macquarie Funds Management Hong Kong Limited, Macquarie Investment Management Austria Kapitalanlage AG, Macquarie Investment Management Global Limited, Macquarie Investment Management Europe Limited, Macquarie Capital Investment Management LLC, and Macquarie Investment Management Europe S.A.
The Fund is distributed byDelaware Distributors, L.P. (DDLP), an affiliate of MIMBT and Macquarie Group Limited.
Other than Macquarie Bank Limited (MBL), none of the entities noted are authorized deposit-taking institutions for the purposes of the Banking Act 1959 (Commonwealth of Australia). The obligations of these entities do not represent deposits or other liabilities of MBL. MBL does not guarantee or otherwise provide assurance in respect of the obligations of these entities, unless noted otherwise. The Fund is governed by US laws and regulations.
Table of contents
Unless otherwise noted, views expressed herein are current as of March 31, 2020, and subject to change for events occurring after such date.
The Fund is not FDIC insured and is not guaranteed. It is possible to lose the principal amount invested.
Advisory services provided by Delaware Management Company, a series of MIMBT, a US registered investment advisor.
All third-party marks cited are the property of their respective owners.
© 2020 Macquarie Management Holdings, Inc.
| | |
| Portfolio management review |
| Delaware Investments Ultrashort Fund | | April 7, 2020 (Unaudited) |
| | | | | | | | |
Performance preview (for the year ended March 31, 2020) | | | | | | | | |
| | |
Delaware Investments Ultrashort Fund (Institutional Class shares) | | | 1-year return | | | | -0.21% | |
| | |
Delaware Investments Ultrashort Fund (Class A shares) | | | 1-year return | | | | -0.21% | |
| | |
ICE BofA US6-Month Treasury Bill Index (benchmark) | | | 1-year return | | | | +2.85% | |
Past performance does not guarantee future results.
For complete, annualized performance for Delaware Investments Ultrashort Fund, please see the table on page 4. Institutional Class shares are not subject to a sales charge and are offered for sale exclusively to certain eligible investors. In addition, Institutional Class shares pay no distribution and service fee.
The performance of Class A shares excludes the applicable sales charge. Both Institutional Class shares and Class A shares reflect the reinvestment of all distributions.
Please see page 8 for a description of the index. Index performance returns do not reflect any management fees, transaction costs, or expenses. Indices are unmanaged and one cannot invest directly in an index.
Investment objective
The Fund seeks total return to the extent consistent with a relatively low volatility of principal.
Market review
Both the Fund and capital markets generally enjoyed steady growth through the first 10 months of the fiscal year ended March 31, 2020. Beginning inmid-February, however, and continuing through March, the coronavirus pandemic wreaked havoc on the global economy and financial markets, erasing earlier gains.
The US economy posted annualized gross domestic product (GDP) growth of 2.1% in both the third and fourth quarters of 2019. Economists and investors expected continued economic expansion in the first quarter of 2020, but the coronavirus caused markets to plunge and the economy to stall. Although there had been some concern about slowing global growth, it had been addressed throughout the past year, largely through increasingly supportive central bank measures. For example, the US Federal Reserve cut the short-term federal funds rate in three quarter-point moves inmid-summer, September, and late October 2019, bringing it down to a range of1.50%-1.75%. (Source: Bloomberg.)
Given the market’s uncertainty, we believe it is prudent to own assets and companies that appear to us to have the staying power to work through this uncertain period. We expect that the assets in the Fund’s portfolio have the balance-sheet strength to weather the storm. With so much market dislocation, we believe that investors would be well advised to remain high in quality and defensive, with access to capital as markets reopen.
1
Portfolio management review
Delaware Investments Ultrashort Fund
The ongoingUS-China trade dispute had also been a concern during much of the12-month period, but the December announcement of a Phase 1 agreement, which was signed in January 2020, seemed to assuage investors.
When it became apparent, however, that the coronavirus had spread throughout Asia and Europe, and then made landfall in the United States, state and local governments began shutting down schools and businesses in an effort to stop the spread ofCOVID-19. With similar measures undertaken around the world, the virtual shutting down of the global economy sparked panic selling in almost all capital markets in late February and March, creating a liquidity shortage. Almost no assets were safe from rush selling in order to free up cash.
In early March 2020, the Fed acted twice –between regular meetings of the Federal Open Market Committee (FOMC) – to cut its key short-term interest rate by 1.50 percentage points to a0%-0.25% range. Additionally, the Fed aggressively provided liquidity support through a variety of unconventional moves. These included purchases of asset-backed securities (ABS), commercial paper, money markets, small-business loans, and investment grade corporate bonds. Meanwhile, the US Congress passed a wide-ranging $2 trillion fiscal relief bill. These moves helped calm markets and initiate a rebound that began in late March.
Within the Fund
For the fiscal year ended March 31, 2020, Delaware Investments Ultrashort Fund Institutional Class shares declined-0.21%. The Fund’s Class A shares fell-0.21% at net asset value and declined-2.17% at maximum offer price. These figures reflect all distributions reinvested. For the same period, the Fund’s benchmark, the ICE BofA US6-Month Treasury Bill Index, gained 2.85%.
Complete annualized performance for Delaware Investments Ultrashort Fund is shown in the table on page 4.
In the face of the market unrest the coronavirus created, no assets were safe. We believe the Fund is positioned very conservatively, in high-quality assets. However, as the crisis unfolded in March, many funds sold short-duration high-quality assets as an available means of liquidity. So, even though we owned short-duration high-quality assets, because of a market liquidity crisis, these high-quality, highly liquid assets became more volatile as investors sold what they could.
During March, the Fund underperformed its benchmark by 3.42 percentage points. Prior to that, the Fund had outperformed the index for the fiscal year to date February 2020 by 1.29%. March presented a highly challenging environment. In order to meet drawdowns from the Fund, we utilized money market instruments, such as commercial paper and Treasury bills, as well as short duration corporate bonds. The lack of liquidity in the marketplace created significant price imbalances even for the highest quality assets.
The Fund’s key contributors to performance and detractors from performance were actually one and the same based on the periods of market strength and weakness. The volatility the pandemic caused was liquidity driven. High-quality investment grade corporate bonds, particularly financials, were strong contributors to performance, along with consumer ABS. Within consumer ABS, most of the Fund’s holdings were concentrated inAAA-rated credit card and prime auto receivables.
Given that the Fund’s portfolio positioning held steady, those same securities became detractors in March when the liquidity crisis unfolded and caused forced selling of quality liquid assets.
Money market instruments, which made up roughly8%-12% of the portfolio, were less
2
affected by the liquidity crisis. These included holdings in commercial paper, short-term Treasury bills, and overnight agency securities.
Looking at the Fund’s performance leading up to the period of heightened volatility in March, our objective was to maintain a stable cash flow and invest in high-quality companies and borrowers. That led us to focus on US banks with strong balance sheets built up after the 2008-2009 global financial crisis. Within consumer ABS, we predominantly invest only in prime underlying collateral borrowers, including credit card issuers, auto loans, and equipment manufacturers. Our premise was that those types of institutions would have the financial strength to survive any kind of economic downturn, and we recognized the need for a defensive posture given that we were quite late in the economic cycle that began in 2009.
The key risk we face at the end of the Fund’s fiscal year is how the economy will perform as we come out of this sudden economic disruption the global pandemic created. It’s extremely challenging to gauge, as there is no precedent and no clear timeline associated with this. How can you predict what the economy will look like? Our view is that the economy will incrementally open across the country as businesses reopen.
Given the market’s uncertainty, we believe it is prudent to own assets and companies that appear to us to have the staying power to work through this uncertain period. We expect that the assets in the Fund’s portfolio have the balance-sheet strength to weather the storm. With so much market dislocation, we believe that investors
would be well advised to remain high in quality and defensive, with access to capital as markets reopen.
We had positioned the Fund’s portfolio for a late economic cycle before the pandemic and believe that positioning remains appropriate. We expect that we will go through a recession for a couple of quarters and that earnings growth will most likely be compressed. Valuations of financial assets are likely to contract because of that. So, we plan to keep the portfolio defensively positioned and look for opportunities to invest in what we view as good companies and prospects that fit well with the portfolio’s high-quality profile. We do not believe it would be wise to stretch and reach for yield this late in the cycle.
The Fund’s mandate is to maintain a relative balance between short-term investment grade corporate bonds and ABS. At period end, the Fund was allocated nearly 45% in each of these two asset classes, with approximately 10% in money market instruments as a liquidity buffer. We attempt to maintain anA-rating among corporate securities and aAAA-rating for ABS holdings.
We understand that this is a challenging time for investors. To use a much-used phrase, this is an unprecedented situation. There is less clarity than usual regarding the market outlook. While the outcome of the pandemic is unknown, we see the need to be proactive in any type of black-swan event such as this. To react during the market volatility or afterward could be self-defeating in many cases, in our opinion, and we remain committed to the Fund’s conservative positioning.
3
| | |
| Performance summary |
| Delaware Investments Ultrashort Fund | | March 31, 2020 (Unaudited) |
The performance quoted represents past performance and does not guarantee future results. Investment return and principal value of an investment will fluctuate so that shares, when redeemed, may be worth more or less than their original cost. Current performance may be lower or higher than the performance quoted. Performance data current to the most recent month end may be obtained by calling 800523-1918 or visiting delawarefunds.com/performance.
Fund and benchmark performance1,2
| | | | | | | | |
| | | Average annual total returns through March 31, 2020 |
| | | 1 year | | 5 year | | 10 year | | Lifetime |
| | | | |
Class A (Est. March 10, 1988)* | | | | | | | | |
Excluding sales charge | | -0.21% | | +0.90% | | +0.47% | | +2.66% |
Including sales charge | | -2.17% | | +0.50% | | +0.27% | | +2.60% |
Class C (Est. Nov. 29, 1995) | | | | | | | | |
Excluding sales charge | | -0.21% | | +0.90% | | +0.47% | | +1.54% |
Including sales charge | | -1.19% | | +0.90% | | +0.47% | | +1.54% |
Class L (Est. June 30, 1978)* | | | | | | | | |
Excluding sales charge | | -0.21% | | +0.90% | | +0.47% | | +4.50% |
Including sales charge | | -0.21% | | +0.90% | | +0.47% | | +4.50% |
Institutional Class (Est. Jan. 5, 2016) | | | | | | | | |
Excluding sales charge | | -0.21% | | — | | — | | +1.08% |
Including sales charge | | -0.21% | | — | | — | | +1.08% |
ICE BofA US6-Month Treasury Bill Index | | +2.85% | | +1.44% | | +0.83% | | +3.46%** |
*In conjunction with the conversion, Class A shares became Class L shares and Consultant Class shares became Class A shares.
**The benchmark lifetime return is for Class A share comparison only and is calculated using the last business day in the month of the Fund’s Class A inception date.
1 Returns reflect the reinvestment of all distributions and are presented both with and without the applicable sales charges described below. Returns do not reflect the deduction of taxes the shareholder would pay on Fund distributions or redemptions of Fund shares.
Expense limitations were in effect for certain classes during some or all of the periods shown in the “Fund and benchmark performance” table. Expenses for each class are listed on the “Fund expense ratios” table on page 6. Performance would have been lower had expense limitations not been in effect.
Institutional Class shares are not subject to a sales charge and are offered for sale exclusively to certain eligible investors. In addition, Institutional Class shares pay no distribution and service(12b-1) fee.
Class A shares are sold with a maximumfront-end sales charge of 2.00%, and have an annual12b-1 fee of 0.25% of average daily net assets. Performance for Class A shares, excluding sales charges, assumes that nofront-end sales charge applied.
Class C shares are sold with a contingent deferred sales charge of 1.00% if redeemed during the first 12 months. They are also subject to an annual
4
12b-1 fee of 1.00% of average daily net assets. Performance for Class C shares, excluding sales charges, assumes either that contingent deferred sales charges did not apply or that the investment was not redeemed. A sales load was not applicable for periods prior to Jan. 5, 2016 for Class A/Class C shares.
The Fund’s distributor, Delaware Distributors, L.P. (Distributor), has also contracted to limit the Fund’s Class A and Class C shares’12b-1 fee to 0.00% of the respective share class’ average daily net assets from April 1, 2019 through March 31, 2020.* These waivers and reimbursements may only be terminated by agreement of the Manager or Distributor, as applicable, and the Fund.
Class L shares are only available to Fund shareholders who held Class A shares of the Fund prior to the conversion of the Fund. Class L shares are closed to all additional purchases.
Fixed income securities and bond funds can lose value, and investors can lose principal, as interest rates rise. They also may be affected by economic conditions that hinder an issuer’s ability to make interest and principal payments on its debt.
The Fund may also be subject to prepayment risk, the risk that the principal of a bond that is held by a portfolio will be prepaid prior to maturity, at the time when interest rates are lower than what the bond was paying. A portfolio may then have to reinvest that money at a lower interest rate.
International investments entail risks not ordinarily associated with US investments including fluctuation in currency values, differences in accounting principles, or economic or political instability in other nations. Investing in emerging markets can be riskier than investing in established foreign markets due to increased volatility and lower trading volume.
The Fund may invest in derivatives, which may involve additional expenses and are subject to risk, including the risk that an underlying security
or securities index moves in the opposite direction from what the portfolio manager anticipated. A derivatives transaction depends upon the counterparties’ ability to fulfill their contractual obligations.
Interest payments on inflation-indexed debt securities will vary as the principal and/or interest is adjusted for inflation.
LIBOR risk is the risk that potential changes related to the use of the London interbank offered rate (LIBOR) could have adverse impacts on financial instruments which reference LIBOR. The potential abandonment of LIBOR could affect the value and liquidity of instruments which reference LIBOR.
The disruptions caused by natural disasters, pandemics, or similar events could prevent the Fund from executing advantageous investment decisions in a timely manner and could negatively impact the Fund’s ability to achieve its investment objective and the value of the Fund’s investments.
Gross domestic product is a measure of all goods and services produced by a nation in a year.
5
Performance summary
Delaware Investments Ultrashort Fund
2 The Fund’s expense ratios, as described in the most recent prospectus, are disclosed in the following “Fund expense ratios” table. Delaware Management Company has agreed to reimburse certain expenses and/or waive certain fees in order to prevent total annual fund operating expenses (excluding any12b-1 fees, acquired fund fees and expenses, taxes, interest, short sale and dividend and interest expenses, brokerage fees, certain insurance costs, and nonroutine expenses or costs, including, but not limited to, those relating to reorganizations, litigation, conducting shareholder meetings, and liquidations (collectively, nonroutine expenses)) from exceeding 0.40% of the Fund’s average daily net assets from April 1, 2019 to March 31, 2020.* Please see the most recent prospectus and any applicable supplement(s) for additional information on these fee waivers and/or reimbursements. Please see the “Financial highlights” section in this report for the most recent expense ratios.
| | | | | | | | |
| | | | | | | | | Institutional |
| Fund expense ratios | | Class A | | Class C | | Class L | | Class |
Total annual operating expenses (without fee waivers) | | 0.97% | | 1.72% | | 0.72% | | 0.72% |
Net expenses (including fee waivers, if any) | | 0.40% | | 0.40% | | 0.40% | | 0.40% |
Type of waiver | | Contractual | | Contractual | | Contractual | | Contractual |
*The aggregate contractual waiver period covering this report is from July 30, 2018 through July 29, 2020.
6
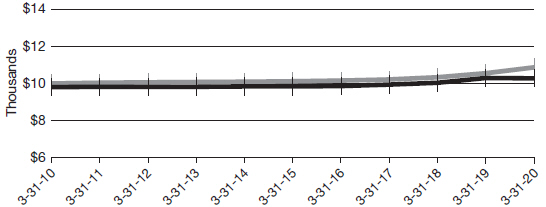
Performance of a $10,000 investment1
Class A shares
Average annual total returns from March 31, 2010 through March 31, 2020
| | | | | | | | |
| | | |
| For period beginning March 31, 2010 through March 31, 2020 | | Starting value | | | Ending value | |
| | |
 ICE BofA US6-Month Treasury Bill Index ICE BofA US6-Month Treasury Bill Index
| | | $10,000 | | | | $10,858 | |
| | |
 Delaware Investments Ultrashort Fund — Class A shares Delaware Investments Ultrashort Fund — Class A shares
| | | $9,800 | | | | $10,278 | |
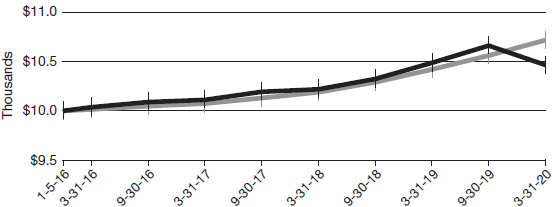
Institutional Class shares
Average annual total returns from Jan. 5, 2016 (inception date) through March 31, 2020
| | | | | | | | |
| | | |
| For period beginning Jan. 5, 2016 through March 31, 2020 | | Starting value | | | Ending value | |
| | |
ICE BofA US6-Month Treasury Bill Index | | | $10,000 | | | | $10,718 | |
| | |
Delaware Investments Ultrashort Fund — Institutional Class | | | $10,000 | | | | $10,463 | |
7
Performance summary
Delaware Investments Ultrashort Fund
1The “Performance of a $10,000 investment” graph for Class A shares assumes $10,000 invested in Class A shares of the Fund on March 31, 2010, and includes the effect of a 2.00%front-end sales charge and the reinvestment of all distributions. The graph also assumes $10,000 invested in the ICE BofA US 6–Month Treasury Bill Index as of March 31, 2010.
The “Performance of a $10,000 investment” graph for Institutional Class shares assumes $10,000 invested in Institutional Class shares of the Fund on Jan. 5, 2016, and includes the reinvestment of all distributions. The graph also assumes $10,000 invested in the ICE BofA US 6–Month Treasury Bill Index as of Jan. 5, 2016.
The graphs do not reflect the deduction of taxes the shareholders would pay on Fund distributions or redemptions of Fund shares. Expense limitations were in effect for some or all of the periods shown. Performance would have been lower had expense limitations not been in effect. Expenses are listed in the “Fund expense ratios” table on page 6. Please note additional details on pages 4 through 8.
The ICE BofA US 6–Month Treasury Bill Index tracks the performance of US Treasury bills with a maturity of six months. The index comprises a single Treasury issue purchased at the beginning of the month, which is then sold at the end of the month and rolled into a newly selected issue that matures closest to, but not beyond, six months from the transaction date (known as the rebalancing date).
Index performance returns do not reflect any management fees, transaction costs, or expenses. Indices are unmanaged and one cannot invest directly in an index.Past performance is not a guarantee of future results.
Performance of other Fund classes will vary due to different charges and expenses.
| | | | | | | | |
| | | Nasdaq symbols | | CUSIPs | | | | |
Class A | | DLTAX | | 245910609 | | | | |
Class C | | DLTCX | | 245910708 | | | | |
Class L | | DLTLX | | 245910807 | | | | |
Institutional Class | | DULTX | | 245910500 | | | | |
8
Disclosure of Fund expenses
For thesix-month period from October 1, 2019 to March 31, 2020 (Unaudited)
As a shareholder of the Fund, you incur two types of costs: (1) transaction costs, including sales charges (loads) on purchase payments, reinvested dividends, or other distributions; redemption fees; and exchange fees; and (2) ongoing costs, including management fees; distribution and service(12b-1) fees; and other Fund expenses. This example is intended to help you understand your ongoing costs (in dollars) of investing in the Fund and to compare these costs with the ongoing costs of investing in other mutual funds.
The example is based on an investment of $1,000 invested at the beginning of the period and held for the entiresix-month period from Oct. 1, 2019 to March 31, 2020.
Actual expenses
The first section of the table shown, “Actual Fund return,” provides information about actual account values and actual expenses. You may use the information in this section of the table, together with the amount you invested, to estimate the expenses that you paid over the period. Simply divide your account value by $1,000 (for example, an $8,600 account value divided by $1,000 = 8.6), then multiply the result by the number in the first section under the heading entitled “Expenses Paid During Period” to estimate the expenses you paid on your account during this period.
Hypothetical example for comparison purposes
The second section of the table shown, “Hypothetical 5% return,” provides information about hypothetical account values and hypothetical expenses based on the Fund’s actual expense ratio and an assumed rate of return of 5% per year before expenses, which is not the Fund’s actual return. The hypothetical account values and expenses may not be used to estimate the actual ending account balance or expenses you paid for the period. You may use this information to compare the ongoing costs of investing in the Fund and other funds. To do so, compare this 5% hypothetical example with the 5% hypothetical examples that appear in the shareholder reports of the other funds.
Please note that the expenses shown in the table are meant to highlight your ongoing costs only and do not reflect any transactional costs, such as sales charges (loads), redemption fees, or exchange fees. Therefore, the second section of the table is useful in comparing ongoing costs only, and will not help you determine the relative total costs of owning different funds. In addition, if these transactional costs were included, your costs would have been higher. The Fund’s expenses shown in the table reflect fee waivers in effect and assume reinvestment of all dividends and distributions.
9
Disclosure of Fund expenses
For thesix-month period from October 1, 2019 to March 31, 2020 (Unaudited)
Delaware Investments Ultrashort Fund
Expense analysis of an investment of $1,000
| | | | | | | | | | | | | | | | |
| | | Beginning | | | Ending | | | | | | Expenses | |
| | | Account Value | | | Account Value | | | Annualized | | | Paid During Period | |
| | | 10/1/19 | | | 3/31/20 | | | Expense Ratio | | | 10/1/19 to 3/31/20* | |
Actual Fund return† | | | | | | | | | | | | | | | | |
Class A | | | $1,000.00 | | | | $981.80 | | | | 0.40% | | | | $1.98 | |
Class C | | | 1,000.00 | | | | 981.80 | | | | 0.40% | | | | 1.98 | |
Class L | | | 1,000.00 | | | | 981.80 | | | | 0.40% | | | | 1.98 | |
Institutional Class | | | 1,000.00 | | | | 980.90 | | | | 0.40% | | | | 1.98 | |
Hypothetical 5% return(5% return before expenses) | | | | | | | | | |
Class A | | | $1,000.00 | | | | $1,023.00 | | | | 0.40% | | | | $2.02 | |
Class C | | | 1,000.00 | | | | 1,023.00 | | | | 0.40% | | | | 2.02 | |
Class L | | | 1,000.00 | | | | 1,023.00 | | | | 0.40% | | | | 2.02 | |
Institutional Class | | | 1,000.00 | | | | 1,023.00 | | | | 0.40% | | | | 2.02 | |
*“Expenses Paid During Period” are equal to the Fund’s annualized expense ratio, multiplied by the average account value over the period, multiplied by 183/366 (to reflect theone-half year period).
†Because actual returns reflect only the most recentsix-month period, the returns shown may differ significantly from fiscal year returns.
10
| | |
Security type / sector allocation | | |
Delaware Investments Ultrashort Fund | | As of March 31, 2020 (Unaudited) |
Sector designations may be different than the sector designations presented in other Fund materials. The sector designations may represent the investment manager’s internal sector classifications.
| | | | | |
| Security type / sector | | Percentage of net assets |
Agency Collateralized Mortgage Obligations | | | | 3.63 | % |
Commercial Paper | | | | 11.81 | % |
Banks | | | | 4.07 | % |
Capital Goods | | | | 5.70 | % |
ConsumerNon-Cyclical | | | | 2.04 | % |
Corporate Bonds | | | | 39.23 | % |
Banks | | | | 18.35 | % |
Basic Industry | | | | 1.70 | % |
Capital Goods | | | | 1.94 | % |
Communications | | | | 7.38 | % |
Consumer Cyclical | | | | 1.38 | % |
ConsumerNon-Cyclical | | | | 3.49 | % |
Electric | | | | 1.72 | % |
Energy | | | | 1.65 | % |
Financials | | | | 1.62 | % |
Non-Agency Asset-Backed Securities | | | | 45.41 | % |
Total Value of Securities | | | | 100.08 | % |
Liabilities Net of Receivables and Other Assets | | | | (0.08 | %) |
Total Net Assets | | | | 100.00 | % |
11
| | |
| Schedule of investments | | |
| Delaware Investments Ultrashort Fund | | March 31, 2020 |
| | | | | | | | |
| | | Principal amount° | | | Value (US $) | |
| |
Agency Collateralized Mortgage Obligations – 3.63% | | | | | | | | |
| |
Fannie Mae Connecticut Avenue Securities | | | | | | | | |
Series2017-C03 1M1 1.897% (LIBOR01M + 0.95%) 10/25/29● | | | 1,428,303 | | | $ | 1,384,891 | |
Series2018-C01 1M1 1.547% (LIBOR01M + 0.60%, Floor 0.60%) 7/25/30● | | | 359,498 | | | | 357,003 | |
Freddie Mac Structured Agency Credit Risk Debt Notes
Series 2015-DNA2 M2 3.547% (LIBOR01M + 2.60%) 12/25/27● | | | 16,033 | | | | 15,986 | |
Silverstone Master Issuer
Series2018-1A 1A 144A 2.209% (LIBOR03M + 0.39%) 1/21/70 #● | | | 930,000 | | | | 911,871 | |
| | | | | | | | |
Total Agency Collateralized Mortgage Obligations(cost $2,734,055) | | | | | | | 2,669,751 | |
| | | | | | | | |
|
| |
Commercial Paper – 11.81% | | | | | | | | |
| |
Banks – 4.07% | | | | | | | | |
BNP Paribas 0.03% 4/1/20¹ | | | 3,000,000 | | | | 3,000,000 | |
| | | | | | | | |
| | | | | | | 3,000,000 | |
| | | | | | | | |
Capital Goods – 5.70% | | | | | | | | |
Koch Industries 1.201% 4/2/20¹ | | | 1,000,000 | | | | 999,996 | |
Siemens Capital 0.04% 4/1/20¹ | | | 3,200,000 | | | | 3,200,000 | |
| | | | | | | | |
| | | | | | | 4,199,996 | |
| | | | | | | | |
ConsumerNon-Cyclical – 2.04% | | | | | | | | |
University of Chicago 1.624% 4/2/20¹ | | | 1,500,000 | | | | 1,499,861 | |
| | | | | | | | |
| | | | | | | 1,499,861 | |
| | | | | | | | |
Total Commercial Paper(cost $8,699,899) | | | | | | | 8,699,857 | |
| | | | | | | | |
|
| |
Corporate Bonds – 39.23% | | | | | | | | |
| |
Banks – 18.35% | | | | | | | | |
Bank of America 2.801% (LIBOR03M + 1.00%) 4/24/23● | | | 1,500,000 | | | | 1,456,737 | |
Citigroup 2.792% (LIBOR03M + 1.10%) 5/17/24● | | | 1,500,000 | | | | 1,433,649 | |
Citizens Bank 2.20% 5/26/20 | | | 1,250,000 | | | | 1,247,964 | |
Fifth Third Bank 2.20% 10/30/20 | | | 1,500,000 | | | | 1,495,332 | |
Goldman Sachs Group 3.213% (LIBOR03M + 1.60%) 11/29/23● | | | 1,250,000 | | | | 1,222,048 | |
JPMorgan Chase & Co. 2.694% (LIBOR03M + 0.90%) 4/25/23● | | | 1,410,000 | | | | 1,360,580 | |
Morgan Stanley 2.954% (LIBOR03M + 1.22%) 5/8/24● | | | 1,500,000 | | | | 1,439,056 | |
Santander UK 2.125% 11/3/20 | | | 1,000,000 | | | | 994,358 | |
Truist Bank 0.883% (SOFRRATE + 0.73%) 3/9/23● | | | 1,500,000 | | | | 1,366,921 | |
UBS 144A 2.45% 12/1/20 # | | | 1,500,000 | | | | 1,496,372 | |
| | | | | | | | |
| | | | | | | 13,513,017 | |
| | | | | | | | |
12
| | | | | | | | |
| | | Principal amount° | | | Value (US $) | |
| |
Corporate Bonds (continued) | | | | | | | | |
| |
Basic Industry – 1.70% | | | | | | | | |
DuPont de Nemours 3.766% 11/15/20 | | | 1,250,000 | | | $ | 1,254,115 | |
| | | | | | | | |
| | | | | | | 1,254,115 | |
| | | | | | | | |
Capital Goods – 1.94% | | | | | | | | |
Otis Worldwide 144A 1.823% (LIBOR03M + 0.45%) 4/5/23 #● | | | 1,500,000 | | | | 1,428,263 | |
| | | | | | | | |
| | | | | | | 1,428,263 | |
| | | | | | | | |
Communications – 7.38% | | | | | | | | |
AT&T 3.875% 8/15/21 | | | 1,250,000 | | | | 1,280,744 | |
Deutsche Telekom International Finance 144A 1.95% 9/19/21 # | | | 1,500,000 | | | | 1,482,347 | |
Fox 144A 3.666% 1/25/22 # | | | 1,500,000 | | | | 1,533,119 | |
Verizon Communications 2.792% (LIBOR03M + 1.10%) 5/15/25● | | | 1,250,000 | | | | 1,140,134 | |
| | | | | | | | |
| | | | | | | 5,436,344 | |
| | | | | | | | |
Consumer Cyclical – 1.38% | | | | | | | | |
General Motors Financial 2.363% (LIBOR03M + 0.99%) 1/5/23● | | | 1,250,000 | | | | 1,012,359 | |
| | | | | | | | |
| | | | | | | 1,012,359 | |
| | | | | | | | |
ConsumerNon-Cyclical – 3.49% | | | | | | | | |
AbbVie 144A 2.346% (LIBOR03M + 0.65%) 11/21/22 #● | | | 1,405,000 | | | | 1,315,005 | |
CVS Health 3.35% 3/9/21 | | | 1,249,000 | | | | 1,258,026 | |
| | | | | | | | |
| | | | | | | 2,573,031 | |
| | | | | | | | |
Electric – 1.72% | | | | | | | | |
American Electric Power 3.65% 12/1/21 | | | 1,250,000 | | | | 1,266,162 | |
| | | | | | | | |
| | | | | | | 1,266,162 | |
| | | | | | | | |
Energy – 1.65% | | | | | | | | |
Occidental Petroleum 4.85% 3/15/21 | | | 1,450,000 | | | | 1,215,024 | |
| | | | | | | | |
| | | | | | | 1,215,024 | |
| | | | | | | | |
Financials – 1.62% | | | | | | | | |
Aviation Capital Group 144A 2.53% (LIBOR03M + 0.95%) 6/1/21 #● | | | 1,250,000 | | | | 1,193,664 | |
| | | | | | | | |
| | | | | | | 1,193,664 | |
| | | | | | | | |
Total Corporate Bonds(cost $30,196,885) | | | | | | | 28,891,979 | |
| | | | | | | | |
|
| |
Non-Agency Asset-Backed Securities – 45.41% | | | | | | | | |
| |
American Express Credit Account Master Trust | | | | | | | | |
Series2017-2 A 1.155% (LIBOR01M + 0.45%) 9/16/24● | | | 675,000 | | | | 668,278 | |
Series2018-6 A 3.06% 2/15/24 | | | 1,000,000 | | | | 1,018,458 | |
Avis Budget Rental Car Funding AESOP
Series2015-2A A 144A 2.63% 12/20/21 # | | | 1,000,000 | | | | 991,065 | |
13
Schedule of investments
Delaware Investments Ultrashort Fund
| | | | | | | | |
| | | Principal amount° | | | Value (US $) | |
| |
Non-Agency Asset-Backed Securities (continued) | | | | | | | | |
| |
BMW Floorplan Master Owner Trust
Series2018-1 A2 144A 1.025% (LIBOR01M + 0.32%) 5/15/23 #● | | | 1,000,000 | | | $ | 975,575 | |
Chase Issuance Trust
Series2016-A3 A3 1.255% (LIBOR01M + 0.55%) 6/15/23● | | | 500,000 | | | | 495,609 | |
Chesapeake Funding II | | | | | | | | |
Series2017-2A A2 144A 1.155% (LIBOR01M + 0.45%, Floor 0.45%) 5/15/29 #● | | | 389,173 | | | | 385,656 | |
Series2017-4A A2 144A 1.045% (LIBOR01M + 0.34%) 11/15/29 #● | | | 799,407 | | | | 789,282 | |
Citibank Credit Card Issuance Trust
Series2017-A7 A7 1.375% (LIBOR01M + 0.37%) 8/8/24● | | | 1,000,000 | | | | 985,800 | |
Daimler Trucks Retail Trust
Series2020-1 A2 1.14% 4/15/22 | | | 1,500,000 | | | | 1,500,598 | |
Discover Card Execution Note Trust | | | | | | | | |
Series2017-A1 A1 1.195% (LIBOR01M + 0.49%) 7/15/24● | | | 1,500,000 | | | | 1,473,342 | |
Series2019-A2 A 0.975% (LIBOR01M + 0.27%) 12/15/23● | | | 2,000,000 | | | | 1,970,394 | |
Ford Credit Auto Lease Trust
Series2020-A A2 1.80% 7/15/22 | | | 1,250,000 | | | | 1,241,495 | |
Ford Credit Auto Owner Trust | | | | | | | | |
Series2015-2 A 144A 2.44% 1/15/27 # | | | 1,000,000 | | | | 990,698 | |
Series2017-A A3 1.67% 6/15/21 | | | 283,941 | | | | 283,845 | |
Series2017-C A3 2.01% 3/15/22 | | | 124,658 | | | | 124,680 | |
Great American Auto Leasing
Series2019-1 A2 144A 2.97% 6/15/21 # | | | 665,683 | | | | 664,886 | |
Honda Auto Receivables Owner Trust
Series2019-2 A2 2.57% 12/21/21 | | | 808,029 | | | | 808,951 | |
Hyundai Auto Receivables Trust
Series2019-B A2 1.93% 7/15/22 | | | 1,000,000 | | | | 997,549 | |
Invitation Homes Trust
Series 2018-SFR1 A 144A 1.50% (LIBOR01M + 0.70%) 3/17/37 #● | | | 1,814,566 | | | | 1,656,164 | |
John Deere Owner Trust
Series2019-B A2 2.28% 5/16/22 | | | 944,209 | | | | 945,532 | |
Master Credit Card Trust II
Series2018-3A A 144A 1.264% (LIBOR01M + 0.34%) 1/21/22 #● | | | 875,000 | | | | 870,143 | |
Mercedes-Benz Auto Lease Trust
Series2019-B A2 2.01% 12/15/21 | | | 1,500,000 | | | | 1,498,497 | |
Nissan Auto Lease Trust
Series2018-A A3 3.25% 9/15/21 | | | 2,000,000 | | | | 2,002,197 | |
14
| | | | | | | | |
| | | Principal amount° | | | Value (US $) | |
| |
Non-Agency Asset-Backed Securities (continued) | | | | | | | | |
| |
Nissan Master Owner Trust Receivables | | | | | | | | |
Series2017-C A 1.025% (LIBOR01M + 0.32%) 10/17/22● | | | 1,500,000 | | | $ | 1,473,582 | |
Series2019-A A 1.265% (LIBOR01M + 0.56%) 2/15/24● | | | 1,500,000 | | | | 1,440,235 | |
Tesla Auto Lease Trust
Series2018-B A 144A 3.71% 8/20/21 # | | | 2,973,601 | | | | 2,987,009 | |
Trafigura Securitisation Finance
Series2017-1A A1 144A 1.555% (LIBOR01M + 0.85%) 12/15/20 #● | | | 1,000,000 | | | | 992,451 | |
Trillium Credit Card Trust II
Series2019-1A A 144A 1.405% (LIBOR01M + 0.48%) 1/26/24 #● | | | 1,500,000 | | | | 1,472,321 | |
Verizon Owner Trust
Series2017-3A A1A 144A 2.06% 4/20/22 # | | | 764,660 | | | | 764,655 | |
Volvo Financial Equipment Master Owner Trust
Series2017-A A 144A 1.205% (LIBOR01M + 0.50%) 11/15/22 #● | | | 1,000,000 | | | | 966,322 | |
Wheels SPV 2
Series2017-1A A2 144A 1.88% 4/20/26 # | | | 10,916 | | | | 10,906 | |
| | | | | | | | |
TotalNon-Agency Asset-Backed Securities
(cost $33,997,373) | | | | | | | 33,446,175 | |
| | | | | | | | |
Total Value of Securities – 100.08%
(cost $75,628,212) | | | | | | $ | 73,707,762 | |
| | | | | | | | |
| # | Security exempt from registration under Rule 144A of the Securities Act of 1933, as amended. At March 31, 2020, the aggregate value of Rule 144A securities was $23,877,774, which represents 32.42% of the Fund’s net assets. See Note 8 in “Notes to financial statements.” |
| ¹ | The rate shown is the effective yield at the time of purchase. |
| ° | Principal amount shown is stated in USD. |
| ● | Variable rate investment. Rates reset periodically. Rate shown reflects the rate in effect at March 31, 2020. For securities based on a published reference rate and spread, the reference rate and spread are indicated in their description above. The reference rate descriptions (i.e. LIBOR03M, LIBOR06M, etc.) used in this report are identical for different securities, but the underlying reference rates may differ due to the timing of the reset period. Certain variable rate securities are not based on a published reference rate and spread but are determined by the issuer or agent and are based on current market conditions, or for mortgage-backed securities, are impacted by the individual mortgages which are paying off over time. These securities do not indicate a reference rate and spread in their description above. |
15
Schedule of investments
Delaware Investments Ultrashort Fund
Summary of abbreviations:
ICE – Intercontinental Exchange
LIBOR – London interbank offered rate
LIBOR01M – ICE LIBOR USD 1 Month
LIBOR03M – ICE LIBOR USD 3 Month
LIBOR06M – ICE LIBOR USD 6 Month
SOFRRATE – Secured Overnight Financing Rate
USD – US Dollar
See accompanying notes, which are an integral part of the financial statements.
16
| | |
Statement of assets and liabilities | | |
Delaware Investments Ultrashort Fund | | March 31, 2020 |
| | | | |
Assets: | | | | |
Investments, at value1 | | $ | 73,707,762 | |
Cash | | | 227,728 | |
Receivable for fund shares sold | | | 199,755 | |
Interest receivable | | | 185,434 | |
| | | | |
Total assets | | | 74,320,679 | |
| | | | |
Liabilities: | | | | |
Payable for fund shares redeemed | | | 575,082 | |
Distribution payable | | | 26,386 | |
Dividend disbursing and transfer agent fees and expenses payable tonon-affiliates | | | 19,056 | |
Reports and statements to shareholders expenses payable tonon-affiliates | | | 18,703 | |
Other accrued expenses | | | 16,846 | |
Audit and tax fees payable | | | 6,450 | |
Investment management fees payable to affiliates | | | 3,982 | |
Accounting and administration expenses payable to affiliates | | | 646 | |
Dividend disbursing and transfer agent fees and expenses payable to affiliates | | | 568 | |
Trustees’ fees and expenses payable to affiliates | | | 488 | |
Legal fees payable to affiliates | | | 130 | |
Reports and statements to shareholders expenses payable to affiliates | | | 97 | |
| | | | |
Total liabilities | | | 668,434 | |
| | | | |
Total Net Assets | | $ | 73,652,245 | |
| | | | |
| |
Net Assets Consist of: | | | | |
Paid-in capital | | $ | 75,709,329 | |
Total distributable earnings (loss) | | | (2,057,084 | ) |
| | | | |
Total Net Assets | | $ | 73,652,245 | |
| | | | |
17
Statement of assets and liabilities
Delaware Investments Ultrashort Fund
| | | | |
Net Asset Value | | | | |
Class A: | | | | |
Net assets | | $ | 15,718,295 | |
Shares of beneficial interest outstanding, unlimited authorization, no par | | | 1,612,887 | |
Net asset value per share | | $ | 9.75 | |
Sales charge | | | 2.00 | % |
Offering price per share, equal to net asset value per share / (1 – sales charge) | | $ | 9.95 | |
| |
Class C: | | | | |
Net assets | | $ | 7,364,025 | |
Shares of beneficial interest outstanding, unlimited authorization, no par | | | 755,655 | |
Net asset value per share | | $ | 9.75 | |
| |
Class L: | | | | |
Net assets | | $ | 46,517,442 | |
Shares of beneficial interest outstanding, unlimited authorization, no par | | | 4,772,235 | |
Net asset value per share | | $ | 9.75 | |
| |
Institutional Class: | | | | |
Net assets | | $ | 4,052,483 | |
Shares of beneficial interest outstanding, unlimited authorization, no par | | | 415,616 | |
Net asset value per share | | $ | 9.75 | |
| |
1Investments, at cost | | $ | 75,628,212 | |
See accompanying notes, which are an integral part of the financial statements.
18
| | |
Statement of operations | | |
Delaware Investments Ultrashort Fund | | Year ended March 31, 2020 |
| | | | |
Investment Income: | | | | |
Interest | | $ | 1,911,717 | |
| | | | |
Expenses: | | | | |
Management fees | | | 219,997 | |
Distribution expenses — Class A | | | 33,193 | |
Distribution expenses — Class C | | | 74,739 | |
Dividend disbursing and transfer agent fees and expenses | | | 68,862 | |
Registration fees | | | 66,887 | |
Accounting and administration expenses | | | 51,512 | |
Audit and tax fees | | | 40,307 | |
Reports and statements to shareholders expenses | | | 33,395 | |
Legal fees | | | 22,686 | |
Dues and services fees | | | 8,642 | |
Custodian fees | | | 4,658 | |
Trustees’ fees and expenses | | | 4,161 | |
Other | | | 11,098 | |
| | | | |
| | | 640,137 | |
Less expenses waived | | | (235,235 | ) |
Less waived distribution expenses — Class A | | | (33,193 | ) |
Less waived distribution expenses — Class C | | | (74,739 | ) |
Less expenses paid indirectly | | | (3,180 | ) |
| | | | |
Total operating expenses | | | 293,790 | |
| | | | |
Net Investment Income | | | 1,617,927 | |
| | | | |
| |
Net Realized and Unrealized Gain (Loss): | | | | |
Net realized gain on investments | | | 86,169 | |
Net change in unrealized appreciation (depreciation) of investments | | | (2,047,022 | ) |
| | | | |
Net Realized and Unrealized Loss | | | (1,960,853 | ) |
| | | | |
| |
Net Decrease in Net Assets Resulting from Operations | | $ | (342,926 | ) |
| | | | |
See accompanying notes, which are an integral part of the financial statements.
19
Statements of changes in net assets
Delaware Investments Ultrashort Fund
| | | | | | | | |
| | | Year ended | |
| | | 3/31/20 | | | 3/31/19 | |
Increase (Decrease) in Net Assets from Operations: | | | | | | | | |
Net investment income | | $ | 1,617,927 | | | $ | 1,666,574 | |
Net realized gain (loss) | | | 86,169 | | | | (58,579 | ) |
Net change in unrealized appreciation (depreciation) | | | (2,047,022 | ) | | | 308,555 | |
| | | | | | | | |
Net increase (decrease) in net assets resulting from operations | | | (342,926 | ) | | | 1,916,550 | |
| | | | | | | | |
| | |
Dividends and Distributions to Shareholders from: | | | | | | | | |
Distributable earnings: | | | | | | | | |
Class A | | | (292,153 | ) | | | (237,050 | ) |
Class C | | | (165,906 | ) | | | (128,966 | ) |
Class L | | | (1,106,374 | ) | | | (1,226,829 | ) |
Institutional Class | | | (63,663 | ) | | | (91,971 | ) |
| | | | | | | | |
| | | (1,628,096 | ) | | | (1,684,816 | ) |
| | | | | | | | |
| | |
Capital Share Transactions: | | | | | | | | |
Proceeds from shares sold: | | | | | | | | |
Class A | | | 13,198,449 | | | | 6,936,250 | |
Class C | | | 2,450,423 | | | | 5,240,123 | |
Class L | | | 20 | | | | 446 | |
Institutional Class | | | 19,654,840 | | | | 18,217,457 | |
| | |
Net asset value of shares issued upon reinvestment of dividends: | | | | | | | | |
Class A | | | 277,562 | | | | 231,419 | |
Class C | | | 156,664 | | | | 116,707 | |
Class L | | | 1,097,818 | | | | 1,209,158 | |
Institutional Class | | | 59,332 | | | | 86,130 | |
| | | | | | | | |
| | | 36,895,108 | | | | 32,037,690 | |
| | | | | | | | |
20
| | | | | | | | |
| | | Year ended | |
| | | 3/31/20 | | | 3/31/19 | |
Capital Share Transactions (continued): | | | | | | | | |
Cost of shares redeemed: | | | | | | | | |
Class A | | $ | (9,508,607 | ) | | $ | (3,763,409 | ) |
Class C | | | (2,437,117 | ) | | | (3,749,806 | ) |
Class L | | | (4,935,394 | ) | | | (8,946,596 | ) |
Institutional Class | | | (17,326,861 | ) | | | (16,849,044 | ) |
| | | | | | | | |
| | | (34,207,979 | ) | | | (33,308,855 | ) |
| | | | | | | | |
Increase (Decrease) in net assets derived from capital share transactions | | | 2,687,129 | | | | (1,271,165 | ) |
| | | | | | | | |
Net Increase (Decrease) in Net Assets | | | 716,107 | | | | (1,039,431 | ) |
| | |
Net Assets: | | | | | | | | |
Beginning of year | | | 72,936,138 | | | | 73,975,569 | |
| | | | | | | | |
End of year | | $ | 73,652,245 | | | $ | 72,936,138 | |
| | | | | | | | |
See accompanying notes, which are an integral part of the financial statements.
21
Financial highlights
Delaware Investments Ultrashort Fund Class A
Selected data for each share of the Fund outstanding throughout each period were as follows:
|
|
Net asset value, beginning of period |
|
Income (loss) from investment operations: |
Net investment income2 |
Net realized and unrealized gain (loss) |
Capital contribution from Advisor |
Total from investment operations |
|
Less dividends and distributions from: |
Net investment income |
Net realized gain |
Total dividends and distributions |
|
Net asset value, end of period |
|
Total return4 |
|
Ratios and supplemental data: |
Net assets, end of period (000 omitted) |
Ratio of expenses to average net assets |
Ratio of expenses to average net assets prior to fees waived |
Ratio of net investment income to average net assets |
Ratio of net investment income (loss) to average net assets prior to fees waived |
Portfolio turnover |
|
| 1 | The Class A shares financial highlights for the periods prior to Jan. 5, 2016 reflect the performance of Delaware Cash Reserve® Fund Consultant Class shares. |
| 2 | The average shares outstanding method has been applied for per share information. |
| 3 | For the year ended March 31, 2016, capital contribution from Advisor of $8,961 was made to the Fund’s Class A shares, which calculated to a de minimis amount of $0.00 per share. |
| 4 | Total return is based on the change in net asset value of a share during the period and assumes reinvestment of dividends and distributions at net asset value and does not reflect the impact of a sales charge. Total return during all of the periods shown reflects waivers by the manager and/or distributor. Performance would have been lower had the waivers not been in effect. |
See accompanying notes, which are an integral part of the financial statements.
22
| | | | | | | | | | | | | | | | | | | | | | | | | | | | |
| Year ended | |
| |
| | | 3/31/20 | | | | | 3/31/19 | | | | | 3/31/18 | | | | | 3/31/17 | | | | | 3/31/161 | |
| |
| | $ | 9.99 | | | | | $ | 9.96 | | | | | $ | 10.00 | | | | | $ | 10.02 | | | | | $ | 10.00 | |
| | | | | | | | | |
| | | 0.22 | | | | | | 0.22 | | | | | | 0.14 | | | | | | 0.07 | | | | | | 0.01 | |
| | | (0.24 | ) | | | | | 0.03 | | | | | | (0.03 | ) | | | | | — | | | | | | 0.02 | |
| | | — | | | | | | — | | | | | | — | | | | | | — | | | | | | — | 3 |
| | | | | | | | | | | | | | | | | | | | | | | | | | | | |
| | | (0.02 | ) | | | | | 0.25 | | | | | | 0.11 | | | | | | 0.07 | | | | | | 0.03 | |
| | | | | | | | | | | | | | | | | | | | | | | | | | | | |
| | | | | | | | | |
| | | (0.22 | ) | | | | | (0.22 | ) | | | | | (0.14 | ) | | | | | (0.07 | ) | | | | | (0.01 | ) |
| | | — | | | | | | — | | | | | | (0.01 | ) | | | | | (0.02 | ) | | | | | — | |
| | | | | | | | | | | | | | | | | | | | | | | | | | | | |
| | | (0.22 | ) | | | | | (0.22 | ) | | | | | (0.15 | ) | | | | | (0.09 | ) | | | | | (0.01 | ) |
| | | | | | | | | | | | | | | | | | | | | | | | | | | | |
| | | | | | | | | |
| | $ | 9.75 | | | | | $ | 9.99 | | | | | $ | 9.96 | | | | | $ | 10.00 | | | | | $ | 10.02 | |
| | | | | | | | | | | | | | | | | | | | | | | | | | | | |
| | | | | | | | | |
| | | (0.21% | ) | | | | | 2.59% | | | | | | 1.05% | | | | | | 0.76% | | | | | | 0.32% | |
| | | | | | | | | |
| | | | | | | | | | | | | | | | | | | | | | | | | | | | |
| | $ | 15,718 | | | | | $ | 12,169 | | | | | $ | 8,722 | | | | | $ | 9,430 | | | | | $ | 6,305 | |
| | | 0.40% | | | | | | 0.40% | | | | | | 0.40% | | | | | | 0.40% | | | | | | 0.19% | |
| | | 0.97% | | | | | | 0.97% | | | | | | 0.92% | | | | | | 1.08% | | | | | | 1.03% | |
| | | 2.21% | | | | | | 2.24% | | | | | | 1.38% | | | | | | 0.73% | | | | | | 0.14% | |
| | | 1.64% | | | | | | 1.67% | | | | | | 0.86% | | | | | | 0.05% | | | | | | (0.70% | ) |
| | | 82% | | | | | | 53% | | | | | | 134% | | | | | | 104% | | | | | | 123% | |
| |
23
Financial highlights
Delaware Investments Ultrashort Fund Class C
Selected data for each share of the Fund outstanding throughout each period were as follows:
|
|
Net asset value, beginning of period |
|
Income (loss) from investment operations: |
Net investment income2 |
Net realized and unrealized gain (loss) |
Capital contribution from Advisor |
Total from investment operations |
|
Less dividends and distributions from: |
Net investment income |
Net realized gain |
Total dividends and distributions |
|
Net asset value, end of period |
|
Total return4 |
|
Ratios and supplemental data: |
Net assets, end of period (000 omitted) |
Ratio of expenses to average net assets |
Ratio of expenses to average net assets prior to fees waived |
Ratio of net investment income to average net assets |
Ratio of net investment income (loss) to average net assets prior to fees waived |
Portfolio turnover |
|
| 1 | The Class C shares financial highlights for the periods prior to Jan. 5, 2016 reflect the performance of Delaware Cash Reserve® Fund Class C shares. |
| 2 | The average shares outstanding method has been applied for per share information. |
| 3 | For the year ended March 31, 2016, capital contribution from Advisor of $16,212 was made to the Fund’s Class C shares, which calculated to a de minimis amount of $0.00 per share. |
| 4 | Total return is based on the change in net asset value of a share during the period and assumes reinvestment of dividends and distributions at net asset value and does not reflect the impact of a sales charge. Total return during all of the periods shown reflects waivers by the manager and/or distributor. Performance would have been lower had the waivers not been in effect. |
See accompanying notes, which are an integral part of the financial statements.
24
| | | | | | | | | | | | | | | | | | | | | | | | | | | | |
| Year ended | |
| |
| | | 3/31/20 | | | | | 3/31/19 | | | | | 3/31/18 | | | | | 3/31/17 | | | | | 3/31/161 | |
| |
| | $ | 9.99 | | | | | $ | 9.96 | | | | | $ | 10.00 | | | | | $ | 10.02 | | | | | $ | 10.00 | |
| | | | | | | | | |
| | | 0.22 | | | | | | 0.22 | | | | | | 0.14 | | | | | | 0.07 | | | | | | 0.01 | |
| | | (0.24 | ) | | | | | 0.03 | | | | | | (0.03 | ) | | | | | — | | | | | | 0.02 | |
| | | — | | | | | | — | | | | | | — | | | | | | — | | | | | | — | 3 |
| | | | | | | | | | | | | | | | | | | | | | | | | | | | |
| | | (0.02 | ) | | | | | 0.25 | | | | | | 0.11 | | | | | | 0.07 | | | | | | 0.03 | |
| | | | | | | | | | | | | | | | | | | | | | | | | | | | |
| | | | | | | | | |
| | | (0.22 | ) | | | | | (0.22 | ) | | | | | (0.14 | ) | | | | | (0.07 | ) | | | | | (0.01 | ) |
| | | — | | | | | | — | | | | | | (0.01 | ) | | | | | (0.02 | ) | | | | | — | |
| | | | | | | | | | | | | | | | | | | | | | | | | | | | |
| | | (0.22 | ) | | | | | (0.22 | ) | | | | | (0.15 | ) | | | | | (0.09 | ) | | | | | (0.01 | ) |
| | | | | | | | | | | | | | | | | | | | | | | | | | | | |
| | | | | | | | | |
| | $ | 9.75 | | | | | $ | 9.99 | | | | | $ | 9.96 | | | | | $ | 10.00 | | | | | $ | 10.02 | |
| | | | | | | | | | | | | | | | | | | | | | | | | | | | |
| | | | | | | | | |
| | | (0.21% | ) | | | | | 2.59% | | | | | | 1.05% | | | | | | 0.75% | | | | | | 0.32% | |
| | | | | | | | | |
| | | | | | | | | | | | | | | | | | | | | | | | | | | | |
| | $ | 7,364 | | | | | $ | 7,386 | | | | | $ | 5,752 | | | | | $ | 7,527 | | | | | $ | 9,927 | |
| | | 0.40% | | | | | | 0.40% | | | | | | 0.40% | | | | | | 0.40% | | | | | | 0.19% | |
| | | 1.72% | | | | | | 1.72% | | | | | | 1.67% | | | | | | 1.83% | | | | | | 1.78% | |
| | | 2.21% | | | | | | 2.24% | | | | | | 1.38% | | | | | | 0.73% | | | | | | 0.14% | |
| | | 0.89% | | | | | | 0.92% | | | | | | 0.11% | | | | | | (0.70% | ) | | | | | (1.45% | ) |
| | | 82% | | | | | | 53% | | | | | | 134% | | | | | | 104% | | | | | | 123% | |
| |
25
Financial highlights
Delaware Investments Ultrashort Fund Class L
Selected data for each share of the Fund outstanding throughout each period were as follows:
|
|
Net asset value, beginning of period |
|
Income (loss) from investment operations: |
Net investment income2 |
Net realized and unrealized gain (loss) |
Capital contribution from Advisor |
Total from investment operations |
|
Less dividends and distributions from: |
Net investment income |
Net realized gain |
Total dividends and distributions |
|
Net asset value, end of period |
|
Total return4 |
|
Ratios and supplemental data: |
Net assets, end of period (000 omitted) |
Ratio of expenses to average net assets |
Ratio of expenses to average net assets prior to fees waived |
Ratio of net investment income to average net assets |
Ratio of net investment income (loss) to average net assets prior to fees waived |
Portfolio turnover |
|
| 1 | The Class L shares financial highlights for the periods prior to Jan. 5, 2016 reflect the performance of Delaware Cash Reserve® Fund Class A shares. |
| 2 | The average shares outstanding method has been applied for per share information. |
| 3 | For the year ended March 31, 2016, capital contribution from Advisor of $305,752 was made to the Fund’s Class L shares, which calculated to a de minimis amount of $0.00 per share. |
| 4 | Total return is based on the change in net asset value of a share during the period and assumes reinvestment of dividends and distributions at net asset value. Total return during all of the periods shown reflects a waiver by the manager. Performance would have been lower had the waiver not been in effect. |
See accompanying notes, which are an integral part of the financial statements.
26
| | | | | | | | | | | | | | | | | | | | | | | | | | | | |
| Year ended | |
| |
| | | 3/31/20 | | | | | 3/31/19 | | | | | 3/31/18 | | | | | 3/31/17 | | | | | 3/31/161 | |
| |
| | $ | 9.99 | | | | | $ | 9.96 | | | | | $ | 10.00 | | | | | $ | 10.02 | | | | | $ | 10.00 | |
| | | | | | | | | |
| | | 0.22 | | | | | | 0.22 | | | | | | 0.14 | | | | | | 0.07 | | | | | | 0.01 | |
| | | (0.24 | ) | | | | | 0.03 | | | | | | (0.03 | ) | | | | | — | | | | | | 0.02 | |
| | | — | | | | | | — | | | | | | — | | | | | | — | | | | | | — | 3 |
| | | | | | | | | | | | | | | | | | | | | | | | | | | | |
| | | (0.02 | ) | | | | | 0.25 | | | | | | 0.11 | | | | | | 0.07 | | | | | | 0.03 | |
| | | | | | | | | | | | | | | | | | | | | | | | | | | | |
| | | | | | | | | |
| | | (0.22 | ) | | | | | (0.22 | ) | | | | | (0.14 | ) | | | | | (0.07 | ) | | | | | (0.01 | ) |
| | | — | | | | | | — | | | | | | (0.01 | ) | | | | | (0.02 | ) | | | | | — | |
| | | | | | | | | | | | | | | | | | | | | | | | | | | | |
| | | (0.22 | ) | | | | | (0.22 | ) | | | | | (0.15 | ) | | | | | (0.09 | ) | | | | | (0.01 | ) |
| | | | | | | | | | | | | | | | | | | | | | | | | | | | |
| | | | | | | | | |
| | $ | 9.75 | | | | | $ | 9.99 | | | | | $ | 9.96 | | | | | $ | 10.00 | | | | | $ | 10.02 | |
| | | | | | | | | | | | | | | | | | | | | | | | | | | | |
| | | | | | | | | |
| | | (0.21% | ) | | | | | 2.59% | | | | | | 1.05% | | | | | | 0.75% | | | | | | 0.32% | |
| | | | | | | | | |
| | | | | | | | | | | | | | | | | | | | | | | | | | | | |
| | $ | 46,517 | | | | | $ | 51,512 | | | | | $ | 59,084 | | | | | $ | 68,119 | | | | | $ | 83,641 | |
| | | 0.40% | | | | | | 0.40% | | | | | | 0.40% | | | | | | 0.40% | | | | | | 0.19% | |
| | | 0.72% | | | | | | 0.72% | | | | | | 0.67% | | | | | | 0.83% | | | | | | 0.78% | |
| | | 2.21% | | | | | | 2.24% | | | | | | 1.38% | | | | | | 0.73% | | | | | | 0.14% | |
| | | 1.89% | | | | | | 1.92% | | | | | | 1.11% | | | | | | 0.30% | | | | | | (0.45% | ) |
| | | 82% | | | | | | 53% | | | | | | 134% | | | | | | 104% | | | | | | 123% | |
| |
27
Financial highlights
Delaware Investments Ultrashort Fund Institutional Class
Selected data for each share of the Fund outstanding throughout each period were as follows:
|
|
Net asset value, beginning of period |
|
Income (loss) from investment operations: |
Net investment income2 |
Net realized and unrealized gain (loss) |
Total from investment operations |
|
Less dividends and distributions from: |
Net investment income |
Net realized gain |
Total dividends and distributions |
|
Net asset value, end of period |
|
Total return3 |
|
Ratios and supplemental data: |
Net assets, end of period (000 omitted) |
Ratio of expenses to average net assets |
Ratio of expenses to average net assets prior to fees waived |
Ratio of net investment income to average net assets |
Ratio of net investment income to average net assets prior to fees waived |
Portfolio turnover |
|
| 1 | Date of commencement of operations; ratios have been annualized and total return has not been annualized. |
| 2 | The average shares outstanding method has been applied for per share information. |
| 3 | Total return is based on the change in net asset value of a share during the period and assumes reinvestment of dividends and distributions at net asset value. Total return during all of the periods shown reflects a waiver by the manager. Performance would have been lower had the waiver not been in effect. |
| 4 | Portfolio turnover is representative of the Fund for the year ended March 31, 2016. |
See accompanying notes, which are an integral part of the financial statements.
28
| | | | | | | | | | | | | | | | | | | | | | | | | | | | |
| | | | | | | | | | | | | | | | | | | | | | | 1/5/161 | |
| Year ended | | to | |
| | | | |
| | | 3/31/20 | | | | | 3/31/19 | | | | | 3/31/18 | | | | | 3/31/17 | | | | | 3/31/16 | |
| |
| | $ | 9.99 | | | | | $ | 9.96 | | | | | $ | 10.00 | | | | | $ | 10.02 | | | | | $ | 10.00 | |
| | | | | | | | | |
| | | 0.22 | | | | | | 0.22 | | | | | | 0.14 | | | | | | 0.07 | | | | | | 0.02 | |
| | | (0.24 | ) | | | | | 0.03 | | | | | | (0.03 | ) | | | | | — | | | | | | 0.02 | |
| | | | | | | | | | | | | | | | | | | | | | | | | | | | |
| | | (0.02 | ) | | | | | 0.25 | | | | | | 0.11 | | | | | | 0.07 | | | | | | 0.04 | |
| | | | | | | | | | | | | | | | | | | | | | | | | | | | |
| | | | | | | | | |
| | | (0.22 | ) | | | | | (0.22 | ) | | | | | (0.14 | ) | | | | | (0.07 | ) | | | | | (0.02 | ) |
| | | — | | | | | | — | | | | | | (0.01 | ) | | | | | (0.02 | ) | | | | | — | |
| | | | | | | | | | | | | | | | | | | | | | | | | | | | |
| | | (0.22 | ) | | | | | (0.22 | ) | | | | | (0.15 | ) | | | | | (0.09 | ) | | | | | (0.02 | ) |
| | | | | | | | | | | | | | | | | | | | | | | | | | | | |
| | | | | | | | | |
| | $ | 9.75 | | | | | $ | 9.99 | | | | | $ | 9.96 | | | | | $ | 10.00 | | | | | $ | 10.02 | |
| | | | | | | | | | | | | | | | | | | | | | | | | | | | |
| | | | | | | | | |
| | | (0.21% | ) | | | | | 2.59% | | | | | | 1.05% | | | | | | 0.75% | | | | | | 0.39% | |
| | | | | | | | | |
| | | | | | | | | | | | | | | | | | | | | | | | | | | | |
| | $ | 4,053 | | | | | $ | 1,869 | | | | | $ | 418 | | | | | $ | 331 | | | | | $ | 303 | |
| | | 0.40% | | | | | | 0.40% | | | | | | 0.40% | | | | | | 0.40% | | | | | | 0.40% | |
| | | 0.72% | | | | | | 0.72% | | | | | | 0.67% | | | | | | 0.83% | | | | | | 0.74% | |
| | | 2.21% | | | | | | 2.24% | | | | | | 1.38% | | | | | | 0.73% | | | | | | 0.36% | |
| | | 1.89% | | | | | | 1.92% | | | | | | 1.11% | | | | | | 0.30% | | | | | | 0.02% | |
| | | 82% | | | | | | 53% | | | | | | 134% | | | | | | 104% | | | | | | 123% | 4 |
| |
29
| | |
| Notes to financial statements | | |
| Delaware Investments Ultrashort Fund | | March 31, 2020 |
Delaware Group® Cash Reserve (Trust) is organized as a Delaware statutory trust and offers one series, Delaware Investments Ultrashort Fund (Fund). The Fund is anopen-end investment company. The Fund is considered diversified under the Investment Company Act of 1940, as amended and offers Class A, Class C, Class L, and Institutional Class shares. Class A shares are sold with a maximumfront-end sales charge of 2.00%. Class L and Institutional Class shares are not subject to a sales charge and are offered for sale exclusively to certain eligible investors. Class C shares are sold with a contingent deferred sales charge (CDSC) of 1.00%, which if redeemed during the first 12 months.
1. Significant Accounting Policies
The Fund follows accounting and reporting guidance under Financial Accounting Standards Board (FASB) Accounting Standards Codification Topic 946, Financial Services — Investment Companies. The following accounting policies are in accordance with US generally accepted accounting principles (US GAAP) and are consistently followed by the Fund.
Security Valuation— Debt securities are valued based upon valuations provided by an independent pricing service or broker and reviewed by management. To the extent current market prices are not available, the pricing service may take into account developments related to the specific security, as well as transactions in comparable securities. Valuations for fixed income securities utilize matrix systems, which reflect such factors as security prices, yields, maturities, and ratings, and are supplemented by dealer and exchange quotations. For asset-backed securities, collateralized mortgage obligations, commercial mortgage securities, and US government agency mortgage securities, pricing vendors utilize matrix pricing which considers prepayment speed, attributes of the collateral, yield or price of bonds of comparable quality, coupon, maturity, and type as well as broker/dealer-supplied prices. Generally, other securities and assets for which market quotations are not readily available are valued at fair value as determined in good faith under the direction of the Trust’s Board of Trustees (Board). In determining whether market quotations are readily available or fair valuation will be used, various factors will be taken into consideration, such as market closures or suspension of trading in a security. Restricted securities are valued at fair value using methods approved by the Board.
Federal Income Taxes— No provision for federal income taxes has been made as the Fund intends to continue to qualify for federal income tax purposes as a regulated investment company under Subchapter M of the Internal Revenue Code of 1986, as amended, and make the requisite distributions to shareholders. The Fund evaluates tax positions taken or expected to be taken in the course of preparing the Fund’s tax returns to determine whether the tax positions are“more-likely-than-not” of being sustained by the applicable tax authority. Tax positions not deemed to meet the“more-likely-than-not” threshold are recorded as a tax benefit or expense in the current year. Management has analyzed the Fund’s tax positions taken or expected to be taken on the Fund’s federal income tax returns through the year ended March 31, 2020 and for all open tax years (years ended March 31, 2017–March 31, 2019), and has concluded that no provision for federal income tax is required in the Fund’s financial statements. If applicable, the Fund recognizes interest accrued on unrecognized tax benefits in interest expense and penalties in “Other” on the “Statement of operations.” During the year ended March 31, 2020, the Fund did not incur any interest or tax penalties.
Class Accounting— Investment income and common expenses are allocated to the various classes of the Fund on the basis of “settled shares” of each class in relation to the net assets of the Fund. Realized
30
and unrealized gain (loss) on investments are allocated to the various classes of the Fund on the basis of daily net assets of each class. Distribution expenses relating to a specific class are charged directly to that class.
Use of Estimates— The preparation of financial statements in conformity with US GAAP requires management to make estimates and assumptions that affect the fair value of investments, the reported amounts of assets and liabilities and disclosure of contingent assets and liabilities at the date of the financial statements, and the reported amounts of revenues and expenses during the reporting period. Actual results could differ from those estimates and the differences could be material.
Other— Expenses directly attributable to the Fund are charged directly to the Fund. Other expenses common to various funds within the Delaware Funds® by Macquarie (Delaware Funds) are generally allocated among such funds on the basis of average net assets. Management fees and certain other expenses are paid monthly. Security transactions are recorded on the date the securities are purchased or sold (trade date) for financial reporting purposes. Costs used in calculating realized gains and losses on the sale of investment securities are those of the specific securities sold. Interest income is recorded on the accrual basis. Discounts and premiums on debt securities are accreted or amortized to interest income, respectively, over the lives of the respective securities using the effective interest method. Realized gains (losses) on paydowns of asset- and mortgage-backed securities are classified as interest income. The Fund declares dividends daily from net investment income and pays the dividends monthly and declares and pays distributions from net realized gain on investments, if any, annually. The Fund may distribute more frequently, if necessary for tax purposes. Dividends and distributions, if any, are recorded on theex-dividend date.
The Fund receives earnings credits from its custodian when positive cash balances are maintained, which may be used to offset custody fees. The expenses paid under this arrangement are included on the “Statement of operations” under “Custodian fees” with the corresponding expenses offset included under “Less expenses paid indirectly.” For the year ended March 31, 2020, the Fund earned $2,685 under this arrangement.
The Fund receives earnings credits from its transfer agent when positive cash balances are maintained, which may be used to offset transfer agent fees. If the amount earned is greater than $1, the expenses paid under this arrangement are included on the “Statement of operations” under “Dividend disbursing and transfer agent fees and expenses” with the corresponding expenses offset included under “Less expenses paid indirectly.” For the year ended March 31, 2020, the Fund earned $495 under this arrangement.
2. Investment Management, Administration Agreements, and Other Transactions with Affiliates
In accordance with the terms of its investment management agreement, the Fund pays Delaware Management Company (DMC), a series of Macquarie Investment Management Business Trust and the investment manager, an annual fee which is calculated daily and paid monthly at the rate of 0.30% on average daily net assets of the Fund.
DMC has contractually agreed to waive all or a portion of its investment advisory fees and/or pay/reimburse expenses (excluding any distribution and service(12b-1) fees, taxes, interest, acquired fund fees and expenses, short sale, dividend and interest expenses, brokerage fees, certain insurance
31
Notes to financial statements
Delaware Investments Ultrashort Fund
2. Investment Management, Administration Agreements, and Other Transactions with Affiliates (continued)
costs, and nonroutine expenses or costs, including, but not limited to, those relating to reorganizations, litigation, conducting shareholder meetings, and liquidations) in order to prevent total annual fund operating expenses from exceeding 0.40% of the Fund’s average daily net assets from April 1, 2019 through March 31, 2020.* These waivers and reimbursements may only be terminated by agreement of DMC and the Fund.
Delaware Investments Fund Services Company (DIFSC), an affiliate of DMC, provides fund accounting and financial administrative oversight services to the Fund. For these services, DIFSC’s fees are calculated daily and paid monthly based on the aggregate daily net assets of all funds within the Delaware Funds at the following annual rates: 0.00475% of the first $35 billion; 0.0040% of the next $10 billion; and 0.0025% of aggregate average daily net assets in excess of $45 billion (Total Fee). Each fund in the Delaware Funds pays a minimum of $4,000, which, in aggregate, is subtracted from the Total Fee. Each fund then pays its portion of the remainder of the Total Fee on a relative net asset value (NAV) basis. This amount is included on the “Statement of operations” under “Accounting and administration expenses.” For the year ended March 31, 2020, the Fund was charged $6,704 for these services.
Effective May 30, 2019, DMC may seek investment advice and recommendations from its affiliates: Macquarie Investment Management Europe Limited, Macquarie Investment Management Austria Kapitalanlage AG, and Macquarie Investment Management Global Limited (together, the “AffiliatedSub-Advisors”). The Manager may also permit these AffiliatedSub-Advisors to execute Fund security trades on behalf of the Manager and exercise investment discretion for securities in certain markets where DMC believes it will be beneficial to utilize an AffiliatedSub-Advisor’s specialized market knowledge. Although the AffiliatedSub-Advisors serve assub-advisors, DMC has ultimate responsibility for all investment advisory services. For these services, DMC, not the Fund, pays each AffiliatedSub-Advisor a portion of its investment management fee.
DIFSC is also the transfer agent and dividend disbursing agent of the Fund. For these services, DIFSC’s fees are calculated daily and paid monthly based on the aggregate daily net assets of the retail funds within the Delaware Funds at the following annual rates: 0.014% of the first $20 billion; 0.011% of the next $5 billion; 0.007% of the next $5 billion; 0.005% of the next $20 billion; and 0.0025% of average daily net assets in excess of $50 billion. The fees payable to DIFSC under the shareholder services agreement described above are allocated among all retail funds in the Delaware Funds on a relative NAV basis. This amount is included on the “Statement of operations” under “Dividend disbursing and transfer agent fees and expenses.” For the year ended March 31, 2020, the Fund was charged $6,790 for these services. Pursuant to asub-transfer agency agreement between DIFSC and BNY Mellon Investment Servicing (US) Inc. (BNYMIS), BNYMIS provides certainsub-transfer agency services to the Fund.Sub-transfer agency fees are paid by the Fund and are also included on the “Statement of operations” under “Dividend disbursing and transfer agent fees and expenses.” The fees that are calculated daily and paid as invoices are received on a monthly or quarterly basis.
Pursuant to a distribution agreement and distribution plan, the Fund pays DDLP, the distributor and an affiliate of DMC, an annual12b-1 fee of 0.25% of the average daily net assets of the Class A shares, and 1.00% of the average daily net assets of the Class C shares. The fees are calculated daily and paid
32
monthly. Class L and Institutional Class shares do not pay12b-1 fees. DDLP has contracted to limit the12b-1 fees to 0.00% of average daily net assets for Class A and Class C shares from April 1, 2019 through March 31, 2020.*
As provided in the investment management agreement, the Fund bears a portion of the cost of certain resources shared with DMC, including the cost of internal personnel of DMC and/or its affiliates that provide legal, tax, and regulatory reporting services to the Fund. For the year ended March 31, 2020, the Fund was charged $1,904 for internal legal, tax, and regulatory reporting services provided by DMC and/or its affiliates’ employees. This amount is included on the “Statement of operations” under “Legal fees.”
For the year ended March 31, 2020, DDLP earned $1,016 for commissions on sales of the Fund’s Class A shares. For the year ended March 31, 2020, DDLP received gross CDSC commissions of $1,825 on redemptions of the Fund’s Class C shares, and these commissions were entirely used to offset upfront commissions previously paid by DDLP to broker/dealers on sales of those shares. Class A shares had no CDSC commissions during the period.
Trustees’ fees include expenses accrued by the Fund for each Trustee’s retainer and meeting fees. Certain officers of DMC, DIFSC, and DDLP are officers and/or Trustees of the Trust. These officers and Trustees are paid no compensation by the Fund.
*The aggregate contractual waiver period covering this report is from July 30, 2018 through July 29, 2020.
3. Investments
For the year ended March 31, 2020, the Fund made purchases and sales of investment securities other than short-term investments as follows:
| | | | |
Purchases other than US government securities | | | $54,723,444 | |
Purchases of US government securities | | | — | |
Sales other than US government securities | | | 56,493,647 | |
Sales of US government securities | | | 173,912 | |
The tax cost of investments includes adjustments to net unrealized appreciation (depreciation) which may not necessarily be the final tax cost basis adjustments, but approximate the tax basis unrealized gains and losses that may be realized and distributed to shareholders. At March 31, 2020, the cost and unrealized appreciation (depreciation) of investments for federal income tax purposes for the Fund were as follows:
| | | | |
Cost of investments | | $ | 75,628,217 | |
| | | | |
Aggregate unrealized appreciation of investments | | $ | 47,276 | |
Aggregate unrealized depreciation of investments | | | (1,967,731 | ) |
| | | | |
Net unrealized depreciation of investments | | $ | (1,920,455 | ) |
| | | | |
US GAAP defines fair value as the price that the Fund would receive to sell an asset or pay to transfer a liability in an orderly transaction between market participants at the measurement date under current market conditions. A three-level hierarchy for fair value measurements has been established based upon
33
Notes to financial statements
Delaware Investments Ultrashort Fund
3. Investments (continued)
the transparency of inputs to the valuation of an asset or liability. Inputs may be observable or unobservable and refer broadly to the assumptions that market participants would use in pricing the asset or liability. Observable inputs reflect the assumptions market participants would use in pricing the asset or liability based on market data obtained from sources independent of the reporting entity. Unobservable inputs reflect the reporting entity’s own assumptions about the assumptions that market participants would use in pricing the asset or liability based on the best information available under the circumstances. The Fund’s investment in its entirety is assigned a level based upon the observability of the inputs which are significant to the overall valuation. The three-level hierarchy of inputs is summarized below.
| | | | |
| Level 1 | | – | | Inputs are quoted prices in active markets for identical investments. (Examples: equity securities,open-end investment companies, futures contracts, and exchange-traded options contracts) |
| | |
| Level 2 | | – | | Other observable inputs, including, but not limited to: quoted prices for similar assets or liabilities in markets that are active, quoted prices for identical or similar assets or liabilities in markets that are not active, inputs other than quoted prices that are observable for the assets or liabilities (such as interest rates, yield curves, volatilities, prepayment speeds, loss severities, credit risks, and default rates) or other market-corroborated inputs. (Examples: debt securities, government securities, swap contracts, foreign currency exchange contracts, foreign securities utilizing international fair value pricing, broker-quoted securities, and fair valued securities) |
| | |
| Level 3 | | – | | Significant unobservable inputs, including the Fund’s own assumptions used to determine the fair value of investments. (Examples: broker-quoted securities and fair valued securities) |
Level 3 investments are valued using significant unobservable inputs. The Fund may also use an income-based valuation approach in which the anticipated future cash flows of the investment are discounted to calculate fair value. Discounts may also be applied due to the nature or duration of any restrictions on the disposition of the investments. Valuations may also be based upon current market prices of securities that are comparable in coupon, rating, maturity, and industry. The derived value of a Level 3 investment may not represent the value which is received upon disposition and this could impact the results of operations.
The following table summarizes the valuation of the Fund’s investments by fair value hierarchy levels as of March 31, 2020:
| | | | |
| | | Level 2 | |
Securities | | | | |
Assets: | | | | |
Agency, Collateralized Debt Obligation, and
Asset-Backed Securities | | $ | 36,115,926 | |
Commercial Paper | | | 8,699,857 | |
Corporate Bonds | | | 28,891,979 | |
| | | | |
Total Value of Securities | | $ | 73,707,762 | |
| | | | |
34
During the year ended March 31, 2020, there were no transfers between Level 1 investments, Level 2 investments, or Level 3 investments that had a significant impact to the Fund. The Fund’s policy is to recognize transfers between levels based on fair value at the beginning of the reporting period.
A reconciliation of Level 3 investments is presented when the Fund has a significant amount of Level 3 investments at the beginning, interim, or end of the period in relation to net assets. During the year ended March 31, 2020, there were no Level 3 investments.
4. Dividend and Distribution Information
Income and long-term capital gain distributions are determined in accordance with federal income tax regulations, which may differ from US GAAP. Additionally, distributions from net short-term gains on sales of investment securities are treated as ordinary income for federal income tax purposes. The tax character of dividends and distributions paid during the years ended March 31, 2020 and 2019 was as follows:
| | | | | | | | |
| | | Year ended | |
| | | 3/31/20 | | | 3/31/19 | |
Ordinary income | | $ | 1,628,096 | | | $ | 1,684,816 | |
5. Components of Net Assets on a Tax Basis
As of March 31, 2020, the components of net assets on a tax basis were as follows:
| | | | |
Shares of beneficial interest | | $ | 75,709,329 | |
Undistributed ordinary income | | | 24,940 | |
Capital loss carryforward | | | (135,183 | ) |
Distributions payable | | | (26,386 | ) |
Net unrealized depreciation on investments | | | (1,920,455 | ) |
| | | | |
Net assets | | $ | 73,652,245 | |
| | | | |
The differences between book basis and tax basis components of net assets are primarily attributable to market premium on debt instruments.
At March 31, 2020, the Fund utilized $65,417 of capital loss carryforwards.
The Fund has capital loss carryforwards available to offset future realized capital gains as follows:
| | | | | | |
| | | Loss carryforward character |
| | | Short-term | | Long-term | | Total |
| | $135,183 | | $— | | $135,183 |
35
Notes to financial statements
Delaware Investments Ultrashort Fund
6. Capital Shares
Transactions in capital shares were as follows:
| | | | | | | | | | | | |
| | | Year ended | |
| | | 3/31/20 | | | | | | 3/31/19 | |
Shares sold: | | | | | | | | | | | | |
Class A | | | 1,329,041 | | | | | | | | 697,212 | |
Class C | | | 246,152 | | | | | | | | 526,762 | |
Class L | | | 2 | | | | | | | | 45 | |
Institutional Class | | | 1,962,612 | | | | | | | | 1,831,444 | |
| | | |
Shares issued upon reinvestment of dividends and distributions: | | | | | | | | | | | | |
Class A | | | 27,774 | | | | | | | | 23,246 | |
Class C | | | 15,674 | | | | | | | | 11,726 | |
Class L | | | 109,812 | | | | | | | | 121,436 | |
Institutional Class | | | 5,966 | | | | | | | | 8,658 | |
| | | | | | | | | | | | |
| | | 3,697,033 | | | | | | | | 3,220,529 | |
| | | | | | | | | | | | |
| | | |
Shares redeemed: | | | | | | | | | | | | |
Class A | | | (962,163 | ) | | | | | | | (378,214 | ) |
Class C | | | (245,583 | ) | | | | | | | (376,836 | ) |
Class L | | | (493,853 | ) | | | | | | | (898,885 | ) |
Institutional Class | | | (1,740,036 | ) | | | | | | | (1,695,026 | ) |
| | | | | | | | | | | | |
| | | (3,441,635 | ) | | | | | | | (3,348,961 | ) |
| | | | | | | | | | | | |
Net increase (decrease) | | | 255,398 | | | | | | | | (128,432 | ) |
| | | | | | | | | | | | |
Certain shareholders may exchange shares of one class for shares of another class in the same Fund. These exchange transactions are included as subscriptions and redemptions in the tables above and the “Statements of changes in net assets.” For the years ended March 31, 2020 and 2019, the Fund had the following exchange transactions:
| | | | | | | | | | | | |
| | | Exchange Redemptions | | Exchange Subscriptions |
| | | | | | | | | | | Institutional | | |
| | | Class A | | Class C | | Class L | | Class A | | Class | | |
| Year ended | | Shares | | Shares | | Shares | | Shares | | Shares | | Value |
| | | | | | |
| 3/31/20 | | — | | 5,791 | | — | | 5,793 | | — | | $58,111 |
| 3/31/19 | | 511 | | 75,599 | | 1,641 | | 75,653 | | 2,154 | | 774,207 |
7. Line of Credit
The Fund, along with certain other funds in the Delaware Funds (Participants), was a participant in a $220,000,000 revolving line of credit intended to be used for temporary or emergency purposes as an additional source of liquidity to fund redemptions of investor shares. Under the agreement, the Participants were charged an annual commitment fee of 0.15%, which was allocated across the Participants based on a weighted average of the respective net assets of each Participant. The
36
Participants were permitted to borrow up to a maximum ofone-third of their net assets under the agreement. Each Participant was individually, and not jointly, liable for its particular advances, if any, under the line of credit. The line of credit available under the agreement expired on Nov. 4, 2019.
On Nov. 4, 2019, the Participants entered into an amendment to the agreement for a $250,000,000 revolving line of credit. The revolving line of credit is to be used as described above and operates in substantially the same manner as the original agreement. The line of credit available under the agreement expires on Nov. 2, 2020.
The Fund had no amounts outstanding as of March 31, 2020, or at any time during the year then ended.
8. Credit and Market Risks
The risk that potential changes related to the use of the London interbank offered rate (LIBOR) could have adverse impacts on financial instruments which reference LIBOR. The potential abandonment of LIBOR could affect the value and liquidity of instruments which reference LIBOR.
The risk that the principal on mortgage-backed or asset-backed securities may be prepaid at any time, which will reduce the yield and market value.
The Fund invests in certain obligations that may have liquidity protection designed to ensure that the receipt of payments due on the underlying security is timely. Such protection may be provided through guarantees, insurance policies or letters of credit obtained by the issuer or sponsor through third parties, through various means of structuring the transaction, or through a combination of such approaches. The Fund will not pay any additional fees for such credit support, although the existence of credit support may increase the price of a security.
The Fund may invest up to 5% of its net assets in illiquid securities, which may include securities with contractual restrictions on resale, securities exempt from registration under Rule 144A promulgated under the Securities Act of 1933 (Act), as amended, and other securities which may not be readily marketable. The relative illiquidity of these securities may impair the Fund from disposing of them in a timely manner and at a fair price when it is necessary or desirable to do so. While maintaining oversight, the Board has delegated to DMC, theday-to-day functions of determining whether individual securities are liquid for purposes of the Fund’s limitation on investments in illiquid securities. The Fund may also invest in securities exempt from registration under Section 4(2) of the Act, which exempts from registration transactions by an issuer not involving any public offering. Securities eligible for resale pursuant to Rule 144A, which are determined to be liquid, are not subject to the Fund’s 5% limit on investments in illiquid securities. Rule 144A securities have been identified on the “Schedule of investments.”
9. Contractual Obligations
The Fund enters into contracts in the normal course of business that contain a variety of indemnifications. The Fund’s maximum exposure under these arrangements is unknown. However, the Fund has not had prior claims or losses pursuant to these contracts. Management has reviewed the Fund’s existing contracts and expects the risk of loss to be remote.
37
Notes to financial statements
Delaware Investments Ultrashort Fund
10. Recent Accounting Pronouncements
In March 2017, the FASB issued an Accounting Standards Update (ASU), ASU2017-08, Receivables — Nonrefundable Fees and Other Costs (Subtopic310-20), Premium Amortization on Purchased Callable Debt Securities which amends the amortization period for certain callable debt securities purchased at a premium, shortening such period to the earliest call date. The ASU2017-08 does not require any accounting change for debt securities held at a discount; the discount continues to be amortized to maturity. The ASU2017-08 is effective for fiscal years, and interim periods within those fiscal years, beginning after Dec. 15, 2018. Management has implemented the ASU2017-08 and determined that the impact of this guidance to the Fund’s net assets at the end of the year is not material.
In August 2018, the FASB issued an ASU2018-13, which changes certain fair value measurement disclosure requirements. The ASU2018-13, in addition to other modifications and additions, removes the requirement to disclose the amount and reasons for transfers between Level 1 and Level 2 of the fair value hierarchy, the policy for the timing of transfers between levels and the valuation process for Level 3 fair value measurements. The ASU2018-13 is effective for fiscal years, and interim periods within those fiscal years, beginning after Dec. 15, 2019. At this time, Management is evaluating the implications of these changes on the financial statements.
In March 2020, the FASB issued ASU2020-04, Reference Rate Reform (Topic 848) – Facilitation of the Effects of Reference Rate Reform on Financial Reporting. The amendments in the ASU2020-04 provides optional temporary financial reporting relief from the effect of certain types of contract modifications due to the planned discontinuation of LIBOR and other interbank-offered based reference rates as of the end of 2021. The ASU2020-04 is effective for certain reference rate-related contract modifications that occur during the period March 12, 2020 through December 31, 2022. Management is currently evaluating the impact, if any, of applying this ASU.
11. Subsequent Events
On Nov. 4, 2019, the Fund, along with certain other funds in the Delaware Funds (Participants), entered into an amendment to the agreement for a $250,000,000 revolving line of credit. The revolving line of credit available was increased to $275,000,000 on May 6, 2020. The revolving line of credit is to be used as described above and operates in substantially the same manner as the original agreement.
Beginning in January 2020, global financial markets have experienced and may continue to experience significant volatility resulting from the spread of a novel coronavirus known asCOVID-19. The outbreak ofCOVID-19 has resulted in travel and border restrictions, quarantines, supply chain disruptions, lower consumer demand and general market uncertainty. The effects ofCOVID-19 have and may continue to adversely affect the global economy, the economies of certain nations and individual issuers, all of which may negatively impact the Fund’s performance.
Management has determined that no other material events or transactions occurred subsequent to March 31, 2020, that would require recognition or disclosure in the Fund’s financial statements.
38
Report of independent
registered public accounting firm
To the Board of Trustees of Delaware Group® Cash Reserve and Shareholders of Delaware Investments Ultrashort Fund
Opinion on the Financial Statements
We have audited the accompanying statement of assets and liabilities, including the schedule of investments, of Delaware Investments Ultrashort Fund (the “Fund”) as of March 31, 2020, the related statement of operations for the year ended March 31, 2020, the statements of changes in net assets for each of the two years in the period ended March 31, 2020, including the related notes, and the financial highlights for each of the periods indicated therein (collectively referred to as the “financial statements”). In our opinion, the financial statements present fairly, in all material respects, the financial position of the Fund as of March 31, 2020, the results of its operations for the year then ended, the changes in its net assets for each of the two years in the period ended March 31, 2020 and the financial highlights for each of the periods indicated therein in conformity with accounting principles generally accepted in the United States of America.
Basis for Opinion
These financial statements are the responsibility of the Fund’s management. Our responsibility is to express an opinion on the Fund’s financial statements based on our audits. We are a public accounting firm registered with the Public Company Accounting Oversight Board (United States) (PCAOB) and are required to be independent with respect to the Fund in accordance with the U.S. federal securities laws and the applicable rules and regulations of the Securities and Exchange Commission and the PCAOB.
We conducted our audits of these financial statements in accordance with the standards of the PCAOB. Those standards require that we plan and perform the audit to obtain reasonable assurance about whether the financial statements are free of material misstatement, whether due to error or fraud.
Our audits included performing procedures to assess the risks of material misstatement of the financial statements, whether due to error or fraud, and performing procedures that respond to those risks. Such procedures included examining, on a test basis, evidence regarding the amounts and disclosures in the financial statements. Our audits also included evaluating the accounting principles used and significant estimates made by management, as well as evaluating the overall presentation of the financial statements. Our procedures included confirmation of securities owned as of March 31, 2020 by correspondence with the custodian. We believe that our audits provide a reasonable basis for our opinions.
/s/ PricewaterhouseCoopers LLP
Philadelphia, Pennsylvania
May 26, 2020
We have served as the auditor of one or more investment companies in Delaware Funds® by Macquarie since 2010.
39
Other Fund information (Unaudited)
Delaware Investments Ultrashort Fund
Tax Information
The information set forth below is for the Fund’s fiscal year as required by federal income tax laws. Shareholders, however, must report distributions on a calendar year basis for income tax purposes, which may include distributions for portions of two fiscal years of a fund. Accordingly, the information needed by shareholders for income tax purposes will be sent to them in January of each year. Please consult your tax advisor for proper treatment of this information.
All disclosures are based on financial information available as of the date of this annual report and, accordingly are subject to change. For any and all items requiring reporting, it is the intention of the Fund to report the maximum amount permitted under the Internal Revenue Code and the regulations thereunder.
For the year ended March 31, 2020, the Fund reports distributions paid during the year as follows:
| | | | |
(A) Ordinary Income Distributions (Tax Basis) | | | 100.00 | % |
(A) is based on a percentage of the Fund’s total distributions.
For the fiscal year ended March 31, 2020, certain distributions paid by the Funds, determined to be from Qualified Interest Income may be subject to relief from US withholding for foreign shareholders, as provided by the American Jobs Creation Act of 2004; the Tax Relief Unemployment Insurance Reauthorization, and Job Creations Act of 2010; and as extended by the American Taxpayer Relief Act of 2012. For the fiscal year ended March 31, 2020, the Fund has reported maximum distributions of Qualified Interest Income of $1,628,096.
40
This page intentionally left blank.
Board of trustees / directors and officers addendum
Delaware Funds®by Macquarie
A mutual fund is governed by a Board of Trustees/Directors (“Trustees”), which has oversight responsibility for the management of a fund’s business affairs. Trustees establish procedures and oversee and review the performance of the investment manager, the distributor, and others who perform services for the fund. The independent fund trustees, in particular, are advocates
| | | | |
Name, Address, and Birth Date | | Position(s) Held with Fund(s) | | Length of Time Served |
Interested Trustee | | |
| Shawn K. Lytle1 | | President, | | President and |
| 2005 Market Street | | Chief Executive Officer, | | Chief Executive Officer |
| Philadelphia, PA 19103 | | and Trustee | | since August 2015 |
| February 1970 | | | | |
| | | | Trustee since |
| | | | September 2015 |
| | |
| | | | |
Independent Trustees | | |
| Thomas L. Bennett | | Chair and Trustee | | Trustee since |
| 2005 Market Street | | | | March 2005 |
| Philadelphia, PA 19103 | | | | |
| October 1947 | | | | Chair since |
| | | | | March 2015 |
| Jerome D. Abernathy | | Trustee | | Since January 2019 |
| 2005 Market Street | | | | |
| Philadelphia, PA 19103 | | | | |
| July 1959 | | | | |
| | |
| | | | |
| Ann D. Borowiec | | Trustee | | Since March 2015 |
| 2005 Market Street | | | | |
| Philadelphia, PA 19103 | | | | |
November 1958 | | | | |
| 1 | Shawn K. Lytle is considered to be an “Interested Trustee” because he is an executive officer of the Fund’s(s’) investment advisor. |
42
for shareholder interests. Each trustee has served in that capacity since he or she was elected to or appointed to the Board of Trustees, and will continue to serve until his or her retirement or the election of a new trustee in his or her place. The following is a list of the Trustees and Officers with certain background and related information.
| | | | |
Principal Occupation(s) During the Past Five Years | | Number of Portfolios in Fund Complex Overseen by Trustee or Officer | | Other Directorships Held by Trustee or Officer |
| | | | |
| President — Macquarie | | 95 | | Trustee — UBS |
| Investment Management2 | | | | Relationship Funds, |
| (June 2015–Present) | | | | SMA Relationship |
| | | | Trust, and UBS Funds |
| Regional Head of | | | | (May 2010–April 2015) |
| Americas —UBS Global | | | | |
| Asset Management | | | | |
| (April 2010–May 2015) | | | | |
| | | | |
| | | | |
| Private Investor | | 95 | | None |
| (March 2004–Present) | | | | |
| | |
| | | | |
| Managing Member, | | 95 | | None |
| Stonebrook Capital | | | | |
| Management, LLC (financial | | | | |
| technology: macro factors | | | | |
| and databases) | | | | |
(January 1993–Present) | | | | |
| Chief Executive Officer, | | 95 | | Director — |
| Private Wealth Management | | | | Banco Santander International |
| (2011–2013) and | | | | (October 2016– |
| Market Manager, | | | | December 2019) |
| New Jersey Private | | | | |
| Bank (2005–2011) — | | | | Director — |
| J.P. Morgan Chase & Co. | | | | Santander Bank, N.A. |
| | | | (December 2016– |
| | | | | December 2019) |
| 2 | Macquarie Investment Management is the marketing name for Macquarie Management Holdings, Inc. and its subsidiaries, including the Fund’s(s’) investment advisor, principal underwriter, and its transfer agent. |
43
Board of trustees / directors and officers addendum
Delaware Funds®by Macquarie
| | | | |
Name, Address, and Birth Date | | Position(s) Held with Fund(s) | | Length of Time Served |
Independent Trustees (continued) |
| Joseph W. Chow | | Trustee | | Since January 2013 |
| 2005 Market Street | | | | |
| Philadelphia, PA 19103 | | | | |
| January 1953 | | | | |
| | | | | |
| | | | |
| John A. Fry | | Trustee | | Since January 2001 |
| 2005 Market Street | | | | |
| Philadelphia, PA 19103 | | | | |
| May 1960 | | | | |
| | |
| | | | | |
| Lucinda S. Landreth | | Trustee | | Since March 2005 |
| 2005 Market Street | | | | |
| Philadelphia, PA 19103 | | | | |
June 1947 | | | | |
44
| | | | |
Principal Occupation(s) During the Past Five Years | | Number of Portfolios in Fund Complex Overseen by Trustee or Officer | | Other Directorships Held by Trustee or Officer |
| | | | |
| Private Investor | | 95 | | Director and Audit Committee |
| (April 2011–Present) | | | | Member — Hercules |
| | | | Technology Growth |
| | | | Capital, Inc. |
| | | | (July 2004–July 2014) |
| President — | | 95 | | Director; Compensation |
| Drexel University | | | | Committee and |
| (August 2010–Present) | | | | Governance Committee |
| | | | Member — Community |
| President — | | | | Health Systems |
| Franklin & Marshall College | | | | (May 2004–Present) |
| (July 2002–June 2010) | | | | |
| | | | Director — Drexel |
| | | | Morgan & Co. |
| | | | (2015–2019) |
| | |
| | | | Director and Audit Committee |
| | | | Member — vTv |
| | | | Therapeutics Inc. |
| | | | (2017–Present) |
| | |
| | | | Director and Audit Committee |
| | | | Member — FS Credit Real |
| | | | Estate Income Trust, Inc. |
| | | | (2018–Present) |
| | |
| | | | Director — Federal Reserve |
| | | | Bank of Philadelphia |
| | | | (January 2020–Present) |
| Private Investor | | 95 | | None |
(2004–Present) | | | | |
45
Board of trustees / directors and officers addendum
Delaware Funds®by Macquarie
| | | | |
Name, Address, and Birth Date | | Position(s) Held with Fund(s) | | Length of Time Served |
Independent Trustees (continued) |
| Frances A. Sevilla-Sacasa | | Trustee | | Since September 2011 |
| 2005 Market Street | | | | |
| Philadelphia, PA 19103 | | | | |
| January 1956 | | | | |
| | | | |
| | | | |
| | |
| | | | | |
| Thomas K. Whitford | | Trustee | | Since January 2013 |
| 2005 Market Street | | | | |
| Philadelphia, PA 19103 | | | | |
| March 1956 | | | | |
| | |
| | | | | |
46
| | | | |
Principal Occupation(s) During the Past Five Years | | Number of Portfolios in Fund Complex Overseen by Trustee or Officer | | Other Directorships Held by Trustee or Officer |
|
| Private Investor | | 95 | | Trust Manager and |
| (January 2017–Present) | | | | Audit Committee |
| | | | Chair — Camden |
| Chief Executive Officer — | | | | Property Trust |
| Banco Itaú | | | | (August 2011–Present) |
| International | | | | |
| (April 2012–December 2016) | | | | Director; Strategic |
| | | | Planning and Reserves |
| Executive Advisor to Dean | | | | Committee and Nominating |
| (August 2011–March 2012) | | | | and Governance |
| and Interim Dean | | | | Committee Member — |
| (January 2011–July 2011) — | | | | Callon Petroleum Company |
| University of Miami School of | | | | (December 2019–Present) |
| Business Administration | | | | |
| | | | Director; Audit |
| President — U.S. Trust, | | | | Committee Member — |
| Bank of America Private | | | | Carrizo Oil & Gas, Inc. |
| Wealth Management | | | | (March 2018–December 2019) |
| (Private Banking) | | | | |
| (July 2007–December 2008) | | | | |
| Vice Chairman | | 95 | | Director — HSBC North |
| (2010–April 2013) — | | | | America Holdings Inc. |
| PNC Financial | | | | (December 2013–Present) |
| Services Group | | | | |
| | | | Director — HSBC USA Inc. |
| | | | (July 2014–Present) |
| | |
| | | | Director — |
| | | | HSBC Bank USA, |
| | | | National Association |
| | | | (July 2014–March 2017) |
| | |
| | | | Director — HSBC |
| | | | Finance Corporation |
| | | | | (December 2013–April 2018) |
47
Board of trustees / directors and officers addendum
Delaware Funds®by Macquarie
| | | | |
Name, Address, and Birth Date | | Position(s) Held with Fund(s) | | Length of Time Served |
Independent Trustees (continued) |
| Christianna Wood | | Trustee | | Since January 2019 |
| 2005 Market Street | | | | |
| Philadelphia, PA 19103 | | | | |
| August 1959 | | | | |
| | |
| | | | | |
48
| | | | |
Principal Occupation(s) During the Past Five Years | | Number of Portfolios in Fund Complex Overseen by Trustee or Officer | | Other Directorships Held by Trustee or Officer |
| | | | |
| Chief Executive Officer | | 95 | | Director; Finance Committee |
| and President — | | | | and Audit Committee |
| Gore Creek | | | | Member — H&R |
| Capital, Ltd. | | | | Block Corporation |
| (August 2009–Present) | | | | (July 2008–Present) |
| | |
| | | | Director; Investments |
| | | | Committee, Capital |
| | | | and Finance |
| | | | Committee, and Audit |
| | | | Committee Member — |
| | | | Grange Insurance |
| | | | (2013–Present) |
| | |
| | | | Trustee; Chair of |
| | | | Nominating and Governance |
| | | | Committee and Audit |
| | | | Committee Member — |
| | | | The Merger Fund |
| | | | (2013–Present), |
| | | | The Merger Fund VL |
| | | | (2013-Present), |
| | | | WCM Alternatives: |
| | | | Event-Driven Fund |
| | | | (2013–Present), |
| | | | and WCM Alternatives: |
| | | | Credit Event Fund |
| | | | (December 2017–Present) |
| | |
| | | | Director; Chair of |
| | | | Governance Committee |
| | | | and Audit Committee |
| | | | Member — International |
| | | | Securities Exchange |
| | | | | (2010–2016) |
49
Board of trustees / directors and officers addendum
Delaware Funds®by Macquarie
| | | | |
Name, Address, and Birth Date | | Position(s) Held with Fund(s) | | Length of Time Served |
Independent Trustees (continued) | | |
| Janet L. Yeomans | | Trustee | | Since April 1999 |
| 2005 Market Street | | | | |
| Philadelphia, PA 19103 | | | | |
| July 1948 | | | | |
| | | | |
| | | | |
| | | | |
| | | | |
Officers | | |
| David F. Connor | | Senior Vice President, | | Senior Vice President since |
| 2005 Market Street | | General Counsel, | | May 2013; General |
| Philadelphia, PA 19103 | | and Secretary | | Counsel since May 2015; |
| December 1963 | | | | Secretary since |
| | | | October 2005 |
| | | | | |
| Daniel V. Geatens | | Vice President | | Vice President and |
| 2005 Market Street | | and Treasurer | | Treasurer since October 2007 |
| Philadelphia, PA 19103 | | | | |
| October 1972 | | | | |
| | | | |
| | | | | |
| Richard Salus | | Senior Vice President | | Senior Vice President and |
| 2005 Market Street | | and Chief Financial Officer | | Chief Financial Officer |
| Philadelphia, PA 19103 | | | | since November 2006 |
| October 1963 | | | | |
| | | | |
| | | | | |
The Statement of Additional Information for the Fund(s) includes additional information about the Trustees and Officers and is available, without charge, upon request by calling 800523-1918.
50
| | | | |
Principal Occupation(s) During the Past Five Years | | Number of Portfolios in Fund Complex Overseen by Trustee or Officer | | Other Directorships Held by Trustee or Officer |
| | | | |
| Vice President and Treasurer | | 95 | | Director; Personnel and |
| (January 2006–July 2012), | | | | Compensation Committee |
| Vice President — | | | | Chair; Member of Nominating, |
| Mergers & Acquisitions | | | | Investments, and Audit |
| (January 2003–January 2006), | | | | Committees for various |
| and Vice President | | | | periods throughout |
| and Treasurer | | | | directorship — |
| (July 1995–January 2003) — | | | | Okabena Company |
| 3M Company | | | | (2009–2017) |
|
| David F. Connor has served | | 95 | | None3 |
| in various capacities at | | | | |
| different times at | | | | |
| Macquarie Investment | | | | |
| Management. | | | | |
| Daniel V. Geatens has served | | 95 | | None3 |
| in various capacities at | | | | |
| different times at | | | | |
| Macquarie Investment | | | | |
| Management. | | | | |
| Richard Salus has served | | 95 | | None |
| in various capacities | | | | |
| at different times at | | | | |
| Macquarie Investment | | | | |
| Management. | | | | |
| 3 | David F. Connor and Daniel V. Geatens serve in similar capacities for the six portfolios of the Optimum Fund Trust, which have the same investment advisor, principal underwriter, and transfer agent as the registrant. Mr. Geatens also serves as the Chief Financial Officer of the Optimum Fund Trust, and he is the Chief Financial Officer and Treasurer for Macquarie Global Infrastructure Total Return Fund Inc. |
51
About the organization
| | | | | | |
| Board of trustees | | | | | | |
| | | |
Shawn K. Lytle President and Chief Executive Officer Delaware Funds® by Macquarie Philadelphia, PA Thomas L. Bennett Chairman of the Board Delaware Funds by Macquarie Private Investor Rosemont, PA Jerome D. Abernathy Managing Member Stonebrook Capital Management, LLC Jersey City, NJ | | Ann D. Borowiec Former Chief Executive Officer Private Wealth Management J.P. Morgan Chase & Co. New York, NY Joseph W. Chow Former Executive Vice President State Street Corporation Boston, MA John A. Fry President Drexel University Philadelphia, PA | | Lucinda S. Landreth Former Chief Investment Officer Assurant, Inc. New York, NY Frances A. Sevilla-Sacasa Former Chief Executive Officer Banco Itaú International Miami, FL | | Thomas K. Whitford Former Vice Chairman PNC Financial Services Group Pittsburgh, PA Christianna Wood Chief Executive Officer and President Gore Creek Capital, Ltd. Golden, CO Janet L. Yeomans Former Vice President and Treasurer 3M Company St. Paul, MN |
| | | |
| Affiliated officers | | | | | | |
| | | |
| David F. Connor | | Daniel V. Geatens | | Richard Salus | | |
| | | |
Senior Vice President, General Counsel, and Secretary Delaware Funds by Macquarie Philadelphia, PA | | Vice President and Treasurer Delaware Funds by Macquarie Philadelphia, PA | | Senior Vice President and Chief Financial Officer Delaware Funds by Macquarie Philadelphia, PA | | |
This annual report is for the information of Delaware Investments Ultrashort Fund shareholders, but it may be used with prospective investors when preceded or accompanied by the Delaware Fund fact sheet for the most recently completed calendar quarter. These documents are available at delawarefunds.com/literature.
The Fund files its complete schedule of portfolio holdings with the Securities and Exchange Commission (SEC) for the first and third quarters of each fiscal year on FormN-PORT. The Fund’s FormsN-PORT, as well as a description of the policies and procedures that the Fund uses to determine how to vote proxies (if any) relating to portfolio securities, are available without charge (i) upon request, by calling 800523-1918; and (ii) on the SEC’s website at sec.gov. In addition, a description of the policies and procedures that the Fund uses to determine how to vote proxies (if any) relating to portfolio securities and the Schedule of Investments included in the Fund’s most recent FormN-PORT are available without charge on the Fund’s website at delawarefunds.com/literature. The Fund’s FormsN-PORT may be reviewed and copied at the SEC’s Public Reference Room in Washington, D.C.; information on the operation of the Public Reference Room may be obtained by calling 800SEC-0330.
Information (if any) regarding how the Fund voted proxies relating to portfolio securities during the most recently disclosed12-month period ended June 30 is available without charge (i) through the Fund’s website at delawarefunds.com/proxy; and (ii) on the SEC’s website at sec.gov.
52
Item 2. Code of Ethics
Item 3. Audit Committee Financial Expert
The registrant’s Board of Trustees has determined that certain members of the registrant’s Audit Committee are audit committee financial experts, as defined below. For purposes of this item, an “audit committee financial expert” is a person who has the following attributes:
a. An understanding of generally accepted accounting principles and financial statements;
b. The ability to assess the general application of such principles in connection with the accounting for estimates, accruals, and reserves;
c. Experience preparing, auditing, analyzing, or evaluating financial statements that present a breadth and level of complexity of accounting issues that are generally comparable to the breadth and complexity of issues that can reasonably be expected to be raised by the registrant’s financial statements, or experience actively supervising one or more persons engaged in such activities;
d. An understanding of internal controls and procedures for financial reporting; and
e. An understanding of audit committee functions.
An “audit committee financial expert” shall have acquired such attributes through:
a. Education and experience as a principal financial officer, principal accounting officer, controller, public accountant, or auditor or experience in one or more positions that involve the performance of similar functions;
b. Experience actively supervising a principal financial officer, principal accounting officer, controller, public accountant, auditor, or person performing similar functions;
c. Experience overseeing or assessing the performance of companies or public accountants with respect to the preparation, auditing, or evaluation of financial statements; or
d. Other relevant experience.
The registrant’s Board of Trustees has also determined that each member of the registrant’s Audit Committee is independent. In order to be “independent” for purposes of this item, the Audit Committee member may not: (i) other than in his or her capacity as a member of the Board of Trustees or any committee thereof, accept directly or indirectly any consulting, advisory or other compensatory fee from the issuer; or (ii) be an “interested person” of the registrant as defined in Section 2(a)(19) of the Investment Company Act of 1940.
The names of the audit committee financial experts on the registrant’s Audit Committee are set forth below:
Jerome D. Abernathy
John A. Fry
Thomas K. Whitford, Chair
Christianna Wood
Item 4. Principal Accountant Fees and Services
The aggregate fees billed for services provided to the registrant by its independent auditors for the audit of the registrant’s annual financial statements and for services normally provided by the independent auditors in connection with statutory and regulatory filings or engagements were $33,140 for the fiscal year ended March 31, 2020.
The aggregate fees billed for services provided to the registrant by its independent auditors for the audit of the registrant’s annual financial statements and for services normally provided by the independent auditors in connection with statutory and regulatory filings or engagements were $32,490 for the fiscal year ended March 31, 2019.
The aggregate fees billed by the registrant’s independent auditors for services relating to the performance of the audit of the registrant’s financial statements and not reported under paragraph (a) of this Item were $0 for the fiscal year ended March 31, 2020.
The aggregate fees billed by the registrant’s independent auditors for services relating to the performance of the audit of the registrant’s financial statements and not reported under paragraph (a) of this Item were $0 for the fiscal year ended March 31, 2019.
The aggregate fees billed by the registrant’s independent auditors for tax-related services provided to the registrant’s investment adviser and other service providers under common control with the adviser and that relate directly to the operations or financial reporting of the registrant were $0 for the registrant’s fiscal year ended March 31, 2020.
The aggregate fees billed by the registrant’s independent auditors for tax-related services provided to the registrant’s investment adviser and other service providers under common control with the adviser and that relate directly to the operations or financial reporting of the registrant were $0 for the registrant’s fiscal year ended March 31, 2019.
The aggregate fees billed for all services provided by the independent auditors to the registrant other than those set forth in paragraphs (a), (b) and (c) of this Item were $0 for the fiscal year ended March 31, 2020.
The aggregate fees billed for all services provided by the independent auditors to the registrant other than those set forth in paragraphs (a), (b) and (c) of this Item were $0 for the fiscal year ended March 31, 2019.
Under the Pre-Approval Policy, the Audit Committee has also pre-approved the services set forth in the table below with respect to the registrant’s investment adviser and other entities controlling, controlled by or under common control with the investment adviser that provide ongoing services to the registrant (the “Control Affiliates”) up to the specified fee limit. This fee limit is based on aggregate fees to the investment adviser and its Control Affiliates.
The Pre-Approval Policy requires the registrant’s independent auditors to report to the Audit Committee at each of its regular meetings regarding all services initiated since the last such report was rendered, including those services authorized by the Pre-Approval Policy.
(f) Not applicable.
(g) The aggregate non-audit fees billed by the registrant’s independent auditors for services rendered to the registrant and to its investment adviser and other service providers under common control with the adviser were $4,687,000 and $11,748,000 for the registrant’s fiscal years ended March 31, 2020 and March 31, 2019, respectively.
(h) In connection with its selection of the independent auditors, the registrant’s Audit Committee has considered the independent auditors’ provision of non-audit services to the registrant’s investment adviser and other service providers under common control with the adviser that were not required to be pre-approved pursuant to Rule 2-01(c)(7)(ii) of Regulation S-X. The Audit Committee has determined that the independent auditors’ provision of these services is compatible with maintaining the auditors’ independence.
Item 5. Audit Committee of Listed Registrants
Not applicable.
Item 6. Investments
(a) Included as part of report to shareholders filed under Item 1 of this Form N-CSR.
(b) Divestment of securities in accordance with Section 13(c) of the Investment Company Act of 1940.
Not applicable.
Item 7. Disclosure of Proxy Voting Policies and Procedures for Closed-End Management Investment Companies
Not applicable.
Item 8. Portfolio Managers of Closed-End Management Investment Companies
Not applicable.
Item 9. Purchases of Equity Securities by Closed-End Management Investment Company and Affiliated Purchasers
Not applicable.
Item 10. Submission of Matters to a Vote of Security Holders
Not applicable.
Item 11. Controls and Procedures
The registrant’s principal executive officer and principal financial officer have evaluated the registrant’s disclosure controls and procedures within 90 days of the filing of this report and have concluded that they are effective in providing reasonable assurance that the information required to be disclosed by the registrant in its reports or statements filed under the Securities Exchange Act of 1934 is recorded, processed, summarized and reported within the time periods specified in the rules and forms of the Securities and Exchange Commission.
There were no significant changes in the registrant’s internal control over financial reporting that occurred during the period covered by the report to stockholders included herein that have materially affected, or are reasonably likely to materially affect, the registrant’s internal control over financial reporting.
Item 12. Disclosure of Securities Lending Activities for Closed-End Management Investment Companies
Not applicable.
Item 13. Exhibits
Pursuant to the requirements of the Securities Exchange Act of 1934 and the Investment Company Act of 1940, the registrant has duly caused this report to be signed on its behalf, by the undersigned, thereunto duly authorized.
Pursuant to the requirements of the Securities Exchange Act of 1934 and the Investment Company Act of 1940, this report has been signed below by the following persons on behalf of the registrant and in the capacities and on the dates indicated.