Item 1. Reports to Stockholders

Annual report
Fixed income mutual fund
Delaware Investments Ultrashort Fund
March 31, 2017
Carefully consider the Fund’s investment objectives, risk factors, charges, and expenses before investing. This and other information can be found in the Fund’s prospectus and its summary prospectus, which may be obtained by visiting delawarefunds.com/literature or calling 800 523-1918. Investors should read the prospectus and the summary prospectus carefully before investing.
You can obtain shareholder reports and prospectuses online instead of in the mail.
Visit delawarefunds.com/edelivery.
Experience Delaware Investments
Delaware Investments is committed to the pursuit of consistently superior asset management and unparalleled client service. We believe in our investment processes, which seek to deliver consistent results, and in convenient services that help add value for our clients.
If you are interested in learning more about creating an investment plan, contact your financial advisor.
You can learn more about Delaware Investments or obtain a prospectus for Delaware Investments Ultrashort Fund at delawarefunds.com/literature.
Manage your investments online
| ● | | 24-hour access to your account information |
| ● | | Check your account balance and recent transactions |
| ● | | Request statements or literature |
| ● | | Make purchases and redemptions |
Delaware Management Holdings, Inc. and its subsidiaries (collectively known by the marketing name of Delaware Investments) are wholly owned subsidiaries of Macquarie Group Limited, a global provider of banking, financial, advisory, investment, and funds management services.
Neither Delaware Investments nor its affiliates referred to in this document are authorized deposit-taking institutions for the purpose of the Banking Act 1959 (Commonwealth of Australia). The obligations of these entities do not represent deposits or other liabilities of Macquarie Bank Limited (MBL), a subsidiary of Macquarie Group Limited and an affiliate of Delaware Investments. MBL does not guarantee or otherwise provide assurance in respect of the obligations of these entities, unless noted otherwise. The Fund is governed by US laws and regulations.
Unless otherwise noted, views expressed herein are current as of March 31, 2017, and subject to change for events occurring after such date.
The Fund is not FDIC insured and is not guaranteed. It is possible to lose the principal amount invested.
Mutual fund advisory services provided by Delaware Management Company, a series of Delaware Management Business Trust, which is a registered investment advisor. Delaware Investments, a member of Macquarie Group, refers to Delaware Management Holdings, Inc. and its subsidiaries, including the Fund’s distributor, Delaware Distributors, L.P. Macquarie Group refers to Macquarie Group Limited and its subsidiaries and affiliates worldwide.
© 2017 Delaware Management Holdings, Inc.
All third-party marks cited are the property of their respective owners.
| | |
| Portfolio management review | | |
| Delaware Investments Ultrashort Fund | | April 11, 2017 (Unaudited) |
| | | | | | | | |
| Performance preview (for the year ended March 31, 2017) | | | | | | |
Delaware Investments Ultrashort Fund (Institutional Class shares) | | | 1-year return | | | | +0.75% | |
Delaware Investments Ultrashort Fund (Class A shares) | | | 1-year return | | | | +0.76% | |
BofA Merrill Lynch US 6-Month Treasury Bill Index (benchmark) | | | 1-year return | | | | +0.58% | |
Past performance does not guarantee future results.
For complete, annualized performance for Delaware Investments Ultrashort Fund, please see the table on page 3. Institutional Class Shares are available without sales or asset-based distribution charges only to certain eligible accounts. The performance of Class A shares excludes the applicable sales charge. Both Institutional Class shares and Class A shares reflect the reinvestment of all distributions.
Please see page 7 for a description of the index. Index performance returns do not reflect any management fees, transaction costs, or expenses. Indices are unmanaged and one cannot invest directly in an index.
Market overview
The lengthy period of historically low short-term interest rates — during which the US Federal Reserve held its federal funds rate at zero — ended in December 2015 with a 0.25 percentage point increase. After a year of steadily improving economic data, the Fed raised rates again in December 2016, little more than a month after Donald Trump’s surprising victory in the US presidential election.
Those two events had a significant effect on US financial markets, including the money market and short-term bond market. The prospect of Trump’s aggressive pro-growth and pro-business policies on tax reform, deregulation, and infrastructure spending, and their potential effects on the financial market, led to a strong rally in US stocks. Equities, investors reasoned, stood to gain broadly from lower corporate taxes and less regulation. In addition, government spending on, or tax credits related to, infrastructure projects could potentially benefit firms in the construction and materials industries.
Accompanying the stock rally was a selloff in bonds, with interest rates pushed even higher by another rate hike in March 2017. Combined, the recent rate increases — generated at two out of the Fed’s last three meetings held during the
Fund’s fiscal year — boosted expectations for further normalization of US short-term interest rates in the near term. This is widely expected to include two more 0.25 percentage point increases by the end of 2017.
The stock rally paused, and the bond selloff and rate increases reversed direction in March 2017, when the Trump administration’s failure to execute on various initiatives, including the effort to repeal and replace the Affordable Care Act (ACA), seemed to cast doubt on other Trump agenda items, including tax reform, deregulation, and infrastructure spending.
Fund performance
For the fiscal year ended March 31, 2017, Delaware Investments Ultrashort Fund Institutional Class shares returned +0.75%. The Fund’s Class A shares returned +0.76% at net asset value and -1.22% at maximum offer price. These figures reflect all distributions reinvested. During the same period, the Fund’s benchmark, the BofA Merrill Lynch US 6-Month Treasury Bill Index, returned +0.58%. For complete, annualized performance of Delaware Investments Ultrashort Fund, please see the table on page 3.
The Fund outperformed its benchmark as interest rates rose during the fiscal year, particularly after the election of President Trump in November and
1
Portfolio management review
Delaware Investments Ultrashort Fund
the market rally that followed. The Fund’s return improved in absolute and relative terms from November 2016 through the end of the fiscal period.
The Fund is structured into three roughly evenly divided segments: money markets (employed largely for liquidity), investment grade corporate bonds (used for yield), and AAA-rated floating-rate asset-backed securities (ABS) (used in an effort to respond to rate increases). Additionally, with their shorter maturities, the money market securities can help the Fund quickly capture rate increases and can be used to help manage the portfolio’s average duration. We may tweak the Fund’s allocations to these three segments slightly, but generally allocation remains at one-third for each segment. The goal is to maintain a high-quality portfolio.
The Fund maintains an average duration of less than 18 months; at the end of the fiscal year it was neutral at roughly nine months. The benefit of a shorter duration is faster responsiveness in an effort to capture interest rate increases. However, longer durations are generally accompanied by the potential for higher yields. We believe that in this rising rate environment, a neutral duration is prudent. We might extend the duration once the Fed has finished raising interest rates.
Financial sector commercial paper and corporate bonds were the largest contributors to the Fund’s results. The Fund’s AAA-rated ABS segment was also positive because of its floating-rate nature. New issues, in high demand, also performed well for the Fund overall.
Asset allocation and sector selection played a large positive role for the Fund. Within money markets, holding some longer-maturing commercial paper helped, particularly in the bank and finance sector. Asset-backed floating-rate issues contributed 1.26 percentage points to Fund returns, while corporate bonds added
1.32 percentage points and money markets added 0.77 percentage points in absolute terms.
The Fund uses a barbell approach, balancing the responsiveness and high liquidity of money markets with relatively longer-term corporate bonds. That approach served the Fund well during its fiscal year.
The largest factor detracting from the Fund’s performance was the portfolio’s focus on higher-quality but generally lower-yielding securities, which can put the Fund at a relative disadvantage against certain competitors. For instance, the Fund only holds AAA-rated ABS, tier-1 (highest-rated) commercial paper in the money market segment, and investment grade corporate bonds, typically rated higher than BBB. Accordingly, it is more difficult to compete on yield relative to lower-quality portfolios.
The federal funds rate increases have been a long time coming. Recent statements by Fed governors indicate that the market could still be about five years away from seeing normalized rates. The pace of rate increases could depend, in part, on whether Trump’s fiscal policies and tax reforms are implemented (and how quickly and effectively they are executed). If economic growth accelerates further, and inflation picks up, more rate increases could occur sooner.
For now, the Fund remains at a neutral duration. With the expectation that the Fed will likely continue to raise rates slowly and deliberately, we plan to choose what we believe to be the most suitable duration extensions for the Fund as we go forward. For example, as money market instruments mature, we could replace 3-month paper with 6- and 9-month maturities. Although that wouldn’t affect the Fund’s overall duration significantly, it could help position the Fund to pick up some incremental yield. A similar approach could be applied to the corporate sector, allowing the Fund the opportunity to capture some yield as rates rise.
2
| | |
| Performance summary | | |
| Delaware Investments Ultrashort Fund | | March 31, 2017 (Unaudited) |
The performance data quoted represent past performance; past performance does not guarantee future results. Investment return and principal value will fluctuate so your shares, when redeemed, may be worth more or less than their original cost. Please obtain the performance data current for the most recent month end by calling 800 523-1918 or visiting our website at delawarefunds.com/performance. Current performance may be lower or higher than the performance data quoted.
Fund and benchmark performance1,2
| | | | | | | | | | | | | | |
| | | Average annual total returns through March 31, 2017 |
| | | 1 year | | | 5 years | | | 10 years | | | Lifetime |
| | | | |
Class A (Est. March 10, 1988)* | | | | | | | | | | | | | | |
Excluding sales charge | | | +0.76% | | | | +0.25% | | | | +0.66% | | | +2.82% |
Including sales charge | | | -1.22% | | | | -0.15% | | | | +0.47% | | | +2.75% |
Class C (Est. Nov. 29, 1995) | | | | | | | | | | | | | | |
Excluding sales charge | | | +0.75% | | | | +0.25% | | | | +0.53% | | | +1.60% |
Including sales charge | | | -0.24% | | | | +0.25% | | | | +0.53% | | | +1.60% |
Class L (Est. June 30, 1978)* | | | | | | | | | | | | | | |
Excluding sales charge | | | +0.75% | | | | +0.24% | | | | +0.71% | | | +4.77% |
Including sales charge | | | +0.75% | | | | +0.24% | | | | +0.71% | | | +4.77% |
Institutional Class (Est. Jan. 5, 2016) | | | | | | | | | | | | | | |
Excluding sales charge | | | +0.75% | | | | n/a | | | | n/a | | | +0.93% |
Including sales charge | | | +0.75% | | | | n/a | | | | n/a | | | +0.93% |
BofA Merrill Lynch US 6-Month Treasury Bill Index | | | +0.58% | | | | +0.30% | | | | +1.05% | | | +3.61%** |
*In conjunction with the conversion, Class A shares became Class L shares and Consultant Class shares became Class A shares.
**The benchmark lifetime return is for Class A share comparison only and is calculated using the last business day in the month of the Fund’s Class A inception date.
1 Returns reflect the reinvestment of all distributions and are presented both with and without the applicable sales charges described below. Returns do not reflect the deduction of taxes the shareholder would pay on Fund distributions or redemptions of Fund shares.
Expense limitations were in effect for certain classes during some or all of the periods shown in the “Fund and benchmark performance” table. Expenses for each class are listed on the “Fund expense ratios” table on page 5. Performance would have been lower had expense limitations not been in effect.
Institutional Class shares are available without sales or asset-based distribution charges only to certain eligible accounts.
Class A shares are sold with a maximum front-end sales charge of 2.00%, and have an annual distribution and service fee of 0.25% of average daily net assets. Performance for Class A shares, excluding sales charges, assumes that no front-end sales charge applied.
3
Performance summary
Delaware Investments Ultrashort Fund
Class C shares are sold with a contingent deferred sales charge of 1.00% if redeemed during the first 12 months. They are also subject to an annual distribution and service fee of 1.00% of average daily net assets. Performance for Class C shares, excluding sales charges, assumes either that contingent deferred sales charges did not apply or that the investment was not redeemed. A sales load was not applicable for periods prior to Jan. 5, 2016 for Class A/Class C shares.
The Fund’s distributor, Delaware Distributors, L.P. (Distributor), has also contracted to limit the Fund’s Class A and Class C shares’ 12b-1 fee to 0.00% of the respective share class’ average daily net assets from April 1, 2016 through July 29, 2017.* These waivers and reimbursements may only be terminated by agreement of the Manager or Distributor, as applicable, and the Fund.
Class L shares are only available to Fund shareholders who held Class A shares of the Fund prior to the conversion of the Fund. Class L shares are closed to all additional purchases.
Fixed income securities and bond funds can lose value, and investors can lose principal, as interest rates rise. They also may be affected by economic conditions that hinder an issuer’s ability to make interest and principal payments on its debt.
The Fund may also be subject to prepayment risk, the risk that the principal of a bond that is held by a portfolio will be prepaid prior to maturity, at the time when interest rates are lower than what the bond was paying. A portfolio may then have to reinvest that money at a lower interest rate.
International investments entail risks not ordinarily associated with US investments including fluctuation in currency values, differences in accounting principles, or economic or political instability in other nations. Investing in emerging markets can be riskier than investing in established foreign markets due to increased volatility and lower trading volume.
The Fund may invest in derivatives, which may involve additional expenses and are subject to risk, including the risk that an underlying security or securities index moves in the opposite direction from what the portfolio manager anticipated. A derivatives transaction depends upon the counterparties’ ability to fulfill their contractual obligations.
Interest payments on inflation-indexed debt securities will vary as the principal and/or interest is adjusted for inflation.
4
2 The Fund’s expense ratios, as described in the most recent prospectus, are disclosed in the following “Fund expense ratios” table. Delaware Management Company has agreed to reimburse certain expenses and/or waive certain fees in order to prevent total annual fund operating expenses (excluding any 12b-1 fees, acquired fund fees and expenses, taxes, interest, short sale and dividend interest expenses, brokerage fees, certain insurance costs, and nonroutine expenses or costs, including, but not limited to, those relating to reorganizations, litigation, conducting shareholder meetings, and liquidations (collectively, nonroutine expenses)) from exceeding 0.40% of the Fund’s average daily net assets during the period from April 1, 2016 through March 31, 2017.* Please see the most recent prospectus and any applicable supplement(s) for additional information on these fee waivers and/or reimbursements.
| | | | | | | | |
| Fund expense ratios | | Class A | | Class C | | Class L | | Institutional Class |
Total annual operating expenses | | 0.89% | | 1.64% | | 0.64% | | 0.64% |
(without fee waivers) | | | | | | | | |
Net expenses | | 0.40% | | 0.40% | | 0.40% | | 0.40% |
(including fee waivers, if any) | | | | | | | | |
Type of waiver* | | Contractual | | Contractual | | Contractual | | Contractual |
*The aggregate contractual waiver period covering this report is from Jan. 4, 2016, through July 29, 2017.
5
Performance summary
Delaware Investments Ultrashort Fund
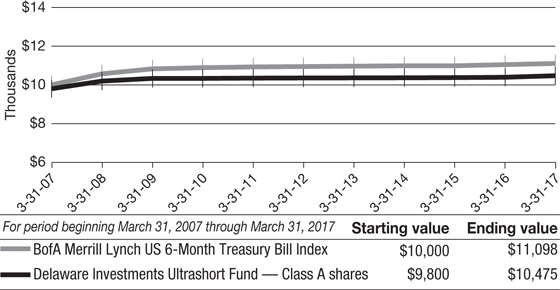
Performance of a $10,000 investment1
Class A shares
Average annual total returns from March 31, 2007 through March 31, 2017
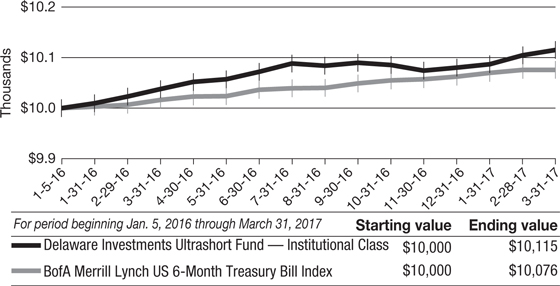
Institutional Class shares
Average annual total returns from Jan. 5, 2016 (inception date) through March 31, 2017
6
1The “Performance of a $10,000 investment” graph for Class A shares assumes $10,000 invested in Class A shares of the Fund on March 31, 2007, and includes the effect of a 2.00% front-end sales charge and the reinvestment of all distributions. The graph also assumes $10,000 invested in the BofA Merrill Lynch US 6-Month Treasury Bill Index as of March 31, 2007.
The “Performance of a $10,000 investment” graph for Institutional Class shares assumes $10,000 invested in Institutional Class shares of the Fund on Jan. 5, 2016, and includes the reinvestment of all distributions. The graph also assumes $10,000 invested in the BofA Merrill Lynch US 6-Month Treasury Bill Index as of Jan. 5, 2016.
The graphs do not reflect the deduction of taxes the shareholders would pay on Fund distributions or redemptions of Fund shares. Expense limitations were in effect for some or all of the periods shown. Performance would have been lower had expense limitations not been in effect. Expenses are listed in the “Fund expense ratios” table on page 5. Please note additional details on pages 4 through 7.
The BofA Merrill Lynch US 6-Month Treasury Bill Index tracks the performance of US Treasury bills with a maturity of six months. The index comprises a single Treasury issue purchased at the beginning of the month, which is then sold at the end of the month and rolled into a newly selected issue that matures closest to, but not beyond, six months from the transaction date (known as the rebalancing date).
Index performance returns do not reflect any management fees, transaction costs, or expenses. Indices are unmanaged and one cannot invest directly in an index. Past performance is not a guarantee of future results.
Performance of other Fund classes will vary due to different charges and expenses.
| | | | | | |
| | | Nasdaq symbols | | CUSIPs | | |
| Class A | | DLTAX | | 245910609 | | |
| Class C | | DLTCX | | 245910708 | | |
| Class L | | DLTLX | | 245910807 | | |
Institutional Class | | DULTX | | 245910500 | | |
7
Disclosure of Fund expenses
For the six-month period from October 1, 2016 to March 31, 2017 (Unaudited)
As a shareholder of the Fund, you incur two types of costs: (1) transaction costs, including sales charges (loads) on purchase payments, reinvested dividends, or other distributions; redemption fees; and exchange fees; and (2) ongoing costs, including management fees; distribution and/or service (12b-1) fees; and other Fund expenses. This example is intended to help you understand your ongoing costs (in dollars) of investing in the Fund and to compare these costs with the ongoing costs of investing in other mutual funds.
The example is based on an investment of $1,000 invested at the beginning of the period and held for the entire six-month period from Oct. 1, 2016 to March 31, 2017.
Actual expenses
The first section of the table shown, “Actual Fund return,” provides information about actual account values and actual expenses. You may use the information in this section of the table, together with the amount you invested, to estimate the expenses that you paid over the period. Simply divide your account value by $1,000 (for example, an $8,600 account value divided by $1,000 = 8.6), then multiply the result by the number in the first section under the heading entitled “Expenses Paid During Period” to estimate the expenses you paid on your account during this period.
Hypothetical example for comparison purposes
The second section of the table shown, “Hypothetical 5% return,” provides information about hypothetical account values and hypothetical expenses based on the Fund’s actual expense ratio and an assumed rate of return of 5% per year before expenses, which is not the Fund’s actual return. The hypothetical account values and expenses may not be used to estimate the actual ending account balance or expenses you paid for the period. You may use this information to compare the ongoing costs of investing in the Fund and other funds. To do so, compare this 5% hypothetical example with the 5% hypothetical examples that appear in the shareholder reports of the other funds.
Please note that the expenses shown in the table are meant to highlight your ongoing costs only and do not reflect any transactional costs, such as sales charges (loads), redemption fees, or exchange fees. Therefore, the second section of the table is useful in comparing ongoing costs only, and will not help you determine the relative total costs of owning different funds. In addition, if these transactional costs were included, your costs would have been higher. The Fund’s expenses shown in the table reflect fee waivers in effect. The expenses shown in the table assume reinvestment of all dividends and distributions.
8
Delaware Investments Ultrashort Fund
Expense analysis of an investment of $1,000
| | | | | | | | | | | | | | | | | | | | |
| | | Beginning Account Value 10/1/16 | | Ending Account Value 3/31/17 | | Annualized Expense Ratio | | Expenses Paid During Period 10/1/16 to 3/31/17* |
Actual Fund return† | | | | | | | | | | | | | | | | | | | | |
Class A | | | | $1,000.00 | | | | | $1,002.30 | | | | | 0.40% | | | | | $2.00 | |
Class C | | | | 1,000.00 | | | | | 1,002.30 | | | | | 0.40% | | | | | 2.00 | |
Class L | | | | 1,000.00 | | | | | 1,002.30 | | | | | 0.40% | | | | | 2.00 | |
Institutional Class | | | | 1,000.00 | | | | | 1,002.30 | | | | | 0.40% | | | | | 2.00 | |
Hypothetical 5% return (5% return before expenses) | | | | | | | | | | | | | | | | | | | | |
Class A | | | | $1,000.00 | | | | | $1,022.94 | | | | | 0.40% | | | | | $2.02 | |
Class C | | | | 1,000.00 | | | | | 1,022.94 | | | | | 0.40% | | | | | 2.02 | |
Class L | | | | 1,000.00 | | | | | 1,022.94 | | | | | 0.40% | | | | | 2.02 | |
Institutional Class | | | | 1,000.00 | | | | | 1,022.94 | | | | | 0.40% | | | | | 2.02 | |
*“Expenses Paid During Period” are equal to the Fund’s annualized expense ratio, multiplied by the average account value over the period, multiplied by 182/365 (to reflect the one-half year period).
| † | Because actual returns reflect only the most recent six-month period, the returns shown may differ significantly from fiscal year returns. |
9
Security type / sector allocation
| | |
| Delaware Investments Ultrashort Fund | | As of March 31, 2017 (Unaudited) |
Sector designations may be different than the sector designations presented in other fund materials. The sector designations may represent the investment manager’s internal sector classifications.
| | | | | |
Security type / sector | | Percentage of net assets |
Certificate of Deposit | | 1.75% |
Commercial Paper | | 29.72% |
Banks | | 12.53% |
Colleges & Universities | | 13.09% |
Diversified Financial Services | | 4.10% |
| |
Corporate Bonds | | 39.10% |
Banks | | 21.17% |
Basic Industry | | 0.71% |
Capital Goods | | 4.39% |
Communications | | 1.73% |
Consumer Cyclical | | 2.93% |
Consumer Non-Cyclical | | 2.32% |
Electric | | 1.47% |
Energy | | 1.48% |
Insurance | | 1.45% |
Natural Gas | | 1.45% |
Non-Agency Asset-Backed Securities | | 28.73% |
Sovereign Bond | | 1.76% |
Total Value of Securities | | 101.06% |
Liabilities Net of Receivables and Other Assets | | (1.06%) |
Total Net Assets | | 100.00% |
10
| | |
| Schedule of investments | | |
| Delaware Investments Ultrashort Fund | | March 31, 2017 |
| | | | | | | | |
| | | Principal amount° | | | Value (U.S. $) | |
| |
Certificate of Deposit – 1.75% | | | | | | | | |
| |
Banco Estado Chile | | | | | | | | |
1.21% 7/28/17 | | | 1,500,000 | | | $ | 1,500,000 | |
| | | | | | | | |
Total Certificate of Deposit (cost $1,500,000) | | | | | | | 1,500,000 | |
| | | | | | | | |
| |
Commercial Paper – 29.72% | | | | | | | | |
| |
Banks – 12.53% | | | | | | | | |
Abbey National Treasury Services 0.81% 4/3/17 ≠ | | | 2,250,000 | | | | 2,249,899 | |
Bank of New York Mellon 0.90% 4/10/17 ≠ | | | 3,000,000 | | | | 2,999,299 | |
BNP Paribas New York Branch 0.80% 4/3/17 ≠ | | | 1,710,000 | | | | 1,709,924 | |
DNB Bank 1.167% 6/19/17 ≠> | | | 1,500,000 | | | | 1,496,617 | |
JPMorgan Securities 1.247% 7/10/17 ● | | | 1,000,000 | | | | 1,000,721 | |
Wells Fargo Bank 1.207% 8/4/17 ≠ | | | 1,250,000 | | | | 1,244,792 | |
| | | | | | | | |
| | | | | | | 10,701,252 | |
| | | | | | | | |
Colleges & Universities – 13.09% | | | | | | | | |
Cornell University | | | | | | | | |
0.718% 4/5/17 ≠ | | | 1,000,000 | | | | 999,960 | |
0.781% 5/3/17 ≠ | | | 750,000 | | | | 749,423 | |
0.902% 5/23/17 ≠ | | | 750,000 | | | | 748,867 | |
1.002% 6/8/17 ≠ | | | 390,000 | | | | 389,208 | |
Dartmouth College 0.851% 5/18/17 ≠ | | | 1,300,000 | | | | 1,298,284 | |
Duke University | | | | | | | | |
0.802% 5/10/17 ≠ | | | 500,000 | | | | 499,516 | |
0.832% 4/12/17 ≠ | | | 753,000 | | | | 752,795 | |
0.902% 6/12/17 ≠ | | | 1,500,000 | | | | 1,497,156 | |
Princeton University | | | | | | | | |
0.82% 5/16/17 ≠ | | | 750,000 | | | | 749,940 | |
0.90% 5/15/17 ≠ | | | 1,000,000 | | | | 1,000,023 | |
University of California 0.751% 4/10/17 ≠ | | | 1,500,000 | | | | 1,499,745 | |
University of Chicago 1.003% 6/20/17 ≠ | | | 1,000,000 | | | | 997,720 | |
| | | | | | | | |
| | | | | | | 11,182,637 | |
| | | | | | | | |
Diversified Financial Services – 4.10% | | | | | | | | |
CPPIB Capital 0.892% 4/20/17 ≠> | | | 3,500,000 | | | | 3,498,380 | |
| | | | | | | | |
| | | | | | | 3,498,380 | |
| | | | | | | | |
Total Commercial Paper (cost $25,381,895) | | | | | | | 25,382,269 | |
| | | | | | | | |
|
| |
Corporate Bonds – 39.10% | | | | | | | | |
Banks – 21.17% | | | | | | | | |
Abbey National Treasury Services 1.573% 10/17/17 • | | | 1,500,000 | | | | 1,500,000 | |
Bank of America 6.10% 6/15/17 | | | 1,500,000 | | | | 1,513,812 | |
Branch Banking & Trust 1.45% 5/10/19 | | | 1,000,000 | | | | 989,860 | |
Citizens Bank 2.25% 3/2/20 | | | 1,000,000 | | | | 999,255 | |
Fifth Third Bank 2.30% 3/15/19 | | | 1,000,000 | | | | 1,006,960 | |
11
Schedule of investments
Delaware Investments Ultrashort Fund
| | | | | | | | |
| | | Principal amount° | | | Value (U.S. $) | |
| |
Corporate Bonds (continued) | | | | | | | | |
| |
Banks (continued) | | | | | | | | |
Goldman Sachs Group 2.30% 12/13/19 | | | 1,250,000 | | | $ | 1,251,417 | |
Huntington National Bank 2.375% 3/10/20 | | | 1,250,000 | | | | 1,255,107 | |
JPMorgan Securities 1.425% 10/19/17 ● | | | 1,500,000 | | | | 1,502,562 | |
Morgan Stanley 6.25% 8/28/17 | | | 1,500,000 | | | | 1,528,891 | |
Toronto-Dominion Bank 1.423% 10/17/17 ● | | | 1,500,000 | | | | 1,500,000 | |
US Bank 2.00% 1/24/20 | | | 1,250,000 | | | | 1,255,009 | |
Wells Fargo Bank | | | | | | | | |
1.652% 9/7/17 ● | | | 500,000 | | | | 501,086 | |
2.15% 12/6/19 | | | 1,250,000 | | | | 1,255,011 | |
5.75% 6/15/17 | | | 2,000,000 | | | | 2,017,532 | |
| | | | | | | | |
| | | | | | | 18,076,502 | |
| | | | | | | | |
Basic Industry – 0.71% | | | | | | | | |
Dow Chemical 8.55% 5/15/19 | | | 535,000 | | | | 606,730 | |
| | | | | | | | |
| | | | | | | 606,730 | |
| | | | | | | | |
Capital Goods – 4.39% | | | | | | | | |
Fortive 144A 1.80% 6/15/19 # | | | 1,250,000 | | | | 1,242,646 | |
Rockwell Collins 1.95% 7/15/19 | | | 1,250,000 | | | | 1,251,503 | |
Siemens Financieringsmat 144A 2.20% 3/16/20 # | | | 1,250,000 | | | | 1,255,884 | |
| | | | | | | | |
| | | | | | | 3,750,033 | |
| | | | | | | | |
Communications – 1.73% | | | | | | | | |
Deutsche Telekom International Finance 144A | | | | | | | | |
1.50% 9/19/19 # | | | 1,500,000 | | | | 1,476,337 | |
| | | | | | | | |
| | | | | | | 1,476,337 | |
| | | | | | | | |
Consumer Cyclical – 2.93% | | | | | | | | |
BMW US Capital 144A 2.15% 4/6/20 # | | | 1,250,000 | | | | 1,250,917 | |
General Motors Financial 2.35% 10/4/19 | | | 1,250,000 | | | | 1,252,213 | |
| | | | | | | | |
| | | | | | | 2,503,130 | |
| | | | | | | | |
Consumer Non-Cyclical – 2.32% | | | | | | | | |
Shire Acquisitions Investments Ireland 1.90% 9/23/19 | | | 2,000,000 | | | | 1,985,238 | |
| | | | | | | | |
| | | | | | | 1,985,238 | |
| | | | | | | | |
Electric – 1.47% | | | | | | | | |
Great Plains Energy 2.50% 3/9/20 | | | 1,250,000 | | | | 1,257,860 | |
| | | | | | | | |
| | | | | | | 1,257,860 | |
| | | | | | | | |
Energy – 1.48% | | | | | | | | |
BP Capital Markets 2.315% 2/13/20 | | | 1,250,000 | | | | 1,260,820 | |
| | | | | | | | |
| | | | | | | 1,260,820 | |
| | | | | | | | |
Insurance – 1.45% | | | | | | | | |
Principal Life Global Funding II 144A 1.50% 4/18/19 # | | | 1,250,000 | | | | 1,239,696 | |
| | | | | | | | |
| | | | | | | 1,239,696 | |
| | | | | | | | |
Natural Gas – 1.45% | | | | | | | | |
Sempra Energy 1.625% 10/7/19 | | | 1,250,000 | | | | 1,238,169 | |
| | | | | | | | |
12
| | | | | | | | |
| | | Principal amount° | | | Value (U.S. $) | |
| |
Corporate Bonds (continued) | | | | | | | | |
| |
Natural Gas (continued) | | | | | | | | |
Sempra Energy 1.625% 10/7/19 | | | 1,250,000 | | | | 1,238,169 | |
| | | | | | | 1,238,169 | |
| | | | | | | | |
Total Corporate Bonds (cost $33,404,119) | | | | 33,394,515 | |
| | | | | | | | |
|
| |
Non-Agency Asset-Backed Securities – 28.73% | | | | | | | | |
| |
American Express Credit Account Master Trust | | | | | | | | |
Series 2012-1 A 1.182% 1/15/20 ● | | | 1,130,000 | | | | 1,130,500 | |
Series 2013-2 A 1.332% 5/17/21 ● | | | 510,000 | | | | 512,216 | |
American Express Credit Account Secured Note Trust | | | | | | | | |
Series 2012-4 A 1.152% 5/15/20 ● | | | 2,000,000 | | | | 2,001,879 | |
Bank of America Credit Card Trust | | | | | | | | |
Series 2014-A2 A 1.182% 9/16/19 ● | | | 730,000 | | | | 730,000 | |
Series 2014-A3 A 1.202% 1/15/20 ● | | | 1,000,000 | | | | 1,000,919 | |
Series 2015-A1 A 1.242% 6/15/20 ● | | | 1,160,000 | | | | 1,162,289 | |
BMW Floorplan Master Owner Trust | | | | | | | | |
Series 2015-1A A 144A 1.412% 7/15/20 #● | | | 1,000,000 | | | | 1,002,129 | |
BMW Vehicle Lease Trust | | | | | | | | |
Series 2016-1 A2B 1.478% 1/22/18 ● | | | 515,784 | | | | 516,251 | |
Chase Issuance Trust | | | | | | | | |
Series 2012-A10 A10 1.172% 12/16/19 �� | | | 1,000,000 | | | | 1,001,439 | |
Series 2013-A7 A 1.342% 9/15/20 ● | | | 1,000,000 | | | | 1,004,130 | |
Series 2015-A6 A6 1.162% 5/15/19 ● | | | 750,000 | | | | 750,156 | |
Series 2016-A1 A 1.322% 5/17/21 ● | | | 2,000,000 | | | | 2,011,032 | |
Series 2017-A2 A 1.291% 3/15/24 ● | | | 1,000,000 | | | | 1,002,422 | |
Citibank Credit Card Issuance Trust | | | | | | | | |
Series 2013-A2 A2 1.264% 5/26/20 ● | | | 1,000,000 | | | | 1,002,000 | |
Discover Card Execution Note Trust | | | | | | | | |
Series 2013-A1 A1 1.212% 8/17/20 ● | | | 1,400,000 | | | | 1,402,451 | |
Series 2015-A1 A1 1.262% 8/17/20 ● | | | 1,860,000 | | | | 1,864,103 | |
Ford Credit Floorplan Master Owner Trust A | | | | | | | | |
Series 2015-2 A2 1.482% 1/15/22 ● | | | 1,000,000 | | | | 1,007,266 | |
Hyundai Auto Lease Securitization Trust | | | | | | | | |
Series 2016-A A2B 144A 1.462% 7/16/18 #● | | | 662,970 | | | | 664,017 | |
Mercedes-Benz Master Owner Trust | | | | | | | | |
Series 2015-AA A 144A 1.232% 4/15/19 #● | | | 2,000,000 | | | | 2,000,162 | |
Nissan Auto Receivables Owner Trust | | | | | | | | |
Series 2016-A A2B 1.262% 2/15/19 ● | | | 597,137 | | | | 597,750 | |
Nissan Master Owner Trust Receivables | | | | | | | | |
Series 2015-A A1 1.312% 1/15/20 ● | | | 1,175,000 | | | | 1,176,858 | |
Toyota Auto Receivables | | | | | | | | |
Series 2016-C A2A 1.00% 1/15/19 | | | 1,000,000 | | | | 998,934 | |
| | | | | | | | |
Total Non-Agency Asset-Backed Securities | | | | | | | | |
(cost $24,481,825) | | | | | | | 24,538,903 | |
| | | | | | | | |
13
Schedule of investments
Delaware Investments Ultrashort Fund
| | | | | | | | |
| | | Principal amount° | | | Value (U.S. $) | |
| |
Sovereign Bond – 1.76%D | | | | | | | | |
| |
Austria – 1.76% | | | | | | | | |
Oesterreichische Kontrollbank 1.214% 8/10/17 ● | | | 1,500,000 | | | $ | 1,500,527 | |
| | | | | | | | |
Total Sovereign Bond (cost $1,500,000) | | | | | | | 1,500,527 | |
| | | | | | | | |
| | | | | | | | |
Total Value of Securities – 101.06% | | | | | | | | |
(cost $86,267,839) | | | | | | $ | 86,316,214 | |
| | | | | | | | |
| # | Security exempt from registration under Rule 144A of the Securities Act of 1933, as amended. At March 31, 2017, the aggregate value of Rule 144A securities was $10,131,788, which represents 11.86% of the Fund’s net assets. See Note 8 in “Notes to financial statements.” |
| ≠ | The rate shown is the effective yield at the time of purchase. |
| > | Commercial paper exempt from registration under Section 4(2) and/or Rule 144A of the Securities Act of 1933, as amended, and may be resold in transactions exempt from registration only to dealers in that program or other “accredited investors”. At March 31, 2017, the aggregate value of these securities was $4,994,997, which represented 5.85% of the Fund’s net assets. See Note 8 in “Notes to financial statements.” |
| ° | Principal amount shown is stated in US dollars. |
| D | Securities have been classified by country of origin. |
| ● | Variable rate security. Each rate shown is as of March 31, 2017. Interest rates reset periodically. |
See accompanying notes, which are an integral part of the financial statements.
14
This page intentionally left blank.
| | | | |
| Statement of assets and liabilities | | | |
| Delaware Investments Ultrashort Fund | | | March 31, 2017 | |
| | | | |
Assets: | | | | |
Investments, at value1 | | $ | 86,316,214 | |
Cash | | | 38,960 | |
Receivable for securities sold | | | 1,494,504 | |
Interest receivable | | | 201,806 | |
Receivable from investment manager | | | 17,136 | |
Receivable for fund shares sold | | | 16,639 | |
| | | | |
Total assets | | | 88,085,259 | |
| | | | |
Liabilities: | | | | |
Payable for securities purchased | | | 2,497,100 | |
Payable for fund shares redeemed | | | 82,559 | |
Income distribution payable | | | 20,017 | |
Other accrued expenses | | | 75,831 | |
Dividend disbursing and transfer agent fees and expenses payable to affiliates | | | 1,455 | |
Accounting and administration expenses payable to affiliates | | | 339 | |
Legal fees payable to affiliates | | | 182 | |
Trustees’ fees and expenses payable | | | 229 | |
Reports and statements to shareholders expenses payable to affiliates | | | 112 | |
| | | | |
Total liabilities | | | 2,677,824 | |
| | | | |
Total Net Assets | | $ | 85,407,435 | |
| | | | |
| |
Net Assets Consist of: | | | | |
Paid-in capital | | $ | 85,414,476 | |
Distributions in excess of net investment income | | | (20,017 | ) |
Accumulated net realized loss on investments | | | (35,399 | ) |
Net unrealized appreciation of investments | | | 48,375 | |
| | | | |
Total Net Assets | | $ | 85,407,435 | |
| | | | |
16
| | | | |
Net Asset Value | | | | |
Class A: | | | | |
Net assets | | $ | 9,430,500 | |
Shares of beneficial interest outstanding, unlimited authorization, no par | | | 943,122 | |
Net asset value per share | | $ | 10.00 | |
Sales charge | | | 2.00 | % |
Offering price per share, equal to net asset value per share / (1 – sales charge) | | $ | 10.20 | |
| |
Class C: | | | | |
Net assets | | $ | 7,526,977 | |
Shares of beneficial interest outstanding, unlimited authorization, no par | | | 752,847 | |
Net asset value per share | | $ | 10.00 | |
| |
Class L: | | | | |
Net assets | | $ | 68,118,773 | |
Shares of beneficial interest outstanding, unlimited authorization, no par | | | 6,812,479 | |
Net asset value per share | | $ | 10.00 | |
| |
Institutional Class: | | | | |
Net assets | | $ | 331,185 | |
Shares of beneficial interest outstanding, unlimited authorization, no par | | | 33,120 | |
Net asset value per share | | $ | 10.00 | |
| |
1Investments, at cost | | $ | 86,267,839 | |
See accompanying notes, which are an integral part of the financial statements.
17
| | | | |
| Statement of operations | | | |
| Delaware Investments Ultrashort Fund | | | Year ended March 31, 2017 | |
| | | | |
Investment Income: | | | | |
Interest | | $ | 1,042,100 | |
| | | | |
Expenses: | | | | |
Management fees | | | 276,094 | |
Distribution expenses – Class A | | | 20,408 | |
Distribution expenses – Class C | | | 89,866 | |
Legal fees | | | 137,097 | |
Registration fees | | | 117,415 | |
Dividend disbursing and transfer agent fees and expenses | | | 95,462 | |
Reports and statements to shareholders expenses | | | 44,365 | |
Audit and tax fees | | | 37,138 | |
Accounting and administration expenses | | | 28,934 | |
Dues and services fees | | | 8,432 | |
Custodian fees | | | 7,980 | |
Trustees’ fees and expenses | | | 4,678 | |
Other | | | 8,659 | |
| | | | |
| | | 876,528 | |
Less expenses waived | | | (396,897 | ) |
Less waived distribution expenses – Class A | | | (20,408 | ) |
Less waived distribution expenses – Class C | | | (89,866 | ) |
Less expense paid indirectly | | | (451 | ) |
| | | | |
Total operating expenses | | | 368,906 | |
| | | | |
Net Investment Income | | | 673,194 | |
| | | | |
| |
Net Realized and Unrealized Gain (Loss): | | | | |
Net realized gain on investments | | | 106,163 | |
Net change in unrealized appreciation (depreciation) of investments | | | (120,718 | ) |
| | | | |
Net Realized and Unrealized Loss | | | (14,555 | ) |
| | | | |
| |
Net Increase in Net Assets Resulting from Operations | | $ | 658,639 | |
| | | | |
See accompanying notes, which are an integral part of the financial statements.
18
This page intentionally left blank.
Statements of changes in net assets
Delaware Investments Ultrashort Fund
| | | | | | | | |
| | | Year ended | |
| | | 3/31/17 | | | 3/31/16 | |
Increase (Decrease) in Net Assets from Operations: | | | | | | | | |
Net investment income | | $ | 673,194 | | | $ | 148,994 | |
Net realized gain | | | 106,163 | | | | 45,656 | |
Net change in unrealized appreciation (depreciation) | | | (120,718 | ) | | | 169,093 | |
| | | | | | | | |
Net increase in net assets resulting from operations | | | 658,639 | | | | 363,743 | |
| | | | | | | | |
| | |
Dividends and Distributions to Shareholders from: | | | | | | | | |
Net investment income: | | | | | | | | |
Class A* | | | (61,714 | ) | | | (7,362 | ) |
Class C | | | (65,331 | ) | | | (11,987 | ) |
Class L* | | | (541,122 | ) | | | (129,757 | ) |
Institutional Class | | | (2,302 | ) | | | (288 | ) |
| | |
Net realized gain: | | | | | | | | |
Class A* | | | (19,826 | ) | | | — | |
Class C | | | (28,823 | ) | | | — | |
Class L* | | | (159,652 | ) | | | — | |
Institutional Class | | | (720 | ) | | | — | |
| | | | | | | | |
| | | (879,490 | ) | | | (149,394 | ) |
| | | | | | | | |
Capital Share Transactions**: | | | | | | | | |
Proceeds from shares sold: | | | | | | | | |
Class A* | | | 15,259,316 | | | | 3,892,557 | |
Class C | | | 6,744,579 | | | | 9,487,356 | |
Class L* | | | 829 | | | | 43,840,979 | |
Institutional Class | | | 137,599 | | | | 396,270 | |
| | |
Net asset value of shares issued upon reinvestment of dividends: | | | | | | | | |
Class A* | | | 78,351 | | | | 6,292 | |
Class C | | | 84,439 | | | | 9,623 | |
Class L* | | | 684,797 | | | | 116,454 | |
Institutional Class | | | 2,393 | | | | 251 | |
| | |
Capital contribution from Advisor***: | | | | | | | | |
Class A* | | | — | | | | 8,961 | |
Class C | | | — | | | | 16,212 | |
Class L* | | | — | | | | 305,752 | |
| | | | | | | | |
| | | 22,992,303 | | | | 58,080,707 | |
| | | | | | | | |
20
| | | | | | | | |
| | | Year ended | |
| | | 3/31/17 | | | | 3/31/16 | |
Capital Share Transactions** (continued): | | | | | | | | |
Cost of shares redeemed: | | | | | | | | |
Class A* | | $ | (12,188,279 | ) | | $ | (2,934,654 | ) |
Class C | | | (9,189,104 | ) | | | (8,070,529 | ) |
Class L* | | | (16,052,118 | ) | | | (136,565,673 | ) |
Institutional Class | | | (110,808 | ) | | | (94,427 | ) |
| | | | | | | | |
| | | (37,540,309 | ) | | | (147,665,283 | ) |
| | | | | | | | |
Decrease in net assets derived from capital share transactions | | | (14,548,006 | ) | | | (89,584,576 | ) |
| | | | | | | | |
Net Decrease in Net Assets | | | (14,768,857 | ) | | | (89,370,227 | ) |
| | |
Net Assets: | | | | | | | | |
Beginning of year | | | 100,176,292 | | | | 189,546,519 | |
| | | | | | | | |
End of year | | $ | 85,407,435 | | | $ | 100,176,292 | |
| | | | | | | | |
| | |
Undistributed (distributions in excess of) net investment income | | $ | (20,017 | ) | | $ | 519 | |
| | | | | | | | |
*In conjunction with the Fund’s conversion from a money market fund to an ultrashort, non-money
market fund, Class A shares became Class L shares and Consultant Class shares became
Class A shares.
**See Note 6 in “Notes to the financial statements.”
***See Note 2 in “Notes to financial statements.”
See accompanying notes, which are an integral part of the financial statements.
21
Financial highlights
Delaware Investments Ultrashort Fund Class A
Selected data for each share of the Fund outstanding throughout each period were as follows:
|
Net asset value, beginning of period |
|
Income from investment operations: |
|
Net investment income3 |
|
Net realized and unrealized gain |
Capital contribution from Advisor |
Total from investment operations |
|
|
Less dividends and distributions from: |
|
Net investment income |
Net realized gain |
Total dividends and distributions |
|
|
Net asset value, end of period |
|
Total return4 |
|
|
Ratios and supplemental data: |
Net assets, end of period (000 omitted) |
Ratio of expenses to average net assets |
Ratio of expenses to average net assets prior to fees waived |
Ratio of net investment income to average net assets |
Ratio of net investment income (loss) to average net assets prior to fees waived |
Portfolio turnover |
|
| 1 | The Class A shares financial highlights for the periods prior to Jan. 5, 2016 reflect the performance of the Delaware Cash Reserve® Fund Consultant Class shares. |
| 2 | On Jan. 5, 2015, the Fund declared a 10 for 1 reverse stock split. The net asset values and per share information listed have been revised/adjusted to reflect the reverse stock split. |
| 3 | The average shares outstanding have been applied for per share information for years ended March 31, 2016 and 2017. |
| 4 | Total investment return is based on the change in net asset value of a share during the period and assumes reinvestment of dividends and distributions at net asset value and does not reflect the impact of a sales charge. Total investment return during all of the periods shown reflects waivers by the manager and/or distributor. Performance would have been lower had the waivers not been in effect. |
See accompanying notes, which are an integral part of the financial statements.
22
| | | | | | | | | | | | | | | | | | | | | | | | | | | | | | | | | | | | |
|
| Year ended |
| | | 3/31/17 | | | | 3/31/161,2 | | | | 3/31/151,2 | | | | 3/31/141,2 | | | | 3/31/131,2 |
| | | | | | | $ | 10.020 | | | | | | $ | 10.000 | | | | | | $ | 10.000 | | | | | | $ | 10.000 | | | | | | $ | 10.000 | |
| | | | | | | | | |
| | | | | | | | | | | | | | | | | | | | | | | | | | | | | | | | | | | | | |
| | | | | | | | 0.073 | | | | | | | 0.009 | | | | | | | 0.003 | | | | | | | 0.003 | | | | | | | 0.010 | |
| | | | | | | | 0.002 | | | | | | | 0.018 | | | | | | | — | | | | | | | — | | | | | | | — | |
| | | | | | | | — | | | | | | | 0.002 | | | | | | | — | | | | | | | — | | | | | | | — | |
| | | | | | | | | | | | | | | | | | | | | | | | | | | | | | | | | | | | | |
| | | | | | | | 0.075 | | | | | | | 0.029 | | | | | | | 0.003 | | | | | | | 0.003 | | | | | | | 0.010 | |
| | | | | | | | | | | | | | | | | | | | | | | | | | | | | | | | | | | | | |
| | | | | | | | | |
| | | | | | | | | | | | | | | | | | | | | | | | | | | | | | | | | | | | | |
| | | | | | | | (0.073 | ) | | | | | | (0.009 | ) | | | | | | (0.003 | ) | | | | | | (0.003 | ) | | | | | | (0.010 | ) |
| | | | | | | | (0.022 | ) | | | | | | — | | | | | | | — | | | | | | | — | | | | | | | — | |
| | | | | | | | | | | | | | | | | | | | | | | | | | | | | | | | | | | | | |
| | | | | | | | (0.095 | ) | | | | | | (0.009 | ) | | | | | | (0.003 | ) | | | | | | (0.003 | ) | | | | | | (0.010 | ) |
| | | | | | | | | | | | | | | | | | | | | | | | | | | | | | | | | | | | | |
| | | | | | | | | |
| | | | | | | | | | | | | | | | | | | | | | | | | | | | | | | | | | | | | |
| | | | | | | $ | 10.000 | | | | | | $ | 10.020 | | | | | | $ | 10.000 | | | | | | $ | 10.000 | | | | | | $ | 10.000 | |
| | | | | | | | | | | | | | | | | | | | | | | | | | | | | | | | | | | | | |
| | | | | | | | | |
| | | | | | | | 0.76% | | | | | | | 0.32% | | | | | | | 0.03% | | | | | | | 0.03% | | | | | | | 0.09% | |
| | | | | | | | | |
| | | | | | | | | | | | | | | | | | | | | | | | | | | | | | | | | | | | | |
| | | | | | | $ | 9,430 | | | | | | $ | 6,305 | | | | | | $ | 5,319 | | | | | | $ | 6,675 | | | | | | $ | 7,200 | |
| | | | | | | | 0.40% | | | | | | | 0.19% | | | | | | | 0.13% | | | | | | | 0.15% | | | | | | | 0.15% | |
| | | | | | | | 1.08% | | | | | | | 1.03% | | | | | | | 0.98% | | | | | | | 0.97% | | | | | | | 0.99% | |
| | | | | | | | 0.73% | | | | | | | 0.14% | | | | | | | 0.03% | | | | | | | 0.03% | | | | | | | 0.09% | |
| | | | | | | | 0.05% | | | | | | | (0.70% | ) | | | | | | (0.82% | ) | | | | | | (0.79% | ) | | | | | | (0.75% | ) |
| | | | | | | | 104% | | | | | | | 123% | | | | | | | 0% | | | | | | | 0% | | | | | | | 0% | |
23
Financial highlights
Delaware Investments Ultrashort Fund Class C
Selected data for each share of the Fund outstanding throughout each period were as follows:
|
Net asset value, beginning of period |
|
Income from investment operations: |
|
Net investment income3 |
|
Net realized and unrealized gain |
Capital contribution from Advisor |
Total from investment operations |
|
|
Less dividends and distributions from: |
Net investment income |
Net realized gain |
Total dividends and distributions |
|
Net asset value, end of period |
|
Total return4 |
|
Ratios and supplemental data: |
Net assets, end of period (000 omitted) |
Ratio of expenses to average net assets |
Ratio of expenses to average net assets prior to fees waived |
Ratio of net investment income to average net assets |
Ratio of net investment loss to average net assets prior to fees waived |
Portfolio turnover |
| 1 | The Class C shares financial highlights for the periods prior to Jan. 5, 2016 reflect the performance of the Delaware Cash Reserve® Fund Class C shares. |
| 2 | On Jan. 5, 2015, the Fund declared a 10 for 1 reverse stock split. The net asset values and per share information listed have been revised/adjusted to reflect the reverse stock split. |
| 3 | The average shares outstanding have been applied for per share information for years ended March 31, 2016 and 2017. |
| 4 | Total investment return is based on the change in net asset value of a share during the period and assumes reinvestment of dividends and distributions at net asset value and does not reflect the impact of a sales charge. Total investment return during all of the periods shown reflects waivers by the manager and/or distributor. Performance would have been lower had the waivers not been in effect. |
See accompanying notes, which are an integral part of the financial statements.
24
| | | | | | | | | | | | | | | | | | | | | | | | | | | | | | | | | |
|
| |
| | | | | | | | | | | Year ended | | | | | | | | |
| | | 3/31/17 | | | | 3/31/161,2 | | | | 3/31/151,2 | | | | 3/31/141,2 | | | | 3/31/131,2 |
| | | $ | 10.020 | | | | | | $ | 10.000 | | | | | | $ | 10.000 | | | | | | $ | 10.000 | | | | | | $ | 10.000 | |
| | | | | | | | | |
| | | | | | | | | | | | | | | | | | | | | | | | | | | | | | | | | |
| | | | 0.073 | | | | | | | 0.009 | | | | | | | 0.003 | | | | | | | 0.003 | | | | | | | 0.010 | |
| | | | 0.002 | | | | | | | 0.018 | | | | | | | — | | | | | | | — | | | | | | | — | |
| | | | — | | | | | | | 0.002 | | | | | | | — | | | | | | | — | | | | | | | — | |
| | | | | | | | | | | | | | | | | | | | | | | | | | | | | | | | | |
| | | | 0.075 | | | | | | | 0.029 | | | | | | | 0.003 | | | | | | | 0.003 | | | | | | | 0.010 | |
| | | | | | | | | | | | | | | | | | | | | | | | | | | | | | | | | |
| | | | | | | | | |
| | | | | | | | | | | | | | | | | | | | | | | | | | | | | | | | | |
| | | | (0.073 | ) | | | | | | (0.009 | ) | | | | | | (0.003 | ) | | | | | | (0.003 | ) | | | | | | (0.010 | ) |
| | | | (0.022 | ) | | | | | | — | | | | | | | — | | | | | | | — | | | | | | | — | |
| | | | | | | | | | | | | | | | | | | | | | | | | | | | | | | | | |
| | | | (0.095 | ) | | | | | | (0.009 | ) | | | | | | (0.003 | ) | | | | | | (0.003 | ) | | | | | | (0.010 | ) |
| | | | | | | | | | | | | | | | | | | | | | | | | | | | | | | | | |
| | | | | | | | | |
| | | | | | | | | | | | | | | | | | | | | | | | | | | | | | | | | |
| | | $ | 10.000 | | | | | | $ | 10.020 | | | | | | $ | 10.000 | | | | | | $ | 10.000 | | | | | | $ | 10.000 | |
| | | | | | | | | | | | | | | | | | | | | | | | | | | | | | | | | |
| | | | | | | | | |
| | | | 0.75% | | | | | | | 0.32% | | | | | | | 0.03% | | | | | | | 0.03% | | | | | | | 0.09% | |
| | | | | | | | | |
| | | | | | | | | | | | | | | | | | | | | | | | | | | | | | | | | |
| | | $ | 7,527 | | | | | | $ | 9,927 | | | | | | $ | 8,463 | | | | | | $ | 10,430 | | | | | | $ | 9,544 | |
| | | | 0.40% | | | | | | | 0.19% | | | | | | | 0.13% | | | | | | | 0.15% | | | | | | | 0.15% | |
| | | | 1.83% | | | | | | | 1.78% | | | | | | | 1.73% | | | | | | | 1.69% | | | | | | | 1.69% | |
| | | | 0.73% | | | | | | | 0.14% | | | | | | | 0.03% | | | | | | | 0.03% | | | | | | | 0.09% | |
| | | | (0.70% | ) | | | | | | (1.45% | ) | | | | | | (1.57% | ) | | | | | | (1.51% | ) | | | | | | (1.45% | ) |
| | | | 104% | | | | | | | 123% | | | | | | | 0% | | | | | | | 0% | | | | | | | 0% | |
25
Financial highlights
Delaware Investments Ultrashort Fund Class L
Selected data for each share of the Fund outstanding throughout each period were as follows:
|
Net asset value, beginning of period |
|
Income from investment operations: |
Net investment income3 |
Net realized and unrealized gain |
Capital contribution from Advisor |
Total from investment operations |
|
Less dividends and distributions from: |
Net investment income |
Net realized gain |
Total dividends and distributions |
|
Net asset value, end of period |
|
Total return4 |
|
Ratios and supplemental data: |
Net assets, end of period (000 omitted) |
Ratio of expenses to average net assets |
Ratio of expenses to average net assets prior to fees waived |
Ratio of net investment income to average net assets |
Ratio of net investment income (loss) to average net assets prior to fees waived |
Portfolio turnover |
| 1 | The Class L shares financial highlights for the periods prior to Jan. 5, 2016 reflect the performance of the Delaware Cash Reserve® Fund Class A shares. |
| 2 | On Jan. 5, 2015, the Fund declared a 10 for 1 reverse stock split. The net asset values and per shares information listed have been revised/adjusted to reflect the reverse stock split. |
| 3 | The average shares outstanding have been applied for per share information for years ended March 31, 2016 and 2017. |
| 4 | Total investment return is based on the change in net asset value of a share during the period and assumes reinvestment of dividends and distributions at net asset value. Total investment return during all of the periods shown reflects a waiver by the manager. Performance would have been lower had the waiver not been in effect. |
See accompanying notes, which are an integral part of the financial statements.
26
| | | | | | | | | | | | | | | | | | | | | | | | | | | | | | | | | | | | |
|
| Year ended |
| | | 3/31/17 | | | | 3/31/161,2 | | | | 3/31/151,2 | | | | 3/31/141,2 | | | | 3/31/131,2 |
| | | | | | | $ | 10.020 | | | | | | $ | 10.000 | | | | | | $ | 10.000 | | | | | | $ | 10.000 | | | | | | $ | 10.000 | |
| | | | | | | | | |
| | | | | | | | | | | | | | | | | | | | | | | | | | | | | | | | | | | | | |
| | | | | | | | 0.073 | | | | | | | 0.009 | | | | | | | 0.003 | | | | | | | 0.003 | | | | | | | 0.010 | |
| | | | | | | | 0.002 | | | | | | | 0.018 | | | | | | | — | | | | | | | — | | | | | | | — | |
| | | | | | | | — | | | | | | | 0.002 | | | | | | | — | | | | | | | — | | | | | | | — | |
| | | | | | | | | | | | | | | | | | | | | | | | | | | | | | | | | | | | | |
| | | | | | | | 0.075 | | | | | | | 0.029 | | | | | | | 0.003 | | | | | | | 0.003 | | | | | | | 0.010 | |
| | | | | | | | | | | | | | | | | | | | | | | | | | | | | | | | | | | | | |
| | | | | | | | | |
| | | | | | | | | | | | | | | | | | | | | | | | | | | | | | | | | | | | | |
| | | | | | | | (0.073 | ) | | | | | | (0.009 | ) | | | | | | (0.003 | ) | | | | | | (0.003 | ) | | | | | | (0.010 | ) |
| | | | | | | | (0.022 | ) | | | | | | — | | | | | | | — | | | | | | | — | | | | | | | — | |
| | | | | | | | | | | | | | | | | | | | | | | | | | | | | | | | | | | | | |
| | | | | | | | (0.095 | ) | | | | | | (0.009 | ) | | | | | | (0.003 | ) | | | | | | (0.003 | ) | | | | | | (0.010 | ) |
| | | | | | | | | | | | | | | | | | | | | | | | | | | | | | | | | | | | | |
| | | | | | | | | |
| | | | | | | | | | | | | | | | | | | | | | | | | | | | | | | | | | | | | |
| | | | | | | $ | 10.000 | | | | | | $ | 10.020 | | | | | | $ | 10.000 | | | | | | $ | 10.000 | | | | | | $ | 10.000 | |
| | | | | | | | | | | | | | | | | | | | | | | | | | | | | | | | | | | | | |
| | | | | | | | | |
| | | | | | | | 0.75% | | | | | | | 0.32% | | | | | | | 0.03% | | | | | | | 0.03% | | | | | | | 0.09% | |
| | | | | | | | | |
| | | | | | | | | | | | | | | | | | | | | | | | | | | | | | | | | | | | | |
| | | | | | | $ | 68,119 | | | | | | $ | 83,641 | | | | | | $ | 175,765 | | | | | | $ | 224,475 | | | | | | $ | 229,809 | |
| | | | | | | | 0.40% | | | | | | | 0.19% | | | | | | | 0.13% | | | | | | | 0.15% | | | | | | | 0.15% | |
| | | | | | | | 0.83% | | | | | | | 0.78% | | | | | | | 0.73% | | | | | | | 0.69% | | | | | | | 0.69% | |
| | | | | | | | 0.73% | | | | | | | 0.14% | | | | | | | 0.03% | | | | | | | 0.03% | | | | | | | 0.09% | |
| | | | | | | | 0.30% | | | | | | | (0.45% | ) | | | | | | (0.57% | ) | | | | | | (0.51% | ) | | | | | | (0.45% | ) |
| | | | | | | | 104% | | | | | | | 123% | | | | | | | 0% | | | | | | | 0% | | | | | | | 0% | |
27
Financial highlights
Delaware Investments Ultrashort Fund Institutional Class
Selected data for each share of the Fund outstanding throughout each period were as follows:
|
Net asset value, beginning of period |
|
Income from investment operations: |
Net investment income2 |
Net realized and unrealized gain |
Total from investment operations |
|
Less dividends and distributions from: |
Net investment income |
Net realized gain |
Total dividends and distributions |
|
Net asset value, end of period |
|
Total return3 |
|
Ratios and supplemental data: |
Net assets, end of period (000 omitted) |
Ratio of expenses to average net assets |
Ratio of expenses to average net assets prior to fees waived |
Ratio of net investment income to average net assets |
Ratio of net investment income to average net assets prior to fees waived |
Portfolio turnover |
|
| 1 | Date of commencement of operations; ratios have been annualized and total return has not been annualized. |
| 2 | The average shares outstanding has been applied for per share information. |
| 3 | Total investment return is based on the change in net asset value of a share during the period and assumes reinvestment of dividends and distributions at net asset value. Total investment return during all of the periods shown reflects a waiver by the manager. Performance would have been lower had the waiver not been in effect. |
| 4 | Portfolio turnover is representative of the Fund for the entire year. |
See accompanying notes, which are an integral part of the financial statements.
28
| | | | | | | | | | | | | | | | | | | | | | | | | | | | |
| | | | | | | 1/5/161 | | | | | | | | | | |
| | | Year ended | | | | to | | | | | | | | | | |
| | | 3/31/17 | | | | 3/31/16 | | | | | | | | | | |
| | | $ | 10.020 | | | | | | $ | 10.000 | | | | | | | | | | | | | | | | | |
| | | | | | | | |
| | | | | | | | | | | | | | | | | | | | | | | | | | | | |
| | | | 0.073 | | | | | | | 0.019 | | | | | | | | | | | | | | | | | |
| | | | 0.002 | | | | | | | 0.020 | | | | | | | | | | | | | | | | | |
| | | | | | | | | | | | | | | | | | | | | | | | | | | | |
| | | | 0.075 | | | | | | | 0.039 | | | | | | | | | | | | | | | | | |
| | | | | | | | | | | | | | | | | | | | | | | | | | | | |
| | | | | | | | |
| | | | | | | | | | | | | | | | | | | | | | | | | | | | |
| | | | (0.073 | ) | | | | | | (0.019 | ) | | | | | | | | | | | | | | | | |
| | | | (0.022 | ) | | | | | | — | | | | | | | | | | | | | | | | | |
| | | | | | | | | | | | | | | | | | | | | | | | | | | | |
| | | | (0.095 | ) | | | | | | (0.019 | ) | | | | | | | | | | | | | | | | |
| | | | | | | | | | | | | | | | | | | | | | | | | | | | |
| | | | | | | | |
| | | | | | | | | | | | | | | | | | | | | | | | | | | | |
| | | $ | 10.000 | | | | | | $ | 10.020 | | | | | | | | | | | | | | | | | |
| | | | | | | | | | | | | | | | | | | | | | | | | | | | |
| | | | | | | | |
| | | | 0.75% | | | | | | | 0.39% | | | | | | | | | | | | | | | | | |
| | | | | | | | |
| | | | | | | | | | | | | | | | | | | | | | | | | | | | |
| | | $ | 331 | | | | | | $ | 303 | | | | | | | | | | | | | | | | | |
| | | | 0.40% | | | | | | | 0.40% | | | | | | | | | | | | | | | | | |
| | | | 0.83% | | | | | | | 0.74% | | | | | | | | | | | | | | | | | |
| | | | 0.73% | | | | | | | 0.36% | | | | | | | | | | | | | | | | | |
| | | | 0.30% | | | | | | | 0.02% | | | | | | | | | | | | | | | | | |
| | | | 104% | | | | | | | 123% | 4 | | | | | | | | | | | | | | | | |
29
Notes to financial statements
| | |
| Delaware Investments Ultrashort Fund | | March 31, 2017 |
Delaware Group® Cash Reserve (Trust) is organized as a Delaware statutory trust and offers one series, Delaware Investments Ultrashort Fund (Fund). The Trust is an open-end investment company. The Fund is considered diversified under the Investment Company Act of 1940 (1940 Act), as amended, and offers Class A (formerly Consultant Class), Class C, Class L (formerly Class A), and Institutional Class shares. Class A shares are sold with a maximum front-end sales charge of 2.00%. Class L and Institutional Class shares are not subject to a sales charge and are offered for sale exclusively to certain eligible investors. Class C shares are sold with a contingent deferred sales charge (CDSC) of 1.00%, if redeemed during the first 12 months.
Following the close of business on Jan. 4, 2016, pursuant to a Plan of Reorganization (Reorganization), the Fund received all of the assets and liabilities of Delaware Cash Reserve® Fund (Portfolio). The shareholders of the Portfolio received Class A shares, Class C shares, and Class L shares of the Fund with an aggregate net asset value equal to the aggregate net asset value of their shares in the Portfolio immediately prior to the Reorganization. The Reorganization was treated as a tax-free reorganization for federal income purposes and, accordingly, the basis of the assets of the Fund reflected the historical basis of the assets of the Portfolio as of the date of the Reorganization. For financial reporting purposes, the Portfolio’s operating history prior to the Reorganization is reflected in the Fund’s financial statements and financial highlights.
The investment objective of the Fund is to seek total return to the extent consistent with a relatively low volatility of principal.
1. Significant Accounting Policies
The following accounting policies are in accordance with U.S. generally accepted accounting principles (U.S. GAAP) and are consistently followed by the Fund.
Security Valuation – Debt securities are valued based upon valuations provided by an independent pricing service or broker and reviewed by management. To the extent current market prices are not available, the pricing service may take into account developments related to the specific security, as well as transactions in comparable securities. Valuations for fixed income securities utilize matrix systems, which reflect such factors as security prices, yields, maturities, and ratings, and are supplemented by dealer and exchange quotations. For asset-backed securities, pricing vendors utilize matrix pricing which considers prepayment speed, attributes of the collateral, yield or price of bonds of comparable quality, coupon, maturity, and type as well as broker/dealer-supplied prices. Generally, other securities and assets for which market quotations are not readily available are valued at fair value as determined in good faith under the direction of the Trust’s Board of Trustees (Board). In determining whether market quotations are readily available or fair valuation will be used, various factors will be taken into consideration, such as market closures or suspension of trading in a security.
Federal Income Taxes – No provision for federal income taxes has been made as the Fund intends to continue to qualify for federal income tax purposes as a regulated investment company under Subchapter M of the Internal Revenue Code of 1986, as amended, and make the requisite distributions to shareholders. The Fund evaluates tax positions taken or expected to be taken in the course of preparing the Fund’s tax returns to determine whether the tax positions are “more-likely-than-not” of
30
being sustained by the applicable tax authority. Tax positions not deemed to meet the “more-likely-than-not” threshold are recorded as a tax benefit or expense in the current year. Management has analyzed the Fund’s tax positions taken for all open federal income tax years (March 31, 2014–March 31, 2017), and has concluded that no provision for federal income tax is required in the Fund’s financial statements.
Class Accounting – Investment income and common expenses are allocated to the various classes of the Fund on the basis of “settled shares” of each class in relation to the net assets of the Fund. Realized and unrealized gain (loss) on investments are allocated to the various classes of the Fund on the basis of daily net assets of each class. Distribution expenses relating to a specific class are charged directly to that class.
Use of Estimates – This Fund is an investment company, whose financial statements are prepared in conformity with U.S. GAAP. Therefore, the Fund follows the accounting and reporting guidelines for investment companies. The preparation of financial statements in conformity with U.S. GAAP requires management to make estimates and assumptions that affect the fair value of investments, the reported amounts of assets and liabilities and disclosure of contingent assets and liabilities at the date of the financial statements, and the reported amounts of revenues and expenses during the reporting period. Actual results could differ from those estimates and the differences could be material.
Other – Expenses directly attributable to the Fund are charged directly to the Fund. Other expenses common to various funds within the Delaware Investments® Family of Funds are generally allocated among such funds on the basis of average net assets. Management fees and certain other expenses are paid monthly. Security transactions are recorded on the date the securities are purchased or sold (trade date) for financial reporting purposes. Costs used in calculating realized gains and losses on the sale of investment securities are those of the specific securities sold. Interest income is recorded on the accrual basis. Discounts and premiums on debt securities are accreted or amortized to interest income, respectively, over the lives of the respective securities using the effective interest method. The Fund declares dividends daily from net investment income and pays the dividends monthly and declares and pays distributions from net realized gain on investments, if any, annually. The Fund may distribute more frequently, if necessary for tax purposes. Dividends and distributions, if any, are recorded on the ex-dividend date.
The Fund may receive earnings credits from its custodian when positive cash balances are maintained, which may be used to offset custody fees. There were no such earnings credits for the year ended March 31, 2017.
The Fund receives earnings credits from its transfer agent when positive cash balances are maintained, which may be used to offset transfer agent fees. If the amount earned is greater than $1.00, the expense paid under this arrangement is included on the “Statement of operations” under “Dividend disbursing and transfer agent fees and expenses” with the corresponding expense offset shown under “Less expense paid indirectly.” For the year ended March 31, 2017, the Fund earned $451 under this agreement.
31
Notes to financial statements
Delaware Investments Ultrashort Fund
2. Investment Management, Administration Agreements, and Other Transactions with Affiliates
In accordance with the terms of its investment management agreement, the Fund pays Delaware Management Company (DMC), a series of Delaware Management Business Trust and the investment manager, an annual fee which is calculated daily at the rate of 0.30% on average daily net assets of the Fund.
DMC has contractually agreed to waive all or a portion of its investment advisory fees and/or pay/reimburse expenses (excluding any distribution and service (12b-1) fees, taxes, interest, acquired fund fees and expenses, short sale and dividend interest expenses, brokerage fees, certain insurance costs, and nonroutine expenses or costs, including, but not limited to, those relating to reorganizations, litigation, conducting shareholder meetings, and liquidations) in order to prevent total annual fund operating expenses from exceeding 0.40% of the Fund’s average daily net assets from April 1, 2016 through March 31, 2017.* These waivers and reimbursements may only be terminated by agreement of DMC and the Fund.
Delaware Investments Fund Services Company (DIFSC), an affiliate of DMC, provides fund accounting and financial administration oversight services to the Fund. For these services, DIFSC’s fees are calculated based on the aggregate daily net assets of the Delaware Investments® Family of Funds at the following annual rate: 0.0050% of the first $30 billion; 0.0045% of the next $10 billion; 0.0040% of the next $10 billion; and 0.0025% of aggregate average daily net assets in excess of $50 billion. The fees payable to DIFSC under the service agreement described above are allocated among all funds in the Delaware Investments Family of Funds on a relative net asset value (NAV) basis. For the year ended March 31, 2017, the Fund was charged $4,319 for these services. This amount is included on the “Statement of operations” under “Accounting and administration expenses.”
DIFSC is also the transfer agent and dividend disbursing agent of the Fund. For these services, DIFSC’s fees are calculated based on the aggregate daily net assets of the retail funds within the Delaware Investments Family of Funds at the following annual rate: 0.025% of the first $20 billion; 0.020% of the next $5 billion; 0.015% of the next $5 billion; and 0.013% on average daily net assets in excess of $30 billion. The fees payable to DIFSC under the service agreement described above are allocated among all retail funds in the Delaware Investments Family of Funds on a relative NAV basis. For the year ended March 31, 2017, the Fund was charged $18,627 for these services. This amount is included on the “Statement of operations” under “Dividend disbursing and transfer agent fees and expenses.” Pursuant to a sub-transfer agency agreement between DIFSC and BNY Mellon Investment Servicing (US) Inc. (BNYMIS), BNYMIS provides certain sub-transfer agency services to the Fund. Sub-transfer agency fees are passed on to and paid by the Fund and are also included on the “Statement of operations” under “Dividend disbursing and transfer agent fees and expenses.”
Pursuant to a distribution agreement and distribution plan, the Fund pays Delaware Distributors, L.P. (DDLP), the distributor and an affiliate of DMC, an annual 12b-1 fee of 0.25% of the average daily net assets of the Class A shares, and 1.00% of the average daily net assets of the Class C shares. Class L and Institutional Class shares pay no 12b-1 fees. DDLP has contracted to limit the 12b-1 fees to 0.00% of average daily net assets for Class A and Class C shares from April 1, 2016 through March 31, 2017.*
32
As provided in the investment management agreement, the Fund bears a portion of the cost of certain resources shared with DMC, including the cost of internal personnel of DMC and/or its affiliates that provide legal, tax, and regulatory reporting services to the Fund. For the year ended March 31, 2017, the Fund was charged $2,046 for internal legal, tax, and regulatory reporting services provided by DMC and/or its affiliates’ employees. This amount is included on the “Statement of operations” under “Legal fees.”
For the year ended March 31, 2017, DDLP earned $1,086 for commissions on sales of the Fund’s Class A shares. For the year ended March 31, 2017, DDLP received gross CDSC commissions of $12,311 and $3,262 on redemption of the Fund’s Class A and Class C shares, respectively, and these commissions were entirely used to offset upfront commissions previously paid by DDLP to broker/dealers on sales of those shares.
Trustees’ fees include expenses accrued by the Fund for each Trustee’s retainer and meeting fees. Certain officers of DMC, DIFSC, and DDLP are officers and/or Trustees of the Trust. These officers and Trustees are paid no compensation by the Fund.
On July 9, 2015, DMC made a capital contribution of $305,752, $16,212, and $8,961 to the Fund’s Class A, Class C and Class L, respectively, in order to facilitate the conversion of the Fund from a money market fund to an ultrashort-term bond fund while avoiding any capital gain or loss being recognized by the Fund’s shareholders.
*The aggregate contractual waiver period covering this report is from Jan. 4, 2016 through July 29, 2017.
3. Investments
For the year ended March 31, 2017, the Fund made purchases and sales of investment securities other than short-term investments as follows:
| | | | |
Purchases | | $ | 63,095,732 | |
Sales | | | 76,091,449 | |
At March 31, 2017, the cost and unrealized appreciation (depreciation) of investments for federal income tax purposes for the fund were as follows:
| | | | |
Cost of investments | | $ | 86,267,839 | |
| | | | |
Aggregate unrealized appreciation of investments | | $ | 119,773 | |
Aggregate unrealized depreciation of investments | | | (71,398 | ) |
| | | | |
Net unrealized appreciation of investments | | $ | 48,375 | |
| | | | |
U.S. GAAP defines fair value as the price that the Fund would receive to sell an asset or pay to transfer a liability in an orderly transaction between market participants at the measurement date under current market conditions. A three-level hierarchy for fair value measurements has been established based upon the transparency of inputs to the valuation of an asset or liability. Inputs may be observable or unobservable and refer broadly to the assumptions that market participants would use in pricing the asset or liability. Observable inputs reflect the assumptions market participants would use in pricing the asset or liability based on market data obtained from sources independent of the reporting entity.
33
Notes to financial statements
Delaware Investments Ultrashort Fund
3. Investments (continued)
Unobservable inputs reflect the reporting entity’s own assumptions about the assumptions that market participants would use in pricing the asset or liability based on the best information available under the circumstances. The Fund’s investment in its entirety is assigned a level based upon the observability of the inputs which are significant to the overall valuation. The three-level hierarchy of inputs is summarized below.
| | |
| Level 1 – | | Inputs are quoted prices in active markets for identical investments. (Examples: equity securities, open-end investment companies, futures contracts, exchange-traded options contracts) |
| |
| Level 2 – | | Other observable inputs, including, but not limited to: quoted prices for similar assets or liabilities in markets that are active, quoted prices for identical or similar assets or liabilities in markets that are not active, inputs other than quoted prices that are observable for the assets or liabilities (such as interest rates, yield curves, volatilities, prepayment speeds, loss severities, credit risks, and default rates), or other market-corroborated inputs. (Examples: debt securities, government securities, swap contracts, foreign currency exchange contracts, foreign securities utilizing international fair value pricing, broker-quoted securities, fair valued securities) |
| |
| Level 3 – | | Significant unobservable inputs, including the Fund’s own assumptions used to determine the fair value of investments. (Examples: broker-quoted securities, fair valued securities) |
Level 3 investments are valued using significant unobservable inputs. The Fund may also use an income-based valuation approach in which the anticipated future cash flows of the investment are discounted to calculate fair value. Discounts may also be applied due to the nature or duration of any restrictions on the disposition of the investments. Valuations may also be based upon current market prices of securities that are comparable in coupon, rating, maturity, and industry. The derived value of a Level 3 investment may not represent the value which is received upon disposition and this could impact the results of operations.
The following table summarizes the valuation of the Fund’s investments by fair value hierarchy levels as of March 31, 2017:
| | | | |
Securities | | Level 2 | |
Assets: | | | | |
Certificates of Deposit | | $ | 1,500,000 | |
Commercial Paper | | | 25,382,269 | |
Corporate Debt | | | 33,394,515 | |
Non-Agency Asset-Backed Securities | | | 24,538,903 | |
Sovereign Debt | | | 1,500,527 | |
| | | | |
Total Value of Securities | | $ | 86,316,214 | |
| | | | |
During the year ended March 31, 2017, there were no transfers between Level 1 investments, Level 2 investments, or Level 3 investments that had a significant impact to the Fund. The Fund’s policy is to recognize transfers between levels at the beginning of the reporting period.
34
A reconciliation of Level 3 investments is presented when the Fund has a significant amount of Level 3 investments at the beginning, interim, or end of the period in relation to net assets. At March 31, 2017, there were no Level 3 investments.
4. Dividend and Distribution Information
Income and long-term capital gain distributions are determined in accordance with federal income tax regulations, which may differ from U.S. GAAP. Additionally, distributions from net short-term gains on sales of investment securities are treated as ordinary income for federal income tax purposes. The tax character of dividends and distributions paid during the years ended March 31, 2017 and 2016 was as follows:
| | | | | | | | |
| | | Year ended | |
| | | 3/31/17 | | | 3/31/16 | |
Ordinary income | | $ | 879,490 | | | $ | 149,394 | |
5. Components of Net Assets on a Tax Basis
As of March 31, 2017, the components of net assets on a tax basis were as follows:
| | | | |
Shares of beneficial interest | | $ | 85,414,476 | |
Qualified late year capital losses deferred | | | (35,399 | ) |
Distributions payable | | | (20,017 | ) |
Net unrealized appreciation on investments | | | 48,375 | |
| | | | |
Net assets | | $ | 85,407,435 | |
| | | | |
Qualified late year capital losses represent losses realized on investment transactions from Nov. 1, 2016 through March 31, 2017 that, in accordance with federal income tax regulations, the Fund has elected to defer and treat as having arisen in the following fiscal year.
For financial reporting purposes, capital accounts are adjusted to reflect the tax character of permanent book/tax differences. Reclassifications are primarily due to redesignation of dividends and distributions and paydowns of asset-backed securities. Results of operations and net assets were not affected by these reclassifications. For the year ended March 31, 2017 the Fund recorded the following reclassifications:
| | | | |
Distributions in excess of net investment income | | $ | (23,261 | ) |
Accumulated net realized loss on investments | | | 23,261 | |
35
Notes to financial statements
Delaware Investments Ultrashort Fund
6. Capital Shares
Transactions in capital shares were as follows:
| | | | | | | | |
| | | Year ended | |
| | | 3/31/17 | | | 3/31/16 | |
Shares sold: | | | | | | | | |
Class A | | | 1,523,916 | | | | 2,125,950 | |
Class C | | | 672,727 | | | | 8,569,077 | |
Class L | | | 83 | | | | 43,934,930 | |
Institutional Class | | | 13,732 | | | | 39,625 | |
| | |
Shares issued upon reinvestment of dividends and distributions: | | | | | | | | |
Class A | | | 7,834 | | | | 2,051 | |
Class C | | | 8,439 | | | | 3,453 | |
Class L | | | 68,428 | | | | 58,838 | |
Institutional Class | | | 239 | | | | 25 | |
| | | 2,295,398 | | | | 54,733,949 | |
| | |
Shares tendered from reverse stock split* | | | | | | | | |
Class A | | | — | | | | (4,711,240) | |
Class C | | | — | | | | (10,335,021) | |
Class L | | | — | | | | (88,334,181) | |
| | |
Shares redeemed: | | | | | | | | |
Class A | | | (1,217,806) | | | | (2,114,899) | |
Class C | | | (918,915) | | | | (5,726,225) | |
Class L | | | (1,602,412) | | | | (123,384,023) | |
Institutional Class | | | (11,061) | | | | (9,440) | |
| | | (3,750,194) | | | | (234,615,029) | |
Net decrease | | | (1,454,796) | | | | (179,881,080) | |
* On Jan. 5, 2016, the Fund recorded a reverse stock split to shareholders of record on Jan. 4, 2016, which resulted in a reduction of shares.
7. Line of Credit
The Fund, along with certain other funds in the Delaware Investments® Family of Funds (Participants), was a participant in a $155,000,000 revolving line of credit to be used for temporary or emergency purposes as an additional source of liquidity to fund redemptions of investor shares. Under the agreement, the Participants were charged an annual commitment fee of 0.10%, which was allocated across the Participants on the basis of relative net assets of each Participant’s allocation of the entire facility. The Participants were permitted to borrow up to a maximum of one third of their net assets under the agreement. Each Participant was individually, and not jointly, liable for its particular advances, if any, under the line of credit. The line of credit available under the agreement expired on Nov. 7, 2016.
36
On Nov. 7, 2016, the Fund, along with the other Participants, entered into an amendment to the agreement for a $155,000,000 revolving line of credit. The line of credit is to be used as described above and operates in substantially the same manner as the original agreement, with the exception of the annual commitment fee. Under the amendment to the agreement, the Participants are charged an annual commitment fee of 0.15%, which is allocated across the Participants on the basis of relative net assets of each Participant’s allocation of the entire facility. The line of credit available under the agreement expires on Nov. 6, 2017.
The Fund had no amounts outstanding as of March 31, 2017, or at any time during the year then ended.
8. Credit and Market Risks
The Fund invests in certain obligations that may have liquidity protection designed to ensure that the receipt of payments due on the underlying security is timely. Such protection may be provided through guarantees, insurance policies or letters of credit obtained by the issuer or sponsor through third parties, through various means of structuring the transaction, or through a combination of such approaches. The Fund will not pay any additional fees for such credit support, although the existence of credit support may increase the price of a security.
The Fund may invest up to 5% of its net assets in illiquid securities, which may include securities with contractual restrictions on resale, securities exempt from registration under Rule 144A promulgated under the Securities Act of 1933 (Act), as amended, and other securities which may not be readily marketable. The relative illiquidity of these securities may impair the Fund from disposing of them in a timely manner and at a fair price when it is necessary or desirable to do so. While maintaining oversight, the Fund’s Board has delegated to DMC the day-to-day functions of determining whether individual securities are liquid for purposes of the Fund’s limitation on investments in illiquid securities. The Fund may also invest in securities exempt from registration under Section 4(2) of the Act, which exempts from registration transactions by an issuer not involving any public offering. Securities eligible for resale pursuant to Rule 144A, which are determined to be liquid, are not subject to the Fund’s 5% limit on investments in illiquid securities. Section 4(a)(2), Rule 144A and illiquid securities have been identified on the “Schedule of investments.”
9. Contractual Obligations
The Fund enters into contracts in the normal course of business that contain a variety of indemnifications. The Fund’s maximum exposure under these arrangements is unknown. However, the Fund has not had prior claims or losses pursuant to these contracts. Management has reviewed the Fund’s existing contracts and expects the risk of loss to be remote.
37
Notes to financial statements
Delaware Investments Ultrashort Fund
10. Recent Accounting Pronouncements
On Oct. 13, 2016, the Securities and Exchange Commission amended existing rules intended to modernize reporting and disclosure of information. These amendments relate to Regulation S-X which sets forth the form and content of financial statements. At this time, management is evaluating the implications of adopting these amendments and their impact on the financial statements and accompanying notes.
11. Subsequent Events
Effective April 3, 2017, Delaware Investments® Family of Funds became Delaware FundsSM by Macquarie and Delaware Investments changed its name to Macquarie Investment Management (MIM). MIM is the marketing name for the companies comprising the asset management division of Macquarie Group Limited. Certain entities providing services to the Fund have also changed their names to reflect the use of the MIM name.
Management has determined that no other material events or transactions occurred subsequent to March 31, 2017, that would require recognition or disclosure in the Fund’s financial statements.
38
Report of independent
registered public accounting firm
To the Board of Trustees of Delaware Group® Cash Reserve
and Shareholders of Delaware Investments Ultrashort Fund:
In our opinion, the accompanying statement of assets and liabilities, including the schedule of investments, and the related statements of operations and of changes in net assets and the financial highlights present fairly, in all material respects, the financial position of the Delaware Investments Ultrashort Fund (constituting Delaware Group Cash Reserve, hereafter referred to as the “Fund”) as of March 31, 2017, the results of its operations for the year then ended, the changes in its net assets for each of the two years in the period then ended and the financial highlights for each of the periods indicated, in conformity with accounting principles generally accepted in the United States of America. These financial statements and financial highlights (hereafter referred to as “financial statements”) are the responsibility of the Fund’s management. Our responsibility is to express an opinion on these financial statements based on our audits. We conducted our audits of these financial statements in accordance with the standards of the Public Company Accounting Oversight Board (United States). Those standards require that we plan and perform the audit to obtain reasonable assurance about whether the financial statements are free of material misstatement. An audit includes examining, on a test basis, evidence supporting the amounts and disclosures in the financial statements, assessing the accounting principles used and significant estimates made by management, and evaluating the overall financial statement presentation. We believe that our audits, which included confirmation of securities as of March 31, 2017 by correspondence with the custodian and brokers, provide a reasonable basis for our opinion.
|
| PricewaterhouseCoopers LLP |
| Philadelphia, Pennsylvania |
| May 25, 2017 |
39
Other Fund information (Unaudited)
Delaware Investments Ultrashort Fund
Tax Information
The information set forth below is for the Fund’s fiscal year as required by federal income tax laws. Shareholders, however, must report distributions on a calendar year basis for income tax purposes, which may include distributions for portions of two fiscal years of a fund. Accordingly, the information needed by shareholders for income tax purposes will be sent to them in January of each year. Please consult your tax advisor for proper treatment of this information.
All disclosures are based on financial information available as of the date of this annual report and, accordingly are subject to change. For any and all items requiring reporting, it is the intention of the Fund to report the maximum amount permitted under the Internal Revenue Code and the regulations thereunder.
For the year ended March 31, 2017, the Fund reports distributions paid during the year as follows:
| | | | |
(A) Ordinary Income Distributions (Tax Basis) | | | 100.00 | % |
Total Distributions (Tax Basis) | | | 100.00 | % |
(A) is based on a percentage of the Fund’s total distributions.
For the fiscal year ended March 31, 2017, certain interest income paid by the Fund, determined to be Qualified Interest Income, may be subject to relief from U.S. withholding for foreign shareholders, as provided by the American Jobs Creation Act of 2004 and as extended by the Tax Relief, Unemployment Insurance Reauthorization and Jobs Creation Act of 2010 and made permanent by the American Taxpayer Relief Act of 2012. For the fiscal year ended March 31, 2017, the Fund has reported maximum distributions of Qualified Interest Income of $717,575.
40
This page intentionally left blank.
Board of trustees / directors and officers addendum
Delaware Investments® Family of Funds
A mutual fund is governed by a Board of Trustees/Directors (“Trustees”), which has oversight responsibility for the management of a fund’s business affairs. Trustees establish procedures and oversee and review the performance of the investment manager, the distributor, and others who perform services for the fund. The independent fund trustees, in particular, are advocates
| | | | | | |
Name, Address, and Birth Date | | Position(s) Held with Fund(s) | | Length of Time Served | |
Interested Trustee | | | | | | |
Shawn K. Lytle1, 4 2005 Market Street Philadelphia, PA 19103 February 1970 | | President, Chief Executive Officer, and Trustee | |
| Trustee since
September 2015 President and Chief Executive Officer since August 2015 |
|
| | |
| | | | | | | |
Ann D. Borowiec2 2005 Market Street Philadelphia, PA 19103 November 1958 | | Trustee | | | Since March 2015 | |
Independent Trustees | | | | | | |
Thomas L. Bennett 2005 Market Street Philadelphia, PA 19103 October 1947 | | Chairman and Trustee | |
| Trustee since
March 2005 Chairman since March 2015 |
|
| | |
| | | | | | | |
Joseph W. Chow 2005 Market Street Philadelphia, PA 19103 January 1953 | | Trustee | | | Since January 2013 | |
| | |
| | | | | | | |
| 1 | Shawn K. Lytle is considered to be an “Interested Trustee” because he is an executive officer of the Fund’s(s’) investment advisor. |
| 2 | Ann D. Borowiec is not a director, officer, or employee of the Delaware Funds’ investment manager or any of its affiliates, other than serving as a trustee/director of the Delaware Funds. Nonetheless, she has been designated as an “Interested Trustee” solely by virtue of being a director of two banking entities that may enter into principal transactions with, or receive distribution-related payments with respect to, funds and other accounts managed by the Delaware Funds’ investment manager (or by certain of its advisory affiliates) or their sub-advisors. |
42
for shareholder interests. Each trustee has served in that capacity since he or she was elected to or appointed to the Board of Trustees, and will continue to serve until his or her retirement or the election of a new trustee in his or her place. The following is a list of the Trustees and Officers with certain background and related information.
| | | | |
Principal Occupation(s) During the Past Five Years | | Number of Portfolios in Fund Complex Overseen by Trustee or Officer | | Other Directorships Held by Trustee or Officer |
| | | | |
Shawn K. Lytle has served as President of Delaware Investments3 since June 2015 and was the Regional Head of Americas for UBS Global Asset Management from 2010 through 2015. | | 62 | | Trustee — UBS Relationship Funds, SMA Relationship Trust, and UBS Funds (May 2010–April 2015) |
| | | | | |
Chief Executive Officer Private Wealth Management (2011–2013) and Market Manager, New Jersey Private Bank (2005–2011) — J.P. Morgan Chase & Co. | | 62 | | Director — Banco Santander International Director — Santander Bank, N.A. |
| | | | |
Private Investor (March 2004–Present) | | 62 | | None |
| | | | | |
Executive Vice President (Emerging Economies Strategies, Risks, and Corporate Administration) State Street Corporation (July 2004–March 2011) | | 62 | | Director and Audit Committee Member — Hercules Technology Growth Capital, Inc. (2004–2014) |
| | | | | |
| 3 | Delaware Investments is the marketing name for Delaware Management Holdings, Inc. and its subsidiaries, including the Fund’s(s’) investment advisor, principal underwriter, and its transfer agent. |
43
Board of trustees / directors and officers addendum
Delaware Investments® Family of Funds
| | | | |
Name, Address, and Birth Date | | Position(s) Held with Fund(s) | | Length of Time Served |
Independent Trustees (continued) | | | | |
John A. Fry 2005 Market Street Philadelphia, PA 19103 May 1960 | | Trustee | | Since January 2001 |
| | | | | |
Lucinda S. Landreth 2005 Market Street Philadelphia, PA 19103 June 1947 | | Trustee | | Since March 2005 |
| | | | | |
Frances A. Sevilla-Sacasa 2005 Market Street Philadelphia, PA 19103 January 1956 | | Trustee | | Since September 2011 |
| | | | | |
44
| | | | |
Principal Occupation(s) During the Past Five Years | | Number of Portfolios in Fund Complex Overseen by Trustee or Officer | | Other Directorships Held by Trustee or Officer |
| | | | |
President — Drexel University (August 2010–Present) | | 62 | | Director, Audit Committee,
and Governance Committee
Member — Community Health Systems |
| | |
President — Franklin & Marshall College (July 2002–July 2010) | | | | Director — Drexel
Morgan & Co. Director, Audit Committee Member — vTv Therapeutics LLC |
| | | | | |
Private Investor
(2004–Present) | | 62 | | None |
| | | | | |
Chief Executive Officer — Banco Itaú International (April 2012–December 2016) | | 62 | | Trust Manager and Audit
Committee Member — Camden
Property Trust |
| | |
Executive Advisor to Dean (August 2011–March 2012) and Interim Dean (January 2011–July 2011) — University of Miami School of Business Administration | | | | |
| | |
President — U.S. Trust, Bank of America Private Wealth Management (Private Banking) (July 2007–December 2008) | | | | |
| | | | | |
45
Board of trustees / directors and officers addendum
Delaware Investments® Family of Funds
| | | | |
Name, Address, and Birth Date | | Position(s) Held with Fund(s) | | Length of Time Served |
Independent Trustees (continued) |
Thomas K. Whitford 2005 Market Street Philadelphia, PA 19103 March 1956 | | Trustee | | Since January 2013 |
| | |
| | | | | |
Janet L. Yeomans 2005 Market Street Philadelphia, PA 19103 July 1948 | | Trustee | | Since April 1999 |
| | |
| | | | |
Officers |
David F. Connor 2005 Market Street Philadelphia, PA 19103 December 1963 | | Senior Vice President, General Counsel, and Secretary | | Senior Vice President
since May 2013; General Counsel since May 2015; Secretary since October 2005 |
| | | | | |
Daniel V. Geatens 2005 Market Street Philadelphia, PA 19103 October 1972 | | Vice President and Treasurer | | Treasurer since October 2007 |
| | | | | |
Richard Salus 2005 Market Street Philadelphia, PA 19103 October 1963 | | Senior Vice President and Chief Financial Officer | | Chief Financial Officer
since November 2006 |
| | | | | |
The Statement of Additional Information for the Fund(s) includes additional information about the Trustees and Officers and is available, without charge, upon request by calling 800 523-1918.
46
| | | | |
Principal Occupation(s) During the Past Five Years | | Number of Portfolios in Fund Complex Overseen by Trustee or Officer | | Other Directorships Held by Trustee or Officer |
| | | | |
Vice Chairman (2010–April 2013)— PNC Financial Services Group | | 62 | | Director — HSBC Finance Corporation and HSBC North America Holdings Inc. |
| | |
| | | | Director — HSBC USA Inc. |
| | | | | |
Vice President and Treasurer (January 2006–July 2012), Vice President — Mergers & Acquisitions (January 2003–January 2006), and Vice President and Treasurer (July 1995–January 2003) — 3M Company | | 62 | | Director, Personnel and Compensation Committee Chair, and Audit Committee Member — Okabena Company |
| | | | |
David F. Connor has served in various capacities at different times at Delaware Investments. | | 62 | | None4 |
| | | | | |
Daniel V. Geatens has served in various capacities at different times at Delaware Investments. | | 62 | | None4 |
| | | | | |
Richard Salus has served in various executive capacities at different times at Delaware Investments. | | 62 | | None4 |
| | | | | |
| 4 | Shawn K. Lytle, David F. Connor, Daniel V. Geatens, and Richard Salus serve in similar capacities for the six portfolios of the Optimum Fund Trust, which have the same investment advisor, principal underwriter, and transfer agent as the registrant. |
47
About the organization
| | | | | | | | | | |
Board of trustees | | | | | | | | | | |
| Shawn K. Lytle | | Ann D. Borowiec | | | John A. Fry | | | | Frances A. | |
President and Chief Executive Officer Delaware Investments® Family of Funds Philadelphia, PA Thomas L. Bennett Chairman of the Board Delaware Investments Family of Funds Private Investor Rosemont, PA | | Former Chief Executive Officer Private Wealth Management J.P. Morgan Chase & Co. New York, NY Joseph W. Chow Former Executive Vice President State Street Corporation Boston, MA | |
| President
Drexel University Philadelphia, PA Lucinda S. Landreth Former Chief Investment Officer Assurant, Inc. New York, NY |
| |
| Sevilla-Sacasa
Former Chief Executive Officer Banco Itaú International Miami, FL Thomas K. Whitford Former Vice Chairman
PNC Financial Services Group Pittsburgh, PA |
|
| | | | | | | |
| Janet L. Yeomans
Former Vice President and
Treasurer
3M Company St. Paul, MN |
|
Affiliated officers | | | | | | | | | | |
| David F. Connor | | Daniel V. Geatens | | | Richard Salus | | | | | |
| Senior Vice President, | | Vice President and | | | Senior Vice President and | | | | | |
| General Counsel, | | Treasurer | | | Chief Financial Officer | | | | | |
| and Secretary | | Delaware Investments | | | Delaware Investments | | | | | |
| Delaware Investments | | Family of Funds | | | Family of Funds | | | | | |
| Family of Funds | | Philadelphia, PA | | | Philadelphia, PA | | | | | |
| Philadelphia, PA | | | | | | | | | | |
This annual report is for the information of Delaware Investments Ultrashort Fund shareholders, but it may be used with prospective investors when preceded or accompanied by the Delaware Investments Fund fact sheet for the most recently completed calendar quarter. These documents are available at delawarefunds.com/literature.
Delaware Investments is the marketing name of Delaware Management Holdings, Inc. and its subsidiaries.
The Fund files its complete schedule of portfolio holdings with the Securities and Exchange Commission (SEC) for the first and third quarters of each fiscal year on Form N-Q. The Fund’s Forms N-Q, as well as a description of the policies and procedures that the Fund uses to determine how to vote proxies (if any) relating to portfolio securities are available without charge (i) upon request, by calling 800 523-1918; and (ii) on the SEC’s website at sec.gov. In addition, a description of the policies and procedures that the Fund uses to determine how to vote proxies (if any) relating to portfolio securities and the Schedule of Investments included in the Fund’s most recent Form N-Q are available without charge on the Fund’s website at delawarefunds.com/literature. The Fund’s Forms N-Q may be reviewed and copied at the SEC’s Public Reference Room in Washington, D.C.; information on the operation of the Public Reference Room may be obtained by calling 800 SEC-0330.
Information (if any) regarding how the Fund voted proxies relating to portfolio securities during the most recently disclosed 12-month period ended June 30 is available without charge (i) through the Fund’s website at delawarefunds.com/proxy; and (ii) on the SEC’s website at sec.gov.
48
Item 2. Code of Ethics
Item 3. Audit Committee Financial Expert
The registrant’s Board of Trustees/Directors has determined that certain members of the registrant’s Audit Committee are audit committee financial experts, as defined below. For purposes of this item, an “audit committee financial expert” is a person who has the following attributes:
a. An understanding of generally accepted accounting principles and financial statements;
b. The ability to assess the general application of such principles in connection with the accounting for estimates, accruals, and reserves;
c. Experience preparing, auditing, analyzing, or evaluating financial statements that present a breadth and level of complexity of accounting issues that are generally comparable to the breadth and complexity of issues that can reasonably be expected to be raised by the registrant’s financial statements, or experience actively supervising one or more persons engaged in such activities;
d. An understanding of internal controls and procedures for financial reporting; and
e. An understanding of audit committee functions.
An “audit committee financial expert” shall have acquired such attributes through:
a. Education and experience as a principal financial officer, principal accounting officer, controller, public accountant, or auditor or experience in one or more positions that involve the performance of similar functions;
b. Experience actively supervising a principal financial officer, principal accounting officer, controller, public accountant, auditor, or person performing similar functions;
c. Experience overseeing or assessing the performance of companies or public accountants with respect to the preparation, auditing, or evaluation of financial statements; or
d. Other relevant experience.
The registrant’s Board of Trustees/Directors has also determined that each member of the registrant’s Audit Committee is independent. In order to be “independent” for purposes of this item, the Audit Committee member may not: (i) other than in his or her capacity as a member of the Board of Trustees/Directors or any committee thereof, accept directly or indirectly any consulting, advisory or other compensatory fee from the issuer; or (ii) be an “interested person” of the registrant as defined in Section 2(a)(19) of the Investment Company Act of 1940.
The names of the audit committee financial experts on the registrant’s Audit Committee are set forth below:
Joseph W. Chow
John A. Fry
Lucinda S. Landreth
Thomas K. Whitford
Item 4. Principal Accountant Fees and Services
PricewaterhouseCoopers LLP (“PwC”), the Independent Accountant to the series portfolio of Delaware Group Cash Reserve (“Fund”), has advised the Audit Committee of the Board of Trustees of the Fund (“Audit Committee”) that, as of the date of the filing of this Annual Report on Form N-CSR, it is in discussions with the staff of the Securities and Exchange Commission (“SEC Staff”), or the SEC, regarding the interpretation and application of Rule 2-01(c)(1)(ii)(A) of Regulation S-X, or the Loan Rule.
The Audit Committee has considered the lending relationships described by PwC and has concluded that (1) the lending relationships did not affect PwC’s application of objective judgment in conducting its audits and issuing reports on the Fund’s financial statements; and (2) a reasonable investor with knowledge of the lending relationships described by PwC would reach the same conclusion. In making this determination, the Audit Committee considered, among other things, PwC’s description of the relevant lending relationships and PwC’s representation that its objectivity was not impaired in conducting its audit of the Fund’s financial statements. In connection with this determination, PwC advised the Audit Committee that it believes PwC is independent and it continues to have discussions with the SEC Staff.
If the SEC were ultimately to determine that PwC was not independent with respect to the Fund for certain time periods, the Fund’s filings with the SEC that contain the Fund’s financial statements for such periods would be non-compliant with the applicable securities laws. If the SEC determines that PwC was not independent, among other things, the Fund could be required to have independent audits conducted on the Fund’s previously audited financial statements by another registered public accounting firm for the affected periods. The time involved to conduct such independent audits may impair the Fund’s ability to issue shares. Any of the foregoing possible outcomes potentially could have a material adverse effect on the Fund.
The aggregate fees billed for services provided to the registrant by its independent auditors for the audit of the registrant’s annual financial statements and for services normally provided by the independent auditors in connection with statutory and regulatory filings or engagements were $31,580 for the fiscal year ended March 31, 2017.
The aggregate fees billed for services provided to the registrant by its independent auditors for the audit of the registrant’s annual financial statements and for services normally provided by the independent auditors in connection with statutory and regulatory filings or engagements were $30,380 for the fiscal year ended March 31, 2016.
The aggregate fees billed by the registrant’s independent auditors for services relating to the performance of the audit of the registrant’s financial statements and not reported under paragraph (a) of this Item were $0 for the fiscal year ended March 31, 2017.
The aggregate fees billed by the registrant’s independent auditors for services relating to the performance of the audit of the registrant’s financial statements and not reported under paragraph (a) of this Item were $0 for the fiscal year ended March 31, 2016.
The aggregate fees billed by the registrant’s independent auditors for tax-related services provided to the registrant’s investment adviser and other service providers under common control with the adviser and that relate directly to the operations or financial reporting of the registrant were $0 for the registrant’s fiscal year ended March 31, 2017.
The aggregate fees billed by the registrant’s independent auditors for tax-related services provided to the registrant’s investment adviser and other service providers under common control with the adviser and that relate directly to the operations or financial reporting of the registrant were $0 for the registrant’s fiscal year ended March 31, 2016.
The aggregate fees billed for all services provided by the independent auditors to the registrant other than those set forth in paragraphs (a), (b) and (c) of this Item were $0 for the fiscal year ended March 31, 2017.
The aggregate fees billed for all services provided by the independent auditors to the registrant other than those set forth in paragraphs (a), (b) and (c) of this Item were $0 for the fiscal year ended March 31, 2016.
Under the Pre-Approval Policy, the Audit Committee has also pre-approved the services set forth in the table below with respect to the registrant’s investment adviser and other entities controlling, controlled by or under common control with the investment adviser that provide ongoing services to the registrant (the “Control Affiliates”) up to the specified fee limit. This fee limit is based on aggregate fees to the investment adviser and its Control Affiliates.
The Pre-Approval Policy requires the registrant’s independent auditors to report to the Audit Committee at each of its regular meetings regarding all services initiated since the last such report was rendered, including those services authorized by the Pre-Approval Policy.
(f) Not applicable.
(g) The aggregate non-audit fees billed by the registrant’s independent auditors for services rendered to the registrant and to its investment adviser and other service providers under common control with the adviser were $11,180,000 and $10,036,000 for the registrant’s fiscal years ended March 31, 2017 and March 31, 2016, respectively.
(h) In connection with its selection of the independent auditors, the registrant’s Audit Committee has considered the independent auditors’ provision of non-audit services to the registrant’s investment adviser and other service providers under common control with the adviser that were not required to be pre-approved pursuant to Rule 2-01(c)(7)(ii) of Regulation S-X. The Audit Committee has determined that the independent auditors’ provision of these services is compatible with maintaining the auditors’ independence.
Item 5. Audit Committee of Listed Registrants
Not applicable.
Item 6. Investments
(a) Included as part of report to shareholders filed under Item 1 of this Form N-CSR.
(b) Divestment of securities in accordance with Section 13(c) of the Investment Company Act of 1940.
Not applicable.
Item 7. Disclosure of Proxy Voting Policies and Procedures for Closed-End Management Investment Companies
Not applicable.
Item 8. Portfolio Managers of Closed-End Management Investment Companies
Not applicable.
Item 9. Purchases of Equity Securities by Closed-End Management Investment Company and Affiliated Purchasers
Not applicable.
Item 10. Submission of Matters to a Vote of Security Holders
Not applicable.
Item 11. Controls and Procedures
The registrant’s principal executive officer and principal financial officer have evaluated the registrant’s disclosure controls and procedures within 90 days of the filing of this report and have concluded that they are effective in providing reasonable assurance that the information required to be disclosed by the registrant in its reports or statements filed under the Securities Exchange Act of 1934 is recorded, processed, summarized and reported within the time periods specified in the rules and forms of the Securities and Exchange Commission.
There were no significant changes in the registrant’s internal control over financial reporting that occurred during the second fiscal quarter of the period covered by the report to stockholders included herein (i.e., the registrant’s fourth fiscal quarter) that have materially affected, or are reasonably likely to materially affect, the registrant’s internal control over financial reporting.
Item 12. Exhibits
Pursuant to the requirements of the Securities Exchange Act of 1934 and the Investment Company Act of 1940, the registrant has duly caused this report to be signed on its behalf, by the undersigned, thereunto duly authorized.
Pursuant to the requirements of the Securities Exchange Act of 1934 and the Investment Company Act of 1940, this report has been signed below by the following persons on behalf of the registrant and in the capacities and on the dates indicated.