© CTO Realty Growth, Inc. | ctoreit.com Daytona Beach Restaurants Daytona Beach, FL Supplemental Reporting Information Q1 2024 REALTY GROWTH |
© CTO Realty Growth, Inc. | ctoreit.com 2 Table of Contents First Quarter 2024 Earnings Release 4 Key Financial Information Consolidated Balance Sheets 12 Consolidated Statements of Operations 13 Non-GAAP Financial Measures 14 Capitalization & Dividends 17 Summary of Debt 18 Debt Maturity Schedule 19 Current Year Investment Activity 20 Current Year Disposition Activity 21 Real Estate Portfolio Capital Investments 22 Real Estate Portfolio Summary 23 Real Estate Portfolio Detail 24 |
© CTO Realty Growth, Inc. | ctoreit.com 3 Table of Contents Leasing Summary 26 Comparable Leasing Summary 27 Same-Property NOI 28 Lease Expirations 29 Top Tenant Summary 31 Geographic Diversification 32 Other Assets 33 2024 Guidance 34 Contact Information & Research Coverage 35 Safe Harbor, Non-GAAP Financial Measures, and Definitions and Terms 36 |
Page 4 Press Release Contact: Lisa M. Vorakoun Senior Vice President, Chief Accounting Officer (386) 944-5641 lvorakoun@ctoreit.com FOR IMMEDIATE RELEASE CTO REALTY GROWTH REPORTS FIRST QUARTER 2024 OPERATING RESULTS WINTER PARK, FL – May 2, 2024 – CTO Realty Growth, Inc. (NYSE: CTO) (the “Company” or “CTO”) today announced its operating results and earnings for the quarter ended March 31, 2024. First Quarter and Recent Highlights Reported Net Income per diluted share attributable to common stockholders of $0.20 for the quarter ended March 31, 2024. Reported Core FFO per diluted share attributable to common stockholders of $0.48 for the quarter ended March 31, 2024. Reported AFFO per diluted share attributable to common stockholders of $0.52 for the quarter ended March 31, 2024. Invested $71.0 million into two retail property acquisitions, totaling 319,066 leasable square feet at a weighted-average going-in cash cap rate of 8.0%. Sold one property for $20.0 million at an exit cap rate of 8.2%, generating a gain of $4.6 million. Originated a short term $10.0 million first mortgage retail development loan in Florida, of which $6.7 million was funded during the three months ended March 31, 2024, at a fixed interest rate of 11.0%. Reported an increase in Same-Property NOI of 6.0% as compared to the first quarter of 2023. Signed 15 comparable leases during the quarter totaling 94,669 square feet at an average cash base rent of $26.09 per square foot, resulting in comparable rent per square foot growth of 68.2%. Signed not open pipeline represents $4.2 million, or 5.4%, of annual cash base rent in place as of March 31, 2024. Reported a 1.0% increase in leased occupancy of 94.3% as of March 31, 2024, as compared to 93.3% as of December 31, 2023. Georgia, Texas, and Florida, represent our top three states, or 70.9% of annualized base rent, as of March 31, 2024. Increased the midpoint of full year Core FFO per diluted share guidance by 2.5% and full year AFFO per diluted share guidance by 2.3%. Utilized proceeds from our recent preferred offering and the early repayment of our seller-financing loan to repay all floating rate exposure on our credit facility to a current total debt balance of $483.8 million as of May 2, 2024. |
Page 5 CEO Comments “We are pleased with our strong acquisition activity to start the year with $71.0 million in property acquisitions, including our $68.7 million Marketplace at Seminole Towne Center in Orlando, Florida. We also successfully sold a small mixed-use property in Santa Fe, New Mexico at a good profit,” said John P. Albright, President and Chief Executive Officer of CTO Realty Growth. “Due to positive momentum in our leasing efforts and strong Same-Property NOI growth in the first quarter, we have increased our full-year Core FFO and AFFO guidance. This increased guidance is being assisted by over 200,000 square feet of new leases signed in the last six months.” Quarterly Financial Results Highlights The table below provides a summary of the Company’s operating results for the three months ended March 31, 2024: (in thousands, except per share data) For the Three Months Ended March 31, 2024 For the Three Months Ended March 31, 2023 Variance to Comparable Period in the Prior Year Net Income (Loss) Attributable to the Company $ 5,842 $ (5,993) $ 11,835 197.5% Net Income (Loss) Attributable to Common Stockholders $ 4,655 $ (7,188) $ 11,843 164.8% Net Income (Loss) per Diluted Share Attributable to Common Stockholders (1) $ 0.20 $ (0.32) $ 0.52 162.5% Core FFO Attributable to Common Stockholders (2) $ 10,737 $ 8,867 $ 1,870 21.1% Core FFO per Common Share – Diluted (2) $ 0.48 $ 0.39 $ 0.09 23.1% AFFO Attributable to Common Stockholders (2) $ 11,648 $ 9,863 $ 1,785 18.1% AFFO per Common Share – Diluted (2) $ 0.52 $ 0.43 $ 0.09 20.9% Dividends Declared and Paid, per Preferred Share $ 0.40 $ 0.40 $ 0.00 0.00% Dividends Declared and Paid, per Common Share $ 0.38 $ 0.38 $ 0.00 0.00% (1) For the three months ended March 31, 2024, the denominator for this measure includes the impact of 3.5 million shares related to the Company’s adoption of ASU 2020-06, effective January 1, 2022, which requires presentation on an if-converted basis for the Company’s 2025 Convertible Senior Notes, as the impact was dilutive for the period. For the three months ended March 31, 2023, the denominator for this measure excludes the impact of 3.2 million shares, as the impact would be anti-dilutive for the period. (2) See the “Non-GAAP Financial Measures” section and tables at the end of this press release for a discussion and reconciliation of Net Income (Loss) Attributable to the Company to non-GAAP financial measures, including FFO Attributable to Common Stockholders, FFO per Common Share - Diluted, Core FFO Attributable to Common Stockholders, Core FFO per Common Share – Diluted, AFFO Attributable to Common Stockholders and AFFO per Common Share - Diluted. Investments During the three months ended March 31, 2024, the Company invested $71.0 million into two multi-tenant retail property acquisitions totaling 319,066 leasable square feet at a weighted average going-in cash cap rate of 8.0%. The Company’s first quarter 2024 acquisitions included the following: Purchased Marketplace at Seminole Towne Center, a 315,066 square foot multi-tenant retail power center in the Sanford submarket of Orlando, Florida for a purchase price of $68.7 million. The property is situated on 41 acres along I-4 just over 20 miles north of downtown Orlando, Florida and is anchored by Burlington, Marshalls, World Market, Petco, Ross Dress for Less, Old Navy, Ulta Beauty, and Five Below. Purchased the final 4,000 square foot property within the 28,100 square foot retail portion of Phase II of The Exchange at Gwinnett in Buford, Georgia for a purchase price of $2.3 million. |
Page 6 During the three months ended March 31, 2024, the Company originated a $10.0 million first mortgage loan, secured by a retail development in the West Palm Beach, Florida market, of which $6.7 million was funded during the three months ended March 31, 2024, at a fixed interest rate of 11.0%. Dispositions During the three months ended March 31, 2024, the Company sold its mixed-use property totaling approximately 136,000 square feet in downtown Santa Fe, New Mexico for $20.0 million at an exit cap rate of 8.2%, generating a gain of $4.6 million. Subsequent to March 31, 2024, the Company received proceeds of $15.2 million as an early repayment of our Sabal Pavilion seller-financing loan. Portfolio Summary The Company’s income property portfolio consisted of the following as of March 31, 2024: Asset Type # of Properties Square Feet Weighted Average Remaining Lease Term Single Tenant 6 252 6.0 years Multi-Tenant 14 3,643 5.2 years Total / Weighted Average Lease Term 20 3,895 5.1 years Square feet in thousands. Property Type # of Properties Square Feet % of Cash Base Rent Retail 15 2,467 62.1% Office 1 210 4.7% Mixed-Use 4 1,218 33.2% Total / Weighted Average Lease Term 20 3,895 100% Square feet in thousands. Leased Occupancy 94.3% Occupancy 92.6% Same Property Net Operating Income During the first quarter of 2024, the Company’s Same-Property NOI totaled $15.1 million, an increase of 6.0% over the comparable prior year period, as presented in the following table. For the Three Months Ended March 31, 2024 For the Three Months Ended March 31, 2023 Variance to Comparable Period in the Prior Year Single Tenant $ 1,148 $ 949 $ 199 21.0% Multi-Tenant 13,966 13,305 661 5.0% Total $ 15,114 $ 14,254 $ 860 6.0% $ in thousands. |
Page 7 Leasing Activity During the quarter ended March 31, 2024, the Company signed 19 leases totaling 104,114 square feet. On a comparable basis, which excludes vacancy existing at the time of acquisition, CTO signed 15 leases totaling 94,699 square feet at an average cash base rent of $26.09 per square foot compared to a previous average cash base rent of $15.51 per square foot, representing 68.2% comparable growth. A summary of the Company’s overall leasing activity for the quarter ended March 31, 2024, is as follows: Square Feet Weighted Average Lease Term Cash Rent Per Square Foot Tenant Improvements Leasing Commissions New Leases 70 12.4 years $26.09 $ 4,842 $ 1,133 Renewals & Extensions 34 3.8 years $29.26 15 40 Total / Weighted Average 104 9.4 years $27.12 $ 4,857 $ 1,173 In thousands except for per square foot and weighted average lease term data. Comparable leases compare leases signed on a space for which there was previously a tenant. Overall leasing activity does not include lease termination agreements or lease amendments related to tenant bankruptcy proceedings. Subsurface Interests and Mitigation Credits During the three months ended March 31, 2024, the Company completed the sale of our remaining approximately 351,581 acres of subsurface oil, gas, and mineral rights for $5.0 million, resulting in a gain of $4.5 million. As part of the subsurface sale, the Company entered into a management agreement with the buyer to provide ongoing management services. During the three months ended March 31, 2024, the Company sold approximately 7.5 mitigation credits for $1.0 million, resulting in a gain of $0.2 million. Capital Markets and Balance Sheet During the quarter ended March 31, 2024, the Company completed the following capital markets activities: Repurchased 40,726 shares of common stock for $0.7 million at an average price of $16.28 per share. Issued 125,857 common shares under its ATM offering program at a weighted average gross price of $17.05 per share, for total net proceeds of $2.1 million. Subsequent to March 31, 2024, the Company completed a follow-on public offering of 1,718,417 shares of the Company’s 6.375% Series A Cumulative Redeemable Preferred Stock. The Company received net proceeds of $33.1 million, after deducting the underwriting discount and offering expenses payable by the Company. The following table provides a summary of the Company’s long-term debt, at face value, as of March 31, 2024: Component of Long-Term Debt Principal Interest Rate Maturity Date 2025 Convertible Senior Notes $51.0 million 3.875% April 2025 2026 Term Loan (1) 65.0 million SOFR + 10 bps + [1.25% – 2.20%] March 2026 Mortgage Note (2) 17.8 million 4.06% August 2026 Revolving Credit Facility (3) 209.5 million SOFR + 10 bps + [1.25% – 2.20%] January 2027 2027 Term Loan (4) 100.0 million SOFR + 10 bps + [1.25% – 2.20%] January 2027 2028 Term Loan (5) 100.0 million SOFR + 10 bps + [1.20% – 2.15%] January 2028 Total Debt / Weighted Average Interest Rate $543.3 million 4.52% |
Page 8 (1) The Company utilized interest rate swaps on the $65.0 million 2026 Term Loan balance to fix SOFR and achieve a weighted average fixed swap rate of 1.27% plus the 10 bps SOFR adjustment plus the applicable spread. (2) Mortgage note assumed in connection with the acquisition of Price Plaza Shopping Center located in Katy, Texas. (3) The Company utilized interest rate swaps on $150.0 million of the Credit Facility balance to fix SOFR and achieve a weighted average fixed swap rate of 3.47% plus the 10 bps SOFR adjustment plus the applicable spread. (4) The Company utilized interest rate swaps on the $100.0 million 2027 Term Loan balance to fix SOFR and achieve a fixed swap rate of 1.35% plus the 10 bps SOFR adjustment plus the applicable spread. (5) The Company utilized interest rate swaps on the $100.0 million 2028 Term Loan balance to fix SOFR and achieve a weighted average fixed swap rate of 3.78% plus the 10 bps SOFR adjustment plus the applicable spread. As of March 31, 2024, the Company’s net debt to Pro Forma EBITDA was 7.6 times, and as defined in the Company’s credit agreement, the Company’s fixed charge coverage ratio was 2.7 times. As of March 31, 2024, the Company’s net debt to total enterprise value was 53.3%. The Company calculates total enterprise value as the sum of net debt, par value of its 6.375% Series A preferred equity, and the market value of the Company's outstanding common shares. Subsequent to March 31, 2024, with the proceeds from the preferred offering and the early repayment of the Sabal Pavilion loan, our outstanding balance on our Revolving Credit Facility is $150.0 million. Dividends On February 20, 2024, the Company announced a cash dividend on its common stock and Series A Preferred Stock for the first quarter of 2024 of $0.38 per share and $0.40 per share, respectively, payable on March 28, 2024 to stockholders of record as of the close of business on March 14, 2024. The first quarter 2024 common stock cash dividend represents a payout ratio of 79.2% and 73.1% of the Company’s first quarter 2024 Core FFO per diluted share and AFFO per diluted share, respectively. 2024 Outlook The Company has increased its Core FFO and AFFO outlook for 2024 and has revised certain assumptions to take into account the Company’s first quarter performance and revised expectations regarding the Company’s disposition activities. The Company’s outlook for 2024 assumes continued stability in economic activity, stable or positive business trends related to each of our tenants and other significant assumptions. The Company’s increased outlook for 2024 is as follows: 2024 Guidance Range Low High Core FFO Per Diluted Share $1.60 to $1.68 AFFO Per Diluted Share $1.74 to $1.82 The Company’s 2024 guidance includes but is not limited to the following assumptions: Same-Property NOI growth of 2% to 4%, including the known impact of bad debt expense, occupancy loss and costs associated with tenants in bankruptcy, and/or tenant lease defaults, and before any impact from potential 2024 income property acquisitions and/or dispositions. General and administrative expenses within a range of $15.2 million to $16.2 million. Weighted average diluted shares outstanding of 22.5 million shares. Year-end 2024 leased occupancy projected to be within a range of 95% to 96% before any impact from potential 2024 income property acquisitions and/or dispositions. |
Page 9 Investment, including structured investments, between $100 million and $150 million at a weighted average initial cash yield between 7.75% and 8.25%. Disposition of assets between $50 million and $75 million at a weighted average exit cash yield between 7.50% and 8.25% Earnings Conference Call & Webcast The Company will host a conference call to present its operating results for the quarter ended March 31, 2024, on Friday, May 3, 2024, at 9:00 AM ET. A live webcast of the call will be available on the Investor Relations page of the Company’s website at www.ctoreit.com or at the link provided in the event details below. To access the call by phone, please go to the link provided in the event details below and you will be provided with dial-in details. Webcast: https://edge.media-server.com/mmc/p/ag748f8u Dial-In: https://register.vevent.com/register/BIad19b5289aae4cb8b9fdd1c46a0d84c9 We encourage participants to dial into the conference call at least fifteen minutes ahead of the scheduled start time. A replay of the earnings call will be archived and available online through the Investor Relations section of the Company’s website at www.ctoreit.com. About CTO Realty Growth, Inc. CTO Realty Growth, Inc. is a publicly traded real estate investment trust that owns and operates a portfolio of high-quality, retail-based properties located primarily in higher growth markets in the United States. CTO also externally manages and owns a meaningful interest in Alpine Income Property Trust, Inc. (NYSE: PINE), a publicly traded net lease REIT. We encourage you to review our most recent investor presentation and supplemental financial information, which is available on our website at www.ctoreit.com. Safe Harbor Certain statements contained in this press release (other than statements of historical fact) are forward-looking statements within the meaning of Section 27A of the Securities Act of 1933, as amended, and Section 21E of the Securities Exchange Act of 1934, as amended. Forward-looking statements can typically be identified by words such as “believe,” “estimate,” “expect,” “intend,” “anticipate,” “will,” “could,” “may,” “should,” “plan,” “potential,” “predict,” “forecast,” “project,” and similar expressions, as well as variations or negatives of these words. Although forward-looking statements are made based upon management’s present expectations and reasonable beliefs concerning future developments and their potential effect upon the Company, a number of factors could cause the Company’s actual results to differ materially from those set forth in the forward-looking statements. Such factors may include, but are not limited to: the Company’s ability to remain qualified as a REIT; the Company’s exposure to U.S. federal and state income tax law changes, including changes to the REIT requirements; general adverse economic and real estate conditions; macroeconomic and geopolitical factors, including but not limited to inflationary pressures, interest rate volatility, distress in the banking sector, global supply chain disruptions, and ongoing geopolitical war; credit risk associated with the Company investing in structured investments; the ultimate geographic spread, severity and duration of pandemics such as the COVID-19 Pandemic and its variants, actions that may be taken by governmental authorities to contain or address the impact of such pandemics, and the potential negative impacts of such pandemics |
Page 10 on the global economy and the Company’s financial condition and results of operations; the inability of major tenants to continue paying their rent or obligations due to bankruptcy, insolvency or a general downturn in their business; the loss or failure, or decline in the business or assets of PINE; the completion of 1031 exchange transactions; the availability of investment properties that meet the Company’s investment goals and criteria; the uncertainties associated with obtaining required governmental permits and satisfying other closing conditions for planned acquisitions and sales; and the uncertainties and risk factors discussed in the Company’s Annual Report on Form 10-K for the fiscal year ended December 31, 2023 and other risks and uncertainties discussed from time to time in the Company’s filings with the U.S. Securities and Exchange Commission. There can be no assurance that future developments will be in accordance with management’s expectations or that the effect of future developments on the Company will be those anticipated by management. Readers are cautioned not to place undue reliance on these forward-looking statements, which speak only as of the date of this press release. The Company undertakes no obligation to update the information contained in this press release to reflect subsequently occurring events or circumstances. Non-GAAP Financial Measures Our reported results are presented in accordance with accounting principles generally accepted in the United States of America (“GAAP”). We also disclose Funds From Operations (“FFO”), Core Funds From Operations (“Core FFO”), Adjusted Funds From Operations (“AFFO”), Pro Forma Earnings Before Interest, Taxes, Depreciation and Amortization (“Pro Forma EBITDA”), and Same-Property Net Operating Income (“Same-Property NOI”), each of which are non-GAAP financial measures. We believe these non-GAAP financial measures are useful to investors because they are widely accepted industry measures used by analysts and investors to compare the operating performance of REITs. FFO, Core FFO, AFFO, Pro Forma EBITDA, and Same-Property NOI do not represent cash generated from operating activities and are not necessarily indicative of cash available to fund cash requirements; accordingly, they should not be considered alternatives to net income as a performance measure or cash flows from operating activities as reported on our statement of cash flows as a liquidity measure and should be considered in addition to, and not in lieu of, GAAP financial measures. We compute FFO in accordance with the definition adopted by the Board of Governors of the National Association of Real Estate Investment Trusts, or NAREIT. NAREIT defines FFO as GAAP net income or loss adjusted to exclude real estate related depreciation and amortization, as well as extraordinary items (as defined by GAAP) such as net gain or loss from sales of depreciable real estate assets, impairment write-downs associated with depreciable real estate assets and impairments associated with the implementation of current expected credit losses on commercial loans and investments at the time of origination, including the pro rata share of such adjustments of unconsolidated subsidiaries. The Company also excludes the gains or losses from sales of assets incidental to the primary business of the REIT which specifically include the sales of mitigation credits, subsurface sales, investment securities, and land sales, in addition to the mark-to-market of the Company’s investment securities and interest related to the 2025 Convertible Senior Notes, if the effect is dilutive. To derive Core FFO, we modify the NAREIT computation of FFO to include other adjustments to GAAP net income related to gains and losses recognized on the extinguishment of debt, amortization of above- and below-market lease related intangibles, and other unforecastable market- or transaction-driven non-cash items, as well as adding back the interest related to the 2025 Convertible Senior Notes, if the effect is dilutive. To derive AFFO, we further modify the NAREIT computation of FFO and Core FFO to include other adjustments to GAAP net income related to non-cash revenues and expenses such as straight-line rental revenue, non-cash compensation, and other non-cash amortization. Such items may cause short-term fluctuations in net income but have no impact on operating cash flows or long-term operating performance. We use AFFO as one measure of our performance when we formulate corporate goals. To derive Pro Forma EBITDA, GAAP net income or loss attributable to the Company is adjusted to exclude real estate related depreciation and amortization, as well as extraordinary items (as defined by GAAP) such as net gain or loss |
Page 11 from sales of depreciable real estate assets, impairment write-downs associated with depreciable real estate assets, impairments associated with the implementation of current expected credit losses on commercial loans and investments at the time of origination, including the pro rata share of such adjustments of unconsolidated subsidiaries, non-cash revenues and expenses such as straight-line rental revenue, amortization of deferred financing costs, above- and below-market lease related intangibles, non-cash compensation, other non-recurring items such as termination fees, forfeitures of tenant security deposits, and certain adjustments to reconciliation estimates related to reimbursable revenue for recently acquired properties, and other non-cash income or expense. The Company also excludes the gains or losses from sales of assets incidental to the primary business of the REIT which specifically include the sales of mitigation credits, subsurface sales, investment securities, and land sales, in addition to the mark-to-market of the Company’s investment securities. Cash interest expense is also excluded from Pro Forma EBITDA, and GAAP net income or loss is adjusted for the annualized impact of acquisitions, dispositions and other similar activities. To derive Same-Property NOI, GAAP net income or loss attributable to the Company is adjusted to exclude real estate related depreciation and amortization, as well as extraordinary items (as defined by GAAP) such as net gain or loss from sales of depreciable real estate assets, impairment write-downs associated with depreciable real estate assets, impairments associated with the implementation of current expected credit losses on commercial loans and investments at the time of origination, including the pro rata share of such adjustments of unconsolidated subsidiaries, non-cash revenues and expenses such as straight-line rental revenue, amortization of deferred financing costs, above- and below-market lease related intangibles, non-cash compensation, other non-recurring items such as termination fees, forfeitures of tenant security deposits, and certain adjustments to reconciliation estimates related to reimbursable revenue for recently acquired properties, and other non-cash income or expense. Interest expense, general and administrative expenses, investment and other income or loss, income tax benefit or expense, real estate operations revenues and direct cost of revenues, management fee income, and interest income from commercial loans and investments are also excluded from Same-Property NOI. GAAP net income or loss is further adjusted to remove the impact of properties that were not owned for the full current and prior year reporting periods presented. Cash rental income received under the leases pertaining to the Company’s assets that are presented as commercial loans and investments in accordance with GAAP is also used in lieu of the interest income equivalent. FFO is used by management, investors and analysts to facilitate meaningful comparisons of operating performance between periods and among our peers primarily because it excludes the effect of real estate depreciation and amortization and net gains or losses on sales, which are based on historical costs and implicitly assume that the value of real estate diminishes predictably over time, rather than fluctuating based on existing market conditions. We believe that Core FFO and AFFO are additional useful supplemental measures for investors to consider because they will help them to better assess our operating performance without the distortions created by other non-cash revenues or expenses. We also believe that Pro Forma EBITDA is an additional useful supplemental measure for investors to consider as it allows for a better assessment of our operating performance without the distortions created by other non-cash revenues, expenses or certain effects of the Company’s capital structure on our operating performance. We use Same-Property NOI to compare the operating performance of our assets between periods. It is an accepted and important measurement used by management, investors and analysts because it includes all property-level revenues from the Company’s properties, less operating and maintenance expenses, real estate taxes and other property-specific expenses (“Net Operating Income” or “NOI”) of properties that have been owned and stabilized for the entire current and prior year reporting periods. Same-Property NOI attempts to eliminate differences due to the acquisition or disposition of properties during the particular period presented, and therefore provides a more comparable and consistent performance measure for the comparison of the Company’s properties. FFO, Core FFO, AFFO, Pro Forma EBITDA, and Same-Property NOI may not be comparable to similarly titled measures employed by other companies. |
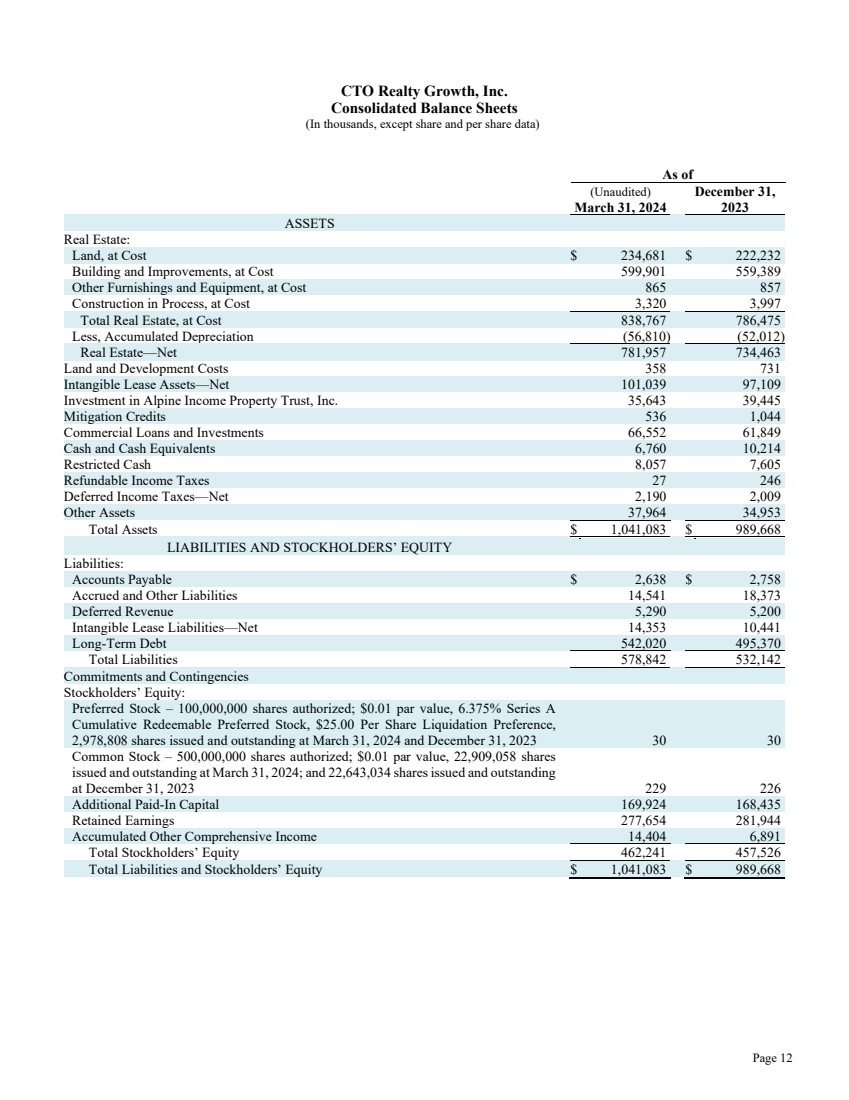
Page 12 CTO Realty Growth, Inc. Consolidated Balance Sheets (In thousands, except share and per share data) As of (Unaudited) March 31, 2024 December 31, 2023 ASSETS Real Estate: Land, at Cost $ 234,681 $ 222,232 Building and Improvements, at Cost 599,901 559,389 Other Furnishings and Equipment, at Cost 865 857 Construction in Process, at Cost 3,320 3,997 Total Real Estate, at Cost 838,767 786,475 Less, Accumulated Depreciation (56,810) (52,012) Real Estate—Net 781,957 734,463 Land and Development Costs 358 731 Intangible Lease Assets—Net 101,039 97,109 Investment in Alpine Income Property Trust, Inc. 35,643 39,445 Mitigation Credits 536 1,044 Commercial Loans and Investments 66,552 61,849 Cash and Cash Equivalents 6,760 10,214 Restricted Cash 8,057 7,605 Refundable Income Taxes 27 246 Deferred Income Taxes—Net 2,190 2,009 Other Assets 37,964 34,953 Total Assets $ 1,041,083 $ 989,668 LIABILITIES AND STOCKHOLDERS’ EQUITY Liabilities: Accounts Payable $ 2,638 $ 2,758 Accrued and Other Liabilities 14,541 18,373 Deferred Revenue 5,290 5,200 Intangible Lease Liabilities—Net 14,353 10,441 Long-Term Debt 542,020 495,370 Total Liabilities 578,842 532,142 Commitments and Contingencies Stockholders’ Equity: Preferred Stock – 100,000,000 shares authorized; $0.01 par value, 6.375% Series A Cumulative Redeemable Preferred Stock, $25.00 Per Share Liquidation Preference, 2,978,808 shares issued and outstanding at March 31, 2024 and December 31, 2023 30 30 Common Stock – 500,000,000 shares authorized; $0.01 par value, 22,909,058 shares issued and outstanding at March 31, 2024; and 22,643,034 shares issued and outstanding at December 31, 2023 229 226 Additional Paid-In Capital 169,924 168,435 Retained Earnings 277,654 281,944 Accumulated Other Comprehensive Income 14,404 6,891 Total Stockholders’ Equity 462,241 457,526 Total Liabilities and Stockholders’ Equity $ 1,041,083 $ 989,668 |
Page 13 CTO Realty Growth, Inc. Consolidated Statements of Operations (Unaudited) (In thousands, except share, per share and dividend data) Three Months Ended March 31, 2024 March 31, 2023 Revenues Income Properties $ 24,623 $ 22,432 Management Fee Income 1,105 1,098 Interest Income from Commercial Loans and Investments 1,351 795 Real Estate Operations 1,048 392 Total Revenues 28,127 24,717 Direct Cost of Revenues Income Properties (6,753) (7,153) Real Estate Operations (819) (85) Total Direct Cost of Revenues (7,572) (7,238) General and Administrative Expenses (4,216) (3,727) Provision for Impairment (48) (479) Depreciation and Amortization (10,931) (10,316) Total Operating Expenses (22,767) (21,760) Gain on Disposition of Assets 9,163 — Other Gain 9,163 — Total Operating Income 14,523 2,957 Investment and Other Loss (3,259) (4,291) Interest Expense (5,529) (4,632) Income (Loss) Before Income Tax Benefit (Expense) 5,735 (5,966) Income Tax Benefit (Expense) 107 (27) Net Income (Loss) Attributable to the Company $ 5,842 $ (5,993) Distributions to Preferred Stockholders (1,187) (1,195) Net Income (Loss) Attributable to Common Stockholders $ 4,655 $ (7,188) Per Share Information: Basic Net Income (Loss) Attributable to Common Stockholders $ 0.21 $ (0.32) Diluted Net Income (Loss) Attributable to Common Stockholders $ 0.20 $ (0.32) Weighted Average Number of Common Shares: Basic 22,551,241 22,704,829 Diluted 26,057,652 22,704,829 Dividends Declared and Paid – Preferred Stock $ 0.40 $ 0.40 Dividends Declared and Paid – Common Stock $ 0.38 $ 0.38 |
Page 14 CTO Realty Growth, Inc. Non-GAAP Financial Measures Same-Property NOI Reconciliation (Unaudited) (In thousands) Three Months Ended March 31, 2024 March 31, 2023 Net Income (Loss) Attributable to the Company $ 5,842 $ (5,993) Gain on Disposition of Assets (9,163) — Provision for Impairment 48 479 Depreciation and Amortization of Real Estate 10,931 10,316 Amortization of Intangibles to Lease Income (474) (679) Straight-Line Rent Adjustment 693 251 COVID-19 Rent Repayments — (26) Accretion of Tenant Contribution 13 38 Interest Expense 5,529 4,632 General and Administrative Expenses 4,216 3,727 Investment and Other (Income) Loss 3,259 4,291 Income Tax (Benefit) Expense (107) 27 Real Estate Operations Revenues (1,048) (392) Real Estate Operations Direct Cost of Revenues 819 85 Management Fee Income (1,105) (1,098) Interest Income from Commercial Loans and Investments (1,351) (795) Other Non-Recurring Items(1) (250) — Less: Impact of Properties Not Owned for the Full Reporting Period (2,738) (609) Same-Property NOI $ 15,114 $ 14,254 (1) Includes non-recurring items including termination fees, forfeitures of tenant security deposits, and certain adjustments to estimates related to recently acquired property CAM reconciliations. |
Page 15 CTO Realty Growth, Inc. Non-GAAP Financial Measures Funds from Operations, Core Funds from Operations, and Adjusted Funds from Operations Attributable to Common Stockholders (Unaudited) (In thousands, except per share data) Three Months Ended March 31, 2024 March 31, 2023 Net Income (Loss) Attributable to the Company $ 5,842 $ (5,993) Add Back: Effect of Dilutive Interest Related to 2025 Convertible Senior Notes (1) 534 — Net Income (Loss) Attributable to the Company, If-Converted $ 6,376 $ (5,993) Depreciation and Amortization of Real Estate 10,915 10,302 Gains on Disposition of Assets (9,163) — Gains on Disposition of Other Assets (231) (323) Provision for Impairment 48 479 Unrealized and Realized (Gain) Loss on Investment Securities 4,039 4,918 Funds from Operations $ 11,984 $ 9,383 Distributions to Preferred Stockholders (1,187) (1,195) Funds from Operations Attributable to Common Stockholders $ 10,797 $ 8,188 Amortization of Intangibles to Lease Income 474 679 Less: Effect of Dilutive Interest Related to 2025 Convertible Senior Notes (1) (534) — Core Funds from Operations Attributable to Common Stockholders $ 10,737 $ 8,867 Adjustments: Straight-Line Rent Adjustment (693) (251) COVID-19 Rent Repayments — 26 Other Depreciation and Amortization (4) (59) Amortization of Loan Costs, Discount on Convertible Debt, and Capitalized Interest 221 208 Non-Cash Compensation 1,387 1,072 Adjusted Funds from Operations Attributable to Common Stockholders $ 11,648 $ 9,863 FFO Attributable to Common Stockholders per Common Share – Diluted $ 0.41 $ 0.36 Core FFO Attributable to Common Stockholders per Common Share – Diluted (2) $ 0.48 $ 0.39 AFFO Attributable to Common Stockholders per Common Share – Diluted (2) $ 0.52 $ 0.43 (1) For the three months ended March 31, 2024, interest related to the 2025 Convertible Senior Notes was added back to net income attributable to the Company to derive FFO, as the impact to net income attributable to common stockholders was dilutive. For the three months ended March 31, 2023, interest related to the 2025 Convertible Senior Notes was not added back, as the impact to net loss attributable to common stockholders was anti-dilutive. (2) These amounts are calculated utilizing the number of shares identified in the sub-table below as “Non-GAAP Weighted Average Shares Outstanding, Diluted” which share number reflects, if applicable, the elimination of the dilutive impact of the 2025 Convertible Senior Notes. Reconciliation of Weighted Average Common Shares Outstanding, Diluted (Unaudited) Three Months Ended March 31, 2024 March 31, 2023 Weighted Average Shares Outstanding, Basic 22,551,241 22,704,829 Common Shares Applicable to Restricted Stock Using the Treasury Stock Method 554 — Common Shares Applicable to Dilutive Effect of 2025 Convertible Senior Notes 3,505,857 — Weighted Average Shares Outstanding, Diluted 26,057,652 22,704,829 Non-GAAP Adjustment for the Dilutive Effect of 2025 Convertible Senior Notes (3,505,857) — Non-GAAP Weighted Average Shares Outstanding, Diluted 22,551,795 22,704,829 |
Page 16 CTO Realty Growth, Inc. Non-GAAP Financial Measures Reconciliation of Net Debt to Pro Forma EBITDA (Unaudited) (In thousands) Three Months Ended March 31, 2024 Net Income Attributable to the Company $ 5,842 Depreciation and Amortization of Real Estate 10,915 Gain on Disposition of Assets (9,163) Gains on the Disposition of Other Assets (231) Provision for Impairment 48 Unrealized and Realized Loss on Investment Securities 4,039 Distributions to Preferred Stockholders (1,187) Straight-Line Rent Adjustment (693) Amortization of Intangibles to Lease Income 474 Other Depreciation and Amortization (4) Amortization of Loan Costs, Discount on Convertible Debt, and Capitalized Interest 221 Non-Cash Compensation 1,387 Other Non-Recurring Items(1) (250) Interest Expense, Net of Amortization of Loan Costs and Discount on Convertible Debt 5,308 EBITDA $ 16,706 Annualized EBITDA $ 66,824 Pro Forma Annualized Impact of Current Quarter Investments and Dispositions, Net (2) 2,811 Pro Forma EBITDA $ 69,635 Total Long-Term Debt $ 542,020 Financing Costs, Net of Accumulated Amortization 1,149 Unamortized Convertible Debt Discount 165 Cash & Cash Equivalents (6,760) Restricted Cash (8,057) Net Debt $ 528,517 Net Debt to Pro Forma EBITDA 7.6x (1) Includes non-recurring items including termination fees, forfeitures of tenant security deposits, and certain adjustments to estimates related to recently acquired property CAM reconciliations. (2) Reflects the pro forma annualized impact on Annualized EBITDA of the Company’s investments and disposition activity during the three months ended March 31, 2024. |
© CTO Realty Growth, Inc. | ctoreit.com 17 Capitalization & Dividends Equity Capitalization Common Shares Outstanding 22,909 Common Share Price $16.95 Total Common Equity Market Capitalization $388,309 Series A Preferred Shares Outstanding 2,979 Series A Preferred Par Value Per Share $25.00 Series A Preferred Par Value $74,470 Total Equity Capitalization $462,779 Debt Capitalization Total Debt Outstanding $543,334 Total Capitalization $1,006,113 Cash, Restricted Cash & Cash Equivalents $14,817 Total Enterprise Value $991,296 Dividends Paid Common Preferred Q2 2023 $0.38 $0.40 Q3 2023 $0.38 $0.40 Q4 2023 $0.38 $0.40 Q1 2024 $0.38 $0.40 Trailing Twelve Months Q1 2024 $1.52 $1.59 Q1 2024 Core FFO Per Diluted Share $0.48 Q1 2024 AFFO Per Diluted Share $0.52 Q1 2024 Core FFO Payout Ratio 79.2% Q1 2024 AFFO Payout Ratio 73.1% Dividend Yield Q1 2024 $0.38 $0.40 Annualized Q1 2024 Dividend $1.52 $1.59 Price Per Share as of March 31, 2024 $16.95 $20.25 Implied Dividend Yield 9.0% 7.9% $ and shares outstanding in thousands, except per share data. Any differences are a result of rounding. |
© CTO Realty Growth, Inc. | ctoreit.com 18 Debt Summary $ in thousands. Any differences are a result of rounding. 1. See reconciliation as part of Non-GAAP Financial Measures in the Company’s First Quarter 2024 Earnings Release. Indebtedness Outstanding Face Value Interest Rate Maturity Date Type 2025 Convertible Senior Notes $51,034 3.88% April 2025 Fixed 2026 Term Loan 65,000 SOFR + 10 bps + [1.25% – 2.20%] March 2026 Fixed Mortgage Note 17,800 4.06% August 2026 Fixed Revolving Credit Facility 59,500 SOFR + 10 bps + [1.25% – 2.20%] January 2027 Variable Revolving Credit Facility 150,000 SOFR + 10 bps + [1.25% – 2.20%] January 2027 Fixed 2027 Term Loan 100,000 SOFR + 10 bps + [1.25% – 2.20%] January 2027 Fixed 2028 Term Loan 100,000 SOFR + 10 bps + [1.20% – 2.15%] January 2028 Fixed Total / Weighted Average $543,334 4.52% Fixed vs. Variable Face Value Interest Rate % of Total Debt Total Fixed Rate Debt $483,834 4.23% 89% Total Variable Rate Debt 59,500 SOFR + 10 bps + [1.25% – 2.20%] 11% Total / Weighted Average $543,334 4.52% 100% Leverage Metrics Face Value of Debt $543,334 Cash, Restricted Cash & Cash Equivalents (14,817) Net Debt $528,517 Total Enterprise Value $991,296 Net Debt to Total Enterprise Value 53% Net Debt to Pro Forma EBITDA 7.6x 1 |
© CTO Realty Growth, Inc. | ctoreit.com 19 Debt Maturities Year Outstanding % of Debt Maturing Cumulative % of Debt Maturing Weighted Average Rate 2024 $ − − % − % − % 2025 51,034 9% 9% 3.88% 2026 82,800 16% 25% 3.13% 2027 309,500 57% 82% 4.74% 2028 100,000 18% 100% 5.33% Total $543,334 100% 4.52% $ in thousands. Any differences are a result of rounding. |
© CTO Realty Growth, Inc. | ctoreit.com 20 Year-to-Date Investments Occupancy At Price Acquisition Square Property Acquisitions Market Type Date Acquired Feet Atlanta, GA Single Tenant Retail February 2024 4,000 $2,272 100% Phase II of The Exchange at Gwinnett (5 of 5 parcels) Buford, GA Orlando, FL Multi-Tenant Retail March 2024 315,066 68,700 98% Marketplace at Seminole Towne Center Sanford, FL Total Acquisitions 319,066 $70,972 Structure Initial Interest Rate Capital Structured Investments Market Type Date Originated Commitment Miami, FL Retail March 2024 $10,000 11.00% First Mortgage Hypoluxo Development Loan Lake Worth, FL Total Structured Investments $10,000 11.00% $ in thousands. Any differences are a result of rounding. |
© CTO Realty Growth, Inc. | ctoreit.com 21 Year-to-Date Dispositions Price Gain Square Property Market Type Date Sold Feet Santa Fe Mixed Use March 2024 136,240 $19,977 $4,618 125 Lincoln & 150 Washington Santa Fe, NM Total Dispositions 136,240 $19,977 $4,618 $ in thousands. Any differences are a result of rounding. |
© CTO Realty Growth, Inc. | ctoreit.com 22 Real Estate Portfolio Capital Investments Investment in Previously Occupied Space Q1 2024 Q2 2024 Q3 2024 Q4 2024 2024 Capital Expenditures $ − $ − Tenant Improvement Allowances 48 48 Leasing Commissions 541 541 Total Investment in Previously Occupied Space $589 $589 New Investment in Acquired Vacancy Q1 2024 Q2 2024 Q3 2024 Q4 2024 2024 Capital Expenditures $561 $561 Tenant Improvement Allowances 1,233 1,233 Leasing Commissions 489 489 Total New Investment in Acquired Vacancy $2,283 $2,283 Other Capital Investments Q1 2024 Q2 2024 Q3 2024 Q4 2024 2024 Property Improvement Costs $427 $427 Investment in Property Repositioning 26 26 Total Other Capital Investments $453 $453 Total Capital Investments Q1 2024 Q2 2024 Q3 2024 Q4 2024 2024 Capital Expenditures and Other Capital Investments $1,014 $1,014 Tenant Improvement Allowances 1,281 1,281 Leasing Commissions 1,030 1,030 Total New Investment in Acquired Vacancy $3,326 $3,326 $ in thousands. Any differences are a result of rounding. |
© CTO Realty Growth, Inc. | ctoreit.com 23 Real Estate Portfolio Summary Total Portfolio as of March 31, 2024 Square Feet Cash ABR PSF Occupancy Leased Occupancy Number of Asset Type Properties Single Tenant 6 252 $21.98 100.0% 100.0% Multi-Tenant 14 3,643 $19.75 92.1% 93.9% Total Portfolio 20 3,895 $19.89 92.6% 94.3% Square Feet Cash ABR PSF Occupancy Leased Occupancy Number of Property Type Properties Retail 15 2,467 $19.51 96.1% 97.8% Office 1 210 $17.49 100.0% 100.0% Mixed Use 4 1,218 $21.08 84.4% 86.1% Total Portfolio 20 3,895 $19.89 92.6% 94.3% Total Portfolio as of March 31, 2023 Square Feet Cash ABR PSF Occupancy Leased Occupancy Number of Asset Type Properties Single Tenant 8 435 $19.69 100.0% 100.0% Multi-Tenant 15 3,288 $19.82 88.6% 92.6% Total Portfolio 23 3,723 $19.80 89.9% 93.5% Square Feet Cash ABR PSF Occupancy Leased Occupancy Number of Property Type Properties Retail 15 1,972 $18.58 91.5% 95.2% Office 3 395 $19.01 100.0% 100.0% Mixed Use 5 1,356 $21.81 84.7% 89.2% Total Portfolio 23 3,723 $19.80 89.9% 93.5% $ and square feet in thousands, except per square foot data. Any differences are a result of rounding. |
© CTO Realty Growth, Inc. | ctoreit.com 24 Real Estate Portfolio Detail Cash ABR PSF Leased Occupancy In-Place Year Built Acreage Square Feet Occupancy Year Acquired/ Property Type Developed Atlanta, GA The Collection at Forsyth Lifestyle 2022 2008 69.5 560,658 87% 88% $19.72 Ashford Lane Lifestyle 2020 2005 43.7 277,123 86% 91% $25.16 Madison Yards Grocery-Anchored 2022 2019 10.3 162,521 99% 99% $30.80 The Exchange at Gwinnett Grocery-Anchored 2021/2023 2021/2023 16.4 97,366 100% 100% $36.80 Total Atlanta, GA 139.9 1,097,668 90% 96% $24.25 Dallas, TX Plaza at Rockwall Retail Power Center 2023 2007 42.0 446,521 96% 96% $12.74 The Shops at Legacy Lifestyle 2021 2007 12.7 237,572 66% 67% $22.46 Total Dallas, TX 54.7 684,093 86% 86% $16.12 Richmond, VA West Broad Village Grocery-Anchored 2022 2007 32.6 392,092 90% 94% $21.59 Jacksonville, FL The Strand at St. Johns Town Center Retail Power Center 2019 2017 52.0 211,197 92% 99% $23.78 Phoenix, AZ Crossroads Town Center Retail Power Center 2020 2005 31.1 221,658 100% 100% $20.42 Raleigh, NC Beaver Creek Crossings Retail Power Center 2021 2005 51.6 322,113 94% 100% $14.20 Any differences are a result of rounding. |
© CTO Realty Growth, Inc. | ctoreit.com 25 Portfolio Detail Cash ABR PSF Leased Occupancy In-Place Year Built Acreage Square Feet Occupancy Year Acquired/ Property Type Developed Albuquerque, NM Fidelity Single Tenant Office 2018 2009 25.3 210,067 100% 100% $17.49 Houston, TX Price Plaza Shopping Center Retail Power Center 2022 1999 23.2 200,576 100% 100% $16.76 Daytona Beach, FL Daytona Beach Restaurant Portfolio Single Tenant (5) 2018 / 2022 1915 - 2018 8.3 41,725 100% 100% $44.57 Salt Lake City, UT Jordan Landing Retail Power Center 2021 2003 16.1 170,996 100% 100% $9.90 Orlando, FL Winter Park Office Mixed Use 2021 1982 2.3 27,948 100% 100% $29.28 Marketplace at Seminole Towne Center Retail Power Center 2024 2006 40.6 315,066 98% 98% $18.53 Total Orlando, FL 42.9 342,014 98% 98% $19.43 Total Portfolio 477.6 3,895,198 93% 94% $19.89 Any differences are a result of rounding. |
© CTO Realty Growth, Inc. | ctoreit.com 26 Leasing Summary Renewals and Extensions Q1 2024 Q2 2024 Q3 2024 Q4 2024 2024 Leases 10 10 Square Feet 34 34 New Cash Rent PSF $29.26 $29.26 Tenant Improvements $15 $15 Leasing Commissions $40 $40 Weighted Average Term 3.8 years 3.8 years New Leases Q1 2024 Q2 2024 Q3 2024 Q4 2024 2024 Leases 9 9 Square Feet 70 70 New Cash Rent PSF $26.09 $26.09 Tenant Improvements $4,842 $4,842 Leasing Commissions $1,133 $1,133 Weighted Average Term 12.4 years 12.4 years All Leases Summary Q1 2024 Q2 2024 Q3 2024 Q4 2024 2024 Leases 19 19 Square Feet 104 104 New Cash Rent PSF $27.12 $27.12 Tenant Improvements $4,857 $4,857 Leasing Commissions $1,173 $1,173 Weighted Average Term 9.4 years 9.4 years $ and square feet in thousands, except per square foot data. Any differences are a result of rounding. Overall leasing activity does not include lease termination agreements or lease amendments related to tenant bankruptcy proceedings. |
© CTO Realty Growth, Inc. | ctoreit.com 27 Comparable Leasing Summary Lease Commissions Tenant Improvements Weighted Average Lease Term % Increase Over Expiring Rent Expiring Cash Rent PSF New Cash Rent PSF GLA Signed Number of Leases Signed Renewals and Extensions - Comparable 1st Quarter 2024 10 34 $29.26 $26.96 8.5% 3.8 $15 $40 2nd Quarter 2024 3rd Quarter 2024 4th Quarter 2024 Total 10 34 $29.26 $26.96 8.5% 3.8 $15 $40 Lease Commissions Tenant Improvements Weighted Average Lease Term % Increase Over Expiring Rent Expiring Cash Rent PSF New Cash Rent PSF GLA Signed Number of Leases Signed New Leases – Comparable 1st Quarter 2024 5 61 $24.32 $9.08 167.9% 13.2 $4,541 $914 2nd Quarter 2024 3rd Quarter 2024 4th Quarter 2024 Total 5 61 $24.32 $9.08 167.9% 13.2 $4,541 $914 Lease Commissions Tenant Improvements Weighted Average Lease Term % Increase Over Expiring Rent Expiring Cash Rent PSF New Cash Rent PSF GLA Signed Number of Leases Signed All Comparable Leases Summary 1st Quarter 2024 15 95 $26.09 $15.51 68.2% 9.4 $4,556 $955 2nd Quarter 2024 3rd Quarter 2024 4th Quarter 2024 Total 15 95 $26.09 $15.51 68.2% 9.4 $4,556 $955 $ and square feet in thousands, except per square foot data. Any differences are a result of rounding. Comparable leases compare leases signed on a space for which there was previously a tenant. |
© CTO Realty Growth, Inc. | ctoreit.com 28 Same-Property NOI Multi-Tenant Q1 2024 Q2 2024 Q3 2024 Q4 2024 2024 Number of Comparable Properties 12 12 Same-Property NOI – 2024 $13,966 $13,966 Same-Property NOI – 2023 $13,305 $13,305 $ Variance $661 $661 % Variance 5.0% 5.0% Single-Tenant Q1 2024 Q2 2024 Q3 2024 Q4 2024 2024 Number of Comparable Properties 6 6 Same-Property NOI – 2024 $1,148 $1,148 Same-Property NOI – 2023 $949 $949 $ Variance $199 $199 % Variance 21.0% 21.0% All Properties Q1 2024 Q2 2024 Q3 2024 Q4 2024 2024 Number of Comparable Properties 18 18 Same-Property NOI – 2024 $15,114 $15,114 Same-Property NOI – 2023 $14,254 $14,254 $ Variance $860 $860 % Variance 6.0% 6.0% $ and square feet in thousands, except per square foot data. Any differences are a result of rounding. |
© CTO Realty Growth, Inc. | ctoreit.com 29 Lease Expiration Schedule Anchor Tenants Year Leases Expiring Expiring SF % of Total Cash ABR % of Total Cash ABR PSF 2024 4 101 2.8% $913 1.2% $8.99 2025 6 113 3.1% 2,469 3.2% $21.76 2026 8 266 7.4% 4,883 6.3% $18.37 2027 11 413 11.4% 4,379 5.7% $10.61 2028 15 738 20.5% 11,997 15.5% $16.25 2029 5 160 4.4% 1,410 1.8% $8.83 2030 3 79 2.2% 959 1.2% $12.13 2031 5 75 2.1% 1,178 1.5% $15.65 2032 5 77 2.1% 1,318 1.7% $17.06 Thereafter 10 295 8.2% 5,870 7.6% $19.92 Total 72 2,317 64.2% $35,376 45.7% $15.26 Small Shop Tenants Year Leases Expiring Expiring SF % of Total Cash ABR % of Total Cash ABR PSF 2024 27 87 2.4% $2,179 2.8% $25.16 2025 36 118 3.3% 3,667 4.7% $31.15 2026 51 186 5.2% 5,488 7.1% $29.50 2027 58 170 4.7% 5,095 6.6% $29.90 2028 48 180 5.0% 6,120 7.9% $34.00 2029 37 128 3.5% 4,268 5.5% $33.38 2030 35 117 3.3% 4,060 5.2% $34.61 2031 31 80 2.2% 2,786 3.6% $35.03 2032 26 81 2.3% 2,858 3.7% $35.18 Thereafter 38 143 4.0% 5,584 7.2% $39.02 Total 387 1,290 35.8% $42,105 54.3% $32.61 $ and square feet in thousands, except per square foot data. Any differences are a result of rounding. |
© CTO Realty Growth, Inc. | ctoreit.com 30 Lease Expiration Schedule Total Year Leases Expiring Expiring SF % of Total Cash ABR % of Total Cash ABR PSF 2024 31 188 5.2% $3,091 4.0% $16.44 2025 42 231 6.4% 6,137 7.9% $26.54 2026 59 452 12.5% 10,371 13.4% $22.95 2027 69 583 16.2% 9,474 12.2% $16.25 2028 63 918 25.5% 18,117 23.4% $19.73 2029 42 288 8.0% 5,677 7.3% $19.74 2030 38 196 5.4% 5,019 6.5% $25.55 2031 36 155 4.3% 3,964 5.1% $25.61 2032 31 158 4.4% 4,176 5.4% $26.35 Thereafter 48 438 12.1% 11,454 14.8% $26.16 Total 459 3,607 100.0% $77,481 100.0% $21.47 $ and square feet in thousands, except per square foot data. Any differences are a result of rounding. |
© CTO Realty Growth, Inc. | ctoreit.com 31 Top Tenant Summary % of Total Cash ABR % of Total Leased Credit Rating Leases Square Feet Tenant/Concept 1 Fidelity A+ / A3 2 218 5.6% $3,674 4.7% AMC CCC+ / Caa2 2 90 2.3% 2,189 2.8% Best Buy BBB+ / A3 3 112 2.9% 1,749 2.3% Whole Foods Market AA- / A1 1 60 1.5% 1,633 2.1% Ross/dd’s Discount BBB+ / A2 5 133 3.4% 1,619 2.1% Southern University NR / NR 1 60 1.5% 1,616 2.1% TJ Maxx/HomeGoods/Marshalls A / A2 4 133 3.4% 1,456 1.9% Dick’s Sporting Goods BBB / Baa3 2 95 2.4% 1,244 1.6% Darden Restaurants BBB / Baa2 3 25 0.6% 1,195 1.5% Burlington BB+ / Ba2 2 79 2.0% 1,158 1.5% Publix NR / NR 1 54 1.4% 1,076 1.4% Harkins Theatres NR / NR 1 56 1.4% 1,066 1.4% Landshark Bar & Grill NR / NR 1 6 0.2% 904 1.2% Other 432 2,487 63.9% 56,902 73.4% Total Occupied 460 3,608 92.6% $77,481 100.0% Vacant − 287 7.4% Total 460 3,895 100.0% $ and square feet in thousands. Any differences are a result of rounding. 1. Credit Rating is the available rating from S&P Global Ratings and/or Moody’s Investors Service, as of March 31, 2024. “NR” indicates the company is not rated. |
© CTO Realty Growth, Inc. | ctoreit.com 32 Geographic Diversification 2023-2028 Projected Population Annual Growth 5-Mile 2023 Total Population 5-Mile 2023 Average Markets Properties Square Feet % of Total Cash ABR % of Total Household Income Atlanta, GA 4 1,098 28% $26,617 34% $157,418 220,272 1.0% Dallas, TX 2 684 18% 11,025 14% 149,416 206,507 0.8% Richmond, VA 1 392 10% 8,463 11% 146,903 175,023 0.4% Orlando, FL 2 343 9% 6,664 9% 92,679 146,980 0.5% Jacksonville, FL 1 211 5% 5,021 6% 93,407 201,089 0.6% Raleigh, NC 1 322 8% 4,575 6% 181,119 133,529 0.9% Phoenix, AZ 1 222 6% 4,527 6% 143,944 314,629 0.4% Albuquerque, NM 1 210 5% 3,674 5% 68,911 50,072 5.9% Houston, TX 1 201 5% 3,361 4% 116,635 277,236 0.8% Daytona Beach, FL 5 42 1% 1,860 2% 61,420 109,883 0.1% Salt Lake City, UT 1 171 4% 1,693 2% 109,138 363,721 0.4% Total 20 3,895 100% $77,481 100% $136,701 201,099 1.0% 2023-2028 Projected Population Annual Growth 5-Mile 2023 Total Population 5-Mile 2023 Average States Properties Square Feet % of Total Cash ABR % of Total Household Income Georgia 4 1,098 28% $26,617 34% $157,418 220,272 1.0% Texas 3 885 23% 14,386 19% 141,758 223,030 0.8% Florida 8 596 15% 13,546 17% 88,657 161,945 0.5% Virginia 1 392 10% 8,463 11% 146,903 175,023 0.4% North Carolina 1 322 8% 4,575 6% 181,119 133,529 0.9% Arizona 1 222 6% 4,527 6% 143,944 314,629 0.4% New Mexico 1 210 5% 3,674 5% 68,911 50,072 5.9% Utah 1 171 4% 1,693 2% 109,138 363,721 0.4% Total 20 3,895 100% $77,481 100% $136,701 201,099 1.0% $ and square feet in thousands, except for average household income demographic information. Any differences are a result of rounding. Demographic information sourced from Esri. Market, state and portfolio averages weighted by the Annualized Cash Base Rent of each property. |
© CTO Realty Growth, Inc. | ctoreit.com 33 Other Assets In-Place Annualized Dividend Income Annualized Dividend Estimated Value Per Share Value Per Share March 31, 2024 Shares & Operating Investment Securities Partnership Units Owned Alpine Income Property Trust 2,333 $15.28 $35,643 $1.10 $2,566 Interest Rate Amount Outstanding Original Loan Amount Maturity Structured Investments Type Origination Date Date Sabal Pavilion First Mortgage December 2023 June 2024 15,400 15,400 7.50% Watters Creek at Montgomery Farm Preferred Investment April 2022 April 2025 30,000 30,000 8.75% Founders Square First Mortgage March 2023 March 2026 15,000 15,000 8.75% Hypoluxo First Mortgage March 2024 September 2025 10,000 6,675 11.00% Total Structured Investments $70,400 $67,075 8.69% Mitigation Credits and Rights State Credits Federal Credits Total Book Value Mitigation Credits 8.7 1.8 $536 $ and square feet in thousands, except per square foot data. Any differences are a result of rounding. 1. The Phase II Exchange at Gwinnett loan was paid off in January 2024 in conjunction with CTO’s acquisition of the final property that was part of the Phase II Exchange at Gwinnett project. |
© CTO Realty Growth, Inc. | ctoreit.com 34 2024 Guidance Low High Core FFO Per Diluted Share $1.60 − $1.68 AFFO Per Diluted Share $1.74 − $1.82 The Company’s estimated Core FFO per diluted share and AFFO per diluted share for 2024 is as follows: The Company’s 2024 guidance includes but is not limited to the following assumptions: Low High Same-Property NOI Growth 2% − 4% 1,2 General and Administrative Expense $15.2 − $16.2 Weighted Average Diluted Shares Outstanding 22.5 − 22.5 Year-end 2024 Leased Occupancy 95% − 96% 2 Investments $100 − $150 Target Initial Investment Cash Yield 7.75% − 8.25% Dispositions $50 − $75 Target Disposition Cash Yield 7.50% − 8.25% $ and shares outstanding in millions, except per share data. 1. Includes the effects of bad debt expense, occupancy loss and costs associated with tenants in bankruptcy and/or tenant lease defaults. 2. Before potential impact from income producing acquisitions and dispositions. |
© CTO Realty Growth, Inc. | ctoreit.com 35 Contact Information & Research Coverage Contact Information New York Investor Relations Transfer Agent Stock Exchange Corporate Office Locations Ticker Symbol: CTO Series A Preferred Ticker Symbol: CTO-PA www.ctoreit.com Computershare Trust Company, N.A. (800) 368-5948 www.computershare.com Lisa Vorakoun SVP, CAO & Interim CFO & Treasurer (386) 944-5641 lvorakoun@ctoreit.com 369 N. New York Ave., Suite 201 Winter Park, FL 32789 1140 N. Williamson Blvd., Suite 140 Daytona Beach, FL 32114 Research Analyst Coverage Institution Coverage Analyst Email Phone B. Riley John Massocca jmassocca@brileyfin.com (646) 885-5424 BTIG Michael Gorman mgorman@btig.com (212) 738-6138 Compass Point Floris van Dijkum fvandijkum@compasspointllc.com (646) 757-2621 EF Hutton Michael Albanese malbanese@efhuttongroup.com (212) 970-5258 Janney Rob Stevenson robstevenson@janney.com (646) 840-3217 Jones Research Matthew Erdner merdner@jonestrading.com (843) 414-9430 Raymond James RJ Milligan rjmilligan@raymondjames.com (727) 567-2585 |
© CTO Realty Growth, Inc. | ctoreit.com 36 Safe Harbor Certain statements contained in this presentation (other than statements of historical fact) are forward-looking statements within the meaning of Section 27A of the Securities Act of 1933, as amended, and Section 21E of the Securities Exchange Act of 1934, as amended. Forward-looking statements can typically be identified by words such as “believe,” “estimate,” “expect,” “intend,” “anticipate,” “will,” “could,” “may,” “should,” “plan,” “potential,” “predict,” “forecast,” “project,” and similar expressions, as well as variations or negatives of these words. Although forward-looking statements are made based upon management’s present expectations and reasonable beliefs concerning future developments and their potential effect upon the Company, a number of factors could cause the Company’s actual results to differ materially from those set forth in the forward-looking statements. Such factors may include, but are not limited to: the Company’s ability to remain qualified as a REIT; the Company’s exposure to U.S. federal and state income tax law changes, including changes to the REIT requirements; general adverse economic and real estate conditions; macroeconomic and geopolitical factors, including but not limited to inflationary pressures, interest rate volatility, distress in the banking sector, global supply chain disruptions, and ongoing geopolitical war; credit risk associated with the Company investing in structured investments; the ultimate geographic spread, severity and duration of pandemics such as the COVID-19 Pandemic and its variants, actions that may be taken by governmental authorities to contain or address the impact of such pandemics, and the potential negative impacts of such pandemics on the global economy and the Company’s financial condition and results of operations; the inability of major tenants to continue paying their rent or obligations due to bankruptcy, insolvency or a general downturn in their business; the loss or failure, or decline in the business or assets of PINE; the completion of 1031 exchange transactions; the availability of investment properties that meet the Company’s investment goals and criteria; the uncertainties associated with obtaining required governmental permits and satisfying other closing conditions for planned acquisitions and sales; and the uncertainties and risk factors discussed in the Company’s Annual Report on Form 10-K for the fiscal year ended December 31, 2023 and other risks and uncertainties discussed from time to time in the Company’s filings with the U.S. Securities and Exchange Commission. There can be no assurance that future developments will be in accordance with management’s expectations or that the effect of future developments on the Company will be those anticipated by management. Readers are cautioned not to place undue reliance on these forward-looking statements, which speak only as of the date of this presentation. The Company undertakes no obligation to update the information contained in this presentation to reflect subsequently occurring events or circumstances. |
© CTO Realty Growth, Inc. | ctoreit.com 37 Non-GAAP Financial Measures Our reported results are presented in accordance with accounting principles generally accepted in the United States of America (“GAAP”). We also disclose Funds From Operations (“FFO”), Core Funds From Operations (“Core FFO”), Adjusted Funds From Operations (“AFFO”), Pro Forma Earnings Before Interest, Taxes, Depreciation and Amortization (“Pro Forma EBITDA”), and Same-Property Net Operating Income (“Same-Property NOI”), each of which are non-GAAP financial measures. We believe these non-GAAP financial measures are useful to investors because they are widely accepted industry measures used by analysts and investors to compare the operating performance of REITs. FFO, Core FFO, AFFO, Pro Forma EBITDA, and Same-Property NOI do not represent cash generated from operating activities and are not necessarily indicative of cash available to fund cash requirements; accordingly, they should not be considered alternatives to net income as a performance measure or cash flows from operating activities as reported on our statement of cash flows as a liquidity measure and should be considered in addition to, and not in lieu of, GAAP financial measures. We compute FFO in accordance with the definition adopted by the Board of Governors of the National Association of Real Estate Investment Trusts, or NAREIT. NAREIT defines FFO as GAAP net income or loss adjusted to exclude real estate related depreciation and amortization, as well as extraordinary items (as defined by GAAP) such as net gain or loss from sales of depreciable real estate assets, impairment write-downs associated with depreciable real estate assets and impairments associated with the implementation of current expected credit losses on commercial loans and investments at the time of origination, including the pro rata share of such adjustments of unconsolidated subsidiaries. The Company also excludes the gains or losses from sales of assets incidental to the primary business of the REIT which specifically include the sales of mitigation credits, subsurface sales, investment securities, and land sales, in addition to the mark-to-market of the Company’s investment securities and interest related to the 2025 Convertible Senior Notes, if the effect is dilutive. To derive Core FFO, we modify the NAREIT computation of FFO to include other adjustments to GAAP net income related to gains and losses recognized on the extinguishment of debt, amortization of above- and below-market lease related intangibles, and other unforecastable market- or transaction-driven non-cash items, as well as adding back the interest related to the 2025 Convertible Senior Notes, if the effect is dilutive. To derive AFFO, we further modify the NAREIT computation of FFO and Core FFO to include other adjustments to GAAP net income related to non-cash revenues and expenses such as straight-line rental revenue, non-cash compensation, and other non-cash amortization. Such items may cause short-term fluctuations in net income but have no impact on operating cash flows or long-term operating performance. We use AFFO as one measure of our performance when we formulate corporate goals. To derive Pro Forma EBITDA, GAAP net income or loss attributable to the Company is adjusted to exclude real estate related depreciation and amortization, as well as extraordinary items (as defined by GAAP) such as net gain or loss from sales of depreciable real estate assets, impairment write-downs associated with depreciable real estate assets, impairments associated with the implementation of current expected credit losses on commercial loans and investments at the time of origination, including the pro rata share of such adjustments of unconsolidated subsidiaries, non-cash revenues and expenses such as straight-line rental revenue, amortization of deferred financing costs, above- and below-market lease related intangibles, non-cash compensation, other non-recurring items such as termination fees, forfeitures of tenant security deposits, and certain adjustments to reconciliation estimates related to reimbursable revenue for recently acquired properties, and other non-cash income or expense. The Company also excludes the gains or losses from sales of assets incidental to the primary business of the REIT which specifically include the sales of mitigation credits, subsurface sales, investment securities, and land sales, in addition to the mark-to-market of the Company’s investment securities. Cash interest expense is also excluded from Pro Forma EBITDA, and GAAP net income or loss is adjusted for the annualized impact of acquisitions, dispositions and other similar activities. |
© CTO Realty Growth, Inc. | ctoreit.com 38 Non-GAAP Financial Measures (Continued) To derive Same-Property NOI, GAAP net income or loss attributable to the Company is adjusted to exclude real estate related depreciation and amortization, as well as extraordinary items (as defined by GAAP) such as net gain or loss from sales of depreciable real estate assets, impairment write-downs associated with depreciable real estate assets, impairments associated with the implementation of current expected credit losses on commercial loans and investments at the time of origination, including the pro rata share of such adjustments of unconsolidated subsidiaries, non-cash revenues and expenses such as straight-line rental revenue, amortization of deferred financing costs, above- and below-market lease related intangibles, non-cash compensation, other non-recurring items such as termination fees, forfeitures of tenant security deposits, and certain adjustments to reconciliation estimates related to reimbursable revenue for recently acquired properties, and other non-cash income or expense. Interest expense, general and administrative expenses, investment and other income or loss, income tax benefit or expense, real estate operations revenues and direct cost of revenues, management fee income, and interest income from commercial loans and investments are also excluded from Same-Property NOI. GAAP net income or loss is further adjusted to remove the impact of properties that were not owned for the full current and prior year reporting periods presented. Cash rental income received under the leases pertaining to the Company’s assets that are presented as commercial loans and investments in accordance with GAAP is also used in lieu of the interest income equivalent. FFO is used by management, investors and analysts to facilitate meaningful comparisons of operating performance between periods and among our peers primarily because it excludes the effect of real estate depreciation and amortization and net gains or losses on sales, which are based on historical costs and implicitly assume that the value of real estate diminishes predictably over time, rather than fluctuating based on existing market conditions. We believe that Core FFO and AFFO are additional useful supplemental measures for investors to consider because they will help them to better assess our operating performance without the distortions created by other non-cash revenues or expenses. We also believe that Pro Forma EBITDA is an additional useful supplemental measure for investors to consider as it allows for a better assessment of our operating performance without the distortions created by other non-cash revenues, expenses or certain effects of the Company’s capital structure on our operating performance. We use Same-Property NOI to compare the operating performance of our assets between periods. It is an accepted and important measurement used by management, investors and analysts because it includes all property-level revenues from the Company’s properties, less operating and maintenance expenses, real estate taxes and other property-specific expenses (“Net Operating Income” or “NOI”) of properties that have been owned and stabilized for the entire current and prior year reporting periods. Same-Property NOI attempts to eliminate differences due to the acquisition or disposition of properties during the particular period presented, and therefore provides a more comparable and consistent performance measure for the comparison of the Company’s properties. FFO, Core FFO, AFFO, Pro Forma EBITDA, and Same-Property NOI may not be comparable to similarly titled measures employed by other companies. |
© CTO Realty Growth, Inc. | ctoreit.com 39 Definitions & Terms References and terms used in this presentation that are in addition to terms defined in the Non-GAAP Financial Measures include: This presentation was published on May 2, 2024. All information is as of March 31, 2024, unless otherwise noted. Any calculation differences are assumed to be a result of rounding. “2024 Guidance” in this presentation is based on the 2024 Guidance provided in the Company’s First Quarter 2024 Operating Results press release filed on May 2, 2024. “Alpine” or “PINE” refers to Alpine Income Property Trust, a publicly traded net lease REIT traded on the New York Stock Exchange under the ticker symbol PINE. “Annualized Base Rent”, “ABR” or “Rent” and the statistics based on ABR are calculated based on our current portfolio and represent straight-line rent calculated in accordance with GAAP. “Annualized Cash Base Rent”, “Cash ABR” and the statistics based on Cash ABR are calculated based on our current portfolio and represent the annualized cash base rent calculated in accordance with GAAP due from the tenants at a specific point in time. “Credit Rated” is a tenant or the parent of a tenant with a credit rating from S&P Global Ratings, Moody’s Investors Service, Fitch Ratings or the National Association of Insurance Commissioners (NAIC) (together, the “Major Rating Agencies”). The Company defines an Investment Grade Rated Tenant as a tenant or the parent of a tenant with a credit rating from S&P Global Ratings, Moody’s Investors Service, Fitch Ratings or the National Association of Insurance Commissioners of Baa3, BBB-, or NAIC-2 or higher. If applicable, in the event of a split rating between S&P Global Ratings and Moody’s Investors Services, the Company utilizes the higher of the two ratings as its reference point as to whether a tenant is defined as an Investment Grade Rated Tenant. “Dividend” or “Dividends”, subject to the required dividends to maintain our qualification as a REIT, are set by the Board of Directors and declared on a quarterly basis and there can be no assurances as to the likelihood or number of dividends in the future. “Investment in Alpine Income Property Trust” or “Alpine Investment” or “PINE Ownership” is calculated based on the 2,332,668 common shares and partnership units CTO owns in PINE and is based on PINE’s closing stock price as of the referenced period on the respective slide. “Leased Occupancy” refers to space that is currently leased but for which rent payments have not yet commenced. “MSA” or “Metropolitan Statistical Area” is a region that consists of a city and surrounding communities that are linked by social and economic factors, as established by the U.S. Office of Management and Budget. The names of the MSA have been shortened for ease of reference. “Net Debt” is calculated as our total long-term debt as presented on the face of our balance sheet; plus financing costs, net of accumulated amortization and unamortized convertible debt discount; less cash, restricted cash and cash equivalents. “Net Operating Income” or “NOI” is revenues from all income properties less operating expense, maintenance expense, real estate taxes and rent expense. “Total Enterprise Value” is calculated as the Company’s Total Common Shares Outstanding multiplied by the common stock price; plus the par value of the Series A perpetual preferred equity outstanding and Net Debt. |