Exhibit 13
Financial Highlights – Continuing Operations
Year-end 2004 Store Count and Square Footage by State
| | No. of | | | |
Market Share Group | | Stores | | Retail Sq Ft. | |
| | | | (in thousands) | |
 10%+ Market Share 10%+ Market Share
| | | | | |
Arizona | | 39 | | 4,618 | |
California | | 193 | | 23,895 | |
Colorado | | 30 | | 4,039 | |
Illinois | | 71 | | 9,233 | |
Iowa | | 21 | | 2,833 | |
Maryland | | 28 | | 3,494 | |
Minnesota | | 63 | | 8,373 | |
Nebraska | | 11 | | 1,397 | |
New Jersey | | 32 | | 4,137 | |
North Dakota | | 4 | | 505 | |
Group Total | | 492 | | 62,524 | |
| | | | | |
 7.5%-9.9% Market Share 7.5%-9.9% Market Share
| | | | | |
Florida | | 83 | | 10,604 | |
Georgia | | 40 | | 5,126 | |
Indiana | | 34 | | 4,252 | |
Kansas | | 16 | | 2,188 | |
Massachusetts | | 20 | | 2,512 | |
Montana | | 7 | | 767 | |
Nevada | | 14 | | 1,736 | |
New York | | 44 | | 5,880 | |
North Carolina | | 34 | | 4,226 | |
Rhode Island | | 2 | | 254 | |
South Dakota | | 4 | | 417 | |
Texas | | 114 | | 14,964 | |
Utah | | 9 | | 1,428 | |
Virginia | | 35 | | 4,508 | |
Washington | | 31 | | 3,573 | |
Wisconsin | | 31 | | 3,590 | |
Group Total | | 518 | | 66,025 | |
| | | | | |
 5.0%-7.4% Market Share 5.0%-7.4% Market Share
| | | | | |
Connecticut | | 9 | | 1,199 | |
Delaware | | 2 | | 268 | |
Michigan | | 51 | | 5,727 | |
Missouri | | 26 | | 3,369 | |
New Hampshire | | 5 | | 649 | |
New Mexico | | 8 | | 872 | |
Ohio | | 47 | | 5,648 | |
Oregon | | 17 | | 2,029 | |
Pennsylvania | | 31 | | 3,956 | |
South Carolina | | 17 | | 2,097 | |
Tennessee | | 23 | | 2,723 | |
Group Total | | 236 | | 28,537 | |
| | | | | |
 2.5%-4.9% Market Share 2.5%-4.9% Market Share
| | | | | |
Alabama | | 10 | | 1,540 | |
Idaho | | 5 | | 536 | |
Kentucky | | 12 | | 1,360 | |
Louisiana | | 11 | | 1,552 | |
Maine | | 2 | | 250 | |
Oklahoma | | 10 | | 1,273 | |
Wyoming | | 2 | | 187 | |
Group Total | | 52 | | 6,698 | |
| | | | | |
 0.0%-2.4% Market Share 0.0%-2.4% Market Share
| | | | | |
Arkansas | | 4 | | 492 | |
Mississippi | | 3 | | 364 | |
Vermont | | 0 | | 0 | |
West Virginia | | 3 | | 375 | |
Group Total | | 10 | | 1,231 | |
Total | | 1,308 | | 165,015 | |
For purposes of this schedule, market share is defined as Target sales by state as a percentage of U.S. General Merchandise Store sales, including department stores, discount stores, supercenters and warehouse clubs. See map on page 3. For other purposes, broader or narrower measures of market share may be more appropriate.
FINANCIAL SUMMARY – CONTINUING OPERATIONS
| | 2004 | | 2003 | | 2002 | | 2001 | | 2000 | |
| | | | | | | | | | | |
Total revenues | | $ | 46,839 | | $ | 42,025 | | $ | 37,410 | | $ | 33,021 | | $ | 29,740 | |
| | | | | | | | | | | |
Earnings before income taxes | | $ | 3,031 | | $ | 2,603 | | $ | 2,227 | | $ | 1,776 | | $ | 1,562 | |
| | | | | | | | | | | |
Per Share: | | | | | | | | | | | |
| | | | | | | | | | | |
Basic earnings per share | | $ | 2.09 | | $ | 1.78 | | $ | 1.52 | | $ | 1.22 | | $ | 1.06 | |
| | | | | | | | | | | |
Diluted earnings per share | | $ | 2.07 | | $ | 1.76 | | $ | 1.51 | | $ | 1.21 | | $ | 1.06 | |
| | | | | | | | | | | |
Cash dividends declared | | $ | 0.310 | | $ | 0.270 | | $ | 0.240 | | $ | 0.225 | | $ | 0.215 | |
| | | | | | | | | | | |
Financial Position: (in millions) | | | | | | | | | | | |
| | | | | | | | | | | |
Total assets | | $ | 32,293 | | $ | 27,390 | | $ | 24,506 | | $ | 19,808 | | $ | 15,349 | |
| | | | | | | | | | | |
Long-term debt | | $ | 9,034 | | $ | 10,155 | | $ | 10,119 | | $ | 8,055 | | $ | 5,598 | |
16
MANAGEMENT’S DISCUSSION AND ANALYSIS
Executive Summary
Target Corporation operates large-format general merchandise discount stores in the United States and a much smaller, rapidly growing on-line business. We drive incremental merchandise sales and profitability through increases in our comparable-store sales and through contributions from new stores. Additionally, our credit card operations represent an integral component of our retail business. We focus on delighting our guests by offering both everyday essentials and fashionable, differentiated merchandise at exceptional prices. Our ability to deliver a shopping experience that is preferred by our guests is supported by our strong supply chain and technology network, a devotion to innovation which is ingrained in our organization and culture, and our disciplined approach to managing our current business and investing in future growth. Although our industry is highly competitive and subject to macro-economic conditions, we believe we are well-positioned to deliver continued profitable market share growth for many years to come.
In 2004, we completed the disposition of two segments of our business, Marshall Field’s and Mervyn’s, and recorded a total gain on the sale of $1,999 million ($1.36 per share). As a result, our current and prior year financial statements have been restated to reflect the results of these businesses as discontinued operations. See Notes to Consolidated Financial Statements on page 29. Also during 2004, we elected to adopt the provisions of Statement of Financial Accounting Standards No. 123R, “Share-Based Payment” (SFAS No. 123R) under the modified retrospective transition method. All prior period financial statements have been restated to recognize compensation cost in the amounts previously reported in the Notes to Consolidated Financial Statements under the provisions of SFAS No. 123, “Accounting for Stock-Based Compensation.”
Management’s Discussion and Analysis is based on our Consolidated Financial Statements as shown on pages 24-27.
Analysis of Continuing Operations
Revenues and Comparable-store Sales
Sales include merchandise sales, net of expected returns, from our stores and our on-line business. Total revenues include sales and net credit card revenues. Net credit card revenues represent income derived from finance charges, late fees and other revenues from use of our Target Visa and proprietary Target Card. Comparable-store sales are sales from stores open longer than one year, including stores that were moved to a new location or remodeled as a general merchandise store. General merchandise stores that are converted to a SuperTarget store format are removed from the comparable-store sales calculation until they are open longer than one year. Sales from our on-line business are not included in comparable store sales.
Factors Affecting Revenue Growth
| | 2004 | | 2003 | | 2002 | |
Sales growth | | 11.6 | % | 12.1 | % | 12.0 | % |
Net credit card revenue growth | | 5.5 | % | 23.2 | % | 112.6 | % |
Total revenue growth | | 11.5 | % | 12.3 | % | 13.3 | % |
Estimated impact of deflation on sales | | (1.4 | )% | (4.2 | )% | (3.8 | )% |
The revenue increases in both 2004 and 2003 were driven by new store expansion, growth in comparable-store sales and increases in net credit revenues. In 2005, we expect these same factors to contribute to a low double digit percentage increase in revenues. Inflation/deflation is not expected to have a significant effect on sales growth.
Gross Margin Rate
Gross margin rate represents gross margin (sales less cost of sales) as a percent of sales. Cost of sales primarily include purchases, markdowns, shortage, and other costs associated with our merchandise. These costs are partially offset by various forms of consideration earned from our vendors, which we refer to as “vendor income.” Refer to the Critical Accounting Estimates section on page 21 for further discussion of retail inventory accounting and vendor income.
In 2004, our consolidated gross margin rate increased 0.6 percentage points to a rate of 31.2 percent primarily due to an increase in markup. We have continued to lower our product costs through strategic sourcing initiatives such as increasing our direct import penetration.
In 2003, our consolidated gross margin rate increased by 0.4 percentage points to a rate of 30.6 percent. The growth was attributable to the adoption of Emerging Issues Task Force (EITF) Issue No. 02-16 “Accounting by a Customer (Including a Reseller) for Certain Consideration Received from a Vendor.” The adoption resulted in a reclassification of a portion of our vendor income from selling, general and administrative expenses to cost of sales and had a slight negative impact on net earnings. See further discussions in the Notes to Consolidated Financial Statements on page 28.
Consolidated gross margin rate in 2005 is expected to be approximately equal to or slightly greater than 2004.
Selling, General and Administrative Expense Rate
Our selling, general and administrative (SG&A) expense rate represents payroll, benefits, advertising, distribution, buying and occupancy, start-up and other expenses as a percentage of sales. SG&A expense excludes depreciation and amortization and expenses associated with our credit card operations, which are reflected separately in our Consolidated Results of Operations. In 2004 and 2003 approximately $72 million and $58 million, respectively, of vendor income was recorded as an offset to SG&A expenses as it met the specific, incremental and identifiable criteria of EITF No. 02-16. In 2002, approximately $195 million of vendor income was recorded as an offset to SG&A expenses. This vendor income primarily represented advertising reimbursements.
17
In 2004, our consolidated SG&A expense rate increased to 21.4 percent compared to 21.2 percent in 2003. Approximately half of the year-over-year increase was attributable to a change in the method of accounting for leases. See further discussions in the Notes to Consolidated Financial Statements on page 32. The primary driver of the remaining increase was higher workers’ compensation costs.
In 2003, our consolidated SG&A expense rate rose to 21.2 percent compared to 20.5 percent in 2002 primarily due to the reclassification of vendor income.
In 2005, we expect our SG&A expense rate to be equal to or increase slightly from 2004, reflecting our belief that certain expenses, such as health care costs, will increase at a faster pace than sales.
Depreciation and Amortization
In 2004, depreciation and amortization increased 14.6 percent to $1,259 million compared to 2003. Depreciation and amortization expense grew faster than sales partially due to accelerated depreciation on existing stores that were planned to be closed, or torn down and rebuilt. In 2003, depreciation and amortization increased 13.6 percent to $1,098 million compared to 2002 due to new store growth. In 2005, we expect depreciation and amortization to increase in line with our sales growth.
Credit Card Contribution
We offer credit to qualified guests through our branded credit cards: the Target Visa and proprietary Target Card. Our credit card products strategically support earnings growth by driving sales at our stores and through the continued growth of our credit card contribution.
Our credit card revenues are primarily derived from finance charges, late fees and other revenues. Also, third-party merchant fees are paid to us by merchants who have accepted the Target Visa credit card. In 2004 and 2003, our net credit card revenues increased 5.5 percent and 23.2 percent, respectively, due to continued growth in the Target Visa portfolio.
Credit card expenses include a bad debt provision as well as operations and marketing expenses supporting our credit card portfolio. In 2004, our bad debt provision decreased $25 million to $451 million, primarily due to improved quality of the portfolio. In 2003, our bad debt provision increased $85 million to $476 million, primarily due to the substantial growth of the Target Visa portfolio. In 2004, 2003 and 2002, the allowance for doubtful accounts as a percent of year-end receivables was 7.1 percent, 7.1 percent and 7.0 percent, respectively.
In 2004, operations and marketing expense increased to $286 million from $246 million in 2003 and $238 million in 2002, primarily due to the growth of the Target Visa portfolio.
We expect our 2005 credit card operations to grow at a rate similar to our growth rate in 2004. Our pre-tax credit card contribution as a percent of total average receivables is expected to continue to be in line with recent performance. The impact of the change to our revenue related to a prime-based floating rate instead of a fixed rate, as discussed on pages 19 and 21, will be determined by future changes in the prime rate.
Credit Card Contribution
(millions) | | 2004 | | 2003 | | 2002 | |
Revenues: | | | | | | | |
Finance charges, late fees and other revenues | | $ | 1,059 | | $ | 1,015 | | $ | 821 | |
Merchant fees | | | | | | | |
Intracompany | | 65 | | 49 | | 49 | |
Third-party | | 98 | | 82 | | 70 | |
Total revenues | | 1,222 | | 1,146 | | 940 | |
Expenses: | | | | | | | |
Bad debt provision | | 451 | | 476 | | 391 | |
Operations and marketing | | 286 | | 246 | | 238 | |
Total expenses | | 737 | | 722 | | 629 | |
Pre-tax credit card contribution | | $ | 485 | | $ | 424 | | $ | 311 | |
As a percent of average receivables | | 9.8 | % | 9.1 | % | 8.8 | % |
(millions, before allowance) | | 2004 | | 2003 | | 2002 | |
Year-end receivables | | $ | 5,456 | | $ | 4,973 | | $ | 4,601 | |
Average receivables | | $ | 4,927 | | $ | 4,661 | | $ | 3,515 | |
Past Due | | | | | | | |
Accounts with three or more payments past due as a percent of year-end receivables: | | 3.5 | % | 4.2 | % | 4.0 | % |
Allowance for Doubtful Accounts | | | | | | | |
(millions) | | 2004 | | 2003 | | 2002 | |
Allowance at beginning of year | | $ | 352 | | $ | 320 | | $ | 180 | |
Bad debt provision | | 451 | | 476 | | 391 | |
Net write-offs | | (416 | ) | (444 | ) | (251 | ) |
Allowance at end of year | | $ | 387 | | $ | 352 | | $ | 320 | |
As a percent of year-end receivables | | 7.1 | % | 7.1 | % | 7.0 | % |
Other Credit Card Contribution Information | | | | | | | |
| | 2004 | | 2003 | | 2002 | |
Total revenues as a percent of average receivables: | | 24.8 | % | 24.6 | % | 26.7 | % |
Net write-offs as a percent of average receivables: | | 8.4 | % | 9.5 | % | 7.1 | % |
18
Net Interest Expense
In 2004, net interest expense was $570 million, $14 million higher than 2003. This increase was due to a $74 million higher loss on debt called or repurchased and a higher average portfolio interest rate resulting from the unfavorable mix effect of higher balances of short-term investments and higher market rates. This increase was partially offset by significantly lower average debt, net of investments, due to cash received from the dispositions of Marshall Field’s and Mervyn’s. The average portfolio interest rate was 5.5 percent in 2004 and 4.9 percent in 2003. The $542 million of debt called or repurchased during 2004 resulted in a loss of $89 million (approximately $.06 per share) and had an average interest rate of 7.0 percent and an average remaining life of 24 years.
In 2003, net interest expense was $556 million, $28 million lower than 2002. The decrease was due to a lower average portfolio interest rate and a smaller loss on debt called or repurchased, partially offset by higher average debt outstanding. The average portfolio interest rate in 2003 was 4.9 percent compared with 5.6 percent in 2002. The $297 million of debt called or repurchased during 2003 resulted in a loss of $15 million (approximately $.01 per share) and had an average interest rate of 7.8 percent and an average remaining life of 20 years.
Excluding any effect of future debt repurchases, we expect net interest expense in 2005 to be lower than 2004 due to lower loss on debt repurchase and lower average net debt balances in the first half of the year. Additionally, the majority of our credit card receivables will be assessed finance charges at a prime-based floating rate instead of a fixed rate in 2005. In order to protect our credit card economics in light of future changes in the prime rate, we plan to maintain a sufficient level of floating-rate debt to achieve parallel changes in our finance charge revenue and interest expense.
Analysis of Financial Condition

Liquidity and Capital Resources
Our financial condition remains strong. In assessing our financial condition, we consider factors such as cash flows provided or used by operations, capital expenditures and debt service obligations. Cash flow provided by operations increased to $3,821 million in 2004 from $3,213 million in 2003, primarily due to higher net income. During 2004, cash provided from the divestiture of Marshall Field’s and Mervyn’s (before consideration of associated taxes) was $4,881 million.
Our year-end receivables (before allowance) increased 9.7 percent, or $483 million, to $5,456 million. The growth in year-end receivables was driven by growth in issuance and usage of the Target Visa credit card during 2004. Average receivables in 2004 increased 5.7 percent.
Year-end inventory levels increased $853 million, or 18.8 percent. The increase in inventory was a result of additional square footage and same store sales growth, as well as the refinement of our measurement of the point in our supply chain at which effective ownership of direct imports occurs. This growth was primarily funded by an $823 million increase in accounts payable over the same period.
In June 2004, our Board of Directors authorized the repurchase of $3 billion of our common stock which we expect to complete over two to three years. This authorization replaced our previous repurchase programs that were authorized by our Board of Directors in January 1999 and March 2000. During 2004, we repurchased 29 million shares at a total cost of $1,290 million ($44.68 per share).
Our financing strategy is to ensure liquidity and access to capital markets, to manage our net exposure to floating rates and to maintain a balanced spectrum of debt maturities. Within these parameters, we seek to minimize our cost of borrowing.
Management believes that cash flows from operations, together with current levels of cash equivalents, proceeds from long-term financing activities and issuance of short-term debt will be sufficient to fund capital expenditures, share repurchases, growth in receivables, maturities of long-term debt, and other cash requirements, including seasonal buildup in inventories.
A key to our liquidity and access to capital markets is maintaining strong investment-grade debt ratings.
| | | | Standard | | | |
| | Moody’s | | and Poor’s | | Fitch | |
Long-term debt | | A2 | | A+ | | A+ | |
Commercial paper | | P-1 | | A-1 | | F1 | |
Securitized receivables | | Aaa | | AAA | | n/a | |
Further liquidity is provided by $1,600 million of committed lines of credit obtained through a group of 25 banks. Of these credit lines, an $800 million credit facility expires in June 2005 and includes a one-year term-out option to June 2006. The remaining $800 million credit facility expires in June 2008. There were no balances outstanding at any time during 2004 or 2003 under these agreements. These committed credit lines, as well as most of our long-term debt obligations, contain certain financial covenants. We are, and expect to remain, in compliance within these covenants. No material debt instrument contains provisions requiring acceleration of payment upon a debt rating downgrade.
19
Interest coverage ratio represents the ratio of pre-tax earnings before fixed charges (interest expense and the interest portion of rent expense) to fixed charges. Our interest coverage ratio calculated under generally accepted accounting principles was 5.4x, 5.1x and 4.3x in 2004, 2003 and 2002, respectively. These ratios are adversely affected by the losses from discretionary debt repurchase transactions and they exclude the historical income from discontinued operations. Management believes that adjustments for these two issues are necessary to make the coverage ratio a more useful and consistent indicator of creditworthiness.
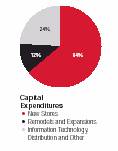
Capital Expenditures
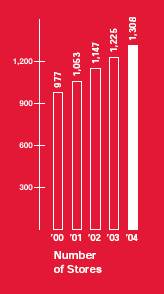
Capital expenditures were $3,068 million in 2004, compared with $2,738 million in 2003 and $3,040 million in 2002. Our higher spending level in 2004 is primarily due to the increase in new store expansion, our remodel program and more land purchases in lieu of leases. Net property and equipment increased $1,707 million in 2004, compared with an increase of $1,612 million in 2003. Over the past five years, Target’s net retail square footage has grown at a compound annual rate of 9.8 percent.
Approximately 76 percent and 78 percent of total capital expenditures in 2004 and 2003, respectively, were for new stores, expansions and remodels. Other capital investments were for information system hardware and software, distribution capacity and other infrastructure to support store growth.
| | January 29, | | | | | | January 31, | |
| | 2005 | | Opened | | Closed * | | 2004 | |
Target General Merchandise Stores | | 1,172 | | 80 | | 15 | | 1,107 | |
SuperTarget Stores | | 136 | | 18 | | — | | 118 | |
Total | | 1,308 | | 98 | | 15 | | 1,225 | |
| | January 29, | | | | | | January 31, | |
(thousands) | | 2005 | | Opened | | Closed* | | 2004 | |
Target General Merchandise Stores | | 140,953 | | 10,950 | | 1,635 | | 131,638 | |
SuperTarget Stores | | 24,062 | | 3,137 | | — | | 20,925 | |
Total | | 165,015 | | 14,087 | | 1,635 | | 152,563 | |
* Typically relates to stores that have been relocated to a new store in the same trade area.
At year-end 2004, we owned 1,071 stores, leased 86 stores and operated 151 “combined” stores for a total of 1,308 locations. Stores within the “combined” category are primarily owned buildings on leased land.
In 2005, we expect to invest $3,200 million to $3,400 million, mostly in new store square footage, as well as the distribution infrastructure and systems to support this growth. Our estimated 2005 store opening program reflects net square footage growth of approximately 8 percent, reflecting 105 to 110 new stores partially offset by closings and relocations. In addition, we expect to substantially remodel approximately 75 stores, some of which will also be expanded.

Commitments and Contingencies
At January 29, 2005, our debt, lease and royalty contractual obligations were as follows:
| | Payments Due by Period | |
| | | | Less than | | 1-3 | | 3-5 | | After 5 | |
(millions) | | Total | | 1 Year | | Years | | Years | | Years | |
Long-term debt * | | $ | 9,402 | | $ | 501 | | $ | 2,072 | | $ | 2,202 | | $ | 4,627 | |
Interest payments ** | | 4,580 | | 532 | | 943 | | 711 | | 2,394 | |
Capital lease obligations | | 189 | | 12 | | 25 | | 25 | | 127 | |
Operating leases *** | | 3,049 | | 146 | | 279 | | 219 | | 2,405 | |
Merchandise royalties | | 102 | | 49 | | 49 | | 4 | | — | |
| | | | | | | | | | | |
Contractual cash obligations | | $ | 17,322 | | $ | 1,240 | | $ | 3,368 | | $ | 3,161 | | $ | 9,553 | |
* Required principal payments only. Excludes SFAS No. 133, “Accounting for Derivative Instruments and Hedging Activities,” fair market value adjustments recorded in long-term debt.
** Includes payments on $750 million of floating-rate long-term debt secured by credit card receivables which matures in 2007. These payments are calculated assuming rates of 3.25 percent, 3.75 percent and 4.25 percent, for 2005, 2006, and 2007, respectively. Excludes payments received or made relating to interest rate swaps discussed on page 32.
*** Total contractual lease payments include certain options to extend the lease term, in the amount of $1,415 million, that are expected to be exercised because the investment in leasehold improvements is significant.
Commitments for the purchase, construction, lease or remodeling of real estate, facilities and equipment were approximately $544 million at year-end 2004.
Throughout the year, we enter into various commitments to purchase inventory. In addition to the accounts payable reflected in our Consolidated Statements of Financial Position on page 25, we had commitments with various vendors for the purchase of inventory as of January 29, 2005. The previous table excludes these commitments because they are cancelable by their terms.
20
Market Risk
Our exposure to market risk results primarily from changes in interest rates on our debt obligations, as well as the effect of market returns on our non-qualified defined contribution and qualified defined benefit pension plans. We hold derivative instruments primarily to manage our exposure to these risks, and all derivative instruments are matched against specific debt obligations or other liabilities. There have been no material changes in the primary risk exposures or management of the risks since the prior year. See further discussions in the Notes to Consolidated Financial Statements on pages 31-36.
The annualized effect of a one percentage point increase in floating interest rates on our interest rate swap agreements and other floating-rate debt obligations, net of floating-rate cash equivalents, at January 29, 2005 would be to increase interest expense by approximately $19 million. The annualized effect of a one percentage point change in equity market returns on our non-qualified defined contribution plans (inclusive of the effect of derivative instruments used to hedge or manage these exposures) would not be significant. The annualized effect of a one percentage point decrease in the return on pension plan assets would be to decrease plan assets by $17 million. The resulting impact on net pension expense would be determined consistent with the provisions of SFAS No. 87, “Employers’ Accounting for Pensions.” In 2005, the majority of our credit card receivables will be assessed finance charges at a prime-based floating rate instead of a fixed rate. The impact of this change to our revenue will be determined by future changes in the prime rate. In order to protect our credit card economics in light of future changes in the prime rate, we plan to maintain a sufficient level of floating-rate debt to achieve parallel changes in our finance charge revenue and interest expense.
Analysis of Discontinued Operations
In 2004, revenues and earnings from discontinued operations were lower than prior years due to only a partial year of results, which excluded the holiday season.
The financial results included in discontinued operations were as follows:
| | January 29, | | January 31, | | February 1, | |
(millions) | | 2005 | | 2004 | | 2003 | |
Revenue | | $ | 3,095 | | $ | 6,138 | | $ | 6,507 | |
Earnings from discontinued operations before income taxes | | 121 | | 306 | | 399 | |
Earnings from discontinued operations, net of $46, $116 and $152 tax, respectively | | 75 | | 190 | | 247 | |
Gain on sale of discontinued operations, net of $761 tax | | 1,238 | | — | | — | |
Total income from discontinued operations, net of tax | | $ | 1,313 | | $ | 190 | | $ | 247 | |
Critical Accounting Estimates
Our analysis of operations and financial condition is based upon our consolidated financial statements, which have been prepared in accordance with accounting principles generally accepted in the United States. The preparation of these financial statements requires us to make estimates and assumptions that affect the reported amounts of assets and liabilities at the date of the financial statements, the reported amounts of revenues and expenses during the reporting period and the related disclosures of contingent assets and liabilities. In the Notes to Consolidated Financial Statements, we describe our significant accounting policies used in preparation of the consolidated financial statements. We evaluate our estimates on an ongoing basis. We base our estimates on historical experience and on other assumptions that we believe to be reasonable under the circumstances. Actual results could differ from these estimates under different assumptions or conditions.
The following items in our consolidated financial statements require significant estimation or judgment:
Inventory and cost of sales We account for substantially all of our inventory and the related cost of sales under the retail inventory method. Under the retail inventory method, inventory is stated at cost, which is determined by applying a cost-to-retail ratio to each merchandise grouping’s ending retail value. Since this inventory value is adjusted regularly to reflect market conditions, our inventory methodology reflects the lower of cost or market. We reduce inventory for estimated losses related to shortage and markdowns. Shortage is based upon historical losses verified by prior physical inventory counts. Markdowns designated for clearance activity are recorded when the salability of the merchandise has diminished. Inventory is at risk of obsolescence if economic conditions change, such as shifting consumer demand, changing consumer credit markets, or increasing competition. These risks are mitigated because substantially all of our inventory sells in less than six months. Inventory is described in the Notes to Consolidated Financial Statements on page 30.
Vendor income receivable Cost of sales is partially offset by various forms of consideration earned from our vendors. We receive income for a variety of vendor-sponsored programs such as volume rebates, markdown allowances, promotions and advertising, and for our compliance programs. We establish a receivable for the vendor income that is earned but not yet received from our vendors. This receivable is based on provisions of the programs in place, and is computed by estimating the point at which we’ve completed our performance under the agreement and the amount is earned. Due to the complexity and diversity of the individual agreements with vendors, we perform detailed analyses and review historical trends to determine an appropriate level of the receivable in aggregate. See further discussions in the Notes to Consolidated Financial Statements on page 28.
21
Allowance for doubtful accounts When receivables are recorded, we recognize an allowance for doubtful accounts in an amount equal to anticipated future write-offs. This allowance includes provisions for uncollectible finance charges and other credit fees. We estimate future write-offs based on delinquencies, risk scores, aging trends, industry risk trends and our historical experience. Management believes that the allowance for doubtful accounts is adequate to cover anticipated losses in our credit card accounts receivable under current conditions; however, significant deterioration in any of the factors mentioned above or in general economic conditions could materially change these expectations. Net accounts receivable and its related allowance are described in the Notes to Consolidated Financial Statements on page 30.
Analysis of assets for impairment We review assets at the lowest level for which there are identifiable cash flows, which is usually at the store level. The carrying amount of store assets is compared to the expected undiscounted future cash flows to be generated by those assets over the estimated remaining useful life of the store. No impairments were recorded in 2004 or 2003 as a result of the tests performed.
We evaluate goodwill for impairment on an annual basis or more often if an event occurs or circumstances change that indicate impairment might exist. Goodwill is evaluated for impairment through the comparison of fair value of the related reporting unit to its carrying value. No impairments were recorded in 2004, 2003 and 2002 as a result of the tests performed. See further discussions in the Notes to Consolidated Financial Statements on pages 30-31.
Pension and postretirement health care accounting We fund and maintain a qualified defined-benefit pension plan and maintain certain related non-qualified plans as well. Our pension costs are determined based on actuarial calculations using key assumptions including our expected long-term rate of return on qualified plan assets, the discount rate and our estimate of future compensation increases. We also maintain a postretirement health care plan for certain retired employees. Postretirement health care costs are calculated based on actuarial calculations using key assumptions, including the discount rate and health care cost trend rates. Pension and postretirement health care benefits are further described in the Notes to Consolidated Financial Statements on pages 35-36.
Insurance/self-insurance We retain a portion of the risk related to certain general liability, workers’ compensation, property loss and employee medical and dental claims. Liabilities associated with these losses include estimates of both claims filed and claims incurred but not yet reported. We estimate our ultimate cost based upon analysis of historical data and actuarial estimates. General liability and workers’ compensation liabilities are recorded at our estimate of their net present value; other liabilities are not discounted. We believe the amounts accrued are adequate, although our ultimate loss may differ from the amounts provided. We maintain stop-loss coverage to limit the exposure related to certain risks.
Income taxes We pay income taxes based on the tax statutes, regulations and case law of the various jurisdictions in which we operate. Our effective income tax rate from continuing operations was 37.8 percent, 37.8 percent and 38.2 percent in 2004, 2003 and 2002, respectively. The income tax provision includes estimates for certain unresolved matters in dispute with state and federal tax authorities. Management believes the resolution of such disputes will not have a material impact on our financial statements. Our effective income tax rate in 2005 is expected to be approximately 37.5 to 38.1 percent. Income taxes are further described in the Notes to Consolidated Financial Statements on page 33.
New Accounting Pronouncements
2005 Adoptions
SFAS No. 151, “Inventory Costs, an amendment of ARB No. 43, Chapter 4” was issued in November 2004 and is effective for fiscal years beginning after June 15, 2005 with early adoption permitted. SFAS No. 151 clarifies that abnormal amounts of idle facilities expense, freight, handling costs and spoilage are to be recognized as current period charges and provides guidance on the allocation of overhead. We do not expect this statement to have an impact on our net earnings, cash flows or financial position upon adoption.
SFAS No. 153, “Exchanges of Nonmonetary Assets – An Amendment of APB Opinion No. 29,” was issued in December 2004 and is effective for nonmonetary asset exchanges occurring in fiscal periods beginning after June 15, 2005 with earlier application permitted. SFAS No. 153 addresses the measurement of exchanges of nonmonetary assets. We do not expect this statement to have an impact on our net earnings, cash flows or financial position upon adoption.
22
2004 Adoptions
Financial Accounting Standards Board (FASB) Interpretation No. 46, “Consolidation of Variable Interest Entities, an interpretation of Accounting Research Bulletin No. 51” (FIN No. 46) was issued in January 2003 and was effective the first reporting period that ended after March 15, 2004. FIN No. 46 requires the consolidation of entities in which an enterprise absorbs a majority of the entity’s expected losses, receives a majority of the entity’s expected residual returns, or both, as a result of ownership, contractual or other financial interest in the entity. The adoption of FIN No. 46 did not have a material impact on our net earnings, cash flows or financial position.
The Medicare Prescription Drug, Improvements and Modernization Act of 2003 (The Act) was signed into law in December 2003. The Act introduces a prescription drug benefit under Medicare (Medicare Part D), as well as a federal subsidy to sponsors of retiree health care benefit plans that provide a prescription drug benefit that is at least actuarially equivalent to Medicare Part D. In May 2004, the FASB issued Staff Position (FSP) No. 106-2, “Accounting and Disclosure Requirements Related to the Medicare Prescription Drug, Improvement and Modernization Act of 2003.” This FSP is effective for interim or annual periods beginning after June 15, 2004. Final regulations that would define actuarial equivalency have not yet been issued. However, we have made a preliminary determination that our plans will be actuarially equivalent. As a result, we recorded a reduction in our accumulated post-retirement benefit obligation of $7 million in the third quarter of 2004. In addition, the expense amounts shown in the Pension and Postretirement Health Care Benefits Note reflect a $1 million reduction due to the amortization of the actuarial gain and reduction in interest cost due to the effects of the Act.
The American Jobs Creation Act of 2004 (The Act) was signed into law in October 2004. The Act introduces a tax deduction for qualified production activities and a special one-time dividend received deduction for repatriation of certain foreign earnings to a U.S. taxpayer. In December 2004, the FASB issued Staff Position (FSP) No. 109-1, “Application of FASB Statement No. 109, Accounting for Income Taxes, to the Tax Deduction on Qualified Production Activities Provided by the American Jobs Creation Act of 2004” and FSP No. 109-2, “Accounting and Disclosure Guidance for the Foreign Earnings Repatriation Provision within the American Jobs Creation Act of 2004,” both were effective upon issuance. The adoption of FSP No. 109-1 and FSP No. 109-2 did not have a material impact on our net earnings, cash flows, financial position or effective tax rate.
SFAS No. 123R, “Share-Based Payment” was issued in December 2004 and eliminates accounting for share-based compensation transactions using the intrinsic value method prescribed in APB Opinion No. 25, “Accounting for Stock Issued to Employees,” and requires instead that such transactions be accounted for using a fair-value-based method. We have elected to adopt the provisions of SFAS No. 123R in 2004 under the modified retrospective transition method. All prior period financial statements have been restated to recognize compensation cost in the amounts previously reported in the Notes to Consolidated Financial Statements under the provisions of SFAS No. 123, “Accounting for Stock-Based Compensation.”
Forward-looking Statements
This Annual Report, including the preceding Management’s Discussion and Analysis, contains forward-looking statements regarding our performance, liquidity and the adequacy of our capital resources. Those statements are based on our current assumptions and expectations and are subject to certain risks and uncertainties that could cause actual results to differ materially from those projected. We caution that the forward-looking statements are qualified by the risks and challenges posed by increased competition (including the effects of competitor liquidation activities), shifting consumer demand, changing consumer credit markets, changing health care costs, changing capital markets and general economic conditions, hiring and retaining effective team members, sourcing merchandise from domestic and international vendors, investing in new business strategies, achieving our growth objectives, the outbreak of war and other significant national and international events, and other risks and uncertainties. As a result, while we believe that there is a reasonable basis for the forward-looking statements, you should not place undue reliance on those statements. You are encouraged to review Exhibit (99)C attached to our Form 10-K Report for the year-ended January 29, 2005, which contains additional important factors that may cause actual results to differ materially from those projected in the forward-looking statements.
23
CONSOLIDATED RESULTS OF OPERATIONS
(millions, except per share data) | | 2004 | | 2003 | | 2002 | |
Sales | | $ | 45,682 | | $ | 40,928 | | $ | 36,519 | |
Net credit card revenues | | 1,157 | | 1,097 | | 891 | |
Total revenues | | 46,839 | | 42,025 | | 37,410 | |
Cost of sales | | 31,445 | | 28,389 | | 25,498 | |
Selling, general and administrative expense | | 9,797 | | 8,657 | | 7,505 | |
Credit card expense | | 737 | | 722 | | 629 | |
Depreciation and amortization | | 1,259 | | 1,098 | | 967 | |
Earnings from continuing operations before interest expense and income taxes | | 3,601 | | 3,159 | | 2,811 | |
Net interest expense | | 570 | | 556 | | 584 | |
Earnings from continuing operations before income taxes | | 3,031 | | 2,603 | | 2,227 | |
Provision for income taxes | | 1,146 | | 984 | | 851 | |
Earnings from continuing operations | | $ | 1,885 | | $ | 1,619 | | $ | 1,376 | |
Earnings from discontinued operations, net of $46, $116 and $152 tax | | $ | 75 | | $ | 190 | | $ | 247 | |
Gain on disposal of discontinued operations, net of $761 tax | | $ | 1,238 | | $ | — | | $ | — | |
Net earnings | | $ | 3,198 | | $ | 1,809 | | $ | 1,623 | |
Basic earnings per share | | | | | | | |
Continuing operations | | $ | 2.09 | | $ | 1.78 | | $ | 1.52 | |
Discontinued operations | | $ | 0.08 | | $ | 0.21 | | $ | 0.27 | |
Gain from discontinued operations | | $ | 1.37 | | $ | — | | $ | — | |
Basic earnings per share | | $ | 3.54 | | $ | 1.99 | | $ | 1.79 | |
Diluted earnings per share | | | | | | | |
Continuing operations | | $ | 2.07 | | $ | 1.76 | | $ | 1.51 | |
Discontinued operations | | $ | 0.08 | | $ | 0.21 | | $ | 0.27 | |
Gain from discontinued operations | | $ | 1.36 | | $ | — | | $ | — | |
Diluted earnings per share | | $ | 3.51 | | $ | 1.97 | | $ | 1.78 | |
Weighted average common shares outstanding: | | | | | | | |
Basic | | 903.8 | | 911.0 | | 908.0 | |
Diluted | | 912.1 | | 919.2 | | 914.3 | |
See Notes to Consolidated Financial Statements throughout pages 28-37.
24
CONSOLIDATED STATEMENTS OF FINANCIAL POSITION
| | January 29, | | January 31, | |
(millions) | | 2005 | | 2004 | |
Assets | | | | | |
Cash and cash equivalents | | $ | 2,245 | | $ | 708 | |
Accounts receivable, net | | 5,069 | | 4,621 | |
Inventory | | 5,384 | | 4,531 | |
Other current assets | | 1,224 | | 1,000 | |
Current assets of discontinued operations | | — | | 2,092 | |
Total current assets | | 13,922 | | 12,952 | |
Property and equipment | | | | | |
Land | | 3,804 | | 3,312 | |
Buildings and improvements | | 12,518 | | 11,022 | |
Fixtures and equipment | | 4,988 | | 4,577 | |
Construction-in-progress | | 962 | | 969 | |
Accumulated depreciation | | (5,412 | ) | (4,727 | ) |
Property and equipment, net | | 16,860 | | 15,153 | |
Other non-current assets | | 1,511 | | 1,377 | |
Non-current assets of discontinued operations | | — | | 1,934 | |
Total assets | | $ | 32,293 | | $ | 31,416 | |
Liabilities and shareholders investment | | | | | |
Accounts payable | | $ | 5,779 | | $ | 4,956 | |
Accrued liabilities | | 1,633 | | 1,288 | |
Income taxes payable | | 304 | | 382 | |
Current portion of long-term debt and notes payable | | 504 | | 863 | |
Current liabilities of discontinued operations | | — | | 825 | |
Total current liabilities | | 8,220 | | 8,314 | |
Long-term debt | | 9,034 | | 10,155 | |
Deferred income taxes | | 973 | | 632 | |
Other non-current liabilities | | 1,037 | | 917 | |
Non-current liabilities of discontinued operations | | — | | 266 | |
Shareholders’ investment | | | | | |
Common stock* | | 74 | | 76 | |
Additional paid-in-capital | | 1,810 | | 1,530 | |
Retained earnings | | 11,148 | | 9,523 | |
Accumulated other comprehensive income | | (3 | ) | 3 | |
Total shareholders’ investment | | 13,029 | | 11,132 | |
Total liabilities and shareholders’ investment | | $ | 32,293 | | $ | 31,416 | |
* Common Stock Authorized 6,000,000,000 shares, $.0833 par value; 890,643,966 shares issued and outstanding at January 29, 2005; 911,808,051 shares issued and outstanding at January 31, 2004.
Preferred Stock Authorized 5,000,000 shares, $.01 par value; no shares were issued or outstanding at January 29, 2005 or January 31, 2004
See Notes to Consolidated Financial Statements throughout pages 28-37.
25
CONSOLIDATED STATEMENTS OF CASH FLOWS
(millions) | | 2004 | | 2003 | | 2002 | |
| | | | | | | |
Operating activities | | | | | | | |
Net earnings | | $ | 3,198 | | $ | 1,809 | | $ | 1,623 | |
Earnings from and gain on disposal of discontinued operations, net of tax | | 1,313 | | 190 | | 247 | |
Earnings from continuing operations | | 1,885 | | 1,619 | | 1,376 | |
Reconciliation to cash flow: | | | | | | | |
Depreciation and amortization | | 1,259 | | 1,098 | | 967 | |
Deferred tax provision | | 233 | | 208 | | 208 | |
Bad debt provision | | 451 | | 476 | | 391 | |
Loss on disposal of fixed assets, net | | 59 | | 41 | | 54 | |
Other non-cash items affecting earnings | | 133 | | 67 | | 179 | |
Changes in operating accounts providing/(requiring) cash: | | | | | | | |
Accounts receivable originated at Target | | (209 | ) | (279 | ) | (454 | ) |
Inventory | | (853 | ) | (579 | ) | (370 | ) |
Other current assets | | (37 | ) | (196 | ) | 13 | |
Other non-current assets | | (147 | ) | (166 | ) | (136 | ) |
Accounts payable | | 823 | | 721 | | 545 | |
Accrued liabilities | | 319 | | 85 | | 3 | |
Income taxes payable | | (78 | ) | 99 | | (80 | ) |
Other | | (17 | ) | 19 | | 29 | |
Cash flow provided by operations | | 3,821 | | 3,213 | | 2,725 | |
Investing activities | | | | | | | |
Expenditures for property and equipment | | (3,068 | ) | (2,738 | ) | (3,040 | ) |
Proceeds from disposals of fixed assets | | 56 | | 67 | | 32 | |
Change in accounts receivable originated at third parties | | (690 | ) | (538 | ) | (1,768 | ) |
Proceeds from sale of discontinued operations | | 4,881 | | — | | — | |
Cash flow provided by/(required for) investing activities | | 1,179 | | (3,209 | ) | (4,776 | ) |
Financing activities | | | | | | | |
Decrease in notes payable, net | | — | | (100 | ) | — | |
Additions to long-term debt | | 10 | | 1,200 | | 3,116 | |
Reductions of long-term debt | | (1,487 | ) | (1,179 | ) | (1,098 | ) |
Dividends paid | | (272 | ) | (237 | ) | (218 | ) |
Repurchase of stock | | (1,290 | ) | (48 | ) | (3 | ) |
Stock option exercises | | 146 | | 36 | | 27 | |
Other | | 56 | | (10 | ) | (20 | ) |
Cash flow (required for)/provided by financing activities | | (2,837 | ) | (338 | ) | 1,804 | |
Net cash (required)/provided by discontinued operations | | (626 | ) | 292 | | 508 | |
Net increase/(decrease) in cash and cash equivalents | | 1,537 | | (42 | ) | 261 | |
Cash and cash equivalents at beginning of year | | 708 | | 750 | | 489 | |
Cash and cash equivalents at end of year | | $ | 2,245 | | $ | 708 | | $ | 750 | |
Amounts presented herein are on a cash basis and therefore may differ from those shown in other sections of this Annual Report. Consistent with the provisions of SFAS No. 95, “Statement of Cash Flows,” cash flows related to accounts receivable are classified as either Provided by Operations or From Investing Activities, depending on their origin.
Cash paid for income taxes was $1,742 million, $781 million and $853 million during 2004, 2003 and 2002, respectively. Cash paid for interest (including interest capitalized) was $498 million, $550 million and $526 million during 2004, 2003 and 2002, respectively.
See Notes to Consolidated Financial Statements throughout pages 28-37.
26
CONSOLIDATED STATEMENTS OF SHAREHOLDERS’ INVESTMENT
| | | | | | | | | | Accumulated | | | |
| | Common | | Stock | | Additional | | | | Other | | | |
| | Stock | | Par | | Paid-in | | Retained | | Comprehensive | | | |
(millions, except footnotes) | | Shares | | Value | | Capital | | Earnings | | Income | | Total | |
| | | | | | | | | | | | | |
February 2, 2002 | | 905.2 | | $ | 75 | | $ | 1,193 | | $ | 6,628 | | $ | — | | $ | 7,896 | |
Consolidated net earnings | | — | | — | | — | | 1,623 | | — | | 1,623 | |
Other comprehensive income | | — | | — | | — | | — | | 4 | | 4 | |
Total comprehensive income | | | | | | | | | | | | 1,627 | |
Dividends declared | | — | | — | | — | | (218 | ) | — | | (218 | ) |
Repurchase of stock | | (.5 | ) | — | | — | | (16 | ) | — | | (16 | ) |
Issuance of stock for ESOP | | 3.0 | | 1 | | 105 | | — | | — | | 106 | |
Stock options and awards | | 2.1 | | — | | 102 | | — | | — | | 102 | |
February 1, 2003 | | 909.8 | | 76 | | 1,400 | | 8,017 | | 4 | | 9,497 | |
Consolidated net earnings | | — | | — | | — | | 1,809 | | — | | 1,809 | |
Other comprehensive income | | — | | — | | — | | — | | (1 | ) | (1 | ) |
Total comprehensive income | | | | | | | | | | | | 1,808 | |
Dividends declared | | — | | — | | — | | (246 | ) | — | | (246 | ) |
Repurchase of stock | | (1.5 | ) | — | | — | | (57 | ) | — | | (57 | ) |
Issuance of stock for ESOP | | 0.6 | | — | | 17 | | — | | — | | 17 | |
Stock options and awards | | 2.9 | | — | | 113 | | — | | — | | 113 | |
January 31, 2004 | | 911.8 | | 76 | | 1,530 | | 9,523 | | 3 | | 11,132 | |
Consolidated net earnings | | — | | — | | — | | 3,198 | | — | | 3,198 | |
Other comprehensive income | | — | | — | | — | | — | | (6 | ) | (6 | ) |
Total comprehensive income | | | | | | | | | | | | 3,192 | |
Dividends declared | | — | | — | | — | | (280 | ) | — | | (280 | ) |
Repurchase of stock | | (28.9 | ) | (3 | ) | — | | (1,293 | ) | — | | (1,296 | ) |
Issuance of stock for ESOP | | — | | — | | — | | — | | — | | — | |
Stock options and awards | | 7.7 | | 1 | | 280 | | — | | — | | 281 | |
January 29, 2005 | | 890.6 | | $ | 74 | | $ | 1,810 | | $ | 11,148 | | $ | (3 | ) | $ | 13,029 | |
Common Stock Authorized 6,000,000,000 shares, $.0833 par value; 890,643,966 shares issued and outstanding at January 29, 2005; 911,808,051 shares issued and outstanding at January 31, 2004; 909,801,560 shares issued and outstanding at February 1, 2003.
In June of 2004, our Board of Directors authorized the repurchase of $3 billion of our common stock. The repurchase of our common stock is expected to be made primarily in open market transactions, subject to market conditions, and is expected to be completed over two to three years. This authorization replaced our previous repurchase programs that were authorized by our Board of Directors in January 1999 and March 2000. In 2004, we repurchased a total of 29 million shares of our common stock at a total cost of approximately $1,290 million ($44.68 per share)
Preferred Stock Authorized 5,000,000 shares, $.01 par value; no shares were issued or outstanding at January 29, 2005, January 31, 2004 or February 1, 2003.
Junior Preferred Stock Rights In 2001, we declared a distribution of preferred share purchase rights. Terms of the plan provide for a distribution of one preferred share purchase right for each outstanding share of our common stock. Each right will entitle shareholders to buy one twelve-hundredth of a share of a new series of junior participating preferred stock at an exercise price of $125.00, subject to adjustment. The rights will be exercisable only if a person or group acquires ownership of 20 percent or more of our common stock or announces a tender offer to acquire 30 percent or more of our common stock.
Dividends Dividends declared per share were $0.31, $0.27 and $0.24 in 2004, 2003 and 2002, respectively.
See Notes to Consolidated Financial Statements throughout pages 28-37.
27
NOTES TO CONSOLIDATED FINANCIAL STATEMENTS
Summary of Accounting Policies
Organization Target Corporation operates large-format general merchandise discount stores in the United States and a much smaller, rapidly growing on-line business. Additionally, our credit card operations represent an integral component of our retail business.
Consolidation The financial statements include the balances of the Corporation and its subsidiaries after elimination of material intercompany balances and transactions. All material subsidiaries are wholly owned.
Use of Estimates The preparation of our financial statements, in conformity with accounting principles generally accepted in the United States (GAAP), requires management to make estimates and assumptions that affect the reported amounts in the financial statements and accompanying notes. Actual results may differ from those estimates.
Fiscal Year Our fiscal year ends on the Saturday nearest January 31. Unless otherwise stated, references to years in this report relate to fiscal years rather than to calendar years. Fiscal years 2004, 2003 and 2002 each consisted of 52 weeks.
Reclassifications Certain prior year amounts have been reclassified to conform to the current year presentation.
Stock-based Compensation In December 2004, the Financial Accounting Standards Board finalized Statement of Financial Accounting Standards No. 123R, “Share-Based Payment” (SFAS No. 123R). SFAS No. 123R eliminates accounting for share-based compensation transactions using the intrinsic value method prescribed in APB Opinion No. 25, “Accounting for Stock Issued to Employees,” and requires instead that such transactions be accounted for using a fair-value-based method. We adopted SFAS No. 123, “Accounting for Stock-Based Compensation,” in accordance with the prospective transition method prescribed in SFAS No. 148, “Accounting for Stock-Based Compensation –Transition and Disclosure” in the first quarter of 2003. Therefore, the fair value based method has been applied prospectively to awards granted subsequent to February 1, 2003 (the last day of our 2002 fiscal year). We have elected to adopt the provisions of SFAS No. 123R in 2004 under the modified retrospective transition method. All prior period financial statements have been restated to recognize compensation cost in the amounts previously reported in the Notes to Consolidated Financial Statements under the provisions of SFAS No. 123. Information related to outstanding stock options and performance shares is disclosed on pages 33-34.
Revenues
The contribution to revenue from sales is recognized when the sales occur and are net of expected returns. Revenue from gift card sales is recognized upon redemption of the gift card. Commissions earned on sales generated by leased departments are included within sales and were $46 million in 2004, $32 million in 2003 and $19 million in 2002. Net credit card revenues are comprised of finance charges and late fees from credit card holders, as well as third-party merchant fees earned from the use of our Target Visa credit card. Net credit card revenues are recognized according to the contractual provisions of each applicable credit card agreement. If an account is written-off, any uncollected finance charges or late fees are recorded as a reduction of credit card revenue. The amount of our retail sales charged to our credit cards was $3,269 million, $3,006 million and $2,980 million in 2004, 2003 and 2002, respectively.
Consideration Received from Vendors
We receive income for a variety of vendor-sponsored programs such as volume rebates, markdown allowances, promotions and advertising, and for our compliance programs. Promotional and advertising allowances are intended to offset our costs of promoting and selling the vendor’s merchandise in our stores and are recognized when we incur the cost or complete the promotion. Under our compliance programs, vendors are charged for merchandise shipments that do not meet our requirements, such as late or incomplete shipments, and we record these allowances when the violation occurs. Vendor income either reduces our inventory costs or our operating expenses based on the requirements of Emerging Issues Task Force (EITF) Issue No. 02-16, “Accounting by a Customer (Including a Reseller) for Certain Consideration Received from a Vendor” as discussed below.
In the first quarter of 2003, we adopted EITF No. 02-16 which resulted in the reclassification of certain vendor income items from operating expenses to inventory purchases and recognized into income as the vendors’ merchandise is sold. The guidance was applied on a prospective basis only as required by EITF No. 02-16. This guidance had no material impact on sales, cash flows or financial position for any period.
In the fourth quarter of 2003, we adopted EITF No. 03-10, “Application of Issue 02-16 by Resellers to Sales Incentives Offered to Consumers by Manufacturers,” which amends EITF No. 02-16. In accordance with EITF No. 03-10, if certain criteria are met, consideration received from a vendor for honoring the vendor’s sales incentives offered directly to consumers (i.e. manufacturer’s coupons) should not be recorded as a reduction of the cost of the reseller’s purchases from the vendor. The adoption of EITF No. 03-10 did not have a material impact on net earnings, cash flows or financial position.
Buying, Occupancy and Distribution Expenses
Buying expenses primarily consist of salaries and expenses incurred by our merchandising operations, while occupancy expenses primarily consist of rent, property taxes and other operating costs of our retail, distribution and headquarters facilities. Buying and occupancy expenses classified in selling, general and administrative expenses were $1,421 million, $1,213 million and $1,063 million in 2004, 2003 and 2002, respectively. In addition, we recorded $1,035 million, $910 million and $789 million of depreciation expense for our retail, distribution and headquarters facilities in 2004, 2003 and 2002, respectively.
28
Advertising Costs
Advertising costs, included in selling, general and administrative expense, are expensed at first showing of the advertisement and were $888 million, $872 million and $666 million for 2004, 2003 and 2002, respectively. Advertising vendor income used to reduce advertising expenses was approximately $72 million, $58 million and $173 million for 2004, 2003 and 2002, respectively. Television and radio broadcast and newspaper circulars make up the majority of our advertising costs in all three years.
Discontinued Operations
On March 10, 2004, we began a review of strategic alternatives for our Marshall Field’s and Mervyn’s businesses, which included but was not limited to the possible sale of one or both as ongoing businesses to existing retailers or other qualified buyers.
On June 9, 2004, we agreed to sell Marshall Field’s and the Mervyn’s stores located in Minnesota to The May Department Store Company (May). We completed the sale of Marshall Field’s on July 31, 2004 and the sale of the Minnesota Mervyn’s stores on August 24, 2004. May acquired total assets and liabilities with a net carrying value of $1,563 million in exchange for $3,240 million cash consideration, resulting in a gain on the sale of $1,677 million or $1.14 per share.
On July 29, 2004, we agreed to sell the remaining Mervyn’s retail stores and distribution centers to an investment consortium including Sun Capital Partners, Inc., Cerberus Capital Management, L.P., and Lubert-Adler/Klaff and Partners, L.P. and to sell Mervyn’s credit card receivables to GE Consumer Finance, a unit of General Electric Company, for total cash consideration of $1,641 million. This sale transaction was completed as of August 28, 2004, resulting in a gain of $322 million or $.22 per share.
In accordance with SFAS No. 144, “Accounting for the Impairment or Disposal of Long-Lived Assets,” the financial results of Marshall Field’s and Mervyn’s are reported as discontinued operations for all periods presented.
In connection with the sale of Marshall Field’s, May is purchasing transition support services from us until the end of first quarter 2005. We are providing transition services to the buyer of Mervyn’s for a fee until the earlier of August 2007 or the date on which an alternative long-term solution for providing these services is in place. The fees received for providing these services exceed our marginal costs, but when an allocable share of our fixed costs is included, the consideration received is essentially equal to our total costs.
The financial results included in discontinued operations were as follows:
| | January 29, | | January 31, | | February 1, | |
(millions) | | 2005 | | 2004 | | 2003 | |
| | | | | | | |
Revenue | | $ | 3,095 | | $ | 6,138 | | $ | 6,507 | |
Earnings from discontinued operations before income taxes | | 121 | | 306 | | 399 | |
Earnings from discontinued operations, net of $46, $116 and $152 tax, respectively | | 75 | | 190 | | 247 | |
Gain on sale of discontinued operations, net of $761 tax | | 1,238 | | — | | — | |
Total income from discontinued operations, net of tax | | $ | 1,313 | | $ | 190 | | $ | 247 | |
There were no assets or liabilities of Marshall Field’s or Mervyn’s included in our Consolidated Statements of Financial Position at January 29, 2005. The major classes of assets and liabilities of discontinued operations in the Consolidated Statements of Financial Position on January 31, 2004 were as follows:
| | January 31, | |
(millions) | | 2004 | |
| | | |
Cash and cash equivalents | | $ | 8 | |
Accounts receivable, net | | 1,155 | |
Inventory | | 812 | |
Other | | 117 | |
Current assets of discontinued operations | | $ | 2,092 | |
Property and equipment, net | | $ | 1,816 | |
Other | | 118 | |
Non-current assets of discontinued operations | | $ | 1,934 | |
Accounts payable | | $ | 492 | |
Accrued liabilities | | 330 | |
Current portion of long-term debt and notes payable | | 3 | |
Current liabilities of discontinued operations | | $ | 825 | |
Long-term debt | | $ | 62 | |
Deferred income taxes | | — | |
Other | | 204 | |
Non-current liabilities of discontinued operations | | $ | 266 | |
Earnings per Share
Basic earnings per share (EPS) is net earnings divided by the average number of common shares outstanding during the period. Diluted EPS includes the incremental shares that are assumed to be issued on the exercise of stock options.
(millions, except | | Basic EPS | | Diluted EPS | |
per share data) | | 2004 | | 2003 | | 2002 | | 2004 | | 2003 | | 2002 | |
| | | | | | | | | | | | | |
Net earnings | | $ | 3,198 | | $ | 1,809 | | $ | 1,623 | | $ | 3,198 | | $ | 1,809 | | $ | 1,623 | |
Basic weighted average common shares outstanding | | 903.8 | | 911.0 | | 908.0 | | 903.8 | | 911.0 | | 908.0 | |
Stock options | | — | | — | | — | | 8.3 | | 8.2 | | 6.3 | |
Weighted average common shares outstanding | | 903.8 | | 911.0 | | 908.0 | | 912.1 | | 919.2 | | 914.3 | |
Earnings per share | | $ | 3.54 | | $ | 1.99 | | $ | 1.79 | | $ | 3.51 | | $ | 1.97 | | $ | 1.78 | |
The shares related to stock options shown above do not include shares issuable upon exercise of approximately 4.5 million and 13.2 million at January 31, 2004 and February 1, 2003, respectively, because the effect would have been antidilutive. There were no antidilutive shares issuable upon exercise at January 29, 2005.
Other Comprehensive Income
Other comprehensive income includes revenues, expenses, gains and losses that are excluded from net earnings under GAAP. In 2004 and 2003, other comprehensive income primarily included gains and losses on certain hedge transactions and the change in our minimum pension liability, net of related taxes.
29
Cash Equivalents
Cash equivalents represent short-term investments with a maturity of three months or less from the time of purchase and were $1,732 million, $244 million and $357 million in 2004, 2003 and 2002, respectively. The increase of $1,488 in 2004 compared to 2003 is primarily due to investment of the remaining proceeds at year end from the divestitures of Marshall Field’s and Mervyn’s.
Accounts Receivable
Accounts receivable are recorded net of an allowance for expected losses. The allowance, recognized in an amount equal to the anticipated future write-offs based on delinquencies, risk scores, aging trends, industry risk trends and our historical experience, was $387 million at January 29, 2005 and $352 million at January 31, 2004.
Through our special purpose subsidiary, Target Receivables Corporation (TRC), we transfer, on an ongoing basis, substantially all of our receivables to the Target Credit Card Master Trust (the Trust) in return for certificates representing undivided interests in the Trust’s assets. TRC owns the undivided interest in the Trust’s assets, other than the Trust’s assets securing the financing transactions entered into by the Trust and the 2 percent of Trust assets held by Target National Bank (TNB). TNB is a wholly owned subsidiary of the Corporation that also services receivables. SFAS No. 140 “Accounting for Transfers and Servicing of Financial Assets and Extinguishments of Liabilities (a replacement of SFAS No. 125)” is the accounting guidance applicable to such transactions. SFAS No. 140 requires that we include the receivables within the Trust and any debt securities issued by the Trust in our Consolidated Statement of Financial Position. Notwithstanding this accounting treatment, the receivables within the Trust are owned by our wholly-owned, bankruptcy remote subsidiary, TRC, and thus are not available to general creditors of Target.
Inventory
Substantially all of our inventory and the related cost of sales are accounted for under the retail inventory accounting method using the last-in, first-out (LIFO) basis. Inventory is stated at the lower of LIFO cost or market. Inventory also includes a LIFO provision that is calculated based on inventory levels, markup rates and internally generated retail price indices. Our only accumulated LIFO reserve relates to Target Commercial Interiors and is immaterial to our consolidated financial statements. Because we have experienced price deflation recently, we have not recorded a LIFO provision for Target Stores.
Other Current Assets
Other current assets as of January 29, 2005 and January 31, 2004 consist of the following:
| | 2004 | | 2003 | |
Vendor income and other receivables | | $ | 428 | | $ | 391 | |
Deferred taxes | | 344 | | 236 | |
Other | | 452 | | 373 | |
Total | | $ | 1,224 | | $ | 1,000 | |
In addition to vendor income, other receivables relate primarily to pharmacy receivables and merchandise sourcing services provided to third parties.
Property and Equipment
Property and equipment are recorded at cost, less accumulated depreciation. Depreciation is computed using the straight-line method over estimated useful lives. Depreciation expense for the years 2004, 2003 and 2002 was $1,232 million, $1,068 million and $942 million, respectively. Accelerated depreciation methods are generally used for income tax purposes. Repair and maintenance costs were $453 million, $393 million and $355 million in 2004, 2003 and 2002, respectively.
Estimated useful lives by major asset category are as follows:
Asset | | Life (in years) | |
Buildings and improvements | | 8-39 | |
Fixtures and equipment | | 4-15 | |
Computer hardware and software | | 4 | |
In accordance with SFAS No. 144, “Accounting for the Impairment or Disposal of Long-Lived Assets,” all long-lived assets are reviewed when events or changes in circumstances indicate that the carrying value of the asset may not be recoverable. We review assets at the lowest level for which there are identifiable cash flows, which is usually at the store level. The carrying amount of the store assets is compared to the expected undiscounted future cash flows to be generated by those assets over the estimated remaining useful life of the store. Cash flows are projected for each store based upon historical results and expectations. In cases where the expected future cash flows and fair value are less than the carrying amount of the assets, those stores are considered impaired and the assets are written down to fair value. Fair value is based on appraisals or other reasonable methods to estimate fair value. Impairment losses are included in depreciation expense for assets held and in use and included within selling, general and administrative expense on assets classified as held for sale. No impairments were recorded in 2004 or 2003 as a result of the tests performed.
Other Non-current Assets
Other non-current assets as of January 29, 2005 and January 31, 2004 consist of the following:
| | 2004 | | 2003 | |
Prepaid pension expense | | $ | 711 | | $ | 580 | |
Cash value of life insurance | | 439 | | 363 | |
Goodwill and intangible assets | | 206 | | 229 | |
Other | | 155 | | 205 | |
Total | | $ | 1,511 | | $ | 1,377 | |
Goodwill and Intangible Assets
Goodwill and intangible assets are recorded within other non-current assets at cost less accumulated amortization. Amortization is computed on intangible assets with definite useful lives using the straight-line method over estimated useful lives that range from three to fifteen years. Amortization expense for the years 2004, 2003 and 2002 was $27 million, $30 million and $25 million, respectively. At January 29, 2005 and January 31, 2004, goodwill and intangible assets by major classes were as follows:
30
| | | | | | Leasehold | | | | | | | | | |
| | | | | | Acquisition | | | | | | | | | |
| | Goodwill | | Costs | | Other | | Total | |
(millions) | | 2004 | | 2003 | | 2004 | | 2003 | | 2004 | | 2003 | | 2004 | | 2003 | |
| | | | | | | | | | | | | | | | | |
Gross asset | | $ | 80 | | $ | 80 | | $ | 185 | | $ | 182 | | $ | 201 | | $ | 200 | | $ | 466 | | $ | 462 | |
Accumulated amortization | | (20 | ) | (20 | ) | (52 | ) | (34 | ) | (188 | ) | (179 | ) | (260 | ) | (233 | ) |
Net goodwill and intangible assets | | $ | 60 | | $ | 60 | | $ | 133 | | $ | 148 | | $ | 13 | | $ | 21 | | $ | 206 | | $ | 229 | |
As required, we adopted SFAS No. 142, “Goodwill and Other Intangible Assets,” during the first quarter of 2002. In 2004, 2003 and 2002, the adoption of this statement reduced annual amortization expense of certain intangible assets by approximately $5 million (less than $.01 per share). The estimated aggregate amortization expense of our definite-lived intangible assets for each of the five succeeding fiscal years, 2005 to 2009, is expected to be $24 million, $22 million, $20 million, $19 million and $19 million, respectively. During 2004, goodwill with an approximate carrying value of $63 million was sold as part of the Marshall Field’s transaction. There was no goodwill included in the Mervyn’s sale transaction that also occurred in 2004.
Discounted cash flow models were used in determining fair value for the purposes of the required annual goodwill impairment analysis. No impairments were recorded in 2004, 2003 and 2002 as a result of the tests performed.
Accounts Payable
Our accounting policy is to reduce accounts payable when checks to vendors clear the bank from which they were drawn. Outstanding checks included in accounts payable were $992 million and $966 million at year-end 2004 and 2003, respectively.
Accrued Liabilities
Accrued liabilities as of January 29, 2005 and January 31, 2004 consist of the following:
| | 2004 | | 2003 | |
Wages and benefits | | $ | 412 | | $ | 369 | |
Taxes payable | | 287 | | 245 | |
Gift card liability | | 214 | | 169 | |
Other | | 720 | | 505 | |
Total | | $ | 1,633 | | $ | 1,288 | |
Taxes payable consist of real estate, employee withholdings and sales tax liabilities. Gift card liability represents the amount of gift cards that have been issued but have not been presented for redemption.
Commitments and Contingencies
At January 29, 2005, our obligations included notes and debentures of $9,447 million (discussed in detail under Notes Payable and Long-term Debt below), the present value of capital lease obligations of $91 million and total future payments of operating leases with total contractual lease payments of $3,049 million, including certain options to extend the lease term that are expected to be exercised in the amount of $1,415 million (discussed in detail under Leases on page 32). In addition, commitments for the purchase, construction, lease or remodeling of real estate, facilities and equipment were approximately $544 million at year-end 2004. Merchandise royalty commitments of approximately $102 million are due during the five-year period ending in 2009. Throughout the year, we enter into various commitments to purchase inventory. In addition to the accounts payable reflected in our Consolidated Statements of Financial Position on page 25, we had commitments with various vendors for the purchase of inventory as of January 29, 2005. These purchase commitments are cancelable by their terms.
We expect to receive a share of the proceeds from the $3 billion Visa/MasterCard antitrust litigation settlement, as we are a member of the class action lawsuit. However, the amount and timing of the payment are not certain at this time.
We are exposed to claims and litigation arising out of the ordinary course of business and use various methods to resolve these matters in a manner that we believe serves the best interest of our shareholders and other constituents. Our policy is to disclose pending lawsuits and other known claims that we expect may have a material impact on our results of operations, cash flows or financial condition. Other than the matter discussed above, we do not believe any of the currently identified claims and litigated matters meet this criterion, either individually or in the aggregate.
Notes Payable and Long-term Debt
At January 29, 2005, no notes payable were outstanding. The average amount of notes payable outstanding during 2004 was $55 million at a weighted average interest rate of 1.3 percent. In 2004, notes payable balances fluctuated significantly during the year due to seasonal financing needs, proceeds from sale of Marshall Field’s and Mervyn’s and other factors. On July 28, 2004, our short-term borrowing reached $1,422 million, its highest level for the year.
At January 31, 2004, no notes payable were outstanding. The average amount of notes payable outstanding during 2003 was $377 million at a weighted average interest rate of 1.2 percent. On October 31, 2003, our short-term borrowing reached $1,409 million, its highest level for the year.
At January 29, 2005, two committed credit agreements totaling $1,600 million were in place through a group of 25 banks at specified rates. Of these credit lines, an $800 million credit facility expires in June 2005 and includes a one-year term-out option to June 2006. The remaining $800 million credit facility expires in June 2008. There were no balances outstanding at any time during 2004 or 2003 under these agreements.
In 2004, we issued no long-term debt. We called or repurchased $542 million of long-term debt with an average remaining life of 24 years and a weighted average interest rate of 7.0 percent, resulting in a pre-tax loss of $89 million (approximately $.06 per share), reflected in interest expense.
In 2003, we issued $500 million of long-term debt maturing in 2008 at 3.38 percent, $200 million of long-term debt maturing in 2018 at 4.88 percent and $500 million of long-term debt maturing in 2013 at 4.00 percent. We also called or repurchased $297 million of long-term debt with an average remaining life of 20 years and a weighted average interest rate of 7.8 percent, resulting in a pre-tax loss of $15 million (approximately $.01 per share), reflected in interest expense.
The portion of long-term debt secured by credit card receivables was $750 million at January 29, 2005. On January 31, 2004, we had $1,500 million of long-term debt secured by credit card receivables, $750 million of which was classified as current portion of long-term debt.
31
At year-end, our debt portfolio, including adjustments related to swap transactions discussed in the following derivatives section, was as follows:
Notes Payable and Long-term Debt | | | | |
| | January 29, 2005 | | January 31, 2004 | |
(millions) | | Rate * | | Balance | | Rate * | | Balance | |
Notes payable | | — | % | $ | — | | — | % | $ | — | |
Notes and debentures: | | | | | | | | | |
Due 2004-2008 | | 4.0 | | 4,045 | | 3.1 | | 4,953 | |
Due 2009-2013 | | 5.9 | | 3,726 | | 5.8 | | 3,795 | |
Due 2014-2018 | | 3.3 | | 234 | | 2.3 | | 227 | |
Due 2019-2023 | | 9.3 | | 213 | | 9.3 | | 214 | |
Due 2024-2028 | | 6.7 | | 325 | | 6.7 | | 400 | |
Due 2029-2033 | | 6.6 | | 904 | | 6.7 | | 1,300 | |
| | | | | | | | | |
Total notes payable, notes and debentures ** | | 5.2 | % | $ | 9,447 | | 4.7 | % | $ | 10,889 | |
Capital lease obligations | | | | 91 | | | | 129 | |
Less: current portion | | | | (504 | ) | | | (863 | ) |
Notes payable and long-term debt | | | | $ | 9,034 | | | | $ | 10,155 | |
* Reflects the weighted average stated interest rate as of year-end, including the impact of interest rate swaps.
** The estimated fair value of total notes payable, notes and debentures, using a discounted cash flow analysis based on our incremental interest rates for similar types of financial instruments, was $10,171 million at January 29, 2005 and $11,681 million at January 31, 2004.
Required principal payments on long-term debt over the next five years, excluding capital lease obligations, are $501 million in 2005, $751 million in 2006, $1,321 million in 2007, $1,451 million in 2008 and $751 million in 2009.
Derivatives
Our derivative instruments are primarily interest rate swaps which hedge the fair value of certain debt by effectively converting interest from a fixed rate to a variable rate. We also hold derivative instruments to manage our exposure to risks associated with the effect of equity market returns on our non-qualified defined contribution plans as discussed on page 34.
At January 29, 2005 and January 31, 2004, interest rate swaps were outstanding in notional amounts totaling $2,850 million and $2,150 million, respectively. The change in market value of an interest rate swap as well as the offsetting change in market value of the hedged debt is recognized into earnings in the current period. Ineffectiveness would result when changes in the market value of the hedged debt are not completely offset by changes in the market value of the interest rate swap. There was no ineffectiveness recognized in 2004 or 2003 related to these instruments. The fair value of outstanding interest rate swaps and net unamortized gains from terminated interest rate swaps was $45 million at January 29, 2005 and $97 million at January 31, 2004.
During 2004, we entered into two interest rate swaps with notional amounts of $200 million and two interest rate swaps with notional amounts of $250 million. We also terminated an interest rate swap with a notional amount of $200 million, resulting in a loss of $16 million that will be amortized into expense over the remaining life of the hedged debt. During 2003, we entered into interest rate swaps with notional amounts of $200 million, $500 million and $400 million. We also terminated an interest rate swap with a notional amount of $400 million, resulting in a gain of $24 million that will be amortized into income over the remaining life of the hedged debt. In 2004 and 2003, the gains and losses amortized into income for terminated swaps were not material to our results of operations.
Interest Rate Swaps Outstanding at Year-end | |
January 29, 2005 | | January 31, 2004 | |
Notional | | Receive | | Pay | | Notional | | Receive | | Pay | |
Amount | | Fixed | | Floating * | | Amount | | Fixed | | Floating * | |
$ | 500 | | 7.5 | % | 2.4 | % | $ | 500 | | 7.5 | % | 1.2 | % |
200 | | 5.8 | | 3.3 | | — | | — | | — | |
550 | | 4.6 | | 3.3 | | 550 | | 4.6 | | 1.3 | |
500 | | 4.4 | | 3.2 | | 500 | | 4.4 | | 1.2 | |
400 | | 4.4 | | 3.3 | | 400 | | 4.4 | | 1.4 | |
200 | | 3.9 | | 2.4 | | — | | — | | — | |
250 | | 3.8 | | 2.5 | | — | | — | | — | |
250 | | 3.8 | | 2.4 | | — | | — | | — | |
— | | — | | — | | 200 | | 4.9 | | 1.1 | |
$ | 2,850 | | | | | | $ | 2,150 | | | | | |
* Reflects floating interest rate accrued at the end of the year.
The weighted average life of the interest rate swaps was approximately 3 years at January 29, 2005.
Leases
Assets held under capital leases are included in property and equipment and are charged to depreciation and interest over the life of the lease. Operating leases are not capitalized and lease rentals are expensed on a straight-line basis over the life of the lease. Rent expense on buildings, classified in selling, general and administrative expense, includes percentage rents that are based on a percentage of retail sales over contractual levels. Total rent expense was $240 million in 2004, $150 million in 2003 and $150 million in 2002. Most of the long-term leases include options to renew, with terms varying from one to 50 years. Certain leases also include options to purchase the property.
Future minimum lease payments required under noncancelable lease agreements existing at January 29, 2005, were:
Future Minimum Lease Payments | | |
| | Operating | | Capital | |
(millions) | | Leases | | Leases | |
| | | | | |
2005 | | $ | 146 | | $ | 12 | |
2006 | | 142 | | 12 | |
2007 | | 137 | | 13 | |
2008 | | 117 | | 13 | |
2009 | | 102 | | 12 | |
After 2009 | | 2,405 | | 127 | |
Total future minimum lease payments | | $ | 3,049 | *** | $ | 189 | |
Less: Interest * | | | | (98 | ) |
Present value of minimum capital lease payments | | | | $ | 91 | ** |
* Calculated using the interest rate at inception for each lease.
** Includes current portion of $3 million.
*** Total contractual lease payments include certain options to extend lease terms, in the amount of $1,415, that are expected to be exercised because the investment in leasehold improvement is significant.
32
Income Taxes
Reconciliation of tax rates is as follows:
Tax Rate Reconciliation
| | 2004 | | 2003 | | 2002 | |
Federal statutory rate | | 35.0 | % | 35.0 | % | 35.0 | % |
State income taxes, net of federal tax benefit | | 3.3 | | 3.3 | | 3.4 | |
Dividends on ESOP stock | | (0.2 | ) | (0.2 | ) | (0.2 | ) |
Work opportunity tax credits | | (0.2 | ) | (0.2 | ) | (0.2 | ) |
Other | | (0.1 | ) | (0.1 | ) | 0.2 | |
Effective tax rate | | 37.8 | % | 37.8 | % | 38.2 | % |
The components of the provision for income taxes were:
Income Tax Provision: Expense | | | | | |
(millions) | | 2004 | | 2003 | | 2002 | |
Current: | | | | | | | |
Federal | | $ | 908 | | $ | 669 | | $ | 550 | |
State | | 144 | | 107 | | 93 | |
| | 1,052 | | 776 | | 643 | |
Deferred: | | | | | | | |
Federal | | 83 | | 184 | | 185 | |
State | | 11 | | 24 | | 23 | |
| | 94 | | 208 | | 208 | |
Total | | $ | 1,146 | | $ | 984 | | $ | 851 | |
The components of the net deferred tax asset/(liability) were:
Net Deferred Tax Asset/(Liability) | | | | | |
| | January 29, | | January 31, | |
(millions) | | 2005 | | 2004 | |
Gross deferred tax assets: | | | | | |
Deferred compensation | | $ | 332 | | $ | 297 | |
Self-insured benefits | | 179 | | 143 | |
Accounts receivable valuation allowance | | 147 | | 133 | |
Inventory | | 47 | | 44 | |
Postretirement health care obligation | | 38 | | 42 | |
Other | | 128 | | 53 | |
| | 871 | | 712 | |
Gross deferred tax liabilities: | | | | | |
Property and equipment | | (1,136 | ) | (806 | ) |
Pension | | (268 | ) | (218 | ) |
Other | | (96 | ) | (84 | ) |
| | (1,500 | ) | (1,108 | ) |
Total | | $ | (629 | ) | $ | (396 | ) |
In the Consolidated Statement of Financial Position, the current deferred tax asset balance is the net of all current deferred tax assets and current deferred tax liabilities. The non-current deferred tax liability is the net of all non-current deferred tax assets and non-current deferred tax liabilities.
Approximately $566 million of the proceeds attributable to the real properties sold in the Marshall Field’s and Mervyn’s dispositions were used to acquire replacement properties which will be used in our business. Approximately $371 million of the gain related to the sold real properties was deferred for income tax purposes as required by Section 1031 of the Internal Revenue Code until such time as the replacement properties are disposed.
Other Non-current Liabilities
Other non-current liabilities as of January 29, 2005 and January 31, 2004 consist of the following:
| | 2004 | | 2003 | |
Deferred compensation | | $ | 528 | | $ | 464 | |
Worker’s compensation and general liability | | 317 | | 286 | |
Other | | 192 | | 167 | |
Total | | $ | 1,037 | | $ | 917 | |
Share Repurchase
In June 2004, our Board of Directors authorized the repurchase of $3 billion of our common stock, which we expect to complete over two to three years. This authorization replaced our previous repurchase programs that were authorized by our Board of Directors in January 1999 and March 2000. We repurchased 29 million shares at an average price per share of $44.68 during 2004, at a total cost of $1,290 million.
Stock-based Compensation
We maintain a long-term incentive plan for key employees and non-employee members of our Board of Directors. Our long-term incentive plan allows for the grant of equity-based compensation awards, including stock options, performance share awards, restricted stock awards, or a combination of awards. A majority of the awards are non-qualified stock options that vest annually in equal amounts over a four-year period. Therefore, in accordance with SFAS No. 23R, we recognize compensation expense for these awards on a straight-line basis over the four-year vesting period. These options generally expire no later than ten years after the date of the grant. Options granted to the non-employee members of our Board of Directors vest after one year and have a ten-year term. Performance share awards represent shares issuable in the future based upon attainment of specified levels of future financial performance. We use a three or four year performance measurement period for performance share awards. The number of unissued common shares reserved for future grants under the stock-based compensation plans was 51,560,249 at January 29, 2005 and 19,279,658 at January 31, 2004.
33
Options and Performance Share Awards Outstanding
| | Options | | Performance | |
| | Total Outstanding | | Currently Exercisable | | Shares | |
(options and shares | | Number of | | Average | | Average | | Number of | | Average | | Average | | Potentially | |
in thousands) | | Options | | Price * | | Life ** | | Options | | Price * | | Life ** | | Issuable | |
February 2, 2002 | | 31,315 | | $ | 24.07 | | 5.7 | | 17,629 | | $ | 17.04 | | 5.7 | | — | |
Granted | | 6,096 | | 30.60 | | | | | | | | | | 552 | |
Canceled | | (561 | ) | 35.55 | | | | | | | | | | | |
Exercised | | (2,063 | ) | 12.22 | | | | | | | | | | | |
| | | | | | | | | | | | | | | |
February 1, 2003 | | 34,787 | | $ | 25.73 | | 5.5 | | 21,931 | | $ | 20.89 | | 5.4 | | 552 | |
Granted | | 4,638 | | 38.34 | | | | | | | | | | 573 | |
Canceled | | (407 | ) | 34.77 | | | | | | | | | | | |
Exercised | | (2,859 | ) | 12.58 | | | | | | | | | | | |
| | | | | | | | | | | | | | | |
January 31, 2004 | | 36,159 | | $ | 28.28 | | 6.2 | | 23,689 | | $ | 24.48 | | 5.2 | | 1,125 | |
Granted | | 4,072 | | 49.12 | | | | | | | | | | 629 | |
Canceled/forfeited | | (513 | ) | 35.32 | | | | | | | | | | (73 | ) |
Exercised/earned | | (7,727 | ) | 20.95 | | | | | | | | | | (73 | ) |
January 29, 2005 | | 31,991 | | $ | 32.59 | | 5.8 | | 22,102 | | $ | 28.79 | | 5.3 | | 1,608 | |
* Weighted average exercise price.
** Weighted average contractual life remaining in years.
Total compensation expense related to stock-based compensation, which is the total fair value of shares vested was $60 million, $57 million and $49 million, during 2004, 2003 and 2002, respectively. The weighted-average grant date fair value of options granted during 2004, 2003 and 2002 was $13.10, $11.04 and $10.07, respectively. The total intrinsic value of options (the amount by which the stock price exceeded the strike price of the option on the date of exercise) that were exercised during 2004, 2003 and 2002 was $201 million, $72 million and $66 million, respectively.
Nonvested Options and Performance Share Awards
| | Weighted Average | | Weighted Average | |
(options and shares in thousands) | | Stock
Options | | Fair Value at
Grant Date | | Performance
Shares | | Fair Value at
Grant Date | |
Nonvested at February 1, 2004 | | 12,470 | | $ | 11.07 | | 1,125 | | $ | 34.33 | |
Granted | | 4,072 | | 13.10 | | 419 | | 49.43 | |
Vested/earned | | (6,237 | ) | 11.25 | | (73 | ) | 34.44 | |
Forfeited/cancelled | | (416 | ) | 11.00 | | (73 | ) | 34.44 | |
Nonvested at January 29, 2005 | | 9,889 | | $ | 11.83 | | 1,398 | | $ | 38.84 | |
As of January 29, 2005, there was $104 million of total unrecognized compensation expense related to nonvested share-based compensation arrangements granted under our plans. That cost is expected to be recognized over a weighted-average period of 1.5 years.
We have elected to adopt the provisions of SFAS No. 123R in 2004 under the modified retrospective transition method. The beginning balances of deferred taxes, paid-in capital and retained earnings for 2003 have been restated by $54 million, $143 million and $90 million, respectively, to recognize compensation cost for fiscal years 1996 through 2002 in the amounts previously reported in the Notes to Consolidated Financial Statements under the provisions of SFAS No. 123. The requirements of SFAS No. 123R are discussed on page 23.
The Black-Scholes model was used to estimate the fair value of the options at grant date based on the following assumptions:
| | 2004 | | 2003 | | 2002 | |
Dividend yield | | .7 | % | .8 | % | .8 | % |
Volatility | | 22 | % | 29 | % | 35 | % |
Risk-free interest rate | | 3.8 | % | 3.0 | % | 3.0 | % |
Expected life in years | | 5.5 | | 5.0 | | 5.0 | |
Defined Contribution Plans
Employees who meet certain eligibility requirements can participate in a defined contribution 401(k) plan by investing up to 80 percent of their compensation. Highly compensated employees, however, are further limited by federal law and related regulation. Subject to these limits, we match 100 percent of each employee’s contribution up to 5 percent of total compensation. Our contribution to the plan is initially invested in Target Corporation common stock but once vested after a period of three years the amounts are free to be diversified. Benefits expense related to these matching contributions was $118 million, $117 million and $111 million in 2004, 2003 and 2002, respectively.
In addition, we maintain other non-qualified, unfunded plans that allow participants who are otherwise limited by qualified plan statutes or regulations. They can defer compensation including remaining company match amounts, and earn returns tied to the results of either our 401(k) plan investment choices, including Target stock, or in the case of a frozen plan, market levels of interest rates, plus an additional return determined by the terms of each plan. We recognized benefits expense for these non-qualified plans of $63 million and $86 million in 2004 and 2003, respectively, and income of $20 million in 2002. We manage the risk of offering these retirement savings plans through a variety of activities, which include investing in vehicles that offset a substantial portion of our exposure to these returns. Including the impact of these related investments, net benefits expense from these plans was $23 million, $28 million, and $16 million in 2004, 2003, and 2002, respectively. We adjusted our position in some of the investment vehicles resulting in the repurchase of 0.8 million, 1.5 million and 0.5 million shares of our common stock in 2004, 2003 and 2002, respectively.
In 2004 and 2003, certain retired executives accepted our offer to exchange our obligation to them under our frozen non-qualified plan for cash or deferrals in our current non-qualified plans, which resulted in expense of $17 million in both years. Additionally, during 2002, certain non-qualified pension and survivor benefits owed to current executives were exchanged for deferrals in our current non-qualified plans and certain retired executives accepted our offer to exchange our obligation to them in our frozen non-qualified plan for deferrals in our current plans. These exchanges resulted in expense of $33 million. We expect lower future expenses as a result of these transactions because they were designed to be economically neutral or slightly favorable to us.
Participants in our non-qualified plans deferred compensation of $33 million, $42 million and $35 million in 2004, 2003 and 2002, respectively.
34
Pension and Postretirement Health Care Benefits
We have a qualified defined benefit pension plan that covers all U.S. employees who meet certain age, length of service and hours worked per year requirements. We also have unfunded non-qualified pension plans for employees who have qualified plan compensation restrictions. Benefits are provided based upon years of service and the employee’s compensation. Retired employees also become eligible for certain health care benefits if they meet minimum age and service requirements and agree to contribute a portion of the cost. Prior to the end of 2004, but after the measurement date, we merged our three qualified U.S. pension plans into one plan. The expected impact of this merger on future accounting results is immaterial.
The Medicare Prescription Drug, Improvements and Modernization Act of 2003 (the Act) was signed into law in December 2003. As a result of the Act we recorded a reduction in our accumulated post-retirement benefit obligation of $7 million in 2004. In addition, the expense amounts shown in the table below reflect a $1 million reduction due to the amortization of the actuarial gain and reduction in interest cost due to the effects of the Act.
Obligations and Funded Status at October31, 2004
| | Pension Benefits | | Postretirement | |
| | | | | | Non-qualified | | Health Care | |
| | Qualified Plans | | Plans | | Benefits | |
(millions) | | 2004 | | 2003 | | 2004 | | 2003 | | 2004 | | 2003 | |
Change in Benefit Obligation | | | | | | | | | | | | | |
Benefit obligation at beginning of measurement period | | $ | 1,333 | | $ | 1,078 | | $ | 29 | | $ | 23 | | $ | 123 | | $ | 116 | |
Service cost | | 78 | | 73 | | 1 | | 1 | | 3 | | 2 | |
Interest cost | | 82 | | 74 | | 2 | | 2 | | 7 | | 8 | |
Actuarial loss | | 68 | | 164 | | 4 | | 6 | | (6 | ) | 7 | |
Benefits paid | | (65 | ) | (56 | ) | (3 | ) | (3 | ) | (13 | ) | (10 | ) |
Plan amendments | | 19 | | — | | 1 | | — | | (7 | ) | — | |
Settlement | | — | | — | | — | | — | | — | | — | |
Benefit obligation at end of measurement period | | $ | 1,515 | | $ | 1,333 | | $ | 34 | | $ | 29 | | $ | 107 | | $ | 123 | |
Change in Plan Assets | | | | | | | | | | | | | |
Fair value of plan assets at beginning of measurement period | | $ | 1,405 | | $ | 1,058 | | $ | — | | $ | — | | $ | — | | $ | — | |
Actual return on plan assets | | 157 | | 203 | | — | | — | | — | | — | |
Employer contribution | | 201 | | 200 | | 3 | | 3 | | 13 | | 10 | |
Benefits paid | | (65 | ) | (56 | ) | (3 | ) | (3 | ) | (13 | ) | (10 | ) |
Fair value of plan assets at end of measurement period | | $ | 1,698 | | $ | 1,405 | | $ | — | | $ | — | | $ | — | | $ | — | |
Funded status | | $ | 183 | | $ | 72 | | $ | (34 | ) | $ | (29 | ) | $ | (107 | ) | $ | (123 | ) |
Unrecognized actuarial loss | | 584 | | 587 | | 15 | | 12 | | 6 | | 12 | |
Unrecognized prior service cost | | (39 | ) | (65 | ) | 2 | | 3 | | — | | 1 | |
Net amount recognized | | $ | 728 | | $ | 594 | | $ | (17 | ) | $ | (14 | ) | $ | (101 | ) | $ | (110 | ) |
Amounts recognized in the Statements of Financial Position consist of:
| | Pension Benefits | | Postretirement | |
| | | | | | Non-qualified | | Health Care | |
| | Qualified Plans | | Plans | | Benefits | |
(millions) | | 2004 | | 2003 | | 2004 | | 2003 | | 2004 | | 2003 | |
Prepaid benefit cost | | $ | 733 | | $ | 600 | | $ | — | | $ | — | | $ | — | | $ | — | |
Accrued benefit cost | | (11 | ) | (6 | ) | (24 | ) | (20 | ) | (101 | ) | (110 | ) |
Intangible assets | | — | | — | | 2 | | 3 | | n/a | | n/a | |
Accumulated OCI | | 6 | | — | | 5 | | 3 | | n/a | | n/a | |
Net amount recognized | | $ | 728 | | $ | 594 | | $ | (17 | ) | $ | (14 | ) | $ | (101 | ) | $ | (110 | ) |
The accumulated benefit obligation for all defined benefit pension plans was $1,501 million and $1,237 million at October 31, 2004 and 2003, respectively. The projected benefit obligation, accumulated benefit obligation and fair value of plan assets for the pension plans with an accumulated benefit obligation in excess of plan assets were $49 million, $45 million and $5 million, respectively, as of October 31, 2004 and $34 million, $30 million and $1 million, respectively, as of October 31, 2003.
Net Pension and Postretirement Health Care Benefits Expense
| | Pension Benefits | | Postretirement
Health Care Benefits | |
(millions) | | 2004 | | 2003 | | 2002 | | 2004 | | 2003 | | 2002 | |
Service cost benefits earned during the period | | $ | 79 | | $ | 74 | | $ | 58 | | $ | 3 | | $ | 2 | | $ | 2 | |
Interest cost on projected benefit obligation | | 84 | | 75 | | 75 | | 7 | | 8 | | 8 | |
Expected return on assets | | (122 | ) | (114 | ) | (108 | ) | — | | — | | — | |
Recognized losses | | 36 | | 18 | | 10 | | 1 | | 1 | | 1 | |
Recognized prior service cost | | (7 | ) | (7 | ) | 1 | | — | | — | | — | |
Settlement/curtailment charges | | 1 | | — | | (12 | ) | (7 | ) | — | | — | |
Total | | $ | 71 | | $ | 46 | | $ | 24 | | $ | 4 | | $ | 11 | | $ | 11 | |
The amortization of any prior service cost is determined using a straight-line amortization of the cost over the average remaining service period of employees expected to receive benefits under the plan. Curtailment gains recorded in 2004 were a result of the sale of Marshall Field’s and Mervyn’s. These curtailment gains are included in the gain on disposal of discontinued operations as a result of freezing the benefits for Marshall Field’s and Mervyn’s employees and retaining the related assets and obligations of the plans.
35
Assumptions
Weighted average assumptions used to determine benefit obligations at October 31:
| | Pension Benefits | | Postretirement
Health Care Benefits | |
| | 2004 | | 2003 | | 2004 | | 2003 | |
Discount rate | | 5.75 | % | 6.25 | % | 5.75 | % | 6.25 | % |
Average assumed rate of compensation increase | | 2.75 | % | 3.25 | % | n/a | | n/a | |
Weighted average assumptions used to determine net periodic benefit cost for years ended October 31:
| | Pension Benefits | | Postretirement
Health Care Benefits | |
| | 2004 | | 2003 | | 2004 | | 2003 | |
Discount rate | | 6.25 | % | 7.00 | % | 6.25 | % | 7.00 | % |
Expected long-term rate of return on plan assets | | 8.00 | % | 8.50 | % | n/a | | n/a | |
Average assumed rate of compensation increase | | 3.25 | % | 4.00 | % | n/a | | n/a | |
Our rate of return on qualified plans’ assets has averaged 4.9 percent and 10.2 percent per year over the 5-year and 10-year periods, respectively, ending October 31, 2004 (our measurement date).
An increase in the cost of covered health care benefits of 6 percent was assumed for 2004. The rate is assumed to be 10 percent in 2005 and is reduced by 1 percent annually to 5 percent in 2010 and thereafter. The health care cost trend rate assumption may have a significant effect on the amounts reported.
A one percent change in assumed health care cost trend rates would have the following effects:
| | 1% Increase | | 1% Decrease | |
Effect on total of service and interest cost components of net periodic postretirement health care benefit cost | | $ | — | | $ | — | |
Effect on the health care component of the postretirement benefit obligation | | $ | 4 | | $ | (4 | ) |
Additional Information
Our pension plan weighted average asset allocations at October 31, 2004 and 2003 by asset category are as follows:
Asset Category
| | 2004 | | 2003 | |
Equity securities | | 58 | % | 56 | % |
Debt securities | | 26 | | 26 | |
Other | | 16 | | 18 | |
Total | | 100 | % | 100 | % |
Our asset allocation strategy for 2005 targets 55 percent in equity securities, 25 percent in debt securities and 20 percent in other assets. Equity securities include our common stock in amounts substantially less than 1 percent of total plan assets at October 31, 2004 and 2003. Other assets include private equity, mezzanine and distressed debt and timber and less than a 5 percent allocation to real estate. Our expected long-term rate of return assumptions as of October 31, 2004 are 8.5 percent, 5 percent and 10 percent for equity securities, debt securities and other assets, respectively.
Contributions
Given the qualified pension plans’ funded position, we are not required to make any contributions in 2005. In similar situations in the past, we have chosen to make discretionary contributions for various purposes, including minimizing Pension Benefit Guaranty Corporation premium payments and maintaining the fully-funded status of the plans. In 2005, such discretionary contributions could range from $0 to $50 million. We expect to make contributions in the range of $5 million to $15 million to our other postretirement benefit plans in 2005.
Estimated Future Benefit Payments
The following benefit payments, which reflect expected future service, as appropriate, are expected to be paid:
(millions) | | Pension
Benefits | | Postretirement
Health Care Benefits | |
2005 | | $ | 59 | | $ | 8 | |
2006 | | 62 | | 8 | |
2007 | | 66 | | 8 | |
2008 | | 70 | | 9 | |
2009 | | 75 | | 9 | |
2010–2014 | | $ | 476 | | $ | 53 | |
36
Quarterly Results (Unaudited)
Due to the seasonal nature of our business, fourth quarter operating results typically represent a substantially larger share of total year revenues and earnings due to the inclusion of the holiday shopping season. The same accounting policies are followed in preparing quarterly financial data as are followed in preparing annual data. The table below summarizes results by quarter for 2004 and 2003:
| | First Quarter | | Second Quarter | | Third Quarter | | Fourth Quarter | | Total Year | |
(millions, except per share data) | | 2004 | | 2003 | | 2004 | | 2003 | | 2004 | | 2003 | | 2004 | | 2003 | | 2004 | | 2003 | |
Total revenues | | $ | 10,180 | | $ | 8,928 | | $ | 10,556 | | $ | 9,594 | | $ | 10,909 | | $ | 9,827 | | $ | 15,194 | | $ | 13,676 | | $ | 46,839 | | $ | 42,025 | |
| | | | | | | | | | | | | | | | | | | | | |
Gross margin | | $ | 3,140 | | $ | 2,706 | | $ | 3,268 | | $ | 2,874 | | $ | 3,300 | | $ | 2,909 | | $ | 4,529 | | $ | 4,050 | | $ | 14,237 | | $ | 12,539 | |
| | | | | | | | | | | | | | | | | | | | | |
Earnings from continuing operations | | $ | 392 | | $ | 313 | | $ | 360 | | $ | 322 | | $ | 324 | | $ | 262 | | $ | 809 | | $ | 722 | | $ | 1,885 | | $ | 1,619 | |
| | | | | | | | | | | | | | | | | | | | | |
Earnings from discontinued operations, net of $25, $18, $19, $18, $2, $18, $62, $46 and $116 tax | | $ | 40 | | $ | 29 | | $ | 31 | | $ | 29 | | $ | 4 | | $ | 31 | | $ | — | | $ | 101 | | $ | 75 | | $ | 190 | |
| | | | | | | | | | | | | | | | | | | | | |
Gain/(loss) on disposal of discontinued operations, net of $650, $132, $(21), and $761 tax (c) | | $ | — | | $ | — | | $ | 1,019 | | $ | — | | $ | 203 | | $ | — | | $ | 16 | | $ | — | | $ | 1,238 | | $ | — | |
| | | | | | | | | | | | | | | | | | | | | |
Net earnings (a) (b) | | $ | 432 | | $ | 342 | | $ | 1,410 | | $ | 351 | | $ | 531 | | $ | 293 | | $ | 825 | | $ | 823 | | $ | 3,198 | | $ | 1,809 | |
| | | | | | | | | | | | | | | | | | | | | |
Basic earnings per share (d) | | | | | | | | | | | | | | | | | | | | | |
| | | | | | | | | | | | | | | | | | | | | |
Continuing operations | | $ | 0.43 | | $ | 0.34 | | $ | 0.40 | | $ | 0.35 | | $ | 0.36 | | $ | 0.29 | | $ | 0.91 | | $ | 0.79 | | $ | 2.09 | | $ | 1.78 | |
| | | | | | | | | | | | | | | | | | | | | |
Discontinued operations | | $ | 0.04 | | $ | 0.03 | | $ | 0.03 | | $ | 0.03 | | $ | — | | $ | 0.03 | | $ | — | | $ | 0.11 | | $ | 0.08 | | $ | 0.21 | |
| | | | | | | | | | | | | | | | | | | | | |
Gain from discontinued operations | | $ | — | | $ | — | | $ | 1.12 | | $ | — | | $ | 0.23 | | $ | — | | $ | 0.01 | | $ | — | | $ | 1.37 | | $ | — | |
| | | | | | | | | | | | | | | | | | | | | |
Basic earnings per share (a) (b) | | $ | 0.47 | | $ | 0.37 | | $ | 1.55 | | $ | 0.38 | | $ | 0.59 | | $ | 0.32 | | $ | 0.92 | | $ | 0.90 | | $ | 3.54 | | $ | 1.99 | |
| | | | | | | | | | | | | | | | | | | | | |
Diluted earnings per share (d) | | | | | | | | | | | | | | | | | | | | | |
| | | | | | | | | | | | | | | | | | | | | |
Continuing operations | | $ | 0.43 | | $ | 0.34 | | $ | 0.39 | | $ | 0.35 | | $ | 0.36 | | $ | 0.29 | | $ | 0.90 | | $ | 0.79 | | $ | 2.07 | | $ | 1.76 | |
| | | | | | | | | | | | | | | | | | | | | |
Discontinued operations | | $ | 0.04 | | $ | 0.03 | | $ | 0.03 | | $ | 0.03 | | $ | — | | $ | 0.03 | | $ | — | | $ | 0.11 | | $ | 0.08 | | $ | 0.21 | |
| | | | | | | | | | | | | | | | | | | | | |
Gain from discontinued operations | | $ | — | | $ | — | | $ | 1.11 | | $ | — | | $ | 0.23 | | $ | — | | $ | 0.01 | | $ | — | | $ | 1.36 | | $ | — | |
| | | | | | | | | | | | | | | | | | | | | |
Diluted earnings per share (a) (b) | | $ | 0.47 | | $ | 0.37 | | $ | 1.53 | | $ | 0.38 | | $ | 0.59 | | $ | 0.32 | | $ | 0.91 | | $ | 0.90 | | $ | 3.51 | | $ | 1.97 | |
| | | | | | | | | | | | | | | | | | | | | |
Dividends declared per share (d) | | $ | .070 | | $ | .060 | | $ | .080 | | $ | .070 | | $ | .080 | | $ | .070 | | $ | .080 | | $ | .070 | | $ | .310 | | $ | .270 | |
| | | | | | | | | | | | | | | | | | | | | |
Closing common stock price (e) | | | | | | | | | | | | | | | | | | | | | |
| | | | | | | | | | | | | | | | | | | | | |
High | | $ | 45.63 | | $ | 33.44 | | $ | 46.43 | | $ | 39.82 | | $ | 50.02 | | $ | 41.54 | | $ | 52.43 | | $ | 40.15 | | $ | 52.43 | | $ | 41.54 | |
| | | | | | | | | | | | | | | | | | | | | |
Low | | $ | 38.59 | | $ | 26.06 | | $ | 40.80 | | $ | 33.06 | | $ | 40.42 | | $ | 37.55 | | $ | 48.50 | | $ | 37.05 | | $ | 38.59 | | $ | 26.06 | |
| | | | | | | | | | | | | | | | | | | | | | | | | | | | | | | | | | | |
(a) Net earnings for first, second and third quarter of 2004 and all four quarters of 2003 has been adjusted to reflect the impact of the SFAS No. 123R restatement for those periods. The amount of the restatement was $6 million for each of the three quarters in 2004 and $8 million for each of the four quarters in 2003. The restatement impact on per share amounts for each respective quarter was all less than $0.01 per share.
(b) Target adjusted its method of accounting for leases related to a specific category of owned store locations on leased land which resulted in a non-cash adjustment, primarily attributable to an increase in the straight-line rent accrual, of $65 million ($0.04 per share) in the fourth quarter of 2004.
(c) Minor tax adjustments related to the dispositions of Marshall Field’s and Mervyn’s were recorded in fourth quarter 2004.
(d) Per share amounts are computed independently for each of the quarters presented. The sum of the quarters may not equal the total year amount due to the impact of changes in average quarterly shares outstanding.
(e) Our common stock is listed on the New York Stock Exchange and Pacific Exchange. At March 21, 2005, there were 18,030 registered shareholders and the closing common stock price was $50.28 per share.
37
Report of Independent Registered Public Accounting Firm
on Consolidated Financial Statements
The Board of Directors and Shareholders
Target Corporation
We have audited the accompanying consolidated statements of financial position of Target Corporation and subsidiaries as of January 29, 2005, and January 31, 2004, and the related consolidated results of operations, cash flows and shareholders’ investment for each of the three years in the period ended January 29, 2005. These financial statements are the responsibility of the Corporation’s management. Our responsibility is to express an opinion on these financial statements based on our audits.
We conducted our audits in accordance with the standards of the Public Company Accounting Oversight Board (PCAOB) (United States). Those standards require that we plan and perform the audit to obtain reasonable assurance about whether the financial statements are free of material misstatement. An audit includes examining, on a test basis, evidence supporting the amounts and disclosures in the financial statements. An audit also includes assessing the accounting principles used and significant estimates made by management, as well as evaluating the overall financial statement presentation. We believe that our audits provide a reasonable basis for our opinion.
In our opinion, the financial statements referred to above present fairly, in all material respects, the consolidated financial position of Target Corporation and subsidiaries at January 29, 2005, and January 31, 2004, and the consolidated results of their operations and their cash flows for each of the three years in the period ended January 29, 2005, in conformity with U.S. generally accepted accounting principles.
We also have audited, in accordance with the standards of the PCAOB (United States), the effectiveness of the Corporation’s internal control over financial reporting as of January 29, 2005, based on criteria established in Internal Control – Integrated Framework issued by the Committee of Sponsoring Organizations of the Treadway Commission, and our report dated March 25, 2005, expressed an unqualified opinion thereon.
As discussed in the Stock-based Compensation note to the financial statements, effective February 1, 2004, the Corporation adopted Statement of Financial Accounting Standards No. 123 (revised 2004), “Share-Based Payment” using the modified retrospective transition method.
Minneapolis, Minnesota | /s/ Ernst & Young LLP | |
March 25, 2005 | |
Report of Management on Internal Control
Our management is responsible for establishing and maintaining adequate internal control over financial reporting, as such term is defined in Exchange Act Rules 13a-15(f). Under the supervision and with the participation of our management, including our chief executive officer and chief financial officer, we assessed the effectiveness of our internal control over financial reporting as of January 29, 2005 based on the framework in Internal Control – Integrated Framework issued by the Committee of Sponsoring Organizations of the Treadway Commission. Based on our assessment we conclude that the Corporation’s internal control over financial reporting is effective based on those criteria.
Our management’s assessment of the effectiveness of our internal control over financial reporting as of January 29, 2005 has been audited by Ernst & Young LLP, an independent registered public accounting firm, as stated in their report which is included herein.
/s/ Robert J. Ulrich | | /s/ Douglas A. Scovanner | |
Robert J. Ulrich | Douglas A. Scovanner |
Chairman of the Board and | Executive Vice President and |
Chief Executive Officer | Chief Financial Officer |
March 25, 2005 | |
Report of Independent Registered Public Accounting Firm
on Internal Control over Financial Reporting
The Board of Directors and Shareholders
Target Corporation
We have audited management’s assessment, included in the accompanying Report of Management on Internal Control, that Target Corporation and subsidiaries maintained effective internal control over financial reporting as of January 29, 2005, based on criteria established in Internal Control – Integrated Framework issued by the Committee of Sponsoring Organizations of the Treadway Commission (the COSO criteria). The Corporation’s management is responsible for maintaining effective internal control over financial reporting and for its assessment of the effectiveness of internal control over financial reporting. Our responsibility is to express an opinion on management’s assessment and an opinion on the effectiveness of the Corporation’s internal control over financial reporting based on our audit.
We conducted our audit in accordance with the standards of the Public Company Accounting Oversight Board (PCAOB) (United States). Those standards require that we plan and perform the audit to obtain reasonable assurance about whether effective internal control over financial reporting was maintained in all material respects. Our audit included obtaining an understanding of internal control over financial reporting, evaluating management’s assessment, testing and evaluating the design and operating effectiveness of internal control, and performing such other procedures as we considered necessary in the circumstances. We believe that our audit provides a reasonable basis for our opinion.
A company’s internal control over financial reporting is a process designed to provide reasonable assurance regarding the reliability of financial reporting and the preparation of financial statements for external purposes in accordance with generally accepted accounting principles. A company’s internal control over financial reporting includes those policies and procedures that (1) pertain to the maintenance of records that, in reasonable detail, accurately and fairly reflect the transactions and dispositions of the assets of the company; (2) provide reasonable assurance that transactions are recorded as necessary to permit preparation of financial statements in accordance with generally accepted accounting principles, and that receipts and expenditures of the company are being made only in accordance with authorizations of management and directors of the company; and (3) provide reasonable assurance regarding prevention or timely detection of unauthorized acquisition, use, or disposition of the company’s assets that could have a material effect on the financial statements.
Because of its inherent limitations, internal control over financial reporting may not prevent or detect misstatements. Also, projections of any evaluation of effectiveness to future periods are subject to the risk that controls may become inadequate because of changes in conditions, or that the degree of compliance with the policies or procedures may deteriorate.
In our opinion, management’s assessment that Target Corporation and subsidiaries maintained effective internal control over financial reporting as of January 29, 2005, is fairly stated, in all material respects, based on the COSO criteria. Also, in our opinion, the Corporation maintained, in all material respects, effective internal control over financial reporting as of January 29, 2005, based on the COSO criteria.
We also have audited, in accordance with the standards of the PCAOB (United States), the consolidated statements of financial position of Target Corporation and subsidiaries as of January 29, 2005, and January 31, 2004, and the related consolidated results of operations, cash flows, and shareholders’ investment for each of the three years in the period ended January 29, 2005, of Target Corporation and subsidiaries, and our report dated March 25, 2005, expressed an unqualified opinion thereon.
Minneapolis, Minnesota | /s/ Ernst & Young LLP | |
March 25, 2005 | |
38