Exhibit 13
YEAR-END STORE COUNT AND SQUARE FOOTAGE BY STATE
| | No. of | | | |
Market Share Group | | Stores | | Retail Sq Ft. | |
| | | | (in thousands) | |
 10%+ Market Share 10%+ Market Share
| | | | | |
Arizona | | 41 | | 5,036 | |
California | | 205 | | 25,619 | |
Colorado | | 34 | | 4,748 | |
Florida | | 95 | | 12,362 | |
Illinois | | 75 | | 9,951 | |
Iowa | | 21 | | 2,837 | |
Maryland | | 30 | | 3,800 | |
Massachusetts | | 23 | | 2,903 | |
Minnesota | | 64 | | 8,609 | |
Nebraska | | 11 | | 1,397 | |
Nevada | | 14 | | 1,736 | |
New Jersey | | 32 | | 4,137 | |
North Dakota | | 4 | | 513 | |
Virginia | | 40 | | 5,159 | |
Group Total | | 689 | | 88,807 | |
| | | | | |
 7.5%-9.9% Market Share 7.5%-9.9% Market Share
| | | | | |
Connecticut | | 11 | | 1,448 | |
Georgia | | 44 | | 5,752 | |
Indiana | | 32 | | 4,182 | |
Kansas | | 17 | | 2,323 | |
Montana | | 7 | | 767 | |
New York | | 49 | | 6,534 | |
North Carolina | | 38 | | 4,783 | |
Rhode Island | | 3 | | 378 | |
Texas | | 121 | | 15,961 | |
Utah | | 9 | | 1,428 | |
Washington | | 31 | | 3,573 | |
Wisconsin | | 31 | | 3,600 | |
Group Total | | 393 | | 50,729 | |
| | | | | |
 5.0%-7.4% Market Share 5.0%-7.4% Market Share
| | | | | |
Delaware | | 2 | | 268 | |
Louisiana | | 12 | | 1,726 | |
Michigan | | 53 | | 6,054 | |
Missouri | | 28 | | 3,632 | |
New Hampshire | | 6 | | 772 | |
New Mexico | | 9 | | 997 | |
Ohio | | 53 | | 6,397 | |
Oregon | | 17 | | 2,042 | |
Pennsylvania | | 33 | | 4,217 | |
South Carolina | | 17 | | 2,097 | |
South Dakota | | 4 | | 417 | |
Tennessee | | 25 | | 3,041 | |
Group Total | | 259 | | 31,660 | |
| | | | | |
 2.5%-4.9% Market Share 2.5%-4.9% Market Share
| | | | | |
Alabama | | 11 | | 1,665 | |
Idaho | | 5 | | 537 | |
Kentucky | | 12 | | 1,362 | |
Maine | | 2 | | 250 | |
Oklahoma | | 11 | | 1,457 | |
West Virginia | | 4 | | 499 | |
Wyoming | | 2 | | 187 | |
Group Total | | 47 | | 5,957 | |
| | | | | |
 0.0%-2.4% Market Share 0.0%-2.4% Market Share
| | | | | |
Alaska | | 0 | | 0 | |
Arkansas | | 5 | | 618 | |
Hawaii | | 0 | | 0 | |
Mississippi | | 4 | | 489 | |
Vermont | | 0 | | 0 | |
Group Total | | 9 | | 1,107 | |
Total | | 1,397 | | 178,260 | |
For purposes of this schedule, market share is defined as Target sales by state as a percentage of U.S. General Merchandise Store sales, including department stores, discount stores, supercenters and warehouse clubs. For other purposes, broader or narrower measures of market share may be more appropriate.
FINANCIAL SUMMARY – CONTINUING OPERATIONS
| | 2005 | | 2004 | | 2003 | | 2002 | | 2001 | | 2000 | |
Total revenues | | 52,620 | | 46,839 | | 42,025 | | 37,410 | | 33,021 | | 29,740 | |
| | | | | | | | | | | | | |
Earnings from continuing operations | | $ | 2,408 | | $ | 1,885 | | $ | 1,619 | | $ | 1,376 | | $ | 1,101 | | $ | 962 | |
| | | | | | | | | | | | | |
Per Share: | | | | | | | | | | | | | |
Basic earnings per share | | $ | 2.73 | | $ | 2.09 | | $ | 1.78 | | $ | 1.52 | | $ | 1.22 | | $ | 1.06 | |
Diluted earnings per share | | $ | 2.71 | | $ | 2.07 | | $ | 1.76 | | $ | 1.51 | | $ | 1.21 | | $ | 1.06 | |
Cash dividends declared | | $ | .380 | | $ | .310 | | $ | .270 | | $ | .240 | | $ | .225 | | $ | .215 | |
| | | | | | | | | | | | | |
Total assets | | $ | 34,995 | | $ | 32,293 | | $ | 27,390 | | $ | 24,506 | | $ | 19,808 | | $ | 15,349 | |
| | | | | | | | | | | | | |
Long-term debt | | $ | 9,119 | | $ | 9,034 | | $ | 10,155 | | $ | 10,119 | | $ | 8,055 | | $ | 5,598 | |
| | | | | | | | | | | | | |
Total number of distribution centers | | 26 | | 25 | | 22 | | 16 | | 14 | | 12 | |
16
MANAGEMENT’S DISCUSSION AND ANALYSIS
Executive Summary
Target Corporation (the Corporation or Target) operates large-format general merchandise discount stores in the United States. Our credit card operation represents an integral component of our core retail business. Through our branded proprietary credit (or REDcard) products, we strengthen the bond with our guests, drive incremental sales and contribute meaningfully to earnings. We also operate Target.com, an online business which is small relative to our overall size, but is growing at a much more rapid annual pace than our stores and provides important benefits to our stores and to our credit card operation.
Fiscal 2005 was a year of excellent sales and earnings growth for Target. Earnings from continuing operations grew 27.7 percent to $2,408 million and, on this same basis, diluted earnings per share rose 31.0 percent to $2.71. Comparable-store sales increased 5.6 percent and our credit contribution to EBIT increased 32.8 percent to $645 million. The combination of strong sales performance, gross margin rate expansion and enhanced contribution from our credit card operation produced EBIT of $4,323 million, an increase of more than 20 percent from 2004.
We are committed to consistently delighting our guests, providing a workplace that is preferred by our team members and investing to improve the quality of life in communities where we operate. In this way, we believe we will continue to achieve profitable market share growth and deliver superior shareholder value for many years to come.
Management’s Discussion and Analysis is based on our Consolidated Financial Statements, pages 24-27.
Analysis of Continuing Operations
Revenues and
Comparable-Store Sales
Sales include merchandise sales, net of expected returns, from our stores and our online business, as well as gift card breakage revenue. Refer to Note 2, pages 28-29 for a definition of breakage revenue. Total revenues include sales and net credit card revenues (income from finance charges, late fees and other revenues from our proprietary credit card products). Total revenues do not include sales tax as we consider ourselves a pass-through conduit for collecting and remitting sales taxes. Comparable-store sales are sales from stores open longer than one year, including stores that have relocated and general merchandise stores that have been remodeled. Comparable-store sales do not include sales from general merchandise stores that have been converted to a SuperTarget store format in the past twelve months, sales from stores that were intentionally closed to be remodeled or sales from our online business. The method of calculating comparable-store sales varies across the retail industry.
Revenue Growth | | 2005 | | 2004 | | 2003 | |
Comparable-store sales | | 5.6 | % | 5.3 | % | 4.4 | % |
Other sales factors (a) | | 6.6 | % | 6.3 | % | 7.7 | % |
Total sales | | 12.2 | % | 11.6 | % | 12.1 | % |
Net credit card revenues | | 16.5 | % | 5.5 | % | 23.2 | % |
Total revenues | | 12.3 | % | 11.5 | % | 12.3 | % |
(a) Principally contributions from new stores.
Comparable-store sales growth in 2005 and 2004 was attributable to growth in both average transaction amount and the number of transactions in comparable stores. In 2006, we expect to generate a low-double-digit percentage increase in revenues, reflecting contribution from new store expansion, continued growth in comparable-store sales due to increases in average transaction amount and the number of transactions in comparable-stores and growth in net credit card revenues. In 2005, there was essentially no impact of inflation / deflation on sales growth, compared to a deflationary impact of approximately 1 percent in 2004 and 4 percent in 2003. We do not expect inflation / deflation to have a significant effect on sales growth in 2006.
Gross Margin Rate
Gross margin rate represents gross margin (sales less cost of sales) as a percent of sales. Cost of sales includes purchases, markdowns, inventory shrink, and other costs associated with our merchandise, as well as all freight to our stores and global sourcing costs. These costs are partially offset by various forms of consideration earned from our vendors, referred to as “vendor income.” Refer to Critical Accounting Estimates, page 22.
In 2005, our consolidated gross margin rate increased 0.7 percentage points to a rate of 31.9 percent. This change in gross margin rate primarily reflected an improvement in markup, including an increase in direct import penetration, as well as favorable inventory shrinkage performance. Refer to Critical Accounting Estimates, page 22, for further discussion of cost of sales. Markup is the difference between an item’s cost and its retail price (expressed as a percentage of its retail price). Factors that affect markup include vendor offerings and negotiations, vendor income, sourcing strategies, market forces like the cost of raw materials and freight and competitive influences. The definition and method of calculating markup and gross margin varies across the retail industry.
In 2004, our consolidated gross margin rate increased by 0.6 percentage points to a rate of 31.2 percent primarily due to an increase in markup, including an increase in direct import penetration.
17
We expect our consolidated gross margin rate in 2006 to be approximately equal to our 2005 rate as potential opportunities to increase gross margin are expected to approximately offset potential pressures. The factors affecting our outlook include: our introduction of new merchandising strategies, our growth in direct imports and our ability to leverage our increasing scale, offset by the competitive pricing environment and the more rapid pace of growth of lower margin categories, like consumables and commodities.
Selling, General and Administrative Expense Rate
Our SG&A expense rate represents payroll, benefits, advertising, distribution, buying and occupancy, start-up and other expenses as a percentage of sales. SG&A expenses exclude depreciation and amortization and expenses associated with our credit card operation, which are reflected separately in our Consolidated Statements of Operations. In 2005, 2004 and 2003 approximately $110 million, $72 million and $58 million, respectively, of vendor income was recorded as an offset to SG&A expenses because it represented reimbursement for specific, incremental and identifiable advertising costs.
In 2005, our consolidated SG&A expense rate increased to 21.8 percent compared to 21.4 percent in 2004. The expense increase was due to several factors, including the year-over-year impact of reduced transition services income related to our 2004 divestitures of Marshall Field’s and Mervyn’s, higher utilities expense and the effects of stronger year-over-year performance on incentive and share-based compensation expense. Some of the expense rate increase can also be attributed to growth in marketing expenses for which the corresponding vendor income is recorded as a reduction of inventory costs because it did not meet the criteria required for recording it as an element of SG&A expenses. The combination of all unfavorable expense items more than offset the year-over-year favorability from last year’s lease accounting adjustment.
In 2004, our consolidated SG&A expense rate rose to 21.4 percent compared to 21.2 percent in 2003. Approximately half of this year-over-year increase was attributable to a lease expense adjustment that synchronized our straight-line expense term with the depreciable lives of the associated assets. See further discussion in Note 29, page 39. The primary driver of the remaining increase was higher workers’ compensation costs.
In 2006, we expect our SG&A expense rate to be approximately equal to our 2005 rate.
Credit Card Contribution
We offer credit to qualified guests through our REDcard products, including the Target Visa and Target Card. Our credit card revenues are finance charges, late fees and other revenues. In addition, we receive third-party merchant fees from merchants who accept the Target Visa credit card. In 2005 and 2004, our net credit card revenues increased due to continued growth in the Target Visa portfolio. In 2005, growth in net credit card revenues was also attributable to higher interest rates, as a majority of our receivables are assessed finance charges at a prime-based floating rate. Credit card expenses include a bad debt provision, as well as operations and marketing expenses supporting our credit card portfolio. In 2005 versus 2004, our bad debt provision grew at a slower pace than our average receivables balance due to the aging of the portfolio and the favorable macroeconomic credit card environment. However, our total reserve balance as a percentage of average receivables increased in 2005 as we reserve for the expected effects of the mandated increases in minimum payments for certain guests. Our net write-offs as a percentage of average receivables and our delinquency rates continued to improve, despite a significant increase in bankruptcy filings in advance of the October 2005 effective date of the related federal bankruptcy legislation. Operations and marketing expenses increased primarily due to the growth of the Target Visa portfolio.
The contribution from our credit card operation to EBIT includes finance charge revenue, late fees, other revenue, intracompany and third party merchant fees, less bad debt provision and operations and marketing expenses.
We expect our 2006 credit card receivables to grow in line with 2006 sales, and we expect our overall credit card performance to remain strong. The improvement in our delinquency rates is not expected to continue throughout 2006 as we cycle the effects of the October 2005 bankruptcy legislation and experience the effects of the mandated increases in minimum payments for certain guests.
Credit Card Contribution to EBIT
(millions) | | 2005 | | 2004 | | 2003 | |
Revenues: | | | | | | | |
Finance charges, late fees and other revenues | | $ | 1,225 | | $ | 1,059 | | $ | 1,015 | |
Merchant fees | | | | | | | |
Intracompany | | 72 | | 65 | | 49 | |
Third-party | | 124 | | 98 | | 82 | |
Total revenues | | 1,421 | | 1,222 | | 1,146 | |
Expenses: | | | | | | | |
Bad debt provision | | 466 | | 451 | | 476 | |
Operations and marketing | | 310 | | 286 | | 246 | |
Total expenses | | 776 | | 737 | | 722 | |
Pre-tax credit card contribution to EBIT | | $ | 645 | | $ | 485 | | $ | 424 | |
As a percent of average receivables | | 11.6 | % | 9.8 | % | 9.1 | % |
Receivables
(millions) | | 2005 | | 2004 | | 2003 | |
Year-end receivables | | $ | 6,117 | | $ | 5,456 | | $ | 4,973 | |
Average receivables | | $ | 5,544 | | $ | 4,927 | | $ | 4,661 | |
Accounts with three or more payments past due as a percent of year-end receivables | | 2.8 | % | 3.5 | % | 4.2 | % |
18
Allowance for Doubtful Accounts
(millions) | | 2005 | | 2004 | | 2003 | |
Allowance at beginning of year | | $ | 387 | | $ | 352 | | $ | 320 | |
Bad debt provision | | 466 | | 451 | | 476 | |
Net write-offs | | (402 | ) | (416 | ) | (444 | ) |
Allowance at end of year | | $ | 451 | | $ | 387 | | $ | 352 | |
As a percent of year-end receivables | | 7.4 | % | 7.1 | % | 7.1 | % |
Other Credit Card Information
| | 2005 | | 2004 | | 2003 | |
Total revenues as a percent of average receivables | | 25.6 | % | 24.8 | % | 24.6 | % |
Net write-offs as a percent of average receivables | | 7.2 | % | 8.4 | % | 9.5 | % |
Depreciation and Amortization
In 2005, depreciation and amortization expense increased 11.9 percent, in line with our sales growth for the year, to $1,409 million. In 2004, depreciation and amortization increased 14.6 percent to $1,259 million compared to 2003. Expense for 2004 grew faster than sales partially due to accelerated depreciation on existing stores that were planned to be closed, or torn down and rebuilt. In 2006, we expect depreciation and amortization expense to increase in line with our sales growth.
Net Interest Expense
In 2005, net interest expense was $463 million, $107 million lower than 2004. The majority of this decrease was attributable to a significantly smaller loss on debt repurchase in 2005 (less than $1 million in 2005 compared to $89 million in 2004). The decrease in 2005 net interest expense also reflected the benefit of lower average net debt in the first half of the year due to the application of proceeds from the mid-2004 Marshall Field’s and Mervyn’s sale transactions. This benefit was partially offset by higher average net debt balances in the second half of the year and a higher annual average portfolio interest rate. For the full year, the average portfolio interest rate was 5.9 percent in 2005 and 5.5 percent in 2004.
In 2004, net interest expense was $570 million, $14 million higher than 2003. This increase was due to a $74 million higher loss on debt called or repurchased, as well as a higher average portfolio interest rate resulting from the unfavorable mix effect of higher balances of short-term investments and higher market rates. This increase was mostly offset by significantly lower average net debt in the second half of the year due to proceeds received from the dispositions of Marshall Field’s and Mervyn’s. The average portfolio interest rate was 5.5 percent in 2004 and 4.9 percent in 2003. The $542 million of debt called or repurchased during 2004 resulted in a loss of $89 million, or approximately $.06 per share.
Our 2006 net interest expense is expected to increase due to higher average net debt driven in part by planned share repurchase activity. Beginning in 2005, the majority of our credit card receivables were assessed finance charges at a prime-based floating rate instead of a fixed rate. To preserve our net interest margin on our receivables, we intend to maintain a sufficient level of floating-rate debt to generate parallel changes in net interest expense and finance charge revenue.
Provision for Income Taxes
Our effective income tax rate from continuing operations was 37.6 percent in 2005 and 37.8 percent in 2004 and 2003, respectively. The slight decrease in our effective rate for 2005 related to several non-recurring favorable components of our provision for income taxes. We expect our effective income tax rate in 2006 to be approximately 38.0 to 38.5 percent.
Analysis of Financial Condition
Liquidity and Capital Resources
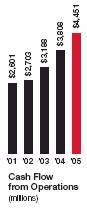
Our financial condition remains strong. In assessing our financial condition, we consider factors such as cash flows provided by operations, capital expenditures and debt service obligations. Cash flow provided by operations increased to $4,451 million in 2005 from $3,808 million in 2004, primarily due to higher earnings from continuing operations. We continue to fund our growth and execute our share repurchase program through a combination of internally-generated funds and debt financing.
Our year-end receivables (before allowance) increased 12.1 percent to $6,117 million. This growth was driven by increased issuance and usage of the Target Visa credit card during 2005. Average receivables in 2005 increased 12.5 percent.
Year-end inventory levels increased $454 million, or 8.4 percent, reflecting the natural increase required to support additional square footage, same-store sales growth and our strategic focus on increasing direct imports. This growth was more than fully funded by the $489 million increase in accounts payable over the same period.
In June 2004, our Board of Directors authorized the repurchase of $3 billion of our common stock. In November 2005, our Board increased the aggregate authorization by $2 billion, for a total authorization of $5 billion. During 2005, we repurchased 23.1 million shares for a total investment of $1,197 million ($51.88 per share). Since June 2004, we have repurchased a total of 51.6 million shares of our common stock for a total investment of $2,473 million ($47.95 per share). Repurchase of the remaining shares under the aggregate program is expected to be completed in the next two to three years.
Our financing strategy is to ensure liquidity and access to capital markets, to manage our net exposure to floating rates and to maintain a balanced spectrum of debt maturities. Within these parameters, we seek to minimize our cost of borrowing.
19
Management believes cash flows from operations, together with current levels of cash equivalents, proceeds from long-term financing activities and issuance of short-term debt will be sufficient in 2006 to fund planned capital expenditures, share repurchases, growth in receivables, maturities of long-term debt, and other cash requirements, including our seasonal inventory buildup.
Maintaining strong investment-grade debt ratings is a key part of our strategy. Our debt ratings as of January 28, 2006 were:
| | | | Standard | | | |
| | Moody’s | | and Poor’s | | Fitch | |
Long-term debt | | A2 | | A+ | | A+ | |
Commercial paper | | P-1 | | A-1 | | F1 | |
Securitized receivables | | Aaa | | AAA | | n/a | |
Further liquidity is provided by a committed $1.6 billion five-year unsecured revolving credit facility obtained through a group of banks in June 2005. This facility replaced our two previous committed credit agreements and is scheduled to expire in June 2010. No balances were outstanding at any time during 2005 under any of the agreements or during 2004 under our previous agreements. Most of our long-term debt obligations contain certain covenants related to secured debt levels. In addition, our credit facility contains a debt leverage covenant. We are, and expect to remain, in compliance with these covenants. No material debt instrument contains provisions requiring acceleration of payment upon a debt rating downgrade.
Interest coverage ratio represents the ratio of pre-tax earnings before fixed charges (interest expense and the interest portion of rent expense) to fixed charges. Our interest coverage ratio calculated as prescribed by SEC rules was 7.2x, 5.4x and 5.1x in 2005, 2004 and 2003, respectively. The ratios in 2004 and 2003 were adversely affected by losses from discretionary debt repurchase transactions and exclude historical income from discontinued operations. Management believes adjustments for these items are necessary to make the coverage ratio a more useful and consistent indicator of creditworthiness.
Capital Expenditures
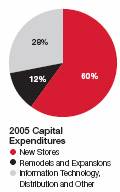
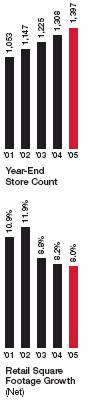
Capital expenditures were $3,388 million in 2005, compared with $3,068 million in 2004 and $2,738 million in 2003. Our higher spending level in 2005 was primarily attributable to growth in our new store expansion and remodel programs and the timing of investments in distribution center growth. Net property and equipment increased $2,178 million in 2005, following an increase of $1,707 million in 2004. Over the past five years, Target’s net retail square footage has grown at a compound annual rate of 9.5 percent.
Spending for new stores, store expansions and remodels represented approximately 72 percent and 76 percent of total capital expenditures in 2005 and 2004, respectively. Capital investments also included information systems hardware and software, distribution capacity and other infrastructure to support store growth.
In 2006, we expect to invest $3.8 billion to $4.0 billion, primarily in new stores, store expansions and remodels, as well as information systems hardware and software, distribution capacity and other infrastructure to support this growth. Our estimated 2006 store opening program reflects net square footage growth of approximately 8 percent, reflecting 110 to 115 total new stores partially offset by closings and relocations. We also expect to substantially remodel 60 to 65 stores, some of which will be expanded. In addition, we expect to open three distribution centers in 2006.
Number of Stores
| | January 28,
2006 | | Opened | | Closed (a) | | January 29,
2005 | |
Target General Merchandise Stores | | 1,239 | | 87 | | 20 | | 1,172 | |
SuperTarget Stores | | 158 | | 22 | | — | | 136 | |
Total | | 1,397 | | 109 | | 20 | | 1,308 | |
Retail Square Feet (b)
(thousands) | | January 28,
2006 | | Opened | | Closed (a) | | January 29,
2005 | |
Target General Merchandise Stores | | 150,318 | | 11,530 | | 2,165 | | 140,953 | |
SuperTarget Stores | | 27,942 | | 3,880 | | — | | 24,062 | |
Total | | 178,260 | | 15,410 | | 2,165 | | 165,015 | |
(a) Typically relates to stores relocated in the same trade area.
(b) Reflects total square feet, less office, distribution center and vacant space.
At year-end 2005, we owned 1,166 stores, leased 77 stores and operated 154 “combined” stores. Stores within the “combined” category are primarily owned buildings on leased land.
20
Commitments and Contingencies
At January 28, 2006, our debt, lease, real estate and purchase contractual obligations were as follows:
Contractual Obligations
| | Payments Due by Period | |
| | | | Less than | | 1–3 | | 3–5 | | After 5 | |
(millions) | | Total | | 1 Year | | Years | | Years | | Years | |
Long-term debt (a) | | $ | 9,792 | | $ | 751 | | $ | 2,772 | | $ | 2,987 | | $ | 3,282 | |
Interest payments – long-term debt (b) | | 4,274 | | 557 | | 929 | | 692 | | 2,096 | |
Capital lease obligations | | 223 | | 12 | | 25 | | 26 | | 160 | |
Operating leases (c) | | 3,097 | | 137 | | 255 | | 221 | | 2,484 | |
Real estate obligations | | 838 | | 818 | | 20 | | — | | — | |
Purchase obligations | | 1,431 | | 431 | | 434 | | 222 | | 344 | |
Standby letters of credit (d) | | 104 | | 102 | | 2 | | — | | — | |
Contractual cash obligations | | $ | 19,759 | | $ | 2,808 | | $ | 4,437 | | $ | 4,148 | | $ | 8,366 | |
| | | | | | | | | | | | | | | | | |
(a) Required principal payments only. Excludes SFAS No. 133, “Accounting for Derivative Instruments and Hedging Activities,” fair market value adjustments recorded in long-term debt.
(b) Includes payments on $1,650 million of floating rate long-term debt secured by credit card receivables, $750 million of which matures in 2007 and $900 million of which matures in 2010. These payments are calculated assuming rates of approximately 5 percent for each year outstanding. Excludes payments received or made related to interest rate swaps discussed on page 33.
(c) Total contractual lease payments include certain options to extend the lease term, in the amount of $1,421 million, that are expected to be exercised because the investment in leasehold improvements is significant and also includes $122 million of legally binding minimum lease payments for stores opening in 2006. Refer to Note 22, pages 33-34, for further discussion of leases, including a definition of what is included in and excluded from rent expense.
(d) Primarily related to the portion of our insurance claims for which we have retained the risk.
Real estate obligations include commitments for the purchase, construction or remodeling of real estate and facilities. Purchase obligations include all legally binding contracts such as firm minimum commitments for inventory purchases, merchandise royalties, purchases of equipment, marketing-related contracts, software acquisition /license commitments and service contracts.
In the normal course of business we issue purchase orders to purchase inventory, which represent authorizations to purchase and are cancelable by their terms. We do not consider purchase orders to be firm inventory commitments and therefore they are excluded from the table above. We also issue letters of credit in the ordinary course of business which are excluded from this table as these obligations are conditional on the purchase order not being cancelled. If under certain circumstances, and at our sole discretion, we choose to cancel a purchase order, we may be obligated to reimburse the vendor for unrecoverable outlays incurred prior to cancellation.
We have not included obligations under our pension and postretirement health care benefit plans in the contractual obligations table above. Our historical practice regarding these plans has been to contribute amounts necessary to satisfy minimum pension funding requirements plus periodic discretionary amounts determined to be appropriate. Further information on these plans, including our expected contributions for 2006, is addressed in Note 28 on pages 36-38.
Market Risk
Our exposure to market risk results primarily from interest rate changes on our debt obligations and on our credit card receivables, the majority of which are now assessed finance charges at a prime-based floating rate. At the end of 2005, our level of floating-rate debt obligations approximated our level of floating-rate credit card assets. As a result, based on our balance sheet position at January 28, 2006, interest rate changes would have approximately offsetting impacts on our net interest expense and finance charge revenues. To preserve our net interest margin, we intend to maintain sufficient levels of floating-rate debt to generate parallel changes in net interest expense as finance charge revenues fluctuate. See further discussion in Note 21, page 33.
In addition, we are exposed to fluctuations of market returns on our qualified defined benefit pension and non-qualified defined contribution plans. The annualized effect of a one percentage point decrease in the return on pension plan assets would decrease plan assets by $19 million at January 28, 2006. The resulting impact on net pension expense would be calculated consistent with the provisions of SFAS No. 87, “Employers’ Accounting for Pensions.” See further discussion in Note 28, pages 36-38. The annualized effect of a one percentage point change in market returns on our non-qualified defined contribution plans (inclusive of the effect of the investment vehicles used to manage our economic exposure) would not be significant. See further discussion in Note 27, page 36.
We do not have significant direct exposure to foreign currency rates as all of our stores are located in the United States and the vast majority of imported merchandise is purchased in U.S. dollars.
Overall, there have been no material changes in our primary risk exposures or management of market risks since the prior year.
Analysis of Discontinued Operations
Marshall Field’s and Mervyn’s were divested in 2004; no financial results of discontinued operations are included for the year ended January 28, 2006. In 2004, revenues and earnings from discontinued operations reflected only a partial year of results and excluded the holiday season. For the years ended January 29, 2005 and January 31, 2004, total revenues included in discontinued operations were $3,095 million and $6,138 million, respectively, and earnings from discontinued operations were $75 million and $190 million, net of taxes of $46 million and $116 million, respectively. In addition, we recorded a gain on the sale of discontinued operations of $1,238 million, net of taxes of $761 million, during the year ended January 29, 2005.
21
Critical Accounting Estimates
Our analysis of operations and financial condition is based on our consolidated financial statements, prepared in accordance with U.S. generally accepted accounting principles. Preparation of these consolidated financial statements requires us to make estimates and assumptions affecting the reported amounts of assets and liabilities at the date of the financial statements, reported amounts of revenues and expenses during the reporting period and related disclosures of contingent assets and liabilities. In the Notes to Consolidated Financial Statements, we describe our significant accounting policies used in preparing the consolidated financial statements. Our estimates are evaluated on an ongoing basis and are drawn from historical experience and other assumptions that we believe to be reasonable under the circumstances. Actual results could differ under different assumptions or conditions. Our senior management has discussed the development and selection of our critical accounting estimates with the Audit Committee of our Board of Directors.
The following items in our consolidated financial statements require significant estimation or judgment:
Inventory and cost of sales We utilize the retail inventory method to account for substantially all of our inventory and the related cost of sales. Under this method, inventory is stated at cost, using the last-in, first-out (LIFO) method, as determined by applying a cost-to-retail ratio to each merchandise grouping’s ending retail value. Since inventory value is adjusted regularly to reflect market conditions, our inventory methodology reflects the lower of cost or market. We reduce inventory for estimated losses related to shrinkage and markdowns. Our shrink estimate is based on historical losses verified by ongoing physical inventory counts. Markdowns designated for clearance activity are recorded when the salability of the merchandise has diminished. Inventory is at risk of obsolescence if economic conditions change. Examples of relevant economic conditions include shifting consumer demand, changing consumer credit markets or increasing competition. We believe these risks are largely mitigated because substantially all of our inventory sells in less than six months. Inventory is further described in Note 11, page 30.
Vendor income receivable Cost of sales and SG&A expenses are partially offset by various forms of consideration earned from our vendors. We receive consideration for a variety of vendor-sponsored programs, such as volume rebates, markdown allowances, promotions and advertising, as well as for our compliance programs. We establish a receivable for vendor income that is earned but not yet received from our vendors. Based on provisions of the programs in place, this receivable is computed by estimating the point at which we have completed our performance under the agreement and the amount earned. Due to the complexity and diversity of the individual vendor agreements, we perform detailed analyses and review historical trends to determine an appropriate level of the receivable in the aggregate. Substantially all of year-end receivables associated with these activities are collected within the following fiscal year and therefore do not require subjective long-term estimates. See further discussions in Note 4, page 29.
Allowance for doubtful accounts When receivables are recorded, we recognize an allowance for doubtful accounts in an amount equal to anticipated future write-offs. This allowance includes provisions for uncollectible finance charges and other credit fees. We estimate future write-offs based on delinquencies, risk scores, aging trends, industry risk trends and our historical experience. Management believes the allowance for doubtful accounts is adequate to cover anticipated losses in our credit card accounts receivable under current conditions; however, significant deterioration in any of the factors mentioned above or in general economic conditions could materially change these expectations. Accounts receivable is further described in Note 10, page 30.
Analysis of assets for impairment We review assets at the lowest level for which there are identifiable cash flows, which is usually at the store level. The carrying amount of store assets is compared to the expected undiscounted future cash flows to be generated by those assets over the estimated remaining economic life of the store. No material impairments were recorded in 2005, 2004 or 2003 as a result of the tests performed.
Insurance/self-insurance We retain a substantial portion of the risk related to certain general liability, workers’ compensation, property loss and employee medical and dental claims. Liabilities associated with these losses include estimates of both claims filed and losses incurred but not yet reported. We estimate our ultimate cost based on analysis of historical data and actuarial estimates. General liability and workers’ compensation liabilities are recorded at our estimate of their net present value; other liabilities are not discounted. We believe the amounts accrued are adequate, although actual losses may differ from the amounts provided. We maintain stop-loss coverage to limit the exposure related to certain risks.
Income taxes We pay income taxes based on the tax statutes, regulations and case law of the various jurisdictions in which we operate. Income tax expense involves management judgment as to the ultimate resolution of any tax matters in dispute with state and federal tax authorities. Historically, our assessments of the ultimate resolution of tax issues have been reasonably accurate. The current open tax issues are not dissimilar in size or substance from historical items. Management believes the resolution of the foregoing matters will not have a material impact on our consolidated financial statements. Income taxes are further described in Note 23, pages 34-35.
Pension and postretirement health care accounting We fund and maintain a qualified defined-benefit pension plan and maintain certain related non-qualified plans as well. We also maintain a postretirement health care plan for certain retired employees. The costs for these plans are calculated based on actuarial calculations using the key assumptions discussed in the following paragraphs.
22
Our expected long-term rate of return on plan assets is determined by the composition of our asset portfolio, our historical long-term investment performance and current market conditions.
The discount rate used to determine benefit obligations is adjusted annually based on the interest rate for long-term high-quality corporate bonds as of the measurement date (October 31) using yields for maturities that are in line with the duration of our pension liabilities. This same discount rate is also used to determine pension and postretirement health care expense for the following plan year.
We believe that the long-term inflationary forces that drive interest rates also affect the rate of compensation growth. As a result, our general practice is to modify our assumed average rate of compensation increase in line with changes in the discount rate. Based on our experience, we use a graduated compensation growth schedule that assumes higher compensation growth for younger, shorter-service pension-eligible team members than it does for older, longer-service pension-eligible team members. In 2005, we made a 0.75 percentage point increase in the assumed rate of compensation increase to better reflect the observed spread between the discount rate and our compensation growth rate.
Pension and postretirement health care benefits are further described in Note 28, pages 36-38.
New Accounting Pronouncements
2006 and Future Adoptions
On July 14, 2005, the Financial Accounting Standards Board (FASB) issued a proposed Interpretation, “Accounting for Uncertain Tax Positions, an Interpretation of FASB Statement No.109.” This proposed Interpretation will clarify the accounting for uncertain tax positions and will address recognition criteria. The final issuance of this statement has been delayed until later in 2006 and the final effective date for adoption is not known at this time. We are in the process of assessing the expected impact of this new guidance on our net earnings, cash flows and financial position.
On October 6, 2005, the FASB issued FASB Staff Position FAS 13-1, “Accounting for Rental Costs Incurred during a Construction Period” (FSP 13-1). FSP 13-1 requires that rental costs associated with ground or building operating leases that are incurred during a construction period be recognized as rental expense. FSP 13-1 is effective for the first reporting period beginning after December 15, 2005. Target Corporation has historically expensed rental costs incurred during a construction period; therefore, the adoption of this guidance will not have an impact on our net earnings, cash flows or financial position.
2005 Adoptions
We adopted various accounting pronouncements during 2005. Please refer to Note 1 (Summary of Accounting Policies), page 28, Note 11 (Inventory), page 30, Note 13 (Property and Equipment), pages 30-31 and Note 22 (Leases), pages 33-34 for further discussion of these adoptions.
Forward-Looking Statements
This Annual Report, including the preceding Management’s Discussion and Analysis, contains forward-looking statements regarding our performance, liquidity and adequacy of our capital resources. Those statements are based on our current assumptions and expectations and are subject to certain risks and uncertainties that could cause actual results to differ materially from those projected. We caution that the forward-looking statements are qualified by the risks and challenges posed by increased competition (including the effects of competitor liquidation activities), shifting consumer demand, changing consumer credit markets, changing health care costs, shifting capital markets and general economic conditions, hiring and retaining effective team members, sourcing merchandise from domestic and international vendors, investing in new business strategies, the outbreak of war or pandemics and other significant national and international events, and other risks and uncertainties. As a result, while we believe there is a reasonable basis for the forward-looking statements, you should not place undue reliance on those statements. You are encouraged to review Exhibit (99)C attached to our Form 10-K for the year ended January 28, 2006, which contains additional important factors that may cause actual results to differ materially from those projected in the forward-looking statements.
23
CONSOLIDATED STATEMENTS OF OPERATIONS
(millions, except per share data) | | 2005 | | 2004 | | 2003 | |
| | | | | | | |
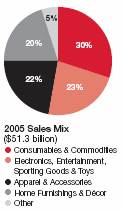
Sales | | $ | 51,271 | | $ | 45,682 | | $ | 40,928 | |
Net credit card revenues | | 1,349 | | 1,157 | | 1,097 | |
| | | | | | | |
Total revenues | | 52,620 | | 46,839 | | 42,025 | |
| | | | | | | |
Cost of sales | | 34,927 | | 31,445 | | 28,389 | |
Selling, general and administrative expenses | | 11,185 | | 9,797 | | 8,657 | |
Credit card expenses | | 776 | | 737 | | 722 | |
Depreciation and amortization | | 1,409 | | 1,259 | | 1,098 | |
| | | | | | | |
Earnings from continuing operations before interest expense and income taxes | | 4,323 | | 3,601 | | 3,159 | |
Net interest expense | | 463 | | 570 | | 556 | |
| | | | | | | |
Earnings from continuing operations before income taxes | | 3,860 | | 3,031 | | 2,603 | |
Provision for income taxes | | 1,452 | | 1,146 | | 984 | |
| | | | | | | |
Earnings from continuing operations | | 2,408 | | 1,885 | | 1,619 | |
Earnings from discontinued operations, net of taxes of $46 and $116 | | — | | 75 | | 190 | |
Gain on disposal of discontinued operations, net of taxes of $761 | | — | | 1,238 | | — | |
| | | | | | | |
Net earnings | | $ | 2,408 | | $ | 3,198 | | $ | 1,809 | |
| | | | | | | |
Basic earnings per share | | | | | | | |
Continuing operations | | $ | 2.73 | | $ | 2.09 | | $ | 1.78 | |
Discontinued operations | | — | | .08 | | .21 | |
Gain from discontinued operations | | — | | 1.37 | | — | |
| | | | | | | |
Basic earnings per share | | $ | 2.73 | | $ | 3.54 | | $ | 1.99 | |
| | | | | | | |
Diluted earnings per share | | | | | | | |
Continuing operations | | $ | 2.71 | | $ | 2.07 | | $ | 1.76 | |
Discontinued operations | | — | | .08 | | .21 | |
Gain from discontinued operations | | — | | 1.36 | | — | |
| | | | | | | |
Diluted earnings per share | | $ | 2.71 | | $ | 3.51 | | $ | 1.97 | |
| | | | | | | |
Weighted average common shares outstanding | | | | | | | |
Basic | | 882.0 | | 903.8 | | 911.0 | |
Diluted | | 889.2 | | 912.1 | | 919.2 | |
See Notes to Consolidated Financial Statements throughout pages 28-39.
24
CONSOLIDATED STATEMENTS OF FINANCIAL POSITION
| | January 28, | | January 29, | |
(millions, except footnotes) | | 2006 | | 2005 | |
Assets | | | | | |
Cash and cash equivalents | | $ | 1,648 | | $ | 2,245 | |
Accounts receivable, net | | 5,666 | | 5,069 | |
Inventory | | 5,838 | | 5,384 | |
Other current assets | | 1,253 | | 1,224 | |
| | | | | |
Total current assets | | 14,405 | | 13,922 | |
| | | | | |
Property and equipment | | | | | |
Land | | 4,449 | | 3,804 | |
Buildings and improvements | | 14,174 | | 12,518 | |
Fixtures and equipment | | 3,219 | | 2,990 | |
Computer hardware and software | | 2,214 | | 1,998 | |
Construction-in-progress | | 1,158 | | 962 | |
Accumulated depreciation | | (6,176 | ) | (5,412 | ) |
Property and equipment, net | | 19,038 | | 16,860 | |
Other non-current assets | | 1,552 | | 1,511 | |
| | | | | |
Total assets | | $ | 34,995 | | $ | 32,293 | |
| | | | | | | |
Liabilities and shareholders’ investment | | | | | |
| | | | | |
Accounts payable | | $ | 6,268 | | $ | 5,779 | |
Accrued liabilities | | 2,193 | | 1,633 | |
Income taxes payable | | 374 | | 304 | |
Current portion of long-term debt and notes payable | | 753 | | 504 | |
Total current liabilities | | 9,588 | | 8,220 | |
Long-term debt | | 9,119 | | 9,034 | |
Deferred income taxes | | 851 | | 973 | |
Other non-current liabilities | | 1,232 | | 1,037 | |
Shareholders’ investment | | | | | |
Common stock (a) | | 73 | | 74 | |
Additional paid-in-capital | | 2,121 | | 1,810 | |
Retained earnings | | 12,013 | | 11,148 | |
Accumulated other comprehensive income | | (2 | ) | (3 | ) |
Total shareholders’ investment | | 14,205 | | 13,029 | |
Total liabilities and shareholders’ investment | | $ | 34,995 | | $ | 32,293 | |
(a) Authorized 6,000,000,000 shares, $.0833 par value; 874,074,850 shares issued and outstanding at January 28, 2006; 890,643,966 shares issued and outstanding at January 29, 2005.
Preferred Stock Authorized 5,000,000 shares, $.01 par value; no shares were issued or outstanding at January 28, 2006 or
January 29, 2005.
See Notes to Consolidated Financial Statements throughout pages 28-39.
25
CONSOLIDATED STATEMENTS OF CASH FLOWS
(millions) | | 2005 | | 2004 | | 2003 | |
| | | | | | | |
Operating activities | | | | | | | |
Net earnings | | $ | 2,408 | | $ | 3,198 | | $ | 1,809 | |
Earnings from and gain on disposal of discontinued operations, net of taxes | | — | | (1,313 | ) | (190 | ) |
| | | | | | | |
Earnings from continuing operations | | 2,408 | | 1,885 | | 1,619 | |
Reconciliation to cash flow | | | | | | | |
Depreciation and amortization | | 1,409 | | 1,259 | | 1,098 | |
Share-based compensation expense | | 93 | | 60 | | 57 | |
Deferred income taxes | | (122 | ) | 233 | | 208 | |
Bad debt provision | | 466 | | 451 | | 476 | |
Loss on disposal of property and equipment, net | | 70 | | 59 | | 41 | |
Other non-cash items affecting earnings | | (50 | ) | 73 | | 10 | |
Changes in operating accounts providing/(requiring) cash: | | | | | | | |
Accounts receivable originated at Target | | (244 | ) | (209 | ) | (279 | ) |
Inventory | | (454 | ) | (853 | ) | (579 | ) |
Other current assets | | (28 | ) | (37 | ) | (196 | ) |
Other non-current assets | | (24 | ) | (147 | ) | (166 | ) |
Accounts payable | | 489 | | 823 | | 721 | |
Accrued liabilities | | 351 | | 319 | | 85 | |
Income taxes payable | | 70 | | (91 | ) | 74 | |
Other | | 17 | | (17 | ) | 19 | |
Cash flow provided by operations | | 4,451 | | 3,808 | | 3,188 | |
Investing activities | | | | | | | |
Expenditures for property and equipment | | (3,388 | ) | (3,068 | ) | (2,738 | ) |
Proceeds from disposals of property and equipment | | 58 | | 56 | | 67 | |
Change in accounts receivable originated at third parties | | (819 | ) | (690 | ) | (538 | ) |
Proceeds from sale of discontinued operations | | — | | 4,881 | | — | |
Cash flow (required for)/provided by investing activities | | (4,149 | ) | 1,179 | | (3,209 | ) |
| | | | | | | |
Financing activities | | | | | | | |
Decrease in notes payable, net | | — | | — | | (100 | ) |
Additions to long-term debt | | 913 | | 10 | | 1,200 | |
Reductions of long-term debt | | (527 | ) | (1,487 | ) | (1,179 | ) |
Dividends paid | | (318 | ) | (272 | ) | (237 | ) |
Repurchase of stock | | (1,197 | ) | (1,290 | ) | (48 | ) |
Stock option exercises | | 172 | | 146 | | 36 | |
Share-based compensation tax benefit | | 59 | | 69 | | 25 | |
Other | | (1 | ) | — | | (10 | ) |
Cash flow required for financing activities | | (899 | ) | (2,824 | ) | (313 | ) |
Cash flows of discontinued operations (Revised) (a) | | | | | | | |
(Required for)/provided by operations | | — | | (549 | ) | 545 | |
Required for investing activities | | — | | (44 | ) | (248 | ) |
Required for financing activities | | — | | (33 | ) | (5 | ) |
Net cash (required for)/provided by discontinued operations | | — | | (626 | ) | 292 | |
| | | | | | | |
Net (decrease)/increase in cash and cash equivalents | | (597 | ) | 1,537 | | (42 | ) |
Cash and cash equivalents at beginning of year | | 2,245 | | 708 | | 750 | |
Cash and cash equivalents at end of year | | $ | 1,648 | | $ | 2,245 | | $ | 708 | |
(a) We have revised this statement for 2004 and 2003 to separately disclose the operating, investing and financing portions of the cash flows attributable to our discontinued operations. We had previously reported these amounts on a combined basis.
Amounts presented herein are on a cash basis and therefore may differ from those shown in other sections of this Annual Report. Consistent with the provisions of SFAS No.95, “Statement of Cash Flows,” cash flows related to accounts receivable are classified as either an operating activity or an investing activity, depending on their origin.
Cash paid for income taxes was $1,448 million, $1,742 million and $781 million during 2005, 2004 and 2003, respectively. Cash paid for interest (net of interest capitalized) was $468 million, $480 million and $542 million during 2005, 2004 and 2003, respectively.
See Notes to Consolidated Financial Statements throughout pages 28-39.
26
CONSOLIDATED STATEMENTS OF SHAREHOLDERS’ INVESTMENT
| | | | | | | | | | Accumulated | | | |
| | Common | | Stock | | Additional | | | | Other | | | |
| | Stock | | Par | | Paid-in | | Retained | | Comprehensive | | | |
(millions, except footnotes) | | Shares | | Value | | Capital | | Earnings | | Income/(Loss) | | Total | |
| | | | | | | | | | | | | |
February 1, 2003 | | 909.8 | | $ | 76 | | $ | 1,400 | | $ | 8,017 | | $ | 4 | | $ | 9,497 | |
Consolidated net earnings | | — | | — | | — | | 1,809 | | — | | 1,809 | |
Other comprehensive loss | | — | | — | | — | | — | | (1 | ) | (1 | ) |
Total comprehensive income | | | | | | | | | | | | 1,808 | |
Dividends declared | | — | | — | | — | | (246 | ) | — | | (246 | ) |
Repurchase of stock | | (1.5 | ) | — | | — | | (57 | ) | — | | (57 | ) |
Issuance of stock for ESOP | | 0.6 | | — | | 17 | | — | | — | | 17 | |
Stock options and awards | | 2.9 | | — | | 113 | | — | | — | | 113 | |
January 31, 2004 | | 911.8 | | 76 | | 1,530 | | 9,523 | | 3 | | 11,132 | |
Consolidated net earnings | | — | | — | | — | | 3,198 | | — | | 3,198 | |
Other comprehensive loss | | — | | — | | — | | — | | (6 | ) | (6 | ) |
Total comprehensive income | | | | | | | | | | | | 3,192 | |
Dividends declared | | — | | — | | — | | (280 | ) | — | | (280 | ) |
Repurchase of stock | | (28.9 | ) | (3 | ) | — | | (1,293 | ) | — | | (1,296 | ) |
Stock options and awards | | 7.7 | | 1 | | 280 | | — | | — | | 281 | |
January 29, 2005 | | 890.6 | | 74 | | 1,810 | | 11,148 | | (3 | ) | 13,029 | |
Consolidated net earnings | | — | | — | | — | | 2,408 | | — | | 2,408 | |
Other comprehensive income | | — | | — | | — | | — | | 1 | | 1 | |
Total comprehensive income | | | | | | | | | | | | 2,409 | |
Dividends declared | | — | | — | | — | | (334 | ) | — | | (334 | ) |
Repurchase of stock | | (23.1 | ) | (2 | ) | — | | (1,209 | ) | — | | (1,211 | ) |
Stock options and awards | | 6.6 | | 1 | | 311 | | — | | — | | 312 | |
January 28, 2006 | | 874.1 | | $ | 73 | | $ | 2,121 | | $ | 12,013 | | $ | (2 | ) | $ | 14,205 | |
In June 2004, our Board of Directors authorized the repurchase of $3 billion of our common stock. In November 2005, our Board increased the aggregate authorization by $2 billion, for a total authorization of $5 billion. We expect the repurchase of our common stock to be made primarily in open market transactions, subject to market conditions, and anticipate completion of the aggregate program in the next two to three years. In 2005, we repurchased a total of 23.1 million shares of our common stock for a total
investment of $1,197 million ($51.88 per share).
Junior Preferred Stock Rights In 2001, we declared a distribution of preferred share purchase rights which expire in September 2006. Terms of the plan provide for a distribution of one preferred share purchase right for each outstanding share of our common stock. Each right will entitle shareholders to buy one twelve-hundredth of a share of a new series of junior participating preferred stock at an exercise price of $125.00, subject to adjustment. The rights will be exercisable only if a person or group acquires ownership of 20 percent or more of our common stock or announces a tender offer to acquire 30 percent or more of our common stock.
Dividends Dividends declared per share were $.38, $.31 and $.27 in 2005, 2004 and 2003, respectively.
See Notes to Consolidated Financial Statements throughout pages 28-39.
27
NOTES TO CONSOLIDATED FINANCIAL STATEMENTS
1. Summary of Accounting Policies
Organization Target Corporation (the Corporation or Target) operates large-format general merchandise discount stores in the United States. Our credit card operation represents an integral component of our core retail business. We also operate Target.com, an online business. We operate as a single business segment.
Consolidation The consolidated financial statements include the balances of the Corporation and its subsidiaries after elimination of material intercompany balances and transactions. All material subsidiaries are wholly owned.
Use of Estimates The preparation of our consolidated financial statements, in conformity with U.S. generally accepted accounting principles (GAAP), requires management to make estimates and assumptions affecting reported amounts in the consolidated financial statements and accompanying notes. Actual results may differ from those estimates.
Fiscal Year Our fiscal year ends on the Saturday nearest January 31. Unless otherwise stated, references to years in this report relate to fiscal years rather than to calendar years. Fiscal years 2005, 2004 and 2003 each consisted of 52 weeks.
Reclassifications Certain prior year amounts have been reclassified to conform to the current year presentation.
Share-Based Compensation We adopted the provisions of Statement of Financial Accounting Standards No.123R, “Share-Based Payment” (SFAS No.123R), in 2004 under the modified retrospective transition method. Therefore, all prior period financial statements have been restated to recognize compensation cost in the amounts previously reported in the Notes to Consolidated Financial Statements under the provisions of SFAS No.123. SFAS No.123R requires that all share-based compensation be accounted for using a fair-value-based method. In 2005, the FASB issued additional guidance on SFAS No.123R in the form of Staff Positions (FSPs). FSP 123(R)-2 clarifies that a share-based compensation award is considered “granted” (and fair value should be estimated) when the employer and its employees have a mutual understanding of the key terms and conditions of the award, and further clarifies that this mutual understanding is presumed to exist at the date the award is approved by the Board of Directors or management with relevant authority, assuming certain conditions are met. We applied this guidance to our share-based awards upon issuance of the FSP.
SFAS No.123R requires companies to determine the amount of an additional paid-in capital (APIC) pool that would be available to absorb deferred tax asset write-offs by calculating the net excess tax benefits credited to APIC as if the company had always been following the provisions of SFAS No.123R. FSP 123(R)-3 provides an elective transition alternative for calculating the beginning balance of the APIC pool, which we have elected to adopt. Our practice with regard to awards that were not fully vested upon our adoption of SFAS No.123R is to treat the entire amount of such awards as partially vested for purposes of calculating the beginning balance of the APIC pool.
Generally, in accordance with SFAS No.123R, we recognize compensation expense for awards on a straight-line basis over the four-year vesting period. However, in certain circumstances under our share-based compensation plans, we allow for the vesting of employee awards to continue post-employment. Accordingly, for awards granted subsequent to our adoption of SFAS No.123R and to the extent those awards continue to vest post-employment because the employee met certain age and service requirements at the date of grant, we accelerate expense recognition, such that the value of the award is fully expensed over the employee’s service period instead of over the explicit vesting period. Awards granted prior to the adoption of SFAS No.123R continue to be expensed over the explicit vesting period in accordance with SEC guidelines. Information related to outstanding stock options, performance shares and restricted stock is disclosed in Note 26, pages 35-36.
Derivative Financial Instruments SFAS No.133, “Accounting for Derivative Instruments and Hedging Activities,” as amended, defines derivatives and requires that they be carried at fair value on the balance sheet. It also provides for hedge accounting when certain conditions are met. Our derivative instruments are primarily interest rate swaps which hedge the fair value of certain debt by effectively converting interest from a fixed rate to a floating rate. These instruments qualify for hedge accounting and the associated assets and liabilities are recorded in the Consolidated Statements of Financial Position. The change in market value of an interest rate swap as well as the offsetting change in market value of the hedged debt is recognized into earnings in the current period. Ineffectiveness would result when changes in the market value of the hedged debt are not completely offset by changes in the market value of the interest rate swap. There was no ineffectiveness recognized in 2005, 2004 or 2003 related to these instruments. Further information related to interest rate swaps is disclosed in Note 21, page 33.
2. Revenues
Revenues are recognized as sales occur and are net of expected returns. Total revenues do not include sales tax as we consider ourselves a pass-through conduit for collecting and remitting sales taxes. Commissions earned on sales generated by leased departments are included within sales and were $14 million in 2005, $14 million in 2004 and $13 million in 2003.
Revenue from gift card sales is recognized at redemption of the gift card. Our gift cards do not have expiration dates. Based on historical redemption rates, a certain percentage of gift cards will never be redeemed, which is referred to as “breakage.” Estimated breakagerevenue is recognized as the remaining gift card values are redeemed.
28
Net credit card revenues are recognized according to the contractual provisions of each applicable credit card agreement. If an account is written-off, any uncollected finance charges or late fees are recorded as a reduction of net credit card revenues. Target retail store sales charged to our credit cards totaled $3,655 million, $3,269 million and $3,006 million in 2005, 2004 and 2003, respectively.
3. Cost of Sales and Selling, General and Administrative (SG&A) Expenses
The following illustrates the primary costs classified in each major expense category:
Cost of Sales | | SG&A Expenses |
| | |
Total cost of products sold including: | | Payroll and benefit costs |
• Freight expenses associated with moving merchandise from our vendors to our distribution centers and our retail stores | | Occupancy and operating costs of retail, distribution, and corporate facilities |
| | Advertising offset by vendor income that is a reimbursement of specific, incremental and identifiable costs Other administrative costs |
• Vendor income that is not reimbursement of specific, incremental and identifiable costs | |
|
Inventory shrink | | |
Markdowns | | |
Shipping and handling expenses | | |
Terms cash discount | | |
The methodology behind the classification of expenses varies across the retail industry.
4. Consideration Received from Vendors
We receive consideration for a variety of vendor-sponsored programs, such as volume rebates, markdown allowances, promotions and advertising and for our compliance programs, referred to as “vendor income.” Vendor income reduces either our inventory costs or SG&A expenses based on application of EITF Issue No. 02-16, “Accounting by a Customer (Including a Reseller) for Certain Consideration Received from a Vendor,” as amended by EITF Issue No. 03-10, “Application of Issue 02-16 by Resellers to Sales Incentives Offered to Consumers by Manufacturers.” Promotional and advertising allowances are intended to offset our costs of promoting and selling the vendor’s merchandise in our stores. Under our compliance programs, vendors are charged for merchandise shipments that do not meet our requirements (“violations”), such as late or incomplete shipments. These allowances are recorded when violations occur.
5. Advertising Costs
Advertising costs are expensed at first showing of the advertisement and were $1,028 million, $888 million and $872 million for 2005, 2004 and 2003, respectively. Advertising vendor income that offset advertising expenses was approximately $110 million, $72 million and $58 million for 2005, 2004 and 2003, respectively. Newspaper circulars and media broadcast made up the majority of our advertising costs in all three years.
6. Discontinued Operations
We completed the sale of our Marshall Field’s and Mervyn’s businesses during 2004. In accordance with SFAS No. 144, “Accounting for the Impairment or Disposal of Long-Lived Assets,” the financial results of Marshall Field’s and Mervyn’s are reported as discontinued operations.
No financial results of discontinued operations are included for the year ended January 28, 2006. For the years ended January 29, 2005 and January 31, 2004, total revenues included in discontinued operations were $3,095 million and $6,138 million, respectively, and earnings from discontinued operations were $75 million and $190 million, net of taxes of $46 million and $116 million, respectively. In addition, we recorded a gain on the sale of discontinued operations of $1,238 million, net of taxes of $761 million, during the year ended January 29, 2005.
There were no assets or liabilities of Marshall Field’s or Mervyn’s included in our Consolidated Statements of Financial Position at January 28, 2006 or January 29, 2005.
7. Earnings per Share
Basic earnings per share (EPS) is net earnings divided by the average number of common shares outstanding during the period. Diluted EPS includes the incremental shares assumed to be issued on the exercise of stock options and the potentially issuable performance shares.
(millions, except | | Basic EPS | | Diluted EPS | |
per share data) | | 2005 | | 2004 | | 2003 | | 2005 | | 2004 | | 2003 | |
| | | | | | | | | | | | | |
Net earnings | | $ | 2,408 | | $ | 3,198 | | $ | 1,809 | | $ | 2,408 | | $ | 3,198 | | $ | 1,809 | |
Basic weighted average common shares outstanding | | 882.0 | | 903.8 | | 911.0 | | 882.0 | | 903.8 | | 911.0 | |
Stock options and performance shares | | — | | — | | — | | 7.2 | | 8.3 | | 8.2 | |
Weighted average common shares outstanding | | 882.0 | | 903.8 | | 911.0 | | 889.2 | | 912.1 | | 919.2 | |
Earnings per share | | $ | 2.73 | | $ | 3.54 | | $ | 1.99 | | $ | 2.71 | | $ | 3.51 | | $ | 1.97 | |
Our diluted EPS calculation excludes any shares related to stock options for which the effect would have been antidilutive. There were no material antidilutive shares issuable upon exercise excluded from the dilutive EPS calculations at January 28, 2006, January 29, 2005 and January 31, 2004, respectively.
8. Other Comprehensive Income/(Loss)
Other comprehensive income/ (loss) includes revenues, expenses, gains and losses that are excluded from net earnings under GAAP and are recorded directly to shareholders’ investment. In 2005, 2004 and 2003, other comprehensive income/(loss) primarily included gains and losses on certain hedge transactions and the change in our minimum pension liability, net of related taxes.
29
9. Cash Equivalents
Cash equivalents include highly liquid investments with an original maturity of three months or less from the time of purchase. We carry these investments at cost, which approximates market value. These investments were $1,172 million and $1,732 million in 2005 and 2004, respectively. Also included in cash equivalents are proceeds due from credit and debit card transactions with settlement terms of less than five days. Credit and debit card receivables included within cash equivalents were $285 million and $242 million, respectively, for 2005 and 2004.
10. Accounts Receivable
Accounts receivable are recorded net of an allowance for expected losses. The allowance, recognized in an amount equal to the anticipated future write-offs based on delinquencies, risk scores, aging trends, industry risk trends and our historical experience, was $451 million at January 28, 2006 and $387 million at January 29, 2005. Substantially all accounts continue to accrue finance charges until they are written off. Accounts are written off when they become 180 days past due.
In 2004, we chartered Target Bank for the purpose of issuing credit cards to qualified businesses, as our Target National Bank charter does not allow for the issuance of commercial credit cards.
As a method of providing funding for our accounts receivable, we sell on an ongoing basis all of our consumer credit card receivables to Target Receivables Corporation (TRC), a wholly-owned bankruptcy remote subsidiary. TRC then transfers the receivables to the Target Credit Card Master Trust (the Trust), which from time to time will sell debt securities to third parties, either directly or through a related trust. These debt securities represent undivided interests in the Trust assets. TRC has also retained an undivided interest in the Trust’s assets that are not represented by the debt securities sold to third parties and a 2 percent undivided interest in the Trust assets that is held by Target National Bank, a wholly-owned subsidiary of Target which also services receivables. TRC uses the proceeds from the sale of debt securities and its share of collections on the receivables to pay the purchase price of the receivables to Target.
The accounting guidance for such transactions, SFAS No.140, “Accounting for Transfers and Servicing of Financial Assets and Extinguishments of Liabilities (a replacement of SFAS No.125),” requires the inclusion of the receivables within the Trust and any debt securities issued by the Trust, or a related trust, in our Consolidated Statements of Financial Position. Notwithstanding this accounting treatment, the receivables transferred to the Trust are not available to general creditors of Target. Upon termination of the securitization program and repayment of all debt securities issued from time to time by the Trust, or a related trust, any remaining assets could be distributed to Target in a liquidation of TRC.
11. Inventory
Substantially all of our inventory and the related cost of sales are accounted for under the retail inventory accounting method using the last-in, first-out (LIFO) method. Inventory is stated at the lower of LIFO cost or market. The LIFO provision is calculated based on inventory levels, markup rates and internally-measured retail price indices. We have not recorded any material LIFO provision in 2005 or 2004.
We routinely enter into arrangements with certain vendors whereby we do not purchase or pay for merchandise until that merchandise is ultimately sold to a guest. Revenues under this program are included in the sales line in the Consolidated Statements of Operations, but the merchandise received under the program is not included in our Consolidated Statements of Financial Position because of the simultaneous timing of our purchase and sale of this inventory. Sales made under these arrangements totaled $872 million, $357 million and $142 million for 2005, 2004 and 2003, respectively.
In 2005, we adopted SFAS No.151, “Inventory Costs, an amendment of ARB No. 43, Chapter 4,” which clarifies that abnormal amounts of idle facilities expense, freight, handling costs and spoilage are to be recognized as current period charges and provides guidance on the allocation of overhead. This adoption did not have a material impact on our net earnings, cash flows or financial position.
12. Other Current Assets
| | January 28, | | January 29, | |
(millions) | | 2006 | | 2005 | |
| | | | | |
Vendor income and other receivables | | $ | 560 | | $ | 428 | |
Deferred taxes | | 344 | | 344 | |
Other | | 349 | | 452 | |
Total | | $ | 1,253 | | $ | 1,224 | |
In addition to vendor income, other receivables relate primarily to pharmacy receivables and merchandise sourcing services provided to third parties.
13. Property and Equipment
Property and equipment are recorded at cost, less accumulated depreciation. Depreciation is computed using the straight-line method over estimated useful lives. Depreciation expense for the years 2005, 2004 and 2003 was $1,384 million, $1,232 million and $1,068 million, respectively. Accelerated depreciation methods are generally used for income tax purposes. Repair and maintenance costs were $474 million, $453 million and $393 million in 2005, 2004 and 2003, respectively, and are expensed as incurred.
Estimated useful lives by major asset category are as follows:
Asset | | Life (in years) | |
| | | |
Buildings and improvements | | 8–39 | |
Fixtures and equipment | | 4–15 | |
Computer hardware and software | | 4 | |
30
In accordance with SFAS No.144, “Accounting for the Impairment or Disposal of Long-Lived Assets,” all long-lived assets are reviewed when events or changes in circumstances indicate that the asset’s carrying value may not be recoverable. No material impairments were recorded in 2005, 2004 or 2003 as a result of the tests performed.
In March 2005, the FASB issued FASB Interpretation No. 47, “Accounting for Conditional Asset Retirement Obligations, an interpretation of FASB Statement No.143” (FIN 47). The primary purpose of FIN 47 is to clarify that an entity is required to recognize a liability for the fair value of a conditional asset retirement obligation when incurred if the liability’s fair value can be reasonably estimated. FIN 47 is effective no later than the end of fiscal years ending after December 15, 2005. The adoption of this guidance did not have a material impact on our net earnings, cash flows or financial position.
14. Other Non-Current Assets
| | January 28, | | January 29, | |
(millions) | | 2006 | | 2005 | |
| | | | | |
Prepaid pension expense | | $ | 752 | | $ | 733 | |
Cash value of life insurance | | 524 | | 446 | |
Goodwill and intangible assets | | 183 | | 206 | |
Other | | 93 | | 126 | |
Total | | $ | 1,552 | | $ | 1,511 | |
15. Goodwill and Intangible Assets
Goodwill and intangible assets are recorded within other non-current assets at cost less accumulated amortization. Goodwill and intangible assets by major classes were as follows:
| | | | | | Leasehold | | | | | | | | | |
| | | | | | Acquisition | | | | | | | | | |
| | Goodwill | | Costs | | Other | | Total | |
| | Jan. 28, | | Jan. 29, | | Jan. 28, | | Jan. 29, | | Jan. 28, | | Jan. 29, | | Jan. 28, | | Jan. 29, | |
(millions) | | 2006 | | 2005 | | 2006 | | 2005 | | 2006 | | 2005 | | 2006 | | 2005 | |
| | | | | | | | | | | | | | | | | |
Gross asset | | $ | 80 | | $ | 80 | | $ | 182 | | $ | 185 | | $ | 205 | | $ | 201 | | $ | 467 | | $ | 466 | |
Accumulated amortization | | (20 | ) | (20 | ) | (70 | ) | (52 | ) | (194 | ) | (188 | ) | (284 | ) | (260 | ) |
Net goodwill and intangible assets | | $ | 60 | | $ | 60 | | $ | 112 | | $ | 133 | | $ | 11 | | $ | 13 | | $ | 183 | | $ | 206 | |
Amortization is computed on intangible assets with definite useful lives using the straight-line method over estimated useful lives that range from three to 29 years. Amortization expense for the years 2005, 2004 and 2003 was $25 million, $27 million and $30 million, respectively. The estimated aggregate amortization expense of our definite-lived intangible assets for each of the five succeeding fiscal years is as follows:
(millions) | | 2006 | | 2007 | | 2008 | | 2009 | | 2010 | |
| | | | | | | | | | | |
Amortization expense | | $ | 23 | | $ | 20 | | $ | 19 | | $ | 19 | | $ | 17 | |
| | | | | | | | | | | | | | | | |
We have goodwill and certain intangible assets that are not amortized but instead are subject to an annual impairment test. Discounted cash flow models are used in determining fair value for the purposes of the required annual impairment analysis. No material impairments were recorded in 2005, 2004 and 2003 as a result of the tests performed.
During 2004, goodwill with an approximate carrying value of $63 million was disposed of as part of the Marshall Field’s transaction.
16. Accounts Payable
Our accounting policy is to reduce accounts payable when checks to vendors clear the bank from which they were drawn. Outstanding checks included in accounts payable were $645 million and $992 million at year-end 2005 and 2004, respectively.
17. Accrued Liabilities
| | January 28, | | January 29, | |
(millions) | | 2006 | | 2005 | |
| | | | | |
Wages and benefits | | $ | 506 | | $ | 422 | |
Taxes payable | | 366 | | 287 | |
Gift card liability | | 294 | | 214 | |
Other | | 1,027 | | 710 | |
Total | | $ | 2,193 | | $ | 1,633 | |
Taxes payable consist of real estate, employee withholdings and sales tax liabilities. Gift card liability represents the amount of gift cards that have been issued but have not been redeemed, net of estimated breakage.
18. Commitments and Contingencies
At January 28, 2006, our obligations included notes and debentures of $9,771 million (further discussed in Note 19, page 32), the present value of capital lease obligations of $101 million and total future payments of operating leases with total contractual lease payments of $3,097 million, including certain options for lease term extension that are expected to be exercised in the amount of $1,421 million and $122 million of legally binding minimum lease payments for stores that will open in 2006 (see additional detail in Note 22, pages 33-34). In addition, real estate obligations, including commitments for the purchase, construction, or remodeling of real estate and facilities, were approximately $838 million at January 28, 2006. Purchase obligations, which include all legally binding contracts such as firm commitments for inventory purchases, merchandise royalties, purchases of equipment, marketing-related contracts, software acquisition / license commitments and service contracts and were $1,431 million at January 28, 2006. In the normal course of business we issue purchase orders to purchase inventory, which represent authorizations to purchase and are cancelable by their terms. We do not consider purchase orders to be firm inventory commitments. We also issue letters of credit in the ordinary course of business which are not firm commitments as they are conditional on the purchase order not being cancelled. If under certain circumstances, and at our sole discretion, we choose to cancel a purchase order, we may be
31
obligated to reimburse the vendor for unrecoverable outlays incurred prior to cancellation. Standby letters of credit, which relate primarily to the portion of our insurance claims for which we have retained the risk, totaled $104 million at January 28, 2006.
The terms of a significant portion of the Visa/MasterCard antitrust litigation settlement were finalized during 2005. Consequently, we recorded a $27 million ($.02 per share) gain for our share of the proceeds, which we expect to collect during fiscal 2006. We also expect to receive an additional, smaller payment; however, the amount and timing of that payment are not certain at this time. Accordingly, no additional gain was recorded at January 28, 2006.
We are exposed to claims and litigation arising in the ordinary course of business and use various methods to resolve these matters in a manner that we believe serves the best interest of our shareholders and other constituents. We believe the amounts provided in our consolidated financial statements are adequate in light of the probable and estimable liabilities. Our policy is to disclose pending lawsuits and other known claims that may have a material adverse impact on our results of operations, cash flows or financial condition. We do not believe any of the currently identified claims and litigated matters meet this criterion.
19. Notes Payable and Long-Term Debt
We obtain short-term financing throughout the year under our commercial paper program, which is a form of notes payable. Information on this program is as follows:
(dollars in millions) | | 2005 | | 2004 | |
| | | | | |
Notes payable outstanding at year-end | | $ | — | | $ | — | |
Maximum amount outstanding during the year | | $ | 994 | | $ | 1,422 | |
Average amount outstanding during the year | | $ | 77 | | $ | 55 | |
Weighted-average interest rate | | 4.0 | % | 1.3 | % |
At January 28, 2006, a committed unsecured credit facility totaling $1.6 billion was in place through a group of banks at specified rates. This 2005 facility replaced our two previous committed credit agreements and is scheduled to expire in June 2010. No balances were outstanding at any time during 2005 or 2004 under any of these agreements.
On November 9, 2005, TRC issued to the public, through the Target Credit Card Owner Trust 2005-1, $900 million of debt backed by credit card receivables. This issue of receivable-backed securities has an expected maturity of five years and a floating interest rate set at 1-month LIBOR plus 0.06 percent. Refer to Note 10, page 30, for further discussion of our accounts receivable financing program. The total amount of long-term debt backed by credit card receivables was $1,650 million at January 28, 2006 and $750 million at January 29, 2005. We did not repurchase any significant amount of long-term debt during 2005.
In 2004, we issued no long-term debt and we called or repurchased $542 million of long-term debt with an average remaining life of 24 years and weighted average interest rate of 7.0 percent, resulting in a pre-tax loss of $89 million (approximately $.06 per share), reflected in net interest expense.
Our debt portfolio, including swap valuation adjustments, was as follows:
| | January 28, 2006 | | January 29, 2005 | |
(dollars in millions) | | Rate (a) | | Balance | | Rate (a) | | Balance | |
Notes and debentures: | | | | | | | | | |
Due 2005–2009 | | 5.6 | % | $ | 4,249 | | 4.1 | % | $ | 4,818 | |
Due 2010–2014 | | 5.8 | | 3,840 | | 6.2 | | 2,954 | |
Due 2015–2019 | | 5.5 | | 240 | | 3.3 | | 234 | |
Due 2020–2024 | | 9.3 | | 213 | | 9.3 | | 212 | |
Due 2025–2029 | | 6.7 | | 325 | | 6.7 | | 325 | |
Due 2030–2032 | | 6.6 | | 904 | | 6.6 | | 904 | |
| | | | | | | | | |
Total notes and debentures (b) | | 5.9 | % | 9,771 | | 5.2 | % | 9,447 | |
Capital lease obligations | | | | 101 | | | | 91 | |
Less: current portion | | | | (753 | ) | | | (504 | ) |
| | | | | | | | | |
Long-term debt | | | | $ | 9,119 | | | | $ | 9,034 | |
(a) Reflects the weighted average stated interest rate as of year-end, including the impact of interest rate swaps.
(b) The estimated fair value of total notes and debentures, using a discounted cash flow analysis based on our incremental interest rates for similar types of financial instruments, was $10,229 million at January 28, 2006 and $10,171 million at January 29, 2005.
Required principal payments on total notes and debentures over the next five years, excluding capital lease obligations and fair market value adjustments recorded in long-term debt, are:
(millions) | | 2006 | | 2007 | | 2008 | | 2009 | | 2010 | |
| | | | | | | | | | | |
Required principal payments | | $ | 751 | | $ | 1,321 | | $ | 1,451 | | $ | 751 | | $ | 2,236 | |
| | | | | | | | | | | | | | | | |
Most of our long-term debt obligations contain certain covenants related to secured debt levels. In addition, our credit facility contains a debt leverage covenant. We are, and expect to remain, in compliance with these covenants.
20. Net Interest Expense
(millions) | | 2005 | | 2004 | | 2003 | |
Interest expense on debt | | $ | 524 | | $ | 509 | | $ | 543 | |
Interest expense on capital leases | | 8 | | 9 | | 9 | |
Loss on debt repurchase | | — | | 89 | | 15 | |
Capitalized interest | | (42 | ) | (18 | ) | (8 | ) |
Interest income | | (27 | ) | (19 | ) | (3 | ) |
Net interest expense | | $ | 463 | | $ | 570 | | $ | 556 | |
32
21. Interest Rate Swaps
Our accounting policy for derivative financial instruments is discussed in Note 1 on page 28.
At January 28, 2006 and January 29, 2005, interest rate swaps were outstanding in notional amounts totaling $3,300 million and $2,850 million, respectively. The increase in swap exposure was executed to convert more of our fixed-rate debt to floating-rate debt to minimize the effect on our earnings of changes in interest rates, given that the majority of interest rates on our credit card receivables re-price based on the changes in the prime rate.
During 2005, we entered into four interest rate swaps with notional amounts of $250 million, $350 million, $325 million and $225 million. We also terminated an interest rate swap with a notional amount of $200 million, resulting in a gain of $24 million that will be amortized into net interest expense over the remaining 13-year life of the hedged debt. During 2004, we entered into two interest rate swaps with notional amounts of $200 million and two interest rate swaps with notional amounts of $250 million. We also terminated an interest rate swap with a notional amount of $200 million, resulting in a loss of $16 million that will be amortized into net interest expense over the remaining 14-year life of the hedged debt. In 2005 and 2004, the gains and losses amortized into net interest expense for terminated swaps were not material to our results of operations.
Interest Rate Swaps | | | | | |
(dollars in millions) | | | | | | |
| | | | | | |
| | Notional Amount
Outstanding at | | | | Pay Floating Rate at (a) | |
| | Jan. 28, | | Jan.29, | | Receive | | Jan. 28, | | Jan.29, | |
Maturity | | 2006 | | 2005 | | Fixed | | 2006 | | 2005 | |
| | | | | | | | | | | |
Feb. 2005 | | $ | — | | $ | 500 | | 7.5 | % | — | % | 2.4 | % |
May 2006 | | 550 | | 550 | | 4.6 | | 4.8 | | 3.3 | |
Mar. 2008 | | 250 | | — | | 3.9 | | 4.4 | | — | |
Mar. 2008 | | 250 | | 250 | | 3.8 | | 4.4 | | 2.4 | |
Oct. 2008 | | 500 | | 500 | | 4.4 | | 4.8 | | 3.2 | |
Oct. 2008 | | 250 | | 250 | | 3.8 | | 4.4 | | 2.5 | |
Nov. 2008 | | 200 | | 200 | | 3.9 | | 4.4 | | 2.4 | |
Jun. 2009 | | 400 | | 400 | | 4.4 | | 4.8 | | 3.3 | |
Jun. 2009 | | 350 | | — | | 4.2 | | 4.5 | | — | |
Aug 2010 | | 325 | | — | | 4.8 | | 4.5 | | — | |
Aug.2010 | | 225 | | — | | 4.5 | | 4.5 | | — | |
May 2018 | | — | | 200 | | 5.8 | | — | | 3.3 | |
| | $ | 3,300 | | $ | 2,850 | | | | | | | |
(a) Reflects floating interest rate as of the respective year-end.
The weighted average life of the interest rate swaps was approximately 2.7 years at January 28, 2006.
The fair value of outstanding interest rate swaps and unamortized gains/(losses) from terminated interest rate swaps was $(21) million at January 28, 2006 and $45 million at January 29, 2005. There was no ineffectiveness recognized in 2005, 2004 or 2003 related to these instruments.
22. Leases
We lease certain retail locations, warehouses, distribution centers, office space, equipment and land. Assets held under capital leases are included in property and equipment and lease payments are charged to depreciation and net interest expense over the life of the lease. Operating lease rentals are expensed on a straight-line basis over the life of the lease. Rent expense is recognized beginning with the earlier of the date when we become legally obligated for the rent payments or the date when we take possession of the property. At the inception of a lease, we determine the lease term by assuming the exercise of those renewal options that are reasonably assured because of the significant economic penalty that exists for not exercising those options. The exercise of lease renewal options is at our sole discretion. The expected lease term is used to determine whether a lease is capital or operating and is used to calculate straight-line rent expense. Additionally, the useful life of buildings and leasehold improvements are limited by the expected lease term. Our amortization of leasehold improvements is consistent with the guidance issued by the EITF in 2005 in Issue No. 05-6, “Determining the Amortization Period for Leasehold Improvements Purchased after Lease Inception or Acquired in a Business Combination,” which requires that leasehold improvements purchased after the beginning of the initial lease term be amortized over the shorter of the assets’ useful lives or a term that includes the original lease term plus any renewals that are reasonably assured at the date the leasehold improvements are purchased. Therefore, our adoption of this guidance did not have an impact in our net earnings, cash flows or financial position.
Rent expense on buildings, which is included in selling, general and administrative expenses, includes percentage rents based on a percentage of retail sales over contractual levels. Total rent expense was $154 million in 2005, $240 million in 2004 and $150 million in 2003. Refer to Note 29, page 39 for discussion of the 2004 lease accounting adjustment. Certain leases require us to pay real estate taxes, insurance, maintenance and other operating expenses associated with the leased premises. These amounts are not included in rent expense but are classified in selling, general and administrative expenses consistent with similar costs for owned locations. Most long-term leases include options to renew, with terms varying from one to 50 years. Certain leases also include options to purchase the property.
33
Future minimum lease payments required under noncancelable lease agreements existing at January 28, 2006, were:
Future Minimum Lease Payments | | |
| | Operating | | Capital | |
(millions) | | Leases | | Leases | |
| | | | | |
2006 | | $ | 137 | | $ | 12 | |
2007 | | 132 | | 12 | |
2008 | | 123 | | 13 | |
2009 | | 114 | | 13 | |
2010 | | 107 | | 13 | |
After 2010 | | 2,484 | | 160 | |
| | | | | |
Total future minimum lease payments | | $ | 3,097 | (a) | 223 | |
Less: Interest (b) | | | | (122 | ) |
Present value of minimum capital lease payments | | | | $ | 101 | (c) |
(a) Total contractual lease payments include certain options to extend lease terms, in the amount of $1,421 million, that are expected to be exercised because the investment in leasehold improvements is significant and also includes $122 million of legally binding minimum lease payments for stores that will open in 2006.
(b) Calculated using the interest rate at inception for each lease.
(c) Includes current portion of $2 million.
23. Income Taxes
We account for income taxes under the asset and liability method. We have recognized deferred tax assets and liabilities for the estimated future tax consequences attributable to differences between the financial statement carrying amounts of existing assets and liabilities and their respective tax bases. Deferred tax assets and liabilities are measured using enacted income tax rates in effect for the year in which those temporary differences are expected to be recovered or settled. The effect on deferred tax assets and liabilities of a change in tax rate is recognized into income in the period that includes the enactment date. In the Consolidated Statements of Financial Position, the current deferred tax asset balance is the net of all current deferred tax assets and current deferred tax liabilities. The non-current deferred tax liability is the net of all non-current deferred tax assets and non-current deferred tax liabilities.
To determine our quarterly provision for income taxes, we use annual effective tax rates based on expected annual income and statutory tax rates, adjusted for discrete tax events that occur during the quarter.
Reconciliation of tax rates is as follows:
| | 2005 | | 2004 | | 2003 | |
| | | | | | | |
Federal statutory rate | | 35.0 | % | 35.0 | % | 35.0 | % |
State income taxes, | | | | | | | |
net of federal tax benefit | | 3.3 | | 3.3 | | 3.3 | |
Dividends on ESOP stock | | (0.2 | ) | (0.2 | ) | (0.2 | ) |
Work opportunity tax credits | | (0.2 | ) | (0.2 | ) | (0.2 | ) |
Other | | (0.3 | ) | (0.1 | ) | (0.1 | ) |
Effective tax rate | | 37.6 | % | 37.8 | % | 37.8 | % |
The components of the provision for income taxes were:
Income Tax Provision: Expense | | | | | |
(millions) | | 2005 | | 2004 | | 2003 | |
| | | | | | | |
Current | | | | | | | |
Federal | | $ | 1,361 | | $ | 908 | | $ | 669 | |
State/other | | 213 | | 144 | | 107 | |
| | 1,574 | | 1,052 | | 776 | |
Deferred | | | | | | | |
Federal | | (110 | ) | 83 | | 184 | |
State/other | | (12 | ) | 11 | | 24 | |
| | (122 | ) | 94 | | 208 | |
Total | | $ | 1,452 | | $ | 1,146 | | $ | 984 | |
The components of the net deferred tax asset / (liability) were:
Net Deferred Tax Asset/(Liability) | | | | |
| | January 28, | | January 29, | |
(millions) | | 2006 | | 2005 | |
| | | | | |
Gross deferred tax assets | | | | | |
Deferred and other compensation | | $ | 399 | | $ | 332 | |
Self-insured benefits | | 217 | | 179 | |
Accounts receivable valuation allowance | | 167 | | 147 | |
Inventory | | 1 | | 47 | |
Postretirement health care obligation | | 39 | | 38 | |
Other | | 151 | | 128 | |
| | 974 | | 871 | |
Gross deferred tax liabilities | | | | | |
Property and equipment | | (1,080 | ) | (1,136 | ) |
Pension | | (287 | ) | (268 | ) |
Deferred credit card income | | (103 | ) | (87 | ) |
Other | | (11 | ) | (9 | ) |
| | (1,481 | ) | (1,500 | ) |
Total | | $ | (507 | ) | $ | (629 | ) |
34
During the year ended January 29, 2005, $566 million of the proceeds attributable to the real properties sold in the Marshall Field’s and Mervyn’s dispositions were used to acquire replacement properties which will be used in our business. $373 million of the gain related to the sold real properties was deferred for income tax purposes as allowed by Section 1031 of the Internal Revenue Code until such time as the replacement properties are disposed.
24. Other Non-Current Liabilities
| | January 28, | | January 29, | |
(millions) | | 2006 | | 2005 | |
| | | | | |
Deferred compensation | | $ | 596 | | $ | 528 | |
Worker’s compensation and general liability | | 362 | | 317 | |
Other | | 274 | | 192 | |
Total | | $ | 1,232 | | $ | 1,037 | |
25. Share Repurchase
In June 2004, our Board of Directors authorized the repurchase of $3 billion of our common stock. In November 2005, our Board increased the aggregate authorization by $2 billion, for a total authorization of $5 billion. In 2005, we repurchased 23.1 million shares at an average price per share of $51.88, for a total investment of $1,197 million. Since June 2004, we have repurchased a total of 51.6 million shares at an average price per share of $47.95, for a total investment of $2,473 million. We expect to complete the aggregate program in the next two to three years.
26. Share-Based Compensation
Our accounting policy for share-based compensation is discussed in Note 1 on page 28.
We maintain a long-term incentive plan for key employees and non-employee members of our Board of Directors. Our long-term incentive plan allows us to grant equity-based compensation awards, including stock options, performance share awards, restricted stock awards, or a combination of awards. A majority of granted awards are non-qualified stock options that vest annually in equal amounts over a four-year period. These options generally expire no later than 10 years after the date of the grant. Options granted to the non-employee members of our Board of Directors become exercisable after one year and have a 10-year term. We have issued performance share or performance share unit awards annually since January 2003. These awards represent shares potentially issuable in the future based upon the attainment of performance criteria including compound annual growth rates in revenue and EPS. The number of unissued common shares reserved for future grants under the share-based compensation plans was 47,659,572 at January 28, 2006 and 51,560,249 at January 29, 2005.
Share-Based Compensation Awards | | | | |
| | Stock Options | | | |
| | Total Outstanding | | Currently Exercisable | | Performance | |
| | | | | | | | | | | | | | Shares | |
(options and shares | | Number of | | Exercise | | Intrinsic | | Number of | | Exercise | | Intrinsic | | Potentially | |
in thousands) | | Options | | Price(a) | | Value(b) | | Options | | Price(a) | | Value(b) | | Issuable | |
| | | | | | | | | | | | | | | |
February 1, 2003 | | 34,787 | | $ | 25.73 | | $ | 204 | | 21,931 | | $ | 20.89 | | $ | 204 | | 552 | (c) |
Granted | | 4,638 | | 38.34 | | | | | | | | | | 573 | (d) |
Canceled/forfeited | | (407 | ) | 34.77 | | | | | | | | | | — | |
Exercised | | (2,859 | ) | 12.58 | | | | | | | | | | — | |
January 31, 2004 | | 36,159 | | $ | 28.28 | | $ | 363 | | 23,689 | | $ | 24.48 | | $ | 326 | | 1,125 | |
Granted | | 4,072 | | 49.12 | | | | | | | | | | 629 | (e) |
Canceled/forfeited | | (513 | ) | 35.32 | | | | | | | | | | (73 | ) |
Exercised/earned | | (7,727 | ) | 20.95 | | | | | | | | | | (73 | ) |
January 29, 2005 | | 31,991 | | $ | 32.59 | | $ | 540 | | 22,102 | | $ | 28.79 | | $ | 458 | | 1,608 | |
Granted | | 4,057 | | 53.94 | | | | | | | | | | 597 | (f) |
Canceled/forfeited | | (691 | ) | 40.67 | | | | | | | | | | (252 | ) |
Exercised | | (6,643 | ) | 26.58 | | | | | | | | | | — | |
January 28, 2006 | | 28,714 | | $ | 36.82 | | $ | 505 | | 19,229 | | $ | 31.64 | | $ | 438 | | 1,953 | (g) |
(a) Weighted average.
(b) Represents stock price appreciation subsequent to the grant date, in millions.
(c) Awards are earned based on performance during four years ending February 3, 2007.
(d) Awards are earned based on performance during four years ending February 2, 2008.
(e) Awards are earned based on performance during three years ending February 2, 2008.
(f) Awards are earned based on performance during three years ending January 31, 2009.
(g) Approximately 34 percent of these potentially issuable performance shares, if and when earned, will be paid in cash or deferred through a credit to the deferred compensation accounts of the participants in an amount equal to the value of any earned performance shares.
Nonvested Options and Performance Share Awards
| | | | Weighted | | Performance | | Weighted | |
| | | | Average | | Shares | | Average | |
| | Stock | | Fair Value at | | Potentially | | Fair Value at | |
(options and shares in thousands) | | Options | | Grant Date | | Issuable | | Grant Date | |
| | | | | | | | | |
Nonvested at January 30, 2005 | | 9,889 | | $ | 11.83 | | 1,608 | | $ | 38.84 | |
Granted | | 4,057 | | 16.85 | | 597 | | 53.96 | |
Vested/earned (a) | | (3,774 | ) | 11.75 | | — | | — | |
Cancelled/forfeited | | (687 | ) | 11.78 | | (252 | ) | 39.28 | |
Nonvested at January 28, 2006 | | 9,485 | | $ | 14.01 | | 1,953 | | $ | 44.55 | |
(a) Based on the explicit vesting period.
The Black-Scholes model was used to estimate the fair value of the options at grant date based on the assumptions noted in the following table. Volatility represents an average of market quotes for implied volatility of 5.5-year options on Target stock. The expected life is estimated based on analysis of options already exercised and any foreseeable trends or changes in behavior. The risk-free interest rate is an interpolation of the relevant U.S. Treasury security maturities as of each applicable grant date. The assumptions disclosed below represent a weighted average of the assumptions used for all of our stock option grants throughout the year.
35
Valuation of Share-Based Compensation | | |
| | 2005 | | 2004 | | 2003 | |
| | | | | | | |
Stock option valuation assumptions: | | | | | | | |
Dividend yield | | 0.7 | % | 0.7 | % | 0.8 | % |
Volatility | | 27 | % | 22 | % | 29 | % |
Risk-free interest rate | | 4.4 | % | 3.8 | % | 3.0 | % |
Expected life in years | | 5.5 | | 5.5 | | 5.0 | |
Grant date weighted-average fair value | | $ | 16.85 | | $ | 13.10 | | $ | 11.04 | |
Performance share grant date weighted-average fair value | | $ | 53.96 | | $ | 49.43 | | $ | 38.25 | |
Compensation expense recognized in Statements of Operations (millions) (a) | | $ | 93 | | $ | 60 | | $ | 57 | |
Related income tax benefit (millions) | | $ | 37 | | $ | 23 | | $ | 22 | |
Compensation realized by employees upon option exercises (millions) | | $ | 180 | | $ | 201 | | $ | 72 | |
Related income tax benefit (millions) | | $ | 71 | | $ | 77 | | $ | 28 | |
(a) Represents the total fair value of options vested and performance shares earned.
As of January 28, 2006, there was $102 million of total unrecognized compensation expense related to nonvested stock options. That cost is expected to be recognized over a weighted average period of 1.4 years. The weighted average remaining life of currently exercisable options is 4.6 years, while total outstanding options have a weighted average remaining life of six years. Future compensation expense related to performance shares depends on future performance and could range from a credit of $39 million for previously recognized amounts up to a maximum of $50 million of expense assuming full payout under all outstanding awards.
27. Defined Contribution Plans
Employees who meet certain eligibility requirements can participate in a defined contribution 401(k) plan by investing up to 80 percent of their compensation, as limited by statute or regulation. Generally, we match 100 percent of each employee’s contribution up to 5 percent of total compensation. Our contribution to the plan is initially invested in Target Corporation common stock. These amounts are free to be diversified by the employee three years after initial eligibility in the plan.
In addition, we maintain non-qualified, unfunded deferred compensation plans for highly-compensated employees whose participation in our 401(k) plan is limited by statute or regulation. These employees choose from a menu of crediting rate alternatives which are the same as the investment choices in our 401(k) plan. We credit an additional 2 percent per year to the accounts of active employees, in part to recognize the risks inherent to their participation in a plan of this nature. We also maintain a frozen non-qualified, unfunded plan for certain officers in which deferred compensation earns returns tied to market levels of interest rates plus an additional 6 percent return as determined by the plan’s terms. We control some of our risk of offering the non-qualified plans through investing in vehicles that offset a substantial portion of our economic exposure to the returns of those plans. These investment vehicles are marked to market with the related gains and losses recognized in the Consolidated Statements of Operations in the period they occur. At times, adjusting our position in these investment vehicles includes repurchasing shares of Target common stock. In 2005, 2004 and 2003, these repurchases totaled 1.5 million, 0.8 million and 1.5 million shares, respectively.
(millions) | | 2005 | | 2004 | | 2003 | |
| | | | | | | |
401(k) Defined Contribution Plan | | | | | | | |
401(k) matching contributions | | $ | 118 | | $ | 118 | | $ | 117 | |
| | | | | | | |
Non-Qualified Deferred Compensation Plans | | | | | | | |
Benefits expense | | $ | 64 | | $ | 63 | | $ | 86 | |
Related investments | | (34 | ) | (40 | ) | (58 | ) |
Net expense | | $ | 30 | | $ | 23 | | $ | 28 | |
In 2005, 2004 and 2003, certain retired executives accepted our offer to exchange our obligation to them under certain frozen non-qualified plans for cash or deferrals in our current non-qualified deferred compensation plan. These exchange transactions resulted in expense of $7 million, $17 million, and $17 million, respectively. We expect lower future expenses as a result of these transactions.
Expenses for Marshall Field’s and Mervyn’s employees are included in the table above to the extent we retained the related assets and obligations of their plans subsequent to the 2004 divestiture of those businesses.
28. Pension and Postretirement Health Care Benefits
We have a qualified defined benefit pension plan covering all U.S. employees who meet age and service requirements. We also have unfunded non-qualified pension plans for employees with qualified plan compensation restrictions. Benefits are provided based on years of service and the employee’s compensation. During fiscal 2004, we merged our three qualified U.S. pension plans into one plan. This merger did not have a material impact on the financial results of the plan. Upon retirement employees also become eligible for certain health care benefits if they meet minimum age and service requirements and agree to contribute a portion of the cost.
We recorded a reduction in our accumulated post-retirement benefit obligation of $7 million in 2004 as a result of the Medicare Prescription Drug, Improvements and Modernization Act of 2003. In addition, the expense amounts shown in the table below for 2004 reflect a $1 million reduction due to the amortization of the actuarial gain and reduction in interest cost due to the effects of the Act.
In 2005, certain non-qualified pension and survivor benefits owed to current officers were exchanged for cash or deferrals in our current non-qualified deferred compensation plan, which resulted in expense of $11 million. The effect of these exchange transactions is included in the pension tables below. There were no such exchange transactions during 2004 or 2003.
36
Obligations and Funded Status | | | | | | | |
| | | | | | | |
| | Pension Benefits | | Postretirement | |
| | | | | | Non-qualified | | Health Care | |
| | Qualified Plans | | Plans | | Benefits | |
(millions) | | 2005 | | 2004 | | 2005 | | 2004 | | 2005 | | 2004 | |
| | | | | | | | | | | | | |
Change in Projected Benefit Obligation | | | | | | | | | | | | | |
| | | | | | | | | | | | | |
Benefit obligation at beginning of measurement period (a) | | $ | 1,515 | | $ | 1,333 | | $ | 34 | | $ | 29 | | $ | 107 | | $ | 123 | |
Service cost | | 66 | | 78 | | 1 | | 1 | | 2 | | 3 | |
Interest cost | | 85 | | 82 | | 2 | | 2 | | 6 | | 7 | |
Actuarial loss | | 55 | | 68 | | 4 | | 4 | | 3 | | (6 | ) |
Benefits paid | | (94 | ) | (65 | ) | (5 | ) | (3 | ) | (13 | ) | (13 | ) |
Plan amendments | | (1 | ) | 19 | | (3 | ) | 1 | | — | | (7 | ) |
Benefit obligation at end of measurement period | | $ | 1,626 | | $ | 1,515 | | $ | 33 | | $ | 34 | | $ | 105 | | $ | 107 | |
Change in Plan Assets | | | | | | | | | | | | | |
Fair value of plan assets at beginning of measurement | | | | | | | | | | | | | |
period | | $ | 1,698 | | $ | 1,405 | | $ | — | | $ | — | | $ | — | | $ | — | |
Actual return on plan assets | | 174 | | 157 | | — | | — | | — | | — | |
Employer contribution | | 67 | | 201 | | 5 | | 3 | | 13 | | 13 | |
Benefits paid | | (94 | ) | (65 | ) | (5 | ) | (3 | ) | (13 | ) | (13 | ) |
Fair value of plan assets at end of measurement period | | $ | 1,845 | | $ | 1,698 | | $ | — | | $ | — | | $ | — | | $ | — | |
Funded status | | $ | 219 | | $ | 183 | | $ | (33 | ) | $ | (34 | ) | $ | (105 | ) | $ | (107 | ) |
Unrecognized actuarial loss | | 561 | | 584 | | 16 | | 15 | | 8 | | 6 | |
Unrecognized prior service cost | | (32 | ) | (39 | ) | — | | 2 | | — | | — | |
Net amount recognized | | $ | 748 | | $ | 728 | | $ | (17 | ) | $ | (17 | ) | $ | (97 | ) | $ | (101 | ) |
(a) Measurement date is October 31 of each year.
Amounts recognized in the Consolidated Statements of Financial Position consist of:
| | | | | | |
| | Pension Benefits | | Postretirement | |
| | | | | | Non-qualified | | Health Care | |
| | Qualified Plans | | Plans | | Benefits | |
(millions) | | 2005 | | 2004 | | 2005 | | 2004 | | 2005 | | 2004 | |
| | | | | | | | | | | | | |
Prepaid benefit cost | | $ | 752 | | $ | 733 | | $ | — | | $ | — | | $ | — | | $ | — | |
Accrued benefit cost | | (9 | ) | (11 | ) | (22 | ) | (24 | ) | (97 | ) | (101 | ) |
Intangible assets | | — | | — | | — | | 2 | | — | | — | |
Accumulated OCI | | 5 | | 6 | | 5 | | 5 | | — | | — | |
Net amount recognized | | $ | 748 | | $ | 728 | | $ | (17 | ) | $ | (17 | ) | $ | (97 | ) | $ | (101 | ) |
| | | | | | | | | | | | | | | | | | | | |
Net Pension and Postretirement Health Care Benefits Expense
| | | | | | | | Postretirement | |
| | Pension Benefits | | Health Care Benefits | |
(millions) | | 2005 | | 2004 | | 2003 | | 2005 | | 2004 | | 2003 | |
| | | | | | | | | | | | | |
Service cost benefits earned during the period | | $ | 67 | | $ | 79 | | $ | 74 | | $ | 2 | | $ | 3 | | $ | 2 | |
Interest cost on projected benefit obligation | | 87 | | 84 | | 75 | | 6 | | 7 | | 8 | |
Expected return on assets | | (137 | ) | (122 | ) | (114 | ) | — | | — | | — | |
Recognized losses | | 43 | | 36 | | 18 | | 1 | | 1 | | 1 | |
Recognized prior service cost | | (5 | ) | (7 | ) | (7 | ) | — | | — | | — | |
Settlement/curtailment charges | | — | | 1 | | — | | — | | (7 | ) | — | |
Total | | $ | 55 | | $ | 71 | | $ | 46 | | $ | 9 | | $ | 4 | | $ | 11 | |
The amortization of any prior service cost is determined using the straight-line method over the average remaining service period of employees expected to receive benefits under the plan. As a result of freezing the benefits for Marshall Field’s and Mervyn’s team members at the time of their respective dispositions and retaining the related assets and obligations of the plans, we were required to record curtailment charges in 2004. These charges are also included in the gain on disposal of discontinued operations in the Consolidated Statements of Operations.
Other information related to defined benefit pension plans is as follows:
(millions) | | 2005 | | 2004 | |
| | | | | |
Accumulated benefit obligation (ABO) for all plans (a) | | $ | 1,534 | | $ | 1,501 | |
Projected benefit obligation for pension plans with an ABO in excess of plan assets (b) | | 46 | | 49 | |
Total ABO for pension plans with an ABO in excess of plan assets | | 41 | | 45 | |
Fair value of plan assets for pension plans with an ABO in excess of plan assets | | 3 | | 5 | |
| | | | | | | |
(a) The present value of benefits earned to date assuming no future salary growth.
(b) The present value of benefits earned to date by plan participants, including the effect of assumed future salary increases.
Assumptions
Weighted average assumptions used to determine benefit obligations at October 31:
| | | | | | Postretirement | |
| | Pension Benefits | | Health Care Benefits | |
| | 2005 | | 2004 | | 2005 | | 2004 | |
| | | | | | | | | |
Discount rate | | 5.75 | % | 5.75 | % | 5.75 | % | 5.75 | % |
Average assumed rate of compensation increase | | 3.50 | % | 2.75 | % | n/a | | n/a | |
37
Weighted average assumptions used to determine net periodic benefit cost for years ended October 31:
| | | | | | Postretirement | |
| | Pension Benefits | | Health Care Benefits | |
| | 2005 | | 2004 | | 2005 | | 2004 | |
| | | | | | | | | |
Discount rate | | 5.75 | % | 6.25 | % | 5.75 | % | 6.25 | % |
Expected long-term rate of return on plan assets | | 8.00 | % | 8.00 | % | n/a | | n/a | |
Average assumed rate of compensation increase | | 2.75 | % | 3.25 | % | n/a | | n/a | |
The discount rate used to measure net periodic benefit cost each year is the rate as of the beginning of the year (i.e. the prior measurement date). With an essentially stable asset allocation over the following time periods, our annualized rate of return on qualified plans’ assets has averaged 5.1 percent, 9.9 percent and 11.5 percent for the 5-year, 10-year and 15-year periods, respectively, ending October 31, 2005.
An increase in the cost of covered health care benefits of 10 percent was assumed for 2005. The rate is assumed to be 9 percent in 2006 and is reduced by 1 percent annually to 5 percent in 2010 and thereafter.
A 1 percent change in assumed health care cost trend rates would have the following effects:
| | 1% Increase | | 1% Decrease | |
| | | | | |
Effect on total of service and interest cost components of net periodic postretirement health care benefit cost | | $ | — | | $ | — | |
Effect on the health care component of the postretirement benefit obligation | | $ | 5 | | $ | (4 | ) |
Additional Information
Our pension plan weighted average asset allocations at October 31, 2005 and 2004 by asset category were as follows:
| | 2005 | | 2004 | |
| | | | | |
Domestic equity securities | | 36 | % | 37 | % |
International equity securities | | 20 | | 21 | |
Debt securities | | 26 | | 26 | |
Other | | 18 | | 16 | |
Total | | 100 | % | 100 | % |
Our asset allocation strategy for 2006 targets 35 percent in domestic equity securities, 20 percent in international equity securities, 25 percent in debt securities and 20 percent in other assets. Equity securities include our common stock in amounts substantially less than 1 percent of total plan assets at October 31, 2005 and 2004. Other assets include private equity, mezzanine and distressed debt and timber and less than a 5 percent allocation to real estate. Our expected long-term rate of return assumptions as of October 31, 2005 were 8.5 percent, 8.5 percent, 5 percent and 10 percent for domestic equity securities, international equity securities, debt securities and other assets, respectively.
Contributions
Given the qualified pension plan’s funded position, we are not required to make any contributions in 2006, although we may choose to make discretionary contributions of up to $80 million. We expect to make contributions in the range of $5 million to $15 million to our postretirement health care benefit plan in 2006.
Estimated Future Benefit Payments
Benefit payments by the plans, which reflect expected future service as appropriate, are expected to be paid as follows:
| | Pension | | Postretirement | |
(millions) | | Benefits | | Health Care Benefits | |
| | | | | |
2006 | | $ | 64 | | $ | 11 | |
2007 | | 72 | | 12 | |
2008 | | 80 | | 13 | |
2009 | | 86 | | 13 | |
2010 | | 90 | | 14 | |
2011—2015 | | $ | 540 | | $ | 79 | |
38
29. Quarterly Results (Unaudited)
Due to the seasonal nature of our business, fourth quarter operating results typically represent a substantially larger share of total year revenues and earnings because it includes the holiday shopping season. We follow the same accounting policies for preparing quarterly and annual financial data. The table below summarizes quarterly results for 2005 and 2004:
| | First Quarter | | Second Quarter | | Third Quarter | | Fourth Quarter | | Total Year | |
(millions, except per share data) | | 2005 | | 2004 | | 2005 | | 2004 | | 2005 | | 2004 | | 2005 | | 2004 | | 2005 | | 2004 | |
Total revenues | | $ | 11,477 | | $ | 10,180 | | $ | 11,990 | | $ | 10,556 | | $ | 12,206 | | $ | 10,909 | | $ | 16,947 | | $ | 15,194 | | $ | 52,620 | | $ | 46,839 | |
Gross margin | | $ | 3,615 | | $ | 3,140 | | $ | 3,839 | | $ | 3,268 | | $ | 3,829 | | $ | 3,300 | | $ | 5,061 | | $ | 4,529 | | $ | 16,344 | | $ | 14,237 | |
Earnings from continuing operations | | $ | 494 | | $ | 392 | | $ | 540 | | $ | 360 | | $ | 435 | | $ | 324 | | $ | 939 | | $ | 809 | | $ | 2,408 | | $ | 1,885 | |
Earnings from discontinued operations, net of taxes of $25, $19, $2 and $46 | | $ | — | | $ | 40 | | $ | — | | $ | 31 | | $ | — | | $ | 4 | | $ | — | | $ | — | | $ | — | | $ | 75 | |
Gain/(loss) on disposal of discontinued operations, net of taxes of $650, $132, $(21) and $761 (a) | | $ | — | | $ | — | | $ | — | | $ | 1,019 | | $ | — | | $ | 203 | | $ | — | | $ | 16 | | $ | — | | $ | 1,238 | |
Net earnings (b) | | $ | 494 | | $ | 432 | | $ | 540 | | $ | 1,410 | | $ | 435 | | $ | 531 | | $ | 939 | | $ | 825 | | $ | 2,408 | | $ | 3,198 | |
Basic earnings per share (c) | | | | | | | | | | | | | | | | | | | | | |
Continuing operations | | $ | .56 | | $ | .43 | | $ | .61 | | $ | .40 | | $ | .49 | | $ | .36 | | $ | 1.07 | | $ | .91 | | $ | 2.73 | | $ | 2.09 | |
Discontinued operations | | $ | — | | $ | .04 | | $ | — | | $ | .03 | | $ | — | | $ | — | | $ | — | | $ | — | | $ | — | | $ | .08 | |
Gain from discontinued operations | | $ | — | | $ | — | | $ | — | | $ | 1.12 | | $ | — | | $ | .23 | | $ | — | | $ | .01 | | $ | — | | $ | 1.37 | |
Basic earnings per share (b) | | $ | .56 | | $ | .47 | | $ | .61 | | $ | 1.55 | | $ | .49 | | $ | .59 | | $ | 1.07 | | $ | .92 | | $ | 2.73 | | $ | 3.54 | |
Diluted earnings per share (c) | | | | | | | | | | | | | | | | | | | | | |
Continuing operations | | $ | .55 | | $ | .43 | | $ | .61 | | $ | .39 | | $ | .49 | | $ | .36 | | $ | 1.06 | | $ | .90 | | $ | 2.71 | | $ | 2.07 | |
Discontinued operations | | $ | — | | $ | .04 | | $ | — | | $ | .03 | | $ | — | | $ | — | | $ | — | | $ | — | | $ | — | | $ | .08 | |
Gain from discontinued operations | | $ | — | | $ | — | | $ | — | | $ | 1.11 | | $ | — | | $ | .23 | | $ | — | | $ | .01 | | $ | — | | $ | 1.36 | |
Diluted earnings per share (b) | | $ | .55 | | $ | .47 | | $ | .61 | | $ | 1.53 | | $ | .49 | | $ | .59 | | $ | 1.06 | | $ | .91 | | $ | 2.71 | | $ | 3.51 | |
Dividends declared per share (c) | | $ | .08 | | $ | .07 | | $ | .10 | | $ | .08 | | $ | .10 | | $ | .08 | | $ | .10 | | $ | .08 | | $ | .38 | | $ | .31 | |
Closing common stock price | | | | | | | | | | | | | | | | | | | | | |
High | | $ | 52.50 | | $ | 45.63 | | $ | 59.98 | | $ | 46.43 | | $ | 57.80 | | $ | 50.02 | | $ | 58.85 | | $ | 52.43 | | $ | 59.98 | | $ | 52.43 | |
Low | | $ | 46.41 | | $ | 38.59 | | $ | 46.28 | | $ | 40.80 | | $ | 50.84 | | $ | 40.42 | | $ | 52.61 | | $ | 48.50 | | $ | 46.28 | | $ | 38.59 | |
(a)Minor tax adjustments related to the dispositions of Marshall Field’s and Mervyn’s were recorded in fourth quarter 2004.
(b)Target adjusted its method of accounting for leases related to a specific category of owned store locations on leased land, which resulted in a non-cash adjustment, primarily attributable to an increase in the straight-line rent accrual, of $65million ($.04 per share) in the fourth quarter of 2004.
(c)Per share amounts are computed independently for each of the quarters presented. The sum of the quarters may not equal the total year amount due to the impact of changes in average quarterly shares outstanding.
39
Report of Independent Registered Public Accounting Firm on Consolidated Financial Statements
The Board of Directors and Shareholders Target Corporation
We have audited the accompanying consolidated statements of financial position of Target Corporation and subsidiaries as of January 28, 2006 and January 29, 2005, and the related consolidated statements of operations, cash flows, and shareholders’ investment for each of the three years in the period ended January 28, 2006. These financial statements are the responsibility of the Corporation’s management. Our responsibility is to express an opinion on these financial statements based on our audits.
We conducted our audits in accordance with the standards of the Public Company Accounting Oversight Board (United States). Those standards require that we plan and perform the audit to obtain reasonable assurance about whether the financial statements are free of material misstatement. An audit includes examining, on a test basis, evidence supporting the amounts and disclosures in the financial statements. An audit also includes assessing the accounting principles used and significant estimates made by management, as well as evaluating the overall financial statement presentation. We believe that our audits provide a reasonable basis for our opinion.
In our opinion, the financial statements referred to above present fairly, in all material respects, the consolidated financial position of Target Corporation and subsidiaries at January 28, 2006 and January 29, 2005, and the consolidated results of their operations and their cash flows for each of the three years in the period ended January 28, 2006, in conformity with U.S. generally accepted accounting principles.
We also have audited, in accordance with the standards of the Public Company Accounting Oversight Board (United States), the effectiveness of the Corporation’s internal control over financial reporting as of January 28, 2006, based on criteria established in Internal Control – Integrated Framework, issued by the Committee of Sponsoring Organizations of the Treadway Commission and our report dated March 29, 2006, expressed an unqualified opinion thereon.
Minneapolis, Minnesota | 
|
March 29, 2006 |
Report of Management on Internal Control
Our management is responsible for establishing and maintaining adequate internal control over financial reporting, as such term is defined in Exchange Act Rules 13a-15(f). Under the supervision and with the participation of our management, including our chief executive officer and chief financial officer, we assessed the effectiveness of our internal control over financial reporting as of January 28, 2006, based on the framework in Internal Control – Integrated Framework, issued by the Committee of Sponsoring Organizations of the Treadway Commission. Based on our assessment, we conclude that the Corporation’s internal control over financial reporting is effective based on those criteria.
Our management’s assessment of the effectiveness of our internal control over financial reporting as of January 28, 2006, has been audited by Ernst & Young LLP, independent registered public accounting firm, whose report also appears on this page.

| 
|
Robert J. Ulrich | Douglas A. Scovanner |
Chairman of the Board and | Executive Vice President and |
Chief Executive Officer | Chief Financial Officer |
March 29, 2006 | |
Report of Independent Registered Public Accounting Firm on Internal Control over Financial Reporting
The Board of Directors and Shareholders Target Corporation
We have audited management’s assessment, included in the accompanying Report of Management on Internal Control, that Target Corporation and subsidiaries maintained effective internal control over financial reporting as of January 28, 2006, based on criteria established in Internal Control – Integrated Framework, issued by the Committee of Sponsoring Organizations of the Treadway Commission (the COSO criteria). The Corporation’s management is responsible for maintaining effective internal control over financial reporting and for its assessment of the effectiveness of internal control over financial reporting. Our responsibility is to express an opinion on management’s assessment and an opinion on the effectiveness of the Corporation’s internal control over financial reporting based on our audit.
We conducted our audit in accordance with the standards of the Public Company Accounting Oversight Board (United States). Those standards require that we plan and perform the audit to obtain reasonable assurance about whether effective internal control over financial reporting was maintained in all material respects. Our audit included obtaining an understanding of internal control over financial reporting, evaluating management’s assessment, testing and evaluating the design and operating effectiveness of internal control, and performing such other procedures as we considered necessary in the circumstances. We believe that our audit provides a reasonable basis for our opinion.
A company’s internal control over financial reporting is a process designed to provide reasonable assurance regarding the reliability of financial reporting and the preparation of financial statements for external purposes in accordance with generally accepted accounting principles. A company’s internal control over financial reporting includes those policies and procedures that (1) pertain to the maintenance of records that, in reasonable detail, accurately and fairly reflect the transactions and dispositions of the assets of the company, (2) provide reasonable assurance that transactions are recorded as necessary to permit preparation of financial statements in accordance with generally accepted accounting principles and that receipts and expenditures of the company are being made only in accordance with authorizations of management and directors of the company, and (3) provide reasonable assurance regarding prevention or timely detection of unauthorized acquisition, use, or disposition of the company’s assets that could have a material effect on the financial statements.
Because of its inherent limitations, internal control over financial reporting may not prevent or detect misstatements. Also, projections of any evaluation of effectiveness to future periods are subject to the risk that controls may become nadequate because of changes in conditions or that the degree of compliance with the policies or procedures may deteriorate.
In our opinion, management’s assessment that Target Corporation and subsidiaries maintained effective internal control over financial reporting as of January 28, 2006, is fairly stated, in all material respects, based on the COSO criteria. Also, in our opinion, the Corporation maintained, in all material respects, effective internal control over financial reporting as of January 28, 2006, based on the COSO criteria.
We also have audited, in accordance with the standards of the Public Company Accounting Oversight Board (United States), the consolidated statements of financial position of Target Corporation and subsidiaries as of January 28, 2006 and January 29, 2005, and the related consolidated statements of operations, cash flows and shareholders’ investment for each of the three years in the period ended January 28, 2006, of Target Corporation and subsidiaries and our report dated March 29, 2006, expressed an unqualified opinion thereon.
Minneapolis, Minnesota | 
|
March 29, 2006 |
40