UNITED STATES
SECURITIES AND EXCHANGE COMMISSION
Washington, D.C. 20549
FORM N-CSR
CERTIFIED SHAREHOLDER REPORT OF REGISTERED
MANAGEMENT INVESTMENT COMPANIES
Investment Company Act file number 811-2841
Fidelity Capital Trust
(Exact name of registrant as specified in charter)
245 Summer St., Boston, Massachusetts 02210
(Address of principal executive offices) (Zip code)
Marc Bryant, Secretary
245 Summer St.
Boston, Massachusetts 02210
(Name and address of agent for service)
Registrant's telephone number, including area code:
617-563-7000
| |
Date of fiscal year end: | October 31 |
| |
Date of reporting period: | October 31, 2017 |
Item 1.
Reports to Stockholders
Fidelity® Stock Selector Small Cap Fund
Annual Report October 31, 2017 |
 |
Contents
To view a fund's proxy voting guidelines and proxy voting record for the 12-month period ended June 30, visit http://www.fidelity.com/proxyvotingresults or visit the Securities and Exchange Commission's (SEC) web site at http://www.sec.gov.
You may also call 1-800-544-8544 to request a free copy of the proxy voting guidelines.
Standard & Poor's, S&P and S&P 500 are registered service marks of The McGraw-Hill Companies, Inc. and have been licensed for use by Fidelity Distributors Corporation.
Other third-party marks appearing herein are the property of their respective owners.
All other marks appearing herein are registered or unregistered trademarks or service marks of FMR LLC or an affiliated company. © 2017 FMR LLC. All rights reserved.
This report and the financial statements contained herein are submitted for the general information of the shareholders of the Fund. This report is not authorized for distribution to prospective investors in the Fund unless preceded or accompanied by an effective prospectus.
A fund files its complete schedule of portfolio holdings with the SEC for the first and third quarters of each fiscal year on Form N-Q. Forms N-Q are available on the SEC’s web site at http://www.sec.gov. A fund's Forms N-Q may be reviewed and copied at the SEC’s Public Reference Room in Washington, DC. Information regarding the operation of the SEC's Public Reference Room may be obtained by calling 1-800-SEC-0330.
For a complete list of a fund's portfolio holdings, view the most recent holdings listing, semiannual report, or annual report on Fidelity's web site at http://www.fidelity.com, http://www.institutional.fidelity.com, or http://www.401k.com, as applicable.
NOT FDIC INSURED •MAY LOSE VALUE •NO BANK GUARANTEE
Neither the Fund nor Fidelity Distributors Corporation is a bank.
Performance: The Bottom Line
Average annual total return reflects the change in the value of an investment, assuming reinvestment of distributions from dividend income and capital gains (the profits earned upon the sale of securities that have grown in value, if any) and assuming a constant rate of performance each year. The hypothetical investment and the average annual total returns do not reflect the deduction of taxes that a shareholder would pay on fund distributions or the redemption of fund shares. During periods of reimbursement by Fidelity, a fund’s total return will be greater than it would be had the reimbursement not occurred. How a fund did yesterday is no guarantee of how it will do tomorrow.
Average Annual Total Returns
| For the periods ended October 31, 2017 | Past 1 year | Past 5 years | Past 10 years |
| Fidelity® Stock Selector Small Cap Fund | 22.00% | 12.92% | 5.23% |
$10,000 Over 10 Years
Let's say hypothetically that $10,000 was invested in Fidelity® Stock Selector Small Cap Fund, a class of the fund, on October 31, 2007.
The chart shows how the value of your investment would have changed, and also shows how the Russell 2000® Index performed over the same period.

| Period Ending Values |
| $16,643 | Fidelity® Stock Selector Small Cap Fund |
| $20,870 | Russell 2000® Index |
Management's Discussion of Fund Performance
Market Recap: The U.S. equity bellwether S&P 500
® index gained 23.63% for the year ending October 31, 2017. Equity markets rose sharply following the November election and continued to rally through the end of February on optimism for President Trump’s pro-business agenda. Stocks leveled off in March amid fading optimism and stalled efforts by Congress to repeal and replace the Affordable Care Act. Upward momentum soon returned and continued through period end amid positive consumer sentiment and other market indicators. The lone exception was a brief cooldown in August, when geopolitical tension escalated and uncertainty grew regarding the future of health care, tax reform and the debt ceiling. Sector-wise, information technology (+39%) performed best, surging as a handful of major index constituents posted strong returns. Financials gained 37%, riding an uptick in bond yields and a surge in banks. Materials (+29%) also did well, spurred by higher demand, especially from China. Conversely, consumer discretionary (+20%) lagged the broader market, as brick-and-mortar retailers continued to suffer from increased online competition. Rising interest rates held back real estate (+9%) and sluggish oil prices dragged on energy (+2%). Consumer staples (+4%) and telecommunication services (-1%) struggled due to investors’ general preference for risk assets.
Comments from Lead Portfolio Manager Richard Thompson: For the fiscal year ending October 31, 2017, the fund’s Retail Class shares gained 22%, lagging the 27.85% return of the benchmark Russell 2000
® Index. Weak stock selection was the biggest detractor versus the benchmark, with nine of 11 sector sleeves underperforming the corresponding results of the Russell index. Specifically, our picks in financials, particularly in banks, and information technology were the most detrimental on a relative basis. Individually, the fund’s overweighting in non-bank ATM operator Cardtronics was the fund’s biggest relative detractor. Shares declined after the company reduced its earnings estimates, which were hampered by lower interchange fees in Australia (a primary market), investors became concerned about a slowdown in earnings growth as one of Cardtronics’ largest customers winds down its contract with the company. Elsewhere, a non-benchmark stake in oil and natural gas drilling operator Nabors Industries also hurt, as the company reported poor operational performance and a less-bullish land-drilling outlook in the U.S. On the positive side, choices in consumer staples helped most. The fund’s largest individual contributor, however, came from the health care segment: biotechnology company AnaptysBio. In early October, shares of the stock soared after the company announced positive Phase 2 data on its atopic dermatitis drug in clinical trials.
The views expressed above reflect those of the portfolio manager(s) only through the end of the period as stated on the cover of this report and do not necessarily represent the views of Fidelity or any other person in the Fidelity organization. Any such views are subject to change at any time based upon market or other conditions and Fidelity disclaims any responsibility to update such views. These views may not be relied on as investment advice and, because investment decisions for a Fidelity fund are based on numerous factors, may not be relied on as an indication of trading intent on behalf of any Fidelity fund.
Investment Summary (Unaudited)
Top Ten Stocks as of October 31, 2017
| | % of fund's net assets | % of fund's net assets 6 months ago |
| EMCOR Group, Inc. | 1.2 | 1.1 |
| RingCentral, Inc. | 1.0 | 0.0 |
| BancFirst Corp. | 0.9 | 1.0 |
| Banner Corp. | 0.9 | 0.9 |
| Cotiviti Holdings, Inc. | 0.9 | 0.7 |
| WSFS Financial Corp. | 0.9 | 1.0 |
| Associated Banc-Corp. | 0.9 | 0.9 |
| Wintrust Financial Corp. | 0.9 | 0.0 |
| Washington Federal, Inc. | 0.9 | 0.8 |
| Primerica, Inc. | 0.9 | 0.7 |
| | 9.4 | |
Top Five Market Sectors as of October 31, 2017
| | % of fund's net assets | % of fund's net assets 6 months ago |
| Financials | 19.2 | 19.4 |
| Information Technology | 17.7 | 17.2 |
| Industrials | 16.0 | 15.3 |
| Health Care | 13.6 | 12.1 |
| Consumer Discretionary | 11.0 | 12.2 |
Asset Allocation (% of fund's net assets)
| As of October 31, 2017* |
| | Stocks | 98.3% |
| | Short-Term Investments and Net Other Assets (Liabilities) | 1.7% |

* Foreign investments - 9.8%
| As of April 30, 2017 * |
| | Stocks and Equity Futures | 98.3% |
| | Short-Term Investments and Net Other Assets (Liabilities) | 1.7% |

* Foreign investments - 8.9%
Percentages shown as 0.0% may reflect amounts less than 0.05%.
Investments October 31, 2017
Showing Percentage of Net Assets
| Common Stocks - 98.3% | | | |
| | | Shares | Value (000s) |
| CONSUMER DISCRETIONARY - 11.0% | | | |
| Auto Components - 1.3% | | | |
| Standard Motor Products, Inc. | | 149,102 | $6,511 |
| Tenneco, Inc. | | 135,284 | 7,861 |
| Visteon Corp. (a) | | 53,100 | 6,693 |
| | | | 21,065 |
| Diversified Consumer Services - 0.4% | | | |
| Service Corp. International | | 185,400 | 6,574 |
| Hotels, Restaurants & Leisure - 1.9% | | | |
| Bojangles', Inc. (a)(b) | | 16,250 | 199 |
| Cedar Fair LP (depositary unit) | | 88,100 | 5,515 |
| Dave & Buster's Entertainment, Inc. (a) | | 22,200 | 1,070 |
| Eldorado Resorts, Inc. (a) | | 47,600 | 1,223 |
| Marriott Vacations Worldwide Corp. | | 72,800 | 9,582 |
| Papa John's International, Inc. (b) | | 103,900 | 7,070 |
| Penn National Gaming, Inc. (a) | | 202,500 | 5,283 |
| | | | 29,942 |
| Household Durables - 2.6% | | | |
| CalAtlantic Group, Inc. | | 117,500 | 5,797 |
| Cavco Industries, Inc. (a) | | 51,700 | 8,112 |
| Helen of Troy Ltd. (a) | | 77,569 | 7,206 |
| Taylor Morrison Home Corp. (a) | | 375,800 | 9,076 |
| TopBuild Corp. (a) | | 150,800 | 9,951 |
| TRI Pointe Homes, Inc. (a) | | 93,660 | 1,657 |
| | | | 41,799 |
| Leisure Products - 0.4% | | | |
| Brunswick Corp. | | 78,496 | 3,976 |
| Johnson Outdoors, Inc. Class A | | 37,533 | 2,823 |
| | | | 6,799 |
| Media - 0.9% | | | |
| Cinemark Holdings, Inc. | | 176,400 | 6,410 |
| Lions Gate Entertainment Corp. Class B | | 255,500 | 7,067 |
| | | | 13,477 |
| Multiline Retail - 0.5% | | | |
| Ollie's Bargain Outlet Holdings, Inc. (a) | | 163,900 | 7,318 |
| Specialty Retail - 1.3% | | | |
| Burlington Stores, Inc. (a) | | 63,100 | 5,924 |
| Murphy U.S.A., Inc. (a) | | 78,900 | 5,867 |
| The Children's Place Retail Stores, Inc. | | 74,000 | 8,051 |
| | | | 19,842 |
| Textiles, Apparel & Luxury Goods - 1.7% | | | |
| Deckers Outdoor Corp. (a) | | 80,500 | 5,493 |
| Emerald Expositions Events, Inc. | | 240,000 | 5,590 |
| Steven Madden Ltd. (a) | | 224,259 | 8,746 |
| Wolverine World Wide, Inc. | | 276,000 | 7,535 |
| | | | 27,364 |
|
| TOTAL CONSUMER DISCRETIONARY | | | 174,180 |
|
| CONSUMER STAPLES - 2.4% | | | |
| Beverages - 0.2% | | | |
| Cott Corp. | | 193,700 | 2,906 |
| Food & Staples Retailing - 0.4% | | | |
| Performance Food Group Co. (a) | | 204,175 | 5,778 |
| Food Products - 1.2% | | | |
| Cranswick PLC | | 84,500 | 3,457 |
| Hostess Brands, Inc. Class A (a) | | 260,667 | 3,005 |
| Ingredion, Inc. | | 31,700 | 3,974 |
| J&J Snack Foods Corp. | | 33,575 | 4,471 |
| Lamb Weston Holdings, Inc. | | 75,800 | 3,865 |
| | | | 18,772 |
| Household Products - 0.3% | | | |
| Central Garden & Pet Co. Class A (non-vtg.) (a) | | 140,900 | 5,201 |
| Personal Products - 0.3% | | | |
| Inter Parfums, Inc. | | 109,300 | 5,061 |
|
| TOTAL CONSUMER STAPLES | | | 37,718 |
|
| ENERGY - 4.1% | | | |
| Energy Equipment & Services - 1.1% | | | |
| Archrock, Inc. | | 244,329 | 2,932 |
| Nabors Industries Ltd. | | 787,700 | 4,435 |
| Rowan Companies PLC (a) | | 362,340 | 5,192 |
| Total Energy Services, Inc. | | 419,493 | 4,939 |
| | | | 17,498 |
| Oil, Gas & Consumable Fuels - 3.0% | | | |
| Boardwalk Pipeline Partners, LP | | 391,408 | 5,488 |
| DCP Midstream Partners LP | | 82,200 | 2,719 |
| Delek U.S. Holdings, Inc. | | 230,900 | 6,015 |
| Diamondback Energy, Inc. (a) | | 61,507 | 6,591 |
| Newfield Exploration Co. (a) | | 177,488 | 5,465 |
| PDC Energy, Inc. (a) | | 151,000 | 7,690 |
| Warrior Metropolitan Coal, Inc. (b) | | 215,000 | 5,594 |
| WPX Energy, Inc. (a) | | 728,590 | 8,218 |
| | | | 47,780 |
|
| TOTAL ENERGY | | | 65,278 |
|
| FINANCIALS - 19.2% | | | |
| Banks - 11.6% | | | |
| Associated Banc-Corp. | | 554,923 | 14,040 |
| BancFirst Corp. | | 271,156 | 14,819 |
| Banner Corp. | | 250,429 | 14,355 |
| Boston Private Financial Holdings, Inc. | | 382,327 | 6,079 |
| City Holding Co. | | 143,799 | 10,136 |
| Columbia Banking Systems, Inc. | | 315,500 | 13,727 |
| Community Bank System, Inc. | | 137,351 | 7,594 |
| Cullen/Frost Bankers, Inc. | | 89,300 | 8,796 |
| CVB Financial Corp. | | 528,200 | 12,603 |
| First Merchants Corp. | | 268,637 | 11,551 |
| Hilltop Holdings, Inc. | | 250,428 | 5,900 |
| Huntington Bancshares, Inc. | | 53,114 | 733 |
| Independent Bank Corp., Massachusetts | | 144,342 | 10,407 |
| Stock Yards Bancorp, Inc. | | 305,882 | 11,547 |
| Tompkins Financial Corp. | | 143,738 | 12,522 |
| TowneBank | | 304,162 | 10,189 |
| Trico Bancshares | | 105,347 | 4,363 |
| Wintrust Financial Corp. | | 171,700 | 13,957 |
| | | | 183,318 |
| Capital Markets - 0.7% | | | |
| OM Asset Management Ltd. | | 729,210 | 11,142 |
| Diversified Financial Services - 1.3% | | | |
| Camping World Holdings, Inc. | | 126,200 | 5,303 |
| Cotiviti Holdings, Inc. (a) | | 408,200 | 14,352 |
| | | | 19,655 |
| Insurance - 3.0% | | | |
| Employers Holdings, Inc. | | 280,386 | 13,374 |
| First American Financial Corp. | | 196,800 | 10,710 |
| James River Group Holdings Ltd. | | 233,853 | 9,897 |
| Primerica, Inc. | | 157,200 | 13,912 |
| | | | 47,893 |
| Thrifts & Mortgage Finance - 2.6% | | | |
| Beneficial Bancorp, Inc. | | 736,800 | 12,157 |
| Washington Federal, Inc. | | 400,863 | 13,950 |
| WSFS Financial Corp. | | 287,442 | 14,286 |
| | | | 40,393 |
|
| TOTAL FINANCIALS | | | 302,401 |
|
| HEALTH CARE - 13.6% | | | |
| Biotechnology - 8.0% | | | |
| Abeona Therapeutics, Inc. (a)(b) | | 223,873 | 4,019 |
| ACADIA Pharmaceuticals, Inc. (a) | | 107,652 | 3,750 |
| Acorda Therapeutics, Inc. (a) | | 237,800 | 6,320 |
| Advanced Accelerator Applications SA sponsored ADR (a)(b) | | 109,900 | 8,902 |
| Agios Pharmaceuticals, Inc. (a)(b) | | 87,515 | 5,625 |
| Amarin Corp. PLC ADR (a)(b) | | 278,200 | 946 |
| AnaptysBio, Inc. | | 121,000 | 7,990 |
| Ascendis Pharma A/S sponsored ADR (a) | | 189,306 | 6,433 |
| Audentes Therapeutics, Inc. (a) | | 172,300 | 4,581 |
| BioMarin Pharmaceutical, Inc. (a) | | 41,256 | 3,387 |
| bluebird bio, Inc. (a) | | 61,728 | 8,586 |
| Cellectis SA sponsored ADR (a) | | 117,600 | 4,117 |
| Coherus BioSciences, Inc. (a) | | 147,300 | 1,657 |
| Curis, Inc. (a) | | 1,510,448 | 2,387 |
| CytomX Therapeutics, Inc. (a) | | 78,100 | 1,562 |
| CytomX Therapeutics, Inc. (a)(c) | | 27,627 | 553 |
| FibroGen, Inc. (a) | | 110,500 | 6,171 |
| Five Prime Therapeutics, Inc. (a) | | 95,400 | 4,280 |
| Heron Therapeutics, Inc. (a) | | 144,200 | 2,213 |
| Insmed, Inc. (a) | | 232,765 | 6,287 |
| Intercept Pharmaceuticals, Inc. (a) | | 27,988 | 1,725 |
| Ionis Pharmaceuticals, Inc. (a) | | 76,128 | 4,348 |
| La Jolla Pharmaceutical Co. (a) | | 167,600 | 5,759 |
| Neurocrine Biosciences, Inc. (a) | | 118,260 | 7,345 |
| Protagonist Therapeutics, Inc. (a)(b) | | 164,000 | 2,455 |
| Sage Therapeutics, Inc. (a) | | 26,400 | 1,671 |
| Sienna Biopharmaceuticals, Inc. (b) | | 37,784 | 741 |
| Spark Therapeutics, Inc. (a) | | 81,100 | 6,561 |
| TESARO, Inc. (a) | | 45,600 | 5,279 |
| | | | 125,650 |
| Health Care Equipment & Supplies - 3.5% | | | |
| Cantel Medical Corp. | | 140,200 | 13,751 |
| Integra LifeSciences Holdings Corp. (a) | | 191,312 | 8,950 |
| iRhythm Technologies, Inc. | | 136,800 | 6,970 |
| Nanosonics Ltd. (a) | | 2,344,958 | 5,384 |
| Orthofix International NV (a) | | 37,894 | 2,036 |
| Steris PLC | | 82,900 | 7,737 |
| Wright Medical Group NV (a) | | 409,857 | 10,742 |
| | | | 55,570 |
| Health Care Providers & Services - 0.6% | | | |
| G1 Therapeutics, Inc. (b) | | 193,300 | 4,568 |
| Premier, Inc. (a) | | 151,300 | 4,943 |
| | | | 9,511 |
| Life Sciences Tools & Services - 0.7% | | | |
| ICON PLC (a) | | 93,400 | 11,102 |
| Pharmaceuticals - 0.8% | | | |
| Clearside Biomedical, Inc. (a)(b) | | 215,500 | 1,534 |
| Innoviva, Inc. (a) | | 281,851 | 3,450 |
| Prestige Brands Holdings, Inc. (a) | | 69,346 | 3,252 |
| Theravance Biopharma, Inc. (a)(b) | | 171,578 | 4,952 |
| | | | 13,188 |
|
| TOTAL HEALTH CARE | | | 215,021 |
|
| INDUSTRIALS - 16.0% | | | |
| Aerospace & Defense - 1.6% | | | |
| Moog, Inc. Class A (a) | | 157,007 | 13,779 |
| Teledyne Technologies, Inc. (a) | | 64,865 | 11,024 |
| | | | 24,803 |
| Air Freight & Logistics - 0.5% | | | |
| Air Transport Services Group, Inc. (a) | | 344,918 | 8,347 |
| Airlines - 0.4% | | | |
| JetBlue Airways Corp. (a) | | 355,246 | 6,803 |
| Building Products - 1.1% | | | |
| Allegion PLC | | 80,055 | 6,676 |
| GCP Applied Technologies, Inc. (a) | | 122,600 | 3,586 |
| Simpson Manufacturing Co. Ltd. | | 128,293 | 7,151 |
| | | | 17,413 |
| Commercial Services & Supplies - 2.1% | | | |
| Deluxe Corp. | | 159,129 | 11,083 |
| Interface, Inc. | | 446,930 | 10,190 |
| Matthews International Corp. Class A | | 111,897 | 7,033 |
| Multi-Color Corp. | | 57,200 | 4,730 |
| | | | 33,036 |
| Construction & Engineering - 3.3% | | | |
| Comfort Systems U.S.A., Inc. | | 258,344 | 11,445 |
| EMCOR Group, Inc. | | 237,739 | 19,148 |
| KBR, Inc. | | 582,472 | 11,434 |
| Valmont Industries, Inc. | | 63,633 | 10,111 |
| | | | 52,138 |
| Industrial Conglomerates - 0.8% | | | |
| ITT, Inc. | | 263,837 | 12,305 |
| Machinery - 2.3% | | | |
| AGCO Corp. | | 103,462 | 7,094 |
| Colfax Corp. (a) | | 112,400 | 4,688 |
| John Bean Technologies Corp. | | 60,600 | 6,478 |
| SPX Flow, Inc. (a) | | 212,209 | 8,749 |
| Standex International Corp. | | 86,640 | 8,972 |
| | | | 35,981 |
| Road & Rail - 0.7% | | | |
| Landstar System, Inc. | | 102,100 | 10,082 |
| Trading Companies & Distributors - 3.2% | | | |
| Kaman Corp. | | 209,850 | 11,739 |
| MRC Global, Inc. (a) | | 492,424 | 8,445 |
| SiteOne Landscape Supply, Inc. (a) | | 115,800 | 7,354 |
| Titan Machinery, Inc. (a) | | 363,125 | 5,407 |
| Watsco, Inc. | | 54,969 | 9,156 |
| WESCO International, Inc. (a) | | 137,954 | 8,712 |
| | | | 50,813 |
|
| TOTAL INDUSTRIALS | | | 251,721 |
|
| INFORMATION TECHNOLOGY - 17.7% | | | |
| Communications Equipment - 0.1% | | | |
| CommScope Holding Co., Inc. (a) | | 33,300 | 1,070 |
| Electronic Equipment & Components - 3.9% | | | |
| Cardtronics PLC (a) | | 236,800 | 5,423 |
| ePlus, Inc. (a) | | 125,852 | 12,031 |
| Jabil, Inc. | | 217,079 | 6,139 |
| Orbotech Ltd. (a) | | 173,412 | 7,755 |
| Plexus Corp. (a) | | 172,200 | 10,578 |
| Tech Data Corp. (a) | | 117,854 | 10,933 |
| TTM Technologies, Inc. (a) | | 587,784 | 9,275 |
| | | | 62,134 |
| Internet Software & Services - 2.2% | | | |
| 2U, Inc. (a) | | 195,400 | 12,433 |
| Five9, Inc. (a) | | 227,270 | 5,734 |
| j2 Global, Inc. | | 132,400 | 9,816 |
| Web.com Group, Inc. (a) | | 273,160 | 6,583 |
| | | | 34,566 |
| IT Services - 3.5% | | | |
| Amdocs Ltd. | | 51,000 | 3,320 |
| Blackhawk Network Holdings, Inc. (a) | | 196,071 | 6,657 |
| EPAM Systems, Inc. (a) | | 133,498 | 12,168 |
| Euronet Worldwide, Inc. (a) | | 105,187 | 10,165 |
| ExlService Holdings, Inc. (a) | | 169,091 | 10,555 |
| Maximus, Inc. | | 176,500 | 11,725 |
| | | | 54,590 |
| Semiconductors & Semiconductor Equipment - 4.2% | | | |
| Diodes, Inc. (a) | | 317,800 | 10,913 |
| Entegris, Inc. | | 391,300 | 12,815 |
| Integrated Device Technology, Inc. (a) | | 433,000 | 13,453 |
| Nanometrics, Inc. (a) | | 247,201 | 6,988 |
| ON Semiconductor Corp. (a) | | 452,400 | 9,645 |
| Semtech Corp. (a) | | 301,400 | 12,372 |
| | | | 66,186 |
| Software - 3.8% | | | |
| Aspen Technology, Inc. (a) | | 188,300 | 12,149 |
| Paycom Software, Inc. (a)(b) | | 134,500 | 11,056 |
| Pegasystems, Inc. | | 165,719 | 9,661 |
| RealPage, Inc. (a) | | 275,500 | 11,929 |
| RingCentral, Inc. (a) | | 362,700 | 15,288 |
| | | | 60,083 |
|
| TOTAL INFORMATION TECHNOLOGY | | | 278,629 |
|
| MATERIALS - 3.6% | | | |
| Chemicals - 1.9% | | | |
| Chase Corp. | | 82,936 | 9,849 |
| Innospec, Inc. | | 153,099 | 9,469 |
| Trinseo SA | | 93,131 | 6,612 |
| Tronox Ltd. Class A | | 168,600 | 4,463 |
| | | | 30,393 |
| Containers & Packaging - 1.1% | | | |
| Berry Global Group, Inc. (a) | | 113,940 | 6,774 |
| Owens-Illinois, Inc. (a) | | 203,100 | 4,852 |
| Sonoco Products Co. | | 106,441 | 5,513 |
| | | | 17,139 |
| Metals & Mining - 0.6% | | | |
| B2Gold Corp. (a) | | 1,378,657 | 3,505 |
| Steel Dynamics, Inc. | | 172,400 | 6,415 |
| | | | 9,920 |
|
| TOTAL MATERIALS | | | 57,452 |
|
| REAL ESTATE - 7.0% | | | |
| Equity Real Estate Investment Trusts (REITs) - 6.4% | | | |
| CareTrust (REIT), Inc. | | 488,800 | 9,238 |
| CoreSite Realty Corp. | | 99,597 | 11,030 |
| Corporate Office Properties Trust (SBI) | | 278,200 | 8,883 |
| Equity Lifestyle Properties, Inc. | | 129,900 | 11,494 |
| Four Corners Property Trust, Inc. | | 437,013 | 10,785 |
| Healthcare Realty Trust, Inc. | | 355,006 | 11,445 |
| Mid-America Apartment Communities, Inc. | | 53,284 | 5,454 |
| Potlatch Corp. | | 224,800 | 11,645 |
| Store Capital Corp. | | 365,915 | 9,034 |
| Terreno Realty Corp. | | 351,100 | 12,892 |
| | | | 101,900 |
| Real Estate Management & Development - 0.6% | | | |
| Realogy Holdings Corp. | | 283,980 | 9,181 |
|
| TOTAL REAL ESTATE | | | 111,081 |
|
| TELECOMMUNICATION SERVICES - 0.3% | | | |
| Diversified Telecommunication Services - 0.3% | | | |
| Cogent Communications Group, Inc. | | 74,000 | 3,989 |
| UTILITIES - 3.4% | | | |
| Electric Utilities - 1.6% | | | |
| El Paso Electric Co. | | 113,620 | 6,533 |
| IDACORP, Inc. | | 111,400 | 10,252 |
| Portland General Electric Co. | | 154,268 | 7,365 |
| | | | 24,150 |
| Gas Utilities - 1.8% | | | |
| Atmos Energy Corp. | | 48,038 | 4,191 |
| New Jersey Resources Corp. | | 107,200 | 4,765 |
| South Jersey Industries, Inc. | | 107,400 | 3,648 |
| Southwest Gas Holdings, Inc. | | 109,000 | 8,981 |
| Spire, Inc. | | 90,900 | 7,177 |
| | | | 28,762 |
|
| TOTAL UTILITIES | | | 52,912 |
|
| TOTAL COMMON STOCKS | | | |
| (Cost $1,237,867) | | | 1,550,382 |
| | | Principal Amount (000s) | Value (000s) |
|
| U.S. Treasury Obligations - 0.0% | | | |
| U.S. Treasury Bills, yield at date of purchase 1.01% to 1.07% 11/2/17 to 1/11/18 (d) | | | |
| (Cost $389) | | 390 | 389 |
| | | Shares | Value (000s) |
|
| Money Market Funds - 4.4% | | | |
| Fidelity Cash Central Fund, 1.10% (e) | | 32,194,803 | $32,201 |
| Fidelity Securities Lending Cash Central Fund 1.11% (e)(f) | | 36,660,766 | 36,664 |
| TOTAL MONEY MARKET FUNDS | | | |
| (Cost $68,861) | | | 68,865 |
| TOTAL INVESTMENT IN SECURITIES - 102.7% | | | |
| (Cost $1,307,117) | | | 1,619,636 |
| NET OTHER ASSETS (LIABILITIES) - (2.7)% | | | (42,861) |
| NET ASSETS - 100% | | | $1,576,775 |
Legend
(a) Non-income producing
(b) Security or a portion of the security is on loan at period end.
(c) Security exempt from registration under Rule 144A of the Securities Act of 1933. These securities may be resold in transactions exempt from registration, normally to qualified institutional buyers. At the end of the period, the value of these securities amounted to $553,000 or 0.0% of net assets.
(d) Security or a portion of the security was pledged to cover margin requirements for futures contracts. At period end, the value of securities pledged amounted to $160,000.
(e) Affiliated fund that is generally available only to investment companies and other accounts managed by Fidelity Investments. The rate quoted is the annualized seven-day yield of the fund at period end. A complete unaudited listing of the fund's holdings as of its most recent quarter end is available upon request. In addition, each Fidelity Central Fund's financial statements, which are not covered by the Fund's Report of Independent Registered Public Accounting Firm, are available on the SEC's website or upon request.
(f) Investment made with cash collateral received from securities on loan.
Affiliated Central Funds
Information regarding fiscal year to date income earned by the Fund from investments in Fidelity Central Funds is as follows:
| Fund | Income earned |
| | (Amounts in thousands) |
| Fidelity Cash Central Fund | $301 |
| Fidelity Securities Lending Cash Central Fund | 194 |
| Total | $495 |
Investment Valuation
The following is a summary of the inputs used, as of October 31, 2017, involving the Fund's assets and liabilities carried at fair value. The inputs or methodology used for valuing securities may not be an indication of the risk associated with investing in those securities. For more information on valuation inputs, and their aggregation into the levels used below, please refer to the Investment Valuation section in the accompanying Notes to Financial Statements.
| | Valuation Inputs at Reporting Date: |
| Description | Total | Level 1 | Level 2 | Level 3 |
| (Amounts in thousands) | | | | |
| Investments in Securities: | | | | |
| Equities: | | | | |
| Consumer Discretionary | $174,180 | $174,180 | $-- | $-- |
| Consumer Staples | 37,718 | 37,718 | -- | -- |
| Energy | 65,278 | 65,278 | -- | -- |
| Financials | 302,401 | 302,401 | -- | -- |
| Health Care | 215,021 | 215,021 | -- | -- |
| Industrials | 251,721 | 251,721 | -- | -- |
| Information Technology | 278,629 | 278,629 | -- | -- |
| Materials | 57,452 | 57,452 | -- | -- |
| Real Estate | 111,081 | 111,081 | -- | -- |
| Telecommunication Services | 3,989 | 3,989 | -- | -- |
| Utilities | 52,912 | 52,912 | -- | -- |
| U.S. Government and Government Agency Obligations | 389 | -- | 389 | -- |
| Money Market Funds | 68,865 | 68,865 | -- | -- |
| Total Investments in Securities: | $1,619,636 | $1,619,247 | $389 | $-- |
See accompanying notes which are an integral part of the financial statements.
Financial Statements
Statement of Assets and Liabilities
| Amounts in thousands (except per-share amounts) | | October 31, 2017 |
| Assets | | |
Investment in securities, at value (including securities loaned of $36,234) — See accompanying schedule:
Unaffiliated issuers (cost $1,238,256) | $1,550,771 | |
| Fidelity Central Funds (cost $68,861) | 68,865 | |
| Total Investment in Securities (cost $1,307,117) | | $1,619,636 |
| Cash | | 27 |
| Receivable for investments sold | | 5,808 |
| Receivable for fund shares sold | | 812 |
| Dividends receivable | | 160 |
| Distributions receivable from Fidelity Central Funds | | 60 |
| Receivable for daily variation margin on futures contracts | | 18 |
| Prepaid expenses | | 3 |
| Other receivables | | 44 |
| Total assets | | 1,626,568 |
| Liabilities | | |
| Payable for investments purchased | $6,430 | |
| Payable for fund shares redeemed | 5,659 | |
| Accrued management fee | 705 | |
| Distribution and service plan fees payable | 8 | |
| Other affiliated payables | 276 | |
| Other payables and accrued expenses | 53 | |
| Collateral on securities loaned | 36,662 | |
| Total liabilities | | 49,793 |
| Net Assets | | $1,576,775 |
| Net Assets consist of: | | |
| Paid in capital | | $1,118,019 |
| Undistributed net investment income | | 820 |
| Accumulated undistributed net realized gain (loss) on investments and foreign currency transactions | | 145,416 |
| Net unrealized appreciation (depreciation) on investments and assets and liabilities in foreign currencies | | 312,520 |
| Net Assets | | $1,576,775 |
| Calculation of Maximum Offering Price | | |
| Class A: | | |
| Net Asset Value and redemption price per share ($14,065 ÷ 499.478 shares) | | $28.16 |
| Maximum offering price per share (100/94.25 of $28.16) | | $29.88 |
| Class M: | | |
| Net Asset Value and redemption price per share ($3,157 ÷ 114.840 shares) | | $27.49 |
| Maximum offering price per share (100/96.50 of $27.49) | | $28.49 |
| Class C: | | |
| Net Asset Value and offering price per share ($4,584 ÷ 174.946 shares)(a) | | $26.20 |
| Stock Selector Small Cap: | | |
| Net Asset Value, offering price and redemption price per share ($1,511,263 ÷ 52,644.383 shares) | | $28.71 |
| Class I: | | |
| Net Asset Value, offering price and redemption price per share ($43,051 ÷ 1,495.791 shares) | | $28.78 |
| Class Z: | | |
| Net Asset Value, offering price and redemption price per share ($655 ÷ 22.737 shares) | | $28.81 |
(a) Redemption price per share is equal to net asset value less any applicable contingent deferred sales charge.
See accompanying notes which are an integral part of the financial statements.
Statement of Operations
| Amounts in thousands | | Year ended October 31, 2017 |
| Investment Income | | |
| Dividends | | $15,729 |
| Interest | | 3 |
| Income from Fidelity Central Funds | | 495 |
| Total income | | 16,227 |
| Expenses | | |
| Management fee | | |
| Basic fee | $9,161 | |
| Performance adjustment | (1,207) | |
| Transfer agent fees | 2,857 | |
| Distribution and service plan fees | 94 | |
| Accounting and security lending fees | 486 | |
| Custodian fees and expenses | 64 | |
| Independent trustees' fees and expenses | 6 | |
| Registration fees | 114 | |
| Audit | 65 | |
| Legal | 7 | |
| Miscellaneous | 12 | |
| Total expenses before reductions | 11,659 | |
| Expense reductions | (121) | 11,538 |
| Net investment income (loss) | | 4,689 |
| Realized and Unrealized Gain (Loss) | | |
| Net realized gain (loss) on: | | |
| Investment securities: | | |
| Unaffiliated issuers | 159,235 | |
| Fidelity Central Funds | 6 | |
| Foreign currency transactions | 23 | |
| Futures contracts | 424 | |
| Total net realized gain (loss) | | 159,688 |
| Change in net unrealized appreciation (depreciation) on: | | |
| Investment securities: | | |
| Unaffiliated issuers | 136,247 | |
| Fidelity Central Funds | (10) | |
| Assets and liabilities in foreign currencies | 3 | |
| Futures contracts | 49 | |
| Total change in net unrealized appreciation (depreciation) | | 136,289 |
| Net gain (loss) | | 295,977 |
| Net increase (decrease) in net assets resulting from operations | | $300,666 |
See accompanying notes which are an integral part of the financial statements.
Statement of Changes in Net Assets
| Amounts in thousands | Year ended October 31, 2017 | Year ended October 31, 2016 |
| Increase (Decrease) in Net Assets | | |
| Operations | | |
| Net investment income (loss) | $4,689 | $6,798 |
| Net realized gain (loss) | 159,688 | 19,298 |
| Change in net unrealized appreciation (depreciation) | 136,289 | 9,316 |
| Net increase (decrease) in net assets resulting from operations | 300,666 | 35,412 |
| Distributions to shareholders from net investment income | (7,120) | (6,157) |
| Distributions to shareholders from net realized gain | (17,708) | (88,057) |
| Total distributions | (24,828) | (94,214) |
| Share transactions - net increase (decrease) | (119,619) | 41,751 |
| Redemption fees | 78 | 179 |
| Total increase (decrease) in net assets | 156,297 | (16,872) |
| Net Assets | | |
| Beginning of period | 1,420,478 | 1,437,350 |
| End of period | $1,576,775 | $1,420,478 |
| Other Information | | |
| Undistributed net investment income end of period | $820 | $4,434 |
See accompanying notes which are an integral part of the financial statements.
Financial Highlights
Fidelity Stock Selector Small Cap Fund Class A
| Years ended October 31, | 2017 | 2016 | 2015 | 2014 | 2013 |
| Selected Per–Share Data | | | | | |
| Net asset value, beginning of period | $23.48 | $24.48 | $25.76 | $25.32 | $19.40 |
| Income from Investment Operations | | | | | |
| Net investment income (loss)A | –B | .05 | .06 | .01 | (.02) |
| Net realized and unrealized gain (loss) | 5.05 | .52 | .96 | 1.68 | 5.98 |
| Total from investment operations | 5.05 | .57 | 1.02 | 1.69 | 5.96 |
| Distributions from net investment income | (.07) | (.05) | (.03) | –B | (.04) |
| Distributions from net realized gain | (.30) | (1.52) | (2.27) | (1.25) | (.01) |
| Total distributions | (.37) | (1.57) | (2.30) | (1.25) | (.04)C |
| Redemption fees added to paid in capitalA,B | – | – | – | – | – |
| Net asset value, end of period | $28.16 | $23.48 | $24.48 | $25.76 | $25.32 |
| Total ReturnD,E | 21.62% | 2.30% | 4.19% | 6.83% | 30.81% |
| Ratios to Average Net AssetsF,G | | | | | |
| Expenses before reductions | 1.05% | 1.16% | 1.01% | .99% | 1.22% |
| Expenses net of fee waivers, if any | 1.04% | 1.16% | 1.01% | .99% | 1.22% |
| Expenses net of all reductions | 1.04% | 1.15% | 1.00% | .99% | 1.20% |
| Net investment income (loss) | .02% | .22% | .24% | .06% | (.09)% |
| Supplemental Data | | | | | |
| Net assets, end of period (in millions) | $14 | $12 | $11 | $10 | $8 |
| Portfolio turnover rateH | 62% | 57% | 48% | 73% | 79% |
A Calculated based on average shares outstanding during the period.
B Amount represents less than $.005 per share.
C Total distributions of $.04 per share is comprised of distributions from net investment income of $.037 and distributions from net realized gain of $.007 per share.
D Total returns would have been lower if certain expenses had not been reduced during the applicable periods shown.
E Total returns do not include the effect of the sales charges.
F Fees and expenses of any underlying Fidelity Central Funds are not included in the Fund's expense ratio. The Fund indirectly bears its proportionate share of the expenses of any underlying Fidelity Central Funds.
G Expense ratios reflect operating expenses of the class. Expenses before reductions do not reflect amounts reimbursed by the investment adviser or reductions from brokerage service arrangements or reductions from other expense offset arrangements and do not represent the amount paid by the class during periods when reimbursements or reductions occur. Expenses net of fee waivers reflect expenses after reimbursement by the investment adviser but prior to reductions from brokerage service arrangements or other expense offset arrangements. Expenses net of all reductions represent the net expenses paid by the class.
H Amount does not include the portfolio activity of any underlying Fidelity Central Funds.
See accompanying notes which are an integral part of the financial statements.
Fidelity Stock Selector Small Cap Fund Class M
| Years ended October 31, | 2017 | 2016 | 2015 | 2014 | 2013 |
| Selected Per–Share Data | | | | | |
| Net asset value, beginning of period | $22.95 | $24.00 | $25.30 | $24.97 | $19.15 |
| Income from Investment Operations | | | | | |
| Net investment income (loss)A | (.08) | (.03) | (.03) | (.07) | (.08) |
| Net realized and unrealized gain (loss) | 4.92 | .50 | .97 | 1.65 | 5.90 |
| Total from investment operations | 4.84 | .47 | .94 | 1.58 | 5.82 |
| Distributions from net investment income | – | – | – | – | – |
| Distributions from net realized gain | (.30) | (1.52) | (2.24) | (1.25) | – |
| Total distributions | (.30) | (1.52) | (2.24) | (1.25) | – |
| Redemption fees added to paid in capitalA,B | – | – | – | – | – |
| Net asset value, end of period | $27.49 | $22.95 | $24.00 | $25.30 | $24.97 |
| Total ReturnC,D | 21.20% | 1.89% | 3.90% | 6.46% | 30.39% |
| Ratios to Average Net AssetsE,F | | | | | |
| Expenses before reductions | 1.39% | 1.51% | 1.35% | 1.32% | 1.51% |
| Expenses net of fee waivers, if any | 1.39% | 1.51% | 1.35% | 1.32% | 1.51% |
| Expenses net of all reductions | 1.39% | 1.50% | 1.34% | 1.31% | 1.49% |
| Net investment income (loss) | (.33)% | (.13)% | (.10)% | (.27)% | (.38)% |
| Supplemental Data | | | | | |
| Net assets, end of period (in millions) | $3 | $3 | $3 | $3 | $2 |
| Portfolio turnover rateG | 62% | 57% | 48% | 73% | 79% |
A Calculated based on average shares outstanding during the period.
B Amount represents less than $.005 per share.
C Total returns would have been lower if certain expenses had not been reduced during the applicable periods shown.
D Total returns do not include the effect of the sales charges.
E Fees and expenses of any underlying Fidelity Central Funds are not included in the Fund's expense ratio. The Fund indirectly bears its proportionate share of the expenses of any underlying Fidelity Central Funds.
F Expense ratios reflect operating expenses of the class. Expenses before reductions do not reflect amounts reimbursed by the investment adviser or reductions from brokerage service arrangements or reductions from other expense offset arrangements and do not represent the amount paid by the class during periods when reimbursements or reductions occur. Expenses net of fee waivers reflect expenses after reimbursement by the investment adviser but prior to reductions from brokerage service arrangements or other expense offset arrangements. Expenses net of all reductions represent the net expenses paid by the class.
G Amount does not include the portfolio activity of any underlying Fidelity Central Funds.
See accompanying notes which are an integral part of the financial statements.
Fidelity Stock Selector Small Cap Fund Class C
| Years ended October 31, | 2017 | 2016 | 2015 | 2014 | 2013 |
| Selected Per–Share Data | | | | | |
| Net asset value, beginning of period | $21.99 | $23.16 | $24.49 | $24.32 | $18.73 |
| Income from Investment Operations | | | | | |
| Net investment income (loss)A | (.20) | (.13) | (.14) | (.18) | (.19) |
| Net realized and unrealized gain (loss) | 4.71 | .48 | .93 | 1.60 | 5.78 |
| Total from investment operations | 4.51 | .35 | .79 | 1.42 | 5.59 |
| Distributions from net investment income | – | – | – | – | – |
| Distributions from net realized gain | (.30) | (1.52) | (2.12) | (1.25) | – |
| Total distributions | (.30) | (1.52) | (2.12) | (1.25) | – |
| Redemption fees added to paid in capitalA,B | – | – | – | – | – |
| Net asset value, end of period | $26.20 | $21.99 | $23.16 | $24.49 | $24.32 |
| Total ReturnC,D | 20.62% | 1.41% | 3.36% | 5.95% | 29.85% |
| Ratios to Average Net AssetsE,F | | | | | |
| Expenses before reductions | 1.87% | 1.98% | 1.84% | 1.79% | 1.98% |
| Expenses net of fee waivers, if any | 1.87% | 1.98% | 1.84% | 1.79% | 1.98% |
| Expenses net of all reductions | 1.86% | 1.97% | 1.83% | 1.79% | 1.96% |
| Net investment income (loss) | (.81)% | (.60)% | (.59)% | (.74)% | (.85)% |
| Supplemental Data | | | | | |
| Net assets, end of period (in millions) | $5 | $3 | $4 | $4 | $3 |
| Portfolio turnover rateG | 62% | 57% | 48% | 73% | 79% |
A Calculated based on average shares outstanding during the period.
B Amount represents less than $.005 per share.
C Total returns would have been lower if certain expenses had not been reduced during the applicable periods shown.
D Total returns do not include the effect of the contingent deferred sales charge.
E Fees and expenses of any underlying Fidelity Central Funds are not included in the Fund's expense ratio. The Fund indirectly bears its proportionate share of the expenses of any underlying Fidelity Central Funds.
F Expense ratios reflect operating expenses of the class. Expenses before reductions do not reflect amounts reimbursed by the investment adviser or reductions from brokerage service arrangements or reductions from other expense offset arrangements and do not represent the amount paid by the class during periods when reimbursements or reductions occur. Expenses net of fee waivers reflect expenses after reimbursement by the investment adviser but prior to reductions from brokerage service arrangements or other expense offset arrangements. Expenses net of all reductions represent the net expenses paid by the class.
G Amount does not include the portfolio activity of any underlying Fidelity Central Funds.
See accompanying notes which are an integral part of the financial statements.
Fidelity Stock Selector Small Cap Fund
| Years ended October 31, | 2017 | 2016 | 2015 | 2014 | 2013 |
| Selected Per–Share Data | | | | | |
| Net asset value, beginning of period | $23.91 | $24.89 | $26.15 | $25.64 | $19.65 |
| Income from Investment Operations | | | | | |
| Net investment income (loss)A | .08 | .11 | .12 | .08 | .04 |
| Net realized and unrealized gain (loss) | 5.15 | .54 | .98 | 1.70 | 6.06 |
| Total from investment operations | 5.23 | .65 | 1.10 | 1.78 | 6.10 |
| Distributions from net investment income | (.12) | (.11) | (.09) | (.01)B | (.10) |
| Distributions from net realized gain | (.30) | (1.52) | (2.27) | (1.26)B | (.01) |
| Total distributions | (.43)C | (1.63) | (2.36) | (1.27) | (.11) |
| Redemption fees added to paid in capitalA,D | – | – | – | – | – |
| Net asset value, end of period | $28.71 | $23.91 | $24.89 | $26.15 | $25.64 |
| Total ReturnE | 22.00% | 2.57% | 4.46% | 7.08% | 31.20% |
| Ratios to Average Net AssetsF,G | | | | | |
| Expenses before reductions | .75% | .89% | .77% | .73% | .94% |
| Expenses net of fee waivers, if any | .75% | .89% | .77% | .73% | .93% |
| Expenses net of all reductions | .74% | .88% | .76% | .72% | .91% |
| Net investment income (loss) | .31% | .49% | .48% | .32% | .20% |
| Supplemental Data | | | | | |
| Net assets, end of period (in millions) | $1,511 | $1,359 | $1,372 | $1,406 | $1,487 |
| Portfolio turnover rateH | 62% | 57% | 48% | 73% | 79% |
A Calculated based on average shares outstanding during the period.
B The amounts shown reflect certain reclassifications related to book to tax differences that were made in the year shown.
C Total distributions of $.43 per share is comprised of distributions from net investment income of $.123 and distributions from net realized gain of $.303 per share.
D Amount represents less than $.005 per share.
E Total returns would have been lower if certain expenses had not been reduced during the applicable periods shown.
F Fees and expenses of any underlying Fidelity Central Funds are not included in the Fund's expense ratio. The Fund indirectly bears its proportionate share of the expenses of any underlying Fidelity Central Funds.
G Expense ratios reflect operating expenses of the class. Expenses before reductions do not reflect amounts reimbursed by the investment adviser or reductions from brokerage service arrangements or reductions from other expense offset arrangements and do not represent the amount paid by the class during periods when reimbursements or reductions occur. Expenses net of fee waivers reflect expenses after reimbursement by the investment adviser but prior to reductions from brokerage service arrangements or other expense offset arrangements. Expenses net of all reductions represent the net expenses paid by the class.
H Amount does not include the portfolio activity of any underlying Fidelity Central Funds.
See accompanying notes which are an integral part of the financial statements.
Fidelity Stock Selector Small Cap Fund Class I
| Years ended October 31, | 2017 | 2016 | 2015 | 2014 | 2013 |
| Selected Per–Share Data | | | | | |
| Net asset value, beginning of period | $23.97 | $24.96 | $26.21 | $25.69 | $19.72 |
| Income from Investment Operations | | | | | |
| Net investment income (loss)A | .08 | .12 | .13 | .09 | .05 |
| Net realized and unrealized gain (loss) | 5.15 | .53 | .99 | 1.70 | 6.06 |
| Total from investment operations | 5.23 | .65 | 1.12 | 1.79 | 6.11 |
| Distributions from net investment income | (.12) | (.12) | (.10) | (.01)B | (.14) |
| Distributions from net realized gain | (.30) | (1.52) | (2.27) | (1.26)B | (.01) |
| Total distributions | (.42) | (1.64) | (2.37) | (1.27) | (.14)C |
| Redemption fees added to paid in capitalA,D | – | – | – | – | – |
| Net asset value, end of period | $28.78 | $23.97 | $24.96 | $26.21 | $25.69 |
| Total ReturnE | 21.97% | 2.55% | 4.52% | 7.11% | 31.22% |
| Ratios to Average Net AssetsF,G | | | | | |
| Expenses before reductions | .75% | .87% | .74% | .70% | .91% |
| Expenses net of fee waivers, if any | .75% | .87% | .73% | .70% | .91% |
| Expenses net of all reductions | .75% | .87% | .73% | .70% | .89% |
| Net investment income (loss) | .31% | .50% | .51% | .35% | .22% |
| Supplemental Data | | | | | |
| Net assets, end of period (in millions) | $43 | $43 | $46 | $51 | $56 |
| Portfolio turnover rateH | 62% | 57% | 48% | 73% | 79% |
A Calculated based on average shares outstanding during the period.
B The amounts shown reflect certain reclassifications related to book to tax differences that were made in the year shown.
C Total distributions of $.14 per share is comprised of distributions from net investment income of $.136 and distributions from net realized gain of $.007 per share.
D Amount represents less than $.005 per share.
E Total returns would have been lower if certain expenses had not been reduced during the applicable periods shown.
F Fees and expenses of any underlying Fidelity Central Funds are not included in the Fund's expense ratio. The Fund indirectly bears its proportionate share of the expenses of any underlying Fidelity Central Funds.
G Expense ratios reflect operating expenses of the class. Expenses before reductions do not reflect amounts reimbursed by the investment adviser or reductions from brokerage service arrangements or reductions from other expense offset arrangements and do not represent the amount paid by the class during periods when reimbursements or reductions occur. Expenses net of fee waivers reflect expenses after reimbursement by the investment adviser but prior to reductions from brokerage service arrangements or other expense offset arrangements. Expenses net of all reductions represent the net expenses paid by the class.
H Amount does not include the portfolio activity of any underlying Fidelity Central Funds.
See accompanying notes which are an integral part of the financial statements.
Fidelity Stock Selector Small Cap Fund Class Z
| Years ended October 31, | 2017 A |
| Selected Per–Share Data | |
| Net asset value, beginning of period | $26.36 |
| Income from Investment Operations | |
| Net investment income (loss)B | .07 |
| Net realized and unrealized gain (loss) | 2.38 |
| Total from investment operations | 2.45 |
| Distributions from net investment income | – |
| Distributions from net realized gain | – |
| Total distributions | – |
| Redemption fees added to paid in capitalB,C | – |
| Net asset value, end of period | $28.81 |
| Total ReturnD,E | 9.29% |
| Ratios to Average Net AssetsF,G | |
| Expenses before reductions | .62%H |
| Expenses net of fee waivers, if any | .61%H |
| Expenses net of all reductions | .61%H |
| Net investment income (loss) | .34%H |
| Supplemental Data | |
| Net assets, end of period (in millions) | $1 |
| Portfolio turnover rateI | 62% |
A For the period February 1, 2017 (commencement of sale of shares) to October 31, 2017.
B Calculated based on average shares outstanding during the period.
C Amount represents less than $.005 per share.
D Total returns for periods of less than one year are not annualized.
E Total returns would have been lower if certain expenses had not been reduced during the applicable periods shown.
F Fees and expenses of any underlying Fidelity Central Funds are not included in the Fund's expense ratio. The Fund indirectly bears its proportionate share of the expenses of any underlying Fidelity Central Funds.
G Expense ratios reflect operating expenses of the class. Expenses before reductions do not reflect amounts reimbursed by the investment adviser or reductions from brokerage service arrangements or reductions from other expense offset arrangements and do not represent the amount paid by the class during periods when reimbursements or reductions occur. Expense ratios before reductions for start-up periods may not be representative of longer-term operating periods. Expenses net of fee waivers reflect expenses after reimbursement by the investment adviser but prior to reductions from brokerage service arrangements or other expense offset arrangements. Expenses net of all reductions represent the net expenses paid by the class.
H Annualized
I Amount does not include the portfolio activity of any underlying Fidelity Central Funds.
See accompanying notes which are an integral part of the financial statements.
Notes to Financial Statements
For the period ended October 31, 2017
(Amounts in thousands except percentages)
1. Organization.
Fidelity Stock Selector Small Cap Fund (the Fund) is a fund of Fidelity Capital Trust (the Trust) and is authorized to issue an unlimited number of shares. The Trust is registered under the Investment Company Act of 1940, as amended (the 1940 Act), as an open-end management investment company organized as a Massachusetts business trust. The Fund commenced sale of Class Z shares on February 1, 2017. The Fund offers Class A, Class M (formerly Class T), Class C, Stock Selector Small Cap, Class I and Class Z shares, each of which has equal rights as to assets and voting privileges. Each class has exclusive voting rights with respect to matters that affect that class.
After the close of business on June 24, 2016, all outstanding Class B shares were converted to Class A shares. All prior fiscal period dollar and share amounts for Class B presented in the Notes to Financial Statements are for the period November 1, 2015 through June 24, 2016.
2. Investments in Fidelity Central Funds.
The Fund invest in Fidelity Central Funds, which are open-end investment companies generally available only to other investment companies and accounts managed by the investment adviser and its affiliates. The Fund's Schedule of Investments lists each of the Fidelity Central Funds held as of period end, if any, as an investment of the Fund, but does not include the underlying holdings of each Fidelity Central Fund. As an Investing Fund, the Fund indirectly bears its proportionate share of the expenses of the underlying Fidelity Central Funds.
The Money Market Central Funds seek preservation of capital and current income and are managed by Fidelity Investments Money Management, Inc. (FIMM), an affiliate of the investment adviser. Annualized expenses of the Money Market Central Funds as of their most recent shareholder report date are less than .005%.
A complete unaudited list of holdings for each Fidelity Central Fund is available upon request or at the Securities and Exchange Commission (the SEC) website at www.sec.gov. In addition, the financial statements of the Fidelity Central Funds, which are not covered by the Fund's Report of Independent Registered Public Accounting Firm, are available on the SEC website or upon request.
3. Significant Accounting Policies.
The Fund is an investment company and applies the accounting and reporting guidance of the Financial Accounting Standards Board (FASB) Accounting Standards Codification Topic 946 Financial Services – Investments Companies. The financial statements have been prepared in conformity with accounting principles generally accepted in the United States of America (GAAP), which require management to make certain estimates and assumptions at the date of the financial statements. Actual results could differ from those estimates. Subsequent events, if any, through the date that the financial statements were issued have been evaluated in the preparation of the financial statements. The following summarizes the significant accounting policies of the Fund:
Investment Valuation. Investments are valued as of 4:00 p.m. Eastern time on the last calendar day of the period. The Board of Trustees (the Board) has delegated the day to day responsibility for the valuation of the Fund's investments to the Fair Value Committee (the Committee) established by the Fund's investment adviser. In accordance with valuation policies and procedures approved by the Board, the Fund attempts to obtain prices from one or more third party pricing vendors or brokers to value its investments. When current market prices, quotations or currency exchange rates are not readily available or reliable, investments will be fair valued in good faith by the Committee, in accordance with procedures adopted by the Board. Factors used in determining fair value vary by investment type and may include market or investment specific events, changes in interest rates and credit quality. The frequency with which these procedures are used cannot be predicted and they may be utilized to a significant extent. The Committee oversees the Fund's valuation policies and procedures and reports to the Board on the Committee's activities and fair value determinations. The Board monitors the appropriateness of the procedures used in valuing the Fund's investments and ratifies the fair value determinations of the Committee.
The Fund categorizes the inputs to valuation techniques used to value its investments into a disclosure hierarchy consisting of three levels as shown below:
- Level 1 – quoted prices in active markets for identical investments
- Level 2 – other significant observable inputs (including quoted prices for similar investments, interest rates, prepayment speeds, etc.)
- Level 3 – unobservable inputs (including the Fund's own assumptions based on the best information available)
Valuation techniques used to value the Fund's investments by major category are as follows:
Equity securities, including restricted securities, for which market quotations are readily available, are valued at the last reported sale price or official closing price as reported by a third party pricing vendor on the primary market or exchange on which they are traded and are categorized as Level 1 in the hierarchy. In the event there were no sales during the day or closing prices are not available, securities are valued at the last quoted bid price or may be valued using the last available price and are generally categorized as Level 2 in the hierarchy. For foreign equity securities, when market or security specific events arise, comparisons to the valuation of American Depositary Receipts (ADRs), futures contracts, Exchange-Traded Funds (ETFs) and certain indexes as well as quoted prices for similar securities may be used and would be categorized as Level 2 in the hierarchy. Utilizing these techniques may result in transfers between Level 1 and Level 2. For equity securities, including restricted securities, where observable inputs are limited, assumptions about market activity and risk are used and these securities may be categorized as Level 3 in the hierarchy.
Debt securities, including restricted securities, are valued based on evaluated prices received from third party pricing vendors or from brokers who make markets in such securities. U.S. government and government agency obligations are valued by pricing vendors who utilize matrix pricing which considers yield or price of bonds of comparable quality, coupon, maturity and type or by broker-supplied prices. When independent prices are unavailable or unreliable, debt securities may be valued utilizing pricing methodologies which consider similar factors that would be used by third party pricing vendors. Debt securities are generally categorized as Level 2 in the hierarchy but may be Level 3 depending on the circumstances.
Futures contracts are valued at the settlement price established each day by the board of trade or exchange on which they are traded and are categorized as Level 1 in the hierarchy. Investments in open-end mutual funds, including the Fidelity Central Funds, are valued at their closing net asset value (NAV) each business day and are categorized as Level 1 in the hierarchy.
Changes in valuation techniques may result in transfers in or out of an assigned level within the disclosure hierarchy. The aggregate value of investments by input level as of October 31, 2017 is included at the end of the Fund's Schedule of Investments.
Foreign Currency. The Fund may use foreign currency contracts to facilitate transactions in foreign-denominated securities. Gains and losses from these transactions may arise from changes in the value of the foreign currency or if the counterparties do not perform under the contracts' terms.
Foreign-denominated assets, including investment securities, and liabilities are translated into U.S. dollars at the exchange rates at period end. Purchases and sales of investment securities, income and dividends received and expenses denominated in foreign currencies are translated into U.S. dollars at the exchange rate in effect on the transaction date.
The effects of exchange rate fluctuations on investments are included with the net realized and unrealized gain (loss) on investment securities. Other foreign currency transactions resulting in realized and unrealized gain (loss) are disclosed separately.
Investment Transactions and Income. For financial reporting purposes, the Fund's investment holdings and NAV include trades executed through the end of the last business day of the period. The NAV per share for processing shareholder transactions is calculated as of the close of business of the New York Stock Exchange (NYSE), normally 4:00 p.m. Eastern time and includes trades executed through the end of the prior business day. Gains and losses on securities sold are determined on the basis of identified cost and includes proceeds received from litigation. Dividend income is recorded on the ex-dividend date, except for certain dividends from foreign securities where the ex-dividend date may have passed, which are recorded as soon as the Fund is informed of the ex-dividend date. Non-cash dividends included in dividend income, if any, are recorded at the fair market value of the securities received. Income and capital gain distributions from Fidelity Central Funds, if any, are recorded on the ex-dividend date. Certain distributions received by the Fund represent a return of capital or capital gain. The Fund determines the components of these distributions subsequent to the ex-dividend date, based upon receipt of tax filings or other correspondence relating to the underlying investment. These distributions are recorded as a reduction of cost of investments and/or as a realized gain. Interest income is accrued as earned and includes coupon interest and amortization of premium and accretion of discount on debt securities as applicable. Investment income is recorded net of foreign taxes withheld where recovery of such taxes is uncertain.
Class Allocations and Expenses. Investment income, realized and unrealized capital gains and losses, common expenses of the Fund, and certain fund-level expense reductions, if any, are allocated daily on a pro-rata basis to each class based on the relative net assets of each class to the total net assets of the Fund. Each class differs with respect to transfer agent and distribution and service plan fees incurred. Certain expense reductions may also differ by class. For the reporting period, the allocated portion of income and expenses to each class as a percent of its average net assets may vary due to the timing of recording these transactions in relation to fluctuating net assets of the classes. Expenses directly attributable to a fund are charged to that fund. Expenses attributable to more than one fund are allocated among the respective funds on the basis of relative net assets or other appropriate methods. Expense estimates are accrued in the period to which they relate and adjustments are made when actual amounts are known.
Income Tax Information and Distributions to Shareholders. Each year, the Fund intends to qualify as a regulated investment company under Subchapter M of the Internal Revenue Code, including distributing substantially all of its taxable income and realized gains. As a result, no provision for U.S. Federal income taxes is required. As of October 31, 2017, the Fund did not have any unrecognized tax benefits in the financial statements; nor is the Fund aware of any tax positions for which it is reasonably possible that the total amounts of unrecognized tax benefits will significantly change in the next twelve months. The Fund files a U.S. federal tax return, in addition to state and local tax returns as required. The Fund's federal income tax returns are subject to examination by the Internal Revenue Service (IRS) for a period of three fiscal years after they are filed. State and local tax returns may be subject to examination for an additional fiscal year depending on the jurisdiction. Foreign taxes are provided for based on the Fund's understanding of the tax rules and rates that exist in the foreign markets in which it invests.
Distributions are declared and recorded on the ex-dividend date. Income dividends and capital gain distributions are declared separately for each class. Income and capital gain distributions are determined in accordance with income tax regulations, which may differ from GAAP. In addition, the Fund claimed a portion of the payment made to redeeming shareholders as a distribution for income tax purposes.
Capital accounts within the financial statements are adjusted for permanent book-tax differences. These adjustments have no impact on net assets or the results of operations. Capital accounts are not adjusted for temporary book-tax differences which will reverse in a subsequent period.
Book-tax differences are primarily due to futures contracts, foreign currency transactions, passive foreign investment companies (PFIC), market discount, partnerships, deferred trustees compensation and losses deferred due to wash sales.
As of period end, the cost and unrealized appreciation (depreciation) in securities, and derivatives if applicable, for federal income tax purposes were as follows:
| Gross unrealized appreciation | $352,241 |
| Gross unrealized depreciation | (39,592) |
| Net unrealized appreciation (depreciation) | $312,649 |
| Tax Cost | $1,306,987 |
The tax-based components of distributable earnings as of period end were as follows:
| Undistributed ordinary income | $1,669 |
| Undistributed long-term capital gain | $145,287 |
| Net unrealized appreciation (depreciation) on securities and other investments | $311,801 |
The tax character of distributions paid was as follows:
| | October 31, 2017 | October 31, 2016 |
| Ordinary Income | $7,120 | $ 6,157 |
| Long-term Capital Gains | 17,708 | 88,057 |
| Total | $24,828 | $ 94,214 |
Short-Term Trading (Redemption) Fees. Shares held by investors in the Fund less than 90 days may have been subject to a redemption fee equal to 1.50% of the NAV of shares redeemed. All redemption fees, which reduce the proceeds of the shareholder redemption, are retained by the Fund and accounted for as an addition to paid in capital. In November 2017, the Board of Trustees approved the elimination of these redemption fees effective December 18, 2017.
Restricted Securities. The Fund may invest in securities that are subject to legal or contractual restrictions on resale. These securities generally may be resold in transactions exempt from registration or to the public if the securities are registered. Disposal of these securities may involve time-consuming negotiations and expense, and prompt sale at an acceptable price may be difficult. Information regarding restricted securities is included at the end of the Fund's Schedule of Investments.
4. Derivative Instruments.
Risk Exposures and the Use of Derivative Instruments. The Fund's investment objective allows the Fund to enter into various types of derivative contracts, including futures contracts. Derivatives are investments whose value is primarily derived from underlying assets, indices or reference rates and may be transacted on an exchange or over-the-counter (OTC). Derivatives may involve a future commitment to buy or sell a specified asset based on specified terms, to exchange future cash flows at periodic intervals based on a notional principal amount, or for one party to make one or more payments upon the occurrence of specified events in exchange for periodic payments from the other party.
The Fund used derivatives to increase returns and to manage exposure to certain risks as defined below. The success of any strategy involving derivatives depends on analysis of numerous economic factors, and if the strategies for investment do not work as intended, the Fund may not achieve its objectives.
The Fund's use of derivatives increased or decreased its exposure to the following risk:
| Equity Risk | Equity risk relates to the fluctuations in the value of financial instruments as a result of changes in market prices (other than those arising from interest rate risk or foreign exchange risk), whether caused by factors specific to an individual investment, its issuer, or all factors affecting all instruments traded in a market or market segment.
|
The Fund is also exposed to additional risks from investing in derivatives, such as liquidity risk and counterparty credit risk. Liquidity risk is the risk that the Fund will be unable to close out the derivative in the open market in a timely manner. Counterparty credit risk is the risk that the counterparty will not be able to fulfill its obligation to the Fund. Counterparty credit risk related to exchange-traded futures contracts may be mitigated by the protection provided by the exchange on which they trade.
Investing in derivatives may involve greater risks than investing in the underlying assets directly and, to varying degrees, may involve risk of loss in excess of any initial investment and collateral received and amounts recognized in the Statement of Assets and Liabilities. In addition, there may be the risk that the change in value of the derivative contract does not correspond to the change in value of the underlying instrument.
Futures Contracts. A futures contract is an agreement between two parties to buy or sell a specified underlying instrument for a fixed price at a specified future date. The Fund used futures contracts to manage its exposure to the stock market.
Upon entering into a futures contract, a fund is required to deposit either cash or securities (initial margin) with a clearing broker in an amount equal to a certain percentage of the face value of the contract. Futures contracts are marked-to-market daily and subsequent daily payments (variation margin) are made or received by a fund depending on the daily fluctuations in the value of the futures contracts and are recorded as unrealized appreciation or (depreciation). This receivable and/or payable, if any, is included in daily variation margin on futures contracts in the Statement of Assets and Liabilities. Realized gain or (loss) is recorded upon the expiration or closing of a futures contract. The net realized gain (loss) and change in net unrealized appreciation (depreciation) on futures contracts during the period is presented in the Statement of Operations.
Any open futures contracts at period end are presented in the Schedule of Investments under the caption "Futures Contracts". The notional amount at value reflects each contract's exposure to the underlying instrument or index at period end and is representative of volume of activity during the period. Securities deposited to meet initial margin requirements are identified in the Schedule of Investments.
5. Purchases and Sales of Investments.
Purchases and sales of securities, other than short-term securities, aggregated $928,775 and $1,061,558, respectively.
6. Fees and Other Transactions with Affiliates.
Management Fee. Fidelity Management & Research Company (the investment adviser) and its affiliates provide the Fund with investment management related services for which the Fund pays a monthly management fee. The management fee is the sum of an individual fund fee rate that is based on an annual rate of .35% of the Fund's average net assets and an annualized group fee rate that averaged .25% during the period. The group fee rate is based upon the average net assets of all the mutual funds advised by the investment adviser, including any mutual funds previously advised by the investment adviser that are currently advised by Fidelity SelectCo, LLC, an affiliate of the investment adviser. The group fee rate decreases as assets under management increase and increases as assets under management decrease. In addition, the management fee is subject to a performance adjustment (up to a maximum of +/- .20% of the Fund's average net assets over a 36 month performance period). The upward or downward adjustment to the management fee is based on relative investment performance of Stock Selector Small Cap as compared to its benchmark index, the Russell 2000 Index, over the same 36 month performance period. For the reporting period, the total annual management fee rate, including the performance adjustment, was .52% of the Fund's average net assets. The performance adjustment included in the management fee rate may be higher or lower than the maximum performance adjustment rate due to the difference between the average net assets for the reporting and performance periods.
Distribution and Service Plan Fees. In accordance with Rule 12b-1 of the 1940 Act, the Fund has adopted separate Distribution and Service Plans for each class of shares. Certain classes pay Fidelity Distributors Corporation (FDC), an affiliate of the investment adviser, separate Distribution and Service Fees, each of which is based on an annual percentage of each class' average net assets. In addition, FDC may pay financial intermediaries for selling shares of the Fund and providing shareholder support services. For the period, the Distribution and Service Fee rates, total fees and amounts retained by FDC were as follows:
| | Distribution
Fee | Service
Fee | Total Fees | Retained
by FDC |
| Class A | -% | .25% | $34 | $1 |
| Class M | .25% | .25% | 15 | –(a) |
| Class C | .75% | .25% | 45 | 6 |
| | | | $94 | $7 |
(a) In the amount of less than five hundred dollars.
Sales Load. FDC may receive a front-end sales charge of up to 5.75% for selling Class A shares and 3.50% for selling Class M shares, some of which is paid to financial intermediaries for selling shares of the Fund. Depending on the holding period, FDC may receive contingent deferred sales charges levied on Class A, Class M and Class C redemptions. The deferred sales charges are 1.00% for Class C shares, 1.00% for certain purchases of Class A shares and .25% for certain purchases of Class M shares.
For the period, sales charge amounts retained by FDC were as follows:
| | Retained
by FDC |
| Class A | $5 |
| Class M | 1 |
| Class C(a) | 1 |
| | $7 |
(a) When Class C shares are initially sold, FDC pays commissions from its own resources to financial intermediaries through which the sales are made.
Transfer Agent Fees. Fidelity Investments Institutional Operations Company, Inc., (FIIOC), an affiliate of the investment adviser, is the transfer, dividend disbursing and shareholder servicing agent for each class of the Fund. FIIOC receives account fees and asset-based fees that vary according to the account size and type of account of the shareholders of the respective classes of the Fund, except for Class Z. FIIOC receives an asset-based fee of Class Z's average net assets. FIIOC pays for typesetting, printing and mailing of shareholder reports, except proxy statements.
For the period, transfer agent fees for each class were as follows:
| | Amount | % of
Class-Level Average
Net Assets |
| Class A | $31 | .23 |
| Class M | 10 | .33 |
| Class C | 14 | .30 |
| Stock Selector Small Cap | 2,719 | .18 |
| Class I | 83 | .19 |
| Class Z | –(a) | .05(b) |
| | $2,857 | |
(a) In the amount of less than five-hundred dollars
(b) Annualized
Accounting and Security Lending Fees. Fidelity Service Company, Inc. (FSC), an affiliate of the investment adviser, maintains the Fund's accounting records. The accounting fee is based on the level of average net assets for each month. Under a separate contract, FSC administers the security lending program. The security lending fee is based on the number and duration of lending transactions.
Brokerage Commissions. The Fund placed a portion of its portfolio transactions with brokerage firms which are affiliates of the investment adviser. Brokerage commissions are included in net realized gain (loss) and change in net unrealized appreciation (depreciation) in the Statement of Operations. The commissions paid to these affiliated firms were $48 for the period.
Interfund Trades. The Fund may purchase from or sell securities to other Fidelity Funds under procedures adopted by the Board. The procedures have been designed to ensure these interfund trades are executed in accordance with Rule 17a-7 of the 1940 Act. Interfund trades are included within the respective purchases and sales amounts shown in the Purchases and Sales of Investments note.
7. Committed Line of Credit.
The Fund participates with other funds managed by the investment adviser or an affiliate in a $4.25 billion credit facility (the "line of credit") to be utilized for temporary or emergency purposes to fund shareholder redemptions or for other short-term liquidity purposes. The Fund has agreed to pay commitment fees on its pro-rata portion of the line of credit, which amounted to $5 and is reflected in Miscellaneous expenses on the Statement of Operations. During the period, the Fund did not borrow on this line of credit.
8. Security Lending.
The Fund lends portfolio securities through a lending agent from time to time in order to earn additional income. For equity securities, a lending agent is used and may loan securities to certain qualified borrowers, including Fidelity Capital Markets (FCM), a broker-dealer affiliated with the Fund. On the settlement date of the loan, the Fund receives collateral (in the form of U.S. Treasury obligations, letters of credit and/or cash) against the loaned securities and maintains collateral in an amount not less than 100% of the market value of the loaned securities during the period of the loan. The market value of the loaned securities is determined at the close of business of the Fund and any additional required collateral is delivered to the Fund on the next business day. The Fund or borrower may terminate the loan at any time, and if the borrower defaults on its obligation to return the securities loaned because of insolvency or other reasons, the Fund may apply collateral received from the borrower against the obligation. The Fund may experience delays and costs in recovering the securities loaned. Any cash collateral received is invested in the Fidelity Securities Lending Cash Central Fund. The value of loaned securities and cash collateral at period end are disclosed on the Fund's Statement of Assets and Liabilities. At period end, there were no security loans outstanding with FCM. Security lending income represents the income earned on investing cash collateral, less rebates paid to borrowers and any lending agent fees associated with the loan, plus any premium payments received for lending certain types of securities. Security lending income is presented in the Statement of Operations as a component of income from Fidelity Central Funds. Total security lending income during the period amounted to $194, including $7 from securities loaned to FCM.
9. Expense Reductions.
The investment adviser voluntarily agreed to reimburse a portion of the Fund's Class A, Class M, Class C, Stock Selector Small Cap and Class I operating expenses. During the period, this reimbursement reduced expenses as follows:
| | Reimbursement |
| Class A | –(a) |
| Class M | –(a) |
| Class C | –(a) |
| Stock Selector Small Cap | 16 |
| Class I | 1 |
| | $17 |
(a) In the amount of less than five-hundred dollars
Commissions paid to certain brokers with whom the investment adviser, or its affiliates, places trades on behalf of the Fund include an amount in addition to trade execution, which may be rebated back to the Fund to offset certain expenses. This amount totaled $90 for the period.
In addition, during the period the investment adviser reimbursed and/or waived a portion of fund-level operating expenses in the amount of $14.
10. Distributions to Shareholders.
Distributions to shareholders of each class were as follows:
| | Year ended
October 31, 2017 | Year ended
October 31, 2016 |
| From net investment income | | |
| Class A | $34 | $25 |
| Stock Selector Small Cap | 6,885 | 5,925 |
| Class I | 201 | 207 |
| Total | $7,120 | $6,157 |
| From net realized gain | | |
| Class A | $156 | $712 |
| Class M | 34 | 181 |
| Class B | – | 10 |
| Class C | 55 | 261 |
| Stock Selector Small Cap | 16,959 | 84,153 |
| Class I | 504 | 2,740 |
| Total | $17,708 | $88,057 |
11. Share Transactions.
Share transactions for each class were as follows and may contain automatic conversions between classes or exchanges between affiliated funds:
| | Shares | Shares | Dollars | Dollars |
| | Year ended October 31, 2017 | Year ended October 31, 2016 | Year ended October 31, 2017 | Year ended October 31, 2016 |
| Class A | | | | |
| Shares sold | 118 | 61 | $3,090 | $1,389 |
| Reinvestment of distributions | 7 | 30 | 186 | 721 |
| Shares redeemed | (125) | (59) | (3,277) | (1,344) |
| Net increase (decrease) | – | 32 | $(1) | $766 |
| Class M | | | | |
| Shares sold | 46 | 14 | $1,150 | $306 |
| Reinvestment of distributions | 1 | 8 | 33 | 178 |
| Shares redeemed | (47) | (25) | (1,187) | (554) |
| Net increase (decrease) | – | (3) | $(4) | $(70) |
| Class B | | | | |
| Shares sold | – | –(a) | $– | $1 |
| Reinvestment of distributions | – | –(a) | – | 10 |
| Shares redeemed | – | (7) | – | (164) |
| Net increase (decrease) | – | (7) | $– | $(153) |
| Class C | | | | |
| Shares sold | 80 | 45 | $1,940 | $965 |
| Reinvestment of distributions | 2 | 11 | 53 | 248 |
| Shares redeemed | (65) | (69) | (1,593) | (1,458) |
| Net increase (decrease) | 17 | (13) | $400 | $(245) |
| Stock Selector Small Cap | | | | |
| Shares sold | 6,895 | 9,805 | $183,697 | $225,506 |
| Reinvestment of distributions | 876 | 3,668 | 23,306 | 88,117 |
| Shares redeemed | (11,988) | (11,744) | (319,370) | (270,444) |
| Net increase (decrease) | (4,217) | 1,729 | $(112,367) | $43,179 |
| Class I | | | | |
| Shares sold | 214 | 274 | $5,746 | $6,249 |
| Reinvestment of distributions | 26 | 122 | 702 | 2,937 |
| Shares redeemed | (549) | (454) | (14,715) | (10,912) |
| Net increase (decrease) | (309) | (58) | $(8,267) | $(1,726) |
| Class Z(b) | | | | |
| Shares sold | 26 | – | $706 | $– |
| Shares redeemed | (3) | – | (86) | – |
| Net increase (decrease) | 23 | – | $620 | $– |
(a) In the amount of less than five hundred shares.
(b) Share transactions for Class Z are for the period February 1, 2017 (commencement of sale of shares) to October 31, 2017.
12. Other.
The Fund's organizational documents provide former and current trustees and officers with a limited indemnification against liabilities arising in connection with the performance of their duties to the Fund. In the normal course of business, the Fund may also enter into contracts that provide general indemnifications. The Fund's maximum exposure under these arrangements is unknown as this would be dependent on future claims that may be made against the Fund. The risk of material loss from such claims is considered remote.
Report of Independent Registered Public Accounting Firm
To the Trustees of Fidelity Capital Trust and Shareholders of Fidelity Stock Selector Small Cap Fund:
We have audited the accompanying statement of assets and liabilities of Fidelity Stock Selector Small Cap Fund (the Fund), a fund of Fidelity Capital Trust, including the schedule of investments, as of October 31, 2017, and the related statement of operations for the year then ended, the statement of changes in net assets for each of the two years in the period then ended, and the financial highlights for each of the periods presented. These financial statements and financial highlights are the responsibility of the Fund's management. Our responsibility is to express an opinion on these financial statements and financial highlights based on our audits.
We conducted our audits in accordance with the standards of the Public Company Accounting Oversight Board (United States). Those standards require that we plan and perform the audit to obtain reasonable assurance about whether the financial statements and financial highlights are free of material misstatement. The Fund is not required to have, nor were we engaged to perform, an audit of its internal control over financial reporting. Our audits included consideration of internal control over financial reporting as a basis for designing audit procedures that are appropriate in the circumstances, but not for the purpose of expressing an opinion on the effectiveness of the Fund's internal control over financial reporting. Accordingly, we express no such opinion. An audit also includes examining, on a test basis, evidence supporting the amounts and disclosures in the financial statements, assessing the accounting principles used and significant estimates made by management, as well as evaluating the overall financial statement presentation. Our procedures included confirmation of securities owned as of October 31, 2017, by correspondence with the custodians and brokers; when replies were not received from brokers, we performed other auditing procedures. We believe that our audits provide a reasonable basis for our opinion.
In our opinion, such financial statements and financial highlights referred to above present fairly, in all material respects, the financial position of Fidelity Stock Selector Small Cap Fund as of October 31, 2017, the results of its operations for the year then ended, the statement of changes in its net assets for each of the two years in the period then ended, and the financial highlights for each of the periods presented, in conformity with accounting principles generally accepted in the United States of America.
DELOITTE & TOUCHE LLP
Boston, Massachusetts
December 15, 2017
Trustees and Officers
The Trustees, Members of the Advisory Board (if any), and officers of the trust and fund, as applicable, are listed below. The Board of Trustees governs the fund and is responsible for protecting the interests of shareholders. The Trustees are experienced executives who meet periodically throughout the year to oversee the fund's activities, review contractual arrangements with companies that provide services to the fund, oversee management of the risks associated with such activities and contractual arrangements, and review the fund's performance. Each of the Trustees oversees 190 funds.
The Trustees hold office without limit in time except that (a) any Trustee may resign; (b) any Trustee may be removed by written instrument, signed by at least two-thirds of the number of Trustees prior to such removal; (c) any Trustee who requests to be retired or who has become incapacitated by illness or injury may be retired by written instrument signed by a majority of the other Trustees; and (d) any Trustee may be removed at any special meeting of shareholders by a two-thirds vote of the outstanding voting securities of the trust. Each Trustee who is not an interested person (as defined in the 1940 Act) of the trust and the fund is referred to herein as an Independent Trustee. Each Independent Trustee shall retire not later than the last day of the calendar year in which his or her 75th birthday occurs. The Independent Trustees may waive this mandatory retirement age policy with respect to individual Trustees. Officers and Advisory Board Members hold office without limit in time, except that any officer or Advisory Board Member may resign or may be removed by a vote of a majority of the Trustees at any regular meeting or any special meeting of the Trustees. Except as indicated, each individual has held the office shown or other offices in the same company for the past five years.
The fund’s Statement of Additional Information (SAI) includes more information about the Trustees. To request a free copy, call Fidelity at 1-800-544-8544.
Experience, Skills, Attributes, and Qualifications of the Trustees. The Governance and Nominating Committee has adopted a statement of policy that describes the experience, qualifications, attributes, and skills that are necessary and desirable for potential Independent Trustee candidates (Statement of Policy). The Board believes that each Trustee satisfied at the time he or she was initially elected or appointed a Trustee, and continues to satisfy, the standards contemplated by the Statement of Policy. The Governance and Nominating Committee also engages professional search firms to help identify potential Independent Trustee candidates who have the experience, qualifications, attributes, and skills consistent with the Statement of Policy. From time to time, additional criteria based on the composition and skills of the current Independent Trustees, as well as experience or skills that may be appropriate in light of future changes to board composition, business conditions, and regulatory or other developments, have also been considered by the professional search firms and the Governance and Nominating Committee. In addition, the Board takes into account the Trustees' commitment and participation in Board and committee meetings, as well as their leadership of standing and ad hoc committees throughout their tenure.
In determining that a particular Trustee was and continues to be qualified to serve as a Trustee, the Board has considered a variety of criteria, none of which, in isolation, was controlling. The Board believes that, collectively, the Trustees have balanced and diverse experience, qualifications, attributes, and skills, which allow the Board to operate effectively in governing the fund and protecting the interests of shareholders. Information about the specific experience, skills, attributes, and qualifications of each Trustee, which in each case led to the Board's conclusion that the Trustee should serve (or continue to serve) as a trustee of the fund, is provided below.
Board Structure and Oversight Function. James C. Curvey is an interested person and currently serves as Chairman. The Trustees have determined that an interested Chairman is appropriate and benefits shareholders because an interested Chairman has a personal and professional stake in the quality and continuity of services provided to the fund. Independent Trustees exercise their informed business judgment to appoint an individual of their choosing to serve as Chairman, regardless of whether the Trustee happens to be independent or a member of management. The Independent Trustees have determined that they can act independently and effectively without having an Independent Trustee serve as Chairman and that a key structural component for assuring that they are in a position to do so is for the Independent Trustees to constitute a substantial majority for the Board. The Independent Trustees also regularly meet in executive session. Ned C. Lautenbach serves as Chairman of the Independent Trustees and as such (i) acts as a liaison between the Independent Trustees and management with respect to matters important to the Independent Trustees and (ii) with management prepares agendas for Board meetings.
Fidelity® funds are overseen by different Boards of Trustees. The fund's Board oversees Fidelity's high income and certain equity funds, and other Boards oversee Fidelity's investment-grade bond, money market, asset allocation, and sector funds. The asset allocation funds may invest in Fidelity® funds overseen by the fund's Board. The use of separate Boards, each with its own committee structure, allows the Trustees of each group of Fidelity® funds to focus on the unique issues of the funds they oversee, including common research, investment, and operational issues. On occasion, the separate Boards establish joint committees to address issues of overlapping consequences for the Fidelity® funds overseen by each Board.
The Trustees operate using a system of committees to facilitate the timely and efficient consideration of all matters of importance to the Trustees, the fund, and fund shareholders and to facilitate compliance with legal and regulatory requirements and oversight of the fund's activities and associated risks. The Board, acting through its committees, has charged FMR and its affiliates with (i) identifying events or circumstances the occurrence of which could have demonstrably adverse effects on the fund's business and/or reputation; (ii) implementing processes and controls to lessen the possibility that such events or circumstances occur or to mitigate the effects of such events or circumstances if they do occur; and (iii) creating and maintaining a system designed to evaluate continuously business and market conditions in order to facilitate the identification and implementation processes described in (i) and (ii) above. Because the day-to-day operations and activities of the fund are carried out by or through FMR, its affiliates, and other service providers, the fund's exposure to risks is mitigated but not eliminated by the processes overseen by the Trustees. While each of the Board's committees has responsibility for overseeing different aspects of the fund's activities, oversight is exercised primarily through the Operations, Audit, and Compliance Committees. In addition, the Independent Trustees have worked with FMR to enhance the Board's oversight of investment and financial risks, legal and regulatory risks, technology risks, and operational risks, including the development of additional risk reporting to the Board. For example, a working group comprised of Independent Trustees and FMR has worked and continues to work to review the Fidelity® funds' valuation-related activities, reporting and risk management. Appropriate personnel, including but not limited to the fund's Chief Compliance Officer (CCO), FMR's internal auditor, the independent accountants, the fund's Treasurer and portfolio management personnel, make periodic reports to the Board's committees, as appropriate, including an annual review of Fidelity's risk management program for the Fidelity® funds. The responsibilities of each standing committee, including their oversight responsibilities, are described further under "Standing Committees of the Trustees."
Interested Trustees*:
Correspondence intended for a Trustee who is an interested person may be sent to Fidelity Investments, 245 Summer Street, Boston, Massachusetts 02210.
Name, Year of Birth; Principal Occupations and Other Relevant Experience+
James C. Curvey (1935)
Year of Election or Appointment: 2007
Trustee
Chairman of the Board of Trustees
Mr. Curvey also serves as Trustee of other Fidelity® funds. Mr. Curvey is a Director of Fidelity Research & Analysis Co. (investment adviser firm, 2009-present), and Vice Chairman (2007-present) and Director of FMR LLC (diversified financial services company). In addition, Mr. Curvey serves as an Overseer for the Boston Symphony Orchestra and a member of the board of Artis-Naples, Naples, Florida, and as a Trustee for Brewster Academy, Wolfeboro, New Hampshire. Previously, Mr. Curvey served as a Director of Fidelity Investments Money Management, Inc. (investment adviser firm, 2009-2014) and a Director of FMR and FMR Co., Inc. (investment adviser firms, 2007-2014).
Charles S. Morrison (1960)
Year of Election or Appointment: 2014
Trustee
Mr. Morrison also serves as Trustee of other funds. He serves as President of Fidelity Management & Research Company (FMR) (investment adviser firm, 2016-present), a Director of Fidelity Investments Money Management, Inc. (FIMM) (investment adviser firm, 2014-present), Director of Fidelity SelectCo, LLC (investment adviser firm, 2014-present), President, Asset Management (2014-present), and is an employee of Fidelity Investments. Previously, Mr. Morrison served as Vice President of Fidelity's Fixed Income and Asset Allocation Funds (2012-2014), President, Fixed Income (2011-2014), Vice President of Fidelity's Money Market Funds (2005-2009), President, Money Market Group Leader of FMR (investment adviser firm, 2009), and Senior Vice President, Money Market Group of FMR (2004-2009). Mr. Morrison also served as Vice President of Fidelity's Bond Funds (2002-2005), certain Balanced Funds (2002-2005), and certain Asset Allocation Funds (2002-2007), and as Senior Vice President (2002-2005) of Fidelity's Bond Division.
* Determined to be an “Interested Trustee” by virtue of, among other things, his or her affiliation with the trust or various entities under common control with FMR.
+ The information includes the Trustee's principal occupation during the last five years and other information relating to the experience, attributes, and skills relevant to the Trustee's qualifications to serve as a Trustee, which led to the conclusion that the Trustee should serve as a Trustee for the fund.
Independent Trustees:
Correspondence intended for an Independent Trustee may be sent to Fidelity Investments, P.O. Box 55235, Boston, Massachusetts 02205-5235.
Name, Year of Birth; Principal Occupations and Other Relevant Experience+
Dennis J. Dirks (1948)
Year of Election or Appointment: 2005
Trustee
Mr. Dirks also serves as Trustee of other Fidelity® funds. Prior to his retirement in May 2003, Mr. Dirks was Chief Operating Officer and a member of the Board of The Depository Trust & Clearing Corporation (DTCC). He also served as President, Chief Operating Officer, and Board member of The Depository Trust Company (DTC) and President and Board member of the National Securities Clearing Corporation (NSCC). In addition, Mr. Dirks served as Chief Executive Officer and Board member of the Government Securities Clearing Corporation, Chief Executive Officer and Board member of the Mortgage-Backed Securities Clearing Corporation, as a Trustee and a member of the Finance Committee of Manhattan College (2005-2008), as a Trustee and a member of the Finance Committee of AHRC of Nassau County (2006-2008), as a member of the Independent Directors Council (IDC) Governing Council (2010-2015), and as a member of the Board of Directors for The Brookville Center for Children’s Services, Inc. (2009-2017). Mr. Dirks is a member of the Finance Committee (2016-present) and Board of Directors (2017-present) of the Asolo Repertory Theatre.
Alan J. Lacy (1953)
Year of Election or Appointment: 2008
Trustee
Mr. Lacy also serves as Trustee of other Fidelity® funds. Mr. Lacy serves as a Director of Bristol-Myers Squibb Company (global pharmaceuticals, 2008-present). He is a Trustee of the California Chapter of The Nature Conservancy (2015-present) and a Director of the Center for Advanced Study in the Behavioral Sciences at Stanford University (2015-present). In addition, Mr. Lacy served as Senior Adviser (2007-2014) of Oak Hill Capital Partners, L.P. (private equity) and also served as Chief Executive Officer (2005) and Vice Chairman (2005-2006) of Sears Holdings Corporation (retail) and Chief Executive Officer and Chairman of the Board of Sears, Roebuck and Co. (retail, 2000-2005). Previously, Mr. Lacy served as Chairman (2014-2017) and a member (2010-2017) of the Board of Directors of Dave & Buster’s Entertainment, Inc. (restaurant and entertainment complexes), as Chairman (2008-2011) and a member (2006-2015) of the Board of Trustees of the National Parks Conservation Association, and as a member of the Board of Directors for The Hillman Companies, Inc. (hardware wholesalers, 2010-2014), Earth Fare, Inc. (retail grocery, 2010-2014), and The Western Union Company (global money transfer, 2006-2011).
Ned C. Lautenbach (1944)
Year of Election or Appointment: 2000
Trustee
Chairman of the Independent Trustees
Mr. Lautenbach also serves as Trustee of other Fidelity® funds. Mr. Lautenbach currently serves as Vice Chair of the Board of Governors, State University System of Florida (2013-present) and is a member of the Council on Foreign Relations (1994-present). He is also a member and has most recently served as Chairman of the Board of Directors of Artis-Naples (2012-present). Previously, Mr. Lautenbach served as a member and then Lead Director of the Board of Directors of Eaton Corporation (diversified industrial, 1997-2016). He was also a Partner and Advisory Partner at Clayton, Dubilier & Rice, LLC (private equity investment, 1998-2010), as well as a Director of Sony Corporation (2006-2007). In addition, Mr. Lautenbach also had a 30-year career with IBM (technology company) during which time he served as Senior Vice President and a member of the Corporate Executive Committee (1968-1998).
Joseph Mauriello (1944)
Year of Election or Appointment: 2008
Trustee
Mr. Mauriello also serves as Trustee of other Fidelity® funds. Prior to his retirement in January 2006, Mr. Mauriello served in numerous senior management positions including Deputy Chairman and Chief Operating Officer (2004-2005), and Vice Chairman of Financial Services (2002-2004) of KPMG LLP US (professional services, 1965-2005). Mr. Mauriello currently serves as a member of the Board of Directors of XL Group plc. (global insurance and re-insurance, 2006-present) and the Independent Directors Council (IDC) Governing Council (2015-present). Previously, Mr. Mauriello served as a Director of the Hamilton Funds of the Bank of New York (2006-2007) and of Arcadia Resources Inc. (health care services and products, 2007-2012).
Cornelia M. Small (1944)
Year of Election or Appointment: 2005
Trustee
Ms. Small also serves as Trustee of other Fidelity® funds. Ms. Small is a member of the Board of Directors (2009-present) and Chair of the Investment Committee (2010-present) of the Teagle Foundation. Ms. Small also serves on the Investment Committee of the Berkshire Taconic Community Foundation (2008-present). Previously, Ms. Small served as Chairperson (2002-2008) and a member of the Investment Committee and Chairperson (2008-2012) and a member of the Board of Trustees of Smith College. In addition, Ms. Small served as Chief Investment Officer, Director of Global Equity Investments, and a member of the Board of Directors of Scudder, Stevens & Clark and Scudder Kemper Investments.
William S. Stavropoulos (1939)
Year of Election or Appointment: 2002
Trustee
Vice Chairman of the Independent Trustees
Mr. Stavropoulos also serves as Trustee of other Fidelity® funds. Mr. Stavropoulos serves as President and Founder of the Michigan Baseball Foundation, the Great Lakes Loons (2007-present). Mr. Stavropoulos is Chairman Emeritus of the Board of Directors of The Dow Chemical Company, where he previously served in numerous senior management positions, including President, CEO (1995-2000; 2002-2004), Chairman of the Executive Committee (2000-2006), and as a member of the Board of Directors (1990-2006). Currently, Mr. Stavropoulos is Chairman of the Board of Directors of Univar Inc. (global distributor of commodity and specialty chemicals), a Director of Teradata Corporation (data warehousing and technology solutions), and a member of the Advisory Board for Metalmark Capital LLC (private equity investment, 2005-present). Mr. Stavropoulos is an operating advisor to Clayton, Dubilier & Rice, LLC (private equity investment). In addition, Mr. Stavropoulos is a member of the University of Notre Dame Advisory Council for the College of Science, a Trustee of the Rollin L. Gerstacker Foundation, and a Director of Artis-Naples in Naples, Florida. Previously, Mr. Stavropoulos served as a Director of Chemical Financial Corporation (bank holding company, 1993-2012) and Tyco International, Ltd. (multinational manufacturing and services, 2007-2012).
David M. Thomas (1949)
Year of Election or Appointment: 2008
Trustee
Mr. Thomas also serves as Trustee of other Fidelity® funds. Mr. Thomas serves as Non-Executive Chairman of the Board of Directors of Fortune Brands Home and Security (home and security products, 2011-present), as a member of the Board of Directors (2004-present) and Presiding Director (2013-present) of Interpublic Group of Companies, Inc. (marketing communication), and as a member of the Board of Trustees of the University of Florida (2013-present). Previously, Mr. Thomas served as Executive Chairman (2005-2006) and Chairman and Chief Executive Officer (2000-2005) of IMS Health, Inc. (pharmaceutical and healthcare information solutions), and a Director of Fortune Brands, Inc. (consumer products, 2000-2011).
+ The information includes the Trustee's principal occupation during the last five years and other information relating to the experience, attributes, and skills relevant to the Trustee's qualifications to serve as a Trustee, which led to the conclusion that the Trustee should serve as a Trustee for the fund.
Advisory Board Members and Officers:
Correspondence intended for an officer or Peter S. Lynch may be sent to Fidelity Investments, 245 Summer Street, Boston, Massachusetts 02210. Officers appear below in alphabetical order.
Name, Year of Birth; Principal Occupation
Peter S. Lynch (1944)
Year of Election or Appointment: 2003
Member of the Advisory Board
Mr. Lynch also serves as Member of the Advisory Board of other Fidelity® funds. Mr. Lynch is Vice Chairman and a Director of FMR (investment adviser firm) and FMR Co., Inc. (investment adviser firm). In addition, Mr. Lynch serves as a Trustee of Boston College and as the Chairman of the Inner-City Scholarship Fund. Previously, Mr. Lynch served on the Special Olympics International Board of Directors (1997-2006).
Elizabeth Paige Baumann (1968)
Year of Election or Appointment: 2017
Anti-Money Laundering (AML) Officer
Ms. Baumann also serves as AML Officer of other funds. She is Chief AML Officer (2012-present) and Senior Vice President (2014-present) of FMR LLC (diversified financial services company) and is an employee of Fidelity Investments. Previously, Ms. Baumann served as AML Officer of the funds (2012-2016), and Vice President (2007-2014) and Deputy Anti-Money Laundering Officer (2007-2012) of FMR LLC.
Marc R. Bryant (1966)
Year of Election or Appointment: 2015
Secretary and Chief Legal Officer (CLO)
Mr. Bryant also serves as Secretary and CLO of other funds. Mr. Bryant serves as CLO, Secretary, and Senior Vice President of Fidelity Management & Research Company (investment adviser firm, 2015-present) and FMR Co., Inc. (investment adviser firm, 2015-present); Secretary of Fidelity SelectCo, LLC (investment adviser firm, 2015-present) and Fidelity Investments Money Management, Inc. (investment adviser firm, 2015-present); and CLO of Fidelity Management & Research (Hong Kong) Limited and FMR Investment Management (UK) Limited (investment adviser firms, 2015-present) and Fidelity Management & Research (Japan) Limited (investment adviser firm, 2016-present). He is Senior Vice President and Deputy General Counsel of FMR LLC (diversified financial services company). Previously, Mr. Bryant served as Secretary and CLO of Fidelity Rutland Square Trust II (2010-2014) and Assistant Secretary of Fidelity's Fixed Income and Asset Allocation Funds (2013-2015). Prior to joining Fidelity Investments, Mr. Bryant served as a Senior Vice President and the Head of Global Retail Legal for AllianceBernstein L.P. (2006-2010), and as the General Counsel for ProFund Advisors LLC (2001-2006).
William C. Coffey (1969)
Year of Election or Appointment: 2009
Assistant Secretary
Mr. Coffey also serves as Assistant Secretary of other funds. He is Senior Vice President and Deputy General Counsel of FMR LLC (diversified financial services company, 2010-present), and is an employee of Fidelity Investments. Previously, Mr. Coffey served as Vice President and Associate General Counsel of FMR LLC (2005-2009).
Jonathan Davis (1968)
Year of Election or Appointment: 2010
Assistant Treasurer
Mr. Davis also serves as Assistant Treasurer of other funds, and is an employee of Fidelity Investments. Previously, Mr. Davis served as Vice President and Associate General Counsel of FMR LLC (diversified financial services company, 2003-2010).
Adrien E. Deberghes (1967)
Year of Election or Appointment: 2016
Assistant Treasurer
Mr. Deberghes also serves as an officer of other funds. He serves as Executive Vice President of Fidelity Investments Money Management, Inc. (FIMM) (investment adviser firm, 2016-present) and is an employee of Fidelity Investments (2008-present). Prior to joining Fidelity Investments, Mr. Deberghes was Senior Vice President of Mutual Fund Administration at State Street Corporation (2007-2008), Senior Director of Mutual Fund Administration at Investors Bank & Trust (2005-2007), and Director of Finance for Dunkin' Brands (2000-2005). Previously, Mr. Deberghes served in other fund officer roles.
Stephanie J. Dorsey (1969)
Year of Election or Appointment: 2010
Assistant Treasurer
Ms. Dorsey also serves as an officer of other funds. She is an employee of Fidelity Investments (2008-present) and has served in other fund officer roles. Prior to joining Fidelity Investments, Ms. Dorsey served as Treasurer (2004-2008) of the JPMorgan Mutual Funds and Vice President (2004-2008) of JPMorgan Chase Bank.
Howard J. Galligan III (1966)
Year of Election or Appointment: 2014
Chief Financial Officer
Mr. Galligan also serves as Chief Financial Officer of other funds. Mr. Galligan serves as President of Fidelity Pricing and Cash Management Services (FPCMS) (2014-present) and as a Director of Strategic Advisers, Inc. (investment adviser firm, 2008-present). Previously, Mr. Galligan served as Chief Administrative Officer of Asset Management (2011-2014) and Chief Operating Officer and Senior Vice President of Investment Support for Strategic Advisers, Inc. (2003-2011).
Thomas C. Hense (1964)
Year of Election or Appointment: 2008, 2010, or 2015
Vice President
Mr. Hense serves as Vice President of Fidelity Advisor® Multi-Asset Income Fund (2015) and other funds (High Income (2008), Small Cap (2008), and Value (2010) funds), and is an employee of Fidelity Investments (1993-present). Previously, Mr. Hense served as a portfolio manager for Fidelity's Institutional Money Management Group (Pyramis) (2003-2008).
Brian B. Hogan (1964)
Year of Election or Appointment: 2009
Vice President
Mr. Hogan also serves as Trustee or Vice President of other funds. Mr. Hogan serves as a Director of FMR Investment Management (UK) Limited (investment adviser firm, 2015-present) and Fidelity SelectCo, LLC (investment adviser firm, 2014-present) and President of the Equity Division of FMR (investment adviser firm, 2009-present). Previously, Mr. Hogan served as Senior Vice President, Equity Research of FMR (2006-2009) and as a portfolio manager. Mr. Brian B. Hogan is not related to Mr. Colm A. Hogan.
Colm A. Hogan (1973)
Year of Election or Appointment: 2016
Deputy Treasurer
Mr. Hogan also serves as an officer of other funds. Mr. Hogan is an employee of Fidelity Investments (2005-present). Mr. Colm A. Hogan is not related to Mr. Brian B. Hogan.
Chris Maher (1972)
Year of Election or Appointment: 2013
Assistant Treasurer
Mr. Maher serves as Assistant Treasurer of other funds. Mr. Maher is Vice President of Valuation Oversight and is an employee of Fidelity Investments. Previously, Mr. Maher served as Vice President of Asset Management Compliance (2013), Vice President of the Program Management Group of FMR (investment adviser firm, 2010-2013), and Vice President of Valuation Oversight (2008-2010).
Rieco E. Mello (1969)
Year of Election or Appointment: 2017
Assistant Treasurer
Mr. Mello also serves as Assistant Treasurer of other funds. Mr. Mello is an employee of Fidelity Investments (1995-present).
Kenneth B. Robins (1969)
Year of Election or Appointment: 2016
Chief Compliance Officer
Mr. Robins also serves as an officer of other funds. Mr. Robins serves as Compliance Officer of Fidelity Management & Research Company and FMR Co., Inc. (investment adviser firms, 2016-present) and is an employee of Fidelity Investments (2004-present). Previously, Mr. Robins served as Executive Vice President of Fidelity Investments Money Management, Inc. (investment adviser firm, 2013-2016) and served in other fund officer roles.
Stacie M. Smith (1974)
Year of Election or Appointment: 2016
President and Treasurer
Ms. Smith also serves as an officer of other funds. She is an employee of Fidelity Investments (2009-present) and has served in other fund officer roles. Prior to joining Fidelity Investments, Ms. Smith served as Senior Audit Manager of Ernst & Young LLP (accounting firm, 1996-2009). Previously, Ms. Smith served as Deputy Treasurer of certain Fidelity® funds (2013-2016).
Marc L. Spector (1972)
Year of Election or Appointment: 2016
Assistant Treasurer
Mr. Spector also serves as an officer of other funds. Mr. Spector is an employee of Fidelity Investments (2016-present). Prior to joining Fidelity Investments, Mr. Spector served as Director at the Siegfried Group (accounting firm, 2013-2016), and prior to Siegfried Group as audit senior manager at Deloitte & Touche (accounting firm, 2005-2013).
Renee Stagnone (1975)
Year of Election or Appointment: 2016
Assistant Treasurer
Ms. Stagnone also serves as an officer of other funds. Ms. Stagnone is an employee of Fidelity Investments (1997-present). Previously, Ms. Stagnone served as Deputy Treasurer of certain Fidelity® funds (2013-2016).
Shareholder Expense Example
As a shareholder of the Fund, you incur two types of costs: (1) transaction costs, including sales charges (loads) on purchase payments or redemption proceeds, redemption fees and (2) ongoing costs, including management fees, distribution and/or service (12b-1) fees and other Fund expenses. This Example is intended to help you understand your ongoing costs (in dollars) of investing in the Fund and to compare these costs with the ongoing costs of investing in other mutual funds.
The Example is based on an investment of $1,000 invested at the beginning of the period and held for the entire period (May 1, 2017 to October 31, 2017).
Actual Expenses
The first line of the accompanying table for each class of the Fund provides information about actual account values and actual expenses. You may use the information in this line, together with the amount you invested, to estimate the expenses that you paid over the period. Simply divide your account value by $1,000.00 (for example, an $8,600 account value divided by $1,000.00 = 8.6), then multiply the result by the number in the first line for a class of the Fund under the heading entitled "Expenses Paid During Period" to estimate the expenses you paid on your account during this period. A small balance maintenance fee of $12.00 that is charged once a year may apply for certain accounts with a value of less than $2,000. This fee is not included in the table below. If it was, the estimate of expenses you paid during the period would be higher, and your ending account value lower, by this amount. In addition, the Fund, as a shareholder in the underlying Fidelity Central Funds, will indirectly bear its pro-rata share of the fees and expenses incurred by the underlying Fidelity Central Funds. These fees and expenses are not included in the Fund's annualized expense ratio used to calculate the expense estimate in the table below.
Hypothetical Example for Comparison Purposes
The second line of the accompanying table for each class of the Fund provides information about hypothetical account values and hypothetical expenses based on a Class' actual expense ratio and an assumed rate of return of 5% per year before expenses, which is not the Class' actual return. The hypothetical account values and expenses may not be used to estimate the actual ending account balance or expenses you paid for the period. You may use this information to compare the ongoing costs of investing in the Fund and other funds. To do so, compare this 5% hypothetical example with the 5% hypothetical examples that appear in the shareholder reports of the other funds. A small balance maintenance fee of $12.00 that is charged once a year may apply for certain accounts with a value of less than $2,000. This fee is not included in the table below. If it was, the estimate of expenses you paid during the period would be higher, and your ending account value lower, by this amount. In addition, the Fund, as a shareholder in the underlying Fidelity Central Funds, will indirectly bear its pro-rata share of the fees and expenses incurred by the underlying Fidelity Central Funds. These fees and expenses are not included in the Fund's annualized expense ratio used to calculate the expense estimate in the table below.
Please note that the expenses shown in the table are meant to highlight your ongoing costs only and do not reflect any transaction costs. Therefore, the second line of the table is useful in comparing ongoing costs only, and will not help you determine the relative total costs of owning different funds. In addition, if these transactional costs were included, your costs would have been higher.
| | Annualized Expense Ratio-A | Beginning
Account Value
May 1, 2017 | Ending
Account Value
October 31, 2017 | Expenses Paid
During Period-B
May 1, 2017
to October 31, 2017 |
| Class A | 1.02% | | | |
| Actual | | $1,000.00 | $1,067.50 | $5.32 |
| Hypothetical-C | | $1,000.00 | $1,020.06 | $5.19 |
| Class M | 1.37% | | | |
| Actual | | $1,000.00 | $1,065.50 | $7.13 |
| Hypothetical-C | | $1,000.00 | $1,018.30 | $6.97 |
| Class C | 1.84% | | | |
| Actual | | $1,000.00 | $1,062.90 | $9.57 |
| Hypothetical-C | | $1,000.00 | $1,015.93 | $9.35 |
| Stock Selector Small Cap | .72% | | | |
| Actual | | $1,000.00 | $1,069.30 | $3.76 |
| Hypothetical-C | | $1,000.00 | $1,021.58 | $3.67 |
| Class I | .72% | | | |
| Actual | | $1,000.00 | $1,069.10 | $3.75 |
| Hypothetical-C | | $1,000.00 | $1,021.58 | $3.67 |
| Class Z | .62% | | | |
| Actual | | $1,000.00 | $1,069.80 | $3.23 |
| Hypothetical-C | | $1,000.00 | $1,022.08 | $3.16 |
A Annualized expense ratio reflects expenses net of applicable fee waivers.
B Expenses are equal to each Class' annualized expense ratio, multiplied by the average account value over the period, multiplied by 184/365 (to reflect the one-half year period).
C 5% return per year before expenses
Distributions (Unaudited)
The Board of Trustees of Fidelity Stock Selector Small Cap Fund voted to pay to shareholders of record at the opening of business on record date, the following distributions per share derived from capital gains realized from sales of portfolio securities, and dividends derived from net investment income:
| | Pay Date | Record Date | Dividends | Capital Gains |
| Fidelity Stock Selector Small Cap Fund | | | | |
| Class A | 12/11/17 | 12/08/17 | $0.034 | $2.651 |
| Class M | 12/11/17 | 12/08/17 | $0.000 | $2.651 |
| Class C | 12/11/17 | 12/08/17 | $0.000 | $2.651 |
| Class I | 12/11/17 | 12/08/17 | $0.109 | $2.651 |
| Class Z | 12/11/17 | 12/08/17 | $0.159 | $2.651 |
| Stock Selector Small Cap | 12/11/17 | 12/08/17 | $0.113 | $2.651 |
|
The fund hereby designates as a capital gain dividend with respect to the taxable year ended October 31, 2017, $158,713,867, or, if subsequently determined to be different, the net capital gain of such year.
Class A, Class I, and Stock Selector Small Cap designate 100% of the dividends distributed in December 2017, during the fiscal year, as qualifying for the dividends–received deduction for corporate shareholders.
Class A, Class I, and Stock Selector Small Cap designate 100% of the dividends distributed during the fiscal year as amounts which may be taken into account as a dividend for purposes of the maximum rate under section 1(h)(11) of the Internal Revenue Code.
The fund will notify shareholders in January 2018 of amounts for use in preparing 2017 income tax returns.
Board Approval of Investment Advisory Contracts and Management Fees
Fidelity Stock Selector Small Cap Fund
Each year, the Board of Trustees, including the Independent Trustees (together, the Board), votes on the renewal of the management contract with Fidelity Management & Research Company (FMR) and the sub-advisory agreements (together, the Advisory Contracts) for the fund. FMR and the sub-advisers are referred to herein as the Investment Advisers. The Board, assisted by the advice of fund counsel and Independent Trustees' counsel, requests and considers a broad range of information relevant to the renewal of the Advisory Contracts throughout the year.
The Board meets regularly and, at each of its meetings, covers an extensive agenda of topics and materials and considers factors that are relevant to its annual consideration of the renewal of the fund's Advisory Contracts, including the services and support provided to the fund and its shareholders. The Board has established various standing committees (Committees), each composed of and chaired by Independent Trustees with varying backgrounds, to which the Board has assigned specific subject matter responsibilities in order to enhance effective decision-making by the Board. The Board, acting directly and through its Committees, requests and receives information concerning the annual consideration of the renewal of the fund's Advisory Contracts. The Board also meets as needed to review matters specifically related to the Board's annual consideration of the renewal of the Advisory Contracts. Members of the Board may also meet with trustees of other Fidelity funds through ad hoc joint committees to discuss certain matters relevant to all of the Fidelity funds.
At its July 2017 meeting, the Board unanimously determined to renew the fund's Advisory Contracts. In reaching its determination, the Board considered all factors it believed relevant, including (i) the nature, extent, and quality of the services to be provided to the fund and its shareholders (including the investment performance of the fund); (ii) the competitiveness of the fund's management fee and total expense ratio relative to peer funds; (iii) the total costs of the services to be provided by and the profits to be realized by Fidelity from its relationships with the fund; and (iv) the extent to which, if any, economies of scale exist and would be realized as the fund grows, and whether any economies of scale are appropriately shared with fund shareholders.
In considering whether to renew the Advisory Contracts for the fund, the Board reached a determination, with the assistance of fund counsel and Independent Trustees' counsel and through the exercise of its business judgment, that the renewal of the Advisory Contracts was in the best interests of the fund and its shareholders and that the compensation payable under the Advisory Contracts was fair and reasonable. The Board's decision to renew the Advisory Contracts was not based on any single factor, but rather was based on a comprehensive consideration of all the information provided to the Board at its meetings throughout the year. The Board, in reaching its determination to renew the Advisory Contracts, was aware that shareholders of the fund have a broad range of investment choices available to them, including a wide choice among funds offered by Fidelity's competitors, and that the fund's shareholders, who have the opportunity to review and weigh the disclosure provided by the fund in its prospectus and other public disclosures, have chosen to invest in this fund, which is part of the Fidelity family of funds.
Amendment to Group Fee Rate. The Board also approved an amendment to the management contract for the fund to add an additional breakpoint to the group fee schedule, effective October 1, 2017. The Board noted that the additional breakpoint would result in lower management fee rates as Fidelity's assets under management increase.
Nature, Extent, and Quality of Services Provided. The Board considered Fidelity's staffing as it relates to the fund, including the backgrounds of investment personnel of Fidelity, and also considered the fund's investment objective, strategies, and related investment philosophy. The Independent Trustees also had discussions with senior management of Fidelity's investment operations and investment groups. The Board considered the structure of the investment personnel compensation program and whether this structure provides appropriate incentives to act in the best interests of the fund. Additionally, the Board considered the portfolio managers' investments, if any, in the funds that they manage.
Resources Dedicated to Investment Management and Support Services. The Board and the Fund Oversight and Research Committees reviewed the general qualifications and capabilities of Fidelity's investment staff, including its size, education, experience, and resources, as well as Fidelity's approach to recruiting, training, managing, and compensating investment personnel. The Board noted that Fidelity has continued to increase the resources devoted to non-U.S. offices, including expansion of Fidelity's global investment organization. The Board also noted that Fidelity's analysts have extensive resources, tools and capabilities that allow them to conduct sophisticated quantitative and fundamental analysis, as well as credit analysis of issuers, counterparties and guarantors. Further, the Board considered that Fidelity's investment professionals have sufficient access to global information and data so as to provide competitive investment results over time, and that those professionals also have access to sophisticated tools that permit them to assess portfolio construction and risk and performance attribution characteristics continuously, as well as to transmit new information and research conclusions rapidly around the world. Additionally, in its deliberations, the Board considered Fidelity's trading, risk management, compliance, and technology and operations capabilities and resources, which are integral parts of the investment management process.
Shareholder and Administrative Services. The Board considered (i) the nature, extent, quality, and cost of advisory, administrative, and shareholder services performed by the Investment Advisers and their affiliates under the Advisory Contracts and under separate agreements covering transfer agency, pricing and bookkeeping, and securities lending services for the fund; (ii) the nature and extent of the supervision of third party service providers, principally custodians, subcustodians, and pricing vendors; and (iii) the resources devoted to, and the record of compliance with, the fund's compliance policies and procedures. The Board also reviewed the allocation of fund brokerage, including allocations to brokers affiliated with the Investment Advisers, the use of brokerage commissions to pay fund expenses, and the use of "soft" commission dollars to pay for research services.
The Board noted that the growth of fund assets over time across the complex allows Fidelity to reinvest in the development of services designed to enhance the value or convenience of the Fidelity funds as investment vehicles. These services include 24-hour access to account information and market information through telephone representatives and over the Internet, investor education materials and asset allocation tools, and the expanded availability of Fidelity Investor Centers.
In 2014, the Board formed an ad hoc Committee on Transfer Agency Fees to review the variety of transfer agency fee structures throughout the industry and Fidelity's competitive positioning with respect to industry participants.
Investment in a Large Fund Family. The Board considered the benefits to shareholders of investing in a Fidelity fund, including the benefits of investing in a fund that is part of a large family of funds offering a variety of investment disciplines and providing a large variety of mutual fund investor services. The Board noted that Fidelity had taken, or had made recommendations that resulted in the Fidelity funds taking, a number of actions over the previous year that benefited particular funds, including: (i) continuing to dedicate additional resources to Fidelity's investment research process, and to the support of the senior management team that oversees asset management; (ii) continuing efforts to enhance Fidelity's global research capabilities; (iii) launching new funds and making other enhancements to meet client needs; (iv) launching new share classes of existing funds; (v) eliminating purchase minimums and broadening eligibility requirements for certain lower-priced share classes; (vi) reducing management fees and total expenses for certain growth equity funds and index funds; (vii) lowering expense caps for certain existing funds and classes to reduce expenses borne by shareholders; (viii) eliminating short-term redemption fees for certain funds; (ix) introducing a new pricing structure for certain funds of funds that is expected to reduce overall expenses paid by shareholders; (x) rationalizing product lines and gaining increased efficiencies through proposals for fund mergers and share class consolidations; (xi) continuing to develop, acquire and implement systems and technology to improve services to the funds and shareholders, strengthen information security, and increase efficiency; and (xii) implementing enhancements to further strengthen Fidelity's product line to increase investors' probability of success in achieving their investment goals, including retirement income goals.
Investment Performance. The Board considered whether the fund has operated in accordance with its investment objective, as well as its record of compliance with its investment restrictions and its performance history.
The Board took into account discussions with representatives of the Investment Advisers about fund investment performance that occur at Board meetings throughout the year. In this regard the Board noted that as part of regularly scheduled fund reviews and other reports to the Board on fund performance, the Board considers annualized return information for the fund for different time periods, measured against a securities market index ("benchmark index") and a peer group of funds with similar objectives ("peer group"), if any. In its evaluation of fund investment performance, the Board gave particular attention to information indicating changes in performance of certain Fidelity funds for specific time periods and discussed with the Investment Advisers the reasons for any overperformance or underperformance.
In addition to reviewing absolute and relative fund performance, the Independent Trustees periodically consider the appropriateness of fund performance metrics in evaluating the results achieved. In general, the Independent Trustees believe that fund performance should be evaluated based on net performance (after fees and expenses) of both the highest performing and lowest performing fund share classes, where applicable, compared to appropriate benchmark indices, over appropriate time periods that may include full market cycles, and compared to peer groups, as applicable, over the same periods, taking into account relevant factors including the following: general market conditions; issuer-specific information; and fund cash flows and other factors.
The Independent Trustees recognize that shareholders evaluate performance on a net basis over their own holding periods, for which one-, three-, and five-year periods are often used as a proxy. For this reason, the performance information reviewed by the Board also included net cumulative calendar year total return information for the fund and an appropriate benchmark index and peer group for the most recent one-, three-, and five-year periods, as shown below. Returns are shown compared to the 25th percentile (top of box, 75% beaten) and 75th percentile (bottom of box, 25% beaten) of the peer universe.
Fidelity Stock Selector Small Cap Fund
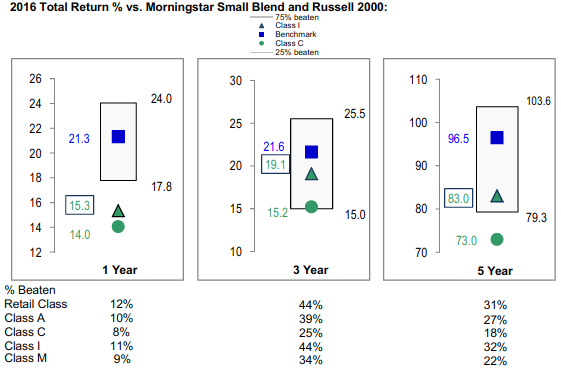
The Board has discussed the fund's underperformance with FMR, including the fund's investment strategy, the portfolio management team, and broader trends in the market that may have impacted the fund's performance, and has engaged with FMR to consider what steps might be taken to remediate the fund's underperformance. The Board noted that there were portfolio management changes for the fund in October 2013, September 2014, and May 2016.
The Board also considered that the fund's management fee is subject to upward or downward adjustment depending upon whether, and to what extent, the fund's investment performance for the performance period (a rolling 36-month period) exceeds, or is exceeded by, a securities index, thus leading to a performance adjustment for the same period. The Board noted that the performance adjustment provides FMR with a strong economic incentive to seek to achieve superior long-term performance for the fund's shareholders and helps to more closely align the interests of FMR and the shareholders of the fund.
Based on its review, the Board concluded that the nature, extent, and quality of services provided to the fund under the Advisory Contracts should continue to benefit the shareholders of the fund.
Competitiveness of Management Fee and Total Expense Ratio. The Board considered the fund's management fee and total expense ratio compared to "mapped groups" of competitive funds and classes created for the purpose of facilitating the Trustees' competitive analysis of management fees and total expenses. Fidelity creates "mapped groups" by combining similar Lipper investment objective categories that have comparable investment mandates. Combining Lipper investment objective categories aids the Board's management fee and total expense ratio comparisons by broadening the competitive group used for comparison.
Management Fee. The Board considered two proprietary management fee comparisons for the 12-month periods shown in basis points (BP) in the chart below. The group of Lipper funds used by the Board for management fee comparisons is referred to below as the "Total Mapped Group." The Total Mapped Group comparison focuses on a fund's standing in terms of gross management fees before expense reimbursements or caps, and without giving effect to the fund's performance adjustment, relative to the total universe of funds with comparable investment mandates, regardless of whether their management fee structures also are comparable. Funds with comparable investment mandates offer exposure to similar types of securities. Funds with comparable management fee structures have similar management fee contractual arrangements (
e.g., flat rate charged for advisory services, all-inclusive fee rate,
etc.). "TMG %" represents the percentage of funds in the Total Mapped Group that had management fees that were lower than the fund's. For example, a hypothetical TMG % of 20% would mean that 80% of the funds in the Total Mapped Group had higher, and 20% had lower, management fees than the fund. The fund's actual TMG %s and the number of funds in the Total Mapped Group are in the chart below. The "Asset-Size Peer Group" (ASPG) comparison focuses on a fund's standing relative to a subset of non-Fidelity funds within the Total Mapped Group that are similar in size and management fee structure without taking into account performance adjustments, if any. For example, if a fund is in the first quartile of the ASPG, the fund's management fee ranks in the least expensive or lowest 25% of funds in the ASPG. The ASPG represents at least 15% of the funds in the Total Mapped Group with comparable asset size and management fee structures, subject to a minimum of 50 funds (or all funds in the Total Mapped Group if fewer than 50). Additional information, such as the ASPG quartile in which the fund's management fee rate ranked and the impact of the fund's performance adjustment, is also included in the chart and considered by the Board.
Fidelity Stock Selector Small Cap Fund

The Board noted that the fund's management fee rate ranked below the median of its Total Mapped Group and below the median of its ASPG for 2016. The Board also noted the effect of the fund's performance adjustment, if any, on the fund's management fee ranking. The Board noted that the comparisons for 2015 and 2016 reflect a revised Total Mapped Group that no longer includes funds with micro-cap objectives and that FMR believes this Total Mapped Group is a more appropriate comparison because the fund does not have a micro-cap objective.
The Board noted that, in 2014, the Board and the boards of other Fidelity funds formed the ad hoc Committee on Group Fee to conduct an in-depth review of the "group fee" component of the management fee of funds with such management fee structures. The Committee's focus included the mechanics of the group fee, the competitive landscape of group fee structures, Fidelity funds with no group fee component and investment products not included in group fee assets. The Board also considered that, for funds subject to the group fee, FMR agreed to voluntarily waive fees over a specified period of time in amounts designed to account for assets converted from certain funds to certain collective investment trusts.
The Board also noted that, in 2013, the ad hoc Committee on Management Fees was formed to conduct an in-depth review of the management fee rates of Fidelity's active equity mutual funds. The Committee focused on the following areas: (i) standard fee structures; (ii) research consumption and trading evolution; (iii) management fee competitiveness/profitability by category; and (iv) factors that drive institutional pricing.
Based on its review, the Board concluded that the fund's management fee is fair and reasonable in light of the services that the fund receives and the other factors considered.
Total Expense Ratio. In its review of each class's total expense ratio, the Board considered the fund's management fee rate as well as other fund or class expenses, as applicable, such as transfer agent fees, pricing and bookkeeping fees, fund-paid 12b-1 fees, and custodial, legal, and audit fees. The Board noted the impact of the fund's performance adjustment. The Board also noted that Fidelity may agree to waive fees and expenses from time to time, and the extent to which, if any, it has done so for the fund. As part of its review, the Board also considered the current and historical total expense ratios of each class of the fund compared to competitive fund median expenses. Each class of the fund is compared to those funds and classes in the Total Mapped Group (used by the Board for management fee comparisons) that have a similar sales load structure.
The Board noted that the total expense ratio of each of Class A, Class C, Class I, and the retail class ranked below the competitive median for 2016 and the total expense ratio of Class M (formerly Class T) ranked above the competitive median for 2016. The Board considered that, in general, various factors can affect total expense ratios. The Board noted that the total expense ratio of Class M was above the competitive median primarily because of higher 12b-1 fees on Class M as compared to most competitor funds. Class M has a higher 12b-1 fee, but a lower front-end sales charge, than traditionally priced front-end sales charge classes. The Board considered that Class M is primarily sold load-waived in the retirement plan market where its 0.50% 12b-1 fee is comparable to competing no-load, higher 12b-1 fee classes designed specifically for retirement plans. The Board noted that the fund offers multiple classes, each of which has a different sales load and 12b-1 fee structure, and that the multiple structures are intended to offer a range of pricing options for the intermediary market. The Board also noted that the total expense ratios of the classes vary primarily by the level of their 12b-1 fees, although differences in transfer agent fees may also cause expenses to vary from class to class.
Fees Charged to Other Fidelity Clients. The Board also considered Fidelity fee structures and other information with respect to clients of Fidelity, such as other funds advised or subadvised by Fidelity, pension plan clients, and other institutional clients with similar mandates. The Board noted that an ad hoc joint committee created by it and the boards of other Fidelity funds periodically (most recently in 2013) reviews and compares Fidelity's institutional investment advisory business with its business of providing services to the Fidelity funds, including the differences in services provided, fees charged, and costs incurred, as well as competition in their respective marketplaces.
Based on its review of total expense ratios and fees charged to other Fidelity clients, the Board concluded that, although Class M was above the median of the universe presented for comparison, the total expense ratio of each class of the fund was reasonable in light of the services that the fund and its shareholders receive and the other factors considered.
Costs of the Services and Profitability. The Board considered the revenues earned and the expenses incurred by Fidelity in conducting the business of developing, marketing, distributing, managing, administering and servicing the fund and servicing the fund's shareholders. The Board also considered the level of Fidelity's profits in respect of all the Fidelity funds.
On an annual basis, Fidelity presents to the Board information about the profitability of its relationships with the fund. Fidelity calculates profitability information for each fund, as well as aggregate profitability information for groups of Fidelity funds and all Fidelity funds, using a series of detailed revenue and cost allocation methodologies which originate with the books and records of Fidelity on which Fidelity's audited financial statements are based. The Audit Committee of the Board reviews any significant changes from the prior year's methodologies.
PricewaterhouseCoopers LLP (PwC), independent registered public accounting firm and auditor to Fidelity and certain Fidelity funds, has been engaged annually by the Board as part of the Board's assessment of Fidelity's profitability analysis. PwC's engagement includes the review and assessment of the methodologies used by Fidelity in determining the revenues and expenses attributable to Fidelity's mutual fund business, and completion of agreed-upon procedures in respect of the mathematical accuracy of the fund profitability information and its conformity to established allocation methodologies. After considering PwC's reports issued under the engagement and information provided by Fidelity, the Board concluded that while other allocation methods may also be reasonable, Fidelity's profitability methodologies are reasonable in all material respects.
The Board also reviewed Fidelity's non-fund businesses and potential fall-out benefits related to the mutual fund business as well as cases where Fidelity's affiliates may benefit from or be related to the fund's business.
The Board considered the costs of the services provided by and the profits realized by Fidelity in connection with the operation of the fund and was satisfied that the profitability was not excessive.
Economies of Scale. The Board considered whether there have been economies of scale in respect of the management of the Fidelity funds, whether the Fidelity funds (including the fund) have appropriately benefited from any such economies of scale, and whether there is potential for realization of any further economies of scale. The Board considered the extent to which the fund will benefit from economies of scale as assets grow through increased services to the fund, through waivers or reimbursements, or through fee or expense ratio reductions. The Board also noted that a committee (the Economies of Scale Committee) created by it and the boards of other Fidelity funds periodically (most recently in 2013) analyzes whether Fidelity attains economies of scale in respect of the management and servicing of the Fidelity funds, whether the Fidelity funds have appropriately benefited from such economies of scale, and whether there is potential for realization of any further economies of scale.
The Board recognized that the fund's management contract incorporates a "group fee" structure, which provides for lower group fee rates as total group assets increase, and for higher group fee rates as total group assets decrease (with "group assets" defined to include fund assets under FMR's management plus the assets of sector funds previously under FMR's management). FMR calculates the group fee rates based on a tiered asset "breakpoint" schedule that varies based on asset class. The Board considered that the group fee is designed to deliver the benefits of economies of scale to fund shareholders when total Fidelity fund assets increase, even if assets of any particular fund are unchanged or have declined, because some portion of Fidelity's costs are attributable to services provided to all Fidelity funds, and all funds benefit if those costs can be allocated among more assets. The Board concluded that, given the group fee structure, fund shareholders will benefit from lower management fees as group assets increase at the fund complex level, regardless of whether Fidelity achieves any such economies of scale.
The Board concluded, taking into account the analysis of the Economies of Scale Committee, that economies of scale, if any, are being appropriately shared between fund shareholders and Fidelity.
Additional Information Requested by the Board. In order to develop fully the factual basis for consideration of the Fidelity funds' advisory contracts, the Board requested and received additional information on certain topics, including: (i) fund performance trends, in particular the underperformance of certain funds, and Fidelity's long-term strategies for certain funds; (ii) Fidelity's fund profitability methodology, profitability trends for certain funds, and the impact of certain factors on fund profitability results, including the impact of market trends on actively managed funds; (iii) the use of performance fees and the calculation of performance adjustments, including the impact of underperformance and fund outflows on performance adjustments; (iv) metrics for evaluating index fund performance; (v) Fidelity's group fee structure, including the group fee breakpoint schedules; (vi) the terms of Fidelity's contractual and voluntary expense cap arrangements with the funds; (vii) the methodology with respect to evaluating competitive fund data and peer group classifications and fee comparisons; (viii) the expense structures for different funds and classes; (ix) Fidelity's arrangements with affiliated sub-advisers on behalf of the funds; (x) information regarding other accounts managed by Fidelity, including institutional accounts and collective investment trusts; (xi) recent changes to the fee structure for certain funds of funds; and (xii) the impact of the Department of Labor's new fiduciary rule on the funds' comparative expense information.
Based on its evaluation of all of the conclusions noted above, and after considering all factors it believed relevant, the Board concluded that the advisory fee structures are fair and reasonable, and that the fund's Advisory Contracts should be renewed.

Corporate Headquarters
245 Summer St.
Boston, MA 02210
www.fidelity.com
SCS-ANN-1217
1.703160.120
Fidelity® Capital Appreciation Fund
Annual Report October 31, 2017 |
|
Contents
To view a fund's proxy voting guidelines and proxy voting record for the 12-month period ended June 30, visit http://www.fidelity.com/proxyvotingresults or visit the Securities and Exchange Commission's (SEC) web site at http://www.sec.gov.
You may also call 1-800-544-8544 to request a free copy of the proxy voting guidelines.
Standard & Poor's, S&P and S&P 500 are registered service marks of The McGraw-Hill Companies, Inc. and have been licensed for use by Fidelity Distributors Corporation.
Other third-party marks appearing herein are the property of their respective owners.
All other marks appearing herein are registered or unregistered trademarks or service marks of FMR LLC or an affiliated company. © 2017 FMR LLC. All rights reserved.
This report and the financial statements contained herein are submitted for the general information of the shareholders of the Fund. This report is not authorized for distribution to prospective investors in the Fund unless preceded or accompanied by an effective prospectus.
A fund files its complete schedule of portfolio holdings with the SEC for the first and third quarters of each fiscal year on Form N-Q. Forms N-Q are available on the SEC’s web site at http://www.sec.gov. A fund's Forms N-Q may be reviewed and copied at the SEC’s Public Reference Room in Washington, DC. Information regarding the operation of the SEC's Public Reference Room may be obtained by calling 1-800-SEC-0330.
For a complete list of a fund's portfolio holdings, view the most recent holdings listing, semiannual report, or annual report on Fidelity's web site at http://www.fidelity.com, http://www.institutional.fidelity.com, or http://www.401k.com, as applicable.
NOT FDIC INSURED •MAY LOSE VALUE •NO BANK GUARANTEE
Neither the Fund nor Fidelity Distributors Corporation is a bank.
Performance: The Bottom Line
Average annual total return reflects the change in the value of an investment, assuming reinvestment of distributions from dividend income and capital gains (the profits earned upon the sale of securities that have grown in value, if any) and assuming a constant rate of performance each year. The hypothetical investment and the average annual total returns do not reflect the deduction of taxes that a shareholder would pay on fund distributions or the redemption of fund shares. During periods of reimbursement by Fidelity, a fund’s total return will be greater than it would be had the reimbursement not occurred. How a fund did yesterday is no guarantee of how it will do tomorrow.
Average Annual Total Returns
| For the periods ended October 31, 2017 | Past 1 year | Past 5 years | Past 10 years |
| Fidelity® Capital Appreciation Fund | 25.93% | 14.31% | 6.91% |
$10,000 Over 10 Years
Let's say hypothetically that $10,000 was invested in Fidelity® Capital Appreciation Fund, a class of the fund, on October 31, 2007.
The chart shows how the value of your investment would have changed, and also shows how the S&P 500® Index performed over the same period.

| Period Ending Values |
| $19,511 | Fidelity® Capital Appreciation Fund |
| $20,638 | S&P 500® Index |
Management's Discussion of Fund Performance
Market Recap: The U.S. equity bellwether S&P 500
® index gained 23.63% for the year ending October 31, 2017. Equity markets rose sharply following the November election and continued to rally through the end of February on optimism for President Trump’s pro-business agenda. Stocks leveled off in March amid fading optimism and stalled efforts by Congress to repeal and replace the Affordable Care Act. Upward momentum soon returned and continued through period end amid positive consumer sentiment and other market indicators. The lone exception was a brief cooldown in August, when geopolitical tension escalated and uncertainty grew regarding the future of health care, tax reform and the debt ceiling. Sector-wise, information technology (+39%) performed best, surging as a handful of major index constituents posted strong returns. Financials gained 37%, riding an uptick in bond yields and a surge in banks, particularly post-election. Materials (+29%) also did well, spurred by higher demand, especially from China. Conversely, consumer discretionary (+20%) lagged the broader market, as brick-and-mortar retailers continued to suffer from increased online competition. Rising interest rates held back real estate (+9%) and sluggish oil prices dragged on energy (+2%). Consumer staples (+4%) and telecommunication services (-1%) struggled due to investors’ general preference for risk assets.
Comments from Portfolio Manager Fergus Shiel: For the year, the fund’s share classes gained about 26%, topping the benchmark S&P 500
®. Versus the benchmark, minimal exposure to the lagging consumer staples sector was the biggest positive. Stock picking in information technology, industrials and health care also added value. Additionally, our foreign holdings lifted performance against the backdrop of a generally weaker U.S. dollar. Among individual stocks, Vertex Pharmaceuticals, a biotech company focused on developing treatments for cystic fibrosis, proved the fund’s top relative contributor. The stock almost doubled in value, and I exited most of this position. Also bolstering the fund’s relative result were publishing-software developer Adobe Systems – the fund’s fourth-largest holding at period end – and FMC, a supplier of agricultural chemicals and a position I increased significantly this period. Conversely, the fund’s primary headwind came from unfavorable stock picking in the consumer discretionary sector. A modest cash position also hurt. The biggest individual relative detractor by far was retailer J.C. Penney, an out-of-benchmark position that suffered a steady erosion in value. The company recorded its fifth straight quarter of weaker sales in August. Biotech holding Alexion Pharmaceuticals and a sizable out-of-benchmark position in Netherlands-based telecommunications company Altice also worked against us.
The views expressed above reflect those of the portfolio manager(s) only through the end of the period as stated on the cover of this report and do not necessarily represent the views of Fidelity or any other person in the Fidelity organization. Any such views are subject to change at any time based upon market or other conditions and Fidelity disclaims any responsibility to update such views. These views may not be relied on as investment advice and, because investment decisions for a Fidelity fund are based on numerous factors, may not be relied on as an indication of trading intent on behalf of any Fidelity fund.
Investment Summary (Unaudited)
Top Ten Stocks as of October 31, 2017
| | % of fund's net assets | % of fund's net assets 6 months ago |
| Apple, Inc. | 5.3 | 4.1 |
| Las Vegas Sands Corp. | 3.4 | 3.8 |
| Alphabet, Inc. Class C | 3.4 | 2.3 |
| Adobe Systems, Inc. | 3.0 | 3.1 |
| CME Group, Inc. | 2.9 | 3.1 |
| Morgan Stanley | 2.9 | 1.3 |
| Goldman Sachs Group, Inc. | 2.6 | 2.3 |
| Amgen, Inc. | 2.4 | 3.1 |
| PayPal Holdings, Inc. | 2.3 | 1.1 |
| FMC Corp. | 2.2 | 1.7 |
| | 30.4 | |
Top Five Market Sectors as of October 31, 2017
| | % of fund's net assets | % of fund's net assets 6 months ago |
| Information Technology | 30.7 | 21.8 |
| Financials | 18.3 | 14.7 |
| Consumer Discretionary | 15.1 | 21.6 |
| Health Care | 10.7 | 12.2 |
| Industrials | 9.9 | 8.3 |
Asset Allocation (% of fund's net assets)
| As of October 31, 2017 * |
| | Stocks | 99.2% |
| | Short-Term Investments and Net Other Assets (Liabilities) | 0.8% |

* Foreign investments - 12.5%
| As of April 30, 2017 * |
| | Stocks | 94.7% |
| | Short-Term Investments and Net Other Assets (Liabilities) | 5.3% |

* Foreign investments - 15.7%
Investments October 31, 2017
Showing Percentage of Net Assets
| Common Stocks - 99.2% | | | |
| | | Shares | Value (000s) |
| CONSUMER DISCRETIONARY - 15.1% | | | |
| Auto Components - 0.4% | | | |
| BorgWarner, Inc. | | 618,102 | $32,586 |
| Automobiles - 0.1% | | | |
| General Motors Co. | | 235,000 | 10,100 |
| Diversified Consumer Services - 0.2% | | | |
| DeVry, Inc. | | 401,780 | 14,846 |
| Hotels, Restaurants & Leisure - 7.6% | | | |
| Carnival Corp. | | 401,400 | 26,649 |
| Dalata Hotel Group PLC (a)(b) | | 9,716,029 | 60,550 |
| Las Vegas Sands Corp. | | 3,978,566 | 252,162 |
| Marriott International, Inc. Class A | | 295,057 | 35,253 |
| Marriott Vacations Worldwide Corp. | | 68,500 | 9,016 |
| MGM Mirage, Inc. | | 1,174,800 | 36,830 |
| Penn National Gaming, Inc. (a) | | 597,564 | 15,590 |
| Planet Fitness, Inc. | | 97,900 | 2,608 |
| Royal Caribbean Cruises Ltd. | | 235,000 | 29,086 |
| Whitbread PLC | | 230,303 | 11,296 |
| Wyndham Worldwide Corp. | | 740,394 | 79,111 |
| | | | 558,151 |
| Internet & Direct Marketing Retail - 1.3% | | | |
| Priceline Group, Inc. (a) | | 48,900 | 93,495 |
| Media - 2.4% | | | |
| Altice NV Class A (a) | | 5,351,954 | 100,963 |
| Interpublic Group of Companies, Inc. | | 3,702,294 | 71,269 |
| | | | 172,232 |
| Multiline Retail - 2.2% | | | |
| B&M European Value Retail S.A. | | 4,404,452 | 23,241 |
| Dollar General Corp. | | 1,139,629 | 92,128 |
| JC Penney Corp., Inc. (a)(c) | | 12,832,085 | 35,930 |
| Ollie's Bargain Outlet Holdings, Inc. (a) | | 145,480 | 6,496 |
| | | | 157,795 |
| Specialty Retail - 0.9% | | | |
| Five Below, Inc. (a) | | 215,400 | 11,901 |
| Home Depot, Inc. | | 340,689 | 56,479 |
| | | | 68,380 |
|
| TOTAL CONSUMER DISCRETIONARY | | | 1,107,585 |
|
| CONSUMER STAPLES - 0.9% | | | |
| Food & Staples Retailing - 0.9% | | | |
| Wal-Mart Stores, Inc. | | 771,673 | 67,375 |
| ENERGY - 3.4% | | | |
| Energy Equipment & Services - 0.2% | | | |
| Shelf Drilling Ltd. | | 1,468,200 | 11,684 |
| Oil, Gas & Consumable Fuels - 3.2% | | | |
| Anadarko Petroleum Corp. | | 489,500 | 24,167 |
| Cheniere Energy, Inc.(a) | | 489,560 | 22,882 |
| Devon Energy Corp. | | 502,743 | 18,551 |
| Marathon Oil Corp. | | 3,943,330 | 56,074 |
| Southwestern Energy Co. (a) | | 12,168,173 | 67,533 |
| Whiting Petroleum Corp. (a)(c) | | 7,584,536 | 45,583 |
| | | | 234,790 |
|
| TOTAL ENERGY | | | 246,474 |
|
| FINANCIALS - 18.3% | | | |
| Banks - 3.1% | | | |
| Bank of America Corp. | | 3,891,150 | 106,579 |
| Citigroup, Inc. | | 1,027,900 | 75,551 |
| PNC Financial Services Group, Inc. | | 358,816 | 49,082 |
| | | | 231,212 |
| Capital Markets - 14.6% | | | |
| BlackRock, Inc. Class A | | 48,194 | 22,691 |
| Brookfield Asset Management, Inc. Class A | | 97,900 | 4,107 |
| CBOE Holdings, Inc. | | 718,849 | 81,273 |
| Charles Schwab Corp. | | 391,600 | 17,559 |
| CME Group, Inc. | | 1,561,471 | 214,187 |
| E*TRADE Financial Corp. (a) | | 1,116,000 | 48,646 |
| Goldman Sachs Group, Inc. | | 775,277 | 187,989 |
| Legg Mason, Inc. | | 450,178 | 17,188 |
| MarketAxess Holdings, Inc. | | 43,703 | 7,604 |
| Moody's Corp. | | 244,700 | 34,848 |
| Morgan Stanley | | 4,218,962 | 210,948 |
| MSCI, Inc. | | 575,447 | 67,534 |
| S&P Global, Inc. | | 554,266 | 86,726 |
| T. Rowe Price Group, Inc. | | 724,400 | 67,297 |
| | | | 1,068,597 |
| Insurance - 0.6% | | | |
| Progressive Corp. | | 264,300 | 12,858 |
| Willis Group Holdings PLC | | 205,600 | 33,118 |
| | | | 45,976 |
|
| TOTAL FINANCIALS | | | 1,345,785 |
|
| HEALTH CARE - 10.7% | | | |
| Biotechnology - 4.9% | | | |
| Alexion Pharmaceuticals, Inc. (a) | | 457,361 | 54,728 |
| Amgen, Inc. | | 990,109 | 173,487 |
| Celgene Corp. (a) | | 225,970 | 22,816 |
| Epizyme, Inc. (a) | | 172,800 | 2,886 |
| Portola Pharmaceuticals, Inc. (a) | | 180,100 | 8,899 |
| Vertex Pharmaceuticals, Inc. (a) | | 669,546 | 97,908 |
| | | | 360,724 |
| Health Care Equipment & Supplies - 2.5% | | | |
| Abiomed, Inc. (a) | | 260,800 | 50,314 |
| Align Technology, Inc. (a) | | 107,700 | 25,738 |
| Boston Scientific Corp. (a) | | 1,302,100 | 36,641 |
| Intuitive Surgical, Inc. (a) | | 117,600 | 44,142 |
| Varian Medical Systems, Inc. (a) | | 225,200 | 23,464 |
| | | | 180,299 |
| Health Care Providers & Services - 1.4% | | | |
| AMN Healthcare Services, Inc. (a) | | 97,900 | 4,298 |
| Cigna Corp. | | 244,700 | 48,260 |
| UnitedHealth Group, Inc. | | 222,697 | 46,815 |
| | | | 99,373 |
| Health Care Technology - 0.2% | | | |
| Medidata Solutions, Inc. (a) | | 200,300 | 15,069 |
| Life Sciences Tools & Services - 1.6% | | | |
| Agilent Technologies, Inc. | | 884,714 | 60,187 |
| Bio-Rad Laboratories, Inc. Class A (a) | | 59,915 | 13,169 |
| ICON PLC (a) | | 199,579 | 23,722 |
| Mettler-Toledo International, Inc. (a) | | 31,300 | 21,366 |
| | | | 118,444 |
| Pharmaceuticals - 0.1% | | | |
| The Medicines Company (a) | | 301,320 | 8,660 |
|
| TOTAL HEALTH CARE | | | 782,569 |
|
| INDUSTRIALS - 9.9% | | | |
| Aerospace & Defense - 0.8% | | | |
| The Boeing Co. | | 215,400 | 55,569 |
| Air Freight & Logistics - 0.3% | | | |
| XPO Logistics, Inc. (a) | | 282,140 | 19,566 |
| Airlines - 1.5% | | | |
| Air Canada (a) | | 3,624,300 | 71,806 |
| Ryanair Holdings PLC sponsored ADR (a) | | 324,592 | 36,390 |
| | | | 108,196 |
| Building Products - 1.8% | | | |
| A.O. Smith Corp. | | 699,500 | 41,410 |
| Allegion PLC | | 458,890 | 38,267 |
| Builders FirstSource, Inc. (a) | | 97,900 | 1,764 |
| Kingspan Group PLC (Ireland) | | 1,120,130 | 46,842 |
| | | | 128,283 |
| Commercial Services & Supplies - 1.3% | | | |
| Cintas Corp. | | 269,200 | 40,122 |
| Copart, Inc. (a) | | 1,192,966 | 43,293 |
| Waste Connection, Inc. (United States) | | 206,400 | 14,586 |
| | | | 98,001 |
| Machinery - 2.8% | | | |
| Caterpillar, Inc. | | 244,700 | 33,230 |
| Cummins, Inc. | | 195,800 | 34,633 |
| Deere & Co. | | 224,138 | 29,783 |
| Graco, Inc. | | 264,300 | 34,832 |
| Manitowoc Co., Inc. (a) | | 2,735,780 | 26,045 |
| PACCAR, Inc. | | 189,878 | 13,620 |
| Parker Hannifin Corp. | | 171,300 | 31,281 |
| | | | 203,424 |
| Marine - 0.5% | | | |
| Irish Continental Group PLC unit | | 5,928,035 | 39,498 |
| Professional Services - 0.2% | | | |
| IHS Markit Ltd. (a) | | 405,700 | 17,287 |
| Road & Rail - 0.7% | | | |
| Norfolk Southern Corp. | | 197,711 | 25,983 |
| Union Pacific Corp. | | 239,900 | 27,778 |
| | | | 53,761 |
|
| TOTAL INDUSTRIALS | | | 723,585 |
|
| INFORMATION TECHNOLOGY - 30.7% | | | |
| Communications Equipment - 0.2% | | | |
| Palo Alto Networks, Inc. (a) | | 88,100 | 12,968 |
| Electronic Equipment & Components - 0.2% | | | |
| Cognex Corp. | | 93,768 | 11,548 |
| Internet Software & Services - 8.6% | | | |
| Alarm.com Holdings, Inc. (a) | | 31,100 | 1,452 |
| Alibaba Group Holding Ltd. sponsored ADR (a) | | 646,100 | 119,457 |
| Alphabet, Inc. Class C (a) | | 244,479 | 248,547 |
| CarGurus, Inc. Class A (c) | | 349,665 | 11,399 |
| Coupa Software, Inc. | | 158,202 | 5,498 |
| Facebook, Inc. Class A (a) | | 743,585 | 133,890 |
| GoDaddy, Inc. (a) | | 401,400 | 18,745 |
| LogMeIn, Inc. | | 301,280 | 36,470 |
| MINDBODY, Inc. (a) | | 116,000 | 3,741 |
| New Relic, Inc. (a) | | 145,333 | 7,460 |
| Okta, Inc. | | 301,700 | 8,725 |
| The Trade Desk, Inc. (a)(c) | | 135,400 | 8,926 |
| VeriSign, Inc. (a)(c) | | 274,100 | 29,471 |
| | | | 633,781 |
| IT Services - 4.9% | | | |
| EPAM Systems, Inc. (a) | | 317,149 | 28,908 |
| ExlService Holdings, Inc. (a) | | 17,480 | 1,091 |
| Fiserv, Inc. (a) | | 236,802 | 30,649 |
| Gartner, Inc. (a) | | 286,274 | 35,873 |
| Paychex, Inc. | | 78,300 | 4,995 |
| PayPal Holdings, Inc. (a) | | 2,367,057 | 171,754 |
| Visa, Inc. Class A | | 783,320 | 86,150 |
| | | | 359,420 |
| Semiconductors & Semiconductor Equipment - 2.8% | | | |
| NVIDIA Corp. | | 508,600 | 105,184 |
| Taiwan Semiconductor Manufacturing Co. Ltd. sponsored ADR | | 1,292,300 | 54,703 |
| Texas Instruments, Inc. | | 467,696 | 45,222 |
| | | | 205,109 |
| Software - 8.7% | | | |
| Adobe Systems, Inc. (a) | | 1,257,546 | 220,272 |
| ANSYS, Inc. (a) | | 293,700 | 40,152 |
| Atlassian Corp. PLC (a) | | 234,483 | 11,342 |
| Autodesk, Inc. (a) | | 401,400 | 50,159 |
| Electronic Arts, Inc. (a) | | 968,238 | 115,801 |
| Everbridge, Inc. (a) | | 157,700 | 4,201 |
| Intuit, Inc. | | 93,471 | 14,116 |
| Microsoft Corp. | | 1,421,740 | 118,260 |
| Paycom Software, Inc. (a) | | 95,249 | 7,829 |
| Paylocity Holding Corp. (a) | | 156,600 | 8,364 |
| Take-Two Interactive Software, Inc. (a) | | 340,800 | 37,710 |
| Varonis Systems, Inc. (a) | | 203,300 | 8,864 |
| | | | 637,070 |
| Technology Hardware, Storage & Peripherals - 5.3% | | | |
| Apple, Inc. | | 2,304,900 | 389,618 |
|
| TOTAL INFORMATION TECHNOLOGY | | | 2,249,514 |
|
| MATERIALS - 8.1% | | | |
| Chemicals - 5.2% | | | |
| DowDuPont, Inc. | | 1,170,361 | 84,629 |
| Eastman Chemical Co. | | 264,300 | 24,001 |
| FMC Corp. | | 1,716,010 | 159,349 |
| Ingevity Corp. (a) | | 79,974 | 5,697 |
| LyondellBasell Industries NV Class A | | 261,813 | 27,105 |
| Sherwin-Williams Co. | | 68,500 | 27,068 |
| Sociedad Quimica y Minera de Chile SA (PN-B) sponsored ADR | | 312,954 | 18,696 |
| The Chemours Co. LLC | | 566,541 | 32,072 |
| | | | 378,617 |
| Construction Materials - 0.3% | | | |
| Eagle Materials, Inc. | | 183,685 | 19,392 |
| Containers & Packaging - 0.5% | | | |
| Avery Dennison Corp. | | 352,400 | 37,414 |
| Metals & Mining - 2.1% | | | |
| Freeport-McMoRan, Inc. (a) | | 3,050,700 | 42,649 |
| Glencore Xstrata PLC | | 8,224,739 | 39,653 |
| Rio Tinto PLC | | 1,107,752 | 52,353 |
| Vale SA sponsored ADR | | 2,447,400 | 23,960 |
| | | | 158,615 |
|
| TOTAL MATERIALS | | | 594,038 |
|
| REAL ESTATE - 0.4% | | | |
| Equity Real Estate Investment Trusts (REITs) - 0.4% | | | |
| Equinix, Inc. | | 60,143 | 27,876 |
| TELECOMMUNICATION SERVICES - 1.7% | | | |
| Wireless Telecommunication Services - 1.7% | | | |
| T-Mobile U.S., Inc. (a) | | 2,120,172 | 126,723 |
| TOTAL COMMON STOCKS | | | |
| (Cost $5,739,654) | | | 7,271,524 |
|
| Money Market Funds - 3.2% | | | |
| Fidelity Cash Central Fund, 1.10% (d) | | 168,660,050 | 168,694 |
| Fidelity Securities Lending Cash Central Fund 1.11% (d)(e) | | 63,066,510 | 63,073 |
| TOTAL MONEY MARKET FUNDS | | | |
| (Cost $231,763) | | | 231,767 |
| TOTAL INVESTMENT IN SECURITIES - 102.4% | | | |
| (Cost $5,971,417) | | | 7,503,291 |
| NET OTHER ASSETS (LIABILITIES) - (2.4)% | | | (172,636) |
| NET ASSETS - 100% | | | $7,330,655 |
Legend
(a) Non-income producing
(b) Affiliated company
(c) Security or a portion of the security is on loan at period end.
(d) Affiliated fund that is generally available only to investment companies and other accounts managed by Fidelity Investments. The rate quoted is the annualized seven-day yield of the fund at period end. A complete unaudited listing of the fund's holdings as of its most recent quarter end is available upon request. In addition, each Fidelity Central Fund's financial statements, which are not covered by the Fund's Report of Independent Registered Public Accounting Firm, are available on the SEC's website or upon request.
(e) Investment made with cash collateral received from securities on loan.
Affiliated Central Funds
Information regarding fiscal year to date income earned by the Fund from investments in Fidelity Central Funds is as follows:
| Fund | Income earned |
| | (Amounts in thousands) |
| Fidelity Cash Central Fund | $1,584 |
| Fidelity Securities Lending Cash Central Fund | 2,082 |
| Total | $3,666 |
Other Affiliated Issuers
An affiliated company is a company in which the Fund has ownership of at least 5% of the voting securities. Fiscal year to date transactions with companies which are or were affiliates are as follows:
| Affiliate (Amounts in thousands) | Value, beginning of period | Purchases | Sales Proceeds | Dividend Income | Realized Gain (loss) | Change in Unrealized appreciation (depreciation) | Value, end of period |
| Dalata Hotel Group PLC | $43,516 | $-- | $-- | $-- | $-- | $17,034 | $60,550 |
| Total | $43,516 | $-- | $-- | $-- | $-- | $17,034 | $60,550 |
Investment Valuation
The following is a summary of the inputs used, as of October 31, 2017, involving the Fund's assets and liabilities carried at fair value. The inputs or methodology used for valuing securities may not be an indication of the risk associated with investing in those securities. For more information on valuation inputs, and their aggregation into the levels used below, please refer to the Investment Valuation section in the accompanying Notes to Financial Statements.
| | Valuation Inputs at Reporting Date: |
| Description | Total | Level 1 | Level 2 | Level 3 |
| (Amounts in thousands) | | | | |
| Investments in Securities: | | | | |
| Equities: | | | | |
| Consumer Discretionary | $1,107,585 | $1,107,585 | $-- | $-- |
| Consumer Staples | 67,375 | 67,375 | -- | -- |
| Energy | 246,474 | 246,474 | -- | -- |
| Financials | 1,345,785 | 1,345,785 | -- | -- |
| Health Care | 782,569 | 782,569 | -- | -- |
| Industrials | 723,585 | 723,585 | -- | -- |
| Information Technology | 2,249,514 | 2,249,514 | -- | -- |
| Materials | 594,038 | 541,685 | 52,353 | -- |
| Real Estate | 27,876 | 27,876 | -- | -- |
| Telecommunication Services | 126,723 | 126,723 | -- | -- |
| Money Market Funds | 231,767 | 231,767 | -- | -- |
| Total Investments in Securities: | $7,503,291 | $7,450,938 | $52,353 | $-- |
Other Information
Distribution of investments by country or territory of incorporation, as a percentage of Total Net Assets, is as follows (Unaudited):
| United States of America | 87.5% |
| Ireland | 3.3% |
| Cayman Islands | 1.8% |
| Netherlands | 1.8% |
| Canada | 1.3% |
| United Kingdom | 1.1% |
| Others (Individually Less Than 1%) | 3.2% |
| | 100.0% |
See accompanying notes which are an integral part of the financial statements.
Financial Statements
Statement of Assets and Liabilities
| Amounts in thousands (except per-share amounts) | | October 31, 2017 |
| Assets | | |
Investment in securities, at value (including securities loaned of $60,370) — See accompanying schedule:
Unaffiliated issuers (cost $5,698,814) | $7,210,974 | |
| Fidelity Central Funds (cost $231,763) | 231,767 | |
| Other affiliated issuers (cost $40,840) | 60,550 | |
| Total Investment in Securities (cost $5,971,417) | | $7,503,291 |
| Cash | | 238 |
| Receivable for investments sold | | 53,155 |
| Receivable for fund shares sold | | 1,559 |
| Dividends receivable | | 2,512 |
| Distributions receivable from Fidelity Central Funds | | 487 |
| Prepaid expenses | | 16 |
| Other receivables | | 244 |
| Total assets | | 7,561,502 |
| Liabilities | | |
| Payable for investments purchased | $160,810 | |
| Payable for fund shares redeemed | 3,956 | |
| Accrued management fee | 2,015 | |
| Other affiliated payables | 816 | |
| Other payables and accrued expenses | 186 | |
| Collateral on securities loaned | 63,064 | |
| Total liabilities | | 230,847 |
| Net Assets | | $7,330,655 |
| Net Assets consist of: | | |
| Paid in capital | | $5,056,990 |
| Undistributed net investment income | | 49,558 |
| Accumulated undistributed net realized gain (loss) on investments and foreign currency transactions | | 692,240 |
| Net unrealized appreciation (depreciation) on investments and assets and liabilities in foreign currencies | | 1,531,867 |
| Net Assets | | $7,330,655 |
| Capital Appreciation: | | |
| Net Asset Value, offering price and redemption price per share ($5,156,510 ÷ 136,063 shares) | | $37.90 |
| Class K: | | |
| Net Asset Value, offering price and redemption price per share ($2,174,145 ÷ 57,233 shares) | | $37.99 |
See accompanying notes which are an integral part of the financial statements.
Statement of Operations
| Amounts in thousands | | Year ended October 31, 2017 |
| Investment Income | | |
| Dividends | | $110,276 |
| Income from Fidelity Central Funds | | 3,666 |
| Total income | | 113,942 |
| Expenses | | |
| Management fee | | |
| Basic fee | $38,860 | |
| Performance adjustment | (14,652) | |
| Transfer agent fees | 8,589 | |
| Accounting and security lending fees | 1,190 | |
| Custodian fees and expenses | 161 | |
| Independent trustees' fees and expenses | 28 | |
| Appreciation in deferred trustee compensation account | 1 | |
| Registration fees | 74 | |
| Audit | 66 | |
| Legal | 24 | |
| Miscellaneous | 64 | |
| Total expenses before reductions | 34,405 | |
| Expense reductions | (658) | 33,747 |
| Net investment income (loss) | | 80,195 |
| Realized and Unrealized Gain (Loss) | | |
| Net realized gain (loss) on: | | |
| Investment securities: | | |
| Unaffiliated issuers | 765,394 | |
| Fidelity Central Funds | 20 | |
| Foreign currency transactions | 191 | |
| Total net realized gain (loss) | | 765,605 |
| Change in net unrealized appreciation (depreciation) on: | | |
| Investment securities: | | |
| Unaffiliated issuers | 779,506 | |
| Fidelity Central Funds | (51) | |
| Other affiliated issuers | 17,034 | |
| Assets and liabilities in foreign currencies | 13 | |
| Total change in net unrealized appreciation (depreciation) | | 796,502 |
| Net gain (loss) | | 1,562,107 |
| Net increase (decrease) in net assets resulting from operations | | $1,642,302 |
See accompanying notes which are an integral part of the financial statements.
Statement of Changes in Net Assets
| Amounts in thousands | Year ended October 31, 2017 | Year ended October 31, 2016 |
| Increase (Decrease) in Net Assets | | |
| Operations | | |
| Net investment income (loss) | $80,195 | $81,754 |
| Net realized gain (loss) | 765,605 | 322,979 |
| Change in net unrealized appreciation (depreciation) | 796,502 | (657,770) |
| Net increase (decrease) in net assets resulting from operations | 1,642,302 | (253,037) |
| Distributions to shareholders from net investment income | (85,881) | (62,147) |
| Distributions to shareholders from net realized gain | (295,130) | (898,286) |
| Total distributions | (381,011) | (960,433) |
| Share transactions - net increase (decrease) | (842,529) | (304,573) |
| Total increase (decrease) in net assets | 418,762 | (1,518,043) |
| Net Assets | | |
| Beginning of period | 6,911,893 | 8,429,936 |
| End of period | $7,330,655 | $6,911,893 |
| Other Information | | |
| Undistributed net investment income end of period | $49,558 | $59,893 |
See accompanying notes which are an integral part of the financial statements.
Financial Highlights
Fidelity Capital Appreciation Fund
| Years ended October 31, | 2017 | 2016 | 2015 | 2014 | 2013 |
| Selected Per–Share Data | | | | | |
| Net asset value, beginning of period | $31.75 | $37.03 | $39.82 | $37.30 | $29.21 |
| Income from Investment Operations | | | | | |
| Net investment income (loss)A | .38 | .34 | .24 | .11 | .19 |
| Net realized and unrealized gain (loss) | 7.55 | (1.34) | 1.13 | 6.05 | 8.66 |
| Total from investment operations | 7.93 | (1.00) | 1.37 | 6.16 | 8.85 |
| Distributions from net investment income | (.39) | (.27) | (.10) | (.14) | (.17) |
| Distributions from net realized gain | (1.39) | (4.01) | (4.06) | (3.50) | (.59) |
| Total distributions | (1.78) | (4.28) | (4.16) | (3.64) | (.76) |
| Net asset value, end of period | $37.90 | $31.75 | $37.03 | $39.82 | $37.30 |
| Total ReturnB | 25.93% | (3.06)% | 3.50% | 17.86% | 31.03% |
| Ratios to Average Net AssetsC,D | | | | | |
| Expenses before reductions | .51% | .61% | .83% | .82% | .79% |
| Expenses net of fee waivers, if any | .51% | .61% | .83% | .82% | .79% |
| Expenses net of all reductions | .50% | .60% | .82% | .81% | .77% |
| Net investment income (loss) | 1.09% | 1.05% | .63% | .28% | .57% |
| Supplemental Data | | | | | |
| Net assets, end of period (in millions) | $5,157 | $4,809 | $5,906 | $6,132 | $5,920 |
| Portfolio turnover rateE | 129% | 120% | 126% | 112% | 156% |
A Calculated based on average shares outstanding during the period.
B Total returns would have been lower if certain expenses had not been reduced during the applicable periods shown.
C Fees and expenses of any underlying Fidelity Central Funds are not included in the Fund's expense ratio. The Fund indirectly bears its proportionate share of the expenses of any underlying Fidelity Central Funds.
D Expense ratios reflect operating expenses of the class. Expenses before reductions do not reflect amounts reimbursed by the investment adviser or reductions from brokerage service arrangements or reductions from other expense offset arrangements and do not represent the amount paid by the class during periods when reimbursements or reductions occur. Expenses net of fee waivers reflect expenses after reimbursement by the investment adviser but prior to reductions from brokerage service arrangements or other expense offset arrangements. Expenses net of all reductions represent the net expenses paid by the class.
E Amount does not include the portfolio activity of any underlying Fidelity Central Funds.
See accompanying notes which are an integral part of the financial statements.
Fidelity Capital Appreciation Fund Class K
| Years ended October 31, | 2017 | 2016 | 2015 | 2014 | 2013 |
| Selected Per–Share Data | | | | | |
| Net asset value, beginning of period | $31.83 | $37.11 | $39.90 | $37.38 | $29.28 |
| Income from Investment Operations | | | | | |
| Net investment income (loss)A | .41 | .37 | .28 | .15 | .23 |
| Net realized and unrealized gain (loss) | 7.57 | (1.33) | 1.14 | 6.06 | 8.67 |
| Total from investment operations | 7.98 | (.96) | 1.42 | 6.21 | 8.90 |
| Distributions from net investment income | (.43) | (.31) | (.15) | (.19) | (.21) |
| Distributions from net realized gain | (1.39) | (4.01) | (4.06) | (3.50) | (.59) |
| Total distributions | (1.82) | (4.32) | (4.21) | (3.69) | (.80) |
| Net asset value, end of period | $37.99 | $31.83 | $37.11 | $39.90 | $37.38 |
| Total ReturnB | 26.04% | (2.93)% | 3.62% | 17.97% | 31.19% |
| Ratios to Average Net AssetsC,D | | | | | |
| Expenses before reductions | .41% | .50% | .72% | .70% | .66% |
| Expenses net of fee waivers, if any | .41% | .50% | .72% | .70% | .66% |
| Expenses net of all reductions | .40% | .48% | .72% | .70% | .63% |
| Net investment income (loss) | 1.20% | 1.17% | .74% | .40% | .70% |
| Supplemental Data | | | | | |
| Net assets, end of period (in millions) | $2,174 | $2,103 | $2,524 | $2,460 | $2,125 |
| Portfolio turnover rateE | 129% | 120% | 126% | 112% | 156% |
A Calculated based on average shares outstanding during the period.
B Total returns would have been lower if certain expenses had not been reduced during the applicable periods shown.
C Fees and expenses of any underlying Fidelity Central Funds are not included in the Fund's expense ratio. The Fund indirectly bears its proportionate share of the expenses of any underlying Fidelity Central Funds.
D Expense ratios reflect operating expenses of the class. Expenses before reductions do not reflect amounts reimbursed by the investment adviser or reductions from brokerage service arrangements or reductions from other expense offset arrangements and do not represent the amount paid by the class during periods when reimbursements or reductions occur. Expenses net of fee waivers reflect expenses after reimbursement by the investment adviser but prior to reductions from brokerage service arrangements or other expense offset arrangements. Expenses net of all reductions represent the net expenses paid by the class.
E Amount does not include the portfolio activity of any underlying Fidelity Central Funds.
See accompanying notes which are an integral part of the financial statements.
Notes to Financial Statements
For the period ended October 31, 2017
(Amounts in thousands except percentages)
1. Organization.
Fidelity Capital Appreciation Fund (the Fund) is a fund of Fidelity Capital Trust (the Trust) and is authorized to issue an unlimited number of shares. The Trust is registered under the Investment Company Act of 1940, as amended (the 1940 Act), as an open-end management investment company organized as a Massachusetts business trust. The Fund offers Capital Appreciation and Class K shares, each of which has equal rights as to assets and voting privileges. Each class has exclusive voting rights with respect to matters that affect that class.
2. Investments in Fidelity Central Funds.
The Fund invests in Fidelity Central Funds, which are open-end investment companies generally available only to other investment companies and accounts managed by the investment adviser and its affiliates. The Fund's Schedule of Investments lists each of the Fidelity Central Funds held as of period end, if any, as an investment of the Fund, but does not include the underlying holdings of each Fidelity Central Fund. As an Investing Fund, the Fund indirectly bears its proportionate share of the expenses of the underlying Fidelity Central Funds.
The Money Market Central Funds seek preservation of capital and current income and are managed by Fidelity Investments Money Management, Inc. (FIMM), an affiliate of the investment adviser. Annualized expenses of the Money Market Central Funds as of their most recent shareholder report date are less than .005%.
A complete unaudited list of holdings for each Fidelity Central Fund is available upon request or at the Securities and Exchange Commission (the SEC) website at www.sec.gov. In addition, the financial statements of the Fidelity Central Funds, which are not covered by the Fund's Report of Independent Registered Public Accounting Firm, are available on the SEC website or upon request.
3. Significant Accounting Policies.
The Fund is an investment company and applies the accounting and reporting guidance of the Financial Accounting Standards Board (FASB) Accounting Standards Codification Topic 946 Financial Services – Investments Companies. The financial statements have been prepared in conformity with accounting principles generally accepted in the United States of America (GAAP), which require management to make certain estimates and assumptions at the date of the financial statements. Actual results could differ from those estimates. Subsequent events, if any, through the date that the financial statements were issued have been evaluated in the preparation of the financial statements. The following summarizes the significant accounting policies of the Fund:
Investment Valuation. Investments are valued as of 4:00 p.m. Eastern time on the last calendar day of the period. The Board of Trustees (the Board) has delegated the day to day responsibility for the valuation of the Fund's investments to the Fair Value Committee (the Committee) established by the Fund's investment adviser. In accordance with valuation policies and procedures approved by the Board, the Fund attempts to obtain prices from one or more third party pricing vendors or brokers to value its investments. When current market prices, quotations or currency exchange rates are not readily available or reliable, investments will be fair valued in good faith by the Committee, in accordance with procedures adopted by the Board. Factors used in determining fair value vary by investment type and may include market or investment specific events. The frequency with which these procedures are used cannot be predicted and they may be utilized to a significant extent. The Committee oversees the Fund's valuation policies and procedures and reports to the Board on the Committee's activities and fair value determinations. The Board monitors the appropriateness of the procedures used in valuing the Fund's investments and ratifies the fair value determinations of the Committee.
The Fund categorizes the inputs to valuation techniques used to value its investments into a disclosure hierarchy consisting of three levels as shown below:
- Level 1 – quoted prices in active markets for identical investments
- Level 2 – other significant observable inputs (including quoted prices for similar investments, interest rates, prepayment speeds, etc.)
- Level 3 – unobservable inputs (including the Fund's own assumptions based on the best information available)
Valuation techniques used to value the Fund's investments by major category are as follows:
Equity securities, including restricted securities, for which market quotations are readily available, are valued at the last reported sale price or official closing price as reported by a third party pricing vendor on the primary market or exchange on which they are traded and are categorized as Level 1 in the hierarchy. In the event there were no sales during the day or closing prices are not available, securities are valued at the last quoted bid price or may be valued using the last available price and are generally categorized as Level 2 in the hierarchy. For foreign equity securities, when market or security specific events arise, comparisons to the valuation of American Depositary Receipts (ADRs), futures contracts, Exchange-Traded Funds (ETFs) and certain indexes as well as quoted prices for similar securities may be used and would be categorized as Level 2 in the hierarchy. Utilizing these techniques may result in transfers between Level 1 and Level 2. For equity securities, including restricted securities, where observable inputs are limited, assumptions about market activity and risk are used and these securities may be categorized as Level 3 in the hierarchy.
Investments in open-end mutual funds, including the Fidelity Central Funds, are valued at their closing net asset value (NAV) each business day and are categorized as Level 1 in the hierarchy.
Changes in valuation techniques may result in transfers in or out of an assigned level within the disclosure hierarchy. The aggregate value of investments by input level as of October 31, 2017 is included at the end of the Fund's Schedule of Investments.
Foreign Currency. The Fund may use foreign currency contracts to facilitate transactions in foreign-denominated securities. Gains and losses from these transactions may arise from changes in the value of the foreign currency or if the counterparties do not perform under the contracts' terms.
Foreign-denominated assets, including investment securities, and liabilities are translated into U.S. dollars at the exchange rates at period end. Purchases and sales of investment securities, income and dividends received and expenses denominated in foreign currencies are translated into U.S. dollars at the exchange rate in effect on the transaction date.
The effects of exchange rate fluctuations on investments are included with the net realized and unrealized gain (loss) on investment securities. Other foreign currency transactions resulting in realized and unrealized gain (loss) are disclosed separately.
Investment Transactions and Income. For financial reporting purposes, the Fund's investment holdings and NAV include trades executed through the end of the last business day of the period. The NAV per share for processing shareholder transactions is calculated as of the close of business of the New York Stock Exchange (NYSE), normally 4:00 p.m. Eastern time and includes trades executed through the end of the prior business day. Gains and losses on securities sold are determined on the basis of identified cost and includes proceeds received from litigation. Dividend income is recorded on the ex-dividend date, except for certain dividends from foreign securities where the ex-dividend date may have passed, which are recorded as soon as the Fund is informed of the ex-dividend date. Non-cash dividends included in dividend income, if any, are recorded at the fair market value of the securities received. Income and capital gain distributions from Fidelity Central Funds, if any, are recorded on the ex-dividend date. Certain distributions received by the Fund represent a return of capital or capital gain. The Fund determines the components of these distributions subsequent to the ex-dividend date, based upon receipt of tax filings or other correspondence relating to the underlying investment. These distributions are recorded as a reduction of cost of investments and/or as a realized gain. Investment income is recorded net of foreign taxes withheld where recovery of such taxes is uncertain.
Class Allocations and Expenses. Investment income, realized and unrealized capital gains and losses, common expenses of the Fund, and certain fund-level expense reductions, if any, are allocated daily on a pro-rata basis to each class based on the relative net assets of each class to the total net assets of the Fund. Each class differs with respect to transfer agent fees incurred. Certain expense reductions may also differ by class. For the reporting period, the allocated portion of income and expenses to each class as a percent of its average net assets may vary due to the timing of recording these transactions in relation to fluctuating net assets of the classes. Expenses directly attributable to a fund are charged to that fund. Expenses attributable to more than one fund are allocated among the respective funds on the basis of relative net assets or other appropriate methods. Expense estimates are accrued in the period to which they relate and adjustments are made when actual amounts are known.
Deferred Trustee Compensation. Under a Deferred Compensation Plan (the Plan), independent Trustees may elect to defer receipt of a portion of their annual compensation. Deferred amounts are invested in a cross-section of Fidelity funds, are marked-to-market and remain in the Fund until distributed in accordance with the Plan. The investment of deferred amounts and the offsetting payable to the Trustees are included in the accompanying Statement of Assets and Liabilities.
Income Tax Information and Distributions to Shareholders. Each year, the Fund intends to qualify as a regulated investment company under Subchapter M of the Internal Revenue Code, including distributing substantially all of its taxable income and realized gains. As a result, no provision for U.S. Federal income taxes is required. As of October 31, 2017, the Fund did not have any unrecognized tax benefits in the financial statements; nor is the Fund aware of any tax positions for which it is reasonably possible that the total amounts of unrecognized tax benefits will significantly change in the next twelve months. The Fund files a U.S. federal tax return, in addition to state and local tax returns as required. The Fund's federal income tax returns are subject to examination by the Internal Revenue Service (IRS) for a period of three fiscal years after they are filed. State and local tax returns may be subject to examination for an additional fiscal year depending on the jurisdiction. Foreign taxes are provided for based on the Fund's understanding of the tax rules and rates that exist in the foreign markets in which it invests.
Distributions are declared and recorded on the ex-dividend date. Income dividends and capital gain distributions are declared separately for each class. Income and capital gain distributions are determined in accordance with income tax regulations, which may differ from GAAP. In addition, the Fund claimed a portion of the payment made to redeeming shareholders as a distribution for income tax purposes.
Capital accounts within the financial statements are adjusted for permanent book-tax differences. These adjustments have no impact on net assets or the results of operations. Capital accounts are not adjusted for temporary book-tax differences which will reverse in a subsequent period.
Book-tax differences are primarily due to foreign currency transactions, deferred trustees compensation and losses deferred due to wash sales.
As of period end, the cost and unrealized appreciation (depreciation) in securities, and derivatives if applicable, for federal income tax purposes were as follows:
| Gross unrealized appreciation | $1,641,922 |
| Gross unrealized depreciation | (113,332) |
| Net unrealized appreciation (depreciation) | $1,528,590 |
| Tax Cost | $5,974,701 |
The tax-based components of distributable earnings as of period end were as follows:
| Undistributed ordinary income | $100,958 |
| Undistributed long-term capital gain | $644,232 |
| Net unrealized appreciation (depreciation) on securities and other investments | $1,528,584 |
The tax character of distributions paid was as follows:
| | October 31, 2017 | October 31, 2016 |
| Ordinary Income | $85,881 | $ 62,147 |
| Long-term Capital Gains | 295,130 | 898,286 |
| Total | $381,011 | $ 960,433 |
4. Purchases and Sales of Investments.
Purchases and sales of securities, other than short-term securities aggregated $8,951,380 and $9,973,504, respectively.
5. Fees and Other Transactions with Affiliates.
Management Fee. Fidelity Management & Research Company (the investment adviser) and its affiliates provide the Fund with investment management related services for which the Fund pays a monthly management fee. The management fee is the sum of an individual fund fee rate that is based on an annual rate of .30% of the Fund's average net assets and an annualized group fee rate that averaged .25% during the period. The group fee rate is based upon the average net assets of all the mutual funds advised by the investment adviser, including any mutual funds previously advised by the investment adviser that are currently advised by Fidelity SelectCo, LLC, an affiliate of the investment adviser. The group fee rate decreases as assets under management increase and increases as assets under management decrease. In addition, the management fee is subject to a performance adjustment (up to a maximum of +/- .20% of the Fund's average net assets over a 36 month performance period. The upward or downward adjustment to the management fee is based on the relative investment performance of Capital Appreciation as compared to its benchmark index, the S&P 500 Index, over the same 36 month performance period. For the reporting period, the total annual management fee rate, including the performance adjustment, was .34% of the Fund's average net assets. The performance adjustment included in the management fee rate may be higher or lower than the maximum performance adjustment rate due to the difference between the average net assets for the reporting and performance periods.
Transfer Agent Fees. Fidelity Investments Institutional Operations Company, Inc., (FIIOC), an affiliate of the investment adviser, is the transfer, dividend disbursing and shareholder servicing agent for each class of the Fund. FIIOC receives account fees and asset-based fees that vary according to the account size and type of account of the shareholders of Capital Appreciation, except for Class K. FIIOC receives an asset-based fee of Class K's average net assets. FIIOC pays for typesetting, printing and mailing of shareholder reports, except proxy statements.
For the period, transfer agent fees for each applicable class were as follows:
| | Amount | % of
Class-Level Average
Net Assets |
| Capital Appreciation | $7,591 | .15 |
| Class K | 998 | .05 |
| | $8,589 | |
Accounting and Security Lending Fees. Fidelity Service Company, Inc. (FSC), an affiliate of the investment adviser, maintains the Fund's accounting records. The accounting fee is based on the level of average net assets for each month. Under a separate contract, FSC administers the security lending program. The security lending fee is based on the number and duration of lending transactions.
Brokerage Commissions. The Fund placed a portion of its portfolio transactions with brokerage firms which are affiliates of the investment adviser. Brokerage commissions are included in net realized gain (loss) and change in net unrealized appreciation (depreciation) in the Statement of Operations. The commissions paid to these affiliated firms were $216 for the period.
Interfund Lending Program. Pursuant to an Exemptive Order issued by the SEC, the Fund, along with other registered investment companies having management contracts with Fidelity Management & Research Company (FMR) or other affiliated entities of FMR, may participate in an interfund lending program. This program provides an alternative credit facility allowing the funds to borrow from, or lend money to, other participating affiliated funds. At period end, there were no interfund loans outstanding. The Fund's activity in this program during the period for which loans were outstanding was as follows:
| Borrower or Lender | Average Loan Balance | Weighted Average Interest Rate | Interest Expense |
| Borrower | $5,027 | 1.09% | $–(a) |
(a) In the amount less than five hundred dollars.
Interfund Trades. The Fund may purchase from or sell securities to other Fidelity Funds under procedures adopted by the Board. The procedures have been designed to ensure these interfund trades are executed in accordance with Rule 17a-7 of the 1940 Act. Interfund trades are included within the respective purchases and sales amounts shown in the Purchases and Sales of Investments note.
Other. During the period, the investment adviser reimbursed the Fund for certain losses in the amount of $8.
6. Committed Line of Credit.
The Fund participates with other funds managed by the investment adviser or an affiliate in a $4.25 billion credit facility (the "line of credit") to be utilized for temporary or emergency purposes to fund shareholder redemptions or for other short-term liquidity purposes. The Fund has agreed to pay commitment fees on its pro-rata portion of the line of credit, which amounted to $23 and is reflected in Miscellaneous expenses on the Statement of Operations. During the period, the Fund did not borrow on this line of credit
7. Security Lending.
The Fund lends portfolio securities through a lending agent from time to time in order to earn additional income. For equity securities, a lending agent is used and may loan securities to certain qualified borrowers, including Fidelity Capital Markets (FCM), a broker-dealer affiliated with the Fund. On the settlement date of the loan, the Fund receives collateral (in the form of U.S. Treasury obligations, letters of credit and/or cash) against the loaned securities and maintains collateral in an amount not less than 100% of the market value of the loaned securities during the period of the loan. The market value of the loaned securities is determined at the close of business of the Fund and any additional required collateral is delivered to the Fund on the next business day. The Fund or borrower may terminate the loan at any time, and if the borrower defaults on its obligation to return the securities loaned because of insolvency or other reasons, the Fund may apply collateral received from the borrower against the obligation. The Fund may experience delays and costs in recovering the securities loaned. Any cash collateral received is invested in the Fidelity Securities Lending Cash Central Fund. The value of loaned securities and cash collateral at period end are disclosed on the Fund's Statement of Assets and Liabilities. At period end, there were no security loans outstanding with FCM. Security lending income represents the income earned on investing cash collateral, less rebates paid to borrowers and any lending agent fees associated with the loan, plus any premium payments received for lending certain types of securities. Security lending income is presented in the Statement of Operations as a component of income from Fidelity Central Funds. Total security lending income during the period amounted to $2,082, including $11 from securities loaned to FCM.
8. Expense Reductions.
Commissions paid to certain brokers with whom the investment adviser, or its affiliates, places trades on behalf of the Fund include an amount in addition to trade execution, which may be rebated back to the Fund to offset certain expenses. This amount totaled $592 for the period. Through arrangements with the Fund's custodian, credits realized as a result of certain uninvested cash balances were used to reduce the Fund's expenses. During the period, these credits reduced the Fund's custody expenses by $2.
In addition, during the period the investment adviser reimbursed and/or waived a portion of fund-level operating expenses in the amount of $64.
9. Distributions to Shareholders.
Distributions to shareholders of each class were as follows:
| | Year ended
October 31, 2017 | Year ended
October 31, 2016 |
| From net investment income | | |
| Capital Appreciation | $57,933 | $41,709 |
| Class K | 27,948 | 20,438 |
| Total | $85,881 | $62,147 |
| From net realized gain | | |
| Capital Appreciation | $204,981 | $631,322 |
| Class K | 90,149 | 266,964 |
| Total | $295,130 | $898,286 |
10. Share Transactions.
Share transactions for each class were as follows and may contain automatic conversions between classes or exchanges between affiliated funds:
| | Shares | Shares | Dollars | Dollars |
| | Year ended October 31, 2017 | Year ended October 31, 2016 | Year ended October 31, 2017 | Year ended October 31, 2016 |
| Capital Appreciation | | | | |
| Shares sold | 6,471 | 8,622 | $219,571 | $274,837 |
| Reinvestment of distributions | 7,688 | 19,416 | 248,876 | 635,303 |
| Shares redeemed | (29,530) | (36,117) | (1,007,227) | (1,157,228) |
| Net increase (decrease) | (15,371) | (8,079) | $(538,780) | $(247,088) |
| Class K | | | | |
| Shares sold | 6,448 | 9,379 | $221,397 | $299,911 |
| Reinvestment of distributions | 3,643 | 8,770 | 118,097 | 287,402 |
| Shares redeemed | (18,939) | (20,071) | (643,243) | (644,798) |
| Net increase (decrease) | (8,848) | (1,922) | $(303,749) | $(57,485) |
11. Other.
The Fund's organizational documents provide former and current trustees and officers with a limited indemnification against liabilities arising in connection with the performance of their duties to the Fund. In the normal course of business, the Fund may also enter into contracts that provide general indemnifications. The Fund's maximum exposure under these arrangements is unknown as this would be dependent on future claims that may be made against the Fund. The risk of material loss from such claims is considered remote.
Report of Independent Registered Public Accounting Firm
To the Trustees of Fidelity Capital Trust and Shareholders of Fidelity Capital Appreciation Fund:
In our opinion, the accompanying statement of assets and liabilities, including the schedule of investments, and the related statements of operations and of changes in net assets and the financial highlights present fairly, in all material respects, the financial position of Fidelity Capital Appreciation Fund (a fund of Fidelity Capital Trust) as of October 31, 2017, the results of its operations for the year then ended, the changes in its net assets for each of the two years in the period then ended and the financial highlights for each of the five years in the period then ended, in conformity with accounting principles generally accepted in the United States of America. These financial statements and financial highlights (hereafter referred to as “financial statements”) are the responsibility of the Fidelity Capital Appreciation Fund’s management. Our responsibility is to express an opinion on these financial statements based on our audits. We conducted our audits of these financial statements in accordance with the standards of the Public Company Accounting Oversight Board (United States). Those standards require that we plan and perform the audit to obtain reasonable assurance about whether the financial statements are free of material misstatement. An audit includes examining, on a test basis, evidence supporting the amounts and disclosures in the financial statements, assessing the accounting principles used and significant estimates made by management, and evaluating the overall financial statement presentation. Our procedures included confirmation of securities owned as of October 31, 2017 by correspondence with the custodian and brokers; when replies were not received from brokers, we performed other auditing procedures. We believe that our audits provide a reasonable basis for our opinion.
PricewaterhouseCoopers LLP
Boston, Massachusetts
December 12, 2017
Trustees and Officers
The Trustees, Members of the Advisory Board (if any), and officers of the trust and fund, as applicable, are listed below. The Board of Trustees governs the fund and is responsible for protecting the interests of shareholders. The Trustees are experienced executives who meet periodically throughout the year to oversee the fund's activities, review contractual arrangements with companies that provide services to the fund, oversee management of the risks associated with such activities and contractual arrangements, and review the fund's performance. Each of the Trustees oversees 190 funds.
The Trustees hold office without limit in time except that (a) any Trustee may resign; (b) any Trustee may be removed by written instrument, signed by at least two-thirds of the number of Trustees prior to such removal; (c) any Trustee who requests to be retired or who has become incapacitated by illness or injury may be retired by written instrument signed by a majority of the other Trustees; and (d) any Trustee may be removed at any special meeting of shareholders by a two-thirds vote of the outstanding voting securities of the trust. Each Trustee who is not an interested person (as defined in the 1940 Act) of the trust and the fund is referred to herein as an Independent Trustee. Each Independent Trustee shall retire not later than the last day of the calendar year in which his or her 75th birthday occurs. The Independent Trustees may waive this mandatory retirement age policy with respect to individual Trustees. Officers and Advisory Board Members hold office without limit in time, except that any officer or Advisory Board Member may resign or may be removed by a vote of a majority of the Trustees at any regular meeting or any special meeting of the Trustees. Except as indicated, each individual has held the office shown or other offices in the same company for the past five years.
The fund’s Statement of Additional Information (SAI) includes more information about the Trustees. To request a free copy, call Fidelity at 1-800-544-8544.
Experience, Skills, Attributes, and Qualifications of the Trustees. The Governance and Nominating Committee has adopted a statement of policy that describes the experience, qualifications, attributes, and skills that are necessary and desirable for potential Independent Trustee candidates (Statement of Policy). The Board believes that each Trustee satisfied at the time he or she was initially elected or appointed a Trustee, and continues to satisfy, the standards contemplated by the Statement of Policy. The Governance and Nominating Committee also engages professional search firms to help identify potential Independent Trustee candidates who have the experience, qualifications, attributes, and skills consistent with the Statement of Policy. From time to time, additional criteria based on the composition and skills of the current Independent Trustees, as well as experience or skills that may be appropriate in light of future changes to board composition, business conditions, and regulatory or other developments, have also been considered by the professional search firms and the Governance and Nominating Committee. In addition, the Board takes into account the Trustees' commitment and participation in Board and committee meetings, as well as their leadership of standing and ad hoc committees throughout their tenure.
In determining that a particular Trustee was and continues to be qualified to serve as a Trustee, the Board has considered a variety of criteria, none of which, in isolation, was controlling. The Board believes that, collectively, the Trustees have balanced and diverse experience, qualifications, attributes, and skills, which allow the Board to operate effectively in governing the fund and protecting the interests of shareholders. Information about the specific experience, skills, attributes, and qualifications of each Trustee, which in each case led to the Board's conclusion that the Trustee should serve (or continue to serve) as a trustee of the fund, is provided below.
Board Structure and Oversight Function. James C. Curvey is an interested person and currently serves as Chairman. The Trustees have determined that an interested Chairman is appropriate and benefits shareholders because an interested Chairman has a personal and professional stake in the quality and continuity of services provided to the fund. Independent Trustees exercise their informed business judgment to appoint an individual of their choosing to serve as Chairman, regardless of whether the Trustee happens to be independent or a member of management. The Independent Trustees have determined that they can act independently and effectively without having an Independent Trustee serve as Chairman and that a key structural component for assuring that they are in a position to do so is for the Independent Trustees to constitute a substantial majority for the Board. The Independent Trustees also regularly meet in executive session. Ned C. Lautenbach serves as Chairman of the Independent Trustees and as such (i) acts as a liaison between the Independent Trustees and management with respect to matters important to the Independent Trustees and (ii) with management prepares agendas for Board meetings.
Fidelity® funds are overseen by different Boards of Trustees. The fund's Board oversees Fidelity's high income and certain equity funds, and other Boards oversee Fidelity's investment-grade bond, money market, asset allocation, and sector funds. The asset allocation funds may invest in Fidelity® funds overseen by the fund's Board. The use of separate Boards, each with its own committee structure, allows the Trustees of each group of Fidelity® funds to focus on the unique issues of the funds they oversee, including common research, investment, and operational issues. On occasion, the separate Boards establish joint committees to address issues of overlapping consequences for the Fidelity® funds overseen by each Board.
The Trustees operate using a system of committees to facilitate the timely and efficient consideration of all matters of importance to the Trustees, the fund, and fund shareholders and to facilitate compliance with legal and regulatory requirements and oversight of the fund's activities and associated risks. The Board, acting through its committees, has charged FMR and its affiliates with (i) identifying events or circumstances the occurrence of which could have demonstrably adverse effects on the fund's business and/or reputation; (ii) implementing processes and controls to lessen the possibility that such events or circumstances occur or to mitigate the effects of such events or circumstances if they do occur; and (iii) creating and maintaining a system designed to evaluate continuously business and market conditions in order to facilitate the identification and implementation processes described in (i) and (ii) above. Because the day-to-day operations and activities of the fund are carried out by or through FMR, its affiliates, and other service providers, the fund's exposure to risks is mitigated but not eliminated by the processes overseen by the Trustees. While each of the Board's committees has responsibility for overseeing different aspects of the fund's activities, oversight is exercised primarily through the Operations, Audit, and Compliance Committees. In addition, the Independent Trustees have worked with FMR to enhance the Board's oversight of investment and financial risks, legal and regulatory risks, technology risks, and operational risks, including the development of additional risk reporting to the Board. For example, a working group comprised of Independent Trustees and FMR has worked and continues to work to review the Fidelity® funds' valuation-related activities, reporting and risk management. Appropriate personnel, including but not limited to the fund's Chief Compliance Officer (CCO), FMR's internal auditor, the independent accountants, the fund's Treasurer and portfolio management personnel, make periodic reports to the Board's committees, as appropriate, including an annual review of Fidelity's risk management program for the Fidelity® funds. The responsibilities of each standing committee, including their oversight responsibilities, are described further under "Standing Committees of the Trustees."
Interested Trustees*:
Correspondence intended for a Trustee who is an interested person may be sent to Fidelity Investments, 245 Summer Street, Boston, Massachusetts 02210.
Name, Year of Birth; Principal Occupations and Other Relevant Experience+
James C. Curvey (1935)
Year of Election or Appointment: 2007
Trustee
Chairman of the Board of Trustees
Mr. Curvey also serves as Trustee of other Fidelity® funds. Mr. Curvey is a Director of Fidelity Research & Analysis Co. (investment adviser firm, 2009-present), and Vice Chairman (2007-present) and Director of FMR LLC (diversified financial services company). In addition, Mr. Curvey serves as an Overseer for the Boston Symphony Orchestra and a member of the board of Artis-Naples, Naples, Florida, and as a Trustee for Brewster Academy, Wolfeboro, New Hampshire. Previously, Mr. Curvey served as a Director of Fidelity Investments Money Management, Inc. (investment adviser firm, 2009-2014) and a Director of FMR and FMR Co., Inc. (investment adviser firms, 2007-2014).
Charles S. Morrison (1960)
Year of Election or Appointment: 2014
Trustee
Mr. Morrison also serves as Trustee of other funds. He serves as President of Fidelity Management & Research Company (FMR) (investment adviser firm, 2016-present), a Director of Fidelity Investments Money Management, Inc. (FIMM) (investment adviser firm, 2014-present), Director of Fidelity SelectCo, LLC (investment adviser firm, 2014-present), President, Asset Management (2014-present), and is an employee of Fidelity Investments. Previously, Mr. Morrison served as Vice President of Fidelity's Fixed Income and Asset Allocation Funds (2012-2014), President, Fixed Income (2011-2014), Vice President of Fidelity's Money Market Funds (2005-2009), President, Money Market Group Leader of FMR (investment adviser firm, 2009), and Senior Vice President, Money Market Group of FMR (2004-2009). Mr. Morrison also served as Vice President of Fidelity's Bond Funds (2002-2005), certain Balanced Funds (2002-2005), and certain Asset Allocation Funds (2002-2007), and as Senior Vice President (2002-2005) of Fidelity's Bond Division.
* Determined to be an “Interested Trustee” by virtue of, among other things, his or her affiliation with the trust or various entities under common control with FMR.
+ The information includes the Trustee's principal occupation during the last five years and other information relating to the experience, attributes, and skills relevant to the Trustee's qualifications to serve as a Trustee, which led to the conclusion that the Trustee should serve as a Trustee for the fund.
Independent Trustees:
Correspondence intended for an Independent Trustee may be sent to Fidelity Investments, P.O. Box 55235, Boston, Massachusetts 02205-5235.
Name, Year of Birth; Principal Occupations and Other Relevant Experience+
Dennis J. Dirks (1948)
Year of Election or Appointment: 2005
Trustee
Mr. Dirks also serves as Trustee of other Fidelity® funds. Prior to his retirement in May 2003, Mr. Dirks was Chief Operating Officer and a member of the Board of The Depository Trust & Clearing Corporation (DTCC). He also served as President, Chief Operating Officer, and Board member of The Depository Trust Company (DTC) and President and Board member of the National Securities Clearing Corporation (NSCC). In addition, Mr. Dirks served as Chief Executive Officer and Board member of the Government Securities Clearing Corporation, Chief Executive Officer and Board member of the Mortgage-Backed Securities Clearing Corporation, as a Trustee and a member of the Finance Committee of Manhattan College (2005-2008), as a Trustee and a member of the Finance Committee of AHRC of Nassau County (2006-2008), as a member of the Independent Directors Council (IDC) Governing Council (2010-2015), and as a member of the Board of Directors for The Brookville Center for Children’s Services, Inc. (2009-2017). Mr. Dirks is a member of the Finance Committee (2016-present) and Board of Directors (2017-present) of the Asolo Repertory Theatre.
Alan J. Lacy (1953)
Year of Election or Appointment: 2008
Trustee
Mr. Lacy also serves as Trustee of other Fidelity® funds. Mr. Lacy serves as a Director of Bristol-Myers Squibb Company (global pharmaceuticals, 2008-present). He is a Trustee of the California Chapter of The Nature Conservancy (2015-present) and a Director of the Center for Advanced Study in the Behavioral Sciences at Stanford University (2015-present). In addition, Mr. Lacy served as Senior Adviser (2007-2014) of Oak Hill Capital Partners, L.P. (private equity) and also served as Chief Executive Officer (2005) and Vice Chairman (2005-2006) of Sears Holdings Corporation (retail) and Chief Executive Officer and Chairman of the Board of Sears, Roebuck and Co. (retail, 2000-2005). Previously, Mr. Lacy served as Chairman (2014-2017) and a member (2010-2017) of the Board of Directors of Dave & Buster’s Entertainment, Inc. (restaurant and entertainment complexes), as Chairman (2008-2011) and a member (2006-2015) of the Board of Trustees of the National Parks Conservation Association, and as a member of the Board of Directors for The Hillman Companies, Inc. (hardware wholesalers, 2010-2014), Earth Fare, Inc. (retail grocery, 2010-2014), and The Western Union Company (global money transfer, 2006-2011).
Ned C. Lautenbach (1944)
Year of Election or Appointment: 2000
Trustee
Chairman of the Independent Trustees
Mr. Lautenbach also serves as Trustee of other Fidelity® funds. Mr. Lautenbach currently serves as Vice Chair of the Board of Governors, State University System of Florida (2013-present) and is a member of the Council on Foreign Relations (1994-present). He is also a member and has most recently served as Chairman of the Board of Directors of Artis-Naples (2012-present). Previously, Mr. Lautenbach served as a member and then Lead Director of the Board of Directors of Eaton Corporation (diversified industrial, 1997-2016). He was also a Partner and Advisory Partner at Clayton, Dubilier & Rice, LLC (private equity investment, 1998-2010), as well as a Director of Sony Corporation (2006-2007). In addition, Mr. Lautenbach also had a 30-year career with IBM (technology company) during which time he served as Senior Vice President and a member of the Corporate Executive Committee (1968-1998).
Joseph Mauriello (1944)
Year of Election or Appointment: 2008
Trustee
Mr. Mauriello also serves as Trustee of other Fidelity® funds. Prior to his retirement in January 2006, Mr. Mauriello served in numerous senior management positions including Deputy Chairman and Chief Operating Officer (2004-2005), and Vice Chairman of Financial Services (2002-2004) of KPMG LLP US (professional services, 1965-2005). Mr. Mauriello currently serves as a member of the Board of Directors of XL Group plc. (global insurance and re-insurance, 2006-present) and the Independent Directors Council (IDC) Governing Council (2015-present). Previously, Mr. Mauriello served as a Director of the Hamilton Funds of the Bank of New York (2006-2007) and of Arcadia Resources Inc. (health care services and products, 2007-2012).
Cornelia M. Small (1944)
Year of Election or Appointment: 2005
Trustee
Ms. Small also serves as Trustee of other Fidelity® funds. Ms. Small is a member of the Board of Directors (2009-present) and Chair of the Investment Committee (2010-present) of the Teagle Foundation. Ms. Small also serves on the Investment Committee of the Berkshire Taconic Community Foundation (2008-present). Previously, Ms. Small served as Chairperson (2002-2008) and a member of the Investment Committee and Chairperson (2008-2012) and a member of the Board of Trustees of Smith College. In addition, Ms. Small served as Chief Investment Officer, Director of Global Equity Investments, and a member of the Board of Directors of Scudder, Stevens & Clark and Scudder Kemper Investments.
William S. Stavropoulos (1939)
Year of Election or Appointment: 2002
Trustee
Vice Chairman of the Independent Trustees
Mr. Stavropoulos also serves as Trustee of other Fidelity® funds. Mr. Stavropoulos serves as President and Founder of the Michigan Baseball Foundation, the Great Lakes Loons (2007-present). Mr. Stavropoulos is Chairman Emeritus of the Board of Directors of The Dow Chemical Company, where he previously served in numerous senior management positions, including President, CEO (1995-2000; 2002-2004), Chairman of the Executive Committee (2000-2006), and as a member of the Board of Directors (1990-2006). Currently, Mr. Stavropoulos is Chairman of the Board of Directors of Univar Inc. (global distributor of commodity and specialty chemicals), a Director of Teradata Corporation (data warehousing and technology solutions), and a member of the Advisory Board for Metalmark Capital LLC (private equity investment, 2005-present). Mr. Stavropoulos is an operating advisor to Clayton, Dubilier & Rice, LLC (private equity investment). In addition, Mr. Stavropoulos is a member of the University of Notre Dame Advisory Council for the College of Science, a Trustee of the Rollin L. Gerstacker Foundation, and a Director of Artis-Naples in Naples, Florida. Previously, Mr. Stavropoulos served as a Director of Chemical Financial Corporation (bank holding company, 1993-2012) and Tyco International, Ltd. (multinational manufacturing and services, 2007-2012).
David M. Thomas (1949)
Year of Election or Appointment: 2008
Trustee
Mr. Thomas also serves as Trustee of other Fidelity® funds. Mr. Thomas serves as Non-Executive Chairman of the Board of Directors of Fortune Brands Home and Security (home and security products, 2011-present), as a member of the Board of Directors (2004-present) and Presiding Director (2013-present) of Interpublic Group of Companies, Inc. (marketing communication), and as a member of the Board of Trustees of the University of Florida (2013-present). Previously, Mr. Thomas served as Executive Chairman (2005-2006) and Chairman and Chief Executive Officer (2000-2005) of IMS Health, Inc. (pharmaceutical and healthcare information solutions), and a Director of Fortune Brands, Inc. (consumer products, 2000-2011).
+ The information includes the Trustee's principal occupation during the last five years and other information relating to the experience, attributes, and skills relevant to the Trustee's qualifications to serve as a Trustee, which led to the conclusion that the Trustee should serve as a Trustee for the fund.
Advisory Board Members and Officers:
Correspondence intended for an officer or Peter S. Lynch may be sent to Fidelity Investments, 245 Summer Street, Boston, Massachusetts 02210. Officers appear below in alphabetical order.
Name, Year of Birth; Principal Occupation
Peter S. Lynch (1944)
Year of Election or Appointment: 2003
Member of the Advisory Board
Mr. Lynch also serves as Member of the Advisory Board of other Fidelity® funds. Mr. Lynch is Vice Chairman and a Director of FMR (investment adviser firm) and FMR Co., Inc. (investment adviser firm). In addition, Mr. Lynch serves as a Trustee of Boston College and as the Chairman of the Inner-City Scholarship Fund. Previously, Mr. Lynch served on the Special Olympics International Board of Directors (1997-2006).
Elizabeth Paige Baumann (1968)
Year of Election or Appointment: 2017
Anti-Money Laundering (AML) Officer
Ms. Baumann also serves as AML Officer of other funds. She is Chief AML Officer (2012-present) and Senior Vice President (2014-present) of FMR LLC (diversified financial services company) and is an employee of Fidelity Investments. Previously, Ms. Baumann served as AML Officer of the funds (2012-2016), and Vice President (2007-2014) and Deputy Anti-Money Laundering Officer (2007-2012) of FMR LLC.
Marc R. Bryant (1966)
Year of Election or Appointment: 2015
Secretary and Chief Legal Officer (CLO)
Mr. Bryant also serves as Secretary and CLO of other funds. Mr. Bryant serves as CLO, Secretary, and Senior Vice President of Fidelity Management & Research Company (investment adviser firm, 2015-present) and FMR Co., Inc. (investment adviser firm, 2015-present); Secretary of Fidelity SelectCo, LLC (investment adviser firm, 2015-present) and Fidelity Investments Money Management, Inc. (investment adviser firm, 2015-present); and CLO of Fidelity Management & Research (Hong Kong) Limited and FMR Investment Management (UK) Limited (investment adviser firms, 2015-present) and Fidelity Management & Research (Japan) Limited (investment adviser firm, 2016-present). He is Senior Vice President and Deputy General Counsel of FMR LLC (diversified financial services company). Previously, Mr. Bryant served as Secretary and CLO of Fidelity Rutland Square Trust II (2010-2014) and Assistant Secretary of Fidelity's Fixed Income and Asset Allocation Funds (2013-2015). Prior to joining Fidelity Investments, Mr. Bryant served as a Senior Vice President and the Head of Global Retail Legal for AllianceBernstein L.P. (2006-2010), and as the General Counsel for ProFund Advisors LLC (2001-2006).
William C. Coffey (1969)
Year of Election or Appointment: 2009
Assistant Secretary
Mr. Coffey also serves as Assistant Secretary of other funds. He is Senior Vice President and Deputy General Counsel of FMR LLC (diversified financial services company, 2010-present), and is an employee of Fidelity Investments. Previously, Mr. Coffey served as Vice President and Associate General Counsel of FMR LLC (2005-2009).
Jonathan Davis (1968)
Year of Election or Appointment: 2010
Assistant Treasurer
Mr. Davis also serves as Assistant Treasurer of other funds, and is an employee of Fidelity Investments. Previously, Mr. Davis served as Vice President and Associate General Counsel of FMR LLC (diversified financial services company, 2003-2010).
Adrien E. Deberghes (1967)
Year of Election or Appointment: 2016
Assistant Treasurer
Mr. Deberghes also serves as an officer of other funds. He serves as Executive Vice President of Fidelity Investments Money Management, Inc. (FIMM) (investment adviser firm, 2016-present) and is an employee of Fidelity Investments (2008-present). Prior to joining Fidelity Investments, Mr. Deberghes was Senior Vice President of Mutual Fund Administration at State Street Corporation (2007-2008), Senior Director of Mutual Fund Administration at Investors Bank & Trust (2005-2007), and Director of Finance for Dunkin' Brands (2000-2005). Previously, Mr. Deberghes served in other fund officer roles.
Stephanie J. Dorsey (1969)
Year of Election or Appointment: 2010
Assistant Treasurer
Ms. Dorsey also serves as an officer of other funds. She is an employee of Fidelity Investments (2008-present) and has served in other fund officer roles. Prior to joining Fidelity Investments, Ms. Dorsey served as Treasurer (2004-2008) of the JPMorgan Mutual Funds and Vice President (2004-2008) of JPMorgan Chase Bank.
Howard J. Galligan III (1966)
Year of Election or Appointment: 2014
Chief Financial Officer
Mr. Galligan also serves as Chief Financial Officer of other funds. Mr. Galligan serves as President of Fidelity Pricing and Cash Management Services (FPCMS) (2014-present) and as a Director of Strategic Advisers, Inc. (investment adviser firm, 2008-present). Previously, Mr. Galligan served as Chief Administrative Officer of Asset Management (2011-2014) and Chief Operating Officer and Senior Vice President of Investment Support for Strategic Advisers, Inc. (2003-2011).
Brian B. Hogan (1964)
Year of Election or Appointment: 2009
Vice President
Mr. Hogan also serves as Trustee or Vice President of other funds. Mr. Hogan serves as a Director of FMR Investment Management (UK) Limited (investment adviser firm, 2015-present) and Fidelity SelectCo, LLC (investment adviser firm, 2014-present) and President of the Equity Division of FMR (investment adviser firm, 2009-present). Previously, Mr. Hogan served as Senior Vice President, Equity Research of FMR (2006-2009) and as a portfolio manager. Mr. Brian B. Hogan is not related to Mr. Colm A. Hogan.
Colm A. Hogan (1973)
Year of Election or Appointment: 2016
Deputy Treasurer
Mr. Hogan also serves as an officer of other funds. Mr. Hogan is an employee of Fidelity Investments (2005-present). Mr. Colm A. Hogan is not related to Mr. Brian B. Hogan.
Chris Maher (1972)
Year of Election or Appointment: 2013
Assistant Treasurer
Mr. Maher serves as Assistant Treasurer of other funds. Mr. Maher is Vice President of Valuation Oversight and is an employee of Fidelity Investments. Previously, Mr. Maher served as Vice President of Asset Management Compliance (2013), Vice President of the Program Management Group of FMR (investment adviser firm, 2010-2013), and Vice President of Valuation Oversight (2008-2010).
Rieco E. Mello (1969)
Year of Election or Appointment: 2017
Assistant Treasurer
Mr. Mello also serves as Assistant Treasurer of other funds. Mr. Mello is an employee of Fidelity Investments (1995-present).
Melissa M. Reilly (1971)
Year of Election or Appointment: 2014
Vice President of certain Equity Funds
Ms. Reilly also serves as Vice President of other funds. Ms. Reilly is an employee of Fidelity Investments (2004-present).
Kenneth B. Robins (1969)
Year of Election or Appointment: 2016
Chief Compliance Officer
Mr. Robins also serves as an officer of other funds. Mr. Robins serves as Compliance Officer of Fidelity Management & Research Company and FMR Co., Inc. (investment adviser firms, 2016-present) and is an employee of Fidelity Investments (2004-present). Previously, Mr. Robins served as Executive Vice President of Fidelity Investments Money Management, Inc. (investment adviser firm, 2013-2016) and served in other fund officer roles.
Stacie M. Smith (1974)
Year of Election or Appointment: 2016
President and Treasurer
Ms. Smith also serves as an officer of other funds. She is an employee of Fidelity Investments (2009-present) and has served in other fund officer roles. Prior to joining Fidelity Investments, Ms. Smith served as Senior Audit Manager of Ernst & Young LLP (accounting firm, 1996-2009). Previously, Ms. Smith served as Deputy Treasurer of certain Fidelity® funds (2013-2016).
Marc L. Spector (1972)
Year of Election or Appointment: 2016
Assistant Treasurer
Mr. Spector also serves as an officer of other funds. Mr. Spector is an employee of Fidelity Investments (2016-present). Prior to joining Fidelity Investments, Mr. Spector served as Director at the Siegfried Group (accounting firm, 2013-2016), and prior to Siegfried Group as audit senior manager at Deloitte & Touche (accounting firm, 2005-2013).
Renee Stagnone (1975)
Year of Election or Appointment: 2016
Assistant Treasurer
Ms. Stagnone also serves as an officer of other funds. Ms. Stagnone is an employee of Fidelity Investments (1997-present). Previously, Ms. Stagnone served as Deputy Treasurer of certain Fidelity® funds (2013-2016).
Shareholder Expense Example
As a shareholder of the Fund, you incur two types of costs: (1) transaction costs and (2) ongoing costs, including management fees and other Fund expenses. This Example is intended to help you understand your ongoing costs (in dollars) of investing in the Fund and to compare these costs with the ongoing costs of investing in other mutual funds.
The Example is based on an investment of $1,000 invested at the beginning of the period and held for the entire period (May 1, 2017 to October 31, 2017).
Actual Expenses
The first line of the accompanying table for each class of the Fund provides information about actual account values and actual expenses. You may use the information in this line, together with the amount you invested, to estimate the expenses that you paid over the period. Simply divide your account value by $1,000.00 (for example, an $8,600 account value divided by $1,000.00 = 8.6), then multiply the result by the number in the first line for a class of the Fund under the heading entitled "Expenses Paid During Period" to estimate the expenses you paid on your account during this period. A small balance maintenance fee of $12.00 that is charged once a year may apply for certain accounts with a value of less than $2,000. This fee is not included in the table below. If it was, the estimate of expenses you paid during the period would be higher, and your ending account value lower, by this amount. In addition, the Fund, as a shareholder in the underlying Fidelity Central Funds, will indirectly bear its pro-rata share of the fees and expenses incurred by the underlying Fidelity Central Funds. These fees and expenses are not included in the Fund's annualized expense ratio used to calculate the expense estimate in the table below.
Hypothetical Example for Comparison Purposes
The second line of the accompanying table for each class of the Fund provides information about hypothetical account values and hypothetical expenses based on a Class' actual expense ratio and an assumed rate of return of 5% per year before expenses, which is not the Class' actual return. The hypothetical account values and expenses may not be used to estimate the actual ending account balance or expenses you paid for the period. You may use this information to compare the ongoing costs of investing in the Fund and other funds. To do so, compare this 5% hypothetical example with the 5% hypothetical examples that appear in the shareholder reports of the other funds. A small balance maintenance fee of $12.00 that is charged once a year may apply for certain accounts with a value of less than $2,000. This fee is not included in the table below. If it was, the estimate of expenses you paid during the period would be higher, and your ending account value lower, by this amount. In addition, the Fund, as a shareholder in the underlying Fidelity Central Funds, will indirectly bear its pro-rata share of the fees and expenses incurred by the underlying Fidelity Central Funds. These fees and expenses are not included in the Fund's annualized expense ratio used to calculate the expense estimate in the table below.
Please note that the expenses shown in the table are meant to highlight your ongoing costs only and do not reflect any transaction costs. Therefore, the second line of the table is useful in comparing ongoing costs only, and will not help you determine the relative total costs of owning different funds.
| | Annualized Expense Ratio-A | Beginning
Account Value
May 1, 2017 | Ending
Account Value
October 31, 2017 | Expenses Paid
During Period-B
May 1, 2017
to October 31, 2017 |
| Capital Appreciation | .52% | | | |
| Actual | | $1,000.00 | $1,098.60 | $2.75 |
| Hypothetical-C | | $1,000.00 | $1,022.58 | $2.65 |
| Class K | .41% | | | |
| Actual | | $1,000.00 | $1,099.20 | $2.17 |
| Hypothetical-C | | $1,000.00 | $1,023.14 | $2.09 |
A Annualized expense ratio reflects expenses net of applicable fee waivers.
B Expenses are equal to each Class' annualized expense ratio, multiplied by the average account value over the period, multiplied by 184/365 (to reflect the one-half year period).
C 5% return per year before expenses
Distributions (Unaudited)
The Board of Trustees of Fidelity Capital Appreciation Fund voted to pay to shareholders of record at the opening of business on record date, the following distributions per share derived from capital gains realized from sales of portfolio securities, and dividends derived from net investment income:
| | Pay Date | Record Date | Dividends | Capital Gains |
| Fidelity Capital Appreciation Fund | | | | |
| Capital Appreciation | 12/11/17 | 12/08/17 | $0.335 | $3.671 |
| Class K | 12/11/17 | 12/08/17 | $0.374 | $3.671 |
|
The fund hereby designates as a capital gain dividend with respect to the taxable year ended October 31 2017, $644,336,664, or, if subsequently determined to be different, the net capital gain of such year.
Capital Appreciation and Class K designate 100% of the dividend distributed in December during the fiscal year as qualifying for the dividends–received deduction for corporate shareholders.
Capital Appreciation and Class K designate 100% of the dividend distributed during the fiscal year as amounts which may be taken into account as a dividend for purposes of the maximum rate under section 1(h)(11) of the Internal Revenue Code.
The fund will notify shareholders in January 2018 of amounts for use in preparing 2017 income tax returns.
Board Approval of Investment Advisory Contracts and Management Fees
Fidelity Capital Appreciation Fund
Each year, the Board of Trustees, including the Independent Trustees (together, the Board), votes on the renewal of the management contract with Fidelity Management & Research Company (FMR) and the sub-advisory agreements (together, the Advisory Contracts) for the fund. FMR and the sub-advisers are referred to herein as the Investment Advisers. The Board, assisted by the advice of fund counsel and Independent Trustees' counsel, requests and considers a broad range of information relevant to the renewal of the Advisory Contracts throughout the year.
The Board meets regularly and, at each of its meetings, covers an extensive agenda of topics and materials and considers factors that are relevant to its annual consideration of the renewal of the fund's Advisory Contracts, including the services and support provided to the fund and its shareholders. The Board has established various standing committees (Committees), each composed of and chaired by Independent Trustees with varying backgrounds, to which the Board has assigned specific subject matter responsibilities in order to enhance effective decision-making by the Board. The Board, acting directly and through its Committees, requests and receives information concerning the annual consideration of the renewal of the fund's Advisory Contracts. The Board also meets as needed to review matters specifically related to the Board's annual consideration of the renewal of the Advisory Contracts. Members of the Board may also meet with trustees of other Fidelity funds through ad hoc joint committees to discuss certain matters relevant to all of the Fidelity funds.
At its July 2017 meeting, the Board unanimously determined to renew the fund's Advisory Contracts. In reaching its determination, the Board considered all factors it believed relevant, including (i) the nature, extent, and quality of the services to be provided to the fund and its shareholders (including the investment performance of the fund); (ii) the competitiveness of the fund's management fee and total expense ratio relative to peer funds; (iii) the total costs of the services to be provided by and the profits to be realized by Fidelity from its relationships with the fund; and (iv) the extent to which, if any, economies of scale exist and would be realized as the fund grows, and whether any economies of scale are appropriately shared with fund shareholders.
In considering whether to renew the Advisory Contracts for the fund, the Board reached a determination, with the assistance of fund counsel and Independent Trustees' counsel and through the exercise of its business judgment, that the renewal of the Advisory Contracts was in the best interests of the fund and its shareholders and that the compensation payable under the Advisory Contracts was fair and reasonable. The Board's decision to renew the Advisory Contracts was not based on any single factor, but rather was based on a comprehensive consideration of all the information provided to the Board at its meetings throughout the year. The Board, in reaching its determination to renew the Advisory Contracts, was aware that shareholders of the fund have a broad range of investment choices available to them, including a wide choice among funds offered by Fidelity's competitors, and that the fund's shareholders, who have the opportunity to review and weigh the disclosure provided by the fund in its prospectus and other public disclosures, have chosen to invest in this fund, which is part of the Fidelity family of funds.
Amendment to Group Fee Rate. The Board also approved an amendment to the management contract for the fund to add an additional breakpoint to the group fee schedule, effective October 1, 2017. The Board noted that the additional breakpoint would result in lower management fee rates as Fidelity's assets under management increase.
Nature, Extent, and Quality of Services Provided. The Board considered Fidelity's staffing as it relates to the fund, including the backgrounds of investment personnel of Fidelity, and also considered the fund's investment objective, strategies, and related investment philosophy. The Independent Trustees also had discussions with senior management of Fidelity's investment operations and investment groups. The Board considered the structure of the investment personnel compensation program and whether this structure provides appropriate incentives to act in the best interests of the fund. Additionally, the Board considered the portfolio managers' investments, if any, in the funds that they manage.
Resources Dedicated to Investment Management and Support Services. The Board and the Fund Oversight and Research Committees reviewed the general qualifications and capabilities of Fidelity's investment staff, including its size, education, experience, and resources, as well as Fidelity's approach to recruiting, training, managing, and compensating investment personnel. The Board noted that Fidelity has continued to increase the resources devoted to non-U.S. offices, including expansion of Fidelity's global investment organization. The Board also noted that Fidelity's analysts have extensive resources, tools and capabilities that allow them to conduct sophisticated quantitative and fundamental analysis, as well as credit analysis of issuers, counterparties and guarantors. Further, the Board considered that Fidelity's investment professionals have sufficient access to global information and data so as to provide competitive investment results over time, and that those professionals also have access to sophisticated tools that permit them to assess portfolio construction and risk and performance attribution characteristics continuously, as well as to transmit new information and research conclusions rapidly around the world. Additionally, in its deliberations, the Board considered Fidelity's trading, risk management, compliance, and technology and operations capabilities and resources, which are integral parts of the investment management process.
Shareholder and Administrative Services. The Board considered (i) the nature, extent, quality, and cost of advisory, administrative, and shareholder services performed by the Investment Advisers and their affiliates under the Advisory Contracts and under separate agreements covering transfer agency, pricing and bookkeeping, and securities lending services for the fund; (ii) the nature and extent of the supervision of third party service providers, principally custodians, subcustodians, and pricing vendors; and (iii) the resources devoted to, and the record of compliance with, the fund's compliance policies and procedures. The Board also reviewed the allocation of fund brokerage, including allocations to brokers affiliated with the Investment Advisers, the use of brokerage commissions to pay fund expenses, and the use of "soft" commission dollars to pay for research services.
The Board noted that the growth of fund assets over time across the complex allows Fidelity to reinvest in the development of services designed to enhance the value or convenience of the Fidelity funds as investment vehicles. These services include 24-hour access to account information and market information through telephone representatives and over the Internet, investor education materials and asset allocation tools, and the expanded availability of Fidelity Investor Centers.
In 2014, the Board formed an ad hoc Committee on Transfer Agency Fees to review the variety of transfer agency fee structures throughout the industry and Fidelity's competitive positioning with respect to industry participants.
Investment in a Large Fund Family. The Board considered the benefits to shareholders of investing in a Fidelity fund, including the benefits of investing in a fund that is part of a large family of funds offering a variety of investment disciplines and providing a large variety of mutual fund investor services. The Board noted that Fidelity had taken, or had made recommendations that resulted in the Fidelity funds taking, a number of actions over the previous year that benefited particular funds, including: (i) continuing to dedicate additional resources to Fidelity's investment research process, and to the support of the senior management team that oversees asset management; (ii) continuing efforts to enhance Fidelity's global research capabilities; (iii) launching new funds and making other enhancements to meet client needs; (iv) launching new share classes of existing funds; (v) eliminating purchase minimums and broadening eligibility requirements for certain lower-priced share classes; (vi) reducing management fees and total expenses for certain growth equity funds and index funds; (vii) lowering expense caps for certain existing funds and classes to reduce expenses borne by shareholders; (viii) eliminating short-term redemption fees for certain funds; (ix) introducing a new pricing structure for certain funds of funds that is expected to reduce overall expenses paid by shareholders; (x) rationalizing product lines and gaining increased efficiencies through proposals for fund mergers and share class consolidations; (xi) continuing to develop, acquire and implement systems and technology to improve services to the funds and shareholders, strengthen information security, and increase efficiency; and (xii) implementing enhancements to further strengthen Fidelity's product line to increase investors' probability of success in achieving their investment goals, including retirement income goals.
Investment Performance. The Board considered whether the fund has operated in accordance with its investment objective, as well as its record of compliance with its investment restrictions and its performance history.
The Board took into account discussions with representatives of the Investment Advisers about fund investment performance that occur at Board meetings throughout the year. In this regard the Board noted that as part of regularly scheduled fund reviews and other reports to the Board on fund performance, the Board considers annualized return information for the fund for different time periods, measured against a securities market index ("benchmark index") and a peer group of funds with similar objectives ("peer group"), if any. In its evaluation of fund investment performance, the Board gave particular attention to information indicating changes in performance of certain Fidelity funds for specific time periods and discussed with the Investment Advisers the reasons for any overperformance or underperformance.
In addition to reviewing absolute and relative fund performance, the Independent Trustees periodically consider the appropriateness of fund performance metrics in evaluating the results achieved. In general, the Independent Trustees believe that fund performance should be evaluated based on net performance (after fees and expenses) of both the highest performing and lowest performing fund share classes, where applicable, compared to appropriate benchmark indices, over appropriate time periods that may include full market cycles, and compared to peer groups, as applicable, over the same periods, taking into account relevant factors including the following: general market conditions; issuer-specific information; and fund cash flows and other factors.
The Independent Trustees recognize that shareholders evaluate performance on a net basis over their own holding periods, for which one-, three-, and five-year periods are often used as a proxy. For this reason, the performance information reviewed by the Board also included net cumulative calendar year total return information for the fund and an appropriate benchmark index and peer group for the most recent one-, three-, and five-year periods, as shown below. Returns are shown compared to the 25th percentile (top of box, 75% beaten) and 75th percentile (bottom of box, 25% beaten) of the peer universe.
Fidelity Capital Appreciation Fund
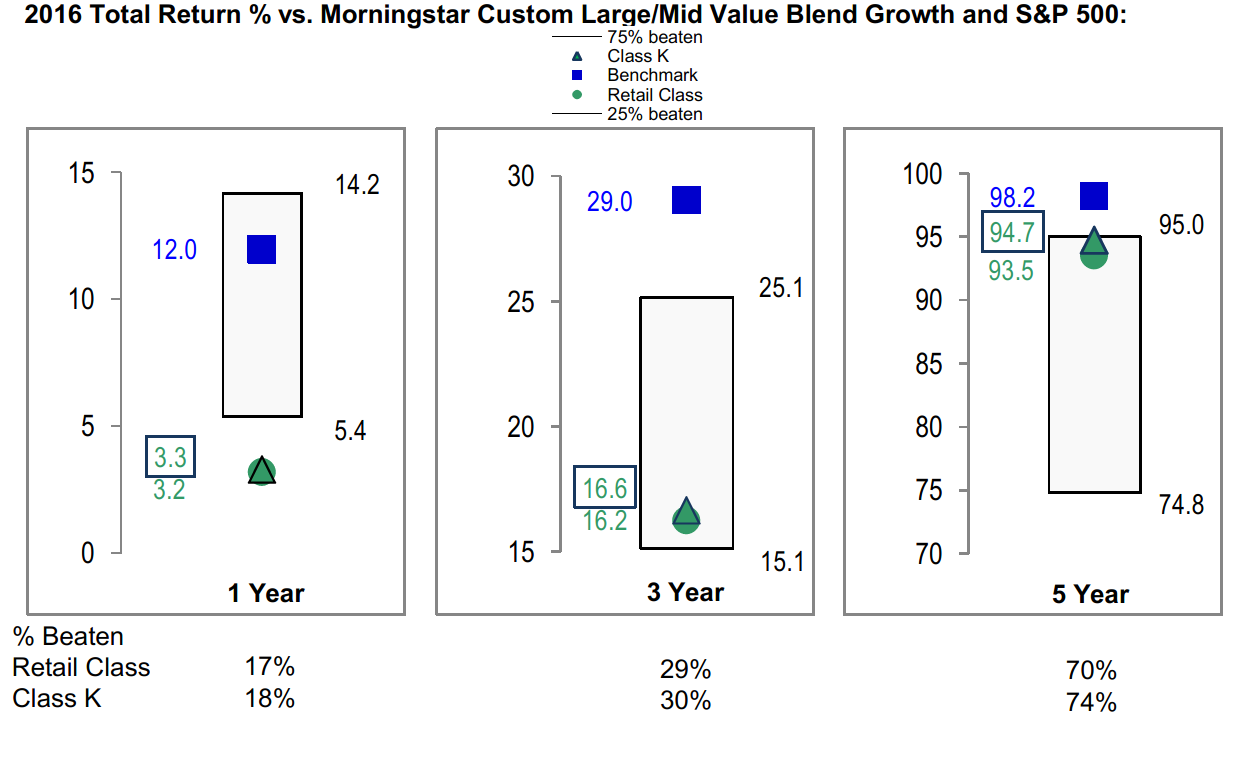
The Board has discussed the fund's underperformance (based on the December 31, 2016 data presented herein) with FMR, including the fund's investment strategy, the portfolio management team, and broader trends in the market that may have impacted the fund's performance, and has engaged with FMR to consider what steps might be taken to remediate the fund's underperformance. The Board noted that the fund's performance has improved since the period shown.
The Board also considered that the fund's management fee is subject to upward or downward adjustment depending upon whether, and to what extent, the fund's investment performance for the performance period (a rolling 36-month period) exceeds, or is exceeded by, a securities index, thus leading to a performance adjustment for the same period. The Board noted that the performance adjustment provides FMR with a strong economic incentive to seek to achieve superior long-term performance for the fund's shareholders and helps to more closely align the interests of FMR and the shareholders of the fund.
Based on its review, the Board concluded that the nature, extent, and quality of services provided to the fund under the Advisory Contracts should continue to benefit the shareholders of the fund.
Competitiveness of Management Fee and Total Expense Ratio. The Board considered the fund's management fee and total expense ratio compared to "mapped groups" of competitive funds and classes created for the purpose of facilitating the Trustees' competitive analysis of management fees and total expenses. Fidelity creates "mapped groups" by combining similar Lipper investment objective categories that have comparable investment mandates. Combining Lipper investment objective categories aids the Board's management fee and total expense ratio comparisons by broadening the competitive group used for comparison.
Management Fee. The Board considered two proprietary management fee comparisons for the 12-month periods shown in basis points (BP) in the chart below. The group of Lipper funds used by the Board for management fee comparisons is referred to below as the "Total Mapped Group." The Total Mapped Group comparison focuses on a fund's standing in terms of gross management fees before expense reimbursements or caps, and without giving effect to the fund's performance adjustment, relative to the total universe of funds with comparable investment mandates, regardless of whether their management fee structures also are comparable. Funds with comparable investment mandates offer exposure to similar types of securities. Funds with comparable management fee structures have similar management fee contractual arrangements (
e.g., flat rate charged for advisory services, all-inclusive fee rate,
etc.). "TMG %" represents the percentage of funds in the Total Mapped Group that had management fees that were lower than the fund's. For example, a hypothetical TMG % of 20% would mean that 80% of the funds in the Total Mapped Group had higher, and 20% had lower, management fees than the fund. The fund's actual TMG %s and the number of funds in the Total Mapped Group are in the chart below. The "Asset-Size Peer Group" (ASPG) comparison focuses on a fund's standing relative to a subset of non-Fidelity funds within the Total Mapped Group that are similar in size and management fee structure without taking into account performance adjustments, if any. For example, if a fund is in the first quartile of the ASPG, the fund's management fee ranks in the least expensive or lowest 25% of funds in the ASPG. The ASPG represents at least 15% of the funds in the Total Mapped Group with comparable asset size and management fee structures, subject to a minimum of 50 funds (or all funds in the Total Mapped Group if fewer than 50). Additional information, such as the ASPG quartile in which the fund's management fee rate ranked and the impact of the fund's performance adjustment, is also included in the chart and considered by the Board.
Fidelity Capital Appreciation Fund

The Board noted that the fund's management fee rate ranked below the median of its Total Mapped Group and below the median of its ASPG for 2016. The Board also noted the effect of the fund's performance adjustment, if any, on the fund's management fee ranking.
The Board noted that, in 2014, the Board and the boards of other Fidelity funds formed the ad hoc Committee on Group Fee to conduct an in-depth review of the "group fee" component of the management fee of funds with such management fee structures. The Committee's focus included the mechanics of the group fee, the competitive landscape of group fee structures, Fidelity funds with no group fee component and investment products not included in group fee assets. The Board also considered that, for funds subject to the group fee, FMR agreed to voluntarily waive fees over a specified period of time in amounts designed to account for assets converted from certain funds to certain collective investment trusts.
The Board also noted that, in 2013, the ad hoc Committee on Management Fees was formed to conduct an in-depth review of the management fee rates of Fidelity's active equity mutual funds. The Committee focused on the following areas: (i) standard fee structures; (ii) research consumption and trading evolution; (iii) management fee competitiveness/profitability by category; and (iv) factors that drive institutional pricing.
Based on its review, the Board concluded that the fund's management fee is fair and reasonable in light of the services that the fund receives and the other factors considered.
Total Expense Ratio. In its review of each class's total expense ratio, the Board considered the fund's management fee rate as well as other fund or class expenses, as applicable, such as transfer agent fees, pricing and bookkeeping fees, and custodial, legal, and audit fees. The Board noted the impact of the fund's performance adjustment. The Board also noted that Fidelity may agree to waive fees and expenses from time to time, and the extent to which, if any, it has done so for the fund. As part of its review, the Board also considered the current and historical total expense ratios of each class of the fund compared to competitive fund median expenses. Each class of the fund is compared to those funds and classes in the Total Mapped Group (used by the Board for management fee comparisons) that have a similar sales load structure.
The Board noted that the total expense ratio of each class ranked below the competitive median for 2016.
Fees Charged to Other Fidelity Clients. The Board also considered Fidelity fee structures and other information with respect to clients of Fidelity, such as other funds advised or subadvised by Fidelity, pension plan clients, and other institutional clients with similar mandates. The Board noted that an ad hoc joint committee created by it and the boards of other Fidelity funds periodically (most recently in 2013) reviews and compares Fidelity's institutional investment advisory business with its business of providing services to the Fidelity funds, including the differences in services provided, fees charged, and costs incurred, as well as competition in their respective marketplaces.
Based on its review of total expense ratios and fees charged to other Fidelity clients, the Board concluded that the total expense ratio of each class of the fund was reasonable in light of the services that the fund and its shareholders receive and the other factors considered.
Costs of the Services and Profitability. The Board considered the revenues earned and the expenses incurred by Fidelity in conducting the business of developing, marketing, distributing, managing, administering and servicing the fund and servicing the fund's shareholders. The Board also considered the level of Fidelity's profits in respect of all the Fidelity funds.
On an annual basis, Fidelity presents to the Board information about the profitability of its relationships with the fund. Fidelity calculates profitability information for each fund, as well as aggregate profitability information for groups of Fidelity funds and all Fidelity funds, using a series of detailed revenue and cost allocation methodologies which originate with the books and records of Fidelity on which Fidelity's audited financial statements are based. The Audit Committee of the Board reviews any significant changes from the prior year's methodologies.
PricewaterhouseCoopers LLP (PwC), independent registered public accounting firm and auditor to Fidelity and certain Fidelity funds, has been engaged annually by the Board as part of the Board's assessment of Fidelity's profitability analysis. PwC's engagement includes the review and assessment of the methodologies used by Fidelity in determining the revenues and expenses attributable to Fidelity's mutual fund business, and completion of agreed-upon procedures in respect of the mathematical accuracy of the fund profitability information and its conformity to established allocation methodologies. After considering PwC's reports issued under the engagement and information provided by Fidelity, the Board concluded that while other allocation methods may also be reasonable, Fidelity's profitability methodologies are reasonable in all material respects.
The Board also reviewed Fidelity's non-fund businesses and potential fall-out benefits related to the mutual fund business as well as cases where Fidelity's affiliates may benefit from or be related to the fund's business.
The Board considered the costs of the services provided by and the profits realized by Fidelity in connection with the operation of the fund and was satisfied that the profitability was not excessive.
Economies of Scale. The Board considered whether there have been economies of scale in respect of the management of the Fidelity funds, whether the Fidelity funds (including the fund) have appropriately benefited from any such economies of scale, and whether there is potential for realization of any further economies of scale. The Board considered the extent to which the fund will benefit from economies of scale as assets grow through increased services to the fund, through waivers or reimbursements, or through fee or expense ratio reductions. The Board also noted that a committee (the Economies of Scale Committee) created by it and the boards of other Fidelity funds periodically (most recently in 2013) analyzes whether Fidelity attains economies of scale in respect of the management and servicing of the Fidelity funds, whether the Fidelity funds have appropriately benefited from such economies of scale, and whether there is potential for realization of any further economies of scale.
The Board recognized that the fund's management contract incorporates a "group fee" structure, which provides for lower group fee rates as total group assets increase, and for higher group fee rates as total group assets decrease (with "group assets" defined to include fund assets under FMR's management plus the assets of sector funds previously under FMR's management). FMR calculates the group fee rates based on a tiered asset "breakpoint" schedule that varies based on asset class. The Board considered that the group fee is designed to deliver the benefits of economies of scale to fund shareholders when total Fidelity fund assets increase, even if assets of any particular fund are unchanged or have declined, because some portion of Fidelity's costs are attributable to services provided to all Fidelity funds, and all funds benefit if those costs can be allocated among more assets. The Board concluded that, given the group fee structure, fund shareholders will benefit from lower management fees as group assets increase at the fund complex level, regardless of whether Fidelity achieves any such economies of scale.
The Board concluded, taking into account the analysis of the Economies of Scale Committee, that economies of scale, if any, are being appropriately shared between fund shareholders and Fidelity.
Additional Information Requested by the Board. In order to develop fully the factual basis for consideration of the Fidelity funds' advisory contracts, the Board requested and received additional information on certain topics, including: (i) fund performance trends, in particular the underperformance of certain funds, and Fidelity's long-term strategies for certain funds; (ii) Fidelity's fund profitability methodology, profitability trends for certain funds, and the impact of certain factors on fund profitability results, including the impact of market trends on actively managed funds; (iii) the use of performance fees and the calculation of performance adjustments, including the impact of underperformance and fund outflows on performance adjustments; (iv) metrics for evaluating index fund performance; (v) Fidelity's group fee structure, including the group fee breakpoint schedules; (vi) the terms of Fidelity's contractual and voluntary expense cap arrangements with the funds; (vii) the methodology with respect to evaluating competitive fund data and peer group classifications and fee comparisons; (viii) the expense structures for different funds and classes; (ix) Fidelity's arrangements with affiliated sub-advisers on behalf of the funds; (x) information regarding other accounts managed by Fidelity, including institutional accounts and collective investment trusts; (xi) recent changes to the fee structure for certain funds of funds; and (xii) the impact of the Department of Labor's new fiduciary rule on the funds' comparative expense information.
Based on its evaluation of all of the conclusions noted above, and after considering all factors it believed relevant, the Board concluded that the advisory fee structures are fair and reasonable, and that the fund's Advisory Contracts should be renewed.
Corporate Headquarters
245 Summer St.
Boston, MA 02210
www.fidelity.com
CAF-ANN-1217
1.538293.120
Fidelity® Capital Appreciation Fund Class K
Annual Report October 31, 2017 |
|
Contents
To view a fund's proxy voting guidelines and proxy voting record for the 12-month period ended June 30, visit http://www.fidelity.com/proxyvotingresults or visit the Securities and Exchange Commission's (SEC) web site at http://www.sec.gov.
You may also call 1-800-835-5092 to request a free copy of the proxy voting guidelines.
Standard & Poor's, S&P and S&P 500 are registered service marks of The McGraw-Hill Companies, Inc. and have been licensed for use by Fidelity Distributors Corporation.
Other third-party marks appearing herein are the property of their respective owners.
All other marks appearing herein are registered or unregistered trademarks or service marks of FMR LLC or an affiliated company. © 2017 FMR LLC. All rights reserved.
This report and the financial statements contained herein are submitted for the general information of the shareholders of the Fund. This report is not authorized for distribution to prospective investors in the Fund unless preceded or accompanied by an effective prospectus.
A fund files its complete schedule of portfolio holdings with the SEC for the first and third quarters of each fiscal year on Form N-Q. Forms N-Q are available on the SEC’s web site at http://www.sec.gov. A fund's Forms N-Q may be reviewed and copied at the SEC’s Public Reference Room in Washington, DC. Information regarding the operation of the SEC's Public Reference Room may be obtained by calling 1-800-SEC-0330.
For a complete list of a fund's portfolio holdings, view the most recent holdings listing, semiannual report, or annual report on Fidelity's web site at http://www.fidelity.com, http://www.institutional.fidelity.com, or http://www.401k.com, as applicable.
NOT FDIC INSURED •MAY LOSE VALUE •NO BANK GUARANTEE
Neither the Fund nor Fidelity Distributors Corporation is a bank.
Performance: The Bottom Line
Average annual total return reflects the change in the value of an investment, assuming reinvestment of distributions from dividend income and capital gains (the profits earned upon the sale of securities that have grown in value, if any) and assuming a constant rate of performance each year. The hypothetical investment and the average annual total returns do not reflect the deduction of taxes that a shareholder would pay on fund distributions or the redemption of fund shares. During periods of reimbursement by Fidelity, a fund’s total return will be greater than it would be had the reimbursement not occurred. How a fund did yesterday is no guarantee of how it will do tomorrow.
Average Annual Total Returns
| For the periods ended October 31, 2017 | Past 1 year | Past 5 years | Past 10 years |
| Class K | 26.04% | 14.43% | 7.06% |
The initial offering of Class K shares took place on May 9, 2008. Returns prior to May 9, 2008 are those of Fidelity® Capital Appreciation Fund, the original class of the fund.
$10,000 Over 10 Years
Let's say hypothetically that $10,000 was invested in Fidelity® Capital Appreciation Fund - Class K on October 31, 2007.
The chart shows how the value of your investment would have changed, and also shows how the S&P 500® Index performed over the same period.
See above for additional information regarding the performance of Class K.
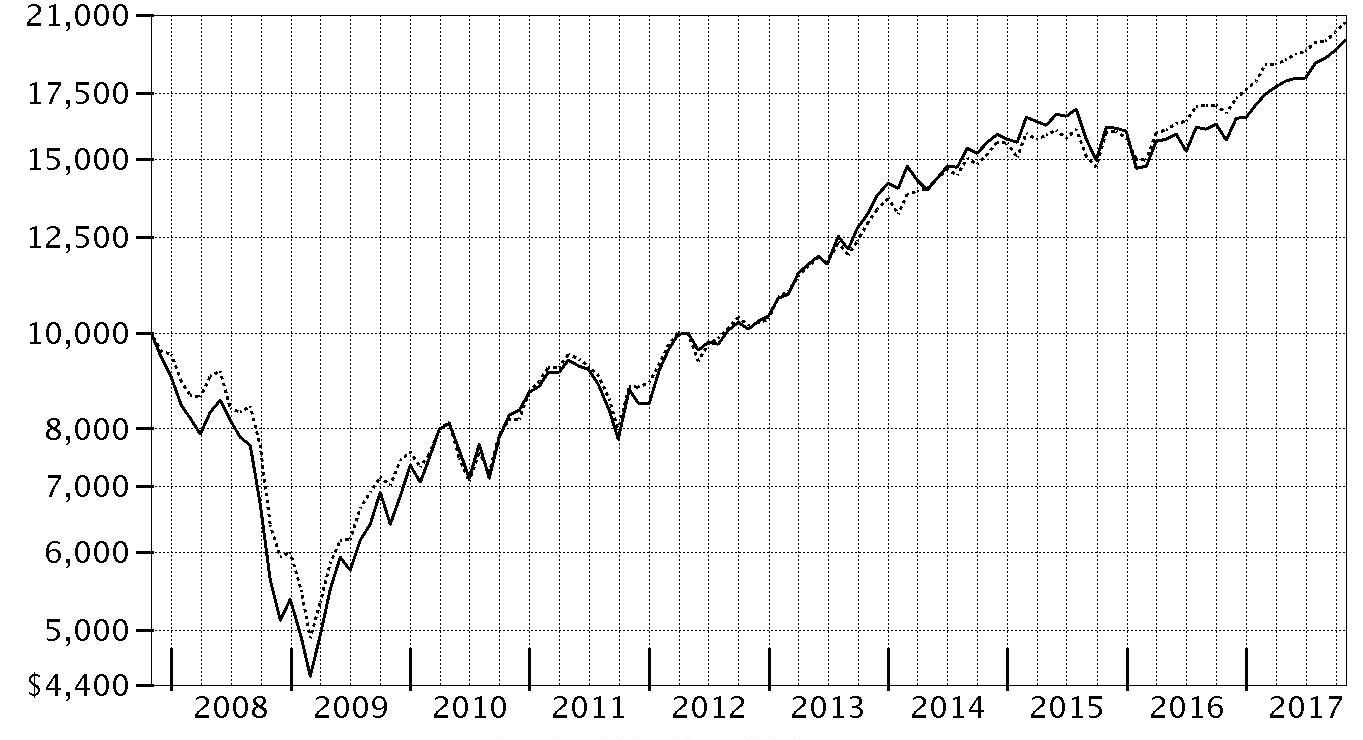
| Period Ending Values |
| $19,786 | Fidelity® Capital Appreciation Fund - Class K |
| $20,638 | S&P 500® Index |
Management's Discussion of Fund Performance
Market Recap: The U.S. equity bellwether S&P 500
® index gained 23.63% for the year ending October 31, 2017. Equity markets rose sharply following the November election and continued to rally through the end of February on optimism for President Trump’s pro-business agenda. Stocks leveled off in March amid fading optimism and stalled efforts by Congress to repeal and replace the Affordable Care Act. Upward momentum soon returned and continued through period end amid positive consumer sentiment and other market indicators. The lone exception was a brief cooldown in August, when geopolitical tension escalated and uncertainty grew regarding the future of health care, tax reform and the debt ceiling. Sector-wise, information technology (+39%) performed best, surging as a handful of major index constituents posted strong returns. Financials gained 37%, riding an uptick in bond yields and a surge in banks, particularly post-election. Materials (+29%) also did well, spurred by higher demand, especially from China. Conversely, consumer discretionary (+20%) lagged the broader market, as brick-and-mortar retailers continued to suffer from increased online competition. Rising interest rates held back real estate (+9%) and sluggish oil prices dragged on energy (+2%). Consumer staples (+4%) and telecommunication services (-1%) struggled due to investors’ general preference for risk assets.
Comments from Portfolio Manager Fergus Shiel: For the year, the fund’s share classes gained about 26%, topping the benchmark S&P 500
®. Versus the benchmark, minimal exposure to the lagging consumer staples sector was the biggest positive. Stock picking in information technology, industrials and health care also added value. Additionally, our foreign holdings lifted performance against the backdrop of a generally weaker U.S. dollar. Among individual stocks, Vertex Pharmaceuticals, a biotech company focused on developing treatments for cystic fibrosis, proved the fund’s top relative contributor. The stock almost doubled in value, and I exited most of this position. Also bolstering the fund’s relative result were publishing-software developer Adobe Systems – the fund’s fourth-largest holding at period end – and FMC, a supplier of agricultural chemicals and a position I increased significantly this period. Conversely, the fund’s primary headwind came from unfavorable stock picking in the consumer discretionary sector. A modest cash position also hurt. The biggest individual relative detractor by far was retailer J.C. Penney, an out-of-benchmark position that suffered a steady erosion in value. The company recorded its fifth straight quarter of weaker sales in August. Biotech holding Alexion Pharmaceuticals and a sizable out-of-benchmark position in Netherlands-based telecommunications company Altice also worked against us.
The views expressed above reflect those of the portfolio manager(s) only through the end of the period as stated on the cover of this report and do not necessarily represent the views of Fidelity or any other person in the Fidelity organization. Any such views are subject to change at any time based upon market or other conditions and Fidelity disclaims any responsibility to update such views. These views may not be relied on as investment advice and, because investment decisions for a Fidelity fund are based on numerous factors, may not be relied on as an indication of trading intent on behalf of any Fidelity fund.
Investment Summary (Unaudited)
Top Ten Stocks as of October 31, 2017
| | % of fund's net assets | % of fund's net assets 6 months ago |
| Apple, Inc. | 5.3 | 4.1 |
| Las Vegas Sands Corp. | 3.4 | 3.8 |
| Alphabet, Inc. Class C | 3.4 | 2.3 |
| Adobe Systems, Inc. | 3.0 | 3.1 |
| CME Group, Inc. | 2.9 | 3.1 |
| Morgan Stanley | 2.9 | 1.3 |
| Goldman Sachs Group, Inc. | 2.6 | 2.3 |
| Amgen, Inc. | 2.4 | 3.1 |
| PayPal Holdings, Inc. | 2.3 | 1.1 |
| FMC Corp. | 2.2 | 1.7 |
| | 30.4 | |
Top Five Market Sectors as of October 31, 2017
| | % of fund's net assets | % of fund's net assets 6 months ago |
| Information Technology | 30.7 | 21.8 |
| Financials | 18.3 | 14.7 |
| Consumer Discretionary | 15.1 | 21.6 |
| Health Care | 10.7 | 12.2 |
| Industrials | 9.9 | 8.3 |
Asset Allocation (% of fund's net assets)
| As of October 31, 2017 * |
| | Stocks | 99.2% |
| | Short-Term Investments and Net Other Assets (Liabilities) | 0.8% |

* Foreign investments - 12.5%
| As of April 30, 2017 * |
| | Stocks | 94.7% |
| | Short-Term Investments and Net Other Assets (Liabilities) | 5.3% |

* Foreign investments - 15.7%
Investments October 31, 2017
Showing Percentage of Net Assets
| Common Stocks - 99.2% | | | |
| | | Shares | Value (000s) |
| CONSUMER DISCRETIONARY - 15.1% | | | |
| Auto Components - 0.4% | | | |
| BorgWarner, Inc. | | 618,102 | $32,586 |
| Automobiles - 0.1% | | | |
| General Motors Co. | | 235,000 | 10,100 |
| Diversified Consumer Services - 0.2% | | | |
| DeVry, Inc. | | 401,780 | 14,846 |
| Hotels, Restaurants & Leisure - 7.6% | | | |
| Carnival Corp. | | 401,400 | 26,649 |
| Dalata Hotel Group PLC (a)(b) | | 9,716,029 | 60,550 |
| Las Vegas Sands Corp. | | 3,978,566 | 252,162 |
| Marriott International, Inc. Class A | | 295,057 | 35,253 |
| Marriott Vacations Worldwide Corp. | | 68,500 | 9,016 |
| MGM Mirage, Inc. | | 1,174,800 | 36,830 |
| Penn National Gaming, Inc. (a) | | 597,564 | 15,590 |
| Planet Fitness, Inc. | | 97,900 | 2,608 |
| Royal Caribbean Cruises Ltd. | | 235,000 | 29,086 |
| Whitbread PLC | | 230,303 | 11,296 |
| Wyndham Worldwide Corp. | | 740,394 | 79,111 |
| | | | 558,151 |
| Internet & Direct Marketing Retail - 1.3% | | | |
| Priceline Group, Inc. (a) | | 48,900 | 93,495 |
| Media - 2.4% | | | |
| Altice NV Class A (a) | | 5,351,954 | 100,963 |
| Interpublic Group of Companies, Inc. | | 3,702,294 | 71,269 |
| | | | 172,232 |
| Multiline Retail - 2.2% | | | |
| B&M European Value Retail S.A. | | 4,404,452 | 23,241 |
| Dollar General Corp. | | 1,139,629 | 92,128 |
| JC Penney Corp., Inc. (a)(c) | | 12,832,085 | 35,930 |
| Ollie's Bargain Outlet Holdings, Inc. (a) | | 145,480 | 6,496 |
| | | | 157,795 |
| Specialty Retail - 0.9% | | | |
| Five Below, Inc. (a) | | 215,400 | 11,901 |
| Home Depot, Inc. | | 340,689 | 56,479 |
| | | | 68,380 |
|
| TOTAL CONSUMER DISCRETIONARY | | | 1,107,585 |
|
| CONSUMER STAPLES - 0.9% | | | |
| Food & Staples Retailing - 0.9% | | | |
| Wal-Mart Stores, Inc. | | 771,673 | 67,375 |
| ENERGY - 3.4% | | | |
| Energy Equipment & Services - 0.2% | | | |
| Shelf Drilling Ltd. | | 1,468,200 | 11,684 |
| Oil, Gas & Consumable Fuels - 3.2% | | | |
| Anadarko Petroleum Corp. | | 489,500 | 24,167 |
| Cheniere Energy, Inc.(a) | | 489,560 | 22,882 |
| Devon Energy Corp. | | 502,743 | 18,551 |
| Marathon Oil Corp. | | 3,943,330 | 56,074 |
| Southwestern Energy Co. (a) | | 12,168,173 | 67,533 |
| Whiting Petroleum Corp. (a)(c) | | 7,584,536 | 45,583 |
| | | | 234,790 |
|
| TOTAL ENERGY | | | 246,474 |
|
| FINANCIALS - 18.3% | | | |
| Banks - 3.1% | | | |
| Bank of America Corp. | | 3,891,150 | 106,579 |
| Citigroup, Inc. | | 1,027,900 | 75,551 |
| PNC Financial Services Group, Inc. | | 358,816 | 49,082 |
| | | | 231,212 |
| Capital Markets - 14.6% | | | |
| BlackRock, Inc. Class A | | 48,194 | 22,691 |
| Brookfield Asset Management, Inc. Class A | | 97,900 | 4,107 |
| CBOE Holdings, Inc. | | 718,849 | 81,273 |
| Charles Schwab Corp. | | 391,600 | 17,559 |
| CME Group, Inc. | | 1,561,471 | 214,187 |
| E*TRADE Financial Corp. (a) | | 1,116,000 | 48,646 |
| Goldman Sachs Group, Inc. | | 775,277 | 187,989 |
| Legg Mason, Inc. | | 450,178 | 17,188 |
| MarketAxess Holdings, Inc. | | 43,703 | 7,604 |
| Moody's Corp. | | 244,700 | 34,848 |
| Morgan Stanley | | 4,218,962 | 210,948 |
| MSCI, Inc. | | 575,447 | 67,534 |
| S&P Global, Inc. | | 554,266 | 86,726 |
| T. Rowe Price Group, Inc. | | 724,400 | 67,297 |
| | | | 1,068,597 |
| Insurance - 0.6% | | | |
| Progressive Corp. | | 264,300 | 12,858 |
| Willis Group Holdings PLC | | 205,600 | 33,118 |
| | | | 45,976 |
|
| TOTAL FINANCIALS | | | 1,345,785 |
|
| HEALTH CARE - 10.7% | | | |
| Biotechnology - 4.9% | | | |
| Alexion Pharmaceuticals, Inc. (a) | | 457,361 | 54,728 |
| Amgen, Inc. | | 990,109 | 173,487 |
| Celgene Corp. (a) | | 225,970 | 22,816 |
| Epizyme, Inc. (a) | | 172,800 | 2,886 |
| Portola Pharmaceuticals, Inc. (a) | | 180,100 | 8,899 |
| Vertex Pharmaceuticals, Inc. (a) | | 669,546 | 97,908 |
| | | | 360,724 |
| Health Care Equipment & Supplies - 2.5% | | | |
| Abiomed, Inc. (a) | | 260,800 | 50,314 |
| Align Technology, Inc. (a) | | 107,700 | 25,738 |
| Boston Scientific Corp. (a) | | 1,302,100 | 36,641 |
| Intuitive Surgical, Inc. (a) | | 117,600 | 44,142 |
| Varian Medical Systems, Inc. (a) | | 225,200 | 23,464 |
| | | | 180,299 |
| Health Care Providers & Services - 1.4% | | | |
| AMN Healthcare Services, Inc. (a) | | 97,900 | 4,298 |
| Cigna Corp. | | 244,700 | 48,260 |
| UnitedHealth Group, Inc. | | 222,697 | 46,815 |
| | | | 99,373 |
| Health Care Technology - 0.2% | | | |
| Medidata Solutions, Inc. (a) | | 200,300 | 15,069 |
| Life Sciences Tools & Services - 1.6% | | | |
| Agilent Technologies, Inc. | | 884,714 | 60,187 |
| Bio-Rad Laboratories, Inc. Class A (a) | | 59,915 | 13,169 |
| ICON PLC (a) | | 199,579 | 23,722 |
| Mettler-Toledo International, Inc. (a) | | 31,300 | 21,366 |
| | | | 118,444 |
| Pharmaceuticals - 0.1% | | | |
| The Medicines Company (a) | | 301,320 | 8,660 |
|
| TOTAL HEALTH CARE | | | 782,569 |
|
| INDUSTRIALS - 9.9% | | | |
| Aerospace & Defense - 0.8% | | | |
| The Boeing Co. | | 215,400 | 55,569 |
| Air Freight & Logistics - 0.3% | | | |
| XPO Logistics, Inc. (a) | | 282,140 | 19,566 |
| Airlines - 1.5% | | | |
| Air Canada (a) | | 3,624,300 | 71,806 |
| Ryanair Holdings PLC sponsored ADR (a) | | 324,592 | 36,390 |
| | | | 108,196 |
| Building Products - 1.8% | | | |
| A.O. Smith Corp. | | 699,500 | 41,410 |
| Allegion PLC | | 458,890 | 38,267 |
| Builders FirstSource, Inc. (a) | | 97,900 | 1,764 |
| Kingspan Group PLC (Ireland) | | 1,120,130 | 46,842 |
| | | | 128,283 |
| Commercial Services & Supplies - 1.3% | | | |
| Cintas Corp. | | 269,200 | 40,122 |
| Copart, Inc. (a) | | 1,192,966 | 43,293 |
| Waste Connection, Inc. (United States) | | 206,400 | 14,586 |
| | | | 98,001 |
| Machinery - 2.8% | | | |
| Caterpillar, Inc. | | 244,700 | 33,230 |
| Cummins, Inc. | | 195,800 | 34,633 |
| Deere & Co. | | 224,138 | 29,783 |
| Graco, Inc. | | 264,300 | 34,832 |
| Manitowoc Co., Inc. (a) | | 2,735,780 | 26,045 |
| PACCAR, Inc. | | 189,878 | 13,620 |
| Parker Hannifin Corp. | | 171,300 | 31,281 |
| | | | 203,424 |
| Marine - 0.5% | | | |
| Irish Continental Group PLC unit | | 5,928,035 | 39,498 |
| Professional Services - 0.2% | | | |
| IHS Markit Ltd. (a) | | 405,700 | 17,287 |
| Road & Rail - 0.7% | | | |
| Norfolk Southern Corp. | | 197,711 | 25,983 |
| Union Pacific Corp. | | 239,900 | 27,778 |
| | | | 53,761 |
|
| TOTAL INDUSTRIALS | | | 723,585 |
|
| INFORMATION TECHNOLOGY - 30.7% | | | |
| Communications Equipment - 0.2% | | | |
| Palo Alto Networks, Inc. (a) | | 88,100 | 12,968 |
| Electronic Equipment & Components - 0.2% | | | |
| Cognex Corp. | | 93,768 | 11,548 |
| Internet Software & Services - 8.6% | | | |
| Alarm.com Holdings, Inc. (a) | | 31,100 | 1,452 |
| Alibaba Group Holding Ltd. sponsored ADR (a) | | 646,100 | 119,457 |
| Alphabet, Inc. Class C (a) | | 244,479 | 248,547 |
| CarGurus, Inc. Class A (c) | | 349,665 | 11,399 |
| Coupa Software, Inc. | | 158,202 | 5,498 |
| Facebook, Inc. Class A (a) | | 743,585 | 133,890 |
| GoDaddy, Inc. (a) | | 401,400 | 18,745 |
| LogMeIn, Inc. | | 301,280 | 36,470 |
| MINDBODY, Inc. (a) | | 116,000 | 3,741 |
| New Relic, Inc. (a) | | 145,333 | 7,460 |
| Okta, Inc. | | 301,700 | 8,725 |
| The Trade Desk, Inc. (a)(c) | | 135,400 | 8,926 |
| VeriSign, Inc. (a)(c) | | 274,100 | 29,471 |
| | | | 633,781 |
| IT Services - 4.9% | | | |
| EPAM Systems, Inc. (a) | | 317,149 | 28,908 |
| ExlService Holdings, Inc. (a) | | 17,480 | 1,091 |
| Fiserv, Inc. (a) | | 236,802 | 30,649 |
| Gartner, Inc. (a) | | 286,274 | 35,873 |
| Paychex, Inc. | | 78,300 | 4,995 |
| PayPal Holdings, Inc. (a) | | 2,367,057 | 171,754 |
| Visa, Inc. Class A | | 783,320 | 86,150 |
| | | | 359,420 |
| Semiconductors & Semiconductor Equipment - 2.8% | | | |
| NVIDIA Corp. | | 508,600 | 105,184 |
| Taiwan Semiconductor Manufacturing Co. Ltd. sponsored ADR | | 1,292,300 | 54,703 |
| Texas Instruments, Inc. | | 467,696 | 45,222 |
| | | | 205,109 |
| Software - 8.7% | | | |
| Adobe Systems, Inc. (a) | | 1,257,546 | 220,272 |
| ANSYS, Inc. (a) | | 293,700 | 40,152 |
| Atlassian Corp. PLC (a) | | 234,483 | 11,342 |
| Autodesk, Inc. (a) | | 401,400 | 50,159 |
| Electronic Arts, Inc. (a) | | 968,238 | 115,801 |
| Everbridge, Inc. (a) | | 157,700 | 4,201 |
| Intuit, Inc. | | 93,471 | 14,116 |
| Microsoft Corp. | | 1,421,740 | 118,260 |
| Paycom Software, Inc. (a) | | 95,249 | 7,829 |
| Paylocity Holding Corp. (a) | | 156,600 | 8,364 |
| Take-Two Interactive Software, Inc. (a) | | 340,800 | 37,710 |
| Varonis Systems, Inc. (a) | | 203,300 | 8,864 |
| | | | 637,070 |
| Technology Hardware, Storage & Peripherals - 5.3% | | | |
| Apple, Inc. | | 2,304,900 | 389,618 |
|
| TOTAL INFORMATION TECHNOLOGY | | | 2,249,514 |
|
| MATERIALS - 8.1% | | | |
| Chemicals - 5.2% | | | |
| DowDuPont, Inc. | | 1,170,361 | 84,629 |
| Eastman Chemical Co. | | 264,300 | 24,001 |
| FMC Corp. | | 1,716,010 | 159,349 |
| Ingevity Corp. (a) | | 79,974 | 5,697 |
| LyondellBasell Industries NV Class A | | 261,813 | 27,105 |
| Sherwin-Williams Co. | | 68,500 | 27,068 |
| Sociedad Quimica y Minera de Chile SA (PN-B) sponsored ADR | | 312,954 | 18,696 |
| The Chemours Co. LLC | | 566,541 | 32,072 |
| | | | 378,617 |
| Construction Materials - 0.3% | | | |
| Eagle Materials, Inc. | | 183,685 | 19,392 |
| Containers & Packaging - 0.5% | | | |
| Avery Dennison Corp. | | 352,400 | 37,414 |
| Metals & Mining - 2.1% | | | |
| Freeport-McMoRan, Inc. (a) | | 3,050,700 | 42,649 |
| Glencore Xstrata PLC | | 8,224,739 | 39,653 |
| Rio Tinto PLC | | 1,107,752 | 52,353 |
| Vale SA sponsored ADR | | 2,447,400 | 23,960 |
| | | | 158,615 |
|
| TOTAL MATERIALS | | | 594,038 |
|
| REAL ESTATE - 0.4% | | | |
| Equity Real Estate Investment Trusts (REITs) - 0.4% | | | |
| Equinix, Inc. | | 60,143 | 27,876 |
| TELECOMMUNICATION SERVICES - 1.7% | | | |
| Wireless Telecommunication Services - 1.7% | | | |
| T-Mobile U.S., Inc. (a) | | 2,120,172 | 126,723 |
| TOTAL COMMON STOCKS | | | |
| (Cost $5,739,654) | | | 7,271,524 |
|
| Money Market Funds - 3.2% | | | |
| Fidelity Cash Central Fund, 1.10% (d) | | 168,660,050 | 168,694 |
| Fidelity Securities Lending Cash Central Fund 1.11% (d)(e) | | 63,066,510 | 63,073 |
| TOTAL MONEY MARKET FUNDS | | | |
| (Cost $231,763) | | | 231,767 |
| TOTAL INVESTMENT IN SECURITIES - 102.4% | | | |
| (Cost $5,971,417) | | | 7,503,291 |
| NET OTHER ASSETS (LIABILITIES) - (2.4)% | | | (172,636) |
| NET ASSETS - 100% | | | $7,330,655 |
Legend
(a) Non-income producing
(b) Affiliated company
(c) Security or a portion of the security is on loan at period end.
(d) Affiliated fund that is generally available only to investment companies and other accounts managed by Fidelity Investments. The rate quoted is the annualized seven-day yield of the fund at period end. A complete unaudited listing of the fund's holdings as of its most recent quarter end is available upon request. In addition, each Fidelity Central Fund's financial statements, which are not covered by the Fund's Report of Independent Registered Public Accounting Firm, are available on the SEC's website or upon request.
(e) Investment made with cash collateral received from securities on loan.
Affiliated Central Funds
Information regarding fiscal year to date income earned by the Fund from investments in Fidelity Central Funds is as follows:
| Fund | Income earned |
| | (Amounts in thousands) |
| Fidelity Cash Central Fund | $1,584 |
| Fidelity Securities Lending Cash Central Fund | 2,082 |
| Total | $3,666 |
Other Affiliated Issuers
An affiliated company is a company in which the Fund has ownership of at least 5% of the voting securities. Fiscal year to date transactions with companies which are or were affiliates are as follows:
| Affiliate (Amounts in thousands) | Value, beginning of period | Purchases | Sales Proceeds | Dividend Income | Realized Gain (loss) | Change in Unrealized appreciation (depreciation) | Value, end of period |
| Dalata Hotel Group PLC | $43,516 | $-- | $-- | $-- | $-- | $17,034 | $60,550 |
| Total | $43,516 | $-- | $-- | $-- | $-- | $17,034 | $60,550 |
Investment Valuation
The following is a summary of the inputs used, as of October 31, 2017, involving the Fund's assets and liabilities carried at fair value. The inputs or methodology used for valuing securities may not be an indication of the risk associated with investing in those securities. For more information on valuation inputs, and their aggregation into the levels used below, please refer to the Investment Valuation section in the accompanying Notes to Financial Statements.
| | Valuation Inputs at Reporting Date: |
| Description | Total | Level 1 | Level 2 | Level 3 |
| (Amounts in thousands) | | | | |
| Investments in Securities: | | | | |
| Equities: | | | | |
| Consumer Discretionary | $1,107,585 | $1,107,585 | $-- | $-- |
| Consumer Staples | 67,375 | 67,375 | -- | -- |
| Energy | 246,474 | 246,474 | -- | -- |
| Financials | 1,345,785 | 1,345,785 | -- | -- |
| Health Care | 782,569 | 782,569 | -- | -- |
| Industrials | 723,585 | 723,585 | -- | -- |
| Information Technology | 2,249,514 | 2,249,514 | -- | -- |
| Materials | 594,038 | 541,685 | 52,353 | -- |
| Real Estate | 27,876 | 27,876 | -- | -- |
| Telecommunication Services | 126,723 | 126,723 | -- | -- |
| Money Market Funds | 231,767 | 231,767 | -- | -- |
| Total Investments in Securities: | $7,503,291 | $7,450,938 | $52,353 | $-- |
Other Information
Distribution of investments by country or territory of incorporation, as a percentage of Total Net Assets, is as follows (Unaudited):
| United States of America | 87.5% |
| Ireland | 3.3% |
| Cayman Islands | 1.8% |
| Netherlands | 1.8% |
| Canada | 1.3% |
| United Kingdom | 1.1% |
| Others (Individually Less Than 1%) | 3.2% |
| | 100.0% |
See accompanying notes which are an integral part of the financial statements.
Financial Statements
Statement of Assets and Liabilities
| Amounts in thousands (except per-share amounts) | | October 31, 2017 |
| Assets | | |
Investment in securities, at value (including securities loaned of $60,370) — See accompanying schedule:
Unaffiliated issuers (cost $5,698,814) | $7,210,974 | |
| Fidelity Central Funds (cost $231,763) | 231,767 | |
| Other affiliated issuers (cost $40,840) | 60,550 | |
| Total Investment in Securities (cost $5,971,417) | | $7,503,291 |
| Cash | | 238 |
| Receivable for investments sold | | 53,155 |
| Receivable for fund shares sold | | 1,559 |
| Dividends receivable | | 2,512 |
| Distributions receivable from Fidelity Central Funds | | 487 |
| Prepaid expenses | | 16 |
| Other receivables | | 244 |
| Total assets | | 7,561,502 |
| Liabilities | | |
| Payable for investments purchased | $160,810 | |
| Payable for fund shares redeemed | 3,956 | |
| Accrued management fee | 2,015 | |
| Other affiliated payables | 816 | |
| Other payables and accrued expenses | 186 | |
| Collateral on securities loaned | 63,064 | |
| Total liabilities | | 230,847 |
| Net Assets | | $7,330,655 |
| Net Assets consist of: | | |
| Paid in capital | | $5,056,990 |
| Undistributed net investment income | | 49,558 |
| Accumulated undistributed net realized gain (loss) on investments and foreign currency transactions | | 692,240 |
| Net unrealized appreciation (depreciation) on investments and assets and liabilities in foreign currencies | | 1,531,867 |
| Net Assets | | $7,330,655 |
| Capital Appreciation: | | |
| Net Asset Value, offering price and redemption price per share ($5,156,510 ÷ 136,063 shares) | | $37.90 |
| Class K: | | |
| Net Asset Value, offering price and redemption price per share ($2,174,145 ÷ 57,233 shares) | | $37.99 |
See accompanying notes which are an integral part of the financial statements.
Statement of Operations
| Amounts in thousands | | Year ended October 31, 2017 |
| Investment Income | | |
| Dividends | | $110,276 |
| Income from Fidelity Central Funds | | 3,666 |
| Total income | | 113,942 |
| Expenses | | |
| Management fee | | |
| Basic fee | $38,860 | |
| Performance adjustment | (14,652) | |
| Transfer agent fees | 8,589 | |
| Accounting and security lending fees | 1,190 | |
| Custodian fees and expenses | 161 | |
| Independent trustees' fees and expenses | 28 | |
| Appreciation in deferred trustee compensation account | 1 | |
| Registration fees | 74 | |
| Audit | 66 | |
| Legal | 24 | |
| Miscellaneous | 64 | |
| Total expenses before reductions | 34,405 | |
| Expense reductions | (658) | 33,747 |
| Net investment income (loss) | | 80,195 |
| Realized and Unrealized Gain (Loss) | | |
| Net realized gain (loss) on: | | |
| Investment securities: | | |
| Unaffiliated issuers | 765,394 | |
| Fidelity Central Funds | 20 | |
| Foreign currency transactions | 191 | |
| Total net realized gain (loss) | | 765,605 |
| Change in net unrealized appreciation (depreciation) on: | | |
| Investment securities: | | |
| Unaffiliated issuers | 779,506 | |
| Fidelity Central Funds | (51) | |
| Other affiliated issuers | 17,034 | |
| Assets and liabilities in foreign currencies | 13 | |
| Total change in net unrealized appreciation (depreciation) | | 796,502 |
| Net gain (loss) | | 1,562,107 |
| Net increase (decrease) in net assets resulting from operations | | $1,642,302 |
See accompanying notes which are an integral part of the financial statements.
Statement of Changes in Net Assets
| Amounts in thousands | Year ended October 31, 2017 | Year ended October 31, 2016 |
| Increase (Decrease) in Net Assets | | |
| Operations | | |
| Net investment income (loss) | $80,195 | $81,754 |
| Net realized gain (loss) | 765,605 | 322,979 |
| Change in net unrealized appreciation (depreciation) | 796,502 | (657,770) |
| Net increase (decrease) in net assets resulting from operations | 1,642,302 | (253,037) |
| Distributions to shareholders from net investment income | (85,881) | (62,147) |
| Distributions to shareholders from net realized gain | (295,130) | (898,286) |
| Total distributions | (381,011) | (960,433) |
| Share transactions - net increase (decrease) | (842,529) | (304,573) |
| Total increase (decrease) in net assets | 418,762 | (1,518,043) |
| Net Assets | | |
| Beginning of period | 6,911,893 | 8,429,936 |
| End of period | $7,330,655 | $6,911,893 |
| Other Information | | |
| Undistributed net investment income end of period | $49,558 | $59,893 |
See accompanying notes which are an integral part of the financial statements.
Financial Highlights
Fidelity Capital Appreciation Fund
| Years ended October 31, | 2017 | 2016 | 2015 | 2014 | 2013 |
| Selected Per–Share Data | | | | | |
| Net asset value, beginning of period | $31.75 | $37.03 | $39.82 | $37.30 | $29.21 |
| Income from Investment Operations | | | | | |
| Net investment income (loss)A | .38 | .34 | .24 | .11 | .19 |
| Net realized and unrealized gain (loss) | 7.55 | (1.34) | 1.13 | 6.05 | 8.66 |
| Total from investment operations | 7.93 | (1.00) | 1.37 | 6.16 | 8.85 |
| Distributions from net investment income | (.39) | (.27) | (.10) | (.14) | (.17) |
| Distributions from net realized gain | (1.39) | (4.01) | (4.06) | (3.50) | (.59) |
| Total distributions | (1.78) | (4.28) | (4.16) | (3.64) | (.76) |
| Net asset value, end of period | $37.90 | $31.75 | $37.03 | $39.82 | $37.30 |
| Total ReturnB | 25.93% | (3.06)% | 3.50% | 17.86% | 31.03% |
| Ratios to Average Net AssetsC,D | | | | | |
| Expenses before reductions | .51% | .61% | .83% | .82% | .79% |
| Expenses net of fee waivers, if any | .51% | .61% | .83% | .82% | .79% |
| Expenses net of all reductions | .50% | .60% | .82% | .81% | .77% |
| Net investment income (loss) | 1.09% | 1.05% | .63% | .28% | .57% |
| Supplemental Data | | | | | |
| Net assets, end of period (in millions) | $5,157 | $4,809 | $5,906 | $6,132 | $5,920 |
| Portfolio turnover rateE | 129% | 120% | 126% | 112% | 156% |
A Calculated based on average shares outstanding during the period.
B Total returns would have been lower if certain expenses had not been reduced during the applicable periods shown.
C Fees and expenses of any underlying Fidelity Central Funds are not included in the Fund's expense ratio. The Fund indirectly bears its proportionate share of the expenses of any underlying Fidelity Central Funds.
D Expense ratios reflect operating expenses of the class. Expenses before reductions do not reflect amounts reimbursed by the investment adviser or reductions from brokerage service arrangements or reductions from other expense offset arrangements and do not represent the amount paid by the class during periods when reimbursements or reductions occur. Expenses net of fee waivers reflect expenses after reimbursement by the investment adviser but prior to reductions from brokerage service arrangements or other expense offset arrangements. Expenses net of all reductions represent the net expenses paid by the class.
E Amount does not include the portfolio activity of any underlying Fidelity Central Funds.
See accompanying notes which are an integral part of the financial statements.
Fidelity Capital Appreciation Fund Class K
| Years ended October 31, | 2017 | 2016 | 2015 | 2014 | 2013 |
| Selected Per–Share Data | | | | | |
| Net asset value, beginning of period | $31.83 | $37.11 | $39.90 | $37.38 | $29.28 |
| Income from Investment Operations | | | | | |
| Net investment income (loss)A | .41 | .37 | .28 | .15 | .23 |
| Net realized and unrealized gain (loss) | 7.57 | (1.33) | 1.14 | 6.06 | 8.67 |
| Total from investment operations | 7.98 | (.96) | 1.42 | 6.21 | 8.90 |
| Distributions from net investment income | (.43) | (.31) | (.15) | (.19) | (.21) |
| Distributions from net realized gain | (1.39) | (4.01) | (4.06) | (3.50) | (.59) |
| Total distributions | (1.82) | (4.32) | (4.21) | (3.69) | (.80) |
| Net asset value, end of period | $37.99 | $31.83 | $37.11 | $39.90 | $37.38 |
| Total ReturnB | 26.04% | (2.93)% | 3.62% | 17.97% | 31.19% |
| Ratios to Average Net AssetsC,D | | | | | |
| Expenses before reductions | .41% | .50% | .72% | .70% | .66% |
| Expenses net of fee waivers, if any | .41% | .50% | .72% | .70% | .66% |
| Expenses net of all reductions | .40% | .48% | .72% | .70% | .63% |
| Net investment income (loss) | 1.20% | 1.17% | .74% | .40% | .70% |
| Supplemental Data | | | | | |
| Net assets, end of period (in millions) | $2,174 | $2,103 | $2,524 | $2,460 | $2,125 |
| Portfolio turnover rateE | 129% | 120% | 126% | 112% | 156% |
A Calculated based on average shares outstanding during the period.
B Total returns would have been lower if certain expenses had not been reduced during the applicable periods shown.
C Fees and expenses of any underlying Fidelity Central Funds are not included in the Fund's expense ratio. The Fund indirectly bears its proportionate share of the expenses of any underlying Fidelity Central Funds.
D Expense ratios reflect operating expenses of the class. Expenses before reductions do not reflect amounts reimbursed by the investment adviser or reductions from brokerage service arrangements or reductions from other expense offset arrangements and do not represent the amount paid by the class during periods when reimbursements or reductions occur. Expenses net of fee waivers reflect expenses after reimbursement by the investment adviser but prior to reductions from brokerage service arrangements or other expense offset arrangements. Expenses net of all reductions represent the net expenses paid by the class.
E Amount does not include the portfolio activity of any underlying Fidelity Central Funds.
See accompanying notes which are an integral part of the financial statements.
Notes to Financial Statements
For the period ended October 31, 2017
(Amounts in thousands except percentages)
1. Organization.
Fidelity Capital Appreciation Fund (the Fund) is a fund of Fidelity Capital Trust (the Trust) and is authorized to issue an unlimited number of shares. The Trust is registered under the Investment Company Act of 1940, as amended (the 1940 Act), as an open-end management investment company organized as a Massachusetts business trust. The Fund offers Capital Appreciation and Class K shares, each of which has equal rights as to assets and voting privileges. Each class has exclusive voting rights with respect to matters that affect that class.
2. Investments in Fidelity Central Funds.
The Fund invests in Fidelity Central Funds, which are open-end investment companies generally available only to other investment companies and accounts managed by the investment adviser and its affiliates. The Fund's Schedule of Investments lists each of the Fidelity Central Funds held as of period end, if any, as an investment of the Fund, but does not include the underlying holdings of each Fidelity Central Fund. As an Investing Fund, the Fund indirectly bears its proportionate share of the expenses of the underlying Fidelity Central Funds.
The Money Market Central Funds seek preservation of capital and current income and are managed by Fidelity Investments Money Management, Inc. (FIMM), an affiliate of the investment adviser. Annualized expenses of the Money Market Central Funds as of their most recent shareholder report date are less than .005%.
A complete unaudited list of holdings for each Fidelity Central Fund is available upon request or at the Securities and Exchange Commission (the SEC) website at www.sec.gov. In addition, the financial statements of the Fidelity Central Funds, which are not covered by the Fund's Report of Independent Registered Public Accounting Firm, are available on the SEC website or upon request.
3. Significant Accounting Policies.
The Fund is an investment company and applies the accounting and reporting guidance of the Financial Accounting Standards Board (FASB) Accounting Standards Codification Topic 946 Financial Services – Investments Companies. The financial statements have been prepared in conformity with accounting principles generally accepted in the United States of America (GAAP), which require management to make certain estimates and assumptions at the date of the financial statements. Actual results could differ from those estimates. Subsequent events, if any, through the date that the financial statements were issued have been evaluated in the preparation of the financial statements. The following summarizes the significant accounting policies of the Fund:
Investment Valuation. Investments are valued as of 4:00 p.m. Eastern time on the last calendar day of the period. The Board of Trustees (the Board) has delegated the day to day responsibility for the valuation of the Fund's investments to the Fair Value Committee (the Committee) established by the Fund's investment adviser. In accordance with valuation policies and procedures approved by the Board, the Fund attempts to obtain prices from one or more third party pricing vendors or brokers to value its investments. When current market prices, quotations or currency exchange rates are not readily available or reliable, investments will be fair valued in good faith by the Committee, in accordance with procedures adopted by the Board. Factors used in determining fair value vary by investment type and may include market or investment specific events. The frequency with which these procedures are used cannot be predicted and they may be utilized to a significant extent. The Committee oversees the Fund's valuation policies and procedures and reports to the Board on the Committee's activities and fair value determinations. The Board monitors the appropriateness of the procedures used in valuing the Fund's investments and ratifies the fair value determinations of the Committee.
The Fund categorizes the inputs to valuation techniques used to value its investments into a disclosure hierarchy consisting of three levels as shown below:
- Level 1 – quoted prices in active markets for identical investments
- Level 2 – other significant observable inputs (including quoted prices for similar investments, interest rates, prepayment speeds, etc.)
- Level 3 – unobservable inputs (including the Fund's own assumptions based on the best information available)
Valuation techniques used to value the Fund's investments by major category are as follows:
Equity securities, including restricted securities, for which market quotations are readily available, are valued at the last reported sale price or official closing price as reported by a third party pricing vendor on the primary market or exchange on which they are traded and are categorized as Level 1 in the hierarchy. In the event there were no sales during the day or closing prices are not available, securities are valued at the last quoted bid price or may be valued using the last available price and are generally categorized as Level 2 in the hierarchy. For foreign equity securities, when market or security specific events arise, comparisons to the valuation of American Depositary Receipts (ADRs), futures contracts, Exchange-Traded Funds (ETFs) and certain indexes as well as quoted prices for similar securities may be used and would be categorized as Level 2 in the hierarchy. Utilizing these techniques may result in transfers between Level 1 and Level 2. For equity securities, including restricted securities, where observable inputs are limited, assumptions about market activity and risk are used and these securities may be categorized as Level 3 in the hierarchy.
Investments in open-end mutual funds, including the Fidelity Central Funds, are valued at their closing net asset value (NAV) each business day and are categorized as Level 1 in the hierarchy.
Changes in valuation techniques may result in transfers in or out of an assigned level within the disclosure hierarchy. The aggregate value of investments by input level as of October 31, 2017 is included at the end of the Fund's Schedule of Investments.
Foreign Currency. The Fund may use foreign currency contracts to facilitate transactions in foreign-denominated securities. Gains and losses from these transactions may arise from changes in the value of the foreign currency or if the counterparties do not perform under the contracts' terms.
Foreign-denominated assets, including investment securities, and liabilities are translated into U.S. dollars at the exchange rates at period end. Purchases and sales of investment securities, income and dividends received and expenses denominated in foreign currencies are translated into U.S. dollars at the exchange rate in effect on the transaction date.
The effects of exchange rate fluctuations on investments are included with the net realized and unrealized gain (loss) on investment securities. Other foreign currency transactions resulting in realized and unrealized gain (loss) are disclosed separately.
Investment Transactions and Income. For financial reporting purposes, the Fund's investment holdings and NAV include trades executed through the end of the last business day of the period. The NAV per share for processing shareholder transactions is calculated as of the close of business of the New York Stock Exchange (NYSE), normally 4:00 p.m. Eastern time and includes trades executed through the end of the prior business day. Gains and losses on securities sold are determined on the basis of identified cost and includes proceeds received from litigation. Dividend income is recorded on the ex-dividend date, except for certain dividends from foreign securities where the ex-dividend date may have passed, which are recorded as soon as the Fund is informed of the ex-dividend date. Non-cash dividends included in dividend income, if any, are recorded at the fair market value of the securities received. Income and capital gain distributions from Fidelity Central Funds, if any, are recorded on the ex-dividend date. Certain distributions received by the Fund represent a return of capital or capital gain. The Fund determines the components of these distributions subsequent to the ex-dividend date, based upon receipt of tax filings or other correspondence relating to the underlying investment. These distributions are recorded as a reduction of cost of investments and/or as a realized gain. Investment income is recorded net of foreign taxes withheld where recovery of such taxes is uncertain.
Class Allocations and Expenses. Investment income, realized and unrealized capital gains and losses, common expenses of the Fund, and certain fund-level expense reductions, if any, are allocated daily on a pro-rata basis to each class based on the relative net assets of each class to the total net assets of the Fund. Each class differs with respect to transfer agent fees incurred. Certain expense reductions may also differ by class. For the reporting period, the allocated portion of income and expenses to each class as a percent of its average net assets may vary due to the timing of recording these transactions in relation to fluctuating net assets of the classes. Expenses directly attributable to a fund are charged to that fund. Expenses attributable to more than one fund are allocated among the respective funds on the basis of relative net assets or other appropriate methods. Expense estimates are accrued in the period to which they relate and adjustments are made when actual amounts are known.
Deferred Trustee Compensation. Under a Deferred Compensation Plan (the Plan), independent Trustees may elect to defer receipt of a portion of their annual compensation. Deferred amounts are invested in a cross-section of Fidelity funds, are marked-to-market and remain in the Fund until distributed in accordance with the Plan. The investment of deferred amounts and the offsetting payable to the Trustees are included in the accompanying Statement of Assets and Liabilities.
Income Tax Information and Distributions to Shareholders. Each year, the Fund intends to qualify as a regulated investment company under Subchapter M of the Internal Revenue Code, including distributing substantially all of its taxable income and realized gains. As a result, no provision for U.S. Federal income taxes is required. As of October 31, 2017, the Fund did not have any unrecognized tax benefits in the financial statements; nor is the Fund aware of any tax positions for which it is reasonably possible that the total amounts of unrecognized tax benefits will significantly change in the next twelve months. The Fund files a U.S. federal tax return, in addition to state and local tax returns as required. The Fund's federal income tax returns are subject to examination by the Internal Revenue Service (IRS) for a period of three fiscal years after they are filed. State and local tax returns may be subject to examination for an additional fiscal year depending on the jurisdiction. Foreign taxes are provided for based on the Fund's understanding of the tax rules and rates that exist in the foreign markets in which it invests.
Distributions are declared and recorded on the ex-dividend date. Income dividends and capital gain distributions are declared separately for each class. Income and capital gain distributions are determined in accordance with income tax regulations, which may differ from GAAP. In addition, the Fund claimed a portion of the payment made to redeeming shareholders as a distribution for income tax purposes.
Capital accounts within the financial statements are adjusted for permanent book-tax differences. These adjustments have no impact on net assets or the results of operations. Capital accounts are not adjusted for temporary book-tax differences which will reverse in a subsequent period.
Book-tax differences are primarily due to foreign currency transactions, deferred trustees compensation and losses deferred due to wash sales.
As of period end, the cost and unrealized appreciation (depreciation) in securities, and derivatives if applicable, for federal income tax purposes were as follows:
| Gross unrealized appreciation | $1,641,922 |
| Gross unrealized depreciation | (113,332) |
| Net unrealized appreciation (depreciation) | $1,528,590 |
| Tax Cost | $5,974,701 |
The tax-based components of distributable earnings as of period end were as follows:
| Undistributed ordinary income | $100,958 |
| Undistributed long-term capital gain | $644,232 |
| Net unrealized appreciation (depreciation) on securities and other investments | $1,528,584 |
The tax character of distributions paid was as follows:
| | October 31, 2017 | October 31, 2016 |
| Ordinary Income | $85,881 | $ 62,147 |
| Long-term Capital Gains | 295,130 | 898,286 |
| Total | $381,011 | $ 960,433 |
4. Purchases and Sales of Investments.
Purchases and sales of securities, other than short-term securities aggregated $8,951,380 and $9,973,504, respectively.
5. Fees and Other Transactions with Affiliates.
Management Fee. Fidelity Management & Research Company (the investment adviser) and its affiliates provide the Fund with investment management related services for which the Fund pays a monthly management fee. The management fee is the sum of an individual fund fee rate that is based on an annual rate of .30% of the Fund's average net assets and an annualized group fee rate that averaged .25% during the period. The group fee rate is based upon the average net assets of all the mutual funds advised by the investment adviser, including any mutual funds previously advised by the investment adviser that are currently advised by Fidelity SelectCo, LLC, an affiliate of the investment adviser. The group fee rate decreases as assets under management increase and increases as assets under management decrease. In addition, the management fee is subject to a performance adjustment (up to a maximum of +/- .20% of the Fund's average net assets over a 36 month performance period. The upward or downward adjustment to the management fee is based on the relative investment performance of Capital Appreciation as compared to its benchmark index, the S&P 500 Index, over the same 36 month performance period. For the reporting period, the total annual management fee rate, including the performance adjustment, was .34% of the Fund's average net assets. The performance adjustment included in the management fee rate may be higher or lower than the maximum performance adjustment rate due to the difference between the average net assets for the reporting and performance periods.
Transfer Agent Fees. Fidelity Investments Institutional Operations Company, Inc., (FIIOC), an affiliate of the investment adviser, is the transfer, dividend disbursing and shareholder servicing agent for each class of the Fund. FIIOC receives account fees and asset-based fees that vary according to the account size and type of account of the shareholders of Capital Appreciation, except for Class K. FIIOC receives an asset-based fee of Class K's average net assets. FIIOC pays for typesetting, printing and mailing of shareholder reports, except proxy statements.
For the period, transfer agent fees for each applicable class were as follows:
| | Amount | % of
Class-Level Average
Net Assets |
| Capital Appreciation | $7,591 | .15 |
| Class K | 998 | .05 |
| | $8,589 | |
Accounting and Security Lending Fees. Fidelity Service Company, Inc. (FSC), an affiliate of the investment adviser, maintains the Fund's accounting records. The accounting fee is based on the level of average net assets for each month. Under a separate contract, FSC administers the security lending program. The security lending fee is based on the number and duration of lending transactions.
Brokerage Commissions. The Fund placed a portion of its portfolio transactions with brokerage firms which are affiliates of the investment adviser. Brokerage commissions are included in net realized gain (loss) and change in net unrealized appreciation (depreciation) in the Statement of Operations. The commissions paid to these affiliated firms were $216 for the period.
Interfund Lending Program. Pursuant to an Exemptive Order issued by the SEC, the Fund, along with other registered investment companies having management contracts with Fidelity Management & Research Company (FMR) or other affiliated entities of FMR, may participate in an interfund lending program. This program provides an alternative credit facility allowing the funds to borrow from, or lend money to, other participating affiliated funds. At period end, there were no interfund loans outstanding. The Fund's activity in this program during the period for which loans were outstanding was as follows:
| Borrower or Lender | Average Loan Balance | Weighted Average Interest Rate | Interest Expense |
| Borrower | $5,027 | 1.09% | $–(a) |
(a) In the amount less than five hundred dollars.
Interfund Trades. The Fund may purchase from or sell securities to other Fidelity Funds under procedures adopted by the Board. The procedures have been designed to ensure these interfund trades are executed in accordance with Rule 17a-7 of the 1940 Act. Interfund trades are included within the respective purchases and sales amounts shown in the Purchases and Sales of Investments note.
Other. During the period, the investment adviser reimbursed the Fund for certain losses in the amount of $8.
6. Committed Line of Credit.
The Fund participates with other funds managed by the investment adviser or an affiliate in a $4.25 billion credit facility (the "line of credit") to be utilized for temporary or emergency purposes to fund shareholder redemptions or for other short-term liquidity purposes. The Fund has agreed to pay commitment fees on its pro-rata portion of the line of credit, which amounted to $23 and is reflected in Miscellaneous expenses on the Statement of Operations. During the period, the Fund did not borrow on this line of credit
7. Security Lending.
The Fund lends portfolio securities through a lending agent from time to time in order to earn additional income. For equity securities, a lending agent is used and may loan securities to certain qualified borrowers, including Fidelity Capital Markets (FCM), a broker-dealer affiliated with the Fund. On the settlement date of the loan, the Fund receives collateral (in the form of U.S. Treasury obligations, letters of credit and/or cash) against the loaned securities and maintains collateral in an amount not less than 100% of the market value of the loaned securities during the period of the loan. The market value of the loaned securities is determined at the close of business of the Fund and any additional required collateral is delivered to the Fund on the next business day. The Fund or borrower may terminate the loan at any time, and if the borrower defaults on its obligation to return the securities loaned because of insolvency or other reasons, the Fund may apply collateral received from the borrower against the obligation. The Fund may experience delays and costs in recovering the securities loaned. Any cash collateral received is invested in the Fidelity Securities Lending Cash Central Fund. The value of loaned securities and cash collateral at period end are disclosed on the Fund's Statement of Assets and Liabilities. At period end, there were no security loans outstanding with FCM. Security lending income represents the income earned on investing cash collateral, less rebates paid to borrowers and any lending agent fees associated with the loan, plus any premium payments received for lending certain types of securities. Security lending income is presented in the Statement of Operations as a component of income from Fidelity Central Funds. Total security lending income during the period amounted to $2,082, including $11 from securities loaned to FCM.
8. Expense Reductions.
Commissions paid to certain brokers with whom the investment adviser, or its affiliates, places trades on behalf of the Fund include an amount in addition to trade execution, which may be rebated back to the Fund to offset certain expenses. This amount totaled $592 for the period. Through arrangements with the Fund's custodian, credits realized as a result of certain uninvested cash balances were used to reduce the Fund's expenses. During the period, these credits reduced the Fund's custody expenses by $2.
In addition, during the period the investment adviser reimbursed and/or waived a portion of fund-level operating expenses in the amount of $64.
9. Distributions to Shareholders.
Distributions to shareholders of each class were as follows:
| | Year ended
October 31, 2017 | Year ended
October 31, 2016 |
| From net investment income | | |
| Capital Appreciation | $57,933 | $41,709 |
| Class K | 27,948 | 20,438 |
| Total | $85,881 | $62,147 |
| From net realized gain | | |
| Capital Appreciation | $204,981 | $631,322 |
| Class K | 90,149 | 266,964 |
| Total | $295,130 | $898,286 |
10. Share Transactions.
Share transactions for each class were as follows and may contain automatic conversions between classes or exchanges between affiliated funds:
| | Shares | Shares | Dollars | Dollars |
| | Year ended October 31, 2017 | Year ended October 31, 2016 | Year ended October 31, 2017 | Year ended October 31, 2016 |
| Capital Appreciation | | | | |
| Shares sold | 6,471 | 8,622 | $219,571 | $274,837 |
| Reinvestment of distributions | 7,688 | 19,416 | 248,876 | 635,303 |
| Shares redeemed | (29,530) | (36,117) | (1,007,227) | (1,157,228) |
| Net increase (decrease) | (15,371) | (8,079) | $(538,780) | $(247,088) |
| Class K | | | | |
| Shares sold | 6,448 | 9,379 | $221,397 | $299,911 |
| Reinvestment of distributions | 3,643 | 8,770 | 118,097 | 287,402 |
| Shares redeemed | (18,939) | (20,071) | (643,243) | (644,798) |
| Net increase (decrease) | (8,848) | (1,922) | $(303,749) | $(57,485) |
11. Other.
The Fund's organizational documents provide former and current trustees and officers with a limited indemnification against liabilities arising in connection with the performance of their duties to the Fund. In the normal course of business, the Fund may also enter into contracts that provide general indemnifications. The Fund's maximum exposure under these arrangements is unknown as this would be dependent on future claims that may be made against the Fund. The risk of material loss from such claims is considered remote.
Report of Independent Registered Public Accounting Firm
To the Trustees of Fidelity Capital Trust and Shareholders of Fidelity Capital Appreciation Fund:
In our opinion, the accompanying statement of assets and liabilities, including the schedule of investments, and the related statements of operations and of changes in net assets and the financial highlights present fairly, in all material respects, the financial position of Fidelity Capital Appreciation Fund (a fund of Fidelity Capital Trust) as of October 31, 2017, the results of its operations for the year then ended, the changes in its net assets for each of the two years in the period then ended and the financial highlights for each of the five years in the period then ended, in conformity with accounting principles generally accepted in the United States of America. These financial statements and financial highlights (hereafter referred to as “financial statements”) are the responsibility of the Fidelity Capital Appreciation Fund’s management. Our responsibility is to express an opinion on these financial statements based on our audits. We conducted our audits of these financial statements in accordance with the standards of the Public Company Accounting Oversight Board (United States). Those standards require that we plan and perform the audit to obtain reasonable assurance about whether the financial statements are free of material misstatement. An audit includes examining, on a test basis, evidence supporting the amounts and disclosures in the financial statements, assessing the accounting principles used and significant estimates made by management, and evaluating the overall financial statement presentation. Our procedures included confirmation of securities owned as of October 31, 2017 by correspondence with the custodian and brokers; when replies were not received from brokers, we performed other auditing procedures. We believe that our audits provide a reasonable basis for our opinion.
PricewaterhouseCoopers LLP
Boston, Massachusetts
December 12, 2017
Trustees and Officers
The Trustees, Members of the Advisory Board (if any), and officers of the trust and fund, as applicable, are listed below. The Board of Trustees governs the fund and is responsible for protecting the interests of shareholders. The Trustees are experienced executives who meet periodically throughout the year to oversee the fund's activities, review contractual arrangements with companies that provide services to the fund, oversee management of the risks associated with such activities and contractual arrangements, and review the fund's performance. Each of the Trustees oversees 190 funds.
The Trustees hold office without limit in time except that (a) any Trustee may resign; (b) any Trustee may be removed by written instrument, signed by at least two-thirds of the number of Trustees prior to such removal; (c) any Trustee who requests to be retired or who has become incapacitated by illness or injury may be retired by written instrument signed by a majority of the other Trustees; and (d) any Trustee may be removed at any special meeting of shareholders by a two-thirds vote of the outstanding voting securities of the trust. Each Trustee who is not an interested person (as defined in the 1940 Act) of the trust and the fund is referred to herein as an Independent Trustee. Each Independent Trustee shall retire not later than the last day of the calendar year in which his or her 75th birthday occurs. The Independent Trustees may waive this mandatory retirement age policy with respect to individual Trustees. Officers and Advisory Board Members hold office without limit in time, except that any officer or Advisory Board Member may resign or may be removed by a vote of a majority of the Trustees at any regular meeting or any special meeting of the Trustees. Except as indicated, each individual has held the office shown or other offices in the same company for the past five years.
The fund’s Statement of Additional Information (SAI) includes more information about the Trustees. To request a free copy, call Fidelity at 1-800-835-5092.
Experience, Skills, Attributes, and Qualifications of the Trustees. The Governance and Nominating Committee has adopted a statement of policy that describes the experience, qualifications, attributes, and skills that are necessary and desirable for potential Independent Trustee candidates (Statement of Policy). The Board believes that each Trustee satisfied at the time he or she was initially elected or appointed a Trustee, and continues to satisfy, the standards contemplated by the Statement of Policy. The Governance and Nominating Committee also engages professional search firms to help identify potential Independent Trustee candidates who have the experience, qualifications, attributes, and skills consistent with the Statement of Policy. From time to time, additional criteria based on the composition and skills of the current Independent Trustees, as well as experience or skills that may be appropriate in light of future changes to board composition, business conditions, and regulatory or other developments, have also been considered by the professional search firms and the Governance and Nominating Committee. In addition, the Board takes into account the Trustees' commitment and participation in Board and committee meetings, as well as their leadership of standing and ad hoc committees throughout their tenure.
In determining that a particular Trustee was and continues to be qualified to serve as a Trustee, the Board has considered a variety of criteria, none of which, in isolation, was controlling. The Board believes that, collectively, the Trustees have balanced and diverse experience, qualifications, attributes, and skills, which allow the Board to operate effectively in governing the fund and protecting the interests of shareholders. Information about the specific experience, skills, attributes, and qualifications of each Trustee, which in each case led to the Board's conclusion that the Trustee should serve (or continue to serve) as a trustee of the fund, is provided below.
Board Structure and Oversight Function. James C. Curvey is an interested person and currently serves as Chairman. The Trustees have determined that an interested Chairman is appropriate and benefits shareholders because an interested Chairman has a personal and professional stake in the quality and continuity of services provided to the fund. Independent Trustees exercise their informed business judgment to appoint an individual of their choosing to serve as Chairman, regardless of whether the Trustee happens to be independent or a member of management. The Independent Trustees have determined that they can act independently and effectively without having an Independent Trustee serve as Chairman and that a key structural component for assuring that they are in a position to do so is for the Independent Trustees to constitute a substantial majority for the Board. The Independent Trustees also regularly meet in executive session. Ned C. Lautenbach serves as Chairman of the Independent Trustees and as such (i) acts as a liaison between the Independent Trustees and management with respect to matters important to the Independent Trustees and (ii) with management prepares agendas for Board meetings.
Fidelity® funds are overseen by different Boards of Trustees. The fund's Board oversees Fidelity's high income and certain equity funds, and other Boards oversee Fidelity's investment-grade bond, money market, asset allocation, and sector funds. The asset allocation funds may invest in Fidelity® funds overseen by the fund's Board. The use of separate Boards, each with its own committee structure, allows the Trustees of each group of Fidelity® funds to focus on the unique issues of the funds they oversee, including common research, investment, and operational issues. On occasion, the separate Boards establish joint committees to address issues of overlapping consequences for the Fidelity® funds overseen by each Board.
The Trustees operate using a system of committees to facilitate the timely and efficient consideration of all matters of importance to the Trustees, the fund, and fund shareholders and to facilitate compliance with legal and regulatory requirements and oversight of the fund's activities and associated risks. The Board, acting through its committees, has charged FMR and its affiliates with (i) identifying events or circumstances the occurrence of which could have demonstrably adverse effects on the fund's business and/or reputation; (ii) implementing processes and controls to lessen the possibility that such events or circumstances occur or to mitigate the effects of such events or circumstances if they do occur; and (iii) creating and maintaining a system designed to evaluate continuously business and market conditions in order to facilitate the identification and implementation processes described in (i) and (ii) above. Because the day-to-day operations and activities of the fund are carried out by or through FMR, its affiliates, and other service providers, the fund's exposure to risks is mitigated but not eliminated by the processes overseen by the Trustees. While each of the Board's committees has responsibility for overseeing different aspects of the fund's activities, oversight is exercised primarily through the Operations, Audit, and Compliance Committees. In addition, the Independent Trustees have worked with FMR to enhance the Board's oversight of investment and financial risks, legal and regulatory risks, technology risks, and operational risks, including the development of additional risk reporting to the Board. For example, a working group comprised of Independent Trustees and FMR has worked and continues to work to review the Fidelity® funds' valuation-related activities, reporting and risk management. Appropriate personnel, including but not limited to the fund's Chief Compliance Officer (CCO), FMR's internal auditor, the independent accountants, the fund's Treasurer and portfolio management personnel, make periodic reports to the Board's committees, as appropriate, including an annual review of Fidelity's risk management program for the Fidelity® funds. The responsibilities of each standing committee, including their oversight responsibilities, are described further under "Standing Committees of the Trustees."
Interested Trustees*:
Correspondence intended for a Trustee who is an interested person may be sent to Fidelity Investments, 245 Summer Street, Boston, Massachusetts 02210.
Name, Year of Birth; Principal Occupations and Other Relevant Experience+
James C. Curvey (1935)
Year of Election or Appointment: 2007
Trustee
Chairman of the Board of Trustees
Mr. Curvey also serves as Trustee of other Fidelity® funds. Mr. Curvey is a Director of Fidelity Research & Analysis Co. (investment adviser firm, 2009-present), and Vice Chairman (2007-present) and Director of FMR LLC (diversified financial services company). In addition, Mr. Curvey serves as an Overseer for the Boston Symphony Orchestra and a member of the board of Artis-Naples, Naples, Florida, and as a Trustee for Brewster Academy, Wolfeboro, New Hampshire. Previously, Mr. Curvey served as a Director of Fidelity Investments Money Management, Inc. (investment adviser firm, 2009-2014) and a Director of FMR and FMR Co., Inc. (investment adviser firms, 2007-2014).
Charles S. Morrison (1960)
Year of Election or Appointment: 2014
Trustee
Mr. Morrison also serves as Trustee of other funds. He serves as President of Fidelity Management & Research Company (FMR) (investment adviser firm, 2016-present), a Director of Fidelity Investments Money Management, Inc. (FIMM) (investment adviser firm, 2014-present), Director of Fidelity SelectCo, LLC (investment adviser firm, 2014-present), President, Asset Management (2014-present), and is an employee of Fidelity Investments. Previously, Mr. Morrison served as Vice President of Fidelity's Fixed Income and Asset Allocation Funds (2012-2014), President, Fixed Income (2011-2014), Vice President of Fidelity's Money Market Funds (2005-2009), President, Money Market Group Leader of FMR (investment adviser firm, 2009), and Senior Vice President, Money Market Group of FMR (2004-2009). Mr. Morrison also served as Vice President of Fidelity's Bond Funds (2002-2005), certain Balanced Funds (2002-2005), and certain Asset Allocation Funds (2002-2007), and as Senior Vice President (2002-2005) of Fidelity's Bond Division.
* Determined to be an “Interested Trustee” by virtue of, among other things, his or her affiliation with the trust or various entities under common control with FMR.
+ The information includes the Trustee's principal occupation during the last five years and other information relating to the experience, attributes, and skills relevant to the Trustee's qualifications to serve as a Trustee, which led to the conclusion that the Trustee should serve as a Trustee for the fund.
Independent Trustees:
Correspondence intended for an Independent Trustee may be sent to Fidelity Investments, P.O. Box 55235, Boston, Massachusetts 02205-5235.
Name, Year of Birth; Principal Occupations and Other Relevant Experience+
Dennis J. Dirks (1948)
Year of Election or Appointment: 2005
Trustee
Mr. Dirks also serves as Trustee of other Fidelity® funds. Prior to his retirement in May 2003, Mr. Dirks was Chief Operating Officer and a member of the Board of The Depository Trust & Clearing Corporation (DTCC). He also served as President, Chief Operating Officer, and Board member of The Depository Trust Company (DTC) and President and Board member of the National Securities Clearing Corporation (NSCC). In addition, Mr. Dirks served as Chief Executive Officer and Board member of the Government Securities Clearing Corporation, Chief Executive Officer and Board member of the Mortgage-Backed Securities Clearing Corporation, as a Trustee and a member of the Finance Committee of Manhattan College (2005-2008), as a Trustee and a member of the Finance Committee of AHRC of Nassau County (2006-2008), as a member of the Independent Directors Council (IDC) Governing Council (2010-2015), and as a member of the Board of Directors for The Brookville Center for Children’s Services, Inc. (2009-2017). Mr. Dirks is a member of the Finance Committee (2016-present) and Board of Directors (2017-present) of the Asolo Repertory Theatre.
Alan J. Lacy (1953)
Year of Election or Appointment: 2008
Trustee
Mr. Lacy also serves as Trustee of other Fidelity® funds. Mr. Lacy serves as a Director of Bristol-Myers Squibb Company (global pharmaceuticals, 2008-present). He is a Trustee of the California Chapter of The Nature Conservancy (2015-present) and a Director of the Center for Advanced Study in the Behavioral Sciences at Stanford University (2015-present). In addition, Mr. Lacy served as Senior Adviser (2007-2014) of Oak Hill Capital Partners, L.P. (private equity) and also served as Chief Executive Officer (2005) and Vice Chairman (2005-2006) of Sears Holdings Corporation (retail) and Chief Executive Officer and Chairman of the Board of Sears, Roebuck and Co. (retail, 2000-2005). Previously, Mr. Lacy served as Chairman (2014-2017) and a member (2010-2017) of the Board of Directors of Dave & Buster’s Entertainment, Inc. (restaurant and entertainment complexes), as Chairman (2008-2011) and a member (2006-2015) of the Board of Trustees of the National Parks Conservation Association, and as a member of the Board of Directors for The Hillman Companies, Inc. (hardware wholesalers, 2010-2014), Earth Fare, Inc. (retail grocery, 2010-2014), and The Western Union Company (global money transfer, 2006-2011).
Ned C. Lautenbach (1944)
Year of Election or Appointment: 2000
Trustee
Chairman of the Independent Trustees
Mr. Lautenbach also serves as Trustee of other Fidelity® funds. Mr. Lautenbach currently serves as Vice Chair of the Board of Governors, State University System of Florida (2013-present) and is a member of the Council on Foreign Relations (1994-present). He is also a member and has most recently served as Chairman of the Board of Directors of Artis-Naples (2012-present). Previously, Mr. Lautenbach served as a member and then Lead Director of the Board of Directors of Eaton Corporation (diversified industrial, 1997-2016). He was also a Partner and Advisory Partner at Clayton, Dubilier & Rice, LLC (private equity investment, 1998-2010), as well as a Director of Sony Corporation (2006-2007). In addition, Mr. Lautenbach also had a 30-year career with IBM (technology company) during which time he served as Senior Vice President and a member of the Corporate Executive Committee (1968-1998).
Joseph Mauriello (1944)
Year of Election or Appointment: 2008
Trustee
Mr. Mauriello also serves as Trustee of other Fidelity® funds. Prior to his retirement in January 2006, Mr. Mauriello served in numerous senior management positions including Deputy Chairman and Chief Operating Officer (2004-2005), and Vice Chairman of Financial Services (2002-2004) of KPMG LLP US (professional services, 1965-2005). Mr. Mauriello currently serves as a member of the Board of Directors of XL Group plc. (global insurance and re-insurance, 2006-present) and the Independent Directors Council (IDC) Governing Council (2015-present). Previously, Mr. Mauriello served as a Director of the Hamilton Funds of the Bank of New York (2006-2007) and of Arcadia Resources Inc. (health care services and products, 2007-2012).
Cornelia M. Small (1944)
Year of Election or Appointment: 2005
Trustee
Ms. Small also serves as Trustee of other Fidelity® funds. Ms. Small is a member of the Board of Directors (2009-present) and Chair of the Investment Committee (2010-present) of the Teagle Foundation. Ms. Small also serves on the Investment Committee of the Berkshire Taconic Community Foundation (2008-present). Previously, Ms. Small served as Chairperson (2002-2008) and a member of the Investment Committee and Chairperson (2008-2012) and a member of the Board of Trustees of Smith College. In addition, Ms. Small served as Chief Investment Officer, Director of Global Equity Investments, and a member of the Board of Directors of Scudder, Stevens & Clark and Scudder Kemper Investments.
William S. Stavropoulos (1939)
Year of Election or Appointment: 2002
Trustee
Vice Chairman of the Independent Trustees
Mr. Stavropoulos also serves as Trustee of other Fidelity® funds. Mr. Stavropoulos serves as President and Founder of the Michigan Baseball Foundation, the Great Lakes Loons (2007-present). Mr. Stavropoulos is Chairman Emeritus of the Board of Directors of The Dow Chemical Company, where he previously served in numerous senior management positions, including President, CEO (1995-2000; 2002-2004), Chairman of the Executive Committee (2000-2006), and as a member of the Board of Directors (1990-2006). Currently, Mr. Stavropoulos is Chairman of the Board of Directors of Univar Inc. (global distributor of commodity and specialty chemicals), a Director of Teradata Corporation (data warehousing and technology solutions), and a member of the Advisory Board for Metalmark Capital LLC (private equity investment, 2005-present). Mr. Stavropoulos is an operating advisor to Clayton, Dubilier & Rice, LLC (private equity investment). In addition, Mr. Stavropoulos is a member of the University of Notre Dame Advisory Council for the College of Science, a Trustee of the Rollin L. Gerstacker Foundation, and a Director of Artis-Naples in Naples, Florida. Previously, Mr. Stavropoulos served as a Director of Chemical Financial Corporation (bank holding company, 1993-2012) and Tyco International, Ltd. (multinational manufacturing and services, 2007-2012).
David M. Thomas (1949)
Year of Election or Appointment: 2008
Trustee
Mr. Thomas also serves as Trustee of other Fidelity® funds. Mr. Thomas serves as Non-Executive Chairman of the Board of Directors of Fortune Brands Home and Security (home and security products, 2011-present), as a member of the Board of Directors (2004-present) and Presiding Director (2013-present) of Interpublic Group of Companies, Inc. (marketing communication), and as a member of the Board of Trustees of the University of Florida (2013-present). Previously, Mr. Thomas served as Executive Chairman (2005-2006) and Chairman and Chief Executive Officer (2000-2005) of IMS Health, Inc. (pharmaceutical and healthcare information solutions), and a Director of Fortune Brands, Inc. (consumer products, 2000-2011).
+ The information includes the Trustee's principal occupation during the last five years and other information relating to the experience, attributes, and skills relevant to the Trustee's qualifications to serve as a Trustee, which led to the conclusion that the Trustee should serve as a Trustee for the fund.
Advisory Board Members and Officers:
Correspondence intended for an officer or Peter S. Lynch may be sent to Fidelity Investments, 245 Summer Street, Boston, Massachusetts 02210. Officers appear below in alphabetical order.
Name, Year of Birth; Principal Occupation
Peter S. Lynch (1944)
Year of Election or Appointment: 2003
Member of the Advisory Board
Mr. Lynch also serves as Member of the Advisory Board of other Fidelity® funds. Mr. Lynch is Vice Chairman and a Director of FMR (investment adviser firm) and FMR Co., Inc. (investment adviser firm). In addition, Mr. Lynch serves as a Trustee of Boston College and as the Chairman of the Inner-City Scholarship Fund. Previously, Mr. Lynch served on the Special Olympics International Board of Directors (1997-2006).
Elizabeth Paige Baumann (1968)
Year of Election or Appointment: 2017
Anti-Money Laundering (AML) Officer
Ms. Baumann also serves as AML Officer of other funds. She is Chief AML Officer (2012-present) and Senior Vice President (2014-present) of FMR LLC (diversified financial services company) and is an employee of Fidelity Investments. Previously, Ms. Baumann served as AML Officer of the funds (2012-2016), and Vice President (2007-2014) and Deputy Anti-Money Laundering Officer (2007-2012) of FMR LLC.
Marc R. Bryant (1966)
Year of Election or Appointment: 2015
Secretary and Chief Legal Officer (CLO)
Mr. Bryant also serves as Secretary and CLO of other funds. Mr. Bryant serves as CLO, Secretary, and Senior Vice President of Fidelity Management & Research Company (investment adviser firm, 2015-present) and FMR Co., Inc. (investment adviser firm, 2015-present); Secretary of Fidelity SelectCo, LLC (investment adviser firm, 2015-present) and Fidelity Investments Money Management, Inc. (investment adviser firm, 2015-present); and CLO of Fidelity Management & Research (Hong Kong) Limited and FMR Investment Management (UK) Limited (investment adviser firms, 2015-present) and Fidelity Management & Research (Japan) Limited (investment adviser firm, 2016-present). He is Senior Vice President and Deputy General Counsel of FMR LLC (diversified financial services company). Previously, Mr. Bryant served as Secretary and CLO of Fidelity Rutland Square Trust II (2010-2014) and Assistant Secretary of Fidelity's Fixed Income and Asset Allocation Funds (2013-2015). Prior to joining Fidelity Investments, Mr. Bryant served as a Senior Vice President and the Head of Global Retail Legal for AllianceBernstein L.P. (2006-2010), and as the General Counsel for ProFund Advisors LLC (2001-2006).
William C. Coffey (1969)
Year of Election or Appointment: 2009
Assistant Secretary
Mr. Coffey also serves as Assistant Secretary of other funds. He is Senior Vice President and Deputy General Counsel of FMR LLC (diversified financial services company, 2010-present), and is an employee of Fidelity Investments. Previously, Mr. Coffey served as Vice President and Associate General Counsel of FMR LLC (2005-2009).
Jonathan Davis (1968)
Year of Election or Appointment: 2010
Assistant Treasurer
Mr. Davis also serves as Assistant Treasurer of other funds, and is an employee of Fidelity Investments. Previously, Mr. Davis served as Vice President and Associate General Counsel of FMR LLC (diversified financial services company, 2003-2010).
Adrien E. Deberghes (1967)
Year of Election or Appointment: 2016
Assistant Treasurer
Mr. Deberghes also serves as an officer of other funds. He serves as Executive Vice President of Fidelity Investments Money Management, Inc. (FIMM) (investment adviser firm, 2016-present) and is an employee of Fidelity Investments (2008-present). Prior to joining Fidelity Investments, Mr. Deberghes was Senior Vice President of Mutual Fund Administration at State Street Corporation (2007-2008), Senior Director of Mutual Fund Administration at Investors Bank & Trust (2005-2007), and Director of Finance for Dunkin' Brands (2000-2005). Previously, Mr. Deberghes served in other fund officer roles.
Stephanie J. Dorsey (1969)
Year of Election or Appointment: 2010
Assistant Treasurer
Ms. Dorsey also serves as an officer of other funds. She is an employee of Fidelity Investments (2008-present) and has served in other fund officer roles. Prior to joining Fidelity Investments, Ms. Dorsey served as Treasurer (2004-2008) of the JPMorgan Mutual Funds and Vice President (2004-2008) of JPMorgan Chase Bank.
Howard J. Galligan III (1966)
Year of Election or Appointment: 2014
Chief Financial Officer
Mr. Galligan also serves as Chief Financial Officer of other funds. Mr. Galligan serves as President of Fidelity Pricing and Cash Management Services (FPCMS) (2014-present) and as a Director of Strategic Advisers, Inc. (investment adviser firm, 2008-present). Previously, Mr. Galligan served as Chief Administrative Officer of Asset Management (2011-2014) and Chief Operating Officer and Senior Vice President of Investment Support for Strategic Advisers, Inc. (2003-2011).
Brian B. Hogan (1964)
Year of Election or Appointment: 2009
Vice President
Mr. Hogan also serves as Trustee or Vice President of other funds. Mr. Hogan serves as a Director of FMR Investment Management (UK) Limited (investment adviser firm, 2015-present) and Fidelity SelectCo, LLC (investment adviser firm, 2014-present) and President of the Equity Division of FMR (investment adviser firm, 2009-present). Previously, Mr. Hogan served as Senior Vice President, Equity Research of FMR (2006-2009) and as a portfolio manager. Mr. Brian B. Hogan is not related to Mr. Colm A. Hogan.
Colm A. Hogan (1973)
Year of Election or Appointment: 2016
Deputy Treasurer
Mr. Hogan also serves as an officer of other funds. Mr. Hogan is an employee of Fidelity Investments (2005-present). Mr. Colm A. Hogan is not related to Mr. Brian B. Hogan.
Chris Maher (1972)
Year of Election or Appointment: 2013
Assistant Treasurer
Mr. Maher serves as Assistant Treasurer of other funds. Mr. Maher is Vice President of Valuation Oversight and is an employee of Fidelity Investments. Previously, Mr. Maher served as Vice President of Asset Management Compliance (2013), Vice President of the Program Management Group of FMR (investment adviser firm, 2010-2013), and Vice President of Valuation Oversight (2008-2010).
Rieco E. Mello (1969)
Year of Election or Appointment: 2017
Assistant Treasurer
Mr. Mello also serves as Assistant Treasurer of other funds. Mr. Mello is an employee of Fidelity Investments (1995-present).
Melissa M. Reilly (1971)
Year of Election or Appointment: 2014
Vice President of certain Equity Funds
Ms. Reilly also serves as Vice President of other funds. Ms. Reilly is an employee of Fidelity Investments (2004-present).
Kenneth B. Robins (1969)
Year of Election or Appointment: 2016
Chief Compliance Officer
Mr. Robins also serves as an officer of other funds. Mr. Robins serves as Compliance Officer of Fidelity Management & Research Company and FMR Co., Inc. (investment adviser firms, 2016-present) and is an employee of Fidelity Investments (2004-present). Previously, Mr. Robins served as Executive Vice President of Fidelity Investments Money Management, Inc. (investment adviser firm, 2013-2016) and served in other fund officer roles.
Stacie M. Smith (1974)
Year of Election or Appointment: 2016
President and Treasurer
Ms. Smith also serves as an officer of other funds. She is an employee of Fidelity Investments (2009-present) and has served in other fund officer roles. Prior to joining Fidelity Investments, Ms. Smith served as Senior Audit Manager of Ernst & Young LLP (accounting firm, 1996-2009). Previously, Ms. Smith served as Deputy Treasurer of certain Fidelity® funds (2013-2016).
Marc L. Spector (1972)
Year of Election or Appointment: 2016
Assistant Treasurer
Mr. Spector also serves as an officer of other funds. Mr. Spector is an employee of Fidelity Investments (2016-present). Prior to joining Fidelity Investments, Mr. Spector served as Director at the Siegfried Group (accounting firm, 2013-2016), and prior to Siegfried Group as audit senior manager at Deloitte & Touche (accounting firm, 2005-2013).
Renee Stagnone (1975)
Year of Election or Appointment: 2016
Assistant Treasurer
Ms. Stagnone also serves as an officer of other funds. Ms. Stagnone is an employee of Fidelity Investments (1997-present). Previously, Ms. Stagnone served as Deputy Treasurer of certain Fidelity® funds (2013-2016).
Shareholder Expense Example
As a shareholder of the Fund, you incur two types of costs: (1) transaction costs and (2) ongoing costs, including management fees and other Fund expenses. This Example is intended to help you understand your ongoing costs (in dollars) of investing in the Fund and to compare these costs with the ongoing costs of investing in other mutual funds.
The Example is based on an investment of $1,000 invested at the beginning of the period and held for the entire period (May 1, 2017 to October 31, 2017).
Actual Expenses
The first line of the accompanying table for each class of the Fund provides information about actual account values and actual expenses. You may use the information in this line, together with the amount you invested, to estimate the expenses that you paid over the period. Simply divide your account value by $1,000.00 (for example, an $8,600 account value divided by $1,000.00 = 8.6), then multiply the result by the number in the first line for a class of the Fund under the heading entitled "Expenses Paid During Period" to estimate the expenses you paid on your account during this period. A small balance maintenance fee of $12.00 that is charged once a year may apply for certain accounts with a value of less than $2,000. This fee is not included in the table below. If it was, the estimate of expenses you paid during the period would be higher, and your ending account value lower, by this amount. In addition, the Fund, as a shareholder in the underlying Fidelity Central Funds, will indirectly bear its pro-rata share of the fees and expenses incurred by the underlying Fidelity Central Funds. These fees and expenses are not included in the Fund's annualized expense ratio used to calculate the expense estimate in the table below.
Hypothetical Example for Comparison Purposes
The second line of the accompanying table for each class of the Fund provides information about hypothetical account values and hypothetical expenses based on a Class' actual expense ratio and an assumed rate of return of 5% per year before expenses, which is not the Class' actual return. The hypothetical account values and expenses may not be used to estimate the actual ending account balance or expenses you paid for the period. You may use this information to compare the ongoing costs of investing in the Fund and other funds. To do so, compare this 5% hypothetical example with the 5% hypothetical examples that appear in the shareholder reports of the other funds. A small balance maintenance fee of $12.00 that is charged once a year may apply for certain accounts with a value of less than $2,000. This fee is not included in the table below. If it was, the estimate of expenses you paid during the period would be higher, and your ending account value lower, by this amount. In addition, the Fund, as a shareholder in the underlying Fidelity Central Funds, will indirectly bear its pro-rata share of the fees and expenses incurred by the underlying Fidelity Central Funds. These fees and expenses are not included in the Fund's annualized expense ratio used to calculate the expense estimate in the table below.
Please note that the expenses shown in the table are meant to highlight your ongoing costs only and do not reflect any transaction costs. Therefore, the second line of the table is useful in comparing ongoing costs only, and will not help you determine the relative total costs of owning different funds.
| | Annualized Expense Ratio-A | Beginning
Account Value
May 1, 2017 | Ending
Account Value
October 31, 2017 | Expenses Paid
During Period-B
May 1, 2017
to October 31, 2017 |
| Capital Appreciation | .52% | | | |
| Actual | | $1,000.00 | $1,098.60 | $2.75 |
| Hypothetical-C | | $1,000.00 | $1,022.58 | $2.65 |
| Class K | .41% | | | |
| Actual | | $1,000.00 | $1,099.20 | $2.17 |
| Hypothetical-C | | $1,000.00 | $1,023.14 | $2.09 |
A Annualized expense ratio reflects expenses net of applicable fee waivers.
B Expenses are equal to each Class' annualized expense ratio, multiplied by the average account value over the period, multiplied by 184/365 (to reflect the one-half year period).
C 5% return per year before expenses
Distributions (Unaudited)
The Board of Trustees of Fidelity Capital Appreciation Fund voted to pay to shareholders of record at the opening of business on record date, the following distributions per share derived from capital gains realized from sales of portfolio securities, and dividends derived from net investment income:
| | Pay Date | Record Date | Dividends | Capital Gains |
| Fidelity Capital Appreciation Fund | | | | |
| Capital Appreciation | 12/11/17 | 12/08/17 | $0.335 | $3.671 |
| Class K | 12/11/17 | 12/08/17 | $0.374 | $3.671 |
|
The fund hereby designates as a capital gain dividend with respect to the taxable year ended October 31 2017, $644,336,664, or, if subsequently determined to be different, the net capital gain of such year.
Capital Appreciation and Class K designate 100% of the dividend distributed in December during the fiscal year as qualifying for the dividends–received deduction for corporate shareholders.
Capital Appreciation and Class K designate 100% of the dividend distributed during the fiscal year as amounts which may be taken into account as a dividend for purposes of the maximum rate under section 1(h)(11) of the Internal Revenue Code.
The fund will notify shareholders in January 2018 of amounts for use in preparing 2017 income tax returns.
Board Approval of Investment Advisory Contracts and Management Fees
Fidelity Capital Appreciation Fund
Each year, the Board of Trustees, including the Independent Trustees (together, the Board), votes on the renewal of the management contract with Fidelity Management & Research Company (FMR) and the sub-advisory agreements (together, the Advisory Contracts) for the fund. FMR and the sub-advisers are referred to herein as the Investment Advisers. The Board, assisted by the advice of fund counsel and Independent Trustees' counsel, requests and considers a broad range of information relevant to the renewal of the Advisory Contracts throughout the year.
The Board meets regularly and, at each of its meetings, covers an extensive agenda of topics and materials and considers factors that are relevant to its annual consideration of the renewal of the fund's Advisory Contracts, including the services and support provided to the fund and its shareholders. The Board has established various standing committees (Committees), each composed of and chaired by Independent Trustees with varying backgrounds, to which the Board has assigned specific subject matter responsibilities in order to enhance effective decision-making by the Board. The Board, acting directly and through its Committees, requests and receives information concerning the annual consideration of the renewal of the fund's Advisory Contracts. The Board also meets as needed to review matters specifically related to the Board's annual consideration of the renewal of the Advisory Contracts. Members of the Board may also meet with trustees of other Fidelity funds through ad hoc joint committees to discuss certain matters relevant to all of the Fidelity funds.
At its July 2017 meeting, the Board unanimously determined to renew the fund's Advisory Contracts. In reaching its determination, the Board considered all factors it believed relevant, including (i) the nature, extent, and quality of the services to be provided to the fund and its shareholders (including the investment performance of the fund); (ii) the competitiveness of the fund's management fee and total expense ratio relative to peer funds; (iii) the total costs of the services to be provided by and the profits to be realized by Fidelity from its relationships with the fund; and (iv) the extent to which, if any, economies of scale exist and would be realized as the fund grows, and whether any economies of scale are appropriately shared with fund shareholders.
In considering whether to renew the Advisory Contracts for the fund, the Board reached a determination, with the assistance of fund counsel and Independent Trustees' counsel and through the exercise of its business judgment, that the renewal of the Advisory Contracts was in the best interests of the fund and its shareholders and that the compensation payable under the Advisory Contracts was fair and reasonable. The Board's decision to renew the Advisory Contracts was not based on any single factor, but rather was based on a comprehensive consideration of all the information provided to the Board at its meetings throughout the year. The Board, in reaching its determination to renew the Advisory Contracts, was aware that shareholders of the fund have a broad range of investment choices available to them, including a wide choice among funds offered by Fidelity's competitors, and that the fund's shareholders, who have the opportunity to review and weigh the disclosure provided by the fund in its prospectus and other public disclosures, have chosen to invest in this fund, which is part of the Fidelity family of funds.
Amendment to Group Fee Rate. The Board also approved an amendment to the management contract for the fund to add an additional breakpoint to the group fee schedule, effective October 1, 2017. The Board noted that the additional breakpoint would result in lower management fee rates as Fidelity's assets under management increase.
Nature, Extent, and Quality of Services Provided. The Board considered Fidelity's staffing as it relates to the fund, including the backgrounds of investment personnel of Fidelity, and also considered the fund's investment objective, strategies, and related investment philosophy. The Independent Trustees also had discussions with senior management of Fidelity's investment operations and investment groups. The Board considered the structure of the investment personnel compensation program and whether this structure provides appropriate incentives to act in the best interests of the fund. Additionally, the Board considered the portfolio managers' investments, if any, in the funds that they manage.
Resources Dedicated to Investment Management and Support Services. The Board and the Fund Oversight and Research Committees reviewed the general qualifications and capabilities of Fidelity's investment staff, including its size, education, experience, and resources, as well as Fidelity's approach to recruiting, training, managing, and compensating investment personnel. The Board noted that Fidelity has continued to increase the resources devoted to non-U.S. offices, including expansion of Fidelity's global investment organization. The Board also noted that Fidelity's analysts have extensive resources, tools and capabilities that allow them to conduct sophisticated quantitative and fundamental analysis, as well as credit analysis of issuers, counterparties and guarantors. Further, the Board considered that Fidelity's investment professionals have sufficient access to global information and data so as to provide competitive investment results over time, and that those professionals also have access to sophisticated tools that permit them to assess portfolio construction and risk and performance attribution characteristics continuously, as well as to transmit new information and research conclusions rapidly around the world. Additionally, in its deliberations, the Board considered Fidelity's trading, risk management, compliance, and technology and operations capabilities and resources, which are integral parts of the investment management process.
Shareholder and Administrative Services. The Board considered (i) the nature, extent, quality, and cost of advisory, administrative, and shareholder services performed by the Investment Advisers and their affiliates under the Advisory Contracts and under separate agreements covering transfer agency, pricing and bookkeeping, and securities lending services for the fund; (ii) the nature and extent of the supervision of third party service providers, principally custodians, subcustodians, and pricing vendors; and (iii) the resources devoted to, and the record of compliance with, the fund's compliance policies and procedures. The Board also reviewed the allocation of fund brokerage, including allocations to brokers affiliated with the Investment Advisers, the use of brokerage commissions to pay fund expenses, and the use of "soft" commission dollars to pay for research services.
The Board noted that the growth of fund assets over time across the complex allows Fidelity to reinvest in the development of services designed to enhance the value or convenience of the Fidelity funds as investment vehicles. These services include 24-hour access to account information and market information through telephone representatives and over the Internet, investor education materials and asset allocation tools, and the expanded availability of Fidelity Investor Centers.
In 2014, the Board formed an ad hoc Committee on Transfer Agency Fees to review the variety of transfer agency fee structures throughout the industry and Fidelity's competitive positioning with respect to industry participants.
Investment in a Large Fund Family. The Board considered the benefits to shareholders of investing in a Fidelity fund, including the benefits of investing in a fund that is part of a large family of funds offering a variety of investment disciplines and providing a large variety of mutual fund investor services. The Board noted that Fidelity had taken, or had made recommendations that resulted in the Fidelity funds taking, a number of actions over the previous year that benefited particular funds, including: (i) continuing to dedicate additional resources to Fidelity's investment research process, and to the support of the senior management team that oversees asset management; (ii) continuing efforts to enhance Fidelity's global research capabilities; (iii) launching new funds and making other enhancements to meet client needs; (iv) launching new share classes of existing funds; (v) eliminating purchase minimums and broadening eligibility requirements for certain lower-priced share classes; (vi) reducing management fees and total expenses for certain growth equity funds and index funds; (vii) lowering expense caps for certain existing funds and classes to reduce expenses borne by shareholders; (viii) eliminating short-term redemption fees for certain funds; (ix) introducing a new pricing structure for certain funds of funds that is expected to reduce overall expenses paid by shareholders; (x) rationalizing product lines and gaining increased efficiencies through proposals for fund mergers and share class consolidations; (xi) continuing to develop, acquire and implement systems and technology to improve services to the funds and shareholders, strengthen information security, and increase efficiency; and (xii) implementing enhancements to further strengthen Fidelity's product line to increase investors' probability of success in achieving their investment goals, including retirement income goals.
Investment Performance. The Board considered whether the fund has operated in accordance with its investment objective, as well as its record of compliance with its investment restrictions and its performance history.
The Board took into account discussions with representatives of the Investment Advisers about fund investment performance that occur at Board meetings throughout the year. In this regard the Board noted that as part of regularly scheduled fund reviews and other reports to the Board on fund performance, the Board considers annualized return information for the fund for different time periods, measured against a securities market index ("benchmark index") and a peer group of funds with similar objectives ("peer group"), if any. In its evaluation of fund investment performance, the Board gave particular attention to information indicating changes in performance of certain Fidelity funds for specific time periods and discussed with the Investment Advisers the reasons for any overperformance or underperformance.
In addition to reviewing absolute and relative fund performance, the Independent Trustees periodically consider the appropriateness of fund performance metrics in evaluating the results achieved. In general, the Independent Trustees believe that fund performance should be evaluated based on net performance (after fees and expenses) of both the highest performing and lowest performing fund share classes, where applicable, compared to appropriate benchmark indices, over appropriate time periods that may include full market cycles, and compared to peer groups, as applicable, over the same periods, taking into account relevant factors including the following: general market conditions; issuer-specific information; and fund cash flows and other factors.
The Independent Trustees recognize that shareholders evaluate performance on a net basis over their own holding periods, for which one-, three-, and five-year periods are often used as a proxy. For this reason, the performance information reviewed by the Board also included net cumulative calendar year total return information for the fund and an appropriate benchmark index and peer group for the most recent one-, three-, and five-year periods, as shown below. Returns are shown compared to the 25th percentile (top of box, 75% beaten) and 75th percentile (bottom of box, 25% beaten) of the peer universe.
Fidelity Capital Appreciation Fund
The Board has discussed the fund's underperformance (based on the December 31, 2016 data presented herein) with FMR, including the fund's investment strategy, the portfolio management team, and broader trends in the market that may have impacted the fund's performance, and has engaged with FMR to consider what steps might be taken to remediate the fund's underperformance. The Board noted that the fund's performance has improved since the period shown.
The Board also considered that the fund's management fee is subject to upward or downward adjustment depending upon whether, and to what extent, the fund's investment performance for the performance period (a rolling 36-month period) exceeds, or is exceeded by, a securities index, thus leading to a performance adjustment for the same period. The Board noted that the performance adjustment provides FMR with a strong economic incentive to seek to achieve superior long-term performance for the fund's shareholders and helps to more closely align the interests of FMR and the shareholders of the fund.
Based on its review, the Board concluded that the nature, extent, and quality of services provided to the fund under the Advisory Contracts should continue to benefit the shareholders of the fund.
Competitiveness of Management Fee and Total Expense Ratio. The Board considered the fund's management fee and total expense ratio compared to "mapped groups" of competitive funds and classes created for the purpose of facilitating the Trustees' competitive analysis of management fees and total expenses. Fidelity creates "mapped groups" by combining similar Lipper investment objective categories that have comparable investment mandates. Combining Lipper investment objective categories aids the Board's management fee and total expense ratio comparisons by broadening the competitive group used for comparison.
Management Fee. The Board considered two proprietary management fee comparisons for the 12-month periods shown in basis points (BP) in the chart below. The group of Lipper funds used by the Board for management fee comparisons is referred to below as the "Total Mapped Group." The Total Mapped Group comparison focuses on a fund's standing in terms of gross management fees before expense reimbursements or caps, and without giving effect to the fund's performance adjustment, relative to the total universe of funds with comparable investment mandates, regardless of whether their management fee structures also are comparable. Funds with comparable investment mandates offer exposure to similar types of securities. Funds with comparable management fee structures have similar management fee contractual arrangements (
e.g., flat rate charged for advisory services, all-inclusive fee rate,
etc.). "TMG %" represents the percentage of funds in the Total Mapped Group that had management fees that were lower than the fund's. For example, a hypothetical TMG % of 20% would mean that 80% of the funds in the Total Mapped Group had higher, and 20% had lower, management fees than the fund. The fund's actual TMG %s and the number of funds in the Total Mapped Group are in the chart below. The "Asset-Size Peer Group" (ASPG) comparison focuses on a fund's standing relative to a subset of non-Fidelity funds within the Total Mapped Group that are similar in size and management fee structure without taking into account performance adjustments, if any. For example, if a fund is in the first quartile of the ASPG, the fund's management fee ranks in the least expensive or lowest 25% of funds in the ASPG. The ASPG represents at least 15% of the funds in the Total Mapped Group with comparable asset size and management fee structures, subject to a minimum of 50 funds (or all funds in the Total Mapped Group if fewer than 50). Additional information, such as the ASPG quartile in which the fund's management fee rate ranked and the impact of the fund's performance adjustment, is also included in the chart and considered by the Board.
Fidelity Capital Appreciation Fund
The Board noted that the fund's management fee rate ranked below the median of its Total Mapped Group and below the median of its ASPG for 2016. The Board also noted the effect of the fund's performance adjustment, if any, on the fund's management fee ranking.
The Board noted that, in 2014, the Board and the boards of other Fidelity funds formed the ad hoc Committee on Group Fee to conduct an in-depth review of the "group fee" component of the management fee of funds with such management fee structures. The Committee's focus included the mechanics of the group fee, the competitive landscape of group fee structures, Fidelity funds with no group fee component and investment products not included in group fee assets. The Board also considered that, for funds subject to the group fee, FMR agreed to voluntarily waive fees over a specified period of time in amounts designed to account for assets converted from certain funds to certain collective investment trusts.
The Board also noted that, in 2013, the ad hoc Committee on Management Fees was formed to conduct an in-depth review of the management fee rates of Fidelity's active equity mutual funds. The Committee focused on the following areas: (i) standard fee structures; (ii) research consumption and trading evolution; (iii) management fee competitiveness/profitability by category; and (iv) factors that drive institutional pricing.
Based on its review, the Board concluded that the fund's management fee is fair and reasonable in light of the services that the fund receives and the other factors considered.
Total Expense Ratio. In its review of each class's total expense ratio, the Board considered the fund's management fee rate as well as other fund or class expenses, as applicable, such as transfer agent fees, pricing and bookkeeping fees, and custodial, legal, and audit fees. The Board noted the impact of the fund's performance adjustment. The Board also noted that Fidelity may agree to waive fees and expenses from time to time, and the extent to which, if any, it has done so for the fund. As part of its review, the Board also considered the current and historical total expense ratios of each class of the fund compared to competitive fund median expenses. Each class of the fund is compared to those funds and classes in the Total Mapped Group (used by the Board for management fee comparisons) that have a similar sales load structure.
The Board noted that the total expense ratio of each class ranked below the competitive median for 2016.
Fees Charged to Other Fidelity Clients. The Board also considered Fidelity fee structures and other information with respect to clients of Fidelity, such as other funds advised or subadvised by Fidelity, pension plan clients, and other institutional clients with similar mandates. The Board noted that an ad hoc joint committee created by it and the boards of other Fidelity funds periodically (most recently in 2013) reviews and compares Fidelity's institutional investment advisory business with its business of providing services to the Fidelity funds, including the differences in services provided, fees charged, and costs incurred, as well as competition in their respective marketplaces.
Based on its review of total expense ratios and fees charged to other Fidelity clients, the Board concluded that the total expense ratio of each class of the fund was reasonable in light of the services that the fund and its shareholders receive and the other factors considered.
Costs of the Services and Profitability. The Board considered the revenues earned and the expenses incurred by Fidelity in conducting the business of developing, marketing, distributing, managing, administering and servicing the fund and servicing the fund's shareholders. The Board also considered the level of Fidelity's profits in respect of all the Fidelity funds.
On an annual basis, Fidelity presents to the Board information about the profitability of its relationships with the fund. Fidelity calculates profitability information for each fund, as well as aggregate profitability information for groups of Fidelity funds and all Fidelity funds, using a series of detailed revenue and cost allocation methodologies which originate with the books and records of Fidelity on which Fidelity's audited financial statements are based. The Audit Committee of the Board reviews any significant changes from the prior year's methodologies.
PricewaterhouseCoopers LLP (PwC), independent registered public accounting firm and auditor to Fidelity and certain Fidelity funds, has been engaged annually by the Board as part of the Board's assessment of Fidelity's profitability analysis. PwC's engagement includes the review and assessment of the methodologies used by Fidelity in determining the revenues and expenses attributable to Fidelity's mutual fund business, and completion of agreed-upon procedures in respect of the mathematical accuracy of the fund profitability information and its conformity to established allocation methodologies. After considering PwC's reports issued under the engagement and information provided by Fidelity, the Board concluded that while other allocation methods may also be reasonable, Fidelity's profitability methodologies are reasonable in all material respects.
The Board also reviewed Fidelity's non-fund businesses and potential fall-out benefits related to the mutual fund business as well as cases where Fidelity's affiliates may benefit from or be related to the fund's business.
The Board considered the costs of the services provided by and the profits realized by Fidelity in connection with the operation of the fund and was satisfied that the profitability was not excessive.
Economies of Scale. The Board considered whether there have been economies of scale in respect of the management of the Fidelity funds, whether the Fidelity funds (including the fund) have appropriately benefited from any such economies of scale, and whether there is potential for realization of any further economies of scale. The Board considered the extent to which the fund will benefit from economies of scale as assets grow through increased services to the fund, through waivers or reimbursements, or through fee or expense ratio reductions. The Board also noted that a committee (the Economies of Scale Committee) created by it and the boards of other Fidelity funds periodically (most recently in 2013) analyzes whether Fidelity attains economies of scale in respect of the management and servicing of the Fidelity funds, whether the Fidelity funds have appropriately benefited from such economies of scale, and whether there is potential for realization of any further economies of scale.
The Board recognized that the fund's management contract incorporates a "group fee" structure, which provides for lower group fee rates as total group assets increase, and for higher group fee rates as total group assets decrease (with "group assets" defined to include fund assets under FMR's management plus the assets of sector funds previously under FMR's management). FMR calculates the group fee rates based on a tiered asset "breakpoint" schedule that varies based on asset class. The Board considered that the group fee is designed to deliver the benefits of economies of scale to fund shareholders when total Fidelity fund assets increase, even if assets of any particular fund are unchanged or have declined, because some portion of Fidelity's costs are attributable to services provided to all Fidelity funds, and all funds benefit if those costs can be allocated among more assets. The Board concluded that, given the group fee structure, fund shareholders will benefit from lower management fees as group assets increase at the fund complex level, regardless of whether Fidelity achieves any such economies of scale.
The Board concluded, taking into account the analysis of the Economies of Scale Committee, that economies of scale, if any, are being appropriately shared between fund shareholders and Fidelity.
Additional Information Requested by the Board. In order to develop fully the factual basis for consideration of the Fidelity funds' advisory contracts, the Board requested and received additional information on certain topics, including: (i) fund performance trends, in particular the underperformance of certain funds, and Fidelity's long-term strategies for certain funds; (ii) Fidelity's fund profitability methodology, profitability trends for certain funds, and the impact of certain factors on fund profitability results, including the impact of market trends on actively managed funds; (iii) the use of performance fees and the calculation of performance adjustments, including the impact of underperformance and fund outflows on performance adjustments; (iv) metrics for evaluating index fund performance; (v) Fidelity's group fee structure, including the group fee breakpoint schedules; (vi) the terms of Fidelity's contractual and voluntary expense cap arrangements with the funds; (vii) the methodology with respect to evaluating competitive fund data and peer group classifications and fee comparisons; (viii) the expense structures for different funds and classes; (ix) Fidelity's arrangements with affiliated sub-advisers on behalf of the funds; (x) information regarding other accounts managed by Fidelity, including institutional accounts and collective investment trusts; (xi) recent changes to the fee structure for certain funds of funds; and (xii) the impact of the Department of Labor's new fiduciary rule on the funds' comparative expense information.
Based on its evaluation of all of the conclusions noted above, and after considering all factors it believed relevant, the Board concluded that the advisory fee structures are fair and reasonable, and that the fund's Advisory Contracts should be renewed.
Corporate Headquarters
245 Summer St.
Boston, MA 02210
www.fidelity.com
CAF-K-ANN-1217
1.863090.109
Fidelity® Disciplined Equity Fund
Annual Report October 31, 2017 |
|
Contents
To view a fund's proxy voting guidelines and proxy voting record for the 12-month period ended June 30, visit http://www.fidelity.com/proxyvotingresults or visit the Securities and Exchange Commission's (SEC) web site at http://www.sec.gov.
You may also call 1-800-544-8544 to request a free copy of the proxy voting guidelines.
Standard & Poor's, S&P and S&P 500 are registered service marks of The McGraw-Hill Companies, Inc. and have been licensed for use by Fidelity Distributors Corporation.
Other third-party marks appearing herein are the property of their respective owners.
All other marks appearing herein are registered or unregistered trademarks or service marks of FMR LLC or an affiliated company. © 2017 FMR LLC. All rights reserved.
This report and the financial statements contained herein are submitted for the general information of the shareholders of the Fund. This report is not authorized for distribution to prospective investors in the Fund unless preceded or accompanied by an effective prospectus.
A fund files its complete schedule of portfolio holdings with the SEC for the first and third quarters of each fiscal year on Form N-Q. Forms N-Q are available on the SEC’s web site at http://www.sec.gov. A fund's Forms N-Q may be reviewed and copied at the SEC’s Public Reference Room in Washington, DC. Information regarding the operation of the SEC's Public Reference Room may be obtained by calling 1-800-SEC-0330.
For a complete list of a fund's portfolio holdings, view the most recent holdings listing, semiannual report, or annual report on Fidelity's web site at http://www.fidelity.com, http://www.institutional.fidelity.com, or http://www.401k.com, as applicable.
NOT FDIC INSURED •MAY LOSE VALUE •NO BANK GUARANTEE
Neither the Fund nor Fidelity Distributors Corporation is a bank.
Performance: The Bottom Line
Average annual total return reflects the change in the value of an investment, assuming reinvestment of distributions from dividend income and capital gains (the profits earned upon the sale of securities that have grown in value, if any) and assuming a constant rate of performance each year. The hypothetical investment and the average annual total returns do not reflect the deduction of taxes that a shareholder would pay on fund distributions or the redemption of fund shares. During periods of reimbursement by Fidelity, a fund’s total return will be greater than it would be had the reimbursement not occurred. How a fund did yesterday is no guarantee of how it will do tomorrow.
Average Annual Total Returns
| For the periods ended October 31, 2017 | Past 1 year | Past 5 years | Past 10 years |
| Fidelity® Disciplined Equity Fund | 22.51% | 14.23% | 5.03% |
$10,000 Over 10 Years
Let's say hypothetically that $10,000 was invested in Fidelity® Disciplined Equity Fund, a class of the fund, on October 31, 2007.
The chart shows how the value of your investment would have changed, and also shows how the S&P 500® Index performed over the same period.
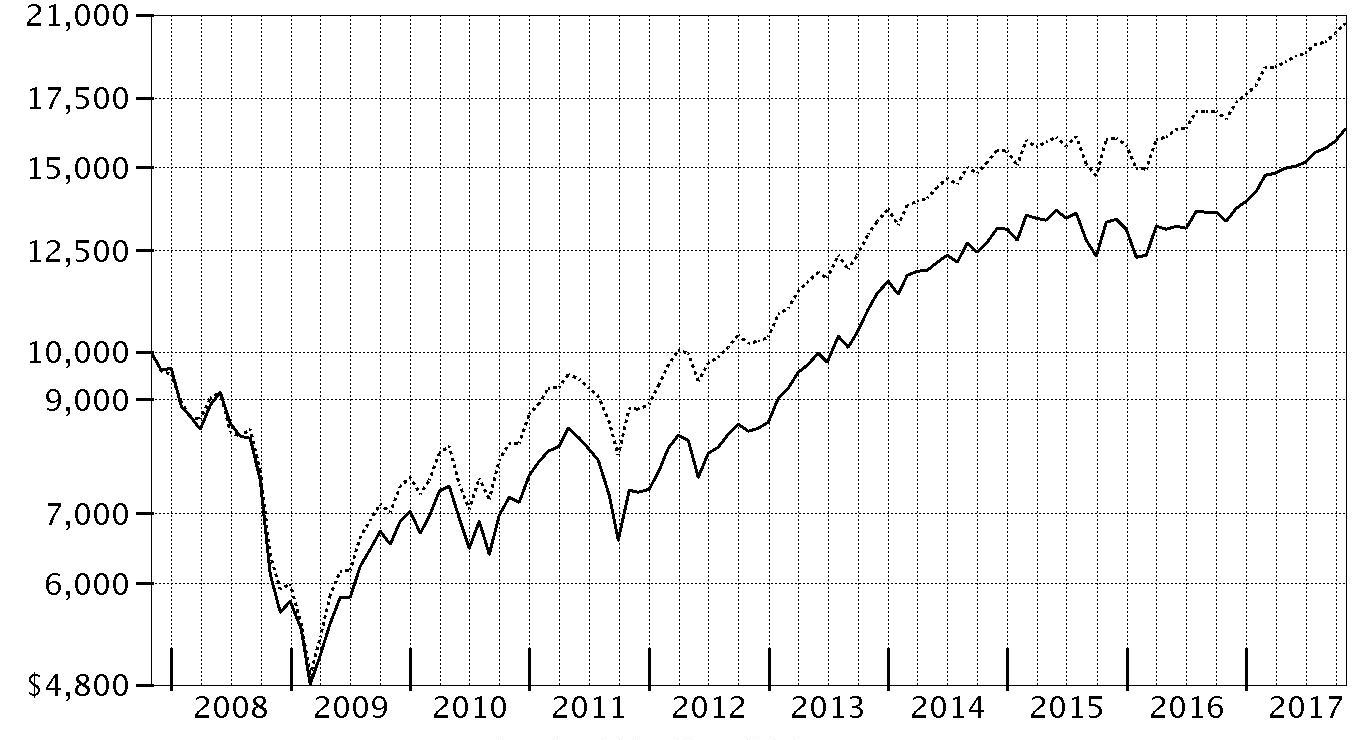
| Period Ending Values |
| $16,339 | Fidelity® Disciplined Equity Fund |
| $20,638 | S&P 500® Index |
Management's Discussion of Fund Performance
Market Recap: The U.S. equity bellwether S&P 500
® index gained 23.63% for the year ending October 31, 2017. Equity markets rose sharply following the November election and continued to rally through the end of February on optimism for President Trump’s pro-business agenda. Stocks leveled off in March amid fading optimism and stalled efforts by Congress to repeal and replace the Affordable Care Act. Upward momentum soon returned and continued through period end amid positive consumer sentiment and other market indicators. The lone exception was a brief cooldown in August, when geopolitical tension escalated and uncertainty grew regarding the future of health care, tax reform and the debt ceiling. Sector-wise, information technology (+39%) performed best, surging as a handful of major index constituents posted strong returns. Financials gained 37%, riding an uptick in bond yields and a surge in banks. Materials (+29%) also did well, spurred by higher demand, especially from China. Conversely, consumer discretionary (+20%) lagged the broader market, as brick-and-mortar retailers continued to suffer from increased online competition. Rising interest rates held back real estate (+9%) and sluggish oil prices dragged on energy (+2%). Consumer staples (+4%) and telecommunication services (-1%) struggled due to investors’ general preference for risk assets.
Comments from Portfolio Manager Alex Devereaux: For the year, the fund’s share classes gained roughly 23%, modestly trailing the 23.63% gain of the S&P 500
® index. Relative to the benchmark, stock picking within the consumer discretionary sector hurt most. In particular, an out-of-benchmark stake in International Game Technology disappointed, returning -34%. The manufacturer and distributor of computerized gaming equipment reported declining revenues, soft guidance and significant debt. We exited the position in July. Underweighting Amazon, and selling the stock too soon, also hurt, as its shares advanced 40% for the year. Elsewhere, choices in financials and materials weighed on relative results. Conversely, stock selection in the information technology and energy sectors aided relative performance. Our decision to avoid industrial conglomerate General Electric (GE) provided the biggest boost to relative results. Previously held in the fund, we eliminated our position in GE prior to the start of the period due to its expensive valuation. Our overweight stake in Bank of America (BofA) also contributed versus the index, as the stock gained about 66% for the fund. We liked BofA’s strong valuation, positive estimate revisions, and its deployment of capital to shareholders. Litigation income received during the period also added to the fund’s return.
The views expressed above reflect those of the portfolio manager(s) only through the end of the period as stated on the cover of this report and do not necessarily represent the views of Fidelity or any other person in the Fidelity organization. Any such views are subject to change at any time based upon market or other conditions and Fidelity disclaims any responsibility to update such views. These views may not be relied on as investment advice and, because investment decisions for a Fidelity fund are based on numerous factors, may not be relied on as an indication of trading intent on behalf of any Fidelity fund.
Investment Summary (Unaudited)
Top Ten Stocks as of October 31, 2017
| | % of fund's net assets | % of fund's net assets 6 months ago |
| Apple, Inc. | 4.8 | 4.5 |
| Alphabet, Inc. Class A | 3.3 | 3.1 |
| Facebook, Inc. Class A | 2.7 | 2.2 |
| Johnson & Johnson | 2.5 | 2.2 |
| Berkshire Hathaway, Inc. Class B | 2.4 | 2.3 |
| Bank of America Corp. | 2.1 | 1.4 |
| Wells Fargo & Co. | 1.9 | 1.9 |
| Chevron Corp. | 1.8 | 1.7 |
| UnitedHealth Group, Inc. | 1.8 | 1.6 |
| Microsoft Corp. | 1.7 | 2.2 |
| | 25.0 | |
Top Five Market Sectors as of October 31, 2017
| | % of fund's net assets | % of fund's net assets 6 months ago |
| Information Technology | 26.5 | 21.5 |
| Health Care | 15.0 | 16.2 |
| Financials | 12.7 | 12.1 |
| Consumer Discretionary | 10.7 | 11.1 |
| Consumer Staples | 9.2 | 10.4 |
Asset Allocation (% of fund's net assets)
| As of October 31, 2017* |
| | Stocks | 98.7% |
| | Short-Term Investments and Net Other Assets (Liabilities) | 1.3% |

* Foreign investments - 7.3%
| As of April 30, 2017 * |
| | Stocks | 98.3% |
| | Short-Term Investments and Net Other Assets (Liabilities) | 1.7% |

* Foreign investments - 7.6%
Investments October 31, 2017
Showing Percentage of Net Assets
| Common Stocks - 98.7% | | | |
| | | Shares | Value (000s) |
| CONSUMER DISCRETIONARY - 10.7% | | | |
| Hotels, Restaurants & Leisure - 5.7% | | | |
| Carnival Corp. | | 158,153 | $10,500 |
| Darden Restaurants, Inc. | | 54,041 | 4,446 |
| Marriott International, Inc. Class A | | 87,143 | 10,412 |
| McDonald's Corp. | | 114,479 | 19,108 |
| Royal Caribbean Cruises Ltd. | | 98,274 | 12,163 |
| U.S. Foods Holding Corp. (a) | | 365,647 | 9,975 |
| Wyndham Worldwide Corp. | | 107,850 | 11,524 |
| | | | 78,128 |
| Household Durables - 0.6% | | | |
| CalAtlantic Group, Inc. | | 166,942 | 8,237 |
| Internet & Direct Marketing Retail - 1.4% | | | |
| Liberty Interactive Corp. QVC Group Series A (a) | | 437,424 | 9,938 |
| Netflix, Inc. (a) | | 35,059 | 6,887 |
| Priceline Group, Inc. (a) | | 1,036 | 1,981 |
| | | | 18,806 |
| Media - 0.8% | | | |
| Charter Communications, Inc. Class A (a) | | 1,321 | 441 |
| Comcast Corp. Class A | | 291,014 | 10,485 |
| | | | 10,926 |
| Multiline Retail - 0.7% | | | |
| Dollar Tree, Inc. (a) | | 22,890 | 2,089 |
| Macy's, Inc. | | 413,819 | 7,763 |
| | | | 9,852 |
| Specialty Retail - 0.7% | | | |
| Best Buy Co., Inc. | | 174,561 | 9,772 |
| Textiles, Apparel & Luxury Goods - 0.8% | | | |
| PVH Corp. | | 86,607 | 10,983 |
|
| TOTAL CONSUMER DISCRETIONARY | | | 146,704 |
|
| CONSUMER STAPLES - 9.2% | | | |
| Beverages - 0.6% | | | |
| The Coca-Cola Co. | | 194,033 | 8,922 |
| Food & Staples Retailing - 2.4% | | | |
| CVS Health Corp. | | 201,060 | 13,779 |
| Wal-Mart Stores, Inc. | | 218,385 | 19,067 |
| | | | 32,846 |
| Food Products - 3.4% | | | |
| Bunge Ltd. | | 152,104 | 10,462 |
| ConAgra Foods, Inc. | | 331,527 | 11,325 |
| Pilgrim's Pride Corp. (a)(b) | | 352,823 | 11,213 |
| The J.M. Smucker Co. | | 100,425 | 10,650 |
| Tyson Foods, Inc. Class A | | 39,335 | 2,868 |
| | | | 46,518 |
| Household Products - 1.4% | | | |
| Procter & Gamble Co. | | 224,172 | 19,355 |
| Tobacco - 1.4% | | | |
| Philip Morris International, Inc. | | 187,214 | 19,590 |
|
| TOTAL CONSUMER STAPLES | | | 127,231 |
|
| ENERGY - 6.1% | | | |
| Oil, Gas & Consumable Fuels - 6.1% | | | |
| Chevron Corp. | | 211,039 | 24,457 |
| ConocoPhillips Co. | | 31,001 | 1,586 |
| Exxon Mobil Corp. | | 192,351 | 16,032 |
| HollyFrontier Corp. | | 112,311 | 4,150 |
| Kinder Morgan, Inc. | | 409,656 | 7,419 |
| Phillips 66 Co. | | 143,651 | 13,084 |
| The Williams Companies, Inc. | | 139,427 | 3,974 |
| Valero Energy Corp. | | 168,910 | 13,325 |
| | | | 84,027 |
| FINANCIALS - 12.7% | | | |
| Banks - 7.4% | | | |
| Bank of America Corp. | | 1,034,919 | 28,346 |
| Citigroup, Inc. | | 314,865 | 23,143 |
| JPMorgan Chase & Co. | | 234,024 | 23,545 |
| Wells Fargo & Co. | | 476,902 | 26,773 |
| | | | 101,807 |
| Consumer Finance - 1.1% | | | |
| Capital One Financial Corp. | | 155,072 | 14,295 |
| Santander Consumer U.S.A. Holdings, Inc. | | 18,722 | 312 |
| | | | 14,607 |
| Diversified Financial Services - 2.4% | | | |
| Berkshire Hathaway, Inc. Class B (a)�� | | 178,612 | 33,390 |
| Insurance - 0.3% | | | |
| Chubb Ltd. | | 25,778 | 3,888 |
| Mortgage Real Estate Investment Trusts - 1.5% | | | |
| AGNC Investment Corp. | | 489,232 | 9,848 |
| Annaly Capital Management, Inc. | | 769,627 | 8,820 |
| New Residential Investment Corp. | | 146,255 | 2,578 |
| | | | 21,246 |
|
| TOTAL FINANCIALS | | | 174,938 |
|
| HEALTH CARE - 15.0% | | | |
| Biotechnology - 2.5% | | | |
| Alexion Pharmaceuticals, Inc. (a) | | 64,633 | 7,734 |
| Amgen, Inc. | | 104,378 | 18,289 |
| Biogen, Inc. (a) | | 15,722 | 4,900 |
| Celgene Corp. (a) | | 31,609 | 3,192 |
| | | | 34,115 |
| Health Care Equipment & Supplies - 1.1% | | | |
| Danaher Corp. | | 161,134 | 14,868 |
| Health Care Providers & Services - 6.4% | | | |
| Anthem, Inc. | | 33,977 | 7,108 |
| Centene Corp. (a) | | 93,307 | 8,740 |
| Cigna Corp. | | 73,374 | 14,471 |
| Express Scripts Holding Co. (a) | | 166,606 | 10,211 |
| Humana, Inc. | | 51,535 | 13,159 |
| McKesson Corp. | | 73,135 | 10,084 |
| UnitedHealth Group, Inc. | | 114,562 | 24,083 |
| | | | 87,856 |
| Life Sciences Tools & Services - 0.3% | | | |
| Agilent Technologies, Inc. | | 69,944 | 4,758 |
| Pharmaceuticals - 4.7% | | | |
| Allergan PLC | | 64,753 | 11,476 |
| Johnson & Johnson | | 250,823 | 34,967 |
| Mallinckrodt PLC (a) | | 151,423 | 4,796 |
| Pfizer, Inc. | | 379,275 | 13,297 |
| | | | 64,536 |
|
| TOTAL HEALTH CARE | | | 206,133 |
|
| INDUSTRIALS - 8.3% | | | |
| Aerospace & Defense - 1.1% | | | |
| Spirit AeroSystems Holdings, Inc. Class A | | 128,919 | 10,326 |
| United Technologies Corp. | | 44,205 | 5,294 |
| | | | 15,620 |
| Airlines - 0.7% | | | |
| Copa Holdings SA Class A | | 81,350 | 10,022 |
| Building Products - 0.2% | | | |
| Owens Corning | | 27,608 | 2,283 |
| Construction & Engineering - 1.5% | | | |
| AECOM (a) | | 301,326 | 10,564 |
| Jacobs Engineering Group, Inc. | | 182,589 | 10,629 |
| | | | 21,193 |
| Electrical Equipment - 0.8% | | | |
| AMETEK, Inc. | | 117,973 | 7,962 |
| Regal Beloit Corp. | | 39,468 | 3,203 |
| | | | 11,165 |
| Machinery - 2.4% | | | |
| Allison Transmission Holdings, Inc. | | 69,281 | 2,944 |
| Caterpillar, Inc. | | 122,836 | 16,681 |
| Cummins, Inc. | | 72,126 | 12,758 |
| | | | 32,383 |
| Professional Services - 0.8% | | | |
| Manpower, Inc. | | 89,371 | 11,018 |
| Trading Companies & Distributors - 0.8% | | | |
| MSC Industrial Direct Co., Inc. Class A | | 51 | 4 |
| WESCO International, Inc. (a) | | 172,716 | 10,907 |
| | | | 10,911 |
|
| TOTAL INDUSTRIALS | | | 114,595 |
|
| INFORMATION TECHNOLOGY - 26.5% | | | |
| Electronic Equipment & Components - 0.7% | | | |
| Jabil, Inc. | | 332,906 | 9,415 |
| Internet Software & Services - 6.3% | | | |
| Alphabet, Inc.: | | | |
| Class A (a) | | 44,480 | 45,950 |
| Class C (a) | | 3,230 | 3,284 |
| Facebook, Inc. Class A (a) | | 206,851 | 37,246 |
| | | | 86,480 |
| IT Services - 5.1% | | | |
| Accenture PLC Class A | | 17,220 | 2,451 |
| Alliance Data Systems Corp. | | 45,784 | 10,243 |
| Cognizant Technology Solutions Corp. Class A | | 184,905 | 13,992 |
| Conduent, Inc. | | 392,190 | 6,071 |
| CSRA, Inc. | | 31,910 | 1,021 |
| DXC Technology Co. | | 115,752 | 10,594 |
| Euronet Worldwide, Inc. (a) | | 8,410 | 813 |
| First Data Corp. Class A (a) | | 263,059 | 4,685 |
| Genpact Ltd. | | 86,679 | 2,639 |
| Leidos Holdings, Inc. | | 175,785 | 10,990 |
| MasterCard, Inc. Class A | | 46,880 | 6,974 |
| | | | 70,473 |
| Semiconductors & Semiconductor Equipment - 3.6% | | | |
| Broadcom Ltd. | | 66,164 | 17,461 |
| First Solar, Inc. (a) | | 99,228 | 5,440 |
| Micron Technology, Inc. (a) | | 335,709 | 14,875 |
| ON Semiconductor Corp. (a) | | 564,383 | 12,033 |
| | | | 49,809 |
| Software - 5.2% | | | |
| Adobe Systems, Inc. (a) | | 42,273 | 7,405 |
| Electronic Arts, Inc. (a) | | 63,535 | 7,599 |
| Intuit, Inc. | | 85,795 | 12,957 |
| Microsoft Corp. | | 284,250 | 23,644 |
| Oracle Corp. | | 400,248 | 20,373 |
| | | | 71,978 |
| Technology Hardware, Storage & Peripherals - 5.6% | | | |
| Apple, Inc. | | 392,793 | 66,395 |
| Western Digital Corp. | | 112,473 | 10,040 |
| | | | 76,435 |
|
| TOTAL INFORMATION TECHNOLOGY | | | 364,590 |
|
| MATERIALS - 4.5% | | | |
| Chemicals - 3.2% | | | |
| FMC Corp. | | 122,895 | 11,412 |
| LyondellBasell Industries NV Class A | | 130,332 | 13,493 |
| Platform Specialty Products Corp. (a) | | 725,829 | 7,766 |
| The Chemours Co. LLC | | 198,806 | 11,254 |
| | | | 43,925 |
| Metals & Mining - 1.3% | | | |
| Freeport-McMoRan, Inc. (a) | | 797,646 | 11,151 |
| United States Steel Corp. (b) | | 286,368 | 7,251 |
| | | | 18,402 |
|
| TOTAL MATERIALS | | | 62,327 |
|
| REAL ESTATE - 1.9% | | | |
| Equity Real Estate Investment Trusts (REITs) - 1.2% | | | |
| Colony NorthStar, Inc. | | 202,165 | 2,483 |
| Corrections Corp. of America | | 337,115 | 8,313 |
| Welltower, Inc. | | 81,454 | 5,454 |
| | | | 16,250 |
| Real Estate Management & Development - 0.7% | | | |
| Realogy Holdings Corp. | | 297,863 | 9,630 |
|
| TOTAL REAL ESTATE | | | 25,880 |
|
| TELECOMMUNICATION SERVICES - 0.7% | | | |
| Wireless Telecommunication Services - 0.7% | | | |
| T-Mobile U.S., Inc. (a) | | 165,984 | 9,921 |
| UTILITIES - 3.1% | | | |
| Electric Utilities - 2.3% | | | |
| Exelon Corp. | | 337,101 | 13,555 |
| FirstEnergy Corp. | | 250,511 | 8,254 |
| NextEra Energy, Inc. | | 64,414 | 9,989 |
| | | | 31,798 |
| Independent Power and Renewable Electricity Producers - 0.8% | | | |
| The AES Corp. | | 951,568 | 10,115 |
|
| TOTAL UTILITIES | | | 41,913 |
|
| TOTAL COMMON STOCKS | | | |
| (Cost $1,183,931) | | | 1,358,259 |
|
| Money Market Funds - 2.0% | | | |
| Fidelity Cash Central Fund, 1.10% (c) | | 18,269,243 | 18,273 |
| Fidelity Securities Lending Cash Central Fund 1.11% (c)(d) | | 9,808,361 | 9,809 |
| TOTAL MONEY MARKET FUNDS | | | |
| (Cost $28,083) | | | 28,082 |
| TOTAL INVESTMENT IN SECURITIES - 100.7% | | | |
| (Cost $1,212,014) | | | 1,386,341 |
| NET OTHER ASSETS (LIABILITIES) - (0.7)% | | | (9,405) |
| NET ASSETS - 100% | | | $1,376,936 |
Legend
(a) Non-income producing
(b) Security or a portion of the security is on loan at period end.
(c) Affiliated fund that is generally available only to investment companies and other accounts managed by Fidelity Investments. The rate quoted is the annualized seven-day yield of the fund at period end. A complete unaudited listing of the fund's holdings as of its most recent quarter end is available upon request. In addition, each Fidelity Central Fund's financial statements, which are not covered by the Fund's Report of Independent Registered Public Accounting Firm, are available on the SEC's website or upon request.
(d) Investment made with cash collateral received from securities on loan.
Affiliated Central Funds
Information regarding fiscal year to date income earned by the Fund from investments in Fidelity Central Funds is as follows:
| Fund | Income earned |
| | (Amounts in thousands) |
| Fidelity Cash Central Fund | $171 |
| Fidelity Securities Lending Cash Central Fund | 32 |
| Total | $203 |
Investment Valuation
All investments are categorized as Level 1 under the Fair Value Hierarchy. The inputs or methodology used for valuing securities may not be an indication of the risk associated with investing in those securities. For more information on valuation inputs please refer to the Investment Valuation section in the accompanying Notes to Financial Statements.
See accompanying notes which are an integral part of the financial statements.
Financial Statements
Statement of Assets and Liabilities
| Amounts in thousands (except per-share amounts) | | October 31, 2017 |
| Assets | | |
Investment in securities, at value (including securities loaned of $9,453) — See accompanying schedule:
Unaffiliated issuers (cost $1,183,931) | $1,358,259 | |
| Fidelity Central Funds (cost $28,083) | 28,082 | |
| Total Investment in Securities (cost $1,212,014) | | $1,386,341 |
| Receivable for fund shares sold | | 769 |
| Dividends receivable | | 903 |
| Distributions receivable from Fidelity Central Funds | | 22 |
| Prepaid expenses | | 3 |
| Other receivables | | 443 |
| Total assets | | 1,388,481 |
| Liabilities | | |
| Payable for fund shares redeemed | 596 | |
| Accrued management fee | 444 | |
| Other affiliated payables | 192 | |
| Other payables and accrued expenses | 503 | |
| Collateral on securities loaned | 9,810 | |
| Total liabilities | | 11,545 |
| Net Assets | | $1,376,936 |
| Net Assets consist of: | | |
| Paid in capital | | $1,151,468 |
| Undistributed net investment income | | 11,985 |
| Accumulated undistributed net realized gain (loss) on investments and foreign currency transactions | | 39,156 |
| Net unrealized appreciation (depreciation) on investments | | 174,327 |
| Net Assets | | $1,376,936 |
| Disciplined Equity: | | |
| Net Asset Value, offering price and redemption price per share ($1,266,377 ÷ 32,506 shares) | | $38.96 |
| Class K: | | |
| Net Asset Value, offering price and redemption price per share ($110,559 ÷ 2,840 shares) | | $38.93 |
See accompanying notes which are an integral part of the financial statements.
Statement of Operations
| Amounts in thousands | | Year ended October 31, 2017 |
| Investment Income | | |
| Dividends | | $24,484 |
| Income from Fidelity Central Funds | | 203 |
| Total income | | 24,687 |
| Expenses | | |
| Management fee | | |
| Basic fee | $7,190 | |
| Performance adjustment | (2,542) | |
| Transfer agent fees | 1,840 | |
| Accounting and security lending fees | 421 | |
| Custodian fees and expenses | 21 | |
| Independent trustees' fees and expenses | 5 | |
| Registration fees | 43 | |
| Audit | 72 | |
| Legal | 7 | |
| Miscellaneous | 12 | |
| Total expenses before reductions | 7,069 | |
| Expense reductions | (15) | 7,054 |
| Net investment income (loss) | | 17,633 |
| Realized and Unrealized Gain (Loss) | | |
| Net realized gain (loss) on: | | |
| Investment securities: | | |
| Unaffiliated issuers | 144,459 | |
| Fidelity Central Funds | 1 | |
| Futures contracts | (2) | |
| Total net realized gain (loss) | | 144,458 |
| Change in net unrealized appreciation (depreciation) on: | | |
| Investment securities: | | |
| Unaffiliated issuers | 105,059 | |
| Fidelity Central Funds | (4) | |
| Total change in net unrealized appreciation (depreciation) | | 105,055 |
| Net gain (loss) | | 249,513 |
| Net increase (decrease) in net assets resulting from operations | | $267,146 |
See accompanying notes which are an integral part of the financial statements.
Statement of Changes in Net Assets
| Amounts in thousands | Year ended October 31, 2017 | Year ended October 31, 2016 |
| Increase (Decrease) in Net Assets | | |
| Operations | | |
| Net investment income (loss) | $17,633 | $18,118 |
| Net realized gain (loss) | 144,458 | 1,549 |
| Change in net unrealized appreciation (depreciation) | 105,055 | (20,684) |
| Net increase (decrease) in net assets resulting from operations | 267,146 | (1,017) |
| Distributions to shareholders from net investment income | (18,783) | (15,984) |
| Distributions to shareholders from net realized gain | – | (73,227) |
| Total distributions | (18,783) | (89,211) |
| Share transactions - net increase (decrease) | (125,908) | (169,880) |
| Total increase (decrease) in net assets | 122,455 | (260,108) |
| Net Assets | | |
| Beginning of period | 1,254,481 | 1,514,589 |
| End of period | $1,376,936 | $1,254,481 |
| Other Information | | |
| Undistributed net investment income end of period | $11,985 | $14,124 |
See accompanying notes which are an integral part of the financial statements.
Financial Highlights
Fidelity Disciplined Equity Fund
| Years ended October 31, | 2017 | 2016 | 2015 | 2014 | 2013 |
| Selected Per–Share Data | | | | | |
| Net asset value, beginning of period | $32.26 | $34.19 | $35.18 | $31.30 | $24.47 |
| Income from Investment Operations | | | | | |
| Net investment income (loss)A | .47 | .42 | .35 | .41 | .53 |
| Net realized and unrealized gain (loss) | 6.72 | (.34)B | 1.26 | 4.43 | 6.85 |
| Total from investment operations | 7.19 | .08 | 1.61 | 4.84 | 7.38 |
| Distributions from net investment income | (.49) | (.36) | (.38) | (.69) | (.55) |
| Distributions from net realized gain | – | (1.65) | (2.22) | (.27) | – |
| Total distributions | (.49) | (2.01) | (2.60) | (.96) | (.55) |
| Net asset value, end of period | $38.96 | $32.26 | $34.19 | $35.18 | $31.30 |
| Total ReturnC | 22.51% | .16%B | 4.66% | 15.80% | 30.80% |
| Ratios to Average Net AssetsD,E | | | | | |
| Expenses before reductions | .54% | .68% | .89% | .50% | .07% |
| Expenses net of fee waivers, if any | .54% | .68% | .89% | .50% | .07% |
| Expenses net of all reductions | .54% | .68% | .89% | .50% | (.01)%F |
| Net investment income (loss) | 1.33% | 1.30% | 1.02% | 1.24% | 1.97% |
| Supplemental Data | | | | | |
| Net assets, end of period (in millions) | $1,266 | $1,150 | $1,385 | $1,238 | $1,156 |
| Portfolio turnover rateG | 184% | 179% | 187% | 184% | 156% |
A Calculated based on average shares outstanding during the period.
B Net realized and unrealized gain (loss) per share reflects proceeds received from litigation which amounted to $.05 per share. Excluding these litigation proceeds, the total return would have been (.01)%
C Total returns would have been lower if certain expenses had not been reduced during the applicable periods shown.
D Fees and expenses of any underlying Fidelity Central Funds are not included in the Fund's expense ratio. The Fund indirectly bears its proportionate share of the expenses of any underlying Fidelity Central Funds.
E Expense ratios reflect operating expenses of the class. Expenses before reductions do not reflect amounts reimbursed by the investment adviser or reductions from brokerage service arrangements or reductions from other expense offset arrangements and do not represent the amount paid by the class during periods when reimbursements or reductions occur. Expenses net of fee waivers reflect expenses after reimbursement by the investment adviser but prior to reductions from brokerage service arrangements or other expense offset arrangements. Expenses net of all reductions represent the net expenses paid by the class.
F The ratio of expenses net of all reductions to average net assets includes non-recurring payments by certain of the fund's brokers for commissions recaptured during the period. Excluding these payments, the ratio would have been .05% and the total return would've been 30.74%.
G Amount does not include the portfolio activity of any underlying Fidelity Central Funds.
See accompanying notes which are an integral part of the financial statements.
Fidelity Disciplined Equity Fund Class K
| Years ended October 31, | 2017 | 2016 | 2015 | 2014 | 2013 |
| Selected Per–Share Data | | | | | |
| Net asset value, beginning of period | $32.23 | $34.16 | $35.15 | $31.29 | $24.49 |
| Income from Investment Operations | | | | | |
| Net investment income (loss)A | .51 | .45 | .38 | .45 | .61 |
| Net realized and unrealized gain (loss) | 6.71 | (.34)B | 1.27 | 4.41 | 6.79 |
| Total from investment operations | 7.22 | .11 | 1.65 | 4.86 | 7.40 |
| Distributions from net investment income | (.52) | (.39) | (.42) | (.73) | (.60) |
| Distributions from net realized gain | – | (1.65) | (2.22) | (.27) | – |
| Total distributions | (.52) | (2.04) | (2.64) | (1.00) | (.60) |
| Net asset value, end of period | $38.93 | $32.23 | $34.16 | $35.15 | $31.29 |
| Total ReturnC | 22.65% | .26%B | 4.78% | 15.89% | 30.96% |
| Ratios to Average Net AssetsD,E | | | | | |
| Expenses before reductions | .44% | .57% | .79% | .39% | (.18)%F |
| Expenses net of fee waivers, if any | .44% | .57% | .79% | .39% | (.18)%F |
| Expenses net of all reductions | .44% | .57% | .79% | .39% | (.26)%F,G |
| Net investment income (loss) | 1.43% | 1.41% | 1.12% | 1.35% | 2.22% |
| Supplemental Data | | | | | |
| Net assets, end of period (in millions) | $111 | $104 | $129 | $158 | $153 |
| Portfolio turnover rateH | 184% | 179% | 187% | 184% | 156% |
A Calculated based on average shares outstanding during the period.
B Net realized and unrealized gain (loss) per share reflects proceeds received from litigation which amounted to $.05 per share. Excluding these litigation proceeds, the total return would have been .09%
C Total returns would have been lower if certain expenses had not been reduced during the applicable periods shown.
D Fees and expenses of any underlying Fidelity Central Funds are not included in the Fund's expense ratio. The Fund indirectly bears its proportionate share of the expenses of any underlying Fidelity Central Funds.
E Expense ratios reflect operating expenses of the class. Expenses before reductions do not reflect amounts reimbursed by the investment adviser or reductions from brokerage service arrangements or reductions from other expense offset arrangements and do not represent the amount paid by the class during periods when reimbursements or reductions occur. Expenses net of fee waivers reflect expenses after reimbursement by the investment adviser but prior to reductions from brokerage service arrangements or other expense offset arrangements. Expenses net of all reductions represent the net expenses paid by the class.
F Expense ratio is negative due to the timing of negative management fee performance adjustments in relation to fluctuating net assets of the class.
G The ratio of expenses net of all reductions to average net assets includes non-recurring payments by certain of the fund's brokers for commissions recaptured during the period. Excluding these payments, the ratio would have been (.20)% and the total return would've been 30.90%.
H Amount does not include the portfolio activity of any underlying Fidelity Central Funds.
See accompanying notes which are an integral part of the financial statements.
Notes to Financial Statements
For the period ended October 31, 2017
(Amounts in thousands except percentages)
1. Organization.
Fidelity Disciplined Equity Fund (the Fund) is a fund of Fidelity Capital Trust (the Trust) and is authorized to issue an unlimited number of shares. The Trust is registered under the Investment Company Act of 1940, as amended (the 1940 Act), as an open-end management investment company organized as a Massachusetts business trust. The Fund offers Disciplined Equity and Class K shares, each of which has equal rights as to assets and voting privileges. Each class has exclusive voting rights with respect to matters that affect that class.
2. Investments in Fidelity Central Funds.
The Fund invests in Fidelity Central Funds, which are open-end investment companies generally available only to other investment companies and accounts managed by the investment adviser and its affiliates. The Fund's Schedule of Investments lists each of the Fidelity Central Funds held as of period end, if any, as an investment of the Fund, but does not include the underlying holdings of each Fidelity Central Fund. As an Investing Fund, the Fund indirectly bears its proportionate share of the expenses of the underlying Fidelity Central Funds.
The Money Market Central Funds seek preservation of capital and current income and are managed by Fidelity Investments Money Management, Inc. (FIMM), an affiliate of the investment adviser. Annualized expenses of the Money Market Central Funds as of their most recent shareholder report date are less than .005%.
A complete unaudited list of holdings for each Fidelity Central Fund is available upon request or at the Securities and Exchange Commission (the SEC) website at www.sec.gov. In addition, the financial statements of the Fidelity Central Funds, which are not covered by the Fund's Report of Independent Registered Public Accounting Firm, are available on the SEC website or upon request.
3. Significant Accounting Policies.
The Fund is an investment company and applies the accounting and reporting guidance of the Financial Accounting Standards Board (FASB) Accounting Standards Codification Topic 946 Financial Services – Investments Companies. The financial statements have been prepared in conformity with accounting principles generally accepted in the United States of America (GAAP), which require management to make certain estimates and assumptions at the date of the financial statements. Actual results could differ from those estimates. Subsequent events, if any, through the date that the financial statements were issued have been evaluated in the preparation of the financial statements. The following summarizes the significant accounting policies of the Fund:
Investment Valuation. Investments are valued as of 4:00 p.m. Eastern time on the last calendar day of the period. The Board of Trustees (the Board) has delegated the day to day responsibility for the valuation of the Fund's investments to the Fair Value Committee (the Committee) established by the Fund's investment adviser. In accordance with valuation policies and procedures approved by the Board, the Fund attempts to obtain prices from one or more third party pricing vendors or brokers to value its investments. When current market prices, quotations or currency exchange rates are not readily available or reliable, investments will be fair valued in good faith by the Committee, in accordance with procedures adopted by the Board. Factors used in determining fair value vary by investment type and may include market or investment specific events. The frequency with which these procedures are used cannot be predicted and they may be utilized to a significant extent. The Committee oversees the Fund's valuation policies and procedures and reports to the Board on the Committee's activities and fair value determinations. The Board monitors the appropriateness of the procedures used in valuing the Fund's investments and ratifies the fair value determinations of the Committee.
The Fund categorizes the inputs to valuation techniques used to value its investments into a disclosure hierarchy consisting of three levels as shown below:
- Level 1 – quoted prices in active markets for identical investments
- Level 2 – other significant observable inputs (including quoted prices for similar investments, interest rates, prepayment speeds, etc.)
- Level 3 – unobservable inputs (including the Fund's own assumptions based on the best information available)
Valuation techniques used to value the Fund's investments by major category are as follows:
Equity securities, including restricted securities, for which market quotations are readily available, are valued at the last reported sale price or official closing price as reported by a third party pricing vendor on the primary market or exchange on which they are traded and are categorized as Level 1 in the hierarchy. In the event there were no sales during the day or closing prices are not available, securities are valued at the last quoted bid price or may be valued using the last available price and are generally categorized as Level 2 in the hierarchy. For foreign equity securities, when market or security specific events arise, comparisons to the valuation of American Depositary Receipts (ADRs), futures contracts, Exchange-Traded Funds (ETFs) and certain indexes as well as quoted prices for similar securities may be used and would be categorized as Level 2 in the hierarchy. Utilizing these techniques may result in transfers between Level 1 and Level 2. For equity securities, including restricted securities, where observable inputs are limited, assumptions about market activity and risk are used and these securities may be categorized as Level 3 in the hierarchy.
Investments in open-end mutual funds, including the Fidelity Central Funds, are valued at their closing net asset value (NAV) each business day and are categorized as Level 1 in the hierarchy.
Changes in valuation techniques may result in transfers in or out of an assigned level within the disclosure hierarchy.
Foreign Currency. The Fund may use foreign currency contracts to facilitate transactions in foreign-denominated securities. Gains and losses from these transactions may arise from changes in the value of the foreign currency or if the counterparties do not perform under the contracts' terms.
Foreign-denominated assets, including investment securities, and liabilities are translated into U.S. dollars at the exchange rates at period end. Purchases and sales of investment securities, income and dividends received and expenses denominated in foreign currencies are translated into U.S. dollars at the exchange rate in effect on the transaction date.
The effects of exchange rate fluctuations on investments are included with the net realized and unrealized gain (loss) on investment securities. Other foreign currency transactions resulting in realized and unrealized gain (loss) are disclosed separately.
Investment Transactions and Income. For financial reporting purposes, the Fund's investment holdings and NAV include trades executed through the end of the last business day of the period. The NAV per share for processing shareholder transactions is calculated as of the close of business of the New York Stock Exchange (NYSE), normally 4:00 p.m. Eastern time and includes trades executed through the end of the prior business day. Gains and losses on securities sold are determined on the basis of identified cost and includes proceeds received from litigation. Dividend income is recorded on the ex-dividend date, except for certain dividends from foreign securities where the ex-dividend date may have passed, which are recorded as soon as the Fund is informed of the ex-dividend date. Non-cash dividends included in dividend income, if any, are recorded at the fair market value of the securities received. Income and capital gain distributions from Fidelity Central Funds, if any, are recorded on the ex-dividend date. Certain distributions received by the Fund represent a return of capital or capital gain. The Fund determines the components of these distributions subsequent to the ex-dividend date, based upon receipt of tax filings or other correspondence relating to the underlying investment. These distributions are recorded as a reduction of cost of investments and/or as a realized gain. Investment income is recorded net of foreign taxes withheld where recovery of such taxes is uncertain.
Class Allocations and Expenses. Investment income, realized and unrealized capital gains and losses, common expenses of the Fund, and certain fund-level expense reductions, if any, are allocated daily on a pro-rata basis to each class based on the relative net assets of each class to the total net assets of the Fund. Each class differs with respect to transfer agent fees incurred. Certain expense reductions may also differ by class. For the reporting period, the allocated portion of income and expenses to each class as a percent of its average net assets may vary due to the timing of recording these transactions in relation to fluctuating net assets of the classes. Expenses directly attributable to a fund are charged to that fund. Expenses attributable to more than one fund are allocated among the respective funds on the basis of relative net assets or other appropriate methods. Expense estimates are accrued in the period to which they relate and adjustments are made when actual amounts are known.
Deferred Trustee Compensation. Under a Deferred Compensation Plan (the Plan), independent Trustees may elect to defer receipt of a portion of their annual compensation. Deferred amounts are invested in a cross-section of Fidelity funds, are marked-to-market and remain in the Fund until distributed in accordance with the Plan. The investment of deferred amounts and the offsetting payable to the Trustees are included in the accompanying Statement of Assets and Liabilities.
Income Tax Information and Distributions to Shareholders. Each year, the Fund intends to qualify as a regulated investment company under Subchapter M of the Internal Revenue Code, including distributing substantially all of its taxable income and realized gains. As a result, no provision for U.S. Federal income taxes is required. As of October 31, 2017, the Fund did not have any unrecognized tax benefits in the financial statements; nor is the Fund aware of any tax positions for which it is reasonably possible that the total amounts of unrecognized tax benefits will significantly change in the next twelve months. The Fund files a U.S. federal tax return, in addition to state and local tax returns as required. The Fund's federal income tax returns are subject to examination by the Internal Revenue Service (IRS) for a period of three fiscal years after they are filed. State and local tax returns may be subject to examination for an additional fiscal year depending on the jurisdiction. Foreign taxes are provided for based on the Fund's understanding of the tax rules and rates that exist in the foreign markets in which it invests.
Distributions are declared and recorded on the ex-dividend date. Income dividends and capital gain distributions are declared separately for each class. Income and capital gain distributions are determined in accordance with income tax regulations, which may differ from GAAP. In addition, the Fund claimed a portion of the payment made to redeeming shareholders as a distribution for income tax purposes.
Capital accounts within the financial statements are adjusted for permanent book-tax differences. These adjustments have no impact on net assets or the results of operations. Capital accounts are not adjusted for temporary book-tax differences which will reverse in a subsequent period.
Book-tax differences are primarily due to futures contracts, deferred trustees compensation, capital loss carryforwards, expiring capital loss carryforwards, and losses deferred due to wash sales.
As of period end, the cost and unrealized appreciation (depreciation) in securities, and derivatives if applicable, for federal income tax purposes were as follows:
| Gross unrealized appreciation | $200,488 |
| Gross unrealized depreciation | (26,316) |
| Net unrealized appreciation (depreciation) | $174,172 |
| Tax Cost | $1,212,169 |
The tax-based components of distributable earnings as of period end were as follows:
| Undistributed ordinary income | $12,429 |
| Undistributed long-term capital gain | $39,311 |
| Net unrealized appreciation (depreciation) on securities and other investments | $174,171 |
The tax character of distributions paid was as follows:
| | October 31, 2017 | October 31, 2016 |
| Ordinary Income | $18,783 | $ 20,028 |
| Long-term Capital Gains | – | 69,183 |
| Total | $18,783 | $ 89,211 |
4. Derivative Instruments.
Risk Exposures and the Use of Derivative Instruments. The Fund's investment objective allows the Fund to enter into various types of derivative contracts, including futures contracts. Derivatives are investments whose value is primarily derived from underlying assets, indices or reference rates and may be transacted on an exchange or over-the-counter (OTC). Derivatives may involve a future commitment to buy or sell a specified asset based on specified terms, to exchange future cash flows at periodic intervals based on a notional principal amount, or for one party to make one or more payments upon the occurrence of specified events in exchange for periodic payments from the other party.
The Fund used derivatives to increase returns and to manage exposure to certain risks as defined below. The success of any strategy involving derivatives depends on analysis of numerous economic factors, and if the strategies for investment do not work as intended, the Fund may not achieve its objectives.
The Fund's use of derivatives increased or decreased its exposure to the following risk:
| Equity Risk | Equity risk relates to the fluctuations in the value of financial instruments as a result of changes in market prices (other than those arising from interest rate risk or foreign exchange risk), whether caused by factors specific to an individual investment, its issuer, or all factors affecting all instruments traded in a market or market segment.
|
The Fund is also exposed to additional risks from investing in derivatives, such as liquidity risk and counterparty credit risk. Liquidity risk is the risk that the Fund will be unable to close out the derivative in the open market in a timely manner. Counterparty credit risk is the risk that the counterparty will not be able to fulfill its obligation to the Fund. Counterparty credit risk related to exchange-traded futures contracts may be mitigated by the protection provided by the exchange on which they trade.
Investing in derivatives may involve greater risks than investing in the underlying assets directly and, to varying degrees, may involve risk of loss in excess of any initial investment and collateral received and amounts recognized in the Statement of Assets and Liabilities. In addition, there may be the risk that the change in value of the derivative contract does not correspond to the change in value of the underlying instrument.
Futures Contracts. A futures contract is an agreement between two parties to buy or sell a specified underlying instrument for a fixed price at a specified future date. The Fund used futures contracts to manage its exposure to the stock market.
Upon entering into a futures contract, a fund is required to deposit either cash or securities (initial margin) with a clearing broker in an amount equal to a certain percentage of the face value of the contract. Futures contracts are marked-to-market daily and subsequent daily payments are made or received by a fund depending on the daily fluctuations in the value of the futures contracts and are recorded as unrealized appreciation or (depreciation). This receivable and/or payable, if any, is included in daily variation margin on futures contracts in the Statement of Assets and Liabilities. Realized gain or (loss) is recorded upon the expiration or closing of a futures contract. The net realized gain (loss) and change in net unrealized appreciation (depreciation) on futures contracts during the period is presented in the Statement of Operations.
Any open futures contracts at period end are presented in the Schedule of Investments under the caption "Futures Contracts". The notional amount at value reflects each contract's exposure to the underlying instrument or index at period end.
5. Purchases and Sales of Investments.
Purchases and sales of securities, other than short-term securities, aggregated $2,388,781 and $2,492,838, respectively.
6. Fees and Other Transactions with Affiliates.
Management Fee. Fidelity Management & Research Company (the investment adviser) and its affiliates provide the Fund with investment management related services for which the Fund pays a monthly management fee. The management fee is the sum of an individual fund fee rate that is based on an annual rate of .30% of the Fund's average net assets and an annualized group fee rate that averaged .25% during the period. The group fee rate is based upon the average net assets of all the mutual funds advised by the investment adviser, including any mutual funds previously advised by the investment adviser that are currently advised by Fidelity SelectCo, LLC, an affiliate of the investment adviser. The group fee rate decreases as assets under management increase and increases as assets under management decrease. In addition, the management fee is subject to a performance adjustment (up to a maximum of +/- .20% of the Fund's average net assets over a 36 month performance period). The upward or downward adjustment to the management fee is based on the relative investment performance of Disciplined Equity as compared to its benchmark index, the S&P 500 Index, over the same 36 month performance period. For the reporting period, the total annual management fee rate, including the performance adjustment, was .35% of the Fund's average net assets. The performance adjustment included in the management fee rate may be higher or lower than the maximum performance adjustment rate due to the difference between the average net assets for the reporting and performance periods.
Transfer Agent Fees. Fidelity Investments Institutional Operations Company, Inc., (FIIOC), an affiliate of the investment adviser, is the transfer, dividend disbursing and shareholder servicing agent for each class of the Fund. FIIOC receives account fees and asset-based fees that vary according to the account size and type of account of the shareholders of Disciplined Equity. FIIOC receives an asset-based fee of Class K's average net assets. FIIOC pays for typesetting, printing and mailing of shareholder reports, except proxy statements.
For the period, transfer agent fees for each class were as follows:
| | Amount | % of
Class-Level Average
Net Assets |
| Disciplined Equity | $1,788 | .15 |
| Class K | 52 | .05 |
| | $1,840 | |
Accounting and Security Lending Fees. Fidelity Service Company, Inc. (FSC), an affiliate of the investment adviser, maintains the Fund's accounting records. The accounting fee is based on the level of average net assets for each month. Under a separate contract, FSC administers the security lending program. The security lending fee is based on the number and duration of lending transactions.
Brokerage Commissions. The Fund placed a portion of its portfolio transactions with brokerage firms which are affiliates of the investment adviser. Brokerage commissions are included in net realized gain (loss) and change in net unrealized appreciation (depreciation) in the Statement of Operations. The commissions paid to these affiliated firms were $13 for the period.
Interfund Trades. The Fund may purchase from or sell securities to other Fidelity Funds under procedures adopted by the Board. The procedures have been designed to ensure these interfund trades are executed in accordance with Rule 17a-7 of the 1940 Act. Interfund trades are included within the respective purchases and sales amounts shown in the Purchases and Sales of Investments note.
7. Committed Line of Credit.
The Fund participates with other funds managed by the investment adviser or an affiliate in a $4.25 billion credit facility (the "line of credit") to be utilized for temporary or emergency purposes to fund shareholder redemptions or for other short-term liquidity purposes. The Fund has agreed to pay commitment fees on its pro-rata portion of the line of credit, which amounted to $4 and is reflected in Miscellaneous expenses on the Statement of Operations. During the period, the Fund did not borrow on this line of credit.
8. Security Lending.
The Fund lends portfolio securities through a lending agent from time to time in order to earn additional income. For equity securities, a lending agent is used and may loan securities to certain qualified borrowers, including Fidelity Capital Markets (FCM), a broker-dealer affiliated with the Fund. On the settlement date of the loan, the Fund receives collateral (in the form of U.S. Treasury obligations, letters of credit and/or cash) against the loaned securities and maintains collateral in an amount not less than 100% of the market value of the loaned securities during the period of the loan. The market value of the loaned securities is determined at the close of business of the Fund and any additional required collateral is delivered to the Fund on the next business day. The Fund or borrower may terminate the loan at any time, and if the borrower defaults on its obligation to return the securities loaned because of insolvency or other reasons, the Fund may apply collateral received from the borrower against the obligation. The Fund may experience delays and costs in recovering the securities loaned. Any cash collateral received is invested in the Fidelity Securities Lending Cash Central Fund. The value of loaned securities and cash collateral at period end are disclosed on the Fund's Statement of Assets and Liabilities. At period end, there were no security loans outstanding with FCM. Security lending income represents the income earned on investing cash collateral, less rebates paid to borrowers and any lending agent fees associated with the loan, plus any premium payments received for lending certain types of securities. Security lending income is presented in the Statement of Operations as a component of income from Fidelity Central Funds. Total security lending income during the period amounted to $32, including income in the amount of less than five hundred dollars from securities loaned to FCM.
9. Expense Reductions.
Commissions paid to certain brokers with whom the investment adviser, or its affiliates, places trades on behalf of the Fund include an amount in addition to trade execution, which may be rebated back to the Fund to offset certain expenses. This amount totaled $3 for the period.
In addition, during the period the investment adviser reimbursed and/or waived a portion of fund-level operating expenses in the amount of $12.
10. Distributions to Shareholders.
Distributions to shareholders of each class were as follows:
| | Year ended
October 31, 2017 | Year ended
October 31, 2016 |
| From net investment income | | |
| Disciplined Equity | $17,115 | $14,547 |
| Class K | 1,668 | 1,437 |
| Total | $18,783 | $15,984 |
| From net realized gain | | |
| Disciplined Equity | $– | $67,155 |
| Class K | – | 6,072 |
| Total | $– | $73,227 |
11. Share Transactions.
Share transactions for each class were as follows and may contain automatic conversions between classes or exchanges between affiliated funds:
| | Shares | Shares | Dollars | Dollars |
| | Year ended October 31, 2017 | Year ended October 31, 2016 | Year ended October 31, 2017 | Year ended October 31, 2016 |
| Disciplined Equity | | | | |
| Shares sold | 819 | 3,217 | $29,054 | $102,377 |
| Reinvestment of distributions | 474 | 2,353 | 15,948 | 76,727 |
| Shares redeemed | (4,440) | (10,442) | (156,370) | (331,619) |
| Net increase (decrease) | (3,147) | (4,872) | $(111,368) | $(152,515) |
| Class K | | | | |
| Shares sold | 301 | 426 | $10,549 | $13,646 |
| Reinvestment of distributions | 50 | 231 | 1,668 | 7,509 |
| Shares redeemed | (750) | (1,201) | (26,757) | (38,520) |
| Net increase (decrease) | (399) | (544) | $(14,540) | $(17,365) |
12. Other.
The Fund's organizational documents provide former and current trustees and officers with a limited indemnification against liabilities arising in connection with the performance of their duties to the Fund. In the normal course of business, the Fund may also enter into contracts that provide general indemnifications. The Fund's maximum exposure under these arrangements is unknown as this would be dependent on future claims that may be made against the Fund. The risk of material loss from such claims is considered remote.
Report of Independent Registered Public Accounting Firm
To the Trustees of Fidelity Capital Trust and Shareholders of Fidelity Disciplined Equity Fund:
In our opinion, the accompanying statement of assets and liabilities, including the schedule of investments, and the related statements of operations and of changes in net assets and the financial highlights present fairly, in all material respects, the financial position of Fidelity Disciplined Equity Fund (a fund of Fidelity Capital Trust) as of October 31, 2017, the results of its operations for the year then ended, the changes in its net assets for each of the two years in the period then ended and the financial highlights for each of the five years in the period then ended, in conformity with accounting principles generally accepted in the United States of America. These financial statements and financial highlights (hereafter referred to as “financial statements”) are the responsibility of the Fidelity Disciplined Equity Fund’s management. Our responsibility is to express an opinion on these financial statements based on our audits. We conducted our audits of these financial statements in accordance with the standards of the Public Company Accounting Oversight Board (United States). Those standards require that we plan and perform the audit to obtain reasonable assurance about whether the financial statements are free of material misstatement. An audit includes examining, on a test basis, evidence supporting the amounts and disclosures in the financial statements, assessing the accounting principles used and significant estimates made by management, and evaluating the overall financial statement presentation. Our procedures included confirmation of securities owned as of October 31, 2017 by correspondence with the custodian and brokers; when replies were not received from brokers, we performed other auditing procedures. We believe that our audits provide a reasonable basis for our opinion.
PricewaterhouseCoopers LLP
Boston, Massachusetts
December 13, 2017
Trustees and Officers
The Trustees, Members of the Advisory Board (if any), and officers of the trust and fund, as applicable, are listed below. The Board of Trustees governs the fund and is responsible for protecting the interests of shareholders. The Trustees are experienced executives who meet periodically throughout the year to oversee the fund's activities, review contractual arrangements with companies that provide services to the fund, oversee management of the risks associated with such activities and contractual arrangements, and review the fund's performance. Each of the Trustees oversees 190 funds.
The Trustees hold office without limit in time except that (a) any Trustee may resign; (b) any Trustee may be removed by written instrument, signed by at least two-thirds of the number of Trustees prior to such removal; (c) any Trustee who requests to be retired or who has become incapacitated by illness or injury may be retired by written instrument signed by a majority of the other Trustees; and (d) any Trustee may be removed at any special meeting of shareholders by a two-thirds vote of the outstanding voting securities of the trust. Each Trustee who is not an interested person (as defined in the 1940 Act) of the trust and the fund is referred to herein as an Independent Trustee. Each Independent Trustee shall retire not later than the last day of the calendar year in which his or her 75th birthday occurs. The Independent Trustees may waive this mandatory retirement age policy with respect to individual Trustees. Officers and Advisory Board Members hold office without limit in time, except that any officer or Advisory Board Member may resign or may be removed by a vote of a majority of the Trustees at any regular meeting or any special meeting of the Trustees. Except as indicated, each individual has held the office shown or other offices in the same company for the past five years.
The fund’s Statement of Additional Information (SAI) includes more information about the Trustees. To request a free copy, call Fidelity at 1-800-544-8544.
Experience, Skills, Attributes, and Qualifications of the Trustees. The Governance and Nominating Committee has adopted a statement of policy that describes the experience, qualifications, attributes, and skills that are necessary and desirable for potential Independent Trustee candidates (Statement of Policy). The Board believes that each Trustee satisfied at the time he or she was initially elected or appointed a Trustee, and continues to satisfy, the standards contemplated by the Statement of Policy. The Governance and Nominating Committee also engages professional search firms to help identify potential Independent Trustee candidates who have the experience, qualifications, attributes, and skills consistent with the Statement of Policy. From time to time, additional criteria based on the composition and skills of the current Independent Trustees, as well as experience or skills that may be appropriate in light of future changes to board composition, business conditions, and regulatory or other developments, have also been considered by the professional search firms and the Governance and Nominating Committee. In addition, the Board takes into account the Trustees' commitment and participation in Board and committee meetings, as well as their leadership of standing and ad hoc committees throughout their tenure.
In determining that a particular Trustee was and continues to be qualified to serve as a Trustee, the Board has considered a variety of criteria, none of which, in isolation, was controlling. The Board believes that, collectively, the Trustees have balanced and diverse experience, qualifications, attributes, and skills, which allow the Board to operate effectively in governing the fund and protecting the interests of shareholders. Information about the specific experience, skills, attributes, and qualifications of each Trustee, which in each case led to the Board's conclusion that the Trustee should serve (or continue to serve) as a trustee of the fund, is provided below.
Board Structure and Oversight Function. James C. Curvey is an interested person and currently serves as Chairman. The Trustees have determined that an interested Chairman is appropriate and benefits shareholders because an interested Chairman has a personal and professional stake in the quality and continuity of services provided to the fund. Independent Trustees exercise their informed business judgment to appoint an individual of their choosing to serve as Chairman, regardless of whether the Trustee happens to be independent or a member of management. The Independent Trustees have determined that they can act independently and effectively without having an Independent Trustee serve as Chairman and that a key structural component for assuring that they are in a position to do so is for the Independent Trustees to constitute a substantial majority for the Board. The Independent Trustees also regularly meet in executive session. Ned C. Lautenbach serves as Chairman of the Independent Trustees and as such (i) acts as a liaison between the Independent Trustees and management with respect to matters important to the Independent Trustees and (ii) with management prepares agendas for Board meetings.
Fidelity® funds are overseen by different Boards of Trustees. The fund's Board oversees Fidelity's high income and certain equity funds, and other Boards oversee Fidelity's investment-grade bond, money market, asset allocation, and sector funds. The asset allocation funds may invest in Fidelity® funds overseen by the fund's Board. The use of separate Boards, each with its own committee structure, allows the Trustees of each group of Fidelity® funds to focus on the unique issues of the funds they oversee, including common research, investment, and operational issues. On occasion, the separate Boards establish joint committees to address issues of overlapping consequences for the Fidelity® funds overseen by each Board.
The Trustees operate using a system of committees to facilitate the timely and efficient consideration of all matters of importance to the Trustees, the fund, and fund shareholders and to facilitate compliance with legal and regulatory requirements and oversight of the fund's activities and associated risks. The Board, acting through its committees, has charged FMR and its affiliates with (i) identifying events or circumstances the occurrence of which could have demonstrably adverse effects on the fund's business and/or reputation; (ii) implementing processes and controls to lessen the possibility that such events or circumstances occur or to mitigate the effects of such events or circumstances if they do occur; and (iii) creating and maintaining a system designed to evaluate continuously business and market conditions in order to facilitate the identification and implementation processes described in (i) and (ii) above. Because the day-to-day operations and activities of the fund are carried out by or through FMR, its affiliates, and other service providers, the fund's exposure to risks is mitigated but not eliminated by the processes overseen by the Trustees. While each of the Board's committees has responsibility for overseeing different aspects of the fund's activities, oversight is exercised primarily through the Operations, Audit, and Compliance Committees. In addition, the Independent Trustees have worked with FMR to enhance the Board's oversight of investment and financial risks, legal and regulatory risks, technology risks, and operational risks, including the development of additional risk reporting to the Board. For example, a working group comprised of Independent Trustees and FMR has worked and continues to work to review the Fidelity® funds' valuation-related activities, reporting and risk management. Appropriate personnel, including but not limited to the fund's Chief Compliance Officer (CCO), FMR's internal auditor, the independent accountants, the fund's Treasurer and portfolio management personnel, make periodic reports to the Board's committees, as appropriate, including an annual review of Fidelity's risk management program for the Fidelity® funds. The responsibilities of each standing committee, including their oversight responsibilities, are described further under "Standing Committees of the Trustees."
Interested Trustees*:
Correspondence intended for a Trustee who is an interested person may be sent to Fidelity Investments, 245 Summer Street, Boston, Massachusetts 02210.
Name, Year of Birth; Principal Occupations and Other Relevant Experience+
James C. Curvey (1935)
Year of Election or Appointment: 2007
Trustee
Chairman of the Board of Trustees
Mr. Curvey also serves as Trustee of other Fidelity® funds. Mr. Curvey is a Director of Fidelity Research & Analysis Co. (investment adviser firm, 2009-present), and Vice Chairman (2007-present) and Director of FMR LLC (diversified financial services company). In addition, Mr. Curvey serves as an Overseer for the Boston Symphony Orchestra and a member of the board of Artis-Naples, Naples, Florida, and as a Trustee for Brewster Academy, Wolfeboro, New Hampshire. Previously, Mr. Curvey served as a Director of Fidelity Investments Money Management, Inc. (investment adviser firm, 2009-2014) and a Director of FMR and FMR Co., Inc. (investment adviser firms, 2007-2014).
Charles S. Morrison (1960)
Year of Election or Appointment: 2014
Trustee
Mr. Morrison also serves as Trustee of other funds. He serves as President of Fidelity Management & Research Company (FMR) (investment adviser firm, 2016-present), a Director of Fidelity Investments Money Management, Inc. (FIMM) (investment adviser firm, 2014-present), Director of Fidelity SelectCo, LLC (investment adviser firm, 2014-present), President, Asset Management (2014-present), and is an employee of Fidelity Investments. Previously, Mr. Morrison served as Vice President of Fidelity's Fixed Income and Asset Allocation Funds (2012-2014), President, Fixed Income (2011-2014), Vice President of Fidelity's Money Market Funds (2005-2009), President, Money Market Group Leader of FMR (investment adviser firm, 2009), and Senior Vice President, Money Market Group of FMR (2004-2009). Mr. Morrison also served as Vice President of Fidelity's Bond Funds (2002-2005), certain Balanced Funds (2002-2005), and certain Asset Allocation Funds (2002-2007), and as Senior Vice President (2002-2005) of Fidelity's Bond Division.
* Determined to be an “Interested Trustee” by virtue of, among other things, his or her affiliation with the trust or various entities under common control with FMR.
+ The information includes the Trustee's principal occupation during the last five years and other information relating to the experience, attributes, and skills relevant to the Trustee's qualifications to serve as a Trustee, which led to the conclusion that the Trustee should serve as a Trustee for the fund.
Independent Trustees:
Correspondence intended for an Independent Trustee may be sent to Fidelity Investments, P.O. Box 55235, Boston, Massachusetts 02205-5235.
Name, Year of Birth; Principal Occupations and Other Relevant Experience+
Dennis J. Dirks (1948)
Year of Election or Appointment: 2005
Trustee
Mr. Dirks also serves as Trustee of other Fidelity® funds. Prior to his retirement in May 2003, Mr. Dirks was Chief Operating Officer and a member of the Board of The Depository Trust & Clearing Corporation (DTCC). He also served as President, Chief Operating Officer, and Board member of The Depository Trust Company (DTC) and President and Board member of the National Securities Clearing Corporation (NSCC). In addition, Mr. Dirks served as Chief Executive Officer and Board member of the Government Securities Clearing Corporation, Chief Executive Officer and Board member of the Mortgage-Backed Securities Clearing Corporation, as a Trustee and a member of the Finance Committee of Manhattan College (2005-2008), as a Trustee and a member of the Finance Committee of AHRC of Nassau County (2006-2008), as a member of the Independent Directors Council (IDC) Governing Council (2010-2015), and as a member of the Board of Directors for The Brookville Center for Children’s Services, Inc. (2009-2017). Mr. Dirks is a member of the Finance Committee (2016-present) and Board of Directors (2017-present) of the Asolo Repertory Theatre.
Alan J. Lacy (1953)
Year of Election or Appointment: 2008
Trustee
Mr. Lacy also serves as Trustee of other Fidelity® funds. Mr. Lacy serves as a Director of Bristol-Myers Squibb Company (global pharmaceuticals, 2008-present). He is a Trustee of the California Chapter of The Nature Conservancy (2015-present) and a Director of the Center for Advanced Study in the Behavioral Sciences at Stanford University (2015-present). In addition, Mr. Lacy served as Senior Adviser (2007-2014) of Oak Hill Capital Partners, L.P. (private equity) and also served as Chief Executive Officer (2005) and Vice Chairman (2005-2006) of Sears Holdings Corporation (retail) and Chief Executive Officer and Chairman of the Board of Sears, Roebuck and Co. (retail, 2000-2005). Previously, Mr. Lacy served as Chairman (2014-2017) and a member (2010-2017) of the Board of Directors of Dave & Buster’s Entertainment, Inc. (restaurant and entertainment complexes), as Chairman (2008-2011) and a member (2006-2015) of the Board of Trustees of the National Parks Conservation Association, and as a member of the Board of Directors for The Hillman Companies, Inc. (hardware wholesalers, 2010-2014), Earth Fare, Inc. (retail grocery, 2010-2014), and The Western Union Company (global money transfer, 2006-2011).
Ned C. Lautenbach (1944)
Year of Election or Appointment: 2000
Trustee
Chairman of the Independent Trustees
Mr. Lautenbach also serves as Trustee of other Fidelity® funds. Mr. Lautenbach currently serves as Vice Chair of the Board of Governors, State University System of Florida (2013-present) and is a member of the Council on Foreign Relations (1994-present). He is also a member and has most recently served as Chairman of the Board of Directors of Artis-Naples (2012-present). Previously, Mr. Lautenbach served as a member and then Lead Director of the Board of Directors of Eaton Corporation (diversified industrial, 1997-2016). He was also a Partner and Advisory Partner at Clayton, Dubilier & Rice, LLC (private equity investment, 1998-2010), as well as a Director of Sony Corporation (2006-2007). In addition, Mr. Lautenbach also had a 30-year career with IBM (technology company) during which time he served as Senior Vice President and a member of the Corporate Executive Committee (1968-1998).
Joseph Mauriello (1944)
Year of Election or Appointment: 2008
Trustee
Mr. Mauriello also serves as Trustee of other Fidelity® funds. Prior to his retirement in January 2006, Mr. Mauriello served in numerous senior management positions including Deputy Chairman and Chief Operating Officer (2004-2005), and Vice Chairman of Financial Services (2002-2004) of KPMG LLP US (professional services, 1965-2005). Mr. Mauriello currently serves as a member of the Board of Directors of XL Group plc. (global insurance and re-insurance, 2006-present) and the Independent Directors Council (IDC) Governing Council (2015-present). Previously, Mr. Mauriello served as a Director of the Hamilton Funds of the Bank of New York (2006-2007) and of Arcadia Resources Inc. (health care services and products, 2007-2012).
Cornelia M. Small (1944)
Year of Election or Appointment: 2005
Trustee
Ms. Small also serves as Trustee of other Fidelity® funds. Ms. Small is a member of the Board of Directors (2009-present) and Chair of the Investment Committee (2010-present) of the Teagle Foundation. Ms. Small also serves on the Investment Committee of the Berkshire Taconic Community Foundation (2008-present). Previously, Ms. Small served as Chairperson (2002-2008) and a member of the Investment Committee and Chairperson (2008-2012) and a member of the Board of Trustees of Smith College. In addition, Ms. Small served as Chief Investment Officer, Director of Global Equity Investments, and a member of the Board of Directors of Scudder, Stevens & Clark and Scudder Kemper Investments.
William S. Stavropoulos (1939)
Year of Election or Appointment: 2002
Trustee
Vice Chairman of the Independent Trustees
Mr. Stavropoulos also serves as Trustee of other Fidelity® funds. Mr. Stavropoulos serves as President and Founder of the Michigan Baseball Foundation, the Great Lakes Loons (2007-present). Mr. Stavropoulos is Chairman Emeritus of the Board of Directors of The Dow Chemical Company, where he previously served in numerous senior management positions, including President, CEO (1995-2000; 2002-2004), Chairman of the Executive Committee (2000-2006), and as a member of the Board of Directors (1990-2006). Currently, Mr. Stavropoulos is Chairman of the Board of Directors of Univar Inc. (global distributor of commodity and specialty chemicals), a Director of Teradata Corporation (data warehousing and technology solutions), and a member of the Advisory Board for Metalmark Capital LLC (private equity investment, 2005-present). Mr. Stavropoulos is an operating advisor to Clayton, Dubilier & Rice, LLC (private equity investment). In addition, Mr. Stavropoulos is a member of the University of Notre Dame Advisory Council for the College of Science, a Trustee of the Rollin L. Gerstacker Foundation, and a Director of Artis-Naples in Naples, Florida. Previously, Mr. Stavropoulos served as a Director of Chemical Financial Corporation (bank holding company, 1993-2012) and Tyco International, Ltd. (multinational manufacturing and services, 2007-2012).
David M. Thomas (1949)
Year of Election or Appointment: 2008
Trustee
Mr. Thomas also serves as Trustee of other Fidelity® funds. Mr. Thomas serves as Non-Executive Chairman of the Board of Directors of Fortune Brands Home and Security (home and security products, 2011-present), as a member of the Board of Directors (2004-present) and Presiding Director (2013-present) of Interpublic Group of Companies, Inc. (marketing communication), and as a member of the Board of Trustees of the University of Florida (2013-present). Previously, Mr. Thomas served as Executive Chairman (2005-2006) and Chairman and Chief Executive Officer (2000-2005) of IMS Health, Inc. (pharmaceutical and healthcare information solutions), and a Director of Fortune Brands, Inc. (consumer products, 2000-2011).
+ The information includes the Trustee's principal occupation during the last five years and other information relating to the experience, attributes, and skills relevant to the Trustee's qualifications to serve as a Trustee, which led to the conclusion that the Trustee should serve as a Trustee for the fund.
Advisory Board Members and Officers:
Correspondence intended for an officer or Peter S. Lynch may be sent to Fidelity Investments, 245 Summer Street, Boston, Massachusetts 02210. Officers appear below in alphabetical order.
Name, Year of Birth; Principal Occupation
Peter S. Lynch (1944)
Year of Election or Appointment: 2003
Member of the Advisory Board
Mr. Lynch also serves as Member of the Advisory Board of other Fidelity® funds. Mr. Lynch is Vice Chairman and a Director of FMR (investment adviser firm) and FMR Co., Inc. (investment adviser firm). In addition, Mr. Lynch serves as a Trustee of Boston College and as the Chairman of the Inner-City Scholarship Fund. Previously, Mr. Lynch served on the Special Olympics International Board of Directors (1997-2006).
Elizabeth Paige Baumann (1968)
Year of Election or Appointment: 2017
Anti-Money Laundering (AML) Officer
Ms. Baumann also serves as AML Officer of other funds. She is Chief AML Officer (2012-present) and Senior Vice President (2014-present) of FMR LLC (diversified financial services company) and is an employee of Fidelity Investments. Previously, Ms. Baumann served as AML Officer of the funds (2012-2016), and Vice President (2007-2014) and Deputy Anti-Money Laundering Officer (2007-2012) of FMR LLC.
Marc R. Bryant (1966)
Year of Election or Appointment: 2015
Secretary and Chief Legal Officer (CLO)
Mr. Bryant also serves as Secretary and CLO of other funds. Mr. Bryant serves as CLO, Secretary, and Senior Vice President of Fidelity Management & Research Company (investment adviser firm, 2015-present) and FMR Co., Inc. (investment adviser firm, 2015-present); Secretary of Fidelity SelectCo, LLC (investment adviser firm, 2015-present) and Fidelity Investments Money Management, Inc. (investment adviser firm, 2015-present); and CLO of Fidelity Management & Research (Hong Kong) Limited and FMR Investment Management (UK) Limited (investment adviser firms, 2015-present) and Fidelity Management & Research (Japan) Limited (investment adviser firm, 2016-present). He is Senior Vice President and Deputy General Counsel of FMR LLC (diversified financial services company). Previously, Mr. Bryant served as Secretary and CLO of Fidelity Rutland Square Trust II (2010-2014) and Assistant Secretary of Fidelity's Fixed Income and Asset Allocation Funds (2013-2015). Prior to joining Fidelity Investments, Mr. Bryant served as a Senior Vice President and the Head of Global Retail Legal for AllianceBernstein L.P. (2006-2010), and as the General Counsel for ProFund Advisors LLC (2001-2006).
William C. Coffey (1969)
Year of Election or Appointment: 2009
Assistant Secretary
Mr. Coffey also serves as Assistant Secretary of other funds. He is Senior Vice President and Deputy General Counsel of FMR LLC (diversified financial services company, 2010-present), and is an employee of Fidelity Investments. Previously, Mr. Coffey served as Vice President and Associate General Counsel of FMR LLC (2005-2009).
Jonathan Davis (1968)
Year of Election or Appointment: 2010
Assistant Treasurer
Mr. Davis also serves as Assistant Treasurer of other funds, and is an employee of Fidelity Investments. Previously, Mr. Davis served as Vice President and Associate General Counsel of FMR LLC (diversified financial services company, 2003-2010).
Adrien E. Deberghes (1967)
Year of Election or Appointment: 2016
Assistant Treasurer
Mr. Deberghes also serves as an officer of other funds. He serves as Executive Vice President of Fidelity Investments Money Management, Inc. (FIMM) (investment adviser firm, 2016-present) and is an employee of Fidelity Investments (2008-present). Prior to joining Fidelity Investments, Mr. Deberghes was Senior Vice President of Mutual Fund Administration at State Street Corporation (2007-2008), Senior Director of Mutual Fund Administration at Investors Bank & Trust (2005-2007), and Director of Finance for Dunkin' Brands (2000-2005). Previously, Mr. Deberghes served in other fund officer roles.
Stephanie J. Dorsey (1969)
Year of Election or Appointment: 2010
Assistant Treasurer
Ms. Dorsey also serves as an officer of other funds. She is an employee of Fidelity Investments (2008-present) and has served in other fund officer roles. Prior to joining Fidelity Investments, Ms. Dorsey served as Treasurer (2004-2008) of the JPMorgan Mutual Funds and Vice President (2004-2008) of JPMorgan Chase Bank.
Howard J. Galligan III (1966)
Year of Election or Appointment: 2014
Chief Financial Officer
Mr. Galligan also serves as Chief Financial Officer of other funds. Mr. Galligan serves as President of Fidelity Pricing and Cash Management Services (FPCMS) (2014-present) and as a Director of Strategic Advisers, Inc. (investment adviser firm, 2008-present). Previously, Mr. Galligan served as Chief Administrative Officer of Asset Management (2011-2014) and Chief Operating Officer and Senior Vice President of Investment Support for Strategic Advisers, Inc. (2003-2011).
Brian B. Hogan (1964)
Year of Election or Appointment: 2009
Vice President
Mr. Hogan also serves as Trustee or Vice President of other funds. Mr. Hogan serves as a Director of FMR Investment Management (UK) Limited (investment adviser firm, 2015-present) and Fidelity SelectCo, LLC (investment adviser firm, 2014-present) and President of the Equity Division of FMR (investment adviser firm, 2009-present). Previously, Mr. Hogan served as Senior Vice President, Equity Research of FMR (2006-2009) and as a portfolio manager. Mr. Brian B. Hogan is not related to Mr. Colm A. Hogan.
Colm A. Hogan (1973)
Year of Election or Appointment: 2016
Deputy Treasurer
Mr. Hogan also serves as an officer of other funds. Mr. Hogan is an employee of Fidelity Investments (2005-present). Mr. Colm A. Hogan is not related to Mr. Brian B. Hogan.
Chris Maher (1972)
Year of Election or Appointment: 2013
Assistant Treasurer
Mr. Maher serves as Assistant Treasurer of other funds. Mr. Maher is Vice President of Valuation Oversight and is an employee of Fidelity Investments. Previously, Mr. Maher served as Vice President of Asset Management Compliance (2013), Vice President of the Program Management Group of FMR (investment adviser firm, 2010-2013), and Vice President of Valuation Oversight (2008-2010).
Rieco E. Mello (1969)
Year of Election or Appointment: 2017
Assistant Treasurer
Mr. Mello also serves as Assistant Treasurer of other funds. Mr. Mello is an employee of Fidelity Investments (1995-present).
Melissa M. Reilly (1971)
Year of Election or Appointment: 2014
Vice President of certain Equity Funds
Ms. Reilly also serves as Vice President of other funds. Ms. Reilly is an employee of Fidelity Investments (2004-present).
Kenneth B. Robins (1969)
Year of Election or Appointment: 2016
Chief Compliance Officer
Mr. Robins also serves as an officer of other funds. Mr. Robins serves as Compliance Officer of Fidelity Management & Research Company and FMR Co., Inc. (investment adviser firms, 2016-present) and is an employee of Fidelity Investments (2004-present). Previously, Mr. Robins served as Executive Vice President of Fidelity Investments Money Management, Inc. (investment adviser firm, 2013-2016) and served in other fund officer roles.
Stacie M. Smith (1974)
Year of Election or Appointment: 2016
President and Treasurer
Ms. Smith also serves as an officer of other funds. She is an employee of Fidelity Investments (2009-present) and has served in other fund officer roles. Prior to joining Fidelity Investments, Ms. Smith served as Senior Audit Manager of Ernst & Young LLP (accounting firm, 1996-2009). Previously, Ms. Smith served as Deputy Treasurer of certain Fidelity® funds (2013-2016).
Marc L. Spector (1972)
Year of Election or Appointment: 2016
Assistant Treasurer
Mr. Spector also serves as an officer of other funds. Mr. Spector is an employee of Fidelity Investments (2016-present). Prior to joining Fidelity Investments, Mr. Spector served as Director at the Siegfried Group (accounting firm, 2013-2016), and prior to Siegfried Group as audit senior manager at Deloitte & Touche (accounting firm, 2005-2013).
Renee Stagnone (1975)
Year of Election or Appointment: 2016
Assistant Treasurer
Ms. Stagnone also serves as an officer of other funds. Ms. Stagnone is an employee of Fidelity Investments (1997-present). Previously, Ms. Stagnone served as Deputy Treasurer of certain Fidelity® funds (2013-2016).
Shareholder Expense Example
As a shareholder of the Fund, you incur two types of costs: (1) transaction costs and (2) ongoing costs, including management fees and other Fund expenses. This Example is intended to help you understand your ongoing costs (in dollars) of investing in the Fund and to compare these costs with the ongoing costs of investing in other mutual funds.
The Example is based on an investment of $1,000 invested at the beginning of the period and held for the entire period (May 1, 2017 to October 31, 2017).
Actual Expenses
The first line of the accompanying table for each class of the Fund provides information about actual account values and actual expenses. You may use the information in this line, together with the amount you invested, to estimate the expenses that you paid over the period. Simply divide your account value by $1,000.00 (for example, an $8,600 account value divided by $1,000.00 = 8.6), then multiply the result by the number in the first line for a class of the Fund under the heading entitled "Expenses Paid During Period" to estimate the expenses you paid on your account during this period. A small balance maintenance fee of $12.00 that is charged once a year may apply for certain accounts with a value of less than $2,000. This fee is not included in the table below. If it was, the estimate of expenses you paid during the period would be higher, and your ending account value lower, by this amount. In addition, the Fund, as a shareholder in the underlying Fidelity Central Funds, will indirectly bear its pro-rata share of the fees and expenses incurred by the underlying Fidelity Central Funds. These fees and expenses are not included in the Fund's annualized expense ratio used to calculate the expense estimate in the table below.
Hypothetical Example for Comparison Purposes
The second line of the accompanying table for each class of the Fund provides information about hypothetical account values and hypothetical expenses based on a Class' actual expense ratio and an assumed rate of return of 5% per year before expenses, which is not the Class' actual return. The hypothetical account values and expenses may not be used to estimate the actual ending account balance or expenses you paid for the period. You may use this information to compare the ongoing costs of investing in the Fund and other funds. To do so, compare this 5% hypothetical example with the 5% hypothetical examples that appear in the shareholder reports of the other funds. A small balance maintenance fee of $12.00 that is charged once a year may apply for certain accounts with a value of less than $2,000. This fee is not included in the table below. If it was, the estimate of expenses you paid during the period would be higher, and your ending account value lower, by this amount. In addition, the Fund, as a shareholder in the underlying Fidelity Central Funds, will indirectly bear its pro-rata share of the fees and expenses incurred by the underlying Fidelity Central Funds. These fees and expenses are not included in the Fund's annualized expense ratio used to calculate the expense estimate in the table below.
Please note that the expenses shown in the table are meant to highlight your ongoing costs only and do not reflect any transaction costs. Therefore, the second line of the table is useful in comparing ongoing costs only, and will not help you determine the relative total costs of owning different funds.
| | Annualized Expense Ratio-A | Beginning
Account Value
May 1, 2017 | Ending
Account Value
October 31, 2017 | Expenses Paid
During Period-B
May 1, 2017
to October 31, 2017 |
| Disciplined Equity | .55% | | | |
| Actual | | $1,000.00 | $1,090.40 | $2.90 |
| Hypothetical-C | | $1,000.00 | $1,022.43 | $2.80 |
| Class K | .45% | | | |
| Actual | | $1,000.00 | $1,091.10 | $2.37 |
| Hypothetical-C | | $1,000.00 | $1,022.94 | $2.29 |
A Annualized expense ratio reflects expenses net of applicable fee waivers.
B Expenses are equal to each Class' annualized expense ratio, multiplied by the average account value over the period, multiplied by 184/365 (to reflect the one-half year period).
C 5% return per year before expenses
Distributions (Unaudited)
The Board of Trustees of Fidelity Disciplined Equity Fund voted to pay to shareholders of record at the opening of business on record date, the following distributions per share derived from capital gains realized from sales of portfolio securities, and dividends derived from net investment income:
| | Pay Date | Record Date | Dividends | Capital Gains |
| Fidelity Disciplined Equity Fund | | | | |
| Disciplined Equity | 12/11/17 | 12/08/17 | $0.452 | $1.121 |
| Class K | 12/11/17 | 12/08/17 | $0.490 | $1.121 |
|
The fund hereby designates as a capital gain dividend with respect to the taxable year ended October 31, 2017, $42,430,232, or, if subsequently determined to be different, the net capital gain of such year.
Disciplined Equity Fund designates 100% and Class K designates 93% of the dividends distributed during the fiscal year as qualifying for the dividends–received deduction for corporate shareholders.
Disciplined Equity Fund and Class K designates 100% of the dividends distributed during the fiscal year as amounts which may be taken into account as a dividend for purposes of the maximum rate under section 1(h)(11) of the Internal Revenue Code.
The fund will notify shareholders in January 2018 of amounts for use in preparing 2017 income tax returns.
Board Approval of Investment Advisory Contracts and Management Fees
Fidelity Disciplined Equity Fund
Each year, the Board of Trustees, including the Independent Trustees (together, the Board), votes on the renewal of the management contract with Fidelity Management & Research Company (FMR) and the sub-advisory agreements (together, the Advisory Contracts) for the fund. FMR and the sub-advisers are referred to herein as the Investment Advisers. The Board, assisted by the advice of fund counsel and Independent Trustees' counsel, requests and considers a broad range of information relevant to the renewal of the Advisory Contracts throughout the year.
The Board meets regularly and, at each of its meetings, covers an extensive agenda of topics and materials and considers factors that are relevant to its annual consideration of the renewal of the fund's Advisory Contracts, including the services and support provided to the fund and its shareholders. The Board has established various standing committees (Committees), each composed of and chaired by Independent Trustees with varying backgrounds, to which the Board has assigned specific subject matter responsibilities in order to enhance effective decision-making by the Board. The Board, acting directly and through its Committees, requests and receives information concerning the annual consideration of the renewal of the fund's Advisory Contracts. The Board also meets as needed to review matters specifically related to the Board's annual consideration of the renewal of the Advisory Contracts. Members of the Board may also meet with trustees of other Fidelity funds through ad hoc joint committees to discuss certain matters relevant to all of the Fidelity funds.
At its July 2017 meeting, the Board unanimously determined to renew the fund's Advisory Contracts. In reaching its determination, the Board considered all factors it believed relevant, including (i) the nature, extent, and quality of the services to be provided to the fund and its shareholders (including the investment performance of the fund); (ii) the competitiveness of the fund's management fee and total expense ratio relative to peer funds; (iii) the total costs of the services to be provided by and the profits to be realized by Fidelity from its relationships with the fund; and (iv) the extent to which, if any, economies of scale exist and would be realized as the fund grows, and whether any economies of scale are appropriately shared with fund shareholders.
In considering whether to renew the Advisory Contracts for the fund, the Board reached a determination, with the assistance of fund counsel and Independent Trustees' counsel and through the exercise of its business judgment, that the renewal of the Advisory Contracts was in the best interests of the fund and its shareholders and that the compensation payable under the Advisory Contracts was fair and reasonable. The Board's decision to renew the Advisory Contracts was not based on any single factor, but rather was based on a comprehensive consideration of all the information provided to the Board at its meetings throughout the year. The Board, in reaching its determination to renew the Advisory Contracts, was aware that shareholders of the fund have a broad range of investment choices available to them, including a wide choice among funds offered by Fidelity's competitors, and that the fund's shareholders, who have the opportunity to review and weigh the disclosure provided by the fund in its prospectus and other public disclosures, have chosen to invest in this fund, which is part of the Fidelity family of funds.
Amendment to Group Fee Rate. The Board also approved an amendment to the management contract for the fund to add an additional breakpoint to the group fee schedule, effective October 1, 2017. The Board noted that the additional breakpoint would result in lower management fee rates as Fidelity's assets under management increase.
Nature, Extent, and Quality of Services Provided. The Board considered Fidelity's staffing as it relates to the fund, including the backgrounds of investment personnel of Fidelity, and also considered the fund's investment objective, strategies, and related investment philosophy. The Independent Trustees also had discussions with senior management of Fidelity's investment operations and investment groups. The Board considered the structure of the investment personnel compensation program and whether this structure provides appropriate incentives to act in the best interests of the fund. Additionally, the Board considered the portfolio managers' investments, if any, in the funds that they manage.
Resources Dedicated to Investment Management and Support Services. The Board and the Fund Oversight and Research Committees reviewed the general qualifications and capabilities of Fidelity's investment staff, including its size, education, experience, and resources, as well as Fidelity's approach to recruiting, training, managing, and compensating investment personnel. The Board noted that Fidelity has continued to increase the resources devoted to non-U.S. offices, including expansion of Fidelity's global investment organization. The Board also noted that Fidelity's analysts have extensive resources, tools and capabilities that allow them to conduct sophisticated quantitative and fundamental analysis, as well as credit analysis of issuers, counterparties and guarantors. Further, the Board considered that Fidelity's investment professionals have sufficient access to global information and data so as to provide competitive investment results over time, and that those professionals also have access to sophisticated tools that permit them to assess portfolio construction and risk and performance attribution characteristics continuously, as well as to transmit new information and research conclusions rapidly around the world. Additionally, in its deliberations, the Board considered Fidelity's trading, risk management, compliance, and technology and operations capabilities and resources, which are integral parts of the investment management process.
Shareholder and Administrative Services. The Board considered (i) the nature, extent, quality, and cost of advisory, administrative, and shareholder services performed by the Investment Advisers and their affiliates under the Advisory Contracts and under separate agreements covering transfer agency, pricing and bookkeeping, and securities lending services for the fund; (ii) the nature and extent of the supervision of third party service providers, principally custodians, subcustodians, and pricing vendors; and (iii) the resources devoted to, and the record of compliance with, the fund's compliance policies and procedures. The Board also reviewed the allocation of fund brokerage, including allocations to brokers affiliated with the Investment Advisers, the use of brokerage commissions to pay fund expenses, and the use of "soft" commission dollars to pay for research services.
The Board noted that the growth of fund assets over time across the complex allows Fidelity to reinvest in the development of services designed to enhance the value or convenience of the Fidelity funds as investment vehicles. These services include 24-hour access to account information and market information through telephone representatives and over the Internet, investor education materials and asset allocation tools, and the expanded availability of Fidelity Investor Centers.
In 2014, the Board formed an ad hoc Committee on Transfer Agency Fees to review the variety of transfer agency fee structures throughout the industry and Fidelity's competitive positioning with respect to industry participants.
Investment in a Large Fund Family. The Board considered the benefits to shareholders of investing in a Fidelity fund, including the benefits of investing in a fund that is part of a large family of funds offering a variety of investment disciplines and providing a large variety of mutual fund investor services. The Board noted that Fidelity had taken, or had made recommendations that resulted in the Fidelity funds taking, a number of actions over the previous year that benefited particular funds, including: (i) continuing to dedicate additional resources to Fidelity's investment research process, and to the support of the senior management team that oversees asset management; (ii) continuing efforts to enhance Fidelity's global research capabilities; (iii) launching new funds and making other enhancements to meet client needs; (iv) launching new share classes of existing funds; (v) eliminating purchase minimums and broadening eligibility requirements for certain lower-priced share classes; (vi) reducing management fees and total expenses for certain growth equity funds and index funds; (vii) lowering expense caps for certain existing funds and classes to reduce expenses borne by shareholders; (viii) eliminating short-term redemption fees for certain funds; (ix) introducing a new pricing structure for certain funds of funds that is expected to reduce overall expenses paid by shareholders; (x) rationalizing product lines and gaining increased efficiencies through proposals for fund mergers and share class consolidations; (xi) continuing to develop, acquire and implement systems and technology to improve services to the funds and shareholders, strengthen information security, and increase efficiency; and (xii) implementing enhancements to further strengthen Fidelity's product line to increase investors' probability of success in achieving their investment goals, including retirement income goals.
Investment Performance. The Board considered whether the fund has operated in accordance with its investment objective, as well as its record of compliance with its investment restrictions and its performance history.
The Board took into account discussions with representatives of the Investment Advisers about fund investment performance that occur at Board meetings throughout the year. In this regard the Board noted that as part of regularly scheduled fund reviews and other reports to the Board on fund performance, the Board considers annualized return information for the fund for different time periods, measured against a securities market index ("benchmark index") and a peer group of funds with similar objectives ("peer group"), if any. In its evaluation of fund investment performance, the Board gave particular attention to information indicating changes in performance of certain Fidelity funds for specific time periods and discussed with the Investment Advisers the reasons for any overperformance or underperformance.
In addition to reviewing absolute and relative fund performance, the Independent Trustees periodically consider the appropriateness of fund performance metrics in evaluating the results achieved. In general, the Independent Trustees believe that fund performance should be evaluated based on net performance (after fees and expenses) of both the highest performing and lowest performing fund share classes, where applicable, compared to appropriate benchmark indices, over appropriate time periods that may include full market cycles, and compared to peer groups, as applicable, over the same periods, taking into account relevant factors including the following: general market conditions; issuer-specific information; and fund cash flows and other factors.
The Independent Trustees recognize that shareholders evaluate performance on a net basis over their own holding periods, for which one-, three-, and five-year periods are often used as a proxy. For this reason, the performance information reviewed by the Board also included net cumulative calendar year total return information for the fund and an appropriate benchmark index and peer group for the most recent one-, three-, and five-year periods, as shown below. Returns are shown compared to the 25th percentile (top of box, 75% beaten) and 75th percentile (bottom of box, 25% beaten) of the peer universe.
Fidelity Disciplined Equity Fund
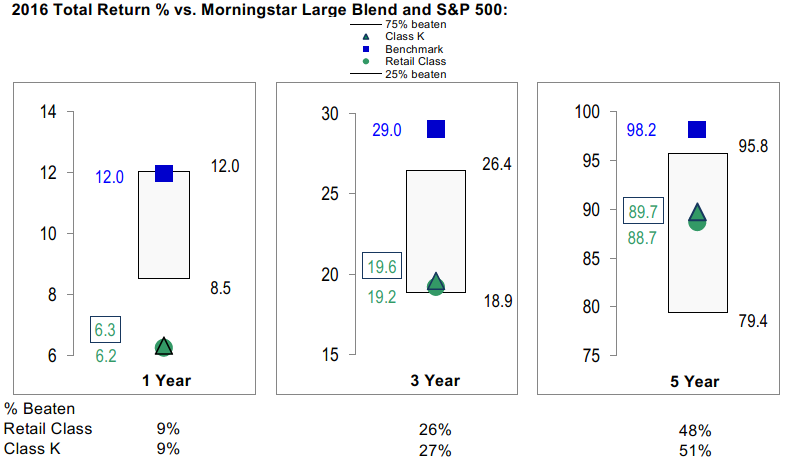
The Board has discussed the fund's underperformance with FMR, including the fund's investment strategy, the portfolio management team, and broader trends in the market that may have impacted the fund's performance, and has engaged with FMR to consider what steps might be taken to remediate the fund's underperformance. The Board noted that there was a portfolio management change for the fund in January 2014.
The Board also considered that the fund's management fee is subject to upward or downward adjustment depending upon whether, and to what extent, the fund's investment performance for the performance period (a rolling 36-month period) exceeds, or is exceeded by, a securities index, thus leading to a performance adjustment for the same period. The Board noted that the performance adjustment provides FMR with a strong economic incentive to seek to achieve superior long-term performance for the fund's shareholders and helps to more closely align the interests of FMR and the shareholders of the fund.
Based on its review, the Board concluded that the nature, extent, and quality of services provided to the fund under the Advisory Contracts should continue to benefit the shareholders of the fund.
Competitiveness of Management Fee and Total Expense Ratio. The Board considered the fund's management fee and total expense ratio compared to "mapped groups" of competitive funds and classes created for the purpose of facilitating the Trustees' competitive analysis of management fees and total expenses. Fidelity creates "mapped groups" by combining similar Lipper investment objective categories that have comparable investment mandates. Combining Lipper investment objective categories aids the Board's management fee and total expense ratio comparisons by broadening the competitive group used for comparison.
Management Fee. The Board considered two proprietary management fee comparisons for the 12-month periods shown in basis points (BP) in the chart below. The group of Lipper funds used by the Board for management fee comparisons is referred to below as the "Total Mapped Group." The Total Mapped Group comparison focuses on a fund's standing in terms of gross management fees before expense reimbursements or caps, and without giving effect to the fund's performance adjustment, relative to the total universe of funds with comparable investment mandates, regardless of whether their management fee structures also are comparable. Funds with comparable investment mandates offer exposure to similar types of securities. Funds with comparable management fee structures have similar management fee contractual arrangements (
e.g., flat rate charged for advisory services, all-inclusive fee rate,
etc.). "TMG %" represents the percentage of funds in the Total Mapped Group that had management fees that were lower than the fund's. For example, a hypothetical TMG % of 20% would mean that 80% of the funds in the Total Mapped Group had higher, and 20% had lower, management fees than the fund. The fund's actual TMG %s and the number of funds in the Total Mapped Group are in the chart below. The "Asset-Size Peer Group" (ASPG) comparison focuses on a fund's standing relative to a subset of non-Fidelity funds within the Total Mapped Group that are similar in size and management fee structure without taking into account performance adjustments, if any. For example, if a fund is in the first quartile of the ASPG, the fund's management fee ranks in the least expensive or lowest 25% of funds in the ASPG. The ASPG represents at least 15% of the funds in the Total Mapped Group with comparable asset size and management fee structures, subject to a minimum of 50 funds (or all funds in the Total Mapped Group if fewer than 50). Additional information, such as the ASPG quartile in which the fund's management fee rate ranked and the impact of the fund's performance adjustment, is also included in the chart and considered by the Board.
Fidelity Disciplined Equity Fund
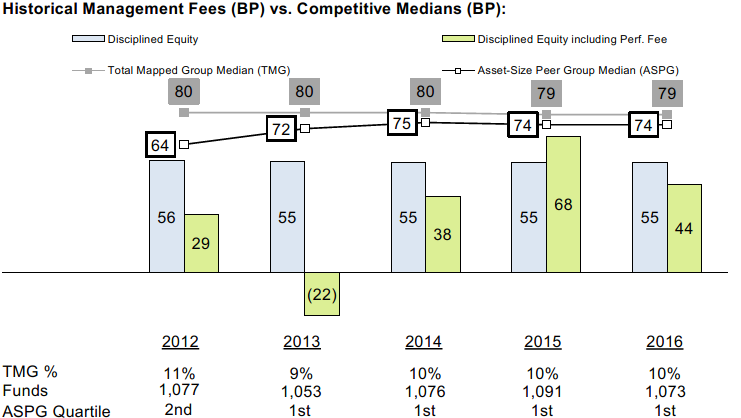
The Board noted that the fund's management fee rate ranked below the median of its Total Mapped Group and below the median of its ASPG for 2016. The Board also noted the effect of the fund's performance adjustment, if any, on the fund's management fee ranking.
The Board noted that, in 2014, the Board and the boards of other Fidelity funds formed the ad hoc Committee on Group Fee to conduct an in-depth review of the "group fee" component of the management fee of funds with such management fee structures. The Committee's focus included the mechanics of the group fee, the competitive landscape of group fee structures, Fidelity funds with no group fee component and investment products not included in group fee assets. The Board also considered that, for funds subject to the group fee, FMR agreed to voluntarily waive fees over a specified period of time in amounts designed to account for assets converted from certain funds to certain collective investment trusts.
The Board also noted that, in 2013, the ad hoc Committee on Management Fees was formed to conduct an in-depth review of the management fee rates of Fidelity's active equity mutual funds. The Committee focused on the following areas: (i) standard fee structures; (ii) research consumption and trading evolution; (iii) management fee competitiveness/profitability by category; and (iv) factors that drive institutional pricing.
Based on its review, the Board concluded that the fund's management fee is fair and reasonable in light of the services that the fund receives and the other factors considered.
Total Expense Ratio. In its review of each class's total expense ratio, the Board considered the fund's management fee rate as well as other fund or class expenses, as applicable, such as transfer agent fees, pricing and bookkeeping fees, and custodial, legal, and audit fees. The Board noted the impact of the fund's performance adjustment. The Board also noted that Fidelity may agree to waive fees and expenses from time to time, and the extent to which, if any, it has done so for the fund. As part of its review, the Board also considered the current and historical total expense ratios of each class of the fund compared to competitive fund median expenses. Each class of the fund is compared to those funds and classes in the Total Mapped Group (used by the Board for management fee comparisons) that have a similar sales load structure.
The Board noted that the total expense ratio of each class ranked below the competitive median for 2016.
Fees Charged to Other Fidelity Clients. The Board also considered Fidelity fee structures and other information with respect to clients of Fidelity, such as other funds advised or subadvised by Fidelity, pension plan clients, and other institutional clients with similar mandates. The Board noted that an ad hoc joint committee created by it and the boards of other Fidelity funds periodically (most recently in 2013) reviews and compares Fidelity's institutional investment advisory business with its business of providing services to the Fidelity funds, including the differences in services provided, fees charged, and costs incurred, as well as competition in their respective marketplaces.
Based on its review of total expense ratios and fees charged to other Fidelity clients, the Board concluded that the total expense ratio of each class of the fund was reasonable in light of the services that the fund and its shareholders receive and the other factors considered.
Costs of the Services and Profitability. The Board considered the revenues earned and the expenses incurred by Fidelity in conducting the business of developing, marketing, distributing, managing, administering and servicing the fund and servicing the fund's shareholders. The Board also considered the level of Fidelity's profits in respect of all the Fidelity funds.
On an annual basis, Fidelity presents to the Board information about the profitability of its relationships with the fund. Fidelity calculates profitability information for each fund, as well as aggregate profitability information for groups of Fidelity funds and all Fidelity funds, using a series of detailed revenue and cost allocation methodologies which originate with the books and records of Fidelity on which Fidelity's audited financial statements are based. The Audit Committee of the Board reviews any significant changes from the prior year's methodologies.
PricewaterhouseCoopers LLP (PwC), independent registered public accounting firm and auditor to Fidelity and certain Fidelity funds, has been engaged annually by the Board as part of the Board's assessment of Fidelity's profitability analysis. PwC's engagement includes the review and assessment of the methodologies used by Fidelity in determining the revenues and expenses attributable to Fidelity's mutual fund business, and completion of agreed-upon procedures in respect of the mathematical accuracy of the fund profitability information and its conformity to established allocation methodologies. After considering PwC's reports issued under the engagement and information provided by Fidelity, the Board concluded that while other allocation methods may also be reasonable, Fidelity's profitability methodologies are reasonable in all material respects.
The Board also reviewed Fidelity's non-fund businesses and potential fall-out benefits related to the mutual fund business as well as cases where Fidelity's affiliates may benefit from or be related to the fund's business.
The Board considered the costs of the services provided by and the profits realized by Fidelity in connection with the operation of the fund and was satisfied that the profitability was not excessive.
Economies of Scale. The Board considered whether there have been economies of scale in respect of the management of the Fidelity funds, whether the Fidelity funds (including the fund) have appropriately benefited from any such economies of scale, and whether there is potential for realization of any further economies of scale. The Board considered the extent to which the fund will benefit from economies of scale as assets grow through increased services to the fund, through waivers or reimbursements, or through fee or expense ratio reductions. The Board also noted that a committee (the Economies of Scale Committee) created by it and the boards of other Fidelity funds periodically (most recently in 2013) analyzes whether Fidelity attains economies of scale in respect of the management and servicing of the Fidelity funds, whether the Fidelity funds have appropriately benefited from such economies of scale, and whether there is potential for realization of any further economies of scale.
The Board recognized that the fund's management contract incorporates a "group fee" structure, which provides for lower group fee rates as total group assets increase, and for higher group fee rates as total group assets decrease (with "group assets" defined to include fund assets under FMR's management plus the assets of sector funds previously under FMR's management). FMR calculates the group fee rates based on a tiered asset "breakpoint" schedule that varies based on asset class. The Board considered that the group fee is designed to deliver the benefits of economies of scale to fund shareholders when total Fidelity fund assets increase, even if assets of any particular fund are unchanged or have declined, because some portion of Fidelity's costs are attributable to services provided to all Fidelity funds, and all funds benefit if those costs can be allocated among more assets. The Board concluded that, given the group fee structure, fund shareholders will benefit from lower management fees as group assets increase at the fund complex level, regardless of whether Fidelity achieves any such economies of scale.
The Board concluded, taking into account the analysis of the Economies of Scale Committee, that economies of scale, if any, are being appropriately shared between fund shareholders and Fidelity.
Additional Information Requested by the Board. In order to develop fully the factual basis for consideration of the Fidelity funds' advisory contracts, the Board requested and received additional information on certain topics, including: (i) fund performance trends, in particular the underperformance of certain funds, and Fidelity's long-term strategies for certain funds; (ii) Fidelity's fund profitability methodology, profitability trends for certain funds, and the impact of certain factors on fund profitability results, including the impact of market trends on actively managed funds; (iii) the use of performance fees and the calculation of performance adjustments, including the impact of underperformance and fund outflows on performance adjustments; (iv) metrics for evaluating index fund performance; (v) Fidelity's group fee structure, including the group fee breakpoint schedules; (vi) the terms of Fidelity's contractual and voluntary expense cap arrangements with the funds; (vii) the methodology with respect to evaluating competitive fund data and peer group classifications and fee comparisons; (viii) the expense structures for different funds and classes; (ix) Fidelity's arrangements with affiliated sub-advisers on behalf of the funds; (x) information regarding other accounts managed by Fidelity, including institutional accounts and collective investment trusts; (xi) recent changes to the fee structure for certain funds of funds; and (xii) the impact of the Department of Labor's new fiduciary rule on the funds' comparative expense information.
Based on its evaluation of all of the conclusions noted above, and after considering all factors it believed relevant, the Board concluded that the advisory fee structures are fair and reasonable, and that the fund's Advisory Contracts should be renewed.
Corporate Headquarters
245 Summer St.
Boston, MA 02210
www.fidelity.com
FDE-ANN-1217
1.538372.120
Fidelity Advisor® Stock Selector Small Cap Fund - Class A, Class M (formerly Class T), Class C, Class I and Class Z
Annual Report October 31, 2017 Class A, Class M, Class C, Class I and Class Z are classes of Fidelity® Stock Selector Small Cap Fund |
|
Contents
To view a fund's proxy voting guidelines and proxy voting record for the 12-month period ended June 30, visit http://www.fidelity.com/proxyvotingresults or visit the Securities and Exchange Commission's (SEC) web site at http://www.sec.gov.
You may also call 1-877-208-0098 to request a free copy of the proxy voting guidelines.
Standard & Poor's, S&P and S&P 500 are registered service marks of The McGraw-Hill Companies, Inc. and have been licensed for use by Fidelity Distributors Corporation.
Other third-party marks appearing herein are the property of their respective owners.
All other marks appearing herein are registered or unregistered trademarks or service marks of FMR LLC or an affiliated company. © 2017 FMR LLC. All rights reserved.
This report and the financial statements contained herein are submitted for the general information of the shareholders of the Fund. This report is not authorized for distribution to prospective investors in the Fund unless preceded or accompanied by an effective prospectus.
A fund files its complete schedule of portfolio holdings with the SEC for the first and third quarters of each fiscal year on Form N-Q. Forms N-Q are available on the SEC’s web site at http://www.sec.gov. A fund's Forms N-Q may be reviewed and copied at the SEC’s Public Reference Room in Washington, DC. Information regarding the operation of the SEC's Public Reference Room may be obtained by calling 1-800-SEC-0330.
For a complete list of a fund's portfolio holdings, view the most recent holdings listing, semiannual report, or annual report on Fidelity's web site at http://www.fidelity.com, http://www.institutional.fidelity.com, or http://www.401k.com, as applicable.
NOT FDIC INSURED •MAY LOSE VALUE •NO BANK GUARANTEE
Neither the Fund nor Fidelity Distributors Corporation is a bank.
Performance: The Bottom Line
Average annual total return reflects the change in the value of an investment, assuming reinvestment of distributions from dividend income and capital gains (the profits earned upon the sale of securities that have grown in value, if any) and assuming a constant rate of performance each year. The hypothetical investment and the average annual total returns do not reflect the deduction of taxes that a shareholder would pay on fund distributions or the redemption of fund shares. During periods of reimbursement by Fidelity, a fund’s total return will be greater than it would be had the reimbursement not occurred. How a fund did yesterday is no guarantee of how it will do tomorrow.
Average Annual Total Returns
| For the periods ended October 31, 2017 | Past 1 year | Past 5 years | Past 10 years |
| Class A (incl. 5.75% sales charge) | 14.63% | 11.29% | 4.32% |
| Class M (incl. 3.50% sales charge) | 16.96% | 11.44% | 4.25% |
| Class C (incl. contingent deferred sales charge) | 19.62% | 11.71% | 4.11% |
| Class I | 21.97% | 12.94% | 5.29% |
| Class Z | 22.10% | 12.97% | 5.30% |
Class C shares' contingent deferred sales charges included in the past one year, past five years and past ten years total return figures are 1%, 0% and 0%, respectively.
The initial offering of Class Z shares took place on February 1, 2017. Returns prior to February 1, 2017, are those of Class I.
$10,000 Over 10 Years
Let's say hypothetically that $10,000 was invested in Fidelity Advisor® Stock Selector Small Cap Fund - Class A on October 31, 2007, and the current 5.75% sales charge was paid.
The chart shows how the value of your investment would have changed, and also shows how the Russell 2000® Index performed over the same period.
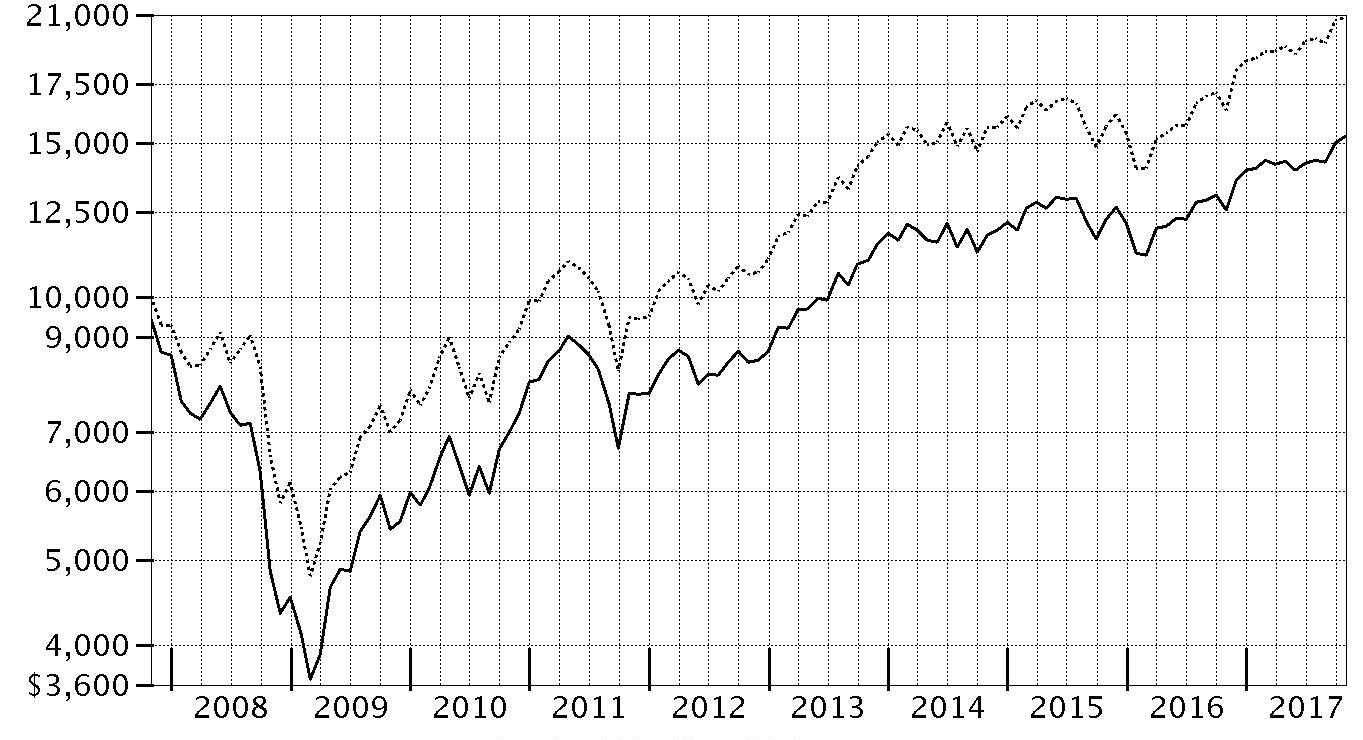
| Period Ending Values |
| $15,260 | Fidelity Advisor® Stock Selector Small Cap Fund - Class A |
| $20,870 | Russell 2000® Index |
Management's Discussion of Fund Performance
Market Recap: The U.S. equity bellwether S&P 500
® index gained 23.63% for the year ending October 31, 2017. Equity markets rose sharply following the November election and continued to rally through the end of February on optimism for President Trump’s pro-business agenda. Stocks leveled off in March amid fading optimism and stalled efforts by Congress to repeal and replace the Affordable Care Act. Upward momentum soon returned and continued through period end amid positive consumer sentiment and other market indicators. The lone exception was a brief cooldown in August, when geopolitical tension escalated and uncertainty grew regarding the future of health care, tax reform and the debt ceiling. Sector-wise, information technology (+39%) performed best, surging as a handful of major index constituents posted strong returns. Financials gained 37%, riding an uptick in bond yields and a surge in banks. Materials (+29%) also did well, spurred by higher demand, especially from China. Conversely, consumer discretionary (+20%) lagged the broader market, as brick-and-mortar retailers continued to suffer from increased online competition. Rising interest rates held back real estate (+9%) and sluggish oil prices dragged on energy (+2%). Consumer staples (+4%) and telecommunication services (-1%) struggled due to investors’ general preference for risk assets.
Comments from Lead Portfolio Manager Richard Thompson: For the fiscal year ending October 31, 2017, the fund’s Retail Class shares gained 22%, lagging the 27.85% return of the benchmark Russell 2000
® Index. Weak stock selection was the biggest detractor versus the benchmark, with nine of 11 sector sleeves underperforming the corresponding results of the Russell index. Specifically, our picks in financials, particularly in banks, and information technology were the most detrimental on a relative basis. Individually, the fund’s overweighting in non-bank ATM operator Cardtronics was the fund’s biggest relative detractor. Shares declined after the company reduced its earnings estimates, which were hampered by lower interchange fees in Australia (a primary market), investors became concerned about a slowdown in earnings growth as one of Cardtronics’ largest customers winds down its contract with the company. Elsewhere, a non-benchmark stake in oil and natural gas drilling operator Nabors Industries also hurt, as the company reported poor operational performance and a less-bullish land-drilling outlook in the U.S. On the positive side, choices in consumer staples helped most. The fund’s largest individual contributor, however, came from the health care segment: biotechnology company AnaptysBio. In early October, shares of the stock soared after the company announced positive Phase 2 data on its atopic dermatitis drug in clinical trials.
The views expressed above reflect those of the portfolio manager(s) only through the end of the period as stated on the cover of this report and do not necessarily represent the views of Fidelity or any other person in the Fidelity organization. Any such views are subject to change at any time based upon market or other conditions and Fidelity disclaims any responsibility to update such views. These views may not be relied on as investment advice and, because investment decisions for a Fidelity fund are based on numerous factors, may not be relied on as an indication of trading intent on behalf of any Fidelity fund.
Investment Summary (Unaudited)
Top Ten Stocks as of October 31, 2017
| | % of fund's net assets | % of fund's net assets 6 months ago |
| EMCOR Group, Inc. | 1.2 | 1.1 |
| RingCentral, Inc. | 1.0 | 0.0 |
| BancFirst Corp. | 0.9 | 1.0 |
| Banner Corp. | 0.9 | 0.9 |
| Cotiviti Holdings, Inc. | 0.9 | 0.7 |
| WSFS Financial Corp. | 0.9 | 1.0 |
| Associated Banc-Corp. | 0.9 | 0.9 |
| Wintrust Financial Corp. | 0.9 | 0.0 |
| Washington Federal, Inc. | 0.9 | 0.8 |
| Primerica, Inc. | 0.9 | 0.7 |
| | 9.4 | |
Top Five Market Sectors as of October 31, 2017
| | % of fund's net assets | % of fund's net assets 6 months ago |
| Financials | 19.2 | 19.4 |
| Information Technology | 17.7 | 17.2 |
| Industrials | 16.0 | 15.3 |
| Health Care | 13.6 | 12.1 |
| Consumer Discretionary | 11.0 | 12.2 |
Asset Allocation (% of fund's net assets)
| As of October 31, 2017* |
| | Stocks | 98.3% |
| | Short-Term Investments and Net Other Assets (Liabilities) | 1.7% |

* Foreign investments - 9.8%
| As of April 30, 2017 * |
| | Stocks and Equity Futures | 98.3% |
| | Short-Term Investments and Net Other Assets (Liabilities) | 1.7% |

* Foreign investments - 8.9%
Percentages shown as 0.0% may reflect amounts less than 0.05%.
Investments October 31, 2017
Showing Percentage of Net Assets
| Common Stocks - 98.3% | | | |
| | | Shares | Value (000s) |
| CONSUMER DISCRETIONARY - 11.0% | | | |
| Auto Components - 1.3% | | | |
| Standard Motor Products, Inc. | | 149,102 | $6,511 |
| Tenneco, Inc. | | 135,284 | 7,861 |
| Visteon Corp. (a) | | 53,100 | 6,693 |
| | | | 21,065 |
| Diversified Consumer Services - 0.4% | | | |
| Service Corp. International | | 185,400 | 6,574 |
| Hotels, Restaurants & Leisure - 1.9% | | | |
| Bojangles', Inc. (a)(b) | | 16,250 | 199 |
| Cedar Fair LP (depositary unit) | | 88,100 | 5,515 |
| Dave & Buster's Entertainment, Inc. (a) | | 22,200 | 1,070 |
| Eldorado Resorts, Inc. (a) | | 47,600 | 1,223 |
| Marriott Vacations Worldwide Corp. | | 72,800 | 9,582 |
| Papa John's International, Inc. (b) | | 103,900 | 7,070 |
| Penn National Gaming, Inc. (a) | | 202,500 | 5,283 |
| | | | 29,942 |
| Household Durables - 2.6% | | | |
| CalAtlantic Group, Inc. | | 117,500 | 5,797 |
| Cavco Industries, Inc. (a) | | 51,700 | 8,112 |
| Helen of Troy Ltd. (a) | | 77,569 | 7,206 |
| Taylor Morrison Home Corp. (a) | | 375,800 | 9,076 |
| TopBuild Corp. (a) | | 150,800 | 9,951 |
| TRI Pointe Homes, Inc. (a) | | 93,660 | 1,657 |
| | | | 41,799 |
| Leisure Products - 0.4% | | | |
| Brunswick Corp. | | 78,496 | 3,976 |
| Johnson Outdoors, Inc. Class A | | 37,533 | 2,823 |
| | | | 6,799 |
| Media - 0.9% | | | |
| Cinemark Holdings, Inc. | | 176,400 | 6,410 |
| Lions Gate Entertainment Corp. Class B | | 255,500 | 7,067 |
| | | | 13,477 |
| Multiline Retail - 0.5% | | | |
| Ollie's Bargain Outlet Holdings, Inc. (a) | | 163,900 | 7,318 |
| Specialty Retail - 1.3% | | | |
| Burlington Stores, Inc. (a) | | 63,100 | 5,924 |
| Murphy U.S.A., Inc. (a) | | 78,900 | 5,867 |
| The Children's Place Retail Stores, Inc. | | 74,000 | 8,051 |
| | | | 19,842 |
| Textiles, Apparel & Luxury Goods - 1.7% | | | |
| Deckers Outdoor Corp. (a) | | 80,500 | 5,493 |
| Emerald Expositions Events, Inc. | | 240,000 | 5,590 |
| Steven Madden Ltd. (a) | | 224,259 | 8,746 |
| Wolverine World Wide, Inc. | | 276,000 | 7,535 |
| | | | 27,364 |
|
| TOTAL CONSUMER DISCRETIONARY | | | 174,180 |
|
| CONSUMER STAPLES - 2.4% | | | |
| Beverages - 0.2% | | | |
| Cott Corp. | | 193,700 | 2,906 |
| Food & Staples Retailing - 0.4% | | | |
| Performance Food Group Co. (a) | | 204,175 | 5,778 |
| Food Products - 1.2% | | | |
| Cranswick PLC | | 84,500 | 3,457 |
| Hostess Brands, Inc. Class A (a) | | 260,667 | 3,005 |
| Ingredion, Inc. | | 31,700 | 3,974 |
| J&J Snack Foods Corp. | | 33,575 | 4,471 |
| Lamb Weston Holdings, Inc. | | 75,800 | 3,865 |
| | | | 18,772 |
| Household Products - 0.3% | | | |
| Central Garden & Pet Co. Class A (non-vtg.) (a) | | 140,900 | 5,201 |
| Personal Products - 0.3% | | | |
| Inter Parfums, Inc. | | 109,300 | 5,061 |
|
| TOTAL CONSUMER STAPLES | | | 37,718 |
|
| ENERGY - 4.1% | | | |
| Energy Equipment & Services - 1.1% | | | |
| Archrock, Inc. | | 244,329 | 2,932 |
| Nabors Industries Ltd. | | 787,700 | 4,435 |
| Rowan Companies PLC (a) | | 362,340 | 5,192 |
| Total Energy Services, Inc. | | 419,493 | 4,939 |
| | | | 17,498 |
| Oil, Gas & Consumable Fuels - 3.0% | | | |
| Boardwalk Pipeline Partners, LP | | 391,408 | 5,488 |
| DCP Midstream Partners LP | | 82,200 | 2,719 |
| Delek U.S. Holdings, Inc. | | 230,900 | 6,015 |
| Diamondback Energy, Inc. (a) | | 61,507 | 6,591 |
| Newfield Exploration Co. (a) | | 177,488 | 5,465 |
| PDC Energy, Inc. (a) | | 151,000 | 7,690 |
| Warrior Metropolitan Coal, Inc. (b) | | 215,000 | 5,594 |
| WPX Energy, Inc. (a) | | 728,590 | 8,218 |
| | | | 47,780 |
|
| TOTAL ENERGY | | | 65,278 |
|
| FINANCIALS - 19.2% | | | |
| Banks - 11.6% | | | |
| Associated Banc-Corp. | | 554,923 | 14,040 |
| BancFirst Corp. | | 271,156 | 14,819 |
| Banner Corp. | | 250,429 | 14,355 |
| Boston Private Financial Holdings, Inc. | | 382,327 | 6,079 |
| City Holding Co. | | 143,799 | 10,136 |
| Columbia Banking Systems, Inc. | | 315,500 | 13,727 |
| Community Bank System, Inc. | | 137,351 | 7,594 |
| Cullen/Frost Bankers, Inc. | | 89,300 | 8,796 |
| CVB Financial Corp. | | 528,200 | 12,603 |
| First Merchants Corp. | | 268,637 | 11,551 |
| Hilltop Holdings, Inc. | | 250,428 | 5,900 |
| Huntington Bancshares, Inc. | | 53,114 | 733 |
| Independent Bank Corp., Massachusetts | | 144,342 | 10,407 |
| Stock Yards Bancorp, Inc. | | 305,882 | 11,547 |
| Tompkins Financial Corp. | | 143,738 | 12,522 |
| TowneBank | | 304,162 | 10,189 |
| Trico Bancshares | | 105,347 | 4,363 |
| Wintrust Financial Corp. | | 171,700 | 13,957 |
| | | | 183,318 |
| Capital Markets - 0.7% | | | |
| OM Asset Management Ltd. | | 729,210 | 11,142 |
| Diversified Financial Services - 1.3% | | | |
| Camping World Holdings, Inc. | | 126,200 | 5,303 |
| Cotiviti Holdings, Inc. (a) | | 408,200 | 14,352 |
| | | | 19,655 |
| Insurance - 3.0% | | | |
| Employers Holdings, Inc. | | 280,386 | 13,374 |
| First American Financial Corp. | | 196,800 | 10,710 |
| James River Group Holdings Ltd. | | 233,853 | 9,897 |
| Primerica, Inc. | | 157,200 | 13,912 |
| | | | 47,893 |
| Thrifts & Mortgage Finance - 2.6% | | | |
| Beneficial Bancorp, Inc. | | 736,800 | 12,157 |
| Washington Federal, Inc. | | 400,863 | 13,950 |
| WSFS Financial Corp. | | 287,442 | 14,286 |
| | | | 40,393 |
|
| TOTAL FINANCIALS | | | 302,401 |
|
| HEALTH CARE - 13.6% | | | |
| Biotechnology - 8.0% | | | |
| Abeona Therapeutics, Inc. (a)(b) | | 223,873 | 4,019 |
| ACADIA Pharmaceuticals, Inc. (a) | | 107,652 | 3,750 |
| Acorda Therapeutics, Inc. (a) | | 237,800 | 6,320 |
| Advanced Accelerator Applications SA sponsored ADR (a)(b) | | 109,900 | 8,902 |
| Agios Pharmaceuticals, Inc. (a)(b) | | 87,515 | 5,625 |
| Amarin Corp. PLC ADR (a)(b) | | 278,200 | 946 |
| AnaptysBio, Inc. | | 121,000 | 7,990 |
| Ascendis Pharma A/S sponsored ADR (a) | | 189,306 | 6,433 |
| Audentes Therapeutics, Inc. (a) | | 172,300 | 4,581 |
| BioMarin Pharmaceutical, Inc. (a) | | 41,256 | 3,387 |
| bluebird bio, Inc. (a) | | 61,728 | 8,586 |
| Cellectis SA sponsored ADR (a) | | 117,600 | 4,117 |
| Coherus BioSciences, Inc. (a) | | 147,300 | 1,657 |
| Curis, Inc. (a) | | 1,510,448 | 2,387 |
| CytomX Therapeutics, Inc. (a) | | 78,100 | 1,562 |
| CytomX Therapeutics, Inc. (a)(c) | | 27,627 | 553 |
| FibroGen, Inc. (a) | | 110,500 | 6,171 |
| Five Prime Therapeutics, Inc. (a) | | 95,400 | 4,280 |
| Heron Therapeutics, Inc. (a) | | 144,200 | 2,213 |
| Insmed, Inc. (a) | | 232,765 | 6,287 |
| Intercept Pharmaceuticals, Inc. (a) | | 27,988 | 1,725 |
| Ionis Pharmaceuticals, Inc. (a) | | 76,128 | 4,348 |
| La Jolla Pharmaceutical Co. (a) | | 167,600 | 5,759 |
| Neurocrine Biosciences, Inc. (a) | | 118,260 | 7,345 |
| Protagonist Therapeutics, Inc. (a)(b) | | 164,000 | 2,455 |
| Sage Therapeutics, Inc. (a) | | 26,400 | 1,671 |
| Sienna Biopharmaceuticals, Inc. (b) | | 37,784 | 741 |
| Spark Therapeutics, Inc. (a) | | 81,100 | 6,561 |
| TESARO, Inc. (a) | | 45,600 | 5,279 |
| | | | 125,650 |
| Health Care Equipment & Supplies - 3.5% | | | |
| Cantel Medical Corp. | | 140,200 | 13,751 |
| Integra LifeSciences Holdings Corp. (a) | | 191,312 | 8,950 |
| iRhythm Technologies, Inc. | | 136,800 | 6,970 |
| Nanosonics Ltd. (a) | | 2,344,958 | 5,384 |
| Orthofix International NV (a) | | 37,894 | 2,036 |
| Steris PLC | | 82,900 | 7,737 |
| Wright Medical Group NV (a) | | 409,857 | 10,742 |
| | | | 55,570 |
| Health Care Providers & Services - 0.6% | | | |
| G1 Therapeutics, Inc. (b) | | 193,300 | 4,568 |
| Premier, Inc. (a) | | 151,300 | 4,943 |
| | | | 9,511 |
| Life Sciences Tools & Services - 0.7% | | | |
| ICON PLC (a) | | 93,400 | 11,102 |
| Pharmaceuticals - 0.8% | | | |
| Clearside Biomedical, Inc. (a)(b) | | 215,500 | 1,534 |
| Innoviva, Inc. (a) | | 281,851 | 3,450 |
| Prestige Brands Holdings, Inc. (a) | | 69,346 | 3,252 |
| Theravance Biopharma, Inc. (a)(b) | | 171,578 | 4,952 |
| | | | 13,188 |
|
| TOTAL HEALTH CARE | | | 215,021 |
|
| INDUSTRIALS - 16.0% | | | |
| Aerospace & Defense - 1.6% | | | |
| Moog, Inc. Class A (a) | | 157,007 | 13,779 |
| Teledyne Technologies, Inc. (a) | | 64,865 | 11,024 |
| | | | 24,803 |
| Air Freight & Logistics - 0.5% | | | |
| Air Transport Services Group, Inc. (a) | | 344,918 | 8,347 |
| Airlines - 0.4% | | | |
| JetBlue Airways Corp. (a) | | 355,246 | 6,803 |
| Building Products - 1.1% | | | |
| Allegion PLC | | 80,055 | 6,676 |
| GCP Applied Technologies, Inc. (a) | | 122,600 | 3,586 |
| Simpson Manufacturing Co. Ltd. | | 128,293 | 7,151 |
| | | | 17,413 |
| Commercial Services & Supplies - 2.1% | | | |
| Deluxe Corp. | | 159,129 | 11,083 |
| Interface, Inc. | | 446,930 | 10,190 |
| Matthews International Corp. Class A | | 111,897 | 7,033 |
| Multi-Color Corp. | | 57,200 | 4,730 |
| | | | 33,036 |
| Construction & Engineering - 3.3% | | | |
| Comfort Systems U.S.A., Inc. | | 258,344 | 11,445 |
| EMCOR Group, Inc. | | 237,739 | 19,148 |
| KBR, Inc. | | 582,472 | 11,434 |
| Valmont Industries, Inc. | | 63,633 | 10,111 |
| | | | 52,138 |
| Industrial Conglomerates - 0.8% | | | |
| ITT, Inc. | | 263,837 | 12,305 |
| Machinery - 2.3% | | | |
| AGCO Corp. | | 103,462 | 7,094 |
| Colfax Corp. (a) | | 112,400 | 4,688 |
| John Bean Technologies Corp. | | 60,600 | 6,478 |
| SPX Flow, Inc. (a) | | 212,209 | 8,749 |
| Standex International Corp. | | 86,640 | 8,972 |
| | | | 35,981 |
| Road & Rail - 0.7% | | | |
| Landstar System, Inc. | | 102,100 | 10,082 |
| Trading Companies & Distributors - 3.2% | | | |
| Kaman Corp. | | 209,850 | 11,739 |
| MRC Global, Inc. (a) | | 492,424 | 8,445 |
| SiteOne Landscape Supply, Inc. (a) | | 115,800 | 7,354 |
| Titan Machinery, Inc. (a) | | 363,125 | 5,407 |
| Watsco, Inc. | | 54,969 | 9,156 |
| WESCO International, Inc. (a) | | 137,954 | 8,712 |
| | | | 50,813 |
|
| TOTAL INDUSTRIALS | | | 251,721 |
|
| INFORMATION TECHNOLOGY - 17.7% | | | |
| Communications Equipment - 0.1% | | | |
| CommScope Holding Co., Inc. (a) | | 33,300 | 1,070 |
| Electronic Equipment & Components - 3.9% | | | |
| Cardtronics PLC (a) | | 236,800 | 5,423 |
| ePlus, Inc. (a) | | 125,852 | 12,031 |
| Jabil, Inc. | | 217,079 | 6,139 |
| Orbotech Ltd. (a) | | 173,412 | 7,755 |
| Plexus Corp. (a) | | 172,200 | 10,578 |
| Tech Data Corp. (a) | | 117,854 | 10,933 |
| TTM Technologies, Inc. (a) | | 587,784 | 9,275 |
| | | | 62,134 |
| Internet Software & Services - 2.2% | | | |
| 2U, Inc. (a) | | 195,400 | 12,433 |
| Five9, Inc. (a) | | 227,270 | 5,734 |
| j2 Global, Inc. | | 132,400 | 9,816 |
| Web.com Group, Inc. (a) | | 273,160 | 6,583 |
| | | | 34,566 |
| IT Services - 3.5% | | | |
| Amdocs Ltd. | | 51,000 | 3,320 |
| Blackhawk Network Holdings, Inc. (a) | | 196,071 | 6,657 |
| EPAM Systems, Inc. (a) | | 133,498 | 12,168 |
| Euronet Worldwide, Inc. (a) | | 105,187 | 10,165 |
| ExlService Holdings, Inc. (a) | | 169,091 | 10,555 |
| Maximus, Inc. | | 176,500 | 11,725 |
| | | | 54,590 |
| Semiconductors & Semiconductor Equipment - 4.2% | | | |
| Diodes, Inc. (a) | | 317,800 | 10,913 |
| Entegris, Inc. | | 391,300 | 12,815 |
| Integrated Device Technology, Inc. (a) | | 433,000 | 13,453 |
| Nanometrics, Inc. (a) | | 247,201 | 6,988 |
| ON Semiconductor Corp. (a) | | 452,400 | 9,645 |
| Semtech Corp. (a) | | 301,400 | 12,372 |
| | | | 66,186 |
| Software - 3.8% | | | |
| Aspen Technology, Inc. (a) | | 188,300 | 12,149 |
| Paycom Software, Inc. (a)(b) | | 134,500 | 11,056 |
| Pegasystems, Inc. | | 165,719 | 9,661 |
| RealPage, Inc. (a) | | 275,500 | 11,929 |
| RingCentral, Inc. (a) | | 362,700 | 15,288 |
| | | | 60,083 |
|
| TOTAL INFORMATION TECHNOLOGY | | | 278,629 |
|
| MATERIALS - 3.6% | | | |
| Chemicals - 1.9% | | | |
| Chase Corp. | | 82,936 | 9,849 |
| Innospec, Inc. | | 153,099 | 9,469 |
| Trinseo SA | | 93,131 | 6,612 |
| Tronox Ltd. Class A | | 168,600 | 4,463 |
| | | | 30,393 |
| Containers & Packaging - 1.1% | | | |
| Berry Global Group, Inc. (a) | | 113,940 | 6,774 |
| Owens-Illinois, Inc. (a) | | 203,100 | 4,852 |
| Sonoco Products Co. | | 106,441 | 5,513 |
| | | | 17,139 |
| Metals & Mining - 0.6% | | | |
| B2Gold Corp. (a) | | 1,378,657 | 3,505 |
| Steel Dynamics, Inc. | | 172,400 | 6,415 |
| | | | 9,920 |
|
| TOTAL MATERIALS | | | 57,452 |
|
| REAL ESTATE - 7.0% | | | |
| Equity Real Estate Investment Trusts (REITs) - 6.4% | | | |
| CareTrust (REIT), Inc. | | 488,800 | 9,238 |
| CoreSite Realty Corp. | | 99,597 | 11,030 |
| Corporate Office Properties Trust (SBI) | | 278,200 | 8,883 |
| Equity Lifestyle Properties, Inc. | | 129,900 | 11,494 |
| Four Corners Property Trust, Inc. | | 437,013 | 10,785 |
| Healthcare Realty Trust, Inc. | | 355,006 | 11,445 |
| Mid-America Apartment Communities, Inc. | | 53,284 | 5,454 |
| Potlatch Corp. | | 224,800 | 11,645 |
| Store Capital Corp. | | 365,915 | 9,034 |
| Terreno Realty Corp. | | 351,100 | 12,892 |
| | | | 101,900 |
| Real Estate Management & Development - 0.6% | | | |
| Realogy Holdings Corp. | | 283,980 | 9,181 |
|
| TOTAL REAL ESTATE | | | 111,081 |
|
| TELECOMMUNICATION SERVICES - 0.3% | | | |
| Diversified Telecommunication Services - 0.3% | | | |
| Cogent Communications Group, Inc. | | 74,000 | 3,989 |
| UTILITIES - 3.4% | | | |
| Electric Utilities - 1.6% | | | |
| El Paso Electric Co. | | 113,620 | 6,533 |
| IDACORP, Inc. | | 111,400 | 10,252 |
| Portland General Electric Co. | | 154,268 | 7,365 |
| | | | 24,150 |
| Gas Utilities - 1.8% | | | |
| Atmos Energy Corp. | | 48,038 | 4,191 |
| New Jersey Resources Corp. | | 107,200 | 4,765 |
| South Jersey Industries, Inc. | | 107,400 | 3,648 |
| Southwest Gas Holdings, Inc. | | 109,000 | 8,981 |
| Spire, Inc. | | 90,900 | 7,177 |
| | | | 28,762 |
|
| TOTAL UTILITIES | | | 52,912 |
|
| TOTAL COMMON STOCKS | | | |
| (Cost $1,237,867) | | | 1,550,382 |
| | | Principal Amount (000s) | Value (000s) |
|
| U.S. Treasury Obligations - 0.0% | | | |
| U.S. Treasury Bills, yield at date of purchase 1.01% to 1.07% 11/2/17 to 1/11/18 (d) | | | |
| (Cost $389) | | 390 | 389 |
| | | Shares | Value (000s) |
|
| Money Market Funds - 4.4% | | | |
| Fidelity Cash Central Fund, 1.10% (e) | | 32,194,803 | $32,201 |
| Fidelity Securities Lending Cash Central Fund 1.11% (e)(f) | | 36,660,766 | 36,664 |
| TOTAL MONEY MARKET FUNDS | | | |
| (Cost $68,861) | | | 68,865 |
| TOTAL INVESTMENT IN SECURITIES - 102.7% | | | |
| (Cost $1,307,117) | | | 1,619,636 |
| NET OTHER ASSETS (LIABILITIES) - (2.7)% | | | (42,861) |
| NET ASSETS - 100% | | | $1,576,775 |
Legend
(a) Non-income producing
(b) Security or a portion of the security is on loan at period end.
(c) Security exempt from registration under Rule 144A of the Securities Act of 1933. These securities may be resold in transactions exempt from registration, normally to qualified institutional buyers. At the end of the period, the value of these securities amounted to $553,000 or 0.0% of net assets.
(d) Security or a portion of the security was pledged to cover margin requirements for futures contracts. At period end, the value of securities pledged amounted to $160,000.
(e) Affiliated fund that is generally available only to investment companies and other accounts managed by Fidelity Investments. The rate quoted is the annualized seven-day yield of the fund at period end. A complete unaudited listing of the fund's holdings as of its most recent quarter end is available upon request. In addition, each Fidelity Central Fund's financial statements, which are not covered by the Fund's Report of Independent Registered Public Accounting Firm, are available on the SEC's website or upon request.
(f) Investment made with cash collateral received from securities on loan.
Affiliated Central Funds
Information regarding fiscal year to date income earned by the Fund from investments in Fidelity Central Funds is as follows:
| Fund | Income earned |
| | (Amounts in thousands) |
| Fidelity Cash Central Fund | $301 |
| Fidelity Securities Lending Cash Central Fund | 194 |
| Total | $495 |
Investment Valuation
The following is a summary of the inputs used, as of October 31, 2017, involving the Fund's assets and liabilities carried at fair value. The inputs or methodology used for valuing securities may not be an indication of the risk associated with investing in those securities. For more information on valuation inputs, and their aggregation into the levels used below, please refer to the Investment Valuation section in the accompanying Notes to Financial Statements.
| | Valuation Inputs at Reporting Date: |
| Description | Total | Level 1 | Level 2 | Level 3 |
| (Amounts in thousands) | | | | |
| Investments in Securities: | | | | |
| Equities: | | | | |
| Consumer Discretionary | $174,180 | $174,180 | $-- | $-- |
| Consumer Staples | 37,718 | 37,718 | -- | -- |
| Energy | 65,278 | 65,278 | -- | -- |
| Financials | 302,401 | 302,401 | -- | -- |
| Health Care | 215,021 | 215,021 | -- | -- |
| Industrials | 251,721 | 251,721 | -- | -- |
| Information Technology | 278,629 | 278,629 | -- | -- |
| Materials | 57,452 | 57,452 | -- | -- |
| Real Estate | 111,081 | 111,081 | -- | -- |
| Telecommunication Services | 3,989 | 3,989 | -- | -- |
| Utilities | 52,912 | 52,912 | -- | -- |
| U.S. Government and Government Agency Obligations | 389 | -- | 389 | -- |
| Money Market Funds | 68,865 | 68,865 | -- | -- |
| Total Investments in Securities: | $1,619,636 | $1,619,247 | $389 | $-- |
See accompanying notes which are an integral part of the financial statements.
Financial Statements
Statement of Assets and Liabilities
| Amounts in thousands (except per-share amounts) | | October 31, 2017 |
| Assets | | |
Investment in securities, at value (including securities loaned of $36,234) — See accompanying schedule:
Unaffiliated issuers (cost $1,238,256) | $1,550,771 | |
| Fidelity Central Funds (cost $68,861) | 68,865 | |
| Total Investment in Securities (cost $1,307,117) | | $1,619,636 |
| Cash | | 27 |
| Receivable for investments sold | | 5,808 |
| Receivable for fund shares sold | | 812 |
| Dividends receivable | | 160 |
| Distributions receivable from Fidelity Central Funds | | 60 |
| Receivable for daily variation margin on futures contracts | | 18 |
| Prepaid expenses | | 3 |
| Other receivables | | 44 |
| Total assets | | 1,626,568 |
| Liabilities | | |
| Payable for investments purchased | $6,430 | |
| Payable for fund shares redeemed | 5,659 | |
| Accrued management fee | 705 | |
| Distribution and service plan fees payable | 8 | |
| Other affiliated payables | 276 | |
| Other payables and accrued expenses | 53 | |
| Collateral on securities loaned | 36,662 | |
| Total liabilities | | 49,793 |
| Net Assets | | $1,576,775 |
| Net Assets consist of: | | |
| Paid in capital | | $1,118,019 |
| Undistributed net investment income | | 820 |
| Accumulated undistributed net realized gain (loss) on investments and foreign currency transactions | | 145,416 |
| Net unrealized appreciation (depreciation) on investments and assets and liabilities in foreign currencies | | 312,520 |
| Net Assets | | $1,576,775 |
| Calculation of Maximum Offering Price | | |
| Class A: | | |
| Net Asset Value and redemption price per share ($14,065 ÷ 499.478 shares) | | $28.16 |
| Maximum offering price per share (100/94.25 of $28.16) | | $29.88 |
| Class M: | | |
| Net Asset Value and redemption price per share ($3,157 ÷ 114.840 shares) | | $27.49 |
| Maximum offering price per share (100/96.50 of $27.49) | | $28.49 |
| Class C: | | |
| Net Asset Value and offering price per share ($4,584 ÷ 174.946 shares)(a) | | $26.20 |
| Stock Selector Small Cap: | | |
| Net Asset Value, offering price and redemption price per share ($1,511,263 ÷ 52,644.383 shares) | | $28.71 |
| Class I: | | |
| Net Asset Value, offering price and redemption price per share ($43,051 ÷ 1,495.791 shares) | | $28.78 |
| Class Z: | | |
| Net Asset Value, offering price and redemption price per share ($655 ÷ 22.737 shares) | | $28.81 |
(a) Redemption price per share is equal to net asset value less any applicable contingent deferred sales charge.
See accompanying notes which are an integral part of the financial statements.
Statement of Operations
| Amounts in thousands | | Year ended October 31, 2017 |
| Investment Income | | |
| Dividends | | $15,729 |
| Interest | | 3 |
| Income from Fidelity Central Funds | | 495 |
| Total income | | 16,227 |
| Expenses | | |
| Management fee | | |
| Basic fee | $9,161 | |
| Performance adjustment | (1,207) | |
| Transfer agent fees | 2,857 | |
| Distribution and service plan fees | 94 | |
| Accounting and security lending fees | 486 | |
| Custodian fees and expenses | 64 | |
| Independent trustees' fees and expenses | 6 | |
| Registration fees | 114 | |
| Audit | 65 | |
| Legal | 7 | |
| Miscellaneous | 12 | |
| Total expenses before reductions | 11,659 | |
| Expense reductions | (121) | 11,538 |
| Net investment income (loss) | | 4,689 |
| Realized and Unrealized Gain (Loss) | | |
| Net realized gain (loss) on: | | |
| Investment securities: | | |
| Unaffiliated issuers | 159,235 | |
| Fidelity Central Funds | 6 | |
| Foreign currency transactions | 23 | |
| Futures contracts | 424 | |
| Total net realized gain (loss) | | 159,688 |
| Change in net unrealized appreciation (depreciation) on: | | |
| Investment securities: | | |
| Unaffiliated issuers | 136,247 | |
| Fidelity Central Funds | (10) | |
| Assets and liabilities in foreign currencies | 3 | |
| Futures contracts | 49 | |
| Total change in net unrealized appreciation (depreciation) | | 136,289 |
| Net gain (loss) | | 295,977 |
| Net increase (decrease) in net assets resulting from operations | | $300,666 |
See accompanying notes which are an integral part of the financial statements.
Statement of Changes in Net Assets
| Amounts in thousands | Year ended October 31, 2017 | Year ended October 31, 2016 |
| Increase (Decrease) in Net Assets | | |
| Operations | | |
| Net investment income (loss) | $4,689 | $6,798 |
| Net realized gain (loss) | 159,688 | 19,298 |
| Change in net unrealized appreciation (depreciation) | 136,289 | 9,316 |
| Net increase (decrease) in net assets resulting from operations | 300,666 | 35,412 |
| Distributions to shareholders from net investment income | (7,120) | (6,157) |
| Distributions to shareholders from net realized gain | (17,708) | (88,057) |
| Total distributions | (24,828) | (94,214) |
| Share transactions - net increase (decrease) | (119,619) | 41,751 |
| Redemption fees | 78 | 179 |
| Total increase (decrease) in net assets | 156,297 | (16,872) |
| Net Assets | | |
| Beginning of period | 1,420,478 | 1,437,350 |
| End of period | $1,576,775 | $1,420,478 |
| Other Information | | |
| Undistributed net investment income end of period | $820 | $4,434 |
See accompanying notes which are an integral part of the financial statements.
Financial Highlights
Fidelity Stock Selector Small Cap Fund Class A
| Years ended October 31, | 2017 | 2016 | 2015 | 2014 | 2013 |
| Selected Per–Share Data | | | | | |
| Net asset value, beginning of period | $23.48 | $24.48 | $25.76 | $25.32 | $19.40 |
| Income from Investment Operations | | | | | |
| Net investment income (loss)A | –B | .05 | .06 | .01 | (.02) |
| Net realized and unrealized gain (loss) | 5.05 | .52 | .96 | 1.68 | 5.98 |
| Total from investment operations | 5.05 | .57 | 1.02 | 1.69 | 5.96 |
| Distributions from net investment income | (.07) | (.05) | (.03) | –B | (.04) |
| Distributions from net realized gain | (.30) | (1.52) | (2.27) | (1.25) | (.01) |
| Total distributions | (.37) | (1.57) | (2.30) | (1.25) | (.04)C |
| Redemption fees added to paid in capitalA,B | – | – | – | – | – |
| Net asset value, end of period | $28.16 | $23.48 | $24.48 | $25.76 | $25.32 |
| Total ReturnD,E | 21.62% | 2.30% | 4.19% | 6.83% | 30.81% |
| Ratios to Average Net AssetsF,G | | | | | |
| Expenses before reductions | 1.05% | 1.16% | 1.01% | .99% | 1.22% |
| Expenses net of fee waivers, if any | 1.04% | 1.16% | 1.01% | .99% | 1.22% |
| Expenses net of all reductions | 1.04% | 1.15% | 1.00% | .99% | 1.20% |
| Net investment income (loss) | .02% | .22% | .24% | .06% | (.09)% |
| Supplemental Data | | | | | |
| Net assets, end of period (in millions) | $14 | $12 | $11 | $10 | $8 |
| Portfolio turnover rateH | 62% | 57% | 48% | 73% | 79% |
A Calculated based on average shares outstanding during the period.
B Amount represents less than $.005 per share.
C Total distributions of $.04 per share is comprised of distributions from net investment income of $.037 and distributions from net realized gain of $.007 per share.
D Total returns would have been lower if certain expenses had not been reduced during the applicable periods shown.
E Total returns do not include the effect of the sales charges.
F Fees and expenses of any underlying Fidelity Central Funds are not included in the Fund's expense ratio. The Fund indirectly bears its proportionate share of the expenses of any underlying Fidelity Central Funds.
G Expense ratios reflect operating expenses of the class. Expenses before reductions do not reflect amounts reimbursed by the investment adviser or reductions from brokerage service arrangements or reductions from other expense offset arrangements and do not represent the amount paid by the class during periods when reimbursements or reductions occur. Expenses net of fee waivers reflect expenses after reimbursement by the investment adviser but prior to reductions from brokerage service arrangements or other expense offset arrangements. Expenses net of all reductions represent the net expenses paid by the class.
H Amount does not include the portfolio activity of any underlying Fidelity Central Funds.
See accompanying notes which are an integral part of the financial statements.
Fidelity Stock Selector Small Cap Fund Class M
| Years ended October 31, | 2017 | 2016 | 2015 | 2014 | 2013 |
| Selected Per–Share Data | | | | | |
| Net asset value, beginning of period | $22.95 | $24.00 | $25.30 | $24.97 | $19.15 |
| Income from Investment Operations | | | | | |
| Net investment income (loss)A | (.08) | (.03) | (.03) | (.07) | (.08) |
| Net realized and unrealized gain (loss) | 4.92 | .50 | .97 | 1.65 | 5.90 |
| Total from investment operations | 4.84 | .47 | .94 | 1.58 | 5.82 |
| Distributions from net investment income | – | – | – | – | – |
| Distributions from net realized gain | (.30) | (1.52) | (2.24) | (1.25) | – |
| Total distributions | (.30) | (1.52) | (2.24) | (1.25) | – |
| Redemption fees added to paid in capitalA,B | – | – | – | – | – |
| Net asset value, end of period | $27.49 | $22.95 | $24.00 | $25.30 | $24.97 |
| Total ReturnC,D | 21.20% | 1.89% | 3.90% | 6.46% | 30.39% |
| Ratios to Average Net AssetsE,F | | | | | |
| Expenses before reductions | 1.39% | 1.51% | 1.35% | 1.32% | 1.51% |
| Expenses net of fee waivers, if any | 1.39% | 1.51% | 1.35% | 1.32% | 1.51% |
| Expenses net of all reductions | 1.39% | 1.50% | 1.34% | 1.31% | 1.49% |
| Net investment income (loss) | (.33)% | (.13)% | (.10)% | (.27)% | (.38)% |
| Supplemental Data | | | | | |
| Net assets, end of period (in millions) | $3 | $3 | $3 | $3 | $2 |
| Portfolio turnover rateG | 62% | 57% | 48% | 73% | 79% |
A Calculated based on average shares outstanding during the period.
B Amount represents less than $.005 per share.
C Total returns would have been lower if certain expenses had not been reduced during the applicable periods shown.
D Total returns do not include the effect of the sales charges.
E Fees and expenses of any underlying Fidelity Central Funds are not included in the Fund's expense ratio. The Fund indirectly bears its proportionate share of the expenses of any underlying Fidelity Central Funds.
F Expense ratios reflect operating expenses of the class. Expenses before reductions do not reflect amounts reimbursed by the investment adviser or reductions from brokerage service arrangements or reductions from other expense offset arrangements and do not represent the amount paid by the class during periods when reimbursements or reductions occur. Expenses net of fee waivers reflect expenses after reimbursement by the investment adviser but prior to reductions from brokerage service arrangements or other expense offset arrangements. Expenses net of all reductions represent the net expenses paid by the class.
G Amount does not include the portfolio activity of any underlying Fidelity Central Funds.
See accompanying notes which are an integral part of the financial statements.
Fidelity Stock Selector Small Cap Fund Class C
| Years ended October 31, | 2017 | 2016 | 2015 | 2014 | 2013 |
| Selected Per–Share Data | | | | | |
| Net asset value, beginning of period | $21.99 | $23.16 | $24.49 | $24.32 | $18.73 |
| Income from Investment Operations | | | | | |
| Net investment income (loss)A | (.20) | (.13) | (.14) | (.18) | (.19) |
| Net realized and unrealized gain (loss) | 4.71 | .48 | .93 | 1.60 | 5.78 |
| Total from investment operations | 4.51 | .35 | .79 | 1.42 | 5.59 |
| Distributions from net investment income | – | – | – | – | – |
| Distributions from net realized gain | (.30) | (1.52) | (2.12) | (1.25) | – |
| Total distributions | (.30) | (1.52) | (2.12) | (1.25) | – |
| Redemption fees added to paid in capitalA,B | – | – | – | – | – |
| Net asset value, end of period | $26.20 | $21.99 | $23.16 | $24.49 | $24.32 |
| Total ReturnC,D | 20.62% | 1.41% | 3.36% | 5.95% | 29.85% |
| Ratios to Average Net AssetsE,F | | | | | |
| Expenses before reductions | 1.87% | 1.98% | 1.84% | 1.79% | 1.98% |
| Expenses net of fee waivers, if any | 1.87% | 1.98% | 1.84% | 1.79% | 1.98% |
| Expenses net of all reductions | 1.86% | 1.97% | 1.83% | 1.79% | 1.96% |
| Net investment income (loss) | (.81)% | (.60)% | (.59)% | (.74)% | (.85)% |
| Supplemental Data | | | | | |
| Net assets, end of period (in millions) | $5 | $3 | $4 | $4 | $3 |
| Portfolio turnover rateG | 62% | 57% | 48% | 73% | 79% |
A Calculated based on average shares outstanding during the period.
B Amount represents less than $.005 per share.
C Total returns would have been lower if certain expenses had not been reduced during the applicable periods shown.
D Total returns do not include the effect of the contingent deferred sales charge.
E Fees and expenses of any underlying Fidelity Central Funds are not included in the Fund's expense ratio. The Fund indirectly bears its proportionate share of the expenses of any underlying Fidelity Central Funds.
F Expense ratios reflect operating expenses of the class. Expenses before reductions do not reflect amounts reimbursed by the investment adviser or reductions from brokerage service arrangements or reductions from other expense offset arrangements and do not represent the amount paid by the class during periods when reimbursements or reductions occur. Expenses net of fee waivers reflect expenses after reimbursement by the investment adviser but prior to reductions from brokerage service arrangements or other expense offset arrangements. Expenses net of all reductions represent the net expenses paid by the class.
G Amount does not include the portfolio activity of any underlying Fidelity Central Funds.
See accompanying notes which are an integral part of the financial statements.
Fidelity Stock Selector Small Cap Fund
| Years ended October 31, | 2017 | 2016 | 2015 | 2014 | 2013 |
| Selected Per–Share Data | | | | | |
| Net asset value, beginning of period | $23.91 | $24.89 | $26.15 | $25.64 | $19.65 |
| Income from Investment Operations | | | | | |
| Net investment income (loss)A | .08 | .11 | .12 | .08 | .04 |
| Net realized and unrealized gain (loss) | 5.15 | .54 | .98 | 1.70 | 6.06 |
| Total from investment operations | 5.23 | .65 | 1.10 | 1.78 | 6.10 |
| Distributions from net investment income | (.12) | (.11) | (.09) | (.01)B | (.10) |
| Distributions from net realized gain | (.30) | (1.52) | (2.27) | (1.26)B | (.01) |
| Total distributions | (.43)C | (1.63) | (2.36) | (1.27) | (.11) |
| Redemption fees added to paid in capitalA,D | – | – | – | – | – |
| Net asset value, end of period | $28.71 | $23.91 | $24.89 | $26.15 | $25.64 |
| Total ReturnE | 22.00% | 2.57% | 4.46% | 7.08% | 31.20% |
| Ratios to Average Net AssetsF,G | | | | | |
| Expenses before reductions | .75% | .89% | .77% | .73% | .94% |
| Expenses net of fee waivers, if any | .75% | .89% | .77% | .73% | .93% |
| Expenses net of all reductions | .74% | .88% | .76% | .72% | .91% |
| Net investment income (loss) | .31% | .49% | .48% | .32% | .20% |
| Supplemental Data | | | | | |
| Net assets, end of period (in millions) | $1,511 | $1,359 | $1,372 | $1,406 | $1,487 |
| Portfolio turnover rateH | 62% | 57% | 48% | 73% | 79% |
A Calculated based on average shares outstanding during the period.
B The amounts shown reflect certain reclassifications related to book to tax differences that were made in the year shown.
C Total distributions of $.43 per share is comprised of distributions from net investment income of $.123 and distributions from net realized gain of $.303 per share.
D Amount represents less than $.005 per share.
E Total returns would have been lower if certain expenses had not been reduced during the applicable periods shown.
F Fees and expenses of any underlying Fidelity Central Funds are not included in the Fund's expense ratio. The Fund indirectly bears its proportionate share of the expenses of any underlying Fidelity Central Funds.
G Expense ratios reflect operating expenses of the class. Expenses before reductions do not reflect amounts reimbursed by the investment adviser or reductions from brokerage service arrangements or reductions from other expense offset arrangements and do not represent the amount paid by the class during periods when reimbursements or reductions occur. Expenses net of fee waivers reflect expenses after reimbursement by the investment adviser but prior to reductions from brokerage service arrangements or other expense offset arrangements. Expenses net of all reductions represent the net expenses paid by the class.
H Amount does not include the portfolio activity of any underlying Fidelity Central Funds.
See accompanying notes which are an integral part of the financial statements.
Fidelity Stock Selector Small Cap Fund Class I
| Years ended October 31, | 2017 | 2016 | 2015 | 2014 | 2013 |
| Selected Per–Share Data | | | | | |
| Net asset value, beginning of period | $23.97 | $24.96 | $26.21 | $25.69 | $19.72 |
| Income from Investment Operations | | | | | |
| Net investment income (loss)A | .08 | .12 | .13 | .09 | .05 |
| Net realized and unrealized gain (loss) | 5.15 | .53 | .99 | 1.70 | 6.06 |
| Total from investment operations | 5.23 | .65 | 1.12 | 1.79 | 6.11 |
| Distributions from net investment income | (.12) | (.12) | (.10) | (.01)B | (.14) |
| Distributions from net realized gain | (.30) | (1.52) | (2.27) | (1.26)B | (.01) |
| Total distributions | (.42) | (1.64) | (2.37) | (1.27) | (.14)C |
| Redemption fees added to paid in capitalA,D | – | – | – | – | – |
| Net asset value, end of period | $28.78 | $23.97 | $24.96 | $26.21 | $25.69 |
| Total ReturnE | 21.97% | 2.55% | 4.52% | 7.11% | 31.22% |
| Ratios to Average Net AssetsF,G | | | | | |
| Expenses before reductions | .75% | .87% | .74% | .70% | .91% |
| Expenses net of fee waivers, if any | .75% | .87% | .73% | .70% | .91% |
| Expenses net of all reductions | .75% | .87% | .73% | .70% | .89% |
| Net investment income (loss) | .31% | .50% | .51% | .35% | .22% |
| Supplemental Data | | | | | |
| Net assets, end of period (in millions) | $43 | $43 | $46 | $51 | $56 |
| Portfolio turnover rateH | 62% | 57% | 48% | 73% | 79% |
A Calculated based on average shares outstanding during the period.
B The amounts shown reflect certain reclassifications related to book to tax differences that were made in the year shown.
C Total distributions of $.14 per share is comprised of distributions from net investment income of $.136 and distributions from net realized gain of $.007 per share.
D Amount represents less than $.005 per share.
E Total returns would have been lower if certain expenses had not been reduced during the applicable periods shown.
F Fees and expenses of any underlying Fidelity Central Funds are not included in the Fund's expense ratio. The Fund indirectly bears its proportionate share of the expenses of any underlying Fidelity Central Funds.
G Expense ratios reflect operating expenses of the class. Expenses before reductions do not reflect amounts reimbursed by the investment adviser or reductions from brokerage service arrangements or reductions from other expense offset arrangements and do not represent the amount paid by the class during periods when reimbursements or reductions occur. Expenses net of fee waivers reflect expenses after reimbursement by the investment adviser but prior to reductions from brokerage service arrangements or other expense offset arrangements. Expenses net of all reductions represent the net expenses paid by the class.
H Amount does not include the portfolio activity of any underlying Fidelity Central Funds.
See accompanying notes which are an integral part of the financial statements.
Fidelity Stock Selector Small Cap Fund Class Z
| Years ended October 31, | 2017 A |
| Selected Per–Share Data | |
| Net asset value, beginning of period | $26.36 |
| Income from Investment Operations | |
| Net investment income (loss)B | .07 |
| Net realized and unrealized gain (loss) | 2.38 |
| Total from investment operations | 2.45 |
| Distributions from net investment income | – |
| Distributions from net realized gain | – |
| Total distributions | – |
| Redemption fees added to paid in capitalB,C | – |
| Net asset value, end of period | $28.81 |
| Total ReturnD,E | 9.29% |
| Ratios to Average Net AssetsF,G | |
| Expenses before reductions | .62%H |
| Expenses net of fee waivers, if any | .61%H |
| Expenses net of all reductions | .61%H |
| Net investment income (loss) | .34%H |
| Supplemental Data | |
| Net assets, end of period (in millions) | $1 |
| Portfolio turnover rateI | 62% |
A For the period February 1, 2017 (commencement of sale of shares) to October 31, 2017.
B Calculated based on average shares outstanding during the period.
C Amount represents less than $.005 per share.
D Total returns for periods of less than one year are not annualized.
E Total returns would have been lower if certain expenses had not been reduced during the applicable periods shown.
F Fees and expenses of any underlying Fidelity Central Funds are not included in the Fund's expense ratio. The Fund indirectly bears its proportionate share of the expenses of any underlying Fidelity Central Funds.
G Expense ratios reflect operating expenses of the class. Expenses before reductions do not reflect amounts reimbursed by the investment adviser or reductions from brokerage service arrangements or reductions from other expense offset arrangements and do not represent the amount paid by the class during periods when reimbursements or reductions occur. Expense ratios before reductions for start-up periods may not be representative of longer-term operating periods. Expenses net of fee waivers reflect expenses after reimbursement by the investment adviser but prior to reductions from brokerage service arrangements or other expense offset arrangements. Expenses net of all reductions represent the net expenses paid by the class.
H Annualized
I Amount does not include the portfolio activity of any underlying Fidelity Central Funds.
See accompanying notes which are an integral part of the financial statements.
Notes to Financial Statements
For the period ended October 31, 2017
(Amounts in thousands except percentages)
1. Organization.
Fidelity Stock Selector Small Cap Fund (the Fund) is a fund of Fidelity Capital Trust (the Trust) and is authorized to issue an unlimited number of shares. The Trust is registered under the Investment Company Act of 1940, as amended (the 1940 Act), as an open-end management investment company organized as a Massachusetts business trust. The Fund commenced sale of Class Z shares on February 1, 2017. The Fund offers Class A, Class M (formerly Class T), Class C, Stock Selector Small Cap, Class I and Class Z shares, each of which has equal rights as to assets and voting privileges. Each class has exclusive voting rights with respect to matters that affect that class.
After the close of business on June 24, 2016, all outstanding Class B shares were converted to Class A shares. All prior fiscal period dollar and share amounts for Class B presented in the Notes to Financial Statements are for the period November 1, 2015 through June 24, 2016.
2. Investments in Fidelity Central Funds.
The Fund invest in Fidelity Central Funds, which are open-end investment companies generally available only to other investment companies and accounts managed by the investment adviser and its affiliates. The Fund's Schedule of Investments lists each of the Fidelity Central Funds held as of period end, if any, as an investment of the Fund, but does not include the underlying holdings of each Fidelity Central Fund. As an Investing Fund, the Fund indirectly bears its proportionate share of the expenses of the underlying Fidelity Central Funds.
The Money Market Central Funds seek preservation of capital and current income and are managed by Fidelity Investments Money Management, Inc. (FIMM), an affiliate of the investment adviser. Annualized expenses of the Money Market Central Funds as of their most recent shareholder report date are less than .005%.
A complete unaudited list of holdings for each Fidelity Central Fund is available upon request or at the Securities and Exchange Commission (the SEC) website at www.sec.gov. In addition, the financial statements of the Fidelity Central Funds, which are not covered by the Fund's Report of Independent Registered Public Accounting Firm, are available on the SEC website or upon request.
3. Significant Accounting Policies.
The Fund is an investment company and applies the accounting and reporting guidance of the Financial Accounting Standards Board (FASB) Accounting Standards Codification Topic 946 Financial Services – Investments Companies. The financial statements have been prepared in conformity with accounting principles generally accepted in the United States of America (GAAP), which require management to make certain estimates and assumptions at the date of the financial statements. Actual results could differ from those estimates. Subsequent events, if any, through the date that the financial statements were issued have been evaluated in the preparation of the financial statements. The following summarizes the significant accounting policies of the Fund:
Investment Valuation. Investments are valued as of 4:00 p.m. Eastern time on the last calendar day of the period. The Board of Trustees (the Board) has delegated the day to day responsibility for the valuation of the Fund's investments to the Fair Value Committee (the Committee) established by the Fund's investment adviser. In accordance with valuation policies and procedures approved by the Board, the Fund attempts to obtain prices from one or more third party pricing vendors or brokers to value its investments. When current market prices, quotations or currency exchange rates are not readily available or reliable, investments will be fair valued in good faith by the Committee, in accordance with procedures adopted by the Board. Factors used in determining fair value vary by investment type and may include market or investment specific events, changes in interest rates and credit quality. The frequency with which these procedures are used cannot be predicted and they may be utilized to a significant extent. The Committee oversees the Fund's valuation policies and procedures and reports to the Board on the Committee's activities and fair value determinations. The Board monitors the appropriateness of the procedures used in valuing the Fund's investments and ratifies the fair value determinations of the Committee.
The Fund categorizes the inputs to valuation techniques used to value its investments into a disclosure hierarchy consisting of three levels as shown below:
- Level 1 – quoted prices in active markets for identical investments
- Level 2 – other significant observable inputs (including quoted prices for similar investments, interest rates, prepayment speeds, etc.)
- Level 3 – unobservable inputs (including the Fund's own assumptions based on the best information available)
Valuation techniques used to value the Fund's investments by major category are as follows:
Equity securities, including restricted securities, for which market quotations are readily available, are valued at the last reported sale price or official closing price as reported by a third party pricing vendor on the primary market or exchange on which they are traded and are categorized as Level 1 in the hierarchy. In the event there were no sales during the day or closing prices are not available, securities are valued at the last quoted bid price or may be valued using the last available price and are generally categorized as Level 2 in the hierarchy. For foreign equity securities, when market or security specific events arise, comparisons to the valuation of American Depositary Receipts (ADRs), futures contracts, Exchange-Traded Funds (ETFs) and certain indexes as well as quoted prices for similar securities may be used and would be categorized as Level 2 in the hierarchy. Utilizing these techniques may result in transfers between Level 1 and Level 2. For equity securities, including restricted securities, where observable inputs are limited, assumptions about market activity and risk are used and these securities may be categorized as Level 3 in the hierarchy.
Debt securities, including restricted securities, are valued based on evaluated prices received from third party pricing vendors or from brokers who make markets in such securities. U.S. government and government agency obligations are valued by pricing vendors who utilize matrix pricing which considers yield or price of bonds of comparable quality, coupon, maturity and type or by broker-supplied prices. When independent prices are unavailable or unreliable, debt securities may be valued utilizing pricing methodologies which consider similar factors that would be used by third party pricing vendors. Debt securities are generally categorized as Level 2 in the hierarchy but may be Level 3 depending on the circumstances.
Futures contracts are valued at the settlement price established each day by the board of trade or exchange on which they are traded and are categorized as Level 1 in the hierarchy. Investments in open-end mutual funds, including the Fidelity Central Funds, are valued at their closing net asset value (NAV) each business day and are categorized as Level 1 in the hierarchy.
Changes in valuation techniques may result in transfers in or out of an assigned level within the disclosure hierarchy. The aggregate value of investments by input level as of October 31, 2017 is included at the end of the Fund's Schedule of Investments.
Foreign Currency. The Fund may use foreign currency contracts to facilitate transactions in foreign-denominated securities. Gains and losses from these transactions may arise from changes in the value of the foreign currency or if the counterparties do not perform under the contracts' terms.
Foreign-denominated assets, including investment securities, and liabilities are translated into U.S. dollars at the exchange rates at period end. Purchases and sales of investment securities, income and dividends received and expenses denominated in foreign currencies are translated into U.S. dollars at the exchange rate in effect on the transaction date.
The effects of exchange rate fluctuations on investments are included with the net realized and unrealized gain (loss) on investment securities. Other foreign currency transactions resulting in realized and unrealized gain (loss) are disclosed separately.
Investment Transactions and Income. For financial reporting purposes, the Fund's investment holdings and NAV include trades executed through the end of the last business day of the period. The NAV per share for processing shareholder transactions is calculated as of the close of business of the New York Stock Exchange (NYSE), normally 4:00 p.m. Eastern time and includes trades executed through the end of the prior business day. Gains and losses on securities sold are determined on the basis of identified cost and includes proceeds received from litigation. Dividend income is recorded on the ex-dividend date, except for certain dividends from foreign securities where the ex-dividend date may have passed, which are recorded as soon as the Fund is informed of the ex-dividend date. Non-cash dividends included in dividend income, if any, are recorded at the fair market value of the securities received. Income and capital gain distributions from Fidelity Central Funds, if any, are recorded on the ex-dividend date. Certain distributions received by the Fund represent a return of capital or capital gain. The Fund determines the components of these distributions subsequent to the ex-dividend date, based upon receipt of tax filings or other correspondence relating to the underlying investment. These distributions are recorded as a reduction of cost of investments and/or as a realized gain. Interest income is accrued as earned and includes coupon interest and amortization of premium and accretion of discount on debt securities as applicable. Investment income is recorded net of foreign taxes withheld where recovery of such taxes is uncertain.
Class Allocations and Expenses. Investment income, realized and unrealized capital gains and losses, common expenses of the Fund, and certain fund-level expense reductions, if any, are allocated daily on a pro-rata basis to each class based on the relative net assets of each class to the total net assets of the Fund. Each class differs with respect to transfer agent and distribution and service plan fees incurred. Certain expense reductions may also differ by class. For the reporting period, the allocated portion of income and expenses to each class as a percent of its average net assets may vary due to the timing of recording these transactions in relation to fluctuating net assets of the classes. Expenses directly attributable to a fund are charged to that fund. Expenses attributable to more than one fund are allocated among the respective funds on the basis of relative net assets or other appropriate methods. Expense estimates are accrued in the period to which they relate and adjustments are made when actual amounts are known.
Income Tax Information and Distributions to Shareholders. Each year, the Fund intends to qualify as a regulated investment company under Subchapter M of the Internal Revenue Code, including distributing substantially all of its taxable income and realized gains. As a result, no provision for U.S. Federal income taxes is required. As of October 31, 2017, the Fund did not have any unrecognized tax benefits in the financial statements; nor is the Fund aware of any tax positions for which it is reasonably possible that the total amounts of unrecognized tax benefits will significantly change in the next twelve months. The Fund files a U.S. federal tax return, in addition to state and local tax returns as required. The Fund's federal income tax returns are subject to examination by the Internal Revenue Service (IRS) for a period of three fiscal years after they are filed. State and local tax returns may be subject to examination for an additional fiscal year depending on the jurisdiction. Foreign taxes are provided for based on the Fund's understanding of the tax rules and rates that exist in the foreign markets in which it invests.
Distributions are declared and recorded on the ex-dividend date. Income dividends and capital gain distributions are declared separately for each class. Income and capital gain distributions are determined in accordance with income tax regulations, which may differ from GAAP. In addition, the Fund claimed a portion of the payment made to redeeming shareholders as a distribution for income tax purposes.
Capital accounts within the financial statements are adjusted for permanent book-tax differences. These adjustments have no impact on net assets or the results of operations. Capital accounts are not adjusted for temporary book-tax differences which will reverse in a subsequent period.
Book-tax differences are primarily due to futures contracts, foreign currency transactions, passive foreign investment companies (PFIC), market discount, partnerships, deferred trustees compensation and losses deferred due to wash sales.
As of period end, the cost and unrealized appreciation (depreciation) in securities, and derivatives if applicable, for federal income tax purposes were as follows:
| Gross unrealized appreciation | $352,241 |
| Gross unrealized depreciation | (39,592) |
| Net unrealized appreciation (depreciation) | $312,649 |
| Tax Cost | $1,306,987 |
The tax-based components of distributable earnings as of period end were as follows:
| Undistributed ordinary income | $1,669 |
| Undistributed long-term capital gain | $145,287 |
| Net unrealized appreciation (depreciation) on securities and other investments | $311,801 |
The tax character of distributions paid was as follows:
| | October 31, 2017 | October 31, 2016 |
| Ordinary Income | $7,120 | $ 6,157 |
| Long-term Capital Gains | 17,708 | 88,057 |
| Total | $24,828 | $ 94,214 |
Short-Term Trading (Redemption) Fees. Shares held by investors in the Fund less than 90 days may have been subject to a redemption fee equal to 1.50% of the NAV of shares redeemed. All redemption fees, which reduce the proceeds of the shareholder redemption, are retained by the Fund and accounted for as an addition to paid in capital. In November 2017, the Board of Trustees approved the elimination of these redemption fees effective December 18, 2017.
Restricted Securities. The Fund may invest in securities that are subject to legal or contractual restrictions on resale. These securities generally may be resold in transactions exempt from registration or to the public if the securities are registered. Disposal of these securities may involve time-consuming negotiations and expense, and prompt sale at an acceptable price may be difficult. Information regarding restricted securities is included at the end of the Fund's Schedule of Investments.
4. Derivative Instruments.
Risk Exposures and the Use of Derivative Instruments. The Fund's investment objective allows the Fund to enter into various types of derivative contracts, including futures contracts. Derivatives are investments whose value is primarily derived from underlying assets, indices or reference rates and may be transacted on an exchange or over-the-counter (OTC). Derivatives may involve a future commitment to buy or sell a specified asset based on specified terms, to exchange future cash flows at periodic intervals based on a notional principal amount, or for one party to make one or more payments upon the occurrence of specified events in exchange for periodic payments from the other party.
The Fund used derivatives to increase returns and to manage exposure to certain risks as defined below. The success of any strategy involving derivatives depends on analysis of numerous economic factors, and if the strategies for investment do not work as intended, the Fund may not achieve its objectives.
The Fund's use of derivatives increased or decreased its exposure to the following risk:
| Equity Risk | Equity risk relates to the fluctuations in the value of financial instruments as a result of changes in market prices (other than those arising from interest rate risk or foreign exchange risk), whether caused by factors specific to an individual investment, its issuer, or all factors affecting all instruments traded in a market or market segment.
|
The Fund is also exposed to additional risks from investing in derivatives, such as liquidity risk and counterparty credit risk. Liquidity risk is the risk that the Fund will be unable to close out the derivative in the open market in a timely manner. Counterparty credit risk is the risk that the counterparty will not be able to fulfill its obligation to the Fund. Counterparty credit risk related to exchange-traded futures contracts may be mitigated by the protection provided by the exchange on which they trade.
Investing in derivatives may involve greater risks than investing in the underlying assets directly and, to varying degrees, may involve risk of loss in excess of any initial investment and collateral received and amounts recognized in the Statement of Assets and Liabilities. In addition, there may be the risk that the change in value of the derivative contract does not correspond to the change in value of the underlying instrument.
Futures Contracts. A futures contract is an agreement between two parties to buy or sell a specified underlying instrument for a fixed price at a specified future date. The Fund used futures contracts to manage its exposure to the stock market.
Upon entering into a futures contract, a fund is required to deposit either cash or securities (initial margin) with a clearing broker in an amount equal to a certain percentage of the face value of the contract. Futures contracts are marked-to-market daily and subsequent daily payments (variation margin) are made or received by a fund depending on the daily fluctuations in the value of the futures contracts and are recorded as unrealized appreciation or (depreciation). This receivable and/or payable, if any, is included in daily variation margin on futures contracts in the Statement of Assets and Liabilities. Realized gain or (loss) is recorded upon the expiration or closing of a futures contract. The net realized gain (loss) and change in net unrealized appreciation (depreciation) on futures contracts during the period is presented in the Statement of Operations.
Any open futures contracts at period end are presented in the Schedule of Investments under the caption "Futures Contracts". The notional amount at value reflects each contract's exposure to the underlying instrument or index at period end and is representative of volume of activity during the period. Securities deposited to meet initial margin requirements are identified in the Schedule of Investments.
5. Purchases and Sales of Investments.
Purchases and sales of securities, other than short-term securities, aggregated $928,775 and $1,061,558, respectively.
6. Fees and Other Transactions with Affiliates.
Management Fee. Fidelity Management & Research Company (the investment adviser) and its affiliates provide the Fund with investment management related services for which the Fund pays a monthly management fee. The management fee is the sum of an individual fund fee rate that is based on an annual rate of .35% of the Fund's average net assets and an annualized group fee rate that averaged .25% during the period. The group fee rate is based upon the average net assets of all the mutual funds advised by the investment adviser, including any mutual funds previously advised by the investment adviser that are currently advised by Fidelity SelectCo, LLC, an affiliate of the investment adviser. The group fee rate decreases as assets under management increase and increases as assets under management decrease. In addition, the management fee is subject to a performance adjustment (up to a maximum of +/- .20% of the Fund's average net assets over a 36 month performance period). The upward or downward adjustment to the management fee is based on relative investment performance of Stock Selector Small Cap as compared to its benchmark index, the Russell 2000 Index, over the same 36 month performance period. For the reporting period, the total annual management fee rate, including the performance adjustment, was .52% of the Fund's average net assets. The performance adjustment included in the management fee rate may be higher or lower than the maximum performance adjustment rate due to the difference between the average net assets for the reporting and performance periods.
Distribution and Service Plan Fees. In accordance with Rule 12b-1 of the 1940 Act, the Fund has adopted separate Distribution and Service Plans for each class of shares. Certain classes pay Fidelity Distributors Corporation (FDC), an affiliate of the investment adviser, separate Distribution and Service Fees, each of which is based on an annual percentage of each class' average net assets. In addition, FDC may pay financial intermediaries for selling shares of the Fund and providing shareholder support services. For the period, the Distribution and Service Fee rates, total fees and amounts retained by FDC were as follows:
| | Distribution
Fee | Service
Fee | Total Fees | Retained
by FDC |
| Class A | -% | .25% | $34 | $1 |
| Class M | .25% | .25% | 15 | –(a) |
| Class C | .75% | .25% | 45 | 6 |
| | | | $94 | $7 |
(a) In the amount of less than five hundred dollars.
Sales Load. FDC may receive a front-end sales charge of up to 5.75% for selling Class A shares and 3.50% for selling Class M shares, some of which is paid to financial intermediaries for selling shares of the Fund. Depending on the holding period, FDC may receive contingent deferred sales charges levied on Class A, Class M and Class C redemptions. The deferred sales charges are 1.00% for Class C shares, 1.00% for certain purchases of Class A shares and .25% for certain purchases of Class M shares.
For the period, sales charge amounts retained by FDC were as follows:
| | Retained
by FDC |
| Class A | $5 |
| Class M | 1 |
| Class C(a) | 1 |
| | $7 |
(a) When Class C shares are initially sold, FDC pays commissions from its own resources to financial intermediaries through which the sales are made.
Transfer Agent Fees. Fidelity Investments Institutional Operations Company, Inc., (FIIOC), an affiliate of the investment adviser, is the transfer, dividend disbursing and shareholder servicing agent for each class of the Fund. FIIOC receives account fees and asset-based fees that vary according to the account size and type of account of the shareholders of the respective classes of the Fund, except for Class Z. FIIOC receives an asset-based fee of Class Z's average net assets. FIIOC pays for typesetting, printing and mailing of shareholder reports, except proxy statements.
For the period, transfer agent fees for each class were as follows:
| | Amount | % of
Class-Level Average
Net Assets |
| Class A | $31 | .23 |
| Class M | 10 | .33 |
| Class C | 14 | .30 |
| Stock Selector Small Cap | 2,719 | .18 |
| Class I | 83 | .19 |
| Class Z | –(a) | .05(b) |
| | $2,857 | |
(a) In the amount of less than five-hundred dollars
(b) Annualized
Accounting and Security Lending Fees. Fidelity Service Company, Inc. (FSC), an affiliate of the investment adviser, maintains the Fund's accounting records. The accounting fee is based on the level of average net assets for each month. Under a separate contract, FSC administers the security lending program. The security lending fee is based on the number and duration of lending transactions.
Brokerage Commissions. The Fund placed a portion of its portfolio transactions with brokerage firms which are affiliates of the investment adviser. Brokerage commissions are included in net realized gain (loss) and change in net unrealized appreciation (depreciation) in the Statement of Operations. The commissions paid to these affiliated firms were $48 for the period.
Interfund Trades. The Fund may purchase from or sell securities to other Fidelity Funds under procedures adopted by the Board. The procedures have been designed to ensure these interfund trades are executed in accordance with Rule 17a-7 of the 1940 Act. Interfund trades are included within the respective purchases and sales amounts shown in the Purchases and Sales of Investments note.
7. Committed Line of Credit.
The Fund participates with other funds managed by the investment adviser or an affiliate in a $4.25 billion credit facility (the "line of credit") to be utilized for temporary or emergency purposes to fund shareholder redemptions or for other short-term liquidity purposes. The Fund has agreed to pay commitment fees on its pro-rata portion of the line of credit, which amounted to $5 and is reflected in Miscellaneous expenses on the Statement of Operations. During the period, the Fund did not borrow on this line of credit.
8. Security Lending.
The Fund lends portfolio securities through a lending agent from time to time in order to earn additional income. For equity securities, a lending agent is used and may loan securities to certain qualified borrowers, including Fidelity Capital Markets (FCM), a broker-dealer affiliated with the Fund. On the settlement date of the loan, the Fund receives collateral (in the form of U.S. Treasury obligations, letters of credit and/or cash) against the loaned securities and maintains collateral in an amount not less than 100% of the market value of the loaned securities during the period of the loan. The market value of the loaned securities is determined at the close of business of the Fund and any additional required collateral is delivered to the Fund on the next business day. The Fund or borrower may terminate the loan at any time, and if the borrower defaults on its obligation to return the securities loaned because of insolvency or other reasons, the Fund may apply collateral received from the borrower against the obligation. The Fund may experience delays and costs in recovering the securities loaned. Any cash collateral received is invested in the Fidelity Securities Lending Cash Central Fund. The value of loaned securities and cash collateral at period end are disclosed on the Fund's Statement of Assets and Liabilities. At period end, there were no security loans outstanding with FCM. Security lending income represents the income earned on investing cash collateral, less rebates paid to borrowers and any lending agent fees associated with the loan, plus any premium payments received for lending certain types of securities. Security lending income is presented in the Statement of Operations as a component of income from Fidelity Central Funds. Total security lending income during the period amounted to $194, including $7 from securities loaned to FCM.
9. Expense Reductions.
The investment adviser voluntarily agreed to reimburse a portion of the Fund's Class A, Class M, Class C, Stock Selector Small Cap and Class I operating expenses. During the period, this reimbursement reduced expenses as follows:
| | Reimbursement |
| Class A | –(a) |
| Class M | –(a) |
| Class C | –(a) |
| Stock Selector Small Cap | 16 |
| Class I | 1 |
| | $17 |
(a) In the amount of less than five-hundred dollars
Commissions paid to certain brokers with whom the investment adviser, or its affiliates, places trades on behalf of the Fund include an amount in addition to trade execution, which may be rebated back to the Fund to offset certain expenses. This amount totaled $90 for the period.
In addition, during the period the investment adviser reimbursed and/or waived a portion of fund-level operating expenses in the amount of $14.
10. Distributions to Shareholders.
Distributions to shareholders of each class were as follows:
| | Year ended
October 31, 2017 | Year ended
October 31, 2016 |
| From net investment income | | |
| Class A | $34 | $25 |
| Stock Selector Small Cap | 6,885 | 5,925 |
| Class I | 201 | 207 |
| Total | $7,120 | $6,157 |
| From net realized gain | | |
| Class A | $156 | $712 |
| Class M | 34 | 181 |
| Class B | – | 10 |
| Class C | 55 | 261 |
| Stock Selector Small Cap | 16,959 | 84,153 |
| Class I | 504 | 2,740 |
| Total | $17,708 | $88,057 |
11. Share Transactions.
Share transactions for each class were as follows and may contain automatic conversions between classes or exchanges between affiliated funds:
| | Shares | Shares | Dollars | Dollars |
| | Year ended October 31, 2017 | Year ended October 31, 2016 | Year ended October 31, 2017 | Year ended October 31, 2016 |
| Class A | | | | |
| Shares sold | 118 | 61 | $3,090 | $1,389 |
| Reinvestment of distributions | 7 | 30 | 186 | 721 |
| Shares redeemed | (125) | (59) | (3,277) | (1,344) |
| Net increase (decrease) | – | 32 | $(1) | $766 |
| Class M | | | | |
| Shares sold | 46 | 14 | $1,150 | $306 |
| Reinvestment of distributions | 1 | 8 | 33 | 178 |
| Shares redeemed | (47) | (25) | (1,187) | (554) |
| Net increase (decrease) | – | (3) | $(4) | $(70) |
| Class B | | | | |
| Shares sold | – | –(a) | $– | $1 |
| Reinvestment of distributions | – | –(a) | – | 10 |
| Shares redeemed | – | (7) | – | (164) |
| Net increase (decrease) | – | (7) | $– | $(153) |
| Class C | | | | |
| Shares sold | 80 | 45 | $1,940 | $965 |
| Reinvestment of distributions | 2 | 11 | 53 | 248 |
| Shares redeemed | (65) | (69) | (1,593) | (1,458) |
| Net increase (decrease) | 17 | (13) | $400 | $(245) |
| Stock Selector Small Cap | | | | |
| Shares sold | 6,895 | 9,805 | $183,697 | $225,506 |
| Reinvestment of distributions | 876 | 3,668 | 23,306 | 88,117 |
| Shares redeemed | (11,988) | (11,744) | (319,370) | (270,444) |
| Net increase (decrease) | (4,217) | 1,729 | $(112,367) | $43,179 |
| Class I | | | | |
| Shares sold | 214 | 274 | $5,746 | $6,249 |
| Reinvestment of distributions | 26 | 122 | 702 | 2,937 |
| Shares redeemed | (549) | (454) | (14,715) | (10,912) |
| Net increase (decrease) | (309) | (58) | $(8,267) | $(1,726) |
| Class Z(b) | | | | |
| Shares sold | 26 | – | $706 | $– |
| Shares redeemed | (3) | – | (86) | – |
| Net increase (decrease) | 23 | – | $620 | $– |
(a) In the amount of less than five hundred shares.
(b) Share transactions for Class Z are for the period February 1, 2017 (commencement of sale of shares) to October 31, 2017.
12. Other.
The Fund's organizational documents provide former and current trustees and officers with a limited indemnification against liabilities arising in connection with the performance of their duties to the Fund. In the normal course of business, the Fund may also enter into contracts that provide general indemnifications. The Fund's maximum exposure under these arrangements is unknown as this would be dependent on future claims that may be made against the Fund. The risk of material loss from such claims is considered remote.
Report of Independent Registered Public Accounting Firm
To the Trustees of Fidelity Capital Trust and Shareholders of Fidelity Stock Selector Small Cap Fund:
We have audited the accompanying statement of assets and liabilities of Fidelity Stock Selector Small Cap Fund (the Fund), a fund of Fidelity Capital Trust, including the schedule of investments, as of October 31, 2017, and the related statement of operations for the year then ended, the statement of changes in net assets for each of the two years in the period then ended, and the financial highlights for each of the periods presented. These financial statements and financial highlights are the responsibility of the Fund's management. Our responsibility is to express an opinion on these financial statements and financial highlights based on our audits.
We conducted our audits in accordance with the standards of the Public Company Accounting Oversight Board (United States). Those standards require that we plan and perform the audit to obtain reasonable assurance about whether the financial statements and financial highlights are free of material misstatement. The Fund is not required to have, nor were we engaged to perform, an audit of its internal control over financial reporting. Our audits included consideration of internal control over financial reporting as a basis for designing audit procedures that are appropriate in the circumstances, but not for the purpose of expressing an opinion on the effectiveness of the Fund's internal control over financial reporting. Accordingly, we express no such opinion. An audit also includes examining, on a test basis, evidence supporting the amounts and disclosures in the financial statements, assessing the accounting principles used and significant estimates made by management, as well as evaluating the overall financial statement presentation. Our procedures included confirmation of securities owned as of October 31, 2017, by correspondence with the custodians and brokers; when replies were not received from brokers, we performed other auditing procedures. We believe that our audits provide a reasonable basis for our opinion.
In our opinion, such financial statements and financial highlights referred to above present fairly, in all material respects, the financial position of Fidelity Stock Selector Small Cap Fund as of October 31, 2017, the results of its operations for the year then ended, the statement of changes in its net assets for each of the two years in the period then ended, and the financial highlights for each of the periods presented, in conformity with accounting principles generally accepted in the United States of America.
DELOITTE & TOUCHE LLP
Boston, Massachusetts
December 15, 2017
Trustees and Officers
The Trustees, Members of the Advisory Board (if any), and officers of the trust and fund, as applicable, are listed below. The Board of Trustees governs the fund and is responsible for protecting the interests of shareholders. The Trustees are experienced executives who meet periodically throughout the year to oversee the fund's activities, review contractual arrangements with companies that provide services to the fund, oversee management of the risks associated with such activities and contractual arrangements, and review the fund's performance. Each of the Trustees oversees 190 funds.
The Trustees hold office without limit in time except that (a) any Trustee may resign; (b) any Trustee may be removed by written instrument, signed by at least two-thirds of the number of Trustees prior to such removal; (c) any Trustee who requests to be retired or who has become incapacitated by illness or injury may be retired by written instrument signed by a majority of the other Trustees; and (d) any Trustee may be removed at any special meeting of shareholders by a two-thirds vote of the outstanding voting securities of the trust. Each Trustee who is not an interested person (as defined in the 1940 Act) of the trust and the fund is referred to herein as an Independent Trustee. Each Independent Trustee shall retire not later than the last day of the calendar year in which his or her 75th birthday occurs. The Independent Trustees may waive this mandatory retirement age policy with respect to individual Trustees. Officers and Advisory Board Members hold office without limit in time, except that any officer or Advisory Board Member may resign or may be removed by a vote of a majority of the Trustees at any regular meeting or any special meeting of the Trustees. Except as indicated, each individual has held the office shown or other offices in the same company for the past five years.
The fund’s Statement of Additional Information (SAI) includes more information about the Trustees. To request a free copy, call Fidelity at 1-877-208-0098.
Experience, Skills, Attributes, and Qualifications of the Trustees. The Governance and Nominating Committee has adopted a statement of policy that describes the experience, qualifications, attributes, and skills that are necessary and desirable for potential Independent Trustee candidates (Statement of Policy). The Board believes that each Trustee satisfied at the time he or she was initially elected or appointed a Trustee, and continues to satisfy, the standards contemplated by the Statement of Policy. The Governance and Nominating Committee also engages professional search firms to help identify potential Independent Trustee candidates who have the experience, qualifications, attributes, and skills consistent with the Statement of Policy. From time to time, additional criteria based on the composition and skills of the current Independent Trustees, as well as experience or skills that may be appropriate in light of future changes to board composition, business conditions, and regulatory or other developments, have also been considered by the professional search firms and the Governance and Nominating Committee. In addition, the Board takes into account the Trustees' commitment and participation in Board and committee meetings, as well as their leadership of standing and ad hoc committees throughout their tenure.
In determining that a particular Trustee was and continues to be qualified to serve as a Trustee, the Board has considered a variety of criteria, none of which, in isolation, was controlling. The Board believes that, collectively, the Trustees have balanced and diverse experience, qualifications, attributes, and skills, which allow the Board to operate effectively in governing the fund and protecting the interests of shareholders. Information about the specific experience, skills, attributes, and qualifications of each Trustee, which in each case led to the Board's conclusion that the Trustee should serve (or continue to serve) as a trustee of the fund, is provided below.
Board Structure and Oversight Function. James C. Curvey is an interested person and currently serves as Chairman. The Trustees have determined that an interested Chairman is appropriate and benefits shareholders because an interested Chairman has a personal and professional stake in the quality and continuity of services provided to the fund. Independent Trustees exercise their informed business judgment to appoint an individual of their choosing to serve as Chairman, regardless of whether the Trustee happens to be independent or a member of management. The Independent Trustees have determined that they can act independently and effectively without having an Independent Trustee serve as Chairman and that a key structural component for assuring that they are in a position to do so is for the Independent Trustees to constitute a substantial majority for the Board. The Independent Trustees also regularly meet in executive session. Ned C. Lautenbach serves as Chairman of the Independent Trustees and as such (i) acts as a liaison between the Independent Trustees and management with respect to matters important to the Independent Trustees and (ii) with management prepares agendas for Board meetings.
Fidelity® funds are overseen by different Boards of Trustees. The fund's Board oversees Fidelity's high income and certain equity funds, and other Boards oversee Fidelity's investment-grade bond, money market, asset allocation, and sector funds. The asset allocation funds may invest in Fidelity® funds overseen by the fund's Board. The use of separate Boards, each with its own committee structure, allows the Trustees of each group of Fidelity® funds to focus on the unique issues of the funds they oversee, including common research, investment, and operational issues. On occasion, the separate Boards establish joint committees to address issues of overlapping consequences for the Fidelity® funds overseen by each Board.
The Trustees operate using a system of committees to facilitate the timely and efficient consideration of all matters of importance to the Trustees, the fund, and fund shareholders and to facilitate compliance with legal and regulatory requirements and oversight of the fund's activities and associated risks. The Board, acting through its committees, has charged FMR and its affiliates with (i) identifying events or circumstances the occurrence of which could have demonstrably adverse effects on the fund's business and/or reputation; (ii) implementing processes and controls to lessen the possibility that such events or circumstances occur or to mitigate the effects of such events or circumstances if they do occur; and (iii) creating and maintaining a system designed to evaluate continuously business and market conditions in order to facilitate the identification and implementation processes described in (i) and (ii) above. Because the day-to-day operations and activities of the fund are carried out by or through FMR, its affiliates, and other service providers, the fund's exposure to risks is mitigated but not eliminated by the processes overseen by the Trustees. While each of the Board's committees has responsibility for overseeing different aspects of the fund's activities, oversight is exercised primarily through the Operations, Audit, and Compliance Committees. In addition, the Independent Trustees have worked with FMR to enhance the Board's oversight of investment and financial risks, legal and regulatory risks, technology risks, and operational risks, including the development of additional risk reporting to the Board. For example, a working group comprised of Independent Trustees and FMR has worked and continues to work to review the Fidelity® funds' valuation-related activities, reporting and risk management. Appropriate personnel, including but not limited to the fund's Chief Compliance Officer (CCO), FMR's internal auditor, the independent accountants, the fund's Treasurer and portfolio management personnel, make periodic reports to the Board's committees, as appropriate, including an annual review of Fidelity's risk management program for the Fidelity® funds. The responsibilities of each standing committee, including their oversight responsibilities, are described further under "Standing Committees of the Trustees."
Interested Trustees*:
Correspondence intended for a Trustee who is an interested person may be sent to Fidelity Investments, 245 Summer Street, Boston, Massachusetts 02210.
Name, Year of Birth; Principal Occupations and Other Relevant Experience+
James C. Curvey (1935)
Year of Election or Appointment: 2007
Trustee
Chairman of the Board of Trustees
Mr. Curvey also serves as Trustee of other Fidelity® funds. Mr. Curvey is a Director of Fidelity Research & Analysis Co. (investment adviser firm, 2009-present), and Vice Chairman (2007-present) and Director of FMR LLC (diversified financial services company). In addition, Mr. Curvey serves as an Overseer for the Boston Symphony Orchestra and a member of the board of Artis-Naples, Naples, Florida, and as a Trustee for Brewster Academy, Wolfeboro, New Hampshire. Previously, Mr. Curvey served as a Director of Fidelity Investments Money Management, Inc. (investment adviser firm, 2009-2014) and a Director of FMR and FMR Co., Inc. (investment adviser firms, 2007-2014).
Charles S. Morrison (1960)
Year of Election or Appointment: 2014
Trustee
Mr. Morrison also serves as Trustee of other funds. He serves as President of Fidelity Management & Research Company (FMR) (investment adviser firm, 2016-present), a Director of Fidelity Investments Money Management, Inc. (FIMM) (investment adviser firm, 2014-present), Director of Fidelity SelectCo, LLC (investment adviser firm, 2014-present), President, Asset Management (2014-present), and is an employee of Fidelity Investments. Previously, Mr. Morrison served as Vice President of Fidelity's Fixed Income and Asset Allocation Funds (2012-2014), President, Fixed Income (2011-2014), Vice President of Fidelity's Money Market Funds (2005-2009), President, Money Market Group Leader of FMR (investment adviser firm, 2009), and Senior Vice President, Money Market Group of FMR (2004-2009). Mr. Morrison also served as Vice President of Fidelity's Bond Funds (2002-2005), certain Balanced Funds (2002-2005), and certain Asset Allocation Funds (2002-2007), and as Senior Vice President (2002-2005) of Fidelity's Bond Division.
* Determined to be an “Interested Trustee” by virtue of, among other things, his or her affiliation with the trust or various entities under common control with FMR.
+ The information includes the Trustee's principal occupation during the last five years and other information relating to the experience, attributes, and skills relevant to the Trustee's qualifications to serve as a Trustee, which led to the conclusion that the Trustee should serve as a Trustee for the fund.
Independent Trustees:
Correspondence intended for an Independent Trustee may be sent to Fidelity Investments, P.O. Box 55235, Boston, Massachusetts 02205-5235.
Name, Year of Birth; Principal Occupations and Other Relevant Experience+
Dennis J. Dirks (1948)
Year of Election or Appointment: 2005
Trustee
Mr. Dirks also serves as Trustee of other Fidelity® funds. Prior to his retirement in May 2003, Mr. Dirks was Chief Operating Officer and a member of the Board of The Depository Trust & Clearing Corporation (DTCC). He also served as President, Chief Operating Officer, and Board member of The Depository Trust Company (DTC) and President and Board member of the National Securities Clearing Corporation (NSCC). In addition, Mr. Dirks served as Chief Executive Officer and Board member of the Government Securities Clearing Corporation, Chief Executive Officer and Board member of the Mortgage-Backed Securities Clearing Corporation, as a Trustee and a member of the Finance Committee of Manhattan College (2005-2008), as a Trustee and a member of the Finance Committee of AHRC of Nassau County (2006-2008), as a member of the Independent Directors Council (IDC) Governing Council (2010-2015), and as a member of the Board of Directors for The Brookville Center for Children’s Services, Inc. (2009-2017). Mr. Dirks is a member of the Finance Committee (2016-present) and Board of Directors (2017-present) of the Asolo Repertory Theatre.
Alan J. Lacy (1953)
Year of Election or Appointment: 2008
Trustee
Mr. Lacy also serves as Trustee of other Fidelity® funds. Mr. Lacy serves as a Director of Bristol-Myers Squibb Company (global pharmaceuticals, 2008-present). He is a Trustee of the California Chapter of The Nature Conservancy (2015-present) and a Director of the Center for Advanced Study in the Behavioral Sciences at Stanford University (2015-present). In addition, Mr. Lacy served as Senior Adviser (2007-2014) of Oak Hill Capital Partners, L.P. (private equity) and also served as Chief Executive Officer (2005) and Vice Chairman (2005-2006) of Sears Holdings Corporation (retail) and Chief Executive Officer and Chairman of the Board of Sears, Roebuck and Co. (retail, 2000-2005). Previously, Mr. Lacy served as Chairman (2014-2017) and a member (2010-2017) of the Board of Directors of Dave & Buster’s Entertainment, Inc. (restaurant and entertainment complexes), as Chairman (2008-2011) and a member (2006-2015) of the Board of Trustees of the National Parks Conservation Association, and as a member of the Board of Directors for The Hillman Companies, Inc. (hardware wholesalers, 2010-2014), Earth Fare, Inc. (retail grocery, 2010-2014), and The Western Union Company (global money transfer, 2006-2011).
Ned C. Lautenbach (1944)
Year of Election or Appointment: 2000
Trustee
Chairman of the Independent Trustees
Mr. Lautenbach also serves as Trustee of other Fidelity® funds. Mr. Lautenbach currently serves as Vice Chair of the Board of Governors, State University System of Florida (2013-present) and is a member of the Council on Foreign Relations (1994-present). He is also a member and has most recently served as Chairman of the Board of Directors of Artis-Naples (2012-present). Previously, Mr. Lautenbach served as a member and then Lead Director of the Board of Directors of Eaton Corporation (diversified industrial, 1997-2016). He was also a Partner and Advisory Partner at Clayton, Dubilier & Rice, LLC (private equity investment, 1998-2010), as well as a Director of Sony Corporation (2006-2007). In addition, Mr. Lautenbach also had a 30-year career with IBM (technology company) during which time he served as Senior Vice President and a member of the Corporate Executive Committee (1968-1998).
Joseph Mauriello (1944)
Year of Election or Appointment: 2008
Trustee
Mr. Mauriello also serves as Trustee of other Fidelity® funds. Prior to his retirement in January 2006, Mr. Mauriello served in numerous senior management positions including Deputy Chairman and Chief Operating Officer (2004-2005), and Vice Chairman of Financial Services (2002-2004) of KPMG LLP US (professional services, 1965-2005). Mr. Mauriello currently serves as a member of the Board of Directors of XL Group plc. (global insurance and re-insurance, 2006-present) and the Independent Directors Council (IDC) Governing Council (2015-present). Previously, Mr. Mauriello served as a Director of the Hamilton Funds of the Bank of New York (2006-2007) and of Arcadia Resources Inc. (health care services and products, 2007-2012).
Cornelia M. Small (1944)
Year of Election or Appointment: 2005
Trustee
Ms. Small also serves as Trustee of other Fidelity® funds. Ms. Small is a member of the Board of Directors (2009-present) and Chair of the Investment Committee (2010-present) of the Teagle Foundation. Ms. Small also serves on the Investment Committee of the Berkshire Taconic Community Foundation (2008-present). Previously, Ms. Small served as Chairperson (2002-2008) and a member of the Investment Committee and Chairperson (2008-2012) and a member of the Board of Trustees of Smith College. In addition, Ms. Small served as Chief Investment Officer, Director of Global Equity Investments, and a member of the Board of Directors of Scudder, Stevens & Clark and Scudder Kemper Investments.
William S. Stavropoulos (1939)
Year of Election or Appointment: 2002
Trustee
Vice Chairman of the Independent Trustees
Mr. Stavropoulos also serves as Trustee of other Fidelity® funds. Mr. Stavropoulos serves as President and Founder of the Michigan Baseball Foundation, the Great Lakes Loons (2007-present). Mr. Stavropoulos is Chairman Emeritus of the Board of Directors of The Dow Chemical Company, where he previously served in numerous senior management positions, including President, CEO (1995-2000; 2002-2004), Chairman of the Executive Committee (2000-2006), and as a member of the Board of Directors (1990-2006). Currently, Mr. Stavropoulos is Chairman of the Board of Directors of Univar Inc. (global distributor of commodity and specialty chemicals), a Director of Teradata Corporation (data warehousing and technology solutions), and a member of the Advisory Board for Metalmark Capital LLC (private equity investment, 2005-present). Mr. Stavropoulos is an operating advisor to Clayton, Dubilier & Rice, LLC (private equity investment). In addition, Mr. Stavropoulos is a member of the University of Notre Dame Advisory Council for the College of Science, a Trustee of the Rollin L. Gerstacker Foundation, and a Director of Artis-Naples in Naples, Florida. Previously, Mr. Stavropoulos served as a Director of Chemical Financial Corporation (bank holding company, 1993-2012) and Tyco International, Ltd. (multinational manufacturing and services, 2007-2012).
David M. Thomas (1949)
Year of Election or Appointment: 2008
Trustee
Mr. Thomas also serves as Trustee of other Fidelity® funds. Mr. Thomas serves as Non-Executive Chairman of the Board of Directors of Fortune Brands Home and Security (home and security products, 2011-present), as a member of the Board of Directors (2004-present) and Presiding Director (2013-present) of Interpublic Group of Companies, Inc. (marketing communication), and as a member of the Board of Trustees of the University of Florida (2013-present). Previously, Mr. Thomas served as Executive Chairman (2005-2006) and Chairman and Chief Executive Officer (2000-2005) of IMS Health, Inc. (pharmaceutical and healthcare information solutions), and a Director of Fortune Brands, Inc. (consumer products, 2000-2011).
+ The information includes the Trustee's principal occupation during the last five years and other information relating to the experience, attributes, and skills relevant to the Trustee's qualifications to serve as a Trustee, which led to the conclusion that the Trustee should serve as a Trustee for the fund.
Advisory Board Members and Officers:
Correspondence intended for an officer or Peter S. Lynch may be sent to Fidelity Investments, 245 Summer Street, Boston, Massachusetts 02210. Officers appear below in alphabetical order.
Name, Year of Birth; Principal Occupation
Peter S. Lynch (1944)
Year of Election or Appointment: 2003
Member of the Advisory Board
Mr. Lynch also serves as Member of the Advisory Board of other Fidelity® funds. Mr. Lynch is Vice Chairman and a Director of FMR (investment adviser firm) and FMR Co., Inc. (investment adviser firm). In addition, Mr. Lynch serves as a Trustee of Boston College and as the Chairman of the Inner-City Scholarship Fund. Previously, Mr. Lynch served on the Special Olympics International Board of Directors (1997-2006).
Elizabeth Paige Baumann (1968)
Year of Election or Appointment: 2017
Anti-Money Laundering (AML) Officer
Ms. Baumann also serves as AML Officer of other funds. She is Chief AML Officer (2012-present) and Senior Vice President (2014-present) of FMR LLC (diversified financial services company) and is an employee of Fidelity Investments. Previously, Ms. Baumann served as AML Officer of the funds (2012-2016), and Vice President (2007-2014) and Deputy Anti-Money Laundering Officer (2007-2012) of FMR LLC.
Marc R. Bryant (1966)
Year of Election or Appointment: 2015
Secretary and Chief Legal Officer (CLO)
Mr. Bryant also serves as Secretary and CLO of other funds. Mr. Bryant serves as CLO, Secretary, and Senior Vice President of Fidelity Management & Research Company (investment adviser firm, 2015-present) and FMR Co., Inc. (investment adviser firm, 2015-present); Secretary of Fidelity SelectCo, LLC (investment adviser firm, 2015-present) and Fidelity Investments Money Management, Inc. (investment adviser firm, 2015-present); and CLO of Fidelity Management & Research (Hong Kong) Limited and FMR Investment Management (UK) Limited (investment adviser firms, 2015-present) and Fidelity Management & Research (Japan) Limited (investment adviser firm, 2016-present). He is Senior Vice President and Deputy General Counsel of FMR LLC (diversified financial services company). Previously, Mr. Bryant served as Secretary and CLO of Fidelity Rutland Square Trust II (2010-2014) and Assistant Secretary of Fidelity's Fixed Income and Asset Allocation Funds (2013-2015). Prior to joining Fidelity Investments, Mr. Bryant served as a Senior Vice President and the Head of Global Retail Legal for AllianceBernstein L.P. (2006-2010), and as the General Counsel for ProFund Advisors LLC (2001-2006).
William C. Coffey (1969)
Year of Election or Appointment: 2009
Assistant Secretary
Mr. Coffey also serves as Assistant Secretary of other funds. He is Senior Vice President and Deputy General Counsel of FMR LLC (diversified financial services company, 2010-present), and is an employee of Fidelity Investments. Previously, Mr. Coffey served as Vice President and Associate General Counsel of FMR LLC (2005-2009).
Jonathan Davis (1968)
Year of Election or Appointment: 2010
Assistant Treasurer
Mr. Davis also serves as Assistant Treasurer of other funds, and is an employee of Fidelity Investments. Previously, Mr. Davis served as Vice President and Associate General Counsel of FMR LLC (diversified financial services company, 2003-2010).
Adrien E. Deberghes (1967)
Year of Election or Appointment: 2016
Assistant Treasurer
Mr. Deberghes also serves as an officer of other funds. He serves as Executive Vice President of Fidelity Investments Money Management, Inc. (FIMM) (investment adviser firm, 2016-present) and is an employee of Fidelity Investments (2008-present). Prior to joining Fidelity Investments, Mr. Deberghes was Senior Vice President of Mutual Fund Administration at State Street Corporation (2007-2008), Senior Director of Mutual Fund Administration at Investors Bank & Trust (2005-2007), and Director of Finance for Dunkin' Brands (2000-2005). Previously, Mr. Deberghes served in other fund officer roles.
Stephanie J. Dorsey (1969)
Year of Election or Appointment: 2010
Assistant Treasurer
Ms. Dorsey also serves as an officer of other funds. She is an employee of Fidelity Investments (2008-present) and has served in other fund officer roles. Prior to joining Fidelity Investments, Ms. Dorsey served as Treasurer (2004-2008) of the JPMorgan Mutual Funds and Vice President (2004-2008) of JPMorgan Chase Bank.
Howard J. Galligan III (1966)
Year of Election or Appointment: 2014
Chief Financial Officer
Mr. Galligan also serves as Chief Financial Officer of other funds. Mr. Galligan serves as President of Fidelity Pricing and Cash Management Services (FPCMS) (2014-present) and as a Director of Strategic Advisers, Inc. (investment adviser firm, 2008-present). Previously, Mr. Galligan served as Chief Administrative Officer of Asset Management (2011-2014) and Chief Operating Officer and Senior Vice President of Investment Support for Strategic Advisers, Inc. (2003-2011).
Thomas C. Hense (1964)
Year of Election or Appointment: 2008, 2010, or 2015
Vice President
Mr. Hense serves as Vice President of Fidelity Advisor® Multi-Asset Income Fund (2015) and other funds (High Income (2008), Small Cap (2008), and Value (2010) funds), and is an employee of Fidelity Investments (1993-present). Previously, Mr. Hense served as a portfolio manager for Fidelity's Institutional Money Management Group (Pyramis) (2003-2008).
Brian B. Hogan (1964)
Year of Election or Appointment: 2009
Vice President
Mr. Hogan also serves as Trustee or Vice President of other funds. Mr. Hogan serves as a Director of FMR Investment Management (UK) Limited (investment adviser firm, 2015-present) and Fidelity SelectCo, LLC (investment adviser firm, 2014-present) and President of the Equity Division of FMR (investment adviser firm, 2009-present). Previously, Mr. Hogan served as Senior Vice President, Equity Research of FMR (2006-2009) and as a portfolio manager. Mr. Brian B. Hogan is not related to Mr. Colm A. Hogan.
Colm A. Hogan (1973)
Year of Election or Appointment: 2016
Deputy Treasurer
Mr. Hogan also serves as an officer of other funds. Mr. Hogan is an employee of Fidelity Investments (2005-present). Mr. Colm A. Hogan is not related to Mr. Brian B. Hogan.
Chris Maher (1972)
Year of Election or Appointment: 2013
Assistant Treasurer
Mr. Maher serves as Assistant Treasurer of other funds. Mr. Maher is Vice President of Valuation Oversight and is an employee of Fidelity Investments. Previously, Mr. Maher served as Vice President of Asset Management Compliance (2013), Vice President of the Program Management Group of FMR (investment adviser firm, 2010-2013), and Vice President of Valuation Oversight (2008-2010).
Rieco E. Mello (1969)
Year of Election or Appointment: 2017
Assistant Treasurer
Mr. Mello also serves as Assistant Treasurer of other funds. Mr. Mello is an employee of Fidelity Investments (1995-present).
Kenneth B. Robins (1969)
Year of Election or Appointment: 2016
Chief Compliance Officer
Mr. Robins also serves as an officer of other funds. Mr. Robins serves as Compliance Officer of Fidelity Management & Research Company and FMR Co., Inc. (investment adviser firms, 2016-present) and is an employee of Fidelity Investments (2004-present). Previously, Mr. Robins served as Executive Vice President of Fidelity Investments Money Management, Inc. (investment adviser firm, 2013-2016) and served in other fund officer roles.
Stacie M. Smith (1974)
Year of Election or Appointment: 2016
President and Treasurer
Ms. Smith also serves as an officer of other funds. She is an employee of Fidelity Investments (2009-present) and has served in other fund officer roles. Prior to joining Fidelity Investments, Ms. Smith served as Senior Audit Manager of Ernst & Young LLP (accounting firm, 1996-2009). Previously, Ms. Smith served as Deputy Treasurer of certain Fidelity® funds (2013-2016).
Marc L. Spector (1972)
Year of Election or Appointment: 2016
Assistant Treasurer
Mr. Spector also serves as an officer of other funds. Mr. Spector is an employee of Fidelity Investments (2016-present). Prior to joining Fidelity Investments, Mr. Spector served as Director at the Siegfried Group (accounting firm, 2013-2016), and prior to Siegfried Group as audit senior manager at Deloitte & Touche (accounting firm, 2005-2013).
Renee Stagnone (1975)
Year of Election or Appointment: 2016
Assistant Treasurer
Ms. Stagnone also serves as an officer of other funds. Ms. Stagnone is an employee of Fidelity Investments (1997-present). Previously, Ms. Stagnone served as Deputy Treasurer of certain Fidelity® funds (2013-2016).
Shareholder Expense Example
As a shareholder of the Fund, you incur two types of costs: (1) transaction costs, including sales charges (loads) on purchase payments or redemption proceeds, redemption fees and (2) ongoing costs, including management fees, distribution and/or service (12b-1) fees and other Fund expenses. This Example is intended to help you understand your ongoing costs (in dollars) of investing in the Fund and to compare these costs with the ongoing costs of investing in other mutual funds.
The Example is based on an investment of $1,000 invested at the beginning of the period and held for the entire period (May 1, 2017 to October 31, 2017).
Actual Expenses
The first line of the accompanying table for each class of the Fund provides information about actual account values and actual expenses. You may use the information in this line, together with the amount you invested, to estimate the expenses that you paid over the period. Simply divide your account value by $1,000.00 (for example, an $8,600 account value divided by $1,000.00 = 8.6), then multiply the result by the number in the first line for a class of the Fund under the heading entitled "Expenses Paid During Period" to estimate the expenses you paid on your account during this period. A small balance maintenance fee of $12.00 that is charged once a year may apply for certain accounts with a value of less than $2,000. This fee is not included in the table below. If it was, the estimate of expenses you paid during the period would be higher, and your ending account value lower, by this amount. In addition, the Fund, as a shareholder in the underlying Fidelity Central Funds, will indirectly bear its pro-rata share of the fees and expenses incurred by the underlying Fidelity Central Funds. These fees and expenses are not included in the Fund's annualized expense ratio used to calculate the expense estimate in the table below.
Hypothetical Example for Comparison Purposes
The second line of the accompanying table for each class of the Fund provides information about hypothetical account values and hypothetical expenses based on a Class' actual expense ratio and an assumed rate of return of 5% per year before expenses, which is not the Class' actual return. The hypothetical account values and expenses may not be used to estimate the actual ending account balance or expenses you paid for the period. You may use this information to compare the ongoing costs of investing in the Fund and other funds. To do so, compare this 5% hypothetical example with the 5% hypothetical examples that appear in the shareholder reports of the other funds. A small balance maintenance fee of $12.00 that is charged once a year may apply for certain accounts with a value of less than $2,000. This fee is not included in the table below. If it was, the estimate of expenses you paid during the period would be higher, and your ending account value lower, by this amount. In addition, the Fund, as a shareholder in the underlying Fidelity Central Funds, will indirectly bear its pro-rata share of the fees and expenses incurred by the underlying Fidelity Central Funds. These fees and expenses are not included in the Fund's annualized expense ratio used to calculate the expense estimate in the table below.
Please note that the expenses shown in the table are meant to highlight your ongoing costs only and do not reflect any transaction costs. Therefore, the second line of the table is useful in comparing ongoing costs only, and will not help you determine the relative total costs of owning different funds. In addition, if these transactional costs were included, your costs would have been higher.
| | Annualized Expense Ratio-A | Beginning
Account Value
May 1, 2017 | Ending
Account Value
October 31, 2017 | Expenses Paid
During Period-B
May 1, 2017
to October 31, 2017 |
| Class A | 1.02% | | | |
| Actual | | $1,000.00 | $1,067.50 | $5.32 |
| Hypothetical-C | | $1,000.00 | $1,020.06 | $5.19 |
| Class M | 1.37% | | | |
| Actual | | $1,000.00 | $1,065.50 | $7.13 |
| Hypothetical-C | | $1,000.00 | $1,018.30 | $6.97 |
| Class C | 1.84% | | | |
| Actual | | $1,000.00 | $1,062.90 | $9.57 |
| Hypothetical-C | | $1,000.00 | $1,015.93 | $9.35 |
| Stock Selector Small Cap | .72% | | | |
| Actual | | $1,000.00 | $1,069.30 | $3.76 |
| Hypothetical-C | | $1,000.00 | $1,021.58 | $3.67 |
| Class I | .72% | | | |
| Actual | | $1,000.00 | $1,069.10 | $3.75 |
| Hypothetical-C | | $1,000.00 | $1,021.58 | $3.67 |
| Class Z | .62% | | | |
| Actual | | $1,000.00 | $1,069.80 | $3.23 |
| Hypothetical-C | | $1,000.00 | $1,022.08 | $3.16 |
A Annualized expense ratio reflects expenses net of applicable fee waivers.
B Expenses are equal to each Class' annualized expense ratio, multiplied by the average account value over the period, multiplied by 184/365 (to reflect the one-half year period).
C 5% return per year before expenses
Distributions (Unaudited)
The Board of Trustees of Fidelity Stock Selector Small Cap Fund voted to pay to shareholders of record at the opening of business on record date, the following distributions per share derived from capital gains realized from sales of portfolio securities, and dividends derived from net investment income:
| | Pay Date | Record Date | Dividends | Capital Gains |
| Fidelity Stock Selector Small Cap Fund | | | | |
| Class A | 12/11/17 | 12/08/17 | $0.034 | $2.651 |
| Class M | 12/11/17 | 12/08/17 | $0.000 | $2.651 |
| Class C | 12/11/17 | 12/08/17 | $0.000 | $2.651 |
| Class I | 12/11/17 | 12/08/17 | $0.109 | $2.651 |
| Class Z | 12/11/17 | 12/08/17 | $0.159 | $2.651 |
| Stock Selector Small Cap | 12/11/17 | 12/08/17 | $0.113 | $2.651 |
|
The fund hereby designates as a capital gain dividend with respect to the taxable year ended October 31, 2017, $158,713,867, or, if subsequently determined to be different, the net capital gain of such year.
Class A, Class I, and Stock Selector Small Cap designate 100% of the dividends distributed in December 2017, during the fiscal year, as qualifying for the dividends–received deduction for corporate shareholders.
Class A, Class I, and Stock Selector Small Cap designate 100% of the dividends distributed during the fiscal year as amounts which may be taken into account as a dividend for purposes of the maximum rate under section 1(h)(11) of the Internal Revenue Code.
The fund will notify shareholders in January 2018 of amounts for use in preparing 2017 income tax returns.
Board Approval of Investment Advisory Contracts and Management Fees
Fidelity Stock Selector Small Cap Fund
Each year, the Board of Trustees, including the Independent Trustees (together, the Board), votes on the renewal of the management contract with Fidelity Management & Research Company (FMR) and the sub-advisory agreements (together, the Advisory Contracts) for the fund. FMR and the sub-advisers are referred to herein as the Investment Advisers. The Board, assisted by the advice of fund counsel and Independent Trustees' counsel, requests and considers a broad range of information relevant to the renewal of the Advisory Contracts throughout the year.
The Board meets regularly and, at each of its meetings, covers an extensive agenda of topics and materials and considers factors that are relevant to its annual consideration of the renewal of the fund's Advisory Contracts, including the services and support provided to the fund and its shareholders. The Board has established various standing committees (Committees), each composed of and chaired by Independent Trustees with varying backgrounds, to which the Board has assigned specific subject matter responsibilities in order to enhance effective decision-making by the Board. The Board, acting directly and through its Committees, requests and receives information concerning the annual consideration of the renewal of the fund's Advisory Contracts. The Board also meets as needed to review matters specifically related to the Board's annual consideration of the renewal of the Advisory Contracts. Members of the Board may also meet with trustees of other Fidelity funds through ad hoc joint committees to discuss certain matters relevant to all of the Fidelity funds.
At its July 2017 meeting, the Board unanimously determined to renew the fund's Advisory Contracts. In reaching its determination, the Board considered all factors it believed relevant, including (i) the nature, extent, and quality of the services to be provided to the fund and its shareholders (including the investment performance of the fund); (ii) the competitiveness of the fund's management fee and total expense ratio relative to peer funds; (iii) the total costs of the services to be provided by and the profits to be realized by Fidelity from its relationships with the fund; and (iv) the extent to which, if any, economies of scale exist and would be realized as the fund grows, and whether any economies of scale are appropriately shared with fund shareholders.
In considering whether to renew the Advisory Contracts for the fund, the Board reached a determination, with the assistance of fund counsel and Independent Trustees' counsel and through the exercise of its business judgment, that the renewal of the Advisory Contracts was in the best interests of the fund and its shareholders and that the compensation payable under the Advisory Contracts was fair and reasonable. The Board's decision to renew the Advisory Contracts was not based on any single factor, but rather was based on a comprehensive consideration of all the information provided to the Board at its meetings throughout the year. The Board, in reaching its determination to renew the Advisory Contracts, was aware that shareholders of the fund have a broad range of investment choices available to them, including a wide choice among funds offered by Fidelity's competitors, and that the fund's shareholders, who have the opportunity to review and weigh the disclosure provided by the fund in its prospectus and other public disclosures, have chosen to invest in this fund, which is part of the Fidelity family of funds.
Amendment to Group Fee Rate. The Board also approved an amendment to the management contract for the fund to add an additional breakpoint to the group fee schedule, effective October 1, 2017. The Board noted that the additional breakpoint would result in lower management fee rates as Fidelity's assets under management increase.
Nature, Extent, and Quality of Services Provided. The Board considered Fidelity's staffing as it relates to the fund, including the backgrounds of investment personnel of Fidelity, and also considered the fund's investment objective, strategies, and related investment philosophy. The Independent Trustees also had discussions with senior management of Fidelity's investment operations and investment groups. The Board considered the structure of the investment personnel compensation program and whether this structure provides appropriate incentives to act in the best interests of the fund. Additionally, the Board considered the portfolio managers' investments, if any, in the funds that they manage.
Resources Dedicated to Investment Management and Support Services. The Board and the Fund Oversight and Research Committees reviewed the general qualifications and capabilities of Fidelity's investment staff, including its size, education, experience, and resources, as well as Fidelity's approach to recruiting, training, managing, and compensating investment personnel. The Board noted that Fidelity has continued to increase the resources devoted to non-U.S. offices, including expansion of Fidelity's global investment organization. The Board also noted that Fidelity's analysts have extensive resources, tools and capabilities that allow them to conduct sophisticated quantitative and fundamental analysis, as well as credit analysis of issuers, counterparties and guarantors. Further, the Board considered that Fidelity's investment professionals have sufficient access to global information and data so as to provide competitive investment results over time, and that those professionals also have access to sophisticated tools that permit them to assess portfolio construction and risk and performance attribution characteristics continuously, as well as to transmit new information and research conclusions rapidly around the world. Additionally, in its deliberations, the Board considered Fidelity's trading, risk management, compliance, and technology and operations capabilities and resources, which are integral parts of the investment management process.
Shareholder and Administrative Services. The Board considered (i) the nature, extent, quality, and cost of advisory, administrative, and shareholder services performed by the Investment Advisers and their affiliates under the Advisory Contracts and under separate agreements covering transfer agency, pricing and bookkeeping, and securities lending services for the fund; (ii) the nature and extent of the supervision of third party service providers, principally custodians, subcustodians, and pricing vendors; and (iii) the resources devoted to, and the record of compliance with, the fund's compliance policies and procedures. The Board also reviewed the allocation of fund brokerage, including allocations to brokers affiliated with the Investment Advisers, the use of brokerage commissions to pay fund expenses, and the use of "soft" commission dollars to pay for research services.
The Board noted that the growth of fund assets over time across the complex allows Fidelity to reinvest in the development of services designed to enhance the value or convenience of the Fidelity funds as investment vehicles. These services include 24-hour access to account information and market information through telephone representatives and over the Internet, investor education materials and asset allocation tools, and the expanded availability of Fidelity Investor Centers.
In 2014, the Board formed an ad hoc Committee on Transfer Agency Fees to review the variety of transfer agency fee structures throughout the industry and Fidelity's competitive positioning with respect to industry participants.
Investment in a Large Fund Family. The Board considered the benefits to shareholders of investing in a Fidelity fund, including the benefits of investing in a fund that is part of a large family of funds offering a variety of investment disciplines and providing a large variety of mutual fund investor services. The Board noted that Fidelity had taken, or had made recommendations that resulted in the Fidelity funds taking, a number of actions over the previous year that benefited particular funds, including: (i) continuing to dedicate additional resources to Fidelity's investment research process, and to the support of the senior management team that oversees asset management; (ii) continuing efforts to enhance Fidelity's global research capabilities; (iii) launching new funds and making other enhancements to meet client needs; (iv) launching new share classes of existing funds; (v) eliminating purchase minimums and broadening eligibility requirements for certain lower-priced share classes; (vi) reducing management fees and total expenses for certain growth equity funds and index funds; (vii) lowering expense caps for certain existing funds and classes to reduce expenses borne by shareholders; (viii) eliminating short-term redemption fees for certain funds; (ix) introducing a new pricing structure for certain funds of funds that is expected to reduce overall expenses paid by shareholders; (x) rationalizing product lines and gaining increased efficiencies through proposals for fund mergers and share class consolidations; (xi) continuing to develop, acquire and implement systems and technology to improve services to the funds and shareholders, strengthen information security, and increase efficiency; and (xii) implementing enhancements to further strengthen Fidelity's product line to increase investors' probability of success in achieving their investment goals, including retirement income goals.
Investment Performance. The Board considered whether the fund has operated in accordance with its investment objective, as well as its record of compliance with its investment restrictions and its performance history.
The Board took into account discussions with representatives of the Investment Advisers about fund investment performance that occur at Board meetings throughout the year. In this regard the Board noted that as part of regularly scheduled fund reviews and other reports to the Board on fund performance, the Board considers annualized return information for the fund for different time periods, measured against a securities market index ("benchmark index") and a peer group of funds with similar objectives ("peer group"), if any. In its evaluation of fund investment performance, the Board gave particular attention to information indicating changes in performance of certain Fidelity funds for specific time periods and discussed with the Investment Advisers the reasons for any overperformance or underperformance.
In addition to reviewing absolute and relative fund performance, the Independent Trustees periodically consider the appropriateness of fund performance metrics in evaluating the results achieved. In general, the Independent Trustees believe that fund performance should be evaluated based on net performance (after fees and expenses) of both the highest performing and lowest performing fund share classes, where applicable, compared to appropriate benchmark indices, over appropriate time periods that may include full market cycles, and compared to peer groups, as applicable, over the same periods, taking into account relevant factors including the following: general market conditions; issuer-specific information; and fund cash flows and other factors.
The Independent Trustees recognize that shareholders evaluate performance on a net basis over their own holding periods, for which one-, three-, and five-year periods are often used as a proxy. For this reason, the performance information reviewed by the Board also included net cumulative calendar year total return information for the fund and an appropriate benchmark index and peer group for the most recent one-, three-, and five-year periods, as shown below. Returns are shown compared to the 25th percentile (top of box, 75% beaten) and 75th percentile (bottom of box, 25% beaten) of the peer universe.
Fidelity Stock Selector Small Cap Fund
The Board has discussed the fund's underperformance with FMR, including the fund's investment strategy, the portfolio management team, and broader trends in the market that may have impacted the fund's performance, and has engaged with FMR to consider what steps might be taken to remediate the fund's underperformance. The Board noted that there were portfolio management changes for the fund in October 2013, September 2014, and May 2016.
The Board also considered that the fund's management fee is subject to upward or downward adjustment depending upon whether, and to what extent, the fund's investment performance for the performance period (a rolling 36-month period) exceeds, or is exceeded by, a securities index, thus leading to a performance adjustment for the same period. The Board noted that the performance adjustment provides FMR with a strong economic incentive to seek to achieve superior long-term performance for the fund's shareholders and helps to more closely align the interests of FMR and the shareholders of the fund.
Based on its review, the Board concluded that the nature, extent, and quality of services provided to the fund under the Advisory Contracts should continue to benefit the shareholders of the fund.
Competitiveness of Management Fee and Total Expense Ratio. The Board considered the fund's management fee and total expense ratio compared to "mapped groups" of competitive funds and classes created for the purpose of facilitating the Trustees' competitive analysis of management fees and total expenses. Fidelity creates "mapped groups" by combining similar Lipper investment objective categories that have comparable investment mandates. Combining Lipper investment objective categories aids the Board's management fee and total expense ratio comparisons by broadening the competitive group used for comparison.
Management Fee. The Board considered two proprietary management fee comparisons for the 12-month periods shown in basis points (BP) in the chart below. The group of Lipper funds used by the Board for management fee comparisons is referred to below as the "Total Mapped Group." The Total Mapped Group comparison focuses on a fund's standing in terms of gross management fees before expense reimbursements or caps, and without giving effect to the fund's performance adjustment, relative to the total universe of funds with comparable investment mandates, regardless of whether their management fee structures also are comparable. Funds with comparable investment mandates offer exposure to similar types of securities. Funds with comparable management fee structures have similar management fee contractual arrangements (
e.g., flat rate charged for advisory services, all-inclusive fee rate,
etc.). "TMG %" represents the percentage of funds in the Total Mapped Group that had management fees that were lower than the fund's. For example, a hypothetical TMG % of 20% would mean that 80% of the funds in the Total Mapped Group had higher, and 20% had lower, management fees than the fund. The fund's actual TMG %s and the number of funds in the Total Mapped Group are in the chart below. The "Asset-Size Peer Group" (ASPG) comparison focuses on a fund's standing relative to a subset of non-Fidelity funds within the Total Mapped Group that are similar in size and management fee structure without taking into account performance adjustments, if any. For example, if a fund is in the first quartile of the ASPG, the fund's management fee ranks in the least expensive or lowest 25% of funds in the ASPG. The ASPG represents at least 15% of the funds in the Total Mapped Group with comparable asset size and management fee structures, subject to a minimum of 50 funds (or all funds in the Total Mapped Group if fewer than 50). Additional information, such as the ASPG quartile in which the fund's management fee rate ranked and the impact of the fund's performance adjustment, is also included in the chart and considered by the Board.
Fidelity Stock Selector Small Cap Fund
The Board noted that the fund's management fee rate ranked below the median of its Total Mapped Group and below the median of its ASPG for 2016. The Board also noted the effect of the fund's performance adjustment, if any, on the fund's management fee ranking. The Board noted that the comparisons for 2015 and 2016 reflect a revised Total Mapped Group that no longer includes funds with micro-cap objectives and that FMR believes this Total Mapped Group is a more appropriate comparison because the fund does not have a micro-cap objective.
The Board noted that, in 2014, the Board and the boards of other Fidelity funds formed the ad hoc Committee on Group Fee to conduct an in-depth review of the "group fee" component of the management fee of funds with such management fee structures. The Committee's focus included the mechanics of the group fee, the competitive landscape of group fee structures, Fidelity funds with no group fee component and investment products not included in group fee assets. The Board also considered that, for funds subject to the group fee, FMR agreed to voluntarily waive fees over a specified period of time in amounts designed to account for assets converted from certain funds to certain collective investment trusts.
The Board also noted that, in 2013, the ad hoc Committee on Management Fees was formed to conduct an in-depth review of the management fee rates of Fidelity's active equity mutual funds. The Committee focused on the following areas: (i) standard fee structures; (ii) research consumption and trading evolution; (iii) management fee competitiveness/profitability by category; and (iv) factors that drive institutional pricing.
Based on its review, the Board concluded that the fund's management fee is fair and reasonable in light of the services that the fund receives and the other factors considered.
Total Expense Ratio. In its review of each class's total expense ratio, the Board considered the fund's management fee rate as well as other fund or class expenses, as applicable, such as transfer agent fees, pricing and bookkeeping fees, fund-paid 12b-1 fees, and custodial, legal, and audit fees. The Board noted the impact of the fund's performance adjustment. The Board also noted that Fidelity may agree to waive fees and expenses from time to time, and the extent to which, if any, it has done so for the fund. As part of its review, the Board also considered the current and historical total expense ratios of each class of the fund compared to competitive fund median expenses. Each class of the fund is compared to those funds and classes in the Total Mapped Group (used by the Board for management fee comparisons) that have a similar sales load structure.
The Board noted that the total expense ratio of each of Class A, Class C, Class I, and the retail class ranked below the competitive median for 2016 and the total expense ratio of Class M (formerly Class T) ranked above the competitive median for 2016. The Board considered that, in general, various factors can affect total expense ratios. The Board noted that the total expense ratio of Class M was above the competitive median primarily because of higher 12b-1 fees on Class M as compared to most competitor funds. Class M has a higher 12b-1 fee, but a lower front-end sales charge, than traditionally priced front-end sales charge classes. The Board considered that Class M is primarily sold load-waived in the retirement plan market where its 0.50% 12b-1 fee is comparable to competing no-load, higher 12b-1 fee classes designed specifically for retirement plans. The Board noted that the fund offers multiple classes, each of which has a different sales load and 12b-1 fee structure, and that the multiple structures are intended to offer a range of pricing options for the intermediary market. The Board also noted that the total expense ratios of the classes vary primarily by the level of their 12b-1 fees, although differences in transfer agent fees may also cause expenses to vary from class to class.
Fees Charged to Other Fidelity Clients. The Board also considered Fidelity fee structures and other information with respect to clients of Fidelity, such as other funds advised or subadvised by Fidelity, pension plan clients, and other institutional clients with similar mandates. The Board noted that an ad hoc joint committee created by it and the boards of other Fidelity funds periodically (most recently in 2013) reviews and compares Fidelity's institutional investment advisory business with its business of providing services to the Fidelity funds, including the differences in services provided, fees charged, and costs incurred, as well as competition in their respective marketplaces.
Based on its review of total expense ratios and fees charged to other Fidelity clients, the Board concluded that, although Class M was above the median of the universe presented for comparison, the total expense ratio of each class of the fund was reasonable in light of the services that the fund and its shareholders receive and the other factors considered.
Costs of the Services and Profitability. The Board considered the revenues earned and the expenses incurred by Fidelity in conducting the business of developing, marketing, distributing, managing, administering and servicing the fund and servicing the fund's shareholders. The Board also considered the level of Fidelity's profits in respect of all the Fidelity funds.
On an annual basis, Fidelity presents to the Board information about the profitability of its relationships with the fund. Fidelity calculates profitability information for each fund, as well as aggregate profitability information for groups of Fidelity funds and all Fidelity funds, using a series of detailed revenue and cost allocation methodologies which originate with the books and records of Fidelity on which Fidelity's audited financial statements are based. The Audit Committee of the Board reviews any significant changes from the prior year's methodologies.
PricewaterhouseCoopers LLP (PwC), independent registered public accounting firm and auditor to Fidelity and certain Fidelity funds, has been engaged annually by the Board as part of the Board's assessment of Fidelity's profitability analysis. PwC's engagement includes the review and assessment of the methodologies used by Fidelity in determining the revenues and expenses attributable to Fidelity's mutual fund business, and completion of agreed-upon procedures in respect of the mathematical accuracy of the fund profitability information and its conformity to established allocation methodologies. After considering PwC's reports issued under the engagement and information provided by Fidelity, the Board concluded that while other allocation methods may also be reasonable, Fidelity's profitability methodologies are reasonable in all material respects.
The Board also reviewed Fidelity's non-fund businesses and potential fall-out benefits related to the mutual fund business as well as cases where Fidelity's affiliates may benefit from or be related to the fund's business.
The Board considered the costs of the services provided by and the profits realized by Fidelity in connection with the operation of the fund and was satisfied that the profitability was not excessive.
Economies of Scale. The Board considered whether there have been economies of scale in respect of the management of the Fidelity funds, whether the Fidelity funds (including the fund) have appropriately benefited from any such economies of scale, and whether there is potential for realization of any further economies of scale. The Board considered the extent to which the fund will benefit from economies of scale as assets grow through increased services to the fund, through waivers or reimbursements, or through fee or expense ratio reductions. The Board also noted that a committee (the Economies of Scale Committee) created by it and the boards of other Fidelity funds periodically (most recently in 2013) analyzes whether Fidelity attains economies of scale in respect of the management and servicing of the Fidelity funds, whether the Fidelity funds have appropriately benefited from such economies of scale, and whether there is potential for realization of any further economies of scale.
The Board recognized that the fund's management contract incorporates a "group fee" structure, which provides for lower group fee rates as total group assets increase, and for higher group fee rates as total group assets decrease (with "group assets" defined to include fund assets under FMR's management plus the assets of sector funds previously under FMR's management). FMR calculates the group fee rates based on a tiered asset "breakpoint" schedule that varies based on asset class. The Board considered that the group fee is designed to deliver the benefits of economies of scale to fund shareholders when total Fidelity fund assets increase, even if assets of any particular fund are unchanged or have declined, because some portion of Fidelity's costs are attributable to services provided to all Fidelity funds, and all funds benefit if those costs can be allocated among more assets. The Board concluded that, given the group fee structure, fund shareholders will benefit from lower management fees as group assets increase at the fund complex level, regardless of whether Fidelity achieves any such economies of scale.
The Board concluded, taking into account the analysis of the Economies of Scale Committee, that economies of scale, if any, are being appropriately shared between fund shareholders and Fidelity.
Additional Information Requested by the Board. In order to develop fully the factual basis for consideration of the Fidelity funds' advisory contracts, the Board requested and received additional information on certain topics, including: (i) fund performance trends, in particular the underperformance of certain funds, and Fidelity's long-term strategies for certain funds; (ii) Fidelity's fund profitability methodology, profitability trends for certain funds, and the impact of certain factors on fund profitability results, including the impact of market trends on actively managed funds; (iii) the use of performance fees and the calculation of performance adjustments, including the impact of underperformance and fund outflows on performance adjustments; (iv) metrics for evaluating index fund performance; (v) Fidelity's group fee structure, including the group fee breakpoint schedules; (vi) the terms of Fidelity's contractual and voluntary expense cap arrangements with the funds; (vii) the methodology with respect to evaluating competitive fund data and peer group classifications and fee comparisons; (viii) the expense structures for different funds and classes; (ix) Fidelity's arrangements with affiliated sub-advisers on behalf of the funds; (x) information regarding other accounts managed by Fidelity, including institutional accounts and collective investment trusts; (xi) recent changes to the fee structure for certain funds of funds; and (xii) the impact of the Department of Labor's new fiduciary rule on the funds' comparative expense information.
Based on its evaluation of all of the conclusions noted above, and after considering all factors it believed relevant, the Board concluded that the advisory fee structures are fair and reasonable, and that the fund's Advisory Contracts should be renewed.
ASCS-ANN-1217
1.843151.110
Fidelity Flex℠ Funds Fidelity Flex℠ Small Cap Fund
Annual Report October 31, 2017 |
|
Contents
To view a fund's proxy voting guidelines and proxy voting record for the 12-month period ended June 30, visit http://www.fidelity.com/proxyvotingresults or visit the Securities and Exchange Commission's (SEC) web site at http://www.sec.gov.
You may also call 1-800-835-5092 to request a free copy of the proxy voting guidelines.
Standard & Poor's, S&P and S&P 500 are registered service marks of The McGraw-Hill Companies, Inc. and have been licensed for use by Fidelity Distributors Corporation.
Other third-party marks appearing herein are the property of their respective owners.
All other marks appearing herein are registered or unregistered trademarks or service marks of FMR LLC or an affiliated company. © 2017 FMR LLC. All rights reserved.
This report and the financial statements contained herein are submitted for the general information of the shareholders of the Fund. This report is not authorized for distribution to prospective investors in the Fund unless preceded or accompanied by an effective prospectus.
A fund files its complete schedule of portfolio holdings with the SEC for the first and third quarters of each fiscal year on Form N-Q. Forms N-Q are available on the SEC’s web site at http://www.sec.gov. A fund's Forms N-Q may be reviewed and copied at the SEC’s Public Reference Room in Washington, DC. Information regarding the operation of the SEC's Public Reference Room may be obtained by calling 1-800-SEC-0330.
For a complete list of a fund's portfolio holdings, view the most recent holdings listing, semiannual report, or annual report on Fidelity's web site at http://www.fidelity.com, http://www.institutional.fidelity.com, or http://www.401k.com, as applicable.
NOT FDIC INSURED •MAY LOSE VALUE •NO BANK GUARANTEE
Neither the Fund nor Fidelity Distributors Corporation is a bank.
Performance: The Bottom Line
Average annual total return reflects the change in the value of an investment, assuming reinvestment of distributions from dividend income and capital gains (the profits earned upon the sale of securities that have grown in value, if any) and assuming a constant rate of performance each year. The hypothetical investment and the average annual total returns do not reflect the deduction of taxes that a shareholder would pay on fund distributions or the redemption of fund shares. During periods of reimbursement by Fidelity, a fund’s total return will be greater than it would be had the reimbursement not occurred. How a fund did yesterday is no guarantee of how it will do tomorrow.
Average annual total returns for Fidelity Flex℠ Small Cap Fund will be reported once the fund is a year old.
$10,000 Over Life of Fund
Let's say hypothetically that $10,000 was invested in Fidelity Flex℠ Small Cap Fund on March 7, 2017, when the fund started.
The chart shows how the value of your investment would have changed, and also shows how the Russell 2000® Index performed over the same period.
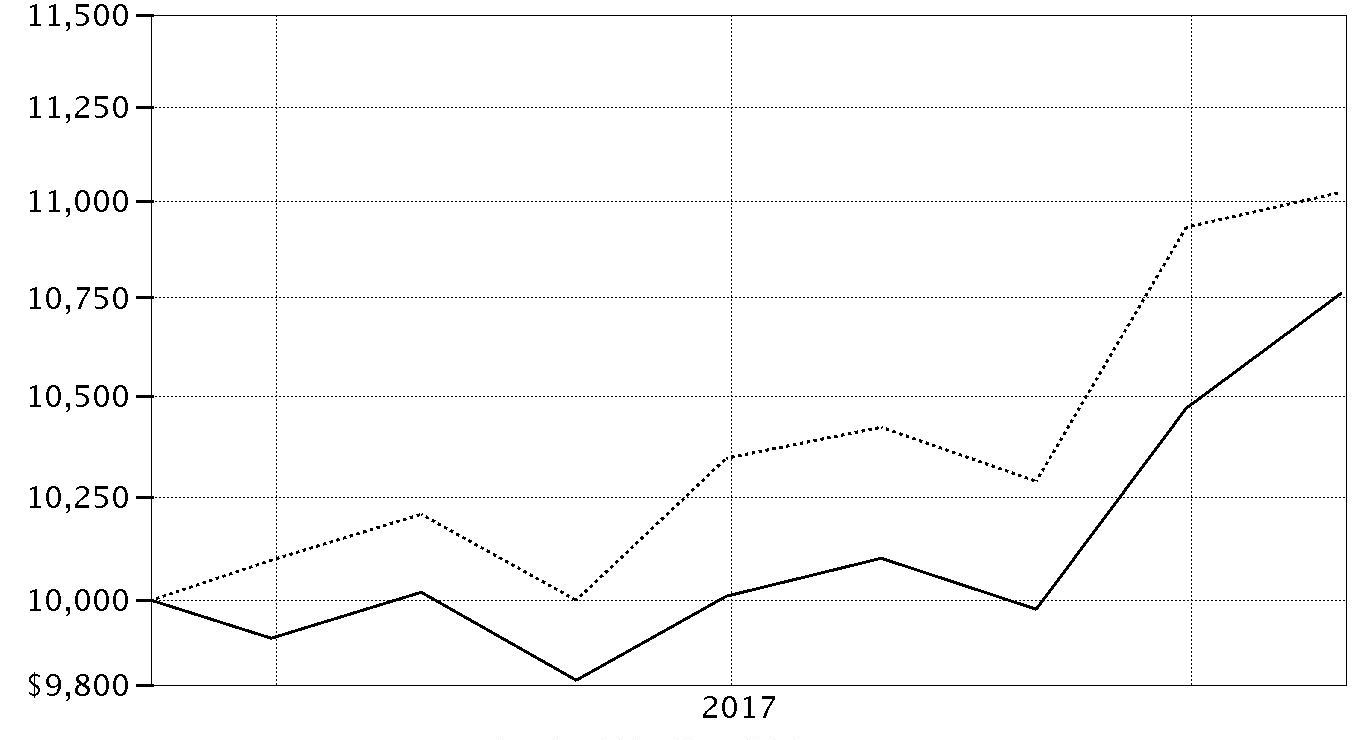
| Period Ending Values |
| $10,760 | Fidelity Flex℠ Small Cap Fund |
| $11,025 | Russell 2000® Index |
Management's Discussion of Fund Performance
Market Recap: The U.S. equity bellwether S&P 500
® index gained 23.63% for the year ending October 31, 2017. Equity markets rose sharply following the November election and continued to rally through the end of February on optimism for President Trump’s pro-business agenda. Stocks leveled off in March amid fading optimism and stalled efforts by Congress to repeal and replace the Affordable Care Act. Upward momentum soon returned and continued through period end amid positive consumer sentiment and other market indicators. The lone exception was a brief cooldown in August, when geopolitical tension escalated and uncertainty grew regarding the future of health care, tax reform and the debt ceiling. Sector-wise, information technology (+39%) performed best, surging as a handful of major index constituents posted strong returns. Financials gained 37%, riding an uptick in bond yields and a surge in banks. Materials (+29%) also did well, spurred by higher demand, especially from China. Conversely, consumer discretionary (+20%) lagged the broader market, as brick-and-mortar retailers continued to suffer from increased online competition. Rising interest rates held back real estate (+9%) and sluggish oil prices dragged on energy (+2%). Consumer staples (+4%) and telecommunication services (-1%) struggled due to investors’ general preference for risk assets.
Comments from Lead Portfolio Manager Richard Thompson: From inception on March 7, 2017, through October 31, 2017, the fund gained 7.60%, lagging the 10.25% return of the benchmark Russell 2000
® Index. Versus the benchmark, stock selection was the primary detractor, especially in health care and financials. Our position in non-bank ATM operator Cardtronics was the fund’s biggest individual detractor. The company reduced its earnings estimates, which were hampered by lower interchange fees in Australia (a primary market) and concerns about a slowdown in earnings growth as one of Cardtronics’ largest customers winds down its contract with the company. Elsewhere, a non-benchmark stake in oil and natural gas drilling operator Nabors Industries also hurt, as the firm reported poor operational performance and a less-bullish land-drilling outlook in the U.S. On the positive side, stock picking in consumer discretionary helped our relative result most, led by a non-benchmark stake in CalAtlantic Group. Shares of this homebuilder soared in late October on news it agreed to merge with Lennar.
The views expressed above reflect those of the portfolio manager(s) only through the end of the period as stated on the cover of this report and do not necessarily represent the views of Fidelity or any other person in the Fidelity organization. Any such views are subject to change at any time based upon market or other conditions and Fidelity disclaims any responsibility to update such views. These views may not be relied on as investment advice and, because investment decisions for a Fidelity fund are based on numerous factors, may not be relied on as an indication of trading intent on behalf of any Fidelity fund.
Note to Shareholders: On August 25, 2017, Clint Lawrence became a Co-Manager of the fund, joining Co-Manager Patrick Venanzi and Lead Manager Richard Thompson. Eirene Kontopoulos, Morgen Peck and Shadman Riaz are no longer managers on the fund.
Investment Summary (Unaudited)
Top Ten Stocks as of October 31, 2017
| | % of fund's net assets | % of fund's net assets 6 months ago |
| First Citizen Bancshares, Inc. | 2.0 | 0.0 |
| Moog, Inc. Class A | 1.9 | 0.7 |
| First American Financial Corp. | 1.7 | 0.0 |
| CalAtlantic Group, Inc. | 1.7 | 0.0 |
| Store Capital Corp. | 1.7 | 0.6 |
| 2U, Inc. | 1.7 | 0.0 |
| CVB Financial Corp. | 1.6 | 0.0 |
| LGI Homes, Inc. | 1.5 | 0.0 |
| Enstar Group Ltd. | 1.5 | 0.0 |
| ProAssurance Corp. | 1.5 | 0.5 |
| | 16.8 | |
Top Five Market Sectors as of October 31, 2017
| | % of fund's net assets | % of fund's net assets 6 months ago |
| Financials | 19.4 | 19.0 |
| Information Technology | 18.1 | 17.1 |
| Industrials | 17.8 | 15.2 |
| Consumer Discretionary | 13.4 | 12.0 |
| Health Care | 9.1 | 11.9 |
Asset Allocation (% of fund's net assets)
| As of October 31, 2017* |
| | Stocks | 93.0% |
| | Short-Term Investments and Net Other Assets (Liabilities) | 7.0% |

* Foreign investments – 8.0%
| As of April 30, 2017* |
| | Stocks | 97.1% |
| | Short-Term Investments and Net Other Assets (Liabilities) | 2.9% |

* Foreign investments – 8.2%
Percentages shown as 0.0% may reflect amounts less than 0.05%.
Investments October 31, 2017
Showing Percentage of Net Assets
| Common Stocks - 93.0% | | | |
| | | Shares | Value |
| CONSUMER DISCRETIONARY - 13.4% | | | |
| Auto Components - 0.9% | | | |
| Standard Motor Products, Inc. | | 105 | $4,585 |
| Diversified Consumer Services - 2.0% | | | |
| Bright Horizons Family Solutions, Inc. (a) | | 11 | 949 |
| Grand Canyon Education, Inc. (a) | | 59 | 5,281 |
| Strayer Education, Inc. | | 51 | 4,780 |
| | | | 11,010 |
| Hotels, Restaurants & Leisure - 3.1% | | | |
| Boyd Gaming Corp. | | 60 | 1,754 |
| Cedar Fair LP (depositary unit) | | 71 | 4,445 |
| Churchill Downs, Inc. | | 8 | 1,668 |
| Marriott Vacations Worldwide Corp. | | 11 | 1,448 |
| U.S. Foods Holding Corp. (a) | | 70 | 1,910 |
| Vail Resorts, Inc. | | 20 | 4,580 |
| Wingstop, Inc. | | 32 | 1,084 |
| | | | 16,889 |
| Household Durables - 5.3% | | | |
| CalAtlantic Group, Inc. | | 186 | 9,177 |
| Cavco Industries, Inc. (a) | | 23 | 3,609 |
| LGI Homes, Inc. (a) | | 134 | 8,084 |
| Meritage Homes Corp. (a) | | 126 | 6,136 |
| SodaStream International Ltd. (a) | | 25 | 1,592 |
| | | | 28,598 |
| Internet & Direct Marketing Retail - 0.2% | | | |
| Gaia, Inc. Class A (a) | | 77 | 936 |
| Media - 0.3% | | | |
| Cinemark Holdings, Inc. | | 43 | 1,563 |
| Multiline Retail - 0.2% | | | |
| Ollie's Bargain Outlet Holdings, Inc. (a) | | 25 | 1,116 |
| Specialty Retail - 1.0% | | | |
| Aaron's, Inc. Class A | | 110 | 4,048 |
| The Children's Place Retail Stores, Inc. | | 14 | 1,523 |
| | | | 5,571 |
| Textiles, Apparel & Luxury Goods - 0.4% | | | |
| Emerald Expositions Events, Inc. | | 47 | 1,095 |
| PetIQ, Inc. Class A | | 42 | 1,011 |
| | | | 2,106 |
|
| TOTAL CONSUMER DISCRETIONARY | | | 72,374 |
|
| CONSUMER STAPLES - 1.8% | | | |
| Food & Staples Retailing - 0.3% | | | |
| Performance Food Group Co. (a) | | 62 | 1,755 |
| Food Products - 0.4% | | | |
| Post Holdings, Inc. (a) | | 24 | 1,990 |
| Household Products - 0.7% | | | |
| Central Garden & Pet Co. (a) | | 34 | 1,298 |
| Central Garden & Pet Co. Class A (non-vtg.) (a) | | 65 | 2,399 |
| | | | 3,697 |
| Personal Products - 0.4% | | | |
| Herbalife Ltd. (a) | | 29 | 2,106 |
|
| TOTAL CONSUMER STAPLES | | | 9,548 |
|
| ENERGY - 2.1% | | | |
| Energy Equipment & Services - 1.0% | | | |
| ShawCor Ltd. Class A | | 240 | 5,201 |
| Oil, Gas & Consumable Fuels - 1.1% | | | |
| LINN Energy, Inc. | | 161 | 6,207 |
|
| TOTAL ENERGY | | | 11,408 |
|
| FINANCIALS - 19.4% | | | |
| Banks - 10.8% | | | |
| Associated Banc-Corp. | | 201 | 5,085 |
| Banner Corp. | | 96 | 5,503 |
| BOK Financial Corp. | | 75 | 6,485 |
| Cullen/Frost Bankers, Inc. | | 75 | 7,388 |
| CVB Financial Corp. | | 367 | 8,757 |
| First Citizen Bancshares, Inc. | | 27 | 10,936 |
| Hilltop Holdings, Inc. | | 282 | 6,644 |
| Prosperity Bancshares, Inc. | | 12 | 789 |
| UMB Financial Corp. | | 89 | 6,544 |
| | | | 58,131 |
| Capital Markets - 1.3% | | | |
| Apollo Global Management LLC Class A | | 84 | 2,653 |
| CBOE Holdings, Inc. | | 16 | 1,809 |
| MSCI, Inc. | | 20 | 2,347 |
| | | | 6,809 |
| Diversified Financial Services - 0.5% | | | |
| Cotiviti Holdings, Inc. (a) | | 75 | 2,637 |
| Insurance - 5.5% | | | |
| Argo Group International Holdings, Ltd. | | 68 | 4,281 |
| Enstar Group Ltd. (a) | | 35 | 7,973 |
| First American Financial Corp. | | 175 | 9,524 |
| ProAssurance Corp. | | 142 | 7,959 |
| | | | 29,737 |
| Thrifts & Mortgage Finance - 1.3% | | | |
| Essent Group Ltd. (a) | | 49 | 2,088 |
| Meridian Bancorp, Inc. Maryland | | 89 | 1,753 |
| Washington Federal, Inc. | | 93 | 3,236 |
| | | | 7,077 |
|
| TOTAL FINANCIALS | | | 104,391 |
|
| HEALTH CARE - 9.1% | | | |
| Biotechnology - 2.6% | | | |
| Achaogen, Inc. (a) | | 42 | 534 |
| Adamas Pharmaceuticals, Inc. (a) | | 23 | 567 |
| Advanced Accelerator Applications SA sponsored ADR (a) | | 13 | 1,053 |
| Alder Biopharmaceuticals, Inc. (a) | | 27 | 304 |
| Amarin Corp. PLC ADR (a) | | 81 | 275 |
| AnaptysBio, Inc. | | 30 | 1,981 |
| Audentes Therapeutics, Inc. (a) | | 43 | 1,143 |
| Coherus BioSciences, Inc. (a) | | 24 | 270 |
| Curis, Inc. (a) | | 195 | 308 |
| Epizyme, Inc. (a) | | 38 | 635 |
| FibroGen, Inc. (a) | | 25 | 1,396 |
| Ligand Pharmaceuticals, Inc. Class B (a) | | 8 | 1,163 |
| Loxo Oncology, Inc. (a) | | 15 | 1,292 |
| Madrigal Pharmaceuticals, Inc. (a) | | 12 | 600 |
| Puma Biotechnology, Inc. (a) | | 5 | 637 |
| TESARO, Inc. (a) | | 7 | 810 |
| Ultragenyx Pharmaceutical, Inc. (a) | | 8 | 369 |
| uniQure B.V. (a) | | 22 | 328 |
| Zai Lab Ltd. ADR | | 2 | 54 |
| | | | 13,719 |
| Health Care Equipment & Supplies - 2.1% | | | |
| Cantel Medical Corp. | | 26 | 2,550 |
| Inogen, Inc. (a) | | 11 | 1,088 |
| Insulet Corp. (a) | | 35 | 2,058 |
| iRhythm Technologies, Inc. | | 24 | 1,223 |
| Novocure Ltd. (a) | | 117 | 2,527 |
| Tactile Systems Technology, Inc. (a) | | 32 | 918 |
| Wright Medical Group NV (a) | | 45 | 1,179 |
| | | | 11,543 |
| Health Care Providers & Services - 1.2% | | | |
| G1 Therapeutics, Inc. | | 40 | 945 |
| LHC Group, Inc. (a) | | 18 | 1,203 |
| OptiNose, Inc. | | 50 | 1,008 |
| Premier, Inc. (a) | | 44 | 1,437 |
| Tivity Health, Inc. (a) | | 40 | 1,850 |
| | | | 6,443 |
| Health Care Technology - 0.9% | | | |
| athenahealth, Inc. (a) | | 6 | 767 |
| Cegedim SA (a) | | 50 | 1,945 |
| Veeva Systems, Inc. Class A (a) | | 23 | 1,402 |
| Vocera Communications, Inc. (a) | | 34 | 959 |
| | | | 5,073 |
| Life Sciences Tools & Services - 0.7% | | | |
| Accelerate Diagnostics, Inc. (a) | | 32 | 635 |
| ICON PLC (a) | | 24 | 2,853 |
| | | | 3,488 |
| Pharmaceuticals - 1.6% | | | |
| Aclaris Therapeutics, Inc. (a) | | 47 | 1,185 |
| Aerie Pharmaceuticals, Inc. (a) | | 21 | 1,297 |
| Akcea Therapeutics, Inc. | | 45 | 824 |
| Catalent, Inc. (a) | | 41 | 1,746 |
| Innoviva, Inc. (a) | | 200 | 2,448 |
| Intersect ENT, Inc. (a) | | 38 | 1,127 |
| Zogenix, Inc. (a) | | 5 | 188 |
| | | | 8,815 |
|
| TOTAL HEALTH CARE | | | 49,081 |
|
| INDUSTRIALS - 17.8% | | | |
| Aerospace & Defense - 3.8% | | | |
| BWX Technologies, Inc. | | 67 | 4,015 |
| Elbit Systems Ltd. | | 6 | 892 |
| HEICO Corp. Class A | | 36 | 2,740 |
| Moog, Inc. Class A (a) | | 119 | 10,443 |
| Teledyne Technologies, Inc. (a) | | 15 | 2,549 |
| | | | 20,639 |
| Air Freight & Logistics - 0.3% | | | |
| Atlas Air Worldwide Holdings, Inc. (a) | | 24 | 1,472 |
| Airlines - 0.5% | | | |
| SkyWest, Inc. | | 55 | 2,591 |
| Building Products - 0.7% | | | |
| A.O. Smith Corp. | | 38 | 2,250 |
| Continental Building Products, Inc. (a) | | 52 | 1,388 |
| | | | 3,638 |
| Commercial Services & Supplies - 0.9% | | | |
| Copart, Inc. (a) | | 43 | 1,560 |
| Healthcare Services Group, Inc. | | 23 | 1,216 |
| Viad Corp. | | 36 | 2,090 |
| | | | 4,866 |
| Construction & Engineering - 0.5% | | | |
| EMCOR Group, Inc. | | 35 | 2,818 |
| Electrical Equipment - 2.7% | | | |
| AZZ, Inc. | | 37 | 1,769 |
| Generac Holdings, Inc. (a) | | 38 | 1,979 |
| Melrose Industries PLC | | 1,118 | 3,265 |
| Regal Beloit Corp. | | 91 | 7,385 |
| | | | 14,398 |
| Machinery - 3.9% | | | |
| AGCO Corp. | | 22 | 1,509 |
| Allison Transmission Holdings, Inc. | | 68 | 2,889 |
| John Bean Technologies Corp. | | 16 | 1,710 |
| Milacron Holdings Corp. (a) | | 137 | 2,459 |
| Mueller Industries, Inc. | | 156 | 5,421 |
| Oshkosh Corp. | | 22 | 2,014 |
| WABCO Holdings, Inc. (a) | | 33 | 4,870 |
| | | | 20,872 |
| Professional Services - 0.9% | | | |
| CBIZ, Inc. (a) | | 71 | 1,203 |
| Exponent, Inc. | | 18 | 1,329 |
| On Assignment, Inc. (a) | | 40 | 2,449 |
| | | | 4,981 |
| Road & Rail - 1.8% | | | |
| Genesee & Wyoming, Inc. Class A (a) | | 93 | 6,676 |
| Marten Transport Ltd. | | 52 | 1,022 |
| Swift Transporation Co. (a) | | 45 | 1,865 |
| | | | 9,563 |
| Trading Companies & Distributors - 1.8% | | | |
| SiteOne Landscape Supply, Inc. (a) | | 60 | 3,811 |
| Univar, Inc. (a) | | 58 | 1,726 |
| WESCO International, Inc. (a) | | 67 | 4,231 |
| | | | 9,768 |
|
| TOTAL INDUSTRIALS | | | 95,606 |
|
| INFORMATION TECHNOLOGY - 18.1% | | | |
| Electronic Equipment & Components - 2.2% | | | |
| Cardtronics PLC (a) | | 44 | 1,008 |
| Dolby Laboratories, Inc. Class A | | 13 | 753 |
| FLIR Systems, Inc. | | 52 | 2,435 |
| Jabil, Inc. | | 48 | 1,357 |
| Novanta, Inc. (a) | | 31 | 1,466 |
| SYNNEX Corp. | | 37 | 4,991 |
| | | | 12,010 |
| Internet Software & Services - 7.8% | | | |
| 2U, Inc. (a) | | 141 | 8,972 |
| Alarm.com Holdings, Inc. (a) | | 18 | 840 |
| Cimpress NV (a) | | 16 | 1,746 |
| Five9, Inc. (a) | | 44 | 1,110 |
| GoDaddy, Inc. (a) | | 55 | 2,569 |
| Gogo, Inc. (a) | | 119 | 1,183 |
| GrubHub, Inc. (a) | | 57 | 3,478 |
| Instructure, Inc. (a) | | 49 | 1,705 |
| j2 Global, Inc. | | 75 | 5,561 |
| LogMeIn, Inc. | | 15 | 1,816 |
| MINDBODY, Inc. (a) | | 76 | 2,451 |
| Okta, Inc. | | 30 | 868 |
| Quotient Technology, Inc. (a) | | 69 | 1,080 |
| Stamps.com, Inc. (a) | | 29 | 6,508 |
| The Trade Desk, Inc. (a) | | 19 | 1,252 |
| Yext, Inc. | | 57 | 654 |
| | | | 41,793 |
| IT Services - 3.3% | | | |
| EPAM Systems, Inc. (a) | | 22 | 2,005 |
| Euronet Worldwide, Inc. (a) | | 13 | 1,256 |
| Leidos Holdings, Inc. | | 48 | 3,001 |
| Presidio, Inc. | | 349 | 5,165 |
| Science Applications International Corp. | | 89 | 6,527 |
| | | | 17,954 |
| Semiconductors & Semiconductor Equipment - 2.4% | | | |
| Cavium, Inc. (a) | | 16 | 1,104 |
| Entegris, Inc. | | 120 | 3,930 |
| Integrated Device Technology, Inc. (a) | | 82 | 2,548 |
| Nanometrics, Inc. (a) | | 58 | 1,640 |
| PDF Solutions, Inc. (a) | | 102 | 1,494 |
| Semtech Corp. (a) | | 57 | 2,340 |
| | | | 13,056 |
| Software - 1.9% | | | |
| Everbridge, Inc. (a) | | 35 | 932 |
| Paycom Software, Inc. (a) | | 25 | 2,055 |
| Proofpoint, Inc. (a) | | 17 | 1,571 |
| PROS Holdings, Inc. (a) | | 45 | 1,017 |
| RingCentral, Inc. (a) | | 40 | 1,686 |
| Take-Two Interactive Software, Inc. (a) | | 13 | 1,438 |
| Workiva, Inc. (a) | | 66 | 1,475 |
| | | | 10,174 |
| Technology Hardware, Storage & Peripherals - 0.5% | | | |
| Super Micro Computer, Inc. (a) | | 128 | 2,547 |
|
| TOTAL INFORMATION TECHNOLOGY | | | 97,534 |
|
| MATERIALS - 4.5% | | | |
| Chemicals - 0.7% | | | |
| The Chemours Co. LLC | | 70 | 3,963 |
| Construction Materials - 0.9% | | | |
| Eagle Materials, Inc. | | 23 | 2,428 |
| Summit Materials, Inc. | | 71 | 2,229 |
| | | | 4,657 |
| Containers & Packaging - 1.8% | | | |
| Avery Dennison Corp. | | 16 | 1,699 |
| Berry Global Group, Inc. (a) | | 21 | 1,248 |
| Silgan Holdings, Inc. | | 224 | 6,552 |
| | | | 9,499 |
| Metals & Mining - 0.9% | | | |
| Compass Minerals International, Inc. | | 77 | 5,051 |
| Paper & Forest Products - 0.2% | | | |
| Neenah Paper, Inc. | | 11 | 955 |
|
| TOTAL MATERIALS | | | 24,125 |
|
| REAL ESTATE - 4.6% | | | |
| Equity Real Estate Investment Trusts (REITs) - 4.4% | | | |
| CareTrust (REIT), Inc. | | 281 | 5,311 |
| Hudson Pacific Properties, Inc. | | 35 | 1,184 |
| Potlatch Corp. | | 6 | 311 |
| Rexford Industrial Realty, Inc. | | 46 | 1,366 |
| Sabra Health Care REIT, Inc. | | 242 | 4,821 |
| Store Capital Corp. | | 367 | 9,061 |
| Terreno Realty Corp. | | 40 | 1,469 |
| | | | 23,523 |
| Real Estate Management & Development - 0.2% | | | |
| Redfin Corp. | | 47 | 1,106 |
|
| TOTAL REAL ESTATE | | | 24,629 |
|
| UTILITIES - 2.2% | | | |
| Electric Utilities - 2.0% | | | |
| El Paso Electric Co. | | 137 | 7,878 |
| IDACORP, Inc. | | 30 | 2,761 |
| | | | 10,639 |
| Independent Power and Renewable Electricity Producers - 0.2% | | | |
| NRG Yield, Inc. Class C | | 34 | 632 |
| Ormat Technologies, Inc. | | 11 | 714 |
| | | | 1,346 |
|
| TOTAL UTILITIES | | | 11,985 |
|
| TOTAL COMMON STOCKS | | | |
| (Cost $459,998) | | | 500,681 |
|
| Money Market Funds - 2.4% | | | |
| Fidelity Cash Central Fund, 1.10% (b) | | | |
| (Cost $12,777) | | 12,774 | 12,777 |
| TOTAL INVESTMENT IN SECURITIES - 95.4% | | | |
| (Cost $472,775) | | | 513,458 |
| NET OTHER ASSETS (LIABILITIES) - 4.6% | | | 24,633 |
| NET ASSETS - 100% | | | $538,091 |
Legend
(a) Non-income producing
(b) Affiliated fund that is generally available only to investment companies and other accounts managed by Fidelity Investments. The rate quoted is the annualized seven-day yield of the fund at period end. A complete unaudited listing of the fund's holdings as of its most recent quarter end is available upon request. In addition, each Fidelity Central Fund's financial statements, which are not covered by the Fund's Report of Independent Registered Public Accounting Firm, are available on the SEC's website or upon request.
Affiliated Central Funds
Information regarding fiscal year to date income earned by the Fund from investments in Fidelity Central Funds is as follows:
| Fund | Income earned |
| Fidelity Cash Central Fund | $88 |
| Total | $88 |
Investment Valuation
All investments are categorized as Level 1 under the Fair Value Hierarchy. The inputs or methodology used for valuing securities may not be an indication of the risk associated with investing in those securities. For more information on valuation inputs please refer to the Investment Valuation section in the accompanying Notes to Financial Statements.
See accompanying notes which are an integral part of the financial statements.
Financial Statements
Statement of Assets and Liabilities
| | | October 31, 2017 |
| Assets | | |
Investment in securities, at value — See accompanying schedule:
Unaffiliated issuers (cost $459,998) | $500,681 | |
| Fidelity Central Funds (cost $12,777) | 12,777 | |
| Total Investment in Securities (cost $472,775) | | $513,458 |
| Cash | | 24,564 |
| Receivable for investments sold | | 2,400 |
| Dividends receivable | | 21 |
| Distributions receivable from Fidelity Central Funds | | 13 |
| Other receivables | | 9 |
| Total assets | | 540,465 |
| Liabilities | | |
| Payable for investments purchased | $2,374 | |
| Total liabilities | | 2,374 |
| Net Assets | | $538,091 |
| Net Assets consist of: | | |
| Paid in capital | | $500,001 |
| Undistributed net investment income | | 3,459 |
| Accumulated undistributed net realized gain (loss) on investments and foreign currency transactions | | (6,052) |
| Net unrealized appreciation (depreciation) on investments | | 40,683 |
| Net Assets, for 50,000 shares outstanding | | $538,091 |
| Net Asset Value, offering price and redemption price per share ($538,091 ÷ 50,000 shares) | | $10.76 |
See accompanying notes which are an integral part of the financial statements.
Statement of Operations
| | | For the period
March 7, 2017 (commencement of operations) to
October 31, 2017 |
| Investment Income | | |
| Dividends | | $3,507 |
| Income from Fidelity Central Funds | | 88 |
| Total income | | 3,595 |
| Expenses | | |
| Independent trustees' fees and expenses | $1 | |
| Miscellaneous | 1 | |
| Total expenses | | 2 |
| Net investment income (loss) | | 3,593 |
| Realized and Unrealized Gain (Loss) | | |
| Net realized gain (loss) on: | | |
| Investment securities: | | |
| Unaffiliated issuers | (6,202) | |
| Foreign currency transactions | 17 | |
| Total net realized gain (loss) | | (6,185) |
| Change in net unrealized appreciation (depreciation) on investment securities | | 40,683 |
| Net gain (loss) | | 34,498 |
| Net increase (decrease) in net assets resulting from operations | | $38,091 |
See accompanying notes which are an integral part of the financial statements.
Statement of Changes in Net Assets
| | For the period
March 7, 2017 (commencement of operations) to
October 31, 2017 |
| Increase (Decrease) in Net Assets | |
| Operations | |
| Net investment income (loss) | $3,593 |
| Net realized gain (loss) | (6,185) |
| Change in net unrealized appreciation (depreciation) | 40,683 |
| Net increase (decrease) in net assets resulting from operations | 38,091 |
| Share transactions | |
| Proceeds from sales of shares | 500,000 |
| Net increase (decrease) in net assets resulting from share transactions | 500,000 |
| Total increase (decrease) in net assets | 538,091 |
| Net Assets | |
| Beginning of period | – |
| End of period | $538,091 |
| Other Information | |
| Undistributed net investment income end of period | $3,459 |
| Shares | |
| Sold | 50,000 |
| Net increase (decrease) | 50,000 |
See accompanying notes which are an integral part of the financial statements.
Financial Highlights
Fidelity Flex Small Cap Fund
| Years ended October 31, | 2017 A |
| Selected Per–Share Data | |
| Net asset value, beginning of period | $10.00 |
| Income from Investment Operations | |
| Net investment income (loss)B | .07 |
| Net realized and unrealized gain (loss) | .69 |
| Total from investment operations | .76 |
| Net asset value, end of period | $10.76 |
| Total ReturnC | 7.60% |
| Ratios to Average Net AssetsD,E | |
| Expenses before reductionsF,G | -% |
| Expenses net of fee waivers, if anyF,G | -% |
| Expenses net of all reductionsF,G | -% |
| Net investment income (loss)F | 1.10% |
| Supplemental Data | |
| Net assets, end of period (000 omitted) | $538 |
| Portfolio turnover rateH | 249%F |
A For the period March 7, 2017 (commencement of operations) to October 31, 2017.
B Calculated based on average shares outstanding during the period.
C Total returns for periods of less than one year are not annualized.
D Fees and expenses of any underlying Fidelity Central Funds are not included in the Fund's expense ratio. The Fund indirectly bears its proportionate share of the expenses of any underlying Fidelity Central Funds.
E Expense ratios reflect operating expenses of the Fund. Expenses before reductions do not reflect amounts reimbursed by the investment adviser or reductions from expense offset arrangements and do not represent the amount paid by the Fund during periods when reimbursements or reductions occur. Expense ratios before reductions for start-up periods may not be representative of longer term operating periods. Expenses net of fee waivers reflect expenses after reimbursement by the investment adviser but prior to reductions from expense offset arrangements. Expenses net of all reductions represent the net expenses paid by the Fund.
F Annualized
G Amount represents less than .005%.
H Amount does not include the portfolio activity of any underlying Fidelity Central Funds.
See accompanying notes which are an integral part of the financial statements.
Notes to Financial Statements
For the period ended October 31, 2017
1. Organization.
Fidelity Flex Small Cap Fund (the Fund) is a fund of Fidelity Capital Trust (the Trust) and is authorized to issue an unlimited number of shares. Share transactions on the Statement of Changes in Net Assets may contain exchanges between affiliated funds. The Trust is registered under the Investment Company Act of 1940, as amended (the 1940 Act), as an open-end management investment company organized as a Massachusetts business trust. The Fund is available only to certain fee-based accounts offered by Fidelity.
2. Investments in Fidelity Central Funds.
The Fund invests in Fidelity Central Funds, which are open-end investment companies generally available only to other investment companies and accounts managed by the investment adviser and its affiliates. The Fund's Schedule of Investments lists each of the Fidelity Central Funds held as of period end, as an investment of the Fund, but does not include the underlying holdings of each Fidelity Central Fund. As an Investing Fund, the Fund indirectly bears its proportionate share of the expenses of the underlying Fidelity Central Funds.
The Money Market Central Funds seek preservation of capital and current income and are managed by Fidelity Investments Money Management, Inc. (FIMM), an affiliate of the investment adviser. Annualized expenses of the Money Market Central Funds as of their most recent shareholder report date are less than .005%.
A complete unaudited list of holdings for each Fidelity Central Fund is available upon request or at the Securities and Exchange Commission (the SEC) website at www.sec.gov. In addition, the financial statements of the Fidelity Central Funds, which are not covered by the Fund's Report of Independent Registered Public Accounting Firm, are available on the SEC website or upon request.
3. Significant Accounting Policies.
The Fund is an investment company and applies the accounting and reporting guidance of the Financial Accounting Standards Board (FASB) Accounting Standards Codification Topic 946 Financial Services – Investments Companies. The financial statements have been prepared in conformity with accounting principles generally accepted in the United States of America (GAAP), which require management to make certain estimates and assumptions at the date of the financial statements. Actual results could differ from those estimates. Subsequent events, if any, through the date that the financial statements were issued have been evaluated in the preparation of the financial statements. The following summarizes the significant accounting policies of the Fund:
Investment Valuation. Investments are valued as of 4:00 p.m. Eastern time on the last calendar day of the period. The Board of Trustees (the Board) has delegated the day to day responsibility for the valuation of the Fund's investments to the Fair Value Committee (the Committee) established by the Fund's investment adviser. In accordance with valuation policies and procedures approved by the Board, the Fund attempts to obtain prices from one or more third party pricing vendors or brokers to value its investments. When current market prices, quotations or currency exchange rates are not readily available or reliable, investments will be fair valued in good faith by the Committee, in accordance with procedures adopted by the Board. Factors used in determining fair value vary by investment type and may include market or investment specific events. The frequency with which these procedures are used cannot be predicted and they may be utilized to a significant extent. The Committee oversees the Fund's valuation policies and procedures and reports to the Board on the Committee's activities and fair value determinations. The Board monitors the appropriateness of the procedures used in valuing the Fund's investments and ratifies the fair value determinations of the Committee.
The Fund categorizes the inputs to valuation techniques used to value its investments into a disclosure hierarchy consisting of three levels as shown below:
- Level 1 – quoted prices in active markets for identical investments
- Level 2 – other significant observable inputs (including quoted prices for similar investments, interest rates, prepayment speeds, etc.)
- Level 3 – unobservable inputs (including the Fund's own assumptions based on the best information available)
Valuation techniques used to value the Fund's investments by major category are as follows:
Equity securities, including restricted securities, for which market quotations are readily available, are valued at the last reported sale price or official closing price as reported by a third party pricing vendor on the primary market or exchange on which they are traded and are categorized as Level 1 in the hierarchy. In the event there were no sales during the day or closing prices are not available, securities are valued at the last quoted bid price or may be valued using the last available price and are generally categorized as Level 2 in the hierarchy. For foreign equity securities, when market or security specific events arise, comparisons to the valuation of American Depositary Receipts (ADRs), futures contracts, Exchange-Traded Funds (ETFs) and certain indexes as well as quoted prices for similar securities may be used and would be categorized as Level 2 in the hierarchy. Utilizing these techniques may result in transfers between Level 1 and Level 2. For equity securities, including restricted securities, where observable inputs are limited, assumptions about market activity and risk are used and these securities may be categorized as Level 3 in the hierarchy.
Investments in open-end mutual funds, including the Fidelity Central Funds, are valued at their closing net asset value (NAV) each business day and are categorized as Level 1 in the hierarchy.
Changes in valuation techniques may result in transfers in or out of an assigned level within the disclosure hierarchy.
Foreign Currency. The Fund may use foreign currency contracts to facilitate transactions in foreign-denominated securities. Gains and losses from these transactions may arise from changes in the value of the foreign currency or if the counterparties do not perform under the contracts' terms.
Foreign-denominated assets, including investment securities, and liabilities are translated into U.S. dollars at the exchange rates at period end. Purchases and sales of investment securities, income and dividends received and expenses denominated in foreign currencies are translated into U.S. dollars at the exchange rate in effect on the transaction date.
The effects of exchange rate fluctuations on investments are included with the net realized and unrealized gain (loss) on investment securities. Other foreign currency transactions resulting in realized and unrealized gain (loss) are disclosed separately.
Investment Transactions and Income. For financial reporting purposes, the Fund's investment holdings and NAV include trades executed through the end of the last business day of the period. The NAV per share for processing shareholder transactions is calculated as of the close of business of the New York Stock Exchange (NYSE), normally 4:00 p.m. Eastern time and includes trades executed through the end of the prior business day. Gains and losses on securities sold are determined on the basis of identified cost. Dividend income is recorded on the ex-dividend date, except for certain dividends from foreign securities where the ex-dividend date may have passed, which are recorded as soon as the Fund is informed of the ex-dividend date. Non-cash dividends included in dividend income, if any, are recorded at the fair market value of the securities received. Income and capital gain distributions from Fidelity Central Funds, if any, are recorded on the ex-dividend date. Certain distributions received by the Fund represent a return of capital or capital gain. The Fund determines the components of these distributions subsequent to the ex-dividend date, based upon receipt of tax filings or other correspondence relating to the underlying investment. These distributions are recorded as a reduction of cost of investments and/or as a realized gain. Investment income is recorded net of foreign taxes withheld where recovery of such taxes is uncertain.
Expenses. Expenses directly attributable to a fund are charged to that fund. Expenses attributable to more than one fund are allocated among the respective funds on the basis of relative net assets or other appropriate methods. Expense estimates are accrued in the period to which they relate and adjustments are made when actual amounts are known.
Income Tax Information and Distributions to Shareholders. Each year, the Fund intends to qualify as a regulated investment company under Subchapter M of the Internal Revenue Code, including distributing substantially all of its taxable income and realized gains. As a result, no provision for U.S. Federal income taxes is required. As of October 31, 2017, the Fund did not have any unrecognized tax benefits in the financial statements; nor is the Fund aware of any tax positions for which it is reasonably possible that the total amounts of unrecognized tax benefits will significantly change in the next twelve months. The Fund files a U.S. federal tax return, in addition to state and local tax returns as required. The Fund's federal income tax returns are subject to examination by the Internal Revenue Service (IRS) for a period of three fiscal years after they are filed. State and local tax returns may be subject to examination for an additional fiscal year depending on the jurisdiction. Foreign taxes are provided for based on the Fund's understanding of the tax rules and rates that exist in the foreign markets in which it invests.
Distributions are declared and recorded on the ex-dividend date. Income and capital gain distributions are determined in accordance with income tax regulations, which may differ from GAAP.
Capital accounts within the financial statements are adjusted for permanent book-tax differences. These adjustments have no impact on net assets or the results of operations. Capital accounts are not adjusted for temporary book-tax differences which will reverse in a subsequent period.
Book-tax differences are primarily due to foreign currency transactions, partnerships, capital loss carryforwards, and losses deferred due to wash sales.
As of period end, the cost and unrealized appreciation (depreciation) in securities, and derivatives if applicable, for federal income tax purposes were as follows:
| Gross unrealized appreciation | $44,495 |
| Gross unrealized depreciation | (8,510) |
| Net unrealized appreciation (depreciation) | $35,985 |
| Tax Cost | $477,473 |
The tax-based components of distributable earnings as of period end were as follows:
| Undistributed ordinary income | $3,459 |
| Capital loss carryforward | $(1,354) |
| Net unrealized appreciation (depreciation) on securities and other investments | $35,985 |
Capital loss carryforwards are only available to offset future capital gains of the Fund to the extent provided by regulations and may be limited. Under the Regulated Investment Company Modernization Act of 2010 (the Act), the Fund is permitted to carry forward capital losses incurred in taxable years beginning after December 22, 2010 for an unlimited period and such capital losses are required to be used prior to any losses that expire. The capital loss carryforward information presented below, including any applicable limitation, is estimated as of fiscal period end and is subject to adjustment.
| No expiration | |
| Short-term | $(1,354) |
| Total capital loss carryforward | $(1,354) |
4. Purchases and Sales of Investments.
Purchases and sales of securities, other than short-term securities, aggregated $1,254,770 and $786,312, respectively.
5. Fees and Other Transactions with Affiliates.
Management Fee. Fidelity Management & Research Company (the investment adviser) and its affiliates provide the Fund with investment management related services and the Fund does not pay any fees for these services. Under the management contract, the investment adviser or an affiliate pays all other expenses of the Fund, excluding fees and expenses of the independent Trustees, and certain miscellaneous expenses such as proxy and shareholder meeting expenses.
Brokerage Commissions. The Fund placed a portion of its portfolio transactions with brokerage firms which are affiliates of the investment adviser. Brokerage commissions are included in net realized gain (loss) and change in net unrealized appreciation (depreciation) in the Statement of Operations. The commissions paid to these affiliated firms were $79 for the period.
Interfund Trades. The Fund may purchase from or sell securities to other Fidelity Funds under procedures adopted by the Board. The procedures have been designed to ensure these interfund trades are executed in accordance with Rule 17a-7 of the 1940 Act. Interfund trades are included within the respective purchases and sales amounts shown in the Purchases and Sales of Investments note.
6. Committed Line of Credit.
The Fund participates with other funds managed by the investment adviser or an affiliate in a $4.25 billion credit facility (the "line of credit") to be utilized for temporary or emergency purposes to fund shareholder redemptions or for other short-term liquidity purposes. The Fund has agreed to pay commitment fees on its pro-rata portion of the line of credit, which amounted to $1 and is reflected in Miscellaneous expenses on the Statement of Operations. During the period, the Fund did not borrow on this line of credit.
7. Other.
The Fund's organizational documents provide former and current trustees and officers with a limited indemnification against liabilities arising in connection with the performance of their duties to the Fund. In the normal course of business, the Fund may also enter into contracts that provide general indemnifications. The Fund's maximum exposure under these arrangements is unknown as this would be dependent on future claims that may be made against the Fund. The risk of material loss from such claims is considered remote.
At the end of the period, the investment adviser or its affiliates were the owners of record of 100% of the total outstanding shares of the Fund.
Report of Independent Registered Public Accounting Firm
To the Trustees of Fidelity Capital Trust and Shareholders of Fidelity Flex Small Cap Fund:
We have audited the accompanying statement of assets and liabilities of Fidelity Flex Small Cap Fund (the Fund), a fund of Fidelity Capital Trust, including the schedule of investments, as of October 31, 2017, and the related statement of operations, the statement of changes in net assets and the financial highlights for the period from March 7, 2017 (commencement of operations) to October 31, 2017. These financial statements and financial highlights are the responsibility of the Fund's management. Our responsibility is to express an opinion on these financial statements and financial highlights based on our audit.
We conducted our audit in accordance with the standards of the Public Company Accounting Oversight Board (United States). Those standards require that we plan and perform the audit to obtain reasonable assurance about whether the financial statements and financial highlights are free of material misstatement. The Fund is not required to have, nor were we engaged to perform, an audit of its internal control over financial reporting. Our audit included consideration of internal control over financial reporting as a basis for designing audit procedures that are appropriate in the circumstances, but not for the purpose of expressing an opinion on the effectiveness of the Fund's internal control over financial reporting. Accordingly, we express no such opinion. An audit also includes examining, on a test basis, evidence supporting the amounts and disclosures in the financial statements, assessing the accounting principles used and significant estimates made by management, as well as evaluating the overall financial statement presentation. Our procedures included confirmation of securities owned as of October 31, 2017, by correspondence with the custodians and brokers; when replies were not received from brokers, we performed other auditing procedures. We believe that our audit provides a reasonable basis for our opinion.
In our opinion, such financial statements and financial highlights referred to above present fairly, in all material respects, the financial position of Fidelity Flex Small Cap Fund as of October 31, 2017, and the results of its operations, the changes in its net assets and the financial highlights for the period from March 7, 2017 (commencement of operations) to October 31, 2017, in conformity with accounting principles generally accepted in the United States of America.
DELOITTE & TOUCHE LLP
Boston, Massachusetts
December 14, 2017
Trustees and Officers
The Trustees, Members of the Advisory Board (if any), and officers of the trust and fund, as applicable, are listed below. The Board of Trustees governs the fund and is responsible for protecting the interests of shareholders. The Trustees are experienced executives who meet periodically throughout the year to oversee the fund's activities, review contractual arrangements with companies that provide services to the fund, oversee management of the risks associated with such activities and contractual arrangements, and review the fund's performance. Each of the Trustees oversees 190 funds.
The Trustees hold office without limit in time except that (a) any Trustee may resign; (b) any Trustee may be removed by written instrument, signed by at least two-thirds of the number of Trustees prior to such removal; (c) any Trustee who requests to be retired or who has become incapacitated by illness or injury may be retired by written instrument signed by a majority of the other Trustees; and (d) any Trustee may be removed at any special meeting of shareholders by a two-thirds vote of the outstanding voting securities of the trust. Each Trustee who is not an interested person (as defined in the 1940 Act) of the trust and the fund is referred to herein as an Independent Trustee. Each Independent Trustee shall retire not later than the last day of the calendar year in which his or her 75th birthday occurs. The Independent Trustees may waive this mandatory retirement age policy with respect to individual Trustees. Officers and Advisory Board Members hold office without limit in time, except that any officer or Advisory Board Member may resign or may be removed by a vote of a majority of the Trustees at any regular meeting or any special meeting of the Trustees. Except as indicated, each individual has held the office shown or other offices in the same company for the past five years.
The fund’s Statement of Additional Information (SAI) includes more information about the Trustees. To request a free copy, call Fidelity at 1-800-850-5092.
Experience, Skills, Attributes, and Qualifications of the Trustees. The Governance and Nominating Committee has adopted a statement of policy that describes the experience, qualifications, attributes, and skills that are necessary and desirable for potential Independent Trustee candidates (Statement of Policy). The Board believes that each Trustee satisfied at the time he or she was initially elected or appointed a Trustee, and continues to satisfy, the standards contemplated by the Statement of Policy. The Governance and Nominating Committee also engages professional search firms to help identify potential Independent Trustee candidates who have the experience, qualifications, attributes, and skills consistent with the Statement of Policy. From time to time, additional criteria based on the composition and skills of the current Independent Trustees, as well as experience or skills that may be appropriate in light of future changes to board composition, business conditions, and regulatory or other developments, have also been considered by the professional search firms and the Governance and Nominating Committee. In addition, the Board takes into account the Trustees' commitment and participation in Board and committee meetings, as well as their leadership of standing and ad hoc committees throughout their tenure.
In determining that a particular Trustee was and continues to be qualified to serve as a Trustee, the Board has considered a variety of criteria, none of which, in isolation, was controlling. The Board believes that, collectively, the Trustees have balanced and diverse experience, qualifications, attributes, and skills, which allow the Board to operate effectively in governing the fund and protecting the interests of shareholders. Information about the specific experience, skills, attributes, and qualifications of each Trustee, which in each case led to the Board's conclusion that the Trustee should serve (or continue to serve) as a trustee of the fund, is provided below.
Board Structure and Oversight Function. James C. Curvey is an interested person and currently serves as Chairman. The Trustees have determined that an interested Chairman is appropriate and benefits shareholders because an interested Chairman has a personal and professional stake in the quality and continuity of services provided to the fund. Independent Trustees exercise their informed business judgment to appoint an individual of their choosing to serve as Chairman, regardless of whether the Trustee happens to be independent or a member of management. The Independent Trustees have determined that they can act independently and effectively without having an Independent Trustee serve as Chairman and that a key structural component for assuring that they are in a position to do so is for the Independent Trustees to constitute a substantial majority for the Board. The Independent Trustees also regularly meet in executive session. Ned C. Lautenbach serves as Chairman of the Independent Trustees and as such (i) acts as a liaison between the Independent Trustees and management with respect to matters important to the Independent Trustees and (ii) with management prepares agendas for Board meetings.
Fidelity® funds are overseen by different Boards of Trustees. The fund's Board oversees Fidelity's high income and certain equity funds, and other Boards oversee Fidelity's investment-grade bond, money market, asset allocation, and sector funds. The asset allocation funds may invest in Fidelity® funds overseen by the fund's Board. The use of separate Boards, each with its own committee structure, allows the Trustees of each group of Fidelity® funds to focus on the unique issues of the funds they oversee, including common research, investment, and operational issues. On occasion, the separate Boards establish joint committees to address issues of overlapping consequences for the Fidelity® funds overseen by each Board.
The Trustees operate using a system of committees to facilitate the timely and efficient consideration of all matters of importance to the Trustees, the fund, and fund shareholders and to facilitate compliance with legal and regulatory requirements and oversight of the fund's activities and associated risks. The Board, acting through its committees, has charged FMR and its affiliates with (i) identifying events or circumstances the occurrence of which could have demonstrably adverse effects on the fund's business and/or reputation; (ii) implementing processes and controls to lessen the possibility that such events or circumstances occur or to mitigate the effects of such events or circumstances if they do occur; and (iii) creating and maintaining a system designed to evaluate continuously business and market conditions in order to facilitate the identification and implementation processes described in (i) and (ii) above. Because the day-to-day operations and activities of the fund are carried out by or through FMR, its affiliates, and other service providers, the fund's exposure to risks is mitigated but not eliminated by the processes overseen by the Trustees. While each of the Board's committees has responsibility for overseeing different aspects of the fund's activities, oversight is exercised primarily through the Operations, Audit, and Compliance Committees. In addition, the Independent Trustees have worked with FMR to enhance the Board's oversight of investment and financial risks, legal and regulatory risks, technology risks, and operational risks, including the development of additional risk reporting to the Board. For example, a working group comprised of Independent Trustees and FMR has worked and continues to work to review the Fidelity® funds' valuation-related activities, reporting and risk management. Appropriate personnel, including but not limited to the fund's Chief Compliance Officer (CCO), FMR's internal auditor, the independent accountants, the fund's Treasurer and portfolio management personnel, make periodic reports to the Board's committees, as appropriate, including an annual review of Fidelity's risk management program for the Fidelity® funds. The responsibilities of each standing committee, including their oversight responsibilities, are described further under "Standing Committees of the Trustees."
Interested Trustees*:
Correspondence intended for a Trustee who is an interested person may be sent to Fidelity Investments, 245 Summer Street, Boston, Massachusetts 02210.
Name, Year of Birth; Principal Occupations and Other Relevant Experience+
James C. Curvey (1935)
Year of Election or Appointment: 2007
Trustee
Chairman of the Board of Trustees
Mr. Curvey also serves as Trustee of other Fidelity® funds. Mr. Curvey is a Director of Fidelity Research & Analysis Co. (investment adviser firm, 2009-present), and Vice Chairman (2007-present) and Director of FMR LLC (diversified financial services company). In addition, Mr. Curvey serves as an Overseer for the Boston Symphony Orchestra and a member of the board of Artis-Naples, Naples, Florida, and as a Trustee for Brewster Academy, Wolfeboro, New Hampshire. Previously, Mr. Curvey served as a Director of Fidelity Investments Money Management, Inc. (investment adviser firm, 2009-2014) and a Director of FMR and FMR Co., Inc. (investment adviser firms, 2007-2014).
Charles S. Morrison (1960)
Year of Election or Appointment: 2014
Trustee
Mr. Morrison also serves as Trustee of other funds. He serves as President of Fidelity Management & Research Company (FMR) (investment adviser firm, 2016-present), a Director of Fidelity Investments Money Management, Inc. (FIMM) (investment adviser firm, 2014-present), Director of Fidelity SelectCo, LLC (investment adviser firm, 2014-present), President, Asset Management (2014-present), and is an employee of Fidelity Investments. Previously, Mr. Morrison served as Vice President of Fidelity's Fixed Income and Asset Allocation Funds (2012-2014), President, Fixed Income (2011-2014), Vice President of Fidelity's Money Market Funds (2005-2009), President, Money Market Group Leader of FMR (investment adviser firm, 2009), and Senior Vice President, Money Market Group of FMR (2004-2009). Mr. Morrison also served as Vice President of Fidelity's Bond Funds (2002-2005), certain Balanced Funds (2002-2005), and certain Asset Allocation Funds (2002-2007), and as Senior Vice President (2002-2005) of Fidelity's Bond Division.
* Determined to be an “Interested Trustee” by virtue of, among other things, his or her affiliation with the trust or various entities under common control with FMR.
+ The information includes the Trustee's principal occupation during the last five years and other information relating to the experience, attributes, and skills relevant to the Trustee's qualifications to serve as a Trustee, which led to the conclusion that the Trustee should serve as a Trustee for the fund.
Independent Trustees:
Correspondence intended for an Independent Trustee may be sent to Fidelity Investments, P.O. Box 55235, Boston, Massachusetts 02205-5235.
Name, Year of Birth; Principal Occupations and Other Relevant Experience+
Dennis J. Dirks (1948)
Year of Election or Appointment: 2005
Trustee
Mr. Dirks also serves as Trustee of other Fidelity® funds. Prior to his retirement in May 2003, Mr. Dirks was Chief Operating Officer and a member of the Board of The Depository Trust & Clearing Corporation (DTCC). He also served as President, Chief Operating Officer, and Board member of The Depository Trust Company (DTC) and President and Board member of the National Securities Clearing Corporation (NSCC). In addition, Mr. Dirks served as Chief Executive Officer and Board member of the Government Securities Clearing Corporation, Chief Executive Officer and Board member of the Mortgage-Backed Securities Clearing Corporation, as a Trustee and a member of the Finance Committee of Manhattan College (2005-2008), as a Trustee and a member of the Finance Committee of AHRC of Nassau County (2006-2008), as a member of the Independent Directors Council (IDC) Governing Council (2010-2015), and as a member of the Board of Directors for The Brookville Center for Children’s Services, Inc. (2009-2017). Mr. Dirks is a member of the Finance Committee (2016-present) and Board of Directors (2017-present) of the Asolo Repertory Theatre.
Alan J. Lacy (1953)
Year of Election or Appointment: 2008
Trustee
Mr. Lacy also serves as Trustee of other Fidelity® funds. Mr. Lacy serves as a Director of Bristol-Myers Squibb Company (global pharmaceuticals, 2008-present). He is a Trustee of the California Chapter of The Nature Conservancy (2015-present) and a Director of the Center for Advanced Study in the Behavioral Sciences at Stanford University (2015-present). In addition, Mr. Lacy served as Senior Adviser (2007-2014) of Oak Hill Capital Partners, L.P. (private equity) and also served as Chief Executive Officer (2005) and Vice Chairman (2005-2006) of Sears Holdings Corporation (retail) and Chief Executive Officer and Chairman of the Board of Sears, Roebuck and Co. (retail, 2000-2005). Previously, Mr. Lacy served as Chairman (2014-2017) and a member (2010-2017) of the Board of Directors of Dave & Buster’s Entertainment, Inc. (restaurant and entertainment complexes), as Chairman (2008-2011) and a member (2006-2015) of the Board of Trustees of the National Parks Conservation Association, and as a member of the Board of Directors for The Hillman Companies, Inc. (hardware wholesalers, 2010-2014), Earth Fare, Inc. (retail grocery, 2010-2014), and The Western Union Company (global money transfer, 2006-2011).
Ned C. Lautenbach (1944)
Year of Election or Appointment: 2000
Trustee
Chairman of the Independent Trustees
Mr. Lautenbach also serves as Trustee of other Fidelity® funds. Mr. Lautenbach currently serves as Vice Chair of the Board of Governors, State University System of Florida (2013-present) and is a member of the Council on Foreign Relations (1994-present). He is also a member and has most recently served as Chairman of the Board of Directors of Artis-Naples (2012-present). Previously, Mr. Lautenbach served as a member and then Lead Director of the Board of Directors of Eaton Corporation (diversified industrial, 1997-2016). He was also a Partner and Advisory Partner at Clayton, Dubilier & Rice, LLC (private equity investment, 1998-2010), as well as a Director of Sony Corporation (2006-2007). In addition, Mr. Lautenbach also had a 30-year career with IBM (technology company) during which time he served as Senior Vice President and a member of the Corporate Executive Committee (1968-1998).
Joseph Mauriello (1944)
Year of Election or Appointment: 2008
Trustee
Mr. Mauriello also serves as Trustee of other Fidelity® funds. Prior to his retirement in January 2006, Mr. Mauriello served in numerous senior management positions including Deputy Chairman and Chief Operating Officer (2004-2005), and Vice Chairman of Financial Services (2002-2004) of KPMG LLP US (professional services, 1965-2005). Mr. Mauriello currently serves as a member of the Board of Directors of XL Group plc. (global insurance and re-insurance, 2006-present) and the Independent Directors Council (IDC) Governing Council (2015-present). Previously, Mr. Mauriello served as a Director of the Hamilton Funds of the Bank of New York (2006-2007) and of Arcadia Resources Inc. (health care services and products, 2007-2012).
Cornelia M. Small (1944)
Year of Election or Appointment: 2005
Trustee
Ms. Small also serves as Trustee of other Fidelity® funds. Ms. Small is a member of the Board of Directors (2009-present) and Chair of the Investment Committee (2010-present) of the Teagle Foundation. Ms. Small also serves on the Investment Committee of the Berkshire Taconic Community Foundation (2008-present). Previously, Ms. Small served as Chairperson (2002-2008) and a member of the Investment Committee and Chairperson (2008-2012) and a member of the Board of Trustees of Smith College. In addition, Ms. Small served as Chief Investment Officer, Director of Global Equity Investments, and a member of the Board of Directors of Scudder, Stevens & Clark and Scudder Kemper Investments.
William S. Stavropoulos (1939)
Year of Election or Appointment: 2002
Trustee
Vice Chairman of the Independent Trustees
Mr. Stavropoulos also serves as Trustee of other Fidelity® funds. Mr. Stavropoulos serves as President and Founder of the Michigan Baseball Foundation, the Great Lakes Loons (2007-present). Mr. Stavropoulos is Chairman Emeritus of the Board of Directors of The Dow Chemical Company, where he previously served in numerous senior management positions, including President, CEO (1995-2000; 2002-2004), Chairman of the Executive Committee (2000-2006), and as a member of the Board of Directors (1990-2006). Currently, Mr. Stavropoulos is Chairman of the Board of Directors of Univar Inc. (global distributor of commodity and specialty chemicals), a Director of Teradata Corporation (data warehousing and technology solutions), and a member of the Advisory Board for Metalmark Capital LLC (private equity investment, 2005-present). Mr. Stavropoulos is an operating advisor to Clayton, Dubilier & Rice, LLC (private equity investment). In addition, Mr. Stavropoulos is a member of the University of Notre Dame Advisory Council for the College of Science, a Trustee of the Rollin L. Gerstacker Foundation, and a Director of Artis-Naples in Naples, Florida. Previously, Mr. Stavropoulos served as a Director of Chemical Financial Corporation (bank holding company, 1993-2012) and Tyco International, Ltd. (multinational manufacturing and services, 2007-2012).
David M. Thomas (1949)
Year of Election or Appointment: 2008
Trustee
Mr. Thomas also serves as Trustee of other Fidelity® funds. Mr. Thomas serves as Non-Executive Chairman of the Board of Directors of Fortune Brands Home and Security (home and security products, 2011-present), as a member of the Board of Directors (2004-present) and Presiding Director (2013-present) of Interpublic Group of Companies, Inc. (marketing communication), and as a member of the Board of Trustees of the University of Florida (2013-present). Previously, Mr. Thomas served as Executive Chairman (2005-2006) and Chairman and Chief Executive Officer (2000-2005) of IMS Health, Inc. (pharmaceutical and healthcare information solutions), and a Director of Fortune Brands, Inc. (consumer products, 2000-2011).
+ The information includes the Trustee's principal occupation during the last five years and other information relating to the experience, attributes, and skills relevant to the Trustee's qualifications to serve as a Trustee, which led to the conclusion that the Trustee should serve as a Trustee for the fund.
Advisory Board Members and Officers:
Correspondence intended for an officer or Peter S. Lynch may be sent to Fidelity Investments, 245 Summer Street, Boston, Massachusetts 02210. Officers appear below in alphabetical order.
Name, Year of Birth; Principal Occupation
Peter S. Lynch (1944)
Year of Election or Appointment: 2003
Member of the Advisory Board
Mr. Lynch also serves as Member of the Advisory Board of other Fidelity® funds. Mr. Lynch is Vice Chairman and a Director of FMR (investment adviser firm) and FMR Co., Inc. (investment adviser firm). In addition, Mr. Lynch serves as a Trustee of Boston College and as the Chairman of the Inner-City Scholarship Fund. Previously, Mr. Lynch served on the Special Olympics International Board of Directors (1997-2006).
Elizabeth Paige Baumann (1968)
Year of Election or Appointment: 2017
Anti-Money Laundering (AML) Officer
Ms. Baumann also serves as AML Officer of other funds. She is Chief AML Officer (2012-present) and Senior Vice President (2014-present) of FMR LLC (diversified financial services company) and is an employee of Fidelity Investments. Previously, Ms. Baumann served as AML Officer of the funds (2012-2016), and Vice President (2007-2014) and Deputy Anti-Money Laundering Officer (2007-2012) of FMR LLC.
Marc R. Bryant (1966)
Year of Election or Appointment: 2015
Secretary and Chief Legal Officer (CLO)
Mr. Bryant also serves as Secretary and CLO of other funds. Mr. Bryant serves as CLO, Secretary, and Senior Vice President of Fidelity Management & Research Company (investment adviser firm, 2015-present) and FMR Co., Inc. (investment adviser firm, 2015-present); Secretary of Fidelity SelectCo, LLC (investment adviser firm, 2015-present) and Fidelity Investments Money Management, Inc. (investment adviser firm, 2015-present); and CLO of Fidelity Management & Research (Hong Kong) Limited and FMR Investment Management (UK) Limited (investment adviser firms, 2015-present) and Fidelity Management & Research (Japan) Limited (investment adviser firm, 2016-present). He is Senior Vice President and Deputy General Counsel of FMR LLC (diversified financial services company). Previously, Mr. Bryant served as Secretary and CLO of Fidelity Rutland Square Trust II (2010-2014) and Assistant Secretary of Fidelity's Fixed Income and Asset Allocation Funds (2013-2015). Prior to joining Fidelity Investments, Mr. Bryant served as a Senior Vice President and the Head of Global Retail Legal for AllianceBernstein L.P. (2006-2010), and as the General Counsel for ProFund Advisors LLC (2001-2006).
William C. Coffey (1969)
Year of Election or Appointment: 2009
Assistant Secretary
Mr. Coffey also serves as Assistant Secretary of other funds. He is Senior Vice President and Deputy General Counsel of FMR LLC (diversified financial services company, 2010-present), and is an employee of Fidelity Investments. Previously, Mr. Coffey served as Vice President and Associate General Counsel of FMR LLC (2005-2009).
Jonathan Davis (1968)
Year of Election or Appointment: 2010
Assistant Treasurer
Mr. Davis also serves as Assistant Treasurer of other funds, and is an employee of Fidelity Investments. Previously, Mr. Davis served as Vice President and Associate General Counsel of FMR LLC (diversified financial services company, 2003-2010).
Adrien E. Deberghes (1967)
Year of Election or Appointment: 2016
Assistant Treasurer
Mr. Deberghes also serves as an officer of other funds. He serves as Executive Vice President of Fidelity Investments Money Management, Inc. (FIMM) (investment adviser firm, 2016-present) and is an employee of Fidelity Investments (2008-present). Prior to joining Fidelity Investments, Mr. Deberghes was Senior Vice President of Mutual Fund Administration at State Street Corporation (2007-2008), Senior Director of Mutual Fund Administration at Investors Bank & Trust (2005-2007), and Director of Finance for Dunkin' Brands (2000-2005). Previously, Mr. Deberghes served in other fund officer roles.
Stephanie J. Dorsey (1969)
Year of Election or Appointment: 2010
Assistant Treasurer
Ms. Dorsey also serves as an officer of other funds. She is an employee of Fidelity Investments (2008-present) and has served in other fund officer roles. Prior to joining Fidelity Investments, Ms. Dorsey served as Treasurer (2004-2008) of the JPMorgan Mutual Funds and Vice President (2004-2008) of JPMorgan Chase Bank.
Howard J. Galligan III (1966)
Year of Election or Appointment: 2014
Chief Financial Officer
Mr. Galligan also serves as Chief Financial Officer of other funds. Mr. Galligan serves as President of Fidelity Pricing and Cash Management Services (FPCMS) (2014-present) and as a Director of Strategic Advisers, Inc. (investment adviser firm, 2008-present). Previously, Mr. Galligan served as Chief Administrative Officer of Asset Management (2011-2014) and Chief Operating Officer and Senior Vice President of Investment Support for Strategic Advisers, Inc. (2003-2011).
Thomas C. Hense (1964)
Year of Election or Appointment: 2008, 2010, or 2015
Vice President
Mr. Hense serves as Vice President of Fidelity Advisor® Multi-Asset Income Fund (2015) and other funds (High Income (2008), Small Cap (2008), and Value (2010) funds), and is an employee of Fidelity Investments (1993-present). Previously, Mr. Hense served as a portfolio manager for Fidelity's Institutional Money Management Group (Pyramis) (2003-2008).
Brian B. Hogan (1964)
Year of Election or Appointment: 2009
Vice President
Mr. Hogan also serves as Trustee or Vice President of other funds. Mr. Hogan serves as a Director of FMR Investment Management (UK) Limited (investment adviser firm, 2015-present) and Fidelity SelectCo, LLC (investment adviser firm, 2014-present) and President of the Equity Division of FMR (investment adviser firm, 2009-present). Previously, Mr. Hogan served as Senior Vice President, Equity Research of FMR (2006-2009) and as a portfolio manager. Mr. Brian B. Hogan is not related to Mr. Colm A. Hogan.
Colm A. Hogan (1973)
Year of Election or Appointment: 2016
Deputy Treasurer
Mr. Hogan also serves as an officer of other funds. Mr. Hogan is an employee of Fidelity Investments (2005-present). Mr. Colm A. Hogan is not related to Mr. Brian B. Hogan.
Chris Maher (1972)
Year of Election or Appointment: 2013
Assistant Treasurer
Mr. Maher serves as Assistant Treasurer of other funds. Mr. Maher is Vice President of Valuation Oversight and is an employee of Fidelity Investments. Previously, Mr. Maher served as Vice President of Asset Management Compliance (2013), Vice President of the Program Management Group of FMR (investment adviser firm, 2010-2013), and Vice President of Valuation Oversight (2008-2010).
Rieco E. Mello (1969)
Year of Election or Appointment: 2017
Assistant Treasurer
Mr. Mello also serves as Assistant Treasurer of other funds. Mr. Mello is an employee of Fidelity Investments (1995-present).
Kenneth B. Robins (1969)
Year of Election or Appointment: 2016
Chief Compliance Officer
Mr. Robins also serves as an officer of other funds. Mr. Robins serves as Compliance Officer of Fidelity Management & Research Company and FMR Co., Inc. (investment adviser firms, 2016-present) and is an employee of Fidelity Investments (2004-present). Previously, Mr. Robins served as Executive Vice President of Fidelity Investments Money Management, Inc. (investment adviser firm, 2013-2016) and served in other fund officer roles.
Stacie M. Smith (1974)
Year of Election or Appointment: 2016
President and Treasurer
Ms. Smith also serves as an officer of other funds. She is an employee of Fidelity Investments (2009-present) and has served in other fund officer roles. Prior to joining Fidelity Investments, Ms. Smith served as Senior Audit Manager of Ernst & Young LLP (accounting firm, 1996-2009). Previously, Ms. Smith served as Deputy Treasurer of certain Fidelity® funds (2013-2016).
Marc L. Spector (1972)
Year of Election or Appointment: 2016
Assistant Treasurer
Mr. Spector also serves as an officer of other funds. Mr. Spector is an employee of Fidelity Investments (2016-present). Prior to joining Fidelity Investments, Mr. Spector served as Director at the Siegfried Group (accounting firm, 2013-2016), and prior to Siegfried Group as audit senior manager at Deloitte & Touche (accounting firm, 2005-2013).
Renee Stagnone (1975)
Year of Election or Appointment: 2016
Assistant Treasurer
Ms. Stagnone also serves as an officer of other funds. Ms. Stagnone is an employee of Fidelity Investments (1997-present). Previously, Ms. Stagnone served as Deputy Treasurer of certain Fidelity® funds (2013-2016).
Shareholder Expense Example
As a shareholder of a Fund, you incur two types of costs: (1) transaction costs and (2) ongoing costs, including management fees and other Fund expenses. This Example is intended to help you understand your ongoing costs (in dollars) of investing in the Funds and to compare these costs with the ongoing costs of investing in other mutual funds.
The Example is based on an investment of $1,000 invested at the beginning of the period and held for the entire period (May 1, 2017 to October 31, 2017).
Actual Expenses
The first line of the accompanying table provides information about actual account values and actual expenses. You may use the information in this line, together with the amount you invested, to estimate the expenses that you paid over the period. Simply divide your account value by $1,000.00 (for example, an $8,600 account value divided by $1,000.00 = 8.6), then multiply the result by the number in the first line under the heading entitled "Expenses Paid During Period" to estimate the expenses you paid on your account during this period. In addition, the Fund, as a shareholder in the underlying Fidelity Central Funds, will indirectly bear its pro-rata share of the fees and expenses incurred by the underlying Fidelity Central Funds. These fees and expenses are not included in the Fund's annualized expense ratio used to calculate the expense estimate in the table below.
Hypothetical Example for Comparison Purposes
The second line of the accompanying table provides information about hypothetical account values and hypothetical expenses based on the Fund's actual expense ratio and an assumed rate of return of 5% per year before expenses, which is not the Fund's actual return. The hypothetical account values and expenses may not be used to estimate the actual ending account balance or expenses you paid for the period. You may use this information to compare the ongoing costs of investing in the Fund and other funds. To do so, compare this 5% hypothetical example with the 5% hypothetical examples that appear in the shareholder reports of the other funds. In addition, the Fund, as a shareholder in the underlying Fidelity Central Funds, will indirectly bear its pro-rata share of the fees and expenses incurred by the underlying Fidelity Central Funds. These fees and expenses are not included in the Fund's annualized expense ratio used to calculate the expense estimate in the table below.
Please note that the expenses shown in the table are meant to highlight your ongoing costs only and do not reflect any transaction costs. Therefore, the second line of the table is useful in comparing ongoing costs only, and will not help you determine the relative total costs of owning different funds.
| | Annualized Expense Ratio-A | Beginning
Account Value
May 1, 2017 | Ending
Account Value
October 31, 2017 | Expenses Paid
During Period-B
May 1, 2017
to October 31, 2017 |
| Actual | - %-C | $1,000.00 | $1,073.90 | $- |
| Hypothetical-D | | $1,000.00 | $1,025.21 | $- |
A Annualized expense ratio reflects expenses net of applicable fee waivers.
B Expenses are equal to the Fund's annualized expense ratio, multiplied by the average account value over the period, multiplied by 184/365 (to reflect the one-half year period).
C Amount represents less than .005%.
D 5% return per year before expenses
Board Approval of Investment Advisory Contracts and Management Fees
Fidelity Flex Small Cap Fund
On January 18, 2017, the Board of Trustees, including the Independent Trustees (together, the Board), voted to approve the management contract with Fidelity Management & Research Company (FMR) and the sub-advisory agreements with affiliates of FMR (together, the Advisory Contracts) for the fund. The Board, assisted by the advice of fund counsel and Independent Trustees' counsel, considered a broad range of information.
Nature, Extent, and Quality of Services Provided. The Board considered Fidelity's staffing as it relates to the fund, including the backgrounds of investment personnel of Fidelity, and also considered the fund's investment objective, strategies, and related investment philosophy. The Board considered the structure of the investment personnel compensation program and whether this structure provides appropriate incentives to act in the best interests of the fund.
Resources Dedicated to Investment Management and Support Services. The Board and the Fund Oversight and Research Committees reviewed the general qualifications and capabilities of Fidelity's investment staff, including its size, education, experience, and resources, as well as Fidelity's approach to recruiting,training, managing, and compensating investment personnel. The Board noted that Fidelity has continued to increase the resources devoted to non-U.S. offices, including expansion of Fidelity's global investment organization. The Board also noted that Fidelity's analysts have extensive resources, tools and capabilities that allow them to conduct sophisticated quantitative and fundamental analysis, as well as credit analysis of issuers, counterparties and guarantors. Further, the Board considered that Fidelity's investment professionals have sufficient access to global information and data so as to provide competitive investment results over time, and that those professionals also have access to sophisticated tools that permit them to assess portfolio construction and risk and performance attribution characteristics continuously, as well as to transmit new information and research conclusions rapidly around the world. Additionally, in its deliberations, the Board considered Fidelity's trading, risk management, compliance, and technology and operationscapabilities and resources, which are integral parts of the investment management process.
Shareholder and Administrative Services. The Board considered the nature, extent, quality, and cost of advisory, administrative, and shareholder services to be performed by FMR, the sub-advisers (together with FMR, the Investment Advisers), and their affiliates under the Advisory Contracts and under separate agreements covering transfer agency, pricing and bookkeeping, and securities lending services for the fund. The Board also considered the nature and extent of the supervision of third party service providers, principally custodians, subcustodians, and pricing vendors.
The Board noted that the growth of fund assets over time across the complex allows Fidelity to reinvest in the development of services designed to enhance the value or convenience of the Fidelity funds as investment vehicles. These services include 24-hour access to account information and market information through telephone representatives and over the Internet, investor education materials and asset allocation tools, and the expanded availability of Fidelity Investor Centers.
Investment Performance. The fund is a new fund and therefore had no historical performance for the Board to review at the time it approved the fund's Advisory Contracts. The Board considered the Investment Advisers' strength in fundamental, research-driven security selection, which the Board is familiar with through its supervision of other Fidelity funds.
Based on its review, the Board concluded that the nature, extent, and quality of services to be provided to the fund under the Advisory Contracts should benefit the shareholders of the fund.
Competitiveness of Management Fee and Total Expense Ratio ..The Board noted that the fund is available exclusively to retirement plans offered through certain Fidelity fee-based programs. The Board considered that while the fund does not pay a management fee, FMR is indirectly compensated for its services out of the program fee. The Board noted that FMR pays all operating expenses, with certain limited exceptions, on behalf of the fund. Based on its review, the Board concluded that the fund's management fee and projected total expense ratio were reasonable in light of the services that the fund and its shareholders will receive and the other factors considered.
Costs of the Services and Profitability. The fund is a new fund and therefore no revenue, cost, or profitability data was available for the Board to review in respect of the fund at the time it approved the Advisory Contracts. In connection with its future renewal of the fund's Advisory Contracts, the Board will consider the revenues earned and the expenses incurred by Fidelity in conducting the business of developing, marketing, distributing, managing, administering and servicing the fund and servicing the fund's shareholders.
Economies of Scale. The Board will consider economies of scale when there is operating experience to permit assessment thereof. It noted, however, that because the fund pays no advisory fees and FMR bears most expenses of the fund, economies of scale cannot be realized by the fund.
Based on its evaluation of all of the conclusions noted above, and after considering all factors it believed relevant, the Board concluded that the advisory fee structures are fair and reasonable, and that the fund's Advisory Contracts should be approved.
Corporate Headquarters
245 Summer St.
Boston, MA 02210
www.fidelity.com
ZSC-ANN-1217
1.9881583.100
Fidelity® Focused Stock Fund
Annual Report October 31, 2017 |
|
Contents
To view a fund's proxy voting guidelines and proxy voting record for the 12-month period ended June 30, visit http://www.fidelity.com/proxyvotingresults or visit the Securities and Exchange Commission's (SEC) web site at http://www.sec.gov.
You may also call 1-800-544-8544 to request a free copy of the proxy voting guidelines.
Standard & Poor's, S&P and S&P 500 are registered service marks of The McGraw-Hill Companies, Inc. and have been licensed for use by Fidelity Distributors Corporation.
Other third-party marks appearing herein are the property of their respective owners.
All other marks appearing herein are registered or unregistered trademarks or service marks of FMR LLC or an affiliated company. © 2017 FMR LLC. All rights reserved.
This report and the financial statements contained herein are submitted for the general information of the shareholders of the Fund. This report is not authorized for distribution to prospective investors in the Fund unless preceded or accompanied by an effective prospectus.
A fund files its complete schedule of portfolio holdings with the SEC for the first and third quarters of each fiscal year on Form N-Q. Forms N-Q are available on the SEC’s web site at http://www.sec.gov. A fund's Forms N-Q may be reviewed and copied at the SEC’s Public Reference Room in Washington, DC. Information regarding the operation of the SEC's Public Reference Room may be obtained by calling 1-800-SEC-0330.
For a complete list of a fund's portfolio holdings, view the most recent holdings listing, semiannual report, or annual report on Fidelity's web site at http://www.fidelity.com, http://www.institutional.fidelity.com, or http://www.401k.com, as applicable.
NOT FDIC INSURED •MAY LOSE VALUE •NO BANK GUARANTEE
Neither the Fund nor Fidelity Distributors Corporation is a bank.
Performance: The Bottom Line
Average annual total return reflects the change in the value of an investment, assuming reinvestment of distributions from dividend income and capital gains (the profits earned upon the sale of securities that have grown in value, if any) and assuming a constant rate of performance each year. The hypothetical investment and the average annual total returns do not reflect the deduction of taxes that a shareholder would pay on fund distributions or the redemption of fund shares. During periods of reimbursement by Fidelity, a fund’s total return will be greater than it would be had the reimbursement not occurred. How a fund did yesterday is no guarantee of how it will do tomorrow.
Average Annual Total Returns
| For the periods ended October 31, 2017 | Past 1 year | Past 5 years | Past 10 years |
| Fidelity® Focused Stock Fund | 27.37% | 14.61% | 8.44% |
$10,000 Over 10 Years
Let's say hypothetically that $10,000 was invested in Fidelity® Focused Stock Fund on October 31, 2007.
The chart shows how the value of your investment would have changed, and also shows how the S&P 500® Index performed over the same period.
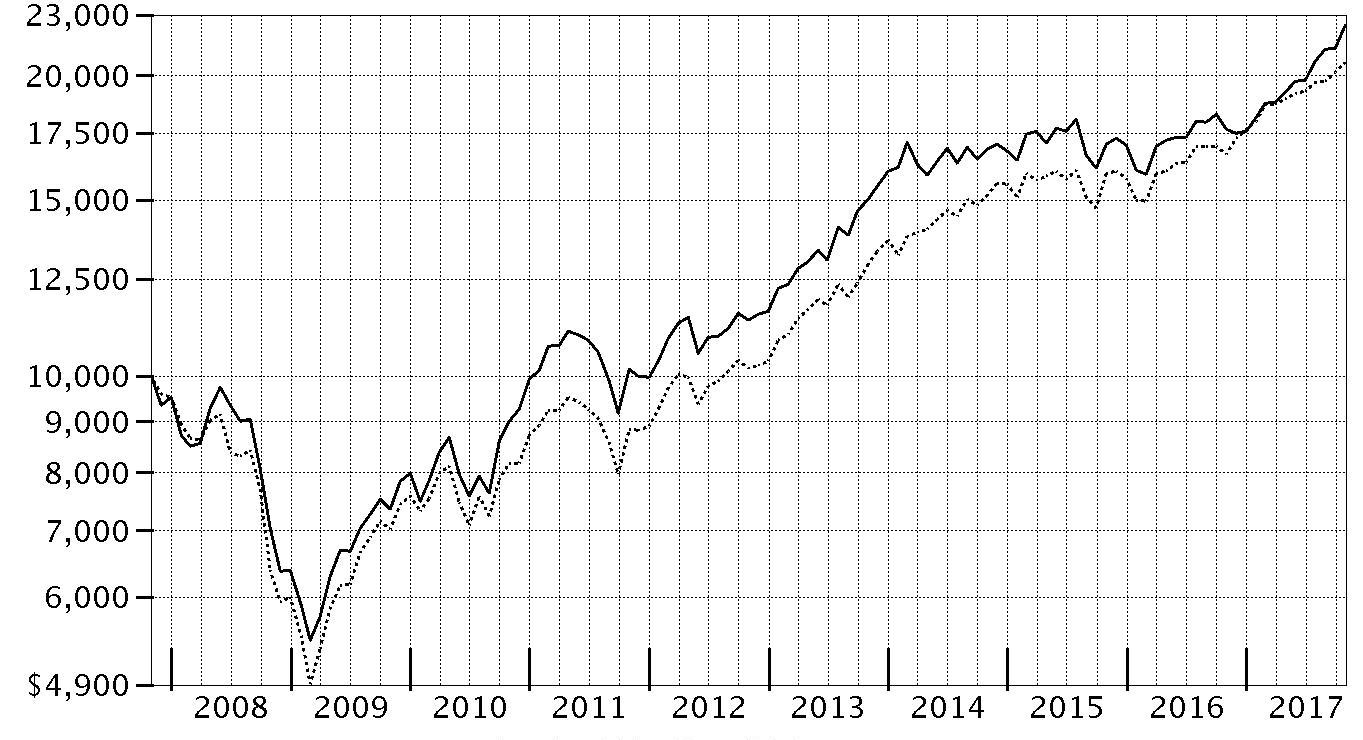
| Period Ending Values |
| $22,482 | Fidelity® Focused Stock Fund |
| $20,638 | S&P 500® Index |
Management's Discussion of Fund Performance
Market Recap: The U.S. equity bellwether S&P 500
® index gained 23.63% for the year ending October 31, 2017. Equity markets rose sharply following the November election and continued to rally through the end of February on optimism for President Trump’s pro-business agenda. Stocks leveled off in March amid fading optimism and stalled efforts by Congress to repeal and replace the Affordable Care Act. Upward momentum soon returned and continued through period end amid positive consumer sentiment and other market indicators. The lone exception was a brief cooldown in August, when geopolitical tension escalated and uncertainty grew regarding the future of health care, tax reform and the debt ceiling. Sector-wise, information technology (+39%) performed best, surging as a handful of major index constituents posted strong returns. Financials gained 37%, riding an uptick in bond yields and a surge in banks. Materials (+29%) also did well, spurred by higher demand, especially from China. Conversely, consumer discretionary (+20%) lagged the broader market, as brick-and-mortar retailers continued to suffer from increased online competition. Rising interest rates held back real estate (+9%) and sluggish oil prices dragged on energy (+2%). Consumer staples (+4%) and telecommunication services (-1%) struggled due to investors’ general preference for risk assets.
Comments from Portfolio Manager Stephen DuFour: For the fiscal year, the fund gained 27.37%, outpacing the benchmark S&P 500
® index. Versus the benchmark, the biggest contributors by a wide margin were security selection and a sizable overweighting in the top-performing information technology sector, particularly the software & services segment. Picks in consumer discretionary also had a notably positive impact. Our top individual relative contributor was payment processor PayPal Holdings. The fund’s shares rose roughly 73% the past year, helped by an increase in the number of retailers accepting payments through the PayPal system, general growth in online purchases, and a strong outlook for Venmo, PayPal’s peer-to-peer, mobile-based payment application. Another "winner" from tech was Adobe Systems, a leader in desktop publishing software and the fund’s largest holding. Adobe's stock returned 63% this period, helped by the recurring revenue generated by its subscription model and by growing demand for its products. By contrast, stock picks in health care and materials detracted most from relative performance. Individual disappointments included Intercept Pharmaceuticals, a non-benchmark position that saw its stock plunge when its only drug, a product in late-stage trial for a certain liver disease, was linked to the deaths of 19 patients with a different type of liver disease.
The views expressed above reflect those of the portfolio manager(s) only through the end of the period as stated on the cover of this report and do not necessarily represent the views of Fidelity or any other person in the Fidelity organization. Any such views are subject to change at any time based upon market or other conditions and Fidelity disclaims any responsibility to update such views. These views may not be relied on as investment advice and, because investment decisions for a Fidelity fund are based on numerous factors, may not be relied on as an indication of trading intent on behalf of any Fidelity fund.
Investment Summary (Unaudited)
Top Ten Stocks as of October 31, 2017
| | % of fund's net assets | % of fund's net assets 6 months ago |
| Adobe Systems, Inc. | 5.9 | 5.1 |
| Caterpillar, Inc. | 5.1 | 2.6 |
| CBOE Holdings, Inc. | 4.9 | 3.1 |
| adidas AG | 4.9 | 5.3 |
| PayPal Holdings, Inc. | 4.9 | 2.9 |
| Intuit, Inc. | 4.4 | 0.0 |
| S&P Global, Inc. | 4.4 | 3.1 |
| Microsoft Corp. | 4.2 | 3.4 |
| Alphabet, Inc. Class A | 4.0 | 3.7 |
| Boston Scientific Corp. | 4.0 | 3.4 |
| | 46.7 | |
Top Five Market Sectors as of October 31, 2017
| | % of fund's net assets | % of fund's net assets 6 months ago |
| Information Technology | 40.8 | 29.8 |
| Financials | 16.8 | 22.5 |
| Health Care | 13.0 | 14.1 |
| Consumer Discretionary | 10.4 | 10.9 |
| Industrials | 5.5 | 14.5 |
Asset Allocation (% of fund's net assets)
| As of October 31, 2017* |
| | Stocks | 99.3% |
| | Short-Term Investments and Net Other Assets (Liabilities) | 0.7% |

* Foreign investments - 12.3%
| As of April 30, 2017* |
| | Stocks | 99.3% |
| | Short-Term Investments and Net Other Assets (Liabilities) | 0.7% |

* Foreign investments - 16.0%
Percentages shown as 0.0% may reflect amounts less than 0.05%.
Investments October 31, 2017
Showing Percentage of Net Assets
| Common Stocks - 99.3% | | | |
| | | Shares | Value |
| CONSUMER DISCRETIONARY - 10.4% | | | |
| Hotels, Restaurants & Leisure - 1.3% | | | |
| Marriott International, Inc. Class A | | 193,000 | $23,059,640 |
| Internet & Direct Marketing Retail - 4.2% | | | |
| Amazon.com, Inc. (a) | | 35,300 | 39,016,384 |
| JD.com, Inc. sponsored ADR (a) | | 390,000 | 14,632,800 |
| Netflix, Inc. (a) | | 91,000 | 17,875,130 |
| | | | 71,524,314 |
| Textiles, Apparel & Luxury Goods - 4.9% | | | |
| adidas AG | | 377,800 | 84,077,347 |
|
| TOTAL CONSUMER DISCRETIONARY | | | 178,661,301 |
|
| CONSUMER STAPLES - 4.9% | | | |
| Food & Staples Retailing - 1.4% | | | |
| Wal-Mart Stores, Inc. | | 275,000 | 24,010,250 |
| Tobacco - 3.5% | | | |
| British American Tobacco PLC sponsored ADR | | 925,000 | 59,570,000 |
|
| TOTAL CONSUMER STAPLES | | | 83,580,250 |
|
| ENERGY - 2.6% | | | |
| Oil, Gas & Consumable Fuels - 2.6% | | | |
| Phillips 66 Co. | | 214,000 | 19,491,120 |
| PrairieSky Royalty Ltd. (b) | | 960,900 | 25,577,324 |
| | | | 45,068,444 |
| FINANCIALS - 16.8% | | | |
| Banks - 2.7% | | | |
| Bank of America Corp. | | 1,688,000 | 46,234,320 |
| Capital Markets - 14.1% | | | |
| Apollo Global Management LLC Class A | | 281,000 | 8,873,980 |
| CBOE Holdings, Inc. | | 746,000 | 84,342,760 |
| Charles Schwab Corp. | | 790,000 | 35,423,600 |
| Morgan Stanley | | 211,000 | 10,550,000 |
| MSCI, Inc. | | 236,800 | 27,790,848 |
| S&P Global, Inc. | | 479,394 | 75,010,779 |
| | | | 241,991,967 |
|
| TOTAL FINANCIALS | | | 288,226,287 |
|
| HEALTH CARE - 13.0% | | | |
| Biotechnology - 3.5% | | | |
| Amgen, Inc. | | 325,579 | 57,047,952 |
| Intercept Pharmaceuticals, Inc. (a)(b) | | 57,279 | 3,530,105 |
| | | | 60,578,057 |
| Health Care Equipment & Supplies - 4.0% | | | |
| Boston Scientific Corp. (a) | | 2,435,200 | 68,526,528 |
| Health Care Providers & Services - 5.5% | | | |
| Humana, Inc. | | 178,000 | 45,452,300 |
| UnitedHealth Group, Inc. | | 234,000 | 49,191,480 |
| | | | 94,643,780 |
|
| TOTAL HEALTH CARE | | | 223,748,365 |
|
| INDUSTRIALS - 5.5% | | | |
| Machinery - 5.5% | | | |
| Caterpillar, Inc. | | 648,000 | 87,998,400 |
| Cummins, Inc. | | 37,000 | 6,544,560 |
| | | | 94,542,960 |
| INFORMATION TECHNOLOGY - 40.8% | | | |
| Internet Software & Services - 8.4% | | | |
| Alibaba Group Holding Ltd. sponsored ADR (a) | | 222,000 | 41,045,580 |
| Alphabet, Inc. Class A (a) | | 67,600 | 69,833,504 |
| Facebook, Inc. Class A (a) | | 191,700 | 34,517,502 |
| | | | 145,396,586 |
| IT Services - 9.2% | | | |
| PayPal Holdings, Inc. (a) | | 1,151,000 | 83,516,560 |
| Square, Inc. (a) | | 1,532,100 | 56,978,799 |
| Visa, Inc. Class A | | 158,000 | 17,376,840 |
| | | | 157,872,199 |
| Semiconductors & Semiconductor Equipment - 1.2% | | | |
| Broadcom Ltd. | | 48,000 | 12,667,680 |
| NVIDIA Corp. | | 40,000 | 8,272,400 |
| | | | 20,940,080 |
| Software - 18.5% | | | |
| Activision Blizzard, Inc. | | 577,200 | 37,800,828 |
| Adobe Systems, Inc. (a) | | 581,112 | 101,787,579 |
| Electronic Arts, Inc. (a) | | 248,400 | 29,708,640 |
| Intuit, Inc. | | 503,000 | 75,963,060 |
| Microsoft Corp. | | 866,000 | 72,033,880 |
| | | | 317,293,987 |
| Technology Hardware, Storage & Peripherals - 3.5% | | | |
| Apple, Inc. | | 356,000 | 60,178,240 |
|
| TOTAL INFORMATION TECHNOLOGY | | | 701,681,092 |
|
| MATERIALS - 5.3% | | | |
| Chemicals - 3.4% | | | |
| DowDuPont, Inc. | | 190,000 | 13,738,900 |
| FMC Corp. | | 477,000 | 44,294,220 |
| | | | 58,033,120 |
| Metals & Mining - 1.9% | | | |
| First Quantum Minerals Ltd. | | 2,925,000 | 32,716,650 |
|
| TOTAL MATERIALS | | | 90,749,770 |
|
| TOTAL COMMON STOCKS | | | |
| (Cost $1,242,862,449) | | | 1,706,258,469 |
|
| Money Market Funds - 1.6% | | | |
| Fidelity Cash Central Fund, 1.10% (c) | | 5,780,129 | 5,781,285 |
| Fidelity Securities Lending Cash Central Fund 1.11% (c)(d) | | 21,822,142 | 21,824,324 |
| TOTAL MONEY MARKET FUNDS | | | |
| (Cost $27,605,609) | | | 27,605,609 |
| TOTAL INVESTMENT IN SECURITIES - 100.9% | | | |
| (Cost $1,270,468,058) | | | 1,733,864,078 |
| NET OTHER ASSETS (LIABILITIES) - (0.9)% | | | (16,084,862) |
| NET ASSETS - 100% | | | $1,717,779,216 |
Legend
(a) Non-income producing
(b) Security or a portion of the security is on loan at period end.
(c) Affiliated fund that is generally available only to investment companies and other accounts managed by Fidelity Investments. The rate quoted is the annualized seven-day yield of the fund at period end. A complete unaudited listing of the fund's holdings as of its most recent quarter end is available upon request. In addition, each Fidelity Central Fund's financial statements, which are not covered by the Fund's Report of Independent Registered Public Accounting Firm, are available on the SEC's website or upon request.
(d) Investment made with cash collateral received from securities on loan.
Affiliated Central Funds
Information regarding fiscal year to date income earned by the Fund from investments in Fidelity Central Funds is as follows:
| Fund | Income earned |
| Fidelity Cash Central Fund | $101,548 |
| Fidelity Securities Lending Cash Central Fund | 679,910 |
| Total | $781,458 |
Investment Valuation
All investments are categorized as Level 1 under the Fair Value Hierarchy. The inputs or methodology used for valuing securities may not be an indication of the risk associated with investing in those securities. For more information on valuation inputs please refer to the Investment Valuation section in the accompanying Notes to Financial Statements.
The following is a summary of transfers between Level 1 and Level 2 for the period ended October 31, 2017. Transfers are assumed to have occurred at the beginning of the period, and are primarily attributable to the valuation techniques used for foreign equity securities, as discussed in the accompanying Notes to Financial Statements:
| Transfers | Total |
| Level 1 to Level 2 | $0 |
| Level 2 to Level 1 | $47,776,688 |
Other Information
Distribution of investments by country or territory of incorporation, as a percentage of Total Net Assets, is as follows (Unaudited):
| United States of America | 87.7% |
| Germany | 4.9% |
| Canada | 3.4% |
| Cayman Islands | 3.3% |
| Others (Individually Less Than 1%) | 0.7% |
| | 100.0% |
See accompanying notes which are an integral part of the financial statements.
Financial Statements
Statement of Assets and Liabilities
| | | October 31, 2017 |
| Assets | | |
Investment in securities, at value (including securities loaned of $20,453,952) — See accompanying schedule:
Unaffiliated issuers (cost $1,242,862,449) | $1,706,258,469 | |
| Fidelity Central Funds (cost $27,605,609) | 27,605,609 | |
| Total Investment in Securities (cost $1,270,468,058) | | $1,733,864,078 |
| Receivable for investments sold | | 6,748,260 |
| Receivable for fund shares sold | | 926,220 |
| Dividends receivable | | 707,387 |
| Distributions receivable from Fidelity Central Funds | | 19,998 |
| Prepaid expenses | | 3,670 |
| Other receivables | | 20,769 |
| Total assets | | 1,742,290,382 |
| Liabilities | | |
| Payable for investments purchased | $623,624 | |
| Payable for fund shares redeemed | 1,070,105 | |
| Accrued management fee | 680,578 | |
| Other affiliated payables | 276,759 | |
| Other payables and accrued expenses | 45,312 | |
| Collateral on securities loaned | 21,814,788 | |
| Total liabilities | | 24,511,166 |
| Net Assets | | $1,717,779,216 |
| Net Assets consist of: | | |
| Paid in capital | | $1,164,126,887 |
| Undistributed net investment income | | 6,253,127 |
| Accumulated undistributed net realized gain (loss) on investments and foreign currency transactions | | 83,999,074 |
| Net unrealized appreciation (depreciation) on investments and assets and liabilities in foreign currencies | | 463,400,128 |
| Net Assets, for 73,160,397 shares outstanding | | $1,717,779,216 |
| Net Asset Value, offering price and redemption price per share ($1,717,779,216 ÷ 73,160,397 shares) | | $23.48 |
See accompanying notes which are an integral part of the financial statements.
Statement of Operations
| | | Year ended October 31, 2017 |
| Investment Income | | |
| Dividends | | $18,365,617 |
| Income from Fidelity Central Funds | | 781,458 |
| Total income | | 19,147,075 |
| Expenses | | |
| Management fee | | |
| Basic fee | $8,656,521 | |
| Performance adjustment | (3,004,262) | |
| Transfer agent fees | 2,805,854 | |
| Accounting and security lending fees | 501,671 | |
| Custodian fees and expenses | 49,317 | |
| Independent trustees' fees and expenses | 6,296 | |
| Registration fees | 27,950 | |
| Audit | 51,788 | |
| Legal | 13,771 | |
| Miscellaneous | 14,105 | |
| Total expenses before reductions | 9,123,011 | |
| Expense reductions | (62,550) | 9,060,461 |
| Net investment income (loss) | | 10,086,614 |
| Realized and Unrealized Gain (Loss) | | |
| Net realized gain (loss) on: | | |
| Investment securities: | | |
| Unaffiliated issuers | 114,385,963 | |
| Fidelity Central Funds | 6,705 | |
| Foreign currency transactions | (23,023) | |
| Total net realized gain (loss) | | 114,369,645 |
| Change in net unrealized appreciation (depreciation) on: | | |
| Investment securities: | | |
| Unaffiliated issuers | 262,444,736 | |
| Fidelity Central Funds | (5,145) | |
| Assets and liabilities in foreign currencies | 5,843 | |
| Total change in net unrealized appreciation (depreciation) | | 262,445,434 |
| Net gain (loss) | | 376,815,079 |
| Net increase (decrease) in net assets resulting from operations | | $386,901,693 |
See accompanying notes which are an integral part of the financial statements.
Statement of Changes in Net Assets
| | Year ended October 31, 2017 | Year ended October 31, 2016 |
| Increase (Decrease) in Net Assets | | |
| Operations | | |
| Net investment income (loss) | $10,086,614 | $8,642,162 |
| Net realized gain (loss) | 114,369,645 | 2,599,018 |
| Change in net unrealized appreciation (depreciation) | 262,445,434 | 40,467,602 |
| Net increase (decrease) in net assets resulting from operations | 386,901,693 | 51,708,782 |
| Distributions to shareholders from net investment income | (8,564,910) | (4,404,702) |
| Distributions to shareholders from net realized gain | (8,145,061) | (99,546,249) |
| Total distributions | (16,709,971) | (103,950,951) |
| Share transactions | | |
| Proceeds from sales of shares | 76,989,324 | 79,249,821 |
| Reinvestment of distributions | 15,984,451 | 99,274,474 |
| Cost of shares redeemed | (347,873,098) | (420,548,217) |
| Net increase (decrease) in net assets resulting from share transactions | (254,899,323) | (242,023,922) |
| Total increase (decrease) in net assets | 115,292,399 | (294,266,091) |
| Net Assets | | |
| Beginning of period | 1,602,486,817 | 1,896,752,908 |
| End of period | $1,717,779,216 | $1,602,486,817 |
| Other Information | | |
| Undistributed net investment income end of period | $6,253,127 | $5,523,675 |
| Shares | | |
| Sold | 3,758,035 | 4,395,212 |
| Issued in reinvestment of distributions | 851,596 | 5,424,835 |
| Redeemed | (17,461,631) | (23,222,221) |
| Net increase (decrease) | (12,852,000) | (13,402,174) |
See accompanying notes which are an integral part of the financial statements.
Financial Highlights
Fidelity Focused Stock Fund
| Years ended October 31, | 2017 | 2016 | 2015 | 2014 | 2013 |
| Selected Per–Share Data | | | | | |
| Net asset value, beginning of period | $18.63 | $19.08 | $20.74 | $19.60 | $15.63 |
| Income from Investment Operations | | | | | |
| Net investment income (loss)A | .13 | .09 | .04 | (.01) | (.02) |
| Net realized and unrealized gain (loss) | 4.92 | .52 | .24 | 2.28 | 4.81 |
| Total from investment operations | 5.05 | .61 | .28 | 2.27 | 4.79 |
| Distributions from net investment income | (.10) | (.05) | (.02) | – | (.03) |
| Distributions from net realized gain | (.10) | (1.02) | (1.92) | (1.13) | (.79) |
| Total distributions | (.20) | (1.06)B | (1.94) | (1.13) | (.82) |
| Net asset value, end of period | $23.48 | $18.63 | $19.08 | $20.74 | $19.60 |
| Total ReturnC | 27.37% | 3.31% | 1.33% | 12.14% | 32.25% |
| Ratios to Average Net AssetsD,E | | | | | |
| Expenses before reductions | .57% | .62% | .73% | .78% | .91% |
| Expenses net of fee waivers, if any | .57% | .62% | .72% | .78% | .91% |
| Expenses net of all reductions | .57% | .62% | .72% | .78% | .89% |
| Net investment income (loss) | .63% | .50% | .18% | (.04)% | (.09)% |
| Supplemental Data | | | | | |
| Net assets, end of period (000 omitted) | $1,717,779 | $1,602,487 | $1,896,753 | $1,848,723 | $1,571,884 |
| Portfolio turnover rateF | 121% | 141% | 189%G | 223% | 200% |
A Calculated based on average shares outstanding during the period.
B Total distributions of $1.06 per share is comprised of distributions from net investment income of $.045 and distributions from net realized gain of $1.017 per share.
C Total returns would have been lower if certain expenses had not been reduced during the applicable periods shown.
D Fees and expenses of any underlying Fidelity Central Funds are not included in the Fund's expense ratio. The Fund indirectly bears its proportionate share of the expenses of any underlying Fidelity Central Funds.
E Expense ratios reflect operating expenses of the Fund. Expenses before reductions do not reflect amounts reimbursed by the investment adviser or reductions from brokerage service arrangements or reductions from other expense offset arrangements and do not represent the amount paid by the Fund during periods when reimbursements or reductions occur. Expenses net of fee waivers reflect expenses after reimbursement by the investment adviser but prior to reductions from brokerage service arrangements or other expense offset arrangements. Expenses net of all reductions represent the net expenses paid by the Fund.
F Amount does not include the portfolio activity of any underlying Fidelity Central Funds.
G The portfolio turnover rate does not include the assets acquired in the merger.
See accompanying notes which are an integral part of the financial statements.
Notes to Financial Statements
For the period ended October 31, 2017
1. Organization.
Fidelity Focused Stock Fund (the Fund) is a fund of Fidelity Capital Trust (the Trust) and is authorized to issue an unlimited number of shares. Share transactions on the Statement of Changes in Net Assets may contain exchanges between affiliated funds. The Trust is registered under the Investment Company Act of 1940, as amended (the 1940 Act), as an open-end management investment company organized as a Massachusetts business trust.
2. Investments in Fidelity Central Funds.
The Fund invests in Fidelity Central Funds, which are open-end investment companies generally available only to other investment companies and accounts managed by the investment adviser and its affiliates. The Fund's Schedule of Investments lists each of the Fidelity Central Funds held as of period end, if any, as an investment of the Fund, but does not include the underlying holdings of each Fidelity Central Fund. As an Investing Fund, the Fund indirectly bears its proportionate share of the expenses of the underlying Fidelity Central Funds.
The Money Market Central Funds seek preservation of capital and current income and are managed by Fidelity Investments Money Management, Inc. (FIMM), an affiliate of the investment adviser. Annualized expenses of the Money Market Central Funds as of their most recent shareholder report date are less than .005%.
A complete unaudited list of holdings for each Fidelity Central Fund is available upon request or at the Securities and Exchange Commission (the SEC) website at www.sec.gov. In addition, the financial statements of the Fidelity Central Funds, which are not covered by the Fund's Report of Independent Registered Public Accounting Firm, are available on the SEC website or upon request.
3. Significant Accounting Policies.
The Fund is an investment company and applies the accounting and reporting guidance of the Financial Accounting Standards Board (FASB) Accounting Standards Codification Topic 946 Financial Services – Investments Companies. The financial statements have been prepared in conformity with accounting principles generally accepted in the United States of America (GAAP), which require management to make certain estimates and assumptions at the date of the financial statements. Actual results could differ from those estimates. Subsequent events, if any, through the date that the financial statements were issued have been evaluated in the preparation of the financial statements. The following summarizes the significant accounting policies of the Fund:
Investment Valuation. Investments are valued as of 4:00 p.m. Eastern time on the last calendar day of the period. The Board of Trustees (the Board) has delegated the day to day responsibility for the valuation of the Fund's investments to the Fair Value Committee (the Committee) established by the Fund's investment adviser. In accordance with valuation policies and procedures approved by the Board, the Fund attempts to obtain prices from one or more third party pricing vendors or brokers to value its investments. When current market prices, quotations or currency exchange rates are not readily available or reliable, investments will be fair valued in good faith by the Committee, in accordance with procedures adopted by the Board. Factors used in determining fair value vary by investment type and may include market or investment specific events. The frequency with which these procedures are used cannot be predicted and they may be utilized to a significant extent. The Committee oversees the Fund's valuation policies and procedures and reports to the Board on the Committee's activities and fair value determinations. The Board monitors the appropriateness of the procedures used in valuing the Fund's investments and ratifies the fair value determinations of the Committee.
The Fund categorizes the inputs to valuation techniques used to value its investments into a disclosure hierarchy consisting of three levels as shown below:
- Level 1 – quoted prices in active markets for identical investments
- Level 2 – other significant observable inputs (including quoted prices for similar investments, interest rates, prepayment speeds, etc.)
- Level 3 – unobservable inputs (including the Fund's own assumptions based on the best information available)
Valuation techniques used to value the Fund's investments by major category are as follows:
Equity securities, including restricted securities, for which market quotations are readily available, are valued at the last reported sale price or official closing price as reported by a third party pricing vendor on the primary market or exchange on which they are traded and are categorized as Level 1 in the hierarchy. In the event there were no sales during the day or closing prices are not available, securities are valued at the last quoted bid price or may be valued using the last available price and are generally categorized as Level 2 in the hierarchy. For foreign equity securities, when market or security specific events arise, comparisons to the valuation of American Depositary Receipts (ADRs), futures contracts, Exchange-Traded Funds (ETFs) and certain indexes as well as quoted prices for similar securities may be used and would be categorized as Level 2 in the hierarchy. Utilizing these techniques may result in transfers between Level 1 and Level 2. For equity securities, including restricted securities, where observable inputs are limited, assumptions about market activity and risk are used and these securities may be categorized as Level 3 in the hierarchy.
Investments in open-end mutual funds, including Fidelity Central Funds, are valued at their closing net asset value (NAV) each business day and are categorized as Level 1 in the hierarchy.
Changes in valuation techniques may result in transfers in or out of an assigned level within the disclosure hierarchy. Information on transfers between Levels 1 and 2 is included at the end of the Fund's Schedule of Investments.
Foreign Currency. The Fund may use foreign currency contracts to facilitate transactions in foreign-denominated securities. Gains and losses from these transactions may arise from changes in the value of the foreign currency or if the counterparties do not perform under the contracts' terms.
Foreign-denominated assets, including investment securities, and liabilities are translated into U.S. dollars at the exchange rates at period end. Purchases and sales of investment securities, income and dividends received and expenses denominated in foreign currencies are translated into U.S. dollars at the exchange rate in effect on the transaction date.
The effects of exchange rate fluctuations on investments are included with the net realized and unrealized gain (loss) on investment securities. Other foreign currency transactions resulting in realized and unrealized gain (loss) are disclosed separately.
Investment Transactions and Income. For financial reporting purposes, the Fund's investment holdings and NAV include trades executed through the end of the last business day of the period. The NAV per share for processing shareholder transactions is calculated as of the close of business of the New York Stock Exchange (NYSE), normally 4:00 p.m. Eastern time and includes trades executed through the end of the prior business day. Gains and losses on securities sold are determined on the basis of identified cost and includes proceeds received from litigation. Dividend income is recorded on the ex-dividend date, except for certain dividends from foreign securities where the ex-dividend date may have passed, which are recorded as soon as the Fund is informed of the ex-dividend date. Non-cash dividends included in dividend income, if any, are recorded at the fair market value of the securities received. Income and capital gain distributions from Fidelity Central Funds, if any, are recorded on the ex-dividend date. Certain distributions received by the Fund represent a return of capital or capital gain. The Fund determines the components of these distributions subsequent to the ex-dividend date, based upon receipt of tax filings or other correspondence relating to the underlying investment. These distributions are recorded as a reduction of cost of investments and/or as a realized gain. Investment income is recorded net of foreign taxes withheld where recovery of such taxes is uncertain.
Expenses. Expenses directly attributable to a fund are charged to that fund. Expenses attributable to more than one fund are allocated among the respective funds on the basis of relative net assets or other appropriate methods. Expense estimates are accrued in the period to which they relate and adjustments are made when actual amounts are known.
Income Tax Information and Distributions to Shareholders. Each year, the Fund intends to qualify as a regulated investment company under Subchapter M of the Internal Revenue Code, including distributing substantially all of its taxable income and realized gains. As a result, no provision for U.S. Federal income taxes is required. As of October 31, 2017, the Fund did not have any unrecognized tax benefits in the financial statements; nor is the Fund aware of any tax positions for which it is reasonably possible that the total amounts of unrecognized tax benefits will significantly change in the next twelve months. The Fund files a U.S. federal tax return, in addition to state and local tax returns as required. The Fund's federal income tax returns are subject to examination by the Internal Revenue Service (IRS) for a period of three fiscal years after they are filed. State and local tax returns may be subject to examination for an additional fiscal year depending on the jurisdiction. Foreign taxes are provided for based on the Fund's understanding of the tax rules and rates that exist in the foreign markets in which it invests.
Distributions are declared and recorded on the ex-dividend date. Income and capital gain distributions are determined in accordance with income tax regulations, which may differ from GAAP. In addition, the Fund claimed a portion of the payment made to redeeming shareholders as a distribution for income tax purposes.
Capital accounts within the financial statements are adjusted for permanent book-tax differences. These adjustments have no impact on net assets or the results of operations. Capital accounts are not adjusted for temporary book-tax differences which will reverse in a subsequent period.
Book-tax differences are primarily due to foreign currency transactions, passive foreign investment companies (PFIC), partnerships, capital loss carryforwards and losses deferred due to wash sales.
As of period end, the cost and unrealized appreciation (depreciation) in securities, and derivatives if applicable, for federal income tax purposes were as follows:
| Gross unrealized appreciation | $467,400,185 |
| Gross unrealized depreciation | (16,892,874) |
| Net unrealized appreciation (depreciation) | $450,507,311 |
| Tax Cost | $1,283,356,767 |
The tax-based components of distributable earnings as of period end were as follows:
| Undistributed ordinary income | $29,562,616 |
| Undistributed long-term capital gain | $73,578,293 |
| Net unrealized appreciation (depreciation) on securities and other investments | $450,511,419 |
The tax character of distributions paid was as follows:
| | October 31, 2017 | October 31, 2016 |
| Ordinary Income | $16,709,971 | $ 4,404,702 |
| Long-term Capital Gains | – | 99,546,249 |
| Total | $16,709,971 | $ 103,950,951 |
4. Purchases and Sales of Investments.
Purchases and sales of securities, other than short-term securities, aggregated $1,909,060,773 and $2,171,217,532, respectively.
5. Fees and Other Transactions with Affiliates.
Management Fee. Fidelity Management & Research Company (the investment adviser) and its affiliates provide the Fund with investment management related services for which the Fund pays a monthly management fee. The management fee is the sum of an individual fund fee rate that is based on an annual rate of .30% of the Fund's average net assets and an annualized group fee rate that averaged .25% during the period. The group fee rate is based upon the average net assets of all the mutual funds advised by the investment adviser, including any mutual funds previously advised by the investment adviser that are currently advised by Fidelity SelectCo, LLC, an affiliate of the investment adviser. The group fee rate decreases as assets under management increase and increases as assets under management decrease. In addition, the management fee is subject to a performance adjustment (up to a maximum of +/- .20% of the Fund's average net assets over a 36 month performance period). The upward or downward adjustment to the management fee is based on the Fund's relative investment performance as compared to its benchmark index, the S&P 500 Index, over the same 36 month performance period. For the reporting period, the total annual management fee rate, including the performance adjustment, was .36% of the Fund's average net assets. The performance adjustment included in the management fee rate may be higher or lower than the maximum performance adjustment rate due to the difference between the average net assets for the reporting and performance periods.
Transfer Agent Fees. Fidelity Investments Institutional Operations Company, Inc. (FIIOC), an affiliate of the investment adviser, is the Fund's transfer, dividend disbursing and shareholder servicing agent. FIIOC receives account fees and asset-based fees that vary according to account size and type of account. FIIOC pays for typesetting, printing and mailing of shareholder reports, except proxy statements. For the period, the transfer agent fees were equivalent to an annual rate of .18% of average net assets.
Accounting and Security Lending Fees. Fidelity Service Company, Inc. (FSC), an affiliate of the investment adviser, maintains the Fund's accounting records. The accounting fee is based on the level of average net assets for each month. Under a separate contract, FSC administers the security lending program. The security lending fee is based on the number and duration of lending transactions.
Brokerage Commissions. The Fund placed a portion of its portfolio transactions with brokerage firms which are affiliates of the investment adviser. Brokerage commissions are included in net realized gain (loss) and change in net unrealized appreciation (depreciation) in the Statement of Operations. The commissions paid to these affiliated firms were $36,091 for the period.
Interfund Trades. The Fund may purchase from or sell securities to other Fidelity Funds under procedures adopted by the Board. The procedures have been designed to ensure these interfund trades are executed in accordance with Rule 17a-7 of the 1940 Act. Interfund trades are included within the respective purchases and sales amounts shown in the Purchases and Sales of Investments note.
Other. During the period, the investment adviser reimbursed the Fund for certain losses in the amount of $66,469.
6. Committed Line of Credit.
The Fund participates with other funds managed by the investment adviser or an affiliate in a $4.25 billion credit facility (the "line of credit") to be utilized for temporary or emergency purposes to fund shareholder redemptions or for other short-term liquidity purposes. The Fund has agreed to pay commitment fees on its pro-rata portion of the line of credit, which amounted to $5,075 and is reflected in Miscellaneous expenses on the Statement of Operations. During the period, the Fund did not borrow on this line of credit.
7. Security Lending.
The Fund lends portfolio securities through a lending agent from time to time in order to earn additional income. For equity securities, a lending agent is used and may loan securities to certain qualified borrowers, including Fidelity Capital Markets (FCM), a broker-dealer affiliated with the Fund. On the settlement date of the loan, the Fund receives collateral (in the form of U.S. Treasury obligations, letters of credit and/or cash) against the loaned securities and maintains collateral in an amount not less than 100% of the market value of the loaned securities during the period of the loan. The market value of the loaned securities is determined at the close of business of the Fund and any additional required collateral is delivered to the Fund on the next business day. The Fund or borrower may terminate the loan at any time, and if the borrower defaults on its obligation to return the securities loaned because of insolvency or other reasons, the Fund may apply collateral received from the borrower against the obligation. The Fund may experience delays and costs in recovering the securities loaned. Any cash collateral received is invested in the Fidelity Securities Lending Cash Central Fund. At period end, there were no security loans outstanding with FCM. The value of loaned securities and cash collateral at period end are disclosed on the Fund's Statement of Assets and Liabilities. Security lending income represents the income earned on investing cash collateral, less rebates paid to borrowers, plus any premium payments received for lending certain types of securities. Security lending income is presented in the Statement of Operations as a component of income from Fidelity Central Funds. Total security lending income during the period amounted to $679,910, including $2,098 from securities loaned to FCM.
8. Expense Reductions.
Commissions paid to certain brokers with whom the investment adviser, or its affiliates, places trades on behalf of the Fund include an amount in addition to trade execution, which may be rebated back to the Fund to offset certain expenses. This amount totaled $47,506 for the period. In addition, through arrangements with the Fund's custodian, credits realized as a result of certain uninvested cash balances were used to reduce the Fund's expenses. During the period, these credits reduced the Fund's expenses by $985.
In addition, during the period the investment adviser reimbursed and/or waived a portion of operating expenses in the amount of $14,059.
9. Other.
The Fund's organizational documents provide former and current trustees and officers with a limited indemnification against liabilities arising in connection with the performance of their duties to the Fund. In the normal course of business, the Fund may also enter into contracts that provide general indemnifications. The Fund's maximum exposure under these arrangements is unknown as this would be dependent on future claims that may be made against the Fund. The risk of material loss from such claims is considered remote.
Report of Independent Registered Public Accounting Firm
To the Trustees of Fidelity Capital Trust and Shareholders of Fidelity Focused Stock Fund:
In our opinion, the accompanying statement of assets and liabilities, including the schedule of investments, and the related statements of operations and of changes in net assets and the financial highlights present fairly, in all material respects, the financial position of Fidelity Focused Stock Fund (a fund of Fidelity Capital Trust) as of October 31, 2017, the results of its operations for the year then ended, the changes in its net assets for each of the two years in the period then ended and the financial highlights for each of the five years in the period then ended, in conformity with accounting principles generally accepted in the United States of America. These financial statements and financial highlights (hereafter referred to as “financial statements”) are the responsibility of the Fidelity Focused Stock Fund’s management. Our responsibility is to express an opinion on these financial statements based on our audits. We conducted our audits of these financial statements in accordance with the standards of the Public Company Accounting Oversight Board (United States). Those standards require that we plan and perform the audit to obtain reasonable assurance about whether the financial statements are free of material misstatement. An audit includes examining, on a test basis, evidence supporting the amounts and disclosures in the financial statements, assessing the accounting principles used and significant estimates made by management, and evaluating the overall financial statement presentation. Our procedures included confirmation of securities owned as of October 31, 2017 by correspondence with the custodian and brokers; when replies were not received from brokers, we performed other auditing procedures. We believe that our audits provide a reasonable basis for our opinion.
PricewaterhouseCoopers LLP
Boston, Massachusetts
December 14, 2017
Trustees and Officers
The Trustees, Members of the Advisory Board (if any), and officers of the trust and fund, as applicable, are listed below. The Board of Trustees governs the fund and is responsible for protecting the interests of shareholders. The Trustees are experienced executives who meet periodically throughout the year to oversee the fund's activities, review contractual arrangements with companies that provide services to the fund, oversee management of the risks associated with such activities and contractual arrangements, and review the fund's performance. Each of the Trustees oversees 190 funds.
The Trustees hold office without limit in time except that (a) any Trustee may resign; (b) any Trustee may be removed by written instrument, signed by at least two-thirds of the number of Trustees prior to such removal; (c) any Trustee who requests to be retired or who has become incapacitated by illness or injury may be retired by written instrument signed by a majority of the other Trustees; and (d) any Trustee may be removed at any special meeting of shareholders by a two-thirds vote of the outstanding voting securities of the trust. Each Trustee who is not an interested person (as defined in the 1940 Act) of the trust and the fund is referred to herein as an Independent Trustee. Each Independent Trustee shall retire not later than the last day of the calendar year in which his or her 75th birthday occurs. The Independent Trustees may waive this mandatory retirement age policy with respect to individual Trustees. Officers and Advisory Board Members hold office without limit in time, except that any officer or Advisory Board Member may resign or may be removed by a vote of a majority of the Trustees at any regular meeting or any special meeting of the Trustees. Except as indicated, each individual has held the office shown or other offices in the same company for the past five years.
The fund’s Statement of Additional Information (SAI) includes more information about the Trustees. To request a free copy, call Fidelity at 1-800-544-8544.
Experience, Skills, Attributes, and Qualifications of the Trustees. The Governance and Nominating Committee has adopted a statement of policy that describes the experience, qualifications, attributes, and skills that are necessary and desirable for potential Independent Trustee candidates (Statement of Policy). The Board believes that each Trustee satisfied at the time he or she was initially elected or appointed a Trustee, and continues to satisfy, the standards contemplated by the Statement of Policy. The Governance and Nominating Committee also engages professional search firms to help identify potential Independent Trustee candidates who have the experience, qualifications, attributes, and skills consistent with the Statement of Policy. From time to time, additional criteria based on the composition and skills of the current Independent Trustees, as well as experience or skills that may be appropriate in light of future changes to board composition, business conditions, and regulatory or other developments, have also been considered by the professional search firms and the Governance and Nominating Committee. In addition, the Board takes into account the Trustees' commitment and participation in Board and committee meetings, as well as their leadership of standing and ad hoc committees throughout their tenure.
In determining that a particular Trustee was and continues to be qualified to serve as a Trustee, the Board has considered a variety of criteria, none of which, in isolation, was controlling. The Board believes that, collectively, the Trustees have balanced and diverse experience, qualifications, attributes, and skills, which allow the Board to operate effectively in governing the fund and protecting the interests of shareholders. Information about the specific experience, skills, attributes, and qualifications of each Trustee, which in each case led to the Board's conclusion that the Trustee should serve (or continue to serve) as a trustee of the fund, is provided below.
Board Structure and Oversight Function. James C. Curvey is an interested person and currently serves as Chairman. The Trustees have determined that an interested Chairman is appropriate and benefits shareholders because an interested Chairman has a personal and professional stake in the quality and continuity of services provided to the fund. Independent Trustees exercise their informed business judgment to appoint an individual of their choosing to serve as Chairman, regardless of whether the Trustee happens to be independent or a member of management. The Independent Trustees have determined that they can act independently and effectively without having an Independent Trustee serve as Chairman and that a key structural component for assuring that they are in a position to do so is for the Independent Trustees to constitute a substantial majority for the Board. The Independent Trustees also regularly meet in executive session. Ned C. Lautenbach serves as Chairman of the Independent Trustees and as such (i) acts as a liaison between the Independent Trustees and management with respect to matters important to the Independent Trustees and (ii) with management prepares agendas for Board meetings.
Fidelity® funds are overseen by different Boards of Trustees. The fund's Board oversees Fidelity's high income and certain equity funds, and other Boards oversee Fidelity's investment-grade bond, money market, asset allocation, and sector funds. The asset allocation funds may invest in Fidelity® funds overseen by the fund's Board. The use of separate Boards, each with its own committee structure, allows the Trustees of each group of Fidelity® funds to focus on the unique issues of the funds they oversee, including common research, investment, and operational issues. On occasion, the separate Boards establish joint committees to address issues of overlapping consequences for the Fidelity® funds overseen by each Board.
The Trustees operate using a system of committees to facilitate the timely and efficient consideration of all matters of importance to the Trustees, the fund, and fund shareholders and to facilitate compliance with legal and regulatory requirements and oversight of the fund's activities and associated risks. The Board, acting through its committees, has charged FMR and its affiliates with (i) identifying events or circumstances the occurrence of which could have demonstrably adverse effects on the fund's business and/or reputation; (ii) implementing processes and controls to lessen the possibility that such events or circumstances occur or to mitigate the effects of such events or circumstances if they do occur; and (iii) creating and maintaining a system designed to evaluate continuously business and market conditions in order to facilitate the identification and implementation processes described in (i) and (ii) above. Because the day-to-day operations and activities of the fund are carried out by or through FMR, its affiliates, and other service providers, the fund's exposure to risks is mitigated but not eliminated by the processes overseen by the Trustees. While each of the Board's committees has responsibility for overseeing different aspects of the fund's activities, oversight is exercised primarily through the Operations, Audit, and Compliance Committees. In addition, the Independent Trustees have worked with FMR to enhance the Board's oversight of investment and financial risks, legal and regulatory risks, technology risks, and operational risks, including the development of additional risk reporting to the Board. For example, a working group comprised of Independent Trustees and FMR has worked and continues to work to review the Fidelity® funds' valuation-related activities, reporting and risk management. Appropriate personnel, including but not limited to the fund's Chief Compliance Officer (CCO), FMR's internal auditor, the independent accountants, the fund's Treasurer and portfolio management personnel, make periodic reports to the Board's committees, as appropriate, including an annual review of Fidelity's risk management program for the Fidelity® funds. The responsibilities of each standing committee, including their oversight responsibilities, are described further under "Standing Committees of the Trustees."
Interested Trustees*:
Correspondence intended for a Trustee who is an interested person may be sent to Fidelity Investments, 245 Summer Street, Boston, Massachusetts 02210.
Name, Year of Birth; Principal Occupations and Other Relevant Experience+
James C. Curvey (1935)
Year of Election or Appointment: 2007
Trustee
Chairman of the Board of Trustees
Mr. Curvey also serves as Trustee of other Fidelity® funds. Mr. Curvey is a Director of Fidelity Research & Analysis Co. (investment adviser firm, 2009-present), and Vice Chairman (2007-present) and Director of FMR LLC (diversified financial services company). In addition, Mr. Curvey serves as an Overseer for the Boston Symphony Orchestra and a member of the board of Artis-Naples, Naples, Florida, and as a Trustee for Brewster Academy, Wolfeboro, New Hampshire. Previously, Mr. Curvey served as a Director of Fidelity Investments Money Management, Inc. (investment adviser firm, 2009-2014) and a Director of FMR and FMR Co., Inc. (investment adviser firms, 2007-2014).
Charles S. Morrison (1960)
Year of Election or Appointment: 2014
Trustee
Mr. Morrison also serves as Trustee of other funds. He serves as President of Fidelity Management & Research Company (FMR) (investment adviser firm, 2016-present), a Director of Fidelity Investments Money Management, Inc. (FIMM) (investment adviser firm, 2014-present), Director of Fidelity SelectCo, LLC (investment adviser firm, 2014-present), President, Asset Management (2014-present), and is an employee of Fidelity Investments. Previously, Mr. Morrison served as Vice President of Fidelity's Fixed Income and Asset Allocation Funds (2012-2014), President, Fixed Income (2011-2014), Vice President of Fidelity's Money Market Funds (2005-2009), President, Money Market Group Leader of FMR (investment adviser firm, 2009), and Senior Vice President, Money Market Group of FMR (2004-2009). Mr. Morrison also served as Vice President of Fidelity's Bond Funds (2002-2005), certain Balanced Funds (2002-2005), and certain Asset Allocation Funds (2002-2007), and as Senior Vice President (2002-2005) of Fidelity's Bond Division.
* Determined to be an “Interested Trustee” by virtue of, among other things, his or her affiliation with the trust or various entities under common control with FMR.
+ The information includes the Trustee's principal occupation during the last five years and other information relating to the experience, attributes, and skills relevant to the Trustee's qualifications to serve as a Trustee, which led to the conclusion that the Trustee should serve as a Trustee for the fund.
Independent Trustees:
Correspondence intended for an Independent Trustee may be sent to Fidelity Investments, P.O. Box 55235, Boston, Massachusetts 02205-5235.
Name, Year of Birth; Principal Occupations and Other Relevant Experience+
Dennis J. Dirks (1948)
Year of Election or Appointment: 2005
Trustee
Mr. Dirks also serves as Trustee of other Fidelity® funds. Prior to his retirement in May 2003, Mr. Dirks was Chief Operating Officer and a member of the Board of The Depository Trust & Clearing Corporation (DTCC). He also served as President, Chief Operating Officer, and Board member of The Depository Trust Company (DTC) and President and Board member of the National Securities Clearing Corporation (NSCC). In addition, Mr. Dirks served as Chief Executive Officer and Board member of the Government Securities Clearing Corporation, Chief Executive Officer and Board member of the Mortgage-Backed Securities Clearing Corporation, as a Trustee and a member of the Finance Committee of Manhattan College (2005-2008), as a Trustee and a member of the Finance Committee of AHRC of Nassau County (2006-2008), as a member of the Independent Directors Council (IDC) Governing Council (2010-2015), and as a member of the Board of Directors for The Brookville Center for Children’s Services, Inc. (2009-2017). Mr. Dirks is a member of the Finance Committee (2016-present) and Board of Directors (2017-present) of the Asolo Repertory Theatre.
Alan J. Lacy (1953)
Year of Election or Appointment: 2008
Trustee
Mr. Lacy also serves as Trustee of other Fidelity® funds. Mr. Lacy serves as a Director of Bristol-Myers Squibb Company (global pharmaceuticals, 2008-present). He is a Trustee of the California Chapter of The Nature Conservancy (2015-present) and a Director of the Center for Advanced Study in the Behavioral Sciences at Stanford University (2015-present). In addition, Mr. Lacy served as Senior Adviser (2007-2014) of Oak Hill Capital Partners, L.P. (private equity) and also served as Chief Executive Officer (2005) and Vice Chairman (2005-2006) of Sears Holdings Corporation (retail) and Chief Executive Officer and Chairman of the Board of Sears, Roebuck and Co. (retail, 2000-2005). Previously, Mr. Lacy served as Chairman (2014-2017) and a member (2010-2017) of the Board of Directors of Dave & Buster’s Entertainment, Inc. (restaurant and entertainment complexes), as Chairman (2008-2011) and a member (2006-2015) of the Board of Trustees of the National Parks Conservation Association, and as a member of the Board of Directors for The Hillman Companies, Inc. (hardware wholesalers, 2010-2014), Earth Fare, Inc. (retail grocery, 2010-2014), and The Western Union Company (global money transfer, 2006-2011).
Ned C. Lautenbach (1944)
Year of Election or Appointment: 2000
Trustee
Chairman of the Independent Trustees
Mr. Lautenbach also serves as Trustee of other Fidelity® funds. Mr. Lautenbach currently serves as Vice Chair of the Board of Governors, State University System of Florida (2013-present) and is a member of the Council on Foreign Relations (1994-present). He is also a member and has most recently served as Chairman of the Board of Directors of Artis-Naples (2012-present). Previously, Mr. Lautenbach served as a member and then Lead Director of the Board of Directors of Eaton Corporation (diversified industrial, 1997-2016). He was also a Partner and Advisory Partner at Clayton, Dubilier & Rice, LLC (private equity investment, 1998-2010), as well as a Director of Sony Corporation (2006-2007). In addition, Mr. Lautenbach also had a 30-year career with IBM (technology company) during which time he served as Senior Vice President and a member of the Corporate Executive Committee (1968-1998).
Joseph Mauriello (1944)
Year of Election or Appointment: 2008
Trustee
Mr. Mauriello also serves as Trustee of other Fidelity® funds. Prior to his retirement in January 2006, Mr. Mauriello served in numerous senior management positions including Deputy Chairman and Chief Operating Officer (2004-2005), and Vice Chairman of Financial Services (2002-2004) of KPMG LLP US (professional services, 1965-2005). Mr. Mauriello currently serves as a member of the Board of Directors of XL Group plc. (global insurance and re-insurance, 2006-present) and the Independent Directors Council (IDC) Governing Council (2015-present). Previously, Mr. Mauriello served as a Director of the Hamilton Funds of the Bank of New York (2006-2007) and of Arcadia Resources Inc. (health care services and products, 2007-2012).
Cornelia M. Small (1944)
Year of Election or Appointment: 2005
Trustee
Ms. Small also serves as Trustee of other Fidelity® funds. Ms. Small is a member of the Board of Directors (2009-present) and Chair of the Investment Committee (2010-present) of the Teagle Foundation. Ms. Small also serves on the Investment Committee of the Berkshire Taconic Community Foundation (2008-present). Previously, Ms. Small served as Chairperson (2002-2008) and a member of the Investment Committee and Chairperson (2008-2012) and a member of the Board of Trustees of Smith College. In addition, Ms. Small served as Chief Investment Officer, Director of Global Equity Investments, and a member of the Board of Directors of Scudder, Stevens & Clark and Scudder Kemper Investments.
William S. Stavropoulos (1939)
Year of Election or Appointment: 2002
Trustee
Vice Chairman of the Independent Trustees
Mr. Stavropoulos also serves as Trustee of other Fidelity® funds. Mr. Stavropoulos serves as President and Founder of the Michigan Baseball Foundation, the Great Lakes Loons (2007-present). Mr. Stavropoulos is Chairman Emeritus of the Board of Directors of The Dow Chemical Company, where he previously served in numerous senior management positions, including President, CEO (1995-2000; 2002-2004), Chairman of the Executive Committee (2000-2006), and as a member of the Board of Directors (1990-2006). Currently, Mr. Stavropoulos is Chairman of the Board of Directors of Univar Inc. (global distributor of commodity and specialty chemicals), a Director of Teradata Corporation (data warehousing and technology solutions), and a member of the Advisory Board for Metalmark Capital LLC (private equity investment, 2005-present). Mr. Stavropoulos is an operating advisor to Clayton, Dubilier & Rice, LLC (private equity investment). In addition, Mr. Stavropoulos is a member of the University of Notre Dame Advisory Council for the College of Science, a Trustee of the Rollin L. Gerstacker Foundation, and a Director of Artis-Naples in Naples, Florida. Previously, Mr. Stavropoulos served as a Director of Chemical Financial Corporation (bank holding company, 1993-2012) and Tyco International, Ltd. (multinational manufacturing and services, 2007-2012).
David M. Thomas (1949)
Year of Election or Appointment: 2008
Trustee
Mr. Thomas also serves as Trustee of other Fidelity® funds. Mr. Thomas serves as Non-Executive Chairman of the Board of Directors of Fortune Brands Home and Security (home and security products, 2011-present), as a member of the Board of Directors (2004-present) and Presiding Director (2013-present) of Interpublic Group of Companies, Inc. (marketing communication), and as a member of the Board of Trustees of the University of Florida (2013-present). Previously, Mr. Thomas served as Executive Chairman (2005-2006) and Chairman and Chief Executive Officer (2000-2005) of IMS Health, Inc. (pharmaceutical and healthcare information solutions), and a Director of Fortune Brands, Inc. (consumer products, 2000-2011).
+ The information includes the Trustee's principal occupation during the last five years and other information relating to the experience, attributes, and skills relevant to the Trustee's qualifications to serve as a Trustee, which led to the conclusion that the Trustee should serve as a Trustee for the fund.
Advisory Board Members and Officers:
Correspondence intended for an officer or Peter S. Lynch may be sent to Fidelity Investments, 245 Summer Street, Boston, Massachusetts 02210. Officers appear below in alphabetical order.
Name, Year of Birth; Principal Occupation
Peter S. Lynch (1944)
Year of Election or Appointment: 2003
Member of the Advisory Board
Mr. Lynch also serves as Member of the Advisory Board of other Fidelity® funds. Mr. Lynch is Vice Chairman and a Director of FMR (investment adviser firm) and FMR Co., Inc. (investment adviser firm). In addition, Mr. Lynch serves as a Trustee of Boston College and as the Chairman of the Inner-City Scholarship Fund. Previously, Mr. Lynch served on the Special Olympics International Board of Directors (1997-2006).
Elizabeth Paige Baumann (1968)
Year of Election or Appointment: 2017
Anti-Money Laundering (AML) Officer
Ms. Baumann also serves as AML Officer of other funds. She is Chief AML Officer (2012-present) and Senior Vice President (2014-present) of FMR LLC (diversified financial services company) and is an employee of Fidelity Investments. Previously, Ms. Baumann served as AML Officer of the funds (2012-2016), and Vice President (2007-2014) and Deputy Anti-Money Laundering Officer (2007-2012) of FMR LLC.
Marc R. Bryant (1966)
Year of Election or Appointment: 2015
Secretary and Chief Legal Officer (CLO)
Mr. Bryant also serves as Secretary and CLO of other funds. Mr. Bryant serves as CLO, Secretary, and Senior Vice President of Fidelity Management & Research Company (investment adviser firm, 2015-present) and FMR Co., Inc. (investment adviser firm, 2015-present); Secretary of Fidelity SelectCo, LLC (investment adviser firm, 2015-present) and Fidelity Investments Money Management, Inc. (investment adviser firm, 2015-present); and CLO of Fidelity Management & Research (Hong Kong) Limited and FMR Investment Management (UK) Limited (investment adviser firms, 2015-present) and Fidelity Management & Research (Japan) Limited (investment adviser firm, 2016-present). He is Senior Vice President and Deputy General Counsel of FMR LLC (diversified financial services company). Previously, Mr. Bryant served as Secretary and CLO of Fidelity Rutland Square Trust II (2010-2014) and Assistant Secretary of Fidelity's Fixed Income and Asset Allocation Funds (2013-2015). Prior to joining Fidelity Investments, Mr. Bryant served as a Senior Vice President and the Head of Global Retail Legal for AllianceBernstein L.P. (2006-2010), and as the General Counsel for ProFund Advisors LLC (2001-2006).
William C. Coffey (1969)
Year of Election or Appointment: 2009
Assistant Secretary
Mr. Coffey also serves as Assistant Secretary of other funds. He is Senior Vice President and Deputy General Counsel of FMR LLC (diversified financial services company, 2010-present), and is an employee of Fidelity Investments. Previously, Mr. Coffey served as Vice President and Associate General Counsel of FMR LLC (2005-2009).
Jonathan Davis (1968)
Year of Election or Appointment: 2010
Assistant Treasurer
Mr. Davis also serves as Assistant Treasurer of other funds, and is an employee of Fidelity Investments. Previously, Mr. Davis served as Vice President and Associate General Counsel of FMR LLC (diversified financial services company, 2003-2010).
Adrien E. Deberghes (1967)
Year of Election or Appointment: 2016
Assistant Treasurer
Mr. Deberghes also serves as an officer of other funds. He serves as Executive Vice President of Fidelity Investments Money Management, Inc. (FIMM) (investment adviser firm, 2016-present) and is an employee of Fidelity Investments (2008-present). Prior to joining Fidelity Investments, Mr. Deberghes was Senior Vice President of Mutual Fund Administration at State Street Corporation (2007-2008), Senior Director of Mutual Fund Administration at Investors Bank & Trust (2005-2007), and Director of Finance for Dunkin' Brands (2000-2005). Previously, Mr. Deberghes served in other fund officer roles.
Stephanie J. Dorsey (1969)
Year of Election or Appointment: 2010
Assistant Treasurer
Ms. Dorsey also serves as an officer of other funds. She is an employee of Fidelity Investments (2008-present) and has served in other fund officer roles. Prior to joining Fidelity Investments, Ms. Dorsey served as Treasurer (2004-2008) of the JPMorgan Mutual Funds and Vice President (2004-2008) of JPMorgan Chase Bank.
Howard J. Galligan III (1966)
Year of Election or Appointment: 2014
Chief Financial Officer
Mr. Galligan also serves as Chief Financial Officer of other funds. Mr. Galligan serves as President of Fidelity Pricing and Cash Management Services (FPCMS) (2014-present) and as a Director of Strategic Advisers, Inc. (investment adviser firm, 2008-present). Previously, Mr. Galligan served as Chief Administrative Officer of Asset Management (2011-2014) and Chief Operating Officer and Senior Vice President of Investment Support for Strategic Advisers, Inc. (2003-2011).
Brian B. Hogan (1964)
Year of Election or Appointment: 2009
Vice President
Mr. Hogan also serves as Trustee or Vice President of other funds. Mr. Hogan serves as a Director of FMR Investment Management (UK) Limited (investment adviser firm, 2015-present) and Fidelity SelectCo, LLC (investment adviser firm, 2014-present) and President of the Equity Division of FMR (investment adviser firm, 2009-present). Previously, Mr. Hogan served as Senior Vice President, Equity Research of FMR (2006-2009) and as a portfolio manager. Mr. Brian B. Hogan is not related to Mr. Colm A. Hogan.
Colm A. Hogan (1973)
Year of Election or Appointment: 2016
Deputy Treasurer
Mr. Hogan also serves as an officer of other funds. Mr. Hogan is an employee of Fidelity Investments (2005-present). Mr. Colm A. Hogan is not related to Mr. Brian B. Hogan.
Chris Maher (1972)
Year of Election or Appointment: 2013
Assistant Treasurer
Mr. Maher serves as Assistant Treasurer of other funds. Mr. Maher is Vice President of Valuation Oversight and is an employee of Fidelity Investments. Previously, Mr. Maher served as Vice President of Asset Management Compliance (2013), Vice President of the Program Management Group of FMR (investment adviser firm, 2010-2013), and Vice President of Valuation Oversight (2008-2010).
Rieco E. Mello (1969)
Year of Election or Appointment: 2017
Assistant Treasurer
Mr. Mello also serves as Assistant Treasurer of other funds. Mr. Mello is an employee of Fidelity Investments (1995-present).
Melissa M. Reilly (1971)
Year of Election or Appointment: 2014
Vice President of certain Equity Funds
Ms. Reilly also serves as Vice President of other funds. Ms. Reilly is an employee of Fidelity Investments (2004-present).
Kenneth B. Robins (1969)
Year of Election or Appointment: 2016
Chief Compliance Officer
Mr. Robins also serves as an officer of other funds. Mr. Robins serves as Compliance Officer of Fidelity Management & Research Company and FMR Co., Inc. (investment adviser firms, 2016-present) and is an employee of Fidelity Investments (2004-present). Previously, Mr. Robins served as Executive Vice President of Fidelity Investments Money Management, Inc. (investment adviser firm, 2013-2016) and served in other fund officer roles.
Stacie M. Smith (1974)
Year of Election or Appointment: 2016
President and Treasurer
Ms. Smith also serves as an officer of other funds. She is an employee of Fidelity Investments (2009-present) and has served in other fund officer roles. Prior to joining Fidelity Investments, Ms. Smith served as Senior Audit Manager of Ernst & Young LLP (accounting firm, 1996-2009). Previously, Ms. Smith served as Deputy Treasurer of certain Fidelity® funds (2013-2016).
Marc L. Spector (1972)
Year of Election or Appointment: 2016
Assistant Treasurer
Mr. Spector also serves as an officer of other funds. Mr. Spector is an employee of Fidelity Investments (2016-present). Prior to joining Fidelity Investments, Mr. Spector served as Director at the Siegfried Group (accounting firm, 2013-2016), and prior to Siegfried Group as audit senior manager at Deloitte & Touche (accounting firm, 2005-2013).
Renee Stagnone (1975)
Year of Election or Appointment: 2016
Assistant Treasurer
Ms. Stagnone also serves as an officer of other funds. Ms. Stagnone is an employee of Fidelity Investments (1997-present). Previously, Ms. Stagnone served as Deputy Treasurer of certain Fidelity® funds (2013-2016).
Shareholder Expense Example
As a shareholder of the Fund, you incur two types of costs: (1) transaction costs, and (2) ongoing costs, including management fees and other Fund expenses. This Example is intended to help you understand your ongoing costs (in dollars) of investing in the Fund and to compare these costs with the ongoing costs of investing in other mutual funds.
The Example is based on an investment of $1,000 invested at the beginning of the period and held for the entire period (May 1, 2017 to October 31, 2017).
Actual Expenses
The first line of the accompanying table provides information about actual account values and actual expenses. You may use the information in this line, together with the amount you invested, to estimate the expenses that you paid over the period. Simply divide your account value by $1,000.00 (for example, an $8,600 account value divided by $1,000.00 = 8.6), then multiply the result by the number in the first line under the heading entitled "Expenses Paid During Period" to estimate the expenses you paid on your account during this period. A small balance maintenance fee of $12.00 that is charged once a year may apply for certain accounts with a value of less than $2,000. This fee is not included in the table below. If it was, the estimate of expenses you paid during the period would be higher, and your ending account value lower, by this amount. In addition, the Fund, as a shareholder in the underlying Fidelity Central Funds, will indirectly bear its pro-rata share of the fees and expenses incurred by the underlying Fidelity Central Funds. These fees and expenses are not included in the Fund's annualized expense ratio used to calculate the expense estimate in the table below.
Hypothetical Example for Comparison Purposes
The second line of the accompanying table provides information about hypothetical account values and hypothetical expenses based on the Fund's actual expense ratio and an assumed rate of return of 5% per year before expenses, which is not the Fund's actual return. The hypothetical account values and expenses may not be used to estimate the actual ending account balance or expenses you paid for the period. You may use this information to compare the ongoing costs of investing in the Fund and other funds. To do so, compare this 5% hypothetical example with the 5% hypothetical examples that appear in the shareholder reports of the other funds. A small balance maintenance fee of $12.00 that is charged once a year may apply for certain accounts with a value of less than $2,000. This fee is not included in the table below. If it was, the estimate of expenses you paid during the period would be higher, and your ending account value lower, by this amount. In addition, the Fund, as a shareholder in the underlying Fidelity Central Funds, will indirectly bear its pro-rata share of the fees and expenses incurred by the underlying Fidelity Central Funds. These fees and expenses are not included in the Fund's annualized expense ratio used to calculate the expense estimate in the table below.
Please note that the expenses shown in the table are meant to highlight your ongoing costs only and do not reflect any transaction costs. Therefore, the second line of the table is useful in comparing ongoing costs only, and will not help you determine the relative total costs of owning different funds.
| | Annualized Expense Ratio-A | Beginning
Account Value
May 1, 2017 | Ending
Account Value
October 31, 2017 | Expenses Paid
During Period-B
May 1, 2017
to October 31, 2017 |
| Actual | .60% | $1,000.00 | $1,168.70 | $3.28 |
| Hypothetical-C | | $1,000.00 | $1,022.18 | $3.06 |
A Annualized expense ratio reflects expenses net of applicable fee waivers.
B Expenses are equal to the Fund's annualized expense ratio, multiplied by the average account value over the period, multiplied by 184/365 (to reflect the one-half year period).
C 5% return per year before expenses
Distributions (Unaudited)
The Board of Trustees of Fidelity Focused Stock Fund voted to pay on December 11, 2017, to shareholders of record at the opening of business on December 8, 2017, a distribution of $1.334 per share derived from capital gains realized from sales of portfolio securities and a dividend of $.102 per share from net investment income.
The fund hereby designates as a capital gain dividend with respect to the taxable year ended October 31, 2017, $73,578,293, or, if subsequently determined to be different, the net capital gain of such year.
The fund designates 88% of the dividend distributed during the fiscal year as qualifying for the dividends–received deduction for corporate shareholders.
The fund designates 92% of the dividend distributed in December during the fiscal year as amounts which may be taken into account as a dividend for the purposes of the maximum rate under section 1(h)(11) of the Internal Revenue Code.
The fund will notify shareholders in January 2018 of amounts for use in preparing 2017 income tax returns.
Board Approval of Investment Advisory Contracts and Management Fees
Fidelity Focused Stock Fund
Each year, the Board of Trustees, including the Independent Trustees (together, the Board), votes on the renewal of the management contract with Fidelity Management & Research Company (FMR) and the sub-advisory agreements (together, the Advisory Contracts) for the fund. FMR and the sub-advisers are referred to herein as the Investment Advisers. The Board, assisted by the advice of fund counsel and Independent Trustees' counsel, requests and considers a broad range of information relevant to the renewal of the Advisory Contracts throughout the year.
The Board meets regularly and, at each of its meetings, covers an extensive agenda of topics and materials and considers factors that are relevant to its annual consideration of the renewal of the fund's Advisory Contracts, including the services and support provided to the fund and its shareholders. The Board has established various standing committees (Committees), each composed of and chaired by Independent Trustees with varying backgrounds, to which the Board has assigned specific subject matter responsibilities in order to enhance effective decision-making by the Board. The Board, acting directly and through its Committees, requests and receives information concerning the annual consideration of the renewal of the fund's Advisory Contracts. The Board also meets as needed to review matters specifically related to the Board's annual consideration of the renewal of the Advisory Contracts. Members of the Board may also meet with trustees of other Fidelity funds through ad hoc joint committees to discuss certain matters relevant to all of the Fidelity funds.
At its July 2017 meeting, the Board unanimously determined to renew the fund's Advisory Contracts. In reaching its determination, the Board considered all factors it believed relevant, including (i) the nature, extent, and quality of the services to be provided to the fund and its shareholders (including the investment performance of the fund); (ii) the competitiveness of the fund's management fee and total expense ratio relative to peer funds; (iii) the total costs of the services to be provided by and the profits to be realized by Fidelity from its relationships with the fund; and (iv) the extent to which, if any, economies of scale exist and would be realized as the fund grows, and whether any economies of scale are appropriately shared with fund shareholders.
In considering whether to renew the Advisory Contracts for the fund, the Board reached a determination, with the assistance of fund counsel and Independent Trustees' counsel and through the exercise of its business judgment, that the renewal of the Advisory Contracts was in the best interests of the fund and its shareholders and that the compensation payable under the Advisory Contracts was fair and reasonable. The Board's decision to renew the Advisory Contracts was not based on any single factor, but rather was based on a comprehensive consideration of all the information provided to the Board at its meetings throughout the year. The Board, in reaching its determination to renew the Advisory Contracts, was aware that shareholders of the fund have a broad range of investment choices available to them, including a wide choice among funds offered by Fidelity's competitors, and that the fund's shareholders, who have the opportunity to review and weigh the disclosure provided by the fund in its prospectus and other public disclosures, have chosen to invest in this fund, which is part of the Fidelity family of funds.
Amendment to Group Fee Rate. The Board also approved an amendment to the management contract for the fund to add an additional breakpoint to the group fee schedule, effective October 1, 2017. The Board noted that the additional breakpoint would result in lower management fee rates as Fidelity's assets under management increase.
Nature, Extent, and Quality of Services Provided. The Board considered Fidelity's staffing as it relates to the fund, including the backgrounds of investment personnel of Fidelity, and also considered the fund's investment objective, strategies, and related investment philosophy. The Independent Trustees also had discussions with senior management of Fidelity's investment operations and investment groups. The Board considered the structure of the investment personnel compensation program and whether this structure provides appropriate incentives to act in the best interests of the fund. Additionally, the Board considered the portfolio managers' investments, if any, in the funds that they manage.
Resources Dedicated to Investment Management and Support Services. The Board and the Fund Oversight and Research Committees reviewed the general qualifications and capabilities of Fidelity's investment staff, including its size, education, experience, and resources, as well as Fidelity's approach to recruiting, training, managing, and compensating investment personnel. The Board noted that Fidelity has continued to increase the resources devoted to non-U.S. offices, including expansion of Fidelity's global investment organization. The Board also noted that Fidelity's analysts have extensive resources, tools and capabilities that allow them to conduct sophisticated quantitative and fundamental analysis, as well as credit analysis of issuers, counterparties and guarantors. Further, the Board considered that Fidelity's investment professionals have sufficient access to global information and data so as to provide competitive investment results over time, and that those professionals also have access to sophisticated tools that permit them to assess portfolio construction and risk and performance attribution characteristics continuously, as well as to transmit new information and research conclusions rapidly around the world. Additionally, in its deliberations, the Board considered Fidelity's trading, risk management, compliance, and technology and operations capabilities and resources, which are integral parts of the investment management process.
Shareholder and Administrative Services. The Board considered (i) the nature, extent, quality, and cost of advisory, administrative, and shareholder services performed by the Investment Advisers and their affiliates under the Advisory Contracts and under separate agreements covering transfer agency, pricing and bookkeeping, and securities lending services for the fund; (ii) the nature and extent of the supervision of third party service providers, principally custodians, subcustodians, and pricing vendors; and (iii) the resources devoted to, and the record of compliance with, the fund's compliance policies and procedures. The Board also reviewed the allocation of fund brokerage, including allocations to brokers affiliated with the Investment Advisers, the use of brokerage commissions to pay fund expenses, and the use of "soft" commission dollars to pay for research services.
The Board noted that the growth of fund assets over time across the complex allows Fidelity to reinvest in the development of services designed to enhance the value or convenience of the Fidelity funds as investment vehicles. These services include 24-hour access to account information and market information through telephone representatives and over the Internet, investor education materials and asset allocation tools, and the expanded availability of Fidelity Investor Centers.
In 2014, the Board formed an ad hoc Committee on Transfer Agency Fees to review the variety of transfer agency fee structures throughout the industry and Fidelity's competitive positioning with respect to industry participants.
Investment in a Large Fund Family. The Board considered the benefits to shareholders of investing in a Fidelity fund, including the benefits of investing in a fund that is part of a large family of funds offering a variety of investment disciplines and providing a large variety of mutual fund investor services. The Board noted that Fidelity had taken, or had made recommendations that resulted in the Fidelity funds taking, a number of actions over the previous year that benefited particular funds, including: (i) continuing to dedicate additional resources to Fidelity's investment research process, and to the support of the senior management team that oversees asset management; (ii) continuing efforts to enhance Fidelity's global research capabilities; (iii) launching new funds and making other enhancements to meet client needs; (iv) launching new share classes of existing funds; (v) eliminating purchase minimums and broadening eligibility requirements for certain lower-priced share classes; (vi) reducing management fees and total expenses for certain growth equity funds and index funds; (vii) lowering expense caps for certain existing funds and classes to reduce expenses borne by shareholders; (viii) eliminating short-term redemption fees for certain funds; (ix) introducing a new pricing structure for certain funds of funds that is expected to reduce overall expenses paid by shareholders; (x) rationalizing product lines and gaining increased efficiencies through proposals for fund mergers and share class consolidations; (xi) continuing to develop, acquire and implement systems and technology to improve services to the funds and shareholders, strengthen information security, and increase efficiency; and (xii) implementing enhancements to further strengthen Fidelity's product line to increase investors' probability of success in achieving their investment goals, including retirement income goals.
Investment Performance. The Board considered whether the fund has operated in accordance with its investment objective, as well as its record of compliance with its investment restrictions and its performance history.
The Board took into account discussions with representatives of the Investment Advisers about fund investment performance that occur at Board meetings throughout the year. In this regard the Board noted that as part of regularly scheduled fund reviews and other reports to the Board on fund performance, the Board considers annualized return information for the fund for different time periods, measured against a securities market index ("benchmark index") and a peer group of funds with similar objectives ("peer group"), if any. In its evaluation of fund investment performance, the Board gave particular attention to information indicating changes in performance of certain Fidelity funds for specific time periods and discussed with the Investment Advisers the reasons for any overperformance or underperformance.
In addition to reviewing absolute and relative fund performance, the Independent Trustees periodically consider the appropriateness of fund performance metrics in evaluating the results achieved. In general, the Independent Trustees believe that fund performance should be evaluated based on net performance (after fees and expenses) of both the highest performing and lowest performing fund share classes, where applicable, compared to appropriate benchmark indices, over appropriate time periods that may include full market cycles, and compared to peer groups, as applicable, over the same periods, taking into account relevant factors including the following: general market conditions; issuer-specific information; and fund cash flows and other factors.
The Independent Trustees recognize that shareholders evaluate performance on a net basis over their own holding periods, for which one-, three-, and five-year periods are often used as a proxy. For this reason, the performance information reviewed by the Board also included net cumulative calendar year total return information for the fund and an appropriate benchmark index and peer group for the most recent one-, three-, and five-year periods, as shown below. Returns are shown compared to the 25th percentile (top of box, 75% beaten) and 75th percentile (bottom of box, 25% beaten) of the peer universe.
Fidelity Focused Stock Fund
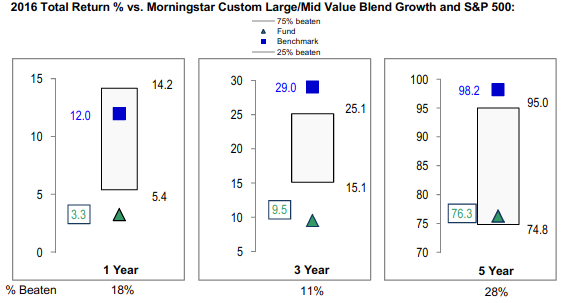
The Board has discussed the fund's underperformance with FMR, including the fund's investment strategy, the portfolio management team, and broader trends in the market that may have impacted the fund's performance, and has engaged with FMR to consider what steps might be taken to remediate the fund's underperformance.
The Board also considered that the fund's management fee is subject to upward or downward adjustment depending upon whether, and to what extent, the fund's investment performance for the performance period (a rolling 36-month period) exceeds, or is exceeded by, a securities index, thus leading to a performance adjustment for the same period. The Board noted that the performance adjustment provides FMR with a strong economic incentive to seek to achieve superior long-term performance for the fund's shareholders and helps to more closely align the interests of FMR and the shareholders of the fund.
Based on its review, the Board concluded that the nature, extent, and quality of services provided to the fund under the Advisory Contracts should continue to benefit the shareholders of the fund.
Competitiveness of Management Fee and Total Expense Ratio. The Board considered the fund's management fee and total expense ratio compared to "mapped groups" of competitive funds and classes created for the purpose of facilitating the Trustees' competitive analysis of management fees and total expenses. Fidelity creates "mapped groups" by combining similar Lipper investment objective categories that have comparable investment mandates. Combining Lipper investment objective categories aids the Board's management fee and total expense ratio comparisons by broadening the competitive group used for comparison.
Management Fee. The Board considered two proprietary management fee comparisons for the 12-month periods shown in basis points (BP) in the chart below. The group of Lipper funds used by the Board for management fee comparisons is referred to below as the "Total Mapped Group." The Total Mapped Group comparison focuses on a fund's standing in terms of gross management fees before expense reimbursements or caps, and without giving effect to the fund's performance adjustment, relative to the total universe of funds with comparable investment mandates, regardless of whether their management fee structures also are comparable. Funds with comparable investment mandates offer exposure to similar types of securities. Funds with comparable management fee structures have similar management fee contractual arrangements (
e.g., flat rate charged for advisory services, all-inclusive fee rate,
etc.). "TMG %" represents the percentage of funds in the Total Mapped Group that had management fees that were lower than the fund's. For example, a hypothetical TMG % of 20% would mean that 80% of the funds in the Total Mapped Group had higher, and 20% had lower, management fees than the fund. The fund's actual TMG %s and the number of funds in the Total Mapped Group are in the chart below. The "Asset-Size Peer Group" (ASPG) comparison focuses on a fund's standing relative to a subset of non-Fidelity funds within the Total Mapped Group that are similar in size and management fee structure without taking into account performance adjustments, if any. For example, if a fund is in the first quartile of the ASPG, the fund's management fee ranks in the least expensive or lowest 25% of funds in the ASPG. The ASPG represents at least 15% of the funds in the Total Mapped Group with comparable asset size and management fee structures, subject to a minimum of 50 funds (or all funds in the Total Mapped Group if fewer than 50). Additional information, such as the ASPG quartile in which the fund's management fee rate ranked and the impact of the fund's performance adjustment, is also included in the chart and considered by the Board.
Fidelity Focused Stock Fund

The Board noted that the fund's management fee rate ranked below the median of its Total Mapped Group and below the median of its ASPG for 2016. The Board also noted the effect of the fund's performance adjustment, if any, on the fund's management fee ranking.
The Board noted that, in 2014, the Board and the boards of other Fidelity funds formed the ad hoc Committee on Group Fee to conduct an in-depth review of the "group fee" component of the management fee of funds with such management fee structures. The Committee's focus included the mechanics of the group fee, the competitive landscape of group fee structures, Fidelity funds with no group fee component and investment products not included in group fee assets. The Board also considered that, for funds subject to the group fee, FMR agreed to voluntarily waive fees over a specified period of time in amounts designed to account for assets converted from certain funds to certain collective investment trusts.
The Board also noted that, in 2013, the ad hoc Committee on Management Fees was formed to conduct an in-depth review of the management fee rates of Fidelity's active equity mutual funds. The Committee focused on the following areas: (i) standard fee structures; (ii) research consumption and trading evolution; (iii) management fee competitiveness/profitability by category; and (iv) factors that drive institutional pricing.
Based on its review, the Board concluded that the fund's management fee is fair and reasonable in light of the services that the fund receives and the other factors considered.
Total Expense Ratio. In its review of the fund's total expense ratio, the Board considered the fund's management fee rate as well as other fund expenses, such as transfer agent fees, pricing and bookkeeping fees, and custodial, legal, and audit fees. The Board noted the impact of the fund's performance adjustment. The Board also noted that Fidelity may agree to waive fees and expenses from time to time, and the extent to which, if any, it has done so for the fund. As part of its review, the Board also considered the current and historical total expense ratios of the fund compared to competitive fund median expenses. The fund is compared to those funds and classes in the Total Mapped Group (used by the Board for management fee comparisons) that have a similar sales load structure.
The Board noted that the fund's total expense ratio ranked below the competitive median for 2016.
Fees Charged to Other Fidelity Clients. The Board also considered Fidelity fee structures and other information with respect to clients of Fidelity, such as other funds advised or subadvised by Fidelity, pension plan clients, and other institutional clients with similar mandates. The Board noted that an ad hoc joint committee created by it and the boards of other Fidelity funds periodically (most recently in 2013) reviews and compares Fidelity's institutional investment advisory business with its business of providing services to the Fidelity funds, including the differences in services provided, fees charged, and costs incurred, as well as competition in their respective marketplaces.
Based on its review of total expense ratios and fees charged to other Fidelity clients, the Board concluded that the fund's total expense ratio was reasonable in light of the services that the fund and its shareholders receive and the other factors considered.
Costs of the Services and Profitability. The Board considered the revenues earned and the expenses incurred by Fidelity in conducting the business of developing, marketing, distributing, managing, administering and servicing the fund and servicing the fund's shareholders. The Board also considered the level of Fidelity's profits in respect of all the Fidelity funds.
On an annual basis, Fidelity presents to the Board information about the profitability of its relationships with the fund. Fidelity calculates profitability information for each fund, as well as aggregate profitability information for groups of Fidelity funds and all Fidelity funds, using a series of detailed revenue and cost allocation methodologies which originate with the books and records of Fidelity on which Fidelity's audited financial statements are based. The Audit Committee of the Board reviews any significant changes from the prior year's methodologies.
PricewaterhouseCoopers LLP (PwC), independent registered public accounting firm and auditor to Fidelity and certain Fidelity funds, has been engaged annually by the Board as part of the Board's assessment of Fidelity's profitability analysis. PwC's engagement includes the review and assessment of the methodologies used by Fidelity in determining the revenues and expenses attributable to Fidelity's mutual fund business, and completion of agreed-upon procedures in respect of the mathematical accuracy of the fund profitability information and its conformity to established allocation methodologies. After considering PwC's reports issued under the engagement and information provided by Fidelity, the Board concluded that while other allocation methods may also be reasonable, Fidelity's profitability methodologies are reasonable in all material respects.
The Board also reviewed Fidelity's non-fund businesses and potential fall-out benefits related to the mutual fund business as well as cases where Fidelity's affiliates may benefit from or be related to the fund's business.
The Board considered the costs of the services provided by and the profits realized by Fidelity in connection with the operation of the fund and was satisfied that the profitability was not excessive.
Economies of Scale. The Board considered whether there have been economies of scale in respect of the management of the Fidelity funds, whether the Fidelity funds (including the fund) have appropriately benefited from any such economies of scale, and whether there is potential for realization of any further economies of scale. The Board considered the extent to which the fund will benefit from economies of scale as assets grow through increased services to the fund, through waivers or reimbursements, or through fee or expense ratio reductions. The Board also noted that a committee (the Economies of Scale Committee) created by it and the boards of other Fidelity funds periodically (most recently in 2013) analyzes whether Fidelity attains economies of scale in respect of the management and servicing of the Fidelity funds, whether the Fidelity funds have appropriately benefited from such economies of scale, and whether there is potential for realization of any further economies of scale.
The Board recognized that the fund's management contract incorporates a "group fee" structure, which provides for lower group fee rates as total group assets increase, and for higher group fee rates as total group assets decrease (with "group assets" defined to include fund assets under FMR's management plus the assets of sector funds previously under FMR's management). FMR calculates the group fee rates based on a tiered asset "breakpoint" schedule that varies based on asset class. The Board considered that the group fee is designed to deliver the benefits of economies of scale to fund shareholders when total Fidelity fund assets increase, even if assets of any particular fund are unchanged or have declined, because some portion of Fidelity's costs are attributable to services provided to all Fidelity funds, and all funds benefit if those costs can be allocated among more assets. The Board concluded that, given the group fee structure, fund shareholders will benefit from lower management fees as group assets increase at the fund complex level, regardless of whether Fidelity achieves any such economies of scale.
The Board concluded, taking into account the analysis of the Economies of Scale Committee, that economies of scale, if any, are being appropriately shared between fund shareholders and Fidelity.
Additional Information Requested by the Board. In order to develop fully the factual basis for consideration of the Fidelity funds' advisory contracts, the Board requested and received additional information on certain topics, including: (i) fund performance trends, in particular the underperformance of certain funds, and Fidelity's long-term strategies for certain funds; (ii) Fidelity's fund profitability methodology, profitability trends for certain funds, and the impact of certain factors on fund profitability results, including the impact of market trends on actively managed funds; (iii) the use of performance fees and the calculation of performance adjustments, including the impact of underperformance and fund outflows on performance adjustments; (iv) metrics for evaluating index fund performance; (v) Fidelity's group fee structure, including the group fee breakpoint schedules; (vi) the terms of Fidelity's contractual and voluntary expense cap arrangements with the funds; (vii) the methodology with respect to evaluating competitive fund data and peer group classifications and fee comparisons; (viii) the expense structures for different funds and classes; (ix) Fidelity's arrangements with affiliated sub-advisers on behalf of the funds; (x) information regarding other accounts managed by Fidelity, including institutional accounts and collective investment trusts; (xi) recent changes to the fee structure for certain funds of funds; and (xii) the impact of the Department of Labor's new fiduciary rule on the funds' comparative expense information.
Based on its evaluation of all of the conclusions noted above, and after considering all factors it believed relevant, the Board concluded that the advisory fee structures are fair and reasonable, and that the fund's Advisory Contracts should be renewed.
Corporate Headquarters
245 Summer St.
Boston, MA 02210
www.fidelity.com
TQG-ANN-1217
1.538682.120
Fidelity® Value Fund
Annual Report October 31, 2017 |
|
Contents
To view a fund's proxy voting guidelines and proxy voting record for the 12-month period ended June 30, visit http://www.fidelity.com/proxyvotingresults or visit the Securities and Exchange Commission's (SEC) web site at http://www.sec.gov.
You may also call 1-800-544-8544 to request a free copy of the proxy voting guidelines.
Standard & Poor's, S&P and S&P 500 are registered service marks of The McGraw-Hill Companies, Inc. and have been licensed for use by Fidelity Distributors Corporation.
Other third-party marks appearing herein are the property of their respective owners.
All other marks appearing herein are registered or unregistered trademarks or service marks of FMR LLC or an affiliated company. © 2017 FMR LLC. All rights reserved.
This report and the financial statements contained herein are submitted for the general information of the shareholders of the Fund. This report is not authorized for distribution to prospective investors in the Fund unless preceded or accompanied by an effective prospectus.
A fund files its complete schedule of portfolio holdings with the SEC for the first and third quarters of each fiscal year on Form N-Q. Forms N-Q are available on the SEC’s web site at http://www.sec.gov. A fund's Forms N-Q may be reviewed and copied at the SEC’s Public Reference Room in Washington, DC. Information regarding the operation of the SEC's Public Reference Room may be obtained by calling 1-800-SEC-0330.
For a complete list of a fund's portfolio holdings, view the most recent holdings listing, semiannual report, or annual report on Fidelity's web site at http://www.fidelity.com, http://www.institutional.fidelity.com, or http://www.401k.com, as applicable.
NOT FDIC INSURED •MAY LOSE VALUE •NO BANK GUARANTEE
Neither the Fund nor Fidelity Distributors Corporation is a bank.
Performance: The Bottom Line
Average annual total return reflects the change in the value of an investment, assuming reinvestment of distributions from dividend income and capital gains (the profits earned upon the sale of securities that have grown in value, if any) and assuming a constant rate of performance each year. The hypothetical investment and the average annual total returns do not reflect the deduction of taxes that a shareholder would pay on fund distributions or the redemption of fund shares. During periods of reimbursement by Fidelity, a fund’s total return will be greater than it would be had the reimbursement not occurred. How a fund did yesterday is no guarantee of how it will do tomorrow.
Average Annual Total Returns
| For the periods ended October 31, 2017 | Past 1 year | Past 5 years | Past 10 years |
| Fidelity® Value Fund | 19.86% | 14.01% | 6.16% |
$10,000 Over 10 Years
Let's say hypothetically that $10,000 was invested in Fidelity® Value Fund, a class of the fund, on October 31, 2007.
The chart shows how the value of your investment would have changed, and also shows how the Russell Midcap® Value Index performed over the same period.

| Period Ending Values |
| $18,178 | Fidelity® Value Fund |
| $21,382 | Russell Midcap® Value Index |
Management's Discussion of Fund Performance
Market Recap: The U.S. equity bellwether S&P 500
® index gained 23.63% for the year ending October 31, 2017. Equity markets rose sharply following the November election and continued to rally through the end of February on optimism for President Trump’s pro-business agenda. Stocks leveled off in March amid fading optimism and stalled efforts by Congress to repeal and replace the Affordable Care Act. Upward momentum soon returned and continued through period end amid positive consumer sentiment and other market indicators. The lone exception was a brief cooldown in August, when geopolitical tension escalated and uncertainty grew regarding the future of health care, tax reform and the debt ceiling. Sector-wise, information technology (+39%) performed best, surging as a handful of major index constituents posted strong returns. Financials gained 37%, riding an uptick in bond yields and a surge in banks. Materials (+29%) also did well, spurred by higher demand, especially from China. Conversely, consumer discretionary (+20%) lagged the broader market, as brick-and-mortar retailers continued to suffer from increased online competition. Rising interest rates held back real estate (+9%) and sluggish oil prices dragged on energy (+2%). Consumer staples (+4%) and telecommunication services (-1%) struggled due to investors’ general preference for risk assets.
Comments from Co-Portfolio Manager Matthew Friedman: For the fiscal year, the fund’s share classes gained roughly 20%, outpacing the 17.12% return of the benchmark Russell Midcap
® Value Index. Versus the benchmark, the top individual contributor was Aerojet Rocketdyne Holdings. Shares of the maker of propulsion systems for rockets and missiles were driven by the Trump administration's promise to boost military spending. Elsewhere, it helped to establish a position in DXC Technology in April. The stock of the provider of technology consulting services benefited from the firm's better-than-expected earnings. Aerojet Rocketdyne and DXC were both non-benchmark holdings. Among individual detractors, untimely ownership of Israel-based Teva Pharmaceutical Industries hurt most. Shares of the maker of generic drugs were hurt by a combination of excess debt from the company’s 2016 acquisition of Actavis’ generics business and drug-pricing pressure stemming from poor industry fundamentals and turnover in the broader generics product cycle. We sold our non-benchmark stake in Teva in October.
The views expressed above reflect those of the portfolio manager(s) only through the end of the period as stated on the cover of this report and do not necessarily represent the views of Fidelity or any other person in the Fidelity organization. Any such views are subject to change at any time based upon market or other conditions and Fidelity disclaims any responsibility to update such views. These views may not be relied on as investment advice and, because investment decisions for a Fidelity fund are based on numerous factors, may not be relied on as an indication of trading intent on behalf of any Fidelity fund.
Note to shareholders: Effective December 31, 2016, Steve Barwikowski is no longer a Co-Manager of the fund. On December 1, 2017, Matt Friedman transitioned from Co-Manager to Lead Manager of the fund and also assumed joint responsibility of its consumer sleeves with Kathy Buck, who plans to retire from portfolio management on March 31, 2017.
Investment Summary (Unaudited)
Top Ten Stocks as of October 31, 2017
| | % of fund's net assets | % of fund's net assets 6 months ago |
| Sempra Energy | 1.8 | 2.1 |
| Xcel Energy, Inc. | 1.7 | 1.8 |
| Synchrony Financial | 1.6 | 1.1 |
| Discover Financial Services | 1.5 | 1.0 |
| Edison International | 1.5 | 1.7 |
| Wells Fargo & Co. | 1.4 | 1.1 |
| U.S. Bancorp | 1.3 | 1.0 |
| American Tower Corp. | 1.3 | 1.7 |
| Berkshire Hathaway, Inc. Class B | 1.1 | 1.0 |
| Chubb Ltd. | 1.0 | 1.0 |
| | 14.2 | |
Top Five Market Sectors as of October 31, 2017
| | % of fund's net assets | % of fund's net assets 6 months ago |
| Financials | 17.2 | 16.3 |
| Real Estate | 12.4 | 12.1 |
| Consumer Discretionary | 12.4 | 11.4 |
| Industrials | 12.0 | 12.1 |
| Materials | 8.8 | 8.3 |
Asset Allocation (% of fund's net assets)
| As of October 31, 2017 * |
| | Stocks and Equity Futures | 98.3% |
| | Convertible Securities | 0.1% |
| | Short-Term Investments and Net Other Assets (Liabilities) | 1.6% |

* Foreign investments - 15.9%
| As of April 30, 2017 * |
| | Stocks and Equity Futures | 97.8% |
| | Convertible Securities | 0.2% |
| | Short-Term Investments and Net Other Assets (Liabilities) | 2.0% |

* Foreign investments - 16.9%
Investments October 31, 2017
Showing Percentage of Net Assets
| Common Stocks - 97.6% | | | |
| | | Shares | Value (000s) |
| CONSUMER DISCRETIONARY - 12.4% | | | |
| Auto Components - 1.2% | | | |
| American Axle & Manufacturing Holdings, Inc. (a) | | 1,676,700 | $29,828 |
| Delphi Automotive PLC | | 613,300 | 60,950 |
| Hertz Global Holdings, Inc. (a)(b) | | 293,200 | 7,292 |
| | | | 98,070 |
| Diversified Consumer Services - 1.4% | | | |
| Houghton Mifflin Harcourt Co. (a) | | 4,809,306 | 47,612 |
| Service Corp. International | | 882,027 | 31,277 |
| ServiceMaster Global Holdings, Inc. (a) | | 854,620 | 40,261 |
| | | | 119,150 |
| Hotels, Restaurants & Leisure - 1.6% | | | |
| DineEquity, Inc. | | 675,818 | 32,176 |
| Eldorado Resorts, Inc. (a) | | 990,165 | 25,447 |
| U.S. Foods Holding Corp. (a) | | 1,174,400 | 32,038 |
| Wyndham Worldwide Corp. | | 456,200 | 48,745 |
| | | | 138,406 |
| Household Durables - 1.5% | | | |
| D.R. Horton, Inc. | | 1,456,100 | 64,374 |
| Newell Brands, Inc. | | 347,400 | 14,167 |
| Techtronic Industries Co. Ltd. | | 5,895,500 | 34,573 |
| Whirlpool Corp. | | 77,200 | 12,655 |
| | | | 125,769 |
| Internet & Direct Marketing Retail - 0.8% | | | |
| Liberty Interactive Corp. QVC Group: | | | |
| (Venture Group) Series A (a) | | 496,600 | 28,286 |
| Series A (a) | | 1,859,200 | 42,241 |
| | | | 70,527 |
| Leisure Products - 0.8% | | | |
| Mattel, Inc. (b) | | 3,735,800 | 52,749 |
| Vista Outdoor, Inc. (a) | | 591,800 | 12,375 |
| | | | 65,124 |
| Media - 3.4% | | | |
| DISH Network Corp. Class A (a) | | 435,700 | 21,149 |
| Entercom Communications Corp. Class A (b) | | 1,985,700 | 21,942 |
| Grupo Televisa SA de CV (CPO) sponsored ADR | | 1,010,000 | 22,109 |
| Liberty Broadband Corp. Class C (a) | | 418,271 | 36,511 |
| Liberty Global PLC Class C (a) | | 1,062,200 | 31,749 |
| Nexstar Broadcasting Group, Inc. Class A | | 297,800 | 19,000 |
| Omnicom Group, Inc. | | 887,000 | 59,598 |
| Sinclair Broadcast Group, Inc. Class A (b) | | 1,224,156 | 38,806 |
| Twenty-First Century Fox, Inc.: | | | |
| Class A | | 804,000 | 21,025 |
| Class B | | 434,900 | 11,068 |
| | | | 282,957 |
| Specialty Retail - 1.4% | | | |
| AutoZone, Inc. (a) | | 91,500 | 53,939 |
| O'Reilly Automotive, Inc. (a) | | 132,700 | 27,993 |
| Sally Beauty Holdings, Inc. (a) | | 779,200 | 13,488 |
| Signet Jewelers Ltd. (b) | | 363,200 | 23,815 |
| | | | 119,235 |
| Textiles, Apparel & Luxury Goods - 0.3% | | | |
| PVH Corp. | | 215,472 | 27,324 |
|
| TOTAL CONSUMER DISCRETIONARY | | | 1,046,562 |
|
| CONSUMER STAPLES - 4.8% | | | |
| Beverages - 1.1% | | | |
| Cott Corp. | | 2,064,911 | 30,955 |
| Molson Coors Brewing Co. Class B | | 763,386 | 61,735 |
| | | | 92,690 |
| Food & Staples Retailing - 0.4% | | | |
| CVS Health Corp. | | 449,800 | 30,825 |
| Walgreens Boots Alliance, Inc. | | 97,800 | 6,481 |
| | | | 37,306 |
| Food Products - 2.8% | | | |
| Bunge Ltd. | | 114,509 | 7,876 |
| Darling International, Inc. (a) | | 3,348,600 | 61,112 |
| Nomad Foods Ltd. (a) | | 2,300,517 | 34,738 |
| The J.M. Smucker Co. | | 577,031 | 61,194 |
| TreeHouse Foods, Inc. (a) | | 677,500 | 44,972 |
| Tyson Foods, Inc. Class A | | 309,600 | 22,573 |
| | | | 232,465 |
| Personal Products - 0.5% | | | |
| Coty, Inc. Class A | | 2,437,409 | 37,536 |
|
| TOTAL CONSUMER STAPLES | | | 399,997 |
|
| ENERGY - 7.7% | | | |
| Energy Equipment & Services - 1.2% | | | |
| Baker Hughes, a GE Co. Class A | | 505,334 | 15,883 |
| C&J Energy Services, Inc. | | 313,600 | 8,934 |
| Dril-Quip, Inc. (a) | | 611,633 | 25,750 |
| Halliburton Co. | | 222,155 | 9,495 |
| Nabors Industries Ltd. | | 4,676,000 | 26,326 |
| Odfjell Drilling A/S (a) | | 2,299,782 | 9,207 |
| TechnipFMC PLC | | 221,427 | 6,065 |
| | | | 101,660 |
| Oil, Gas & Consumable Fuels - 6.5% | | | |
| Anadarko Petroleum Corp. | | 263,800 | 13,024 |
| Boardwalk Pipeline Partners, LP | | 3,015,800 | 42,282 |
| Cabot Oil & Gas Corp. | | 958,300 | 26,545 |
| Cenovus Energy, Inc. | | 3,355,600 | 32,565 |
| Cheniere Energy, Inc. (a) | | 666,500 | 31,152 |
| Diamondback Energy, Inc. (a) | | 232,617 | 24,927 |
| Energen Corp. (a) | | 358,279 | 18,523 |
| Enterprise Products Partners LP | | 690,100 | 16,907 |
| EQT Corp. | | 853,664 | 53,388 |
| GasLog Ltd. (b) | | 1,803,700 | 31,114 |
| Golar LNG Ltd. (b) | | 713,748 | 15,081 |
| Lundin Petroleum AB | | 1,323,400 | 31,126 |
| Marathon Petroleum Corp. | | 682,399 | 40,767 |
| Newfield Exploration Co. (a) | | 526,610 | 16,214 |
| Phillips 66 Co. | | 330,100 | 30,066 |
| Plains GP Holdings LP Class A | | 707,600 | 14,435 |
| Teekay Corp. (b) | | 3,146,864 | 25,490 |
| Teekay LNG Partners LP | | 1,977,280 | 34,108 |
| Teekay Offshore Partners LP | | 8,874,100 | 22,718 |
| WPX Energy, Inc. (a) | | 1,877,800 | 21,182 |
| | | | 541,614 |
|
| TOTAL ENERGY | | | 643,274 |
|
| FINANCIALS - 17.2% | | | |
| Banks - 5.0% | | | |
| Bank Ireland Group PLC (a) | | 758,257 | 5,922 |
| CIT Group, Inc. | | 1,672,274 | 77,961 |
| EFG Eurobank Ergasias SA (a) | | 6,391,260 | 5,219 |
| First Citizen Bancshares, Inc. Class A | | 73,592 | 29,805 |
| PNC Financial Services Group, Inc. | | 376,100 | 51,447 |
| Popular, Inc. | | 337,800 | 12,391 |
| Prosperity Bancshares, Inc. | | 165,000 | 10,854 |
| U.S. Bancorp | | 2,085,115 | 113,389 |
| Wells Fargo & Co. | | 2,059,028 | 115,594 |
| | | | 422,582 |
| Capital Markets - 2.7% | | | |
| Apollo Global Management LLC Class A | | 1,119,832 | 35,364 |
| Ares Capital Corp. (b) | | 901,262 | 14,492 |
| Brookfield Asset Management, Inc. Class A | | 262,850 | 11,027 |
| Carlyle Group LP | | 140,000 | 3,087 |
| Franklin Resources, Inc. | | 796,000 | 33,535 |
| KKR & Co. LP | | 977,936 | 19,608 |
| Legg Mason, Inc. | | 1,193,800 | 45,579 |
| State Street Corp. | | 286,300 | 26,340 |
| The Blackstone Group LP | | 1,109,704 | 36,942 |
| | | | 225,974 |
| Consumer Finance - 4.9% | | | |
| Ally Financial, Inc. | | 1,346,500 | 35,184 |
| Capital One Financial Corp. | | 819,791 | 75,568 |
| Discover Financial Services | | 1,917,300 | 127,558 |
| OneMain Holdings, Inc. (a) | | 1,291,038 | 41,016 |
| Synchrony Financial | | 4,031,100 | 131,494 |
| | | | 410,820 |
| Diversified Financial Services - 1.4% | | | |
| Berkshire Hathaway, Inc. Class B (a) | | 468,689 | 87,617 |
| Donnelley Financial Solutions, Inc. | | 1,230,000 | 26,445 |
| | | | 114,062 |
| Insurance - 3.2% | | | |
| AFLAC, Inc. | | 231,446 | 19,416 |
| AMBAC Financial Group, Inc. (a) | | 2,040,459 | 33,219 |
| American International Group, Inc. | | 96,900 | 6,261 |
| Chubb Ltd. | | 555,648 | 83,803 |
| Fairfax Financial Holdings Ltd. (sub. vtg.) | | 10,000 | 5,266 |
| FNF Group | | 1,554,600 | 58,173 |
| Greenlight Capital Re, Ltd. (a) | | 325,043 | 7,167 |
| Reinsurance Group of America, Inc. | | 240,593 | 35,940 |
| Torchmark Corp. | | 285,851 | 24,049 |
| | | | 273,294 |
| Mortgage Real Estate Investment Trusts - 0.0% | | | |
| MFA Financial, Inc. | | 292,290 | 2,408 |
|
| TOTAL FINANCIALS | | | 1,449,140 |
|
| HEALTH CARE - 6.2% | | | |
| Biotechnology - 1.2% | | | |
| Amgen, Inc. | | 277,700 | 48,659 |
| Shire PLC sponsored ADR | | 157,500 | 23,252 |
| United Therapeutics Corp. (a) | | 262,700 | 31,154 |
| | | | 103,065 |
| Health Care Equipment & Supplies - 0.8% | | | |
| Dentsply Sirona, Inc. | | 109,300 | 6,675 |
| Hill-Rom Holdings, Inc. | | 15,100 | 1,219 |
| Hologic, Inc. (a) | | 68,300 | 2,585 |
| Steris PLC | | 85,600 | 7,989 |
| Teleflex, Inc. | | 36,600 | 8,673 |
| Zimmer Biomet Holdings, Inc. | | 332,146 | 40,396 |
| | | | 67,537 |
| Health Care Providers & Services - 2.2% | | | |
| Cardinal Health, Inc. | | 234,600 | 14,522 |
| Centene Corp. (a) | | 89,300 | 8,365 |
| DaVita HealthCare Partners, Inc. (a) | | 81,800 | 4,969 |
| Envision Healthcare Corp. | | 967,172 | 41,202 |
| Laboratory Corp. of America Holdings (a) | | 219,047 | 33,670 |
| McKesson Corp. | | 214,700 | 29,603 |
| Patterson Companies, Inc. | | 68,234 | 2,525 |
| Quest Diagnostics, Inc. | | 121,600 | 11,404 |
| Universal Health Services, Inc. Class B | | 346,392 | 35,574 |
| | | | 181,834 |
| Life Sciences Tools & Services - 0.1% | | | |
| Bio-Rad Laboratories, Inc. Class A (a) | | 16,600 | 3,649 |
| Quintiles Transnational Holdings, Inc. (a) | | 18,400 | 1,989 |
| | | | 5,638 |
| Pharmaceuticals - 1.9% | | | |
| Allergan PLC | | 115,200 | 20,417 |
| Indivior PLC (a) | | 3,792,300 | 18,717 |
| Jazz Pharmaceuticals PLC (a) | | 525,209 | 74,333 |
| Mallinckrodt PLC (a) | | 897,896 | 28,436 |
| Mylan N.V. (a) | | 316,500 | 11,302 |
| Perrigo Co. PLC | | 47,900 | 3,879 |
| The Medicines Company (a) | | 271,501 | 7,803 |
| | | | 164,887 |
|
| TOTAL HEALTH CARE | | | 522,961 |
|
| INDUSTRIALS - 12.0% | | | |
| Aerospace & Defense - 1.2% | | | |
| Aerojet Rocketdyne Holdings, Inc. (a) | | 918,186 | 28,996 |
| Huntington Ingalls Industries, Inc. | | 130,400 | 30,361 |
| KLX, Inc. (a) | | 446,000 | 24,468 |
| Ultra Electronics Holdings PLC | | 657,000 | 15,916 |
| | | | 99,741 |
| Airlines - 1.7% | | | |
| American Airlines Group, Inc. | | 1,655,578 | 77,514 |
| JetBlue Airways Corp. (a) | | 2,564,000 | 49,101 |
| United Continental Holdings, Inc. (a) | | 323,000 | 18,889 |
| | | | 145,504 |
| Building Products - 0.2% | | | |
| Allegion PLC | | 152,338 | 12,703 |
| Commercial Services & Supplies - 0.6% | | | |
| IWG PLC | | 7,705,200 | 22,043 |
| KAR Auction Services, Inc. | | 666,500 | 31,545 |
| | | | 53,588 |
| Construction & Engineering - 2.0% | | | |
| AECOM (a) | | 1,847,488 | 64,773 |
| Arcadis NV | | 872,123 | 20,165 |
| Astaldi SpA | | 3,366,341 | 23,332 |
| KBR, Inc. | | 3,236,745 | 63,537 |
| | | | 171,807 |
| Electrical Equipment - 1.1% | | | |
| AMETEK, Inc. | | 290,340 | 19,595 |
| Fortive Corp. | | 156,533 | 11,311 |
| Regal Beloit Corp. | | 440,200 | 35,722 |
| Sensata Technologies Holding BV (a) | | 458,601 | 22,430 |
| | | | 89,058 |
| Machinery - 1.0% | | | |
| Allison Transmission Holdings, Inc. | | 1,211,865 | 51,492 |
| SPX Flow, Inc. (a) | | 858,800 | 35,408 |
| | | | 86,900 |
| Road & Rail - 1.3% | | | |
| Avis Budget Group, Inc. (a) | | 1,619,000 | 66,784 |
| CSX Corp. | | 159,587 | 8,048 |
| Norfolk Southern Corp. | | 126,800 | 16,664 |
| Swift Transporation Co. (a) | | 444,768 | 18,436 |
| | | | 109,932 |
| Trading Companies & Distributors - 2.9% | | | |
| AerCap Holdings NV (a) | | 873,496 | 45,981 |
| Ashtead Group PLC | | 1,429,400 | 36,830 |
| Fortress Transportation & Infrastructure Investors LLC | | 1,303,100 | 23,756 |
| HD Supply Holdings, Inc. (a) | | 1,571,256 | 55,607 |
| Nexeo Solutions, Inc. (a) | | 2,044,100 | 15,106 |
| Nexeo Solutions, Inc. (a)(c) | | 1,170,000 | 8,646 |
| WESCO International, Inc. (a) | | 847,051 | 53,491 |
| | | | 239,417 |
|
| TOTAL INDUSTRIALS | | | 1,008,650 |
|
| INFORMATION TECHNOLOGY - 7.6% | | | |
| Communications Equipment - 1.1% | | | |
| CommScope Holding Co., Inc. (a) | | 1,751,900 | 56,306 |
| F5 Networks, Inc. (a) | | 271,500 | 32,925 |
| | | | 89,231 |
| Electronic Equipment & Components - 1.4% | | | |
| Avnet, Inc. | | 263,800 | 10,499 |
| Cardtronics PLC (a) | | 1,123,000 | 25,717 |
| Jabil, Inc. | | 1,570,103 | 44,403 |
| TE Connectivity Ltd. | | 458,966 | 41,752 |
| | | | 122,371 |
| IT Services - 4.1% | | | |
| Amdocs Ltd. | | 984,600 | 64,097 |
| Cognizant Technology Solutions Corp. Class A | | 867,800 | 65,666 |
| Conduent, Inc. | | 2,347,500 | 36,339 |
| DXC Technology Co. | | 625,300 | 57,227 |
| First Data Corp. Class A (a) | | 1,658,600 | 29,540 |
| Leidos Holdings, Inc. | | 678,649 | 42,429 |
| Total System Services, Inc. | | 496,800 | 35,794 |
| Unisys Corp. (a)(b) | | 1,943,076 | 17,002 |
| | | | 348,094 |
| Semiconductors & Semiconductor Equipment - 0.6% | | | |
| Qualcomm, Inc. | | 1,016,954 | 51,875 |
| Software - 0.4% | | | |
| Micro Focus International PLC | | 836,500 | 29,386 |
| Totvs SA | | 100,900 | 1,005 |
| | | | 30,391 |
|
| TOTAL INFORMATION TECHNOLOGY | | | 641,962 |
|
| MATERIALS - 8.8% | | | |
| Chemicals - 5.0% | | | |
| Axalta Coating Systems (a) | | 1,460,446 | 48,560 |
| Celanese Corp. Class A | | 187,200 | 19,527 |
| CF Industries Holdings, Inc. | | 892,600 | 33,901 |
| DowDuPont, Inc. | | 689,406 | 49,851 |
| Eastman Chemical Co. | | 467,503 | 42,454 |
| FMC Corp. | | 159,500 | 14,811 |
| LyondellBasell Industries NV Class A | | 586,580 | 60,729 |
| Monsanto Co. | | 208,500 | 25,249 |
| PPG Industries, Inc. | | 116,200 | 13,507 |
| The Chemours Co. LLC | | 691,500 | 39,146 |
| Tronox Ltd. Class A | | 834,100 | 22,079 |
| Westlake Chemical Corp. | | 566,000 | 48,059 |
| | | | 417,873 |
| Construction Materials - 0.5% | | | |
| Eagle Materials, Inc. | | 425,200 | 44,888 |
| Containers & Packaging - 2.4% | | | |
| Avery Dennison Corp. | | 146,956 | 15,602 |
| Ball Corp. | | 1,301,000 | 55,852 |
| Berry Global Group, Inc. (a) | | 481,100 | 28,601 |
| Graphic Packaging Holding Co. | | 3,054,600 | 47,316 |
| Sealed Air Corp. | | 753,300 | 33,318 |
| Silgan Holdings, Inc. | | 754,000 | 22,055 |
| | | | 202,744 |
| Metals & Mining - 0.7% | | | |
| Alcoa Corp. | | 285,500 | 13,641 |
| Antofagasta PLC | | 483,700 | 6,132 |
| Randgold Resources Ltd. sponsored ADR | | 152,900 | 15,025 |
| Steel Dynamics, Inc. | | 542,065 | 20,170 |
| | | | 54,968 |
| Paper & Forest Products - 0.2% | | | |
| Kapstone Paper & Packaging Corp. | | 884,300 | 19,861 |
|
| TOTAL MATERIALS | | | 740,334 |
|
| REAL ESTATE - 12.4% | | | |
| Equity Real Estate Investment Trusts (REITs) - 11.4% | | | |
| American Tower Corp. | | 735,104 | 105,612 |
| AvalonBay Communities, Inc. | | 160,700 | 29,140 |
| Boston Properties, Inc. | | 199,400 | 24,163 |
| Colony NorthStar, Inc. | | 6,655,108 | 81,725 |
| Corporate Office Properties Trust (SBI) | | 1,151,400 | 36,764 |
| Douglas Emmett, Inc. | | 1,099,500 | 43,749 |
| Equinix, Inc. | | 84,800 | 39,305 |
| Equity Commonwealth (a) | | 69,100 | 2,076 |
| Equity Lifestyle Properties, Inc. | | 853,461 | 75,514 |
| Equity Residential (SBI) | | 456,400 | 30,697 |
| Essex Property Trust, Inc. | | 229,300 | 60,175 |
| Extra Space Storage, Inc. | | 682,800 | 55,710 |
| Forest City Realty Trust, Inc. Class A | | 1,103,995 | 27,191 |
| General Growth Properties, Inc. | | 3,262,000 | 63,479 |
| Grivalia Properties REIC | | 4,452,702 | 46,421 |
| iStar Financial, Inc. (a) | | 2,526,965 | 29,565 |
| Lamar Advertising Co. Class A | | 297,900 | 20,984 |
| National Retail Properties, Inc. | | 1,192,788 | 47,926 |
| Outfront Media, Inc. | | 1,851,500 | 43,418 |
| Public Storage | | 55,400 | 11,482 |
| Safety Income and Growth, Inc. | | 200,000 | 3,594 |
| SBA Communications Corp. Class A (a) | | 16,100 | 2,531 |
| Simon Property Group, Inc. | | 39,000 | 6,058 |
| Spirit Realty Capital, Inc. | | 3,343,100 | 27,781 |
| VEREIT, Inc. | | 1,894,400 | 14,947 |
| Welltower, Inc. | | 219,500 | 14,698 |
| WP Glimcher, Inc. | | 2,408,200 | 18,856 |
| | | | 963,561 |
| Real Estate Management & Development - 1.0% | | | |
| CBRE Group, Inc. (a) | | 1,387,700 | 54,564 |
| Kennedy-Wilson Holdings, Inc. | | 195,642 | 3,805 |
| Realogy Holdings Corp. | | 774,005 | 25,024 |
| | | | 83,393 |
|
| TOTAL REAL ESTATE | | | 1,046,954 |
|
| TELECOMMUNICATION SERVICES - 0.2% | | | |
| Diversified Telecommunication Services - 0.2% | | | |
| Iridium Communications, Inc. (a)(b) | | 410,409 | 4,925 |
| Level 3 Communications, Inc. | | 247,800 | 13,290 |
| | | | 18,215 |
| UTILITIES - 8.3% | | | |
| Electric Utilities - 4.8% | | | |
| Alliant Energy Corp. | | 678,300 | 29,343 |
| Edison International | | 1,539,293 | 123,066 |
| Exelon Corp. | | 447,900 | 18,010 |
| NextEra Energy, Inc. | | 173,518 | 26,907 |
| PG&E Corp. | | 1,058,900 | 61,173 |
| Xcel Energy, Inc. | | 2,830,500 | 140,166 |
| | | | 398,665 |
| Independent Power and Renewable Electricity Producers - 1.0% | | | |
| NRG Energy, Inc. | | 1,428,600 | 35,715 |
| The AES Corp. | | 4,666,100 | 49,601 |
| | | | 85,316 |
| Multi-Utilities - 2.5% | | | |
| CMS Energy Corp. | | 634,900 | 30,710 |
| Public Service Enterprise Group, Inc. | | 676,400 | 33,279 |
| Sempra Energy | | 1,269,897 | 149,212 |
| | | | 213,201 |
|
| TOTAL UTILITIES | | | 697,182 |
|
| TOTAL COMMON STOCKS | | | |
| (Cost $7,010,265) | | | 8,215,231 |
|
| Nonconvertible Preferred Stocks - 0.0% | | | |
| INDUSTRIALS - 0.0% | | | |
| Aerospace & Defense - 0.0% | | | |
| Rolls-Royce Holdings PLC (C Shares) | | | |
| (Cost $58) | | 47,004,088 | 62 |
| | | Principal Amount (000s) | Value (000s) |
|
| Convertible Bonds - 0.1% | | | |
| ENERGY - 0.1% | | | |
| Oil, Gas & Consumable Fuels - 0.1% | | | |
Cobalt International Energy, Inc. 2.625% 12/1/19
(Cost $30,575) | | 47,770 | 6,688 |
|
| U.S. Treasury Obligations - 0.0% | | | |
| U.S. Treasury Bills, yield at date of purchase 1.02% to 1.09% 11/9/17 to 1/25/18 (d) | | | |
| (Cost $2,837) | | 2,840 | 2,837 |
| | | Shares | Value (000s) |
|
| Money Market Funds - 3.7% | | | |
| Fidelity Cash Central Fund, 1.10% (e) | | 162,196,130 | $162,229 |
| Fidelity Securities Lending Cash Central Fund 1.11% (e)(f) | | 144,656,307 | 144,671 |
| TOTAL MONEY MARKET FUNDS | | | |
| (Cost $306,881) | | | 306,900 |
| TOTAL INVESTMENT IN SECURITIES - 101.4% | | | |
| (Cost $7,350,616) | | | 8,531,718 |
| NET OTHER ASSETS (LIABILITIES) - (1.4)% | | | (114,607) |
| NET ASSETS - 100% | | | $8,417,111 |
| Futures Contracts | | | | | |
| | Number of contracts | Expiration Date | Notional Amount (000s) | Value (000s) | Unrealized Appreciation/(Depreciation) (000s) |
| Purchased | | | | | |
| Equity Index Contracts | | | | | |
| CME E-mini S&P MidCap 400 Index Contracts (United States) | 317 | Dec. 2017 | $58,135 | $71 | $71 |
The notional amount of futures purchased as a percentage of Net Assets is 0.7%
Legend
(a) Non-income producing
(b) Security or a portion of the security is on loan at period end.
(c) Restricted securities - Investment in securities not registered under the Securities Act of 1933 (excluding 144A issues). At the end of the period, the value of restricted securities (excluding 144A issues) amounted to $8,646,000 or 0.1% of net assets.
(d) Security or a portion of the security was pledged to cover margin requirements for futures contracts. At period end, the value of securities pledged amounted to $2,309,000.
(e) Affiliated fund that is generally available only to investment companies and other accounts managed by Fidelity Investments. The rate quoted is the annualized seven-day yield of the fund at period end. A complete unaudited listing of the fund's holdings as of its most recent quarter end is available upon request. In addition, each Fidelity Central Fund's financial statements, which are not covered by the Fund's Report of Independent Registered Public Accounting Firm, are available on the SEC's website or upon request.
(f) Investment made with cash collateral received from securities on loan.
Additional information on each restricted holding is as follows:
| Security | Acquisition Date | Acquisition Cost (000s) |
| Nexeo Solutions, Inc. | 6/9/16 | $11,700 |
Affiliated Central Funds
Information regarding fiscal year to date income earned by the Fund from investments in Fidelity Central Funds is as follows:
| Fund | Income earned |
| | (Amounts in thousands) |
| Fidelity Cash Central Fund | $1,481 |
| Fidelity Securities Lending Cash Central Fund | 1,118 |
| Total | $2,599 |
Other Affiliated Issuers
An affiliated company is a company in which the Fund has ownership of at least 5% of the voting securities. Fiscal year to date transactions with companies which are or were affiliates are as follows:
| Affiliate (Amounts in thousands) | Value, beginning of period | Purchases | Sales Proceeds | Dividend Income | Realized Gain (loss) | Change in Unrealized appreciation (depreciation) | Value, end of period |
| iStar Financial, Inc. | $49,984 | $13,606 | $36,125 | $-- | $(4,644) | $6,744 | $-- |
| R1 RCM, Inc. (formerly Accretive Health, Inc.) | 13,132 | -- | 21,097 | -- | 6,387 | 1,578 | -- |
| Teekay Offshore Partners LP | 27,989 | 13,176 | -- | -- | -- | (15,841) | -- |
| Total | $91,105 | $26,782 | $57,222 | $-- | $1,743 | $(7,519) | $-- |
Investment Valuation
The following is a summary of the inputs used, as of October 31, 2017, involving the Fund's assets and liabilities carried at fair value. The inputs or methodology used for valuing securities may not be an indication of the risk associated with investing in those securities. For more information on valuation inputs, and their aggregation into the levels used below, please refer to the Investment Valuation section in the accompanying Notes to Financial Statements.
| | Valuation Inputs at Reporting Date: |
| Description | Total | Level 1 | Level 2 | Level 3 |
| (Amounts in thousands) | | | | |
| Investments in Securities: | | | | |
| Equities: | | | | |
| Consumer Discretionary | $1,046,562 | $1,046,562 | $-- | $-- |
| Consumer Staples | 399,997 | 399,997 | -- | -- |
| Energy | 643,274 | 643,274 | -- | -- |
| Financials | 1,449,140 | 1,449,140 | -- | -- |
| Health Care | 522,961 | 522,961 | -- | -- |
| Industrials | 1,008,712 | 1,008,712 | -- | -- |
| Information Technology | 641,962 | 641,962 | -- | -- |
| Materials | 740,334 | 740,334 | -- | -- |
| Real Estate | 1,046,954 | 1,046,954 | -- | -- |
| Telecommunication Services | 18,215 | 18,215 | -- | -- |
| Utilities | 697,182 | 697,182 | -- | -- |
| Corporate Bonds | 6,688 | -- | 6,688 | -- |
| U.S. Government and Government Agency Obligations | 2,837 | -- | 2,837 | -- |
| Money Market Funds | 306,900 | 306,900 | -- | -- |
| Total Investments in Securities: | $8,531,718 | $8,522,193 | $9,525 | $-- |
| Derivative Instruments: | | | | |
| Assets | | | | |
| Futures Contracts | $71 | $71 | $-- | $-- |
| Total Assets | $71 | $71 | $-- | $-- |
| Total Derivative Instruments: | $71 | $71 | $-- | $-- |
Value of Derivative Instruments
The following table is a summary of the Fund's value of derivative instruments by primary risk exposure as of October 31, 2017. For additional information on derivative instruments, please refer to the Derivative Instruments section in the accompanying Notes to Financial Statements.
| Primary Risk Exposure / Derivative Type | Value (000s) |
| | Asset | Liability |
| (Amounts in thousands) | | |
| Equity Risk | | |
| Futures Contracts(a) | $71 | $0 |
| Total Equity Risk | 71 | 0 |
| Total Value of Derivatives | $71 | $0 |
(a) Reflects gross cumulative appreciation (depreciation) on futures contracts as presented in the Schedule of Investments. In the Statement of Assets and Liabilities, the period end daily variation margin is included in receivable or payable for daily variation margin on futures contracts, and the net cumulative appreciation (depreciation) is included in net unrealized appreciation (depreciation).
Other Information
Distribution of investments by country or territory of incorporation, as a percentage of Total Net Assets, is as follows (Unaudited):
| United States of America | 84.1% |
| United Kingdom | 2.2% |
| Netherlands | 1.9% |
| Ireland | 1.8% |
| Switzerland | 1.5% |
| Bailiwick of Jersey | 1.4% |
| Bermuda | 1.3% |
| Marshall Islands | 1.0% |
| Others (Individually Less Than 1%) | 4.8% |
| | 100.0% |
See accompanying notes which are an integral part of the financial statements.
Financial Statements
Statement of Assets and Liabilities
| Amounts in thousands (except per-share amounts) | | October 31, 2017 |
| Assets | | |
Investment in securities, at value (including securities loaned of $137,000) — See accompanying schedule:
Unaffiliated issuers (cost $7,043,735) | $8,224,818 | |
| Fidelity Central Funds (cost $306,881) | 306,900 | |
| Total Investment in Securities (cost $7,350,616) | | $8,531,718 |
| Cash | | 69 |
| Foreign currency held at value (cost $1,714) | | 1,715 |
| Receivable for investments sold | | 63,884 |
| Receivable for fund shares sold | | 1,384 |
| Dividends receivable | | 3,542 |
| Interest receivable | | 522 |
| Distributions receivable from Fidelity Central Funds | | 387 |
| Receivable for daily variation margin on futures contracts | | 288 |
| Prepaid expenses | | 19 |
| Other receivables | | 821 |
| Total assets | | 8,604,349 |
| Liabilities | | |
| Payable for investments purchased | $32,744 | |
| Payable for fund shares redeemed | 4,750 | |
| Accrued management fee | 3,317 | |
| Other affiliated payables | 1,036 | |
| Other payables and accrued expenses | 717 | |
| Collateral on securities loaned | 144,674 | |
| Total liabilities | | 187,238 |
| Net Assets | | $8,417,111 |
| Net Assets consist of: | | |
| Paid in capital | | $6,901,433 |
| Undistributed net investment income | | 97,741 |
| Accumulated undistributed net realized gain (loss) on investments and foreign currency transactions | | 236,787 |
| Net unrealized appreciation (depreciation) on investments and assets and liabilities in foreign currencies | | 1,181,150 |
| Net Assets | | $8,417,111 |
| Value: | | |
| Net Asset Value, offering price and redemption price per share ($7,344,298 ÷ 60,233 shares) | | $121.93 |
| Class K: | | |
| Net Asset Value, offering price and redemption price per share ($1,072,813 ÷ 8,785 shares) | | $122.12 |
See accompanying notes which are an integral part of the financial statements.
Statement of Operations
| Amounts in thousands | | Year ended October 31, 2017 |
| Investment Income | | |
| Dividends | | $141,068 |
| Special dividends | | 23,197 |
| Interest | | 6,750 |
| Income from Fidelity Central Funds | | 2,599 |
| Total income | | 173,614 |
| Expenses | | |
| Management fee | | |
| Basic fee | $45,330 | |
| Performance adjustment | (10,964) | |
| Transfer agent fees | 11,161 | |
| Accounting and security lending fees | 1,237 | |
| Custodian fees and expenses | 222 | |
| Independent trustees' fees and expenses | 33 | |
| Appreciation in deferred trustee compensation account | 1 | |
| Registration fees | 84 | |
| Audit | 86 | |
| Legal | 28 | |
| Miscellaneous | 66 | |
| Total expenses before reductions | 47,284 | |
| Expense reductions | (521) | 46,763 |
| Net investment income (loss) | | 126,851 |
| Realized and Unrealized Gain (Loss) | | |
| Net realized gain (loss) on: | | |
| Investment securities: | | |
| Unaffiliated issuers | 552,247 | |
| Fidelity Central Funds | (9) | |
| Other affiliated issuers | 1,743 | |
| Foreign currency transactions | 89 | |
| Futures contracts | 2,345 | |
| Total net realized gain (loss) | | 556,415 |
| Change in net unrealized appreciation (depreciation) on: | | |
| Investment securities: | | |
| Unaffiliated issuers | 802,564 | |
| Fidelity Central Funds | (27) | |
| Other affiliated issuers | (7,519) | |
| Assets and liabilities in foreign currencies | (26) | |
| Futures contracts | 824 | |
| Total change in net unrealized appreciation (depreciation) | | 795,816 |
| Net gain (loss) | | 1,352,231 |
| Net increase (decrease) in net assets resulting from operations | | $1,479,082 |
See accompanying notes which are an integral part of the financial statements.
Statement of Changes in Net Assets
| Amounts in thousands | Year ended October 31, 2017 | Year ended October 31, 2016 |
| Increase (Decrease) in Net Assets | | |
| Operations | | |
| Net investment income (loss) | $126,851 | $136,912 |
| Net realized gain (loss) | 556,415 | (275,796) |
| Change in net unrealized appreciation (depreciation) | 795,816 | 298,687 |
| Net increase (decrease) in net assets resulting from operations | 1,479,082 | 159,803 |
| Distributions to shareholders from net investment income | (100,620) | (92,657) |
| Distributions to shareholders from net realized gain | (1,989) | (740,268) |
| Total distributions | (102,609) | (832,925) |
| Share transactions - net increase (decrease) | (621,951) | (505,387) |
| Total increase (decrease) in net assets | 754,522 | (1,178,509) |
| Net Assets | | |
| Beginning of period | 7,662,589 | 8,841,098 |
| End of period | $8,417,111 | $7,662,589 |
| Other Information | | |
| Undistributed net investment income end of period | $97,741 | $76,377 |
See accompanying notes which are an integral part of the financial statements.
Financial Highlights
Fidelity Value Fund
| Years ended October 31, | 2017 | 2016 | 2015 | 2014 | 2013 |
| Selected Per–Share Data | | | | | |
| Net asset value, beginning of period | $102.99 | $110.73 | $113.00 | $99.54 | $74.14 |
| Income from Investment Operations | | | | | |
| Net investment income (loss)A | 1.75B | 1.70 | 1.17 | 1.02 | 1.13 |
| Net realized and unrealized gain (loss) | 18.57 | 1.07 | (.99)C | 13.47 | 25.28 |
| Total from investment operations | 20.32 | 2.77 | .18 | 14.49 | 26.41 |
| Distributions from net investment income | (1.35) | (1.15) | (.91) | (.86) | (1.01) |
| Distributions from net realized gain | (.03) | (9.36) | (1.54) | (.16) | – |
| Total distributions | (1.38) | (10.51) | (2.45) | (1.03)D | (1.01) |
| Net asset value, end of period | $121.93 | $102.99 | $110.73 | $113.00 | $99.54 |
| Total ReturnE | 19.86% | 2.85% | .12%C | 14.68% | 36.07% |
| Ratios to Average Net AssetsF,G | | | | | |
| Expenses before reductions | .58% | .62% | .79% | .73% | .67% |
| Expenses net of fee waivers, if any | .58% | .62% | .79% | .73% | .67% |
| Expenses net of all reductions | .57% | .61% | .78% | .73% | .65% |
| Net investment income (loss) | 1.51%B | 1.71% | 1.02% | .95% | 1.30% |
| Supplemental Data | | | | | |
| Net assets, end of period (in millions) | $7,344 | $6,741 | $7,437 | $8,024 | $7,153 |
| Portfolio turnover rateH | 73% | 72% | 80% | 81% | 99% |
A Calculated based on average shares outstanding during the period.
B Net Investment income per share reflects a large, non-recurring dividend which amounted to $.32 per share. Excluding this non-recurring dividend, the ratio of net investment income (loss) to average net assets would have been 1.23%.
C Net realized and unrealized gain (loss) per share reflects proceeds received from litigation which amounted to $.13 per share. Excluding these litigation proceeds, the total return would have been .01%.
D Total distributions of $1.03 per share is comprised of distributions from net investment income of $.864 and distributions from net realized gain of $.164 per share.
E Total returns would have been lower if certain expenses had not been reduced during the applicable periods shown.
F Fees and expenses of any underlying Fidelity Central Funds are not included in the Fund's expense ratio. The Fund indirectly bears its proportionate share of the expenses of any underlying Fidelity Central Funds.
G Expense ratios reflect operating expenses of the class. Expenses before reductions do not reflect amounts reimbursed by the investment adviser or reductions from brokerage service arrangements or reductions from other expense offset arrangements and do not represent the amount paid by the class during periods when reimbursements or reductions occur. Expenses net of fee waivers reflect expenses after reimbursement by the investment adviser but prior to reductions from brokerage service arrangements or other expense offset arrangements. Expenses net of all reductions represent the net expenses paid by the class.
H Amount does not include the portfolio activity of any underlying Fidelity Central Funds.
See accompanying notes which are an integral part of the financial statements.
Fidelity Value Fund Class K
| Years ended October 31, | 2017 | 2016 | 2015 | 2014 | 2013 |
| Selected Per–Share Data | | | | | |
| Net asset value, beginning of period | $103.15 | $110.91 | $113.17 | $99.70 | $74.27 |
| Income from Investment Operations | | | | | |
| Net investment income (loss)A | 1.86B | 1.82 | 1.30 | 1.15 | 1.25 |
| Net realized and unrealized gain (loss) | 18.60 | 1.06 | (.99)C | 13.47 | 25.30 |
| Total from investment operations | 20.46 | 2.88 | .31 | 14.62 | 26.55 |
| Distributions from net investment income | (1.47) | (1.28) | (1.03) | (.98) | (1.12) |
| Distributions from net realized gain | (.03) | (9.36) | (1.54) | (.16) | – |
| Total distributions | (1.49)D | (10.64) | (2.57) | (1.15)E | (1.12) |
| Net asset value, end of period | $122.12 | $103.15 | $110.91 | $113.17 | $99.70 |
| Total ReturnF | 19.98% | 2.96% | .24%C | 14.81% | 36.26% |
| Ratios to Average Net AssetsG,H | | | | | |
| Expenses before reductions | .48% | .50% | .68% | .62% | .54% |
| Expenses net of fee waivers, if any | .48% | .50% | .68% | .62% | .54% |
| Expenses net of all reductions | .48% | .49% | .67% | .61% | .52% |
| Net investment income (loss) | 1.61%B | 1.82% | 1.13% | 1.07% | 1.42% |
| Supplemental Data | | | | | |
| Net assets, end of period (in millions) | $1,073 | $922 | $1,404 | $1,499 | $1,261 |
| Portfolio turnover rateI | 73% | 72% | 80% | 81% | 99% |
A Calculated based on average shares outstanding during the period.
B Net Investment income per share reflects a large, non-recurring dividend which amounted to $.32 per share. Excluding this non-recurring dividend, the ratio of net investment income (loss) to average net assets would have been 1.33%.
C Net realized and unrealized gain (loss) per share reflects proceeds received from litigation which amounted to $.13 per share. Excluding these litigation proceeds, the total return would have been .13%.
D Total distributions of $1.49 per share is comprised of distributions from net investment income of $1.467 and distributions from net realized gain of $.027 per share.
E Total distributions of $1.15 per share is comprised of distributions from net investment income of $.983 and distributions from net realized gain of $.164 per share.
F Total returns would have been lower if certain expenses had not been reduced during the applicable periods shown.
G Fees and expenses of any underlying Fidelity Central Funds are not included in the Fund's expense ratio. The Fund indirectly bears its proportionate share of the expenses of any underlying Fidelity Central Funds.
H Expense ratios reflect operating expenses of the class. Expenses before reductions do not reflect amounts reimbursed by the investment adviser or reductions from brokerage service arrangements or reductions from other expense offset arrangements and do not represent the amount paid by the class during periods when reimbursements or reductions occur. Expenses net of fee waivers reflect expenses after reimbursement by the investment adviser but prior to reductions from brokerage service arrangements or other expense offset arrangements. Expenses net of all reductions represent the net expenses paid by the class.
I Amount does not include the portfolio activity of any underlying Fidelity Central Funds.
See accompanying notes which are an integral part of the financial statements.
Notes to Financial Statements
For the period ended October 31, 2017
(Amounts in thousands except percentages)
1. Organization.
Fidelity Value Fund (the Fund) is a fund of Fidelity Capital Trust (the Trust) and is authorized to issue an unlimited number of shares. The Trust is registered under the Investment Company Act of 1940, as amended (the 1940 Act), as an open-end management investment company organized as a Massachusetts business trust. The Fund offers Value and Class K shares, each of which has equal rights as to assets and voting privileges. Each class has exclusive voting rights with respect to matters that affect that class.
2. Investments in Fidelity Central Funds.
The Fund invests in Fidelity Central Funds, which are open-end investment companies generally available only to other investment companies and accounts managed by the investment adviser and its affiliates. The Fund's Schedule of Investments lists each of the Fidelity Central Funds held as of period end, if any, as an investment of the Fund, but does not include the underlying holdings of each Fidelity Central Fund. As an Investing Fund, the Fund indirectly bears its proportionate share of the expenses of the underlying Fidelity Central Funds.
The Money Market Central Funds seek preservation of capital and current income and are managed by Fidelity Investments Money Management, Inc. (FIMM), an affiliate of the investment adviser. Annualized expenses of the Money Market Central Funds as of their most recent shareholder report date are less than .005%.
A complete unaudited list of holdings for each Fidelity Central Fund is available upon request or at the Securities and Exchange Commission (the SEC) website at www.sec.gov. In addition, the financial statements of the Fidelity Central Funds, which are not covered by the Fund's Report of Independent Registered Public Accounting Firm, are available on the SEC website or upon request.
3. Significant Accounting Policies.
The Fund is an investment company and applies the accounting and reporting guidance of the Financial Accounting Standards Board (FASB) Accounting Standards Codification Topic 946 Financial Services – Investments Companies. The financial statements have been prepared in conformity with accounting principles generally accepted in the United States of America (GAAP), which require management to make certain estimates and assumptions at the date of the financial statements. Actual results could differ from those estimates. Subsequent events, if any, through the date that the financial statements were issued have been evaluated in the preparation of the financial statements. The following summarizes the significant accounting policies of the Fund:
Investment Valuation. Investments are valued as of 4:00 p.m. Eastern time on the last calendar day of the period. The Board of Trustees (the Board) has delegated the day to day responsibility for the valuation of the Fund's investments to the Fair Value Committee (the Committee) established by the Fund's investment adviser. In accordance with valuation policies and procedures approved by the Board, the Fund attempts to obtain prices from one or more third party pricing vendors or brokers to value its investments. When current market prices, quotations or currency exchange rates are not readily available or reliable, investments will be fair valued in good faith by the Committee, in accordance with procedures adopted by the Board. Factors used in determining fair value vary by investment type and may include market or investment specific events, changes in interest rates and credit quality. The frequency with which these procedures are used cannot be predicted and they may be utilized to a significant extent. The Committee oversees the Fund's valuation policies and procedures and reports to the Board on the Committee's activities and fair value determinations. The Board monitors the appropriateness of the procedures used in valuing the Fund's investments and ratifies the fair value determinations of the Committee.
The Fund categorizes the inputs to valuation techniques used to value its investments into a disclosure hierarchy consisting of three levels as shown below:
- Level 1 – quoted prices in active markets for identical investments
- Level 2 – other significant observable inputs (including quoted prices for similar investments, interest rates, prepayment speeds, etc.)
- Level 3 – unobservable inputs (including the Fund's own assumptions based on the best information available)
Valuation techniques used to value the Fund's investments by major category are as follows:
Equity securities, including restricted securities, for which market quotations are readily available, are valued at the last reported sale price or official closing price as reported by a third party pricing vendor on the primary market or exchange on which they are traded and are categorized as Level 1 in the hierarchy. In the event there were no sales during the day or closing prices are not available, securities are valued at the last quoted bid price or may be valued using the last available price and are generally categorized as Level 2 in the hierarchy. For foreign equity securities, when market or security specific events arise, comparisons to the valuation of American Depositary Receipts (ADRs), futures contracts, Exchange-Traded Funds (ETFs) and certain indexes as well as quoted prices for similar securities may be used and would be categorized as Level 2 in the hierarchy. Utilizing these techniques may result in transfers between Level 1 and Level 2. For equity securities, including restricted securities, where observable inputs are limited, assumptions about market activity and risk are used and these securities may be categorized as Level 3 in the hierarchy.
Debt securities, including restricted securities, are valued based on evaluated prices received from third party pricing vendors or from brokers who make markets in such securities. Corporate bonds and U.S. government and government agency obligations are valued by pricing vendors who utilize matrix pricing which considers yield or price of bonds of comparable quality, coupon, maturity and type or by broker-supplied prices. When independent prices are unavailable or unreliable, debt securities may be valued utilizing pricing methodologies which consider similar factors that would be used by third party pricing vendors. Debt securities are generally categorized as Level 2 in the hierarchy but may be Level 3 depending on the circumstances.
Futures contracts are valued at the settlement price established each day by the board of trade or exchange on which they are traded and are categorized as Level 1 in the hierarchy. Investments in open-end mutual funds, including the Fidelity Central Funds, are valued at their closing net asset value (NAV) each business day and are categorized as Level 1 in the hierarchy.
Changes in valuation techniques may result in transfers in or out of an assigned level within the disclosure hierarchy. The aggregate value of investments by input level as of October 31, 2017 is included at the end of the Fund's Schedule of Investments.
Foreign Currency. The Fund may use foreign currency contracts to facilitate transactions in foreign-denominated securities. Gains and losses from these transactions may arise from changes in the value of the foreign currency or if the counterparties do not perform under the contracts' terms.
Foreign-denominated assets, including investment securities, and liabilities are translated into U.S. dollars at the exchange rates at period end. Purchases and sales of investment securities, income and dividends received and expenses denominated in foreign currencies are translated into U.S. dollars at the exchange rate in effect on the transaction date.
The effects of exchange rate fluctuations on investments are included with the net realized and unrealized gain (loss) on investment securities. Other foreign currency transactions resulting in realized and unrealized gain (loss) are disclosed separately.
Investment Transactions and Income. For financial reporting purposes, the Fund's investment holdings and NAV include trades executed through the end of the last business day of the period. The NAV per share for processing shareholder transactions is calculated as of the close of business of the New York Stock Exchange (NYSE), normally 4:00 p.m. Eastern time and includes trades executed through the end of the prior business day. Gains and losses on securities sold are determined on the basis of identified cost and includes proceeds received from litigation. Dividend income is recorded on the ex-dividend date, except for certain dividends from foreign securities where the ex-dividend date may have passed, which are recorded as soon as the Fund is informed of the ex-dividend date. Non-cash dividends included in dividend income, if any, are recorded at the fair market value of the securities received. Income and capital gain distributions from Fidelity Central Funds, if any, are recorded on the ex-dividend date. Certain distributions received by the Fund represent a return of capital or capital gain. The Fund determines the components of these distributions subsequent to the ex-dividend date, based upon receipt of tax filings or other correspondence relating to the underlying investment. These distributions are recorded as a reduction of cost of investments and/or as a realized gain. Large, non-recurring dividends recognized by the Fund are presented separately on the Statement of Operations as "Special Dividends" and the impact of these dividends is presented in the Financial Highlights. Interest income is accrued as earned and includes coupon interest and amortization of premium and accretion of discount on debt securities as applicable. Investment income is recorded net of foreign taxes withheld where recovery of such taxes is uncertain.
Class Allocations and Expenses. Investment income, realized and unrealized capital gains and losses, common expenses of the Fund, and certain fund-level expense reductions, if any, are allocated daily on a pro-rata basis to each class based on the relative net assets of each class to the total net assets of the Fund. Each class differs with respect to transfer agent fees incurred. Certain expense reductions may also differ by class. For the reporting period, the allocated portion of income and expenses to each class as a percent of its average net assets may vary due to the timing of recording these transactions in relation to fluctuating net assets of the classes. Expenses directly attributable to a fund are charged to that fund. Expenses attributable to more than one fund are allocated among the respective funds on the basis of relative net assets or other appropriate methods. Expense estimates are accrued in the period to which they relate and adjustments are made when actual amounts are known.
Deferred Trustee Compensation. Under a Deferred Compensation Plan (the Plan), independent Trustees may elect to defer receipt of a portion of their annual compensation. Deferred amounts are invested in a cross-section of Fidelity funds, are marked-to-market and remain in the Fund until distributed in accordance with the Plan. The investment of deferred amounts and the offsetting payable to the Trustees are included in the accompanying Statement of Assets and Liabilities.
Income Tax Information and Distributions to Shareholders. Each year, the Fund intends to qualify as a regulated investment company under Subchapter M of the Internal Revenue Code, including distributing substantially all of its taxable income and realized gains. As a result, no provision for U.S. Federal income taxes is required. As of October 31, 2017, the Fund did not have any unrecognized tax benefits in the financial statements; nor is the Fund aware of any tax positions for which it is reasonably possible that the total amounts of unrecognized tax benefits will significantly change in the next twelve months. The Fund files a U.S. federal tax return, in addition to state and local tax returns as required. The Fund's federal income tax returns are subject to examination by the Internal Revenue Service (IRS) for a period of three fiscal years after they are filed. State and local tax returns may be subject to examination for an additional fiscal year depending on the jurisdiction. Foreign taxes are provided for based on the Fund's understanding of the tax rules and rates that exist in the foreign markets in which it invests.
Distributions are declared and recorded on the ex-dividend date. Income dividends and capital gain distributions are declared separately for each class. Income and capital gain distributions are determined in accordance with income tax regulations, which may differ from GAAP. In addition, the Fund claimed a portion of the payment made to redeeming shareholders as a distribution for income tax purposes.
Capital accounts within the financial statements are adjusted for permanent book-tax differences. These adjustments have no impact on net assets or the results of operations. Capital accounts are not adjusted for temporary book-tax differences which will reverse in a subsequent period.
Book-tax differences are primarily due to short-term gain distributions from the Underlying Funds, futures contracts, foreign currency transactions, passive foreign investment companies (PFIC), market discount, deferred trustees compensation, partnerships, capital loss carryforwards and losses deferred due to wash sales.
As of period end, the cost and unrealized appreciation (depreciation) in securities, and derivatives if applicable, for federal income tax purposes were as follows:
| Gross unrealized appreciation | $1,552,730 |
| Gross unrealized depreciation | (411,038) |
| Net unrealized appreciation (depreciation) | $1,141,692 |
| Tax Cost | $7,390,026 |
The tax-based components of distributable earnings as of period end were as follows:
| Undistributed ordinary income | $277,987 |
| Undistributed long-term capital gain | $99,142 |
| Net unrealized appreciation (depreciation) on securities and other investments | $1,139,157 |
The tax character of distributions paid was as follows:
| | October 31, 2017 | October 31, 2016 |
| Ordinary Income | $102,609 | $ 236,991 |
| Long-term Capital Gains | – | 595,934 |
| Total | $102,609 | $ 832,925 |
Restricted Securities. The Fund may invest in securities that are subject to legal or contractual restrictions on resale. These securities generally may be resold in transactions exempt from registration or to the public if the securities are registered. Disposal of these securities may involve time-consuming negotiations and expense, and prompt sale at an acceptable price may be difficult. Information regarding restricted securities is included at the end of the Fund's Schedule of Investments.
4. Derivative Instruments.
Risk Exposures and the Use of Derivative Instruments. The Fund's investment objective allows the Fund to enter into various types of derivative contracts, including futures contracts. Derivatives are investments whose value is primarily derived from underlying assets, indices or reference rates and may be transacted on an exchange or over-the-counter (OTC). Derivatives may involve a future commitment to buy or sell a specified asset based on specified terms, to exchange future cash flows at periodic intervals based on a notional principal amount, or for one party to make one or more payments upon the occurrence of specified events in exchange for periodic payments from the other party.
The Fund used derivatives to increase returns and to manage exposure to certain risks as defined below. The success of any strategy involving derivatives depends on analysis of numerous economic factors, and if the strategies for investment do not work as intended, the Fund may not achieve its objectives.
The Fund's use of derivatives increased or decreased its exposure to the following risk:
| Equity Risk | Equity risk relates to the fluctuations in the value of financial instruments as a result of changes in market prices (other than those arising from interest rate risk or foreign exchange risk), whether caused by factors specific to an individual investment, its issuer, or all factors affecting all instruments traded in a market or market segment.
|
The Fund is also exposed to additional risks from investing in derivatives, such as liquidity risk and counterparty credit risk. Liquidity risk is the risk that the Fund will be unable to close out the derivative in the open market in a timely manner. Counterparty credit risk is the risk that the counterparty will not be able to fulfill its obligation to the Fund. Counterparty credit risk related to exchange-traded futures contracts may be mitigated by the protection provided by the exchange on which they trade.
Investing in derivatives may involve greater risks than investing in the underlying assets directly and, to varying degrees, may involve risk of loss in excess of any initial investment and collateral received and amounts recognized in the Statement of Assets and Liabilities. In addition, there may be the risk that the change in value of the derivative contract does not correspond to the change in value of the underlying instrument.
Futures Contracts. A futures contract is an agreement between two parties to buy or sell a specified underlying instrument for a fixed price at a specified future date. The Fund used futures contracts to manage its exposure to the stock market.
Upon entering into a futures contract, a fund is required to deposit either cash or securities (initial margin) with a clearing broker in an amount equal to a certain percentage of the face value of the contract. Futures contracts are marked-to-market daily and subsequent daily payments (variation margin) are made or received by a fund depending on the daily fluctuations in the value of the futures contracts and are recorded as unrealized appreciation or (depreciation). This receivable and/or payable, if any, is included in daily variation margin on futures contracts in the Statement of Assets and Liabilities. Realized gain or (loss) is recorded upon the expiration or closing of a futures contract. The net realized gain (loss) and change in net unrealized appreciation (depreciation) on futures contracts during the period is presented in the Statement of Operations.
Any open futures contracts at period end are presented in the Schedule of Investments under the caption "Futures Contracts". The notional amount at value reflects each contract's exposure to the underlying instrument or index at period end and is representative of volume of activity during the period. Securities deposited to meet initial margin requirements are identified in the Schedule of Investments.
5. Purchases and Sales of Investments.
Purchases and sales of securities, other than short-term securities, aggregated $5,881,389 and $6,494,688, respectively.
6. Fees and Other Transactions with Affiliates.
Management Fee. Fidelity Management & Research Company (the investment adviser) and its affiliates provide the Fund with investment management related services for which the Fund pays a monthly management fee. The management fee is the sum of an individual fund fee rate that is based on an annual rate of .30% of the Fund's average net assets and an annualized group fee rate that averaged .25% during the period. The group fee rate is based upon the average net assets of all the mutual funds advised by the investment adviser, including any mutual funds previously advised by the investment adviser that are currently advised by Fidelity SelectCo, LLC, an affiliate of the investment adviser. The group fee rate decreases as assets under management increase and increases as assets under management decrease. In addition, the management fee is subject to a performance adjustment (up to a maximum of +/- .20% of the Fund's average net assets over a 36 month performance period). The upward or downward adjustment to the management fee is based on the relative investment performance of Value as compared to its benchmark index, the Russell Midcap Value Index, over the same 36 month performance period. For the reporting period, the total annual management fee rate, including the performance adjustment, was .41% of the Fund's average net assets. The performance adjustment included in the management fee rate may be higher or lower than the maximum performance adjustment rate due to the difference between the average net assets for the reporting and performance periods.
Transfer Agent Fees. Fidelity Investments Institutional Operations Company, Inc., (FIIOC), an affiliate of the investment adviser, is the transfer, dividend disbursing and shareholder servicing agent for each class of the Fund. FIIOC receives account fees and asset-based fees that vary according to the account size and type of account of the shareholders of Value, except for Class K. FIIOC receives an asset-based fee of Class K's average net assets. FIIOC pays for typesetting, printing and mailing of shareholder reports, except proxy statements.
For the period, transfer agent fees for each class were as follows:
| | Amount | % of
Class-Level Average
Net Assets |
| Value | $10,682 | .15 |
| Class K | 479 | .05 |
| | $11,161 | |
Accounting and Security Lending Fees. Fidelity Service Company, Inc. (FSC), an affiliate of the investment adviser, maintains the Fund's accounting records. The accounting fee is based on the level of average net assets for each month. Under a separate contract, FSC administers the security lending program. The security lending fee is based on the number and duration of lending transactions.
Brokerage Commissions. The Fund placed a portion of its portfolio transactions with brokerage firms which are affiliates of the investment adviser. Brokerage commissions are included in net realized gain (loss) and change in net unrealized appreciation (depreciation) in the Statement of Operations. The commissions paid to these affiliated firms were $244 for the period.
Interfund Trades. The Fund may purchase from or sell securities to other Fidelity Funds under procedures adopted by the Board. The procedures have been designed to ensure these interfund trades are executed in accordance with Rule 17a-7 of the 1940 Act. Interfund trades are included within the respective purchases and sales amounts shown in the Purchases and Sales of Investments note.
Other. During the period, the investment adviser reimbursed the Fund for certain losses in the amount of $204.
7. Committed Line of Credit.
The Fund participates with other funds managed by the investment adviser or an affiliate in a $4.25 billion credit facility (the "line of credit") to be utilized for temporary or emergency purposes to fund shareholder redemptions or for other short-term liquidity purposes. The Fund has agreed to pay commitment fees on its pro-rata portion of the line of credit, which amounted to $26 and is reflected in Miscellaneous expenses on the Statement of Operations. During the period, the Fund did not borrow on this line of credit.
8. Security Lending.
The Fund lends portfolio securities through a lending agent from time to time in order to earn additional income. For equity securities, a lending agent is used and may loan securities to certain qualified borrowers, including Fidelity Capital Markets (FCM), a broker-dealer affiliated with the Fund. On the settlement date of the loan, the Fund receives collateral (in the form of U.S. Treasury obligations, letters of credit and/or cash) against the loaned securities and maintains collateral in an amount not less than 100% of the market value of the loaned securities during the period of the loan. The market value of the loaned securities is determined at the close of business of the Fund and any additional required collateral is delivered to the Fund on the next business day. The Fund or borrower may terminate the loan at any time, and if the borrower defaults on its obligation to return the securities loaned because of insolvency or other reasons, the Fund may apply collateral received from the borrower against the obligation. The Fund may experience delays and costs in recovering the securities loaned. Any cash collateral received is invested in the Fidelity Securities Lending Cash Central Fund. The value of loaned securities and cash collateral at period end are disclosed on the Fund's Statement of Assets and Liabilities. The value of securities loaned to FCM at period end was $6,383. Security lending income represents the income earned on investing cash collateral, less rebates paid to borrowers and any lending agent fees associated with the loan, plus any premium payments received for lending certain types of securities. Security lending income is presented in the Statement of Operations as a component of income from Fidelity Central Funds. Total security lending income during the period amounted to $1,118, including $33 from securities loaned to FCM.
9. Expense Reductions.
Commissions paid to certain brokers with whom the investment adviser, or its affiliates, places trades on behalf of the Fund include an amount in addition to trade execution, which may be rebated back to the Fund to offset certain expenses. This amount totaled $447 for the period.
In addition, during the period the investment adviser reimbursed and/or waived a portion of fund-level operating expenses in the amount of $74.
10. Distributions to Shareholders.
Distributions to shareholders of each class were as follows:
| | Year ended
October 31, 2017 | Year ended
October 31, 2016 |
| From net investment income | | |
| Value | $87,700 | $76,677 |
| Class K | 12,920 | 15,980 |
| Total | $100,620 | $92,657 |
| From net realized gain | | |
| Value | $1,751 | $623,752 |
| Class K | 238 | 116,516 |
| Total | $1,989 | $740,268 |
11. Share Transactions.
Share transactions for each class were as follows and may contain automatic conversions between classes or exchanges between affiliated funds:
| | Shares | Shares | Dollars | Dollars |
| | Year ended
October 31, 2017 | Year ended October 31, 2016 | Year ended
October 31, 2017 | Year ended October 31, 2016 |
| Value | | | | |
| Shares sold | 3,128 | 4,754 | $356,778 | $467,524 |
| Reinvestment of distributions | 755 | 6,670 | 84,080 | 662,418 |
| Shares redeemed | (9,105) | (13,132) | (1,047,226) | (1,315,307) |
| Net increase (decrease) | (5,222) | (1,708) | $(606,368) | $(185,365) |
| Class K | | | | |
| Shares sold | 2,081 | 1,689 | $241,638 | $165,410 |
| Reinvestment of distributions | 118 | 1,333 | 13,157 | 132,496 |
| Shares redeemed | (2,349) | (6,749) | (270,378) | (617,928) |
| Net increase (decrease) | (150) | (3,727) | $(15,583) | $(320,022) |
12. Other.
The Fund's organizational documents provide former and current trustees and officers with a limited indemnification against liabilities arising in connection with the performance of their duties to the Fund. In the normal course of business, the Fund may also enter into contracts that provide general indemnifications. The Fund's maximum exposure under these arrangements is unknown as this would be dependent on future claims that may be made against the Fund. The risk of material loss from such claims is considered remote.
Report of Independent Registered Public Accounting Firm
To the Trustees of Fidelity Capital Trust and Shareholders of Fidelity Value Fund:
In our opinion, the accompanying statement of assets and liabilities, including the schedule of investments, and the related statements of operations and of changes in net assets and the financial highlights present fairly, in all material respects, the financial position of Fidelity Value Fund (a fund of Fidelity Capital Trust) as of October 31, 2017, the results of its operations for the year then ended, the changes in its net assets for each of the two years in the period then ended and the financial highlights for each of the five years in the period then ended, in conformity with accounting principles generally accepted in the United States of America. These financial statements and financial highlights (hereafter referred to as “financial statements”) are the responsibility of the Fidelity Value Fund’s management. Our responsibility is to express an opinion on these financial statements based on our audits. We conducted our audits of these financial statements in accordance with the standards of the Public Company Accounting Oversight Board (United States). Those standards require that we plan and perform the audit to obtain reasonable assurance about whether the financial statements are free of material misstatement. An audit includes examining, on a test basis, evidence supporting the amounts and disclosures in the financial statements, assessing the accounting principles used and significant estimates made by management, and evaluating the overall financial statement presentation. Our procedures included confirmation of securities owned as of October 31, 2017 by correspondence with the custodian and brokers; when replies were not received from brokers, we performed other auditing procedures. We believe that our audits provide a reasonable basis for our opinion.
PricewaterhouseCoopers LLP
Boston, Massachusetts
December 13, 2017
Trustees and Officers
The Trustees, Members of the Advisory Board (if any), and officers of the trust and fund, as applicable, are listed below. The Board of Trustees governs the fund and is responsible for protecting the interests of shareholders. The Trustees are experienced executives who meet periodically throughout the year to oversee the fund's activities, review contractual arrangements with companies that provide services to the fund, oversee management of the risks associated with such activities and contractual arrangements, and review the fund's performance. Each of the Trustees oversees 190 funds.
The Trustees hold office without limit in time except that (a) any Trustee may resign; (b) any Trustee may be removed by written instrument, signed by at least two-thirds of the number of Trustees prior to such removal; (c) any Trustee who requests to be retired or who has become incapacitated by illness or injury may be retired by written instrument signed by a majority of the other Trustees; and (d) any Trustee may be removed at any special meeting of shareholders by a two-thirds vote of the outstanding voting securities of the trust. Each Trustee who is not an interested person (as defined in the 1940 Act) of the trust and the fund is referred to herein as an Independent Trustee. Each Independent Trustee shall retire not later than the last day of the calendar year in which his or her 75th birthday occurs. The Independent Trustees may waive this mandatory retirement age policy with respect to individual Trustees. Officers and Advisory Board Members hold office without limit in time, except that any officer or Advisory Board Member may resign or may be removed by a vote of a majority of the Trustees at any regular meeting or any special meeting of the Trustees. Except as indicated, each individual has held the office shown or other offices in the same company for the past five years.
The fund’s Statement of Additional Information (SAI) includes more information about the Trustees. To request a free copy, call Fidelity at 1-800-544-8544.
Experience, Skills, Attributes, and Qualifications of the Trustees. The Governance and Nominating Committee has adopted a statement of policy that describes the experience, qualifications, attributes, and skills that are necessary and desirable for potential Independent Trustee candidates (Statement of Policy). The Board believes that each Trustee satisfied at the time he or she was initially elected or appointed a Trustee, and continues to satisfy, the standards contemplated by the Statement of Policy. The Governance and Nominating Committee also engages professional search firms to help identify potential Independent Trustee candidates who have the experience, qualifications, attributes, and skills consistent with the Statement of Policy. From time to time, additional criteria based on the composition and skills of the current Independent Trustees, as well as experience or skills that may be appropriate in light of future changes to board composition, business conditions, and regulatory or other developments, have also been considered by the professional search firms and the Governance and Nominating Committee. In addition, the Board takes into account the Trustees' commitment and participation in Board and committee meetings, as well as their leadership of standing and ad hoc committees throughout their tenure.
In determining that a particular Trustee was and continues to be qualified to serve as a Trustee, the Board has considered a variety of criteria, none of which, in isolation, was controlling. The Board believes that, collectively, the Trustees have balanced and diverse experience, qualifications, attributes, and skills, which allow the Board to operate effectively in governing the fund and protecting the interests of shareholders. Information about the specific experience, skills, attributes, and qualifications of each Trustee, which in each case led to the Board's conclusion that the Trustee should serve (or continue to serve) as a trustee of the fund, is provided below.
Board Structure and Oversight Function. James C. Curvey is an interested person and currently serves as Chairman. The Trustees have determined that an interested Chairman is appropriate and benefits shareholders because an interested Chairman has a personal and professional stake in the quality and continuity of services provided to the fund. Independent Trustees exercise their informed business judgment to appoint an individual of their choosing to serve as Chairman, regardless of whether the Trustee happens to be independent or a member of management. The Independent Trustees have determined that they can act independently and effectively without having an Independent Trustee serve as Chairman and that a key structural component for assuring that they are in a position to do so is for the Independent Trustees to constitute a substantial majority for the Board. The Independent Trustees also regularly meet in executive session. Ned C. Lautenbach serves as Chairman of the Independent Trustees and as such (i) acts as a liaison between the Independent Trustees and management with respect to matters important to the Independent Trustees and (ii) with management prepares agendas for Board meetings.
Fidelity® funds are overseen by different Boards of Trustees. The fund's Board oversees Fidelity's high income and certain equity funds, and other Boards oversee Fidelity's investment-grade bond, money market, asset allocation, and sector funds. The asset allocation funds may invest in Fidelity® funds overseen by the fund's Board. The use of separate Boards, each with its own committee structure, allows the Trustees of each group of Fidelity® funds to focus on the unique issues of the funds they oversee, including common research, investment, and operational issues. On occasion, the separate Boards establish joint committees to address issues of overlapping consequences for the Fidelity® funds overseen by each Board.
The Trustees operate using a system of committees to facilitate the timely and efficient consideration of all matters of importance to the Trustees, the fund, and fund shareholders and to facilitate compliance with legal and regulatory requirements and oversight of the fund's activities and associated risks. The Board, acting through its committees, has charged FMR and its affiliates with (i) identifying events or circumstances the occurrence of which could have demonstrably adverse effects on the fund's business and/or reputation; (ii) implementing processes and controls to lessen the possibility that such events or circumstances occur or to mitigate the effects of such events or circumstances if they do occur; and (iii) creating and maintaining a system designed to evaluate continuously business and market conditions in order to facilitate the identification and implementation processes described in (i) and (ii) above. Because the day-to-day operations and activities of the fund are carried out by or through FMR, its affiliates, and other service providers, the fund's exposure to risks is mitigated but not eliminated by the processes overseen by the Trustees. While each of the Board's committees has responsibility for overseeing different aspects of the fund's activities, oversight is exercised primarily through the Operations, Audit, and Compliance Committees. In addition, the Independent Trustees have worked with FMR to enhance the Board's oversight of investment and financial risks, legal and regulatory risks, technology risks, and operational risks, including the development of additional risk reporting to the Board. For example, a working group comprised of Independent Trustees and FMR has worked and continues to work to review the Fidelity® funds' valuation-related activities, reporting and risk management. Appropriate personnel, including but not limited to the fund's Chief Compliance Officer (CCO), FMR's internal auditor, the independent accountants, the fund's Treasurer and portfolio management personnel, make periodic reports to the Board's committees, as appropriate, including an annual review of Fidelity's risk management program for the Fidelity® funds. The responsibilities of each standing committee, including their oversight responsibilities, are described further under "Standing Committees of the Trustees."
Interested Trustees*:
Correspondence intended for a Trustee who is an interested person may be sent to Fidelity Investments, 245 Summer Street, Boston, Massachusetts 02210.
Name, Year of Birth; Principal Occupations and Other Relevant Experience+
James C. Curvey (1935)
Year of Election or Appointment: 2007
Trustee
Chairman of the Board of Trustees
Mr. Curvey also serves as Trustee of other Fidelity® funds. Mr. Curvey is a Director of Fidelity Research & Analysis Co. (investment adviser firm, 2009-present), and Vice Chairman (2007-present) and Director of FMR LLC (diversified financial services company). In addition, Mr. Curvey serves as an Overseer for the Boston Symphony Orchestra and a member of the board of Artis-Naples, Naples, Florida, and as a Trustee for Brewster Academy, Wolfeboro, New Hampshire. Previously, Mr. Curvey served as a Director of Fidelity Investments Money Management, Inc. (investment adviser firm, 2009-2014) and a Director of FMR and FMR Co., Inc. (investment adviser firms, 2007-2014).
Charles S. Morrison (1960)
Year of Election or Appointment: 2014
Trustee
Mr. Morrison also serves as Trustee of other funds. He serves as President of Fidelity Management & Research Company (FMR) (investment adviser firm, 2016-present), a Director of Fidelity Investments Money Management, Inc. (FIMM) (investment adviser firm, 2014-present), Director of Fidelity SelectCo, LLC (investment adviser firm, 2014-present), President, Asset Management (2014-present), and is an employee of Fidelity Investments. Previously, Mr. Morrison served as Vice President of Fidelity's Fixed Income and Asset Allocation Funds (2012-2014), President, Fixed Income (2011-2014), Vice President of Fidelity's Money Market Funds (2005-2009), President, Money Market Group Leader of FMR (investment adviser firm, 2009), and Senior Vice President, Money Market Group of FMR (2004-2009). Mr. Morrison also served as Vice President of Fidelity's Bond Funds (2002-2005), certain Balanced Funds (2002-2005), and certain Asset Allocation Funds (2002-2007), and as Senior Vice President (2002-2005) of Fidelity's Bond Division.
* Determined to be an “Interested Trustee” by virtue of, among other things, his or her affiliation with the trust or various entities under common control with FMR.
+ The information includes the Trustee's principal occupation during the last five years and other information relating to the experience, attributes, and skills relevant to the Trustee's qualifications to serve as a Trustee, which led to the conclusion that the Trustee should serve as a Trustee for the fund.
Independent Trustees:
Correspondence intended for an Independent Trustee may be sent to Fidelity Investments, P.O. Box 55235, Boston, Massachusetts 02205-5235.
Name, Year of Birth; Principal Occupations and Other Relevant Experience+
Dennis J. Dirks (1948)
Year of Election or Appointment: 2005
Trustee
Mr. Dirks also serves as Trustee of other Fidelity® funds. Prior to his retirement in May 2003, Mr. Dirks was Chief Operating Officer and a member of the Board of The Depository Trust & Clearing Corporation (DTCC). He also served as President, Chief Operating Officer, and Board member of The Depository Trust Company (DTC) and President and Board member of the National Securities Clearing Corporation (NSCC). In addition, Mr. Dirks served as Chief Executive Officer and Board member of the Government Securities Clearing Corporation, Chief Executive Officer and Board member of the Mortgage-Backed Securities Clearing Corporation, as a Trustee and a member of the Finance Committee of Manhattan College (2005-2008), as a Trustee and a member of the Finance Committee of AHRC of Nassau County (2006-2008), as a member of the Independent Directors Council (IDC) Governing Council (2010-2015), and as a member of the Board of Directors for The Brookville Center for Children’s Services, Inc. (2009-2017). Mr. Dirks is a member of the Finance Committee (2016-present) and Board of Directors (2017-present) of the Asolo Repertory Theatre.
Alan J. Lacy (1953)
Year of Election or Appointment: 2008
Trustee
Mr. Lacy also serves as Trustee of other Fidelity® funds. Mr. Lacy serves as a Director of Bristol-Myers Squibb Company (global pharmaceuticals, 2008-present). He is a Trustee of the California Chapter of The Nature Conservancy (2015-present) and a Director of the Center for Advanced Study in the Behavioral Sciences at Stanford University (2015-present). In addition, Mr. Lacy served as Senior Adviser (2007-2014) of Oak Hill Capital Partners, L.P. (private equity) and also served as Chief Executive Officer (2005) and Vice Chairman (2005-2006) of Sears Holdings Corporation (retail) and Chief Executive Officer and Chairman of the Board of Sears, Roebuck and Co. (retail, 2000-2005). Previously, Mr. Lacy served as Chairman (2014-2017) and a member (2010-2017) of the Board of Directors of Dave & Buster’s Entertainment, Inc. (restaurant and entertainment complexes), as Chairman (2008-2011) and a member (2006-2015) of the Board of Trustees of the National Parks Conservation Association, and as a member of the Board of Directors for The Hillman Companies, Inc. (hardware wholesalers, 2010-2014), Earth Fare, Inc. (retail grocery, 2010-2014), and The Western Union Company (global money transfer, 2006-2011).
Ned C. Lautenbach (1944)
Year of Election or Appointment: 2000
Trustee
Chairman of the Independent Trustees
Mr. Lautenbach also serves as Trustee of other Fidelity® funds. Mr. Lautenbach currently serves as Vice Chair of the Board of Governors, State University System of Florida (2013-present) and is a member of the Council on Foreign Relations (1994-present). He is also a member and has most recently served as Chairman of the Board of Directors of Artis-Naples (2012-present). Previously, Mr. Lautenbach served as a member and then Lead Director of the Board of Directors of Eaton Corporation (diversified industrial, 1997-2016). He was also a Partner and Advisory Partner at Clayton, Dubilier & Rice, LLC (private equity investment, 1998-2010), as well as a Director of Sony Corporation (2006-2007). In addition, Mr. Lautenbach also had a 30-year career with IBM (technology company) during which time he served as Senior Vice President and a member of the Corporate Executive Committee (1968-1998).
Joseph Mauriello (1944)
Year of Election or Appointment: 2008
Trustee
Mr. Mauriello also serves as Trustee of other Fidelity® funds. Prior to his retirement in January 2006, Mr. Mauriello served in numerous senior management positions including Deputy Chairman and Chief Operating Officer (2004-2005), and Vice Chairman of Financial Services (2002-2004) of KPMG LLP US (professional services, 1965-2005). Mr. Mauriello currently serves as a member of the Board of Directors of XL Group plc. (global insurance and re-insurance, 2006-present) and the Independent Directors Council (IDC) Governing Council (2015-present). Previously, Mr. Mauriello served as a Director of the Hamilton Funds of the Bank of New York (2006-2007) and of Arcadia Resources Inc. (health care services and products, 2007-2012).
Cornelia M. Small (1944)
Year of Election or Appointment: 2005
Trustee
Ms. Small also serves as Trustee of other Fidelity® funds. Ms. Small is a member of the Board of Directors (2009-present) and Chair of the Investment Committee (2010-present) of the Teagle Foundation. Ms. Small also serves on the Investment Committee of the Berkshire Taconic Community Foundation (2008-present). Previously, Ms. Small served as Chairperson (2002-2008) and a member of the Investment Committee and Chairperson (2008-2012) and a member of the Board of Trustees of Smith College. In addition, Ms. Small served as Chief Investment Officer, Director of Global Equity Investments, and a member of the Board of Directors of Scudder, Stevens & Clark and Scudder Kemper Investments.
William S. Stavropoulos (1939)
Year of Election or Appointment: 2002
Trustee
Vice Chairman of the Independent Trustees
Mr. Stavropoulos also serves as Trustee of other Fidelity® funds. Mr. Stavropoulos serves as President and Founder of the Michigan Baseball Foundation, the Great Lakes Loons (2007-present). Mr. Stavropoulos is Chairman Emeritus of the Board of Directors of The Dow Chemical Company, where he previously served in numerous senior management positions, including President, CEO (1995-2000; 2002-2004), Chairman of the Executive Committee (2000-2006), and as a member of the Board of Directors (1990-2006). Currently, Mr. Stavropoulos is Chairman of the Board of Directors of Univar Inc. (global distributor of commodity and specialty chemicals), a Director of Teradata Corporation (data warehousing and technology solutions), and a member of the Advisory Board for Metalmark Capital LLC (private equity investment, 2005-present). Mr. Stavropoulos is an operating advisor to Clayton, Dubilier & Rice, LLC (private equity investment). In addition, Mr. Stavropoulos is a member of the University of Notre Dame Advisory Council for the College of Science, a Trustee of the Rollin L. Gerstacker Foundation, and a Director of Artis-Naples in Naples, Florida. Previously, Mr. Stavropoulos served as a Director of Chemical Financial Corporation (bank holding company, 1993-2012) and Tyco International, Ltd. (multinational manufacturing and services, 2007-2012).
David M. Thomas (1949)
Year of Election or Appointment: 2008
Trustee
Mr. Thomas also serves as Trustee of other Fidelity® funds. Mr. Thomas serves as Non-Executive Chairman of the Board of Directors of Fortune Brands Home and Security (home and security products, 2011-present), as a member of the Board of Directors (2004-present) and Presiding Director (2013-present) of Interpublic Group of Companies, Inc. (marketing communication), and as a member of the Board of Trustees of the University of Florida (2013-present). Previously, Mr. Thomas served as Executive Chairman (2005-2006) and Chairman and Chief Executive Officer (2000-2005) of IMS Health, Inc. (pharmaceutical and healthcare information solutions), and a Director of Fortune Brands, Inc. (consumer products, 2000-2011).
+ The information includes the Trustee's principal occupation during the last five years and other information relating to the experience, attributes, and skills relevant to the Trustee's qualifications to serve as a Trustee, which led to the conclusion that the Trustee should serve as a Trustee for the fund.
Advisory Board Members and Officers:
Correspondence intended for an officer or Peter S. Lynch may be sent to Fidelity Investments, 245 Summer Street, Boston, Massachusetts 02210. Officers appear below in alphabetical order.
Name, Year of Birth; Principal Occupation
Peter S. Lynch (1944)
Year of Election or Appointment: 2003
Member of the Advisory Board
Mr. Lynch also serves as Member of the Advisory Board of other Fidelity® funds. Mr. Lynch is Vice Chairman and a Director of FMR (investment adviser firm) and FMR Co., Inc. (investment adviser firm). In addition, Mr. Lynch serves as a Trustee of Boston College and as the Chairman of the Inner-City Scholarship Fund. Previously, Mr. Lynch served on the Special Olympics International Board of Directors (1997-2006).
Elizabeth Paige Baumann (1968)
Year of Election or Appointment: 2017
Anti-Money Laundering (AML) Officer
Ms. Baumann also serves as AML Officer of other funds. She is Chief AML Officer (2012-present) and Senior Vice President (2014-present) of FMR LLC (diversified financial services company) and is an employee of Fidelity Investments. Previously, Ms. Baumann served as AML Officer of the funds (2012-2016), and Vice President (2007-2014) and Deputy Anti-Money Laundering Officer (2007-2012) of FMR LLC.
Marc R. Bryant (1966)
Year of Election or Appointment: 2015
Secretary and Chief Legal Officer (CLO)
Mr. Bryant also serves as Secretary and CLO of other funds. Mr. Bryant serves as CLO, Secretary, and Senior Vice President of Fidelity Management & Research Company (investment adviser firm, 2015-present) and FMR Co., Inc. (investment adviser firm, 2015-present); Secretary of Fidelity SelectCo, LLC (investment adviser firm, 2015-present) and Fidelity Investments Money Management, Inc. (investment adviser firm, 2015-present); and CLO of Fidelity Management & Research (Hong Kong) Limited and FMR Investment Management (UK) Limited (investment adviser firms, 2015-present) and Fidelity Management & Research (Japan) Limited (investment adviser firm, 2016-present). He is Senior Vice President and Deputy General Counsel of FMR LLC (diversified financial services company). Previously, Mr. Bryant served as Secretary and CLO of Fidelity Rutland Square Trust II (2010-2014) and Assistant Secretary of Fidelity's Fixed Income and Asset Allocation Funds (2013-2015). Prior to joining Fidelity Investments, Mr. Bryant served as a Senior Vice President and the Head of Global Retail Legal for AllianceBernstein L.P. (2006-2010), and as the General Counsel for ProFund Advisors LLC (2001-2006).
William C. Coffey (1969)
Year of Election or Appointment: 2009
Assistant Secretary
Mr. Coffey also serves as Assistant Secretary of other funds. He is Senior Vice President and Deputy General Counsel of FMR LLC (diversified financial services company, 2010-present), and is an employee of Fidelity Investments. Previously, Mr. Coffey served as Vice President and Associate General Counsel of FMR LLC (2005-2009).
Jonathan Davis (1968)
Year of Election or Appointment: 2010
Assistant Treasurer
Mr. Davis also serves as Assistant Treasurer of other funds, and is an employee of Fidelity Investments. Previously, Mr. Davis served as Vice President and Associate General Counsel of FMR LLC (diversified financial services company, 2003-2010).
Adrien E. Deberghes (1967)
Year of Election or Appointment: 2016
Assistant Treasurer
Mr. Deberghes also serves as an officer of other funds. He serves as Executive Vice President of Fidelity Investments Money Management, Inc. (FIMM) (investment adviser firm, 2016-present) and is an employee of Fidelity Investments (2008-present). Prior to joining Fidelity Investments, Mr. Deberghes was Senior Vice President of Mutual Fund Administration at State Street Corporation (2007-2008), Senior Director of Mutual Fund Administration at Investors Bank & Trust (2005-2007), and Director of Finance for Dunkin' Brands (2000-2005). Previously, Mr. Deberghes served in other fund officer roles.
Stephanie J. Dorsey (1969)
Year of Election or Appointment: 2010
Assistant Treasurer
Ms. Dorsey also serves as an officer of other funds. She is an employee of Fidelity Investments (2008-present) and has served in other fund officer roles. Prior to joining Fidelity Investments, Ms. Dorsey served as Treasurer (2004-2008) of the JPMorgan Mutual Funds and Vice President (2004-2008) of JPMorgan Chase Bank.
Howard J. Galligan III (1966)
Year of Election or Appointment: 2014
Chief Financial Officer
Mr. Galligan also serves as Chief Financial Officer of other funds. Mr. Galligan serves as President of Fidelity Pricing and Cash Management Services (FPCMS) (2014-present) and as a Director of Strategic Advisers, Inc. (investment adviser firm, 2008-present). Previously, Mr. Galligan served as Chief Administrative Officer of Asset Management (2011-2014) and Chief Operating Officer and Senior Vice President of Investment Support for Strategic Advisers, Inc. (2003-2011).
Thomas C. Hense (1964)
Year of Election or Appointment: 2008, 2010, or 2015
Vice President
Mr. Hense serves as Vice President of Fidelity Advisor® Multi-Asset Income Fund (2015) and other funds (High Income (2008), Small Cap (2008), and Value (2010) funds), and is an employee of Fidelity Investments (1993-present). Previously, Mr. Hense served as a portfolio manager for Fidelity's Institutional Money Management Group (Pyramis) (2003-2008).
Brian B. Hogan (1964)
Year of Election or Appointment: 2009
Vice President
Mr. Hogan also serves as Trustee or Vice President of other funds. Mr. Hogan serves as a Director of FMR Investment Management (UK) Limited (investment adviser firm, 2015-present) and Fidelity SelectCo, LLC (investment adviser firm, 2014-present) and President of the Equity Division of FMR (investment adviser firm, 2009-present). Previously, Mr. Hogan served as Senior Vice President, Equity Research of FMR (2006-2009) and as a portfolio manager. Mr. Brian B. Hogan is not related to Mr. Colm A. Hogan.
Colm A. Hogan (1973)
Year of Election or Appointment: 2016
Deputy Treasurer
Mr. Hogan also serves as an officer of other funds. Mr. Hogan is an employee of Fidelity Investments (2005-present). Mr. Colm A. Hogan is not related to Mr. Brian B. Hogan.
Chris Maher (1972)
Year of Election or Appointment: 2013
Assistant Treasurer
Mr. Maher serves as Assistant Treasurer of other funds. Mr. Maher is Vice President of Valuation Oversight and is an employee of Fidelity Investments. Previously, Mr. Maher served as Vice President of Asset Management Compliance (2013), Vice President of the Program Management Group of FMR (investment adviser firm, 2010-2013), and Vice President of Valuation Oversight (2008-2010).
Rieco E. Mello (1969)
Year of Election or Appointment: 2017
Assistant Treasurer
Mr. Mello also serves as Assistant Treasurer of other funds. Mr. Mello is an employee of Fidelity Investments (1995-present).
Kenneth B. Robins (1969)
Year of Election or Appointment: 2016
Chief Compliance Officer
Mr. Robins also serves as an officer of other funds. Mr. Robins serves as Compliance Officer of Fidelity Management & Research Company and FMR Co., Inc. (investment adviser firms, 2016-present) and is an employee of Fidelity Investments (2004-present). Previously, Mr. Robins served as Executive Vice President of Fidelity Investments Money Management, Inc. (investment adviser firm, 2013-2016) and served in other fund officer roles.
Stacie M. Smith (1974)
Year of Election or Appointment: 2016
President and Treasurer
Ms. Smith also serves as an officer of other funds. She is an employee of Fidelity Investments (2009-present) and has served in other fund officer roles. Prior to joining Fidelity Investments, Ms. Smith served as Senior Audit Manager of Ernst & Young LLP (accounting firm, 1996-2009). Previously, Ms. Smith served as Deputy Treasurer of certain Fidelity® funds (2013-2016).
Marc L. Spector (1972)
Year of Election or Appointment: 2016
Assistant Treasurer
Mr. Spector also serves as an officer of other funds. Mr. Spector is an employee of Fidelity Investments (2016-present). Prior to joining Fidelity Investments, Mr. Spector served as Director at the Siegfried Group (accounting firm, 2013-2016), and prior to Siegfried Group as audit senior manager at Deloitte & Touche (accounting firm, 2005-2013).
Renee Stagnone (1975)
Year of Election or Appointment: 2016
Assistant Treasurer
Ms. Stagnone also serves as an officer of other funds. Ms. Stagnone is an employee of Fidelity Investments (1997-present). Previously, Ms. Stagnone served as Deputy Treasurer of certain Fidelity® funds (2013-2016).
Shareholder Expense Example
As a shareholder of the Fund, you incur two types of costs: (1) transaction costs and (2) ongoing costs, including management fees and other Fund expenses. This Example is intended to help you understand your ongoing costs (in dollars) of investing in the Fund and to compare these costs with the ongoing costs of investing in other mutual funds.
The Example is based on an investment of $1,000 invested at the beginning of the period and held for the entire period (May 1, 2017 to October 31, 2017).
Actual Expenses
The first line of the accompanying table for each class of the Fund provides information about actual account values and actual expenses. You may use the information in this line, together with the amount you invested, to estimate the expenses that you paid over the period. Simply divide your account value by $1,000.00 (for example, an $8,600 account value divided by $1,000.00 = 8.6), then multiply the result by the number in the first line for a class of the Fund under the heading entitled "Expenses Paid During Period" to estimate the expenses you paid on your account during this period. A small balance maintenance fee of $12.00 that is charged once a year may apply for certain accounts with a value of less than $2,000. This fee is not included in the table below. If it was, the estimate of expenses you paid during the period would be higher, and your ending account value lower, by this amount. In addition, the Fund, as a shareholder in the underlying Fidelity Central Funds, will indirectly bear its pro-rata share of the fees and expenses incurred by the underlying Fidelity Central Funds. These fees and expenses are not included in the Fund's annualized expense ratio used to calculate the expense estimate in the table below.
Hypothetical Example for Comparison Purposes
The second line of the accompanying table for each class of the Fund provides information about hypothetical account values and hypothetical expenses based on a Class' actual expense ratio and an assumed rate of return of 5% per year before expenses, which is not the Class' actual return. The hypothetical account values and expenses may not be used to estimate the actual ending account balance or expenses you paid for the period. You may use this information to compare the ongoing costs of investing in the Fund and other funds. To do so, compare this 5% hypothetical example with the 5% hypothetical examples that appear in the shareholder reports of the other funds. A small balance maintenance fee of $12.00 that is charged once a year may apply for certain accounts with a value of less than $2,000. This fee is not included in the table below. If it was, the estimate of expenses you paid during the period would be higher, and your ending account value lower, by this amount. In addition, the Fund, as a shareholder in the underlying Fidelity Central Funds, will indirectly bear its pro-rata share of the fees and expenses incurred by the underlying Fidelity Central Funds. These fees and expenses are not included in the Fund's annualized expense ratio used to calculate the expense estimate in the table below.
Please note that the expenses shown in the table are meant to highlight your ongoing costs only and do not reflect any transaction costs. Therefore, the second line of the table is useful in comparing ongoing costs only, and will not help you determine the relative total costs of owning different funds.
| | Annualized Expense Ratio-A | Beginning
Account Value
May 1, 2017 | Ending
Account Value
October 31, 2017 | Expenses Paid
During Period-B
May 1, 2017
to October 31, 2017 |
| Value | .62% | | | |
| Actual | | $1,000.00 | $1,049.80 | $3.20 |
| Hypothetical-C | | $1,000.00 | $1,022.08 | $3.16 |
| Class K | .52% | | | |
| Actual | | $1,000.00 | $1,050.20 | $2.69 |
| Hypothetical-C | | $1,000.00 | $1,022.58 | $2.65 |
A Annualized expense ratio reflects expenses net of applicable fee waivers.
B Expenses are equal to each Class' annualized expense ratio, multiplied by the average account value over the period, multiplied by 184/365 (to reflect the one-half year period).
C 5% return per year before expenses
Distributions (Unaudited)
The Board of Trustees of Fidelity Value Fund voted to pay to shareholders of record at the opening of business on record date, the following distributions per share derived from capital gains realized from sales of portfolio securities, and dividends derived from net investment income:
| | Pay Date | Record Date | Dividends | Capital Gains |
| Fidelity Value Fund | | | | |
| Value | 12/11/17 | 12/08/17 | $1.651 | $4.090 |
| Class K | 12/11/17 | 12/08/17 | $1.782 | $4.090 |
|
The fund hereby designates as a capital gain dividend with respect to the taxable year ended October 31, 2017, $99,141,841, or, if subsequently determined to be different, the net capital gain of such year.
The fund designates 89%; Class K designates 83%; of the dividends distributed during the fiscal year as qualifying for the dividends–received deduction for corporate shareholders.
The fund designates 97%; Class K designates 89%; of the dividends distributed during the fiscal year as amounts which may be taken into account as a dividend for purposes of the maximum rate under section 1(h)(11) of the Internal Revenue Code.
The fund will notify shareholders in January 2018 of amounts for use in preparing 2017 income tax returns.
Board Approval of Investment Advisory Contracts and Management Fees
Fidelity Value Fund
Each year, the Board of Trustees, including the Independent Trustees (together, the Board), votes on the renewal of the management contract with Fidelity Management & Research Company (FMR) and the sub-advisory agreements (together, the Advisory Contracts) for the fund. FMR and the sub-advisers are referred to herein as the Investment Advisers. The Board, assisted by the advice of fund counsel and Independent Trustees' counsel, requests and considers a broad range of information relevant to the renewal of the Advisory Contracts throughout the year.
The Board meets regularly and, at each of its meetings, covers an extensive agenda of topics and materials and considers factors that are relevant to its annual consideration of the renewal of the fund's Advisory Contracts, including the services and support provided to the fund and its shareholders. The Board has established various standing committees (Committees), each composed of and chaired by Independent Trustees with varying backgrounds, to which the Board has assigned specific subject matter responsibilities in order to enhance effective decision-making by the Board. The Board, acting directly and through its Committees, requests and receives information concerning the annual consideration of the renewal of the fund's Advisory Contracts. The Board also meets as needed to review matters specifically related to the Board's annual consideration of the renewal of the Advisory Contracts. Members of the Board may also meet with trustees of other Fidelity funds through ad hoc joint committees to discuss certain matters relevant to all of the Fidelity funds.
At its July 2017 meeting, the Board unanimously determined to renew the fund's Advisory Contracts. In reaching its determination, the Board considered all factors it believed relevant, including (i) the nature, extent, and quality of the services to be provided to the fund and its shareholders (including the investment performance of the fund); (ii) the competitiveness of the fund's management fee and total expense ratio relative to peer funds; (iii) the total costs of the services to be provided by and the profits to be realized by Fidelity from its relationships with the fund; and (iv) the extent to which, if any, economies of scale exist and would be realized as the fund grows, and whether any economies of scale are appropriately shared with fund shareholders.
In considering whether to renew the Advisory Contracts for the fund, the Board reached a determination, with the assistance of fund counsel and Independent Trustees' counsel and through the exercise of its business judgment, that the renewal of the Advisory Contracts was in the best interests of the fund and its shareholders and that the compensation payable under the Advisory Contracts was fair and reasonable. The Board's decision to renew the Advisory Contracts was not based on any single factor, but rather was based on a comprehensive consideration of all the information provided to the Board at its meetings throughout the year. The Board, in reaching its determination to renew the Advisory Contracts, was aware that shareholders of the fund have a broad range of investment choices available to them, including a wide choice among funds offered by Fidelity's competitors, and that the fund's shareholders, who have the opportunity to review and weigh the disclosure provided by the fund in its prospectus and other public disclosures, have chosen to invest in this fund, which is part of the Fidelity family of funds.
Amendment to Group Fee Rate. The Board also approved an amendment to the management contract for the fund to add an additional breakpoint to the group fee schedule, effective October 1, 2017. The Board noted that the additional breakpoint would result in lower management fee rates as Fidelity's assets under management increase.
Nature, Extent, and Quality of Services Provided. The Board considered Fidelity's staffing as it relates to the fund, including the backgrounds of investment personnel of Fidelity, and also considered the fund's investment objective, strategies, and related investment philosophy. The Independent Trustees also had discussions with senior management of Fidelity's investment operations and investment groups. The Board considered the structure of the investment personnel compensation program and whether this structure provides appropriate incentives to act in the best interests of the fund. Additionally, the Board considered the portfolio managers' investments, if any, in the funds that they manage.
Resources Dedicated to Investment Management and Support Services. The Board and the Fund Oversight and Research Committees reviewed the general qualifications and capabilities of Fidelity's investment staff, including its size, education, experience, and resources, as well as Fidelity's approach to recruiting, training, managing, and compensating investment personnel. The Board noted that Fidelity has continued to increase the resources devoted to non-U.S. offices, including expansion of Fidelity's global investment organization. The Board also noted that Fidelity's analysts have extensive resources, tools and capabilities that allow them to conduct sophisticated quantitative and fundamental analysis, as well as credit analysis of issuers, counterparties and guarantors. Further, the Board considered that Fidelity's investment professionals have sufficient access to global information and data so as to provide competitive investment results over time, and that those professionals also have access to sophisticated tools that permit them to assess portfolio construction and risk and performance attribution characteristics continuously, as well as to transmit new information and research conclusions rapidly around the world. Additionally, in its deliberations, the Board considered Fidelity's trading, risk management, compliance, and technology and operations capabilities and resources, which are integral parts of the investment management process.
Shareholder and Administrative Services. The Board considered (i) the nature, extent, quality, and cost of advisory, administrative, and shareholder services performed by the Investment Advisers and their affiliates under the Advisory Contracts and under separate agreements covering transfer agency, pricing and bookkeeping, and securities lending services for the fund; (ii) the nature and extent of the supervision of third party service providers, principally custodians, subcustodians, and pricing vendors; and (iii) the resources devoted to, and the record of compliance with, the fund's compliance policies and procedures. The Board also reviewed the allocation of fund brokerage, including allocations to brokers affiliated with the Investment Advisers, the use of brokerage commissions to pay fund expenses, and the use of "soft" commission dollars to pay for research services.
The Board noted that the growth of fund assets over time across the complex allows Fidelity to reinvest in the development of services designed to enhance the value or convenience of the Fidelity funds as investment vehicles. These services include 24-hour access to account information and market information through telephone representatives and over the Internet, investor education materials and asset allocation tools, and the expanded availability of Fidelity Investor Centers.
In 2014, the Board formed an ad hoc Committee on Transfer Agency Fees to review the variety of transfer agency fee structures throughout the industry and Fidelity's competitive positioning with respect to industry participants.
Investment in a Large Fund Family. The Board considered the benefits to shareholders of investing in a Fidelity fund, including the benefits of investing in a fund that is part of a large family of funds offering a variety of investment disciplines and providing a large variety of mutual fund investor services. The Board noted that Fidelity had taken, or had made recommendations that resulted in the Fidelity funds taking, a number of actions over the previous year that benefited particular funds, including: (i) continuing to dedicate additional resources to Fidelity's investment research process, and to the support of the senior management team that oversees asset management; (ii) continuing efforts to enhance Fidelity's global research capabilities; (iii) launching new funds and making other enhancements to meet client needs; (iv) launching new share classes of existing funds; (v) eliminating purchase minimums and broadening eligibility requirements for certain lower-priced share classes; (vi) reducing management fees and total expenses for certain growth equity funds and index funds; (vii) lowering expense caps for certain existing funds and classes to reduce expenses borne by shareholders; (viii) eliminating short-term redemption fees for certain funds; (ix) introducing a new pricing structure for certain funds of funds that is expected to reduce overall expenses paid by shareholders; (x) rationalizing product lines and gaining increased efficiencies through proposals for fund mergers and share class consolidations; (xi) continuing to develop, acquire and implement systems and technology to improve services to the funds and shareholders, strengthen information security, and increase efficiency; and (xii) implementing enhancements to further strengthen Fidelity's product line to increase investors' probability of success in achieving their investment goals, including retirement income goals.
Investment Performance. The Board considered whether the fund has operated in accordance with its investment objective, as well as its record of compliance with its investment restrictions and its performance history.
The Board took into account discussions with representatives of the Investment Advisers about fund investment performance that occur at Board meetings throughout the year. In this regard the Board noted that as part of regularly scheduled fund reviews and other reports to the Board on fund performance, the Board considers annualized return information for the fund for different time periods, measured against a securities market index ("benchmark index") and a peer group of funds with similar objectives ("peer group"), if any. In its evaluation of fund investment performance, the Board gave particular attention to information indicating changes in performance of certain Fidelity funds for specific time periods and discussed with the Investment Advisers the reasons for any overperformance or underperformance.
In addition to reviewing absolute and relative fund performance, the Independent Trustees periodically consider the appropriateness of fund performance metrics in evaluating the results achieved. In general, the Independent Trustees believe that fund performance should be evaluated based on net performance (after fees and expenses) of both the highest performing and lowest performing fund share classes, where applicable, compared to appropriate benchmark indices, over appropriate time periods that may include full market cycles, and compared to peer groups, as applicable, over the same periods, taking into account relevant factors including the following: general market conditions; issuer-specific information; and fund cash flows and other factors.
The Independent Trustees recognize that shareholders evaluate performance on a net basis over their own holding periods, for which one-, three-, and five-year periods are often used as a proxy. For this reason, the performance information reviewed by the Board also included net cumulative calendar year total return information for the fund and an appropriate benchmark index and peer group for the most recent one-, three-, and five-year periods, as shown below. Returns are shown compared to the 25th percentile (top of box, 75% beaten) and 75th percentile (bottom of box, 25% beaten) of the peer universe.
Fidelity Value Fund
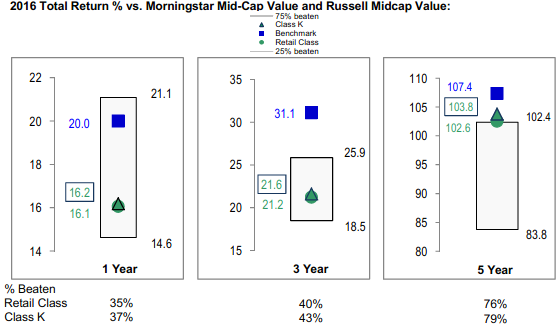
The Board has discussed the fund's underperformance (based on the December 31, 2016 data presented herein) with FMR, including the fund's investment strategy, the portfolio management team, and broader trends in the market that may have impacted the fund's performance, and has engaged with FMR to consider what steps might be taken to remediate the fund's underperformance. The Board noted that the fund's performance has improved since the period shown. The Board noted that there were portfolio management changes for the fund in January 2014 and December 2016.
The Board also considered that the fund's management fee is subject to upward or downward adjustment depending upon whether, and to what extent, the fund's investment performance for the performance period (a rolling 36-month period) exceeds, or is exceeded by, a securities index, thus leading to a performance adjustment for the same period. The Board noted that the performance adjustment provides FMR with a strong economic incentive to seek to achieve superior long-term performance for the fund's shareholders and helps to more closely align the interests of FMR and the shareholders of the fund.
Based on its review, the Board concluded that the nature, extent, and quality of services provided to the fund under the Advisory Contracts should continue to benefit the shareholders of the fund.
Competitiveness of Management Fee and Total Expense Ratio. The Board considered the fund's management fee and total expense ratio compared to "mapped groups" of competitive funds and classes created for the purpose of facilitating the Trustees' competitive analysis of management fees and total expenses. Fidelity creates "mapped groups" by combining similar Lipper investment objective categories that have comparable investment mandates. Combining Lipper investment objective categories aids the Board's management fee and total expense ratio comparisons by broadening the competitive group used for comparison.
Management Fee. The Board considered two proprietary management fee comparisons for the 12-month periods shown in basis points (BP) in the chart below. The group of Lipper funds used by the Board for management fee comparisons is referred to below as the "Total Mapped Group." The Total Mapped Group comparison focuses on a fund's standing in terms of gross management fees before expense reimbursements or caps, and without giving effect to the fund's performance adjustment, relative to the total universe of funds with comparable investment mandates, regardless of whether their management fee structures also are comparable. Funds with comparable investment mandates offer exposure to similar types of securities. Funds with comparable management fee structures have similar management fee contractual arrangements (
e.g., flat rate charged for advisory services, all-inclusive fee rate,
etc.). "TMG %" represents the percentage of funds in the Total Mapped Group that had management fees that were lower than the fund's. For example, a hypothetical TMG % of 20% would mean that 80% of the funds in the Total Mapped Group had higher, and 20% had lower, management fees than the fund. The fund's actual TMG %s and the number of funds in the Total Mapped Group are in the chart below. The "Asset-Size Peer Group" (ASPG) comparison focuses on a fund's standing relative to a subset of non-Fidelity funds within the Total Mapped Group that are similar in size and management fee structure without taking into account performance adjustments, if any. For example, if a fund is in the first quartile of the ASPG, the fund's management fee ranks in the least expensive or lowest 25% of funds in the ASPG. The ASPG represents at least 15% of the funds in the Total Mapped Group with comparable asset size and management fee structures, subject to a minimum of 50 funds (or all funds in the Total Mapped Group if fewer than 50). Additional information, such as the ASPG quartile in which the fund's management fee rate ranked and the impact of the fund's performance adjustment, is also included in the chart and considered by the Board.
Fidelity Value Fund
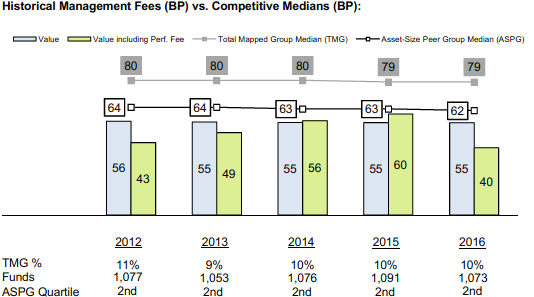
The Board noted that the fund's management fee rate ranked below the median of its Total Mapped Group and below the median of its ASPG for 2016. The Board also noted the effect of the fund's performance adjustment, if any, on the fund's management fee ranking.
The Board noted that, in 2014, the Board and the boards of other Fidelity funds formed the ad hoc Committee on Group Fee to conduct an in-depth review of the "group fee" component of the management fee of funds with such management fee structures. The Committee's focus included the mechanics of the group fee, the competitive landscape of group fee structures, Fidelity funds with no group fee component and investment products not included in group fee assets. The Board also considered that, for funds subject to the group fee, FMR agreed to voluntarily waive fees over a specified period of time in amounts designed to account for assets converted from certain funds to certain collective investment trusts.
The Board also noted that, in 2013, the ad hoc Committee on Management Fees was formed to conduct an in-depth review of the management fee rates of Fidelity's active equity mutual funds. The Committee focused on the following areas: (i) standard fee structures; (ii) research consumption and trading evolution; (iii) management fee competitiveness/profitability by category; and (iv) factors that drive institutional pricing.
Based on its review, the Board concluded that the fund's management fee is fair and reasonable in light of the services that the fund receives and the other factors considered.
Total Expense Ratio. In its review of each class's total expense ratio, the Board considered the fund's management fee rate as well as other fund or class expenses, as applicable, such as transfer agent fees, pricing and bookkeeping fees, and custodial, legal, and audit fees. The Board noted the impact of the fund's performance adjustment. The Board also noted that Fidelity may agree to waive fees and expenses from time to time, and the extent to which, if any, it has done so for the fund. As part of its review, the Board also considered the current and historical total expense ratios of each class of the fund compared to competitive fund median expenses. Each class of the fund is compared to those funds and classes in the Total Mapped Group (used by the Board for management fee comparisons) that have a similar sales load structure.
The Board noted that the total expense ratio of each class ranked below the competitive median for 2016.
Fees Charged to Other Fidelity Clients. The Board also considered Fidelity fee structures and other information with respect to clients of Fidelity, such as other funds advised or subadvised by Fidelity, pension plan clients, and other institutional clients with similar mandates. The Board noted that an ad hoc joint committee created by it and the boards of other Fidelity funds periodically (most recently in 2013) reviews and compares Fidelity's institutional investment advisory business with its business of providing services to the Fidelity funds, including the differences in services provided, fees charged, and costs incurred, as well as competition in their respective marketplaces.
Based on its review of total expense ratios and fees charged to other Fidelity clients, the Board concluded that the total expense ratio of each class of the fund was reasonable in light of the services that the fund and its shareholders receive and the other factors considered.
Costs of the Services and Profitability. The Board considered the revenues earned and the expenses incurred by Fidelity in conducting the business of developing, marketing, distributing, managing, administering and servicing the fund and servicing the fund's shareholders. The Board also considered the level of Fidelity's profits in respect of all the Fidelity funds.
On an annual basis, Fidelity presents to the Board information about the profitability of its relationships with the fund. Fidelity calculates profitability information for each fund, as well as aggregate profitability information for groups of Fidelity funds and all Fidelity funds, using a series of detailed revenue and cost allocation methodologies which originate with the books and records of Fidelity on which Fidelity's audited financial statements are based. The Audit Committee of the Board reviews any significant changes from the prior year's methodologies.
PricewaterhouseCoopers LLP (PwC), independent registered public accounting firm and auditor to Fidelity and certain Fidelity funds, has been engaged annually by the Board as part of the Board's assessment of Fidelity's profitability analysis. PwC's engagement includes the review and assessment of the methodologies used by Fidelity in determining the revenues and expenses attributable to Fidelity's mutual fund business, and completion of agreed-upon procedures in respect of the mathematical accuracy of the fund profitability information and its conformity to established allocation methodologies. After considering PwC's reports issued under the engagement and information provided by Fidelity, the Board concluded that while other allocation methods may also be reasonable, Fidelity's profitability methodologies are reasonable in all material respects.
The Board also reviewed Fidelity's non-fund businesses and potential fall-out benefits related to the mutual fund business as well as cases where Fidelity's affiliates may benefit from or be related to the fund's business.
The Board considered the costs of the services provided by and the profits realized by Fidelity in connection with the operation of the fund and was satisfied that the profitability was not excessive.
Economies of Scale. The Board considered whether there have been economies of scale in respect of the management of the Fidelity funds, whether the Fidelity funds (including the fund) have appropriately benefited from any such economies of scale, and whether there is potential for realization of any further economies of scale. The Board considered the extent to which the fund will benefit from economies of scale as assets grow through increased services to the fund, through waivers or reimbursements, or through fee or expense ratio reductions. The Board also noted that a committee (the Economies of Scale Committee) created by it and the boards of other Fidelity funds periodically (most recently in 2013) analyzes whether Fidelity attains economies of scale in respect of the management and servicing of the Fidelity funds, whether the Fidelity funds have appropriately benefited from such economies of scale, and whether there is potential for realization of any further economies of scale.
The Board recognized that the fund's management contract incorporates a "group fee" structure, which provides for lower group fee rates as total group assets increase, and for higher group fee rates as total group assets decrease (with "group assets" defined to include fund assets under FMR's management plus the assets of sector funds previously under FMR's management). FMR calculates the group fee rates based on a tiered asset "breakpoint" schedule that varies based on asset class. The Board considered that the group fee is designed to deliver the benefits of economies of scale to fund shareholders when total Fidelity fund assets increase, even if assets of any particular fund are unchanged or have declined, because some portion of Fidelity's costs are attributable to services provided to all Fidelity funds, and all funds benefit if those costs can be allocated among more assets. The Board concluded that, given the group fee structure, fund shareholders will benefit from lower management fees as group assets increase at the fund complex level, regardless of whether Fidelity achieves any such economies of scale.
The Board concluded, taking into account the analysis of the Economies of Scale Committee, that economies of scale, if any, are being appropriately shared between fund shareholders and Fidelity.
Additional Information Requested by the Board. In order to develop fully the factual basis for consideration of the Fidelity funds' advisory contracts, the Board requested and received additional information on certain topics, including: (i) fund performance trends, in particular the underperformance of certain funds, and Fidelity's long-term strategies for certain funds; (ii) Fidelity's fund profitability methodology, profitability trends for certain funds, and the impact of certain factors on fund profitability results, including the impact of market trends on actively managed funds; (iii) the use of performance fees and the calculation of performance adjustments, including the impact of underperformance and fund outflows on performance adjustments; (iv) metrics for evaluating index fund performance; (v) Fidelity's group fee structure, including the group fee breakpoint schedules; (vi) the terms of Fidelity's contractual and voluntary expense cap arrangements with the funds; (vii) the methodology with respect to evaluating competitive fund data and peer group classifications and fee comparisons; (viii) the expense structures for different funds and classes; (ix) Fidelity's arrangements with affiliated sub-advisers on behalf of the funds; (x) information regarding other accounts managed by Fidelity, including institutional accounts and collective investment trusts; (xi) recent changes to the fee structure for certain funds of funds; and (xii) the impact of the Department of Labor's new fiduciary rule on the funds' comparative expense information.
Based on its evaluation of all of the conclusions noted above, and after considering all factors it believed relevant, the Board concluded that the advisory fee structures are fair and reasonable, and that the fund's Advisory Contracts should be renewed.
Corporate Headquarters
245 Summer St.
Boston, MA 02210
www.fidelity.com
VAL-ANN-1217
1.538531.120
Fidelity® Value Fund Class K
Annual Report October 31, 2017 |
|
Contents
To view a fund's proxy voting guidelines and proxy voting record for the 12-month period ended June 30, visit http://www.fidelity.com/proxyvotingresults or visit the Securities and Exchange Commission's (SEC) web site at http://www.sec.gov.
You may also call 1-800-835-5092 to request a free copy of the proxy voting guidelines.
Standard & Poor's, S&P and S&P 500 are registered service marks of The McGraw-Hill Companies, Inc. and have been licensed for use by Fidelity Distributors Corporation.
Other third-party marks appearing herein are the property of their respective owners.
All other marks appearing herein are registered or unregistered trademarks or service marks of FMR LLC or an affiliated company. © 2017 FMR LLC. All rights reserved.
This report and the financial statements contained herein are submitted for the general information of the shareholders of the Fund. This report is not authorized for distribution to prospective investors in the Fund unless preceded or accompanied by an effective prospectus.
A fund files its complete schedule of portfolio holdings with the SEC for the first and third quarters of each fiscal year on Form N-Q. Forms N-Q are available on the SEC’s web site at http://www.sec.gov. A fund's Forms N-Q may be reviewed and copied at the SEC’s Public Reference Room in Washington, DC. Information regarding the operation of the SEC's Public Reference Room may be obtained by calling 1-800-SEC-0330.
For a complete list of a fund's portfolio holdings, view the most recent holdings listing, semiannual report, or annual report on Fidelity's web site at http://www.fidelity.com, http://www.institutional.fidelity.com, or http://www.401k.com, as applicable.
NOT FDIC INSURED •MAY LOSE VALUE •NO BANK GUARANTEE
Neither the Fund nor Fidelity Distributors Corporation is a bank.
Performance: The Bottom Line
Average annual total return reflects the change in the value of an investment, assuming reinvestment of distributions from dividend income and capital gains (the profits earned upon the sale of securities that have grown in value, if any) and assuming a constant rate of performance each year. The hypothetical investment and the average annual total returns do not reflect the deduction of taxes that a shareholder would pay on fund distributions or the redemption of fund shares. During periods of reimbursement by Fidelity, a fund’s total return will be greater than it would be had the reimbursement not occurred. How a fund did yesterday is no guarantee of how it will do tomorrow.
Average Annual Total Returns
| For the periods ended October 31, 2017 | Past 1 year | Past 5 years | Past 10 years |
| Class K | 19.98% | 14.14% | 6.30% |
The initial offering of Class K shares took place on May 9, 2008. Returns prior to May 9, 2008 are those of Fidelity® Value Fund, the original class of the fund.
$10,000 Over 10 Years
Let's say hypothetically that $10,000 was invested in Fidelity® Value Fund - Class K on October 31, 2007.
The chart shows how the value of your investment would have changed, and also shows how the Russell Midcap® Value Index performed over the same period.
See above for additional information regarding the performance of Class K.
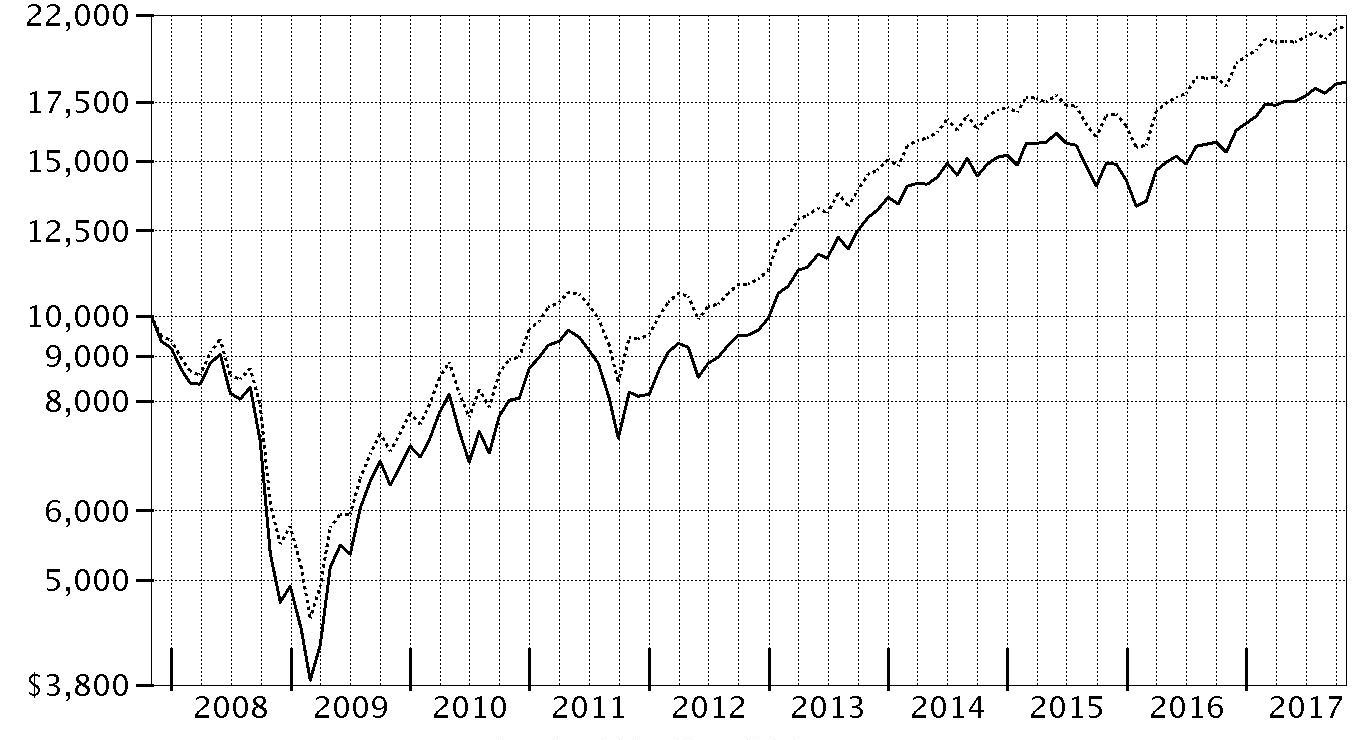
| Period Ending Values |
| $18,427 | Fidelity® Value Fund - Class K |
| $21,382 | Russell Midcap® Value Index |
Management's Discussion of Fund Performance
Market Recap: The U.S. equity bellwether S&P 500
® index gained 23.63% for the year ending October 31, 2017. Equity markets rose sharply following the November election and continued to rally through the end of February on optimism for President Trump’s pro-business agenda. Stocks leveled off in March amid fading optimism and stalled efforts by Congress to repeal and replace the Affordable Care Act. Upward momentum soon returned and continued through period end amid positive consumer sentiment and other market indicators. The lone exception was a brief cooldown in August, when geopolitical tension escalated and uncertainty grew regarding the future of health care, tax reform and the debt ceiling. Sector-wise, information technology (+39%) performed best, surging as a handful of major index constituents posted strong returns. Financials gained 37%, riding an uptick in bond yields and a surge in banks. Materials (+29%) also did well, spurred by higher demand, especially from China. Conversely, consumer discretionary (+20%) lagged the broader market, as brick-and-mortar retailers continued to suffer from increased online competition. Rising interest rates held back real estate (+9%) and sluggish oil prices dragged on energy (+2%). Consumer staples (+4%) and telecommunication services (-1%) struggled due to investors’ general preference for risk assets.
Comments from Co-Portfolio Manager Matthew Friedman: For the fiscal year, the fund’s share classes gained roughly 20%, outpacing the 17.12% return of the benchmark Russell Midcap
® Value Index. Versus the benchmark, the top individual contributor was Aerojet Rocketdyne Holdings. Shares of the maker of propulsion systems for rockets and missiles were driven by the Trump administration's promise to boost military spending. Elsewhere, it helped to establish a position in DXC Technology in April. The stock of the provider of technology consulting services benefited from the firm's better-than-expected earnings. Aerojet Rocketdyne and DXC were both non-benchmark holdings. Among individual detractors, untimely ownership of Israel-based Teva Pharmaceutical Industries hurt most. Shares of the maker of generic drugs were hurt by a combination of excess debt from the company’s 2016 acquisition of Actavis’ generics business and drug-pricing pressure stemming from poor industry fundamentals and turnover in the broader generics product cycle. We sold our non-benchmark stake in Teva in October.
The views expressed above reflect those of the portfolio manager(s) only through the end of the period as stated on the cover of this report and do not necessarily represent the views of Fidelity or any other person in the Fidelity organization. Any such views are subject to change at any time based upon market or other conditions and Fidelity disclaims any responsibility to update such views. These views may not be relied on as investment advice and, because investment decisions for a Fidelity fund are based on numerous factors, may not be relied on as an indication of trading intent on behalf of any Fidelity fund.
Note to shareholders: Effective December 31, 2016, Steve Barwikowski is no longer a Co-Manager of the fund. On December 1, 2017, Matt Friedman transitioned from Co-Manager to Lead Manager of the fund and also assumed joint responsibility of its consumer sleeves with Kathy Buck, who plans to retire from portfolio management on March 31, 2017.
Investment Summary (Unaudited)
Top Ten Stocks as of October 31, 2017
| | % of fund's net assets | % of fund's net assets 6 months ago |
| Sempra Energy | 1.8 | 2.1 |
| Xcel Energy, Inc. | 1.7 | 1.8 |
| Synchrony Financial | 1.6 | 1.1 |
| Discover Financial Services | 1.5 | 1.0 |
| Edison International | 1.5 | 1.7 |
| Wells Fargo & Co. | 1.4 | 1.1 |
| U.S. Bancorp | 1.3 | 1.0 |
| American Tower Corp. | 1.3 | 1.7 |
| Berkshire Hathaway, Inc. Class B | 1.1 | 1.0 |
| Chubb Ltd. | 1.0 | 1.0 |
| | 14.2 | |
Top Five Market Sectors as of October 31, 2017
| | % of fund's net assets | % of fund's net assets 6 months ago |
| Financials | 17.2 | 16.3 |
| Real Estate | 12.4 | 12.1 |
| Consumer Discretionary | 12.4 | 11.4 |
| Industrials | 12.0 | 12.1 |
| Materials | 8.8 | 8.3 |
Asset Allocation (% of fund's net assets)
| As of October 31, 2017 * |
| | Stocks and Equity Futures | 98.3% |
| | Convertible Securities | 0.1% |
| | Short-Term Investments and Net Other Assets (Liabilities) | 1.6% |

* Foreign investments - 15.9%
| As of April 30, 2017 * |
| | Stocks and Equity Futures | 97.8% |
| | Convertible Securities | 0.2% |
| | Short-Term Investments and Net Other Assets (Liabilities) | 2.0% |

* Foreign investments - 16.9%
Investments October 31, 2017
Showing Percentage of Net Assets
| Common Stocks - 97.6% | | | |
| | | Shares | Value (000s) |
| CONSUMER DISCRETIONARY - 12.4% | | | |
| Auto Components - 1.2% | | | |
| American Axle & Manufacturing Holdings, Inc. (a) | | 1,676,700 | $29,828 |
| Delphi Automotive PLC | | 613,300 | 60,950 |
| Hertz Global Holdings, Inc. (a)(b) | | 293,200 | 7,292 |
| | | | 98,070 |
| Diversified Consumer Services - 1.4% | | | |
| Houghton Mifflin Harcourt Co. (a) | | 4,809,306 | 47,612 |
| Service Corp. International | | 882,027 | 31,277 |
| ServiceMaster Global Holdings, Inc. (a) | | 854,620 | 40,261 |
| | | | 119,150 |
| Hotels, Restaurants & Leisure - 1.6% | | | |
| DineEquity, Inc. | | 675,818 | 32,176 |
| Eldorado Resorts, Inc. (a) | | 990,165 | 25,447 |
| U.S. Foods Holding Corp. (a) | | 1,174,400 | 32,038 |
| Wyndham Worldwide Corp. | | 456,200 | 48,745 |
| | | | 138,406 |
| Household Durables - 1.5% | | | |
| D.R. Horton, Inc. | | 1,456,100 | 64,374 |
| Newell Brands, Inc. | | 347,400 | 14,167 |
| Techtronic Industries Co. Ltd. | | 5,895,500 | 34,573 |
| Whirlpool Corp. | | 77,200 | 12,655 |
| | | | 125,769 |
| Internet & Direct Marketing Retail - 0.8% | | | |
| Liberty Interactive Corp. QVC Group: | | | |
| (Venture Group) Series A (a) | | 496,600 | 28,286 |
| Series A (a) | | 1,859,200 | 42,241 |
| | | | 70,527 |
| Leisure Products - 0.8% | | | |
| Mattel, Inc. (b) | | 3,735,800 | 52,749 |
| Vista Outdoor, Inc. (a) | | 591,800 | 12,375 |
| | | | 65,124 |
| Media - 3.4% | | | |
| DISH Network Corp. Class A (a) | | 435,700 | 21,149 |
| Entercom Communications Corp. Class A (b) | | 1,985,700 | 21,942 |
| Grupo Televisa SA de CV (CPO) sponsored ADR | | 1,010,000 | 22,109 |
| Liberty Broadband Corp. Class C (a) | | 418,271 | 36,511 |
| Liberty Global PLC Class C (a) | | 1,062,200 | 31,749 |
| Nexstar Broadcasting Group, Inc. Class A | | 297,800 | 19,000 |
| Omnicom Group, Inc. | | 887,000 | 59,598 |
| Sinclair Broadcast Group, Inc. Class A (b) | | 1,224,156 | 38,806 |
| Twenty-First Century Fox, Inc.: | | | |
| Class A | | 804,000 | 21,025 |
| Class B | | 434,900 | 11,068 |
| | | | 282,957 |
| Specialty Retail - 1.4% | | | |
| AutoZone, Inc. (a) | | 91,500 | 53,939 |
| O'Reilly Automotive, Inc. (a) | | 132,700 | 27,993 |
| Sally Beauty Holdings, Inc. (a) | | 779,200 | 13,488 |
| Signet Jewelers Ltd. (b) | | 363,200 | 23,815 |
| | | | 119,235 |
| Textiles, Apparel & Luxury Goods - 0.3% | | | |
| PVH Corp. | | 215,472 | 27,324 |
|
| TOTAL CONSUMER DISCRETIONARY | | | 1,046,562 |
|
| CONSUMER STAPLES - 4.8% | | | |
| Beverages - 1.1% | | | |
| Cott Corp. | | 2,064,911 | 30,955 |
| Molson Coors Brewing Co. Class B | | 763,386 | 61,735 |
| | | | 92,690 |
| Food & Staples Retailing - 0.4% | | | |
| CVS Health Corp. | | 449,800 | 30,825 |
| Walgreens Boots Alliance, Inc. | | 97,800 | 6,481 |
| | | | 37,306 |
| Food Products - 2.8% | | | |
| Bunge Ltd. | | 114,509 | 7,876 |
| Darling International, Inc. (a) | | 3,348,600 | 61,112 |
| Nomad Foods Ltd. (a) | | 2,300,517 | 34,738 |
| The J.M. Smucker Co. | | 577,031 | 61,194 |
| TreeHouse Foods, Inc. (a) | | 677,500 | 44,972 |
| Tyson Foods, Inc. Class A | | 309,600 | 22,573 |
| | | | 232,465 |
| Personal Products - 0.5% | | | |
| Coty, Inc. Class A | | 2,437,409 | 37,536 |
|
| TOTAL CONSUMER STAPLES | | | 399,997 |
|
| ENERGY - 7.7% | | | |
| Energy Equipment & Services - 1.2% | | | |
| Baker Hughes, a GE Co. Class A | | 505,334 | 15,883 |
| C&J Energy Services, Inc. | | 313,600 | 8,934 |
| Dril-Quip, Inc. (a) | | 611,633 | 25,750 |
| Halliburton Co. | | 222,155 | 9,495 |
| Nabors Industries Ltd. | | 4,676,000 | 26,326 |
| Odfjell Drilling A/S (a) | | 2,299,782 | 9,207 |
| TechnipFMC PLC | | 221,427 | 6,065 |
| | | | 101,660 |
| Oil, Gas & Consumable Fuels - 6.5% | | | |
| Anadarko Petroleum Corp. | | 263,800 | 13,024 |
| Boardwalk Pipeline Partners, LP | | 3,015,800 | 42,282 |
| Cabot Oil & Gas Corp. | | 958,300 | 26,545 |
| Cenovus Energy, Inc. | | 3,355,600 | 32,565 |
| Cheniere Energy, Inc. (a) | | 666,500 | 31,152 |
| Diamondback Energy, Inc. (a) | | 232,617 | 24,927 |
| Energen Corp. (a) | | 358,279 | 18,523 |
| Enterprise Products Partners LP | | 690,100 | 16,907 |
| EQT Corp. | | 853,664 | 53,388 |
| GasLog Ltd. (b) | | 1,803,700 | 31,114 |
| Golar LNG Ltd. (b) | | 713,748 | 15,081 |
| Lundin Petroleum AB | | 1,323,400 | 31,126 |
| Marathon Petroleum Corp. | | 682,399 | 40,767 |
| Newfield Exploration Co. (a) | | 526,610 | 16,214 |
| Phillips 66 Co. | | 330,100 | 30,066 |
| Plains GP Holdings LP Class A | | 707,600 | 14,435 |
| Teekay Corp. (b) | | 3,146,864 | 25,490 |
| Teekay LNG Partners LP | | 1,977,280 | 34,108 |
| Teekay Offshore Partners LP | | 8,874,100 | 22,718 |
| WPX Energy, Inc. (a) | | 1,877,800 | 21,182 |
| | | | 541,614 |
|
| TOTAL ENERGY | | | 643,274 |
|
| FINANCIALS - 17.2% | | | |
| Banks - 5.0% | | | |
| Bank Ireland Group PLC (a) | | 758,257 | 5,922 |
| CIT Group, Inc. | | 1,672,274 | 77,961 |
| EFG Eurobank Ergasias SA (a) | | 6,391,260 | 5,219 |
| First Citizen Bancshares, Inc. Class A | | 73,592 | 29,805 |
| PNC Financial Services Group, Inc. | | 376,100 | 51,447 |
| Popular, Inc. | | 337,800 | 12,391 |
| Prosperity Bancshares, Inc. | | 165,000 | 10,854 |
| U.S. Bancorp | | 2,085,115 | 113,389 |
| Wells Fargo & Co. | | 2,059,028 | 115,594 |
| | | | 422,582 |
| Capital Markets - 2.7% | | | |
| Apollo Global Management LLC Class A | | 1,119,832 | 35,364 |
| Ares Capital Corp. (b) | | 901,262 | 14,492 |
| Brookfield Asset Management, Inc. Class A | | 262,850 | 11,027 |
| Carlyle Group LP | | 140,000 | 3,087 |
| Franklin Resources, Inc. | | 796,000 | 33,535 |
| KKR & Co. LP | | 977,936 | 19,608 |
| Legg Mason, Inc. | | 1,193,800 | 45,579 |
| State Street Corp. | | 286,300 | 26,340 |
| The Blackstone Group LP | | 1,109,704 | 36,942 |
| | | | 225,974 |
| Consumer Finance - 4.9% | | | |
| Ally Financial, Inc. | | 1,346,500 | 35,184 |
| Capital One Financial Corp. | | 819,791 | 75,568 |
| Discover Financial Services | | 1,917,300 | 127,558 |
| OneMain Holdings, Inc. (a) | | 1,291,038 | 41,016 |
| Synchrony Financial | | 4,031,100 | 131,494 |
| | | | 410,820 |
| Diversified Financial Services - 1.4% | | | |
| Berkshire Hathaway, Inc. Class B (a) | | 468,689 | 87,617 |
| Donnelley Financial Solutions, Inc. | | 1,230,000 | 26,445 |
| | | | 114,062 |
| Insurance - 3.2% | | | |
| AFLAC, Inc. | | 231,446 | 19,416 |
| AMBAC Financial Group, Inc. (a) | | 2,040,459 | 33,219 |
| American International Group, Inc. | | 96,900 | 6,261 |
| Chubb Ltd. | | 555,648 | 83,803 |
| Fairfax Financial Holdings Ltd. (sub. vtg.) | | 10,000 | 5,266 |
| FNF Group | | 1,554,600 | 58,173 |
| Greenlight Capital Re, Ltd. (a) | | 325,043 | 7,167 |
| Reinsurance Group of America, Inc. | | 240,593 | 35,940 |
| Torchmark Corp. | | 285,851 | 24,049 |
| | | | 273,294 |
| Mortgage Real Estate Investment Trusts - 0.0% | | | |
| MFA Financial, Inc. | | 292,290 | 2,408 |
|
| TOTAL FINANCIALS | | | 1,449,140 |
|
| HEALTH CARE - 6.2% | | | |
| Biotechnology - 1.2% | | | |
| Amgen, Inc. | | 277,700 | 48,659 |
| Shire PLC sponsored ADR | | 157,500 | 23,252 |
| United Therapeutics Corp. (a) | | 262,700 | 31,154 |
| | | | 103,065 |
| Health Care Equipment & Supplies - 0.8% | | | |
| Dentsply Sirona, Inc. | | 109,300 | 6,675 |
| Hill-Rom Holdings, Inc. | | 15,100 | 1,219 |
| Hologic, Inc. (a) | | 68,300 | 2,585 |
| Steris PLC | | 85,600 | 7,989 |
| Teleflex, Inc. | | 36,600 | 8,673 |
| Zimmer Biomet Holdings, Inc. | | 332,146 | 40,396 |
| | | | 67,537 |
| Health Care Providers & Services - 2.2% | | | |
| Cardinal Health, Inc. | | 234,600 | 14,522 |
| Centene Corp. (a) | | 89,300 | 8,365 |
| DaVita HealthCare Partners, Inc. (a) | | 81,800 | 4,969 |
| Envision Healthcare Corp. | | 967,172 | 41,202 |
| Laboratory Corp. of America Holdings (a) | | 219,047 | 33,670 |
| McKesson Corp. | | 214,700 | 29,603 |
| Patterson Companies, Inc. | | 68,234 | 2,525 |
| Quest Diagnostics, Inc. | | 121,600 | 11,404 |
| Universal Health Services, Inc. Class B | | 346,392 | 35,574 |
| | | | 181,834 |
| Life Sciences Tools & Services - 0.1% | | | |
| Bio-Rad Laboratories, Inc. Class A (a) | | 16,600 | 3,649 |
| Quintiles Transnational Holdings, Inc. (a) | | 18,400 | 1,989 |
| | | | 5,638 |
| Pharmaceuticals - 1.9% | | | |
| Allergan PLC | | 115,200 | 20,417 |
| Indivior PLC (a) | | 3,792,300 | 18,717 |
| Jazz Pharmaceuticals PLC (a) | | 525,209 | 74,333 |
| Mallinckrodt PLC (a) | | 897,896 | 28,436 |
| Mylan N.V. (a) | | 316,500 | 11,302 |
| Perrigo Co. PLC | | 47,900 | 3,879 |
| The Medicines Company (a) | | 271,501 | 7,803 |
| | | | 164,887 |
|
| TOTAL HEALTH CARE | | | 522,961 |
|
| INDUSTRIALS - 12.0% | | | |
| Aerospace & Defense - 1.2% | | | |
| Aerojet Rocketdyne Holdings, Inc. (a) | | 918,186 | 28,996 |
| Huntington Ingalls Industries, Inc. | | 130,400 | 30,361 |
| KLX, Inc. (a) | | 446,000 | 24,468 |
| Ultra Electronics Holdings PLC | | 657,000 | 15,916 |
| | | | 99,741 |
| Airlines - 1.7% | | | |
| American Airlines Group, Inc. | | 1,655,578 | 77,514 |
| JetBlue Airways Corp. (a) | | 2,564,000 | 49,101 |
| United Continental Holdings, Inc. (a) | | 323,000 | 18,889 |
| | | | 145,504 |
| Building Products - 0.2% | | | |
| Allegion PLC | | 152,338 | 12,703 |
| Commercial Services & Supplies - 0.6% | | | |
| IWG PLC | | 7,705,200 | 22,043 |
| KAR Auction Services, Inc. | | 666,500 | 31,545 |
| | | | 53,588 |
| Construction & Engineering - 2.0% | | | |
| AECOM (a) | | 1,847,488 | 64,773 |
| Arcadis NV | | 872,123 | 20,165 |
| Astaldi SpA | | 3,366,341 | 23,332 |
| KBR, Inc. | | 3,236,745 | 63,537 |
| | | | 171,807 |
| Electrical Equipment - 1.1% | | | |
| AMETEK, Inc. | | 290,340 | 19,595 |
| Fortive Corp. | | 156,533 | 11,311 |
| Regal Beloit Corp. | | 440,200 | 35,722 |
| Sensata Technologies Holding BV (a) | | 458,601 | 22,430 |
| | | | 89,058 |
| Machinery - 1.0% | | | |
| Allison Transmission Holdings, Inc. | | 1,211,865 | 51,492 |
| SPX Flow, Inc. (a) | | 858,800 | 35,408 |
| | | | 86,900 |
| Road & Rail - 1.3% | | | |
| Avis Budget Group, Inc. (a) | | 1,619,000 | 66,784 |
| CSX Corp. | | 159,587 | 8,048 |
| Norfolk Southern Corp. | | 126,800 | 16,664 |
| Swift Transporation Co. (a) | | 444,768 | 18,436 |
| | | | 109,932 |
| Trading Companies & Distributors - 2.9% | | | |
| AerCap Holdings NV (a) | | 873,496 | 45,981 |
| Ashtead Group PLC | | 1,429,400 | 36,830 |
| Fortress Transportation & Infrastructure Investors LLC | | 1,303,100 | 23,756 |
| HD Supply Holdings, Inc. (a) | | 1,571,256 | 55,607 |
| Nexeo Solutions, Inc. (a) | | 2,044,100 | 15,106 |
| Nexeo Solutions, Inc. (a)(c) | | 1,170,000 | 8,646 |
| WESCO International, Inc. (a) | | 847,051 | 53,491 |
| | | | 239,417 |
|
| TOTAL INDUSTRIALS | | | 1,008,650 |
|
| INFORMATION TECHNOLOGY - 7.6% | | | |
| Communications Equipment - 1.1% | | | |
| CommScope Holding Co., Inc. (a) | | 1,751,900 | 56,306 |
| F5 Networks, Inc. (a) | | 271,500 | 32,925 |
| | | | 89,231 |
| Electronic Equipment & Components - 1.4% | | | |
| Avnet, Inc. | | 263,800 | 10,499 |
| Cardtronics PLC (a) | | 1,123,000 | 25,717 |
| Jabil, Inc. | | 1,570,103 | 44,403 |
| TE Connectivity Ltd. | | 458,966 | 41,752 |
| | | | 122,371 |
| IT Services - 4.1% | | | |
| Amdocs Ltd. | | 984,600 | 64,097 |
| Cognizant Technology Solutions Corp. Class A | | 867,800 | 65,666 |
| Conduent, Inc. | | 2,347,500 | 36,339 |
| DXC Technology Co. | | 625,300 | 57,227 |
| First Data Corp. Class A (a) | | 1,658,600 | 29,540 |
| Leidos Holdings, Inc. | | 678,649 | 42,429 |
| Total System Services, Inc. | | 496,800 | 35,794 |
| Unisys Corp. (a)(b) | | 1,943,076 | 17,002 |
| | | | 348,094 |
| Semiconductors & Semiconductor Equipment - 0.6% | | | |
| Qualcomm, Inc. | | 1,016,954 | 51,875 |
| Software - 0.4% | | | |
| Micro Focus International PLC | | 836,500 | 29,386 |
| Totvs SA | | 100,900 | 1,005 |
| | | | 30,391 |
|
| TOTAL INFORMATION TECHNOLOGY | | | 641,962 |
|
| MATERIALS - 8.8% | | | |
| Chemicals - 5.0% | | | |
| Axalta Coating Systems (a) | | 1,460,446 | 48,560 |
| Celanese Corp. Class A | | 187,200 | 19,527 |
| CF Industries Holdings, Inc. | | 892,600 | 33,901 |
| DowDuPont, Inc. | | 689,406 | 49,851 |
| Eastman Chemical Co. | | 467,503 | 42,454 |
| FMC Corp. | | 159,500 | 14,811 |
| LyondellBasell Industries NV Class A | | 586,580 | 60,729 |
| Monsanto Co. | | 208,500 | 25,249 |
| PPG Industries, Inc. | | 116,200 | 13,507 |
| The Chemours Co. LLC | | 691,500 | 39,146 |
| Tronox Ltd. Class A | | 834,100 | 22,079 |
| Westlake Chemical Corp. | | 566,000 | 48,059 |
| | | | 417,873 |
| Construction Materials - 0.5% | | | |
| Eagle Materials, Inc. | | 425,200 | 44,888 |
| Containers & Packaging - 2.4% | | | |
| Avery Dennison Corp. | | 146,956 | 15,602 |
| Ball Corp. | | 1,301,000 | 55,852 |
| Berry Global Group, Inc. (a) | | 481,100 | 28,601 |
| Graphic Packaging Holding Co. | | 3,054,600 | 47,316 |
| Sealed Air Corp. | | 753,300 | 33,318 |
| Silgan Holdings, Inc. | | 754,000 | 22,055 |
| | | | 202,744 |
| Metals & Mining - 0.7% | | | |
| Alcoa Corp. | | 285,500 | 13,641 |
| Antofagasta PLC | | 483,700 | 6,132 |
| Randgold Resources Ltd. sponsored ADR | | 152,900 | 15,025 |
| Steel Dynamics, Inc. | | 542,065 | 20,170 |
| | | | 54,968 |
| Paper & Forest Products - 0.2% | | | |
| Kapstone Paper & Packaging Corp. | | 884,300 | 19,861 |
|
| TOTAL MATERIALS | | | 740,334 |
|
| REAL ESTATE - 12.4% | | | |
| Equity Real Estate Investment Trusts (REITs) - 11.4% | | | |
| American Tower Corp. | | 735,104 | 105,612 |
| AvalonBay Communities, Inc. | | 160,700 | 29,140 |
| Boston Properties, Inc. | | 199,400 | 24,163 |
| Colony NorthStar, Inc. | | 6,655,108 | 81,725 |
| Corporate Office Properties Trust (SBI) | | 1,151,400 | 36,764 |
| Douglas Emmett, Inc. | | 1,099,500 | 43,749 |
| Equinix, Inc. | | 84,800 | 39,305 |
| Equity Commonwealth (a) | | 69,100 | 2,076 |
| Equity Lifestyle Properties, Inc. | | 853,461 | 75,514 |
| Equity Residential (SBI) | | 456,400 | 30,697 |
| Essex Property Trust, Inc. | | 229,300 | 60,175 |
| Extra Space Storage, Inc. | | 682,800 | 55,710 |
| Forest City Realty Trust, Inc. Class A | | 1,103,995 | 27,191 |
| General Growth Properties, Inc. | | 3,262,000 | 63,479 |
| Grivalia Properties REIC | | 4,452,702 | 46,421 |
| iStar Financial, Inc. (a) | | 2,526,965 | 29,565 |
| Lamar Advertising Co. Class A | | 297,900 | 20,984 |
| National Retail Properties, Inc. | | 1,192,788 | 47,926 |
| Outfront Media, Inc. | | 1,851,500 | 43,418 |
| Public Storage | | 55,400 | 11,482 |
| Safety Income and Growth, Inc. | | 200,000 | 3,594 |
| SBA Communications Corp. Class A (a) | | 16,100 | 2,531 |
| Simon Property Group, Inc. | | 39,000 | 6,058 |
| Spirit Realty Capital, Inc. | | 3,343,100 | 27,781 |
| VEREIT, Inc. | | 1,894,400 | 14,947 |
| Welltower, Inc. | | 219,500 | 14,698 |
| WP Glimcher, Inc. | | 2,408,200 | 18,856 |
| | | | 963,561 |
| Real Estate Management & Development - 1.0% | | | |
| CBRE Group, Inc. (a) | | 1,387,700 | 54,564 |
| Kennedy-Wilson Holdings, Inc. | | 195,642 | 3,805 |
| Realogy Holdings Corp. | | 774,005 | 25,024 |
| | | | 83,393 |
|
| TOTAL REAL ESTATE | | | 1,046,954 |
|
| TELECOMMUNICATION SERVICES - 0.2% | | | |
| Diversified Telecommunication Services - 0.2% | | | |
| Iridium Communications, Inc. (a)(b) | | 410,409 | 4,925 |
| Level 3 Communications, Inc. | | 247,800 | 13,290 |
| | | | 18,215 |
| UTILITIES - 8.3% | | | |
| Electric Utilities - 4.8% | | | |
| Alliant Energy Corp. | | 678,300 | 29,343 |
| Edison International | | 1,539,293 | 123,066 |
| Exelon Corp. | | 447,900 | 18,010 |
| NextEra Energy, Inc. | | 173,518 | 26,907 |
| PG&E Corp. | | 1,058,900 | 61,173 |
| Xcel Energy, Inc. | | 2,830,500 | 140,166 |
| | | | 398,665 |
| Independent Power and Renewable Electricity Producers - 1.0% | | | |
| NRG Energy, Inc. | | 1,428,600 | 35,715 |
| The AES Corp. | | 4,666,100 | 49,601 |
| | | | 85,316 |
| Multi-Utilities - 2.5% | | | |
| CMS Energy Corp. | | 634,900 | 30,710 |
| Public Service Enterprise Group, Inc. | | 676,400 | 33,279 |
| Sempra Energy | | 1,269,897 | 149,212 |
| | | | 213,201 |
|
| TOTAL UTILITIES | | | 697,182 |
|
| TOTAL COMMON STOCKS | | | |
| (Cost $7,010,265) | | | 8,215,231 |
|
| Nonconvertible Preferred Stocks - 0.0% | | | |
| INDUSTRIALS - 0.0% | | | |
| Aerospace & Defense - 0.0% | | | |
| Rolls-Royce Holdings PLC (C Shares) | | | |
| (Cost $58) | | 47,004,088 | 62 |
| | | Principal Amount (000s) | Value (000s) |
|
| Convertible Bonds - 0.1% | | | |
| ENERGY - 0.1% | | | |
| Oil, Gas & Consumable Fuels - 0.1% | | | |
Cobalt International Energy, Inc. 2.625% 12/1/19
(Cost $30,575) | | 47,770 | 6,688 |
|
| U.S. Treasury Obligations - 0.0% | | | |
| U.S. Treasury Bills, yield at date of purchase 1.02% to 1.09% 11/9/17 to 1/25/18 (d) | | | |
| (Cost $2,837) | | 2,840 | 2,837 |
| | | Shares | Value (000s) |
|
| Money Market Funds - 3.7% | | | |
| Fidelity Cash Central Fund, 1.10% (e) | | 162,196,130 | $162,229 |
| Fidelity Securities Lending Cash Central Fund 1.11% (e)(f) | | 144,656,307 | 144,671 |
| TOTAL MONEY MARKET FUNDS | | | |
| (Cost $306,881) | | | 306,900 |
| TOTAL INVESTMENT IN SECURITIES - 101.4% | | | |
| (Cost $7,350,616) | | | 8,531,718 |
| NET OTHER ASSETS (LIABILITIES) - (1.4)% | | | (114,607) |
| NET ASSETS - 100% | | | $8,417,111 |
| Futures Contracts | | | | | |
| | Number of contracts | Expiration Date | Notional Amount (000s) | Value (000s) | Unrealized Appreciation/(Depreciation) (000s) |
| Purchased | | | | | |
| Equity Index Contracts | | | | | |
| CME E-mini S&P MidCap 400 Index Contracts (United States) | 317 | Dec. 2017 | $58,135 | $71 | $71 |
The notional amount of futures purchased as a percentage of Net Assets is 0.7%
Legend
(a) Non-income producing
(b) Security or a portion of the security is on loan at period end.
(c) Restricted securities - Investment in securities not registered under the Securities Act of 1933 (excluding 144A issues). At the end of the period, the value of restricted securities (excluding 144A issues) amounted to $8,646,000 or 0.1% of net assets.
(d) Security or a portion of the security was pledged to cover margin requirements for futures contracts. At period end, the value of securities pledged amounted to $2,309,000.
(e) Affiliated fund that is generally available only to investment companies and other accounts managed by Fidelity Investments. The rate quoted is the annualized seven-day yield of the fund at period end. A complete unaudited listing of the fund's holdings as of its most recent quarter end is available upon request. In addition, each Fidelity Central Fund's financial statements, which are not covered by the Fund's Report of Independent Registered Public Accounting Firm, are available on the SEC's website or upon request.
(f) Investment made with cash collateral received from securities on loan.
Additional information on each restricted holding is as follows:
| Security | Acquisition Date | Acquisition Cost (000s) |
| Nexeo Solutions, Inc. | 6/9/16 | $11,700 |
Affiliated Central Funds
Information regarding fiscal year to date income earned by the Fund from investments in Fidelity Central Funds is as follows:
| Fund | Income earned |
| | (Amounts in thousands) |
| Fidelity Cash Central Fund | $1,481 |
| Fidelity Securities Lending Cash Central Fund | 1,118 |
| Total | $2,599 |
Other Affiliated Issuers
An affiliated company is a company in which the Fund has ownership of at least 5% of the voting securities. Fiscal year to date transactions with companies which are or were affiliates are as follows:
| Affiliate (Amounts in thousands) | Value, beginning of period | Purchases | Sales Proceeds | Dividend Income | Realized Gain (loss) | Change in Unrealized appreciation (depreciation) | Value, end of period |
| iStar Financial, Inc. | $49,984 | $13,606 | $36,125 | $-- | $(4,644) | $6,744 | $-- |
| R1 RCM, Inc. (formerly Accretive Health, Inc.) | 13,132 | -- | 21,097 | -- | 6,387 | 1,578 | -- |
| Teekay Offshore Partners LP | 27,989 | 13,176 | -- | -- | -- | (15,841) | -- |
| Total | $91,105 | $26,782 | $57,222 | $-- | $1,743 | $(7,519) | $-- |
Investment Valuation
The following is a summary of the inputs used, as of October 31, 2017, involving the Fund's assets and liabilities carried at fair value. The inputs or methodology used for valuing securities may not be an indication of the risk associated with investing in those securities. For more information on valuation inputs, and their aggregation into the levels used below, please refer to the Investment Valuation section in the accompanying Notes to Financial Statements.
| | Valuation Inputs at Reporting Date: |
| Description | Total | Level 1 | Level 2 | Level 3 |
| (Amounts in thousands) | | | | |
| Investments in Securities: | | | | |
| Equities: | | | | |
| Consumer Discretionary | $1,046,562 | $1,046,562 | $-- | $-- |
| Consumer Staples | 399,997 | 399,997 | -- | -- |
| Energy | 643,274 | 643,274 | -- | -- |
| Financials | 1,449,140 | 1,449,140 | -- | -- |
| Health Care | 522,961 | 522,961 | -- | -- |
| Industrials | 1,008,712 | 1,008,712 | -- | -- |
| Information Technology | 641,962 | 641,962 | -- | -- |
| Materials | 740,334 | 740,334 | -- | -- |
| Real Estate | 1,046,954 | 1,046,954 | -- | -- |
| Telecommunication Services | 18,215 | 18,215 | -- | -- |
| Utilities | 697,182 | 697,182 | -- | -- |
| Corporate Bonds | 6,688 | -- | 6,688 | -- |
| U.S. Government and Government Agency Obligations | 2,837 | -- | 2,837 | -- |
| Money Market Funds | 306,900 | 306,900 | -- | -- |
| Total Investments in Securities: | $8,531,718 | $8,522,193 | $9,525 | $-- |
| Derivative Instruments: | | | | |
| Assets | | | | |
| Futures Contracts | $71 | $71 | $-- | $-- |
| Total Assets | $71 | $71 | $-- | $-- |
| Total Derivative Instruments: | $71 | $71 | $-- | $-- |
Value of Derivative Instruments
The following table is a summary of the Fund's value of derivative instruments by primary risk exposure as of October 31, 2017. For additional information on derivative instruments, please refer to the Derivative Instruments section in the accompanying Notes to Financial Statements.
| Primary Risk Exposure / Derivative Type | Value (000s) |
| | Asset | Liability |
| (Amounts in thousands) | | |
| Equity Risk | | |
| Futures Contracts(a) | $71 | $0 |
| Total Equity Risk | 71 | 0 |
| Total Value of Derivatives | $71 | $0 |
(a) Reflects gross cumulative appreciation (depreciation) on futures contracts as presented in the Schedule of Investments. In the Statement of Assets and Liabilities, the period end daily variation margin is included in receivable or payable for daily variation margin on futures contracts, and the net cumulative appreciation (depreciation) is included in net unrealized appreciation (depreciation).
Other Information
Distribution of investments by country or territory of incorporation, as a percentage of Total Net Assets, is as follows (Unaudited):
| United States of America | 84.1% |
| United Kingdom | 2.2% |
| Netherlands | 1.9% |
| Ireland | 1.8% |
| Switzerland | 1.5% |
| Bailiwick of Jersey | 1.4% |
| Bermuda | 1.3% |
| Marshall Islands | 1.0% |
| Others (Individually Less Than 1%) | 4.8% |
| | 100.0% |
See accompanying notes which are an integral part of the financial statements.
Financial Statements
Statement of Assets and Liabilities
| Amounts in thousands (except per-share amounts) | | October 31, 2017 |
| Assets | | |
Investment in securities, at value (including securities loaned of $137,000) — See accompanying schedule:
Unaffiliated issuers (cost $7,043,735) | $8,224,818 | |
| Fidelity Central Funds (cost $306,881) | 306,900 | |
| Total Investment in Securities (cost $7,350,616) | | $8,531,718 |
| Cash | | 69 |
| Foreign currency held at value (cost $1,714) | | 1,715 |
| Receivable for investments sold | | 63,884 |
| Receivable for fund shares sold | | 1,384 |
| Dividends receivable | | 3,542 |
| Interest receivable | | 522 |
| Distributions receivable from Fidelity Central Funds | | 387 |
| Receivable for daily variation margin on futures contracts | | 288 |
| Prepaid expenses | | 19 |
| Other receivables | | 821 |
| Total assets | | 8,604,349 |
| Liabilities | | |
| Payable for investments purchased | $32,744 | |
| Payable for fund shares redeemed | 4,750 | |
| Accrued management fee | 3,317 | |
| Other affiliated payables | 1,036 | |
| Other payables and accrued expenses | 717 | |
| Collateral on securities loaned | 144,674 | |
| Total liabilities | | 187,238 |
| Net Assets | | $8,417,111 |
| Net Assets consist of: | | |
| Paid in capital | | $6,901,433 |
| Undistributed net investment income | | 97,741 |
| Accumulated undistributed net realized gain (loss) on investments and foreign currency transactions | | 236,787 |
| Net unrealized appreciation (depreciation) on investments and assets and liabilities in foreign currencies | | 1,181,150 |
| Net Assets | | $8,417,111 |
| Value: | | |
| Net Asset Value, offering price and redemption price per share ($7,344,298 ÷ 60,233 shares) | | $121.93 |
| Class K: | | |
| Net Asset Value, offering price and redemption price per share ($1,072,813 ÷ 8,785 shares) | | $122.12 |
See accompanying notes which are an integral part of the financial statements.
Statement of Operations
| Amounts in thousands | | Year ended October 31, 2017 |
| Investment Income | | |
| Dividends | | $141,068 |
| Special dividends | | 23,197 |
| Interest | | 6,750 |
| Income from Fidelity Central Funds | | 2,599 |
| Total income | | 173,614 |
| Expenses | | |
| Management fee | | |
| Basic fee | $45,330 | |
| Performance adjustment | (10,964) | |
| Transfer agent fees | 11,161 | |
| Accounting and security lending fees | 1,237 | |
| Custodian fees and expenses | 222 | |
| Independent trustees' fees and expenses | 33 | |
| Appreciation in deferred trustee compensation account | 1 | |
| Registration fees | 84 | |
| Audit | 86 | |
| Legal | 28 | |
| Miscellaneous | 66 | |
| Total expenses before reductions | 47,284 | |
| Expense reductions | (521) | 46,763 |
| Net investment income (loss) | | 126,851 |
| Realized and Unrealized Gain (Loss) | | |
| Net realized gain (loss) on: | | |
| Investment securities: | | |
| Unaffiliated issuers | 552,247 | |
| Fidelity Central Funds | (9) | |
| Other affiliated issuers | 1,743 | |
| Foreign currency transactions | 89 | |
| Futures contracts | 2,345 | |
| Total net realized gain (loss) | | 556,415 |
| Change in net unrealized appreciation (depreciation) on: | | |
| Investment securities: | | |
| Unaffiliated issuers | 802,564 | |
| Fidelity Central Funds | (27) | |
| Other affiliated issuers | (7,519) | |
| Assets and liabilities in foreign currencies | (26) | |
| Futures contracts | 824 | |
| Total change in net unrealized appreciation (depreciation) | | 795,816 |
| Net gain (loss) | | 1,352,231 |
| Net increase (decrease) in net assets resulting from operations | | $1,479,082 |
See accompanying notes which are an integral part of the financial statements.
Statement of Changes in Net Assets
| Amounts in thousands | Year ended October 31, 2017 | Year ended October 31, 2016 |
| Increase (Decrease) in Net Assets | | |
| Operations | | |
| Net investment income (loss) | $126,851 | $136,912 |
| Net realized gain (loss) | 556,415 | (275,796) |
| Change in net unrealized appreciation (depreciation) | 795,816 | 298,687 |
| Net increase (decrease) in net assets resulting from operations | 1,479,082 | 159,803 |
| Distributions to shareholders from net investment income | (100,620) | (92,657) |
| Distributions to shareholders from net realized gain | (1,989) | (740,268) |
| Total distributions | (102,609) | (832,925) |
| Share transactions - net increase (decrease) | (621,951) | (505,387) |
| Total increase (decrease) in net assets | 754,522 | (1,178,509) |
| Net Assets | | |
| Beginning of period | 7,662,589 | 8,841,098 |
| End of period | $8,417,111 | $7,662,589 |
| Other Information | | |
| Undistributed net investment income end of period | $97,741 | $76,377 |
See accompanying notes which are an integral part of the financial statements.
Financial Highlights
Fidelity Value Fund
| Years ended October 31, | 2017 | 2016 | 2015 | 2014 | 2013 |
| Selected Per–Share Data | | | | | |
| Net asset value, beginning of period | $102.99 | $110.73 | $113.00 | $99.54 | $74.14 |
| Income from Investment Operations | | | | | |
| Net investment income (loss)A | 1.75B | 1.70 | 1.17 | 1.02 | 1.13 |
| Net realized and unrealized gain (loss) | 18.57 | 1.07 | (.99)C | 13.47 | 25.28 |
| Total from investment operations | 20.32 | 2.77 | .18 | 14.49 | 26.41 |
| Distributions from net investment income | (1.35) | (1.15) | (.91) | (.86) | (1.01) |
| Distributions from net realized gain | (.03) | (9.36) | (1.54) | (.16) | – |
| Total distributions | (1.38) | (10.51) | (2.45) | (1.03)D | (1.01) |
| Net asset value, end of period | $121.93 | $102.99 | $110.73 | $113.00 | $99.54 |
| Total ReturnE | 19.86% | 2.85% | .12%C | 14.68% | 36.07% |
| Ratios to Average Net AssetsF,G | | | | | |
| Expenses before reductions | .58% | .62% | .79% | .73% | .67% |
| Expenses net of fee waivers, if any | .58% | .62% | .79% | .73% | .67% |
| Expenses net of all reductions | .57% | .61% | .78% | .73% | .65% |
| Net investment income (loss) | 1.51%B | 1.71% | 1.02% | .95% | 1.30% |
| Supplemental Data | | | | | |
| Net assets, end of period (in millions) | $7,344 | $6,741 | $7,437 | $8,024 | $7,153 |
| Portfolio turnover rateH | 73% | 72% | 80% | 81% | 99% |
A Calculated based on average shares outstanding during the period.
B Net Investment income per share reflects a large, non-recurring dividend which amounted to $.32 per share. Excluding this non-recurring dividend, the ratio of net investment income (loss) to average net assets would have been 1.23%.
C Net realized and unrealized gain (loss) per share reflects proceeds received from litigation which amounted to $.13 per share. Excluding these litigation proceeds, the total return would have been .01%.
D Total distributions of $1.03 per share is comprised of distributions from net investment income of $.864 and distributions from net realized gain of $.164 per share.
E Total returns would have been lower if certain expenses had not been reduced during the applicable periods shown.
F Fees and expenses of any underlying Fidelity Central Funds are not included in the Fund's expense ratio. The Fund indirectly bears its proportionate share of the expenses of any underlying Fidelity Central Funds.
G Expense ratios reflect operating expenses of the class. Expenses before reductions do not reflect amounts reimbursed by the investment adviser or reductions from brokerage service arrangements or reductions from other expense offset arrangements and do not represent the amount paid by the class during periods when reimbursements or reductions occur. Expenses net of fee waivers reflect expenses after reimbursement by the investment adviser but prior to reductions from brokerage service arrangements or other expense offset arrangements. Expenses net of all reductions represent the net expenses paid by the class.
H Amount does not include the portfolio activity of any underlying Fidelity Central Funds.
See accompanying notes which are an integral part of the financial statements.
Fidelity Value Fund Class K
| Years ended October 31, | 2017 | 2016 | 2015 | 2014 | 2013 |
| Selected Per–Share Data | | | | | |
| Net asset value, beginning of period | $103.15 | $110.91 | $113.17 | $99.70 | $74.27 |
| Income from Investment Operations | | | | | |
| Net investment income (loss)A | 1.86B | 1.82 | 1.30 | 1.15 | 1.25 |
| Net realized and unrealized gain (loss) | 18.60 | 1.06 | (.99)C | 13.47 | 25.30 |
| Total from investment operations | 20.46 | 2.88 | .31 | 14.62 | 26.55 |
| Distributions from net investment income | (1.47) | (1.28) | (1.03) | (.98) | (1.12) |
| Distributions from net realized gain | (.03) | (9.36) | (1.54) | (.16) | – |
| Total distributions | (1.49)D | (10.64) | (2.57) | (1.15)E | (1.12) |
| Net asset value, end of period | $122.12 | $103.15 | $110.91 | $113.17 | $99.70 |
| Total ReturnF | 19.98% | 2.96% | .24%C | 14.81% | 36.26% |
| Ratios to Average Net AssetsG,H | | | | | |
| Expenses before reductions | .48% | .50% | .68% | .62% | .54% |
| Expenses net of fee waivers, if any | .48% | .50% | .68% | .62% | .54% |
| Expenses net of all reductions | .48% | .49% | .67% | .61% | .52% |
| Net investment income (loss) | 1.61%B | 1.82% | 1.13% | 1.07% | 1.42% |
| Supplemental Data | | | | | |
| Net assets, end of period (in millions) | $1,073 | $922 | $1,404 | $1,499 | $1,261 |
| Portfolio turnover rateI | 73% | 72% | 80% | 81% | 99% |
A Calculated based on average shares outstanding during the period.
B Net Investment income per share reflects a large, non-recurring dividend which amounted to $.32 per share. Excluding this non-recurring dividend, the ratio of net investment income (loss) to average net assets would have been 1.33%.
C Net realized and unrealized gain (loss) per share reflects proceeds received from litigation which amounted to $.13 per share. Excluding these litigation proceeds, the total return would have been .13%.
D Total distributions of $1.49 per share is comprised of distributions from net investment income of $1.467 and distributions from net realized gain of $.027 per share.
E Total distributions of $1.15 per share is comprised of distributions from net investment income of $.983 and distributions from net realized gain of $.164 per share.
F Total returns would have been lower if certain expenses had not been reduced during the applicable periods shown.
G Fees and expenses of any underlying Fidelity Central Funds are not included in the Fund's expense ratio. The Fund indirectly bears its proportionate share of the expenses of any underlying Fidelity Central Funds.
H Expense ratios reflect operating expenses of the class. Expenses before reductions do not reflect amounts reimbursed by the investment adviser or reductions from brokerage service arrangements or reductions from other expense offset arrangements and do not represent the amount paid by the class during periods when reimbursements or reductions occur. Expenses net of fee waivers reflect expenses after reimbursement by the investment adviser but prior to reductions from brokerage service arrangements or other expense offset arrangements. Expenses net of all reductions represent the net expenses paid by the class.
I Amount does not include the portfolio activity of any underlying Fidelity Central Funds.
See accompanying notes which are an integral part of the financial statements.
Notes to Financial Statements
For the period ended October 31, 2017
(Amounts in thousands except percentages)
1. Organization.
Fidelity Value Fund (the Fund) is a fund of Fidelity Capital Trust (the Trust) and is authorized to issue an unlimited number of shares. The Trust is registered under the Investment Company Act of 1940, as amended (the 1940 Act), as an open-end management investment company organized as a Massachusetts business trust. The Fund offers Value and Class K shares, each of which has equal rights as to assets and voting privileges. Each class has exclusive voting rights with respect to matters that affect that class.
2. Investments in Fidelity Central Funds.
The Fund invests in Fidelity Central Funds, which are open-end investment companies generally available only to other investment companies and accounts managed by the investment adviser and its affiliates. The Fund's Schedule of Investments lists each of the Fidelity Central Funds held as of period end, if any, as an investment of the Fund, but does not include the underlying holdings of each Fidelity Central Fund. As an Investing Fund, the Fund indirectly bears its proportionate share of the expenses of the underlying Fidelity Central Funds.
The Money Market Central Funds seek preservation of capital and current income and are managed by Fidelity Investments Money Management, Inc. (FIMM), an affiliate of the investment adviser. Annualized expenses of the Money Market Central Funds as of their most recent shareholder report date are less than .005%.
A complete unaudited list of holdings for each Fidelity Central Fund is available upon request or at the Securities and Exchange Commission (the SEC) website at www.sec.gov. In addition, the financial statements of the Fidelity Central Funds, which are not covered by the Fund's Report of Independent Registered Public Accounting Firm, are available on the SEC website or upon request.
3. Significant Accounting Policies.
The Fund is an investment company and applies the accounting and reporting guidance of the Financial Accounting Standards Board (FASB) Accounting Standards Codification Topic 946 Financial Services – Investments Companies. The financial statements have been prepared in conformity with accounting principles generally accepted in the United States of America (GAAP), which require management to make certain estimates and assumptions at the date of the financial statements. Actual results could differ from those estimates. Subsequent events, if any, through the date that the financial statements were issued have been evaluated in the preparation of the financial statements. The following summarizes the significant accounting policies of the Fund:
Investment Valuation. Investments are valued as of 4:00 p.m. Eastern time on the last calendar day of the period. The Board of Trustees (the Board) has delegated the day to day responsibility for the valuation of the Fund's investments to the Fair Value Committee (the Committee) established by the Fund's investment adviser. In accordance with valuation policies and procedures approved by the Board, the Fund attempts to obtain prices from one or more third party pricing vendors or brokers to value its investments. When current market prices, quotations or currency exchange rates are not readily available or reliable, investments will be fair valued in good faith by the Committee, in accordance with procedures adopted by the Board. Factors used in determining fair value vary by investment type and may include market or investment specific events, changes in interest rates and credit quality. The frequency with which these procedures are used cannot be predicted and they may be utilized to a significant extent. The Committee oversees the Fund's valuation policies and procedures and reports to the Board on the Committee's activities and fair value determinations. The Board monitors the appropriateness of the procedures used in valuing the Fund's investments and ratifies the fair value determinations of the Committee.
The Fund categorizes the inputs to valuation techniques used to value its investments into a disclosure hierarchy consisting of three levels as shown below:
- Level 1 – quoted prices in active markets for identical investments
- Level 2 – other significant observable inputs (including quoted prices for similar investments, interest rates, prepayment speeds, etc.)
- Level 3 – unobservable inputs (including the Fund's own assumptions based on the best information available)
Valuation techniques used to value the Fund's investments by major category are as follows:
Equity securities, including restricted securities, for which market quotations are readily available, are valued at the last reported sale price or official closing price as reported by a third party pricing vendor on the primary market or exchange on which they are traded and are categorized as Level 1 in the hierarchy. In the event there were no sales during the day or closing prices are not available, securities are valued at the last quoted bid price or may be valued using the last available price and are generally categorized as Level 2 in the hierarchy. For foreign equity securities, when market or security specific events arise, comparisons to the valuation of American Depositary Receipts (ADRs), futures contracts, Exchange-Traded Funds (ETFs) and certain indexes as well as quoted prices for similar securities may be used and would be categorized as Level 2 in the hierarchy. Utilizing these techniques may result in transfers between Level 1 and Level 2. For equity securities, including restricted securities, where observable inputs are limited, assumptions about market activity and risk are used and these securities may be categorized as Level 3 in the hierarchy.
Debt securities, including restricted securities, are valued based on evaluated prices received from third party pricing vendors or from brokers who make markets in such securities. Corporate bonds and U.S. government and government agency obligations are valued by pricing vendors who utilize matrix pricing which considers yield or price of bonds of comparable quality, coupon, maturity and type or by broker-supplied prices. When independent prices are unavailable or unreliable, debt securities may be valued utilizing pricing methodologies which consider similar factors that would be used by third party pricing vendors. Debt securities are generally categorized as Level 2 in the hierarchy but may be Level 3 depending on the circumstances.
Futures contracts are valued at the settlement price established each day by the board of trade or exchange on which they are traded and are categorized as Level 1 in the hierarchy. Investments in open-end mutual funds, including the Fidelity Central Funds, are valued at their closing net asset value (NAV) each business day and are categorized as Level 1 in the hierarchy.
Changes in valuation techniques may result in transfers in or out of an assigned level within the disclosure hierarchy. The aggregate value of investments by input level as of October 31, 2017 is included at the end of the Fund's Schedule of Investments.
Foreign Currency. The Fund may use foreign currency contracts to facilitate transactions in foreign-denominated securities. Gains and losses from these transactions may arise from changes in the value of the foreign currency or if the counterparties do not perform under the contracts' terms.
Foreign-denominated assets, including investment securities, and liabilities are translated into U.S. dollars at the exchange rates at period end. Purchases and sales of investment securities, income and dividends received and expenses denominated in foreign currencies are translated into U.S. dollars at the exchange rate in effect on the transaction date.
The effects of exchange rate fluctuations on investments are included with the net realized and unrealized gain (loss) on investment securities. Other foreign currency transactions resulting in realized and unrealized gain (loss) are disclosed separately.
Investment Transactions and Income. For financial reporting purposes, the Fund's investment holdings and NAV include trades executed through the end of the last business day of the period. The NAV per share for processing shareholder transactions is calculated as of the close of business of the New York Stock Exchange (NYSE), normally 4:00 p.m. Eastern time and includes trades executed through the end of the prior business day. Gains and losses on securities sold are determined on the basis of identified cost and includes proceeds received from litigation. Dividend income is recorded on the ex-dividend date, except for certain dividends from foreign securities where the ex-dividend date may have passed, which are recorded as soon as the Fund is informed of the ex-dividend date. Non-cash dividends included in dividend income, if any, are recorded at the fair market value of the securities received. Income and capital gain distributions from Fidelity Central Funds, if any, are recorded on the ex-dividend date. Certain distributions received by the Fund represent a return of capital or capital gain. The Fund determines the components of these distributions subsequent to the ex-dividend date, based upon receipt of tax filings or other correspondence relating to the underlying investment. These distributions are recorded as a reduction of cost of investments and/or as a realized gain. Large, non-recurring dividends recognized by the Fund are presented separately on the Statement of Operations as "Special Dividends" and the impact of these dividends is presented in the Financial Highlights. Interest income is accrued as earned and includes coupon interest and amortization of premium and accretion of discount on debt securities as applicable. Investment income is recorded net of foreign taxes withheld where recovery of such taxes is uncertain.
Class Allocations and Expenses. Investment income, realized and unrealized capital gains and losses, common expenses of the Fund, and certain fund-level expense reductions, if any, are allocated daily on a pro-rata basis to each class based on the relative net assets of each class to the total net assets of the Fund. Each class differs with respect to transfer agent fees incurred. Certain expense reductions may also differ by class. For the reporting period, the allocated portion of income and expenses to each class as a percent of its average net assets may vary due to the timing of recording these transactions in relation to fluctuating net assets of the classes. Expenses directly attributable to a fund are charged to that fund. Expenses attributable to more than one fund are allocated among the respective funds on the basis of relative net assets or other appropriate methods. Expense estimates are accrued in the period to which they relate and adjustments are made when actual amounts are known.
Deferred Trustee Compensation. Under a Deferred Compensation Plan (the Plan), independent Trustees may elect to defer receipt of a portion of their annual compensation. Deferred amounts are invested in a cross-section of Fidelity funds, are marked-to-market and remain in the Fund until distributed in accordance with the Plan. The investment of deferred amounts and the offsetting payable to the Trustees are included in the accompanying Statement of Assets and Liabilities.
Income Tax Information and Distributions to Shareholders. Each year, the Fund intends to qualify as a regulated investment company under Subchapter M of the Internal Revenue Code, including distributing substantially all of its taxable income and realized gains. As a result, no provision for U.S. Federal income taxes is required. As of October 31, 2017, the Fund did not have any unrecognized tax benefits in the financial statements; nor is the Fund aware of any tax positions for which it is reasonably possible that the total amounts of unrecognized tax benefits will significantly change in the next twelve months. The Fund files a U.S. federal tax return, in addition to state and local tax returns as required. The Fund's federal income tax returns are subject to examination by the Internal Revenue Service (IRS) for a period of three fiscal years after they are filed. State and local tax returns may be subject to examination for an additional fiscal year depending on the jurisdiction. Foreign taxes are provided for based on the Fund's understanding of the tax rules and rates that exist in the foreign markets in which it invests.
Distributions are declared and recorded on the ex-dividend date. Income dividends and capital gain distributions are declared separately for each class. Income and capital gain distributions are determined in accordance with income tax regulations, which may differ from GAAP. In addition, the Fund claimed a portion of the payment made to redeeming shareholders as a distribution for income tax purposes.
Capital accounts within the financial statements are adjusted for permanent book-tax differences. These adjustments have no impact on net assets or the results of operations. Capital accounts are not adjusted for temporary book-tax differences which will reverse in a subsequent period.
Book-tax differences are primarily due to short-term gain distributions from the Underlying Funds, futures contracts, foreign currency transactions, passive foreign investment companies (PFIC), market discount, deferred trustees compensation, partnerships, capital loss carryforwards and losses deferred due to wash sales.
As of period end, the cost and unrealized appreciation (depreciation) in securities, and derivatives if applicable, for federal income tax purposes were as follows:
| Gross unrealized appreciation | $1,552,730 |
| Gross unrealized depreciation | (411,038) |
| Net unrealized appreciation (depreciation) | $1,141,692 |
| Tax Cost | $7,390,026 |
The tax-based components of distributable earnings as of period end were as follows:
| Undistributed ordinary income | $277,987 |
| Undistributed long-term capital gain | $99,142 |
| Net unrealized appreciation (depreciation) on securities and other investments | $1,139,157 |
The tax character of distributions paid was as follows:
| | October 31, 2017 | October 31, 2016 |
| Ordinary Income | $102,609 | $ 236,991 |
| Long-term Capital Gains | – | 595,934 |
| Total | $102,609 | $ 832,925 |
Restricted Securities. The Fund may invest in securities that are subject to legal or contractual restrictions on resale. These securities generally may be resold in transactions exempt from registration or to the public if the securities are registered. Disposal of these securities may involve time-consuming negotiations and expense, and prompt sale at an acceptable price may be difficult. Information regarding restricted securities is included at the end of the Fund's Schedule of Investments.
4. Derivative Instruments.
Risk Exposures and the Use of Derivative Instruments. The Fund's investment objective allows the Fund to enter into various types of derivative contracts, including futures contracts. Derivatives are investments whose value is primarily derived from underlying assets, indices or reference rates and may be transacted on an exchange or over-the-counter (OTC). Derivatives may involve a future commitment to buy or sell a specified asset based on specified terms, to exchange future cash flows at periodic intervals based on a notional principal amount, or for one party to make one or more payments upon the occurrence of specified events in exchange for periodic payments from the other party.
The Fund used derivatives to increase returns and to manage exposure to certain risks as defined below. The success of any strategy involving derivatives depends on analysis of numerous economic factors, and if the strategies for investment do not work as intended, the Fund may not achieve its objectives.
The Fund's use of derivatives increased or decreased its exposure to the following risk:
| Equity Risk | Equity risk relates to the fluctuations in the value of financial instruments as a result of changes in market prices (other than those arising from interest rate risk or foreign exchange risk), whether caused by factors specific to an individual investment, its issuer, or all factors affecting all instruments traded in a market or market segment.
|
The Fund is also exposed to additional risks from investing in derivatives, such as liquidity risk and counterparty credit risk. Liquidity risk is the risk that the Fund will be unable to close out the derivative in the open market in a timely manner. Counterparty credit risk is the risk that the counterparty will not be able to fulfill its obligation to the Fund. Counterparty credit risk related to exchange-traded futures contracts may be mitigated by the protection provided by the exchange on which they trade.
Investing in derivatives may involve greater risks than investing in the underlying assets directly and, to varying degrees, may involve risk of loss in excess of any initial investment and collateral received and amounts recognized in the Statement of Assets and Liabilities. In addition, there may be the risk that the change in value of the derivative contract does not correspond to the change in value of the underlying instrument.
Futures Contracts. A futures contract is an agreement between two parties to buy or sell a specified underlying instrument for a fixed price at a specified future date. The Fund used futures contracts to manage its exposure to the stock market.
Upon entering into a futures contract, a fund is required to deposit either cash or securities (initial margin) with a clearing broker in an amount equal to a certain percentage of the face value of the contract. Futures contracts are marked-to-market daily and subsequent daily payments (variation margin) are made or received by a fund depending on the daily fluctuations in the value of the futures contracts and are recorded as unrealized appreciation or (depreciation). This receivable and/or payable, if any, is included in daily variation margin on futures contracts in the Statement of Assets and Liabilities. Realized gain or (loss) is recorded upon the expiration or closing of a futures contract. The net realized gain (loss) and change in net unrealized appreciation (depreciation) on futures contracts during the period is presented in the Statement of Operations.
Any open futures contracts at period end are presented in the Schedule of Investments under the caption "Futures Contracts". The notional amount at value reflects each contract's exposure to the underlying instrument or index at period end and is representative of volume of activity during the period. Securities deposited to meet initial margin requirements are identified in the Schedule of Investments.
5. Purchases and Sales of Investments.
Purchases and sales of securities, other than short-term securities, aggregated $5,881,389 and $6,494,688, respectively.
6. Fees and Other Transactions with Affiliates.
Management Fee. Fidelity Management & Research Company (the investment adviser) and its affiliates provide the Fund with investment management related services for which the Fund pays a monthly management fee. The management fee is the sum of an individual fund fee rate that is based on an annual rate of .30% of the Fund's average net assets and an annualized group fee rate that averaged .25% during the period. The group fee rate is based upon the average net assets of all the mutual funds advised by the investment adviser, including any mutual funds previously advised by the investment adviser that are currently advised by Fidelity SelectCo, LLC, an affiliate of the investment adviser. The group fee rate decreases as assets under management increase and increases as assets under management decrease. In addition, the management fee is subject to a performance adjustment (up to a maximum of +/- .20% of the Fund's average net assets over a 36 month performance period). The upward or downward adjustment to the management fee is based on the relative investment performance of Value as compared to its benchmark index, the Russell Midcap Value Index, over the same 36 month performance period. For the reporting period, the total annual management fee rate, including the performance adjustment, was .41% of the Fund's average net assets. The performance adjustment included in the management fee rate may be higher or lower than the maximum performance adjustment rate due to the difference between the average net assets for the reporting and performance periods.
Transfer Agent Fees. Fidelity Investments Institutional Operations Company, Inc., (FIIOC), an affiliate of the investment adviser, is the transfer, dividend disbursing and shareholder servicing agent for each class of the Fund. FIIOC receives account fees and asset-based fees that vary according to the account size and type of account of the shareholders of Value, except for Class K. FIIOC receives an asset-based fee of Class K's average net assets. FIIOC pays for typesetting, printing and mailing of shareholder reports, except proxy statements.
For the period, transfer agent fees for each class were as follows:
| | Amount | % of
Class-Level Average
Net Assets |
| Value | $10,682 | .15 |
| Class K | 479 | .05 |
| | $11,161 | |
Accounting and Security Lending Fees. Fidelity Service Company, Inc. (FSC), an affiliate of the investment adviser, maintains the Fund's accounting records. The accounting fee is based on the level of average net assets for each month. Under a separate contract, FSC administers the security lending program. The security lending fee is based on the number and duration of lending transactions.
Brokerage Commissions. The Fund placed a portion of its portfolio transactions with brokerage firms which are affiliates of the investment adviser. Brokerage commissions are included in net realized gain (loss) and change in net unrealized appreciation (depreciation) in the Statement of Operations. The commissions paid to these affiliated firms were $244 for the period.
Interfund Trades. The Fund may purchase from or sell securities to other Fidelity Funds under procedures adopted by the Board. The procedures have been designed to ensure these interfund trades are executed in accordance with Rule 17a-7 of the 1940 Act. Interfund trades are included within the respective purchases and sales amounts shown in the Purchases and Sales of Investments note.
Other. During the period, the investment adviser reimbursed the Fund for certain losses in the amount of $204.
7. Committed Line of Credit.
The Fund participates with other funds managed by the investment adviser or an affiliate in a $4.25 billion credit facility (the "line of credit") to be utilized for temporary or emergency purposes to fund shareholder redemptions or for other short-term liquidity purposes. The Fund has agreed to pay commitment fees on its pro-rata portion of the line of credit, which amounted to $26 and is reflected in Miscellaneous expenses on the Statement of Operations. During the period, the Fund did not borrow on this line of credit.
8. Security Lending.
The Fund lends portfolio securities through a lending agent from time to time in order to earn additional income. For equity securities, a lending agent is used and may loan securities to certain qualified borrowers, including Fidelity Capital Markets (FCM), a broker-dealer affiliated with the Fund. On the settlement date of the loan, the Fund receives collateral (in the form of U.S. Treasury obligations, letters of credit and/or cash) against the loaned securities and maintains collateral in an amount not less than 100% of the market value of the loaned securities during the period of the loan. The market value of the loaned securities is determined at the close of business of the Fund and any additional required collateral is delivered to the Fund on the next business day. The Fund or borrower may terminate the loan at any time, and if the borrower defaults on its obligation to return the securities loaned because of insolvency or other reasons, the Fund may apply collateral received from the borrower against the obligation. The Fund may experience delays and costs in recovering the securities loaned. Any cash collateral received is invested in the Fidelity Securities Lending Cash Central Fund. The value of loaned securities and cash collateral at period end are disclosed on the Fund's Statement of Assets and Liabilities. The value of securities loaned to FCM at period end was $6,383. Security lending income represents the income earned on investing cash collateral, less rebates paid to borrowers and any lending agent fees associated with the loan, plus any premium payments received for lending certain types of securities. Security lending income is presented in the Statement of Operations as a component of income from Fidelity Central Funds. Total security lending income during the period amounted to $1,118, including $33 from securities loaned to FCM.
9. Expense Reductions.
Commissions paid to certain brokers with whom the investment adviser, or its affiliates, places trades on behalf of the Fund include an amount in addition to trade execution, which may be rebated back to the Fund to offset certain expenses. This amount totaled $447 for the period.
In addition, during the period the investment adviser reimbursed and/or waived a portion of fund-level operating expenses in the amount of $74.
10. Distributions to Shareholders.
Distributions to shareholders of each class were as follows:
| | Year ended
October 31, 2017 | Year ended
October 31, 2016 |
| From net investment income | | |
| Value | $87,700 | $76,677 |
| Class K | 12,920 | 15,980 |
| Total | $100,620 | $92,657 |
| From net realized gain | | |
| Value | $1,751 | $623,752 |
| Class K | 238 | 116,516 |
| Total | $1,989 | $740,268 |
11. Share Transactions.
Share transactions for each class were as follows and may contain automatic conversions between classes or exchanges between affiliated funds:
| | Shares | Shares | Dollars | Dollars |
| | Year ended
October 31, 2017 | Year ended October 31, 2016 | Year ended
October 31, 2017 | Year ended October 31, 2016 |
| Value | | | | |
| Shares sold | 3,128 | 4,754 | $356,778 | $467,524 |
| Reinvestment of distributions | 755 | 6,670 | 84,080 | 662,418 |
| Shares redeemed | (9,105) | (13,132) | (1,047,226) | (1,315,307) |
| Net increase (decrease) | (5,222) | (1,708) | $(606,368) | $(185,365) |
| Class K | | | | |
| Shares sold | 2,081 | 1,689 | $241,638 | $165,410 |
| Reinvestment of distributions | 118 | 1,333 | 13,157 | 132,496 |
| Shares redeemed | (2,349) | (6,749) | (270,378) | (617,928) |
| Net increase (decrease) | (150) | (3,727) | $(15,583) | $(320,022) |
12. Other.
The Fund's organizational documents provide former and current trustees and officers with a limited indemnification against liabilities arising in connection with the performance of their duties to the Fund. In the normal course of business, the Fund may also enter into contracts that provide general indemnifications. The Fund's maximum exposure under these arrangements is unknown as this would be dependent on future claims that may be made against the Fund. The risk of material loss from such claims is considered remote.
Report of Independent Registered Public Accounting Firm
To the Trustees of Fidelity Capital Trust and Shareholders of Fidelity Value Fund:
In our opinion, the accompanying statement of assets and liabilities, including the schedule of investments, and the related statements of operations and of changes in net assets and the financial highlights present fairly, in all material respects, the financial position of Fidelity Value Fund (a fund of Fidelity Capital Trust) as of October 31, 2017, the results of its operations for the year then ended, the changes in its net assets for each of the two years in the period then ended and the financial highlights for each of the five years in the period then ended, in conformity with accounting principles generally accepted in the United States of America. These financial statements and financial highlights (hereafter referred to as “financial statements”) are the responsibility of the Fidelity Value Fund’s management. Our responsibility is to express an opinion on these financial statements based on our audits. We conducted our audits of these financial statements in accordance with the standards of the Public Company Accounting Oversight Board (United States). Those standards require that we plan and perform the audit to obtain reasonable assurance about whether the financial statements are free of material misstatement. An audit includes examining, on a test basis, evidence supporting the amounts and disclosures in the financial statements, assessing the accounting principles used and significant estimates made by management, and evaluating the overall financial statement presentation. Our procedures included confirmation of securities owned as of October 31, 2017 by correspondence with the custodian and brokers; when replies were not received from brokers, we performed other auditing procedures. We believe that our audits provide a reasonable basis for our opinion.
PricewaterhouseCoopers LLP
Boston, Massachusetts
December 13, 2017
Trustees and Officers
The Trustees, Members of the Advisory Board (if any), and officers of the trust and fund, as applicable, are listed below. The Board of Trustees governs the fund and is responsible for protecting the interests of shareholders. The Trustees are experienced executives who meet periodically throughout the year to oversee the fund's activities, review contractual arrangements with companies that provide services to the fund, oversee management of the risks associated with such activities and contractual arrangements, and review the fund's performance. Each of the Trustees oversees 190 funds.
The Trustees hold office without limit in time except that (a) any Trustee may resign; (b) any Trustee may be removed by written instrument, signed by at least two-thirds of the number of Trustees prior to such removal; (c) any Trustee who requests to be retired or who has become incapacitated by illness or injury may be retired by written instrument signed by a majority of the other Trustees; and (d) any Trustee may be removed at any special meeting of shareholders by a two-thirds vote of the outstanding voting securities of the trust. Each Trustee who is not an interested person (as defined in the 1940 Act) of the trust and the fund is referred to herein as an Independent Trustee. Each Independent Trustee shall retire not later than the last day of the calendar year in which his or her 75th birthday occurs. The Independent Trustees may waive this mandatory retirement age policy with respect to individual Trustees. Officers and Advisory Board Members hold office without limit in time, except that any officer or Advisory Board Member may resign or may be removed by a vote of a majority of the Trustees at any regular meeting or any special meeting of the Trustees. Except as indicated, each individual has held the office shown or other offices in the same company for the past five years.
The fund’s Statement of Additional Information (SAI) includes more information about the Trustees. To request a free copy, call Fidelity at 1-800-835-5092.
Experience, Skills, Attributes, and Qualifications of the Trustees. The Governance and Nominating Committee has adopted a statement of policy that describes the experience, qualifications, attributes, and skills that are necessary and desirable for potential Independent Trustee candidates (Statement of Policy). The Board believes that each Trustee satisfied at the time he or she was initially elected or appointed a Trustee, and continues to satisfy, the standards contemplated by the Statement of Policy. The Governance and Nominating Committee also engages professional search firms to help identify potential Independent Trustee candidates who have the experience, qualifications, attributes, and skills consistent with the Statement of Policy. From time to time, additional criteria based on the composition and skills of the current Independent Trustees, as well as experience or skills that may be appropriate in light of future changes to board composition, business conditions, and regulatory or other developments, have also been considered by the professional search firms and the Governance and Nominating Committee. In addition, the Board takes into account the Trustees' commitment and participation in Board and committee meetings, as well as their leadership of standing and ad hoc committees throughout their tenure.
In determining that a particular Trustee was and continues to be qualified to serve as a Trustee, the Board has considered a variety of criteria, none of which, in isolation, was controlling. The Board believes that, collectively, the Trustees have balanced and diverse experience, qualifications, attributes, and skills, which allow the Board to operate effectively in governing the fund and protecting the interests of shareholders. Information about the specific experience, skills, attributes, and qualifications of each Trustee, which in each case led to the Board's conclusion that the Trustee should serve (or continue to serve) as a trustee of the fund, is provided below.
Board Structure and Oversight Function. James C. Curvey is an interested person and currently serves as Chairman. The Trustees have determined that an interested Chairman is appropriate and benefits shareholders because an interested Chairman has a personal and professional stake in the quality and continuity of services provided to the fund. Independent Trustees exercise their informed business judgment to appoint an individual of their choosing to serve as Chairman, regardless of whether the Trustee happens to be independent or a member of management. The Independent Trustees have determined that they can act independently and effectively without having an Independent Trustee serve as Chairman and that a key structural component for assuring that they are in a position to do so is for the Independent Trustees to constitute a substantial majority for the Board. The Independent Trustees also regularly meet in executive session. Ned C. Lautenbach serves as Chairman of the Independent Trustees and as such (i) acts as a liaison between the Independent Trustees and management with respect to matters important to the Independent Trustees and (ii) with management prepares agendas for Board meetings.
Fidelity® funds are overseen by different Boards of Trustees. The fund's Board oversees Fidelity's high income and certain equity funds, and other Boards oversee Fidelity's investment-grade bond, money market, asset allocation, and sector funds. The asset allocation funds may invest in Fidelity® funds overseen by the fund's Board. The use of separate Boards, each with its own committee structure, allows the Trustees of each group of Fidelity® funds to focus on the unique issues of the funds they oversee, including common research, investment, and operational issues. On occasion, the separate Boards establish joint committees to address issues of overlapping consequences for the Fidelity® funds overseen by each Board.
The Trustees operate using a system of committees to facilitate the timely and efficient consideration of all matters of importance to the Trustees, the fund, and fund shareholders and to facilitate compliance with legal and regulatory requirements and oversight of the fund's activities and associated risks. The Board, acting through its committees, has charged FMR and its affiliates with (i) identifying events or circumstances the occurrence of which could have demonstrably adverse effects on the fund's business and/or reputation; (ii) implementing processes and controls to lessen the possibility that such events or circumstances occur or to mitigate the effects of such events or circumstances if they do occur; and (iii) creating and maintaining a system designed to evaluate continuously business and market conditions in order to facilitate the identification and implementation processes described in (i) and (ii) above. Because the day-to-day operations and activities of the fund are carried out by or through FMR, its affiliates, and other service providers, the fund's exposure to risks is mitigated but not eliminated by the processes overseen by the Trustees. While each of the Board's committees has responsibility for overseeing different aspects of the fund's activities, oversight is exercised primarily through the Operations, Audit, and Compliance Committees. In addition, the Independent Trustees have worked with FMR to enhance the Board's oversight of investment and financial risks, legal and regulatory risks, technology risks, and operational risks, including the development of additional risk reporting to the Board. For example, a working group comprised of Independent Trustees and FMR has worked and continues to work to review the Fidelity® funds' valuation-related activities, reporting and risk management. Appropriate personnel, including but not limited to the fund's Chief Compliance Officer (CCO), FMR's internal auditor, the independent accountants, the fund's Treasurer and portfolio management personnel, make periodic reports to the Board's committees, as appropriate, including an annual review of Fidelity's risk management program for the Fidelity® funds. The responsibilities of each standing committee, including their oversight responsibilities, are described further under "Standing Committees of the Trustees."
Interested Trustees*:
Correspondence intended for a Trustee who is an interested person may be sent to Fidelity Investments, 245 Summer Street, Boston, Massachusetts 02210.
Name, Year of Birth; Principal Occupations and Other Relevant Experience+
James C. Curvey (1935)
Year of Election or Appointment: 2007
Trustee
Chairman of the Board of Trustees
Mr. Curvey also serves as Trustee of other Fidelity® funds. Mr. Curvey is a Director of Fidelity Research & Analysis Co. (investment adviser firm, 2009-present), and Vice Chairman (2007-present) and Director of FMR LLC (diversified financial services company). In addition, Mr. Curvey serves as an Overseer for the Boston Symphony Orchestra and a member of the board of Artis-Naples, Naples, Florida, and as a Trustee for Brewster Academy, Wolfeboro, New Hampshire. Previously, Mr. Curvey served as a Director of Fidelity Investments Money Management, Inc. (investment adviser firm, 2009-2014) and a Director of FMR and FMR Co., Inc. (investment adviser firms, 2007-2014).
Charles S. Morrison (1960)
Year of Election or Appointment: 2014
Trustee
Mr. Morrison also serves as Trustee of other funds. He serves as President of Fidelity Management & Research Company (FMR) (investment adviser firm, 2016-present), a Director of Fidelity Investments Money Management, Inc. (FIMM) (investment adviser firm, 2014-present), Director of Fidelity SelectCo, LLC (investment adviser firm, 2014-present), President, Asset Management (2014-present), and is an employee of Fidelity Investments. Previously, Mr. Morrison served as Vice President of Fidelity's Fixed Income and Asset Allocation Funds (2012-2014), President, Fixed Income (2011-2014), Vice President of Fidelity's Money Market Funds (2005-2009), President, Money Market Group Leader of FMR (investment adviser firm, 2009), and Senior Vice President, Money Market Group of FMR (2004-2009). Mr. Morrison also served as Vice President of Fidelity's Bond Funds (2002-2005), certain Balanced Funds (2002-2005), and certain Asset Allocation Funds (2002-2007), and as Senior Vice President (2002-2005) of Fidelity's Bond Division.
* Determined to be an “Interested Trustee” by virtue of, among other things, his or her affiliation with the trust or various entities under common control with FMR.
+ The information includes the Trustee's principal occupation during the last five years and other information relating to the experience, attributes, and skills relevant to the Trustee's qualifications to serve as a Trustee, which led to the conclusion that the Trustee should serve as a Trustee for the fund.
Independent Trustees:
Correspondence intended for an Independent Trustee may be sent to Fidelity Investments, P.O. Box 55235, Boston, Massachusetts 02205-5235.
Name, Year of Birth; Principal Occupations and Other Relevant Experience+
Dennis J. Dirks (1948)
Year of Election or Appointment: 2005
Trustee
Mr. Dirks also serves as Trustee of other Fidelity® funds. Prior to his retirement in May 2003, Mr. Dirks was Chief Operating Officer and a member of the Board of The Depository Trust & Clearing Corporation (DTCC). He also served as President, Chief Operating Officer, and Board member of The Depository Trust Company (DTC) and President and Board member of the National Securities Clearing Corporation (NSCC). In addition, Mr. Dirks served as Chief Executive Officer and Board member of the Government Securities Clearing Corporation, Chief Executive Officer and Board member of the Mortgage-Backed Securities Clearing Corporation, as a Trustee and a member of the Finance Committee of Manhattan College (2005-2008), as a Trustee and a member of the Finance Committee of AHRC of Nassau County (2006-2008), as a member of the Independent Directors Council (IDC) Governing Council (2010-2015), and as a member of the Board of Directors for The Brookville Center for Children’s Services, Inc. (2009-2017). Mr. Dirks is a member of the Finance Committee (2016-present) and Board of Directors (2017-present) of the Asolo Repertory Theatre.
Alan J. Lacy (1953)
Year of Election or Appointment: 2008
Trustee
Mr. Lacy also serves as Trustee of other Fidelity® funds. Mr. Lacy serves as a Director of Bristol-Myers Squibb Company (global pharmaceuticals, 2008-present). He is a Trustee of the California Chapter of The Nature Conservancy (2015-present) and a Director of the Center for Advanced Study in the Behavioral Sciences at Stanford University (2015-present). In addition, Mr. Lacy served as Senior Adviser (2007-2014) of Oak Hill Capital Partners, L.P. (private equity) and also served as Chief Executive Officer (2005) and Vice Chairman (2005-2006) of Sears Holdings Corporation (retail) and Chief Executive Officer and Chairman of the Board of Sears, Roebuck and Co. (retail, 2000-2005). Previously, Mr. Lacy served as Chairman (2014-2017) and a member (2010-2017) of the Board of Directors of Dave & Buster’s Entertainment, Inc. (restaurant and entertainment complexes), as Chairman (2008-2011) and a member (2006-2015) of the Board of Trustees of the National Parks Conservation Association, and as a member of the Board of Directors for The Hillman Companies, Inc. (hardware wholesalers, 2010-2014), Earth Fare, Inc. (retail grocery, 2010-2014), and The Western Union Company (global money transfer, 2006-2011).
Ned C. Lautenbach (1944)
Year of Election or Appointment: 2000
Trustee
Chairman of the Independent Trustees
Mr. Lautenbach also serves as Trustee of other Fidelity® funds. Mr. Lautenbach currently serves as Vice Chair of the Board of Governors, State University System of Florida (2013-present) and is a member of the Council on Foreign Relations (1994-present). He is also a member and has most recently served as Chairman of the Board of Directors of Artis-Naples (2012-present). Previously, Mr. Lautenbach served as a member and then Lead Director of the Board of Directors of Eaton Corporation (diversified industrial, 1997-2016). He was also a Partner and Advisory Partner at Clayton, Dubilier & Rice, LLC (private equity investment, 1998-2010), as well as a Director of Sony Corporation (2006-2007). In addition, Mr. Lautenbach also had a 30-year career with IBM (technology company) during which time he served as Senior Vice President and a member of the Corporate Executive Committee (1968-1998).
Joseph Mauriello (1944)
Year of Election or Appointment: 2008
Trustee
Mr. Mauriello also serves as Trustee of other Fidelity® funds. Prior to his retirement in January 2006, Mr. Mauriello served in numerous senior management positions including Deputy Chairman and Chief Operating Officer (2004-2005), and Vice Chairman of Financial Services (2002-2004) of KPMG LLP US (professional services, 1965-2005). Mr. Mauriello currently serves as a member of the Board of Directors of XL Group plc. (global insurance and re-insurance, 2006-present) and the Independent Directors Council (IDC) Governing Council (2015-present). Previously, Mr. Mauriello served as a Director of the Hamilton Funds of the Bank of New York (2006-2007) and of Arcadia Resources Inc. (health care services and products, 2007-2012).
Cornelia M. Small (1944)
Year of Election or Appointment: 2005
Trustee
Ms. Small also serves as Trustee of other Fidelity® funds. Ms. Small is a member of the Board of Directors (2009-present) and Chair of the Investment Committee (2010-present) of the Teagle Foundation. Ms. Small also serves on the Investment Committee of the Berkshire Taconic Community Foundation (2008-present). Previously, Ms. Small served as Chairperson (2002-2008) and a member of the Investment Committee and Chairperson (2008-2012) and a member of the Board of Trustees of Smith College. In addition, Ms. Small served as Chief Investment Officer, Director of Global Equity Investments, and a member of the Board of Directors of Scudder, Stevens & Clark and Scudder Kemper Investments.
William S. Stavropoulos (1939)
Year of Election or Appointment: 2002
Trustee
Vice Chairman of the Independent Trustees
Mr. Stavropoulos also serves as Trustee of other Fidelity® funds. Mr. Stavropoulos serves as President and Founder of the Michigan Baseball Foundation, the Great Lakes Loons (2007-present). Mr. Stavropoulos is Chairman Emeritus of the Board of Directors of The Dow Chemical Company, where he previously served in numerous senior management positions, including President, CEO (1995-2000; 2002-2004), Chairman of the Executive Committee (2000-2006), and as a member of the Board of Directors (1990-2006). Currently, Mr. Stavropoulos is Chairman of the Board of Directors of Univar Inc. (global distributor of commodity and specialty chemicals), a Director of Teradata Corporation (data warehousing and technology solutions), and a member of the Advisory Board for Metalmark Capital LLC (private equity investment, 2005-present). Mr. Stavropoulos is an operating advisor to Clayton, Dubilier & Rice, LLC (private equity investment). In addition, Mr. Stavropoulos is a member of the University of Notre Dame Advisory Council for the College of Science, a Trustee of the Rollin L. Gerstacker Foundation, and a Director of Artis-Naples in Naples, Florida. Previously, Mr. Stavropoulos served as a Director of Chemical Financial Corporation (bank holding company, 1993-2012) and Tyco International, Ltd. (multinational manufacturing and services, 2007-2012).
David M. Thomas (1949)
Year of Election or Appointment: 2008
Trustee
Mr. Thomas also serves as Trustee of other Fidelity® funds. Mr. Thomas serves as Non-Executive Chairman of the Board of Directors of Fortune Brands Home and Security (home and security products, 2011-present), as a member of the Board of Directors (2004-present) and Presiding Director (2013-present) of Interpublic Group of Companies, Inc. (marketing communication), and as a member of the Board of Trustees of the University of Florida (2013-present). Previously, Mr. Thomas served as Executive Chairman (2005-2006) and Chairman and Chief Executive Officer (2000-2005) of IMS Health, Inc. (pharmaceutical and healthcare information solutions), and a Director of Fortune Brands, Inc. (consumer products, 2000-2011).
+ The information includes the Trustee's principal occupation during the last five years and other information relating to the experience, attributes, and skills relevant to the Trustee's qualifications to serve as a Trustee, which led to the conclusion that the Trustee should serve as a Trustee for the fund.
Advisory Board Members and Officers:
Correspondence intended for an officer or Peter S. Lynch may be sent to Fidelity Investments, 245 Summer Street, Boston, Massachusetts 02210. Officers appear below in alphabetical order.
Name, Year of Birth; Principal Occupation
Peter S. Lynch (1944)
Year of Election or Appointment: 2003
Member of the Advisory Board
Mr. Lynch also serves as Member of the Advisory Board of other Fidelity® funds. Mr. Lynch is Vice Chairman and a Director of FMR (investment adviser firm) and FMR Co., Inc. (investment adviser firm). In addition, Mr. Lynch serves as a Trustee of Boston College and as the Chairman of the Inner-City Scholarship Fund. Previously, Mr. Lynch served on the Special Olympics International Board of Directors (1997-2006).
Elizabeth Paige Baumann (1968)
Year of Election or Appointment: 2017
Anti-Money Laundering (AML) Officer
Ms. Baumann also serves as AML Officer of other funds. She is Chief AML Officer (2012-present) and Senior Vice President (2014-present) of FMR LLC (diversified financial services company) and is an employee of Fidelity Investments. Previously, Ms. Baumann served as AML Officer of the funds (2012-2016), and Vice President (2007-2014) and Deputy Anti-Money Laundering Officer (2007-2012) of FMR LLC.
Marc R. Bryant (1966)
Year of Election or Appointment: 2015
Secretary and Chief Legal Officer (CLO)
Mr. Bryant also serves as Secretary and CLO of other funds. Mr. Bryant serves as CLO, Secretary, and Senior Vice President of Fidelity Management & Research Company (investment adviser firm, 2015-present) and FMR Co., Inc. (investment adviser firm, 2015-present); Secretary of Fidelity SelectCo, LLC (investment adviser firm, 2015-present) and Fidelity Investments Money Management, Inc. (investment adviser firm, 2015-present); and CLO of Fidelity Management & Research (Hong Kong) Limited and FMR Investment Management (UK) Limited (investment adviser firms, 2015-present) and Fidelity Management & Research (Japan) Limited (investment adviser firm, 2016-present). He is Senior Vice President and Deputy General Counsel of FMR LLC (diversified financial services company). Previously, Mr. Bryant served as Secretary and CLO of Fidelity Rutland Square Trust II (2010-2014) and Assistant Secretary of Fidelity's Fixed Income and Asset Allocation Funds (2013-2015). Prior to joining Fidelity Investments, Mr. Bryant served as a Senior Vice President and the Head of Global Retail Legal for AllianceBernstein L.P. (2006-2010), and as the General Counsel for ProFund Advisors LLC (2001-2006).
William C. Coffey (1969)
Year of Election or Appointment: 2009
Assistant Secretary
Mr. Coffey also serves as Assistant Secretary of other funds. He is Senior Vice President and Deputy General Counsel of FMR LLC (diversified financial services company, 2010-present), and is an employee of Fidelity Investments. Previously, Mr. Coffey served as Vice President and Associate General Counsel of FMR LLC (2005-2009).
Jonathan Davis (1968)
Year of Election or Appointment: 2010
Assistant Treasurer
Mr. Davis also serves as Assistant Treasurer of other funds, and is an employee of Fidelity Investments. Previously, Mr. Davis served as Vice President and Associate General Counsel of FMR LLC (diversified financial services company, 2003-2010).
Adrien E. Deberghes (1967)
Year of Election or Appointment: 2016
Assistant Treasurer
Mr. Deberghes also serves as an officer of other funds. He serves as Executive Vice President of Fidelity Investments Money Management, Inc. (FIMM) (investment adviser firm, 2016-present) and is an employee of Fidelity Investments (2008-present). Prior to joining Fidelity Investments, Mr. Deberghes was Senior Vice President of Mutual Fund Administration at State Street Corporation (2007-2008), Senior Director of Mutual Fund Administration at Investors Bank & Trust (2005-2007), and Director of Finance for Dunkin' Brands (2000-2005). Previously, Mr. Deberghes served in other fund officer roles.
Stephanie J. Dorsey (1969)
Year of Election or Appointment: 2010
Assistant Treasurer
Ms. Dorsey also serves as an officer of other funds. She is an employee of Fidelity Investments (2008-present) and has served in other fund officer roles. Prior to joining Fidelity Investments, Ms. Dorsey served as Treasurer (2004-2008) of the JPMorgan Mutual Funds and Vice President (2004-2008) of JPMorgan Chase Bank.
Howard J. Galligan III (1966)
Year of Election or Appointment: 2014
Chief Financial Officer
Mr. Galligan also serves as Chief Financial Officer of other funds. Mr. Galligan serves as President of Fidelity Pricing and Cash Management Services (FPCMS) (2014-present) and as a Director of Strategic Advisers, Inc. (investment adviser firm, 2008-present). Previously, Mr. Galligan served as Chief Administrative Officer of Asset Management (2011-2014) and Chief Operating Officer and Senior Vice President of Investment Support for Strategic Advisers, Inc. (2003-2011).
Thomas C. Hense (1964)
Year of Election or Appointment: 2008, 2010, or 2015
Vice President
Mr. Hense serves as Vice President of Fidelity Advisor® Multi-Asset Income Fund (2015) and other funds (High Income (2008), Small Cap (2008), and Value (2010) funds), and is an employee of Fidelity Investments (1993-present). Previously, Mr. Hense served as a portfolio manager for Fidelity's Institutional Money Management Group (Pyramis) (2003-2008).
Brian B. Hogan (1964)
Year of Election or Appointment: 2009
Vice President
Mr. Hogan also serves as Trustee or Vice President of other funds. Mr. Hogan serves as a Director of FMR Investment Management (UK) Limited (investment adviser firm, 2015-present) and Fidelity SelectCo, LLC (investment adviser firm, 2014-present) and President of the Equity Division of FMR (investment adviser firm, 2009-present). Previously, Mr. Hogan served as Senior Vice President, Equity Research of FMR (2006-2009) and as a portfolio manager. Mr. Brian B. Hogan is not related to Mr. Colm A. Hogan.
Colm A. Hogan (1973)
Year of Election or Appointment: 2016
Deputy Treasurer
Mr. Hogan also serves as an officer of other funds. Mr. Hogan is an employee of Fidelity Investments (2005-present). Mr. Colm A. Hogan is not related to Mr. Brian B. Hogan.
Chris Maher (1972)
Year of Election or Appointment: 2013
Assistant Treasurer
Mr. Maher serves as Assistant Treasurer of other funds. Mr. Maher is Vice President of Valuation Oversight and is an employee of Fidelity Investments. Previously, Mr. Maher served as Vice President of Asset Management Compliance (2013), Vice President of the Program Management Group of FMR (investment adviser firm, 2010-2013), and Vice President of Valuation Oversight (2008-2010).
Rieco E. Mello (1969)
Year of Election or Appointment: 2017
Assistant Treasurer
Mr. Mello also serves as Assistant Treasurer of other funds. Mr. Mello is an employee of Fidelity Investments (1995-present).
Kenneth B. Robins (1969)
Year of Election or Appointment: 2016
Chief Compliance Officer
Mr. Robins also serves as an officer of other funds. Mr. Robins serves as Compliance Officer of Fidelity Management & Research Company and FMR Co., Inc. (investment adviser firms, 2016-present) and is an employee of Fidelity Investments (2004-present). Previously, Mr. Robins served as Executive Vice President of Fidelity Investments Money Management, Inc. (investment adviser firm, 2013-2016) and served in other fund officer roles.
Stacie M. Smith (1974)
Year of Election or Appointment: 2016
President and Treasurer
Ms. Smith also serves as an officer of other funds. She is an employee of Fidelity Investments (2009-present) and has served in other fund officer roles. Prior to joining Fidelity Investments, Ms. Smith served as Senior Audit Manager of Ernst & Young LLP (accounting firm, 1996-2009). Previously, Ms. Smith served as Deputy Treasurer of certain Fidelity® funds (2013-2016).
Marc L. Spector (1972)
Year of Election or Appointment: 2016
Assistant Treasurer
Mr. Spector also serves as an officer of other funds. Mr. Spector is an employee of Fidelity Investments (2016-present). Prior to joining Fidelity Investments, Mr. Spector served as Director at the Siegfried Group (accounting firm, 2013-2016), and prior to Siegfried Group as audit senior manager at Deloitte & Touche (accounting firm, 2005-2013).
Renee Stagnone (1975)
Year of Election or Appointment: 2016
Assistant Treasurer
Ms. Stagnone also serves as an officer of other funds. Ms. Stagnone is an employee of Fidelity Investments (1997-present). Previously, Ms. Stagnone served as Deputy Treasurer of certain Fidelity® funds (2013-2016).
Shareholder Expense Example
As a shareholder of the Fund, you incur two types of costs: (1) transaction costs and (2) ongoing costs, including management fees and other Fund expenses. This Example is intended to help you understand your ongoing costs (in dollars) of investing in the Fund and to compare these costs with the ongoing costs of investing in other mutual funds.
The Example is based on an investment of $1,000 invested at the beginning of the period and held for the entire period (May 1, 2017 to October 31, 2017).
Actual Expenses
The first line of the accompanying table for each class of the Fund provides information about actual account values and actual expenses. You may use the information in this line, together with the amount you invested, to estimate the expenses that you paid over the period. Simply divide your account value by $1,000.00 (for example, an $8,600 account value divided by $1,000.00 = 8.6), then multiply the result by the number in the first line for a class of the Fund under the heading entitled "Expenses Paid During Period" to estimate the expenses you paid on your account during this period. A small balance maintenance fee of $12.00 that is charged once a year may apply for certain accounts with a value of less than $2,000. This fee is not included in the table below. If it was, the estimate of expenses you paid during the period would be higher, and your ending account value lower, by this amount. In addition, the Fund, as a shareholder in the underlying Fidelity Central Funds, will indirectly bear its pro-rata share of the fees and expenses incurred by the underlying Fidelity Central Funds. These fees and expenses are not included in the Fund's annualized expense ratio used to calculate the expense estimate in the table below.
Hypothetical Example for Comparison Purposes
The second line of the accompanying table for each class of the Fund provides information about hypothetical account values and hypothetical expenses based on a Class' actual expense ratio and an assumed rate of return of 5% per year before expenses, which is not the Class' actual return. The hypothetical account values and expenses may not be used to estimate the actual ending account balance or expenses you paid for the period. You may use this information to compare the ongoing costs of investing in the Fund and other funds. To do so, compare this 5% hypothetical example with the 5% hypothetical examples that appear in the shareholder reports of the other funds. A small balance maintenance fee of $12.00 that is charged once a year may apply for certain accounts with a value of less than $2,000. This fee is not included in the table below. If it was, the estimate of expenses you paid during the period would be higher, and your ending account value lower, by this amount. In addition, the Fund, as a shareholder in the underlying Fidelity Central Funds, will indirectly bear its pro-rata share of the fees and expenses incurred by the underlying Fidelity Central Funds. These fees and expenses are not included in the Fund's annualized expense ratio used to calculate the expense estimate in the table below.
Please note that the expenses shown in the table are meant to highlight your ongoing costs only and do not reflect any transaction costs. Therefore, the second line of the table is useful in comparing ongoing costs only, and will not help you determine the relative total costs of owning different funds.
| | Annualized Expense Ratio-A | Beginning
Account Value
May 1, 2017 | Ending
Account Value
October 31, 2017 | Expenses Paid
During Period-B
May 1, 2017
to October 31, 2017 |
| Value | .62% | | | |
| Actual | | $1,000.00 | $1,049.80 | $3.20 |
| Hypothetical-C | | $1,000.00 | $1,022.08 | $3.16 |
| Class K | .52% | | | |
| Actual | | $1,000.00 | $1,050.20 | $2.69 |
| Hypothetical-C | | $1,000.00 | $1,022.58 | $2.65 |
A Annualized expense ratio reflects expenses net of applicable fee waivers.
B Expenses are equal to each Class' annualized expense ratio, multiplied by the average account value over the period, multiplied by 184/365 (to reflect the one-half year period).
C 5% return per year before expenses
Distributions (Unaudited)
The Board of Trustees of Fidelity Value Fund voted to pay to shareholders of record at the opening of business on record date, the following distributions per share derived from capital gains realized from sales of portfolio securities, and dividends derived from net investment income:
| | Pay Date | Record Date | Dividends | Capital Gains |
| Fidelity Value Fund | | | | |
| Value | 12/11/17 | 12/08/17 | $1.651 | $4.090 |
| Class K | 12/11/17 | 12/08/17 | $1.782 | $4.090 |
|
The fund hereby designates as a capital gain dividend with respect to the taxable year ended October 31, 2017, $99,141,841, or, if subsequently determined to be different, the net capital gain of such year.
The fund designates 89%; Class K designates 83%; of the dividends distributed during the fiscal year as qualifying for the dividends–received deduction for corporate shareholders.
The fund designates 97%; Class K designates 89%; of the dividends distributed during the fiscal year as amounts which may be taken into account as a dividend for purposes of the maximum rate under section 1(h)(11) of the Internal Revenue Code.
The fund will notify shareholders in January 2018 of amounts for use in preparing 2017 income tax returns.
Board Approval of Investment Advisory Contracts and Management Fees
Fidelity Value Fund
Each year, the Board of Trustees, including the Independent Trustees (together, the Board), votes on the renewal of the management contract with Fidelity Management & Research Company (FMR) and the sub-advisory agreements (together, the Advisory Contracts) for the fund. FMR and the sub-advisers are referred to herein as the Investment Advisers. The Board, assisted by the advice of fund counsel and Independent Trustees' counsel, requests and considers a broad range of information relevant to the renewal of the Advisory Contracts throughout the year.
The Board meets regularly and, at each of its meetings, covers an extensive agenda of topics and materials and considers factors that are relevant to its annual consideration of the renewal of the fund's Advisory Contracts, including the services and support provided to the fund and its shareholders. The Board has established various standing committees (Committees), each composed of and chaired by Independent Trustees with varying backgrounds, to which the Board has assigned specific subject matter responsibilities in order to enhance effective decision-making by the Board. The Board, acting directly and through its Committees, requests and receives information concerning the annual consideration of the renewal of the fund's Advisory Contracts. The Board also meets as needed to review matters specifically related to the Board's annual consideration of the renewal of the Advisory Contracts. Members of the Board may also meet with trustees of other Fidelity funds through ad hoc joint committees to discuss certain matters relevant to all of the Fidelity funds.
At its July 2017 meeting, the Board unanimously determined to renew the fund's Advisory Contracts. In reaching its determination, the Board considered all factors it believed relevant, including (i) the nature, extent, and quality of the services to be provided to the fund and its shareholders (including the investment performance of the fund); (ii) the competitiveness of the fund's management fee and total expense ratio relative to peer funds; (iii) the total costs of the services to be provided by and the profits to be realized by Fidelity from its relationships with the fund; and (iv) the extent to which, if any, economies of scale exist and would be realized as the fund grows, and whether any economies of scale are appropriately shared with fund shareholders.
In considering whether to renew the Advisory Contracts for the fund, the Board reached a determination, with the assistance of fund counsel and Independent Trustees' counsel and through the exercise of its business judgment, that the renewal of the Advisory Contracts was in the best interests of the fund and its shareholders and that the compensation payable under the Advisory Contracts was fair and reasonable. The Board's decision to renew the Advisory Contracts was not based on any single factor, but rather was based on a comprehensive consideration of all the information provided to the Board at its meetings throughout the year. The Board, in reaching its determination to renew the Advisory Contracts, was aware that shareholders of the fund have a broad range of investment choices available to them, including a wide choice among funds offered by Fidelity's competitors, and that the fund's shareholders, who have the opportunity to review and weigh the disclosure provided by the fund in its prospectus and other public disclosures, have chosen to invest in this fund, which is part of the Fidelity family of funds.
Amendment to Group Fee Rate. The Board also approved an amendment to the management contract for the fund to add an additional breakpoint to the group fee schedule, effective October 1, 2017. The Board noted that the additional breakpoint would result in lower management fee rates as Fidelity's assets under management increase.
Nature, Extent, and Quality of Services Provided. The Board considered Fidelity's staffing as it relates to the fund, including the backgrounds of investment personnel of Fidelity, and also considered the fund's investment objective, strategies, and related investment philosophy. The Independent Trustees also had discussions with senior management of Fidelity's investment operations and investment groups. The Board considered the structure of the investment personnel compensation program and whether this structure provides appropriate incentives to act in the best interests of the fund. Additionally, the Board considered the portfolio managers' investments, if any, in the funds that they manage.
Resources Dedicated to Investment Management and Support Services. The Board and the Fund Oversight and Research Committees reviewed the general qualifications and capabilities of Fidelity's investment staff, including its size, education, experience, and resources, as well as Fidelity's approach to recruiting, training, managing, and compensating investment personnel. The Board noted that Fidelity has continued to increase the resources devoted to non-U.S. offices, including expansion of Fidelity's global investment organization. The Board also noted that Fidelity's analysts have extensive resources, tools and capabilities that allow them to conduct sophisticated quantitative and fundamental analysis, as well as credit analysis of issuers, counterparties and guarantors. Further, the Board considered that Fidelity's investment professionals have sufficient access to global information and data so as to provide competitive investment results over time, and that those professionals also have access to sophisticated tools that permit them to assess portfolio construction and risk and performance attribution characteristics continuously, as well as to transmit new information and research conclusions rapidly around the world. Additionally, in its deliberations, the Board considered Fidelity's trading, risk management, compliance, and technology and operations capabilities and resources, which are integral parts of the investment management process.
Shareholder and Administrative Services. The Board considered (i) the nature, extent, quality, and cost of advisory, administrative, and shareholder services performed by the Investment Advisers and their affiliates under the Advisory Contracts and under separate agreements covering transfer agency, pricing and bookkeeping, and securities lending services for the fund; (ii) the nature and extent of the supervision of third party service providers, principally custodians, subcustodians, and pricing vendors; and (iii) the resources devoted to, and the record of compliance with, the fund's compliance policies and procedures. The Board also reviewed the allocation of fund brokerage, including allocations to brokers affiliated with the Investment Advisers, the use of brokerage commissions to pay fund expenses, and the use of "soft" commission dollars to pay for research services.
The Board noted that the growth of fund assets over time across the complex allows Fidelity to reinvest in the development of services designed to enhance the value or convenience of the Fidelity funds as investment vehicles. These services include 24-hour access to account information and market information through telephone representatives and over the Internet, investor education materials and asset allocation tools, and the expanded availability of Fidelity Investor Centers.
In 2014, the Board formed an ad hoc Committee on Transfer Agency Fees to review the variety of transfer agency fee structures throughout the industry and Fidelity's competitive positioning with respect to industry participants.
Investment in a Large Fund Family. The Board considered the benefits to shareholders of investing in a Fidelity fund, including the benefits of investing in a fund that is part of a large family of funds offering a variety of investment disciplines and providing a large variety of mutual fund investor services. The Board noted that Fidelity had taken, or had made recommendations that resulted in the Fidelity funds taking, a number of actions over the previous year that benefited particular funds, including: (i) continuing to dedicate additional resources to Fidelity's investment research process, and to the support of the senior management team that oversees asset management; (ii) continuing efforts to enhance Fidelity's global research capabilities; (iii) launching new funds and making other enhancements to meet client needs; (iv) launching new share classes of existing funds; (v) eliminating purchase minimums and broadening eligibility requirements for certain lower-priced share classes; (vi) reducing management fees and total expenses for certain growth equity funds and index funds; (vii) lowering expense caps for certain existing funds and classes to reduce expenses borne by shareholders; (viii) eliminating short-term redemption fees for certain funds; (ix) introducing a new pricing structure for certain funds of funds that is expected to reduce overall expenses paid by shareholders; (x) rationalizing product lines and gaining increased efficiencies through proposals for fund mergers and share class consolidations; (xi) continuing to develop, acquire and implement systems and technology to improve services to the funds and shareholders, strengthen information security, and increase efficiency; and (xii) implementing enhancements to further strengthen Fidelity's product line to increase investors' probability of success in achieving their investment goals, including retirement income goals.
Investment Performance. The Board considered whether the fund has operated in accordance with its investment objective, as well as its record of compliance with its investment restrictions and its performance history.
The Board took into account discussions with representatives of the Investment Advisers about fund investment performance that occur at Board meetings throughout the year. In this regard the Board noted that as part of regularly scheduled fund reviews and other reports to the Board on fund performance, the Board considers annualized return information for the fund for different time periods, measured against a securities market index ("benchmark index") and a peer group of funds with similar objectives ("peer group"), if any. In its evaluation of fund investment performance, the Board gave particular attention to information indicating changes in performance of certain Fidelity funds for specific time periods and discussed with the Investment Advisers the reasons for any overperformance or underperformance.
In addition to reviewing absolute and relative fund performance, the Independent Trustees periodically consider the appropriateness of fund performance metrics in evaluating the results achieved. In general, the Independent Trustees believe that fund performance should be evaluated based on net performance (after fees and expenses) of both the highest performing and lowest performing fund share classes, where applicable, compared to appropriate benchmark indices, over appropriate time periods that may include full market cycles, and compared to peer groups, as applicable, over the same periods, taking into account relevant factors including the following: general market conditions; issuer-specific information; and fund cash flows and other factors.
The Independent Trustees recognize that shareholders evaluate performance on a net basis over their own holding periods, for which one-, three-, and five-year periods are often used as a proxy. For this reason, the performance information reviewed by the Board also included net cumulative calendar year total return information for the fund and an appropriate benchmark index and peer group for the most recent one-, three-, and five-year periods, as shown below. Returns are shown compared to the 25th percentile (top of box, 75% beaten) and 75th percentile (bottom of box, 25% beaten) of the peer universe.
Fidelity Value Fund
The Board has discussed the fund's underperformance (based on the December 31, 2016 data presented herein) with FMR, including the fund's investment strategy, the portfolio management team, and broader trends in the market that may have impacted the fund's performance, and has engaged with FMR to consider what steps might be taken to remediate the fund's underperformance. The Board noted that the fund's performance has improved since the period shown. The Board noted that there were portfolio management changes for the fund in January 2014 and December 2016.
The Board also considered that the fund's management fee is subject to upward or downward adjustment depending upon whether, and to what extent, the fund's investment performance for the performance period (a rolling 36-month period) exceeds, or is exceeded by, a securities index, thus leading to a performance adjustment for the same period. The Board noted that the performance adjustment provides FMR with a strong economic incentive to seek to achieve superior long-term performance for the fund's shareholders and helps to more closely align the interests of FMR and the shareholders of the fund.
Based on its review, the Board concluded that the nature, extent, and quality of services provided to the fund under the Advisory Contracts should continue to benefit the shareholders of the fund.
Competitiveness of Management Fee and Total Expense Ratio. The Board considered the fund's management fee and total expense ratio compared to "mapped groups" of competitive funds and classes created for the purpose of facilitating the Trustees' competitive analysis of management fees and total expenses. Fidelity creates "mapped groups" by combining similar Lipper investment objective categories that have comparable investment mandates. Combining Lipper investment objective categories aids the Board's management fee and total expense ratio comparisons by broadening the competitive group used for comparison.
Management Fee. The Board considered two proprietary management fee comparisons for the 12-month periods shown in basis points (BP) in the chart below. The group of Lipper funds used by the Board for management fee comparisons is referred to below as the "Total Mapped Group." The Total Mapped Group comparison focuses on a fund's standing in terms of gross management fees before expense reimbursements or caps, and without giving effect to the fund's performance adjustment, relative to the total universe of funds with comparable investment mandates, regardless of whether their management fee structures also are comparable. Funds with comparable investment mandates offer exposure to similar types of securities. Funds with comparable management fee structures have similar management fee contractual arrangements (
e.g., flat rate charged for advisory services, all-inclusive fee rate,
etc.). "TMG %" represents the percentage of funds in the Total Mapped Group that had management fees that were lower than the fund's. For example, a hypothetical TMG % of 20% would mean that 80% of the funds in the Total Mapped Group had higher, and 20% had lower, management fees than the fund. The fund's actual TMG %s and the number of funds in the Total Mapped Group are in the chart below. The "Asset-Size Peer Group" (ASPG) comparison focuses on a fund's standing relative to a subset of non-Fidelity funds within the Total Mapped Group that are similar in size and management fee structure without taking into account performance adjustments, if any. For example, if a fund is in the first quartile of the ASPG, the fund's management fee ranks in the least expensive or lowest 25% of funds in the ASPG. The ASPG represents at least 15% of the funds in the Total Mapped Group with comparable asset size and management fee structures, subject to a minimum of 50 funds (or all funds in the Total Mapped Group if fewer than 50). Additional information, such as the ASPG quartile in which the fund's management fee rate ranked and the impact of the fund's performance adjustment, is also included in the chart and considered by the Board.
Fidelity Value Fund
The Board noted that the fund's management fee rate ranked below the median of its Total Mapped Group and below the median of its ASPG for 2016. The Board also noted the effect of the fund's performance adjustment, if any, on the fund's management fee ranking.
The Board noted that, in 2014, the Board and the boards of other Fidelity funds formed the ad hoc Committee on Group Fee to conduct an in-depth review of the "group fee" component of the management fee of funds with such management fee structures. The Committee's focus included the mechanics of the group fee, the competitive landscape of group fee structures, Fidelity funds with no group fee component and investment products not included in group fee assets. The Board also considered that, for funds subject to the group fee, FMR agreed to voluntarily waive fees over a specified period of time in amounts designed to account for assets converted from certain funds to certain collective investment trusts.
The Board also noted that, in 2013, the ad hoc Committee on Management Fees was formed to conduct an in-depth review of the management fee rates of Fidelity's active equity mutual funds. The Committee focused on the following areas: (i) standard fee structures; (ii) research consumption and trading evolution; (iii) management fee competitiveness/profitability by category; and (iv) factors that drive institutional pricing.
Based on its review, the Board concluded that the fund's management fee is fair and reasonable in light of the services that the fund receives and the other factors considered.
Total Expense Ratio. In its review of each class's total expense ratio, the Board considered the fund's management fee rate as well as other fund or class expenses, as applicable, such as transfer agent fees, pricing and bookkeeping fees, and custodial, legal, and audit fees. The Board noted the impact of the fund's performance adjustment. The Board also noted that Fidelity may agree to waive fees and expenses from time to time, and the extent to which, if any, it has done so for the fund. As part of its review, the Board also considered the current and historical total expense ratios of each class of the fund compared to competitive fund median expenses. Each class of the fund is compared to those funds and classes in the Total Mapped Group (used by the Board for management fee comparisons) that have a similar sales load structure.
The Board noted that the total expense ratio of each class ranked below the competitive median for 2016.
Fees Charged to Other Fidelity Clients. The Board also considered Fidelity fee structures and other information with respect to clients of Fidelity, such as other funds advised or subadvised by Fidelity, pension plan clients, and other institutional clients with similar mandates. The Board noted that an ad hoc joint committee created by it and the boards of other Fidelity funds periodically (most recently in 2013) reviews and compares Fidelity's institutional investment advisory business with its business of providing services to the Fidelity funds, including the differences in services provided, fees charged, and costs incurred, as well as competition in their respective marketplaces.
Based on its review of total expense ratios and fees charged to other Fidelity clients, the Board concluded that the total expense ratio of each class of the fund was reasonable in light of the services that the fund and its shareholders receive and the other factors considered.
Costs of the Services and Profitability. The Board considered the revenues earned and the expenses incurred by Fidelity in conducting the business of developing, marketing, distributing, managing, administering and servicing the fund and servicing the fund's shareholders. The Board also considered the level of Fidelity's profits in respect of all the Fidelity funds.
On an annual basis, Fidelity presents to the Board information about the profitability of its relationships with the fund. Fidelity calculates profitability information for each fund, as well as aggregate profitability information for groups of Fidelity funds and all Fidelity funds, using a series of detailed revenue and cost allocation methodologies which originate with the books and records of Fidelity on which Fidelity's audited financial statements are based. The Audit Committee of the Board reviews any significant changes from the prior year's methodologies.
PricewaterhouseCoopers LLP (PwC), independent registered public accounting firm and auditor to Fidelity and certain Fidelity funds, has been engaged annually by the Board as part of the Board's assessment of Fidelity's profitability analysis. PwC's engagement includes the review and assessment of the methodologies used by Fidelity in determining the revenues and expenses attributable to Fidelity's mutual fund business, and completion of agreed-upon procedures in respect of the mathematical accuracy of the fund profitability information and its conformity to established allocation methodologies. After considering PwC's reports issued under the engagement and information provided by Fidelity, the Board concluded that while other allocation methods may also be reasonable, Fidelity's profitability methodologies are reasonable in all material respects.
The Board also reviewed Fidelity's non-fund businesses and potential fall-out benefits related to the mutual fund business as well as cases where Fidelity's affiliates may benefit from or be related to the fund's business.
The Board considered the costs of the services provided by and the profits realized by Fidelity in connection with the operation of the fund and was satisfied that the profitability was not excessive.
Economies of Scale. The Board considered whether there have been economies of scale in respect of the management of the Fidelity funds, whether the Fidelity funds (including the fund) have appropriately benefited from any such economies of scale, and whether there is potential for realization of any further economies of scale. The Board considered the extent to which the fund will benefit from economies of scale as assets grow through increased services to the fund, through waivers or reimbursements, or through fee or expense ratio reductions. The Board also noted that a committee (the Economies of Scale Committee) created by it and the boards of other Fidelity funds periodically (most recently in 2013) analyzes whether Fidelity attains economies of scale in respect of the management and servicing of the Fidelity funds, whether the Fidelity funds have appropriately benefited from such economies of scale, and whether there is potential for realization of any further economies of scale.
The Board recognized that the fund's management contract incorporates a "group fee" structure, which provides for lower group fee rates as total group assets increase, and for higher group fee rates as total group assets decrease (with "group assets" defined to include fund assets under FMR's management plus the assets of sector funds previously under FMR's management). FMR calculates the group fee rates based on a tiered asset "breakpoint" schedule that varies based on asset class. The Board considered that the group fee is designed to deliver the benefits of economies of scale to fund shareholders when total Fidelity fund assets increase, even if assets of any particular fund are unchanged or have declined, because some portion of Fidelity's costs are attributable to services provided to all Fidelity funds, and all funds benefit if those costs can be allocated among more assets. The Board concluded that, given the group fee structure, fund shareholders will benefit from lower management fees as group assets increase at the fund complex level, regardless of whether Fidelity achieves any such economies of scale.
The Board concluded, taking into account the analysis of the Economies of Scale Committee, that economies of scale, if any, are being appropriately shared between fund shareholders and Fidelity.
Additional Information Requested by the Board. In order to develop fully the factual basis for consideration of the Fidelity funds' advisory contracts, the Board requested and received additional information on certain topics, including: (i) fund performance trends, in particular the underperformance of certain funds, and Fidelity's long-term strategies for certain funds; (ii) Fidelity's fund profitability methodology, profitability trends for certain funds, and the impact of certain factors on fund profitability results, including the impact of market trends on actively managed funds; (iii) the use of performance fees and the calculation of performance adjustments, including the impact of underperformance and fund outflows on performance adjustments; (iv) metrics for evaluating index fund performance; (v) Fidelity's group fee structure, including the group fee breakpoint schedules; (vi) the terms of Fidelity's contractual and voluntary expense cap arrangements with the funds; (vii) the methodology with respect to evaluating competitive fund data and peer group classifications and fee comparisons; (viii) the expense structures for different funds and classes; (ix) Fidelity's arrangements with affiliated sub-advisers on behalf of the funds; (x) information regarding other accounts managed by Fidelity, including institutional accounts and collective investment trusts; (xi) recent changes to the fee structure for certain funds of funds; and (xii) the impact of the Department of Labor's new fiduciary rule on the funds' comparative expense information.
Based on its evaluation of all of the conclusions noted above, and after considering all factors it believed relevant, the Board concluded that the advisory fee structures are fair and reasonable, and that the fund's Advisory Contracts should be renewed.
Corporate Headquarters
245 Summer St.
Boston, MA 02210
www.fidelity.com
VAL-K-ANN-1217
1.863247.109
Fidelity® Disciplined Equity Fund Class K
Annual Report October 31, 2017 |
|
Contents
To view a fund's proxy voting guidelines and proxy voting record for the 12-month period ended June 30, visit http://www.fidelity.com/proxyvotingresults or visit the Securities and Exchange Commission's (SEC) web site at http://www.sec.gov.
You may also call 1-800-835-5092 to request a free copy of the proxy voting guidelines.
Standard & Poor's, S&P and S&P 500 are registered service marks of The McGraw-Hill Companies, Inc. and have been licensed for use by Fidelity Distributors Corporation.
Other third-party marks appearing herein are the property of their respective owners.
All other marks appearing herein are registered or unregistered trademarks or service marks of FMR LLC or an affiliated company. © 2017 FMR LLC. All rights reserved.
This report and the financial statements contained herein are submitted for the general information of the shareholders of the Fund. This report is not authorized for distribution to prospective investors in the Fund unless preceded or accompanied by an effective prospectus.
A fund files its complete schedule of portfolio holdings with the SEC for the first and third quarters of each fiscal year on Form N-Q. Forms N-Q are available on the SEC’s web site at http://www.sec.gov. A fund's Forms N-Q may be reviewed and copied at the SEC’s Public Reference Room in Washington, DC. Information regarding the operation of the SEC's Public Reference Room may be obtained by calling 1-800-SEC-0330.
For a complete list of a fund's portfolio holdings, view the most recent holdings listing, semiannual report, or annual report on Fidelity's web site at http://www.fidelity.com, http://www.institutional.fidelity.com, or http://www.401k.com, as applicable.
NOT FDIC INSURED •MAY LOSE VALUE •NO BANK GUARANTEE
Neither the Fund nor Fidelity Distributors Corporation is a bank.
Performance: The Bottom Line
Average annual total return reflects the change in the value of an investment, assuming reinvestment of distributions from dividend income and capital gains (the profits earned upon the sale of securities that have grown in value, if any) and assuming a constant rate of performance each year. The hypothetical investment and the average annual total returns do not reflect the deduction of taxes that a shareholder would pay on fund distributions or the redemption of fund shares. During periods of reimbursement by Fidelity, a fund’s total return will be greater than it would be had the reimbursement not occurred. How a fund did yesterday is no guarantee of how it will do tomorrow.
Average Annual Total Returns
| For the periods ended October 31, 2017 | Past 1 year | Past 5 years | Past 10 years |
| Class K | 22.65% | 14.36% | 5.18% |
The initial offering of Class K shares took place on May 9, 2008. Returns prior to May 9, 2008 are those of Fidelity® Disciplined Equity Fund, the original class of the fund.
$10,000 Over 10 Years
Let's say hypothetically that $10,000 was invested in Fidelity® Disciplined Equity Fund - Class K on October 31, 2007.
The chart shows how the value of your investment would have changed, and also shows how the S&P 500® Index performed over the same period.
See above for additional information regarding the performance of Class K.
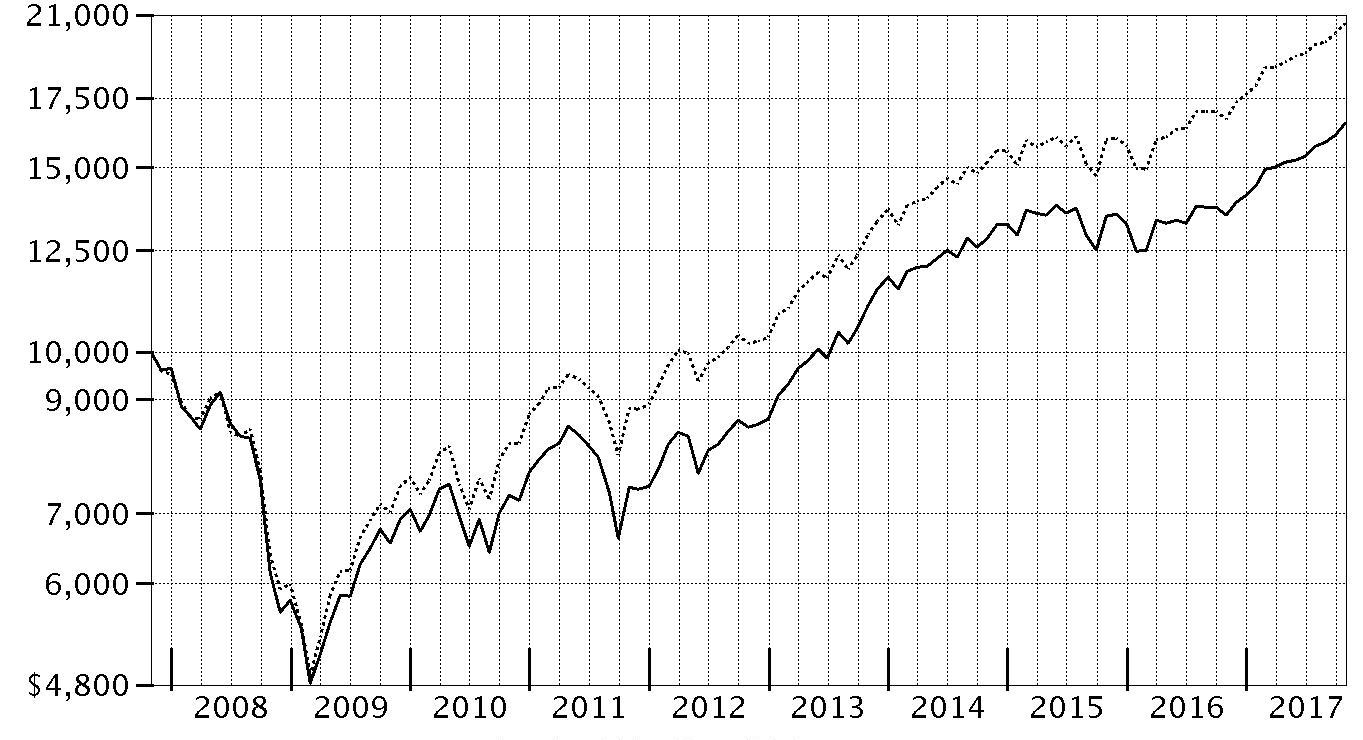
| Period Ending Values |
| $16,563 | Fidelity® Disciplined Equity Fund - Class K |
| $20,638 | S&P 500® Index |
Management's Discussion of Fund Performance
Market Recap: The U.S. equity bellwether S&P 500
® index gained 23.63% for the year ending October 31, 2017. Equity markets rose sharply following the November election and continued to rally through the end of February on optimism for President Trump’s pro-business agenda. Stocks leveled off in March amid fading optimism and stalled efforts by Congress to repeal and replace the Affordable Care Act. Upward momentum soon returned and continued through period end amid positive consumer sentiment and other market indicators. The lone exception was a brief cooldown in August, when geopolitical tension escalated and uncertainty grew regarding the future of health care, tax reform and the debt ceiling. Sector-wise, information technology (+39%) performed best, surging as a handful of major index constituents posted strong returns. Financials gained 37%, riding an uptick in bond yields and a surge in banks. Materials (+29%) also did well, spurred by higher demand, especially from China. Conversely, consumer discretionary (+20%) lagged the broader market, as brick-and-mortar retailers continued to suffer from increased online competition. Rising interest rates held back real estate (+9%) and sluggish oil prices dragged on energy (+2%). Consumer staples (+4%) and telecommunication services (-1%) struggled due to investors’ general preference for risk assets.
Comments from Portfolio Manager Alex Devereaux: For the year, the fund’s share classes gained roughly 23%, modestly trailing the 23.63% gain of the S&P 500
® index. Relative to the benchmark, stock picking within the consumer discretionary sector hurt most. In particular, an out-of-benchmark stake in International Game Technology disappointed, returning -34%. The manufacturer and distributor of computerized gaming equipment reported declining revenues, soft guidance and significant debt. We exited the position in July. Underweighting Amazon, and selling the stock too soon, also hurt, as its shares advanced 40% for the year. Elsewhere, choices in financials and materials weighed on relative results. Conversely, stock selection in the information technology and energy sectors aided relative performance. Our decision to avoid industrial conglomerate General Electric (GE) provided the biggest boost to relative results. Previously held in the fund, we eliminated our position in GE prior to the start of the period due to its expensive valuation. Our overweight stake in Bank of America (BofA) also contributed versus the index, as the stock gained about 66% for the fund. We liked BofA’s strong valuation, positive estimate revisions, and its deployment of capital to shareholders. Litigation income received during the period also added to the fund’s return.
The views expressed above reflect those of the portfolio manager(s) only through the end of the period as stated on the cover of this report and do not necessarily represent the views of Fidelity or any other person in the Fidelity organization. Any such views are subject to change at any time based upon market or other conditions and Fidelity disclaims any responsibility to update such views. These views may not be relied on as investment advice and, because investment decisions for a Fidelity fund are based on numerous factors, may not be relied on as an indication of trading intent on behalf of any Fidelity fund.
Investment Summary (Unaudited)
Top Ten Stocks as of October 31, 2017
| | % of fund's net assets | % of fund's net assets 6 months ago |
| Apple, Inc. | 4.8 | 4.5 |
| Alphabet, Inc. Class A | 3.3 | 3.1 |
| Facebook, Inc. Class A | 2.7 | 2.2 |
| Johnson & Johnson | 2.5 | 2.2 |
| Berkshire Hathaway, Inc. Class B | 2.4 | 2.3 |
| Bank of America Corp. | 2.1 | 1.4 |
| Wells Fargo & Co. | 1.9 | 1.9 |
| Chevron Corp. | 1.8 | 1.7 |
| UnitedHealth Group, Inc. | 1.8 | 1.6 |
| Microsoft Corp. | 1.7 | 2.2 |
| | 25.0 | |
Top Five Market Sectors as of October 31, 2017
| | % of fund's net assets | % of fund's net assets 6 months ago |
| Information Technology | 26.5 | 21.5 |
| Health Care | 15.0 | 16.2 |
| Financials | 12.7 | 12.1 |
| Consumer Discretionary | 10.7 | 11.1 |
| Consumer Staples | 9.2 | 10.4 |
Asset Allocation (% of fund's net assets)
| As of October 31, 2017 * |
| | Stocks | 98.7% |
| | Short-Term Investments and Net Other Assets (Liabilities) | 1.3% |

* Foreign investments - 7.3%
| As of April 30, 2017 * |
| | Stocks | 98.3% |
| | Short-Term Investments and Net Other Assets (Liabilities) | 1.7% |

* Foreign investments - 7.6%
Investments October 31, 2017
Showing Percentage of Net Assets
| Common Stocks - 98.7% | | | |
| | | Shares | Value (000s) |
| CONSUMER DISCRETIONARY - 10.7% | | | |
| Hotels, Restaurants & Leisure - 5.7% | | | |
| Carnival Corp. | | 158,153 | $10,500 |
| Darden Restaurants, Inc. | | 54,041 | 4,446 |
| Marriott International, Inc. Class A | | 87,143 | 10,412 |
| McDonald's Corp. | | 114,479 | 19,108 |
| Royal Caribbean Cruises Ltd. | | 98,274 | 12,163 |
| U.S. Foods Holding Corp. (a) | | 365,647 | 9,975 |
| Wyndham Worldwide Corp. | | 107,850 | 11,524 |
| | | | 78,128 |
| Household Durables - 0.6% | | | |
| CalAtlantic Group, Inc. | | 166,942 | 8,237 |
| Internet & Direct Marketing Retail - 1.4% | | | |
| Liberty Interactive Corp. QVC Group Series A (a) | | 437,424 | 9,938 |
| Netflix, Inc. (a) | | 35,059 | 6,887 |
| Priceline Group, Inc. (a) | | 1,036 | 1,981 |
| | | | 18,806 |
| Media - 0.8% | | | |
| Charter Communications, Inc. Class A (a) | | 1,321 | 441 |
| Comcast Corp. Class A | | 291,014 | 10,485 |
| | | | 10,926 |
| Multiline Retail - 0.7% | | | |
| Dollar Tree, Inc. (a) | | 22,890 | 2,089 |
| Macy's, Inc. | | 413,819 | 7,763 |
| | | | 9,852 |
| Specialty Retail - 0.7% | | | |
| Best Buy Co., Inc. | | 174,561 | 9,772 |
| Textiles, Apparel & Luxury Goods - 0.8% | | | |
| PVH Corp. | | 86,607 | 10,983 |
|
| TOTAL CONSUMER DISCRETIONARY | | | 146,704 |
|
| CONSUMER STAPLES - 9.2% | | | |
| Beverages - 0.6% | | | |
| The Coca-Cola Co. | | 194,033 | 8,922 |
| Food & Staples Retailing - 2.4% | | | |
| CVS Health Corp. | | 201,060 | 13,779 |
| Wal-Mart Stores, Inc. | | 218,385 | 19,067 |
| | | | 32,846 |
| Food Products - 3.4% | | | |
| Bunge Ltd. | | 152,104 | 10,462 |
| ConAgra Foods, Inc. | | 331,527 | 11,325 |
| Pilgrim's Pride Corp. (a)(b) | | 352,823 | 11,213 |
| The J.M. Smucker Co. | | 100,425 | 10,650 |
| Tyson Foods, Inc. Class A | | 39,335 | 2,868 |
| | | | 46,518 |
| Household Products - 1.4% | | | |
| Procter & Gamble Co. | | 224,172 | 19,355 |
| Tobacco - 1.4% | | | |
| Philip Morris International, Inc. | | 187,214 | 19,590 |
|
| TOTAL CONSUMER STAPLES | | | 127,231 |
|
| ENERGY - 6.1% | | | |
| Oil, Gas & Consumable Fuels - 6.1% | | | |
| Chevron Corp. | | 211,039 | 24,457 |
| ConocoPhillips Co. | | 31,001 | 1,586 |
| Exxon Mobil Corp. | | 192,351 | 16,032 |
| HollyFrontier Corp. | | 112,311 | 4,150 |
| Kinder Morgan, Inc. | | 409,656 | 7,419 |
| Phillips 66 Co. | | 143,651 | 13,084 |
| The Williams Companies, Inc. | | 139,427 | 3,974 |
| Valero Energy Corp. | | 168,910 | 13,325 |
| | | | 84,027 |
| FINANCIALS - 12.7% | | | |
| Banks - 7.4% | | | |
| Bank of America Corp. | | 1,034,919 | 28,346 |
| Citigroup, Inc. | | 314,865 | 23,143 |
| JPMorgan Chase & Co. | | 234,024 | 23,545 |
| Wells Fargo & Co. | | 476,902 | 26,773 |
| | | | 101,807 |
| Consumer Finance - 1.1% | | | |
| Capital One Financial Corp. | | 155,072 | 14,295 |
| Santander Consumer U.S.A. Holdings, Inc. | | 18,722 | 312 |
| | | | 14,607 |
| Diversified Financial Services - 2.4% | | | |
| Berkshire Hathaway, Inc. Class B (a) | | 178,612 | 33,390 |
| Insurance - 0.3% | | | |
| Chubb Ltd. | | 25,778 | 3,888 |
| Mortgage Real Estate Investment Trusts - 1.5% | | | |
| AGNC Investment Corp. | | 489,232 | 9,848 |
| Annaly Capital Management, Inc. | | 769,627 | 8,820 |
| New Residential Investment Corp. | | 146,255 | 2,578 |
| | | | 21,246 |
|
| TOTAL FINANCIALS | | | 174,938 |
|
| HEALTH CARE - 15.0% | | | |
| Biotechnology - 2.5% | | | |
| Alexion Pharmaceuticals, Inc. (a) | | 64,633 | 7,734 |
| Amgen, Inc. | | 104,378 | 18,289 |
| Biogen, Inc. (a) | | 15,722 | 4,900 |
| Celgene Corp. (a) | | 31,609 | 3,192 |
| | | | 34,115 |
| Health Care Equipment & Supplies - 1.1% | | | |
| Danaher Corp. | | 161,134 | 14,868 |
| Health Care Providers & Services - 6.4% | | | |
| Anthem, Inc. | | 33,977 | 7,108 |
| Centene Corp. (a) | | 93,307 | 8,740 |
| Cigna Corp. | | 73,374 | 14,471 |
| Express Scripts Holding Co. (a) | | 166,606 | 10,211 |
| Humana, Inc. | | 51,535 | 13,159 |
| McKesson Corp. | | 73,135 | 10,084 |
| UnitedHealth Group, Inc. | | 114,562 | 24,083 |
| | | | 87,856 |
| Life Sciences Tools & Services - 0.3% | | | |
| Agilent Technologies, Inc. | | 69,944 | 4,758 |
| Pharmaceuticals - 4.7% | | | |
| Allergan PLC | | 64,753 | 11,476 |
| Johnson & Johnson | | 250,823 | 34,967 |
| Mallinckrodt PLC (a) | | 151,423 | 4,796 |
| Pfizer, Inc. | | 379,275 | 13,297 |
| | | | 64,536 |
|
| TOTAL HEALTH CARE | | | 206,133 |
|
| INDUSTRIALS - 8.3% | | | |
| Aerospace & Defense - 1.1% | | | |
| Spirit AeroSystems Holdings, Inc. Class A | | 128,919 | 10,326 |
| United Technologies Corp. | | 44,205 | 5,294 |
| | | | 15,620 |
| Airlines - 0.7% | | | |
| Copa Holdings SA Class A | | 81,350 | 10,022 |
| Building Products - 0.2% | | | |
| Owens Corning | | 27,608 | 2,283 |
| Construction & Engineering - 1.5% | | | |
| AECOM (a) | | 301,326 | 10,564 |
| Jacobs Engineering Group, Inc. | | 182,589 | 10,629 |
| | | | 21,193 |
| Electrical Equipment - 0.8% | | | |
| AMETEK, Inc. | | 117,973 | 7,962 |
| Regal Beloit Corp. | | 39,468 | 3,203 |
| | | | 11,165 |
| Machinery - 2.4% | | | |
| Allison Transmission Holdings, Inc. | | 69,281 | 2,944 |
| Caterpillar, Inc. | | 122,836 | 16,681 |
| Cummins, Inc. | | 72,126 | 12,758 |
| | | | 32,383 |
| Professional Services - 0.8% | | | |
| Manpower, Inc. | | 89,371 | 11,018 |
| Trading Companies & Distributors - 0.8% | | | |
| MSC Industrial Direct Co., Inc. Class A | | 51 | 4 |
| WESCO International, Inc. (a) | | 172,716 | 10,907 |
| | | | 10,911 |
|
| TOTAL INDUSTRIALS | | | 114,595 |
|
| INFORMATION TECHNOLOGY - 26.5% | | | |
| Electronic Equipment & Components - 0.7% | | | |
| Jabil, Inc. | | 332,906 | 9,415 |
| Internet Software & Services - 6.3% | | | |
| Alphabet, Inc.: | | | |
| Class A (a) | | 44,480 | 45,950 |
| Class C (a) | | 3,230 | 3,284 |
| Facebook, Inc. Class A (a) | | 206,851 | 37,246 |
| | | | 86,480 |
| IT Services - 5.1% | | | |
| Accenture PLC Class A | | 17,220 | 2,451 |
| Alliance Data Systems Corp. | | 45,784 | 10,243 |
| Cognizant Technology Solutions Corp. Class A | | 184,905 | 13,992 |
| Conduent, Inc. | | 392,190 | 6,071 |
| CSRA, Inc. | | 31,910 | 1,021 |
| DXC Technology Co. | | 115,752 | 10,594 |
| Euronet Worldwide, Inc. (a) | | 8,410 | 813 |
| First Data Corp. Class A (a) | | 263,059 | 4,685 |
| Genpact Ltd. | | 86,679 | 2,639 |
| Leidos Holdings, Inc. | | 175,785 | 10,990 |
| MasterCard, Inc. Class A | | 46,880 | 6,974 |
| | | | 70,473 |
| Semiconductors & Semiconductor Equipment - 3.6% | | | |
| Broadcom Ltd. | | 66,164 | 17,461 |
| First Solar, Inc. (a) | | 99,228 | 5,440 |
| Micron Technology, Inc. (a) | | 335,709 | 14,875 |
| ON Semiconductor Corp. (a) | | 564,383 | 12,033 |
| | | | 49,809 |
| Software - 5.2% | | | |
| Adobe Systems, Inc. (a) | | 42,273 | 7,405 |
| Electronic Arts, Inc. (a) | | 63,535 | 7,599 |
| Intuit, Inc. | | 85,795 | 12,957 |
| Microsoft Corp. | | 284,250 | 23,644 |
| Oracle Corp. | | 400,248 | 20,373 |
| | | | 71,978 |
| Technology Hardware, Storage & Peripherals - 5.6% | | | |
| Apple, Inc. | | 392,793 | 66,395 |
| Western Digital Corp. | | 112,473 | 10,040 |
| | | | 76,435 |
|
| TOTAL INFORMATION TECHNOLOGY | | | 364,590 |
|
| MATERIALS - 4.5% | | | |
| Chemicals - 3.2% | | | |
| FMC Corp. | | 122,895 | 11,412 |
| LyondellBasell Industries NV Class A | | 130,332 | 13,493 |
| Platform Specialty Products Corp. (a) | | 725,829 | 7,766 |
| The Chemours Co. LLC | | 198,806 | 11,254 |
| | | | 43,925 |
| Metals & Mining - 1.3% | | | |
| Freeport-McMoRan, Inc. (a) | | 797,646 | 11,151 |
| United States Steel Corp. (b) | | 286,368 | 7,251 |
| | | | 18,402 |
|
| TOTAL MATERIALS | | | 62,327 |
|
| REAL ESTATE - 1.9% | | | |
| Equity Real Estate Investment Trusts (REITs) - 1.2% | | | |
| Colony NorthStar, Inc. | | 202,165 | 2,483 |
| Corrections Corp. of America | | 337,115 | 8,313 |
| Welltower, Inc. | | 81,454 | 5,454 |
| | | | 16,250 |
| Real Estate Management & Development - 0.7% | | | |
| Realogy Holdings Corp. | | 297,863 | 9,630 |
|
| TOTAL REAL ESTATE | | | 25,880 |
|
| TELECOMMUNICATION SERVICES - 0.7% | | | |
| Wireless Telecommunication Services - 0.7% | | | |
| T-Mobile U.S., Inc. (a) | | 165,984 | 9,921 |
| UTILITIES - 3.1% | | | |
| Electric Utilities - 2.3% | | | |
| Exelon Corp. | | 337,101 | 13,555 |
| FirstEnergy Corp. | | 250,511 | 8,254 |
| NextEra Energy, Inc. | | 64,414 | 9,989 |
| | | | 31,798 |
| Independent Power and Renewable Electricity Producers - 0.8% | | | |
| The AES Corp. | | 951,568 | 10,115 |
|
| TOTAL UTILITIES | | | 41,913 |
|
| TOTAL COMMON STOCKS | | | |
| (Cost $1,183,931) | | | 1,358,259 |
|
| Money Market Funds - 2.0% | | | |
| Fidelity Cash Central Fund, 1.10% (c) | | 18,269,243 | 18,273 |
| Fidelity Securities Lending Cash Central Fund 1.11% (c)(d) | | 9,808,361 | 9,809 |
| TOTAL MONEY MARKET FUNDS | | | |
| (Cost $28,083) | | | 28,082 |
| TOTAL INVESTMENT IN SECURITIES - 100.7% | | | |
| (Cost $1,212,014) | | | 1,386,341 |
| NET OTHER ASSETS (LIABILITIES) - (0.7)% | | | (9,405) |
| NET ASSETS - 100% | | | $1,376,936 |
Legend
(a) Non-income producing
(b) Security or a portion of the security is on loan at period end.
(c) Affiliated fund that is generally available only to investment companies and other accounts managed by Fidelity Investments. The rate quoted is the annualized seven-day yield of the fund at period end. A complete unaudited listing of the fund's holdings as of its most recent quarter end is available upon request. In addition, each Fidelity Central Fund's financial statements, which are not covered by the Fund's Report of Independent Registered Public Accounting Firm, are available on the SEC's website or upon request.
(d) Investment made with cash collateral received from securities on loan.
Affiliated Central Funds
Information regarding fiscal year to date income earned by the Fund from investments in Fidelity Central Funds is as follows:
| Fund | Income earned |
| | (Amounts in thousands) |
| Fidelity Cash Central Fund | $171 |
| Fidelity Securities Lending Cash Central Fund | 32 |
| Total | $203 |
Investment Valuation
All investments are categorized as Level 1 under the Fair Value Hierarchy. The inputs or methodology used for valuing securities may not be an indication of the risk associated with investing in those securities. For more information on valuation inputs please refer to the Investment Valuation section in the accompanying Notes to Financial Statements.
See accompanying notes which are an integral part of the financial statements.
Financial Statements
Statement of Assets and Liabilities
| Amounts in thousands (except per-share amounts) | | October 31, 2017 |
| Assets | | |
Investment in securities, at value (including securities loaned of $9,453) — See accompanying schedule:
Unaffiliated issuers (cost $1,183,931) | $1,358,259 | |
| Fidelity Central Funds (cost $28,083) | 28,082 | |
| Total Investment in Securities (cost $1,212,014) | | $1,386,341 |
| Receivable for fund shares sold | | 769 |
| Dividends receivable | | 903 |
| Distributions receivable from Fidelity Central Funds | | 22 |
| Prepaid expenses | | 3 |
| Other receivables | | 443 |
| Total assets | | 1,388,481 |
| Liabilities | | |
| Payable for fund shares redeemed | 596 | |
| Accrued management fee | 444 | |
| Other affiliated payables | 192 | |
| Other payables and accrued expenses | 503 | |
| Collateral on securities loaned | 9,810 | |
| Total liabilities | | 11,545 |
| Net Assets | | $1,376,936 |
| Net Assets consist of: | | |
| Paid in capital | | $1,151,468 |
| Undistributed net investment income | | 11,985 |
| Accumulated undistributed net realized gain (loss) on investments and foreign currency transactions | | 39,156 |
| Net unrealized appreciation (depreciation) on investments | | 174,327 |
| Net Assets | | $1,376,936 |
| Disciplined Equity: | | |
| Net Asset Value, offering price and redemption price per share ($1,266,377 ÷ 32,506 shares) | | $38.96 |
| Class K: | | |
| Net Asset Value, offering price and redemption price per share ($110,559 ÷ 2,840 shares) | | $38.93 |
See accompanying notes which are an integral part of the financial statements.
Statement of Operations
| Amounts in thousands | | Year ended October 31, 2017 |
| Investment Income | | |
| Dividends | | $24,484 |
| Income from Fidelity Central Funds | | 203 |
| Total income | | 24,687 |
| Expenses | | |
| Management fee | | |
| Basic fee | $7,190 | |
| Performance adjustment | (2,542) | |
| Transfer agent fees | 1,840 | |
| Accounting and security lending fees | 421 | |
| Custodian fees and expenses | 21 | |
| Independent trustees' fees and expenses | 5 | |
| Registration fees | 43 | |
| Audit | 72 | |
| Legal | 7 | |
| Miscellaneous | 12 | |
| Total expenses before reductions | 7,069 | |
| Expense reductions | (15) | 7,054 |
| Net investment income (loss) | | 17,633 |
| Realized and Unrealized Gain (Loss) | | |
| Net realized gain (loss) on: | | |
| Investment securities: | | |
| Unaffiliated issuers | 144,459 | |
| Fidelity Central Funds | 1 | |
| Futures contracts | (2) | |
| Total net realized gain (loss) | | 144,458 |
| Change in net unrealized appreciation (depreciation) on: | | |
| Investment securities: | | |
| Unaffiliated issuers | 105,059 | |
| Fidelity Central Funds | (4) | |
| Total change in net unrealized appreciation (depreciation) | | 105,055 |
| Net gain (loss) | | 249,513 |
| Net increase (decrease) in net assets resulting from operations | | $267,146 |
See accompanying notes which are an integral part of the financial statements.
Statement of Changes in Net Assets
| Amounts in thousands | Year ended October 31, 2017 | Year ended October 31, 2016 |
| Increase (Decrease) in Net Assets | | |
| Operations | | |
| Net investment income (loss) | $17,633 | $18,118 |
| Net realized gain (loss) | 144,458 | 1,549 |
| Change in net unrealized appreciation (depreciation) | 105,055 | (20,684) |
| Net increase (decrease) in net assets resulting from operations | 267,146 | (1,017) |
| Distributions to shareholders from net investment income | (18,783) | (15,984) |
| Distributions to shareholders from net realized gain | – | (73,227) |
| Total distributions | (18,783) | (89,211) |
| Share transactions - net increase (decrease) | (125,908) | (169,880) |
| Total increase (decrease) in net assets | 122,455 | (260,108) |
| Net Assets | | |
| Beginning of period | 1,254,481 | 1,514,589 |
| End of period | $1,376,936 | $1,254,481 |
| Other Information | | |
| Undistributed net investment income end of period | $11,985 | $14,124 |
See accompanying notes which are an integral part of the financial statements.
Financial Highlights
Fidelity Disciplined Equity Fund
| Years ended October 31, | 2017 | 2016 | 2015 | 2014 | 2013 |
| Selected Per–Share Data | | | | | |
| Net asset value, beginning of period | $32.26 | $34.19 | $35.18 | $31.30 | $24.47 |
| Income from Investment Operations | | | | | |
| Net investment income (loss)A | .47 | .42 | .35 | .41 | .53 |
| Net realized and unrealized gain (loss) | 6.72 | (.34)B | 1.26 | 4.43 | 6.85 |
| Total from investment operations | 7.19 | .08 | 1.61 | 4.84 | 7.38 |
| Distributions from net investment income | (.49) | (.36) | (.38) | (.69) | (.55) |
| Distributions from net realized gain | – | (1.65) | (2.22) | (.27) | – |
| Total distributions | (.49) | (2.01) | (2.60) | (.96) | (.55) |
| Net asset value, end of period | $38.96 | $32.26 | $34.19 | $35.18 | $31.30 |
| Total ReturnC | 22.51% | .16%B | 4.66% | 15.80% | 30.80% |
| Ratios to Average Net AssetsD,E | | | | | |
| Expenses before reductions | .54% | .68% | .89% | .50% | .07% |
| Expenses net of fee waivers, if any | .54% | .68% | .89% | .50% | .07% |
| Expenses net of all reductions | .54% | .68% | .89% | .50% | (.01)%F |
| Net investment income (loss) | 1.33% | 1.30% | 1.02% | 1.24% | 1.97% |
| Supplemental Data | | | | | |
| Net assets, end of period (in millions) | $1,266 | $1,150 | $1,385 | $1,238 | $1,156 |
| Portfolio turnover rateG | 184% | 179% | 187% | 184% | 156% |
A Calculated based on average shares outstanding during the period.
B Net realized and unrealized gain (loss) per share reflects proceeds received from litigation which amounted to $.05 per share. Excluding these litigation proceeds, the total return would have been (.01)%
C Total returns would have been lower if certain expenses had not been reduced during the applicable periods shown.
D Fees and expenses of any underlying Fidelity Central Funds are not included in the Fund's expense ratio. The Fund indirectly bears its proportionate share of the expenses of any underlying Fidelity Central Funds.
E Expense ratios reflect operating expenses of the class. Expenses before reductions do not reflect amounts reimbursed by the investment adviser or reductions from brokerage service arrangements or reductions from other expense offset arrangements and do not represent the amount paid by the class during periods when reimbursements or reductions occur. Expenses net of fee waivers reflect expenses after reimbursement by the investment adviser but prior to reductions from brokerage service arrangements or other expense offset arrangements. Expenses net of all reductions represent the net expenses paid by the class.
F The ratio of expenses net of all reductions to average net assets includes non-recurring payments by certain of the fund's brokers for commissions recaptured during the period. Excluding these payments, the ratio would have been .05% and the total return would've been 30.74%.
G Amount does not include the portfolio activity of any underlying Fidelity Central Funds.
See accompanying notes which are an integral part of the financial statements.
Fidelity Disciplined Equity Fund Class K
| Years ended October 31, | 2017 | 2016 | 2015 | 2014 | 2013 |
| Selected Per–Share Data | | | | | |
| Net asset value, beginning of period | $32.23 | $34.16 | $35.15 | $31.29 | $24.49 |
| Income from Investment Operations | | | | | |
| Net investment income (loss)A | .51 | .45 | .38 | .45 | .61 |
| Net realized and unrealized gain (loss) | 6.71 | (.34)B | 1.27 | 4.41 | 6.79 |
| Total from investment operations | 7.22 | .11 | 1.65 | 4.86 | 7.40 |
| Distributions from net investment income | (.52) | (.39) | (.42) | (.73) | (.60) |
| Distributions from net realized gain | – | (1.65) | (2.22) | (.27) | – |
| Total distributions | (.52) | (2.04) | (2.64) | (1.00) | (.60) |
| Net asset value, end of period | $38.93 | $32.23 | $34.16 | $35.15 | $31.29 |
| Total ReturnC | 22.65% | .26%B | 4.78% | 15.89% | 30.96% |
| Ratios to Average Net AssetsD,E | | | | | |
| Expenses before reductions | .44% | .57% | .79% | .39% | (.18)%F |
| Expenses net of fee waivers, if any | .44% | .57% | .79% | .39% | (.18)%F |
| Expenses net of all reductions | .44% | .57% | .79% | .39% | (.26)%F,G |
| Net investment income (loss) | 1.43% | 1.41% | 1.12% | 1.35% | 2.22% |
| Supplemental Data | | | | | |
| Net assets, end of period (in millions) | $111 | $104 | $129 | $158 | $153 |
| Portfolio turnover rateH | 184% | 179% | 187% | 184% | 156% |
A Calculated based on average shares outstanding during the period.
B Net realized and unrealized gain (loss) per share reflects proceeds received from litigation which amounted to $.05 per share. Excluding these litigation proceeds, the total return would have been .09%
C Total returns would have been lower if certain expenses had not been reduced during the applicable periods shown.
D Fees and expenses of any underlying Fidelity Central Funds are not included in the Fund's expense ratio. The Fund indirectly bears its proportionate share of the expenses of any underlying Fidelity Central Funds.
E Expense ratios reflect operating expenses of the class. Expenses before reductions do not reflect amounts reimbursed by the investment adviser or reductions from brokerage service arrangements or reductions from other expense offset arrangements and do not represent the amount paid by the class during periods when reimbursements or reductions occur. Expenses net of fee waivers reflect expenses after reimbursement by the investment adviser but prior to reductions from brokerage service arrangements or other expense offset arrangements. Expenses net of all reductions represent the net expenses paid by the class.
F Expense ratio is negative due to the timing of negative management fee performance adjustments in relation to fluctuating net assets of the class.
G The ratio of expenses net of all reductions to average net assets includes non-recurring payments by certain of the fund's brokers for commissions recaptured during the period. Excluding these payments, the ratio would have been (.20)% and the total return would've been 30.90%.
H Amount does not include the portfolio activity of any underlying Fidelity Central Funds.
See accompanying notes which are an integral part of the financial statements.
Notes to Financial Statements
For the period ended October 31, 2017
(Amounts in thousands except percentages)
1. Organization.
Fidelity Disciplined Equity Fund (the Fund) is a fund of Fidelity Capital Trust (the Trust) and is authorized to issue an unlimited number of shares. The Trust is registered under the Investment Company Act of 1940, as amended (the 1940 Act), as an open-end management investment company organized as a Massachusetts business trust. The Fund offers Disciplined Equity and Class K shares, each of which has equal rights as to assets and voting privileges. Each class has exclusive voting rights with respect to matters that affect that class.
2. Investments in Fidelity Central Funds.
The Fund invests in Fidelity Central Funds, which are open-end investment companies generally available only to other investment companies and accounts managed by the investment adviser and its affiliates. The Fund's Schedule of Investments lists each of the Fidelity Central Funds held as of period end, if any, as an investment of the Fund, but does not include the underlying holdings of each Fidelity Central Fund. As an Investing Fund, the Fund indirectly bears its proportionate share of the expenses of the underlying Fidelity Central Funds.
The Money Market Central Funds seek preservation of capital and current income and are managed by Fidelity Investments Money Management, Inc. (FIMM), an affiliate of the investment adviser. Annualized expenses of the Money Market Central Funds as of their most recent shareholder report date are less than .005%.
A complete unaudited list of holdings for each Fidelity Central Fund is available upon request or at the Securities and Exchange Commission (the SEC) website at www.sec.gov. In addition, the financial statements of the Fidelity Central Funds, which are not covered by the Fund's Report of Independent Registered Public Accounting Firm, are available on the SEC website or upon request.
3. Significant Accounting Policies.
The Fund is an investment company and applies the accounting and reporting guidance of the Financial Accounting Standards Board (FASB) Accounting Standards Codification Topic 946 Financial Services – Investments Companies. The financial statements have been prepared in conformity with accounting principles generally accepted in the United States of America (GAAP), which require management to make certain estimates and assumptions at the date of the financial statements. Actual results could differ from those estimates. Subsequent events, if any, through the date that the financial statements were issued have been evaluated in the preparation of the financial statements. The following summarizes the significant accounting policies of the Fund:
Investment Valuation. Investments are valued as of 4:00 p.m. Eastern time on the last calendar day of the period. The Board of Trustees (the Board) has delegated the day to day responsibility for the valuation of the Fund's investments to the Fair Value Committee (the Committee) established by the Fund's investment adviser. In accordance with valuation policies and procedures approved by the Board, the Fund attempts to obtain prices from one or more third party pricing vendors or brokers to value its investments. When current market prices, quotations or currency exchange rates are not readily available or reliable, investments will be fair valued in good faith by the Committee, in accordance with procedures adopted by the Board. Factors used in determining fair value vary by investment type and may include market or investment specific events. The frequency with which these procedures are used cannot be predicted and they may be utilized to a significant extent. The Committee oversees the Fund's valuation policies and procedures and reports to the Board on the Committee's activities and fair value determinations. The Board monitors the appropriateness of the procedures used in valuing the Fund's investments and ratifies the fair value determinations of the Committee.
The Fund categorizes the inputs to valuation techniques used to value its investments into a disclosure hierarchy consisting of three levels as shown below:
- Level 1 – quoted prices in active markets for identical investments
- Level 2 – other significant observable inputs (including quoted prices for similar investments, interest rates, prepayment speeds, etc.)
- Level 3 – unobservable inputs (including the Fund's own assumptions based on the best information available)
Valuation techniques used to value the Fund's investments by major category are as follows:
Equity securities, including restricted securities, for which market quotations are readily available, are valued at the last reported sale price or official closing price as reported by a third party pricing vendor on the primary market or exchange on which they are traded and are categorized as Level 1 in the hierarchy. In the event there were no sales during the day or closing prices are not available, securities are valued at the last quoted bid price or may be valued using the last available price and are generally categorized as Level 2 in the hierarchy. For foreign equity securities, when market or security specific events arise, comparisons to the valuation of American Depositary Receipts (ADRs), futures contracts, Exchange-Traded Funds (ETFs) and certain indexes as well as quoted prices for similar securities may be used and would be categorized as Level 2 in the hierarchy. Utilizing these techniques may result in transfers between Level 1 and Level 2. For equity securities, including restricted securities, where observable inputs are limited, assumptions about market activity and risk are used and these securities may be categorized as Level 3 in the hierarchy.
Investments in open-end mutual funds, including the Fidelity Central Funds, are valued at their closing net asset value (NAV) each business day and are categorized as Level 1 in the hierarchy.
Changes in valuation techniques may result in transfers in or out of an assigned level within the disclosure hierarchy.
Foreign Currency. The Fund may use foreign currency contracts to facilitate transactions in foreign-denominated securities. Gains and losses from these transactions may arise from changes in the value of the foreign currency or if the counterparties do not perform under the contracts' terms.
Foreign-denominated assets, including investment securities, and liabilities are translated into U.S. dollars at the exchange rates at period end. Purchases and sales of investment securities, income and dividends received and expenses denominated in foreign currencies are translated into U.S. dollars at the exchange rate in effect on the transaction date.
The effects of exchange rate fluctuations on investments are included with the net realized and unrealized gain (loss) on investment securities. Other foreign currency transactions resulting in realized and unrealized gain (loss) are disclosed separately.
Investment Transactions and Income. For financial reporting purposes, the Fund's investment holdings and NAV include trades executed through the end of the last business day of the period. The NAV per share for processing shareholder transactions is calculated as of the close of business of the New York Stock Exchange (NYSE), normally 4:00 p.m. Eastern time and includes trades executed through the end of the prior business day. Gains and losses on securities sold are determined on the basis of identified cost and includes proceeds received from litigation. Dividend income is recorded on the ex-dividend date, except for certain dividends from foreign securities where the ex-dividend date may have passed, which are recorded as soon as the Fund is informed of the ex-dividend date. Non-cash dividends included in dividend income, if any, are recorded at the fair market value of the securities received. Income and capital gain distributions from Fidelity Central Funds, if any, are recorded on the ex-dividend date. Certain distributions received by the Fund represent a return of capital or capital gain. The Fund determines the components of these distributions subsequent to the ex-dividend date, based upon receipt of tax filings or other correspondence relating to the underlying investment. These distributions are recorded as a reduction of cost of investments and/or as a realized gain. Investment income is recorded net of foreign taxes withheld where recovery of such taxes is uncertain.
Class Allocations and Expenses. Investment income, realized and unrealized capital gains and losses, common expenses of the Fund, and certain fund-level expense reductions, if any, are allocated daily on a pro-rata basis to each class based on the relative net assets of each class to the total net assets of the Fund. Each class differs with respect to transfer agent fees incurred. Certain expense reductions may also differ by class. For the reporting period, the allocated portion of income and expenses to each class as a percent of its average net assets may vary due to the timing of recording these transactions in relation to fluctuating net assets of the classes. Expenses directly attributable to a fund are charged to that fund. Expenses attributable to more than one fund are allocated among the respective funds on the basis of relative net assets or other appropriate methods. Expense estimates are accrued in the period to which they relate and adjustments are made when actual amounts are known.
Deferred Trustee Compensation. Under a Deferred Compensation Plan (the Plan), independent Trustees may elect to defer receipt of a portion of their annual compensation. Deferred amounts are invested in a cross-section of Fidelity funds, are marked-to-market and remain in the Fund until distributed in accordance with the Plan. The investment of deferred amounts and the offsetting payable to the Trustees are included in the accompanying Statement of Assets and Liabilities.
Income Tax Information and Distributions to Shareholders. Each year, the Fund intends to qualify as a regulated investment company under Subchapter M of the Internal Revenue Code, including distributing substantially all of its taxable income and realized gains. As a result, no provision for U.S. Federal income taxes is required. As of October 31, 2017, the Fund did not have any unrecognized tax benefits in the financial statements; nor is the Fund aware of any tax positions for which it is reasonably possible that the total amounts of unrecognized tax benefits will significantly change in the next twelve months. The Fund files a U.S. federal tax return, in addition to state and local tax returns as required. The Fund's federal income tax returns are subject to examination by the Internal Revenue Service (IRS) for a period of three fiscal years after they are filed. State and local tax returns may be subject to examination for an additional fiscal year depending on the jurisdiction. Foreign taxes are provided for based on the Fund's understanding of the tax rules and rates that exist in the foreign markets in which it invests.
Distributions are declared and recorded on the ex-dividend date. Income dividends and capital gain distributions are declared separately for each class. Income and capital gain distributions are determined in accordance with income tax regulations, which may differ from GAAP. In addition, the Fund claimed a portion of the payment made to redeeming shareholders as a distribution for income tax purposes.
Capital accounts within the financial statements are adjusted for permanent book-tax differences. These adjustments have no impact on net assets or the results of operations. Capital accounts are not adjusted for temporary book-tax differences which will reverse in a subsequent period.
Book-tax differences are primarily due to futures contracts, deferred trustees compensation, capital loss carryforwards, expiring capital loss carryforwards, and losses deferred due to wash sales.
As of period end, the cost and unrealized appreciation (depreciation) in securities, and derivatives if applicable, for federal income tax purposes were as follows:
| Gross unrealized appreciation | $200,488 |
| Gross unrealized depreciation | (26,316) |
| Net unrealized appreciation (depreciation) | $174,172 |
| Tax Cost | $1,212,169 |
The tax-based components of distributable earnings as of period end were as follows:
| Undistributed ordinary income | $12,429 |
| Undistributed long-term capital gain | $39,311 |
| Net unrealized appreciation (depreciation) on securities and other investments | $174,171 |
The tax character of distributions paid was as follows:
| | October 31, 2017 | October 31, 2016 |
| Ordinary Income | $18,783 | $ 20,028 |
| Long-term Capital Gains | – | 69,183 |
| Total | $18,783 | $ 89,211 |
4. Derivative Instruments.
Risk Exposures and the Use of Derivative Instruments. The Fund's investment objective allows the Fund to enter into various types of derivative contracts, including futures contracts. Derivatives are investments whose value is primarily derived from underlying assets, indices or reference rates and may be transacted on an exchange or over-the-counter (OTC). Derivatives may involve a future commitment to buy or sell a specified asset based on specified terms, to exchange future cash flows at periodic intervals based on a notional principal amount, or for one party to make one or more payments upon the occurrence of specified events in exchange for periodic payments from the other party.
The Fund used derivatives to increase returns and to manage exposure to certain risks as defined below. The success of any strategy involving derivatives depends on analysis of numerous economic factors, and if the strategies for investment do not work as intended, the Fund may not achieve its objectives.
The Fund's use of derivatives increased or decreased its exposure to the following risk:
| Equity Risk | Equity risk relates to the fluctuations in the value of financial instruments as a result of changes in market prices (other than those arising from interest rate risk or foreign exchange risk), whether caused by factors specific to an individual investment, its issuer, or all factors affecting all instruments traded in a market or market segment.
|
The Fund is also exposed to additional risks from investing in derivatives, such as liquidity risk and counterparty credit risk. Liquidity risk is the risk that the Fund will be unable to close out the derivative in the open market in a timely manner. Counterparty credit risk is the risk that the counterparty will not be able to fulfill its obligation to the Fund. Counterparty credit risk related to exchange-traded futures contracts may be mitigated by the protection provided by the exchange on which they trade.
Investing in derivatives may involve greater risks than investing in the underlying assets directly and, to varying degrees, may involve risk of loss in excess of any initial investment and collateral received and amounts recognized in the Statement of Assets and Liabilities. In addition, there may be the risk that the change in value of the derivative contract does not correspond to the change in value of the underlying instrument.
Futures Contracts. A futures contract is an agreement between two parties to buy or sell a specified underlying instrument for a fixed price at a specified future date. The Fund used futures contracts to manage its exposure to the stock market.
Upon entering into a futures contract, a fund is required to deposit either cash or securities (initial margin) with a clearing broker in an amount equal to a certain percentage of the face value of the contract. Futures contracts are marked-to-market daily and subsequent daily payments are made or received by a fund depending on the daily fluctuations in the value of the futures contracts and are recorded as unrealized appreciation or (depreciation). This receivable and/or payable, if any, is included in daily variation margin on futures contracts in the Statement of Assets and Liabilities. Realized gain or (loss) is recorded upon the expiration or closing of a futures contract. The net realized gain (loss) and change in net unrealized appreciation (depreciation) on futures contracts during the period is presented in the Statement of Operations.
Any open futures contracts at period end are presented in the Schedule of Investments under the caption "Futures Contracts". The notional amount at value reflects each contract's exposure to the underlying instrument or index at period end.
5. Purchases and Sales of Investments.
Purchases and sales of securities, other than short-term securities, aggregated $2,388,781 and $2,492,838, respectively.
6. Fees and Other Transactions with Affiliates.
Management Fee. Fidelity Management & Research Company (the investment adviser) and its affiliates provide the Fund with investment management related services for which the Fund pays a monthly management fee. The management fee is the sum of an individual fund fee rate that is based on an annual rate of .30% of the Fund's average net assets and an annualized group fee rate that averaged .25% during the period. The group fee rate is based upon the average net assets of all the mutual funds advised by the investment adviser, including any mutual funds previously advised by the investment adviser that are currently advised by Fidelity SelectCo, LLC, an affiliate of the investment adviser. The group fee rate decreases as assets under management increase and increases as assets under management decrease. In addition, the management fee is subject to a performance adjustment (up to a maximum of +/- .20% of the Fund's average net assets over a 36 month performance period). The upward or downward adjustment to the management fee is based on the relative investment performance of Disciplined Equity as compared to its benchmark index, the S&P 500 Index, over the same 36 month performance period. For the reporting period, the total annual management fee rate, including the performance adjustment, was .35% of the Fund's average net assets. The performance adjustment included in the management fee rate may be higher or lower than the maximum performance adjustment rate due to the difference between the average net assets for the reporting and performance periods.
Transfer Agent Fees. Fidelity Investments Institutional Operations Company, Inc., (FIIOC), an affiliate of the investment adviser, is the transfer, dividend disbursing and shareholder servicing agent for each class of the Fund. FIIOC receives account fees and asset-based fees that vary according to the account size and type of account of the shareholders of Disciplined Equity. FIIOC receives an asset-based fee of Class K's average net assets. FIIOC pays for typesetting, printing and mailing of shareholder reports, except proxy statements.
For the period, transfer agent fees for each class were as follows:
| | Amount | % of
Class-Level Average
Net Assets |
| Disciplined Equity | $1,788 | .15 |
| Class K | 52 | .05 |
| | $1,840 | |
Accounting and Security Lending Fees. Fidelity Service Company, Inc. (FSC), an affiliate of the investment adviser, maintains the Fund's accounting records. The accounting fee is based on the level of average net assets for each month. Under a separate contract, FSC administers the security lending program. The security lending fee is based on the number and duration of lending transactions.
Brokerage Commissions. The Fund placed a portion of its portfolio transactions with brokerage firms which are affiliates of the investment adviser. Brokerage commissions are included in net realized gain (loss) and change in net unrealized appreciation (depreciation) in the Statement of Operations. The commissions paid to these affiliated firms were $13 for the period.
Interfund Trades. The Fund may purchase from or sell securities to other Fidelity Funds under procedures adopted by the Board. The procedures have been designed to ensure these interfund trades are executed in accordance with Rule 17a-7 of the 1940 Act. Interfund trades are included within the respective purchases and sales amounts shown in the Purchases and Sales of Investments note.
7. Committed Line of Credit.
The Fund participates with other funds managed by the investment adviser or an affiliate in a $4.25 billion credit facility (the "line of credit") to be utilized for temporary or emergency purposes to fund shareholder redemptions or for other short-term liquidity purposes. The Fund has agreed to pay commitment fees on its pro-rata portion of the line of credit, which amounted to $4 and is reflected in Miscellaneous expenses on the Statement of Operations. During the period, the Fund did not borrow on this line of credit.
8. Security Lending.
The Fund lends portfolio securities through a lending agent from time to time in order to earn additional income. For equity securities, a lending agent is used and may loan securities to certain qualified borrowers, including Fidelity Capital Markets (FCM), a broker-dealer affiliated with the Fund. On the settlement date of the loan, the Fund receives collateral (in the form of U.S. Treasury obligations, letters of credit and/or cash) against the loaned securities and maintains collateral in an amount not less than 100% of the market value of the loaned securities during the period of the loan. The market value of the loaned securities is determined at the close of business of the Fund and any additional required collateral is delivered to the Fund on the next business day. The Fund or borrower may terminate the loan at any time, and if the borrower defaults on its obligation to return the securities loaned because of insolvency or other reasons, the Fund may apply collateral received from the borrower against the obligation. The Fund may experience delays and costs in recovering the securities loaned. Any cash collateral received is invested in the Fidelity Securities Lending Cash Central Fund. The value of loaned securities and cash collateral at period end are disclosed on the Fund's Statement of Assets and Liabilities. At period end, there were no security loans outstanding with FCM. Security lending income represents the income earned on investing cash collateral, less rebates paid to borrowers and any lending agent fees associated with the loan, plus any premium payments received for lending certain types of securities. Security lending income is presented in the Statement of Operations as a component of income from Fidelity Central Funds. Total security lending income during the period amounted to $32, including income in the amount of less than five hundred dollars from securities loaned to FCM.
9. Expense Reductions.
Commissions paid to certain brokers with whom the investment adviser, or its affiliates, places trades on behalf of the Fund include an amount in addition to trade execution, which may be rebated back to the Fund to offset certain expenses. This amount totaled $3 for the period.
In addition, during the period the investment adviser reimbursed and/or waived a portion of fund-level operating expenses in the amount of $12.
10. Distributions to Shareholders.
Distributions to shareholders of each class were as follows:
| | Year ended
October 31, 2017 | Year ended
October 31, 2016 |
| From net investment income | | |
| Disciplined Equity | $17,115 | $14,547 |
| Class K | 1,668 | 1,437 |
| Total | $18,783 | $15,984 |
| From net realized gain | | |
| Disciplined Equity | $– | $67,155 |
| Class K | – | 6,072 |
| Total | $– | $73,227 |
11. Share Transactions.
Share transactions for each class were as follows and may contain automatic conversions between classes or exchanges between affiliated funds:
| | Shares | Shares | Dollars | Dollars |
| | Year ended October 31, 2017 | Year ended October 31, 2016 | Year ended October 31, 2017 | Year ended October 31, 2016 |
| Disciplined Equity | | | | |
| Shares sold | 819 | 3,217 | $29,054 | $102,377 |
| Reinvestment of distributions | 474 | 2,353 | 15,948 | 76,727 |
| Shares redeemed | (4,440) | (10,442) | (156,370) | (331,619) |
| Net increase (decrease) | (3,147) | (4,872) | $(111,368) | $(152,515) |
| Class K | | | | |
| Shares sold | 301 | 426 | $10,549 | $13,646 |
| Reinvestment of distributions | 50 | 231 | 1,668 | 7,509 |
| Shares redeemed | (750) | (1,201) | (26,757) | (38,520) |
| Net increase (decrease) | (399) | (544) | $(14,540) | $(17,365) |
12. Other.
The Fund's organizational documents provide former and current trustees and officers with a limited indemnification against liabilities arising in connection with the performance of their duties to the Fund. In the normal course of business, the Fund may also enter into contracts that provide general indemnifications. The Fund's maximum exposure under these arrangements is unknown as this would be dependent on future claims that may be made against the Fund. The risk of material loss from such claims is considered remote.
Report of Independent Registered Public Accounting Firm
To the Trustees of Fidelity Capital Trust and Shareholders of Fidelity Disciplined Equity Fund:
In our opinion, the accompanying statement of assets and liabilities, including the schedule of investments, and the related statements of operations and of changes in net assets and the financial highlights present fairly, in all material respects, the financial position of Fidelity Disciplined Equity Fund (a fund of Fidelity Capital Trust) as of October 31, 2017, the results of its operations for the year then ended, the changes in its net assets for each of the two years in the period then ended and the financial highlights for each of the five years in the period then ended, in conformity with accounting principles generally accepted in the United States of America. These financial statements and financial highlights (hereafter referred to as “financial statements”) are the responsibility of the Fidelity Disciplined Equity Fund’s management. Our responsibility is to express an opinion on these financial statements based on our audits. We conducted our audits of these financial statements in accordance with the standards of the Public Company Accounting Oversight Board (United States). Those standards require that we plan and perform the audit to obtain reasonable assurance about whether the financial statements are free of material misstatement. An audit includes examining, on a test basis, evidence supporting the amounts and disclosures in the financial statements, assessing the accounting principles used and significant estimates made by management, and evaluating the overall financial statement presentation. Our procedures included confirmation of securities owned as of October 31, 2017 by correspondence with the custodian and brokers; when replies were not received from brokers, we performed other auditing procedures. We believe that our audits provide a reasonable basis for our opinion.
PricewaterhouseCoopers LLP
Boston, Massachusetts
December 13, 2017
Trustees and Officers
The Trustees, Members of the Advisory Board (if any), and officers of the trust and fund, as applicable, are listed below. The Board of Trustees governs the fund and is responsible for protecting the interests of shareholders. The Trustees are experienced executives who meet periodically throughout the year to oversee the fund's activities, review contractual arrangements with companies that provide services to the fund, oversee management of the risks associated with such activities and contractual arrangements, and review the fund's performance. Each of the Trustees oversees 190 funds.
The Trustees hold office without limit in time except that (a) any Trustee may resign; (b) any Trustee may be removed by written instrument, signed by at least two-thirds of the number of Trustees prior to such removal; (c) any Trustee who requests to be retired or who has become incapacitated by illness or injury may be retired by written instrument signed by a majority of the other Trustees; and (d) any Trustee may be removed at any special meeting of shareholders by a two-thirds vote of the outstanding voting securities of the trust. Each Trustee who is not an interested person (as defined in the 1940 Act) of the trust and the fund is referred to herein as an Independent Trustee. Each Independent Trustee shall retire not later than the last day of the calendar year in which his or her 75th birthday occurs. The Independent Trustees may waive this mandatory retirement age policy with respect to individual Trustees. Officers and Advisory Board Members hold office without limit in time, except that any officer or Advisory Board Member may resign or may be removed by a vote of a majority of the Trustees at any regular meeting or any special meeting of the Trustees. Except as indicated, each individual has held the office shown or other offices in the same company for the past five years.
The fund’s Statement of Additional Information (SAI) includes more information about the Trustees. To request a free copy, call Fidelity at 1-800-835-5092.
Experience, Skills, Attributes, and Qualifications of the Trustees. The Governance and Nominating Committee has adopted a statement of policy that describes the experience, qualifications, attributes, and skills that are necessary and desirable for potential Independent Trustee candidates (Statement of Policy). The Board believes that each Trustee satisfied at the time he or she was initially elected or appointed a Trustee, and continues to satisfy, the standards contemplated by the Statement of Policy. The Governance and Nominating Committee also engages professional search firms to help identify potential Independent Trustee candidates who have the experience, qualifications, attributes, and skills consistent with the Statement of Policy. From time to time, additional criteria based on the composition and skills of the current Independent Trustees, as well as experience or skills that may be appropriate in light of future changes to board composition, business conditions, and regulatory or other developments, have also been considered by the professional search firms and the Governance and Nominating Committee. In addition, the Board takes into account the Trustees' commitment and participation in Board and committee meetings, as well as their leadership of standing and ad hoc committees throughout their tenure.
In determining that a particular Trustee was and continues to be qualified to serve as a Trustee, the Board has considered a variety of criteria, none of which, in isolation, was controlling. The Board believes that, collectively, the Trustees have balanced and diverse experience, qualifications, attributes, and skills, which allow the Board to operate effectively in governing the fund and protecting the interests of shareholders. Information about the specific experience, skills, attributes, and qualifications of each Trustee, which in each case led to the Board's conclusion that the Trustee should serve (or continue to serve) as a trustee of the fund, is provided below.
Board Structure and Oversight Function. James C. Curvey is an interested person and currently serves as Chairman. The Trustees have determined that an interested Chairman is appropriate and benefits shareholders because an interested Chairman has a personal and professional stake in the quality and continuity of services provided to the fund. Independent Trustees exercise their informed business judgment to appoint an individual of their choosing to serve as Chairman, regardless of whether the Trustee happens to be independent or a member of management. The Independent Trustees have determined that they can act independently and effectively without having an Independent Trustee serve as Chairman and that a key structural component for assuring that they are in a position to do so is for the Independent Trustees to constitute a substantial majority for the Board. The Independent Trustees also regularly meet in executive session. Ned C. Lautenbach serves as Chairman of the Independent Trustees and as such (i) acts as a liaison between the Independent Trustees and management with respect to matters important to the Independent Trustees and (ii) with management prepares agendas for Board meetings.
Fidelity® funds are overseen by different Boards of Trustees. The fund's Board oversees Fidelity's high income and certain equity funds, and other Boards oversee Fidelity's investment-grade bond, money market, asset allocation, and sector funds. The asset allocation funds may invest in Fidelity® funds overseen by the fund's Board. The use of separate Boards, each with its own committee structure, allows the Trustees of each group of Fidelity® funds to focus on the unique issues of the funds they oversee, including common research, investment, and operational issues. On occasion, the separate Boards establish joint committees to address issues of overlapping consequences for the Fidelity® funds overseen by each Board.
The Trustees operate using a system of committees to facilitate the timely and efficient consideration of all matters of importance to the Trustees, the fund, and fund shareholders and to facilitate compliance with legal and regulatory requirements and oversight of the fund's activities and associated risks. The Board, acting through its committees, has charged FMR and its affiliates with (i) identifying events or circumstances the occurrence of which could have demonstrably adverse effects on the fund's business and/or reputation; (ii) implementing processes and controls to lessen the possibility that such events or circumstances occur or to mitigate the effects of such events or circumstances if they do occur; and (iii) creating and maintaining a system designed to evaluate continuously business and market conditions in order to facilitate the identification and implementation processes described in (i) and (ii) above. Because the day-to-day operations and activities of the fund are carried out by or through FMR, its affiliates, and other service providers, the fund's exposure to risks is mitigated but not eliminated by the processes overseen by the Trustees. While each of the Board's committees has responsibility for overseeing different aspects of the fund's activities, oversight is exercised primarily through the Operations, Audit, and Compliance Committees. In addition, the Independent Trustees have worked with FMR to enhance the Board's oversight of investment and financial risks, legal and regulatory risks, technology risks, and operational risks, including the development of additional risk reporting to the Board. For example, a working group comprised of Independent Trustees and FMR has worked and continues to work to review the Fidelity® funds' valuation-related activities, reporting and risk management. Appropriate personnel, including but not limited to the fund's Chief Compliance Officer (CCO), FMR's internal auditor, the independent accountants, the fund's Treasurer and portfolio management personnel, make periodic reports to the Board's committees, as appropriate, including an annual review of Fidelity's risk management program for the Fidelity® funds. The responsibilities of each standing committee, including their oversight responsibilities, are described further under "Standing Committees of the Trustees."
Interested Trustees*:
Correspondence intended for a Trustee who is an interested person may be sent to Fidelity Investments, 245 Summer Street, Boston, Massachusetts 02210.
Name, Year of Birth; Principal Occupations and Other Relevant Experience+
James C. Curvey (1935)
Year of Election or Appointment: 2007
Trustee
Chairman of the Board of Trustees
Mr. Curvey also serves as Trustee of other Fidelity® funds. Mr. Curvey is a Director of Fidelity Research & Analysis Co. (investment adviser firm, 2009-present), and Vice Chairman (2007-present) and Director of FMR LLC (diversified financial services company). In addition, Mr. Curvey serves as an Overseer for the Boston Symphony Orchestra and a member of the board of Artis-Naples, Naples, Florida, and as a Trustee for Brewster Academy, Wolfeboro, New Hampshire. Previously, Mr. Curvey served as a Director of Fidelity Investments Money Management, Inc. (investment adviser firm, 2009-2014) and a Director of FMR and FMR Co., Inc. (investment adviser firms, 2007-2014).
Charles S. Morrison (1960)
Year of Election or Appointment: 2014
Trustee
Mr. Morrison also serves as Trustee of other funds. He serves as President of Fidelity Management & Research Company (FMR) (investment adviser firm, 2016-present), a Director of Fidelity Investments Money Management, Inc. (FIMM) (investment adviser firm, 2014-present), Director of Fidelity SelectCo, LLC (investment adviser firm, 2014-present), President, Asset Management (2014-present), and is an employee of Fidelity Investments. Previously, Mr. Morrison served as Vice President of Fidelity's Fixed Income and Asset Allocation Funds (2012-2014), President, Fixed Income (2011-2014), Vice President of Fidelity's Money Market Funds (2005-2009), President, Money Market Group Leader of FMR (investment adviser firm, 2009), and Senior Vice President, Money Market Group of FMR (2004-2009). Mr. Morrison also served as Vice President of Fidelity's Bond Funds (2002-2005), certain Balanced Funds (2002-2005), and certain Asset Allocation Funds (2002-2007), and as Senior Vice President (2002-2005) of Fidelity's Bond Division.
* Determined to be an “Interested Trustee” by virtue of, among other things, his or her affiliation with the trust or various entities under common control with FMR.
+ The information includes the Trustee's principal occupation during the last five years and other information relating to the experience, attributes, and skills relevant to the Trustee's qualifications to serve as a Trustee, which led to the conclusion that the Trustee should serve as a Trustee for the fund.
Independent Trustees:
Correspondence intended for an Independent Trustee may be sent to Fidelity Investments, P.O. Box 55235, Boston, Massachusetts 02205-5235.
Name, Year of Birth; Principal Occupations and Other Relevant Experience+
Dennis J. Dirks (1948)
Year of Election or Appointment: 2005
Trustee
Mr. Dirks also serves as Trustee of other Fidelity® funds. Prior to his retirement in May 2003, Mr. Dirks was Chief Operating Officer and a member of the Board of The Depository Trust & Clearing Corporation (DTCC). He also served as President, Chief Operating Officer, and Board member of The Depository Trust Company (DTC) and President and Board member of the National Securities Clearing Corporation (NSCC). In addition, Mr. Dirks served as Chief Executive Officer and Board member of the Government Securities Clearing Corporation, Chief Executive Officer and Board member of the Mortgage-Backed Securities Clearing Corporation, as a Trustee and a member of the Finance Committee of Manhattan College (2005-2008), as a Trustee and a member of the Finance Committee of AHRC of Nassau County (2006-2008), as a member of the Independent Directors Council (IDC) Governing Council (2010-2015), and as a member of the Board of Directors for The Brookville Center for Children’s Services, Inc. (2009-2017). Mr. Dirks is a member of the Finance Committee (2016-present) and Board of Directors (2017-present) of the Asolo Repertory Theatre.
Alan J. Lacy (1953)
Year of Election or Appointment: 2008
Trustee
Mr. Lacy also serves as Trustee of other Fidelity® funds. Mr. Lacy serves as a Director of Bristol-Myers Squibb Company (global pharmaceuticals, 2008-present). He is a Trustee of the California Chapter of The Nature Conservancy (2015-present) and a Director of the Center for Advanced Study in the Behavioral Sciences at Stanford University (2015-present). In addition, Mr. Lacy served as Senior Adviser (2007-2014) of Oak Hill Capital Partners, L.P. (private equity) and also served as Chief Executive Officer (2005) and Vice Chairman (2005-2006) of Sears Holdings Corporation (retail) and Chief Executive Officer and Chairman of the Board of Sears, Roebuck and Co. (retail, 2000-2005). Previously, Mr. Lacy served as Chairman (2014-2017) and a member (2010-2017) of the Board of Directors of Dave & Buster’s Entertainment, Inc. (restaurant and entertainment complexes), as Chairman (2008-2011) and a member (2006-2015) of the Board of Trustees of the National Parks Conservation Association, and as a member of the Board of Directors for The Hillman Companies, Inc. (hardware wholesalers, 2010-2014), Earth Fare, Inc. (retail grocery, 2010-2014), and The Western Union Company (global money transfer, 2006-2011).
Ned C. Lautenbach (1944)
Year of Election or Appointment: 2000
Trustee
Chairman of the Independent Trustees
Mr. Lautenbach also serves as Trustee of other Fidelity® funds. Mr. Lautenbach currently serves as Vice Chair of the Board of Governors, State University System of Florida (2013-present) and is a member of the Council on Foreign Relations (1994-present). He is also a member and has most recently served as Chairman of the Board of Directors of Artis-Naples (2012-present). Previously, Mr. Lautenbach served as a member and then Lead Director of the Board of Directors of Eaton Corporation (diversified industrial, 1997-2016). He was also a Partner and Advisory Partner at Clayton, Dubilier & Rice, LLC (private equity investment, 1998-2010), as well as a Director of Sony Corporation (2006-2007). In addition, Mr. Lautenbach also had a 30-year career with IBM (technology company) during which time he served as Senior Vice President and a member of the Corporate Executive Committee (1968-1998).
Joseph Mauriello (1944)
Year of Election or Appointment: 2008
Trustee
Mr. Mauriello also serves as Trustee of other Fidelity® funds. Prior to his retirement in January 2006, Mr. Mauriello served in numerous senior management positions including Deputy Chairman and Chief Operating Officer (2004-2005), and Vice Chairman of Financial Services (2002-2004) of KPMG LLP US (professional services, 1965-2005). Mr. Mauriello currently serves as a member of the Board of Directors of XL Group plc. (global insurance and re-insurance, 2006-present) and the Independent Directors Council (IDC) Governing Council (2015-present). Previously, Mr. Mauriello served as a Director of the Hamilton Funds of the Bank of New York (2006-2007) and of Arcadia Resources Inc. (health care services and products, 2007-2012).
Cornelia M. Small (1944)
Year of Election or Appointment: 2005
Trustee
Ms. Small also serves as Trustee of other Fidelity® funds. Ms. Small is a member of the Board of Directors (2009-present) and Chair of the Investment Committee (2010-present) of the Teagle Foundation. Ms. Small also serves on the Investment Committee of the Berkshire Taconic Community Foundation (2008-present). Previously, Ms. Small served as Chairperson (2002-2008) and a member of the Investment Committee and Chairperson (2008-2012) and a member of the Board of Trustees of Smith College. In addition, Ms. Small served as Chief Investment Officer, Director of Global Equity Investments, and a member of the Board of Directors of Scudder, Stevens & Clark and Scudder Kemper Investments.
William S. Stavropoulos (1939)
Year of Election or Appointment: 2002
Trustee
Vice Chairman of the Independent Trustees
Mr. Stavropoulos also serves as Trustee of other Fidelity® funds. Mr. Stavropoulos serves as President and Founder of the Michigan Baseball Foundation, the Great Lakes Loons (2007-present). Mr. Stavropoulos is Chairman Emeritus of the Board of Directors of The Dow Chemical Company, where he previously served in numerous senior management positions, including President, CEO (1995-2000; 2002-2004), Chairman of the Executive Committee (2000-2006), and as a member of the Board of Directors (1990-2006). Currently, Mr. Stavropoulos is Chairman of the Board of Directors of Univar Inc. (global distributor of commodity and specialty chemicals), a Director of Teradata Corporation (data warehousing and technology solutions), and a member of the Advisory Board for Metalmark Capital LLC (private equity investment, 2005-present). Mr. Stavropoulos is an operating advisor to Clayton, Dubilier & Rice, LLC (private equity investment). In addition, Mr. Stavropoulos is a member of the University of Notre Dame Advisory Council for the College of Science, a Trustee of the Rollin L. Gerstacker Foundation, and a Director of Artis-Naples in Naples, Florida. Previously, Mr. Stavropoulos served as a Director of Chemical Financial Corporation (bank holding company, 1993-2012) and Tyco International, Ltd. (multinational manufacturing and services, 2007-2012).
David M. Thomas (1949)
Year of Election or Appointment: 2008
Trustee
Mr. Thomas also serves as Trustee of other Fidelity® funds. Mr. Thomas serves as Non-Executive Chairman of the Board of Directors of Fortune Brands Home and Security (home and security products, 2011-present), as a member of the Board of Directors (2004-present) and Presiding Director (2013-present) of Interpublic Group of Companies, Inc. (marketing communication), and as a member of the Board of Trustees of the University of Florida (2013-present). Previously, Mr. Thomas served as Executive Chairman (2005-2006) and Chairman and Chief Executive Officer (2000-2005) of IMS Health, Inc. (pharmaceutical and healthcare information solutions), and a Director of Fortune Brands, Inc. (consumer products, 2000-2011).
+ The information includes the Trustee's principal occupation during the last five years and other information relating to the experience, attributes, and skills relevant to the Trustee's qualifications to serve as a Trustee, which led to the conclusion that the Trustee should serve as a Trustee for the fund.
Advisory Board Members and Officers:
Correspondence intended for an officer or Peter S. Lynch may be sent to Fidelity Investments, 245 Summer Street, Boston, Massachusetts 02210. Officers appear below in alphabetical order.
Name, Year of Birth; Principal Occupation
Peter S. Lynch (1944)
Year of Election or Appointment: 2003
Member of the Advisory Board
Mr. Lynch also serves as Member of the Advisory Board of other Fidelity® funds. Mr. Lynch is Vice Chairman and a Director of FMR (investment adviser firm) and FMR Co., Inc. (investment adviser firm). In addition, Mr. Lynch serves as a Trustee of Boston College and as the Chairman of the Inner-City Scholarship Fund. Previously, Mr. Lynch served on the Special Olympics International Board of Directors (1997-2006).
Elizabeth Paige Baumann (1968)
Year of Election or Appointment: 2017
Anti-Money Laundering (AML) Officer
Ms. Baumann also serves as AML Officer of other funds. She is Chief AML Officer (2012-present) and Senior Vice President (2014-present) of FMR LLC (diversified financial services company) and is an employee of Fidelity Investments. Previously, Ms. Baumann served as AML Officer of the funds (2012-2016), and Vice President (2007-2014) and Deputy Anti-Money Laundering Officer (2007-2012) of FMR LLC.
Marc R. Bryant (1966)
Year of Election or Appointment: 2015
Secretary and Chief Legal Officer (CLO)
Mr. Bryant also serves as Secretary and CLO of other funds. Mr. Bryant serves as CLO, Secretary, and Senior Vice President of Fidelity Management & Research Company (investment adviser firm, 2015-present) and FMR Co., Inc. (investment adviser firm, 2015-present); Secretary of Fidelity SelectCo, LLC (investment adviser firm, 2015-present) and Fidelity Investments Money Management, Inc. (investment adviser firm, 2015-present); and CLO of Fidelity Management & Research (Hong Kong) Limited and FMR Investment Management (UK) Limited (investment adviser firms, 2015-present) and Fidelity Management & Research (Japan) Limited (investment adviser firm, 2016-present). He is Senior Vice President and Deputy General Counsel of FMR LLC (diversified financial services company). Previously, Mr. Bryant served as Secretary and CLO of Fidelity Rutland Square Trust II (2010-2014) and Assistant Secretary of Fidelity's Fixed Income and Asset Allocation Funds (2013-2015). Prior to joining Fidelity Investments, Mr. Bryant served as a Senior Vice President and the Head of Global Retail Legal for AllianceBernstein L.P. (2006-2010), and as the General Counsel for ProFund Advisors LLC (2001-2006).
William C. Coffey (1969)
Year of Election or Appointment: 2009
Assistant Secretary
Mr. Coffey also serves as Assistant Secretary of other funds. He is Senior Vice President and Deputy General Counsel of FMR LLC (diversified financial services company, 2010-present), and is an employee of Fidelity Investments. Previously, Mr. Coffey served as Vice President and Associate General Counsel of FMR LLC (2005-2009).
Jonathan Davis (1968)
Year of Election or Appointment: 2010
Assistant Treasurer
Mr. Davis also serves as Assistant Treasurer of other funds, and is an employee of Fidelity Investments. Previously, Mr. Davis served as Vice President and Associate General Counsel of FMR LLC (diversified financial services company, 2003-2010).
Adrien E. Deberghes (1967)
Year of Election or Appointment: 2016
Assistant Treasurer
Mr. Deberghes also serves as an officer of other funds. He serves as Executive Vice President of Fidelity Investments Money Management, Inc. (FIMM) (investment adviser firm, 2016-present) and is an employee of Fidelity Investments (2008-present). Prior to joining Fidelity Investments, Mr. Deberghes was Senior Vice President of Mutual Fund Administration at State Street Corporation (2007-2008), Senior Director of Mutual Fund Administration at Investors Bank & Trust (2005-2007), and Director of Finance for Dunkin' Brands (2000-2005). Previously, Mr. Deberghes served in other fund officer roles.
Stephanie J. Dorsey (1969)
Year of Election or Appointment: 2010
Assistant Treasurer
Ms. Dorsey also serves as an officer of other funds. She is an employee of Fidelity Investments (2008-present) and has served in other fund officer roles. Prior to joining Fidelity Investments, Ms. Dorsey served as Treasurer (2004-2008) of the JPMorgan Mutual Funds and Vice President (2004-2008) of JPMorgan Chase Bank.
Howard J. Galligan III (1966)
Year of Election or Appointment: 2014
Chief Financial Officer
Mr. Galligan also serves as Chief Financial Officer of other funds. Mr. Galligan serves as President of Fidelity Pricing and Cash Management Services (FPCMS) (2014-present) and as a Director of Strategic Advisers, Inc. (investment adviser firm, 2008-present). Previously, Mr. Galligan served as Chief Administrative Officer of Asset Management (2011-2014) and Chief Operating Officer and Senior Vice President of Investment Support for Strategic Advisers, Inc. (2003-2011).
Brian B. Hogan (1964)
Year of Election or Appointment: 2009
Vice President
Mr. Hogan also serves as Trustee or Vice President of other funds. Mr. Hogan serves as a Director of FMR Investment Management (UK) Limited (investment adviser firm, 2015-present) and Fidelity SelectCo, LLC (investment adviser firm, 2014-present) and President of the Equity Division of FMR (investment adviser firm, 2009-present). Previously, Mr. Hogan served as Senior Vice President, Equity Research of FMR (2006-2009) and as a portfolio manager. Mr. Brian B. Hogan is not related to Mr. Colm A. Hogan.
Colm A. Hogan (1973)
Year of Election or Appointment: 2016
Deputy Treasurer
Mr. Hogan also serves as an officer of other funds. Mr. Hogan is an employee of Fidelity Investments (2005-present). Mr. Colm A. Hogan is not related to Mr. Brian B. Hogan.
Chris Maher (1972)
Year of Election or Appointment: 2013
Assistant Treasurer
Mr. Maher serves as Assistant Treasurer of other funds. Mr. Maher is Vice President of Valuation Oversight and is an employee of Fidelity Investments. Previously, Mr. Maher served as Vice President of Asset Management Compliance (2013), Vice President of the Program Management Group of FMR (investment adviser firm, 2010-2013), and Vice President of Valuation Oversight (2008-2010).
Rieco E. Mello (1969)
Year of Election or Appointment: 2017
Assistant Treasurer
Mr. Mello also serves as Assistant Treasurer of other funds. Mr. Mello is an employee of Fidelity Investments (1995-present).
Melissa M. Reilly (1971)
Year of Election or Appointment: 2014
Vice President of certain Equity Funds
Ms. Reilly also serves as Vice President of other funds. Ms. Reilly is an employee of Fidelity Investments (2004-present).
Kenneth B. Robins (1969)
Year of Election or Appointment: 2016
Chief Compliance Officer
Mr. Robins also serves as an officer of other funds. Mr. Robins serves as Compliance Officer of Fidelity Management & Research Company and FMR Co., Inc. (investment adviser firms, 2016-present) and is an employee of Fidelity Investments (2004-present). Previously, Mr. Robins served as Executive Vice President of Fidelity Investments Money Management, Inc. (investment adviser firm, 2013-2016) and served in other fund officer roles.
Stacie M. Smith (1974)
Year of Election or Appointment: 2016
President and Treasurer
Ms. Smith also serves as an officer of other funds. She is an employee of Fidelity Investments (2009-present) and has served in other fund officer roles. Prior to joining Fidelity Investments, Ms. Smith served as Senior Audit Manager of Ernst & Young LLP (accounting firm, 1996-2009). Previously, Ms. Smith served as Deputy Treasurer of certain Fidelity® funds (2013-2016).
Marc L. Spector (1972)
Year of Election or Appointment: 2016
Assistant Treasurer
Mr. Spector also serves as an officer of other funds. Mr. Spector is an employee of Fidelity Investments (2016-present). Prior to joining Fidelity Investments, Mr. Spector served as Director at the Siegfried Group (accounting firm, 2013-2016), and prior to Siegfried Group as audit senior manager at Deloitte & Touche (accounting firm, 2005-2013).
Renee Stagnone (1975)
Year of Election or Appointment: 2016
Assistant Treasurer
Ms. Stagnone also serves as an officer of other funds. Ms. Stagnone is an employee of Fidelity Investments (1997-present). Previously, Ms. Stagnone served as Deputy Treasurer of certain Fidelity® funds (2013-2016).
Shareholder Expense Example
As a shareholder of the Fund, you incur two types of costs: (1) transaction costs and (2) ongoing costs, including management fees and other Fund expenses. This Example is intended to help you understand your ongoing costs (in dollars) of investing in the Fund and to compare these costs with the ongoing costs of investing in other mutual funds.
The Example is based on an investment of $1,000 invested at the beginning of the period and held for the entire period (May 1, 2017 to October 31, 2017).
Actual Expenses
The first line of the accompanying table for each class of the Fund provides information about actual account values and actual expenses. You may use the information in this line, together with the amount you invested, to estimate the expenses that you paid over the period. Simply divide your account value by $1,000.00 (for example, an $8,600 account value divided by $1,000.00 = 8.6), then multiply the result by the number in the first line for a class of the Fund under the heading entitled "Expenses Paid During Period" to estimate the expenses you paid on your account during this period. A small balance maintenance fee of $12.00 that is charged once a year may apply for certain accounts with a value of less than $2,000. This fee is not included in the table below. If it was, the estimate of expenses you paid during the period would be higher, and your ending account value lower, by this amount. In addition, the Fund, as a shareholder in the underlying Fidelity Central Funds, will indirectly bear its pro-rata share of the fees and expenses incurred by the underlying Fidelity Central Funds. These fees and expenses are not included in the Fund's annualized expense ratio used to calculate the expense estimate in the table below.
Hypothetical Example for Comparison Purposes
The second line of the accompanying table for each class of the Fund provides information about hypothetical account values and hypothetical expenses based on a Class' actual expense ratio and an assumed rate of return of 5% per year before expenses, which is not the Class' actual return. The hypothetical account values and expenses may not be used to estimate the actual ending account balance or expenses you paid for the period. You may use this information to compare the ongoing costs of investing in the Fund and other funds. To do so, compare this 5% hypothetical example with the 5% hypothetical examples that appear in the shareholder reports of the other funds. A small balance maintenance fee of $12.00 that is charged once a year may apply for certain accounts with a value of less than $2,000. This fee is not included in the table below. If it was, the estimate of expenses you paid during the period would be higher, and your ending account value lower, by this amount. In addition, the Fund, as a shareholder in the underlying Fidelity Central Funds, will indirectly bear its pro-rata share of the fees and expenses incurred by the underlying Fidelity Central Funds. These fees and expenses are not included in the Fund's annualized expense ratio used to calculate the expense estimate in the table below.
Please note that the expenses shown in the table are meant to highlight your ongoing costs only and do not reflect any transaction costs. Therefore, the second line of the table is useful in comparing ongoing costs only, and will not help you determine the relative total costs of owning different funds.
| | Annualized Expense Ratio-A | Beginning
Account Value
May 1, 2017 | Ending
Account Value
October 31, 2017 | Expenses Paid
During Period-B
May 1, 2017
to October 31, 2017 |
| Disciplined Equity | .55% | | | |
| Actual | | $1,000.00 | $1,090.40 | $2.90 |
| Hypothetical-C | | $1,000.00 | $1,022.43 | $2.80 |
| Class K | .45% | | | |
| Actual | | $1,000.00 | $1,091.10 | $2.37 |
| Hypothetical-C | | $1,000.00 | $1,022.94 | $2.29 |
A Annualized expense ratio reflects expenses net of applicable fee waivers.
B Expenses are equal to each Class' annualized expense ratio, multiplied by the average account value over the period, multiplied by 184/365 (to reflect the one-half year period).
C 5% return per year before expenses
Distributions (Unaudited)
The Board of Trustees of Fidelity Disciplined Equity Fund voted to pay to shareholders of record at the opening of business on record date, the following distributions per share derived from capital gains realized from sales of portfolio securities, and dividends derived from net investment income:
| | Pay Date | Record Date | Dividends | Capital Gains |
| Fidelity Disciplined Equity Fund | | | | |
| Disciplined Equity | 12/11/17 | 12/08/17 | $0.452 | $1.121 |
| Class K | 12/11/17 | 12/08/17 | $0.490 | $1.121 |
|
The fund hereby designates as a capital gain dividend with respect to the taxable year ended October 31, 2017, $42,430,232, or, if subsequently determined to be different, the net capital gain of such year.
Disciplined Equity Fund designates 100% and Class K designates 93% of the dividends distributed during the fiscal year as qualifying for the dividends–received deduction for corporate shareholders.
Disciplined Equity Fund and Class K designates 100% of the dividends distributed during the fiscal year as amounts which may be taken into account as a dividend for purposes of the maximum rate under section 1(h)(11) of the Internal Revenue Code.
The fund will notify shareholders in January 2018 of amounts for use in preparing 2017 income tax returns.
Board Approval of Investment Advisory Contracts and Management Fees
Fidelity Disciplined Equity Fund
Each year, the Board of Trustees, including the Independent Trustees (together, the Board), votes on the renewal of the management contract with Fidelity Management & Research Company (FMR) and the sub-advisory agreements (together, the Advisory Contracts) for the fund. FMR and the sub-advisers are referred to herein as the Investment Advisers. The Board, assisted by the advice of fund counsel and Independent Trustees' counsel, requests and considers a broad range of information relevant to the renewal of the Advisory Contracts throughout the year.
The Board meets regularly and, at each of its meetings, covers an extensive agenda of topics and materials and considers factors that are relevant to its annual consideration of the renewal of the fund's Advisory Contracts, including the services and support provided to the fund and its shareholders. The Board has established various standing committees (Committees), each composed of and chaired by Independent Trustees with varying backgrounds, to which the Board has assigned specific subject matter responsibilities in order to enhance effective decision-making by the Board. The Board, acting directly and through its Committees, requests and receives information concerning the annual consideration of the renewal of the fund's Advisory Contracts. The Board also meets as needed to review matters specifically related to the Board's annual consideration of the renewal of the Advisory Contracts. Members of the Board may also meet with trustees of other Fidelity funds through ad hoc joint committees to discuss certain matters relevant to all of the Fidelity funds.
At its July 2017 meeting, the Board unanimously determined to renew the fund's Advisory Contracts. In reaching its determination, the Board considered all factors it believed relevant, including (i) the nature, extent, and quality of the services to be provided to the fund and its shareholders (including the investment performance of the fund); (ii) the competitiveness of the fund's management fee and total expense ratio relative to peer funds; (iii) the total costs of the services to be provided by and the profits to be realized by Fidelity from its relationships with the fund; and (iv) the extent to which, if any, economies of scale exist and would be realized as the fund grows, and whether any economies of scale are appropriately shared with fund shareholders.
In considering whether to renew the Advisory Contracts for the fund, the Board reached a determination, with the assistance of fund counsel and Independent Trustees' counsel and through the exercise of its business judgment, that the renewal of the Advisory Contracts was in the best interests of the fund and its shareholders and that the compensation payable under the Advisory Contracts was fair and reasonable. The Board's decision to renew the Advisory Contracts was not based on any single factor, but rather was based on a comprehensive consideration of all the information provided to the Board at its meetings throughout the year. The Board, in reaching its determination to renew the Advisory Contracts, was aware that shareholders of the fund have a broad range of investment choices available to them, including a wide choice among funds offered by Fidelity's competitors, and that the fund's shareholders, who have the opportunity to review and weigh the disclosure provided by the fund in its prospectus and other public disclosures, have chosen to invest in this fund, which is part of the Fidelity family of funds.
Amendment to Group Fee Rate. The Board also approved an amendment to the management contract for the fund to add an additional breakpoint to the group fee schedule, effective October 1, 2017. The Board noted that the additional breakpoint would result in lower management fee rates as Fidelity's assets under management increase.
Nature, Extent, and Quality of Services Provided. The Board considered Fidelity's staffing as it relates to the fund, including the backgrounds of investment personnel of Fidelity, and also considered the fund's investment objective, strategies, and related investment philosophy. The Independent Trustees also had discussions with senior management of Fidelity's investment operations and investment groups. The Board considered the structure of the investment personnel compensation program and whether this structure provides appropriate incentives to act in the best interests of the fund. Additionally, the Board considered the portfolio managers' investments, if any, in the funds that they manage.
Resources Dedicated to Investment Management and Support Services. The Board and the Fund Oversight and Research Committees reviewed the general qualifications and capabilities of Fidelity's investment staff, including its size, education, experience, and resources, as well as Fidelity's approach to recruiting, training, managing, and compensating investment personnel. The Board noted that Fidelity has continued to increase the resources devoted to non-U.S. offices, including expansion of Fidelity's global investment organization. The Board also noted that Fidelity's analysts have extensive resources, tools and capabilities that allow them to conduct sophisticated quantitative and fundamental analysis, as well as credit analysis of issuers, counterparties and guarantors. Further, the Board considered that Fidelity's investment professionals have sufficient access to global information and data so as to provide competitive investment results over time, and that those professionals also have access to sophisticated tools that permit them to assess portfolio construction and risk and performance attribution characteristics continuously, as well as to transmit new information and research conclusions rapidly around the world. Additionally, in its deliberations, the Board considered Fidelity's trading, risk management, compliance, and technology and operations capabilities and resources, which are integral parts of the investment management process.
Shareholder and Administrative Services. The Board considered (i) the nature, extent, quality, and cost of advisory, administrative, and shareholder services performed by the Investment Advisers and their affiliates under the Advisory Contracts and under separate agreements covering transfer agency, pricing and bookkeeping, and securities lending services for the fund; (ii) the nature and extent of the supervision of third party service providers, principally custodians, subcustodians, and pricing vendors; and (iii) the resources devoted to, and the record of compliance with, the fund's compliance policies and procedures. The Board also reviewed the allocation of fund brokerage, including allocations to brokers affiliated with the Investment Advisers, the use of brokerage commissions to pay fund expenses, and the use of "soft" commission dollars to pay for research services.
The Board noted that the growth of fund assets over time across the complex allows Fidelity to reinvest in the development of services designed to enhance the value or convenience of the Fidelity funds as investment vehicles. These services include 24-hour access to account information and market information through telephone representatives and over the Internet, investor education materials and asset allocation tools, and the expanded availability of Fidelity Investor Centers.
In 2014, the Board formed an ad hoc Committee on Transfer Agency Fees to review the variety of transfer agency fee structures throughout the industry and Fidelity's competitive positioning with respect to industry participants.
Investment in a Large Fund Family. The Board considered the benefits to shareholders of investing in a Fidelity fund, including the benefits of investing in a fund that is part of a large family of funds offering a variety of investment disciplines and providing a large variety of mutual fund investor services. The Board noted that Fidelity had taken, or had made recommendations that resulted in the Fidelity funds taking, a number of actions over the previous year that benefited particular funds, including: (i) continuing to dedicate additional resources to Fidelity's investment research process, and to the support of the senior management team that oversees asset management; (ii) continuing efforts to enhance Fidelity's global research capabilities; (iii) launching new funds and making other enhancements to meet client needs; (iv) launching new share classes of existing funds; (v) eliminating purchase minimums and broadening eligibility requirements for certain lower-priced share classes; (vi) reducing management fees and total expenses for certain growth equity funds and index funds; (vii) lowering expense caps for certain existing funds and classes to reduce expenses borne by shareholders; (viii) eliminating short-term redemption fees for certain funds; (ix) introducing a new pricing structure for certain funds of funds that is expected to reduce overall expenses paid by shareholders; (x) rationalizing product lines and gaining increased efficiencies through proposals for fund mergers and share class consolidations; (xi) continuing to develop, acquire and implement systems and technology to improve services to the funds and shareholders, strengthen information security, and increase efficiency; and (xii) implementing enhancements to further strengthen Fidelity's product line to increase investors' probability of success in achieving their investment goals, including retirement income goals.
Investment Performance. The Board considered whether the fund has operated in accordance with its investment objective, as well as its record of compliance with its investment restrictions and its performance history.
The Board took into account discussions with representatives of the Investment Advisers about fund investment performance that occur at Board meetings throughout the year. In this regard the Board noted that as part of regularly scheduled fund reviews and other reports to the Board on fund performance, the Board considers annualized return information for the fund for different time periods, measured against a securities market index ("benchmark index") and a peer group of funds with similar objectives ("peer group"), if any. In its evaluation of fund investment performance, the Board gave particular attention to information indicating changes in performance of certain Fidelity funds for specific time periods and discussed with the Investment Advisers the reasons for any overperformance or underperformance.
In addition to reviewing absolute and relative fund performance, the Independent Trustees periodically consider the appropriateness of fund performance metrics in evaluating the results achieved. In general, the Independent Trustees believe that fund performance should be evaluated based on net performance (after fees and expenses) of both the highest performing and lowest performing fund share classes, where applicable, compared to appropriate benchmark indices, over appropriate time periods that may include full market cycles, and compared to peer groups, as applicable, over the same periods, taking into account relevant factors including the following: general market conditions; issuer-specific information; and fund cash flows and other factors.
The Independent Trustees recognize that shareholders evaluate performance on a net basis over their own holding periods, for which one-, three-, and five-year periods are often used as a proxy. For this reason, the performance information reviewed by the Board also included net cumulative calendar year total return information for the fund and an appropriate benchmark index and peer group for the most recent one-, three-, and five-year periods, as shown below. Returns are shown compared to the 25th percentile (top of box, 75% beaten) and 75th percentile (bottom of box, 25% beaten) of the peer universe.
Fidelity Disciplined Equity Fund
The Board has discussed the fund's underperformance with FMR, including the fund's investment strategy, the portfolio management team, and broader trends in the market that may have impacted the fund's performance, and has engaged with FMR to consider what steps might be taken to remediate the fund's underperformance. The Board noted that there was a portfolio management change for the fund in January 2014.
The Board also considered that the fund's management fee is subject to upward or downward adjustment depending upon whether, and to what extent, the fund's investment performance for the performance period (a rolling 36-month period) exceeds, or is exceeded by, a securities index, thus leading to a performance adjustment for the same period. The Board noted that the performance adjustment provides FMR with a strong economic incentive to seek to achieve superior long-term performance for the fund's shareholders and helps to more closely align the interests of FMR and the shareholders of the fund.
Based on its review, the Board concluded that the nature, extent, and quality of services provided to the fund under the Advisory Contracts should continue to benefit the shareholders of the fund.
Competitiveness of Management Fee and Total Expense Ratio. The Board considered the fund's management fee and total expense ratio compared to "mapped groups" of competitive funds and classes created for the purpose of facilitating the Trustees' competitive analysis of management fees and total expenses. Fidelity creates "mapped groups" by combining similar Lipper investment objective categories that have comparable investment mandates. Combining Lipper investment objective categories aids the Board's management fee and total expense ratio comparisons by broadening the competitive group used for comparison.
Management Fee. The Board considered two proprietary management fee comparisons for the 12-month periods shown in basis points (BP) in the chart below. The group of Lipper funds used by the Board for management fee comparisons is referred to below as the "Total Mapped Group." The Total Mapped Group comparison focuses on a fund's standing in terms of gross management fees before expense reimbursements or caps, and without giving effect to the fund's performance adjustment, relative to the total universe of funds with comparable investment mandates, regardless of whether their management fee structures also are comparable. Funds with comparable investment mandates offer exposure to similar types of securities. Funds with comparable management fee structures have similar management fee contractual arrangements (
e.g., flat rate charged for advisory services, all-inclusive fee rate,
etc.). "TMG %" represents the percentage of funds in the Total Mapped Group that had management fees that were lower than the fund's. For example, a hypothetical TMG % of 20% would mean that 80% of the funds in the Total Mapped Group had higher, and 20% had lower, management fees than the fund. The fund's actual TMG %s and the number of funds in the Total Mapped Group are in the chart below. The "Asset-Size Peer Group" (ASPG) comparison focuses on a fund's standing relative to a subset of non-Fidelity funds within the Total Mapped Group that are similar in size and management fee structure without taking into account performance adjustments, if any. For example, if a fund is in the first quartile of the ASPG, the fund's management fee ranks in the least expensive or lowest 25% of funds in the ASPG. The ASPG represents at least 15% of the funds in the Total Mapped Group with comparable asset size and management fee structures, subject to a minimum of 50 funds (or all funds in the Total Mapped Group if fewer than 50). Additional information, such as the ASPG quartile in which the fund's management fee rate ranked and the impact of the fund's performance adjustment, is also included in the chart and considered by the Board.
Fidelity Disciplined Equity Fund
The Board noted that the fund's management fee rate ranked below the median of its Total Mapped Group and below the median of its ASPG for 2016. The Board also noted the effect of the fund's performance adjustment, if any, on the fund's management fee ranking.
The Board noted that, in 2014, the Board and the boards of other Fidelity funds formed the ad hoc Committee on Group Fee to conduct an in-depth review of the "group fee" component of the management fee of funds with such management fee structures. The Committee's focus included the mechanics of the group fee, the competitive landscape of group fee structures, Fidelity funds with no group fee component and investment products not included in group fee assets. The Board also considered that, for funds subject to the group fee, FMR agreed to voluntarily waive fees over a specified period of time in amounts designed to account for assets converted from certain funds to certain collective investment trusts.
The Board also noted that, in 2013, the ad hoc Committee on Management Fees was formed to conduct an in-depth review of the management fee rates of Fidelity's active equity mutual funds. The Committee focused on the following areas: (i) standard fee structures; (ii) research consumption and trading evolution; (iii) management fee competitiveness/profitability by category; and (iv) factors that drive institutional pricing.
Based on its review, the Board concluded that the fund's management fee is fair and reasonable in light of the services that the fund receives and the other factors considered.
Total Expense Ratio. In its review of each class's total expense ratio, the Board considered the fund's management fee rate as well as other fund or class expenses, as applicable, such as transfer agent fees, pricing and bookkeeping fees, and custodial, legal, and audit fees. The Board noted the impact of the fund's performance adjustment. The Board also noted that Fidelity may agree to waive fees and expenses from time to time, and the extent to which, if any, it has done so for the fund. As part of its review, the Board also considered the current and historical total expense ratios of each class of the fund compared to competitive fund median expenses. Each class of the fund is compared to those funds and classes in the Total Mapped Group (used by the Board for management fee comparisons) that have a similar sales load structure.
The Board noted that the total expense ratio of each class ranked below the competitive median for 2016.
Fees Charged to Other Fidelity Clients. The Board also considered Fidelity fee structures and other information with respect to clients of Fidelity, such as other funds advised or subadvised by Fidelity, pension plan clients, and other institutional clients with similar mandates. The Board noted that an ad hoc joint committee created by it and the boards of other Fidelity funds periodically (most recently in 2013) reviews and compares Fidelity's institutional investment advisory business with its business of providing services to the Fidelity funds, including the differences in services provided, fees charged, and costs incurred, as well as competition in their respective marketplaces.
Based on its review of total expense ratios and fees charged to other Fidelity clients, the Board concluded that the total expense ratio of each class of the fund was reasonable in light of the services that the fund and its shareholders receive and the other factors considered.
Costs of the Services and Profitability. The Board considered the revenues earned and the expenses incurred by Fidelity in conducting the business of developing, marketing, distributing, managing, administering and servicing the fund and servicing the fund's shareholders. The Board also considered the level of Fidelity's profits in respect of all the Fidelity funds.
On an annual basis, Fidelity presents to the Board information about the profitability of its relationships with the fund. Fidelity calculates profitability information for each fund, as well as aggregate profitability information for groups of Fidelity funds and all Fidelity funds, using a series of detailed revenue and cost allocation methodologies which originate with the books and records of Fidelity on which Fidelity's audited financial statements are based. The Audit Committee of the Board reviews any significant changes from the prior year's methodologies.
PricewaterhouseCoopers LLP (PwC), independent registered public accounting firm and auditor to Fidelity and certain Fidelity funds, has been engaged annually by the Board as part of the Board's assessment of Fidelity's profitability analysis. PwC's engagement includes the review and assessment of the methodologies used by Fidelity in determining the revenues and expenses attributable to Fidelity's mutual fund business, and completion of agreed-upon procedures in respect of the mathematical accuracy of the fund profitability information and its conformity to established allocation methodologies. After considering PwC's reports issued under the engagement and information provided by Fidelity, the Board concluded that while other allocation methods may also be reasonable, Fidelity's profitability methodologies are reasonable in all material respects.
The Board also reviewed Fidelity's non-fund businesses and potential fall-out benefits related to the mutual fund business as well as cases where Fidelity's affiliates may benefit from or be related to the fund's business.
The Board considered the costs of the services provided by and the profits realized by Fidelity in connection with the operation of the fund and was satisfied that the profitability was not excessive.
Economies of Scale. The Board considered whether there have been economies of scale in respect of the management of the Fidelity funds, whether the Fidelity funds (including the fund) have appropriately benefited from any such economies of scale, and whether there is potential for realization of any further economies of scale. The Board considered the extent to which the fund will benefit from economies of scale as assets grow through increased services to the fund, through waivers or reimbursements, or through fee or expense ratio reductions. The Board also noted that a committee (the Economies of Scale Committee) created by it and the boards of other Fidelity funds periodically (most recently in 2013) analyzes whether Fidelity attains economies of scale in respect of the management and servicing of the Fidelity funds, whether the Fidelity funds have appropriately benefited from such economies of scale, and whether there is potential for realization of any further economies of scale.
The Board recognized that the fund's management contract incorporates a "group fee" structure, which provides for lower group fee rates as total group assets increase, and for higher group fee rates as total group assets decrease (with "group assets" defined to include fund assets under FMR's management plus the assets of sector funds previously under FMR's management). FMR calculates the group fee rates based on a tiered asset "breakpoint" schedule that varies based on asset class. The Board considered that the group fee is designed to deliver the benefits of economies of scale to fund shareholders when total Fidelity fund assets increase, even if assets of any particular fund are unchanged or have declined, because some portion of Fidelity's costs are attributable to services provided to all Fidelity funds, and all funds benefit if those costs can be allocated among more assets. The Board concluded that, given the group fee structure, fund shareholders will benefit from lower management fees as group assets increase at the fund complex level, regardless of whether Fidelity achieves any such economies of scale.
The Board concluded, taking into account the analysis of the Economies of Scale Committee, that economies of scale, if any, are being appropriately shared between fund shareholders and Fidelity.
Additional Information Requested by the Board. In order to develop fully the factual basis for consideration of the Fidelity funds' advisory contracts, the Board requested and received additional information on certain topics, including: (i) fund performance trends, in particular the underperformance of certain funds, and Fidelity's long-term strategies for certain funds; (ii) Fidelity's fund profitability methodology, profitability trends for certain funds, and the impact of certain factors on fund profitability results, including the impact of market trends on actively managed funds; (iii) the use of performance fees and the calculation of performance adjustments, including the impact of underperformance and fund outflows on performance adjustments; (iv) metrics for evaluating index fund performance; (v) Fidelity's group fee structure, including the group fee breakpoint schedules; (vi) the terms of Fidelity's contractual and voluntary expense cap arrangements with the funds; (vii) the methodology with respect to evaluating competitive fund data and peer group classifications and fee comparisons; (viii) the expense structures for different funds and classes; (ix) Fidelity's arrangements with affiliated sub-advisers on behalf of the funds; (x) information regarding other accounts managed by Fidelity, including institutional accounts and collective investment trusts; (xi) recent changes to the fee structure for certain funds of funds; and (xii) the impact of the Department of Labor's new fiduciary rule on the funds' comparative expense information.
Based on its evaluation of all of the conclusions noted above, and after considering all factors it believed relevant, the Board concluded that the advisory fee structures are fair and reasonable, and that the fund's Advisory Contracts should be renewed.
Corporate Headquarters
245 Summer St.
Boston, MA 02210
www.fidelity.com
FDE-K-ANN-1217
1.863075.109
Item 2.
Code of Ethics
As of the end of the period, October 31, 2017, Fidelity Capital Trust (the trust) has adopted a code of ethics, as defined in Item 2 of Form N-CSR, that applies to its President and Treasurer and its Chief Financial Officer. A copy of the code of ethics is filed as an exhibit to this Form N-CSR.
Item 3.
Audit Committee Financial Expert
The Board of Trustees of the trust has determined that Joseph Mauriello is an audit committee financial expert, as defined in Item 3 of Form N-CSR. Mr. Mauriello is independent for purposes of Item 3 of Form N-CSR.
Item 4.
Principal Accountant Fees and Services
Fees and Services
The following table presents fees billed by Deloitte & Touche LLP, the member firms of Deloitte Touche Tohmatsu, and their respective affiliates (collectively, “Deloitte Entities”) in each of the last two fiscal years for services rendered to Fidelity Flex Small Cap Fund and Fidelity Stock Selector Small Cap Fund (the “Funds”):
Services Billed by Deloitte Entities
October 31, 2017 FeesA,B
| | | | |
| Audit Fees | Audit-Related Fees | Tax Fees | All Other Fees |
Fidelity Flex Small Cap Fund | $33,000 | $- | $4,900 | $600 |
Fidelity Stock Selector Small Cap Fund | $49,000 | $100 | $5,100 | $1,300 |
October 31, 2016 FeesA,B,C
| | | | |
| Audit Fees | Audit-Related Fees | Tax Fees | All Other Fees |
Fidelity Flex Small Cap Fund | $- | $- | $- | $- |
Fidelity Stock Selector Small Cap Fund | $46,000 | $100 | $5,400 | $1,300 |
A Amounts may reflect rounding.
B Fidelity Flex Small Cap Fund commenced operations on March 7, 2017.
C Certain amounts have been reclassified to align with current period presentation.
The following table presents fees billed by PricewaterhouseCoopers LLP (“PwC”) in each of the last two fiscal years for services rendered to Fidelity Capital Appreciation Fund, Fidelity Disciplined Equity Fund, Fidelity Focused Stock Fund, and Fidelity Value Fund (the “Funds”):
Services Billed by PwC
October 31, 2017 FeesA
| | | | |
| Audit Fees | Audit-Related Fees | Tax Fees | All Other Fees |
Fidelity Capital Appreciation Fund | $53,000 | $4,900 | $3,500 | $2,400 |
Fidelity Disciplined Equity Fund | $58,000 | $5,400 | $5,200 | $2,600 |
Fidelity Focused Stock Fund | $35,000 | $3,300 | $3,500 | $1,600 |
Fidelity Value Fund | $61,000 | $5,800 | $7,000 | $2,700 |
| | | | |
| Audit Fees | Audit-Related Fees | Tax Fees | All Other Fees |
Fidelity Capital Appreciation Fund | $53,000 | $6,200 | $3,500 | $2,900 |
Fidelity Disciplined Equity Fund | $60,000 | $5,600 | $3,500 | $2,700 |
Fidelity Focused Stock Fund | $37,000 | $3,800 | $4,100 | $1,800 |
Fidelity Value Fund | $61,000 | $7,000 | $6,200 | $3,300 |
A Amounts may reflect rounding.
B Certain amounts have been reclassified to align with current period presentation.
The following table presents fees billed by PwC and Deloitte Entities that were required to be approved by the Audit Committee for services that relate directly to the operations and financial reporting of the Funds and that are rendered on behalf of Fidelity Management & Research Company (“FMR”) and entities controlling, controlled by, or under common control with FMR (not including any sub-adviser whose role is primarily portfolio management and is subcontracted with or overseen by another investment adviser) that provide ongoing services to the Funds (“Fund Service Providers”):
Services Billed by Deloitte Entities
| | |
| October 31, 2017A,B | October 31, 2016A,B |
Audit-Related Fees | $- | $40,000 |
Tax Fees | $25,000 | $- |
All Other Fees | $- | $- |
A Amounts may reflect rounding.
B May include amounts billed prior to the Fidelity Flex Small Cap Fund’s commencement of operations.
Services Billed by PwC
| | |
| October 31, 2017A | October 31, 2016A,B |
Audit-Related Fees | $12,525,000 | $5,550,000 |
Tax Fees | $155,000 | $10,000 |
All Other Fees | $- | $- |
A Amounts may reflect rounding.
B Certain amounts have been reclassified to align with current period presentation.
“Audit-Related Fees” represent fees billed for assurance and related services that are reasonably related to the performance of the fund audit or the review of the fund's financial statements and that are not reported under Audit Fees.
“Tax Fees” represent fees billed for tax compliance, tax advice or tax planning that relate directly to the operations and financial reporting of the fund.
“All Other Fees” represent fees billed for services provided to the fund or Fund Service Provider, a significant portion of which are assurance related, that relate directly to the operations and financial reporting of the fund, excluding those services that are reported under Audit Fees, Audit-Related Fees or Tax Fees.
Assurance services must be performed by an independent public accountant.
* * *
The aggregate non-audit fees billed by PwC and Deloitte Entities for services rendered to the Funds, FMR (not including any sub-adviser whose role is primarily portfolio management and is subcontracted with or overseen by another investment adviser), and any Fund Service Provider for each of the last two fiscal years of the Funds are as follows:
| | |
Billed By | October 31, 2017A,B | October 31, 2016A,B,C |
PwC | $16,265,000 | $6,610,000 |
Deloitte Entities | $540,000 | $75,000 |
A Amounts may reflect rounding.
B May include amounts billed prior to the Fidelity Flex Small Cap Fund’s commencement of operations.
C Certain amounts have been reclassified to align with current period presentation.
The trust's Audit Committee has considered non-audit services that were not pre-approved that were provided by PwC and Deloitte Entities to Fund Service Providers to be compatible with maintaining the independence of PwC and Deloitte Entities in their audits of the Funds, taking into account representations from PwC and Deloitte Entities, in accordance with Public Company Accounting Oversight Board rules, regarding their independence from the Funds and their related entities and FMR’s review of the appropriateness and permissibility under applicable law of such non-audit services prior to their provision to the Fund Service Providers.
Audit Committee Pre-Approval Policies and Procedures
The trust’s Audit Committee must pre-approve all audit and non-audit services provided by a fund’s independent registered public accounting firm relating to the operations or financial reporting of the fund. Prior to the commencement of any audit or non-audit services to a fund, the Audit Committee reviews the services to determine whether they are appropriate and permissible under applicable law.
The Audit Committee has adopted policies and procedures to, among other purposes, provide a framework for the Committee’s consideration of non-audit services by the audit firms that audit the Fidelity funds. The policies and procedures require that any non-audit service provided by a fund audit firm to a Fidelity fund and any non-audit service provided by a fund auditor to a Fund Service Provider that relates directly to the operations and financial reporting of a Fidelity fund (“Covered Service”) are subject to approval by the Audit Committee before such service is provided.
All Covered Services must be approved in advance of provision of the service either: (i) by formal resolution of the Audit Committee, or (ii) by oral or written approval of the service by the Chair of the Audit Committee (or if the Chair is unavailable, such other member of the Audit Committee as may be designated by the Chair to act in the Chair’s absence). The approval contemplated by (ii) above is permitted where the Treasurer determines that action on such an engagement is necessary before the next meeting of the Audit Committee.
Non-audit services provided by a fund audit firm to a Fund Service Provider that do not relate directly to the operations and financial reporting of a Fidelity fund are reported to the Audit Committee on a periodic basis.
Non-Audit Services Approved Pursuant to Rule 2-01(c)(7)(i)(C) and (ii) of Regulation S-X (“De Minimis Exception”)
There were no non-audit services approved or required to be approved by the Audit Committee pursuant to the De Minimis Exception during the Funds’ last two fiscal years relating to services provided to (i) the Funds or (ii) any Fund Service Provider that relate directly to the operations and financial reporting of the Funds.
Item 5.
Audit Committee of Listed Registrants
Not applicable.
Item 6.
Investments
(a)
Not applicable.
(b)
Not applicable
Item 7.
Disclosure of Proxy Voting Policies and Procedures for Closed-End Management Investment Companies
Not applicable.
Item 8.
Portfolio Managers of Closed-End Management Investment Companies
Not applicable.
Item 9.
Purchase of Equity Securities by Closed-End Management Investment Company and Affiliated Purchasers
Not applicable.
Item 10.
Submission of Matters to a Vote of Security Holders
There were no material changes to the procedures by which shareholders may recommend nominees to the trust’s Board of Trustees.
Item 11.
Controls and Procedures
(a)(i) The President and Treasurer and the Chief Financial Officer have concluded that the trust’s disclosure controls and procedures (as defined in Rule 30a-3(c) under the Investment Company Act) provide reasonable assurances that material information relating to the trust is made known to them by the appropriate persons, based on their evaluation of these controls and procedures as of a date within 90 days of the filing date of this report.
(a)(ii) There was no change in the trust’s internal control over financial reporting (as defined in Rule 30a-3(d) under the Investment Company Act) that occurred during the second fiscal quarter of the period covered by this report that has materially affected, or is reasonably likely to materially affect, the trust’s internal control over financial reporting.
Item 12.
Exhibits
| | |
(a) | (1) | Code of Ethics pursuant to Item 2 of Form N-CSR is filed and attached hereto as EX-99.CODE ETH. |
(a) | (2) | Certification pursuant to Rule 30a-2(a) under the Investment Company Act of 1940 (17 CFR 270.30a-2(a)) is filed and attached hereto as Exhibit 99.CERT. |
(a) | (3) | Not applicable. |
(b) | | Certification pursuant to Rule 30a-2(b) under the Investment Company Act of 1940 (17 CFR 270.30a-2(b)) is furnished and attached hereto as Exhibit 99.906CERT. |
SIGNATURES
Pursuant to the requirements of the Securities Exchange Act of 1934 and the Investment Company Act of 1940, the registrant has duly caused this report to be signed on its behalf by the undersigned, thereunto duly authorized.
Fidelity Capital Trust
| |
By: | /s/ Stacie M. Smith |
| Stacie M. Smith |
| President and Treasurer |
| |
Date: | December 27, 2017 |
Pursuant to the requirements of the Securities Exchange Act of 1934 and the Investment Company Act of 1940, this report has been signed below by the following persons on behalf of the registrant and in the capacities and on the dates indicated.
| |
By: | /s/Stacie M. Smith |
| Stacie M. Smith |
| President and Treasurer |
| |
Date: | December 27, 2017 |
| |
By: | /s/Howard J. Galligan III |
| Howard J. Galligan III |
| Chief Financial Officer |
| |
Date: | December 27, 2017 |