Fidelity® Stock Selector All Cap Fund
Annual Report
September 30, 2019
Includes Fidelity and Fidelity Advisor share classes


Beginning on January 1, 2021, as permitted by regulations adopted by the Securities and Exchange Commission, paper copies of a fund’s shareholder reports will no longer be sent by mail, unless you specifically request paper copies of the reports from the fund or from your financial intermediary, such as a financial advisor, broker-dealer or bank. Instead, the reports will be made available on a website, and you will be notified by mail each time a report is posted and provided with a website link to access the report.
If you already elected to receive shareholder reports electronically, you will not be affected by this change and you need not take any action. You may elect to receive shareholder reports and other communications from a fund electronically, by contacting your financial intermediary. For Fidelity customers, visit Fidelity's web site or call Fidelity using the contact information listed below.
You may elect to receive all future reports in paper free of charge. If you wish to continue receiving paper copies of your shareholder reports, you may contact your financial intermediary or, if you are a Fidelity customer, visit Fidelity’s website, or call Fidelity at the applicable toll-free number listed below. Your election to receive reports in paper will apply to all funds held with the fund complex/your financial intermediary.
| Account Type | Website | Phone Number |
| Brokerage, Mutual Fund, or Annuity Contracts: | fidelity.com/mailpreferences | 1-800-343-3548 |
| Employer Provided Retirement Accounts: | netbenefits.fidelity.com/preferences (choose 'no' under Required Disclosures to continue to print) | 1-800-343-0860 |
| Advisor Sold Accounts Serviced Through Your Financial Intermediary: | Contact Your Financial Intermediary | Your Financial Intermediary's phone number |
| Advisor Sold Accounts Serviced by Fidelity: | institutional.fidelity.com | 1-877-208-0098 |
Contents
To view a fund's proxy voting guidelines and proxy voting record for the 12-month period ended June 30, visit http://www.fidelity.com/proxyvotingresults or visit the Securities and Exchange Commission's (SEC) web site at http://www.sec.gov.
You may also call 1-800-544-8544 if you’re an individual investing directly with Fidelity, call 1-800-835-5092 if you’re a plan sponsor or participant with Fidelity as your recordkeeper or call 1-877-208-0098 on institutional accounts or if you’re an advisor or invest through one to request a free copy of the proxy voting guidelines.
Standard & Poor's, S&P and S&P 500 are registered service marks of The McGraw-Hill Companies, Inc. and have been licensed for use by Fidelity Distributors Corporation.
Other third-party marks appearing herein are the property of their respective owners.
All other marks appearing herein are registered or unregistered trademarks or service marks of FMR LLC or an affiliated company. © 2019 FMR LLC. All rights reserved.
This report and the financial statements contained herein are submitted for the general information of the shareholders of the Fund. This report is not authorized for distribution to prospective investors in the Fund unless preceded or accompanied by an effective prospectus.
A fund files its complete schedule of portfolio holdings with the SEC for the first and third quarters of each fiscal year on Form N-PORT. Forms N-PORT are available on the SEC’s web site at http://www.sec.gov. A fund's Forms N-PORT may be reviewed and copied at the SEC’s Public Reference Room in Washington, DC. Information regarding the operation of the SEC's Public Reference Room may be obtained by calling 1-800-SEC-0330.
For a complete list of a fund's portfolio holdings, view the most recent holdings listing, semiannual report, or annual report on Fidelity's web site at http://www.fidelity.com, http://www.institutional.fidelity.com, or http://www.401k.com, as applicable.
NOT FDIC INSURED •MAY LOSE VALUE •NO BANK GUARANTEE
Neither the Fund nor Fidelity Distributors Corporation is a bank.
Notes to Shareholders:
On October 1, 2018, Fidelity added the Dow Jones U.S. Total Stock Market Index as the fund's supplemental benchmark to better reflect the breadth of investment opportunities available to the underlying sector managers.
On December 1, 2018, Chad Colman and Ali Khan assumed co-management responsibilities for the fund.
On December 31, 2018, former Co-Managers Charlie Chai and Tobias Welo retired from Fidelity.
On October 1, 2019, Pierre Sorel assumed co-management responsibilities for the fund's financials sleeve, succeeding Christopher Lee.
On November 1, 2019, Nicola Stafford assumed co-management responsibilities for the fund, succeeding James McElligott.
On November 8, 2019, Jody Simes assumed co-management responsibilities for the fund, succeeding Richard Malnight.
Performance: The Bottom Line
Average annual total return reflects the change in the value of an investment, assuming reinvestment of distributions from dividend income and capital gains (the profits earned upon the sale of securities that have grown in value, if any) and assuming a constant rate of performance each year. The hypothetical investment and the average annual total returns do not reflect the deduction of taxes that a shareholder would pay on fund distributions or the redemption of fund shares. During periods of reimbursement by Fidelity, a fund’s total return will be greater than it would be had the reimbursement not occurred. How a fund did yesterday is no guarantee of how it will do tomorrow.
Average Annual Total Returns
| For the periods ended September 30, 2019 | Past 1 year | Past 5 years | Past 10 years |
| Class A (incl. 5.75% sales charge) | (6.96)% | 7.69% | 11.32% |
| Class M (incl. 3.50% sales charge) | (4.98)% | 7.92% | 11.38% |
| Class C (incl. contingent deferred sales charge) | (3.01)% | 8.13% | 11.38% |
| Fidelity® Stock Selector All Cap Fund | (0.98)% | 9.32% | 12.23% |
| Class K | (0.89)% | 9.42% | 12.36% |
| Class I | (1.05)% | 9.26% | 12.18% |
| Class Z | (0.89)% | 9.42% | 12.29% |
Class A shares bear a 0.25% 12b-1 fee. The initial offering of Class A shares took place on October 23, 2012. Returns prior to October 23, 2012, are those of Fidelity® Stock Selector All Cap Fund, the original class of the fund, which has no 12b-1 fee. Had Class A's 12b-1 fee been reflected, returns prior to October 23, 2012, would have been lower.
Class M shares bear a 0.50% 12b-1 fee. The initial offering of Class M shares took place on October 23, 2012. Returns prior to October 23, 2012, are those of Fidelity® Stock Selector All Cap Fund, the original class of the fund, which has no 12b-1 fee. Had Class M's 12b-1 fee been reflected, returns prior to October 23, 2012, would have been lower.
Class C shares bear a 1.00% 12b-1 fee. The initial offering of Class C shares took place on October 23, 2012. Returns prior to October 23, 2012, are those of Fidelity® Stock Selector All Cap Fund, the original class of the fund, which has no 12b-1 fee. Had Class C's 12b-1 fee been reflected, returns prior to October 23, 2012, would have been lower.
Class C shares' contingent deferred sales charges included in the past one year, past five years and past ten years total return figures are 1%, 0% and 0%, respectively.
The initial offering of Class I shares took place on October 23, 2012. Returns prior to October 23, 2012 are those of Fidelity® Stock Selector All Cap Fund, the original class of the fund.
The initial offering of Class Z shares took place on August 13, 2013. Returns between October 23, 2012 and August 13, 2013, are those of Class I. Returns prior to October 23, 2012, are those of Fidelity® Stock Selector All Cap Fund, the original class of the fund.
$10,000 Over 10 Years
Let's say hypothetically that $10,000 was invested in Fidelity® Stock Selector All Cap Fund, a class of the fund, on September 30, 2009.
The chart shows how the value of your investment would have changed, and also shows how the S&P 500® Index performed over the same period.
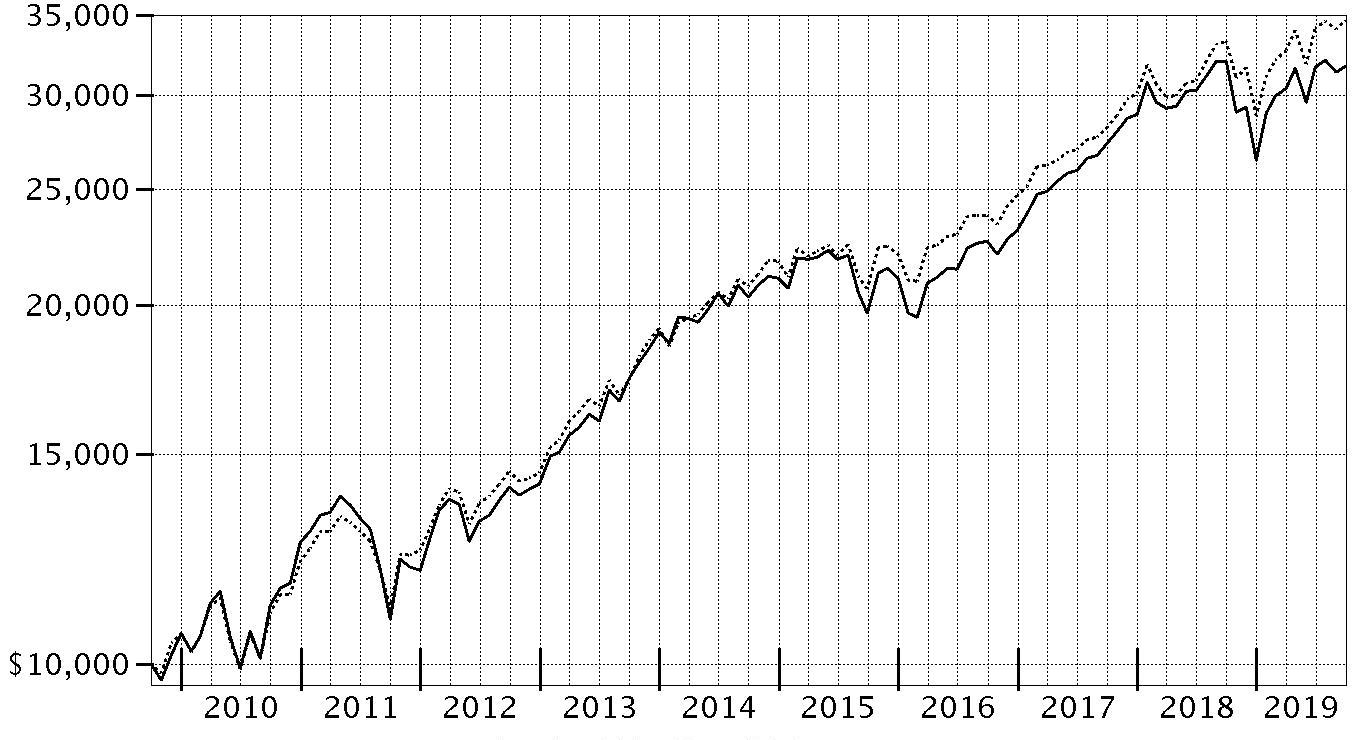
| Period Ending Values |
| $31,711 | Fidelity® Stock Selector All Cap Fund - Fidelity® Stock Selector All Cap Fund |
| $34,674 | S&P 500® Index |
Management's Discussion of Fund Performance
Market Recap: The S&P 500
® index gained 4.25% for the 12 months ending September 30, 2019, a choppy period in which stocks seesawed due to trade tension, interest rates, economic data and an inverted yield curve, among other factors. Equities began the new year on a high note after enduring a historically volatile final quarter of 2018. Upbeat company earnings and outlooks, along with signs the Federal Reserve may pause on rates, boosted stocks to an all-time high on April 30. In May, however, volatility spiked and the index sunk as trade negotiations between the U.S. and China broke down and tit-for-tat tariff fighting ensued. The bull market roared back in June and recorded a series of highs in July, when the Fed, affirming a dovish shift in policy, cut interest rates for the first time since 2008. Volatility intensified in August, however, as the U.S. Treasury yield curve inverted for the first time since 2007, which some investors viewed as a sign the world's biggest economy could be heading for recession. For the full 12 months, three defensive sectors led the way: utilities (+27%), real estate (+25%) and consumer staples (+17%). Information technology rose about 9%, boosted by software & services (+14%), the market’s largest industry. Communication services stocks gained roughly 6%. In contrast, energy (-19%) was by far the weakest sector – slipping on lower oil prices – followed by health care (-4%) and industrials (+1%). Other laggards included consumer discretionary (+2%), materials (+3%) and financials (+4%).
Comments from Lead Portfolio Manager Geoff Stein: For the fiscal year, the fund's share classes (excluding sales charges, if applicable) returned roughly -1% to -2%, notably trailing the benchmark S&P 500 index. Lackluster security selection across a number of sectors, including information technology, health care, communication services and energy were the primary drivers of the portfolio’s underperformance versus the benchmark this period. In contrast, only investment choices among consumer discretionary stocks – namely within the retailing segment – contributed the past 12 months, albeit modestly. Shares of chip designer Nvidia proved to be the fund’s biggest detractor for the period, followed by video-game maker Activision Blizzard and an out-of-benchmark stake in biopharmaceutical developer Sarepta Therapeutics. On the other hand, smartphone maker and index heavyweight Apple was the portfolio’s leading contributor, while an underweighting in integrated oil & gas company Exxon Mobil also added value.
The views expressed above reflect those of the portfolio manager(s) only through the end of the period as stated on the cover of this report and do not necessarily represent the views of Fidelity or any other person in the Fidelity organization. Any such views are subject to change at any time based upon market or other conditions and Fidelity disclaims any responsibility to update such views. These views may not be relied on as investment advice and, because investment decisions for a Fidelity fund are based on numerous factors, may not be relied on as an indication of trading intent on behalf of any Fidelity fund.
Investment Summary (Unaudited)
The information in the following tables is based on the Fund’s pro-rata share of the investments of Fidelity’s Equity Central Funds.Top Ten Stocks as of September 30, 2019
| | % of fund's net assets |
| Microsoft Corp. | 4.9 |
| Apple, Inc. | 4.6 |
| Alphabet, Inc. Class A | 2.7 |
| Amazon.com, Inc. | 2.1 |
| Facebook, Inc. Class A | 1.5 |
| Adobe, Inc. | 1.1 |
| UnitedHealth Group, Inc. | 1.1 |
| Capital One Financial Corp. | 1.0 |
| Boston Scientific Corp. | 1.0 |
| The Home Depot, Inc. | 1.0 |
| | 21.0 |
Top Five Market Sectors as of September 30, 2019
| | % of fund's net assets |
| Information Technology | 22.2 |
| Health Care | 13.5 |
| Financials | 12.9 |
| Communication Services | 10.2 |
| Consumer Discretionary | 10.0 |
At period end, investments in foreign securities including the Fund's pro-rata share of Fidelity's Equity Central Funds, was 8.9% of net assets.
An unaudited holdings listing for the Fund, which presents direct holdings as well as the pro-rata share of any securities and other investments held indirectly through its investment in underlying Fidelity Central Funds, other than the Money Market Central Funds, is available at fidelity.com and/or institutional.fidelity.com, as applicable.
Schedule of Investments September 30, 2019
Showing Percentage of Net Assets
| Equity Central Funds - 100.1% | | | |
| | | Shares | Value (000s) |
| Fidelity Communication Services Central Fund (a) | | 3,744,185 | $770,403 |
| Fidelity Consumer Discretionary Central Fund (a) | | 2,371,148 | 815,865 |
| Fidelity Consumer Staples Central Fund (a) | | 2,810,251 | 576,832 |
| Fidelity Energy Central Fund (a) | | 3,665,658 | 355,569 |
| Fidelity Financials Central Fund (a) | | 13,372,193 | 1,387,365 |
| Fidelity Health Care Central Fund (a) | | 2,724,573 | 1,115,522 |
| Fidelity Industrials Central Fund (a) | | 2,620,795 | 746,455 |
| Fidelity Information Technology Central Fund (a) | | 4,715,671 | 1,906,027 |
| Fidelity Materials Central Fund (a) | | 989,922 | 192,074 |
| Fidelity Utilities Central Fund (a) | | 1,335,026 | 273,240 |
| TOTAL EQUITY CENTRAL FUNDS | | | |
| (Cost $6,713,936) | | | 8,139,352 |
|
| Money Market Central Funds - 0.0% | | | |
| Fidelity Cash Central Fund 1.96% (b) | | | |
| (Cost $1,577) | | 1,576,218 | 1,577 |
| TOTAL INVESTMENT IN SECURITIES - 100.1% | | | |
| (Cost $6,715,513) | | | 8,140,929 |
| NET OTHER ASSETS (LIABILITIES) - (0.1)% | | | (4,563) |
| NET ASSETS - 100% | | | $8,136,366 |
Legend
(a) Affiliated fund that is generally available only to investment companies and other accounts managed by Fidelity Investments. A complete unaudited schedule of portfolio holdings for each Fidelity Central Fund is filed with the SEC for the first and third quarters of each fiscal year on Form N-PORT and is available upon request or at the SEC's website at www.sec.gov. An unaudited holdings listing for the Fund, which presents direct holdings as well as the pro-rata share of securities and other investments held indirectly through its investment in underlying non-money market Fidelity Central Funds, is available at fidelity.com and/or institutional.fidelity.com, as applicable. In addition, each Fidelity Central Fund's financial statements, which are not covered by the Fund's Report of Independent Registered Public Accounting Firm, are available on the SEC's website or upon request.
(b) Affiliated fund that is generally available only to investment companies and other accounts managed by Fidelity Investments. The rate quoted is the annualized seven-day yield of the fund at period end. A complete unaudited listing of the fund's holdings as of its most recent quarter end is available upon request. In addition, each Fidelity Central Fund's financial statements, which are not covered by the Fund's Report of Independent Registered Public Accounting Firm, are available on the SEC's website or upon request.
Affiliated Central Funds
Information regarding fiscal year to date income earned by the Fund from investments in Fidelity Central Funds is as follows:
| Fund | Income earned |
| | (Amounts in thousands) |
| Fidelity Cash Central Fund | $33 |
| Fidelity Communication Services Central Fund | 5,686 |
| Fidelity Consumer Discretionary Central Fund | 38,267 |
| Fidelity Consumer Staples Central Fund | 65,778 |
| Fidelity Energy Central Fund | 10,304 |
| Fidelity Financials Central Fund | 105,254 |
| Fidelity Health Care Central Fund | 86,189 |
| Fidelity Industrials Central Fund | 51,514 |
| Fidelity Information Technology Central Fund | 373,673 |
| Fidelity Materials Central Fund | 21,819 |
| Fidelity Utilities Central Fund | 30,248 |
| Total | $788,765 |
Amounts in the income column in the above table include any capital gain distributions from underlying funds, which are presented in the corresponding line-item in the Statement of Operations, if applicable.
Fiscal year to date information regarding the Fund’s investments in non-Money Market Central Funds, including the ownership percentage, is presented below.
| Fund (Amounts in thousands) | Value, beginning of period | Purchases(a) | Sales Proceeds(a) | Realized Gain/Loss | Change in Unrealized appreciation (depreciation) | Value, end of period | % ownership, end of period |
| Fidelity Communication Services Central Fund | $192,092 | $676,591 | $187,842 | $11,570 | $77,992 | $770,403 | 46.7% |
| Fidelity Consumer Discretionary Central Fund | 1,178,469 | 80,410 | 409,849 | 20,157 | (53,322) | 815,865 | 43.5% |
| Fidelity Consumer Staples Central Fund | 652,902 | 114,051 | 197,550 | (13,818) | 21,247 | 576,832 | 45.6% |
| Fidelity Energy Central Fund | 604,802 | 42,353 | 120,324 | (24,151) | (147,111) | 355,569 | 45.2% |
| Fidelity Financials Central Fund | 1,664,788 | 209,133 | 466,979 | (18,035) | (1,542) | 1,387,365 | 42.0% |
| Fidelity Health Care Central Fund | 1,636,563 | 176,115 | 465,287 | 15,001 | (246,870) | 1,115,522 | 44.2% |
| Fidelity Industrials Central Fund | 1,044,555 | 92,582 | 311,277 | (13,387) | (66,018) | 746,455 | 42.6% |
| Fidelity Information Technology Central Fund | 2,858,637 | 546,208 | 1,055,588 | (117,546) | (325,684) | 1,906,027 | 44.3% |
| Fidelity Materials Central Fund | 265,666 | 37,716 | 65,243 | (14,038) | (32,027) | 192,074 | 43.6% |
| Fidelity Utilities Central Fund | 291,688 | 50,889 | 91,609 | 5,784 | 16,488 | 273,240 | 42.6% |
| Total | $10,390,162 | $2,026,048 | $3,371,548 | $(148,463) | $(756,847) | $8,139,352 | |
(a) Includes the value of shares purchased or redeemed through in-kind transactions, if applicable.
Investment Valuation
All investments are categorized as Level 1 under the Fair Value Hierarchy. The inputs or methodology used for valuing securities may not be an indication of the risk associated with investing in those securities. For more information on valuation inputs please refer to the Investment Valuation section in the accompanying Notes to Financial Statements.
See accompanying notes which are an integral part of the financial statements.
Financial Statements
Statement of Assets and Liabilities
| Amounts in thousands (except per-share amounts) | | September 30, 2019 |
| Assets | | |
Investment in securities, at value — See accompanying schedule:
| | |
| Investments in Fidelity Central Funds (cost $6,715,513) | | $8,140,929 |
| Cash | | 16 |
| Receivable for investments sold | | 1,822 |
| Receivable for fund shares sold | | 1,652 |
| Dividends receivable | | 7 |
| Distributions receivable from Fidelity Central Funds | | 3 |
| Prepaid expenses | | 19 |
| Other receivables | | 37 |
| Total assets | | 8,144,485 |
| Liabilities | | |
| Payable for investments purchased | $359 | |
| Payable for fund shares redeemed | 3,149 | |
| Accrued management fee | 3,249 | |
| Transfer agent fee payable | 1,079 | |
| Distribution and service plan fees payable | 113 | |
| Other affiliated payables | 104 | |
| Other payables and accrued expenses | 66 | |
| Total liabilities | | 8,119 |
| Net Assets | | $8,136,366 |
| Net Assets consist of: | | |
| Paid in capital | | $6,543,172 |
| Total accumulated earnings (loss) | | 1,593,194 |
| Net Assets | | $8,136,366 |
| Net Asset Value and Maximum Offering Price | | |
| Class A: | | |
| Net Asset Value and redemption price per share ($198,029 ÷ 4,294.97 shares)(a) | | $46.11 |
| Maximum offering price per share (100/94.25 of $46.11) | | $48.92 |
| Class M: | | |
| Net Asset Value and redemption price per share ($110,824 ÷ 2,406.43 shares)(a) | | $46.05 |
| Maximum offering price per share (100/96.50 of $46.05) | | $47.72 |
| Class C: | | |
| Net Asset Value and offering price per share ($29,107 ÷ 640.96 shares)(a) | | $45.41 |
| Stock Selector All Cap: | | |
| Net Asset Value, offering price and redemption price per share ($7,669,174 ÷ 166,341.30 shares) | | $46.11 |
| Class K: | | |
| Net Asset Value, offering price and redemption price per share ($78,859 ÷ 1,706.10 shares) | | $46.22 |
| Class I: | | |
| Net Asset Value, offering price and redemption price per share ($38,786 ÷ 840.71 shares) | | $46.13 |
| Class Z: | | |
| Net Asset Value, offering price and redemption price per share ($11,587 ÷ 251.75 shares) | | $46.03 |
(a) Redemption price per share is equal to net asset value less any applicable contingent deferred sales charge.
See accompanying notes which are an integral part of the financial statements.
Statement of Operations
| Amounts in thousands | | Year ended September 30, 2019 |
| Investment Income | | |
| Income from Fidelity Central Funds | | $144,299 |
| Expenses | | |
| Management fee | | |
| Basic fee | $48,803 | |
| Performance adjustment | (4,018) | |
| Transfer agent fees | 13,166 | |
| Distribution and service plan fees | 1,464 | |
| Accounting fees and expenses | 1,248 | |
| Custodian fees and expenses | 1 | |
| Independent trustees' fees and expenses | 52 | |
| Registration fees | 124 | |
| Audit | 51 | |
| Legal | 40 | |
| Miscellaneous | 62 | |
| Total expenses before reductions | 60,993 | |
| Expense reductions | (68) | |
| Total expenses after reductions | | 60,925 |
| Net investment income (loss) | | 83,374 |
| Realized and Unrealized Gain (Loss) | | |
| Net realized gain (loss) on: | | |
| Investment securities: | | |
| Unaffiliated issuers | 271 | |
| Fidelity Central Funds | (148,463) | |
| Capital gain distributions from Fidelity Central Funds | 644,466 | |
| Total net realized gain (loss) | | 496,274 |
| Change in net unrealized appreciation (depreciation) on: | | |
| Investment securities: | | |
| Fidelity Central Funds | (756,847) | |
| Total change in net unrealized appreciation (depreciation) | | (756,847) |
| Net gain (loss) | | (260,573) |
| Net increase (decrease) in net assets resulting from operations | | $(177,199) |
See accompanying notes which are an integral part of the financial statements.
Statement of Changes in Net Assets
| Amounts in thousands | Year ended September 30, 2019 | Year ended September 30, 2018 |
| Increase (Decrease) in Net Assets | | |
| Operations | | |
| Net investment income (loss) | $83,374 | $64,773 |
| Net realized gain (loss) | 496,274 | 2,497,659 |
| Change in net unrealized appreciation (depreciation) | (756,847) | (1,121,423) |
| Net increase (decrease) in net assets resulting from operations | (177,199) | 1,441,009 |
| Distributions to shareholders | (352,107) | – |
| Distributions to shareholders from net investment income | – | (56,168) |
| Distributions to shareholders from net realized gain | – | (259,414) |
| Total distributions | (352,107) | (315,582) |
| Share transactions - net increase (decrease) | (1,723,792) | 1,316,314 |
| Total increase (decrease) in net assets | (2,253,098) | 2,441,741 |
| Net Assets | | |
| Beginning of period | 10,389,464 | 7,947,723 |
| End of period | $8,136,366 | $10,389,464 |
| Other Information | | |
| Undistributed net investment income end of period | | $25,502 |
See accompanying notes which are an integral part of the financial statements.
Financial Highlights
Fidelity Stock Selector All Cap Fund Class A
| Years ended September 30, | 2019 | 2018 | 2017 | 2016 | 2015 |
| Selected Per–Share Data | | | | | |
| Net asset value, beginning of period | $48.62 | $43.04 | $35.99 | $32.94 | $38.00 |
| Income from Investment Operations | | | | | |
| Net investment income (loss)A | .28 | .18 | .15 | .18 | .12 |
| Net realized and unrealized gain (loss) | (1.23) | 6.90 | 7.15 | 4.47 | (1.25) |
| Total from investment operations | (.95) | 7.08 | 7.30 | 4.65 | (1.13) |
| Distributions from net investment income | (.17) | (.16) | (.17) | (.10) | (.09) |
| Distributions from net realized gain | (1.39) | (1.35) | (.09) | (1.50) | (3.84) |
| Total distributions | (1.56) | (1.50)B | (.25)C | (1.60) | (3.93) |
| Net asset value, end of period | $46.11 | $48.62 | $43.04 | $35.99 | $32.94 |
| Total ReturnD,E | (1.28)% | 16.82% | 20.41% | 14.55% | (3.39)% |
| Ratios to Average Net AssetsF,G | | | | | |
| Expenses before reductions | .96% | .99% | .94% | .96% | 1.06% |
| Expenses net of fee waivers, if any | .96% | .99% | .94% | .96% | 1.06% |
| Expenses net of all reductions | .96% | .99% | .94% | .96% | 1.05% |
| Net investment income (loss) | .63% | .40% | .39% | .52% | .33% |
| Supplemental Data | | | | | |
| Net assets, end of period (in millions) | $198 | $201 | $196 | $193 | $197 |
| Portfolio turnover rateH | 22% | 12%I | 9% | 14% | 6% |
A Calculated based on average shares outstanding during the period.
B Total distributions of $1.50 per share is comprised of distributions from net investment income of $.156 and distributions from net realized gain of $1.348 per share.
C Total distributions of $.25 per share is comprised of distributions from net investment income of $.166 and distributions from net realized gain of $.087 per share.
D Total returns would have been lower if certain expenses had not been reduced during the applicable periods shown.
E Total returns do not include the effect of the sales charges.
F Fees and expenses of any underlying Fidelity Central Funds are not included in the Fund's expense ratio. The Fund indirectly bears its proportionate share of the expenses of any underlying Fidelity Central Funds. Based on their most recent shareholder report date, the expenses ranged from less than. 005% to .01%.
G Expense ratios reflect operating expenses of the class. Expenses before reductions do not reflect amounts reimbursed by the investment adviser or reductions from brokerage service arrangements or reductions from other expense offset arrangements and do not represent the amount paid by the class during periods when reimbursements or reductions occur. Expenses net of fee waivers reflect expenses after reimbursement by the investment adviser but prior to reductions from brokerage service arrangements or other expense offset arrangements. Expenses net of all reductions represent the net expenses paid by the class.
H Amount does not include the portfolio activity of any underlying Fidelity Central Funds.
I Portfolio turnover rate excludes securities received or delivered in-kind.
See accompanying notes which are an integral part of the financial statements.
Fidelity Stock Selector All Cap Fund Class M
| Years ended September 30, | 2019 | 2018 | 2017 | 2016 | 2015 |
| Selected Per–Share Data | | | | | |
| Net asset value, beginning of period | $48.53 | $42.97 | $35.94 | $32.88 | $37.91 |
| Income from Investment Operations | | | | | |
| Net investment income (loss)A | .17 | .07 | .05 | .09 | .03 |
| Net realized and unrealized gain (loss) | (1.21) | 6.88 | 7.14 | 4.47 | (1.25) |
| Total from investment operations | (1.04) | 6.95 | 7.19 | 4.56 | (1.22) |
| Distributions from net investment income | (.05) | (.04) | (.07) | – | – |
| Distributions from net realized gain | (1.39) | (1.35) | (.09) | (1.50) | (3.81) |
| Total distributions | (1.44) | (1.39) | (.16) | (1.50) | (3.81) |
| Net asset value, end of period | $46.05 | $48.53 | $42.97 | $35.94 | $32.88 |
| Total ReturnB,C | (1.54)% | 16.50% | 20.08% | 14.26% | (3.63)% |
| Ratios to Average Net AssetsD,E | | | | | |
| Expenses before reductions | 1.21% | 1.25% | 1.20% | 1.23% | 1.32% |
| Expenses net of fee waivers, if any | 1.21% | 1.25% | 1.20% | 1.23% | 1.32% |
| Expenses net of all reductions | 1.21% | 1.25% | 1.20% | 1.22% | 1.31% |
| Net investment income (loss) | .38% | .14% | .13% | .25% | .07% |
| Supplemental Data | | | | | |
| Net assets, end of period (in millions) | $111 | $126 | $121 | $119 | $120 |
| Portfolio turnover rateF | 22% | 12%G | 9% | 14% | 6% |
A Calculated based on average shares outstanding during the period.
B Total returns would have been lower if certain expenses had not been reduced during the applicable periods shown.
C Total returns do not include the effect of the sales charges.
D Fees and expenses of any underlying Fidelity Central Funds are not included in the Fund's expense ratio. The Fund indirectly bears its proportionate share of the expenses of any underlying Fidelity Central Funds. Based on their most recent shareholder report date, the expenses ranged from less than .005% to .01%.
E Expense ratios reflect operating expenses of the class. Expenses before reductions do not reflect amounts reimbursed by the investment adviser or reductions from brokerage service arrangements or reductions from other expense offset arrangements and do not represent the amount paid by the class during periods when reimbursements or reductions occur. Expenses net of fee waivers reflect expenses after reimbursement by the investment adviser but prior to reductions from brokerage service arrangements or other expense offset arrangements. Expenses net of all reductions represent the net expenses paid by the class.
F Amount does not include the portfolio activity of any underlying Fidelity Central Funds.
G Portfolio turnover rate excludes securities received or delivered in-kind.
See accompanying notes which are an integral part of the financial statements.
Fidelity Stock Selector All Cap Fund Class C
| Years ended September 30, | 2019 | 2018 | 2017 | 2016 | 2015 |
| Selected Per–Share Data | | | | | |
| Net asset value, beginning of period | $48.00 | $42.52 | $35.59 | $32.70 | $37.68 |
| Income from Investment Operations | | | | | |
| Net investment income (loss)A | (.07) | (.17) | (.15) | (.09) | (.16) |
| Net realized and unrealized gain (loss) | (1.19) | 6.82 | 7.08 | 4.44 | (1.23) |
| Total from investment operations | (1.26) | 6.65 | 6.93 | 4.35 | (1.39) |
| Distributions from net investment income | – | – | – | – | – |
| Distributions from net realized gain | (1.33) | (1.17) | – | (1.46) | (3.59) |
| Total distributions | (1.33) | (1.17) | – | (1.46) | (3.59) |
| Net asset value, end of period | $45.41 | $48.00 | $42.52 | $35.59 | $32.70 |
| Total ReturnB,C | (2.06)% | 15.91% | 19.47% | 13.68% | (4.14)% |
| Ratios to Average Net AssetsD,E | | | | | |
| Expenses before reductions | 1.75% | 1.76% | 1.72% | 1.74% | 1.83% |
| Expenses net of fee waivers, if any | 1.75% | 1.76% | 1.72% | 1.73% | 1.83% |
| Expenses net of all reductions | 1.75% | 1.76% | 1.72% | 1.73% | 1.82% |
| Net investment income (loss) | (.16)% | (.37)% | (.39)% | (.25)% | (.44)% |
| Supplemental Data | | | | | |
| Net assets, end of period (in millions) | $29 | $66 | $68 | $63 | $63 |
| Portfolio turnover rateF | 22% | 12%G | 9% | 14% | 6% |
A Calculated based on average shares outstanding during the period.
B Total returns would have been lower if certain expenses had not been reduced during the applicable periods shown.
C Total returns do not include the effect of the contingent deferred sales charge.
D Fees and expenses of any underlying Fidelity Central Funds are not included in the Fund's expense ratio. The Fund indirectly bears its proportionate share of the expenses of any underlying Fidelity Central Funds. Based on their most recent shareholder report date, the expenses ranged from less than .005% to .01%.
E Expense ratios reflect operating expenses of the class. Expenses before reductions do not reflect amounts reimbursed by the investment adviser or reductions from brokerage service arrangements or reductions from other expense offset arrangements and do not represent the amount paid by the class during periods when reimbursements or reductions occur. Expenses net of fee waivers reflect expenses after reimbursement by the investment adviser but prior to reductions from brokerage service arrangements or other expense offset arrangements. Expenses net of all reductions represent the net expenses paid by the class.
F Amount does not include the portfolio activity of any underlying Fidelity Central Funds.
G Portfolio turnover rate excludes securities received or delivered in-kind.
See accompanying notes which are an integral part of the financial statements.
Fidelity Stock Selector All Cap Fund
| Years ended September 30, | 2019 | 2018 | 2017 | 2016 | 2015 |
| Selected Per–Share Data | | | | | |
| Net asset value, beginning of period | $48.66 | $43.08 | $36.03 | $33.00 | $38.12 |
| Income from Investment Operations | | | | | |
| Net investment income (loss)A | .41 | .32 | .28 | .29 | .24 |
| Net realized and unrealized gain (loss) | (1.25) | 6.91 | 7.15 | 4.47 | (1.25) |
| Total from investment operations | (.84) | 7.23 | 7.43 | 4.76 | (1.01) |
| Distributions from net investment income | (.32) | (.30) | (.29) | (.23) | (.27) |
| Distributions from net realized gain | (1.39) | (1.35) | (.09) | (1.50) | (3.84) |
| Total distributions | (1.71) | (1.65) | (.38) | (1.73) | (4.11) |
| Net asset value, end of period | $46.11 | $48.66 | $43.08 | $36.03 | $33.00 |
| Total ReturnB | (.98)% | 17.18% | 20.80% | 14.92% | (3.05)% |
| Ratios to Average Net AssetsC,D | | | | | |
| Expenses before reductions | .65% | .68% | .62% | .64% | .72% |
| Expenses net of fee waivers, if any | .65% | .68% | .62% | .64% | .72% |
| Expenses net of all reductions | .65% | .68% | .62% | .63% | .71% |
| Net investment income (loss) | .94% | .71% | .71% | .85% | .67% |
| Supplemental Data | | | | | |
| Net assets, end of period (in millions) | $7,669 | $9,307 | $7,144 | $6,078 | $4,722 |
| Portfolio turnover rateE | 22% | 12%F | 9% | 14% | 6% |
A Calculated based on average shares outstanding during the period.
B Total returns would have been lower if certain expenses had not been reduced during the applicable periods shown.
C Fees and expenses of any underlying Fidelity Central Funds are not included in the Fund's expense ratio. The Fund indirectly bears its proportionate share of the expenses of any underlying Fidelity Central Funds. Based on their most recent shareholder report date, the expenses ranged from less than .005% to .01%.
D Expense ratios reflect operating expenses of the class. Expenses before reductions do not reflect amounts reimbursed by the investment adviser or reductions from brokerage service arrangements or reductions from other expense offset arrangements and do not represent the amount paid by the class during periods when reimbursements or reductions occur. Expenses net of fee waivers reflect expenses after reimbursement by the investment adviser but prior to reductions from brokerage service arrangements or other expense offset arrangements. Expenses net of all reductions represent the net expenses paid by the class.
E Amount does not include the portfolio activity of any underlying Fidelity Central Funds.
F Portfolio turnover rate excludes securities received or delivered in-kind.
See accompanying notes which are an integral part of the financial statements.
Fidelity Stock Selector All Cap Fund Class K
| Years ended September 30, | 2019 | 2018 | 2017 | 2016 | 2015 |
| Selected Per–Share Data | | | | | |
| Net asset value, beginning of period | $48.69 | $43.12 | $36.06 | $33.02 | $38.14 |
| Income from Investment Operations | | | | | |
| Net investment income (loss)A | .46 | .37 | .31 | .32 | .28 |
| Net realized and unrealized gain (loss) | (1.25) | 6.90 | 7.16 | 4.47 | (1.26) |
| Total from investment operations | (.79) | 7.27 | 7.47 | 4.79 | (.98) |
| Distributions from net investment income | (.29) | (.35) | (.32) | (.25) | (.31) |
| Distributions from net realized gain | (1.39) | (1.35) | (.09) | (1.50) | (3.84) |
| Total distributions | (1.68) | (1.70) | (.41) | (1.75) | (4.14)B |
| Net asset value, end of period | $46.22 | $48.69 | $43.12 | $36.06 | $33.02 |
| Total ReturnC | (.89)% | 17.28% | 20.91% | 15.02% | (2.96)% |
| Ratios to Average Net AssetsD,E | | | | | |
| Expenses before reductions | .56% | .59% | .53% | .54% | .64% |
| Expenses net of fee waivers, if any | .55% | .59% | .53% | .54% | .64% |
| Expenses net of all reductions | .55% | .59% | .53% | .54% | .63% |
| Net investment income (loss) | 1.03% | .80% | .80% | .94% | .75% |
| Supplemental Data | | | | | |
| Net assets, end of period (in millions) | $79 | $368 | $86 | $100 | $76 |
| Portfolio turnover rateF | 22% | 12%G | 9% | 14% | 6% |
A Calculated based on average shares outstanding during the period.
B Total distributions of $4.14 per share is comprised of distributions from net investment income of $.307 and distributions from net realized gain of $3.836 per share.
C Total returns would have been lower if certain expenses had not been reduced during the applicable periods shown.
D Fees and expenses of any underlying Fidelity Central Funds are not included in the Fund's expense ratio. The Fund indirectly bears its proportionate share of the expenses of any underlying Fidelity Central Funds. Based on their most recent shareholder report date, the expenses ranged from less than .005% to .01%.
E Expense ratios reflect operating expenses of the class. Expenses before reductions do not reflect amounts reimbursed by the investment adviser or reductions from brokerage service arrangements or reductions from other expense offset arrangements and do not represent the amount paid by the class during periods when reimbursements or reductions occur. Expenses net of fee waivers reflect expenses after reimbursement by the investment adviser but prior to reductions from brokerage service arrangements or other expense offset arrangements. Expenses net of all reductions represent the net expenses paid by the class.
F Amount does not include the portfolio activity of any underlying Fidelity Central Funds.
G Portfolio turnover rate excludes securities received or delivered in-kind.
See accompanying notes which are an integral part of the financial statements.
Fidelity Stock Selector All Cap Fund Class I
| Years ended September 30, | 2019 | 2018 | 2017 | 2016 | 2015 |
| Selected Per–Share Data | | | | | |
| Net asset value, beginning of period | $48.68 | $43.09 | $36.04 | $32.99 | $38.10 |
| Income from Investment Operations | | | | | |
| Net investment income (loss)A | .40 | .30 | .26 | .27 | .22 |
| Net realized and unrealized gain (loss) | (1.26) | 6.91 | 7.15 | 4.48 | (1.26) |
| Total from investment operations | (.86) | 7.21 | 7.41 | 4.75 | (1.04) |
| Distributions from net investment income | (.29) | (.27) | (.27) | (.20) | (.23) |
| Distributions from net realized gain | (1.39) | (1.35) | (.09) | (1.50) | (3.84) |
| Total distributions | (1.69)B | (1.62) | (.36) | (1.70) | (4.07) |
| Net asset value, end of period | $46.13 | $48.68 | $43.09 | $36.04 | $32.99 |
| Total ReturnC | (1.05)% | 17.13% | 20.73% | 14.87% | (3.14)% |
| Ratios to Average Net AssetsD,E | | | | | |
| Expenses before reductions | .69% | .73% | .67% | .69% | .79% |
| Expenses net of fee waivers, if any | .69% | .73% | .67% | .69% | .79% |
| Expenses net of all reductions | .69% | .73% | .67% | .69% | .78% |
| Net investment income (loss) | .90% | .66% | .66% | .79% | .60% |
| Supplemental Data | | | | | |
| Net assets, end of period (in millions) | $39 | $295 | $313 | $297 | $304 |
| Portfolio turnover rateF | 22% | 12%G | 9% | 14% | 6% |
A Calculated based on average shares outstanding during the period.
B Total distributions of $1.69 per share is comprised of distributions from net investment income of $.293 and distributions from net realized gain of $1.394 per share.
C Total returns would have been lower if certain expenses had not been reduced during the applicable periods shown.
D Fees and expenses of any underlying Fidelity Central Funds are not included in the Fund's expense ratio. The Fund indirectly bears its proportionate share of the expenses of any underlying Fidelity Central Funds. Based on their most recent shareholder report date, the expenses ranged from less than .005% to .01%.
E Expense ratios reflect operating expenses of the class. Expenses before reductions do not reflect amounts reimbursed by the investment adviser or reductions from brokerage service arrangements or reductions from other expense offset arrangements and do not represent the amount paid by the class during periods when reimbursements or reductions occur. Expenses net of fee waivers reflect expenses after reimbursement by the investment adviser but prior to reductions from brokerage service arrangements or other expense offset arrangements. Expenses net of all reductions represent the net expenses paid by the class.
F Amount does not include the portfolio activity of any underlying Fidelity Central Funds.
G Portfolio turnover rate excludes securities received or delivered in-kind.
See accompanying notes which are an integral part of the financial statements.
Fidelity Stock Selector All Cap Fund Class Z
| Years ended September 30, | 2019 | 2018 | 2017 | 2016 | 2015 |
| Selected Per–Share Data | | | | | |
| Net asset value, beginning of period | $48.59 | $43.02 | $35.98 | $32.95 | $38.09 |
| Income from Investment Operations | | | | | |
| Net investment income (loss)A | .45 | .37 | .32 | .32 | .27 |
| Net realized and unrealized gain (loss) | (1.25) | 6.89 | 7.13 | 4.46 | (1.25) |
| Total from investment operations | (.80) | 7.26 | 7.45 | 4.78 | (.98) |
| Distributions from net investment income | (.36) | (.34) | (.33) | (.25) | (.32) |
| Distributions from net realized gain | (1.39) | (1.35) | (.09) | (1.50) | (3.84) |
| Total distributions | (1.76)B | (1.69) | (.41)C | (1.75) | (4.16) |
| Net asset value, end of period | $46.03 | $48.59 | $43.02 | $35.98 | $32.95 |
| Total ReturnD | (.89)% | 17.30% | 20.91% | 15.02% | (2.98)% |
| Ratios to Average Net AssetsE,F | | | | | |
| Expenses before reductions | .56% | .59% | .53% | .54% | .64% |
| Expenses net of fee waivers, if any | .56% | .59% | .53% | .54% | .64% |
| Expenses net of all reductions | .56% | .59% | .53% | .54% | .63% |
| Net investment income (loss) | 1.03% | .80% | .80% | .94% | .75% |
| Supplemental Data | | | | | |
| Net assets, end of period (in millions) | $12 | $26 | $20 | $8 | $7 |
| Portfolio turnover rateG | 22% | 12%H | 9% | 14% | 6% |
A Calculated based on average shares outstanding during the period.
B Total distributions of $1.76 per share is comprised of distributions from net investment income of $.364 and distributions from net realized gain of $1.394 per share.
C Total distributions of $.41 per share is comprised of distributions from net investment income of $.325 and distributions from net realized gain of $.087 per share.
D Total returns would have been lower if certain expenses had not been reduced during the applicable periods shown.
E Fees and expenses of any underlying Fidelity Central Funds are not included in the Fund's expense ratio. The Fund indirectly bears its proportionate share of the expenses of any underlying Fidelity Central Funds. Based on their most recent shareholder report date, the expenses ranged from less than .005% to .01%.
F Expense ratios reflect operating expenses of the class. Expenses before reductions do not reflect amounts reimbursed by the investment adviser or reductions from brokerage service arrangements or reductions from other expense offset arrangements and do not represent the amount paid by the class during periods when reimbursements or reductions occur. Expenses net of fee waivers reflect expenses after reimbursement by the investment adviser but prior to reductions from brokerage service arrangements or other expense offset arrangements. Expenses net of all reductions represent the net expenses paid by the class.
G Amount does not include the portfolio activity of any underlying Fidelity Central Funds.
H Portfolio turnover rate excludes securities received or delivered in-kind.
See accompanying notes which are an integral part of the financial statements.
Notes to Financial Statements
For the period ended September 30, 2019
(Amounts in thousands except percentages)
1. Organization.
Fidelity Stock Selector All Cap Fund (the Fund) is a fund of Fidelity Capital Trust (the Trust) and is authorized to issue an unlimited number of shares. The Trust is registered under the Investment Company Act of 1940, as amended (the 1940 Act), as an open-end management investment company organized as a Massachusetts business trust. The Fund offers Class A, Class M, Class C, Stock Selector All Cap, Class K, Class I and Class Z shares, each of which has equal rights as to assets and voting privileges. Each class has exclusive voting rights with respect to matters that affect that class. Effective March 1, 2019, Class C shares will automatically convert to Class A shares after a holding period of ten years from the initial date of purchase, with certain exceptions. Certain Underlying Funds incurred name changes since their most recent shareholder report. The names of the Underlying Funds are those in effect at period end.
2. Investments in Fidelity Central Funds.
The Fund invests in Fidelity Central Funds, which are open-end investment companies generally available only to other investment companies and accounts managed by the investment adviser and its affiliates. The Fund's Schedule of Investments lists each of the Fidelity Central Funds held as of period end, if any, as an investment of the Fund, but does not include the underlying holdings of each Fidelity Central Fund. As an Investing Fund, the Fund indirectly bears its proportionate share of the expenses of the underlying Fidelity Central Funds.
Based on its investment objective, each Fidelity Central Fund may invest or participate in various investment vehicles or strategies that are similar to those of the Fund. These strategies are consistent with the investment objectives of the Fund and may involve certain economic risks which may cause a decline in value of each of the Fidelity Central Funds and thus a decline in the value of the Fund. The Money Market Central Funds seek preservation of capital and current income and are managed by Fidelity Investments Money Management, Inc. (FIMM), an affiliate of the investment adviser. Annualized expenses of the Money Market Central Funds as of their most recent shareholder report date ranged from less than .005% to .01%. The following summarizes the Fund's investment in each non-money market Fidelity Central Fund.
| Fidelity Central Fund | Investment Manager | Investment Objective | Investment Practices | Expense Ratio(a) |
| Fidelity Equity Central Funds | FMR Co., Inc. (FMRC) | Each fund seeks capital appreciation by investing primarily in common stocks, with a concentration in a particular industry. | Foreign Securities
Restricted Securities | Less than .005% to .01% |
(a) Expenses expressed as a percentage of average net assets and are as of each underlying Central Fund's most recent annual or semi-annual shareholder report.
An unaudited holdings listing for the Fund, which presents direct holdings as well as the pro-rata share of any securities and other investments held indirectly through its investment in underlying non-money market Fidelity Central Funds, is available at fidelity.com and/or institutional.fidelity.com, as applicable. A complete unaudited list of holdings for each Fidelity Central Fund is available upon request or at the Securities and Exchange Commission (the SEC) website at www.sec.gov. In addition, the financial statements of the Fidelity Central Funds which contain the significant accounting policies (including investment valuation policies) of those funds, which are not covered by the Fund's Report of Independent Registered Public Accounting Firm, are available on the SEC website or upon request.
3. Significant Accounting Policies.
The Fund is an investment company and applies the accounting and reporting guidance of the Financial Accounting Standards Board (FASB) Accounting Standards Codification Topic 946 Financial Services – Investments Companies. The financial statements have been prepared in conformity with accounting principles generally accepted in the United States of America (GAAP), which require management to make certain estimates and assumptions at the date of the financial statements. Actual results could differ from those estimates. Subsequent events, if any, through the date that the financial statements were issued have been evaluated in the preparation of the financial statements. The following summarizes the significant accounting policies of the Fund:
Investment Valuation. Investments are valued as of 4:00 p.m. Eastern time on the last calendar day of the period. The Board of Trustees (the Board) has delegated the day to day responsibility for the valuation of the Fund's investments to the Fair Value Committee (the Committee) established by the Fund's investment adviser. In accordance with valuation policies and procedures approved by the Board, the Fund attempts to obtain prices from one or more third party pricing vendors or brokers to value its investments. When current market prices, quotations or currency exchange rates are not readily available or reliable, investments will be fair valued in good faith by the Committee, in accordance with procedures adopted by the Board. Factors used in determining fair value vary by investment type and may include market or investment specific events. The frequency with which these procedures are used cannot be predicted and they may be utilized to a significant extent. The Committee oversees the Fund's valuation policies and procedures and reports to the Board on the Committee's activities and fair value determinations. The Board monitors the appropriateness of the procedures used in valuing the Fund's investments and ratifies the fair value determinations of the Committee. The Fund categorizes the inputs to valuation techniques used to value its investments into a disclosure hierarchy consisting of three levels as shown below:
- Level 1 – quoted prices in active markets for identical investments
- Level 2 – other significant observable inputs (including quoted prices for similar investments, interest rates, prepayment speeds, etc.)
- Level 3 – unobservable inputs (including the Fund's own assumptions based on the best information available)
Valuation techniques used to value the Fund's investments by major category are as follows.
Investments in open-end mutual funds, including the Fidelity Central Funds, are valued at their closing net asset value (NAV) each business day and are categorized as Level 1 in the hierarchy.
Foreign Currency. The Fund may use foreign currency contracts to facilitate transactions in foreign-denominated securities. Gains and losses from these transactions may arise from changes in the value of the foreign currency or if the counterparties do not perform under the contracts' terms.
Foreign-denominated assets, including investment securities, and liabilities are translated into U.S. dollars at the exchange rates at period end. Purchases and sales of investment securities, income and dividends received and expenses denominated in foreign currencies are translated into U.S. dollars at the exchange rate in effect on the transaction date.
The effects of exchange rate fluctuations on investments are included with the net realized and unrealized gain (loss) on investment securities. Other foreign currency transactions resulting in realized and unrealized gain (loss) are disclosed separately.
Investment Transactions and Income. For financial reporting purposes, the Fund's investment holdings and NAV include trades executed through the end of the last business day of the period. The NAV per share for processing shareholder transactions is calculated as of the close of business of the New York Stock Exchange (NYSE), normally 4:00 p.m. Eastern time and includes trades executed through the end of the prior business day. Gains and losses on securities sold are determined on the basis of identified cost and include proceeds received from litigation. Income and capital gain distributions from Fidelity Central Funds, if any, are recorded on the ex-dividend date. Investment income is recorded net of foreign taxes withheld where recovery of such taxes is uncertain.
Class Allocations and Expenses. Investment income, realized and unrealized capital gains and losses, common expenses of the Fund, and certain fund-level expense reductions, if any, are allocated daily on a pro-rata basis to each class based on the relative net assets of each class to the total net assets of the Fund. Each class differs with respect to transfer agent and distribution and service plan fees incurred. Certain expense reductions may also differ by class. For the reporting period, the allocated portion of income and expenses to each class as a percent of its average net assets may vary due to the timing of recording these transactions in relation to fluctuating net assets of the classes. Expenses directly attributable to a fund are charged to that fund. Expenses attributable to more than one fund are allocated among the respective funds on the basis of relative net assets or other appropriate methods. Expense estimates are accrued in the period to which they relate and adjustments are made when actual amounts are known. Expenses included in the accompanying financial statements reflect the expenses of the Fund and do not include any expenses of the Fidelity Central Funds. Although not included in the Fund's expenses, the Fund indirectly bears its proportionate share of the Fidelity Central Funds' expenses through the impact of these expenses on each Fidelity Central Fund's NAV.
Deferred Trustee Compensation. Under a Deferred Compensation Plan (the Plan) for the Fund, certain independent Trustees have elected to defer receipt of a portion of their annual compensation. Deferred amounts are invested in a cross-section of Fidelity funds, are marked-to-market and remain in the Fund until distributed in accordance with the Plan. The investment of deferred amounts and the offsetting payable to the Trustees of $37 are included in the accompanying Statement of Assets and Liabilities in other receivables and other payables and accrued expenses, respectively.
Income Tax Information and Distributions to Shareholders. Each year, the Fund intends to qualify as a regulated investment company under Subchapter M of the Internal Revenue Code, including distributing substantially all of its taxable income and realized gains. As a result, no provision for U.S. Federal income taxes is required. As of September 30, 2019, the Fund did not have any unrecognized tax benefits in the financial statements; nor is the Fund aware of any tax positions for which it is reasonably possible that the total amounts of unrecognized tax benefits will significantly change in the next twelve months. The Fund files a U.S. federal tax return, in addition to state and local tax returns as required. The Fund's federal income tax returns are subject to examination by the Internal Revenue Service (IRS) for a period of three fiscal years after they are filed. State and local tax returns may be subject to examination for an additional fiscal year depending on the jurisdiction. Foreign taxes are provided for based on the Fund's understanding of the tax rules and rates that exist in the foreign markets in which it invests.
Distributions are declared and recorded on the ex-dividend date. Income and capital gain distributions are declared separately for each class. Income and capital gain distributions are determined in accordance with income tax regulations, which may differ from GAAP. In addition, the Fund claimed a portion of the payment made to redeeming shareholders as a distribution for income tax purposes.
Capital accounts within the financial statements are adjusted for permanent book-tax differences. These adjustments have no impact on net assets or the results of operations. Capital accounts are not adjusted for temporary book-tax differences which will reverse in a subsequent period.
Book-tax differences are primarily due to the short-term gain distributions from the Fidelity Central Funds, deferred trustees compensation and losses deferred due to wash sales.
As of period end, the cost and unrealized appreciation (depreciation) in securities, and derivatives if applicable, for federal income tax purposes were as follows:
| Gross unrealized appreciation | $1,305,242 |
| Gross unrealized depreciation | (171,289) |
| Net unrealized appreciation (depreciation) | $1,133,953 |
| Tax Cost | $7,006,976 |
The tax-based components of distributable earnings as of period end were as follows:
| Undistributed ordinary income | $44,351 |
| Undistributed long-term capital gain | $414,927 |
| Net unrealized appreciation (depreciation) on securities and other investments | $1,133,952 |
The tax character of distributions paid was as follows:
| | September 30, 2019 | September 30, 2018 |
| Ordinary Income | $76,710 | $ 203,847 |
| Long-term Capital Gains | 275,397 | 111,735 |
| Total | $352,107 | $ 315,582 |
New Rule Issuance. During August 2018, the U.S. Securities and Exchange Commission issued Final Rule Release No. 33-10532, Disclosure Update and Simplification. This Final Rule includes amendments specific to registered investment companies that are intended to eliminate overlap in disclosure requirements between Regulation S-X and GAAP. In accordance with these amendments, certain line-items in the Fund's financial statements have been combined or removed for the current period as outlined in the table below.
| Financial Statement | Current Line-Item Presentation (As Applicable) | Prior Line-Item Presentation (As Applicable) |
| Statement of Assets and Liabilities | Total distributable earnings (loss) | Undistributed/Distributions in excess of/Accumulated net investment income (loss)
Accumulated/Undistributed net realized gain (loss)
Net unrealized appreciation (depreciation) |
| Statement of Changes in Net Assets | N/A - removed | Undistributed/Distributions in excess of/Accumulated net investment income (loss) end of period |
| Statement of Changes in Net Assets | Distributions to shareholders | Distributions to shareholders from net investment income
Distributions to shareholders from net realized gain |
| Distributions to Shareholders Note to Financial Statements | Distributions to shareholders | Distributions to shareholders from net investment income
Distributions to shareholders from net realized gain |
4. Purchases and Redemptions of Underlying Fund Shares.
Purchases and redemptions of the Underlying Fund shares, including in-kind transactions, aggregated $2,026,050 and $3,371,550, respectively.
5. Fees and Other Transactions with Affiliates.
Management Fee. Fidelity Management & Research Company (the investment adviser) and its affiliates provide the Fund with investment management related services for which the Fund pays a monthly management fee. The management fee is the sum of an individual fund fee rate that is based on an annual rate of .30% of the Fund's average net assets and an annualized group fee rate that averaged .24% during the period. The group fee rate is based upon the average net assets of all the mutual funds advised by the investment adviser, including any mutual funds previously advised by the investment adviser that are currently advised by Fidelity SelectCo, LLC, an affiliate of the investment adviser. The group fee rate decreases as assets under management increase and increases as assets under management decrease. In addition, the management fee is subject to a performance adjustment (up to a maximum of +/- .20% of the Fund's average net assets over a 36 month performance period). The upward or downward adjustment to the management fee is based on the relative investment performance of Stock Selector All Cap as compared to its benchmark index, the S&P 500 Index, over the same 36 month performance period. For the reporting period, the total annual management fee rate, including the performance adjustment, was .49% of the Fund's average net assets. The performance adjustment included in the management fee rate may be higher or lower than the maximum performance adjustment rate due to the difference between the average net assets for the reporting and performance periods.
The investment adviser pays a portion of the management fees received from the Fund to the Fidelity Central Funds' investment advisers, who are also affiliates, for managing the assets of the Fidelity Central Funds.
Distribution and Service Plan Fees. In accordance with Rule 12b-1 of the 1940 Act, the Fund has adopted separate Distribution and Service Plans for each class of shares. Certain classes pay Fidelity Distributors Corporation (FDC), an affiliate of the investment adviser, separate Distribution and Service Fees, each of which is based on an annual percentage of each class' average net assets. In addition, FDC may pay financial intermediaries for selling shares of the Fund and providing shareholder support services. For the period, the Distribution and Service Fee rates, total fees and amounts retained by FDC were as follows:
| | Distribution Fee | Service Fee | Total Fees | Retained by FDC |
| Class A | -% | .25% | $473 | $8 |
| Class M | .25% | .25% | 560 | 9 |
| Class C | .75% | .25% | 431 | 26 |
| | | | $1,464 | $43 |
Sales Load. FDC may receive a front-end sales charge of up to 5.75% for selling Class A shares and 3.50% for selling Class M shares, some of which is paid to financial intermediaries for selling shares of the Fund. Depending on the holding period, FDC may receive contingent deferred sales charges levied on Class A, Class M and Class C redemptions. The deferred sales charges are 1.00% for Class C shares, 1.00% for certain purchases of Class A shares and .25% for certain purchases of Class M shares.
For the period, sales charge amounts retained by FDC were as follows:
| | Retained by FDC |
| Class A | $23 |
| Class M | 6 |
| Class C(a) | 4 |
| | $33 |
(a) When Class C shares are initially sold, FDC pays commissions from its own resources to financial intermediaries through which the sales are made.
Transfer Agent Fees. Fidelity Investments Institutional Operations Company, Inc., (FIIOC), an affiliate of the investment adviser, is the transfer, dividend disbursing and shareholder servicing agent for each class of the Fund. FIIOC receives account fees and asset-based fees that vary according to the account size and type of account of the shareholders of the respective classes of the Fund, except for Class K and Class Z. FIIOC receives an asset-based fee of Class K's and Class Z's average net assets. FIIOC pays for typesetting, printing and mailing of shareholder reports, except proxy statements.
For the period, transfer agent fees for each class were as follows:
| | Amount | % of Class-Level Average Net Assets |
| Class A | $374 | .20 |
| Class M | 226 | .20 |
| Class C | 101 | .23 |
| Stock Selector All Cap | 11,908 | .14 |
| Class K | 57 | .05 |
| Class I | 491 | .18 |
| Class Z | 9 | .05 |
| | $13,166 | |
.
Accounting Fees. Fidelity Service Company, Inc. (FSC), an affiliate of the investment adviser, maintains the Fund's accounting records. The fee is based on the level of average net assets for each month. For the period, the fees were equivalent to an annual rate of .01%.
Interfund Trades. The Fund may purchase from or sell securities to other Fidelity Funds under procedures adopted by the Board. The procedures have been designed to ensure these interfund trades are executed in accordance with Rule 17a-7 of the 1940 Act. Interfund trades are included within the respective purchases and sales amounts shown in the Purchases and Sales of Investments note.
Reallocation of Underlying Fund Investments. During the period, the investment adviser reallocated portions of investments of the Fund. This involved taxable redemptions of Fidelity Consumer Discretionary Central Fund and Fidelity Information Technology Central Fund for investments with a value of $131,727 and $355,159, respectively, and a non-taxable exchange of those investments for 2,651 shares of Fidelity Communication Services Central Fund. Net realized gain(loss) of $5,307 and $(25,448) on redemptions from Fidelity Consumer Discretionary Central Fund and Fidelity Information Technology Central Fund, respectively, in connection with the reallocation is included in the Statement of Operations as "Net realized gain (loss) on Fidelity Central Funds". Fidelity Communication Services Central Fund, Fidelity Consumer Discretionary Central Fund and Fidelity Information Technology Central Fund are affiliated investment companies managed by FMR.
Affiliated Redemptions In-Kind. During the period, 16,154 shares of the Fund were redeemed in-kind for securities and cash. The Fund did not realize any gains or losses for federal income tax purposes on the investments delivered of $741,812.
This was accomplished by the Fund processing taxable exchanges in-kind of its investments in the Fidelity Equity Central Funds with a total value of $741,812, in exchange for securities and cash, realizing a net loss of $26,671. The Fund recognized these losses for federal income tax purposes on the exchanges of the Fidelity Equity Central Funds and is included in the accompanying Statement of Operations as "Net realized gain (loss) on Fidelity Central Funds". The amount of the in-kind redemptions is included in share transactions in the accompanying Statement of Changes in Net Assets as well as the Notes to Financial Statements.
Prior Fiscal Year Affiliated Redemptions In-Kind. During the prior period, 82,077 shares of the Fund were redeemed in-kind for investments and cash with a value of $3,657,305. The Fund had a net realized gain of $1,860,210 on investments delivered through in-kind redemptions. The amount of the in-kind redemptions is included in share transactions in the accompanying Statement of Changes in Net Assets as well as the Notes to Financial Statements. The Fund recognized no gain or loss for federal income tax purposes.
Prior Fiscal Year Affiliated Exchanges In-Kind. During the prior period, the Fund received investments valued at $4,422,766 in exchange for 98,175 shares of the Fund. The amount of in-kind exchanges is included in share transactions in the accompanying Statement of Changes in Net Assets as well as Notes to Financial Statements.
6. Committed Line of Credit.
The Fund participates with other funds managed by the investment adviser or an affiliate in a $4.25 billion credit facility (the "line of credit") to be utilized for temporary or emergency purposes to fund shareholder redemptions or for other short-term liquidity purposes. The Fund has agreed to pay commitment fees on its pro-rata portion of the line of credit, which amounted to $25 and is reflected in Miscellaneous expenses on the Statement of Operations. During the period, the Fund did not borrow on this line of credit.
7. Expense Reductions.
During the period the investment adviser reimbursed and/or waived a portion of fund-level operating expenses in the amount of $68.
8. Distributions to Shareholders.
Distributions to shareholders of each class were as follows:
| | Year ended
September 30, 2019 | Year ended
September 30, 2018 |
| Distributions to shareholders | | |
| Class A | $6,230 | $– |
| Class M | 3,635 | – |
| Class C | 1,760 | – |
| Stock Selector All Cap | 326,227 | – |
| Class K | 3,046 | – |
| Class I | 10,268 | – |
| Class Z | 941 | – |
| Total | $352,107 | $– |
| From net investment income | | |
| Class A | $– | $681 |
| Class M | – | 118 |
| Stock Selector All Cap | – | 49,651 |
| Class K | – | 3,652 |
| Class I | – | 1,897 |
| Class Z | – | 169 |
| Total | $– | $56,168 |
| From net realized gain | | |
| Class A | $– | $5,887 |
| Class M | – | 3,694 |
| Class C | – | 1,826 |
| Stock Selector All Cap | – | 223,839 |
| Class K | – | 14,067 |
| Class I | – | 9,437 |
| Class Z | – | 664 |
| Total | $– | $259,414 |
9. Share Transactions.
Share transactions for each class were as follows and may contain automatic conversions between classes or exchanges between affiliated funds:
| | Shares | Shares | Dollars | Dollars |
| | Year ended September 30, 2019 | Year ended September 30, 2018 | Year ended September 30, 2019 | Year ended September 30, 2018 |
| Class A | | | | |
| Shares sold | 822 | 348 | $36,144 | $15,889 |
| Reinvestment of distributions | 158 | 146 | 6,047 | 6,447 |
| Shares redeemed | (812) | (912) | (35,937) | (41,377) |
| Net increase (decrease) | 168 | (418) | $6,254 | $(19,041) |
| Class M | | | | |
| Shares sold | 143 | 144 | $6,295 | $6,620 |
| Reinvestment of distributions | 94 | 86 | 3,590 | 3,771 |
| Shares redeemed | (421) | (459) | (18,637) | (20,965) |
| Net increase (decrease) | (184) | (229) | $(8,752) | $(10,574) |
| Class C | | | | |
| Shares sold | 85 | 85 | $3,706 | $3,835 |
| Reinvestment of distributions | 46 | 40 | 1,739 | 1,751 |
| Shares redeemed | (875) | (342) | (37,980) | (15,565) |
| Net increase (decrease) | (744) | (217) | $(32,535) | $(9,979) |
| Stock Selector All Cap | | | | |
| Shares sold | 18,082 | 128,907(a) | $795,561 | $5,810,366(a) |
| Reinvestment of distributions | 8,481 | 6,149 | 323,138 | 270,559 |
| Shares redeemed | (51,490)(b) | (109,629)(c) | (2,298,308)(b) | (4,913,262)(c) |
| Net increase (decrease) | (24,927) | 25,427 | $(1,179,609) | $1,167,663 |
| Class K | | | | |
| Shares sold | 335 | 9,716 | $14,774 | $432,882 |
| Reinvestment of distributions | 80 | 403 | 3,046 | 17,719 |
| Shares redeemed | (6,260) | (4,561) | (272,575) | (211,385) |
| Net increase (decrease) | (5,845) | 5,558 | $(254,755) | $239,216 |
| Class I | | | | |
| Shares sold | 1,532 | 1,172 | $68,017 | $53,523 |
| Reinvestment of distributions | 266 | 254 | 10,156 | 11,166 |
| Shares redeemed | (7,025)(b) | (2,614) | (319,246)(b) | (119,290) |
| Net increase (decrease) | (5,227) | (1,188) | $(241,073) | $(54,601) |
| Class Z | | | | |
| Shares sold | 115 | 187 | $4,953 | $8,550 |
| Reinvestment of distributions | 24 | 19 | 916 | 815 |
| Shares redeemed | (432) | (127) | (19,191) | (5,735) |
| Net increase (decrease) | (293) | 79 | $(13,322) | $3,630 |
(a) Amount includes in-kind exchanges (see the Prior Fiscal Year Affiliated Exchanges In-Kind note for additional details).
(b) Amount includes in-kind redemptions (see the Affiliated Redemptions In-Kind note for additional details).
(c) Amount includes in-kind redemptions (see the Prior Fiscal Year Affiliated Redemptions In-Kind note for additional details).
10. Other.
The Fund's organizational documents provide former and current trustees and officers with a limited indemnification against liabilities arising in connection with the performance of their duties to the Fund. In the normal course of business, the Fund may also enter into contracts that provide general indemnifications. The Fund's maximum exposure under these arrangements is unknown as this would be dependent on future claims that may be made against the Fund. The risk of material loss from such claims is considered remote.
At the end of the period, a shareholder of record owned approximately 29% of the total outstanding shares of the Fund.
At the end of the period, VIP FundsManager 50% Portfolio and VIP FundsManager 60% Portfolio were the owners of record of approximately 19% and 23%, respectively, of the total outstanding shares of the Fund.
Report of Independent Registered Public Accounting Firm
To the Trustees of Fidelity Capital Trust and Shareholders of Fidelity Stock Selector All Cap Fund:
Opinion on the Financial Statements and Financial Highlights
We have audited the accompanying statement of assets and liabilities of Fidelity Stock Selector All Cap Fund (the "Fund"), a fund of Fidelity Capital Trust, including the schedule of investments, as of September 30, 2019, the related statement of operations for the year then ended, the statement of changes in net assets for each of the two years in the period then ended, the financial highlights for each of the five years in the period then ended, and the related notes. In our opinion, the financial statements and financial highlights present fairly, in all material respects, the financial position of the Fund as of September 30, 2019, the results of its operations for the year then ended, the changes in its net assets for each of the two years in the period then ended, and the financial highlights for each of the five years in the period then ended in conformity with accounting principles generally accepted in the United States of America.
Basis for Opinion
These financial statements and financial highlights are the responsibility of the Fund's management. Our responsibility is to express an opinion on the Fund's financial statements and financial highlights based on our audits. We are a public accounting firm registered with the Public Company Accounting Oversight Board (United States) (PCAOB) and are required to be independent with respect to the Fund in accordance with the U.S. federal securities laws and the applicable rules and regulations of the Securities and Exchange Commission and the PCAOB.
We conducted our audits in accordance with the standards of the PCAOB. Those standards require that we plan and perform the audit to obtain reasonable assurance about whether the financial statements and financial highlights are free of material misstatement, whether due to error or fraud. The Fund is not required to have, nor were we engaged to perform, an audit of its internal control over financial reporting. As part of our audits we are required to obtain an understanding of internal control over financial reporting but not for the purpose of expressing an opinion on the effectiveness of the Fund’s internal control over financial reporting. Accordingly, we express no such opinion.
Our audits included performing procedures to assess the risks of material misstatement of the financial statements and financial highlights, whether due to error or fraud, and performing procedures that respond to those risks. Such procedures included examining, on a test basis, evidence regarding the amounts and disclosures in the financial statements and financial highlights. Our audits also included evaluating the accounting principles used and significant estimates made by management, as well as evaluating the overall presentation of the financial statements and financial highlights. Our procedures included confirmation of securities owned as of September 30, 2019, by correspondence with the custodians and brokers; when replies were not received from brokers, we performed other auditing procedures. We believe that our audits provide a reasonable basis for our opinion.
/s/ Deloitte & Touche LLP
Boston, Massachusetts
November 15, 2019
We have served as the auditor of one or more of the Fidelity investment companies since 1999.
Trustees and Officers
The Trustees, Members of the Advisory Board (if any), and officers of the trust and fund, as applicable, are listed below. The Board of Trustees governs the fund and is responsible for protecting the interests of shareholders. The Trustees are experienced executives who meet periodically throughout the year to oversee the fund's activities, review contractual arrangements with companies that provide services to the fund, oversee management of the risks associated with such activities and contractual arrangements, and review the fund's performance. Except for Michael Wiley, each of the Trustees oversees 298 funds. Mr. Wiley oversees 197 funds.
The Trustees hold office without limit in time except that (a) any Trustee may resign; (b) any Trustee may be removed by written instrument, signed by at least two-thirds of the number of Trustees prior to such removal; (c) any Trustee who requests to be retired or who has become incapacitated by illness or injury may be retired by written instrument signed by a majority of the other Trustees; and (d) any Trustee may be removed at any special meeting of shareholders by a two-thirds vote of the outstanding voting securities of the trust. Each Trustee who is not an interested person (as defined in the 1940 Act) of the trust and the fund is referred to herein as an Independent Trustee. Each Independent Trustee shall retire not later than the last day of the calendar year in which his or her 75th birthday occurs. The Independent Trustees may waive this mandatory retirement age policy with respect to individual Trustees. Officers and Advisory Board Members hold office without limit in time, except that any officer or Advisory Board Member may resign or may be removed by a vote of a majority of the Trustees at any regular meeting or any special meeting of the Trustees. Except as indicated, each individual has held the office shown or other offices in the same company for the past five years.
The fund's Statement of Additional Information (SAI) includes more information about the Trustees. To request a free copy, call Fidelity at 1-800-544-8544 if you’re an individual investing directly with Fidelity, call 1-800-835-5092 if you’re a plan sponsor or participant with Fidelity as your recordkeeper or call 1-877-208-0098 on institutional accounts or if you’re an advisor or invest through one.
Experience, Skills, Attributes, and Qualifications of the Trustees. The Governance and Nominating Committee has adopted a statement of policy that describes the experience, qualifications, attributes, and skills that are necessary and desirable for potential Independent Trustee candidates (Statement of Policy). The Board believes that each Trustee satisfied at the time he or she was initially elected or appointed a Trustee, and continues to satisfy, the standards contemplated by the Statement of Policy. The Governance and Nominating Committee also engages professional search firms to help identify potential Independent Trustee candidates who have the experience, qualifications, attributes, and skills consistent with the Statement of Policy. From time to time, additional criteria based on the composition and skills of the current Independent Trustees, as well as experience or skills that may be appropriate in light of future changes to board composition, business conditions, and regulatory or other developments, have also been considered by the professional search firms and the Governance and Nominating Committee. In addition, the Board takes into account the Trustees' commitment and participation in Board and committee meetings, as well as their leadership of standing and ad hoc committees throughout their tenure.
In determining that a particular Trustee was and continues to be qualified to serve as a Trustee, the Board has considered a variety of criteria, none of which, in isolation, was controlling. The Board believes that, collectively, the Trustees have balanced and diverse experience, qualifications, attributes, and skills, which allow the Board to operate effectively in governing the fund and protecting the interests of shareholders. Information about the specific experience, skills, attributes, and qualifications of each Trustee, which in each case led to the Board's conclusion that the Trustee should serve (or continue to serve) as a trustee of the fund, is provided below.
Board Structure and Oversight Function. James C. Curvey is an interested person and currently serves as Chairman. The Trustees have determined that an interested Chairman is appropriate and benefits shareholders because an interested Chairman has a personal and professional stake in the quality and continuity of services provided to the fund. Independent Trustees exercise their informed business judgment to appoint an individual of their choosing to serve as Chairman, regardless of whether the Trustee happens to be independent or a member of management. The Independent Trustees have determined that they can act independently and effectively without having an Independent Trustee serve as Chairman and that a key structural component for assuring that they are in a position to do so is for the Independent Trustees to constitute a substantial majority for the Board. The Independent Trustees also regularly meet in executive session. Ned C. Lautenbach serves as Chairman of the Independent Trustees and as such (i) acts as a liaison between the Independent Trustees and management with respect to matters important to the Independent Trustees and (ii) with management prepares agendas for Board meetings.
Fidelity® funds are overseen by different Boards of Trustees. The fund's Board oversees Fidelity's high income and certain equity funds, and other Boards oversee Fidelity's investment-grade bond, money market, asset allocation, and other equity funds. The asset allocation funds may invest in Fidelity® funds overseen by the fund's Board. The use of separate Boards, each with its own committee structure, allows the Trustees of each group of Fidelity® funds to focus on the unique issues of the funds they oversee, including common research, investment, and operational issues. On occasion, the separate Boards establish joint committees to address issues of overlapping consequences for the Fidelity® funds overseen by each Board.
The Trustees operate using a system of committees to facilitate the timely and efficient consideration of all matters of importance to the Trustees, the fund, and fund shareholders and to facilitate compliance with legal and regulatory requirements and oversight of the fund's activities and associated risks. The Board, acting through its committees, has charged FMR and its affiliates with (i) identifying events or circumstances the occurrence of which could have demonstrably adverse effects on the fund's business and/or reputation; (ii) implementing processes and controls to lessen the possibility that such events or circumstances occur or to mitigate the effects of such events or circumstances if they do occur; and (iii) creating and maintaining a system designed to evaluate continuously business and market conditions in order to facilitate the identification and implementation processes described in (i) and (ii) above. Because the day-to-day operations and activities of the fund are carried out by or through FMR, its affiliates, and other service providers, the fund's exposure to risks is mitigated but not eliminated by the processes overseen by the Trustees. While each of the Board's committees has responsibility for overseeing different aspects of the fund's activities, oversight is exercised primarily through the Operations, Audit, and Compliance Committees. Appropriate personnel, including but not limited to the fund's Chief Compliance Officer (CCO), FMR's internal auditor, the independent accountants, the fund's Treasurer and portfolio management personnel, make periodic reports to the Board's committees, as appropriate, including an annual review of Fidelity's risk management program for the Fidelity® funds. The responsibilities of each standing committee, including their oversight responsibilities, are described further under "Standing Committees of the Trustees."
Interested Trustees*:
Correspondence intended for a Trustee who is an interested person may be sent to Fidelity Investments, 245 Summer Street, Boston, Massachusetts 02210.
Name, Year of Birth; Principal Occupations and Other Relevant Experience+
James C. Curvey (1935)
Year of Election or Appointment: 2007
Trustee
Chairman of the Board of Trustees
Mr. Curvey also serves as Trustee of other Fidelity® funds. Mr. Curvey is Vice Chairman (2007-present) and Director of FMR LLC (diversified financial services company). In addition, Mr. Curvey is an Overseer Emeritus for the Boston Symphony Orchestra, a Director of Artis-Naples, and a Trustee of Brewster Academy in Wolfeboro, New Hampshire. Previously, Mr. Curvey served as a Director of Fidelity Research & Analysis Co. (investment adviser firm, 2009-2018), Director of Fidelity Investments Money Management, Inc. (investment adviser firm, 2009-2014) and a Director of FMR and FMR Co., Inc. (investment adviser firms, 2007-2014).
* Determined to be an “Interested Trustee” by virtue of, among other things, his or her affiliation with the trust or various entities under common control with FMR.
+ The information includes the Trustee's principal occupation during the last five years and other information relating to the experience, attributes, and skills relevant to the Trustee's qualifications to serve as a Trustee, which led to the conclusion that the Trustee should serve as a Trustee for the fund.
Independent Trustees:
Correspondence intended for an Independent Trustee may be sent to Fidelity Investments, P.O. Box 55235, Boston, Massachusetts 02205-5235.
Name, Year of Birth; Principal Occupations and Other Relevant Experience+
Dennis J. Dirks (1948)
Year of Election or Appointment: 2005
Trustee
Mr. Dirks also serves as Trustee of other Fidelity® funds. Prior to his retirement in May 2003, Mr. Dirks was Chief Operating Officer and a member of the Board of The Depository Trust & Clearing Corporation (DTCC). He also served as President, Chief Operating Officer, and Board member of The Depository Trust Company (DTC) and President and Board member of the National Securities Clearing Corporation (NSCC). In addition, Mr. Dirks served as Chief Executive Officer and Board member of the Government Securities Clearing Corporation, Chief Executive Officer and Board member of the Mortgage-Backed Securities Clearing Corporation, as a Trustee and a member of the Finance Committee of Manhattan College (2005-2008), as a Trustee and a member of the Finance Committee of AHRC of Nassau County (2006-2008), as a member of the Independent Directors Council (IDC) Governing Council (2010-2015), and as a member of the Board of Directors for The Brookville Center for Children’s Services, Inc. (2009-2017). Mr. Dirks is a member of the Finance Committee (2016-present) and Board of Directors (2017-present) and is Treasurer (2018-present) of the Asolo Repertory Theatre.
Donald F. Donahue (1950)
Year of Election or Appointment: 2018
Trustee
Mr. Donahue also serves as a Trustee of other Fidelity® funds. Mr. Donahue is President and Chief Executive Officer of Miranda Partners, LLC (risk consulting for the financial services industry, 2012-present). Previously, Mr. Donahue served as a Member of the Advisory Board of certain Fidelity® funds (2015-2018) and Chief Executive Officer (2006-2012), Chief Operating Officer (2003-2006), and Managing Director, Customer Marketing and Development (1999-2003) of The Depository Trust & Clearing Corporation (financial markets infrastructure). Mr. Donahue serves as a Member (2007-present) and Co-Chairman (2016-present) of the Board of Directors of United Way of New York, Member of the Board of Directors of NYC Leadership Academy (2012-present) and Member of the Board of Advisors of Ripple Labs, Inc. (financial services, 2015-present). He also served as Chairman (2010-2012) and Member of the Board of Directors (2012-2013) of Omgeo, LLC (financial services), Treasurer of United Way of New York (2012-2016), and Member of the Board of Directors of XBRL US (financial services non-profit, 2009-2012) and the International Securities Services Association (2009-2012).
Alan J. Lacy (1953)
Year of Election or Appointment: 2008
Trustee
Mr. Lacy also serves as Trustee of other Fidelity® funds. Mr. Lacy serves as a Director of Bristol-Myers Squibb Company (global pharmaceuticals, 2008-present). He is a Trustee of the California Chapter of The Nature Conservancy (2015-present) and a Director of the Center for Advanced Study in the Behavioral Sciences at Stanford University (2015-present). In addition, Mr. Lacy served as Senior Adviser (2007-2014) of Oak Hill Capital Partners, L.P. (private equity) and also served as Chief Executive Officer (2005) and Vice Chairman (2005-2006) of Sears Holdings Corporation (retail) and Chief Executive Officer and Chairman of the Board of Sears, Roebuck and Co. (retail, 2000-2005). Previously, Mr. Lacy served as Chairman (2014-2017) and a member (2010-2017) of the Board of Directors of Dave & Buster’s Entertainment, Inc. (restaurant and entertainment complexes), as Chairman (2008-2011) and a member (2006-2015) of the Board of Trustees of the National Parks Conservation Association, and as a member of the Board of Directors for The Hillman Companies, Inc. (hardware wholesalers, 2010-2014), Earth Fare, Inc. (retail grocery, 2010-2014), and The Western Union Company (global money transfer, 2006-2011).
Ned C. Lautenbach (1944)
Year of Election or Appointment: 2000
Trustee
Chairman of the Independent Trustees
Mr. Lautenbach also serves as Trustee of other Fidelity® funds. Mr. Lautenbach currently serves as Chair (2018-present) and Member (2013-present) of the Board of Governors, State University System of Florida and is a member of the Council on Foreign Relations (1994-present). He is also a member and has most recently served as Chairman of the Board of Directors of Artis-Naples (2012-present). Previously, Mr. Lautenbach served as a member and then Lead Director of the Board of Directors of Eaton Corporation (diversified industrial, 1997-2016). He was also a Partner and Advisory Partner at Clayton, Dubilier & Rice, LLC (private equity investment, 1998-2010), as well as a Director of Sony Corporation (2006-2007). In addition, Mr. Lautenbach also had a 30-year career with IBM (technology company) during which time he served as Senior Vice President and a member of the Corporate Executive Committee (1968-1998).
Joseph Mauriello (1944)
Year of Election or Appointment: 2008
Trustee
Mr. Mauriello also serves as Trustee of other Fidelity® funds. Prior to his retirement in January 2006, Mr. Mauriello served in numerous senior management positions including Deputy Chairman and Chief Operating Officer (2004-2005), and Vice Chairman of Financial Services (2002-2004) of KPMG LLP US (professional services, 1965-2005). Mr. Mauriello currently serves as a member of the Independent Directors Council (IDC) Governing Council (2015-present). Previously, Mr. Mauriello served as a member of the Board of Directors of XL Group plc. (global insurance and re-insurance, 2006-2018).
Cornelia M. Small (1944)
Year of Election or Appointment: 2005
Trustee
Ms. Small also serves as Trustee of other Fidelity® funds. Ms. Small is a member of the Board of Directors (2009-present) and Chair of the Investment Committee (2010-present) of the Teagle Foundation. Ms. Small also serves on the Investment Committee of the Berkshire Taconic Community Foundation (2008-present). Previously, Ms. Small served as Chairperson (2002-2008) and a member of the Investment Committee and Chairperson (2008-2012) and a member of the Board of Trustees of Smith College. In addition, Ms. Small served as Chief Investment Officer, Director of Global Equity Investments, and a member of the Board of Directors of Scudder, Stevens & Clark and Scudder Kemper Investments.
Garnett A. Smith (1947)
Year of Election or Appointment: 2018
Trustee
Mr. Smith also serves as Trustee of other Fidelity® funds. Prior to Mr. Smith's retirement, he served as Chairman and Chief Executive Officer of Inbrand Corp. (manufacturer of personal absorbent products, 1990-1997). He also served as President (1986-1990) of Inbrand Corp. Prior to his employment with Inbrand Corp., he was employed by a retail fabric chain and North Carolina National Bank. In addition, Mr. Smith served as a Member of the Advisory Board of certain Fidelity® funds (2012-2013) and as a board member of the Jackson Hole Land Trust (2009-2012).
David M. Thomas (1949)
Year of Election or Appointment: 2008
Trustee
Mr. Thomas also serves as Trustee of other Fidelity® funds. Mr. Thomas serves as Non-Executive Chairman of the Board of Directors of Fortune Brands Home and Security (home and security products, 2011-present) and as a member of the Board of Directors (2004-present) and Presiding Director (2013-present) of Interpublic Group of Companies, Inc. (marketing communication). Previously, Mr. Thomas served as Executive Chairman (2005-2006) and Chairman and Chief Executive Officer (2000-2005) of IMS Health, Inc. (pharmaceutical and healthcare information solutions), a Director of Fortune Brands, Inc. (consumer products, 2000-2011), and a member of the Board of Trustees of the University of Florida (2013-2018).
Michael E. Wiley (1950)
Year of Election or Appointment: 2018
Trustee
Mr. Wiley also serves as Trustee or Member of the Advisory Board of other Fidelity® funds. Mr. Wiley serves as a Director of High Point Resources (exploration and production, 2005-present). Previously, Mr. Wiley served as a Director of Andeavor Corporation (independent oil refiner and marketer, 2005-2018), a Director of Andeavor Logistics LP (natural resources logistics, 2015-2018), a Director of Post Oak Bank (privately-held bank, 2004-2018), a Director of Asia Pacific Exploration Consolidated (international oil and gas exploration and production, 2008-2013), a member of the Board of Trustees of the University of Tulsa (2000-2006; 2007-2010), a Senior Energy Advisor of Katzenbach Partners, LLC (consulting, 2006-2007), an Advisory Director of Riverstone Holdings (private investment), a Director of Spinnaker Exploration Company (exploration and production, 2001-2005) and Chairman, President, and CEO of Baker Hughes, Inc. (oilfield services, 2000-2004).
+ The information includes the Trustee's principal occupation during the last five years and other information relating to the experience, attributes, and skills relevant to the Trustee's qualifications to serve as a Trustee, which led to the conclusion that the Trustee should serve as a Trustee for the fund.
Advisory Board Members and Officers:
Correspondence intended for a Member of the Advisory Board (if any) may be sent to Fidelity Investments, P.O. Box 55235, Boston, Massachusetts 02205-5235. Correspondence intended for an officer or Peter S. Lynch may be sent to Fidelity Investments, 245 Summer Street, Boston, Massachusetts 02210. Officers appear below in alphabetical order.
Name, Year of Birth; Principal Occupation
Vicki L. Fuller (1957)
Year of Election or Appointment: 2018
Member of the Advisory Board
Ms. Fuller also serves as Member of the Advisory Board of other Fidelity® funds. Ms. Fuller serves as a member of the Board of Directors, Audit Committee, and Nominating and Governance Committee of The Williams Companies, Inc. (natural gas infrastructure, 2018-present). Previously, Ms. Fuller served as the Chief Investment Officer of the New York State Common Retirement Fund (2012-2018) and held a variety of positions at AllianceBernstein L.P. (global asset management, 1985-2012), including Managing Director (2006-2012) and Senior Vice President and Senior Portfolio Manager (2001-2006).
Peter S. Lynch (1944)
Year of Election or Appointment: 2003
Member of the Advisory Board
Mr. Lynch also serves as Member of the Advisory Board of other Fidelity® funds. Mr. Lynch is Vice Chairman and a Director of FMR (investment adviser firm) and FMR Co., Inc. (investment adviser firm). In addition, Mr. Lynch serves as a Trustee of Boston College and as the Chairman of the Inner-City Scholarship Fund. Previously, Mr. Lynch served on the Special Olympics International Board of Directors (1997-2006).
Elizabeth Paige Baumann (1968)
Year of Election or Appointment: 2017
Anti-Money Laundering (AML) Officer
Ms. Baumann also serves as AML Officer of other funds. She is Chief AML Officer (2012-present) and Senior Vice President (2014-present) of FMR LLC (diversified financial services company) and is an employee of Fidelity Investments. Previously, Ms. Baumann served as AML Officer of the funds (2012-2016), and Vice President (2007-2014) and Deputy Anti-Money Laundering Officer (2007-2012) of FMR LLC.
Craig S. Brown (1977)
Year of Election or Appointment: 2019
Assistant Treasurer
Mr. Brown also serves as Assistant Treasurer of other funds. Mr. Brown is an employee of Fidelity Investments (2013-present).
John J. Burke III (1964)
Year of Election or Appointment: 2018
Chief Financial Officer
Mr. Burke also serves as Chief Financial Officer of other funds. Mr. Burke serves as Head of Investment Operations for Fidelity Fund and Investment Operations (2018-present) and is an employee of Fidelity Investments (1998-present). Previously Mr. Burke served as head of Asset Management Investment Operations (2012-2018).
William C. Coffey (1969)
Year of Election or Appointment: 2019
Assistant Secretary
Mr. Coffey also serves as Assistant Secretary of other funds. He is Senior Vice President and Deputy General Counsel of FMR LLC (diversified financial services company, 2010-present), and is an employee of Fidelity Investments. Previously, Mr. Coffey served as Secretary and CLO of certain funds (2018-2019); CLO, Secretary, and Senior Vice President of Fidelity Management & Research Company and FMR Co., Inc. (investment adviser firms, 2018-2019); Secretary of Fidelity SelectCo, LLC and Fidelity Investments Money Management, Inc. (investment adviser firms, 2018-2019); CLO of Fidelity Management & Research (Hong Kong) Limited, FMR Investment Management (UK) Limited, and Fidelity Management & Research (Japan) Limited (investment adviser firms, 2018-2019); and Assistant Secretary of certain funds (2009-2018).
Timothy M. Cohen (1969)
Year of Election or Appointment: 2018
Vice President
Mr. Cohen also serves as Vice President of other funds. Mr. Cohen serves as Executive Vice President of Fidelity SelectCo, LLC (2019-present), Co-Head of Equity (2018-present), a Director of Fidelity Management & Research (Japan) Limited (investment adviser firm, 2016-present), and is an employee of Fidelity Investments. Previously, Mr. Cohen served as Head of Global Equity Research (2016-2018), Chief Investment Officer - Equity and a Director of Fidelity Management & Research (U.K.) Inc. (investment adviser firm, 2013-2015) and as a Director of Fidelity Management & Research (Hong Kong) Limited (investment adviser firm, 2017).
Jonathan Davis (1968)
Year of Election or Appointment: 2010
Assistant Treasurer
Mr. Davis also serves as Assistant Treasurer of other funds. Mr. Davis serves as Assistant Treasurer of FMR Capital, Inc. (2017-present) and is an employee of Fidelity Investments. Previously, Mr. Davis served as Vice President and Associate General Counsel of FMR LLC (diversified financial services company, 2003-2010).
Adrien E. Deberghes (1967)
Year of Election or Appointment: 2016
Assistant Treasurer
Mr. Deberghes also serves as an officer of other funds. He serves as Assistant Treasurer of FMR Capital, Inc. (2017-present), Executive Vice President of Fidelity Investments Money Management, Inc. (FIMM) (investment adviser firm, 2016-present), and is an employee of Fidelity Investments (2008-present). Previously, Mr. Deberghes served as President and Treasurer of certain Fidelity® funds (2013-2018). Prior to joining Fidelity Investments, Mr. Deberghes was Senior Vice President of Mutual Fund Administration at State Street Corporation (2007-2008), Senior Director of Mutual Fund Administration at Investors Bank & Trust (2005-2007), and Director of Finance for Dunkin' Brands (2000-2005). Previously, Mr. Deberghes served in other fund officer roles.
Laura M. Del Prato (1964)
Year of Election or Appointment: 2018
Assistant Treasurer
Ms. Del Prato also serves as an officer of other funds. Ms. Del Prato is an employee of Fidelity Investments (2017-present). Prior to joining Fidelity Investments, Ms. Del Prato served as a Managing Director and Treasurer of the JPMorgan Mutual Funds (2014-2017). Prior to JPMorgan, Ms. Del Prato served as a partner at Cohen Fund Audit Services (accounting firm, 2012-2013) and KPMG LLP (accounting firm, 2004-2012).
Colm A. Hogan (1973)
Year of Election or Appointment: 2016
Deputy Treasurer
Mr. Hogan also serves as an officer of other funds. Mr. Hogan serves as Assistant Treasurer of FMR Capital, Inc. (2017-present) and is an employee of Fidelity Investments (2005-present). Previously, Mr. Hogan served as Assistant Treasurer of certain Fidelity® funds (2016-2018).
Pamela R. Holding (1964)
Year of Election or Appointment: 2018
Vice President
Ms. Holding also serves as Vice President of other funds. Ms. Holding serves as Executive Vice President of Fidelity SelectCo, LLC (2019-present), Co-Head of Equity (2018-present) and is an employee of Fidelity Investments (2013-present). Previously, Ms. Holding served as Chief Investment Officer of Fidelity Institutional Asset Management (2013-2018).
Cynthia Lo Bessette (1969)
Year of Election or Appointment: 2019
Secretary and Chief Legal Officer (CLO)
Ms. Lo Bessette also serves as Secretary and CLO of other funds. Ms. Lo Bessette serves as CLO, Secretary, and Senior Vice President of Fidelity Management & Research Company and FMR Co., Inc. (investment adviser firms, 2019-present); Secretary of Fidelity SelectCo, LLC and Fidelity Investments Money Management, Inc. (investment adviser firms, 2019-present); and CLO of Fidelity Management & Research (Hong Kong) Limited, FMR Investment Management (UK) Limited, and Fidelity Management & Research (Japan) Limited (investment adviser firms, 2019-present). She is a Senior Vice President and Deputy General Counsel of FMR LLC (diversified financial services company, 2019-present), and is an employee of Fidelity Investments. Previously, Ms. Lo Bessette served as Executive Vice President, General Counsel (2016-2019) and Senior Vice President, Deputy General Counsel (2015-2016) of OppenheimerFunds (investment management company) and Deputy Chief Legal Officer (2013-2015) of Jennison Associates LLC (investment adviser firm).
Chris Maher (1972)
Year of Election or Appointment: 2013
Assistant Treasurer
Mr. Maher serves as Assistant Treasurer of other funds. Mr. Maher is Vice President of Valuation Oversight, serves as Assistant Treasurer of FMR Capital, Inc. (2017-present), and is an employee of Fidelity Investments. Previously, Mr. Maher served as Vice President of Asset Management Compliance (2013), Vice President of the Program Management Group of FMR (investment adviser firm, 2010-2013), and Vice President of Valuation Oversight (2008-2010).
Kenneth B. Robins (1969)
Year of Election or Appointment: 2016
Chief Compliance Officer
Mr. Robins also serves as an officer of other funds. Mr. Robins serves as Compliance Officer of Fidelity Management & Research Company and FMR Co., Inc. (investment adviser firms, 2016-present) and is an employee of Fidelity Investments (2004-present). Previously, Mr. Robins served as Executive Vice President of Fidelity Investments Money Management, Inc. (investment adviser firm, 2013-2016) and served in other fund officer roles.
Stacie M. Smith (1974)
Year of Election or Appointment: 2016
President and Treasurer
Ms. Smith also serves as an officer of other funds. Ms. Smith serves as Assistant Treasurer of FMR Capital, Inc. (2017-present), is an employee of Fidelity Investments (2009-present), and has served in other fund officer roles. Prior to joining Fidelity Investments, Ms. Smith served as Senior Audit Manager of Ernst & Young LLP (accounting firm, 1996-2009). Previously, Ms. Smith served as Assistant Treasurer (2013-2018) and Deputy Treasurer (2013-2016) of certain Fidelity® funds.
Marc L. Spector (1972)
Year of Election or Appointment: 2016
Assistant Treasurer
Mr. Spector also serves as an officer of other funds. Mr. Spector serves as Assistant Treasurer of FMR Capital, Inc. (2017-present) and is an employee of Fidelity Investments (2016-present). Prior to joining Fidelity Investments, Mr. Spector served as Director at the Siegfried Group (accounting firm, 2013-2016), and prior to Siegfried Group as audit senior manager at Deloitte & Touche (accounting firm, 2005-2013).
Jim Wegmann (1979)
Year of Election or Appointment: 2019
Assistant Treasurer
Mr. Wegmann also serves as Assistant Treasurer of other funds. Mr. Wegmann is an employee of Fidelity Investments (2011-present).
Vadim Zlotnikov (1962)
Year of Election or Appointment: 2019
Vice President
Mr. Zlotnikov also serves as Vice President of other funds. Mr. Zlotnikov serves as President and Chief Investment Officer of Global Asset Allocation and is an employee of Fidelity Investments (2018-present). Prior to joining Fidelity Investments, Mr. Zlotnikov served as Co-Head of Multi-Asset Solutions, Chief Market Strategist, and CIO of Systematic Strategies with AllianceBernstein (investment adviser firm, 2013-2018).
Shareholder Expense Example
The Fund invests in Fidelity Central Funds, which are open-end investment companies with similar investment objectives to those of the Fund, available only to other mutual funds and accounts managed by Fidelity Management & Research Company (FMR) and its affiliates. In addition to the direct expenses incurred by the Fund presented in the table, as a shareholder of the underlying Fidelity Central Funds, the Fund also indirectly bear their proportionate share of the expenses of the underlying Fidelity Central Funds. These expenses are not included in the Fund's annualized expense ratio used to calculate either the actual or hypothetical expense estimates presented in the table but are summarized in a footnote to the table.
As a shareholder of the Fund, you incur two types of costs: (1) transaction costs, including sales charges (loads) on purchase payments or redemption proceeds, and (2) ongoing costs, including management fees, distribution and/or service (12b-1) fees and other Fund expenses. This Example is intended to help you understand your ongoing costs (in dollars) of investing in the Fund and to compare these costs with the ongoing costs of investing in other mutual funds.
The Example is based on an investment of $1,000 invested at the beginning of the period and held for the entire period (April 1, 2019 to September 30, 2019).
Actual Expenses
The first line of the accompanying table for each class of the Fund provides information about actual account values and actual expenses. You may use the information in this line, together with the amount you invested, to estimate the expenses that you paid over the period. Simply divide your account value by $1,000.00 (for example, an $8,600 account value divided by $1,000.00 = 8.6), then multiply the result by the number in the first line for a class of the Fund under the heading entitled "Expenses Paid During Period" to estimate the expenses you paid on your account during this period.
Hypothetical Example for Comparison Purposes
The second line of the accompanying table for each class of the Fund provides information about hypothetical account values and hypothetical expenses based on a Class' actual expense ratio and an assumed rate of return of 5% per year before expenses, which is not the Class' actual return. The hypothetical account values and expenses may not be used to estimate the actual ending account balance or expenses you paid for the period. You may use this information to compare the ongoing costs of investing in the Fund and other funds. To do so, compare this 5% hypothetical example with the 5% hypothetical examples that appear in the shareholder reports of the other funds.
Please note that the expenses shown in the table are meant to highlight your ongoing costs only and do not reflect any transaction costs. Therefore, the second line of the table is useful in comparing ongoing costs only, and will not help you determine the relative total costs of owning different funds. In addition, if these transactional costs were included, your costs would have been higher.
| | Annualized Expense Ratio-A | Beginning
Account Value
April 1, 2019 | Ending
Account Value
September 30, 2019 | Expenses Paid
During Period-B
April 1, 2019
to September 30, 2019 |
| Class A | .95% | | | |
| Actual | | $1,000.00 | $1,042.00 | $4.86 |
| Hypothetical-C | | $1,000.00 | $1,020.31 | $4.81 |
| Class M | 1.20% | | | |
| Actual | | $1,000.00 | $1,040.70 | $6.14 |
| Hypothetical-C | | $1,000.00 | $1,019.05 | $6.07 |
| Class C | 1.72% | | | |
| Actual | | $1,000.00 | $1,037.90 | $8.79 |
| Hypothetical-C | | $1,000.00 | $1,016.44 | $8.69 |
| Stock Selector All Cap | .64% | | | |
| Actual | | $1,000.00 | $1,043.70 | $3.28 |
| Hypothetical-C | | $1,000.00 | $1,021.86 | $3.24 |
| Class K | .53% | | | |
| Actual | | $1,000.00 | $1,044.00 | $2.72 |
| Hypothetical-C | | $1,000.00 | $1,022.41 | $2.69 |
| Class I | .68% | | | |
| Actual | | $1,000.00 | $1,043.20 | $3.48 |
| Hypothetical-C | | $1,000.00 | $1,021.66 | $3.45 |
| Class Z | .54% | | | |
| Actual | | $1,000.00 | $1,044.20 | $2.77 |
| Hypothetical-C | | $1,000.00 | $1,022.36 | $2.74 |
A Annualized expense ratio reflects expenses net of applicable fee waivers.
B Expenses are equal to each Class' annualized expense ratio, multiplied by the average account value over the period, multiplied by 183/365 (to reflect the one-half year period). The fees and expenses of the underlying Fidelity Central Funds in which the Fund invests are not included in each Class' annualized expense ratio. In addition to the expenses noted above, the Fund also indirectly bears its proportional share of the expenses of the underlying Fidelity Central Funds. Annualized expenses of the underlying Fidelity Central Funds as of their most recent fiscal half year were less than .005%.
C 5% return per year before expenses
Distributions (Unaudited)
The fund hereby designates as a capital gain dividend with respect to the taxable year ended September 30, 2019, $563,054,539, or, if subsequently determined to be different, the net capital gain of such year.
Class A designates 100%; Class M designates 100%; Stock Selector All Cap designates 72%; Class K designates 79%; Class I designates 78%; and Class Z designates 65%; of the dividend distributed during the fiscal year as qualifying for the dividends–received deduction for corporate shareholders.
Class A designates 100%; Class M designates 100%; Stock Selector All Cap designates 82%; Class K designates 89%; Class I designates 88%; and Class Z designates 73%; of the dividend distributed during the fiscal year as amounts which may be taken into account as a dividend for purposes of the maximum rate under section 1(h)(11) of the Internal Revenue Code.
The fund will notify shareholders in January 2020 of amounts for use in preparing 2019 income tax returns.

FSS-ANN-1119
1.538295.122